Embed Size (px)
Citation preview
Annual Financial Statements
TABLE OF CONTENTS
Combined Management Report4 Fundamental Information
about the Group
4 Merck
16 Strategy
25 Internal Management System
31 Sustainability
40 Research and Development
57 People at Merck
66 Report on Economic Position
66 Macroeconomic and Sector-Specific Environment
70 Review of Forecast against Actual Business Developments
78 Course of Business and Economic Position
78 Merck Group
88 Healthcare
94 Life Science
98 Performance Materials
102 Corporate and Other
103 Report on Risks and Opportunities
120 Report on Expected Developments
125 Report in accordance with Section 315a (1) of the German Commercial Code (HGB)
128 Additional Information on Merck KGaA in accordance with the German Commercial Code (HGB)
Annual Financial Statements138 Balance Sheet as of December 31, 2020
139 Income Statement for the period from January 1 to December 31, 2020
140 Statement of Changes in Fixed Assets
141 Notes for the fiscal year 2020
145 Notes to the Balance Sheet
155 Notes to the Income Statement
159 Other Disclosures
163 Members of the Executive Board of Merck KGaA
164 Members of the Supervisory Board of Merck KGaA
165 Disclosures in accordance with section 160 (1) no. 8 of the German Stock Corporation Act (AktG)
167 List of Shareholdings of Merck KGaA as of December 31, 2020
186 Reproduction of the Independent Auditor’s Report
193 Responsibility Statement in accordance with section 264 (2) sentence 3 HGB and section 289 (1) sentence 5 HGB
194 Report of the Supervisory Board
198 Financial Calendar
Annual Financial Statements
COMBINED MANAGEMENT REPORT*
4 Fundamental Information about the Group 4 Merck 16 Strategy 25 Internal Management System 31 Sustainability 40 Research and Development 57 People at Merck
66 Report on Economic Position 66 MacroeconomicandSector-SpecificEnvironment 70 Review of Forecast against Actual Business Developments 78 Course of Business and Economic Position 78 Merck Group 88 Healthcare 94 Life Science 98 Performance Materials 102 Corporate and Other
103 Report on Risks and Opportunities
120 Report on Expected Developments
125 Report in accordance with Section 315a (1) of the German Commercial Code (HGB)
128 Additional Information on Merck KGaA in accordance with the German Commercial Code (HGB)
* The management report of Merck KGaA has been combined with the Group management report and published in the 2020 Merck Annual Report as well as in theannualfinancialstatementsofMerckKGaA.The2020AnnualReportisanadditional,non-officialpublication,whichdoescomplywiththerequirementsoftheEuropeanSingleElectronicFormat(ESEF).Theofficialannualfinancialreportforfiscal2020,preparedinaccordancewiththeESEFformat,hasbeenfiledwiththeelectronicGermanFederalGazette(elektronischerBundesanzeiger)andisavailableonthewebsiteoftheGermancompanyregister.
Thiscombinedmanagementreportcontainscertainfinancialindicatorssuchasoperatingresult(EBIT),EBITDA,EBITDApre,businessfreecashflow(BFCF),freecashflow,netfinancialdebtandearningspersharepre,whicharenotdefinedbyInternationalFinancialReportingStandards(IFRS).ThesefinancialindicatorsshouldnotbetakenintoaccountinordertoassesstheperformanceofMerckinisolationorusedasanalternativetothefinancialindicatorspresentedintheconsolidatedfinancialstatementsanddeterminedinaccordancewithIFRSs.
Thefigurespresentedinthiscombinedmanagementreporthavebeenrounded.Thismayleadtoindividualvaluesnotaddinguptothetotalspresented.
The Statement of Corporate Governance according to section 15d HGB in conjunction with section 289f (1) sentence 2 HGB is available at https://www.merckgroup.com/en/investors/corporate-governance/reports.
Theseparate,combinednon-financial(Group)reportofMerckKGaA,whichweissuepursuanttosections289b–289eand315b–315cHGB,isavailableasanonlineversiononourwebsiteasofApril13,2021atwww.merckgroup.com/en/sustainability-report/2020/.Itisintegratedintothe2020SustainabilityReport.Wehavecompiledanoverviewoftheinformationcontainedinthecombinednon-financial(Group)declarationathttps://www.merckgroup.com/nfr20.
Forreasonsofbetterreadability,wedonotusegender-specificformulationsinthisannualreport.Thechosenmaleformrepresentsallgenders.
4 Combined Management Report ___ Fundamental Information about the Group ___ Merck
Fundamental Information about the Group
Merck
We are Merck, a vibrant science and technology company. Science is at the heart of everything we do. It drives
the discoveries we make and the technologies we create. We make a positive difference in the lives of millions
of people every day.
In the Healthcare business sector, we accompany people in every phase of their life and help them to shape,
improve, and prolong it. We enable personalized treatments for serious illnesses and help many couples to
realize their wish to have children. The digital platform and the products and services in our Life Science
business sector make precision research simpler and help to speed up scientific breakthroughs. They enable
quicker access to healthcare and ensure that analyses are accurate and medications are trustworthy. The
developments we make in our Performance Materials business sector sit inside the technologies that are
changing the way we use information and shaping our future. They make mobility safer, houses and devices
more intelligent, and technologies more sustainable.
Everything we do is fueled by a belief in science and technology as a force for good – a belief that has driven
our work since 1668, and will continue to inspire us to find more joyful and sustainable ways to live. We are
curious minds dedicated to human progress.
We hold the global rights to the Merck name and brand. The only exceptions are Canada and the United States.
In these countries, we operate as EMD Serono in the biopharmaceutical business, as MilliporeSigma in the life
science business, and as EMD Performance Materials in the high-tech materials business.
Apart from our three business sectors, our financial reporting presents five regions: Europe, North America,
Asia-Pacific, Latin America, and the Middle East & Africa. As of December 31, 2020, we had 58,127 employees
worldwide1. This compares with 57,071 employees as of December 31, 2019.
Our contributions to combating Covid-19*
As a science and technology company, we are convinced that we can help to combat the global challenges
resulting from Covid-19. Our top priority is ensuring the health and safety of our employees and their families
and continuing our business activities for the benefit of the many patients, scientists, and customers who
depend on us. In specific terms, our commitment takes various forms:
• We are collaborating with other healthcare and life sciences companies as well as the Bill & Melinda
Gates Foundation to accelerate the development, manufacture, and delivery of vaccines, diagnostics,
and treatments for Covid-19 and to enhance access for everyone around the world.
• We are part of the European CARE (Corona Accelerated R&D in Europe) consortium, which aims to
accelerate the discovery and development of urgently needed medicines to treat SARS-CoV2, the virus
that causes Covid-19.
1 Merck also has employees at sites that are not fully consolidated subsidiaries. These figures refer to all people directly employed by Merck and
therefore may deviate from figures in the financial section of this report.
* The contents of this chapter or section are voluntary and therefore not audited. However, our auditor has read the text critically.
5 Combined Management Report ___ Fundamental Information about the Group ___ Merck
• Our Life Science products and services are supporting pharma and biotech companies in the
development of Covid-19 vaccines and treatments, including more than 50 potential Covid-19
vaccines, more than 35 solutions for testing, and more than 20 monoclonal antibodies, plasma
products, and antiviral drugs.
• We donated units of our drug Rebif® to the World Health Organization (WHO), the French Institute for
Health and Medical Research (INSERM) and the U.S. National Institute of Allergy and Infectious
Diseases (NIAID) for investigation in Covid-19 clinical trials.2
• We are conducting a Phase II study to evaluate the safety and efficacy of M5049 in patients with
Covid-19 pneumonia. The aim of the study is to investigate if M5049 may prevent or ameliorate the
hyper-inflammatory response in these patients and prevent progression to ‛cytokine storm’.
• We are producing electronic materials that allow the global scientific community to interact intensively
and share the results of their important work, among other things.
• We are particularly proud of the exceptional performance of our employees during these pandemic
times. Thanks to their contribution, we succeeded in staying on course and achieving good results in
2020. To honor this contribution, around 46,000 Merck employees worldwide received a one-time
bonus payment.
• Above and beyond this, we are supporting many who are doing great things in the fight against the
pandemic with donations in-kind and financial donations. To that end, we approved more than € 8
million in Covid-19-related donations in 2020, including two million FFP2 respiratory masks and more
than 240,000 liters of disinfectant, among other things.
You can find more information on our contribution to combating the global challenges resulting from Covid-19
in the following sections on the business sectors and on our website:
https://www.merckgroup.com/en/company/press/press-kits/corona-pandemic.html.
Healthcare
Healthcare discovers, develops, manufactures, and markets innovative pharmaceutical and biological
prescription drugs to treat cancer, multiple sclerosis (MS), infertility, growth disorders, and certain
cardiovascular and metabolic diseases. Healthcare operates in four franchises: Neurology and Immunology,
Oncology, Fertility, and General Medicine & Endocrinology. Our R&D pipeline positions us with a clear focus on
becoming a global specialty innovator in oncology, immuno-oncology, neurology, and immunology.
In 2020, Healthcare generated 38% of Group sales and 40% of EBITDA pre (excluding Corporate and Other).
Europe and North America generated 55% of Healthcare’s net sales in 2020. In recent years, we have steadily
expanded our presence in growth markets. In 2020, Asia-Pacific and Latin America accounted for 38% of sales.
Neurology & Immunology*
Mavenclad® (cladribine tablets) is now approved in more than 80 countries worldwide, including those of the
European Union, United States, Australia, Canada, and Switzerland. We view Mavenclad® as a complementary
oral treatment option in our MS product portfolio. Rebif® (interferon beta-1a), a disease-modifying drug used to
treat relapsing forms of MS (RMS), is and remains a well-established therapy. Rebif® has been a standard
treatment in RMS for more than 20 years, and has more than 1.6 million patient-years of therapy since
approval. Following the European Union approval of the Rebif® label update last year, making it a treatment
option for RMS that may be continued into pregnancy if clinically needed and while breastfeeding, the U.S. Food
and Drug Administration (FDA) followed in May of this year by approving the inclusion of new safety data on
pregnancy and breastfeeding in the prescribing information for Rebif® in the United States. This is an important
2 To date, Rebif® is not approved by any regulatory authority for the treatment of Covid-19 or for use as an antiviral agent.
* The contents of this chapter or section are voluntary and therefore not audited. However, our auditor has read the text criti cally.
6 Combined Management Report ___ Fundamental Information about the Group ___ Merck
update for women living with MS who wish to start or expand their family, not having to choose between
treating their disease or becoming pregnant.
Rebif® has also played an important role in our company support to fight the Covid-19 pandemic, which
includes in-kind contributions, product donations, resources, and expertise in consortia and partnerships aimed
at fighting the pandemic. As part of the global effort to investigate potential Covid-19 therapeutics and our
support of independent research, we worked with the World Health Organization (WHO) and INSERM (the
French National Institute of Health) on a donation of up to 300,000 units Rebif® (interferon beta-1a) for their
important global Covid-19 clinical trials known as SOLIDARITY and DISCOVERY, respectively. This donation was
followed by a collaboration with the US National Institute of Allergy and Infectious Diseases (NIAID), part of the
U.S. National Institutes of Health (NIH) with a contribution of 3,000 units of Rebif® for the Adaptive Covid-19
Treatment Trial 3 (ACTT 3), which is currently enrolling hospitalized adults with Covid-19 in the United States
and in other countries. The NIAID-led study is evaluating treatment with Rebif® in combination with remdesivir,
compared with remdesivir alone, in over 1,000 hospitalized adults diagnosed with Covid-19 and will evaluate
time to recovery in the combination therapy group relative to the remdesivir-only group.
Generating data around our MS treatments and the risk of respiratory viral infections has been important to
help support clinicians as they make treatment decisions for their patients living with MS. At MSVirtual2020:
8th Joint ACTRIMS-ECTRIMS Meeting, which took place virtually from September 11-13, we presented a total of
54 abstracts across our MS portfolio, including data providing insights on how Mavenclad® and Rebif® do not
affect the risk of respiratory viral infections and Covid-19 outcomes in MS patients. We also presented data
demonstrating investigational treatment evobrutinib is the first and only Bruton’s tyrosine kinase inhibitor
(BTKi) to demonstrate high and sustained efficacy through 108 weeks in clinical studies (for further details see
“Research & Development”).
Oncology & Immuno-Oncology*
Erbitux® (cetuximab) is the third best-selling drug in terms of revenue in the portfolio of our Biopharma
business and is our flagship product in oncology. Treating more than 1 million patients since authorization, the
product is a standard of care for patients with epidermal growth factor receptor (EGFR)-expressing, RAS
wildtype metastatic colorectal cancer (mCRC), as well as both recurrent and/or metastatic and locally advanced
squamous cell carcinoma of the head and neck (SCCHN). During the last year, encorafenib in combination with
cetuximab has received regulatory approval in several markets worldwide for mCRC BRAF mutant patients. In
December, Erbitux® was once again officially included in the China National Drug Reimbursement List (NDRL)
for the treatment of RAS wild-type mCRC. This achievement will enable more patients with mCRC in need of
innovative targeted therapies to benefit from the use of Erbitux®.
Together with Pfizer Inc., we have made progress in sharing new data, securing additional regulatory approvals
and reimbursement decisions with our anti-PD-L1 antibody Bavencio® (avelumab) (for further details see
“Research & Development”).
On June 30, the FDA approved Bavencio® for the maintenance treatment of patients with locally advanced or
metastatic urothelial carcinoma (UC) that has not progressed with first-line platinum-containing chemotherapy,
based on the results of JAVELIN Bladder 100. On December 11, 2020, the Committee for Medicinal Products for
Human Use (CHMP) of the European Medicines Agency (EMA) adopted a positive opinion recommending
approval of Bavencio® as monotherapy for the first-line maintenance treatment of adult patients with locally
advanced or metastatic UC who are progression-free following platinum-based chemotherapy. The CHMP’s
positive opinion will now be reviewed by the European Commission (EC), with a decision expected in early
2021.
* The contents of this chapter or section are voluntary and therefore not audited. However, our auditor has read the text critically.
7 Combined Management Report ___ Fundamental Information about the Group ___ Merck
Other highlights from our development pipeline included the advancement of several potential first-in-
class/best-in-class compounds. The development program for tepotinib, our oral MET inhibitor designed to
inhibit the oncogenic MET receptor signaling caused by MET (gene) alterations, has continued to see pivotal
clinical, regulatory, and commercial milestones in 2020. Discovered in-house, tepotinib underscores our
strategic focus on delivering innovative precision medicines to patients with cancer.
On March 25, tepotinib was approved in Japan for the treatment of patients with unresectable, advanced or
recurrent non-small cell lung cancer (NSCLC) with METex14 skipping alterations. The treatment, known as
Tepmetko® in Japan, was the first oral MET inhibitor to have received a regulatory approval for NSCLC
with MET gene alterations.
On August 25, 2020, the U.S. FDA accepted and granted Priority Review to our New Drug Application for once-
daily, orally dosed tepotinib for the treatment of patients with metastatic NSCLC whose tumors have a mutation
that leads to mesenchymal-epithelial transition exon 14 (METex14) skipping. Tepotinib was granted
Breakthrough Therapy Designation by the FDA in September 2019. On November 26, 2020, the EMA validated
our tepotinib application for the treatment of advanced NSCLC with METex14 skipping alterations. On
February 3, 2021, we announced that the FDA has approved Tepmetko® (tepotinib) following Priority Review for
the treatment of adult patients with metastatic NSCLC harboring mesenchymal-epithelial transition (MET) exon
14 skipping alterations.
In February 2019, Merck entered a global strategic alliance with GlaxoSmithKline (GSK) to jointly develop and
commercialize the investigational bifunctional fusion protein, bintrafusp alfa (M7824), discovered as a result of
our own research. Bintrafusp alfa is a potential first-in-class investigational bifunctional fusion protein designed
to simultaneously block two immunosuppressive pathways, TGF-β and PD-L1, within the tumor
microenvironment. This bifunctional approach is thought to control tumor growth by potentially restoring and
enhancing anti-tumor responses. In preclinical studies, bintrafusp alfa has demonstrated antitumor activity both
as monotherapy and in combination with chemotherapy. Based on its mechanism of action, bintrafusp alfa
offers a potential targeted approach to addressing the underlying pathophysiology of difficult-to-treat cancers
(for further details see “Research & Development”).
In June 2020, the Japanese Ministry of Health, Labour and Welfare (MHLW) granted SAKIGAKE ‘fast-track’
designation for the investigational bifunctional fusion protein bintrafusp alfa, as a potential treatment for
patients with BTC. Bintrafusp alfa was previously granted orphan drug designation by both the FDA as well as
the EMA in BTC in December 2018. Bintrafusp alfa is being studied in more than 15 different cancers and 11
alliance-led clinical studies, each exploring distinct mechanistic hypotheses related to the action of TGF-β in
supporting cancer growth. To date, more than 1,300 patients have been dosed globally in the bintrafusp alfa
INTR@PID clinical development program.
Our broad portfolio of small-molecule DNA Damage Response (DDR) inhibitors represents multiple development
paths as monotherapies or in combination with immunotherapy, chemotherapy, or radiotherapy (for further
details see “Research & Development”).
8 Combined Management Report ___ Fundamental Information about the Group ___ Merck
Fertility*
To date, an estimated 4 million babies have been born with the help of our fertility portfolio. Being the global
market leader in fertility drugs and treatments, with a unique and broad portfolio from therapeutics to lab
technologies, our Fertility franchise is an important growth driver for our Biopharma business. Infertility
represents an increasing challenge globally due to demographic changes and growing lifestyle adjustments like
delayed childbearing. In this highly specialized market, we enable treatment individualization including digital
health solutions and technologies in assisted reproductive technologies (ART) for patient convenience. With our
current portfolio, we are well equipped to be the Fertility partner of choice for our customers and to further
improve ART through innovative solutions across therapeutics, lab technologies, services, and digital health
solutions.
The Pergoveris® Pen is the first product with a combination of recombinant follicle-stimulating hormone (FSH)
and recombinant luteinizing hormone (LH) in a ready-to-use liquid version, eliminating the need for mixing. It
thus provides an improved and convenient treatment option for women with severe deficiency of both FSH and
LH. Launches around the globe will continue in order to provide patients with access to this therapeutic.
On the occasion of the annual meeting of the European Society of Human Reproduction and Embryology
(ESHRE), we launched the Merck Digital Congress Center (DCC). Merck DCC provides opportunities to leverage
the interaction in a digital way and to reach the customers, especially during pandemic times. Merck DCC allows
digital means for collaboration, bringing together internal and external expertise.
General Medicine & Endocrinology*
Every day, more than 80 million patients around the world use our trusted general medicine and endocrinology
(GM&E) medications. Concor®, Euthyrox®, Glucophage®, and Saizen® are highly valued brands and market
leaders in many key markets worldwide. As a result, GM&E is the largest business franchise of the Healthcare
business sector in terms of sales, with strong growth in all major therapeutic areas of focus, contributing
significantly to the overall profitability of Healthcare and Merck. Although no longer patent-protected, the brand
equity of our products, built up over decades, makes them cornerstones for the treatment of chronic
cardiovascular, metabolic, and endocrine diseases.
Concor®/Concor Cor®, containing bisoprolol, is the leading beta-blocker worldwide in volume shares for treating
hypertension and cardiovascular diseases such as coronary heart diseases and chronic heart failure. In addition
to the plain preparations, the Concor® family offers fixed-dose combinations such as Concor Plus®/Lodoz®
(bisoprolol with hydrochlorothiazide) and Concor AM® (bisoprolol with amlodipine). Euthyrox®, with the active
ingredient levothyroxine, is the worldwide market leader with a market share of 39% in volume for the
treatment of hypothyroidism, a disease with high prevalence but still low diagnosis rates in most emerging
markets. Glucophage®, containing the active ingredient metformin, is the drug of choice for first-line treatment
of type 2 diabetes. During 2020, multiple health authorities worldwide continued to approve Glucophage® in
prediabetes when intensive lifestyle changes have failed. This indication for Glucophage® is now registered in
64 countries. Overall, considering the high prevalence of prediabetes and diabetes, we continue seeing great
potential for Glucophage®.
We help to raise awareness and education in the areas we operate in, such as thyroid diseases and diabetes.
This is well demonstrated by our active role in International Thyroid Awareness Week and our partnership with
the International Diabetes Federation (IDF), which serves as a basis for implementation of education and
communication activities that emphasize the importance of type 2 diabetes prevention.
Saizen®, with its active ingredient somatropin, is our main endocrinology product and is indicated for the
treatment of growth hormone deficiency in children and adults. Saizen® can be delivered with the Easypod®
electromechanical injection device, the only growth hormone injection device able to wirelessly transfer data
such as injection times, dates, and doses to the web-based software system Easypod® Connect, making it
* The contents of this chapter or section are voluntary and therefore not audited. However, our auditor has read the text critically.

9 Combined Management Report ___ Fundamental Information about the Group ___ Merck
easier for healthcare practitioners and patients to manage adherence and reach their treatment goals. Since
2019, Aluetta® (the new Saizen® pen) has been rolled out to select markets with the objective of expanding the
reach of Saizen®, offering additional options for healthcare practitioners and patients and expanding our devices
portfolio.
In endocrinology, we differentiate ourselves from competitors through leadership in the e-health space, both by
building evidence and by leveraging the meaningful use of technology to provide breakthrough solutions for
patient engagement, partnership with healthcare practitioners and better payer value proposition.
Further contributions against Covid-19 *
Right from the start of the Covid-19 pandemic and all throughout 2020, we have been continuously making
every effort to proactively handle the situation and minimize the impact of the pandemic on the supply of our
medicines locally and globally through three main levers: the thorough implementation of our business
continuity plans across our network, the active management of our stocks, and the assessment of alternative
transportation routes to reach our customers and patients. As we continue to navigate the Covid-19 pandemic,
we are thinking about the most vulnerable people with chronic diseases such as diabetes and cardiovascular
diseases. Through our collaboration with the nonprofit organization Direct Relief, we provided over 8.3 million
tablets of Glucophage® (metformin) and Glucovance® (glibenclamide/metformin), 5.5 million tablets of Concor®
(bisoprolol) and Concor Plus® (bisoprolol/hydrochlorothiazide), and over 2.7 million tablets to people affected
by poverty or emergency situations. Direct Relief has estimated that our donation has helped more than 32,000
patients in crisis areas.
Divestment of the allergy business Allergopharma*
On February 19, 2020, Merck signed an agreement to sell its allergy business Allergopharma to Dermapharm
Beteiligungs GmbH, Grünwald, Germany. The transaction was completed effective March 31, 2020, following
regulatory approval and satisfaction of other customary closing conditions. Only the transfer of the business in
China, which is to be considered immaterial, was completed on August 31, 2020. Allergopharma is a leading
provider of specific immunotherapies for type 1 allergies. In addition to the Allergopharma business in Europe
and Asia with its broad portfolio of therapeutic and diagnostic products, the transaction includes the production
site in Reinbek near Hamburg. An existing adrenaline autoinjector development project for the treatment of
anaphylactic reactions was not part of the transaction and remained with Merck.
* The contents of this chapter or section are voluntary and therefore not audited. However, our auditor has read the text critically.
10 Combined Management Report ___ Fundamental Information about the Group ___ Merck
Life Science
Our purpose is to solve the toughest challenges in the life science industry in collaboration with the global
scientific community. With our Research Solutions, Process Solutions, and Applied Solutions business units, we
are a leading worldwide supplier of tools, high-grade chemicals, and equipment for academic labs, biotech, and
biopharmaceutical manufacturers, as well as the industrial sector. Research Solutions provides our academic
customers with the chemicals and biological tools needed to make scientific discovery easier and faster. Process
Solutions provides drug manufacturers with process development expertise and technologies, such as
continuous bioprocessing. Applied Solutions offers analytical workflows and both lab connectivity and
digitization solutions to empower the labs of the future.
Our strategy includes strengthening our core business by expanding our leading positions and capabilities as
well as establishing new pillars of growth in scientific areas including gene editing, cell and gene therapies,
contract development and manufacturing services, and digitization. The Life Science business sector is a top-
three player by revenue in the global life science market, with leading positions across many of our portfolios.
Our complete portfolio comprises more than 300,000 products, ranging from lab water systems to genome-
editing tools, antibodies, and cell lines, as well as end-to-end bioprocessing systems to support the
manufacturing needs of both emerging biotech and large pharma companies. We have and will continue to play
a critical role in aiding the ongoing response to the Covid-19 pandemic, supporting our customers working on
combatting the novel virus through our products, services, and expertise.
In 2020, the Life Science business sector generated 43% of Group sales as well as 42% of EBITDA pre
(excluding Corporate and Other).
Our Response to Covid-19*
The Life Science business sector is responding to the Covid-19 pandemic with products and solutions that
empower scientists to detect and characterize viruses and to develop vaccines and therapies. We support more
than 35 testing solutions, 50 vaccines, and 20 therapeutic Covid-19 programs for our customers across the
globe. Our e-commerce platform, www.sigmaaldrich.com, continues to grow and connect customers globally
with the products needed to advance their research, development, and production efforts, and our newly
consolidated offering of relevant Covid-19 products, services, and necessary raw materials allows scientists and
researchers to detect and characterize viruses and to develop vaccines and therapies.
In addition, we are tapping into our existing collaborations to support projects that target Covid-19 vaccine and
therapy development. As part of our collaborations with Oxford University in the United Kingdom and Baylor
College of Medicine in Houston, Texas, USA, we supported the process development, manufacturing, and scale
up of their respective Covid-19 vaccines candidates. In May, we began a new collaboration with the
Massachusetts Institute of Technology’s (MIT) Center for Collective Intelligence and Community Biotechnology
Initiative focused on driving innovative pandemic response efforts, which included the release of a new report
detailing potential paths to solutions to combat Covid-19 and future pandemics. Additionally, in October, we
announced our collaboration with Mammoth Biosciences Inc., of South San Francisco, California, USA, for the
development, scale-up, and commercial production of their CRISPR-based SARS-CoV-2 diagnostic test.
* The contents of this chapter or section are voluntary and therefore not audited. However, our auditor has read the text critically.

11 Combined Management Report ___ Fundamental Information about the Group ___ Merck
Promoting scientific engagement and STEM disciplines remains a passion of our business sector. In the spirit of
continuing to ignite youth interest in science and offering inspiring, engaging learning opportunities during
challenging times, we launched Curiosity Labs™ at Home, a virtual video series of scientific experiments that
can be conducted with materials typically found around the house. In 2020, the program generated more than
2.7 million video views, reaching users in 132 countries.
Research Solutions*
In the pursuit of solving the toughest challenges in life science, we seek opportunities to support our global
customers and collaborators with the skills and equipment they need to make critical advancements for the
industry. Aligning with this goal, in January, we announced the opening of a non-profit, high-tech skill
development center in collaboration with the Council of Scientific and Industrial Research’s Institute of Microbial
Technology (CSIR-IMTECH), an organization under the government of India’s Ministry of Science and
Technology. Located in Chandigarh, India, the center is equipped with genome-editing, single-molecule
biomarker detection, and other technologies to help local students build life science skills.
To further the drug discovery process, in September, we launched the MILLIPLEX® SARS-CoV-2 antigen panels
for IgG, IgA, and IgM, which utilize multiplexing technology. The panels are invaluable research tools for Covid-
19 serologicals, epidemiological studies, and vaccine development.
Process Solutions*
A key goal for our Life Science business sector is to support our customers that manufacture drugs, from small
to large innovator companies, bring life-enhancing medicines and therapies to market – and to patients –
faster. To facilitate reaching this target, we continue to add building blocks to our BioContinuum™ Platform to
address intensified bioprocessing and continuous manufacturing. In July, we acquired Resolution Spectra
Systems, a Meylan, France-based leader in bioprocess analytical monitoring, whose Raman technology
bioprocess monitoring sensors complement our newly launched Bio4C™ Software Suite. This acquisition further
enhances our advanced bioprocess portfolio with Good Manufacturing Practice (GMP)-ready instrumentation and
software to analyze and manage generated data.
In November, we announced our agreement with Donghao Lansheng (Group) Co., Ltd. to pilot a new customs
clearance process in China. The new import policy means we will be able to process shipments with fewer
application and technical dossier requirements. The agreement made us the first and only company to be
accepted by the Shanghai government to pilot this new process, representing an important milestone in
improving the availability of global research materials and ensuring more efficient flow of supplies critical to the
development of life-saving therapies in China.
Our portfolio now includes 28 patents for CRISPR technology granted worldwide, including six patents granted
in 2020. In April, we were awarded our second U.S. patent for CRISPR-chrom technology, making us the only
provider with a patent covering the fusion of chromatin modulating peptides to CRISPR proteins. We were
awarded two additional U.S. patents for foundational CRISPR-Cas9 technology in May, which both support
scientists and researchers in their work to advance gene therapy development programs.
* The contents of this chapter or section are voluntary and therefore not audited. However, our auditor has read the text critically.
12 Combined Management Report ___ Fundamental Information about the Group ___ Merck
A strategic fit with our goal of advancing cell-based therapies to patients, our numerous investments in viral
and gene therapy manufacturing will allow further advancement toward potentially life-saving treatments. In
April, we announced an expansion to this offering with plans for a second facility at our site in Carlsbad,
California, USA. This € 100 million, 140,000-square-foot manufacturing facility will support viral and gene
therapy production at the 1,000-liter scale using Mobius® single-use equipment and is expected to open next
year. In September, we announced the expansion of our biosafety testing laboratory services, including our
BioReliance® viral clearance offering, in Singapore. This increased viral capacity at our Singapore lab by 50% to
meet demand from biopharmaceutical and cell and gene therapy developers and manufacturers in Asia-Pacific,
allowing customers to continue developing life-saving medicines amid the Covid-19 pandemic.
We took many steps forward with our Life Science expansion plans throughout 2020. A key growth pillar for the
Life Science business sector, our BioReliance® End-to-End Solutions are service offerings for process
development and manufacturing for emerging biotech companies. In July, we opened our M Lab™ Collaboration
Center in Shanghai, which will host a new BioReliance® End-to-End Solutions GMP manufacturing facility
offering contract development manufacturing organization services to customers in China and Asia-Pacific. The
new M Lab™ Collaboration Center, which is the largest of our nine centers worldwide and located in a hub for
biomedical sciences and the research community in China, also offers customizable solutions to help advance
drug development.
We announced continued expansion in September with a € 59 million addition to our facility near Madison,
Wisconsin, USA, that supports high-potent active pharmaceutical ingredient (HPAPI) and antibody-drug
conjugate (ADC) manufacturing. With more than 35 years of experience in the development and manufacturing
of small molecules, biologics, and ADC technologies, we offer extensive experience in both clinical and
commercial manufacturing. This investment allows large-scale manufacturing of increasingly potent compounds
for therapies with the potential to treat cancer. The project is an addition to our campus in St. Louis, Missouri,
USA, which was the first commercial ADC facility in North America, and which specializes in ADC bio-
conjugation, active pharmaceutical ingredients, excipient and adjuvants manufacturing. Expected to be
completed by mid-2022, it also creates one of the largest dedicated HPAPI manufacturing facilities specially
designed to handle single-digit nanogram containment.
In October, we celebrated another expansion with the topping-out ceremony for our new € 140 million
membrane production plant in Darmstadt, Germany. The project is part of Merck’s plan to invest € 1 billion in
global headquarters by 2025, as announced in 2019. The new membrane manufacturing facility for aseptic
filters will help meet customer demand in the growing biopharmaceutical market, expanding manufacturing of
Millipore Express® membranes, which are critical components in Millipore Express® filters and help ensure the
sterility of biological drug products. Broadening our global manufacturing footprint, we invested a combined
€ 40 million in our facilities in Jaffrey, New Hampshire, USA, and Danvers, Massachusetts, USA, which supply
critical products to customers developing life-saving therapies, including Covid-19 vaccines. The expansion of
our facility in Jaffrey will add 275 jobs to the filtration plant and a new, state-of-the-art water system that
treats and reduces concentration of organic solvents. The expansion will allow the site to operate on a 24-hour
cycle by the end of the year, delivering on increased demand for the manufacturing of filtration devices and
membrane products, specifically Durapore® filters, Express® filters and the Viresolve® product lines, which are
used to ensure the sterility of many life-saving therapies and to remove viral contamination for a variety of
therapies. The expansion to our site in Danvers will add capacity for the manufacturing of Mobius® single-use
consumables and virus filtration technologies, which have seen significantly increased demand. These
expansions, significantly increasing our capacity at both sites, will help meet unprecedented demand of key life-
saving products and demonstrate our commitment to growing our global presence while providing employment
opportunities.
Applied Solutions*
An additional expansion to our site in Buchs, Switzerland, will support our offering of testing kits and services
that ensure our food is safe to eat and our water is safe to drink. In July, we announced an investment of
* The contents of this chapter or section are voluntary and therefore not audited. However, our auditor has read the text criti cally.
13 Combined Management Report ___ Fundamental Information about the Group ___ Merck
€ 18 million to build a new laboratory facility that will support our reference materials business and allow
increased support of researchers and testing labs in pharmaceutical, environmental, and food and beverage
analysis. Completion of the expansion is scheduled for December 2021, adding modern, flexible space to one of
our most important research and development centers.
To ensure safe laboratory work and analysis, our leading lab water offerings provide reliable, consistent sources
of high-quality pure water. To further support our customers in this space, in May, we launched the Milli-Q® IX
7003/7005/7010/7015 Type 2 water purification system, a redesigned version of our benchtop pure water
system.
We aim to optimize digitization across Life Science to increase lab productivity, efficiency, and safety. In
February, we introduced the BrightLab™ platform, our cloud-based software solution bringing inventory
management and instrument connectivity functionalities to research scientists. In March, we launched the
LANEXO™ system for lab inventory, safety, and compliance management. Together, these two components of
our laboratory informatics offering will boost our digital lab productivity business and commercial growth for
Life Science.

14 Combined Management Report ___ Fundamental Information about the Group ___ Merck
Performance Materials
Performance Materials is advancing digital living. Our main focus is on the electronics market with our materials
and solutions changing the way we generate, access, store, process, and display information. In addition, our
highly specialized, application-driven Surface Solutions business makes life more colorful. Together with our
customers, we are discovering the next generation of high-tech materials and solutions. With strong growth
trends such as 5G and Big Data, and new applications such as autonomous driving and Internet of Things (IoT),
we have set the course for future growth.
The business sector consists of three business units: Semiconductor Solutions, Display Solutions and Surface
Solutions. Comparing Performance Materials with a smartphone, Display Solutions represents the user
interface, Semiconductor Solutions the intelligence, and Surface Solutions the aesthetics. We offer innovative
solutions especially for the electronics industry – for microchips and displays – and for surfaces of every kind.
We are well on track with the execution of our five-year Bright Future transformation program announced in
2018. With the completion of the Intermolecular and Versum Materials acquisitions, we achieved two major
milestones to transform Performance Materials into a strong solutions provider and leading player in the
electronic materials market. After closing the acquisition of Versum Materials on October 7, 2019, our newly
integrated organization went live on June 1, 2020. Effective March 4, 2021, we plan to change the name of the
Performance Materials business sector to Electronics.
Performance Materials accounted for 19% of Group sales in 2020 and its share of EBITDA pre (excluding
Corporate and Other) was 18%. The EBITDA pre margin was 30.3% of net sales.
Semiconductor Solutions*
Semiconductor Solutions is at the heart of electronics and enables transformation in communications, mobility,
and healthcare. As almost every electronic device uses one of our products, we are advancing almost every
aspect of digital development. We are developing solutions for smaller, faster, and more powerful devices. As
an industry leader, we are pushing the boundaries of science and technology to help our customers create the
next generation of digital devices and experiences.
Semiconductor Solutions is the largest business unit within Performance Materials. It consists of materials,
delivery systems, and services for the semiconductor industry. Our Semiconductor Materials unit supplies
products for every major production step in the wafer processing, including doping, lithography, patterning,
deposition, planarization, etching, and cleaning. Specialty cleans, photoresists, and conductive pastes for
semiconductor packaging round out the portfolio. Our material innovation accelerator Intermolecular is a
trusted partner for materials innovation and is our Silicon Valley science hub. Its capabilities allow material
combinations to be tested directly in the specific application environment. Compared to conventional methods,
this means enormous time savings in the development process, considerably faster learning cycles, and
findings on new material combinations, providing a unique service for customers.
The Delivery Systems & Services (DS&S) business enables the safe and responsible handling of gases and liquid
chemicals for electronic manufacturers. It focuses on the development and deployment of safe and reliable
delivery equipment. This allows our materials to be handled with the highest quality and safety standards for
our customers.
* The contents of this chapter or section are voluntary and therefore not audited. However, our auditor has read the text critically.

15 Combined Management Report ___ Fundamental Information about the Group ___ Merck
Display Solutions*
Our Display Solutions business unit consists of the Liquid Crystals, Organic Light-Emitting Diodes (OLED),
Photoresists, and Liquid Crystal Windows businesses, among others. We are supporting our display customers
in the development of novel display technologies and product concepts for applications, while also addressing
new requirements that have emerged from the Covid-19 pandemic. With the proliferation of multiple use cases
and display trends, technological requirements for the display industry are significantly expanding. We are in a
leading position to develop required new display materials and technology concepts to contribute to the diverse
display landscape. We remain active in the development of a broad range of display materials, including Liquid
Crystals, OLED, Quantum Dots Pixel Color Converters (QDPCC), and Display Patterning Materials (DPM).
In Liquid Crystals we continue to see very dynamic market developments. Covid-19 has accelerated the market
shift toward China and increased competition. We maintained our position as the technology leader, and with
our XtraBright™ products we were able to win new projects for large-area displays as well as high-resolution
mobile devices. Our OLED materials qualified for free-form display-based products that entered the market this
year. Our photoresist materials are also being used in flexible displays. Our low-temperature processable
positive tone photoresists are widely used to pattern on-cell touch sensors. These sensors enable a thinner
display structure, which is crucial for foldable devices. Our Liquid Crystal Windows business reached a major
milestone with the opening of the Niemeyer Sphere located at the headquarters of crane manufacturer Kirow in
Leipzig, Germany, in July. The prestigious architectural piece is one of the last works of renowned Brazilian
architect Oscar Niemeyer. The construction of the building was realized using triangular versions of our eyrise®
dynamic liquid crystal windows. The Liquid Crystal Windows business is now preparing for the market launch of
privacy-on-demand eyrise® windows in the first quarter of 2021.
Surface Solutions*
The core markets for Surface Solutions are automotive coatings, cosmetics, and, to a smaller extent,
industrials. We are serving these markets with functional and decorative solutions. Our focus is on expanding
our portfolio through innovation in all areas and proactive solution development in close cooperation with our
customers. We provide our customers with solutions that help them to create innovative surfaces of all kinds.
Our materials enable more beautiful, more resistant, and more effective products. Our pearlescent pigments
allow striking automotive coatings, fascinating cosmetics, extraordinary packaging, and innovative product
design. With a broad portfolio of active ingredients, we enable cosmetics manufacturers to enrich their skin care
products with moisturizing, protecting, or anti-aging effects. Moreover, with our functional solutions we serve a
large number of innovative applications, from dirt-repellent and easy-care surfaces to laser markings of plastic
parts and cables. While Covid-19 has had significant impacts across the automotive and cosmetics markets,
Surface Solutions is implementing measures to stabilize the business and to prepare for future growth.
* The contents of this chapter or section are voluntary and therefore not audited. However, our auditor has read the text criti cally.
16
Combined Management Report ___ Fundamental Information about the Group ___ Strategy
Strategy*
Strategy Fundamentals
We are curious minds dedicated to human progress. We believe that scientific exploration and responsible
entrepreneurship are key to technological advances that benefit us all. Our values – courage, achievement,
responsibility, respect, integrity, and transparency – guide us in every step we take and in every decision we
make.
As a company, we have a strong foundation. These fundamentals have been defined by the Merck family. We
always take them into consideration when discussing and deciding on our Group strategy.
• We follow a risk-diversification strategy with three distinct business sectors, and we avoid
overexposure to any single customer, industry, or geography. We ensure resilience against business
disruption and deep crises.
• With our science and technology focus, we want to be leaders in our fields of expertise and markets,
always pushing the boundaries to find new solutions and drive innovation. We aim to create value for
our business and for society.
• We continue to operate under our current ownership with the Merck family as the majority owner.
• We deliver sustainable value, and we want to maintain an attractive financial profile (for example, a
strong credit rating) while assessing and considering the ESG (Environmental, Social, Governance)
impact of our growth ambition.
• Mergers and acquisitions (M&A) are an important driver of our long-term value creation strategy with
a focus on innovation-driven technology.
Group Strategy
Ambition for the future
Over the past years, Merck has grown significantly through a series of strategic moves that have enabled us to
develop into a vibrant science and technology company. We have systematically and continuously strengthened
and focused our portfolio of innovative science and technology throughout our business sectors.
In Healthcare, we focus on development and commercialization of innovative specialty medicines. To do so we
actively managed our portfolio and acquired Serono SA in 2007. Today, we are focusing our R&D efforts on
oncology, immuno-oncology, neurology, and immunology.
Within Life Science, we solidified our position as one of the industry leaders following the acquisition of Millipore
Corporation in 2010 and Sigma-Aldrich Corporation in 2015.
Performance Materials is currently undergoing a major transformation by repositioning its overall business
toward the highly attractive electronic materials market. With the acquisitions of Versum Materials Inc. and
Intermolecular Inc., both in 2019, we have achieved a leading position in this market, with a focus on
Semiconductor Solutions.
With our Group strategy, we want to become the vibrant science and technology company. By 2022, we aim to
have strong, innovative science- and technology-focused business sectors with leadership positions in our
areas. We want to be a top-tier company in relation to our peers in terms of sales growth and margin, and we
aim to continue to deliver sustainable returns to our owners.
* The contents of this chapter or section are voluntary and therefore not audited. However, our auditor has read the text critically.
17
Combined Management Report ___ Fundamental Information about the Group ___ Strategy
We are now in the growth and expansion phase of our strategy and are well on track. Following the Versum
Materials acquisition in 2019, we are giving priority to organic growth while rapidly lowering our debt and
pursuing a sustainable culture of cost consciousness until 2022. We do not rule out making large transformative
deals, yet in light of our strong business portfolio, it is more likely that we will complement our businesses
through a number of small to medium-sized acquisitions after 2022.
In Healthcare, we intend to fully leverage our pipeline’s potential. Our new product launches, Mavenclad® and
Bavencio®, are increasingly contributing to earnings. We expect sales performance in our established products
to remain at least stable through to 2022. By 2022, we aim to achieve additional annual sales of around
€ 2 billion with new medicines and see significant growth potential beyond that year.
Life Science’s growth is driven by our robust product portfolio and backed by our global supply chain, our
e-commerce platform, and our strong track record of service and innovation excellence. The business sector
plans to deliver annual organic sales growth of 6% to 9% (CAGR) per year in the mid-term, continuing to
outpace the market. Our strong positions in Process Solutions and selective pursuit of attractive segments in
the Research Solutions and Applied Solutions markets all contribute to sustaining our profitable growth.
Performance Materials benefits from strong and long-term growth trends, especially from digitization and the
heavily increasing data volumes. We expect Semiconductor Solutions to be the fastest-growing business unit of
Performance Materials with annual organic sales growth in the mid- to high-single-digit percentage range in the
coming years.
To achieve our strategic ambition of becoming the vibrant science and technology company, we focus on our
three Group-wide priorities: Performance, People, and Technology.
Performance
Our priority Performance focuses on the financial aspects of our activities. It provides a clear definition and
tangible targets of financial success. We focus on organic growth while rapidly lowering our debt and pursuing a
sustainable culture of cost consciousness until 2022.
We have made significant progress on this journey in recent years. In the past months, the strengths of our
business model with three innovation-driven business sectors have become particularly evident during the
Covid-19 crisis.
Our three business sectors have moved forward in delivering on their strategic priorities in recent years.
Healthcare has seen increasing sales contributions from the medicines Bavencio® and Mavenclad® and has
made good progress with its development pipeline. The Life Science business sector continues to deliver above-
market growth and has been operating more profitably than most of its competitors. With the acquisition of
Versum Materials, Performance Materials has shifted its portfolio to focus on the high-growth semiconductor
business and generates high margins.
The transformation in recent years and our clear focus on science and technology have paid off. All our business
sectors operate in highly attractive markets and have excellent prospects for the future. Our Healthcare
pipeline, our Process Solutions business with products and services for drug manufacturing, and our
Semiconductor Solutions business will be the main growth drivers (“BIG 3”) in the coming years.
People
To become the vibrant science and technology company, we focus on our people – their talent, their
performance, their ideas. Merck’s People strategy aims at building the capabilities we need to shape the future
by attracting and retaining the right people as well as creating the right culture for them to collaborate and
perform at their best.
18
Combined Management Report ___ Fundamental Information about the Group ___ Strategy
The People strategy acts as a basis for our continuous efforts to attract, retain and develop our leaders and our
talents. It serves as an illustration of our belief that strategic efforts can only be successful if we maintain a
focus on our people.
The delivery concentrates on three key strategic cornerstones – empowered leaders, curious talents, and result
driven teams and networks – that all play an instrumental role in distinguishing and focusing our actions.
Empowered leaders
We drive a high standard of leadership to sustain engaged and curious employees. Establishing a culture of
inspiration and inclusion in which leaders set an example through their attitude and behavior, as well as
selecting and placing the right employees, is key. To support our growth and innovation course, we need a
working environment that actively promotes diversity. One of our strategic goals is to recognize unique voices
and strengths and to foster a culture of inclusion by appreciating individual differences.
In this context, we actively engage and challenge our leaders to become “leaders of people”, and we empower
them to support our company in its transformation. Our leaders are encouraged to embrace new technologies
for data-driven decision-making and development of people.
As “leaders of innovation”, our leaders are encouraged to set a clear, inspiring direction to empower employees
and to provide structure, resources, and clear prioritization to achieve our goals.
Curious talents
Curious talents play an instrumental role in achieving our goals in a globally competitive environment.
Therefore, we have launched a number of new offerings to stimulate individual learning and deliver company-
wide change, such as our new LinkedIn learning platform. By modeling the values and behaviors required to
promote a culture of innovation and curiosity, we encourage our people to challenge the status quo, to think
critically and to demonstrate a pioneering spirit and a passion for innovation. By doing so, our talents are
motivated to break down ambiguous and complex questions and to embrace fast, effective, and unbiased
decision-making.
Results-driven teams and networks
Our activities not only support our people but also the way they work together. In a highly connected world, we
put special emphasis on results-driven teams and networks to ensure a stimulating work environment that
fosters high performance. To enhance our growth and innovation potential over the long-term and ensure the
necessary flexibility to allow us to respond promptly to new trends, we support the development of and
collaboration among our employees. Our focus on team collaboration is underpinned by our endeavor to always
provide future-oriented solutions. This applies to the way we work and also to the frameworks we provide as an
employer to ensure flexibility for individuals and teams to drive results.
Technology
Our approach to technology paves the way for discovering and scaling the most exciting technologies. The
majority of our innovations come from within our existing business sectors, with approximately 7,900 scientists
and researchers working for our company. These innovations include everything from incremental innovations
to disruptive opportunities in the fields of Healthcare, Life Science, and Performance Materials.
Generating new business
Complementary to the business sectors, we are also looking into innovations that fall between our business
sectors or beyond our company’s current scope. With our Innovation Center in Darmstadt, Germany, and our
Innovation Hubs in Menlo Park, California, United States, in Shanghai, China, and in Guangzhou, China, we are
discovering new ideas and technologies, then scaling them up to build new businesses.
19
Combined Management Report ___ Fundamental Information about the Group ___ Strategy
Propelling innovation fields
We are focusing on our activities within the following core innovation fields of interest: Clean Meat, Artificial
Intelligence (AI)-enabled Health Solutions, and Liquid Biopsy.
A growing population, climate change, and the threats of antibiotic-resistant and zoonotic diseases demonstrate
the need for sustainable, pathogen-free, and transparently produced animal protein. Our innovation field “Clean
Meat” – also referred to as cultured, cultivated or cell-based meat – focuses on the biotechnology required to
produce genuine meat and seafood grown in vitro using stem cells taken from animals. This will enable the
production of animal protein that is healthier, more ethical, and environmentally sustainable. We aim to become
the technology enabler for the emerging cultured meat industry, leveraging our vast expertise in cell culture,
advanced materials, bioprocessing and cellular manufacturing. Cell culture media, free of any animal-derived
material, is the major cost driver for cultured meat products. One of our projects in this innovation field is
tackling this challenge by designing and commercializing custom formulations for the production of different
cultured meat and seafood species.
The innovation field of AI-enabled health solutions is the first China-specific innovation field. It includes AI-
related products and services, which mainly help our China Healthcare business grow, and focuses on AI
solutions for patient journey and clinical trial in Merck’s therapeutic areas in China.
This approach is complemented by offering a platform to capture the full innovation potential of Merck between
and beyond our sectors. An example in this area is our Additive Manufacturing of Tablets project. Producing
tablets for clinical trials today is still quite time-consuming and expensive when using traditional tablet
manufacturing processes. Through a newly created partnership with AMCM GmbH, a sister company of 3D
printing world-market leader EOS GmbH, a GMP (Good Manufacturing Practice)-certified 3D printing solution is
being developed that will make tablet production simpler and more flexible, saving time and money. This novel,
simplified process in clinical development of drugs can be enabled by using powder bed fusion methods,
whereby a laser melts and fuses powder together layer by layer. In addition, 3D printing allows for API
formulation to be scalable while avoiding costly reformulations throughout the entire pharmaceutical
development and commercial production process.
Investing strategically in innovative technologies
When it comes to external innovation, we focus on investments in disruptive emerging fields adjacent to, in
between, and beyond our established business sectors. We strive to transform groundbreaking scientific ideas
into businesses with the potential to improve patients’ lives, disrupt industries, and transform the way we live.
This includes M Ventures, our € 400 million evergreen corporate venture capital fund. M Ventures has the
mandate to drive innovation through equity investments in innovative and disruptive technologies and products
with the potential to significantly impact the vitality and sustainability of our core and future business areas.
The team invests globally in transformational ideas driven by great entrepreneurs, taking an active role in
portfolio companies and teaming up with these entrepreneurs and our co-investors to translate innovation into
commercial success. M Ventures has a significant focus on early stage investing and company creation including
the creation of spin-offs to leverage our science and technology base. Since inception, M Ventures has invested
in over 60 promising startups and companies that could impact our core and future business areas, while at the
same time providing Merck with strategic and financial returns, such as through the successful IPO of Progyny
(October 19, 2019) and the recent IPO of Galecto (October 29, 2020), a phase II biotech developing
therapeutics directed at biological targets which are at the heart of fibrosis, inflammation, and cancer. In
addition, M Ventures runs multiple incubators in Israel and a China seed fund worth RMB 100 million
(€ 13 million) to further foster early stage innovation in this market with strategic importance for us.
20
Combined Management Report ___ Fundamental Information about the Group ___ Strategy
Digitalization
A major focus of our innovation efforts is digitalization. We are leveraging related opportunities through our
Digital Organization in order to create value for patients, customers, and business associates. To us,
digitalization means the digital integration of our entire value chain, the digitalization of our products, services,
and communication interfaces to customers, as well as the development of new digital business models.
We believe that responsible data-driven collaboration has the power to transform healthcare and accelerate
scientific discovery. Syntropy, our joint venture with Palantir Technologies Inc., is aimed at unlocking the value
of scientific data and empowering the world’s leading experts to collaborate in the fight against cancer and
many other diseases. Syntropy’s user-centric data integration platform safeguards data ownership while
allowing users to structure and analyze data from disparate sources. Following a successful pilot, Syntropy has
signed its first collaboration with a major NCI (National Cancer Institute) Designated Cancer Center in the
United States. We also recently announced a partnership with MITRE Corporation, United States, to improve the
overall quality and consistency of cancer data available to clinicians, patients, researchers, and other
stakeholders.
Business Strategies
Healthcare
Global megatrends such as growing and aging populations as well as better access to healthcare continue to
drive the demand for our products. To meet these demands and respond appropriately to the dynamics of our
markets, we have significantly transformed our Healthcare business sector in recent years.
Following our successes over the past years, we continue to drive pipeline projects with the aims of bringing
groundbreaking medicines to patients, maximizing our existing portfolio, and continuing our expansion in
growth markets. Our ambition is to become a global specialty innovator, operating in franchises with significant
unmet medical needs and bringing high value to patients. Therefore, we continue to invest in research and
development to discover new treatment options and improve existing ones. Together with our stakeholders and
partners, we want to ensure that people can access the medicines they need to stay healthy and live longer.
The first pillar of our strategy is to reinforce our global footprint, bringing the innovation of our pipeline to
patients and growing our presence – in the United States and in China, for example. The emerging markets and
China are expected to be the largest growth drivers for many of our established products in the future.
Managing the balance between delivering innovative new medicines while expanding our reach and ensuring
the profitable growth of the existing business will be one of the strategic challenges. Fertility and endocrinology,
for instance, offer significant opportunities to bring value to patients. Given their high profitability and growth
potential, maximizing the commercial potential of these areas will remain important.
The second pillar of our strategy is the focus on specialty medicine franchises. Here, we expect the oncology,
immuno-oncology, neurology, and immunology markets to remain highly attractive in terms of size, growth
prospects, and profitability. Within each specialty franchise, our approach is to develop deep internal expertise
and insight, from internal research to commercialization, augmented by external talent sourcing and strategic
partnering. In order to optimize the value and focus of our pipeline we continuously monitor and assess the
potential of our pipeline candidates, based on clinical data, strategic fit and financial criteria, to determine the
best way forward.
The third strategic pillar is innovation: We aim to develop high-quality, first-to-market, and best-in-disease
therapies and to build a portfolio in each of our franchises. We have streamlined our pipeline and expanded our
innovation capabilities with strong investigational drug candidates and technologies. In order to maximize the
output of our R&D investments and increase our chances of success in discovering and developing new
therapies, we focus our expertise on specific franchises and are exploiting synergies in disease mechanisms and
biological pathways. We are investing in digital technologies as well as personalized and translational medicine
in order to drive continued pipeline success.

21
Combined Management Report ___ Fundamental Information about the Group ___ Strategy
In this context, strategic collaborations are an integral part of delivering on our commitment to transform the
lives of patients living with serious unmet medical needs. We recognize the value of collaboration in the
research and development of breakthrough therapies, as well as in strengthening our current portfolio. Here,
we focus on balancing the right blend of internal capabilities and external partnerships (for example, with Pfizer
Inc. on Bavencio® and with GlaxoSmithKline plc on bintrafusp alfa) and on building strong collaborations with
other leaders in the industry.
Life Science
Life Science continues to deliver above-market growth and profitability through a strategic pursuit of leading
positions in attractive market segments.
We have become one of the top players in the industry and set the standard for financial performance and
innovation, with average annual revenue growth of 6% to 8% since 2016. Our Research Solutions business unit
holds solid positions across chemistry and biology consumables, which we are enhancing with innovations such
as multiplex, high-sensitivity protein detection kits and genome-editing tools. Within our Process Solutions
business unit, we offer a complete suite of products for monoclonal antibody production, hold a strong position
in single-use systems, and are gaining scale in contract development and manufacturing services. Our Applied
Solutions business unit provides the broadest range of reference materials and continues to strengthen our
established position in lab water with sustained momentum from recent launches and new digital offerings.
The Covid-19 pandemic, rather than changing our outlook, has reinforced that we are going in the right
direction. Our purpose – to solve the toughest problems in life science in collaboration with the global scientific
community – has strengthened our resolve to accelerate access to better health for people worldwide. Whether
it is in labs, on the manufacturing floor with templates to bring therapeutic breakthroughs to scale, or at the
point-of-care as patients worldwide receive vaccines, therapies and diagnostic tests, this year has put our
purpose into action.
Our aspiration is to sustain this momentum, which is reflected in our three-pillar strategy:
• Strengthen the core organization by expanding our long-held positions in chemistry, lab water and
bioprocessing, as well as enhancing our e-commerce and supply chain capabilities.
• Establish new growth pillars and capabilities in gene editing, cell and gene therapies, contract
development and manufacturing services, and digitization while exploring new ways to address
bottlenecks and inefficiencies in drug discovery and development.
• Sustain momentum of our core through operational excellence and investments in our capacity and
capabilities, such as expansions at our global manufacturing and production sites as well as testing
labs.
Staying this course will reinforce our position as a leading, innovation-driven, global supplier of tools,
technologies, and services. In 2021, we will continue to serve our customers combatting the Covid-19
pandemic and support research labs in adjusting to new ways of working. Our innovations will enable next-
generation bioprocessing, streamline testing workflows, and drive new advances in biology and chemistry. We
are investing for our future, especially to build scale in bioprocess services such as contract development and
manufacturing services, and testing of monoclonal antibodies, viral vectors, and antibody-drug conjugates. Our
pursuit of profitable growth from our strong core positions us to sustain momentum and shape the future of the
life science industry.
Performance Materials
Performance Materials is currently undergoing a major transformation by repositioning its overall business to
that of a global electronic materials, equipment, and service provider. The target markets are attractive due to
their long-term growth and value potential. The electronic content of any product is increasing; electronics are
now part of nearly every product, and our diversification is securing long-term stability. Effective
March 4, 2021, we plan to change the name of the Performance Materials business sector to Electronics.
22
Combined Management Report ___ Fundamental Information about the Group ___ Strategy
In 2019, we acquired Versum Materials, a leading industry player, and Intermolecular, a testing and
prototyping expert for materials innovation. With those two acquisitions we have further expanded our offerings
in innovative and critical technologies for the electronics industry. Based on our best-in-class portfolio of
products and services, we are well positioned in high-growth segments. Our industry-spanning customer base
with a strong focus on thought and investment leaders in the industry allows us to target growth above the
highly attractive semiconductor market.
Megatrends like Internet of things (IoT), AI, and autonomous driving lead to high innovation pressure and drive
the growth of data from every side. The global data volume grows exponentially at around 30% annually; the
“data explosion” will transform electronics far beyond what today’s systems can handle. Data needs to be
generated, transferred, processed, stored, and made comprehensible for humans through smart interfaces. Our
strategy is to cover all aspects of this data handling and to enable processes by providing customized solutions
for the production of innovative electronic components. We are the company behind the companies, advancing
digital living. Performance Materials targets mainly the electronic materials market with a focus on the
semiconductor and display industries in order to participate in the growth of data-driven electronic solutions.
The Bright Future program ensures the successful transformation of Performance Materials by driving the
realization of our strategy. The main outcomes of the program are the shift of our portfolio into growing
electronics segments, safeguarding our margin ambition, and changes in organization and culture within
Performance Materials. The absolute growth of Semiconductor Solutions and future growth in OLED are
expected to outweigh the decline in liquid crystal sales. We expect to stabilize the EBITDA pre margins at
around 30% in the long-term, well above the industry average. Performance Materials expects an organic sales
growth in the range of 3% to 4% (CAGR) per year in the mid-term. With Versum Materials and Intermolecular,
we are able to obtain a leading position in the electronic materials market. Overall, our strategy realization
within the electronics market is well on track, and we are working on measures in Surface Solutions to manage
the Covid-19 effects and to stabilize the business.
Sustainability Strategy
Sustainability is enshrined in our strategy
Humankind is being confronted with global societal challenges. Issues such as climate change, resource
scarcity, a growing global population, demographic change, and insufficient access to healthcare in low- and
middle-income countries are becoming increasingly relevant.
Our businesses create long-term value. Our aim is to reconcile ecological, social, and societal aspects for our
company, for our stakeholders, and for society as a whole. Merck has been guided by strong values for more
than 350 years and across many generations. Sustainability has always been a high priority in all our business
activities.
We believe that sustainable business and profitable growth go hand in hand: The only way for us to secure our
future competitiveness is by creating sustainable added value for society.
Our sustainability strategy centers on a commitment to using science and technology to achieve sustainable
progress for humankind. With this we help to solve the problems described in the United Nations’ 17 global
Sustainable Development Goals (SDGs). Another key objective is to make our business model resistant to
challenges and sudden changes. For example, this includes protecting our supply chains against continued
resource scarcity in order to ensure that we can reliably provide our customers and patients with our products
and medicines.
Our new strategic sustainability goals build on what we have achieved in recent years. The rapidly growing
challenges in society and the environment demand a clear perspective for the years ahead. This is why we have
enshrined sustainability as an essential component of our company’s overall strategy. Through our business
activities, we want to be economically successful and create value for society. At the same time, we endeavor
to avoid generating subsequent costs for society.
23
Combined Management Report ___ Fundamental Information about the Group ___ Strategy
New sustainability goals
We have defined three new goals with our sustainability strategy:
• In 2030, we will achieve progress for more than one billion people through sustainable science and
technology.
• By 2030, we will integrate sustainability into all our value chains.
• By 2040, we will be climate-neutral and reduce our resource consumption.
In order to achieve our sustainability goals, we are concentrating on seven focus areas:
• Sustainable innovations and technologies for our customers
• Impact of our technologies and products on health and well-being
• Sustainability culture and values
• Sustainability and transparency in the supply chain
• Securing our social license to operate in all regions
• Climate change and emissions
• Water and resource intensity
Today and in the future, we are pursuing numerous initiatives and projects in these focus areas and measuring
our progress. These efforts ensure that sustainability will become a key indicator of our success across all our
business sectors. We are also planning to also link the long-term variable compensation of the Executive Board
from 2022 onward with the progress made toward achieving the company’s sustainability goals.
The goals we have set ourselves to 2030 and beyond will contribute to the attainment of the United Nations
SDGs. Our business activities contribute to the following five SDGs in particular:
• SDG 3: Good Health and Well-being
• SDG 8: Decent Work and Economic Growth
• SDG 9: Industry, Innovation, and Infrastructure
• SDG 12: Responsible Consumption and Production
• SDG 17: Partnerships for the Goals
You can find more information about our sustainability activities in the “Sustainability” chapter and in our
2020 Sustainability Report.
24
Combined Management Report ___ Fundamental Information about the Group ___ Strategy
Strategic finance and dividend policy
We are pursuing a conservative financial policy characterized by the following:
Financial flexibility and a conservative funding strategy
We ensure that we meet our obligations at all times and adhere to a conservative and proactive funding
strategy that involves the use of various financial instruments. Our diversified and profitable businesses form
the basis for our strong and sustainable cash flow generation capacity. Moreover, we have several funding
resources in place. A € 2 billion syndicated loan facility, renewed in 2018, is in place until 2025 to cover any
unexpected cash needs.
This credit line is a backup facility that should only be used in exceptional situations. In addition, we have a
commercial paper program with a volume of € 2 billion at our disposal. Within the scope of this program, we
can issue short-term commercial paper with a maturity of up to one year. Furthermore, in 2020, we used
bilateral bank loan facilities with first-class banks to optimize our funding structure. For the acquisition of
Versum Materials in 2019, Merck also agreed on a US$ 2.3 billion term loan, which was partially drawn and
further reduced in the course of 2020.
Additionally, as a general rule, the bond market represents a key element. The most recent bond issues took
place in January 2020 (€ 1.5 billion euro bonds) and September 2020 (€ 1.0 billion hybrid bond). The use of
various instruments provides a broad financing basis and addresses different investor groups.
Maintaining long-term and reliable business relations with a core group of banks
We mainly work with a well-diversified, financially stable and reliable group of banks. Due to our long-term
business approach, bank relationships typically last for many years and are characterized by professionalism
and trust. The banking group consists of banks with strong capabilities and expertise in various products and
geographic regions. We regard these banks as strategic partners. Accordingly, we involve them in important
financing transactions.
Strong investment-grade rating
The rating of our creditworthiness by external rating agencies is an important indicator of financial stability. A
strong investment-grade rating is an important cornerstone of our financial policy, as it safeguards access to
capital markets at attractive financial conditions. Merck currently has a Baa1 rating from Moody’s, an A rating
from Standard & Poor’s (S&P), and an A– rating from Scope, each with a stable outlook. Continuing to reduce
our debt after the Versum Materials acquisition is of utmost importance to us.
Sustainable dividend policy
We are pursuing a sustainable dividend policy. Provided the economic environment develops in a stable
manner, the current dividend represents the minimum level for future dividend proposals. Our dividend policy
will follow the business development and earnings increases over the coming years. However, dividend growth
could deviate, for example, within the scope of restructuring or in the event of significant global economic
developments. We aim for a target corridor of 20% to 25% of earnings per share pre.
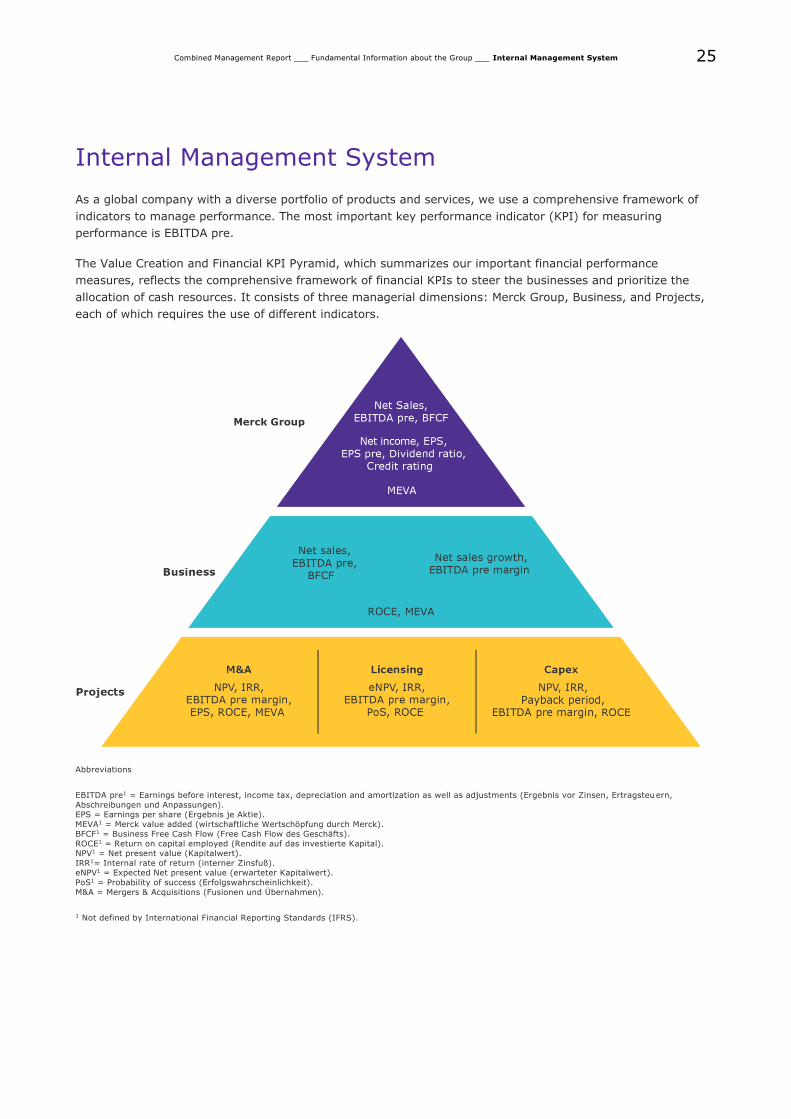
25
Combined Management Report ___ Fundamental Information about the Group ___ Internal Management System
Internal Management System
As a global company with a diverse portfolio of products and services, we use a comprehensive framework of
indicators to manage performance. The most important key performance indicator (KPI) for measuring
performance is EBITDA pre.
The Value Creation and Financial KPI Pyramid, which summarizes our important financial performance
measures, reflects the comprehensive framework of financial KPIs to steer the businesses and prioritize the
allocation of cash resources. It consists of three managerial dimensions: Merck Group, Business, and Projects,
each of which requires the use of different indicators.
Abbreviations
EBITDA pre1 = Earnings before interest, income tax, depreciation and amortization as well as adjustments (Ergebnis vor Zinsen, Ertragsteuern,
Abschreibungen und Anpassungen). EPS = Earnings per share (Ergebnis je Aktie).
MEVA1 = Merck value added (wirtschaftliche Wertschöpfung durch Merck). BFCF1 = Business Free Cash Flow (Free Cash Flow des Geschäfts).
ROCE1 = Return on capital employed (Rendite auf das investierte Kapital). NPV1 = Net present value (Kapitalwert).
IRR1= Internal rate of return (interner Zinsfuß). eNPV1 = Expected Net present value (erwarteter Kapitalwert).
PoS1 = Probability of success (Erfolgswahrscheinlichkeit).
M&A = Mergers & Acquisitions (Fusionen und Übernahmen).
1 Not defined by International Financial Reporting Standards (IFRS).
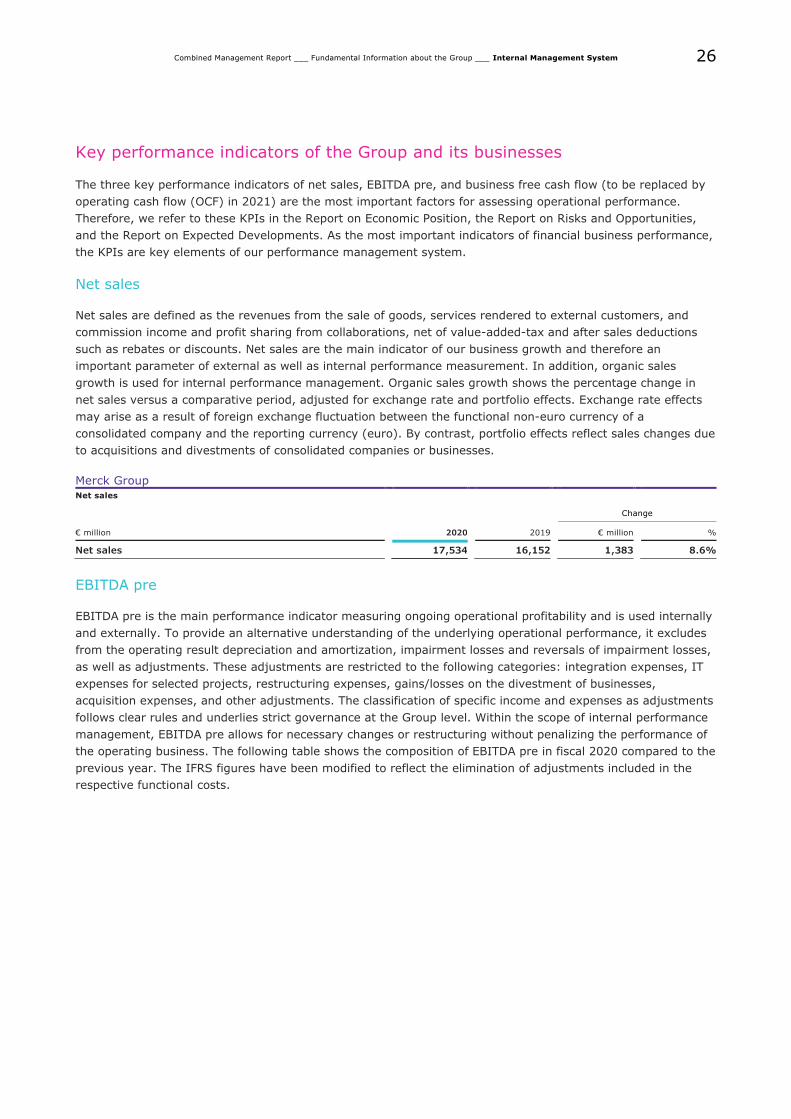
26
Combined Management Report ___ Fundamental Information about the Group ___ Internal Management System
Key performance indicators of the Group and its businesses
The three key performance indicators of net sales, EBITDA pre, and business free cash flow (to be replaced by
operating cash flow (OCF) in 2021) are the most important factors for assessing operational performance.
Therefore, we refer to these KPIs in the Report on Economic Position, the Report on Risks and Opportunities,
and the Report on Expected Developments. As the most important indicators of financial business performance,
the KPIs are key elements of our performance management system.
Net sales
Net sales are defined as the revenues from the sale of goods, services rendered to external customers, and
commission income and profit sharing from collaborations, net of value-added-tax and after sales deductions
such as rebates or discounts. Net sales are the main indicator of our business growth and therefore an
important parameter of external as well as internal performance measurement. In addition, organic sales
growth is used for internal performance management. Organic sales growth shows the percentage change in
net sales versus a comparative period, adjusted for exchange rate and portfolio effects. Exchange rate effects
may arise as a result of foreign exchange fluctuation between the functional non-euro currency of a
consolidated company and the reporting currency (euro). By contrast, portfolio effects reflect sales changes due
to acquisitions and divestments of consolidated companies or businesses.
Merck Group
Net sales
Change
€ million 2020 2019 € million %
Net sales 17,534 16,152 1,383 8.6%
EBITDA pre
EBITDA pre is the main performance indicator measuring ongoing operational profitability and is used internally
and externally. To provide an alternative understanding of the underlying operational performance, it excludes
from the operating result depreciation and amortization, impairment losses and reversals of impairment losses,
as well as adjustments. These adjustments are restricted to the following categories: integration expenses, IT
expenses for selected projects, restructuring expenses, gains/losses on the divestment of businesses,
acquisition expenses, and other adjustments. The classification of specific income and expenses as adjustments
follows clear rules and underlies strict governance at the Group level. Within the scope of internal performance
management, EBITDA pre allows for necessary changes or restructuring without penalizing the performance of
the operating business. The following table shows the composition of EBITDA pre in fiscal 2020 compared to the
previous year. The IFRS figures have been modified to reflect the elimination of adjustments included in the
respective functional costs.
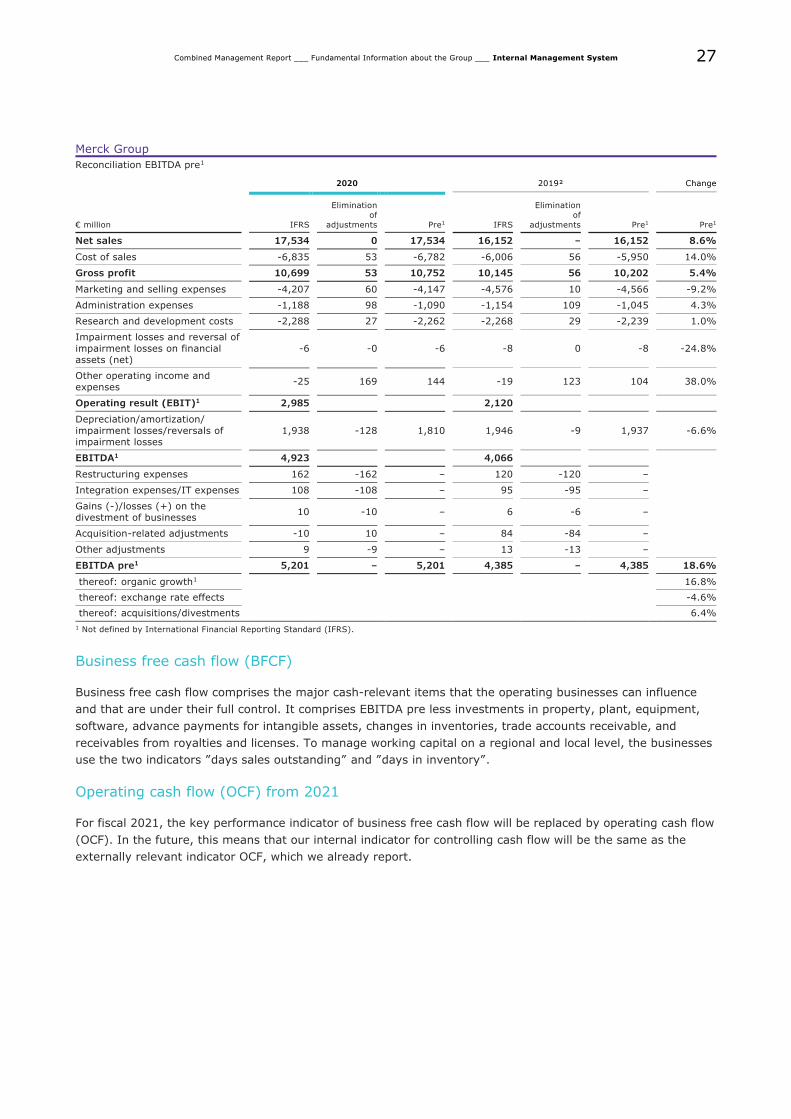
27
Combined Management Report ___ Fundamental Information about the Group ___ Internal Management System
Merck Group
Reconciliation EBITDA pre1
2020 2019² Change
€ million IFRS
Elimination
of
adjustments Pre1 IFRS
Elimination
of
adjustments Pre1 Pre1
Net sales 17,534 0 17,534 16,152 – 16,152 8.6%
Cost of sales -6,835 53 -6,782 -6,006 56 -5,950 14.0%
Gross profit 10,699 53 10,752 10,145 56 10,202 5.4%
Marketing and selling expenses -4,207 60 -4,147 -4,576 10 -4,566 -9.2%
Administration expenses -1,188 98 -1,090 -1,154 109 -1,045 4.3%
Research and development costs -2,288 27 -2,262 -2,268 29 -2,239 1.0%
Impairment losses and reversal of
impairment losses on financial assets (net)
-6 -0 -6 -8 0 -8 -24.8%
Other operating income and
expenses -25 169 144 -19 123 104 38.0%
Operating result (EBIT)1 2,985 2,120
Depreciation/amortization/
impairment losses/reversals of impairment losses
1,938 -128 1,810 1,946 -9 1,937 -6.6%
EBITDA1 4,923 4,066
Restructuring expenses 162 -162 – 120 -120 –
Integration expenses/IT expenses 108 -108 – 95 -95 –
Gains (-)/losses (+) on the divestment of businesses
10 -10 – 6 -6 –
Acquisition-related adjustments -10 10 – 84 -84 –
Other adjustments 9 -9 – 13 -13 –
EBITDA pre1 5,201 – 5,201 4,385 – 4,385 18.6%
thereof: organic growth1 16.8%
thereof: exchange rate effects -4.6%
thereof: acquisitions/divestments 6.4%
1 Not defined by International Financial Reporting Standard (IFRS).
Business free cash flow (BFCF)
Business free cash flow comprises the major cash-relevant items that the operating businesses can influence
and that are under their full control. It comprises EBITDA pre less investments in property, plant, equipment,
software, advance payments for intangible assets, changes in inventories, trade accounts receivable, and
receivables from royalties and licenses. To manage working capital on a regional and local level, the businesses
use the two indicators ”days sales outstanding” and ”days in inventory”.
Operating cash flow (OCF) from 2021
For fiscal 2021, the key performance indicator of business free cash flow will be replaced by operating cash flow
(OCF). In the future, this means that our internal indicator for controlling cash flow will be the same as the
externally relevant indicator OCF, which we already report.
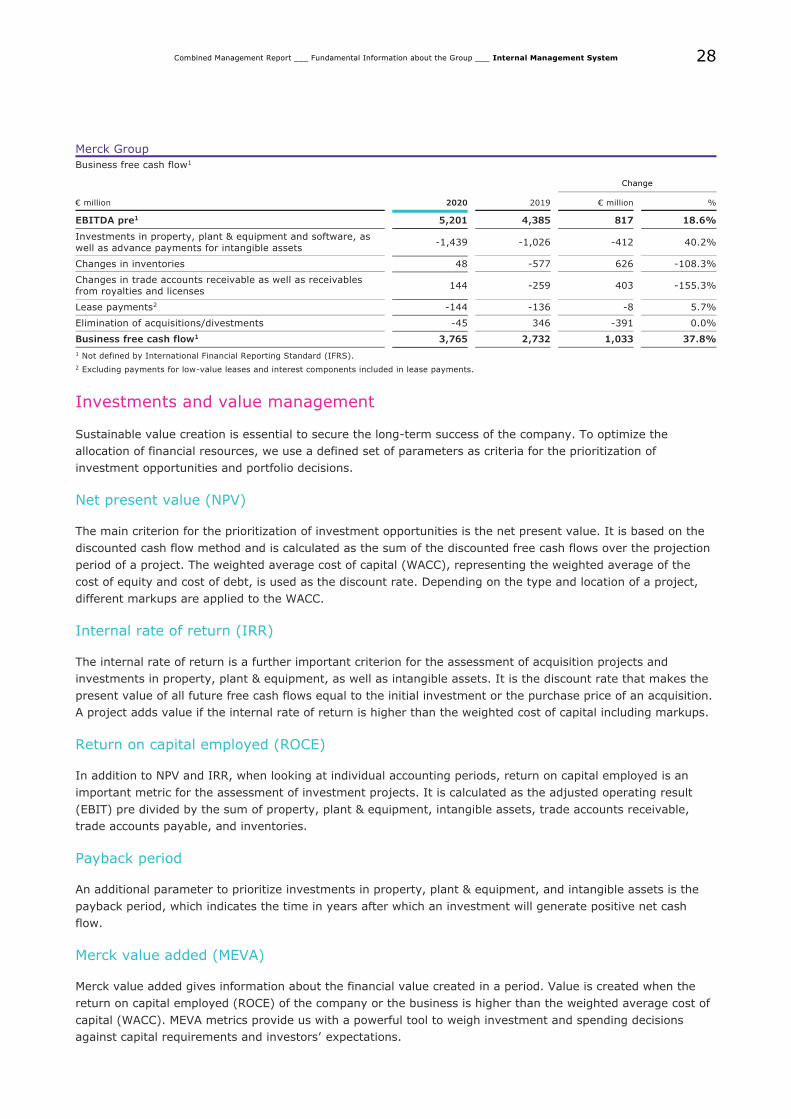
28
Combined Management Report ___ Fundamental Information about the Group ___ Internal Management System
Merck Group
Business free cash flow1
Change
€ million 2020 2019 € million %
EBITDA pre1 5,201 4,385 817 18.6%
Investments in property, plant & equipment and software, as
well as advance payments for intangible assets -1,439 -1,026 -412 40.2%
Changes in inventories 48 -577 626 -108.3%
Changes in trade accounts receivable as well as receivables
from royalties and licenses 144 -259 403 -155.3%
Lease payments2 -144 -136 -8 5.7%
Elimination of acquisitions/divestments -45 346 -391 0.0%
Business free cash flow1 3,765 2,732 1,033 37.8%
1 Not defined by International Financial Reporting Standard (IFRS).
2 Excluding payments for low-value leases and interest components included in lease payments.
Investments and value management
Sustainable value creation is essential to secure the long-term success of the company. To optimize the
allocation of financial resources, we use a defined set of parameters as criteria for the prioritization of
investment opportunities and portfolio decisions.
Net present value (NPV)
The main criterion for the prioritization of investment opportunities is the net present value. It is based on the
discounted cash flow method and is calculated as the sum of the discounted free cash flows over the projection
period of a project. The weighted average cost of capital (WACC), representing the weighted average of the
cost of equity and cost of debt, is used as the discount rate. Depending on the type and location of a project,
different markups are applied to the WACC.
Internal rate of return (IRR)
The internal rate of return is a further important criterion for the assessment of acquisition projects and
investments in property, plant & equipment, as well as intangible assets. It is the discount rate that makes the
present value of all future free cash flows equal to the initial investment or the purchase price of an acquisition.
A project adds value if the internal rate of return is higher than the weighted cost of capital including markups.
Return on capital employed (ROCE)
In addition to NPV and IRR, when looking at individual accounting periods, return on capital employed is an
important metric for the assessment of investment projects. It is calculated as the adjusted operating result
(EBIT) pre divided by the sum of property, plant & equipment, intangible assets, trade accounts receivable,
trade accounts payable, and inventories.
Payback period
An additional parameter to prioritize investments in property, plant & equipment, and intangible assets is the
payback period, which indicates the time in years after which an investment will generate positive net cash
flow.
Merck value added (MEVA)
Merck value added gives information about the financial value created in a period. Value is created when the
return on capital employed (ROCE) of the company or the business is higher than the weighted average cost of
capital (WACC). MEVA metrics provide us with a powerful tool to weigh investment and spending decisions
against capital requirements and investors’ expectations.
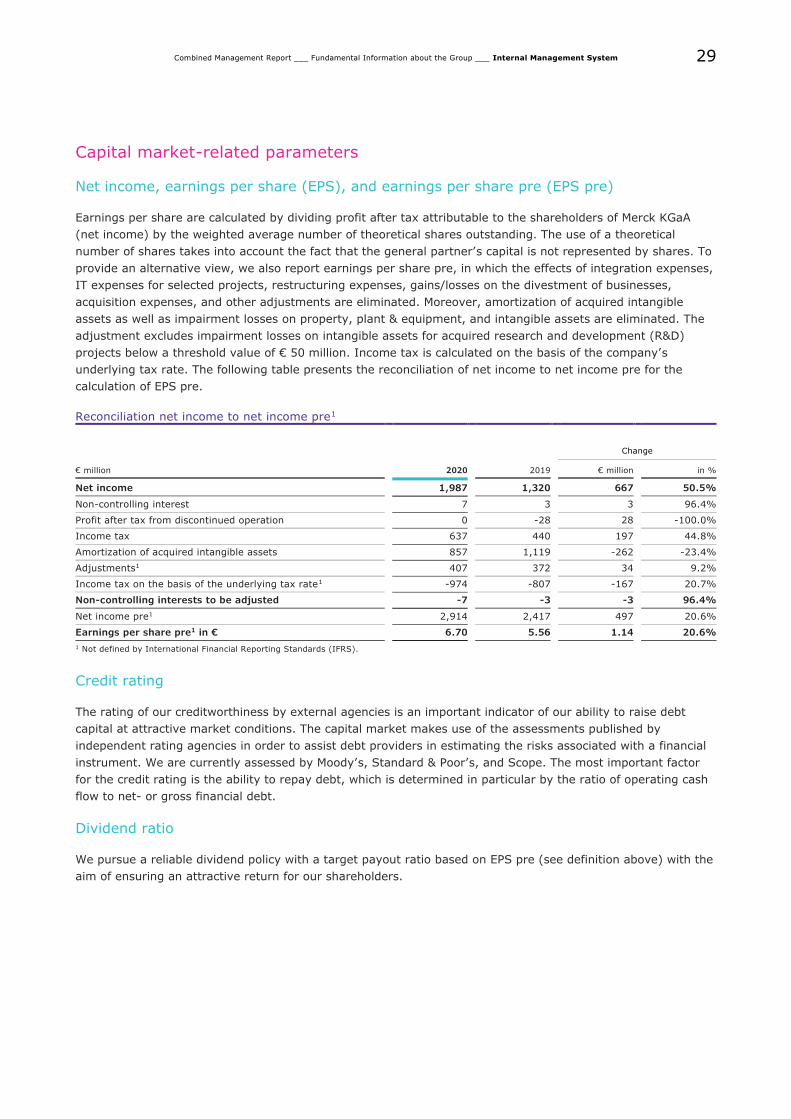
29
Combined Management Report ___ Fundamental Information about the Group ___ Internal Management System
Capital market-related parameters
Net income, earnings per share (EPS), and earnings per share pre (EPS pre)
Earnings per share are calculated by dividing profit after tax attributable to the shareholders of Merck KGaA
(net income) by the weighted average number of theoretical shares outstanding. The use of a theoretical
number of shares takes into account the fact that the general partner’s capital is not represented by shares. To
provide an alternative view, we also report earnings per share pre, in which the effects of integration expenses,
IT expenses for selected projects, restructuring expenses, gains/losses on the divestment of businesses,
acquisition expenses, and other adjustments are eliminated. Moreover, amortization of acquired intangible
assets as well as impairment losses on property, plant & equipment, and intangible assets are eliminated. The
adjustment excludes impairment losses on intangible assets for acquired research and development (R&D)
projects below a threshold value of € 50 million. Income tax is calculated on the basis of the company’s
underlying tax rate. The following table presents the reconciliation of net income to net income pre for the
calculation of EPS pre.
Reconciliation net income to net income pre1
Change
€ million 2020 2019 € million in %
Net income 1,987 1,320 667 50.5%
Non-controlling interest 7 3 3 96.4%
Profit after tax from discontinued operation 0 -28 28 -100.0%
Income tax 637 440 197 44.8%
Amortization of acquired intangible assets 857 1,119 -262 -23.4%
Adjustments1 407 372 34 9.2%
Income tax on the basis of the underlying tax rate1 -974 -807 -167 20.7%
Non-controlling interests to be adjusted -7 -3 -3 96.4%
Net income pre1 2,914 2,417 497 20.6%
Earnings per share pre1 in € 6.70 5.56 1.14 20.6%
1 Not defined by International Financial Reporting Standards (IFRS).
Credit rating
The rating of our creditworthiness by external agencies is an important indicator of our ability to raise debt
capital at attractive market conditions. The capital market makes use of the assessments published by
independent rating agencies in order to assist debt providers in estimating the risks associated with a financial
instrument. We are currently assessed by Moody’s, Standard & Poor’s, and Scope. The most important factor
for the credit rating is the ability to repay debt, which is determined in particular by the ratio of operating cash
flow to net- or gross financial debt.
Dividend ratio
We pursue a reliable dividend policy with a target payout ratio based on EPS pre (see definition above) with the
aim of ensuring an attractive return for our shareholders.

30
Combined Management Report ___ Fundamental Information about the Group ___ Internal Management System
Other relevant/non-financial performance measures
Along with the indicators of the financial performance of the businesses, non-financial measures also play an
important role in furthering the success of the company. From a Group perspective, innovations in the
businesses as well as the promotion of a diverse workforce, especially at the leadership level, and sustained
planning for the filling of company-critical positions, are of particular importance.
Innovation
Innovations are the foundation of our business and will also be prerequisites for future success in changing
markets. We are continuously working to develop new products and service innovations for patients and
customers. Indicators for the degree of innovation are defined based on the specifics of the respective
businesses.
Sustained employee development
We believe that a diverse workforce strengthens our ability to innovate. We actively promote diversity among
our leaders to create an integrative culture that reflects our values and enables every employee to fulfill their
potential. We ensure that our ambitious corporate goals can be realized through strategic succession planning
for company-critical positions. To gauge the success of the related measures, we have introduced diversity and
succession planning as focus issues and non-financial indicators.
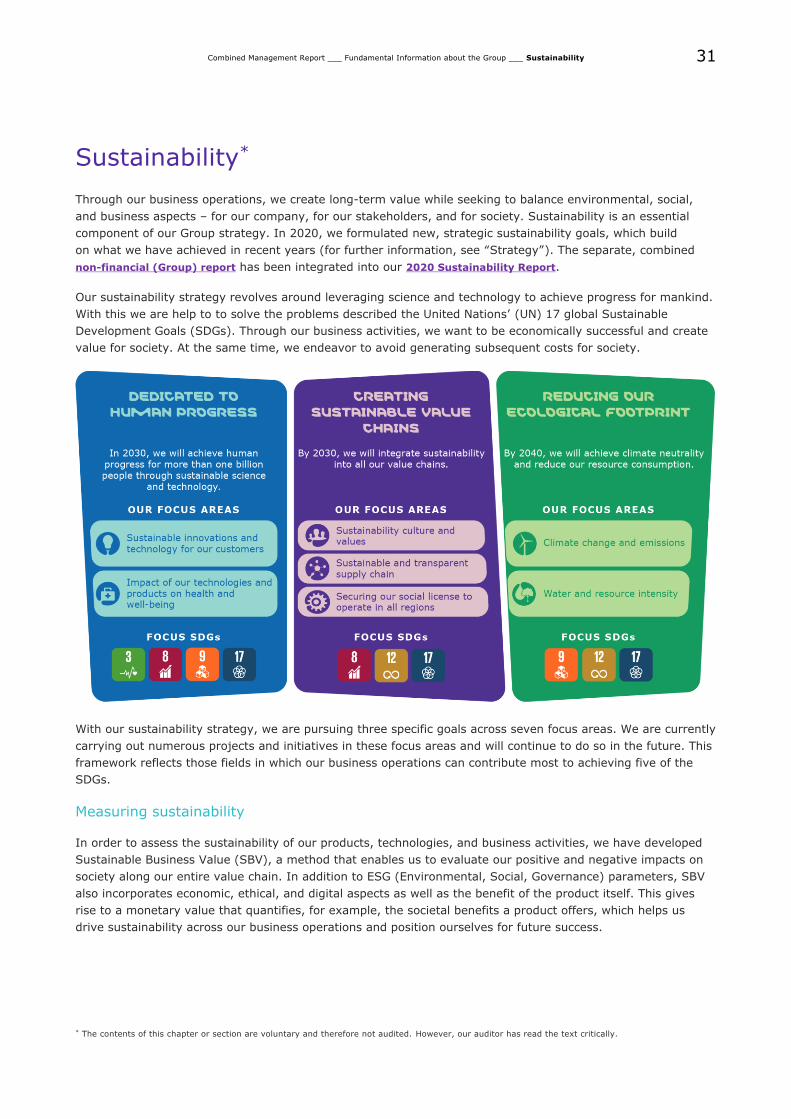
31
Combined Management Report ___ Fundamental Information about the Group ___ Sustainability
Sustainability*
Through our business operations, we create long-term value while seeking to balance environmental, social,
and business aspects – for our company, for our stakeholders, and for society. Sustainability is an essential
component of our Group strategy. In 2020, we formulated new, strategic sustainability goals, which build
on what we have achieved in recent years (for further information, see “Strategy”). The separate, combined
non-financial (Group) report has been integrated into our 2020 Sustainability Report.
Our sustainability strategy revolves around leveraging science and technology to achieve progress for mankind.
With this we are help to to solve the problems described the United Nations’ (UN) 17 global Sustainable
Development Goals (SDGs). Through our business activities, we want to be economically successful and create
value for society. At the same time, we endeavor to avoid generating subsequent costs for society.
With our sustainability strategy, we are pursuing three specific goals across seven focus areas. We are currently
carrying out numerous projects and initiatives in these focus areas and will continue to do so in the future. This
framework reflects those fields in which our business operations can contribute most to achieving five of the
SDGs.
Measuring sustainability
In order to assess the sustainability of our products, technologies, and business activities, we have developed
Sustainable Business Value (SBV), a method that enables us to evaluate our positive and negative impacts on
society along our entire value chain. In addition to ESG (Environmental, Social, Governance) parameters, SBV
also incorporates economic, ethical, and digital aspects as well as the benefit of the product itself. This gives
rise to a monetary value that quantifies, for example, the societal benefits a product offers, which helps us
drive sustainability across our business operations and position ourselves for future success.
* The contents of this chapter or section are voluntary and therefore not audited. However, our auditor has read the text critically.
32
Combined Management Report ___ Fundamental Information about the Group ___ Sustainability
Innovations and technology for our customers
We believe that we can harness science and technology to help tackle many global challenges. From supplying
innovative therapies and empowering scientists around the world to advancing digital living, our business
models are oriented around creating both business and societal value. Our goal is to minimize and ultimately
exclude negative sustainability impacts – not only during production but also during their use. These efforts
also help our customers achieve their own sustainability goals.
Life Science: Reducing environmental impacts throughout the product life cycle
We work to decrease the environmental impacts of our products. This applies to the entire life cycle – from
production and use through to the disposal of our products. To reduce the environmental impact of our devices
and instruments during their use by customers, we apply our Design for Sustainability (DfS) program. This
comprehensive approach keeps sustainability criteria in the foreground during product development, capturing
the improvements in a scorecard to help inform customers. When developing a new product, our aim is to
improve as many of these criteria scores as possible. Beginning with the concept stage, product teams identify
potential environmental impacts and opportunities to make improvements. By the end of 2020, 38% of these
product development projects met at least three or more sustainability criteria.
In addition, our scientists are developing innovative solutions in line with the 12 Principles of Green Chemistry
developed by chemists Paul T. Anastas and John C. Warner. The objective is to enable research that is as
environmentally conscious as possible and to minimize adverse effects on human health. More than 1,100
greener alternatives to conventional products have been made available to date, such as the new bio-based
solvent CyreneTM. Derived from waste cellulose, this product serves as an alternative to widely used solvents,
which are subject to increasing regulatory restrictions due to their associated toxicity. CyreneTM was awarded an
EU Horizon 2020 grant to expand the production of the material in Europe.
With DOZN®, we developed a web-based quantitative Green Chemistry analysis tool. DOZN® 2.0 now brings
new possibilities for sustainable product design to our customers and empowers them with data to make more
environmentally friendly choices in their sourcing and development processes.
To ensure that our packaging impacts the environment as little as possible, we developed a sustainable
packaging strategy for Life Science called SMASH. We have set four goals: reducing the amount of packaging,
achieving zero deforestation, improving plastic sustainability, and maximizing recycling. For instance, thanks to
the collaboration with our vendors and customers, we have conducted several product and distribution
packaging improvement projects that will cut plastic and corrugated packaging by more than 100 metric tons
annually. Additionally, for the shipment of our glass reagent bottles, we have been working continuously to
replace expanded polystyrene inserts with molded pulp inserts, which resulted in the use of more than three
million molded pulp inserts in 2020.
Performance Materials: Increasing the sustainability of end products
Thanks to our liquid crystal window (LCW) technology, windows can be darkened in a matter of seconds. We
commercialize this technology under our eyrise® brand. These darkened windows regulate the heat generated
by direct sunlight. Estimates based on planned customer projects show that this technology can reduce the
energy consumed by building climate control systems and lighting by up to 10%, thereby replacing
conventional shading. In addition, the people behind these windows feel more comfortable and work more
efficiently thanks to the positive effects of natural daylight.
Over the past decade, our semiconductor materials customers have been increasing their efforts to use more
environmentally sustainable materials in their chip manufacturing, while simultaneously improving the
performance of their computer chips at lower costs. We have responded to this challenge by developing next-
generation colloidal silica products using at least 30% less colloidal silica. This reduces the volume of product
needed, which in turn shrinks our environmental footprint.
33
Combined Management Report ___ Fundamental Information about the Group ___ Sustainability
In the cosmetics industry, we are addressing the continuing trend towards ingredients that meet stringent
sustainability criteria. Our portfolio of fillers eliminates the need for microplastic particles, which are highly
resistant to environmental biodegradation, fragment into ever smaller pieces, and do not dissolve in water. Our
cosmetic formulations comply with strict criteria. By the end of 2020, 78 of our cosmetic pigments and active
ingredients had been certified according to Ecocert’s COSMOS standard for organic and natural cosmetics.
Contribution of our technologies and products to health and quality of life
At least half of the world’s population still does not have adequate access to health. We are striving to make
health solutions affordable and raise awareness of diseases. Our aim is to create a healthier future for all. We
use innovation in science and technology to improve the health of underserved populations mainly in low- and
middle-income countries. To achieve this, we leverage our expertise from all business sectors and collaborate
closely with a wide range of partners. We also participate in industry-wide initiatives to develop new
approaches.
Our Global Health strategy
Our Global Health strategy focuses on the elimination of schistosomiasis and malaria as public health problems
and the prevention and control of non-communicable diseases, such as diabetes and hypertension in low- and
middle-income countries. Our projects and programs are guided by the concept of “shared value”: We create a
measurable and sustainable positive impact on society through our products and services. For us, this means
developing business models that increase the value and competitiveness of our company by solving unmet
health needs and strengthening local health systems.
Our fight against schistosomiasis
Schistosomiasis, a neglected tropical disease (NTD), is one of the most prevalent parasitic infections in Africa,
placing a significant burden on public health and the local economy. The disease affects almost 240 million
people worldwide, with more than 90% of cases occurring in Africa. An estimated 200,000 people die every
year from long-term effects of schistosomiasis, such as liver and kidney infections, bladder cancer, genital
schistosomiasis, and anemia. School-aged children are particularly vulnerable to the disease.
Our ultimate aim is to eliminate the disease as a public health problem. To help achieve this goal, we have
adopted an integrated schistosomiasis strategy that we are implementing in close collaboration with multiple
partners worldwide. This approach focuses on five building blocks: treatment; research and development
(R&D); water, sanitation and hygiene (WASH); health education; and advocacy and partnerships.
As part of our longstanding partnership with the World Health Organization (WHO), we are committed to
provide up to 250 million praziquantel tablets per year for distribution in endemic countries. To date, our tablets
have been distributed in 47 endemic African countries to treat school-aged children. In 2020, we donated
around 226 million tablets for distribution in 30 countries, 27 of which are in sub-Saharan Africa. Together with
the Global Schistosomiasis Alliance, we held a consultation meeting with experts and stakeholders and provided
feedback to WHO ahead of the new NTD Roadmap passed by the World Health Assembly in autumn 2020.
Over time, we have developed a portfolio of R&D projects on schistosomiasis. These include the development of
a new pediatric formulation of praziquantel to treat children under the age of six. This project, implemented
through a consortium of partners, is in Phase III clinical development to generate data for registration. Other
projects include the setup of a platform to identify new drugs to prevent and treat schistosomiasis and the
development of highly sensitive diagnostic methods for schistosomiasis and other neglected tropical diseases.
In 2020, we entered into a strategic alliance with Janssen Pharmaceuticals Inc. to develop an artificial
intelligence-based diagnostic tool and new technologies for transmission control.
34
Combined Management Report ___ Fundamental Information about the Group ___ Sustainability
As One Against Malaria
More than 200 million cases of malaria and over 400,000 related deaths are recorded every year, with almost
70% of deaths occurring in children under the age of five. Over 90% of cases and 90% of deaths occur in
Africa. Through our As One against Malaria program, we are implementing several initiatives and projects for
new treatments, diagnostics, prevention methods, and approaches to strengthen health systems. As part of this
integrated program, we are in early clinical development with an innovative drug (M5717) for the prevention
and treatment of malaria.
Furthermore, we are working toward making our insect repellent IR3535® available as a malaria prevention
method in Africa. We joined forces with our partners in Ghana to implement a new program and test IR3535®,
using a new formulation technology for long-lasting efficacy to reduce application times. This insect repellent is
already used for protection against the bites of insects and ticks that can transmit diseases such as Lyme, Zika,
dengue, and chikungunya.
Addressing affordability challenges
Our proactive approach to intellectual property enables research into solutions to the global health challenges
that affect millions in developing low- and middle-income countries. We have adopted a framework of Open
Innovation to accelerate research and development into innovative treatments for infectious diseases. We
provide free access to our proprietary compound library for drug discovery activities to identify new drugs. We
engage non-profit organizations and academia, as well as drive collaborative efforts in line with our mission to
improve the health of underserved populations in low- and middle-income countries.
As part of our Open Innovation initiatives, we contribute to WIPO Re:Search, a partnership between the World
Intellectual Property Organization (WIPO) and BIO Ventures for Global Health (BVGH) that engages private
industry to early stage R&D for vaccines, diagnostics, and drugs against neglected tropical diseases (including
schistosomiasis), malaria and tuberculosis. We are also a member of the DNDi (Drugs for Neglected Diseases
initiative) to accelerate research of novel medicines for infectious diseases. This initiative has proved the
success of a transformative open innovation model through which participating companies can simultaneously
search for new treatments. In addition to our Open Innovation projects, including the new Open Global Health
Library, we have adopted a policy to not file or enforce patents in many low- and middle-income countries and
use a publicly available database (Pat-Informed) to be transparent about our patents and patent applications.
Promoting accessibility and improving supply chains
Our Access to Health approach aims to address the health system gaps that prevent underserved populations
from receiving healthcare. We coordinate with our partners to identify and develop solutions, such as future-
oriented access models for both neglected and non-communicable diseases in low- and middle-income
countries.
We also promote initiatives to strengthen supply chains and to guarantee the targeted supply of medicines in
those countries. For instance, NTDeliver is a digital information tool for improving transparency in medicine
donation supply chains created through public-private partnerships. Deliveries from companies running
donation programs are clearly tracked – from purchase orders made by the WHO through to delivery to the first
warehouse in the destination country. This improves coordination and efficiency and provides a more
transparent overview of the in-country inventory. We deploy our NTDeliver tool to monitor the amount of
schistosomiasis medicine reaching schools, particularly those in last-mile deliveries to remote, rural locations,
for example in Kenya.
35
Combined Management Report ___ Fundamental Information about the Group ___ Sustainability
Sustainability culture and values
Sustainability has been part of our company culture for centuries and is reflected in our values. Our new
sustainability strategy is a natural step in our evolution and is actively supported by the Merck family. To put
this strategy into practice, we are focusing on amplifying this aspect of our company culture, which includes
educating our workforce on sustainability. Additionally, the company is planning to also link the long-term
variable compensation of the Executive Board from 2022 onward with the progress made toward achieving the
company’s sustainability goals.
For us, sustainable entrepreneurship also means taking social responsibility. We see ourselves as part of the
community – both at our individual sites as well as worldwide. Our mission is to help shape society, not only
through our products and technologies but also through our community engagement. We therefore work with
our employees to promote a diverse array of social initiatives that help tackle challenges at the local level.
Our community outreach primarily focuses on those areas where we can leverage the expertise from our core
business. For instance, we promote health and educational initiatives – especially in the natural sciences –
along with cultural programs. Moreover, we provide disaster relief and offer support to people in need in the
vicinity of our sites. In 2020, we spent around € 53 million in total on community engagement, carrying out
274 charitable projects in 96 countries worldwide. We empower and encourage our employees to take action
and engage in activities that benefit the community. Employees are granted up to two days of leave per year to
support volunteer efforts on behalf of our company.
Boosting scientific education
Because education is key to raising awareness for sustainability, we focus our community engagement in part
on the holistic promotion of science and education. In doing so, we nurture characteristics that are essential to
our business activities as a science and technology company, namely creativity, enthusiasm for new
discoveries, curiosity, and the courage to transcend boundaries. For instance, we grant scholarships and,
through the volunteer efforts of our employees, help make science classes more engaging.
In 2020, Covid-19 prompted us to take our science education program virtual; our Curiosity Labs™ at Home
program features 20 simple experiments that can be conducted using materials commonly found around the
home. Each experiment is explained via video and comes with step-by-step instructions. In 2020, the program
generated more than 2.7 million video views, reaching users in 132 countries.
Sustainability and transparency in the supply chain
By securing social, ethical, and environmental standards, sustainability is a key aspect of managing supply
chains. We procure many raw materials, packaging materials, technical products, components, and services
worldwide. We aim to promote supply chain stability while providing our customers with high-quality products
and services. Our supplier management focuses on compliance with fundamental environmental and social
standards in addition to high-quality, delivery reliability, and competitive prices. To achieve this, we have
introduced relevant strategies, processes, and guidelines that we are continuously improving to prevent
violations of supply chain standards. We make sure that all legal requirements are considered and
corresponding measures are initiated where necessary. In this context, we are closely monitoring the
developments relating to a potential supply chain law and the resulting requirements. To ensure supply
security, we select our suppliers based on diverse criteria such as country risk, material risk, supplier risk, and
business criticality. This helps our sourcing employees to identify potential mitigation actions with relevant
suppliers and work on improvements.
36
Combined Management Report ___ Fundamental Information about the Group ___ Sustainability
We expect all our suppliers to comply with the labor, social, and environmental standards defined in our
Responsible Sourcing Principles, which are primarily derived from the core labor standards of the ILO
(International Labour Organisation) and the UN Global Compact. We are continuously working to ensure
adherence to our supply chain standards. As a member of the industry initiative Together for Sustainability
(TfS), we have access to the supplier self-assessments and audit results shared among all member companies,
who in turn abide by all restrictions stipulated within antitrust law.
Securing our social license to operate in all regions
We do our best to mitigate the ethical, financial, and legal risks of our business activities, thereby advocating
for and ensuring our social license to operate. To this end, we have comprehensive structures and systems in
place to ensure compliance with legal requirements, along with ethical, social, and ecological standards in all
the countries where we operate. In view of the dynamic environment of change across all regions with respect
to our social license to operate, we pay special attention to regional aspects.
Safety of our products
The safety of our products is at the core of our sustainability efforts. When used properly, they must pose no
risk to customers, patients, consumers, or the environment. We regularly examine safety throughout the
product’s entire life cycle and continuously take steps to minimize risks. We provide patients, consumers, and
customers with extensive informational material so that they can use our products in a safe, responsible, and
proper manner.
Chemical product safety is all about protecting human health and the environment from negative impacts
resulting from the use of chemical products throughout their entire life cycle. We support developments related
to the European Green Deal and are preparing to implement the European Commission’s Chemicals Strategy for
Sustainability in our company. During the import, manufacture, and commercialization of our products, we
provide relevant information to our customers and the public. This helps them understand the hazards, how to
mitigate risks, and how to use the products safely, in line with local and regional regulatory requirements. We
have automated and standardized most of our hazard communication processes within our business sectors.
Information is communicated via the pertinent digital channels, the Safety Data Sheets, and the labels of our
products.
Throughout the entire life cycle of our medicines, we provide patients and physicians with up-to-date safety
information based on benefit-risk evaluations. Patient safety is a top priority in everything we do. To this end,
company experts process safety-relevant information from various sources such as clinical trials, adverse
reaction reports, and medical and scientific literature. Our Global Patient Safety unit continuously monitors and
evaluates the safety and benefit-risk ratio of our pharmaceutical products worldwide (pharmacovigilance). Our
Medical Safety and Ethics Board oversees the safety and benefit-risk assessments of all our commercialized
products and investigational drugs worldwide. For the safety of patients, we have established a global
pharmacovigilance system that we are always working to enhance.
Attractive workplace for our employees
Our employees contribute to groundbreaking progress in science and technology across the world. They are the
basis of our success and therefore play a central role in our responsible business conduct. In accordance with
the Merck values, we live a culture of mutual esteem and respect. We are dedicated to upholding international
social and labor standards. These are stipulated in our Social and Labor Standards Policy, which complements
our Human Rights Charter and our Code of Conduct. This policy is the foundation for fair and open interactions
with our employees.
To remain successful going forward, we want to attract people to our company who contribute their curiosity,
courage, and spirit of invention. We therefore place a strategic focus on employee development, leadership,
and performance management. Furthermore, we strive to foster diversity among our employees (more
information can be found under “People at Merck”).
37
Combined Management Report ___ Fundamental Information about the Group ___ Sustainability
Supporting relevant responsible governance initiatives
As a participant in the United Nations Global Compact, we have committed ourselves to 10 principles based on
key UN conventions regarding human rights, labor standards, environmental protection, and anti-corruption.
We actively support the implementation of the principles within our sphere of influence and regularly
communicate on our progress. We follow the guidelines of the Responsible Care® Global Charter, which is an
initiative of the International Council of Chemical Associations (ICCA). Responsible Care® aims to help the
chemical industry enhance its environmental, health, and safety performance. We are also a member of the
Chemie3 initiative in Germany, a collaboration between the German Chemical Industry Association (VCI), the
German Employers’ Federation of the Chemical Industry (BAVC), and the German Mining, Chemical, and Energy
Industrial Union (IG BCE). This globally unique alliance seeks to make sustainability a core part of the chemical
industry’s guiding principles and to drive the sector’s position within the German economy as a key contributor
to sustainable development. In implementing sustainability in our business, the frequent dialogue with our
various stakeholders is very important to us. These stakeholders include employees, business associates, the
Merck family, investors, regulatory agencies, industry associations, and non-governmental organizations
(NGOs). This continuous exchange creates transparency and clearly demonstrates how we live our values.
Comprehensive environmental management system
Defining our principles and strategies for environmental stewardship, health and safety (EHS), our Group EHS
Policy is an integral part of our EHS management system, which undergoes an external ISO 14001 audit every
year. At all our sites, local EHS managers are in charge of operational environmental protection. Because our
business is constantly evolving, we conduct internal audits to review our environmental management system
and also have external audits regularly performed to confirm that ISO 14001 requirements are still being met.
In 2020, we obtained an ISO 14001 group certificate for the 11th consecutive year, which covers 92 sites
around the world.
Climate change and emissions
Climate change is one of the major challenges facing us in the 21st century. Because our company is no
exception when it comes to generating greenhouse gases, we had set a goal to reduce total direct (Scope 1)
and indirect (Scope 2) greenhouse gas emissions by 20% by 2020 (2006 baseline), irrespective of production
growth. We have now accomplished this objective. In 2020, we recorded a 25% overall reduction relative to
2006, despite growth in our operating business. However, this excludes emissions from the 2019 acquisition of
Versum Materials, which could not be incorporated into our emission footprint because the available emissions
data available does not reach back to our 2006 baseline. This acquisition increased our emissions significantly.
In total, we emitted approximately 2,010,000 metric tons of CO2 equivalents in 2020.
Building on our previous target, we drew up new climate action goals in 2020. By 2030, we intend to reduce
our direct (Scope 1) and indirect (Scope 2) emissions by 50% compared to 2020 and to source 80% of our
purchased electricity from renewable sources. Moreover, we plan to set a new reduction target for our
emissions from the upstream and downsteam value chain (Scope 3). We are currently setting up processes to
record non-reported Scope 3 data more precisely. We will validate the data basis for a specific target in
2021.Overall, by 2040 we are aiming for climate neutrality across our entire value chain in terms of our Scope
1, Scope 2 and Scope 3 emissions.
In 2020, we improved our rating from CDP for our greenhouse gas emissions performance to B (2019: C). CDP
assesses companies in terms of their performance and transparency when it comes to climate action and water
management.

38
Combined Management Report ___ Fundamental Information about the Group ___ Sustainability
Greenhouse Gas Emissions, Scope 1 and Scope 21
In metric kilotons 20062 2017 20183 2019 20204
Total CO2eq5 emissions 754 653 636 630 2,010
Thereof:
Direct CO2eq emissions 352 341 332 341 1,706
Indirect CO2eq emissions6 402 312 304 289 304
Biogenic CO2 emissions – 13 13 13 13
1 In line with the Greenhouse Gas Protocol, for all previous years (up to the 2006 baseline) greenhouse gas emissions were calculated based on the
current corporate structure as of December 31 of the reporting year and retroactively adjusted for acquisitions or divestments of (parts of) companies, or for changes in emission factors (portfolio-adjusted). Exceptions to this are company units that were added as a result of the acquisition of Versum
Materials. Figures dating back to the 2006 baseline are not available for these units.
2 Baseline for our emission targets is 2006.
3 Since 2018, our reported figures have excluded the Consumer Health business, which was divested on December 1, 2018.
4 Includes Versum Materials as of 2020. Excluding Versum Materials, our greenhouse gas emissions totaled 563 kilotons in 2020.
5 eq = equivalent.
6 The figures presented here have been calculated in accordance with the market-based method.
Energy management plays a key role in energy efficiency and climate impact mitigation. Our production sites in
Darmstadt and Gernsheim – Germany, account for around 25% of our global energy consumption. Both sites
fulfill the requirements of ISO 50001, the international standard for energy management systems. Currently,
13 of our production sites have a certified energy management system.
Energy Consumption1
In gigawatt hours 2017 20182 20193 2020
Total energy consumption 2,073 2,158 2,178 2,372
Direct energy consumption 1,205 1,261 1,288 1,265
Natural gas 1,140 1,194 1,222 1,178
Liquid fossil fuels3 32 33 33 52
Biomass and self-generated renewable energy 33 34 33 35
Indirect energy consumption 868 897 890 1,107
Electricity 723 749 745 944
Steam, heat, cold 145 148 145 163
Total energy sold 0.1 0.0 0.1 0.2
Electricity 0.1 0.0 0.1 0.2
Steam, heat, cold – – – –
1 In line with the Greenhouse Gas Protocol, for all previous years (up to the 2006 baseline) energy consumption has been calculated based on the current corporate structure as of December 31 of the reporting year and retroactively adjusted for acquisitions or divestments of (parts of) companies, or for
changes in emission factors (portfolio-adjusted). Exceptions to this are company units that were added as a result of the acquisition of Versum
Materials. Figures dating back to the 2006 baseline are not available for these units.
2 Since 2018, our reported figures have excluded the Consumer Health business, which was divested on December 1, 2018.
3 Light and heavy fuel oil, liquefied petroleum gas (LPG), diesel, biodiesel, gasoline and kerosene.
Additional facts and figures can be found in our Sustainability Report 2020.
39
Combined Management Report ___ Fundamental Information about the Group ___ Sustainability
Water and resource intensity
In 2020, we successfully finished implementing a sustainable water management system across all high water
use sites, a process we started in 2016. At sites that consume large quantities of water and are also located in
water-stressed areas, we reduced our water use by 27% relative to 2014, surpassing our original target of
10%.
Building on this success, in 2020 we developed a new set of goals for 2025 and 2030 aimed at enhancing the
water efficiency of our processes and reducing the environmental impacts of our waste water. For instance, we
defined an intensity score aimed at boosting water efficiency, which we intend to improve by 10% by 2025
(2019 baseline). Furthermore, it is our stated goal to exceed regulatory water-quality requirements. In an effort
to minimize our negative environmental impacts, we plan to reduce potentially harmful emission residues in our
waste water to below a scientifically defined threshold by 2030. In 2020, CDP gave our Water Security efforts a
B rating (2019: B).
Water is not the only resource growing scarcer, which makes it imperative for us to use raw materials as
efficiently as possible while simultaneously reducing our waste. We use a variety of methods for recycling,
recovering and disposing of the waste we generate, each of which has a different impact on the environment.
To systematically account for these effects, we have put in place the Merck Waste Score. We aim to reduce this
score by 5% by 2025 compared with 2016. In order to support waste reduction, we are also constantly
evaluating ways to enhance our production processes and waste disposal methods. By the end of 2020, we had
achieved a 4.6% reduction.

40
Combined Management Report ___ Fundamental Information about the Group ___ Research and Development
Research and Development
Science is at the heart of everything we do. We conduct research and development (R&D) worldwide in order to
develop new products and services to improve the quality of life of patients and satisfy the needs of our
customers. Further optimizing the relevance and efficiency of our research and development activities – either
on our own or in cooperation with third parties – is one of our top priorities.
In 2020, approximately 7,900 employees worked for Merck, researching innovations to address long-term
health and technology trends in both established and growth markets (2019: approximately 7,800).
Expenditures for R&D amounted to € 2.3 billion in 2020 (2019: € 2.3 billion). In our R&D activities, we focus on
both in-house research and external collaborations that enable us to increase the productivity of our research
while simultaneously reducing financial outlay. The organizational setup of our R&D activities reflects our
structure with three business sectors. With our Healthcare business sector’s research pipeline, we aspire with
our research pipeline to make a positive difference for patients – always with the goal to help create, improve,
and prolong life. Our main research areas include oncology, immuno-oncology, and immunology including
multiple sclerosis. In the Life Science business sector, our research activities focus on technologies for
laboratory and life science applications as well as the support of new developments. We continue to focus on
digitized and automated labware, DNA purification for downstream applications and emerging chemical
synthesis, as well as software for our BioContinuum™ Platform to accelerate Biopharma 4.0. We remain
dedicated to delivering on our core competencies, such as filtration, pure lab water, and diagnostic solutions.
The main focus of our Performance Materials business sector’s research is on the development of innovative
materials and technologies required for the latest generations of memory chips and processors. In addition,
Performance Materials develops materials for OLED and LC displays as well as new effect pigments for use in
the automotive, cosmetics and printing industries.
Research and Development Costs
Change
€ million 2020 2019 € million %
Healthcare 1,640 1,666 -26 -1.5%
Life Science 313 276 37 13.3%
Performance Materials 274 267 6 2.4%
Corporate and Other 62 59 3 4.3%
Total 2,288 2,268 20 0.9%
The ratio of research expenditure to Group sales was 13.0% (2019: 14.0%). The decline is due to the positive
sales development.
Healthcare*
With our Healthcare research pipeline, we aspire to make a positive difference for patients – always with the
purpose to help create, improve, and prolong life. Our main focus areas include oncology, immuno-oncology,
and neurology & immunology.
* The contents of this chapter or section are voluntary and therefore not audited. However, our auditor has read the text critically.
41
Combined Management Report ___ Fundamental Information about the Group ___ Research and Development
Neurology & Immunology
Multiple sclerosis (MS) is one of the world’s most common neurological disorders. Despite the emergence of a
number of therapies in the last two decades, there are still significant unmet needs for MS patients. We have
more than 20 years of experience in MS, and we remain committed to finding solutions for patients’ significant
unmet medical needs.
We continue to receive regulatory approvals for our oral treatment option Mavenclad® (cladribine tablets)
around the world. Mavenclad® is now approved in more than 80 countries worldwide, including those of the
European Union, the United States, Australia, Canada, and Switzerland.
New data for both our marketed MS treatments Mavenclad® and Rebif® (interferon beta-1a) and our
investigational treatment evobrutinib, the first and only Bruton’s tyrosine kinase inhibitor (BTKi) to demonstrate
high and sustained efficacy through 108 weeks in clinical studies, have been presented across key congresses
this year, including the 6th Congress of the European Academy of Neurology (EAN). We presented a total of
16 abstracts at this congress, which took place virtually from May 23-26.
In June, the U.S. Food and Drug Administration (FDA) cleared our investigational new drug application (IND)
for M5049 for the potential treatment of patients with Covid-19 pneumonia. The first patient was dosed in the
Phase II trial at end of July. M5049 is a potentially first-in-class small molecule that blocks the activation of
Toll-like receptor (TLR)7 and TLR8, two innate immune sensors that detect single-stranded RNA from viruses
such as SARS-CoV-2, the virus responsible for Covid-19. The aim of the study is to investigate if M5049
intervention at a critical point in the course of Covid-19 disease may prevent or ameliorate the hyper-
inflammatory response in patients with Covid-19 pneumonia and prevent progression to “cytokine storm”.
Successful intervention with the investigational drug may reduce life-threatening complications of Covid-19,
including severe respiratory symptoms that often necessitate further medical interventions such as mechanical
ventilation.
Generating data around our MS treatments and the risk of respiratory viral infections has been important this
year to help support clinicians as they make treatment decisions for their patients living with MS. At
MSVirtual2020: 8th Joint ACTRIMS-ECTRIMS Meeting that took place virtually from September 11-13, we
presented a total of 54 abstracts across our MS portfolio, including data providing insights on how Mavenclad®
and Rebif® do not affect the risk of respiratory viral infections and Covid-19 outcomes in MS patients. Other
important data presented at ACTRIMS-ECTRIMS included new efficacy and real-world safety data on
Mavenclad®:
• Early onset of action: Efficacy results from the Phase IV MAGNIFY-MS study, demonstrating an early
onset of action from end of month one through a reduction in mean combined unique active (CUA)
lesion count in the first six months of Mavenclad® treatment for highly active RMS
• Sustained efficacy: New data evaluating cumulative relapse incidence over five years in patients
enrolled in the CLARITY and CLARITY Extension trials, showing the sustained efficacy of Mavenclad®
• Late-breaking interim data from the CLASSIC-MS study on the long-term efficacy and real-world
treatment patterns for patients receiving Mavenclad®, with eight to 14 years of follow-up
• Disability improvement: Results from a post hoc analysis from the CLARITY Extension, showing
patients receiving early treatment with Mavenclad® had a greater prevalence of disability
improvement over five years, as measured by the Expanded Disability Status Scale (EDSS)
• The global Phase III clinical development program evaluating evobrutinib in relapsing MS includes two
pivotal studies, EVOLUTION RMS 1 and 2. Evobrutinib was developed within our own laboratories and
further demonstrates our commitment to improving the lives of people with MS and other chronic
progressive diseases.
42
Combined Management Report ___ Fundamental Information about the Group ___ Research and Development
We have continued to deliver on the strategic evolution of our immunology pipeline this year, which includes
out-licensing certain assets to allow us to focus on our priority areas and assets. In September, we announced
that we are looking for a partner to take sonelokimab (M1095), an investigational anti-IL-17 A/F Nanobody®
that neutralizes both IL-17A and IL-17F in patients with moderate to severe chronic plaque-type psoriasis, into
Phase III. In October, we announced the out-licensing of M6495, an anti-ADAMTS5 Nanobody® for the potential
treatment of osteoarthritis (OA), to Novartis, and in November, we entered into an out-licensing agreement
with Vera Therapeutics for atacicept.
Oncology & Immuno-Oncology
Oncology and immuno-oncology are core focus areas in our R&D portfolio. With an emphasis on biology-driven
research, we aim to deliver transformative treatments. Translational research is embedded into the whole R&D
process, with several projects addressing unmet needs in hard-to-treat cancers through innovative treatment
approaches and novel combinations. In 2020, we achieved a number of significant milestones across our
oncology and immuno-oncology pipeline.
Treating more than 1 million patients since authorization, Erbitux® (cetuximab) is a standard of care for
patients with epidermal growth factor receptor (EGFR)-expressing, RAS wildtype metastatic colorectal cancer
(mCRC), as well as both recurrent and/or metastatic and locally advanced squamous cell carcinoma of the head
and neck (SCCHN). We continue to invest in cetuximab and are committed to making it available to those
patients it will benefit most. In March, Erbitux® obtained the approval of the National Medical Products
Administration of China for the first-line treatment of patients with recurrent and/or metastatic squamous cell
carcinoma of the head and neck in combination with platinum-based therapy with fluorouracil.
We continue to develop much-needed new treatment options for patients with hard-to-treat cancers and have
made key progress in this area with avelumab, an anti-PD-L1 antibody we are co-developing and co-
commercializing with Pfizer. To date, avelumab has received approval in more than 50 countries across the
world under the brand name Bavencio®.
On January 6, we announced top-line results from the Phase III JAVELIN Bladder 100 trial, which showed that
patients with previously untreated locally advanced or metastatic urothelial carcinoma (UC) whose disease did
not progress on initial chemotherapy and who were randomized to receive first-line maintenance therapy with
Bavencio® and best supportive care (BSC) lived significantly longer than those who received BSC only. These
results were subsequently published online ahead of print on September 18 in The New England Journal of
Medicine simultaneously with the presentation of additional analyses at the European Society for Medical
Oncology (ESMO) Virtual Congress 2020, describing the efficacy of Bavencio® as a first-line maintenance
treatment across various subgroups of patients and highlighting exploratory biomarkers as well as patient-
reported outcomes.
On April 9, Merck and Pfizer announced that the FDA granted Breakthrough Therapy Designation for Bavencio®
in first-line maintenance treatment of locally advanced or metastatic UC, and that the companies had submitted
a supplemental Biologics License Application for review under the FDA’s Real-Time Oncology Review (RTOR)
pilot program.
On June 22, we announced that the European Medicines Agency (EMA) had validated for review the Type II
variation application for Bavencio® for this proposed indication. A supplemental application was also submitted
in Japan.
We also have continued to progress our efforts to bring Bavencio® in combination with axitinib to patients with
advanced renal cell carcinoma (RCC). On July 31, we and our Alliance partner Pfizer announced that in the
United Kingdom, the National Institute for Health and Care Excellence (NICE) recommended Bavencio® in
combination with axitinib for first-line treatment of adult patients with advanced RCC. This is the first
combination of an immunotherapy with a targeted antiangiogenic therapy to be recommended by NICE as a
first-line treatment option for advanced RCC for use within the Cancer Drugs Fund in the United Kingdom.
43
Combined Management Report ___ Fundamental Information about the Group ___ Research and Development
Other highlights from our development pipeline included the advancement of several potential first-in-
class/best-in-class compounds. The development program for tepotinib, our oral MET inhibitor designed to
inhibit the oncogenic MET receptor signaling caused by MET (gene) alterations, has continued to see pivotal
clinical, regulatory, and commercial milestones in 2020. Discovered in-house at Merck, tepotinib underscores
our strategic focus on delivering innovative precision medicines to patients with cancer.
On March 25, tepotinib was approved in Japan for the treatment of patients with unresectable, advanced or
recurrent non-small cell lung cancer (NSCLC) with METex14 skipping alterations. The treatment, known as
TEPMETKO® in Japan, was the first MET inhibitor to have received a regulatory approval for NSCLC
with MET gene alterations.
On May 29, The New England Journal of Medicine published the primary analysis of the Phase II VISION study
of tepotinib in advanced NSCLC with METex14 skipping alterations. Also presented during the ASCO20 Virtual
Scientific Program, results showed consistent response and durable anti-tumor activity across lines of treatment
in patients assessed by both liquid biopsy (LBx) and tissue biopsy (TBx).
On August 25, the U.S. FDA accepted and granted Priority Review to our New Drug Application for once-daily,
orally dosed tepotinib for the treatment of patients with metastatic NSCLC whose tumors have a mutation that
leads to mesenchymal-epithelial transition exon 14 (METex14) skipping. Tepotinib is being reviewed by the FDA
under its Real-Time Oncology Review (RTOR) pilot program. Tepotinib was granted Breakthrough Therapy
Designation by the FDA in September 2019.
Several new clinical studies were initiated in 2020 for bintrafusp alfa (M7824), discovered as a result of our own
research and under clinical development through an alliance with GlaxoSmithKline (GSK). Bintrafusp alfa is a
potential first-in-class investigational bifunctional fusion protein designed to simultaneously block two
immunosuppressive pathways, TGF-β and PD-L1, within the tumor microenvironment. This approach is thought
to control tumor growth by potentially restoring and enhancing anti-tumor responses. In preclinical studies,
bintrafusp alfa has demonstrated antitumor activity both as monotherapy and in combination with
chemotherapy. Based on its proposed mechanism of action, the compound offers a potential targeted approach
to addressing the underlying pathophysiology of difficult-to-treat cancers. Studies initiated in 2020 included a
new Phase II monotherapy study in mobility group AT-hook 2 (HMGA2) expressing triple negative breast cancer
(INTR@PID BREAST 020), a Phase I monotherapy study in metastatic or locally advanced urothelial cancer
(INTR@PID UROTHELIAL 152) and two studies in HPV-associated tumors, including the Phase II monotherapy
study in platinum-experienced cervical cancer (INTR@PID CERVICAL 017) and Phase I combination study with
other anti-cancer therapies in participants with locally advanced or advanced cervical cancer (INTR@PID
CERVICAL 046). A Phase I combination study evaluating bintrafusp alfa and M6223, a t-cell
immunoreceptor with immunoglobulin and ITIM domains (TIGIT), which is an immune checkpoint receptor
thought to inhibit t-cell activation and contribute to t-cell exhaustion was initiated (NCT04457778). Like
bintrafusp alfa, M6223 was also discovered in our research labs.
Additionally, bintrafusp alfa is under investigation as a Phase II monotherapy study in patients with locally
advanced or metastatic biliary tract cancer (BTC) who did not respond to, or were intolerant to, first line
platinum-based chemotherapy (INTR@PID BTC 047) and in a Phase II/III combination study as a first-line
treatment of gemcitabine plus cisplatin with or without bintrafusp alfa in BTC patients. It is also being studied in
two lung cancer studies a Phase II study of bintrafusp alfa with concurrent chemoradiation therapy (cCRT) in
unresectable Stage III non-small cell lung cancer (NSCLC) (INTR@PID LUNG 005), and a Phase Ib/II, open-
label study of bintrafusp alfa in combination with chemotherapy in participants with Stage IV NSCLC regardless
of PD-(L)1 expression status (INTR@PID LUNG 024). On January 20, 2021, Merck announced the
discontinuation of the INTR@PID Lung 037 clinical trial, a randomized, open label controlled adaptive Phase III
study of bintrafusp alfa compared with pembrolizumab as a first-line (1L) treatment in patients with PD-L1
expressing advanced NSCLC after a review of the totality of clinical data by the independent data monitoring
panel concluded that the study was unlikely to meet the co-primary endpoint, specifically progression-free
survival.

44
Combined Management Report ___ Fundamental Information about the Group ___ Research and Development
To date, more than 1,300 patients have been dosed globally in the bintrafusp alfa INTR@PID clinical
development program.
At the 2020 American Society of Clinical Oncology (ASCO) Annual Virtual Meeting held on May 31 and June 4,
we had a significant presence at the Virtual Scientific Program. Potential first-in-class early and late stage
pipeline compounds, and investigational uses of our approved medicines were featured at the meeting:
• Data from the Phase III JAVELIN Bladder 100 study (Abstract# LBA1) of Bavencio® in the first-line
maintenance treatment of patients with locally advanced or metastatic urothelial carcinoma (UC) were
highlighted in the ASCO embargoed presscast on May 26 and at the plenary session on May 31. The
data showed that Bavencio® as first-line maintenance significantly improved overall survival in the
primary population of all randomized patients by 7.1 months, with a 31% reduction in the risk of
death compared with initial chemotherapy followed by BSC alone.
• In addition, a late-breaking oral presentation of results of the investigator-sponsored, multicenter
Phase II TROPHIMMUN study of Bavencio® for the treatment of chemotherapy-resistant gestational
trophoblastic tumors (Cohort A), was also featured in the ASCO press program.
• Several oral presentations for both the TPExtreme ISS and the independent BEACON-CRC study data
featuring Erbitux®, the standard of care for patients with epidermal growth factor receptor (EGFR)-
expressing, RAS wildtype metastatic colorectal cancer (mCRC), as well as both recurrent and/or
metastatic and locally advanced squamous cell carcinoma of the head and neck (SCCHN),
demonstrated its steady role across the continuum of care in mCRC and as the backbone of treatment
of SCCHN.
• For oral MET inhibitor tepotinib, results from the primary analysis of the Phase II VISION study
showed consistent response and durable anti-tumor activity across lines of treatment in patients
assessed by both liquid biopsy (LBx) and tissue biopsy (TBx).
• For bintrafusp alfa, two-year follow-up data from a Phase I global study of bintrafusp alfa, an
investigational bifunctional fusion protein targeting TGF-β and PD-L1, in second-line treatment of
patients with NSCLC (INTR@PID SOLID TUMOR 001) were presented. These data highlighted the
potential of this dual-targeting proposed mode of action in NSCLC, and additionally, the potential to
offer new ways to fight difficult-to-treat cancers beyond PD-1/PD-L1 in the future.
• Abstracts also showcased the scientific innovation and diversity of our pipeline, with results from a
number of high-priority clinical development programs, including tepotinib, bintrafusp alfa and our
comprehensive DNA Damage Response (DDR) portfolio.
• At the 2020 European Society of Medical Oncology Annual Virtual Meeting in September, we had a
significant presence at the ESMO20 Virtual Scientific Program. Data from more than 30 abstracts
across multiple tumor types highlighted our biology-driven approach with breakthrough innovations
and significant advances in cancer care across our oncology assets.
• Data from the Phase III JAVELIN Bladder 100 study (Presentations #6990; 704MO; 745P) of
Bavencio® in the first-line maintenance treatment of patients with locally advanced or metastatic
urothelial carcinoma (UC) versus best supportive care were presented. In addition, the primary results
of the Phase III JAVELIN Head and Neck 100 (Presentation #9110) were presented.
• For tepotinib, three posters were presented from VISION, the largest study in patients with NSCLC
harboring METex14 skipping treated with tepotinib, with data highlighting durable clinical activity
consistent across clinically relevant subgroups (Poster #1283P); health-related quality of life shown to
be maintained, with clinically meaningful delays in the time to deterioration of cough, dyspnea, and
chest pain (Poster #1286P); and a safety profile consisting of mostly mild to moderate adverse events
with few treatment discontinuations. Additionally, trial in progress data was presented from the
INSIGHT 2 study assessing the combination of osimertinib and tepotinib in patients with EGFR-mutant
NSCLC that has developed resistance to first-line osimertinib treatment due to MET amplification is
ongoing and actively recruiting patients (Poster #1415TiP).
• Erbitux® (cetuximab) demonstrated its steady role across the continuum of care in mCRC, and as the
backbone of treatment of SCCHN. And a number of investigator-sponsored studies (ISS), including in

45
Combined Management Report ___ Fundamental Information about the Group ___ Research and Development
combination with Bavencio® (avelumab), demonstrating the role of Erbitux® as a promising
combination partner. Data was presented in an oral presentation investigating avelumab plus
cetuximab in pre-treated RAS wild type metastatic colorectal cancer patients as rechallenge strategy:
the phase II CAVE (cetuximab-avelumab) mCRC study (Presentation #397O).
• For bintrafusp alfa, our investigational bifunctional fusion protein targeting TGF-β and PD-L1, two
long-term follow-up studies in BTC and NSCLC assessing the efficacy of and safety from the
INTR@PID clinical trial program were presented. These data highlighted notably the potential to offer
new ways to treat difficult-to-treat cancers beyond PD-1/PD-L1 in the future.
• Three-year follow-up results from a global Phase I study (INTR@PID SOLID TUMOR 001) of bintrafusp
alfa as a second-line treatment for patients with NSCLC represent the longest treatment and
observational period with bintrafusp alfa in this setting to date and further deepen the understanding
of bintrafusp alfa’s potential long-term efficacy and safety profile. Results demonstrated a promising
duration of response (DOR) and long-term clinical benefit, especially in patients with high PD-L1
expression, as well as a manageable safety profile in a setting of high medical need where there is no
globally accepted standard of care. Data presented at ESMO reinforced prior two-year follow-up
results for this study presented at ASCO 2020.
• Data presented at ESMO 2020 for bintrafusp alfa in patients with pretreated BTC represent the longest
treatment and observational period to date in this setting and further deepen the understanding of the
long-term efficacy and safety profile of bintrafusp alfa in BTC. Results presented were from an
expansion cohort in an ongoing Phase I, open-label trial in patients with locally advanced/metastatic
BTC for which first-line chemotherapy failed (INTR@PID SOLID TUMOR 008). After 28 months,
bintrafusp alfa demonstrated a manageable safety profile with durable responses and long-term
survival in patients with pre-treated BTC.
• Our investigational ATR inhibitor berzosertib (M6620), was first presented as a late-breaking oral
presentation from a randomized Phase II study of M6620, in combination with gemcitabine compared
with gemcitabine alone in patients with platinum-resistant high-grade serous ovarian cancer, as well
as published in The Lancet Oncology, in June. The study is sponsored by the National Cancer Institute
(NCI) under its Cooperative Research and Development Agreement with Merck for M6620, and these
results were the first-ever randomized data to be presented for an ATR inhibitor.
Our broad portfolio of small-molecule DDR inhibitors represents multiple development paths, including
combinations with other agents and modalities, and we are investing in this promising approach with the
objective of becoming a leader in this therapeutic class. Peposertib inhibits DNA-dependent protein kinase
(DNA-PK), a key enzyme needed for DNA repair, which may enhance the efficacy of agents such as
radiotherapy and chemotherapy. Ataxia telangiectasia and rad3-related (ATR) kinase inhibitors target the ATR
protein believed to be a key sensor for DNA damage and may enhance the efficacy of DNA-damaging agents
and potentially also be efficacious as monotherapy against tumors with high levels of replication stress induced
by overexpression of oncogenes.
Fertility
The Pergoveris® Pen, a convenient and ready-to-use fertility combination treatment option for women with
severe follicle-stimulating hormone and luteinizing hormone deficiency, was successfully launched in several
countries in Europe, Asia-Pacific, and Latin America in 2019.
During the Covid-19 pandemic, we supported patients with advancing their treatment at home with the release
of our Gonal-f® (follitropin alfa) 150 IU pen. In January, the European Commission granted Marketing
Authorization for the Gonal-f® 150 IU pen. Since then, it was launched in Germany, Spain and
Sweden. Further launches are planned next year. A series of studies conducted with fertility patients and nurses
highlighted both the ease of use and the patient-friendliness of our Gonal-f pen®.
46
Combined Management Report ___ Fundamental Information about the Group ___ Research and Development
We continue to support efforts to save the northern white rhinoceros from extinction. Merck is a partner of the
BioRescue Project of the Leibniz Institute for Zoo and Wildlife Research (Leibniz-IZW) in the Forschungsverbund
Berlin e.V., donating technology and financial support, as well as sharing expertise and experience in fertility.
General Medicine & Endocrinology
The new formulation of Euthyrox® (levothyroxine) for the treatment of hypothyroidism obtained further
regulatory approvals in 2020, resulting in a total of 65 countries where this incremental innovation is
registered, allowing for more precise dosing. The product is currently launched in 31 countries worldwide such
as Germany, Spain, China, United States and Colombia.
Glucophage®, containing the active ingredient metformin, is now approved in 61 countries for prediabetes when
lifestyle intervention is not enough to control the condition. With the successful submission and launch in Brazil
of Glucophage® XR 850 for prediabetes in July 2019, in 2020 this project was expanded at the global level to be
rolled out to additional countries to serve prediabetes patients, and we have successfully submitted in the
Central America Region (El Salvador, Guatemala, Honduras, Nicaragua, Dominican Republic, Panama) according
to our rollout plan for this product indication.
Concor® AM, a fixed-dose combination of Bisoprolol and Amlodipine, continues its worldwide rollout to include
new countries, taking the total number to 59.
The number of patients taking Saizen® (somatropin) enrolled on Easypod® Connect continued to grow in 2020,
reaching 23,762 in October. Saizen® is our main endocrinology product and is indicated for the treatment of
growth hormone deficiency in children and adults, while Easypod® Connect is a unique web-based platform that
allows HCPs to monitor their patients’ adherence to treatment with real-time injection data collected and
transmitted from their Easypod® devices.
The launch of Aluetta®, our new pen for the injection of Saizen®, complements our device portfolio and
supports the growth of Saizen® by expanding our business in key geographies like Germany. Aluetta® is
currently available in 23 countries.
Building for the Future
As part of our commitment to speed up the availability of new medicines for patients in need, we are investing
€ 250 million from 2019 to 2022 in a new facility in Corsier-sur-Vevey, Switzerland – the Merck Biotech
Development Center – dedicated to biotech development and manufacturing for clinical studies. Driven by the
growth of our Healthcare business sector R&D pipeline, this investment will help to sustainably secure capacity
and high agility to deliver clinical trial material in a cost-effective way, contribute to accelerated development
timelines of new biological entities, and address the increasing manufacturing complexity of the next
generations of biotech compounds. The Biotech Development Center adds to recent investments aiming to
further increase our capacities in the research, development, and manufacturing of medicines, such as the
expansions of the R&D facility of Billerica, Massachusetts, United States, of the biotech manufacturing site of
Aubonne, Switzerland, and of the pharma manufacturing site of Darmstadt, Germany.

47
Combined Management Report ___ Fundamental Information about the Group ___ Research and Development
Healthcare Pipeline
As of: December 31, 2020
Therapeutic area
Compound Indication Status
Neurology
Evobrutinib (BTK inhibitor) Multiple sclerosis Phase III
Oncology
Tepotinib (MET kinase inhibitor) Non-small cell lung cancer, METex14 skipping 1,2 Registration
Tepotinib (MET kinase inhibitor) Non-small cell lung cancer, METex14 skipping Phase II
Tepotinib (MET kinase inhibitor) Non-small cell lung cancer, EGFR mutant, MET amplified 3 Phase II
Peposertib (M3814) (DNA-PK inhibitor) Rectal cancer Phase II
Peposertib (M3814) (DNA-PK inhibitor) Solid tumors 4 Phase I
Berzosertib (M6620) (ATR inhibitor) Solid tumors 5 Phase I
M1774 (ATR inhibitor) Solid tumors Phase I
M3258 (LMP7 inhibitor) Multiple myeloma Phase I
M4344 (ATR inhibitor) Solid tumors Phase I
M8891 (MetAP2 inhibitor) Solid tumors Phase I
Immuno-Oncology
Avelumab (anti-PD-L1 mAb) Urothelial cancer, 1st line maintenance 6 Registration
Avelumab (anti-PD-L1 mAb) Non-small cell lung cancer, 1st line Phase III
Bintrafusp alfa (TGFbeta trap/anti-PD-L1) Non-small cell lung cancer, 1st line Phase III
Avelumab (anti-PD-L1 mAb) Non-small cell lung cancer 7 Phase II
Avelumab (anti-PD-L1 mAb) Urothelial cancer 7 Phase II
Avelumab (anti-PD-L1 mAb) Solid tumors 7 Phase II
Bintrafusp alfa (TGFbeta trap/anti-PD-L1) Non-small cell lung cancer 1st and 2nd line Phase II
Bintrafusp alfa (TGFbeta trap/anti-PD-L1) Locally advanced non-small cell lung cancer Phase II
Bintrafusp alfa (TGFbeta trap/anti-PD-L1) Biliary tract cancer 1st line Phase II
Bintrafusp alfa (TGFbeta trap/anti-PD-L1) Biliary tract cancer 2nd line Phase II
Bintrafusp alfa (TGFbeta trap/anti-PD-L1) Cervical cancer 2nd line Phase II
Bintrafusp alfa (TGFbeta trap/anti-PD-L1) Triple negative breast cancer Phase II
Bintrafusp alfa (TGFbeta trap/anti-PD-L1) Cervical cancer 1st line Phase I
Bintrafusp alfa (TGFbeta trap/anti-PD-L1) Solid tumors Phase I
M6223 (anti-TIGIT mAb) Solid tumors 8 Phase I
Footnotes on next page

48
Combined Management Report ___ Fundamental Information about the Group ___ Research and Development
Healthcare Pipeline
Immunology
Atacicept (anti-BLyS/anti-APRIL fusion protein) Systemic lupus erythematosus 9 Phase II
Atacicept (anti-BLyS/anti-APRIL fusion protein) IgA nephropathy 9 Phase II
Sprifermin (fibroblast growth factor 18) Osteoarthritis Phase II
Sonelokimab (M1095) (anti-IL-17 A/F nanobody) Psoriasis 10 Phase II
M5049 (TLR7/8 antagonist) Covid-19 pneumonia Phase II
M5049 (TLR7/8 antagonist) Immunology Phase I
Global Health
M5717 (PeEF2 inhibitor) Malaria Phase I
Unless noted otherwise, clinical programs conducted in collaboration with external partners are not shown unless Merck is the sponsor of that respective trial. More information on the ongoing clinical trials can be found at www.clinicaltrials.gov. Pipeline products are under clinical investigation and have not
been proven to be safe and effective. There is no guarantee any product will be approved in the sought-after indication.
1 As announced on August 25, 2020, the US Food and Drug Administration (FDA) has accepted and granted Priority Review to the new drug application
(NDA) in non-small cell lung cancer (NSCLC).
2 As announced on November 26, 2020, the European Medicines Agency (EMA) has validated for review the application for Tepotinib for the treatment of
adult patients with advanced non-small cell lung cancer.
3 In combination with Osimertinib.
4 Includes studies in combination with Avelumab.
5 Includes studies (phase I/II) in collaboration with NCI.
6 As announced on December 11, 2020, the Committee for Medicinal Products for Humans Use (CHMP) of the European Medicines Agency adopted a
positive opinion recommending approval of Avelumab as monotherapy for the first-line maintenance treatment of adult patients with locally advanced or
metastatic urothelial carcinoma.
7 Avelumab combination studies with Talazoparib, Axitinib, ALK inhibitors, Cetuximab or chemotherapy.
8 Includes study in combination with Bintrafusp alfa.
9 As announced on November 09, 2020, Merck has entered into an out-licensing agreement with Vera Therapeutics.
10 Pending Phase III initiation in 2021.
APRIL: A proliferation-inducing ligand
ATR: Ataxia telangiectasia and Rad3-related kinase
BLyS: B-lymphocyte stimulator
BTK: Bruton’s tyrosine kinase
IgA: Immunoglobulin A
IL: Interleukin
mAb: Monoclonal antibody
MetAP2: Methionine aminopeptidase 2
METex14: MET exon 14
MET: MET proto-oncogene, receptor tyrosine kinase
PD-L1: Programmed cell death ligand 1
PeEF2: Plasmodium eukaryotic elongation factor 2
PK: Protein kinase
TGFbeta: Transforming growth factor beta
TIGIT: T cell immunoreceptor with Ig and ITIM domains
TLR7/8: Toll-like receptors 7 and 8
49
Combined Management Report ___ Fundamental Information about the Group ___ Research and Development
Life Science*
Across our three business units, Research Solutions, Process Solutions, and Applied Solutions, our R&D teams
of more than 2,000 employees continue to bring expertise and a diversified and relevant portfolio of products
and services to our customers around the world. In 2020, our Life Science business sector focused on delivering
the promise of accelerating access to health for people everywhere by collaborating with the global scientific
community.
As such, we launched more than 18,300 products in 2020, including those launched through our “faucet
program” for antibodies, reference materials, chemicals, and nanomaterials. These included key innovations
from all our business units, such as our GenElute™-E Single Spin DNA kits, MILLIPLEX® immunoassay kits and
ZooMAb® recombinant antibodies from Research Solutions; the sodium-acetate granulated, Bio4C™
Orchestrator, our perfusion-ready bioreactor, Cellicon™ perfusion device and controller, and VirusExpress™
Lentiviral production cells from Process Solutions; and the Milli-Q® IX 7003/7005/7010/7015 Type 2 water
purification system from Applied Solutions.
The engine behind the solutions for Covid-19
As a global life science tools and equipment supplier, we are committed to providing the critical research and
diagnostic tools, products, and reagents, therapy manufacturing and vaccine development products, as well as
biosafety testing that can aid the global scientific effort to fight this novel virus. We continue to support many
of our customers working on Covid-19 projects through our products and services, providing for more than 35
different testing solutions across RT-PCR, antigen and antibody diagnostics for both high-throughput centralized
and distributed point-of-care settings; more than 50 different vaccine candidates, consisting of several
platforms that include DNA, inactivated, live attenuated virus, viral vector, protein subunit and mRNA; and
more than 20 monoclonal antibody, plasma products, and antivirals.
We remain conscious of ensuring ease of access to our broad product portfolio, especially amid the rush to
develop solutions for Covid-19. Leveraging our industry-leading e-commerce website, www.sigmaaldrich.com,
we created a dedicated Covid-19 webpage that provides a one-stop-shop of more than 200 products
and corresponding information for scientists working on Covid-19 research and potential vaccines. In doing so,
we continue to support the significant increase in research of Covid-19, coronaviruses and related immune
responses, much of which uses our products such as enzyme-linked immunosorbent assays (ELISAs), ZooMAb®
recombinant antibodies, and MILLIPLEX® multiplex panels to study Covid-19-related serological and
immunological responses.
To expand our capacity for manufacturing Covid-19 related products and critical therapies, in November, we
invested US$ 47 million in a combined expansion of our facilities in Jaffrey, New Hampshire, USA, and Danvers,
Massachusetts, USA. Both sites supply critical products to customers developing life-saving therapies, including
Covid-19 vaccines, such as single-use and virus filtration technologies.
Collaboration remains an important focus for the Life Science business sector as we work to drive innovation
and solve the industry’s toughest problems, especially those related to Covid-19. While delivering on our own
portfolio and capabilities, we also seek to collaborate with other key players in the industry to work toward our
shared goal of bettering and increasing access to health globally. As such, we joined Oxford University in the
United Kingdom in their announcement that they laid the foundation for large-scale production of the Covid-19
vaccine candidate, ChAdOx1 nCoV-19, which leveraged our previous collaborative work to develop the
manufacturing process for a rabies vaccine candidate. Our support enabled the development of the
manufacturing process, which would normally take at least six months to a year, to take place in just two
months’ time, saving valuable time for the vaccine developer.
* The contents of this chapter or section are voluntary and therefore not audited. However, our auditor has read the text critically.

50
Combined Management Report ___ Fundamental Information about the Group ___ Research and Development
We also announced an extension of our ongoing collaboration with Baylor College of Medicine in Houston,
Texas, USA, which previously focused on vaccine development for tropical disease outbreaks, to now advance a
vaccine manufacturing platform for Covid-19. Our joint work supports the accelerated transition to Phase I
clinical trials, optimizing the production process to advance two Covid-19 vaccine candidates, including the CoV
RBD219-N1 vaccine candidate originally developed to target SARS. Additionally, our new collaboration with the
Massachusetts Institute of Technology’s (MIT) Center for Collective Intelligence and Community Biotechnology
Initiative began with the release of a report detailing potential paths to solutions for pandemic response. The
report summarizes the results of a three-week collective intelligence exercise conducted with more than 180
science, healthcare, and policy experts from around the world, which generated suggestions to combat Covid-
19 via transmission control, diagnostics, and monitoring, and accelerating access to vaccines and therapies,
among other technical topics.
We announced another new collaboration with Mammoth Biosciences Inc., of San Francisco, California, USA, for
the development, scale-up and commercial production of their CRISPR-based DETECTR BOOST™ SARS-CoV-2
Reagent Kit. Once this new test isapproved by the FDA, Clinical Laboratory Improvement Amendments labs in
the U.S. will be able to significantly improve capacity to regularly perform testing. Mammoth recently secured
funding from the National Institute of Health’s RADx program to scale its CRISPR-based testing workflow and
we will serve as contract manufacturer for this high-throughput Covid-19 test.
Additionally, we have worked with academic partners to license or co-develop ELISAs, monoclonal antibodies,
MILLIPLEX® panels, and proteins and scaled up those tools to become more broadly available to the research
community.
Further, we are empowering virtual R&D by leveraging smart technology to collaborate with our customers and
stakeholders. Our teams provided virtual offerings and interactions, including a self-service portal for audit
stakeholders, a global pilot study of Emprove® Smart Glasses Kits, and digital collaborations and trainings at
our M Lab™ Collaboration Centers using cutting-edge tools like Microsoft Surface Hub that allow customers to
get a first-hand view from the lab floor and explore solutions virtually.
Research Solutions
Throughout the year, our R&D teams have demonstrated exceptional agility while navigating the impacts of the
Covid-19 pandemic. Our colleagues have worked swiftly and diligently to accelerate necessary product
launches, pause on others and bring new, innovative ideas into the pipeline and launch within months.
In September, we launched the MILLIPLEX® SARS-CoV-2 antigen panels for IgG, IgA and IgM. These panels
utilize multiplexing technology to simultaneously detect the presence of different antibody classes against four
different SARS-CoV-2 protein antigens in a single reaction from human serum or plasma samples. These panels
were developed in close collaboration with academic researchers to deliver excellent sensitivity and specificity.
We continue to support the significant increase in research about Covid-19, coronaviruses, and related immune
responses, much of which uses our products such as enzyme-linked immunosorbent assays, ZooMAb®
recombinant antibodies and MILLIPLEX® multiplex panels to study Covid-19-related serological and
immunological responses. We also collaborated with academic partners to apply our retrosynthetic analysis
software for novel synthesis of critical antiviral drugs with cheaper or alternate starting materials, alleviating
supply chain problems. Furthermore, we focused on delivering critical raw materials for use in antiviral drug
synthesis or for Covid-19 diagnostic kit manufacturing.
Our major launches in 2020 include the ScepterTM 3.0 handheld cell counter, GeneluteTM-E Single Spin DNA kits,
a full DNA Encoded Library (DEL) technology, proteolysis targeting chimeras (PROTACS), MILLIPLEX® kits, and
an additional 200 ZooMAb® recombinant antibodies.
51
Combined Management Report ___ Fundamental Information about the Group ___ Research and Development
Process Solutions
Over the course of the year, we continued to deliver solutions for today’s biomanufacturing processes while
developing leading-edge technologies for the factories of the future. In April, we unveiled our Bio4C™ Software
Suite, a first-of-its kind digital ecosystem that combines process control, analytics and plant-level automation.
It includes two browser-based platforms: the Bio4C™ ProcessPad, which will allow users to acquire, aggregate
and analyze data from disparate sources such as equipment, batch records, databases and historians across the
bioprocess; and the Bio4C™ Orchestrator, which will provide remote access to systems, recipes, reports, user
accounts, and alarms from a holistic process dashboard. Part of our expanding BioContinuum™ Platform, this
transformative software suite allows users to look across the entire manufacturing process versus individual
operational units, giving biomanufacturers complete process control and deep insights, bringing Bioprocessing
4.0 to the here and now.
With this launch and others, our BioContinuum™ pipeline continues to drive the biopharmaceutical industry on
a journey to evolve and digitize the next generation of bioprocessing to increase speed and reduce costs.
Additional launches from this year include our BioContinuum™ Buffer Dilution 30L System, part of the
BioContinuum™ Buffer Deliver Platform; our perfusion-ready bioreactor, Cellicon™ perfusion device and
controller for seed train intensification with optimized process control; and the Cellvento® 4CHO-X expansion
medium.
In October, we announced our collaboration with D1Med, a Shanghai-based biopharmaceutical startup and
precision-medical company, to advance the application of three-dimensional (3D) cell culture technology in
China. As part of the collaboration, we will provide D1Med with 3D cell culture products and application support,
including local and global expertise to co-develop the 3D cell culture protocol for PDO applications, which come
from humans and mimic the biological characteristics of the original tumor as tools to study cancer
development, drug screening and disease modelling.
Additionally, in November, we announced our collaboration with Transcenta, a global biotherapeutics company,
to advance continuous biomanufacturing with strategic technology implementation. The collaboration will co-
develop a first-of-its-kind, single-use, flow-through polishing system for GMP operation. The first phase of this
multi-year partnership will focus on developing and designing the process technologies, single-use system and
automation, while the second phase will focus on an expanded scope of process and digital technologies to
optimize a continuous manufacturing process.
With more than 35 years of experience in the development and manufacturing of small molecules, biologics,
and antibody-drug conjugates (ADCs), we offer extensive experience in both clinical and commercial
manufacturing. In September, we continued investing in ADC technologies with an expansion of our
manufacturing capacities at our site in Madison, Wisconsin, USA, marking another critical advancement of
increasingly potent compounds for therapies that have the potential to treat cancer.
To further advance our portfolio of gene-editing and novel modalities, in October, we launched the
VirusExpress™ Lentiviral Production Platform to bolster our viral vector manufacturing capabilities and offer a
simplified upstream workflow that makes processes easier to manage, adjust, and scale. This new platform
helps to overcome lentiviral production challenges and can reduce process development time by approximately
40%, based on our experience as a contract development and manufacturing organization. In addition to
accelerating process development, the VirusExpress™ Platform’s suspension culture format allows each batch of
virus to be larger, yielding more patient doses while being amenable to true scale-up and less labor-intensive.
The chemically defined medium also eliminates the safety, regulatory, and supply chain concerns related to
animal- and human-derived materials. This marks the latest of Merck’s continued investments in the rapidly
growing cell and gene therapy market.
Merck has 16 years of experience in genome editing, from early development to manufacture. Our portfolio now
includes 28 patents for CRISPR technology, granted worldwide, including six additional patents granted in 2020.
We were awarded our second U.S. patent for CRISPR-chrom technology and two U.S. patents for foundational
CRISPR-Cas9 technology. In June, we joined 10x Genomics, a single-cell and spatial genomics technologies
52
Combined Management Report ___ Fundamental Information about the Group ___ Research and Development
company, in announcing our development of two linked technologies: single-cell transcriptomics and pooled
CRISPR screening. This is the first solution for simultaneous gene perturbation measurement and unbiased
single-cell gene expression. Further, in October, we announced our agreement to license CRISPR technology to
two companies: PanCELLa, a cell therapy firm based in Toronto, Canada, and Takara Bio USA, Inc., a
biotechnology company based in Mountain View, California, USA. The licenses aim to accelerate drug discovery
leading to development of new therapies.
The growing potential of CRISPR technologies also raises scientific, legal, and social questions. We support
genome-editing research only after careful consideration of ethical and legal standards. Our work is guided by
the Merck Bioethics Advisory Panel, an independent panel made up of a diverse group of international
biomedical experts that provides guidance for research in which Merck’s businesses are involved.
We also announced a global licensing agreement with ReForm Biologics, a pharmaceutical technology company
in Woburn, Massachusetts, USA, for excipient development and commercialization. The collaboration will
accelerate R&D activities and GMP manufacturing for ReForm’s excipients, making them available to our
customers for use in biologic formulations.
Since 2018, 63% of drugs in the pipeline were being developed by biotech start-ups focused on innovative
therapies, including those intended to treat niche diseases with small patient populations. Our global health
commitment focuses on these companies and supports bringing their drugs to market through our grant
programs. Grants provide selected companies with access to our products and services to help accelerate
market entry for new therapies. Through our Advance Biotech Grant Program, which we run in North America,
Europe, and Asia, we announced two grant recipients for 2020, selected based on the scientific and societal
merit of their respective therapies in development, as well as process challenges and expertise gaps. Additional
finalists were also announced.
Applied Solutions
To continue strategically advancing our core capabilities, in May, we launched the Milli-Q® IX
7003/7005/7010/7015 Type 2 water purification system, a redesigned version of our benchtop pure water
system that provides laboratories with a reliable and consistent source of high-quality pure water. This is a
smaller and more intuitive and ergonomic device than previous generations of the water purification system.
For half a century, we have been the partner of choice for water purification systems and services for lab
scientists who need to ensure their water is free of contaminants. This new system goes a step further to
incorporate a range of sustainable purification technologies and design features aimed at minimizing
environmental impact. Additionally, in January, we launched the new Milliflex Oasis® System to provide
enhanced result reliability, increased productivity, and advanced traceability. The system offers enhanced
benefits for pharmaceutical bioburden and water testing, including 96 new features, while streamlining the
bioburden testing workflow.
Life Science has more than 30 years of experience in the diagnostics space, and our products and capabilities
have played a significant role in Covid-19 testing efforts, as evidenced by our collaboration with Mammoth
Biosciences. Covid-19 developments and other advancements in the area of innovative personalized medicines
have resulted in an increased demand for more rapid sterility testing solutions to support the development and
release of these products. Additionally, we continue to establish new growth opportunities and capabilities in
contract development and manufacturing services. In February, we announced that our business was selected
by Elypta, a molecular diagnostics firm in Sweden, as the contract manufacturer for their Research Use Only
(RUO) clinical diagnostic liquid biopsy kits. Once validated and commercialized, the kits will be intended to
improve the accuracy of cancer diagnoses by analyzing metabolites deregulated in several cancer types. The
kits will be manufactured at our facility in St. Louis, Missouri, USA.
We remain focused on advancing digitalization, especially our offering of digital lab productivity tools. To
continue growing our laboratory informatics solutions to create the labs of the future, in February, we
introduced the BrightLab™ platform. The tool brings Internet of Things (IoT) integrations to R&D, meeting the
increasing demand for data automation and accessible, real-time monitoring of centralized and synched lab
53
Combined Management Report ___ Fundamental Information about the Group ___ Research and Development
data. Additionally, in March, we launched the LANEXO™ system. This first-to-market digital lab informatics
solution offers radio-frequency identification (RFID) labels, cloud-based integration, mobile and web
applications for easily accessible digital data capture and real-time documentation. These solutions recognize
the increasing demand for data automation that can be easily set up and rapidly integrated into existing lab
workflows to ultimately help speed up the discovery process.
Increasing digital tools while adding to our titration portfolio, in March, we launched a new SmartChemicals
technology that uses Supelco® SmartTitrants and Supelco® SmartStandards to transfer data seamlessly to a
titrator. With this new technology, an RFID label is embedded on our Titripur® volumetric solutions, Certipur®
volumetric standards and all Aquastar® Karl Fischer titrants and standards. These RFID labels store all relevant
data from the Certificate of Analysis, which helps eliminate time-consuming steps and errors by transferring
data wirelessly and instantly to titration instruments.
Recognized for award-winning innovation
To begin the year, Life Science received a 2020 CMO Award from Life Science Leader and Outsourced Pharma,
an honor determined based on primary market research and customer feedback. The award honors outsourcing
respondents who exceed customer expectations with their capabilities, compatibility, expertise, quality,
reliability, and service.
In July, our DOZN™ green chemistry tool won Environment + Energy Leader’s Top Project of the Year award.
The award recognizes excellence in environmental, sustainability, and energy management. With more than
300 active, registered users, the DOZN™ system helps customers make data-driven decisions to increase
environmental sustainability by evaluating the relative greenness of chemicals and chemical processes against
the 12 Principles of Green Chemistry. Additionally, in recognition of our continued effort to create safer, more
sustainable solutions, our Stericup®E and Steritop®E filtration devices were awarded New Product of the Year by
Business Intelligence Group through its BIG Awards for Business program.
Also in July, we were recognized with two awards at INTERPHEX 2020, which honors the future of
pharmaceutical, biotech and device development and manufacturing innovation. Our BioReliance® Blazar™
Platform won the Editor’s Choice Award while our BioContinuum™ Buffer Delivery Platform, one of our
BioContinuum™ Platform’s newly launched building blocks, received Best in Show. We received two additional
awards at the 2020 Asia-Pacific Bioprocessing Excellence Awards. Our BioContinuum™ Platform was awarded
Best Bioprocessing Innovation of the Year, and the Life Science business sector was awarded Best
Bioprocessing Supplier of the Year in Downstream Processing.
Our Blazar™ platform was honored with two additional awards in 2020. First, the CPhI’s Excellence in Pharma
award for its analysis, testing, and quality control, which recognizes innovations for and dedication to driving
the pharmaceutical industry forward. Second, the Blazar™ platform also won a prestigious R&D 100 Award for
analytical and testing capabilities, recognizing the global best that are pioneering revolutionary ideas in science
and technology. Bio4C™ ProcessPad, part of our expanding BioContinuum™ Platform, also made the shortlist
for the 2020 CPhI Awards.
We also received the CiteAb award for Innovative Product of the Yearfor our ZooMAb® Recombinant Antibodies.
This new range of recombinant monoclonal antibodies is manufactured using a proprietary expression system
as well as with less preservatives and freeze-dried, making shipping easier and giving long-term stability.
Further, our LANEXO™ system won the Gold German Design Award for excellent communications design apps,
recognizing how helpful digitalization can be in boosting efficiency, optimizing safety, and simplifying
compliance in the regulated analytical and research laboratory.
54
Combined Management Report ___ Fundamental Information about the Group ___ Research and Development
Performance Materials*
Within our Performance Materials business sector, we are a market and technology leader in most of our
industries. As a science and technology company, we offer leading-edge products and solutions that, in many
cases, set us apart from the competition. We integrated our supply chain units into the respective business
units to fully reflect business accountability in the organizational design across the entire supply chain. In order
to bring our R&D closer to our businesses and reflect our new organizational structure, we transferred our
research activities to our business units. Our Chief Technology Office (CTO) focuses on identifying trends and
vetting technologies that are beyond the time horizon or scope of our business units. As a dedicated technology
organization, the CTO is managing research partnerships, shaping our technology roadmaps, and managing our
long-term R&D portfolio. We have also created a Technology Leadership Board to review and optimize our
technology investment across the business sector.
In September, we opened a new Research Center for electronic applications in Darmstadt, Germany. With this
investment we are scaling up our research & development capabilities for next-generation display and
semiconductor materials to further expand our position a as leading supplier to the electronics industry. In
October, we announced a € 20 million investment to expand OLED manufacturing capacities in South Korea and
China. In November we also announced our plans to build a new Electronics Technology Center in Shanghai,
China, which will focus on semiconductor and OLED materials.
To better support our customers, in late August, we made significant investments in developing advanced
analytical and container capabilities in Kaohsiung, Taiwan to continually drive quality enhancement. The facility
is in close proximity to many of our Taiwanese customers and aims to provide local collaboration support and
faster time to market.
Our Planarization business continues to make significant progress in new product development in memory and
logic across both slurry and cleans products. To better support our customers, in late June, we inaugurated a
new R&D center in Korea to develop next-generation chemical mechanical planarization (CMP) materials. Since
the opening, our team has been able to support several demos with key Korean customers, which is critical to
enable rapid local collaboration.
Semiconductor Solutions
We are addressing our customers’ critical material needs through every step of the wafer manufacturing
process. The outstanding capabilities and competencies of the businesses are diverse and will enable us to
bring game-changing innovations for our customers into the market faster.
In Semiconductor Materials, our Thin Film Solutions business achieved significant progress in advancing critical
PORs (Process of Record) for new organosilanes for conformal high-performance atomic layer deposition (ALD)
and progressed our plasma-enhanced chemical vapor deposition (PECVD) for low dielectric constant
applications. We also continue to make progress in developing high-purity metal-containing precursor offerings
enabled by new engineered container delivery systems. We continue to focus on developing new spin-on
dielectric formulations for processes with improved dielectric characteristics for faster and better logic and
memory devices.
With our Specialty Gases we continue to make progress with our new etch gas technology program, which is
focused on advancing the development of new chemistries to enable more than 100-layer single-stack etching
for advanced memory devices such as V-NAND. We continue to see significant performance in new POR wins
across our existing portfolio and new product introductions.
* The contents of this chapter or section are voluntary and therefore not audited. However, our auditor has read the text critically.
55
Combined Management Report ___ Fundamental Information about the Group ___ Research and Development
Our material innovation accelerator Intermolecular saw an increase in the amount of work done in their labs for
quantum computing and neuromorphic computing companies. These companies benefit from the flexible device
processing infrastructure and deep materials knowledge to quickly achieve tangible products in these emerging
technology areas. Intermolecular is a trusted partner for materials innovation and is our Silicon Valley science
hub. For more than 15 years, Intermolecular has being exploring, testing, and developing advanced materials
that are revolutionizing the next generation of electronics.
Delivery Systems & Services (DS&S) develops, deploys, and operates equipment that enables safe and reliable
delivery of hazardous materials in the manufacturing process of our customers. The unit is in the process of
increasing its manufacturing capacity to meet the growing demand in memory and foundry, and we
commenced a project to manufacture our second CHEMGUARD product line, BCD100 and 200, state-of-the-art
bulk chemical delivery systems. We also released our CHEMGUARD CG600 model for bulk
Tetrakis(dimethylamino)titanium (TDMAT) delivery. This product extends our prior TDMAT technology to
remote, bulk supply to support our customers’ ever-increasing flow rate and uptime requirements of advanced
nodes. The first container changes were successfully completed and executed much faster than anticipated,
reducing container change time significantly.
DS&S has successfully applied its GASGUARD Active Control technology to low vapor pressure compressed
gases. Originally, it was developed to maintain, repeat and stabilize pressure for high vapor pressure gases
under varying manufacturing conditions and with zero pressure drift. GASGUARD Active Control now allows
semiconductor fabs to achieve much greater precision in controlling the pressure of low vapor pressure
compressed gases, such as WF6 and others.
This technology and all DS&S equipment are operated and maintained by our MEGASYS® Total Gas and
Chemical Services at many of our customer sites. As part of a global operations infrastructure, we are a
premier supplier of semiconductor fab and subfab services to the worldwide electronics industry.
Display Solutions
In our Display Solutions business unit, our liquid crystal technology UB-FFS (ultra-brightness fringe-field
switching) continues its successful growth, thanks to new product qualifications and rising demand in the liquid
crystal displays (LCD) sector for mobile devices, especially mobile phones and tablet PCs. The development of
high-resolution 4K and 8K TV sets continues to pose a challenge, as the LCD backlight transmission and
efficiency will be reduced due to higher pixel density. We are therefore actively working to expand our ultra-
bright (UB) technology offering with our UBplus liquid crystal materials for the TV market. With such
technologies, we increase the light transmission efficiency of applications for large-format TV sets and display
panels by 10% to 15%.
Our VA (vertical alignment) liquid crystal platform including PS-VA (polymer-stabilized vertical alignment)
technology remains predominant when it comes to large-format TV sets. Here, our latest materials provide
additional performance benefits and improve processing efficiency in the production of TV sets. Moreover, we
have successfully demonstrated our manufacturing expertise with respect to the new liquid crystal technology
SA-VA (self-aligned vertical alignment). We are now focusing our attention on applications for specialized
display products from the premium segment through to TV applications produced in large numbers, as this
technology offers the high contrast and image quality of the PS-VA technology while also enabling
improvements in display design and panel production, for example through the reduction of waste and energy
consumption in the production of LCDs.
56
Combined Management Report ___ Fundamental Information about the Group ___ Research and Development
Our display materials are contributing to the fast-growing market of free-form displays, which includes foldable
smartphones and rollable TVs. We further strengthened our ability to drive innovations in the fast-growing
OLED market by acquiring OLED patents from Konica Minolta in April. Additional sublimation units will be built
at our sites in Pyeongtaek, South Korea, and Shanghai to help meet customer demand in the growing OLED
market. The investment will further increase our local OLED production footprint in Korea and establish OLED
production capacity in China. In late November, we announced partnership agreements with Optitune Oy and
Solip Tech Co., Ltd. to advance display patterning materials for free-form applications. The partnerships will
enable the commercialization of liviFlex™-H, the first product from the company’s new range of display
materials that addresses challenges in the manufacturing of free-form OLED displays.
Surface Solutions
In our Cosmetics business, we are putting sustainability at the center of our efforts by more and more focusing
on natural materials in our portfolio of active ingredients. For example, we will add to our offerings through the
launch of a series of cosmetic applications containing four superfood extracts, which are backed by in-house
scientific efficacy studies. Another new development will offer our customers an attractive portfolio of algae
extracts that unlock the power of the ocean for the skin, together with RonaCare® RenouMer. Furthermore, we
are tapping into the potential of the haircare market with the launch of a series of third-party products enabling
the formulation of multi-tasking haircare products. Our well-established Functional Fillers portfolio RonaFlair®
will be extended by a new ingredient combining two features, soft focus effect and transparency. RonaFlair®
Infinity will address market needs like flawless skin without a masking effect.
In our automotive pigments business, we continue to focus on developing achromatic pigments. The latest
example is Xirallic NXT Amur Black, a blue-black effect pigment with a silky-silvery fine texture including Living
Sparkle®. In our pipeline, we address the special requirements that radar and lidar sensor applications have for
coating pigments. Another key topic in our development is fueled by the evolution of autonomous driving.
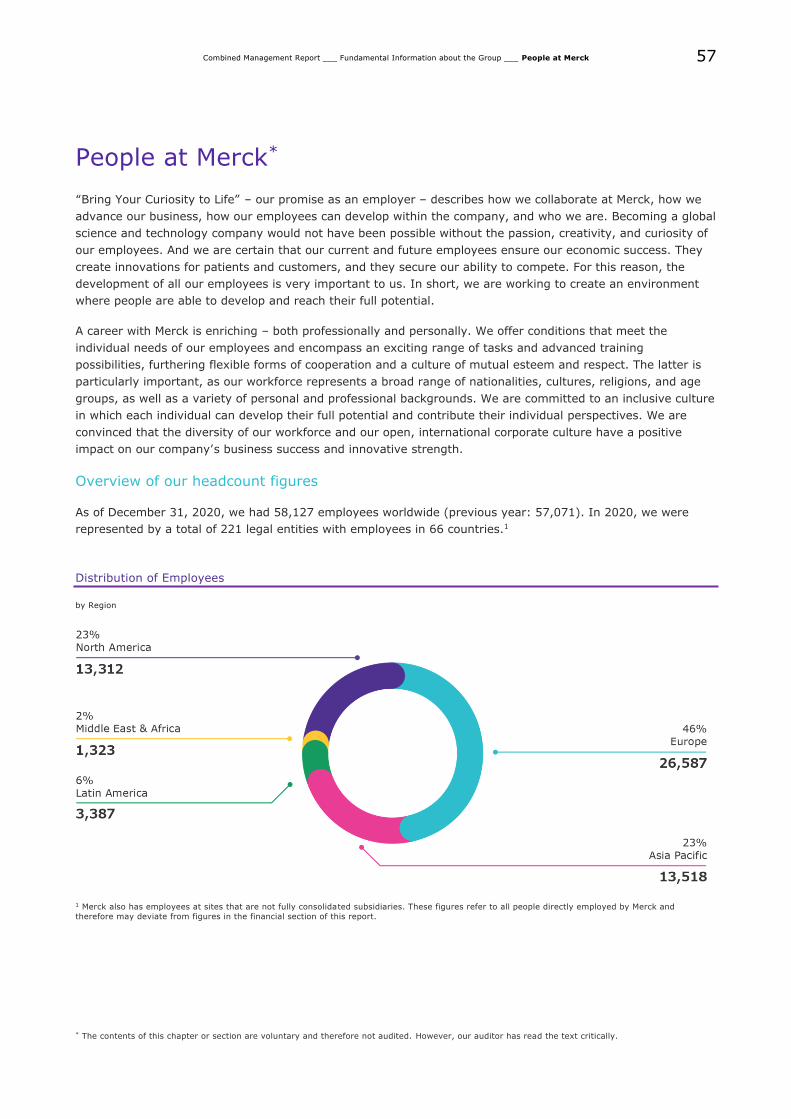
57
Combined Management Report ___ Fundamental Information about the Group ___ People at Merck
People at Merck*
“Bring Your Curiosity to Life” – our promise as an employer – describes how we collaborate at Merck, how we
advance our business, how our employees can develop within the company, and who we are. Becoming a global
science and technology company would not have been possible without the passion, creativity, and curiosity of
our employees. And we are certain that our current and future employees ensure our economic success. They
create innovations for patients and customers, and they secure our ability to compete. For this reason, the
development of all our employees is very important to us. In short, we are working to create an environment
where people are able to develop and reach their full potential.
A career with Merck is enriching – both professionally and personally. We offer conditions that meet the
individual needs of our employees and encompass an exciting range of tasks and advanced training
possibilities, furthering flexible forms of cooperation and a culture of mutual esteem and respect. The latter is
particularly important, as our workforce represents a broad range of nationalities, cultures, religions, and age
groups, as well as a variety of personal and professional backgrounds. We are committed to an inclusive culture
in which each individual can develop their full potential and contribute their individual perspectives. We are
convinced that the diversity of our workforce and our open, international corporate culture have a positive
impact on our company’s business success and innovative strength.
Overview of our headcount figures
As of December 31, 2020, we had 58,127 employees worldwide (previous year: 57,071). In 2020, we were
represented by a total of 221 legal entities with employees in 66 countries.1
Distribution of Employees
by Region
1 Merck also has employees at sites that are not fully consolidated subsidiaries. These figures refer to all people directly employed by Merck and
therefore may deviate from figures in the financial section of this report.
* The contents of this chapter or section are voluntary and therefore not audited. However, our auditor has read the text critically.
58
Combined Management Report ___ Fundamental Information about the Group ___ People at Merck
Building empowered leaders
Good leaders are key to the success of not only our employees but also our company. Because they provide our
talent with the right framework to unleash their potential and generate new ideas, we highly value the
continuing education and development of our managers.
Strategic competency development
A transparent competency model is the pillar of our personnel development efforts. Managers and employees
should show strategic competence by being purposeful, future-oriented, innovative, results-driven,
collaborative, and empowering. By demonstrating these qualities, our managers can build a strong culture of
collaboration based on curiosity, creativity, and trust. In addition, our leaders are expected to set an example
by living the Merck values and taking responsibility for their own decisions. Based on this competency model,
we have defined six leadership behaviors that summarize the conduct we expect from our leaders. To assess
the performance and potential of every individual and to establish an effective leadership culture, regular and
differentiated feedback is also of great importance. In this way, employees and supervisors can develop a
shared vision, execute the business strategy, and further develop a unifying corporate culture.
Management programs for executives
In recent years, we have initiated three programs to enhance the skills of our people managers. The Managerial
Foundation program imparts the basics of leadership, such as communication techniques, leadership styles,
conflict management, motivation, and emotional intelligence. The Advanced Management program covers
topics such as change management, self-reflection, and resilience. The third initiative is our Global Leadership
program, which focuses on competencies needed to ensure successful international collaboration. Due to the
Covid-19 pandemic, we also offer the majority of the programs entirely virtually. We have also introduced a
range of support programs for leaders (e.g. group coaching and virtual workshop formats). We will also
continue to work with our leaders to ensure that they gain the necessary skills to manage their employees
responsibly in uncertain and challenging times.
For the past 21 years, we have been partnering with top international universities to offer the Merck University
program. Over a period of around a year, senior executives take classes on management techniques and
strategic business development. To date, a total of 522 executives have completed this program.
Another initiative we have been offering our up-and-coming leaders since the 1990s is our International
Management Program, where participants work on an interdisciplinary project over a period of eight months.
The results are then presented to the Executive Board. In the reporting period, 25 of our employees worked on
a project as part of this program.
In addition to these various programs, we partner with universities across the globe to enable our employees to
obtain qualifications such as an executive MBA.
Diversity and management
In order to manage our global and diverse organization, we need managers who can build international teams
and promote international collaboration so as to contribute to a productive and flexible working environment.
We seek managers whose inclusive leadership style also reflects different employee and customer traits. This
opens up career opportunities for talented employees from all areas of our company and ensures a broad
experience base as well as differentiated decision-making.
At Merck, many teams work across sites and internationally. The diversity of competencies and experiences
among the team members offers tremendous potential that our leaders can use. Internationality and a global
mindset characterize our company culture and are therefore mirrored by our international management team.
At present, 66% of our managers are not German citizens. All in all, 75 different nationalities are represented in
such positions.

59
Combined Management Report ___ Fundamental Information about the Group ___ People at Merck
At the end of 2020, women occupied 35% of leadership roles Group-wide, meaning that we again exceeded our
goal of maintaining the proportion of female leaders at a stable level of 30% by 2021. At the same time, we
developed goals and measures to ensure a balance of men and women when filling vacancies at the different
levels of our businesses. Factors such as the stronger female presence in leadership programs are already
helping to ensure that female candidates are taken into account to a greater extent when filling vacancies. Our
flexible working models and unconscious bias training are also helping to increase the percentage of women in
the Group.
The report on stipulations to promote the proportion of women in leadership positions at Merck KGaA,
pursuant to section 76 (4) and section 111 (5) of the German Stock Corporation Act (AktG), can be found
in the Corporate Governance statement. This is made available on the website
https://www.merckgroup.com/en/investors/corporate-governance/reports.html.
Leveraging the opportunities of digitalization
Digital transformation has been leaving its mark on the world of work for a long time now. New, agile ways of
working and artificial intelligence (AI) are thus increasingly gaining ground, a shift we are actively supporting at
Merck. For example, we have been developing an intelligent humanoid robot in collaboration with Darmstadt
Technical University since 2017. The aim is to find out how employees and managers respond to intelligent
robots and AI in the workplace and in which areas they could be used. Another goal is to prepare our
executives and staff for the introduction of AI in the working environment. The studies are also intended to
make new technologies hands-on so as to create acceptance of them early on.
State-of-the-art big data applications provide leaders with rapid and specific answers to HR-related questions.
In addition to conventional master data, this may take the form of information on compensation, performance,
and potential as well as strategic succession and HR planning. The Visier software developed by the People
Analytics HR unit can connect this data in order to allow trends to be identified at an early stage. This means
that managers have access to an extensive trove of data that they can utilize for operational and, above all,
strategic (HR) decisions as long as this is consistent with data privacy regulations.
Data and technology at Merck have become more important than ever before in light of the Covid-19 pandemic.
So far, our strong foundations have helped us to overcome the crisis and keep our employees safe and active.
We want to make even greater use of innovative technologies like artificial intelligence in order to advance the
way in which our employees work.
Digitalization is also impacting our vocational training and continuing education programs, where IT skills are
becoming increasingly crucial. At the same time, digital media is creating new opportunities for learning, which
is why we are increasingly integrating 3D printing, robotics, big data, and artificial intelligence into our
curricula. Moreover, we are testing novel learning and innovation methods such as Scrum and design thinking.
To learn how to operate machinery, our apprentices also utilize virtual reality environments, initially learning
how to operate the machinery through virtual images before developing the corresponding expertise in real
environments.
Furthering and asking more of talent
We believe that curiosity can make great things happen. We therefore seek to provide an environment that
gives our employees plenty of scope for creativity and awakens their desire to innovate. In particular, training
and career development play a key role. Focusing on their individual strengths, aspirations, and skills, we
support their personal and professional development, thereby laying the groundwork for an enriching and
challenging career with our company. We endeavor to discover qualified employees at an early stage in their
career and develop their talents.

60
Combined Management Report ___ Fundamental Information about the Group ___ People at Merck
A holistic recruitment approach
When filling job vacancies, we pursue a holistic recruitment approach coupled with globally uniform and binding
procedures. This starts with an internal job posting before external channels such as job portals and
recruitment agencies are used. This process enables us to offer employees better development opportunities.
For employees with leadership responsibility, we offer targeted interview coaching to support them in selecting
candidates and to establish uniform quality standards.
A globally accessible welcome portal is available to new employees in order to help them prepare for their new
job at Merck and to support their onboarding phase. To further improve the onboarding process, supervisors,
Human Resources, and new employees can exchange information and documents before their first day of work.
In addition, all new employees are assigned an experienced colleague who can help familiarize them with the
daily work routine. Our managers are also given detailed information such as onboarding plans and process
descriptions to support them with this task.
Vocational training to recruit young people
Although the conditions were more difficult on account of the Covid-19 pandemic, we maintained a consistently
high vocational training rate in Darmstadt, Germany, our largest site, in 2020. A total of 600 young people
were enrolled in vocational training in 28 different occupations at our headquarters in the reporting period. We
give unlimited employment contracts to all employees in vocational training who work in occupations for which
we have sustainable demand. On average, the post-vocational training hiring rate – taking voluntary
terminations into account – was more than 90% over the past five years. We also offer vocational training at
other sites in Germany, with a total of 607 young employees participating. We promote the professional and
social expertise of our employees in vocational training through numerous regional and global project activities.
In Darmstadt, the Starting Vocational Training and Integrating Refugees through Training programs help young
people to enter the job market: The 11-month preparation program gives them an insight into working life and
readies them to enter vocational training. In this way, we assist young people who have a school-leaving
qualification but have been searching for a vocational training position for at least one year without success, as
well as refugees who have been forced to leave their home country and are seeking to build a new life in
Germany. In the reporting year, we combined the programs so that the participants can learn and benefit from
each other. Encouraging cultural awareness in both directions, promoting language development through
personal contact with native speakers, and integrating the role model function of highly motivated people are
just a few of the benefits of the Starting Vocational Training program. In 2020, the program accepted
participants ages 16 to 30.
Targeted advanced training and maximizing performance capability
Our focus on systematic personnel development allows us to sustainably strengthen the performance potential
within our company and to increase the motivation of our people. Only by expanding the abilities of each
individual can we count on innovative and curious employees and managers in the future and flexibly respond
to different requirements.
Employee development at Merck is founded on regular exchanges and a culture in which employees aspire to
high levels of performance and engagement. As the basis for internal strategic talent management, the
performance and potential management process is globally aligned for all employees in accordance with the
same principles and is part of a shared IT system. We systematically combine talent recognition with
performance assessments based on employee target agreements, as we are convinced that ongoing feedback
helps all employees to grow in terms of their performance and potential. Regular individual assessments permit
us to more readily identify high-potential employees and to further them accordingly. Clear objectives,
differentiated and open feedback, and individual development plans are thus important prerequisites for both
the personal development of every individual and the success of the company.
61
Combined Management Report ___ Fundamental Information about the Group ___ People at Merck
Global training courses and workshops developed specifically for teams help our employees develop and build
individual abilities in line with new requirements and perspectives. Digital solutions in the form of e-learning
and language courses are also available to our employees. To enable our employees and managers to realize
their full potential, we also provide local business and function-related offers. In response to the crisis, we
offered global training in 2020 on topics such as virtual leadership, employee well-being, and working from
home. This also included guidance on conducting team meetings in order to help teams adapt their cooperation
to the new situation and to create an inclusive atmosphere. The range of training is supplemented by individual
and group coaching on topics such as self-resilience and self-motivation.
All measures are documented in a globally standardized development plan. Individual development
opportunities are also supported by our job architecture, which applies globally and enables us to harmonize all
positions and simplify their classification. This job architecture defines three fundamental career types:
managers, experts, and project managers. They are all equal. Employees who wish to advance in their careers
and aim for a top position within the company can also do so via the expert and project manager career paths.
A transparent and flexible employee reward system
At Merck, we reward the performance of every individual through appropriate and competitive total
compensation. For years, we have been achieving this through global processes and programs that are
supported by digital platforms. We also offer our managers flexible, market-, and needs-oriented compensation
tools. These support well-informed decisions and thus provide comprehensible, performance-, and position-
based compensation. Apart from monetary compensation components, we also offer our employees attractive
fringe and social benefits. Our fringe benefits feature globally under the internal benefits4me brand. Its
offerings comprise three pillars:
• Company benefits including a company pension
• Health and well-being
• Service offers
Specific benefit packages are in place at a national level to meet the different needs of our employees using
well-established management mechanisms. Focusing more closely on individualized fringe and social benefits in
the future will continue to enable our employees to individually choose those benefits that best meet their
personal situation and stage of life.
Valuing diversity and dialogue
We appreciate the diversity that our employees bring to our workforce in terms of their gender, national or
ethnic background, sexual orientation, religion, or personal life experience. We are committed to an inclusive
culture in which each individual can develop their full potential and contribute their individual perspectives. We
deeply believe that a diverse workforce and a respectful corporate culture are indispensable for our ability to
innovate and that they contribute significantly to our business success.
Our diversity strategy
Our Chief Diversity Officer is responsible for strategic management with regard to the topics of diversity and
inclusion. In addition, all the business sectors and larger Group functions have active leadership teams that
implement our diversity and inclusion strategy in their respective area of responsibility. A committee with
responsibility for diversity – the Diversity Council – is composed of high-ranking managers from all the business
sectors and selected Group functions. The work of the committee focuses on advancing our diversity strategy,
which involves two key areas. First, we aim to promote the advancement of women into leadership positions
and give talented people from the Asian region greater opportunities. Secondly, we aim to develop a better
understanding of this growth market. The focus has recently been expanded to include LGBTQI+ (lesbian, gay,
bisexual, transgender, queer or questioning, intersex and other gender identities), disability and ethnic
62
Combined Management Report ___ Fundamental Information about the Group ___ People at Merck
background as additional dimensions, with activities in North America and Europe concentrating in particular on
the topic of ethnicity.
At the same time, our other goals remain unchanged: We aim to recruit people representing a breadth of
qualifications, skills, and experiences. In order to foster exchanges among like-minded individuals, we also
support the specific employee networks in which several thousand of our employees participate. As well as our
women’s networks in various countries, we support networks that promote the interests of the LGBTQI+
community, employees from different ethnic groups and international employees, for example. In China,
Generation Now is a network for young people that provides them with access to mentoring and innovation
projects. Our Carer network brings together employees from all over the world who care for a relative. In
addition, we organize regular events to mark occasions such as our Diversity Days, International Women’s Day,
Pride Month, Coming Out Day, and Black History Month, where we discuss current developments that are
particularly relevant to us.
We also raise awareness of unconscious bias throughout the Group. We help executives to identify and reassess
these thought patterns in their daily encounters as well as in decision-making processes and to bring about
long-term changes in their own behavior in this regard. We also use the Job Analyzer, an online tool that allows
job advertisements to be checked for critical wordings prior to their publication, to foster gender-neutral
communication with those applying for jobs.
In Germany, we have signed the Charta der Vielfalt (Diversity Charter), the Charta der Gleichstellung (Equal
Opportunity Charter), and the Inclusion Action Plan of the German Mining, Chemical, and Energy Industrial Union
(IG BCE). At an international level, we support the Women’s Empowerment Principles, an initiative of UN Women
and the UN Global Compact aimed at empowering women in the workplace. We are also a member of the
Business Coalition for Equality Act, a group of leading employers in the United States that supports the Equality
Act. By joining these initiatives, we underscore our commitment to fairness and tolerance in the workplace.
Different aspects of diversity
As a global employer with intercultural expertise, people from a total of 141 nations work for Merck; 21% of our
employees are German citizens, and 77% of our employees work outside Germany. At our headquarters in
Darmstadt, 11% of staff are not German citizens.
Women currently account for 43% of our workforce. However, the ratio of women to men varies widely across
the different regions, businesses, and functions. We are therefore working to raise the proportion of women
wherever they are underrepresented, taking into account the situation typical for the industry as well as
regional differences.
Demographic change is posing challenges to society in Germany as well as several other European Union
countries, the United States, China, and Japan. The average age of our employees is approximately 42. We
assume that this figure will continue to rise in the coming years and are preparing for this situation. As part of
our range of Health and Well-Being offerings, we specifically promote our employees’ physical and psychological
well-being throughout their entire career.
Understanding our employees
We want to create a working environment that empowers our employees to think outside of the box and find
new solutions, opening the door to creative ideas and the discovery of new market opportunities. In order to
promote this and to allow us to carry out even better comparisons both within the company and with our
competitors, we conduct Group-wide employee engagement surveys every year. In this way, we ensure a
regular exchange between employees, leaders, and senior management. The honest feedback we receive from
staff shows us whether the measures and initiatives specified here are successful and highlights areas where we
can improve further.
In October, the global employee engagement survey was again conducted in 21 languages and the status of
implementation was reviewed. Around 50,500 employees (86%) took part. In the midst of the pandemic, our
63
Combined Management Report ___ Fundamental Information about the Group ___ People at Merck
Group-wide score, which indicates how attached our employees feel to the company, was actually three
percentage points higher than in the previous year at 77%. In addition, regular snapshot surveys have been
conducted during the peak phases of Covid-19 to determine the mood of employees in light of the changes in
their working situation. The results are used to identify strategic focus areas and feed into company-wide work
on an ongoing basis.
Differentiated solutions to support employee well-being
As an employer, we take responsibility for the well-being of our people and offer a wide range of opportunities
to optimize work-life balance and protect their health and safety.
Covid-19-related activities
Social distancing and face coverings, home working and home schooling: The Covid-19 pandemic is presenting
our employees with new challenges. Our overriding priority is to ensure the health and safety of our employees
and their families. However, maintaining our business processes and supporting customers and institutions,
including in areas such as vaccine development, are also important aspects.
Supporting our employees is an integral component of our crisis management throughout all phases of the
crisis. For example, we offer online training and coaching. We have also established a global hotline for our
employees, allowing them to ask questions at any time of day and obtain assistance with whatever professional
or personal problems they may have.
One particular focal point is the provision of guidelines and tools aimed at helping employees to achieve a
healthy balance between their work, childcare, and family obligations and supporting employees who are at a
particularly high health risk.
One thing has become particularly clear to us in the months since the crisis began: Flexible working models and
virtual cooperation are more important than ever before. In many countries, we were fortunate in that we were
able to fall back on proven flexible working models like MyWork@Merck and digital work tools.
We have established a special working group to address the experiences gained from the Covid-19 pandemic.
Its aim is to establish what lessons can be learned from the pandemic and how they can be applied to the
potential workplace of tomorrow. The working group has identified three focus areas:
• Flexible working models: We want to create even more flexible working models that enable employees
to work flexible hours in the office, in their workplace, at home, or elsewhere – whatever the nature
of their work. Merck will also make increased use of part-time work and job sharing in order to
provide employees with flexible alternatives to full-time work. Another special feature will be the
creation of location-independent roles, allowing us to recruit talented employees who meet the
respective job requirements regardless of where in the world they may live.
• Investments in new technologies: We want to make even greater use of innovative technologies like
artificial intelligence in order to advance the way in which our employees work.
• Leadership development: We want to provide our leaders with the skills they need to manage their
employees successfully in a new world of work and make the right decisions.
Fostering work-life balance
We know that people’s priorities in life can change. The Covid-19 pandemic has provided a vivid demonstration
of how important it is to achieve a healthy balance between work, childcare, and family obligations. We take
this into account by offering flexible working time/location models, working time accounts for early retirement,
and the possibility of taking an extended break from work, among other things. We also place great emphasis
on family life. Here our commitment ranges from parental leave to childcare as well as support of employees
caring for a relative.

64
Combined Management Report ___ Fundamental Information about the Group ___ People at Merck
Even before the Covid-19 pandemic, our employees had the choice between different flexible working models.
Thanks to the consistently positive experiences in terms of performance and commitment during the pandemic,
we decided to roll out our proven mywork@Merck program at all of our locations worldwide. The program allows
employees to freely choose their working hours and location (in the same country) in agreement with their teams
and supervisors. Employees agree with their direct supervisors on when and how often all team members are
required to be in the office. Time tracking and time control are no longer required. The model reinforces our
company’s performance culture and culture of trust and forms part of our global Future Ways of Working program.
Workplace suitability permitting, the model can be taken up both by employees formally covered by collective
agreements and employees exempt from them. Implementation will be complete by the end of 2021.
By offering information, advice, and assistance in finding childcare and nursing care as well as home and garden
services, we help employees to reconcile the demands of their professional and personal lives. At various sites,
employees benefit from childcare options that we subsidize. As an example, our headquarters in Darmstadt has
featured a daycare center offering 150 slots in crèche, kindergarten, and after-school care for more than 50 years
now. The Parents@Merck program makes it easier for our employees to return to work following parental leave by
giving mothers and fathers on parental leave the chance to talk and interact, as well as helping them to keep in
touch with the company. Moreover, they can make use of our various training and networking opportunities. We
have also established similar programs in other locations.
A constant focus on health and safety
The health and safety of our employees constitute an important part of our daily responsibilities – especially in
times of new challenges like the Covid-19 pandemic. We do everything to protect our employees against accidents
and work-related illnesses, including in the areas of stress prevention, nutrition, and exercise. We employ
preventive measures that can be easily incorporated into the daily work routine. They are designed to help our
employees to avoid health problems.
As part of our response to the Covid-19 pandemic, we established global and local working groups to develop risk
scenarios and plans of action. We built up internal coronavirus testing capacities, developed and implemented
work safety standards, ensured the procurement of protective equipment, and made employees fully aware of the
need to maintain social distancing and wear a face covering.
At our Darmstadt and Gernsheim sites, our Health Management unit conducts an array of campaigns and
programs to promote the health of our workforce. Our employees have access to a health catalog detailing our
Health Management services in both English and German. Among other things, this contains information on
ergonomics, nutrition, stress, and mental health issues.
Workplace safety and health protection are the highest priority at Merck. It is especially important to us to do
everything we can to prevent workplace-related illnesses and accidents. We apply the lost time injury rate (LTIR),
which describes the number of accidents worldwide resulting in lost time of one day or more per million working
hours, as a key indicator in measuring the success of our occupational safety measures. We calculate the LTIR for
our employees as well as for temporary staff. Our previous target was to reduce the LTIR to 1.5 (accidents
resulting in lost time of one day or more per million working hours) by 2020. The LTIR in 2020 was 1.3. We are
currently developing a new target for the period beyond 2020.
Experience shows that most workplace accidents can be prevented by proper conduct. Through our BeSafe! safety
culture initiative, we are working to educate our employees on dangers in the workplace and provide them with
rules of conduct that help keep them safe. Uniform standards as well as local modules to meet specific safety
requirements at individual sites can help achieve a steady improvement in the current situation. The program
focuses on engaging managers in the safety culture and building their buy-in, aiming to make safety an intrinsic
value and empower our employees to take responsibility for their own safety. The Covid-19 pandemic and the
resulting restrictions meant it was not possible to conduct as many awareness campaigns in 2020. We are also
working hard on the next phase of the safety culture initiative. Its new name, TeamSafe, reflects the fact that all
employees bear collective responsibility for safety. In the next phase, the initiative will focus on enthusiasm,
empowerment, and a role model function in the area of occupational health and safety.
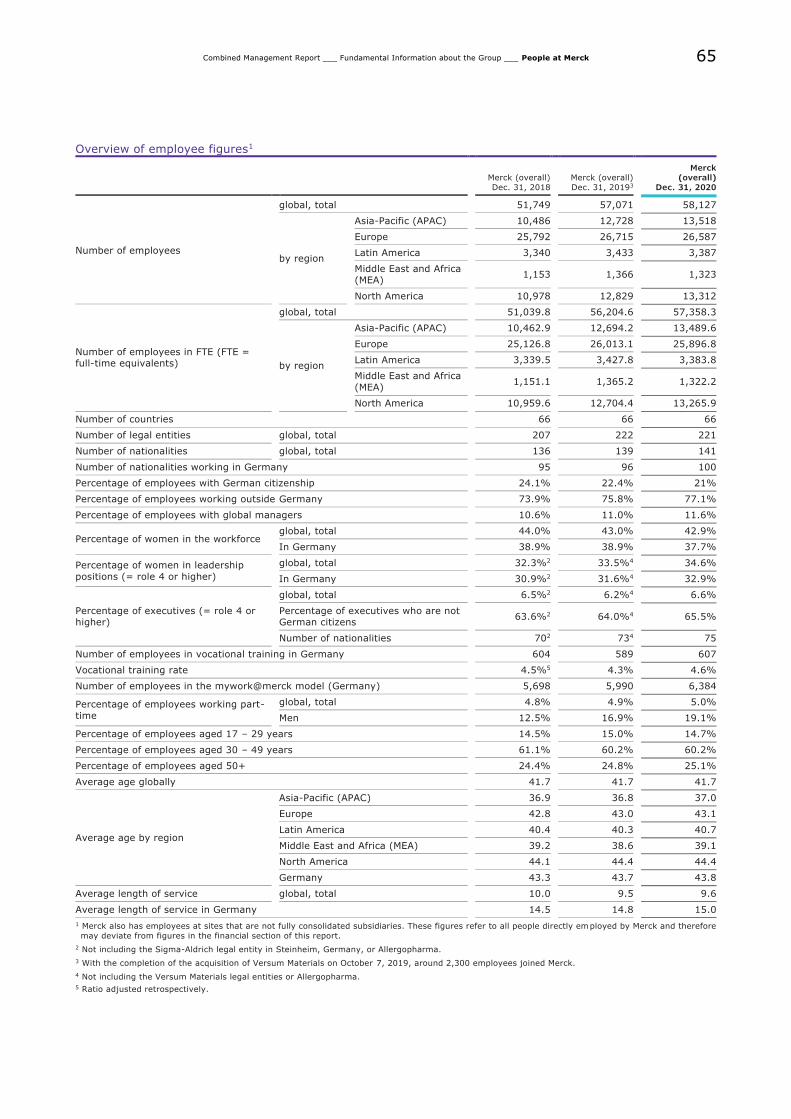
65
Combined Management Report ___ Fundamental Information about the Group ___ People at Merck
Overview of employee figures1
Merck (overall)
Dec. 31, 2018
Merck (overall)
Dec. 31, 20193
Merck
(overall)
Dec. 31, 2020
Number of employees
global, total 51,749 57,071 58,127
by region
Asia-Pacific (APAC) 10,486 12,728 13,518
Europe 25,792 26,715 26,587
Latin America 3,340 3,433 3,387
Middle East and Africa (MEA)
1,153 1,366 1,323
North America 10,978 12,829 13,312
Number of employees in FTE (FTE = full-time equivalents)
global, total 51,039.8 56,204.6 57,358.3
by region
Asia-Pacific (APAC) 10,462.9 12,694.2 13,489.6
Europe 25,126.8 26,013.1 25,896.8
Latin America 3,339.5 3,427.8 3,383.8
Middle East and Africa
(MEA) 1,151.1 1,365.2 1,322.2
North America 10,959.6 12,704.4 13,265.9
Number of countries 66 66 66
Number of legal entities global, total 207 222 221
Number of nationalities global, total 136 139 141
Number of nationalities working in Germany 95 96 100
Percentage of employees with German citizenship 24.1% 22.4% 21%
Percentage of employees working outside Germany 73.9% 75.8% 77.1%
Percentage of employees with global managers 10.6% 11.0% 11.6%
Percentage of women in the workforce global, total 44.0% 43.0% 42.9%
In Germany 38.9% 38.9% 37.7%
Percentage of women in leadership
positions (= role 4 or higher)
global, total 32.3%2 33.5%4 34.6%
In Germany 30.9%2 31.6%4 32.9%
Percentage of executives (= role 4 or higher)
global, total 6.5%2 6.2%4 6.6%
Percentage of executives who are not German citizens
63.6%2 64.0%4 65.5%
Number of nationalities 702 734 75
Number of employees in vocational training in Germany 604 589 607
Vocational training rate 4.5%5 4.3% 4.6%
Number of employees in the mywork@merck model (Germany) 5,698 5,990 6,384
Percentage of employees working part-
time
global, total 4.8% 4.9% 5.0%
Men 12.5% 16.9% 19.1%
Percentage of employees aged 17 – 29 years 14.5% 15.0% 14.7%
Percentage of employees aged 30 – 49 years 61.1% 60.2% 60.2%
Percentage of employees aged 50+ 24.4% 24.8% 25.1%
Average age globally 41.7 41.7 41.7
Average age by region
Asia-Pacific (APAC) 36.9 36.8 37.0
Europe 42.8 43.0 43.1
Latin America 40.4 40.3 40.7
Middle East and Africa (MEA) 39.2 38.6 39.1
North America 44.1 44.4 44.4
Germany 43.3 43.7 43.8
Average length of service global, total 10.0 9.5 9.6
Average length of service in Germany 14.5 14.8 15.0
1 Merck also has employees at sites that are not fully consolidated subsidiaries. These figures refer to all people directly employed by Merck and therefore
may deviate from figures in the financial section of this report.
2 Not including the Sigma-Aldrich legal entity in Steinheim, Germany, or Allergopharma.
3 With the completion of the acquisition of Versum Materials on October 7, 2019, around 2,300 employees joined Merck.
4 Not including the Versum Materials legal entities or Allergopharma.
5 Ratio adjusted retrospectively.
66
Combined Management Report ___ Report on Economic Position ___ Report on Economic Position
Report on Economic Position
Macroeconomic and Sector-Specific Environment
Based on the World Economic Outlook published by the International Monetary Fund (IMF) on January 26,
2021, the recession in the second quarter of 2020 was followed by a recovery in the global economy from the
second half of 2020 onward. However, there is considerable variation between individual countries when it
comes to the pace of the continued recovery. Key factors include the comprehensive rollout of vaccines as
quickly as possible, the extent to which those vaccines are effective against Covid-19 mutations, and effective
containment measures. Government fiscal policy measures could also have a further positive impact. Yet, the
IMF does not expect the global economic activity to return to the level forecast prior to the outbreak of the
Covid-19 pandemic by 2022.
According to the latest forecasts by the IMF, global gross domestic product (GDP) fell by -3.5% in 2020
(previous year: +2.8%). Activity resumed more quickly after the lockdowns than had been initially anticipated,
especially in the advanced economies, although there are general differences in terms of the impact of the
pandemic in the individual countries. While economic output in the industrialized nations fell by -4.9% (previous
year: +1.6%), the emerging markets and developing economies saw a less pronounced downturn of -2.4%
(previous year: +3.6%). GDP in the United States declined by -3.4% (previous year: +2.2%). The eurozone
was hit harder by the pandemic, with GDP decreasing by -7.2% (previous year: +1.3%). The downturn in GDP
in the emerging economies of Asia was relatively minor at -1.1% (previous year: +5.4%). While the Indian
economy contracted by -8.0% (previous year: +4.2%), the rapid recovery of the Chinese economy to record
growth of 2.3% (previous year: 6.0%) meant that the overall figure decreased only slightly. As part of the
advanced economies, Japan reported a downturn of -5.1% (previous year: +0.3%).
As in the previous year, Merck’s organic sales growth was significantly higher than the IMF’s global growth
expectations at 6.0%. With the exception of the Middle East and Africa, all regions contributed to this growth in
the reporting year. North America accounted for the highest share of Group-wide growth at 42.4%, followed by
Europe with 33.4%, Asia-Pacific with 17.8%, and Latin America with 8.2%. The organic downturn in the Middle
East and Africa region was reflected in a slightly negative contribution to Group growth of -1.8%.
The overall growth was driven in particular by the Life Science business sector, with Healthcare also making a
positive contribution to organic growth. Performance Materials was down on the previous year in terms of
organic sales. This illustrates the fact that the growth in the North America and Europe regions is primarily
attributable to the Life Science business sector. In the Asia-Pacific region, the growth contributions from the
Life Science and Healthcare business sectors were more than enough to offset the downturn in the Performance
Materials business sector.
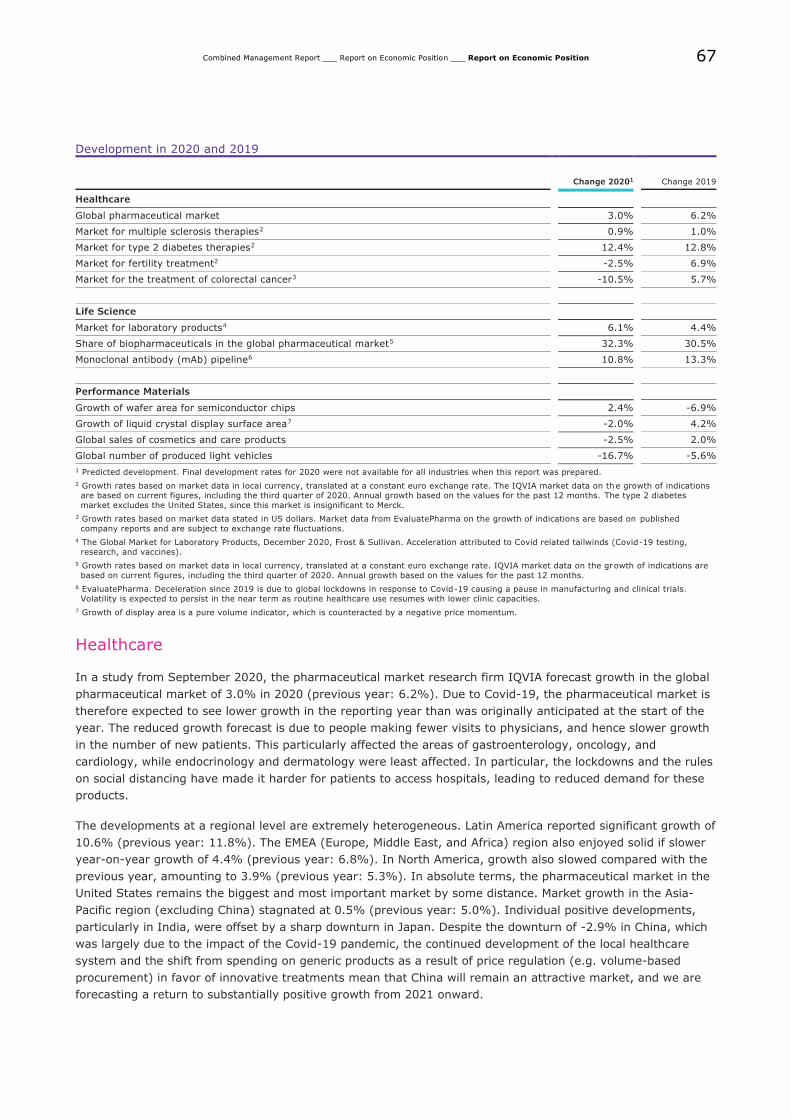
67
Combined Management Report ___ Report on Economic Position ___ Report on Economic Position
Development in 2020 and 2019
Change 20201 Change 2019
Healthcare
Global pharmaceutical market 3.0% 6.2%
Market for multiple sclerosis therapies2 0.9% 1.0%
Market for type 2 diabetes therapies2 12.4% 12.8%
Market for fertility treatment2 -2.5% 6.9%
Market for the treatment of colorectal cancer3 -10.5% 5.7%
Life Science
Market for laboratory products4 6.1% 4.4%
Share of biopharmaceuticals in the global pharmaceutical market5 32.3% 30.5%
Monoclonal antibody (mAb) pipeline6 10.8% 13.3%
Performance Materials
Growth of wafer area for semiconductor chips 2.4% -6.9%
Growth of liquid crystal display surface area7 -2.0% 4.2%
Global sales of cosmetics and care products -2.5% 2.0%
Global number of produced light vehicles -16.7% -5.6%
1 Predicted development. Final development rates for 2020 were not available for all industries when this report was prepared.
2 Growth rates based on market data in local currency, translated at a constant euro exchange rate. The IQVIA market data on the growth of indications are based on current figures, including the third quarter of 2020. Annual growth based on the values for the past 12 months. The type 2 diabetes
market excludes the United States, since this market is insignificant to Merck.
3 Growth rates based on market data stated in US dollars. Market data from EvaluatePharma on the growth of indications are based on published
company reports and are subject to exchange rate fluctuations.
4 The Global Market for Laboratory Products, December 2020, Frost & Sullivan. Acceleration attributed to Covid related tailwinds (Covid-19 testing,
research, and vaccines).
5 Growth rates based on market data in local currency, translated at a constant euro exchange rate. IQVIA market data on the growth of indications are
based on current figures, including the third quarter of 2020. Annual growth based on the values for the past 12 months.
6 EvaluatePharma. Deceleration since 2019 is due to global lockdowns in response to Covid-19 causing a pause in manufacturing and clinical trials.
Volatility is expected to persist in the near term as routine healthcare use resumes with lower clinic capacities.
7 Growth of display area is a pure volume indicator, which is counteracted by a negative price momentum.
Healthcare
In a study from September 2020, the pharmaceutical market research firm IQVIA forecast growth in the global
pharmaceutical market of 3.0% in 2020 (previous year: 6.2%). Due to Covid-19, the pharmaceutical market is
therefore expected to see lower growth in the reporting year than was originally anticipated at the start of the
year. The reduced growth forecast is due to people making fewer visits to physicians, and hence slower growth
in the number of new patients. This particularly affected the areas of gastroenterology, oncology, and
cardiology, while endocrinology and dermatology were least affected. In particular, the lockdowns and the rules
on social distancing have made it harder for patients to access hospitals, leading to reduced demand for these
products.
The developments at a regional level are extremely heterogeneous. Latin America reported significant growth of
10.6% (previous year: 11.8%). The EMEA (Europe, Middle East, and Africa) region also enjoyed solid if slower
year-on-year growth of 4.4% (previous year: 6.8%). In North America, growth also slowed compared with the
previous year, amounting to 3.9% (previous year: 5.3%). In absolute terms, the pharmaceutical market in the
United States remains the biggest and most important market by some distance. Market growth in the Asia-
Pacific region (excluding China) stagnated at 0.5% (previous year: 5.0%). Individual positive developments,
particularly in India, were offset by a sharp downturn in Japan. Despite the downturn of -2.9% in China, which
was largely due to the impact of the Covid-19 pandemic, the continued development of the local healthcare
system and the shift from spending on generic products as a result of price regulation (e.g. volume-based
procurement) in favor of innovative treatments mean that China will remain an attractive market, and we are
forecasting a return to substantially positive growth from 2021 onward.
68
Combined Management Report ___ Report on Economic Position ___ Report on Economic Position
Besides the growth of the pharmaceutical sector as a whole, the development of the biopharmaceutical market
is particularly relevant to our business. According to IQVIA, the market volume for biological pharmaceuticals
totaled approximately € 316 billion in 2020 (previous year: approximately € 288 billion), thus continuing the
recent trend of a continuous increase in market share. These products accounted for 32.3% of the global
pharmaceutical market in 2020 (previous year: 30.5%). The most important market for biological
pharmaceuticals remains the United States, with a 61.0% share of the global market volume.
The developments in the therapeutic areas of relevance to Merck saw differing trends in the reporting year. The
global market for type 2 diabetes excluding the United States followed the positive trend of previous years,
achieving growth of 12.4% in 2020 (previous year: 12.8%). The therapeutic area of infertility saw a downturn
of -2.5% in the reporting year (previous year: +6.9%). Following a strong upturn in recent years, the market
for colorectal cancer also declined by -10.5% in 2020 (previous year: +5.7%). The growth trend in the market
for multiple sclerosis patients remains at previous year’s level with 0.9% (previous year: 1.0%).
Life Science
Our Life Science business sector is a leading global supplier of products, tools and services for research
laboratories, pharma and biotech production, and industrial and testing laboratories. While Covid-19 is having a
pronounced impact on many sectors and the global economy as a whole, the life science market has proven
itself to be robust.
According to the market research firm Frost & Sullivan, the market for laboratory products, which is relevant to
our Research Solutions and Applied Solutions business units, grew 6.1% in 2020 (previous year: +4.4%). This
was primarily due to a surge in demand for products related to Covid-19 testing, research, and vaccination.
These developments served to more than offset the temporary reduction in laboratory activity during the
lockdowns that were imposed in response to the Covid-19 pandemic. The impact of the closures was most
pronounced in the second quarter of 2020, when just 12.2% of the laboratories surveyed by the market
research firm Bioinformatics were fully operational. Lab activity picked up steadily throughout the fall and
winter (39% of laboratories were fully operational in the fourth quarter of 2020) and is expected to return to
pre-pandemic levels in 2021. Market development for 2021-2022 is expected to continue growing between 4%
and 6%.
In the pharma and biotech production market in which our Process Solutions business unit is active, demand is
driven by the development and manufacture of therapeutics and vaccines. According to IQVIA, the end market
for biopharmaceuticals grew by 9.9% in 2020 (previous year: 13.9%) to € 316 billion (or 32.3% of the global
pharmaceutical market). Monoclonal antibodies, currently the leading area of biopharmaceuticals, continued on
their growth path in 2020 with positive development of 10.8% (previous year: 13.3%). The slowdown
compared with the previous year is due to the global lockdowns in response to Covid-19, which led to
production and clinical trials being suspended. Volatility is expected to persist in the near term as routine
healthcare applications start to resume, albeit with reduced hospital capacities. The rapid development of
treatment methods and vaccines in connection with Covid-19 is giving the pharma and biotech production a
considerable boost. As of January 21, 2021, a total of 1,083 programs for the development and production of
billions of vaccine doses were in progress.
69
Combined Management Report ___ Report on Economic Position ___ Report on Economic Position
Performance Materials
The semiconductor industry is the most important market for Merck’s business with materials for the production
of integrated circuits (Semiconductor Solutions). In particular, the growth in demand for semiconductor
materials depends on the wafer area produced for semiconductors. The silicon wafers required as raw materials
are used as an indicator to estimate the demand for semiconductor materials. According to the global industry
association SEMI.org, the area of delivered silicon wafers increased by approximately 2.4% in 2020 (previous
year: -6.9%). Although the global economy fell into a severe recession in the first half of 2020 as a result of
the global lockdowns to protect public health in response to Covid-19, demand for semiconductor chips
remained robust. This was due to the strict social distancing rules, which triggered a significant wave of IT
spending on the part of companies, governments, and individuals. With entire production facilities, offices,
schools, and companies closing their doors temporarily, working from home, home schooling, online shopping
and online entertainment suddenly became considerably more important as a means of enabling economic
activity to resume, at least in part. To this end, demand for electronics – and hence semiconductor chips –
remained robust and even intensified as the digitalization of the world picked up pace. McKinsey estimates that
the global digital transformation has accelerated by around five years as a result of the Covid-19 lockdowns. As
a consequence, the production capacities of semiconductor manufacturers remained largely constant with
sustained high utilization rates throughout 2020, meaning that the development of the semiconductor and
electronics industry was entirely decoupled from the wider GDP trend. As social distancing rules look set to
remain in place or be intensified in order to prevent a renewed rise in new infections from the fourth quarter of
2020 onward, demand for laptops/PCs, servers, communication infrastructure, storage capacity, and similar
products will be high, especially in 2021.
With its Liquid Crystals business, Merck is the leading producer of liquid crystal mixtures for the display
industry. According to surveys by market researchers at Omdia (formerly IHS), growth in the display surface
area was negative at around -2.0% in 2020 (previous year: +4.2%). This was primarily due to the low level of
demand for televisions and mobile phones as a result of the weaker consumer demand in connection with
Covid-19, as well as the trade dispute between the United States and China. Liquid crystals will continue to play
a key role in the display industry in the future. OLED technology, for which Merck is also one of the leading
material suppliers, is becoming increasingly important in high-end display applications.
The markets for automotive coatings and cosmetics are crucial to Merck’s Surface Solutions business. Global
automobile production fell by -16.7% in 2020 (previous year: -5.6%). Factory closures in response to Covid-19,
supply chain interruptions and a slump in consumer demand are the main reasons for this development. In
China, one of the most important markets, the recovery has already progressed well, whereas in Europe and
North America the markets are not yet on the pre-Covid-19 level.
The market for cosmetics and care products fell by -2.5% overall in 2020 (previous year: +2.0%). Our relevant
market of color cosmetics declined by as much as -8.4% in 2020 due to Covid-19-related effects such as
lockdowns and social distancing. The trade conflicts between the United States and China and uncertainties in
connection with Brexit also served to slow market growth further.
70
Combined Management Report ___ Report on Economic Position ___ Review of Forecast against Actual Business Developments
Review of Forecast against Actual Business
Developments
The forecast of the Merck Group for fiscal 2020 published in the Annual Report for fiscal 2019 comprised the
forecast for the Group as well as the forecast for the three business sectors: Healthcare, Life Science, and
Performance Materials.
Net sales
We forecast solid organic net sales growth for the Group in 2020. Over the course of the year, Merck reported
more dynamic organic sales growth, driven by the strong organic growth of the Life Science business sector in
particular. This meant we slightly exceeded our forecast with strong overall organic net sales growth of 6.0% in
fiscal 2020. At the start of the year, we still anticipated a slightly negative to slightly positive exchange rate
effect on our net sales. However, several currencies saw increasingly unfavorable development as the year
progressed, particularly the US dollar. The negative exchange rate effect in 2020 as a whole was -2.6% and
thus slightly outside our most recent update in the third quarter, which provided for a range of -3% to -4%.
The positive portfolio effect of 5.3% was primarily due to the acquisition of Versum Materials and developed in
line with our original assessment.
Healthcare
We originally forecast solid organic sales growth for our Healthcare business sector compared with the previous
year. Despite the impact of the Covid-19 pandemic, the business sector recorded moderate organic growth of
3.4% in 2020 as a whole. This was slightly above the forecast we updated in the third quarter, which provided
for organic growth of between 2% and 3%. This development was driven in particular by the significant growth
contribution of our most recently approved products, especially Mavenclad®. Together with the positive sales
performance of the rest of our base business, this more than offset the downturn in sales in the fertility
business in the second quarter as a result of Covid-19.
Life Science
Our Life Science business sector significantly exceeded our original forecast, generating organic sales growth of
11.8% in 2020. Following an especially strong fourth quarter, this was also above the most recently updated
range of 9% to 10%. Thanks in particular to the extreme relevance of our product and service range in the
context of the pandemic, Process Solutions was the most dynamic business unit, as expected, and delivered the
largest contribution to organic sales growth within Life Science. Applied Solutions and Research Solutions also
contributed positively to the organic sales performance, as anticipated, albeit to a considerably lesser extent
than Process Solutions.
Performance Materials
Since we expected the growth in semiconductor business to exceed the downturn in sales in the Display
Solutions business unit, we originally forecast slight organic growth for our Performance Materials business
sector. In light of the impact of Covid-19 on our display, automotive, and cosmetics end markets in the first
quarter, we were forced to significantly downgrade our forecast to a moderate to strong organic decline.
Our key assumption of high growth momentum in the Semiconductor Solutions business unit proved to be
correct. Thanks to a particularly strong fourth quarter for Semiconductor Solutions in particular, the
business sector closed the year with an organic sales decline of -3.2%, ahead of our most recent forecast of
between -4% and -5%. As consistently forecast, the portfolio effect of 35.4% primarily resulting from the
Versum Materials acquisition, was in the mid-thirties percentage range.
71
Combined Management Report ___ Report on Economic Position ___ Review of Forecast against Actual Business Developments
EBITDA pre
For 2020, we originally forecast strong year-on-year organic growth in EBITDA pre for the Merck Group. This
assumption was based on the expectation of strong organic growth in Life Science, supported by solid organic
growth in Healthcare and slight organic growth in Performance Materials. Furthermore, because of the expected
unfavorable foreign exchange environment, we still expected moderate negative exchange rate effects to
burden EBITDA pre by between 0% and -3% compared with the prior year. In 2020, EBITDA pre amounted to
€ 5,201 million, equivalent to an increase of 18.6% compared with the prior year (2019: € 4,385 million). The
organic growth of 16.8% included in this figure was slightly above the forecast range of 14% to 16% we issued
in the third quarter of 2020. Both figures included € 365 million from the reversal of a provision for a patent
dispute. However, exchange rate effects had a more negative impact than expected at the start of the year,
which is why we narrowed our forecast range to between -3% and -5% in our reporting over the course of the
year. We ultimately closed 2020 at -4.6%.
Healthcare
For our Healthcare business sector, we originally forecast solid year-on-year organic growth in EBITDA pre
thanks to substantial anticipated earnings contributions from our new products, particularly Mavenclad®, and a
decline in marketing and selling expenses and development expenses in relation to sales. This was expected to
offset the effect of the forecast downturn in sales of Rebif®. In light of the impact of Covid-19 on our fertility
business in particular in the first quarter, we significantly downgraded our forecast to a slight organic decline.
In 2020, EBITDA pre in the Healthcare business sector amounted to € 2,267 million thanks to a rapid recovery
from the middle of the year onward (2019: € 1,922 million). This is equivalent to an increase of 18.0% over
2019; the organic rise of 26.6% corresponded to the upper end of the forecast range we issued at the end of
the year. Both figures included € 365 million from the reversal of a provision for a patent dispute. By contrast,
the foreign exchange effect on EBITDA pre in 2020 as a whole was substantially more negative than expected
at the start of the year at -8.5%, although this was within the range of between -7% and -9% to which we had
adjusted in the course of our reporting on the third quarter of 2020.
Life Science
For the Life Science business sector, we originally forecast strong organic growth in EBITDA pre on the back of
the expected organic sales growth and a slight improvement in margins. However, the impact of the Covid-19
pandemic on the three Life Science business units became increasingly evident as the year progressed. Thanks
to a particularly strong fourth quarter, EBITDA pre amounted to € 2,405 million in fiscal 2020 and year-on-year
organic growth came in at 17.2%, thereby exceeding the forecast range that had already been significantly
raised to between 13% and 15% in the course of our reporting on the third quarter. Foreign exchange
development impacted EBITDA pre in the Life Science business sector by -3.8%, thereby developing in line with
our most recent forecast.
72
Combined Management Report ___ Report on Economic Position ___ Review of Forecast against Actual Business Developments
Performance Materials
Due to the expected sales growth accompanied by the Bright Future transformation program, we also originally
forecast slight organic growth in EBITDA pre in the Performance Material business sector. In the light of the
impact of Covid-19 on our display, automotive, and cosmetics end markets in the first quarter, we were forced
to significantly downgrade our forecast to an organic decline in the low to mid-teens percentage range. Thanks
to sustained positive development in our semiconductor business, we most recently raised our forecast to an
organic decline of between -6% and -9%. For 2020 as a whole, Performance Materials achieved an EBITDA pre
of € 1,024 million (2019: € 803 million). This represented an organic decline of -7.5% compared with the
previous year, which was within our most recent forecast range of -6% to -9%. As consistently forecast, the
portfolio effect of 36.3% primarily resulting from the Versum Materials acquisition was in the mid-thirties
percentage range. The foreign exchange effect of -1.3% was also at the upper end of our forecast range from
the third quarter of -1% to -3%.
Corporate and Other
EBITDA pre of Corporate and Other amounted to € -495 million in fiscal 2020, thus exceeding the forecast
range of € -460 million to € -490 million that we specified in the reporting on the third quarter of 2020.
Compared with the prior-year figure of € -469 million, this corresponded to a rise in costs of 5.5%. The higher
expenditures compared to the last forecast were mainly due to higher losses from our currency hedging
transactions.
Business free cash flow
We originally expected the business free cash flow of the Merck Group to see an increase in the mid-twenties
percentage range in 2020. Even excluding the € 365 million reversal of a provision for a patent dispute, this
forecast was achieved with growth of 24.5% to € 3,400 million (2019: € 2,732 million). Including the reversal
of the provision in the amount of € 365 million, business free cash flow rose by 37.8% to € 3,765 million.
The year-on-year increase of 22.2% in the Healthcare business sector (less € 365 million from the reversal of
provisions) exceeded the growth in the low double-digit teens percentage range that we forecast at the start of
the year. At € 1,895 million (including € 365 million from the reversal of provisions), it was also above the third
quarter forecast range of between € 1,625 million and € 1,775 million. At 16.0%, business free cash flow in the
Life Science business sector fell below the original forecast range of growth in the low to mid-twenties
percentage range. At € 1,595 million, it also fell slightly short of the range of € 1,600 million to € 1,750 million
that we forecast in the third quarter. In the Performance Materials business sector, we originally forecast
growth rates in the low thirties percentage range, which we achieved with an increase of 32%. At € 847 million,
Performance Materials also fell within the third quarter forecast range of between € 770 million and
€ 870 million.
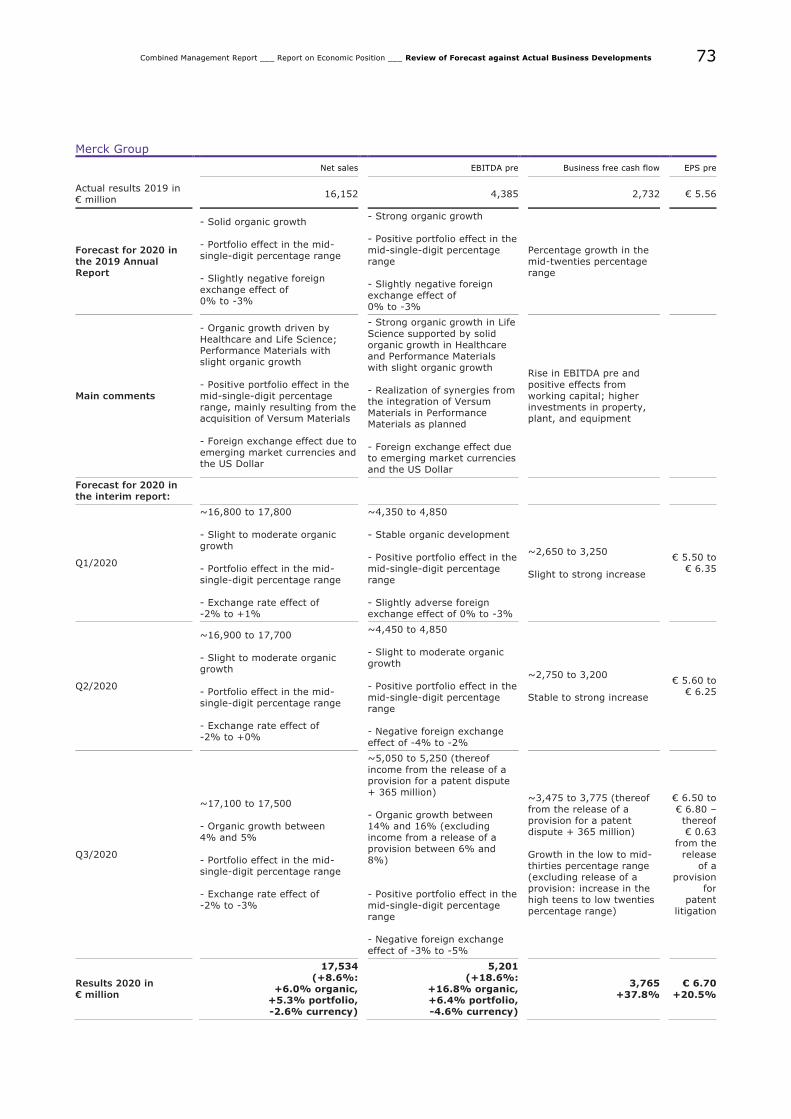
73
Combined Management Report ___ Report on Economic Position ___ Review of Forecast against Actual Business Developments
Merck Group
Net sales EBITDA pre Business free cash flow EPS pre
Actual results 2019 in € million
16,152 4,385 2,732 € 5.56
Forecast for 2020 in the 2019 Annual Report
- Solid organic growth - Portfolio effect in the mid-single-digit percentage range - Slightly negative foreign exchange effect of 0% to -3%
- Strong organic growth - Positive portfolio effect in the mid-single-digit percentage range - Slightly negative foreign exchange effect of 0% to -3%
Percentage growth in the mid-twenties percentage range
Main comments
- Organic growth driven by
Healthcare and Life Science; Performance Materials with slight organic growth - Positive portfolio effect in the mid-single-digit percentage range, mainly resulting from the acquisition of Versum Materials - Foreign exchange effect due to emerging market currencies and the US Dollar
- Strong organic growth in Life
Science supported by solid organic growth in Healthcare and Performance Materials with slight organic growth - Realization of synergies from the integration of Versum Materials in Performance Materials as planned - Foreign exchange effect due to emerging market currencies and the US Dollar
Rise in EBITDA pre and
positive effects from working capital; higher investments in property, plant, and equipment
Forecast for 2020 in the interim report:
Q1/2020
~16,800 to 17,800
- Slight to moderate organic growth
- Portfolio effect in the mid-single-digit percentage range - Exchange rate effect of -2% to +1%
~4,350 to 4,850
- Stable organic development
- Positive portfolio effect in the mid-single-digit percentage range - Slightly adverse foreign exchange effect of 0% to -3%
~2,650 to 3,250
Slight to strong increase
€ 5.50 to
€ 6.35
Q2/2020
~16,900 to 17,700
- Slight to moderate organic growth - Portfolio effect in the mid-single-digit percentage range - Exchange rate effect of -2% to +0%
~4,450 to 4,850
- Slight to moderate organic growth - Positive portfolio effect in the mid-single-digit percentage range - Negative foreign exchange effect of -4% to -2%
~2,750 to 3,200 Stable to strong increase
€ 5.60 to
€ 6.25
Q3/2020
~17,100 to 17,500
- Organic growth between 4% and 5% - Portfolio effect in the mid-single-digit percentage range - Exchange rate effect of -2% to -3%
~5,050 to 5,250 (thereof
income from the release of a provision for a patent dispute + 365 million) - Organic growth between 14% and 16% (excluding income from a release of a provision between 6% and 8%) - Positive portfolio effect in the mid-single-digit percentage range
- Negative foreign exchange effect of -3% to -5%
~3,475 to 3,775 (thereof from the release of a provision for a patent dispute + 365 million) Growth in the low to mid-thirties percentage range (excluding release of a provision: increase in the high teens to low twenties percentage range)
€ 6.50 to € 6.80 – thereof € 0.63
from the release
of a provision
for patent
litigation
Results 2020 in
€ million
17,534 (+8.6%:
+6.0% organic, +5.3% portfolio, -2.6% currency)
5,201 (+18.6%:
+16.8% organic, +6.4% portfolio, -4.6% currency)
3,765
+37.8%
€ 6.70
+20.5%
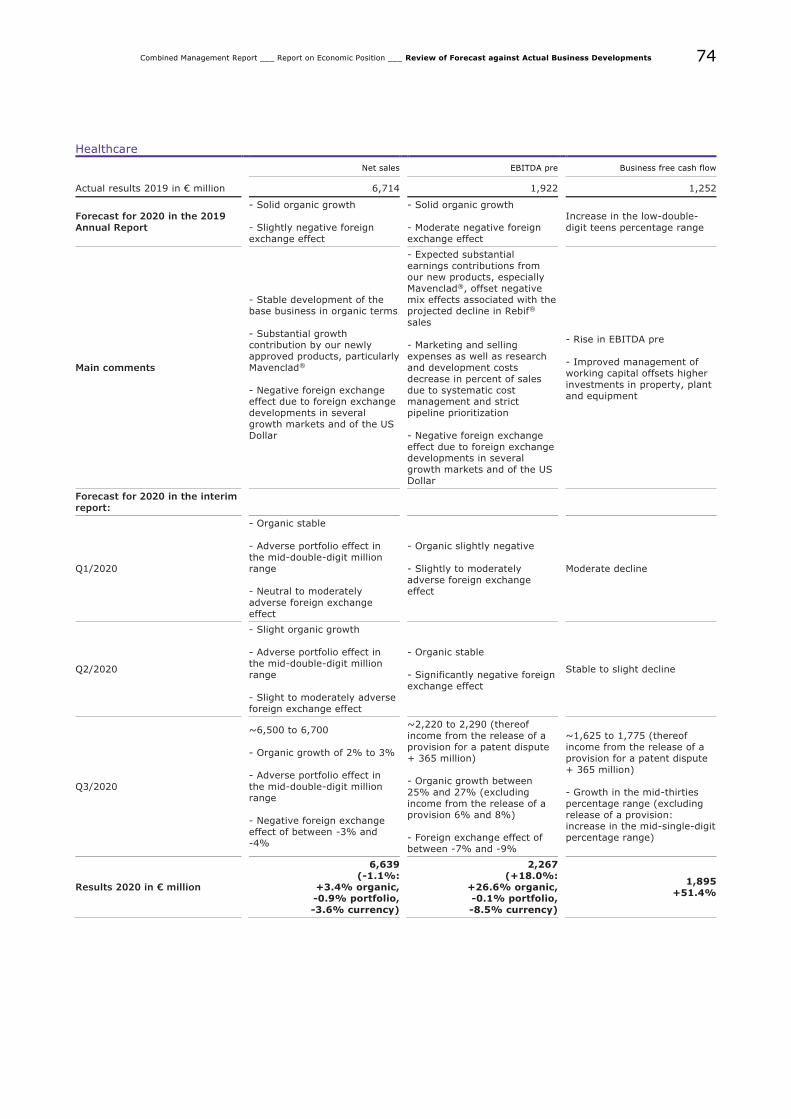
74
Combined Management Report ___ Report on Economic Position ___ Review of Forecast against Actual Business Developments
Healthcare
Net sales EBITDA pre Business free cash flow
Actual results 2019 in € million 6,714 1,922 1,252
Forecast for 2020 in the 2019
Annual Report
- Solid organic growth
- Slightly negative foreign exchange effect
- Solid organic growth
- Moderate negative foreign exchange effect
Increase in the low-double-
digit teens percentage range
Main comments
- Stable development of the base business in organic terms - Substantial growth contribution by our newly approved products, particularly Mavenclad® - Negative foreign exchange effect due to foreign exchange developments in several growth markets and of the US Dollar
- Expected substantial earnings contributions from our new products, especially Mavenclad®, offset negative mix effects associated with the projected decline in Rebif® sales - Marketing and selling expenses as well as research and development costs decrease in percent of sales due to systematic cost management and strict pipeline prioritization - Negative foreign exchange effect due to foreign exchange developments in several growth markets and of the US Dollar
- Rise in EBITDA pre - Improved management of working capital offsets higher investments in property, plant and equipment
Forecast for 2020 in the interim
report:
Q1/2020
- Organic stable - Adverse portfolio effect in
the mid-double-digit million range - Neutral to moderately adverse foreign exchange effect
- Organic slightly negative
- Slightly to moderately adverse foreign exchange effect
Moderate decline
Q2/2020
- Slight organic growth
- Adverse portfolio effect in the mid-double-digit million range - Slight to moderately adverse foreign exchange effect
- Organic stable - Significantly negative foreign exchange effect
Stable to slight decline
Q3/2020
~6,500 to 6,700 - Organic growth of 2% to 3% - Adverse portfolio effect in the mid-double-digit million range - Negative foreign exchange effect of between -3% and -4%
~2,220 to 2,290 (thereof income from the release of a provision for a patent dispute + 365 million) - Organic growth between 25% and 27% (excluding income from the release of a provision 6% and 8%) - Foreign exchange effect of between -7% and -9%
~1,625 to 1,775 (thereof income from the release of a provision for a patent dispute + 365 million) - Growth in the mid-thirties percentage range (excluding release of a provision: increase in the mid-single-digit percentage range)
Results 2020 in € million
6,639 (-1.1%:
+3.4% organic, -0.9% portfolio, -3.6% currency)
2,267 (+18.0%:
+26.6% organic, -0.1% portfolio, -8.5% currency)
1,895
+51.4%
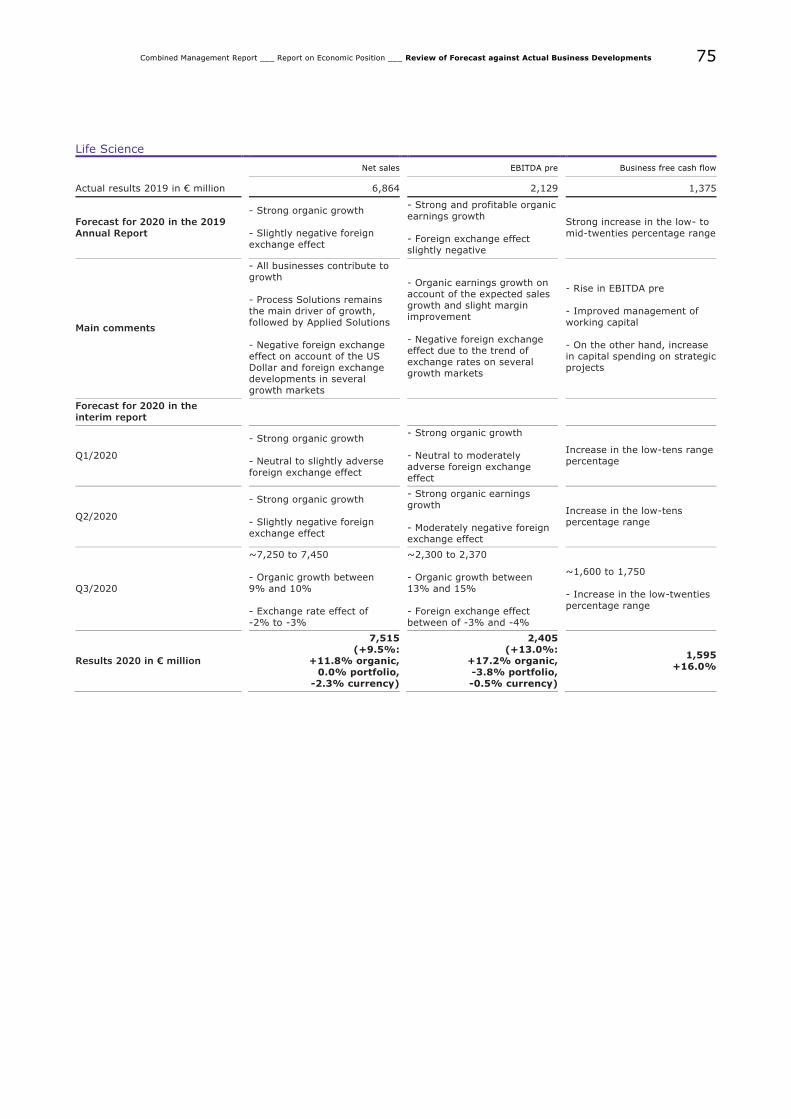
75
Combined Management Report ___ Report on Economic Position ___ Review of Forecast against Actual Business Developments
Life Science
Net sales EBITDA pre Business free cash flow
Actual results 2019 in € million 6,864 2,129 1,375
Forecast for 2020 in the 2019
Annual Report
- Strong organic growth
- Slightly negative foreign exchange effect
- Strong and profitable organic
earnings growth - Foreign exchange effect slightly negative
Strong increase in the low- to
mid-twenties percentage range
Main comments
- All businesses contribute to growth - Process Solutions remains the main driver of growth, followed by Applied Solutions - Negative foreign exchange effect on account of the US Dollar and foreign exchange developments in several growth markets
- Organic earnings growth on account of the expected sales growth and slight margin improvement - Negative foreign exchange effect due to the trend of exchange rates on several growth markets
- Rise in EBITDA pre - Improved management of working capital - On the other hand, increase in capital spending on strategic projects
Forecast for 2020 in the
interim report
Q1/2020
- Strong organic growth - Neutral to slightly adverse foreign exchange effect
- Strong organic growth - Neutral to moderately adverse foreign exchange effect
Increase in the low-tens range percentage
Q2/2020
- Strong organic growth - Slightly negative foreign exchange effect
- Strong organic earnings growth - Moderately negative foreign exchange effect
Increase in the low-tens percentage range
Q3/2020
~7,250 to 7,450 - Organic growth between 9% and 10% - Exchange rate effect of -2% to -3%
~2,300 to 2,370 - Organic growth between 13% and 15% - Foreign exchange effect between of -3% and -4%
~1,600 to 1,750 - Increase in the low-twenties percentage range
Results 2020 in € million
7,515 (+9.5%:
+11.8% organic, 0.0% portfolio,
-2.3% currency)
2,405 (+13.0%:
+17.2% organic, -3.8% portfolio, -0.5% currency)
1,595
+16.0%
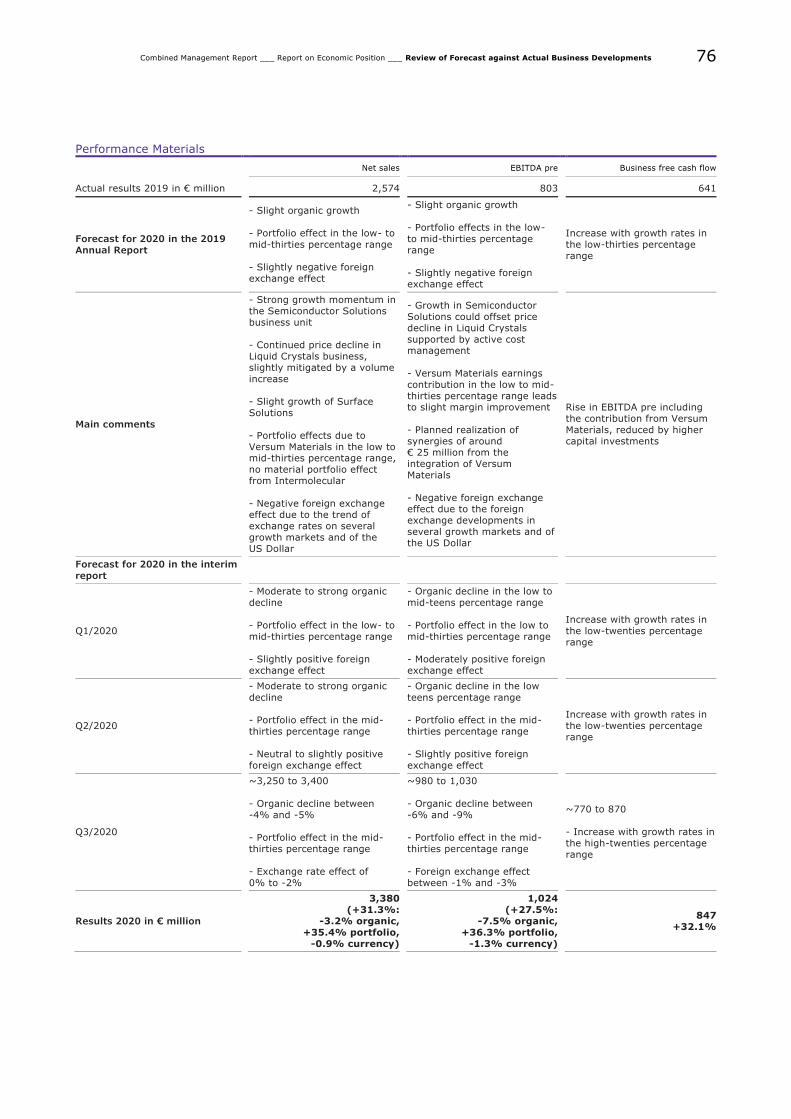
76
Combined Management Report ___ Report on Economic Position ___ Review of Forecast against Actual Business Developments
Performance Materials
Net sales EBITDA pre Business free cash flow
Actual results 2019 in € million 2,574 803 641
Forecast for 2020 in the 2019 Annual Report
- Slight organic growth
- Portfolio effect in the low- to mid-thirties percentage range - Slightly negative foreign exchange effect
- Slight organic growth
- Portfolio effects in the low- to mid-thirties percentage range - Slightly negative foreign exchange effect
Increase with growth rates in the low-thirties percentage range
Main comments
- Strong growth momentum in the Semiconductor Solutions business unit - Continued price decline in Liquid Crystals business, slightly mitigated by a volume increase - Slight growth of Surface Solutions - Portfolio effects due to Versum Materials in the low to mid-thirties percentage range, no material portfolio effect from Intermolecular - Negative foreign exchange effect due to the trend of exchange rates on several growth markets and of the US Dollar
- Growth in Semiconductor Solutions could offset price decline in Liquid Crystals supported by active cost management - Versum Materials earnings contribution in the low to mid-thirties percentage range leads to slight margin improvement - Planned realization of synergies of around € 25 million from the integration of Versum Materials - Negative foreign exchange effect due to the foreign exchange developments in several growth markets and of the US Dollar
Rise in EBITDA pre including the contribution from Versum Materials, reduced by higher capital investments
Forecast for 2020 in the interim
report
Q1/2020
- Moderate to strong organic decline - Portfolio effect in the low- to mid-thirties percentage range - Slightly positive foreign exchange effect
- Organic decline in the low to mid-teens percentage range - Portfolio effect in the low to mid-thirties percentage range - Moderately positive foreign exchange effect
Increase with growth rates in
the low-twenties percentage range
Q2/2020
- Moderate to strong organic
decline - Portfolio effect in the mid-thirties percentage range - Neutral to slightly positive foreign exchange effect
- Organic decline in the low
teens percentage range - Portfolio effect in the mid-thirties percentage range - Slightly positive foreign exchange effect
Increase with growth rates in the low-twenties percentage range
Q3/2020
~3,250 to 3,400 - Organic decline between -4% and -5% - Portfolio effect in the mid-thirties percentage range - Exchange rate effect of 0% to -2%
~980 to 1,030 - Organic decline between -6% and -9% - Portfolio effect in the mid-thirties percentage range - Foreign exchange effect between -1% and -3%
~770 to 870
- Increase with growth rates in the high-twenties percentage range
Results 2020 in € million
3,380 (+31.3%:
-3.2% organic,
+35.4% portfolio, -0.9% currency)
1,024 (+27.5%:
-7.5% organic,
+36.3% portfolio, -1.3% currency)
847
+32.1%
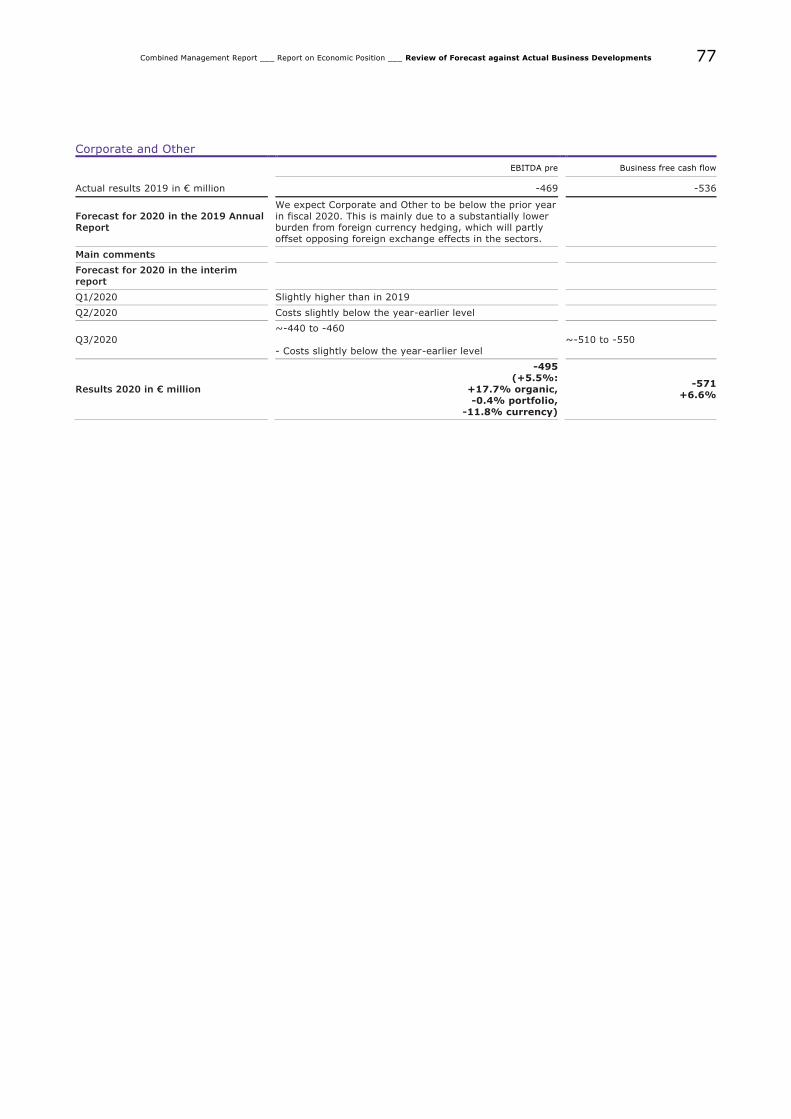
77
Combined Management Report ___ Report on Economic Position ___ Review of Forecast against Actual Business Developments
Corporate and Other
EBITDA pre Business free cash flow
Actual results 2019 in € million -469 -536
Forecast for 2020 in the 2019 Annual
Report
We expect Corporate and Other to be below the prior year
in fiscal 2020. This is mainly due to a substantially lower burden from foreign currency hedging, which will partly offset opposing foreign exchange effects in the sectors.
Main comments
Forecast for 2020 in the interim report
Q1/2020 Slightly higher than in 2019
Q2/2020 Costs slightly below the year-earlier level
Q3/2020
~-440 to -460
- Costs slightly below the year-earlier level
~-510 to -550
Results 2020 in € million
-495 (+5.5%:
+17.7% organic, -0.4% portfolio,
-11.8% currency)
-571
+6.6%
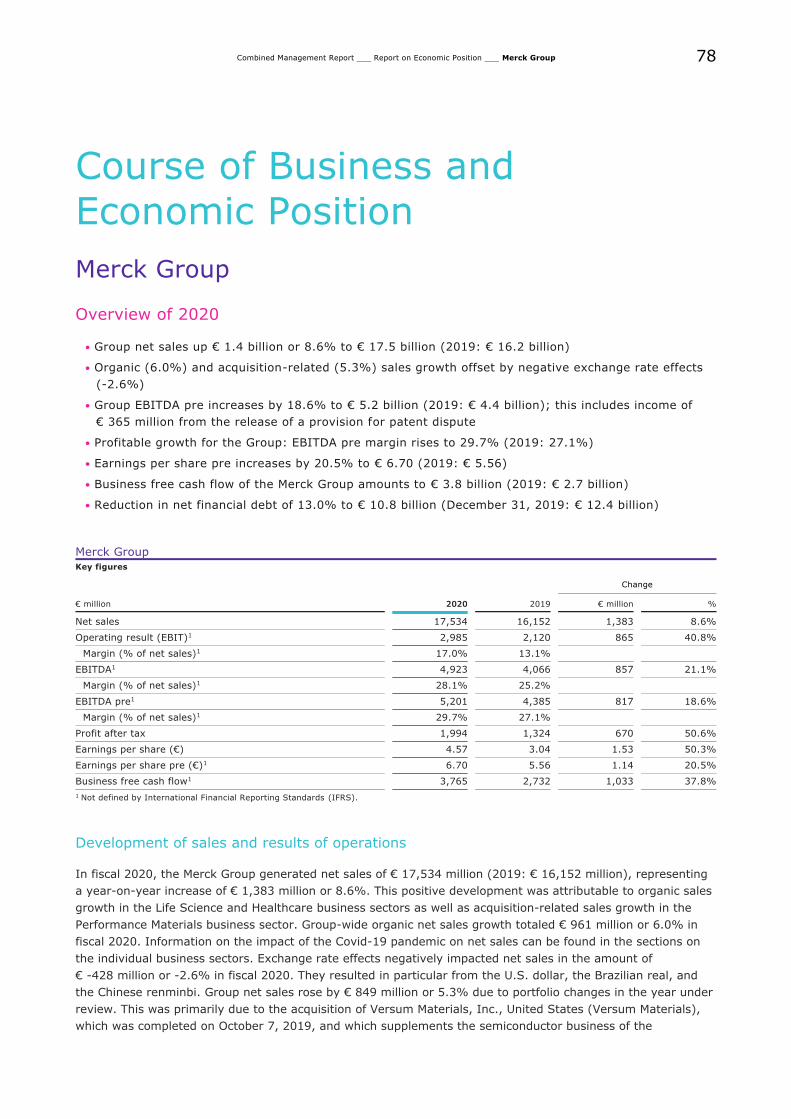
78
Combined Management Report ___ Report on Economic Position ___ Merck Group
Course of Business and Economic Position
Merck Group
Overview of 2020
• Group net sales up € 1.4 billion or 8.6% to € 17.5 billion (2019: € 16.2 billion)
• Organic (6.0%) and acquisition-related (5.3%) sales growth offset by negative exchange rate effects
(-2.6%)
• Group EBITDA pre increases by 18.6% to € 5.2 billion (2019: € 4.4 billion); this includes income of
€ 365 million from the release of a provision for patent dispute
• Profitable growth for the Group: EBITDA pre margin rises to 29.7% (2019: 27.1%)
• Earnings per share pre increases by 20.5% to € 6.70 (2019: € 5.56)
• Business free cash flow of the Merck Group amounts to € 3.8 billion (2019: € 2.7 billion)
• Reduction in net financial debt of 13.0% to € 10.8 billion (December 31, 2019: € 12.4 billion)
Merck Group
Key figures
Change
€ million 2020 2019 € million %
Net sales 17,534 16,152 1,383 8.6%
Operating result (EBIT)1 2,985 2,120 865 40.8%
Margin (% of net sales)1 17.0% 13.1%
EBITDA1 4,923 4,066 857 21.1%
Margin (% of net sales)1 28.1% 25.2%
EBITDA pre1 5,201 4,385 817 18.6%
Margin (% of net sales)1 29.7% 27.1%
Profit after tax 1,994 1,324 670 50.6%
Earnings per share (€) 4.57 3.04 1.53 50.3%
Earnings per share pre (€)1 6.70 5.56 1.14 20.5%
Business free cash flow1 3,765 2,732 1,033 37.8%
1 Not defined by International Financial Reporting Standards (IFRS).
Development of sales and results of operations
In fiscal 2020, the Merck Group generated net sales of € 17,534 million (2019: € 16,152 million), representing
a year-on-year increase of € 1,383 million or 8.6%. This positive development was attributable to organic sales
growth in the Life Science and Healthcare business sectors as well as acquisition-related sales growth in the
Performance Materials business sector. Group-wide organic net sales growth totaled € 961 million or 6.0% in
fiscal 2020. Information on the impact of the Covid-19 pandemic on net sales can be found in the sections on
the individual business sectors. Exchange rate effects negatively impacted net sales in the amount of
€ -428 million or -2.6% in fiscal 2020. They resulted in particular from the U.S. dollar, the Brazilian real, and
the Chinese renminbi. Group net sales rose by € 849 million or 5.3% due to portfolio changes in the year under
review. This was primarily due to the acquisition of Versum Materials, Inc., United States (Versum Materials),
which was completed on October 7, 2019, and which supplements the semiconductor business of the
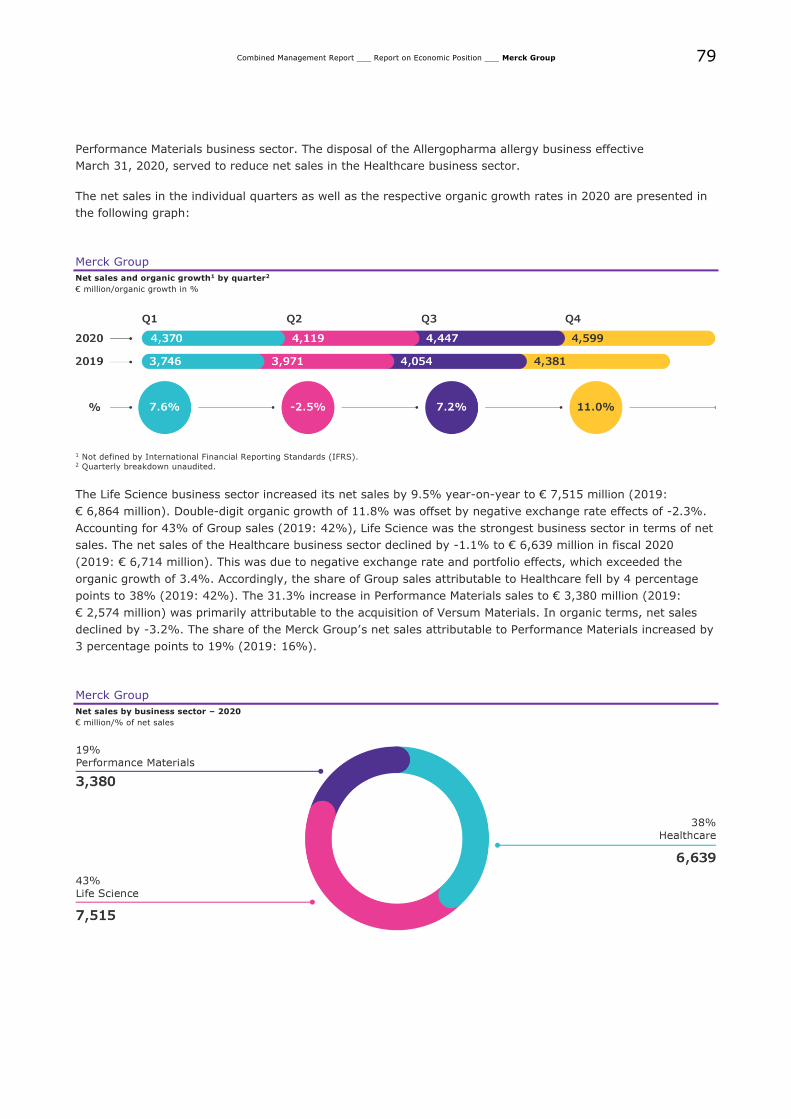
79
Combined Management Report ___ Report on Economic Position ___ Merck Group
Performance Materials business sector. The disposal of the Allergopharma allergy business effective
March 31, 2020, served to reduce net sales in the Healthcare business sector.
The net sales in the individual quarters as well as the respective organic growth rates in 2020 are presented in
the following graph:
Merck Group
Net sales and organic growth1 by quarter2
€ million/organic growth in %
1 Not defined by International Financial Reporting Standards (IFRS). 2 Quarterly breakdown unaudited.
The Life Science business sector increased its net sales by 9.5% year-on-year to € 7,515 million (2019:
€ 6,864 million). Double-digit organic growth of 11.8% was offset by negative exchange rate effects of -2.3%.
Accounting for 43% of Group sales (2019: 42%), Life Science was the strongest business sector in terms of net
sales. The net sales of the Healthcare business sector declined by -1.1% to € 6,639 million in fiscal 2020
(2019: € 6,714 million). This was due to negative exchange rate and portfolio effects, which exceeded the
organic growth of 3.4%. Accordingly, the share of Group sales attributable to Healthcare fell by 4 percentage
points to 38% (2019: 42%). The 31.3% increase in Performance Materials sales to € 3,380 million (2019:
€ 2,574 million) was primarily attributable to the acquisition of Versum Materials. In organic terms, net sales
declined by -3.2%. The share of the Merck Group’s net sales attributable to Performance Materials increased by
3 percentage points to 19% (2019: 16%).
Merck Group
Net sales by business sector – 2020
€ million/% of net sales
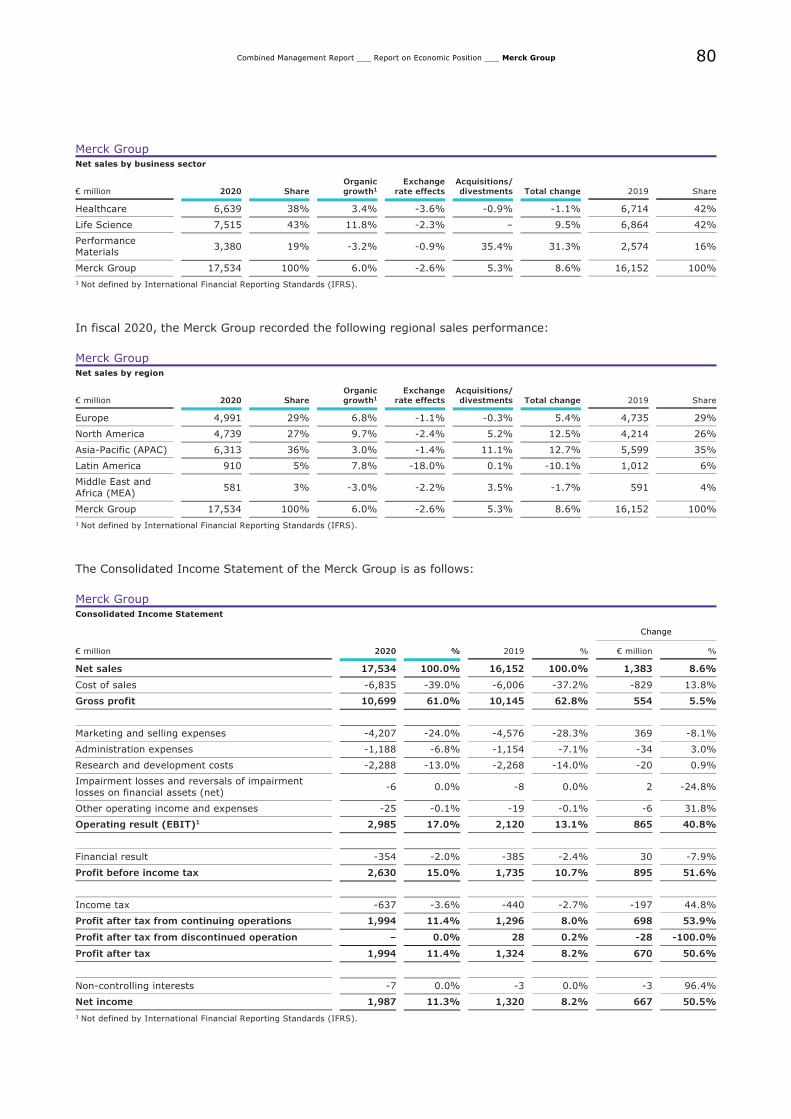
80
Combined Management Report ___ Report on Economic Position ___ Merck Group
Merck Group
Net sales by business sector
€ million 2020 Share
Organic
growth1
Exchange
rate effects
Acquisitions/
divestments Total change 2019 Share
Healthcare 6,639 38% 3.4% -3.6% -0.9% -1.1% 6,714 42%
Life Science 7,515 43% 11.8% -2.3% – 9.5% 6,864 42%
Performance
Materials 3,380 19% -3.2% -0.9% 35.4% 31.3% 2,574 16%
Merck Group 17,534 100% 6.0% -2.6% 5.3% 8.6% 16,152 100%
1 Not defined by International Financial Reporting Standards (IFRS).
In fiscal 2020, the Merck Group recorded the following regional sales performance:
Merck Group
Net sales by region
€ million 2020 Share
Organic
growth1
Exchange
rate effects
Acquisitions/
divestments Total change 2019 Share
Europe 4,991 29% 6.8% -1.1% -0.3% 5.4% 4,735 29%
North America 4,739 27% 9.7% -2.4% 5.2% 12.5% 4,214 26%
Asia-Pacific (APAC) 6,313 36% 3.0% -1.4% 11.1% 12.7% 5,599 35%
Latin America 910 5% 7.8% -18.0% 0.1% -10.1% 1,012 6%
Middle East and
Africa (MEA) 581 3% -3.0% -2.2% 3.5% -1.7% 591 4%
Merck Group 17,534 100% 6.0% -2.6% 5.3% 8.6% 16,152 100%
1 Not defined by International Financial Reporting Standards (IFRS).
The Consolidated Income Statement of the Merck Group is as follows:
Merck Group
Consolidated Income Statement
Change
€ million 2020 % 2019 % € million %
Net sales 17,534 100.0% 16,152 100.0% 1,383 8.6%
Cost of sales -6,835 -39.0% -6,006 -37.2% -829 13.8%
Gross profit 10,699 61.0% 10,145 62.8% 554 5.5%
Marketing and selling expenses -4,207 -24.0% -4,576 -28.3% 369 -8.1%
Administration expenses -1,188 -6.8% -1,154 -7.1% -34 3.0%
Research and development costs -2,288 -13.0% -2,268 -14.0% -20 0.9%
Impairment losses and reversals of impairment
losses on financial assets (net) -6 0.0% -8 0.0% 2 -24.8%
Other operating income and expenses -25 -0.1% -19 -0.1% -6 31.8%
Operating result (EBIT)1 2,985 17.0% 2,120 13.1% 865 40.8%
Financial result -354 -2.0% -385 -2.4% 30 -7.9%
Profit before income tax 2,630 15.0% 1,735 10.7% 895 51.6%
Income tax -637 -3.6% -440 -2.7% -197 44.8%
Profit after tax from continuing operations 1,994 11.4% 1,296 8.0% 698 53.9%
Profit after tax from discontinued operation – 0.0% 28 0.2% -28 -100.0%
Profit after tax 1,994 11.4% 1,324 8.2% 670 50.6%
Non-controlling interests -7 0.0% -3 0.0% -3 96.4%
Net income 1,987 11.3% 1,320 8.2% 667 50.5%
1 Not defined by International Financial Reporting Standards (IFRS).
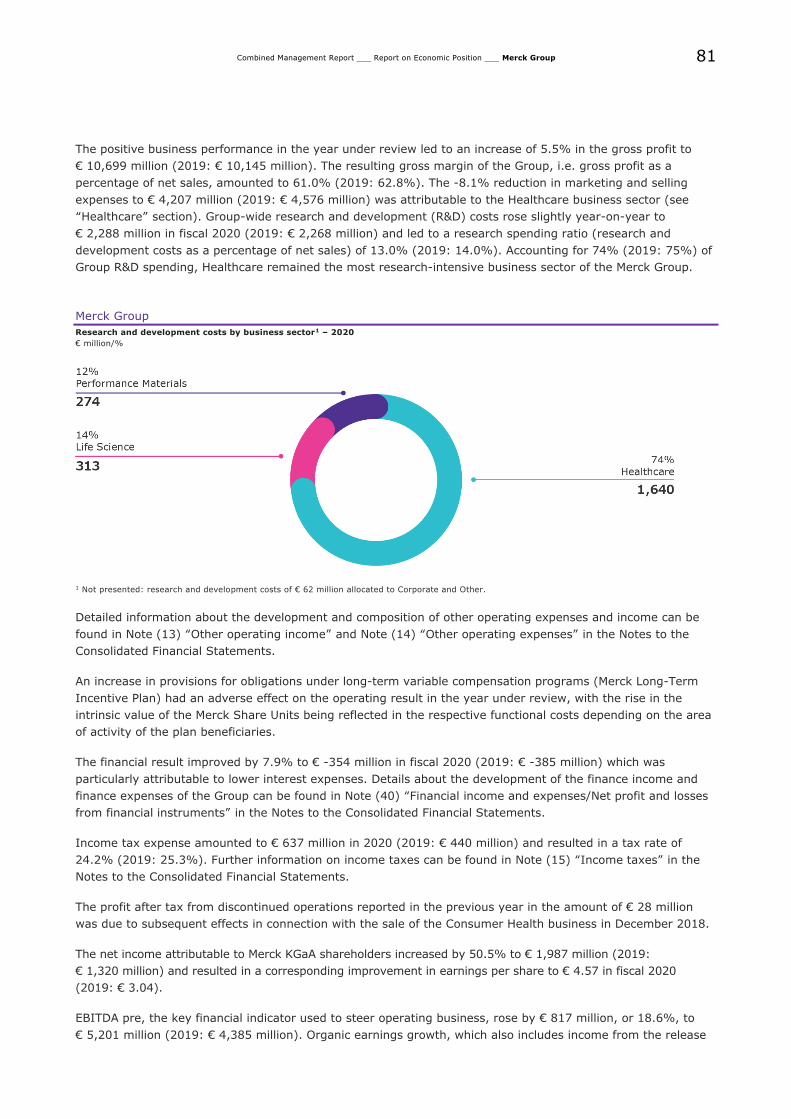
81
Combined Management Report ___ Report on Economic Position ___ Merck Group
The positive business performance in the year under review led to an increase of 5.5% in the gross profit to
€ 10,699 million (2019: € 10,145 million). The resulting gross margin of the Group, i.e. gross profit as a
percentage of net sales, amounted to 61.0% (2019: 62.8%). The -8.1% reduction in marketing and selling
expenses to € 4,207 million (2019: € 4,576 million) was attributable to the Healthcare business sector (see
“Healthcare” section). Group-wide research and development (R&D) costs rose slightly year-on-year to
€ 2,288 million in fiscal 2020 (2019: € 2,268 million) and led to a research spending ratio (research and
development costs as a percentage of net sales) of 13.0% (2019: 14.0%). Accounting for 74% (2019: 75%) of
Group R&D spending, Healthcare remained the most research-intensive business sector of the Merck Group.
Merck Group
Research and development costs by business sector1 – 2020
€ million/%
1 Not presented: research and development costs of € 62 million allocated to Corporate and Other.
Detailed information about the development and composition of other operating expenses and income can be
found in Note (13) “Other operating income” and Note (14) “Other operating expenses” in the Notes to the
Consolidated Financial Statements.
An increase in provisions for obligations under long-term variable compensation programs (Merck Long-Term
Incentive Plan) had an adverse effect on the operating result in the year under review, with the rise in the
intrinsic value of the Merck Share Units being reflected in the respective functional costs depending on the area
of activity of the plan beneficiaries.
The financial result improved by 7.9% to € -354 million in fiscal 2020 (2019: € -385 million) which was
particularly attributable to lower interest expenses. Details about the development of the finance income and
finance expenses of the Group can be found in Note (40) “Financial income and expenses/Net profit and losses
from financial instruments” in the Notes to the Consolidated Financial Statements.
Income tax expense amounted to € 637 million in 2020 (2019: € 440 million) and resulted in a tax rate of
24.2% (2019: 25.3%). Further information on income taxes can be found in Note (15) “Income taxes” in the
Notes to the Consolidated Financial Statements.
The profit after tax from discontinued operations reported in the previous year in the amount of € 28 million
was due to subsequent effects in connection with the sale of the Consumer Health business in December 2018.
The net income attributable to Merck KGaA shareholders increased by 50.5% to € 1,987 million (2019:
€ 1,320 million) and resulted in a corresponding improvement in earnings per share to € 4.57 in fiscal 2020
(2019: € 3.04).
EBITDA pre, the key financial indicator used to steer operating business, rose by € 817 million, or 18.6%, to
€ 5,201 million (2019: € 4,385 million). Organic earnings growth, which also includes income from the release

82
Combined Management Report ___ Report on Economic Position ___ Merck Group
of a provision for patent dispute in the amount of € 365 million (see Note (27) “Other provisions” in the Notes
to the Consolidated Financial Statements), amounted to 16.8%. Portfolio effects – primarily resulting from the
acquisition of Versum Materials – led to a 6.4% increase in EBITDA pre in fiscal 2020. This was offset by
negative exchange rate effects of -4.6%. Relative to net sales, the Merck Group recorded an EBITDA pre
margin of 29.7% (2019: 27.1%). The reconciliation of the operating result (EBIT) to EBITDA pre is presented in
the chapter entitled “Internal Management System”.
The development of EBITDA pre in the individual quarters in comparison with 2019 as well as the respective
growth rates are presented in the following overview:
Merck Group
EBITDA pre1 and change by quarter2
€ million/change in %
1 Not defined by International Financial Reporting Standards (IFRS). 2 Quarterly breakdown unaudited.
All business sectors contributed to the growth in Group EBITDA pre. Life Science generated EBITDA pre of
€ 2,405 million, up 13.0% on the previous year (2019: € 2,129 million). This meant the EBITDA pre margin in
the Life Science business sector increased to 32.0% in fiscal 2020 (2019: 31.0%). The share of Group EBITDA
pre attributable to the Life Science business sector (not taking into account the € -495 million reduction due to
Corporate and Other) amounted to 42% in the year under review (2019: 44%).
EBITDA pre in the Healthcare business sector increased by 18.0% to € 2,267 million (2019: € 1,922 million).
The resulting EBITDA pre margin improved substantially to 34.1% (2019: 28.6%). The share of Group EBITDA
pre attributable to Healthcare remained unchanged year-on-year at 40%.
In fiscal 2020, the Performance Materials business sector benefited considerably from the acquisition of Versum
Materials in October 2019, reporting a 27.5% increase in EBITDA pre to € 1,024 million (2019: € 803 million).
Accordingly, the share of Group EBITDA pre attributable to Performance Materials rose by 2 percentage points
to 18% (2019: 16%). The EBITDA pre margin declined slightly to 30.3% (2019: 31.2%).
Merck Group
EBITDA pre1 by business sector2 – 2020
€ million/%
1 Not defined by International Financial Reporting Standards (IFRS). 2 Not presented: Decline in Group EBITDA pre by €-495 million due to Corporate and Other.
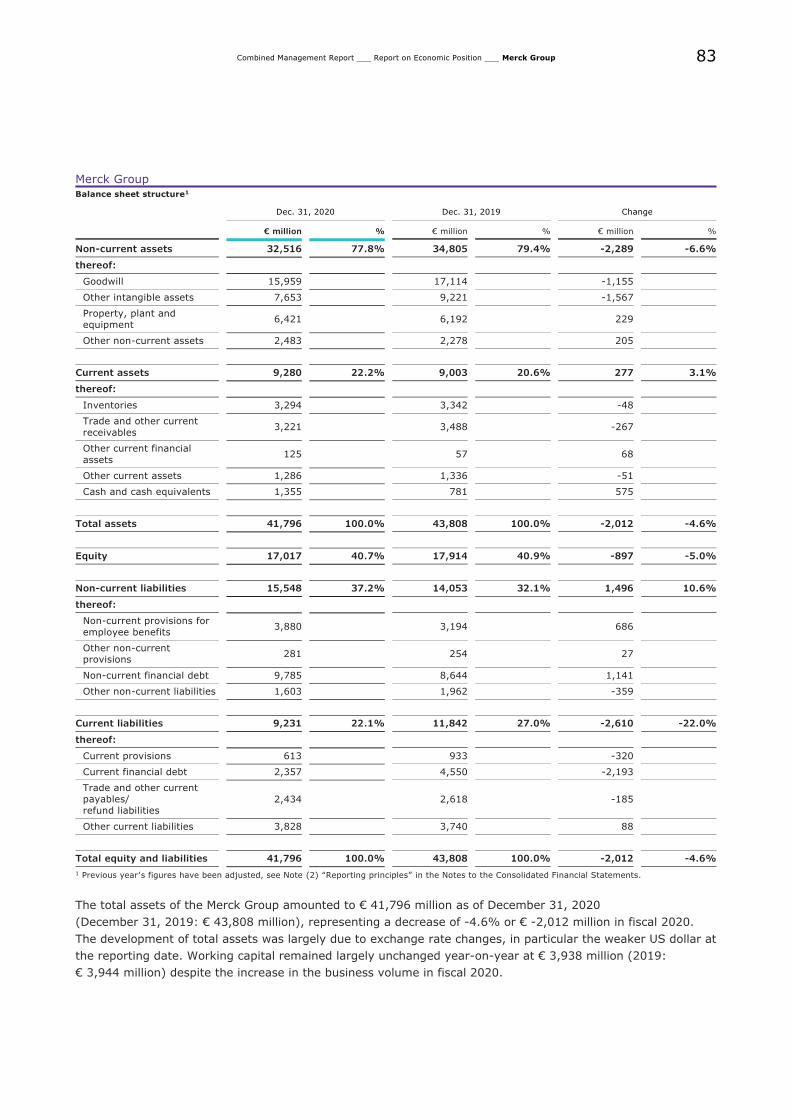
83
Combined Management Report ___ Report on Economic Position ___ Merck Group
Merck Group
Balance sheet structure1
Dec. 31, 2020 Dec. 31, 2019 Change
€ million % € million % € million %
Non-current assets 32,516 77.8% 34,805 79.4% -2,289 -6.6%
thereof:
Goodwill 15,959 17,114 -1,155
Other intangible assets 7,653 9,221 -1,567
Property, plant and equipment
6,421 6,192 229
Other non-current assets 2,483 2,278 205
Current assets 9,280 22.2% 9,003 20.6% 277 3.1%
thereof:
Inventories 3,294 3,342 -48
Trade and other current
receivables 3,221 3,488 -267
Other current financial
assets 125 57 68
Other current assets 1,286 1,336 -51
Cash and cash equivalents 1,355 781 575
Total assets 41,796 100.0% 43,808 100.0% -2,012 -4.6%
Equity 17,017 40.7% 17,914 40.9% -897 -5.0%
Non-current liabilities 15,548 37.2% 14,053 32.1% 1,496 10.6%
thereof:
Non-current provisions for
employee benefits 3,880 3,194 686
Other non-current provisions
281 254 27
Non-current financial debt 9,785 8,644 1,141
Other non-current liabilities 1,603 1,962 -359
Current liabilities 9,231 22.1% 11,842 27.0% -2,610 -22.0%
thereof:
Current provisions 613 933 -320
Current financial debt 2,357 4,550 -2,193
Trade and other current payables/ refund liabilities
2,434 2,618 -185
Other current liabilities 3,828 3,740 88
Total equity and liabilities 41,796 100.0% 43,808 100.0% -2,012 -4.6%
1 Previous year’s figures have been adjusted, see Note (2) “Reporting principles” in the Notes to the Consolidated Financial Statements.
The total assets of the Merck Group amounted to € 41,796 million as of December 31, 2020
(December 31, 2019: € 43,808 million), representing a decrease of -4.6% or € -2,012 million in fiscal 2020.
The development of total assets was largely due to exchange rate changes, in particular the weaker US dollar at
the reporting date. Working capital remained largely unchanged year-on-year at € 3,938 million (2019:
€ 3,944 million) despite the increase in the business volume in fiscal 2020.
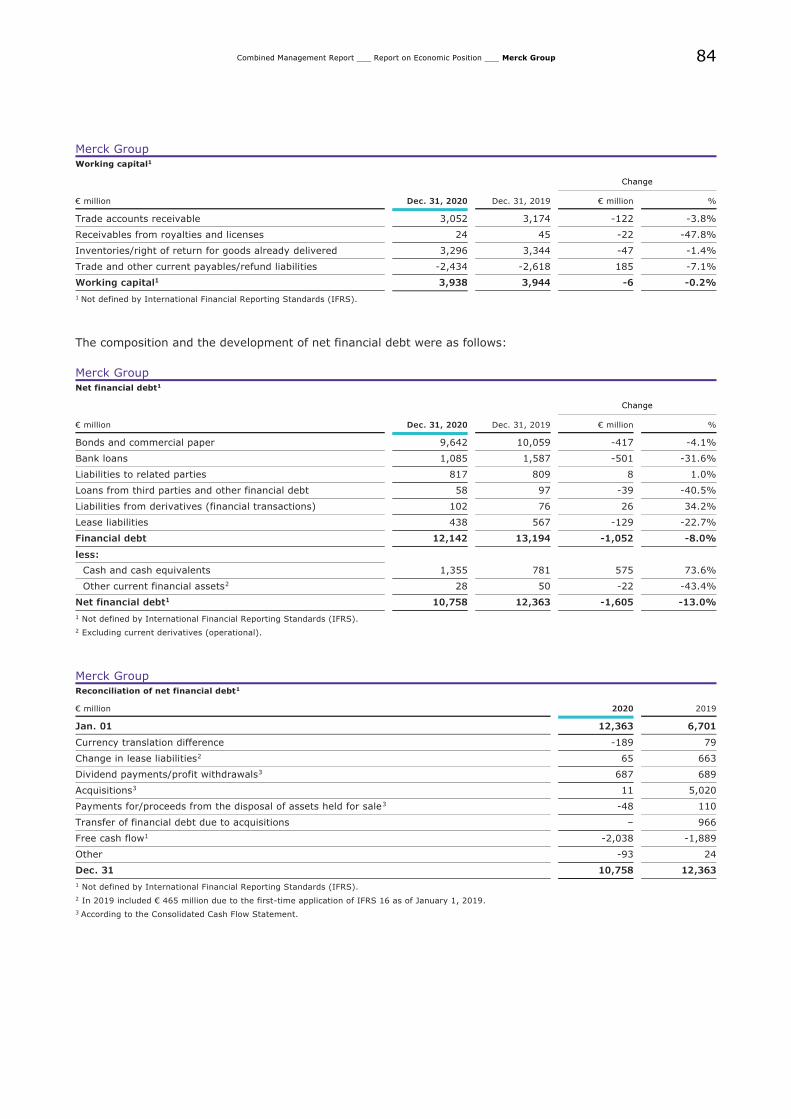
84
Combined Management Report ___ Report on Economic Position ___ Merck Group
Merck Group
Working capital1
Change
€ million Dec. 31, 2020 Dec. 31, 2019 € million %
Trade accounts receivable 3,052 3,174 -122 -3.8%
Receivables from royalties and licenses 24 45 -22 -47.8%
Inventories/right of return for goods already delivered 3,296 3,344 -47 -1.4%
Trade and other current payables/refund liabilities -2,434 -2,618 185 -7.1%
Working capital1 3,938 3,944 -6 -0.2%
1 Not defined by International Financial Reporting Standards (IFRS).
The composition and the development of net financial debt were as follows:
Merck Group
Net financial debt1
Change
€ million Dec. 31, 2020 Dec. 31, 2019 € million %
Bonds and commercial paper 9,642 10,059 -417 -4.1%
Bank loans 1,085 1,587 -501 -31.6%
Liabilities to related parties 817 809 8 1.0%
Loans from third parties and other financial debt 58 97 -39 -40.5%
Liabilities from derivatives (financial transactions) 102 76 26 34.2%
Lease liabilities 438 567 -129 -22.7%
Financial debt 12,142 13,194 -1,052 -8.0%
less:
Cash and cash equivalents 1,355 781 575 73.6%
Other current financial assets2 28 50 -22 -43.4%
Net financial debt1 10,758 12,363 -1,605 -13.0%
1 Not defined by International Financial Reporting Standards (IFRS).
2 Excluding current derivatives (operational).
Merck Group
Reconciliation of net financial debt1
€ million 2020 2019
Jan. 01 12,363 6,701
Currency translation difference -189 79
Change in lease liabilities2 65 663
Dividend payments/profit withdrawals3 687 689
Acquisitions3 11 5,020
Payments for/proceeds from the disposal of assets held for sale3 -48 110
Transfer of financial debt due to acquisitions – 966
Free cash flow1 -2,038 -1,889
Other -93 24
Dec. 31 10,758 12,363
1 Not defined by International Financial Reporting Standards (IFRS).
2 In 2019 included € 465 million due to the first-time application of IFRS 16 as of January 1, 2019.
3 According to the Consolidated Cash Flow Statement.
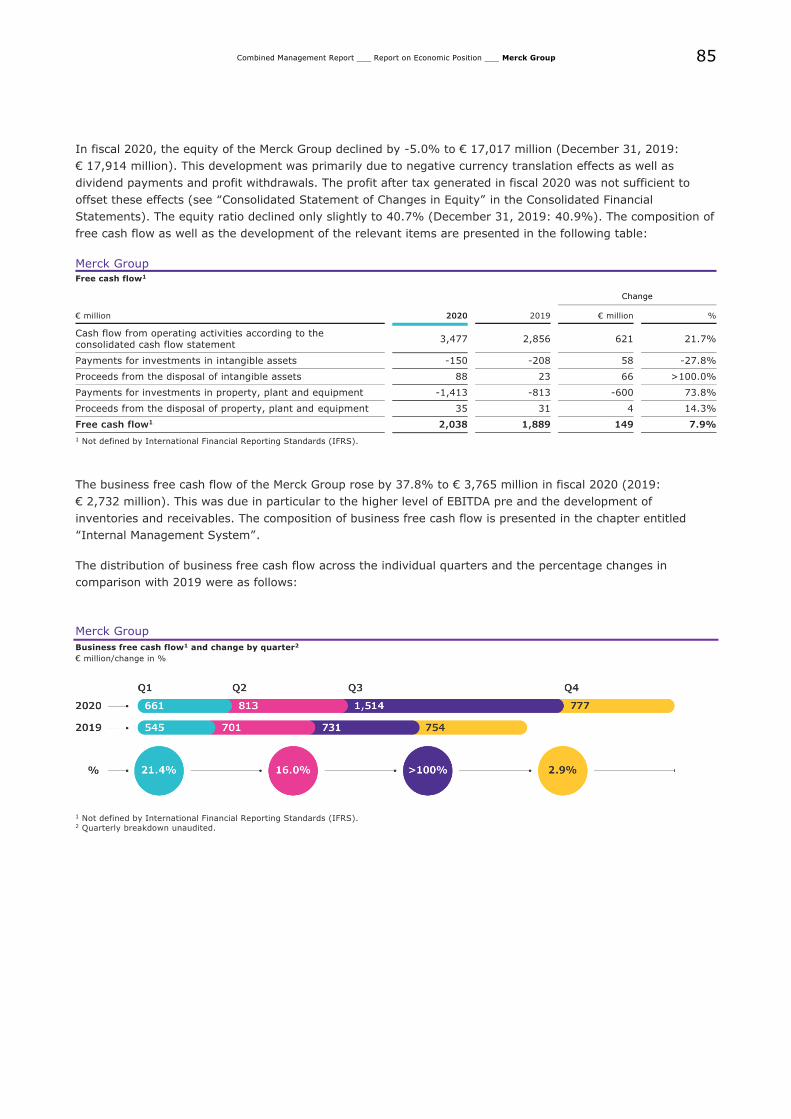
85
Combined Management Report ___ Report on Economic Position ___ Merck Group
In fiscal 2020, the equity of the Merck Group declined by -5.0% to € 17,017 million (December 31, 2019:
€ 17,914 million). This development was primarily due to negative currency translation effects as well as
dividend payments and profit withdrawals. The profit after tax generated in fiscal 2020 was not sufficient to
offset these effects (see “Consolidated Statement of Changes in Equity” in the Consolidated Financial
Statements). The equity ratio declined only slightly to 40.7% (December 31, 2019: 40.9%). The composition of
free cash flow as well as the development of the relevant items are presented in the following table:
Merck Group
Free cash flow1
Change
€ million 2020 2019 € million %
Cash flow from operating activities according to the consolidated cash flow statement
3,477 2,856 621 21.7%
Payments for investments in intangible assets -150 -208 58 -27.8%
Proceeds from the disposal of intangible assets 88 23 66 >100.0%
Payments for investments in property, plant and equipment -1,413 -813 -600 73.8%
Proceeds from the disposal of property, plant and equipment 35 31 4 14.3%
Free cash flow1 2,038 1,889 149 7.9%
1 Not defined by International Financial Reporting Standards (IFRS).
The business free cash flow of the Merck Group rose by 37.8% to € 3,765 million in fiscal 2020 (2019:
€ 2,732 million). This was due in particular to the higher level of EBITDA pre and the development of
inventories and receivables. The composition of business free cash flow is presented in the chapter entitled
“Internal Management System”.
The distribution of business free cash flow across the individual quarters and the percentage changes in
comparison with 2019 were as follows:
Merck Group
Business free cash flow1 and change by quarter2
€ million/change in %
1 Not defined by International Financial Reporting Standards (IFRS). 2 Quarterly breakdown unaudited.
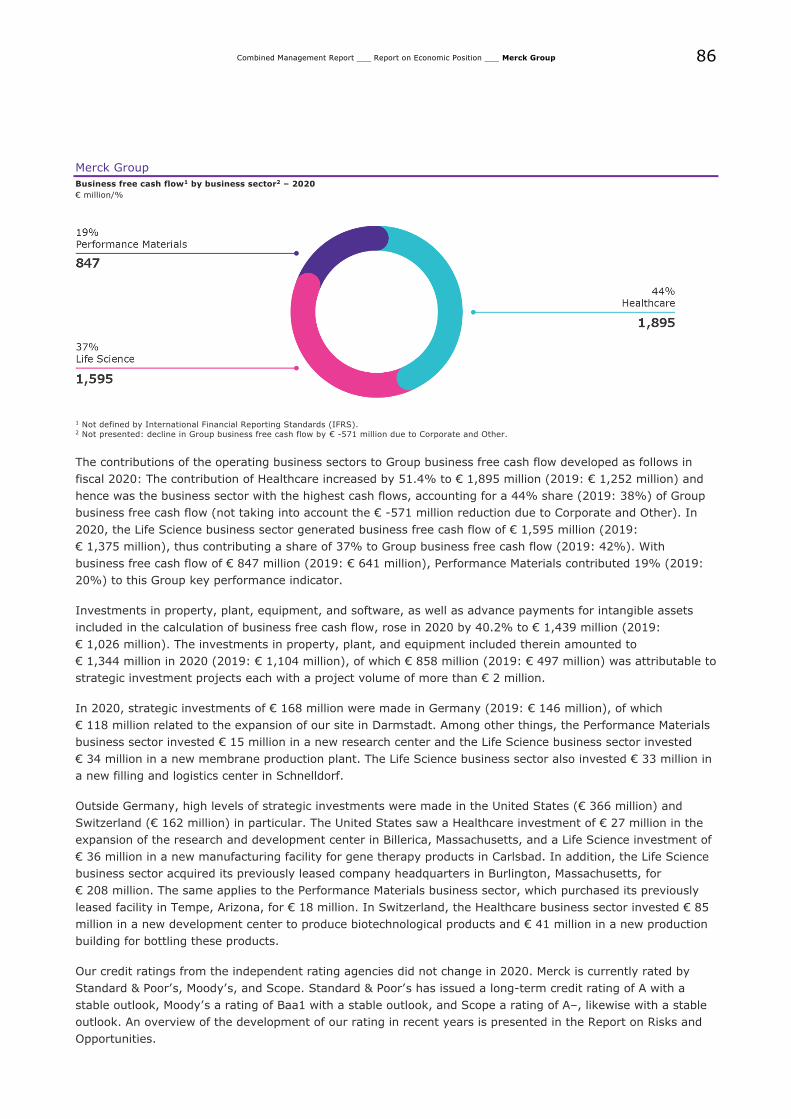
86
Combined Management Report ___ Report on Economic Position ___ Merck Group
Merck Group
Business free cash flow1 by business sector2 – 2020
€ million/%
1 Not defined by International Financial Reporting Standards (IFRS). 2 Not presented: decline in Group business free cash flow by € -571 million due to Corporate and Other.
The contributions of the operating business sectors to Group business free cash flow developed as follows in
fiscal 2020: The contribution of Healthcare increased by 51.4% to € 1,895 million (2019: € 1,252 million) and
hence was the business sector with the highest cash flows, accounting for a 44% share (2019: 38%) of Group
business free cash flow (not taking into account the € -571 million reduction due to Corporate and Other). In
2020, the Life Science business sector generated business free cash flow of € 1,595 million (2019:
€ 1,375 million), thus contributing a share of 37% to Group business free cash flow (2019: 42%). With
business free cash flow of € 847 million (2019: € 641 million), Performance Materials contributed 19% (2019:
20%) to this Group key performance indicator.
Investments in property, plant, equipment, and software, as well as advance payments for intangible assets
included in the calculation of business free cash flow, rose in 2020 by 40.2% to € 1,439 million (2019:
€ 1,026 million). The investments in property, plant, and equipment included therein amounted to
€ 1,344 million in 2020 (2019: € 1,104 million), of which € 858 million (2019: € 497 million) was attributable to
strategic investment projects each with a project volume of more than € 2 million.
In 2020, strategic investments of € 168 million were made in Germany (2019: € 146 million), of which
€ 118 million related to the expansion of our site in Darmstadt. Among other things, the Performance Materials
business sector invested € 15 million in a new research center and the Life Science business sector invested
€ 34 million in a new membrane production plant. The Life Science business sector also invested € 33 million in
a new filling and logistics center in Schnelldorf.
Outside Germany, high levels of strategic investments were made in the United States (€ 366 million) and
Switzerland (€ 162 million) in particular. The United States saw a Healthcare investment of € 27 million in the
expansion of the research and development center in Billerica, Massachusetts, and a Life Science investment of
€ 36 million in a new manufacturing facility for gene therapy products in Carlsbad. In addition, the Life Science
business sector acquired its previously leased company headquarters in Burlington, Massachusetts, for
€ 208 million. The same applies to the Performance Materials business sector, which purchased its previously
leased facility in Tempe, Arizona, for € 18 million. In Switzerland, the Healthcare business sector invested € 85
million in a new development center to produce biotechnological products and € 41 million in a new production
building for bottling these products.
Our credit ratings from the independent rating agencies did not change in 2020. Merck is currently rated by
Standard & Poor’s, Moody’s, and Scope. Standard & Poor’s has issued a long-term credit rating of A with a
stable outlook, Moody’s a rating of Baa1 with a stable outlook, and Scope a rating of A–, likewise with a stable
outlook. An overview of the development of our rating in recent years is presented in the Report on Risks and
Opportunities.
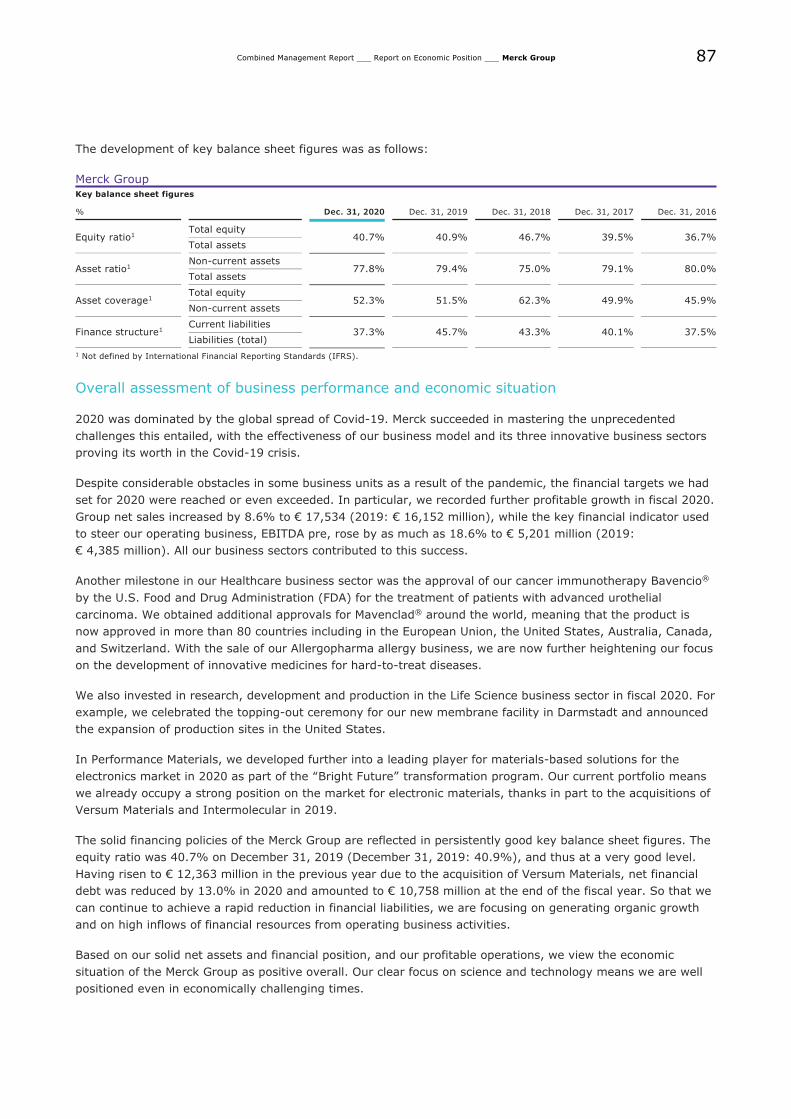
87
Combined Management Report ___ Report on Economic Position ___ Merck Group
The development of key balance sheet figures was as follows:
Merck Group
Key balance sheet figures
% Dec. 31, 2020 Dec. 31, 2019 Dec. 31, 2018 Dec. 31, 2017 Dec. 31, 2016
Equity ratio1 Total equity
40.7%
40.9%
46.7%
39.5%
36.7% Total assets
Asset ratio1 Non-current assets
77.8%
79.4%
75.0%
79.1%
80.0% Total assets
Asset coverage1 Total equity
52.3%
51.5%
62.3%
49.9%
45.9% Non-current assets
Finance structure1 Current liabilities
37.3%
45.7%
43.3%
40.1%
37.5% Liabilities (total)
1 Not defined by International Financial Reporting Standards (IFRS).
Overall assessment of business performance and economic situation
2020 was dominated by the global spread of Covid-19. Merck succeeded in mastering the unprecedented
challenges this entailed, with the effectiveness of our business model and its three innovative business sectors
proving its worth in the Covid-19 crisis.
Despite considerable obstacles in some business units as a result of the pandemic, the financial targets we had
set for 2020 were reached or even exceeded. In particular, we recorded further profitable growth in fiscal 2020.
Group net sales increased by 8.6% to € 17,534 (2019: € 16,152 million), while the key financial indicator used
to steer our operating business, EBITDA pre, rose by as much as 18.6% to € 5,201 million (2019:
€ 4,385 million). All our business sectors contributed to this success.
Another milestone in our Healthcare business sector was the approval of our cancer immunotherapy Bavencio®
by the U.S. Food and Drug Administration (FDA) for the treatment of patients with advanced urothelial
carcinoma. We obtained additional approvals for Mavenclad® around the world, meaning that the product is
now approved in more than 80 countries including in the European Union, the United States, Australia, Canada,
and Switzerland. With the sale of our Allergopharma allergy business, we are now further heightening our focus
on the development of innovative medicines for hard-to-treat diseases.
We also invested in research, development and production in the Life Science business sector in fiscal 2020. For
example, we celebrated the topping-out ceremony for our new membrane facility in Darmstadt and announced
the expansion of production sites in the United States.
In Performance Materials, we developed further into a leading player for materials-based solutions for the
electronics market in 2020 as part of the “Bright Future” transformation program. Our current portfolio means
we already occupy a strong position on the market for electronic materials, thanks in part to the acquisitions of
Versum Materials and Intermolecular in 2019.
The solid financing policies of the Merck Group are reflected in persistently good key balance sheet figures. The
equity ratio was 40.7% on December 31, 2019 (December 31, 2019: 40.9%), and thus at a very good level.
Having risen to € 12,363 million in the previous year due to the acquisition of Versum Materials, net financial
debt was reduced by 13.0% in 2020 and amounted to € 10,758 million at the end of the fiscal year. So that we
can continue to achieve a rapid reduction in financial liabilities, we are focusing on generating organic growth
and on high inflows of financial resources from operating business activities.
Based on our solid net assets and financial position, and our profitable operations, we view the economic
situation of the Merck Group as positive overall. Our clear focus on science and technology means we are well
positioned even in economically challenging times.
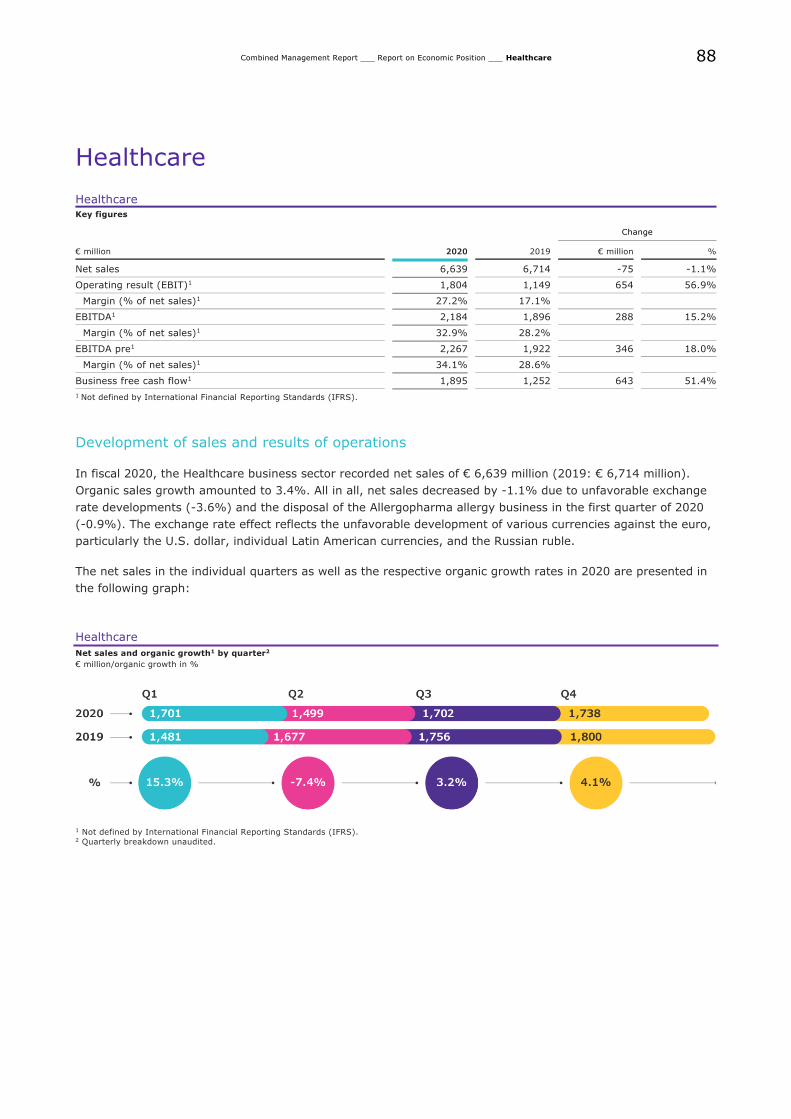
88
Combined Management Report ___ Report on Economic Position ___ Healthcare
Healthcare
Healthcare
Key figures
Change
€ million 2020 2019 € million %
Net sales 6,639 6,714 -75 -1.1%
Operating result (EBIT)1 1,804 1,149 654 56.9%
Margin (% of net sales)1 27.2% 17.1%
EBITDA1 2,184 1,896 288 15.2%
Margin (% of net sales)1 32.9% 28.2%
EBITDA pre1 2,267 1,922 346 18.0%
Margin (% of net sales)1 34.1% 28.6%
Business free cash flow1 1,895 1,252 643 51.4%
1 Not defined by International Financial Reporting Standards (IFRS).
Development of sales and results of operations
In fiscal 2020, the Healthcare business sector recorded net sales of € 6,639 million (2019: € 6,714 million).
Organic sales growth amounted to 3.4%. All in all, net sales decreased by -1.1% due to unfavorable exchange
rate developments (-3.6%) and the disposal of the Allergopharma allergy business in the first quarter of 2020
(-0.9%). The exchange rate effect reflects the unfavorable development of various currencies against the euro,
particularly the U.S. dollar, individual Latin American currencies, and the Russian ruble.
The net sales in the individual quarters as well as the respective organic growth rates in 2020 are presented in
the following graph:
Healthcare
Net sales and organic growth1 by quarter2
€ million/organic growth in %
1 Not defined by International Financial Reporting Standards (IFRS). 2 Quarterly breakdown unaudited.
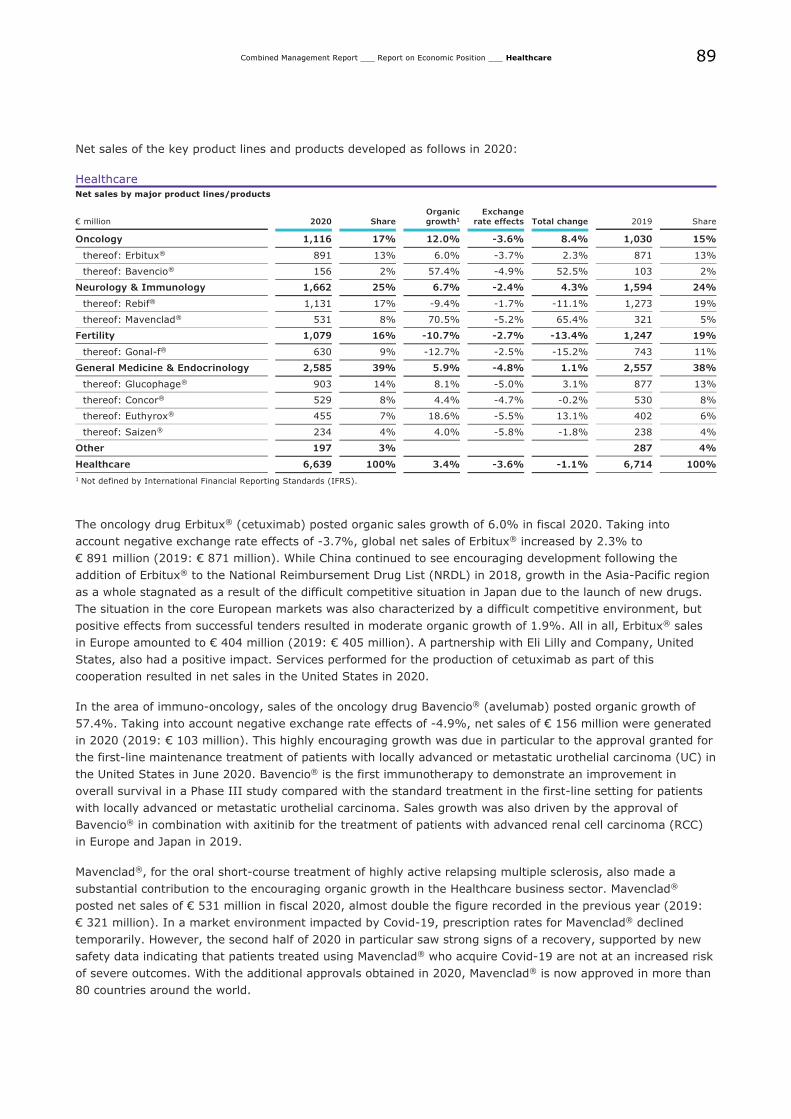
89
Combined Management Report ___ Report on Economic Position ___ Healthcare
Net sales of the key product lines and products developed as follows in 2020:
Healthcare
Net sales by major product lines/products
€ million 2020 Share
Organic
growth1
Exchange
rate effects Total change 2019 Share
Oncology 1,116 17% 12.0% -3.6% 8.4% 1,030 15%
thereof: Erbitux® 891 13% 6.0% -3.7% 2.3% 871 13%
thereof: Bavencio® 156 2% 57.4% -4.9% 52.5% 103 2%
Neurology & Immunology 1,662 25% 6.7% -2.4% 4.3% 1,594 24%
thereof: Rebif® 1,131 17% -9.4% -1.7% -11.1% 1,273 19%
thereof: Mavenclad® 531 8% 70.5% -5.2% 65.4% 321 5%
Fertility 1,079 16% -10.7% -2.7% -13.4% 1,247 19%
thereof: Gonal-f® 630 9% -12.7% -2.5% -15.2% 743 11%
General Medicine & Endocrinology 2,585 39% 5.9% -4.8% 1.1% 2,557 38%
thereof: Glucophage® 903 14% 8.1% -5.0% 3.1% 877 13%
thereof: Concor® 529 8% 4.4% -4.7% -0.2% 530 8%
thereof: Euthyrox® 455 7% 18.6% -5.5% 13.1% 402 6%
thereof: Saizen® 234 4% 4.0% -5.8% -1.8% 238 4%
Other 197 3% 287 4%
Healthcare 6,639 100% 3.4% -3.6% -1.1% 6,714 100%
1 Not defined by International Financial Reporting Standards (IFRS).
The oncology drug Erbitux® (cetuximab) posted organic sales growth of 6.0% in fiscal 2020. Taking into
account negative exchange rate effects of -3.7%, global net sales of Erbitux® increased by 2.3% to
€ 891 million (2019: € 871 million). While China continued to see encouraging development following the
addition of Erbitux® to the National Reimbursement Drug List (NRDL) in 2018, growth in the Asia-Pacific region
as a whole stagnated as a result of the difficult competitive situation in Japan due to the launch of new drugs.
The situation in the core European markets was also characterized by a difficult competitive environment, but
positive effects from successful tenders resulted in moderate organic growth of 1.9%. All in all, Erbitux® sales
in Europe amounted to € 404 million (2019: € 405 million). A partnership with Eli Lilly and Company, United
States, also had a positive impact. Services performed for the production of cetuximab as part of this
cooperation resulted in net sales in the United States in 2020.
In the area of immuno-oncology, sales of the oncology drug Bavencio® (avelumab) posted organic growth of
57.4%. Taking into account negative exchange rate effects of -4.9%, net sales of € 156 million were generated
in 2020 (2019: € 103 million). This highly encouraging growth was due in particular to the approval granted for
the first-line maintenance treatment of patients with locally advanced or metastatic urothelial carcinoma (UC) in
the United States in June 2020. Bavencio® is the first immunotherapy to demonstrate an improvement in
overall survival in a Phase III study compared with the standard treatment in the first-line setting for patients
with locally advanced or metastatic urothelial carcinoma. Sales growth was also driven by the approval of
Bavencio® in combination with axitinib for the treatment of patients with advanced renal cell carcinoma (RCC)
in Europe and Japan in 2019.
Mavenclad®, for the oral short-course treatment of highly active relapsing multiple sclerosis, also made a
substantial contribution to the encouraging organic growth in the Healthcare business sector. Mavenclad®
posted net sales of € 531 million in fiscal 2020, almost double the figure recorded in the previous year (2019:
€ 321 million). In a market environment impacted by Covid-19, prescription rates for Mavenclad® declined
temporarily. However, the second half of 2020 in particular saw strong signs of a recovery, supported by new
safety data indicating that patients treated using Mavenclad® who acquire Covid-19 are not at an increased risk
of severe outcomes. With the additional approvals obtained in 2020, Mavenclad® is now approved in more than
80 countries around the world.
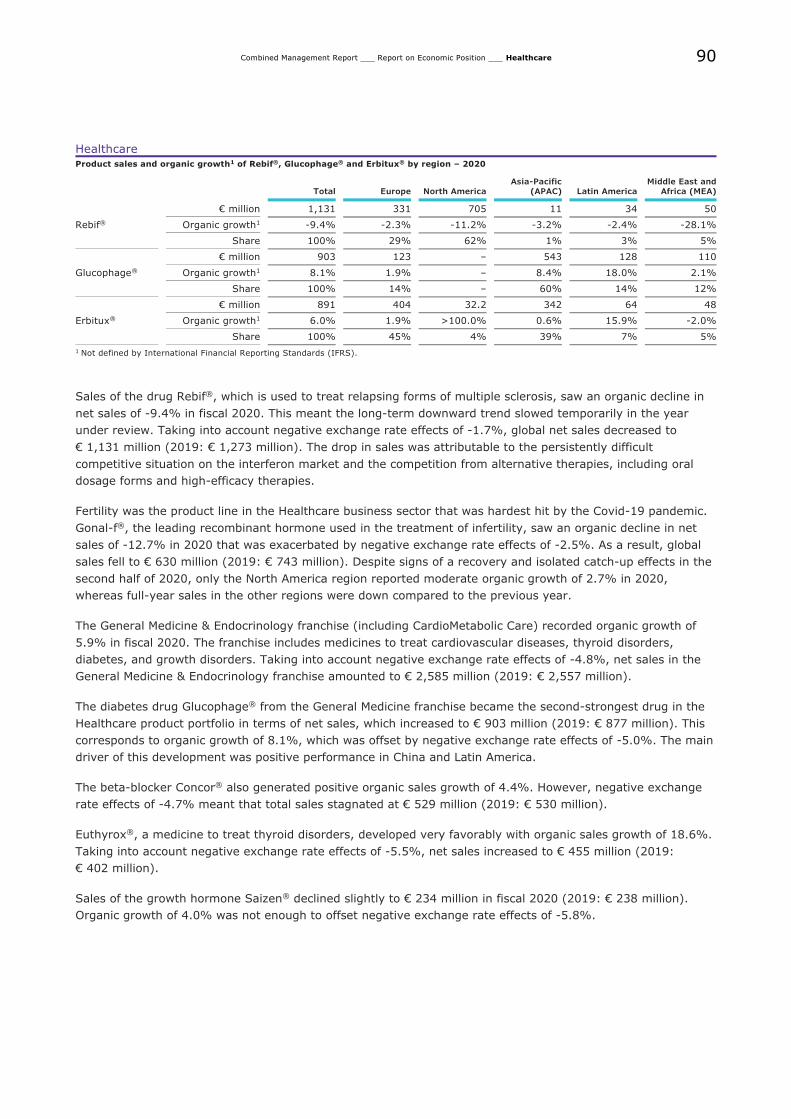
90
Combined Management Report ___ Report on Economic Position ___ Healthcare
Healthcare
Product sales and organic growth1 of Rebif®, Glucophage® and Erbitux® by region – 2020
Total Europe North America
Asia-Pacific
(APAC) Latin America
Middle East and
Africa (MEA)
Rebif®
€ million 1,131 331 705 11 34 50
Organic growth1 -9.4% -2.3% -11.2% -3.2% -2.4% -28.1%
Share 100% 29% 62% 1% 3% 5%
Glucophage®
€ million 903 123 – 543 128 110
Organic growth1 8.1% 1.9% – 8.4% 18.0% 2.1%
Share 100% 14% – 60% 14% 12%
Erbitux®
€ million 891 404 32.2 342 64 48
Organic growth1 6.0% 1.9% >100.0% 0.6% 15.9% -2.0%
Share 100% 45% 4% 39% 7% 5%
1 Not defined by International Financial Reporting Standards (IFRS).
Sales of the drug Rebif®, which is used to treat relapsing forms of multiple sclerosis, saw an organic decline in
net sales of -9.4% in fiscal 2020. This meant the long-term downward trend slowed temporarily in the year
under review. Taking into account negative exchange rate effects of -1.7%, global net sales decreased to
€ 1,131 million (2019: € 1,273 million). The drop in sales was attributable to the persistently difficult
competitive situation on the interferon market and the competition from alternative therapies, including oral
dosage forms and high-efficacy therapies.
Fertility was the product line in the Healthcare business sector that was hardest hit by the Covid-19 pandemic.
Gonal-f®, the leading recombinant hormone used in the treatment of infertility, saw an organic decline in net
sales of -12.7% in 2020 that was exacerbated by negative exchange rate effects of -2.5%. As a result, global
sales fell to € 630 million (2019: € 743 million). Despite signs of a recovery and isolated catch-up effects in the
second half of 2020, only the North America region reported moderate organic growth of 2.7% in 2020,
whereas full-year sales in the other regions were down compared to the previous year.
The General Medicine & Endocrinology franchise (including CardioMetabolic Care) recorded organic growth of
5.9% in fiscal 2020. The franchise includes medicines to treat cardiovascular diseases, thyroid disorders,
diabetes, and growth disorders. Taking into account negative exchange rate effects of -4.8%, net sales in the
General Medicine & Endocrinology franchise amounted to € 2,585 million (2019: € 2,557 million).
The diabetes drug Glucophage® from the General Medicine franchise became the second-strongest drug in the
Healthcare product portfolio in terms of net sales, which increased to € 903 million (2019: € 877 million). This
corresponds to organic growth of 8.1%, which was offset by negative exchange rate effects of -5.0%. The main
driver of this development was positive performance in China and Latin America.
The beta-blocker Concor® also generated positive organic sales growth of 4.4%. However, negative exchange
rate effects of -4.7% meant that total sales stagnated at € 529 million (2019: € 530 million).
Euthyrox®, a medicine to treat thyroid disorders, developed very favorably with organic sales growth of 18.6%.
Taking into account negative exchange rate effects of -5.5%, net sales increased to € 455 million (2019:
€ 402 million).
Sales of the growth hormone Saizen® declined slightly to € 234 million in fiscal 2020 (2019: € 238 million).
Organic growth of 4.0% was not enough to offset negative exchange rate effects of -5.8%.
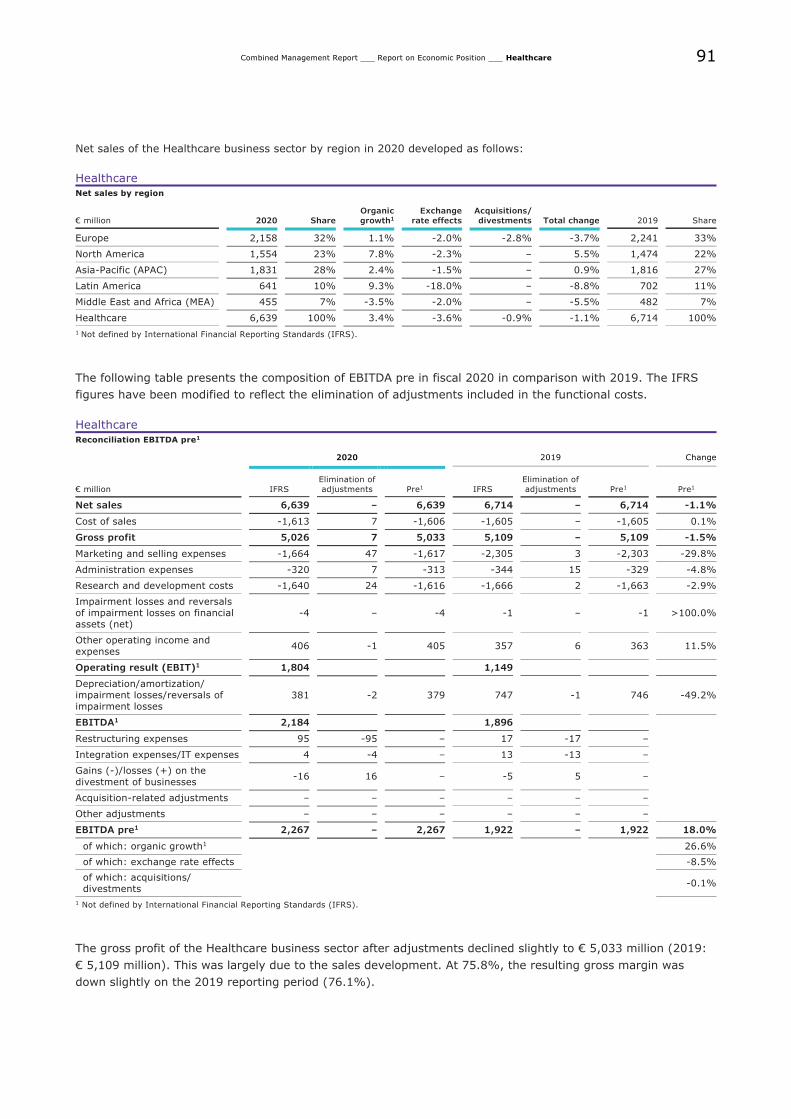
91
Combined Management Report ___ Report on Economic Position ___ Healthcare
Net sales of the Healthcare business sector by region in 2020 developed as follows:
Healthcare
Net sales by region
€ million 2020 Share
Organic
growth1
Exchange
rate effects
Acquisitions/
divestments Total change 2019 Share
Europe 2,158 32% 1.1% -2.0% -2.8% -3.7% 2,241 33%
North America 1,554 23% 7.8% -2.3% – 5.5% 1,474 22%
Asia-Pacific (APAC) 1,831 28% 2.4% -1.5% – 0.9% 1,816 27%
Latin America 641 10% 9.3% -18.0% – -8.8% 702 11%
Middle East and Africa (MEA) 455 7% -3.5% -2.0% – -5.5% 482 7%
Healthcare 6,639 100% 3.4% -3.6% -0.9% -1.1% 6,714 100%
1 Not defined by International Financial Reporting Standards (IFRS).
The following table presents the composition of EBITDA pre in fiscal 2020 in comparison with 2019. The IFRS
figures have been modified to reflect the elimination of adjustments included in the functional costs.
Healthcare
Reconciliation EBITDA pre1
2020 2019 Change
€ million IFRS
Elimination of
adjustments Pre1 IFRS
Elimination of
adjustments Pre1 Pre1
Net sales 6,639 – 6,639 6,714 – 6,714 -1.1%
Cost of sales -1,613 7 -1,606 -1,605 – -1,605 0.1%
Gross profit 5,026 7 5,033 5,109 – 5,109 -1.5%
Marketing and selling expenses -1,664 47 -1,617 -2,305 3 -2,303 -29.8%
Administration expenses -320 7 -313 -344 15 -329 -4.8%
Research and development costs -1,640 24 -1,616 -1,666 2 -1,663 -2.9%
Impairment losses and reversals of impairment losses on financial assets (net)
-4 – -4 -1 – -1 >100.0%
Other operating income and expenses
406 -1 405 357 6 363 11.5%
Operating result (EBIT)1 1,804 1,149
Depreciation/amortization/ impairment losses/reversals of impairment losses
381 -2 379 747 -1 746 -49.2%
EBITDA1 2,184 1,896
Restructuring expenses 95 -95 – 17 -17 –
Integration expenses/IT expenses 4 -4 – 13 -13 –
Gains (-)/losses (+) on the
divestment of businesses -16 16 – -5 5 –
Acquisition-related adjustments – – – – – –
Other adjustments – – – – – –
EBITDA pre1 2,267 – 2,267 1,922 – 1,922 18.0%
of which: organic growth1 26.6%
of which: exchange rate effects -8.5%
of which: acquisitions/ divestments
-0.1%
1 Not defined by International Financial Reporting Standards (IFRS).
The gross profit of the Healthcare business sector after adjustments declined slightly to € 5,033 million (2019:
€ 5,109 million). This was largely due to the sales development. At 75.8%, the resulting gross margin was
down slightly on the 2019 reporting period (76.1%).
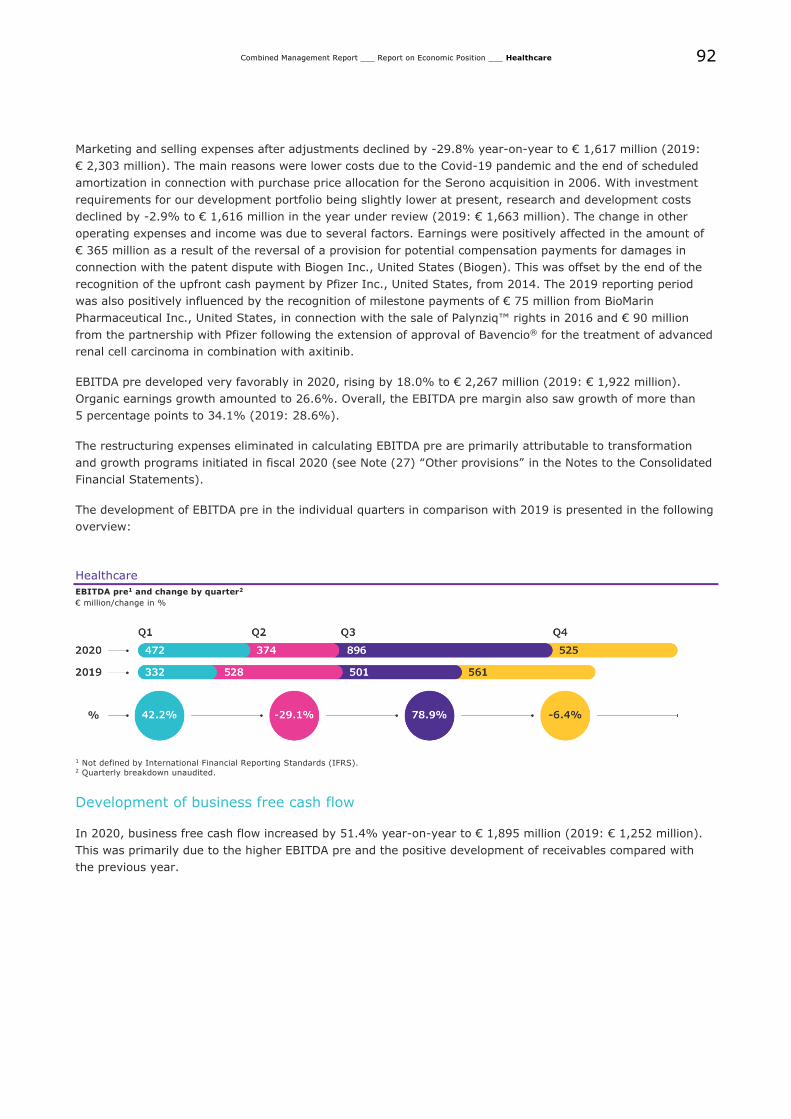
92
Combined Management Report ___ Report on Economic Position ___ Healthcare
Marketing and selling expenses after adjustments declined by -29.8% year-on-year to € 1,617 million (2019:
€ 2,303 million). The main reasons were lower costs due to the Covid-19 pandemic and the end of scheduled
amortization in connection with purchase price allocation for the Serono acquisition in 2006. With investment
requirements for our development portfolio being slightly lower at present, research and development costs
declined by -2.9% to € 1,616 million in the year under review (2019: € 1,663 million). The change in other
operating expenses and income was due to several factors. Earnings were positively affected in the amount of
€ 365 million as a result of the reversal of a provision for potential compensation payments for damages in
connection with the patent dispute with Biogen Inc., United States (Biogen). This was offset by the end of the
recognition of the upfront cash payment by Pfizer Inc., United States, from 2014. The 2019 reporting period
was also positively influenced by the recognition of milestone payments of € 75 million from BioMarin
Pharmaceutical Inc., United States, in connection with the sale of Palynziq™ rights in 2016 and € 90 million
from the partnership with Pfizer following the extension of approval of Bavencio® for the treatment of advanced
renal cell carcinoma in combination with axitinib.
EBITDA pre developed very favorably in 2020, rising by 18.0% to € 2,267 million (2019: € 1,922 million).
Organic earnings growth amounted to 26.6%. Overall, the EBITDA pre margin also saw growth of more than
5 percentage points to 34.1% (2019: 28.6%).
The restructuring expenses eliminated in calculating EBITDA pre are primarily attributable to transformation
and growth programs initiated in fiscal 2020 (see Note (27) “Other provisions” in the Notes to the Consolidated
Financial Statements).
The development of EBITDA pre in the individual quarters in comparison with 2019 is presented in the following
overview:
Healthcare
EBITDA pre1 and change by quarter2
€ million/change in %
1 Not defined by International Financial Reporting Standards (IFRS). 2 Quarterly breakdown unaudited.
Development of business free cash flow
In 2020, business free cash flow increased by 51.4% year-on-year to € 1,895 million (2019: € 1,252 million).
This was primarily due to the higher EBITDA pre and the positive development of receivables compared with
the previous year.
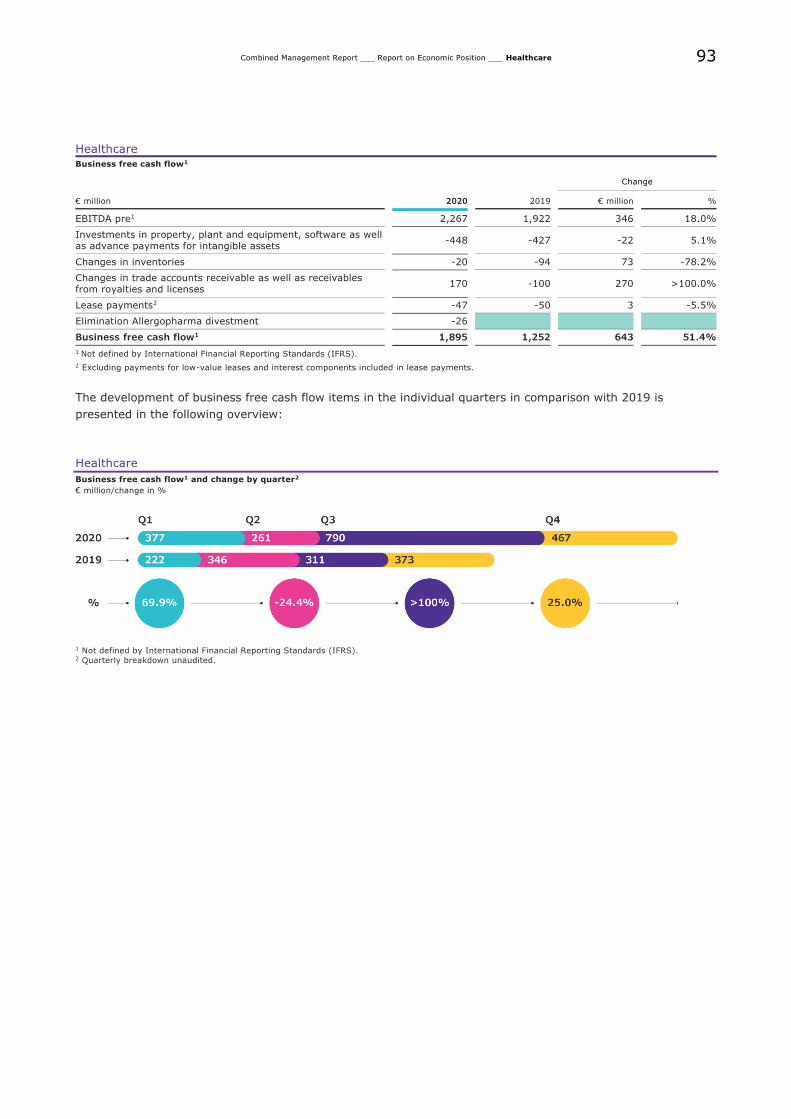
93
Combined Management Report ___ Report on Economic Position ___ Healthcare
Healthcare
Business free cash flow1
Change
€ million 2020 2019 € million %
EBITDA pre1 2,267 1,922 346 18.0%
Investments in property, plant and equipment, software as well as advance payments for intangible assets
-448 -427 -22 5.1%
Changes in inventories -20 -94 73 -78.2%
Changes in trade accounts receivable as well as receivables from royalties and licenses
170 -100 270 >100.0%
Lease payments2 -47 -50 3 -5.5%
Elimination Allergopharma divestment -26
Business free cash flow1 1,895 1,252 643 51.4%
1 Not defined by International Financial Reporting Standards (IFRS).
2 Excluding payments for low-value leases and interest components included in lease payments.
The development of business free cash flow items in the individual quarters in comparison with 2019 is
presented in the following overview:
Healthcare
Business free cash flow1 and change by quarter2
€ million/change in %
1 Not defined by International Financial Reporting Standards (IFRS). 2 Quarterly breakdown unaudited.

94
Combined Management Report ___ Report on Economic Position ___ Life Science
Life Science
Life Science
Key figures
Change
€ million 2020 2019 € million %
Net sales 7,515 6,864 651 9.5%
Operating result (EBIT)1 1,599 1,280 318 24.9%
Margin (% of net sales)1 21.3% 18.7%
EBITDA1 2,387 2,070 317 15.3%
Margin (% of net sales)1 31.8% 30.2%
EBITDA pre1 2,405 2,129 276 13.0%
Margin (% of net sales)1 32.0% 31.0%
Business free cash flow1 1,595 1,375 220 16.0%
1 Not defined by International Financial Reporting Standards (IFRS).
Development of sales and results of operations
In fiscal 2020, Life Science posted organic sales growth of 11.8% with unfavorable foreign exchange impact of
-2.3%, resulting in a total net sales growth of 9.5% compared to the previous year. All three business units
contributed to the organic growth, with the largest contribution coming from Process Solutions followed by
Research Solutions. Overall, Life Science net sales increased to € 7,515 million (2019: € 6,864 million).
The development of sales in the individual quarters in comparison with 2019 as well as the respective organic
growth rates are presented in the following graph:
Life Science
Net sales and organic growth1 by quarter2
€ million/organic growth in %
1 Not defined by International Financial Reporting Standards (IFRS). 2 Quarterly breakdown unaudited.
Life Science
Net sales by business unit1
€ million 2020 Share
Organic
growth2
Exchange
rate effects
Acquisitions/
divestments Total change 2019 Share
Process Solutions 3,596 48% 21.8% -2.1% – 19.8% 3,002 44%
Research Solutions 2,215 29% 4.6% -2.5% – 2.1% 2,170 31%
Applied Solutions 1,704 23% 3.3% -2.6% – 0.8% 1,692 25%
Life Science 7,515 100% 11.8% -2.3% – 9.5% 6,864 100%
1 Previous year’s figures have been adjusted due to internal realignment.
2 Not defined by International Financial Accounting Standards (IFRS).
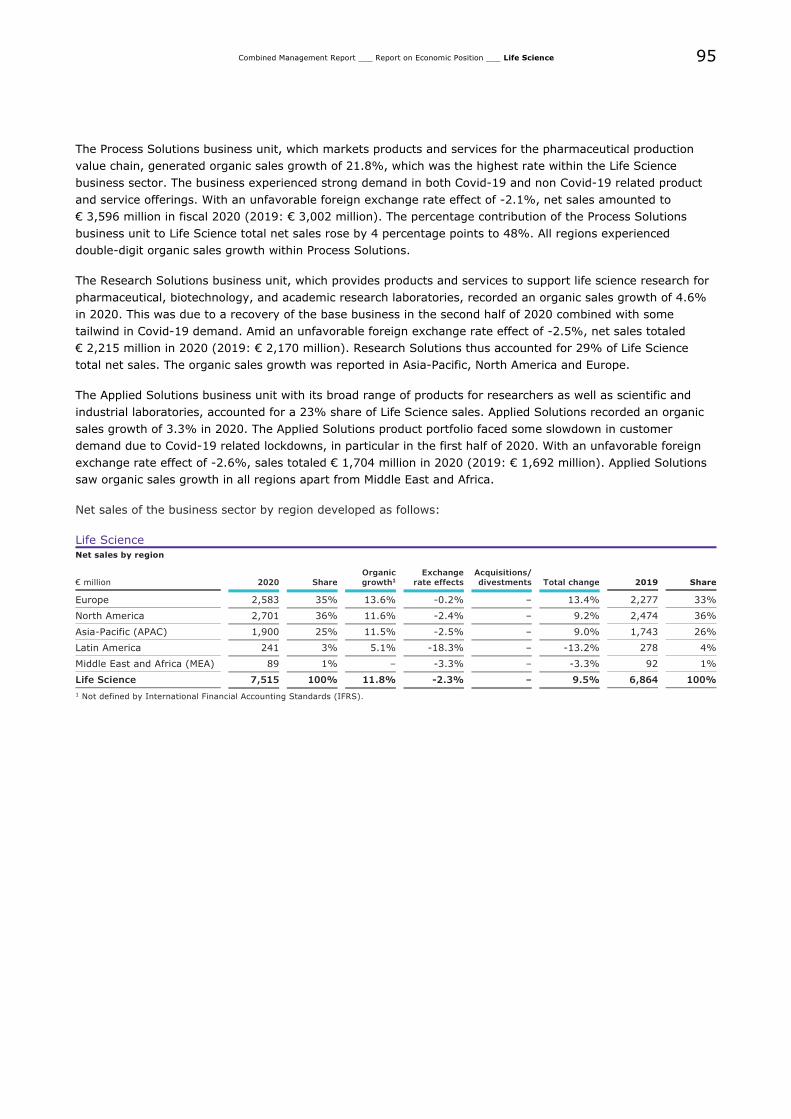
95
Combined Management Report ___ Report on Economic Position ___ Life Science
The Process Solutions business unit, which markets products and services for the pharmaceutical production
value chain, generated organic sales growth of 21.8%, which was the highest rate within the Life Science
business sector. The business experienced strong demand in both Covid-19 and non Covid-19 related product
and service offerings. With an unfavorable foreign exchange rate effect of -2.1%, net sales amounted to
€ 3,596 million in fiscal 2020 (2019: € 3,002 million). The percentage contribution of the Process Solutions
business unit to Life Science total net sales rose by 4 percentage points to 48%. All regions experienced
double-digit organic sales growth within Process Solutions.
The Research Solutions business unit, which provides products and services to support life science research for
pharmaceutical, biotechnology, and academic research laboratories, recorded an organic sales growth of 4.6%
in 2020. This was due to a recovery of the base business in the second half of 2020 combined with some
tailwind in Covid-19 demand. Amid an unfavorable foreign exchange rate effect of -2.5%, net sales totaled
€ 2,215 million in 2020 (2019: € 2,170 million). Research Solutions thus accounted for 29% of Life Science
total net sales. The organic sales growth was reported in Asia-Pacific, North America and Europe.
The Applied Solutions business unit with its broad range of products for researchers as well as scientific and
industrial laboratories, accounted for a 23% share of Life Science sales. Applied Solutions recorded an organic
sales growth of 3.3% in 2020. The Applied Solutions product portfolio faced some slowdown in customer
demand due to Covid-19 related lockdowns, in particular in the first half of 2020. With an unfavorable foreign
exchange rate effect of -2.6%, sales totaled € 1,704 million in 2020 (2019: € 1,692 million). Applied Solutions
saw organic sales growth in all regions apart from Middle East and Africa.
Net sales of the business sector by region developed as follows:
Life Science
Net sales by region
€ million 2020 Share
Organic
growth1
Exchange
rate effects
Acquisitions/
divestments Total change 2019 Share
Europe 2,583 35% 13.6% -0.2% – 13.4% 2,277 33%
North America 2,701 36% 11.6% -2.4% – 9.2% 2,474 36%
Asia-Pacific (APAC) 1,900 25% 11.5% -2.5% – 9.0% 1,743 26%
Latin America 241 3% 5.1% -18.3% – -13.2% 278 4%
Middle East and Africa (MEA) 89 1% – -3.3% – -3.3% 92 1%
Life Science 7,515 100% 11.8% -2.3% – 9.5% 6,864 100%
1 Not defined by International Financial Accounting Standards (IFRS).
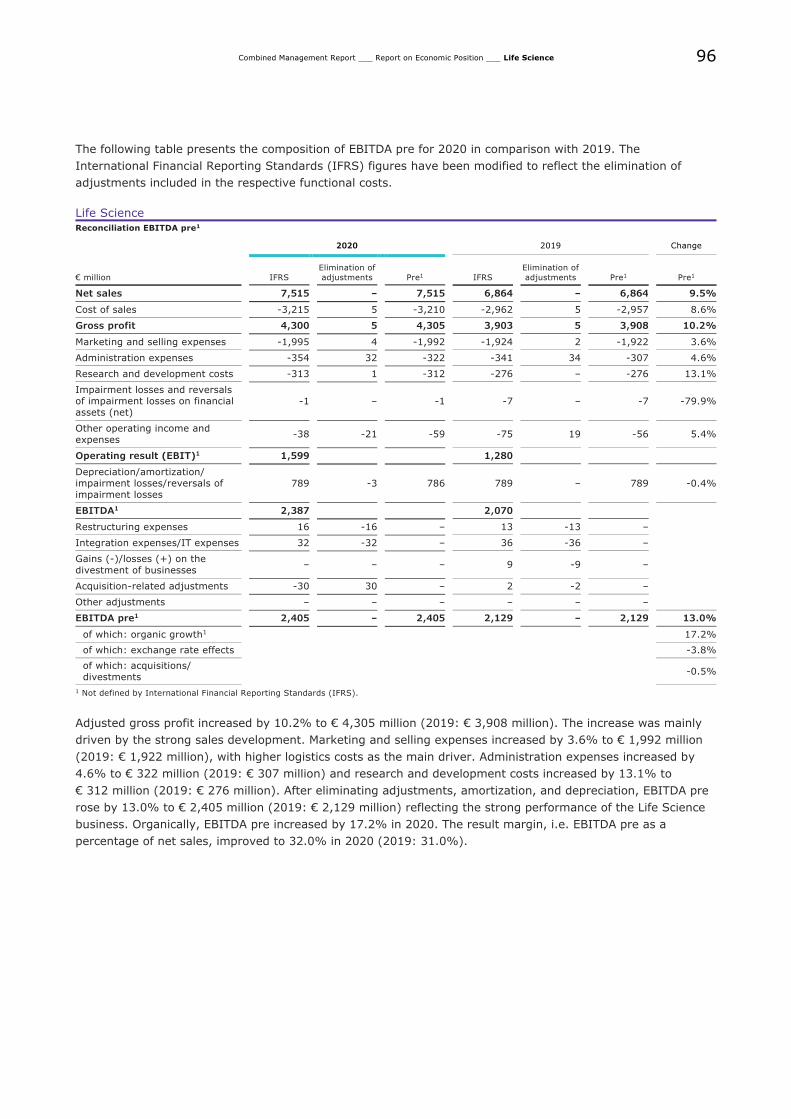
96
Combined Management Report ___ Report on Economic Position ___ Life Science
The following table presents the composition of EBITDA pre for 2020 in comparison with 2019. The
International Financial Reporting Standards (IFRS) figures have been modified to reflect the elimination of
adjustments included in the respective functional costs.
Life Science
Reconciliation EBITDA pre1
2020 2019 Change
€ million IFRS
Elimination of
adjustments Pre1 IFRS
Elimination of
adjustments Pre1 Pre1
Net sales 7,515 – 7,515 6,864 – 6,864 9.5%
Cost of sales -3,215 5 -3,210 -2,962 5 -2,957 8.6%
Gross profit 4,300 5 4,305 3,903 5 3,908 10.2%
Marketing and selling expenses -1,995 4 -1,992 -1,924 2 -1,922 3.6%
Administration expenses -354 32 -322 -341 34 -307 4.6%
Research and development costs -313 1 -312 -276 – -276 13.1%
Impairment losses and reversals of impairment losses on financial assets (net)
-1 – -1 -7 – -7 -79.9%
Other operating income and expenses
-38 -21 -59 -75 19 -56 5.4%
Operating result (EBIT)1 1,599 1,280
Depreciation/amortization/ impairment losses/reversals of impairment losses
789 -3 786 789 – 789 -0.4%
EBITDA1 2,387 2,070
Restructuring expenses 16 -16 – 13 -13 –
Integration expenses/IT expenses 32 -32 – 36 -36 –
Gains (-)/losses (+) on the
divestment of businesses – – – 9 -9 –
Acquisition-related adjustments -30 30 – 2 -2 –
Other adjustments – – – – – –
EBITDA pre1 2,405 – 2,405 2,129 – 2,129 13.0%
of which: organic growth1 17.2%
of which: exchange rate effects -3.8%
of which: acquisitions/ divestments
-0.5%
1 Not defined by International Financial Reporting Standards (IFRS).
Adjusted gross profit increased by 10.2% to € 4,305 million (2019: € 3,908 million). The increase was mainly
driven by the strong sales development. Marketing and selling expenses increased by 3.6% to € 1,992 million
(2019: € 1,922 million), with higher logistics costs as the main driver. Administration expenses increased by
4.6% to € 322 million (2019: € 307 million) and research and development costs increased by 13.1% to
€ 312 million (2019: € 276 million). After eliminating adjustments, amortization, and depreciation, EBITDA pre
rose by 13.0% to € 2,405 million (2019: € 2,129 million) reflecting the strong performance of the Life Science
business. Organically, EBITDA pre increased by 17.2% in 2020. The result margin, i.e. EBITDA pre as a
percentage of net sales, improved to 32.0% in 2020 (2019: 31.0%).
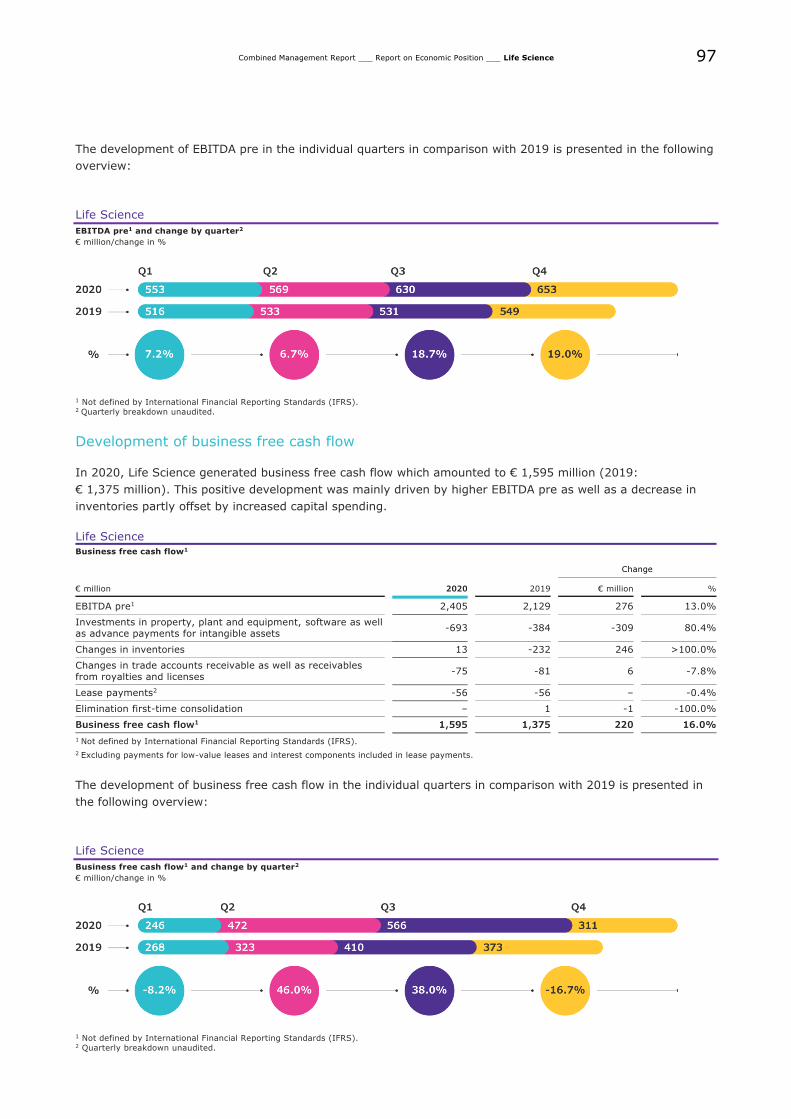
97
Combined Management Report ___ Report on Economic Position ___ Life Science
The development of EBITDA pre in the individual quarters in comparison with 2019 is presented in the following
overview:
Life Science
EBITDA pre1 and change by quarter2
€ million/change in %
1 Not defined by International Financial Reporting Standards (IFRS). 2 Quarterly breakdown unaudited.
Development of business free cash flow
In 2020, Life Science generated business free cash flow which amounted to € 1,595 million (2019:
€ 1,375 million). This positive development was mainly driven by higher EBITDA pre as well as a decrease in
inventories partly offset by increased capital spending.
Life Science
Business free cash flow1
Change
€ million 2020 2019 € million %
EBITDA pre1 2,405 2,129 276 13.0%
Investments in property, plant and equipment, software as well as advance payments for intangible assets
-693 -384 -309 80.4%
Changes in inventories 13 -232 246 >100.0%
Changes in trade accounts receivable as well as receivables from royalties and licenses
-75 -81 6 -7.8%
Lease payments2 -56 -56 – -0.4%
Elimination first-time consolidation – 1 -1 -100.0%
Business free cash flow1 1,595 1,375 220 16.0%
1 Not defined by International Financial Reporting Standards (IFRS).
2 Excluding payments for low-value leases and interest components included in lease payments.
The development of business free cash flow in the individual quarters in comparison with 2019 is presented in
the following overview:
Life Science
Business free cash flow1 and change by quarter2
€ million/change in %
1 Not defined by International Financial Reporting Standards (IFRS). 2 Quarterly breakdown unaudited.
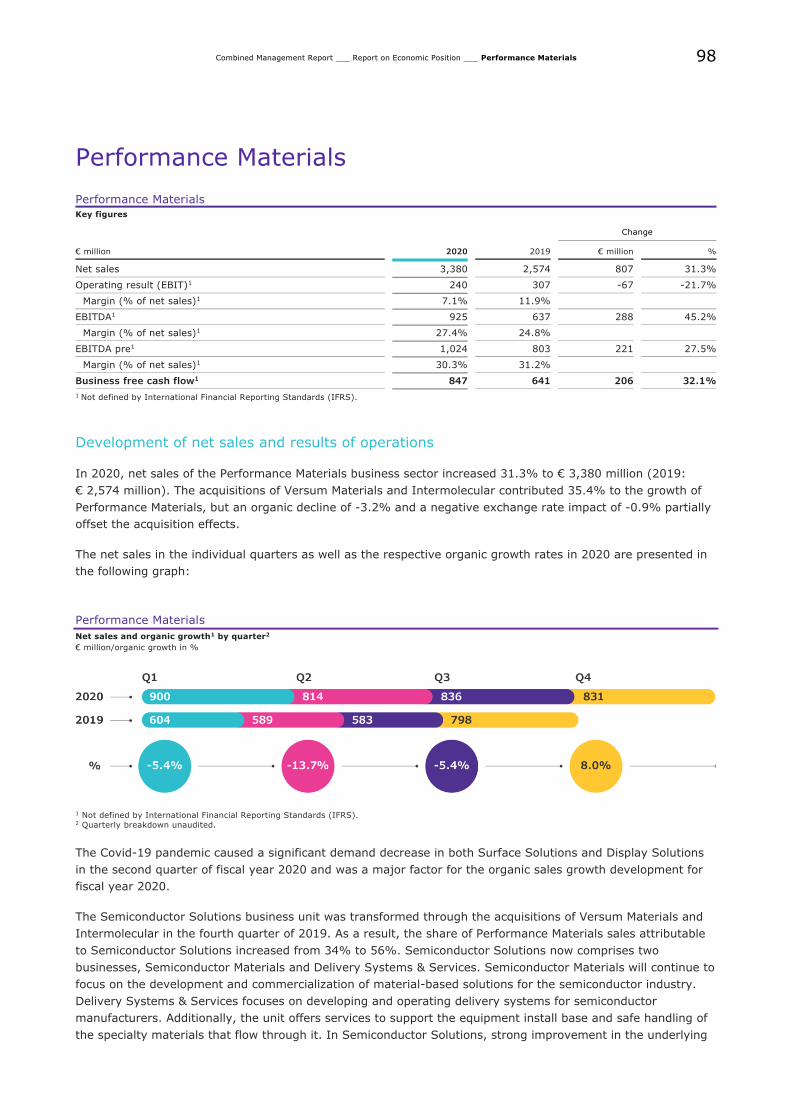
98
Combined Management Report ___ Report on Economic Position ___ Performance Materials
Performance Materials
Performance Materials
Key figures
Change
€ million 2020 2019 € million %
Net sales 3,380 2,574 807 31.3%
Operating result (EBIT)1 240 307 -67 -21.7%
Margin (% of net sales)1 7.1% 11.9%
EBITDA1 925 637 288 45.2%
Margin (% of net sales)1 27.4% 24.8%
EBITDA pre1 1,024 803 221 27.5%
Margin (% of net sales)1 30.3% 31.2%
Business free cash flow1 847 641 206 32.1%
1 Not defined by International Financial Reporting Standards (IFRS).
Development of net sales and results of operations
In 2020, net sales of the Performance Materials business sector increased 31.3% to € 3,380 million (2019:
€ 2,574 million). The acquisitions of Versum Materials and Intermolecular contributed 35.4% to the growth of
Performance Materials, but an organic decline of -3.2% and a negative exchange rate impact of -0.9% partially
offset the acquisition effects.
The net sales in the individual quarters as well as the respective organic growth rates in 2020 are presented in
the following graph:
Performance Materials
Net sales and organic growth1 by quarter2
€ million/organic growth in %
1 Not defined by International Financial Reporting Standards (IFRS). 2 Quarterly breakdown unaudited.
The Covid-19 pandemic caused a significant demand decrease in both Surface Solutions and Display Solutions
in the second quarter of fiscal year 2020 and was a major factor for the organic sales growth development for
fiscal year 2020.
The Semiconductor Solutions business unit was transformed through the acquisitions of Versum Materials and
Intermolecular in the fourth quarter of 2019. As a result, the share of Performance Materials sales attributable
to Semiconductor Solutions increased from 34% to 56%. Semiconductor Solutions now comprises two
businesses, Semiconductor Materials and Delivery Systems & Services. Semiconductor Materials will continue to
focus on the development and commercialization of material-based solutions for the semiconductor industry.
Delivery Systems & Services focuses on developing and operating delivery systems for semiconductor
manufacturers. Additionally, the unit offers services to support the equipment install base and safe handling of
the specialty materials that flow through it. In Semiconductor Solutions, strong improvement in the underlying
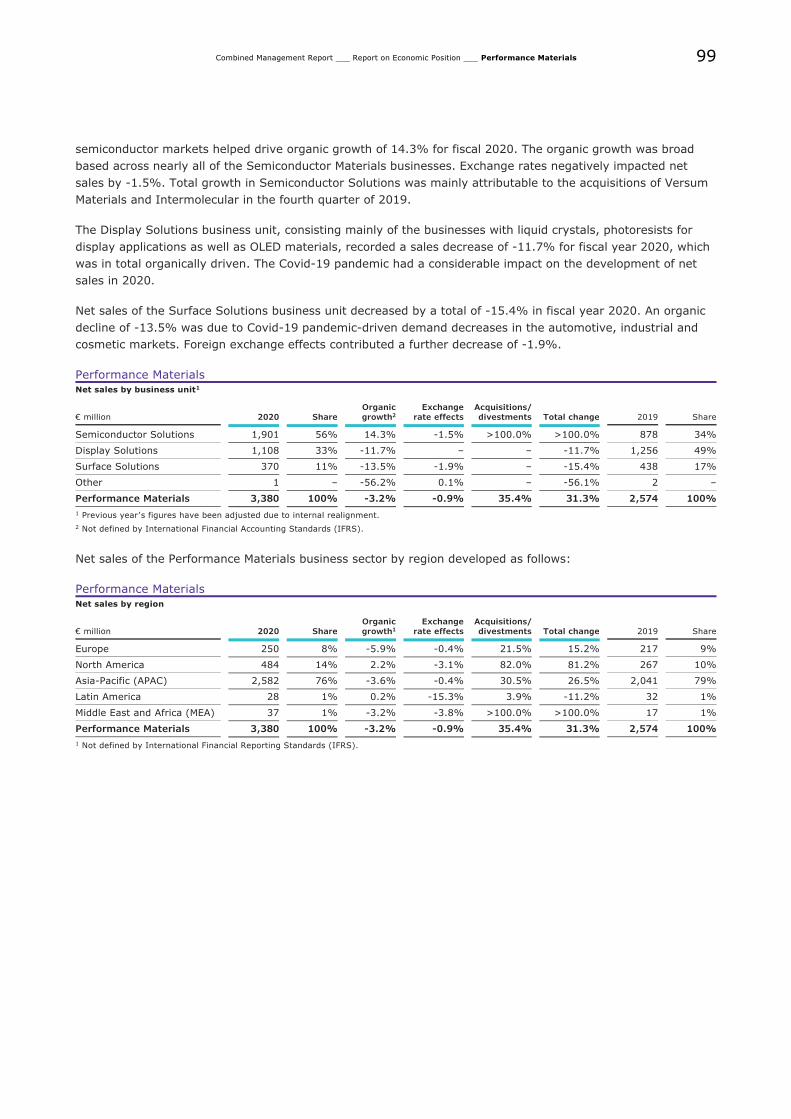
99
Combined Management Report ___ Report on Economic Position ___ Performance Materials
semiconductor markets helped drive organic growth of 14.3% for fiscal 2020. The organic growth was broad
based across nearly all of the Semiconductor Materials businesses. Exchange rates negatively impacted net
sales by -1.5%. Total growth in Semiconductor Solutions was mainly attributable to the acquisitions of Versum
Materials and Intermolecular in the fourth quarter of 2019.
The Display Solutions business unit, consisting mainly of the businesses with liquid crystals, photoresists for
display applications as well as OLED materials, recorded a sales decrease of -11.7% for fiscal year 2020, which
was in total organically driven. The Covid-19 pandemic had a considerable impact on the development of net
sales in 2020.
Net sales of the Surface Solutions business unit decreased by a total of -15.4% in fiscal year 2020. An organic
decline of -13.5% was due to Covid-19 pandemic-driven demand decreases in the automotive, industrial and
cosmetic markets. Foreign exchange effects contributed a further decrease of -1.9%.
Performance Materials
Net sales by business unit1
€ million 2020 Share
Organic
growth2
Exchange
rate effects
Acquisitions/
divestments Total change 2019 Share
Semiconductor Solutions 1,901 56% 14.3% -1.5% >100.0% >100.0% 878 34%
Display Solutions 1,108 33% -11.7% – – -11.7% 1,256 49%
Surface Solutions 370 11% -13.5% -1.9% – -15.4% 438 17%
Other 1 – -56.2% 0.1% – -56.1% 2 –
Performance Materials 3,380 100% -3.2% -0.9% 35.4% 31.3% 2,574 100%
1 Previous year’s figures have been adjusted due to internal realignment.
2 Not defined by International Financial Accounting Standards (IFRS).
Net sales of the Performance Materials business sector by region developed as follows:
Performance Materials
Net sales by region
€ million 2020 Share
Organic
growth1
Exchange
rate effects
Acquisitions/
divestments Total change 2019 Share
Europe 250 8% -5.9% -0.4% 21.5% 15.2% 217 9%
North America 484 14% 2.2% -3.1% 82.0% 81.2% 267 10%
Asia-Pacific (APAC) 2,582 76% -3.6% -0.4% 30.5% 26.5% 2,041 79%
Latin America 28 1% 0.2% -15.3% 3.9% -11.2% 32 1%
Middle East and Africa (MEA) 37 1% -3.2% -3.8% >100.0% >100.0% 17 1%
Performance Materials 3,380 100% -3.2% -0.9% 35.4% 31.3% 2,574 100%
1 Not defined by International Financial Reporting Standards (IFRS).

100
Combined Management Report ___ Report on Economic Position ___ Performance Materials
The following table presents the composition of EBITDA pre for 2020 in comparison with 2019. The IFRS figures
have been modified to reflect the elimination of adjustments included in the respective functional costs.
Performance Materials
Reconciliation EBITDA pre1
2020 2019 Change
€ million IFRS
Elimination of
adjustments Pre1 IFRS
Elimination of
adjustments Pre1 Pre1
Net sales 3,380 – 3,380 2,574 – 2,574 31.3%
Cost of sales -2,007 40 -1,966 -1,437 51 -1,386 41.9%
Gross profit 1,374 40 1,414 1,137 51 1,188 19.0%
Marketing and selling expenses -539 9 -530 -329 6 -323 64.0%
Administration expenses -162 17 -144 -118 11 -107 34.7%
Research and development costs -274 2 -272 -267 26 -241 12.9%
Impairment losses and reversals of impairment losses on financial assets (net)
– – – – – – –
Other operating income and
expenses -160 154 -5 -116 80 -37 -85.3%
Operating result (EBIT)1 240 307
Depreciation/amortization/
impairment losses/reversals of impairment losses
684 -123 561 330 -7 323 74.0%
EBITDA1 925 637
Restructuring expenses 31 -31 – 61 -61 –
Integration expenses/IT expenses 47 -47 – 23 -23 –
Gains (-)/losses (+) on the divestment of businesses
1 -1 – – – –
Acquisition-related adjustments 21 -21 – 82 -82 –
Other adjustments – – – – – –
EBITDA pre1 1,024 – 1,024 803 – 803 27.5%
of which: organic growth1 -7.5%
of which: exchange rate effects -1.3%
of which: acquisitions/ divestments
36.3%
1 Not defined by International Financial Reporting Standards (IFRS).
Adjusted gross profit of the Performance Materials business sector rose by 19.0% to € 1,414 million in fiscal
2020 (2019: € 1,188 million). The main driver for the increase was the acquisition of Versum Materials in the
fourth quarter of 2019. The adjusted gross margin declined to 41.8% in 2020 (2019: 46.2%), primarily owing
to the consolidation of the lower-margin Versum Materials business and the additional depreciation and
amortization associated with acquisition accounting (purchase price allocation). Not including adjustments, the
operating result (EBIT) decreased by € 67 million to € 240 million in 2020 (2019: € 307 million). The decrease
was attributable to additional amortization and impairments partially offset by the additional EBIT provided by
the Versum Materials acquisition.
The rise in marketing and selling expenses, administrative expenses and research and development costs was
due to the additional costs of the Versum Materials and Intermolecular organizations. The successful
implementation of the “Bright Future” transformation program reduced the underlying research and
development costs of the legacy business – excluding the increase associated with the acquisitions of Versum
Materials and Intermolecular. EBITDA pre of the business sector grew by 27.5% to € 1,024 million (2019:
€ 803 million) as the additional EBITDA pre from the acquisitions (36.3%) more than offset the decline in
organic EBITDA pre (-7.5%) and negative foreign exchange effects (-1.3%). At 30.3%, the EBITDA pre margin
in 2020 was down from the prior-year figure (2019: 31.2%).
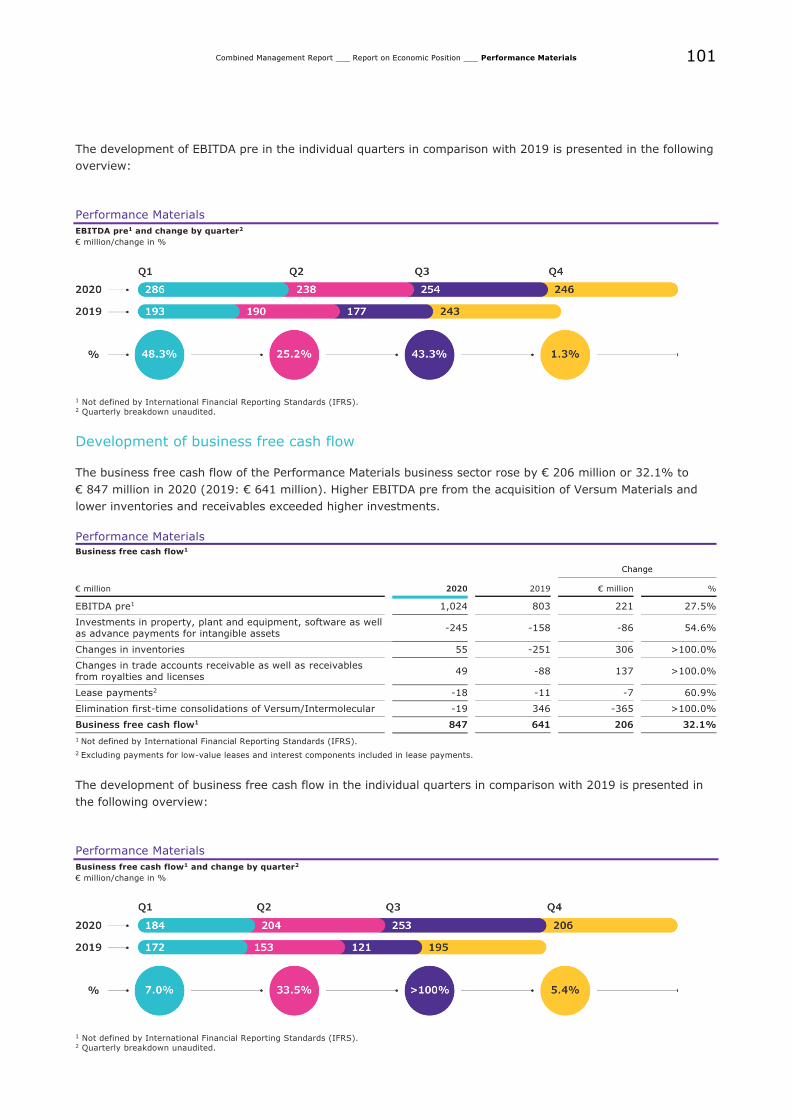
101
Combined Management Report ___ Report on Economic Position ___ Performance Materials
The development of EBITDA pre in the individual quarters in comparison with 2019 is presented in the following
overview:
Performance Materials
EBITDA pre1 and change by quarter2
€ million/change in %
1 Not defined by International Financial Reporting Standards (IFRS). 2 Quarterly breakdown unaudited.
Development of business free cash flow
The business free cash flow of the Performance Materials business sector rose by € 206 million or 32.1% to
€ 847 million in 2020 (2019: € 641 million). Higher EBITDA pre from the acquisition of Versum Materials and
lower inventories and receivables exceeded higher investments.
Performance Materials
Business free cash flow1
Change
€ million 2020 2019 € million %
EBITDA pre1 1,024 803 221 27.5%
Investments in property, plant and equipment, software as well as advance payments for intangible assets
-245 -158 -86 54.6%
Changes in inventories 55 -251 306 >100.0%
Changes in trade accounts receivable as well as receivables from royalties and licenses
49 -88 137 >100.0%
Lease payments2 -18 -11 -7 60.9%
Elimination first-time consolidations of Versum/Intermolecular -19 346 -365 >100.0%
Business free cash flow1 847 641 206 32.1%
1 Not defined by International Financial Reporting Standards (IFRS).
2 Excluding payments for low-value leases and interest components included in lease payments.
The development of business free cash flow in the individual quarters in comparison with 2019 is presented in
the following overview:
Performance Materials
Business free cash flow1 and change by quarter2
€ million/change in %
1 Not defined by International Financial Reporting Standards (IFRS). 2 Quarterly breakdown unaudited.
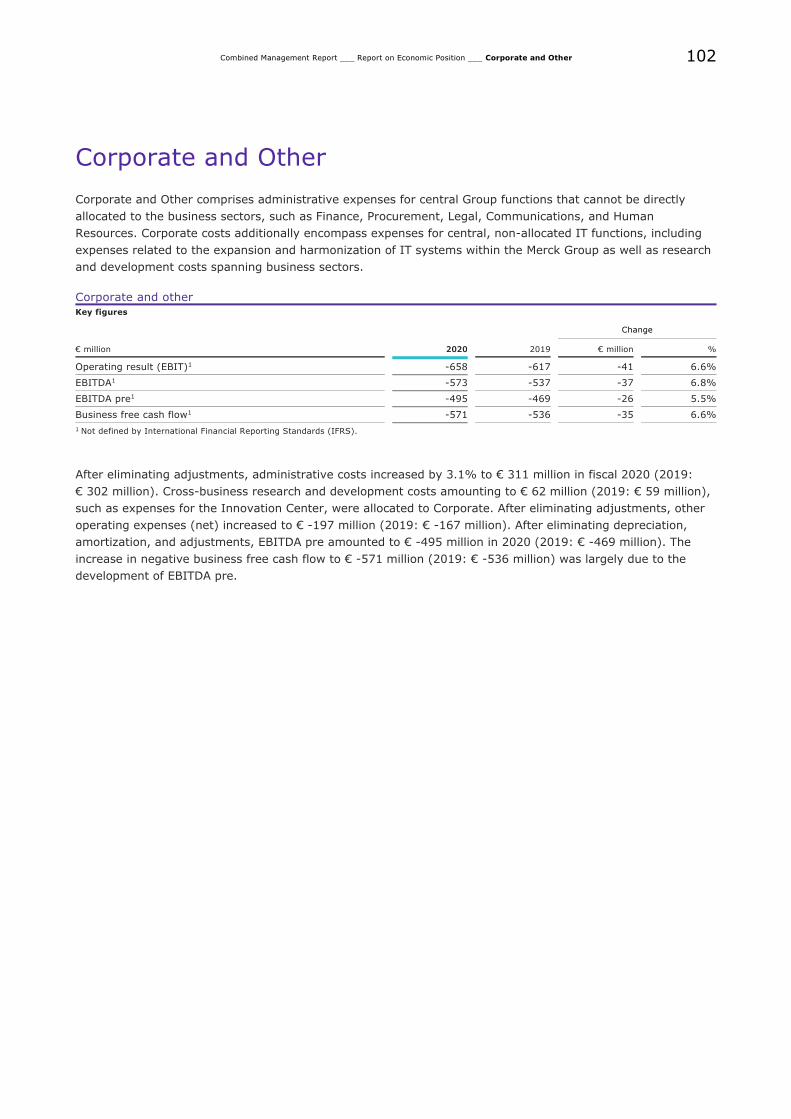
102
Combined Management Report ___ Report on Economic Position ___ Corporate and Other
Corporate and Other
Corporate and Other comprises administrative expenses for central Group functions that cannot be directly
allocated to the business sectors, such as Finance, Procurement, Legal, Communications, and Human
Resources. Corporate costs additionally encompass expenses for central, non-allocated IT functions, including
expenses related to the expansion and harmonization of IT systems within the Merck Group as well as research
and development costs spanning business sectors.
Corporate and other
Key figures
Change
€ million 2020 2019 € million %
Operating result (EBIT)1 -658 -617 -41 6.6%
EBITDA1 -573 -537 -37 6.8%
EBITDA pre1 -495 -469 -26 5.5%
Business free cash flow1 -571 -536 -35 6.6%
1 Not defined by International Financial Reporting Standards (IFRS).
After eliminating adjustments, administrative costs increased by 3.1% to € 311 million in fiscal 2020 (2019:
€ 302 million). Cross-business research and development costs amounting to € 62 million (2019: € 59 million),
such as expenses for the Innovation Center, were allocated to Corporate. After eliminating adjustments, other
operating expenses (net) increased to € -197 million (2019: € -167 million). After eliminating depreciation,
amortization, and adjustments, EBITDA pre amounted to € -495 million in 2020 (2019: € -469 million). The
increase in negative business free cash flow to € -571 million (2019: € -536 million) was largely due to the
development of EBITDA pre.
103
Combined Management Report ___ Report on Risks and Opportunities
Report on Risks and Opportunities Risks and opportunities are inherent to entrepreneurial activity. We have put systems and processes in place to
identify risks at an early stage and counteract them by taking appropriate action. Within the company,
opportunity management is an integral component of our internal decision-making processes such as short-
and medium-term planning and intra-year business plans.
Risk and opportunity management
Merck is part of a complex, global business world and is therefore exposed to a multitude of external and
internal influences. Every business decision is therefore based on the associated risks and opportunities.
In our internal risk reporting, risks are defined as potential future events or developments that could lead to a
negative deviation from our (financial) targets. In parallel, opportunities are defined as potential events or
developments that imply a positive deviation from our planned (financial and non-financial) targets. Identified
future events and expected developments are taken into account in internal planning, provided that it can be
assumed that their occurrence is likely in the planning period. The risks and opportunities presented in the
following risk and opportunities report are those potential future events or developments that could respectively
lead to a negative or positive deviation from the targets covered by planning.
Risk management process
The objective of our risk management activities is to recognize, assess, and manage risks early on and to
implement appropriate measures to minimize them. The responsibilities, objectives, and processes of risk
management are described in our internal risk management guidelines. The business heads, managing
directors of Merck subsidiaries, and the heads of Group functions are specified as employees with responsibility
for risks. The group of consolidated companies for risk reporting purposes is the same as the group of
consolidated companies for the Consolidated Financial Statements. Every six months, the risk owners assess
their risk status and report their risk portfolio to Risk Management. We use special risk management software
in the context of these activities.
Likewise, risk-mitigating measures are reported and assessed. The effectiveness of these measures and the
planned implementation time frame are monitored by Group Risk Management.
The residual risk after the implementation of these measures is presented in the internal risk report as net risk.
Group Controlling & Risk Management forms the organizational framework for risk management and reports
directly to the Group Chief Financial Officer. Group Risk Management uses the information reported to
determine the current risk portfolio for the Merck Group, presenting this in a report to the Executive Board, the
Supervisory Board, and the Finance Committee with detailed explanations twice per year. This also
encompasses a probability-weighted aggregation of risks at the Group level using a Monte Carlo simulation.
Furthermore, significant changes in the assessment of the risks already known and new significant risks can be
reported at any time and are communicated to the Executive Board on an ad hoc basis.
For reporting risks with a potential negative impact on our EBITDA pre, a minimum threshold is set at the level
of € 5 million before mitigation measures in the standard process and € 25 million in the ad hoc process. Risks
below these thresholds are steered independently within the business sectors. The relevant timeframe for
internal risk reporting is five years. It can go beyond five years, e.g. for regulatory risks related to climate
change. The effects of risks described in this report on risks and opportunities are presented as annual values.
The assessment of the risks presented relates to December 31, 2020. There were no relevant changes after the
balance sheet date that would have necessitated an amended presentation of the risk situation of the Group.
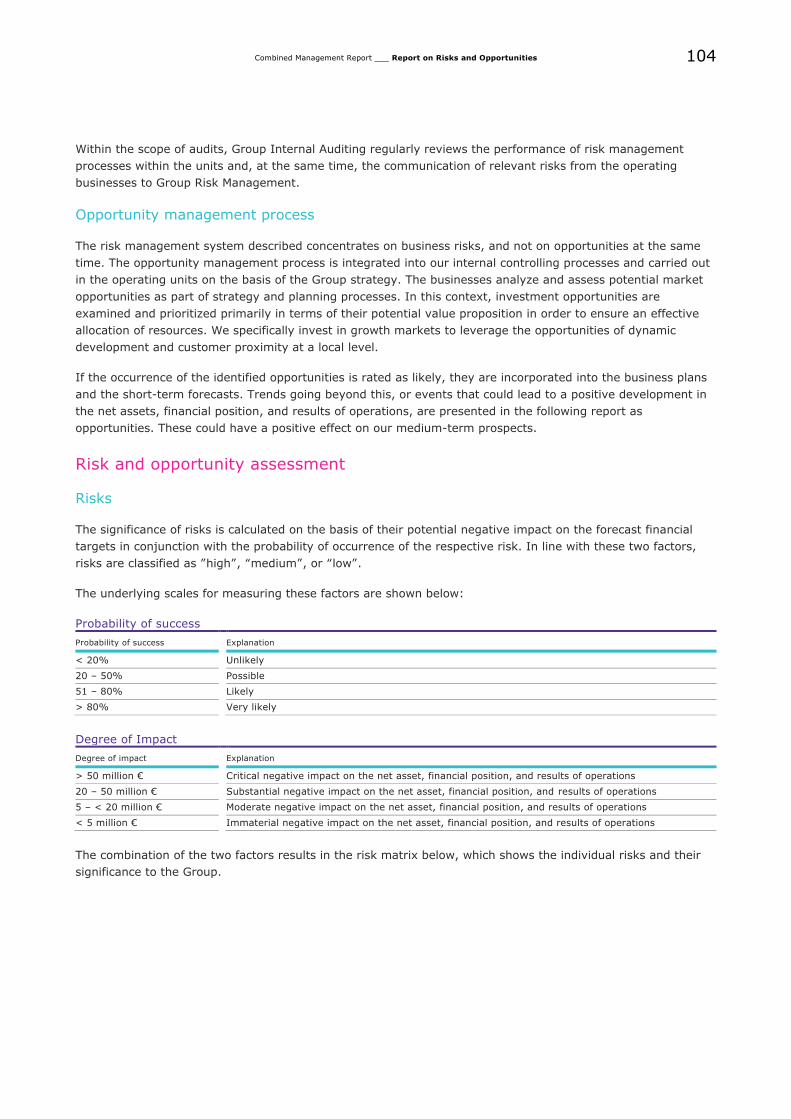
104
Combined Management Report ___ Report on Risks and Opportunities
Within the scope of audits, Group Internal Auditing regularly reviews the performance of risk management
processes within the units and, at the same time, the communication of relevant risks from the operating
businesses to Group Risk Management.
Opportunity management process
The risk management system described concentrates on business risks, and not on opportunities at the same
time. The opportunity management process is integrated into our internal controlling processes and carried out
in the operating units on the basis of the Group strategy. The businesses analyze and assess potential market
opportunities as part of strategy and planning processes. In this context, investment opportunities are
examined and prioritized primarily in terms of their potential value proposition in order to ensure an effective
allocation of resources. We specifically invest in growth markets to leverage the opportunities of dynamic
development and customer proximity at a local level.
If the occurrence of the identified opportunities is rated as likely, they are incorporated into the business plans
and the short-term forecasts. Trends going beyond this, or events that could lead to a positive development in
the net assets, financial position, and results of operations, are presented in the following report as
opportunities. These could have a positive effect on our medium-term prospects.
Risk and opportunity assessment
Risks
The significance of risks is calculated on the basis of their potential negative impact on the forecast financial
targets in conjunction with the probability of occurrence of the respective risk. In line with these two factors,
risks are classified as ”high”, “medium”, or “low”.
The underlying scales for measuring these factors are shown below:
Probability of success
Probability of success Explanation
< 20% Unlikely
20 – 50% Possible
51 – 80% Likely
> 80% Very likely
Degree of Impact
Degree of impact Explanation
> 50 million € Critical negative impact on the net asset, financial position, and results of operations
20 – 50 million € Substantial negative impact on the net asset, financial position, and results of operations
5 – < 20 million € Moderate negative impact on the net asset, financial position, and results of operations
< 5 million € Immaterial negative impact on the net asset, financial position, and results of operations
The combination of the two factors results in the risk matrix below, which shows the individual risks and their
significance to the Group.
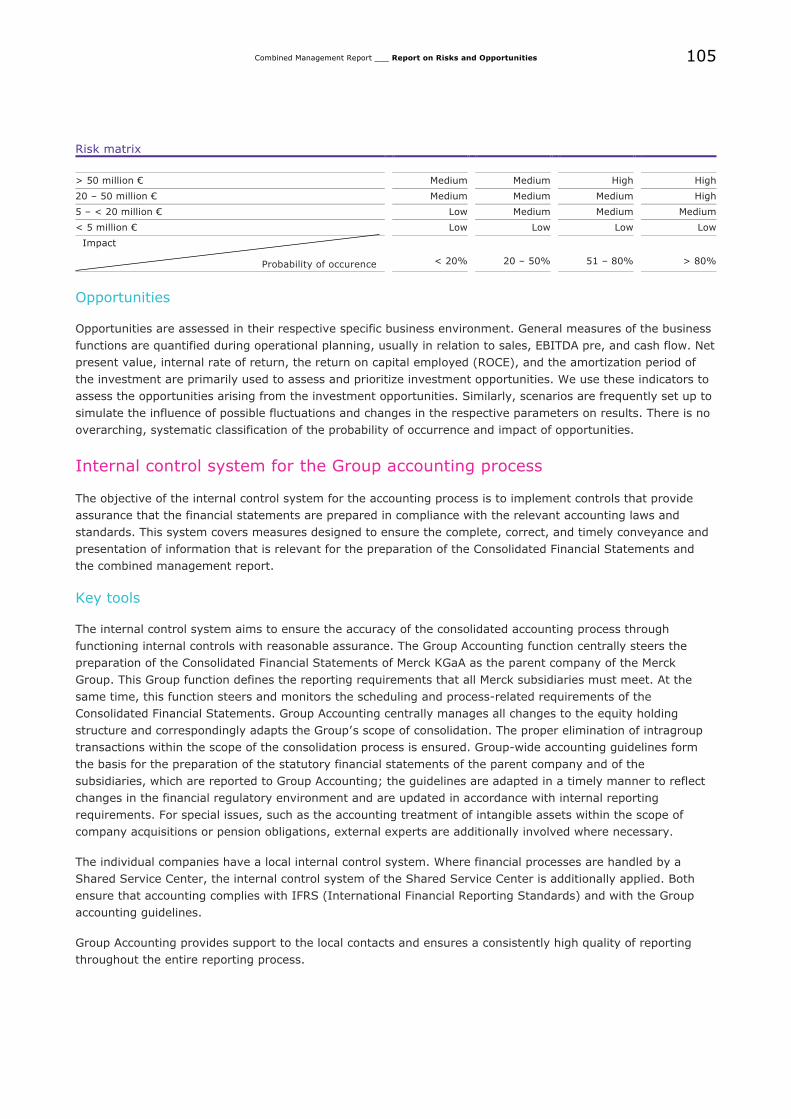
105
Combined Management Report ___ Report on Risks and Opportunities
Risk matrix
> 50 million € Medium Medium High High
20 – 50 million € Medium Medium Medium High
5 – < 20 million € Low Medium Medium Medium
< 5 million € Low Low Low Low
Impact
Probability of occurence
< 20% 20 – 50% 51 – 80% > 80%
Opportunities
Opportunities are assessed in their respective specific business environment. General measures of the business
functions are quantified during operational planning, usually in relation to sales, EBITDA pre, and cash flow. Net
present value, internal rate of return, the return on capital employed (ROCE), and the amortization period of
the investment are primarily used to assess and prioritize investment opportunities. We use these indicators to
assess the opportunities arising from the investment opportunities. Similarly, scenarios are frequently set up to
simulate the influence of possible fluctuations and changes in the respective parameters on results. There is no
overarching, systematic classification of the probability of occurrence and impact of opportunities.
Internal control system for the Group accounting process
The objective of the internal control system for the accounting process is to implement controls that provide
assurance that the financial statements are prepared in compliance with the relevant accounting laws and
standards. This system covers measures designed to ensure the complete, correct, and timely conveyance and
presentation of information that is relevant for the preparation of the Consolidated Financial Statements and
the combined management report.
Key tools
The internal control system aims to ensure the accuracy of the consolidated accounting process through
functioning internal controls with reasonable assurance. The Group Accounting function centrally steers the
preparation of the Consolidated Financial Statements of Merck KGaA as the parent company of the Merck
Group. This Group function defines the reporting requirements that all Merck subsidiaries must meet. At the
same time, this function steers and monitors the scheduling and process-related requirements of the
Consolidated Financial Statements. Group Accounting centrally manages all changes to the equity holding
structure and correspondingly adapts the Group’s scope of consolidation. The proper elimination of intragroup
transactions within the scope of the consolidation process is ensured. Group-wide accounting guidelines form
the basis for the preparation of the statutory financial statements of the parent company and of the
subsidiaries, which are reported to Group Accounting; the guidelines are adapted in a timely manner to reflect
changes in the financial regulatory environment and are updated in accordance with internal reporting
requirements. For special issues, such as the accounting treatment of intangible assets within the scope of
company acquisitions or pension obligations, external experts are additionally involved where necessary.
The individual companies have a local internal control system. Where financial processes are handled by a
Shared Service Center, the internal control system of the Shared Service Center is additionally applied. Both
ensure that accounting complies with IFRS (International Financial Reporting Standards) and with the Group
accounting guidelines.
Group Accounting provides support to the local contacts and ensures a consistently high quality of reporting
throughout the entire reporting process.
106
Combined Management Report ___ Report on Risks and Opportunities
For Group financial reporting purposes, most of our subsidiaries use standard SAP software. Consolidation
software from SAP is also used for the elimination of intragroup transactions. A detailed authorization concept
ensures the separation of duties with respect to both single-entity reporting and the Consolidated Financial
Statements. The accounting process is generally designed to ensure that all units involved adhere to the
principle of dual control.
The effectiveness of Merck’s internal control system with regard to accounting and compliance with financial
reporting on the part of the individual companies is confirmed by both the local managing director and the local
chief financial officer by signing the single-entity reporting. For the accounting treatment of balance sheet
items, Group Accounting closely cooperates with Group Risk Management in order to correctly present potential
risks in the balance sheet. All the structures and processes described are subject to regular review by Group
Internal Auditing based on an annual audit plan set out by the Executive Board. The results of these audits are
dealt with by the Executive Board, the Supervisory Board, and the Finance Committee. The internal control
system at Merck makes it possible to lower the risk of material misstatements in accounting to a minimum.
However, no internal control system can entirely rule out a residual risk, whatever its design.
Business-related risks and opportunities
Political and regulatory risks and opportunities
As a global company, we face political and regulatory changes in a large number of countries and markets.
Risk of more restrictive regulatory requirements regarding drug pricing and reimbursement
In the Healthcare business sector, the known trend toward increasingly restrictive requirements in terms of
drug pricing, reimbursement, and the expansion of high-rebate groups is continuing. These requirements can
negatively influence the profitability of our products, as can market referencing between countries, and the
success of market launches. Foreseeable effects are taken into account as far as possible in the business
sector’s plans. Close communication with health and regulatory authorities serves as a preventive measure to
avert risks.
Remaining risks beyond the current plans resulting from restrictive regulatory requirements are classified as a
medium risk owing to the possible critical negative impact.
Risk of stricter regulations for the manufacturing, testing, and marketing of products
Likewise, in our Life Science and Performance Materials business sectors, we must adhere to a multitude of
regulatory specifications regarding the manufacturing, testing, and marketing of many of our products.
Specifically in the European Union, we are subject to the European chemicals regulation REACH. It demands
comprehensive tests for chemical products. Moreover, the use of chemicals in production could be restricted,
which would make it impossible to continue manufacturing certain products. We are constantly pursuing
research and development in substance characterization and the possible substitution of critical substances so
as to reduce the occurrence of this risk, and therefore view it as unlikely. Nevertheless, it is classified as a
medium risk given its critical negative impact on the net assets, financial position, and results of operations.
Risk of negative political and macroeconomic developments
The destabilization of political systems, and the possible establishment of trade barriers, sanctions, and foreign
exchange policy changes, can lead to declines in sales in certain countries and regions. These risks are taken
into account as much as possible in the business plans of the affected countries and regions, and mitigated
through product, industry, and regional diversification.
Potential negative macroeconomic developments can also impact our business. To minimize these impacts,
corresponding measures pertaining to the sales strategy have been initiated in these countries.
107
Combined Management Report ___ Report on Risks and Opportunities
The spread of the Corona virus since the beginning of 2020 is associated with risks in global macroeconomic
developments, likewise with the potential for negative effects on our businesses. The opportunities in
connection with combating the Covid-19 pandemic are described in the “Risks and opportunities of research
and development” section.
The net risk of negative political and macroeconomic developments is seen as possible and has critical negative
effects on the net assets, financial position, and results of operations. We thus rate this as a medium risk.
Market risks and opportunities
We compete with numerous companies in the pharmaceutical, chemical, and life science sectors. Rising
competitive pressure can have a significant impact on the quantities that can be sold and prices attainable for
our products.
Opportunities due to new technologies in the manufacturing of displays
We see major opportunities in significant market growth of organic light-emitting diode (OLED) materials in
high-quality display applications. According to industry estimates, the overall market volume for OLED materials
will exceed that for liquid crystal materials as of 2022. We have been performing research and development in
the area of organic light-emitting diode (OLED) technology for more than 15 years and have become one of the
leading material suppliers for OLEDs. We focus on the production of ultrapure, extremely stable materials that
are precisely tailored to customer requirements. To this end, we acquired the OLED patent portfolio for display
applications from Konica Minolta. Comprising over 700 patent families, the portfolio will allow us to further
expand our market position and advance our development pipeline.
Opportunities in liquid crystal distribution
We are pursuing a strategy of leveraging our expertise as the global market leader in liquid crystals in order to
develop new fields of application for innovative liquid crystal technologies. For instance, we are pressing ahead
to capture the future markets for liquid crystal windows (LCWs) and mobile antennas. LCWs are creating new
architectural possibilities and solar shading that can be managed while maintaining transparency and color-
neutrality. In 2020, we entered into a strategic partnership with Guardian Glass, a leading international
manufacturer of float, coated, and other glass products. We intend for this partnership to boost commission
sales of dynamic liquid crystal windows from our eyrise® brand, which uses our Licrivision® technology. Mobile
antennas can receive signals transmitted in the high frequency range. As a result, mobile data exchange could
improve significantly in a wide variety of fields of application. Since novel liquid crystal materials for antennas
are currently being developed, we expect liquid crystal antennas to reach market maturity in the coming years.
Opportunities in the semiconductor industry
We see huge opportunities arising from our innovative Directed Self Assembly (DSA) technique for advanced
lithography processing in Semiconductor Solutions. As semiconductor manufacturers continue to advance their
device technologies, the image processing steps are becoming increasingly complex and the production of high-
performance products is becoming more cost intensive. Our novel DSA platform and recent material
advancements enable improved wafer performance and reduce the cost of ownership (COO) for the customer.
This has helped Merck to secure its leading position as the “process of record” (POR) with several key
semiconductor customers. Adoption of this disruptive lithography platform is expected to completely change
how semiconductor manufacturing is conducted and could lead to a market leadership position for advanced
lithography over the next few years. Furthermore, we are developing new dielectric platforms in cooperation
with our key customers for 3D NAND applications. There has been a change in 3D NAND device architecture
and some of our customers are moving from floating gate to replacement gate technology. Therefore, we are
currently working with those customers on this new device architecture.
108
Combined Management Report ___ Report on Risks and Opportunities
Opportunities from leveraging the e-commerce and distribution platform
With the acquisition of Sigma-Aldrich in 2015, we gained access to the leading e-commerce platform in life
science, www.sigmaaldrich.com. With this distribution platform, our customers continue to benefit from a
portfolio of more than 300,000 products, including highly respected brands. We are further expanding this
platform to continuously increase the number of products available through e-commerce. Increasing speed and
convenience during our customers’ ordering processes as well as offering support through individualized
product recommendations can lead to higher sales volumes and the winning of new customers. Consequently,
this distribution channel can lead to an above-average development of sales in the medium term.
Risks and opportunities of research and development
For us, innovation is a major element of the Group strategy. Research and development projects can
experience delays, expected budgets can be exceeded, or targets can remain unmet. Research and
development activities are of special importance to the Healthcare business sector. In the course of portfolio
management, we regularly evaluate and, if necessary, refocus research areas and all R&D pipeline projects.
Alliances with external partners and the out-licensing of programs also form part of the catalog of measures for
the efficient allocation of resources. The conclusion and continuation of these partnerships and externalizations
plays an important role. A deviation from the strategic targets defined in this area could have a critical negative
impact on net assets, financial position, and results of operations. The occurrence of a risk of this magnitude is
considered unlikely, which means that this is a medium risk.
The global strategic alliance with GlaxoSmithKline plc., United Kingdom, (GSK) for the joint development and
marketing of the bintrafusp alfa (M7824) immunotherapy developed by Merck is one example of an opportunity
for research and development in the Healthcare business sector. This year, the Japanese Ministry of Health,
Labor and Welfare granted fast-track status to bintrafusp alfa as a potential treatment for biliary tract cancer
(BTC) as part of its SAKIGAKE strategy. In addition, we are currently exploring bintrafusp alfa in multiple non-
correlated clinical studies. This innovative immunotherapy shows potential for new options for several hard-to-
treat cancers. Despite the latest findings and the discontinuation of the INTR@PID Lung 037 study on the first-
line treatment of patients with stage IV non-small cell lung cancer (NSCLC) that have high expression of PD-L1,
we remain committed to investigating bintrafusp alfa in other indications. The findings from the INTR@PID Lung
037 study may be applied in other studies.
The strategic alliance concluded with Pfizer Inc. in 2014 enabled us to jointly develop Bavencio®. Following
approvals for patients with metastatic Merkel cell carcinoma and those with locally advanced or metastatic
urothelial carcinoma in 2017, the United States Food and Drug Administration (FDA) and the European
Commission issued approvals for Bavencio® (avelumab) plus Inlyta® (axitinib) for the first-line treatment of
patients with advanced renal cell carcinoma last year. This year, the FDA approved Bavencio® for the
maintenance treatment of patients with locally advanced or metastatic urothelial carcinoma (UC) that has not
progressed with first-line platinum-containing chemotherapy. After the Committee for Medicinal Products for
Human Use (CHMP) of the European Medicines Agency (EMA) adopted a positive opinion, Bavencio® has been
approved recently as monotherapy for the first-line maintenance treatment of adult patients with locally
advanced or metastatic urothelial carcinoma (UC) who are progression-free following platinum-based
chemotherapy. Additional applications for Bavencio® have been submitted to regulatory authorities worldwide.
Mavenclad® was approved by the European Commission in 2017. It is the first short-course oral treatment
approved in Europe for the treatment of relapsing multiple sclerosis in patients with high disease activity. With
the approvals in a number of additional countries in 2018 and 2019, including the United States and
Switzerland, Mavenclad® is now approved in around 80 countries.
In March, the Japanese Ministry of Health, Labor and Welfare approved the oncology drug tepotinib for the
treatment of patients with inoperable, advanced or recurrent non-small cell lung cancer (NSCLC) with METex14
skipping alterations. In addition, the FDA has accepted the filing of the application for tepotinib for the
treatment of adult patients with metastatic NSCLC and granted priority review.
109
Combined Management Report ___ Report on Risks and Opportunities
This year, Erbitux was approved by the National Medical Products Administration (NMPA) of China for the first-
line treatment of patients with recurrent and/or metastatic squamous cell carcinoma of the head and neck in
combination with platinum-based treatment with fluorouracil. This represents another step in our focus on
acting as a global innovator for specialty products, including bringing innovative medicines to markets with high
unmet medical needs.
In addition to marketing already approved medicines, we are pushing ahead with research projects in other
important therapeutic areas. The portfolio of projects is evaluated on a regular basis. This may also lead to in-
licensing or out-licensing, or further strategic alliances.
Investments made in 2020, e.g. to expand biotech development in Switzerland, are intended to accelerate
scientific progress and the further development of our innovative clinical pipeline worldwide. The expenses
currently being incurred, especially in our Healthcare research and development, are already reflected in the
current plans. The same applies to sales of products for approved indications in the respective markets (e.g.
Bavencio® and Mavenclad®). Further approvals may result in an increased sales potential.
Risks due to increased competition and customer technology changes
In the Healthcare business sector, both our biopharmaceutical products and classic pharmaceutical business are
exposed to increased competition from rival products (in the form of biosimilars and generics). In the Life
Science and Performance Materials business sectors, risks are posed by not only cyclical business fluctuations
but also changes in the technologies used or customer sourcing strategies, particularly with respect to liquid
crystals. We use close customer relationships and in-house further developments as well as market proximity,
including precise market analyses, as mitigating measures. Overall, owing to its possible occurrence with a
critical negative impact, the market risk is classified as a medium risk.
Opportunities presented by activities to boost innovative strength
With the M Lab™ Collaboration Center in Shanghai, we opened the doors to the largest of our nine centers
worldwide to date. Encompassing non-GMP (Good Manufacturing Practice) laboratory space for pilot projects
and process developments, it offers customizable solutions that are tailored to the Chinese life science
community to advance drug development. Pharmaceutical and biopharmaceutical manufacturers can explore
ideas, learn innovative techniques and work side-by-side with our scientists and engineers. The Collaboration
Center is located in Pudong, at the heart of the biomedical sciences and research community in Shanghai,
meaning we have our pulse right on the finger of Asia’s rapidly growing pharmaceutical market. Other M Lab™
Collaboration Centers are located in the United States, Singapore, Japan, Korea, India, France, and Brazil.
Digital technologies are becoming increasingly important for our markets and our world of work. In 2015, we
launched several strategic digital initiatives geared toward improving the efficiency of our internal processes
and toward evaluating the opportunities of digitalization for our products and customers. In this context, we set
up a collaborative partnership with Siemens in 2020 in order to advance our modular production and to meet
customer and market requirements quicker, more efficiently and more flexibly. Developing and adhering to
rigorous ethical standards is of utmost importance for all our activities. Therefore, we created the Merck Digital
Ethics Advisory Panel to provide external guidance and expertise on complex ethical matters around data
usage, algorithms and new digital innovations, ensuring that the company develops new digital technologies
responsibly. We are also working on establishing new business outside our three business sectors, with a focus
on digitalization and our innovation fields of Clean Meat, Liquid Biopsy, and Biosensing and Interfaces. In
addition to collaborations with external partners such as the European Space Agency, the Accelerator program,
which is being driven by our Innovation Center, is one component of our innovation strategy.
Cooperating with start-ups gives us extensive opportunities to drive innovative approaches and ideas. In 2020,
we helped to advance numerous projects through various support models like our Innovation Labs and Centers
and different investment programs, such as the China Seeds Fund. Among other things, we invested in
SynSense, a neuromorphic computing start-up based in China and Switzerland whose AI (artificial intelligence)
processors and sensors provide an unprecedented combination of ultra-low power consumption and low latency
for a broad range of edge applications for smart home, smart security, autonomous driving, drones and robots.

110
Combined Management Report ___ Report on Risks and Opportunities
The Industry 4.0 start-up Feelit also launched its first commercial product on the market. RetroFeel™ combines
a wireless edge computing device with a printed nanotechnology sticker sensor that detects structural changes
in mechanical parts and systems and is able to predict upcoming failures (predictive maintenance). This sensor
solution can be used in process industries such as pharmaceuticals, food and beverage, oil and gas, as well as
in semiconductor manufacturing. We take an active role in our portfolio companies and focus our investments
on the early stage and the foundation of companies or spin-offs with a view to utilizing their science and
technology base.
In the Life Science business sector, we strengthened our viral vector manufacturing capabilities with the launch
of the VirusExpress™ lentiviral production platform. We are committed to accelerating the manufacture of cell
and gene therapies with the goal of getting these lifesaving treatments to patients faster. This proven, scalable
platform increases dose yields and reduces process development times.
In Life Science, we also expanded our HPAPI and ADC manufacturing capabilities in the United States with the
creation of one of the largest single-digit nanogram containment production facilities for high-potent
pharmaceutical ingredients (HPAPI). This will allow the continuous manufacturing at an industrial scale of
increasingly potent agents for therapies with the potential to treat cancer. Antibody drug conjugates (ADCs) are
an emerging class of medicines designed for the high-specificity targeting and destruction of cancer cells while
preserving healthy cells. Only nine ADCs are currently approved worldwide. The ADC industry is experiencing
strong growth and is expected to reach € 13 billion by 2030.
Merck also opened a new research center for electronic applications on the campus at its headquarters in
Darmstadt, Germany. The building offers space for additional research and development activities, especially
for next-generation materials including display materials – such as innovative liquid crystals and quantum dot
pixel color converters (QDPCC) – as well as semiconductor materials such as photoresist materials, dielectrics,
and directional self-alignment materials (DSA).
Opportunities provided by the CRISPR technology
As a pioneer of genome-editing innovation for 15 years, we are leveraging CRISPR technology as a core
competency of our business. Around the world, our Life Science business sector holds 28 CRISPR-related
patents in methods and composition, including the fundamental technology of CRISPR Cas9 for gene editing
and integration in mammalian cells and paired Cas9 nickases. Two of the CRISPR-Cas9-assisted genome-editing
patents were approved in the United States in 2020. This gives us the opportunity to support US scientists and
researchers in their work to advance and protect gene therapy development programs. In the reporting year,
we also signed agreements licensing our CRISPR technology to two companies: panCELLa, a cell therapy
company based in Toronto, Canada, and Takara Bio USA, Inc., a biotechnology company based in Mountain
View, California, United States. The licenses are aimed at accelerating drug discovery leading to the
development of new treatments.
CRISPR technologies open up promising new avenues for medical research and potential solutions to treat some
of the most difficult diseases, including cancer as well as hereditary and rare diseases. Merck recognizes that
the growing potential of genome-editing technologies is accompanied by scientific, legal and societal concerns.
It supports research using genome editing under careful consideration of ethical and legal standards. Among
other things, it has established an independent, external Bioethics Advisory Panel to provide guidance for its
research.
Opportunities in connection with combating the Covid-19 pandemic
As a science and technology company, we have helped to combat the global challenges resulting from Covid-19
in various ways. In Life Science, we are working with more than 50 vaccine developers around the world and
supporting more than 35 testing solutions and more than 20 projects involving monoclonal antibodies, plasma
products, and antiviral drugs. We are collaborating with numerous researchers and institutions to assist them
with process development of and the production process for potential Covid-19 vaccine candidates, as well as
development and preparations for the mass production of SARS-CoV-2 diagnostic tests. To meet the
unprecedented demand in our Life Science business sector, we expand our production capability with

111
Combined Management Report ___ Report on Risks and Opportunities
investments in the US, Singapore and Germany. These investments will strengthen our manufacturing footprint
to meet demand for key-life saving products. Additionally, we acquired AmpTec, a leading Hamburg, Germany-
based, mRNA contract development and manufacturing organization (CDMO) to strengthen our capabilities
across the mRNA manufacturing chain. Combining our expertise in lipids manufacturing with AmpTec’s PCR-
based technology will allow us to offer customers innovative technologies, products and services to help
advance life-enhancing therapeutics and vaccines for Covid-19.
In the Healthcare business sector, the FDA cleared the investigational new drug application (IND) for M5049 for
the treatment of patients with Covid-19 pneumonia. M5049 is a potentially first-in-class small molecule that
blocks the activation of the toll-like receptors TLR7 and TLR8. A Phase II randomized, controlled clinical study
evaluating the safety and efficacy of M5049 in this patient population began in late July. The results of the
study are expected by the second quarter of 2021.
Opportunities arising from the further integration of Sustainability in the Corporate Strategy
In 2020, we integrated sustainability more strongly in the corporate strategy, setting three goals in the areas of
science & technology, value chain and climate & environment. By considering the goals of the sustainability
strategy when making business decisions, Merck contributes to achieving the United Nations Sustainable
Development Goals. Additionally, the company is planning to also link the long-term variable compensation of
the Executive Board from 2022 onward with the progress made toward achieving the company’s sustainability
goals.
Risks of discontinuing development projects and regulatory approval of developed medicines
Sometimes development projects are discontinued after high levels of investment at a late phase of clinical
development. Decisions – such as those relating to the transition to the next clinical phase – are taken with a
view to minimizing risk. We are currently not aware of any risks beyond general development risks that could
significantly affect the net assets, financial position, and results of operations.
Furthermore, there is the risk that regulatory authorities either do not grant or delay approval or grant only
restricted approval. Additionally, there is the risk that undesirable side effects of a pharmaceutical product
could remain undetected until after approval or registration, which could result in a restriction of approval or
withdrawal from the market. Well-advanced programs in our pipeline and those of our partners result in
potential new approvals; on the other hand, missing targets in this area may have critical negative effects on
our financial position and operating result, for example due to lower net sales or the non-occurrence of
milestone payments from collaboration agreements. These risks are considered to be medium overall, with
probabilities ranging from unlikely to possible.
Risks and opportunities related to the quality and availability of products
Risk of a temporary ban on products/production facilities or of non-registration of products due to
non-compliance with quality standards
We are required to comply with the highest standards of quality in the manufacturing of pharmaceutical
products (Good Manufacturing Practice or official pharmacopoeia). In this regard, we are subject to the
supervision of the regulatory authorities. Conditions imposed by national regulatory authorities could result in a
temporary ban on products/production facilities, and possibly affect new registrations with the respective
authority. We make the utmost effort to ensure compliance with regulations, regularly perform our own internal
inspections, and carry out external audits. Thanks to these quality assurance processes, the occurrence of a
risk with a critical negative impact is unlikely; however, it cannot be entirely ruled out. Depending on the
product concerned and the severity of the objection, such a risk can have a moderate negative impact on the
net assets, financial position, and results of operations. Therefore, we rate this as a medium risk.
112
Combined Management Report ___ Report on Risks and Opportunities
Risks of production availability
Further risks include operational failures due to fire or force majeure, for example natural disasters such as
floods or earthquakes, which could lead to a substantial interruption or restriction of business activities. Insofar
as it is possible and economically viable, the Group limits its damage risks with insurance coverage, the nature
and extent of which is constantly adapted to current requirements. Likewise, we are exposed to risks of
production outages and the related supply bottlenecks that can be triggered by technical problems in
production facilities with very high-capacity utilization. Furthermore, there are risks of supply bottlenecks due
to a lack or disappearance of capacity. We are working to continuously mitigate the risks by making regular
investments, setting up alternative sourcing options, and maintaining inventory levels.
Although the occurrence of these risks is considered unlikely, an individual event could have a critical negative
effect on the net assets, financial position, and results of operations, and they are therefore classified as a
medium risk.
Risks of dependency on suppliers
Quality controls along the entire value chain reduce the risks related to product quality and availability. This
starts with the qualification of our suppliers. Quality controls also include comprehensive quality requirements
for raw materials, purchased semi-finished products, and plants. We are dependent on individual suppliers for a
number of precursor products, packaging materials, and finished goods. In the event that one of these
suppliers curtails or discontinues production, or supply is disrupted, this could potentially have a critical impact
on the business concerned. With long-term strategic alliances for precursor products critical to supply and price
as well as alternative sourcing strategies, we reduce the probability of occurrence of these risks and rate them
as unlikely. Overall, these are classified as medium risks.
Product liability risks
Companies in the chemical and pharmaceutical industries are particularly exposed to product liability risks.
Product liability risks can lead to considerable claims for damages, loss of reputation, and costs to avert
damages. We have taken out the liability insurance that is standard in the industry for such risks. However, it
could be that the insurance coverage available is insufficient for individual cases. Although the occurrence of
product liability claims in excess of the existing insurance coverage is considered unlikely, individual cases could
still have a critical negative effect on the net assets, financial position, and results of operations. We therefore
rate a potential product liability risk as a medium risk.
Risks due to product-related crime and espionage
Owing to our portfolio, we are exposed to a number of sector-specific crime risks. This relates primarily to
products, including among other things, counterfeiting, illegal channeling, and misuse, as well as all types of
property crime, including attempts at these crimes. Crime phenomena such as cybercrime and espionage could
equally affect our innovations or innovation abilities as such.
To combat product-related crime, an internal coordination network covering all functions and businesses, the
Merck Anti-Counterfeiting Operational Network was set up several years ago. In addition, security measures are
in use to protect products against counterfeiting. Innovative technical security solutions and defined preventive
approaches are used to ward off dangers relating to cybercrime and espionage. Measures to prevent risks and
to prosecute identified offenses are conducted in all the relevant crime areas in close and trustworthy
cooperation with the responsible authorities. The impact of these risks on business operations depends on the
respective individual case, product-specific factors, the value chain, and regional aspects in particular. Our
Corporate Security department is responsible for the overall coordination of all measures in this area. Overall,
the threat resulting from crime in general is seen as being possible and is classified as a medium risk.
113
Combined Management Report ___ Report on Risks and Opportunities
Risks and opportunities from the use of social media
Merck and its employees are active on numerous social media channels. The consistent and legally compliant
use of the channels and their content is important in terms of increasing awareness of our brand, among other
things. Merck takes precautions and implements processes to ensure awareness of the proper handling of social
media, controlling publication, and actively managing communication.
Nevertheless, reputational risks could result, for instance through public dialogues in social media.
Overall, we rate this as a low risk.
Financial risks and opportunities
As a corporate group that operates internationally, and due to our presence in the capital market, we are
exposed to various financial risks and opportunities. Above all, these are liquidity and counterparty risks,
financial market risks and opportunities, risks of fluctuations in the market values of operational tangible and
intangible assets, as well as risks and opportunities from pension obligations.
Risk and opportunity management in relation to the use of financial instruments
In the area of financial risks and opportunities, we use an active management strategy to reduce the effects of
fluctuations in exchange and interest rates. The management of financial risks and opportunities by using
derivatives in particular is regulated by extensive guidelines. Speculation is prohibited. Derivative transactions
are subject to constant risk controls. The strict separation of functions between trading, settlement, and control
functions is ensured.
Liquidity risks
In order to ensure its continued existence, a company must be able to fulfill its commitments from operating
and financial activities at all times. Therefore, to reduce potential liquidity risks, we have a central Group-wide
liquidity management system in place, and a balanced maturity profile. The maturities of our financial liabilities
are aligned with our planned free cash flow. Furthermore, we have a multi-currency revolving credit facility of
€ 2 billion with a term until 2025, which ensures continuing solvency if any liquidity bottlenecks occur. As our
loan agreements do not contain any financial covenants, these agreed lines of credit can be accessed even if
Merck’s credit rating should deteriorate. Additionally, we have a commercial paper program with a maximum
volume of € 2 billion.
Overall, the liquidity risk is unlikely and rated as low.
Counterparty risks
Counterparty risks arise from the potential default by a partner in connection with financial investments, loans,
and financing commitments on the one hand and receivables in operating business on the other.
As for counterparty risks from financial transactions, we review all positions relating to trading partners and
their credit ratings on a daily basis. We manage financial risks of default by diversifying our financial positions
and through the related active management of our trading partners. Significant financial transactions involving
credit risk are entered into with banks and industrial companies that have a good credit rating. Moreover, our
large banking syndicate – the multi-currency revolving credit facility of € 2 billion was syndicated by 20 banks –
reduces possible losses in the event of default.
114
Combined Management Report ___ Report on Risks and Opportunities
The solvency and operational development of trading partners are regularly reviewed as part of the
management of operational counterparty risks. Sovereign risks are also analyzed. The volume of receivables of
each customer is capped in line with their credit ratings. Risk-mitigating measures, such as credit insurance,
are utilized as appropriate. Nevertheless, defaults by isolated trading partners, even those with outstanding
credit ratings, cannot be entirely ruled out, although rated as unlikely (further information can be found in
“Credit risks” in the note “Management of financial risks” in the Notes to the Consolidated Financial
Statements).
Counterparty risk is classified as a medium risk overall owing to the unlikely probability of occurrence with a
potential critical negative effect.
Financial market risks and opportunities
As a result of our international business activities and global corporate structure, we are exposed to risks and
opportunities from fluctuations in exchange rates. These result from financial transactions, operating
receivables and liabilities, as well as forecast future cash flows from sales and costs in foreign currency. We use
derivatives to manage and reduce the aforementioned risks and opportunities (further information can be found
in the note “Derivative financial instruments” in the Notes to the Consolidated Financial Statements). Due to
their possible occurrence with a potentially critical negative effect on the net assets, financial position, and
results of operations, foreign exchange rate risks are rated as medium risk.
Variable interest and current financial liabilities are exposed to the risks and opportunities of interest rate
fluctuations. These are also managed and reduced using derivatives. Interest rate risks have a potentially
moderate negative impact, are considered unlikely, and pose low risks overall.
Risks of impairment of balance sheet items
The carrying amounts of individual balance sheet items are subject to the risk of changing market and business
conditions and thus to changes in fair values as well. Necessary impairments could have a significant negative
non-cash impact on earnings and affect the accounting ratios. This applies in particular to the high level of
intangible assets including goodwill, which mainly derive from the purchase price allocations made in connection
with past acquisitions (further information can be found in the note “Intangible assets” in the Notes to the
Consolidated Financial Statements). All relevant risks were assessed during the preparation of the Consolidated
Financial Statements and taken into account accordingly. We rate risks beyond this as unlikely with a critical
negative impact. Therefore, this is seen as a medium risk.
Risks and opportunities from pension obligations
We have commitments in connection with pension obligations. The present value of defined benefit obligations
can be significantly increased or reduced by changes in the relevant valuation parameters, for example the
interest rate or future salary increases. Pension obligations are regularly assessed as part of annual actuarial
reports. The obligations are covered by the pension provisions reported in the balance sheet based on the
assumptions as of the balance sheet date. Some of these obligations are funded by plan assets (further
information can be found in the note “Provisions for pensions and other post-employment benefits” in the Notes
to the Consolidated Financial Statements). To the extent that pension obligations are covered by plan assets
consisting of interest-bearing securities, shares, real estate, and other financial assets, decreasing or negative
returns on these assets can adversely affect the fair value of plan assets and thus result in further additions to
pension provisions. By contrast, rising returns increase the value of plan assets, thereby resulting in excess
cover of plan liabilities. We increase the opportunities of fluctuations in the market value of plan assets on the
one hand and reduce the risks on the other by using a diversified investment strategy. The unlikely risk due to
pension obligations could have moderate negative effects on the net assets, financial position, and results of
operations, and is classified as low.
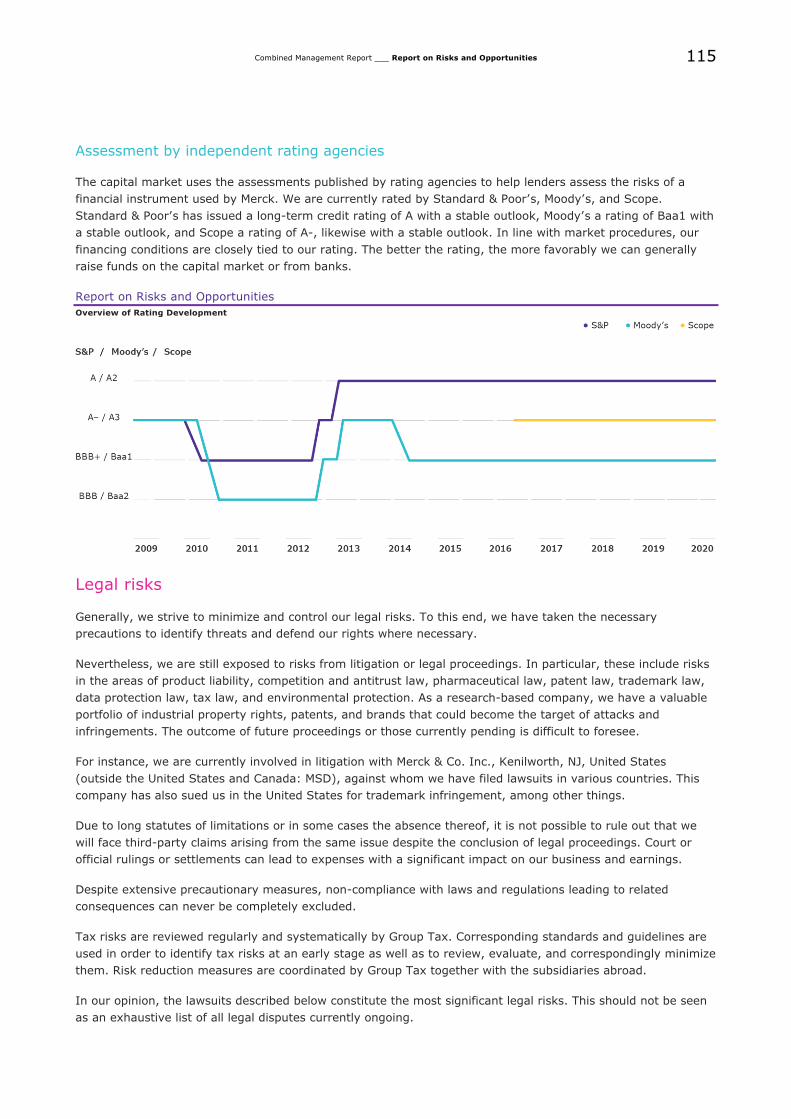
115
Combined Management Report ___ Report on Risks and Opportunities
Assessment by independent rating agencies
The capital market uses the assessments published by rating agencies to help lenders assess the risks of a
financial instrument used by Merck. We are currently rated by Standard & Poor’s, Moody’s, and Scope.
Standard & Poor’s has issued a long-term credit rating of A with a stable outlook, Moody’s a rating of Baa1 with
a stable outlook, and Scope a rating of A-, likewise with a stable outlook. In line with market procedures, our
financing conditions are closely tied to our rating. The better the rating, the more favorably we can generally
raise funds on the capital market or from banks.
Report on Risks and Opportunities
Overview of Rating Development
Legal risks
Generally, we strive to minimize and control our legal risks. To this end, we have taken the necessary
precautions to identify threats and defend our rights where necessary.
Nevertheless, we are still exposed to risks from litigation or legal proceedings. In particular, these include risks
in the areas of product liability, competition and antitrust law, pharmaceutical law, patent law, trademark law,
data protection law, tax law, and environmental protection. As a research-based company, we have a valuable
portfolio of industrial property rights, patents, and brands that could become the target of attacks and
infringements. The outcome of future proceedings or those currently pending is difficult to foresee.
For instance, we are currently involved in litigation with Merck & Co. Inc., Kenilworth, NJ, United States
(outside the United States and Canada: MSD), against whom we have filed lawsuits in various countries. This
company has also sued us in the United States for trademark infringement, among other things.
Due to long statutes of limitations or in some cases the absence thereof, it is not possible to rule out that we
will face third-party claims arising from the same issue despite the conclusion of legal proceedings. Court or
official rulings or settlements can lead to expenses with a significant impact on our business and earnings.
Despite extensive precautionary measures, non-compliance with laws and regulations leading to related
consequences can never be completely excluded.
Tax risks are reviewed regularly and systematically by Group Tax. Corresponding standards and guidelines are
used in order to identify tax risks at an early stage as well as to review, evaluate, and correspondingly minimize
them. Risk reduction measures are coordinated by Group Tax together with the subsidiaries abroad.
In our opinion, the lawsuits described below constitute the most significant legal risks. This should not be seen
as an exhaustive list of all legal disputes currently ongoing.
116
Combined Management Report ___ Report on Risks and Opportunities
Risks from product-related and patent law disputes
Merck is involved in a patent dispute with Biogen Inc., Massachusetts, United States (“Biogen”), in the United
States. Biogen claims that the sale of Rebif® in the United States infringes on a Biogen patent. The disputed
patent was granted to Biogen in the United States in 2009. Subsequently, Biogen sued Merck and other
pharmaceutical companies for infringement of this patent. Merck defended itself against all allegations and
brought a countersuit claiming that the patent is invalid and not infringed by our actions. In the first instance, a
jury recognized the invalidity of the patent. This jury verdict was overturned by a judge in the same instance in
September 2018. For the time being, the patent is thus deemed to be legally valid and to have been infringed.
Merck already filed a complaint with the United States Court of Appeals for the Federal Circuit (second instance)
against the first-instance ruling in October 2018. On September 28, 2020, this court overturned the verdict of
the judge in the first instance, declared Biogen’s patent to be invalid, and instructed the District Court to
reinstate the original jury verdict. A cash outflow is considered to be unlikely based on this decision.
Accordingly, the provision of € 365 million that was recognized at that point in time for potential compensation
payments for damages was reversed.
In the Performance Materials business sector, Merck is involved in a legal dispute with JNC Corporation, Japan
(JNC). JNC claims that by manufacturing and marketing certain liquid crystal mixtures, Merck has infringed JNC
patents in China, Taiwan and Korea. Merck maintains that the above mentioned patents are invalid owing to
relevant prior art. At the end of the second quarter of fiscal 2020, the actions in China and Taiwan were
concluded with legally binding effect in favor of Merck. In view of these developments, the provision was
reduced accordingly. In Korea however, a patent infringement action, a patent nullity action and a “correction
trial” are still pending ex parte JNC. In addition, new statutory rules were implemented in Korea that could
have an adverse effect on any potential amount of damage. Merck has taken appropriate accounting measures
according to the remaining litigation risk in Korea. A potentially considerable impact of the legal dispute on the
financial position cannot be ruled out. A cash outflow within the next 12 months is considered possible at
present.
Risks due to antitrust and other government proceedings
Raptiva®: In December 2011, the federal state of São Paulo, Brazil, sued Merck for damages because of alleged
collusion between various pharmaceutical companies and an association of patients suffering from psoriasis and
vitiligo. This collusion is alleged to have been intended to increase sales of the medicines from the companies
involved to the detriment of patients and state coffers. Moreover, patients are also suing for damages in
connection with the product Raptiva®. Merck has taken appropriate accounting measures for these issues,
which relate to various legal cases. Risks in excess of this with a substantial negative effect on the net assets,
financial position, and results of operations cannot be ruled out, but are considered unlikely. This is rated as a
medium risk.
On July 6, 2017, Merck received notice from the European Commission (EU Commission) in connection with the
antitrust review proceedings for the acquisition of Sigma-Aldrich, in which the EU Commission informed Merck
of its preliminary conclusion that Merck and Sigma-Aldrich allegedly transmitted incorrect and/or misleading
information within the scope of the acquisition of Sigma-Aldrich. The EU Commission received registration of
the merger on April 21, 2015, and granted clearance on June 15, 2015, subject to the condition that Merck and
Sigma-Aldrich divest parts of the European solvents and inorganic chemicals businesses of Sigma-Aldrich in
order to resolve antitrust concerns. According to the preliminary viewpoint of the EU Commission
communicated in a letter dated July 6, 2017, Merck and Sigma-Aldrich withheld related important information
about an innovation project. According to the EU Commission, the innovation project should have been included
in the remedies package. This resulted in an administrative procedure with the EU Commission. On July 1,
2020, the EU Commission informed Merck that the parts of the procedure relating to Merck were no longer
under investigation and that the procedure now related solely to the allegations against Sigma-Aldrich. Merck
again countered these remaining accusations at a hearing on November 13, 2020. The administrative procedure
could result in the issuance of a fine that would be open to appeal. In the second quarter of 2020, the existing
provision in a mid double-digit euro amount was reduced to a low double-digit euro amount. A potential outflow
of resources is considered possible for 2021.

117
Combined Management Report ___ Report on Risks and Opportunities
This is currently classified as a medium risk with a probable substantial negative impact on the financial
position.
Risks in connection with a settlement agreement concluded by the divested Generics
group
Paroxetine: In connection with the divested generics business, Merck is subject to antitrust investigations by
the British Competition and Market Authority (CMA) in the United Kingdom. In March 2013, the authorities
informed Merck of the assumption that a settlement agreement entered into in 2002 between Generics (UK)
Ltd. and several subsidiaries of GlaxoSmithKline plc, United Kingdom, in connection with the antidepressant
drug paroxetine, violated British and European competition law. Merck, the then-owner of Generics (UK) Ltd.,
was allegedly involved in the negotiations for the settlement agreement and is therefore liable. The
investigations into Generics (UK) Ltd. started in 2011, without this being known to Merck. On February 11,
2016, the CMA imposed a fine in this matter. Merck has taken legal action against this fine. The Appeals
Tribunal has since submitted the relevant legal questions to the European Court of Justice (CJEU) for a
preliminary ruling. The CJEU confirmed in January 2020 that such settlement agreements in general may
breach European competition law. The proceeding will now be continued at the UK Competition Appeal Tribunal
(CAT). A decision is pending. Appropriate accounting measures have been taken. A decision and an outflow of
resources within the next 12 months are considered possible. A provision in a low double-digit million euro
amount was recognized for these proceedings. This is currently classified as a medium risk with a moderate
negative impact on the financial position.
Citalopram: In connection with the divested generics business in 2007, Merck is accused of breaching EU
antitrust law through agreements concluded by its former subsidiary Generics (UK) Ltd., Denmark, relating to
the antidepressant Citalopram patented by Lundbeck A/S. In 2013, the EU Commission imposed a
corresponding fine in a double-digit euro amount. Merck filed a lawsuit against the Commission’s decision with
the European Court in August 2013. The lawsuit was rejected in 2016. Merck subsequently filed an appeal with
the European Court of Justice (CJEU). In the course of these proceedings, the Advocate General of the CJEU
recommended that the European Court’s verdict be confirmed. The Court announced that it will issue a ruling in
March 25, 2021. In light of the disadvantageous development in this matter, additional accounting measures
were taken for potential additional claims and the corresponding provision has increased by a double-digit
million euro amount as a result. This is currently classified as a medium risk with a probable substantial
negative impact on the financial position.
Human resources risks
Our future growth is highly dependent on our innovative strength. Therefore, the expertise and engagement of
employees in all sectors in which we operate are crucial to the success of the company. The markets relevant to
the company are characterized by intensive competition for qualified specialists and by the challenge of being
perceived by the public as an attractive employer. Fluctuation risks specific to countries and industries have to
be identified ahead of time and specifically addressed in order to keep the skills and expertise critical to success
and business within the company.
Recruiting and retaining specialists and talent are therefore key priorities for the company and are managed
through the targeted use of, for instance, employer branding initiatives, global talent and succession
management processes, as well as competitive compensation packages. Nevertheless, employee-related risks
that affect business activities are possible, even though their impact is difficult to assess. We rate this as a
medium risk.

118
Combined Management Report ___ Report on Risks and Opportunities
Information technology risks
We use a variety of IT systems and processes in order to optimally support our globalization. Trends in
information technology offer various opportunities but also harbor risks.
Risks due to cybercrime and the failure of business-critical applications
Increasing international networking and the related possibility of IT system abuse are resulting in cybercrime
risks for Merck, such as the failure of central IT systems, the disclosure or loss of the data integrity of
confidential data from research and business activities, the manipulation of IT systems in process control, or an
increased burden or adverse impact on IT systems as a result of virus attacks.
The Merck Group operates an information protection management system based on ISO 27001 comprising
security guidelines as well as organizational and technical measures to prevent and address IT security
incidents. Globally used IT applications form the basis for the contractual delivery of products and solutions.
The failure of business-critical IT applications could therefore have a direct influence on our ability to deliver
and on the quality of our products. This also applies to the failure of a data center. To achieve the required
service quality, we use a quality management system certified to ISO 9001 that also applies to the provision of
IT. In addition, to reduce the risk of failure, we operate several redundantly designed data centers.
Furthermore, insurance solutions for cybercrime offenses are in place at Group level.
Likewise, complications with the changeover of IT systems could negatively impact the earnings situation. Close
monitoring of critical IT projects serves to mitigate this risk.
Despite the mitigating measures taken and functional continuity plans, the effects of cybercrime or the failure
of business-critical IT applications and their influence on the net assets, financial position, and results of
operations are considered high risks owing to likely and potentially critical negative impacts.
Environmental, climate related and safety risks
As a company with global production operations, we are exposed to risks of possible damage to people, goods,
and our reputation. Those include physical risks stemming from exposure to droughts, storms and floods.
Audits, consulting, and training on environmental protection, and occupational health and safety minimize these
risks to people and the environment. In order to ensure the continuity of plant and equipment, we monitor
these risks both at our own sites as well as at suppliers and contract manufacturers. By adhering to high
technical standards, our rules of conduct, and all legal requirements in environmental protection and
occupational health and safety, we ensure the preservation of goods and assets. We have taken sufficient
appropriate accounting measures for the environmental risks known to us. We monitor regulatory risks in
connection with the transition to a low-carbon economy, which could materialize in the mid- and long-term
through rising carbon prices through emissions trading systems, taxes or energy legislation. We mitigate those
risks with our energy and carbon management measures. We classify these as a high risk since a critical
negative impact on the financial position cannot be ruled out.
119
Combined Management Report ___ Report on Risks and Opportunities
Risks due to the divestment, acquisition, and integration of companies
and businesses
Irrespective of the fact that acquisitions made in the past have been successfully completed, the risk of
conducting acquisitions and subsequent integration exists for future transactions. This includes, among other
things, the inability to meet sales volume targets, and higher integration costs than expected, as well as the
failure to meet synergy goals. The divestment of companies and businesses can lead to liability vis-à-vis the
buyer or additional expenses, for instance through indemnity clauses and guarantee commitments or long-term
supply contracts. Through strong due diligence processes and closely managed integration processes, we seek
to reduce the probability of occurrence of this risk. Therefore, we classify this as a low risk with an unlikely
probability of occurrence and potentially moderate negative effects on the net assets, financial position, and
results of operations.
Overall view of the risk and opportunity situation and management
assessment
The most significant individual risks in the businesses have been named in the report above, with business-
related risks being the most significant alongside IT and legal risks. These risks include already the risks
stemming from the recent developments regarding the Covid-19 pandemic. Most notably, the pandemic
increases existing risks related to more restrictive regulatory requirements regarding drug pricing and
reimbursement, the demand for our products, business interruptions at our production facilities, lack of
availability of good quality materials or services, risks related to research and development, and negative
macroeconomic developments.
With respect to high and medium risks, certain changes have occurred, as the assessment of the individual
risks has of course shifted over the fiscal year due to changing external and internal conditions while the overall
risk profile remained stable. Thanks to the risk reduction measures taken – such as the consistent
implementation of management action (organizational responsibility and process improvements), existing
insurance coverage, and accounting precautions – we were able to take counteraction, in particular against
significant individual risks.
The overall risk of the Group, which is derived from the probability-weighted aggregation of the identified risks,
leads to the assessment that we are not exposed to risks of a nature to threaten the existence of the Group as
a going concern, or for which coverage and financing of the losses are questionable. We are confident that we
will continue to successfully master the challenges arising from the above risks in the future as well. Our
company also benefits from diversification through our different products and markets.
In our view, business-related opportunities offer the greatest potential. An important element here is the
continuous expansion of our businesses. With the successful focusing and continued intensification of our
research and development activities, we want to be able to continue to offer our customers innovative products
and help shape markets. Moreover, we also consolidate our expertise in numerous alliances with industrial
partners as well as various universities and international organizations. We are making targeted investments in
future-oriented companies and start-ups via our Merck Ventures Investment Fund and our Accelerator
programs. The topic of innovation is at the forefront of all our activities. Externally, this is becoming particularly
apparent through our Innovation Center at Group headquarters in Darmstadt, Germany, which is to develop
into a nucleus of creativity at Merck. The activities listed hold significant opportunities for us in the medium to
long term, beyond the underlying forecast period.
We pursue the opportunities that arise and specify their expected effects in the forecast development of net
sales, EBITDA pre, and cash flow. Furthermore, we will actively seek new opportunities, examine their
implementation, and drive them forward where appropriate. If opportunities arise in addition to the forecast
developments, or these occur more quickly than anticipated, this could have correspondingly positive effects on
our net assets, financial position, and results of operations.
120
Combined Management Report ___ Report on Expected Developments
Report on Expected Developments The following report provides a forecast for fiscal 2021 of the development of the Merck Group and its three
business sectors: Healthcare, Life Science and Performance Materials (to be renamed Electronics).
The divestment of Allergopharma to Dermapharm Beteiligungs GmbH (“Dermapharm”) closed on
March 31, 2020. The allergy business of Merck in Europe was transferred to Dermapharm on March 31, 2020.
The transfer of the Allergopharma business in China closed on August 31, 2020. Accordingly, in 2021 we report
a portfolio effect from this transaction. As expected, however, this will not be material.
Moreover, on December 22, 2020, Merck fully acquired AmpTec GmbH, Hamburg, a leading contract
development and manufacturing organization for mRNA, which is used in vaccines, treatments and diagnostics
in connection with Covid-19 and numerous other diseases. We do not expect this acquisition to have a material
portfolio effect either.
In the United States, Merck was involved in patent litigation with Biogen Inc., USA. Biogen sued Merck for
having allegedly infringed a patent in connection with Rebif®. On September 28, 2020, the U.S. Court of
Appeals for the Federal Circuit set aside the first-instance decision and declared Biogen’s patent invalid.
Therefore, a provision amounting to € 365 million for this patent litigation was released. The income from the
release of the provision led to a corresponding increase in EBITDA pre in fiscal 2020. This forecast and in
particular, organic growth rates, relate to a year-earlier figure adjusted for the income from the release of the
provision.
As regards the Covid-19 pandemic and the negative effects thereof, we assume that the business recovery that
started in the second half of 2020 will continue in fiscal 2021. At present, we do not assume that further
disease waves will have a negative effect comparable to that seen in the first half, especially on the Healthcare
and Performance Materials business sectors. For Life Science, we expect significantly positive contributions
owing to the Covid-19 pandemic, particularly in the Process Solutions business unit. The increasing availability
of Covid-19 vaccines and the associated immunization of the population will contribute to a further stabilization
of the societal and economic situation. Nevertheless, this forecast is subject to a higher degree of estimation
uncertainty than was the case in previous years.
121
Combined Management Report ___ Report on Expected Developments
Forecast for the Merck Group
Forecast for the Merck Group
€ million Actual results 2020 Forecast for 2021 Key assumptions
Net sales
17,534
• Strong organic growth • Organic growth driven by all three business sectors
• Negative foreign ex-change effect of -2% to -5%
• Negative foreign exchange effects from the U.S. dollar in particular
and individual growth markets
EBITDA pre1
5,201
• Organic growth in the high single-digit to low teens percentage range
• Life Science with growth in the low teens range
• Negative foreign ex-change effect of -2% to -5%
• Strong growth in Healthcare
• Solid to strong growth in Performance Materials
• Realization of synergies totaling approximately € 83 million as planned from the integration of Versum Materials into Performance Materials
• Negative foreign exchange effects from the U.S. dollar in particular
and individual growth markets
Operating Cash Flow
3,477
• Slight increase over the previous year
• Rise in EBITDA pre
• Increase in net working capital and adverse impact from negative
foreign exchange effects
• Payments in connection with the transformation and growth
program THRIVE commenced by Healthcare in 2020
• Higher fluctuation corridors than for net sales and EBITDA pre are
to be expected
1 EBITDA pre of fiscal 2020 included income from the release of a provision for patent litigation amounting to € 365 million. Including this amount in the
previous year, we expect slight to moderate organic growth.
Net sales
For the Merck Group in fiscal 2021, we expect strong organic net sales growth, driven mainly by our Healthcare
and Life Science business sectors. For Performance Materials we forecast a solid organic increase. The
divestment of Allergopharma will be reported in the first three quarters of 2021 as a portfolio effect, which will
not be material for the Group. With regard to foreign exchange developments, we continue to expect a volatile
environment due to political and macroeconomic developments. We expect a negative foreign exchange effect
between -2% and -5%, These effects will result in particular from the development of the U.S. dollar as well as
individual growth market currencies. This forecast for 2021 is based on a euro-U.S. dollar exchange rate in a
corridor of 1.17 to 1.22.
EBITDA pre
EBITDA pre is our key financial indicator to steer operating business. For fiscal 2021, we expect organic growth
of EBITDA pre in a high single digit to low teens percentage range. All three business sectors will contribute to
this development with organic growth. Excluding the release of the provision for the patent litigation with
Biogen amounting to € 365 million, we expect that in fiscal 2021, the EBITDA pre margin will be higher than in
fiscal 2021. Including the income from the release of the provision in the previous year, we are forecasting
moderate organic growth and a margin below that of the previous year.
The expected foreign exchange development is forecast to adversely affect Group EBITDA pre by between -2%
and -5% compared with fiscal 2020; it is likely to be seen mainly in the Healthcare and Performance Materials
businesses. In this context, we assume that in particular, the euro-U.S. dollar exchange rate will impact foreign
exchange developments. These foreign exchange effects will be partly mitigated by currency hedging, although
we do not hedge all growth market currencies.

122
Combined Management Report ___ Report on Expected Developments
Operating cash flow
Apart from EBITDA pre, operating cash flow as of fiscal 2021 will represent one of our key performance
indicators at Group level and replace business free cash flow (BFCF) as a steering parameter. Operating cash
flow takes the cash-relevant variables before investments and financing into account and serves to manage
internal financing power and liquidity. In general, the forecast for operating cash flow is subject to a higher
fluctuation corridor than the forecast for net sales, EBITDA pre and the previous steering parameter BFCF.
The expected strong development of operating business in fiscal 2021 will be a main driver of operating cash
flow. However, in fiscal 2020 operating cash flow reflected the increasing receipt of payments from customers
in the fourth quarter of 2020. Since we do not expect a comparable effect in fiscal 2021, this will have a
negative impact on the steering parameter. We continue to expect payouts in the context of ongoing
restructuring programs on a larger scale in 2021. Among other things, this relates to the transformation and
growth program THRIVE that was launched in Healthcare in 2020. Negative foreign exchange effects will also
weigh on operating cash flow. Against this backdrop, overall we expect a slight increase in 2021.
Forecast for the Healthcare business sector
Forecast for the Healthcare Business Sector
€ million Actual results 2020 Forecast for 2021 Key assumptions
Net Sales
6,639
• Strong organic growth • Roughly stable organic development of the core business
• Slight to moderately negative foreign exchange effect
• Substantial contribution to growth by Mavenclad® and Bavencio®
• Negative foreign exchange effects, in particular the U.S. dollar and
individual growth market currencies
EBITDA pre1
2,267
• Strong organic growth
• Expected substantial earnings contribution especially from
Mavenclad® can more than offset the effect from the expected decline in sales of Rebif®
• Strongly negative foreign
exchange effect
• Marketing and selling expenses as well as research and development costs with decrease in percentage of sales due to systematic cost management and strict pipeline prioritization
• Negative foreign exchange effects, in particular the U.S. dollar and
individual growth market currencies
1 EBITDA pre of fiscal 2020 included income from the release of a provision for patent litigation amounting to € 365 million. Including this amount in the
previous year, we expect a strong organic decline.
Net sales
Following the significantly negative effects from the Covid-19 pandemic that impacted the Healthcare business
sector in fiscal 2020, we now expect to see strong organic growth of net sales in 2021. This will be driven
mainly by Mavenclad® and Bavencio®. We thus believe that both products will generate a further significant
increase in sales. For the core business, we forecast a roughly stable development. This reflects the continued
competitive pressure and the associated decline in sales of Rebif®. Although the negative impacts of the
volume-based procurement regulations that took effect in China in 2020 will now be seen in full in 2021, we
forecast a roughly stable organic development for our products in the General Medicine & Endocrinology
franchise. We assume that General Medicine & Endocrinology will resume its growth course as of 2022. The
performance of the Fertility franchise will have a mitigating effect. At present we do not assume that the Covid-
19 pandemic will have considerable negative effects on Healthcare sales. We forecast a slight to moderately
negative foreign exchange effect.
EBITDA pre
For 2021, we expect EBITDA pre of the Healthcare business sector to see strong organic growth. The negative
earnings effects resulting from the expected decline in Rebif® sales should be more than offset by substantial
earnings contributions from Mavenclad®. In addition, we will continue our rigorous cost management and strict
pipeline prioritization. We therefore expect marketing and selling expenses as well as research and
development costs to decline as a percentage of sales. Research and development costs will remain heavily
123
Combined Management Report ___ Report on Expected Developments
dependent on the development of clinical data and further expected study results. We forecast the upfront cash
payment in the context of the global strategic alliance with GlaxoSmithKline for the joint development and
marketing of bintrafusp alfa to have a positive earnings effect in the higher double-digit euro millions, which will
be recognized in other operating income. The amount generally depends on the cost evolution. Development
milestones will no longer occur subsequent to the recently communicated discontinuation of the INTR@PID
Lung 037 trial. For fiscal 2021, we expect income from active portfolio management in a low to mid double-digit
million range as well as income from the realization of milestone payments within the scope of our strategic
alliance with Pfizer to develop and commercialize Bavencio®. By contrast, we expect foreign exchange effects to
weigh heavily on EBITDA pre.
Forecast for the Life Science business sector
Forecast for the Life Science Business Sector
€ million Actual results 2020 Forecast for 2021 Key assumptions
Net Sales
7,515
• Organic growth in the low teens percentage range
• All businesses contribute to growth
• Process Solutions remains the main driver of growth, followed by
Applied Solutions
• Slight to moderately
negative foreign exchange effect
• Negative foreign exchange effects from the U.S. dollar in particular
EBITDA pre
2,405
• Organic earnings growth in the low teens percentage range
• Organic earnings growth owing to the expected sales growth and
positive Covid-19 effects amid a slight margin improvement
• Slightly negative foreign
exchange effects • Negative foreign exchange effects primarily owing to the
development of individual growth market currencies
Net sales
For the Life Science business sector in fiscal 2021, we forecast growth in the low teens percentage range. The
Process Solutions business unit will clearly remain the strongest driver of growth and will be further propelled
by significantly positive Covid-19 effects. Solid organic growth in Applied and Research Solutions will also
contribute positively to the overall performance of Life Science. We expect no material portfolio effects from the
acquisitions of AmpTec and Resolution Spectra Systems S.A.S., France. We forecast a slight to moderately
negative foreign exchange effect.
EBITDA pre
In 2021, the Life Science business sector is expected to show organic growth of EBITDA pre in the low teens
percentage range compared with the previous year. The persistently dynamic demand trend and clearly positive
Covid-19 effects will contribute to organic earnings growth. Based on our estimates, the foreign exchange
impact on earnings in fiscal 2021 should be only slightly negative.
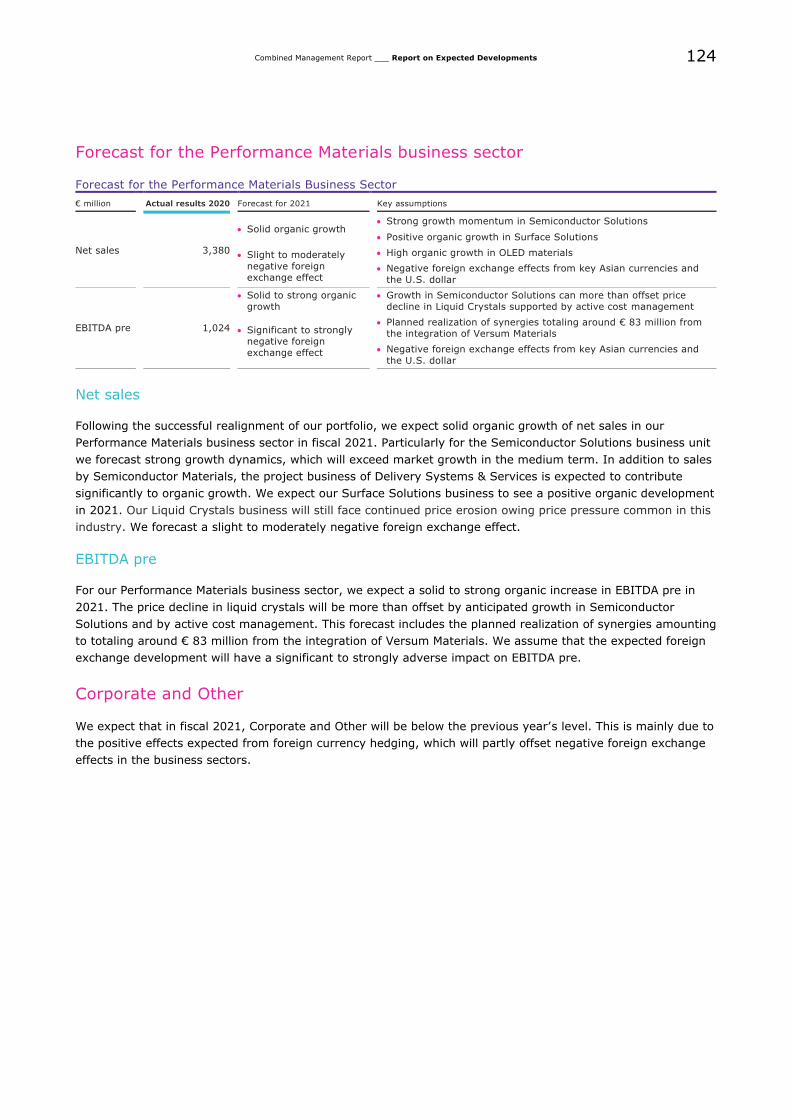
124
Combined Management Report ___ Report on Expected Developments
Forecast for the Performance Materials business sector
Forecast for the Performance Materials Business Sector
€ million Actual results 2020 Forecast for 2021 Key assumptions
Net sales
3,380
• Solid organic growth
• Strong growth momentum in Semiconductor Solutions
• Positive organic growth in Surface Solutions
• Slight to moderately
negative foreign exchange effect
• High organic growth in OLED materials
• Negative foreign exchange effects from key Asian currencies and
the U.S. dollar
EBITDA pre
1,024
• Solid to strong organic
growth • Growth in Semiconductor Solutions can more than offset price
decline in Liquid Crystals supported by active cost management
• Significant to strongly negative foreign exchange effect
• Planned realization of synergies totaling around € 83 million from
the integration of Versum Materials
• Negative foreign exchange effects from key Asian currencies and
the U.S. dollar
Net sales
Following the successful realignment of our portfolio, we expect solid organic growth of net sales in our
Performance Materials business sector in fiscal 2021. Particularly for the Semiconductor Solutions business unit
we forecast strong growth dynamics, which will exceed market growth in the medium term. In addition to sales
by Semiconductor Materials, the project business of Delivery Systems & Services is expected to contribute
significantly to organic growth. We expect our Surface Solutions business to see a positive organic development
in 2021. Our Liquid Crystals business will still face continued price erosion owing price pressure common in this
industry. We forecast a slight to moderately negative foreign exchange effect.
EBITDA pre
For our Performance Materials business sector, we expect a solid to strong organic increase in EBITDA pre in
2021. The price decline in liquid crystals will be more than offset by anticipated growth in Semiconductor
Solutions and by active cost management. This forecast includes the planned realization of synergies amounting
to totaling around € 83 million from the integration of Versum Materials. We assume that the expected foreign
exchange development will have a significant to strongly adverse impact on EBITDA pre.
Corporate and Other
We expect that in fiscal 2021, Corporate and Other will be below the previous year’s level. This is mainly due to
the positive effects expected from foreign currency hedging, which will partly offset negative foreign exchange
effects in the business sectors.
125
Combined Management Report ___ Report in accordance with Section 315a of the German Commercial Code (HGB)
Report in accordance with section 315a of the German Commercial Code (HGB) The following information is provided in accordance with section 315a of the German Commercial Code (HGB)
and the explanatory report pursuant to section 176 (1) sentence 1 of the German Stock Corporation Act (AktG).
As of the balance sheet date, the company’s subscribed capital is divided into 129,242,251 no-par value bearer
shares plus one registered share. Each share therefore corresponds to € 1.30 of the share capital. The holder of
the registered share is E. Merck Beteiligungen KG. It is entitled and obliged to appoint one-third of the
members of the Supervisory Board representing the limited liability shareholders. If the holder of the registered
share is a general partner, he or she has no such right of appointment. The transfer of the registered share
requires the company’s approval. The approval is granted at the sole discretion of the personally liable general
partner with an equity interest, namely E. Merck KG.
Pursuant to the information on voting rights submitted to us in accordance with the German Securities Trading
Act (WpHG), on December 31, 2020, no shareholders owned direct or indirect investments exceeding 10% of
the voting rights.
According to the Articles of Association of Merck, the general partners not holding an equity interest who form
the Executive Board are admitted by E. Merck KG with the consent of a simple majority of the other general
partners. A person may be a general partner not holding an equity interest only if he or she is also a general
partner of E. Merck KG. In addition, at the proposal of E. Merck KG and with the approval of all general partners
not holding an equity interest, further persons who are not general partners not holding an equity interest may
be appointed to the Executive Board.
The Articles of Association can be amended by a resolution at the Annual Meeting that requires the approval of
the general partners. Notwithstanding any statutory provisions to the contrary, the resolutions of the General
Meeting are adopted by a simple majority of the votes cast. Where the law requires a capital majority in
addition to the voting majority, resolutions are adopted by a simple majority of the share capital represented in
the vote. The Articles of Association of the company encompass authorized and contingent capital.
The Executive Board is authorized to increase the company’s share capital with the approval of the Supervisory
Board and of E. Merck KG once or repeatedly, up to and including April 27, 2022, by up to a total of
€ 56,521,124.19 by issuing new no-par value bearer shares against cash and/or non-cash contributions
(Authorized Capital 2017). Limited liability shareholders shall be generally granted the statutory right to
subscribe to the new shares. However, the Executive Board is authorized, with the approval of the Supervisory
Board, to exclude the limited liability shareholders’ subscription right, in full or in part, in case of a capital
increase against cash contributions pursuant to or by analogous application of section 186 (3) sentence 4 AktG,
if the issue price of the new shares is not substantially lower than the stock exchange price of the company’s
shares already listed and if the new shares, which are issued under exclusion of the subscription right, do not
exceed a proportional amount of 10% of the share capital either at the time of the Authorized Capital 2017
taking effect or at the time of the Authorized Capital 2017 being utilized. This restriction to 10% of the share
capital shall include the proportional amount of the share capital that is attributable to shares that are issued
under exclusion of the subscription right or sold during the term of the Authorized Capital 2017, based on an
authorization to issue new shares or sell own shares by direct or analogous application of section 186 (3)
sentence 4 AktG. Further, this restriction shall also include the proportional amount of the share capital that is
attributable to shares which may or must be issued in order to service bonds carrying a conversion or option
right or a conversion or option obligation, if the bonds are issued during the term of the Authorized Capital
126
Combined Management Report ___ Report in accordance with Section 315a of the German Commercial Code (HGB)
2017 under exclusion of the limited liability shareholders’ subscription right by analogous application of section
186 (3) sentence 4 AktG.
It is likewise possible to exclude the subscription right of the limited liability shareholders with the approval of
the Supervisory Board in the case of capital increases through non-cash contributions, particularly for the
purpose of acquiring enterprises, parts of enterprises, or interests in enterprises. In addition, with the approval
of the Supervisory Board, the limited liability shareholders’ subscription rights can be excluded in order to
enable E. Merck KG to exercise its right pursuant to article 32 (3) of the company’s Articles of Association to
participate in a capital increase by issuing shares or freely transferable share subscription rights.
It is likewise possible to exclude, with the approval of the Supervisory Board, the subscription right of the
limited liability shareholders in order to enable E. Merck KG to exercise its right pursuant to article 33 of the
Articles of Association to convert, in full or in part, its equity interest into share capital.
Moreover, with the approval of the Supervisory Board, the subscription right of the limited liability shareholders
can be excluded if and to the extent this is necessary to grant the holders or creditors of conversion or option
rights, and/or the holders or creditors of financing instruments carrying conversion or option obligations, which
were or are issued by the company or by a domestic or foreign company in which the company directly or
indirectly holds the majority of the votes and capital, a subscription right to the extent to which they would be
entitled after the exercise of the conversion or option rights or after the performance of a conversion or option
obligation.
Lastly, with the approval of the Supervisory Board, the subscription right of the limited liability shareholders can
be excluded in order to exclude fractional amounts from the subscription right.
The sum of shares issued on the basis of the Authorized Capital 2017 under exclusion of the limited liability
shareholders’ subscription right must not exceed a proportional amount of 20% of the share capital, by taking
into account other shares of the company which, during the term of the Authorized Capital 2017, are sold or
issued under exclusion of the subscription right or are to be issued under bonds issued after April 28, 2017,
under exclusion of the subscription right; this limitation shall apply both at the time of this authorization taking
effect and at the time of this authorization being exercised.
To the extent that the subscription right is not excluded under the above provisions, it may also be granted to
the limited liability shareholders by way of an indirect subscription right pursuant to section 186 (5) AktG or, in
part, by way of a direct subscription right, and otherwise by way of an indirect subscription right pursuant to
section 186 (5) AktG.
Furthermore, the Executive Board is authorized, with the approval of the Supervisory Board, to determine the
additional details of the capital increase and its implementation, including the content of rights attached to the
shares as well as the terms and conditions of the share issue.
The Articles of Association also encompass contingent capital. The share capital is contingently increased by up
to € 66,406,298.40 divided into 51,081,768 shares (Contingent Capital I). The contingent capital increase
serves to grant exchange rights to E. Merck KG in accordance with article 33 of the Articles of Association to
enable the conversion of its equity interest. The shares carry dividend rights from the beginning of the fiscal
year following the year in which the conversion option is exercised.
127
Combined Management Report ___ Report in accordance with Section 315a of the German Commercial Code (HGB)
Moreover, the share capital is contingently increased by up to € 16,801,491.20 composed of up to 12,924,224
no par value bearer shares (Contingent Capital II). This increase in contingent capital is only to be implemented
insofar as the bearers or creditors of option or conversion rights, or with an obligation to convert or exercise
options on warrant bonds, option participation certificates, option participation bonds, convertible bonds,
convertible participation certificates, or convertible participation bonds issued against contributions that are
issued or guaranteed by the company or a subordinate Group company on the basis of the authorization
resolution of the Annual General Meeting of April 27, 2018, to April 26, 2023, utilize their option or conversion
rights, or to fulfill their conversion obligation or obligation to exercise options insofar as they are obliged to
fulfill their conversion or option exercise obligation, or insofar as the company exercises an option, wholly or in
part, of granting shares in the company instead of paying the sum of money due, and to the extent that in each
case a cash settlement is not granted, or own shares or other forms of fulfillment are used. Each issue of new
shares shall take place at the determined option or conversion price, pursuant to the aforementioned
authorization resolution. The new shares participate in the profit from the beginning of the fiscal year in which
they are created; insofar as this is legally permissible, the Executive Board may, with the approval of the
Supervisory Board, and in deviation from section 60 (2) AktG, stipulate that the new shares also participate in
the profit for a past fiscal year. The Executive Board is authorized, with the approval of the Supervisory Board
and of E. Merck KG, to stipulate the further details of the implementation of the increase in contingent capital.
The company is not authorized to acquire its own shares.
The company has not entered into any material agreements subject to a change of control pursuant to a
takeover offer nor has it entered into any compensation agreements with the members of the Executive Board
or employees in the event of a takeover offer.
128
Combined Management Report ___ Additional Information on Merck KGaA in accordance with the German Commercial Code (HGB)
Additional Information on Merck KGaA in accordance with the German Commercial Code (HGB) The management report of Merck KGaA has been combined with the Group management report. The Annual
Financial Statements and the Combined Management Report of the Merck Group and Merck KGaA for 2020 are
being filed with the electronic German Federal Gazette (elektronischer Bundesanzeiger) and are available on the
website of the German company register.
Merck KGaA, headquartered in Darmstadt, Germany, is the parent company of the Merck Group. In addition to
its function as a holding company, Merck KGaA generates sales in the Healthcare, Life Science, and
Performance Materials business sectors. The Healthcare business sector has been run as a separate company,
Merck Healthcare KGaA, since April 1, 2019 (see Effects of material company agreements on the net assets,
financial position, and results of operations). Merck KGaA employs the majority of the 11,000-plus workforce in
Darmstadt.
The financial statements of Merck KGaA have been prepared in accordance with the provisions of the German
Commercial Code (HGB), as amended by the German Accounting Directive Implementation Act (BilRUG), and
the German Stock Corporation Act (AktG). The full version of the Annual Financial Statements of Merck KGaA
together with the unqualified auditor’s opinion has been submitted to the operator of the electronic Federal
Gazette (elektronischer Bundesanzeiger), where they are published and forwarded to the company register.
Statement on Corporate Governance
For the fiscal year 2020, Merck exercise the option to publish the corporate governance statement on the
Merck Group website in accordance with section 315d HGB in conjunction with section 289f (1) sentence 2 of
the HGB. The corporate governance declaration is available on the website
https://www.merckgroup.com/en/investors/corporate-governance/reports.
Effects of material company agreements on the net assets, financial position,
and results of operations
End of the temporary business lease of the Healthcare and Performance Materials business
sectors
As part of the strategic development of Merck KGaA, the existing operating activities of the Healthcare, Life
Science, and Performance Materials business sectors within Merck KGaA, together with the relevant assets and
liabilities (hereinafter: ”operating sectors”), were spun off at their carrying amounts into three separate
companies (hereinafter: ”OpCo” or plural ”OpCos”) with the legal form of a GmbH or German limited liability
corporation (operating spin-off). This operating spin-off is based on the spin-off and takeover agreement
concluded between Merck KGaA and the OpCos in notarized form on March 2, 2018. Following approval by the
2018 Annual General Meeting, the operating spin-off took place with economic effect as of 0:00 on January 1,
2018.
Immediately after the spin-off took effect, all shares held by Merck KGaA in the respective OpCos were
transferred to holding companies via a further spin-off (holding company spin-off), as a result of which the
129
Combined Management Report ___ Additional Information on Merck KGaA in accordance with the German Commercial Code (HGB)
OpCos are each indirectly held by Merck KGaA via an intermediate holding company. The acquiring legal entities
within the scope of the holding company spin-off were Merck Healthcare Holding GmbH for the business shares
of Healthcare OpCo, Merck Life Science Holding GmbH for the business shares of Life Science OpCo, and Merck
Performance Materials Holding GmbH for the business shares of Performance Materials OpCo (referred to
individually as “HoldCo”, independently of the sector, and jointly as “HoldCos”). To this end, Merck KGaA and
the HoldCos signed a notarized spin-off and takeover agreement on March 2, 2018. The holding company spin-
off took place with economic effect as of 0:00 on January 1, 2018.
Since the technical system requirements for the introduction of the sector-specific enterprise resource planning
(ERP) systems as regards the OpCos were not in place at the time of the spin-off, the business activities spun
off to the OpCos have been temporarily leased back by the relevant OpCos to Merck KGaA until sector-specific
ERP systems have been introduced. For this purpose, also on March 2, 2018, Merck KGaA entered into a
business leasing contract with each respective OpCo with economic effect as of 0:00 on January 1, 2018, to
lease back all the operating business previously spun off to the OpCo. Under the terms of the respective
business leasing contract, Merck KGaA leases the entire operation from the respective OpCo, as well as all fixed
assets in this context; it acquires the current assets as well as certain liabilities and provisions at their carrying
amounts under German commercial law. The business lease allowed the spin-off measures to be implemented
for all OpCos with economic effect at a uniform time, 0:00 on January 1, 2018, while retaining the flexibility of
transitioning the management of the relevant operating business in accordance with the sector-specific ERP
introduction at an individual time to the OpCo in question in a targeted manner. On the basis of the business
leasing contract, Merck KGaA will temporarily continue to operate the spun-off business as a leaseholder in its
own name and for its own account. Once the relevant ERP systems have been introduced for the respective
OpCo, the business lease with this OpCo will be terminated and the business previously leased out will pass to
the OpCo.
The aforementioned spin-off and business leasing contracts form part of an overall entrepreneurial concept.
They were submitted to the General Meeting of Merck KGaA for approval on April 27, 2018, at the 2018 Annual
General Meeting, as a coherent restructuring measure and were approved. In 2018, the Healthcare OpCo
changed its legal form to that of a German corporation with general partners (Kommanditgesellschaft auf
Aktien) and has since been trading under the name of Merck Healthcare KGaA, Darmstadt.
The business leasing contract under which the Healthcare business sector was leased back to Merck KGaA was
terminated on January 11, 2019, with economic effect as of 24:00 on March 31, 2019. The sector-specific ERP
system for the Healthcare business sector was introduced as planned on April 1, 2019. As a result of the end of
the business leasing contract, the leased objects allocated to the Healthcare business sector at the end of the
lease – comprising current assets as well as certain liabilities and provisions, including the leased objects
acquired or created by means of maintenance, replacement, and expansion investments – were transferred to
Merck Healthcare KGaA at their carrying amounts under German commercial law and in a condition
commensurate with their continued and proper operational use up to the date the business leasing contract
ended. As the carrying amounts of the liabilities exceeded the carrying amounts of the assets, Merck KGaA
made a settlement payment to Merck Healthcare KGaA. In addition, the licenses for the intangible assets and
know-how leased to Merck KGaA came to an end.
As planned, the business leasing contract between Merck Performance Materials Germany GmbH and Merck
KGaA for the distribution and sales function of the Performance Materials business sector was terminated on
November 18, 2019, with economic effect as of 24:00 on December 31, 2019. By way of an agreement dated
November 18, 2019, the business leasing contract for the other functions of the Performance Materials business
sector remains in place. Accordingly, the distribution and sales function of the Performance Materials business
sector moved to Merck Performance Materials Germany GmbH with economic effect as of 0:00 on January 1,
2020. The sector-specific ERP system for the distribution and sales function of the Performance Materials
business sector was introduced at Merck Performance Materials Germany GmbH as planned on January 1, 2020.
As a result of the partial termination of the business leasing contract, the leased objects allocated to the
distribution and sales function of the Performance Materials business sector at the end of the lease – comprising
current assets as well as certain liabilities and provisions – were transferred to Merck Performance Materials
Germany GmbH at their carrying amounts under German commercial law. The contractual, process, procedural,
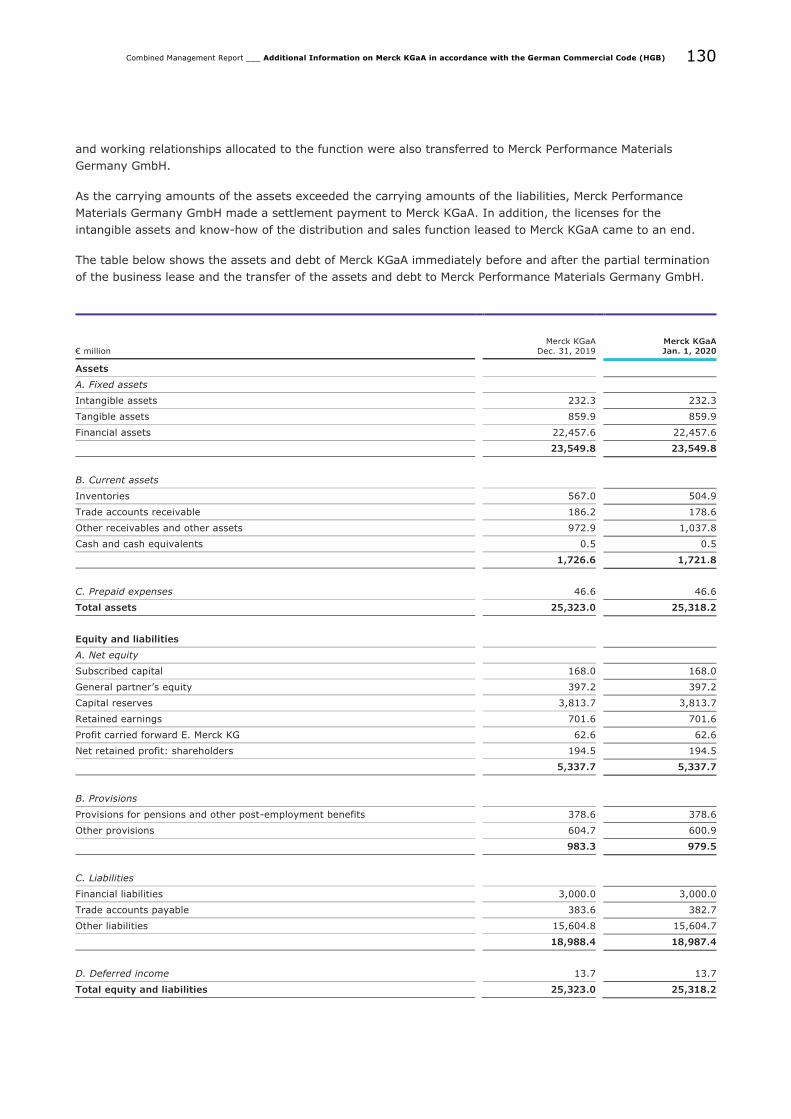
130
Combined Management Report ___ Additional Information on Merck KGaA in accordance with the German Commercial Code (HGB)
and working relationships allocated to the function were also transferred to Merck Performance Materials
Germany GmbH.
As the carrying amounts of the assets exceeded the carrying amounts of the liabilities, Merck Performance
Materials Germany GmbH made a settlement payment to Merck KGaA. In addition, the licenses for the
intangible assets and know-how of the distribution and sales function leased to Merck KGaA came to an end.
The table below shows the assets and debt of Merck KGaA immediately before and after the partial termination
of the business lease and the transfer of the assets and debt to Merck Performance Materials Germany GmbH.
€ million
Merck KGaA
Dec. 31, 2019
Merck KGaA
Jan. 1, 2020
Assets
A. Fixed assets
Intangible assets 232.3 232.3
Tangible assets 859.9 859.9
Financial assets 22,457.6 22,457.6
23,549.8 23,549.8
B. Current assets
Inventories 567.0 504.9
Trade accounts receivable 186.2 178.6
Other receivables and other assets 972.9 1,037.8
Cash and cash equivalents 0.5 0.5
1,726.6 1,721.8
C. Prepaid expenses 46.6 46.6
Total assets 25,323.0 25,318.2
Equity and liabilities
A. Net equity
Subscribed capital 168.0 168.0
General partner’s equity 397.2 397.2
Capital reserves 3,813.7 3,813.7
Retained earnings 701.6 701.6
Profit carried forward E. Merck KG 62.6 62.6
Net retained profit: shareholders 194.5 194.5
5,337.7 5,337.7
B. Provisions
Provisions for pensions and other post-employment benefits 378.6 378.6
Other provisions 604.7 600.9
983.3 979.5
C. Liabilities
Financial liabilities 3,000.0 3,000.0
Trade accounts payable 383.6 382.7
Other liabilities 15,604.8 15,604.7
18,988.4 18,987.4
D. Deferred income 13.7 13.7
Total equity and liabilities 25,323.0 25,318.2
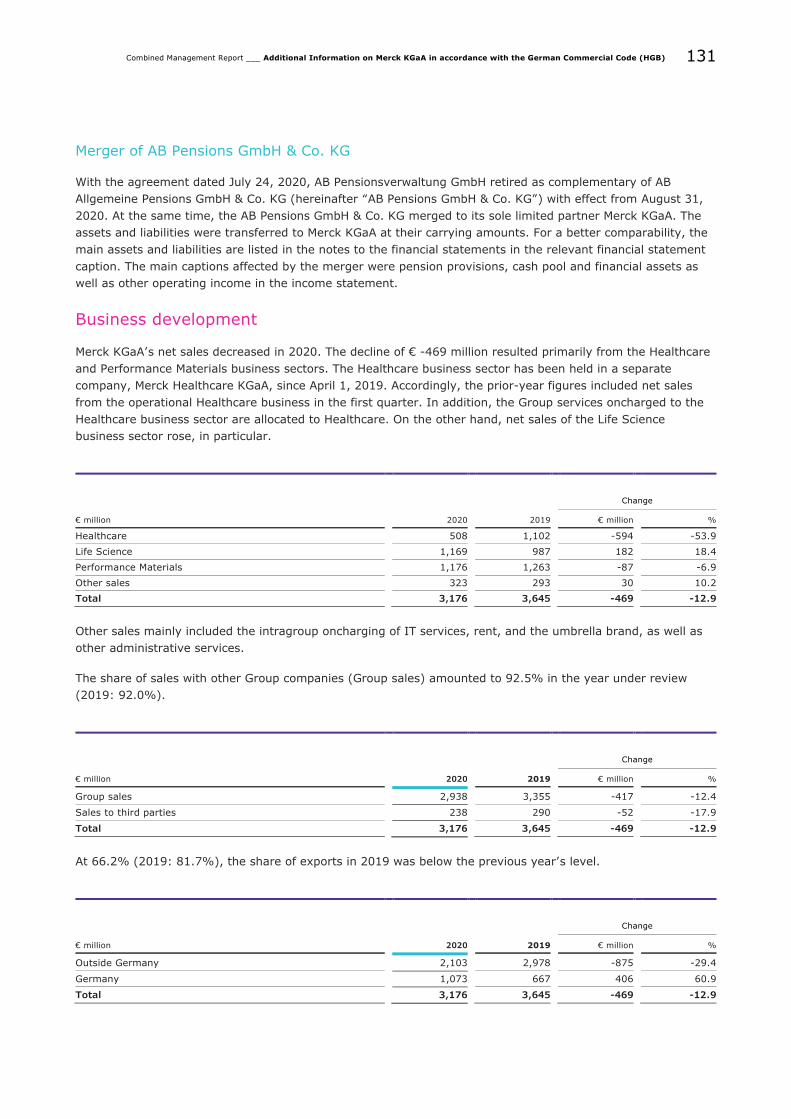
131
Combined Management Report ___ Additional Information on Merck KGaA in accordance with the German Commercial Code (HGB)
Merger of AB Pensions GmbH & Co. KG
With the agreement dated July 24, 2020, AB Pensionsverwaltung GmbH retired as complementary of AB
Allgemeine Pensions GmbH & Co. KG (hereinafter “AB Pensions GmbH & Co. KG”) with effect from August 31,
2020. At the same time, the AB Pensions GmbH & Co. KG merged to its sole limited partner Merck KGaA. The
assets and liabilities were transferred to Merck KGaA at their carrying amounts. For a better comparability, the
main assets and liabilities are listed in the notes to the financial statements in the relevant financial statement
caption. The main captions affected by the merger were pension provisions, cash pool and financial assets as
well as other operating income in the income statement.
Business development
Merck KGaA’s net sales decreased in 2020. The decline of € -469 million resulted primarily from the Healthcare
and Performance Materials business sectors. The Healthcare business sector has been held in a separate
company, Merck Healthcare KGaA, since April 1, 2019. Accordingly, the prior-year figures included net sales
from the operational Healthcare business in the first quarter. In addition, the Group services oncharged to the
Healthcare business sector are allocated to Healthcare. On the other hand, net sales of the Life Science
business sector rose, in particular.
Change
€ million 2020 2019 € million %
Healthcare 508 1,102 -594 -53.9
Life Science 1,169 987 182 18.4
Performance Materials 1,176 1,263 -87 -6.9
Other sales 323 293 30 10.2
Total 3,176 3,645 -469 -12.9
Other sales mainly included the intragroup oncharging of IT services, rent, and the umbrella brand, as well as
other administrative services.
The share of sales with other Group companies (Group sales) amounted to 92.5% in the year under review
(2019: 92.0%).
Change
€ million 2020 2019 € million %
Group sales 2,938 3,355 -417 -12.4
Sales to third parties 238 290 -52 -17.9
Total 3,176 3,645 -469 -12.9
At 66.2% (2019: 81.7%), the share of exports in 2019 was below the previous year’s level.
Change
€ million 2020 2019 € million %
Outside Germany 2,103 2,978 -875 -29.4
Germany 1,073 667 406 60.9
Total 3,176 3,645 -469 -12.9
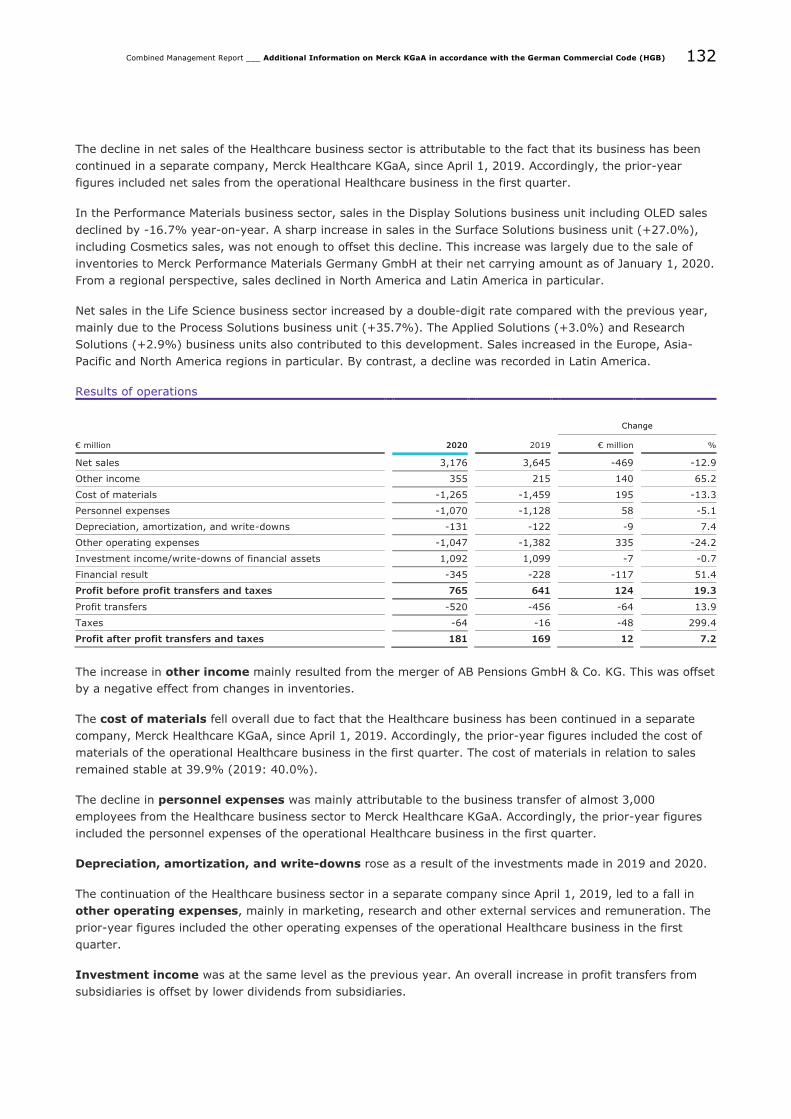
132
Combined Management Report ___ Additional Information on Merck KGaA in accordance with the German Commercial Code (HGB)
The decline in net sales of the Healthcare business sector is attributable to the fact that its business has been
continued in a separate company, Merck Healthcare KGaA, since April 1, 2019. Accordingly, the prior-year
figures included net sales from the operational Healthcare business in the first quarter.
In the Performance Materials business sector, sales in the Display Solutions business unit including OLED sales
declined by -16.7% year-on-year. A sharp increase in sales in the Surface Solutions business unit (+27.0%),
including Cosmetics sales, was not enough to offset this decline. This increase was largely due to the sale of
inventories to Merck Performance Materials Germany GmbH at their net carrying amount as of January 1, 2020.
From a regional perspective, sales declined in North America and Latin America in particular.
Net sales in the Life Science business sector increased by a double-digit rate compared with the previous year,
mainly due to the Process Solutions business unit (+35.7%). The Applied Solutions (+3.0%) and Research
Solutions (+2.9%) business units also contributed to this development. Sales increased in the Europe, Asia-
Pacific and North America regions in particular. By contrast, a decline was recorded in Latin America.
Results of operations
Change
€ million 2020 2019 € million %
Net sales 3,176 3,645 -469 -12.9
Other income 355 215 140 65.2
Cost of materials -1,265 -1,459 195 -13.3
Personnel expenses -1,070 -1,128 58 -5.1
Depreciation, amortization, and write-downs -131 -122 -9 7.4
Other operating expenses -1,047 -1,382 335 -24.2
Investment income/write-downs of financial assets 1,092 1,099 -7 -0.7
Financial result -345 -228 -117 51.4
Profit before profit transfers and taxes 765 641 124 19.3
Profit transfers -520 -456 -64 13.9
Taxes -64 -16 -48 299.4
Profit after profit transfers and taxes 181 169 12 7.2
The increase in other income mainly resulted from the merger of AB Pensions GmbH & Co. KG. This was offset
by a negative effect from changes in inventories.
The cost of materials fell overall due to fact that the Healthcare business has been continued in a separate
company, Merck Healthcare KGaA, since April 1, 2019. Accordingly, the prior-year figures included the cost of
materials of the operational Healthcare business in the first quarter. The cost of materials in relation to sales
remained stable at 39.9% (2019: 40.0%).
The decline in personnel expenses was mainly attributable to the business transfer of almost 3,000
employees from the Healthcare business sector to Merck Healthcare KGaA. Accordingly, the prior-year figures
included the personnel expenses of the operational Healthcare business in the first quarter.
Depreciation, amortization, and write-downs rose as a result of the investments made in 2019 and 2020.
The continuation of the Healthcare business sector in a separate company since April 1, 2019, led to a fall in
other operating expenses, mainly in marketing, research and other external services and remuneration. The
prior-year figures included the other operating expenses of the operational Healthcare business in the first
quarter.
Investment income was at the same level as the previous year. An overall increase in profit transfers from
subsidiaries is offset by lower dividends from subsidiaries.
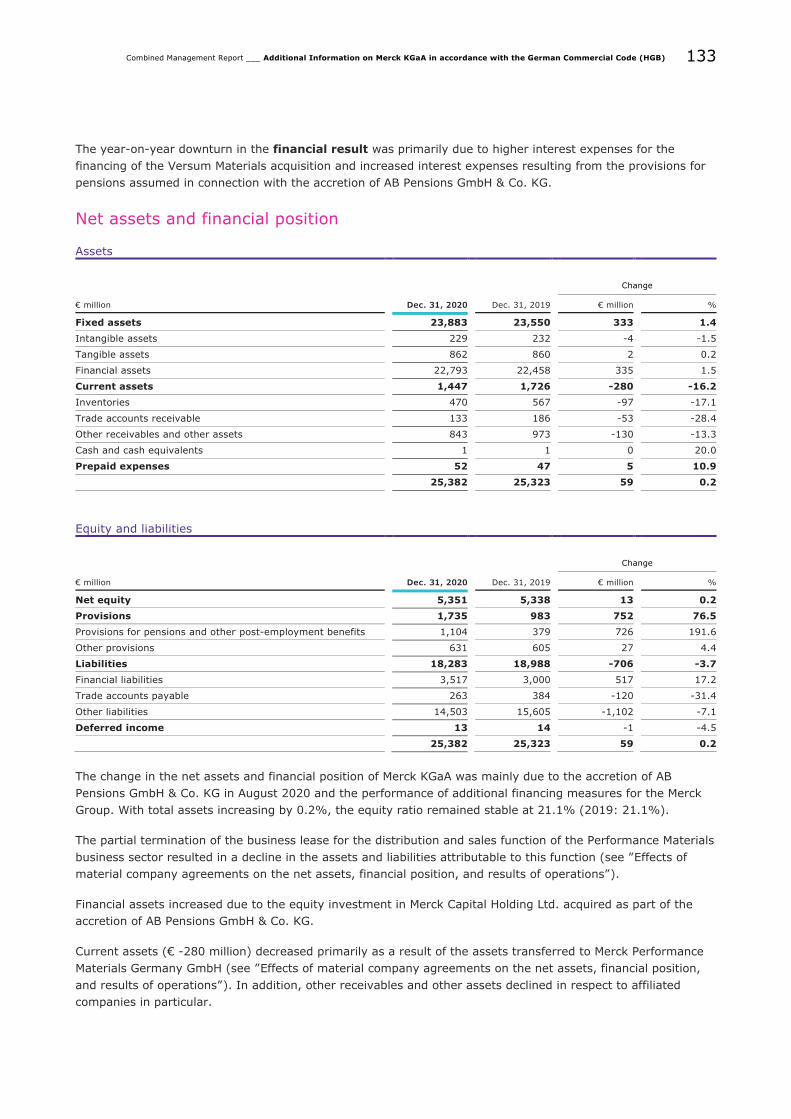
133
Combined Management Report ___ Additional Information on Merck KGaA in accordance with the German Commercial Code (HGB)
The year-on-year downturn in the financial result was primarily due to higher interest expenses for the
financing of the Versum Materials acquisition and increased interest expenses resulting from the provisions for
pensions assumed in connection with the accretion of AB Pensions GmbH & Co. KG.
Net assets and financial position
Assets
Change
€ million Dec. 31, 2020 Dec. 31, 2019 € million %
Fixed assets 23,883 23,550 333 1.4
Intangible assets 229 232 -4 -1.5
Tangible assets 862 860 2 0.2
Financial assets 22,793 22,458 335 1.5
Current assets 1,447 1,726 -280 -16.2
Inventories 470 567 -97 -17.1
Trade accounts receivable 133 186 -53 -28.4
Other receivables and other assets 843 973 -130 -13.3
Cash and cash equivalents 1 1 0 20.0
Prepaid expenses 52 47 5 10.9
25,382 25,323 59 0.2
Equity and liabilities
Change
€ million Dec. 31, 2020 Dec. 31, 2019 € million %
Net equity 5,351 5,338 13 0.2
Provisions 1,735 983 752 76.5
Provisions for pensions and other post-employment benefits 1,104 379 726 191.6
Other provisions 631 605 27 4.4
Liabilities 18,283 18,988 -706 -3.7
Financial liabilities 3,517 3,000 517 17.2
Trade accounts payable 263 384 -120 -31.4
Other liabilities 14,503 15,605 -1,102 -7.1
Deferred income 13 14 -1 -4.5
25,382 25,323 59 0.2
The change in the net assets and financial position of Merck KGaA was mainly due to the accretion of AB
Pensions GmbH & Co. KG in August 2020 and the performance of additional financing measures for the Merck
Group. With total assets increasing by 0.2%, the equity ratio remained stable at 21.1% (2019: 21.1%).
The partial termination of the business lease for the distribution and sales function of the Performance Materials
business sector resulted in a decline in the assets and liabilities attributable to this function (see ”Effects of
material company agreements on the net assets, financial position, and results of operations”).
Financial assets increased due to the equity investment in Merck Capital Holding Ltd. acquired as part of the
accretion of AB Pensions GmbH & Co. KG.
Current assets (€ -280 million) decreased primarily as a result of the assets transferred to Merck Performance
Materials Germany GmbH (see ”Effects of material company agreements on the net assets, financial position,
and results of operations”). In addition, other receivables and other assets declined in respect to affiliated
companies in particular.
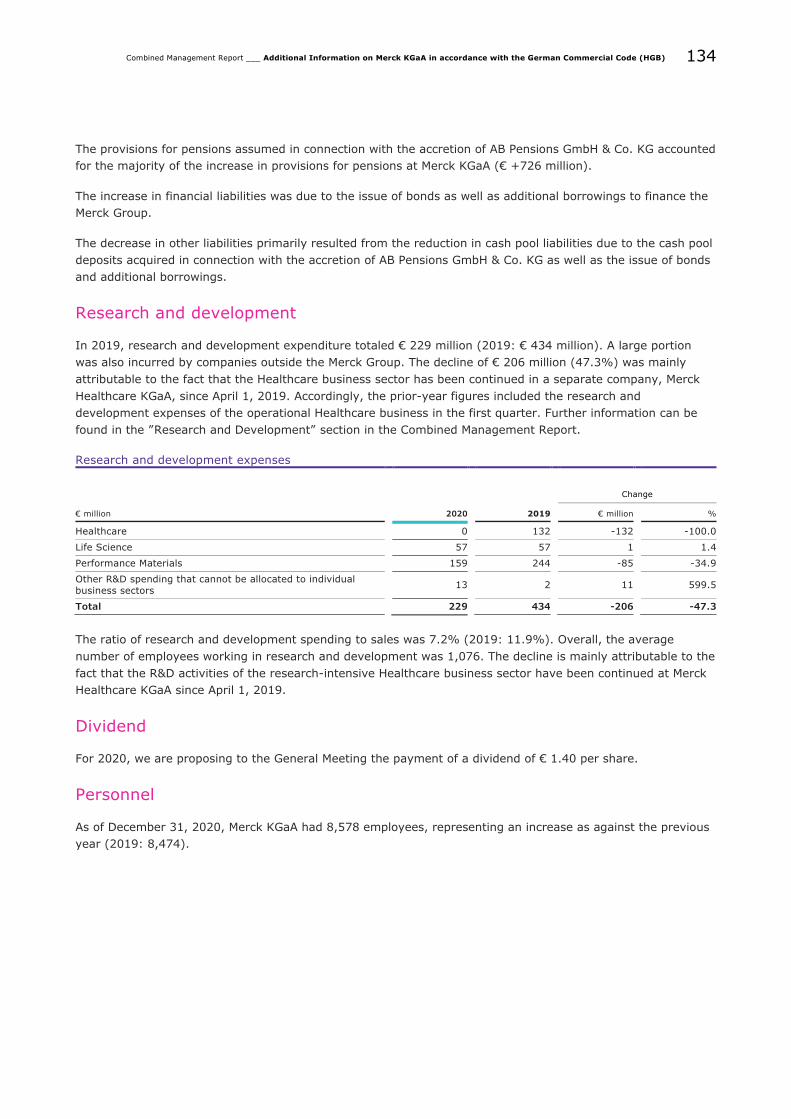
134
Combined Management Report ___ Additional Information on Merck KGaA in accordance with the German Commercial Code (HGB)
The provisions for pensions assumed in connection with the accretion of AB Pensions GmbH & Co. KG accounted
for the majority of the increase in provisions for pensions at Merck KGaA (€ +726 million).
The increase in financial liabilities was due to the issue of bonds as well as additional borrowings to finance the
Merck Group.
The decrease in other liabilities primarily resulted from the reduction in cash pool liabilities due to the cash pool
deposits acquired in connection with the accretion of AB Pensions GmbH & Co. KG as well as the issue of bonds
and additional borrowings.
Research and development
In 2019, research and development expenditure totaled € 229 million (2019: € 434 million). A large portion
was also incurred by companies outside the Merck Group. The decline of € 206 million (47.3%) was mainly
attributable to the fact that the Healthcare business sector has been continued in a separate company, Merck
Healthcare KGaA, since April 1, 2019. Accordingly, the prior-year figures included the research and
development expenses of the operational Healthcare business in the first quarter. Further information can be
found in the ”Research and Development” section in the Combined Management Report.
Research and development expenses
Change
€ million 2020 2019 € million %
Healthcare 0 132 -132 -100.0
Life Science 57 57 1 1.4
Performance Materials 159 244 -85 -34.9
Other R&D spending that cannot be allocated to individual
business sectors 13 2 11 599.5
Total 229 434 -206 -47.3
The ratio of research and development spending to sales was 7.2% (2019: 11.9%). Overall, the average
number of employees working in research and development was 1,076. The decline is mainly attributable to the
fact that the R&D activities of the research-intensive Healthcare business sector have been continued at Merck
Healthcare KGaA since April 1, 2019.
Dividend
For 2020, we are proposing to the General Meeting the payment of a dividend of € 1.40 per share.
Personnel
As of December 31, 2020, Merck KGaA had 8,578 employees, representing an increase as against the previous
year (2019: 8,474).

135
Combined Management Report ___ Additional Information on Merck KGaA in accordance with the German Commercial Code (HGB)
The average number of employees by functional area is as follows:
Personnel
Average number of employees during the year 2020 2019
Production 3,222 3,164
Administration 3,119 3,143
Research 1,076 1,678
Logistics 633 620
Marketing and sales 470 510
Other 16 23
Total 8,536 9,138
Risks and opportunities
Merck KGaA is largely subject to the same opportunities and risks as the Merck Group. More information can be
found in the Report on Risks and Opportunities.
Forecast for Merck KGaA
Deviations of actual business development in 2020 from the previously reported guidance
The Combined Management Report for 2019 initially forecast a substantial decline in net sales in 2020. This was
due to the planned termination of the business leasing contracts with Merck Life Science Germany GmbH and
Merck Performance Materials Germany GmbH as well as the resulting transfer of the operating business of the
Life Science and Performance Materials business sectors. In the updated forecast on May 12, 2020, net sales in
the Life Science and Performance Materials business sectors were expected to be at the same level as in 2019
based on the revised project planning and the development of the Covid-19 pandemic at the time of the
update. Net income was also expected to be the same as in the previous year.
In the Performance Materials business sector, sales in the Display Solutions business unit including OLED sales
declined by -16.7% year-on-year. A sharp increase in sales in the Surface Solutions business unit (+27.0%)
including Cosmetics sales, was not enough to offset this decline. This increase largely resulted from the sale of
inventories to Merck Performance Materials Germany GmbH at their net carrying amount as of January 1, 2020.
Net sales in the Life Science business sector increased by a double-digit rate compared with the previous year,
mainly due to the Process Solutions business unit (+35.7%). The Applied Solutions (+3.0%) and Research
Solutions (+2.9%) business units also contributed to this development.
The continuation of the Healthcare business sector in Merck Healthcare KGaA led to a fall in the associated net
sales and cost of materials and personnel, and other operating expenses at Merck KGaA as expected. Overall,
the net income for the year was at a comparable level to the previous year.

136
Combined Management Report ___ Additional Information on Merck KGaA in accordance with the German Commercial Code (HGB)
Forecast 2021
In fiscal 2021, net sales are expected to be at a similar level to 2020.
As in the previous year, the financing costs of the Sigma-Aldrich acquisition and the Versum Materials
acquisition will continue to adversely affect net income. Nevertheless, net income for 2021 is expected to be at
a comparable level to 2020 due to the positive investment income and dividends from the subsidiaries.
Merck Financial Services GmbH, Darmstadt, will provide the company with sufficient financial resources and
thus ensure liquidity.
No risks that could jeopardize the continued existence of the company have been identified.
ANNUAL FINANCIAL STATEMENTS
138 BalanceSheetasofDecember31,2020
139 IncomeStatementfortheperiodfromJanuary1toDecember31,2020
140 Statement of Changes in Fixed Assets
141 Notesforthefiscalyear2020
145 Notes to the Balance Sheet
155 Notes to the Income Statement
159 Other Disclosures
163 Members of the Executive Board of Merck KGaA
164 Members of the Supervisory Board of Merck KGaA
165 Disclosuresinaccordancewithsection160(1)no.8 of the German Stock Corporation Act (AktG)
167 ListofShareholdingsofMerckKGaAasofDecember31,2020
186 Reproduction of the Independent Auditor’s Report
193 Responsibility Statement in accordance with section 264 (2) sentence 3 HGB and section 289 (1) sentence 5 HGB
194 Report of the Supervisory Board
198 Financial Calendar
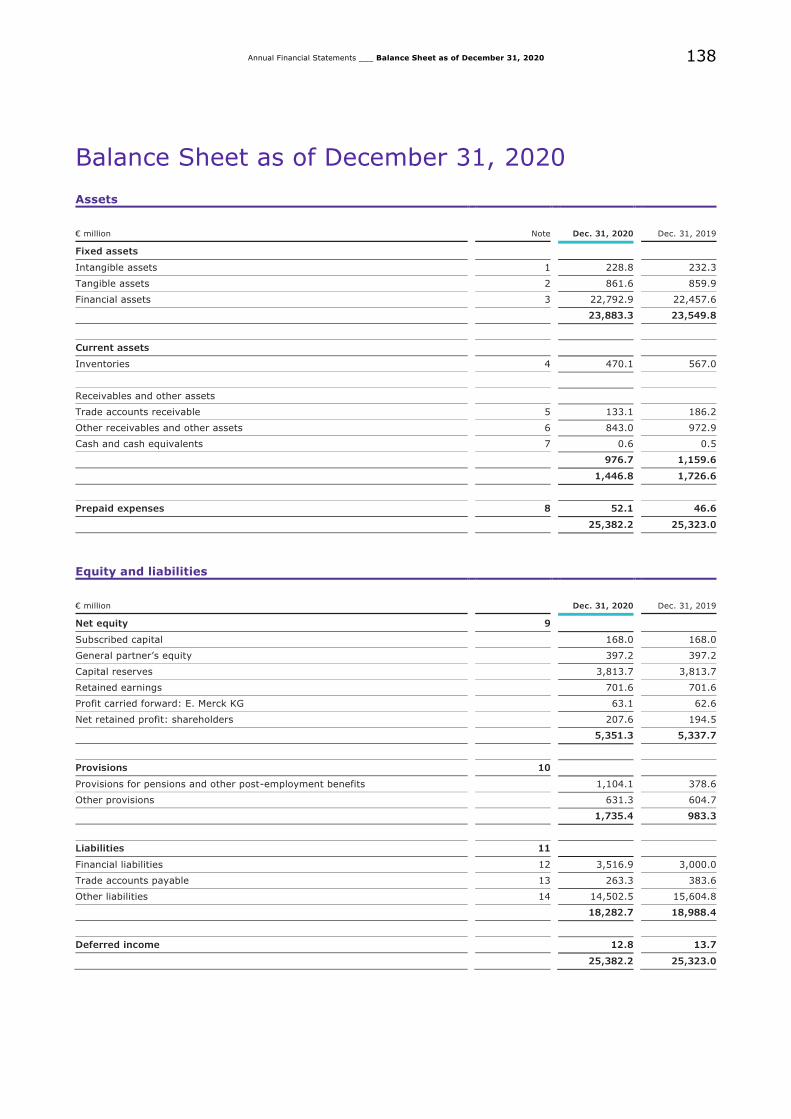
138
Annual Financial Statements ___ Balance Sheet as of December 31, 2020
Balance Sheet as of December 31, 2020
Assets
€ million Note Dec. 31, 2020 Dec. 31, 2019
Fixed assets
Intangible assets 1 228.8 232.3
Tangible assets 2 861.6 859.9
Financial assets 3 22,792.9 22,457.6
23,883.3 23,549.8
Current assets
Inventories 4 470.1 567.0
Receivables and other assets
Trade accounts receivable 5 133.1 186.2
Other receivables and other assets 6 843.0 972.9
Cash and cash equivalents 7 0.6 0.5
976.7 1,159.6
1,446.8 1,726.6
Prepaid expenses 8 52.1 46.6
25,382.2 25,323.0
Equity and liabilities
€ million Dec. 31, 2020 Dec. 31, 2019
Net equity 9
Subscribed capital 168.0 168.0
General partner’s equity 397.2 397.2
Capital reserves 3,813.7 3,813.7
Retained earnings 701.6 701.6
Profit carried forward: E. Merck KG 63.1 62.6
Net retained profit: shareholders 207.6 194.5
5,351.3 5,337.7
Provisions 10
Provisions for pensions and other post-employment benefits 1,104.1 378.6
Other provisions 631.3 604.7
1,735.4 983.3
Liabilities 11
Financial liabilities 12 3,516.9 3,000.0
Trade accounts payable 13 263.3 383.6
Other liabilities 14 14,502.5 15,604.8
18,282.7 18,988.4
Deferred income 12.8 13.7
25,382.2 25,323.0
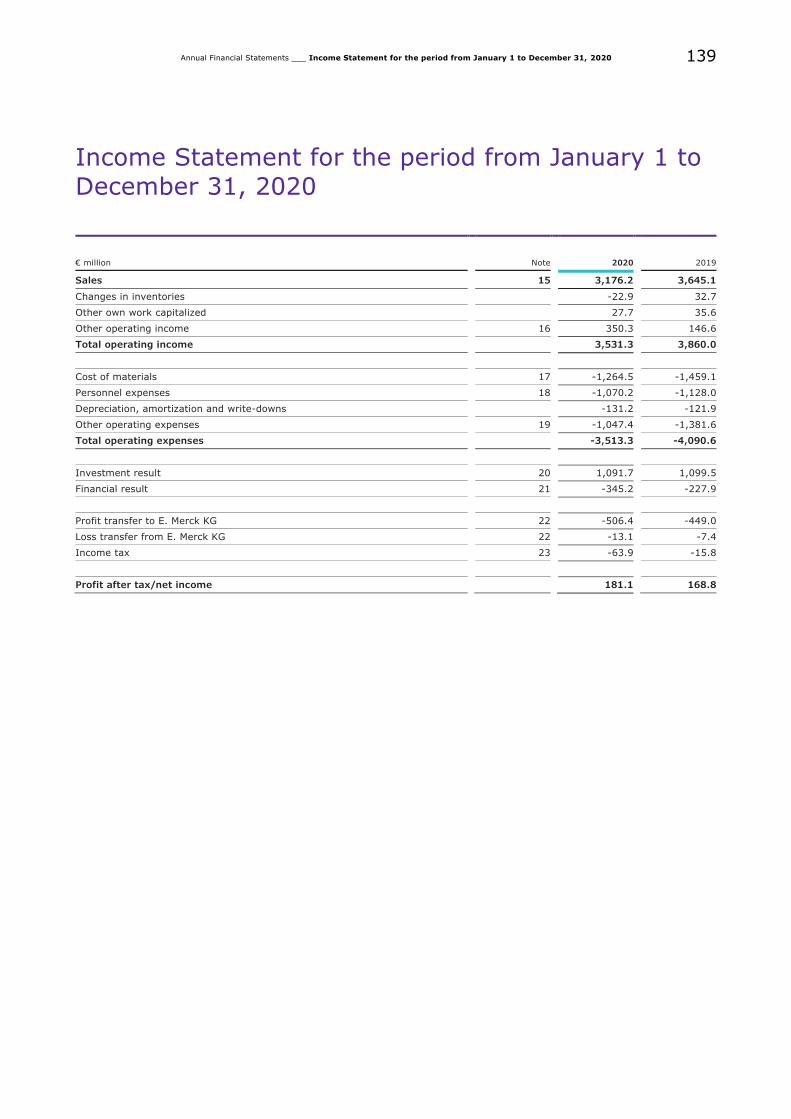
139
Annual Financial Statements ___ Income Statement for the period from January 1 to December 31, 2020
Income Statement for the period from January 1 to
December 31, 2020
€ million Note 2020 2019
Sales 15 3,176.2 3,645.1
Changes in inventories -22.9 32.7
Other own work capitalized 27.7 35.6
Other operating income 16 350.3 146.6
Total operating income 3,531.3 3,860.0
Cost of materials 17 -1,264.5 -1,459.1
Personnel expenses 18 -1,070.2 -1,128.0
Depreciation, amortization and write-downs -131.2 -121.9
Other operating expenses 19 -1,047.4 -1,381.6
Total operating expenses -3,513.3 -4,090.6
Investment result 20 1,091.7 1,099.5
Financial result 21 -345.2 -227.9
Profit transfer to E. Merck KG 22 -506.4 -449.0
Loss transfer from E. Merck KG 22 -13.1 -7.4
Income tax 23 -63.9 -15.8
Profit after tax/net income 181.1 168.8
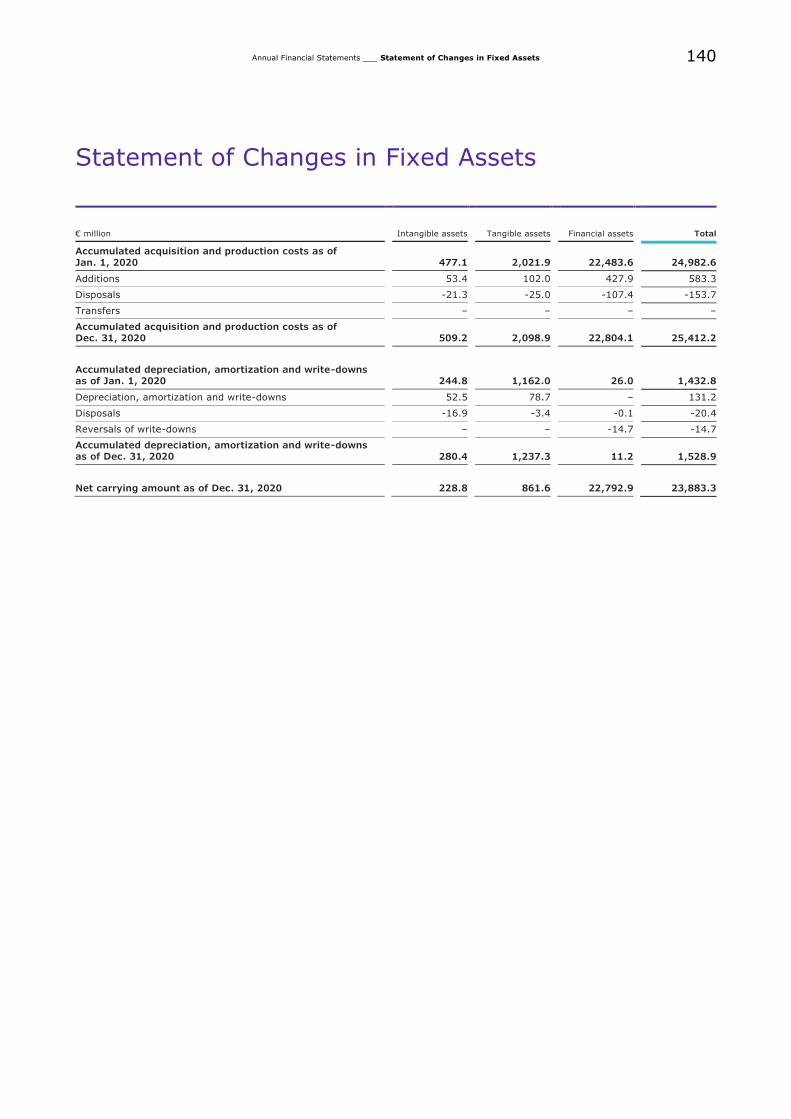
140
Annual Financial Statements ___ Statement of Changes in Fixed Assets
Statement of Changes in Fixed Assets
€ million Intangible assets Tangible assets Financial assets Total
Accumulated acquisition and production costs as of
Jan. 1, 2020 477.1 2,021.9 22,483.6 24,982.6
Additions 53.4 102.0 427.9 583.3
Disposals -21.3 -25.0 -107.4 -153.7
Transfers – – – –
Accumulated acquisition and production costs as of Dec. 31, 2020 509.2 2,098.9 22,804.1 25,412.2
Accumulated depreciation, amortization and write-downs
as of Jan. 1, 2020 244.8 1,162.0 26.0 1,432.8
Depreciation, amortization and write-downs 52.5 78.7 – 131.2
Disposals -16.9 -3.4 -0.1 -20.4
Reversals of write-downs – – -14.7 -14.7
Accumulated depreciation, amortization and write-downs as of Dec. 31, 2020 280.4 1,237.3 11.2 1,528.9
Net carrying amount as of Dec. 31, 2020 228.8 861.6 22,792.9 23,883.3
141
Annual Financial Statements ___ Notes for the fiscal year 2020
Notes for the fiscal year 2020
General Disclosures
The Annual Financial statements of MERCK Kommanditgesellschaft auf Aktien, Darmstadt, (hereinafter Merck
KGaA) have been prepared in accordance with the provisions of the German Commercial Code (HGB) applicable
to large corporations, the German Stock Corporation Act (AktG), and the supplementary provisions of the
Articles of Association. The income statement has been prepared in accordance with the total cost (nature of
expense) method. Deferred taxes have not been reported as there is an excess of deferred tax assets. Plan
assets are offset against the relevant provisions in accordance with section 246 HGB. For details, please see the
Notes to the items of the balance sheet and the income statement. Merck KGaA prepares consolidated financial
statements. In addition, Merck KGaA is included in the consolidated financial statements of the E. Merck KG,
Darmstadt, (hereinafter E. Merck KG). Both sets of financial statements are filed with the German Federal
Gazette (Bundesanzeiger) and are available at www.bundesanzeiger.de. Certain items of the balance sheet and
income statement have been combined in order to enhance the clarity of presentation. These items are shown
separately in the Notes. Notes which may optionally be disclosed in the balance sheet or income statement or in
the notes to the financial statements are included in the notes to the financial statements.
Effects of material company agreements on the net assets, financial position,
and results of operations
End of the temporary business lease of the Healthcare and Performance Materials
business sectors
As part of the strategic development of Merck KGaA, the existing operating activities of the Healthcare, Life
Science, and Performance Materials business sectors within Merck KGaA, together with the relevant assets and
liabilities (hereinafter: “operating sectors”) were spun off at their carrying amounts into three separate
companies (hereinafter: “OpCo” or plural “OpCos”) with the legal form of a GmbH or German limited liability
corporation (operating spin-off). This operating spin-off is based on the spin-off and takeover agreement
concluded between Merck KGaA and the OpCos in notarized form on March 2, 2018. Following approval by the
2018 Annual General Meeting, the operating spin-off took place with economic effect as of 0:00 on
January 1, 2018.
Immediately after the spin-off took effect, all shares held by Merck KGaA in the respective OpCos were
transferred to holding companies via a further spin-off (holding company spin-off), as a result of which the
OpCos are each indirectly held by Merck KGaA via an intermediate holding company. The acquiring legal entities
within the scope of the holding company spin-off were Merck Healthcare Holding GmbH for the business shares
of Healthcare OpCo, Merck Life Science Holding GmbH for the business shares of Life Science OpCo, and Merck
Performance Materials Holding GmbH for the business shares of Performance Materials OpCo (referred to
individually as “HoldCo”, independently of the sector, and jointly as “HoldCos”). To this end, Merck KGaA and
the HoldCos signed a notarized spin-off and takeover agreement on March 2, 2018. The holding company spin-
off took place with economic effect as of 0:00 on January 1, 2018.
Since the technical system requirements for the introduction of the sector-specific enterprise resource planning
(ERP) systems as regards the OpCos were not in place at the time of the spin-off, the business activities spun
off to the OpCos have been temporarily leased back by the relevant OpCos to Merck KGaA until sector-specific
ERP systems have been introduced. For this purpose, also on March 2, 2018, Merck KGaA entered into a
business leasing contract with each respective OpCo with economic effect as of 0:00 on January 1, 2018, to
lease back all the operating business previously spun off to the OpCo. Under the terms of the respective
business leasing contract, Merck KGaA leases the entire operation from the respective OpCo, as well as all fixed
assets in this context; it acquires the current assets as well as certain liabilities and provisions at their carrying
amounts under German commercial law. The business lease allowed the spin-off measures to be implemented
for all OpCos with economic effect at a uniform time, 0:00 on January 1, 2018, while retaining the flexibility of
142
Annual Financial Statements ___ Notes for the fiscal year 2020
transitioning the management of the relevant operating business in accordance with the sector-specific ERP
introduction at an individual time to the OpCo in question in a targeted manner. On the basis of the business
leasing contract, Merck KGaA will temporarily continue to operate the spun-off business as a leaseholder in its
own name and for its own account. Once the relevant ERP systems have been introduced for the respective
OpCo, the business lease with this OpCo will be terminated and the business previously leased out will pass to
the OpCo.
The aforementioned spin-off and business leasing contracts form part of an overall entrepreneurial concept.
They were submitted to the General Meeting of Merck KGaA for approval on April 27, 2018, at the 2018 Annual
General Meeting, as a coherent restructuring measure and were approved. In 2018, the Healthcare OpCo
changed its legal form to that of a German corporation with general partners (“Kommanditgesellschaft auf
Aktien”) and has since been trading under the name of Merck Healthcare KGaA, Darmstadt.
The business leasing contract under which the Healthcare business sector was leased back to Merck KGaA was
terminated on January 11, 2019, with economic effect as of 24:00 on March 31, 2019. The sector-specific ERP
system for the Healthcare business sector was introduced as planned on April 1, 2019. As a result of the end of
the business leasing contract, the leased objects allocated to the Healthcare business sector at the end of the
lease – comprising current assets as well as certain liabilities and provisions, including the leased objects
acquired or created by means of maintenance, replacement, and expansion investments – were transferred to
Merck Healthcare KGaA at their carrying amounts under German commercial law and in a condition
commensurate with their continued and proper operational use up to the date the business leasing contract
ended. As the carrying amounts of the liabilities exceeded the carrying amounts of the assets, Merck KGaA
made a settlement payment to Merck Healthcare KGaA. In addition, the licenses for the intangible assets and
know-how leased to Merck KGaA came to an end.
As planned, the business leasing contract between Merck Performance Materials Germany GmbH and Merck
KGaA for the distribution and sales function of the Performance Materials business sector was terminated on
November 18, 2019, with economic effect as of 24:00 on December 31, 2019. By way of an agreement dated
November 18, 2019, the business leasing contract for the other functions of the Performance Materials business
sector remains in place. Accordingly, the distribution and sales function of the Performance Materials business
sector moved to Merck Performance Materials Germany GmbH with economic effect as of 0:00 on
January 1, 2020. The sector-specific ERP system for the distribution and sales function of the Performance
Materials business sector was introduced at Merck Performance Materials Germany GmbH as planned on
January 1, 2020. As a result of the partial termination of the business leasing contract, the leased objects
allocated to the distribution and sales function of the Performance Materials business sector at the end of the
lease – comprising current assets as well as certain liabilities and provisions – were transferred to Merck
Performance Materials Germany GmbH at their carrying amounts under German commercial law. The
contractual, process, procedural, and working relationships allocated to the function were also transferred to
Merck Performance Materials Germany GmbH.
As the carrying amounts of the assets exceeded the carrying amounts of the liabilities, Merck Performance
Materials Germany GmbH made a settlement payment to Merck KGaA. In addition, the licenses for the
intangible assets and know-how of the distribution and sales function leased to Merck KGaA came to an end.

143
Annual Financial Statements ___ Notes for the fiscal year 2020
The table below shows the assets and debt of Merck KGaA immediately before and after the partial termination
of the business lease and the transfer of the assets and debt to Merck Performance Materials Germany GmbH.
€ million
Merck KGaA
Dec. 31, 2019
Merck KGaA
Jan. 1, 2020
Assets
A. Fixed assets
Intangible assets 232.3 232.3
Tangible assets 859.9 859.9
Financial assets 22,457.6 22,457.6
23,549.8 23,549.8
B. Current assets
Inventories 567.0 504.9
Trade accounts receivable 186.2 178.6
Other receivables and other assets 972.9 1,037.8
Cash and cash equivalents 0.5 0.5
1,726.6 1,721.8
C. Prepaid expenses 46.6 46.6
Total assets 25,323.0 25,318.2
Equity and liabilities
A. Net equity
Subscribed capital 168.0 168.0
General partner's equity 397.2 397.2
Capital reserves 3,813.7 3,813.7
Retained earnings 701.6 701.6
Profit carried forward E. Merck KG 62.6 62.6
Net retained profit: shareholders 194.5 194.5
5,337.7 5,337.7
B. Provisions
Provisions for pensions and other post-employment benefits 378.6 378.6
Other provisions 604.7 600.9
983.3 979.5
C. Liabilities
Financial liabilities 3,000.0 3,000.0
Trade accounts payable 383.6 382.7
Other liabilities 15,604.8 15,604.7
18,988.4 18,987.4
D. Deferred income 13.7 13.7
Total equity and liabilities 25,323.0 25,318.2
144
Annual Financial Statements ___ Notes for the fiscal year 2020
Merger of AB Pensions GmbH & Co. KG
With the agreement dated July 24, 2020, AB Pensionsverwaltung GmbH retired as complementary of AB
Allgemeine Pensions GmbH & Co. KG (hereinafter “AB Pensions GmbH & Co. KG”) with effect from August 31,
2020. At the same time, the AB Pensions GmbH & Co. KG merged to its sole limited partner Merck KGaA. The
assets and liabilities were transferred to Merck KGaA at their carrying amounts. For a better comparability, the
main assets and liabilities are listed in the notes to the financial statements in the relevant financial statement
captions. The main captions affected by the merger were pension provisions, cash pool and financial assets as
well as other operating income in the income statement.
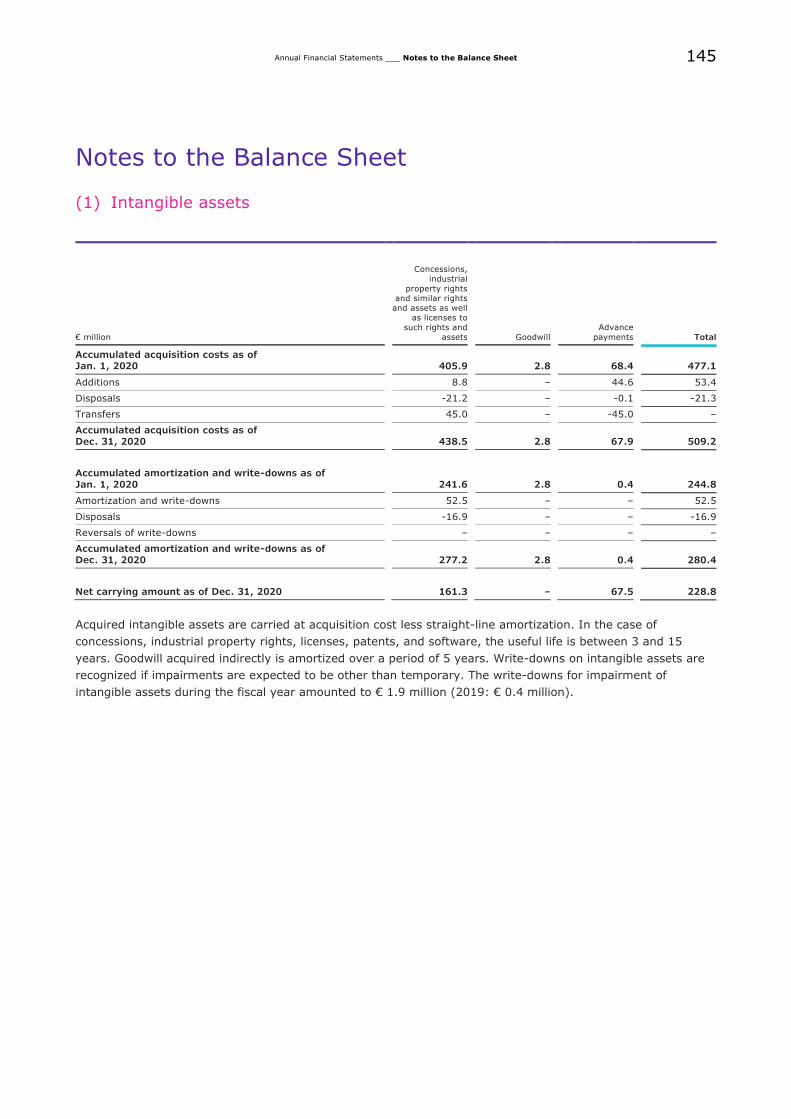
145
Annual Financial Statements ___ Notes to the Balance Sheet
Notes to the Balance Sheet
(1) Intangible assets
€ million
Concessions,
industrial
property rights and similar rights
and assets as well as licenses to
such rights and
assets Goodwill
Advance
payments Total
Accumulated acquisition costs as of Jan. 1, 2020 405.9 2.8 68.4 477.1
Additions 8.8 – 44.6 53.4
Disposals -21.2 – -0.1 -21.3
Transfers 45.0 – -45.0 –
Accumulated acquisition costs as of
Dec. 31, 2020 438.5 2.8 67.9 509.2
Accumulated amortization and write-downs as of
Jan. 1, 2020 241.6 2.8 0.4 244.8
Amortization and write-downs 52.5 – – 52.5
Disposals -16.9 – – -16.9
Reversals of write-downs – – – –
Accumulated amortization and write-downs as of
Dec. 31, 2020 277.2 2.8 0.4 280.4
Net carrying amount as of Dec. 31, 2020 161.3 – 67.5 228.8
Acquired intangible assets are carried at acquisition cost less straight-line amortization. In the case of
concessions, industrial property rights, licenses, patents, and software, the useful life is between 3 and 15
years. Goodwill acquired indirectly is amortized over a period of 5 years. Write-downs on intangible assets are
recognized if impairments are expected to be other than temporary. The write-downs for impairment of
intangible assets during the fiscal year amounted to € 1.9 million (2019: € 0.4 million).
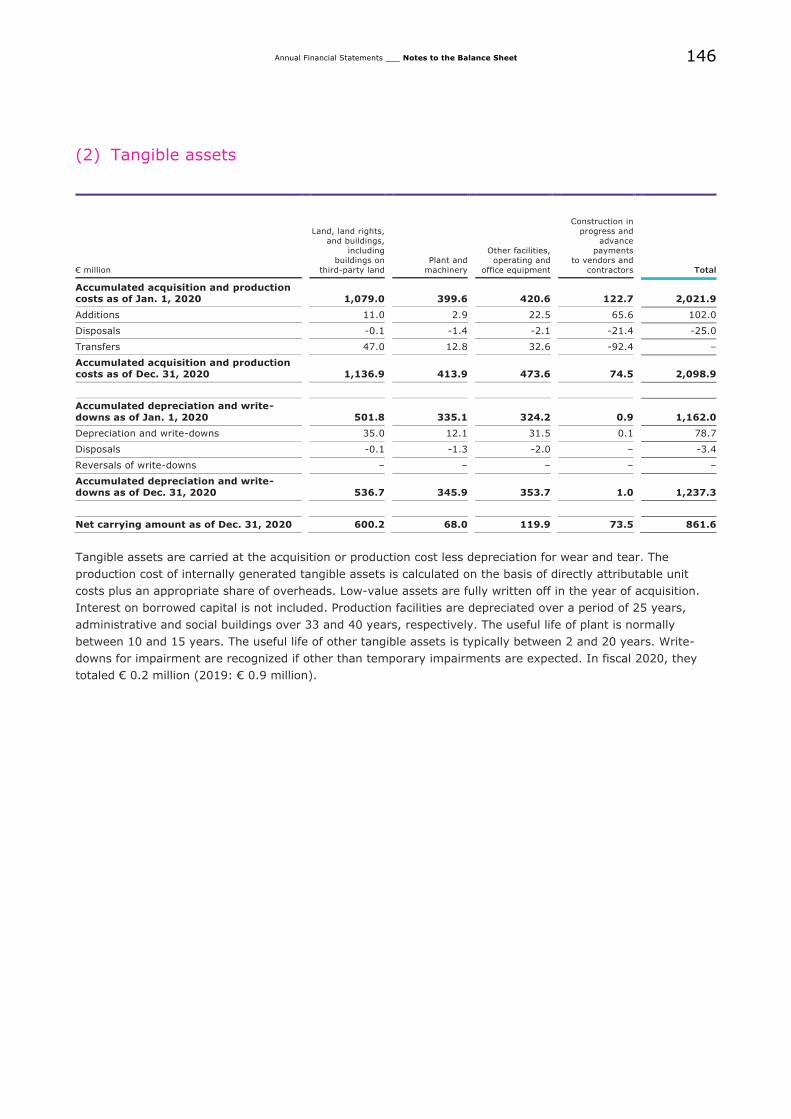
146
Annual Financial Statements ___ Notes to the Balance Sheet
(2) Tangible assets
€ million
Land, land rights,
and buildings, including
buildings on
third-party land
Plant and
machinery
Other facilities,
operating and
office equipment
Construction in
progress and
advance payments
to vendors and
contractors Total
Accumulated acquisition and production costs as of Jan. 1, 2020
1,079.0 399.6 420.6 122.7 2,021.9
Additions 11.0 2.9 22.5 65.6 102.0
Disposals -0.1 -1.4 -2.1 -21.4 -25.0
Transfers 47.0 12.8 32.6 -92.4 –
Accumulated acquisition and production
costs as of Dec. 31, 2020
1,136.9 413.9 473.6 74.5 2,098.9
Accumulated depreciation and write-
downs as of Jan. 1, 2020
501.8 335.1 324.2 0.9 1,162.0
Depreciation and write-downs 35.0 12.1 31.5 0.1 78.7
Disposals -0.1 -1.3 -2.0 – -3.4
Reversals of write-downs – – – – –
Accumulated depreciation and write-downs as of Dec. 31, 2020
536.7 345.9 353.7 1.0 1,237.3
Net carrying amount as of Dec. 31, 2020 600.2 68.0 119.9 73.5 861.6
Tangible assets are carried at the acquisition or production cost less depreciation for wear and tear. The
production cost of internally generated tangible assets is calculated on the basis of directly attributable unit
costs plus an appropriate share of overheads. Low-value assets are fully written off in the year of acquisition.
Interest on borrowed capital is not included. Production facilities are depreciated over a period of 25 years,
administrative and social buildings over 33 and 40 years, respectively. The useful life of plant is normally
between 10 and 15 years. The useful life of other tangible assets is typically between 2 and 20 years. Write-
downs for impairment are recognized if other than temporary impairments are expected. In fiscal 2020, they
totaled € 0.2 million (2019: € 0.9 million).
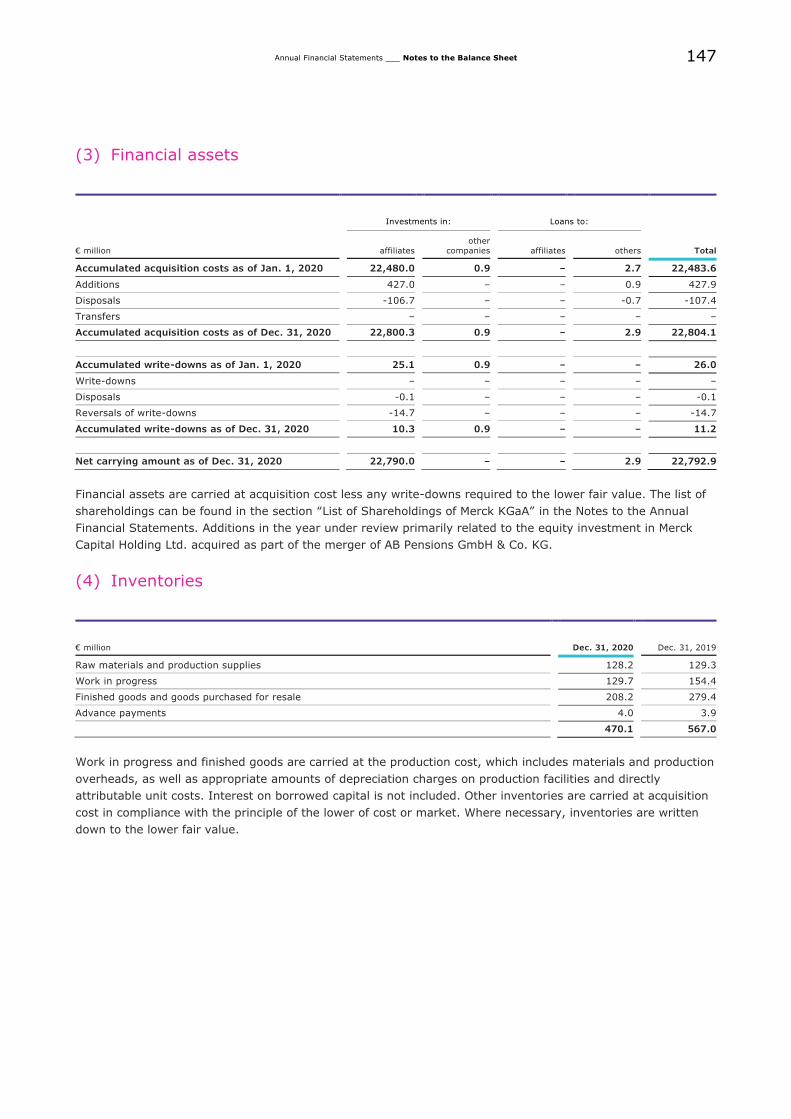
147
Annual Financial Statements ___ Notes to the Balance Sheet
(3) Financial assets
Investments in: Loans to:
€ million
affiliates
other
companies affiliates others Total
Accumulated acquisition costs as of Jan. 1, 2020 22,480.0 0.9 – 2.7 22,483.6
Additions 427.0 – – 0.9 427.9
Disposals -106.7 – – -0.7 -107.4
Transfers – – – – –
Accumulated acquisition costs as of Dec. 31, 2020 22,800.3 0.9 – 2.9 22,804.1
Accumulated write-downs as of Jan. 1, 2020 25.1 0.9 – – 26.0
Write-downs – – – – –
Disposals -0.1 – – – -0.1
Reversals of write-downs -14.7 – – – -14.7
Accumulated write-downs as of Dec. 31, 2020 10.3 0.9 – – 11.2
Net carrying amount as of Dec. 31, 2020 22,790.0 – – 2.9 22,792.9
Financial assets are carried at acquisition cost less any write-downs required to the lower fair value. The list of
shareholdings can be found in the section “List of Shareholdings of Merck KGaA” in the Notes to the Annual
Financial Statements. Additions in the year under review primarily related to the equity investment in Merck
Capital Holding Ltd. acquired as part of the merger of AB Pensions GmbH & Co. KG.
(4) Inventories
€ million Dec. 31, 2020 Dec. 31, 2019
Raw materials and production supplies 128.2 129.3
Work in progress 129.7 154.4
Finished goods and goods purchased for resale 208.2 279.4
Advance payments 4.0 3.9
470.1 567.0
Work in progress and finished goods are carried at the production cost, which includes materials and production
overheads, as well as appropriate amounts of depreciation charges on production facilities and directly
attributable unit costs. Interest on borrowed capital is not included. Other inventories are carried at acquisition
cost in compliance with the principle of the lower of cost or market. Where necessary, inventories are written
down to the lower fair value.

148
Annual Financial Statements ___ Notes to the Balance Sheet
(5) Trade accounts receivable
€ million
Total
Dec. 31, 2020
thereof due after
more than 1 year
Total
Dec. 31, 2019
thereof due after
more than 1 year
Receivables from affiliates 82.6 – 114.7 –
Receivables from other companies 50.5 – 71.5 –
133.1 – 186.2 –
Trade accounts receivable are carried at their nominal amount. Adequate specific and global valuation
allowances are charged for default and transfer risks unless these are covered by insurance. Short-term
receivables denominated in foreign currencies were translated at the closing rates.
(6) Other receivables and other assets
€ million
Total
Dec. 31, 2020
thereof due after
more than 1 year
Total
Dec. 31, 2019
thereof due after
more than 1 year
Receivables from affiliates 630.4 – 753.2 –
- thereof from the general partner E. Merck KG (–) (–) (–) (–)
Receivables from other companies 20.8 – 13.5 –
Tax receivables 189.4 – 203.3 –
Other assets 2.4 – 2.9 –
843.0 – 972.9 –
Other receivables and other assets are carried at their nominal amount. Any default or other risks are covered
by appropriate valuation allowances. Short-term receivables denominated in foreign currencies were translated
at the closing rates. This item essentially relates to clearing accounts and short-term loans with other
companies of the Merck Group, recoverable taxes, and other advance payments.
(7) Cash and cash equivalents
Cash and cash equivalents relate essentially to credit balances at various banks in a variety of currencies.
Foreign currency amounts are measured at the closing rate.
(8) Prepaid expenses
Prepaid expenses comprise amounts that will only be expensed after the end of the reporting period. This item
mainly includes IT services as well as a discount of € 3.3 million (2019: € 4.7 million).
149
Annual Financial Statements ___ Notes to the Balance Sheet
(9) Net equity
The share capital is reported under subscribed capital. The total capital consists of the share capital (Article 5
(1) of the company’s Articles of Association) of € 168,014,927.60, composed of shares, and the equity interest
held by the general partner E. Merck KG, Emanuel-Merck-Platz 1, 64293 Darmstadt, Germany, (Article 8 (1) of
the company’s Articles of Association) of € 397,196,314.35. The company’s share capital is composed of
129,242,251 shares and one registered share. The accounting par value of one share is € 1.30. The Executive
Board is authorized, with the approval of the Supervisory Board and of E. Merck KG, to increase the share
capital on one or several occasions until April 27, 2022, by up to a total of € 56,521,124.19 by issuing new
shares against cash and/or contributions in kind (Authorized Capital 2017). The new shares may be assumed by
certain banks appointed by the Executive Board with the obligation to offer them to the limited liability
shareholders (indirect subscription right). The Executive Board is authorized, with the approval of the
Supervisory Board, to exclude the legal subscription right of the limited liability shareholders in the following
cases:
• in the case of a capital increase against cash contributions pursuant to or by analogous application of
section 186 (3) sentence 4 AktG, if the issue price of the new shares is not substantially lower than
the stock exchange price of the company's shares already listed and if the new shares which are
issued under exclusion of the subscription right do not exceed a proportional amount of 10% of the
share capital either at the time of the Authorized Capital 2017 taking effect or at the time of the
Authorized Capital 2017 being utilized. This restriction to 10% of the share capital shall include the
proportional amount of the share capital that is attributable to shares that are issued under exclusion
of the subscription right or sold during the term of the Authorized Capital 2017, based on an
authorization to issue new shares or sell own shares by direct or analogous application of section 186
(3) sentence 4 AktG. Further, this restriction shall also include the proportional amount of the share
capital that is attributable to shares which may or must be issued in order to service bonds carrying a
conversion or option right or a conversion or option obligation, if the bonds are issued during the term
of the Authorized Capital 2017 under the exclusion of the limited liability shareholders' subscription
right by analogous application of section 186 (3) sentence 4 AktG;
• in the case of capital increases through non-cash contributions, particularly for the purpose of
acquiring enterprises, parts of enterprises or interests in enterprises;
• to enable E. Merck KG to exercise its right in accordance with Article 32 (3) of the company’s Articles
of Association to participate in a capital increase by issuing shares or freely transferable share
subscription rights;
• to enable E. Merck KG to exercise its right in accordance with Article 33 of the company’s Articles of
Association to convert its equity interest into share capital;
• if and to the extent this is necessary to grant the holders or creditors of conversion or option rights,
and/or the holders or creditors of financing instruments carrying conversion or option obligations,
which were or are issued by the company or by a domestic or foreign company in which the company
directly or indirectly holds the majority of the votes and capital, a subscription right to the extent to
which they would be entitled after the exercise of the conversion or option rights or after the
performance of a conversion or option obligation; and
• to exclude fractional amounts from the subscription right.
The Executive Board is authorized, with the approval of the Supervisory Board, to determine the additional
details of the capital increase and its execution, including the content of the share rights as well as the terms
and conditions of the share issue. The Supervisory Board is authorized to amend Article 5 (3) of the Articles of
Association according to the respective utilization of Authorized Capital 2017 or after expiration of the
authorization period. The share capital is contingently increased by up to € 66,406,298.40, divided into
51,081,768 shares (Contingent Capital I). The contingent capital increase serves to grant exchange rights to
E. Merck KG in accordance with Article 33 of the company’s Articles of Association to enable it to convert its
equity interest into shares. The shares carry dividend rights from the beginning of the fiscal year following the
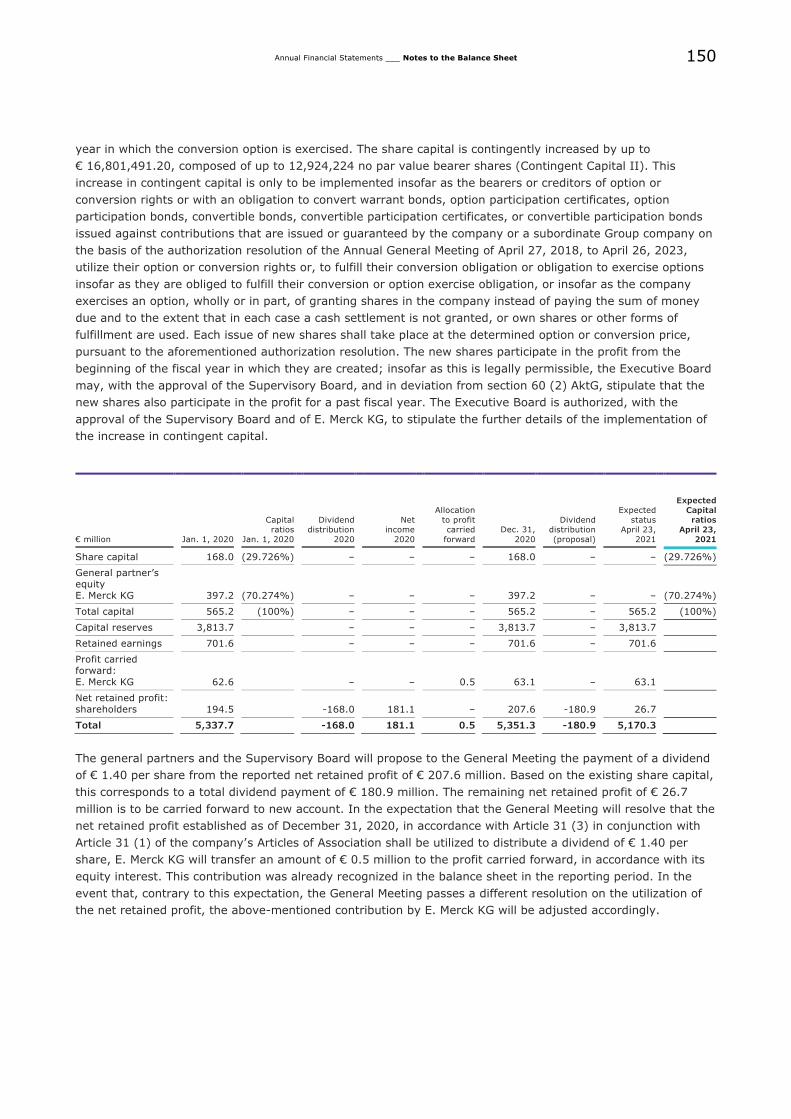
150
Annual Financial Statements ___ Notes to the Balance Sheet
year in which the conversion option is exercised. The share capital is contingently increased by up to
€ 16,801,491.20, composed of up to 12,924,224 no par value bearer shares (Contingent Capital II). This
increase in contingent capital is only to be implemented insofar as the bearers or creditors of option or
conversion rights or with an obligation to convert warrant bonds, option participation certificates, option
participation bonds, convertible bonds, convertible participation certificates, or convertible participation bonds
issued against contributions that are issued or guaranteed by the company or a subordinate Group company on
the basis of the authorization resolution of the Annual General Meeting of April 27, 2018, to April 26, 2023,
utilize their option or conversion rights or, to fulfill their conversion obligation or obligation to exercise options
insofar as they are obliged to fulfill their conversion or option exercise obligation, or insofar as the company
exercises an option, wholly or in part, of granting shares in the company instead of paying the sum of money
due and to the extent that in each case a cash settlement is not granted, or own shares or other forms of
fulfillment are used. Each issue of new shares shall take place at the determined option or conversion price,
pursuant to the aforementioned authorization resolution. The new shares participate in the profit from the
beginning of the fiscal year in which they are created; insofar as this is legally permissible, the Executive Board
may, with the approval of the Supervisory Board, and in deviation from section 60 (2) AktG, stipulate that the
new shares also participate in the profit for a past fiscal year. The Executive Board is authorized, with the
approval of the Supervisory Board and of E. Merck KG, to stipulate the further details of the implementation of
the increase in contingent capital.
€ million Jan. 1, 2020
Capital
ratios
Jan. 1, 2020
Dividend
distribution
2020
Net
income
2020
Allocation
to profit
carried
forward
Dec. 31,
2020
Dividend
distribution
(proposal)
Expected
status
April 23,
2021
Expected
Capital ratios
April 23,
2021
Share capital 168.0 (29.726%) – – – 168.0 – – (29.726%)
General partner’s equity E. Merck KG
397.2 (70.274%) – – – 397.2 – – (70.274%)
Total capital 565.2 (100%) – – – 565.2 – 565.2 (100%)
Capital reserves 3,813.7 – – – 3,813.7 – 3,813.7
Retained earnings 701.6 – – – 701.6 – 701.6
Profit carried forward: E. Merck KG
62.6 – – 0.5 63.1 – 63.1
Net retained profit: shareholders
194.5 -168.0 181.1 – 207.6 -180.9 26.7
Total 5,337.7 -168.0 181.1 0.5 5,351.3 -180.9 5,170.3
The general partners and the Supervisory Board will propose to the General Meeting the payment of a dividend
of € 1.40 per share from the reported net retained profit of € 207.6 million. Based on the existing share capital,
this corresponds to a total dividend payment of € 180.9 million. The remaining net retained profit of € 26.7
million is to be carried forward to new account. In the expectation that the General Meeting will resolve that the
net retained profit established as of December 31, 2020, in accordance with Article 31 (3) in conjunction with
Article 31 (1) of the company’s Articles of Association shall be utilized to distribute a dividend of € 1.40 per
share, E. Merck KG will transfer an amount of € 0.5 million to the profit carried forward, in accordance with its
equity interest. This contribution was already recognized in the balance sheet in the reporting period. In the
event that, contrary to this expectation, the General Meeting passes a different resolution on the utilization of
the net retained profit, the above-mentioned contribution by E. Merck KG will be adjusted accordingly.

151
Annual Financial Statements ___ Notes to the Balance Sheet
(10) Provisions
€ million
Provisions
for pensions
and other post-
employment
benefits
Provisions
for tax
liabilities
Obligations
relating to
personnel
expenses
Provisions
for licenses,
commissions,
and rebates
Provisions
for outstanding
supplier
invoices
Provisions
for
litigation
Provisions
for
litigation Total
Jan. 1, 2020 378.6 127.4 125.0 5.1 85.2 95.4 166.6 983.3
Utilization1 -43.1 -27.3 -97.5 -4.6 -78.6 -2.8 -16.2 -270.1
Reversals -5.3 -18.2 -0.8 -0.9 -4.1 -63.3 -14.7 -107.3
Additions 773.9 89.9 113.7 4.8 71.3 27.5 48.4 1,129.5
Dec. 31, 2020 1,104.1 171.8 140.4 4.4 73.8 56.8 184.1 1,735.4
1 Includes transfers to Merck Performance Materials Germany GmbH.
2 Includes provisions taken over from AB Pensions GmbH & Co. KG.
The pension provisions are based on actuarial calculations. Pension obligations are calculated using the
internationally recognized projected unit credit method.
The carrying values in the financial statements under German commercial law are based on the 2018 G
Heubeck mortality tables. The amount calculated is discounted as a lump sum using the average market
interest rate for an assumed term of 15 years.
The discount rate was determined using a ten-year average of 2.30% (2019: 2.71%) in accordance with the
Deutsche Bundesbank. The difference in the discount rate resulting from the change in 2016 from a seven-year
average to a ten-year average amounted to € 190.0 million as of December 31, 2020 (December 31, 2019:
€ 170.8 million), and according to law it is barred from distribution.
Other key parameters are, as in 2018, a salary trend of 3% for exempt employees and 2.5% for non-exempt
employees, as well as a pension trend of 1% for obligations under the Pension Plan 2005 and 1.75% for prior
obligations.
After adjusting for the partial transfer of plan assets to the OpCos, Merck KGaA paid once its share of
contributions of € 502.9 million to the Merck Pensionstreuhand e. V. under a trust agreement in order to secure
employees’ future pension entitlements. These contributions qualify as plan assets, which must be offset
against pension provisions in accordance with section 246 (2) sentence 2 HGB. The plan assets mainly consist
of exchange-traded securities and were measured at current fair value. They had a fair value of € 647.3 million
as of December 31, 2020 (2019: € 633.1 million), and were fully offset against pension provisions. The increase
in fair value of € 14.2 million (2019: € 43.9 million) was included in the interest expense resulting from the
additions to pension provisions. In accordance with section 268 (8) HGB, an amount of € 144.4 million (2019:
€ 130.2 million) is barred from distribution. The effect of deferred taxes is already taken into account. The
settlement amount of pension obligations disclosed in the balance sheet amounted to € 1,751.5 million (2019:
€ 1,011.7 million). A settlement amount of € 608.3 million was assumed in connection with the merger of AB
Pensions GmbH Co. & KG.
The other provisions cover all identifiable risks and uncertain obligations. These are carried in the settlement
amount dictated by prudent business practice, taking into account any price and cost increases. Long-term
provisions are discounted at the average market interest rate of the preceding seven years in line with their
maturity.
Obligations relating to personnel expenses include provisions of € 108.0 million (2019: € 102.7 million) for
bonus payments, anniversaries, and vacation as well as working time credits.
The provisions for the anniversaries are based on actuarial calculations.
A demography fund was set up for all employees on the basis of the “Lebensarbeitszeit und Demografie
Chemie” (Working Life and Demographic Change – Collective Agreement for the German Chemical Industry)
dated April 16, 2008. Payments are regularly made into this fund and are invested with a trust under a trust
agreement. The corresponding provisions were offset against associated receivables from the trust arising from
the amounts invested (plan assets) in accordance with section 246 (2) sentence 2 HGB. The cost of the offset
plan assets, which were calculated by the weighted average method in the case of investments in securities, is
152
Annual Financial Statements ___ Notes to the Balance Sheet
€ 49.2 million (2019: € 37.1 million); the fair value is € 48.8 million (2019: € 39.9 million). The settlement
amount of the offset liabilities is € 48.8 million (2019: € 39.9 million). The remaining obligations of € 6.3 million
(2019: € 4.7 million) reported in this item relate to employees’ vacation entitlements within the framework of
the future use of long-term time accounts.
To assess a recognition obligation in relation to provisions for litigation and to quantify future outflows of
resources, Merck draws on the knowledge of the legal department as well as outside counsel.
Assessing the need for recognizing provisions for litigation is based on the likelihood of possible outcomes for
proceedings. In particular, the factors influencing this likelihood are:
• the validity of the arguments brought forward by the opposing party; and
• the legal situation and current court rulings in comparable proceedings in the jurisdiction in question.
The following factors are also relevant in measuring provisions for litigation:
• the duration of proceedings in pending legal disputes;
• the applicable license rate plus an expected infringement surcharge;
• the usual damages and fines for comparable legal disputes; and
• the discount factor to be used.
Like the measurement of provisions, the assessment of a recognition obligation for provisions for litigation is to
a particular extent subject to a degree of estimation uncertainty. The uncertainties relate, in particular, to the
assessment of the likelihood and the amount of the outflow of resources.
The legal matters described below represented the most significant legal risks.
Antitrust review proceedings for the acquisition of Sigma-Aldrich Corporation, United States, (Sigma-Aldrich):
On July 6, 2017, Merck received notice from the European Commission (EU Commission) in connection with the
antitrust review proceedings for the acquisition of Sigma-Aldrich, in which the EU Commission informed Merck
of its preliminary conclusion that Merck and Sigma-Aldrich allegedly transmitted incorrect and/or misleading
information within the scope of the acquisition of Sigma-Aldrich. The EU Commission received registration of
the merger on April 21, 2015, and granted clearance on June 15, 2015, subject to the condition that Merck and
Sigma-Aldrich divest parts of the European solvents and inorganic chemicals businesses of Sigma-Aldrich in
order to resolve antitrust concerns. According to the preliminary viewpoint of the EU Commission
communicated in a letter dated July 6, 2017, Merck and Sigma-Aldrich withheld related important information
about an innovation project. According to the EU Commission, the innovation project should have been included
in the remedies package. This resulted in an administrative procedure with the EU Commission. On July 1,
2020, the EU Commission informed Merck that the parts of the procedure relating to Merck were no longer
under investigation and that the procedure now related solely to the allegations against Sigma-Aldrich. The
procedure could result in the issuance of a fine that would be open to appeal. In the second quarter of 2020,
the existing provision in a mid double-digit euro amount was reduced to a low double-digit euro amount. As a
potential fine for the ongoing proceedings against Sigma-Aldrich would be borne by another Group company,
the provision in Merck KGaA was fully released.
Paroxetine: In the United Kingdom, Merck was subject to antitrust investigations by the British Competition and
Market Authority (CMA) in connection with the generics business that was divested in 2007. In March 2013, the
authorities informed Merck of the assumption that a settlement agreement entered into in 2002 between
Generics (UK) Ltd. and several subsidiaries of GlaxoSmithKline plc, United Kingdom, in connection with the
antidepressant drug paroxetine, violated British and European competition law. They stated that Merck was
liable as the then owner of Generics (UK) Ltd. and because it was involved in the negotiations for the
settlement agreement. The investigations into Generics (UK) Ltd. started in 2011, without this being known to
Merck. On February 11, 2016, the CMA imposed a fine in this matter. Merck has taken legal action against this
fine. The United Kingdom Competition Appeal Tribunal (CAT) submitted the relevant legal questions to the
European Court of Justice (CJEU) for a preliminary ruling. The CJEU confirmed in January 2020 that such
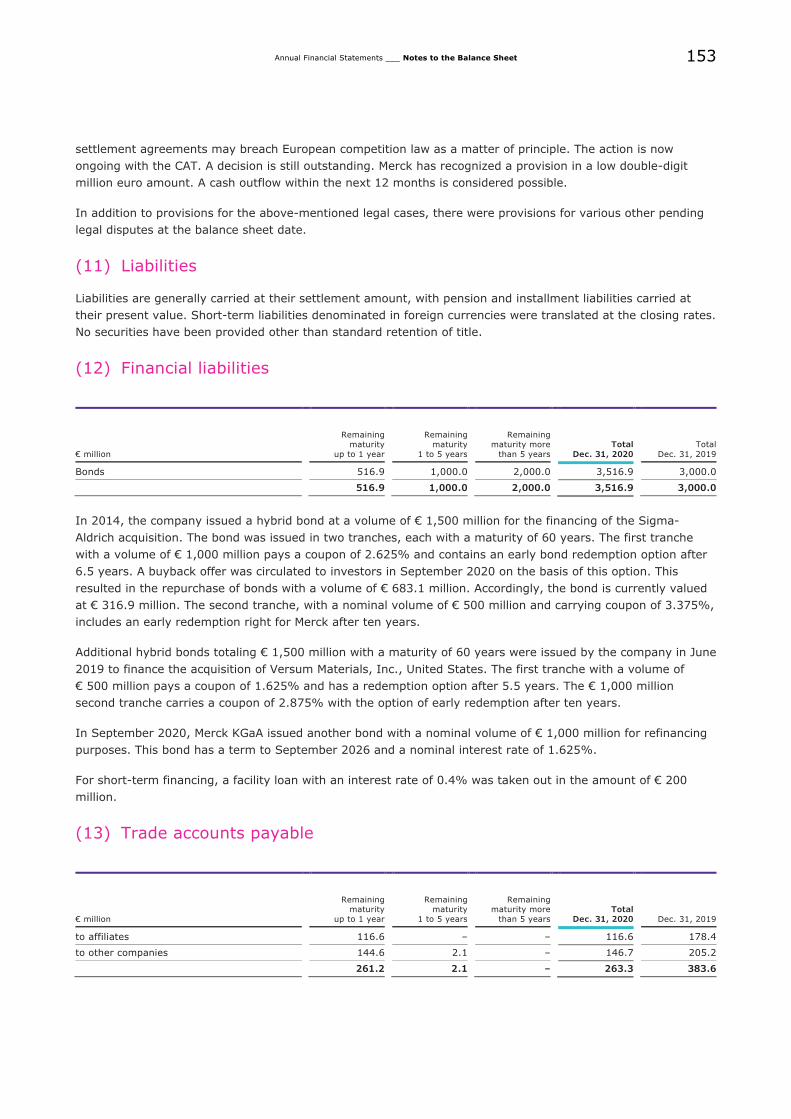
153
Annual Financial Statements ___ Notes to the Balance Sheet
settlement agreements may breach European competition law as a matter of principle. The action is now
ongoing with the CAT. A decision is still outstanding. Merck has recognized a provision in a low double-digit
million euro amount. A cash outflow within the next 12 months is considered possible.
In addition to provisions for the above-mentioned legal cases, there were provisions for various other pending
legal disputes at the balance sheet date.
(11) Liabilities
Liabilities are generally carried at their settlement amount, with pension and installment liabilities carried at
their present value. Short-term liabilities denominated in foreign currencies were translated at the closing rates.
No securities have been provided other than standard retention of title.
(12) Financial liabilities
€ million
Remaining
maturity
up to 1 year
Remaining
maturity
1 to 5 years
Remaining
maturity more
than 5 years
Total
Dec. 31, 2020
Total
Dec. 31, 2019
Bonds 516.9 1,000.0 2,000.0 3,516.9 3,000.0
516.9 1,000.0 2,000.0 3,516.9 3,000.0
In 2014, the company issued a hybrid bond at a volume of € 1,500 million for the financing of the Sigma-
Aldrich acquisition. The bond was issued in two tranches, each with a maturity of 60 years. The first tranche
with a volume of € 1,000 million pays a coupon of 2.625% and contains an early bond redemption option after
6.5 years. A buyback offer was circulated to investors in September 2020 on the basis of this option. This
resulted in the repurchase of bonds with a volume of € 683.1 million. Accordingly, the bond is currently valued
at € 316.9 million. The second tranche, with a nominal volume of € 500 million and carrying coupon of 3.375%,
includes an early redemption right for Merck after ten years.
Additional hybrid bonds totaling € 1,500 million with a maturity of 60 years were issued by the company in June
2019 to finance the acquisition of Versum Materials, Inc., United States. The first tranche with a volume of
€ 500 million pays a coupon of 1.625% and has a redemption option after 5.5 years. The € 1,000 million
second tranche carries a coupon of 2.875% with the option of early redemption after ten years.
In September 2020, Merck KGaA issued another bond with a nominal volume of € 1,000 million for refinancing
purposes. This bond has a term to September 2026 and a nominal interest rate of 1.625%.
For short-term financing, a facility loan with an interest rate of 0.4% was taken out in the amount of € 200
million.
(13) Trade accounts payable
€ million
Remaining maturity
up to 1 year
Remaining maturity
1 to 5 years
Remaining maturity more
than 5 years
Total
Dec. 31, 2020 Dec. 31, 2019
to affiliates 116.6 – – 116.6 178.4
to other companies 144.6 2.1 – 146.7 205.2
261.2 2.1 – 263.3 383.6

154
Annual Financial Statements ___ Notes to the Balance Sheet
(14) Other liabilities
€ million
Remaining
maturity
up to 1 year
Remaining
maturity
1 to 5 years
Remaining
maturity more
than 5 years
Total
Dec. 31, 2020 Dec. 31, 2019
to affiliates 14,431.7 – – 14,431.7 15,497.3
– thereof to the general partner E. Merck KG (519.1) – – (519.1) (454.6)
Advance payments from customers 0.5 – – 0.5 0.4
Other liabilities 66.1 4.2 – 70.3 107.1
– thereof tax liabilities (29.2) – – (29.2) (32.6)
– thereof social security liabilities (0.2) – – (0.2) (3.7)
14,498.3 4.2 – 14,502.5 15,604.8
The liabilities to affiliates relate to short-term loans amounting to € 8.2 billion as well as liabilities of € 5.7
billion from the clearing account with Merck Financial Services GmbH, Darmstadt. The other liabilities include
obligations of € 1.3 million (2019: € 1.9 million) from recourse factoring. Employee loans were transferred, with
Merck KGaA maintaining a contingent liability. These liabilities are secured in this respect by receivables from
employees.
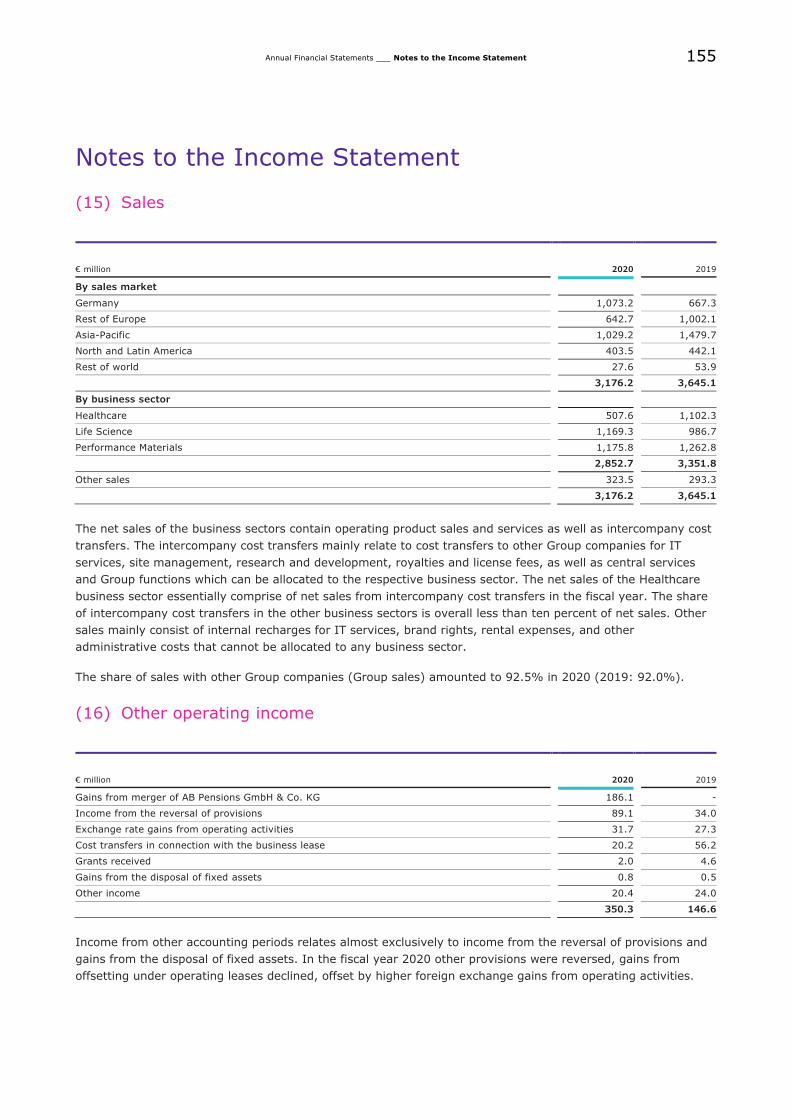
155
Annual Financial Statements ___ Notes to the Income Statement
Notes to the Income Statement
(15) Sales
€ million 2020 2019
By sales market
Germany 1,073.2 667.3
Rest of Europe 642.7 1,002.1
Asia-Pacific 1,029.2 1,479.7
North and Latin America 403.5 442.1
Rest of world 27.6 53.9
3,176.2 3,645.1
By business sector
Healthcare 507.6 1,102.3
Life Science 1,169.3 986.7
Performance Materials 1,175.8 1,262.8
2,852.7 3,351.8
Other sales 323.5 293.3
3,176.2 3,645.1
The net sales of the business sectors contain operating product sales and services as well as intercompany cost
transfers. The intercompany cost transfers mainly relate to cost transfers to other Group companies for IT
services, site management, research and development, royalties and license fees, as well as central services
and Group functions which can be allocated to the respective business sector. The net sales of the Healthcare
business sector essentially comprise of net sales from intercompany cost transfers in the fiscal year. The share
of intercompany cost transfers in the other business sectors is overall less than ten percent of net sales. Other
sales mainly consist of internal recharges for IT services, brand rights, rental expenses, and other
administrative costs that cannot be allocated to any business sector.
The share of sales with other Group companies (Group sales) amounted to 92.5% in 2020 (2019: 92.0%).
(16) Other operating income
€ million 2020 2019
Gains from merger of AB Pensions GmbH & Co. KG 186.1 -
Income from the reversal of provisions 89.1 34.0
Exchange rate gains from operating activities 31.7 27.3
Cost transfers in connection with the business lease 20.2 56.2
Grants received 2.0 4.6
Gains from the disposal of fixed assets 0.8 0.5
Other income 20.4 24.0
350.3 146.6
Income from other accounting periods relates almost exclusively to income from the reversal of provisions and
gains from the disposal of fixed assets. In the fiscal year 2020 other provisions were reversed, gains from
offsetting under operating leases declined, offset by higher foreign exchange gains from operating activities.
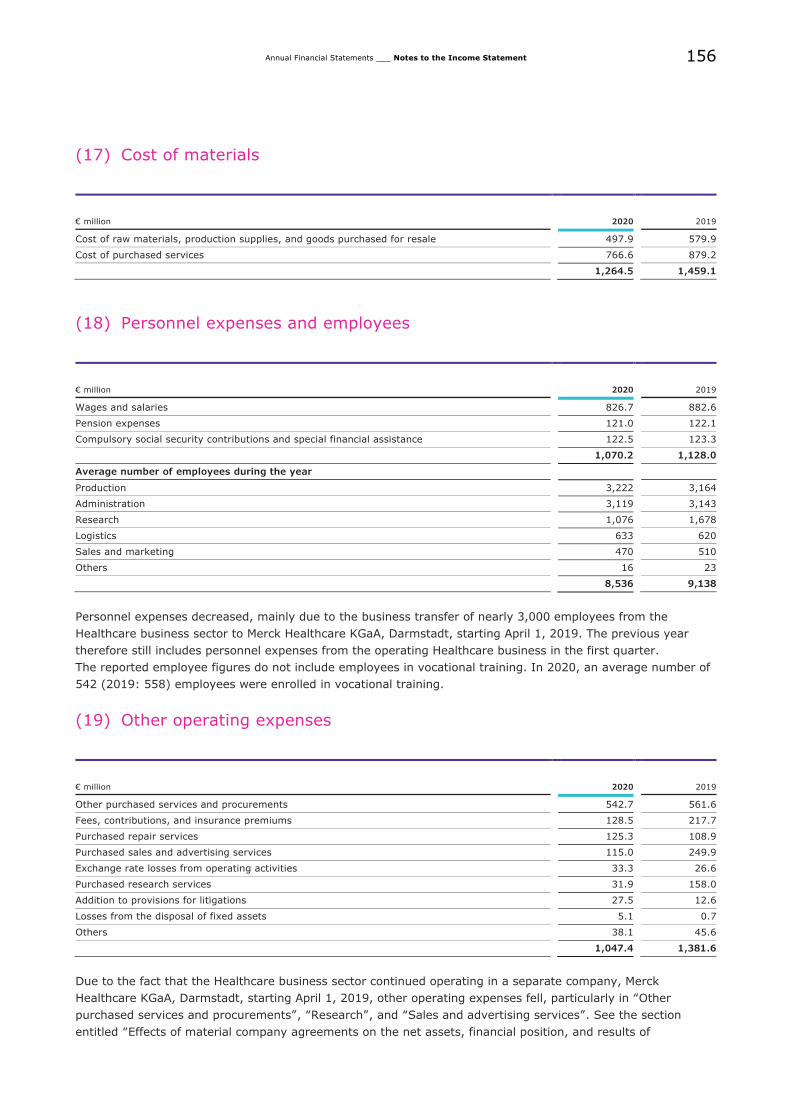
156
Annual Financial Statements ___ Notes to the Income Statement
(17) Cost of materials
€ million 2020 2019
Cost of raw materials, production supplies, and goods purchased for resale 497.9 579.9
Cost of purchased services 766.6 879.2
1,264.5 1,459.1
(18) Personnel expenses and employees
€ million 2020 2019
Wages and salaries 826.7 882.6
Pension expenses 121.0 122.1
Compulsory social security contributions and special financial assistance 122.5 123.3
1,070.2 1,128.0
Average number of employees during the year
Production 3,222 3,164
Administration 3,119 3,143
Research 1,076 1,678
Logistics 633 620
Sales and marketing 470 510
Others 16 23
8,536 9,138
Personnel expenses decreased, mainly due to the business transfer of nearly 3,000 employees from the
Healthcare business sector to Merck Healthcare KGaA, Darmstadt, starting April 1, 2019. The previous year
therefore still includes personnel expenses from the operating Healthcare business in the first quarter.
The reported employee figures do not include employees in vocational training. In 2020, an average number of
542 (2019: 558) employees were enrolled in vocational training.
(19) Other operating expenses
€ million 2020 2019
Other purchased services and procurements 542.7 561.6
Fees, contributions, and insurance premiums 128.5 217.7
Purchased repair services 125.3 108.9
Purchased sales and advertising services 115.0 249.9
Exchange rate losses from operating activities 33.3 26.6
Purchased research services 31.9 158.0
Addition to provisions for litigations 27.5 12.6
Losses from the disposal of fixed assets 5.1 0.7
Others 38.1 45.6
1,047.4 1,381.6
Due to the fact that the Healthcare business sector continued operating in a separate company, Merck
Healthcare KGaA, Darmstadt, starting April 1, 2019, other operating expenses fell, particularly in “Other
purchased services and procurements”, “Research”, and “Sales and advertising services”. See the section
entitled “Effects of material company agreements on the net assets, financial position, and results of
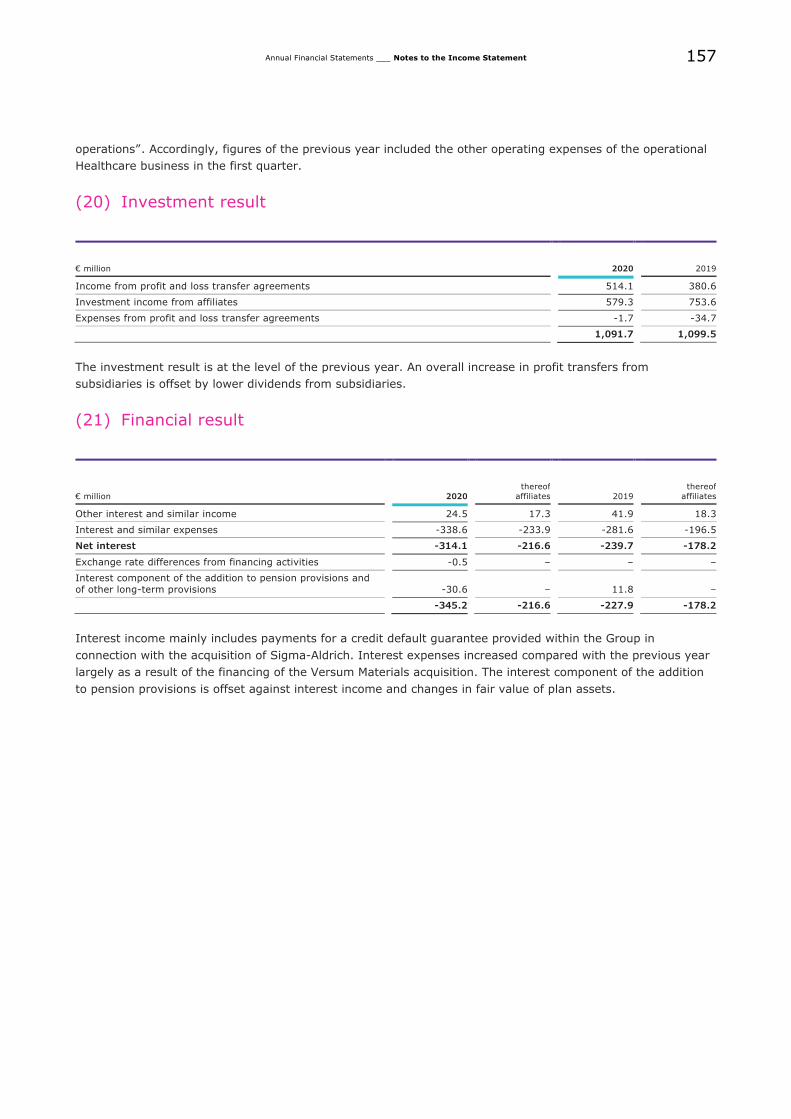
157
Annual Financial Statements ___ Notes to the Income Statement
operations”. Accordingly, figures of the previous year included the other operating expenses of the operational
Healthcare business in the first quarter.
(20) Investment result
€ million 2020 2019
Income from profit and loss transfer agreements 514.1 380.6
Investment income from affiliates 579.3 753.6
Expenses from profit and loss transfer agreements -1.7 -34.7
1,091.7 1,099.5
The investment result is at the level of the previous year. An overall increase in profit transfers from
subsidiaries is offset by lower dividends from subsidiaries.
(21) Financial result
€ million 2020
thereof
affiliates 2019
thereof
affiliates
Other interest and similar income 24.5 17.3 41.9 18.3
Interest and similar expenses -338.6 -233.9 -281.6 -196.5
Net interest -314.1 -216.6 -239.7 -178.2
Exchange rate differences from financing activities -0.5 – – –
Interest component of the addition to pension provisions and
of other long-term provisions
-30.6 – 11.8 –
-345.2 -216.6 -227.9 -178.2
Interest income mainly includes payments for a credit default guarantee provided within the Group in
connection with the acquisition of Sigma-Aldrich. Interest expenses increased compared with the previous year
largely as a result of the financing of the Versum Materials acquisition. The interest component of the addition
to pension provisions is offset against interest income and changes in fair value of plan assets.
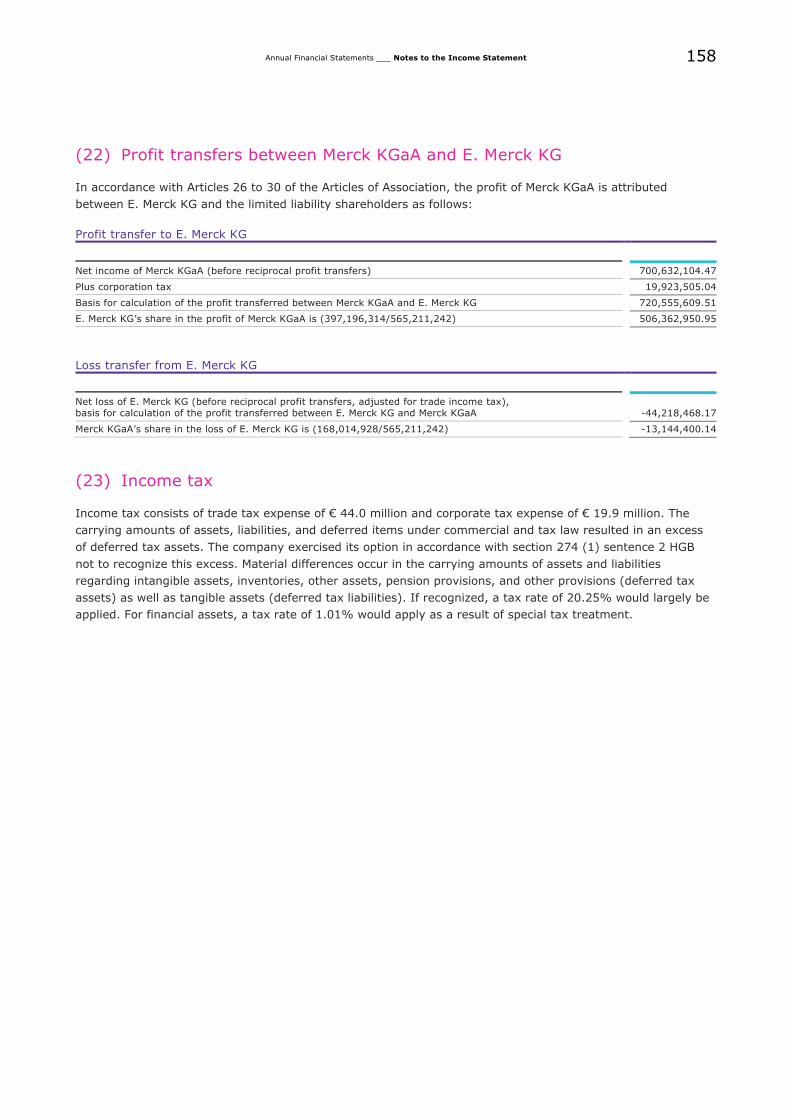
158
Annual Financial Statements ___ Notes to the Income Statement
(22) Profit transfers between Merck KGaA and E. Merck KG
In accordance with Articles 26 to 30 of the Articles of Association, the profit of Merck KGaA is attributed
between E. Merck KG and the limited liability shareholders as follows:
Profit transfer to E. Merck KG
Net income of Merck KGaA (before reciprocal profit transfers) 700,632,104.47
Plus corporation tax 19,923,505.04
Basis for calculation of the profit transferred between Merck KGaA and E. Merck KG 720,555,609.51
E. Merck KG’s share in the profit of Merck KGaA is (397,196,314/565,211,242) 506,362,950.95
Loss transfer from E. Merck KG
Net loss of E. Merck KG (before reciprocal profit transfers, adjusted for trade income tax), basis for calculation of the profit transferred between E. Merck KG and Merck KGaA -44,218,468.17
Merck KGaA’s share in the loss of E. Merck KG is (168,014,928/565,211,242) -13,144,400.14
(23) Income tax
Income tax consists of trade tax expense of € 44.0 million and corporate tax expense of € 19.9 million. The
carrying amounts of assets, liabilities, and deferred items under commercial and tax law resulted in an excess
of deferred tax assets. The company exercised its option in accordance with section 274 (1) sentence 2 HGB
not to recognize this excess. Material differences occur in the carrying amounts of assets and liabilities
regarding intangible assets, inventories, other assets, pension provisions, and other provisions (deferred tax
assets) as well as tangible assets (deferred tax liabilities). If recognized, a tax rate of 20.25% would largely be
applied. For financial assets, a tax rate of 1.01% would apply as a result of special tax treatment.
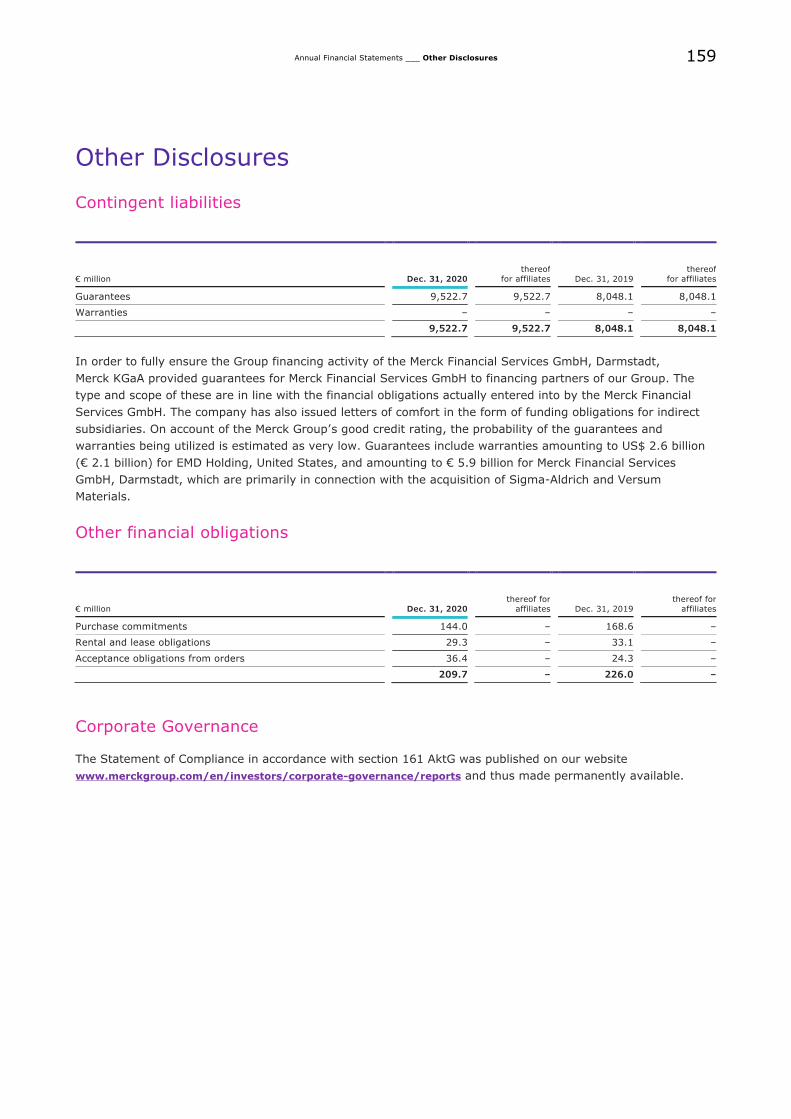
159
Annual Financial Statements ___ Other Disclosures
Other Disclosures
Contingent liabilities
€ million Dec. 31, 2020
thereof
for affiliates Dec. 31, 2019
thereof
for affiliates
Guarantees 9,522.7 9,522.7 8,048.1 8,048.1
Warranties – – – –
9,522.7 9,522.7 8,048.1 8,048.1
In order to fully ensure the Group financing activity of the Merck Financial Services GmbH, Darmstadt,
Merck KGaA provided guarantees for Merck Financial Services GmbH to financing partners of our Group. The
type and scope of these are in line with the financial obligations actually entered into by the Merck Financial
Services GmbH. The company has also issued letters of comfort in the form of funding obligations for indirect
subsidiaries. On account of the Merck Group’s good credit rating, the probability of the guarantees and
warranties being utilized is estimated as very low. Guarantees include warranties amounting to US$ 2.6 billion
(€ 2.1 billion) for EMD Holding, United States, and amounting to € 5.9 billion for Merck Financial Services
GmbH, Darmstadt, which are primarily in connection with the acquisition of Sigma-Aldrich and Versum
Materials.
Other financial obligations
€ million Dec. 31, 2020
thereof for
affiliates Dec. 31, 2019
thereof for
affiliates
Purchase commitments 144.0 – 168.6 –
Rental and lease obligations 29.3 – 33.1 –
Acceptance obligations from orders 36.4 – 24.3 –
209.7 – 226.0 –
Corporate Governance
The Statement of Compliance in accordance with section 161 AktG was published on our website
www.merckgroup.com/en/investors/corporate-governance/reports and thus made permanently available.
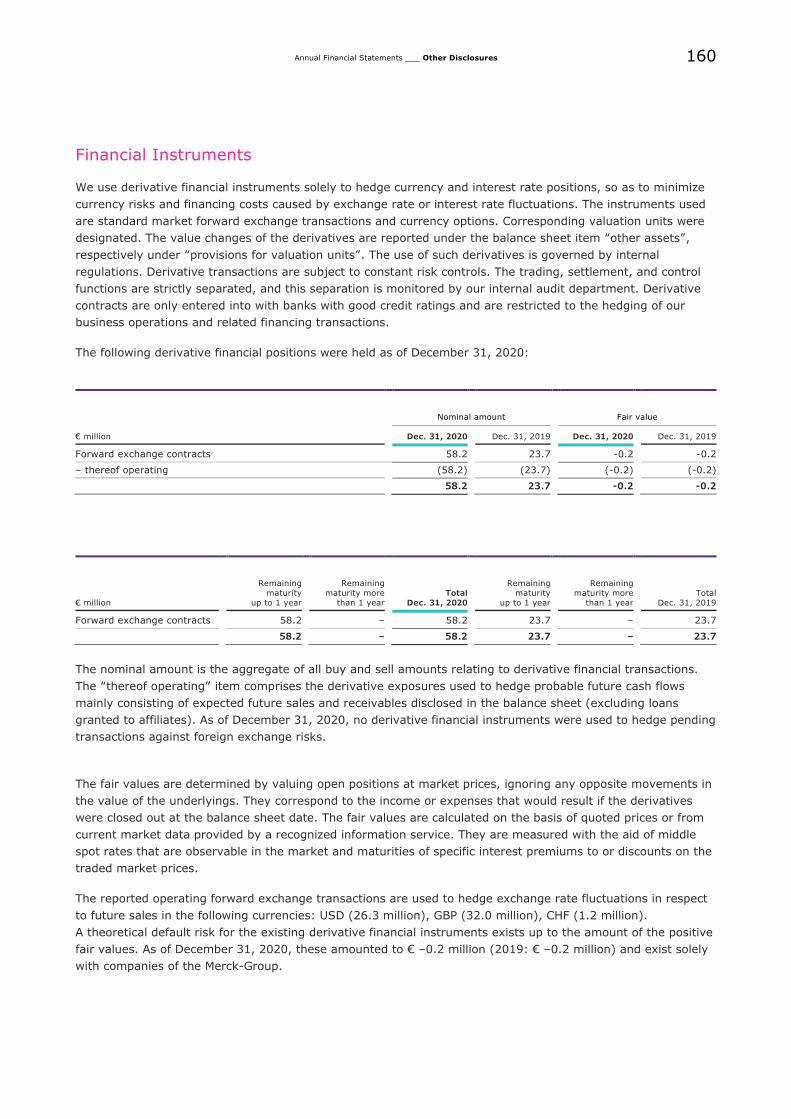
160
Annual Financial Statements ___ Other Disclosures
Financial Instruments
We use derivative financial instruments solely to hedge currency and interest rate positions, so as to minimize
currency risks and financing costs caused by exchange rate or interest rate fluctuations. The instruments used
are standard market forward exchange transactions and currency options. Corresponding valuation units were
designated. The value changes of the derivatives are reported under the balance sheet item “other assets”,
respectively under “provisions for valuation units”. The use of such derivatives is governed by internal
regulations. Derivative transactions are subject to constant risk controls. The trading, settlement, and control
functions are strictly separated, and this separation is monitored by our internal audit department. Derivative
contracts are only entered into with banks with good credit ratings and are restricted to the hedging of our
business operations and related financing transactions.
The following derivative financial positions were held as of December 31, 2020:
Nominal amount Fair value
€ million Dec. 31, 2020 Dec. 31, 2019 Dec. 31, 2020 Dec. 31, 2019
Forward exchange contracts 58.2 23.7 -0.2 -0.2
– thereof operating (58.2) (23.7) (-0.2) (-0.2)
58.2 23.7 -0.2 -0.2
€ million
Remaining
maturity
up to 1 year
Remaining
maturity more
than 1 year
Total
Dec. 31, 2020
Remaining
maturity
up to 1 year
Remaining
maturity more
than 1 year
Total
Dec. 31, 2019
Forward exchange contracts 58.2 – 58.2 23.7 – 23.7
58.2 – 58.2 23.7 – 23.7
The nominal amount is the aggregate of all buy and sell amounts relating to derivative financial transactions.
The “thereof operating” item comprises the derivative exposures used to hedge probable future cash flows
mainly consisting of expected future sales and receivables disclosed in the balance sheet (excluding loans
granted to affiliates). As of December 31, 2020, no derivative financial instruments were used to hedge pending
transactions against foreign exchange risks.
The fair values are determined by valuing open positions at market prices, ignoring any opposite movements in
the value of the underlyings. They correspond to the income or expenses that would result if the derivatives
were closed out at the balance sheet date. The fair values are calculated on the basis of quoted prices or from
current market data provided by a recognized information service. They are measured with the aid of middle
spot rates that are observable in the market and maturities of specific interest premiums to or discounts on the
traded market prices.
The reported operating forward exchange transactions are used to hedge exchange rate fluctuations in respect
to future sales in the following currencies: USD (26.3 million), GBP (32.0 million), CHF (1.2 million).
A theoretical default risk for the existing derivative financial instruments exists up to the amount of the positive
fair values. As of December 31, 2020, these amounted to € –0.2 million (2019: € –0.2 million) and exist solely
with companies of the Merck-Group.
161
Annual Financial Statements ___ Other Disclosures
Further information
Merck KGaA, Frankfurter Straße 250, 64293 Darmstadt, Germany, is registered with the German Commercial
Register under No. HRB 6164. The competent register court is Darmstadt district court.
In accordance with the provisions of the German financial reporting disclosure law (Publizitätsgesetz), as the
ultimate parent company within the Merck Group, E. Merck Kommanditgesellschaft (E. Merck KG) prepares
consolidated financial statements, which include Merck KGaA and its subsidiaries. Merck KGaA, which manages
the operations of the Merck Group, prepares consolidated financial statements for the smallest group of
companies within the Merck Group. Both sets of consolidated financial statements as of December 31, 2020,
are available at www.bundesanzeiger.de.
The information relating to the German Securities Trading Act (WpHG), the Executive Board and the
Supervisory Board are published in the Notes to the Annual Financial Statements of Merck KGaA on sections
“Members of the Executive Board of Merck KGaA”, “Members of the Supervisory Board of Merck KGaA”, and
“Disclosures in accordance with section 160 (1) No. 8 of the German Stock Corporation Act (AktG)”.
Compensation of the Executive Board
The compensation of the Executive Board of Merck KGaA is basically paid by the general partner, E. Merck KG.
From January to December 2020, fixed salaries of € 5.3 million (2019: € 5.6 million), variable compensation of
€ 14.0 million (2019: € 15.3 million), and additional benefits of € 0.4 million (2019: € 0.8 million) were
recorded for members of the Executive Board of Merck KGaA. Furthermore, additions to provisions at these
companies also included expenses of € 17.5 million (2019: € 7.1 million) for the long-term incentive plan.
Additions to pension provisions included current service costs of € 3.0 million (2019: € 3.0 million).
Total compensation of the Supervisory Board
The compensation of the Supervisory Board amounting to € 870.5 thousand (2019: € 880.8 thousand)
consisted of a fixed portion of € 822.5 thousand (2019: € 823.8 thousand) and meeting attendance
compensation of € 48.0 thousand (2019: € 57.0 thousand). Further individualized information and details can
be found in the Compensation Report.
Auditors’ fees
Information on the statutory auditors’ fees is contained in the Consolidated Financial Statements of
Merck KGaA. In addition to the audit of the financial statements, other audit-related services, tax consultancy
services, and other services for the company and/or controlled companies were provided by the auditor. Other
audit-related services pertain to various statutory or contractually agreed audits. Tax consultancy services
encompass services in connection with the preparation of tax returns for employees delegated abroad.
Subsequent events
Effective January 1, 2021, Mr. Peter Guenter was appointed as a new member of the Executive Board and CEO
of the Healthcare business sector.
Subsequent to the balance sheet date, no further events of special importance occurred that could have a
material impact on the net assets, financial position, and results of operations.
162
Annual Financial Statements ___ Other Disclosures
Proposal for the appropriation of net retained profit
A proposal will be made to the General Meeting for the payment of a dividend of € 1.40 per no-par value share
from the portion of net retained profit to which limited liability shareholders are entitled, amounting to
€ 207,612,532.68 (see Note (9)). Based on the current share capital, the resulting total dividend payment for
fiscal 2020 is thus € 180,939,152.80.
It is also proposed to carry forward to new account the remaining portion of the shareholders’ net retained
profit in the amount of € 26,673,379.88.
Darmstadt, February 16, 2021
Stefan Oschmann
Belén Garijo
Kai Beckmann
Peter Guenter
Marcus Kuhnert
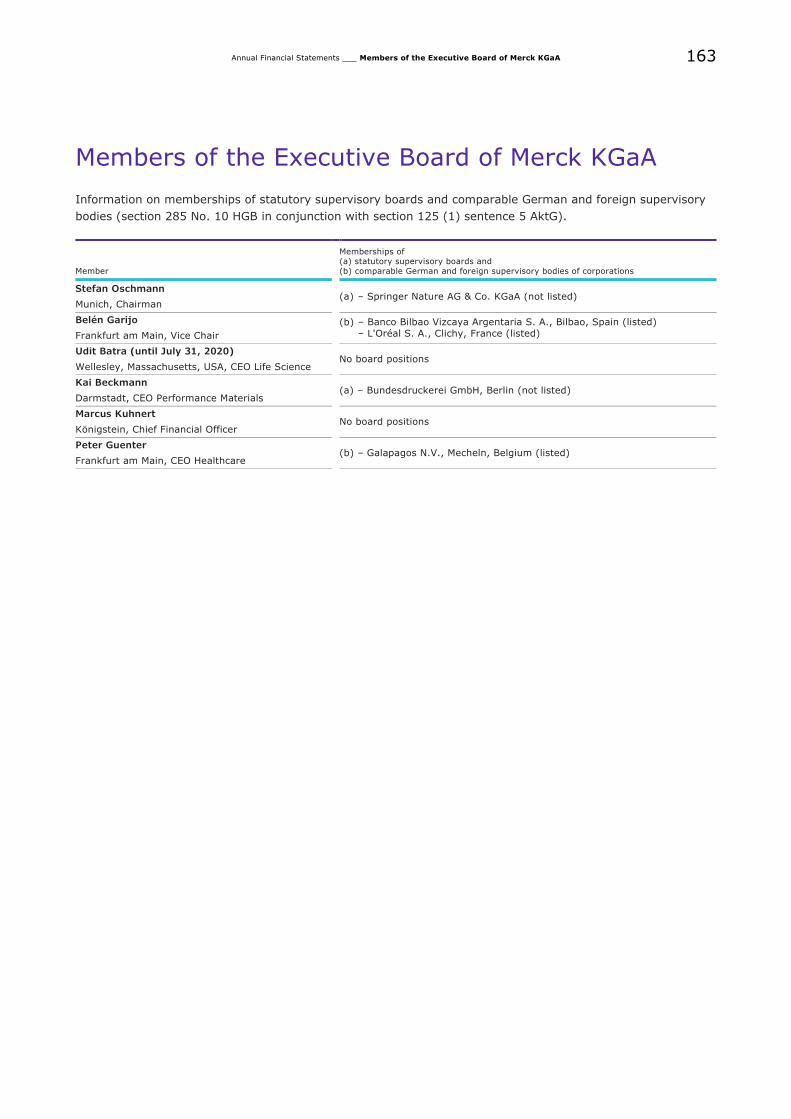
163
Annual Financial Statements ___ Members of the Executive Board of Merck KGaA
Members of the Executive Board of Merck KGaA
Information on memberships of statutory supervisory boards and comparable German and foreign supervisory
bodies (section 285 No. 10 HGB in conjunction with section 125 (1) sentence 5 AktG).
Member
Memberships of
(a) statutory supervisory boards and
(b) comparable German and foreign supervisory bodies of corporations
Stefan Oschmann (a) – Springer Nature AG & Co. KGaA (not listed) Munich, Chairman
Belén Garijo (b) – Banco Bilbao Vizcaya Argentaria S. A., Bilbao, Spain (listed)
– L'Oréal S. A., Clichy, France (listed)
Frankfurt am Main, Vice Chair
Udit Batra (until July 31, 2020) No board positions
Wellesley, Massachusetts, USA, CEO Life Science
Kai Beckmann (a) – Bundesdruckerei GmbH, Berlin (not listed)
Darmstadt, CEO Performance Materials
Marcus Kuhnert No board positions
Königstein, Chief Financial Officer
Peter Guenter (b) – Galapagos N.V., Mecheln, Belgium (listed)
Frankfurt am Main, CEO Healthcare
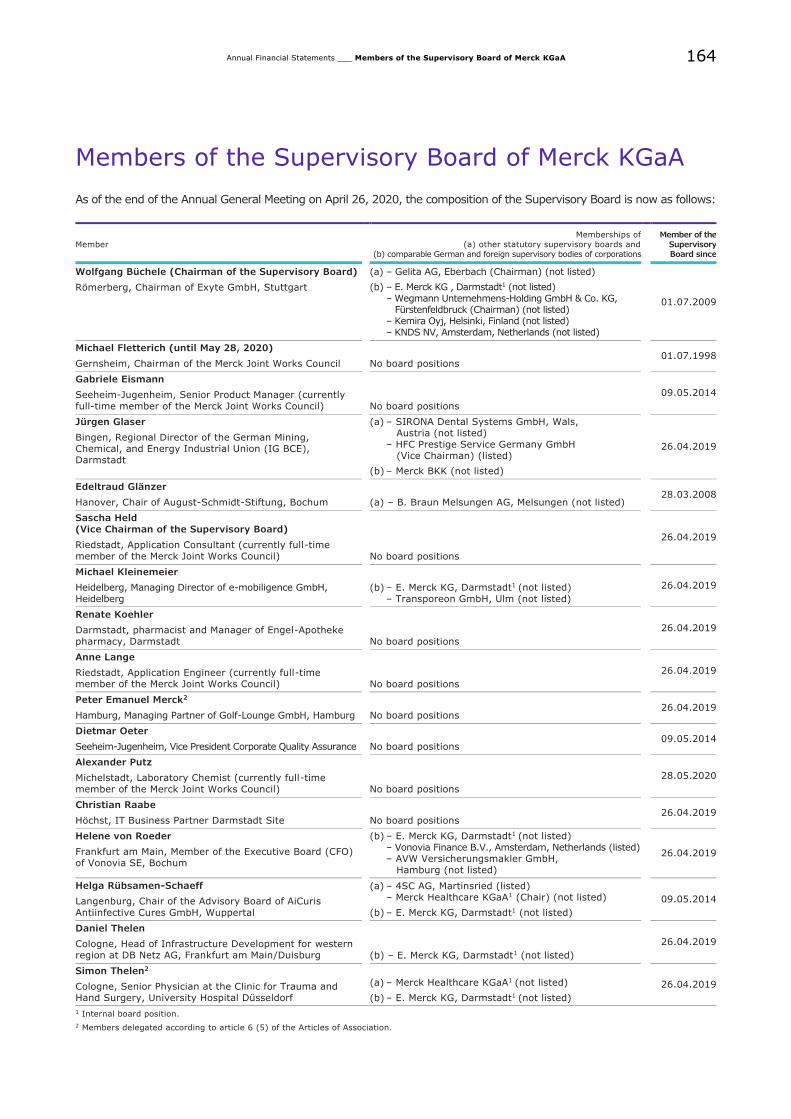
164
Annual Financial Statements ___ Members of the Supervisory Board of Merck KGaA
Members of the Supervisory Board of Merck KGaA
As of the end of the Annual General Meeting on April 26, 2020, the composition of the Supervisory Board is now as follows:
Member
Memberships of
(a) other statutory supervisory boards and
(b) comparable German and foreign supervisory bodies of corporations
Member of the
Supervisory
Board since
Wolfgang Büchele (Chairman of the Supervisory Board) (a) – Gelita AG, Eberbach (Chairman) (not listed)
(b) – E. Merck KG , Darmstadt1 (not listed)
– Wegmann Unternehmens-Holding GmbH & Co. KG, Fürstenfeldbruck (Chairman) (not listed) – Kemira Oyj, Helsinki, Finland (not listed) – KNDS NV, Amsterdam, Netherlands (not listed)
01.07.2009
Römerberg, Chairman of Exyte GmbH, Stuttgart
Michael Fletterich (until May 28, 2020)
No board positions
01.07.1998
Gernsheim, Chairman of the Merck Joint Works Council
Gabriele Eismann
No board positions
09.05.2014 SeeheimJugenheim, Senior Product Manager (currently
full-time member of the Merck Joint Works Council)
Jürgen Glaser (a) – SIRONA Dental Systems GmbH, Wals, Austria (not listed) – HFC Prestige Service Germany GmbH (Vice Chairman) (listed)
(b) – Merck BKK (not listed)
26.04.2019 Bingen, Regional Director of the German Mining, Chemical, and Energy Industrial Union (IG BCE), Darmstadt
Edeltraud Glänzer
(a) – B. Braun Melsungen AG, Melsungen (not listed)
28.03.2008
Hanover, Chair of August-Schmidt-Stiftung, Bochum
Sascha Held (Vice Chairman of the Supervisory Board)
No board positions
26.04.2019 Riedstadt, Application Consultant (currently full-time
member of the Merck Joint Works Council)
Michael Kleinemeier
(b) – E. Merck KG, Darmstadt1 (not listed)
– Transporeon GmbH, Ulm (not listed)
26.04.2019 Heidelberg, Managing Director of e-mobiligence GmbH,
Heidelberg
Renate Koehler
No board positions
26.04.2019 Darmstadt, pharmacist and Manager of Engel-Apotheke
pharmacy, Darmstadt
Anne Lange
No board positions
26.04.2019 Riedstadt, Application Engineer (currently full-time member of the Merck Joint Works Council)
Peter Emanuel Merck2
No board positions
26.04.2019
Hamburg, Managing Partner of Golf-Lounge GmbH, Hamburg
Dietmar Oeter
No board positions
09.05.2014
Seeheim-Jugenheim, Vice President Corporate Quality Assurance
Alexander Putz
No board positions
28.05.2020 Michelstadt, Laboratory Chemist (currently full-time
member of the Merck Joint Works Council)
Christian Raabe
No board positions
26.04.2019
Höchst, IT Business Partner Darmstadt Site
Helene von Roeder (b) – E. Merck KG, Darmstadt1 (not listed) – Vonovia Finance B.V., Amsterdam, Netherlands (listed) – AVW Versicherungsmakler GmbH, Hamburg (not listed)
26.04.2019 Frankfurt am Main, Member of the Executive Board (CFO) of Vonovia SE, Bochum
Helga Rübsamen-Schaeff (a) – 4SC AG, Martinsried (listed) – Merck Healthcare KGaA1 (Chair) (not listed)
(b) – E. Merck KG, Darmstadt1 (not listed)
09.05.2014 Langenburg, Chair of the Advisory Board of AiCuris
Antiinfective Cures GmbH, Wuppertal
Daniel Thelen
(b) – E. Merck KG, Darmstadt1 (not listed)
26.04.2019 Cologne, Head of Infrastructure Development for western region at DB Netz AG, Frankfurt am Main/Duisburg
Simon Thelen2
(a) – Merck Healthcare KGaA1 (not listed)
(b) – E. Merck KG, Darmstadt1 (not listed)
26.04.2019 Cologne, Senior Physician at the Clinic for Trauma and Hand Surgery, University Hospital Düsseldorf
1 Internal board position.
2 Members delegated according to article 6 (5) of the Articles of Association.

165
1 Obsolete version; the numbering of the WpHG changed as of January 3, 2018. The sections of the obsolete vers ion correspond to the following sections
of the current version:
section 21 WpHG corresponds to section 33 WpHG
section 22 WpHG corresponds to section 34 WpHG
section 25 WpHG corresponds to section 38 WpHG
Annual Financial Statements ___ Disclosures in accordance with section 160 (1) No. 8
of the German Stock Corporation Act (AktG)
of the German Stock Corporation Act (AktG)
Disclosures in accordance with section 160 (1)
No. 8 of the German Stock Corporation Act (AktG)
In accordance with the German Securities Trading Act (WpHG), any shareholder whose equity interest reaches,
exceeds, or falls below the thresholds of 3%, 5%, 10%, 15%, 20%, 25%, 30%, 50%, or 75% of the voting
rights in a listed company must notify the company and the German Federal Financial Supervisory Authority
(BaFin) of this without delay. The company was informed of the existence of the following equity interests up
until the preparation of the Annual Financial statements (the number of shares or the percentage equity
interest is taken from the most recent voting rights notification sent to Merck and may therefore no longer be
correct):
BlackRock, Inc., Wilmington, Delaware, United States, notified us that its share of the voting rights amounted
to 7.38% on December 28, 2020. 7.38% of the voting rights (9,531,693 voting rights) were attributed to
BlackRock, Inc. in accordance with section 22 WpHG (obsolete version)1. 0.004% of the voting rights (5,016
voting rights) were attributed to BlackRock, Inc. as instruments pursuant to section 25 (1) no. 1 WpHG
(obsolete version) (securities lending)1. 0.003% of the voting rights (324 voting rights) were attributed to
BlackRock, Inc. as instruments pursuant to section 25 (1) no. 2 WpHG (obsolete version) (contract for
difference)1.
We received the following notification on July 17, 2015 in accordance with section 21 (1) WpHG:
On July 16, 2015, the share of the voting rights of Sun Life Global Investments Inc., Toronto, Ontario, Canada,
in Merck KGaA, Darmstadt, Germany, fell below the threshold of 5% of the voting rights due to the disposal of
shares and amounted to 4.91% (6,342,586 voting rights) on that date1. 4.91% of the voting rights (6,342,586
voting rights) are attributed to the company in accordance with section 22 (1) sentence 1 no. 6 WpHG in
conjunction with section 22 (1) sentence 2 WpHG1.
On July 16, 2015, the share of the voting rights of Sun Life Assurance Company of Canada – U.S. Operations
Holdings, Inc., Wellesley Hills, Massachusetts, United States, in Merck KGaA, Darmstadt, Germany, fell below
the threshold of 5% of the voting rights due to the disposal of shares and amounted to 4.91% (6,342,586
voting rights) on that date1. 4.91% of the voting rights (6,342,586 voting rights) are attributed to the company
in accordance with section 22 (1) sentence 1 no. 6 WpHG in conjunction with section 22 (1) sentence 2 WpHG1.
On July 16, 2015, the share of the voting rights of Sun Life Financial (U.S.) Holdings, Inc., Wellesley Hills,
Massachusetts, United States, in Merck KGaA, Darmstadt, Germany, fell below the threshold of 5% of the
voting rights due to the disposal of shares and amounted to 4.91% (6,342,586 voting rights) on that date1.
4.91% of the voting rights (6,342,586 voting rights) are attributed to the company in accordance with section
22 (1) sentence 1 no. 6 WpHG in conjunction with section 22 (1) sentence 2 WpHG1.
On July 16, 2015, the share of the voting rights of Sun Life Financial (U.S.) Investments LLC, Wellesley Hills,
Massachusetts, United States, in Merck KGaA, Darmstadt, Germany, fell below the threshold of 5% of the
voting rights due to the disposal of shares and amounted to 4.91% (6,342,586 voting rights) on that date1.
4.91% of the voting rights (6,342,586 voting rights) are attributed to the company in accordance with section
22 (1) sentence 1 no. 6 WpHG in conjunction with section 22 (1) sentence 2 WpHG1.
166
1 Obsolete version; the numbering of the WpHG changed as of January 3, 2018. The sections of the obsolete vers ion correspond to the following sections
of the current version:
section 21 WpHG corresponds to section 33 WpHG
section 22 WpHG corresponds to section 34 WpHG
section 25 WpHG corresponds to section 38 WpHG
Annual Financial Statements ___ Disclosures in accordance with section 160 (1) No. 8
of the German Stock Corporation Act (AktG)
of the German Stock Corporation Act (AktG)
On July 16, 2015, the share of the voting rights of Sun Life of Canada (U.S.) Financial Services Holdings, Inc.,
Boston, Massachusetts, United States, in Merck KGaA, Darmstadt, Germany, fell below the threshold of 5% of
the voting rights due to the disposal of shares and amounted to 4.91% (6,342,586 voting rights) on that date1.
4.91% of the voting rights (6,342,586 voting rights) are attributed to the company in accordance with section
22 (1) sentence 1 no. 6 WpHG in conjunction with section 22 (1) sentence 2 WpHG1.
On July 16, 2015, the share of the voting rights of Massachusetts Financial Services Company (MFS), Boston,
Massachusetts, United States, in Merck KGaA, Darmstadt, Germany, fell below the threshold of 5% of the
voting rights due to the disposal of shares and amounted to 4.91% (6,342,586 voting rights) on that date 1.
3.20% of the voting rights (4,138,232 voting rights) are attributed to the company in accordance with section
22 (1) sentence 1 no. 6 WpHG in conjunction with section 22 (1) sentence 2 WpHG1. 1.71% of the voting rights
(2,204,354 voting rights) are attributed to the company in accordance with section 22 (1) sentence 1 no.
6 WpHG1.
Amundi S.A., Paris, France, notified us that its share of the voting rights fell below the threshold of 3% of the
voting rights on April 17, 2020 due to the disposal of shares and amounted to 2.95% on that date. 2.95% of
the voting rights (3,810,633 voting rights) were attributed to Amundi S.A., Paris, France, in accordance with
section 34 WpHG. 0.04% of the voting rights (49,913 voting rights) were attributed to Amundi S.A. as
instruments pursuant to section 38 (1) no. 1 WpHG (obsolete version) (securities lending).
Mr. George Loening, Germany, notified us that his share of the voting rights fell below the threshold of 3% of
the voting rights on November 13, 2020 due to the disposal of shares and amounted to 2.99% on that date.
2.97% of the voting rights (3,832,793 voting rights) were attributed to Mr. George Loening in accordance with
section 34 WpHG. 0.02% of the voting rights (28,774 voting rights) were attributed to Mr. George Loening as
instruments pursuant to section 38 (1) no. 1 WpHG (obsolete version) (CFD).
DWS Investment GmbH, Frankfurt am Main, Germany, notified us that its share of the voting rights exceeded
the threshold of 3% of the voting rights on March 2, 2020 due to the transfer of the authorization to exercise
voting rights from the former DWS Investment S.A. and DWS International GmbH to DWS Investment GmbH
and amounted to 3.98% on that date. 3.97% of the voting rights (5,132,045 voting rights) were attributed to
DWS Investment GmbH in accordance with section 34 WpHG. 0.01% of the voting rights (16,000 voting rights)
were attributed to DWS Investment GmbH as instruments pursuant to section 38 (1) no. 1 WpHG (obsolete
version) (securities lending).
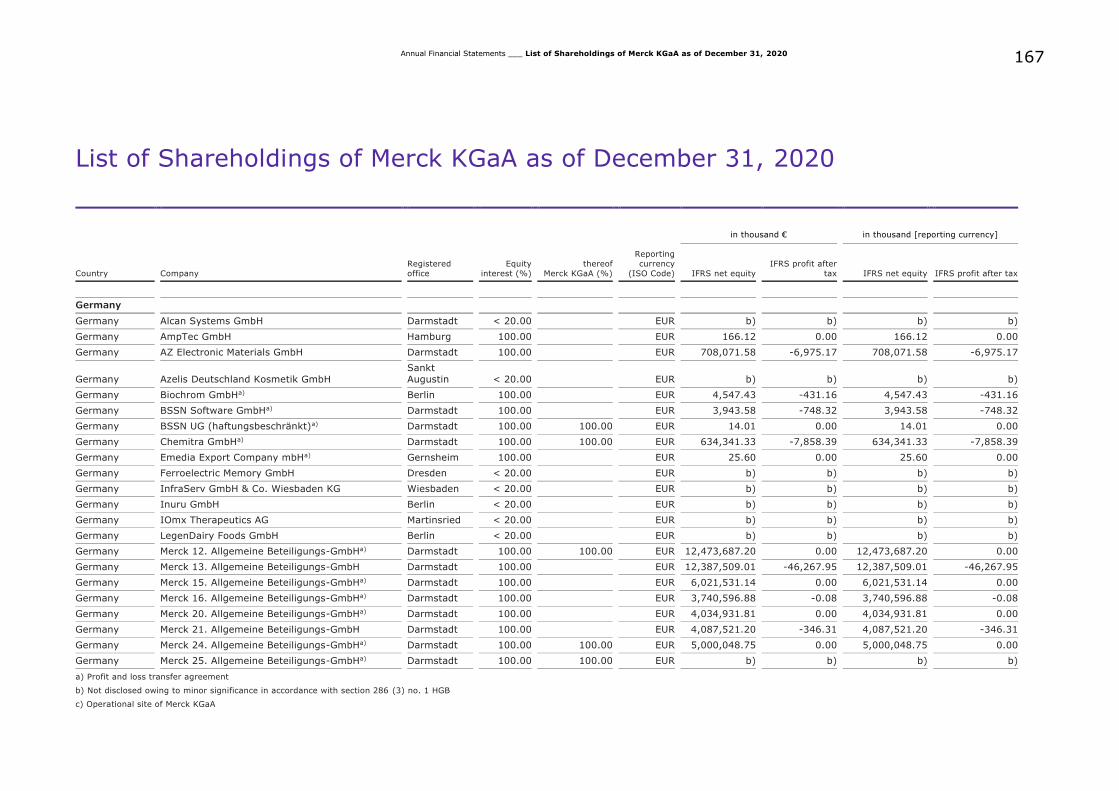
167
Annual Financial Statements ___ List of Shareholdings of Merck KGaA as of December 31, 2020
List of Shareholdings of Merck KGaA as of December 31, 2020
in thousand € in thousand [reporting currency]
Country Company
Registered
office
Equity
interest (%)
thereof
Merck KGaA (%)
Reporting
currency
(ISO Code) IFRS net equity
IFRS profit after
tax IFRS net equity IFRS profit after tax
Germany
Germany Alcan Systems GmbH Darmstadt < 20.00 EUR b) b) b) b)
Germany AmpTec GmbH Hamburg 100.00 EUR 166.12 0.00 166.12 0.00
Germany AZ Electronic Materials GmbH Darmstadt 100.00 EUR 708,071.58 -6,975.17 708,071.58 -6,975.17
Germany Azelis Deutschland Kosmetik GmbH
Sankt
Augustin < 20.00 EUR b) b) b) b)
Germany Biochrom GmbHa) Berlin 100.00 EUR 4,547.43 -431.16 4,547.43 -431.16
Germany BSSN Software GmbHa) Darmstadt 100.00 EUR 3,943.58 -748.32 3,943.58 -748.32
Germany BSSN UG (haftungsbeschränkt)a) Darmstadt 100.00 100.00 EUR 14.01 0.00 14.01 0.00
Germany Chemitra GmbHa) Darmstadt 100.00 100.00 EUR 634,341.33 -7,858.39 634,341.33 -7,858.39
Germany Emedia Export Company mbHa) Gernsheim 100.00 EUR 25.60 0.00 25.60 0.00
Germany Ferroelectric Memory GmbH Dresden < 20.00 EUR b) b) b) b)
Germany InfraServ GmbH & Co. Wiesbaden KG Wiesbaden < 20.00 EUR b) b) b) b)
Germany Inuru GmbH Berlin < 20.00 EUR b) b) b) b)
Germany IOmx Therapeutics AG Martinsried < 20.00 EUR b) b) b) b)
Germany LegenDairy Foods GmbH Berlin < 20.00 EUR b) b) b) b)
Germany Merck 12. Allgemeine Beteiligungs-GmbHa) Darmstadt 100.00 100.00 EUR 12,473,687.20 0.00 12,473,687.20 0.00
Germany Merck 13. Allgemeine Beteiligungs-GmbH Darmstadt 100.00 EUR 12,387,509.01 -46,267.95 12,387,509.01 -46,267.95
Germany Merck 15. Allgemeine Beteiligungs-GmbHa) Darmstadt 100.00 EUR 6,021,531.14 0.00 6,021,531.14 0.00
Germany Merck 16. Allgemeine Beteiligungs-GmbHa) Darmstadt 100.00 EUR 3,740,596.88 -0.08 3,740,596.88 -0.08
Germany Merck 20. Allgemeine Beteiligungs-GmbHa) Darmstadt 100.00 EUR 4,034,931.81 0.00 4,034,931.81 0.00
Germany Merck 21. Allgemeine Beteiligungs-GmbH Darmstadt 100.00 EUR 4,087,521.20 -346.31 4,087,521.20 -346.31
Germany Merck 24. Allgemeine Beteiligungs-GmbHa) Darmstadt 100.00 100.00 EUR 5,000,048.75 0.00 5,000,048.75 0.00
Germany Merck 25. Allgemeine Beteiligungs-GmbHa) Darmstadt 100.00 100.00 EUR b) b) b) b)
a) Profit and loss transfer agreement
b) Not disclosed owing to minor significance in accordance with section 286 (3) no. 1 HGB
c) Operational site of Merck KGaA
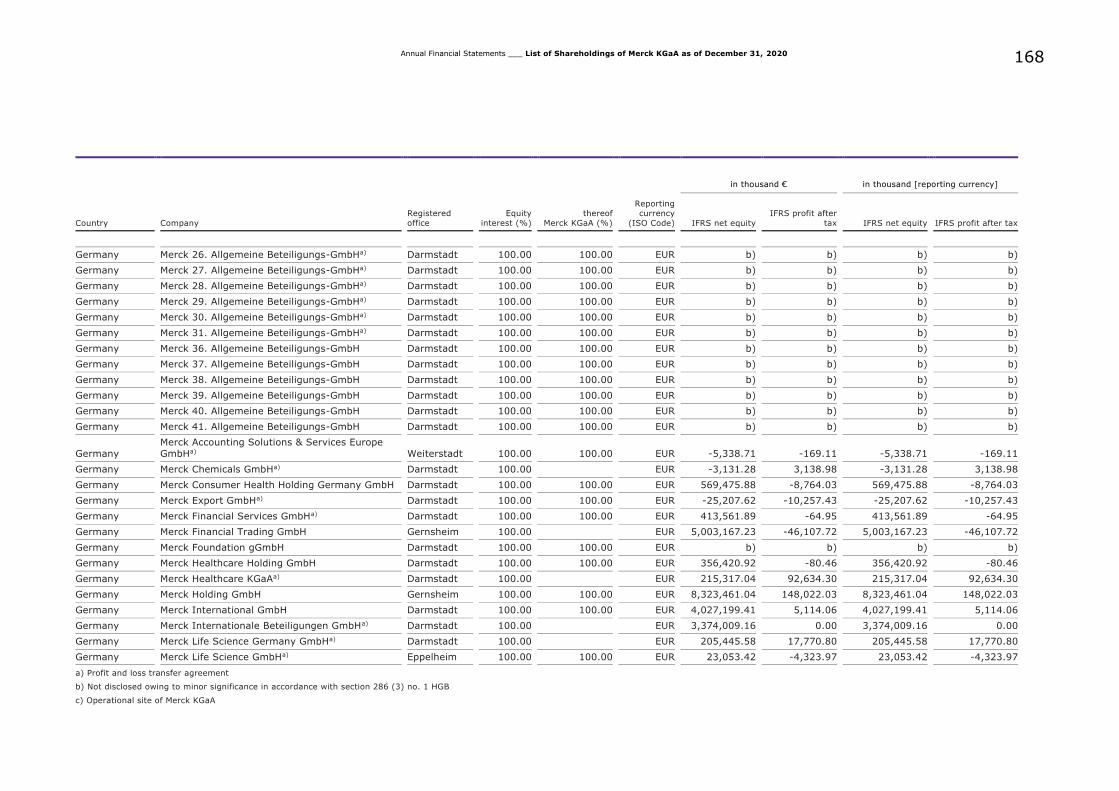
168
Annual Financial Statements ___ List of Shareholdings of Merck KGaA as of December 31, 2020
in thousand € in thousand [reporting currency]
Country Company
Registered
office
Equity
interest (%)
thereof
Merck KGaA (%)
Reporting currency
(ISO Code) IFRS net equity
IFRS profit after
tax IFRS net equity IFRS profit after tax
Germany Merck 26. Allgemeine Beteiligungs-GmbHa) Darmstadt 100.00 100.00 EUR b) b) b) b)
Germany Merck 27. Allgemeine Beteiligungs-GmbHa) Darmstadt 100.00 100.00 EUR b) b) b) b)
Germany Merck 28. Allgemeine Beteiligungs-GmbHa) Darmstadt 100.00 100.00 EUR b) b) b) b)
Germany Merck 29. Allgemeine Beteiligungs-GmbHa) Darmstadt 100.00 100.00 EUR b) b) b) b)
Germany Merck 30. Allgemeine Beteiligungs-GmbHa) Darmstadt 100.00 100.00 EUR b) b) b) b)
Germany Merck 31. Allgemeine Beteiligungs-GmbHa) Darmstadt 100.00 100.00 EUR b) b) b) b)
Germany Merck 36. Allgemeine Beteiligungs-GmbH Darmstadt 100.00 100.00 EUR b) b) b) b)
Germany Merck 37. Allgemeine Beteiligungs-GmbH Darmstadt 100.00 100.00 EUR b) b) b) b)
Germany Merck 38. Allgemeine Beteiligungs-GmbH Darmstadt 100.00 100.00 EUR b) b) b) b)
Germany Merck 39. Allgemeine Beteiligungs-GmbH Darmstadt 100.00 100.00 EUR b) b) b) b)
Germany Merck 40. Allgemeine Beteiligungs-GmbH Darmstadt 100.00 100.00 EUR b) b) b) b)
Germany Merck 41. Allgemeine Beteiligungs-GmbH Darmstadt 100.00 100.00 EUR b) b) b) b)
Germany
Merck Accounting Solutions & Services Europe
GmbHa) Weiterstadt 100.00 100.00 EUR -5,338.71 -169.11 -5,338.71 -169.11
Germany Merck Chemicals GmbHa) Darmstadt 100.00 EUR -3,131.28 3,138.98 -3,131.28 3,138.98
Germany Merck Consumer Health Holding Germany GmbH Darmstadt 100.00 100.00 EUR 569,475.88 -8,764.03 569,475.88 -8,764.03
Germany Merck Export GmbHa) Darmstadt 100.00 100.00 EUR -25,207.62 -10,257.43 -25,207.62 -10,257.43
Germany Merck Financial Services GmbHa) Darmstadt 100.00 100.00 EUR 413,561.89 -64.95 413,561.89 -64.95
Germany Merck Financial Trading GmbH Gernsheim 100.00 EUR 5,003,167.23 -46,107.72 5,003,167.23 -46,107.72
Germany Merck Foundation gGmbH Darmstadt 100.00 100.00 EUR b) b) b) b)
Germany Merck Healthcare Holding GmbH Darmstadt 100.00 100.00 EUR 356,420.92 -80.46 356,420.92 -80.46
Germany Merck Healthcare KGaAa) Darmstadt 100.00 EUR 215,317.04 92,634.30 215,317.04 92,634.30
Germany Merck Holding GmbH Gernsheim 100.00 100.00 EUR 8,323,461.04 148,022.03 8,323,461.04 148,022.03
Germany Merck International GmbH Darmstadt 100.00 100.00 EUR 4,027,199.41 5,114.06 4,027,199.41 5,114.06
Germany Merck Internationale Beteiligungen GmbHa) Darmstadt 100.00 EUR 3,374,009.16 0.00 3,374,009.16 0.00
Germany Merck Life Science Germany GmbHa) Darmstadt 100.00 EUR 205,445.58 17,770.80 205,445.58 17,770.80
Germany Merck Life Science GmbHa) Eppelheim 100.00 100.00 EUR 23,053.42 -4,323.97 23,053.42 -4,323.97
a) Profit and loss transfer agreement
b) Not disclosed owing to minor significance in accordance with section 286 (3) no. 1 HGB
c) Operational site of Merck KGaA
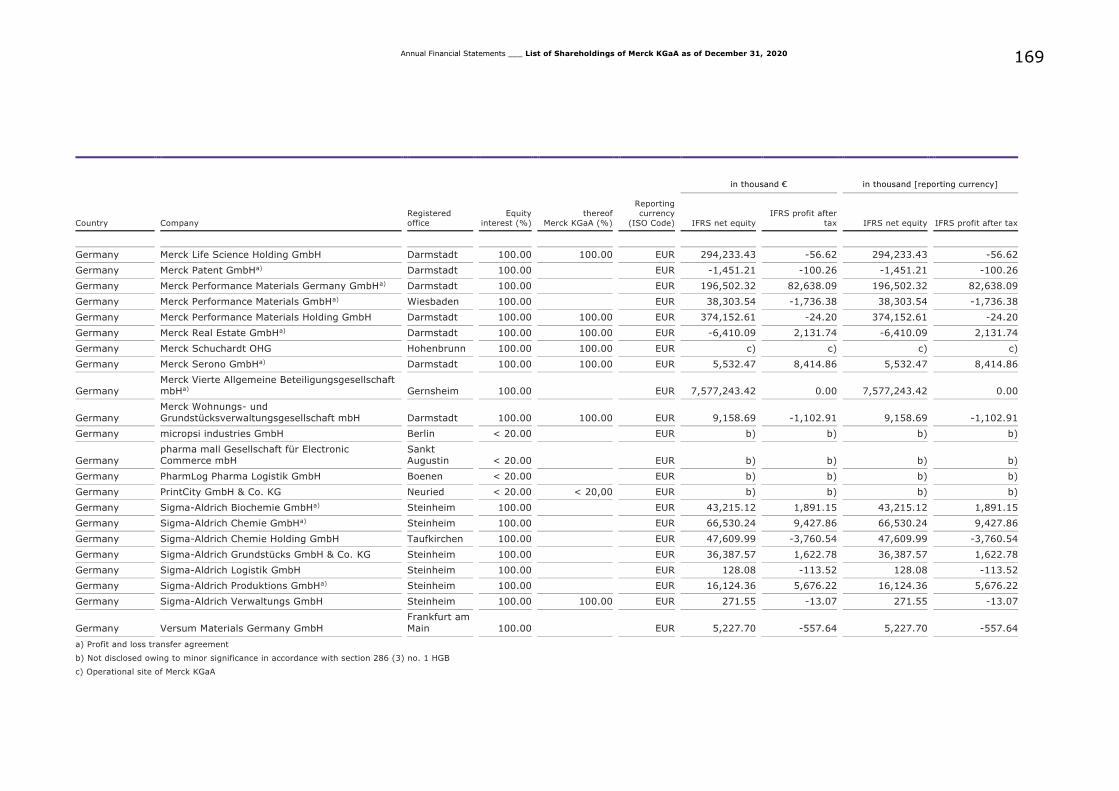
169
Annual Financial Statements ___ List of Shareholdings of Merck KGaA as of December 31, 2020
in thousand € in thousand [reporting currency]
Country Company
Registered
office
Equity
interest (%)
thereof
Merck KGaA (%)
Reporting currency
(ISO Code) IFRS net equity
IFRS profit after
tax IFRS net equity IFRS profit after tax
Germany Merck Life Science Holding GmbH Darmstadt 100.00 100.00 EUR 294,233.43 -56.62 294,233.43 -56.62
Germany Merck Patent GmbHa) Darmstadt 100.00 EUR -1,451.21 -100.26 -1,451.21 -100.26
Germany Merck Performance Materials Germany GmbHa) Darmstadt 100.00 EUR 196,502.32 82,638.09 196,502.32 82,638.09
Germany Merck Performance Materials GmbHa) Wiesbaden 100.00 EUR 38,303.54 -1,736.38 38,303.54 -1,736.38
Germany Merck Performance Materials Holding GmbH Darmstadt 100.00 100.00 EUR 374,152.61 -24.20 374,152.61 -24.20
Germany Merck Real Estate GmbHa) Darmstadt 100.00 100.00 EUR -6,410.09 2,131.74 -6,410.09 2,131.74
Germany Merck Schuchardt OHG Hohenbrunn 100.00 100.00 EUR c) c) c) c)
Germany Merck Serono GmbHa) Darmstadt 100.00 100.00 EUR 5,532.47 8,414.86 5,532.47 8,414.86
Germany Merck Vierte Allgemeine Beteiligungsgesellschaft mbHa) Gernsheim 100.00 EUR 7,577,243.42 0.00 7,577,243.42 0.00
Germany
Merck Wohnungs- und
Grundstücksverwaltungsgesellschaft mbH Darmstadt 100.00 100.00 EUR 9,158.69 -1,102.91 9,158.69 -1,102.91
Germany micropsi industries GmbH Berlin < 20.00 EUR b) b) b) b)
Germany
pharma mall Gesellschaft für Electronic Commerce mbH
Sankt Augustin < 20.00 EUR b) b) b) b)
Germany PharmLog Pharma Logistik GmbH Boenen < 20.00 EUR b) b) b) b)
Germany PrintCity GmbH & Co. KG Neuried < 20.00 < 20,00 EUR b) b) b) b)
Germany Sigma-Aldrich Biochemie GmbHa) Steinheim 100.00 EUR 43,215.12 1,891.15 43,215.12 1,891.15
Germany Sigma-Aldrich Chemie GmbHa) Steinheim 100.00 EUR 66,530.24 9,427.86 66,530.24 9,427.86
Germany Sigma-Aldrich Chemie Holding GmbH Taufkirchen 100.00 EUR 47,609.99 -3,760.54 47,609.99 -3,760.54
Germany Sigma-Aldrich Grundstücks GmbH & Co. KG Steinheim 100.00 EUR 36,387.57 1,622.78 36,387.57 1,622.78
Germany Sigma-Aldrich Logistik GmbH Steinheim 100.00 EUR 128.08 -113.52 128.08 -113.52
Germany Sigma-Aldrich Produktions GmbHa) Steinheim 100.00 EUR 16,124.36 5,676.22 16,124.36 5,676.22
Germany Sigma-Aldrich Verwaltungs GmbH Steinheim 100.00 100.00 EUR 271.55 -13.07 271.55 -13.07
Germany Versum Materials Germany GmbH
Frankfurt am
Main 100.00 EUR 5,227.70 -557.64 5,227.70 -557.64
a) Profit and loss transfer agreement
b) Not disclosed owing to minor significance in accordance with section 286 (3) no. 1 HGB
c) Operational site of Merck KGaA
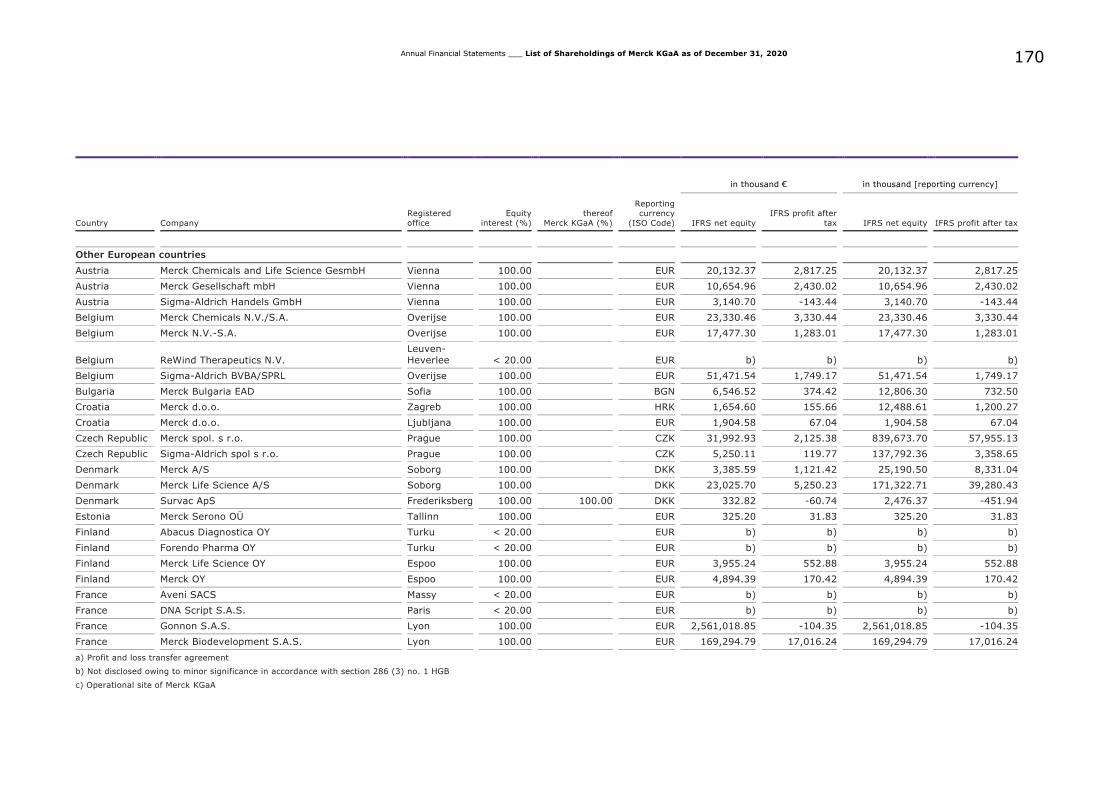
170
Annual Financial Statements ___ List of Shareholdings of Merck KGaA as of December 31, 2020
in thousand € in thousand [reporting currency]
Country Company
Registered
office
Equity
interest (%)
thereof
Merck KGaA (%)
Reporting currency
(ISO Code) IFRS net equity
IFRS profit after
tax IFRS net equity IFRS profit after tax
Other European countries
Austria Merck Chemicals and Life Science GesmbH Vienna 100.00 EUR 20,132.37 2,817.25 20,132.37 2,817.25
Austria Merck Gesellschaft mbH Vienna 100.00 EUR 10,654.96 2,430.02 10,654.96 2,430.02
Austria Sigma-Aldrich Handels GmbH Vienna 100.00 EUR 3,140.70 -143.44 3,140.70 -143.44
Belgium Merck Chemicals N.V./S.A. Overijse 100.00 EUR 23,330.46 3,330.44 23,330.46 3,330.44
Belgium Merck N.V.-S.A. Overijse 100.00 EUR 17,477.30 1,283.01 17,477.30 1,283.01
Belgium ReWind Therapeutics N.V.
Leuven-Heverlee < 20.00 EUR b) b) b) b)
Belgium Sigma-Aldrich BVBA/SPRL Overijse 100.00 EUR 51,471.54 1,749.17 51,471.54 1,749.17
Bulgaria Merck Bulgaria EAD Sofia 100.00 BGN 6,546.52 374.42 12,806.30 732.50
Croatia Merck d.o.o. Zagreb 100.00 HRK 1,654.60 155.66 12,488.61 1,200.27
Croatia Merck d.o.o. Ljubljana 100.00 EUR 1,904.58 67.04 1,904.58 67.04
Czech Republic Merck spol. s r.o. Prague 100.00 CZK 31,992.93 2,125.38 839,673.70 57,955.13
Czech Republic Sigma-Aldrich spol s r.o. Prague 100.00 CZK 5,250.11 119.77 137,792.36 3,358.65
Denmark Merck A/S Soborg 100.00 DKK 3,385.59 1,121.42 25,190.50 8,331.04
Denmark Merck Life Science A/S Soborg 100.00 DKK 23,025.70 5,250.23 171,322.71 39,280.43
Denmark Survac ApS Frederiksberg 100.00 100.00 DKK 332.82 -60.74 2,476.37 -451.94
Estonia Merck Serono OÜ Tallinn 100.00 EUR 325.20 31.83 325.20 31.83
Finland Abacus Diagnostica OY Turku < 20.00 EUR b) b) b) b)
Finland Forendo Pharma OY Turku < 20.00 EUR b) b) b) b)
Finland Merck Life Science OY Espoo 100.00 EUR 3,955.24 552.88 3,955.24 552.88
Finland Merck OY Espoo 100.00 EUR 4,894.39 170.42 4,894.39 170.42
France Aveni SACS Massy < 20.00 EUR b) b) b) b)
France DNA Script S.A.S. Paris < 20.00 EUR b) b) b) b)
France Gonnon S.A.S. Lyon 100.00 EUR 2,561,018.85 -104.35 2,561,018.85 -104.35
France Merck Biodevelopment S.A.S. Lyon 100.00 EUR 169,294.79 17,016.24 169,294.79 17,016.24
a) Profit and loss transfer agreement
b) Not disclosed owing to minor significance in accordance with section 286 (3) no. 1 HGB
c) Operational site of Merck KGaA
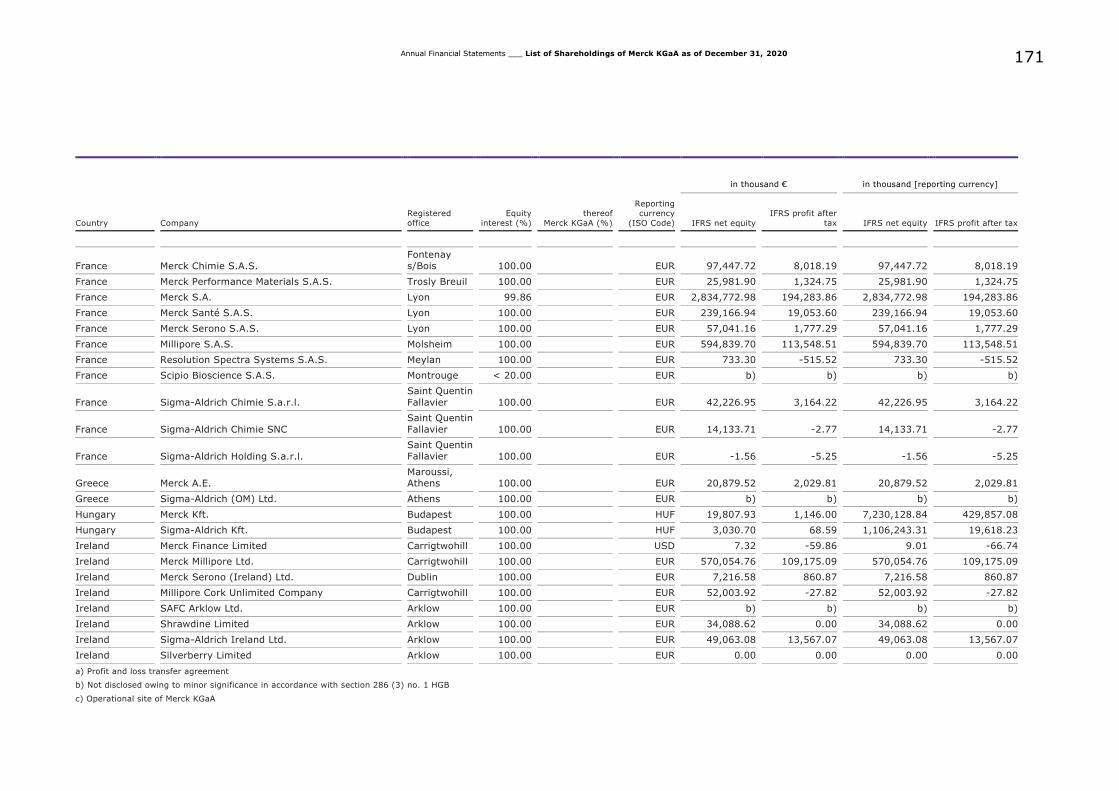
171
Annual Financial Statements ___ List of Shareholdings of Merck KGaA as of December 31, 2020
in thousand € in thousand [reporting currency]
Country Company
Registered
office
Equity
interest (%)
thereof
Merck KGaA (%)
Reporting currency
(ISO Code) IFRS net equity
IFRS profit after
tax IFRS net equity IFRS profit after tax
France Merck Chimie S.A.S.
Fontenay s/Bois 100.00 EUR 97,447.72 8,018.19 97,447.72 8,018.19
France Merck Performance Materials S.A.S. Trosly Breuil 100.00 EUR 25,981.90 1,324.75 25,981.90 1,324.75
France Merck S.A. Lyon 99.86 EUR 2,834,772.98 194,283.86 2,834,772.98 194,283.86
France Merck Santé S.A.S. Lyon 100.00 EUR 239,166.94 19,053.60 239,166.94 19,053.60
France Merck Serono S.A.S. Lyon 100.00 EUR 57,041.16 1,777.29 57,041.16 1,777.29
France Millipore S.A.S. Molsheim 100.00 EUR 594,839.70 113,548.51 594,839.70 113,548.51
France Resolution Spectra Systems S.A.S. Meylan 100.00 EUR 733.30 -515.52 733.30 -515.52
France Scipio Bioscience S.A.S. Montrouge < 20.00 EUR b) b) b) b)
France Sigma-Aldrich Chimie S.a.r.l.
Saint Quentin
Fallavier 100.00 EUR 42,226.95 3,164.22 42,226.95 3,164.22
France Sigma-Aldrich Chimie SNC
Saint Quentin
Fallavier 100.00 EUR 14,133.71 -2.77 14,133.71 -2.77
France Sigma-Aldrich Holding S.a.r.l.
Saint Quentin Fallavier 100.00 EUR -1.56 -5.25 -1.56 -5.25
Greece Merck A.E. Maroussi, Athens 100.00 EUR 20,879.52 2,029.81 20,879.52 2,029.81
Greece Sigma-Aldrich (OM) Ltd. Athens 100.00 EUR b) b) b) b)
Hungary Merck Kft. Budapest 100.00 HUF 19,807.93 1,146.00 7,230,128.84 429,857.08
Hungary Sigma-Aldrich Kft. Budapest 100.00 HUF 3,030.70 68.59 1,106,243.31 19,618.23
Ireland Merck Finance Limited Carrigtwohill 100.00 USD 7.32 -59.86 9.01 -66.74
Ireland Merck Millipore Ltd. Carrigtwohill 100.00 EUR 570,054.76 109,175.09 570,054.76 109,175.09
Ireland Merck Serono (Ireland) Ltd. Dublin 100.00 EUR 7,216.58 860.87 7,216.58 860.87
Ireland Millipore Cork Unlimited Company Carrigtwohill 100.00 EUR 52,003.92 -27.82 52,003.92 -27.82
Ireland SAFC Arklow Ltd. Arklow 100.00 EUR b) b) b) b)
Ireland Shrawdine Limited Arklow 100.00 EUR 34,088.62 0.00 34,088.62 0.00
Ireland Sigma-Aldrich Ireland Ltd. Arklow 100.00 EUR 49,063.08 13,567.07 49,063.08 13,567.07
Ireland Silverberry Limited Arklow 100.00 EUR 0.00 0.00 0.00 0.00
a) Profit and loss transfer agreement
b) Not disclosed owing to minor significance in accordance with section 286 (3) no. 1 HGB
c) Operational site of Merck KGaA
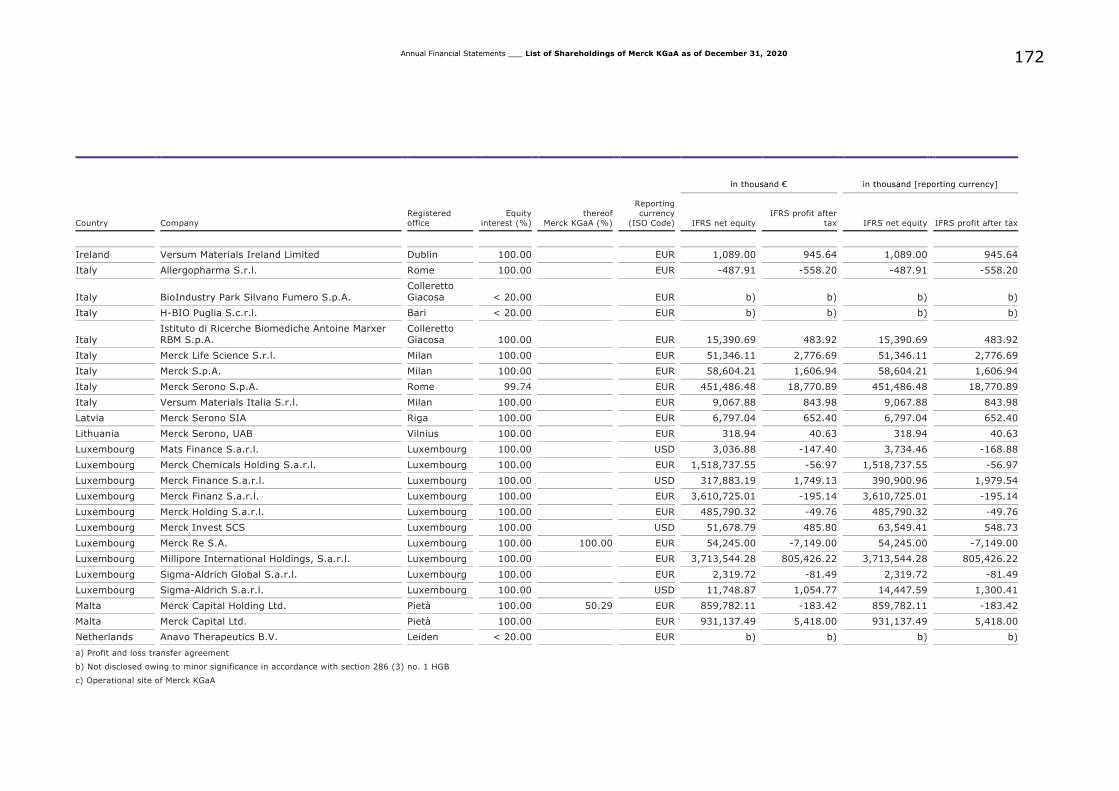
172
Annual Financial Statements ___ List of Shareholdings of Merck KGaA as of December 31, 2020
in thousand € in thousand [reporting currency]
Country Company
Registered
office
Equity
interest (%)
thereof
Merck KGaA (%)
Reporting currency
(ISO Code) IFRS net equity
IFRS profit after
tax IFRS net equity IFRS profit after tax
Ireland Versum Materials Ireland Limited Dublin 100.00 EUR 1,089.00 945.64 1,089.00 945.64
Italy Allergopharma S.r.l. Rome 100.00 EUR -487.91 -558.20 -487.91 -558.20
Italy BioIndustry Park Silvano Fumero S.p.A.
Colleretto Giacosa < 20.00 EUR b) b) b) b)
Italy H-BIO Puglia S.c.r.l. Bari < 20.00 EUR b) b) b) b)
Italy Istituto di Ricerche Biomediche Antoine Marxer RBM S.p.A.
Colleretto Giacosa 100.00 EUR 15,390.69 483.92 15,390.69 483.92
Italy Merck Life Science S.r.l. Milan 100.00 EUR 51,346.11 2,776.69 51,346.11 2,776.69
Italy Merck S.p.A. Milan 100.00 EUR 58,604.21 1,606.94 58,604.21 1,606.94
Italy Merck Serono S.p.A. Rome 99.74 EUR 451,486.48 18,770.89 451,486.48 18,770.89
Italy Versum Materials Italia S.r.l. Milan 100.00 EUR 9,067.88 843.98 9,067.88 843.98
Latvia Merck Serono SIA Riga 100.00 EUR 6,797.04 652.40 6,797.04 652.40
Lithuania Merck Serono, UAB Vilnius 100.00 EUR 318.94 40.63 318.94 40.63
Luxembourg Mats Finance S.a.r.l. Luxembourg 100.00 USD 3,036.88 -147.40 3,734.46 -168.88
Luxembourg Merck Chemicals Holding S.a.r.l. Luxembourg 100.00 EUR 1,518,737.55 -56.97 1,518,737.55 -56.97
Luxembourg Merck Finance S.a.r.l. Luxembourg 100.00 USD 317,883.19 1,749.13 390,900.96 1,979.54
Luxembourg Merck Finanz S.a.r.l. Luxembourg 100.00 EUR 3,610,725.01 -195.14 3,610,725.01 -195.14
Luxembourg Merck Holding S.a.r.l. Luxembourg 100.00 EUR 485,790.32 -49.76 485,790.32 -49.76
Luxembourg Merck Invest SCS Luxembourg 100.00 USD 51,678.79 485.80 63,549.41 548.73
Luxembourg Merck Re S.A. Luxembourg 100.00 100.00 EUR 54,245.00 -7,149.00 54,245.00 -7,149.00
Luxembourg Millipore International Holdings, S.a.r.l. Luxembourg 100.00 EUR 3,713,544.28 805,426.22 3,713,544.28 805,426.22
Luxembourg Sigma-Aldrich Global S.a.r.l. Luxembourg 100.00 EUR 2,319.72 -81.49 2,319.72 -81.49
Luxembourg Sigma-Aldrich S.a.r.l. Luxembourg 100.00 USD 11,748.87 1,054.77 14,447.59 1,300.41
Malta Merck Capital Holding Ltd. Pietà 100.00 50.29 EUR 859,782.11 -183.42 859,782.11 -183.42
Malta Merck Capital Ltd. Pietà 100.00 EUR 931,137.49 5,418.00 931,137.49 5,418.00
Netherlands Anavo Therapeutics B.V. Leiden < 20.00 EUR b) b) b) b)
a) Profit and loss transfer agreement
b) Not disclosed owing to minor significance in accordance with section 286 (3) no. 1 HGB
c) Operational site of Merck KGaA
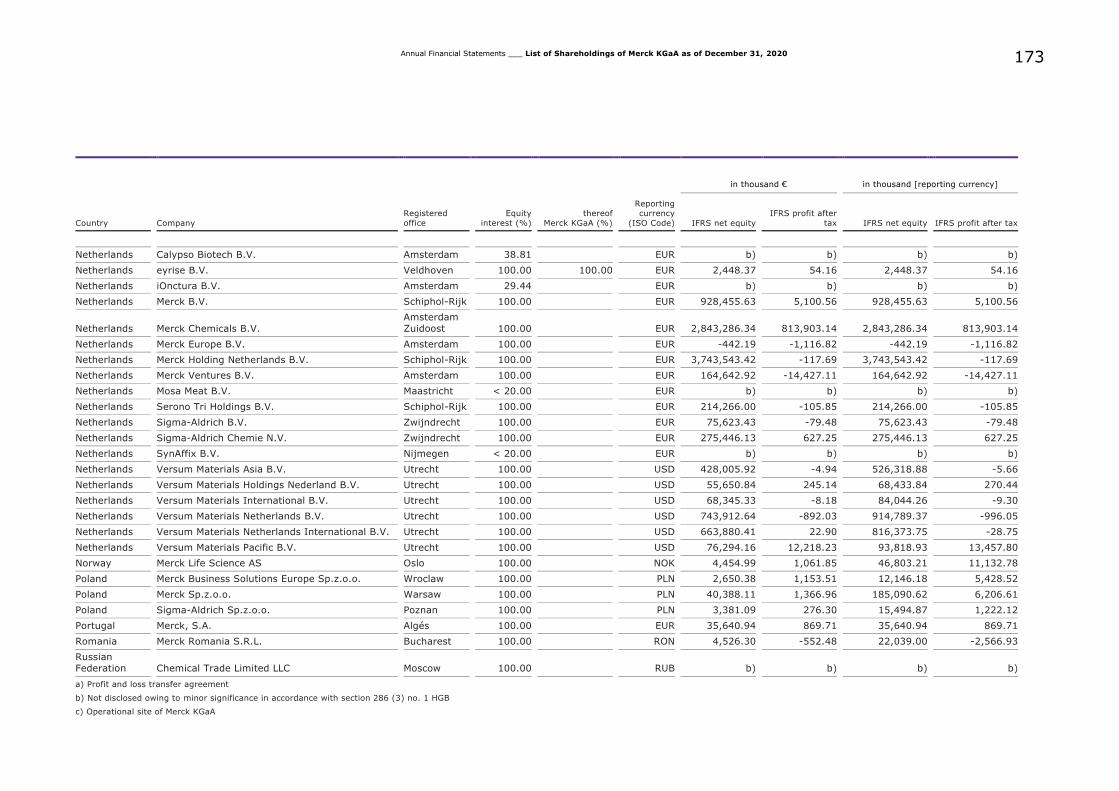
173
Annual Financial Statements ___ List of Shareholdings of Merck KGaA as of December 31, 2020
in thousand € in thousand [reporting currency]
Country Company
Registered
office
Equity
interest (%)
thereof
Merck KGaA (%)
Reporting currency
(ISO Code) IFRS net equity
IFRS profit after
tax IFRS net equity IFRS profit after tax
Netherlands Calypso Biotech B.V. Amsterdam 38.81 EUR b) b) b) b)
Netherlands eyrise B.V. Veldhoven 100.00 100.00 EUR 2,448.37 54.16 2,448.37 54.16
Netherlands iOnctura B.V. Amsterdam 29.44 EUR b) b) b) b)
Netherlands Merck B.V. Schiphol-Rijk 100.00 EUR 928,455.63 5,100.56 928,455.63 5,100.56
Netherlands Merck Chemicals B.V.
Amsterdam
Zuidoost 100.00 EUR 2,843,286.34 813,903.14 2,843,286.34 813,903.14
Netherlands Merck Europe B.V. Amsterdam 100.00 EUR -442.19 -1,116.82 -442.19 -1,116.82
Netherlands Merck Holding Netherlands B.V. Schiphol-Rijk 100.00 EUR 3,743,543.42 -117.69 3,743,543.42 -117.69
Netherlands Merck Ventures B.V. Amsterdam 100.00 EUR 164,642.92 -14,427.11 164,642.92 -14,427.11
Netherlands Mosa Meat B.V. Maastricht < 20.00 EUR b) b) b) b)
Netherlands Serono Tri Holdings B.V. Schiphol-Rijk 100.00 EUR 214,266.00 -105.85 214,266.00 -105.85
Netherlands Sigma-Aldrich B.V. Zwijndrecht 100.00 EUR 75,623.43 -79.48 75,623.43 -79.48
Netherlands Sigma-Aldrich Chemie N.V. Zwijndrecht 100.00 EUR 275,446.13 627.25 275,446.13 627.25
Netherlands SynAffix B.V. Nijmegen < 20.00 EUR b) b) b) b)
Netherlands Versum Materials Asia B.V. Utrecht 100.00 USD 428,005.92 -4.94 526,318.88 -5.66
Netherlands Versum Materials Holdings Nederland B.V. Utrecht 100.00 USD 55,650.84 245.14 68,433.84 270.44
Netherlands Versum Materials International B.V. Utrecht 100.00 USD 68,345.33 -8.18 84,044.26 -9.30
Netherlands Versum Materials Netherlands B.V. Utrecht 100.00 USD 743,912.64 -892.03 914,789.37 -996.05
Netherlands Versum Materials Netherlands International B.V. Utrecht 100.00 USD 663,880.41 22.90 816,373.75 -28.75
Netherlands Versum Materials Pacific B.V. Utrecht 100.00 USD 76,294.16 12,218.23 93,818.93 13,457.80
Norway Merck Life Science AS Oslo 100.00 NOK 4,454.99 1,061.85 46,803.21 11,132.78
Poland Merck Business Solutions Europe Sp.z.o.o. Wroclaw 100.00 PLN 2,650.38 1,153.51 12,146.18 5,428.52
Poland Merck Sp.z.o.o. Warsaw 100.00 PLN 40,388.11 1,366.96 185,090.62 6,206.61
Poland Sigma-Aldrich Sp.z.o.o. Poznan 100.00 PLN 3,381.09 276.30 15,494.87 1,222.12
Portugal Merck, S.A. Algés 100.00 EUR 35,640.94 869.71 35,640.94 869.71
Romania Merck Romania S.R.L. Bucharest 100.00 RON 4,526.30 -552.48 22,039.00 -2,566.93
Russian Federation Chemical Trade Limited LLC Moscow 100.00 RUB b) b) b) b)
a) Profit and loss transfer agreement
b) Not disclosed owing to minor significance in accordance with section 286 (3) no. 1 HGB
c) Operational site of Merck KGaA
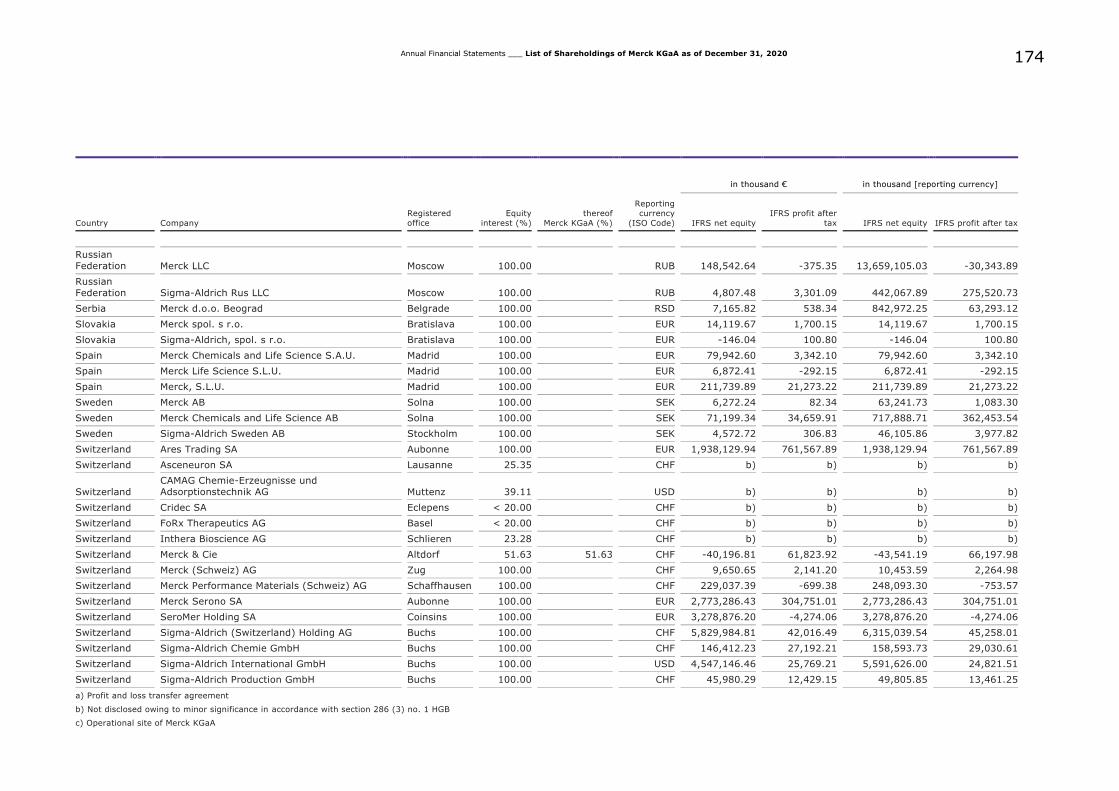
174
Annual Financial Statements ___ List of Shareholdings of Merck KGaA as of December 31, 2020
in thousand € in thousand [reporting currency]
Country Company
Registered
office
Equity
interest (%)
thereof
Merck KGaA (%)
Reporting currency
(ISO Code) IFRS net equity
IFRS profit after
tax IFRS net equity IFRS profit after tax
Russian Federation Merck LLC Moscow 100.00 RUB 148,542.64 -375.35 13,659,105.03 -30,343.89
Russian Federation Sigma-Aldrich Rus LLC Moscow 100.00 RUB 4,807.48 3,301.09 442,067.89 275,520.73
Serbia Merck d.o.o. Beograd Belgrade 100.00 RSD 7,165.82 538.34 842,972.25 63,293.12
Slovakia Merck spol. s r.o. Bratislava 100.00 EUR 14,119.67 1,700.15 14,119.67 1,700.15
Slovakia Sigma-Aldrich, spol. s r.o. Bratislava 100.00 EUR -146.04 100.80 -146.04 100.80
Spain Merck Chemicals and Life Science S.A.U. Madrid 100.00 EUR 79,942.60 3,342.10 79,942.60 3,342.10
Spain Merck Life Science S.L.U. Madrid 100.00 EUR 6,872.41 -292.15 6,872.41 -292.15
Spain Merck, S.L.U. Madrid 100.00 EUR 211,739.89 21,273.22 211,739.89 21,273.22
Sweden Merck AB Solna 100.00 SEK 6,272.24 82.34 63,241.73 1,083.30
Sweden Merck Chemicals and Life Science AB Solna 100.00 SEK 71,199.34 34,659.91 717,888.71 362,453.54
Sweden Sigma-Aldrich Sweden AB Stockholm 100.00 SEK 4,572.72 306.83 46,105.86 3,977.82
Switzerland Ares Trading SA Aubonne 100.00 EUR 1,938,129.94 761,567.89 1,938,129.94 761,567.89
Switzerland Asceneuron SA Lausanne 25.35 CHF b) b) b) b)
Switzerland
CAMAG Chemie-Erzeugnisse und Adsorptionstechnik AG Muttenz 39.11 USD b) b) b) b)
Switzerland Cridec SA Eclepens < 20.00 CHF b) b) b) b)
Switzerland FoRx Therapeutics AG Basel < 20.00 CHF b) b) b) b)
Switzerland Inthera Bioscience AG Schlieren 23.28 CHF b) b) b) b)
Switzerland Merck & Cie Altdorf 51.63 51.63 CHF -40,196.81 61,823.92 -43,541.19 66,197.98
Switzerland Merck (Schweiz) AG Zug 100.00 CHF 9,650.65 2,141.20 10,453.59 2,264.98
Switzerland Merck Performance Materials (Schweiz) AG Schaffhausen 100.00 CHF 229,037.39 -699.38 248,093.30 -753.57
Switzerland Merck Serono SA Aubonne 100.00 EUR 2,773,286.43 304,751.01 2,773,286.43 304,751.01
Switzerland SeroMer Holding SA Coinsins 100.00 EUR 3,278,876.20 -4,274.06 3,278,876.20 -4,274.06
Switzerland Sigma-Aldrich (Switzerland) Holding AG Buchs 100.00 CHF 5,829,984.81 42,016.49 6,315,039.54 45,258.01
Switzerland Sigma-Aldrich Chemie GmbH Buchs 100.00 CHF 146,412.23 27,192.21 158,593.73 29,030.61
Switzerland Sigma-Aldrich International GmbH Buchs 100.00 USD 4,547,146.46 25,769.21 5,591,626.00 24,821.51
Switzerland Sigma-Aldrich Production GmbH Buchs 100.00 CHF 45,980.29 12,429.15 49,805.85 13,461.25
a) Profit and loss transfer agreement
b) Not disclosed owing to minor significance in accordance with section 286 (3) no. 1 HGB
c) Operational site of Merck KGaA
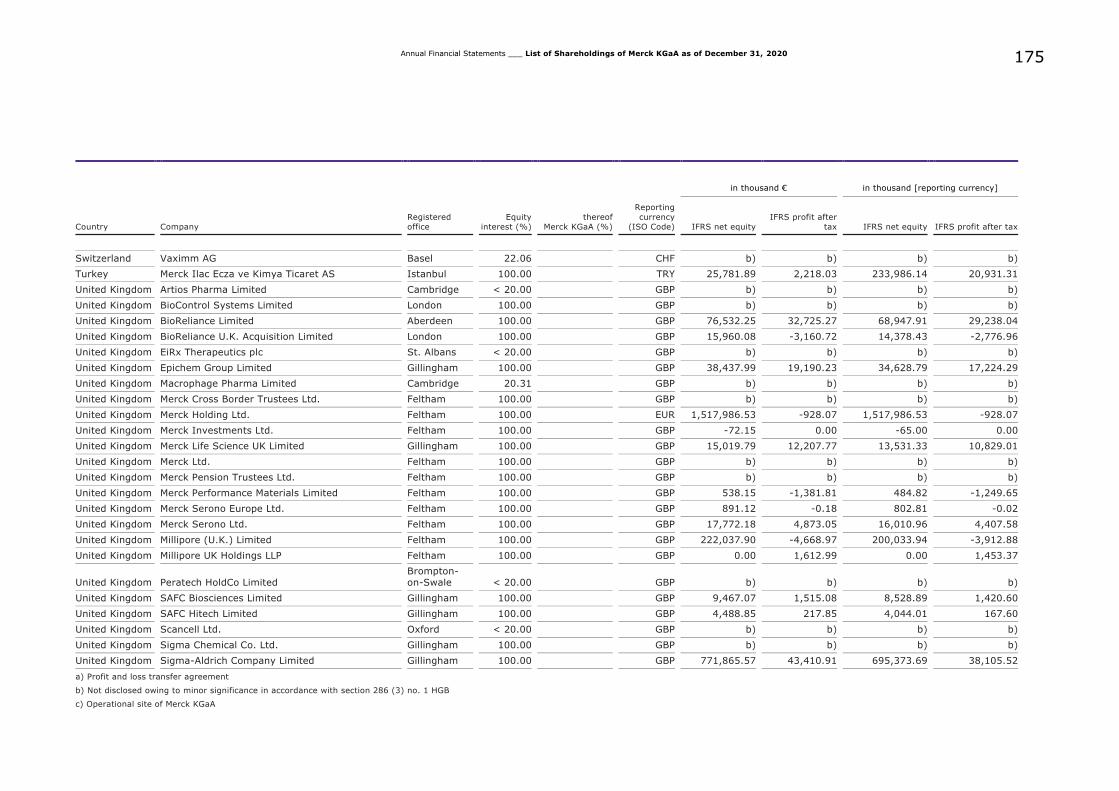
175
Annual Financial Statements ___ List of Shareholdings of Merck KGaA as of December 31, 2020
in thousand € in thousand [reporting currency]
Country Company
Registered
office
Equity
interest (%)
thereof
Merck KGaA (%)
Reporting
currency
(ISO Code) IFRS net equity
IFRS profit after
tax IFRS net equity IFRS profit after tax
Switzerland Vaximm AG Basel 22.06 CHF b) b) b) b)
Turkey Merck Ilac Ecza ve Kimya Ticaret AS Istanbul 100.00 TRY 25,781.89 2,218.03 233,986.14 20,931.31
United Kingdom Artios Pharma Limited Cambridge < 20.00 GBP b) b) b) b)
United Kingdom BioControl Systems Limited London 100.00 GBP b) b) b) b)
United Kingdom BioReliance Limited Aberdeen 100.00 GBP 76,532.25 32,725.27 68,947.91 29,238.04
United Kingdom BioReliance U.K. Acquisition Limited London 100.00 GBP 15,960.08 -3,160.72 14,378.43 -2,776.96
United Kingdom EiRx Therapeutics plc St. Albans < 20.00 GBP b) b) b) b)
United Kingdom Epichem Group Limited Gillingham 100.00 GBP 38,437.99 19,190.23 34,628.79 17,224.29
United Kingdom Macrophage Pharma Limited Cambridge 20.31 GBP b) b) b) b)
United Kingdom Merck Cross Border Trustees Ltd. Feltham 100.00 GBP b) b) b) b)
United Kingdom Merck Holding Ltd. Feltham 100.00 EUR 1,517,986.53 -928.07 1,517,986.53 -928.07
United Kingdom Merck Investments Ltd. Feltham 100.00 GBP -72.15 0.00 -65.00 0.00
United Kingdom Merck Life Science UK Limited Gillingham 100.00 GBP 15,019.79 12,207.77 13,531.33 10,829.01
United Kingdom Merck Ltd. Feltham 100.00 GBP b) b) b) b)
United Kingdom Merck Pension Trustees Ltd. Feltham 100.00 GBP b) b) b) b)
United Kingdom Merck Performance Materials Limited Feltham 100.00 GBP 538.15 -1,381.81 484.82 -1,249.65
United Kingdom Merck Serono Europe Ltd. Feltham 100.00 GBP 891.12 -0.18 802.81 -0.02
United Kingdom Merck Serono Ltd. Feltham 100.00 GBP 17,772.18 4,873.05 16,010.96 4,407.58
United Kingdom Millipore (U.K.) Limited Feltham 100.00 GBP 222,037.90 -4,668.97 200,033.94 -3,912.88
United Kingdom Millipore UK Holdings LLP Feltham 100.00 GBP 0.00 1,612.99 0.00 1,453.37
United Kingdom Peratech HoldCo Limited Brompton-on-Swale < 20.00 GBP b) b) b) b)
United Kingdom SAFC Biosciences Limited Gillingham 100.00 GBP 9,467.07 1,515.08 8,528.89 1,420.60
United Kingdom SAFC Hitech Limited Gillingham 100.00 GBP 4,488.85 217.85 4,044.01 167.60
United Kingdom Scancell Ltd. Oxford < 20.00 GBP b) b) b) b)
United Kingdom Sigma Chemical Co. Ltd. Gillingham 100.00 GBP b) b) b) b)
United Kingdom Sigma-Aldrich Company Limited Gillingham 100.00 GBP 771,865.57 43,410.91 695,373.69 38,105.52
a) Profit and loss transfer agreement
b) Not disclosed owing to minor significance in accordance with section 286 (3) no. 1 HGB
c) Operational site of Merck KGaA
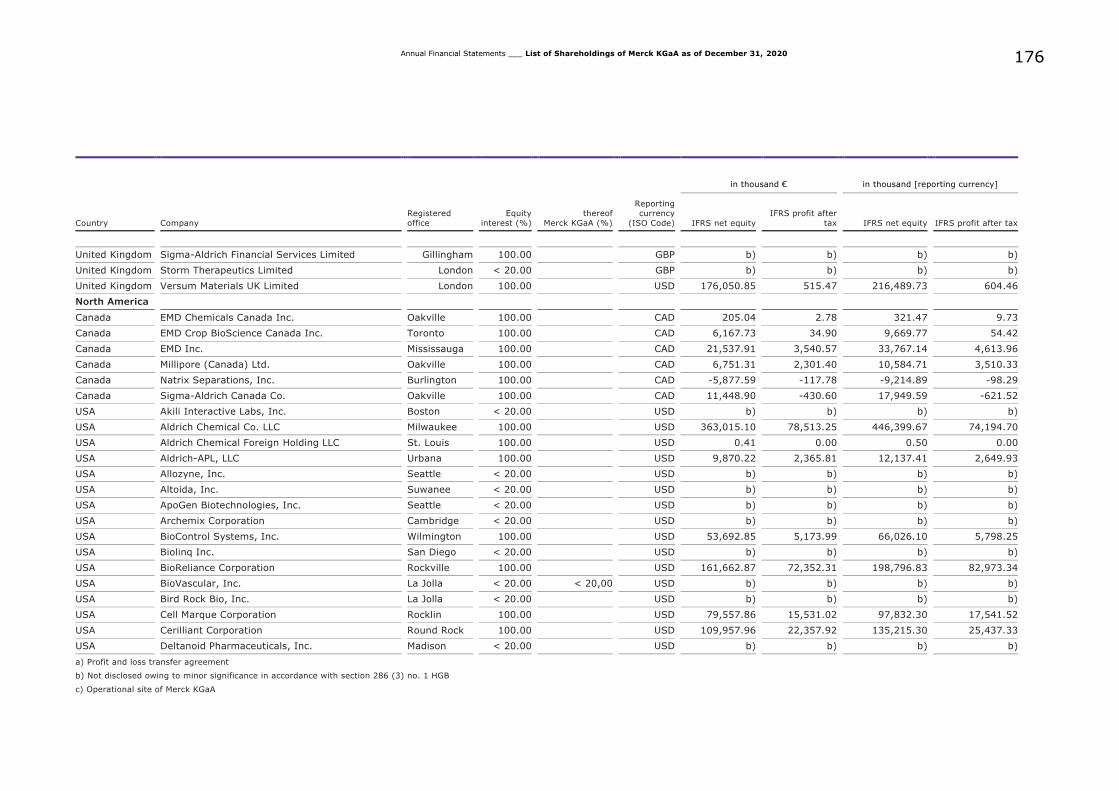
176
Annual Financial Statements ___ List of Shareholdings of Merck KGaA as of December 31, 2020
in thousand € in thousand [reporting currency]
Country Company
Registered
office
Equity
interest (%)
thereof
Merck KGaA (%)
Reporting currency
(ISO Code) IFRS net equity
IFRS profit after
tax IFRS net equity IFRS profit after tax
United Kingdom Sigma-Aldrich Financial Services Limited Gillingham 100.00 GBP b) b) b) b)
United Kingdom Storm Therapeutics Limited London < 20.00 GBP b) b) b) b)
United Kingdom Versum Materials UK Limited London 100.00 USD 176,050.85 515.47 216,489.73 604.46
North America
Canada EMD Chemicals Canada Inc. Oakville 100.00 CAD 205.04 2.78 321.47 9.73
Canada EMD Crop BioScience Canada Inc. Toronto 100.00 CAD 6,167.73 34.90 9,669.77 54.42
Canada EMD Inc. Mississauga 100.00 CAD 21,537.91 3,540.57 33,767.14 4,613.96
Canada Millipore (Canada) Ltd. Oakville 100.00 CAD 6,751.31 2,301.40 10,584.71 3,510.33
Canada Natrix Separations, Inc. Burlington 100.00 CAD -5,877.59 -117.78 -9,214.89 -98.29
Canada Sigma-Aldrich Canada Co. Oakville 100.00 CAD 11,448.90 -430.60 17,949.59 -621.52
USA Akili Interactive Labs, Inc. Boston < 20.00 USD b) b) b) b)
USA Aldrich Chemical Co. LLC Milwaukee 100.00 USD 363,015.10 78,513.25 446,399.67 74,194.70
USA Aldrich Chemical Foreign Holding LLC St. Louis 100.00 USD 0.41 0.00 0.50 0.00
USA Aldrich-APL, LLC Urbana 100.00 USD 9,870.22 2,365.81 12,137.41 2,649.93
USA Allozyne, Inc. Seattle < 20.00 USD b) b) b) b)
USA Altoida, Inc. Suwanee < 20.00 USD b) b) b) b)
USA ApoGen Biotechnologies, Inc. Seattle < 20.00 USD b) b) b) b)
USA Archemix Corporation Cambridge < 20.00 USD b) b) b) b)
USA BioControl Systems, Inc. Wilmington 100.00 USD 53,692.85 5,173.99 66,026.10 5,798.25
USA Biolinq Inc. San Diego < 20.00 USD b) b) b) b)
USA BioReliance Corporation Rockville 100.00 USD 161,662.87 72,352.31 198,796.83 82,973.34
USA BioVascular, Inc. La Jolla < 20.00 < 20,00 USD b) b) b) b)
USA Bird Rock Bio, Inc. La Jolla < 20.00 USD b) b) b) b)
USA Cell Marque Corporation Rocklin 100.00 USD 79,557.86 15,531.02 97,832.30 17,541.52
USA Cerilliant Corporation Round Rock 100.00 USD 109,957.96 22,357.92 135,215.30 25,437.33
USA Deltanoid Pharmaceuticals, Inc. Madison < 20.00 USD b) b) b) b)
a) Profit and loss transfer agreement
b) Not disclosed owing to minor significance in accordance with section 286 (3) no. 1 HGB
c) Operational site of Merck KGaA
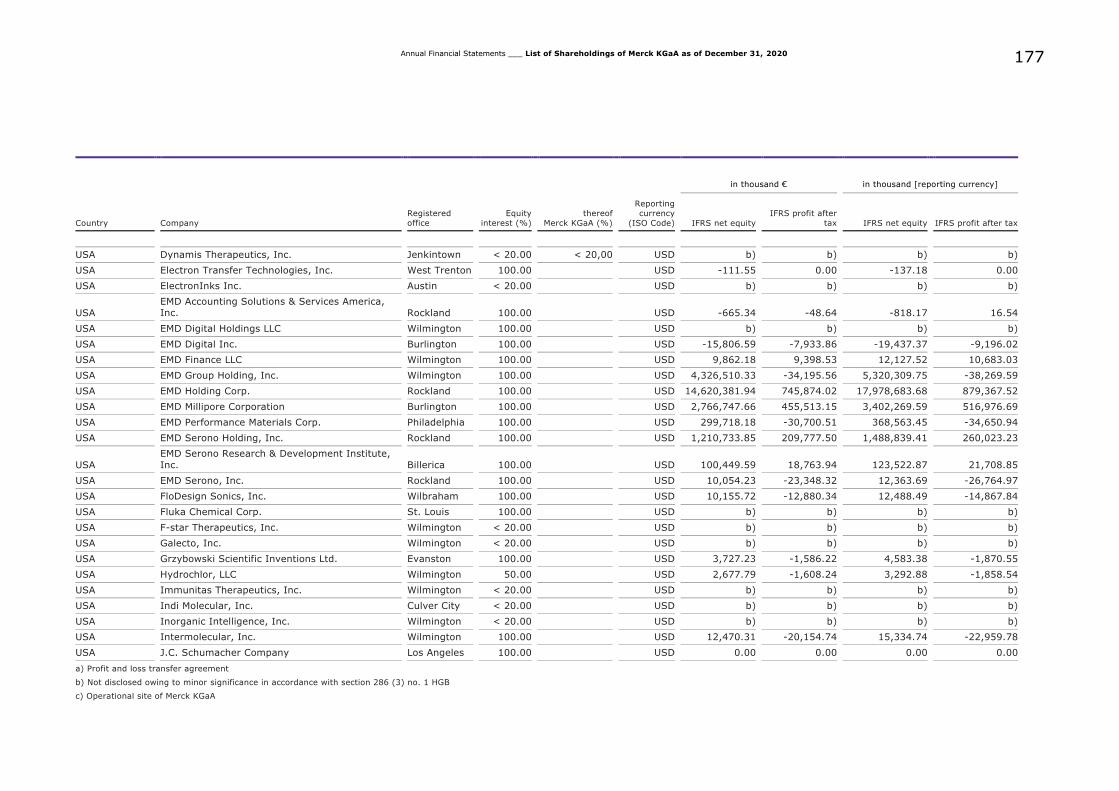
177
Annual Financial Statements ___ List of Shareholdings of Merck KGaA as of December 31, 2020
in thousand € in thousand [reporting currency]
Country Company
Registered
office
Equity
interest (%)
thereof
Merck KGaA (%)
Reporting currency
(ISO Code) IFRS net equity
IFRS profit after
tax IFRS net equity IFRS profit after tax
USA Dynamis Therapeutics, Inc. Jenkintown < 20.00 < 20,00 USD b) b) b) b)
USA Electron Transfer Technologies, Inc. West Trenton 100.00 USD -111.55 0.00 -137.18 0.00
USA ElectronInks Inc. Austin < 20.00 USD b) b) b) b)
USA
EMD Accounting Solutions & Services America, Inc. Rockland 100.00 USD -665.34 -48.64 -818.17 16.54
USA EMD Digital Holdings LLC Wilmington 100.00 USD b) b) b) b)
USA EMD Digital Inc. Burlington 100.00 USD -15,806.59 -7,933.86 -19,437.37 -9,196.02
USA EMD Finance LLC Wilmington 100.00 USD 9,862.18 9,398.53 12,127.52 10,683.03
USA EMD Group Holding, Inc. Wilmington 100.00 USD 4,326,510.33 -34,195.56 5,320,309.75 -38,269.59
USA EMD Holding Corp. Rockland 100.00 USD 14,620,381.94 745,874.02 17,978,683.68 879,367.52
USA EMD Millipore Corporation Burlington 100.00 USD 2,766,747.66 455,513.15 3,402,269.59 516,976.69
USA EMD Performance Materials Corp. Philadelphia 100.00 USD 299,718.18 -30,700.51 368,563.45 -34,650.94
USA EMD Serono Holding, Inc. Rockland 100.00 USD 1,210,733.85 209,777.50 1,488,839.41 260,023.23
USA
EMD Serono Research & Development Institute,
Inc. Billerica 100.00 USD 100,449.59 18,763.94 123,522.87 21,708.85
USA EMD Serono, Inc. Rockland 100.00 USD 10,054.23 -23,348.32 12,363.69 -26,764.97
USA FloDesign Sonics, Inc. Wilbraham 100.00 USD 10,155.72 -12,880.34 12,488.49 -14,867.84
USA Fluka Chemical Corp. St. Louis 100.00 USD b) b) b) b)
USA F-star Therapeutics, Inc. Wilmington < 20.00 USD b) b) b) b)
USA Galecto, Inc. Wilmington < 20.00 USD b) b) b) b)
USA Grzybowski Scientific Inventions Ltd. Evanston 100.00 USD 3,727.23 -1,586.22 4,583.38 -1,870.55
USA Hydrochlor, LLC Wilmington 50.00 USD 2,677.79 -1,608.24 3,292.88 -1,858.54
USA Immunitas Therapeutics, Inc. Wilmington < 20.00 USD b) b) b) b)
USA Indi Molecular, Inc. Culver City < 20.00 USD b) b) b) b)
USA Inorganic Intelligence, Inc. Wilmington < 20.00 USD b) b) b) b)
USA Intermolecular, Inc. Wilmington 100.00 USD 12,470.31 -20,154.74 15,334.74 -22,959.78
USA J.C. Schumacher Company Los Angeles 100.00 USD 0.00 0.00 0.00 0.00
a) Profit and loss transfer agreement
b) Not disclosed owing to minor significance in accordance with section 286 (3) no. 1 HGB
c) Operational site of Merck KGaA
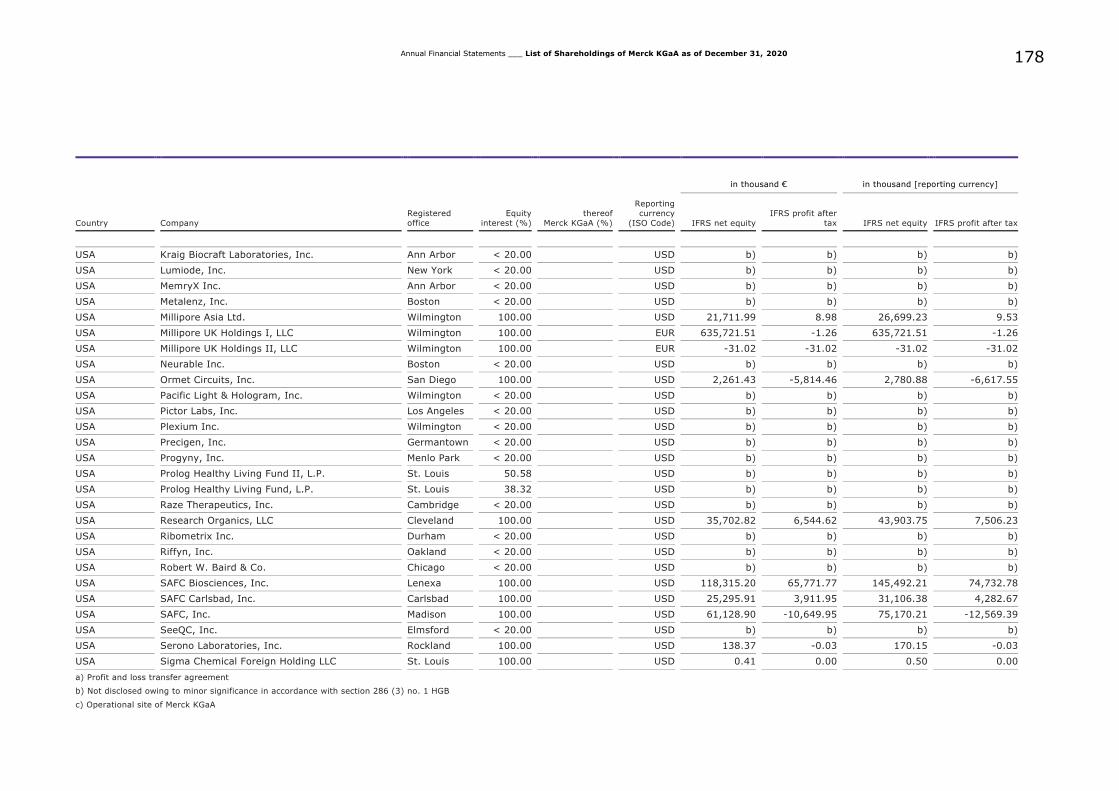
178
Annual Financial Statements ___ List of Shareholdings of Merck KGaA as of December 31, 2020
in thousand € in thousand [reporting currency]
Country Company
Registered
office
Equity
interest (%)
thereof
Merck KGaA (%)
Reporting currency
(ISO Code) IFRS net equity
IFRS profit after
tax IFRS net equity IFRS profit after tax
USA Kraig Biocraft Laboratories, Inc. Ann Arbor < 20.00 USD b) b) b) b)
USA Lumiode, Inc. New York < 20.00 USD b) b) b) b)
USA MemryX Inc. Ann Arbor < 20.00 USD b) b) b) b)
USA Metalenz, Inc. Boston < 20.00 USD b) b) b) b)
USA Millipore Asia Ltd. Wilmington 100.00 USD 21,711.99 8.98 26,699.23 9.53
USA Millipore UK Holdings I, LLC Wilmington 100.00 EUR 635,721.51 -1.26 635,721.51 -1.26
USA Millipore UK Holdings II, LLC Wilmington 100.00 EUR -31.02 -31.02 -31.02 -31.02
USA Neurable Inc. Boston < 20.00 USD b) b) b) b)
USA Ormet Circuits, Inc. San Diego 100.00 USD 2,261.43 -5,814.46 2,780.88 -6,617.55
USA Pacific Light & Hologram, Inc. Wilmington < 20.00 USD b) b) b) b)
USA Pictor Labs, Inc. Los Angeles < 20.00 USD b) b) b) b)
USA Plexium Inc. Wilmington < 20.00 USD b) b) b) b)
USA Precigen, Inc. Germantown < 20.00 USD b) b) b) b)
USA Progyny, Inc. Menlo Park < 20.00 USD b) b) b) b)
USA Prolog Healthy Living Fund II, L.P. St. Louis 50.58 USD b) b) b) b)
USA Prolog Healthy Living Fund, L.P. St. Louis 38.32 USD b) b) b) b)
USA Raze Therapeutics, Inc. Cambridge < 20.00 USD b) b) b) b)
USA Research Organics, LLC Cleveland 100.00 USD 35,702.82 6,544.62 43,903.75 7,506.23
USA Ribometrix Inc. Durham < 20.00 USD b) b) b) b)
USA Riffyn, Inc. Oakland < 20.00 USD b) b) b) b)
USA Robert W. Baird & Co. Chicago < 20.00 USD b) b) b) b)
USA SAFC Biosciences, Inc. Lenexa 100.00 USD 118,315.20 65,771.77 145,492.21 74,732.78
USA SAFC Carlsbad, Inc. Carlsbad 100.00 USD 25,295.91 3,911.95 31,106.38 4,282.67
USA SAFC, Inc. Madison 100.00 USD 61,128.90 -10,649.95 75,170.21 -12,569.39
USA SeeQC, Inc. Elmsford < 20.00 USD b) b) b) b)
USA Serono Laboratories, Inc. Rockland 100.00 USD 138.37 -0.03 170.15 -0.03
USA Sigma Chemical Foreign Holding LLC St. Louis 100.00 USD 0.41 0.00 0.50 0.00
a) Profit and loss transfer agreement
b) Not disclosed owing to minor significance in accordance with section 286 (3) no. 1 HGB
c) Operational site of Merck KGaA
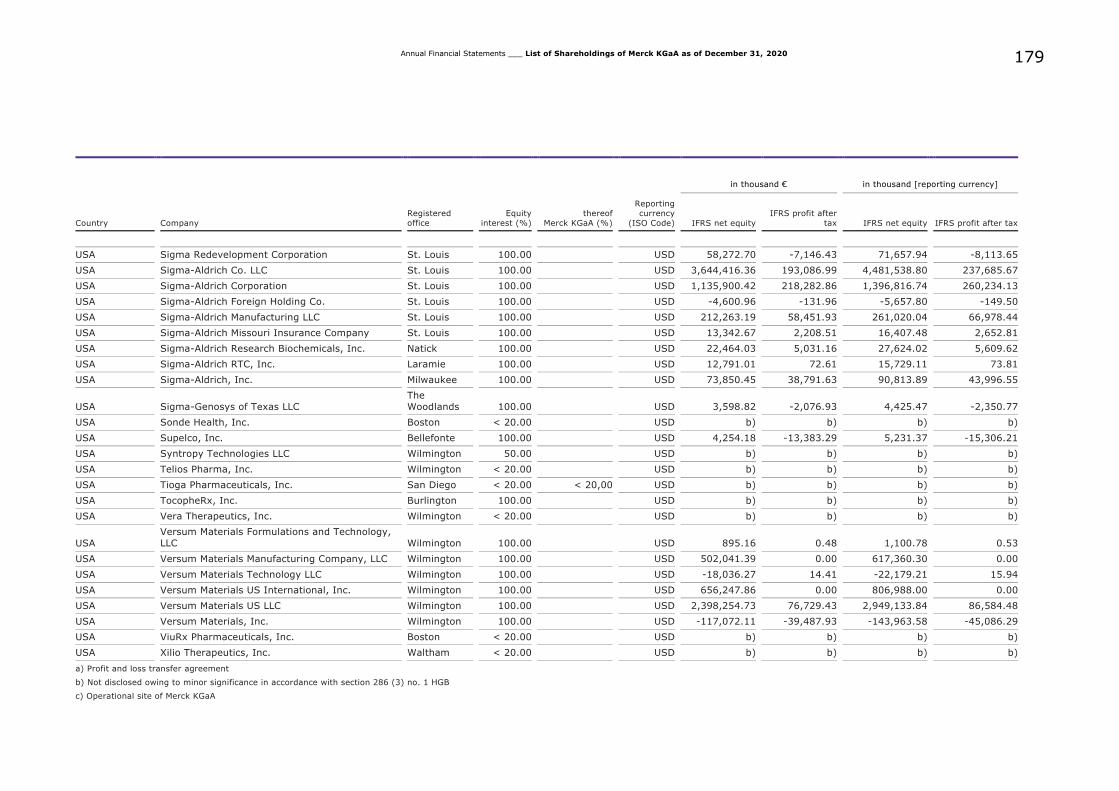
179
Annual Financial Statements ___ List of Shareholdings of Merck KGaA as of December 31, 2020
in thousand € in thousand [reporting currency]
Country Company
Registered
office
Equity
interest (%)
thereof
Merck KGaA (%)
Reporting currency
(ISO Code) IFRS net equity
IFRS profit after
tax IFRS net equity IFRS profit after tax
USA Sigma Redevelopment Corporation St. Louis 100.00 USD 58,272.70 -7,146.43 71,657.94 -8,113.65
USA Sigma-Aldrich Co. LLC St. Louis 100.00 USD 3,644,416.36 193,086.99 4,481,538.80 237,685.67
USA Sigma-Aldrich Corporation St. Louis 100.00 USD 1,135,900.42 218,282.86 1,396,816.74 260,234.13
USA Sigma-Aldrich Foreign Holding Co. St. Louis 100.00 USD -4,600.96 -131.96 -5,657.80 -149.50
USA Sigma-Aldrich Manufacturing LLC St. Louis 100.00 USD 212,263.19 58,451.93 261,020.04 66,978.44
USA Sigma-Aldrich Missouri Insurance Company St. Louis 100.00 USD 13,342.67 2,208.51 16,407.48 2,652.81
USA Sigma-Aldrich Research Biochemicals, Inc. Natick 100.00 USD 22,464.03 5,031.16 27,624.02 5,609.62
USA Sigma-Aldrich RTC, Inc. Laramie 100.00 USD 12,791.01 72.61 15,729.11 73.81
USA Sigma-Aldrich, Inc. Milwaukee 100.00 USD 73,850.45 38,791.63 90,813.89 43,996.55
USA Sigma-Genosys of Texas LLC The Woodlands 100.00 USD 3,598.82 -2,076.93 4,425.47 -2,350.77
USA Sonde Health, Inc. Boston < 20.00 USD b) b) b) b)
USA Supelco, Inc. Bellefonte 100.00 USD 4,254.18 -13,383.29 5,231.37 -15,306.21
USA Syntropy Technologies LLC Wilmington 50.00 USD b) b) b) b)
USA Telios Pharma, Inc. Wilmington < 20.00 USD b) b) b) b)
USA Tioga Pharmaceuticals, Inc. San Diego < 20.00 < 20,00 USD b) b) b) b)
USA TocopheRx, Inc. Burlington 100.00 USD b) b) b) b)
USA Vera Therapeutics, Inc. Wilmington < 20.00 USD b) b) b) b)
USA
Versum Materials Formulations and Technology,
LLC Wilmington 100.00 USD 895.16 0.48 1,100.78 0.53
USA Versum Materials Manufacturing Company, LLC Wilmington 100.00 USD 502,041.39 0.00 617,360.30 0.00
USA Versum Materials Technology LLC Wilmington 100.00 USD -18,036.27 14.41 -22,179.21 15.94
USA Versum Materials US International, Inc. Wilmington 100.00 USD 656,247.86 0.00 806,988.00 0.00
USA Versum Materials US LLC Wilmington 100.00 USD 2,398,254.73 76,729.43 2,949,133.84 86,584.48
USA Versum Materials, Inc. Wilmington 100.00 USD -117,072.11 -39,487.93 -143,963.58 -45,086.29
USA ViuRx Pharmaceuticals, Inc. Boston < 20.00 USD b) b) b) b)
USA Xilio Therapeutics, Inc. Waltham < 20.00 USD b) b) b) b)
a) Profit and loss transfer agreement
b) Not disclosed owing to minor significance in accordance with section 286 (3) no. 1 HGB
c) Operational site of Merck KGaA
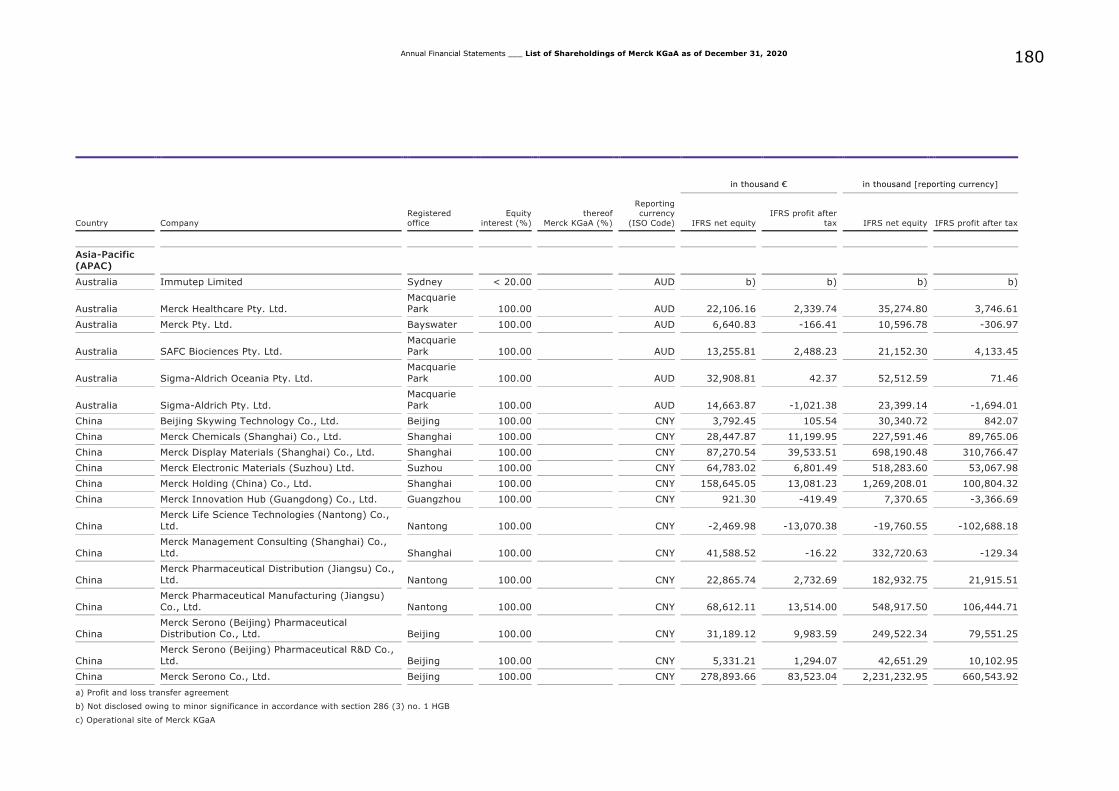
180
Annual Financial Statements ___ List of Shareholdings of Merck KGaA as of December 31, 2020
in thousand € in thousand [reporting currency]
Country Company
Registered
office
Equity
interest (%)
thereof
Merck KGaA (%)
Reporting currency
(ISO Code) IFRS net equity
IFRS profit after
tax IFRS net equity IFRS profit after tax
Asia-Pacific (APAC)
Australia Immutep Limited Sydney < 20.00 AUD b) b) b) b)
Australia Merck Healthcare Pty. Ltd.
Macquarie Park 100.00 AUD 22,106.16 2,339.74 35,274.80 3,746.61
Australia Merck Pty. Ltd. Bayswater 100.00 AUD 6,640.83 -166.41 10,596.78 -306.97
Australia SAFC Biociences Pty. Ltd. Macquarie Park 100.00 AUD 13,255.81 2,488.23 21,152.30 4,133.45
Australia Sigma-Aldrich Oceania Pty. Ltd.
Macquarie
Park 100.00 AUD 32,908.81 42.37 52,512.59 71.46
Australia Sigma-Aldrich Pty. Ltd.
Macquarie Park 100.00 AUD 14,663.87 -1,021.38 23,399.14 -1,694.01
China Beijing Skywing Technology Co., Ltd. Beijing 100.00 CNY 3,792.45 105.54 30,340.72 842.07
China Merck Chemicals (Shanghai) Co., Ltd. Shanghai 100.00 CNY 28,447.87 11,199.95 227,591.46 89,765.06
China Merck Display Materials (Shanghai) Co., Ltd. Shanghai 100.00 CNY 87,270.54 39,533.51 698,190.48 310,766.47
China Merck Electronic Materials (Suzhou) Ltd. Suzhou 100.00 CNY 64,783.02 6,801.49 518,283.60 53,067.98
China Merck Holding (China) Co., Ltd. Shanghai 100.00 CNY 158,645.05 13,081.23 1,269,208.01 100,804.32
China Merck Innovation Hub (Guangdong) Co., Ltd. Guangzhou 100.00 CNY 921.30 -419.49 7,370.65 -3,366.69
China
Merck Life Science Technologies (Nantong) Co.,
Ltd. Nantong 100.00 CNY -2,469.98 -13,070.38 -19,760.55 -102,688.18
China
Merck Management Consulting (Shanghai) Co.,
Ltd. Shanghai 100.00 CNY 41,588.52 -16.22 332,720.63 -129.34
China
Merck Pharmaceutical Distribution (Jiangsu) Co., Ltd. Nantong 100.00 CNY 22,865.74 2,732.69 182,932.75 21,915.51
China Merck Pharmaceutical Manufacturing (Jiangsu) Co., Ltd. Nantong 100.00 CNY 68,612.11 13,514.00 548,917.50 106,444.71
China
Merck Serono (Beijing) Pharmaceutical
Distribution Co., Ltd. Beijing 100.00 CNY 31,189.12 9,983.59 249,522.34 79,551.25
China
Merck Serono (Beijing) Pharmaceutical R&D Co.,
Ltd. Beijing 100.00 CNY 5,331.21 1,294.07 42,651.29 10,102.95
China Merck Serono Co., Ltd. Beijing 100.00 CNY 278,893.66 83,523.04 2,231,232.95 660,543.92
a) Profit and loss transfer agreement
b) Not disclosed owing to minor significance in accordance with section 286 (3) no. 1 HGB
c) Operational site of Merck KGaA
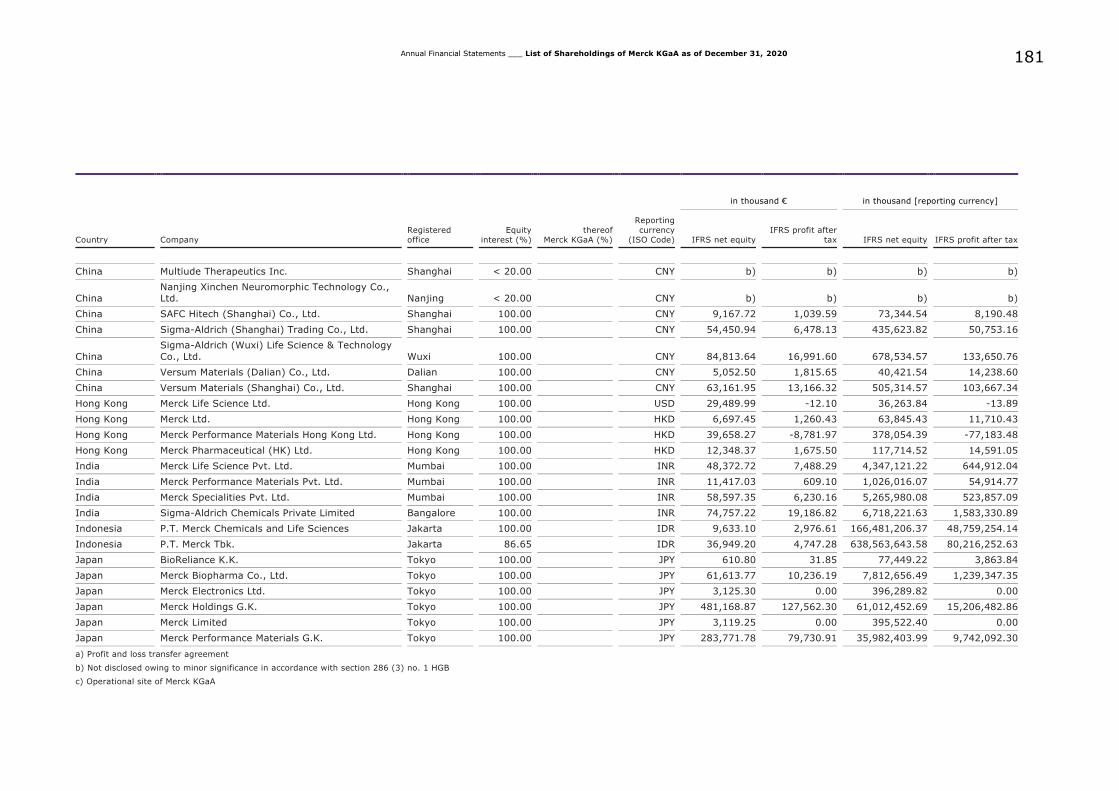
181
Annual Financial Statements ___ List of Shareholdings of Merck KGaA as of December 31, 2020
in thousand € in thousand [reporting currency]
Country Company
Registered
office
Equity
interest (%)
thereof
Merck KGaA (%)
Reporting
currency
(ISO Code) IFRS net equity
IFRS profit after
tax IFRS net equity IFRS profit after tax
China Multiude Therapeutics Inc. Shanghai < 20.00 CNY b) b) b) b)
China Nanjing Xinchen Neuromorphic Technology Co., Ltd. Nanjing < 20.00 CNY b) b) b) b)
China SAFC Hitech (Shanghai) Co., Ltd. Shanghai 100.00 CNY 9,167.72 1,039.59 73,344.54 8,190.48
China Sigma-Aldrich (Shanghai) Trading Co., Ltd. Shanghai 100.00 CNY 54,450.94 6,478.13 435,623.82 50,753.16
China
Sigma-Aldrich (Wuxi) Life Science & Technology
Co., Ltd. Wuxi 100.00 CNY 84,813.64 16,991.60 678,534.57 133,650.76
China Versum Materials (Dalian) Co., Ltd. Dalian 100.00 CNY 5,052.50 1,815.65 40,421.54 14,238.60
China Versum Materials (Shanghai) Co., Ltd. Shanghai 100.00 CNY 63,161.95 13,166.32 505,314.57 103,667.34
Hong Kong Merck Life Science Ltd. Hong Kong 100.00 USD 29,489.99 -12.10 36,263.84 -13.89
Hong Kong Merck Ltd. Hong Kong 100.00 HKD 6,697.45 1,260.43 63,845.43 11,710.43
Hong Kong Merck Performance Materials Hong Kong Ltd. Hong Kong 100.00 HKD 39,658.27 -8,781.97 378,054.39 -77,183.48
Hong Kong Merck Pharmaceutical (HK) Ltd. Hong Kong 100.00 HKD 12,348.37 1,675.50 117,714.52 14,591.05
India Merck Life Science Pvt. Ltd. Mumbai 100.00 INR 48,372.72 7,488.29 4,347,121.22 644,912.04
India Merck Performance Materials Pvt. Ltd. Mumbai 100.00 INR 11,417.03 609.10 1,026,016.07 54,914.77
India Merck Specialities Pvt. Ltd. Mumbai 100.00 INR 58,597.35 6,230.16 5,265,980.08 523,857.09
India Sigma-Aldrich Chemicals Private Limited Bangalore 100.00 INR 74,757.22 19,186.82 6,718,221.63 1,583,330.89
Indonesia P.T. Merck Chemicals and Life Sciences Jakarta 100.00 IDR 9,633.10 2,976.61 166,481,206.37 48,759,254.14
Indonesia P.T. Merck Tbk. Jakarta 86.65 IDR 36,949.20 4,747.28 638,563,643.58 80,216,252.63
Japan BioReliance K.K. Tokyo 100.00 JPY 610.80 31.85 77,449.22 3,863.84
Japan Merck Biopharma Co., Ltd. Tokyo 100.00 JPY 61,613.77 10,236.19 7,812,656.49 1,239,347.35
Japan Merck Electronics Ltd. Tokyo 100.00 JPY 3,125.30 0.00 396,289.82 0.00
Japan Merck Holdings G.K. Tokyo 100.00 JPY 481,168.87 127,562.30 61,012,452.69 15,206,482.86
Japan Merck Limited Tokyo 100.00 JPY 3,119.25 0.00 395,522.40 0.00
Japan Merck Performance Materials G.K. Tokyo 100.00 JPY 283,771.78 79,730.91 35,982,403.99 9,742,092.30
a) Profit and loss transfer agreement
b) Not disclosed owing to minor significance in accordance with section 286 (3) no. 1 HGB
c) Operational site of Merck KGaA
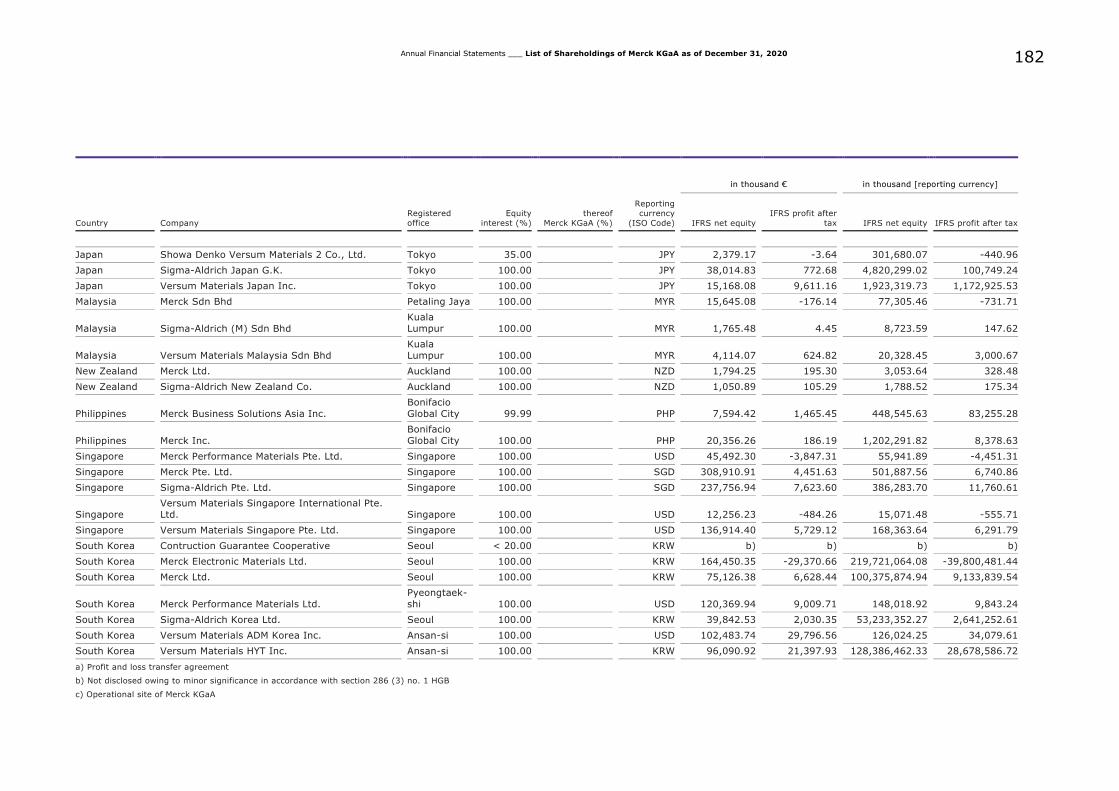
182
Annual Financial Statements ___ List of Shareholdings of Merck KGaA as of December 31, 2020
in thousand € in thousand [reporting currency]
Country Company
Registered
office
Equity
interest (%)
thereof
Merck KGaA (%)
Reporting currency
(ISO Code) IFRS net equity
IFRS profit after
tax IFRS net equity IFRS profit after tax
Japan Showa Denko Versum Materials 2 Co., Ltd. Tokyo 35.00 JPY 2,379.17 -3.64 301,680.07 -440.96
Japan Sigma-Aldrich Japan G.K. Tokyo 100.00 JPY 38,014.83 772.68 4,820,299.02 100,749.24
Japan Versum Materials Japan Inc. Tokyo 100.00 JPY 15,168.08 9,611.16 1,923,319.73 1,172,925.53
Malaysia Merck Sdn Bhd Petaling Jaya 100.00 MYR 15,645.08 -176.14 77,305.46 -731.71
Malaysia Sigma-Aldrich (M) Sdn Bhd
Kuala
Lumpur 100.00 MYR 1,765.48 4.45 8,723.59 147.62
Malaysia Versum Materials Malaysia Sdn Bhd Kuala Lumpur 100.00 MYR 4,114.07 624.82 20,328.45 3,000.67
New Zealand Merck Ltd. Auckland 100.00 NZD 1,794.25 195.30 3,053.64 328.48
New Zealand Sigma-Aldrich New Zealand Co. Auckland 100.00 NZD 1,050.89 105.29 1,788.52 175.34
Philippines Merck Business Solutions Asia Inc.
Bonifacio
Global City 99.99 PHP 7,594.42 1,465.45 448,545.63 83,255.28
Philippines Merck Inc.
Bonifacio Global City 100.00 PHP 20,356.26 186.19 1,202,291.82 8,378.63
Singapore Merck Performance Materials Pte. Ltd. Singapore 100.00 USD 45,492.30 -3,847.31 55,941.89 -4,451.31
Singapore Merck Pte. Ltd. Singapore 100.00 SGD 308,910.91 4,451.63 501,887.56 6,740.86
Singapore Sigma-Aldrich Pte. Ltd. Singapore 100.00 SGD 237,756.94 7,623.60 386,283.70 11,760.61
Singapore Versum Materials Singapore International Pte. Ltd. Singapore 100.00 USD 12,256.23 -484.26 15,071.48 -555.71
Singapore Versum Materials Singapore Pte. Ltd. Singapore 100.00 USD 136,914.40 5,729.12 168,363.64 6,291.79
South Korea Contruction Guarantee Cooperative Seoul < 20.00 KRW b) b) b) b)
South Korea Merck Electronic Materials Ltd. Seoul 100.00 KRW 164,450.35 -29,370.66 219,721,064.08 -39,800,481.44
South Korea Merck Ltd. Seoul 100.00 KRW 75,126.38 6,628.44 100,375,874.94 9,133,839.54
South Korea Merck Performance Materials Ltd.
Pyeongtaek-
shi 100.00 USD 120,369.94 9,009.71 148,018.92 9,843.24
South Korea Sigma-Aldrich Korea Ltd. Seoul 100.00 KRW 39,842.53 2,030.35 53,233,352.27 2,641,252.61
South Korea Versum Materials ADM Korea Inc. Ansan-si 100.00 USD 102,483.74 29,796.56 126,024.25 34,079.61
South Korea Versum Materials HYT Inc. Ansan-si 100.00 KRW 96,090.92 21,397.93 128,386,462.33 28,678,586.72
a) Profit and loss transfer agreement
b) Not disclosed owing to minor significance in accordance with section 286 (3) no. 1 HGB
c) Operational site of Merck KGaA
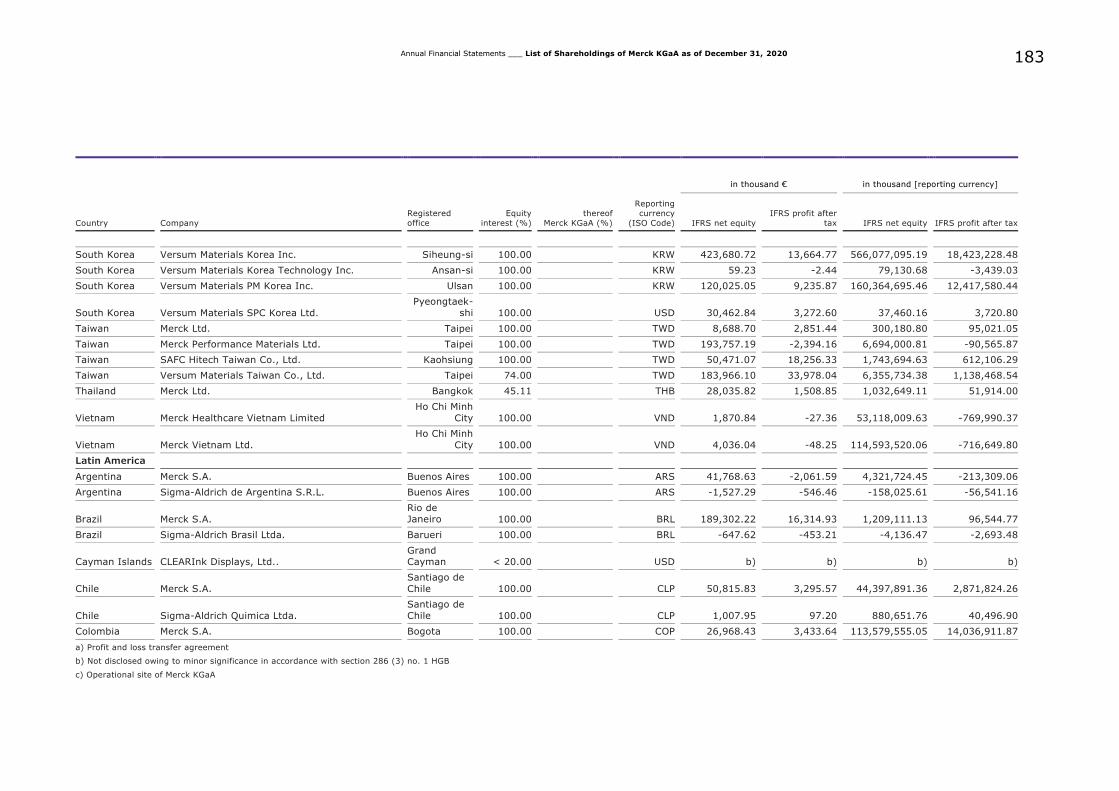
183
Annual Financial Statements ___ List of Shareholdings of Merck KGaA as of December 31, 2020
in thousand € in thousand [reporting currency]
Country Company
Registered
office
Equity
interest (%)
thereof
Merck KGaA (%)
Reporting currency
(ISO Code) IFRS net equity
IFRS profit after
tax IFRS net equity IFRS profit after tax
South Korea Versum Materials Korea Inc. Siheung-si 100.00 KRW 423,680.72 13,664.77 566,077,095.19 18,423,228.48
South Korea Versum Materials Korea Technology Inc. Ansan-si 100.00 KRW 59.23 -2.44 79,130.68 -3,439.03
South Korea Versum Materials PM Korea Inc. Ulsan 100.00 KRW 120,025.05 9,235.87 160,364,695.46 12,417,580.44
South Korea Versum Materials SPC Korea Ltd.
Pyeongtaek-shi 100.00 USD 30,462.84 3,272.60 37,460.16 3,720.80
Taiwan Merck Ltd. Taipei 100.00 TWD 8,688.70 2,851.44 300,180.80 95,021.05
Taiwan Merck Performance Materials Ltd. Taipei 100.00 TWD 193,757.19 -2,394.16 6,694,000.81 -90,565.87
Taiwan SAFC Hitech Taiwan Co., Ltd. Kaohsiung 100.00 TWD 50,471.07 18,256.33 1,743,694.63 612,106.29
Taiwan Versum Materials Taiwan Co., Ltd. Taipei 74.00 TWD 183,966.10 33,978.04 6,355,734.38 1,138,468.54
Thailand Merck Ltd. Bangkok 45.11 THB 28,035.82 1,508.85 1,032,649.11 51,914.00
Vietnam Merck Healthcare Vietnam Limited
Ho Chi Minh
City 100.00 VND 1,870.84 -27.36 53,118,009.63 -769,990.37
Vietnam Merck Vietnam Ltd.
Ho Chi Minh
City 100.00 VND 4,036.04 -48.25 114,593,520.06 -716,649.80
Latin America
Argentina Merck S.A. Buenos Aires 100.00 ARS 41,768.63 -2,061.59 4,321,724.45 -213,309.06
Argentina Sigma-Aldrich de Argentina S.R.L. Buenos Aires 100.00 ARS -1,527.29 -546.46 -158,025.61 -56,541.16
Brazil Merck S.A.
Rio de Janeiro 100.00 BRL 189,302.22 16,314.93 1,209,111.13 96,544.77
Brazil Sigma-Aldrich Brasil Ltda. Barueri 100.00 BRL -647.62 -453.21 -4,136.47 -2,693.48
Cayman Islands CLEARInk Displays, Ltd.. Grand Cayman < 20.00 USD b) b) b) b)
Chile Merck S.A.
Santiago de
Chile 100.00 CLP 50,815.83 3,295.57 44,397,891.36 2,871,824.26
Chile Sigma-Aldrich Quimica Ltda.
Santiago de Chile 100.00 CLP 1,007.95 97.20 880,651.76 40,496.90
Colombia Merck S.A. Bogota 100.00 COP 26,968.43 3,433.64 113,579,555.05 14,036,911.87
a) Profit and loss transfer agreement
b) Not disclosed owing to minor significance in accordance with section 286 (3) no. 1 HGB
c) Operational site of Merck KGaA

184
Annual Financial Statements ___ List of Shareholdings of Merck KGaA as of December 31, 2020
in thousand € in thousand [reporting currency]
Country Company
Registered
office
Equity
interest (%)
thereof
Merck KGaA (%)
Reporting currency
(ISO Code) IFRS net equity
IFRS profit after
tax IFRS net equity IFRS profit after tax
Dominican Republic Merck Dominicana, S.R.L.
Santo Domingo 100.00 DOP b) b) b) b)
Ecuador Merck C.A. Quito 100.00 USD 18,145.52 684.31 22,313.54 814.07
Guatemala Merck, S.A. Guatemala-City 100.00 GTQ 17,331.72 1,286.62 166,133.20 14,824.87
Mexico Merck Biopharma Distribution S.A. de C.V. Mexico City 100.00 MXN 6,945.14 -3,856.48 169,788.57 -94,426.31
Mexico Merck, S.A. de C.V. Mexico City 100.00 MXN 105,291.26 7,951.45 2,574,065.89 169,096.02
Mexico Sigma-Aldrich Quimica, S. de R.L. de C.V. Toluca 100.00 MXN 3,525.16 192.29 86,180.01 2,418.99
Panama Merck, S.A. Panama City 100.00 USD b) b) b) b)
Panama Mesofarma Corporation Panama City 100.00 USD 44,267.05 -333.37 54,435.19 -443.12
Peru Merck Peruana S.A. Lima 100.00 PEN 16,372.58 -1,125.91 72,884.20 -3,798.83
Uruguay Ares Trading Uruguay S.A. Montevideo 100.00 USD 48,886.32 14,040.34 60,115.50 17,177.69
Venezuela Merck S.A. Caracas 100.00 VES b) b) b) b)
Venezuela Representaciones MEPRO S.A. Caracas 100.00 VES b) b) b) b)
Middle East and Africa (MEA)
Algeria MDCA Pharma Promotion SARL Hydra 49.00 DZD b) b) b) b)
Algeria Novapharm Production SARL
Wilaya de
Tipiza 20.00 DZD b) b) b) b)
Egypt Merck Ltd. Cairo 100.00 EGP 5,626.46 2,592.55 108,906.37 47,025.39
Israel ARTSaVIT Ltd. Yavne < 20.00 ILS b) b) b) b)
Israel Immunorizon Ltd. Yavne 20.00 USD b) b) b) b)
Israel Inter-Lab Ltd. Yavne 100.00 USD 7,142.99 -803.52 8,783.73 -964.21
Israel InterPharm Laboratories Ltd. Yavne 100.00 USD 150,700.17 11,541.50 185,316.00 13,096.77
Israel MediSafe Project Ltd. Haifa < 20.00 ILS b) b) b) b)
Israel Merck Serono Ltd. Herzliya Pituach 100.00 USD 15,287.45 839.34 18,798.97 958.26
Israel Metabomed Ltd. Yavne < 20.00 ILS b) b) b) b)
a) Profit and loss transfer agreement
b) Not disclosed owing to minor significance in accordance with section 286 (3) no. 1 HGB
c) Operational site of Merck KGaA

185
Annual Financial Statements ___ List of Shareholdings of Merck KGaA as of December 31, 2020
in thousand € in thousand [reporting currency]
Country Company
Registered
office
Equity
interest (%)
thereof
Merck KGaA (%)
Reporting currency
(ISO Code) IFRS net equity
IFRS profit after
tax IFRS net equity IFRS profit after tax
Israel Pantheon Biosciences Ltd. Yavne < 20.00 USD b) b) b) b)
Israel Pilltracker 2015 Ltd. Tel Aviv < 20.00 ILS b) b) b) b)
Israel PMatX Ltd. Yavne 90.00 ILS -1,009.67 -343.50 -3,986.60 -1,356.03
Israel PxE Computational Imaging Ltd.
Lachish Darom < 20.00 ILS b) b) b) b)
Israel QLight Nanotech Ltd. Jerusalem 100.00 ILS 757.11 296.69 2,989.36 1,112.85
Israel Sentaur Bio Ltd. Yavne 22.50 USD b) b) b) b)
Israel Sigma-Aldrich Israel Ltd. Rehovot 100.00 ILS 70,904.96 2,751.76 279,961.14 10,245.76
Israel Versum Materials Israel Ltd. Tel Aviv 100.00 USD 16,284.57 1,614.86 20,025.13 1,775.75
Israel Wiliot Ltd. Caesarea < 20.00 USD b) b) b) b)
Kenya Merck Healthcare and Life Science Limited Nairobi 100.00 KES 2,682.51 99.28 360,182.78 9,298.38
Morocco Merck Maroc S.A.R.L. Casablanca 100.00 MAD b) b) b) b)
Nigeria Merck Pharmaceutical and Life Sciences Ltd. Lagos 100.00 NGN b) b) b) b)
South Africa Merck (Pty) Ltd.
Halfway
House 100.00 ZAR 25,919.05 -474.92 465,744.51 -10,697.48
South Africa Sigma-Aldrich (Pty) Ltd.
Kempton Park 100.00 ZAR 2,585.28 186.58 46,455.47 2,652.12
Tunisia Merck Promotion SARL Tunis 100.00 TND -29.87 -19.12 -98.64 -74.72
Tunisia Merck SARL Tunis 100.00 TND 1,606.80 1,879.30 5,305.50 5,905.23
United Arab Emirates Merck Serono Middle East FZ-Ltd. Dubai 100.00 AED 104,952.68 3,552.04 474,039.75 10,916.71
a) Profit and loss transfer agreement
b) Not disclosed owing to minor significance in accordance with section 286 (3) no. 1 HGB
c) Operational site of Merck KGaA
186
Annual Financial Statements ___ Reproduction of the Independent Auditor's Report
Reproduction of the Independent Auditor's Report
Based on the results of our audit, we have issued the following unqualified audit opinion:
Independent Auditor's Report
To MERCK Kommanditgesellschaft auf Aktien, Darmstadt
Report on the Audit of the Annual Financial Statements and of the Combined
Management Report
Opinions
We have audited the Annual Financial Statements of MERCK Kommanditgesellschaft auf Aktien, Darmstadt,
which comprise the balance sheet as of December 31, 2020, the income statement for the period from January
1 to December 31, 2020, and notes to the Annual Financial Statements, including the recognition and
measurement policies presented therein. In addition, we have audited the Combined Management Report of
MERCK Kommanditgesellschaft auf Aktien for the financial year from January 1, 2020, to December 31, 2020.
In accordance with German legal requirements, we have not audited the components of the Combined
Management Report specified in the "Other Information" section of our auditor's report.
In our opinion, on the basis of the knowledge obtained in the audit,
• the accompanying Annual Financial Statements comply, in all material respects, with the requirements
of German commercial law applicable to business corporations and give a true and fair view of the
assets, liabilities and financial position of the Company as of December 31, 2020, and of its financial
performance for the financial year from January 1, 2020 to December 31, 2020 in compliance with
German Legally Required Accounting Principles, and
• the accompanying Combined Management Report as a whole provides an appropriate view of the
Company's position. In all material respects, this Combined Management Report is consistent with the
Annual Financial Statements, complies with German legal requirements and appropriately presents the
opportunities and risks of future development. Our opinion on the Combined Management Report does
not cover the content of the components of the Management Report specified in the "Other
Information" section of the auditor's report.
Pursuant to Section 322 (3) sentence 1 HGB [Handelsgesetzbuch: German Commercial Code], we declare that
our audit has not led to any reservations relating to the legal compliance of the Annual Financial Statements
and of the Combined Management Report.
Basis for the Opinions
We conducted our audit of the Annual Financial Statements and of the Combined Management Report in
accordance with Section 317 HGB and EU Audit Regulation No. 537/2014 (referred to subsequently as "EU Audit
Regulation") and in compliance with German Generally Accepted Standards for Financial Statement Audits
promulgated by the Institut der Wirtschaftsprüfer [Institute of Public Auditors in Germany] (IDW). Our
responsibilities under those requirements and principles are further described in the "Auditor's Responsibilities
for the Audit of the Annual Financial Statements and of the Combined Management Report" section of our
auditor's report. We are independent of the Company in accordance with the requirements of European law and
German commercial and professional law, and we have fulfilled our other German professional responsibilities in
accordance with these requirements. In addition, in accordance with Article 10 (2)(f) of the EU Audit
Regulation, we declare that we have not provided non-audit services prohibited under Article 5 (1) of the EU
Audit Regulation. We believe that the evidence we have obtained is sufficient and appropriate to provide a basis
for our opinions on the Annual Financial Statements and on the Combined Management Report.
187
Annual Financial Statements ___ Reproduction of the Independent Auditor's Report
Key Audit Matters in the Audit of the Annual Financial Statements
Key audit matters are those matters that, in our professional judgment, were of most significance in our audit
of the Annual Financial Statements for the financial year from January 1, 2020, to December 31, 2020. These
matters were addressed in the context of our audit of the Annual Financial Statements as a whole, and in
forming our opinion thereon, we do not provide a separate opinion on these matters.
Valuation of investments in affiliated companies
Information on financial assets can be found in the notes to the financial statements under note 3.
The financial statement risk
As of December 31, 2020, the Company reported investments in affiliated companies of EUR 22.790,0 million
(in 2019: EUR 22,454,9 million) as part of financial assets. This amount represents 90% (in 2019: 89%) of
total assets and thus a significant share of the Company's assets.
Investments in affiliated companies are recognized at cost or, if they are expected to be permanently impaired,
at their lower fair value.
Assessing whether investments in affiliated companies are impaired depends considerably on the Company's
estimates and exercise of judgment.
In the financial year 2020, the Company did not – as in the previous year – recognize impairment losses on
investments in affiliated companies. Reversals of prior year impairment losses were recognized in the amount
of EUR 14.7 million (in 2019: EUR 10.3 million) because the reasons for impairment losses have ceased to
apply. As of December 31, 2020, cumulative impairments in in affiliated companies amount to EUR 10.3 million.
There is a risk for the financial statements that impairment of or reversals of prior year impairments in
investments in affiliated companies may not be recognized in the financial statements.
Our audit approach
In a first step, we obtained explanations from the Company’s finance department and evaluated underlying
documentation to obtain an understanding of the Company's process for testing investments in affiliated
companies for impairment. In doing this, we analyzed the Company's approach to determining potentially
impaired investments in affiliated companies and, based on the information obtained in the course of our audit,
assessed whether there were any indicators for impairment or required reversals of impairments resulting from
prior years that were not identified by the Company.
In a second step, we assessed the calculation model used by the Company to determine the value of
investments and reconciled the assumptions concerning the discount rate to external information. For individual
investments in affiliated companies that were selected by us using a risk based approach, we scrutinized the
revenue and earnings forecasts as well as underlying assumptions prepared by the respective CFO (or other
individuals, as applicable), whereby we used the current earnings situation as a starting point for our analysis.
For selected investments in affiliated companies, we also assessed the accuracy of the Company's forecasting
process by comparing the budgets prepared in previous years with actual results and by analyzing deviations, if
any.
Our conclusions
The Company's assumptions and estimates regarding the valuation of participations in affiliated companies are
appropriate.
188
Annual Financial Statements ___ Reproduction of the Independent Auditor's Report
Recognition and measurement of provisions for tax liabilities
For changes in provisions for tax liabilities, please refer to note 10 in the notes to the financial statements.
The financial statement risk
As of December 31, 2020, the Company recorded provisions for tax liabilities in the amount of
EUR 171.8 million (in 2019: EUR 127.4 million).
Application of German regulations on income tax and tax incentives is complex and subject to risks. The
recognition and measurement of income tax liabilities requires Merck to exercise judgement in its assessment
of tax matters and make estimates concerning tax risks. Merck engages external experts to support its own risk
assessment with expert opinions from tax specialists in specific cases.
There is a risk for the financial statements that provisions for tax liabilities may not be fully recognized or not
appropriately measured.
Our audit approach
We involved our own specialists in tax law into the audit team in order to evaluate Merck's assessment of tax
risks, and if experts were engaged, the related opinions of external experts engaged by Merck
We obtained an understanding of existing tax risks through inquiry of employees of the tax department. We
assessed the competence, capabilities and objectivity of the external experts and evaluated their expert
opinions.
In addition, we analyzed correspondence with the relevant tax authorities and assessed the assumptions
underlying the determination of tax liabilities based on our knowledge and experience of how the relevant legal
requirements are currently applied by the tax authorities and courts.
Our conclusions
The assumptions applied by Merck for recognition and measurement of provisions for tax liabilities are
reasonable.
Other Information
Management and the Supervosiry Board are responsible for the other information. The other information
comprises the following components of the Combined Management Report, whose content was not audited:
• the corporate governance statement referred to in the Combined Management Report,
• the components of the combined non-financial statement referred to in the Combined Management
Report,
• information extraneous to Combined Management Reports and marked as unaudited, and
• the remaining parts of the annual report.
The other information does not comprise the Annual Financial Statements, the audited parts of the Combined
Management Report and our auditor's report.

189
Annual Financial Statements ___ Reproduction of the Independent Auditor's Report
Our opinions on the Annual Financial Statements and on the Combined Management Report do not cover the
other information, and consequently we do not express an opinion or any other form of assurance conclusion
thereon.
In connection with our audit, our responsibility is to read the other information and, in so doing, to consider
whether the other information
• is materially inconsistent with the consolidated financial statements, with the information in the
Combined Management Report audited for content or our knowledge obtained in the audit, or
• otherwise appears to be materially misstated.
Responsibilities of Management and the Supervisory Board for the Annual Financial Statements
and the Combined Management Report
Management is responsible for the preparation of the Annual Financial Statements that comply, in all material
respects, with the requirements of German commercial law applicable to business corporations, and that the
Annual Financial Statements give a true and fair view of the assets, liabilities, financial position and financial
performance of the Company in compliance with German Legally Required Accounting Principles. In addition,
management is responsible for such internal control as they, in accordance with German Legally Required
Accounting Principles, have determined necessary to enable the preparation of Annual Financial Statements
that are free from material misstatement, whether due to fraud or error.
In preparing the Annual Financial Statements, management is responsible for assessing the Company's ability
to continue as a going concern. They also have the responsibility for disclosing, as applicable, matters related
to going concern. In addition, they are responsible for financial reporting based on the going concern basis of
accounting, provided no actual or legal circumstances conflict therewith.
Furthermore, management is responsible for the preparation of the Combined Management Report that as a
whole provides an appropriate view of the Company's position and is, in all material respects, consistent with
the Annual Financial Statements, complies with German legal requirements, and appropriately presents the
opportunities and risks of future development. In addition, management is responsible for such arrangements
and measures (systems) as they have considered necessary to enable the preparation of a Combined
Management Report that is in accordance with the applicable German legal requirements, and to be able to
provide sufficient appropriate evidence for the assertions in the Combined Management Report.
The Supervisory Board is responsible for overseeing the Company's financial reporting process for the
preparation of the Annual Financial Statements and of the Combined Management Report.
Auditor's Responsibilities for the Audit of the Annual Financial Statements and of the Combined Management Report
Our objectives are to obtain reasonable assurance about whether the Annual Financial Statements as a whole
are free from material misstatement, whether due to fraud or error, and whether the Combined Management
Report as a whole provides an appropriate view of the Company's position and, in all material respects, is
consistent with the Annual Financial Statements and the knowledge obtained in the audit, complies with the
German legal requirements and appropriately presents the opportunities and risks of future development, as
well as to issue an auditor's report that includes our opinions on the Annual Financial Statements and on the
Combined Management Report.
Reasonable assurance is a high level of assurance, but is not a guarantee that an audit conducted in accordance
with Section 317 HGB and the EU Audit Regulation and in compliance with German Generally Accepted
Standards for Financial Statement Audits promulgated by the Institut der Wirtschaftsprüfer (IDW) will always
detect a material misstatement. Misstatements can arise from fraud or error and are considered material if,
individually or in the aggregate, they could reasonably be expected to influence the economic decisions of users
taken on the basis of these Annual Financial Statements and this Combined Management Report.
190
Annual Financial Statements ___ Reproduction of the Independent Auditor's Report
We exercise professional judgment and maintain professional skepticism throughout the audit. We also:
• Identify and assess the risks of material misstatement of the Annual Financial Statements and of the
Combined Management Report, whether due to fraud or error, design and perform audit procedures
responsive to those risks, and obtain audit evidence that is sufficient and appropriate to provide a
basis for our opinions. The risk of not detecting a material misstatement resulting from fraud is higher
than for one resulting from error, as fraud may involve collusion, forgery, intentional omissions,
misrepresentations, or the override of internal controls.
• Obtain an understanding of internal control relevant to the audit of the Annual Financial Statements
and of arrangements and measures (systems) relevant to the audit of the Combined Management
Report in order to design audit procedures that are appropriate in the circumstances, but not for the
purpose of expressing an opinion on the effectiveness of these systems.
• Evaluate the appropriateness of accounting policies used by management and the reasonableness of
estimates made by management and related disclosures.
• Conclude on the appropriateness of management's use of the going concern basis of accounting and,
based on the audit evidence obtained, whether a material uncertainty exists related to events or
conditions that may cast significant doubt on the Company's ability to continue as a going concern. If
we conclude that a material uncertainty exists, we are required to draw attention in the auditor's
report to the related disclosures in the Annual Financial Statements and in the Combined Management
Report or, if such disclosures are inadequate, to modify our respective opinions. Our conclusions are
based on the audit evidence obtained up to the date of our auditor's report. However, future events or
conditions may cause the Company to cease to be able to continue as a going concern.
• Evaluate the overall presentation, structure and content of the Annual Financial Statements, including
the disclosures, and whether the Annual Financial Statements present the underlying transactions and
events in a manner that the Annual Financial Statements give a true and fair view of the assets,
liabilities, financial position and financial performance of the Company in compliance with German
Legally Required Accounting Principles.
• Evaluate the consistency of the Combined Management Report with the Annual Financial Statements,
its conformity with [German] law, and the view of the Company's position it provides.
• Perform audit procedures on the prospective information presented by management in the Combined
Management Report. On the basis of sufficient appropriate audit evidence we evaluate, in particular,
the significant assumptions used by management as a basis for the prospective information, and
evaluate the proper derivation of the prospective information from these assumptions. We do not
express a separate opinion on the prospective information and on the assumptions used as a basis.
There is a substantial unavoidable risk that future events will differ materially from the prospective
information.
We communicate with those charged with governance regarding, among other matters, the planned scope and
timing of the audit and significant audit findings, including any significant deficiencies in internal control that we
identify during our audit.
We also provide those charged with governance with a statement that we have complied with the relevant
independence requirements, and communicate with them all relationships and other matters that may
reasonably be thought to bear on our independence, and where applicable, the related safeguards.
From the matters communicated with those charged with governance, we determine those matters that were of
most significance in the audit of the Annual Financial Statements of the current period and are therefore the
key audit matters. We describe these matters in our auditor's report unless law or regulation precludes public
disclosure about the matter.

191
Annual Financial Statements ___ Reproduction of the Independent Auditor's Report
Other Legal and Regulatory Requirements
Report on the Assurance in accordance with Section 317 (3b) HGB on the Electronic Reproduction of the Annual Financial Statements and the Combined Management Report Prepared for Publication Purposes
We have performed assurance work in accordance with Section 317 (3b) HGB to obtain reasonable
assurance about whether the reproduction of the annual financial statements and the management report
(hereinafter the “ESEF documents”) contained in the file that can be downloaded by the issuer from
the electronic client portal with access protection, „Merck_KGaA_EA_31.12.2020.xhtml”
(SHA256-Hashwert: da74fe2022b402fb35b89b36a9184779163ed752271e1ee38d2a6637db482f86) and
prepared for publication purposes complies in all material respects with the requirements of
Section 328 (1) HGB for the electronic reporting format (“ESEF format”). In accordance with German legal
requirements, this assurance only extends to the conversion of the information contained in the annual financial
statements and the management report into the ESEF format and therefore relates neither to the information
contained in this reproduction nor any other information contained in the above-mentioned electronic file.
In our opinion, the reproduction of the Annual Financial Statements and the Management Report contained in
the above-mentioned electronic file and prepared for publication purposes complies in all material respects with
the requirements of Section 328 (1) HGB for the electronic reporting format. We do not express any opinion on
the information contained in this reproduction nor on any other information contained in the above-mentioned
file beyond this reasonable assurance opinion and our audit opinion on the accompanying Annual Financial
Statements and the accompanying Management Report for the financial year from January 1, 2020 to
December 31, 2020 contained in the “Report on the Audit of the Annual Financial Statements and of the
Combined Management Report” above.
We conducted our assurance work on the reproduction of the Annual Financial Statements and the Management
Report contained in the above-mentioned electronic file in accordance with Section 317 (3b) HGB and the
Exposure Draft of the IDW Assurance Standard: Assurance in accordance with Section 317 (3b) HGB on the
Electronic Reproduction of Financial Statements and Management Reports Prepared for Publication Purposes
(ED IDW AsS 410) and the International Standard on Assurance Engagements 3000 (Revised)]. Accordingly,
our responsibilities are further described below. Our audit firm has applied the IDW Standard on Quality
Management 1: Requirements for Quality Management in Audit Firms (IDW QS 1).
The Company’s management is responsible for the preparation of the ESEF documents including the electronic
reproduction of the Annual Financial Statements and the Management Report in accordance with
Section 328 (1) sentence 4 item 1 HGB.
In addition, the Company’s management is responsible for the internal controls they consider necessary to
enable the preparation of ESEF documents that are free from material intentional or unintentional non-
compliance with the requirements of Section 328 (1) HGB for the electronic reporting format.
The Company’s management is also responsible for the submission of the ESEF documents together with the
auditor’s report and the attached audited Annual Financial Statements and audited Management Report as well
as other documents to be published to the operator of the German Federal Gazette [Bundesanzeiger].
The supervisory board is responsible for overseeing the preparation of the ESEF documents as part of the
financial reporting process.
192
Annual Financial Statements ___ Reproduction of the Independent Auditor's Report
Our objective is to obtain reasonable assurance about whether the ESEF documents are free from material
intentional or unintentional non-compliance with the requirements of Section 328 (1) HGB. We exercise
professional judgement and maintain professional scepticism throughout the assurance work. We also:
• Identify and assess the risks of material intentional or unintentional non-compliance with the
requirements of Section 328 (1) HGB, design and perform assurance procedures responsive to those
risks, and obtain assurance evidence that is sufficient and appropriate to provide a basis for our
assurance opinion.
• Obtain an understanding of internal control relevant to the assurance of the ESEF documents in order
to design assurance procedures that are appropriate in the circumstances, but not for the purpose of
expressing an assurance opinion on the effectiveness of these controls.
• Evaluate the technical validity of the ESEF documents, i.e. whether the electronic file containing the
ESEF documents meets the requirements of Commission Delegated Regulation (EU) 2019/815 on the
technical specification for this electronic file.
• Evaluate whether the ESEF documents enable an XHTML reproduction with content equivalent to the
audited Annual Financial Statements and the audited Management Report.
Further Information pursuant to Article 10 of the EU Audit Regulation
We were elected as auditor by the Annual General Meeting on May 28, 2020. We were engaged by the
Supervisory Board on June 30, 2020. We have been the auditor of MERCK Kommanditgesellschaft auf Aktien
without interruption since the financial year 1995.
We declare that the opinions expressed in this auditor's report are consistent with the additional report to the
Supervisory Board pursuant to Article 11 of the EU Audit Regulation (long-form audit report).
German Public Auditor Responsible for the Engagement
The German Public Auditor responsible for the engagement is Dirk Janz.
Frankfurt am Main, February 17, 2020
KPMG AG
Wirtschaftsprüfungsgesellschaft
[Original German version signed by:]
[signature] Janz [signature] Brudek Wirtschaftsprüfer Wirtschaftsprüfer
[German Public Auditor] [German Public Auditor]
193
Annual Financial Statements ___ Responsibility Statement in accordance with
section 264 (2) sentence 3 HGB and section 289 (1) sentence 5 HGB
Responsibility Statement in accordance with section
264 (2) sentence 3 HGB and section 289 (1)
sentence 5 HGB
To the best of our knowledge, and in accordance with the applicable reporting principles, the Annual Financial
statements of Merck KGaA give a true and fair view of the assets, liabilities, financial position and profit or loss
of Merck KGaA, and the Combined Management Report includes a fair view of the development and
performance of the business and the position of the company, together with a description of the material
opportunities and risks associated with the expected development of Merck KGaA.
Darmstadt, February 16, 2021
Stefan Oschmann
Belén Garijo
Kai Beckmann
Peter Guenter
Marcus Kuhnert
194 Annual Financial Statements ___ Report of the Supervisory Board
Report of the Supervisory Board The Supervisory Board again properly executed its duties in 2020 in accordance with the law as well as the
company’s Articles of Association and rules of procedure. In particular, the Supervisory Board monitored the
work of the Executive Board diligently and regularly.
Cooperation with the Executive Board
The cooperation with the Executive Board was characterized by intensive, trustworthy exchange. During fiscal
2020, the Executive Board provided the Supervisory Board with regular written and verbal reports on the
business development of Merck KGaA and the Merck Group. In particular, the Supervisory Board was informed
about the current and potential impact of the Covid-19 pandemic, the market and sales situation of the
company against the background of macroeconomic development, and the financial position of the company
and its subsidiaries, along with their earnings development and corporate planning. Within the scope of
quarterly reporting, the sales and operating results were presented for the Merck Group as a whole, and broken
down by business sector. Aside from the Supervisory Board meetings, the Chairman of the Supervisory Board
also maintained, and continues to maintain, a regular exchange of information with the Chairman of the
Executive Board.
Key topics of the Supervisory Board meetings
Four Supervisory Board meetings were held in fiscal 2020. At these meetings, the Supervisory Board intensely
discussed the reports of the Executive Board as well as, together with the Executive Board, company
developments and strategic issues.
At the meeting held on February 28, 2020, the Executive Board first intensively addressed the Annual Financial
Statements and Consolidated Financial Statements for 2019, the Combined Management Report, the audit
report of the auditor on the separate non-financial (Group) report for fiscal 2019, and the proposal for the
appropriation of the net retained profit. The auditor explained the audit reports including the focus areas of the
audit. The Executive Board and the Head of Accounting reported on the financial statements and discussed the
impact of the acquisition of Versum Materials in particular. Furthermore, the Supervisory Board resolved upon
the report and the objectives of the Supervisory Board with respect to its composition and the profile of skills
and expertise, the Declaration of Conformity with the German Corporate Governance Code, and the Statement
on Corporate Governance, which simultaneously includes the joint report on Corporate Governance of the
Executive Board and Supervisory Board. The Supervisory Board also approved the proposals to be made to the
Annual General Meeting. The Executive Board reported on business performance in 2019 and presented the
plans for fiscal 2020 as well as the forecast impact of the Covid-19 pandemic on Merck’s global business, which
it discussed in detail with the Supervisory Board. The Supervisory Board also took note of the written risk
report as well as the report from Group Internal Auditing for 2019. In addition, the Supervisory Board discussed
the mandatory change of auditor.
The meeting held on May 13, 2020, again focused on the Covid-19 pandemic. In particular, the Executive Board
reported on the global pandemic situation, Merck’s crisis strategy (safety and business continuity) and the
impact in terms of the financial forecast, which also required the preparation of supplementary reports on the
Annual Financial Statements and Consolidated Financial Statements for fiscal 2019 and the Combined
Management Report. After intensively addressing the current and potential impact of the Covid-19 pandemic
and the supplementary reports, the Supervisory Board approved the supplementary reports and drew up the
proposed resolution to be made to the Annual General Meeting recommending the adoption of the Annual
Financial Statements (including the supplementary report). The Executive Board also discussed the current
business development in the first quarter of 2020 and provided an outlook concerning the expected business
development in 2020 as a whole. The report of the Research and Development Committee of the Board of
Partners of E. Merck KG for Life Science/Performance Materials was a further focus of the meeting. The
Supervisory Board also discussed the Compliance and Data Protection Report for 2019. Another special topic
195 Annual Financial Statements ___ Report of the Supervisory Board
discussed was the organization of the Annual General Meeting on May 28, 2020, in virtual form. Finally, the
Supervisory Board dealt with the pre-selection of potential auditors in connection with the mandatory change of
auditor.
At the meeting on July 30, 2020, the Executive Board provided an overview of the continued development of
the Covid-19 pandemic and Merck’s strategies, concepts, projects, and partnerships for dealing with the
pandemic, which it discussed with the members of the Supervisory Board. The Supervisory Board elected
Sascha Held as Vice Chairman of the Supervisory Board after Michael Fletterich stepped down as a member of
the Supervisory Board and Vice Chairman during the Annual General Meeting on May 28, 2020. At the meeting,
the Supervisory Board also focused intensively on the report of the Executive Board on business performance in
the second quarter of 2020. In addition, the auditors reported on the results of their review of the half-yearly
financial report. Risk management within the company was a further topic. The Head of Risk Management
presented the status report for the first half of 2020. No risks that could threaten the continued existence of the
company were identified. Moreover, the list of permitted non-audit services was updated, and an external audit
of the non-financial declaration was resolved upon. In addition, a formal amendment to the Articles of
Association of Merck KGaA was resolved to reflect the departure of the former Executive Board member Udit
Batra. The Head of Legal informed the Supervisory Board about new legal provisions concerning transactions
with related parties and recapitulated the organization of the virtual Annual General Meeting.
At its fourth meeting on November 11, 2020, the Supervisory Board started by discussing the current
development of the Covid-19 pandemic and the report of the Executive Board on the third quarter of 2020.
Additional topics focused on by the meeting were the 2020 status reports of Group Internal Auditing, status
reports on compliance and data protection, and the report of the Research and Development Committee for
Healthcare. Merck KGaA’s transactions with related parties within the meaning of section 111a et seq. of the
German Stock Corporation Act (AktG) were also presented and discussed by the Supervisory Board. A
procedure was established to regularly assess whether the conditions of section 111a (2) sentence 1 AktG have
been met for such transactions. There were no transactions requiring the approval of the Supervisory Board in
accordance with section 111b (1) AktG. Furthermore, the Group Executive Conference and the status of the
mandatory change of auditor were discussed. A resolution on preparing for the mandatory change of auditor for
Merck KGaA for the fiscal 2023 audit was adopted. In addition, a transformation project in the Healthcare
business sector was discussed. Finally, the results of the self-assessment of the Supervisory Board were
presented by the Head of Legal and discussed by the Supervisory Board.
In parts of its meetings, the Supervisory Board regularly meets without the members of the Executive Board
being present.
Annual Financial Statements
The Annual Financial Statements of Merck KGaA, the Consolidated Financial Statements of the Merck Group,
and the Combined Management Report for Merck KGaA and the Merck Group, including the accounts, were
audited by KPMG AG Wirtschaftsprüfungsgesellschaft, Berlin.
The auditors issued an unqualified audit opinion on the Annual Financial Statements of Merck KGaA in
accordance with German Auditing Standards.
For the Consolidated Financial Statements prepared in accordance with International Financial Reporting
Standards and for the Combined Management Report, the auditors issued the unqualified auditor’s report
reproduced in the Annual Report of the Merck Group.
196 Annual Financial Statements ___ Report of the Supervisory Board
In addition, the auditor audited the calculation of Merck KGaA’s participation in the profit of E. Merck KG in
accordance with article 27 (2) of the Articles of Association, as well as the separate combined non-financial
(Group) report. The annual financial statements of Merck KGaA, the Consolidated Financial Statements of the
Merck Group, the Combined Management Report for Merck KGaA and the Merck Group, the proposal of the
Executive Board for the appropriation of net retained profit, and the separate combined non-financial (Group)
report were submitted to the Supervisory Board together with the auditor’s report.
In accordance with article 14 (2) of the Articles of Association, the Supervisory Board also examined the Annual
Financial Statements of Merck KGaA, the proposal for the appropriation of net retained profit, and the auditor’s
report presented in accordance with article 27 (2) of the Articles of Association. It also examined the
Consolidated Financial Statements of the Merck Group as well as the Combined Management Report for Merck
KGaA and the Merck Group, and took note of the auditor’s report of KPMG AG Wirtschaftsprüfungsgesellschaft,
Berlin. It focused particularly on the key audit matters of particular importance in the audit opinion, on the
resulting risks for the financial statements, the approach adopted during the audit as described, and the
conclusions drawn by the auditor. Furthermore, the Supervisory Board also examined the separate combined
non-financial (Group) report and the memorandum on a limited assurance engagement prepared by the auditor
on behalf of the Supervisory Board. The discussion of the relevant agenda item at the Supervisory Board’s
meeting on February 26, 2021, to approve the financial statements was also attended by the auditors who sign
the audit opinion on the Annual Financial Statements of Merck KGaA and the Consolidated Financial Statements
of the Merck Group as well as the separate combined non-financial (Group) report. The auditors also reported
on their audit at this meeting. The Supervisory Board took note of and approved the results of the audit. On
completion of its examination, the Supervisory Board raised no objections and thus approved the Annual
Financial Statements for Merck KGaA, the Consolidated Financial Statements of the Merck Group, the Combined
Management Report of Merck KGaA and the Merck Group prepared by the Executive Board, the report
presented by the auditor in accordance with article 27 (2) of the Articles of Association, and the separate non-
financial (Group) report. The Supervisory Board gave its consent to the proposal of the Executive Board for the
appropriation of net retained profit after conducting its own review.
Corporate governance and Declaration of Conformity
Corporate governance is a topic of high priority for the Supervisory Board. In its own estimation, the
Supervisory Board has an adequate number of independent members. There were no conflicts of interest, as
defined by the German Corporate Governance Code, involving Supervisory Board members during the year
under review. In fiscal 2020, the Chairman of the Supervisory Board was prepared to hold talks with investors
on topics pertaining to the Supervisory Board as appropriate, and remains willing to do so. In fiscal 2020, the
Chairman of the Supervisory Board conducted an investor discussion with the shareholders’ association
Deutsche Schutzvereinigung für Wertpapierbesitz (DWS) on the nomination of new candidates for the
Supervisory Board. No other discussions were requested by investors. Following the most recent self-
assessment in fiscal 2020, the next self-assessment of the Supervisory Board is scheduled to take place in fiscal
2022.
After discussing corporate governance issues in detail, the Executive Board (on February 16, 2021) and the
Supervisory Board (on February 26, 2021) adopted the updated Declaration of Conformity and issued it jointly
on February 26, 2021, in accordance with section 161 AktG. The statement is permanently available on the
website of Merck KGaA (www.merckgroup.com/en/investors/corporate-governance/reports.html).
More information about corporate governance at Merck KGaA, including the compensation of the Executive
Board and Supervisory Board, is given in the Statement on Corporate Governance of the Annual Report.
197 Annual Financial Statements ___ Report of the Supervisory Board
Committees
Apart from the Nomination Committee, the Supervisory Board of Merck KGaA currently has no further
committees on account of the special features that apply to the Supervisory Board of a corporation with general
partners (KGaA) under German company law, and because a corresponding need for this has not emerged to
date. In the coming fiscal year, the Supervisory Board will address the formation of an Audit Committee at
Supervisory Board level. The members of the Nomination Committee did not convene in fiscal 2020. No report
is required on the work of other committees.
Personnel matters
All the Supervisory Board meetings were attended by all Supervisory Board members. The composition of the
Supervisory Board changed as follows in 2020: Michael Fletterich stepped down as a member of the
Supervisory Board during the Annual General Meeting on May 28, 2020, and was replaced by Alexander Putz as
a substitute employee representative. Mr. Putz was inducted by Merck KGaA with onboarding activities and
continuing education on topics such as corporate governance, the internal organization, and applicable
regulations and legal requirements. The members of the Supervisory Board are responsible for undertaking the
training and continuing education required for their tasks, such as on changes in the legal framework, with
regular support from the company.
Darmstadt, February 26, 2021
The Supervisory Board of Merck KGaA
Wolfgang Büchele
Chairman

FINANCIAL CALENDAR
Quarterly Statement Q32021
Annual Press Conference2021
Annual General Meeting2021
Quarterly Statement Q12021
Half-yearly Financial Report
2021
November
11
March
4
April
23
May
12
August
5

Published on March 04, 2021by Merck KGaA, Group CommunicationsFrankfurter Strasse 250,64293 Darmstadt, GermanyTelephone: + 49 6151 72-0Fax: + 49 6151 72-5577Website: www.merckgroup.com
DESIGNnexxar GmbH, Viennawww.nexxar.com