Embed Size (px)
Citation preview
1 | P a g e
A n n u a l H o u s i n g R e p o r t 2 0 1 8
Division of Housing Mission & Goals
ANNUAL HOUSING REPORT 2018
October 2018
i
A n n u a l H o u s i n g R e p o r t 2 0 1 8
Introduction 1
Housing Goals 4
I. Housing Goals – Introduction 4
II. 2017 Housing Goals Performance 5
Enterprise Data Compared to Market Data 10
Multifamily Housing 16
Duty to Serve Underserved Markets 18
Affordable Housing Allocations 21
Monthly Survey of Mortgage Markets (National Mortgage Database) 22
Subprime and Nontraditional Loans 24
Higher-Priced Mortgage Loans 25
Public Access to Mortgage Information 27
Appendix A: Preliminary Determination Letters: Enterprise 2017 Housing Goals Performance 28
Appendix B: Subprime and Nontraditional Loans 32
Appendix C: Higher-Priced Mortgage Loans 36
36
I. Purchase Price 37
II. Combined Loan-to-Value Ratio 37
III. Product Type 38
IV. Term at Origination 39
V. Interest Rate at Origination 39
VI. Credit Score 40
ii
A n n u a l H o u s i n g R e p o r t 2 0 1 8
VII. Borrower Income Ratio 41
VIII. Tract Income Ratio 41
IX. 2010 Census Tract/Percent Minority 42
X. Purpose of Loan 43
XI. Federal Guarantee 43
1
A n n u a l H o u s i n g R e p o r t 2 0 1 8
Introduction
The Federal National Mortgage Association (Fannie Mae) and the Federal Home Loan Mortgage Corporation (Freddie Mac) perform an important role under their charters in providing a stable source of housing finance that supports access to mortgage credit for low- and moderate-income families, as well as those in underserved areas.1 Over the last ten years, the Federal Housing Finance Agency (FHFA) has encouraged Fannie Mae and Freddie Mac (the Enterprises) to engage in a number of initiatives that help identify obstacles to accessing mortgage credit, analyze potential solutions, and develop appropriate strategies to improve and maintain availability of credit for housing in a safe and sound manner.
The Federal Housing Enterprises Financial Safety and Soundness Act of 1992 (Safety and Soundness Act) requires that FHFA establish several annual housing goals for both single-family and multifamily mortgages purchased by Fannie Mae and Freddie Mac. As required, FHFA established housing goals for the Enterprises for 2015 through 2017 in a final rule published in the Federal Register on September 3, 2015 and for 2018 through 2020 in a final rule published in the Federal Register on February 12, 2018.2 The housing goals include separate affordable housing categories for both single-family and multifamily mortgages.
FHFA oversees the Enterprises’ annual housing goals requirements. FHFA’s assessment of the Enterprises’ performance against the 2017 single-family housing goals involves a two-step process: (1) an evaluation of each Enterprise’s
1 See Federal National Mortgage Association Charter Act, 12 U.S.C. § 1716, and Federal Home Loan Mortgage Corporation Act, 12 U.S.C. § 1451 Note. 2 See 80 Fed. Reg. 53392 (Sept. 3, 2015) and 83 Fed. Reg. 5878 (Feb. 12, 2018), codified at 12 CFR part 1282.
Mission and Role
FHFA was established by the Housing and Economic Recovery Act of 2008 (HERA) and is responsible for the effective supervision, regulation, and housing mission oversight of Fannie Mae, Freddie Mac, and the Federal Home Loan Bank (Bank or FHLBank) System, which includes 11 FHLBanks and the Office of Finance. FHFA’s mission is to ensure that the regulated entities operate in a safe and sound manner so that they serve as a reliable source of liquidity and funding for housing finance and community investment. Since 2008, FHFA has also served as conservator of Fannie Mae and Freddie Mac, as described in the Strategic Plan for the Conservatorships of Fannie Mae and Freddie Mac.
2
A n n u a l H o u s i n g R e p o r t 2 0 1 8
actual performance against benchmark levels set by FHFA; and (2) an evaluation of actual performance against public loan data submitted under the Home Mortgage Disclosure Act (HMDA). FHFA’s assessment of the Enterprises’ performance against the 2017 multifamily goals involves an evaluation of actual performance against benchmark levels.
Apart from the housing goals, FHFA, in its role as conservator, sets expectations for the Enterprises in its annual Conservatorship Scorecard. The Enterprises undertook various initiatives to identify obstacles to borrowers, analyze potential solutions, assess market opportunities, and test promising solutions through pilot initiatives. Annual conservatorship scorecards set specific objectives within the overall Strategic Plan for the Conservatorships of Fannie Mae and Freddie Mac.3 The Enterprises pursued activities affecting both homeownership and rental housing.
For homeownership, both Enterprises pursued the following initiatives, described more fully in the 2017 Conservatorship Scorecard Progress Report4:
• The Enterprises revised their student debt-related calculations to better assess applicants with significant student debt.
• Freddie Mac updated its automated underwriting system to process applications from borrowers without credit scores. Similar changes were made by Fannie Mae in 2016, and both Enterprises now accept delivery of eligible loans for borrowers without credit scores in accordance with Enterprise-approved policies.
• To expand access for borrowers with limited English proficiency, FHFA and the Enterprises gathered extensive feedback from stakeholders, and, after a thorough review, added a language preference question on the Uniform Residential Loan Application.
For rental housing, which shelters roughly one third of American households, the Enterprises took the following steps to maintain and improve liquidity and stability in the multifamily mortgage market:
• Provided support to the overall multifamily housing market by purchasing loans in accordance with the multifamily Conservatorship Scorecard cap set by FHFA; and
3 See https://www.fhfa.gov/AboutUs/Reports/Pages/2014-Conservatorships-Strategic-Plan.aspx. 4 2017 Scorecard Progress Report, https://www.fhfa.gov/AboutUs/Reports/ReportDocuments/2017-Scorecard-Progress-Report.pdf.
3
A n n u a l H o u s i n g R e p o r t 2 0 1 8
• Provided substantial support for affordable housing and to encourage increased energy and water savings by purchasing loans under an exemption from the multifamily Conservatorship Scorecard cap.
In December 2016, FHFA published a final rule to establish a Duty to Serve program that will impact both homeownership and rental housing. The rule requires the Enterprises to serve very low-, low-, and moderate-income families in three underserved markets: manufactured housing, affordable housing preservation, and rural housing.5 The rule creates a planning, implementation, and assessment process that occurs in three-year cycles and is designed to encourage greater and more liquid mortgage investments by private capital in underserved markets. The Enterprises completed development of their Underserved Markets Plans in 2017 and implementation of the plans started in 2018. The Duty to Serve section of this report describes the planning process and the plans submitted by the Enterprises.
The Enterprises also make contributions to two funds specifically for affordable housing: the National Housing Trust Fund and the Capital Magnet Fund. The contributions follow a statutory formula, and the funds are allocated at the state and federal levels to address affordable housing needs that are not otherwise served fully by private capital sources. The section on these affordable housing allocations provides more information about these funds.
In addition to describing the affordable housing activities of the Enterprises during 2017, this report provides information on single-family loan purchases by the Enterprises by race or ethnicity, gender, census tract median income, fixed-rate vs. adjustable-rate, loan-to-value ratio, and credit score. The report also discusses subprime, nontraditional, and higher-priced mortgage loans.6
5 See 81 Fed. Reg. 96242 (Dec. 29, 2016), codified at 12 CFR part 1282. 6 The Safety and Soundness Act requires reporting of these categories. See 12 U.S.C. § 4544.

4
A n n u a l H o u s i n g R e p o r t 2 0 1 8
Housing Goals
I. Housing Goals – Introduction
The Safety and Soundness Act requires FHFA to establish annual housing goals for both single-family and multifamily mortgages purchased by Fannie Mae and Freddie Mac.7 The housing goals are one measure of the extent to which the Enterprises are meeting their public purposes, which include “an affirmative obligation to facilitate the financing of affordable housing for low- and moderate-income families in a manner consistent with their overall public purposes, while maintaining a strong financial condition and a reasonable economic return.”8
The Enterprises have continued to support a stable and liquid national market for residential mortgage financing. FHFA continues to establish annual housing goals for the Enterprises and assesses their performance against the housing goals each year.9 FHFA established housing goals for the Enterprises for 2018 through 2020 in a final rule published in the Federal Register on February 12, 2018.10 FHFA established the following goals and subgoals for mortgages on single-family, owner-occupied housing and mortgages on multifamily housing:
Single-family Goals and Subgoal
1. A low-income home purchase goal for home purchase mortgages to families with incomes no greater than 80 percent of area median income (AMI);
2. A very low-income home purchase goal for home purchase mortgages to families with
incomes no greater than 50 percent of AMI;
3. A low-income areas home purchase subgoal for home purchase mortgages to families living in census tracts with tract incomes no greater than 80 percent of AMI, or families with incomes no greater than 100 percent of AMI who live in census tracts with a minority population of 30 percent or more and a tract median income of less than 100 percent of AMI;
7 See 12 U.S.C. § 4561(a). 8 See 12 U.S.C. § 4501(7). 9 Under 12 U.S.C. § 4544(b)(1)(A)(i), FHFA is required to discuss in the annual housing report whether and how each Enterprise is achieving the annual housing goals. 10 See 83 Fed. Reg. 5878 (Feb. 12, 2018), codified at 12 CFR part 1282.
5
A n n u a l H o u s i n g R e p o r t 2 0 1 8
4. A low-income areas home purchase goal for mortgages that meet the criteria under the low-income areas home purchase subgoal described above, as well as home purchase mortgages to families with incomes no greater than 100 percent of AMI who live in a federally-declared disaster area; and
5. A low-income refinance goal for refinance mortgages to families with incomes no
greater than 80 percent of AMI.
Multifamily Goal and Subgoals
1. A low-income multifamily goal for rental units in multifamily properties affordable to families with incomes no greater than 80 percent of AMI; 2. A very low-income multifamily subgoal for rental units in multifamily properties affordable to families with incomes no greater than 50 percent of AMI; and 3. A small multifamily low-income subgoal for rental units in multifamily properties with 5-50 units affordable to families with incomes no greater than 80 percent of AMI.
II. 2017 Housing Goals Performance
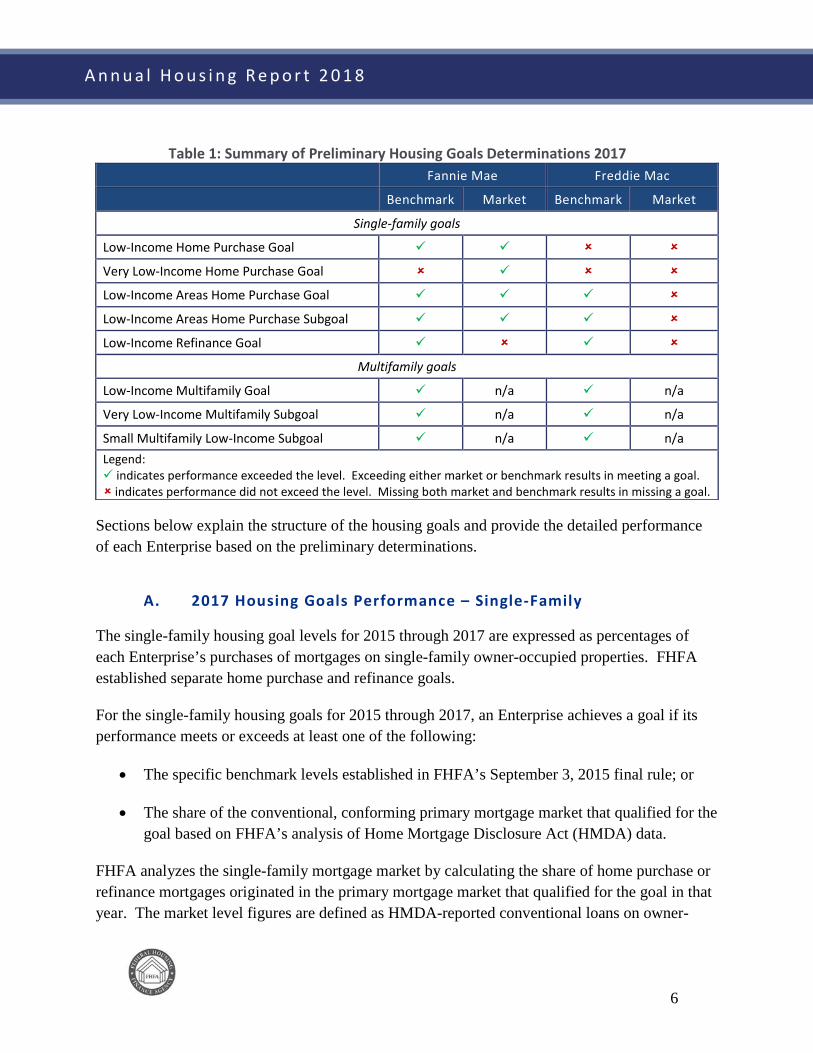
Based on FHFA’s preliminary determinations, the Enterprises’ purchases of mortgages exceeded either the benchmark or the market level for most of the housing goals for 2017, as summarized in the following table and described in further detail below.
6
A n n u a l H o u s i n g R e p o r t 2 0 1 8
Table 1: Summary of Preliminary Housing Goals Determinations 2017 Fannie Mae Freddie Mac
Benchmark Market Benchmark Market
Single-family goals
Low-Income Home Purchase Goal
Very Low-Income Home Purchase Goal
Low-Income Areas Home Purchase Goal
Low-Income Areas Home Purchase Subgoal
Low-Income Refinance Goal
Multifamily goals
Low-Income Multifamily Goal n/a n/a
Very Low-Income Multifamily Subgoal n/a n/a
Small Multifamily Low-Income Subgoal n/a n/a Legend: indicates performance exceeded the level. Exceeding either market or benchmark results in meeting a goal. indicates performance did not exceed the level. Missing both market and benchmark results in missing a goal.
Sections below explain the structure of the housing goals and provide the detailed performance of each Enterprise based on the preliminary determinations.
A. 2017 Housing Goals Performance – Single-Family
The single-family housing goal levels for 2015 through 2017 are expressed as percentages of each Enterprise’s purchases of mortgages on single-family owner-occupied properties. FHFA established separate home purchase and refinance goals.
For the single-family housing goals for 2015 through 2017, an Enterprise achieves a goal if its performance meets or exceeds at least one of the following:
• The specific benchmark levels established in FHFA’s September 3, 2015 final rule; or
• The share of the conventional, conforming primary mortgage market that qualified for the goal based on FHFA’s analysis of Home Mortgage Disclosure Act (HMDA) data.
FHFA analyzes the single-family mortgage market by calculating the share of home purchase or refinance mortgages originated in the primary mortgage market that qualified for the goal in that year. The market level figures are defined as HMDA-reported conventional loans on owner-
7
A n n u a l H o u s i n g R e p o r t 2 0 1 8
occupied properties with principal balances less than or equal to the Enterprises’ conforming loan limits. Therefore, the market level figures11 exclude loans insured or guaranteed by the federal government, such as the Federal Housing Administration (FHA), U.S. Department of Veterans Affairs (VA), and U.S. Department of Agriculture Rural Housing Service (RHS). FHFA based these calculations on its analysis of HMDA data submitted to the Federal Financial Institutions Examination Council (FFIEC) by primary mortgage market originators.
For the 2017 performance year, as in 2010 through 2016, FHFA counted Enterprise loans modified in accordance with the Home Affordable Modification Program (HAMP) as purchases of refinance mortgages for purposes of the low-income refinance goal. Loan modifications resulted in slightly improved performance on the low-income refinance goal for each Enterprise in 2017, though by much smaller amounts than in most previous years. The HAMP program expired at the end of 2016. Some HAMP modifications were counted toward the low-income refinance housing goals in 2017 as applications initiated before the end of the program were converted to permanent modifications, but such modifications were so few in number as to have only a minimal impact on goal performance.
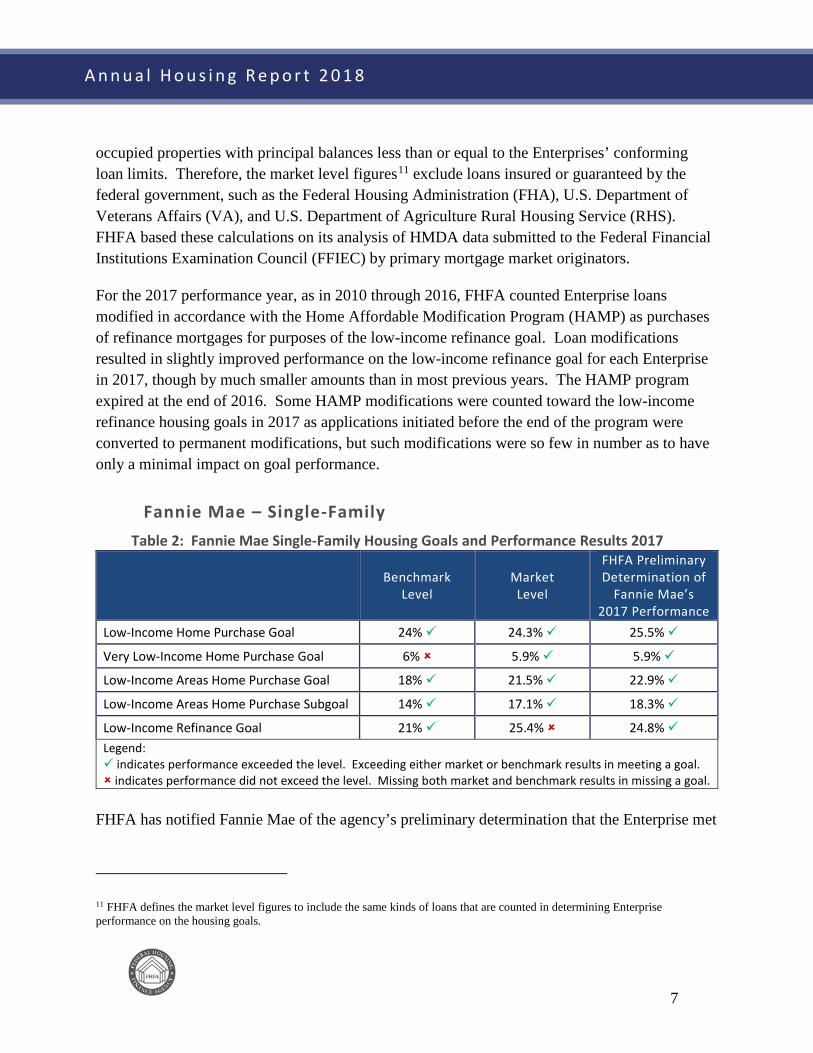
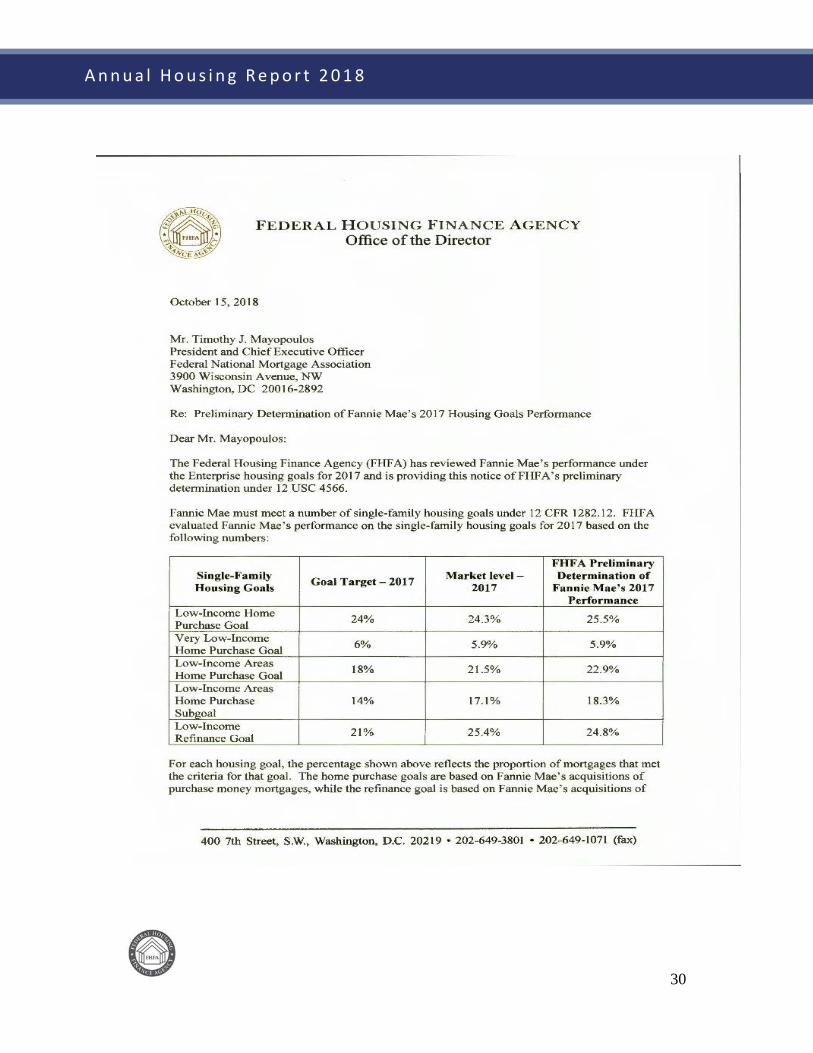
Fannie Mae – Single-Family Table 2: Fannie Mae Single-Family Housing Goals and Performance Results 2017
Benchmark Level
Market Level
FHFA Preliminary Determination of
Fannie Mae’s 2017 Performance
Low-Income Home Purchase Goal 24% 24.3% 25.5%
Very Low-Income Home Purchase Goal 6% 5.9% 5.9%
Low-Income Areas Home Purchase Goal 18% 21.5% 22.9%
Low-Income Areas Home Purchase Subgoal 14% 17.1% 18.3%
Low-Income Refinance Goal 21% 25.4% 24.8% Legend: indicates performance exceeded the level. Exceeding either market or benchmark results in meeting a goal. indicates performance did not exceed the level. Missing both market and benchmark results in missing a goal.
FHFA has notified Fannie Mae of the agency’s preliminary determination that the Enterprise met
11 FHFA defines the market level figures to include the same kinds of loans that are counted in determining Enterprise performance on the housing goals.
8
A n n u a l H o u s i n g R e p o r t 2 0 1 8
all single-family housing goals in 2017 (see Appendix A). Following receipt of Fannie Mae’s response (if any) to the preliminary determination letter and possible additional analyses, FHFA will make a final determination of Fannie Mae’s performance on the housing goals.
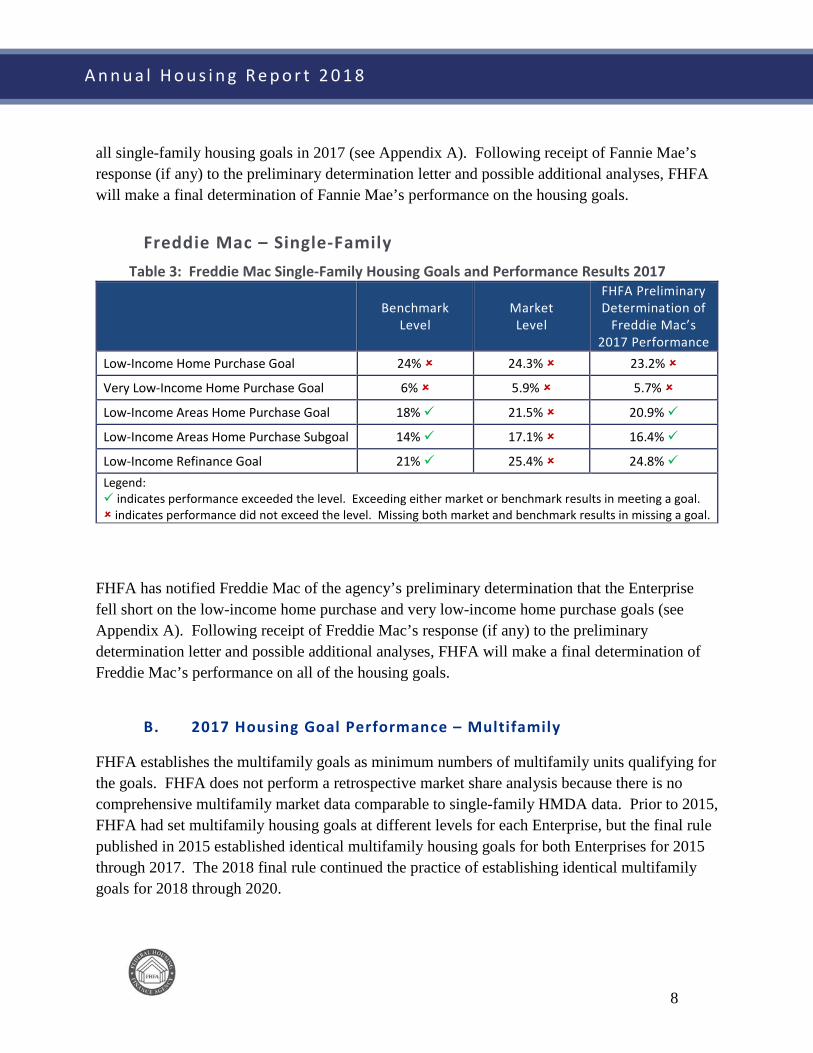
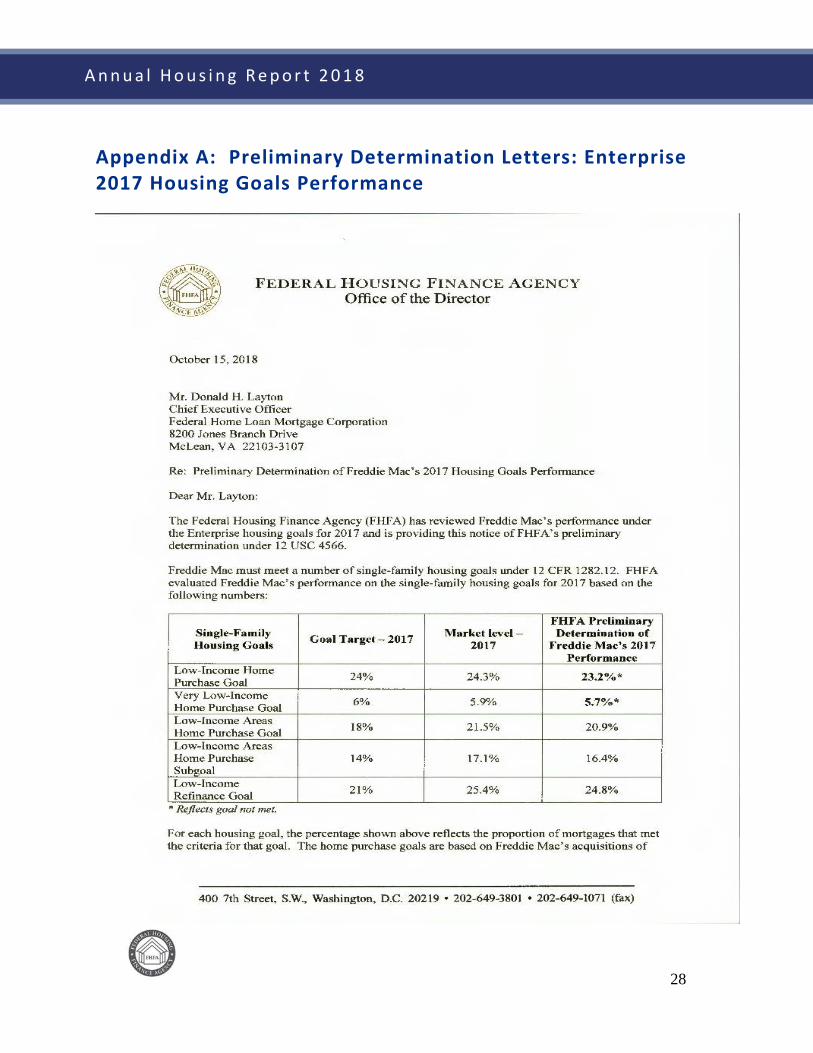
Freddie Mac – Single-Family Table 3: Freddie Mac Single-Family Housing Goals and Performance Results 2017
Benchmark Level
Market Level
FHFA Preliminary Determination of
Freddie Mac’s 2017 Performance
Low-Income Home Purchase Goal 24% 24.3% 23.2%
Very Low-Income Home Purchase Goal 6% 5.9% 5.7%
Low-Income Areas Home Purchase Goal 18% 21.5% 20.9%
Low-Income Areas Home Purchase Subgoal 14% 17.1% 16.4%
Low-Income Refinance Goal 21% 25.4% 24.8% Legend: indicates performance exceeded the level. Exceeding either market or benchmark results in meeting a goal. indicates performance did not exceed the level. Missing both market and benchmark results in missing a goal.
FHFA has notified Freddie Mac of the agency’s preliminary determination that the Enterprise fell short on the low-income home purchase and very low-income home purchase goals (see Appendix A). Following receipt of Freddie Mac’s response (if any) to the preliminary determination letter and possible additional analyses, FHFA will make a final determination of Freddie Mac’s performance on all of the housing goals.
B. 2017 Housing Goal Performance – Multifamily
FHFA establishes the multifamily goals as minimum numbers of multifamily units qualifying for the goals. FHFA does not perform a retrospective market share analysis because there is no comprehensive multifamily market data comparable to single-family HMDA data. Prior to 2015, FHFA had set multifamily housing goals at different levels for each Enterprise, but the final rule published in 2015 established identical multifamily housing goals for both Enterprises for 2015 through 2017. The 2018 final rule continued the practice of establishing identical multifamily goals for 2018 through 2020.
9
A n n u a l H o u s i n g R e p o r t 2 0 1 8
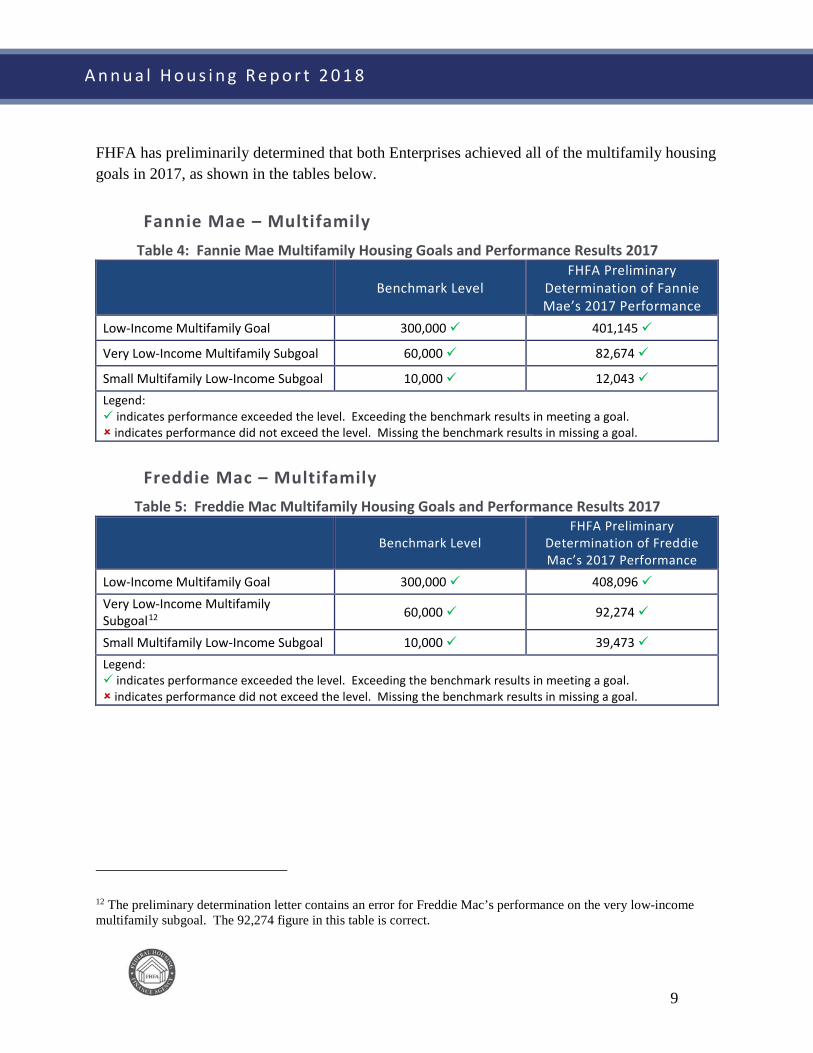
FHFA has preliminarily determined that both Enterprises achieved all of the multifamily housing goals in 2017, as shown in the tables below.
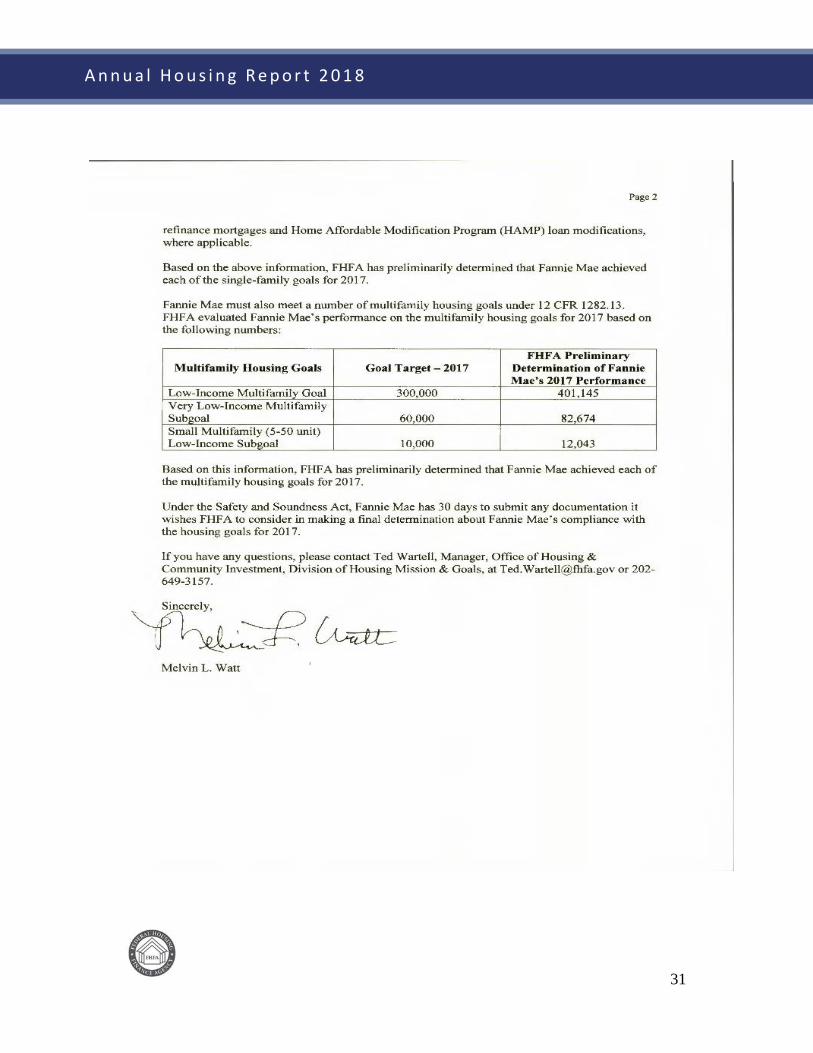
Fannie Mae – Multifamily Table 4: Fannie Mae Multifamily Housing Goals and Performance Results 2017
Benchmark Level FHFA Preliminary
Determination of Fannie Mae’s 2017 Performance
Low-Income Multifamily Goal 300,000 401,145
Very Low-Income Multifamily Subgoal 60,000 82,674
Small Multifamily Low-Income Subgoal 10,000 12,043 Legend: indicates performance exceeded the level. Exceeding the benchmark results in meeting a goal. indicates performance did not exceed the level. Missing the benchmark results in missing a goal.
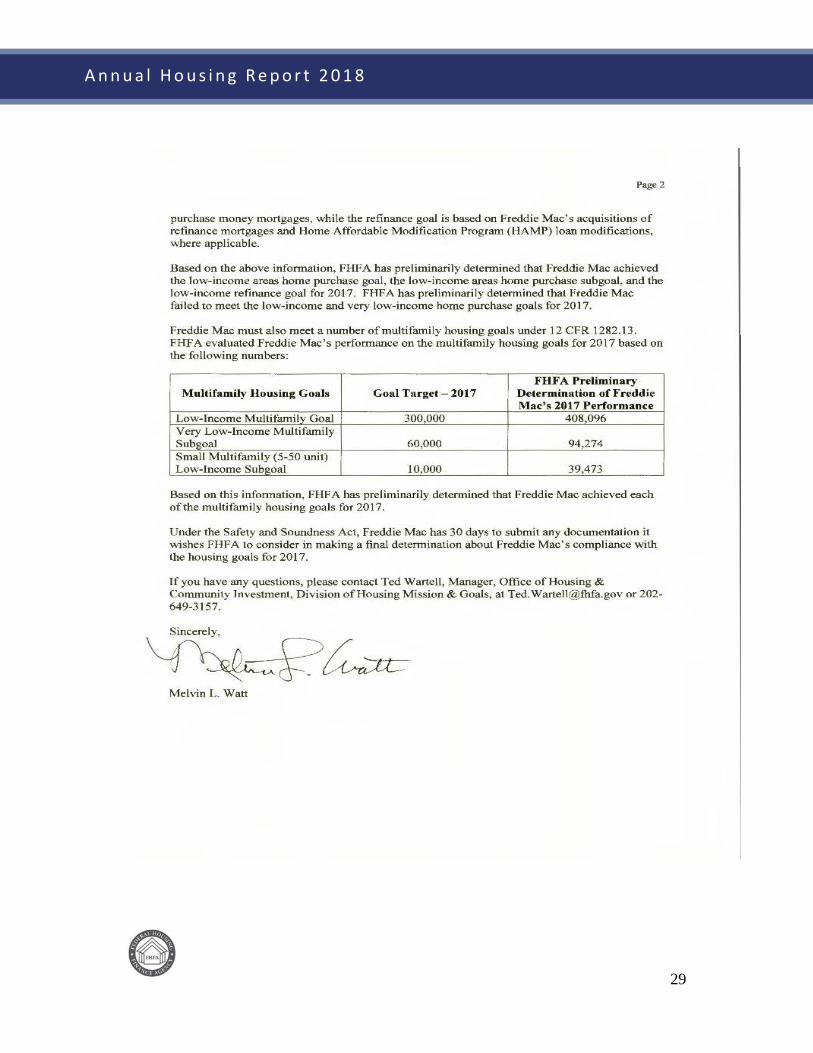
Freddie Mac – Multifamily Table 5: Freddie Mac Multifamily Housing Goals and Performance Results 2017
Benchmark Level FHFA Preliminary
Determination of Freddie Mac’s 2017 Performance
Low-Income Multifamily Goal 300,000 408,096 Very Low-Income Multifamily Subgoal12 60,000 92,274
Small Multifamily Low-Income Subgoal 10,000 39,473 Legend: indicates performance exceeded the level. Exceeding the benchmark results in meeting a goal. indicates performance did not exceed the level. Missing the benchmark results in missing a goal.
12 The preliminary determination letter contains an error for Freddie Mac’s performance on the very low-income multifamily subgoal. The 92,274 figure in this table is correct.
10
A n n u a l H o u s i n g R e p o r t 2 0 1 8
Enterprise Data Compared to Market Data
In its 2017 Annual Mortgage Report, Fannie Mae reported that it acquired $467.1 billion of loans on single-family, owner-occupied housing.17 In Freddie Mac’s 2017 Annual Mortgage Report, Freddie Mac reported that it acquired $315.7 billion of such loans.18 Tables 5 through 9 show various characteristics of the mortgages purchased by Fannie Mae and Freddie Mac in 2017 and the corresponding characteristics of mortgages originated in the conventional, conforming primary market, as determined by FHFA’s analysis of HMDA data.19
The tables reflect the Enterprises’ acquisitions of conventional home purchase and refinance mortgages on single-family, owner-occupied properties. Loans for which information was missing or not provided are not included in this analysis. The market figures in these tables refer to the conventional, conforming market including both Enterprise and non-Enterprise loans, measured by HMDA-reported loans originated each year on owner-occupied properties with principal balances less than or equal to the Enterprises’ conforming loan limits, excluding any loans insured or guaranteed by the federal government, such as FHA, VA, or RHS loans.
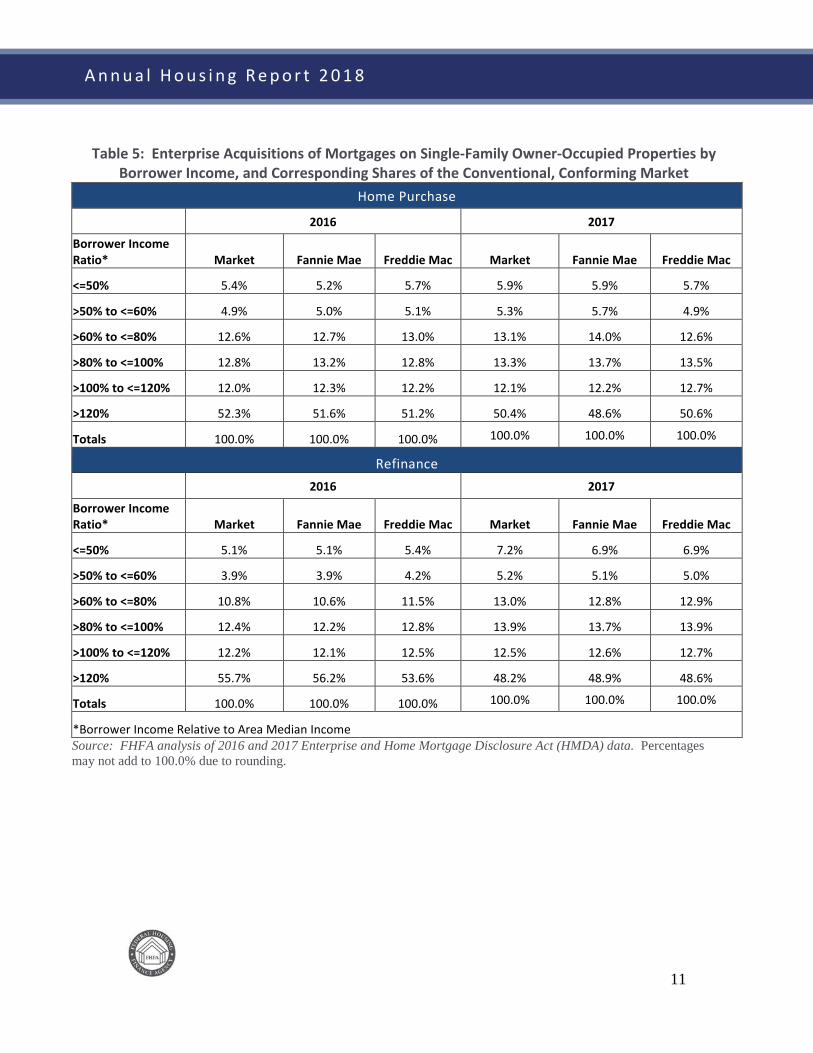
Table 5 shows the distribution of Enterprise mortgages acquired and the distribution of originations in the conventional, conforming market by borrower income in 2016 and 2017.
17 See http://www.fanniemae.com/resources/file/aboutus/pdf/2017ahar.pdf. 18 See http://www.freddiemac.com/about/pdf/2017_Freddie_Mac_AHAR.pdf and https://www.fhfa.gov/PolicyProgramsResearch/Programs/AffordableHousing/Documents/Fred_M_Goals/2018/regtabs_y2017q4_with_port.pdf. 19 Under 12 U.S.C. § 4544(b)(3), FHFA is required to “aggregate and analyze data on income, race, and gender by census tract and other relevant classifications, and compare such data with larger demographic, housing, and economic trends.”
11
A n n u a l H o u s i n g R e p o r t 2 0 1 8
Table 5: Enterprise Acquisitions of Mortgages on Single-Family Owner-Occupied Properties by Borrower Income, and Corresponding Shares of the Conventional, Conforming Market
Home Purchase
2016 2017
Borrower Income Ratio* Market Fannie Mae Freddie Mac Market Fannie Mae Freddie Mac
<=50% 5.4% 5.2% 5.7% 5.9% 5.9% 5.7%
>50% to <=60% 4.9% 5.0% 5.1% 5.3% 5.7% 4.9%
>60% to <=80% 12.6% 12.7% 13.0% 13.1% 14.0% 12.6%
>80% to <=100% 12.8% 13.2% 12.8% 13.3% 13.7% 13.5%
>100% to <=120% 12.0% 12.3% 12.2% 12.1% 12.2% 12.7%
>120% 52.3% 51.6% 51.2% 50.4% 48.6% 50.6%
Totals 100.0% 100.0% 100.0% 100.0% 100.0% 100.0%
Refinance 2016 2017
Borrower Income Ratio* Market Fannie Mae Freddie Mac Market Fannie Mae Freddie Mac
<=50% 5.1% 5.1% 5.4% 7.2% 6.9% 6.9%
>50% to <=60% 3.9% 3.9% 4.2% 5.2% 5.1% 5.0%
>60% to <=80% 10.8% 10.6% 11.5% 13.0% 12.8% 12.9%
>80% to <=100% 12.4% 12.2% 12.8% 13.9% 13.7% 13.9%
>100% to <=120% 12.2% 12.1% 12.5% 12.5% 12.6% 12.7%
>120% 55.7% 56.2% 53.6% 48.2% 48.9% 48.6%
Totals 100.0% 100.0% 100.0% 100.0% 100.0% 100.0%
*Borrower Income Relative to Area Median Income Source: FHFA analysis of 2016 and 2017 Enterprise and Home Mortgage Disclosure Act (HMDA) data. Percentages may not add to 100.0% due to rounding.
12
A n n u a l H o u s i n g R e p o r t 2 0 1 8
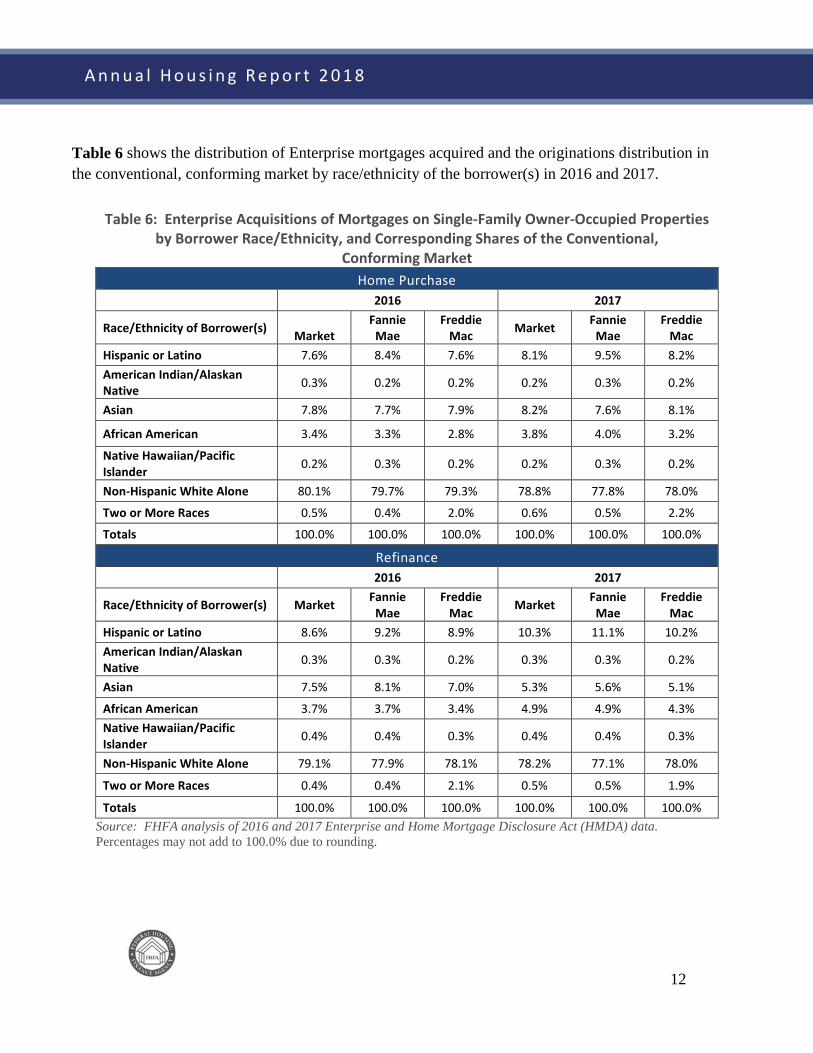
Table 6 shows the distribution of Enterprise mortgages acquired and the originations distribution in the conventional, conforming market by race/ethnicity of the borrower(s) in 2016 and 2017.
Table 6: Enterprise Acquisitions of Mortgages on Single-Family Owner-Occupied Properties by Borrower Race/Ethnicity, and Corresponding Shares of the Conventional,
Conforming Market Home Purchase
2016 2017
Race/Ethnicity of Borrower(s) Market Fannie
Mae Freddie
Mac Market Fannie Mae
Freddie Mac
Hispanic or Latino 7.6% 8.4% 7.6% 8.1% 9.5% 8.2% American Indian/Alaskan Native 0.3% 0.2% 0.2% 0.2% 0.3% 0.2%
Asian 7.8% 7.7% 7.9% 8.2% 7.6% 8.1%
African American 3.4% 3.3% 2.8% 3.8% 4.0% 3.2%
Native Hawaiian/Pacific Islander 0.2% 0.3% 0.2% 0.2% 0.3% 0.2%
Non-Hispanic White Alone 80.1% 79.7% 79.3% 78.8% 77.8% 78.0%
Two or More Races 0.5% 0.4% 2.0% 0.6% 0.5% 2.2%
Totals 100.0% 100.0% 100.0% 100.0% 100.0% 100.0%
Refinance
2016 2017
Race/Ethnicity of Borrower(s) Market Fannie Mae
Freddie Mac Market Fannie
Mae Freddie
Mac Hispanic or Latino 8.6% 9.2% 8.9% 10.3% 11.1% 10.2% American Indian/Alaskan Native 0.3% 0.3% 0.2% 0.3% 0.3% 0.2%
Asian 7.5% 8.1% 7.0% 5.3% 5.6% 5.1%
African American 3.7% 3.7% 3.4% 4.9% 4.9% 4.3% Native Hawaiian/Pacific Islander 0.4% 0.4% 0.3% 0.4% 0.4% 0.3%
Non-Hispanic White Alone 79.1% 77.9% 78.1% 78.2% 77.1% 78.0%
Two or More Races 0.4% 0.4% 2.1% 0.5% 0.5% 1.9%
Totals 100.0% 100.0% 100.0% 100.0% 100.0% 100.0% Source: FHFA analysis of 2016 and 2017 Enterprise and Home Mortgage Disclosure Act (HMDA) data. Percentages may not add to 100.0% due to rounding.
13
A n n u a l H o u s i n g R e p o r t 2 0 1 8
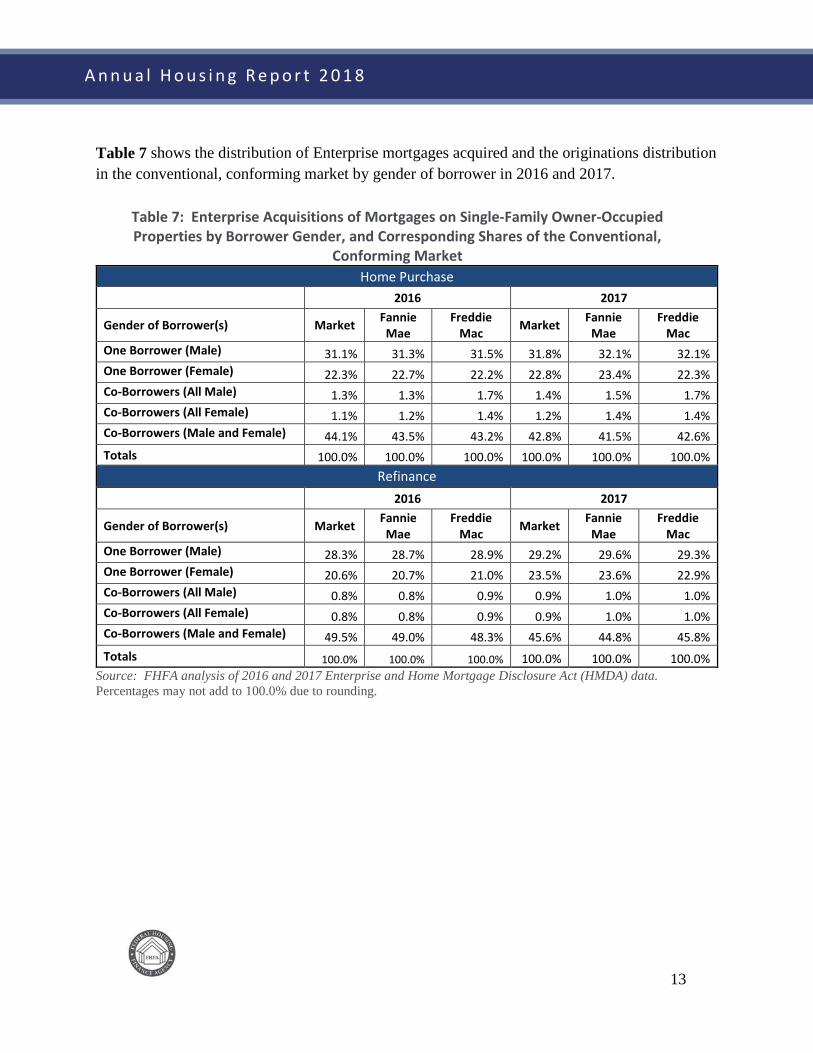
Table 7 shows the distribution of Enterprise mortgages acquired and the originations distribution in the conventional, conforming market by gender of borrower in 2016 and 2017.
Table 7: Enterprise Acquisitions of Mortgages on Single-Family Owner-Occupied Properties by Borrower Gender, and Corresponding Shares of the Conventional,
Conforming Market Home Purchase
2016 2017
Gender of Borrower(s) Market Fannie Mae
Freddie Mac Market Fannie
Mae Freddie
Mac One Borrower (Male) 31.1% 31.3% 31.5% 31.8% 32.1% 32.1% One Borrower (Female) 22.3% 22.7% 22.2% 22.8% 23.4% 22.3% Co-Borrowers (All Male) 1.3% 1.3% 1.7% 1.4% 1.5% 1.7% Co-Borrowers (All Female) 1.1% 1.2% 1.4% 1.2% 1.4% 1.4% Co-Borrowers (Male and Female) 44.1% 43.5% 43.2% 42.8% 41.5% 42.6% Totals 100.0% 100.0% 100.0% 100.0% 100.0% 100.0%
Refinance
2016 2017
Gender of Borrower(s) Market Fannie Mae
Freddie Mac Market Fannie
Mae Freddie
Mac One Borrower (Male) 28.3% 28.7% 28.9% 29.2% 29.6% 29.3% One Borrower (Female) 20.6% 20.7% 21.0% 23.5% 23.6% 22.9% Co-Borrowers (All Male) 0.8% 0.8% 0.9% 0.9% 1.0% 1.0% Co-Borrowers (All Female) 0.8% 0.8% 0.9% 0.9% 1.0% 1.0% Co-Borrowers (Male and Female) 49.5% 49.0% 48.3% 45.6% 44.8% 45.8% Totals 100.0% 100.0% 100.0% 100.0% 100.0% 100.0%
Source: FHFA analysis of 2016 and 2017 Enterprise and Home Mortgage Disclosure Act (HMDA) data. Percentages may not add to 100.0% due to rounding.
14
A n n u a l H o u s i n g R e p o r t 2 0 1 8
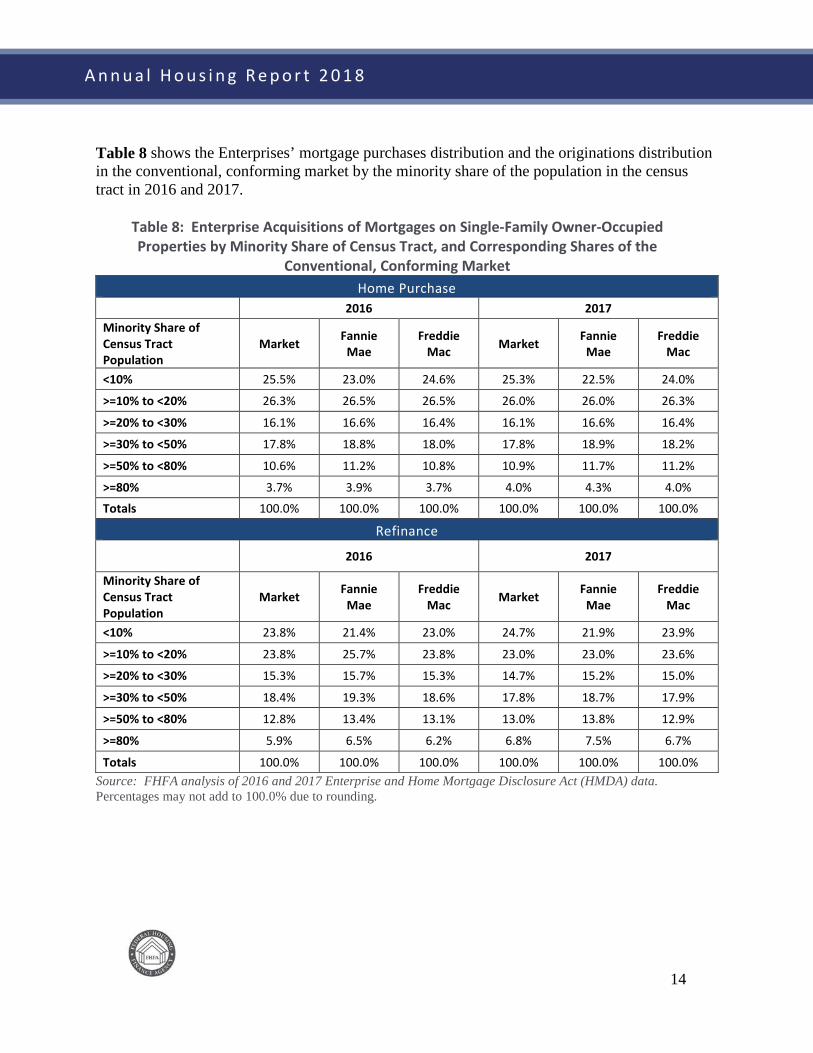
Table 8 shows the Enterprises’ mortgage purchases distribution and the originations distribution in the conventional, conforming market by the minority share of the population in the census tract in 2016 and 2017.
Table 8: Enterprise Acquisitions of Mortgages on Single-Family Owner-Occupied Properties by Minority Share of Census Tract, and Corresponding Shares of the
Conventional, Conforming Market Home Purchase
2016 2017
Minority Share of Census Tract Population
Market Fannie Mae
Freddie Mac Market Fannie
Mae Freddie
Mac
<10% 25.5% 23.0% 24.6% 25.3% 22.5% 24.0%
>=10% to <20% 26.3% 26.5% 26.5% 26.0% 26.0% 26.3%
>=20% to <30% 16.1% 16.6% 16.4% 16.1% 16.6% 16.4%
>=30% to <50% 17.8% 18.8% 18.0% 17.8% 18.9% 18.2%
>=50% to <80% 10.6% 11.2% 10.8% 10.9% 11.7% 11.2%
>=80% 3.7% 3.9% 3.7% 4.0% 4.3% 4.0%
Totals 100.0% 100.0% 100.0% 100.0% 100.0% 100.0%
Refinance
2016 2017
Minority Share of Census Tract Population
Market Fannie Mae
Freddie Mac Market Fannie
Mae Freddie
Mac
<10% 23.8% 21.4% 23.0% 24.7% 21.9% 23.9%
>=10% to <20% 23.8% 25.7% 23.8% 23.0% 23.0% 23.6%
>=20% to <30% 15.3% 15.7% 15.3% 14.7% 15.2% 15.0%
>=30% to <50% 18.4% 19.3% 18.6% 17.8% 18.7% 17.9%
>=50% to <80% 12.8% 13.4% 13.1% 13.0% 13.8% 12.9%
>=80% 5.9% 6.5% 6.2% 6.8% 7.5% 6.7%
Totals 100.0% 100.0% 100.0% 100.0% 100.0% 100.0% Source: FHFA analysis of 2016 and 2017 Enterprise and Home Mortgage Disclosure Act (HMDA) data. Percentages may not add to 100.0% due to rounding.
15
A n n u a l H o u s i n g R e p o r t 2 0 1 8
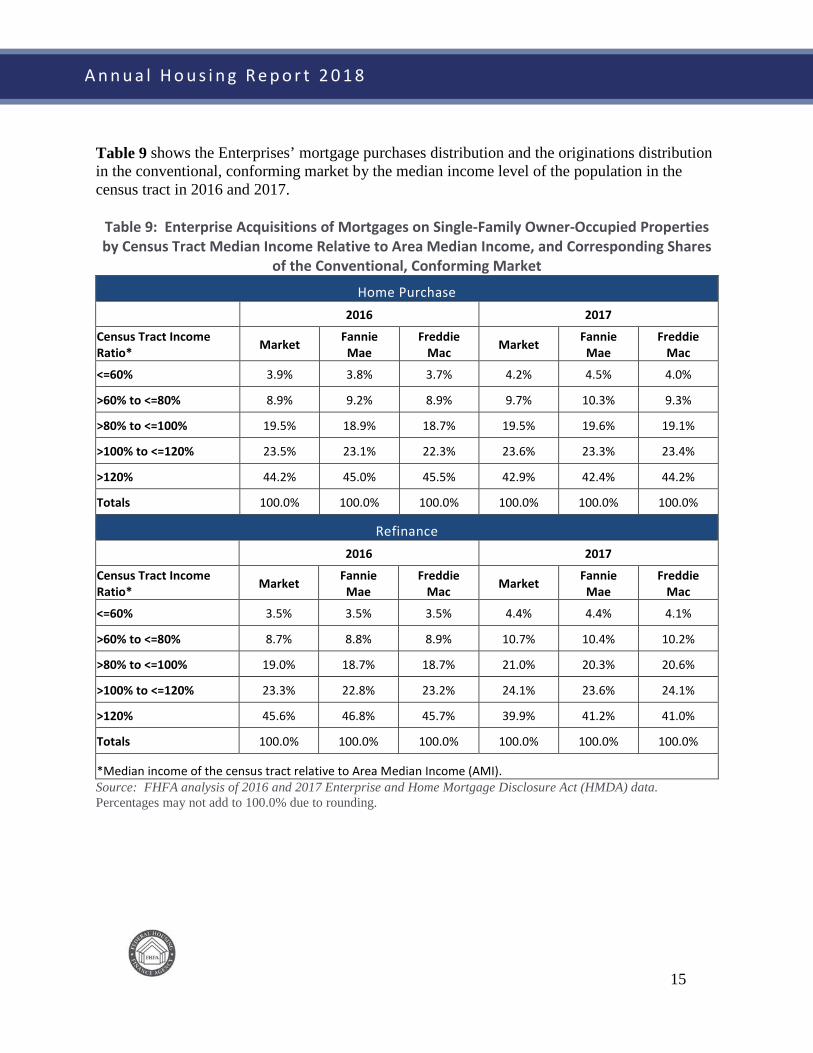
Table 9 shows the Enterprises’ mortgage purchases distribution and the originations distribution in the conventional, conforming market by the median income level of the population in the census tract in 2016 and 2017.
Table 9: Enterprise Acquisitions of Mortgages on Single-Family Owner-Occupied Properties by Census Tract Median Income Relative to Area Median Income, and Corresponding Shares
of the Conventional, Conforming Market
Home Purchase
2016 2017
Census Tract Income Ratio* Market Fannie
Mae Freddie
Mac Market Fannie Mae
Freddie Mac
<=60% 3.9% 3.8% 3.7% 4.2% 4.5% 4.0%
>60% to <=80% 8.9% 9.2% 8.9% 9.7% 10.3% 9.3%
>80% to <=100% 19.5% 18.9% 18.7% 19.5% 19.6% 19.1%
>100% to <=120% 23.5% 23.1% 22.3% 23.6% 23.3% 23.4%
>120% 44.2% 45.0% 45.5% 42.9% 42.4% 44.2%
Totals 100.0% 100.0% 100.0% 100.0% 100.0% 100.0%
Refinance
2016 2017
Census Tract Income Ratio* Market Fannie
Mae Freddie
Mac Market Fannie Mae
Freddie Mac
<=60% 3.5% 3.5% 3.5% 4.4% 4.4% 4.1%
>60% to <=80% 8.7% 8.8% 8.9% 10.7% 10.4% 10.2%
>80% to <=100% 19.0% 18.7% 18.7% 21.0% 20.3% 20.6%
>100% to <=120% 23.3% 22.8% 23.2% 24.1% 23.6% 24.1%
>120% 45.6% 46.8% 45.7% 39.9% 41.2% 41.0%
Totals 100.0% 100.0% 100.0% 100.0% 100.0% 100.0%
*Median income of the census tract relative to Area Median Income (AMI). Source: FHFA analysis of 2016 and 2017 Enterprise and Home Mortgage Disclosure Act (HMDA) data. Percentages may not add to 100.0% due to rounding.
16
A n n u a l H o u s i n g R e p o r t 2 0 1 8
Multifamily Housing
As conservator of the Enterprises, FHFA has established a yearly cap in the Conservatorship Scorecard that limits the amount of conventional, market-rate multifamily loans that each Enterprise can purchase. The multifamily cap furthers FHFA’s conservatorship goals of maintaining the presence of the Enterprises as a backstop for the multifamily finance market while not impeding the participation of private capital. The 2017 Scorecard set the cap for each Enterprise at $36.5 billion to reflect what FHFA considers an appropriate market share for the Enterprises during normal market conditions. FHFA, however, excludes loans eligible for housing goals credit and certain other categories of transactions in the underserved market from counting toward the multifamily cap to allow the Enterprises to provide greater support for the underserved market in which there has historically been minimal participation of private capital.20
FHFA designed exclusions from the cap to support affordable and underserved multifamily segments of the multifamily market that the private sector does not serve adequately:
• subsidized affordable housing, • manufactured housing communities, • small multifamily properties between 5 and 50 units, • affordable properties in rural areas, • seniors housing assisted living properties, • energy efficiency improvements in Enterprise-financed properties, and • market-rate units that are affordable to very low-, low-, and moderate-income tenants in
standard, high-cost, and very-high cost rental markets, respectively.
In 2017, the Enterprises actively managed their loan production consistent with the multifamily Conservatorship Scorecard objectives. Fannie Mae’s total multifamily finance activity for the year was approximately $67 billion, $30.5 billion within the cap and $36.5 billion in the excluded categories. Freddie Mac’s total multifamily finance activity for the year was approximately $73.2 billion, $33.8 billion within the cap and $39.4 billion in the excluded categories.
20 2017 Scorecard Progress Report, p. 13-14, available at https://www.fhfa.gov/AboutUs/Reports/ReportDocuments/2017-Scorecard-Progress-Report.pdf.
17
A n n u a l H o u s i n g R e p o r t 2 0 1 8
The 2017 Scorecard also required the Enterprises to explore opportunities to further support liquidity for multifamily affordable housing. During 2017, the Enterprises conducted research that FHFA used to refine affordable and underserved categories excluded from the multifamily cap. Both Enterprises conducted research about targeted submarkets, evaluated how the definitions of excluded categories affect the multifamily market, and analyzed how potential changes to those categories might affect the multifamily market. The Enterprises’ research and analyses contributed to FHFA’s decision to adjust two of the excluded category definitions in the 2018 Scorecard. First, both Enterprises explored energy and water savings resulting from green financing, as well as methodologies for measuring those savings. Their research and recommendations informed FHFA’s decision to modify the criteria for excluding green loans from the multifamily cap. For 2018, the full loan amount under the Fannie Mae Green Rewards and Freddie Mac Green Up and Green Up Plus loan programs is excluded from the cap if the renovations are projected to reduce either annual energy or annual water whole property consumption by at least 25 percent. Whole property consumption includes both tenant- and property-level savings.
Second, during 2017 the Enterprises researched and analyzed higher cost areas with affordable housing shortages. This research informed FHFA’s decision to address the critical shortage of middle-income housing in certain expensive markets by adding an “extremely” high-cost market category to the 2018 Scorecard. For properties with affordable units, FHFA will allow the Enterprises to exclude a portion of the loan amount from the cap based on the percentage of units with unsubsidized rents that are affordable to those at or below 120 percent of the area median income in extremely high-cost markets.
18
A n n u a l H o u s i n g R e p o r t 2 0 1 8
Duty to Serve Underserved Markets
The Safety and Soundness Act established a duty for the Enterprises to serve very low-, low-, and moderate-income families in three underserved markets – manufactured housing, affordable housing preservation, and rural housing – with the objective of increasing liquidity of mortgage investments and improving the distribution of investment capital available for mortgage financing in each of these markets.21 On December 13, 2016 FHFA issued a final rule implementing the Duty to Serve requirements.22 The final rule specifies the scope of Enterprise activities that are eligible to receive Duty to Serve credit and provides a framework for FHFA’s evaluation and rating of the Enterprises’ compliance with their duty to serve these underserved markets.
Under the final rule, the Enterprises may receive Duty to Serve credit for engaging in the following activities:
• Manufactured housing: Eligible Enterprise activities are those related to manufactured homes financed as personal property or chattel (initially as a pilot) and manufactured homes financed as real property. Duty to Serve credit is also available for certain categories of blanket loans to finance manufactured housing communities.
• Affordable housing preservation: Eligible Enterprise activities are those related to preserving the affordability of housing for renters and homebuyers, including activities under the multifamily rental housing programs specified in the Safety and Soundness Act. Duty to Serve credit is also available for activities related to financing for energy efficiency improvements on both single-family properties with first liens and multifamily rental properties; small multifamily rental properties; purchase or rehabilitation of distressed single-family properties; shared equity homeownership programs; and for the U.S. Department of Housing and Urban Development’s Choice Neighborhoods Initiative and Rental Assistance Demonstration program.
• Rural housing: Eligible Enterprise activities are those related to the financing of housing in rural areas, including activities serving the following high-needs rural regions and populations: Middle Appalachia, the Lower Mississippi Delta, colonias, rural census
21 See 12 U.S.C. § 4565. 22 See 81 Fed. Reg. 96242 (Dec. 29, 2016).
19
A n n u a l H o u s i n g R e p o r t 2 0 1 8
tracts in persistent poverty counties, members of a federally-recognized Native American tribe located in a Native American area, and agricultural workers. Duty to Serve credit is also available for activities that support financing by small financial institutions of housing in rural areas, and activities that support financing of small multifamily rental properties in rural areas.
The final rule required each Enterprise to adopt a three-year Underserved Markets Plan (Plan) describing the activities and objectives the Enterprise will undertake for Duty to Serve credit. Following a public input process, and FHFA’s non-objection, the Enterprises’ Plans went into effect on January 1, 2018.23
The following are a few examples of ways in which the Enterprises’ Duty to Serve Plans will attempt to increase the availability of mortgage credit in underserved markets.
In the manufactured housing market both Enterprises plan to carry out several similar objectives that include:
• Increasing liquidity to resident-owned manufactured housing communities through loan product enhancements;
• Performing research to explore furthering FHFA’s tenant protections in multifamily housing communities with certain consumer protections; and
• Conducting research and outreach to develop a loan pilot for chattel (manufactured homes titled as personal property).
In the affordable housing preservation market, both Enterprises plan to:
• Increase purchases of properties with Section 8 loans; and
• Facilitate the financing of properties participating in HUD’s Rental Assistance Demonstration.
23 Both Enterprise Underserved Markets Plans and other public information on Duty to Serve are available at https://www.fhfa.gov/PolicyProgramsResearch/Programs/Pages/Duty-to-Serve.aspx.
20
A n n u a l H o u s i n g R e p o r t 2 0 1 8
In the rural housing market, both Enterprises plan to:
• Increase single-family loan purchases in high-needs rural regions, with a focus on Middle Appalachia and the Lower Mississippi Delta;
• Conduct research and outreach to develop lending solutions for Native Americans; and
• Increase purchases of loans in rural areas from small financial institutions.
FHFA continues to work closely with the Enterprises to ensure that new initiatives undertaken as part of the Duty to Serve are approached in a safe and sound manner.
21
A n n u a l H o u s i n g R e p o r t 2 0 1 8
Affordable Housing Allocations
As stated in FHFA’s June 2018 Annual Report to Congress, the Safety and Soundness Act, as amended in 2008, requires each Enterprise to set aside in each fiscal year an amount equal to 4.2 basis points (0.042 percent) for each dollar of the unpaid principal balance of its total new business purchases. The Enterprises must allocate or otherwise transfer 65 percent of the amount set aside to the Secretary of the Department of Housing and Urban Development (HUD) to fund the Housing Trust Fund (HTF) and 35 percent to the Secretary of the Treasury Department to fund the Capital Magnet Fund (CMF). FHFA is not involved in the administration of either the HTF or the CMF.
The HTF is designed to assist states in meeting the housing needs of the lowest income families. It provides funds to preserve, rehabilitate and construct housing for extremely low- and very low-income families. HUD allocates funds to states by formula, and states allocate funds to projects. Each state must use at least 80 percent of its funds for rental housing, while up to 10 percent may go to homeownership activities for first-time homebuyers.
The CMF is a special account within the Community Development Financial Institutions (CDFI) Fund designed to increase investment in affordable housing, economic development, and community service facilities in low-income or underserved rural areas. The CMF awards funds competitively to community development financial institutions and qualified nonprofits and aims to attract private capital to economically distressed communities, including underserved rural areas. Funded projects are affordable housing activities as well as related economic development activities and community service facilities.
For purposes of the HTF and CMF set asides and allocations, Fannie Mae’s total new business purchases in 2017 amounted to $569.6 billion. As a result, total affordable housing allocation payments of $239 million were made in February 2018. Freddie Mac’s total new business purchases in 2017 amounted to $416.2 billion. As a result, total affordable housing allocation payments of $174.8 million were made in February 2018.

22
A n n u a l H o u s i n g R e p o r t 2 0 1 8
Monthly Survey of Mortgage Markets (National Mortgage Database)
The Safety and Soundness Act requires FHFA to conduct a monthly survey of mortgage markets to collect information on the characteristics of individual mortgages, both those eligible for and those ineligible for Enterprise purchase.24 The statute requires FHFA to collect the following information for each loan: (1) the price of the house securing the mortgage; (2) the loan-to-value ratio of the mortgage (including secondary financing); (3) the terms of the mortgage; (4) the creditworthiness of the borrower or borrowers; and (5) whether the mortgage (if eligible) was purchased by an Enterprise. The statute also requires FHFA to collect information on the loan and borrower characteristics of subprime mortgages and nontraditional mortgages eligible for purchase by the Enterprises, including the creditworthiness of borrowers and other information needed to determine whether these borrowers could have qualified for prime loans.
At the time Congress enacted HERA, there was no single data source containing all of the items required to comply with the Safety and Soundness Act. As a result, FHFA initiated the development of the National Mortgage Database (NMDB®) to comply with these requirements. In November 2012, FHFA announced a partnership with the Bureau of Consumer Financial Protection (BCFP) to develop the NMDB.
Because the NMDB is still being developed and tested, FHFA has not yet published monthly mortgage surveys. However, the NMDB is expected to start publishing survey data in 2018, which will provide comprehensive information about the U.S. mortgage market based upon a 5 percent nationally representative sample of single-family, first lien mortgages outstanding as of 1998. The NMDB will also include data, based on a subset of this 5 percent sample, from a series of borrower surveys about the borrower experience throughout the mortgage life cycle. These surveys currently include the quarterly National Survey of Mortgage Originations (NSMO) and the annual American Survey of Mortgage Borrowers (ASMB).
FHFA continues to establish strong information security systems and protocols and continues to review and evaluate every aspect of these systems and protocols to ensure that the statutory objectives of the NMDB are achieved.
24 See 12 U.S.C. § 4544(c).

23
A n n u a l H o u s i n g R e p o r t 2 0 1 8
FHFA published or updated the following six reports based on the NMDB since issuing the last Annual Housing Report:
• The National Mortgage Database Technical Report 1.2 updated on October 30, 2017, which provides users of the NMDB data background on the development of the database, as well as an assessment of the quality of the data;
• The National Survey of Mortgage Originations Technical Report 2.2 and 2.3 updated on November 17, 2017 and April 18, 2018, which provides background details on how the National Survey of Mortgage Originations (NSMO) was developed;
• A Profile of 2015 Mortgage Borrowers: Statistics from the National Survey of Mortgage Originations Technical Report 5.0 released on November 17, 2017, which provides information about the 2015 set of responses to the National Survey of Mortgage Originations (NSMO), which is jointly administered by FHFA and BCFP. The NSMO collects information from a representative sample of recent mortgage borrowers about their experiences in choosing and taking out a mortgage.
• A Profile of 2016 Mortgage Borrowers: Statistics from the National Survey of Mortgage Originations Technical Report 6.0 released on April 18, 2018, which provides information about the 2016 set of responses to the National Survey of Mortgage Originations (NSMO), which is jointly administered by FHFA and BCFP.
• NMDB Staff Working Paper 18-01: Mortgage Experience of Rural Borrowers in the United States, Insight from the National Survey of Mortgage Originations released on March 14, 2018, which contrasts the characteristics, experiences, and loan terms of mortgage borrowers in completely rural counties to those of borrowers in metropolitan and other non-metropolitan areas.
• NMDB Staff Working Paper 18-02: First-Time Homebuyer Counseling and the Mortgage Selection Experience in the United States, Evidence from the National Survey of Mortgage Originations released on March 14, 2018, which provides evidence on the benefits of homebuyer counseling to mortgage borrowers in aspects other than mortgage performance.
24
A n n u a l H o u s i n g R e p o r t 2 0 1 8
Subprime and Nontraditional Loans
The Safety and Soundness Act requires FHFA to “identify the extent to which each [E]nterprise is involved in mortgage purchases and secondary market activities involving subprime and nontraditional loans”25 and to “compare the characteristics of subprime and nontraditional loans both purchased and securitized by each [E]nterprise to other loans purchased and securitized by each [E]nterprise.”26 On May 6, 2013, FHFA directed Fannie Mae and Freddie Mac not to purchase interest-only loans, negative amortization loans, loans with terms longer than 30 years, or loans with points and fees exceeding the thresholds established by the Qualified Mortgage rule. This directive became effective on January 10, 2014.27 Consequently, the Enterprises are not involved in mortgage purchases and secondary market activities involving subprime and nontraditional loans.
Appendix B of this Report provides a breakdown of the characteristics of mortgage products purchased by the Enterprises in 2016 and 2017, as well as information on mortgage payment types, loan-to-value ratios, and credit scores.
25 See 12 U.S.C. § 4544(b)(4). 26 See 12 U.S.C. § 4544(b)(5). 27 See http://www.fhfa.gov/Media/PublicAffairs/Pages/FHFA-Limiting-Fannie-Mae-and-Freddie-MacLoan-Purchases-to-Qualified-Mortgages.aspx.
25
A n n u a l H o u s i n g R e p o r t 2 0 1 8
Higher-Priced Mortgage Loans
The Safety and Soundness Act requires FHFA to “compare the characteristics of high-cost loans purchased and securitized [by each Enterprise], where such securities are not held on portfolio to loans purchased and securitized, where such securities are either retained on portfolio or repurchased by the [E]nterprise, including such characteristics as (A) the purchase price of the property that secures the mortgage; (B) the loan-to-value ratio of the mortgage, which shall reflect any secondary liens on the relevant property; (C) the terms of the mortgage; (D) the creditworthiness of the borrower; and (E) any other relevant data, as determined by the Director.”28 The Safety and Soundness Act also requires that FHFA release the high-cost loan characteristics data to the public.29 However, the Safety and Soundness Act does not define the term “high-cost loan,” nor does any legislative history state the intent of this provision. After considering various options, FHFA decided to define “high-cost loan” in this context as a loan with a HMDA-reportable “rate spread” that is 150 basis points or more above the Average Prime Offer Rate (APOR).30 In other contexts, FHFA refers to loans exceeding this rate-spread threshold as “higher-priced mortgage loans.”31 To ensure consistency, the Report uses the “higher-priced” terminology when referring to “high-cost loans.” In 2017, 2.4 percent of all single-family loans purchased by the Enterprises were higher-priced mortgage loans.
For Enterprise mortgage purchases in 2017, the tables in Appendix C show the number of higher-priced mortgage loans in securities compared to the number of higher-priced mortgage loans retained in portfolio at year-end by each Enterprise.32 The tables identify this information according to the following loan characteristics: purchase price, loan-to-value ratio, product type,
28 See 12 U.S.C. § 4544(b)(6). 29 See 12 U.S.C. § 4546(d)(2). 30 See 76 Fed. Reg. 60031 (Sept. 28, 2011) (defining “high-cost loan” for purposes of 12 U.S.C. §§ 4544(b)(6) and 4546(d)(2)). 31 BCFP has defined “higher-priced mortgage loan” in the same way for most mortgages, although the BCFP definition sets higher rate spread cut-offs for jumbo mortgages (250 basis points or more above the APOR) and for subordinate lien mortgages (350 basis points or more above the APOR). See 12 CFR § 1026.35(a). In amending the Truth in Lending Act, the Home Ownership and Equity Protection Act (HOEPA), 15 U.S.C. § 1602(bb), established a separate category of loans designated as “high-cost mortgages.” Mortgages on primary residences that exceed the applicable mortgage interest rate and total point and fee thresholds established under HOEPA are not eligible for sale to the Enterprises. 32 Loans identified as “retained in the portfolio” are generally loans that the Enterprises hold as assets in their mortgage portfolios. Examples of these loans would be loans that are not eligible for securitization, defaulted loans purchased out of mortgage-backed securities, and loans that the Enterprises purchase directly either to hold in portfolio and/or to aggregate for securitization at a future date. Loans identified as “not held in the portfolio” are generally loans that the Enterprises have pooled into mortgage-backed securities and sold to investors.
26
A n n u a l H o u s i n g R e p o r t 2 0 1 8
term at origination, interest rate at origination, credit score, borrower income ratio, tract income ratio, census tract demographics, purpose of the loan, and federal guarantee status.33
33 These loan characteristics are further described in FHFA’s September 28, 2011, Notice of Order. See 76 Fed. Reg. 60031.
27
A n n u a l H o u s i n g R e p o r t 2 0 1 8
Public Access to Mortgage Information
The Safety and Soundness Act requires FHFA to make loan-level data submitted by the Enterprises available to the public, except for certain proprietary information and personally identifiable information.34 The Safety and Soundness Act also requires FHFA to make Enterprise data elements reported under HMDA (at the census tract level) available to the public. Finally, the Safety and Soundness Act requires FHFA to make certain high-cost securitized Enterprise loan data it collects available to the public to compare the characteristics of high-cost loans the Enterprises purchase and securitize.35 As noted earlier in this Report, because the Safety and Soundness Act does not define the term “high-cost loan,” FHFA defines “high-cost loan” based on whether its HMDA rate spread is 150 basis points or more above the APOR. The Safety and Soundness Act requires FHFA to release the data by September 30 of the year following the year the Enterprises acquired the mortgages. On September 19, 2018 FHFA released this data to the public for 2017 through its Public Use Database (PUDB), available on FHFA’s website.36
34 See 12 U.S.C. §§ 4543, 4546. 35 See 12 U.S.C. §§ 4544(b)(6), 4546(d). See also Appendix C for the analysis of the higher-priced securitized loan data for 2015. 36 See http://www.fhfa.gov/DataTools/Downloads/Pages/Public-Use-Databases.aspx.
28
A n n u a l H o u s i n g R e p o r t 2 0 1 8
Appendix A: Preliminary Determination Letters: Enterprise 2017 Housing Goals Performance
29
A n n u a l H o u s i n g R e p o r t 2 0 1 8
30
A n n u a l H o u s i n g R e p o r t 2 0 1 8
31
A n n u a l H o u s i n g R e p o r t 2 0 1 8
32
A n n u a l H o u s i n g R e p o r t 2 0 1 8
Appendix B: Subprime and Nontraditional Loans
I. Overview of Single-Family Mortgages Acquired by the Enterprises
Excluding second liens and reverse mortgages, Fannie Mae and Freddie Mac acquired $855.5 billion of single-family loans in 2017 (See Table B1), a decrease of 12.38 percent from the $976.4 billion of single-family loans the Enterprises acquired in 2016. These totals include loans that collateralize mortgage-backed securities guaranteed by either Enterprise and loans purchased for cash. While Tables 1 through 9 report on only owner-occupied single-family purchases, this Appendix reports on both owner-occupied and investor-owned single-family purchases.
Fully amortizing mortgages comprised 100 percent of the single-family loans acquired by the Enterprises in 2017, consistent with conservatorship guidance. Neither Enterprise purchased any negatively amortizing or interest-only loans in 2016 or 2017. Fully amortizing fixed-rate mortgages accounted for 97.3 percent of combined acquisitions, a decrease from 98.4 percent in 2016 (see Table B1). Fully amortizing hybrid adjustable-rate mortgages accounted for 2.6 percent of 2017 acquisitions, an increase from 1.6 percent in 2016.
33
A n n u a l H o u s i n g R e p o r t 2 0 1 8
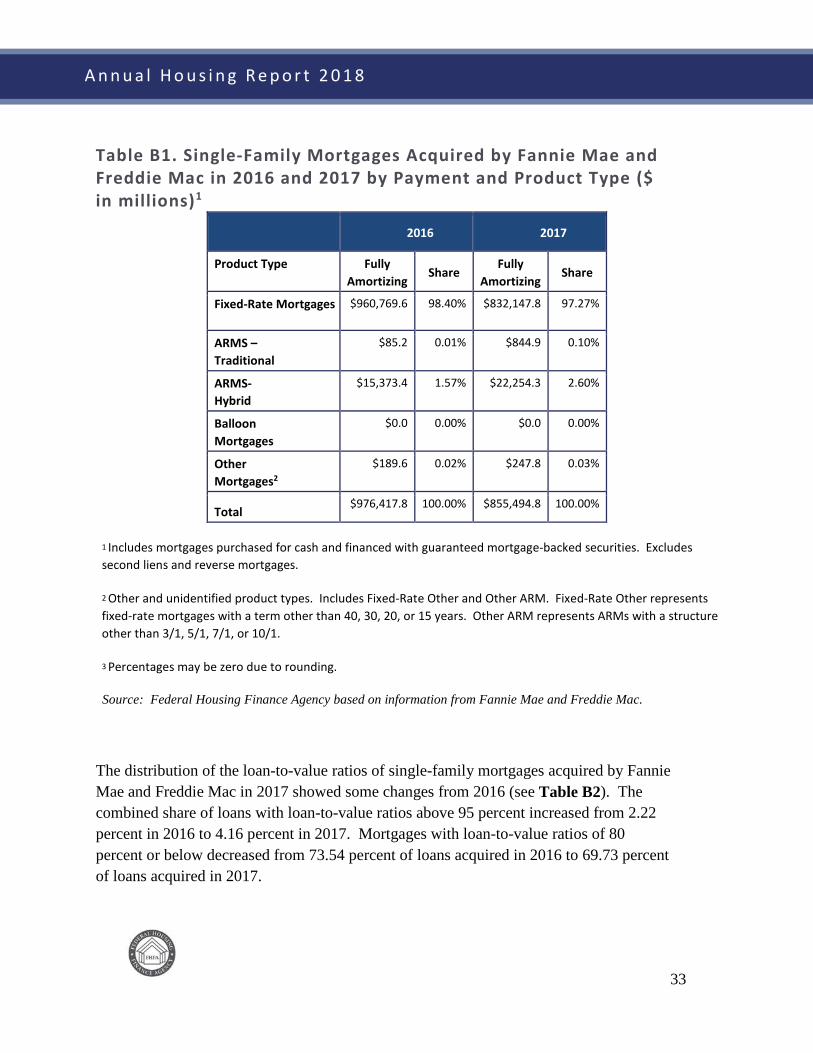
Table B1. Single-Family Mortgages Acquired by Fannie Mae and Freddie Mac in 2016 and 2017 by Payment and Product Type ($ in millions)1
2016 2017
Product Type Fully Amortizing Share Fully
Amortizing Share
Fixed-Rate Mortgages $960,769.6 98.40% $832,147.8 97.27%
ARMS – Traditional
$85.2 0.01% $844.9 0.10%
ARMS- Hybrid
$15,373.4 1.57% $22,254.3 2.60%
Balloon Mortgages
$0.0 0.00% $0.0 0.00%
Other Mortgages2
$189.6 0.02% $247.8 0.03%
Total $976,417.8 100.00% $855,494.8 100.00%
1 Includes mortgages purchased for cash and financed with guaranteed mortgage-backed securities. Excludes second liens and reverse mortgages.
2 Other and unidentified product types. Includes Fixed-Rate Other and Other ARM. Fixed-Rate Other represents fixed-rate mortgages with a term other than 40, 30, 20, or 15 years. Other ARM represents ARMs with a structure other than 3/1, 5/1, 7/1, or 10/1.
3 Percentages may be zero due to rounding.
Source: Federal Housing Finance Agency based on information from Fannie Mae and Freddie Mac.
The distribution of the loan-to-value ratios of single-family mortgages acquired by Fannie Mae and Freddie Mac in 2017 showed some changes from 2016 (see Table B2). The combined share of loans with loan-to-value ratios above 95 percent increased from 2.22 percent in 2016 to 4.16 percent in 2017. Mortgages with loan-to-value ratios of 80 percent or below decreased from 73.54 percent of loans acquired in 2016 to 69.73 percent of loans acquired in 2017.
34
A n n u a l H o u s i n g R e p o r t 2 0 1 8
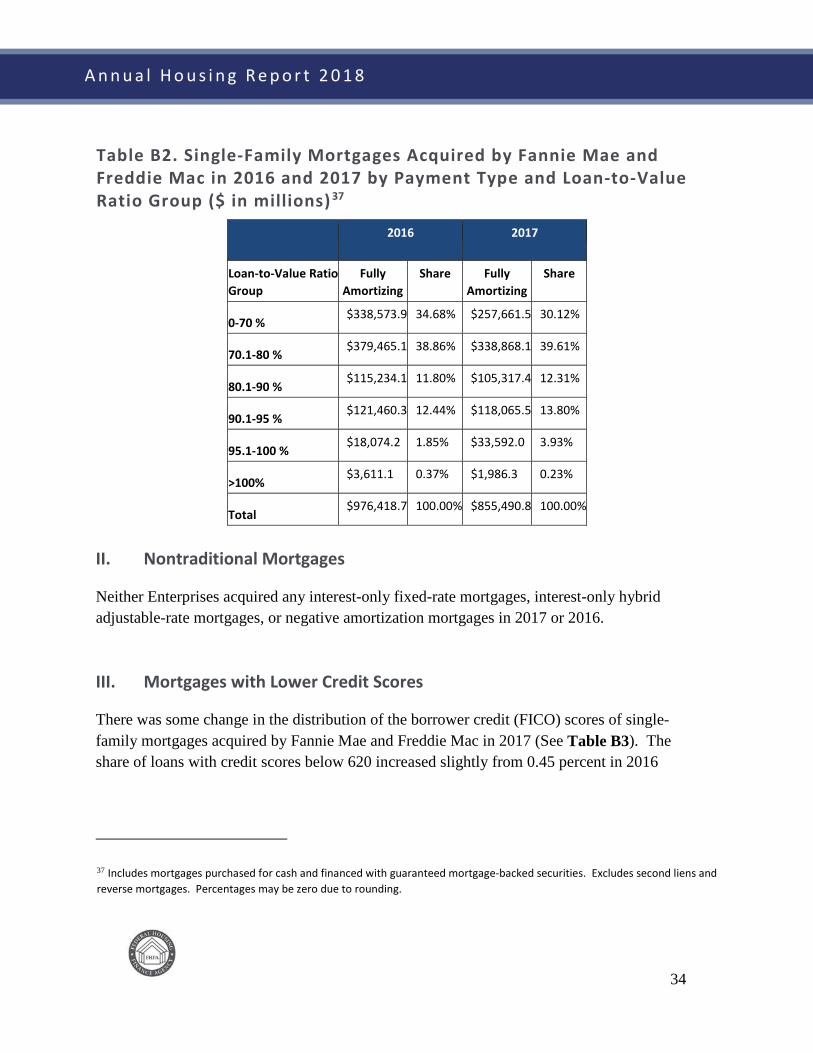
Table B2. Single-Family Mortgages Acquired by Fannie Mae and Freddie Mac in 2016 and 2017 by Payment Type and Loan-to-Value Ratio Group ($ in millions) 37
2016 2017
Loan-to-Value Ratio Group
Fully Amortizing
Share Fully Amortizing
Share
0-70 % $338,573.9 34.68% $257,661.5 30.12%
70.1-80 % $379,465.1 38.86% $338,868.1 39.61%
80.1-90 % $115,234.1 11.80% $105,317.4 12.31%
90.1-95 % $121,460.3 12.44% $118,065.5 13.80%
95.1-100 % $18,074.2 1.85% $33,592.0 3.93%
>100% $3,611.1 0.37% $1,986.3 0.23%
Total $976,418.7 100.00% $855,490.8 100.00%
II. Nontraditional Mortgages
Neither Enterprises acquired any interest-only fixed-rate mortgages, interest-only hybrid adjustable-rate mortgages, or negative amortization mortgages in 2017 or 2016.
III. Mortgages with Lower Credit Scores
There was some change in the distribution of the borrower credit (FICO) scores of single-family mortgages acquired by Fannie Mae and Freddie Mac in 2017 (See Table B3). The share of loans with credit scores below 620 increased slightly from 0.45 percent in 2016
37 Includes mortgages purchased for cash and financed with guaranteed mortgage-backed securities. Excludes second liens and reverse mortgages. Percentages may be zero due to rounding.
35
A n n u a l H o u s i n g R e p o r t 2 0 1 8
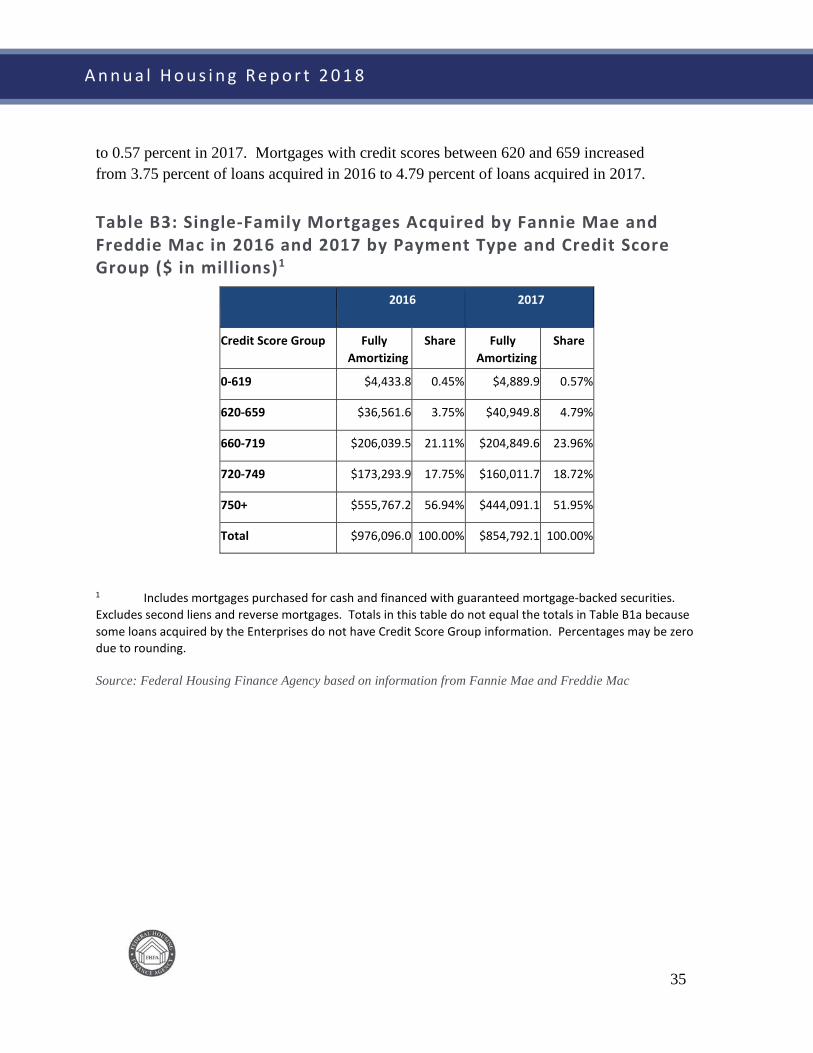
to 0.57 percent in 2017. Mortgages with credit scores between 620 and 659 increased from 3.75 percent of loans acquired in 2016 to 4.79 percent of loans acquired in 2017.
Table B3: Single-Family Mortgages Acquired by Fannie Mae and Freddie Mac in 2016 and 2017 by Payment Type and Credit Score Group ($ in millions)1
2016
2017
Credit Score Group Fully Amortizing
Share Fully Amortizing
Share
0-619 $4,433.8 0.45% $4,889.9 0.57%
620-659 $36,561.6 3.75% $40,949.8 4.79%
660-719 $206,039.5 21.11% $204,849.6 23.96%
720-749 $173,293.9 17.75% $160,011.7 18.72%
750+ $555,767.2 56.94% $444,091.1 51.95%
Total $976,096.0 100.00% $854,792.1 100.00%
1 Includes mortgages purchased for cash and financed with guaranteed mortgage-backed securities. Excludes second liens and reverse mortgages. Totals in this table do not equal the totals in Table B1a because some loans acquired by the Enterprises do not have Credit Score Group information. Percentages may be zero due to rounding.
Source: Federal Housing Finance Agency based on information from Fannie Mae and Freddie Mac
36
A n n u a l H o u s i n g R e p o r t 2 0 1 8
Appendix C: Higher-Priced Mortgage Loans
As discussed in the Higher-Priced Mortgage Loans section of this report, because the Safety and Soundness Act does not define the term “high-cost loan,” FHFA determined that it would define “high-cost loan” by whether its HMDA-reportable rate spread is 150 basis points or more above the APOR. In other contexts, FHFA refers to such loans as “higher-priced mortgage loans.”
In 2017, 2.4 percent of all single-family loans purchased by the Enterprises were higher-priced mortgage loans. The tables below show the number of higher-priced mortgage loans in Enterprise securities compared to the number of higher-priced mortgage loans retained on portfolio at year-end by each Enterprise for 2017.
The Safety and Soundness Act requires FHFA to compare the characteristics of high-cost loans purchased and securitized by each Enterprise “where such securities are not held on portfolio to loans purchased and securitized, where such securities are either retained on portfolio or repurchased by the [E]nterprise.” The comparisons should include “such characteristics as- (A) the purchase price of the property that secures the mortgage; (B) the loan-to-value ratio of the mortgage, which shall reflect any secondary liens on the relevant property; (C) the terms of the mortgage; (D) the creditworthiness of the borrower; and (E) any other relevant data, as determined by the Director.”49 Terms of a mortgage include product type, whether a fixed-rate mortgage (FRM) or an adjustable-rate mortgage (ARM), term (or length) of the mortgage at origination, amortization term, and interest rate at origination. Other relevant data included for comparative analysis are borrower income ratio, census tract income ratio, 2010 Census tract/percent minority, purpose of loan, and whether the loan has a federal guarantee.
49 See 12 U.S.C. § 4544(b)(6).
37
A n n u a l H o u s i n g R e p o r t 2 0 1 8
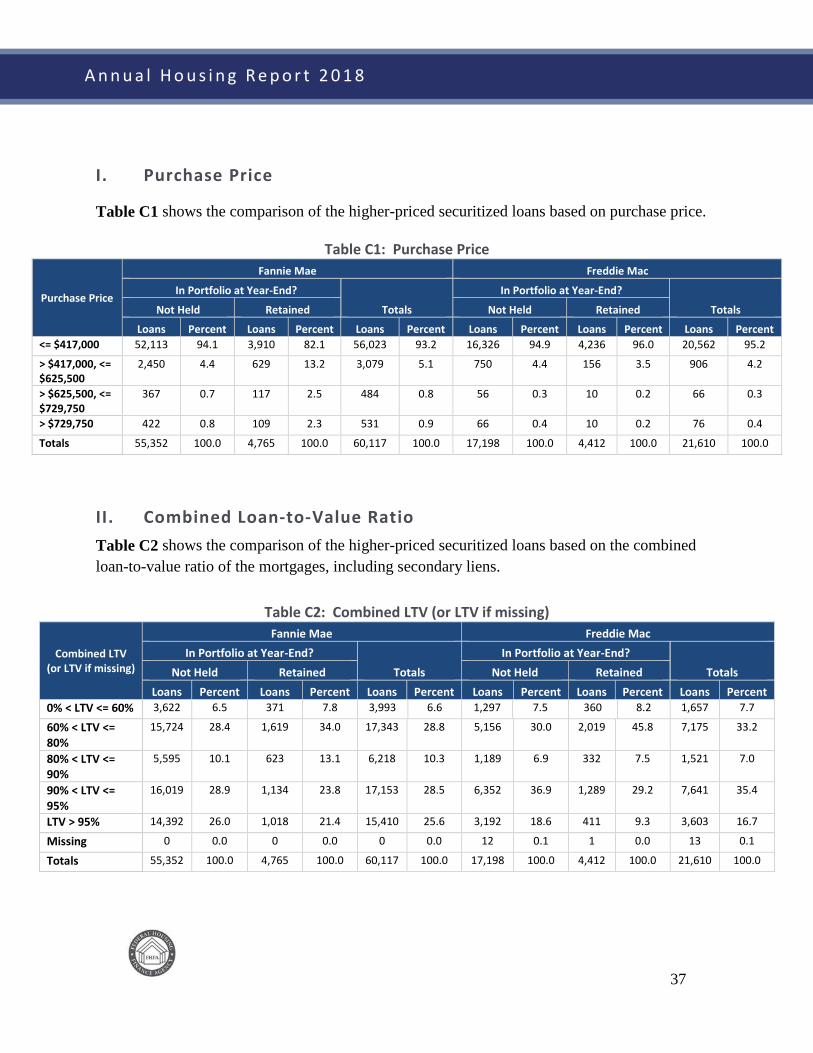
I. Purchase Price
Table C1 shows the comparison of the higher-priced securitized loans based on purchase price.
Table C1: Purchase Price
Purchase Price
Fannie Mae Freddie Mac
In Portfolio at Year-End?
Totals
In Portfolio at Year-End?
Totals Not Held Retained Not Held Retained
Loans Percent Loans Percent Loans Percent Loans Percent Loans Percent Loans Percent <= $417,000 52,113 94.1 3,910 82.1 56,023 93.2 16,326 94.9 4,236 96.0 20,562 95.2
> $417,000, <= $625,500
2,450 4.4 629 13.2 3,079 5.1 750 4.4 156 3.5 906 4.2
> $625,500, <= $729,750
367 0.7 117 2.5 484 0.8 56 0.3 10 0.2 66 0.3
> $729,750 422 0.8 109 2.3 531 0.9 66 0.4 10 0.2 76 0.4
Totals 55,352 100.0 4,765 100.0 60,117 100.0 17,198 100.0 4,412 100.0 21,610 100.0
II. Combined Loan-to-Value Ratio Table C2 shows the comparison of the higher-priced securitized loans based on the combined loan-to-value ratio of the mortgages, including secondary liens.
Table C2: Combined LTV (or LTV if missing)
Combined LTV (or LTV if missing)
Fannie Mae Freddie Mac In Portfolio at Year-End?
Totals In Portfolio at Year-End?
Totals Not Held Retained Not Held Retained Loans Percent Loans Percent Loans Percent Loans Percent Loans Percent Loans Percent
0% < LTV <= 60% 3,622 6.5 371 7.8 3,993 6.6 1,297 7.5 360 8.2 1,657 7.7
60% < LTV <= 80%
15,724 28.4 1,619 34.0 17,343 28.8 5,156 30.0 2,019 45.8 7,175 33.2
80% < LTV <= 90%
5,595 10.1 623 13.1 6,218 10.3 1,189 6.9 332 7.5 1,521 7.0
90% < LTV <= 95%
16,019 28.9 1,134 23.8 17,153 28.5 6,352 36.9 1,289 29.2 7,641 35.4
LTV > 95% 14,392 26.0 1,018 21.4 15,410 25.6 3,192 18.6 411 9.3 3,603 16.7
Missing 0 0.0 0 0.0 0 0.0 12 0.1 1 0.0 13 0.1
Totals 55,352 100.0 4,765 100.0 60,117 100.0 17,198 100.0 4,412 100.0 21,610 100.0
38
A n n u a l H o u s i n g R e p o r t 2 0 1 8
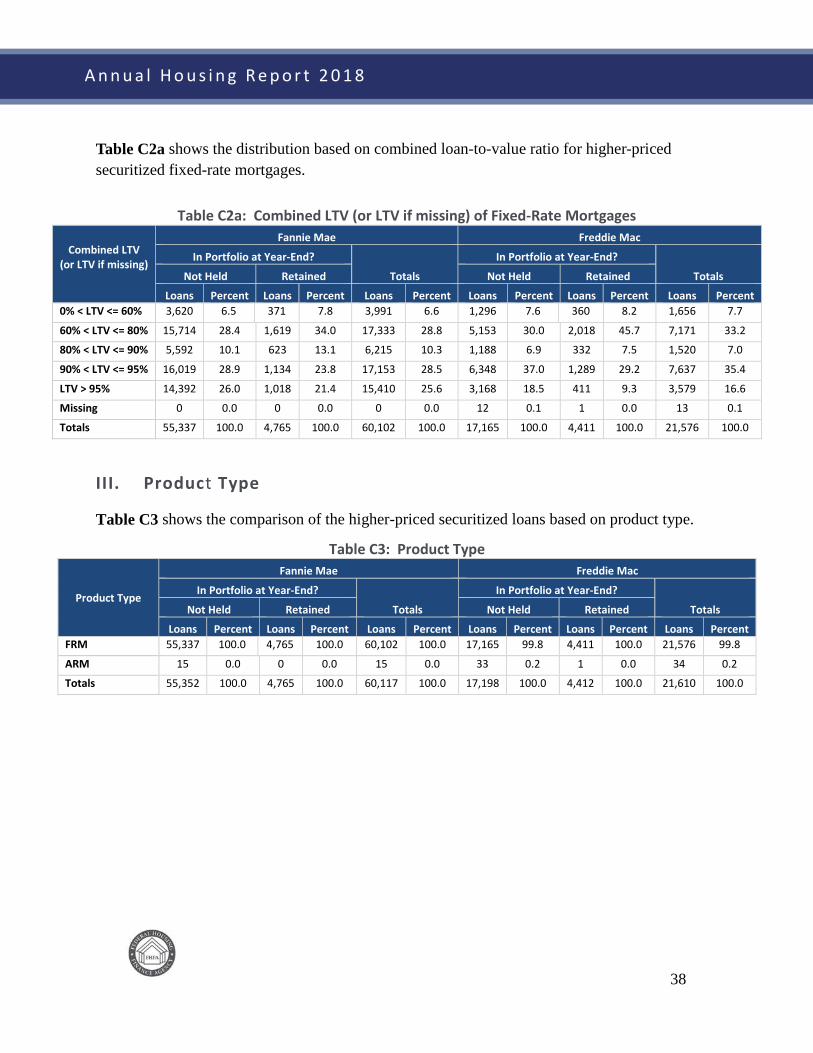
Table C2a shows the distribution based on combined loan-to-value ratio for higher-priced securitized fixed-rate mortgages.
Table C2a: Combined LTV (or LTV if missing) of Fixed-Rate Mortgages
Combined LTV (or LTV if missing)
Fannie Mae Freddie Mac
In Portfolio at Year-End?
Totals
In Portfolio at Year-End?
Totals Not Held Retained Not Held Retained
Loans Percent Loans Percent Loans Percent Loans Percent Loans Percent Loans Percent 0% < LTV <= 60% 3,620 6.5 371 7.8 3,991 6.6 1,296 7.6 360 8.2 1,656 7.7
60% < LTV <= 80% 15,714 28.4 1,619 34.0 17,333 28.8 5,153 30.0 2,018 45.7 7,171 33.2
80% < LTV <= 90% 5,592 10.1 623 13.1 6,215 10.3 1,188 6.9 332 7.5 1,520 7.0
90% < LTV <= 95% 16,019 28.9 1,134 23.8 17,153 28.5 6,348 37.0 1,289 29.2 7,637 35.4
LTV > 95% 14,392 26.0 1,018 21.4 15,410 25.6 3,168 18.5 411 9.3 3,579 16.6
Missing 0 0.0 0 0.0 0 0.0 12 0.1 1 0.0 13 0.1
Totals 55,337 100.0 4,765 100.0 60,102 100.0 17,165 100.0 4,411 100.0 21,576 100.0
III. Product Type
Table C3 shows the comparison of the higher-priced securitized loans based on product type.
Table C3: Product Type
Product Type
Fannie Mae Freddie Mac
In Portfolio at Year-End?
Totals
In Portfolio at Year-End?
Totals Not Held Retained Not Held Retained
Loans Percent Loans Percent Loans Percent Loans Percent Loans Percent Loans Percent FRM 55,337 100.0 4,765 100.0 60,102 100.0 17,165 99.8 4,411 100.0 21,576 99.8
ARM 15 0.0 0 0.0 15 0.0 33 0.2 1 0.0 34 0.2
Totals 55,352 100.0 4,765 100.0 60,117 100.0 17,198 100.0 4,412 100.0 21,610 100.0
39
A n n u a l H o u s i n g R e p o r t 2 0 1 8
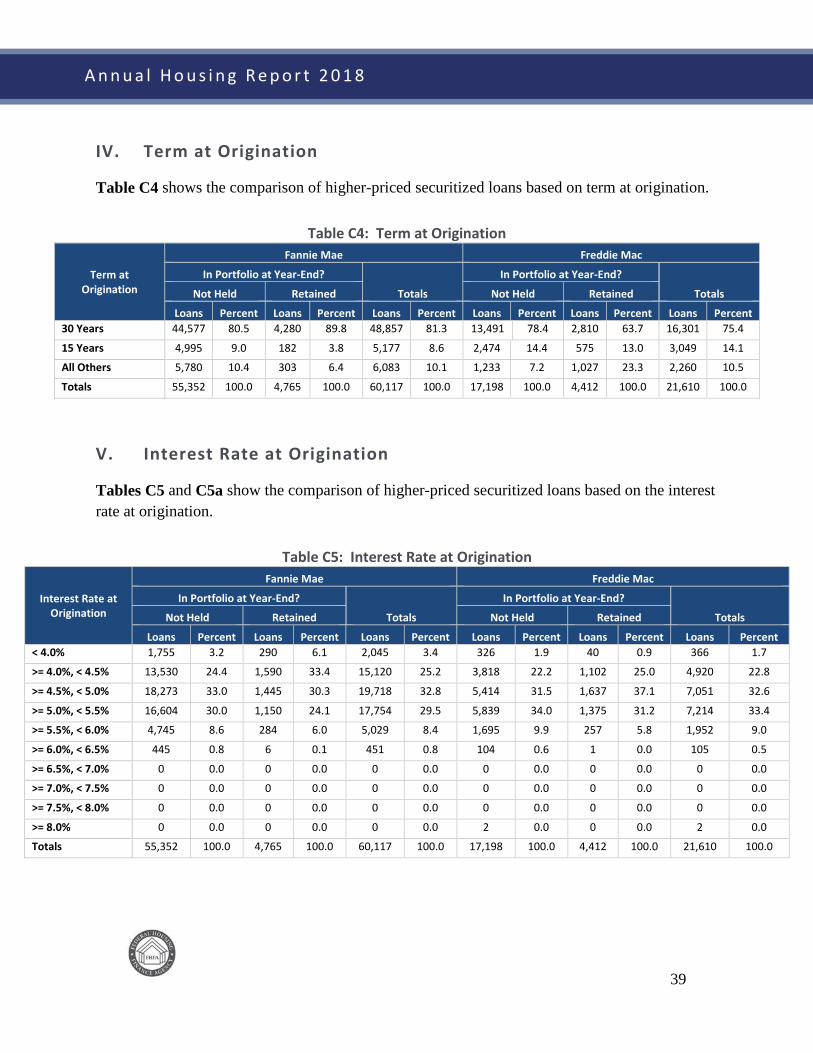
IV. Term at Origination
Table C4 shows the comparison of higher-priced securitized loans based on term at origination.
Table C4: Term at Origination
Term at Origination
Fannie Mae Freddie Mac
In Portfolio at Year-End?
Totals
In Portfolio at Year-End?
Totals Not Held Retained Not Held Retained
Loans Percent Loans Percent Loans Percent Loans Percent Loans Percent Loans Percent 30 Years 44,577 80.5 4,280 89.8 48,857 81.3 13,491 78.4 2,810 63.7 16,301 75.4
15 Years 4,995 9.0 182 3.8 5,177 8.6 2,474 14.4 575 13.0 3,049 14.1
All Others 5,780 10.4 303 6.4 6,083 10.1 1,233 7.2 1,027 23.3 2,260 10.5
Totals 55,352 100.0 4,765 100.0 60,117 100.0 17,198 100.0 4,412 100.0 21,610 100.0
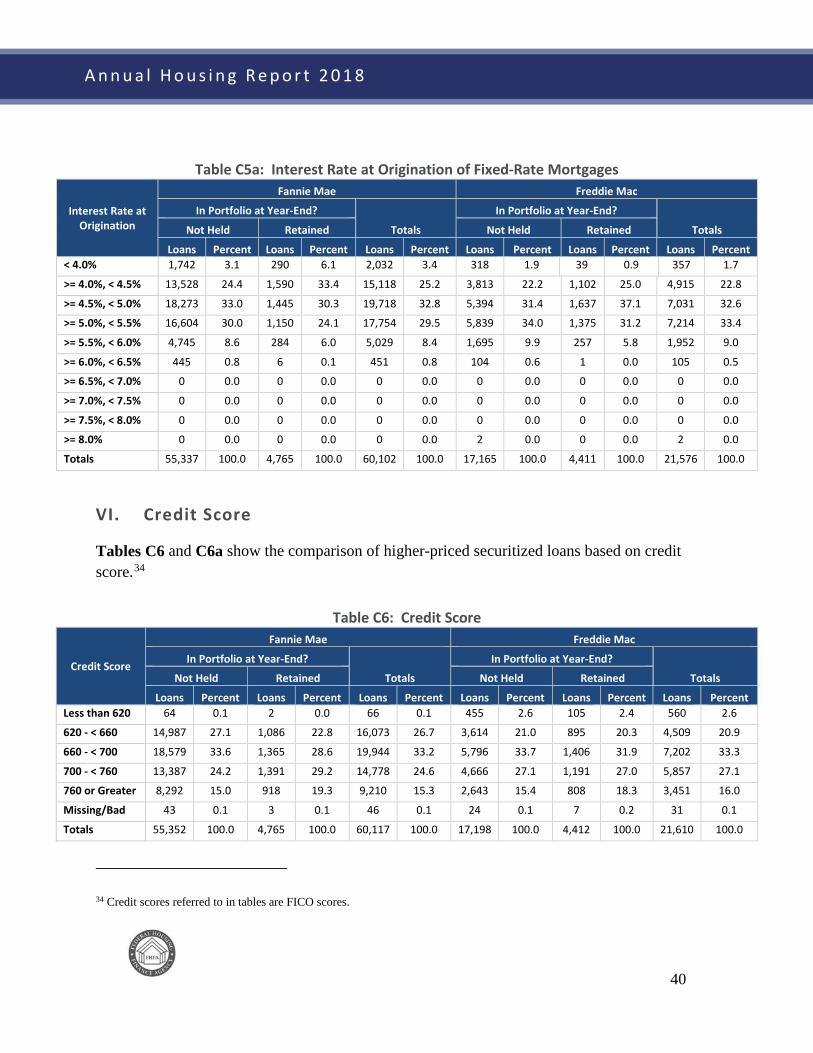
V. Interest Rate at Origination
Tables C5 and C5a show the comparison of higher-priced securitized loans based on the interest rate at origination.
Table C5: Interest Rate at Origination
Interest Rate at Origination
Fannie Mae Freddie Mac
In Portfolio at Year-End?
Totals
In Portfolio at Year-End?
Totals Not Held Retained Not Held Retained
Loans Percent Loans Percent Loans Percent Loans Percent Loans Percent Loans Percent < 4.0% 1,755 3.2 290 6.1 2,045 3.4 326 1.9 40 0.9 366 1.7
>= 4.0%, < 4.5% 13,530 24.4 1,590 33.4 15,120 25.2 3,818 22.2 1,102 25.0 4,920 22.8
>= 4.5%, < 5.0% 18,273 33.0 1,445 30.3 19,718 32.8 5,414 31.5 1,637 37.1 7,051 32.6
>= 5.0%, < 5.5% 16,604 30.0 1,150 24.1 17,754 29.5 5,839 34.0 1,375 31.2 7,214 33.4
>= 5.5%, < 6.0% 4,745 8.6 284 6.0 5,029 8.4 1,695 9.9 257 5.8 1,952 9.0
>= 6.0%, < 6.5% 445 0.8 6 0.1 451 0.8 104 0.6 1 0.0 105 0.5
>= 6.5%, < 7.0% 0 0.0 0 0.0 0 0.0 0 0.0 0 0.0 0 0.0
>= 7.0%, < 7.5% 0 0.0 0 0.0 0 0.0 0 0.0 0 0.0 0 0.0
>= 7.5%, < 8.0% 0 0.0 0 0.0 0 0.0 0 0.0 0 0.0 0 0.0
>= 8.0% 0 0.0 0 0.0 0 0.0 2 0.0 0 0.0 2 0.0
Totals 55,352 100.0 4,765 100.0 60,117 100.0 17,198 100.0 4,412 100.0 21,610 100.0
40
A n n u a l H o u s i n g R e p o r t 2 0 1 8
Table C5a: Interest Rate at Origination of Fixed-Rate Mortgages
Interest Rate at Origination
Fannie Mae Freddie Mac
In Portfolio at Year-End?
Totals
In Portfolio at Year-End?
Totals Not Held Retained Not Held Retained
Loans Percent Loans Percent Loans Percent Loans Percent Loans Percent Loans Percent < 4.0% 1,742 3.1 290 6.1 2,032 3.4 318 1.9 39 0.9 357 1.7
>= 4.0%, < 4.5% 13,528 24.4 1,590 33.4 15,118 25.2 3,813 22.2 1,102 25.0 4,915 22.8
>= 4.5%, < 5.0% 18,273 33.0 1,445 30.3 19,718 32.8 5,394 31.4 1,637 37.1 7,031 32.6
>= 5.0%, < 5.5% 16,604 30.0 1,150 24.1 17,754 29.5 5,839 34.0 1,375 31.2 7,214 33.4
>= 5.5%, < 6.0% 4,745 8.6 284 6.0 5,029 8.4 1,695 9.9 257 5.8 1,952 9.0
>= 6.0%, < 6.5% 445 0.8 6 0.1 451 0.8 104 0.6 1 0.0 105 0.5
>= 6.5%, < 7.0% 0 0.0 0 0.0 0 0.0 0 0.0 0 0.0 0 0.0
>= 7.0%, < 7.5% 0 0.0 0 0.0 0 0.0 0 0.0 0 0.0 0 0.0
>= 7.5%, < 8.0% 0 0.0 0 0.0 0 0.0 0 0.0 0 0.0 0 0.0
>= 8.0% 0 0.0 0 0.0 0 0.0 2 0.0 0 0.0 2 0.0
Totals 55,337 100.0 4,765 100.0 60,102 100.0 17,165 100.0 4,411 100.0 21,576 100.0
VI. Credit Score
Tables C6 and C6a show the comparison of higher-priced securitized loans based on credit score.34
Table C6: Credit Score
Credit Score
Fannie Mae Freddie Mac
In Portfolio at Year-End?
Totals
In Portfolio at Year-End?
Totals Not Held Retained Not Held Retained
Loans Percent Loans Percent Loans Percent Loans Percent Loans Percent Loans Percent Less than 620 64 0.1 2 0.0 66 0.1 455 2.6 105 2.4 560 2.6
620 - < 660 14,987 27.1 1,086 22.8 16,073 26.7 3,614 21.0 895 20.3 4,509 20.9
660 - < 700 18,579 33.6 1,365 28.6 19,944 33.2 5,796 33.7 1,406 31.9 7,202 33.3
700 - < 760 13,387 24.2 1,391 29.2 14,778 24.6 4,666 27.1 1,191 27.0 5,857 27.1
760 or Greater 8,292 15.0 918 19.3 9,210 15.3 2,643 15.4 808 18.3 3,451 16.0
Missing/Bad 43 0.1 3 0.1 46 0.1 24 0.1 7 0.2 31 0.1
Totals 55,352 100.0 4,765 100.0 60,117 100.0 17,198 100.0 4,412 100.0 21,610 100.0
34 Credit scores referred to in tables are FICO scores.

41
A n n u a l H o u s i n g R e p o r t 2 0 1 8
Table C6a: Credit Score of Fixed-Rate Mortgages
Credit Score
Fannie Mae Freddie Mac
In Portfolio at Year-End?
Totals
In Portfolio at Year-End?
Totals Not Held Retained Not Held Retained
Loans Percent Loans Percent Loans Percent Loans Percent Loans Percent Loans Percent Less than 620 64 0.1 2 0.0 66 0.1 455 2.7 105 2.4 560 2.6
620 - < 660 14,985 27.1 1,086 22.8 16,071 26.7 3,613 21.0 895 20.3 4,508 20.9
660 - < 700 18,576 33.6 1,365 28.6 19,941 33.2 5,788 33.7 1,406 31.9 7,194 33.3
700 - < 760 13,382 24.2 1,391 29.2 14,773 24.6 4,654 27.1 1,190 27.0 5,844 27.1
760 or Greater 8,287 15.0 918 19.3 9,205 15.3 2,631 15.3 808 18.3 3,439 15.9
Missing/Bad 43 0.1 3 0.1 46 0.1 24 0.1 7 0.2 31 0.1
Totals 55,337 100.0 4,765 100.0 60,102 100.0 17,165 100.0 4,411 100.0 21,576 100.0
VII. Borrower Income Ratio
Table C7 shows the comparison of higher-priced securitized loans based on borrower income relative to area median income (AMI).
Table C7: Borrower Income Ratio
Borrower Income Ratio
Fannie Mae Freddie Mac
In Portfolio at Year-End? Totals
In Portfolio at Year-End? Totals
Not Held Retained Not Held Retained
Loans Percent Loans Percent Loans Percent Loans Percent Loans Percent Loans Percent
>= 0%, <= 50% 4,962 9.0 268 5.6 5,230 8.7 1,365 7.9 515 11.7 1,880 8.7
> 50%, <= 80% 16,697 30.2 1,009 21.2 17,706 29.5 5,008 29.1 1,471 33.3 6,479 30.0
> 80% 33,272 60.1 3,470 72.8 36,742 61.1 10,476 60.9 2,287 51.8 12,763 59.1
Not Applicable 421 0.8 18 0.4 439 0.7 349 2.0 139 3.2 488 2.3
Totals 55,352 100.0 4,765 100.0 60,117 100.0 17,198 100.0 4,412 100.0 21,610 100.0
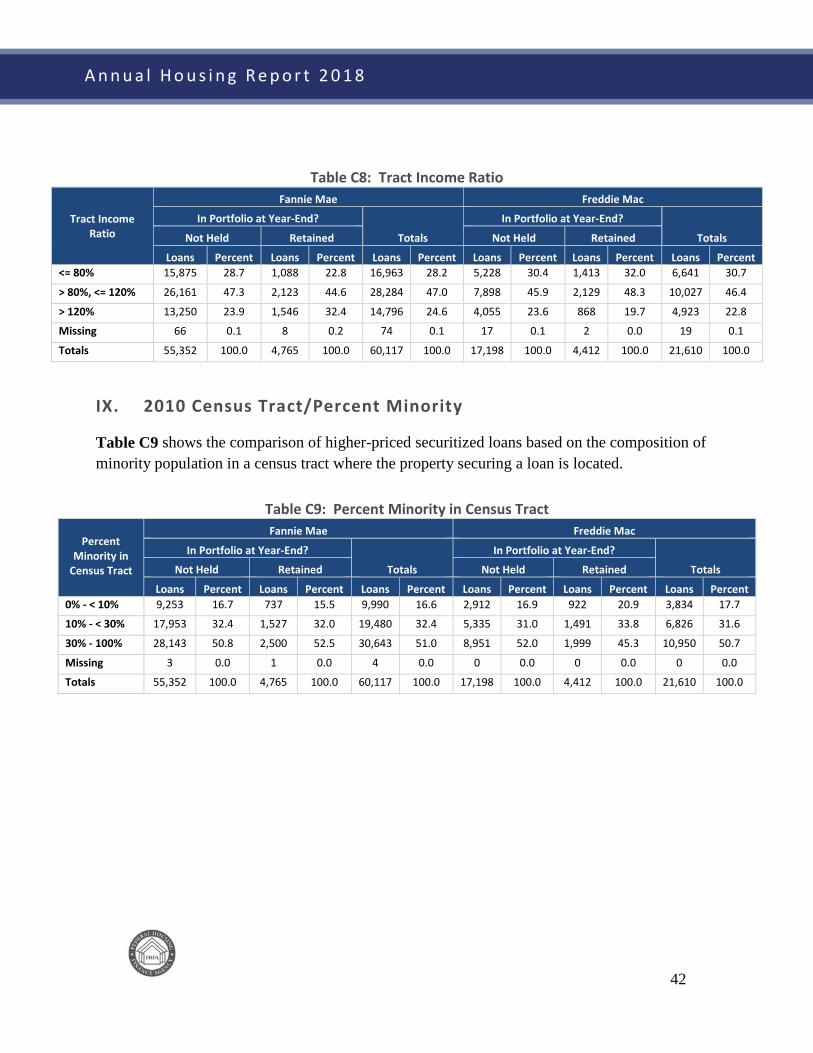
VIII. Tract Income Ratio
Table C8 shows the comparison of higher-priced securitized loans based on the tract income ratio, which is the ratio of the 2010 Census tract median income to the 2010 local AMI.
42
A n n u a l H o u s i n g R e p o r t 2 0 1 8
Table C8: Tract Income Ratio
Tract Income Ratio
Fannie Mae Freddie Mac
In Portfolio at Year-End?
Totals
In Portfolio at Year-End?
Totals Not Held Retained Not Held Retained
Loans Percent Loans Percent Loans Percent Loans Percent Loans Percent Loans Percent <= 80% 15,875 28.7 1,088 22.8 16,963 28.2 5,228 30.4 1,413 32.0 6,641 30.7
> 80%, <= 120% 26,161 47.3 2,123 44.6 28,284 47.0 7,898 45.9 2,129 48.3 10,027 46.4
> 120% 13,250 23.9 1,546 32.4 14,796 24.6 4,055 23.6 868 19.7 4,923 22.8
Missing 66 0.1 8 0.2 74 0.1 17 0.1 2 0.0 19 0.1
Totals 55,352 100.0 4,765 100.0 60,117 100.0 17,198 100.0 4,412 100.0 21,610 100.0
IX. 2010 Census Tract/Percent Minority
Table C9 shows the comparison of higher-priced securitized loans based on the composition of minority population in a census tract where the property securing a loan is located.
Table C9: Percent Minority in Census Tract
Percent Minority in
Census Tract
Fannie Mae Freddie Mac
In Portfolio at Year-End?
Totals
In Portfolio at Year-End?
Totals Not Held Retained Not Held Retained
Loans Percent Loans Percent Loans Percent Loans Percent Loans Percent Loans Percent 0% - < 10% 9,253 16.7 737 15.5 9,990 16.6 2,912 16.9 922 20.9 3,834 17.7
10% - < 30% 17,953 32.4 1,527 32.0 19,480 32.4 5,335 31.0 1,491 33.8 6,826 31.6
30% - 100% 28,143 50.8 2,500 52.5 30,643 51.0 8,951 52.0 1,999 45.3 10,950 50.7
Missing 3 0.0 1 0.0 4 0.0 0 0.0 0 0.0 0 0.0
Totals 55,352 100.0 4,765 100.0 60,117 100.0 17,198 100.0 4,412 100.0 21,610 100.0
43
A n n u a l H o u s i n g R e p o r t 2 0 1 8
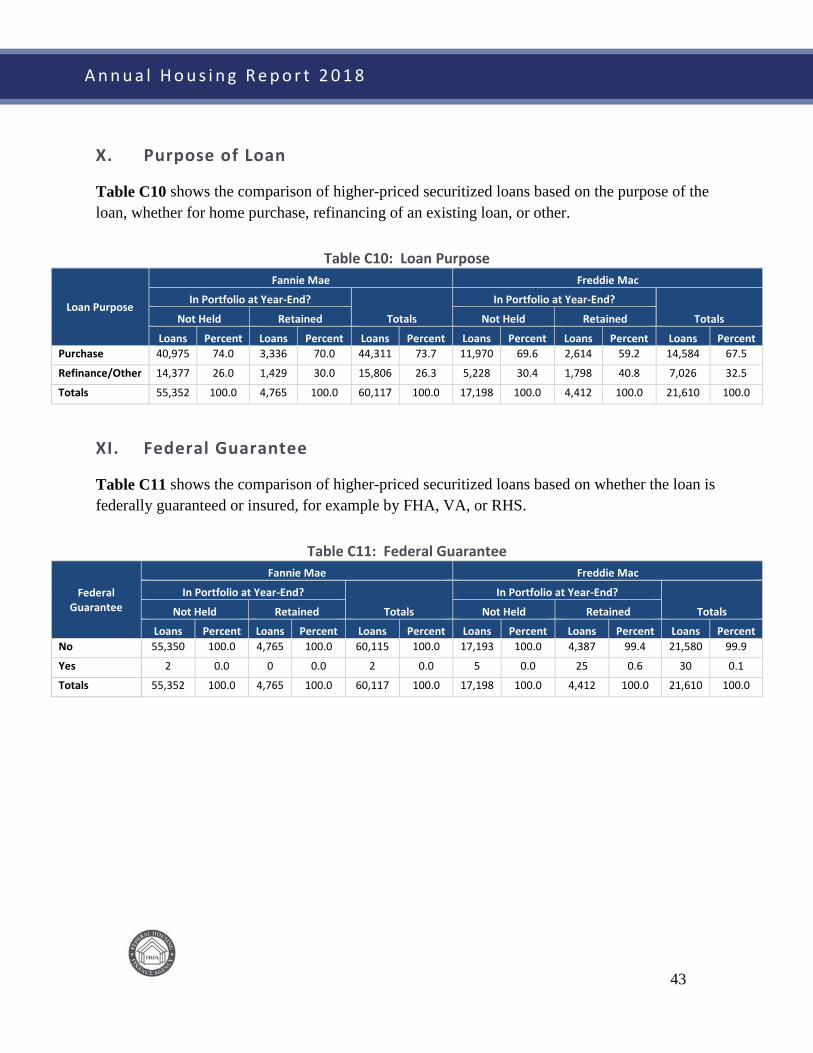
X. Purpose of Loan
Table C10 shows the comparison of higher-priced securitized loans based on the purpose of the loan, whether for home purchase, refinancing of an existing loan, or other.
Table C10: Loan Purpose
Loan Purpose
Fannie Mae Freddie Mac
In Portfolio at Year-End?
Totals
In Portfolio at Year-End?
Totals Not Held Retained Not Held Retained
Loans Percent Loans Percent Loans Percent Loans Percent Loans Percent Loans Percent Purchase 40,975 74.0 3,336 70.0 44,311 73.7 11,970 69.6 2,614 59.2 14,584 67.5
Refinance/Other 14,377 26.0 1,429 30.0 15,806 26.3 5,228 30.4 1,798 40.8 7,026 32.5
Totals 55,352 100.0 4,765 100.0 60,117 100.0 17,198 100.0 4,412 100.0 21,610 100.0
XI. Federal Guarantee
Table C11 shows the comparison of higher-priced securitized loans based on whether the loan is federally guaranteed or insured, for example by FHA, VA, or RHS.
Table C11: Federal Guarantee
Federal Guarantee
Fannie Mae Freddie Mac
In Portfolio at Year-End?
Totals
In Portfolio at Year-End?
Totals Not Held Retained Not Held Retained
Loans Percent Loans Percent Loans Percent Loans Percent Loans Percent Loans Percent No 55,350 100.0 4,765 100.0 60,115 100.0 17,193 100.0 4,387 99.4 21,580 99.9
Yes 2 0.0 0 0.0 2 0.0 5 0.0 25 0.6 30 0.1
Totals 55,352 100.0 4,765 100.0 60,117 100.0 17,198 100.0 4,412 100.0 21,610 100.0