Embed Size (px)
Citation preview

F.18aF.18a
ANNUAL INTEGRATED
REPORT2016
We move people and freight

2 | KIWIRAIL ANNUAL INTEGRATED REPORT 2016
Rose Pettigrew, Terminal Manager Operations and Emma–Jane Wells, Rail Operator

KIWIRAIL ANNUAL INTEGRATED REPORT 2016 | 3
Contents
Overview of our business
Capitals review
Management review
Governance review
Business review
Statutory review
Performance of our business units 16
Our first annual integrated report 8Integrated reporting concept: Value creation process 9Chairman’s message to stakeholders 10Our progress 2010–2016 12Chief Executive’s report 14
How KiwiRail creates value 18Helping to grow our exports 20
Financial 21Increasing the value of tourism 23
People 24High Performance High Engagement 27
Assets 28Inland ports and freight hubs 30
Know–how 31eProtect: Innovative safety initiative helps save lives 33
Relationships 34Working with communities to deliver results 36
Environmental 37Delivering cost and energy savings 39
Outlook 41
The KiwiRail Board 42The KiwiRail Executive Team 44How we are governed 46
Financial statements 48Independent Auditor’s report 82Key Performance Indicators 84Vote Transport 86Employee remuneration 87Directory 88
At a glance 4
Who we are and what we do 6

4 | KIWIRAIL ANNUAL INTEGRATED REPORT 2016
Highlights from FY16 Relationships• 11% growth in import and export markets,
underpinned by strong relationships with ports and customers
Financial• $86 million underlying operating surplus* • $105 million in tourism revenue, up 10% on last
year• $27 million savings through productivity and
efficiency initiativesPeople• 39% reduction in Lost Time Injury Frequency Rate
and 33% reduction in Total Recordable Injury Frequency Rate
• 242 people participated in our Leadership Programmes
Assets• $254m invested in renewal and upgrade of
network, property and rolling stockKnow–how• 29% reduction in mainline derailments, improving
service reliability for customersEnvironment• Reduced heavy vehicle impact of 1.1 million truck
trips, saving 77 million litres of fuel and 209,000 tonnes of CO2 emissions
• 3 million litres of diesel saved in FY16, following the introduction of a fuel conservation programme
Awards • Chartered Institute of Logistics
and Transport “Most Innovative Public Transport project” for electrification and re–signalling of the Auckland urban rail network
• Railway Technical Society of Australasia “Rail Project Award” (with Siemens and Hilor) for electrification and re–signalling of the Auckland urban rail network
• Deloitte Energy Excellence Awards “Large Energy User Initiative of the Year” for the Locomotive Fuel Conservation project
• Northern Explorer nominated for the 2016 “Holiday & Tours Specialist Award” by the UK–based Luxury Travel Guide
• TranzAlpine is ranked No 9 in The Luxury Travel Expert’s Top 10 Greatest Train Journeys in the World
• The Coastal Pacific service is ranked No 2 in Lonely Planet’s The Best Train Journeys You’ve Never Heard Of
Overview of our business: At a glance
*Operating surplus before significant items is a non-GAAP measure used by management to assess the performance of the business and has been derived from KiwiRail’s group financial statements for the year ended 30 June 2016.

KIWIRAIL ANNUAL INTEGRATED REPORT 2016 | 5
At a glance
Overview of our business: At a glance
We move peopleWe help commuters make more than 27 million low–carbon journeys each year
We carry more than one million tourist passengers each year
We enable passenger growth of more than 20% per year in Auckland
We move freightWe move around 18 million tonnes of freight each year
We carry around 16% of New Zealand’s total freight task (tonnes–km)
We transport around 25% of New Zealand’s exports

6 | KIWIRAIL ANNUAL INTEGRATED REPORT 2016
3,087 signals
1,476 public level crossings
Enable 27 million commuter trips in Auckland and Wellington
3 Scenic Journeys’ experiences between Auckland and Greymouth
One of the top rated train journeys in the world
3,400 employees
Economy–wide and geographically diverse jobs
Provide on–going training to develop leaders, improve safety and create culture
Skilled and safe workforce
Support conservation
Promote rail safety
Custodians of rail heritage for the generations
Investing in our growth corridors
Working with our customers to reduce supply chain costs
Long–term viability
3,500 km of track operated and maintained
Who we are and what we do
Our Vision: Trusted Kiwi–owned logistics partner growing New Zealand
Overview of our business: Who we are and what we do
Manage 18 thousand hectares of land

KIWIRAIL ANNUAL INTEGRATED REPORT 2016 | 7
100 Tunnels
Reduce heavy vehicle impact by more than 1 million truck trips per year
60–70% less emissions than road
Less congestion and safer roads
3 ships
Extension of SH1 across Cook Strait
800,000 passengers
4,000 sailings per year
302 locomotives
1,322 bridges
Transport 25% of New Zealand’s exports
4,855 wagons
Connect customers to ports around New Zealand and the global market place
Overview of our business: Who we are and what we do
91589158

8 | KIWIRAIL ANNUAL INTEGRATED REPORT 2016
Welcome to KiwiRail’s first Integrated Report, which uses the internationally recognised Integrated Reporting framework to explain our performance as a business for the year to 30 June 2016.
The report explains how KiwiRail uses six forms of capital (financial, people, assets, know–how, relationships and environmental) to create value for shareholders and customers.
We provide an overview of our activities for each capital input and demonstrate how each area contributes to our vision to be a “trusted Kiwi–owned logistics partner growing New Zealand”.
KiwiRail has evolved over the past six years with a far greater focus on our customers, our people and our strategic role in the Government’s Business Growth Agenda. Taking an integrated approach to the business helps drive real commercial value for our stakeholders and customers.
Our business strategy and value creation model is summarised on pages 18 and 19, and a short overview of strategic challenges and opportunities on page 41. Measures of our progress against key performance indicators and financial statements are provided from page 48 onwards.
We also discuss material issues that are likely to impact our ability to create value in the short, medium and long term. These issues are relevant to both the business and our stakeholders, and are detailed throughout the report.
While this is the first time KiwiRail has used the Integrated Reporting framework, we will look to refine our approach in subsequent years. More information on the integrated reporting framework can be found at http://integratedreporting.org
Our first annual integrated report
Customer relationships
Service performance
Worker health & safety
Employee relations
Public safety
Commercial focus
Transport resilience
Energy and carbon
Financial performance
Operational efficiency
Management review: Our first annual integrated report

KIWIRAIL ANNUAL INTEGRATED REPORT 2016 | 9
Integrated reporting concept: Value creation process
Statement of ResponsibilityWe, the Board of KiwiRail, acknowledge our responsibility to ensure the integrity of this Integrated Report. In preparing and approving the content of the report, we are confident that it aligns with the principles of the International Integrated Reporting Framework.
Audit New Zealand has provided a statement of assurance for the financial statements in this report, but we have not sought external assurance of the contents of this Integrated Report.
Management review: Integrated reporting concept: Value creation process
John Spencer Dame Paula RebstockChairman Deputy Chair
Inputs Outcomes
RELATIONSHIPS
ENVIRONMENTAL
KNOW–HOW
FINANCIAL
RELIABLEPEOPLE
SUSTAINABLE
ASSETS
VALUABLE
We move people
We move freight

10 | KIWIRAIL ANNUAL INTEGRATED REPORT 2016
My term as Chairman of the KiwiRail board finishes at the end of October and this year’s financial results are a timely marker in what has been a significant, multi–year transformation programme for the organisation over the past six years.
Despite numerous challenges and setbacks, the achievements have been significant in a relatively short period and many of the gains impressive. I see the 69% increase in import/export freight as an indicator of the customer focus that KiwiRail now brings to all of its operations. Building resilience for those customers has also been a driving force as seen by the large number of aging bridges that have been replaced, the more than $2 billion invested in metropolitan networks since 2010 and the 85% reduction in derailments over this period.
The commitment to raising our safety standards has seen total injuries drop by 69%. Safety is truly at the centre of everything the organisation now does.
This year’s results are in line with the continuing transformation of the business. The underlying operating surplus of $86 million with total revenue of $694 million has been achieved despite difficult international trading conditions. Productivity initiatives delivered a creditable $27 million in savings.
Targeted investment is based always on the customer’s needs, enabling growth, reducing supply chain costs and driving their – and our – market competitiveness. These efforts have been rewarded by significant growth in freight volumes, building on increases in recent years. We have moved 100 million tonnes of freight since 2010 making KiwiRail truly New Zealand’s logistics partner for growth and a critical part of the Government’s Business Growth Agenda. Working alongside the New Zealand Transport Agency we are focused on improving land transport resilience and optimising planning and investment.
Our commercial focus has benefitted from a cultural shift within the organisation. KiwiRail has a clear eye on the future while it honours its past. A commitment to strong engagement with our people and unions and a strengthening of leadership across all parts of the business will continue to grow the value of rail in New Zealand.
I am proud to have been part of the KiwiRail journey over the past six years and would like to acknowledge the strength of our people and commitment of our shareholders, who have supported the integral role played by KiwiRail in New Zealand’s transport system.
KiwiRail inherited a business that had suffered significant underinvestment, was asset–centric and was often subjected to negative commentary as inefficient and ineffective. With the support of the Government and our partners, the benefits of ongoing investment and a commercial drive are now being realised.
Customers are at the core of that transformation and I would especially like to thank our long–term customers for their ongoing partnership as KiwiRail evolves and changes.
I have been very fortunate to have been supported by a highly competent and dedicated Board. In particular, I acknowledge the commitment of Bob Field who retired from the Board in April and I am pleased to welcome our new members Mike Pohio and Paul Harper.
I look with confidence to the year ahead and beyond.
John Spencer Chairman
Chairman’s message to stakeholders
Management review: Chairman’s message to stakeholders
Customers are at the core of our transformation and I would especially like to thank our long–term customers for their ongoing partnership as KiwiRail evolves and changes.
“

KIWIRAIL ANNUAL INTEGRATED REPORT 2016 | 11
Management review: Chairman’s message to stakeholders
Roger Perry, Track Ganger, Auckland Network Services

12 | KIWIRAIL ANNUAL INTEGRATED REPORT 2016
100 million
Tonnes of freight moved14% increase in Freight volume
69% increase in Import & Export volume19% increase in Domestic volume
29% increase in maximum tonnage capacity for wagons
27million
Commuter trips each year
Over $2b invested in metropolitan networks including completion of Project DART:
Developing Auckland’s Rail Transport and Wellington Region Rail Programme
Our progress 2010–2016
85%Reduction in mainline
derailmentsInvestment in growth corridors, rolling stock and intensified focus on safety and training
Transported 382,000 commercial trucks, 348,000 freight wagons and
4.5 million passengers9% increase in customer satisfaction to 87%
Introduced Kaiarahi
and retired Arahura
Management review: Our progress 2010–2016

KIWIRAIL ANNUAL INTEGRATED REPORT 2016 | 13
Total injuries down by
Timber bridges between Auckland and Tauranga replaced
70 million passengers
15% passenger growth
17% on time performance improvement to 96%
Transformation of Tranz Metro
530,000
1,010km
2,100m
322
69%
New track laid
Long distance Scenic Journeys passengers
Line destressed
Bridge timber piers replaced
Reduced freight fuel burn rate by
New sleepers laid
14%
1.2 million
Reduced freight carbon intensity
Bridge timber spans
replaced
11%
21147km
48New
locomotives introduced
13%Increase in locomotive reliability
Management review: Our progress 2010–2016
1,300New wagons introduced

14 | KIWIRAIL ANNUAL INTEGRATED REPORT 2016
The last two years at KiwiRail have been a period of significant change as we have focussed on a multi–year transformation programme of work reshaping our business to be a trusted Kiwi owned logistics partner growing New Zealand.
I am pleased to report that the momentum we have been building is starting to provide real gains, as reflected in this year’s improved financial management record, our safety performance and the transformation in our leadership and culture.
At the centre of that transformation project is, of course, our customers. At KiwiRail our core purpose is to move people and freight, not trains and ships. This relentless focus on improving our business to help our customers be more competitive, assist the Government’s Business Growth Agenda and offer world–class tourism experiences is the value we bring to New Zealand.
It is fitting, I believe, that 2016 is the year we use the Integrated Reporting framework for the first time, highlighting not only our commercial focus but the know–how, relationships, resilience, environmental practices and people that make us who we are.
Improving our financial positionThis year we achieved a creditable result, with an underlying operating surplus of $86 million and delivered on our budgeted commitment to our shareholder.
Bulk milk and coal revenues were down by $18 million this year due to
market demand and weather conditions which impacted the dairy season. However we’ve achieved continued growth in the import export sector of 11%. The tourism market was also strong, resulting in 10% growth in our Interislander and Scenic Journeys passenger services.
Our productivity intiatives delivered $27 million in savings, reflecting a leadership focus across KiwiRail to implement the changes needed to build a cost efficient service promise for our customers and shareholders.
Empowering our peopleCentral to our transformation programme is the leadership commitment to engage meaningfully with our frontline people, creating a culture which supports fairness, diversity, inclusion, safety and pride.
Some of our programmes which are changing the way we operate include a High Performance High Engagement approach. With the close involvement of union leaders and members, we are enabling direct and meaningful, involvement in problem solving and improving the way work is done, which raises productivity, improves safety and lifts our customer care. This is a significant commitment with our people and union partners to improve the company’s performance for our customers and shareholders.
Sustaining a Zero Harm environmentWe believe that Zero Harm is a proxy for leadership. Zero Harm at KiwiRail includes reducing high safety risks,
Chief Executive’s report
Central to our transformation programme is the leadership commitment to engage meaningfully with our frontline people creating a culture which supports fairness, diversity, inclusion, safety and pride
“
Management review: Chief Executive’s report

KIWIRAIL ANNUAL INTEGRATED REPORT 2016 | 15
improving the health and wellbeing of our employees and reducing our environmental impact. This year we delivered a 39% improvement in Lost Time Injury Frequency Rate and a 33% improvement in Total Recordable Injury Frequency Rate. Over the last two years our total injury frequency rate has reduced by 73%.
Our focus will remain on lifting our leadership engagement and building consistent, fit for purpose safety systems, tools, learning opportunities to reduce our safety and health risks.
Engaging our customersKiwiRail has a significant role in driving New Zealand’s export agenda, carrying a quarter of all New Zealand exports. We work closely with our customers by lowering supply chain costs to help them increase competitiveness in their global market place. We are already realising commercial returns from our partnerships with export–led customers as import/export freight revenue grew $15m in the past 12 months.
This year we have worked closely with Port customers on their decisions to invest in inland freight hubs. We are investing in capacity for future growth which includes investing $18m on freight, intermodal wagons, and additional capital for our freight infrastructure.
Domestic freight growth and additional export container volumes has prompted us to invest $15 million in our Auckland Container Transfer site. We have further investment earmarked to expand the site into a super freight hub for the growth of our largest city.
Delivering operational performanceOur strategic plan to standardise our asset platforms, simplify the business and invest in our people has improved our operational performance and reliability across the entire business.
In July 2015 we farewelled Interislander’s Arahura ferry and welcomed the arrival of Kaiarahi providing our customers more capacity to move freight between road and rail. In June this year we ran a full road–bridging operation across Cook Strait while our rail–ferry Arahura was dry–docked in Singapore. The successful eight–week project demonstrated the benefits of a One KiwiRail approach to our infrastructure investment for our customers. The service performance of our Interislander ferries was particularly notable, with 99% of scheduled sailings going ahead as planned.
I would like to make a special note of the Tranz Metro team who transitioned to Transdev on 3 July 2016. KiwiRail is extremely proud of the Tranz Metro team and the professional operation they have run. We wish to express our utmost appreciation to all the staff and wish them the best for the future.
Along with our commercial performance focus, KiwiRail delivers sustainable wider benefits for New Zealand. In the last 12 months we have reduced heavy vehicle impact of 1.1 million trucks on our roads, 208,000 tonnes of CO2 emissions and 77 million litres of fuel. Diesel fuel savings through the DAS (Driver Advisory System) technology system introduced during the year has
saved 3 million litres of fuel and 8,800 tonnes of CO2 emissions.
I would like to thank our customers for their commitment, particularly in these times of change when we are continually reviewing our asset platforms, service propositions and freight planning systems to improve efficiencies and simplify the business to help us deliver reliable services.
I would also like to thank the Board for their guidance and governance, the Executive team for their leadership and all our people for their hard work in a year which saw us deliver a number of our goals in our transformation project. As One KiwiRail business I am very proud of the significant momentum that our people are delivering to live our vision, personalise our values and make KiwiRail a more commercially focused and inclusive place to work.
Peter Reidy Chief Executive
Niko Koligi, Rail Operator
Management review: Chief Executive’s report

16 | KIWIRAIL ANNUAL INTEGRATED REPORT 2016
Performance of our business units
Contributing 56% of total operating revenue, freight remains the biggest income earner for the business.
Revenue from the import/export freight sector was up 11% in the last 12 months, but tough trading and climate conditions in the bulk coal and milk sectors reduced bulk volumes.
Success in the market is underpinned by more customers and ports using rail as an integral component of their supply chains. Over the last 12 months KiwiRail has worked closely with our partners to develop new rail–served operations that will improve the flow of goods.
Reliability for freight customers remains a core strategic focus, with a number of improvements implemented over the last six months. These include simplifying our train plans, improving network reliability and investing in new rolling stock.
Interislander is key to our logistics business, enabling a seamless customer service between Auckland and Christchurch.
An extension of State Highway 1 linking road and rail networks, Interislander ferries carried more than 1 million net tonnes of freight and 83,000 commercial vehicles across the Cook Strait during the year to 30 June 2016.
The arrival of Interislander’s latest ferry Kaiarahi in September 2015 has enabled us to move freight more readily between road and rail, providing customers with more flexibility in managing supply chain logistics.
We are seeing strong growth in tourism, with more than 800,000 passengers using Interislander services in 2015/16 and record passenger numbers in off–peak and shoulder periods. This reflects increasing customer satisfaction in the quality of the service we offer.
KiwiRail continues to align its infrastructure investment priorities with customer needs and freight demand.
We are targeting investment on growth corridors including the freight critical Auckland/ Hamilton/ Tauranga routes. Over the last 12 months we have continued to invest in the Kaimai Tunnel and have now completed replacement of all 21 timber bridges between Auckland and Tauranga, increasing network resilience by removing speed restrictions and improving reliability for freight customers.
In Auckland we are considering wider transport requirements with key stakeholders to reduce congestion, improve network resilience and improve freight flows to and from the Port of Auckland and Port of Tauranga. This will remain a key focus in 2016/17.
We continue to maintain and upgrade urban metro rail networks in Auckland and Wellington to enable passenger growth, and remain focused on maintaining asset integrity across the balance of the network.
Freight Interislander Infrastructure
87%reduction in mainline
derailments since 2010
82%customer satisfaction
$18minvested in new wagons and containers
$155mcapital investment
$25moperating surplus
$109moperating surplus
99%on time performance (actual
services to advertised sailings)
$15mgrowth in IMEX revenue
Business review: Performance of our business units

KIWIRAIL ANNUAL INTEGRATED REPORT 2016 | 17
Business review: Performance of our business units
Continued growth on all TranzAlpine, Coastal Pacific and Northern Explorer services, boosted by a buoyant tourism sector, resulted in a 19% increase in Scenic Journey revenue to $30 million in 2015/16. In February 2016 we set a new record with more than 1,200 people travelling on Scenic Journey services in one day.
The services are continuing to gain national and international recognition with the TranzAlpine receiving a Trip Advisor Certificate of Excellence, and the Northern Explorer services nominated for the UK based Luxury Travel Guide – Global Awards 2016.
KiwiRail continued to adopt a commercial approach to the property portfolio we manage, which comprises more than 1500 property assets with a combined value of more than $965 million.
We are reviewing our lease and licence arrangements to ensure they are managed in a fair and commercial manner. We are also working with key business partners and tenants to better understand their needs and increase the use of our property assets.
Over the last 12 months we have partnered with a number of customers to lease land for new rail served operations, adjacent to our rail yards.These initiatives enable KiwiRail to improve the efficiency of customers’ supply chains and generate income growth through long term sustainable leasing arrangements.
With a record 12.8 million passenger trips on the Wellington commuter train network in 2015/16, Tranz Metro has been benchmarked as one of the best metro operations in Australasia.
Customer satisfaction for the year was 93%, with 96% of services operating on time (within 5 minutes of the scheduled timetable).
While KiwiRail has a proud history of operating passenger services in the Wellington region, Tranz Metro operations ceased on 3 July 2016, following a decision by the Greater Wellington Regional Council to transfer the contract to Transdev. KiwiRail will continue to maintain and operate the track and signals.
Scenic Journeys Property Tranz Metro
9%growth in passenger numbers in
FY16 (including Capital Connection)
$18mproceeds from property asset sales in
FY16
96%on time performance
93%customer satisfaction
$10moperating surplus
$38moperating surplus*
*excludes facilities management
$4moperating surplus

18 | KIWIRAIL ANNUAL INTEGRATED REPORT 2016
SIMPLIFY• reliable services for our
customers• focus on our strengths• improve productivity
STANDARDISE• wagons• locomotives• track assets• terminals & ferries• intermodal strategy
Capitals review: How KiwiRail creates value
Customers Suppliers Employees Communities Union Iwi Government
RELATIONSHIPS
How KiwiRail creates value
Average age 45 years 15% female 27% employed longer than 20 years 63% union members*post Tranz Metro transition
PEOPLE*
Property, plant and equipment of $17b replacement value
ASSETS91589158
INPUTS VALUE DEPLOYED IN 2016 IN THE KIWIRAIL BUSINESS
Capital grants $33m Revenue generated from operations $694m Government Investment $210m
FINANCIAL
53m litres diesel used 36m litres marine fuel used 111 GWh electricity used
ENVIRONMENTAL
Custodian of the country’s railway infrastructure Specialist rail and marine knowledge
KNOW–HOW

KIWIRAIL ANNUAL INTEGRATED REPORT 2016 | 19
Capitals review: How KiwiRail creates value
Skilled and safe workforce69% reduction in injury rate since FY1085% reduction in mainline derailments since FY1094% customer satisfaction for Scenic JourneysVolumes:
Freight 4.5b net tonne kilometresInterislander 1.3m commercial lane metresInfrastructure 73,000 sleepers laid 249m of bridge replaced 15km new rail installed 93km of track distressed
Capital investment $254mWork with TrackSAFEEducate community groups and schools
RELIABLEINVEST• safety• growth corridors• training• network• leadership
3 million litres of fuel saved in FY16 through the Driver Advisory SystemSaved 209,000 tonnes of CO2 emissionsAvoided 77 million litres of diesel consumptionSupport community conservation initiativesLong term viabilityUpgraded 8 public level crossings
SUSTAINABLE
Major Forestry
Ports
Coal
Major Dairy/Meat/ Manufacturing Plants
Inland Ports / Freight Hubs – Current
IN THE KIWIRAIL BUSINESS OUTCOMES TO BUILD SUSTAINABLE BUSINESS
Underlying operating surplus $86mEnabling transport resilienceEnabling New Zealand export agendaTransported 16% of New Zealand’s total freight11% import/export growth10% passenger growth$105m tourism revenue230,000 Scenic Journey tourism passengers130,000 Capital Connection customers$15m contribution to West Coast economy through TranzAlpine
VALUABLE

20 | KIWIRAIL ANNUAL INTEGRATED REPORT 2016
The world’s largest dairy exporter Fonterra and KiwiRail have together developed a sustainable logistics partnership that’s bringing encouraging results for both organisations.Fonterra transports a wide range of product by rail, including 2.3 million tonnes of bulk milk and finished product.
In the past year, dairy exports by rail have increased by 21% thanks to more flexible and tailored timetables to accommodate Fonterra’s production at its manufacturing sites. For example, Fonterra uses rail to move 90% of product from its Edendale site – the largest dairy production facility in the southern hemisphere. And this is expected to grow further in the coming season.
Fonterra’s General Manager Global Supply Chain Development, Chris Foord, says simplifying the supply chain is critical to improving returns to our shareholders.
“We see KiwiRail as an integral partner in our supply chain by helping us shift large volumes of bulk material efficiently – and improving the carbon efficiency of our supply chain,” says Chris.
KiwiRail’s Steel Wheels reporting tool has created additional value for Fonterra by calculating the number of truck journeys avoided and related savings in fuel and CO2 emissions.
“Sustainable supply chains are important to Fonterra and our customers”, says Chris. “Reducing our carbon footprint is a key component of our relationship with KiwiRail.”
Helping to grow our exports
Case Study: Fonterra
Cas
e St
udy
Fonterra Plant,Photo Andrew Hamblyn

KIWIRAIL ANNUAL INTEGRATED REPORT 2016 | 21
Capitals review: Financial
Financial The financial resources that are available to KiwiRail to develop and grow our business
As a State–Owned Enterprise, KiwiRail operates as a profit–oriented entity. However, shareholder support is currently needed to meet the required level of capital investment in the business. Since 2010, the company has been implementing a sustained programme of investment to ensure the rail network can deliver the highest levels of service expected by passenger and freight customers.
In Budget 2015, the Government announced a two–year funding package to invest in the rail system, with $210 million in FY16 and $190 million in FY17.
Understanding our performance – above and below railWhen considering KiwiRail’s finances, it is useful to distinguish between the “above rail” and “below rail” parts of the business.
Above rail includes operating trains and ferries, and managing the commercial property portfolio – areas that are cash positive, meaning costs are covered by revenue earned.
Below rail includes operating and maintaining tracks, bridges and tunnels – areas that do not generate sufficient revenue to cover costs, requiring Government investment to sustain them.
KiwiRail currently operates and maintains about 3,500km of rail track, regardless of the volume of passenger services and freight. A commercial review of KiwiRail operations in 2014 found insufficient demand to enable KiwiRail to fully fund the rail network including tracks, signals, bridges and tunnels.
The review also underlined the challenges KiwiRail faces in reconfiguring its operations, with historic under–investment in the network a notable barrier to commercial success.
91589158
Above Rail = Cash positive
Below Rail = Requires Crown funding
Our Financial Capital
Operational Revenue
Government Investment
Grant Funding
Asset Sale Proceeds
Debt Funding

22 | KIWIRAIL ANNUAL INTEGRATED REPORT 2016
Economic Value of Rail to New ZealandUnderstanding the value of rail to New Zealand is a key strategic project in the road/rail integration programme currently being undertaken by KiwiRail and the NZ Transport Agency. This is crucial for better planning and investment when considering New Zealand’s land transport needs beyond a traditional ‘return on investment’ analysis.
Rail freight delivers economic benefits and positive outcomes that are not always seen at first look. These include reductions in road accidents, fewer emissions into the environment, the commercial
benefits of easing traffic congestion, and lower repair, maintenance and upgrade costs to our roads.
In the absence of rail freight, these items would all incur costs for New Zealand businesses, Government agencies and other organisations. Together they make up the value of rail, not the more narrow view of the cost of rail. Several stakeholders including New Zealand Transport Agency, Ministry of Transport, Treasury, Auckland Transport and Greater Wellington Regional Council have agreed the framework for the project and outcomes which will inform discussions on what a national rail network brings to New Zealand.
Transforming KiwiRail – Productivity and EfficiencyThe Board and management are committed to lifting performance and making the company commercially stronger to reduce reliance on taxpayer support. While discussions will continue about the viability of maintaining our 3,500–kilometre rail network without customer usage at commercial rates to cover costs, KiwiRail remains focused on operating commercially and supporting the growth of New Zealand exports and tourism.
Last year was a period of significant change for KiwiRail as we worked to transform the business and lift the company’s performance. Over the year we made considerable progress delivering our strategy of simplifying our business, standardising our assets and investing in our people. A key part of this strategy has seen us focus on a range of productivity initiatives to enable us to deliver a more efficient and effective service to our customers.
We’ve worked with teams across the business to identify better ways of working. This approach produced $27m of savings last year, reflecting the strong commitment across the organisation to implement the changes required to achieve better results for our customers and shareholders. Key initiatives included:
• Rolling out the Driver Advisory System to enable us to determine the most fuel–efficient means of operating locomotives
• Right–sizing our corporate overhead and reducing discretionary expenditure
• Optimising the size of our vehicle fleet
• Simplifying our train plan.We have also made some difficult but necessary decisions to reduce our headcount by 240 as a result of productivity and efficiency gains.
You will find further information and examples of these initiatives in our case studies on pages 27 and 39.
Reduce heavy vehicle impact of more than 1 million truck trips
Helping commuters make 27 million low–carbon journeys each year
Diverting over 200,000 tonnes of carbon emissions
Avoiding approximately 80 million litres of diesel consumption by road freight
Creating long–lasting two–way relationships with customers, suppliers and other stakeholders
Helping community groups, schools and sports groups to travel
Reducing congestion, making our roads safer
Contributing to New Zealand’s economic growth
CO2
Capitals review: Financial

KIWIRAIL ANNUAL INTEGRATED REPORT 2016 | 23
With a contribution of more than $19 billion to Gross Domestic Product and 19% of total exports in the year to March 2016, tourism is undoubtedly an engine for New Zealand’s economic growth.In 2015/16, KiwiRail carried more than one million passengers on our tourism services, with increased passenger numbers on both Interislander and Scenic Journey services resulting in record tourism revenue of $105 million. Overseas visitors accounted for 65% of passenger journeys on these services.
The economic benefits of KiwiRail’s tourism services are most keenly felt in smaller towns, such as Greymouth, where businesses including hotels, restaurants, and car hire companies rely on train passengers. West Coast Tourism estimates that the TranzAlpine brings in excess of $15 million per annum to the region.
As the manager of the i–SITE at Greymouth Gina Ashworth says: “The TranzAlpine Train, Punakaiki, and the Glaciers are the three main draw cards for tourists to the West Coast.”
The TranzAlpine service is rated among the world’s best train journeys and the Northern Explorer was nominated for a 2016 Holiday & Tours award by the UK–based Luxury Travel Guide.
KiwiRail’s three Scenic Journeys rail services span the length of the country and traverse some of New Zealand’s most spectacular landscapes. The services connect key tourist destinations including National Park in Ruapehu District, Arthur’s Pass in the Southern Alps, and Picton in the Marlborough Sounds, a gateway to the South Island.
KiwiRail is committed to continued investment in its tourism services to ensure the economic benefits continue to be realised.
Increasing the value of tourism C
ase Study
TranzAlpine service stopped at Greymouth Station
Case Study: Increasing the value of tourism

24 | KIWIRAIL ANNUAL INTEGRATED REPORT 2016
PeopleOur people bring the know–how and skills to enable the business to deliver on our customer promise
Our people are key to reshaping our business and enabling the transformation of KiwiRail.
We are investing in leadership capability and working with staff and our union partners to build a culture of collaboration that underpins a “One KiwiRail” approach. Safety continues to be a critical priority, and we have an ongoing commitment to building safety leadership. Over the past 12 months 460 people have participated in our in–house leadership development programmes.
Our traditional rail and logistics workforce is, as you would expect, heavily dominated by men but our leaders and recruitment team are working on a range of initiatives to lift the profile and number of women in the workplace.
We will support and grow our people by further embedding our One KiwiRail healthy workplace strategy in all teams across the organisation. Our programme of activities will focus on health protection and wellbeing.
Engaging with staff and unionsDuring the year we worked closely with staff and the Rail and Maritime Transport Union (RMTU) to embed a High Performance High Engagement (HPHE) culture. Our objective has been to develop a shared understanding of KiwiRail’s business environment and of the respective visions and strategies of both parties. Key features of the HPHE approach include joint problem solving, collaboration and ensuring that workplace solutions are developed alongside those closest to the challenge at hand.
A joint RMTU/KiwiRail Governance Council has been established to develop a common vision and purpose and a joint working party has developed a HPHE Charter.
3,400Our workforce
27% new appointments
73% new appointments
11% Executive team
89% Executive team
92% on permanent contract
98% on permanent
contract
6 years of service
15 years of service
41 average age (years)
48 average age (years)
15% Women85% Men
Capitals review: People

KIWIRAIL ANNUAL INTEGRATED REPORT 2016 | 25
Prathamesh Bhaswande, Third Officer Engineer
Capitals review: People

26 | KIWIRAIL ANNUAL INTEGRATED REPORT 2016
A HPHE pilot programme is underway at Hutt workshops and is explored further in the case study on page 27.
Investing in our peopleOver the past year, 220 frontline staff took our “Back to Basics” training programme that provides staff with the tools to contribute to our five fundamental focus areas: sustaining a zero harm environment, engaging our customers, delivering operational performance, empowering our people and improving our financial position.
In addition, we hosted “Just and Fair” culture workshops around the country, focused on bringing together managers, staff, union delegates and Health & Safety leaders to understand the tools available to investigate safety incidents, and to run disciplinary processes fairly.
Providing safety leadershipThe risks inherent in any heavy infrastructure business mean that the safety of our people, contractors and the public is a constant focus for the KiwiRail Board, Executive and all staff.
KiwiRail’s ongoing commitment to a zero harm environment has seen a significant reduction in workplace injuries and risk over recent years, with a 69% improvement in our safety incident rate since 2009/10.
While our safety performance has improved markedly when benchmarked against the transport and port sector, we remain behind leading Australian and New Zealand heavy asset/fatal occurrence businesses including Santos, Origin Energy, Rio Tinto and Downer NZ.
To drive continued improvement in our safety performance, the business is placing a strong emphasis on visible
leadership, engaging our workforce in the development of a nationally consistent safety culture, understanding high potential fatal risks, and reducing the number of serious incidents or near misses.
Critical Risk Networks bring subject matter experts from across the business together to focus their collective efforts on the organisational safety risks which have the greatest potential for fatalities. Critical Risk Networks are now in place for track occupancy, Signals Passed at Danger, tunnels, level crossings and contractor management. Each area has a specific strategy and action plan for systematically reducing risk exposure. The action plans include a mix of technological innovation, behavioural change and new processes. Governance for each Critical Risk Network includes an Executive sponsor and progress reporting on a monthly basis.
Capitals review: People
Māori (Toi Toi) Cadetship Dodie Joseph, who is affiliated with Te Arawa and Te Whakatohea iwi, joined the cadetship as a train examiner in the Palmerston North wagons team. The cadetship introduced her to other KiwiRail people from different parts of the
country and she was inspired by what Māori leaders in the business are achieving. This year Dodie moved to the Hutt Workshops to start an apprenticeship. The network Dodie established through the cadetship has helped her to settle into the new role. Dodie is now gaining hands–on
experience refurbishing components of locomotive engines which is fuelling her passion for technical learning. “It has been a humbling experience networking among other KiwiRail people and knowing they truly have your best interests at heart,” Dodie says.
Dodie Joseph, Apprentice Mechanical Engineer
KIWIRAIL ANNUAL INTEGRATED REPORT 2016 | 27
The High Performance High Engagement (HPHE) programme embedded in the Wellington Hutt workshops brings frontline people, unions and management together to review work practices and identify areas for improvement. One opportunity the team has identified is improving the process to reassemble the brake lever arm on a “bogie” or train wheel.
Formerly, our people were working at ground level on pallets, which made the assembly challenging and created safety risks. The HPHE project team designed a new assembly jig table at standing level with clamps to secure the parts, which have been relocated and sorted for easy access. The new system has reduced safety risks and improved efficiency of the process.
The brake lever arm initiative has reduced the build time by up to 8 hours, and is one example of recent improvements that have reduced the turnaround time for a bogie overhaul by 17%.
By involving those closest to the challenge in developing solutions we have been able to achieve tangible improvements in productivity and engagement.
High Performance High Engagement C
ase Study
Strachan Crang Industrial Relations Principal Advisor and Allan
McConnochie, Mechanical Engineer
Case Study: High Performance High Engagement
28 | KIWIRAIL ANNUAL INTEGRATED REPORT 2016
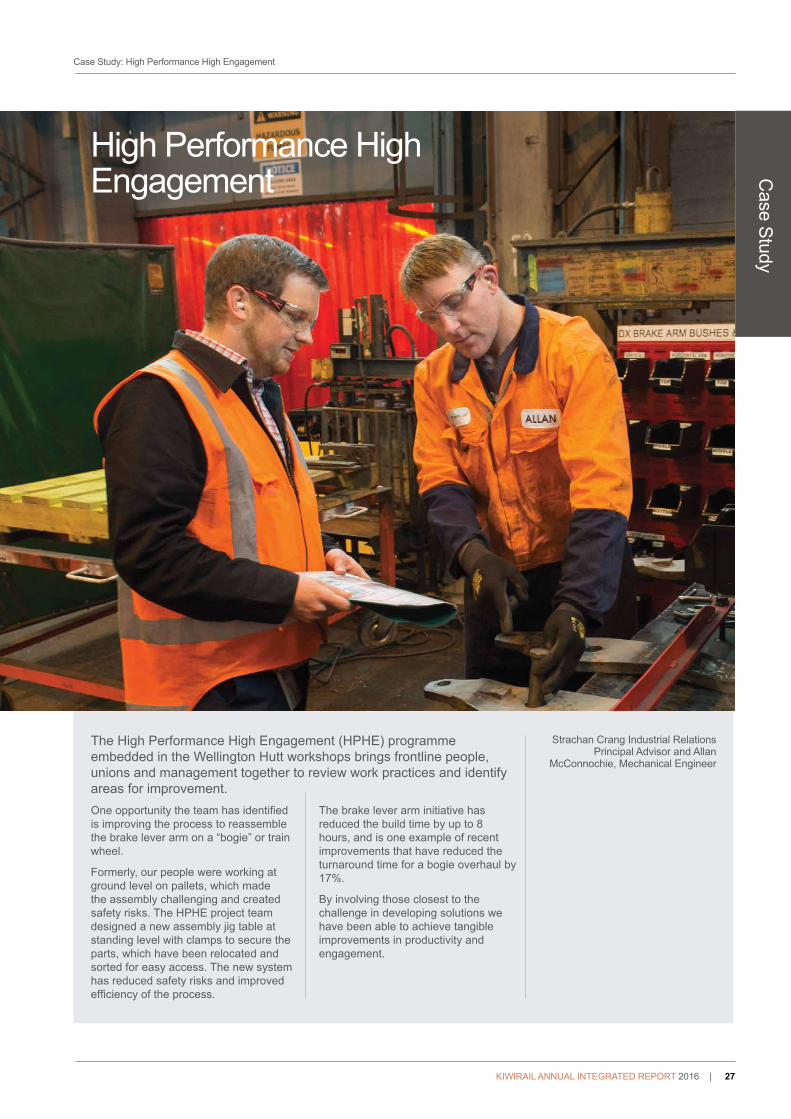
AssetsThe assets and property that we own and utilise to deliver our services to customers
Capitals review: Assets
KiwiRail’s ability to offer a reliable and trusted service to customers is underpinned by the efficiency and effectiveness of our $17 billion asset and infrastructure portfolio.
Aligning our investment priorities with customer needs, and standardising our assets to ensure they are safe, reliable and fit for purpose, is vital to our success.
SERVICES
SUPPORT
ROLLING STOCK
INFRASTRUCTURE
DEPOTS | OFFICES
VEHICLE FLEET
IT SYSTEMS
LOCOMOTIVES
CARRIAGES
WAGONS
SHIPS
TRACK
BRIDGES
TUNNELS
WORKSHOPS
STATIONS
FERRY TERMINALS
OUR CUSTOMERS
FREIGHT
PASSENGERINTERISLANDER

KIWIRAIL ANNUAL INTEGRATED REPORT 2016 | 29
Capitals review: Assets
Improving customer competitiveness KiwiRail has continued to invest in track infrastructure and rolling stock to improve the resilience of the rail network and meet customer expectations of efficiency and flexibility.
Our continued focus on standardising and improving assets is delivering benefits to our customers. Over the last 12 months temporary speed restrictions on the freight–critical North Island Main Trunk have reduced by 46% resulting in improved on–time performance for our customers.
In the past year we have invested $155 million in network capital expenditure, targeting investment on key freight lines including the business–critical Auckland–Hamilton–Tauranga route and the North Island Main Trunk.
The completion of the Taupiri bridge project near Huntly in November 2015 signalled the end of a nine–year programme to remove all timber pier bridges from the ‘golden triangle’.
Refurbishment work is also continuing in the Kaimai Tunnel in the Bay of Plenty, with $6 million of upgrades completed over the last 12 months. This work is part of a longer term programme to reduce maintenance requirements in the tunnel, improve reliability and security of the East Coast Main Trunk, and support key customers including Fonterra and the Port of Tauranga.
We are increasing our rolling stock capacity and improving fleet planning to lift the performance of our premier freight train services. In the last 12 months, 120 wagons have come into service, as part of our strategy to standardise our rail fleet.
In June 2016 we announced plans to purchase 15 additional DL locomotives to replace ageing rolling stock and meet anticipated freight demand on key routes, including the North Island Main Trunk.
Highway across the seaOur three–ship fleet provides our freight and tourism customers with an efficient and resilient ferry service that bridges State Highway 1 in the North and South Islands.
Following the retirement of Arahura in July 2015 and the arrival of Kaiarahi in September 2015, Interislander continued the “road bridge” across the Cook Strait. This provides overall resilience to our freight network, supporting freight movements to and from the South Island and helping in the growth of our regional economies.
Refurbishment work being carried out in the Kaimai Tunnel in the Bay of Plenty

30 | KIWIRAIL ANNUAL INTEGRATED REPORT 2016
An increasing number of our customers and ports are investing in development and upgrade of multimodal freight hubs and inland ports, driven partly by the imminent arrival of bigger container ships to New Zealand. The increase in inland ports and freight hubs also provides safety benefits for motorists by reducing the number of trucks on the road.
Over the last 12 months, KiwiRail has entered into a number of new partnerships with ports, logistics providers and freight manufacturers to link new freight hubs to the rail network.
In March this year, KiwiRail announced a $15 million upgrade to the Auckland container site.
The site is the third largest container handling facility in New Zealand, providing a critical freight gateway for the country and playing a key role in enabling continued economic growth.
The upgrade will deliver an additional 35% to 40% capacity on site, improve truck access and loading times, and enable significantly more freight flows to and from Auckland.
Inland ports and freight hubs
Cas
e St
udy
Palmerston North CT Site.
Case Study: Inland ports and freight hubs

KIWIRAIL ANNUAL INTEGRATED REPORT 2016 | 31
Know–howThe specialist knowledge and information our business has and our ability to innovate to meet the changing needs of our customers, driving efficiencies across the supply chain
Capitals review: Know–how
With a legacy dating back more than 150 years, KiwiRail is able to draw on the depth of logistics, rail and maritime expertise within our business to meet the needs of our customers and drive efficiencies. Many of our staff have developed specialist skill sets in the rail industry during their long careers within KiwiRail. For example, our rail engineering team are renowned experts in their field and are recognised for their innovative approach to developing solutions that perform in our unique and challenging rail environment.
We are continually innovating, embracing new technology and simplifying our business processes to provide better services for our customers.
Building intermodal freight capacity KiwiRail is transitioning to an intermodal asset base, enabling freight to move easily between ships, trains and trucks. With more than half of our wagon fleet now intermodal, we are making it easier for customers to carry freight on our rail and ferry services and transition between road and rail networks.
The arrival of Kaiarahi into the Interislander fleet in September 2015 has taken us closer to standardising our ships and to operating a full “road bridge” service across the Cook Strait.
Road–bridging involves lifting rail containers onto road trailers, which
are then towed aboard the ferries, and discharged using the opposite process on arrival. The trailers used for road bridging need to be designed to carry the high load weights of rail containers and to be easily manoeuvred. Our mechanical teams have developed a new trailer configuration and are currently trialling this solution within the business.
These systems were put to the test in mid–2016, as the Aratere went into dry–dock for eight weeks. The success of the road–bridging operation was evidence of our ability to operate an effective full road–bridging solution in the future.
Michael Keenan, Team Leader Structures

32 | KIWIRAIL ANNUAL INTEGRATED REPORT 2016
During the year, New Zealand’s first commercial 20–tonne axle load rail service began operating between Pacific Steel’s Glenbrook and Otahuhu mills. The higher axle load
makes rail more competitive over the short 45 km journey. Tony Pepperell, from KiwiRail’s Fleet Engineering team, designed the 40–foot wagons that can carry 61 tonnes of steel per
wagon, 15 tonnes more than using standard wagons. KiwiRail also partnered with Royal Wolf to produce purpose–built cradles to carry the steel on the wagons.
Transforming urban commuter servicesKiwiRail’s role in the transformation of Auckland’s urban rail network has been acknowledged with two major awards over the last year. In 2016 KiwiRail, alongside contractors Siemens and Hilor, received the Rail Project Award from the Railway Technical Society of Australasia for the electrification and re–signalling of the Auckland urban rail network. The Chartered Institute of Logistics and Transport also acknowledged the project in 2016, awarding it the “Most Innovative Public Transport project”.
Work to deliver a fully electrified passenger network between Papakura and Swanson began in 2007. It included
ensuring safe clearances for wires under 24 bridges and through two tunnels, installing a 25kV overhead power system to create a high capacity, electrified railway and a state–of–the–art signalling and train control system.
KiwiRail’s infrastructure solutions have enabled Auckland Transport to replace its aging diesel locomotive–hauled trains with modern, electric units that have introduced new levels of comfort, safety and reliability. The new services have contributed to a significant increase in passenger numbers over recent years.
Since 2014, KiwiRail has been working to successfully deploy on–board computer technology on Auckland passenger trains to improve safety and service for train drivers and passengers.
The technology provides real–time data to train drivers and applies brakes automatically if a train gets close to breaching its safe operating speed. KiwiRail’s signalling team is using this technology to better manage journey times and network capacity.
Capitals review: Know–how

KIWIRAIL ANNUAL INTEGRATED REPORT 2016 | 33
eProtect: Innovative safety initiative helps save lives
KiwiRail’s teams have developed an innovative, electronic safety initiative called eProtect to improve the safety of our workers in the rail corridor.eProtect uses GPS to communicate information about worksites to all trains operating on the network and applies to 100% of mainline locomotives in the South Island and 80% in the North Island.
If a train approaches a worksite too quickly, the eProtect system automatically applies the brakes and
stops the train before it encroaches on a worksite.
A simple yet innovative solution, eProtect helps improve efficient operation of the network by reducing the risk of work site over–runs and associated delays from incident investigations.
Case Study
Case Study: eProtect: innovative safety initiative helps save lives
91589158
w
Data sent to loco by cell network when warrant issued or CSP entered
DATA FILE
1000m Cab warning
500m Cab warning
Speed check
Stop check
CSP Mis88
TRAIN CONTROL ISSUES TRACK WARRANT
COMPUTER CREATES PROTECTION DATA FOR STOP POINTS
AUTHORITIES ENTER CSP APPLICATION
Inte
rcep
tor
ePro
tect
Mis88
Rule 905

34 | KIWIRAIL ANNUAL INTEGRATED REPORT 2016
As a national logistics provider that moves people and freight, we interact with a wide range of individuals and organisations on a daily basis.
We rely on the strength of our relationships to understand and address the views and priorities of our customers and stakeholders, and to help shape and grow our business.
Partnering with customers to drive economic growth We are working to reduce supply chain costs to make our customers competitive in the global marketplace.
Through our freight, passenger and commercial property operations, we serve customers across multiple sectors.While the majority of our revenue comes from Freight customers, our Passenger (Interislander and Scenic Journeys) and Property businesses are experiencing significant growth.
The charts on the following page show the source of KiwiRail’s revenue and a breakdown of our Freight revenue by sector. It is worth noting that the non–commodity driven freight activities are where we can have the greatest degree of influence on our market share as they are less susceptible to price movements caused by external factors.
In the Freight business, we have seen strong growth in the import/export (IMEX) sector and this is forecast to continue. The move by shipping lines to bring larger ships to New Zealand is a positive opportunity for KiwiRail as this leverages our ability to aggregate and move large volumes of freight with speed to and from ports. We are continuing to build partnerships with customers and ports, as part of our strategy to simplify supply chain logistics and connect to more inland
ports and freight hubs. In the past 12 months we have seen new hubs in Auckland, Christchurch, Whanganui, Palmerston North and the Wairarapa, with plans announced to develop further facilities in Waikato, Tauranga and New Plymouth.
A number of customers are also moving to longer–term supply agreements and developing logistics facilities that access our rail network. These facilities increase rail freight volumes while allowing freight flows to be optimised across road and rail.
The domestic market remains a sustainable growth sector for KiwiRail
due to population growth and modal conversion opportunities.KiwiRail is continuing to reshape its offering for this market. Our focus is on continuing to partner with our key customers and ensuring we deliver on our service promise.
Our continued focus on growing the domestic and IMEX sectors, and further developing our non–freight markets, will help us to withstand the ongoing challenges in commodities. The current outlook for key commodities such as coal and milk products continues to be challenging due to global demand.
Relationships The relationships we have with customers, logistics partners, unions, Government agencies and communities are central to the commercial success of our business
Government Agencies
(National and Local)
Shareholder Ministries
Suppliers&
Contractors
Employees
Customers
Unions
Iwi
Community
KiwiRail
Capitals review: Relationships

KIWIRAIL ANNUAL INTEGRATED REPORT 2016 | 35
Peter Reidy, Chief Executive and Hon Simon Bridges, Minister of Transport, talk to children from Paekakariki School during Rail Safety Week
Freight
Interislander
Infrastructure
Property & CorporateIMEX
Bulk
Forestry
Domestic
Tranz Metro
Scenic Journeys
Total External Revenue Freight Trading Revenue by Sector
Capitals review: Relationships
Working with Government agencies to build an effective land transport systemWe are working closely with the NZ Transport Agency (NZTA) and other local and central government agencies to coordinate planning and optimise investment in road and rail networks.
We are undertaking a joint partnership approach with key stakeholders for the review of Auckland’s future transport requirements which could involve development of a third main rail line between Westfield and Wiri to enable
passenger and freight growth. The 7km line would improve network resilience and freight flows to and from Ports of Auckland and the Port of Tauranga.
Over the past year, KiwiRail has also been working with NZTA on key cycleway initiatives. These cycleway projects will be developed by councils or NZTA and will utilise KiwiRail land. KiwiRail is also providing assistance to progress Urban Cycleway Fund projects, which are due for completion by June 2018.
Building safer communitiesKiwiRail is a key sponsor of TrackSAFE NZ, a charitable trust that raises
awareness about rail safety and ways to keep safe around tracks and trains.
KiwiRail also works with stakeholders to host Rail Safety Week – a nationwide campaign targeted at addressing the rising number of incidents at pedestrian level crossings, particularly in urban areas.
Working alongside local communities to address specific safety concerns on or around the rail corridor is another area of focus to promote safety. For example, KiwiRail has worked with the people of Ngaruawahia to address incidences of dangerous behaviour and trespass on the rail corridor.

36 | KIWIRAIL ANNUAL INTEGRATED REPORT 2016
Working with iwi and community leaders, Waikato District Council and government agencies has been an integral part of the successful Taupiri rail bridge replacement project. The bridge is located near Taupiri Maunga – a sacred mountain and urupa (cemetery) for many Tainui people, including ancestors of the Māori King.
Together with representatives of our Māori staff network – Te Kupenga Mahi – KiwiRail has worked with Waikato–Tainui iwi representatives and the local community to develop a culturally–appropriate approach to the project.
KiwiRail is working together with many of the local stakeholders to provide safe access to the urupa, by supporting the construction of a new
bridge and eliminating significant safety risks – including a dangerous rail crossing. The new railway bridge work was conducted sensitively and with the full consultation and input of iwi representatives and other stakeholders – a model for other projects in the country.
The Taupiri Bridge project is part of a wider programme to replace eight timber bridges on the North Island Main Trunk with new structures. The strengthened bridges will enable faster train speeds and heavier loads on the line.
Working with communities to deliver results
Cas
e St
udy
Peter Dauterman, Construction Manager and Major Herewini,
Kaumatua for Waikato Tainui and for the Taupiri Urupa Committee
Case Study: Working with communities to deliver results

KIWIRAIL ANNUAL INTEGRATED REPORT 2016 | 37
Capitals review: Environmental
As global interest and consumer awareness about climate change and carbon emissions grows, KiwiRail is well placed to support its customers and the wider transport sector achieve New Zealand’s greenhouse gas emission reduction targets.
Rail has the ability to move large volumes of people and freight along a narrow corridor, using relatively small amounts of energy, which provides economic and environmental benefits for users of the rail network.
Taking carbon out of our customers’ supply chainThe carbon intensity of rail is less than a third of road–based transport, with further gains anticipated as KiwiRail makes ongoing improvements in fuel efficiency.
In February, KiwiRail launched the Steel Wheels tool to show KiwiRail’s contribution to the sustainable operation of New Zealand’s logistics sector. The
tool is a graphic depiction of the number of rail trips undertaken by KiwiRail, the equivalent truck trips avoided by using rail to shift freight, and the resulting fuel and carbon dioxide emission savings, relative to the same volume of freight travelling by road.
KiwiRail provides this information on a monthly, quarterly and annual basis to our customers and stakeholders to assist them in making sustainable choices around logistics providers.
EnvironmentalThe natural resources that we nurture and protect through operations to ensure the environmental and financial sustainability of our business and future generations of New Zealanders
STEEL WHEELS FY2016Your partner in sustainable freight
4.5b 1.1m 76.7m 208,613= ++Net Tonne
Kilometres (NTK’s)Reduced heavy vehicle
road impactFuel savings (L) CO2 emission
savings (T)
CO2

38 | KIWIRAIL ANNUAL INTEGRATED REPORT 2016
A whio in Tongariro National ParkProtecting our environmentWe are continuing to work with stakeholders on ways to minimise the environmental impact of our operations. The Makatote Viaduct upgrade is a good example of environmental benefits that can be achieved through stakeholder collaboration.
The viaduct is located in Tongariro National Park and is home to a resident population of vulnerable New Zealand whio, or native blue ducks.
KiwiRail has worked closely with iwi, the Department of Conservation (DoC), Heritage New Zealand and local councils to ensure the unique environment and the historical integrity of the viaduct are preserved, while we complete a major upgrade of the structure later this year, including removal of old lead–based paint.
Reducing energy consumptionKiwiRail is working to improve the sustainability of our operations, with a continued focus on energy savings.
We have begun a fuel–conservation programme that aims to reduce consumption and improve efficiency across our locomotive fleet. The initiative involves a combination of improved asset planning and deployment, new operational procedures, staff training and technology.
KiwiRail is also working to improve energy performance at our sites. For example, we have reduced the energy consumption of lighting at our Westfield depot in Auckland by 56%, thanks to the installation of 2300 light–emitting diode (LED) bulbs. We will rollout LEDs to several high energy use sites over the next 12 months.
Capitals review: Environmental

KIWIRAIL ANNUAL INTEGRATED REPORT 2016 | 39
Case Study: Delivering cost and energy savings
KiwiRail’s award–winning Driver Advisory System (DAS) has achieved a 6% fuel saving in its first full year of operation ending February 2016 – a saving of 3.2 million litres of diesel, which avoided 8,800 tonnes of greenhouse gas emissions and substantial fuel costs. DAS incorporates the energy–saving Energymiser® system and is part of a comprehensive fuel conservation programme that will reduce emissions and locomotive wear through less braking and smoother acceleration.
DAS provides Locomotive Engineers with a driving guide that ensures fuel use at optimal levels for the journey, while Energymiser® works by using the laws of physics to develop an ideal driving scenario for routes.
In August 2016, KiwiRail won the “Large Energy User Initiative of the Year” at the Deloitte Energy Excellence Awards for the Locomotive Fuel Conservation
project, which includes the rollout of DAS.
KiwiRail’s National Service Delivery Manager Soren Low says the locomotive fuel conservation project is a success for the entire business.
“Ultimately the success of the project came down to our asset servicing teams and locomotive engineers buying into and using the new processes and technology. Having people in the frontline that are committed to the outcome, along with a team of practising locomotive engineers who ‘walk the talk’ delivering the training, was a significant influence on our success.”
Delivering cost and energy savings C
ase Study
Tina Flack, Locomotive Engineer using the driver
advisory system

40 | KIWIRAIL ANNUAL INTEGRATED REPORT 2016
KiwiRail has been gradually reducing the carbon intensity of freight services over the past few years.
Capitals review: Outlook

KIWIRAIL ANNUAL INTEGRATED REPORT 2016 | 41
KiwiRail is confident it has the right strategies in place to maintain momentum towards a commercially strong and sustainable business that moves people and freight more cost effectively than any other carrier.
Our three–part strategy to simplify our business, standardise our assets and invest in our people is enabling the business to successfully navigate the various challenges it faces into the future.
Those challenges include volatile commodity markets, supply chain consolidation, demographic and technological change, and increasing environmental pressures.
Commodity market volatilityDomestic and import/export (IMEX) sectors are forecast to grow, while the outlook for key commodities such as coal, forestry and milk–based products is not as buoyant. In response, KiwiRail is focusing on non–commodity driven activities where we have the greatest degree of influence on market share. This includes the domestic freight market, where service reliability will help to unlock more growth.
Supply chain consolidationThe expected arrival of larger container ships to New Zealand and the population growth and drift northwards is already changing freight flows and supply chains. Ports are investing in rail–served infrastructure outside the port gate and in closer proximity to where the population growth is occurring. With the ability to aggregate and move large volumes of freight at speed, KiwiRail is perfectly positioned to take advantage of these developments
in the port sector. The company is actively partnering with freight hubs and will continue investing in new rolling stock and multimodal assets to improve ease of movement between road, rail and ships.
Auckland resilienceThe significant growth in both freight and commuter services on the Auckland rail network is putting pressure on the operational and infrastructure resilience. Ultimately, as this growth continues, the separation of Freight and Passenger networks will be required. This will require an integrated and comprehensive response from all stakeholders. KiwiRail is engaged with Auckland Transport, New Zealand Transport Agency and government representatives to ensure the needs of Freight and Passenger customers are met.
Workforce planning KiwiRail will need to prepare for the rapidly changing logistics industry and increasing customer and shareholder expectations. This will involve workers in planning for such changes as well as expanding their transferrable skills to prepare for different roles in the future. The company will also work to attract new and diverse talent and skills that enable it to keep innovating and succeeding well into the 21st Century.
TechnologyAlong with the need to manage an ageing workforce, KiwiRail is also facing technological challenges and opportunities, ranging from automation, artificial intelligence, big data, GPS tracking, and electric vehicles, to large–scale disruptions of an entire industry. In the near future, we expect to see
self–drive, electric trucks appearing on our roads, while smaller companies will begin to enter the freight transport sector thanks to lower entry costs. KiwiRail is keeping a close eye on all these developments, while embracing and investing in technology and IT systems to improve operational and safety performance. The company will continue trialling various technologies such as our battery–powered electric–shunt locomotive. Technology–enabled innovation will be critical to KiwiRail’s success in the years ahead.
New emission targetsMeeting the Government’s commitment to reduce emissions by 30% by 2030 will require a contribution from all sectors including transport which makes up 17% of all emissions. Rail produces a very small proportion of all transport emissions (less than 2%) and is already saving emissions by diverting freight from road. Through improvements in fuel efficiency and increases in freight volumes, rail has been gradually reducing the carbon intensity (emissions per net tonne kilometre) of freight services. Continuous improvement in these areas will be critical as new emission targets place a greater focus on carbon.
OutlookWhat challenges and opportunities is the organisation likely to encounter? What are the potential implications for the business model and future performance?
Capitals review: Outlook

42 | KIWIRAIL ANNUAL INTEGRATED REPORT 2016
Mike Pohio
Dr Kevin Thompson
John Spencer CNZM
Guy Royal
Paul Harper
Dame Paula Rebstock
Rebecca Thomas
John Leuchars
The KiwiRail Board
Governance review: The KiwiRail Board

KIWIRAIL ANNUAL INTEGRATED REPORT 2016 | 43
John Spencer CNZMChairmanJohn Spencer joined the Board in 2010 as Chairman. John is a Wellington–based businessman and company director. He is the Chairman of the Tertiary Education Commission, Raukawa Iwi Developments Ltd and Waikato Regional Airport Ltd. John is also a director of Mitre 10 NZ Ltd. John has held a number of senior management positions in New Zealand and Australia, including Chief Executive of NZ Dairy Group – one of the two dairy companies that merged to form Fonterra.
Dame Paula RebstockDeputy ChairDame Paula Rebstock joined the Board in 2009. Dame Paula is an Auckland–based economist and company director. She is Chair of the ACC Board, Insurance and Savings Ombudsman Commission, and the Vulnerable Children’s Board. Dame Paula is also a member of the University of Auckland Business School Advisory Board, a member of the Synergia Limited Advisory Board and a director of Auckland Transport. Her other roles include the Lead Reviewer for the State Services Commission Performance Improvement Framework.
John LeucharsDirectorJohn Leuchars joined the Board in 2010. John is a professional company director and civil engineer. He is currently a director of Genesis Energy Limited, The Wellington Gateway General Partnership Companies Nos.1 and 2 (Transmission Gully motorway) and Milmeq Ltd. John has also held director and managing director positions in international consulting engineering companies. These include Managing Director of Connell Wagner (NZ) Limited (now Aurecon) and Connell Mott MacDonald in London. He is also a fellow of the Institute of Professional Engineers NZ.
Dr Kevin ThompsonDirectorKevin Thompson joined the Board in 2011.Kevin is a Nelson–based professional director and civil engineer. He is Deputy Chair of the Environmental Protection Authority and chairs the Agency’s HSNO Committee. Kevin has previously served as Chief Executive of Opus International Consultants Ltd and Chief Executive of Works Civil Construction. He is a Distinguished Fellow and a past president of the Institution of Professional Engineers New Zealand.
Guy RoyalDirectorGuy Royal joined the Board in 2013.Guy has a background in private equity and commercial and corporate law for more than 20 years in New Zealand, Hong Kong, Vietnam and the United Kingdom. He is an executive director of Tuia Group, a professional advisory firm. He also holds or has held directorships on various Boards in the property, forestry and technology investment sectors.
Rebecca ThomasDirectorRebecca Thomas joined the Board in 2011.Rebecca has more than 29 years’ experience in financial markets in New Zealand and overseas. She has a background in law and business having held roles as both a CEO and Independent Director on UK–based Boards. She is Chair of the Audit, Finance and Risk Committee of the Financial Markets Authority (FMA), a director of Mint Asset Management Ltd and a director of Black and White Group Ltd. Rebecca is also an associate member of the Foundation Board of the Financial Markets Authority.
Mike PohioDirectorMike Pohio joined the Board in May 2016. A qualified Chartered Accountant, Mike has extensive experience both as a Director and an Executive. Mike currently chairs BNZ Partners, Waikato Region and is a Director of NIWA, Panuku Development Auckland and Te Atiawa Iwi Holdings. He has also held a number of executive roles in the NZ Dairy industry and was CEO of Tainui Group Holdings (TGH). Mike is a former shareholder and director of NZL Group Ltd, and was a Ministerial appointment to the University of Waikato Council.
Paul HarperDirectorPaul Harper joined the KiwiRail Board in May 2016.Paul is a non–executive director and Chair of Netlogix Ltd and holds directorships with the Boards of Health Benefits and Health Alliance. His previous roles include directorships at Port Napier, CHH Northport, Cyberlynx and Clifford Bay, together with various senior management roles at Carter Holt Harvey and Interisland Line. Paul is the immediate past Dean of the New Zealand Maritime School and Manukau Institute of Technology Centre for Logistics.
Where a date for appointment to the Board precedes 1 January 2013, it is a reference to the date that the Director was appointed to the Board of the New Zealand Railways Corporation (NZRC), the former parent of the Group. Following a restructure of the Crown’s rail interests in 2012/13 in which the majority of NZRC’s rail assets and liabilities were vested in KiwiRail Holdings Limited, the then Directors of NZRC were appointed to the Board of KiwiRail Holdings Limited as the new parent company for the Group.
Governance review: The KiwiRail Board

44 | KIWIRAIL ANNUAL INTEGRATED REPORT 2016
Peter Reidy
Todd Moyle
Andrew Norton
Kate Jorgensen
Alan Piper
Huw Bridges Roy Sullivan
Iain Hill
David Gordon
The KiwiRail Executive Team
Governance review: The KiwiRail Executive Team

KIWIRAIL ANNUAL INTEGRATED REPORT 2016 | 45
Peter ReidyChief ExecutivePeter joined KiwiRail as Chief Executive in March 2014. He brings to KiwiRail a successful track record of building and leading service and infrastructure–based businesses in the logistics, energy, building products and asset management sectors in New Zealand, Australia, Asia and the United Kingdom. Prior to KiwiRail, Peter held a number of senior leadership roles with Downer Group, Fletcher Building, Todd Energy and Freightways.
Kate JorgensenChief Financial OfficerKate joined KiwiRail in March 2015. She is a strategic CFO who partners with the business to drive results. Prior to KiwiRail, Kate worked for Fletcher Building for six years, where she held several senior commercial roles, including Divisional CFO for Heavy Building Products and Divisional CFO for the Infrastructure Products Division.
Iain HillGroup General Manager OperationsIain joined KiwiRail in October 2009 as General Manager Freight. In his current role Iain is responsible for rail freight, ferry operations, rail freight terminal and container terminal operations, ferry terminals, crew–scheduling, rolling stock and mechanical and maintenance. Prior to joining KiwiRail Iain worked for 15 years at Express Couriers Limited, where he held various General Manager roles including GM Logistics and Distribution.
Todd MoyleGroup General Manager Network ServicesTodd joined KiwiRail in February 2007 and is responsible for the delivery of infrastructure maintenance and renewals, inventory and plant management, contractor management and leadership development. Before moving into his current role, Todd worked as KiwiRail’s Southern Development Manager and Southern Regional Manager – Infrastructure. He also worked for London Underground in the United Kingdom.
Alan PiperGroup General Manager Sales and CommercialAlan joined KiwiRail in September 2013 and is responsible for the freight, commercial vehicles and passenger revenue portfolios. This includes marketing, pricing and sales planning to improve margin and revenue. He previously worked in freight and logistics sales and general management roles with CourierPost and Pace Couriers and had a successful 23–year career with the Bank of New Zealand in retail banking and branch strategy.
David GordonGroup General Manager Asset Management and InvestmentDavid joined KiwiRail in 2007 when he began working on the Wellington Regional Rail Programme as the Project Director. In his current role David is responsible for asset integrity and long–term viability. He previously worked as a consultant in the transport infrastructure business for organisations such as Wellington International Airport.
Andrew NortonGroup General Manager Human ResourcesAndrew joined KiwiRail in June 2014 and has extensive experience in Human Resources and Industrial Relations in both large public and commercial organisations. Andrew has an in–depth understanding of Industrial Relations, strong engagement skills with front line engineering and customer service teams, and experience in developing Executive leadership in large organisations. He previously held high–level roles with Public Service Association (PSA) NZ, Auckland District Health Board and worked as Downer Australia’s Executive General Manager Human Resources.
Huw BridgesGroup General Manager Zero HarmHuw joined KiwiRail in 2016 and is responsible for health and safety. Prior to joining KiwiRail, Huw was General Manager – Safety and Assurance for Transdev in Auckland. Huw has a wealth of operational and strategic rail safety experience earned during a successful 30 year career. He has held roles with a number of rail, light rail and bus businesses in the UK and Europe including major players such as First Group, National Express Group and as the Head of Safety for Eurostar UK.
Roy SullivanGroup General Manager Rolling Stock and Asset ServicesRoy joined KiwiRail in 2016 and is responsible for KiwiRail’s Wellington–based fleet mechanical engineering teams, the Auckland–based locomotive and wagon asset teams and the company’s Northern, Central, Southern and Hutt field maintenance service teams. Roy has more than 30 years rolling stock asset maintenance and manufacturing experience with UK–based Alstom Transport and more recently Downer Rail Australia.
Governance review: The KiwiRail Executive Team

46 | KIWIRAIL ANNUAL INTEGRATED REPORT 2016
Committee structures
Our commercial mandate KiwiRail Holdings Limited is a limited liability company incorporated under the Companies Act 1993 and a state owned enterprise (SOE) under the State Owned Enterprises Act 1986.
As an SOE, all of KiwiRail’s shares are owned by the Crown. They are held in equal proportions by the Minister of Finance and the Minister for State Owned Enterprises.
The principal objective of every SOE is to operate as a successful business and, to this end, to be as profitable and efficient as comparable businesses that are not owned by the Crown. SOEs are also required to be good employers and to exhibit a sense of social responsibility.
Governance functionsThe Board of Directors of KiwiRail is appointed by the Shareholding Ministers and is accountable to the Shareholding Ministers for the performance of KiwiRail. The Shareholding Ministers may jointly remove directors at any time and entirely at their discretion.
The role of the Board is to guide the strategic direction of KiwiRail and to direct and oversee management.
The Board establishes objectives and sets strategies to achieve those objectives. The Board, in the context of the approved policy, risk and compliance framework within which the Group operates, monitors the performance of management and the Group against those strategies. The Board has delegated the day–to–day management of the Group to the Chief Executive.
The Board meets 11 times during the year as part of the regular meeting agenda. In addition, there are four committees of the Board which meet four times a year. These committees are described further below.
The Board is committed to ensuring that the Shareholding Ministers are informed of all major issues and developments affecting the company. Such information is communicated in various ways including Annual/Integrated reports, half yearly reports and continuous disclosure statements.
Governance review: How we are governed
Audit, Finance and Risk Committee (AFRC)
Safety, Health and Human Resources Committee (SHREC)
Infrastructure & Asset Management Committee
Remuneration Committee
Four meetings per year Four meetings per year Four meetings per year Four meetings per year
Dame Paula Rebstock (acting Committee Chair)Rebecca Thomas John Spencer Guy RoyalMike Pohio
Guy Royal (Committee Chair)Dr Kevin ThompsonPaul HarperMike Pohio
John Leuchars (Committee Chair)Dr Kevin Thompson Paul Harper
John Spencer (Committee Chair)Dame Paula RebstockGuy Royal
Assists the Board with the discharge of its responsibilities in relation to audit, finance and risk management. The committee monitors the roles, responsibilities and performance of management and the auditors in financial reporting, business risk management systems and internal control systems.
Advises the Board on compliance with all safety licenses, the Health & Safety at Work Act, and legal safety requirements including effective systems, training, resources and processes for the protection of workers and others who interact with KiwiRail. The committee is also responsible for human resources and environment oversight.
Advises the Board on the performance and management of, and risks associated with KiwiRail’s material assets.
Assists the Board in establishing remuneration strategies and policies for the Chief Executive and his direct reports that support an increase in productivity and the retention of staff

KIWIRAIL ANNUAL INTEGRATED REPORT 2016 | 47
In addition to these committees of the Board, the Board has established an advisory committee of senior external consultants to advise the Board and management on KiwiRail’s property strategy and planning. This Property Committee is chaired by a KiwiRail director (John Leuchars) and the three other members are experienced leaders and professionals in the property industry but are not members of the KiwiRail Board.
Approach to Risk Management KiwiRail is committed to ensuring that risk management is an important element and integral part of the way we undertake our operations. We take an enterprise–wide approach to risk management, and consider the potential impact of risks on our processes, activities, stakeholders, products and services. An Enterprise Risk Management Strategy has been developed and implemented across the
organisation. This Strategy is based on principles that are industry best practice and the National Rail Systems Standard 4 (NRSS), which is aligned to the international standard for Risk Management: AS/NZS ISO31000:2009.
At a strategic level, effective governance of risk is achieved through the Audit, Finance and Risk Committee of the Board. At an operational level, a risk champion network is in place, and risk is actively managed and reported through an enterprise risk register.
Insurance and Indemnity In accordance with the Companies Act 1993 and the terms of its constitution, KiwiRail indemnifies the members of the Board in respect of liability for conduct that comprises acts or omissions by the directors in good faith and in the performance or intended performance of KiwiRail’s functions and for any costs incurred in defending or settling any claim or proceeding related to liability for such conduct.
KiwiRail has insured the directors and employees of the Group against any costs or liabilities of the type referred to in section 162(5) of the Companies Act.
In addition, KiwiRail indemnifies directors of its wholly–owned subsidiaries against any costs or liabilities of the type referred to in section 162(5) of the Companies Act.
Governance review: How we are governed

For the financial year ended 30 June 2016
The accompanying notes form part of these financial statements.
KIWIRAIL HOLDINGS LTD
Statutory review: Financial statements
48 | KIWIRAIL ANNUAL INTEGRATED REPORT 2016
Statement of Comprehensive Income
Note GROUP2016
GROUP2015
$m $m
Operating revenues 2 694.0 720.6
Operating expenses 3(a) (618.1) (630.1)
Operating surplus 75.9 90.5
Capital grants 4 32.9 44.6
Depreciation and amortisation expenses 5 (67.5) (68.8)
Foreign exchange and commodity (losses) and gains 6 (5.0) 7.2
Net finance expenses 7 (14.3) (17.8)
Impairment 9(c) (216.3) (224.7)
Movement in value of investment properties 14 (0.1) 1.7
Other income – 0.8
Share in profit of joint venture 16 0.4 –
Net deficit before taxation (194.0) (166.5)
Income tax (expense)/credit 8 – –
Net deficit after taxation (194.0) (166.5)
Other comprehensive income/(loss)
Items that can be reclassified into net surplus or deficit:
(Losses)/gains from cash flow hedges (0.4) 1.5
Items that cannot be reclassified into net surplus or deficit:
Transfer to asset carrying value from cash flow hedge reserve – 0.1
Building impairment 9(c) – (3.1)
Total comprehensive loss (194.4) (168.0)

The accompanying notes form part of these financial statements.
KIWIRAIL HOLDINGS LTD
Statutory review: Financial statements
KIWIRAIL ANNUAL INTEGRATED REPORT 2016 | 49
As at 30 June 2016Statement of Financial Position
Note GROUP2016
GROUP2015
$m $mCurrent assetsCash and cash equivalents 10 96.5 50.0
Trade and other receivables 11 87.4 87.6
Inventories 12 63.1 56.5
Financial assets 13 0.2 6.5Assets held for sale – 2.1
247.2 202.7Non–current assetsProperty, plant and equipment 9(a) 676.3 675.9
Investment property 14 68.7 67.6
Intangible assets 9(b) 0.8 0.6
Financial assets 13 – 0.2Investment in joint venture 16 2.0 1.6
747.8 745.9Total assets 995.0 948.6Current liabilitiesTrade and other liabilities 17 94.6 87.6
Employee entitlements 18 61.0 62.9
Financial liabilities 13 10.2 31.6
Income taxes payable 8 – –Provisions 19 6.6 4.7
172.4 186.8Non–current liabilitiesEmployee entitlements 18 38.0 35.0
Financial liabilities 13 224.8 201.7Provisions 19 5.9 4.7
268.7 241.4Total liabilities 441.1 428.2Net assets 553.9 520.4EquityShare capital 24 613.6 403.8
Retained earnings (81.7) 94.2
Asset revaluation reserve 22.6 22.6Cash flow hedge reserve (0.6) (0.2)Total equity 553.9 520.4
John Spencer Dame Paula RebstockChairman Deputy Chair26 August 2016 26 August 2016
For the financial year ended 30 June 2016
The accompanying notes form part of these financial statements.
KIWIRAIL HOLDINGS LTD
Statutory review: Financial statements
50 | KIWIRAIL ANNUAL INTEGRATED REPORT 2016
Statement of Movements in Equity
GROUP Share Capital
Retained Earnings
Asset Revaluation
Reserve
Cash Flow Hedge
ReserveTotal
$m $m $m $m $m
As at 30 June 2014 205.8 235.4 37.6 (1.8) 477.0
Net deficit for the period – (166.5) – – (166.5)
Other comprehensive income/(loss)
Gains from cash flow hedges – – – 1.5 1.5
Transfer to asset carrying value from cash flow hedge reserve – – – 0.1 0.1
Buildings impairment charged to asset revaluation reserve – – (3.1) – (3.1)
Revaluation reserve of transferred property, plant and equipment – 11.9 (11.9) – –
Total comprehensive income/(loss) – (154.6) (15.0) 1.6 (168.0)
Transactions with owners
Capital investment 198.0 – – – 198.0
Crown appropriation on land transactions – 13.4 – – 13.4
As at 30 June 2015 403.8 94.2 22.6 (0.2) 520.4
Net deficit for the period – (194.0) – – (194.0)
Other comprehensive income/(loss)
Losses from cash flow hedges – – – (0.4) (0.4)
Total comprehensive (loss) – (194.0) – (0.4) (194.4)
Transactions with owners
Capital investment 209.8 – – – 209.8
Crown appropriation on land transactions (note 20) – 18.1 – – 18.1
As at 30 June 2016 613.6 (81.7) 22.6 (0.6) 553.9

For the financial year ended 30 June 2016
The accompanying notes form part of these financial statements.
KIWIRAIL HOLDINGS LTD
Statutory review: Financial statements
KIWIRAIL ANNUAL INTEGRATED REPORT 2016 | 51
Statement of Cash Flows
Note GROUP2016
GROUP2015
$m $m
Cash flows from operating activities
Receipts from customers 698.9 726.6
Interest received 2.9 3.4
Payments to suppliers and employees (609.8) (642.7)
Interest expense (13.7) (15.5)
Net cash from operating activities 22 78.3 71.8
Cash flows from investing activities
Sale of property, plant and equipment 3.5 4.5
Capital grant receipts 32.9 44.6
Purchase of property, plant and equipment and investment properties (285.2) (280.5)
Purchase of intangibles (5.9) (13.2)
Net cash used in investing activities (254.7) (244.6)
Cash flows from financing activities
Crown capital investment 209.8 198.0
Increase in equity from NZRC land sales 20 18.1 13.4
Loans 24.6 1.6
Repayment of borrowings (28.3) (4.0)
Repayment of finance lease liability (1.3) (1.6)
Net cash from financing activities 222.9 207.4
Net increase in cash and cash equivalents 46.5 34.6
Cash and cash equivalents at the beginning of the year 50.0 15.4
Cash and cash equivalents at the end of the year 10 96.5 50.0

For the financial year ended 30 June 2016
KIWIRAIL HOLDINGS LTD
Notes to the Financial Statements
Statutory review: Financial statements
52 | KIWIRAIL ANNUAL INTEGRATED REPORT 2016
1. GROUP INFORMATION
(a) Reporting entityKiwiRail Holdings Limited (“KHL”, “the Parent”) is a company domiciled in New Zealand, registered under the Companies Act 1993 and is included within the First Schedule of the State Owned Enterprises Act 1986. The beneficial shareholder of the Parent is the Crown. The Group comprises KiwiRail Holdings Limited and its subsidiaries as detailed in the below diagram:
The following activities are required to be carried out by the Group:
• Provide end–to–end transport supply chain services and connect customers with global markets• Own and operate a national rail network which meets the needs of our customers• Provide for the transport of bulk and consolidated freight• Provide ferry services (forming the ‘bridge’ between the North and South Islands) for rail and road freight and for
passengers and their vehicles• Support rail passenger services in metropolitan areas and long distance services for both domestic and tourist markets• Manage and develop property holdings for rail operations and appropriate third–party land use
The financial statements of the Group are for the year ended 30 June 2016 and were authorised for issue by the Board of Directors on 26 August 2016.
(b) Basis of preparationThe financial statements have been prepared in accordance with New Zealand Generally Accepted Accounting Practice (“NZ GAAP”). They comply with New Zealand equivalents to International Financial Reporting Standards (“NZ IFRS”) as appropriate for for–profit entities and other applicable Financial Reporting Standards. They comply with the State–Owned Enterprises Act of 1986, the requirements of the Companies Act 1993 and the Financial Reporting Act 2013. The financial statements have been prepared on the basis of historical cost, except for certain non–financial assets and derivative financial instruments, which have been valued at fair value.
Accounting policies are selected and applied in a manner which ensures that the resulting financial information satisfies the concepts of relevance and reliability, thereby ensuring that the substance of the underlying transactions or other events is reported.
Unless otherwise specified, all dollar amounts in these financial statements and accompanying notes are stated in New Zealand dollars and all values are expressed in millions of dollars ($m). The functional and presentation currency is New Zealand dollars.
KiwiRail Holdings Limited Northland Regional Council
KiwiRail Limited
Joint Arrangement
100%
100%25%
Metrobox Limited
Clifford Bay Limited (non–
trading)

For the financial year ended 30 June 2016
KIWIRAIL HOLDINGS LTD
Notes to the Financial Statements
Statutory review: Financial statements
KIWIRAIL ANNUAL INTEGRATED REPORT 2016 | 53
(c) Consolidated financial statementsThe consolidated financial statements of the Parent and its subsidiaries include the financial statements of subsidiary companies using the acquisition method of consolidation. The acquisition method of consolidation involves recognising at acquisition date, separately from goodwill, the identifiable assets acquired, the liabilities assumed and any non–controlling interest in the acquiree.
Subsidiary companies are those entities that are controlled directly or indirectly by the Parent.
(d) Standards and interpretations issued but not yet in effectNZ IFRS standards and interpretations that have recently been issued or amended but are not yet effective have not been adopted by the Group for the annual reporting period ended 30 June 2016. Significant changes are outlined below:
• IFRS 16 Leases requires lessees to account for all leases under a single on–balance sheet model in a similar way to finance leases under NZ IAS 17. These changes are effective for periods beginning on or after 1 January 2019. The Group is yet to assess the full impact of this standard.
• NZ IFRS 9 Financial Instruments is the standard issued as part of IASB’s project to replace NZ IAS 39. The changes to IFRS 9 are effective for periods beginning on or after 1 January 2018 and are not expected to have material impact on the Group.
(e) ComparativesThe presentation of some information has changed from the previous period with prior period balances re–classified to be comparable with current year figures.
(f) Significant accounting judgements, estimates and assumptionsThe preparation of financial statements requires management to make judgements, estimates and assumptions that affect the application of policies and reported amounts of assets, liabilities, revenues and expenses. These estimates and associated assumptions are based on historical experience and various other factors that are believed to be reasonable under the circumstances, the results of which form the basis of making the judgments about carrying values of assets and liabilities that are not readily apparent from other sources. Actual results may differ from those estimates.
Management’s significant judgements, estimates and assumptions are outlined in the relevant notes to the financial statements.
(g) Going concernKiwiRail continues to operate on a commercial basis. Shareholder support to date has been provided in line with KiwiRail’s business plans, with $190m of equity funding confirmed for proposed investments in the 2016/17 financial year.
The latest business plan assumes additional equity funding for a number of years and future equity funding will be confirmed. We have completed these financial statements on a going concern basis on the assumption that shareholder support will continue, largely in line with business plans.

For the financial year ended 30 June 2016
KIWIRAIL HOLDINGS LTD
Notes to the Financial Statements
Statutory review: Financial statements
54 | KIWIRAIL ANNUAL INTEGRATED REPORT 2016
2. REVENUE
GROUP2016
GROUP2015
$m $m
Freight 389.8 433.7
Interislander 127.6 127.3
Tranz Metro 59.7 53.7
Scenic Journeys 29.7 24.8
Property and Corporate 44.5 43.2
Infrastructure and Asset Management 42.7 37.9
Total revenue 694.0 720.6
Revenue recognitionRevenue is measured at the fair value of the consideration received or receivable by the Group to the extent it is probable that the economic benefits will flow to the Group and the revenue can be reliably measured. Revenue represents amounts receivable for goods and services provided in the normal course of business once significant risks and rewards of ownership have been transferred to the buyer. Revenue is recognised by reference to the stage of completion of the contract activity at the balance date.
3(a). OPERATING EXPENSES
GROUP2016
GROUP2015
$m $m
Salaries and wages 339.9 341.8
Restructuring 8.7 1.0
Defined contribution plan employer contributions 11.6 11.7
Other employee expenses 0.4 3.6
Total staff costs 360.6 358.1
Amounts capitalised (44.0) (51.3)
Net staff costs 316.6 306.8
Materials and supplies 119.2 112.2
Fuel and traction electricity 66.7 92.9
Lease and rental costs 49.2 42.8
Incidents and insurance 13.5 13.1
Contractors expenses 9.0 12.7
Audit fees 0.4 0.4
Impairment/(Recovery from impairment) of receivables 0.3 (2.2)
Directors’ fees 0.3 0.3
Gain on disposal of property, plant and equipment (1.0) (1.7)
Other expenses 43.9 52.8
Total operating expenses 618.1 630.1
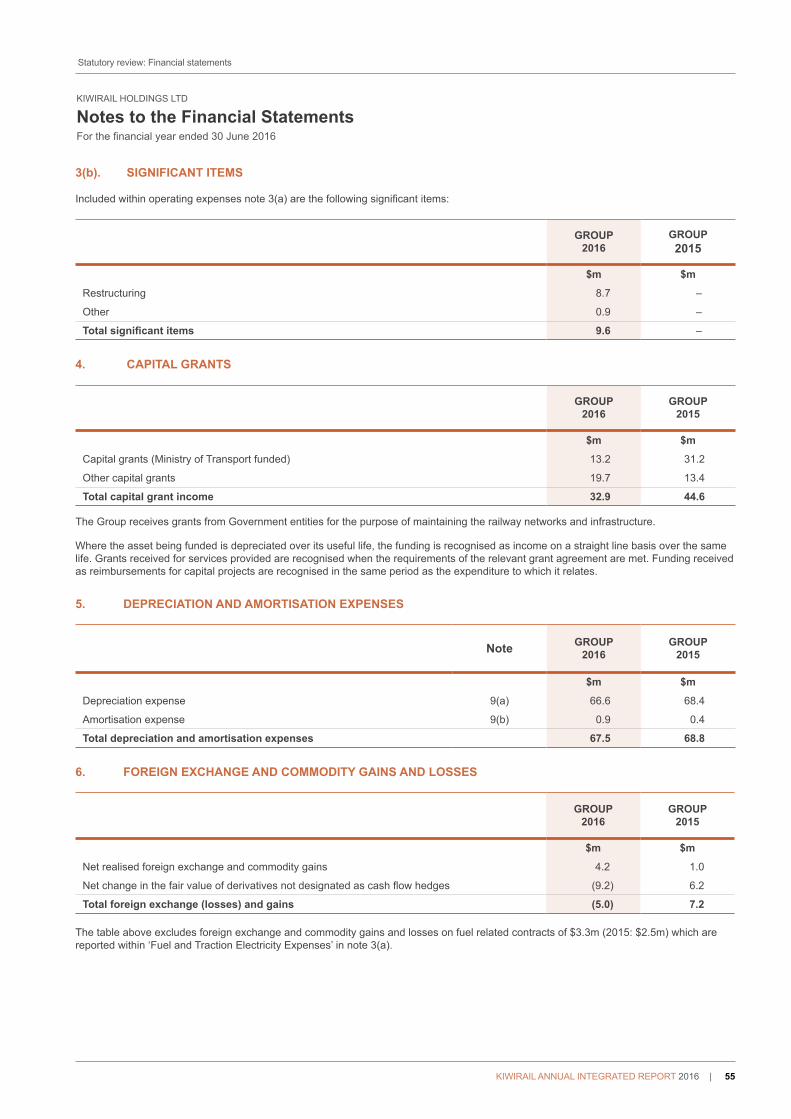
For the financial year ended 30 June 2016
KIWIRAIL HOLDINGS LTD
Notes to the Financial Statements
Statutory review: Financial statements
KIWIRAIL ANNUAL INTEGRATED REPORT 2016 | 55
3(b). SIGNIFICANT ITEMS
Included within operating expenses note 3(a) are the following significant items:
GROUP2016
GROUP2015
$m $m
Restructuring 8.7 –
Other 0.9 –
Total significant items 9.6 –
4. CAPITAL GRANTS
GROUP2016
GROUP2015
$m $m
Capital grants (Ministry of Transport funded) 13.2 31.2
Other capital grants 19.7 13.4
Total capital grant income 32.9 44.6
The Group receives grants from Government entities for the purpose of maintaining the railway networks and infrastructure.
Where the asset being funded is depreciated over its useful life, the funding is recognised as income on a straight line basis over the same life. Grants received for services provided are recognised when the requirements of the relevant grant agreement are met. Funding received as reimbursements for capital projects are recognised in the same period as the expenditure to which it relates.
5. DEPRECIATION AND AMORTISATION EXPENSES
Note GROUP2016
GROUP2015
$m $m
Depreciation expense 9(a) 66.6 68.4
Amortisation expense 9(b) 0.9 0.4
Total depreciation and amortisation expenses 67.5 68.8
6. FOREIGN EXCHANGE AND COMMODITY GAINS AND LOSSES
GROUP2016
GROUP2015
$m $m
Net realised foreign exchange and commodity gains 4.2 1.0
Net change in the fair value of derivatives not designated as cash flow hedges (9.2) 6.2
Total foreign exchange (losses) and gains (5.0) 7.2
The table above excludes foreign exchange and commodity gains and losses on fuel related contracts of $3.3m (2015: $2.5m) which are reported within ‘Fuel and Traction Electricity Expenses’ in note 3(a).

For the financial year ended 30 June 2016
KIWIRAIL HOLDINGS LTD
Notes to the Financial Statements
Statutory review: Financial statements
56 | KIWIRAIL ANNUAL INTEGRATED REPORT 2016
6. FOREIGN EXCHANGE AND COMMODITY GAINS AND LOSSES (continued)
Foreign currency translation
Foreign currency transactions are translated to New Zealand currency at the exchange rates ruling at the transaction date.
Monetary assets and liabilities in foreign currencies at balance date are translated at exchange rates ruling at balance date. All exchange differences arising on the translation of monetary assets and liabilities in foreign currencies, whether realised or unrealised, are recognised in net surplus or deficit, except when deferred in equity as qualifying cash flow hedges.
Non–monetary assets and liabilities denominated in foreign currencies that are measured at fair value are retranslated to the functional currency at the exchange rate at the date that the fair value was determined. Non–monetary items in a foreign currency that are measured based on historical costs are translated using the exchange rate at the date of the transaction.
7. NET FINANCE EXPENSES
GROUP2016
GROUP2015
$m $m
Finance income
Interest income on bank deposits 2.9 3.3
2.9 3.3
Less finance expenses
Interest expense on borrowings (13.3) (14.9)
Interest expense on finance lease (0.5) (0.8)
Net change in fair value of interest rate swaps (3.4) (5.4)
(17.2) (21.1)
Net finance expenses (14.3) (17.8)
Finance income and expenses
Interest income from call and term deposits and interest expense on borrowings are recognised in net surplus or deficit using the effective interest rate method. Interest income is recognised as it accrues.
8. TAXATION
Income tax
All members of the Group are subject to income tax. The accounting policies applied are as follows:
Income tax expense comprises both current and deferred tax. Income tax expense is charged or credited to net surplus or deficit, except when it relates to items charged or credited directly to equity, in which case the tax is charged to equity.
(a) Current tax
Current tax is the expected tax payable on the taxable income for the period, using tax rates enacted or substantively enacted at reporting date and any adjustments to tax in respect of previous years.

For the financial year ended 30 June 2016
KIWIRAIL HOLDINGS LTD
Notes to the Financial Statements
Statutory review: Financial statements
KIWIRAIL ANNUAL INTEGRATED REPORT 2016 | 57
8. TAXATION (continued)
(b) Deferred tax
Deferred tax is provided for temporary differences between the carrying amount of assets and liabilities for financial reporting purposes and the carrying amounts used for taxation purposes. No deferred tax asset is recognised in the financial statements as it is not probable that future taxable surpluses will be available against which the asset can be utilised.
(c) Tax benefit/ (expense)
GROUP2016
GROUP2015
$m $m
Components of tax expense
Current tax expense – –
Deferred tax expense – –
Tax benefit/(expense) – –
Reconciliation between tax expense and accounting surplusDeficit before tax (194.0) (166.5)
Tax at 28% (54.0) (46.6)
Tax effect of:
Non–deductible expenditure 0.4 0.2
Other temporary differences 53.6 46.4
Tax benefit/(expense) – –
The Group has an unrecognised deferred tax asset of $835.7m (2015: $787.4m) arising from deductible temporary differences of $2,264.5m (2015: $2,304.7m) and unused tax losses of $720.1m (2015: $507.4m).
Imputation credits
The Group has formed an imputation Group. The Group has access to $1.2m imputation credits (2015: $1.2m imputation credits).

For the financial year ended 30 June 2016
KIWIRAIL HOLDINGS LTD
Notes to the Financial Statements
Statutory review: Financial statements
58 | KIWIRAIL ANNUAL INTEGRATED REPORT 2016
9. NON–FINANCIAL ASSETS
(a) Property, plant and equipment
2016 Land Buildings Railway Infrastructure
Rolling Stock Ships Plant &
EquipmentAssets Under Construction Total
Cost $m $m $m $m $m $m $m $m
Balance at 1 July 2015 3.1 48.7 111.7 316.6 114.1 199.1 52.0 845.3
Additions – 6.8 77.0 64.7 24.5 13.0 91.9 277.9
Disposals – – – (1.1) – (1.0) – (2.1)
Category transfers – – 0.6 – 0.1 – 0.3 1.0
Impairment – – (80.3) (41.8) – – (105.0) (227.1)
Balance at 30 June 2016 3.1 55.5 109.0 338.4 138.7 211.1 39.2 895.0
Accumulated depreciation
Balance at 1 July 2015 – 3.1 – 52.8 32.8 80.7 – 169.4
Depreciation expense – 3.0 4.4 34.0 10.7 14.5 – 66.6
Disposals – – – (0.9) – (0.8) – (1.7)
Category transfers – – – – – – – –
Impairment – – (4.4) (11.2) – – – (15.6)
Balance at 30 June 2016 – 6.1 – 74.7 43.5 94.4 – 218.7
Net book value
At 1 July 2015 3.1 45.6 111.7 263.8 81.3 118.4 52.0 675.9
At 30 June 2016 3.1 49.4 109.0 263.7 95.2 116.7 39.2 676.3
2015 Land Buildings RailwayInfrastructure Rolling Stock Ships Plant &
EquipmentAssets Under Construction Total
Cost
Balance at 1 July 2014 – 78.9 117.7 294.1 126.4 189.3 34.6 841.0
Additions 0.1 2.8 116.7 41.8 1.7 10.3 98.7 272.1
Disposals – (0.2) – (1.8) – (0.5) – (2.5)
Category transfers 3.0 (26.9) 0.3 – (2.0) – 2.7 (22.9)
Impairment – (5.9) (123.0) (17.5) (12.0) – (84.0) (242.4)
Balance at 30 June 2015 3.1 48.7 111.7 316.6 114.1 199.1 52.0 845.3
Accumulated depreciation
Balance at 1 July 2014 – 0.6 – 29.9 33.5 66.6 – 130.6
Depreciation expense – 4.6 9.0 31.0 9.3 14.5 – 68.4
Disposals – – – (1.1) – (0.4) – (1.5)
Category transfers – (1.6) – – – – – (1.6)
Impairment – (0.5) (9.0) (7.0) (10.0) – – (26.5)
Balance at 30 June 2015 – 3.1 – 52.8 32.8 80.7 – 169.4
Net book valueAt 1 July 2014 – 78.3 117.7 264.2 92.9 122.7 34.6 710.4
At 30 June 2015 3.1 45.6 111.7 263.8 81.3 118.4 52.0 675.9

For the financial year ended 30 June 2016
KIWIRAIL HOLDINGS LTD
Notes to the Financial Statements
Statutory review: Financial statements
KIWIRAIL ANNUAL INTEGRATED REPORT 2016 | 59
9. NON–FINANCIAL ASSETS (continued)
(a) Property, plant and equipment (continued) (i) Recognition and Measurement
Property, plant and equipment is shown at cost or valuation, less any accumulated depreciation and accumulated impairment losses. Items of property, plant and equipment in the course of construction are classified as assets under construction. Cost includes expenditure that is directly attributable to the acquisition of the asset.
Where an asset is acquired for nil or nominal consideration the asset is recognised initially at fair value, where fair value can be reliably determined; and the fair value of the asset received less costs incurred to acquire the asset is also recognised as income in net surplus or deficit.
(ii) Revaluation
Buildings are revalued with sufficient regularity to ensure that the carrying amount does not differ materially from fair value. Refer to Note 25(b)(ii) for the methodology used in the determination of fair value.
Any revaluation increase arising on the revaluation of buildings is credited to the asset revaluation reserve, except to the extent that it reverses a revaluation decrease for the same asset previously recognised as an expense in net surplus or deficit, in which case the increase is credited to net surplus or deficit to the extent of the decrease previously charged. A decrease in carrying amount arising on the revaluation of land or buildings is charged as an expense to net surplus or deficit to the extent that it exceeds the balance, if any, held in the asset revaluation reserve relating to a previous revaluation of that asset.
If buildings were stated on the historical cost basis, the amounts would be as follows:
Group2016
Group2015
$m $m
Cost 127.7 123.2
Accumulated depreciation (35.9) (32.4)
Net carrying value 91.8 90.8
(iii) Derecognition
Realised gains and losses arising from the derecognition of property, plant and equipment are recognised in net surplus or deficit in the period in which the transaction occurs. The gain or loss is calculated as the difference between the carrying amount of the asset and the net disposal proceeds received (if any). Any credit balance attributable to the disposed asset in the asset revaluation reserve is transferred to retained earnings.
(iv) Depreciation
Depreciation is charged on a straight line basis at rates that will allocate the cost or valuation of the asset over its expected useful life to its estimated residual value. Leasehold improvements are depreciated over the period of the lease or estimated useful life, whichever is the shorter. In determining an asset’s useful life, consideration is given to its expected usage, its expected wear and tear, technical or commercial obsolescence, and legal or similar limits on its use.
The average depreciable lives for major categories of property, plant and equipment are as follows:
Category Useful life
Railway InfrastructureTunnels and bridges 75 – 200 yearsTrack and ballast 40 – 50 yearsOverhead traction 20 – 80 yearsSignals and communications 15 – 50 yearsBuildings 35 – 80 years
Rolling Stock and Ships Wagons and carriages 5 – 30 yearsLocomotives 5 – 25 yearsShips 20 yearsContainers 10 years
Category Useful life
Plant and Equipment Plant and equipment 5 – 35 yearsMotor vehicles 5 – 12 yearsFurniture and fittings 5 – 12 yearsOffice equipment 3 – 5 years
Land is not depreciated.

For the financial year ended 30 June 2016
KIWIRAIL HOLDINGS LTD
Notes to the Financial Statements
Statutory review: Financial statements
60 | KIWIRAIL ANNUAL INTEGRATED REPORT 2016
9. NON–FINANCIAL ASSETS (continued)
(a) Property, plant and equipment (continued) Estimation of useful lives of assets
The Group reviews the useful lives and residual values of its property, plant and equipment annually. Assessing the appropriateness of useful life and residual value estimates of property, plant and equipment requires the Group to consider a number of factors such as the physical condition of the asset, expected period of use and expected disposal proceeds from the future sale of the asset.
(v) Finance leases
Leases in which the Group assumes substantially all the risks and rewards of ownership are classified as finance leases. Included within plant and equipment are assets acquired by way of a finance lease with a net book value of $15.0m (2015: $16.0m).
Assets held under finance leases are stated at cost less accumulated depreciation and impairment. Finance charges are recognised as finance expenses in net surplus or deficit. Further details of the lease term are provided in note 21(a).
(b) Intangible assets
Note GROUP2016
GROUP2015
$m $m
Opening balance 0.6 0.3
Additions 5.9 13.2
Amortisation 5 (0.9) (0.4)
Impairment 9(c) (4.8) (12.5)
Balance at 30 June 0.8 0.6
Intangible assets comprise software applications which have a finite useful life and are recorded at cost less accumulated amortisation and impairment losses. Intangible assets with a finite useful life are amortised on a straight–line basis over their estimated useful lives of 3 to 5 years.
(c) Impairment of non–financial assetsReconciliation of Impairment Movements to Net Surplus or Deficit
GROUP2016
GROUP2015
$m $m
Impairment of Cash Generating Units (below) 216.3 223.2
Other – 1.5
Impairment in net surplus or deficit 216.3 224.7
(i) Impairment of Cash Generating Units (“CGUs”)
The Group has three CGUs and management consider that the assets within them form the individual CGU:
• Rail CGU – non–leased buildings, railway infrastructure, rolling stock, plant and equipment and intangible assets;• Interislander – ships and related plant and equipment and intangible assets that relate to the Interislander business unit;
and• Leased Buildings – includes all leased buildings recognised as investment property.

For the financial year ended 30 June 2016
KIWIRAIL HOLDINGS LTD
Notes to the Financial Statements
Statutory review: Financial statements
KIWIRAIL ANNUAL INTEGRATED REPORT 2016 | 61
9. NON–FINANCIAL ASSETS (continued)
(c) Impairment of non–financial assets (continued)The three CGUs are assessed for impairment at each reporting date.
The value in use for each CGU is the present value of expected future cash flows. The recoverable amount of a CGU is the higher of its value in use and its fair value less costs to sell. If the carrying amount exceeds the recoverable amount the asset is impaired and the carrying amount is written down to the recoverable amount. For revalued assets the impairment is treated as a revaluation decrease (see note 9(a)(ii) above). For assets not carried at a revalued amount, the total impairment is recognised in net surplus or deficit.
As at 30 June 2016 the Interislander and Leased Buildings CGUs recoverable amount exceeds the carrying amount and no impairment is recognised. As at 30 June 2016 the recoverable amount of the Rail CGU does not exceed the carrying amount and an impairment has been recognised. We have determined the recoverable amount of the Rail CGU to be fair value less costs to sell. The impairment is allocated across each asset class within the CGU, including intangible assets.
• In determining the fair value less cost to sell of the railway infrastructure assets and rolling stock within the Rail CGU, the Group adopted a market approach assuming an orderly liquidation of the assets to arrive at a net realisable or scrap value.
• The higher of the scrap value or the net realisable value is adopted to determine the individual asset’s fair value less cost to sell.
• Market values such as steel prices and scrap metal rates are taken into account in determining the asset’s fair value. • For assets where scrap value is lower than the cost of removal the assigned fair value less cost to sell was set to nil. • Where assets have a readily determinable market value they have been impaired to this value. Where a market value is
not able to be determined the assets have been impaired to their share of the calculated value in use for the CGU. • Market values have been provided by an independent valuer for buildings based on the most recent valuation. • Market values for all railway infrastructure and rolling stock were calculated with reference to external index data as at 30
June 2016.
The following impairments and revaluation movements have been recorded in relation to the Rail CGU:
GROUP 2016
2016 Carrying amount before revaluation and
impairment
Impairment recognised in net surplus or
deficit
Impairment recognised
in Asset Revaluation
Reserve
Carrying amount after impairment
$m $m $m $m
Rail CGU
Buildings 49.0 – – 49.0
Railway infrastructure 184.9 (75.9) – 109.0
Rolling stock 294.3 (30.6) – 263.7
Plant and equipment 110.4 – – 110.4
Assets under construction 141.9 (105.0) – 36.9
Total property, plant and equipment 780.5 (211.5) – 569.0
Intangible assets 4.8 (4.8) – –
Total Rail CGU 785.3 (216.3) – 569.0

For the financial year ended 30 June 2016
KIWIRAIL HOLDINGS LTD
Notes to the Financial Statements
Statutory review: Financial statements
62 | KIWIRAIL ANNUAL INTEGRATED REPORT 2016
9. NON–FINANCIAL ASSETS (continued)
(c) Impairment of non–financial assets (continued)
GROUP 20152015 Carrying amount before revaluation and
impairment
Impairment recognised in net surplus or
deficit
Movement recognised
in Asset Revaluation
Reserve
Carrying amount after impairment
$m $m $m $m
Rail CGU
Buildings 50.9 (2.2) (3.1) 45.6
Railway infrastructure 225.7 (114.0) – 111.7
Rolling stock 274.3 (10.5) – 263.8
Plant and equipment 112.0 – – 112.0
Assets under construction 129.8 (84.0) – 45.8
Total property, plant and equipment 792.7 (210.7) (3.1) 578.9
Intangible assets 12.5 (12.5) – –
Total Rail CGU 805.2 (223.2) (3.1) 578.9
10. CASH AND CASH EQUIVALENTS
GROUP2016
GROUP2015
$m $m
Current accounts (including cash on hand) 0.3 10.6
Call deposits 96.2 39.4
96.5 50.0
Cash and cash equivalents comprises cash on hand, call deposits and other investments with an initial term of three months or less that are readily convertible to known amounts of cash and which are subject to an insignificant risk of changes in value.
11. TRADE AND OTHER RECEIVABLES
GROUP2016
GROUP2015
$m $m
Trade receivables 57.2 52.8
Accrued and other receivables:
Prepayments 14.4 9.9
Related party receivables 3.5 7.3
Other 13.2 18.2
Gross receivables 88.3 88.2
Less provision for impairment (0.9) (0.6)
87.4 87.6
Current assets 87.4 87.6
Non–current assets – –
87.4 87.6

For the financial year ended 30 June 2016
KIWIRAIL HOLDINGS LTD
Notes to the Financial Statements
Statutory review: Financial statements
KIWIRAIL ANNUAL INTEGRATED REPORT 2016 | 63
11. TRADE AND OTHER RECEIVABLES (continued)
Receivables (excluding prepayments) are financial assets classified as loans and receivables. Short–term receivables are recorded at their face value, less any provision for impairment.
Impairment
Receivables are assessed for indicators of impairment at each balance date. Receivables are impaired where there is objective evidence that, as a result of one or more events that have occurred after the initial recognition of the financial asset, the estimated future cash flows of the financial asset have been impacted. The amount of the impairment is the difference between the asset’s carrying amount and the present value of estimated future cash flows, discounted at the original effective interest rate.
The carrying amount of the receivables is reduced through the use of a doubtful debt provision. When a trade receivable is uncollectible, it is written off against the doubtful debt provision. Subsequent recoveries of amounts previously written off are credited to net surplus or deficit. Changes in the carrying amount of the doubtful debt provision are recognised in net surplus or deficit.
All overdue receivables have been assessed for impairment at balance date and appropriate provisions applied, as detailed below:
Gross2016
Impairment Net Gross2015
Impairment Net
$m $m $m $m $m $m
Not past due 41.1 – 41.1 45.0 – 45.0
Past due 1 – 30 days 7.3 – 7.3 2.2 – 2.2
Past due 31 – 60 days 1.7 – 1.7 1.4 (0.1) 1.3
Past due 61 – 90 days 1.6 – 1.6 0.8 (0.2) 0.6
Past due > 91 days 5.5 (0.9) 4.6 3.4 (0.3) 3.1
Total 57.2 (0.9) 56.3 52.8 (0.6) 52.2
The average credit period on sales of goods and services is 28.4 days (2015: 25.0 days).
12. INVENTORIES
GROUP2016
GROUP2015
$m $m
Operational Activities
– Fuel 1.3 1.5
– Inventory held to maintain rail network 36.6 30.2
– Inventory held to maintain rolling stock and ships 34.9 36.0
Inventory held for resale 0.6 0.7
Contracting Activities – work in progress 0.4 0.4
Gross inventory 73.8 68.8
Less provision for stock obsolescence (10.7) (12.3)
Net inventory 63.1 56.5
Inventory is recorded at the lower of cost and net realisable value. Costs comprise direct materials and, where applicable, direct labour costs and those overheads that have been incurred in bringing the inventory to its present condition and location. Cost is calculated using the weighted average method.
Write–downs or reversals of write–downs of inventories are recognised in operating expenses in net surplus or deficit, in the period the loss or reversal occurs. During the year, the Group has recognised net reversal of write–downs in inventory of $0.6m (2015: write–down of $0.3m).

For the financial year ended 30 June 2016
KIWIRAIL HOLDINGS LTD
Notes to the Financial Statements
Statutory review: Financial statements
64 | KIWIRAIL ANNUAL INTEGRATED REPORT 2016
13. FINANCIAL ASSETS AND LIABILITIES
GROUP2016
GROUP2015
Current Non– current Total Current Non–
current Total
$m $m $m $m $m $m
Financial assets
Foreign currency forward contracts 0.2 – 0.2 6.5 0.2 6.7
Total financial assets 0.2 – 0.2 6.5 0.2 6.7
Financial liabilities
Commodity forward contracts 0.9 0.1 1.0 1.8 0.1 1.9
Loans 5.2 199.3 204.5 28.2 180.0 208.2
Finance leases 1.3 9.0 10.3 1.3 10.3 11.6
Foreign currency forward contracts 2.8 1.8 4.6 0.3 0.1 0.4
Interest rate swaps – 14.6 14.6 – 11.2 11.2
Total financial liabilities 10.2 224.8 235.0 31.6 201.7 233.3
(a) Financial assets
The Group’s financial assets designated at fair value are those derivative financial instruments within predetermined policies and limits in order to manage exposure to fluctuations in foreign exchange, commodity and interest rate risks. The relevant accounting policy for these types of financial assets is set out under ‘Derivative financial instruments’ in note 25(b)(i). Financial assets are classified as non–current when the maturity of the hedged item exceeds 12 months.
(b) Financial liabilities
Financial liabilities are designated at amortised cost or at fair value through net surplus or deficit unless these are designated as hedged items and therefore hedge accounted for. Financial liabilities are classified as non–current when the maturity exceeds 12 months.
(i) Amortised costAmortised cost is the amount at which the financial liability is measured at initial recognition minus principal repayments, plus or minus the cumulative amortisation using the effective interest method of any difference between the initial amount and the maturity amount.
Interest–bearing liabilitiesInterest–bearing liabilities are comprised of loans and finance leases. They are initially measured at fair value, plus directly attributable transaction costs. Interest–bearing liabilities are subsequently measured at amortised cost using the effective interest method.
Unsecured loansThe notional principal amounts of the outstanding loans for the Group were $174.2m (2015: $174.2m).
Secured loansA loan from Bank of New Zealand is secured against MV Aratere. There are no restrictions on title. The amount outstanding for all secured loans as at the reporting date is $30.3m (2015: $34.0m).
The average term to maturity and weighted average interest rates for external unsecured and secured loans and finance leases are shown in the table below:

For the financial year ended 30 June 2016
KIWIRAIL HOLDINGS LTD
Notes to the Financial Statements
Statutory review: Financial statements
KIWIRAIL ANNUAL INTEGRATED REPORT 2016 | 65
13. FINANCIAL ASSETS AND LIABILITIES (continued)
Unit GROUP2016
GROUP2015
Notional principal $ m 214.8 219.9
Average interest rate % 4.60 5.82
Average term to maturity years 2.23 2.67
Committed standby facility The Group has a committed standby facility with Bank of New Zealand for $15.0m as at 30 June 2016 (2015: $15.0m) with an expiry date of 1 July 2017. As at 30 June 2016, the facility is undrawn.
Letter of credit facilitiesThe Group had no letter of credit facilities at 30 June 2016. The Group had one outstanding Import Letter of Credit at 30 June 2016 relating to a rail purchase. The outstanding balance was USD4.5m.
Standby letter of creditThe Group had one outstanding standby letter of credit at 30 June 2016 issued as credit support for fuel hedges. The outstanding balance was USD0.5m (2015: USD1.3m).
14. INVESTMENT PROPERTY
GROUP2016
GROUP2015
$m $m
Opening balance 67.6 39.9
Additions 1.2 3.9
Disposals – (0.1)
Transfers and reclassifications – 22.2
Fair value (losses)/gains on valuation (0.1) 1.7
Balance at 30 June 68.7 67.6
Investment properties are measured initially at cost, including transaction costs. Investment properties include land and buildings held to earn rental income or capital gains through the future resale of the property.
Subsequent to initial recognition, investment properties are measured at fair value. Gains or losses from changes in the fair values of investment properties are recognised in net surplus or deficit in the year in which they arise. Valuation of leased buildings is undertaken with sufficient regularity to ensure carrying value does not materially differ from fair value. See note 25(b)(ii) for the methodology used in the determination of fair value.
Investment properties are derecognised either when they have been disposed of or when the investment property is permanently withdrawn from use and no future economic benefit is expected from its disposal. Any gains or losses on the retirement or disposal of an investment property are recognised in net surplus or deficit in the year of retirement or disposal.
Included within investment property is land (excluding the rail corridor) acquired as part of the joint arrangement with Northland Regional Council. The total carrying amount of investment properties relating to this joint arrangement is $2.6m (2015: $2.5m). See note 15 for further information on this joint arrangement.
The total rental income generated from investment properties for the year ended 30 June 2016 was $4.7m (2015: $5.1m). The direct operating expenses (including maintenance) arising from the use of investment properties during the year was $1.2m (2015: $1.8m).

For the financial year ended 30 June 2016
KIWIRAIL HOLDINGS LTD
Notes to the Financial Statements
Statutory review: Financial statements
66 | KIWIRAIL ANNUAL INTEGRATED REPORT 2016
15. JOINT ARRANGEMENTS WITH NORTHLAND REGIONAL COUNCIL
In January 2009 the New Zealand Railways Corporation (“NZRC”) entered into an agreement with Northland Regional Council, which was vested from NZRC to KHL on 31 December 2012, to create a joint arrangement in order to advance the proposed Oakleigh to Marsden Point rail link. This arrangement is considered as a joint operation under NZ IFRS 11 Joint Arrangements. As a party to a joint operation, the Group has recognised the related assets and liabilities in relation to its interest in the proposed Oakleigh to Marsden Point rail link.
The Council entered into voluntary negotiations with landowners who owned land along the existing corridor and to date have acquired nine properties with a total acquisition cost of $11.5m (the Group’s share is $5.8m).
At 30 June 2016 the Group has a liability of $5.2m (2015: $5.1m) to the Council for its share of the cost of land purchased by the Council as well as other Council expenditure relating to the joint operation. This is included in Trade and Other liabilities in note 17.
16. INVESTMENT IN JOINT VENTURE
The Group is a party to a joint venture arrangement with the Port of Tauranga and Specialised Container Services (Auckland) Limited. The Group has a 25% interest in MetroBox Limited, a joint venture involved in container repair and storage operating from a facility at Southdown, Auckland.
The Group has joint control over the net assets of the joint venture in accordance with NZ IFRS 11. The Group’s investment in the joint venture is accounted for using the equity method.
Summarised financial statements of the joint venture based on its NZ IFRS financial statements, and reconciliation with the carrying amount of the investment in consolidated financial statements are set out below:
GROUP2016
GROUP2015
$m $m
Net assets 8.0 6.3
Interest 25% 25%
Carrying amount of the investment 2.0 1.6
Profit/(loss) for the year 1.7 (0.1)
Total comprehensive income 1.7 (0.1)
Group’s share of profit for the year 0.4 –

For the financial year ended 30 June 2016
KIWIRAIL HOLDINGS LTD
Notes to the Financial Statements
Statutory review: Financial statements
KIWIRAIL ANNUAL INTEGRATED REPORT 2016 | 67
17. TRADE AND OTHER LIABILITIES
Note GROUP2016
GROUP2015
$m $m
Trade payables 36.0 25.3
GST payable 17(a) 0.9 1.1
Unearned revenue 11.5 11.3
Accrued interest 1.5 1.7
Payable to joint operator 15 5.2 5.1
Other payables and accruals 39.5 43.1
Total payables 94.6 87.6
Current liabilities 94.6 87.6
Non–current liabilities – –
94.6 87.6
Payables are recognised when the Group becomes obliged to make future payments resulting from the purchase of goods and services. Payables are initially measured at fair value and subsequently measured at amortised cost using the effective interest rate method.
Trade payables are settled on normal commercial terms and the carrying value approximates fair value. No interest is incurred on trade payables unless the amounts fall overdue. Interest is charged at the discretion of the vendor.
(a) Goods and services tax (GST)
All items in the financial statements are presented exclusive of GST, except for receivables and payables, which are presented on a GST inclusive basis. Where GST is not recoverable as an input tax it is recognised as part of the related asset or expense.
The net amount of GST payable to Inland Revenue (“IR”) is included as part of trade and other liabilities.
18. EMPLOYEE ENTITLEMENTS
GROUP2016
GROUP2015
$m $m
Current portion
Short–term employee benefits 11.5 8.8
Annual leave entitlement accruals 44.6 46.2
Retirement and long service leave liability 4.9 7.9
Total current portion 61.0 62.9
Non–Current portion
Retirement and long service leave 38.0 35.0
Total non–current portion 38.0 35.0
Total employee entitlements 99.0 97.9
Provisions are made for benefits accruing to employees in respect of annual leave, retiring leave (including involuntary retirement as medically unfit) and long service leave when it is probable that settlement will be required and they are capable of being measured reliably. Employee entitlements are accounted for based on NZ IAS 19 Employee Benefits.

For the financial year ended 30 June 2016
KIWIRAIL HOLDINGS LTD
Notes to the Financial Statements
Statutory review: Financial statements
68 | KIWIRAIL ANNUAL INTEGRATED REPORT 2016
18. EMPLOYEE ENTITLEMENTS (continued)
Provisions made in respect of employee benefits expected to be settled within twelve months, are measured at their nominal values using the remuneration rate expected to apply at the time of settlement.
Provisions made in respect of employee benefits which are not expected to be settled within twelve months are measured on an actuarial basis by independent actuaries Melville Jessup Weaver (“MJW”) at the present value of the estimated future cash outflows to be made by the Group in respect of services provided by employees up to the reporting date.
The present value of the retirement and long service leave obligations depend on a number of factors. Two key assumptions used in calculating this liability include the discount rate and the salary inflation factor. The assumptions used by the actuaries in arriving at the retirement and long service leave liabilities were a salary increase rate from 2.04% to 2.5% per annum (2015: from 2.13 to 3.0% per annum) and a term specific risk–free discount rate of between 2.14% and 4.75% per annum (2015: between 3.18% and 5.5% per annum). The discount rate is derived from the yields on Government bonds as at the respective reporting dates, which have terms to maturity that match, as closely as possible, the estimated future cash outflows. The salary inflation factor has been determined after considering historical salary inflation patterns.
Contributions to superannuation plansCertain employees are members of defined contribution schemes and the Group contributes to those schemes. The contributions are recognised as labour and related costs in net surplus or deficit when they are due.
19. PROVISIONS
Provisions are recognised when the Group has a present obligation (legal or constructive) as a result of past events, it is probable that an outflow of resources embodying economic benefits will be required to settle the obligation and the amount can be reliably estimated.
GROUP 2016 ACC AEP Leased vessel costs
Reorganisation costs
Other provisions Total
$m $m $m $m $m
Balance at 1 July 2015 3.2 4.7 1.0 0.5 9.4
Provisions made during the year 0.4 1.2 3.4 1.1 6.1Provisions utilised or released during the year – – (2.7) (0.3) (3.0)
Balance at 30 June 2016 3.6 5.9 1.7 1.3 12.5
Current 3.6 – 1.7 1.3 6.6
Non–current – 5.9 – – 5.9
3.6 5.9 1.7 1.3 12.5
ACC Accredited Employer Programme
KHL and its subsidiary KiwiRail Limited (“KRL”) belong to the ACC Accredited Employer Programme (“ACC AEP”) whereby each company accepts the management and financial responsibility for employee work–related accidents.
The liability for the ACC AEP is measured annually by MJW, an external independent actuarial valuer, using actuarial techniques at the present value of expected future payments to be made in respect of the employee injuries and claims up to the reporting date. Any changes in assumptions will not have a material impact on the financial statements.
Leased vessel costs
The Group has charter agreements in place for the Kaitaki and Kaiarahi ships. Redelivery costs are accrued during the period of the lease.
Reorganisation costs
There are restructuring plans across the Group and provisions have been established for expected costs including employee termination benefits. These restructuring activities are expected to be completed during the next financial year.

For the financial year ended 30 June 2016
KIWIRAIL HOLDINGS LTD
Notes to the Financial Statements
Statutory review: Financial statements
KIWIRAIL ANNUAL INTEGRATED REPORT 2016 | 69
20. SALE AND PURCHASE OF LAND
On 31 December 2012 there was a restructure of the Crown’s investment in rail operations. In accordance with the KiwiRail Holdings Vesting Order 2012 which took effect from 31 December 2012, the KiwiRail business was transferred from the NZRC into KHL. All land previously held by KiwiRail together with the Wellington Railway Station and Social Hall buildings was retained by NZRC.
From time to time NZRC may sell parcels of railway land. Under the Group’s lease agreement with NZRC entered into on 31 December 2012, the Group may identify railway land that should be sold and request NZRC to sell it or surrender it from the lease. The sale proceeds are provided to the Group to support its business as the State–Owned Enterprise responsible for the financial performance of the Crown’s investment in rail operations.
Similarly, the Group can identify new parcels of land that are required for rail purposes. The Group will fund the acquisition of the land and can transfer it to NZRC to be included within the lease.
The sale and purchase of land are treated as common control transactions as the Crown is their ultimate parent. The sale of NZRC’s land is regarded as an increase in equity of the Crown to the Group whilst the Group’s acquisition of land for NZRC is treated as a reduction from the Crown’s equity to the Group.
The total net proceeds from land sold during the year was $18.1m. There was no land acquired during the year. The net proceeds were treated as transactions with owners in the Statement of Movements in Equity.
21. LEASES AND COMMITMENTS
(a) Finance lease
The Group has a lease agreement with Westpac Banking Corporation. Refer to note 9(a)(v) for details. The lease terms range between four to ten years and there are no terms of renewal, escalation clauses or purchase options contained within the agreement. The approved limit of this facility is $13.1m (2015: $13.0m).
At 30 June 2016 the Group had the following liability under this lease agreement:
GROUP2016
GROUP2015
Total minimum lease payments due $m $m
Not later than one year 1.8 1.9
Later than one year but not later than five years 6.0 6.8
Later than five years 5.0 6.0
Total minimum lease payments 12.8 14.7
Future lease finance charges (2.5) (3.1)
Present value of minimum lease payments 10.3 11.6
Represented by:
Current 1.3 1.3
Non–current 9.0 10.3
Total finance leases 10.3 11.6

For the financial year ended 30 June 2016
KIWIRAIL HOLDINGS LTD
Notes to the Financial Statements
Statutory review: Financial statements
70 | KIWIRAIL ANNUAL INTEGRATED REPORT 2016
21. LEASES AND COMMITMENTS (continued)
(b) Operating lease commitments as lessee
NZRC has, along with the Crown, granted a long–term lease to KRL for nominal consideration, under which KRL can enjoy the commercial benefit of the rail corridor land. KRL has primary responsibility for administering the land. Under the lease it can undertake many activities in relation to the land without requiring the consent or involvement of NZRC. It is also able to sub–lease railway land for periods of time within the term of the lease. The total minimum future sublease payments expected to be received under non–cancellable subleases at balance date is $nil.
Expenses incurred that qualify for recognition as an asset under an operating lease is recognised as property, plant and equipment. Capitalised assets are depreciated over the shorter of the estimated useful life of the asset and the lease term if there is no reasonable certainty that the Group will obtain ownership by the end of the lease term.
Operating lease payments are recognised as an operating expense in net surplus or deficit on a straight–line basis over the lease term. Operating lease incentives are recognised as a liability when received and subsequently reduced by allocating lease payments between rental expense and reduction of the liability.
The Group leases vessels and plant and equipment in the normal course of its business. Included in these lease commitments is the Group’s charter for the Kaitaki and Kaiarahi ships. The lease for Kaitaki has a non–cancellable term of four years expiring on 30 June 2017 with an option to extend for an additional three years. The lease for Kaiarahi is non–cancellable for five years expiring on 17 July 2020.
Motor vehicle leases generally have a non–cancellable term of three years.
The future aggregate minimum lease payments payable under non–cancellable operating leases are as follows:
GROUP2016
GROUP2015
$m $m
Total minimum lease payments due:
Not later than one year 28.4 22.8
Later than one year but not later than five years 64.1 58.4
Later than five years 10.7 14.4
103.2 95.6
(c) Operating lease commitments as lessor
The Group has certain non–cancellable property leases. The property lease portfolio is made up of a large number of leases with varying terms.
The future aggregate minimum lease payments to be collected under non–cancellable operating leases are as follows:
GROUP2016
GROUP2015
$m $m
Total minimum lease payments receivable:
Not later than one year 26.2 25.5
Later than one year but not later than five years 75.3 72.3
Later than five years 82.5 82.5
184.0 180.3
For the year ended 30 June 2016, $33.9m was recognised as revenue in net surplus or deficit (2015: $31.3m).

For the financial year ended 30 June 2016
KIWIRAIL HOLDINGS LTD
Notes to the Financial Statements
Statutory review: Financial statements
KIWIRAIL ANNUAL INTEGRATED REPORT 2016 | 71
21. LEASES AND COMMITMENTS (continued)
(d) Capital and other commitments
The Group has capital commitments for network upgrades, infrastructure renewal materials, manufacturing of new rolling stock, refurbish-ment costs relating to rolling stock and purchases of plant and equipment.
GROUP2016
GROUP2015
$m $m
Capital expenditure commitments:
Not later than one year 44.8 88.6
Later than one year but not later than five years 5.8 13.8
50.6 102.4
22. RECONCILIATION OF NET SURPLUS / (DEFICIT) TO NET CASH FLOWS FROM OPERATING ACTIVITIES
GROUP2016
GROUP2015
$m $m
Net deficit after taxation (194.0) (166.5)
Add / (deduct) items classified as investing or financing activities
Gain on sale of assets 1.0 1.7
Fair value movement in derivatives 12.8 (0.3)
Capital grant receipts (32.9) (44.6)
Share in profit of joint venture (0.4) –
(213.5) (209.7)
Add non–cash items
Depreciation and amortisation expense 67.5 68.7
Movements in provisions 6.1 (11.6)
Impairment of non–financial assets 216.3 224.7
Write back of receivable from joint venture – (1.7)
Movement in fair value of investment properties 0.1 (1.7)
76.5 68.7
Add / (deduct) movements in working capital
(Increase)/decrease in trade receivables (4.4) (2.4)
Decrease/(increase) in other receivables 4.3 9.0
(Increase)/decrease in inventories (6.6) 2.2
Increase/(decrease) in trade payables 10.7 (11.0)
(Decrease)/increase in other payables (2.2) 5.3
Net cash flows from operating activities 78.3 71.8

For the financial year ended 30 June 2016
KIWIRAIL HOLDINGS LTD
Notes to the Financial Statements
Statutory review: Financial statements
72 | KIWIRAIL ANNUAL INTEGRATED REPORT 2016
23. RELATED PARTY TRANSACTIONS
The Group enters into transactions with related parties all of which are carried out on normal commercial terms. Transactions that occur within a normal supplier or client / recipient relationship, on terms and conditions no more or less favourable than those which it is reasonable to expect the Parent or its subsidiaries and associates would have adopted if dealing with that entity at arm’s length in the same circumstance, are not disclosed.
Significant transactions with Government–related entitiesThe Group has been provided with equity from the Crown and capital grant funding from Government entities. Equity funding of $209.8m (2015: $198.0m) has been received together with capital grant funding of $13.2m (2015: $31.2m).
The Group receives operating revenue for providing rail freight services to Solid Energy New Zealand and Genesis Energy.
The Group also purchases goods and services from entities controlled, significantly influenced, or jointly controlled by the Crown.
As these transactions are material in nature they have been disclosed in thousands rather than expressed in millions.
GROUP2016
GROUP2015
REVENUE $000 $000
Solid Energy 25,752 37,477
Genesis Energy 982 1,063
New Zealand Transport Agency 4,341 1,955
31,075 40,495
GROUP2016
GROUP2015
EXPENSES $000 $000
Meridian Energy 12,952 12,006
Transpower 2,996 2,937
Air New Zealand 1,853 2,469
New Zealand Post 892 439
Kordia 2,086 717
New Zealand Transport Agency 900 802
Maritime New Zealand 300 720
Land Information New Zealand 293 433
Other 328 486
22,600 21,009
Collectively but not individually significant transactions with Government–related entitiesThe Group is required to pay various taxes and levies (such as GST, FBT, PAYE and ACC levies) to the Crown and entities related to the Crown. The payment of these taxes and levies is based on the standard terms and conditions that apply to all tax and levy payers.

For the financial year ended 30 June 2016
KIWIRAIL HOLDINGS LTD
Notes to the Financial Statements
Statutory review: Financial statements
KIWIRAIL ANNUAL INTEGRATED REPORT 2016 | 73
23. RELATED PARTY TRANSACTIONS (continued)
Transactions with key management personnelKey management personnel is defined as Directors, the Chief Executive and all executive level direct reports of the Chief Executive. Key management personnel of the Group may be directors or officers of other companies or organisations with whom the Group may transact. Such transactions are all carried out independently on normal commercial terms.
The compensation of the key management personnel of the Group was as follows:
GROUP2016
GROUP2015
$000 $000
Key management personnel compensation
Short–term employee benefits 4,932 4,778
Termination benefits 223 537
Total key management personnel compensation 5,155 5,315
The following Directors earned fees during the period:
2016 2015
KHL Directors $000 $000
John Spencer 80 80
Paula Rebstock 50 50
Bob Field 32 40
John Leuchars 40 40
Rebecca Thomas 37 40
Kevin Thompson 40 40
Guy Royal 40 40
Mike Pohio 7 –
Paul Harper 7 –
333 330
Mike Pohio and Paul Harper were appointed as Directors on 1 May 2016. Bob Field’s term as a Director ended on 30 April 2016.

For the financial year ended 30 June 2016
KIWIRAIL HOLDINGS LTD
Notes to the Financial Statements
Statutory review: Financial statements
74 | KIWIRAIL ANNUAL INTEGRATED REPORT 2016
24. SHARE CAPITAL
At 30 June 2016, the Group had issued 613,600,200 ordinary shares with no par value (2015: 403,800,200), each fully paid. The following rights attach to the ordinary shares issued by the Group:
• the right to one vote on a poll at a meeting of the Group on any resolution, including any resolution to appoint or remove a Director or auditor, alter the Group’s constitution, approve a major transaction, approve an amalgamation, and put the Group into liquidation;
• the right to an equal share of dividends approved by the Board; and • the right to an equal share in the distribution of the surplus assets of the Group.
Reconciliation of number of shares GROUP2016
GROUP2015
(m) (m)
Opening balance 403.8 205.8
Shares issued 209.8 198.0
Balance at 30 June 613.6 403.8
25. FAIR VALUE
(a) Classification of Financial Instruments
The classification of each category of financial instruments is set out below:
GROUP2016
GROUP2015
FINANCIAL ASSETS $m $m
Loans and receivables
Cash and cash equivalents 96.5 50.0
Trade and other receivables (excluding prepayments) 73.0 77.7
169.5 127.7
Fair value through net surplus or deficit (Derivatives non–hedge accounted for)
Derivative financial assets 0.2 6.7
FINANCIAL LIABILITIES
Amortised cost
Trade and other liabilities 82.2 75.2
Interest–bearing liabilities 214.8 219.8
297.0 295.0
Fair value through net surplus or deficit (Derivatives non–hedge accounted for)
Derivative financial liabilities 19.6 13.3
Fair value through other comprehensive income (Derivatives hedge accounted for)
Derivative financial liabilities 0.6 0.2
The carrying amounts of the financial assets and financial liabilities approximate their fair value.
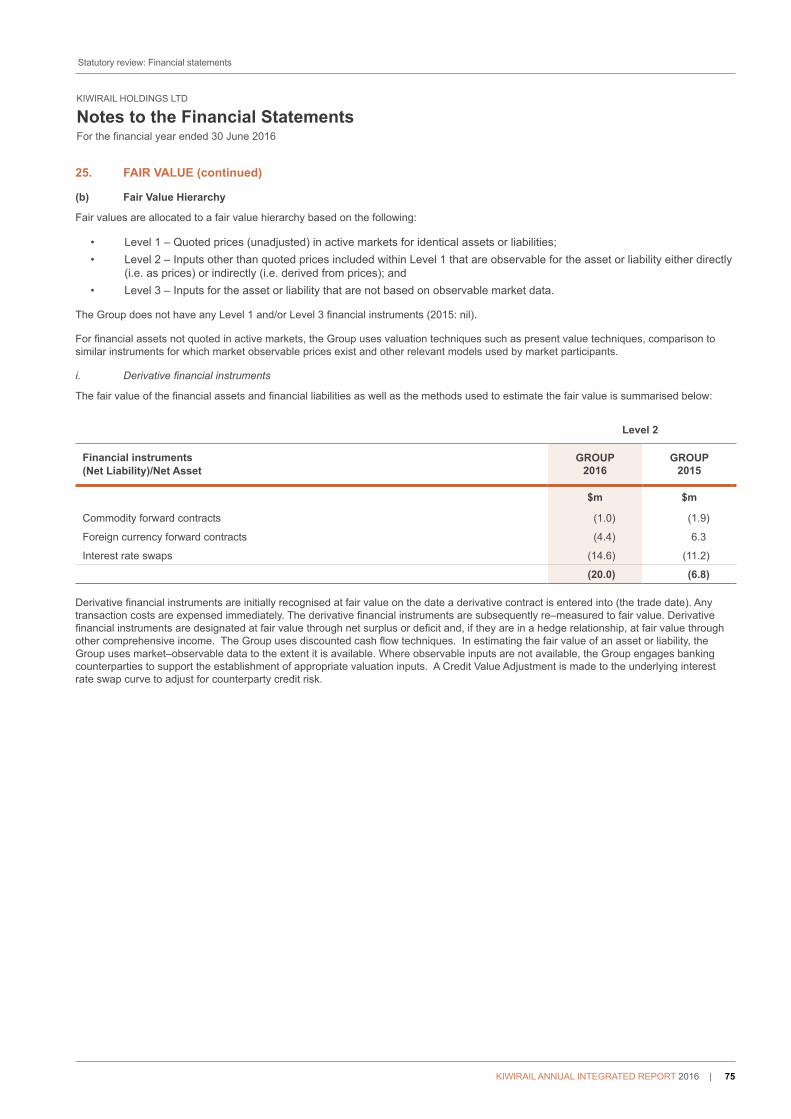
For the financial year ended 30 June 2016
KIWIRAIL HOLDINGS LTD
Notes to the Financial Statements
Statutory review: Financial statements
KIWIRAIL ANNUAL INTEGRATED REPORT 2016 | 75
25. FAIR VALUE (continued)
(b) Fair Value Hierarchy
Fair values are allocated to a fair value hierarchy based on the following:
• Level 1 – Quoted prices (unadjusted) in active markets for identical assets or liabilities;• Level 2 – Inputs other than quoted prices included within Level 1 that are observable for the asset or liability either directly
(i.e. as prices) or indirectly (i.e. derived from prices); and• Level 3 – Inputs for the asset or liability that are not based on observable market data.
The Group does not have any Level 1 and/or Level 3 financial instruments (2015: nil).
For financial assets not quoted in active markets, the Group uses valuation techniques such as present value techniques, comparison to similar instruments for which market observable prices exist and other relevant models used by market participants.
i. Derivative financial instruments
The fair value of the financial assets and financial liabilities as well as the methods used to estimate the fair value is summarised below:
Level 2
Financial instruments(Net Liability)/Net Asset
GROUP2016
GROUP2015
$m $m
Commodity forward contracts (1.0) (1.9)
Foreign currency forward contracts (4.4) 6.3
Interest rate swaps (14.6) (11.2)
(20.0) (6.8)
Derivative financial instruments are initially recognised at fair value on the date a derivative contract is entered into (the trade date). Any transaction costs are expensed immediately. The derivative financial instruments are subsequently re–measured to fair value. Derivative financial instruments are designated at fair value through net surplus or deficit and, if they are in a hedge relationship, at fair value through other comprehensive income. The Group uses discounted cash flow techniques. In estimating the fair value of an asset or liability, the Group uses market–observable data to the extent it is available. Where observable inputs are not available, the Group engages banking counterparties to support the establishment of appropriate valuation inputs. A Credit Value Adjustment is made to the underlying interest rate swap curve to adjust for counterparty credit risk.

For the financial year ended 30 June 2016
KIWIRAIL HOLDINGS LTD
Notes to the Financial Statements
Statutory review: Financial statements
76 | KIWIRAIL ANNUAL INTEGRATED REPORT 2016
25. FAIR VALUE (continued)
(b) Fair Value Hierarchy (continued)
ii. Non–financial assets
The fair value of the non–financial assets which are required to be reflected at fair value during the year was:
Level 2
Non–financial assets GROUP2016
GROUP2015
$m $m
Investment property 68.7 67.6
Buildings 49.4 45.6
Assets held for sale – 2.3
118.1 115.5
NZ IFRS 13 requires that the fair value measurement of non–financial assets take into account a market participant’s ability to generate economic benefits by using the asset in its highest and best use or by selling it to another market participant that would use the asset in its highest and best use.
Highest and best use of a non–financial asset takes into account the use of the asset that is physically possible, legally permissible and financially feasible. It is determined from the perspective of market participants, even if the Group intends a different use.
The valuation techniques used in determining the fair value of non–financial assets are as follows:
• Investment property Valuation of investment property is carried out with sufficient regularity to ensure the carrying value does not materially differ from fair value. The most recent valuation was carried out by an independent valuer who holds a recognised and relevant professional qualification.Each property is treated as an individual CGU. Investment properties are valued accounting for market derived assumptions. When the fair value is determined, the independent valuer has utilised valuers located nationwide that are familiar with the local property market in which the property is situated. They have factored local inputs into the valuation such as rentals, capitalisation rates and land values. The market valuation methodology used for investment properties was the income approach. The capitalisation rates used in the valuation range from 8% to 11%.
• Buildings Buildings are properties held to carry–out the Group’s entity–specific operations. They are revalued with sufficient regularity to ensure the carrying value does not materially differ from fair value. The most recent valuation of buildings that form part of the rail CGU was carried out by an independent valuer who has recognised and relevant qualifications.In carrying out the valuation, the valuers take into account the likely sale price of the property but also assumed that the highest and best use is the properties’ current use. Valuations are undertaken in accordance with the standards issued by the New Zealand Property Institute, NZ IAS 16 Property, Plant and Equipment and NZ IFRS 13 with the following bases of valuation adopted:
• Specialised buildings which are those assets identified as having no readily available market and exist strictly to carry out KiwiRail’s unique operations are valued using optimised depreciated replacement cost.
• Non–specialised buildings which could be sold with relative ease are valued at market value.
• Assets held for sale There are no assets held for sale at balance date. A number of assets held by the Group were identified to be sold as at 30 June 2015. An asset held for sale is required to be measured at the lower of the carrying value and the fair value less cost to sell.We adopted the ‘market approach’ to determine the asset’s fair value by using market multiples derived from a set of comparables. For assets which are actively marketed, the source of fair value was based on the expressions of interest received carried out on an open market basis.

For the financial year ended 30 June 2016
KIWIRAIL HOLDINGS LTD
Notes to the Financial Statements
Statutory review: Financial statements
KIWIRAIL ANNUAL INTEGRATED REPORT 2016 | 77
25. FAIR VALUE (continued)
(b) Fair Value Hierarchy (continued)
Sensitivity analysisThe following represents the financial impact of changes in fair value of non–financial assets:
Increase in fair value by 5% Decrease in fair value by 5%
Non–financial assets 2016 2015 2016 2015
Buildings $0.4m $0.2m $1.0 $0.8m
Investment properties $3.3m $3.3m $3.3m $3.3m
26. FINANCIAL RISK MANAGEMENT POLICIES AND OBJECTIVES
The Group’s principal financial instruments comprise cash and cash equivalents, receivables, interest–bearing liabilities, trade and other liabilities and derivatives.
The Group manages its exposure to key financial risks, including market risk, credit risk and liquidity risk in accordance with the Group’s financial risk management policies. The objective of the policy is to support the delivery of the Group’s financial targets whilst protecting future financial security.
(a) Market Risk
Market risk refers to the risk that the fair value or future cash flows of a financial instrument will fluctuate because of changes in market price. Market risk comprises three types of risk; currency risk, interest rate risk and other price risk.
(i) Foreign Exchange Risk or Currency Risk
Foreign exchange risk is the risk of cash flow volatility arising from the movement in foreign exchange rates to which the Group may be exposed. The Group is exposed to foreign exchange risk from normal operating activities and capital purchases.
The Group’s Treasury Policy requires it to manage foreign currency risks arising from future transactions and liabilities by using Board approved foreign exchange hedging instruments.
The New Zealand Dollar notional principal amounts of outstanding forward foreign exchange contracts were $62.3m (2015: $98.2m).
The Group has hedged 100% (2015: 97.01%) of committed foreign currency capital purchases.
Cash flows in respect of foreign currency cash flow hedges are expected to occur:
GROUP2016
GROUP2015
Currency hedged: EURO $m $m
Not later than 1 year 5.9 6.2
Later than 1 year not later than 2 years – 6.2
5.9 12.4

For the financial year ended 30 June 2016
KIWIRAIL HOLDINGS LTD
Notes to the Financial Statements
Statutory review: Financial statements
78 | KIWIRAIL ANNUAL INTEGRATED REPORT 2016
26. FINANCIAL RISK MANAGEMENT POLICIES AND OBJECTIVES (continued)
Foreign currency sensitivity on financial instruments
The following table demonstrates the sensitivity of the Group’s equity and profit to a 10% strengthening or weakening in the value of the New Zealand Dollar. This analysis does not include future forecast hedged operating or capital transactions.
GROUP2016
GROUP2015
In NZ $m Equity Profit Equity Profit
Impact of a 10% strengthening of the NZD (5.1) (4.6) (8.7) (7.6)
Impact of a 10% weakening of the NZD 6.3 5.6 10.6 9.3
ii. Interest Rate Risk
Interest rate risk is the risk that cost of funds increase due to adverse movements in the interest rates that KiwiRail pays on its borrowings.
The Group borrows a mixture of fixed and floating rate debt in New Zealand Dollars. The Group hedges its re–pricing profile using interest rate swaps in accordance with its Treasury Policy in order to minimise and provide certainty over funding costs.
The notional principal amounts of the outstanding interest rate swaps for the Group were $146.0m (2015: $146.0m), with average term to maturity of 3.56 years (2015: 4.83 years) and weighted average fixed interest rate of 5.97% (2015: 5.95%). As at 30 June 2016, after taking into account the effect of the interest rate swaps, approximately 68.0% of the Group’s borrowings are at a fixed rate of interest (2015: 65.3%).
Interest sensitivity analysis
A change in the interest rates would also have an impact on interest payments and receipts on the Group’s floating rate debt and investment instruments (including the floating rate leg of any interest rate derivatives). The sensitivity to a 100 basis point (bp) movement in interest rates (based on financial assets and liabilities held at the reporting date) is as follows:
GROUP2016
GROUP2015
In NZ $m Profit Profit
Impact of a 100 bp interest rate increase 1.7 2.9
Impact of a 100 bp interest rate decrease (1.8) (3.1)
iii. Price Risk
Price risk is the risk that the fair value or future cash flows of a financial instrument will fluctuate as a result of changes in market prices.
Fuel Price risk
The Group seeks to recover increased costs caused by increased fuel prices from its customers in the form of a fuel surcharge or fuel adjustment factor. Since the Group purchases its fuel at floating market rates, the Group is exposed to fuel price risk to the extent that it is unable to fully recover fuel price increases from its customers in the form of fuel surcharges. Accordingly, the Group’s Treasury Policy allows Board approved hedging instruments to be entered into to manage this exposure.
The Group is party to a number of commodity forward contracts for heavy and light fuel oil. The total notional principal amount of outstanding commodity forward contracts is $6.1m (2015: $10.6m).

For the financial year ended 30 June 2016
KIWIRAIL HOLDINGS LTD
Notes to the Financial Statements
Statutory review: Financial statements
KIWIRAIL ANNUAL INTEGRATED REPORT 2016 | 79
26. FINANCIAL RISK MANAGEMENT POLICIES AND OBJECTIVES (continued)
(b) Credit Risk
Credit risk is the potential loss from a transaction in the event of default by a counterparty during the term of the transaction or on settlement of the transaction. Financial instruments which potentially subject the Group to credit risk consist primarily of cash and cash equivalents and trade and other receivables.
Whilst the Group may be subjected to losses up to the contract value of the instruments in the event of default by its counterparties, it does not expect such losses to occur. On–going credit evaluation is performed on the financial condition of accounts receivable and customers’ compliance with credit terms.
The Group’s Treasury Policy does not require collateral support for financial instruments subject to credit risk, although personal guarantees may be obtained in support of the financial performance of certain customers.
Concentration of credit risk
The Group does not have any significant credit risk exposure to a single counterparty or any group of counterparties having similar characteristics due to the large number of customers included in the Group’s customer base. The credit risk on cash and cash equivalents and foreign exchange dealings is limited as the Group spreads its business amongst a number of Standard & Poors AA rated counterparties.
Credit quality of assets not impaired or not yet due
The Group does not rate its individual debtors as it has a large number of customers. The incident of default on financial assets not impaired or not yet due is minimal. The Group has no other significant exposure to credit risk from financial assets not impaired or not yet due, nor has there been any renegotiation of terms on any of these assets.
Exposure to credit risk
The carrying amount of financial assets represents the maximum credit exposure.
(c) Liquidity Risk
Liquidity risk is the risk that the Group will not be able to meet financial commitments as they fall due. The Group manages liquidity risk by continuously monitoring forecast and actual cash flows and matching the maturity profiles of financial assets and financial liabilities.The Group accesses funds via Crown appropriations for specified capital projects.
Exposure to liquidity risk
The table below analyses the Group’s financial liabilities into relevant maturity groupings based on the remaining period at the balance date to the contractual maturity date. Future interest payments on floating rate debt are based on the floating rate of the instrument at the balance date. The amounts disclosed are the contractual undiscounted cash flows.
GROUP 2016 Carrying amount
Contractual cash flows
Less than 1 year 1 – 2 years 2 – 5 years More than 5
years
$m $m $m $m $m $m
Financial Liabilities
Trade and other payables 82.2 82.2 82.2 – – –
Net settled derivative liabilities 20.0 20.0 3.6 0.6 12.5 3.3
Finance leases 10.3 12.7 1.8 1.8 4.1 5.0
Borrowings 204.5 222.2 14.9 173.5 33.8 –
Total 317.0 337.1 102.5 175.9 50.4 8.3

For the financial year ended 30 June 2016
KIWIRAIL HOLDINGS LTD
Notes to the Financial Statements
Statutory review: Financial statements
80 | KIWIRAIL ANNUAL INTEGRATED REPORT 2016
26. FINANCIAL RISK MANAGEMENT POLICIES AND OBJECTIVES (continued)
GROUP 2015 Carrying amount
Contractual cash flows
Less than 1 year 1 – 2 years 2 – 5 years More than 5
years
$m $m $m $m $m $m
Financial Liabilities
Trade and other payables 75.2 75.2 75.2 – – –
Net settled derivative liabilities 13.5 13.5 2.0 0.3 5.0 6.2
Finance leases 11.6 14.7 1.9 1.8 5.0 6.0
Borrowings 208.2 235.3 40.1 12.2 183.0 –
Total 308.5 338.7 119.2 14.3 193.0 12.2
(d) Derivative Financial Instruments and Hedging Activities
The Group uses derivative financial instruments within predetermined policies and limits in order to manage its exposure to fluctuations in foreign exchange, commodity and interest rate risks. The Group does not engage in speculative transactions or hold derivative financial instruments for trading purposes.
The risk management objectives and strategy for undertaking various hedge transactions is covered by the Group Treasury Policy. The Group documents, at the inception of the transaction, the hedging relationship between hedging financial instruments and the hedged items. The Group also documents its assessment, both at hedge inception and on an on–going basis, of whether the derivatives used in the hedging transaction are highly effective in offsetting changes in fair values or cash flows of hedged items.
Cash flow hedgesChanges in the fair value of derivative financial instruments designated as cash flow hedges are recognised in other comprehensive income and the cash flow hedge reserve within other comprehensive income to the extent that the hedges are deemed effective. To the extent that the hedges are ineffective for accounting, changes in fair value are recognised in net surplus or deficit in foreign exchange and commodity net gains and losses.
In any of the following circumstances, the Group shall discontinue hedge accounting:• If a derivative financial instrument expires or is sold, terminated or exercised• It no longer meets the criteria for hedge accounting• The forecast transaction is no longer expected to occur• The designation of the hedge relationship is revoked or changed
In cases where hedge accounting is discontinued, the cumulative, unrealised gain or loss recognised in the cash flow hedge reserve in other comprehensive income with respect to the derivative instrument is recognised immediately in net surplus or deficit.
Where the hedge relationship continues throughout its designated term, the amount in the cash flow hedge reserve is transferred to the carrying value of the asset when it is recognised.
(e) Capital Risk Management
The Group manages its capital structure to ensure it is able to continue as a going concern whilst maximising its investment into rail infrastructure and rolling stock assets. The State–Owned Enterprises Act 1986 requires the Board to manage the Group as a profitable and efficient organisation that is comparable to businesses that are not owned by the Crown.
The capital structure of the Group consists of borrowings, cash and cash equivalents and equity. Equity comprises a capital contribution from the Crown, retained earnings and reserves.
The Board reviews the capital structure of the Group as part of the Group’s planning cycle and regular on–going reviews. As part of this review, the Board considers the level of capital invested in the business and the amounts retained to ensure it effectively achieves its objectives and purpose.

For the financial year ended 30 June 2016
KIWIRAIL HOLDINGS LTD
Notes to the Financial Statements
Statutory review: Financial statements
KIWIRAIL ANNUAL INTEGRATED REPORT 2016 | 81
27. CONTINGENT LIABILITIES
Marsden Point rail corridor designation
The Group has confirmed its designation of the rail corridor from the North Auckland Line to Marsden Point. The Northland Regional Council will purchase any land that may be required. The Group has an agreement with the Northland Regional Council that it will have a half share in the acquisition and holding costs of land purchases with the Council.
28. EVENTS SUBSEQUENT TO BALANCE DATE
There were no material events subsequent to balance date. Effective 2 July 2016, the Group ceased to be the operator for Tranz Metro passenger services in Wellington. The operating surplus attributable to Tranz Metro operations for year ended 30 June 2016 was $3.5m.

82 | KIWIRAIL ANNUAL INTEGRATED REPORT 2016
Independent Auditor’s Report
To the readers of KiwiRail Holdings Limited group’s
financial statements for the year ended 30 June 2016
The Auditor–General is the auditor of KiwiRail Holdings Limited and its subsidiaries and other controlled entities (collectively referred to as “the Group”). The Auditor–General has appointed me, Stephen Lucy, using the staff and resources of Audit New Zealand, to carry out the audit of the financial statements of the Group on her behalf.
OpinionWe have audited the financial statements of the Group on pages 48 to 81, that comprise the statement of financial position as at 30 June 2016, the statement of comprehensive income, statement of movements in equity and statement of cash flows for the year ended on that date and the notes to the financial statements that include accounting policies and other explanatory information.
In our opinion the financial statements of the Group:
• present fairly, in all material respects:
• its financial position as at 30 June 2016; and
• its financial performance and cash flows for the year then ended; and• comply with generally accepted accounting practice in New Zealand in accordance with New Zealand equivalents to
International Financial Reporting Standards and International Financial Reporting Standards.
Dependence on continuing support from shareholderWithout modifying our opinion, we draw your attention to the disclosure made on page 53 that the Board of Directors’ assessment of the group’s ability to continue as a going concern is dependent on continuing support from the shareholder. We consider the disclosures to be adequate.
Our audit was completed on 26 August 2016. This is the date at which our opinion is expressed.
The basis of our opinion is explained below. In addition, we outline the responsibilities of the Board of Directors and our responsibilities, and explain our independence.
Basis of opinionWe carried out our audit in accordance with the Auditor–General’s Auditing Standards, which incorporate the International Standards on Auditing (New Zealand). Those standards require that we comply with ethical requirements and plan and carry out our audit to obtain reasonable assurance about whether the financial statements are free from material misstatement.
Material misstatements are differences or omissions of amounts and disclosures that, in our judgement, are likely to influence readers’ overall understanding of the financial statements. If we had found material misstatements that were not corrected, we would have referred to them in our opinion.
An audit involves carrying out procedures to obtain audit evidence about the amounts and disclosures in the financial statements. The procedures selected depend on our judgement, including our assessment of risks of material misstatement of the financial statements, whether due to fraud or error. In making those risk assessments, we consider internal control relevant to the preparation of the Group’s financial statements in order to design audit procedures that are appropriate in the circumstances but not for the purpose of expressing an opinion on the effectiveness of the Group’s internal control.
An audit also involves evaluating:
• the appropriateness of accounting policies used and whether they have been consistently applied;
• the reasonableness of the significant accounting estimates and judgements made by the Board of Directors;
• the adequacy of the disclosures in the financial statements; and
• the overall presentation of the financial statements.
Statutory review: Independent Auditor’s report
KIWIRAIL ANNUAL INTEGRATED REPORT 2016 | 83
We did not examine every transaction, nor do we guarantee complete accuracy of the financial statements. Also we did not evaluate the security and controls over the electronic publication of the financial statements.
We believe we have obtained sufficient and appropriate audit evidence to provide a basis for our audit opinion.
Responsibilities of the Board of DirectorsThe Board of Directors is responsible for the preparation and fair presentation of financial statements for the Group that comply with generally accepted accounting practice in New Zealand.
The Board of Directors’ responsibilities arise from the State Owned Enterprises Act 1986.
The Board of Directors is also responsible for such internal control as it determines is necessary to enable the preparation of financial statements that are free from material misstatement, whether due to fraud or error. The Board of Directors is also responsible for the publication of the financial statements, whether in printed or electronic form.
Responsibilities of the AuditorWe are responsible for expressing an independent opinion on the financial statements and reporting that opinion to you based on our audit. Our responsibility arises from the Public Audit Act 2001.
IndependenceWhen carrying out the audit, we followed the independence requirements of the Auditor–General, which incorporate the independence requirements of the External Reporting Board.
In addition to the audit we have carried out a special purpose audit relating to the Funding Agreement for Suburban Rail Services between one of the subsidiaries of the group, KiwiRail Limited, and the Greater Wellington Regional Council. The special purpose audit is compatible with those independence requirements. Other than the audit and the special purpose audit, we have no relationship with or interests in the Group.
S B Lucy
Audit New Zealand On behalf of the Auditor–General Wellington, New Zealand
Statutory review: Independent Auditor’s report

84 | KIWIRAIL ANNUAL INTEGRATED REPORT 2016
2016Actual
2016Target
Sustaining Zero Harm Environment
LTIFR 5.8 6.2
TRIFR 14.6 11.7
GHG emissions per NTK (gms) 29.6 30.3
Engaging our customers and stakeholders
Rail Freight Customers – Net Promoter Score (18) (1)
Commercial Vehicle Customers – Net Promoter Score (17) 5
Interislander – Net Promoter Score 53 35
Scenic Journeys – Net Promoter Score 63 64
Tranz Metro – Customer satisfaction (%) 93 93
Delivering operational performance
Ontime Performance (%)
– All Freight Trains 83 94
– Freight Premium Trains 69 82
– Tranz Metro 96 94
– % Interislander services to advertised sailings 99 99
Fuel litres per 1000 GTK 5.5 5.5
Operating costs as a percentage of revenue 88 88
Network Renewals
– New Sleepers Laid (000) 73 82
– New Rail Laid (km) 15 13
– Lines De–stressed (km) 93 153
Empowering our people
Employee Engagement Net Promoter Score (21) (15)
Meeting our financial targets
Revenue ($m) 694 703
Contribution Margin (%) 25 26
Underlying Operating Surplus ($m) 86 85
Underlying Operating Surplus as % of Revenue 12 12
Capital Expenditure – net of grants ($m) 254 282
Statement of Corporate Intent comparisons*
KIWIRAIL HOLDINGS LTD
Key Performance Indicators
Statutory review: Key Performance Indicators

KIWIRAIL ANNUAL INTEGRATED REPORT 2016 | 85
Statement of Corporate Intent comparisons*
*Refer to Statement of Corporate Intent 2016–2018 for definitions of performance measures
KIWIRAIL HOLDINGS LTD
Key Performance Indicators
2016Actual
2016Target
Shareholder Return Measures
Total Shareholder Return N/A N/A
Dividend Yield 0 0
Dividend Payout 0 0
Return on Average Equity (%) (36) (43)
Profitability/Efficiency Measures
Return on Average Capital Employed (%) (26) (30)
Operating Margin (%) 12 12
Leverage/Solvency Measures
Shareholder’s Funds to Total Assets (%) 56 56
Gearing Ratio – net (%) 21 28
Interest Cover 7.0 6.9
Solvency (current assets/current liabilities) 1.43 1.36
Statutory review: Key Performance Indicators

86 | KIWIRAIL ANNUAL INTEGRATED REPORT 2016
Statutory review: Vote Transport
Vote Transport
Vote Transport: Non-Departmental Capital & Other ExpenditureActivities undertaken by KiwiRail that are funded through Vote Transport Non-Departmental Capital & Other Expenditure are detailed below.
Rail – Railway Safety (M72)This appropriation is intended to achieve improvements in community safety around railway lines and stations.
2016 Actual
2016 Target
Amount of Appropriation ($000) 500 500
Performance Measure:
A safer railway system Achieved Achieved
Rail – Public Policy Projects (M72)This appropriation is intended to achieve public policy rail initiatives that do not have a financial benefit but have positive effects on the community.
2016 Actual
2016 Target
Amount of Appropriation ($000) 3,270 3,270
Performance Measure:
The Public Policy Projects are carried out in line with the programme Achieved Achieved
Rail – KiwiRail Equity Injection (M72)This appropriation is intended to achieve equity injections to KiwiRail Holdings Limited resulting from property transactions by New Zealand Railways Corporation.
2016 Actual
2016 Target
Amount of Appropriation ($000) 18,108 23,010
Rail - KiwiRail Holdings Limited (M72)This appropriation is intended to achieve capital investment in the New Zealand rail system.
2016 Actual
2016 Target
Amount of Appropriation ($000) 209,800 209,800
Performance Measure:
Capital is invested in the New Zealand rail system as approved by shareholding Ministers 100% 100%
Rail – Wellington Metro Rail Network Upgrade (M72)This appropriation is intended to achieve significant improvements to the Wellington metro network, to improve the reliability of commuter services.
2016 Actual
2016 Target
Amount of Appropriation ($000) 12,768 16,513
Performance Measure:
Work is carried out per the agreed programme 77% completed with remainder carried forward to 2016/17
100%

KIWIRAIL ANNUAL INTEGRATED REPORT 2016 | 87
There were 895 KiwiRail employees (or former employees) who received remuneration and benefits in excess of $100,000 (not including Directors) in their capacity as employees during the year ended 30 June 2016, as set out below
1,020–1,030 1 240–250 4
550–560 2 230–240 5
480–490 1 220–230 12
450–460 1 210–220 6
400–410 1 200–210 8
370–380 2 190–200 18
360–370 1 180–190 15
350–360 1 170–180 16
340–350 1 160–170 36
330–340 1 150–160 39
310–320 3 140–150 45
300–310 2 130–140 89
290–300 2 120–130 96
280–290 2 110–120 180
260–270 1 100–110 301
250–260 3
Total employees earning in excess of $100,000 895 (2015: 845)
Employees who are included but who are no longer at KiwiRail as at 30 June 2016 170 (2015: 80)
Net total employees earning in excess of $100,000 and employed at KiwiRail as at 30 June 2016 725 (2015: 765)
This includes fixed remuneration, employee KiwiSaver contributions, short–term performance payments, settlement payments and redundancy payments for all permanent employees
Employee remuneration
Statutory review: Employee remuneration

Statutory review: Directory
Bankers Bank of New Zealand North End Branch, 100 Lambton Quay, Wellington P.O. Box 1596, Wellington 6140
Auditors Stephen Lucy, Audit New Zealand On behalf of the Auditor–General Level 2, 100 Molesworth Street, Wellington Private Bag 99, Wellington 6140
Registered office Level 3, 8–14 Stanley Street, Auckland 1010
Directory
Further informationFor assistance, publications or information concerning KiwiRail please visit our website at www.kiwirail.co.nz or contact:KiwiRail Communications PO Box 593, Wellington, 6140 Telephone: 0800 801 070 | Email: [email protected]
Photos : Lindsay Keats, Brendon O’Hagan, Mark Coote, Michael KilgourFront cover photos clockwise from top left Christine Nuthall, Connor Harding, Matt Croton, Halina Adamiak and Brian Dunleavy