Embed Size (px)
Citation preview

Our people, our value
ANNUAL INTEGRATED REPORT
contents
About this report 1 Introduction
Group overview 2 Group profile
3 Group structure
Performance summary 4 Highlights
6 Ten-year review
Leadership10 Non-executive directors
12 Chairman’s statement
14 Executive directors
15 Chief executive’s report
19 Financial director’s report
Abridged financial information22 Value-added statement
24 Audited financial summary
Operational overview34 CBI-electric
40 Nashua
48 Reutech
Governance report55 Engaging with our stakeholders
56 Corporate governance
61 Risk committee report
63 Remuneration committee report
Scope and boundary of the report
This is our primary report and it covers strategy, financial and non-financial performance, and prospects of Reunert Limited and its subsidiaries (the Reunert group) for the financial year 1 October 2010 to 30 September 2011. The group operates mainly in South Africa.
In preparing the report, management has considered the draft guidelines on integrated reporting provided by the Integrated Reporting Committee (IRC) of South Africa. The audited financial statements are prepared in accordance with International Financial Reporting Standards (IFRS). Sustainability related information, which is integrated into the commentary and newly introduced operating reviews, has been compiled using the G3.1 guidelines of the Global Reporting Initiative (GRI). A consolidated GRI response table can be found on our website.
For this report, we have defined materiality as issues or occurrences that have a significant financial impact on the short-term performance or prospects of Reunert. In the year to come we will work together with our stakeholders on qualifying materiality more specifically according to their interests, particularly in the environmental and social spheres.
Certain statistical information is provided for comparative purposes for up to ten years. Information covers subsidiary, joint venture and investment companies. For sustainability elements, information relating to managed operations is disclosed on a 100% basis, and for our joint venture in CBI-electric: Aberdare ATC telecom cables on a 50% basis.
In the current year we have condensed the presentation relating to our finance company, Quince Capital, in respect of the income statement and balance sheet. Comparatives have been restated accordingly. Details can be found on page 31.
Key dates (dates are subject to change)
Financial calendar
Annual general meeting: 15 February 2012
Interim results announcement: 28 May 2012
Final results announcements: 20 November 2012
Cash dividend to ordinary shareholders
Payment date for the 2011 year: 23 January 2012
Date trading commences ex dividend: 16 January 2012
www.reunert.co.zawww.reunert.com
Visit our website for additional information on the company including results announcements and management presentations
IR pg
AFS pg
Integrated report
Annual financial statements
1
Heading
Section
Introduction
We are pleased to present to stakeholders Reunert’s first annual integrated report, in line with the reporting and disclosure requirements of the King Report on Corporate Governance for South Africa, 2009 (King III), the Companies Act 71 of 2008 (Companies Act) and the JSE Listings Requirements.
Reunert has made a start on its journey to comprehensive integrated reporting and disclosure will be enhanced in the coming years. Our aim is to enable our stakeholders to make a more informed assessment of the group’s ability to create and sustain value into the future.
Feedback
Our hope is that this report provides the basis for meaningful dialogue with our stakeholders. We invite feedback on the format and content of our report, which can be directed to the contact persons listed on page 83 of the audited annual financial statements.
Approval of integrated report
The board acknowledges its responsibility to ensure the integrity of the annual integrated report. The directors confirm they have assessed the content and believe the report addresses material issues and provides a fair representation of the group’s performance.
Trevor Munday David RawlinsonChairman Chief executive
About this report
Combined assurance
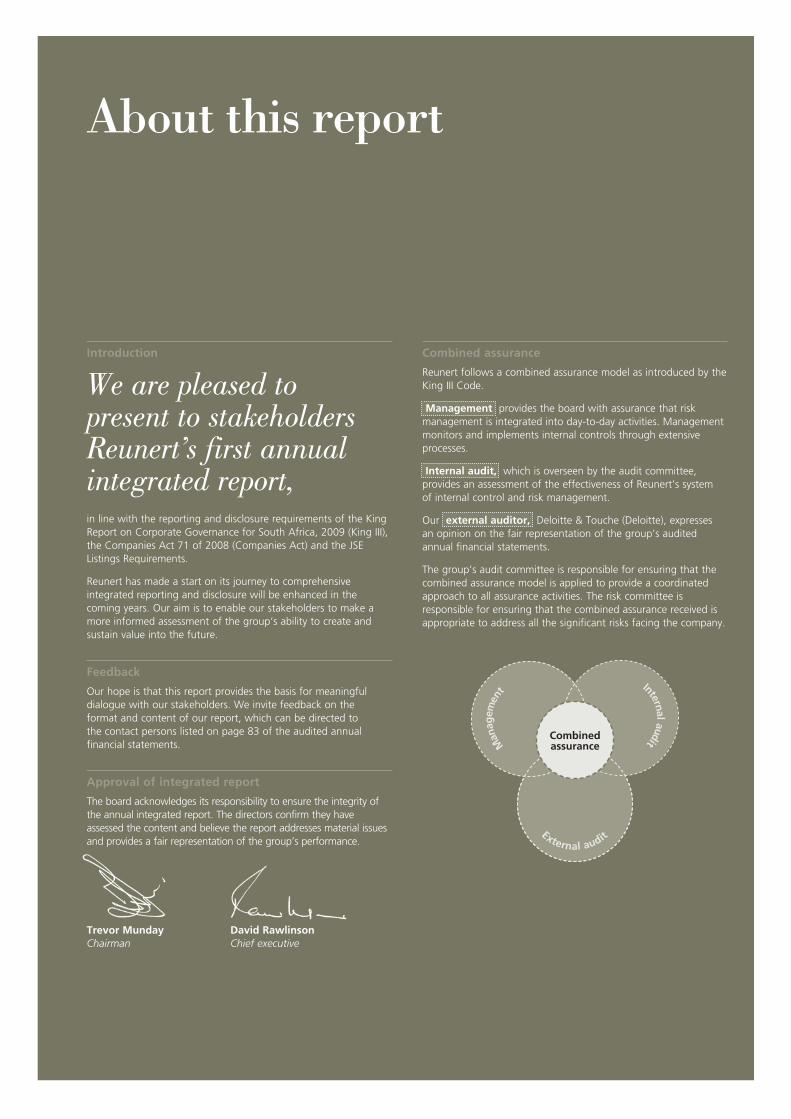
Reunert follows a combined assurance model as introduced by the King III Code.
Management provides the board with assurance that risk management is integrated into day-to-day activities. Management monitors and implements internal controls through extensive processes.
Internal audit, which is overseen by the audit committee, provides an assessment of the effectiveness of Reunert’s system of internal control and risk management.
Our external auditor, Deloitte & Touche (Deloitte), expresses an opinion on the fair representation of the group’s audited annual financial statements.
The group’s audit committee is responsible for ensuring that the combined assurance model is applied to provide a coordinated approach to all assurance activities. The risk committee is responsible for ensuring that the combined assurance received is appropriate to address all the significant risks facing the company.
CombinedassuranceM
anag
emen
t Internal audit
External audit
2 ANNUAL INTEGRATED REPORT 2011
Group overview
Group profile & structure
Group profile
Established in 1888 and first listed on the JSE in 1948, Reunert Limited is a leading South African company. The group is listed in the industrial goods and services (electronic and electrical equipment) sector of the JSE (ticker symbol: RLO). The group operates mainly in South Africa with minor operations situated in Australia, Lesotho, USA and Zimbabwe.
The Reunert group manages businesses in the services, electronics and electrical engineering sectors, supplying value-added products, services, solutions and systems to local and international markets. Each of these businesses will remain capable of meeting the group’s objectives for sustainable growth and earnings. We will seek meaningful growth opportunities that are either compatible with our leading competencies or which are sensible, strategically-aligned extensions of our existing businesses.
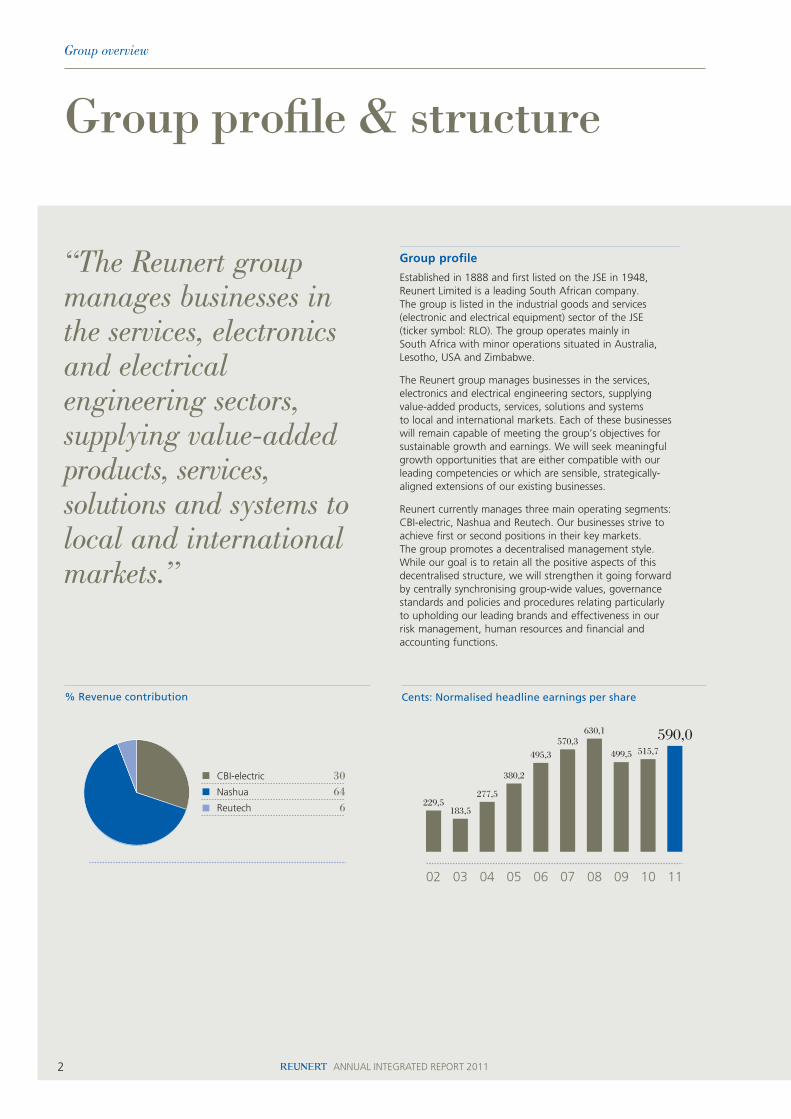
Reunert currently manages three main operating segments: CBI-electric, Nashua and Reutech. Our businesses strive to achieve first or second positions in their key markets. The group promotes a decentralised management style. While our goal is to retain all the positive aspects of this decentralised structure, we will strengthen it going forward by centrally synchronising group-wide values, governance standards and policies and procedures relating particularly to upholding our leading brands and effectiveness in our risk management, human resources and financial and accounting functions.
“The Reunert group manages businesses in the services, electronics and electrical engineering sectors, supplying value-added products, services, solutions and systems to local and international markets.”
229,5
590,0
02 03 04 05 06 07 08 09 10 11
Cents: Normalised headline earnings per share
183,5
277,5
380,2
495,3
570,3630,1
499,5 515,7
3
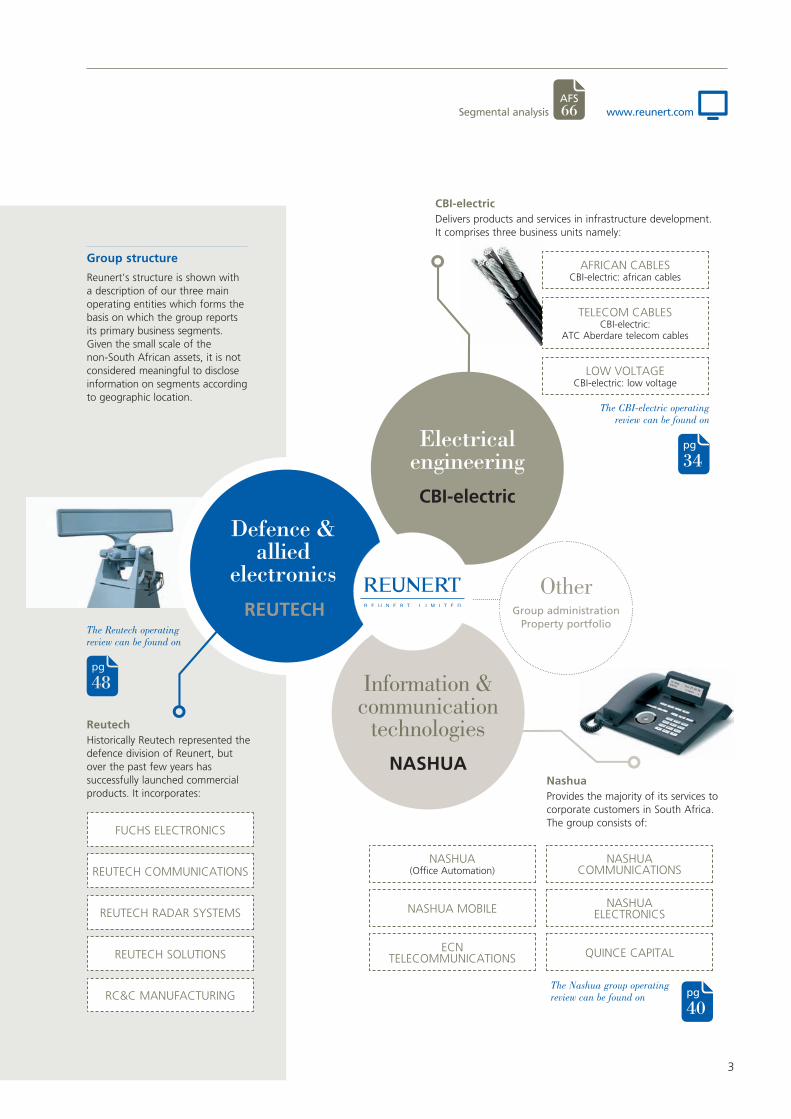
Group structure
Reunert’s structure is shown with a description of our three main operating entities which forms the basis on which the group reports its primary business segments. Given the small scale of the non-South African assets, it is not considered meaningful to disclose information on segments according to geographic location.
NASHUA(Office Automation)
NASHUA MOBILE
ECN TELECOMMUNICATIONS
NASHUA COMMUNICATIONS
NASHUA ELECTRONICS
QUINCE CAPITAL
AFRICAN CABLESCBI-electric: african cables
TELECOM CABLESCBI-electric:
ATC Aberdare telecom cables
LOW VOLTAGECBI-electric: low voltage
FUCHS ELECTRONICS
REUTECH COMMUNICATIONS
REUTECH RADAR SYSTEMS
REUTECH SOLUTIONS
RC&C MANUFACTURING
The Reutech operating review can be found on
The Nashua group operating review can be found on
The CBI-electric operating review can be found on
pg
40
pg
34
pg
48
CBI-electric Delivers products and services in infrastructure development. It comprises three business units namely:
NashuaProvides the majority of its services to corporate customers in South Africa. The group consists of:
Reutech Historically Reutech represented the defence division of Reunert, but over the past few years has successfully launched commercial products. It incorporates:
OtherGroup administration
Property portfolio
Electrical engineeringCBI-electric
Defence & allied
electronicsREUTECH
Information & communication
technologies
NASHUA
AFS 66Segmental analysis www.reunert.com

4 ANNUAL INTEGRATED REPORT 2011
Performance summary
Highlights
OPERATIONS
CBI-electric Revenue up 13%
2011: R3 336,0m2010: R2 961,3m
» Growth in Power Installations’ contribution
» Sustainable return to profitability of Australian operation
Nashua » Strategic acquisition of ECN
to bring converged solutions
» Greater ownership of office automation supply chain
» Nashua Mobile increased subscriber base by 27 436 customers
ReutechMines worldwide using Reutech surveillance radar
2011: 462010: 29
» Building strong order books
Employee profile
Occupational Levels
Total number of employees
in Reunert
African, Indian & Coloured
Total Male Female
Top management 80 10% 9% 1%
Senior management 130 19% 11% 8%
Professionally qualified, experienced specialists and mid management 503 21% 16% 5%
Junior management, skilled technical and academically qualified workers, supervisors, foremen and superintendents 2 471 49% 34% 15%
Semi-skilled and discretionary decision making 1 393 78% 51% 27%
Unskilled and defined decision making 1 117 99% 23% 76%
Total permanent 5 694 62% 33% 29%
Contract workers 223 66% 28% 38%
Temporary 333 77% 52% 25%
Trainees 16 94% 63% 31%
Total non-permanent 572 74% 43% 31%
Total South Africa and Lesotho 6 266 63% 34% 29%
Australia and USA 58
Total 6 324
253cper share final dividend
330cper share total dividendfor the year
Cash dividend
Wealth created per employee
R636 148
5
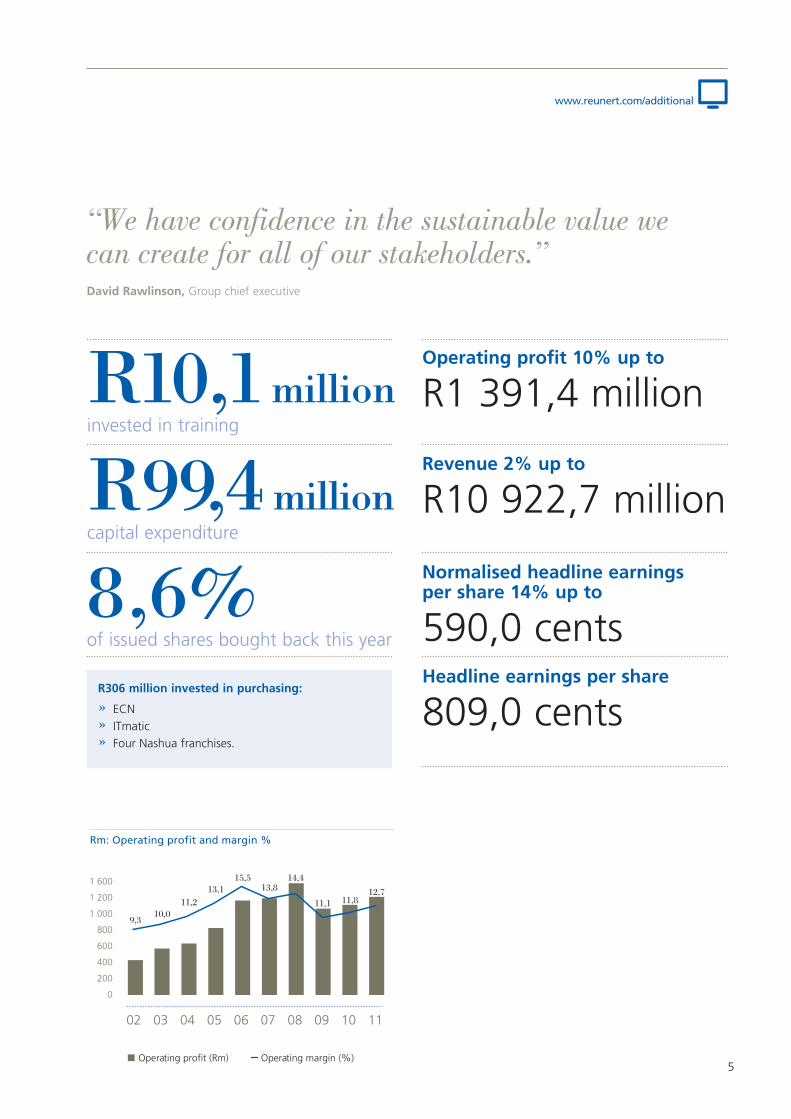
R10,1 millioninvested in training
R99,4 millioncapital expenditure
8,6%of issued shares bought back this year
“We have confidence in the sustainable value we can create for all of our stakeholders.”David Rawlinson, Group chief executive
1 600
1 200
1 000
800
600
400
200
0
02 03 04 05 06 07 08 09 10 11
Rm: Operating profit and margin %
9,310,0
11,213,1
15,513,8
14,4
Operating profit (Rm) Operating margin (%)
12,711,1 11,8
Operating profit 10% up to
R1 391,4 million
Revenue 2% up to
R10 922,7 million
R306 million invested in purchasing:
» ECN» ITmatic» Four Nashua franchises.
Normalised headline earnings per share 14% up to
590,0 centsHeadline earnings per share
809,0 cents
www.reunert.com/additional
6 ANNUAL INTEGRATED REPORT 2011
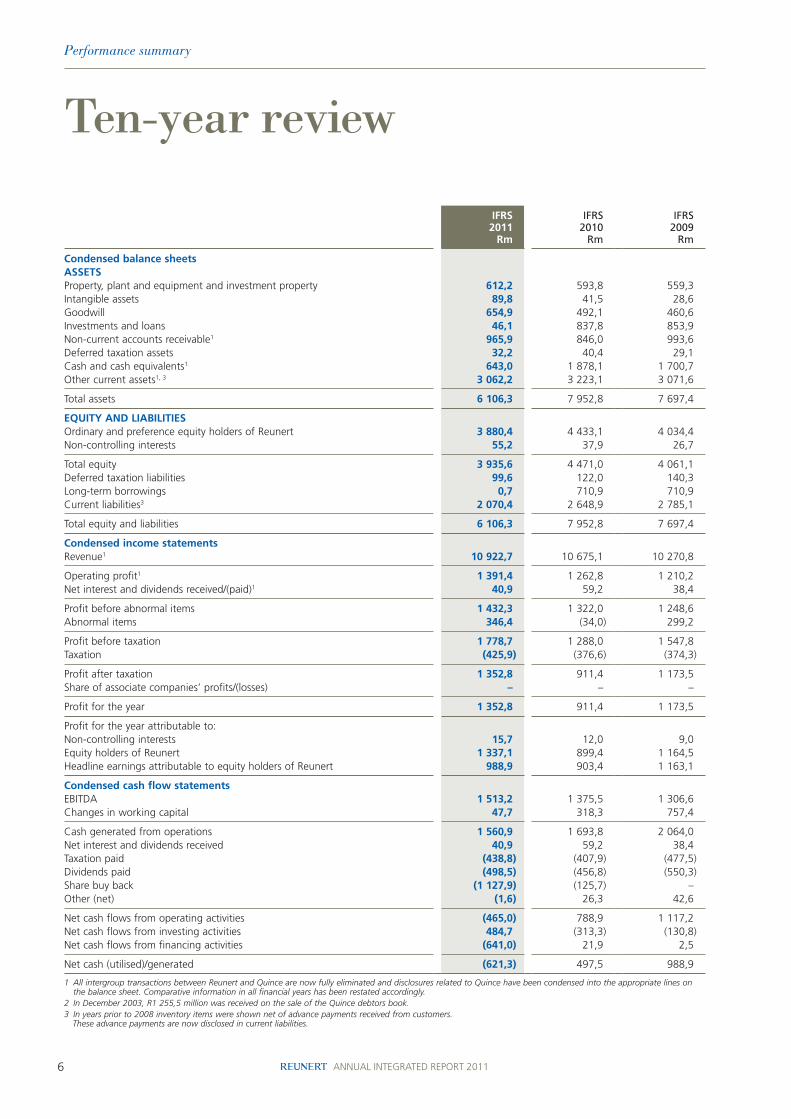
Ten-year review
Performance summary
IFRS2011
Rm
IFRS2010
Rm
IFRS2009
Rm
IFRS2008
Rm
IFRS2007
Rm
IFRS2006
Rm
IFRS2005
Rm
SA GAAP2004
Rm
SA GAAP2003
Rm
SA GAAP2002
Rm
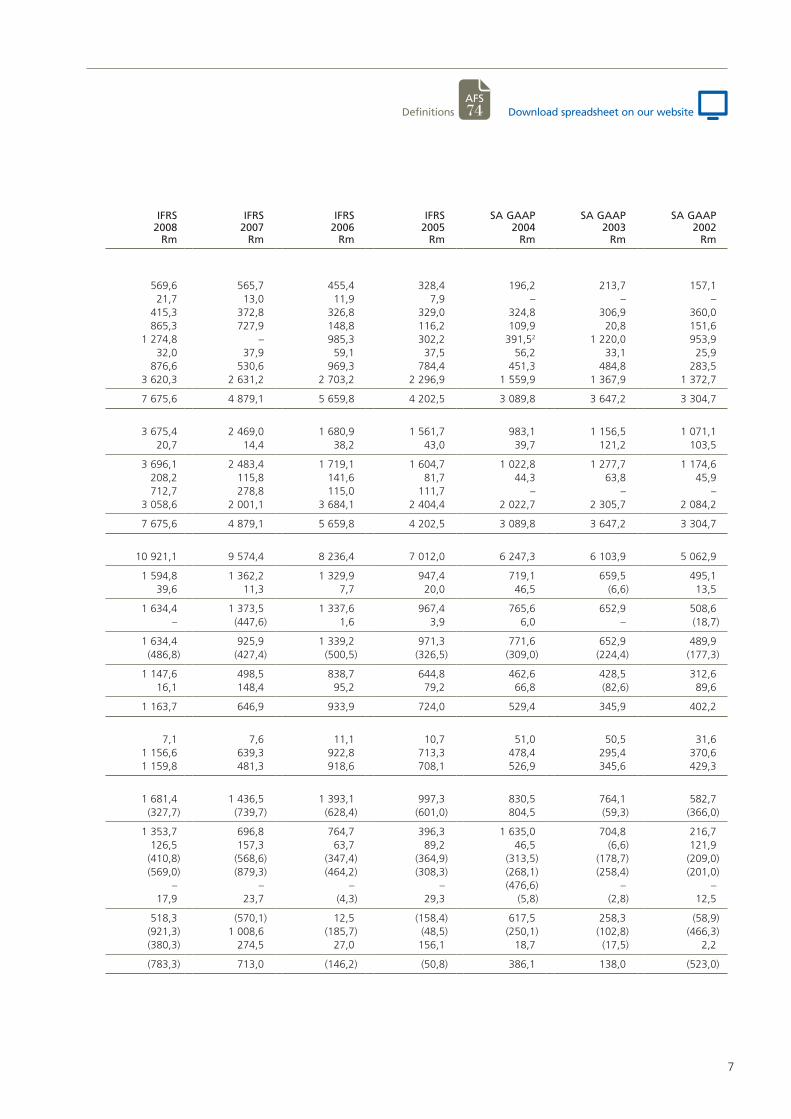
Condensed balance sheetsASSETSProperty, plant and equipment and investment property 612,2 593,8 559,3 569,6 565,7 455,4 328,4 196,2 213,7 157,1 Intangible assets 89,8 41,5 28,6 21,7 13,0 11,9 7,9 – – – Goodwill 654,9 492,1 460,6 415,3 372,8 326,8 329,0 324,8 306,9 360,0 Investments and loans 46,1 837,8 853,9 865,3 727,9 148,8 116,2 109,9 20,8 151,6 Non-current accounts receivable1 965,9 846,0 993,6 1 274,8 – 985,3 302,2 391,52 1 220,0 953,9 Deferred taxation assets 32,2 40,4 29,1 32,0 37,9 59,1 37,5 56,2 33,1 25,9 Cash and cash equivalents1 643,0 1 878,1 1 700,7 876,6 530,6 969,3 784,4 451,3 484,8 283,5 Other current assets1, 3 3 062,2 3 223,1 3 071,6 3 620,3 2 631,2 2 703,2 2 296,9 1 559,9 1 367,9 1 372,7
Total assets 6 106,3 7 952,8 7 697,4 7 675,6 4 879,1 5 659,8 4 202,5 3 089,8 3 647,2 3 304,7
EQUITY AND LIABILITIESOrdinary and preference equity holders of Reunert 3 880,4 4 433,1 4 034,4 3 675,4 2 469,0 1 680,9 1 561,7 983,1 1 156,5 1 071,1 Non-controlling interests 55,2 37,9 26,7 20,7 14,4 38,2 43,0 39,7 121,2 103,5
Total equity 3 935,6 4 471,0 4 061,1 3 696,1 2 483,4 1 719,1 1 604,7 1 022,8 1 277,7 1 174,6 Deferred taxation liabilities 99,6 122,0 140,3 208,2 115,8 141,6 81,7 44,3 63,8 45,9 Long-term borrowings 0,7 710,9 710,9 712,7 278,8 115,0 111,7 – – – Current liabilities3 2 070,4 2 648,9 2 785,1 3 058,6 2 001,1 3 684,1 2 404,4 2 022,7 2 305,7 2 084,2
Total equity and liabilities 6 106,3 7 952,8 7 697,4 7 675,6 4 879,1 5 659,8 4 202,5 3 089,8 3 647,2 3 304,7
Condensed income statementsRevenue1 10 922,7 10 675,1 10 270,8 10 921,1 9 574,4 8 236,4 7 012,0 6 247,3 6 103,9 5 062,9
Operating profit1 1 391,4 1 262,8 1 210,2 1 594,8 1 362,2 1 329,9 947,4 719,1 659,5 495,1 Net interest and dividends received/(paid)1 40,9 59,2 38,4 39,6 11,3 7,7 20,0 46,5 (6,6) 13,5
Profit before abnormal items 1 432,3 1 322,0 1 248,6 1 634,4 1 373,5 1 337,6 967,4 765,6 652,9 508,6 Abnormal items 346,4 (34,0) 299,2 – (447,6) 1,6 3,9 6,0 – (18,7)
Profit before taxation 1 778,7 1 288,0 1 547,8 1 634,4 925,9 1 339,2 971,3 771,6 652,9 489,9 Taxation (425,9) (376,6) (374,3) (486,8) (427,4) (500,5) (326,5) (309,0) (224,4) (177,3)
Profit after taxation 1 352,8 911,4 1 173,5 1 147,6 498,5 838,7 644,8 462,6 428,5 312,6 Share of associate companies’ profits/(losses) – – – 16,1 148,4 95,2 79,2 66,8 (82,6) 89,6
Profit for the year 1 352,8 911,4 1 173,5 1 163,7 646,9 933,9 724,0 529,4 345,9 402,2
Profit for the year attributable to:Non-controlling interests 15,7 12,0 9,0 7,1 7,6 11,1 10,7 51,0 50,5 31,6 Equity holders of Reunert 1 337,1 899,4 1 164,5 1 156,6 639,3 922,8 713,3 478,4 295,4 370,6 Headline earnings attributable to equity holders of Reunert 988,9 903,4 1 163,1 1 159,8 481,3 918,6 708,1 526,9 345,6 429,3
Condensed cash flow statementsEBITDA 1 513,2 1 375,5 1 306,6 1 681,4 1 436,5 1 393,1 997,3 830,5 764,1 582,7 Changes in working capital 47,7 318,3 757,4 (327,7) (739,7) (628,4) (601,0) 804,5 (59,3) (366,0)
Cash generated from operations 1 560,9 1 693,8 2 064,0 1 353,7 696,8 764,7 396,3 1 635,0 704,8 216,7 Net interest and dividends received 40,9 59,2 38,4 126,5 157,3 63,7 89,2 46,5 (6,6) 121,9 Taxation paid (438,8) (407,9) (477,5) (410,8) (568,6) (347,4) (364,9) (313,5) (178,7) (209,0)Dividends paid (498,5) (456,8) (550,3) (569,0) (879,3) (464,2) (308,3) (268,1) (258,4) (201,0)Share buy back (1 127,9) (125,7) – – – – – (476,6) – – Other (net) (1,6) 26,3 42,6 17,9 23,7 (4,3) 29,3 (5,8) (2,8) 12,5
Net cash flows from operating activities (465,0) 788,9 1 117,2 518,3 (570,1) 12,5 (158,4) 617,5 258,3 (58,9)Net cash flows from investing activities 484,7 (313,3) (130,8) (921,3) 1 008,6 (185,7) (48,5) (250,1) (102,8) (466,3)Net cash flows from financing activities (641,0) 21,9 2,5 (380,3) 274,5 27,0 156,1 18,7 (17,5) 2,2
Net cash (utilised)/generated (621,3) 497,5 988,9 (783,3) 713,0 (146,2) (50,8) 386,1 138,0 (523,0)
1 All intergroup transactions between Reunert and Quince are now fully eliminated and disclosures related to Quince have been condensed into the appropriate lines on the balance sheet. Comparative information in all financial years has been restated accordingly.
2 In December 2003, R1 255,5 million was received on the sale of the Quince debtors book.3 In years prior to 2008 inventory items were shown net of advance payments received from customers.
These advance payments are now disclosed in current liabilities.
7
IFRS2011
Rm
IFRS2010
Rm
IFRS2009
Rm
IFRS2008
Rm
IFRS2007
Rm
IFRS2006
Rm
IFRS2005
Rm
SA GAAP2004
Rm
SA GAAP2003
Rm
SA GAAP2002
Rm
Condensed balance sheetsASSETSProperty, plant and equipment and investment property 612,2 593,8 559,3 569,6 565,7 455,4 328,4 196,2 213,7 157,1 Intangible assets 89,8 41,5 28,6 21,7 13,0 11,9 7,9 – – – Goodwill 654,9 492,1 460,6 415,3 372,8 326,8 329,0 324,8 306,9 360,0 Investments and loans 46,1 837,8 853,9 865,3 727,9 148,8 116,2 109,9 20,8 151,6 Non-current accounts receivable1 965,9 846,0 993,6 1 274,8 – 985,3 302,2 391,52 1 220,0 953,9 Deferred taxation assets 32,2 40,4 29,1 32,0 37,9 59,1 37,5 56,2 33,1 25,9 Cash and cash equivalents1 643,0 1 878,1 1 700,7 876,6 530,6 969,3 784,4 451,3 484,8 283,5 Other current assets1, 3 3 062,2 3 223,1 3 071,6 3 620,3 2 631,2 2 703,2 2 296,9 1 559,9 1 367,9 1 372,7
Total assets 6 106,3 7 952,8 7 697,4 7 675,6 4 879,1 5 659,8 4 202,5 3 089,8 3 647,2 3 304,7
EQUITY AND LIABILITIESOrdinary and preference equity holders of Reunert 3 880,4 4 433,1 4 034,4 3 675,4 2 469,0 1 680,9 1 561,7 983,1 1 156,5 1 071,1 Non-controlling interests 55,2 37,9 26,7 20,7 14,4 38,2 43,0 39,7 121,2 103,5
Total equity 3 935,6 4 471,0 4 061,1 3 696,1 2 483,4 1 719,1 1 604,7 1 022,8 1 277,7 1 174,6 Deferred taxation liabilities 99,6 122,0 140,3 208,2 115,8 141,6 81,7 44,3 63,8 45,9 Long-term borrowings 0,7 710,9 710,9 712,7 278,8 115,0 111,7 – – – Current liabilities3 2 070,4 2 648,9 2 785,1 3 058,6 2 001,1 3 684,1 2 404,4 2 022,7 2 305,7 2 084,2
Total equity and liabilities 6 106,3 7 952,8 7 697,4 7 675,6 4 879,1 5 659,8 4 202,5 3 089,8 3 647,2 3 304,7
Condensed income statementsRevenue1 10 922,7 10 675,1 10 270,8 10 921,1 9 574,4 8 236,4 7 012,0 6 247,3 6 103,9 5 062,9
Operating profit1 1 391,4 1 262,8 1 210,2 1 594,8 1 362,2 1 329,9 947,4 719,1 659,5 495,1 Net interest and dividends received/(paid)1 40,9 59,2 38,4 39,6 11,3 7,7 20,0 46,5 (6,6) 13,5
Profit before abnormal items 1 432,3 1 322,0 1 248,6 1 634,4 1 373,5 1 337,6 967,4 765,6 652,9 508,6 Abnormal items 346,4 (34,0) 299,2 – (447,6) 1,6 3,9 6,0 – (18,7)
Profit before taxation 1 778,7 1 288,0 1 547,8 1 634,4 925,9 1 339,2 971,3 771,6 652,9 489,9 Taxation (425,9) (376,6) (374,3) (486,8) (427,4) (500,5) (326,5) (309,0) (224,4) (177,3)
Profit after taxation 1 352,8 911,4 1 173,5 1 147,6 498,5 838,7 644,8 462,6 428,5 312,6 Share of associate companies’ profits/(losses) – – – 16,1 148,4 95,2 79,2 66,8 (82,6) 89,6
Profit for the year 1 352,8 911,4 1 173,5 1 163,7 646,9 933,9 724,0 529,4 345,9 402,2
Profit for the year attributable to:Non-controlling interests 15,7 12,0 9,0 7,1 7,6 11,1 10,7 51,0 50,5 31,6 Equity holders of Reunert 1 337,1 899,4 1 164,5 1 156,6 639,3 922,8 713,3 478,4 295,4 370,6 Headline earnings attributable to equity holders of Reunert 988,9 903,4 1 163,1 1 159,8 481,3 918,6 708,1 526,9 345,6 429,3
Condensed cash flow statementsEBITDA 1 513,2 1 375,5 1 306,6 1 681,4 1 436,5 1 393,1 997,3 830,5 764,1 582,7 Changes in working capital 47,7 318,3 757,4 (327,7) (739,7) (628,4) (601,0) 804,5 (59,3) (366,0)
Cash generated from operations 1 560,9 1 693,8 2 064,0 1 353,7 696,8 764,7 396,3 1 635,0 704,8 216,7 Net interest and dividends received 40,9 59,2 38,4 126,5 157,3 63,7 89,2 46,5 (6,6) 121,9 Taxation paid (438,8) (407,9) (477,5) (410,8) (568,6) (347,4) (364,9) (313,5) (178,7) (209,0)Dividends paid (498,5) (456,8) (550,3) (569,0) (879,3) (464,2) (308,3) (268,1) (258,4) (201,0)Share buy back (1 127,9) (125,7) – – – – – (476,6) – – Other (net) (1,6) 26,3 42,6 17,9 23,7 (4,3) 29,3 (5,8) (2,8) 12,5
Net cash flows from operating activities (465,0) 788,9 1 117,2 518,3 (570,1) 12,5 (158,4) 617,5 258,3 (58,9)Net cash flows from investing activities 484,7 (313,3) (130,8) (921,3) 1 008,6 (185,7) (48,5) (250,1) (102,8) (466,3)Net cash flows from financing activities (641,0) 21,9 2,5 (380,3) 274,5 27,0 156,1 18,7 (17,5) 2,2
Net cash (utilised)/generated (621,3) 497,5 988,9 (783,3) 713,0 (146,2) (50,8) 386,1 138,0 (523,0)
1 All intergroup transactions between Reunert and Quince are now fully eliminated and disclosures related to Quince have been condensed into the appropriate lines on the balance sheet. Comparative information in all financial years has been restated accordingly.
2 In December 2003, R1 255,5 million was received on the sale of the Quince debtors book.3 In years prior to 2008 inventory items were shown net of advance payments received from customers.
These advance payments are now disclosed in current liabilities.
AFS 74Definitions Download spreadsheet on our website

8 ANNUAL INTEGRATED REPORT 2011
Performance summary
IFRS2011
IFRS2010
IFRS2009
IFRS2008
IFRS2007
IFRS2006
IFRS2005
SA GAAP2004
SA GAAP2003
SA GAAP2002
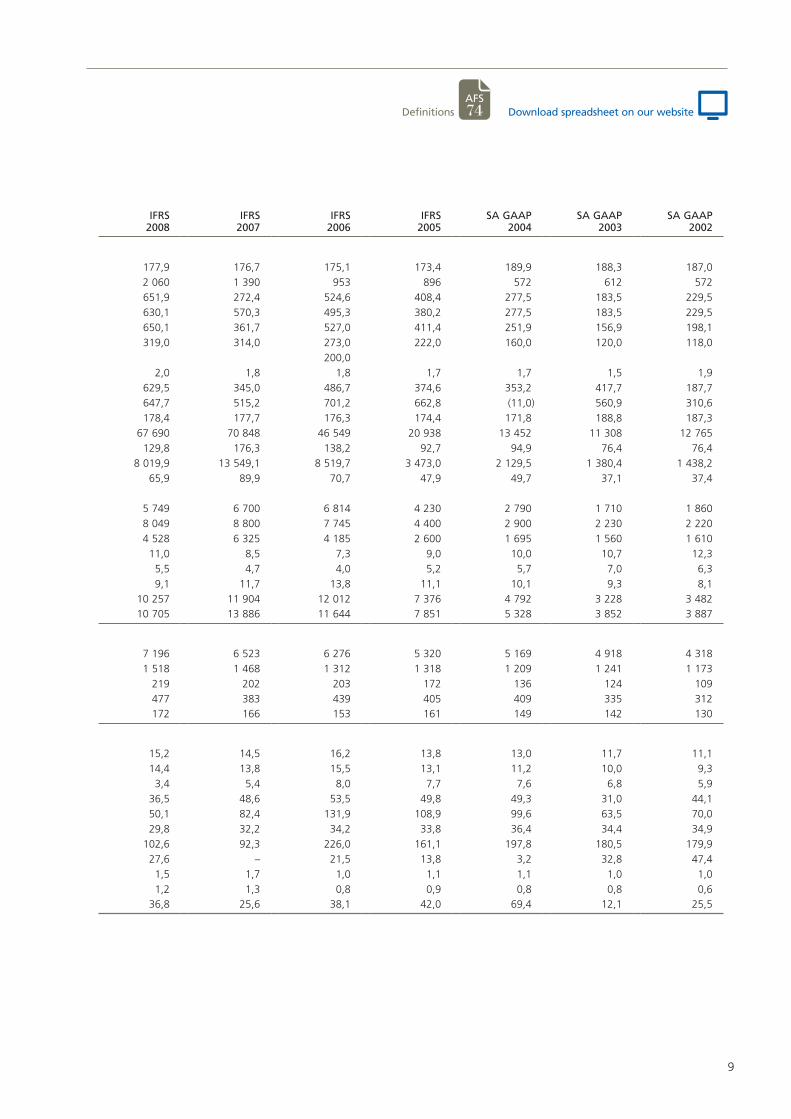
SharesNumber of ordinary shares on which earnings per share is calculated millions 165,3 178,7 178,5 177,9 176,7 175,1 173,4 189,9 188,3 187,0
Net worth per share cents 2 401 2 502 2 258 2 060 1 390 953 896 572 612 572
Headline earnings per share cents 598,3 505,5 651,6 651,9 272,4 524,6 408,4 277,5 183,5 229,5
Normalised headline earnings per share cents 590,0 515,7 499,5 630,1 570,3 495,3 380,2 277,5 183,5 229,5
Basic earnings per share cents 809,0 503,3 652,4 650,1 361,7 527,0 411,4 251,9 156,9 198,1
Dividends per share – normal cents 330,0 287,0 253,0 319,0 314,0 273,0 222,0 160,0 120,0 118,0
– special cents 200,0
Dividend cover times 1,8 1,8 2,0 2,0 1,8 1,8 1,7 1,7 1,5 1,9
Cashflow per share cents 702,8 767,4 797,8 629,5 345,0 486,7 374,6 353,2 417,7 187,7
Cashflow per share (excluding rental book) cents 638,7 635,6 797,6 647,7 515,2 701,2 662,8 (11,0) 560,9 310,6
Ordinary shares in issue (net of treasury shares) millions 161,6 177,2 178,7 178,4 177,7 176,3 174,4 171,8 188,8 187,3
Number of transactions – JSE 99 875 85 444 71 666 67 690 70 848 46 549 20 938 13 452 11 308 12 765
Number of shares traded millions 106,5 134,4 107,7 129,8 176,3 138,2 92,7 94,9 76,4 76,4
Value of shares traded Rm 6 579,4 7 644,8 4 780,6 8 019,9 13 549,1 8 519,7 3 473,0 2 129,5 1 380,4 1 438,2
Number of shares traded as a percentage of gross issued shares 53,4 67,9 54,6 65,9 89,9 70,7 47,9 49,7 37,1 37,4
Market price per share
– year end cents 5 885,0 6 201,0 5 600 5 749 6 700 6 814 4 230 2 790 1 710 1 860
– highest cents 6 970,0 6 247,0 5 900 8 049 8 800 7 745 4 400 2 900 2 230 2 220
– lowest cents 5 101,0 4 950,0 3 201 4 528 6 325 4 185 2 600 1 695 1 560 1 610
Earnings yield % 10,0 8,3 8,9 11,0 8,5 7,3 9,0 10,0 10,7 12,3
Dividend yield % 5,6 4,6 4,5 5,5 4,7 4,0 5,2 5,7 7,0 6,3
Price: Earnings ratio times 10,0 12,0 11,2 9,1 11,7 13,8 11,1 10,1 9,3 8,1
Market capitalisation (net of treasury shares) Rm 9 512 10 988 10 006 10 257 11 904 12 012 7 376 4 792 3 228 3 482JSE actuaries’ electronics sector index at 30 September 9 780 10 462 9 866 10 705 13 886 11 644 7 851 5 328 3 852 3 887
OtherNumber of employees 6 324 6 422 6 321 7 196 6 523 6 276 5 320 5 169 4 918 4 318
Revenue per employee R’000 1 727 1 662 1 625 1 518 1 468 1 312 1 318 1 209 1 241 1 173
Operating profit per employee R’000 220 197 180 219 202 203 172 136 124 109
Wealth created per employee R’000 636 527 530 477 383 439 405 409 335 312Employment cost per employee R’000 248 229 194 172 166 153 161 149 142 130
Profitability, asset management, liquidity and leverageEBITDA as a percentage of revenue1, 2 % 13,9 12,9 12,0 15,2 14,5 16,2 13,8 13,0 11,7 11,1
Operating margin (%)2 % 12,7 11,8 11,1 14,4 13,8 15,5 13,1 11,2 10,0 9,3
Net asset turn2 times 5,4 2,9 2,9 3,4 5,4 8,0 7,7 7,6 6,8 5,9
Normalised return on ordinary shareholders’ funds % 23,5 21,8 23,1 36,5 48,6 53,5 49,8 49,3 31,0 44,1
Return on net operating assets2 % 68,9 34,1 32,0 50,1 82,4 131,9 108,9 99,6 63,5 70,0
Taxation as a percentage of profit before taxation3 % 29,7 28,5 27,0 29,8 32,2 34,2 33,8 36,4 34,4 34,9
Total liabilities to total shareholders’ funds2, 4 % 52,6 75,1 86,7 102,6 92,3 226,0 161,1 197,8 180,5 179,9
Net borrowings to total shareholders’ funds5 % – – 0,6 27,6 – 21,5 13,8 3,2 32,8 47,4
Current ratio 1,8 2,2 1,7 1,5 1,7 1,0 1,1 1,1 1,0 1,0
Quick ratio 1,4 1,9 1,5 1,2 1,3 0,8 0,9 0,8 0,8 0,6 Interest cover (times)2 times 210,8 175,4 54,0 36,8 25,6 38,1 42,0 69,4 12,1 25,5
1 The 2008 percentages have been increased by 1,3% each as a result of the NSN commission now disclosed in operating income, whereas income from NSN was previously disclosed as income from associates.
2 All intergroup transactions between Reunert and Quince are now fully eliminated and disclosures related to Quince have been condensed into the appropriate lines on the balance sheet. The ratios for 2010 only have been restated accordingly.
3 Abnormal items, the STC on a special dividend in 2006 and the share buyback in 2004 have been excluded from this calculation.4 These ratios have been restated in 2003 to 2007 to take account of the reallocation of the advance payments from inventory and contracts in progress to trade and
other payables. 5 There were no net borrowings in 2007 mainly due to Quince being equity accounted.
Ten-year review continued
9
IFRS2011
IFRS2010
IFRS2009
IFRS2008
IFRS2007
IFRS2006
IFRS2005
SA GAAP2004
SA GAAP2003
SA GAAP2002
SharesNumber of ordinary shares on which earnings per share is calculated millions 165,3 178,7 178,5 177,9 176,7 175,1 173,4 189,9 188,3 187,0
Net worth per share cents 2 401 2 502 2 258 2 060 1 390 953 896 572 612 572
Headline earnings per share cents 598,3 505,5 651,6 651,9 272,4 524,6 408,4 277,5 183,5 229,5
Normalised headline earnings per share cents 590,0 515,7 499,5 630,1 570,3 495,3 380,2 277,5 183,5 229,5
Basic earnings per share cents 809,0 503,3 652,4 650,1 361,7 527,0 411,4 251,9 156,9 198,1
Dividends per share – normal cents 330,0 287,0 253,0 319,0 314,0 273,0 222,0 160,0 120,0 118,0
– special cents 200,0
Dividend cover times 1,8 1,8 2,0 2,0 1,8 1,8 1,7 1,7 1,5 1,9
Cashflow per share cents 702,8 767,4 797,8 629,5 345,0 486,7 374,6 353,2 417,7 187,7
Cashflow per share (excluding rental book) cents 638,7 635,6 797,6 647,7 515,2 701,2 662,8 (11,0) 560,9 310,6
Ordinary shares in issue (net of treasury shares) millions 161,6 177,2 178,7 178,4 177,7 176,3 174,4 171,8 188,8 187,3
Number of transactions – JSE 99 875 85 444 71 666 67 690 70 848 46 549 20 938 13 452 11 308 12 765
Number of shares traded millions 106,5 134,4 107,7 129,8 176,3 138,2 92,7 94,9 76,4 76,4
Value of shares traded Rm 6 579,4 7 644,8 4 780,6 8 019,9 13 549,1 8 519,7 3 473,0 2 129,5 1 380,4 1 438,2
Number of shares traded as a percentage of gross issued shares 53,4 67,9 54,6 65,9 89,9 70,7 47,9 49,7 37,1 37,4
Market price per share
– year end cents 5 885,0 6 201,0 5 600 5 749 6 700 6 814 4 230 2 790 1 710 1 860
– highest cents 6 970,0 6 247,0 5 900 8 049 8 800 7 745 4 400 2 900 2 230 2 220
– lowest cents 5 101,0 4 950,0 3 201 4 528 6 325 4 185 2 600 1 695 1 560 1 610
Earnings yield % 10,0 8,3 8,9 11,0 8,5 7,3 9,0 10,0 10,7 12,3
Dividend yield % 5,6 4,6 4,5 5,5 4,7 4,0 5,2 5,7 7,0 6,3
Price: Earnings ratio times 10,0 12,0 11,2 9,1 11,7 13,8 11,1 10,1 9,3 8,1
Market capitalisation (net of treasury shares) Rm 9 512 10 988 10 006 10 257 11 904 12 012 7 376 4 792 3 228 3 482JSE actuaries’ electronics sector index at 30 September 9 780 10 462 9 866 10 705 13 886 11 644 7 851 5 328 3 852 3 887
OtherNumber of employees 6 324 6 422 6 321 7 196 6 523 6 276 5 320 5 169 4 918 4 318
Revenue per employee R’000 1 727 1 662 1 625 1 518 1 468 1 312 1 318 1 209 1 241 1 173
Operating profit per employee R’000 220 197 180 219 202 203 172 136 124 109
Wealth created per employee R’000 636 527 530 477 383 439 405 409 335 312Employment cost per employee R’000 248 229 194 172 166 153 161 149 142 130
Profitability, asset management, liquidity and leverageEBITDA as a percentage of revenue1, 2 % 13,9 12,9 12,0 15,2 14,5 16,2 13,8 13,0 11,7 11,1
Operating margin (%)2 % 12,7 11,8 11,1 14,4 13,8 15,5 13,1 11,2 10,0 9,3
Net asset turn2 times 5,4 2,9 2,9 3,4 5,4 8,0 7,7 7,6 6,8 5,9
Normalised return on ordinary shareholders’ funds % 23,5 21,8 23,1 36,5 48,6 53,5 49,8 49,3 31,0 44,1
Return on net operating assets2 % 68,9 34,1 32,0 50,1 82,4 131,9 108,9 99,6 63,5 70,0
Taxation as a percentage of profit before taxation3 % 29,7 28,5 27,0 29,8 32,2 34,2 33,8 36,4 34,4 34,9
Total liabilities to total shareholders’ funds2, 4 % 52,6 75,1 86,7 102,6 92,3 226,0 161,1 197,8 180,5 179,9
Net borrowings to total shareholders’ funds5 % – – 0,6 27,6 – 21,5 13,8 3,2 32,8 47,4
Current ratio 1,8 2,2 1,7 1,5 1,7 1,0 1,1 1,1 1,0 1,0
Quick ratio 1,4 1,9 1,5 1,2 1,3 0,8 0,9 0,8 0,8 0,6 Interest cover (times)2 times 210,8 175,4 54,0 36,8 25,6 38,1 42,0 69,4 12,1 25,5
1 The 2008 percentages have been increased by 1,3% each as a result of the NSN commission now disclosed in operating income, whereas income from NSN was previously disclosed as income from associates.
2 All intergroup transactions between Reunert and Quince are now fully eliminated and disclosures related to Quince have been condensed into the appropriate lines on the balance sheet. The ratios for 2010 only have been restated accordingly.
3 Abnormal items, the STC on a special dividend in 2006 and the share buyback in 2004 have been excluded from this calculation.4 These ratios have been restated in 2003 to 2007 to take account of the reallocation of the advance payments from inventory and contracts in progress to trade and
other payables. 5 There were no net borrowings in 2007 mainly due to Quince being equity accounted.
AFS 74Definitions Download spreadsheet on our website

10 ANNUAL INTEGRATED REPORT 2011
Non-executive directors
Leadership
(from left to right)
Trevor Munday (62)Appointed 1 June 2008 and as chairman from 1 June 2009» Strategic vision» Corporate leadership» Financial acumen
Sean Jagoe (60)Appointed in 2000 » Corporate finance
expertise» Corporate governance
best practise» Experience in
remuneration policy
Thandi Orleyn (55)Appointed in 2007» Government relationships’
experience» Corporate leadership» Legal and administrative
expertise
Johannes van der Horst (67)Appointed in 1993 » Investment insight» Corporate leadership» Understanding of complex
change processes
Yolanda Cuba (34)Appointed 1 January 2011» Financial and investment
expertise» Empowerment and
transformation know-how» Corporate leadership

11
Rynhardt van Rooyen (62)Appointed 1 November 2009» Financial and governance
expertise» Organisational leadership» Broad management
know-how
Kholeka Mzondeki (44)Appointed 1 November 2009 » Financial knowledge» Business leadership» Change and
transformation experience
Brand Pretorius (63)Appointed 22 February 2011» Corporate and team
leadership» Marketing and customer
expertise» Strategic and risk analysis
Thabang Motsohi (64)Appointed 1 June 2008» Strategic expertise» Management of change
and transformation » Business leadership
AFS 72Non-executive director’s full CV’s

12 ANNUAL INTEGRATED REPORT 2011
Chairman’s statement
Overview
The Reunert group recorded a satisfactory performance under challenging conditions this year. In various market sectors, depressed economic conditions adversely affected demand for our products and services and most of our operations faced increased competition, which put additional pressure on margins.
Change programmes which were introduced to streamline various operations and improve productivity yielded pleasing short-term benefits although on-going and close management oversight of them will be required to ensure that the improvements achieved remain sustainable in the long term. Operations actively sought opportunities to diversify revenue sources and worked hard to bring on stream products, services and systems that will add value to their offerings.
Reunert remained a strong cash generator in 2011 and we continued to seek meaningful growth opportunities that are either compatible with our leading competencies or which are sensible, strategically-aligned extensions of our existing businesses. During the year under review, ECN was acquired at a cost of some R172 million. This is a pleasing, value-enhancing addition to Nashua’s product and service offering.
Reunert’s balance sheet and key financial indicators remained robust throughout the year.
Segmental comment
All CBI-electric operations performed well this year. African Cables benefited from the South African government’s commitment to continue investing in basic infrastructure and services. Low Voltage achieved considerable success in tough export markets despite rand strength. These operations, as well as Telecoms Cables, have invested in value-added services and products that should in future further differentiate them from their competitors.
Nashua was negatively affected by the general economic slowdown and, in particular, by government-mandated reductions in mobile interconnect rates. In a mobile market which is now almost fully mature, various cost-reduction initiatives were initiated.
Lower interconnect rates impacted directly on the business’ least-cost routing offering. The board believes that the acquisition of ECN was an important, timely acquisition that will enable Nashua to retain its market leadership by substituting least-cost routing with a voice-over-internet-protocol offering.
Reutech’s diverse operations ended 2011 well positioned to take advantage of new opportunities both locally and internationally. In 2012, sales of mining radar systems are expected to continue building on the successes achieved in 2011. Renewable energy is an emerging sector in which the group is planning to play a leading role.
Corporate governance and sustainability
The board is fully cognisant of its responsibility to the company. In discharging our obligations, both legal and moral, we recognise the roles and rights of all major stakeholders including shareholders, customers, employees, suppliers, government and their various representative bodies. We seek to achieve equity and fairness as we continue to pursue an inclusive strategy for sustainable performance across the group.
The directors and management of the group aspire to sound governance principles and practices in all of our activities. We foster respect for ethical business practices and expect common sense and transparency to underpin our quest to be a responsible corporate citizen.
We are committed to the King Code of Governance Principles 2009 (King III). We present the board’s review of our progress against these standards in the corporate governance report starting on page 56. We provide explanations in those instances where we presently do not comply.
Reunert has complied with the requirements of the new Companies Act, 2008 since it was introduced on 1 May 2011. Senior executives and management throughout the group are required to attest annually in writing that they comply with relevant laws and regulations, most notably the Competition Act.
In terms of our business structure and organisational philosophy, we are in the process of enhancing Reunert’s federal model which has historically provided a high level of decentralised authority and operating autonomy to our various businesses. While our goal is to retain all of the positive aspects of this decentralised structure, we will strengthen it going forward by centrally synchronising group-wide values, governance standards and policies and procedures relating particularly to upholding our leading brands and the effectiveness of our risk management, human resources and financial and accounting functions. As a consequence, while
Trevor MundayChairman14 November 2011Sandton
Leadership
13
our operating subsidiary boards will retain essential aspects of authority, the role and scope of the group executive committee will be substantially elevated and strengthened.
During the year under review, the terms of reference and composition of the board and its various committees were reviewed and amended. The risk committee was established as a separate entity and a social, ethics and transformation committee was constituted in accordance with the requirements of the new Companies Act. This committee is in the formative stages of its activities.
The non-executive members of the board, individually and collectively, offer wide-ranging experience and knowledge both to the board and the various committees on which they serve. From a transformation perspective, four of our nine non-executive members are black, three of them women. I am grateful to all members of the board for their diligent and committed approach to their duties in what has been a challenging year.
To ensure the group’s sustainability and its moral licence to operate in South Africa, it is imperative that we improve our transformation credentials, especially by appointing more senior management from designated groups. We have an inspiring pipeline of talented black professionals at our middle-management level and we must ensure that they are nurtured, retained and developed to their full potential. We can, and must, do better in this respect and, as a result, the performance criteria for incentive schemes throughout the group are being altered to ensure heightened management focus and success in this critical area.
We are appreciative of the continuing sound relationship with our lead empowerment partner, the Peotona group, and are particularly grateful for their active contributions to various aspects of our transformation ambitions.
The Reunert College remains an important part of our investment in education and in developing our youth. An independent survey commissioned during the year highlighted various aspects of the college’s activities where improvements are both desirable and necessary. These will be attended to and implemented in the year ahead.
We are well aware of our responsibilities towards the environment and communities that may be affected by our operations. We strive, in all respects, to minimise or eradicate any negative impacts our operations may have. The group has a low to medium environmental impact but, as we position ourselves to become a player in providing renewable energy, it is incumbent on all Reunert operations to implement clean energy solutions wherever feasible.
Prospects
The South African economy and those of most of our export markets remain fragile and 2012 is expected to be yet another challenging year. We will continue to promote innovation, a commitment to meeting our customers’ requirements, sound governance principles and a people-oriented culture.
The board has the utmost confidence in the group’s new executive leadership team with its balance of deep understanding of the group and fresh perspectives, and is satisfied that chief executive David Rawlinson, and his senior team possess the skills,
knowledge and vision needed to develop and grow our various businesses.
Subject to prevailing economic conditions not worsening, we anticipate achieving growth in earnings in the year ahead.*
Directorate
At the annual general meeting held on 8 February 2011, Mr Brian Connellan and Mr Bobby Makwetla retired from the board. Brian served as a member for twelve years and Bobby just a year less. Brian’s and Bobby’s contributions to the board during their tenure are deeply admired and appreciated.
Brian set extremely high standards as a non-executive director and his business acumen, probing questions and staunch defence of ethical conduct, sound governance and fairness will be remembered. We thank him and wish him and Merle a healthy and happy retirement. Bobby always stood out as a gentleman and we valued his well-considered counsel and experience. Our very best wishes accompany him and Angie in their retirement.
Ms Yolanda Cuba and Mr Brand Pretorius joined the board as independent non-executive directors early in the year. We welcome them.
Prior to their appointments, an exercise was undertaken to analyse the skills, knowledge and experience profile of the board and its members. Certain requirements in terms of strategic competencies and marketing and financial management capabilities were identified. Yolanda and Brand both bring varied and valuable attributes to the board and their respective appointments admirably address these requirements.
As announced on the Stock Exchange News Service at the
time, chief executive Nick Wentzel left Reunert under a mutual separation agreement on 21 September 2011. We wish him well in his future endeavours. On that date, financial director David Rawlinson was appointed as chief executive and Manuela Krog was appointed as financial director. We are delighted that Manuela has joined the board. We welcome both David and Manuela to their new roles and wish them much success.
On 14 October 2011, executive director Gerrit Oosthuizen left Reunert under a mutual separation agreement. We also wish Gerrit well in his future endeavours.
Dividend
The board remains committed to returning value to shareholders. Given the group’s strong cash reserves, we are pleased to declare a final cash dividend for the year of 253 cents per share. With the interim cash dividend, announced in May 2011 of 77 cents per share, this translates into a total payout for 2011 of 330 cents per share (2010: 287 cents per share).
Appreciation
I thank the members of the board and our executives and employees for their hard work and contribution to Reunert during the past year. Their commitment and energy in a demanding year is highly appreciated. We in turn thank our customers and various business partners for their support and assure them of our continuing quest for mutually beneficial relationships and the shared pursuit of lasting value.
* The financial information on which the above forecast is based has not been reviewed or reported on by the company’s external auditors.
IR 56Corporate governance sectionReunert College

14 ANNUAL INTEGRATED REPORT 2011
Executive directors
Leadership
David Rawlinson (62)Chief executiveAppointed to the board in 1992 and on 21 September 2011 as chief executive» Strategic vision» In-depth understanding of
the Reunert group» Organisational leadership
experience
Manuela Krog (42)Financial directorAppointed to the board 21 September 2011» Wide-ranging business and
industry knowledge» Financial expertise» High-level strategic planning
Pat Gallagher (61)Executive directorAppointed to the board in 1993» Practical operational leadership» In-depth understanding of the
Reunert group» Top-level strategic thinking
AFS 73Executive director’s full CV’s
15
Chief executive’s report
Transformation
The group is underperforming in certain of its transformation objectives. We will ensure progress on our transformation targets for management control, employment equity and skills development by sharpening our focus on these goals and by incentivising executives to reach these targets. These are areas that, given our reliance on human capital and indeed government business, have been prioritised for significant improvement.
Key performance indicators
Our reporting against key performance indicators has traditionally been dominated by financial values, although we have actively managed our environmental and social performance in each of our operations. In 2012 the group will begin to formulate broader non-financial key performance indicators to focus our reporting in these critical areas.
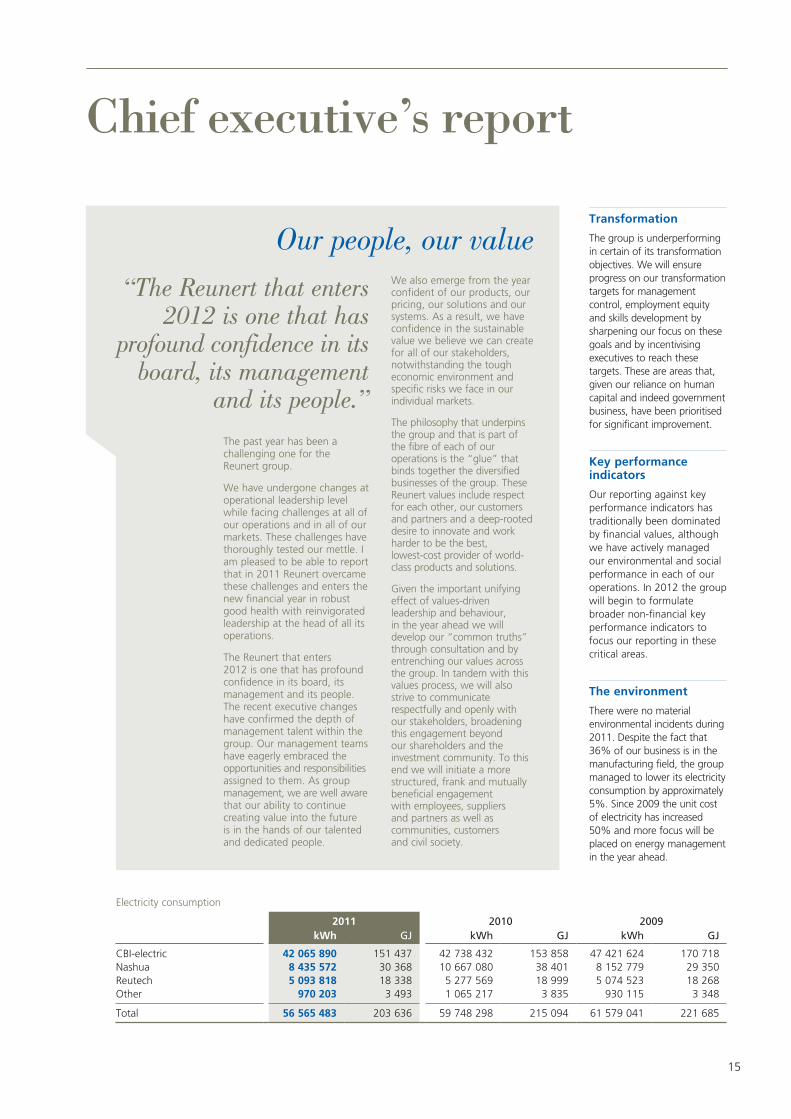
The environment
There were no material environmental incidents during 2011. Despite the fact that 36% of our business is in the manufacturing field, the group managed to lower its electricity consumption by approximately 5%. Since 2009 the unit cost of electricity has increased 50% and more focus will be placed on energy management in the year ahead.
Our people, our value
The past year has been a challenging one for the Reunert group.
We have undergone changes at operational leadership level while facing challenges at all of our operations and in all of our markets. These challenges have thoroughly tested our mettle. I am pleased to be able to report that in 2011 Reunert overcame these challenges and enters the new financial year in robust good health with reinvigorated leadership at the head of all its operations.
The Reunert that enters 2012 is one that has profound confidence in its board, its management and its people. The recent executive changes have confirmed the depth of management talent within the group. Our management teams have eagerly embraced the opportunities and responsibilities assigned to them. As group management, we are well aware that our ability to continue creating value into the future is in the hands of our talented and dedicated people.
We also emerge from the year confident of our products, our pricing, our solutions and our systems. As a result, we have confidence in the sustainable value we believe we can create for all of our stakeholders, notwithstanding the tough economic environment and specific risks we face in our individual markets.
The philosophy that underpins the group and that is part of the fibre of each of our operations is the “glue” that binds together the diversified businesses of the group. These Reunert values include respect for each other, our customers and partners and a deep-rooted desire to innovate and work harder to be the best, lowest-cost provider of world- class products and solutions.
Given the important unifying effect of values-driven leadership and behaviour, in the year ahead we will develop our “common truths” through consultation and by entrenching our values across the group. In tandem with this values process, we will also strive to communicate respectfully and openly with our stakeholders, broadening this engagement beyond our shareholders and the investment community. To this end we will initiate a more structured, frank and mutually beneficial engagement with employees, suppliers and partners as well as communities, customers and civil society.
Electricity consumption
2011 2010 2009kWh GJ kWh GJ kWh GJ
CBI-electric 42 065 890 151 437 42 738 432 153 858 47 421 624 170 718Nashua 8 435 572 30 368 10 667 080 38 401 8 152 779 29 350Reutech 5 093 818 18 338 5 277 569 18 999 5 074 523 18 268Other 970 203 3 493 1 065 217 3 835 930 115 3 348
Total 56 565 483 203 636 59 748 298 215 094 61 579 041 221 685
“The Reunert that enters 2012 is one that has
profound confidence in its board, its management
and its people.”

ANNUAL INTEGRATED REPORT 201116
Leadership
Overview of group financial performance
Revenue for the year has remained relatively static, with an increase of 2% from R10,7 billion to R10,9 billion. Operating profit, on the other hand, increased by 10% to R1,4 billion, while normalised headline earnings per share rose 14% to 590,0 cents.
The abnormal item of R346,4 million relates to the gain on the sale of the NSN investment, which led to earnings per share increasing by 60% to 809,0 cents. Normalised headline earnings per share increased 14%, compared to a 10% rise in operating profit. This was due to the impact of the share buy-back programme concluded in February 2011.
The solid top-line earnings growth achieved by our electrical businesses demonstrated the counter-cyclical ability of these operations to contribute significantly to revenue and profit.
The Nashua operations were not able to achieve revenue growth mainly due to the reduction in the interconnect rates and Pansolutions exiting the Panasonic consumer business. Voice-over-internet-protocol (VoIP) specialist ECN was bought during the year and successfully integrated into the group.
CBI-electric
The CBI-electric group of companies recorded a strong performance during 2011. All operations performed well in light of the tough environment that has persisted over the past few years. Revenue increased by 13% to R3,3 billion and operating profit improved by 14% to R592,1 million. This is a pleasing performance with both the Cables and Low Voltage operations retaining or increasing market share. The stringent and ongoing focus on efficiencies and cost containment allowed the division to improve margins.
The demand for energy cables has continued at reasonably buoyant levels. The price of copper has remained at a high, but relatively stable level during the year. The higher revenue achieved at these copper prices has had a small impact on margins as we have continued to keep copper stocks at levels as low as possible. This strategy minimises stock losses should the price of copper reduce. In 2011 the power installation operation showed strong growth and is expected to contribute some 25% to revenue by 2014.
Low Voltage had a pleasing year, increasing turnover by 9% and operating profit by 18%. The export performance was good, given the state of markets that were – without exception – suffering the ongoing effects of the global financial crisis. While difficulties were encountered in Germany, where the sales office was closed and operations relocated to Sweden, the operation in Australia achieved record sales. Domestically the new housing, commercial, industrial and residential refurbishment markets all showed little growth.
In 2011 Low Voltage acquired ITmatic, a system design and system integrator with in-depth technical expertise and a presence throughout Africa. In the new year it is anticipated that ITmatic will make a healthy contribution to revenue and profits.
As expected, the slowdown in infrastructural spend in South Africa negatively impacted our joint venture operation, CBI-electric: Aberdare ATC Telecom Cables, in the past year. Revenues
declined sharply in the first six months of the year but improved markedly in the second half. The overall result was a small decline in turnover and profits. The business is, however, well entrenched with major local telecoms operators including Telkom, Neotel and the mobile networks. Market share in the industrial, IT, mining and power sectors has been maintained and should expand in the short term with new projects, including the National Long Haul Project, coming on line.
Nashua
Nashua performed to expectation in a quiet market. A number of acquisitions were made in the division which added to revenue, enabling marginal growth of 1% to be achieved. These acquisitions, which included four franchises and ECN, together with substantial increases in the contributions from Quince Capital and Nashua Electronics, resulted in operating profit growth of 21% to R794,2 million.
One of the highlights of the year was the acquisition of ECN on 1 June 2011. The energy and expertise of the ECN team has been beneficial to the group. They have achieved good market penetration and are currently billing over 50 million minutes a month. The conversion of the least-cost routing (LCR) business to ECN’s VoIP network is meeting our customers’ expectations. While this migration will take another 24 months, we are confident that we will retain the majority of our LCR customers during this process.
Quince Capital’s profitability returned to normal levels with the reduction in bad debts. The business is now focussed on financing our office automation and telecommunications equipment customers. We are confident that bad debts will be negligible in the year ahead.
Nashua Electronics’ sales reduced due to the operation exiting the consumer market. The addition of Kyocera Mita to its product offering has been positive and the profitability achieved was very pleasing.
Nashua Mobile had a satisfactory year despite the reduction in interconnect rates. The conversion of its LCR business to ECN’s VoIP platform is ongoing. The focus on mobile data and voice resulted in more than 27 000 net connections during the year.
The Office Automation operations experienced increased unit sales but a competitive market resulted in margins remaining under pressure. Increased offerings in the print service, data management and storage areas increased the operation’s share of the tender business. Nashua acquired the Durban and Cape Town franchises during the year, two of our most important outlets. Customer service in these important markets will be emphasised and the strategy of purchasing our larger franchises will continue in order to get closer to our customers.
Reutech
Revenue for the year decreased by 19% to R639,3 million, while operating profit was reduced by 20% to R48,7 million. The contribution from Fuchs was substantially lower due to the late receipt of an export order. The Radar company, through its mining surveillance radars, has had a successful year while the other businesses performed as expected.
Chief executive’s report continued
17
NSN
Reunert exercised its option to sell its shares in NSN in January 2011. The sale of the investment realised R793,5 million, which resulted in an abnormal profit of R346,4 million.
Capital investment and cash management
Capital expenditure investment of R99,4 million will ensure that we have both the capability and capacity to meet future demand.
Reunert has invested R306 million in acquiring four Nashua franchises, ITmatic and ECN in the past year. The acquisition of the four franchises is in line with the group’s strategy to acquire the larger franchises.
ECN has enhanced Reunert’s capability to successfully migrate LCR customers to a VoIP solution. ECN’s network enables us to provide customers with voice and data solutions while the ITmatic acquisition at CBI-electric: low voltage gives us the capability of being a systems integrator with extensive technical capabilities as well as a footprint in Africa.
Cash resources of R1 127,9 million were used to repurchase 17,1 million shares at an average price of R66,14. Returning cash to shareholders through the mechanism of share buybacks has proven beneficial to the group. We will continue to review our share buyback policy. Changes to the Secondary Tax on Companies, due to come into effect in April 2012, make this strategy more compelling.
Group cash currently used to finance the Quince asset rental book is accessible in the event that this cash is required for investment. There are various alternative mechanisms for funding the Quince book. However, using Reunert’s surplus cash to fund the book is the most earnings-enhancing method while the group has surplus funds.
The balance sheet has remained robust with cash and cash equivalents amounting to R564,6 million.
Strategic direction
The diverse nature and operations of the group have served us well during a period that has been trying for many active in the fields of electrical equipment, manufacturing, telecommunications and office automation.
The group’s executive leadership believes that its primary function is to manage and guide the extremely capable leaders at the helm of our various operations. The executive team and board will investigate ways to improve the allocation of capital and the streamlining of shared services while strengthening the federal organisational model as described in the chairman’s statement, and empowering strong operational leaders to keep improving and growing their businesses.
As I stated at the outset, Reunert’s greatest asset is its human capital and to this end we envisage investing more time and resources in creating a culture of excellence at all of our operations. To achieve this it is imperative that employees at all levels feel that their contributions to our success are valued and respected.
The year ahead
Prospects for the group are generally favourable although the economic outlook, both in South Africa and in our major export markets, remains uncertain at the time of writing. The strength of the rand favoured those operations (principally Nashua) which import and distribute products but counted against those with significant export markets, while fuelling imports of often inferior competing products.
Reutech is particularly well placed to grow revenues in 2012, having developed and improved a number of exciting new products and systems. This optimism was borne out by the signing of a number of sizeable new contracts towards the end of the year. The outlook for sales of our proprietary mining surveillance radar and radio frequency tracking technologies is especially positive.
The electrical generating capacity currently being built for Eskom has to be transmitted and distributed and this fact, together with the upgrading of the electrical networks required by municipalities, will ensure a steady demand for our electrical products into the future.
Nashua’s brand remains very strong among consumers and business customers, a fact that is recognised by those service providers with whom we will soon be entering into licence renegotiations. Convergence will continue to drive the industry and in this area, Nashua Mobile is, through the ECN acquisition, able to convert its customers to VoIP while enhancing the level and range of services. The Nashua group will continue to invest cautiously in its telecommunications convergence capability, mainly utilising ECN’s networks and development expertise.
Appreciation
My thanks are due to Trevor Munday and the board for their advice and support, as well as to the Reunert executives, operational management and employees who have energetically assisted me. I am proud to head a dynamic leadership team, one that faces the future with confidence in our ability to continue offering our shareholders, and other stakeholders, a compelling value proposition.
David RawlinsonChief executive14 November 2011Sandton
IR 34Operational reviews
IR 28Audited financial summaryAdditional sustainability information
18 ANNUAL INTEGRATED REPORT 2011
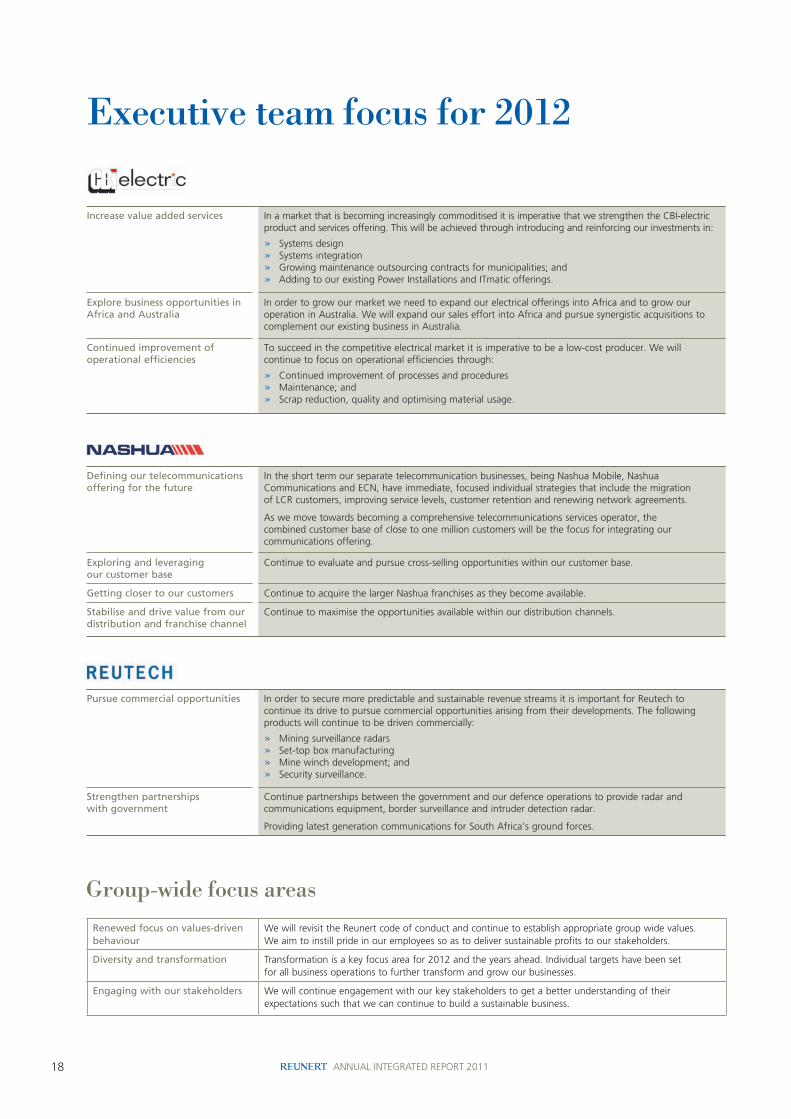
Increase value added services In a market that is becoming increasingly commoditised it is imperative that we strengthen the CBI-electric product and services offering. This will be achieved through introducing and reinforcing our investments in:
» Systems design» Systems integration» Growing maintenance outsourcing contracts for municipalities; and» Adding to our existing Power Installations and ITmatic offerings.
Explore business opportunities in Africa and Australia
In order to grow our market we need to expand our electrical offerings into Africa and to grow our operation in Australia. We will expand our sales effort into Africa and pursue synergistic acquisitions to complement our existing business in Australia.
Continued improvement of operational efficiencies
To succeed in the competitive electrical market it is imperative to be a low-cost producer. We will continue to focus on operational efficiencies through:
» Continued improvement of processes and procedures» Maintenance; and » Scrap reduction, quality and optimising material usage.
Defining our telecommunications offering for the future
In the short term our separate telecommunication businesses, being Nashua Mobile, Nashua Communications and ECN, have immediate, focused individual strategies that include the migration of LCR customers, improving service levels, customer retention and renewing network agreements.
As we move towards becoming a comprehensive telecommunications services operator, the combined customer base of close to one million customers will be the focus for integrating our communications offering.
Exploring and leveraging our customer base
Continue to evaluate and pursue cross-selling opportunities within our customer base.
Getting closer to our customers Continue to acquire the larger Nashua franchises as they become available.
Stabilise and drive value from our distribution and franchise channel
Continue to maximise the opportunities available within our distribution channels.
Pursue commercial opportunities In order to secure more predictable and sustainable revenue streams it is important for Reutech to continue its drive to pursue commercial opportunities arising from their developments. The following products will continue to be driven commercially:
» Mining surveillance radars» Set-top box manufacturing» Mine winch development; and» Security surveillance.
Strengthen partnerships with government
Continue partnerships between the government and our defence operations to provide radar and communications equipment, border surveillance and intruder detection radar.
Providing latest generation communications for South Africa’s ground forces.
Executive team focus for 2012
Group-wide focus areasRenewed focus on values-driven behaviour
We will revisit the Reunert code of conduct and continue to establish appropriate group wide values. We aim to instill pride in our employees so as to deliver sustainable profits to our stakeholders.
Diversity and transformation Transformation is a key focus area for 2012 and the years ahead. Individual targets have been set for all business operations to further transform and grow our businesses.
Engaging with our stakeholders We will continue engagement with our key stakeholders to get a better understanding of their expectations such that we can continue to build a sustainable business.

19
Leadership
Financial director’s report
Introduction
This report is intended to provide additional insight on matters of a financial nature that are not dealt with comprehensively elsewhere in the integrated report.
Normalised headline earningsNormalised headline earnings are used by the group as an indicator of its sustainable earnings. The basis for computation thereof is consistent from year to year.
The adjustment made to headline earnings to arrive at normalised headline earnings was R13,8 million. This adjustment relates to the imputed minority share of profits earned by our BEE minority shareholders, where, in terms of IFRS the risks and rewards of ownership related to these shares has not been transferred, resulting in a full consolidation of profits by the Reunert group.
Financial performance
The prolonged tough economic environment has proved to be challenging, with revenue increasing modestly to R10,9 billion from R10,7 billion. However, a focus on efficiencies and certain cost reductions have allowed for a respectable increase in operating profit from R1,3 billion to R1,4 billion.
Effective tax rate reduced by 5,2 percentage points to
24%
Highlights
Normalised headline earnings per share increased by 14% from 516cps to
590cps
Operating profit increased by 10% from R1 264 million to
R1 391 m Operating cash flows of
R662,9 m generated
20 ANNUAL INTEGRATED REPORT 2011
229,5
590,0
02 03 04 05 06 07 08 09 10 11
Cents: Normalised headline earnings per share
183,5
277,5
380,2
495,3
570,3630,1
499,5 515,7
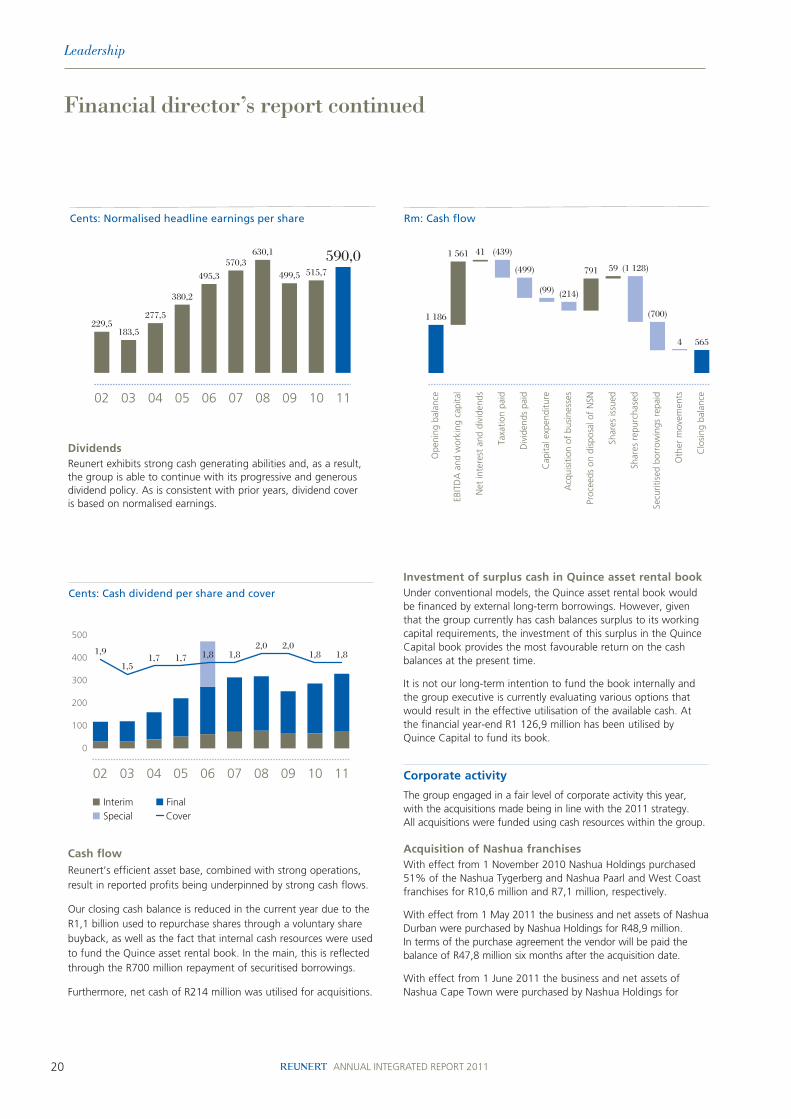
DividendsReunert exhibits strong cash generating abilities and, as a result, the group is able to continue with its progressive and generous dividend policy. As is consistent with prior years, dividend cover is based on normalised earnings.
Investment of surplus cash in Quince asset rental bookUnder conventional models, the Quince asset rental book would be financed by external long-term borrowings. However, given that the group currently has cash balances surplus to its working capital requirements, the investment of this surplus in the Quince Capital book provides the most favourable return on the cash balances at the present time.
It is not our long-term intention to fund the book internally and the group executive is currently evaluating various options that would result in the effective utilisation of the available cash. At the financial year-end R1 126,9 million has been utilised by Quince Capital to fund its book.
Corporate activity
The group engaged in a fair level of corporate activity this year, with the acquisitions made being in line with the 2011 strategy. All acquisitions were funded using cash resources within the group.
Acquisition of Nashua franchisesWith effect from 1 November 2010 Nashua Holdings purchased 51% of the Nashua Tygerberg and Nashua Paarl and West Coast franchises for R10,6 million and R7,1 million, respectively.
With effect from 1 May 2011 the business and net assets of Nashua Durban were purchased by Nashua Holdings for R48,9 million. In terms of the purchase agreement the vendor will be paid the balance of R47,8 million six months after the acquisition date.
With effect from 1 June 2011 the business and net assets of Nashua Cape Town were purchased by Nashua Holdings for
Cash flow
Reunert’s efficient asset base, combined with strong operations, result in reported profits being underpinned by strong cash flows.
Our closing cash balance is reduced in the current year due to the R1,1 billion used to repurchase shares through a voluntary share buyback, as well as the fact that internal cash resources were used to fund the Quince asset rental book. In the main, this is reflected through the R700 million repayment of securitised borrowings.
Furthermore, net cash of R214 million was utilised for acquisitions.
Financial director’s report continued
Leadership

21
Our largest exposure to commodity price risk exists within African Cables, where copper is a significant input cost. Supply contracts with customers in the formal sector, such as Eskom and the municipalities provide for the cost of copper to be passed onto the customer. However, in respect of other customers, the group is exposed to movements in the commodity price. In certain instances, where the supply contract stipulates a fixed price, commodity futures are purchased to match the terms of the contract.
R67,0 million. In terms of the purchase agreement with the vendor, the balance of R41,1 million is payable six months after the acquisition date.
Acquisition of ECNWith effect from 1 June 2011 Reunert purchased the business and net assets of ECN for R171,9 million.
Key financial risks
Global economyWe expect that the economic conditions will continue to be challenging in the short to medium term. As such, our businesses are expected to remain under pressure in terms of their levels of activity and profitability.
Exchange rates and commodity price movementsCommodity price volatility and currency risks are two of the most significant financial risks that are faced by the group. In the current year we have seen continued buoyancy in commodity prices and then a significant weakening in the rand against all major currencies towards the end of the financial year.
To this end, the group actively monitors its exchange risk and commodity price risk on an on-going basis. Forward cover is taken on foreign exchange exposures by factoring in the impact of natural hedges that exist within the operations. Overall, the management of the exposure is based on price sensitivity, competitor practices, rand parity estimates, volatility and timing.
Potential exposures arising from exports are actively managed on a day-to-day basis. Advance payments are utilised to purchase materials for export orders and the balance is held in CFC accounts. Cover is taken in the form of forward exchange contracts, zero cost collars, or currency options, where such cover is deemed appropriate.
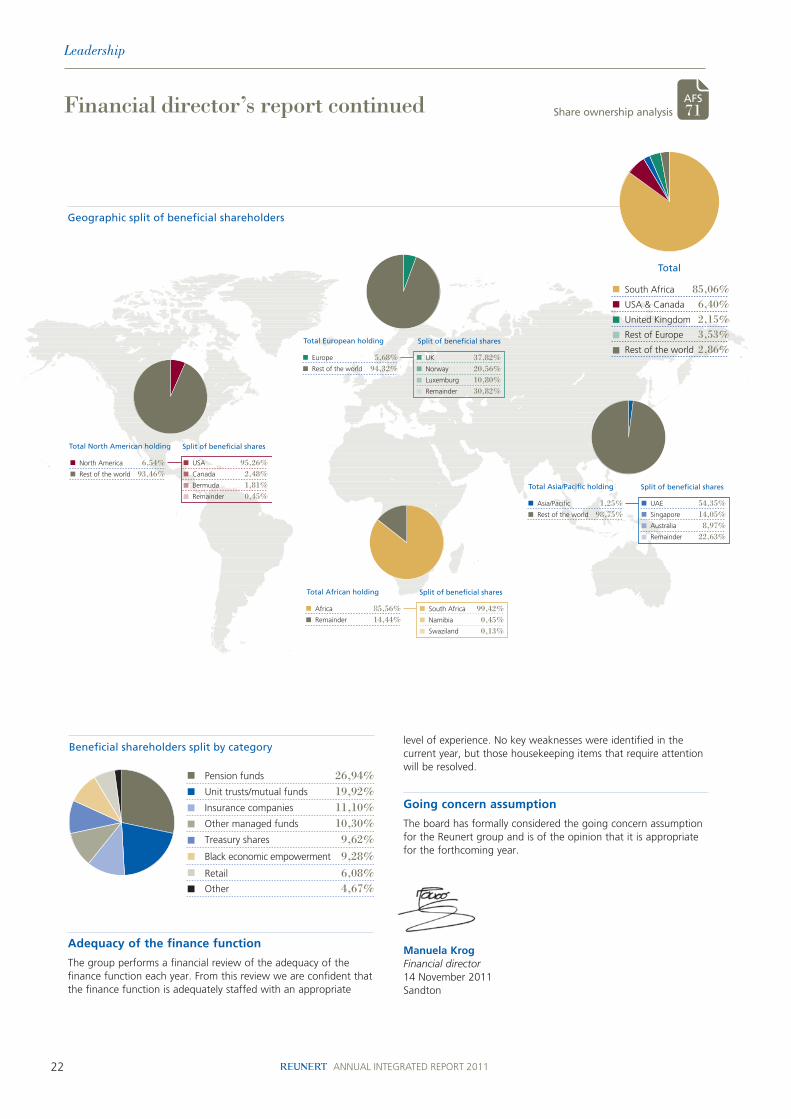
Shareholders’ statistics
Reunert shares continued to trade actively on the JSE in the past year. The total value of shares traded was R6,6 billion, resulting in 53,4% of the market capitalisation of the company being traded during the year. Some 106,5 million shares were traded in over 99 000 transactions.
Fund managers and investors have an active interest in the group, mainly due to its exposure to infrastructure spending through its electrical operations.
22 ANNUAL INTEGRATED REPORT 2011
level of experience. No key weaknesses were identified in the current year, but those housekeeping items that require attention will be resolved.
Going concern assumption
The board has formally considered the going concern assumption for the Reunert group and is of the opinion that it is appropriate for the forthcoming year.
Manuela KrogFinancial director14 November 2011Sandton
Adequacy of the finance function
The group performs a financial review of the adequacy of the finance function each year. From this review we are confident that the finance function is adequately staffed with an appropriate
Financial director’s report continued
Leadership
AFS 71Share ownership analysis

23
Value-added statement
Abridged financial information
2011 Rm %
2010 Rm %
% change2011
over 2010
Revenue 10 922,7 10 675,1 2 Paid to suppliers for materials and services 6 946,8 7 356,2 (6)
Value added 3 975,9 99 3 318,9 98 20 Income from investments 47,5 1 66,4 2 (28)
Total wealth created 4 023,4 100 3 385,3 100 –
Distributed as follows:EmployeesRemuneration and service benefits 1 321,3 1 252,6 Add PAYE collected on behalf of government 247,2 219,1
Gross remuneration and service benefits 1 568,5 39 1 471,7 43 7
Providers of capitalDividends to Reunert shareholders 494,3 13 456,0 14 8
Dividends to outside shareholders in subsidiaries 4,2 – 0,8 – 425 Interest paid on borrowings 6,6 – 7,2 – (8)
505,1 13 464,0 14 9
Payments to governmentTaxation on profits and dividends 425,9 407,9 VAT, customs duties and other taxes 507,1 460,4
933,0 23 868,3 26 7
Social investmentVoluntary contributions and investment of funds in the broader community, including enterprise development 40,7 1 39,7 1
Retained in the group to develop future growthAmortisation, depreciation and impairments 121,8 3 118,3 3 3 Accumulated profit 854,3 21 423,3 13 102
976,1 24 541,6 16 80
Total wealth distributed 4 023,4 100 3 385,3 100 –

24 ANNUAL INTEGRATED REPORT 2011
Abridged financial information
CONDENSED GROuP INCOmE STATEmENTFOR ThE yEAR ENDED 30 SEPTEmbER
Notes2011
Rm%
change
Restated2010
Rm
Revenue 10 922,7 2 10 675,1Earnings before interest, taxation, depreciation, amortisation, other income and dividends 1 472,7 12 1 320,6Other income 40,5 54,9
Earnings before interest, taxation, depreciation and amortisation (EBITDA) 1 1 513,2 10 1 375,5Depreciation and amortisation 121,8 8 112,7
Operating profit 1 391,4 10 1 262,8Net interest and dividend income 2 40,9 (31) 59,2Abnormal items 3 346,4 (34,0)
Profit before taxation 1 778,7 38 1 288,0Taxation 425,9 13 376,6
Profit after taxation 1 352,8 48 911,4
Profit attributable to:Non-controlling interests 15,7 31 12,0Equity holders of Reunert 1 337,1 49 899,4
Basic earnings per share (cents) 5 & 6 809,0 61 503,3Diluted earnings per share (cents) 5 & 6 803,3 61 498,8
Headline earnings per share (cents) 5 & 6 598,3 18 505,5Diluted headline earnings per share (cents) 5 & 6 594,1 19 501,1
Normalised headline earnings per share (cents) 5 & 6 590,0 14 515,7Normalised diluted headline earnings per share (cents) 5 & 6 585,9 15 511,1Cash dividend per ordinary share declared (cents) 330,0 15 287,0Taxation rate including abnormal item 23,9 18 29,2Taxation rate excluding abnormal item 29,7 4 28,5EBITDA as a % of revenue 13,9 8 12,9
CONDENSED GROuP STATEmENT OF COmPREhENSIVE INCOmEFOR ThE yEAR ENDED 30 SEPTEmbER
2011Rm
2010Rm
Profit after taxation 1 352,8 911,4Other comprehensive income, net of taxation:Losses arising from translating the financial results of foreign subsidiaries – (1,9)Gain on disposal of investment (348,6) –Effective portion of gains on hedging instruments 4,2 6,0Income tax relating to components of other comprehensive income (1,2) 1,2
Total comprehensive income 1 007,2 916,7
Total comprehensive income attributable to:Non-controlling interests 15,7 12,0Equity holders of Reunert 991,5 904,7
Audited financial summary
25
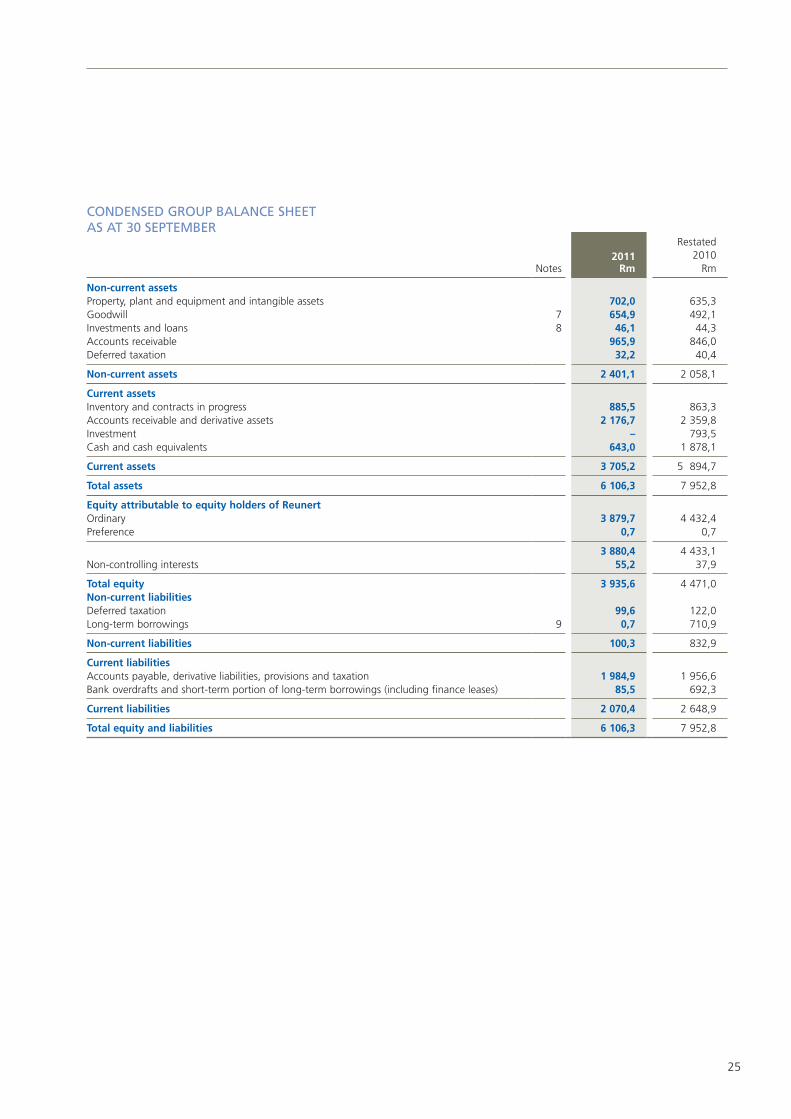
CONDENSED GROuP bALANCE ShEETAS AT 30 SEPTEmbER
Notes2011
Rm
Restated2010
Rm
Non-current assetsProperty, plant and equipment and intangible assets 702,0 635,3Goodwill 7 654,9 492,1Investments and loans 8 46,1 44,3Accounts receivable 965,9 846,0Deferred taxation 32,2 40,4
Non-current assets 2 401,1 2 058,1
Current assetsInventory and contracts in progress 885,5 863,3Accounts receivable and derivative assets 2 176,7 2 359,8Investment – 793,5Cash and cash equivalents 643,0 1 878,1
Current assets 3 705,2 5 894,7
Total assets 6 106,3 7 952,8
Equity attributable to equity holders of ReunertOrdinary 3 879,7 4 432,4Preference 0,7 0,7
3 880,4 4 433,1Non-controlling interests 55,2 37,9
Total equity 3 935,6 4 471,0Non-current liabilitiesDeferred taxation 99,6 122,0Long-term borrowings 9 0,7 710,9
Non-current liabilities 100,3 832,9
Current liabilitiesAccounts payable, derivative liabilities, provisions and taxation 1 984,9 1 956,6Bank overdrafts and short-term portion of long-term borrowings (including finance leases) 85,5 692,3
Current liabilities 2 070,4 2 648,9
Total equity and liabilities 6 106,3 7 952,8

26 ANNUAL INTEGRATED REPORT 2011
Audited financial summary continued
Abridged financial information
CONDENSED GROuP STATEmENT OF ChANGES IN EquITyFOR ThE yEAR ENDED 30 SEPTEmbER
2011Rm
2010Rm
Share capital and premium
Balance at the beginning of the year 140,9 116,0 Issue of shares 59,4 24,9
Balance at the end of the year 200,3 140,9Share-based payment reserve
Balance at the beginning of the year 732,4 679,6 Share-based payment expense and deferred taxation thereon 18,6 52,8
Balance at the end of the year 751,0 732,4Fair value adjustment reserve1
Balance at the beginning of the year 345,6 338,4 Other comprehensive income (345,6) 7,2
Balance at the end of the year – 345,6Equity transaction with BEE partner (35,3) (35,3)BEE shares2 (276,1) (276,1)Treasury shares3
Balance at the beginning of the year (125,7) – Purchases made during the year (1 127,9) (125,7)
Balance at the end of the year (1 253,6) (125,7)Non-distributable reserves
Balance at the beginning of the year 10,0 11,9 Other comprehensive income – (1,9) Transfer to retained earnings (8,9) –
Balance at the end of the year 1,1 10,0Retained earnings Balance at the beginning of the year 3 641,3 3 199,9
Profit after taxation attributable to equity holders of Reunert 1 337,1 899,4 Transfer from non-distributable reserves 8,9 – Taxation charge on transaction with BEE partner – (2,0) Cash dividends declared and paid (494,3) (456,0)
Balance at the end of the year 4 493,0 3 641,3
Equity attributable to equity holders of Reunert 3 880,4 4 433,1Non-controlling interests
Balance at the beginning of the year 37,9 26,7 Share of total comprehensive income 15,7 12,0 Dividends declared and paid (4,2) (0,8) Non-controlling interest introduced 2,0 – Other 3,8 –
Balance at the end of the year 55,2 37,9
Total equity at end of the year 3 935,6 4 471,0
1 This reserve related to fair value adjustments on financial assets classified as “available-for-sale” financial assets.2 These are shares held by Bargenel Investment Limited (Bargenel), a company sold by Reunert to an accredited BEE partner in 2007. Until the amount owing by the BEE
partner is repaid to Reunert, Bargenel is to be consolidated by the group as the significant risks and rewards of ownership of the equity have not passed to the BEE partner.
3 Commencing in August 2010, a group subsidiary purchased Reunert shares on the open market. Up to 30 September 2010, 2,1 million shares had been bought at an average price of R59,18 per share. No further purchases were made after 4 February 2011 at which time a total of 19,2 million shares had been bought at an average price of R65,37 per share.
27
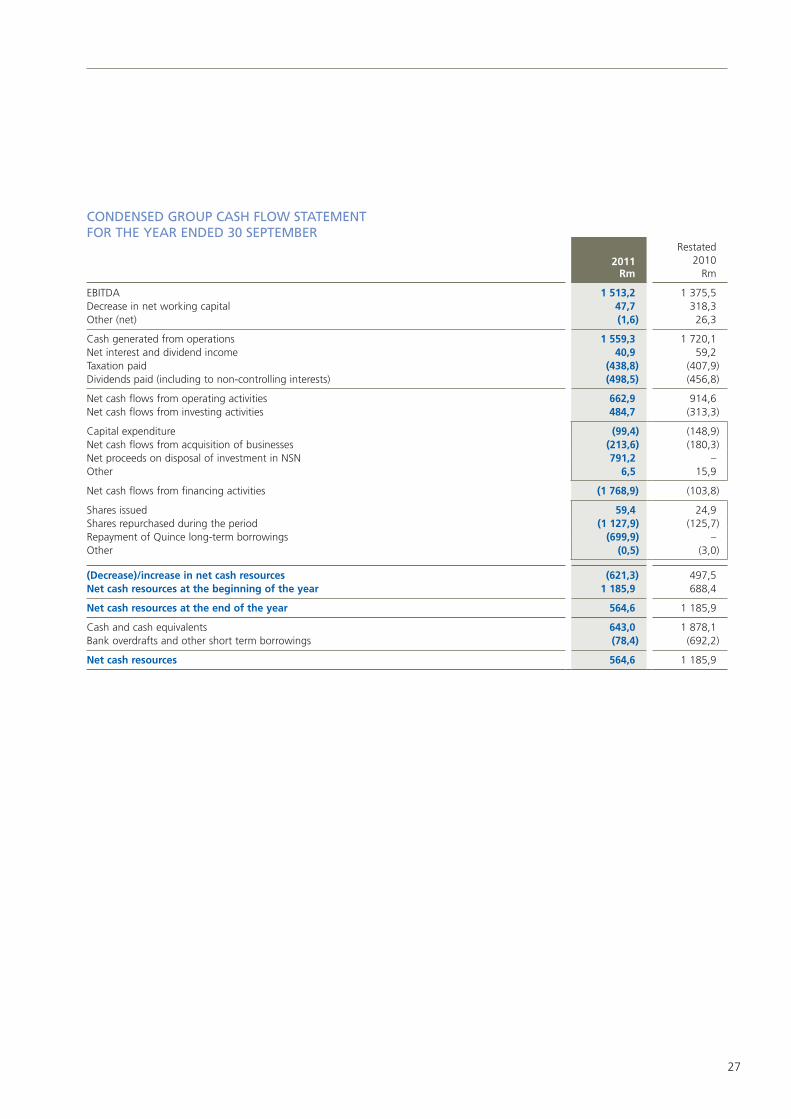
CONDENSED GROuP CASh FLOW STATEmENTFOR ThE yEAR ENDED 30 SEPTEmbER
2011Rm
Restated2010
Rm
EBITDA 1 513,2 1 375,5Decrease in net working capital 47,7 318,3Other (net) (1,6) 26,3
Cash generated from operations 1 559,3 1 720,1Net interest and dividend income 40,9 59,2Taxation paid (438,8) (407,9)Dividends paid (including to non-controlling interests) (498,5) (456,8)
Net cash flows from operating activities 662,9 914,6Net cash flows from investing activities 484,7 (313,3)
Capital expenditure (99,4) (148,9)Net cash flows from acquisition of businesses (213,6) (180,3)Net proceeds on disposal of investment in NSN 791,2 –Other 6,5 15,9
Net cash flows from financing activities (1 768,9) (103,8)
Shares issued 59,4 24,9Shares repurchased during the period (1 127,9) (125,7)Repayment of Quince long-term borrowings (699,9) – Other (0,5) (3,0)
(Decrease)/increase in net cash resources (621,3) 497,5Net cash resources at the beginning of the year 1 185,9 688,4
Net cash resources at the end of the year 564,6 1 185,9
Cash and cash equivalents 643,0 1 878,1Bank overdrafts and other short term borrowings (78,4) (692,2)
Net cash resources 564,6 1 185,9
28 ANNUAL INTEGRATED REPORT 2011
Audited financial summary continued
Abridged financial information
NOTES
2011Rm
Restated2010
Rm
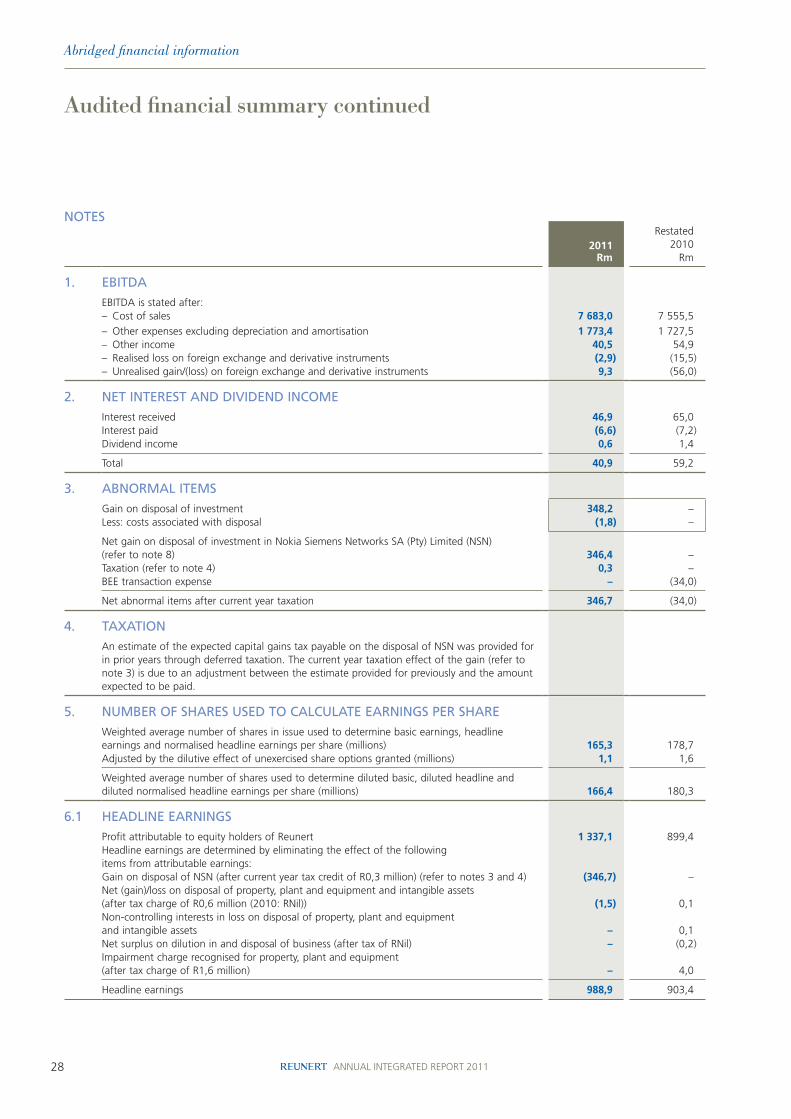
1. EbITDA
EBITDA is stated after:– Cost of sales 7 683,0 7 555,5
– Other expenses excluding depreciation and amortisation 1 773,4 1 727,5– Other income 40,5 54,9– Realised loss on foreign exchange and derivative instruments (2,9) (15,5)– Unrealised gain/(loss) on foreign exchange and derivative instruments 9,3 (56,0)
2. NET INTEREST AND DIVIDEND INCOmE
Interest received 46,9 65,0Interest paid (6,6) (7,2)Dividend income 0,6 1,4
Total 40,9 59,2
3. AbNORmAL ITEmS
Gain on disposal of investment 348,2 –Less: costs associated with disposal (1,8) –
Net gain on disposal of investment in Nokia Siemens Networks SA (Pty) Limited (NSN) (refer to note 8) 346,4 –Taxation (refer to note 4) 0,3 –BEE transaction expense – (34,0)
Net abnormal items after current year taxation 346,7 (34,0)
4. TAxATION
An estimate of the expected capital gains tax payable on the disposal of NSN was provided for in prior years through deferred taxation. The current year taxation effect of the gain (refer to note 3) is due to an adjustment between the estimate provided for previously and the amount expected to be paid.
5. NumbER OF ShARES uSED TO CALCuLATE EARNINGS PER ShARE
Weighted average number of shares in issue used to determine basic earnings, headline earnings and normalised headline earnings per share (millions) 165,3 178,7Adjusted by the dilutive effect of unexercised share options granted (millions) 1,1 1,6
Weighted average number of shares used to determine diluted basic, diluted headline and diluted normalised headline earnings per share (millions) 166,4 180,3
6.1 hEADLINE EARNINGS
Profit attributable to equity holders of Reunert 1 337,1 899,4Headline earnings are determined by eliminating the effect of the following items from attributable earnings:Gain on disposal of NSN (after current year tax credit of R0,3 million) (refer to notes 3 and 4) (346,7) – Net (gain)/loss on disposal of property, plant and equipment and intangible assets (after tax charge of R0,6 million (2010: RNil)) (1,5) 0,1Non-controlling interests in loss on disposal of property, plant and equipment and intangible assets – 0,1Net surplus on dilution in and disposal of business (after tax of RNil) – (0,2)Impairment charge recognised for property, plant and equipment (after tax charge of R1,6 million) – 4,0
Headline earnings 988,9 903,4

29
2011Rm
Restated2010
Rm
6.2 NORmALISED hEADLINE EARNINGS
Headline earnings (refer to note 6.1) 988,9 903,4Normalised headline earnings are determined by eliminating the effect of the following items from attributable headline earnings:BEE transaction expense (after tax of RNil) – 34,0IFRS 3 profit on acquisition of Nashua Communications (Pty) Limited (after tax of RNil) – (8,2)Rate portion of revaluation of interest rate swap derivative assets and liabilities (after tax charge of R3,1 million) – 8,1BEE share of headline earnings adjustments – (6,9)
988,9 930,4Net economic interest in profit attributable to all BEE partners (refer to note 10) (13,8) (8,8)
Normalised headline earnings 975,1 921,6
7. GOODWILL
Carrying value at the beginning of the year 492,1 460,6 Acquisition of businesses 162,8 31,5
Carrying value at the end of the year 654,9 492,1
8. INVESTmENTS AND LOANS
Loans – at cost 44,5 42,8Other unlisted investments – at cost 1,6 1,5Financial instrument – NSN option at fair value1 – 299,2Financial instrument – investment in NSN at fair value1 – 494,3
Carrying value at the end of the year 46,1 837,8
Non-current investments and loans 46,1 44,3Current investments1 – 793,5
Directors’ valuation of unlisted investments– NSN option and investment – 793,5– Other unlisted investments 1,6 1,5
1 As announced on the Securities Exchange News Service (SENS) on 4 February 2011, Reunert exercised its option to sell its investment in NSN and received R793,5 million from the Nokia Siemens Networks group.
9. LONG-TERm bORROWINGS
Total long-term borrowings (including finance leases) 7,7 711,0Less: short-term portion (including finance leases) (7,0) (0,1)
0,7 710,9
In February 2011 Quince repaid its long-term securitised borrowings.
10. bEE TRANSACTIONS
BEE transactions, where the significant risks and rewards of ownership in respect of their equity interests have not passed to the BEE partners, are not recognised as non-controlling interests.
Had the non-controlling interests been recognised, the effect would be the following:
– Net economic interest in current year profit that is attributable to all BEE partners 13,8 8,8– Balance sheet interest that is economically attributable to all BEE partners 77,3 154,1

30 ANNUAL INTEGRATED REPORT 2011
Audited financial summary continued
Abridged financial information
11. mAJOR CORPORATE ACTIVITy
All the acquisitions were funded from cash resources within the group.
Acquisition of Nashua franchisesWith effect from 1 November 2010 Nashua Holdings purchased 51% of the Nashua Tygerberg and Nashua Paarl franchises for R10,6 million and R7,1 million respectively. The non-controlling shareholders of these 2 businesses provided R1,0 million of equity each.
With effect from 1 May 2011 the business and net assets of Nashua Durban were purchased by Nashua Holdings for R48,9 million. In terms of the agreement with the previous owners the balance of R47,8 million is payable six months after the acquisition date.
With effect from 1 June 2011 the business and net assets of Nashua Cape Town were purchased by Nashua Holdings for R67,0 million. In terms of the agreement with the previous owners the balance of R41,1 million is payable six months after the acquisition date.
The R41,1 million goodwill arising on these acquisitions is due to the price paid being in excess of all assets delivered, and represents the intrinsic value of the existing businesses to produce profits into the future. These purchases are in line with Nashua Office Automation’s strategy of acquiring a controlling share in all key existing franchise operations.
Acquisition of ECN Telecommunications (ECN)With effect from 1 June 2011 Reunert purchased the business and net assets of ECN for R171,9 million.
The goodwill of R107,8 million arising from the acquisition consists largely of the synergies expected from enhancing the group’s ability to provide fully converged communications solutions.
Acquisition of ITmaticWith effect from 1 July 2011 the business and net assets of ITmatic were purchased by CBI-electric: low voltage division of Reunert for R1,0 million.
The R13,9 million goodwill arose on the acquisition as ITmatic is a leading process control and automation systems integrator and the acquisition is set to accelerate the division’s growth into other foreign markets.
Nashuafranchises
RmECNRm
ITmaticRm
GroupRm
Net assets acquiredDeferred taxation (5,4) (7,8) – (13,2)Property, plant and equipment and intangible assets 28,6 67,4 1,0 97,0 Inventory 17,0 5,2 – 22,2 Accounts receivable1 74,2 49,5 4,8 128,5 Payables and provisions (21,9) (50,2) (18,7) (90,8)Goodwill 41,1 107,8 13,9 162,8
Cost of investment 133,6 171,9 1,0 306,5
Profit/(loss) since acquisition 4,8 (0,6) (0,3) 3,9 Revenue for the 12 months ended 30 September 2011 as though the acquisition date had been 1 October 2010 325,7 397,4 65,2 788,3Profit/(loss) for the 12 months ended 30 September 2011 as though the acquisition date had been 1 October 2010 14,0 2,8 (7,4) 9,4 1 Gross contractual amounts of accounts receivable at acquisition date 74,2 49,5 4,8 128,5 1 The best estimate of contractual cashflows of accounts receivable
not expected to be received – – – –
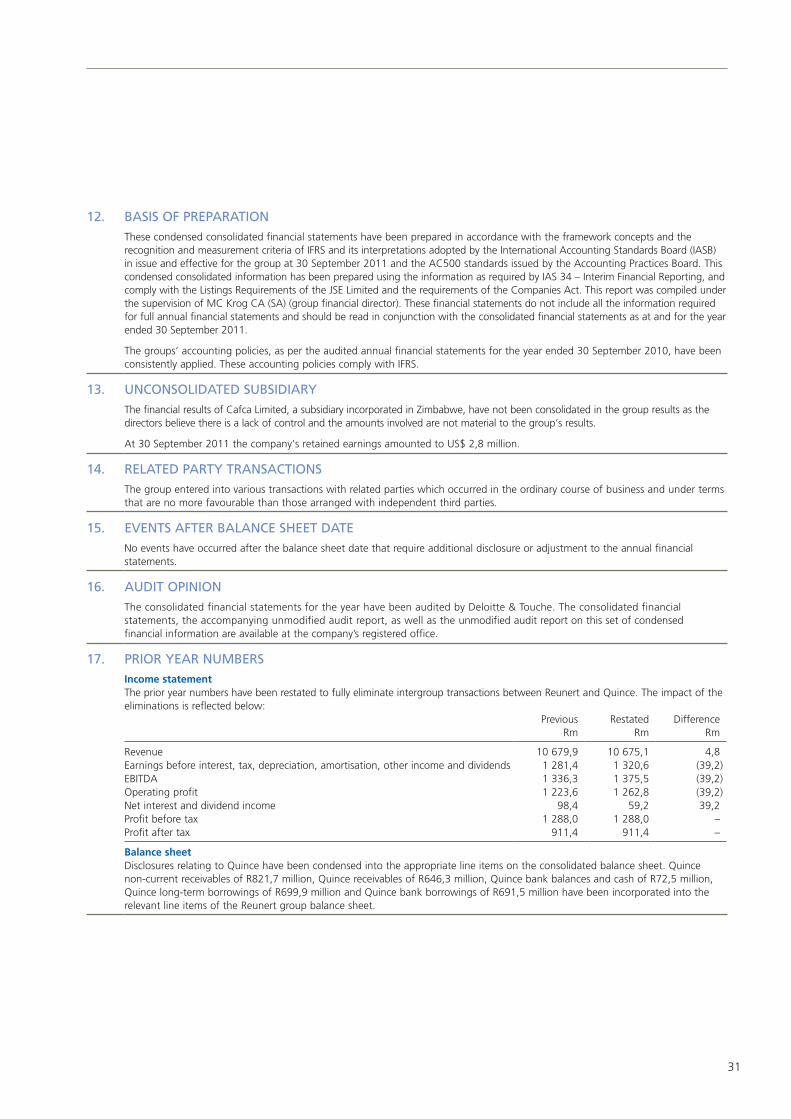
31
12. bASIS OF PREPARATION
These condensed consolidated financial statements have been prepared in accordance with the framework concepts and the recognition and measurement criteria of IFRS and its interpretations adopted by the International Accounting Standards Board (IASB) in issue and effective for the group at 30 September 2011 and the AC500 standards issued by the Accounting Practices Board. This condensed consolidated information has been prepared using the information as required by IAS 34 – Interim Financial Reporting, and comply with the Listings Requirements of the JSE Limited and the requirements of the Companies Act. This report was compiled under the supervision of MC Krog CA (SA) (group financial director). These financial statements do not include all the information required for full annual financial statements and should be read in conjunction with the consolidated financial statements as at and for the year ended 30 September 2011.
The groups’ accounting policies, as per the audited annual financial statements for the year ended 30 September 2010, have been consistently applied. These accounting policies comply with IFRS.
13. uNCONSOLIDATED SubSIDIARy
The financial results of Cafca Limited, a subsidiary incorporated in Zimbabwe, have not been consolidated in the group results as the directors believe there is a lack of control and the amounts involved are not material to the group’s results.
At 30 September 2011 the company’s retained earnings amounted to US$ 2,8 million.
14. RELATED PARTy TRANSACTIONS
The group entered into various transactions with related parties which occurred in the ordinary course of business and under terms that are no more favourable than those arranged with independent third parties.
15. EVENTS AFTER bALANCE ShEET DATE
No events have occurred after the balance sheet date that require additional disclosure or adjustment to the annual financial statements.
16. AuDIT OPINION
The consolidated financial statements for the year have been audited by Deloitte & Touche. The consolidated financial statements, the accompanying unmodified audit report, as well as the unmodified audit report on this set of condensed financial information are available at the company’s registered office.
17. PRIOR yEAR NumbERSIncome statementThe prior year numbers have been restated to fully eliminate intergroup transactions between Reunert and Quince. The impact of the eliminations is reflected below:
PreviousRm
RestatedRm
DifferenceRm
Revenue 10 679,9 10 675,1 4,8 Earnings before interest, tax, depreciation, amortisation, other income and dividends 1 281,4 1 320,6 (39,2)EBITDA 1 336,3 1 375,5 (39,2)Operating profit 1 223,6 1 262,8 (39,2)Net interest and dividend income 98,4 59,2 39,2 Profit before tax 1 288,0 1 288,0 –Profit after tax 911,4 911,4 –
Balance sheetDisclosures relating to Quince have been condensed into the appropriate line items on the consolidated balance sheet. Quince non-current receivables of R821,7 million, Quince receivables of R646,3 million, Quince bank balances and cash of R72,5 million, Quince long-term borrowings of R699,9 million and Quince bank borrowings of R691,5 million have been incorporated into the relevant line items of the Reunert group balance sheet.
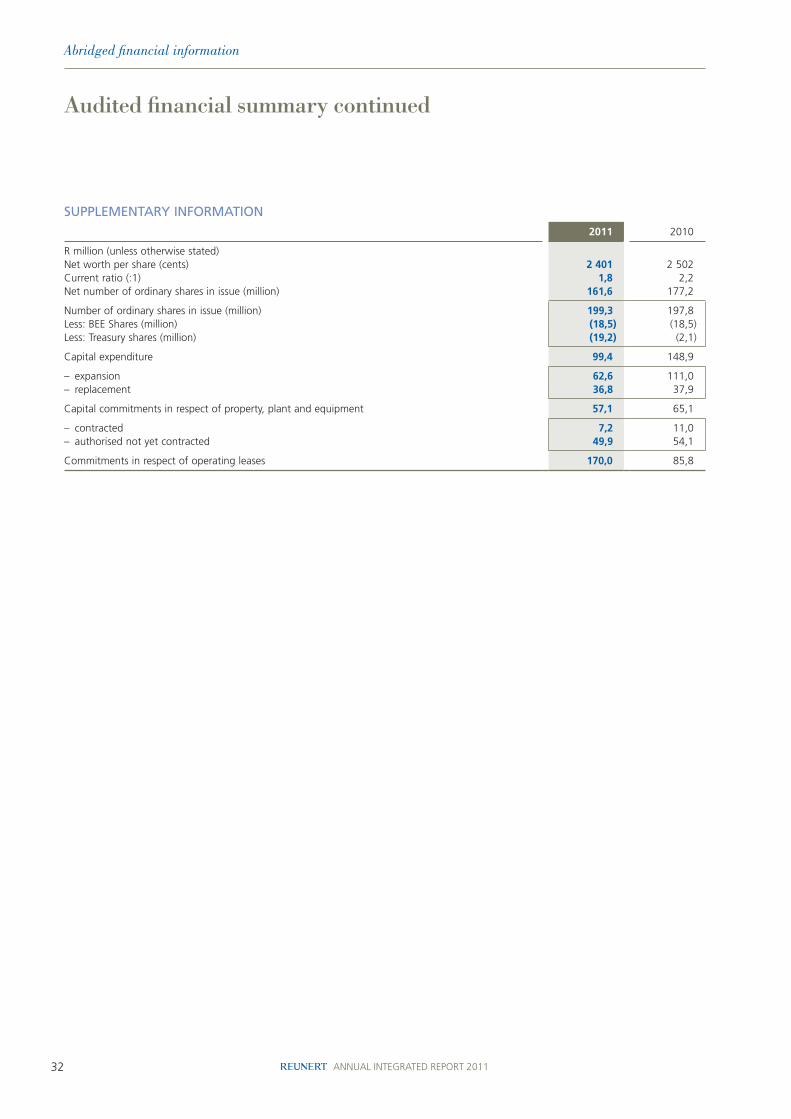
32 ANNUAL INTEGRATED REPORT 2011
Audited financial summary continued
Abridged financial information
SuPPLEmENTARy INFORmATION
2011 2010
R million (unless otherwise stated)Net worth per share (cents) 2 401 2 502Current ratio (:1) 1,8 2,2Net number of ordinary shares in issue (million) 161,6 177,2
Number of ordinary shares in issue (million) 199,3 197,8Less: BEE Shares (million) (18,5) (18,5)Less: Treasury shares (million) (19,2) (2,1)
Capital expenditure 99,4 148,9
– expansion 62,6 111,0– replacement 36,8 37,9
Capital commitments in respect of property, plant and equipment 57,1 65,1
– contracted 7,2 11,0– authorised not yet contracted 49,9 54,1
Commitments in respect of operating leases 170,0 85,8
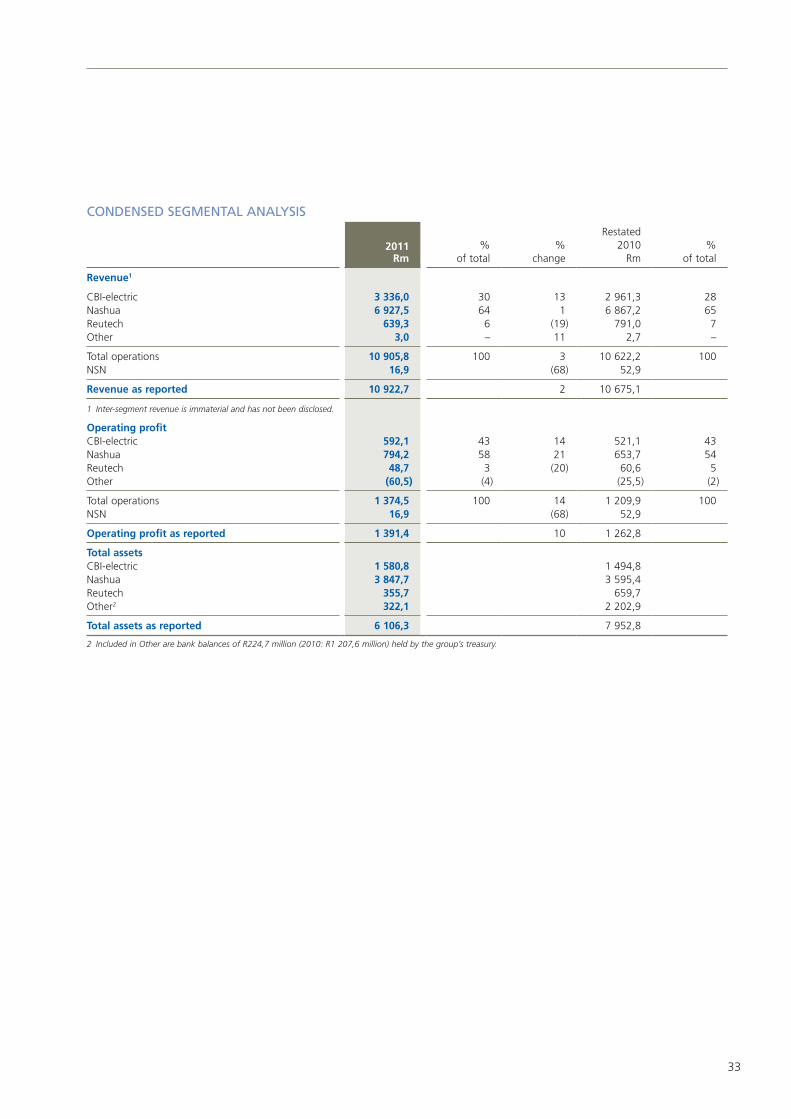
33
CONDENSED SEGmENTAL ANALySIS
2011Rm
%of total
%change
Restated2010
Rm%
of total
Revenue1
CBI-electric 3 336,0 30 13 2 961,3 28Nashua 6 927,5 64 1 6 867,2 65Reutech 639,3 6 (19) 791,0 7Other 3,0 – 11 2,7 –
Total operations 10 905,8 100 3 10 622,2 100NSN 16,9 (68) 52,9
Revenue as reported 10 922,7 2 10 675,1
1 Inter-segment revenue is immaterial and has not been disclosed.
Operating profitCBI-electric 592,1 43 14 521,1 43 Nashua 794,2 58 21 653,7 54 Reutech 48,7 3 (20) 60,6 5 Other (60,5) (4) (25,5) (2)
Total operations 1 374,5 100 14 1 209,9 100 NSN 16,9 (68) 52,9
Operating profit as reported 1 391,4 10 1 262,8
Total assetsCBI-electric 1 580,8 1 494,8Nashua 3 847,7 3 595,4Reutech 355,7 659,7Other2 322,1 2 202,9
Total assets as reported 6 106,3 7 952,8
2 Included in Other are bank balances of R224,7 million (2010: R1 207,6 million) held by the group’s treasury.

34 ANNUAL INTEGRATED REPORT 2011
Operational overview
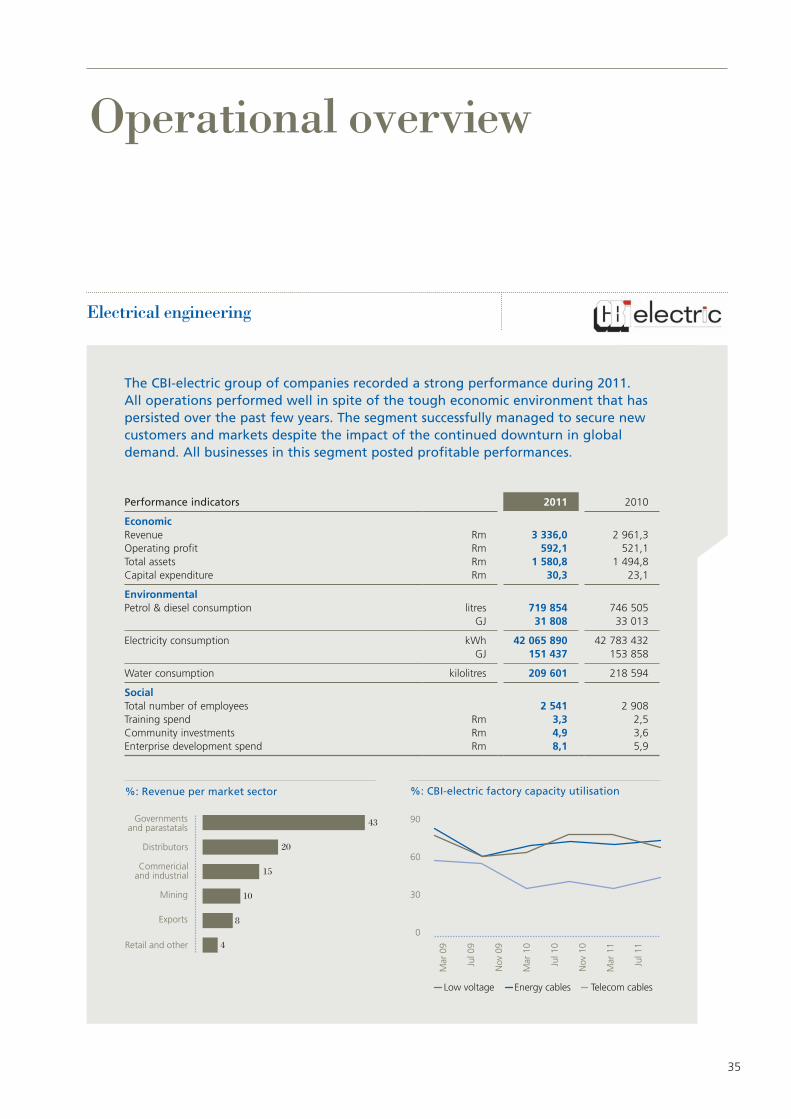
35
Operational overview
Performance indicators 2011 2010
EconomicRevenue Rm 3 336,0 2 961,3Operating profit Rm 592,1 521,1Total assets Rm 1 580,8 1 494,8Capital expenditure Rm 30,3 23,1
EnvironmentalPetrol & diesel consumption litres 719 854 746 505
GJ 31 808 33 013
Electricity consumption kWh 42 065 890 42 783 432GJ 151 437 153 858
Water consumption kilolitres 209 601 218 594
SocialTotal number of employees 2 541 2 908Training spend Rm 3,3 2,5Community investments Rm 4,9 3,6Enterprise development spend Rm 8,1 5,9
The CBI-electric group of companies recorded a strong performance during 2011. All operations performed well in spite of the tough economic environment that has persisted over the past few years. The segment successfully managed to secure new customers and markets despite the impact of the continued downturn in global demand. All businesses in this segment posted profitable performances.
Electrical engineering

36 ANNUAL INTEGRATED REPORT 2011
CBI-electric continued
Operational overview
Revenue for CBI-electric improved to R3 336,0 million (2010: R2 961,3 million) whilst operating profit increased to R592,1 million (2010: R521,1 million). Diversification was a key focus area for the segment during the year. CBI-electric continued servicing existing markets and benefitted from good progress in introducing value-added services for clients. As well as complementing the products produced at our factories and assembly plants, offering value-added services not only contributes to revenue, but helps to strengthen our customer relationships. This strategy enables us to fully utilise the skills and knowledge of our employees in pursuit of growth.
Pleasingly, an excellent performance against safety, health and internal environmental targets accompanied this strong financial and operational performance across all group companies. In July 2011 a number of our factories were affected by an industry wide strike over wages and conditions of employment. A total of 45 333 hours were lost to industrial action – 3% of the total hours worked for the year. The potential impact was, however, mitigated by building up strategic stock in advance of the strike.
A new three-year agreement was signed with the National Union of Metalworkers, guaranteeing union members increases of between 7% and 10%, as well as other concessions. It is envisaged that this agreement will ensure a measure of labour-relations stability until at least mid-2014.
Total tonnes materials used in manufacturing 2011 2010 2009
Copper 13 056 12 394 12 952Aluminium 7 398 5 500 5 410Steel 1 978 1 947 1 302Galvanized steel 6 301 6 315 6 131PVC 4 091 4 123 4 002Brass 62 57 28
Consumption of electricity, water and petrol continued to decline with only diesel use increasing slightly compared to 2010. Our investment in human capital through training increased to R3,3 million (2010: R2,5 million) while enterprise development spend rose to R8,1 million (2010: R5,9 million).
The strong results recorded by the CBI-electric businesses confirm their resilience in tough times. We anticipate respectable prospects for these businesses in the medium to long term, supported by developments such as the South African government’s commitment to infrastructural investment and the rollout of services, particularly in the energy and telecommunications sectors.
To ensure its sustainability as a low-cost producer, the business will focus strongly on continued improvements in operational efficiencies. Opportunities to grow electrical markets in Africa and Australia will be pursued.

37
CBI-electric: african cables (African Cables)
African Cables was the largest contributor to turnover within the CBI-electric group, with increased revenues driven largely by increased copper prices compared to the prior year. This achievement is particularly noteworthy considering that demand for cable in the domestic market has declined by a quarter on 2008 levels, and there remains considerable excess manufacturing capacity in the industry in South Africa.
Productivity improvement initiatives were implemented at the Vereeniging factory over the past three years. Although less pronounced than in previous years, cost reductions of approximately 10% were achieved during 2011. To maintain market share it is important that African Cables retains its position as a low-cost producer. We continue to adopt multifaceted strategies to compete against importers of cheap product.
African Cables holds ISO 9001, 14001 and OHSAS 18001 certifications. Our ISO auditors, who are accredited with the International Register of Certificated Auditors (IRCA), certified our safety, health and environmental performance as Five-Star.
Upgrading and replacing old technology and implementing energy efficient systems resulted in energy savings of 3 457 gigajoules during 2011. Overall, we have reduced energy consumption by more than 5% since 2008. During the year, 80% of the Vereeniging plant’s water was recycled, with some 816 kilolitres discharged into the Klip River. The plant rigorously monitors adherence to the 20 criteria outlined in the Klip River Water Quality Standard. A contracted SMME supplier undertakes most of the recycling of copper, steel, plastics and aluminium at the plant.
African Cables received Level 2 BBBEE status at the end of October. To date this is the highest rating achieved in the Reunert group.
In the past year we increased the investment in our services division, CBI-electric: Power Installations. We anticipate this division will continue to grow its contribution in the year ahead. Given the general shortage of skills – particularly technical skills – in South Africa and the rest of the continent - African Cables’ depth of intellectual capital holds the potential to realise significant opportunities to grow turnover and add value in our service offering.
African Cables’ prospects are largely linked to South Africa’s rate of gross fixed domestic investment. All indications are that the imperatives of job creation and service delivery will continue to drive growth of some 3% to 4% for the foreseeable future. However, the continued decline in South Africa’s manufacturing capacity remains cause for concern.
The business is likely to face increasing pressures in the periods ahead as rising labour and electricity costs and volatile raw material prices negatively impact the cost basis. Cost management will remain a core focus of the business and, coupled with the development of new markets and services, will mitigate the risk.
Primary brands, products and services Manufactures the complete range of power cable from 1 000V – 132 000V.
Designs, installs, commissions and maintains cable systems from 11 000V – 132 000V.
Brands include Zerotox and Power Installations.
Operational areas Operates throughout South Africa with manufacturing facilities in Vereeniging and regional facilities in the Western Cape and KwaZulu-Natal.
The company has access to a manufacturing facility in Harare, Zimbabwe, through its subsidiary Cafca.
Products and services are sold throughout Sub-Saharan Africa and the Indian Ocean islands.
Market sectors Services all market sectors including mining, utility, commercial, contracting and industrial sectors.
Clients include Eskom and major municipalities; gold, platinum and coal miners; Sasol, ArcelorMittal and other major industrial players.
Standards & verifications ISO 9001: 2008; ISO 14001; IRCA 5 Star, OHSAS 18001, IRCA Cap 8 Star
Intellectual property rights Trademarks: Zerotox, CBiD (cable theft prevention system)
Major awards past year CIDB – 9EP, IRCA best overall results achieved, IRCA Best Safety and Health Management System, IRCA Best Environmental Management System, 5 Stars IRCA grading, 4 Stars Alexander Forbes Occupational Health and Safety Management
Current BBBEE level 2
2012 target 2
Cost reductions of approximately
10%
Alan Dickson (41)
» Managing director: CBI-electric: african cables
» MSc (Eng), MBA» Appointed to the group in 1997
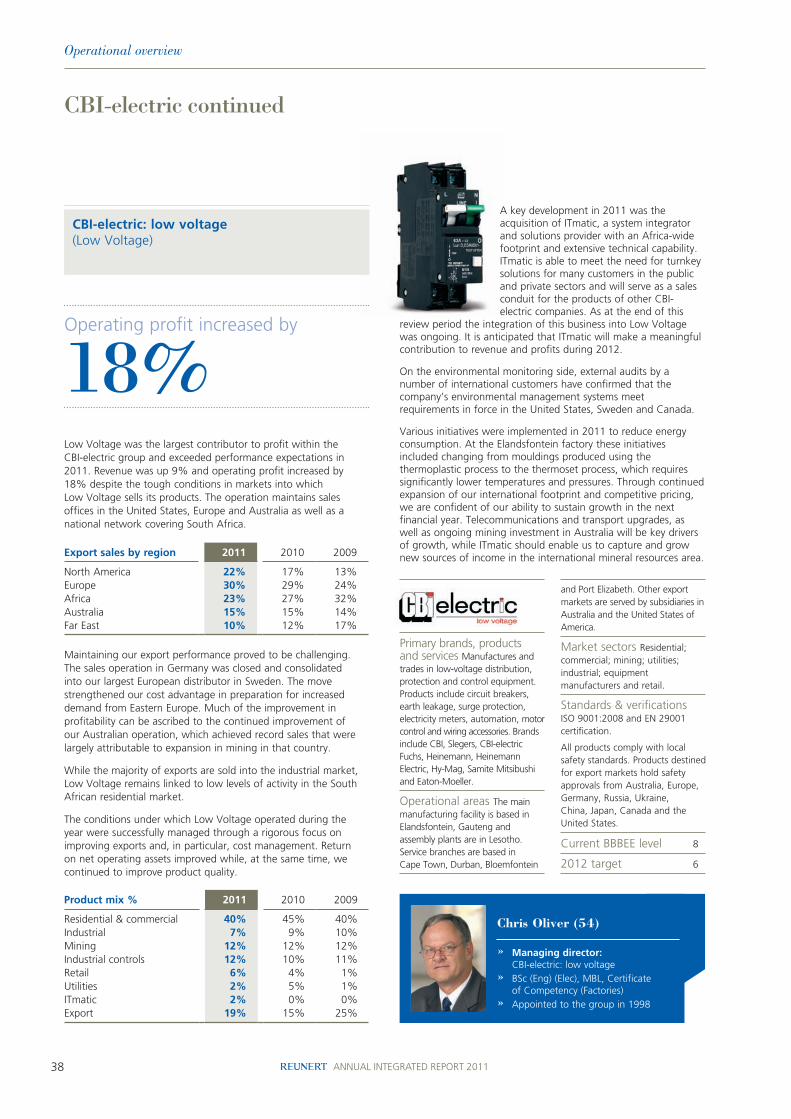
38 ANNUAL INTEGRATED REPORT 2011
Primary brands, products and services Manufactures and trades in low-voltage distribution, protection and control equipment. Products include circuit breakers, earth leakage, surge protection, electricity meters, automation, motor control and wiring accessories. Brands include CBI, Slegers, CBI-electric Fuchs, Heinemann, Heinemann Electric, Hy-Mag, Samite Mitsibushi and Eaton-Moeller.
Operational areas The main manufacturing facility is based in Elandsfontein, Gauteng and assembly plants are in Lesotho. Service branches are based in Cape Town, Durban, Bloemfontein
and Port Elizabeth. Other export markets are served by subsidiaries in Australia and the United States of America.
Market sectors Residential; commercial; mining; utilities; industrial; equipment manufacturers and retail.
Standards & verifications ISO 9001:2008 and EN 29001 certification.
All products comply with local safety standards. Products destined for export markets hold safety approvals from Australia, Europe, Germany, Russia, Ukraine, China, Japan, Canada and the United States.
Current BBBEE level 8
2012 target 6
CBI-electric continued
CBI-electric: low voltage (Low Voltage)
A key development in 2011 was the acquisition of ITmatic, a system integrator and solutions provider with an Africa-wide footprint and extensive technical capability. ITmatic is able to meet the need for turnkey solutions for many customers in the public and private sectors and will serve as a sales conduit for the products of other CBI-electric companies. As at the end of this
review period the integration of this business into Low Voltage was ongoing. It is anticipated that ITmatic will make a meaningful contribution to revenue and profits during 2012.
On the environmental monitoring side, external audits by a number of international customers have confirmed that the company’s environmental management systems meet requirements in force in the United States, Sweden and Canada.
Various initiatives were implemented in 2011 to reduce energy consumption. At the Elandsfontein factory these initiatives included changing from mouldings produced using the thermoplastic process to the thermoset process, which requires significantly lower temperatures and pressures. Through continued expansion of our international footprint and competitive pricing, we are confident of our ability to sustain growth in the next financial year. Telecommunications and transport upgrades, as well as ongoing mining investment in Australia will be key drivers of growth, while ITmatic should enable us to capture and grow new sources of income in the international mineral resources area.
Operational overview
Low Voltage was the largest contributor to profit within the CBI-electric group and exceeded performance expectations in 2011. Revenue was up 9% and operating profit increased by 18% despite the tough conditions in markets into which Low Voltage sells its products. The operation maintains sales offices in the United States, Europe and Australia as well as a national network covering South Africa.
Export sales by region 2011 2010 2009
North America 22% 17% 13%Europe 30% 29% 24%Africa 23% 27% 32%Australia 15% 15% 14%Far East 10% 12% 17%
Maintaining our export performance proved to be challenging. The sales operation in Germany was closed and consolidated into our largest European distributor in Sweden. The move strengthened our cost advantage in preparation for increased demand from Eastern Europe. Much of the improvement in profitability can be ascribed to the continued improvement of our Australian operation, which achieved record sales that were largely attributable to expansion in mining in that country.
While the majority of exports are sold into the industrial market, Low Voltage remains linked to low levels of activity in the South African residential market.
The conditions under which Low Voltage operated during the year were successfully managed through a rigorous focus on improving exports and, in particular, cost management. Return on net operating assets improved while, at the same time, we continued to improve product quality.
Product mix % 2011 2010 2009
Residential & commercial 40% 45% 40%Industrial 7% 9% 10%Mining 12% 12% 12%Industrial controls 12% 10% 11%Retail 6% 4% 1%Utilities 2% 5% 1%ITmatic 2% 0% 0%Export 19% 15% 25%
Operating profit increased by
18%
Chris Oliver (54)
» Managing director: CBI-electric: low voltage
» BSc (Eng) (Elec), MBL, Certificate of Competency (Factories)
» Appointed to the group in 1998

39
CBI-electric: Aberdare ATC Telecom Cables (Telecom Cables)
Reduced spending and a delay in orders impacted Telecom Cables financial performance in the first half of the year. Power disruptions at our Brits manufacturing facility further impacted production. The average number of outages per month increased from 3,5 times the previous year to six in this financial year.
In the first six months, orders declined markedly, but fortunately, rebounded in the second half of the year. These factors resulted in a marginal decline in annual revenue and profits. Our domestic market share of approximately 60% was maintained despite a constrained market. The threat of cheap imports, particularly from China, continued to exert pressure during the year.
Product mix % 2011 2010 2009
Optic fibre 18 26 20Accessories & duct 4 4 3Installations & services 1 1 0Copper telecoms 77 69 77
Sales of copper telecommunication cables for the year increased almost 13%, with fibre sales declining by approximately a third. Copper sales were driven by strong demand from Telkom SA Limited.
Telecom Cables remains well positioned to service all major telecommunications providers in South Africa including Telkom, Neotel and the mobile network operators, as well as IT infrastructure providers, mines, local authorities, Eskom and the petrochemical industry. We have also supplied cable to the National Long Haul Project being undertaken by Vodacom, MTN, Neotel and the South African National Roads Agency, and we are targeting new customers who are entering the market for fibre.
The business’ prospects are further buoyed by the growing demand for broadband capacity, which is expected to make fibre to the home (FTTH) a reality in South Africa in the future.
Telecom Cables has the expertise and capacity to lead the market in supplying the anticipated rise in demand for FTTH, as well as micro duct and micro cable systems.
Our training academy at the Brits factory offers our customers’ technicians intensive two-week courses which are held every month and attended by an average of ten technicians per month.
Primary brands, products and services Designs, manufactures and supplies both copper and optical fibre cables. In addition, turnkey services are provided. These include fibre ducting, splicing, training and installation.
Operational areas Manufacturing facility in Brits, Northwest Province. Products are sold in Sub-Saharan Africa and the Middle East.
Market sectors Fixed and mobile service providers, petrochemical, industrial and mining industries.
Major customers include Telkom, MTN, Neotel, Transnet and Eskom, mines and municipalities.
Standards & verifications ISO 9001: 2008; UL listing, EC (European cable verification certification for data cable), Foundation Fieldbus
Intellectual property rights Infraduct, Fibreworx
Current BBBEE level 6
2012 target 4
We have received export orders from several African states as well as the Arabian Gulf.
The Brits plant recycled 19,3% of water consumed in 2011. Specialists are contracted to verify our water recycling and our water systems on a monthly basis. A closed-loop system results in no water discharge. Approved, accredited suppliers dispose of our hazardous and non-hazardous waste.
Having reduced costs sharply in recent years and with our continued investment in capacity, Telecom Cables is well positioned for any upturn in demand, particularly for fibre. A major risk, not only to Telecom Cables but also to the entire industry, is the possibility that existing duties are reduced and that suppliers from the East dump cable into the South African market. Here the company supports representations being made by its industry association to government urging the maintenance of the status quo. We are hopeful that the recently announced local procurement targets will have a positive impact on the industry.
Selwyn Newnes (54)
» Chief executive: CBI-electric: Aberdare ATC telecom cables
» BCompt» Appointed to the group in 1984

40 ANNUAL INTEGRATED REPORT 2011
Operational overview
“We have an inspiring pipeline of talented black professionals. We must ensure they are nurtured, retained and developed to their full potential.”
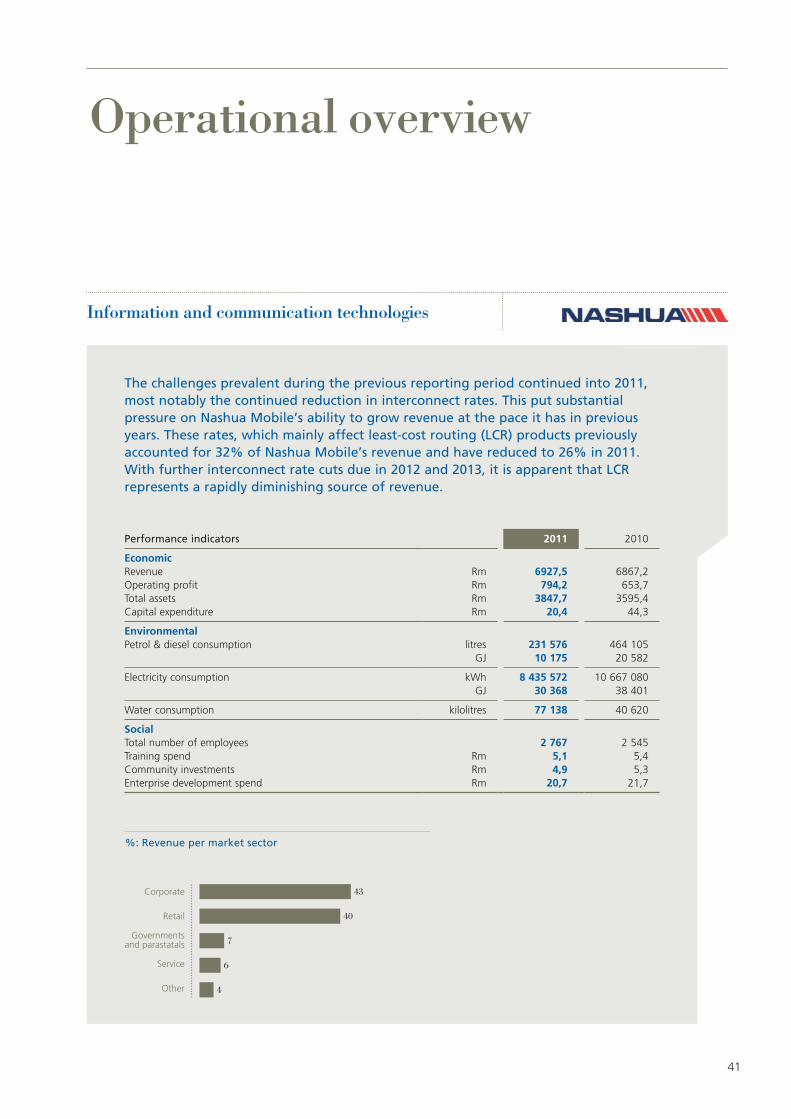
41
Performance indicators 2011 2010
EconomicRevenue Rm 6927,5 6867,2Operating profit Rm 794,2 653,7Total assets Rm 3847,7 3595,4Capital expenditure Rm 20,4 44,3
EnvironmentalPetrol & diesel consumption litres 231 576 464 105
GJ 10 175 20 582
Electricity consumption kWh 8 435 572 10 667 080GJ 30 368 38 401
Water consumption kilolitres 77 138 40 620
SocialTotal number of employees 2 767 2 545Training spend Rm 5,1 5,4Community investments Rm 4,9 5,3Enterprise development spend Rm 20,7 21,7
Operational overview
The challenges prevalent during the previous reporting period continued into 2011, most notably the continued reduction in interconnect rates. This put substantial pressure on Nashua Mobile’s ability to grow revenue at the pace it has in previous years. These rates, which mainly affect least-cost routing (LCR) products previously accounted for 32% of Nashua Mobile’s revenue and have reduced to 26% in 2011. With further interconnect rate cuts due in 2012 and 2013, it is apparent that LCR represents a rapidly diminishing source of revenue.
Information and communication technologies

42 ANNUAL INTEGRATED REPORT 2011
Nashua continued
Operational overview
Despite this challenge and the generally quiet market conditions during the year, the Nashua group companies all produced satisfactory results. Operating revenue for the group rose some 1% to R6 927,5 million (2010: R6 867,2 million), while the operating margin improved to 11,5% (2010: 9,5%). Cost reductions at Nashua Mobile and Nashua Office Automation also accounted for the increase in operating profit by 21% to R794,2 million (2010: R653,7 million).
In July the concept of Nashua One was announced but, following an in-depth due diligence process, it was decided that the various operations would continue to operate independently.
Subsequent to the financial year end, Andy Baker announced his intention to resign but agreed to remain with the Reunert group until January 2012 to assist with various projects. Chris Radley was appointed managing director of Nashua Mobile, Dave Coutinho became managing director of Nashua Limited (Office Automation) and Andy Openshaw the managing director of ECN.
In the medium term a strategy will be implemented to integrate the offerings of Nashua Mobile, Nashua Communications and ECN to deliver world-class LAN, WAN and mobile solutions.
Excellent customer service remains the main differentiator for the various Nashua operations.
Increase in operating profit by
21%A highlight for the year was the successful acquisition of ECN, following unconditional Competition Tribunal approval in June. This acquisition, valued at R172 million, brings many exciting opportunities to the business. Teams at Nashua Mobile and ECN are working hard to integrate the new operation and to realise these opportunities.
Excellent customer service remains the main differentiator for the various Nashua operations. In the short term a key focus of the Nashua executive team will be on even closer engagement with customers and with our all-important franchise and other distribution channel partners. Concerns raised during the year by some of these partners about relationships with Nashua will be effectively addressed.
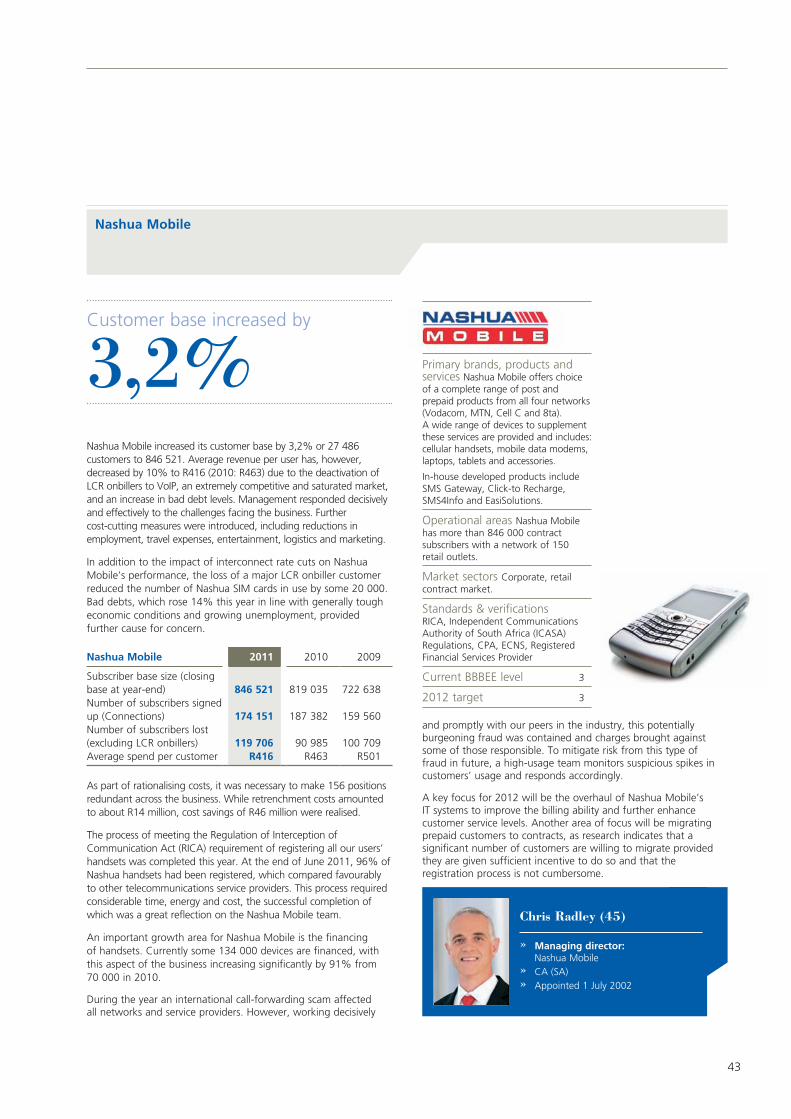
43
Nashua Mobile
Nashua Mobile increased its customer base by 3,2% or 27 486 customers to 846 521. Average revenue per user has, however, decreased by 10% to R416 (2010: R463) due to the deactivation of LCR onbillers to VoIP, an extremely competitive and saturated market, and an increase in bad debt levels. Management responded decisively and effectively to the challenges facing the business. Further cost-cutting measures were introduced, including reductions in employment, travel expenses, entertainment, logistics and marketing.
In addition to the impact of interconnect rate cuts on Nashua Mobile’s performance, the loss of a major LCR onbiller customer reduced the number of Nashua SIM cards in use by some 20 000. Bad debts, which rose 14% this year in line with generally tough economic conditions and growing unemployment, provided further cause for concern.
Nashua Mobile 2011 2010 2009
Subscriber base size (closing base at year-end) 846 521 819 035 722 638Number of subscribers signed up (Connections) 174 151 187 382 159 560Number of subscribers lost (excluding LCR onbillers) 119 706 90 985 100 709Average spend per customer R416 R463 R501
As part of rationalising costs, it was necessary to make 156 positions redundant across the business. While retrenchment costs amounted to about R14 million, cost savings of R46 million were realised.
The process of meeting the Regulation of Interception of Communication Act (RICA) requirement of registering all our users’ handsets was completed this year. At the end of June 2011, 96% of Nashua handsets had been registered, which compared favourably to other telecommunications service providers. This process required considerable time, energy and cost, the successful completion of which was a great reflection on the Nashua Mobile team.
An important growth area for Nashua Mobile is the financing of handsets. Currently some 134 000 devices are financed, with this aspect of the business increasing significantly by 91% from 70 000 in 2010.
During the year an international call-forwarding scam affected all networks and service providers. However, working decisively
Customer base increased by
3, 2%
and promptly with our peers in the industry, this potentially burgeoning fraud was contained and charges brought against some of those responsible. To mitigate risk from this type of fraud in future, a high-usage team monitors suspicious spikes in customers’ usage and responds accordingly.
A key focus for 2012 will be the overhaul of Nashua Mobile’s IT systems to improve the billing ability and further enhance customer service levels. Another area of focus will be migrating prepaid customers to contracts, as research indicates that a significant number of customers are willing to migrate provided they are given sufficient incentive to do so and that the registration process is not cumbersome.
Primary brands, products and services Nashua Mobile offers choice of a complete range of post and prepaid products from all four networks (Vodacom, MTN, Cell C and 8ta). A wide range of devices to supplement these services are provided and includes: cellular handsets, mobile data modems, laptops, tablets and accessories.
In-house developed products include SMS Gateway, Click-to Recharge, SMS4Info and EasiSolutions.
Operational areas Nashua Mobile has more than 846 000 contract subscribers with a network of 150 retail outlets.
Market sectors Corporate, retail contract market.
Standards & verifications RICA, Independent Communications Authority of South Africa (ICASA) Regulations, CPA, ECNS, Registered Financial Services Provider
Current BBBEE level 3
2012 target 3
Chris Radley (45)
» Managing director: Nashua Mobile
» CA (SA)» Appointed 1 July 2002
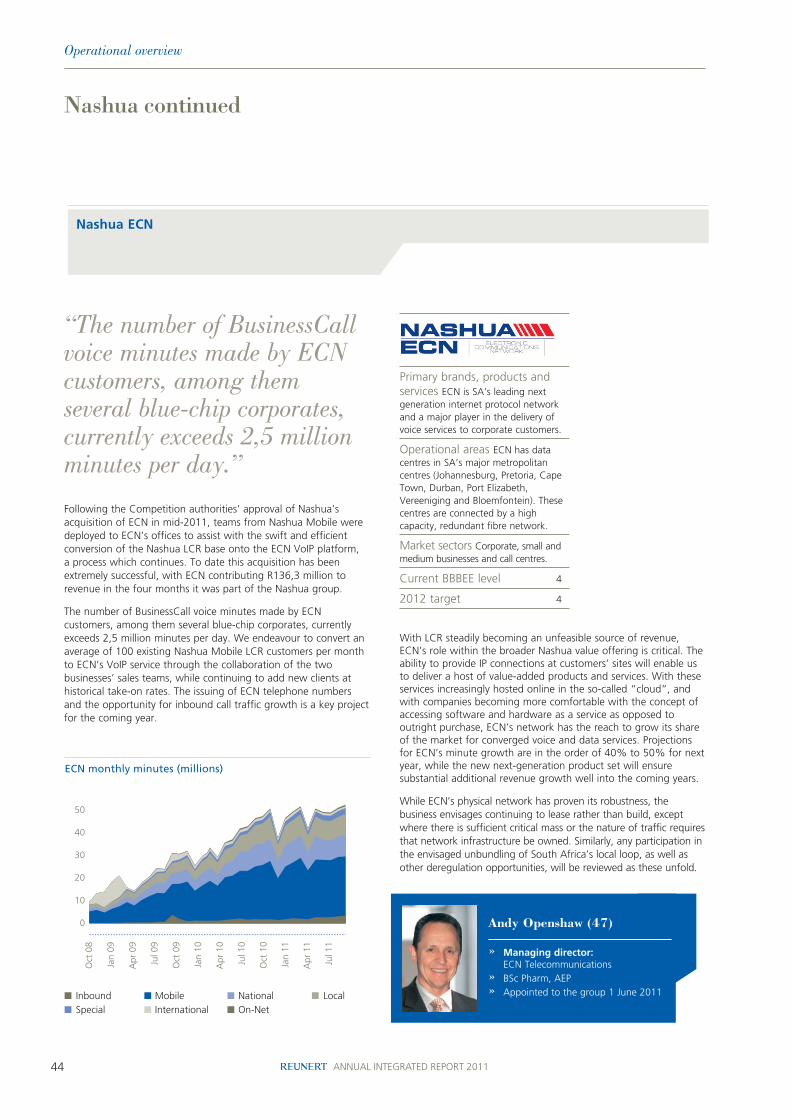
44 ANNUAL INTEGRATED REPORT 2011
Nashua ECN
Nashua continued
Operational overview
Following the Competition authorities’ approval of Nashua’s acquisition of ECN in mid-2011, teams from Nashua Mobile were deployed to ECN’s offices to assist with the swift and efficient conversion of the Nashua LCR base onto the ECN VoIP platform, a process which continues. To date this acquisition has been extremely successful, with ECN contributing R136,3 million to revenue in the four months it was part of the Nashua group.
The number of BusinessCall voice minutes made by ECN customers, among them several blue-chip corporates, currently exceeds 2,5 million minutes per day. We endeavour to convert an average of 100 existing Nashua Mobile LCR customers per month to ECN’s VoIP service through the collaboration of the two businesses’ sales teams, while continuing to add new clients at historical take-on rates. The issuing of ECN telephone numbers and the opportunity for inbound call traffic growth is a key project for the coming year.
With LCR steadily becoming an unfeasible source of revenue, ECN’s role within the broader Nashua value offering is critical. The ability to provide IP connections at customers’ sites will enable us to deliver a host of value-added products and services. With these services increasingly hosted online in the so-called “cloud”, and with companies becoming more comfortable with the concept of accessing software and hardware as a service as opposed to outright purchase, ECN’s network has the reach to grow its share of the market for converged voice and data services. Projections for ECN’s minute growth are in the order of 40% to 50% for next year, while the new next-generation product set will ensure substantial additional revenue growth well into the coming years.
While ECN’s physical network has proven its robustness, the business envisages continuing to lease rather than build, except where there is sufficient critical mass or the nature of traffic requires that network infrastructure be owned. Similarly, any participation in the envisaged unbundling of South Africa’s local loop, as well as other deregulation opportunities, will be reviewed as these unfold.
Primary brands, products and services ECN is SA’s leading next generation internet protocol network and a major player in the delivery of voice services to corporate customers.
Operational areas ECN has data centres in SA’s major metropolitan centres (Johannesburg, Pretoria, Cape Town, Durban, Port Elizabeth, Vereeniging and Bloemfontein). These centres are connected by a high capacity, redundant fibre network.
Market sectors Corporate, small and medium businesses and call centres.
Current BBBEE level 4
2012 target 4
“The number of BusinessCall voice minutes made by ECN customers, among them several blue-chip corporates, currently exceeds 2,5 million minutes per day.”
Andy Openshaw (47)
» Managing director: ECN Telecommunications
» BSc Pharm, AEP» Appointed to the group 1 June 2011
45
Nashua Communications
This year represented the first full year that Nashua Communications – the consolidation of the Siemens Enterprise Communications and Panasonic Telecommunications – operated as a single entity within the group. For this reason year-on-year comparison of results is not meaningful. Results for 2011 indicated a decline in sales compared to budget of around 8% due to a constrained and intensely competitive market, while margins also followed this downward trend.
2011
Communication servers sold 3 529Telephone devices 137 861Customer base 17 195Ports under managed services contracts 310 348
A salient feature of 2011 was the strong market growth of 17% in converged voice and data, while services offerings grew by 7% – well above the market average – now representing more than 40% of Nashua Communications’ revenue.
The short- to medium-term outlook for Nashua Communications remains positive. The business’ traditional strength in voice appeals to its large and loyal customer base and its technology and in-depth technical expertise, inherited from Siemens, position the business well in its strategy to become South Africa’s leading unified communications solutions and services provider. As PABX sales continue their steady decline, opportunities for converged communications solutions are increasing – a demand we are already capable of meeting.
Managed services, which is a complete offering whereby we design, build, implement and service a customer’s full internal communications requirements, continue to be a key focus for Nashua Communications. This is anticipated to become an increasingly prominent feature of the business. A major highlight for the year was the re-awarding of a five-year contract to service Old Mutual Group, our largest managed services client. We have built a proven track record in this area and demonstrated our strong capability to successfully service clients looking for a converged, managed enterprise communications solution.
Primary brands, products and services A leading communications provider using Siemens and Panasonic technologies. Following an open communication approach, the company provides enterprise communication services and products, including software, network components and end-user devices, consulting and system planning and integration.
Operational areas Head office in Gauteng and regional offices in KwaZulu-Natal, Eastern and Western Cape and partners in Namibia, Botswana and Mozambique.
Market sectors Customer base in excess of 17 000 enterprises, which include most of South Africa’s leading corporate companies.
Standards & Verifications ISO 9001: 2008; 14001:2004. Products are Icasa and SABS certified.
Current BBBEE level 4
2012 target 4
Nashua Communications is a level 4 BBBEE contributor and holds both ISO 9001 and ISO 14001 accreditation. The company takes full responsibility for the end-of-life of products supplied to clients, recovering old systems and ensuring that they are recycled by an accredited service provider.
A salient feature was the strong market growth of
17%

46 ANNUAL INTEGRATED REPORT 2011
Office Automation
Nashua continued
Operational overview
Office Automation achieved positive growth in sales of multi-function devices and, in particular, of printers. Our Solutions operation, however, returned disappointing results.
Market share grew marginally but turnover was slightly down on 2010. This is explained by extremely competitive market conditions and the continuing strength of the rand. In December 2010 the business took out extended exchange-rate forward cover, which had a positive impact on results. Operating profit for the year rose 13% on 2010.
Strong growth was achieved in the area of managed print services (MPS). There is a growing demand for such services, especially from larger corporate clients. To meet this growing opportunity, head count at the MPS team was doubled this year.
Office Automation continued to enjoy exceptional success in bidding for, and winning, tenders. This year some 60% of all tender bids were successful. Office Automation management is acutely aware, however, that its BBBEE contributor status will increasingly impact on its ability to keep winning public-sector tenders and has set itself the objective of improving from a Level 5 BBBEE contributor to Level 4. Nashua Kopano will endeavour to improve from its current Level 4 to Level 3.
Organisational and management changes within the Nashua group and at Office Automation created widespread uncertainty this year,
“This year some 60% of all tender bids were successful.”
not only amongst staff but amongst franchisees as well. These are now being addressed. The announcement that Office Automation would continue as an independent operation – announced after the year-end – was extremely well received by the channel.
In 2011 four franchises were repurchased with Cape Town and Durban being the largest. Office Automation now has effective control over 60% of its channel. It is envisaged that a further three franchises will be bought back, but that franchisees will continue to be of critical importance to Office Automation’s future success.
The business embarked on an ISO 14001 environmental management certification. Office Automation envisages offering a much more sophisticated recycling service, which will entail stripping out and recycling different components including plastics and electronic components.
Primary brands, products and services Nashua is the market leader in the supply of copiers, multi-function printers, laser printers, consumables and digital software solutions in the southern African market.
Products are sourced from leading international suppliers of office automation equipment. Nashua remains one of Ricoh’s largest independent distributors worldwide. In different categories, products are complemented with products from HP and Samsung.
Operational areas Nashua’s footprint consists of 64 franchise and company-owned outlets in South Africa, Namibia, Swaziland, Lesotho, Botswana, and Zimbabwe.
Market sectors Mainly corporate
Standards & verifications ISO 9001: 2008
In process of obtaining ISO14001 accreditation.
Intellectual property rights Trademark and naming rights for NASHUA in Southern Africa region
Major awards past year Laserfiche Winner Circle for 2011 (4th time in a row)
Current BBBEE level 5
2012 target 4
Dave Coutinho (48)
» Managing director: Nashua Limited (Office Automation)
» MBA» Appointed to the group
1 September 1987
47
Nashua Electronics
Nashua Electronics exited the consumer electronics market during the 2010 financial year, while the air conditioning business and PABX systems were transferred to CBI-electric and Nashua Communications respectively. This had a significant impact on Nashua Electronics revenue. Since then, the addition of Kyocera Mita to its product offering has been positive and has led to a return to profitability.
Primary brands, products and services Imports, markets, distributes and retails business system products and solutions under the brands of Kyocera Mita, Panasonic, Pansolutions, Samsung and other leading brands. Focuses mainly on office automation and audio visual products.
Operational areas Distributes imported products and solutions via a wide network of branches, franchises and specialised dealers throughout sub-Saharan Africa under the trade name Pansolutions. Nashua Electronics is geared as an e-commerce retailer for electronics products.
Market sectors Corporate, medium and small business enter prises, as well as specific industry leaders in the broadcast, system integrator and motor industries.
Current BBBEE level 4
2012 target 4
Quince Capital
Quince Capital provides in-house finance solutions to Nashua customers through Nashua group businesses. The major feature for the year was the successful reduction in the Quince asset rentals (QAR) book. In 2011, QAR bad debts amounted to R13,5 million, a marked improvement on R39 million in 2010 and R86,3 million in 2009. The QAR book’s losses have been reduced and the remaining book is performing well. Furthermore, we have reduced our exposures from R170,7 million in 2010 to R76,8 million in 2011, and we anticipate the book to further reduce in 2012 to below R20 million.
This year R700 million of securitisation funding provided by Standard Bank was repaid from excess cash in the Reunert group, resulting in significant yield improvements for Reunert.
In the latter months of the year there was some growth in the Nashua book, resulting in a marginal increase in value to R1,26 billion (2010: R1,23 billion). Average monthly discounting in 2011 stood at R55,4 million (2010: R47,7 million). Future opportunities for Quince include capitalising on new and future Nashua franchise acquisitions and collaborating with Nashua Communications and ECN.
2011 2010 2009
Nashua book R1,26bn R1,23bn R1,37bnQuince asset rentals R76,8m R170,7m R333,2mAverage monthly discounting R55,4m R47,7m R52,8m
Primary brands, products and services Quince Capital, trading as Quince Capital and Nashua Finance, provides asset-based financial solutions to Reunert-associated office automation and upgradeable technology suppliers.
Operational areas Nashua franchise network, Nashua Communications and Nashua Electronics dealers throughout South Africa.
Market sectors Total advances exceeded R1,3 billion and are spread over more than 53 000 individual contracts.
Standards & verifications ISO 9001:2008
Intellectual property rights Quince Capital®
FinSight credit vetting system
Current BBBEE level 4
2012 target 4
Bertus Korb (36)
» Managing director: Quince Capital
» CA (SA)» Appointed to the group in 2009

48 ANNUAL INTEGRATED REPORT 2011
Operational overview
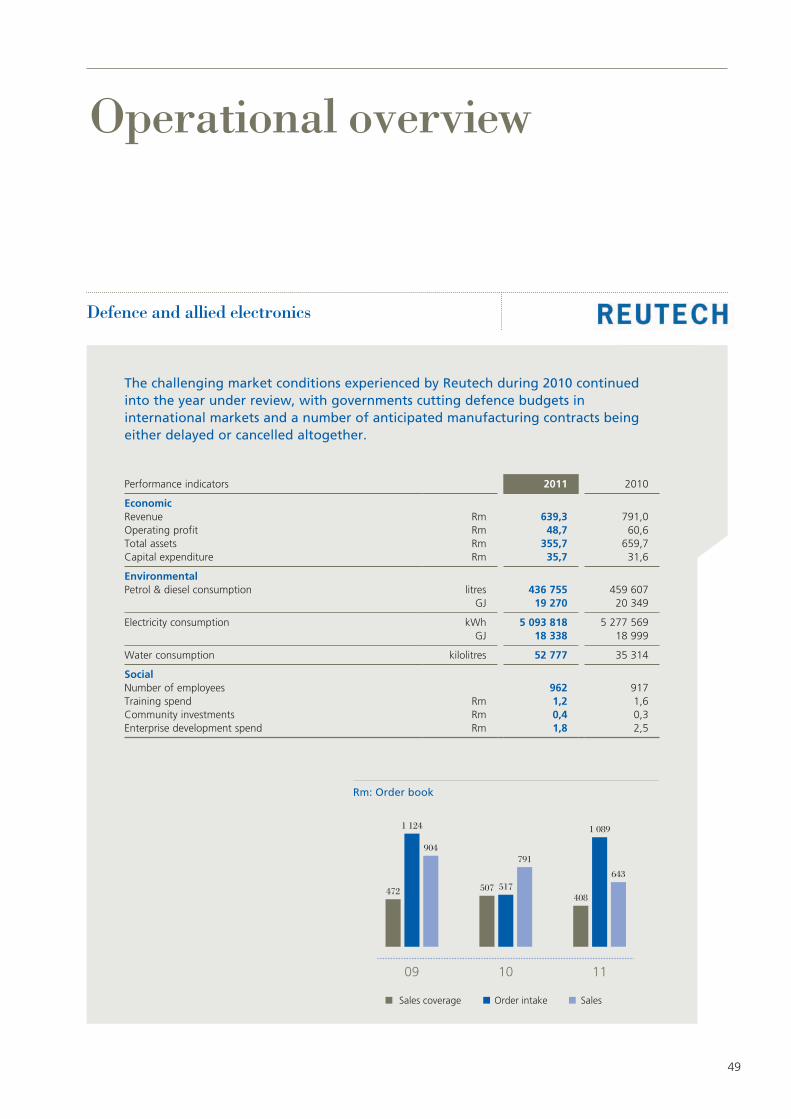
49
Operational overview
The challenging market conditions experienced by Reutech during 2010 continued into the year under review, with governments cutting defence budgets in international markets and a number of anticipated manufacturing contracts being either delayed or cancelled altogether.
Performance indicators 2011 2010
EconomicRevenue Rm 639,3 791,0Operating profit Rm 48,7 60,6Total assets Rm 355,7 659,7Capital expenditure Rm 35,7 31,6
EnvironmentalPetrol & diesel consumption litres 436 755 459 607
GJ 19 270 20 349
Electricity consumption kWh 5 093 818 5 277 569GJ 18 338 18 999
Water consumption kilolitres 52 777 35 314
SocialNumber of employees 962 917Training spend Rm 1,2 1,6Community investments Rm 0,4 0,3Enterprise development spend Rm 1,8 2,5
Defence and allied electronics
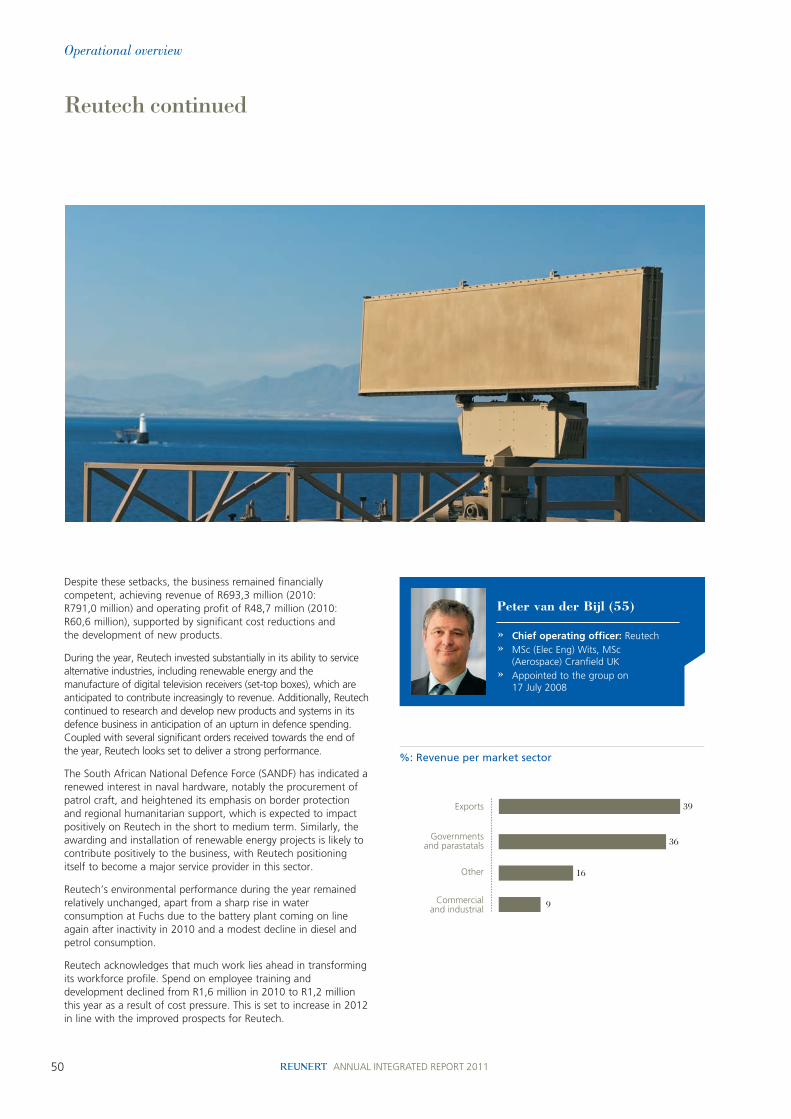
50 ANNUAL INTEGRATED REPORT 2011
Reutech continued
Operational overview
Despite these setbacks, the business remained financially competent, achieving revenue of R693,3 million (2010: R791,0 million) and operating profit of R48,7 million (2010: R60,6 million), supported by significant cost reductions and the development of new products.
During the year, Reutech invested substantially in its ability to service alternative industries, including renewable energy and the manufacture of digital television receivers (set-top boxes), which are anticipated to contribute increasingly to revenue. Additionally, Reutech continued to research and develop new products and systems in its defence business in anticipation of an upturn in defence spending. Coupled with several significant orders received towards the end of the year, Reutech looks set to deliver a strong performance.
The South African National Defence Force (SANDF) has indicated a renewed interest in naval hardware, notably the procurement of patrol craft, and heightened its emphasis on border protection and regional humanitarian support, which is expected to impact positively on Reutech in the short to medium term. Similarly, the awarding and installation of renewable energy projects is likely to contribute positively to the business, with Reutech positioning itself to become a major service provider in this sector.
Reutech’s environmental performance during the year remained relatively unchanged, apart from a sharp rise in water consumption at Fuchs due to the battery plant coming on line again after inactivity in 2010 and a modest decline in diesel and petrol consumption.
Reutech acknowledges that much work lies ahead in transforming its workforce profile. Spend on employee training and development declined from R1,6 million in 2010 to R1,2 million this year as a result of cost pressure. This is set to increase in 2012 in line with the improved prospects for Reutech.
Peter van der Bijl (55)
» Chief operating officer: Reutech» MSc (Elec Eng) Wits, MSc
(Aerospace) Cranfield UK» Appointed to the group on
17 July 2008
51
Reutech Radar Systems
Radar Systems enjoyed a successful year, with financial performance exceeding targets on the back of increased sales in existing and new markets. With the development of new products, the business has successfully broadened its client base beyond its traditional defence sector focus.
During the year, the RSR 210N radar system was successfully trialled by the Norwegian Navy and installed on its frigates, with further systems due to be installed in the new financial year. This order represents an important step into the European and international defence markets. We are also investigating an entry into the Middle East homeland security market. Such has been the success of the Norwegian implementation that we are confident of replicating this success with other customers such as India and Canada.
Similar export success was achieved with sales of mining surveillance radar systems. Mining today represents more than half of Reutech Radar Systems’ revenue. These radar systems are currently being used at 46 mines around the world, up from 29 the previous year and just 18 in 2009. The systems hold a dominant position in the South African market and have been well received in North America, Europe, Australia and Papua New Guinea. A major target for 2012 will be to establish a market presence in India and other emerging markets.
During the year a new facility in Stellenbosch was commissioned to manufacture mining radar systems. This new facility currently produces two to three units per month, and we hope to increase production in 2012. Radar Systems will be launching a new-generation mining radar solution in 2012, which is expected to maintain Reutech’s leadership position in this area.
In addition to a solar tracker system for use in various solar power applications, Radar Systems is developing specialised radar for the mitigation of the negative effects of wind turbine generators on air traffic radar. The research and development team in Stellenbosch is able to develop local intellectual property related to renewable energy projects in conjunction with offshore partners as well as cooperating with other companies within the Reunert group for the rollout of large-scale renewable energy products. This augurs well for the future.
Primary brands, products and services Develops and manufactures ground and naval search and tracking radar systems. Significant contracts include the supply of sensors and software for the country’s Ground Based Air Defence System programme, tracking sensors for the Valour-class frigates and more recently, helicopter management radar for the Royal Norwegian Navy.
Mining radar sensor systems used in open-cast mining operations are supplied internationally in increasing quantities as the product range expands.
Operational areas Based in Stellenbosch
Market sectors Products are developed for open cast mines, local and foreign defence forces. Renewable energy is a new market sector being explored.
Standards & verifications ISO 9001: 2010
Intellectual property rights Floodlight radar system for detecting and locating moving targets in 3D
Current BBBEE level 7
2012 target 6
Number of mines using our radars
46
Carl Kies (48)
» Chief executive: Reutech Radar Systems
» BEng (Elec), MEng (Elec), EMBA» Appointed to the group in 1988
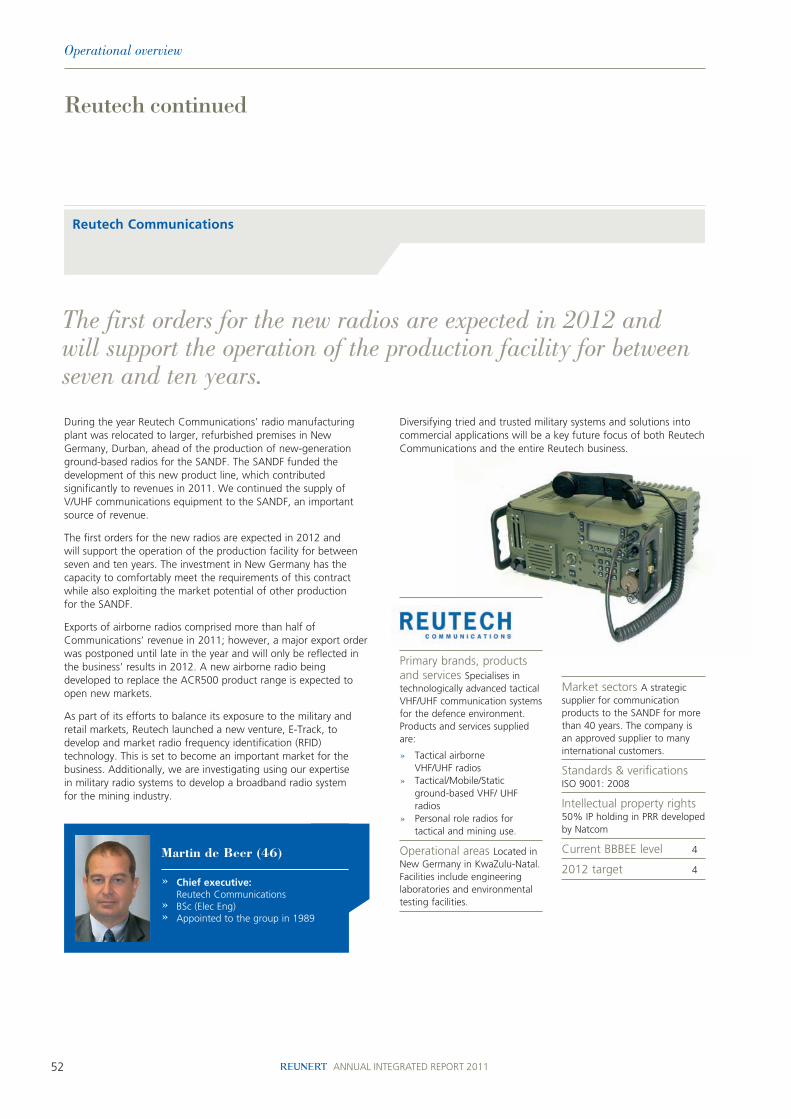
52 ANNUAL INTEGRATED REPORT 2011
Reutech Communications
Reutech continued
Operational overview
During the year Reutech Communications’ radio manufacturing plant was relocated to larger, refurbished premises in New Germany, Durban, ahead of the production of new-generation ground-based radios for the SANDF. The SANDF funded the development of this new product line, which contributed significantly to revenues in 2011. We continued the supply of V/UHF communications equipment to the SANDF, an important source of revenue.
The first orders for the new radios are expected in 2012 and will support the operation of the production facility for between seven and ten years. The investment in New Germany has the capacity to comfortably meet the requirements of this contract while also exploiting the market potential of other production for the SANDF.
Exports of airborne radios comprised more than half of Communications’ revenue in 2011; however, a major export order was postponed until late in the year and will only be reflected in the business’ results in 2012. A new airborne radio being developed to replace the ACR500 product range is expected to open new markets.
As part of its efforts to balance its exposure to the military and retail markets, Reutech launched a new venture, E-Track, to develop and market radio frequency identification (RFID) technology. This is set to become an important market for the business. Additionally, we are investigating using our expertise in military radio systems to develop a broadband radio system for the mining industry.
Diversifying tried and trusted military systems and solutions into commercial applications will be a key future focus of both Reutech Communications and the entire Reutech business.
The first orders for the new radios are expected in 2012 and will support the operation of the production facility for between seven and ten years.
Primary brands, products and services Specialises in technologically advanced tactical VHF/UHF communication systems for the defence environment. Products and services supplied are:
» Tactical airborne VHF/UHF radios
» Tactical/Mobile/Static ground-based VHF/ UHF radios
» Personal role radios for tactical and mining use.
Operational areas Located in New Germany in KwaZulu-Natal. Facilities include engineering laboratories and environmental testing facilities.
Market sectors A strategic supplier for communication products to the SANDF for more than 40 years. The company is an approved supplier to many international customers.
Standards & verifications ISO 9001: 2008
Intellectual property rights 50% IP holding in PRR developed by Natcom
Current BBBEE level 4
2012 target 4
Martin de Beer (46)
» Chief executive: Reutech Communications
» BSc (Elec Eng)» Appointed to the group in 1989
53
Reutech Solutions
During the year Reutech Solutions successfully renewed its static telecoms infrastructure support contract with the SANDF for a further five years. This cements a 30-year relationship with the SANDF and underscores Reutech Solutions’ unrivalled capability in the domestic market.
Results were negatively impacted by the unexpected cancellation of a major order for defensive gun systems. This was partially offset by an order received for a similar system for the export market. Ideally suited for anti-piracy operations and close-quarters self-defence, prospects for this segment of Reutech Solutions’ business remain positive.
Sales of Reutech’s patented remote-controlled scraper winch performed well during the year, with the first controller deployed at Anglo Platinum mines. These controllers dramatically improve safety, extend machine and motor life and reduce energy consumption. The equipment can easily be operated by women and has been well received in the market. Reutech Solutions is initially focusing on distributing these systems in South Africa, and will look to roll out the systems internationally in the medium term.
A significant proportion of Reutech Solutions’ capacity in the year was devoted to contracts for the erection and equipping of base stations for Cell C and Telkom. Regrettably, contractual ambiguities with the prime contractors that could not be resolved on a timely basis resulted in substantial losses being incurred on these contracts.
5-yearsupport contract renewed
Primary brands, products and services Focuses on the supply of turnkey solutions for
» logistics engineering and support
» weapon stabilisation and fire-directing systems
» switching networks – providing managed telecoms network infrastructure and support for strategic industries
» mine scraper winch controller systems
» renewable energy solutions.
Operational areas Based at Midrand with support facilities throughout South Africa.
Imports and distributes internationally acclaimed brands such as Alcatel Lucent.
Market sectors SANDF, other governmental agencies, mining industry and independent power producers providing renewable energy.
Standards & verifications ISO 9001:2008
Intellectual property rights Registered patents and designs for Dome Light Blue/Green LED Single and Double Lights
Mine scraper winch control system
Current BBBEE level 5
2012 target 4
As a result, Reutech has decided to limit its relationships with the two suppliers involved to executable contracts.
Solution’s contract with Nokia to service handsets, with more than 8 000 handsets serviced per month, helps to utilise the available logistics capacity.
Renewable energy
In the past year Reutech Solutions invested considerable time and attention in planning for the generation of renewable energy resources as envisaged in South Africa’s Integrated Resource Plan 2010. The intention is to become a market leader in the design, manufacture and commissioning of components and systems for this new emerging sector.
Solutions has installed a 35 kilowatt solar peak park in Midrand to develop its skills in installing similar solar projects for clients, and to collect site-specific research and development data on the different technologies installed. Additionally, Reutech Radar Systems has developed a solar tracking system for concentrated photovoltaic and concentrated solar power applications.
Frik Kruger (54)
» Chief executive: Reutech Solutions
» NDT (Ind Eng), MDP (Unisa)» Appointed to the group in 1982

54 ANNUAL INTEGRATED REPORT 2011
Mike Tucker (51)
» Chief executive: Reutech Fuchs Electronics
» BEng (Elec) » Appointed to the group in 1984
Fuchs Electronics
Reutech continued
Operational overview
Primary brands, products and services Capabilities include electronic and precision mechanical design and high volume production of electro-mechanical assemblies.
Designs and manufactures the internationally recognised range of Fuchs electronic fuzes and related defence products for artillery, mortar, naval and aircraft weapon applications.
Operational areas Factory based at Alberton, Gauteng.
Market sectors Most of the company’s revenue is generated from export sales to government agencies and ammunition manufacturers.
Standards & verifications ISO 9001: 2008
Intellectual property rights The company owns the intellectual property of all products produced.
Current BBBEE level 8
2012 target 7
RC&C Manufacturing
RC&C is one of South Africa’s largest contract electronics manufacturers. During the year RC&C continued its efforts to diversify revenue streams away from manufacturing television sets, which historically accounted for most of the business’ income. The bulk of income in 2011 was derived from the manufacture of LCD monitors and Electrolux vacuum cleaners, as well as work for Reunert partners, CBI-electric: low voltage and Fuchs Electronics.
Digital television set-top boxes are expected to become a significant part of RC&C’s manufacturing portfolio. Indications are that the Department of Communications will award the first tender for these units in 2012. Through our partnership with Digital Vision Technologies (DiViTech), we are well placed to win a major share of the expected state order for five million units, as well as to service the anticipated public market potential of a further seven million units. Additionally, demand is anticipated to come from other African countries in future.
Fuchs Electronics manufactures electronic fuzes for military application. During the year, Fuchs’ export business was negatively impacted by countries cutting their defence budgets in the wake of the global economic downturn, in some cases by as much as 25%. While new orders were difficult to come by, Fuchs maintained production and supplies on existing contracts and retained its presence in all major markets.
A substantial export contract, which was expected to materialise in the first half of the year, was only confirmed in September. In anticipation of this order, staffing and production levels were retained with a resulting negative effect on the business’ bottom line. However, the confirmation of this order should impact positively on the 2012 results.
Fuchs maintained production and supplies on existing contracts and retained its presence in all major markets.
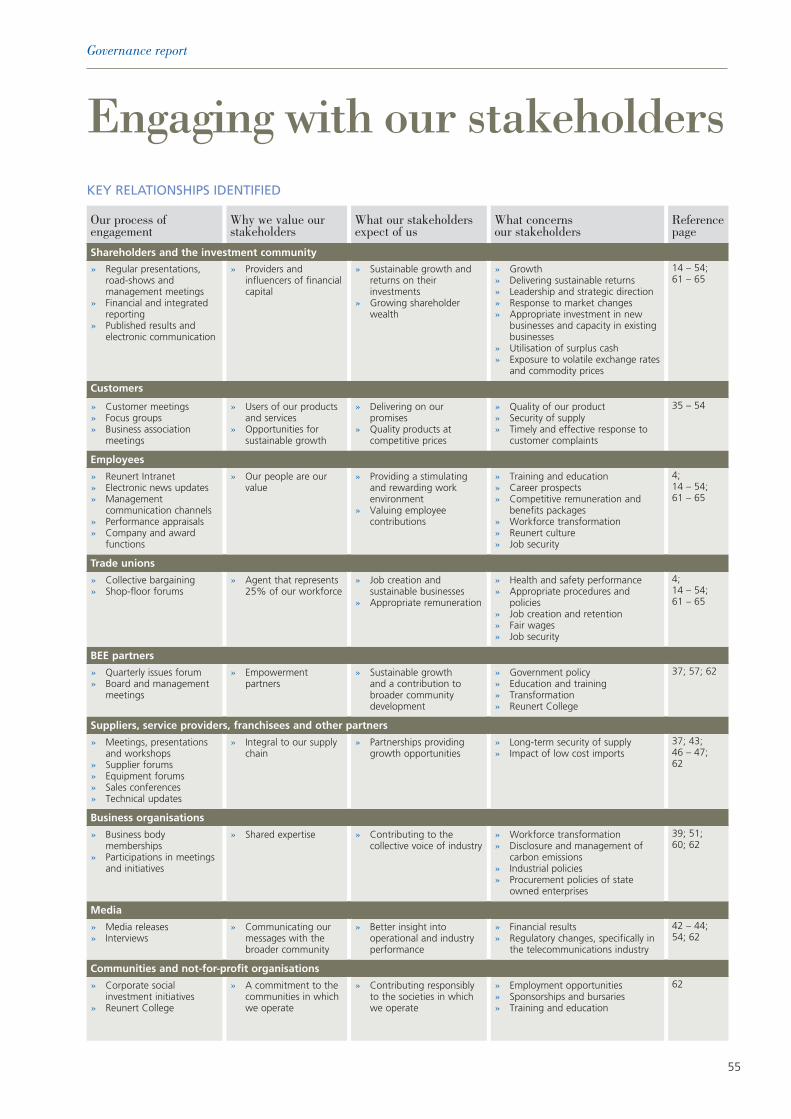
55
Governance report
Engaging with our stakeholdersKey ReLATIoNshIPs IdeNTIfIed
Our process of engagement
Why we value our stakeholders
What our stakeholders expect of us
What concerns our stakeholders
Referencepage
Shareholders and the investment community
» Regular presentations, road-shows and management meetings
» Financial and integrated reporting
» Published results and electronic communication
» Providers and influencers of financial capital
» Sustainable growth and returns on their investments
» Growing shareholder wealth
» Growth» Delivering sustainable returns» Leadership and strategic direction» Response to market changes» Appropriate investment in new
businesses and capacity in existing businesses
» Utilisation of surplus cash» Exposure to volatile exchange rates
and commodity prices
14 – 54;61 – 65
Customers
» Customer meetings» Focus groups» Business association
meetings
» Users of our products and services
» Opportunities for sustainable growth
» Delivering on our promises
» Quality products at competitive prices
» Quality of our product» Security of supply» Timely and effective response to
customer complaints
35 – 54
Employees
» Reunert Intranet» Electronic news updates» Management
communication channels» Performance appraisals» Company and award
functions
» Our people are our value
» Providing a stimulating and rewarding work environment
» Valuing employee contributions
» Training and education» Career prospects» Competitive remuneration and
benefits packages» Workforce transformation» Reunert culture» Job security
4;14 – 54;61 – 65
Trade unions
» Collective bargaining » Shop-floor forums
» Agent that represents 25% of our workforce
» Job creation and sustainable businesses
» Appropriate remuneration
» Health and safety performance» Appropriate procedures and
policies» Job creation and retention» Fair wages» Job security
4;14 – 54;61 – 65
BEE partners
» Quarterly issues forum» Board and management
meetings
» Empowerment partners
» Sustainable growth and a contribution to broader community development
» Government policy » Education and training» Transformation» Reunert College
37; 57; 62
Suppliers, service providers, franchisees and other partners
» Meetings, presentations and workshops
» Supplier forums » Equipment forums » Sales conferences» Technical updates
» Integral to our supply chain
» Partnerships providing growth opportunities
» Long-term security of supply» Impact of low cost imports
37; 43; 46 – 47; 62
Business organisations
» Business body memberships
» Participations in meetings and initiatives
» Shared expertise » Contributing to the collective voice of industry
» Workforce transformation» Disclosure and management of
carbon emissions» Industrial policies» Procurement policies of state
owned enterprises
39; 51; 60; 62
Media
» Media releases» Interviews
» Communicating our messages with the broader community
» Better insight into operational and industry performance
» Financial results» Regulatory changes, specifically in
the telecommunications industry
42 – 44; 54; 62
Communities and not-for-profit organisations
» Corporate social investment initiatives
» Reunert College
» A commitment to the communities in which we operate
» Contributing responsibly to the societies in which we operate
» Employment opportunities» Sponsorships and bursaries» Training and education
62

56 ANNUAL INTEGRATED REPORT 2011
Corporate governance
Governance report
Corporate governance framework
Board of directorsChairman Independent non-executive directors Executive directors
TS Munday (independent non-executive) YZ Cuba BP Gallagher
Chief executive SD Jagoe
DJ Rawlinson (executive) TJ Motsohi
Financial director KW Mzondeki
MC Krog SG Pretorius
JC van der Horst
R van Rooyen
Non-executive director
NDB Orleyn
Board committeesAudit Committee Nomination Committee Remuneration Committee Risk Committee
R van Rooyen (Chairman) TS Munday (Chairman) NDB Orleyn (Chairman) SG Pretorius (Chairman)
YZ Cuba SD Jagoe SD Jagoe MC Krog
SD Jagoe NDB Orleyn TS Munday TJ Motsohi
KW Mzondeki JC van der Horst JC van der Horst TS Munday
DJ Rawlinson
R van Rooyen
Social, Ethics and Transformation Committee Investment Ad-hoc Committee Group Executive Committee
TS Munday (Chairman) TS Munday (Chairman) DJ Rawlinson (Chairman)
KW Mzondeki YZ Cuba BP Gallagher
SG Pretorius SD Jagoe MC Krog
DJ Rawlinson SG PretoriusR van Rooyen
Subsidiary boards
Company management meetings
Forums
afs 72directors’ cVs
CombinedassuranceM
anag
emen
t Internal audit
External audit
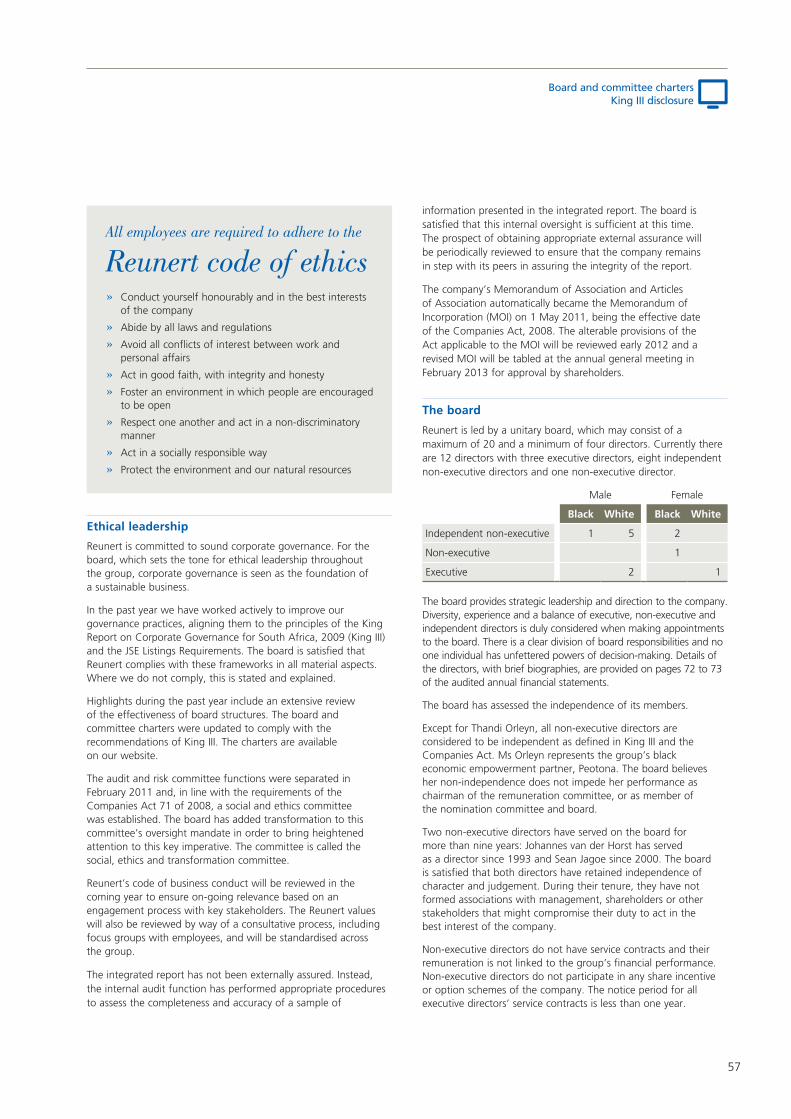
57
Ethical leadership
Reunert is committed to sound corporate governance. For the board, which sets the tone for ethical leadership throughout the group, corporate governance is seen as the foundation of a sustainable business.
In the past year we have worked actively to improve our governance practices, aligning them to the principles of the King Report on Corporate Governance for South Africa, 2009 (King III) and the JSE Listings Requirements. The board is satisfied that Reunert complies with these frameworks in all material aspects. Where we do not comply, this is stated and explained.
Highlights during the past year include an extensive review of the effectiveness of board structures. The board and committee charters were updated to comply with the recommendations of King III. The charters are available on our website.
The audit and risk committee functions were separated in February 2011 and, in line with the requirements of the Companies Act 71 of 2008, a social and ethics committee was established. The board has added transformation to this committee’s oversight mandate in order to bring heightened attention to this key imperative. The committee is called the social, ethics and transformation committee.
Reunert’s code of business conduct will be reviewed in the coming year to ensure on-going relevance based on an engagement process with key stakeholders. The Reunert values will also be reviewed by way of a consultative process, including focus groups with employees, and will be standardised across the group.
The integrated report has not been externally assured. Instead, the internal audit function has performed appropriate procedures to assess the completeness and accuracy of a sample of
information presented in the integrated report. The board is satisfied that this internal oversight is sufficient at this time. The prospect of obtaining appropriate external assurance will be periodically reviewed to ensure that the company remains in step with its peers in assuring the integrity of the report.
The company’s Memorandum of Association and Articles of Association automatically became the Memorandum of Incorporation (MOI) on 1 May 2011, being the effective date of the Companies Act, 2008. The alterable provisions of the Act applicable to the MOI will be reviewed early 2012 and a revised MOI will be tabled at the annual general meeting in February 2013 for approval by shareholders.
The board
Reunert is led by a unitary board, which may consist of a maximum of 20 and a minimum of four directors. Currently there are 12 directors with three executive directors, eight independent non-executive directors and one non-executive director.
Male Female
Black White Black White
Independent non-executive 1 5 2
Non-executive 1
Executive 2 1
The board provides strategic leadership and direction to the company. Diversity, experience and a balance of executive, non-executive and independent directors is duly considered when making appointments to the board. There is a clear division of board responsibilities and no one individual has unfettered powers of decision-making. Details of the directors, with brief biographies, are provided on pages 72 to 73 of the audited annual financial statements.
The board has assessed the independence of its members.
Except for Thandi Orleyn, all non-executive directors are considered to be independent as defined in King III and the Companies Act. Ms Orleyn represents the group’s black economic empowerment partner, Peotona. The board believes her non-independence does not impede her performance as chairman of the remuneration committee, or as member of the nomination committee and board.
Two non-executive directors have served on the board for more than nine years: Johannes van der Horst has served as a director since 1993 and Sean Jagoe since 2000. The board is satisfied that both directors have retained independence of character and judgement. During their tenure, they have not formed associations with management, shareholders or other stakeholders that might compromise their duty to act in the best interest of the company.
Non-executive directors do not have service contracts and their remuneration is not linked to the group’s financial performance. Non-executive directors do not participate in any share incentive or option schemes of the company. The notice period for all executive directors’ service contracts is less than one year.
» Conduct yourself honourably and in the best interests of the company
» Abide by all laws and regulations
» Avoid all conflicts of interest between work and personal affairs
» Act in good faith, with integrity and honesty
» Foster an environment in which people are encouraged to be open
» Respect one another and act in a non-discriminatory manner
» Act in a socially responsible way
» Protect the environment and our natural resources
All employees are required to adhere to the
Reunert code of ethics
Board and committee chartersKing iii disclosure

58 ANNUAL INTEGRATED REPORT 2011
Corporate governance continued
Governance report
Declaration of interests is submitted at least bi-annually by all directors to determine any conflicts of interest and a declaration of interests register is circulated for inspection and confirmation quarterly. Any potential conflict of interest is to be disclosed immediately and affected parties do not participate in the decision-making or voting process on the matters in which they are conflicted. This practice has been extended to all prescribed officers in the group and a register is maintained as part of the statutory records.
New board members complete an induction programme and on-going training, development and exposure to the business of the group is provided through formal processes.
A board charter sets out the responsibilities of the board, which include:
» strategic guidance to the company
» retaining full and effective control of the group
» reviewing and evaluating the group’s risks
» setting criteria, monitoring and evaluating the implementation of strategies, policies and management performance
» approving significant acquisitions and disposals
» approving the composition and terms of reference of committees of the board
» guarding the interests of minorities.
The roles of the chairman and the chief executive are separate. Members of the board elect the chairman. The appointment is confirmed annually after an assessment of the chairman’s performance. The chairman conducts shareholder meetings and has no executive or management responsibilities.
Directors are jointly accountable for decisions of the board. Directors have a legal obligation to act in the best interest of the company and the group, to act with due care and skill in discharging their duties as directors, to declare and avoid conflicts of interest and to account to the company for any advantages gained in discharging their duties on behalf of the company.
The board, on the recommendation of the nomination committee, appoints the chief executive and other executive directors, while the remuneration committee recommends to the board the conditions of their appointment and compensation.
The board has evaluated its performance, processes and procedures by way of a self-assessment questionnaire. The process was aimed at improving the board and committees’ effectiveness and identifying and addressing any weaknesses detected. The results of the assessment have been used to formulate further training and development plans for individual directors. The outcome of the performance review was discussed by the board of directors.
The board meets quarterly and at any additional times as may be required. Members of senior management may, by request, attend board or committee meetings.
Minutes are kept of all board meetings as statutory records and are made available to the external auditors.
The table below records attendance at board meetings:
Director08 Feb 2011
17 May 2011
30 Aug 2011
14 Nov 2011
TS Munday ü ü ü üYZ Cuba ü ü ü üTJ Motsohi ü ü ü üKW Mzondeki ü ü ü üNDB Orleyn ü ü ü üR van Rooyen ü ü ü üSD Jagoe ü ü ü üSG Pretorius n/a ü ü üDJ Rawlinson ü ü ü üJC van der Horst ü ü ü üNC Wentzel ü ü ü n/aBP Gallagher ü ü ü üGJ Oosthuizen ü ü ü n/aMC Krog n/a n/a n/a ü
Appointment and re-election of directorsMs YZ Cuba and Mr SG Pretorius joined the board on 1 January 2011 and 22 February 2011 respectively. Messrs BP Connellan and KJ Makwetla retired from the board at the annual general meeting (AGM) on 8 February 2011 after reaching the mandatory retirement age of 70 for non-executive directors.
Mr NC Wentzel was appointed as chief executive from 1 August 2010. On 21 September 2011 the group announced that mutual agreement had been reached in terms of which Mr Wentzel would leave the group with immediate effect. Mr DJ Rawlinson was appointed as chief executive and Ms MC Krog as financial director from that date. Mr GJ Oosthuizen resigned from the board effective 14 October 2011.
In terms of the company’s MOI, Mr DJ Rawlinson, who was appointed chief executive of the group on 21 September 2011, is required to retire and, being eligible, offers himself for election.
At least one-third of directors retire by rotation at the AGM. Appointments are not for a fixed term and directors that are eligible are re-elected by shareholders. Mr SG Pretorius, having been appointed to the board during the year, is required to retire at the next AGM but, being eligible, offers himself for re-election. Ms MC Krog and Ms KW Mzondeki and Mr R van Rooyen retire by rotation at the next AGM.
The process being followed for appointments are formal and transparent. The nomination committee, at its meeting on 14 November 2011, recommended that the directors named above, be re-elected and was approved by the board. All candidates have made themselves available for re-election.
Details of remuneration, fees and other benefits earned by directors in the past two years are available in the remuneration report on pages 64 and 65 and in note 24 of the financial statements.
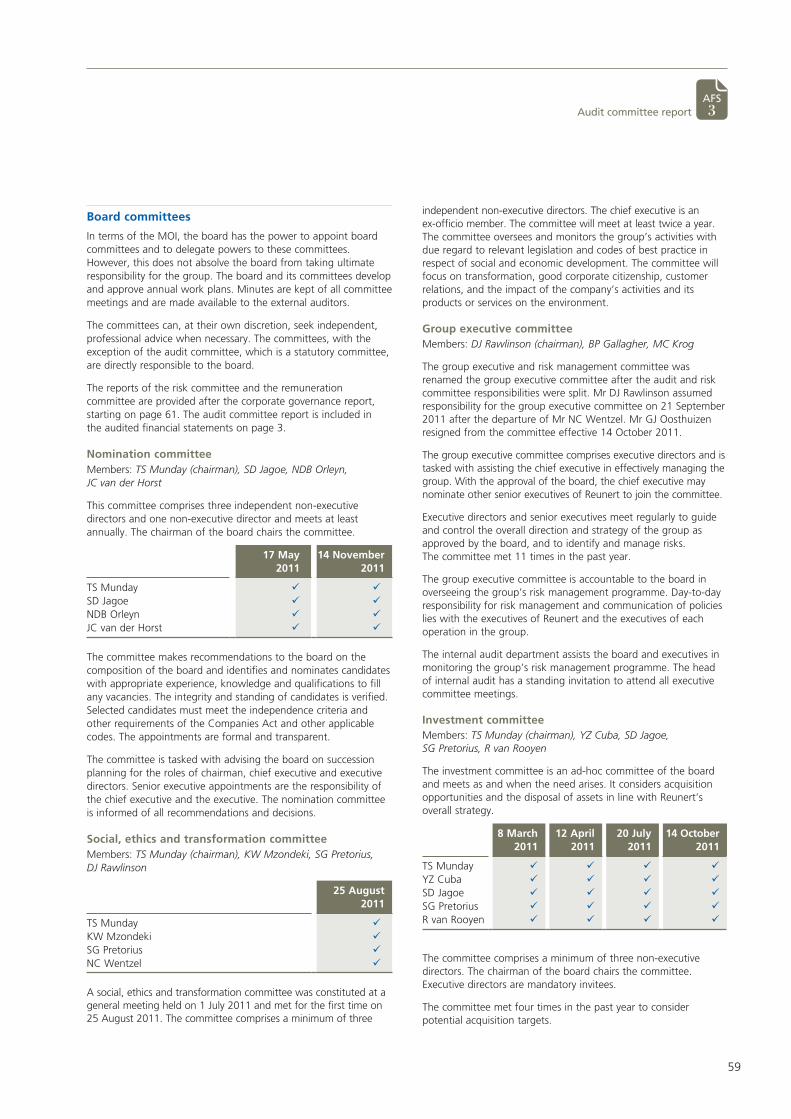
59
Board committees
In terms of the MOI, the board has the power to appoint board committees and to delegate powers to these committees. However, this does not absolve the board from taking ultimate responsibility for the group. The board and its committees develop and approve annual work plans. Minutes are kept of all committee meetings and are made available to the external auditors.
The committees can, at their own discretion, seek independent, professional advice when necessary. The committees, with the exception of the audit committee, which is a statutory committee, are directly responsible to the board.
The reports of the risk committee and the remuneration committee are provided after the corporate governance report, starting on page 61. The audit committee report is included in the audited financial statements on page 3.
Nomination committeeMembers: TS Munday (chairman), SD Jagoe, NDB Orleyn, JC van der Horst
This committee comprises three independent non-executive directors and one non-executive director and meets at least annually. The chairman of the board chairs the committee.
17 May 2011
14 November2011
TS Munday ü üSD Jagoe ü üNDB Orleyn ü üJC van der Horst ü ü
The committee makes recommendations to the board on the composition of the board and identifies and nominates candidates with appropriate experience, knowledge and qualifications to fill any vacancies. The integrity and standing of candidates is verified. Selected candidates must meet the independence criteria and other requirements of the Companies Act and other applicable codes. The appointments are formal and transparent.
The committee is tasked with advising the board on succession planning for the roles of chairman, chief executive and executive directors. Senior executive appointments are the responsibility of the chief executive and the executive. The nomination committee is informed of all recommendations and decisions.
Social, ethics and transformation committeeMembers: TS Munday (chairman), KW Mzondeki, SG Pretorius, DJ Rawlinson
25 August 2011
TS Munday üKW Mzondeki üSG Pretorius üNC Wentzel ü
A social, ethics and transformation committee was constituted at a general meeting held on 1 July 2011 and met for the first time on 25 August 2011. The committee comprises a minimum of three
independent non-executive directors. The chief executive is an ex-officio member. The committee will meet at least twice a year.The committee oversees and monitors the group’s activities with due regard to relevant legislation and codes of best practice in respect of social and economic development. The committee will focus on transformation, good corporate citizenship, customer relations, and the impact of the company’s activities and its products or services on the environment.
Group executive committeeMembers: DJ Rawlinson (chairman), BP Gallagher, MC Krog
The group executive and risk management committee was renamed the group executive committee after the audit and risk committee responsibilities were split. Mr DJ Rawlinson assumed responsibility for the group executive committee on 21 September 2011 after the departure of Mr NC Wentzel. Mr GJ Oosthuizen resigned from the committee effective 14 October 2011.
The group executive committee comprises executive directors and is tasked with assisting the chief executive in effectively managing the group. With the approval of the board, the chief executive may nominate other senior executives of Reunert to join the committee.
Executive directors and senior executives meet regularly to guide and control the overall direction and strategy of the group as approved by the board, and to identify and manage risks. The committee met 11 times in the past year.
The group executive committee is accountable to the board in overseeing the group’s risk management programme. Day-to-day responsibility for risk management and communication of policies lies with the executives of Reunert and the executives of each operation in the group.
The internal audit department assists the board and executives in monitoring the group’s risk management programme. The head of internal audit has a standing invitation to attend all executive committee meetings.
Investment committeeMembers: TS Munday (chairman), YZ Cuba, SD Jagoe, SG Pretorius, R van Rooyen
The investment committee is an ad-hoc committee of the board and meets as and when the need arises. It considers acquisition opportunities and the disposal of assets in line with Reunert’s overall strategy.
8 March2011
12 April2011
20 July2011
14 October2011
TS Munday ü ü ü üYZ Cuba ü ü ü üSD Jagoe ü ü ü üSG Pretorius ü ü ü üR van Rooyen ü ü ü ü
The committee comprises a minimum of three non-executive directors. The chairman of the board chairs the committee. Executive directors are mandatory invitees.
The committee met four times in the past year to consider potential acquisition targets.
afs 3audit committee report

60 ANNUAL INTEGRATED REPORT 2011
Governance report
Corporate governance continued
Business conductDealing in the company’s shares and closed periodsDirectors and employees are restricted from dealing either directly or indirectly in the company’s shares on the basis of privileged price-sensitive information before it is publicly announced to the market. Senior executives, including all prescribed officers, require clearance from the chief executive before shares are exercised, purchased or sold. All directors require clearance from the chairman before dealing in the company’s shares.
The group operates a closed period prior to the publication of its interim and year-end results. During these periods, the group’s directors, officers and senior management may not deal in the shares of the company, nor may they discuss the group’s financial performance or prospects with any outside party. Additional closed periods are enforced as required by corporate activity.
Political donationsReunert remains impartial to party politics and does not contribute any funding to political parties, their elected representatives or persons seeking political office. This includes think-tanks, trade unions and other support organisations linked to the creation of or support for political parties, their representatives or candidates for office. Reunert does contribute to business institutions that might debate policy issues affecting our business operations.
Anti-competitive behaviourAt the date of this report, no legal action for anti-competitive behaviour, anti-trust or monopolistic practices had been brought against the group. All senior managers in each business sign annual declarations confirming they have complied fully with competition legislation. A total of 240 senior employees received training on the Competition Act during the past year.
Consumer protection and customer privacyA significant part of our business activities are subject to the Consumer Protection Act, Act 68 of 2008 (CPA). Even involuntary violation of the provisions of the CPA may have serious consequences. As a result, 195 key employees dealing with consumers received training on the CPA.
Top management are required to sign annual declarations in which they undertake to inform and educate staff of the provisions of the Act and the rights of consumers. Staff compliance is randomly tested.
No substantiated complaints regarding breaches of customer privacy and losses of customer data have been brought against the group.
Access to informationReunert complies with the requirements of the Promotion of Access to Information Act of 2000. Relevant documents are made available on the group’s website.
Other corporate governance issues
Company secretaryReunert Management Services fulfilled the role of company secretary until 31 March 2011 and Ms Natasha Camhee was appointed as company secretary effective 1 April 2011.
The company secretary provides guidance and advice to the board and the company on governance matters and changes in legislation. All directors have access to the advice and services of the company secretary.
The key focus areas for this year were to align all board and committee charters to the recommendations of King III and develop annual work plans for the effective running of the board and its committees. Briefings for all newly appointed directors, as defined in section 3.63 of the JSE Listings Requirements, have been completed.
Board and committee meeting notices, agendas, minutes and papers are made available to all members of the board and committees. These documents are made available to the external auditors for review. The existing governance framework between the group and its subsidiaries addresses reserved matters and is reviewed periodically.
The board believes the company secretarial activities are considered appropriate to fulfil the requirements of the Reunert group.
SponsorRand Merchant Bank is the company’s sponsor. RMB’s services include advising the board on the interpretation of, and compliance with, the JSE Listings Requirements and reviewing all notices required in terms of its statutes and JSE rules and regulations.
Stakeholder relationsReunert is committed to on-going and effective communication with its stakeholders and subscribes to a policy of open, frank and timely communication in line with JSE guidelines and sound corporate governance practice. Executive directors conduct interviews with the investment community during open periods, while executive management interacts with investors and shareholders through regular investor days.
Numerous channels are used to disseminate information according to the preferences of the intended target audiences. These include dialogue with identified stakeholder groups and a corporate website with regularly updated information on the group.
More details of engaging with our stakeholders appear on page 55.
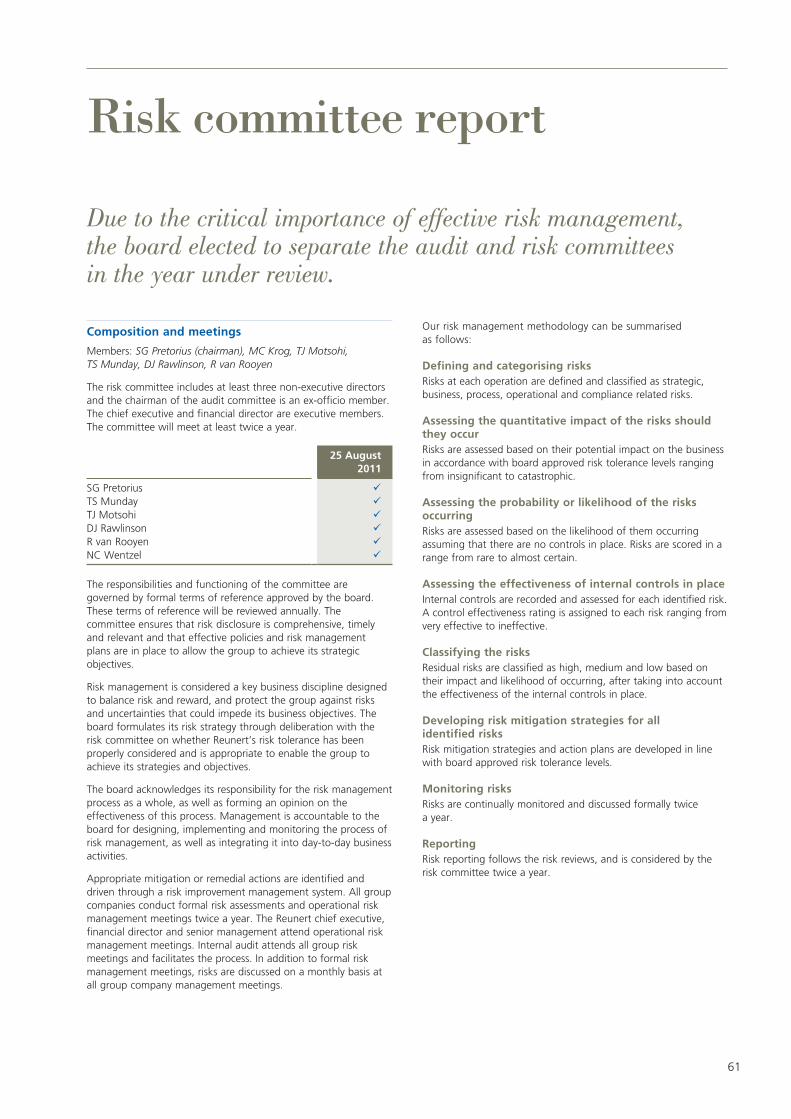
61
Risk committee report
Composition and meetings
Members: SG Pretorius (chairman), MC Krog, TJ Motsohi, TS Munday, DJ Rawlinson, R van Rooyen
The risk committee includes at least three non-executive directors and the chairman of the audit committee is an ex-officio member. The chief executive and financial director are executive members. The committee will meet at least twice a year.
25 August 2011
SG Pretorius üTS Munday üTJ Motsohi üDJ Rawlinson üR van Rooyen üNC Wentzel ü
The responsibilities and functioning of the committee are governed by formal terms of reference approved by the board. These terms of reference will be reviewed annually. The committee ensures that risk disclosure is comprehensive, timely and relevant and that effective policies and risk management plans are in place to allow the group to achieve its strategic objectives.
Risk management is considered a key business discipline designed to balance risk and reward, and protect the group against risks and uncertainties that could impede its business objectives. The board formulates its risk strategy through deliberation with the risk committee on whether Reunert’s risk tolerance has been properly considered and is appropriate to enable the group to achieve its strategies and objectives.
The board acknowledges its responsibility for the risk management process as a whole, as well as forming an opinion on the effectiveness of this process. Management is accountable to the board for designing, implementing and monitoring the process of risk management, as well as integrating it into day-to-day business activities.
Appropriate mitigation or remedial actions are identified and driven through a risk improvement management system. All group companies conduct formal risk assessments and operational risk management meetings twice a year. The Reunert chief executive, financial director and senior management attend operational risk management meetings. Internal audit attends all group risk meetings and facilitates the process. In addition to formal risk management meetings, risks are discussed on a monthly basis at all group company management meetings.
Our risk management methodology can be summarised as follows:
Defining and categorising risksRisks at each operation are defined and classified as strategic, business, process, operational and compliance related risks.
Assessing the quantitative impact of the risks should they occurRisks are assessed based on their potential impact on the business in accordance with board approved risk tolerance levels ranging from insignificant to catastrophic.
Assessing the probability or likelihood of the risks occurringRisks are assessed based on the likelihood of them occurring assuming that there are no controls in place. Risks are scored in a range from rare to almost certain.
Assessing the effectiveness of internal controls in placeInternal controls are recorded and assessed for each identified risk. A control effectiveness rating is assigned to each risk ranging from very effective to ineffective.
Classifying the risksResidual risks are classified as high, medium and low based on their impact and likelihood of occurring, after taking into account the effectiveness of the internal controls in place.
Developing risk mitigation strategies for all identified risksRisk mitigation strategies and action plans are developed in line with board approved risk tolerance levels.
Monitoring risksRisks are continually monitored and discussed formally twice a year.
ReportingRisk reporting follows the risk reviews, and is considered by the risk committee twice a year.
Due to the critical importance of effective risk management, the board elected to separate the audit and risk committees in the year under review.
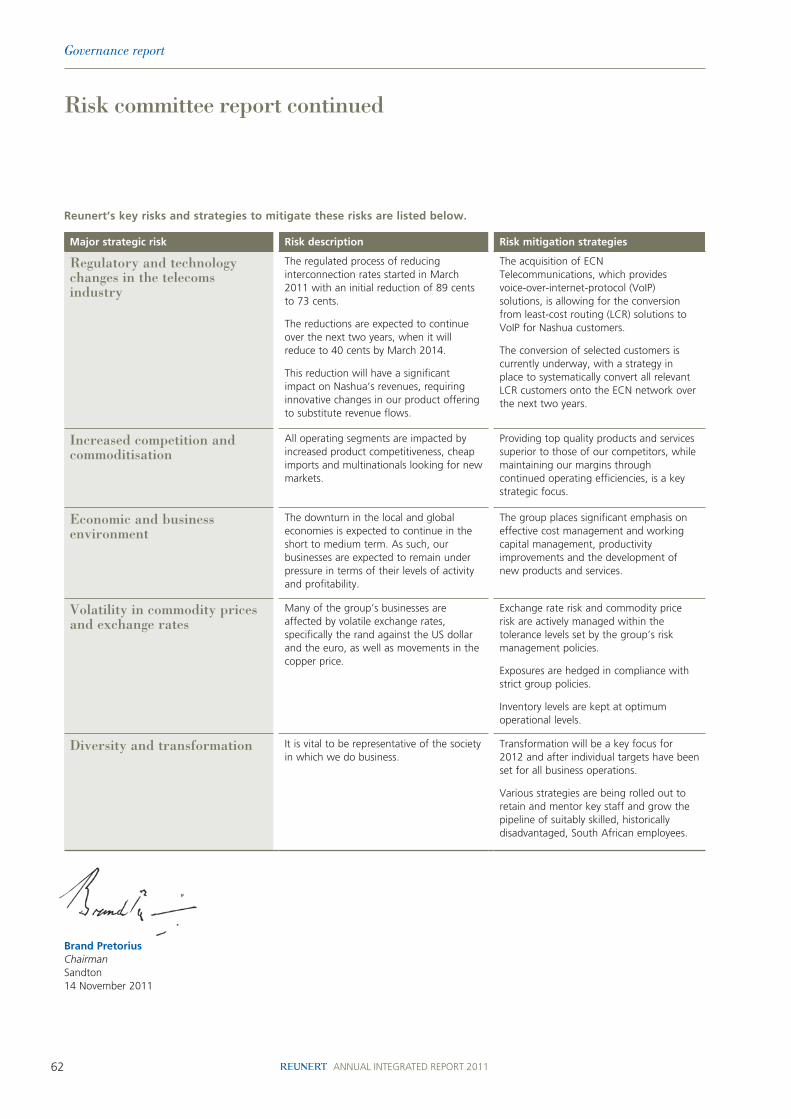
62 ANNUAL INTEGRATED REPORT 2011
Governance report
Risk committee report continued
Reunert’s key risks and strategies to mitigate these risks are listed below.
Major strategic risk Risk description Risk mitigation strategies
Regulatory and technology changes in the telecoms industry
The regulated process of reducing interconnection rates started in March 2011 with an initial reduction of 89 cents to 73 cents.
The reductions are expected to continue over the next two years, when it will reduce to 40 cents by March 2014.
This reduction will have a significant impact on Nashua’s revenues, requiring innovative changes in our product offering to substitute revenue flows.
The acquisition of ECN Telecommunications, which provides voice-over-internet-protocol (VoIP) solutions, is allowing for the conversion from least-cost routing (LCR) solutions to VoIP for Nashua customers.
The conversion of selected customers is currently underway, with a strategy in place to systematically convert all relevant LCR customers onto the ECN network over the next two years.
Increased competition and commoditisation
All operating segments are impacted by increased product competitiveness, cheap imports and multinationals looking for new markets.
Providing top quality products and services superior to those of our competitors, while maintaining our margins through continued operating efficiencies, is a key strategic focus.
Economic and business environment
The downturn in the local and global economies is expected to continue in the short to medium term. As such, our businesses are expected to remain under pressure in terms of their levels of activity and profitability.
The group places significant emphasis on effective cost management and working capital management, productivity improvements and the development of new products and services.
Volatility in commodity prices and exchange rates
Many of the group’s businesses are affected by volatile exchange rates, specifically the rand against the US dollar and the euro, as well as movements in the copper price.
Exchange rate risk and commodity price risk are actively managed within the tolerance levels set by the group’s risk management policies.
Exposures are hedged in compliance with strict group policies.
Inventory levels are kept at optimum operational levels.
Diversity and transformation It is vital to be representative of the society in which we do business.
Transformation will be a key focus for 2012 and after individual targets have been set for all business operations.
Various strategies are being rolled out to retain and mentor key staff and grow the pipeline of suitably skilled, historically disadvantaged, South African employees.
Brand PretoriusChairmanSandton14 November 2011
63
Remuneration committee report
The remuneration committee is responsible for the group’s remuneration philosophy, overseeing performance-based criteria and incentives for executive directors and senior executives, and recommending to the board grants made in terms of the Reunert share option schemes.
The committee is tasked with ensuring that individual awards are linked to performance and aligned with the interests of shareholders.
Remuneration activitiesThe committee dealt with the following matters in the year:
» Reviewed the base salary and other compensation elements for executive directors and group executives
» Approved the bonuses earned in respect of the 2011 financial year
» Approved the performance measures, targets and allocation guidelines for short-term incentives for the 2012 financial year
» Approved the performance criteria for the award of share options to executive directors and group executives in the 2012 financial year
» Conducted a comprehensive review of the group’s remuneration philosophy
» Approved the overall salary increases for all employees in the group.
Executive remuneration
The remuneration structure at senior management level consists of fixed pay, variable pay in the form of incentive bonus schemes, and long-term incentives in the form of employee share incentive schemes. Senior management remuneration is determined by considering market comparisons and assessing performance against pre-determined targets. Strategic and business objectives, which are reviewed periodically, as well as a general assessment of performance, are taken into account.
The remuneration committee and the board conduct an annual review of the fixed salary (cash package) earned by senior management. Packages are set with due consideration of relevant external market data and an assessment of individual experience. Diversity is also considered given the group’s commitment to transformation at senior management level.
The variable (cash incentive) component of senior executive pay, which includes executive directors, is linked to performance and capped at 140% of the fixed salary, including all cost-to-company items. The performance criteria for determining variable pay is the same for all executive directors and is set annually.
The group’s current philosophy is to pay a lower fixed salary with a higher cash-incentive component.
Incentive bonus schemeThe incentive bonus scheme is based on the achievement of pre-determined targets and an assessment of the individual’s overall performance. The targets include corporate and, where applicable, operational performance measures, as well as individual performance against pre-determined objectives related to key business strategies and requirements.
Share incentive schemesThe objective of the group’s share incentive schemes is to align shareholder and management interests, and assist in attracting, retaining and rewarding management appropriately.
Composition and meetings
NDB Orleyn (chairman), SD Jagoe, TS Munday, JC van der Horst
The remuneration committee consists of at least three independent non-executive directors. The chairman of the Reunert board may not act as chairman of this committee. The committee meets at least twice a year to make recommendations to the board on compensation and conditions of service for executives, and to approve salaries and bonuses for employees who earn more than R700 000 per year. The chief executive attends meetings by invitation.
With the exception of the chairman, all members are independent non-executive directors. The board is satisfied that Thandi Orleyn is the most suitable chairman for the remuneration committee given her relevant experience. The board is confident that her non-independence, according to King III, does not impede her ability to chair the committee.
The table below records attendance at the committee’s meetings:
16 Nov 2010 17 Feb 2011 17 May 2011* 30 Aug 2011* 6 Sep 2011* 6 Oct 2011* 14 Nov 2011
Special Special Special Special NDB Orleyn ü ü ü ü ü ü üTS Munday ü ü ü ü ü ü üJC van der Horst ü ü ü ü ü ü üSD Jagoe ü ü ü ü ü ü ü
* The special meetings held by the committee were convened primarily to deliberate various changes proposed by management to the remuneration philosophy and structures of Reunert.
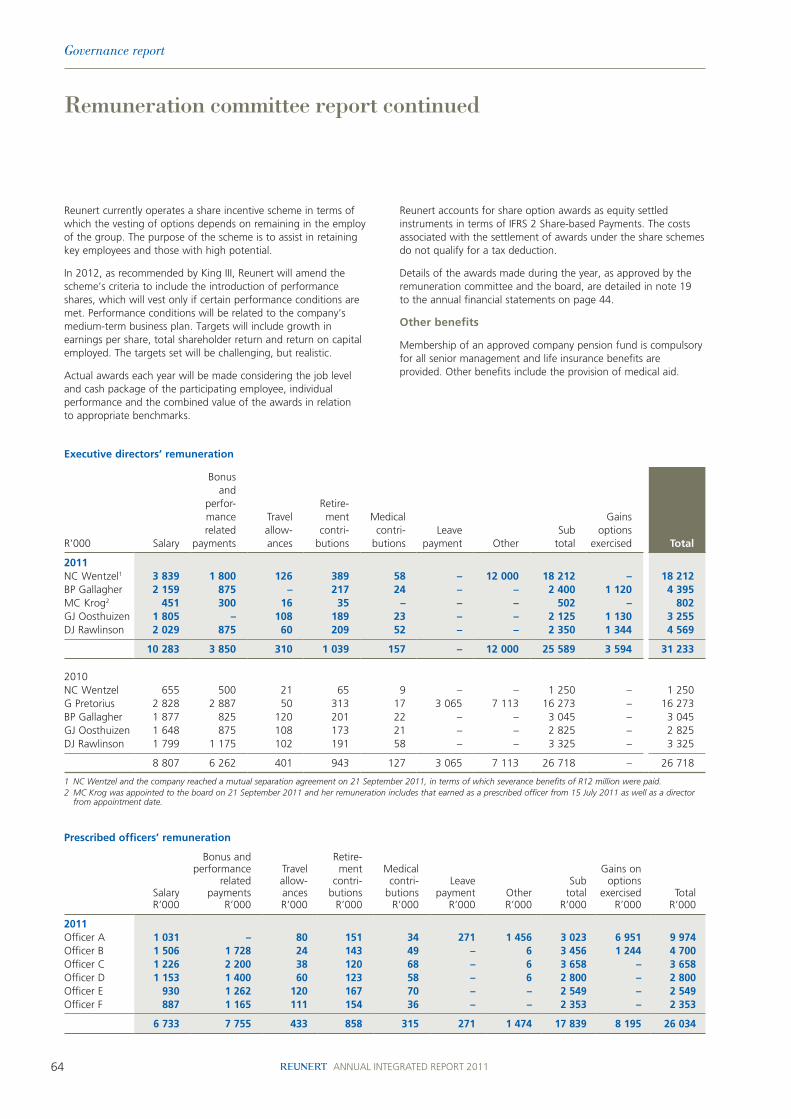
64 ANNUAL INTEGRATED REPORT 2011
Governance report
Remuneration committee report continued
Reunert currently operates a share incentive scheme in terms of which the vesting of options depends on remaining in the employ of the group. The purpose of the scheme is to assist in retaining key employees and those with high potential.
In 2012, as recommended by King III, Reunert will amend the scheme’s criteria to include the introduction of performance shares, which will vest only if certain performance conditions are met. Performance conditions will be related to the company’s medium-term business plan. Targets will include growth in earnings per share, total shareholder return and return on capital employed. The targets set will be challenging, but realistic.
Actual awards each year will be made considering the job level and cash package of the participating employee, individual performance and the combined value of the awards in relation to appropriate benchmarks.
Reunert accounts for share option awards as equity settled instruments in terms of IFRS 2 Share-based Payments. The costs associated with the settlement of awards under the share schemes do not qualify for a tax deduction.
Details of the awards made during the year, as approved by the remuneration committee and the board, are detailed in note 19 to the annual financial statements on page 44.
Other benefits
Membership of an approved company pension fund is compulsory for all senior management and life insurance benefits are provided. Other benefits include the provision of medical aid.
Executive directors’ remuneration
R’000 Salary
Bonusand
perfor-mancerelated
payments
Travel allow-ances
Retire-ment
contri-butions
Medicalcontri-
butionsLeave
payment OtherSub
total
Gains options
exercised Total
2011NC Wentzel1 3 839 1 800 126 389 58 – 12 000 18 212 – 18 212BP Gallagher 2 159 875 – 217 24 – – 2 400 1 120 4 395MC Krog2 451 300 16 35 – – – 502 – 802GJ Oosthuizen 1 805 – 108 189 23 – – 2 125 1 130 3 255DJ Rawlinson 2 029 875 60 209 52 – – 2 350 1 344 4 569
10 283 3 850 310 1 039 157 – 12 000 25 589 3 594 31 233
2010NC Wentzel 655 500 21 65 9 – – 1 250 – 1 250G Pretorius 2 828 2 887 50 313 17 3 065 7 113 16 273 – 16 273 BP Gallagher 1 877 825 120 201 22 – – 3 045 – 3 045GJ Oosthuizen 1 648 875 108 173 21 – – 2 825 – 2 825DJ Rawlinson 1 799 1 175 102 191 58 – – 3 325 – 3 325
8 807 6 262 401 943 127 3 065 7 113 26 718 – 26 718
1 NC Wentzel and the company reached a mutual separation agreement on 21 September 2011, in terms of which severance benefits of R12 million were paid.2 MC Krog was appointed to the board on 21 September 2011 and her remuneration includes that earned as a prescribed officer from 15 July 2011 as well as a director
from appointment date.
Prescribed officers’ remuneration
SalaryR’000
Bonus and performance
related payments
R’000
Travelallow-ancesR’000
Retire-ment
contri-butions
R’000
Medical contri-
butionsR’000
Leavepayment
R’000OtherR’000
Subtotal
R’000
Gains on options
exercisedR’000
TotalR’000
2011Officer A 1 031 – 80 151 34 271 1 456 3 023 6 951 9 974 Officer B 1 506 1 728 24 143 49 – 6 3 456 1 244 4 700 Officer C 1 226 2 200 38 120 68 – 6 3 658 – 3 658 Officer D 1 153 1 400 60 123 58 – 6 2 800 – 2 800 Officer E 930 1 262 120 167 70 – – 2 549 – 2 549 Officer F 887 1 165 111 154 36 – – 2 353 – 2 353
6 733 7 755 433 858 315 271 1 474 17 839 8 195 26 034

65
Share options of executive directors
Balance ofunexercised
share optionsas at 1 October
2010
Number ofoptionsgranted
during theyear
Number ofoptions
exercisedduring the
year
Balance ofunexercised
share options at 30 Sep
2011
Optionprice
R
Marketprice on
exercisingR
Date ofallocation
Date ofexercising
Date fromwhich
exercisable
BP Gallagher 50 000 (50 000) – 41,90 64,30 29/8/2005 18/11/2010 29/8/200850 000 50 000 39,30 18/6/2009 18/6/2012
48 000 48 000 59,55 17/2/2011 17/2/2014
GJ Oosthuizen 50 000 (50 000) – 41,90 64,50 29/8/2005 25/11/2010 29/8/200850 000 50 000 39,30 18/6/2009 14/10/2011
42 000 42 000 59,55 17/2/2011 14/10/2011
DJ Rawlinson 60 000 (60 000) – 41,90 64,30 29/8/2005 18/11/2010 29/8/200850 000 50 000 39,30 18/6/2009 18/6/2012
47 000 47 000 59,55 17/2/2011 17/2/2014
310 000 137 000 (160 000) 287 000
The share options above do not include the 200 000 share options at R59,06 and the 110 000 share options at R59,55 shares of NC Wentzel as he resigned from the board on 21 September 2011. In terms of the mutual separation agreement with the company, he had until 23 October 2011 to early exercise his options, which he did not and therefore the options were forfeited on that date.
Non-executive directors’ remuneration
Non-executive directors receive fees for their services as members of the Reunert board and committees. Directors’ fees are recommended by the remuneration committee and the board, and proposed by the chief executive to the shareholders for approval at each AGM.
As required by the Companies Act, the remuneration of non-executive directors will be authorised by special resolution at the AGM. Remuneration for the period 1 March 2011 to 28 February 2012 was approved by special resolution at a general meeting held on 1 July 2011.
The non-executive directors’ fees paid for 2011, as well as the proposed fee structure for the financial year ending 30 September 2012 are set out below:
2011
R’0002010R’000
TS Munday 643 506BP Connellan (retired 8 February 2011) 64 193YZ Cuba (appointed 1 January 2011) 206 –KS Fuller (retired 2 February 2010) – 75SD Jagoe 377 244KJ Makwetla (retired 8 February 2011) 55 150TJ Motsohi 154 117KW Mzondeki (appointed 1 November 2009) 237 177NDB Orleyn 252 154SG Pretorius (appointed 22 February 2011) 181 –MJ Shaw (retired 2 February 2010) – 96JC van der Horst 250 166R van Rooyen (appointed 1 November 2009) 334 198
2 753 2 076
Thandi OrleynChairman 14 November 2011Sandton
Top three executives’ remunerationKing III recommends that the remuneration of the top three executives, excluding executive directors and prescribed officers, be disclosed. Due to their specialised skills and the competition for top skills in South Africa, Reunert does not wish to disclose the names of these individuals. However, their remuneration is tabled below:
2011 R’ 000
Employee A 4 903 Employee B 2 684 Employee C 2 573

audited annual financial statements

currency conversion tableTo assist foreign investors, the table below gives the approximate value of R1,00 against selected currencies at 30 September:
2011 2010
US dollar 0,1234 0,1435Pound sterling 0,0792 0,0910Swiss franc 0,1114 0,1402Japanese yen 9,4802 11,9521Euro 0,0916 0,1049Australian dollar 0,1270 0,1481
1 Directors’ responsibility statement
1 Company secretary’s certification
2 Independent auditor’s report
3 Audit committee report
5 Directors’ report
8 Accounting policies
18 Income statements
18 Statements of comprehensive income
19 Balance sheets
20 Cash flow statements
22 Notes to the cash flow statements
24 Statements of changes in equity
26 Notes to the annual financial statements
66 Segmental analysis
68 Principal subsidiaries – Annexure A
70 Unconsolidated subsidiary – Annexure B
71 Share ownership analysis
72 Board of directors and management
74 Definitions
75 Abbreviations and acronyms
76 Shareholder’s diary
77 Notice of annual general meeting
81 Proxy form
83 Corporate administration and information
contentsReunert Limited
(Incorporated in the Republic of South Africa)
ISIN: ZAE000057428Short name: REUNERT Share code: RLO Currency: ZAR Registration number: 1913/004355/06 Founded: 1888Listed: 1948 Sector: Electronic & electrical equipmentCorporate headquarters: Sandton, South Africa
Preparation of the audited annual financial statementsThis report was compiled under the supervision of MC Krog CA (SA) (Group financial director).

1
company secretary certificationIn terms of section 88 of the Companies Act, 71 of 2008, I certify that, to the best of my knowledge and belief, the company has lodged with the Companies and Intellectual Property Commission for the financial year ended 30 September 2011, all such returns as are required of a public company in terms of the aforesaid Act and that all such returns are true, correct and up to date.
Natasha Camhee (Appointed effective 1 April 2011)Group company secretary
14 November 2011
for the year ended 30 September 2011
directors’ responsibility statementResponsibility for annual financial statements
The directors of Reunert are responsible for the integrity of the annual financial statements of the company and group and the objectivity of other information presented in the annual financial statements.
In order to fulfil this responsibility, the group maintains internal accounting and administrative control systems designed to provide reasonable assurance that assets are safeguarded and transactions are executed and recorded in accordance with the group’s policies and procedures.
In presenting the accompanying annual financial statements, International Financial Reporting Standards have been followed, applicable accounting policies have been used and prudent judgements and estimates have been made. The annual financial statements are examined by our external auditors in conformity with International Standards on Auditing.
An audit committee, consisting of at least three independent, non-executive directors, one of whom acts as chairman, meets at
least three times per annum with both the internal and external auditors to ensure that internal financial controls provide reasonable assurance that the group’s assets are safeguarded and that the financial records may be relied upon for the preparation of the financial statements.
In terms of Section 11.26 and Section 7 d.11 of the Listings Requirements of the JSE, the directors, whose names are given on pages 72 and 73 are not aware of any legal or arbitration proceedings, including proceedings that are pending or threatened, that may have or have had in the recent past, being at least the previous 12 months, a material effect on the group’s financial position.
Other than the facts and developments reported on in the integrated report, there have been no material changes in the affairs or financial position of Reunert and its subsidiaries since the date of this report.
The annual financial statements appearing on pages 3 to 67 were approved by the board of directors on 14 November 2011 and are signed on its behalf by:
Trevor Munday David RawlinsonChairman Chief executive
2 ANNUAL FINANCIAL STATEMENTS 2011
independent auditor’s report
for the year ended 30 September 2011
To the members of Reunert Limited
We have audited the group annual financial statements and annual financial statements of Reunert Limited, which comprise the consolidated and separate balance sheets as at 30 September 2011, and the consolidated and separate income statements, the consolidated and separate statements of comprehensive income, the consolidated and separate statements of changes in equity and the consolidated and separate cash flow statements for the year then ended, and a summary of significant accounting policies and other explanatory information, and the directors’ report, as set out on pages 3 to 67.
Directors’ responsibility for the financial statements
The directors are responsible for the preparation and fair presentation of these financial statements in accordance with International Financial Reporting Standards and in the manner required by the Companies Act of South Africa, and for such internal control as the directors determine is necessary to enable the preparation of financial statements that are free from material misstatement, whether due to fraud or error.
Auditor’s responsibility
Our responsibility is to express an opinion on these financial statements based on our audit. We conducted our audit in accordance with International Standards on Auditing. Those standards require that we comply with ethical requirements and plan and perform the audit to obtain reasonable assurance about whether the financial statements are free from material misstatement.
An audit involves performing procedures to obtain audit evidence about the amounts and disclosures in the financial statements. The procedures selected depend on the auditor’s judgement, including the assessment of the risks of material misstatement of the financial statements, whether due to fraud or error. In making those risk assessments, the auditor considers internal control relevant to the entity’s preparation and fair presentation of the financial statements in order to design audit procedures that are appropriate in the circumstances, but not for the purpose of expressing an opinion on the effectiveness of the entity’s internal control. An audit also includes evaluating the appropriateness of
accounting policies used and the reasonableness of accounting estimates made by management, as well as evaluating the overall presentation of the financial statements.
We believe that the audit evidence we have obtained is sufficient and appropriate to provide a basis for our audit opinion.
Opinion
In our opinion, the financial statements present fairly, in all material respects, the consolidated and separate financial position of Reunert Limited as at 30 September 2011, and its financial performance and its cash flows for the year then ended in accordance with International Financial Reporting Standards and in the manner required by the Companies Act of South Africa.
Report on other legal and regulatory requirements
We were also recently engaged by the company’s audit committee to review the governance process followed in entering into a long-term lease agreement for proposed new head office premises. This review identified that the lease agreement in question had not been properly authorised. In accordance with our responsibilities in terms of sections 44(2) and 44(3) of the Auditing Profession Act, we considered this to constitute a reportable irregularity in terms of the Auditing Profession Act and reported the matter to the Independent Regulatory Board for Auditors.
The directors responded to the circumstances and conduct in question and took the necessary steps to address the matter and minimise the loss to the company.
Deloitte & ToucheRegistered auditorsPer: PJ SmitPartner
14 November 2011

3
audit committee report
for the year ended 30 September 2011
The audit committee has pleasure in submitting its report to stakeholders for the financial year ended 30 September 2011.
The audit committee is an independent statutory committee appointed by the shareholders. The board delegates duties and responsibilities to the audit committee according to terms of reference, which are formalised in a charter. The charter is approved by the board and reviewed annually. During the year under review, the audit committee conducted its affairs in accordance with its charter, and discharged its responsibilities as required by the Companies Act 71 of 2008 and the King Code of Governance Principles for South Africa, 2009 (King III). The few exceptions where King III requirements have not been applied are explained in the corporate governance section of the integrated report.
Composition and meetings
Members: R van Rooyen (chairman), YZ Cuba, SD Jagoe, KW Mzondeki.
BP Connellan retired from the committee on 8 February 2011.
The audit committee comprises four independent non-executive directors and meets at least three times a year. The chairman of the Reunert board, chief executive, financial director, external auditors, internal auditors and financial executives attend committee meetings by request.
Attendance register
Appointed to committee
10 May2011
16 Sep2011
10 Nov2011
R van Rooyen 17 Nov 2009 ü ü üYZ Cuba 1 Jan 2011 ü ü üSD Jagoe 14 Nov 2000 ü ü üKW Mzondeki 17 Nov 2009 ü Apology ü
Roles and responsibilities
According to its terms of reference, the audit committee assists the board to discharge its duties relating to:
» safeguarding assets
» operating adequate systems and internal controls
» assessing the company’s going concern status
» ensuring there are effective and relevant financial risk management processes in place
» reviewing interim financial information and annual financial statements, which are provided to shareholders and other key stakeholders
» internal and external audit processes
» the company’s process for monitoring compliance with laws and regulations
» information technology governance.
The chairman of the committee meets individually with external and internal audit without any other executives of Reunert present, at least on an annual basis. The committee has unrestricted access to management, external auditors and the internal audit team.
Expertise and experience
The committee has considered and is satisfied that the expertise and experience of the financial director is suitable, and the adequacy of resources of the finance function and experience of the senior members of management responsible for the financial function is appropriate.
External auditor appointment and independence
The audit committee has engaged Deloitte & Touche (Deloitte) to perform an independent and objective audit of the group. The financial statements are prepared in terms of International Financial Reporting Standards (IFRS).
The committee is satisfied that Deloitte is independent of the group, as contemplated in section 94(8) of the Companies Act. In making this determination the committee has considered Deloitte’s compliance with criteria relating to independence or conflicts of interest as prescribed by the Independent Regulatory Board for Auditors. Requisite assurance was sought and provided by Deloitte that internal governance processes in the audit firm support its claim of independence.
The committee, in consultation with executive management, agreed to the engagement letter, terms, audit plan and budgeted audit fees for the 2011 year. Deloitte is considered for non-audit services according to a formal procedure, and the nature and extent of non-audit services that Deloitte may provide is agreed in terms of a pre-approval policy.
The audit committee nominates Deloitte for re-election at the annual general meeting of Reunert Limited, and Mr Patrick Smit as the designated partner to perform the functions of external auditor. The audit committee is satisfied that Deloitte and Mr Smit are accredited and appear on the JSE list of auditors and advisors.
Internal audit
Internal audit operates under a charter recommended by the audit committee and approved by the board. Internal audit attends all audit committee meetings by request and reports its findings to the committee.
The internal audit function reports independently on whether risk management, control and governance processes are adequate and functioning within the group. Internal audit performs periodic independent evaluations of the adequacy and effectiveness of controls, financial reporting structures and integrity of information systems and records. The audit committee approves the annual risk-based internal audit work plan. The head of internal audit has a standing invitation to attend executive committee meetings and attends selected operational management meetings.
Internal audit reports to the chairman of the audit committee and has unrestricted access to him. This committee approves the appointment and dismissal of the head of internal audit and assesses the internal audit team’s performance, objectivity and independence.
The board does not perform an independent quality review of the internal audit function as it has delegated this review to the audit committee. The members of the audit committee engage directly with internal audit and are best placed to perform an effective and independent review.
4 ANNUAL FINANCIAL STATEMENTS 2011
Reunert’s internal audit function has performed a review of the company’s internal control environment, including its internal financial controls, and its risk management process. Based on the results of these reviews, except for an isolated breach of governance as set out in the director’s report and as reported by Deloitte in its audit report, the internal audit function has confirmed to the audit committee and the board that no evidence has come to light to indicate that the company’s internal control environment and risk management process is ineffective. In addition, there is no indication of any material weakness in internal financial controls in terms of design, implementation or operation.
Internal, financial and accounting controls
Financial and internal controls focus on critical risk areas. The controls are designed to provide reasonable assurance that assets are safeguarded from loss and unauthorised use, and financial records may be relied on for preparing the financial statements and maintaining accountability for assets and liabilities. The identification of risks and implementation and monitoring of adequate systems of internal, financial and operating controls to manage such risks is delegated to senior executive management. Financial risk management policies are communicated directly to executive management and the appropriate levels of management in the various operations.
The board acknowledges its responsibility for ensuring that management implements and monitors the effectiveness of systems of internal, financial and operating controls. The board, via the audit committee, monitors the effectiveness of established controls and procedures to ensure the accuracy and integrity of accounting records, and monitors the group’s businesses, financial risks and performance.
Based on internal audit’s review of the design, implementation and effectiveness of Reunert’s system of internal financial controls in 2011, and considering information and explanations given by management and discussions with Deloitte on the results of its audit, nothing has come to the attention of the audit committee to indicate that Reunert’s system of internal financial controls is not effective or the preparation of financial statements is unreliable.
Information technology (IT)
The board recognises that IT is a key enabler for Reunert in providing employees and decision makers with critical information needed to make effective decisions on behalf of the group. The board has assigned the responsibility of monitoring IT governance to the audit committee. An IT steering committee was established during the year to focus on:
» IT security
» Data integrity
» Business continuity
» Standardising IT policies and procedures
» IT procurement.
Key IT risks are assessed and reported bi-annually to the risk committee. A senior manager was appointed in November 2011 as group information officer.
The audit committee believes the systems of internal control over IT are adequate and effective and is not aware of any material breakdown in the functioning of the internal IT control systems during the financial year.
Whistle-blowing function
Reunert outsourced its whistle-blowing reporting function to Deloitte Tip-offs Anonymous in January 2011. Tip-offs Anonymous is an independent, confidential whistle-blowing hotline service and gives employees and all stakeholders the opportunity to anonymously report any unethical practices.
An awareness campaign was rolled out to all operations during the year and calls to the hotline increased towards the end of the financial year. A total of 52 contacts resulted in 38 reports. All reports were thoroughly investigated and appropriately acted on under the guidance of internal audit.
Corruption and fraud
All group companies submit defalcation reports monthly. An isolated corporate governance infraction, as set out in the director’s report, was reported in the past year.
All operational processes are analysed to identify the risk of potential corruption and fraud. Fraud risk is monitored closely and processes are continually improved to curtail and eliminate opportunities for fraud. Two new cases of fraud totalling R1,6 million were reported during the financial year. In addition, there was an armed robbery at a distribution centre and one incident of theft is still under investigation.
Rynhardt van RooyenChairman
Sandton 14 November 2011
audit committee report continued

5
directors’ report
for the year ended 30 September 2011
Authorised and issued capital
The authorised capital of the company remained unchanged.
Options exercised in terms of the Reunert 1985 and 2006 share option schemes accounted for the shares issued during the current year as tabled below:
Number of shares
Issue price per share 2011 2010
R15,99 38 400 51 900R39,30 482 000 92 000R41,90 682 100 485 400R59,55 39 600 –R53,50 24 900 –R71,30 4 300 –R57,50 100 000 –R15,80 53 700 –R14,10 51 800 –R17,70 – 10 000
Commencing in August 2010, a subsidiary company purchased Reunert shares on the open market. During the current financial year, until the beginning of the closed period on 30 September 2011, 17 053 117 (2010: 2 123 372) ordinary shares were bought at an average price of R66,14 (2010: R59,18) per share.
Review of operations and results
Revenue for the year has remained relatively constant, with an increase of 2% from R10,7 billion to R10,9 billion. Operating profit reflected an increase of 10% to R1,4 billion.
The CBI-electric group of companies recorded a strong performance during 2011. All operations performed well in the difficult environment that has persisted over the past few years. Revenue increased by 13% to R3,3 billion and operating profit improved by 14% to R592,1 million.
Nashua performed to expectation in a quiet market. A number of acquisitions were made in the segment which added to revenue, enabling marginal growth of 1% to be achieved. These acquisitions, which included four franchises and ECN, together with substantial increases in the contributions from Quince and Nashua Electronics, resulted in operating profit growth of 21% to R794,2 million.
Disclosure of Quince Capital has been condensed in respect of the income statement and balance sheet. For a number of years we provided more information on the business to provide users with a better understanding of Quince’s activities and the results thereof. Based on recent feedback from various sources we no longer believe it is beneficial to users to continue this disclosure.
Details of the changes and comparatives before the restatements are explained in note 17 of the financial summary on page 31 of the integrated report.
Reutech revenue for the year decreased by 19% to R639,3 million, while operating profit decreased 20% to R48,7 million.
Cash dividends
An interim ordinary cash dividend No 170 of 77 cents (2010: No 168 of 67 cents) per share was declared on
17 May 2011, and a final ordinary cash dividend No 171 of 253 cents (2010: No 169 of 220 cents) per share was declared on 14 November 2011.
A total distribution of 330 cents (2010: 287 cents) per ordinary share was declared relating to the 2011 financial year.
An interim 5,5% cumulative preference dividend No 52 was declared on 17 May 2011 and a final dividend No 53 will be declared on 31 December 2011.
Subsidiary companies
Annexure B to this report sets out the principal subsidiaries of the company.
The directors are of the opinion that the publication of information on all the company’s subsidiaries in this report would entail expense out of proportion to the value to shareholders.
Special resolutions of subsidiaries
During this financial year, as required by section 8.63(i) of the JSE Listings Requirements, the following special resolutions were passed by subsidiaries of Reunert: CBI-electric Aberdare ATC Telecom Cables (Pty) Ltd amended its articles of association and made changes to its capital structure, ATC (Pty) Ltd amended its articles of association and Bridoon Trade and Invest 197 (Pty) Ltd had a transfer of shareholding. Full details of these resolutions may be viewed at the company’s registered office.
Financial assistance to related or inter-related companies or other legal entities
At a general meeting held on 1 July 2011, pursuant to the requirements of Section 45 of the Companies Act, 2008, shareholders passed a special resolution authorising the directors, by way of general authority, to allow the company to provide direct or indirect financial assistance to any company or other legal entity which is related or inter-related to the company, subject to the relevant provisions of Section 45.
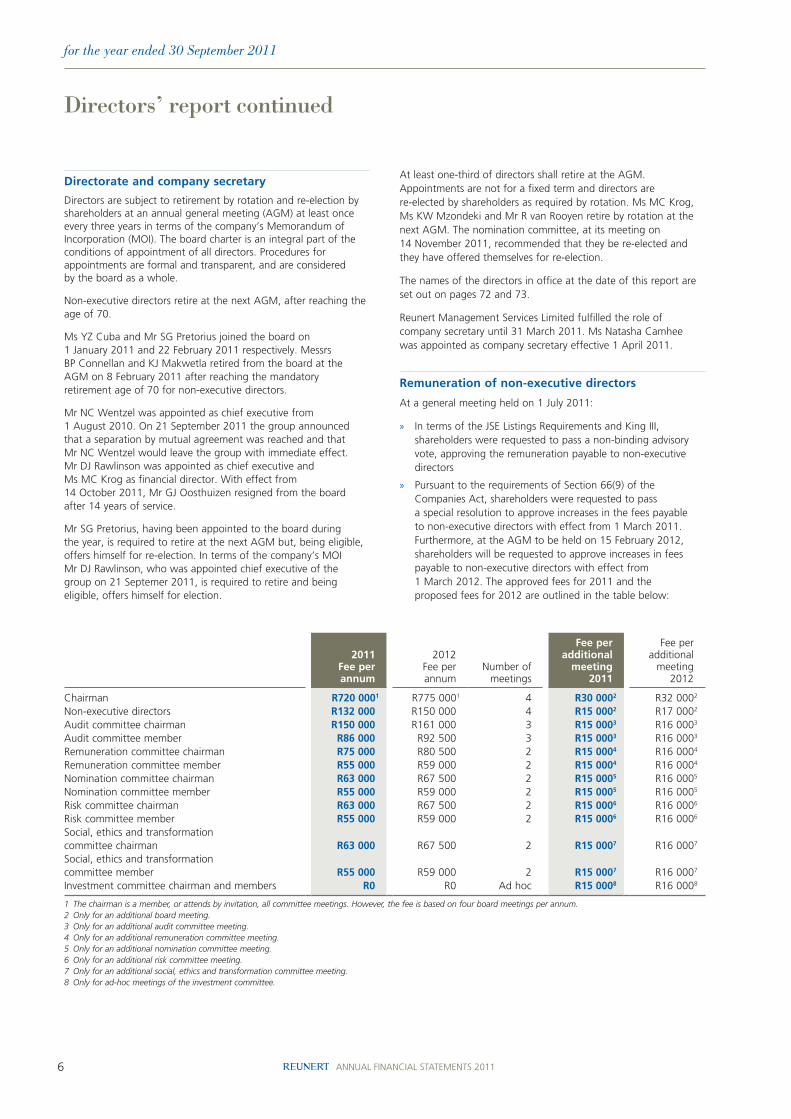
6 ANNUAL FINANCIAL STATEMENTS 2011
for the year ended 30 September 2011
directors’ report continued
Directorate and company secretary
Directors are subject to retirement by rotation and re-election by shareholders at an annual general meeting (AGM) at least once every three years in terms of the company’s Memorandum of Incorporation (MOI). The board charter is an integral part of the conditions of appointment of all directors. Procedures for appointments are formal and transparent, and are considered by the board as a whole.
Non-executive directors retire at the next AGM, after reaching the age of 70.
Ms YZ Cuba and Mr SG Pretorius joined the board on 1 January 2011 and 22 February 2011 respectively. Messrs BP Connellan and KJ Makwetla retired from the board at the AGM on 8 February 2011 after reaching the mandatory retirement age of 70 for non-executive directors.
Mr NC Wentzel was appointed as chief executive from 1 August 2010. On 21 September 2011 the group announced that a separation by mutual agreement was reached and that Mr NC Wentzel would leave the group with immediate effect. Mr DJ Rawlinson was appointed as chief executive and Ms MC Krog as financial director. With effect from 14 October 2011, Mr GJ Oosthuizen resigned from the board after 14 years of service.
Mr SG Pretorius, having been appointed to the board during the year, is required to retire at the next AGM but, being eligible, offers himself for re-election. In terms of the company’s MOI Mr DJ Rawlinson, who was appointed chief executive of the group on 21 Septemer 2011, is required to retire and being eligible, offers himself for election.
At least one-third of directors shall retire at the AGM. Appointments are not for a fixed term and directors are re-elected by shareholders as required by rotation. Ms MC Krog, Ms KW Mzondeki and Mr R van Rooyen retire by rotation at the next AGM. The nomination committee, at its meeting on 14 November 2011, recommended that they be re-elected and they have offered themselves for re-election.
The names of the directors in office at the date of this report are set out on pages 72 and 73.
Reunert Management Services Limited fulfilled the role of company secretary until 31 March 2011. Ms Natasha Camhee was appointed as company secretary effective 1 April 2011.
Remuneration of non-executive directors
At a general meeting held on 1 July 2011:
» In terms of the JSE Listings Requirements and King III, shareholders were requested to pass a non-binding advisory vote, approving the remuneration payable to non-executive directors
» Pursuant to the requirements of Section 66(9) of the Companies Act, shareholders were requested to pass a special resolution to approve increases in the fees payable to non-executive directors with effect from 1 March 2011. Furthermore, at the AGM to be held on 15 February 2012, shareholders will be requested to approve increases in fees payable to non-executive directors with effect from 1 March 2012. The approved fees for 2011 and the proposed fees for 2012 are outlined in the table below:
2011Fee per annum
2012Fee per annum
Number ofmeetings
Fee peradditional
meeting 2011
Fee peradditional
meeting2012
Chairman R720 0001 R775 0001 4 R30 0002 R32 0002
Non-executive directors R132 000 R150 000 4 R15 0002 R17 0002
Audit committee chairman R150 000 R161 000 3 R15 0003 R16 0003
Audit committee member R86 000 R92 500 3 R15 0003 R16 0003
Remuneration committee chairman R75 000 R80 500 2 R15 0004 R16 0004
Remuneration committee member R55 000 R59 000 2 R15 0004 R16 0004
Nomination committee chairman R63 000 R67 500 2 R15 0005 R16 0005
Nomination committee member R55 000 R59 000 2 R15 0005 R16 0005
Risk committee chairman R63 000 R67 500 2 R15 0006 R16 0006
Risk committee member R55 000 R59 000 2 R15 0006 R16 0006
Social, ethics and transformation committee chairman R63 000 R67 500 2 R15 0007 R16 0007
Social, ethics and transformation committee member R55 000 R59 000 2 R15 0007 R16 0007
Investment committee chairman and members R0 R0 Ad hoc R15 0008 R16 0008
1 The chairman is a member, or attends by invitation, all committee meetings. However, the fee is based on four board meetings per annum.2 Only for an additional board meeting.3 Only for an additional audit committee meeting.4 Only for an additional remuneration committee meeting.5 Only for an additional nomination committee meeting.6 Only for an additional risk committee meeting.7 Only for an additional social, ethics and transformation committee meeting.8 Only for ad-hoc meetings of the investment committee.
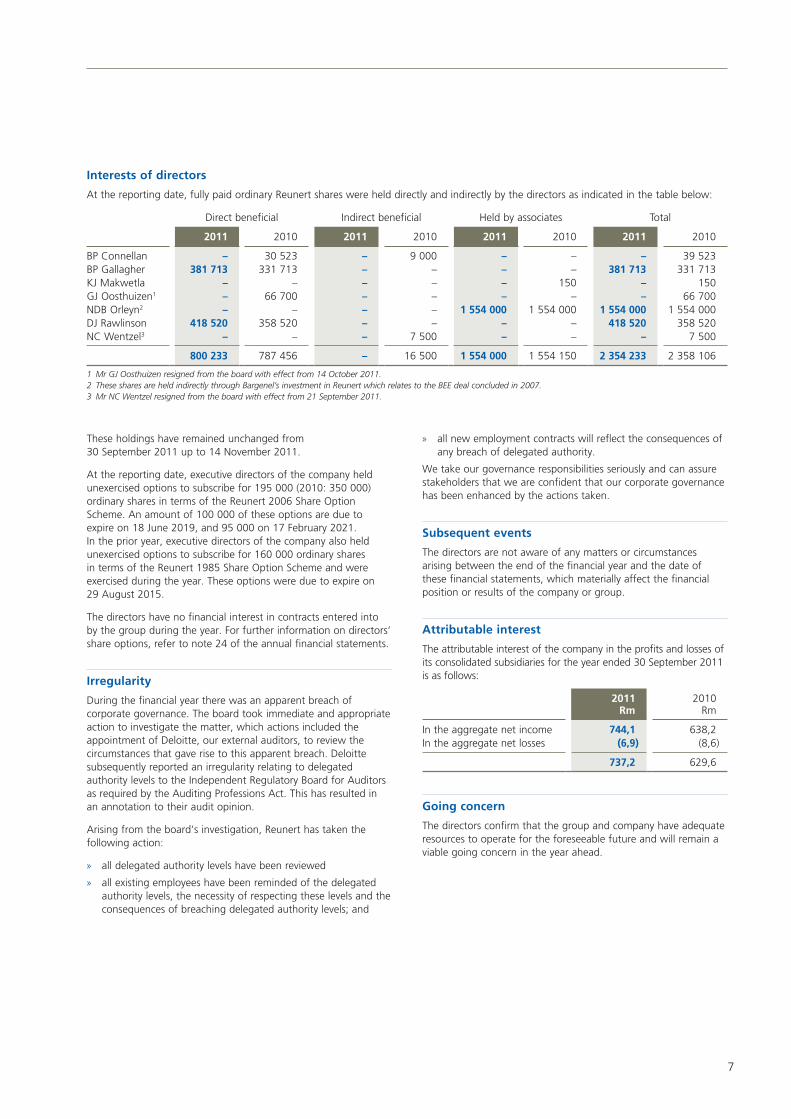
7
Interests of directors
At the reporting date, fully paid ordinary Reunert shares were held directly and indirectly by the directors as indicated in the table below:
Direct beneficial Indirect beneficial Held by associates Total
2011 2010 2011 2010 2011 2010 2011 2010
BP Connellan – 30 523 – 9 000 – – – 39 523BP Gallagher 381 713 331 713 – – – – 381 713 331 713KJ Makwetla – – – – – 150 – 150GJ Oosthuizen1 – 66 700 – – – – – 66 700NDB Orleyn2 – – – – 1 554 000 1 554 000 1 554 000 1 554 000DJ Rawlinson 418 520 358 520 – – – – 418 520 358 520NC Wentzel3 – – – 7 500 – – – 7 500
800 233 787 456 – 16 500 1 554 000 1 554 150 2 354 233 2 358 106
1 Mr GJ Oosthuizen resigned from the board with effect from 14 October 2011.2 These shares are held indirectly through Bargenel’s investment in Reunert which relates to the BEE deal concluded in 2007.3 Mr NC Wentzel resigned from the board with effect from 21 September 2011.
These holdings have remained unchanged from 30 September 2011 up to 14 November 2011.
At the reporting date, executive directors of the company held unexercised options to subscribe for 195 000 (2010: 350 000) ordinary shares in terms of the Reunert 2006 Share Option Scheme. An amount of 100 000 of these options are due to expire on 18 June 2019, and 95 000 on 17 February 2021. In the prior year, executive directors of the company also held unexercised options to subscribe for 160 000 ordinary shares in terms of the Reunert 1985 Share Option Scheme and were exercised during the year. These options were due to expire on 29 August 2015.
The directors have no financial interest in contracts entered into by the group during the year. For further information on directors’ share options, refer to note 24 of the annual financial statements.
Irregularity
During the financial year there was an apparent breach of corporate governance. The board took immediate and appropriate action to investigate the matter, which actions included the appointment of Deloitte, our external auditors, to review the circumstances that gave rise to this apparent breach. Deloitte subsequently reported an irregularity relating to delegated authority levels to the Independent Regulatory Board for Auditors as required by the Auditing Professions Act. This has resulted in an annotation to their audit opinion.
Arising from the board’s investigation, Reunert has taken the following action:
» all delegated authority levels have been reviewed
» all existing employees have been reminded of the delegated authority levels, the necessity of respecting these levels and the consequences of breaching delegated authority levels; and
» all new employment contracts will reflect the consequences of any breach of delegated authority.
We take our governance responsibilities seriously and can assure stakeholders that we are confident that our corporate governance has been enhanced by the actions taken.
Subsequent events
The directors are not aware of any matters or circumstances arising between the end of the financial year and the date of these financial statements, which materially affect the financial position or results of the company or group.
Attributable interest
The attributable interest of the company in the profits and losses of its consolidated subsidiaries for the year ended 30 September 2011 is as follows:
2011Rm
2010Rm
In the aggregate net income 744,1 638,2In the aggregate net losses (6,9) (8,6)
737,2 629,6
Going concern
The directors confirm that the group and company have adequate resources to operate for the foreseeable future and will remain a viable going concern in the year ahead.

8 ANNUAL FINANCIAL STATEMENTS 2011
for the year ended 30 September 2011
accounting policiesThe annual financial statements, comprising Reunert (referred to as “the company”), its subsidiaries, special purpose entities (SPEs), joint ventures, and associates (together referred to as “the group”), incorporate the following principal accounting policies, set out below. In these accounting policies “the group” refers to the group and company.
Statement of compliance
The group annual financial statements have been prepared in accordance with IFRS and interpretations of those standards as issued by the International Accounting Standards Board (IASB) and the IFRS Interpretations Committee (formerly IFRIC) of the IASB, the requirements of the JSE Limited and the requirements of the Companies Act, Act 71 of 2008.
Adoption of new and revised IFRSs
The following new and revised Standards and Interpretations have been adopted in the current period and have not had any material impact on the amounts reported in the current or prior years but may affect the accounting for future arrangements or transactions:
IFRS 2 – Share Based Payments
The amendment clarifies the accounting for group cash-settled share-based payment transactions in the individual annual financial statements of an entity receiving the goods or services when another group entity has the obligation to settle awards.
IAS 17 – Leases The amendment to the standard requires that leases of land are classified as either a finance or operating lease by applying the general principles of this standard. Leases relating to land were previously considered as operating leases.
Improvements to IFRSs issued in 2009
The application of these amendments has not had any material effect on the amounts reported in the financial statements.
At the date of these financial statements, the following relevant Standards and Interpretations were in issue but not yet effective:
Standards and Interpretations Details of Amendment
Effective for annual periods beginning on or after
IFRS 3 – Business Combinations
» Amendments to the transition requirements for contingent consideration from a business combination that occurred before the effective date of the revised IFRS.
1 January 2011
» Clarification of the measurement of non-controlling interests. 1 January 2011 » Additional guidance provided on un-replaced and voluntarily replaced share-based
payment awards.1 January 2011
IFRS 7 – Financial Instruments: Disclosure
» The amendment clarifies the intended interaction between qualitative and quantitative disclosures of the nature and extent of risks arising from financial instruments and removed some disclosure items which were seen to be superfluous or misleading.
1 January 2011
» The amendments require additional disclosure on transfer transactions of financial assets, including the possible effects of any residual risks that the transferring entity retains. The amendments also require additional disclosures if a disproportionate amount of transfer transactions are undertaken around the end of a reporting period.
1 July 2011
IFRS 9 – Financial Instruments
» New standard that forms part of a three-part project to replace IAS 39 – Financial Instruments: Recognition and Measurement.
1 January 2013
IFRS 10 – Consolidated Financial Statements
» New standard that replaces the consolidation requirements in SIC 12 – Consolidation: Special Purpose Entities and IAS 27 – Consolidated and Separate Financial Statements.
1 January 2013
IFRS 11 – Joint Arrangements
» New standard that deals with accounting for joint arrangements. The standard focuses on the rights and obligations of the arrangement, rather than its legal form. The standard requires a single method for accounting for interests in jointly controlled entities.
1 January 2013
IFRS 12 – Disclosure of Interests in Other Entities
» New and comprehensive standard on disclosure requirements for all forms of interests in other entities, including joint arrangements, associates, SPEs and other off balance sheet vehicles.
1 January 2013
IFRS 13 – Fair Value Measurement
» New guidance on fair value measurement and disclosure requirements. 1 January 2013
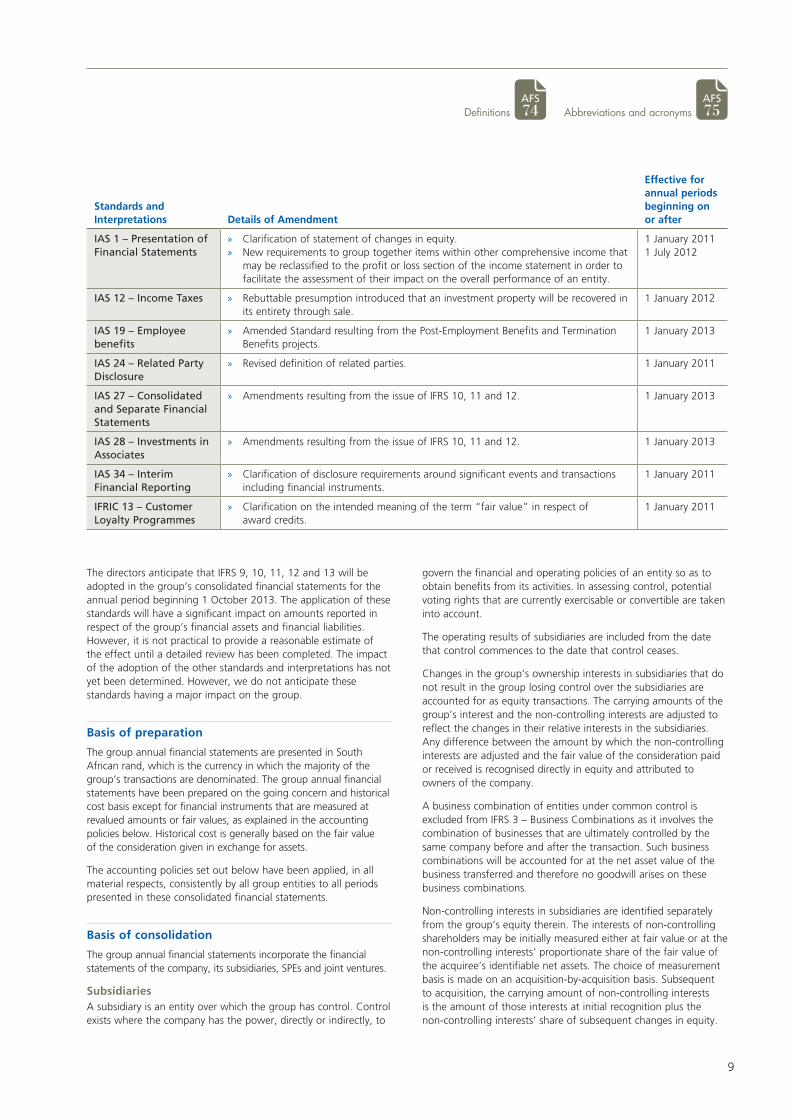
9
Standards and Interpretations Details of Amendment
Effective for annual periods beginning on or after
IAS 1 – Presentation of Financial Statements
» Clarification of statement of changes in equity. 1 January 2011 » New requirements to group together items within other comprehensive income that
may be reclassified to the profit or loss section of the income statement in order to facilitate the assessment of their impact on the overall performance of an entity.
1 July 2012
IAS 12 – Income Taxes » Rebuttable presumption introduced that an investment property will be recovered in its entirety through sale.
1 January 2012
IAS 19 – Employee benefits
» Amended Standard resulting from the Post-Employment Benefits and Termination Benefits projects.
1 January 2013
IAS 24 – Related Party Disclosure
» Revised definition of related parties. 1 January 2011
IAS 27 – Consolidated and Separate Financial Statements
» Amendments resulting from the issue of IFRS 10, 11 and 12. 1 January 2013
IAS 28 – Investments in Associates
» Amendments resulting from the issue of IFRS 10, 11 and 12. 1 January 2013
IAS 34 – Interim Financial Reporting
» Clarification of disclosure requirements around significant events and transactions including financial instruments.
1 January 2011
IFRIC 13 – Customer Loyalty Programmes
» Clarification on the intended meaning of the term “fair value” in respect of award credits.
1 January 2011
The directors anticipate that IFRS 9, 10, 11, 12 and 13 will be adopted in the group’s consolidated financial statements for the annual period beginning 1 October 2013. The application of these standards will have a significant impact on amounts reported in respect of the group’s financial assets and financial liabilities. However, it is not practical to provide a reasonable estimate of the effect until a detailed review has been completed. The impact of the adoption of the other standards and interpretations has not yet been determined. However, we do not anticipate these standards having a major impact on the group.
Basis of preparation
The group annual financial statements are presented in South African rand, which is the currency in which the majority of the group’s transactions are denominated. The group annual financial statements have been prepared on the going concern and historical cost basis except for financial instruments that are measured at revalued amounts or fair values, as explained in the accounting policies below. Historical cost is generally based on the fair value of the consideration given in exchange for assets.
The accounting policies set out below have been applied, in all material respects, consistently by all group entities to all periods presented in these consolidated financial statements.
Basis of consolidation
The group annual financial statements incorporate the financial statements of the company, its subsidiaries, SPEs and joint ventures.
SubsidiariesA subsidiary is an entity over which the group has control. Control exists where the company has the power, directly or indirectly, to
govern the financial and operating policies of an entity so as to obtain benefits from its activities. In assessing control, potential voting rights that are currently exercisable or convertible are taken into account.
The operating results of subsidiaries are included from the date that control commences to the date that control ceases.
Changes in the group’s ownership interests in subsidiaries that do not result in the group losing control over the subsidiaries are accounted for as equity transactions. The carrying amounts of the group’s interest and the non-controlling interests are adjusted to reflect the changes in their relative interests in the subsidiaries. Any difference between the amount by which the non-controlling interests are adjusted and the fair value of the consideration paid or received is recognised directly in equity and attributed to owners of the company.
A business combination of entities under common control is excluded from IFRS 3 – Business Combinations as it involves the combination of businesses that are ultimately controlled by the same company before and after the transaction. Such business combinations will be accounted for at the net asset value of the business transferred and therefore no goodwill arises on these business combinations.
Non-controlling interests in subsidiaries are identified separately from the group’s equity therein. The interests of non-controlling shareholders may be initially measured either at fair value or at the non-controlling interests’ proportionate share of the fair value of the acquiree’s identifiable net assets. The choice of measurement basis is made on an acquisition-by-acquisition basis. Subsequent to acquisition, the carrying amount of non-controlling interests is the amount of those interests at initial recognition plus the non-controlling interests’ share of subsequent changes in equity.
AFS 75Abbreviations and acronyms
AFS 74Definitions
10 ANNUAL FINANCIAL STATEMENTS 2011
for the year ended 30 September 2011
Total comprehensive income is attributed to non-controlling interests even if this results in the non-controlling interests having a deficit balance.
Intra-group transactions and balances, including any unrealised gains and losses or income and expenses arising from intra-group transactions, are eliminated in full in preparing the consolidated annual financial statements.
A SPE is an entity where in substance:
» The activities of the SPE are being conducted on behalf of the group according to its specific business needs so that the group obtains the benefits from the SPE’s operations
» The group has the decision-making powers to obtain the majority of the benefits of the activities of the SPE, or by setting up an “autopilot” mechanism, the group has delegated these decision-making powers
» The group has the rights to obtain the majority of the benefits of the SPE and therefore may be exposed to risks incident to the activities of the SPE
» The group retains the majority of the residual or ownership risks related to the SPE or its assets in order to obtain the benefits from its activities.
The operating results of SPEs are included from the date that control commences to the date that control ceases.
Joint venturesJoint ventures are those entities which are not subsidiaries and over which the group exercises joint control, which is defined as the contractually agreed sharing of control over an economic activity, and exists only when the strategic financial and operating decisions relating to the activity require the unanimous consent of the parties sharing control.
Joint ventures are accounted for using the proportionate consolidation method, whereby the group’s share of each of the assets, liabilities, income, expenses and cash flows of joint ventures are included on a line-by-line basis in the consolidated annual financial statements.
When a group entity transacts with a jointly controlled entity of the group, unrealised profits and losses are eliminated to the extent of the group’s interest in the joint venture.
Any difference between the cost of the acquisition and the group’s share of the net identifiable assets, fairly valued, is recognised and treated according to the group’s accounting policy for goodwill.
GoodwillAll business combinations are accounted for by applying the acquisition method. The cost of acquisition is measured at the aggregate of the fair values, at the date of acquisition, of assets acquired, liabilities incurred or assumed, and equity instruments issued by the group in exchange for control of the acquiree, excluding any costs directly attributable to the business combination. All acquisition related costs are recognised as expenses in the period in which the costs are incurred and the services received, except for the costs relating to the issue of debt or equity instruments, which are recognised as financial assets.
Goodwill represents amounts arising on acquisition of subsidiaries and joint ventures and is measured as the excess of the sum of the consideration transferred, the amount of any non-controlling
interests in the acquirer, and the fair value of the acquirer’s previously held equity interest in the acquiree, (if any), over the net of the acquisition-date amounts of the identifiable assets acquired and liabilities and contingent liabilities assumed. If, after assessment, the group’s interest in the fair value of the acquiree’s identifiable net assets exceeds the sum of the acquirer’s consideration transferred, the amount of any non-controlling interests in the acquiree and the fair value of the acquirer’s previously held equity interests in the acquiree (if any), the excess is recognised immediately in profit or loss as a bargain purchase gain.
When the consideration transferred in a business combination includes assets or liabilities resulting from a contingent consideration arrangement, the contingent consideration is measured at its acquisition-date fair value and included as part of the consideration transferred in a business combination. Changes in the fair value of the contingent consideration that qualify as measurement period adjustments are adjusted retrospectively, with corresponding adjustments against goodwill. Measurement period adjustments are adjustments that arise from additional information obtained during the “measurement period” (a period not exceeding one year from the acquisition date) about facts and circumstances that existed at the acquisition date.
Subsequent accounting for changes in the fair value of the contingent consideration that do not qualify as measurement period adjustments depends on how the contingent consideration is classified. Contingent consideration classified as equity is not remeasured at subsequent reporting dates and its settlement is accounted for as within equity. Contingent consideration that is classified as an asset or liability is remeasured at subsequent reporting dates in accordance with the applicable accounting standard with the corresponding gain or loss being recognised in profit or loss.
If the initial accounting for business combinations is incomplete by the end of the reporting period in which the combination occurs, the group reports provisional amounts for the items for which the accounting is incomplete. Those provisional amounts are adjusted during the measurement period, or additional assets and liabilities are recognised, to reflect new information obtained about facts and circumstances that existed at the acquisition date that, if known, would have affected the amounts recognised at that time.
Goodwill is initially recognised as an asset at cost and is subsequently measured at cost less any accumulated impairment losses.
Goodwill is allocated to cash-generating units (CGUs) expected to benefit from the synergies of the combination. Goodwill is tested annually for impairment or more frequently when there is an indication that the unit may be impaired. If the recoverable amount of the cash-generating unit is less than the carrying amount of the unit, the impairment loss is allocated first to reduce the carrying amount of any goodwill allocated to the unit and then to the other assets of the unit pro-rata on the basis of the carrying amount of each asset in the unit. An impairment loss recognised for goodwill is not reversed in subsequent periods.
On disposal of a subsidiary or a jointly controlled entity, the attributable goodwill is included in the determination of the profit or loss on disposal.
accounting policies continued
11
Investments in subsidiaries
In the company financial statements, investments in subsidiaries are initially recognised at cost and are subsequently carried at cost less any impairment losses recognised.
The carrying values are reduced by any impairment losses recognised to reflect irrecoverable amounts.
Property, plant and equipment and investment property
All owner-occupied property and investment property is initially recognised at cost.
Investment properties are held to earn rental income and for capital appreciation, whereas owner-occupied properties are held for use by the group, in the supply of goods, services or for administration purposes.
Property, plant and equipment in the course of construction for production, supply or administrative purposes, or for purposes not yet determined, are carried at cost, less any recognised impairment loss. Depreciation of these assets, on the same basis as other property, plant and equipment, commences when the assets are ready for their intended use.
Land is not depreciated and is stated at cost less accumulated impairment losses.
All other items of plant and equipment are stated at cost less accumulated depreciation and accumulated impairment losses. The cost of self-constructed assets includes the cost of materials, direct labour and an appropriate proportion of normal production overheads.
Where an item of property, plant and equipment comprises major components with different useful lives, these components are accounted for as separate items.
Subsequent expenditure relating to an item of property, plant and equipment is capitalised when it is probable that future economic benefits will flow to the group and the cost of the item can be measured reliably. All other subsequent expenditure (repairs and maintenance) is recognised as an expense when it is incurred.
Profits or losses on disposal of property, plant and equipment are the difference between the net disposal proceeds and the carrying amount of the asset and are recognised in the income statement. On disposal of an item of property, plant and equipment that is ordinarily sold but was held for rental purposes, the net carrying value of the item is transferred to inventory directly prior to the sale. The proceeds from the sale of the item is included in revenue.
Depreciation is provided on a straight-line basis over the estimated useful lives of property, plant and equipment in order to reduce the cost of the asset to its residual value.
Residual value is the estimated amount that the group would currently obtain from disposal of the asset, after deducting the estimated costs of disposal, if the asset was already of the age and in the condition expected at the end of its useful life.
The depreciation methods, estimated remaining useful lives and residual values are reviewed at least annually.
Intangible assets
Intangible assets acquired separatelyIntangible assets are initially recognised at cost and are subsequently measured at cost less accumulated amortisation and accumulated impairment losses.
Subsequent expenditure on intangible assets is capitalised only when it increases future economic benefits embodied in the specific asset to which it relates. All other subsequent expenditure is expensed as incurred.
Intangible assets with finite useful lives are amortised on a straight-line basis over their estimated useful lives. The amortisation methods and estimated remaining useful lives are reviewed at least annually with the effect of any changes in estimate being accounted for in future periods. Intangible assets with an indefinite useful life are not amortised but are tested at least annually for impairment.
Internally-generated intangible assets – research and development expenditureExpenditure on research activities is recognised as an expense in the period in which it is incurred.
An internally-generated intangible asset arising from development (or from the development phase of an internal project) is recognised if, and only if, all of the following have been demonstrated:
» the technical feasibility of completing the intangible asset so that it will be available for use or sale
» the intention to complete the intangible asset and use or sell it
» the ability to use or sell the intangible asset
» how the intangible asset will generate probable future economic benefits
» the availability of adequate technical, financial and other resources to complete the development and to use or sell the intangible asset, and
» the ability to measure reliably the expenditure attributable to the intangible asset during its development.
The amount initially recognised for internally-generated intangible assets is the sum of the expenditure incurred from the date when the intangible asset first meets the recognition criteria listed above. Where no internally-generated intangible asset can be recognised, development expenditure is recognised in profit or loss in the period in which it is incurred.
Subsequent to initial recognition, internally-generated intangible assets are reported at cost less accumulated amortisation and accumulated impairment losses, on the same basis as intangible assets that are acquired separately.
Intangible assets acquired in a business combinationIntangible assets acquired in a business combination and recognised separately from goodwill are initially recognised at their fair value at the acquisition date (which is regarded as the cost).
Subsequent to initial recognition, intangible assets acquired in a business combination are reported at cost less accumulated amortisation and accumulated impairment losses, on the same basis as intangible assets that are acquired separately.
12 ANNUAL FINANCIAL STATEMENTS 2011
for the year ended 30 September 2011
Impairment of assets
The carrying amounts of the group’s assets, other than deferred tax, are reviewed at the end of each reporting period or whenever events or changes in circumstances indicate that the carrying amount may not be recoverable, to determine whether there is any indication of impairment. If such indication exists, the asset’s recoverable amount is estimated. For goodwill, assets with indefinite useful lives and intangible assets that are not yet available for use, the recoverable amount is estimated at the end of each reporting period. The recoverable amount is the higher of its fair value less costs to sell and its value in use.
In assessing value in use, the expected future cash flows are discounted to their present value using a pre-taxation discount rate that reflects current market assessments of the time value of money and the risks specific to the asset.
For an asset that does not generate cash inflows that are largely independent of those from other assets, the recoverable amount is determined for the CGU to which the asset belongs.
An impairment loss is recognised in the income statement whenever the carrying amount of an asset or its CGU exceeds its recoverable amount.
Impairment losses recognised in respect of CGUs are allocated first to reduce the carrying amount of goodwill allocated to the CGUs and then to reduce the carrying amount of the other assets in the unit on a pro-rata basis.
A previously recognised impairment loss, other than goodwill, is reversed to the income statement if the recoverable amount increases as a result of a change in the estimates used to determine the recoverable amount, but not to an amount higher than the carrying amount that would have been determined (net of depreciation), had no impairment loss been recognised in prior years.
Leases
Group as lessorFinance leasesAmounts due from lessees under finance leases are recognised as receivables at the amount of the group’s net investment in the leases. Finance lease income is allocated to accounting periods so as to reflect a constant periodic rate of return on the group’s net investment outstanding in respect of the leases.
Operating leasesRental income from operating leases is recognised on a straight-line basis over the term of the relevant lease. Initial direct costs incurred in negotiating and arranging an operating lease are added to the carrying amount of the leased asset and recognised on a straight-line basis over the lease term.
Group as lesseeFinance leasesAssets subject to finance lease agreements, where considered material and where the group assumes substantially all the risks and rewards of ownership, are capitalised as property, plant and equipment at the lower of fair value and the present value of the minimum lease payments at inception of the lease and the corresponding liability is raised.
The cost of the asset is depreciated at appropriate rates on the straight-line basis over the estimated useful lives of the assets in order to reduce the cost of the asset to its residual value.
Lease payments are allocated using the effective interest rate method to determine the lease finance cost, which is charged to the income statement over the term of the relevant lease, and the capital payment, which reduces the liability to the lessor.
Operating leasesLeases where the lessor retains the risks and rewards of ownership of the underlying asset are classified as operating leases. Rentals payable under operating leases are charged to the income statement on a straight-line basis over the term of the relevant lease.
Non-current assets held for sale
Non-current assets and disposal groups are classified as held for sale, if their carrying amount will be recovered through a sale transaction rather than through continuing use. This condition is regarded as being met only when the sale is highly probable and the non-current asset or disposal group is available for immediate sale in its present condition. Management must be committed to the sale, which should be expected to qualify for recognition as a complete sale within one year from the date of classification.
Non-current assets and disposal groups are measured at the lower of the carrying amount and fair value less costs to sell. Any change in intention to sell will immediately result in the non-current assets and disposal groups being reclassified at the lower of their carrying amount before they were first classified as held for sale, adjusted for any depreciation, amortisation, revaluations and impairment losses and their recoverable amount at the date of the subsequent decision not to sell.
Inventory and contracts in progress
Inventory is stated at the lower of cost and net realisable value. Net realisable value is the estimated selling price in the ordinary course of business, less the estimated costs of completion and selling expenses. Cost is determined on the first-in first-out, weighted average or standard cost bases and includes direct material costs together with appropriate allocations of labour and overheads based on normal operating capacity.
Obsolete, redundant and slow-moving inventory is identified on a regular basis and is written down to its estimated net realisable value. Consumables are written down with regard to their age, condition and utility.
Contracts in progress are valued at the lower of actual cost less progress invoicing and net realisable value. Cost comprises direct materials, labour, expenses and a proportion of overhead expenditure.
Provisions
A provision is raised when a reliable estimate can be made of a present legal or constructive obligation, resulting from a past event, which will probably result in an outflow of economic benefits, and there is no realistic alternative to settling the obligation created by the event, which occurred before the reporting period date.
accounting policies continued
13
The amount recognised as a provision is the best estimate of the consideration required to settle the present obligation at the end of the reporting period, taking into account the risks and uncertainties surrounding the obligation. Where a provision is measured using the cash flows estimated to settle the present obligation, its carrying amount is the present value of those cash flows. When some or all of the economic benefits required to settle a provision are expected to be recovered from a third party, a receivable is recognised as an asset if it is virtually certain that reimbursement will be received and the amount of the receivable can be measured reliably.
Onerous contractsPresent obligations arising under onerous contracts are recognised and measured as provisions. An onerous contract is considered to exist where the group has a contract under which the unavoidable costs of meeting the obligations under the contract exceed the economic benefits expected to be received under it.
RestructuringA restructuring provision is recognised when the group has developed a detailed formal plan for the restructuring and has raised a valid expectation in those affected, that it will carry out the restructuring by starting to implement the plan or announcing its main features to those affected by it. The measurement of a restructuring provision includes only the direct expenditures arising from the restructuring, which are those amounts that are both necessarily entailed by the restructuring and not associated with the ongoing activities of the entity.
Product warrantiesProvision is made for the group’s estimated liability on all products still under warranty at the reporting period date. The provision is based on historical warranty data and returns and a weighting of possible outcomes against their associated probabilities.
Contingent liabilities acquired in a business combinationContingent liabilities acquired in a business combination are initially measured at fair value at the date of acquisition. At the end of subsequent reporting periods, such contingent liabilities are measured at the higher of the amount that would be recognised in accordance with IAS 37 Provisions, Contingent Liabilities and Contingent Assets, and the amount initially recognised less cumulative amortisation recognised in accordance with IAS 18 – Revenue.
Financial instruments
Financial instruments carried on the balance sheet include cash and cash equivalents, investments, receivables, trade payables, borrowings and derivative instruments. Financial assets and financial liabilities are recognised when a group entity becomes a party to the contractual provisions of the instrument.
Financial assets and financial liabilities are initially measured at fair value. Transaction costs that are directly attributable to the acquisition or issue of financial assets and financial liabilities (other than financial assets and financial liabilities at fair value through profit or loss) are added to or deducted from the fair value of the financial assets or financial liabilities, as appropriate, on initial recognition. Transaction costs directly attributable to the acquisition of financial assets or financial liabilities at fair value through profit or loss, are recognised immediately in profit or loss.
Financial assetsThe group classifies its financial assets into the following categories:
» at fair value through profit or loss (FVTPL)
» held-to-maturity investments
» loans and receivables
» available-for-sale financial assets.
The above classification is dependent on the purpose and nature for which the financial assets have been acquired. Management determines the classification of its financial assets at the time of the initial recognition and re-evaluates such designation at least annually.
Financial assets at FVTPLFinancial assets are classified as at FVTPL where the financial asset is either held for trading or designated as such upon initial recognition. Financial assets at FVTPL are stated at fair value, with any resultant gain or loss recognised in the income statement. The net gain or loss recognised in the income statement includes any dividend or interest earned on the financial asset.
The group classifies derivative instruments as held for trading if it is a derivative that is not a designated and effective hedging instrument.
Held-to-maturity investmentsHeld-to-maturity investments are financial instruments with fixed or determinable payments and fixed maturity dates that the group has the positive intention and ability to hold to maturity. Held-to-maturity investments are recorded at amortised cost using the effective interest rate method, less any impairment.
Loans and receivables Trade receivables, loans and other receivables that have fixed or determinable payments that are not quoted in an active market are classified as loans and receivables. Loans and receivables are measured at amortised cost using the effective interest rate method, less any impairment.
Interest income is recognised by applying the effective interest rate, except for short-term receivables when the recognition of interest would be immaterial.
Available-for-sale financial assets Unlisted shares held by the group are classified as available-for-sale financial assets. On initial recognition, and subsequently at the reporting period date, the available-for-sale assets are stated at fair value. Any unrealised gains and losses arising from the changes in fair value of available-for-sale financial assets are recognised in other comprehensive income. Where the investment is disposed of, the cumulative unrealised gain or loss previously recognised in other comprehensive income is reclassified to profit or loss for the period.
The fair values of financial assets are based on discounted cash flow models. Equity investments for which fair values cannot be measured reliably are recognised at cost, less any impairment.
Premiums or discounts arising from the difference between the fair value of the financial asset and the amount receivable at maturity date are charged to the income statement based on the effective interest rate method.

14 ANNUAL FINANCIAL STATEMENTS 2011
for the year ended 30 September 2011
Effective interest rate methodThe effective interest rate method is a method of calculating the amortised cost of a financial instrument and of allocating interest income over the relevant period. The effective interest rate is the rate that exactly discounts estimated future cash receipts (including all fees that form an integral part of the effective interest rate, transaction costs and other premiums or discounts) through the expected life of the financial instrument, or, (where appropriate) a shorter period, to the net carrying amount on initial recognition. Income is recognised on an effective interest rate basis for financial instruments other than those financial assets classified as at FVTPL.
All financial assets are recognised and derecognised on trade date where the purchase or sale of a financial asset is under a contract whose terms require delivery of the financial asset within the time frame established by the market concerned, and are initially measured at fair value, plus transaction costs, except for those financial assets classified as at FVTPL, which are initially measured at fair value.
Impairment of financial assetsAt each reporting period date, financial assets, other than those at FVTPL, are assessed for indicators of impairment. Financial assets are impaired where there is objective evidence that, as a result of one or more events that occurred after the initial recognition of the financial asset, the estimated future cash flows of the investment have been negatively impacted.
In the case of available-for-sale financial assets, a substantial or prolonged decrease in the fair value of the asset below its cost is considered an indicator of impairment. If any such evidence of impairment exists, the cumulative gain or loss that was previously recognised in comprehensive income is reversed and charged to the income statement. Impairment losses previously charged to the income statement are not subsequently reversed in the income statement. A change in the fair value of available-for-sale financial assets subsequent to the recognition of an impairment loss, is recognised directly in comprehensive income.
Derecognition of financial assetsThe group derecognises a financial asset only when the contractual rights to the cash flows from the asset expire, or when it transfers the financial asset and substantially all the risks and rewards of ownership of the asset to another entity. If the group neither transfers nor retains substantially all the risks and rewards of ownership and continues to control the transferred asset, the group recognises its retained interest in the asset and an associated liability for amounts it may have to pay. If the group retains substantially all the risks and rewards of ownership of a transferred financial asset, the group continues to recognise the financial asset and also recognises a collateralised borrowing for the proceeds received.
Cash and cash equivalentsCash and cash equivalents are stated at carrying value which is deemed to be fair value.
Trade and other receivablesTrade and other receivables are stated at their invoiced value as reduced by appropriate allowances for estimated irrecoverable amounts and cost of collection. An impairment is recognised when there is evidence that the group will not be able to collect all amounts due according to the original terms of the receivable. The amount of the impairment is charged to the income statement.
Derivative instrumentsThe group is exposed to market risks from changes in interest rates, commodity prices, price risk and foreign exchange rates. The group uses forward exchange contracts, commodity hedges, options and interest rate instruments to hedge its exposure to fluctuations in foreign exchange rates, commodity prices, price risk and interest rates. In accordance with its treasury policy, the group does not hold or issue derivative instruments for trading purposes.
Derivative instruments are initially measured at fair value at the date the derivative contract is entered into and are subsequently stated at fair value at each reporting date. The resulting gains or losses are charged to the income statement.
Embedded derivativesDerivatives embedded in other financial instruments or other host contracts are treated as separate derivatives when their risks and characteristics are not closely related to those of the host contracts and the host contracts are not measured at fair value, with change in fair value recognised in profit or loss.
Financial liabilities and equity instruments issued by the groupDebt and equity instruments are classified as either financial liabilities or as equity instruments in accordance with the substance of the contractual terms of the arrangement.
Debt instruments issued, which carry the right to convert to equity that is dependent on the outcome of uncertainties beyond the control of both the group and the holder, are classified as liabilities except where the possibility of conversion is certain.
Equity instrumentsAn equity instrument is any contract that evidences a residual interest in the assets of the entity after deducting all of its liabilities. Equity instruments issued by the group are recorded at the proceeds received net of any direct issue costs.
Financial guarantee contract liabilitiesA financial guarantee contract requires the issuer to make specified payments to reimburse the holder for a loss it incurs because a specified debtor fails to make payment when due in accordance with the original or modified terms of a debt instrument.
Financial guarantee contracts are measured initially at their fair values and are subsequently measured at the higher of:
» the amount of the obligation under the contract; and
» the amount initially recognised less, where appropriate, cumulative amortisation.
Financial liabilitiesFinancial liabilities include interest bearing bank loans and overdrafts and trade and other payables.
Financial liabilities are either classified as:
» financial liabilities at FVTPL; or
» other financial liabilities.
Financial liabilities at FVTPLFinancial liabilities are classified as at FVTPL where the financial liability is either held for trading or it is designated as such upon initial recognition.
accounting policies continued

15
Financial liabilities at FVTPL are stated at fair value, with any resultant gain or loss recognised in profit or loss. The net gain or loss recognised in profit or loss incorporates any interest paid on the financial liability.
Other financial liabilitiesOther financial liabilities, including interest bearing bank loans and overdrafts, are initially measured at fair value, net of transaction costs.
Other financial liabilities are subsequently measured at amortised cost using the effective interest method, with interest expense recognised on an effective yield basis.
Trade and other payables are stated at their nominal value.
Derecognition of financial liabilitiesFinancial liabilities are derecognised when the liability is extinguished, that is, the obligation specified in the contract is discharged, cancelled or expires.
Revenue
Revenue comprises net invoiced sales to customers, revenue from the rendering of services, rental from leasing fixed and moveable assets, commission and interest earned in the group’s financing operations and excludes value added tax (VAT).
Revenue from the sale of goods is recognised when the significant risks and rewards of ownership are transferred to the buyer, there is no continuing managerial involvement to the degree usually associated with ownership nor effective control over the goods sold, the amount of revenue can be measured reliably, it is probable that the economic benefits associated with the transaction will flow to the enterprise, and the costs incurred, or to be incurred, in respect of the transaction can be measured reliably.
Revenue from the rendering of services is recognised when the amount of revenue can be measured reliably, it is probable that the economic benefits will flow to the enterprise, the stage of completion at the reporting period date can be measured reliably, and the costs incurred, or to be incurred, in respect of the transaction can be measured reliably.
When the outcome of a construction contract can be estimated reliably, contract revenue and contract costs are recognised by reference to the stage of completion of the contract activity at the reporting period date, as measured by the proportion that the contract costs incurred for work performed to date bear to the estimated total contract costs. Variations in contract work, claims and incentive payments are included to the extent that they have been agreed with the customer.
Where the outcome of a construction contract cannot be reliably estimated, contract revenue is recognised to the extent that contract costs incurred will be recoverable. Contract costs are recognised as expenses in the period in which they are incurred.
When it is probable that total contract costs will exceed total contract revenue, the expected loss is recognised immediately.
Airtime sales by the cellular service provider are disclosed at the amounts charged to subscribers.
Interest is recognised on a time proportion basis, taking account of the principal amount outstanding and the effective rates over the period to maturity, using the effective interest rate method.
Dividends are recognised when the shareholder’s right to receive them has been established.
Employee benefits
Short-term employee benefitsThe cost of all short-term employee benefits is recognised during the period in which the employee renders the related service. The provisions for employee entitlements to wages, salaries, performance bonuses and annual leave represent the amounts which the group has a present obligation to pay as a result of employee’s services provided to the reporting period date. The provisions have been calculated at undiscounted amounts based on current wage and salary levels.
Retirement benefitsPayments to defined contribution retirement benefit plans are charged as an expense as they fall due. Payments made to state-managed retirement benefit schemes are dealt with as defined contribution plans where the group’s obligations under the schemes are equivalent to those arising in a defined contribution retirement benefit plan.
Share-based payments
The group issues equity-settled share-based payments to certain employees. Equity-settled share-based payments are measured at fair value at the grant date. The fair value determined at the grant date of the equity-settled share-based payments is expensed on a straight-line basis over the vesting period, based on the group’s estimate of shares that will eventually vest, with a corresponding increase in equity. At the end of each reporting period, the group revises its estimate of the number of equity instruments expected to vest. The impact of the revision of the original estimates, if any, is recognised in profit or loss such that the cumulative expense reflects the revised estimate, with a corresponding adjustment to the equity-settled employee benefits reserve.
Fair value is measured by use of a modified binomial option pricing model. The expected lives used in the model have been adjusted, based on management’s best estimate, for the effects of non-transferability, exercise restrictions and behavioural considerations.
BEE transactionsBlack economic empowerment (BEE) transactions involving the disposal or issue of equity interests in subsidiaries are recognised when the accounting recognition criteria have been met.
Although economic and legal ownership of such instruments have transferred to the BEE partner, the accounting derecognition of such equity interest sold by the parent company or recognition of equity instruments issued in the underlying subsidiary is postponed until the significant risks and rewards of ownership of the equity have passed to the BEE partner.
Abnormal items
Abnormal items are items of income or expense that arise from ordinary activities but are of such size, nature or incidence that they are disclosed separately in order to best reflect the group’s performance.

16 ANNUAL FINANCIAL STATEMENTS 2011
for the year ended 30 September 2011
Functional and presentation currency
Items included in the financial statements of each of the group’s entities are measured using the currency of the primary economic environment in which the entity operates (functional currency). The group’s functional and presentation currency is rand and all amounts, unless otherwise stated, are stated in millions of rand (Rm).
Foreign currencies
Foreign currency transactionsTransactions in foreign currencies are translated into the functional currency and accounted for at the rates of exchange ruling on the date of the transaction. Gains and losses arising from the settlement of such transactions are recognised in the income statement on a net basis unless the gains and losses are material, in which case they are reported separately.
Foreign currency balancesForeign monetary assets and liabilities of South African companies are translated into the functional currency at rates of exchange ruling at 30 September.
Unrealised differences on foreign monetary assets and liabilities are recognised in the income statement in the period in which they occur.
Foreign entitiesThe financial statements of foreign operations that are consolidated into the group financial statements are translated into rand as follows:
» Assets and liabilities at rates of exchange ruling at the group’s financial year-end; and
» Income, expenditure and cash flow items at the average rates of exchange during the financial year, to the extent that such average rates approximate actual rates.
Differences arising on translation are reflected in non-distributable reserves as a foreign currency translation reserve.
On disposal of part or all of a consolidated foreign operation, the proportionate share of the related cumulative gains and losses previously recognised in the foreign currency translation reserve are included in determining the profit or loss on disposal of that investment recognised in the income statement.
Goodwill and fair value adjustments arising on the acquisition of foreign operations are treated as assets and liabilities of the foreign operation and translated at closing rates at reporting period date.
Taxation
Income tax comprises current and deferred tax.
Income tax for the group is recognised in the income statement except to the extent that it relates to items recognised directly in other comprehensive income, in which case it is recognised in other comprehensive income. The charge for taxation is based on the results for the year as adjusted for items which are non-taxable or disallowed.
Current taxationCurrent taxation comprises tax payable on the taxable income for the year, using the tax rates enacted at the reporting period date, and any adjustment of tax payable in respect of previous years.
Deferred taxationDeferred tax is provided using the balance sheet liability method, providing for all temporary differences between the carrying amounts of assets and liabilities for financial reporting purposes and the amounts used for taxation purposes.
The following temporary differences are not provided for: goodwill not deductible for tax purposes and the initial recognition of assets or liabilities (other than in a business combination) that affect neither accounting nor taxable profit.
Deferred tax is calculated at the tax rates that are expected to apply to the period when the asset is realised or the liability is settled. Deferred tax is charged or credited in the income statement, except when it relates to items credited or charged directly to comprehensive income, in which case the deferred tax is also dealt with in comprehensive income.
The effect on deferred tax of any changes in tax rates is recognised in the income statement or in comprehensive income to the extent that it relates to items previously charged or credited to comprehensive income.
Secondary tax on companies (STC)STC is recognised as part of the tax charge in the income statement in the period dividends are declared, net of STC credits on dividends received.
Segmental reporting
A segment is a distinguishable component of the group that is engaged in activities from which it may earn revenue and incur expenses, including revenues and expenses relating to transactions with other components of the group, whose operating results are regularly reviewed by the chief operating decision-maker and for which discrete financial information is available. Operating segments are reported in a manner consistent with the internal reporting provided to the chief operating decision-maker. The chief operating decision-maker, which is responsible for allocating resources and assessing performance of the operating segments, has been identified as the board of directors of the group. The board of directors makes the group’s strategic decisions.
Critical judgements and estimations
The preparation of financial statements in conformity with IFRS requires management to make judgements, estimates and assumptions that affect the application of policies and reported amounts of assets and liabilities, income and expenses.
The estimates and associated assumptions are based on historical experience and various other factors that are believed to be reasonable under the circumstances, the results of which form the basis of making the judgements about carrying values of assets and liabilities that are not readily apparent from other resources. Actual results may differ from the estimates.
The estimates and underlying assumptions are reviewed on an ongoing basis. Revisions to accounting estimates are recognised
accounting policies continued
17
in the period in which the estimate is revised, if the revision affects only that period, or, in the period of the revision and future periods if the revision affects both current and future periods.
Judgements made by management in the application of IFRS that may have a significant effect on the financial statements and estimates with a significant risk of material adjustment in the following year, are disclosed.
In preparing the financial statements in conformity with IFRS, the board of directors has made the following significant judgements, estimates and assumptions:
Useful lives and residual valuesThe useful lives and residual values of property, plant and equipment and intangible assets are reviewed at each reporting period date. These useful lives are estimated by management based on historic analysis and other available information. The residual values are based on the assessment of useful lives and other available information.
ImpairmentsProperty, plant and equipment as well as intangible assets are reviewed for impairment when conditions indicate that impairment may be necessary and such reviews take place at least annually. The discounted cash flow method is used, taking into account future expected cash flows, market conditions and the expected useful lives of the assets.
Assumptions were made in assessing any possible impairment of goodwill. Details of these assumptions and risk factors are set out in note 12.
Deferred taxation assetsJudgement is applied by management to determine whether a deferred taxation asset should be recognised in the event of a tax loss, based on whether there will be future taxable income against which to utilise the tax loss.
Contracts in progressVarious assumptions are applied in arriving at the profit or loss recognised on contracts in progress. Refer to the revenue accounting policy for more detail.
Provision for obsolete inventoryJudgement is required to establish whether inventory is obsolete, redundant or slow moving and the extent to which cost exceeds net realisable value.
Provision for doubtful debtsVarious factors are considered when deciding on whether to impair receivables, including general economic conditions, credit terms, payment history and any other knowledge of the financial viability of the customer. Judgement is required to determine the level of provisions to reflect the likely recoverability of trade and other receivables.
ProvisionsVarious assumptions are applied in arriving at the carrying value of provisions that are recognised in terms of the requirements of IAS 37 – Provisions, Contingent Liabilities and Contingent Assets. This includes the provision for warranty claims and contract completion. The carrying amounts of the provisions are disclosed in note 21.
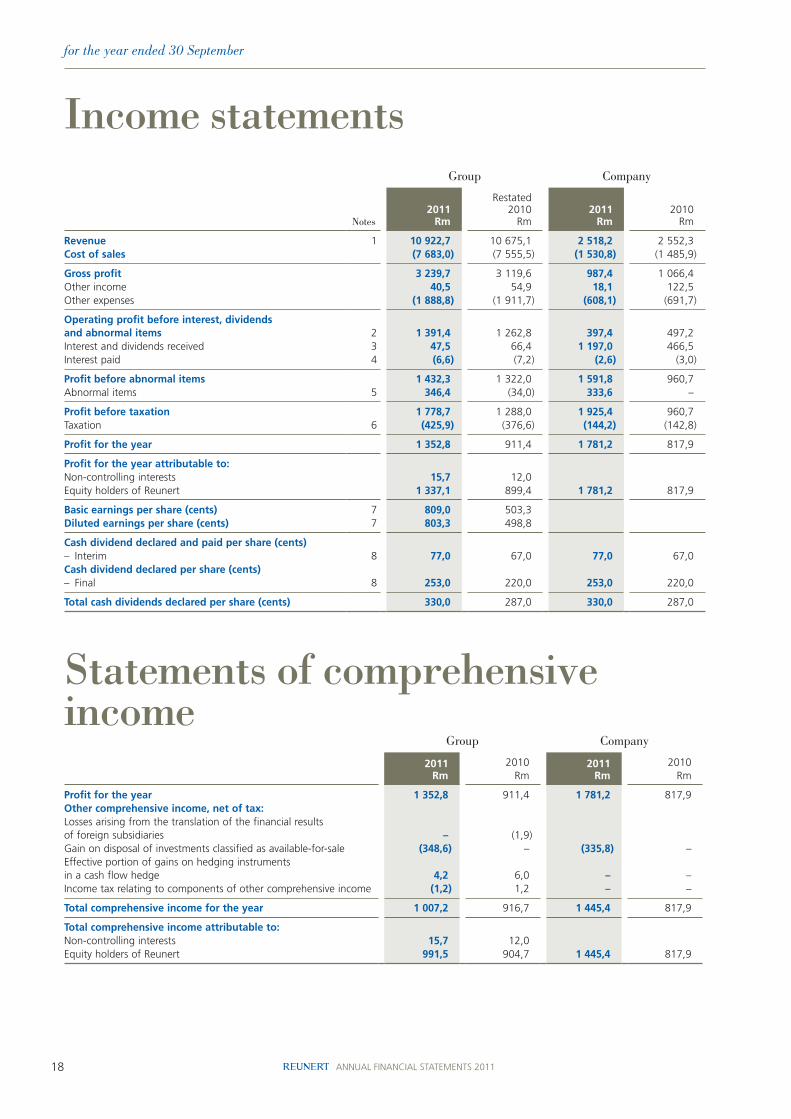
18 ANNUAL FINANCIAL STATEMENTS 2011
for the year ended 30 September
income statements
statements of comprehensive income
Group Company
Notes2011
Rm
Restated2010
Rm2011
Rm2010
Rm
Revenue 1 10 922,7 10 675,1 2 518,2 2 552,3 Cost of sales (7 683,0) (7 555,5) (1 530,8) (1 485,9)
Gross profit 3 239,7 3 119,6 987,4 1 066,4 Other income 40,5 54,9 18,1 122,5 Other expenses (1 888,8) (1 911,7) (608,1) (691,7)
Operating profit before interest, dividends and abnormal items 2 1 391,4 1 262,8 397,4 497,2 Interest and dividends received 3 47,5 66,4 1 197,0 466,5 Interest paid 4 (6,6) (7,2) (2,6) (3,0)
Profit before abnormal items 1 432,3 1 322,0 1 591,8 960,7 Abnormal items 5 346,4 (34,0) 333,6 –
Profit before taxation 1 778,7 1 288,0 1 925,4 960,7 Taxation 6 (425,9) (376,6) (144,2) (142,8)
Profit for the year 1 352,8 911,4 1 781,2 817,9
Profit for the year attributable to:Non-controlling interests 15,7 12,0 Equity holders of Reunert 1 337,1 899,4 1 781,2 817,9
Basic earnings per share (cents) 7 809,0 503,3 Diluted earnings per share (cents) 7 803,3 498,8
Cash dividend declared and paid per share (cents)– Interim 8 77,0 67,0 77,0 67,0 Cash dividend declared per share (cents)– Final 8 253,0 220,0 253,0 220,0
Total cash dividends declared per share (cents) 330,0 287,0 330,0 287,0
Group Company
2011Rm
2010Rm
2011Rm
2010Rm
Profit for the year 1 352,8 911,4 1 781,2 817,9 Other comprehensive income, net of tax:Losses arising from the translation of the financial results of foreign subsidiaries – (1,9)Gain on disposal of investments classified as available-for-sale (348,6) – (335,8) –Effective portion of gains on hedging instruments in a cash flow hedge 4,2 6,0 – –Income tax relating to components of other comprehensive income (1,2) 1,2 – –
Total comprehensive income for the year 1 007,2 916,7 1 445,4 817,9
Total comprehensive income attributable to:Non-controlling interests 15,7 12,0 Equity holders of Reunert 991,5 904,7 1 445,4 817,9
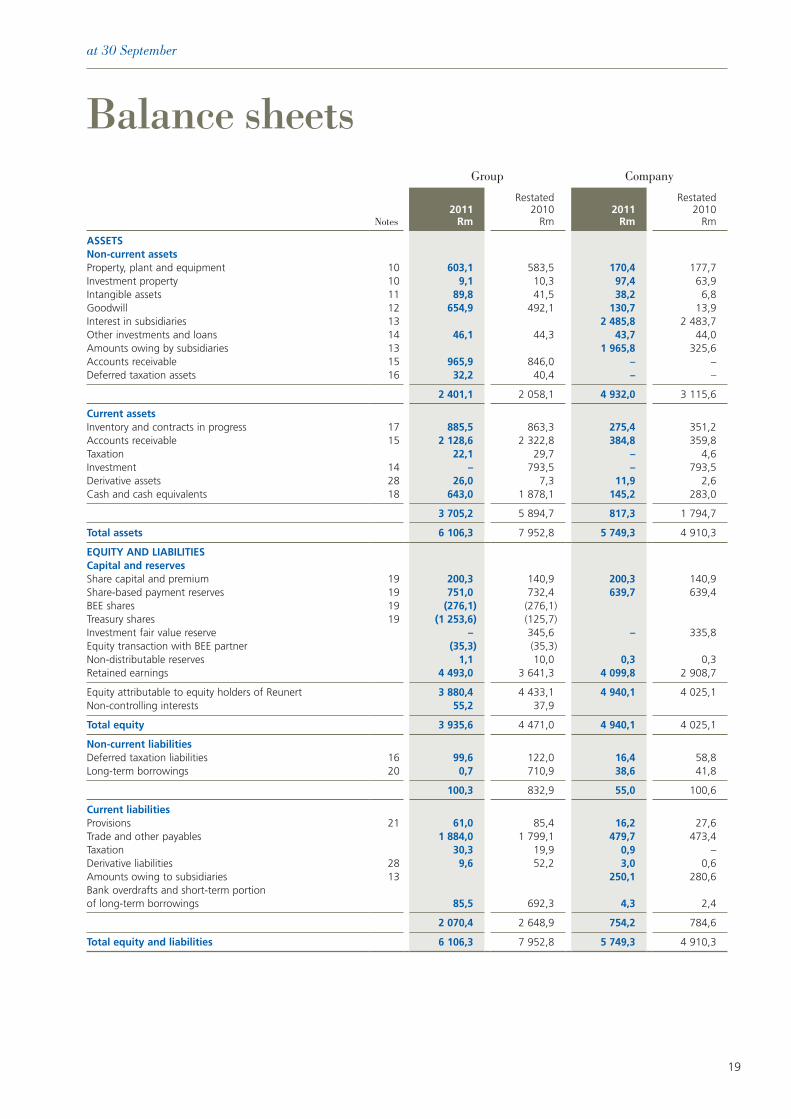
19
Balance sheets
at 30 September
Group Company
Notes2011
Rm
Restated2010
Rm2011
Rm
Restated2010
Rm
ASSETSNon-current assetsProperty, plant and equipment 10 603,1 583,5 170,4 177,7 Investment property 10 9,1 10,3 97,4 63,9 Intangible assets 11 89,8 41,5 38,2 6,8 Goodwill 12 654,9 492,1 130,7 13,9 Interest in subsidiaries 13 2 485,8 2 483,7 Other investments and loans 14 46,1 44,3 43,7 44,0 Amounts owing by subsidiaries 13 1 965,8 325,6 Accounts receivable 15 965,9 846,0 – – Deferred taxation assets 16 32,2 40,4 – –
2 401,1 2 058,1 4 932,0 3 115,6
Current assetsInventory and contracts in progress 17 885,5 863,3 275,4 351,2 Accounts receivable 15 2 128,6 2 322,8 384,8 359,8 Taxation 22,1 29,7 – 4,6 Investment 14 – 793,5 – 793,5 Derivative assets 28 26,0 7,3 11,9 2,6 Cash and cash equivalents 18 643,0 1 878,1 145,2 283,0
3 705,2 5 894,7 817,3 1 794,7
Total assets 6 106,3 7 952,8 5 749,3 4 910,3
EQUITY AND LIABILITIESCapital and reservesShare capital and premium 19 200,3 140,9 200,3 140,9 Share-based payment reserves 19 751,0 732,4 639,7 639,4 BEE shares 19 (276,1) (276,1)Treasury shares 19 (1 253,6) (125,7)Investment fair value reserve – 345,6 – 335,8 Equity transaction with BEE partner (35,3) (35,3)Non-distributable reserves 1,1 10,0 0,3 0,3 Retained earnings 4 493,0 3 641,3 4 099,8 2 908,7
Equity attributable to equity holders of Reunert 3 880,4 4 433,1 4 940,1 4 025,1 Non-controlling interests 55,2 37,9
Total equity 3 935,6 4 471,0 4 940,1 4 025,1
Non-current liabilitiesDeferred taxation liabilities 16 99,6 122,0 16,4 58,8 Long-term borrowings 20 0,7 710,9 38,6 41,8
100,3 832,9 55,0 100,6
Current liabilitiesProvisions 21 61,0 85,4 16,2 27,6 Trade and other payables 1 884,0 1 799,1 479,7 473,4 Taxation 30,3 19,9 0,9 – Derivative liabilities 28 9,6 52,2 3,0 0,6 Amounts owing to subsidiaries 13 250,1 280,6 Bank overdrafts and short-term portion of long-term borrowings 85,5 692,3 4,3 2,4
2 070,4 2 648,9 754,2 784,6
Total equity and liabilities 6 106,3 7 952,8 5 749,3 4 910,3
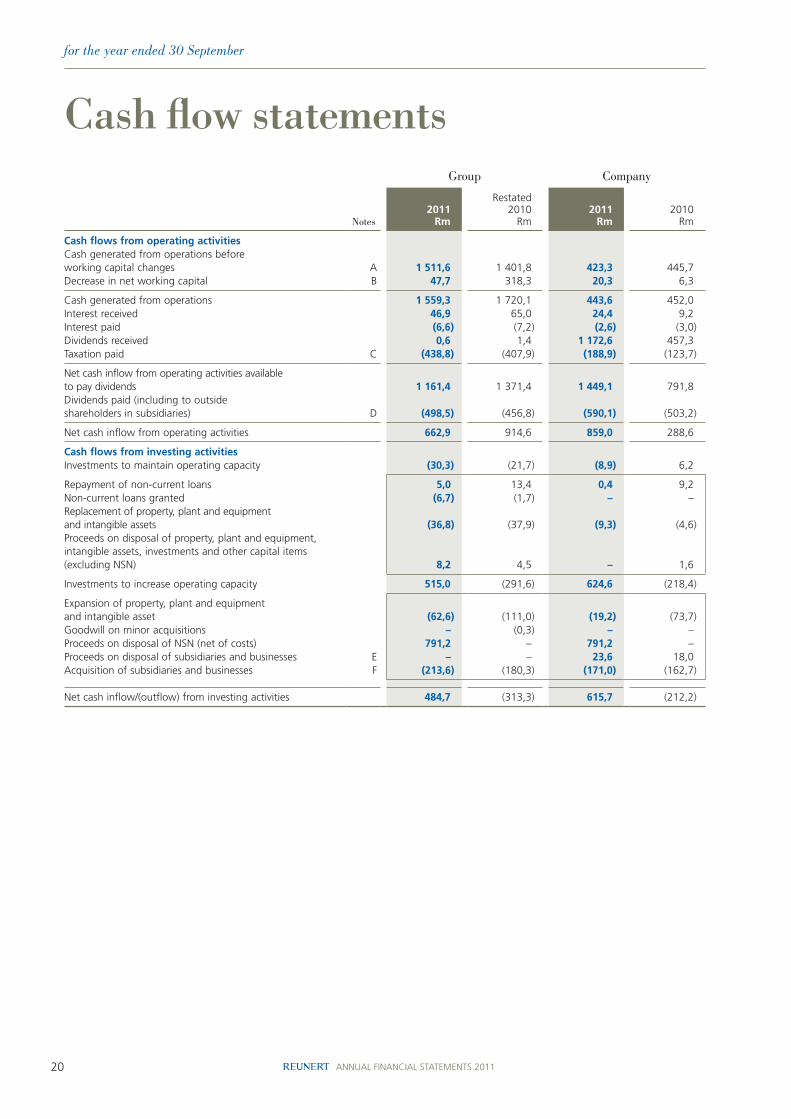
20 ANNUAL FINANCIAL STATEMENTS 2011
for the year ended 30 September
cash flow statementsGroup Company
Notes2011
Rm
Restated2010
Rm2011
Rm2010
Rm
Cash flows from operating activitiesCash generated from operations before working capital changes A 1 511,6 1 401,8 423,3 445,7 Decrease in net working capital B 47,7 318,3 20,3 6,3
Cash generated from operations 1 559,3 1 720,1 443,6 452,0 Interest received 46,9 65,0 24,4 9,2 Interest paid (6,6) (7,2) (2,6) (3,0)Dividends received 0,6 1,4 1 172,6 457,3 Taxation paid C (438,8) (407,9) (188,9) (123,7)
Net cash inflow from operating activities available to pay dividends 1 161,4 1 371,4 1 449,1 791,8 Dividends paid (including to outside shareholders in subsidiaries) D (498,5) (456,8) (590,1) (503,2)
Net cash inflow from operating activities 662,9 914,6 859,0 288,6
Cash flows from investing activitiesInvestments to maintain operating capacity (30,3) (21,7) (8,9) 6,2
Repayment of non-current loans 5,0 13,4 0,4 9,2 Non-current loans granted (6,7) (1,7) – – Replacement of property, plant and equipment and intangible assets (36,8) (37,9) (9,3) (4,6)Proceeds on disposal of property, plant and equipment, intangible assets, investments and other capital items (excluding NSN) 8,2 4,5 – 1,6
Investments to increase operating capacity 515,0 (291,6) 624,6 (218,4)
Expansion of property, plant and equipment and intangible asset (62,6) (111,0) (19,2) (73,7)Goodwill on minor acquisitions – (0,3) – – Proceeds on disposal of NSN (net of costs) 791,2 – 791,2 – Proceeds on disposal of subsidiaries and businesses E – – 23,6 18,0 Acquisition of subsidiaries and businesses F (213,6) (180,3) (171,0) (162,7)
Net cash inflow/(outflow) from investing activities 484,7 (313,3) 615,7 (212,2)
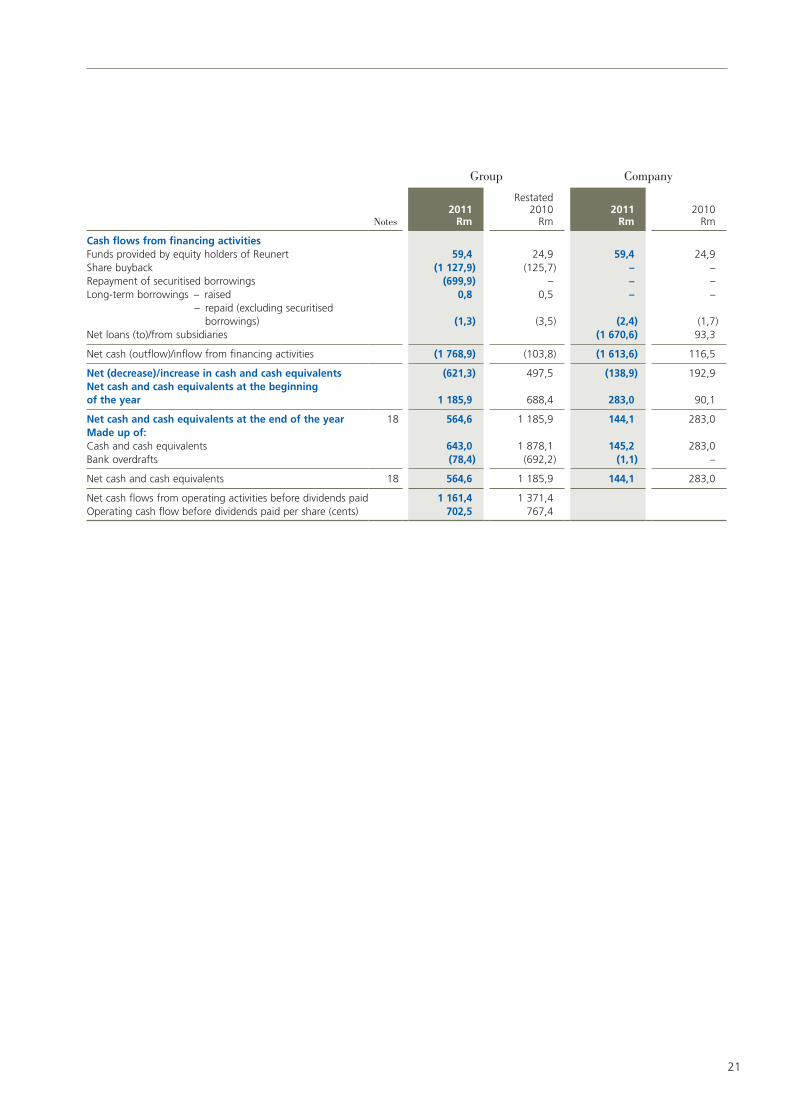
21
Group Company
Notes2011
Rm
Restated2010
Rm2011
Rm2010
Rm
Cash flows from financing activitiesFunds provided by equity holders of Reunert 59,4 24,9 59,4 24,9 Share buyback (1 127,9) (125,7) – – Repayment of securitised borrowings (699,9) – – – Long-term borrowings – raised 0,8 0,5 – – – repaid (excluding securitised
borrowings) (1,3) (3,5) (2,4) (1,7)Net loans (to)/from subsidiaries (1 670,6) 93,3
Net cash (outflow)/inflow from financing activities (1 768,9) (103,8) (1 613,6) 116,5
Net (decrease)/increase in cash and cash equivalents (621,3) 497,5 (138,9) 192,9 Net cash and cash equivalents at the beginning of the year 1 185,9 688,4 283,0 90,1
Net cash and cash equivalents at the end of the year 18 564,6 1 185,9 144,1 283,0 Made up of:Cash and cash equivalents 643,0 1 878,1 145,2 283,0 Bank overdrafts (78,4) (692,2) (1,1) –
Net cash and cash equivalents 18 564,6 1 185,9 144,1 283,0
Net cash flows from operating activities before dividends paid 1 161,4 1 371,4 Operating cash flow before dividends paid per share (cents) 702,5 767,4
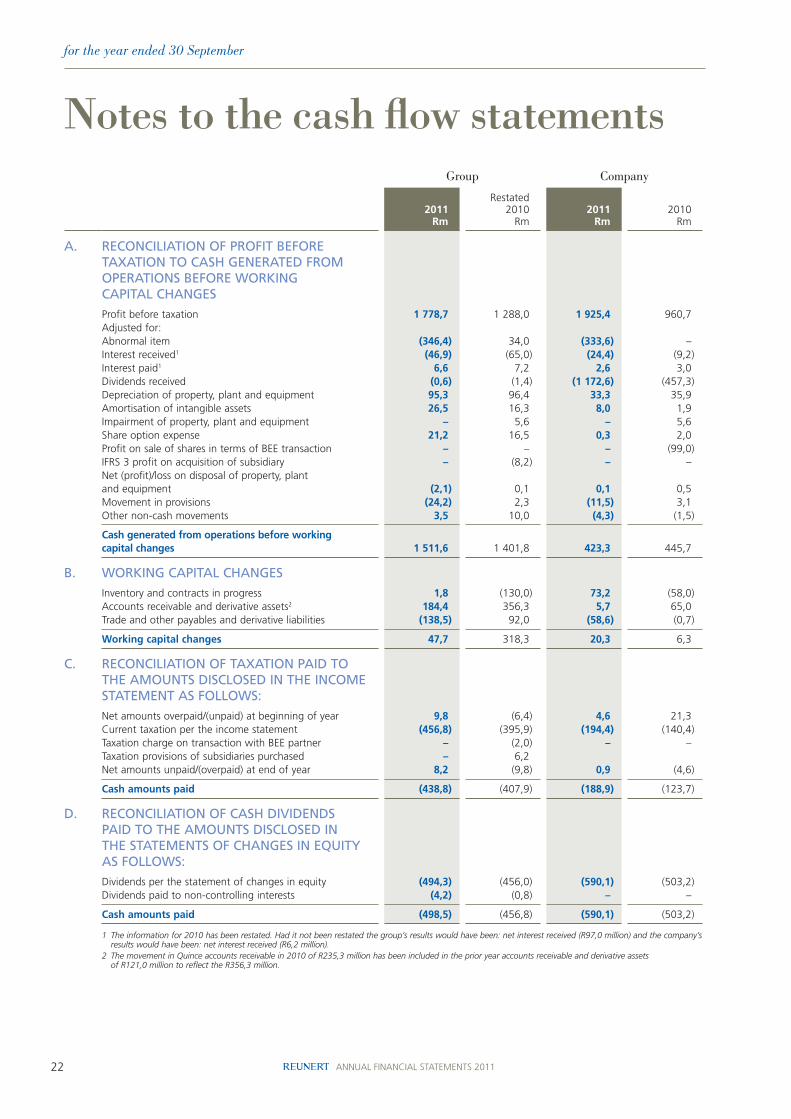
22 ANNUAL FINANCIAL STATEMENTS 2011
for the year ended 30 September
notes to the cash flow statementsGroup Company
2011 Rm
Restated 2010
Rm 2011
Rm2010
Rm
A. RECOnCILIATIOn OF PROFIT BEFORE TAxATIOn TO CASh gEnERATED FROM OPERATIOnS BEFORE wORkIng CAPITAL ChAngES
Profit before taxation 1 778,7 1 288,0 1 925,4 960,7 Adjusted for:Abnormal item (346,4) 34,0 (333,6) –Interest received1 (46,9) (65,0) (24,4) (9,2)Interest paid1 6,6 7,2 2,6 3,0 Dividends received (0,6) (1,4) (1 172,6) (457,3)Depreciation of property, plant and equipment 95,3 96,4 33,3 35,9 Amortisation of intangible assets 26,5 16,3 8,0 1,9 Impairment of property, plant and equipment – 5,6 – 5,6 Share option expense 21,2 16,5 0,3 2,0 Profit on sale of shares in terms of BEE transaction – – – (99,0)IFRS 3 profit on acquisition of subsidiary – (8,2) – – Net (profit)/loss on disposal of property, plant and equipment (2,1) 0,1 0,1 0,5 Movement in provisions (24,2) 2,3 (11,5) 3,1 Other non-cash movements 3,5 10,0 (4,3) (1,5)
Cash generated from operations before working capital changes 1 511,6 1 401,8 423,3 445,7
B. wORkIng CAPITAL ChAngES
Inventory and contracts in progress 1,8 (130,0) 73,2 (58,0)Accounts receivable and derivative assets2 184,4 356,3 5,7 65,0 Trade and other payables and derivative liabilities (138,5) 92,0 (58,6) (0,7)
Working capital changes 47,7 318,3 20,3 6,3
C. RECOnCILIATIOn OF TAxATIOn PAID TO ThE AMOunTS DISCLOSED In ThE InCOME STATEMEnT AS FOLLOwS:
Net amounts overpaid/(unpaid) at beginning of year 9,8 (6,4) 4,6 21,3 Current taxation per the income statement (456,8) (395,9) (194,4) (140,4)Taxation charge on transaction with BEE partner – (2,0) – – Taxation provisions of subsidiaries purchased – 6,2 Net amounts unpaid/(overpaid) at end of year 8,2 (9,8) 0,9 (4,6)
Cash amounts paid (438,8) (407,9) (188,9) (123,7)
D. RECOnCILIATIOn OF CASh DIVIDEnDS PAID TO ThE AMOunTS DISCLOSED In ThE STATEMEnTS OF ChAngES In EquITy AS FOLLOwS:
Dividends per the statement of changes in equity (494,3) (456,0) (590,1) (503,2)Dividends paid to non-controlling interests (4,2) (0,8) – –
Cash amounts paid (498,5) (456,8) (590,1) (503,2)
1 The information for 2010 has been restated. Had it not been restated the group’s results would have been: net interest received (R97,0 million) and the company’s results would have been: net interest received (R6,2 million).
2 The movement in Quince accounts receivable in 2010 of R235,3 million has been included in the prior year accounts receivable and derivative assets of R121,0 million to reflect the R356,3 million.
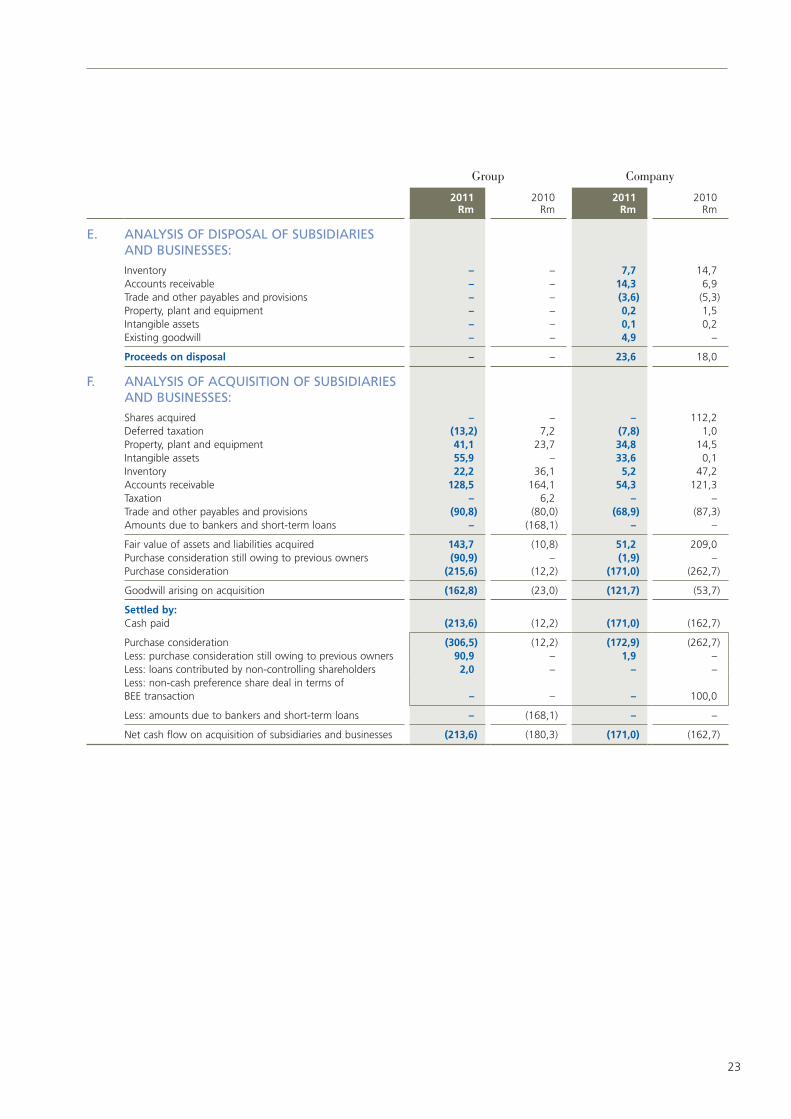
23
Group Company
2011 Rm
2010 Rm
2011Rm
2010Rm
E. AnALySIS OF DISPOSAL OF SuBSIDIARIES AnD BuSInESSES:
Inventory – – 7,7 14,7 Accounts receivable – – 14,3 6,9 Trade and other payables and provisions – – (3,6) (5,3)Property, plant and equipment – – 0,2 1,5 Intangible assets – – 0,1 0,2 Existing goodwill – – 4,9 –
Proceeds on disposal – – 23,6 18,0
F. AnALySIS OF ACquISITIOn OF SuBSIDIARIES AnD BuSInESSES:
Shares acquired – – – 112,2 Deferred taxation (13,2) 7,2 (7,8) 1,0 Property, plant and equipment 41,1 23,7 34,8 14,5 Intangible assets 55,9 – 33,6 0,1 Inventory 22,2 36,1 5,2 47,2 Accounts receivable 128,5 164,1 54,3 121,3 Taxation – 6,2 – – Trade and other payables and provisions (90,8) (80,0) (68,9) (87,3)Amounts due to bankers and short-term loans – (168,1) – –
Fair value of assets and liabilities acquired 143,7 (10,8) 51,2 209,0 Purchase consideration still owing to previous owners (90,9) – (1,9) – Purchase consideration (215,6) (12,2) (171,0) (262,7)
Goodwill arising on acquisition (162,8) (23,0) (121,7) (53,7)
Settled by:Cash paid (213,6) (12,2) (171,0) (162,7)
Purchase consideration (306,5) (12,2) (172,9) (262,7)Less: purchase consideration still owing to previous owners 90,9 – 1,9 – Less: loans contributed by non-controlling shareholders 2,0 – – – Less: non-cash preference share deal in terms of BEE transaction – – – 100,0
Less: amounts due to bankers and short-term loans – (168,1) – –
Net cash flow on acquisition of subsidiaries and businesses (213,6) (180,3) (171,0) (162,7)
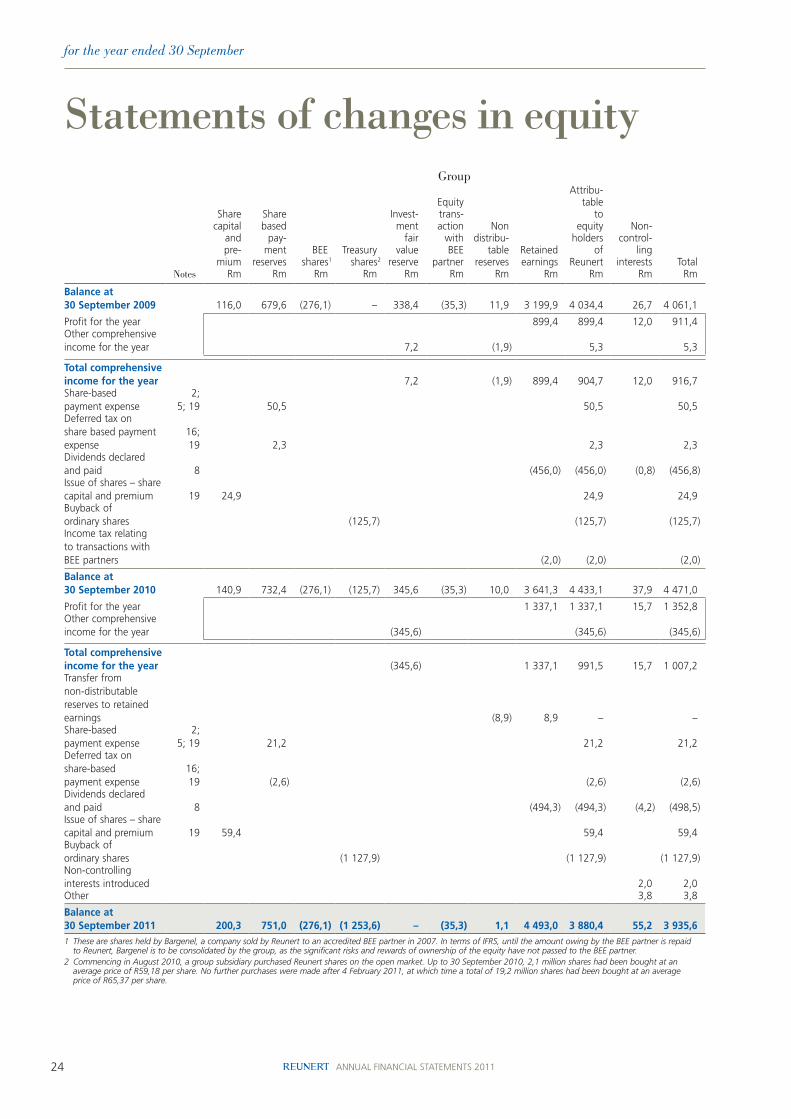
24 ANNUAL FINANCIAL STATEMENTS 2011
for the year ended 30 September
statements of changes in equityGroup
Notes
Share capital
and pre-
miumRm
Share based
pay-ment
reservesRm
BEEshares1
Rm
Treasuryshares2
Rm
Invest-ment
fairvalue
reserveRm
Equitytrans-action
withBEE
partnerRm
Nondistribu-
tablereserves
Rm
Retainedearnings
Rm
Attribu-table
toequity
holdersof
ReunertRm
Non-control-
linginterests
RmTotal
Rm
Balance at 30 September 2009 116,0 679,6 (276,1) – 338,4 (35,3) 11,9 3 199,9 4 034,4 26,7 4 061,1
Profit for the year 899,4 899,4 12,0 911,4 Other comprehensive income for the year 7,2 (1,9) 5,3 5,3
Total comprehensive income for the year 7,2 (1,9) 899,4 904,7 12,0 916,7 Share-based payment expense
2; 5; 19 50,5 50,5 50,5
Deferred tax on share based payment expense
16; 19 2,3 2,3 2,3
Dividends declared and paid 8 (456,0) (456,0) (0,8) (456,8)Issue of shares – share capital and premium 19 24,9 24,9 24,9 Buyback of ordinary shares (125,7) (125,7) (125,7)Income tax relating to transactions with BEE partners (2,0) (2,0) (2,0)
Balance at 30 September 2010 140,9 732,4 (276,1) (125,7) 345,6 (35,3) 10,0 3 641,3 4 433,1 37,9 4 471,0
Profit for the year 1 337,1 1 337,1 15,7 1 352,8 Other comprehensive income for the year (345,6) (345,6) (345,6)
Total comprehensive income for the year (345,6) 1 337,1 991,5 15,7 1 007,2Transfer from non-distributable reserves to retained earnings (8,9) 8,9 – – Share-based payment expense
2; 5; 19 21,2 21,2 21,2
Deferred tax on share-based payment expense
16; 19 (2,6) (2,6) (2,6)
Dividends declared and paid 8 (494,3) (494,3) (4,2) (498,5)Issue of shares – share capital and premium 19 59,4 59,4 59,4Buyback of ordinary shares (1 127,9) (1 127,9) (1 127,9)Non-controlling interests introduced 2,0 2,0Other 3,8 3,8
Balance at 30 September 2011 200,3 751,0 (276,1) (1 253,6) – (35,3) 1,1 4 493,0 3 880,4 55,2 3 935,61 These are shares held by Bargenel, a company sold by Reunert to an accredited BEE partner in 2007. In terms of IFRS, until the amount owing by the BEE partner is repaid
to Reunert, Bargenel is to be consolidated by the group, as the significant risks and rewards of ownership of the equity have not passed to the BEE partner.2 Commencing in August 2010, a group subsidiary purchased Reunert shares on the open market. Up to 30 September 2010, 2,1 million shares had been bought at an
average price of R59,18 per share. No further purchases were made after 4 February 2011, at which time a total of 19,2 million shares had been bought at an average price of R65,37 per share.
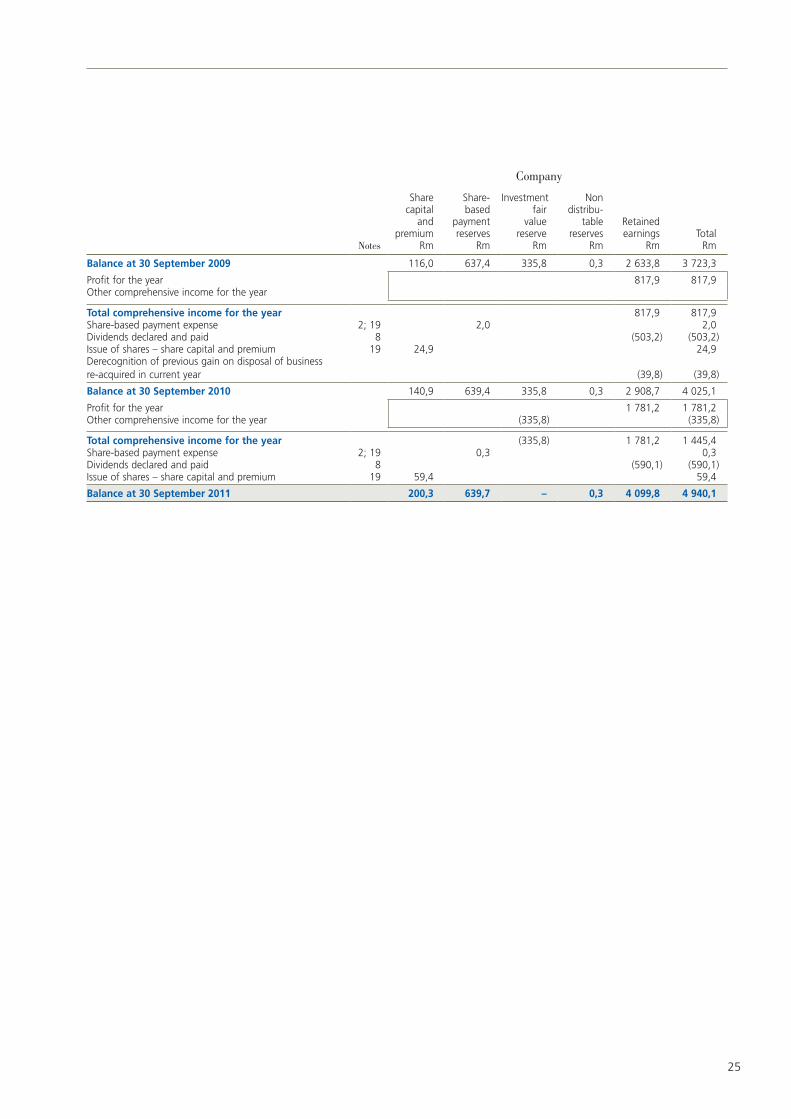
25
Company
Notes
Sharecapital
andpremium
Rm
Share-based
paymentreserves
Rm
Investmentfair
valuereserve
Rm
Nondistribu-
table reserves
Rm
Retainedearnings
RmTotal
Rm
Balance at 30 September 2009 116,0 637,4 335,8 0,3 2 633,8 3 723,3
Profit for the year 817,9 817,9 Other comprehensive income for the year
Total comprehensive income for the year 817,9 817,9 Share-based payment expense 2; 19 2,0 2,0 Dividends declared and paid 8 (503,2) (503,2)Issue of shares – share capital and premium 19 24,9 24,9 Derecognition of previous gain on disposal of business re-acquired in current year (39,8) (39,8)
Balance at 30 September 2010 140,9 639,4 335,8 0,3 2 908,7 4 025,1
Profit for the year 1 781,2 1 781,2 Other comprehensive income for the year (335,8) (335,8)
Total comprehensive income for the year (335,8) 1 781,2 1 445,4 Share-based payment expense 2; 19 0,3 0,3 Dividends declared and paid 8 (590,1) (590,1)Issue of shares – share capital and premium 19 59,4 59,4
Balance at 30 September 2011 200,3 639,7 – 0,3 4 099,8 4 940,1
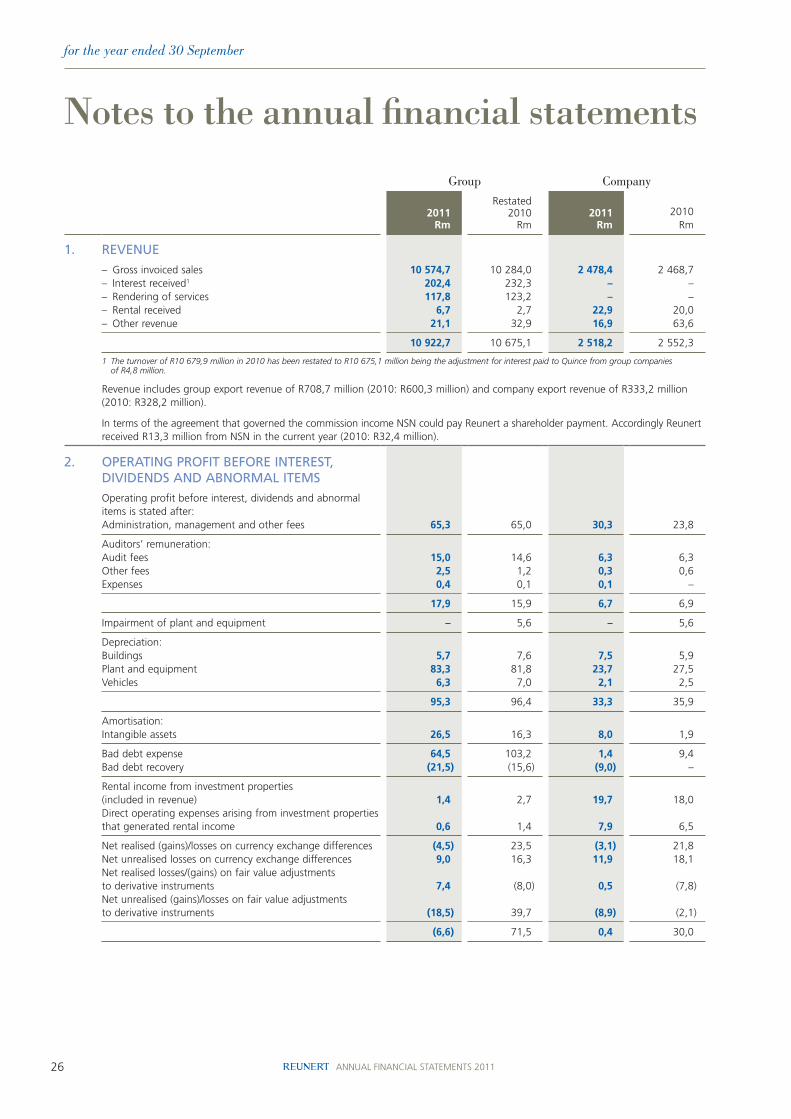
26 ANNUAL FINANCIAL STATEMENTS 2011
for the year ended 30 September
notes to the annual financial statements
Group Company
2011Rm
Restated2010
Rm2011
Rm2010
Rm
1. REVEnuE
– Gross invoiced sales 10 574,7 10 284,0 2 478,4 2 468,7 – Interest received1 202,4 232,3 – –– Rendering of services 117,8 123,2 – –– Rental received 6,7 2,7 22,9 20,0 – Other revenue 21,1 32,9 16,9 63,6
10 922,7 10 675,1 2 518,2 2 552,3
1 The turnover of R10 679,9 million in 2010 has been restated to R10 675,1 million being the adjustment for interest paid to Quince from group companies of R4,8 million.
Revenue includes group export revenue of R708,7 million (2010: R600,3 million) and company export revenue of R333,2 million (2010: R328,2 million).
In terms of the agreement that governed the commission income NSN could pay Reunert a shareholder payment. Accordingly Reunert received R13,3 million from NSN in the current year (2010: R32,4 million).
2. OPERATIng PROFIT BEFORE InTEREST, DIVIDEnDS AnD ABnORMAL ITEMS
Operating profit before interest, dividends and abnormal items is stated after:Administration, management and other fees 65,3 65,0 30,3 23,8
Auditors’ remuneration:Audit fees 15,0 14,6 6,3 6,3 Other fees 2,5 1,2 0,3 0,6 Expenses 0,4 0,1 0,1 –
17,9 15,9 6,7 6,9
Impairment of plant and equipment – 5,6 – 5,6
Depreciation:Buildings 5,7 7,6 7,5 5,9 Plant and equipment 83,3 81,8 23,7 27,5 Vehicles 6,3 7,0 2,1 2,5
95,3 96,4 33,3 35,9
Amortisation:Intangible assets 26,5 16,3 8,0 1,9
Bad debt expense 64,5 103,2 1,4 9,4 Bad debt recovery (21,5) (15,6) (9,0) –
Rental income from investment properties (included in revenue) 1,4 2,7 19,7 18,0 Direct operating expenses arising from investment properties that generated rental income 0,6 1,4 7,9 6,5
Net realised (gains)/losses on currency exchange differences (4,5) 23,5 (3,1) 21,8 Net unrealised losses on currency exchange differences 9,0 16,3 11,9 18,1 Net realised losses/(gains) on fair value adjustments to derivative instruments 7,4 (8,0) 0,5 (7,8)Net unrealised (gains)/losses on fair value adjustments to derivative instruments (18,5) 39,7 (8,9) (2,1)
(6,6) 71,5 0,4 30,0
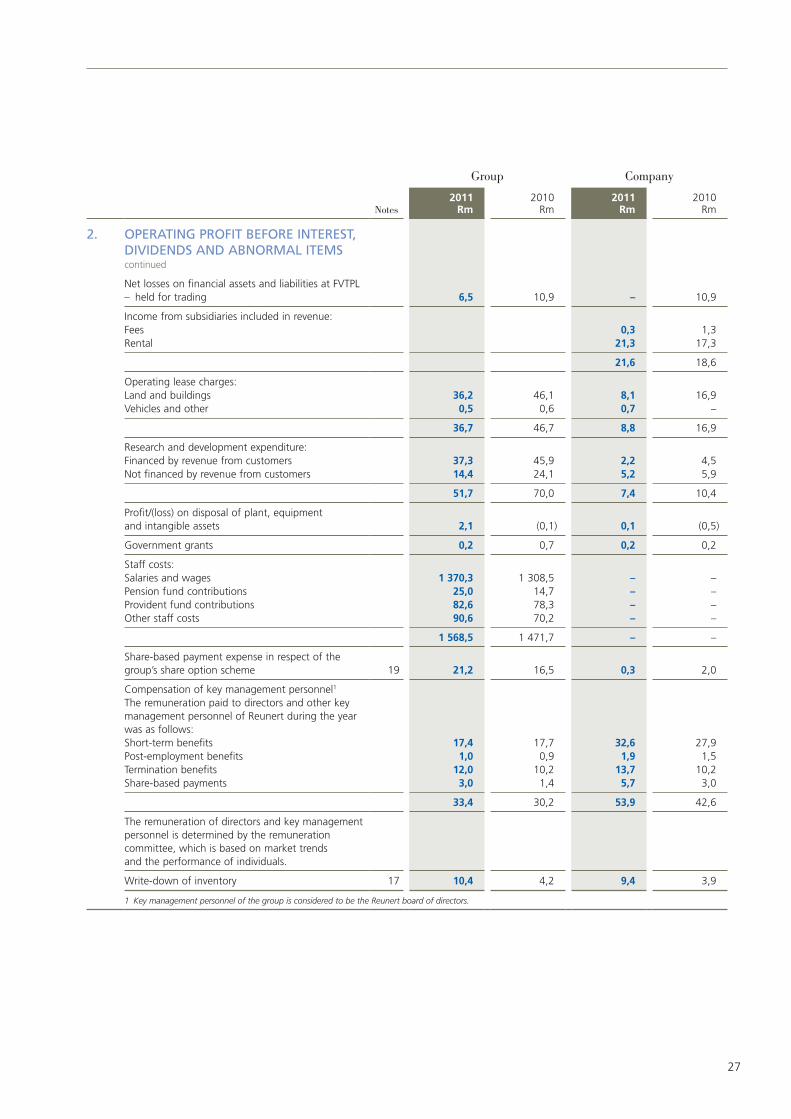
27
Group Company
Notes2011
Rm2010
Rm2011
Rm2010
Rm
2. OPERATIng PROFIT BEFORE InTEREST, DIVIDEnDS AnD ABnORMAL ITEMS continued
Net losses on financial assets and liabilities at FVTPL– held for trading 6,5 10,9 – 10,9
Income from subsidiaries included in revenue:Fees 0,3 1,3 Rental 21,3 17,3
21,6 18,6
Operating lease charges:Land and buildings 36,2 46,1 8,1 16,9 Vehicles and other 0,5 0,6 0,7 –
36,7 46,7 8,8 16,9
Research and development expenditure:Financed by revenue from customers 37,3 45,9 2,2 4,5 Not financed by revenue from customers 14,4 24,1 5,2 5,9
51,7 70,0 7,4 10,4
Profit/(loss) on disposal of plant, equipment and intangible assets 2,1 (0,1) 0,1 (0,5)
Government grants 0,2 0,7 0,2 0,2
Staff costs:Salaries and wages 1 370,3 1 308,5 – – Pension fund contributions 25,0 14,7 – – Provident fund contributions 82,6 78,3 – – Other staff costs 90,6 70,2 – –
1 568,5 1 471,7 – –
Share-based payment expense in respect of the group’s share option scheme 19 21,2 16,5 0,3 2,0
Compensation of key management personnel1
The remuneration paid to directors and other key management personnel of Reunert during the year was as follows:Short-term benefits 17,4 17,7 32,6 27,9Post-employment benefits 1,0 0,9 1,9 1,5Termination benefits 12,0 10,2 13,7 10,2Share-based payments 3,0 1,4 5,7 3,0
33,4 30,2 53,9 42,6
The remuneration of directors and key management personnel is determined by the remuneration committee, which is based on market trends and the performance of individuals.
Write-down of inventory 17 10,4 4,2 9,4 3,9
1 Key management personnel of the group is considered to be the Reunert board of directors.
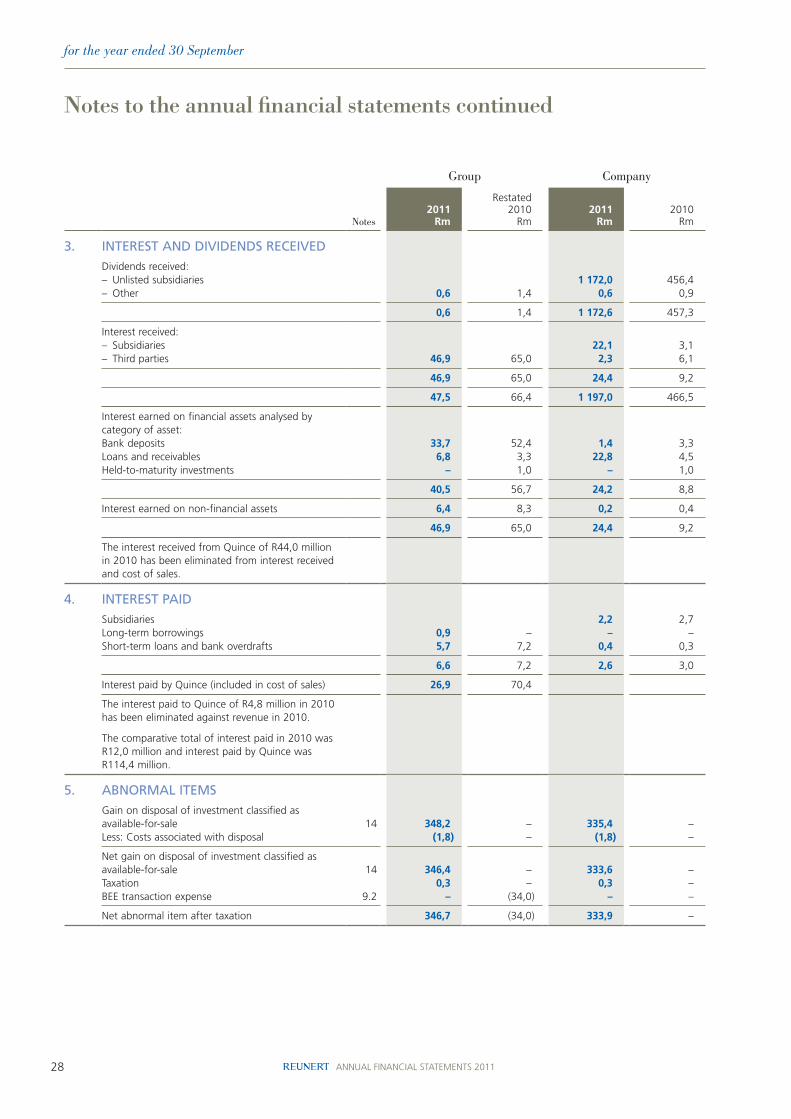
28 ANNUAL FINANCIAL STATEMENTS 2011
for the year ended 30 September
Group Company
Notes2011
Rm
Restated2010
Rm2011
Rm2010
Rm
3. InTEREST AnD DIVIDEnDS RECEIVED
Dividends received:– Unlisted subsidiaries 1 172,0 456,4 – Other 0,6 1,4 0,6 0,9
0,6 1,4 1 172,6 457,3
Interest received:– Subsidiaries 22,1 3,1 – Third parties 46,9 65,0 2,3 6,1
46,9 65,0 24,4 9,2
47,5 66,4 1 197,0 466,5
Interest earned on financial assets analysed by category of asset:Bank deposits 33,7 52,4 1,4 3,3 Loans and receivables 6,8 3,3 22,8 4,5 Held-to-maturity investments – 1,0 – 1,0
40,5 56,7 24,2 8,8
Interest earned on non-financial assets 6,4 8,3 0,2 0,4
46,9 65,0 24,4 9,2
The interest received from Quince of R44,0 million in 2010 has been eliminated from interest received and cost of sales.
4. InTEREST PAID
Subsidiaries 2,2 2,7 Long-term borrowings 0,9 – – – Short-term loans and bank overdrafts 5,7 7,2 0,4 0,3
6,6 7,2 2,6 3,0
Interest paid by Quince (included in cost of sales) 26,9 70,4
The interest paid to Quince of R4,8 million in 2010 has been eliminated against revenue in 2010.
The comparative total of interest paid in 2010 was R12,0 million and interest paid by Quince was R114,4 million.
5. ABnORMAL ITEMS
Gain on disposal of investment classified as available-for-sale 14 348,2 – 335,4 – Less: Costs associated with disposal (1,8) – (1,8) –
Net gain on disposal of investment classified as available-for-sale 14 346,4 – 333,6 – Taxation 0,3 – 0,3 – BEE transaction expense 9.2 – (34,0) – –
Net abnormal item after taxation 346,7 (34,0) 333,9 –
notes to the annual financial statements continued
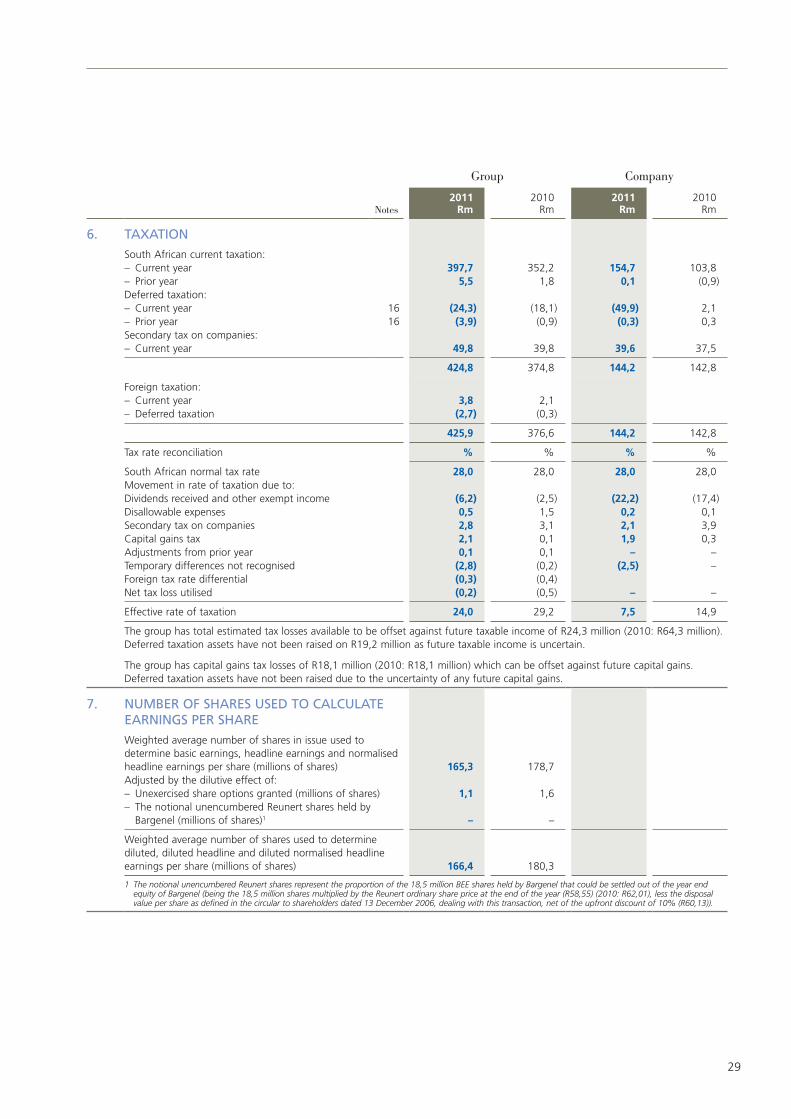
29
Group Company
Notes2011
Rm2010
Rm2011
Rm2010
Rm
6. TAxATIOn
South African current taxation:– Current year 397,7 352,2 154,7 103,8 – Prior year 5,5 1,8 0,1 (0,9)Deferred taxation:– Current year 16 (24,3) (18,1) (49,9) 2,1 – Prior year 16 (3,9) (0,9) (0,3) 0,3 Secondary tax on companies:– Current year 49,8 39,8 39,6 37,5
424,8 374,8 144,2 142,8
Foreign taxation:– Current year 3,8 2,1 – Deferred taxation (2,7) (0,3)
425,9 376,6 144,2 142,8
Tax rate reconciliation % % % %
South African normal tax rate 28,0 28,0 28,0 28,0 Movement in rate of taxation due to:Dividends received and other exempt income (6,2) (2,5) (22,2) (17,4)Disallowable expenses 0,5 1,5 0,2 0,1 Secondary tax on companies 2,8 3,1 2,1 3,9 Capital gains tax 2,1 0,1 1,9 0,3 Adjustments from prior year 0,1 0,1 – – Temporary differences not recognised (2,8) (0,2) (2,5) – Foreign tax rate differential (0,3) (0,4)Net tax loss utilised (0,2) (0,5) – –
Effective rate of taxation 24,0 29,2 7,5 14,9
The group has total estimated tax losses available to be offset against future taxable income of R24,3 million (2010: R64,3 million). Deferred taxation assets have not been raised on R19,2 million as future taxable income is uncertain.
The group has capital gains tax losses of R18,1 million (2010: R18,1 million) which can be offset against future capital gains. Deferred taxation assets have not been raised due to the uncertainty of any future capital gains.
7. nuMBER OF ShARES uSED TO CALCuLATE EARnIngS PER ShARE
Weighted average number of shares in issue used to determine basic earnings, headline earnings and normalised headline earnings per share (millions of shares) 165,3 178,7 Adjusted by the dilutive effect of:– Unexercised share options granted (millions of shares) 1,1 1,6 – The notional unencumbered Reunert shares held by
Bargenel (millions of shares)1 – –
Weighted average number of shares used to determine diluted, diluted headline and diluted normalised headline earnings per share (millions of shares) 166,4 180,3
1 The notional unencumbered Reunert shares represent the proportion of the 18,5 million BEE shares held by Bargenel that could be settled out of the year end equity of Bargenel (being the 18,5 million shares multiplied by the Reunert ordinary share price at the end of the year (R58,55) (2010: R62,01), less the disposal value per share as defined in the circular to shareholders dated 13 December 2006, dealing with this transaction, net of the upfront discount of 10% (R60,13)).
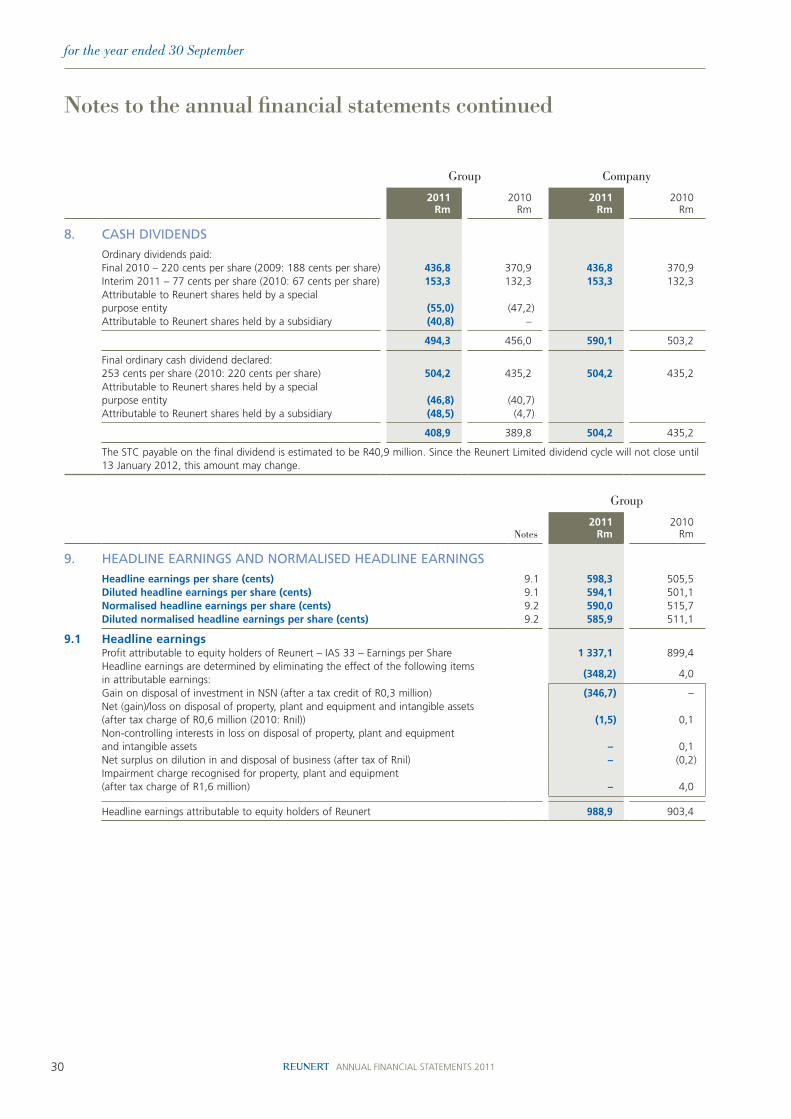
30 ANNUAL FINANCIAL STATEMENTS 2011
for the year ended 30 September
Group Company
2011Rm
2010Rm
2011Rm
2010Rm
8. CASh DIVIDEnDS
Ordinary dividends paid:Final 2010 – 220 cents per share (2009: 188 cents per share) 436,8 370,9 436,8 370,9 Interim 2011 – 77 cents per share (2010: 67 cents per share) 153,3 132,3 153,3 132,3 Attributable to Reunert shares held by a special purpose entity (55,0) (47,2)Attributable to Reunert shares held by a subsidiary (40,8) –
494,3 456,0 590,1 503,2
Final ordinary cash dividend declared:253 cents per share (2010: 220 cents per share) 504,2 435,2 504,2 435,2 Attributable to Reunert shares held by a special purpose entity (46,8) (40,7)Attributable to Reunert shares held by a subsidiary (48,5) (4,7)
408,9 389,8 504,2 435,2
The STC payable on the final dividend is estimated to be R40,9 million. Since the Reunert Limited dividend cycle will not close until 13 January 2012, this amount may change.
Group
Notes2011
Rm2010
Rm
9. hEADLInE EARnIngS AnD nORMALISED hEADLInE EARnIngS
Headline earnings per share (cents) 9.1 598,3 505,5 Diluted headline earnings per share (cents) 9.1 594,1 501,1 Normalised headline earnings per share (cents) 9.2 590,0 515,7 Diluted normalised headline earnings per share (cents) 9.2 585,9 511,1
9.1 Headline earningsProfit attributable to equity holders of Reunert – IAS 33 – Earnings per Share 1 337,1 899,4 Headline earnings are determined by eliminating the effect of the following items in attributable earnings: (348,2) 4,0
Gain on disposal of investment in NSN (after a tax credit of R0,3 million) (346,7) – Net (gain)/loss on disposal of property, plant and equipment and intangible assets (after tax charge of R0,6 million (2010: Rnil)) (1,5) 0,1 Non-controlling interests in loss on disposal of property, plant and equipment and intangible assets – 0,1 Net surplus on dilution in and disposal of business (after tax of Rnil) – (0,2)Impairment charge recognised for property, plant and equipment (after tax charge of R1,6 million) – 4,0
Headline earnings attributable to equity holders of Reunert 988,9 903,4
notes to the annual financial statements continued
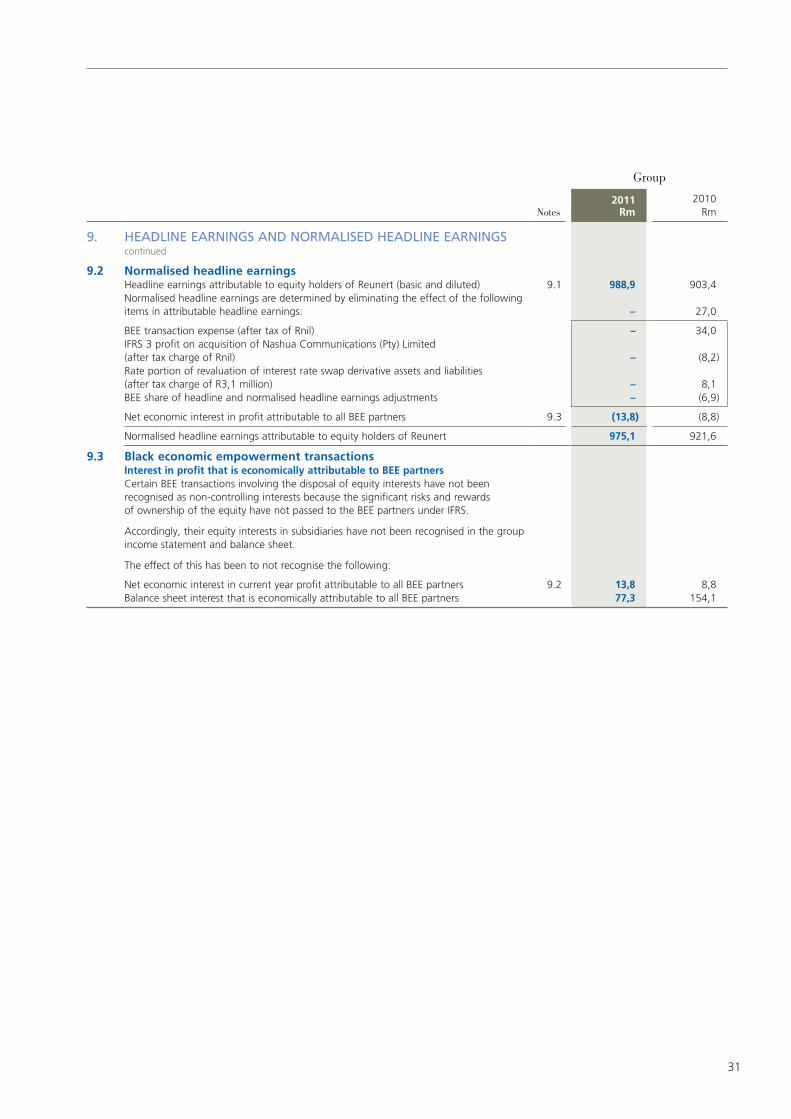
31
Group
Notes2011
Rm2010
Rm
9. hEADLInE EARnIngS AnD nORMALISED hEADLInE EARnIngS continued
9.2 Normalised headline earningsHeadline earnings attributable to equity holders of Reunert (basic and diluted) 9.1 988,9 903,4 Normalised headline earnings are determined by eliminating the effect of the following items in attributable headline earnings: – 27,0
BEE transaction expense (after tax of Rnil) – 34,0 IFRS 3 profit on acquisition of Nashua Communications (Pty) Limited (after tax charge of Rnil) – (8,2)Rate portion of revaluation of interest rate swap derivative assets and liabilities (after tax charge of R3,1 million) – 8,1 BEE share of headline and normalised headline earnings adjustments – (6,9)
Net economic interest in profit attributable to all BEE partners 9.3 (13,8) (8,8)
Normalised headline earnings attributable to equity holders of Reunert 975,1 921,6
9.3 Black economic empowerment transactionsInterest in profit that is economically attributable to BEE partnersCertain BEE transactions involving the disposal of equity interests have not been recognised as non-controlling interests because the significant risks and rewards of ownership of the equity have not passed to the BEE partners under IFRS.
Accordingly, their equity interests in subsidiaries have not been recognised in the group income statement and balance sheet.
The effect of this has been to not recognise the following:
Net economic interest in current year profit attributable to all BEE partners 9.2 13,8 8,8 Balance sheet interest that is economically attributable to all BEE partners 77,3 154,1
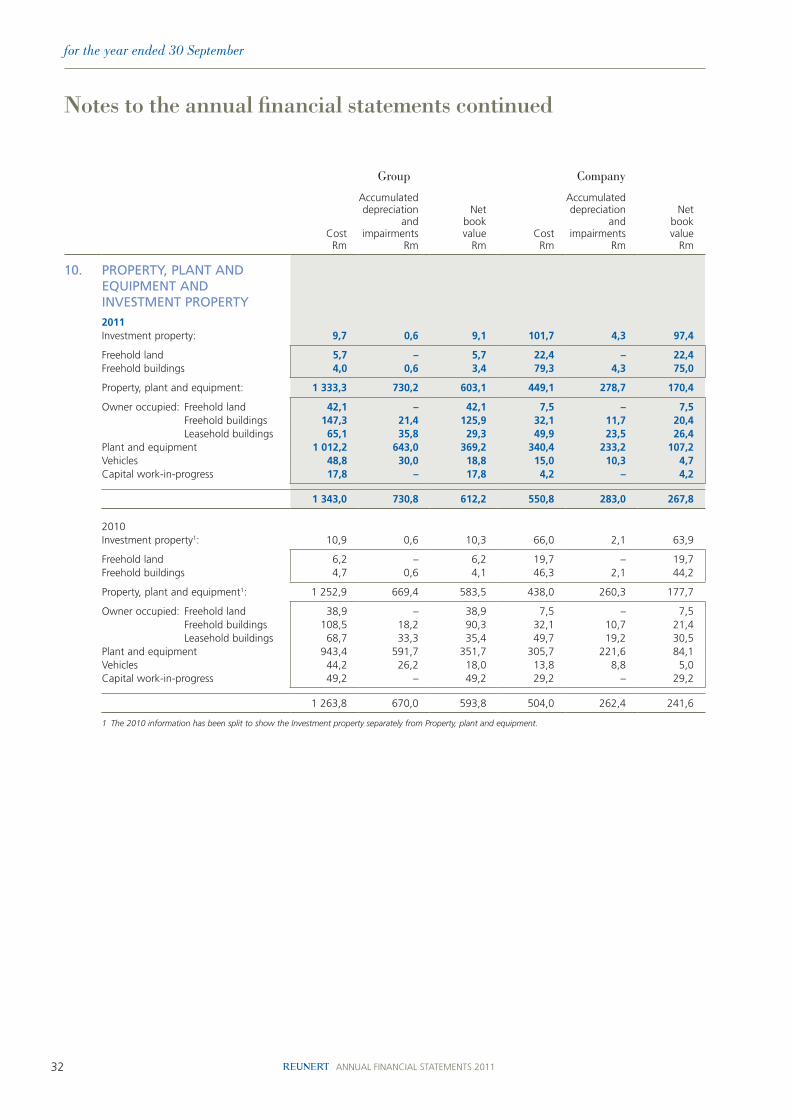
32 ANNUAL FINANCIAL STATEMENTS 2011
for the year ended 30 September
Group Company
CostRm
Accumulateddepreciation
andimpairments
Rm
Netbookvalue
RmCostRm
Accumulateddepreciation
andimpairments
Rm
Netbookvalue
Rm
10. PROPERTy, PLAnT AnD EquIPMEnT AnD InVESTMEnT PROPERTy
2011Investment property: 9,7 0,6 9,1 101,7 4,3 97,4
Freehold land 5,7 – 5,7 22,4 – 22,4 Freehold buildings 4,0 0,6 3,4 79,3 4,3 75,0
Property, plant and equipment: 1 333,3 730,2 603,1 449,1 278,7 170,4
Owner occupied: Freehold land 42,1 – 42,1 7,5 – 7,5 Freehold buildings 147,3 21,4 125,9 32,1 11,7 20,4 Leasehold buildings 65,1 35,8 29,3 49,9 23,5 26,4 Plant and equipment 1 012,2 643,0 369,2 340,4 233,2 107,2 Vehicles 48,8 30,0 18,8 15,0 10,3 4,7 Capital work-in-progress 17,8 – 17,8 4,2 – 4,2
1 343,0 730,8 612,2 550,8 283,0 267,8
2010Investment property1: 10,9 0,6 10,3 66,0 2,1 63,9
Freehold land 6,2 – 6,2 19,7 – 19,7 Freehold buildings 4,7 0,6 4,1 46,3 2,1 44,2
Property, plant and equipment1: 1 252,9 669,4 583,5 438,0 260,3 177,7
Owner occupied: Freehold land 38,9 – 38,9 7,5 – 7,5 Freehold buildings 108,5 18,2 90,3 32,1 10,7 21,4 Leasehold buildings 68,7 33,3 35,4 49,7 19,2 30,5 Plant and equipment 943,4 591,7 351,7 305,7 221,6 84,1 Vehicles 44,2 26,2 18,0 13,8 8,8 5,0 Capital work-in-progress 49,2 – 49,2 29,2 – 29,2
1 263,8 670,0 593,8 504,0 262,4 241,6
1 The 2010 information has been split to show the Investment property separately from Property, plant and equipment.
notes to the annual financial statements continued
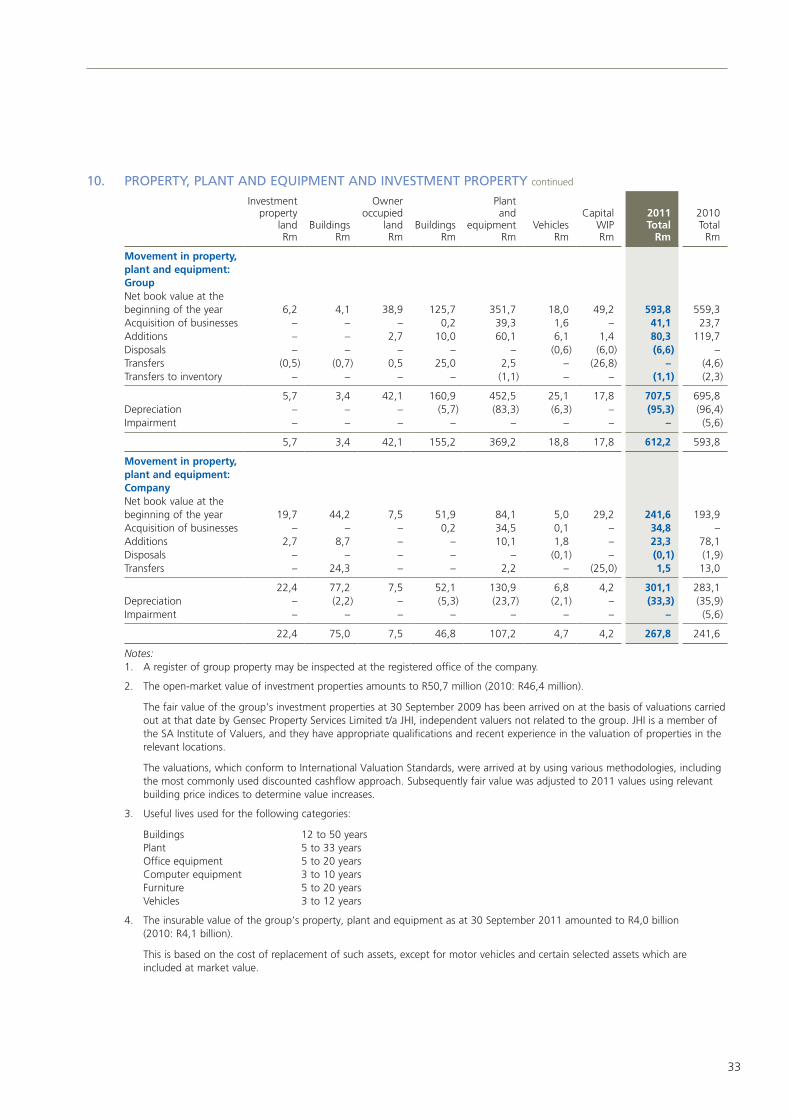
33
10. PROPERTy, PLAnT AnD EquIPMEnT AnD InVESTMEnT PROPERTy continued
Investment property
landRm
BuildingsRm
Owner occupied
landRm
BuildingsRm
Plantand
equipmentRm
VehiclesRm
Capital WIPRm
2011 Total
Rm
2010 Total
Rm
Movement in property, plant and equipment: GroupNet book value at the beginning of the year 6,2 4,1 38,9 125,7 351,7 18,0 49,2 593,8 559,3 Acquisition of businesses – – – 0,2 39,3 1,6 – 41,1 23,7 Additions – – 2,7 10,0 60,1 6,1 1,4 80,3 119,7 Disposals – – – – – (0,6) (6,0) (6,6) – Transfers (0,5) (0,7) 0,5 25,0 2,5 – (26,8) – (4,6)Transfers to inventory – – – – (1,1) – – (1,1) (2,3)
5,7 3,4 42,1 160,9 452,5 25,1 17,8 707,5 695,8 Depreciation – – – (5,7) (83,3) (6,3) – (95,3) (96,4)Impairment – – – – – – – – (5,6)
5,7 3,4 42,1 155,2 369,2 18,8 17,8 612,2 593,8
Movement in property, plant and equipment: CompanyNet book value at the beginning of the year 19,7 44,2 7,5 51,9 84,1 5,0 29,2 241,6 193,9 Acquisition of businesses – – – 0,2 34,5 0,1 – 34,8 – Additions 2,7 8,7 – – 10,1 1,8 – 23,3 78,1 Disposals – – – – – (0,1) – (0,1) (1,9)Transfers – 24,3 – – 2,2 – (25,0) 1,5 13,0
22,4 77,2 7,5 52,1 130,9 6,8 4,2 301,1 283,1 Depreciation – (2,2) – (5,3) (23,7) (2,1) – (33,3) (35,9)Impairment – – – – – – – – (5,6)
22,4 75,0 7,5 46,8 107,2 4,7 4,2 267,8 241,6
Notes:1. A register of group property may be inspected at the registered office of the company.
2. The open-market value of investment properties amounts to R50,7 million (2010: R46,4 million).
The fair value of the group’s investment properties at 30 September 2009 has been arrived on at the basis of valuations carried out at that date by Gensec Property Services Limited t/a JHI, independent valuers not related to the group. JHI is a member of the SA Institute of Valuers, and they have appropriate qualifications and recent experience in the valuation of properties in the relevant locations.
The valuations, which conform to International Valuation Standards, were arrived at by using various methodologies, including the most commonly used discounted cashflow approach. Subsequently fair value was adjusted to 2011 values using relevant building price indices to determine value increases.
3. Useful lives used for the following categories:
Buildings 12 to 50 years Plant 5 to 33 years Office equipment 5 to 20 years Computer equipment 3 to 10 years Furniture 5 to 20 years Vehicles 3 to 12 years
4. The insurable value of the group’s property, plant and equipment as at 30 September 2011 amounted to R4,0 billion (2010: R4,1 billion).
This is based on the cost of replacement of such assets, except for motor vehicles and certain selected assets which are included at market value.
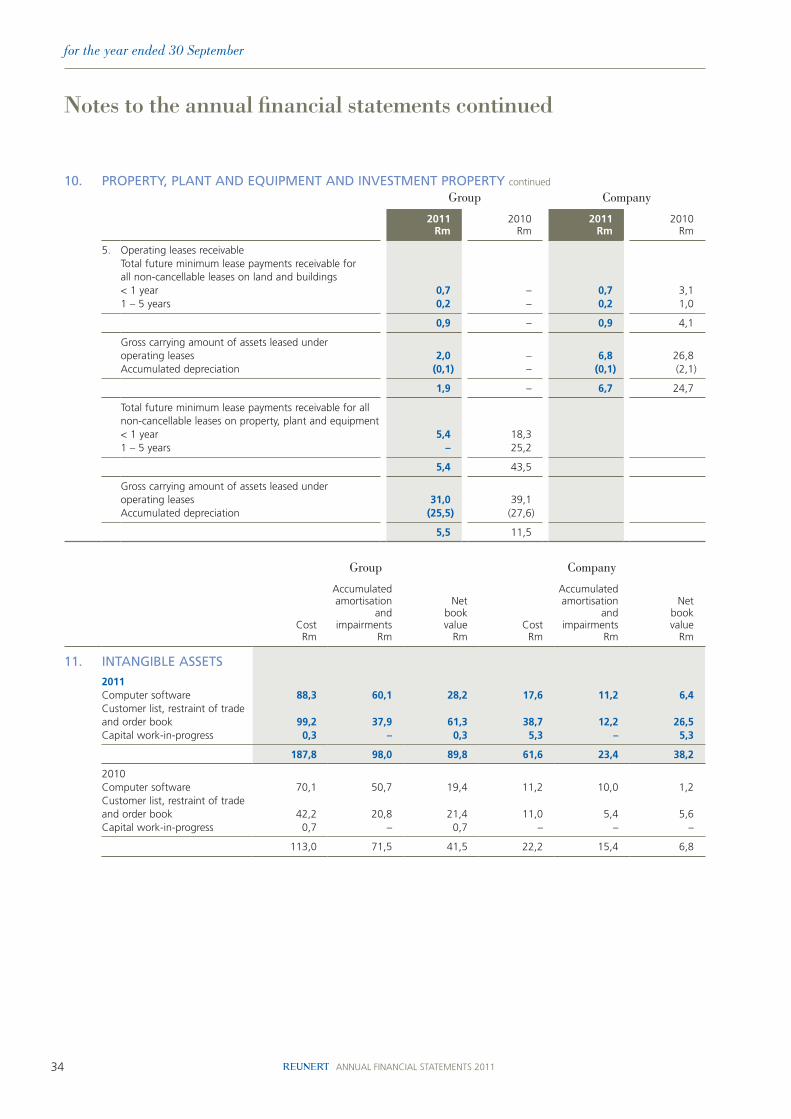
34 ANNUAL FINANCIAL STATEMENTS 2011
for the year ended 30 September
10. PROPERTy, PLAnT AnD EquIPMEnT AnD InVESTMEnT PROPERTy continued
Group Company
2011Rm
2010Rm
2011Rm
2010Rm
5. Operating leases receivableTotal future minimum lease payments receivable for all non-cancellable leases on land and buildings< 1 year 0,7 – 0,7 3,1 1 – 5 years 0,2 – 0,2 1,0
0,9 – 0,9 4,1
Gross carrying amount of assets leased under operating leases 2,0 – 6,8 26,8 Accumulated depreciation (0,1) – (0,1) (2,1)
1,9 – 6,7 24,7
Total future minimum lease payments receivable for all non-cancellable leases on property, plant and equipment< 1 year 5,4 18,3 1 – 5 years – 25,2
5,4 43,5
Gross carrying amount of assets leased under operating leases 31,0 39,1 Accumulated depreciation (25,5) (27,6)
5,5 11,5
Group Company
CostRm
Accumulatedamortisation
andimpairments
Rm
Netbookvalue
RmCostRm
Accumulatedamortisation
and impairments
Rm
Netbookvalue
Rm
11. InTAngIBLE ASSETS
2011Computer software 88,3 60,1 28,2 17,6 11,2 6,4 Customer list, restraint of trade and order book 99,2 37,9 61,3 38,7 12,2 26,5 Capital work-in-progress 0,3 – 0,3 5,3 – 5,3
187,8 98,0 89,8 61,6 23,4 38,2
2010Computer software 70,1 50,7 19,4 11,2 10,0 1,2 Customer list, restraint of trade and order book 42,2 20,8 21,4 11,0 5,4 5,6 Capital work-in-progress 0,7 – 0,7 – – –
113,0 71,5 41,5 22,2 15,4 6,8
notes to the annual financial statements continued
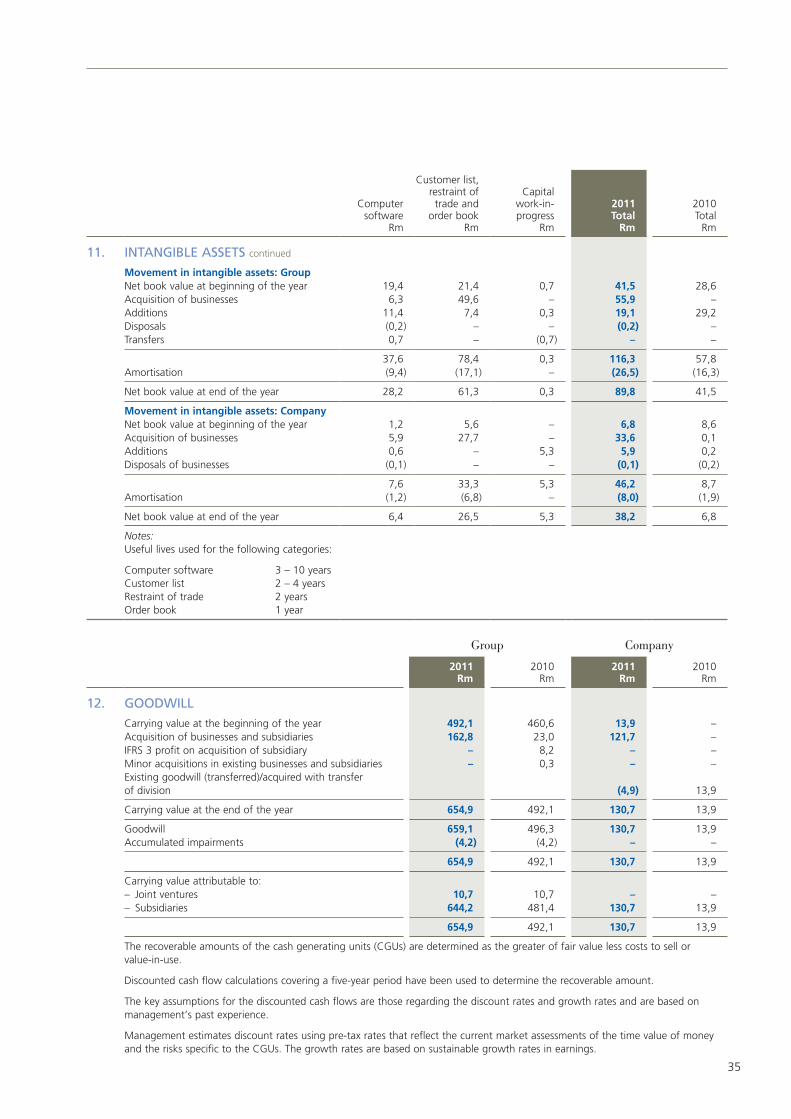
35
Computersoftware
Rm
Customer list, restraint of trade and
order bookRm
Capitalwork-in-progress
Rm
2011Total
Rm
2010Total
Rm
11. InTAngIBLE ASSETS continued
Movement in intangible assets: GroupNet book value at beginning of the year 19,4 21,4 0,7 41,5 28,6 Acquisition of businesses 6,3 49,6 – 55,9 – Additions 11,4 7,4 0,3 19,1 29,2 Disposals (0,2) – – (0,2) – Transfers 0,7 – (0,7) – –
37,6 78,4 0,3 116,3 57,8 Amortisation (9,4) (17,1) – (26,5) (16,3)
Net book value at end of the year 28,2 61,3 0,3 89,8 41,5
Movement in intangible assets: CompanyNet book value at beginning of the year 1,2 5,6 – 6,8 8,6 Acquisition of businesses 5,9 27,7 – 33,6 0,1 Additions 0,6 – 5,3 5,9 0,2 Disposals of businesses (0,1) – – (0,1) (0,2)
7,6 33,3 5,3 46,2 8,7 Amortisation (1,2) (6,8) – (8,0) (1,9)
Net book value at end of the year 6,4 26,5 5,3 38,2 6,8
Notes:Useful lives used for the following categories:
Computer software 3 – 10 yearsCustomer list 2 – 4 yearsRestraint of trade 2 yearsOrder book 1 year
Group Company
2011Rm
2010Rm
2011Rm
2010Rm
12. gOODwILL
Carrying value at the beginning of the year 492,1 460,6 13,9 – Acquisition of businesses and subsidiaries 162,8 23,0 121,7 – IFRS 3 profit on acquisition of subsidiary – 8,2 – – Minor acquisitions in existing businesses and subsidiaries – 0,3 – – Existing goodwill (transferred)/acquired with transfer of division (4,9) 13,9
Carrying value at the end of the year 654,9 492,1 130,7 13,9
Goodwill 659,1 496,3 130,7 13,9 Accumulated impairments (4,2) (4,2) – –
654,9 492,1 130,7 13,9
Carrying value attributable to:– Joint ventures 10,7 10,7 – – – Subsidiaries 644,2 481,4 130,7 13,9
654,9 492,1 130,7 13,9
The recoverable amounts of the cash generating units (CGUs) are determined as the greater of fair value less costs to sell or value-in-use.
Discounted cash flow calculations covering a five-year period have been used to determine the recoverable amount.
The key assumptions for the discounted cash flows are those regarding the discount rates and growth rates and are based on management’s past experience.
Management estimates discount rates using pre-tax rates that reflect the current market assessments of the time value of money and the risks specific to the CGUs. The growth rates are based on sustainable growth rates in earnings.
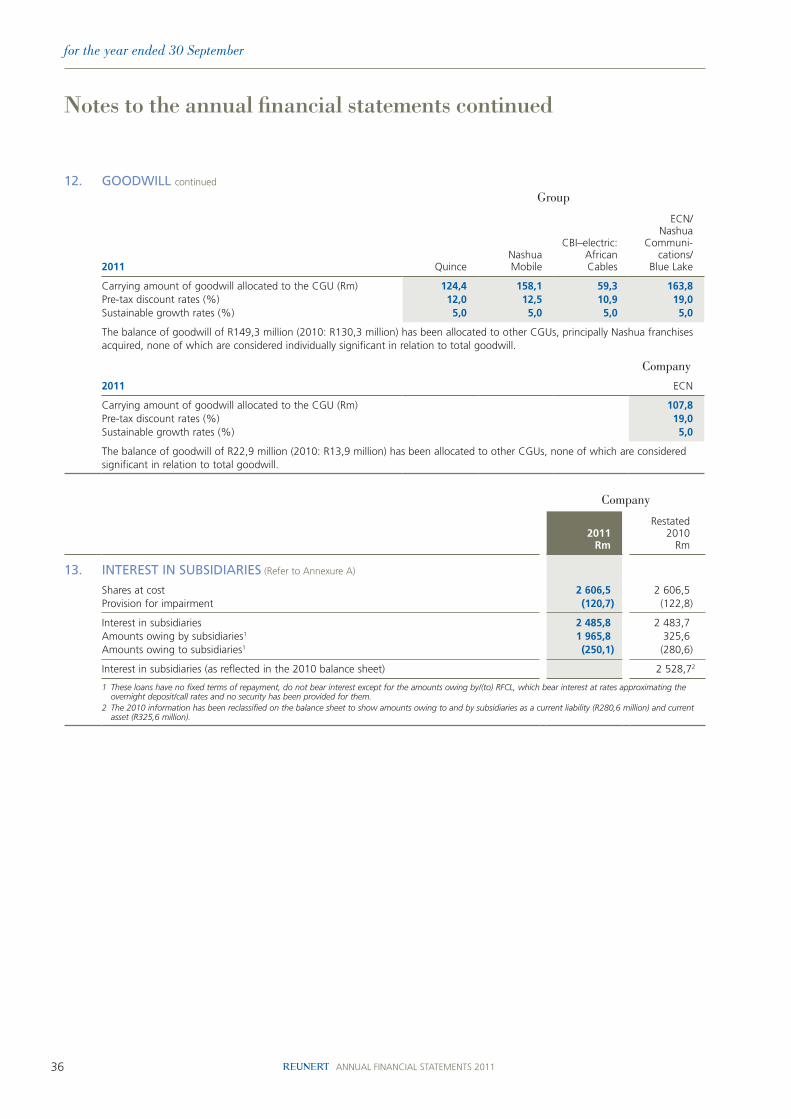
36 ANNUAL FINANCIAL STATEMENTS 2011
for the year ended 30 September
12. gOODwILL continued
Group
2011 QuinceNashua Mobile
CBI–electric:African Cables
ECN/Nashua
Communi-cations/
Blue Lake
Carrying amount of goodwill allocated to the CGU (Rm) 124,4 158,1 59,3 163,8 Pre-tax discount rates (%) 12,0 12,5 10,9 19,0 Sustainable growth rates (%) 5,0 5,0 5,0 5,0
The balance of goodwill of R149,3 million (2010: R130,3 million) has been allocated to other CGUs, principally Nashua franchises acquired, none of which are considered individually significant in relation to total goodwill.
Company
2011 ECN
Carrying amount of goodwill allocated to the CGU (Rm) 107,8 Pre-tax discount rates (%) 19,0 Sustainable growth rates (%) 5,0
The balance of goodwill of R22,9 million (2010: R13,9 million) has been allocated to other CGUs, none of which are considered significant in relation to total goodwill.
Company
2011Rm
Restated2010
Rm
13. InTEREST In SuBSIDIARIES (Refer to Annexure A)
Shares at cost 2 606,5 2 606,5 Provision for impairment (120,7) (122,8)
Interest in subsidiaries 2 485,8 2 483,7 Amounts owing by subsidiaries1 1 965,8 325,6 Amounts owing to subsidiaries1 (250,1) (280,6)
Interest in subsidiaries (as reflected in the 2010 balance sheet) 2 528,72
1 These loans have no fixed terms of repayment, do not bear interest except for the amounts owing by/(to) RFCL, which bear interest at rates approximating the overnight deposit/call rates and no security has been provided for them.
2 The 2010 information has been reclassified on the balance sheet to show amounts owing to and by subsidiaries as a current liability (R280,6 million) and current asset (R325,6 million).
notes to the annual financial statements continued
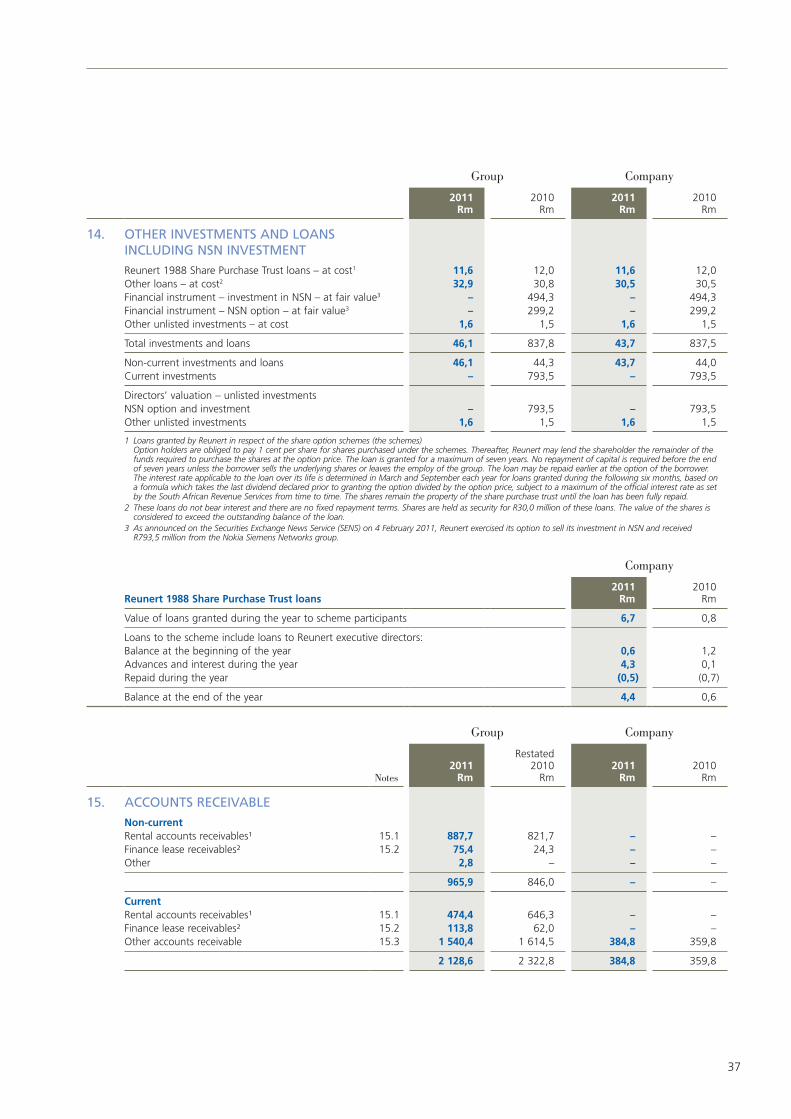
37
Group Company
2011Rm
2010Rm
2011Rm
2010Rm
14. OThER InVESTMEnTS AnD LOAnS InCLuDIng nSn InVESTMEnT
Reunert 1988 Share Purchase Trust loans – at cost1 11,6 12,0 11,6 12,0 Other loans – at cost2 32,9 30,8 30,5 30,5 Financial instrument – investment in NSN – at fair value3 – 494,3 – 494,3 Financial instrument – NSN option – at fair value3 – 299,2 – 299,2 Other unlisted investments – at cost 1,6 1,5 1,6 1,5
Total investments and loans 46,1 837,8 43,7 837,5
Non-current investments and loans 46,1 44,3 43,7 44,0 Current investments – 793,5 – 793,5
Directors’ valuation – unlisted investmentsNSN option and investment – 793,5 – 793,5 Other unlisted investments 1,6 1,5 1,6 1,5
1 Loans granted by Reunert in respect of the share option schemes (the schemes) Option holders are obliged to pay 1 cent per share for shares purchased under the schemes. Thereafter, Reunert may lend the shareholder the remainder of the funds required to purchase the shares at the option price. The loan is granted for a maximum of seven years. No repayment of capital is required before the end of seven years unless the borrower sells the underlying shares or leaves the employ of the group. The loan may be repaid earlier at the option of the borrower. The interest rate applicable to the loan over its life is determined in March and September each year for loans granted during the following six months, based on a formula which takes the last dividend declared prior to granting the option divided by the option price, subject to a maximum of the official interest rate as set by the South African Revenue Services from time to time. The shares remain the property of the share purchase trust until the loan has been fully repaid.
2 These loans do not bear interest and there are no fixed repayment terms. Shares are held as security for R30,0 million of these loans. The value of the shares is considered to exceed the outstanding balance of the loan.
3 As announced on the Securities Exchange News Service (SENS) on 4 February 2011, Reunert exercised its option to sell its investment in NSN and received R793,5 million from the Nokia Siemens Networks group.
Company
Reunert 1988 Share Purchase Trust loans2011
Rm2010
Rm
Value of loans granted during the year to scheme participants 6,7 0,8
Loans to the scheme include loans to Reunert executive directors:Balance at the beginning of the year 0,6 1,2 Advances and interest during the year 4,3 0,1 Repaid during the year (0,5) (0,7)
Balance at the end of the year 4,4 0,6
Group Company
Notes2011
Rm
Restated2010
Rm2011
Rm2010
Rm
15. ACCOunTS RECEIVABLE
Non-currentRental accounts receivables¹ 15.1 887,7 821,7 – –Finance lease receivables² 15.2 75,4 24,3 – –Other 2,8 – – –
965,9 846,0 – –
CurrentRental accounts receivables¹ 15.1 474,4 646,3 – – Finance lease receivables² 15.2 113,8 62,0 – – Other accounts receivable 15.3 1 540,4 1 614,5 384,8 359,8
2 128,6 2 322,8 384,8 359,8
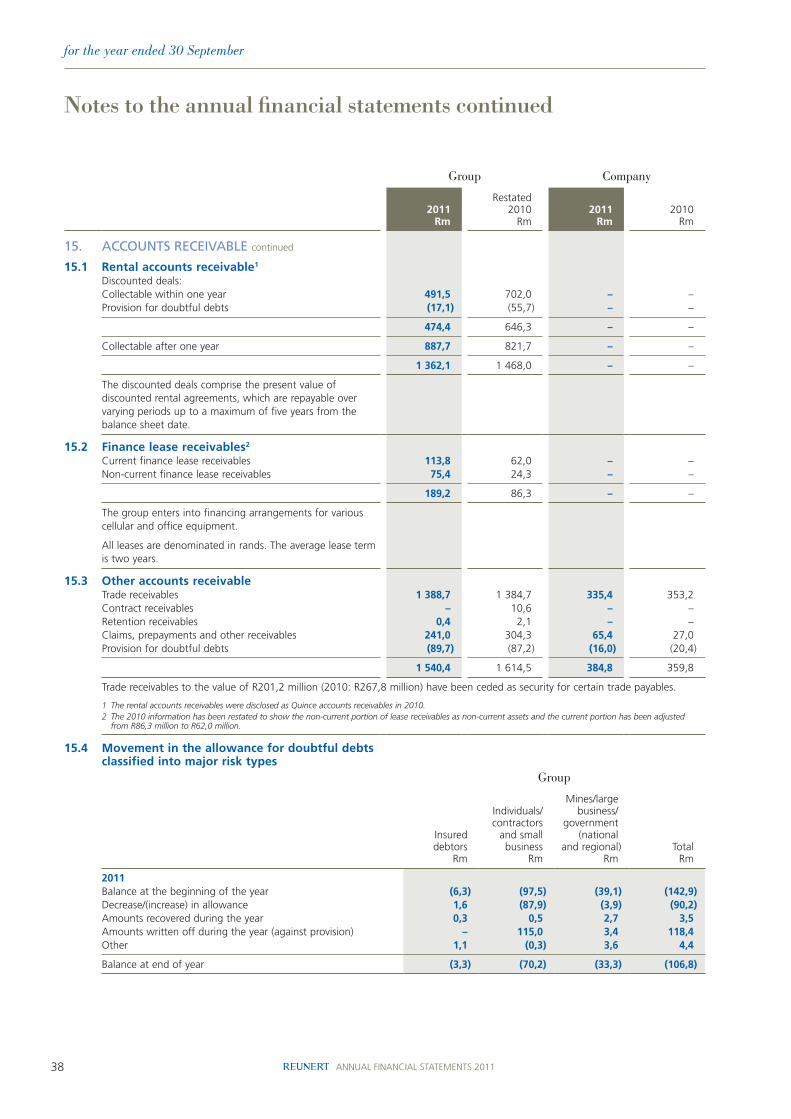
38 ANNUAL FINANCIAL STATEMENTS 2011
for the year ended 30 September
Group Company
2011Rm
Restated2010
Rm2011
Rm2010
Rm
15. ACCOunTS RECEIVABLE continued
15.1 Rental accounts receivable1
Discounted deals:Collectable within one year 491,5 702,0 – –Provision for doubtful debts (17,1) (55,7) – –
474,4 646,3 – –
Collectable after one year 887,7 821,7 – –
1 362,1 1 468,0 – –
The discounted deals comprise the present value of discounted rental agreements, which are repayable over varying periods up to a maximum of five years from the balance sheet date.
15.2 Finance lease receivables2
Current finance lease receivables 113,8 62,0 – –Non-current finance lease receivables 75,4 24,3 – –
189,2 86,3 – –
The group enters into financing arrangements for various cellular and office equipment.
All leases are denominated in rands. The average lease term is two years.
15.3 Other accounts receivableTrade receivables 1 388,7 1 384,7 335,4 353,2 Contract receivables – 10,6 – – Retention receivables 0,4 2,1 – – Claims, prepayments and other receivables 241,0 304,3 65,4 27,0 Provision for doubtful debts (89,7) (87,2) (16,0) (20,4)
1 540,4 1 614,5 384,8 359,8
Trade receivables to the value of R201,2 million (2010: R267,8 million) have been ceded as security for certain trade payables.
1 The rental accounts receivables were disclosed as Quince accounts receivables in 2010.2 The 2010 information has been restated to show the non-current portion of lease receivables as non-current assets and the current portion has been adjusted
from R86,3 million to R62,0 million.
15.4 Movement in the allowance for doubtful debts classified into major risk types
Group
Insured debtors
Rm
Individuals/contractors and small
business Rm
Mines/largebusiness/
government(national
and regional)Rm
Total Rm
2011Balance at the beginning of the year (6,3) (97,5) (39,1) (142,9)Decrease/(increase) in allowance 1,6 (87,9) (3,9) (90,2)Amounts recovered during the year 0,3 0,5 2,7 3,5 Amounts written off during the year (against provision) – 115,0 3,4 118,4 Other 1,1 (0,3) 3,6 4,4
Balance at end of year (3,3) (70,2) (33,3) (106,8)
notes to the annual financial statements continued
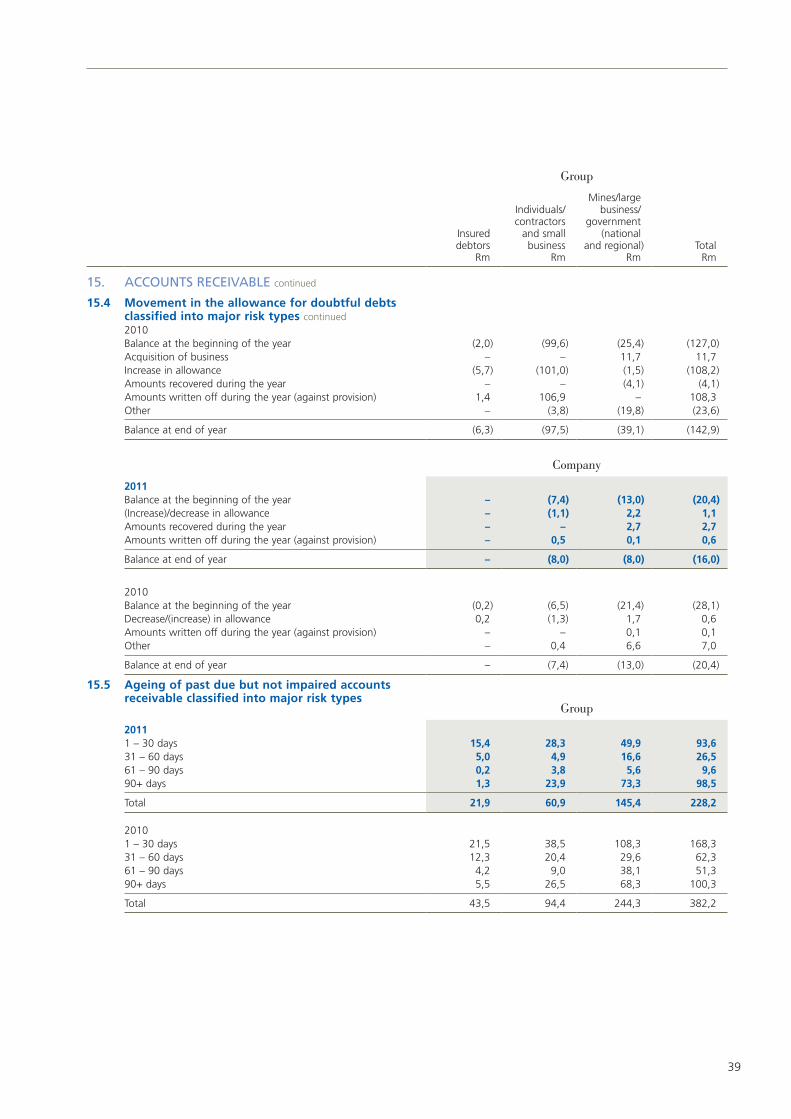
39
Group
Insured debtors
Rm
Individuals/contractors and small
business Rm
Mines/largebusiness/
government(national
and regional)Rm
Total Rm
15. ACCOunTS RECEIVABLE continued
15.4 Movement in the allowance for doubtful debts classified into major risk types continued2010Balance at the beginning of the year (2,0) (99,6) (25,4) (127,0)Acquisition of business – – 11,7 11,7 Increase in allowance (5,7) (101,0) (1,5) (108,2)Amounts recovered during the year – – (4,1) (4,1)Amounts written off during the year (against provision) 1,4 106,9 – 108,3 Other – (3,8) (19,8) (23,6)
Balance at end of year (6,3) (97,5) (39,1) (142,9)
Company
2011Balance at the beginning of the year – (7,4) (13,0) (20,4)(Increase)/decrease in allowance – (1,1) 2,2 1,1 Amounts recovered during the year – – 2,7 2,7 Amounts written off during the year (against provision) – 0,5 0,1 0,6
Balance at end of year – (8,0) (8,0) (16,0)
2010Balance at the beginning of the year (0,2) (6,5) (21,4) (28,1)Decrease/(increase) in allowance 0,2 (1,3) 1,7 0,6 Amounts written off during the year (against provision) – – 0,1 0,1 Other – 0,4 6,6 7,0
Balance at end of year – (7,4) (13,0) (20,4)
15.5 Ageing of past due but not impaired accounts receivable classified into major risk types
Group
20111 – 30 days 15,4 28,3 49,9 93,6 31 – 60 days 5,0 4,9 16,6 26,5 61 – 90 days 0,2 3,8 5,6 9,6 90+ days 1,3 23,9 73,3 98,5
Total 21,9 60,9 145,4 228,2
20101 – 30 days 21,5 38,5 108,3 168,3 31 – 60 days 12,3 20,4 29,6 62,3 61 – 90 days 4,2 9,0 38,1 51,3 90+ days 5,5 26,5 68,3 100,3
Total 43,5 94,4 244,3 382,2

40 ANNUAL FINANCIAL STATEMENTS 2011
for the year ended 30 September
Company
Insured debtors
Rm
Individuals/contractors and small
business Rm
Mines/largebusiness/
government(national
and regional) Rm
Total Rm
15. ACCOunTS RECEIVABLE continued
15.5 Ageing of past due but not impaired accounts receivable classified into major risk types continued20111 – 30 days 6,2 0,1 12,8 19,1 31 – 60 days 0,8 – 15,4 16,2 61 – 90 days 0,1 – 0,3 0,4 90+ days 0,3 – 0,2 0,5
Total 7,4 0,1 28,7 36,2
20101 – 30 days 5,0 12,8 12,5 30,3 31 – 60 days 5,8 9,8 16,7 32,3 61 – 90 days 3,1 1,6 13,9 18,6 90+ days 4,0 13,0 27,8 44,8
Total 17,9 37,2 70,9 126,0
15.6 Ageing of past due and impaired accounts receivable classified into major risk types
Group
20111 – 30 days 2,0 4,7 6,3 13,0 31 – 60 days – 4,4 0,3 4,7 61 – 90 days 0,1 4,7 1,6 6,4 90+ days 1,6 47,5 33,6 82,7
Total 3,7 61,3 41,8 106,8
20101 – 30 days – 3,5 – 3,5 31 – 60 days – 0,9 – 0,9 61 – 90 days 0,8 1,5 1,0 3,3 90+ days 4,2 66,2 55,6 126,0
Total 5,0 72,1 56,6 133,7
Company
20111 – 30 days – – – – 31 – 60 days – 0,3 0,3 0,6 61 – 90 days – 0,3 0,8 1,1 90+ days – 7,5 6,8 14,3
Total – 8,1 7,9 16,0
20101 – 30 days – 0,4 – 0,4 31 – 60 days – – – – 61 – 90 days – 0,3 – 0,3 90+ days – 9,6 2,7 12,3
Total – 10,3 2,7 13,0
notes to the annual financial statements continued
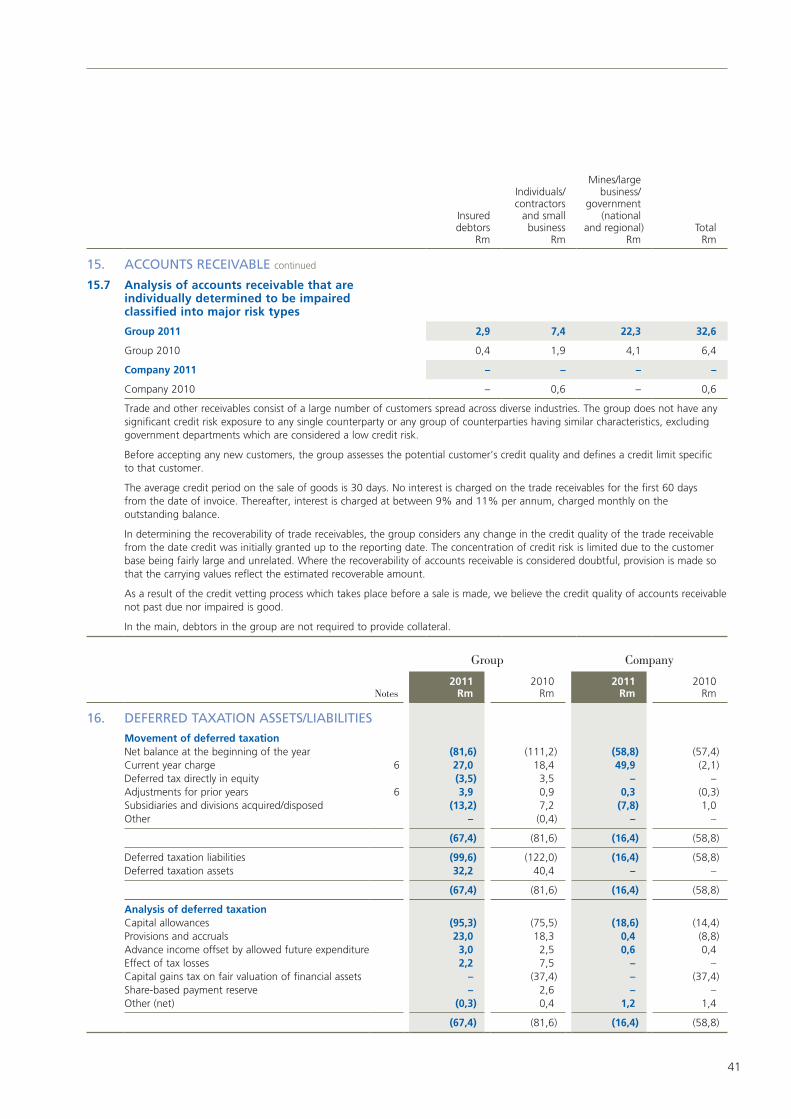
41
Insured debtors
Rm
Individuals/contractors and small
business Rm
Mines/largebusiness/
government(national
and regional) Rm
Total Rm
15. ACCOunTS RECEIVABLE continued
15.7 Analysis of accounts receivable that are individually determined to be impaired classified into major risk types
Group 2011 2,9 7,4 22,3 32,6
Group 2010 0,4 1,9 4,1 6,4
Company 2011 – – – –
Company 2010 – 0,6 – 0,6
Trade and other receivables consist of a large number of customers spread across diverse industries. The group does not have any significant credit risk exposure to any single counterparty or any group of counterparties having similar characteristics, excluding government departments which are considered a low credit risk.
Before accepting any new customers, the group assesses the potential customer’s credit quality and defines a credit limit specific to that customer.
The average credit period on the sale of goods is 30 days. No interest is charged on the trade receivables for the first 60 days from the date of invoice. Thereafter, interest is charged at between 9% and 11% per annum, charged monthly on the outstanding balance.
In determining the recoverability of trade receivables, the group considers any change in the credit quality of the trade receivable from the date credit was initially granted up to the reporting date. The concentration of credit risk is limited due to the customer base being fairly large and unrelated. Where the recoverability of accounts receivable is considered doubtful, provision is made so that the carrying values reflect the estimated recoverable amount.
As a result of the credit vetting process which takes place before a sale is made, we believe the credit quality of accounts receivable not past due nor impaired is good.
In the main, debtors in the group are not required to provide collateral.
Group Company
Notes2011
Rm2010
Rm2011
Rm2010
Rm
16. DEFERRED TAxATIOn ASSETS/LIABILITIES
Movement of deferred taxationNet balance at the beginning of the year (81,6) (111,2) (58,8) (57,4)Current year charge 6 27,0 18,4 49,9 (2,1)Deferred tax directly in equity (3,5) 3,5 – – Adjustments for prior years 6 3,9 0,9 0,3 (0,3)Subsidiaries and divisions acquired/disposed (13,2) 7,2 (7,8) 1,0 Other – (0,4) – –
(67,4) (81,6) (16,4) (58,8)
Deferred taxation liabilities (99,6) (122,0) (16,4) (58,8)Deferred taxation assets 32,2 40,4 – –
(67,4) (81,6) (16,4) (58,8)
Analysis of deferred taxationCapital allowances (95,3) (75,5) (18,6) (14,4)Provisions and accruals 23,0 18,3 0,4 (8,8)Advance income offset by allowed future expenditure 3,0 2,5 0,6 0,4 Effect of tax losses 2,2 7,5 – – Capital gains tax on fair valuation of financial assets – (37,4) – (37,4)Share-based payment reserve – 2,6 – – Other (net) (0,3) 0,4 1,2 1,4
(67,4) (81,6) (16,4) (58,8)
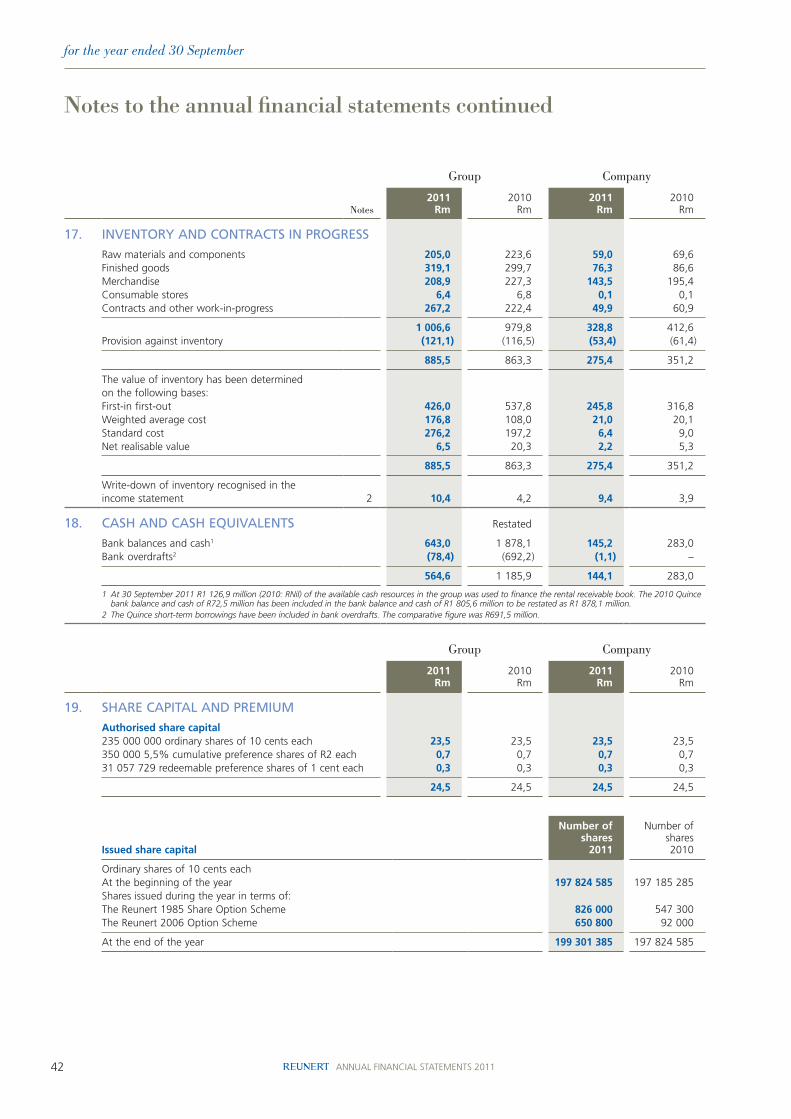
42 ANNUAL FINANCIAL STATEMENTS 2011
for the year ended 30 September
Group Company
Notes2011
Rm2010
Rm2011
Rm2010
Rm
17. InVEnTORy AnD COnTRACTS In PROgRESS
Raw materials and components 205,0 223,6 59,0 69,6 Finished goods 319,1 299,7 76,3 86,6 Merchandise 208,9 227,3 143,5 195,4 Consumable stores 6,4 6,8 0,1 0,1 Contracts and other work-in-progress 267,2 222,4 49,9 60,9
1 006,6 979,8 328,8 412,6 Provision against inventory (121,1) (116,5) (53,4) (61,4)
885,5 863,3 275,4 351,2
The value of inventory has been determined on the following bases:First-in first-out 426,0 537,8 245,8 316,8 Weighted average cost 176,8 108,0 21,0 20,1 Standard cost 276,2 197,2 6,4 9,0 Net realisable value 6,5 20,3 2,2 5,3
885,5 863,3 275,4 351,2
Write-down of inventory recognised in the income statement 2 10,4 4,2 9,4 3,9
18. CASh AnD CASh EquIVALEnTS Restated
Bank balances and cash1 643,0 1 878,1 145,2 283,0 Bank overdrafts2 (78,4) (692,2) (1,1) –
564,6 1 185,9 144,1 283,0
1 At 30 September 2011 R1 126,9 million (2010: RNil) of the available cash resources in the group was used to finance the rental receivable book. The 2010 Quince bank balance and cash of R72,5 million has been included in the bank balance and cash of R1 805,6 million to be restated as R1 878,1 million.
2 The Quince short-term borrowings have been included in bank overdrafts. The comparative figure was R691,5 million.
Group Company
2011Rm
2010Rm
2011Rm
2010Rm
19. ShARE CAPITAL AnD PREMIuM
Authorised share capital235 000 000 ordinary shares of 10 cents each 23,5 23,5 23,5 23,5 350 000 5,5% cumulative preference shares of R2 each 0,7 0,7 0,7 0,7 31 057 729 redeemable preference shares of 1 cent each 0,3 0,3 0,3 0,3
24,5 24,5 24,5 24,5
Issued share capital
Number of shares
2011
Number of shares2010
Ordinary shares of 10 cents eachAt the beginning of the year 197 824 585 197 185 285 Shares issued during the year in terms of: The Reunert 1985 Share Option Scheme 826 000 547 300 The Reunert 2006 Option Scheme 650 800 92 000
At the end of the year 199 301 385 197 824 585
notes to the annual financial statements continued

43
Group Company
Notes2011
Rm2010
Rm2011
Rm2010
Rm
19. ShARE CAPITAL AnD PREMIuM continued
Ordinary shares of 10 cents each 19,8 19,8 19,8 19,8 350 000 5,5% cumulative preference shares of R2 each 0,7 0,7 0,7 0,7
20,5 20,5 20,5 20,5
Share premiumAt the beginning of the year 120,4 95,5 120,4 95,5 Arising on the issue of ordinary shares 59,4 24,9 59,4 24,9
At the end of the year 179,8 120,4 179,8 120,4
Total issued share capital and premium 200,3 140,9 200,3 140,9
Share-based payment reservesAs a result of IFRS 2 – Share Based PaymentAt the beginning of the year 732,4 679,6 639,4 637,4 Share option reserve arising on the expensing of executive share options 2 21,2 16,5 0,3 2,0 Deferred tax on share-based payment expense (2,6) 2,3 – –Reserve arising on a BEE transaction – 34,0 – –
At the end of the year 751,0 732,4 639,7 639,4
BEE sharesReunert shares bought back and held by Bargenel 18 500 000 (2010: 18 500 000) (276,1) (276,1)Treasury sharesReunert shares bought back and held by a subsidiary 19 176 489 (2010: 2 123 372) (1 253,6) (125,7)
Company
Number of shares
2011
Number of shares2010
Unissued ordinary sharesTotal shares reserved to meet the requirements of the Reunert 1985 Share Option Scheme and the Reunert 1988 Share Purchase Scheme 1 474 600 2 041 900Total shares reserved to meet the requirements of the Reunert 2006 Option Scheme 750 000 500 000
2 224 600 2 541 900Shares issued during the year (1 476 800) (639 300)
Number of shares available for the schemes at year end 747 800 1 902 600
The directors have general authority over these shares until the next annual general meeting.
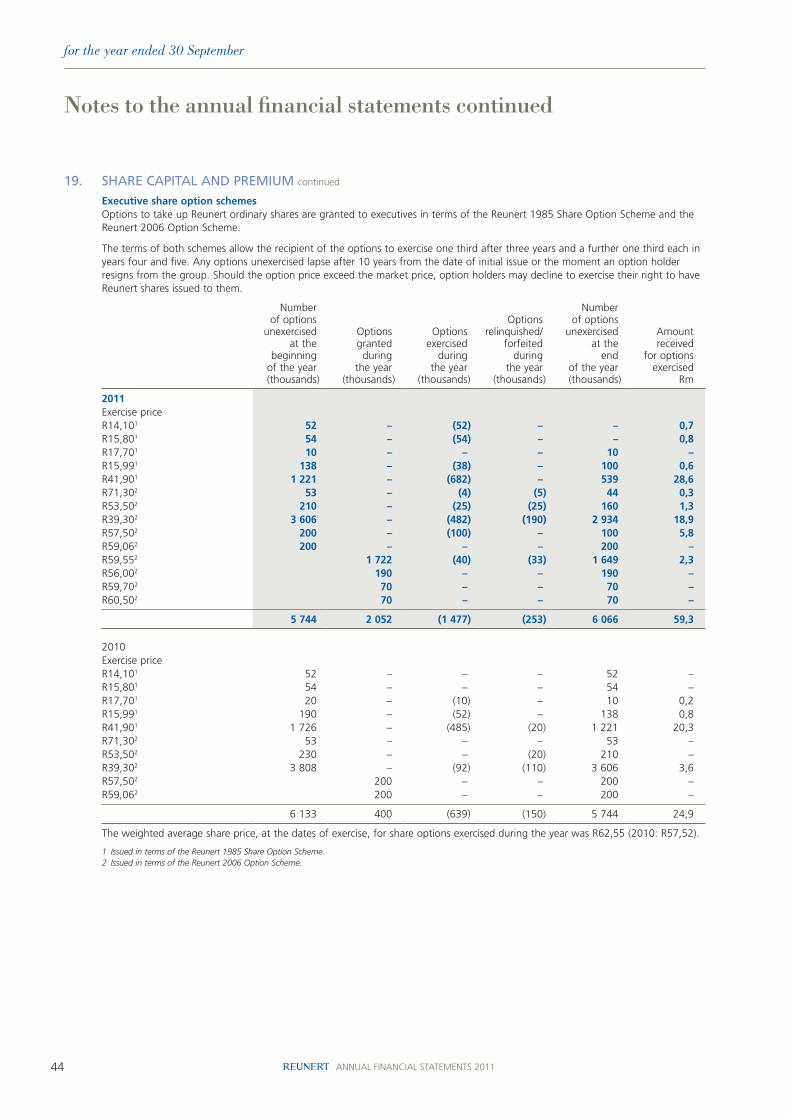
44 ANNUAL FINANCIAL STATEMENTS 2011
for the year ended 30 September
19. ShARE CAPITAL AnD PREMIuM continued
Executive share option schemesOptions to take up Reunert ordinary shares are granted to executives in terms of the Reunert 1985 Share Option Scheme and the Reunert 2006 Option Scheme.
The terms of both schemes allow the recipient of the options to exercise one third after three years and a further one third each in years four and five. Any options unexercised lapse after 10 years from the date of initial issue or the moment an option holder resigns from the group. Should the option price exceed the market price, option holders may decline to exercise their right to have Reunert shares issued to them.
Numberof options
unexercisedat the
beginning of the year(thousands)
Optionsgrantedduring
the year(thousands)
Optionsexercised
duringthe year
(thousands)
Optionsrelinquished/
forfeitedduring
the year(thousands)
Number of options
unexercisedat the
endof the year(thousands)
Amount received
for optionsexercised
Rm
2011Exercise priceR14,101 52 – (52) – – 0,7 R15,801 54 – (54) – – 0,8 R17,701 10 – – – 10 – R15,991 138 – (38) – 100 0,6 R41,901 1 221 – (682) – 539 28,6 R71,302 53 – (4) (5) 44 0,3 R53,502 210 – (25) (25) 160 1,3 R39,302 3 606 – (482) (190) 2 934 18,9 R57,502 200 – (100) – 100 5,8 R59,062 200 – – – 200 – R59,552 1 722 (40) (33) 1 649 2,3 R56,002 190 – – 190 – R59,702 70 – – 70 – R60,502 70 – – 70 –
5 744 2 052 (1 477) (253) 6 066 59,3
2010Exercise priceR14,101 52 – – – 52 – R15,801 54 – – – 54 – R17,701 20 – (10) – 10 0,2 R15,991 190 – (52) – 138 0,8 R41,901 1 726 – (485) (20) 1 221 20,3 R71,302 53 – – – 53 – R53,502 230 – – (20) 210 – R39,302 3 808 – (92) (110) 3 606 3,6 R57,502 200 – – 200 – R59,062 200 – – 200 –
6 133 400 (639) (150) 5 744 24,9
The weighted average share price, at the dates of exercise, for share options exercised during the year was R62,55 (2010: R57,52).
1 Issued in terms of the Reunert 1985 Share Option Scheme.2 Issued in terms of the Reunert 2006 Option Scheme.
notes to the annual financial statements continued
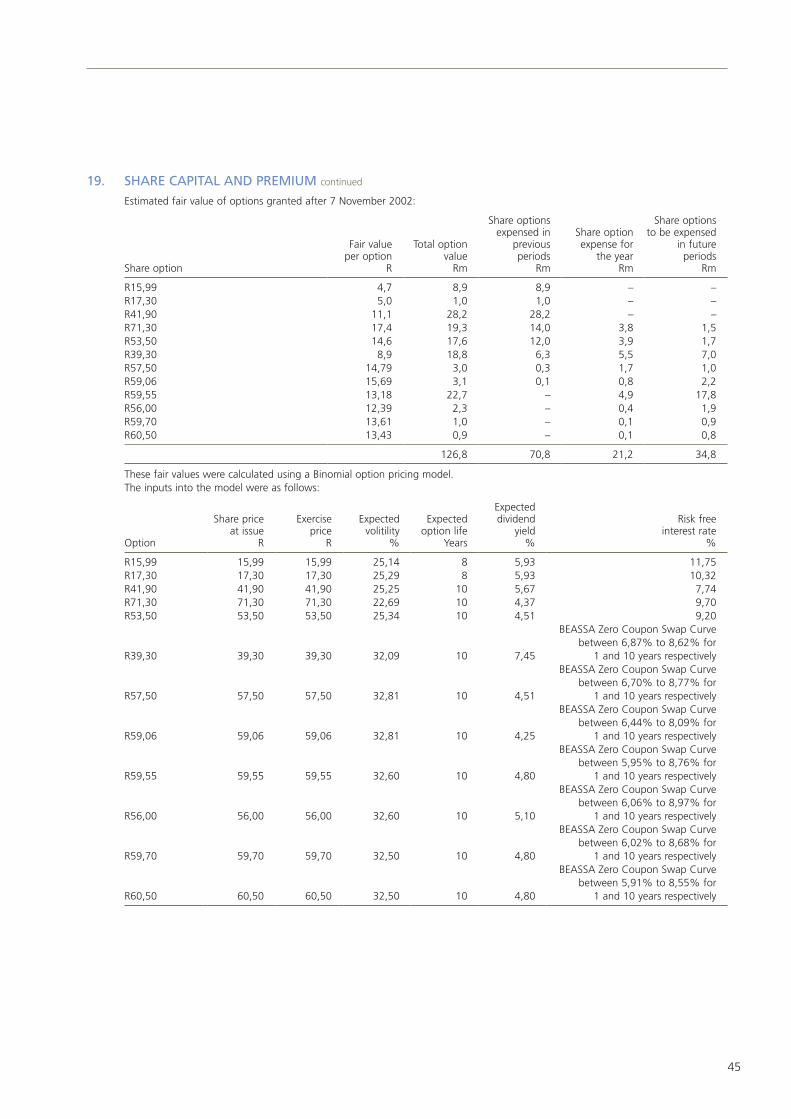
45
19. ShARE CAPITAL AnD PREMIuM continued
Estimated fair value of options granted after 7 November 2002:
Share option
Fair value per option
R
Total optionvalue
Rm
Share optionsexpensed in
previousperiods
Rm
Share optionexpense for
the yearRm
Share optionsto be expensed
in future periods
Rm
R15,99 4,7 8,9 8,9 – – R17,30 5,0 1,0 1,0 – – R41,90 11,1 28,2 28,2 – – R71,30 17,4 19,3 14,0 3,8 1,5 R53,50 14,6 17,6 12,0 3,9 1,7 R39,30 8,9 18,8 6,3 5,5 7,0 R57,50 14,79 3,0 0,3 1,7 1,0 R59,06 15,69 3,1 0,1 0,8 2,2 R59,55 13,18 22,7 – 4,9 17,8 R56,00 12,39 2,3 – 0,4 1,9 R59,70 13,61 1,0 – 0,1 0,9 R60,50 13,43 0,9 – 0,1 0,8
126,8 70,8 21,2 34,8
These fair values were calculated using a Binomial option pricing model. The inputs into the model were as follows:
Option
Share price at issue
R
Exerciseprice
R
Expectedvolitility
%
Expectedoption life
Years
Expecteddividend
yield%
Risk freeinterest rate
%
R15,99 15,99 15,99 25,14 8 5,93 11,75 R17,30 17,30 17,30 25,29 8 5,93 10,32 R41,90 41,90 41,90 25,25 10 5,67 7,74 R71,30 71,30 71,30 22,69 10 4,37 9,70 R53,50 53,50 53,50 25,34 10 4,51 9,20
R39,30 39,30 39,30 32,09 10 7,45
BEASSA Zero Coupon Swap Curve between 6,87% to 8,62% for
1 and 10 years respectively
R57,50 57,50 57,50 32,81 10 4,51
BEASSA Zero Coupon Swap Curve between 6,70% to 8,77% for
1 and 10 years respectively
R59,06 59,06 59,06 32,81 10 4,25
BEASSA Zero Coupon Swap Curve between 6,44% to 8,09% for
1 and 10 years respectively
R59,55 59,55 59,55 32,60 10 4,80
BEASSA Zero Coupon Swap Curve between 5,95% to 8,76% for
1 and 10 years respectively
R56,00 56,00 56,00 32,60 10 5,10
BEASSA Zero Coupon Swap Curve between 6,06% to 8,97% for
1 and 10 years respectively
R59,70 59,70 59,70 32,50 10 4,80
BEASSA Zero Coupon Swap Curve between 6,02% to 8,68% for
1 and 10 years respectively
R60,50 60,50 60,50 32,50 10 4,80
BEASSA Zero Coupon Swap Curve between 5,91% to 8,55% for
1 and 10 years respectively

46 ANNUAL FINANCIAL STATEMENTS 2011
for the year ended 30 September
19. ShARE CAPITAL AnD PREMIuM continued
R15,99, R17,30 and R41,90 optionsExpected volatility was determined by calculating the historical volatility of Reunert’s share price from 30 September 2002 to the issue date of each option. The share price movements prior to 30 September 2002 are considered to be “abnormal” in terms of being a reasonable reflection of the volatility going forward.
The model allowed for early exercises based on rational investor behaviour. A zero forfeiture rate has been used due to the strong performance of the Reunert share and a historic forfeiture rate of 0,9% per annum. This will only affect the timing of the share option expense as opposed to the total expense being recognised in the income statement.
R71,30 and R53,50 optionsExpected volatility was determined by calculating the historical volatility of Reunert’s share price from 23 August 2006 to the issue date of each option. The share price movement from this date was considered to reflect a more normal pattern than the movements prior to that date.
The model allowed for early exercises based on rational investor behaviour. A 6% forfeiture rate has been used due to the performance of the Reunert share of late and a historic forfeiture rate of a similar amount.
R39,30 optionsExpected volatility assumed is a five-year equally weighted volatility of the Reunert share price on the JSE and was estimated using data sourced from iNet.
The model allowed for early exercises based on rational investor behaviour. A 6% forfeiture rate has been used due to the performance of the Reunert share of late and a historic forfeiture rate of a similar amount.
The risk-free interest rate used the BEASSA zero coupon swap curve which ranges from 6,87% (NACC) for one year to 8,62% for 10 years.
3 872 000 options were issued at a strike price of R39,30 per share. 1 757 600 of these options were issued to employees who were also offered the R71,30 and R53,50 options issued in the previous financial year. The new options were granted to those who also received the options previously after the mutual consent between the company and option holder to render the R71,30’s and R53,50’s non-exercisable. This constitutes a modification to the original options in terms of IFRS 2. Under these circumstances, the fair value of the original options will continue to be expensed over the vesting period in terms of the original grant. The granting of the 2 115 000 options to employees who did not receive the R71,30 or R53,50 options amounts to a new issue and the value of this issue is expensed over the vesting period of this new issue.
R57,50 and R59,06 optionsExpected volatility assumed is a five-year equally weighted volatility of the Reunert share price on the JSE and was estimated using data sourced from iNet.
The model allowed for early exercises based on rational investor behaviour. An 8% forfeiture rate has been used due to the performance of the Reunert share of late and a historic forfeiture rate of a similar amount.
The risk-free interest rate used the BEASSA zero coupon swap curve which ranges from 6,44% (NACC) for one year to 8,77% for 10 years as detailed above
R59,55; R56,00; R59,70 and R60,50 optionsExpected volatility assumed is a five-year equally weighted volatility of the Reunert share price on the JSE and was estimated using data sourced from iNet.
The model allowed for early exercises based on rational investor behaviour. A 10% forfeiture rate has been used due to the performance of the Reunert share of late and a historic forfeiture rate of a similar amount.
The risk-free interest rate used the BEASSA zero coupon swap curve which ranges from 5,91% (NACC) for one year to 8,97% for 10 years as detailed above.
notes to the annual financial statements continued
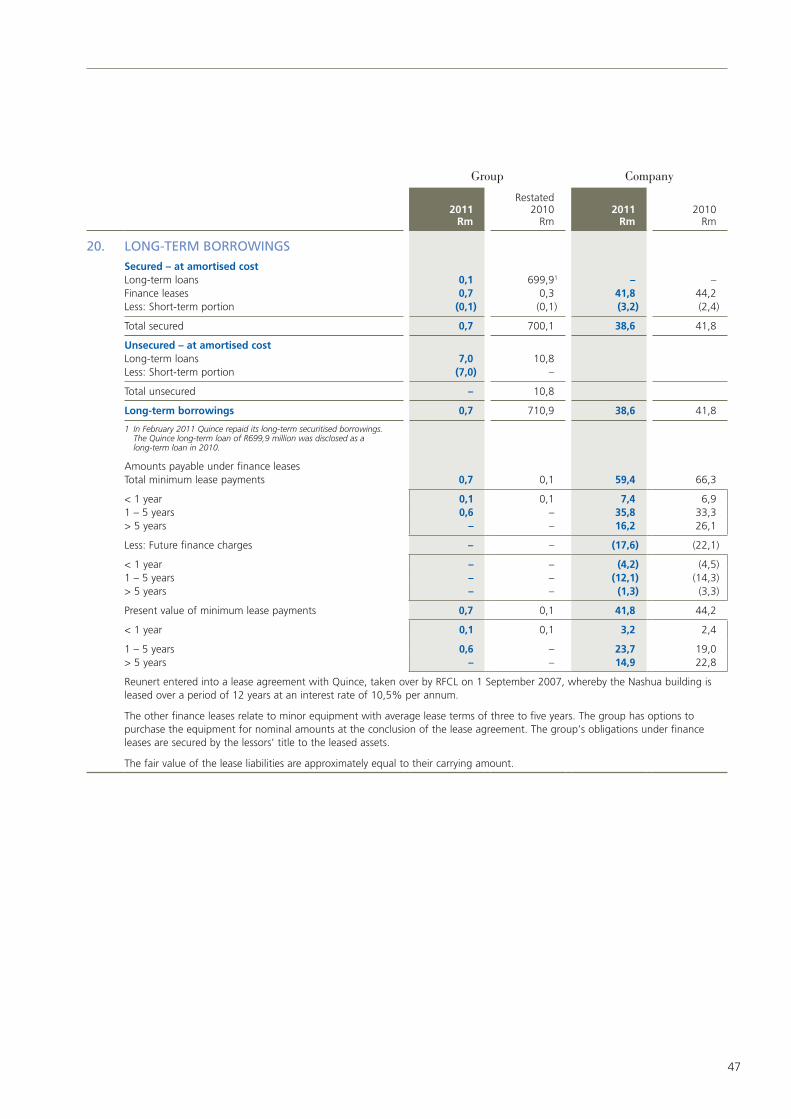
47
Group Company
2011Rm
Restated2010
Rm2011
Rm2010
Rm
20. LOng-TERM BORROwIngS
Secured – at amortised costLong-term loans 0,1 699,91 – – Finance leases 0,7 0,3 41,8 44,2 Less: Short-term portion (0,1) (0,1) (3,2) (2,4)
Total secured 0,7 700,1 38,6 41,8
Unsecured – at amortised cost Long-term loans 7,0 10,8 Less: Short-term portion (7,0) –
Total unsecured – 10,8
Long-term borrowings 0,7 710,9 38,6 41,8
1 In February 2011 Quince repaid its long-term securitised borrowings. The Quince long-term loan of R699,9 million was disclosed as a long-term loan in 2010.
Amounts payable under finance leasesTotal minimum lease payments 0,7 0,1 59,4 66,3
< 1 year 0,1 0,1 7,4 6,9 1 – 5 years 0,6 – 35,8 33,3 > 5 years – – 16,2 26,1
Less: Future finance charges – – (17,6) (22,1)
< 1 year – – (4,2) (4,5)1 – 5 years – – (12,1) (14,3)> 5 years – – (1,3) (3,3)
Present value of minimum lease payments 0,7 0,1 41,8 44,2
< 1 year 0,1 0,1 3,2 2,4
1 – 5 years 0,6 – 23,7 19,0 > 5 years – – 14,9 22,8
Reunert entered into a lease agreement with Quince, taken over by RFCL on 1 September 2007, whereby the Nashua building is leased over a period of 12 years at an interest rate of 10,5% per annum.
The other finance leases relate to minor equipment with average lease terms of three to five years. The group has options to purchase the equipment for nominal amounts at the conclusion of the lease agreement. The group’s obligations under finance leases are secured by the lessors’ title to the leased assets.
The fair value of the lease liabilities are approximately equal to their carrying amount.
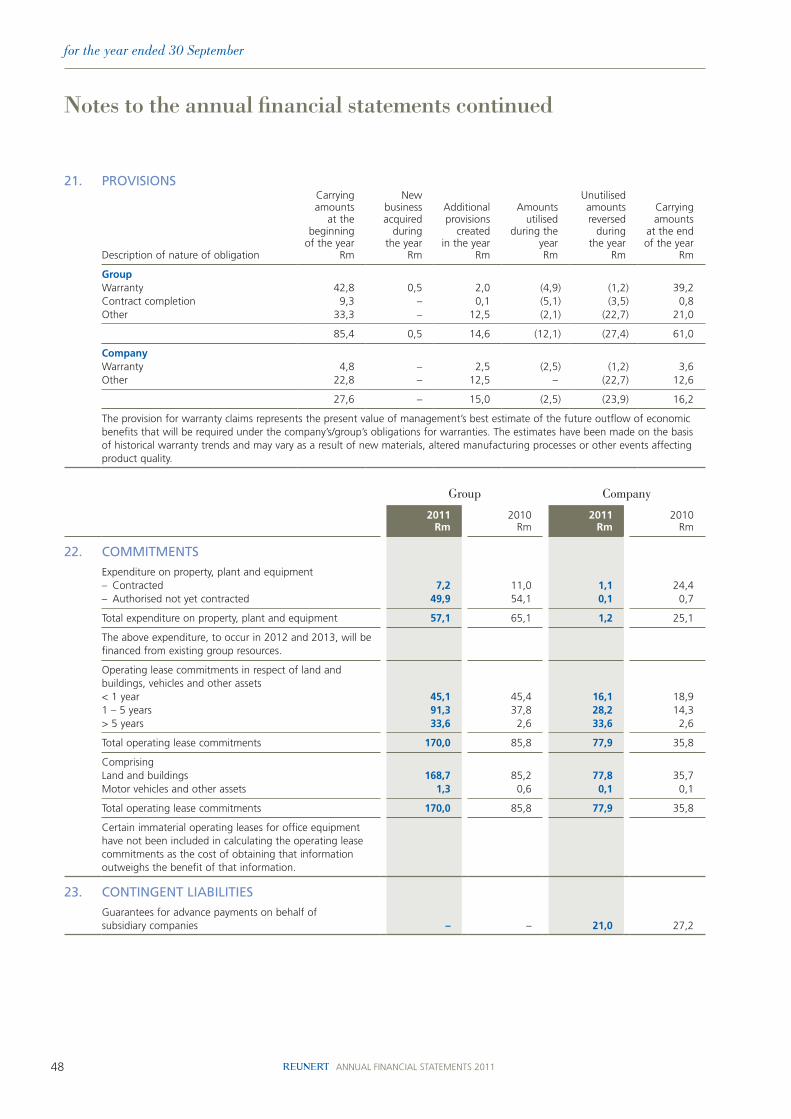
48 ANNUAL FINANCIAL STATEMENTS 2011
for the year ended 30 September
21. PROVISIOnS
Description of nature of obligation
Carrying amounts
at thebeginning
of the yearRm
New business acquired
during the year
Rm
Additionalprovisions
createdin the year
Rm
Amounts utilised
during the year
Rm
Unutilisedamountsreversed
duringthe year
Rm
Carryingamounts
at the endof the year
Rm
GroupWarranty 42,8 0,5 2,0 (4,9) (1,2) 39,2 Contract completion 9,3 – 0,1 (5,1) (3,5) 0,8 Other 33,3 – 12,5 (2,1) (22,7) 21,0
85,4 0,5 14,6 (12,1) (27,4) 61,0
CompanyWarranty 4,8 – 2,5 (2,5) (1,2) 3,6 Other 22,8 – 12,5 – (22,7) 12,6
27,6 – 15,0 (2,5) (23,9) 16,2
The provision for warranty claims represents the present value of management’s best estimate of the future outflow of economic benefits that will be required under the company’s/group’s obligations for warranties. The estimates have been made on the basis of historical warranty trends and may vary as a result of new materials, altered manufacturing processes or other events affecting product quality.
Group Company
2011Rm
2010Rm
2011Rm
2010Rm
22. COMMITMEnTS
Expenditure on property, plant and equipment– Contracted 7,2 11,0 1,1 24,4 – Authorised not yet contracted 49,9 54,1 0,1 0,7
Total expenditure on property, plant and equipment 57,1 65,1 1,2 25,1
The above expenditure, to occur in 2012 and 2013, will be financed from existing group resources.
Operating lease commitments in respect of land and buildings, vehicles and other assets< 1 year 45,1 45,4 16,1 18,9 1 – 5 years 91,3 37,8 28,2 14,3 > 5 years 33,6 2,6 33,6 2,6
Total operating lease commitments 170,0 85,8 77,9 35,8
ComprisingLand and buildings 168,7 85,2 77,8 35,7 Motor vehicles and other assets 1,3 0,6 0,1 0,1
Total operating lease commitments 170,0 85,8 77,9 35,8
Certain immaterial operating leases for office equipment have not been included in calculating the operating lease commitments as the cost of obtaining that information outweighs the benefit of that information.
23. COnTIngEnT LIABILITIES
Guarantees for advance payments on behalf of subsidiary companies – – 21,0 27,2
notes to the annual financial statements continued
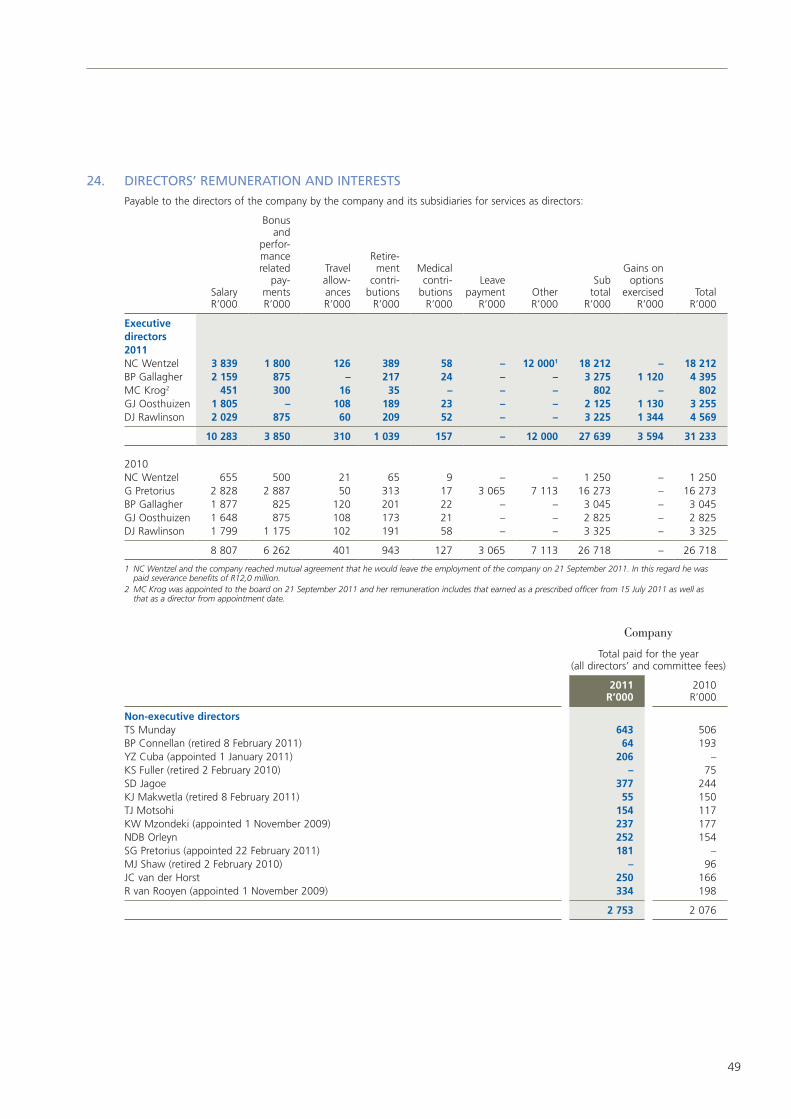
49
24. DIRECTORS’ REMunERATIOn AnD InTERESTS
Payable to the directors of the company by the company and its subsidiaries for services as directors:
SalaryR’000
Bonus and
perfor-mancerelated
pay-mentsR’000
Travelallow-ancesR’000
Retire-ment
contri-butions
R’000
Medical contri-
butionsR’000
Leavepayment
R’000OtherR’000
Subtotal
R’000
Gains on options
exercisedR’000
TotalR’000
Executive directors2011NC Wentzel 3 839 1 800 126 389 58 – 12 0001 18 212 – 18 212 BP Gallagher 2 159 875 – 217 24 – – 3 275 1 120 4 395 MC Krog2 451 300 16 35 – – – 802 – 802 GJ Oosthuizen 1 805 – 108 189 23 – – 2 125 1 130 3 255 DJ Rawlinson 2 029 875 60 209 52 – – 3 225 1 344 4 569
10 283 3 850 310 1 039 157 – 12 000 27 639 3 594 31 233
2010NC Wentzel 655 500 21 65 9 – – 1 250 – 1 250 G Pretorius 2 828 2 887 50 313 17 3 065 7 113 16 273 – 16 273 BP Gallagher 1 877 825 120 201 22 – – 3 045 – 3 045 GJ Oosthuizen 1 648 875 108 173 21 – – 2 825 – 2 825 DJ Rawlinson 1 799 1 175 102 191 58 – – 3 325 – 3 325
8 807 6 262 401 943 127 3 065 7 113 26 718 – 26 718
1 NC Wentzel and the company reached mutual agreement that he would leave the employment of the company on 21 September 2011. In this regard he was paid severance benefits of R12,0 million.
2 MC Krog was appointed to the board on 21 September 2011 and her remuneration includes that earned as a prescribed officer from 15 July 2011 as well as that as a director from appointment date.
Company
Total paid for the year(all directors’ and committee fees)
2011R’000
2010R’000
Non-executive directorsTS Munday 643 506 BP Connellan (retired 8 February 2011) 64 193 YZ Cuba (appointed 1 January 2011) 206 –KS Fuller (retired 2 February 2010) – 75 SD Jagoe 377 244 KJ Makwetla (retired 8 February 2011) 55 150 TJ Motsohi 154 117 KW Mzondeki (appointed 1 November 2009) 237 177 NDB Orleyn 252 154 SG Pretorius (appointed 22 February 2011) 181 –MJ Shaw (retired 2 February 2010) – 96 JC van der Horst 250 166 R van Rooyen (appointed 1 November 2009) 334 198
2 753 2 076
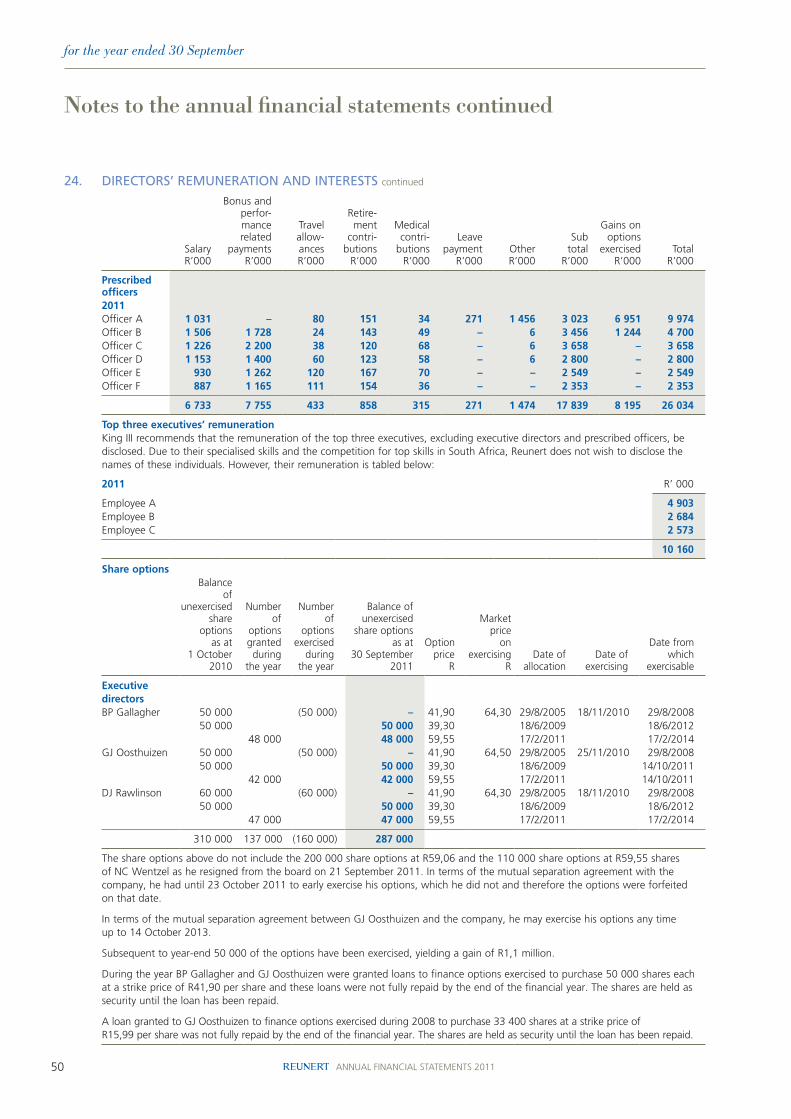
50 ANNUAL FINANCIAL STATEMENTS 2011
for the year ended 30 September
24. DIRECTORS’ REMunERATIOn AnD InTERESTS continued
SalaryR’000
Bonus and perfor-mancerelated
paymentsR’000
Travelallow-ancesR’000
Retire-ment
contri-butions
R’000
Medical contri-
butionsR’000
Leavepayment
R’000OtherR’000
Subtotal
R’000
Gains on options
exercisedR’000
TotalR’000
Prescribedofficers2011Officer A 1 031 – 80 151 34 271 1 456 3 023 6 951 9 974 Officer B 1 506 1 728 24 143 49 – 6 3 456 1 244 4 700 Officer C 1 226 2 200 38 120 68 – 6 3 658 – 3 658 Officer D 1 153 1 400 60 123 58 – 6 2 800 – 2 800 Officer E 930 1 262 120 167 70 – – 2 549 – 2 549 Officer F 887 1 165 111 154 36 – – 2 353 – 2 353
6 733 7 755 433 858 315 271 1 474 17 839 8 195 26 034
Top three executives’ remunerationKing III recommends that the remuneration of the top three executives, excluding executive directors and prescribed officers, be disclosed. Due to their specialised skills and the competition for top skills in South Africa, Reunert does not wish to disclose the names of these individuals. However, their remuneration is tabled below:
2011 R’ 000
Employee A 4 903 Employee B 2 684 Employee C 2 573
10 160
Share optionsBalance
of unexercised
shareoptions
as at1 October
2010
Numberof
optionsgranted during
the year
Numberof
optionsexercised
duringthe year
Balance of unexercised
share optionsas at
30 September2011
Optionprice
R
Marketprice
onexercising
RDate of
allocationDate of
exercising
Date fromwhich
exercisable
Executive directorsBP Gallagher 50 000 (50 000) – 41,90 64,30 29/8/2005 18/11/2010 29/8/2008
50 000 50 000 39,30 18/6/2009 18/6/201248 000 48 000 59,55 17/2/2011 17/2/2014
GJ Oosthuizen 50 000 (50 000) – 41,90 64,50 29/8/2005 25/11/2010 29/8/2008 50 000 50 000 39,30 18/6/2009 14/10/2011
42 000 42 000 59,55 17/2/2011 14/10/2011DJ Rawlinson 60 000 (60 000) – 41,90 64,30 29/8/2005 18/11/2010 29/8/2008
50 000 50 000 39,30 18/6/2009 18/6/201247 000 47 000 59,55 17/2/2011 17/2/2014
310 000 137 000 (160 000) 287 000
The share options above do not include the 200 000 share options at R59,06 and the 110 000 share options at R59,55 shares of NC Wentzel as he resigned from the board on 21 September 2011. In terms of the mutual separation agreement with the company, he had until 23 October 2011 to early exercise his options, which he did not and therefore the options were forfeited on that date.
In terms of the mutual separation agreement between GJ Oosthuizen and the company, he may exercise his options any time up to 14 October 2013.
Subsequent to year-end 50 000 of the options have been exercised, yielding a gain of R1,1 million.
During the year BP Gallagher and GJ Oosthuizen were granted loans to finance options exercised to purchase 50 000 shares each at a strike price of R41,90 per share and these loans were not fully repaid by the end of the financial year. The shares are held as security until the loan has been repaid.
A loan granted to GJ Oosthuizen to finance options exercised during 2008 to purchase 33 400 shares at a strike price of R15,99 per share was not fully repaid by the end of the financial year. The shares are held as security until the loan has been repaid.
notes to the annual financial statements continued
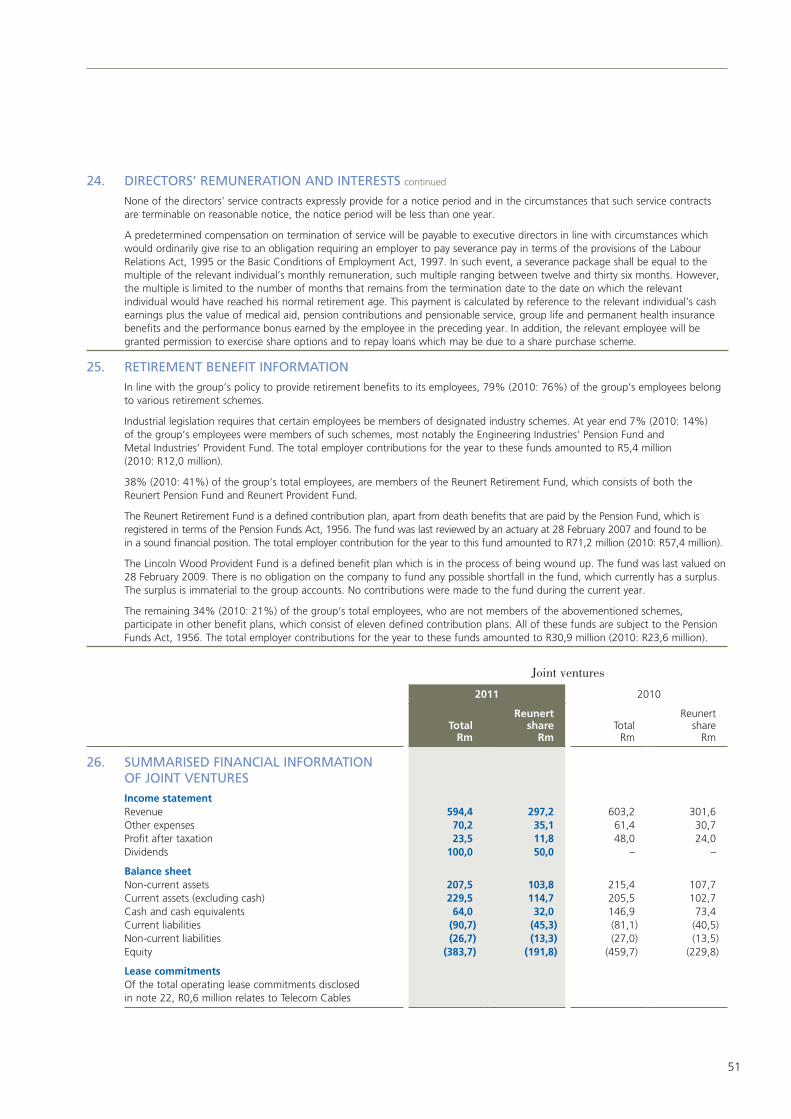
51
24. DIRECTORS’ REMunERATIOn AnD InTERESTS continued
None of the directors’ service contracts expressly provide for a notice period and in the circumstances that such service contracts are terminable on reasonable notice, the notice period will be less than one year.
A predetermined compensation on termination of service will be payable to executive directors in line with circumstances which would ordinarily give rise to an obligation requiring an employer to pay severance pay in terms of the provisions of the Labour Relations Act, 1995 or the Basic Conditions of Employment Act, 1997. In such event, a severance package shall be equal to the multiple of the relevant individual’s monthly remuneration, such multiple ranging between twelve and thirty six months. However, the multiple is limited to the number of months that remains from the termination date to the date on which the relevant individual would have reached his normal retirement age. This payment is calculated by reference to the relevant individual’s cash earnings plus the value of medical aid, pension contributions and pensionable service, group life and permanent health insurance benefits and the performance bonus earned by the employee in the preceding year. In addition, the relevant employee will be granted permission to exercise share options and to repay loans which may be due to a share purchase scheme.
25. RETIREMEnT BEnEFIT InFORMATIOn
In line with the group’s policy to provide retirement benefits to its employees, 79% (2010: 76%) of the group’s employees belong to various retirement schemes.
Industrial legislation requires that certain employees be members of designated industry schemes. At year end 7% (2010: 14%) of the group’s employees were members of such schemes, most notably the Engineering Industries’ Pension Fund and Metal Industries’ Provident Fund. The total employer contributions for the year to these funds amounted to R5,4 million (2010: R12,0 million).
38% (2010: 41%) of the group’s total employees, are members of the Reunert Retirement Fund, which consists of both the Reunert Pension Fund and Reunert Provident Fund.
The Reunert Retirement Fund is a defined contribution plan, apart from death benefits that are paid by the Pension Fund, which is registered in terms of the Pension Funds Act, 1956. The fund was last reviewed by an actuary at 28 February 2007 and found to be in a sound financial position. The total employer contribution for the year to this fund amounted to R71,2 million (2010: R57,4 million).
The Lincoln Wood Provident Fund is a defined benefit plan which is in the process of being wound up. The fund was last valued on 28 February 2009. There is no obligation on the company to fund any possible shortfall in the fund, which currently has a surplus. The surplus is immaterial to the group accounts. No contributions were made to the fund during the current year.
The remaining 34% (2010: 21%) of the group’s total employees, who are not members of the abovementioned schemes, participate in other benefit plans, which consist of eleven defined contribution plans. All of these funds are subject to the Pension Funds Act, 1956. The total employer contributions for the year to these funds amounted to R30,9 million (2010: R23,6 million).
Joint ventures
2011 2010
TotalRm
Reunertshare
RmTotal
Rm
Reunertshare
Rm
26. SuMMARISED FInAnCIAL InFORMATIOn OF JOInT VEnTuRES
Income statementRevenue 594,4 297,2 603,2 301,6 Other expenses 70,2 35,1 61,4 30,7 Profit after taxation 23,5 11,8 48,0 24,0 Dividends 100,0 50,0 – –
Balance sheetNon-current assets 207,5 103,8 215,4 107,7 Current assets (excluding cash) 229,5 114,7 205,5 102,7 Cash and cash equivalents 64,0 32,0 146,9 73,4 Current liabilities (90,7) (45,3) (81,1) (40,5)Non-current liabilities (26,7) (13,3) (27,0) (13,5)Equity (383,7) (191,8) (459,7) (229,8)
Lease commitmentsOf the total operating lease commitments disclosed in note 22, R0,6 million relates to Telecom Cables
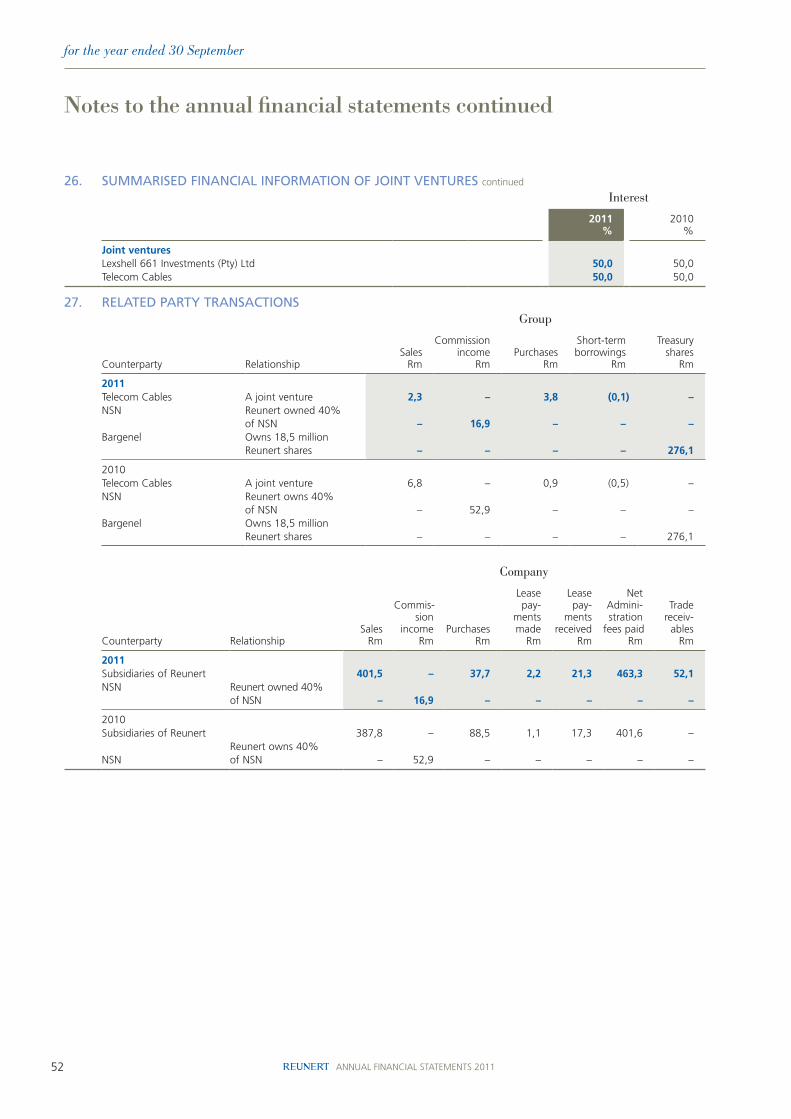
52 ANNUAL FINANCIAL STATEMENTS 2011
for the year ended 30 September
26. SuMMARISED FInAnCIAL InFORMATIOn OF JOInT VEnTuRES continued
Interest
2011 %
2010 %
Joint venturesLexshell 661 Investments (Pty) Ltd 50,0 50,0 Telecom Cables 50,0 50,0
27. RELATED PARTy TRAnSACTIOnSGroup
Counterparty RelationshipSales
Rm
Commissionincome
RmPurchases
Rm
Short-term borrowings
Rm
Treasuryshares
Rm
2011Telecom Cables A joint venture 2,3 – 3,8 (0,1) – NSN Reunert owned 40%
of NSN – 16,9 – – – Bargenel Owns 18,5 million
Reunert shares – – – – 276,1
2010Telecom Cables A joint venture 6,8 – 0,9 (0,5) – NSN Reunert owns 40%
of NSN – 52,9 – – – Bargenel Owns 18,5 million
Reunert shares – – – – 276,1
Company
Counterparty RelationshipSales
Rm
Commis-sion
incomeRm
PurchasesRm
Leasepay-
mentsmade
Rm
Leasepay-
mentsreceived
Rm
NetAdmini-stration
fees paidRm
Trade receiv-
ablesRm
2011Subsidiaries of Reunert 401,5 – 37,7 2,2 21,3 463,3 52,1NSN Reunert owned 40%
of NSN – 16,9 – – – – –
2010Subsidiaries of Reunert 387,8 – 88,5 1,1 17,3 401,6 –
NSNReunert owns 40% of NSN – 52,9 – – – – –
notes to the annual financial statements continued
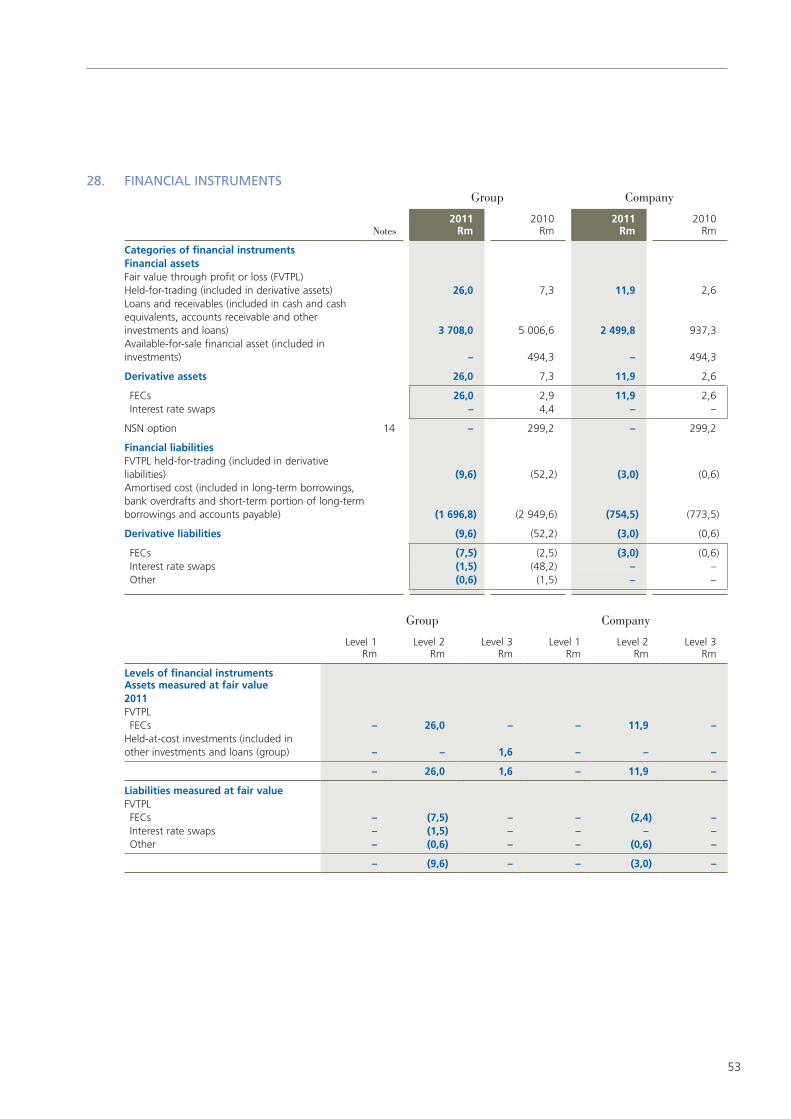
53
28. FInAnCIAL InSTRuMEnTSGroup Company
Notes2011
Rm2010
Rm2011
Rm2010
Rm
Categories of financial instrumentsFinancial assetsFair value through profit or loss (FVTPL)Held-for-trading (included in derivative assets) 26,0 7,3 11,9 2,6 Loans and receivables (included in cash and cash equivalents, accounts receivable and other investments and loans) 3 708,0 5 006,6 2 499,8 937,3 Available-for-sale financial asset (included in investments) – 494,3 – 494,3
Derivative assets 26,0 7,3 11,9 2,6
FECs 26,0 2,9 11,9 2,6 Interest rate swaps – 4,4 – –
NSN option 14 – 299,2 – 299,2
Financial liabilitiesFVTPL held-for-trading (included in derivative liabilities) (9,6) (52,2) (3,0) (0,6)Amortised cost (included in long-term borrowings, bank overdrafts and short-term portion of long-term borrowings and accounts payable) (1 696,8) (2 949,6) (754,5) (773,5)
Derivative liabilities (9,6) (52,2) (3,0) (0,6)
FECs (7,5) (2,5) (3,0) (0,6) Interest rate swaps (1,5) (48,2) – – Other (0,6) (1,5) – –
Group Company
Level 1Rm
Level 2Rm
Level 3Rm
Level 1Rm
Level 2Rm
Level 3Rm
Levels of financial instrumentsAssets measured at fair value2011FVTPL FECs – 26,0 – – 11,9 – Held-at-cost investments (included in other investments and loans (group) – – 1,6 – – –
– 26,0 1,6 – 11,9 –
Liabilities measured at fair valueFVTPL FECs – (7,5) – – (2,4) – Interest rate swaps – (1,5) – – – – Other – (0,6) – – (0,6) –
– (9,6) – – (3,0) –
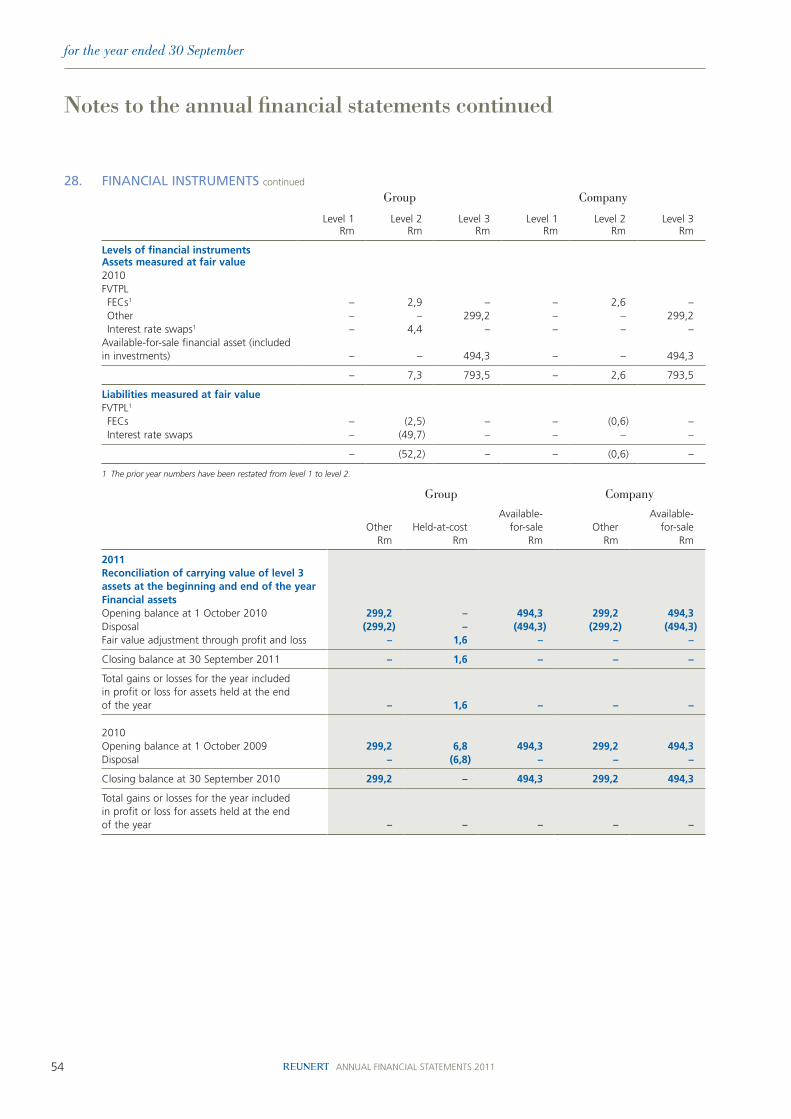
54 ANNUAL FINANCIAL STATEMENTS 2011
for the year ended 30 September
28. FInAnCIAL InSTRuMEnTS continued
Group Company
Level 1Rm
Level 2Rm
Level 3Rm
Level 1Rm
Level 2Rm
Level 3Rm
Levels of financial instrumentsAssets measured at fair value2010FVTPL FECs1 – 2,9 – – 2,6 – Other – – 299,2 – – 299,2 Interest rate swaps1 – 4,4 – – – – Available-for-sale financial asset (included in investments) – – 494,3 – – 494,3
– 7,3 793,5 – 2,6 793,5
Liabilities measured at fair valueFVTPL1
FECs – (2,5) – – (0,6) – Interest rate swaps – (49,7) – – – –
– (52,2) – – (0,6) –
1 The prior year numbers have been restated from level 1 to level 2.
Group Company
OtherRm
Held-at-costRm
Available-for-sale
RmOther
Rm
Available-for-sale
Rm
2011Reconciliation of carrying value of level 3 assets at the beginning and end of the yearFinancial assetsOpening balance at 1 October 2010 299,2 – 494,3 299,2 494,3 Disposal (299,2) – (494,3) (299,2) (494,3)Fair value adjustment through profit and loss – 1,6 – – –
Closing balance at 30 September 2011 – 1,6 – – –
Total gains or losses for the year included in profit or loss for assets held at the end of the year – 1,6 – – –
2010Opening balance at 1 October 2009 299,2 6,8 494,3 299,2 494,3 Disposal – (6,8) – – –
Closing balance at 30 September 2010 299,2 – 494,3 299,2 494,3
Total gains or losses for the year included in profit or loss for assets held at the end of the year – – – – –
notes to the annual financial statements continued

55
28. FInAnCIAL InSTRuMEnTS continued
Risk management
The group is exposed to liquidity, credit, foreign currency, interest rate and commodity price risks arising from its financial instruments.
The risk management relating to each of these risks is discussed under the headings below. The group’s objective in using derivative instruments for hedging purposes is to reduce the uncertainty over future cash flows arising from foreign currency, interest rate and commodity price risk exposures.
Liquidity risk
Liquidity risk is the risk that an entity in the group will be unable to meet its obligations in respect of financial liabilities when they become due.
The group manages liquidity risk by maintaining adequate reserves, banking facilities and reserve borrowing facilities and by continuously monitoring forecast and actual cash flows.
All of the group’s short-term borrowings or excess cash is directed through RFCL, which is managed by senior management from the head office of the group.
The overnight call market is mainly used for short-term borrowings, with three- to six-month borrowings used when deemed appropriate. Excess cash is only deposited with reputable banks and is spread over more than one bank to reduce exposure to any one institution.
The following table details the group’s remaining contractual maturity for its financial liabilities. The table reflects the undiscounted cash flows of financial liabilities based on the earliest date on which the group is required to pay. The table includes both interest and principal cash flows.
Group
<1 yearRm
1–5 yearsRm
> 5 yearsRm
TotalRm
2011Financial liabilities included in trade and other payables (1 610,6) – – (1 610,6)Bank overdrafts and short-term portion of long-term borrowings (85,5) – – (85,5)Long-term borrowings – (0,7) – (0,7)Derivative instruments – FECs (gross settled) (7,5) – – (7,5) Interest rate swaps (1,5) – – (1,5) Other (0,6) – – (0,6)
(1 705,7) (0,7) – (1 706,4)
2010Financial liabilities included in trade and other payables (1 545,5) (0,9) – (1 546,4)Bank overdrafts and short-term portion of long-term borrowings (692,3) – – (692,3)Long-term borrowings – (710,9) – (710,9)Derivative instruments – FECs (gross settled) (2,5) – – (2,5) Interest rate swaps (48,2) – – (48,2) Other derivative instruments (net settled) (1,5) – – (1,5)
(2 290,0) (711,8) – (3 001,8)
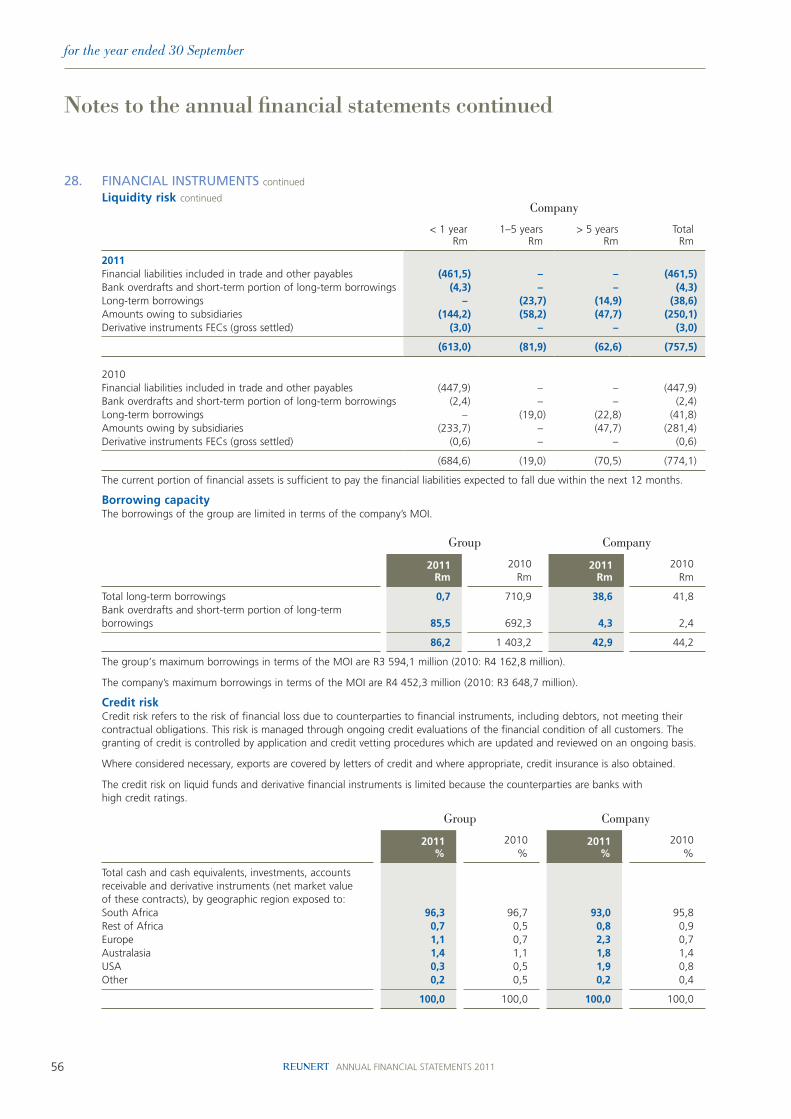
56 ANNUAL FINANCIAL STATEMENTS 2011
for the year ended 30 September
28. FInAnCIAL InSTRuMEnTS continued
Liquidity risk continuedCompany
< 1 yearRm
1–5 yearsRm
> 5 yearsRm
TotalRm
2011Financial liabilities included in trade and other payables (461,5) – – (461,5)Bank overdrafts and short-term portion of long-term borrowings (4,3) – – (4,3)Long-term borrowings – (23,7) (14,9) (38,6)Amounts owing to subsidiaries (144,2) (58,2) (47,7) (250,1)Derivative instruments FECs (gross settled) (3,0) – – (3,0)
(613,0) (81,9) (62,6) (757,5)
2010Financial liabilities included in trade and other payables (447,9) – – (447,9)Bank overdrafts and short-term portion of long-term borrowings (2,4) – – (2,4)Long-term borrowings – (19,0) (22,8) (41,8)Amounts owing by subsidiaries (233,7) – (47,7) (281,4)Derivative instruments FECs (gross settled) (0,6) – – (0,6)
(684,6) (19,0) (70,5) (774,1)
The current portion of financial assets is sufficient to pay the financial liabilities expected to fall due within the next 12 months.
Borrowing capacityThe borrowings of the group are limited in terms of the company’s MOI.
Group Company
2011Rm
2010Rm
2011Rm
2010Rm
Total long-term borrowings 0,7 710,9 38,6 41,8 Bank overdrafts and short-term portion of long-term borrowings 85,5 692,3 4,3 2,4
86,2 1 403,2 42,9 44,2
The group’s maximum borrowings in terms of the MOI are R3 594,1 million (2010: R4 162,8 million).
The company’s maximum borrowings in terms of the MOI are R4 452,3 million (2010: R3 648,7 million).
Credit riskCredit risk refers to the risk of financial loss due to counterparties to financial instruments, including debtors, not meeting their contractual obligations. This risk is managed through ongoing credit evaluations of the financial condition of all customers. The granting of credit is controlled by application and credit vetting procedures which are updated and reviewed on an ongoing basis.
Where considered necessary, exports are covered by letters of credit and where appropriate, credit insurance is also obtained.
The credit risk on liquid funds and derivative financial instruments is limited because the counterparties are banks with high credit ratings.
Group Company
2011 %
2010 %
2011 %
2010 %
Total cash and cash equivalents, investments, accounts receivable and derivative instruments (net market value of these contracts), by geographic region exposed to:South Africa 96,3 96,7 93,0 95,8 Rest of Africa 0,7 0,5 0,8 0,9 Europe 1,1 0,7 2,3 0,7 Australasia 1,4 1,1 1,8 1,4 USA 0,3 0,5 1,9 0,8 Other 0,2 0,5 0,2 0,4
100,0 100,0 100,0 100,0
notes to the annual financial statements continued

57
28. FInAnCIAL InSTRuMEnTS continued
The maximum exposure to credit risk of financial assets included in trade and other receivables before any impairment losses or credit enhancements and excluding any collateral held, classified into major risk types:
Group Company
2011 Rm
2010 Rm
2011Rm
2010Rm
Trade and other receivables 2 161,4 2 458,9 306,7 669,7
Insured debtors 142,5 150,6 63,7 77,7 Contractors 33,5 32,3 0,2 0,4 Individuals/small businesses 660,0 761,1 32,0 99,8 Mines/large businesses/government and parastatals 1 196,5 1 401,6 210,2 487,2 Municipalities 128,9 113,3 0,6 4,6
Derivative contracts 26,0 7,3 11,9 2,6
Insured debtors 10,2 – 10,1 – Individuals/small businesses – 0,4 – 0,3 Mines/large businesses/government and parastatals 15,8 6,9 1,8 2,3
2 187,4 2 466,2 318,6 672,3
Foreign currency riskForeign currency risk refers to the risk that the fair value of future cash flows of a financial instrument will fluctuate because of changes in foreign currency exchange rates.
The group has appointed a foreign currency management firm to manage its major currency exposures. A mandate is agreed with the firm from time to time which then manages the exposure within this mandate.
Forward exchange contracts at 30 September 2011 and 2010 are summarised below:
Group
Foreignamountmillion
Marketvalue
Rm
Contract value
Rm
Unrealisedgains/(losses)
Rm
2011Imports – tradeUSD (19,4) (159,2) (146,3) 12,9 Euro (16,7) (182,3) (171,2) 11,1 GBP (0,2) (3,1) (2,9) 0,2 Yen (148,1) (15,6) (14,0) 1,6 CHF (0,9) (8,3) (8,1) 0,2 SEK (0,1) (0,1) (0,1) –
(368,6) (342,6) 26,0
Exports – tradeUSD 10,0 82,1 77,0 (5,1)Euro 4,8 52,4 50,0 (2,4)
134,5 127,0 (7,5)
Total net forward exchange contracts (234,1) (215,6) 18,5
Rm
Accounts payable in foreign currencies (125,4)Of which covered by forward exchange contracts 122,7 Loans payable in foreign currencies (26,5)Of which covered by forward exchange contracts –Accounts receivable in foreign currencies 25,2 Of which covered by forward exchange contracts (0,4)

58 ANNUAL FINANCIAL STATEMENTS 2011
for the year ended 30 September
28. FInAnCIAL InSTRuMEnTS continued
Foreign currency risk continuedGroup
Foreignamountmillion
Marketvalue
Rm
Contract value
Rm
Unrealisedgains/(losses)
Rm
2010Imports – tradeUSD (10,9) (78,6) (78,0) (0,6)Euro (17,4) (160,0) (160,6) 0,6 GBP (0,6) (7,5) (7,2) (0,3)Yen (241,0) (20,4) (21,0) 0,6 CHF (3,3) (8,5) (8,6) 0,1 SEK (0,3) (0,3) (0,3) –
(275,3) (275,7) 0,4
Exports – tradeEuro 1,0 10,0 10,0 –
10,0 10,0 –
Total net forward exchange contracts (265,3) (265,7) 0,4
Rm
Accounts payable in foreign currencies (249,0)Of which covered by forward exchange contracts 223,1 Accounts receivable in foreign currencies 35,9 Of which covered by forward exchange contracts (10,0)
Company
Foreignamountmillion
Marketvalue
Rm
Contract value
Rm
Unrealisedgains/(losses)
Rm
2011Imports – tradeUSD (1,9) (15,6) (14,3) 1,3 Euro (14,2) (155,1) (145,3) 9,8 Yen (105,9) (11,3) (10,5) 0,8
(182,0) (170,1) 11,9
Exports – tradeUSD 7,0 56,8 53,6 (3,2)Euro 1,2 13,1 13,3 0,2
69,9 66,9 (3,0)
Total net forward exchange contracts (112,1) (103,2) 8,9
Rm
Accounts receivable in foreign currencies 8,5 Of which covered by forward exchange contracts –
2010Imports – tradeUSD (4,4) (31,3) (32,3) 1,0 Euro (13,8) (132,3) (132,7) 0,4 GBP (0,1) (1,5) (1,5) – Yen (241,0) (20,4) (21,0) 0,6
(185,5) (187,5) 2,0
Rm
Accounts payable in foreign currencies (125,8)Of which covered by forward exchange contracts 104,0
notes to the annual financial statements continued
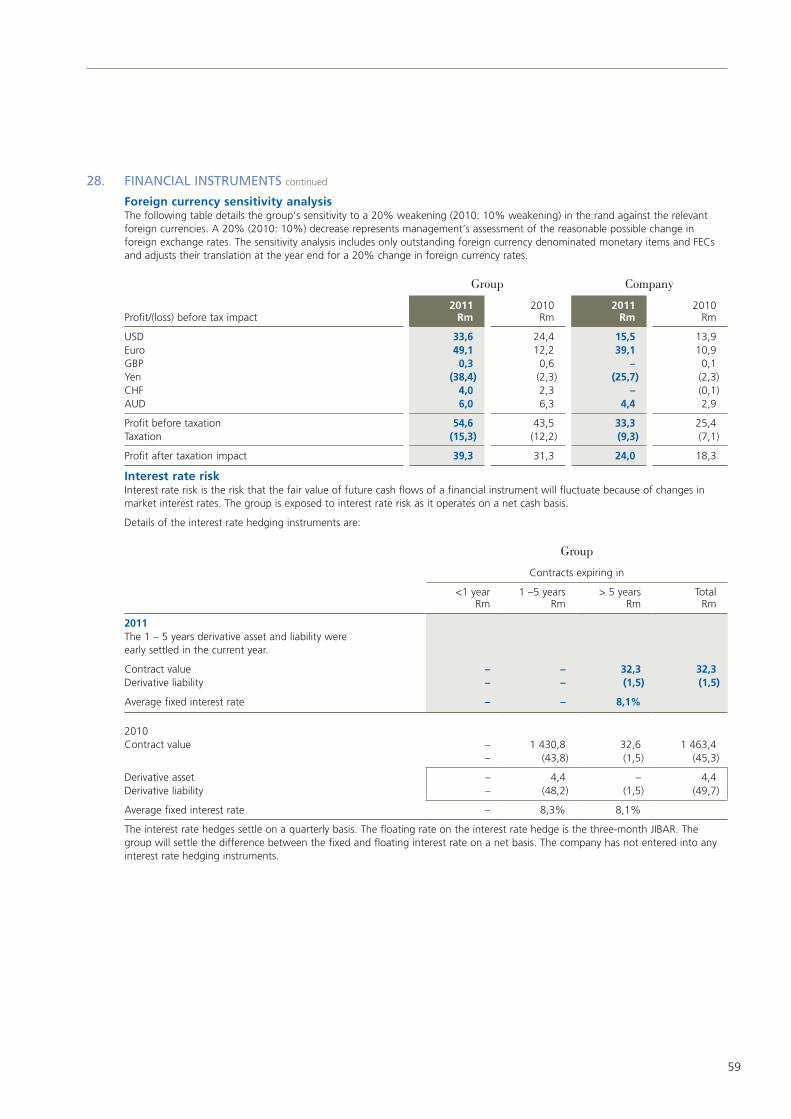
59
28. FInAnCIAL InSTRuMEnTS continued
Foreign currency sensitivity analysisThe following table details the group’s sensitivity to a 20% weakening (2010: 10% weakening) in the rand against the relevant foreign currencies. A 20% (2010: 10%) decrease represents management’s assessment of the reasonable possible change in foreign exchange rates. The sensitivity analysis includes only outstanding foreign currency denominated monetary items and FECs and adjusts their translation at the year end for a 20% change in foreign currency rates.
Group Company
Profit/(loss) before tax impact2011
Rm2010
Rm2011
Rm2010
Rm
USD 33,6 24,4 15,5 13,9 Euro 49,1 12,2 39,1 10,9 GBP 0,3 0,6 – 0,1 Yen (38,4) (2,3) (25,7) (2,3)CHF 4,0 2,3 – (0,1)AUD 6,0 6,3 4,4 2,9
Profit before taxation 54,6 43,5 33,3 25,4 Taxation (15,3) (12,2) (9,3) (7,1)
Profit after taxation impact 39,3 31,3 24,0 18,3
Interest rate riskInterest rate risk is the risk that the fair value of future cash flows of a financial instrument will fluctuate because of changes in market interest rates. The group is exposed to interest rate risk as it operates on a net cash basis.
Details of the interest rate hedging instruments are:
Group
Contracts expiring in
<1 year Rm
1 –5 years Rm
> 5 years Rm
Total Rm
2011The 1 – 5 years derivative asset and liability were early settled in the current year.
Contract value – – 32,3 32,3 Derivative liability – – (1,5) (1,5)
Average fixed interest rate – – 8,1%
2010Contract value – 1 430,8 32,6 1 463,4
– (43,8) (1,5) (45,3)
Derivative asset – 4,4 – 4,4 Derivative liability – (48,2) (1,5) (49,7)
Average fixed interest rate – 8,3% 8,1%
The interest rate hedges settle on a quarterly basis. The floating rate on the interest rate hedge is the three-month JIBAR. The group will settle the difference between the fixed and floating interest rate on a net basis. The company has not entered into any interest rate hedging instruments.
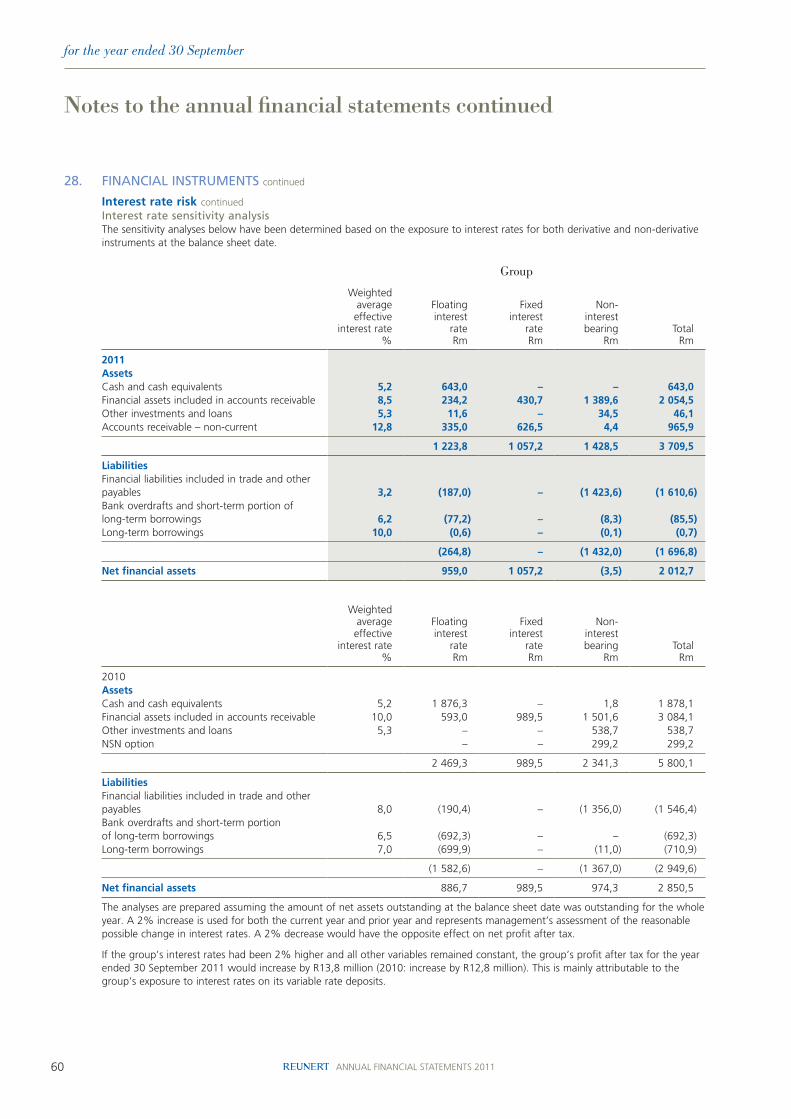
60 ANNUAL FINANCIAL STATEMENTS 2011
for the year ended 30 September
28. FInAnCIAL InSTRuMEnTS continued
Interest rate risk continuedInterest rate sensitivity analysisThe sensitivity analyses below have been determined based on the exposure to interest rates for both derivative and non-derivative instruments at the balance sheet date.
Group
Weightedaverageeffective
interest rate%
Floatinginterest
rateRm
Fixed interest
rateRm
Non- interestbearing
RmTotal
Rm
2011AssetsCash and cash equivalents 5,2 643,0 – – 643,0 Financial assets included in accounts receivable 8,5 234,2 430,7 1 389,6 2 054,5 Other investments and loans 5,3 11,6 – 34,5 46,1 Accounts receivable – non-current 12,8 335,0 626,5 4,4 965,9
1 223,8 1 057,2 1 428,5 3 709,5
LiabilitiesFinancial liabilities included in trade and other payables 3,2 (187,0) – (1 423,6) (1 610,6)Bank overdrafts and short-term portion of long-term borrowings 6,2 (77,2) – (8,3) (85,5)Long-term borrowings 10,0 (0,6) – (0,1) (0,7)
(264,8) – (1 432,0) (1 696,8)
Net financial assets 959,0 1 057,2 (3,5) 2 012,7
Weightedaverageeffective
interest rate%
Floatinginterest
rateRm
Fixed interest
rateRm
Non- interestbearing
RmTotal
Rm
2010AssetsCash and cash equivalents 5,2 1 876,3 – 1,8 1 878,1 Financial assets included in accounts receivable 10,0 593,0 989,5 1 501,6 3 084,1 Other investments and loans 5,3 – – 538,7 538,7 NSN option – – 299,2 299,2
2 469,3 989,5 2 341,3 5 800,1
LiabilitiesFinancial liabilities included in trade and other payables 8,0 (190,4) – (1 356,0) (1 546,4)Bank overdrafts and short-term portion of long-term borrowings 6,5 (692,3) – – (692,3)Long-term borrowings 7,0 (699,9) – (11,0) (710,9)
(1 582,6) – (1 367,0) (2 949,6)
Net financial assets 886,7 989,5 974,3 2 850,5
The analyses are prepared assuming the amount of net assets outstanding at the balance sheet date was outstanding for the whole year. A 2% increase is used for both the current year and prior year and represents management’s assessment of the reasonable possible change in interest rates. A 2% decrease would have the opposite effect on net profit after tax.
If the group’s interest rates had been 2% higher and all other variables remained constant, the group’s profit after tax for the year ended 30 September 2011 would increase by R13,8 million (2010: increase by R12,8 million). This is mainly attributable to the group’s exposure to interest rates on its variable rate deposits.
notes to the annual financial statements continued
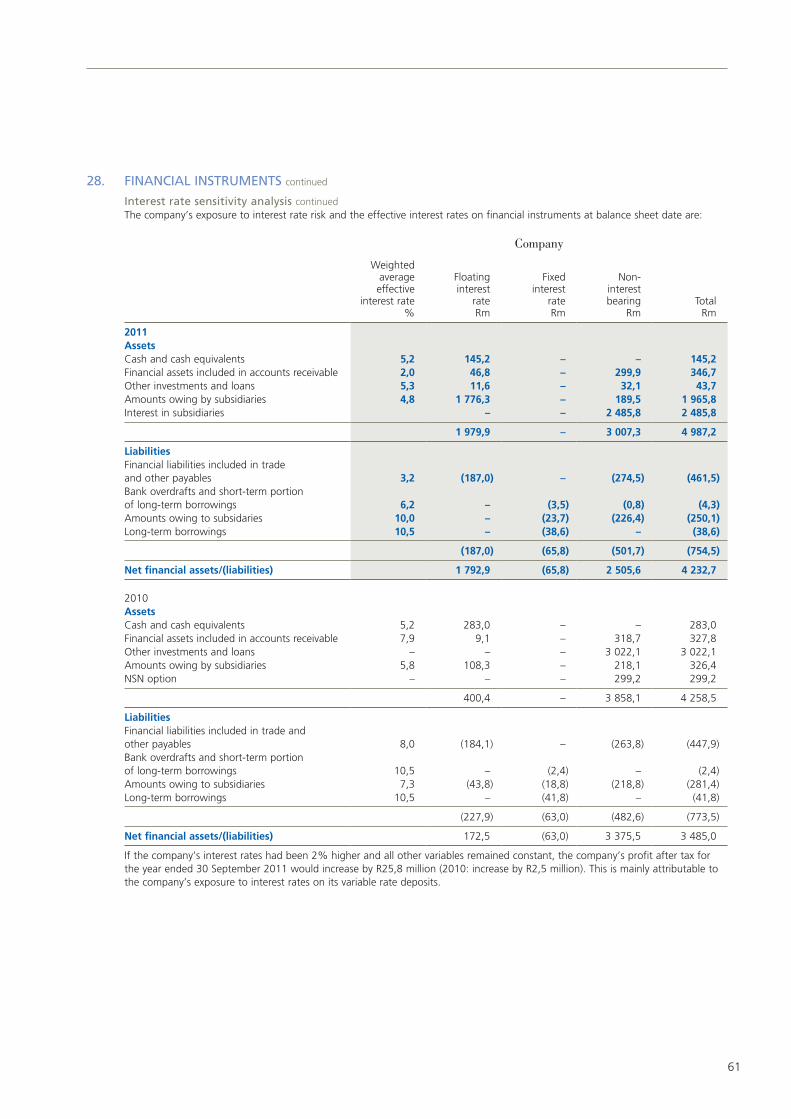
61
28. FInAnCIAL InSTRuMEnTS continued
Interest rate sensitivity analysis continuedThe company’s exposure to interest rate risk and the effective interest rates on financial instruments at balance sheet date are:
Company
Weightedaverageeffective
interest rate%
Floatinginterest
rateRm
Fixed interest
rateRm
Non- interestbearing
RmTotal
Rm
2011AssetsCash and cash equivalents 5,2 145,2 – – 145,2 Financial assets included in accounts receivable 2,0 46,8 – 299,9 346,7 Other investments and loans 5,3 11,6 – 32,1 43,7 Amounts owing by subsidiaries 4,8 1 776,3 – 189,5 1 965,8 Interest in subsidiaries – – 2 485,8 2 485,8
1 979,9 – 3 007,3 4 987,2
LiabilitiesFinancial liabilities included in trade and other payables 3,2 (187,0) – (274,5) (461,5)Bank overdrafts and short-term portion of long-term borrowings 6,2 – (3,5) (0,8) (4,3)Amounts owing to subsidaries 10,0 – (23,7) (226,4) (250,1)Long-term borrowings 10,5 – (38,6) – (38,6)
(187,0) (65,8) (501,7) (754,5)
Net financial assets/(liabilities) 1 792,9 (65,8) 2 505,6 4 232,7
2010AssetsCash and cash equivalents 5,2 283,0 – – 283,0 Financial assets included in accounts receivable 7,9 9,1 – 318,7 327,8 Other investments and loans – – – 3 022,1 3 022,1 Amounts owing by subsidiaries 5,8 108,3 – 218,1 326,4 NSN option – – – 299,2 299,2
400,4 – 3 858,1 4 258,5
LiabilitiesFinancial liabilities included in trade and other payables 8,0 (184,1) – (263,8) (447,9)Bank overdrafts and short-term portion of long-term borrowings 10,5 – (2,4) – (2,4)Amounts owing to subsidiaries 7,3 (43,8) (18,8) (218,8) (281,4)Long-term borrowings 10,5 – (41,8) – (41,8)
(227,9) (63,0) (482,6) (773,5)
Net financial assets/(liabilities) 172,5 (63,0) 3 375,5 3 485,0
If the company’s interest rates had been 2% higher and all other variables remained constant, the company’s profit after tax for the year ended 30 September 2011 would increase by R25,8 million (2010: increase by R2,5 million). This is mainly attributable to the company’s exposure to interest rates on its variable rate deposits.
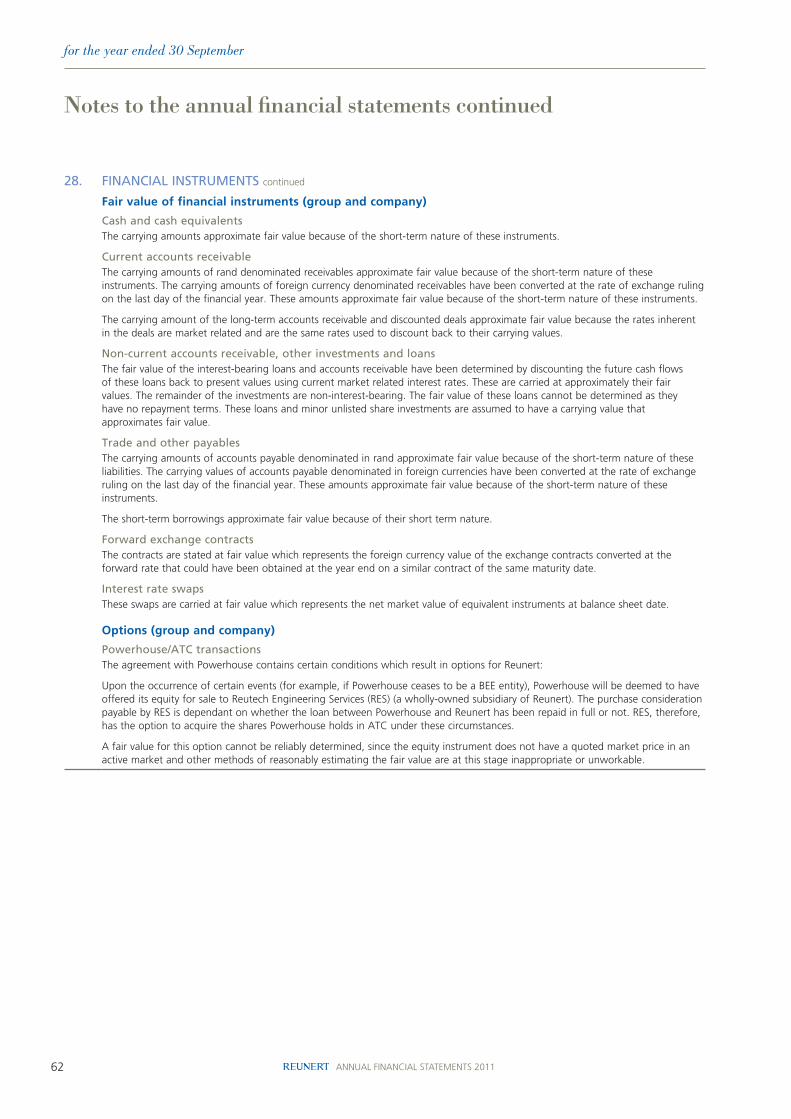
62 ANNUAL FINANCIAL STATEMENTS 2011
for the year ended 30 September
28. FInAnCIAL InSTRuMEnTS continued
Fair value of financial instruments (group and company)
Cash and cash equivalentsThe carrying amounts approximate fair value because of the short-term nature of these instruments.
Current accounts receivable The carrying amounts of rand denominated receivables approximate fair value because of the short-term nature of these instruments. The carrying amounts of foreign currency denominated receivables have been converted at the rate of exchange ruling on the last day of the financial year. These amounts approximate fair value because of the short-term nature of these instruments.
The carrying amount of the long-term accounts receivable and discounted deals approximate fair value because the rates inherent in the deals are market related and are the same rates used to discount back to their carrying values.
non-current accounts receivable, other investments and loansThe fair value of the interest-bearing loans and accounts receivable have been determined by discounting the future cash flows of these loans back to present values using current market related interest rates. These are carried at approximately their fair values. The remainder of the investments are non-interest-bearing. The fair value of these loans cannot be determined as they have no repayment terms. These loans and minor unlisted share investments are assumed to have a carrying value that approximates fair value.
Trade and other payablesThe carrying amounts of accounts payable denominated in rand approximate fair value because of the short-term nature of these liabilities. The carrying values of accounts payable denominated in foreign currencies have been converted at the rate of exchange ruling on the last day of the financial year. These amounts approximate fair value because of the short-term nature of these instruments.
The short-term borrowings approximate fair value because of their short term nature.
Forward exchange contractsThe contracts are stated at fair value which represents the foreign currency value of the exchange contracts converted at the forward rate that could have been obtained at the year end on a similar contract of the same maturity date.
Interest rate swapsThese swaps are carried at fair value which represents the net market value of equivalent instruments at balance sheet date.
Options (group and company)
Powerhouse/ATC transactionsThe agreement with Powerhouse contains certain conditions which result in options for Reunert:
Upon the occurrence of certain events (for example, if Powerhouse ceases to be a BEE entity), Powerhouse will be deemed to have offered its equity for sale to Reutech Engineering Services (RES) (a wholly-owned subsidiary of Reunert). The purchase consideration payable by RES is dependant on whether the loan between Powerhouse and Reunert has been repaid in full or not. RES, therefore, has the option to acquire the shares Powerhouse holds in ATC under these circumstances.
A fair value for this option cannot be reliably determined, since the equity instrument does not have a quoted market price in an active market and other methods of reasonably estimating the fair value are at this stage inappropriate or unworkable.
notes to the annual financial statements continued
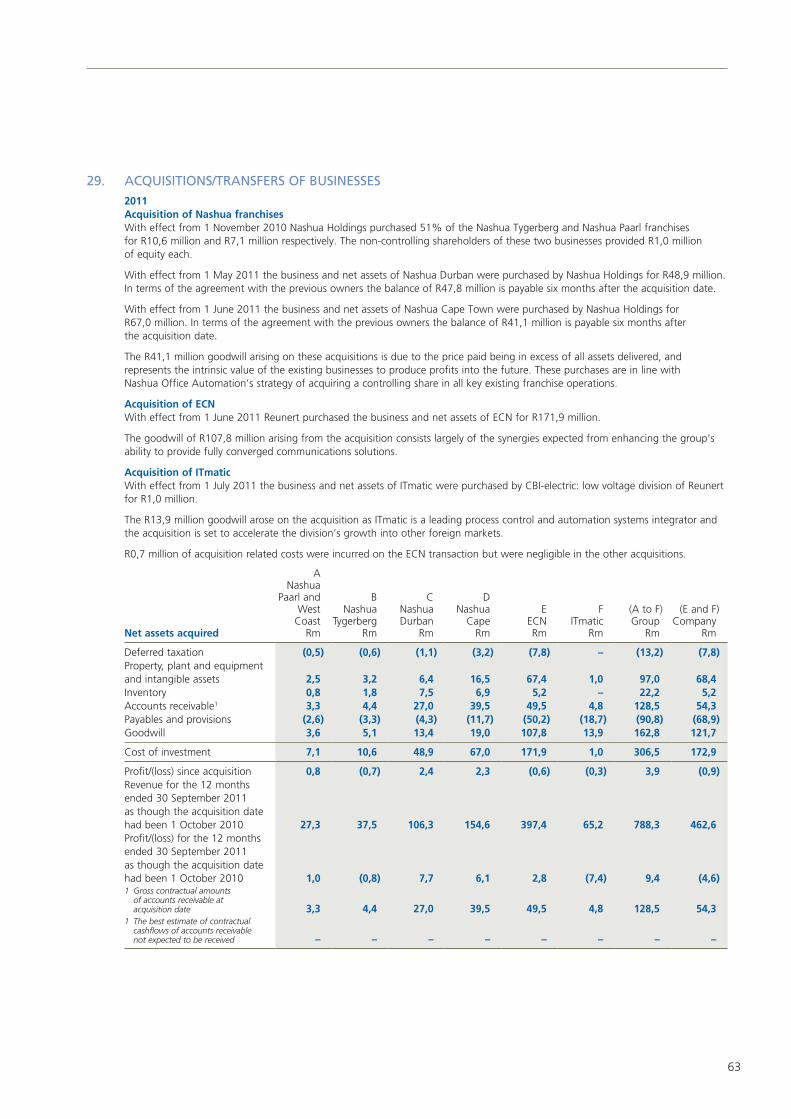
63
29. ACquISITIOnS/TRAnSFERS OF BuSInESSES
2011Acquisition of Nashua franchisesWith effect from 1 November 2010 Nashua Holdings purchased 51% of the Nashua Tygerberg and Nashua Paarl franchises for R10,6 million and R7,1 million respectively. The non-controlling shareholders of these two businesses provided R1,0 million of equity each.
With effect from 1 May 2011 the business and net assets of Nashua Durban were purchased by Nashua Holdings for R48,9 million. In terms of the agreement with the previous owners the balance of R47,8 million is payable six months after the acquisition date.
With effect from 1 June 2011 the business and net assets of Nashua Cape Town were purchased by Nashua Holdings for R67,0 million. In terms of the agreement with the previous owners the balance of R41,1 million is payable six months after the acquisition date.
The R41,1 million goodwill arising on these acquisitions is due to the price paid being in excess of all assets delivered, and represents the intrinsic value of the existing businesses to produce profits into the future. These purchases are in line with Nashua Office Automation’s strategy of acquiring a controlling share in all key existing franchise operations.
Acquisition of ECNWith effect from 1 June 2011 Reunert purchased the business and net assets of ECN for R171,9 million.
The goodwill of R107,8 million arising from the acquisition consists largely of the synergies expected from enhancing the group’s ability to provide fully converged communications solutions.
Acquisition of ITmaticWith effect from 1 July 2011 the business and net assets of ITmatic were purchased by CBI-electric: low voltage division of Reunert for R1,0 million.
The R13,9 million goodwill arose on the acquisition as ITmatic is a leading process control and automation systems integrator and the acquisition is set to accelerate the division’s growth into other foreign markets.
R0,7 million of acquisition related costs were incurred on the ECN transaction but were negligible in the other acquisitions.
Net assets acquired
ANashua
Paarl andWest
CoastRm
BNashua
TygerbergRm
CNashuaDurban
Rm
DNashua
CapeRm
EECNRm
FITmatic
Rm
(A to F)Group
Rm
(E and F)Company
Rm
Deferred taxation (0,5) (0,6) (1,1) (3,2) (7,8) – (13,2) (7,8)Property, plant and equipment and intangible assets 2,5 3,2 6,4 16,5 67,4 1,0 97,0 68,4 Inventory 0,8 1,8 7,5 6,9 5,2 – 22,2 5,2 Accounts receivable1 3,3 4,4 27,0 39,5 49,5 4,8 128,5 54,3 Payables and provisions (2,6) (3,3) (4,3) (11,7) (50,2) (18,7) (90,8) (68,9)Goodwill 3,6 5,1 13,4 19,0 107,8 13,9 162,8 121,7
Cost of investment 7,1 10,6 48,9 67,0 171,9 1,0 306,5 172,9
Profit/(loss) since acquisition 0,8 (0,7) 2,4 2,3 (0,6) (0,3) 3,9 (0,9)Revenue for the 12 months ended 30 September 2011as though the acquisition date had been 1 October 2010 27,3 37,5 106,3 154,6 397,4 65,2 788,3 462,6 Profit/(loss) for the 12 months ended 30 September 2011as though the acquisition date had been 1 October 2010 1,0 (0,8) 7,7 6,1 2,8 (7,4) 9,4 (4,6)1 Gross contractual amounts
of accounts receivable at acquisition date 3,3 4,4 27,0 39,5 49,5 4,8 128,5 54,3
1 The best estimate of contractual cashflows of accounts receivable not expected to be received – – – – – – – –
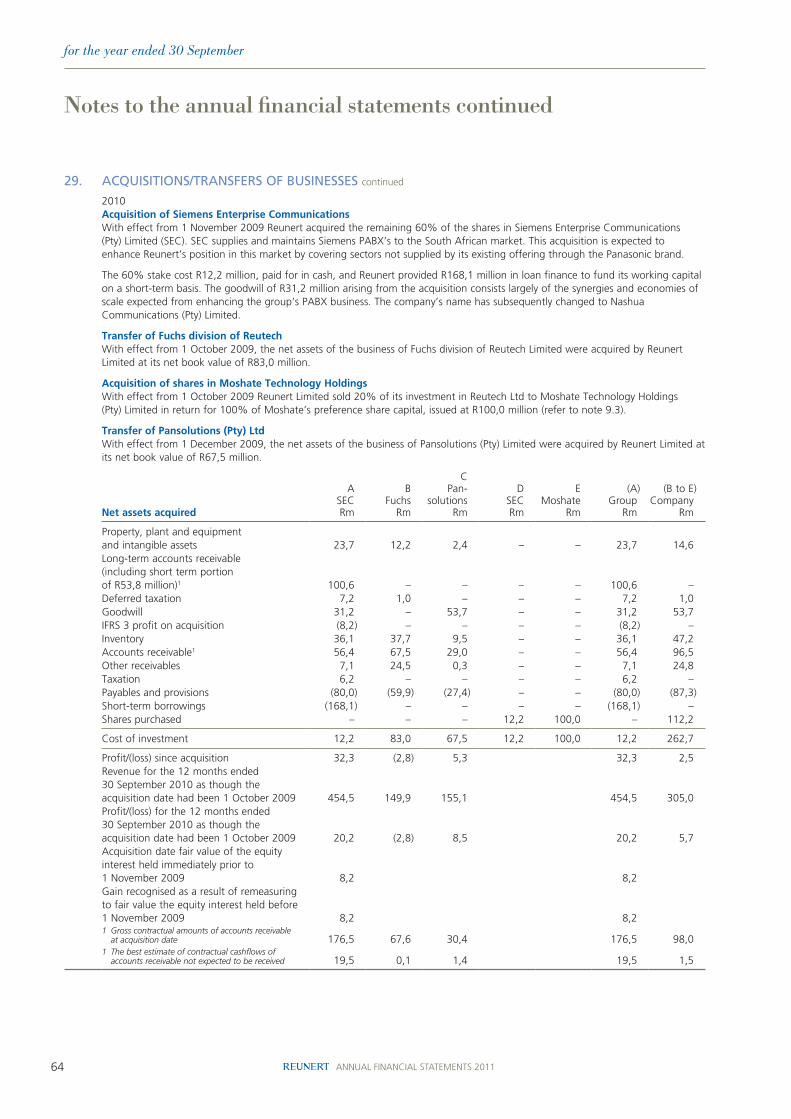
64 ANNUAL FINANCIAL STATEMENTS 2011
for the year ended 30 September
29. ACquISITIOnS/TRAnSFERS OF BuSInESSES continued
2010Acquisition of Siemens Enterprise CommunicationsWith effect from 1 November 2009 Reunert acquired the remaining 60% of the shares in Siemens Enterprise Communications (Pty) Limited (SEC). SEC supplies and maintains Siemens PABX’s to the South African market. This acquisition is expected to enhance Reunert’s position in this market by covering sectors not supplied by its existing offering through the Panasonic brand.
The 60% stake cost R12,2 million, paid for in cash, and Reunert provided R168,1 million in loan finance to fund its working capital on a short-term basis. The goodwill of R31,2 million arising from the acquisition consists largely of the synergies and economies of scale expected from enhancing the group’s PABX business. The company’s name has subsequently changed to Nashua Communications (Pty) Limited.
Transfer of Fuchs division of Reutech With effect from 1 October 2009, the net assets of the business of Fuchs division of Reutech Limited were acquired by Reunert Limited at its net book value of R83,0 million.
Acquisition of shares in Moshate Technology HoldingsWith effect from 1 October 2009 Reunert Limited sold 20% of its investment in Reutech Ltd to Moshate Technology Holdings (Pty) Limited in return for 100% of Moshate’s preference share capital, issued at R100,0 million (refer to note 9.3).
Transfer of Pansolutions (Pty) LtdWith effect from 1 December 2009, the net assets of the business of Pansolutions (Pty) Limited were acquired by Reunert Limited at its net book value of R67,5 million.
Net assets acquired
ASECRm
BFuchs
Rm
CPan-
solutionsRm
DSECRm
EMoshate
Rm
(A)Group
Rm
(B to E)Company
Rm
Property, plant and equipment and intangible assets 23,7 12,2 2,4 – – 23,7 14,6 Long-term accounts receivable (including short term portion of R53,8 million)1 100,6 – – – – 100,6 – Deferred taxation 7,2 1,0 – – – 7,2 1,0 Goodwill 31,2 – 53,7 – – 31,2 53,7 IFRS 3 profit on acquisition (8,2) – – – – (8,2) – Inventory 36,1 37,7 9,5 – – 36,1 47,2 Accounts receivable1 56,4 67,5 29,0 – – 56,4 96,5 Other receivables 7,1 24,5 0,3 – – 7,1 24,8 Taxation 6,2 – – – – 6,2 – Payables and provisions (80,0) (59,9) (27,4) – – (80,0) (87,3)Short-term borrowings (168,1) – – – – (168,1) – Shares purchased – – – 12,2 100,0 – 112,2
Cost of investment 12,2 83,0 67,5 12,2 100,0 12,2 262,7
Profit/(loss) since acquisition 32,3 (2,8) 5,3 32,3 2,5 Revenue for the 12 months ended 30 September 2010 as though the acquisition date had been 1 October 2009 454,5 149,9 155,1 454,5 305,0 Profit/(loss) for the 12 months ended 30 September 2010 as though the acquisition date had been 1 October 2009 20,2 (2,8) 8,5 20,2 5,7 Acquisition date fair value of the equity interest held immediately prior to 1 November 2009 8,2 8,2 Gain recognised as a result of remeasuring to fair value the equity interest held before 1 November 2009 8,2 8,2 1 Gross contractual amounts of accounts receivable
at acquisition date 176,5 67,6 30,4 176,5 98,0 1 The best estimate of contractual cashflows of
accounts receivable not expected to be received 19,5 0,1 1,4 19,5 1,5
notes to the annual financial statements continued

65
30. TRAnSFER OF BuSInESSES
2011Transfer of PABX businessWith effect from 1 October 2010, the net assets and business of the PABX business were transferred from the Pansolutions division of Reunert to Nashua Communications (Pty) Limited at its net book value of R23,6 million.
Net assets transferredPABX
Rm Company
Rm
Inventory (7,7) (7,7)Accounts receivable (14,3) (14,3)Payables and provisions 3,6 3,6 Property, plant and equipment and intangible assets (0,3) (0,3)Goodwill (4,9) (4,9)
Transfer value (23,6) (23,6)
2010Transfer of cellphone repair centre With effect from 1 January 2010, the net assets and business of the cellphone repair centre were transferred from the Fuchs division of Reunert Limited to the Reutech Solutions division of Reutech Limited at its net book value of R5,2 million.
Transfer of airconditioning business With effect from 1 November 2009, the net assets and business of the Panasonic airconditioning business were transferred from the Pansolutions division of Reunert Limited to the Reutech Solutions division of Reutech Limited at its net book value of R12,8 million.
Net assets transferred
A Cellphone
repair centreRm
B Air-
conditioning business
Rm
(A and B) Company
Rm
Property, plant and equipment and intangible assets (1,7) – (1,7)Inventory (1,5) (13,2) (14,7)Accounts receivable (2,7) (4,2) (6,9)Payables and provisions 0,7 4,6 5,3
Transfer value (5,2) (12,8) (18,0)
No disposals were made by the group in 2011 or 2010
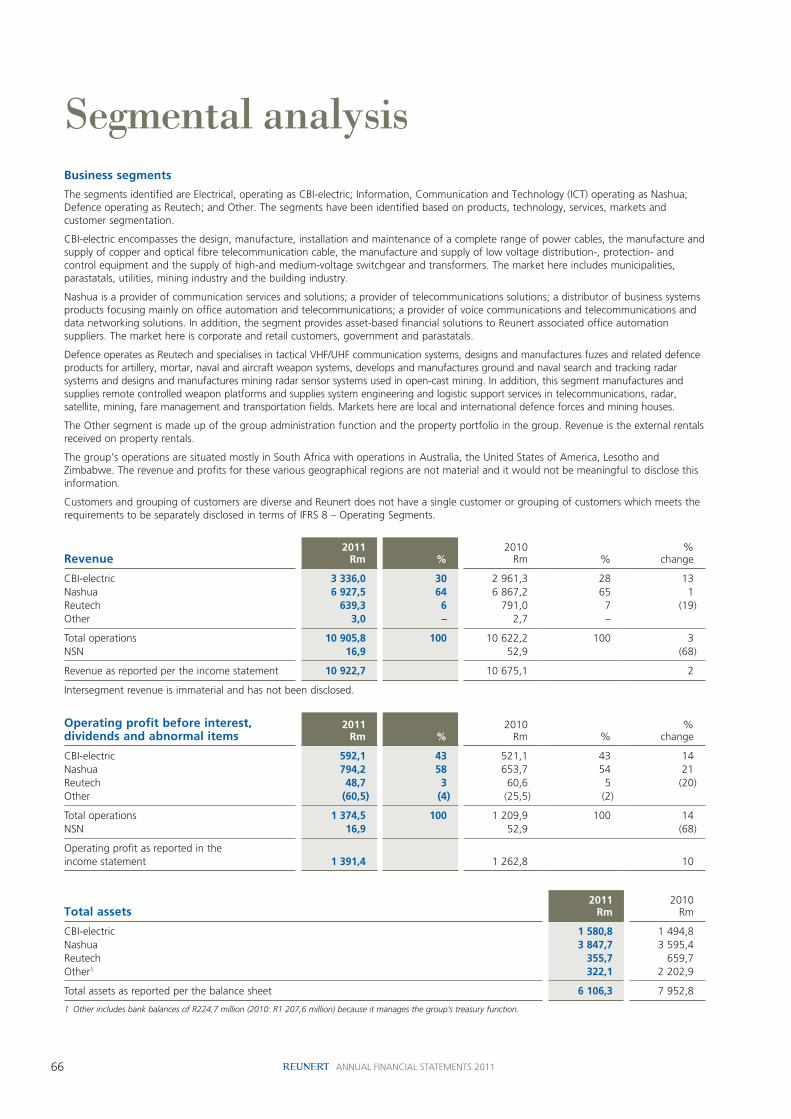
66 ANNUAL FINANCIAL STATEMENTS 2011
segmental analysisBusiness segments
The segments identified are Electrical, operating as CBI-electric; Information, Communication and Technology (ICT) operating as Nashua; Defence operating as Reutech; and Other. The segments have been identified based on products, technology, services, markets and customer segmentation.
CBI-electric encompasses the design, manufacture, installation and maintenance of a complete range of power cables, the manufacture and supply of copper and optical fibre telecommunication cable, the manufacture and supply of low voltage distribution-, protection- and control equipment and the supply of high-and medium-voltage switchgear and transformers. The market here includes municipalities, parastatals, utilities, mining industry and the building industry.
Nashua is a provider of communication services and solutions; a provider of telecommunications solutions; a distributor of business systems products focusing mainly on office automation and telecommunications; a provider of voice communications and telecommunications and data networking solutions. In addition, the segment provides asset-based financial solutions to Reunert associated office automation suppliers. The market here is corporate and retail customers, government and parastatals.
Defence operates as Reutech and specialises in tactical VHF/UHF communication systems, designs and manufactures fuzes and related defence products for artillery, mortar, naval and aircraft weapon systems, develops and manufactures ground and naval search and tracking radar systems and designs and manufactures mining radar sensor systems used in open-cast mining. In addition, this segment manufactures and supplies remote controlled weapon platforms and supplies system engineering and logistic support services in telecommunications, radar, satellite, mining, fare management and transportation fields. Markets here are local and international defence forces and mining houses.
The Other segment is made up of the group administration function and the property portfolio in the group. Revenue is the external rentals received on property rentals.
The group’s operations are situated mostly in South Africa with operations in Australia, the United States of America, Lesotho and Zimbabwe. The revenue and profits for these various geographical regions are not material and it would not be meaningful to disclose this information.
Customers and grouping of customers are diverse and Reunert does not have a single customer or grouping of customers which meets the requirements to be separately disclosed in terms of IFRS 8 – Operating Segments.
Revenue2011
Rm %2010
Rm %%
change
CBI-electric 3 336,0 30 2 961,3 28 13 Nashua 6 927,5 64 6 867,2 65 1 Reutech 639,3 6 791,0 7 (19)Other 3,0 – 2,7 –
Total operations 10 905,8 100 10 622,2 100 3 NSN 16,9 52,9 (68)
Revenue as reported per the income statement 10 922,7 10 675,1 2
Intersegment revenue is immaterial and has not been disclosed.
Operating profit before interest, dividends and abnormal items
2011Rm %
2010Rm %
%change
CBI-electric 592,1 43 521,1 43 14 Nashua 794,2 58 653,7 54 21 Reutech 48,7 3 60,6 5 (20)Other (60,5) (4) (25,5) (2)
Total operations 1 374,5 100 1 209,9 100 14 NSN 16,9 52,9 (68)
Operating profit as reported in the income statement 1 391,4 1 262,8 10
Total assets2011
Rm2010
Rm
CBI-electric 1 580,8 1 494,8 Nashua 3 847,7 3 595,4 Reutech 355,7 659,7 Other1 322,1 2 202,9
Total assets as reported per the balance sheet 6 106,3 7 952,8
1 Other includes bank balances of R224,7 million (2010: R1 207,6 million) because it manages the group’s treasury function.
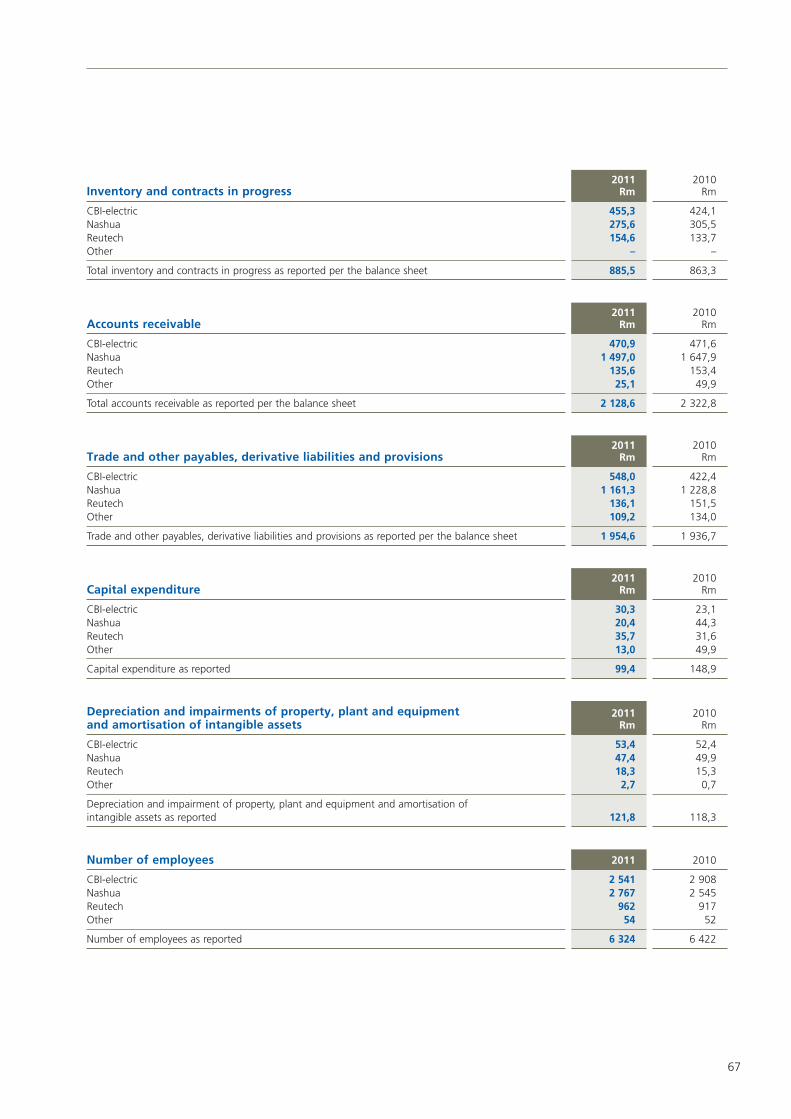
67
Inventory and contracts in progress2011
Rm2010
Rm
CBI-electric 455,3 424,1 Nashua 275,6 305,5 Reutech 154,6 133,7 Other – –
Total inventory and contracts in progress as reported per the balance sheet 885,5 863,3
Accounts receivable2011
Rm2010
Rm
CBI-electric 470,9 471,6 Nashua 1 497,0 1 647,9 Reutech 135,6 153,4 Other 25,1 49,9
Total accounts receivable as reported per the balance sheet 2 128,6 2 322,8
Trade and other payables, derivative liabilities and provisions2011
Rm2010
Rm
CBI-electric 548,0 422,4 Nashua 1 161,3 1 228,8 Reutech 136,1 151,5 Other 109,2 134,0
Trade and other payables, derivative liabilities and provisions as reported per the balance sheet 1 954,6 1 936,7
Capital expenditure2011
Rm2010
Rm
CBI-electric 30,3 23,1 Nashua 20,4 44,3 Reutech 35,7 31,6 Other 13,0 49,9
Capital expenditure as reported 99,4 148,9
Depreciation and impairments of property, plant and equipment and amortisation of intangible assets
2011Rm
2010Rm
CBI-electric 53,4 52,4 Nashua 47,4 49,9 Reutech 18,3 15,3 Other 2,7 0,7
Depreciation and impairment of property, plant and equipment and amortisation of intangible assets as reported 121,8 118,3
Number of employees 2011 2010
CBI-electric 2 541 2 908 Nashua 2 767 2 545 Reutech 962 917 Other 54 52
Number of employees as reported 6 324 6 422

68 ANNUAL FINANCIAL STATEMENTS 2011
Principal subsidiaries – annexure a
Issued capital
R (unlessotherwise
stated)
Effective percentage holding
Interest of holding companyShares Indebtedness
2011%
2010%
2011Rm
2010Rm
2011Rm
2010Rm
CBI-electricCBI-electric: energy cablesAfcab Holdings (Pty) Limited1 4 000 100 100 67,7 67,7 34,4 34,4African Cables Limited 9 886 098 100 100 – – – – ATC (Pty) Limited 845 010 89,9 89,9 48,0 48,0 – – Reutech Engineering Services (Pty) Limited 64 000 100 100 1,7 1,7 174,5 174,5CBI-electric: low and medium voltageCircuit Breaker Industries GmbH (incorporated in Germany) Euro 25 565 100 100 – – – – Circuit Breaker Industries Inc (incorporated in USA) $50 000 100 100 – – – – Circuit Breaker Industries Lesotho (Pty) Limited (incorporated in Lesotho) Moloti 1 000 100 100 – – (75,1) (56,1)Circuit Breaker Industries Qwa Qwa (Pty) Limited 200 100 100 – – (7,5) (7,6)Circuit Breaker Industries Limited 46 100 100 – – (31,0) (23,9)Heinemann Electric (incorporated in Australia) AUD 2 100 100 – – – – Heinemann Holdings Limited 35 000 100 100 16,4 16,4 (4,5) (4,5)CBI-electric: telecom cablesCBI-electric Aberdare ATC Telecom Cables (Pty) Limited (Joint venture) 378 45 45 – – – –
NashuaNashua ElectronicsFutronic (Pty) Limited 100 100 100 – – – – NPC (Airconditioning) Limited 200 000 100 100 2,2 2,2 – – NPC (Electronics) Limited 33 000 100 100 0,2 0,2 – – Pansolutions (Pty) Limited 900 100 100 0,2 0,2 (8,5) (4,9)Pansolutions Holdings Limited 100 100 100 45,0 45,0 (60,9) (52,9)Nashua MobileNashua Mobile (Pty) Limited 9 741 983 100 100 267,8 267,8 – – Blue Lake Telecoms (Pty) Limited 10 000 75 75 – – – – Nashua Office AutomationAcuo Technologies (Pty) Limited 4 000 100 100 – – 52,0 42,9Algoa Office Automation (Pty) Limited 200 51 51 – – – – Circular Drive Property (Pty) Limited 200 51 51 – – – – Classic Number Trading 80 (Pty) Limited 100 51 51 – – – – Kopano Copier Company (Pty) Limited 1 100 74 74 – – 14,5 15,9Nashua Connect (Pty) Limited1 1 000 100 100 – – 55,3 39,0Nashua Holdings (Pty) Limited 2 100 100 – – 10,1 18,6Nashua Limited 947 794 100 100 6,3 6,3 (24,8) (18,8)Royce Imaging Industries (Pty) Limited 100 100 100 – – (2,9) (2,9)Santogyn (Pty) Limited 100 60 60 – – – – Zevoli 151 (Pty) Limited 100 51 51 – – – – Bridoon Trade and Invest 197 (Pty) Limited 100 100 – – PWC Office Automation (Pty) Limited 100 51 – – Just Jasmine Investments 201 (Pty) Limited 120 51 – – Nashua Communications (Pty) Limited 100 100 100 12,2 12,2 – – QuinceQuince Capital Holdings Limited 794 919 100 100 812,7 812,7 – – Quince Capital (Pty) Limited 694 100 100 – – 4,1 0,3
at 30 September
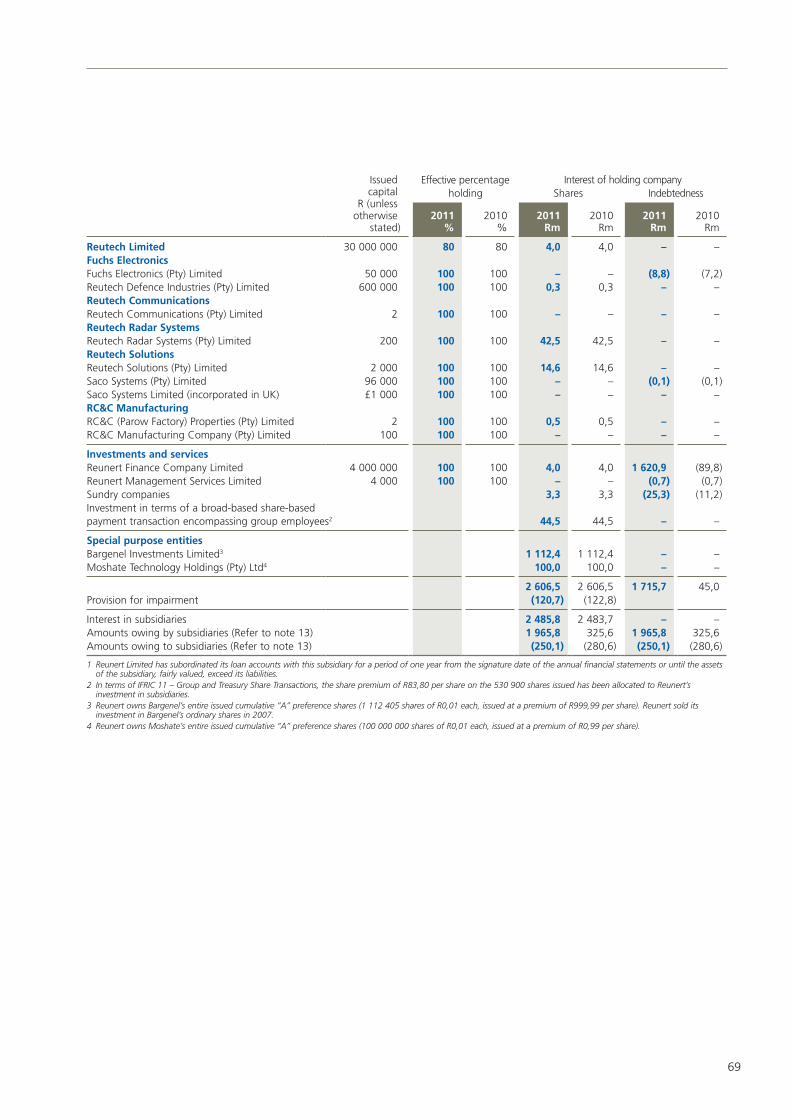
69
Issued capital
R (unlessotherwise
stated)
Effective percentage holding
Interest of holding companyShares Indebtedness
2011%
2010%
2011Rm
2010Rm
2011Rm
2010Rm
Reutech Limited 30 000 000 80 80 4,0 4,0 – – Fuchs Electronics Fuchs Electronics (Pty) Limited 50 000 100 100 – – (8,8) (7,2)Reutech Defence Industries (Pty) Limited 600 000 100 100 0,3 0,3 – – Reutech Communications Reutech Communications (Pty) Limited 2 100 100 – – – – Reutech Radar SystemsReutech Radar Systems (Pty) Limited 200 100 100 42,5 42,5 – – Reutech SolutionsReutech Solutions (Pty) Limited 2 000 100 100 14,6 14,6 – – Saco Systems (Pty) Limited 96 000 100 100 – – (0,1) (0,1)Saco Systems Limited (incorporated in UK) £1 000 100 100 – – – – RC&C ManufacturingRC&C (Parow Factory) Properties (Pty) Limited 2 100 100 0,5 0,5 – – RC&C Manufacturing Company (Pty) Limited 100 100 100 – – – –
Investments and servicesReunert Finance Company Limited 4 000 000 100 100 4,0 4,0 1 620,9 (89,8)Reunert Management Services Limited 4 000 100 100 – – (0,7) (0,7)Sundry companies 3,3 3,3 (25,3) (11,2)Investment in terms of a broad-based share-based payment transaction encompassing group employees2 44,5 44,5 – –
Special purpose entitiesBargenel Investments Limited3 1 112,4 1 112,4 – – Moshate Technology Holdings (Pty) Ltd4 100,0 100,0 – –
2 606,5 2 606,5 1 715,7 45,0 Provision for impairment (120,7) (122,8)
Interest in subsidiaries 2 485,8 2 483,7 – – Amounts owing by subsidiaries (Refer to note 13) 1 965,8 325,6 1 965,8 325,6 Amounts owing to subsidiaries (Refer to note 13) (250,1) (280,6) (250,1) (280,6)
1 Reunert Limited has subordinated its loan accounts with this subsidiary for a period of one year from the signature date of the annual financial statements or until the assets of the subsidiary, fairly valued, exceed its liabilities.
2 In terms of IFRIC 11 – Group and Treasury Share Transactions, the share premium of R83,80 per share on the 530 900 shares issued has been allocated to Reunert’s investment in subsidiaries.
3 Reunert owns Bargenel’s entire issued cumulative “A” preference shares (1 112 405 shares of R0,01 each, issued at a premium of R999,99 per share). Reunert sold its investment in Bargenel’s ordinary shares in 2007.
4 Reunert owns Moshate’s entire issued cumulative “A” preference shares (100 000 000 shares of R0,01 each, issued at a premium of R0,99 per share).
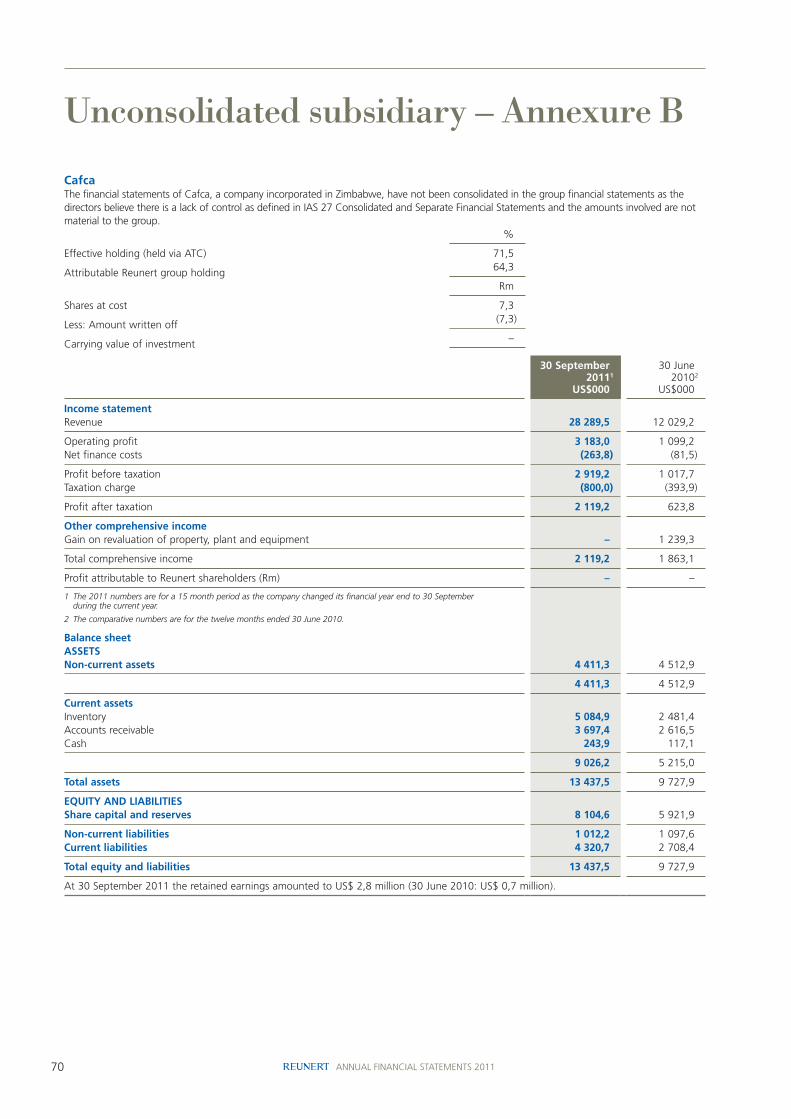
70 ANNUAL FINANCIAL STATEMENTS 2011
unconsolidated subsidiary – annexure B
CafcaThe financial statements of Cafca, a company incorporated in Zimbabwe, have not been consolidated in the group financial statements as the directors believe there is a lack of control as defined in IAS 27 Consolidated and Separate Financial Statements and the amounts involved are not material to the group.
%
Effective holding (held via ATC) 71,5
Attributable Reunert group holding 64,3
Rm
Shares at cost 7,3
Less: Amount written off (7,3)
Carrying value of investment –
30 September20111
US$000
30 June20102
US$000
Income statement Revenue 28 289,5 12 029,2
Operating profit 3 183,0 1 099,2Net finance costs (263,8) (81,5)
Profit before taxation 2 919,2 1 017,7Taxation charge (800,0) (393,9)
Profit after taxation 2 119,2 623,8
Other comprehensive incomeGain on revaluation of property, plant and equipment – 1 239,3
Total comprehensive income 2 119,2 1 863,1
Profit attributable to Reunert shareholders (Rm) – –
1 The 2011 numbers are for a 15 month period as the company changed its financial year end to 30 September during the current year.
2 The comparative numbers are for the twelve months ended 30 June 2010.
Balance sheetASSETSNon-current assets 4 411,3 4 512,9
4 411,3 4 512,9
Current assetsInventory 5 084,9 2 481,4Accounts receivable 3 697,4 2 616,5Cash 243,9 117,1
9 026,2 5 215,0
Total assets 13 437,5 9 727,9
EQUITY AND LIABILITIESShare capital and reserves 8 104,6 5 921,9
Non-current liabilities 1 012,2 1 097,6Current liabilities 4 320,7 2 708,4
Total equity and liabilities 13 437,5 9 727,9
At 30 September 2011 the retained earnings amounted to US$ 2,8 million (30 June 2010: US$ 0,7 million).
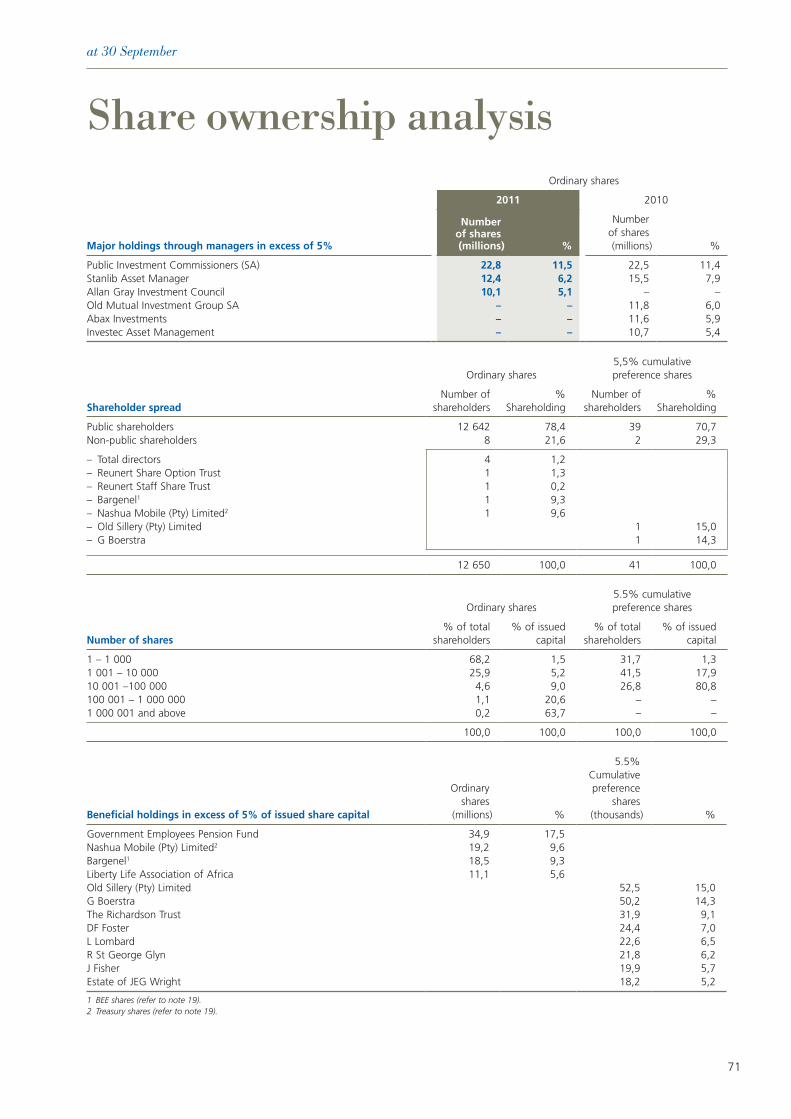
71
at 30 September
share ownership analysis Ordinary shares
2011 2010
Major holdings through managers in excess of 5%
Numberof shares(millions) %
Numberof shares(millions) %
Public Investment Commissioners (SA) 22,8 11,5 22,5 11,4 Stanlib Asset Manager 12,4 6,2 15,5 7,9 Allan Gray Investment Council 10,1 5,1 – –Old Mutual Investment Group SA – – 11,8 6,0 Abax Investments – – 11,6 5,9 Investec Asset Management – – 10,7 5,4
Ordinary shares5,5% cumulative preference shares
Shareholder spreadNumber of
shareholders%
ShareholdingNumber of
shareholders%
Shareholding
Public shareholders 12 642 78,4 39 70,7Non-public shareholders 8 21,6 2 29,3
– Total directors 4 1,2 – Reunert Share Option Trust 1 1,3 – Reunert Staff Share Trust 1 0,2 – Bargenel1 1 9,3 – Nashua Mobile (Pty) Limited2 1 9,6 – Old Sillery (Pty) Limited 1 15,0 – G Boerstra 1 14,3
12 650 100,0 41 100,0
Ordinary shares5.5% cumulativepreference shares
Number of shares% of total
shareholders % of issued
capital % of total
shareholders % of issued
capital
1 – 1 000 68,2 1,5 31,7 1,31 001 – 10 000 25,9 5,2 41,5 17,9 10 001 –100 000 4,6 9,0 26,8 80,8 100 001 – 1 000 000 1,1 20,6 – –1 000 001 and above 0,2 63,7 – –
100,0 100,0 100,0 100,0
Beneficial holdings in excess of 5% of issued share capital
Ordinary shares
(millions) %
5.5%Cumulativepreference
shares(thousands) %
Government Employees Pension Fund 34,9 17,5Nashua Mobile (Pty) Limited2 19,2 9,6Bargenel1 18,5 9,3Liberty Life Association of Africa 11,1 5,6Old Sillery (Pty) Limited 52,5 15,0G Boerstra 50,2 14,3The Richardson Trust 31,9 9,1DF Foster 24,4 7,0L Lombard 22,6 6,5R St George Glyn 21,8 6,2J Fisher 19,9 5,7Estate of JEG Wright 18,2 5,2
1 BEE shares (refer to note 19).2 Treasury shares (refer to note 19).

72 ANNUAL FINANCIAL STATEMENTS 2011
as at the Centre for Responsible Leadership at the University of Pretoria. He serves on the boards of the National Business Initiative, the Free Market Foundation, the READ Educational Trust and the advisory board of the University of Stellenbosch Business School.
Brand serves as non-executive director on the boards of the ABSA Group Limited, ABSA Bank Limited, RGT Smart Market Intelligence Limited, Italtile Limited, Tongaat Hulett Limited and Tata Africa Holdings. He is also a member of the global advisory board of the consultancy firm Alexander Proudfoot.
JC van der HorstIndependent non-executive director
DIRECTOR OF COMPANIES
BA, LLD
Appointed to the board in 1993 Date of birth: 4 February 1944
Johannes worked for Old Mutual from 1971 to 2002. He was general manager (investments) from 1985 to 1997.
In September 1997 he was appointed to lead Old Mutual’s demutualisation project, which culminated in July 1999 with its listing on the London Stock Exchange and the JSE Limited.
Over the past 25 years he has served on the boards of various companies listed on the JSE. He currently serves on the boards of Assore Limited and Foord Compas Limited.
R van RooyenIndependent non-executive director
DIRECTOR OF COMPANIES
CA (SA)
Appointed to the board 1 November 2009 Date of birth: 23 January 1949
Rynhardt retired in 2008 after 31 years as group general manager of Sasol. During his employment with Sasol he held various financial and commercial positions. At retirement he was a member of Sasol’s group executive committee and director and member of most of Sasol’s major subsidiaries and audit committees.
He is a director of Alert Steel Limited, Brikor Limited and WIP Investments Ninety Four (Pty) Limited. In addition, he is a trustee of the Sasol Pension Fund.
Board of directors and management
Chairman
TS MundayChairman, independent non-executive director
DIRECTOR OF COMPANIES
BCom
Appointed to the board from 1 June 2008 and as chairman from 1 June 2009 Date of birth: 12 September 1949
From 1971 Trevor held a wide-ranging number of financial and commercial management positions both in southern Africa and Europe. In the late 1980s he was appointed finance and commercial director of AECI Explosives and Chemicals Limited. In 1990 he was appointed managing director of Dulux Paints and, between 1996 and 2000, was managing director of Polifin Limited. In 2001 Trevor was appointed executive director and chief financial officer of Sasol Limited with responsibility also for corporate affairs and various other portfolios. Two years later he assumed global responsibility for Sasol’s chemicals businesses. In 2005 and 2006 he was deputy chief executive of Sasol Limited. At the end of 2006 he retired from executive roles and in 2007 became a non-executive director of various companies.
He serves as a board member of Absa Group Limited, Absa Bank Limited, Illovo Sugar Limited, Life Healthcare Group Holdings Limited and Iron Minerals Beneficiation Services (Pty) Limited.
YZ CubaIndependent non-executive director
EXECUTIVE DIRECTOR: DEVELOPMENT AND DECISION SUPPORT
BCom (Stats), BCom (Hons) (Acc), CA (SA)
Appointed to the board 1 January 2011 Date of birth: 17 September 1977
Yolanda is the executive director: development and decision support of SA Breweries and was previously the group chief executive officer of Mvelaphanda Group Ltd. She joined Mvelaphanda Holdings’ corporate finance division in January 2003. In July 2007 she was appointed chief executive officer of Mvelaphanda Group Limited, a position she held until the end of December 2010 after concluding the successful unbundling of the company.
Yolanda started her career in marketing with Robertsons’ Foods and then moved to Fisher Hoffman PKF, an auditing firm, where she completed her articles.
She serves on the boards of Absa Group Limited, Absa Bank Limited, Batho Bonke Capital (Pty) Limited, Business Venture Investments No.819, 821 and 906, Mvelaphanda Resources Limited, Reatile Resources (Pty) Limited, Vulani Amasango Investments (Pty) Limited, Z Capital (Pty) Limited and Steinhoff International Holdings Limited.
SD JagoeIndependent non-executive director
MERCHANT BANKER
BSc (Eng), MBA
Appointed to the board in 2000 Date of birth: 9 June 1951
Sean, who has 30 years’ experience in banking and finance, is a senior adviser with JP Morgan. Prior to joining JP Morgan, he worked at Fidelis Partners, Morgan Stanley, Rand Merchant Bank and the Industrial Development Corporation.
Sean also serves on the board of Ceramic Industries Limited, National Ceramic Industries Australia (Pty) Limited, and Fidelis Partners Limited and is a director of Peotona Development, a not-for-profit company.
TJ MotsohiIndependent non-executive director
STRATEGY CONSULTANT
BSc
Appointed to the board 1 June 2008 Date of birth: 9 November 1947
Thabang is a leading strategy consultant with over ten years’ experience helping organisations to deal with corporate strategy development and repositioning challenges in changing market environments. He has consulted to major corporate clients such as DBSA, SA Port Operations, Stats SA, City of Tshwane, FFC, Nozala and Transnet.
Thabang spent 13 years at executive level in the Civil Aviation Directorate in Lesotho. During this period he was elected vice-president of the African Civil Aviation Commission for the East African region for three years. He joined Transnet in 1994 and was promoted to the position of transformation strategist at Transnet Group as general manager in 1997 and to chief executive of PX in 1998, a position which he held until January 2000.
Thabang has attended executive management programmes at London Business School, University of Singapore and the Harvard Business School.
KW MzondekiIndependent non-executive director
DIRECTOR OF COMPANIES
BCom, ACCA (UK)
Appointed to the board 1 November 2009
Date of birth: 21 September 1967
Kholeka has held several senior finance positions across diverse industries. She was finance director at BP South Africa associate company. She joined 3M South Africa as corporate accountant and assumed the role of general manager finance. She has worked for Eskom in the consulting and treasury departments.
She serves on the audit committees of the United Nations World Food Programme and Lovelife, is a non-executive director of Sentula Mining, Bauba Platinum and is a Council member of the Association of Chartered Certified Accountants in London. In 2008, Kholeka was a finalist in the BWA/Nedbank Businesswoman of the Year competition.
She also provides interim management on a contractual basis for companies in transformational change.
NDB OrleynNon-executive director
DIRECTOR OF COMPANIES
BJuris, BProc LLB
Appointed to the board in 2007 Date of birth: 13 January 1956
Thandi is a director and shareholder of Peotona, an investment company owned and managed by four women – Cheryl Carolus, Wendy Lucas-Bull, Dolly Mokgatle and herself. She is also a mediator and arbitrator for Tokiso Dispute Settlement. She is a member of the Competition Tribunal. Thandi is an adjunct professor of Law at the University of Cape Town and a member of the University Council of the University of Fort Hare. She serves on the boards of Toyota SA (Pty) Limited, Arcelor Mittal South Africa Limited, Freeworld Coatings Limited, Tokiso Dispute Settlement (Pty) Limited, BP Southern Africa (Pty) Limited and Foster Wheeler South Africa (Pty) Limited.
Thandi was an attorney and regional director of the Legal Resources Centre, national director of the Commission for Conciliation, Mediation and Arbitration and national director of a commercial law firm. Thandi is an accredited mediator with the Centre for Effective Dispute Resolution.
SG PretoriusIndependent non-executive director
DIRECTOR OF COMPANIES
MCom (Business Economics)
Appointed to the board 22 February 2011 Date of birth: 15 February 1948
Brand Pretorius started his career at Toyota South Africa in March 1973. Following a number of management positions in research, planning, sales and marketing he was appointed managing director of Toyota SA Marketing in 1988. In March 1995 he joined McCarthy Motor Holdings and was promoted to chief executive officer of the holding company, McCarthy Limited, in October 1999. He retired as an executive director of McCarthy and its controlling shareholder Bidvest, on 1 March 2011.
Brand has received numerous national marketing and leadership awards. He holds honorary professorships at the University of Johannesburg and the University of the Free State and is a Fellow in Leadership at the Gordon Institute of Business Science as well
Non-executive directors
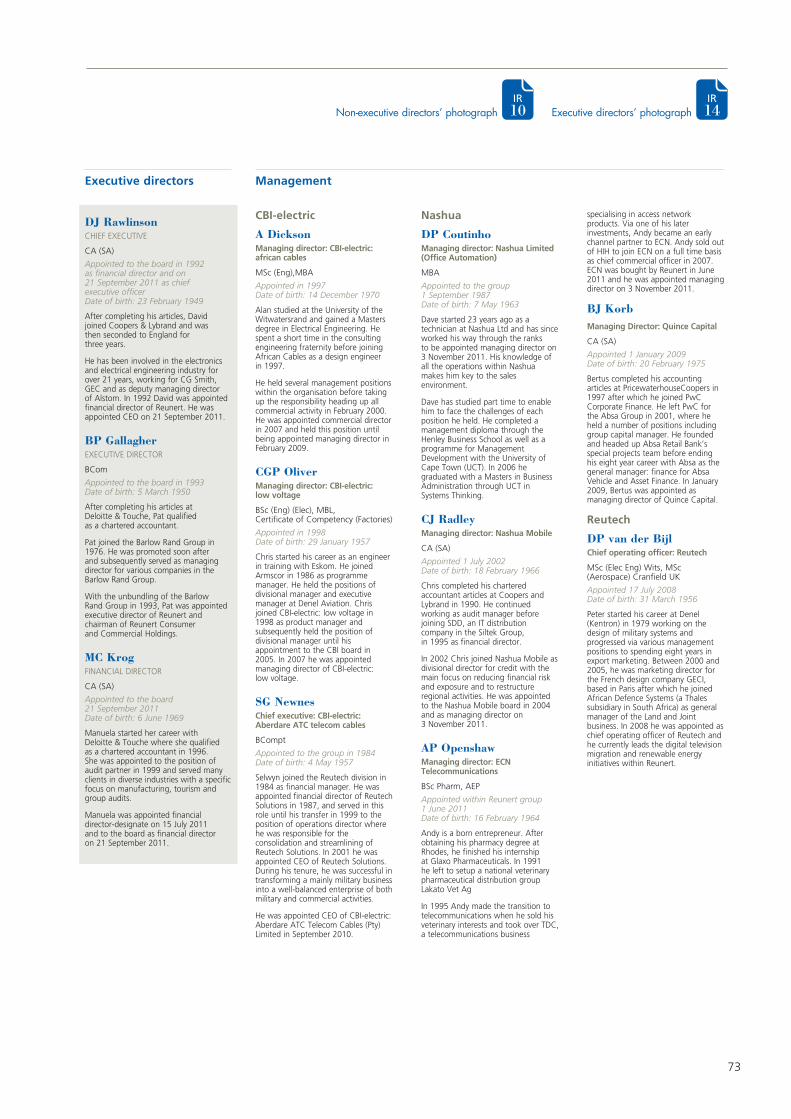
73
IR 14Executive directors’ photograph
DJ RawlinsonCHIEF EXECUTIVE
CA (SA)
Appointed to the board in 1992 as financial director and on 21 September 2011 as chief executive officer Date of birth: 23 February 1949
After completing his articles, David joined Coopers & Lybrand and was then seconded to England for three years.
He has been involved in the electronics and electrical engineering industry for over 21 years, working for CG Smith, GEC and as deputy managing director of Alstom. In 1992 David was appointed financial director of Reunert. He was appointed CEO on 21 September 2011.
BP GallagherEXECUTIVE DIRECTOR
BCom
Appointed to the board in 1993 Date of birth: 5 March 1950
After completing his articles at Deloitte & Touche, Pat qualified as a chartered accountant.
Pat joined the Barlow Rand Group in 1976. He was promoted soon after and subsequently served as managing director for various companies in the Barlow Rand Group.
With the unbundling of the Barlow Rand Group in 1993, Pat was appointed executive director of Reunert and chairman of Reunert Consumer and Commercial Holdings.
MC KrogFINANCIAL DIRECTOR
CA (SA)
Appointed to the board 21 September 2011 Date of birth: 6 June 1969
Manuela started her career with Deloitte & Touche where she qualified as a chartered accountant in 1996. She was appointed to the position of audit partner in 1999 and served many clients in diverse industries with a specific focus on manufacturing, tourism and group audits.
Manuela was appointed financial director- designate on 15 July 2011 and to the board as financial director on 21 September 2011.
Executive directors Management
CBI-electric
A DicksonManaging director: CBI-electric: african cables
MSc (Eng),MBA
Appointed in 1997 Date of birth: 14 December 1970
Alan studied at the University of the Witwatersrand and gained a Masters degree in Electrical Engineering. He spent a short time in the consulting engineering fraternity before joining African Cables as a design engineer in 1997.
He held several management positions within the organisation before taking up the responsibility heading up all commercial activity in February 2000. He was appointed commercial director in 2007 and held this position until being appointed managing director in February 2009.
CGP OliverManaging director: CBI-electric: low voltage
BSc (Eng) (Elec), MBL, Certificate of Competency (Factories)
Appointed in 1998 Date of birth: 29 January 1957
Chris started his career as an engineer in training with Eskom. He joined Armscor in 1986 as programme manager. He held the positions of divisional manager and executive manager at Denel Aviation. Chris joined CBI-electric: low voltage in 1998 as product manager and subsequently held the position of divisional manager until his appointment to the CBI board in 2005. In 2007 he was appointed managing director of CBI-electric: low voltage.
SG NewnesChief executive: CBI-electric: Aberdare ATC telecom cables
BCompt
Appointed to the group in 1984 Date of birth: 4 May 1957
Selwyn joined the Reutech division in 1984 as financial manager. He was appointed financial director of Reutech Solutions in 1987, and served in this role until his transfer in 1999 to the position of operations director where he was responsible for the consolidation and streamlining of Reutech Solutions. In 2001 he was appointed CEO of Reutech Solutions. During his tenure, he was successful in transforming a mainly military business into a well-balanced enterprise of both military and commercial activities.
He was appointed CEO of CBI-electric: Aberdare ATC Telecom Cables (Pty) Limited in September 2010.
Nashua
DP CoutinhoManaging director: Nashua Limited (Office Automation)
MBA
Appointed to the group 1 September 1987 Date of birth: 7 May 1963
Dave started 23 years ago as a technician at Nashua Ltd and has since worked his way through the ranks to be appointed managing director on 3 November 2011. His knowledge of all the operations within Nashua makes him key to the sales environment.
Dave has studied part time to enable him to face the challenges of each position he held. He completed a management diploma through the Henley Business School as well as a programme for Management Development with the University of Cape Town (UCT). In 2006 he graduated with a Masters in Business Administration through UCT in Systems Thinking.
CJ RadleyManaging director: Nashua Mobile
CA (SA)
Appointed 1 July 2002 Date of birth: 18 February 1966
Chris completed his chartered accountant articles at Coopers and Lybrand in 1990. He continued working as audit manager before joining SDD, an IT distribution company in the Siltek Group, in 1995 as financial director.
In 2002 Chris joined Nashua Mobile as divisional director for credit with the main focus on reducing financial risk and exposure and to restructure regional activities. He was appointed to the Nashua Mobile board in 2004 and as managing director on 3 November 2011.
AP Openshaw Managing director: ECN Telecommunications
BSc Pharm, AEP
Appointed within Reunert group 1 June 2011 Date of birth: 16 February 1964
Andy is a born entrepreneur. After obtaining his pharmacy degree at Rhodes, he finished his internship at Glaxo Pharmaceuticals. In 1991 he left to setup a national veterinary pharmaceutical distribution group Lakato Vet Ag
In 1995 Andy made the transition to telecommunications when he sold his veterinary interests and took over TDC, a telecommunications business
specialising in access network products. Via one of his later investments, Andy became an early channel partner to ECN. Andy sold out of HIH to join ECN on a full time basis as chief commercial officer in 2007. ECN was bought by Reunert in June 2011 and he was appointed managing director on 3 November 2011.
BJ KorbManaging Director: Quince Capital
CA (SA)
Appointed 1 January 2009 Date of birth: 20 February 1975
Bertus completed his accounting articles at PricewaterhouseCoopers in 1997 after which he joined PwC Corporate Finance. He left PwC for the Absa Group in 2001, where he held a number of positions including group capital manager. He founded and headed up Absa Retail Bank’s special projects team before ending his eight year career with Absa as the general manager: finance for Absa Vehicle and Asset Finance. In January 2009, Bertus was appointed as managing director of Quince Capital.
Reutech
DP van der Bijl Chief operating officer: Reutech
MSc (Elec Eng) Wits, MSc (Aerospace) Cranfield UK
Appointed 17 July 2008 Date of birth: 31 March 1956
Peter started his career at Denel (Kentron) in 1979 working on the design of military systems and progressed via various management positions to spending eight years in export marketing. Between 2000 and 2005, he was marketing director for the French design company GECI, based in Paris after which he joined African Defence Systems (a Thales subsidiary in South Africa) as general manager of the Land and Joint business. In 2008 he was appointed as chief operating officer of Reutech and he currently leads the digital television migration and renewable energy initiatives within Reunert.
IR 10Non-executive directors’ photograph
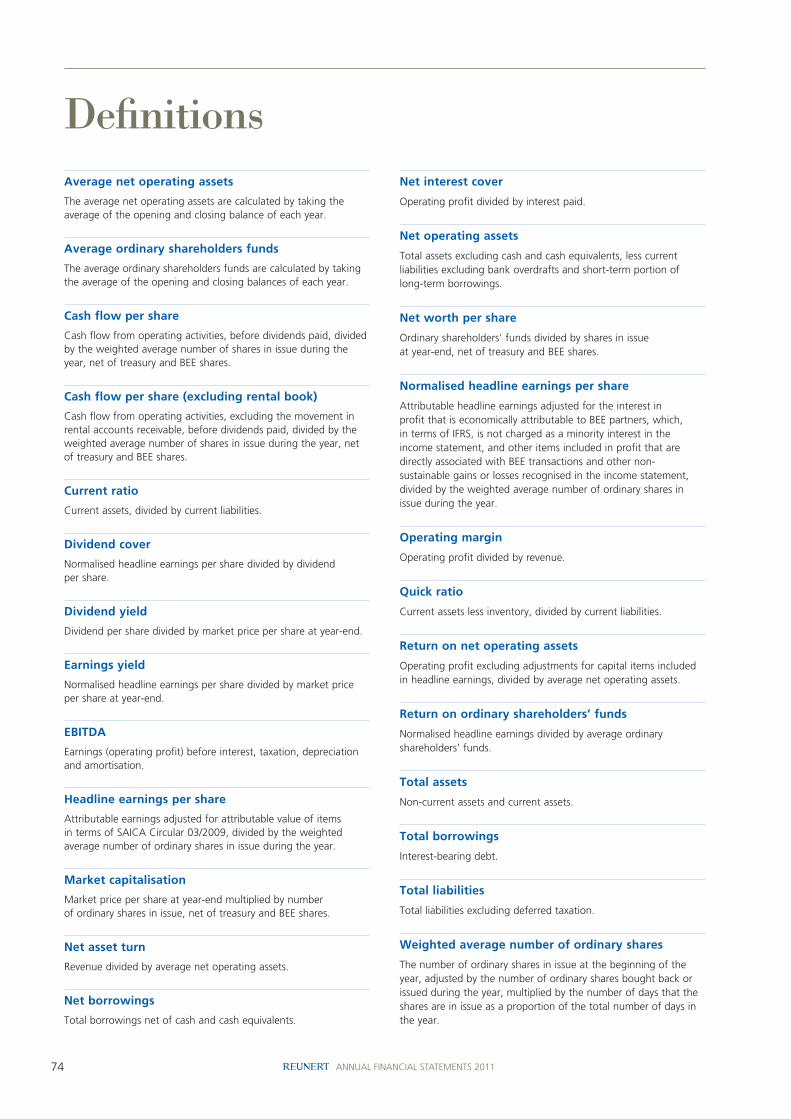
74 ANNUAL FINANCIAL STATEMENTS 2011
definitionsAverage net operating assets
The average net operating assets are calculated by taking the average of the opening and closing balance of each year.
Average ordinary shareholders funds
The average ordinary shareholders funds are calculated by taking the average of the opening and closing balances of each year.
Cash flow per share
Cash flow from operating activities, before dividends paid, divided by the weighted average number of shares in issue during the year, net of treasury and BEE shares.
Cash flow per share (excluding rental book)
Cash flow from operating activities, excluding the movement in rental accounts receivable, before dividends paid, divided by the weighted average number of shares in issue during the year, net of treasury and BEE shares.
Current ratio
Current assets, divided by current liabilities.
Dividend cover
Normalised headline earnings per share divided by dividend per share.
Dividend yield
Dividend per share divided by market price per share at year-end.
Earnings yield
Normalised headline earnings per share divided by market price per share at year-end.
EBITDA
Earnings (operating profit) before interest, taxation, depreciation and amortisation.
Headline earnings per share
Attributable earnings adjusted for attributable value of items in terms of SAICA Circular 03/2009, divided by the weighted average number of ordinary shares in issue during the year.
Market capitalisation
Market price per share at year-end multiplied by number of ordinary shares in issue, net of treasury and BEE shares.
Net asset turn
Revenue divided by average net operating assets.
Net borrowings
Total borrowings net of cash and cash equivalents.
Net interest cover
Operating profit divided by interest paid.
Net operating assets
Total assets excluding cash and cash equivalents, less current liabilities excluding bank overdrafts and short-term portion of long-term borrowings.
Net worth per share
Ordinary shareholders’ funds divided by shares in issue at year-end, net of treasury and BEE shares.
Normalised headline earnings per share
Attributable headline earnings adjusted for the interest in profit that is economically attributable to BEE partners, which, in terms of IFRS, is not charged as a minority interest in the income statement, and other items included in profit that are directly associated with BEE transactions and other non-sustainable gains or losses recognised in the income statement, divided by the weighted average number of ordinary shares in issue during the year.
Operating margin
Operating profit divided by revenue.
Quick ratio
Current assets less inventory, divided by current liabilities.
Return on net operating assets
Operating profit excluding adjustments for capital items included in headline earnings, divided by average net operating assets.
Return on ordinary shareholders’ funds
Normalised headline earnings divided by average ordinary shareholders’ funds.
Total assets
Non-current assets and current assets.
Total borrowings
Interest-bearing debt.
Total liabilities
Total liabilities excluding deferred taxation.
Weighted average number of ordinary shares
The number of ordinary shares in issue at the beginning of the year, adjusted by the number of ordinary shares bought back or issued during the year, multiplied by the number of days that the shares are in issue as a proportion of the total number of days in the year.
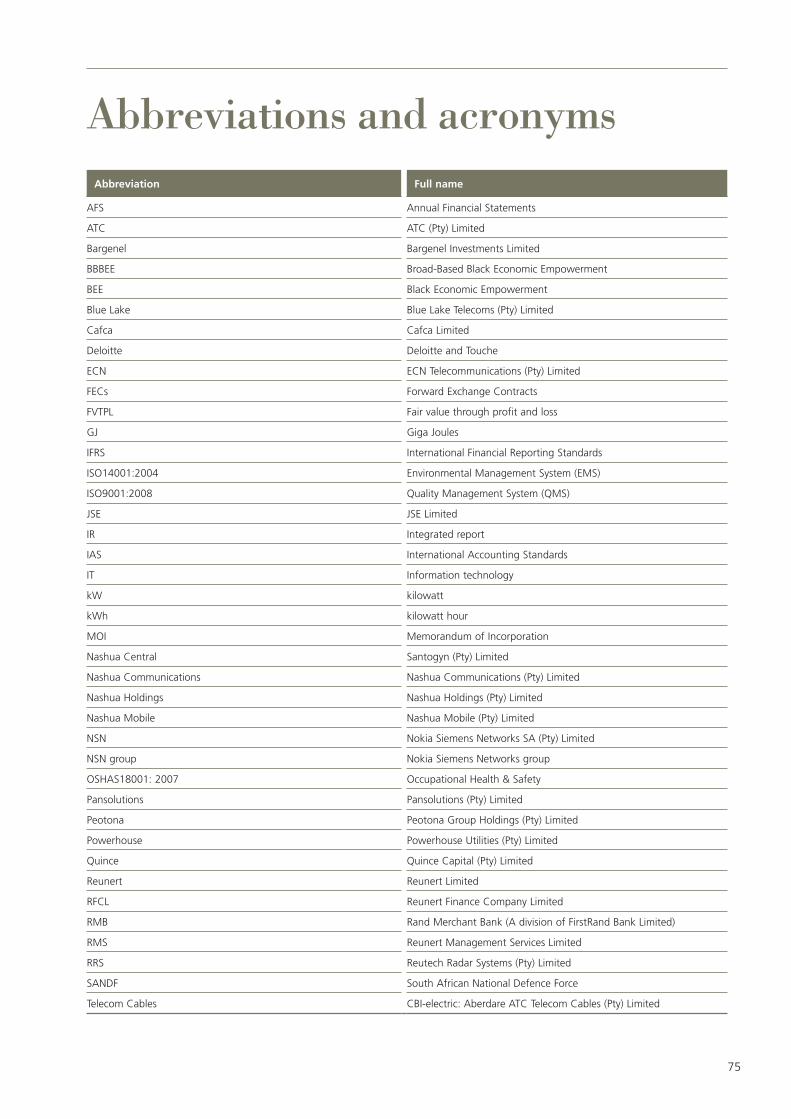
75
abbreviations and acronymsAbbreviation Full name
AFS Annual Financial Statements
ATC ATC (Pty) Limited
Bargenel Bargenel Investments Limited
BBBEE Broad-Based Black Economic Empowerment
BEE Black Economic Empowerment
Blue Lake Blue Lake Telecoms (Pty) Limited
Cafca Cafca Limited
Deloitte Deloitte and Touche
ECN ECN Telecommunications (Pty) Limited
FECs Forward Exchange Contracts
FVTPL Fair value through profit and loss
GJ Giga Joules
IFRS International Financial Reporting Standards
ISO14001:2004 Environmental Management System (EMS)
ISO9001:2008 Quality Management System (QMS)
JSE JSE Limited
IR Integrated report
IAS International Accounting Standards
IT Information technology
kW kilowatt
kWh kilowatt hour
MOI Memorandum of Incorporation
Nashua Central Santogyn (Pty) Limited
Nashua Communications Nashua Communications (Pty) Limited
Nashua Holdings Nashua Holdings (Pty) Limited
Nashua Mobile Nashua Mobile (Pty) Limited
NSN Nokia Siemens Networks SA (Pty) Limited
NSN group Nokia Siemens Networks group
OSHAS18001: 2007 Occupational Health & Safety
Pansolutions Pansolutions (Pty) Limited
Peotona Peotona Group Holdings (Pty) Limited
Powerhouse Powerhouse Utilities (Pty) Limited
Quince Quince Capital (Pty) Limited
Reunert Reunert Limited
RFCL Reunert Finance Company Limited
RMB Rand Merchant Bank (A division of FirstRand Bank Limited)
RMS Reunert Management Services Limited
RRS Reutech Radar Systems (Pty) Limited
SANDF South African National Defence Force
Telecom Cables CBI-electric: Aberdare ATC Telecom Cables (Pty) Limited
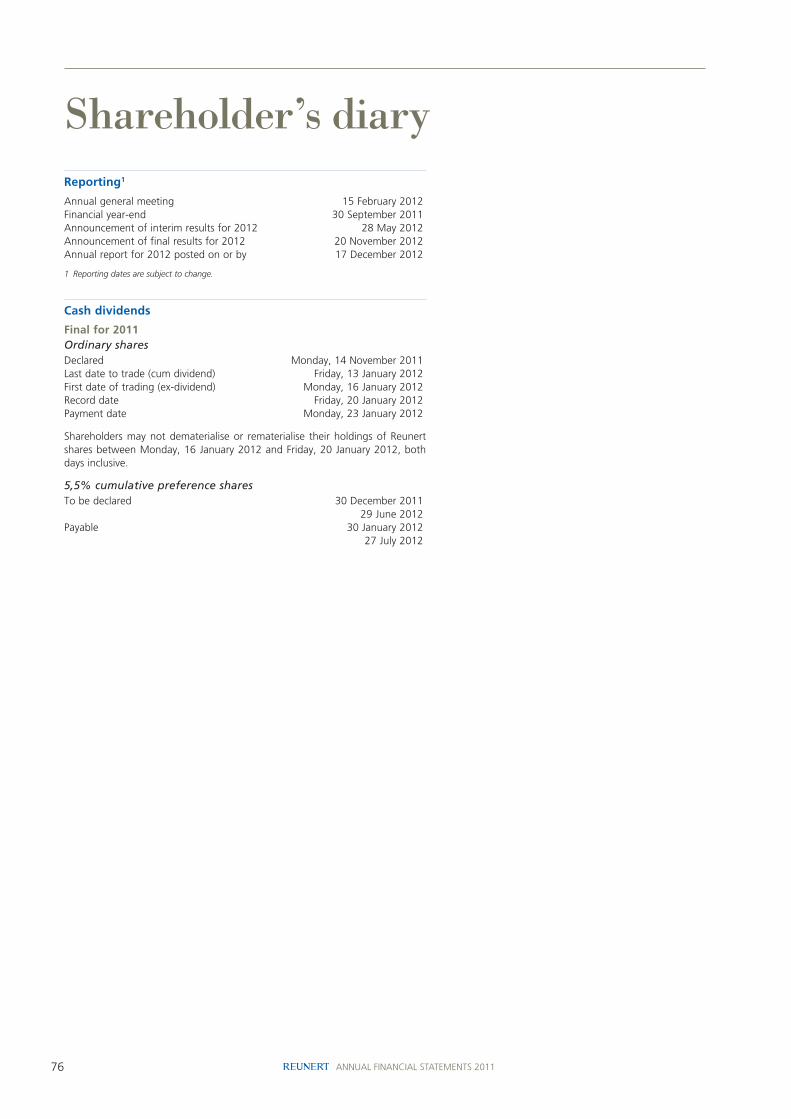
76 ANNUAL FINANCIAL STATEMENTS 2011
shareholder’s diaryReporting1
Annual general meeting 15 February 2012Financial year-end 30 September 2011Announcement of interim results for 2012 28 May 2012Announcement of final results for 2012 20 November 2012Annual report for 2012 posted on or by 17 December 2012
1 Reporting dates are subject to change.
Cash dividends
Final for 2011Ordinary sharesDeclared Monday, 14 November 2011Last date to trade (cum dividend) Friday, 13 January 2012First date of trading (ex-dividend) Monday, 16 January 2012Record date Friday, 20 January 2012Payment date Monday, 23 January 2012
Shareholders may not dematerialise or rematerialise their holdings of Reunert shares between Monday, 16 January 2012 and Friday, 20 January 2012, both days inclusive.
5,5% cumulative preference sharesTo be declared 30 December 2011 29 June 2012Payable 30 January 2012 27 July 2012

77
notice of annual general meetingREUNERT LIMITED
Incorporated in the Republic of South AfricaRegistration number: 1913/004355/06Share code: RLO ISIN code: ZAE000057428(“Reunert” or “the company”)
Notice is hereby given that the ninety-eighth annual general meeting (“AGM”) of shareholders of Reunert Limited will be held in the Reunert boardroom, Lincoln Wood Office Park, 6 – 10 Woodlands Drive, Woodmead, on Wednesday, 15 February 2012 at 09:00.
In terms of section 59(1) of the Companies Act, 71 of 2008 (“the Companies Act”), the record date for the purpose of determining which shareholders of the company are entitled to receive notice of the AGM is 9 December 2011, and the record date for purposes of determining which shareholders of the company are entitled to participate in and vote at the AGM is Friday, 3 February 2012. Accordingly, the last date to trade in order to be registered in the register of members of the company and therefore be eligible to participate in and vote at the AGM is Friday, 27 January 2012.
Memorandum of incorporation
The Companies Act came into effect on 1 May 2011 (“the effective date”). From the effective date, the company’s Memorandum of Association and its Articles of Association automatically became known as its Memorandum of Incorporation (“MOI”).
Who may attend?
If you hold dematerialised shares which are registered in your name or if you are the registered holder of certificated shares, you may:
» Attend the AGM in person; alternatively
» Appoint a proxy or proxies to represent you at the AGM and to attend, participate in and speak and vote in your stead by completing the attached proxy form in accordance with the instructions it contains.
If you hold dematerialised shares which are not registered in your name:
» And you wish to attend the AGM in person, or to appoint a proxy to attend in your stead, you must obtain the requisite letter of representation authority from your Central Depository Participant (“CSDP”), broker or nominee as the case may be
» And you do not wish to attend the AGM, but would like your vote to be recorded, you should contact your CSDP, broker or nominee and furnish them with your voting instructions; and
» You must not complete the proxy form.
Who may vote?
On a show of hands every shareholder present in person or by proxy, and if a member is a body corporate, its representatives, shall have one vote, and on a poll every shareholder present in person or represented by proxy and, if the person is a body corporate, its representative, shall have the number of votes determined in accordance with the voting rights associated with the securities held by that shareholder.
In order to reflect the views of the shareholders, all resolutions and substantive decisions will be put to vote on a poll, it takes into account the number of shares held by each shareholder.
Electronic participation
As required in terms of section 61(10) of the Companies Act, the company will make provision for shareholders or their proxies to participate in the AGM by way of electronic communication. Such shareholder (or proxy) will need to contact the company at +27 11 517 9000 by 13 February 2012, so that the company can provide for a teleconference dial-in facility. Shareholders must ensure that, when such shareholder intends participating in the AGM via teleconference, that the voting proxies are sent through to the share transfer secretaries, Computershare Investor Services (Proprietary) Limited, at the address provided above by not later than 24 hours before the time fixed for the meeting (excluding Saturdays, Sundays and public holidays).
Participants must dial the following telephone number, five minutes prior to the starting time of the AGM: 010 201 6617.
You will be asked for a guest pass key which is 2850181 followed by the hash key (#).
There is no additional cost to the shareholder making use of this service.
Financial statements
The consolidated audited annual financial statements of the company and its subsidiaries, incorporating the report of the external auditors, the audit committee and the directors for the year ended 30 September 2011 will be presented to shareholders as required in terms of section 30(3)(d) of the Companies Act.
General purpose of the AGM
The general purpose of this meeting is to present to the shareholders the following:
» the directors’ report
» the audited financial statements for the year ended 2011
» the audit committee report
» and to deal with any other business as may lawfully be dealt with at the AGM, and to consider and, if deemed fit, to pass, with or without modification, the resolutions as set out below.
Ordinary business
In order for the following ordinary resolutions to be adopted, the support of more than 50% (fifty per cent) of the voting rights exercised on the resolution by shareholders present in person, or represented by proxy, at the AGM is required.
Resolved that each of the following persons, who retire from office at this meeting and who are eligible for re-election, offer themselves to be re-elected as a director of the company. Each of which constitutes an ordinary resolution and will be considered by separate votes. Brief biographies of these directors are set out on pages 72 to 73 of the annual financial statements of which this notice forms part.

78 ANNUAL FINANCIAL STATEMENTS 2011
notice of annual general meeting continued
Ordinary resolution number 1Re-election of Mr SG Pretorius as a director
Ordinary resolution number 2Re-election of Mr DJ Rawlinson as chief executive
Ordinary resolution number 3Re-election of Ms KW Mzondeki as a director
Ordinary resolution number 4Re-election of Ms MC Krog as a director
Ordinary resolution number 5Re-election of Mr R van Rooyen as a director
Ordinary resolution number 6Re-appointment of external auditors
“Resolved to re-appoint Deloitte & Touche Limited (“Deloitte”) as the independent auditor of the company and to appoint Mr Patrick Smit as the individual designated auditor (the designated auditor meeting the requirements of section 90(2)) of the Companies Act to hold office until the conclusion of the next AGM of the company.”
Ordinary resolution number 7Reservation of Shares for the purposes of the Reunert 1985 Share Option Scheme and Reunert 1988 Share Purchase Scheme
“Resolved that 650 000 (six hundred and fifty thousand) of the unissued ordinary shares of R0,10 (ten cents) each in the authorised capital of the company be reserved to meet the requirements of the Reunert 1985 Share Option Scheme and the Reunert 1988 Share Purchase Scheme and that the directors be and they are hereby specifically authorised to allot and issue those shares in terms of the scheme for the purposes of the Reunert 1985 Share Option Scheme and the 1988 Share Purchase Scheme.”
Ordinary resolution number 8Reservation of Shares for the purposes of the Reunert 2006 Share Option Scheme
“Resolved that 1 650 000 (one million six hundred and fifty thousand) of the unissued ordinary shares of R0,10 (ten cents) each in the authorised capital of the company be reserved to meet the requirements of the Reunert 2006 Share Option Scheme and that the directors be and are hereby specifically authorised to allot and issue those shares in terms of the scheme for the purposes of the Reunert 2006 Share Option Scheme.”
Ordinary resolution number 9Endorsement of the Reunert remuneration policy
“Resolved to approve, by way of a non-binding, advisory vote, the company’s remuneration policy. A summary of the company’s executive remuneration policy is set out in pages 64 and 65 of the integrated report.”
Resolved that each of the following independent directors, who are eligible and who fulfills the requirements contemplated in section 94(4) of the Companies Act and offer themselves for re-election be and are hereby re-elected as member of the Reunert audit committee. Each of which constitutes an ordinary resolution and will be considered by separate votes. Brief biographies of these independent directors are set out on page 72 of this report.
Ordinary resolution number 10Election of Mr R van Rooyen as an audit committee member
Ordinary resolution number 11Election of Ms YZ Cuba as an audit committee member
Ordinary resolution number 12Election of Mr SD Jagoe as an audit committee member
Ordinary resolution number 13Election of Ms KW Mzondeki as an audit committee member
Directors’ responsibility statement
The directors, whose names are given on pages 72 and 73 of this report, collectively and individually accept full responsibility for the accuracy of the information pertaining to special resolution number 1 and certify that to the best of their knowledge and belief there are no facts that have been omitted which would make any statement false or misleading, and that all reasonable enquiries to ascertain such facts have been made and that this resolution contains all information required by law and by the JSE Listings Requirements.
Directors’ intention regarding the general authority to repurchase the company’s shares
Reunert commenced buying back its shares in the open market in mid-November 2010 and ceased buying on 4 February 2011. Reunert may recommence its share buying selectively after the announcement of its results in mid-November 2011.
Special business
In order for the following special resolutions to be adopted, the support of at least 75% (seventy-five per cent) of the voting rights exercised on the resolution by the shareholders present in person, or represented by proxy, at the AGM are required.
Special resolution number 1Explanation
The reason for special resolution number 1 is to grant the company’s directors a general authority, up to and including the date of the following annual general meeting of the company, to approve the company’s purchase of ordinary shares in itself, or to permit a subsidiary of the company to purchase ordinary shares in the company. Once adopted this special resolution will permit the company’s directors or any of its subsidiaries, to repurchase such ordinary shares in terms of the Companies Act, its MOI and the JSE Listings Requirements.
General authority to repurchase shares
“Resolved that the company hereby approves, as a general approval, the acquisitions by the company, and/or any subsidiary of the company, in terms of such subsidiaries’ MOI, as the case may be, and subject to the relevant subsidiary passing the necessary special resolution, be and is hereby authorised from time to time, of the issued ordinary shares of the company, upon such terms and conditions and in such amounts as the directors of the company may from time to time determine, but subject to the MOI of the company, the provisions of the Companies Act and the JSE Listings Requirements, when applicable, and provided that:

79
» the general repurchase of securities being effected through the order book operated by the JSE trading system and done without any prior arrangement between the company and the counter party or other manner approved by the JSE (reported trades are prohibited)
» this general authority shall not extend beyond 15 (fifteen) months from the date of this meeting or the date of the next AGM, whichever is the earlier date
» at any point in time, the company only appoints one agent to effect any repurchase(s) on its behalf
» the company or its subsidiaries are not repurchasing securities during a prohibited period as defined in paragraph 3.67 of the JSE Listings Requirements unless they have in place a repurchase programme where the dates and quantities of securities to be traded during the relevant period are fixed (not subject to any variation) and full details of the programme have been disclosed in an announcement on SENS prior to the commencement of the prohibited period
» when the company or its subsidiaries have cumulatively repurchased 3% (three per cent) of the shares in issue and for every 3% (three per cent) in aggregate of the initial number of that class acquired thereafter, an announcement will be made containing full details of such repurchase
» the general repurchase(s) may not in the aggregate in any one financial year exceed 20% (twenty per cent) of the number of shares in the company’s issued share capital at the beginning of the financial year provided that a subsidiary of the company may not hold at any one time more than 10% (ten per cent) of the number of issued shares of the company at the relevant times
» in determining the price at which the company’s ordinary shares are acquired by the company in terms of this general authority, the maximum premium at which such ordinary shares may be acquired will be no higher than 10% (ten per cent) of the weighted average of the market price at which such ordinary shares are traded on the JSE, as determined over the 5 (five) trading days immediately preceding the date of the repurchase of such ordinary shares by the company
» any such general repurchases are subject to exchange control regulations and approval at that point in time
» the directors undertake that, they will not affect a general repurchase of shares unless, for a period of 12 (twelve) months following the date of such repurchase
– the company and the group will, after payment for such repurchase, be able to repay their debts in the ordinary course of business as they become due
– the assets of the company and the group, being fairly valued in accordance with the International Financial Reporting Standards (“IFRS”) used in the latest annual financial statements are, after payment for such repurchase, in excess of the liabilities of the company and the group
– the company’s and the group’s share capital and reserves will, after payment for such repurchase, be adequate for ordinary business purposes
– the available working capital of the company and the group will, after payment for such repurchase, be adequate to continue the operations for ordinary business purposes
– prior to entering the market to repurchase the company’s securities, a board resolution to authorise the repurchase will have been passed in accordance with the requirements of section 46 of the Companies Act, and stating that the board has acknowledged that it has applied the solvency and liquidity test as set out in section 4 of the Companies Act and has reasonably concluded that the company will satisfy the solvency and liquidity test immediately after completing the proposed repurchase; and
– prior to entering the market to proceed with the repurchase, the company’s sponsor has complied with its responsibilities contained in Schedule 25 (working capital requirements) of the JSE Listings Requirements.
Section 48 of the Companies Act authorises the board of directors of the company to approve the acquisition of its own shares subject to the provisions of section 48 and section 46 having been met.
Special resolution number 2Directors’ remuneration
“Resolved that the remuneration proposed hereunder in respect of the directors of the company, for their services as directors, as contemplated in section 66(8), read with section 66(9) of the Companies Act, for the year commencing on 1 March 2012 be and is hereby approved – ”
Current feeper annum
Proposedfee perannum
Number of meetings
Current feeper additional
meeting
Proposed feeper additional
meeting
Chairman R720 0001 R775 0001 4 R30 0002 R32 0002
Non-executive directors R132 000 R150 000 4 R15 0002 R17 0002
Audit committee chairman R150 000 R161 000 3 R15 0003 R16 0003
Audit committee member R86 000 R92 500 3 R15 0003 R16 0003
Remuneration committee chairman R75 000 R80 500 2 R15 0004 R16 0004
Remuneration committee member R55 000 R59 000 2 R15 0004 R16 0004
Nomination committee chairman R63 000 R67 500 2 R15 0005 R16 0005
Nomination committee member R55 000 R59 000 2 R15 0005 R16 0005
Risk committee chairman R63 000 R67 500 2 R15 0006 R16 0006
Risk committee member R55 000 R59 000 2 R15 0006 R16 0006
Social, ethics and transformation committee chairman R63 000 R67 500 2 R15 0007 R16 0007
Social, ethics and transformation committee member R55 000 R59 000 2 R15 0007 R16 0007
Investment committee chairman and members R0 R0 Ad hoc R15 0008 R16 0008
1 The chairman is a member, or attends by invitation, all committee meetings. However, the fee is based on four board meetings per annum.
2 Only for an additional board meeting.3 Only for an additional audit committee meeting.4 Only for an additional remuneration committee meeting.
5 Only for an additional nomination committee meeting.6 Only for an additional risk committee meeting.7 Only for an additional social, ethics and transformation committee meeting.8 Only for ad-hoc meetings of the investment committee.

80 ANNUAL FINANCIAL STATEMENTS 2011
notice of annual general meeting continued
Special resolution number 2 is required in terms of section 66 of the Companies Act, which requires that directors’ remuneration for their services as directors may be paid by a company only in accordance with a special resolution approved by shareholders within the previous two years.
Special resolution number 3Amendment to the company’s MOI – clause 88 (Written resolutions of directors)
“Resolved that the MOI of the company be and is hereby amended by the deletion of the existing article 88 in its entirety and the replacement thereof with the following new article 88:
88.“The provisions of section 74 of the Companies Act, 2008 shall apply provided that a decision taken in terms of section 74 shall only be valid if all directors are notified in writing or by electronic communication, and approved by the majority of directors of whom the chief executive and the chairman of the board or the chairman of the audit committee shall be mandatory signatories.”
Special resolution number 3 is required to amend the company’s MOI in order to align the MOI with the provision of the Companies Act, which provides for a majority of the directors to consent to written resolutions in terms of section 74 of the Companies Act.
The amended MOI is available for inspection by shareholders of the company at the company’s registered office.
Special resolution number 4Financial assistance to entities related or inter-related to the company
“Resolved that, as a general approval, the company may, in terms of section 45(3)(a)(ii) of the Companies Act, provide any direct or indirect financial assistance (“financial assistance” will herein have the meaning attributed to it in section 45(1) of the Companies Act) to any related or inter-related company/ies, subject to compliance with the remainder of section 45 of the Companies Act, as the board of directors of the company may deem fit and on the terms and conditions, to the recipient/s, in the form, nature and extent and for the amounts that the board of directors of the company may determine from time to time.”
The effect of special resolution number 4, if adopted, will be to confer the authority on the board of directors of the company to authorise financial assistance to companies related or inter-related to the company/ies as the board of directors may deem fit, on the terms and conditions, and for the amounts that the board of directors may determine from time to time, for a period of two years from the date of the adoption of the special resolution and in particular as specified in the special resolution. This special resolution number 4, if adopted, does not authorise the provision of financial assistance to a director or prescribed officer of the company.
Ordinary resolution number 14Signature of documents
“Resolved that any director or the company secretary be and is hereby authorised to do all such things and sign all such documents and agreements and procure the doing of all such things and signature of all documents as may be necessary and
take all such action as they consider necessary for or incidental to the implementation of the resolutions passed at the AGM of the company as set out in this notice.”
Additional disclosures
Other disclosures in terms of the JSE Listings Requirements:
The JSE Listings Requirements require the following disclosure, some of which are elsewhere in the report, as set out below:
Directors and management pages 72 and 73;Major shareholders of Reunert page 71;Directors’ interests and securities pages 7 and note 24;Share capital of the company note 19;Litigation statement page 1; andMaterial change page 1.
Voting and proxies
A shareholder entitled to attend and vote at the AGM is entitled to appoint a proxy or proxies to attend, speak and vote in his/her stead. A proxy need not be a shareholder of the company. For the convenience of registered shareholders of the company, a form of proxy is enclosed herewith. Proxy forms must be forwarded to reach the share transfer secretaries, Computershare Investor Services (Proprietary) Limited, 70 Marshall Street, Johannesburg, 2001 (PO Box 61051, Marshalltown, 2107, Johannesburg) so as to be received by them not later than 24 hours before the time fixed for the meeting (excluding Saturdays, Sundays and public holidays). Any forms of proxy not lodged by this time must be handed to the chairman of the AGM immediately prior to the AGM.
Proof of identification required
Section 63(1) of the Companies Act requires that any person who wishes to attend, participate in, and vote at the AGM, must present reasonably satisfactory identification at the meeting. A green bar-coded identification document issued by the South African Department of Home Affairs, a driver’s licence or a valid passport will be accepted as sufficient identification.
Shares held by a share trust or scheme will not have their votes at annual general meetings taken into account for the purposes of the resolutions proposed in terms of the JSE Listings Requirements.
Change of address and banking details
Shareholders are requested to notify any change of address or banking details to the share transfer secretaries.
By order of the board
Natasha CamheeGroup company secretarySandton
14 November 2011
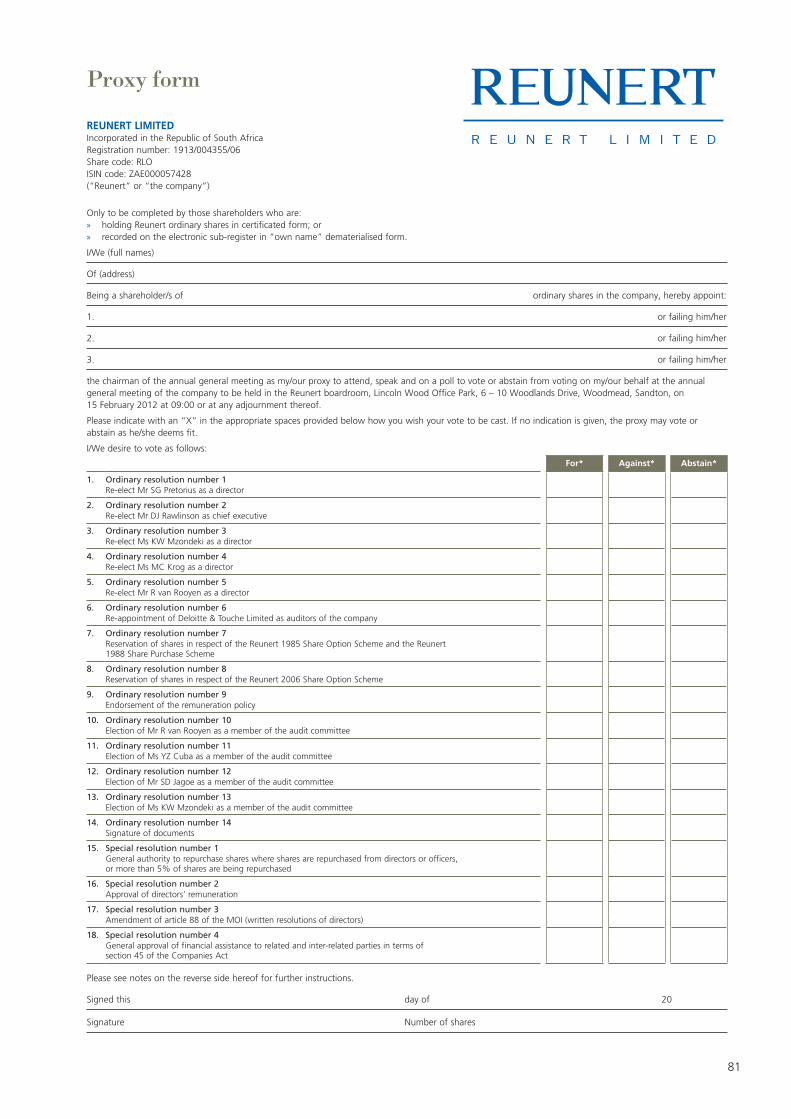
81
Proxy form
REUNERT LIMITEDIncorporated in the Republic of South AfricaRegistration number: 1913/004355/06Share code: RLO ISIN code: ZAE000057428(“Reunert” or “the company”)
Only to be completed by those shareholders who are: » holding Reunert ordinary shares in certificated form; or » recorded on the electronic sub-register in “own name” dematerialised form.
I/We (full names)
Of (address)
Being a shareholder/s of ordinary shares in the company, hereby appoint:
1. or failing him/her
2. or failing him/her
3. or failing him/her
the chairman of the annual general meeting as my/our proxy to attend, speak and on a poll to vote or abstain from voting on my/our behalf at the annual general meeting of the company to be held in the Reunert boardroom, Lincoln Wood Office Park, 6 – 10 Woodlands Drive, Woodmead, Sandton, on 15 February 2012 at 09:00 or at any adjournment thereof.
Please indicate with an “X” in the appropriate spaces provided below how you wish your vote to be cast. If no indication is given, the proxy may vote or abstain as he/she deems fit.
I/We desire to vote as follows:
For* Against* Abstain*
1. Ordinary resolution number 1Re-elect Mr SG Pretorius as a director
2. Ordinary resolution number 2Re-elect Mr DJ Rawlinson as chief executive
3. Ordinary resolution number 3Re-elect Ms KW Mzondeki as a director
4. Ordinary resolution number 4Re-elect Ms MC Krog as a director
5. Ordinary resolution number 5Re-elect Mr R van Rooyen as a director
6. Ordinary resolution number 6Re-appointment of Deloitte & Touche Limited as auditors of the company
7. Ordinary resolution number 7Reservation of shares in respect of the Reunert 1985 Share Option Scheme and the Reunert 1988 Share Purchase Scheme
8. Ordinary resolution number 8Reservation of shares in respect of the Reunert 2006 Share Option Scheme
9. Ordinary resolution number 9Endorsement of the remuneration policy
10. Ordinary resolution number 10Election of Mr R van Rooyen as a member of the audit committee
11. Ordinary resolution number 11Election of Ms YZ Cuba as a member of the audit committee
12. Ordinary resolution number 12Election of Mr SD Jagoe as a member of the audit committee
13. Ordinary resolution number 13Election of Ms KW Mzondeki as a member of the audit committee
14. Ordinary resolution number 14Signature of documents
15. Special resolution number 1General authority to repurchase shares where shares are repurchased from directors or officers, or more than 5% of shares are being repurchased
16. Special resolution number 2Approval of directors’ remuneration
17. Special resolution number 3Amendment of article 88 of the MOI (written resolutions of directors)
18. Special resolution number 4General approval of financial assistance to related and inter-related parties in terms of section 45 of the Companies Act
Please see notes on the reverse side hereof for further instructions.
Signed this day of 20
Signature Number of shares
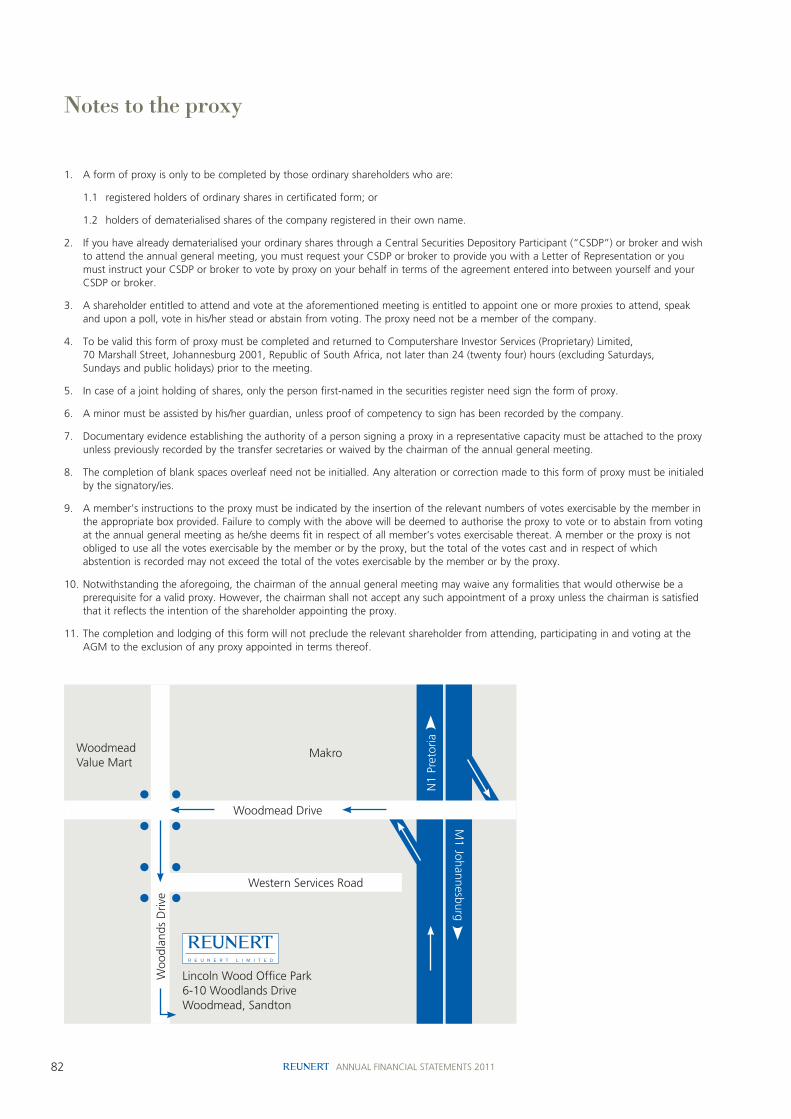
82 ANNUAL FINANCIAL STATEMENTS 2011
notes to the proxy
1. A form of proxy is only to be completed by those ordinary shareholders who are:
1.1 registered holders of ordinary shares in certificated form; or
1.2 holders of dematerialised shares of the company registered in their own name.
2. If you have already dematerialised your ordinary shares through a Central Securities Depository Participant (“CSDP”) or broker and wish to attend the annual general meeting, you must request your CSDP or broker to provide you with a Letter of Representation or you must instruct your CSDP or broker to vote by proxy on your behalf in terms of the agreement entered into between yourself and your CSDP or broker.
3. A shareholder entitled to attend and vote at the aforementioned meeting is entitled to appoint one or more proxies to attend, speak and upon a poll, vote in his/her stead or abstain from voting. The proxy need not be a member of the company.
4. To be valid this form of proxy must be completed and returned to Computershare Investor Services (Proprietary) Limited, 70 Marshall Street, Johannesburg 2001, Republic of South Africa, not later than 24 (twenty four) hours (excluding Saturdays, Sundays and public holidays) prior to the meeting.
5. In case of a joint holding of shares, only the person first-named in the securities register need sign the form of proxy.
6. A minor must be assisted by his/her guardian, unless proof of competency to sign has been recorded by the company.
7. Documentary evidence establishing the authority of a person signing a proxy in a representative capacity must be attached to the proxy unless previously recorded by the transfer secretaries or waived by the chairman of the annual general meeting.
8. The completion of blank spaces overleaf need not be initialled. Any alteration or correction made to this form of proxy must be initialed by the signatory/ies.
9. A member’s instructions to the proxy must be indicated by the insertion of the relevant numbers of votes exercisable by the member in the appropriate box provided. Failure to comply with the above will be deemed to authorise the proxy to vote or to abstain from voting at the annual general meeting as he/she deems fit in respect of all member’s votes exercisable thereat. A member or the proxy is not obliged to use all the votes exercisable by the member or by the proxy, but the total of the votes cast and in respect of which abstention is recorded may not exceed the total of the votes exercisable by the member or by the proxy.
10. Notwithstanding the aforegoing, the chairman of the annual general meeting may waive any formalities that would otherwise be a prerequisite for a valid proxy. However, the chairman shall not accept any such appointment of a proxy unless the chairman is satisfied that it reflects the intention of the shareholder appointing the proxy.
11. The completion and lodging of this form will not preclude the relevant shareholder from attending, participating in and voting at the AGM to the exclusion of any proxy appointed in terms thereof.
Woodmead Value Mart
Makro
Lincoln Wood Office Park6-10 Woodlands DriveWoodmead, Sandton
Woo
dlan
ds D
rive
Western Services Road
Woodmead Drive
N1
Pret
oria
M1 Johannesburg
83
Corporate administration and information
Reunert Limited
(Incorporated in the Republic of South Africa)
ISIN: ZAE000057428Short name: REUNERT Share code: RLO Currency: ZAR Registration number: 1913/004355/06 Founded: 1888Listed: 1948 Sector: Electronic & electrical equipment
Business address and registered office
Lincoln Wood Office Park6 – 10 Woodlands DriveWoodmead 2191SandtonSouth Africa
Postal addressPO Box 784391Sandton 2146South Africa
Telephone: +27 11 517 9000Telefax: +27 11 517 9035Website: www.reunert.com or www.reunert.co.za
Group company secretary
Natasha CamheeCIS, ACIBM, E067Group company secretaryEmail: [email protected]
Corporate information & investor relations
Carina de Klerk BA Comm, PGL4Communications and investor relations managerEmail: [email protected] or [email protected]
Share transfer secretaries
Computershare Investor Services (Pty) Limited70 Marshall StreetJohannesburg 2001 South Africa
Postal addressPO Box 61051Marshalltown 2107South Africa
Telephone: +27 11 370 5000Telefax: +27 11 688 5200Website: www.computershare.com
Auditors
Deloitte & ToucheDeloitte PlaceThe Woodlands20 Woodlands DriveWoodmead 2191South Africa
Telephone: +27 11 806 5000Telefax: +27 11 806 5003
Sponsor
Rand Merchant Bank (A division of FirstRand Bank Limited)
Principal bankers
Nedbank LimitedStandard Corporate and Merchant Bank
This report is printed on Magno, a paper produced in South Africa. It is certified by the Forest Stewardship Council and Programme for the Endorsement of Forest Certification Schemes (PEFC)/Chain of Custody. The paper is essentially chlorine free and manufactured from acid free pulp. Only wood from sustainable forests is used.