Embed Size (px)
Citation preview
Standard Bank Group
Annual integrated report 2014
ContentsAbout Standard Bank
Africa is our home, and we are focused on driving her growth.
With a heritage of over 150 years, we are a leading integrated financial services group on the African continent. We have an on-the-ground presence in 20 countries in sub-Saharan Africa, fit-for-purpose representation outside Africa and a strategic partnership with ICBC. This unique footprint supports our strategy to connect African markets to each other and to pools of capital globally.
We continue to position the group for the future, putting our customers and clients at the centre of everything we do. In line with the realities of risk, regulation, technology and competition that are shaping the African landscape, we are investing significantly in our diversified operations, our people and culture, our systems and infrastructure, and our brand. We understand that our commercial success over the long term depends on our social relevance and outcomes as a financial services organisation that serves the real economies of this continent we call home.
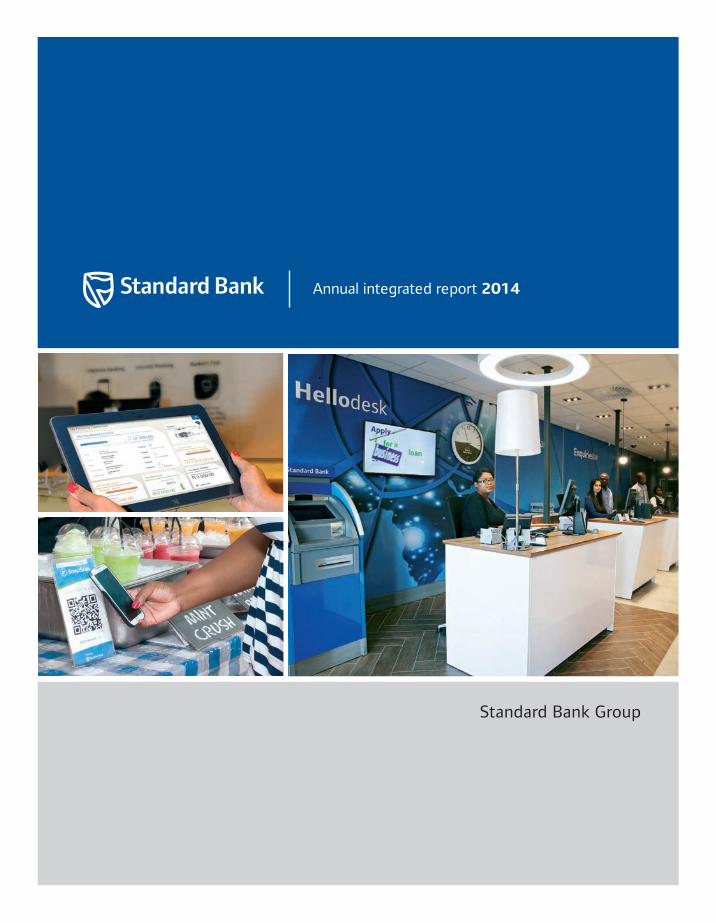
2014 2013
Headline earnings – continuing operations Rm 21 068 17 613
Headline earnings Rm 17 323 17 194
Group return on equity (ROE) % 12.9 14.1
ROE – rest of Africa % 21.5 19.7
Dividend per share cents 598 533
Tier I capital adequacy ratio % 12.9 13.2
Net asset value per share cents 8 625 8 089
IT costs as a % of operating expenditure % 25.3 24.7
Staff costs as a % of operating expenditure % 53.3 54.9
The financial results and related commentary is presented on a normalised basis, unless indicated as being on an IFRS basis. For further details regarding the dividend, refer to page 69.
98 Transparency and accountability
100 Chairman’s overview
102 Corporate governance report
104 • Board of directors
124 • Executive committee
133 Remuneration report
162 Shareholder information
164 Chairman’s letter to shareholders
165 Notice to members
173 Proxy forms
173 • Ordinary shareholders
175 • Preference shareholders
177 Shareholder analysis
179 Share statistics
180 Shareholders' diary
181 Instrument codes
182 Additional information
184 Directorate of key subsidiaries
185 Credit ratings
186 Financial and other definitions
189 Acronyms and abbreviations
192 International representation
195 Pro forma information
196 Contact details
1 Our reports
2 About this report
3 • Integrated thinking
4 Our business
6 How we create value
8 Our group strategic construct
10 Our operating context
12 Realising the Africa opportunity
14 Measuring our strategic progress
16 Responding to our stakeholders
18 Our socioeconomic impact
20 Our indirect environmental impact
22 Our performance
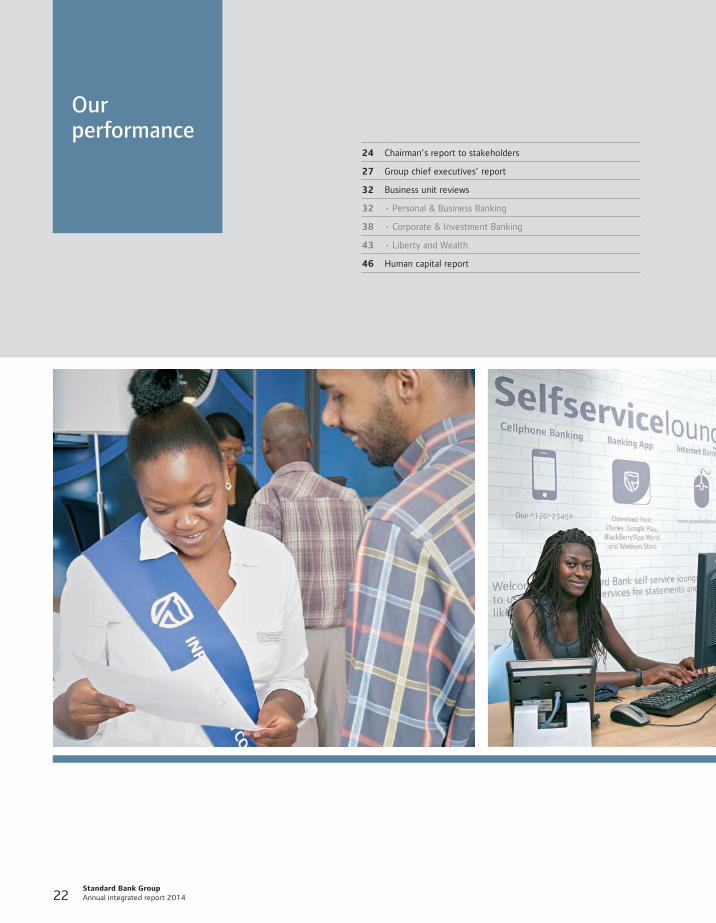
24 Chairman’s report to stakeholders
27 Group chief executives’ report
32 Business unit reviews
32 • Personal & Business Banking
38 • Corporate & Investment Banking
43 • Liberty and Wealth
46 Human capital report
52 IT report
54 Financial review
73 Key accounting concepts
76 Summarised annual financial statements
84 Summarised risk and capital management report
1
Frameworks applied Assurance Cross-referencing
Annual integrated report (this report)
As our primary report, our annual integrated report provides an integrated assessment of the group’s ability to create value over time.
www.standardbank.com/reporting
International <IR> Framework South African Companies Act
71 of 2008 (Companies Act) JSE Listings Requirements King Report on Corporate
Governance (King Code) South African Banks Act 94 of
1990 (Banks Act)
While the annual integrated report is not audited, it contains information extracted from the audited consolidated annual financial statements. Certain externally assured information has been extracted from the sustainability report.
AIR
Risk and capital management report
Provides a detailed discussion of the management of strategic risks related to the group’s banking and insurance operations, including capital and liquidity management and regulatory developments.
www.standardbank.com/reporting
Various regulations relating to financial services, including Basel III
International Financial Reporting Standards (IFRS)
King Code
Selected information in the risk and capital management report forms part of the audited annual financial statements.
RCMAFS
Annual financial statements
Sets out the full audited annual financial statements for Standard Bank Group (the group or SBG), including the report of the group audit committee (GAC).
www.standardbank.com/reporting
IFRS Companies Act JSE Listings Requirements King Code
KPMG Inc. and PricewaterhouseCoopers Inc. have audited the annual financial statements and expressed an unmodified opinion for the year ended 31 December 2014.
Standard Bank Group
Sustainability Report 2014
195405 Sustainability 2014.indd 1 2015/03/24 11:48 AM
Sustainability report
Presents a balanced and comprehensive analysis of the group’s sustainability performance in relation to issues material to the group and its stakeholders.
www.standardbank.com/sustainability
Global Reporting Initiative G4
KPMG Services Proprietary Limited have provided assurance over selected sustainability information in the 2014 sustainability report and expressed an unmodified opinion.
SR
Financial results presentation and booklet
Provides management’s analysis of financial results for the period and the performance of the group’s divisions. www.standardbank.com/reporting.
The Standard Bank of South Africa Limited annual report
The Standard Bank of South Africa (SBSA) is the group’s largest subsidiary. The group’s other subsidiaries also produce their own annual reports, some of which are available at www.standardbank.com/reporting.
As a separate listed entity, Liberty Holdings Limited (Liberty) prepares its own integrated report which is available at www.libertyholdings.co.za.
Denotes text in the risk and capital management report that forms part of the group’s audited financial statements.
Indicates that additional information is available online.
For the latest financial information, refer to our investor relations page at www.standardbank.com/reporting or scan the QR code to be taken there directly.
Our reports
The above icons refer readers to information elsewhere in this report, or in other reports that form part of the group’s suite of reporting publications.
We produce a full suite of reporting publications to cater for the diverse needs of our broad stakeholder base. The following reports, which support our annual integrated report, are tailored to meet our readers' specific information requirements.
Standard Bank Group Annual integrated report 2014 2
About this report
This interdependence requires that we conduct our business ethically and responsibly to create value in the long-term interest of society. Although our annual integrated report is aimed principally at providers of capital, it is also considered to be of interest to a diverse range of other stakeholders.
Scope and boundaryThe 2014 annual integrated report covers the period 1 January 2014 to 31 December 2014. All material matters up to group board of directors (board) approval on 4 March 2015 are included. The annual integrated report discusses our operations in South Africa, the rest of Africa and outside Africa; the terms we use to describe the geographic regions in which we operate. The acronyms and abbreviations used in this report are explained on page 189. Unless indicated otherwise, all data pertains to the group, which includes our banking operations, subsidiaries and Liberty. Any restatements of comparable information are noted as such. While group financial information is prepared according to IFRS, non-financial information deemed material is also included. Information relating only to SBSA, the group’s largest subsidiary and contributor to headline earnings, has been clearly marked.
Materiality determinationOur annual integrated report aims to present a balanced and succinct analysis of our strategy, performance, governance and prospects.
In determining the content to be included in this report, we consider the pertinent developments and initiatives, and the related performance indicators and future expectations that relate to our material issues. We consider an issue to be material if it is likely to impact our ability to achieve our strategy, and to remain commercially sustainable and socially relevant. In particular, material issues are those that have a strong bearing on our stakeholders’ assessments of the extent to which we fulfil their needs over the long term. We also take into account the factors that affect the economic growth and social stability of the countries and regions in which we do business.
In 2013 we undertook an extensive consultative process to determine the material issues that affect our longer-term sustainability. These issues are outlined in relation to our operating context on page 10, and form the lens for the narrative in this report. The specific short- to medium-term matters that relate to how we deliver on our strategy and manage each of these sustainability issues, are discussed with leadership every year in producing the annual integrated report. This year, we broadened this process with the aim of connecting risk disclosure more specifically to the strategic narrative.
Based on our leadership engagement, governance processes and our formal and informal stakeholder engagement initiatives, particularly with investors, we are confident that all material matters have been identified and disclosed in this report. The group audit committee recommends the integrated report for approval to the board. The board and various subcommittees review the report to ensure all material matters have been disclosed and appropriately discussed.
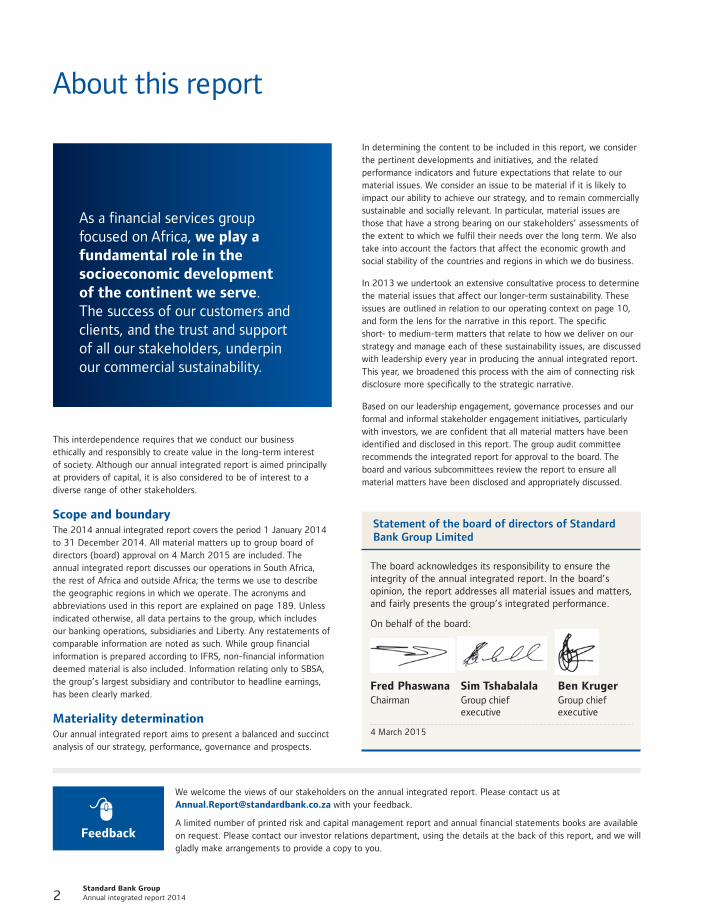
As a financial services group focused on Africa, we play a fundamental role in the socioeconomic development of the continent we serve. The success of our customers and clients, and the trust and support of all our stakeholders, underpin our commercial sustainability.
Statement of the board of directors of Standard Bank Group Limited
The board acknowledges its responsibility to ensure the integrity of the annual integrated report. In the board’s opinion, the report addresses all material issues and matters, and fairly presents the group’s integrated performance.
On behalf of the board:
Fred Phaswana Sim Tshabalala Ben KrugerChairman Group chief Group chief executive executive
4 March 2015
We welcome the views of our stakeholders on the annual integrated report. Please contact us at [email protected] with your feedback.
A limited number of printed risk and capital management report and annual financial statements books are available on request. Please contact our investor relations department, using the details at the back of this report, and we will gladly make arrangements to provide a copy to you.
Feedback
3
Financial capital
is the money we obtain from providers of capital that we use to support our business activities and invest in our strategy. Financial capital, which includes reserves generated through share capital, other equity-related funding and retained profits generated from our operations, is used to fund our business activities.
Natural capital
relates to the natural resources on which we depend to create value and returns for our stakeholders. As a financial services group we must deploy our financial capital in such a way that promotes the preservation or at least minimises the destruction of natural capital.
Manufactured capital
is our tangible and intangible infrastructure that we use to conduct our business activities, including our IT assets.
Human capital
refers to our people and how we select, manage and develop them. This enables them to utilise their skills, capabilities, knowledge and experience to improve and develop products and services that meet the needs of our customers and clients across the diverse regions in which we operate.
Intellectual capital
which includes the knowledge of our people and our intellectual property, brand and reputation, is closely related to financial, human and manufactured capital given the nature of our business.
Social and relationship capital
is the cooperative relationships with our customers, clients, capital providers, regulators and other stakeholders that we create, develop and maintain to remain socially relevant and operate as a responsible corporate citizen.
Our commercial sustainability depends on our effectiveness in
assisting Africa’s people, businesses and institutions to fulfil their
economic potential by facilitating payments, managing risk and
creating and preserving wealth. We intermediate between
providers of capital and employers of capital, providing the
former with competitive returns on their investments, and the
latter with access to the liquidity and capital they need to realise
their objectives.
These functions of our core business can in no way be separated
from our developing social and environmental context – whether
at local, national, regional or global level. Strong institutions are
essential to ensure market outcomes that are socially beneficial
in both the short and long term. These institutions include both
formal regulatory institutions and informal social institutions
such as civil society structures. Well-functioning businesses and
markets require appropriate regulation to continue as constructive
organs of society, to restore trust and to participate in the shared
interest of maintaining stable and thriving African economies and societies.
We believe that a community-minded worldview is integral to our legitimacy and represents a consistent and considered level of integrated thinking, which we continue to deepen within our organisation through our group strategic construct set out on page 8. In effect it corresponds to the capitals model of value creation, adopted by the International Integrated Reporting Council (IIRC) in the International <IR> Framework. While we have not formally adopted the six capitals categorisation, based on our understanding of the IIRC’s guidance, our report explains our dependence and impact on the forms of capital that are fundamental to our ability to create value over the long term. We have not structured this report using the capitals but have embedded them within each section to enable us to plot the interrelationships and trade-offs between them in relation to our group and business unit strategies. The capitals are introduced below.
Integrated thinking
Standard Bank Group Annual integrated report 2014 4
6 How we create value
8 Our group strategic construct
10 Our operating context
12 Realising the Africa opportunity
14 Measuring our strategic progress
16 Responding to our stakeholders
18 Our socioeconomic impact
20 Our indirect environmental impact
Our business
5
5
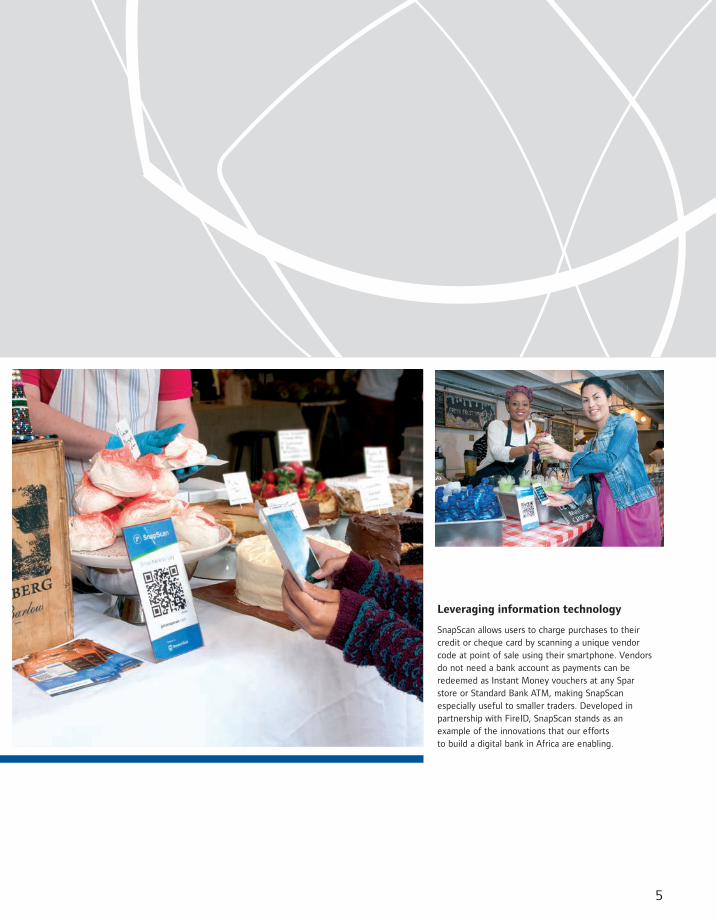
Leveraging information technology
SnapScan allows users to charge purchases to their credit or cheque card by scanning a unique vendor code at point of sale using their smartphone. Vendors do not need a bank account as payments can be redeemed as Instant Money vouchers at any Spar store or Standard Bank ATM, making SnapScan especially useful to smaller traders. Developed in partnership with FireID, SnapScan stands as an example of the innovations that our efforts to build a digital bank in Africa are enabling.
Standard Bank Group Annual integrated report 2014 6
Our business
How we create value
Net profit Retained equity which is reinvested to sustain and grow our business
Dividends to our shareholders
Taxes to governments
Business activityIncome
statement impactPrincipal risks arising
from this activity
Inco
me
afte
r cr
edit
im
pai
rmen
tsE
xpen
ses
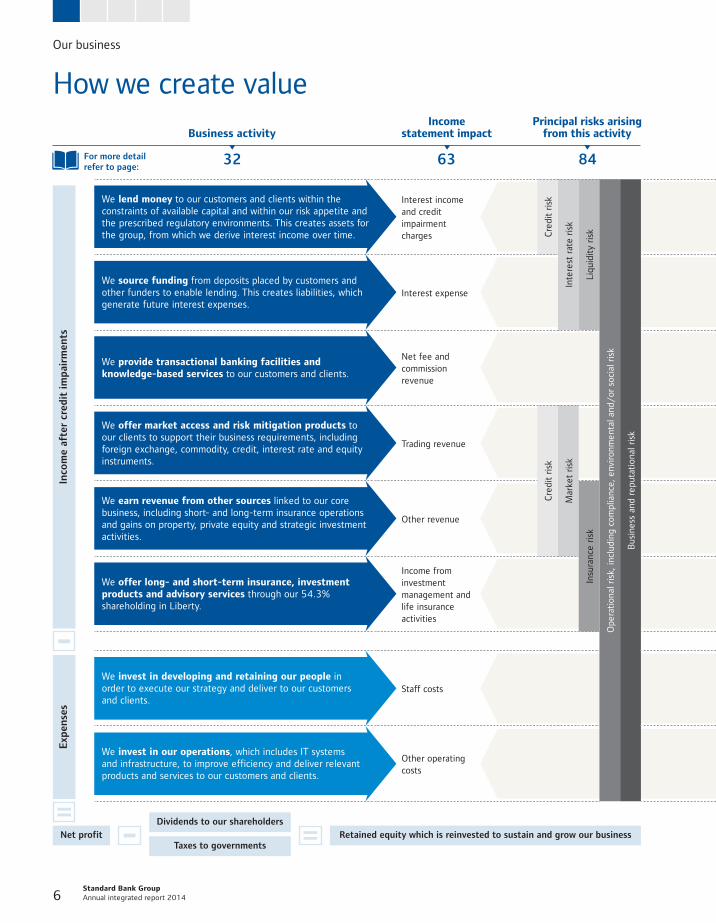
For more detail refer to page:
32 63 84
We lend money to our customers and clients within the constraints of available capital and within our risk appetite and the prescribed regulatory environments. This creates assets for the group, from which we derive interest income over time.
Interest income and credit impairment charges C
redi
t ri
sk
Inte
rest
rat
e ri
sk
Liqu
idit
y ri
sk
Ope
rati
onal
ris
k, in
clud
ing
com
plia
nce,
env
ironm
enta
l and
/or
soc
ial r
isk
Bus
ines
s an
d re
puta
tion
al r
isk
Lending enables our individual customers to create wealth by acquiring assets which either grow in value over time or which support their ability to generate income. For our small- and medium-sized enterprise (SME) clients, lending enables them to manage working capital constraints and cash flow, which supports their commercial sustainability and their role in driving employment and economic growth in Africa. For corporate clients, lending supports the continuity and growth of their businesses, contributing to job creation, sustainable supply of goods and services and the corporate tax base. We employ responsible lending practices and have mechanisms in place to assist distressed customers and clients, and we apply global best practice in mitigating social and environmental risks in projects that we finance.
We source funding from deposits placed by customers and other funders to enable lending. This creates liabilities, which generate future interest expenses.
Interest expense
Customer deposits earn interest at rates depending on the type of savings or investment product and the size of the deposit placed which mitigates against the erosion of capital due to inflation. We participate in equity and debt capital markets to source funding, which contributes to the continued functioning of the broader financial system. Our capital and liquidity management framework ensures that we are able to meet our funding requirements and payment obligations under both normal and stressed conditions, protect our depositors’ funds and reduce systemic risk in the domestic banking system.
We provide transactional banking facilities and knowledge-based services to our customers and clients.
Net fee and commission revenue
We facilitate the movement of money, enabling customers and clients to access their funds in a manner most convenient to them, by enabling electronic forms of payment and providing cash management services. Our knowledge-based services, which include corporate advisory and loan structuring services, allow our customers and clients to benefit from our experience and track record on the continent. We also facilitate payments to national revenue collection agencies via self-service electronic channels in a number of African countries, and offer banking services to multinational companies and donor agencies operating on the continent.
We offer market access and risk mitigation products to our clients to support their business requirements, including foreign exchange, commodity, credit, interest rate and equity instruments.
Trading revenue
Cre
dit
risk
Mar
ket
risk
Providing customers and clients with market access, for example through listings on equity exchanges to raise capital, enables them to grow their businesses, positively impacting on employment and the tax base. We market local equities to an international equity investor base, which creates a conduit for investment into Africa. To help our clients weather market fluctuations and volatilities, we offer risk mitigation products which enable financial protection and diversification through risk transfer. These risks are inherent in trading activities and can be more pronounced when operating in developing markets such as Africa. Supporting trading activities on the continent provides African countries with greater opportunities to monetise their resources and diversify their economies.
We earn revenue from other sources linked to our core business, including short- and long-term insurance operations and gains on property, private equity and strategic investment activities.
Other revenue
Insu
ranc
e ri
sk
By investing in activities other than in the ordinary course of normal business operations, such as property, private equity and strategic investment activities, we invest in non-core opportunities that support the economy and create additional value.
We offer long- and short-term insurance, investment products and advisory services through our 54.3% shareholding in Liberty.
Income from investment management and life insurance activities
Through short- and long-term insurance, investment products and advisory services we help our customers build and protect their wealth. Liberty also offers medical aid, life assurance and retirement products which assist individuals to remain productive members of society and protect themselves and their dependants against loss of income due to illness or at retirement. As an asset and portfolio manager, we are also an active participant in the private equity, property and other strategic investment markets.
We invest in developing and retaining our people in order to execute our strategy and deliver to our customers and clients.
Staff costs
We are a significant employer in many of the countries in which we operate. We aim to hire locally whenever possible as we believe that employees who reflect the diversity of communities within which we operate enables us to better meet the needs of our customers and clients. Through our training and development programmes we enhance the level of financial services and related skills in Africa. The employment multiplier effect means that for each job that we create we sustain, directly and indirectly, a number of other jobs in the local economy. As active consumers and taxpayers, our employees make a significant contribution to their local economies.
We invest in our operations, which includes IT systems and infrastructure, to improve efficiency and deliver relevant products and services to our customers and clients.
Other operating costs
Our ongoing investment in our business ensures that we remain competitive and sustainable, and thus able to continue to make a positive contribution to our host countries. Our substantial investments in transforming our core banking platforms position us to serve our customers and clients more effectively and to innovate, strengthening our competitive position. We are a significant procurer of goods and services in the markets in which we operate, given the scale of our operations. In South Africa, we focus on increasing our procurement spend with black suppliers and in the rest of Africa we aim to procure locally wherever possible. Our suppliers in turn create and sustain employment and form part of the corporate tax base in the countries in which they operate.
7
For specific examples of how our business activities contribute to broader value creation, see Realising the Africa opportunity on page 12, and for more information on our socioeconomic impact, see page 18.
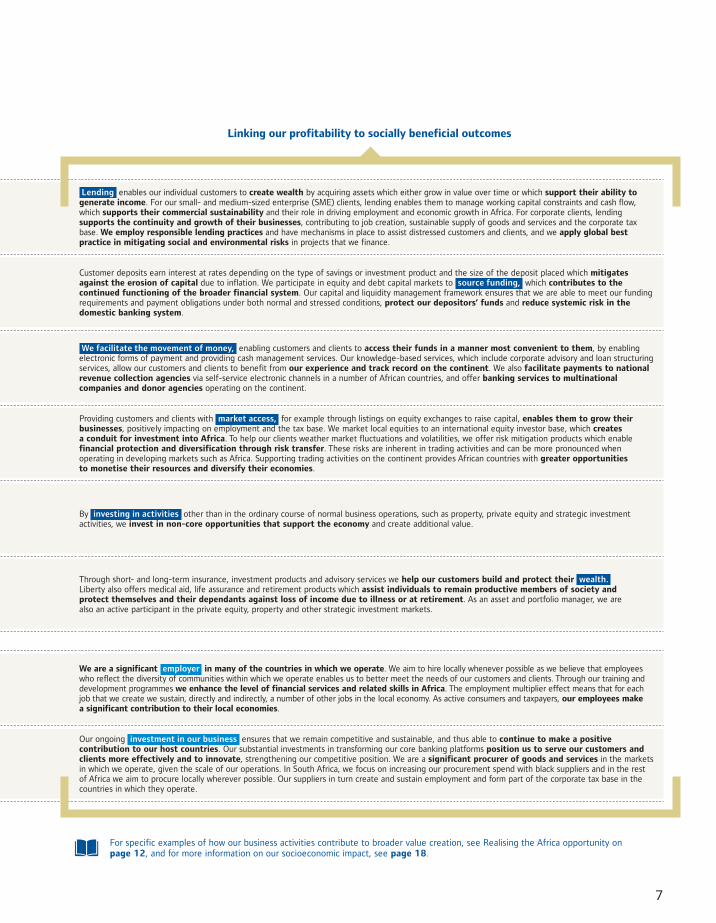
Linking our profitability to socially beneficial outcomes
We lend money to our customers and clients within the constraints of available capital and within our risk appetite and the prescribed regulatory environments. This creates assets for the group, from which we derive interest income over time.
Interest income and credit impairment charges C
redi
t ri
sk
Inte
rest
rat
e ri
sk
Liqu
idit
y ri
sk
Ope
rati
onal
ris
k, in
clud
ing
com
plia
nce,
env
ironm
enta
l and
/or
soc
ial r
isk
Bus
ines
s an
d re
puta
tion
al r
isk
Lending enables our individual customers to create wealth by acquiring assets which either grow in value over time or which support their ability to generate income. For our small- and medium-sized enterprise (SME) clients, lending enables them to manage working capital constraints and cash flow, which supports their commercial sustainability and their role in driving employment and economic growth in Africa. For corporate clients, lending supports the continuity and growth of their businesses, contributing to job creation, sustainable supply of goods and services and the corporate tax base. We employ responsible lending practices and have mechanisms in place to assist distressed customers and clients, and we apply global best practice in mitigating social and environmental risks in projects that we finance.
We source funding from deposits placed by customers and other funders to enable lending. This creates liabilities, which generate future interest expenses.
Interest expense
Customer deposits earn interest at rates depending on the type of savings or investment product and the size of the deposit placed which mitigates against the erosion of capital due to inflation. We participate in equity and debt capital markets to source funding, which contributes to the continued functioning of the broader financial system. Our capital and liquidity management framework ensures that we are able to meet our funding requirements and payment obligations under both normal and stressed conditions, protect our depositors’ funds and reduce systemic risk in the domestic banking system.
We provide transactional banking facilities and knowledge-based services to our customers and clients.
Net fee and commission revenue
We facilitate the movement of money, enabling customers and clients to access their funds in a manner most convenient to them, by enabling electronic forms of payment and providing cash management services. Our knowledge-based services, which include corporate advisory and loan structuring services, allow our customers and clients to benefit from our experience and track record on the continent. We also facilitate payments to national revenue collection agencies via self-service electronic channels in a number of African countries, and offer banking services to multinational companies and donor agencies operating on the continent.
We offer market access and risk mitigation products to our clients to support their business requirements, including foreign exchange, commodity, credit, interest rate and equity instruments.
Trading revenue
Cre
dit
risk
Mar
ket
risk
Providing customers and clients with market access, for example through listings on equity exchanges to raise capital, enables them to grow their businesses, positively impacting on employment and the tax base. We market local equities to an international equity investor base, which creates a conduit for investment into Africa. To help our clients weather market fluctuations and volatilities, we offer risk mitigation products which enable financial protection and diversification through risk transfer. These risks are inherent in trading activities and can be more pronounced when operating in developing markets such as Africa. Supporting trading activities on the continent provides African countries with greater opportunities to monetise their resources and diversify their economies.
We earn revenue from other sources linked to our core business, including short- and long-term insurance operations and gains on property, private equity and strategic investment activities.
Other revenue
Insu
ranc
e ri
sk
By investing in activities other than in the ordinary course of normal business operations, such as property, private equity and strategic investment activities, we invest in non-core opportunities that support the economy and create additional value.
We offer long- and short-term insurance, investment products and advisory services through our 54.3% shareholding in Liberty.
Income from investment management and life insurance activities
Through short- and long-term insurance, investment products and advisory services we help our customers build and protect their wealth. Liberty also offers medical aid, life assurance and retirement products which assist individuals to remain productive members of society and protect themselves and their dependants against loss of income due to illness or at retirement. As an asset and portfolio manager, we are also an active participant in the private equity, property and other strategic investment markets.
We invest in developing and retaining our people in order to execute our strategy and deliver to our customers and clients.
Staff costs
We are a significant employer in many of the countries in which we operate. We aim to hire locally whenever possible as we believe that employees who reflect the diversity of communities within which we operate enables us to better meet the needs of our customers and clients. Through our training and development programmes we enhance the level of financial services and related skills in Africa. The employment multiplier effect means that for each job that we create we sustain, directly and indirectly, a number of other jobs in the local economy. As active consumers and taxpayers, our employees make a significant contribution to their local economies.
We invest in our operations, which includes IT systems and infrastructure, to improve efficiency and deliver relevant products and services to our customers and clients.
Other operating costs
Our ongoing investment in our business ensures that we remain competitive and sustainable, and thus able to continue to make a positive contribution to our host countries. Our substantial investments in transforming our core banking platforms position us to serve our customers and clients more effectively and to innovate, strengthening our competitive position. We are a significant procurer of goods and services in the markets in which we operate, given the scale of our operations. In South Africa, we focus on increasing our procurement spend with black suppliers and in the rest of Africa we aim to procure locally wherever possible. Our suppliers in turn create and sustain employment and form part of the corporate tax base in the countries in which they operate.
Our business
Standard Bank Group Annual integrated report 2014 8
Our group strategic construct
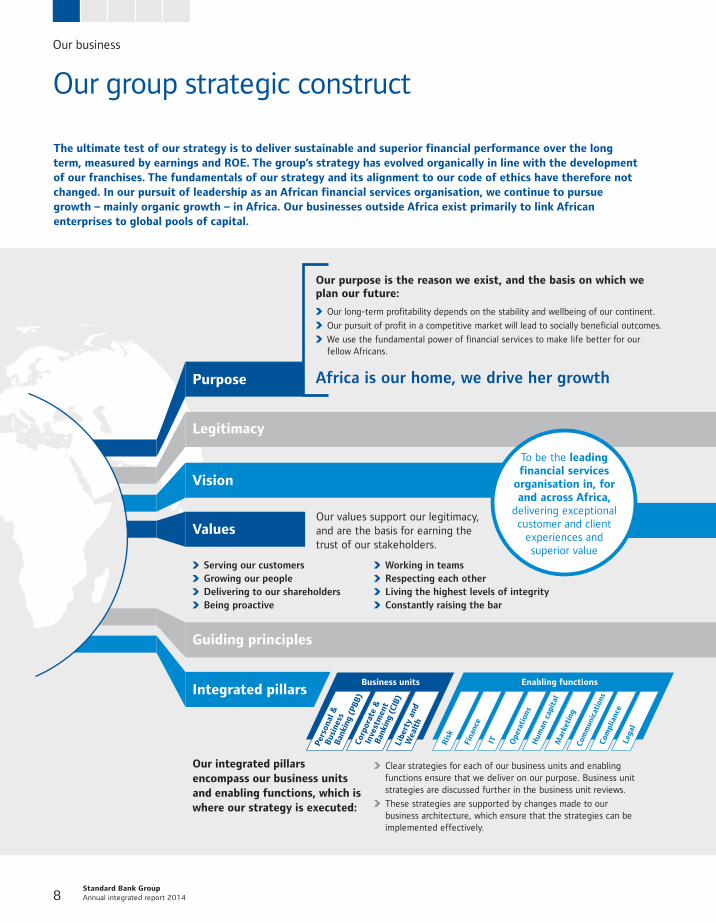
The ultimate test of our strategy is to deliver sustainable and superior financial performance over the long term, measured by earnings and ROE. The group’s strategy has evolved organically in line with the development of our franchises. The fundamentals of our strategy and its alignment to our code of ethics have therefore not changed. In our pursuit of leadership as an African financial services organisation, we continue to pursue growth – mainly organic growth – in Africa. Our businesses outside Africa exist primarily to link African enterprises to global pools of capital.
Our purpose is the reason we exist, and the basis on which we plan our future:
Our long-term profitability depends on the stability and wellbeing of our continent.
Our pursuit of profit in a competitive market will lead to socially beneficial outcomes.
We use the fundamental power of financial services to make life better for our fellow Africans.
Our values support our legitimacy, and are the basis for earning the trust of our stakeholders.
Africa is our home, we drive her growth
Serving our customers Growing our people Delivering to our shareholders Being proactive
Working in teams Respecting each other Living the highest levels of integrity Constantly raising the bar
Vision
Integrated pillars
Legitimacy
Values
Purpose
Business units
Pers
onal
&
B
usin
ess
B
anki
ng (
PBB
)Co
rpor
ate
&
In
vest
men
t
B
anki
ng (
CIB
)Li
bert
y an
d
W
ealt
h
Enabling functions
Ris
k
Fina
nce
IT Ope
rati
ons
Hum
an c
apit
alM
arke
ting
Com
mun
icat
ions
Com
plia
nce
Lega
l
Clear strategies for each of our business units and enabling functions ensure that we deliver on our purpose. Business unit strategies are discussed further in the business unit reviews.
These strategies are supported by changes made to our business architecture, which ensure that the strategies can be implemented effectively.
To be the leading financial services
organisation in, for and across Africa,
delivering exceptional customer and client
experiences and superior value
Guiding principles
Our integrated pillars encompass our business units and enabling functions, which is where our strategy is executed:
9
A strategy refresh was undertaken during the year to update our purpose and provide a strategic construct for the group. This is aimed at improving the effectiveness of our execution in becoming more competitive in the financial services markets we serve. We have clarified the ‘why’ of our strategy by redefining our purpose, the
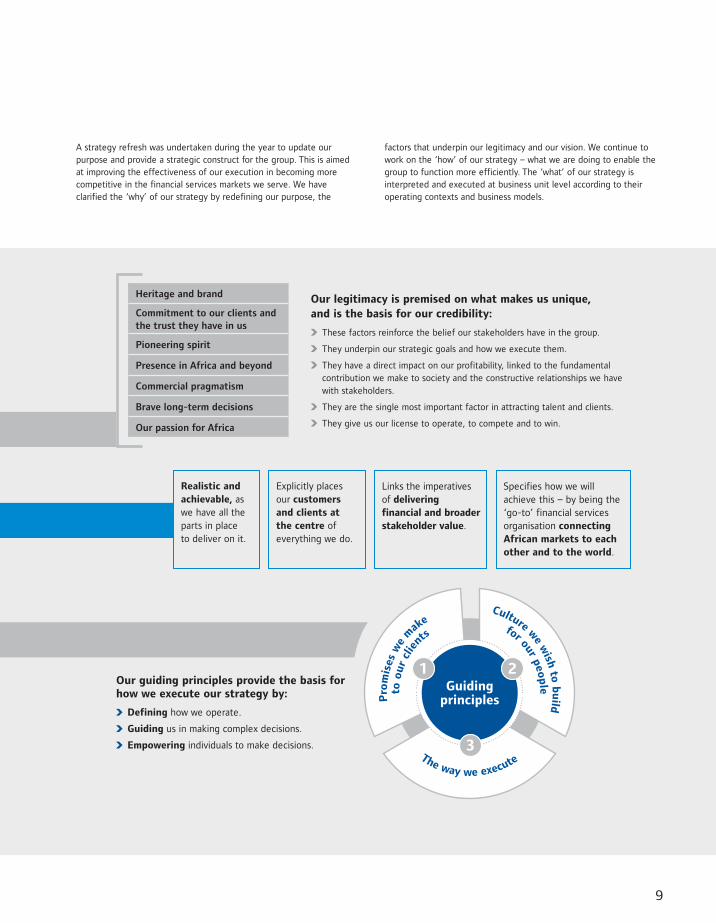
Our legitimacy is premised on what makes us unique, and is the basis for our credibility:
These factors reinforce the belief our stakeholders have in the group.
They underpin our strategic goals and how we execute them.
They have a direct impact on our profitability, linked to the fundamental contribution we make to society and the constructive relationships we have with stakeholders.
They are the single most important factor in attracting talent and clients.
They give us our license to operate, to compete and to win.
Heritage and brand
Commitment to our clients and the trust they have in us
Pioneering spirit
Presence in Africa and beyond
Commercial pragmatism
Brave long-term decisions
Our passion for Africa
1 2
3The way we execute
Pro
mis
es w
e m
ake
Culture we w
ish to b
uild
to o
ur c
lie
nts
for our peop
leGuiding principles
Our guiding principles provide the basis for how we execute our strategy by:
Defining how we operate.
Guiding us in making complex decisions.
Empowering individuals to make decisions.
Realistic and achievable, as we have all the parts in place to deliver on it.
Explicitly places our customers and clients at the centre of everything we do.
Links the imperatives of delivering financial and broader stakeholder value.
Specifies how we will achieve this – by being the ‘go-to’ financial services organisation connecting African markets to each other and to the world.
factors that underpin our legitimacy and our vision. We continue to work on the ‘how’ of our strategy – what we are doing to enable the group to function more efficiently. The ‘what’ of our strategy is interpreted and executed at business unit level according to their operating contexts and business models.
Standard Bank Group Annual integrated report 2014 10
Our business
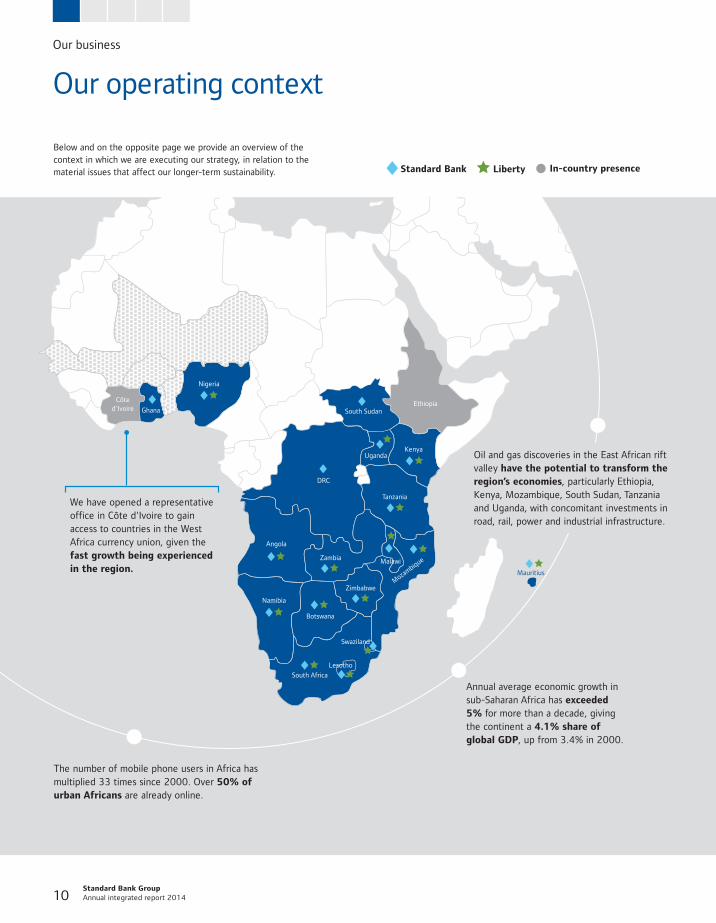
Our operating context
Standard Bank Liberty In-country presence
Annual average economic growth in sub-Saharan Africa has exceeded 5% for more than a decade, giving the continent a 4.1% share of global GDP, up from 3.4% in 2000.
We have opened a representative office in Côte d'Ivoire to gain access to countries in the West Africa currency union, given the fast growth being experienced in the region.
Oil and gas discoveries in the East African rift valley have the potential to transform the region’s economies, particularly Ethiopia, Kenya, Mozambique, South Sudan, Tanzania and Uganda, with concomitant investments in road, rail, power and industrial infrastructure.
The number of mobile phone users in Africa has multiplied 33 times since 2000. Over 50% of urban Africans are already online.
Below and on the opposite page we provide an overview of the context in which we are executing our strategy, in relation to the material issues that affect our longer-term sustainability.
11
The rapid growth in Africa’s middle class bodes well for the further penetration of financial services on the continent. In particular, the potential for wealth and insurance products is largely untapped.
Slower economic growth and increasing inflation and interest rates constrain our ability to lend.
The slowdown in production and manufacturing in China has the ability to constrain growth in commodity exports on the continent.
To meet Basel III requirements, all our banking subsidiaries contribute financial resources. That means that our subsidiaries in the rest of Africa face greater financial pressure than their domestic peers, impacting their competitiveness in the short to medium term.
International reform of the financial sector and the South African government's broader economic policy goals and priorities are driving the volume of regulatory change.
New regulation has an extensive bearing on day-to-day operations, placing upward pressure on operating costs.
In South Africa, the Financial Sector Regulation Bill (Twin Peaks) aims to strengthen the regulation of the domestic financial sector.
Regulatory developments in the rest of Africa relate to foreign exchange control, financial crime, prudential and market conduct requirements.
Sub-Saharan Africa maintained its growth into 2014, supported by foreign direct investment in the resource sectors, public investment in infrastructure and improved agricultural production.
By 2050, it is predicted that a quarter of the world’s population will reside in Africa with at least 60% of the continent’s population living in urban centres.
The relative immaturity of some key economies and the underdevelopment of key institutions requires a particularly effective risk approach and an appropriate risk appetite.
Attracting, retaining and motivating our employees
Competition for local skills in the countries in which we operate requires that we offer our employees a clearly defined value proposition. Specialist skills help determine our success on the continent, and we focus on hiring and retaining the right skills to service our customers and clients.
Our people are custodians of customer experience and brand, and as such are crucial to our ability to realise our customer-centric strategy. Our new guiding principles, developed as part of our strategy refresh, emphasise the importance of empowering our people and developing great leaders.
Establishing and maintaining cost-effective, efficient and
relevant IT infrastructure
The advancement of IT requires that we constantly adapt the way we do business, including how we interact with and service our customers and clients.
Given the rapid uptake of smart mobile devices and accelerating internet penetration in Africa, our investments in IT infrastructure on the continent positions us to deliver more banking services digitally, which greatly extends our customer reach and enables us to service our customers more effectively.
The greater use of technology in delivering banking services increases the risk of cybercrime and banking fraud, which requires continued investment in prevention interventions to limit potential losses.
R19 billioninvested in IT across the group in 2014
49 259employees
The operating environment for retail banking is becoming increasingly competitive as consumers use more than one bank and as non-traditional players begin using digital platforms to offer low-cost banking services (known as disintermediation). Our focus on creating a digital bank is aimed at improving competitiveness and pre-empting disintermediation from non-bank players.
We operate across vastly different regions with significantly diverse cultures and languages. As such we aim to hire locally to gain insight into the dynamics of each country in which we operate.
Knowing our customers and clients and doing the right business with them
in the right way
We have 16,7 millionretail banking customers on the continent
In the rest of Africa, PBB achieved profitability with headline earnings of
Pace, volume and scale of regulatory change
received regulatory compliance training in 2014
Delivering sustainable long-term financial
performance
Managing the risks and opportunities of our Africa
strategy
43 051 employees
R105 million
Our rest of Africa operations achieved
ROE of 21.5% (2013: 19.7%)
Standard Bank Group Annual integrated report 2014 12
Our business
Realising the Africa opportunity
The Africa opportunity is compelling as many of the continent’s economies continue to grow at higher rates than other regions around the world. This growth is underpinned by rich endowments in natural resources and increasing trade flows, both within the continent and with other economic powers, especially China. Our strategic relationship with the Industrial and Commercial Bank of China (ICBC), which now extends to our global markets outside Africa business, provides us with increasing opportunities to drive Africa’s growth.
Our unique competitive position will enable us to benefit from and support Africa’s growth story as we create effective solutions for our clients and sustain improvements in our financial performance.
While we remain firmly aware of the challenges of doing business in Africa and in growing our franchises in line with our strategy, we believe these are outweighed by the opportunities open to us, given our unique competitive position on the continent.
Specifically, the growth in the middle class and small business is advantageous for PBB, and CIB is ideally placed to provide advisory services to international investors, harness local resources and create investment structures that are attractive to investors and governments alike.
We are commercially and morally bound to serve Africa and her people, in return for the long-term profitable growth we envisage as the leading financial services group on the continent.
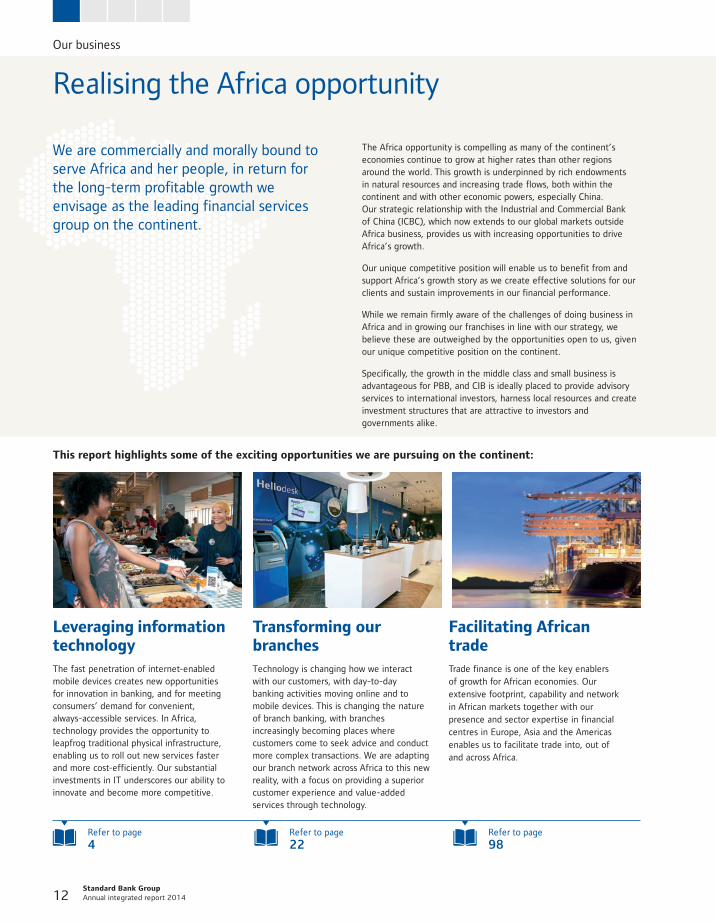
This report highlights some of the exciting opportunities we are pursuing on the continent:
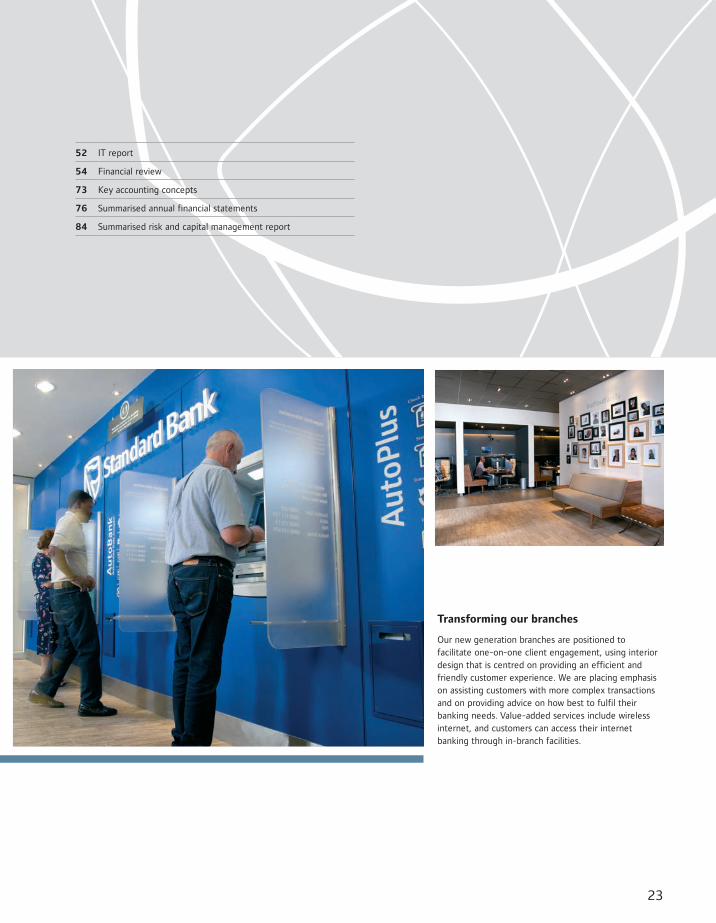
Transforming our branchesTechnology is changing how we interact with our customers, with day-to-day banking activities moving online and to mobile devices. This is changing the nature of branch banking, with branches increasingly becoming places where customers come to seek advice and conduct more complex transactions. We are adapting our branch network across Africa to this new reality, with a focus on providing a superior customer experience and value-added services through technology.
Leveraging information technologyThe fast penetration of internet-enabled mobile devices creates new opportunities for innovation in banking, and for meeting consumers’ demand for convenient, always-accessible services. In Africa, technology provides the opportunity to leapfrog traditional physical infrastructure, enabling us to roll out new services faster and more cost-efficiently. Our substantial investments in IT underscores our ability to innovate and become more competitive.
Facilitating African tradeTrade finance is one of the key enablers of growth for African economies. Our extensive footprint, capability and network in African markets together with our presence and sector expertise in financial centres in Europe, Asia and the Americas enables us to facilitate trade into, out of and across Africa.
Refer to page
4Refer to page
22Refer to page
98
13
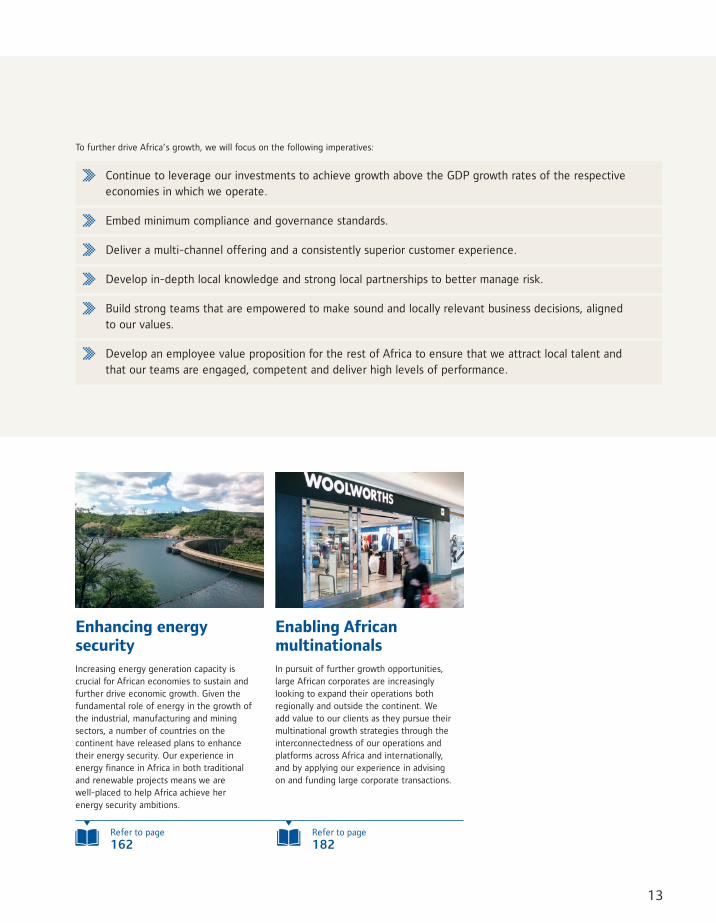
To further drive Africa’s growth, we will focus on the following imperatives:
Continue to leverage our investments to achieve growth above the GDP growth rates of the respective economies in which we operate.
Embed minimum compliance and governance standards.
Deliver a multi-channel offering and a consistently superior customer experience.
Develop in-depth local knowledge and strong local partnerships to better manage risk.
Build strong teams that are empowered to make sound and locally relevant business decisions, aligned to our values.
Develop an employee value proposition for the rest of Africa to ensure that we attract local talent and that our teams are engaged, competent and deliver high levels of performance.
Enabling African multinationalsIn pursuit of further growth opportunities, large African corporates are increasingly looking to expand their operations both regionally and outside the continent. We add value to our clients as they pursue their multinational growth strategies through the interconnectedness of our operations and platforms across Africa and internationally, and by applying our experience in advising on and funding large corporate transactions.
Enhancing energy securityIncreasing energy generation capacity is crucial for African economies to sustain and further drive economic growth. Given the fundamental role of energy in the growth of the industrial, manufacturing and mining sectors, a number of countries on the continent have released plans to enhance their energy security. Our experience in energy finance in Africa in both traditional and renewable projects means we are well-placed to help Africa achieve her energy security ambitions.
Refer to page
162Refer to page
182
Our business
Standard Bank Group Annual integrated report 2014 14
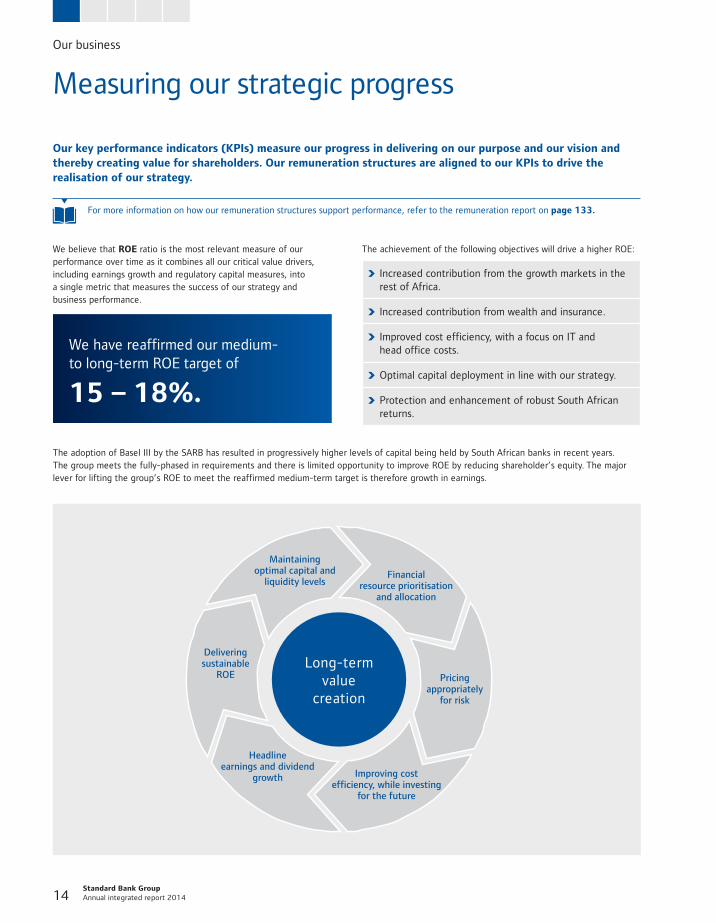
For more information on how our remuneration structures support performance, refer to the remuneration report on page 133.
Measuring our strategic progress
Our key performance indicators (KPIs) measure our progress in delivering on our purpose and our vision and thereby creating value for shareholders. Our remuneration structures are aligned to our KPIs to drive the realisation of our strategy.
We believe that ROE ratio is the most relevant measure of our performance over time as it combines all our critical value drivers, including earnings growth and regulatory capital measures, into a single metric that measures the success of our strategy and business performance.
We have reaffirmed our medium- to long-term ROE target of
15 – 18%.
The achievement of the following objectives will drive a higher ROE:
Increased contribution from the growth markets in the rest of Africa.
Increased contribution from wealth and insurance.
Improved cost efficiency, with a focus on IT and head office costs.
Optimal capital deployment in line with our strategy.
Protection and enhancement of robust South African returns.
The adoption of Basel III by the SARB has resulted in progressively higher levels of capital being held by South African banks in recent years. The group meets the fully-phased in requirements and there is limited opportunity to improve ROE by reducing shareholder’s equity. The major lever for lifting the group’s ROE to meet the reaffirmed medium-term target is therefore growth in earnings.
Long-term value
creation
Delivering sustainable
ROE
Headline earnings and dividend
growth Improving cost efficiency, while investing
for the future
Maintaining optimal capital and
liquidity levelsFinancial
resource prioritisation and allocation
Pricing appropriately
for risk
15
The group maintains sufficient capital and liquidity resources within regulatory constraints to assume and manage the necessary risk that is required to deliver products and solutions to its clients and customers. The optimal allocation of the group’s resources is a key determinant of our ability to drive higher revenue that will achieve sufficient growth in earnings to progressively raise ROE. Cost discipline is also an important component of this strategy and we are determined to achieve higher levels of cost efficiency over time. We are also conscious of the need to invest appropriately in systems and infrastructure to ensure we take advantage of the opportunities provided by a rapidly evolving and competitive marketplace.
For more information on how we manage capital and risk, refer to the summarised risk and capital management report in this report or our full risk and capital management report.
We remain aware that as a financial services group in Africa, we are part of and facilitate at a fundamental level the economic growth and social development of the economies we serve, in line with our purpose and vision.
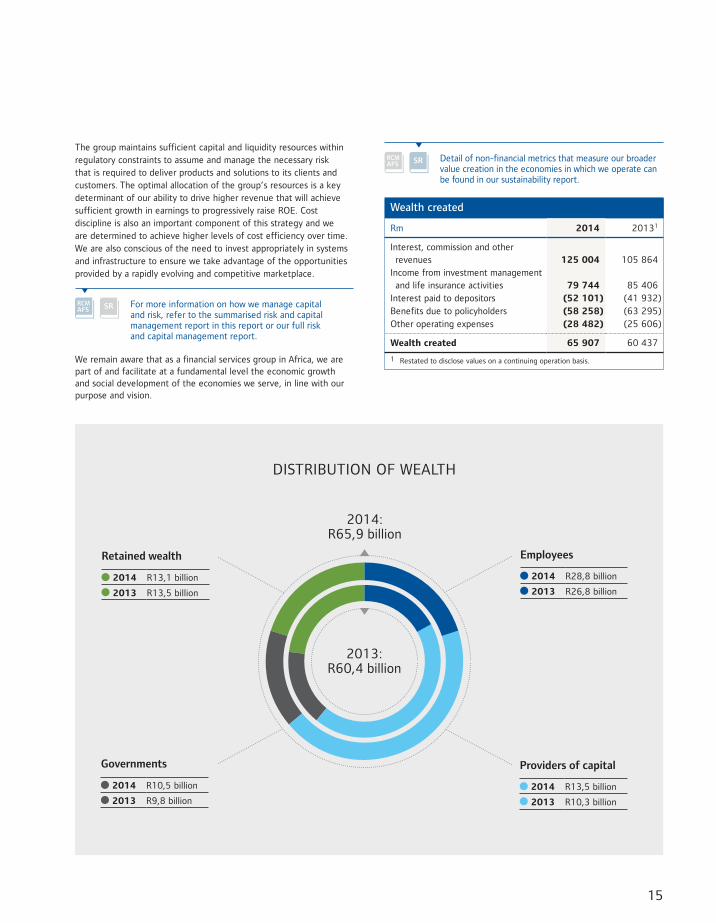
Providers of capital
2014 R13,5 billion
2013 R10,3 billion
Governments
2014 R10,5 billion
2013 R9,8 billion
Employees
2014 R28,8 billion
2013 R26,8 billion
Retained wealth
2014 R13,1 billion
2013 R13,5 billion
2014:R65,9 billion
2013:R60,4 billion
DISTRIBUTION OF WEALTH
Detail of non-financial metrics that measure our broader value creation in the economies in which we operate can be found in our sustainability report.
Wealth created
Rm 2014 20131
Interest, commission and other revenues 125 004 105 864Income from investment management and life insurance activities 79 744 85 406Interest paid to depositors (52 101) (41 932)Benefits due to policyholders (58 258) (63 295)Other operating expenses (28 482) (25 606)
Wealth created 65 907 60 437
1 Restated to disclose values on a continuing operation basis.
Standard Bank Group Annual integrated report 2014 16
Our business
Responding to our stakeholders
Shareholders and investment analysts
Customers and clients
Employees and trade unions
Government and regulators
Suppliers and communities
Business organisations
Key
issu
es r
aise
d an
d ou
r re
spon
se
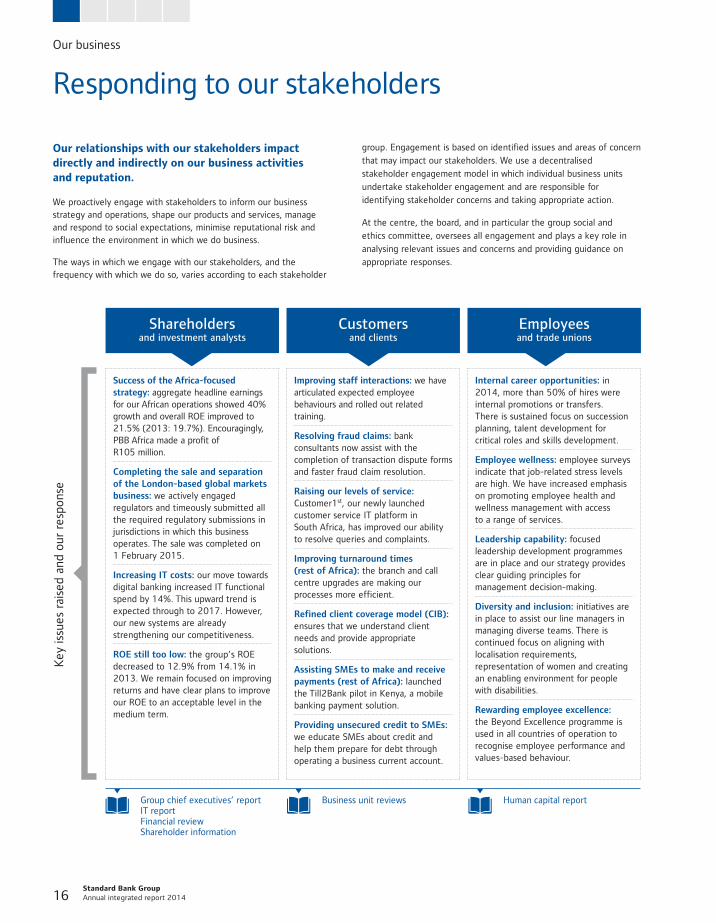
Success of the Africa-focused strategy: aggregate headline earnings for our African operations showed 40% growth and overall ROE improved to 21.5% (2013: 19.7%). Encouragingly, PBB Africa made a profit of R105 million.
Completing the sale and separation of the London-based global markets business: we actively engaged regulators and timeously submitted all the required regulatory submissions in jurisdictions in which this business operates. The sale was completed on 1 February 2015.
Increasing IT costs: our move towards digital banking increased IT functional spend by 14%. This upward trend is expected through to 2017. However, our new systems are already strengthening our competitiveness.
ROE still too low: the group’s ROE decreased to 12.9% from 14.1% in 2013. We remain focused on improving returns and have clear plans to improve our ROE to an acceptable level in the medium term.
Improving staff interactions: we have articulated expected employee behaviours and rolled out related training.
Resolving fraud claims: bank consultants now assist with the completion of transaction dispute forms and faster fraud claim resolution.
Raising our levels of service: Customer1st, our newly launched customer service IT platform in South Africa, has improved our ability to resolve queries and complaints.
Improving turnaround times (rest of Africa): the branch and call centre upgrades are making our processes more efficient.
Refined client coverage model (CIB): ensures that we understand client needs and provide appropriate solutions.
Assisting SMEs to make and receive payments (rest of Africa): launched the Till2Bank pilot in Kenya, a mobile banking payment solution.
Providing unsecured credit to SMEs: we educate SMEs about credit and help them prepare for debt through operating a business current account.
Internal career opportunities: in 2014, more than 50% of hires were internal promotions or transfers. There is sustained focus on succession planning, talent development for critical roles and skills development.
Employee wellness: employee surveys indicate that job-related stress levels are high. We have increased emphasis on promoting employee health and wellness management with access to a range of services.
Leadership capability: focused leadership development programmes are in place and our strategy provides clear guiding principles for management decision-making.
Diversity and inclusion: initiatives are in place to assist our line managers in managing diverse teams. There is continued focus on aligning with localisation requirements, representation of women and creating an enabling environment for people with disabilities.
Rewarding employee excellence: the Beyond Excellence programme is used in all countries of operation to recognise employee performance and values-based behaviour.
Engagement on upcoming regulation: we participated in the parliamentary public hearings on the National Credit Amendment Act, engaged on consumer credit affordability regulation, submitted comment on the draft Financial Sector Regulation Bill and worked with the agricultural sector to formulate a response to the South African government’s proposals on land reform and tenure rights for farmworkers. We also engaged on the impact that European Union financial sector regulation has on emerging markets.
Supporting South Africa’s National Development Plan (NDP): we are involved in a number of high level government/business working groups focused on implementing initiatives and projects in support of the NDP.
Regulatory change in the rest of Africa: we are involved in initiatives to support thought leadership and the sharing of experiences across different geographies.
Increasing the pace of transformation in South Africa: SBSA achieved a black economic empowerment (BEE)transformation score of 94.25 in 2014.
Improving how we engage with our suppliers: we have embarked on a segmentation project to understand the types of relationships required between our various supplier groups and the group. Special attention is being given to improving the vendor payment process and we continue to leverage off our enterprise development initiatives and external business development support providers to improve our pipeline of black-owned and black women-owned SME vendors.
Improving transparency in the procurement process: our newly implemented SAP-based e-sourcing platform is assisting us to manage and govern the procurement of goods and services in a transparent, fair and auditable manner.
Improving the supplier payment process (rest of Africa): we have embarked on a formal project to align our sourcing, contracting and purchasing processes across Africa to the procurement operating model employed in South Africa.
In 2014, we engaged with the Banking Association of South Africa (BASA) and its subcommittees on a range of issues, including:
upcoming regulation
IT governance
financial crime
environmental and social risk management
transformation BEE.
Outside of South Africa, we are members of organisations such as Chatham House and the Commonwealth Business Council in the United Kingdom.
Our relationships with our stakeholders impact directly and indirectly on our business activities and reputation.
We proactively engage with stakeholders to inform our business strategy and operations, shape our products and services, manage and respond to social expectations, minimise reputational risk and influence the environment in which we do business.
The ways in which we engage with our stakeholders, and the frequency with which we do so, varies according to each stakeholder
group. Engagement is based on identified issues and areas of concern
that may impact our stakeholders. We use a decentralised
stakeholder engagement model in which individual business units
undertake stakeholder engagement and are responsible for
identifying stakeholder concerns and taking appropriate action.
At the centre, the board, and in particular the group social and
ethics committee, oversees all engagement and plays a key role in
analysing relevant issues and concerns and providing guidance on
appropriate responses.
Group chief executives’ reportIT reportFinancial reviewShareholder information
Business unit reviews Human capital report
17
More detail on stakeholder engagement, including our strategic business alliances and methods of engagement, can be found in our sustainability report.
The stakeholder relations team works with all business areas across the group to provide a consolidated view of key stakeholder engagement activities. It is responsible for ensuring that we maintain an accurate overview of all significant memberships and engagement activities. Quarterly reports are submitted to the board, identifying any issues raised and how these have been or will be responded to.
The team convenes a regular stakeholder relations forum, comprising business unit managers, to discuss and coordinate stakeholder engagement activities. The objective of the forum is to ensure consistency in the messages we communicate, based on our code of ethics, values and strategy. We are developing a stakeholder engagement policy to formalise areas of responsibility and guidelines for best practice stakeholder engagement for those areas within the group that undertake stakeholder engagement activities on behalf of the group. The policy will apply groupwide and will include performance indicators.
Shareholders and investment analysts
Customers and clients
Employees and trade unions
Government and regulators
Suppliers and communities
Business organisations
Key
issu
es r
aise
d an
d ou
r re
spon
se
Success of the Africa-focused strategy: aggregate headline earnings for our African operations showed 40% growth and overall ROE improved to 21.5% (2013: 19.7%). Encouragingly, PBB Africa made a profit of R105 million.
Completing the sale and separation of the London-based global markets business: we actively engaged regulators and timeously submitted all the required regulatory submissions in jurisdictions in which this business operates. The sale was completed on 1 February 2015.
Increasing IT costs: our move towards digital banking increased IT functional spend by 14%. This upward trend is expected through to 2017. However, our new systems are already strengthening our competitiveness.
ROE still too low: the group’s ROE decreased to 12.9% from 14.1% in 2013. We remain focused on improving returns and have clear plans to improve our ROE to an acceptable level in the medium term.
Improving staff interactions: we have articulated expected employee behaviours and rolled out related training.
Resolving fraud claims: bank consultants now assist with the completion of transaction dispute forms and faster fraud claim resolution.
Raising our levels of service: Customer1st, our newly launched customer service IT platform in South Africa, has improved our ability to resolve queries and complaints.
Improving turnaround times (rest of Africa): the branch and call centre upgrades are making our processes more efficient.
Refined client coverage model (CIB): ensures that we understand client needs and provide appropriate solutions.
Assisting SMEs to make and receive payments (rest of Africa): launched the Till2Bank pilot in Kenya, a mobile banking payment solution.
Providing unsecured credit to SMEs: we educate SMEs about credit and help them prepare for debt through operating a business current account.
Internal career opportunities: in 2014, more than 50% of hires were internal promotions or transfers. There is sustained focus on succession planning, talent development for critical roles and skills development.
Employee wellness: employee surveys indicate that job-related stress levels are high. We have increased emphasis on promoting employee health and wellness management with access to a range of services.
Leadership capability: focused leadership development programmes are in place and our strategy provides clear guiding principles for management decision-making.
Diversity and inclusion: initiatives are in place to assist our line managers in managing diverse teams. There is continued focus on aligning with localisation requirements, representation of women and creating an enabling environment for people with disabilities.
Rewarding employee excellence: the Beyond Excellence programme is used in all countries of operation to recognise employee performance and values-based behaviour.
Engagement on upcoming regulation: we participated in the parliamentary public hearings on the National Credit Amendment Act, engaged on consumer credit affordability regulation, submitted comment on the draft Financial Sector Regulation Bill and worked with the agricultural sector to formulate a response to the South African government’s proposals on land reform and tenure rights for farmworkers. We also engaged on the impact that European Union financial sector regulation has on emerging markets.
Supporting South Africa’s National Development Plan (NDP): we are involved in a number of high level government/business working groups focused on implementing initiatives and projects in support of the NDP.
Regulatory change in the rest of Africa: we are involved in initiatives to support thought leadership and the sharing of experiences across different geographies.
Increasing the pace of transformation in South Africa: SBSA achieved a black economic empowerment (BEE)transformation score of 94.25 in 2014.
Improving how we engage with our suppliers: we have embarked on a segmentation project to understand the types of relationships required between our various supplier groups and the group. Special attention is being given to improving the vendor payment process and we continue to leverage off our enterprise development initiatives and external business development support providers to improve our pipeline of black-owned and black women-owned SME vendors.
Improving transparency in the procurement process: our newly implemented SAP-based e-sourcing platform is assisting us to manage and govern the procurement of goods and services in a transparent, fair and auditable manner.
Improving the supplier payment process (rest of Africa): we have embarked on a formal project to align our sourcing, contracting and purchasing processes across Africa to the procurement operating model employed in South Africa.
In 2014, we engaged with the Banking Association of South Africa (BASA) and its subcommittees on a range of issues, including:
upcoming regulation
IT governance
financial crime
environmental and social risk management
transformation BEE.
Outside of South Africa, we are members of organisations such as Chatham House and the Commonwealth Business Council in the United Kingdom.
SR SRChairman’s reportGroup chief executives’ report
Our socioeconomic impactSustainability report
Sustainability report
Our business
Standard Bank Group Annual integrated report 2014 18
Our socioeconomic impact
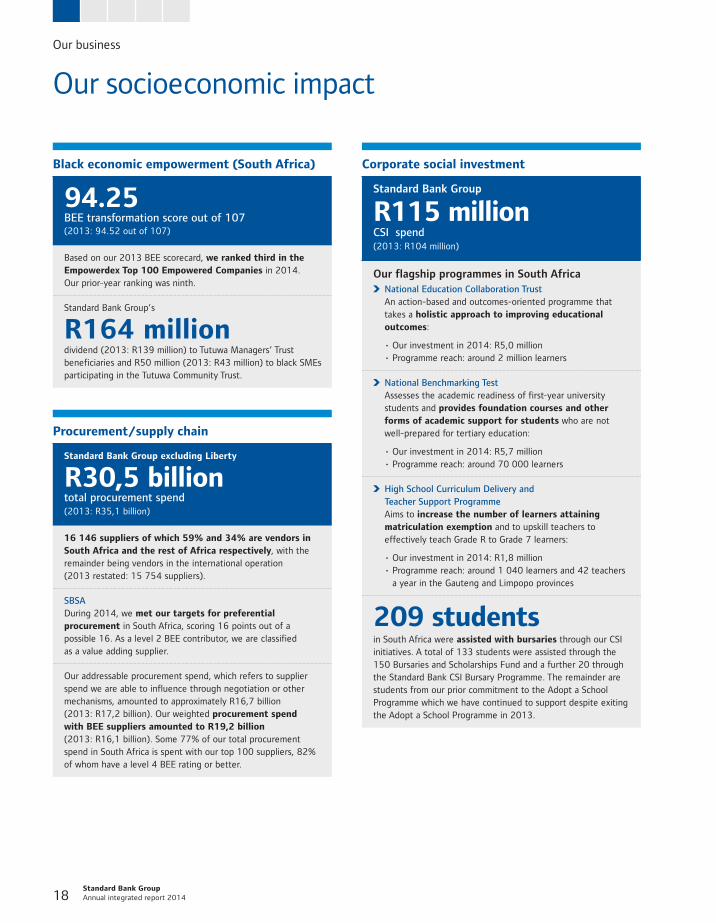
Corporate social investment
Standard Bank Group
R115 million CSI spend(2013: R104 million)
Our flagship programmes in South Africa National Education Collaboration Trust An action-based and outcomes-oriented programme that takes a holistic approach to improving educational outcomes:
• Our investment in 2014: R5,0 million • Programme reach: around 2 million learners
National Benchmarking Test Assesses the academic readiness of first-year university students and provides foundation courses and other forms of academic support for students who are not well-prepared for tertiary education:
• Our investment in 2014: R5,7 million • Programme reach: around 70 000 learners
High School Curriculum Delivery and Teacher Support Programme Aims to increase the number of learners attaining matriculation exemption and to upskill teachers to effectively teach Grade R to Grade 7 learners:
• Our investment in 2014: R1,8 million • Programme reach: around 1 040 learners and 42 teachers
a year in the Gauteng and Limpopo provinces
209 students in South Africa were assisted with bursaries through our CSI initiatives. A total of 133 students were assisted through the 150 Bursaries and Scholarships Fund and a further 20 through the Standard Bank CSI Bursary Programme. The remainder are students from our prior commitment to the Adopt a School Programme which we have continued to support despite exiting the Adopt a School Programme in 2013.
Procurement/supply chain
Standard Bank Group excluding Liberty
R30,5 billion total procurement spend (2013: R35,1 billion)
16 146 suppliers of which 59% and 34% are vendors in South Africa and the rest of Africa respectively, with the remainder being vendors in the international operation (2013 restated: 15 754 suppliers).
SBSA During 2014, we met our targets for preferential procurement in South Africa, scoring 16 points out of a possible 16. As a level 2 BEE contributor, we are classified as a value adding supplier.
Our addressable procurement spend, which refers to supplier spend we are able to influence through negotiation or other mechanisms, amounted to approximately R16,7 billion (2013: R17,2 billion). Our weighted procurement spend with BEE suppliers amounted to R19,2 billion (2013: R16,1 billion). Some 77% of our total procurement spend in South Africa is spent with our top 100 suppliers, 82% of whom have a level 4 BEE rating or better.
Black economic empowerment (South Africa)
94.25 BEE transformation score out of 107 (2013: 94.52 out of 107)
Based on our 2013 BEE scorecard, we ranked third in the Empowerdex Top 100 Empowered Companies in 2014. Our prior-year ranking was ninth.
Standard Bank Group’s
R164 million dividend (2013: R139 million) to Tutuwa Managers’ Trust beneficiaries and R50 million (2013: R43 million) to black SMEs participating in the Tutuwa Community Trust.
19
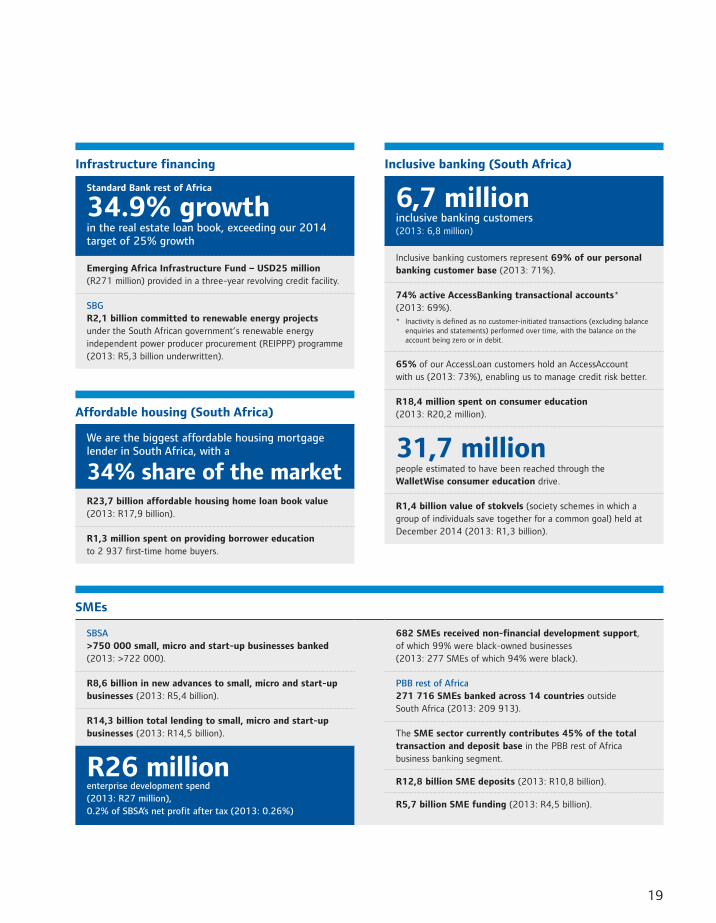
Infrastructure financing
Standard Bank rest of Africa
34.9% growth
in the real estate loan book, exceeding our 2014 target of 25% growth
Emerging Africa Infrastructure Fund – USD25 million (R271 million) provided in a three-year revolving credit facility.
SBG R2,1 billion committed to renewable energy projects under the South African government’s renewable energy independent power producer procurement (REIPPP) programme (2013: R5,3 billion underwritten).
Inclusive banking (South Africa)
6,7 million inclusive banking customers(2013: 6,8 million)
Inclusive banking customers represent 69% of our personal banking customer base (2013: 71%).
74% active AccessBanking transactional accounts* (2013: 69%). * Inactivity is defined as no customer-initiated transactions (excluding balance
enquiries and statements) performed over time, with the balance on the account being zero or in debit.
65% of our AccessLoan customers hold an AccessAccount with us (2013: 73%), enabling us to manage credit risk better.
R18,4 million spent on consumer education (2013: R20,2 million).
31,7 million people estimated to have been reached through the WalletWise consumer education drive.
R1,4 billion value of stokvels (society schemes in which a group of individuals save together for a common goal) held at December 2014 (2013: R1,3 billion).
Affordable housing (South Africa)
We are the biggest affordable housing mortgage lender in South Africa, with a
34% share of the market R23,7 billion affordable housing home loan book value (2013: R17,9 billion).
R1,3 million spent on providing borrower education to 2 937 first-time home buyers.
SMEs
SBSA >750 000 small, micro and start-up businesses banked (2013: >722 000).
R8,6 billion in new advances to small, micro and start-up businesses (2013: R5,4 billion).
R14,3 billion total lending to small, micro and start-up businesses (2013: R14,5 billion).
R26 million enterprise development spend (2013: R27 million), 0.2% of SBSA’s net profit after tax (2013: 0.26%)
682 SMEs received non-financial development support, of which 99% were black-owned businesses (2013: 277 SMEs of which 94% were black).
PBB rest of Africa 271 716 SMEs banked across 14 countries outside South Africa (2013: 209 913).
The SME sector currently contributes 45% of the total transaction and deposit base in the PBB rest of Africa business banking segment.
R12,8 billion SME deposits (2013: R10,8 billion).
R5,7 billion SME funding (2013: R4,5 billion).
Our business
Standard Bank Group Annual integrated report 2014 20
For more information refer to our sustainability report.
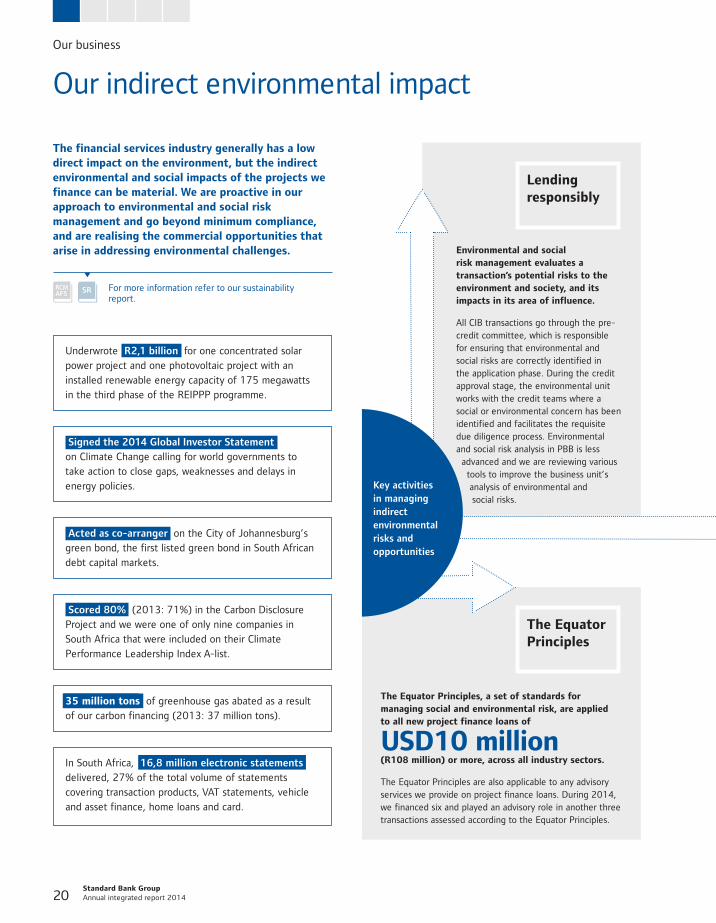
Our indirect environmental impact
The financial services industry generally has a low direct impact on the environment, but the indirect environmental and social impacts of the projects we finance can be material. We are proactive in our approach to environmental and social risk management and go beyond minimum compliance, and are realising the commercial opportunities that arise in addressing environmental challenges.
Underwrote R2,1 billion for one concentrated solar power project and one photovoltaic project with an installed renewable energy capacity of 175 megawatts in the third phase of the REIPPP programme.
Signed the 2014 Global Investor Statement on Climate Change calling for world governments to take action to close gaps, weaknesses and delays in energy policies.
Acted as co-arranger on the City of Johannesburg’s green bond, the first listed green bond in South African debt capital markets.
Scored 80% (2013: 71%) in the Carbon Disclosure Project and we were one of only nine companies in South Africa that were included on their Climate Performance Leadership Index A-list.
35 million tons of greenhouse gas abated as a result of our carbon financing (2013: 37 million tons).
In South Africa, 16,8 million electronic statements delivered, 27% of the total volume of statements covering transaction products, VAT statements, vehicle and asset finance, home loans and card.
Environmental and social risk management evaluates a transaction’s potential risks to the environment and society, and its impacts in its area of influence.
All CIB transactions go through the pre-credit committee, which is responsible for ensuring that environmental and social risks are correctly identified in the application phase. During the credit approval stage, the environmental unit works with the credit teams where a social or environmental concern has been identified and facilitates the requisite due diligence process. Environmental and social risk analysis in PBB is less
advanced and we are reviewing various tools to improve the business unit’s analysis of environmental and social risks.
Lending responsibly
The Equator Principles, a set of standards for managing social and environmental risk, are applied to all new project finance loans of
USD10 million (R108 million) or more, across all industry sectors.
The Equator Principles are also applicable to any advisory services we provide on project finance loans. During 2014, we financed six and played an advisory role in another three transactions assessed according to the Equator Principles.
The Equator Principles
Key activities in managing indirect environmental risks and opportunities
21
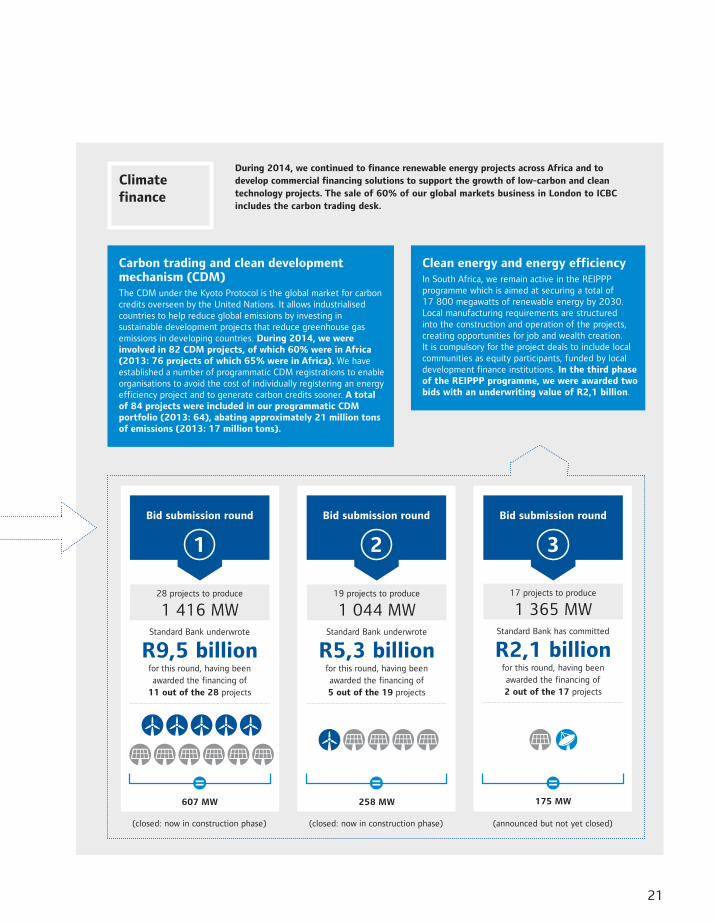
Carbon trading and clean development mechanism (CDM)The CDM under the Kyoto Protocol is the global market for carbon credits overseen by the United Nations. It allows industrialised countries to help reduce global emissions by investing in sustainable development projects that reduce greenhouse gas emissions in developing countries. During 2014, we were involved in 82 CDM projects, of which 60% were in Africa (2013: 76 projects of which 65% were in Africa). We have established a number of programmatic CDM registrations to enable organisations to avoid the cost of individually registering an energy efficiency project and to generate carbon credits sooner. A total of 84 projects were included in our programmatic CDM portfolio (2013: 64), abating approximately 21 million tons of emissions (2013: 17 million tons).
Climate finance
During 2014, we continued to finance renewable energy projects across Africa and to develop commercial financing solutions to support the growth of low-carbon and clean technology projects. The sale of 60% of our global markets business in London to ICBC includes the carbon trading desk.
Clean energy and energy efficiencyIn South Africa, we remain active in the REIPPP programme which is aimed at securing a total of 17 800 megawatts of renewable energy by 2030. Local manufacturing requirements are structured into the construction and operation of the projects, creating opportunities for job and wealth creation. It is compulsory for the project deals to include local communities as equity participants, funded by local development finance institutions. In the third phase of the REIPPP programme, we were awarded two bids with an underwriting value of R2,1 billion.
28 projects to produce
1 416 MWStandard Bank underwrote
R9,5 billion for this round, having been awarded the financing of
11 out of the 28 projects
607 MW
Bid submission round
1
(closed: now in construction phase)
19 projects to produce
1 044 MWStandard Bank underwrote
R5,3 billion for this round, having been awarded the financing of 5 out of the 19 projects
258 MW
Bid submission round
2
(closed: now in construction phase)
17 projects to produce
1 365 MWStandard Bank has committed
R2,1 billion for this round, having been awarded the financing of 2 out of the 17 projects
175 MW
Bid submission round
3
(announced but not yet closed)
Standard Bank Group Annual integrated report 2014 22
Our performance
24 Chairman’s report to stakeholders
27 Group chief executives’ report
32 Business unit reviews
32 • Personal & Business Banking
38 • Corporate & Investment Banking
43 • Liberty and Wealth
46 Human capital report
23
52 IT report
54 Financial review
73 Key accounting concepts
76 Summarised annual financial statements
84 Summarised risk and capital management report
Transforming our branches
Our new generation branches are positioned to facilitate one-on-one client engagement, using interior design that is centred on providing an efficient and friendly customer experience. We are placing emphasis on assisting customers with more complex transactions and on providing advice on how best to fulfil their banking needs. Value-added services include wireless internet, and customers can access their internet banking through in-branch facilities.
Standard Bank Group Annual integrated report 2014 24
Chairman’s report to stakeholders
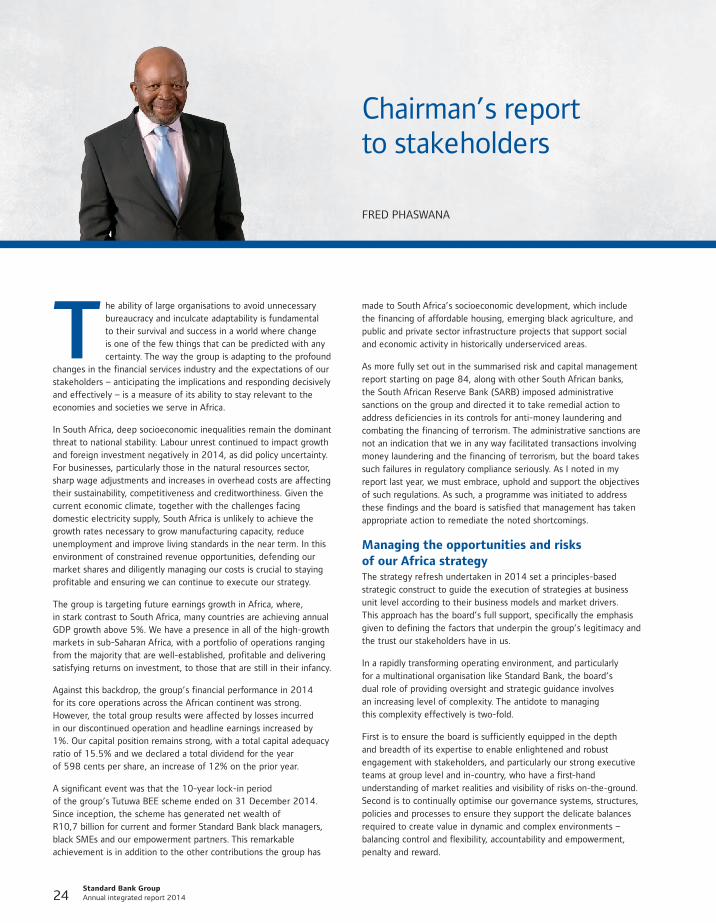
FRED PHASWANA
he ability of large organisations to avoid unnecessary bureaucracy and inculcate adaptability is fundamental to their survival and success in a world where change is one of the few things that can be predicted with any certainty. The way the group is adapting to the profound
changes in the financial services industry and the expectations of our stakeholders – anticipating the implications and responding decisively and effectively – is a measure of its ability to stay relevant to the economies and societies we serve in Africa.
In South Africa, deep socioeconomic inequalities remain the dominant threat to national stability. Labour unrest continued to impact growth and foreign investment negatively in 2014, as did policy uncertainty. For businesses, particularly those in the natural resources sector, sharp wage adjustments and increases in overhead costs are affecting their sustainability, competitiveness and creditworthiness. Given the current economic climate, together with the challenges facing domestic electricity supply, South Africa is unlikely to achieve the growth rates necessary to grow manufacturing capacity, reduce unemployment and improve living standards in the near term. In this environment of constrained revenue opportunities, defending our market shares and diligently managing our costs is crucial to staying profitable and ensuring we can continue to execute our strategy.
The group is targeting future earnings growth in Africa, where, in stark contrast to South Africa, many countries are achieving annual GDP growth above 5%. We have a presence in all of the high-growth markets in sub-Saharan Africa, with a portfolio of operations ranging from the majority that are well-established, profitable and delivering satisfying returns on investment, to those that are still in their infancy.
Against this backdrop, the group’s financial performance in 2014 for its core operations across the African continent was strong. However, the total group results were affected by losses incurred in our discontinued operation and headline earnings increased by 1%. Our capital position remains strong, with a total capital adequacy ratio of 15.5% and we declared a total dividend for the year of 598 cents per share, an increase of 12% on the prior year.
A significant event was that the 10-year lock-in period of the group’s Tutuwa BEE scheme ended on 31 December 2014. Since inception, the scheme has generated net wealth of R10,7 billion for current and former Standard Bank black managers, black SMEs and our empowerment partners. This remarkable achievement is in addition to the other contributions the group has
Tmade to South Africa’s socioeconomic development, which include the financing of affordable housing, emerging black agriculture, and public and private sector infrastructure projects that support social and economic activity in historically underserviced areas.
As more fully set out in the summarised risk and capital management report starting on page 84, along with other South African banks, the South African Reserve Bank (SARB) imposed administrative sanctions on the group and directed it to take remedial action to address deficiencies in its controls for anti-money laundering and combating the financing of terrorism. The administrative sanctions are not an indication that we in any way facilitated transactions involving money laundering and the financing of terrorism, but the board takes such failures in regulatory compliance seriously. As I noted in my report last year, we must embrace, uphold and support the objectives of such regulations. As such, a programme was initiated to address these findings and the board is satisfied that management has taken appropriate action to remediate the noted shortcomings.
Managing the opportunities and risks of our Africa strategyThe strategy refresh undertaken in 2014 set a principles-based strategic construct to guide the execution of strategies at business unit level according to their business models and market drivers. This approach has the board’s full support, specifically the emphasis given to defining the factors that underpin the group’s legitimacy and the trust our stakeholders have in us.
In a rapidly transforming operating environment, and particularly for a multinational organisation like Standard Bank, the board’s dual role of providing oversight and strategic guidance involves an increasing level of complexity. The antidote to managing this complexity effectively is two-fold.
First is to ensure the board is sufficiently equipped in the depth and breadth of its expertise to enable enlightened and robust engagement with stakeholders, and particularly our strong executive teams at group level and in-country, who have a first-hand understanding of market realities and visibility of risks on-the-ground. Second is to continually optimise our governance systems, structures, policies and processes to ensure they support the delicate balances required to create value in dynamic and complex environments – balancing control and flexibility, accountability and empowerment, penalty and reward.
25
independent subject matter experts are standing invitees of the group IT committee. Commencing in 2015, these experts will provide an opinion on the adequacy and effectiveness of our IT governance framework annually to the group IT committee and the board.
Our people are the custodians of the customer experience and the overall strength of our brand, and are therefore the ultimate determinant of success and competitive advantage. Attracting and retaining the skills we need, and creating a desirable and differentiated workplace culture is a complex undertaking in a highly competitive environment where the ability to attract top talent is critical.
As such, our new guiding principles, developed as part of our strategy refresh, emphasise the importance of empowering our people and developing great leaders. Furthermore, while we seek to continually improve our employee value propositions according to international best practice, a cornerstone of our people management philosophy is to value the uniqueness and diversity of each of our operations. The common threads that bind our diverse operations together are our deep heritage, embedded values and clearly defined culture, which together differentiate us as an employer.
DirectorateAs I have indicated, the world in which we conduct our business has become less predictable, affecting the way we manage risk and accountability. This has significant implications for board composition, the induction and ongoing training of directors, and the processes of decision-making.
In 2014, we set about altering the composition of the board to ensure it is adequately positioned to manage the complexities of a constantly changing financial services industry. While making the
The group’s presence in numerous jurisdictions across Africa and beyond, which have different regulatory regimes, together with our commitment to complying with the highest standards of international banking regulations, adds many layers of complexity to managing this material matter. Furthermore, the increased level of interaction with regulators has required that the board be equipped with the necessary specialist expertise and understanding to deal with these engagements effectively.
We enjoy constructive relationships with regulatory authorities in South Africa and in each country in which we have a presence. Our guidance on emerging risks and developments, for instance Basel III implementation, is requested by other regulators across the continent. Where possible, we contribute actively and constructively to the development of national policy, legislation and regulation through formal submissions and regular engagement with policymakers, law-makers and regulatory authorities. Our approach is guided by our aim to promote regulatory frameworks that are unambiguous, cohesive and practical, and that minimise unintended consequences.
The implications of the digital revolution for the financial services industry has been another complex item for the board to manage, and has required a comprehensive overhaul of our IT governance structure. When the board debated this some years ago, there was a concern that we did not have the necessary expertise to assess the business need and the allocation of resources required, given the considerable scale and complexity of the programme and its importance to the group’s competitiveness long into the future.
To remedy this we established the group IT committee, a board committee responsible for ensuring the implementation of the IT governance framework across the group. The committee is chaired by an independent non-executive director. External
“For the board to be an effective custodian of sustainable performance and long-term value creation requires that we are adept at managing the complexities of change. We do not seek perfection in our governance systems, structures, policies and processes, which is impossible, but continuous improvement in relation to a dynamic environment.”
598 cents2013: 533 cents
Dividend per ordinary share +12%
8 625 cents2013: 8 089 cents
Net asset value per share +7%
Our performance
Standard Bank Group Annual integrated report 2014 26
appointments necessary to reflect the group’s Africa-centred strategy, it is also essential to preserve what is working well. Balancing the dual role of oversight and strategic guidance is more an art than a science, and essentially comes down to the right combination of board members, and ensuring that the mix works.
This alignment of the board’s capabilities to the group’s strategy and changing operating context is a work in progress. We continue to seek representation for each of the key economic zones on the continent, which is challenging given the relatively small pool of seasoned directors and the conflicts of interest that arise as a result.
During the year, four new independent non-executive directors were appointed to the board. This, together with the changes to the ICBC nominated directors, resulted in a total of six new non-executive directors being appointed to the board. We welcome all our new non-executive directors to the group. For details on board changes, please refer to the corporate governance report.
During 2014, we also continued to embed governance and compliance minimum standards in all our subsidiaries, strengthened our in-country boards and shifted greater accountability for and ownership of performance to subsidiaries. The board’s effectiveness is assessed annually against its mandate, as is the performance of its committees. During 2014, the board and its committees complied materially with their mandates. My performance and that of the chief executives is assessed annually and our remuneration is determined accordingly. Specific detail can be found in the remuneration report.
I have served as chairman for five years and, having reached retirement age, I will be stepping down at the annual general meeting in May 2015. A process to select and appoint my successor is well advanced and I am confident that the board will be in a position to announce my successor before this shareholders’ meeting. Mr Shu Gu will continue as deputy chairman of the group. Bedding down a significantly changed board will be the first order of business for the new chairman and I have every confidence that the board will continue to function effectively in a complex environment.
AppreciationFor the board to be an effective custodian of sustainable performance and long-term value creation requires that we are adept at managing the complexities of change. We do not seek perfection in our governance systems, structures, policies and processes, which is impossible, but continuous improvement in a dynamic environment. I believe that the advances we have made in recent years attest to the fact that we have equipped our board and our people to anticipate and embrace constant change.
I wish to thank my colleagues on the board for their wise counsel and guidance which has supported this substantial achievement. Ben Kruger and Sim Tshabalala have confirmed our belief in their complementary skills, and their open and collaborative leadership style. I thank the executive leadership teams and the people of Standard Bank for navigating the challenges of our times with commitment and resilience. On behalf of the Standard Bank Group, I extend our thanks to our customers, shareholders and other stakeholders for their continued support.
My personal definition of success when I was appointed in 2010 was that more people would wake up wanting to go to work when my time as chairman was over. Our purpose and strategy is inspiring, and the group’s culture is fit for performance and value creation. Last year I was concerned that our people in the rest of Africa operations did not have the same sense of belonging to this group as a South African staff member – this has shifted significantly. It is gratifying that in the board’s engagement with stakeholders across the continent, the common sentiment is that Standard Bank is succeeding in Africa, and the sense of excitement within the group is tangible. I leave with the certainty that we are indeed a leading African integrated financial services organisation, with an exciting future driving the growth of this continent we call home.
Chairman’s report to stakeholders | continued
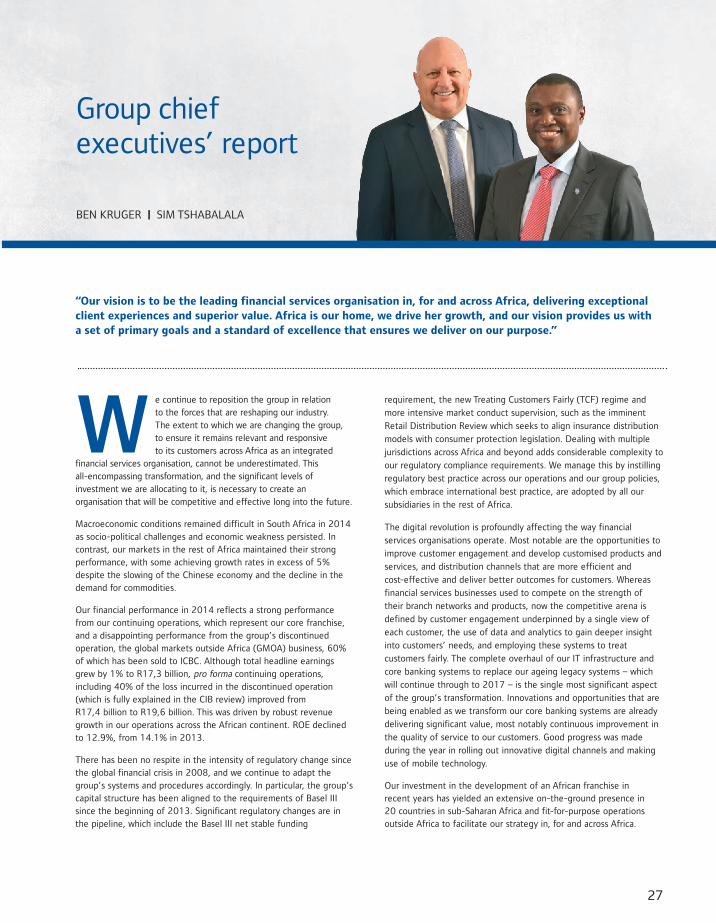
27
e continue to reposition the group in relation to the forces that are reshaping our industry. The extent to which we are changing the group, to ensure it remains relevant and responsive to its customers across Africa as an integrated
financial services organisation, cannot be underestimated. This all-encompassing transformation, and the significant levels of investment we are allocating to it, is necessary to create an organisation that will be competitive and effective long into the future.
Macroeconomic conditions remained difficult in South Africa in 2014 as socio-political challenges and economic weakness persisted. In contrast, our markets in the rest of Africa maintained their strong performance, with some achieving growth rates in excess of 5% despite the slowing of the Chinese economy and the decline in the demand for commodities.
Our financial performance in 2014 reflects a strong performance from our continuing operations, which represent our core franchise, and a disappointing performance from the group’s discontinued operation, the global markets outside Africa (GMOA) business, 60% of which has been sold to ICBC. Although total headline earnings grew by 1% to R17,3 billion, pro forma continuing operations, including 40% of the loss incurred in the discontinued operation (which is fully explained in the CIB review) improved from R17,4 billion to R19,6 billion. This was driven by robust revenue growth in our operations across the African continent. ROE declined to 12.9%, from 14.1% in 2013.
There has been no respite in the intensity of regulatory change since the global financial crisis in 2008, and we continue to adapt the group’s systems and procedures accordingly. In particular, the group’s capital structure has been aligned to the requirements of Basel III since the beginning of 2013. Significant regulatory changes are in the pipeline, which include the Basel III net stable funding
W
Group chief executives’ report
BEN KRUGER | SIM TSHABALALA
“Our vision is to be the leading financial services organisation in, for and across Africa, delivering exceptional client experiences and superior value. Africa is our home, we drive her growth, and our vision provides us with a set of primary goals and a standard of excellence that ensures we deliver on our purpose.”
requirement, the new Treating Customers Fairly (TCF) regime and
more intensive market conduct supervision, such as the imminent
Retail Distribution Review which seeks to align insurance distribution
models with consumer protection legislation. Dealing with multiple
jurisdictions across Africa and beyond adds considerable complexity to
our regulatory compliance requirements. We manage this by instilling
regulatory best practice across our operations and our group policies,
which embrace international best practice, are adopted by all our
subsidiaries in the rest of Africa.
The digital revolution is profoundly affecting the way financial
services organisations operate. Most notable are the opportunities to
improve customer engagement and develop customised products and
services, and distribution channels that are more efficient and
cost-effective and deliver better outcomes for customers. Whereas
financial services businesses used to compete on the strength of
their branch networks and products, now the competitive arena is
defined by customer engagement underpinned by a single view of
each customer, the use of data and analytics to gain deeper insight
into customers’ needs, and employing these systems to treat
customers fairly. The complete overhaul of our IT infrastructure and
core banking systems to replace our ageing legacy systems – which
will continue through to 2017 – is the single most significant aspect
of the group’s transformation. Innovations and opportunities that are
being enabled as we transform our core banking systems are already
delivering significant value, most notably continuous improvement in
the quality of service to our customers. Good progress was made
during the year in rolling out innovative digital channels and making
use of mobile technology.
Our investment in the development of an African franchise in recent years has yielded an extensive on-the-ground presence in 20 countries in sub-Saharan Africa and fit-for-purpose operations outside Africa to facilitate our strategy in, for and across Africa.
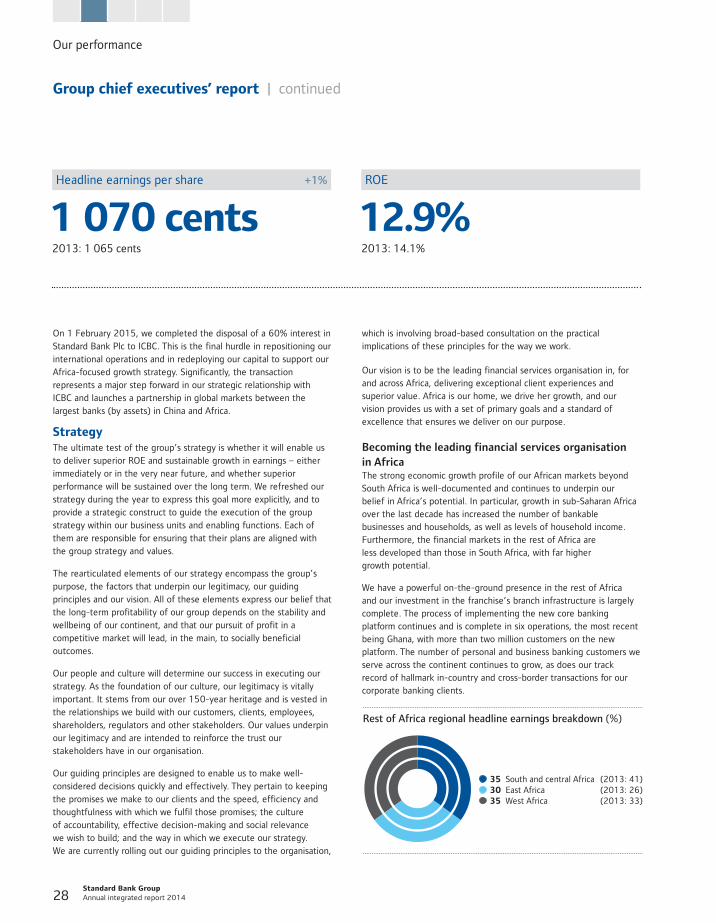
Standard Bank Group Annual integrated report 2014 28
which is involving broad-based consultation on the practical implications of these principles for the way we work.
Our vision is to be the leading financial services organisation in, for and across Africa, delivering exceptional client experiences and superior value. Africa is our home, we drive her growth, and our vision provides us with a set of primary goals and a standard of excellence that ensures we deliver on our purpose.
Becoming the leading financial services organisation in AfricaThe strong economic growth profile of our African markets beyond South Africa is well-documented and continues to underpin our belief in Africa’s potential. In particular, growth in sub-Saharan Africa over the last decade has increased the number of bankable businesses and households, as well as levels of household income. Furthermore, the financial markets in the rest of Africa are less developed than those in South Africa, with far higher growth potential.
We have a powerful on-the-ground presence in the rest of Africa and our investment in the franchise’s branch infrastructure is largely complete. The process of implementing the new core banking platform continues and is complete in six operations, the most recent being Ghana, with more than two million customers on the new platform. The number of personal and business banking customers we serve across the continent continues to grow, as does our track record of hallmark in-country and cross-border transactions for our corporate banking clients.
Rest of Africa regional headline earnings breakdown (%)
� 35 South and central Africa (2013: 41)� 30 East Africa (2013: 26)� 35 West Africa (2013: 33)
On 1 February 2015, we completed the disposal of a 60% interest in Standard Bank Plc to ICBC. This is the final hurdle in repositioning our international operations and in redeploying our capital to support our Africa-focused growth strategy. Significantly, the transaction represents a major step forward in our strategic relationship with ICBC and launches a partnership in global markets between the largest banks (by assets) in China and Africa.
StrategyThe ultimate test of the group’s strategy is whether it will enable us to deliver superior ROE and sustainable growth in earnings – either immediately or in the very near future, and whether superior performance will be sustained over the long term. We refreshed our strategy during the year to express this goal more explicitly, and to provide a strategic construct to guide the execution of the group strategy within our business units and enabling functions. Each of them are responsible for ensuring that their plans are aligned with the group strategy and values.
The rearticulated elements of our strategy encompass the group’s purpose, the factors that underpin our legitimacy, our guiding principles and our vision. All of these elements express our belief that the long-term profitability of our group depends on the stability and wellbeing of our continent, and that our pursuit of profit in a competitive market will lead, in the main, to socially beneficial outcomes.
Our people and culture will determine our success in executing our strategy. As the foundation of our culture, our legitimacy is vitally important. It stems from our over 150-year heritage and is vested in the relationships we build with our customers, clients, employees, shareholders, regulators and other stakeholders. Our values underpin our legitimacy and are intended to reinforce the trust our stakeholders have in our organisation.
Our guiding principles are designed to enable us to make well-considered decisions quickly and effectively. They pertain to keeping the promises we make to our clients and the speed, efficiency and thoughtfulness with which we fulfil those promises; the culture of accountability, effective decision-making and social relevance we wish to build; and the way in which we execute our strategy. We are currently rolling out our guiding principles to the organisation,
1 070 cents2013: 1 065 cents
Headline earnings per share +1%
12.9%2013: 14.1%
ROE
Group chief executives’ report | continued
Our performance
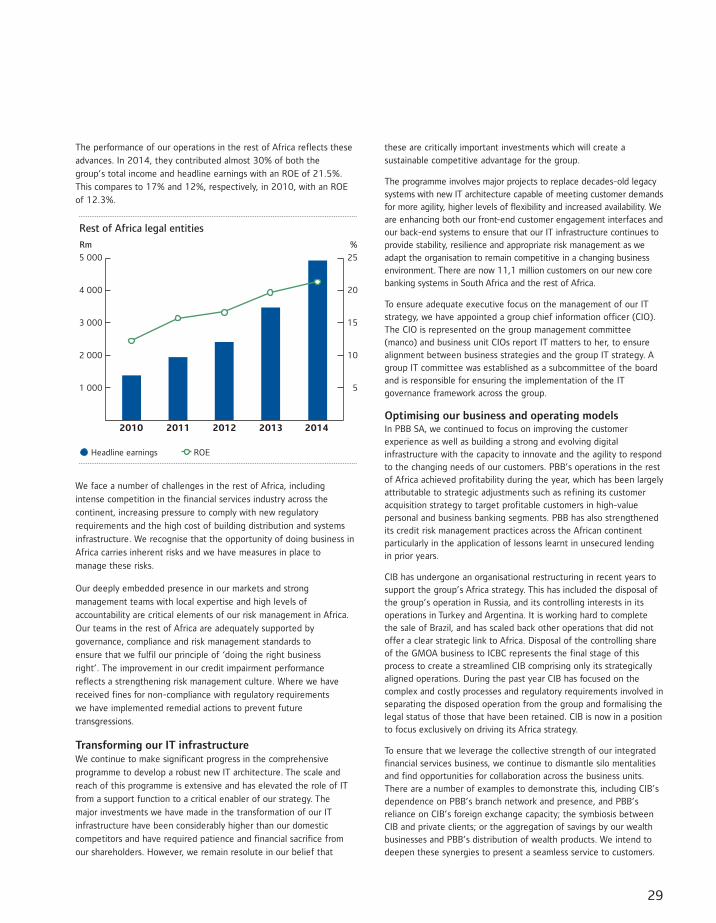
29
The performance of our operations in the rest of Africa reflects these
advances. In 2014, they contributed almost 30% of both the
group’s total income and headline earnings with an ROE of 21.5%.
This compares to 17% and 12%, respectively, in 2010, with an ROE
of 12.3%.
20122010 201420132011
Rest of Africa legal entities
5 000
4 000
3 000
2 000
1 000
%25
20
15
10
5
Rm
� Headline earnings � ROE
We face a number of challenges in the rest of Africa, including
intense competition in the financial services industry across the
continent, increasing pressure to comply with new regulatory
requirements and the high cost of building distribution and systems
infrastructure. We recognise that the opportunity of doing business in
Africa carries inherent risks and we have measures in place to
manage these risks.
Our deeply embedded presence in our markets and strong
management teams with local expertise and high levels of
accountability are critical elements of our risk management in Africa.
Our teams in the rest of Africa are adequately supported by
governance, compliance and risk management standards to
ensure that we fulfil our principle of ‘doing the right business
right’. The improvement in our credit impairment performance
reflects a strengthening risk management culture. Where we have
received fines for non-compliance with regulatory requirements
we have implemented remedial actions to prevent future
transgressions.
Transforming our IT infrastructureWe continue to make significant progress in the comprehensive
programme to develop a robust new IT architecture. The scale and
reach of this programme is extensive and has elevated the role of IT
from a support function to a critical enabler of our strategy. The
major investments we have made in the transformation of our IT
infrastructure have been considerably higher than our domestic
competitors and have required patience and financial sacrifice from
our shareholders. However, we remain resolute in our belief that
these are critically important investments which will create a sustainable competitive advantage for the group.
The programme involves major projects to replace decades-old legacy systems with new IT architecture capable of meeting customer demands for more agility, higher levels of flexibility and increased availability. We are enhancing both our front-end customer engagement interfaces and our back-end systems to ensure that our IT infrastructure continues to provide stability, resilience and appropriate risk management as we adapt the organisation to remain competitive in a changing business environment. There are now 11,1 million customers on our new core banking systems in South Africa and the rest of Africa.
To ensure adequate executive focus on the management of our IT strategy, we have appointed a group chief information officer (CIO). The CIO is represented on the group management committee (manco) and business unit CIOs report IT matters to her, to ensure alignment between business strategies and the group IT strategy. A group IT committee was established as a subcommittee of the board and is responsible for ensuring the implementation of the IT governance framework across the group.
Optimising our business and operating modelsIn PBB SA, we continued to focus on improving the customer experience as well as building a strong and evolving digital infrastructure with the capacity to innovate and the agility to respond to the changing needs of our customers. PBB’s operations in the rest of Africa achieved profitability during the year, which has been largely attributable to strategic adjustments such as refining its customer acquisition strategy to target profitable customers in high-value personal and business banking segments. PBB has also strengthened its credit risk management practices across the African continent particularly in the application of lessons learnt in unsecured lending in prior years.
CIB has undergone an organisational restructuring in recent years to support the group’s Africa strategy. This has included the disposal of the group’s operation in Russia, and its controlling interests in its operations in Turkey and Argentina. It is working hard to complete the sale of Brazil, and has scaled back other operations that did not offer a clear strategic link to Africa. Disposal of the controlling share of the GMOA business to ICBC represents the final stage of this process to create a streamlined CIB comprising only its strategically aligned operations. During the past year CIB has focused on the complex and costly processes and regulatory requirements involved in separating the disposed operation from the group and formalising the legal status of those that have been retained. CIB is now in a position to focus exclusively on driving its Africa strategy.
To ensure that we leverage the collective strength of our integrated financial services business, we continue to dismantle silo mentalities and find opportunities for collaboration across the business units. There are a number of examples to demonstrate this, including CIB’s dependence on PBB’s branch network and presence, and PBB’s reliance on CIB’s foreign exchange capacity; the symbiosis between CIB and private clients; or the aggregation of savings by our wealth businesses and PBB’s distribution of wealth products. We intend to deepen these synergies to present a seamless service to customers.
Our performance
Standard Bank Group Annual integrated report 2014 30
In this regard, the group has established Standard Bank Wealth (SBW) to focus on non-banking financial services across its existing operating segments. SBW will be responsible for aligning the strategies of these businesses to best leverage the group’s existing competitive advantages in the wealth markets of South Africa and the rest of Africa. SBW will enhance the group’s service offerings to the PBB client base and drive additional penetration, and will attempt to realise the potential that exists between CIB and the wealth businesses. SBW will also be responsible for high net worth wealth management, which is a business serving a customer segment across all of Standard Bank’s geographies. A small central team of highly skilled executives has been established to strengthen the group’s focus on developing the wealth franchise in partnership with PBB, CIB and Liberty.
Our greatest competitive advantageOur people represent our definitive competitive advantage and we continue to strengthen our people management practices. Our more open and consultative approach to leadership has increased the level of our engagement with staff, and we believe our people have a clear understanding of how they contribute to our refreshed strategy and to driving Africa’s growth. They also have a deeper understanding of the culture of accountability, effective decision-making and social relevance we wish to build. The business units have increased their levels of staff engagement to embed their strategies, inspire commitment and constantly remind their people that the expectations of customers and clients are at the centre of everything we do. We remain committed to best practice people management and offering a workplace where high performance is expected and rewarded.
We continue to provide significant opportunity for personal advancement. Our group expenditure in 2014 on training amounted to R746 million (2013: R638 million), of which R27,8 million (2013: R19,6 million) was invested in our graduate programme.
Creating wealth through TutuwaStandard Bank Group concluded its BEE ownership transaction, Tutuwa, in October 2004. This resulted in 10% direct ownership of our South African operations by the Tutuwa BEE consortium. The Tutuwa scheme encompassed Tutuwa Managers’ Trusts for current and former black managers of SBSA, the Tutuwa Community Trust focused on black SMEs and community development, and empowerment partners Safika and Shanduka. At December 2014, we had approximately 6 100 black beneficiaries of the managers’ trusts, and 261 black SMEs participating in the initiative.
The Tutuwa initiative’s 10-year lock-in period ended on 31 December 2014. We introduced beneficiary engagement programmes during 2014 to inform beneficiaries of their options in terms of selling their shares and provide them with the necessary financial education to make sound financial decisions. Tutuwa Plus was implemented to ensure the sustainability of the black SME beneficiaries in our Tutuwa initiative beyond the vesting of their shares. The programme assists these businesses in making sound investment choices and will provide for ongoing business advisory support following the SMEs’ exit from the initiative. Standard Bank
believes that the Tutuwa scheme has successfully fulfilled a substantial part of Standard Bank’s commitments under the Financial Sector Charter, by proactively supporting economic transformation in our country, and making a real difference to the lives of historically disadvantaged people. Tutuwa has created R10,7 billion in value for 6 100 current and former Standard Bank employees, 261 black-owned small businesses, and two empowerment partners, while also establishing a foundation to support education and youth initiatives. Each of the small business beneficiaries will receive a direct benefit of between R2 million and R3 million, allowing them to grow their businesses, employ more people and contribute to the overall prosperity of South Africa.
Now that the lock-in period is over, and to the extent that beneficiaries exercise their right to sell some or all of their shares, black ownership of the bank is likely to reduce in the short to medium term. This is because selling at least some shares after 10 years of participation in the scheme would be a natural choice for some beneficiaries. Standard Bank believes that the right of beneficiaries to fully and freely access the value inherent in their shares in a manner of their choosing is very important as a pillar of empowerment.
While Standard Bank will continue its transformation journey both in terms of the other pillars of the financial sector scorecard and more generally, we are confident that we have complied in full in respect of ownership. Having reviewed the level of black ownership in Standard Bank and bearing in mind the pressing need for transformation to be as broad-based as possible, we have concluded that the positive effects of employing our capital to lend into the wider economy – and particularly in support of transformational infrastructure and enterprise development – will yield a far greater benefit to South Africa than a second empowerment deal structured along the lines of Tutuwa.
ProspectsExpected global economic growth has been revised down by the International Monetary Fund to 3.5% from 3.8% previously. Although economic output is expected to receive a boost from lower oil prices, this is expected to be more than offset by diminished medium-term growth expectations in many developed and emerging economies. The global growth profile is expected to continue to be unbalanced with the United States the only major economy with raised growth expectations.
South Africa will continue to face structural and cyclical headwinds in 2015, exacerbated by an under-supplied electricity market. However, some relief is likely from the fall in the price of oil, which has resulted in downward revisions to inflation expectations and upward revisions to growth forecasts due to higher real disposable incomes for households. While sub-Saharan Africa’s outlook is influenced by lower commodity prices, the overall growth profile remains robust. The group’s brand and strategic position has never been stronger following a steady realignment of the group’s resources to focus on our customers on the African continent. The group’s medium-term ROE target of between 15% and 18% remains in place and reflects our confidence in the ability of our people to deliver the necessary consistent growth to achieve this target.
Group chief executives’ report | continued
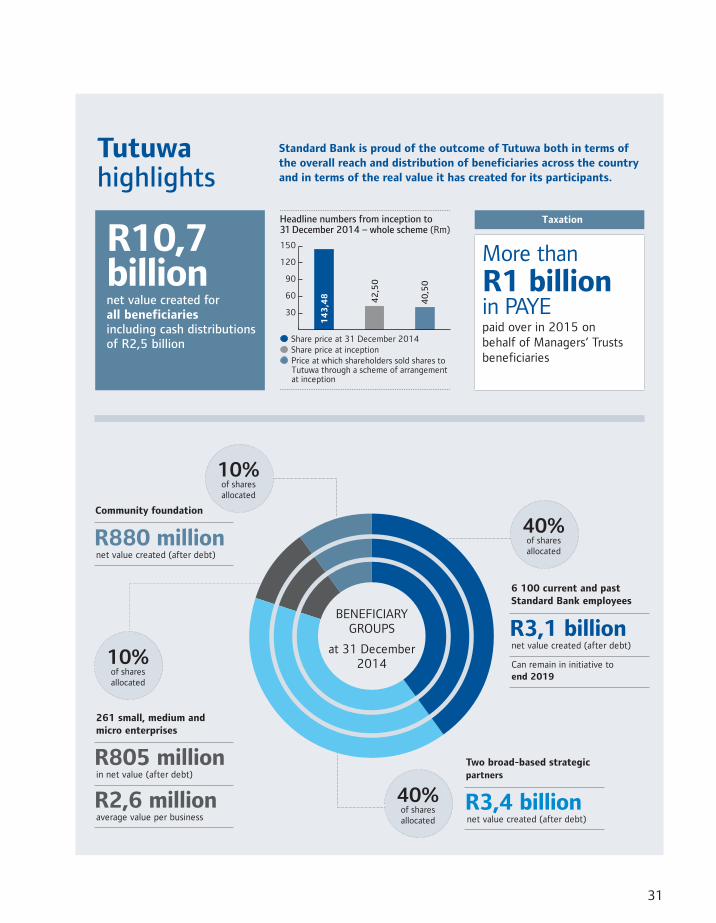
31
Tutuwa highlights
Taxation
More thanR1 billion in PAYEpaid over in 2015 on behalf of Managers’ Trusts beneficiaries
R10,7billionnet value created for all beneficiaries including cash distributions of R2,5 billion
30
60
90
120
150
� Share price at 31 December 2014� Share price at inception� Price at which shareholders sold shares to Tutuwa through a scheme of arrangement at inception
Headline numbers from inception to31 December 2014 – whole scheme (Rm)
14
3,4
8 42
,50
40
,50
6 100 current and past Standard Bank employees
261 small, medium and micro enterprises
Community foundation
Two broad-based strategic partners
BENEFICIARY GROUPS
at 31 December 2014
40%of shares allocated
40%of shares allocated
10%of shares allocated
10%of shares allocated
R805 millionin net value (after debt)
R2,6 millionaverage value per business
R3,4 billionnet value created (after debt)
R3,1 billionnet value created (after debt)
Can remain in initiative to end 2019
R880 millionnet value created (after debt)
Standard Bank is proud of the outcome of Tutuwa both in terms of the overall reach and distribution of beneficiaries across the country and in terms of the real value it has created for its participants.
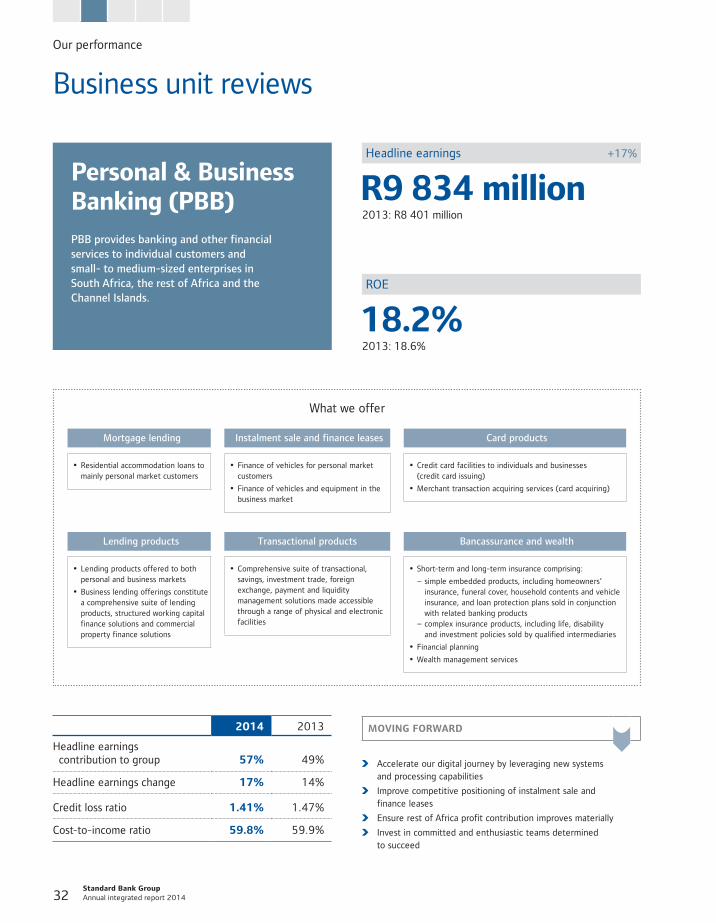
Standard Bank Group Annual integrated report 2014 32
Personal & Business Banking (PBB)PBB provides banking and other financial services to individual customers and small- to medium-sized enterprises in South Africa, the rest of Africa and the Channel Islands.
2014 2013
Headline earnings contribution to group 57% 49%
Headline earnings change 17% 14%
Credit loss ratio 1.41% 1.47%
Cost-to-income ratio 59.8% 59.9%
18.2%2013: 18.6%
ROE
Mortgage lending
�� Residential accommodation loans to mainly personal market customers
What we offer
Instalment sale and finance leases
�� Finance of vehicles for personal market customers
�� Finance of vehicles and equipment in the business market
Card products
�� Credit card facilities to individuals and businesses (credit card issuing)
�� Merchant transaction acquiring services (card acquiring)
Lending products
�� Lending products offered to both personal and business markets
�� Business lending offerings constitute a comprehensive suite of lending products, structured working capital finance solutions and commercial property finance solutions
Transactional products
�� Comprehensive suite of transactional, savings, investment trade, foreign exchange, payment and liquidity management solutions made accessible through a range of physical and electronic facilities
Bancassurance and wealth
�� Short-term and long-term insurance comprising:
�− simple embedded products, including homeowners’ insurance, funeral cover, household contents and vehicle insurance, and loan protection plans sold in conjunction with related banking products �− complex insurance products, including life, disability and investment policies sold by qualified intermediaries
�� Financial planning
�� Wealth management services
Business unit reviews
Our performance
R9 834 million2013: R8 401 million
Headline earnings +17%
MOVING FORWARD
Accelerate our digital journey by leveraging new systems and processing capabilities
Improve competitive positioning of instalment sale and finance leases
Ensure rest of Africa profit contribution improves materially
Invest in committed and enthusiastic teams determined to succeed
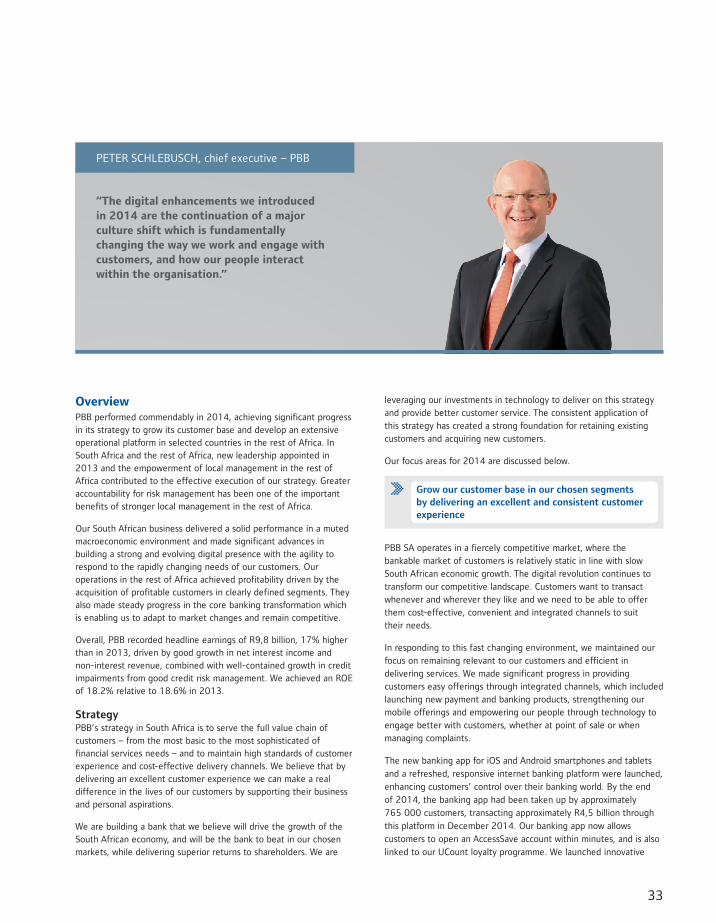
33
“The digital enhancements we introduced in 2014 are the continuation of a major culture shift which is fundamentally changing the way we work and engage with customers, and how our people interact within the organisation.”
PETER SCHLEBUSCH, chief executive – PBB
OverviewPBB performed commendably in 2014, achieving significant progress in its strategy to grow its customer base and develop an extensive operational platform in selected countries in the rest of Africa. In South Africa and the rest of Africa, new leadership appointed in 2013 and the empowerment of local management in the rest of Africa contributed to the effective execution of our strategy. Greater accountability for risk management has been one of the important benefits of stronger local management in the rest of Africa.
Our South African business delivered a solid performance in a muted macroeconomic environment and made significant advances in building a strong and evolving digital presence with the agility to respond to the rapidly changing needs of our customers. Our operations in the rest of Africa achieved profitability driven by the acquisition of profitable customers in clearly defined segments. They also made steady progress in the core banking transformation which is enabling us to adapt to market changes and remain competitive.
Overall, PBB recorded headline earnings of R9,8 billion, 17% higher than in 2013, driven by good growth in net interest income and non-interest revenue, combined with well-contained growth in credit impairments from good credit risk management. We achieved an ROE of 18.2% relative to 18.6% in 2013.
StrategyPBB’s strategy in South Africa is to serve the full value chain of customers – from the most basic to the most sophisticated of financial services needs – and to maintain high standards of customer experience and cost-effective delivery channels. We believe that by delivering an excellent customer experience we can make a real difference in the lives of our customers by supporting their business and personal aspirations.
We are building a bank that we believe will drive the growth of the South African economy, and will be the bank to beat in our chosen markets, while delivering superior returns to shareholders. We are
leveraging our investments in technology to deliver on this strategy and provide better customer service. The consistent application of this strategy has created a strong foundation for retaining existing customers and acquiring new customers.
Our focus areas for 2014 are discussed below.
Grow our customer base in our chosen segments by delivering an excellent and consistent customer experience
PBB SA operates in a fiercely competitive market, where the bankable market of customers is relatively static in line with slow South African economic growth. The digital revolution continues to transform our competitive landscape. Customers want to transact whenever and wherever they like and we need to be able to offer them cost-effective, convenient and integrated channels to suit their needs.
In responding to this fast changing environment, we maintained our focus on remaining relevant to our customers and efficient in delivering services. We made significant progress in providing customers easy offerings through integrated channels, which included launching new payment and banking products, strengthening our mobile offerings and empowering our people through technology to engage better with customers, whether at point of sale or when managing complaints.
The new banking app for iOS and Android smartphones and tablets and a refreshed, responsive internet banking platform were launched, enhancing customers’ control over their banking world. By the end of 2014, the banking app had been taken up by approximately 765 000 customers, transacting approximately R4,5 billion through this platform in December 2014. Our banking app now allows customers to open an AccessSave account within minutes, and is also linked to our UCount loyalty programme. We launched innovative
Standard Bank Group Annual integrated report 2014 34
payment solutions SnapScan and MasterPass which provide faster,
more secure payment at tills and online using a smartphone. At the
end of December, 118 000 cardholders had downloaded SnapScan
and 14 000 merchants are accepting it, giving us access to a new
revenue stream. During 2014 we re-launched InstantMoney and a
new innovation, AirTaxi. InstantMoney is a fast, easy and cost-
effective payment solution that allows a sender to transfer funds to a
beneficiary without a bank account or credit card using their cell
phone. Our customers completed over 7,5 million transactions,
moving close to R6 billion in total value. AirTaxi allows customers to
pay taxi fares with mobile phone airtime. Both InstantMoney and
AirTaxi effectively service our inclusive banking market.
These new payment solutions are as safe as they are convenient,
and eliminate the risk of cash being stolen or cards being cloned.
They assist in reducing fraud, especially the growing incidence
of cybercrime, which remains a key concern and continues to
receive the highest level of attention through a multi-layered
prevention, detection and response system. While we are confident
that our security model is robust, the constantly evolving nature of
fraud and cybercrime requires that we continuously review and invest
in our security systems and processes to ensure our customers are
well protected. During the year we rolled out the ‘tap and go’
contactless card feature on credit cards, which is convenient and
assists in reducing card fraud as customers can make purchases for
amounts less than R200 without handing over their card to the
merchant. The number of customers registered to use MyUpdates
(SMS notification of transactions on the customers’ account)
increased 9% to almost 10 million, allowing early detection and
prevention of fraud.
The first phase of enhancing our customer service functionality was
rolled out during the year and provided a single repository for all
customer queries, leads and complaints. Additional functionality will
ultimately integrate customer management across all channels in the
group and provide a single view of the customer. This will improve our
speed, accuracy and responsiveness and make it easier for our
customers to interact with us, as well as making it easier for our staff
to service customers.
These enhancements are shifting the way we engage with customers
from a branch and contact centre dominated model to an ‘always on,
always connected’ approach, supported by the rollout of stable
digital and other self-service channels. We continued to optimise our
physical branch network during the year, and the number of branches
in South Africa (including lower cost loan centres) dropped by 8% to
665. We opened six ‘new generation’ branches in addition to the
eight opened in 2013, expanding our self-service facilities, as well as
customer education and advice. The total number of ATMs in South
Africa declined from 6 452 in 2013 to 5 991, although the number
of automated note acceptors increased to 1 268 (2013: 936).
Teller and enquiry volumes across all points of representation
declined 7% and 6% respectively, while mobile banking transactions
increased 53%, indicating the change in customer behaviour to
self-service channels.
Unfortunately, our customers and frontline staff were adversely impacted by a systems failure on 1 September 2014 when a technical malfunction triggered a shutdown – intended to protect against data corruption – of the mainframe. We were able to respond decisively based on the scenario planning we undertake as part of our risk management processes, which included rapid communication with stakeholders through the media and other channels. We restored critical services to customers within 90 minutes without compromising data, and no such outages have occurred since then.
PBB SA maintained its focus on primary transaction and deposit accounts. We believe our simplified, highly focused portfolio of products offers value to customers. Since the launch of our loyalty programme UCount in 2013, approximately 553 000 customers have registered for the programme, in total receiving R60 million per month in benefits for using their Standard Bank personal debit, cheque or credit cards. We increased fees for personal customers in 2014 by less than inflation. This was the first fee increase for personal customers in two years.
In business banking, PBB SA maintained its leading position in the commercial market, based on an independent survey conducted by Galactica. The franchise maintained its strength in the public sector and an increased drive to secure more customers in the medium to large business sector resulted in some significant new corporate accounts, including the mandate for Shoprite Checkers’ cash management and card acquiring business, in collaboration with CIB.
In 2014 we deepened our focus on business banking, a key driver of job creation and economic development. We also made progress in developing inter-regional relationships between our business banking teams in South Africa and the rest of Africa, to facilitate the entry of South African businesses into the rest of Africa and vice versa. There were notable achievements in assisting franchise customers, such as KFC, to expand their presence beyond South Africa.
PBB SA’s inclusive banking market continues to be serviced by our AccessBanking suite of products. Our cost structure to service the low-value, low-volume transacting accounts in this market is still too high. Our approach therefore is to maintain our position without significant further investment. To achieve this we are leveraging the investment made in prior years and continuing to move to a lower-cost model that encourages customers to use mobile platforms, ATMs and point of sales devices in combination with third-party infrastructure.
More direct engagement with our customers enables us to achieve two important objectives: a more effective response to customer needs and more efficient management of credit risk. Our strategy to target primary transaction accounts facilitates the responsible extension of credit by providing detailed insight into customers’ cash flows and risk profiles. Unsecured credit extension was sensibly managed given the economic pressure on customers. In the middle market, unsecured revolving credit plan account balances grew by 10% while personal overdraft facilities remained at a similar level to 2013, compared with 22% and 24% growth respectively in the prior
Business unit reviews | Personal & Business Banking continued
Our performance
35
The replacement of our core banking system is a key enabler of the PBB SA vision and allows us to be agile and responsive in meeting the needs of our customers. The new system offers less complex, more efficient and customer-centric infrastructure. Ultimately, we believe that the comprehensive nature of our core banking transformation, which involves the overhaul of both back-office and front-end functions simultaneously, will afford us a powerful competitive advantage and underpin the optimisation of our business and operating model. The programme receives the highest level of executive attention and we have a clear plan to achieve completion in 2017.
Build excellence through engaged and committed people
Our people are critical to our strategic priority of delivering excellent customer experiences. We remain focused on ensuring that each individual understands that PBB exists to serve our customers. We are committed to best practice people management and offer a workplace where high performance is expected and rewarded. Our training and development expenditure to improve competence for 2014 in South Africa was R56 million.
An external survey conducted during the year found that almost 80% of our people are engaged and committed. This indicated high levels of satisfaction and meets the benchmark for a high-performing company. We believe that our people should have an owner-manager orientation with a focus on making a difference and putting our customers at the centre of everything we do.
The digital enhancements we introduced in 2014 are the continuation of a major culture shift which is fundamentally changing the way we work and engage with customers, and how our people interact within the organisation. We have achieved a number of important milestones in our journey to prepare our people for this shift through staff roadshows and forums, conferences for top leadership, and programmes on innovation, entrepreneurship and agility within the organisation. There are specific initiatives to strengthen client engagement and user experience capability.
PBB SA employs the largest staff complement in the group. 78% of junior staff, 69% of middle staff and 54% of senior staff are black. The executive team remains the most transformed in the local banking sector with 23% being women and 50% being black.
Rest of AfricaPBB’s franchise in the rest of Africa achieved overall profitability for the first time – a significant milestone in the group’s strategy. While still only a small profit, it is encouraging that 12 of the 14 countries in which we operate achieved growth in headline earnings, with nine growing headline earnings more than 30%. Pleasingly, PBB in Kenya, Mozambique and Zambia made a profit for the first time during 2014. The majority of operations in our portfolio made solid progress in executing their strategic plans and responding to the myriad challenges of competition and regulatory pressure in their markets. We continued to focus on our businesses in the larger
year. We continued to be very selective in our credit extension to the inclusive banking market and the book declined to approximately R2,1 billion (2013: R2,9 billion).
Our personal market instalment sale and finance lease book was an area in which PBB SA underperformed and did not deliver value to customers or shareholders. Our distribution model has been weak with poor integration into dealers in the industry and a slow turnaround time. This resulted in negative selection and as a result the business we wrote was to customers with elevated risk profiles at higher pricing. We believed that our pricing would be sufficient to compensate for this negative selection; however, our scorecards were not appropriately calibrated to deal with this and as a result our total credit impairment charges for the year increased by 56%. During the year, we have rectified our scorecards and enhanced some of our processes to improve our turnaround times and ease of doing business for the dealers. We have appointed new leadership, with deep instalment sale and finance leasing expertise and experience and have a clear strategy to carve out profitable niches for ourselves, focusing on industry integration with a tighter quality focus. Investment and commitment will be required as this will not be a quick fix but we believe that we will show good progress in turning around this business in 2015.
PBB SA was recognised as the leading brand in consumer banking in the 2014 Sunday Times/TNS Top Brands survey for the second consecutive year. The value of this award is that the ranking is based on a representative consumer survey. The globally accepted net promoter score, which we introduced in 2013 as our key measure of customer loyalty, improved to 36 during the year. This remains below our target, and is being addressed by ongoing programmes to improve service through staff training, more efficient processes and the migration of more basic transactions to digital platforms.
Using technology to improve efficiency, effectiveness and innovation
Our IT investment is transforming our bank to become more customer-centric, agile and digitally enabled. Our core banking transformation is a lengthy, complex and capital intensive project. However, to date we have successfully delivered four releases, which have built the foundation, ensuring that the system is able to support PBB into the future, as well as migrated all banking customers onto the new platform. We currently have 8,6 million customers on our core banking platform and processed almost 430 million transactions on the platform in 2014.
As mentioned earlier, during 2014 we successfully delivered the first phase of the customer relationship management solution and implemented the leads and service request management functionality. The customer service application has enhanced customer experience with 2,6 million service requests, up more than a 100% over legacy processes, and 140 000 leads being logged for the six months since implementation. The completion of this ‘customer first’ journey is expected in 2015. Once delivered, PBB SA will be able to provide a significantly improved customer experience.
Standard Bank Group Annual integrated report 2014 36
and potentially high-growth markets of Nigeria, Kenya, Angola and Ghana, where our operations are sub-scale but which we believe will drive growth in group earnings in years to come. We remain vigilant regarding the potential adverse impact of sustained low oil prices in oil exporting countries – especially Nigeria and Angola.
StrategyPBB’s vision in the rest of Africa is to build a portfolio of personal and business banking franchises across sub-Saharan Africa which is a bank of choice for customers and clients in their countries and is driven and managed by an empowered local leadership. We aim to deliver profitable customer-centred, relevant, easy-to-use and accessible financial solutions to customers in our chosen segments.
Key objectives on which we are focusing to maintain growth momentum in the rest of Africa are discussed below.
Grow our customer base in our chosen segments based on excellent consistent customer experience
At the core of our strategy in the rest of Africa is transactional banking and liability gathering. In 2013, to grow customer numbers we chose to shift our segment focus to high-value middle income to affluent clients and higher value enterprises and commercial customers, with the aim of acquiring their valuable primary transaction accounts. During 2014, this focus evolved slightly and we have begun to lead with business banking and high-value personal segments. This means that we have insight into all elements of the value chain in business banking, which includes business owners and their clients, service providers and staff.
We have seen encouraging signs of growth in our chosen segments. PBB in the rest of Africa recorded 7% growth in total number of customers, showing particularly good growth in sales to commercial (45%), SME tier 1 (62%), private banking (11%) and executive client base (36%). Valuable retail-priced deposits from customers in the rest of Africa grew 20% on a constant currency basis, after several years of consistent growth.
This growth was achieved despite some challenges which threatened to damage customer relationships, including IT system instability in Angola, Namibia and Nigeria, slow turnaround times particularly on credit requests, and poor document management in some countries. Remedial actions have been implemented to resolve these challenges and system stability has been improved. The processing of credit requests has improved substantially following a redesign of the system and people practices. The implementation of electronic document management in 2015 will strengthen this service further, particularly the processing, storage and retrieval of Know Your Customer compliance documentation.
We continued to focus on delivering a superior and consistent experience to our customers during the year, using our multi-channel approach to improve our customer proposition. We further increased investment in ATMs, with the number available to customers increasing 12% to 1 364 at the end of 2014. The volume of ATM transactions rose by 8% after a significant uptake during the prior
year. The deployment of the tablet-based sales application was a significant contributor to the improved performance in business banking, with both commercial banking and SME tier 1 reflecting good growth in new client acquisition, as well as improved cross-selling to existing clients.
Using technology in a smart way to improve efficiency, effectiveness and innovation
Our strategy to grow our customer base is heavily dependent on technology. We continued to roll out the Finacle core banking platform in the rest of Africa and have now completed implementation in Namibia, Nigeria, Uganda, Botswana, Tanzania and Ghana, which together have 2,5 million customers on the new platform. We are improving with each successive implementation, with the Ghana implementation being particularly smooth as we could plan better for potential issues. Our aim was to ensure minimal disruption to customers and to achieve this staff participated in simulation exercises to familiarise themselves with the system, while the Africa core banking teams shared their knowledge and made necessary amendments as required.
We implemented specific system enhancements in Botswana, Namibia and Tanzania during the year to stabilise and optimise existing installations and facilitate the introduction of internet and mobile banking services. The smartphone app is being launched in the rest of Africa, with the rollout of the new banking app for tablets being investigated on a per country basis, as Finacle comes online.
We anticipate that a hub will be developed to serve the smaller southern African franchises that do not have sufficient critical mass to warrant a full deployment of the core banking system in country.
Become the best employer to work for
We remain focused on ensuring our businesses are managed by a local leadership team that is committed, competent and empowered to make effective decisions.
Our research and independent surveys conducted in the rest of Africa confirmed significant improvements in the engagement of our people, which will stand us in good stead as we pursue our growth strategy. This was largely as a result of clarity and consistency in the execution of our strategy, stable and strong leadership after a number of changes during the preceding years and the turnaround to profitability.
The only exceptions were the operations in Botswana, Tanzania and Uganda, where financial underperformance in challenging market conditions and new leadership changes had an impact on staff morale.
Business unit reviews | Personal & Business Banking continued
Our performance
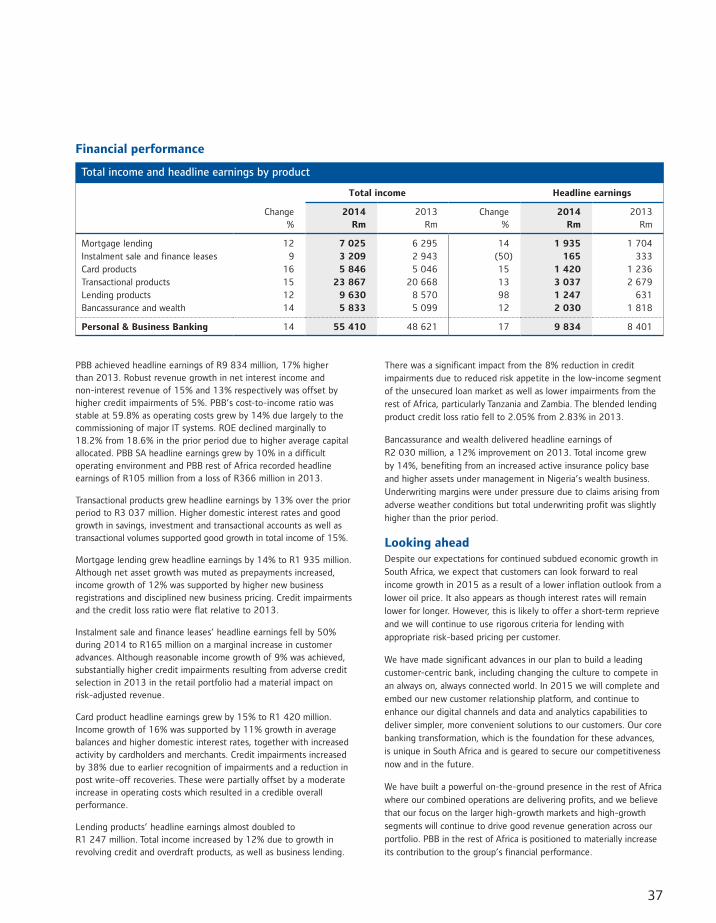
37
Financial performance
Total income and headline earnings by product
Change %
Total income Headline earnings
2014Rm
2013Rm
Change%
2014Rm
2013Rm
Mortgage lending 12 7 025 6 295 14 1 935 1 704 Instalment sale and finance leases 9 3 209 2 943 (50) 165 333 Card products 16 5 846 5 046 15 1 420 1 236 Transactional products 15 23 867 20 668 13 3 037 2 679 Lending products 12 9 630 8 570 98 1 247 631 Bancassurance and wealth 14 5 833 5 099 12 2 030 1 818
Personal & Business Banking 14 55 410 48 621 17 9 834 8 401
PBB achieved headline earnings of R9 834 million, 17% higher than 2013. Robust revenue growth in net interest income and non-interest revenue of 15% and 13% respectively was offset by higher credit impairments of 5%. PBB’s cost-to-income ratio was stable at 59.8% as operating costs grew by 14% due largely to the commissioning of major IT systems. ROE declined marginally to 18.2% from 18.6% in the prior period due to higher average capital allocated. PBB SA headline earnings grew by 10% in a difficult operating environment and PBB rest of Africa recorded headline earnings of R105 million from a loss of R366 million in 2013.
Transactional products grew headline earnings by 13% over the prior period to R3 037 million. Higher domestic interest rates and good growth in savings, investment and transactional accounts as well as transactional volumes supported good growth in total income of 15%.
Mortgage lending grew headline earnings by 14% to R1 935 million. Although net asset growth was muted as prepayments increased, income growth of 12% was supported by higher new business registrations and disciplined new business pricing. Credit impairments and the credit loss ratio were flat relative to 2013.
Instalment sale and finance leases’ headline earnings fell by 50% during 2014 to R165 million on a marginal increase in customer advances. Although reasonable income growth of 9% was achieved, substantially higher credit impairments resulting from adverse credit selection in 2013 in the retail portfolio had a material impact on risk-adjusted revenue.
Card product headline earnings grew by 15% to R1 420 million. Income growth of 16% was supported by 11% growth in average balances and higher domestic interest rates, together with increased activity by cardholders and merchants. Credit impairments increased by 38% due to earlier recognition of impairments and a reduction in post write-off recoveries. These were partially offset by a moderate increase in operating costs which resulted in a credible overall performance.
Lending products’ headline earnings almost doubled to R1 247 million. Total income increased by 12% due to growth in revolving credit and overdraft products, as well as business lending.
There was a significant impact from the 8% reduction in credit impairments due to reduced risk appetite in the low-income segment of the unsecured loan market as well as lower impairments from the rest of Africa, particularly Tanzania and Zambia. The blended lending product credit loss ratio fell to 2.05% from 2.83% in 2013.
Bancassurance and wealth delivered headline earnings of R2 030 million, a 12% improvement on 2013. Total income grew by 14%, benefiting from an increased active insurance policy base and higher assets under management in Nigeria’s wealth business. Underwriting margins were under pressure due to claims arising from adverse weather conditions but total underwriting profit was slightly higher than the prior period.
Looking aheadDespite our expectations for continued subdued economic growth in South Africa, we expect that customers can look forward to real income growth in 2015 as a result of a lower inflation outlook from a lower oil price. It also appears as though interest rates will remain lower for longer. However, this is likely to offer a short-term reprieve and we will continue to use rigorous criteria for lending with appropriate risk-based pricing per customer.
We have made significant advances in our plan to build a leading customer-centric bank, including changing the culture to compete in an always on, always connected world. In 2015 we will complete and embed our new customer relationship platform, and continue to enhance our digital channels and data and analytics capabilities to deliver simpler, more convenient solutions to our customers. Our core banking transformation, which is the foundation for these advances, is unique in South Africa and is geared to secure our competitiveness now and in the future.
We have built a powerful on-the-ground presence in the rest of Africa where our combined operations are delivering profits, and we believe that our focus on the larger high-growth markets and high-growth segments will continue to drive good revenue generation across our portfolio. PBB in the rest of Africa is positioned to materially increase its contribution to the group’s financial performance.
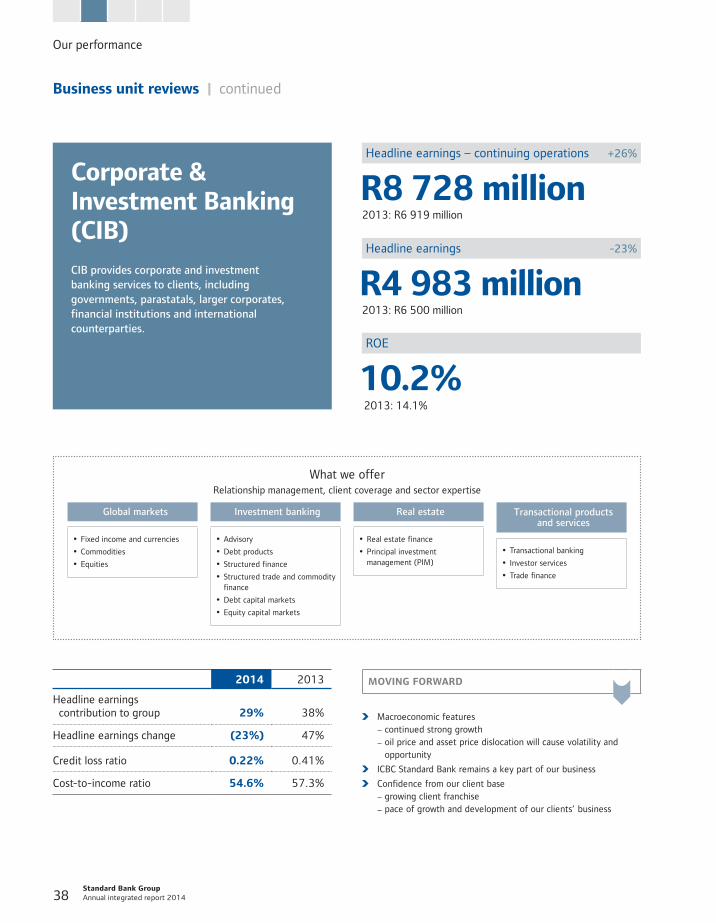
Standard Bank Group Annual integrated report 2014 38
Corporate & Investment Banking (CIB)CIB provides corporate and investment banking services to clients, including governments, parastatals, larger corporates, financial institutions and international counterparties.
R8 728 million2013: R6 919 million
Headline earnings – continuing operations +26%
R4 983 million2013: R6 500 million
Headline earnings -23%
10.2%2013: 14.1%
ROE
Business unit reviews | continued
2014 2013
Headline earnings contribution to group 29% 38%
Headline earnings change (23%) 47%
Credit loss ratio 0.22% 0.41%
Cost-to-income ratio 54.6% 57.3%
What we offerRelationship management, client coverage and sector expertise
Investment banking
�� Advisory
�� Debt products
�� Structured finance
�� Structured trade and commodity finance
�� Debt capital markets
�� Equity capital markets
Global markets
�� Fixed income and currencies
�� Commodities
�� Equities
Real estate
�� Real estate finance
�� Principal investment management (PIM)
Transactional products and services
�� Transactional banking
�� Investor services
�� Trade finance
Our performance
MOVING FORWARD
Macroeconomic features
�− continued strong growth
�− oil price and asset price dislocation will cause volatility and opportunity
ICBC Standard Bank remains a key part of our business
Confidence from our client base
�− growing client franchise
�− pace of growth and development of our clients’ business
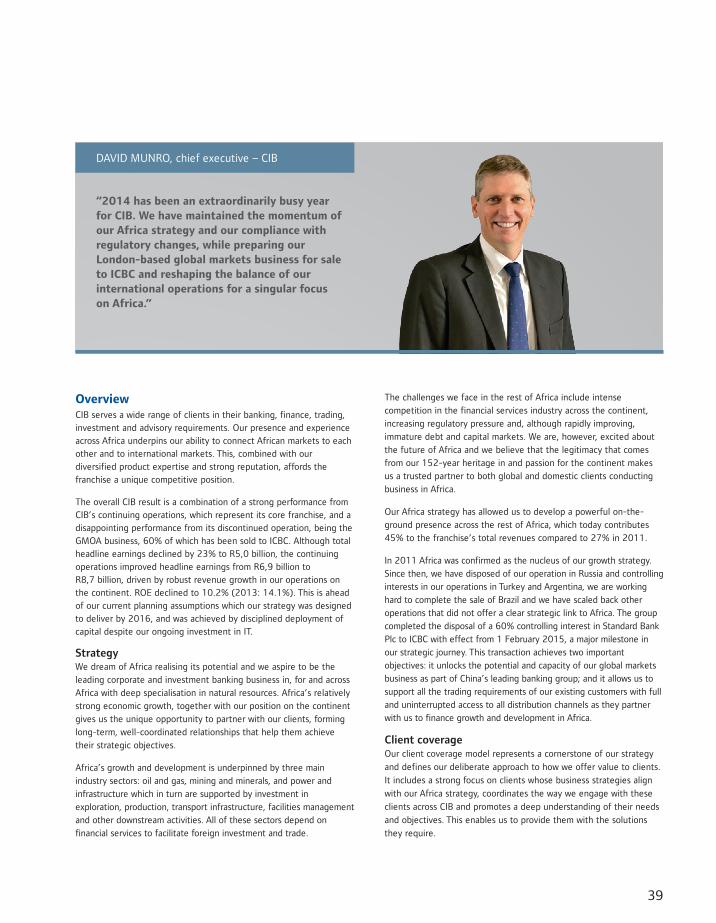
39
“2014 has been an extraordinarily busy year for CIB. We have maintained the momentum of our Africa strategy and our compliance with regulatory changes, while preparing our London-based global markets business for sale to ICBC and reshaping the balance of our international operations for a singular focus on Africa.”
DAVID MUNRO, chief executive – CIB
OverviewCIB serves a wide range of clients in their banking, finance, trading, investment and advisory requirements. Our presence and experience across Africa underpins our ability to connect African markets to each other and to international markets. This, combined with our diversified product expertise and strong reputation, affords the franchise a unique competitive position.
The overall CIB result is a combination of a strong performance from CIB’s continuing operations, which represent its core franchise, and a disappointing performance from its discontinued operation, being the GMOA business, 60% of which has been sold to ICBC. Although total headline earnings declined by 23% to R5,0 billion, the continuing operations improved headline earnings from R6,9 billion to R8,7 billion, driven by robust revenue growth in our operations on the continent. ROE declined to 10.2% (2013: 14.1%). This is ahead of our current planning assumptions which our strategy was designed to deliver by 2016, and was achieved by disciplined deployment of capital despite our ongoing investment in IT.
StrategyWe dream of Africa realising its potential and we aspire to be the leading corporate and investment banking business in, for and across Africa with deep specialisation in natural resources. Africa’s relatively strong economic growth, together with our position on the continent gives us the unique opportunity to partner with our clients, forming long-term, well-coordinated relationships that help them achieve their strategic objectives.
Africa’s growth and development is underpinned by three main industry sectors: oil and gas, mining and minerals, and power and infrastructure which in turn are supported by investment in exploration, production, transport infrastructure, facilities management and other downstream activities. All of these sectors depend on financial services to facilitate foreign investment and trade.
The challenges we face in the rest of Africa include intense
competition in the financial services industry across the continent,
increasing regulatory pressure and, although rapidly improving,
immature debt and capital markets. We are, however, excited about
the future of Africa and we believe that the legitimacy that comes
from our 152-year heritage in and passion for the continent makes
us a trusted partner to both global and domestic clients conducting
business in Africa.
Our Africa strategy has allowed us to develop a powerful on-the-
ground presence across the rest of Africa, which today contributes
45% to the franchise’s total revenues compared to 27% in 2011.
In 2011 Africa was confirmed as the nucleus of our growth strategy.
Since then, we have disposed of our operation in Russia and controlling
interests in our operations in Turkey and Argentina, we are working
hard to complete the sale of Brazil and we have scaled back other
operations that did not offer a clear strategic link to Africa. The group
completed the disposal of a 60% controlling interest in Standard Bank
Plc to ICBC with effect from 1 February 2015, a major milestone in
our strategic journey. This transaction achieves two important
objectives: it unlocks the potential and capacity of our global markets
business as part of China’s leading banking group; and it allows us to
support all the trading requirements of our existing customers with full
and uninterrupted access to all distribution channels as they partner
with us to finance growth and development in Africa.
Client coverageOur client coverage model represents a cornerstone of our strategy
and defines our deliberate approach to how we offer value to clients.
It includes a strong focus on clients whose business strategies align
with our Africa strategy, coordinates the way we engage with these
clients across CIB and promotes a deep understanding of their needs
and objectives. This enables us to provide them with the solutions
they require.
Standard Bank Group Annual integrated report 2014 40
Our most valuable differentiator is the established on-the-ground presence we have built across the African continent which, together with our presence in global capital markets, provides us with a clear understanding of how to manage the risks of doing business in these markets. This is further enhanced by ongoing improvements in the integration of our services across business units and geographies to support our domestic, pan-African and multinational clients in conducting business in Africa, and providing them with access to international capital markets.
We have been refining the client coverage model to ensure that we deliver fit-for-purpose client services with suitable structures, forums and integration across business units and geographies and we are currently in the middle of this five-year strategic journey. We aim to have the right people serving the right customers to deliver commercial success. In 2014, we reviewed our client base and put in place a framework for effective client service teams. We hired a number of key people in strategic client coverage portfolios and will implement a learning and development academy. This will ensure that we have increased insight and knowledge of clients, sectors and industries and an improved understanding of their needs.
A number of hallmark transactions concluded in 2014 offer tangible evidence of the successful execution of our strategy.
In Nigeria, our largest market outside South Africa, we participated in the USD535 million initial public offering (IPO) on the London and Nigerian stock exchanges by Nigerian oil and gas exploration and production company, Seplat. The IPO ranks as the largest concluded in sub-Saharan Africa (excluding South Africa) since 2008 and will enable Seplat to proceed with its strategy of acquiring and developing new assets in the Niger Delta. Standard Bank was the joint global coordinator and book runner while our Stanbic IBTC team acted as joint lead issuing house in Nigeria. We worked with regulators in Nigeria and London to harmonise listings requirements and managed an extensive marketing campaign for Seplat, including hosting over 130 investor meetings in Nigeria, UK, Europe, USA, South Africa and Asia to maximise investor attention. The offering was significantly oversubscribed with almost 50% of the demand originating in Nigeria, an indication of the growing depth of African capital markets and the increased attention they are attracting from foreign investors, as well as the importance of our distribution capability in London.
CIB’s participation in the acquisition by Woolworths in South Africa of David Jones in Australia highlighted the capacity of our South African franchise to support the growth strategies of its domestic clients. Standard Bank acted as the financial co-advisor, transaction sponsor, joint book runner and co-underwriter for this transformational transaction, arranging both debt and equity funding for the acquisition which will establish Woolworths as a leading retailer in the southern hemisphere.
Securing the sole cash management mandate for Shoprite – the largest cash management mandate in South Africa – was another significant award for the domestic franchise and showcased a successful collaboration between CIB and PBB.
The R1,46 billion green bond raised by the City of Johannesburg to fund environmental and social sustainability projects was the first green bond to be listed on South African debt capital markets.
We have a R20 billion funding support agreement with ICBC for renewable energy projects in South Africa. Under the agreement ICBC will co-lend into renewable energy projects with Standard Bank, where we are mandated as the lead arranger, through to 2025. ICBC’s involvement will help to reduce liquidity and capital pressure and will provide further diversification of our sources of funding, in addition to domestic asset managers who are keen to invest in such projects.
We are co-financing the 300 megawatt Lake Turkana wind project in northern Kenya, together with a group of commercial banks and development finance institutions. Once complete, this will be the largest wind farm on the continent. We have also provided a R500 million facility to the Zimbabwe Power Corporation, part of the Zimbabwe Electricity Supply Authority group of companies, to fund the 300 megawatt extension of the Kariba South Hydro Power Plant.
A number of international awards during the year recognised CIB’s leading position in key markets on the continent and in selected product lines:
The Banker 2014
Investment Banking Awards
Global Finance Magazine Regional
Award 2014
World’s Best Sub Custodian
Bank in Africa
Most Innovative Investment Bank from
Africa
EMEA Finance African Banking
Awards 2014
Best Investment
Bank in Africa
Passionate and committed people and cultureOur people remain the critical success factor in our efforts to strengthen and maintain excellent client service. We offer rewarding careers to our people and we are dedicated to their ongoing development. In return, we expect their commitment to a culture of high performance, honesty, transparency, teamwork and collaboration.
Human capital interventions included graduate development, talent management and staff advancement programmes. A highlight for the year was our CIB conference in September where, for the first time, we brought together people from across all geographies. Together, we captured our purpose in the statement: ‘We dream of Africa realising its potential’ which is closely aligned with the group purpose to be a significant part of Africa’s growth story by helping people participate meaningfully in the economies in which we operate. We used similar interventions to create networking opportunities for our staff throughout the year to ensure they understand and are aligned to CIB’s strategy and future ambitions.
Business unit reviews | Corporate & Investment Banking continued
Our performance
41
subject to this legal process. A valuation adjustment of USD147 million (R1 624 million) was recognised in the discontinued operation against the repos, representing our best estimate of the risk adjustment required in determining the fair value of the group’s net exposure. We continue to pursue various alternatives to recover the client exposure, including claiming under the group’s insurance policies.
At this time, the precise quantum and timing of recoveries remains uncertain. Since the purchase price is dependent on the consolidated net asset value of Standard Bank Plc at closing, which in turn is impacted by the valuation of the aluminium exposure, ICBC and the group agreed on a pragmatic and fair approach to determining this value. Standard Bank retains the right to any net recoveries on these exposures when they are received.
One of our main priorities in 2014 was to enhance our online capabilities across our markets and product lines. We continued to invest in our signature IT programmes and have made progress with the electronic distribution of cash management, foreign exchange, and equity and commodity products across Africa. Improved functionality of our online channels has contributed to our competitiveness, particularly in Kenya and Nigeria. We are also adding functionality to our new online channels for South African clients.
The deployment of international trade capability into our African country operations and a trading platform for the global markets business has also been a priority. This capability and trading platform will provide a single integrated solution for trade services, and has already improved our transactional products and services capabilities.
The compliance environment for banks has tightened and we have embedded governance, compliance and risk management standards across our operations to ensure that we fulfil our principle of ‘doing the right business the right way’. A staff campaign was run for most of the year, requiring monthly online learning to ensure our employees understand their regulatory obligations. Where we have received fines for failures in our anti-money laundering controls, we have implemented remedial actions to prevent future transgressions and to ensure that our business meets the highest regulatory standards.
Our employment equity survey offers a strong platform to facilitate change within CIB and we work to ensure we understand and respond constructively to employee feedback. Some of the key areas for action include employment equity, diversity and inclusion, empowerment, reward, and performance accountability, and learning and development. Transformation remains a priority and we are developing an action plan to attract, develop and retain black leaders in the business. Our people have made a significant effort to execute our strategy, with many requesting additional responsibilities and redefined roles, thereby creating new opportunities to develop and build their careers.
The most powerful outward expression of CIB’s culture and identity is the campaign: ‘They call it Africa. We call it home.’ We have sought to increase our market exposure with carefully selected campaigns at locations relevant to our target market, including gateways to and within the rest of Africa such as Oliver Tambo International Airport in Johannesburg and Murtala Muhammed International Airport in Lagos, Nigeria.
Efficient business operations2014 has been an extraordinarily busy year for CIB. We have maintained the momentum of our Africa strategy and our compliance with regulatory changes, while preparing our London-based global markets business for sale to ICBC and reshaping the balance of our international operations for a singular focus on Africa.
Preparing the business for sale has been a complex and costly process, requiring a number of regulatory approvals, including those of the SARB, the China Banking Regulatory Commission and the Prudential Regulation Authority of the United Kingdom. The activities acquired by ICBC include commodities, fixed income, currencies, credit and equity products, in addition to operations in New York, Dubai, Singapore, Shanghai, Hong Kong and Tokyo. Our other activities conducted outside Africa (investment banking, transactional products and services and client coverage) were deliberately excluded from the sale. We incurred significant restructuring costs in carving out the assets and business operations excluded from the transaction and transferred these into new wholly-owned legal entities with advising and arranging licences in the major financial centres of London, New York, Dubai, Hong Kong, Beijing and Sao Paolo. These entities have the advantage of being capital-light and will focus exclusively on originating business and facilitating trade and investment into, from and across Africa, to further enhance our strategic positioning and competitiveness.
During the year an unforeseen matter arose which impacted on the business being disposed. The group instituted legal proceedings against several parties with respect to its rights to physical aluminium held in bonded warehouses in China. The aluminium represents collateral held for a series of commodity financing arrangements undertaken in Standard Bank Plc, otherwise referred to as reverse repurchase agreements (repos). We believe that the financing arrangements were impacted by fraudulent activities in respect of the physical aluminium. The exposure on the group’s balance sheet at 31 December 2014 in respect of the repos is USD167 million, against which USD210 million of aluminium collateral is held and is
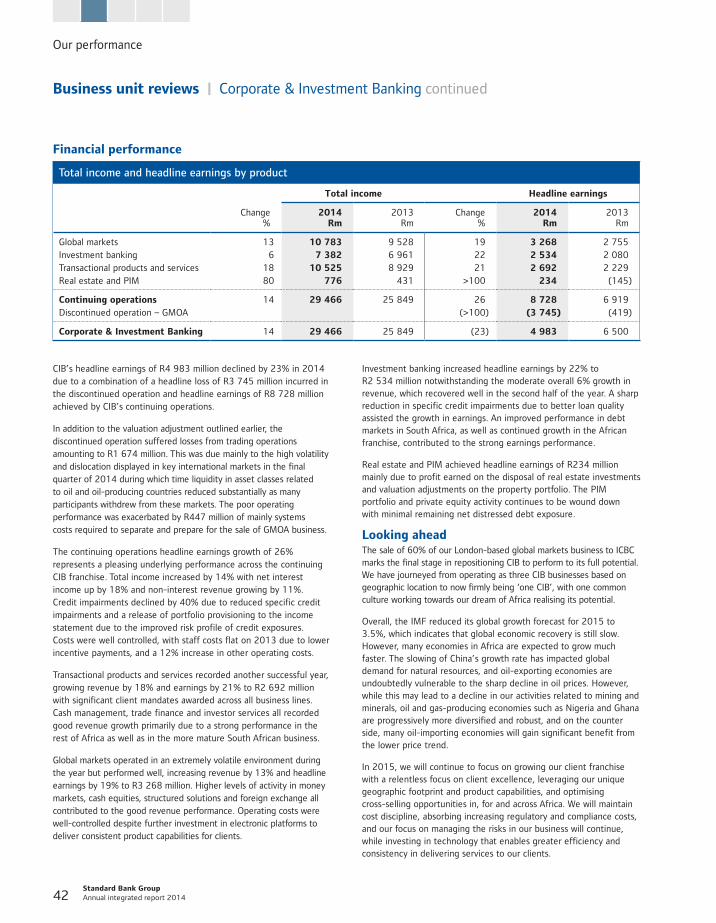
Standard Bank Group Annual integrated report 2014 42
Business unit reviews | Corporate & Investment Banking continued
Financial performance
Total income and headline earnings by product
Change %
Total income Headline earnings
2014Rm
2013Rm
Change%
2014Rm
2013Rm
Global markets 13 10 783 9 528 19 3 268 2 755 Investment banking 6 7 382 6 961 22 2 534 2 080 Transactional products and services 18 10 525 8 929 21 2 692 2 229 Real estate and PIM 80 776 431 >100 234 (145)
Continuing operations 14 29 466 25 849 26 8 728 6 919 Discontinued operation – GMOA (>100) (3 745) (419)
Corporate & Investment Banking 14 29 466 25 849 (23) 4 983 6 500
Investment banking increased headline earnings by 22% to R2 534 million notwithstanding the moderate overall 6% growth in revenue, which recovered well in the second half of the year. A sharp reduction in specific credit impairments due to better loan quality assisted the growth in earnings. An improved performance in debt markets in South Africa, as well as continued growth in the African franchise, contributed to the strong earnings performance.
Real estate and PIM achieved headline earnings of R234 million mainly due to profit earned on the disposal of real estate investments and valuation adjustments on the property portfolio. The PIM portfolio and private equity activity continues to be wound down with minimal remaining net distressed debt exposure.
Looking aheadThe sale of 60% of our London-based global markets business to ICBC marks the final stage in repositioning CIB to perform to its full potential. We have journeyed from operating as three CIB businesses based on geographic location to now firmly being ‘one CIB’, with one common culture working towards our dream of Africa realising its potential.
Overall, the IMF reduced its global growth forecast for 2015 to 3.5%, which indicates that global economic recovery is still slow. However, many economies in Africa are expected to grow much faster. The slowing of China’s growth rate has impacted global demand for natural resources, and oil-exporting economies are undoubtedly vulnerable to the sharp decline in oil prices. However, while this may lead to a decline in our activities related to mining and minerals, oil and gas-producing economies such as Nigeria and Ghana are progressively more diversified and robust, and on the counter side, many oil-importing economies will gain significant benefit from the lower price trend.
In 2015, we will continue to focus on growing our client franchise with a relentless focus on client excellence, leveraging our unique geographic footprint and product capabilities, and optimising cross-selling opportunities in, for and across Africa. We will maintain cost discipline, absorbing increasing regulatory and compliance costs, and our focus on managing the risks in our business will continue, while investing in technology that enables greater efficiency and consistency in delivering services to our clients.
Our performance
CIB’s headline earnings of R4 983 million declined by 23% in 2014 due to a combination of a headline loss of R3 745 million incurred in the discontinued operation and headline earnings of R8 728 million achieved by CIB’s continuing operations.
In addition to the valuation adjustment outlined earlier, the discontinued operation suffered losses from trading operations amounting to R1 674 million. This was due mainly to the high volatility and dislocation displayed in key international markets in the final quarter of 2014 during which time liquidity in asset classes related to oil and oil-producing countries reduced substantially as many participants withdrew from these markets. The poor operating performance was exacerbated by R447 million of mainly systems costs required to separate and prepare for the sale of GMOA business.
The continuing operations headline earnings growth of 26% represents a pleasing underlying performance across the continuing CIB franchise. Total income increased by 14% with net interest income up by 18% and non-interest revenue growing by 11%. Credit impairments declined by 40% due to reduced specific credit impairments and a release of portfolio provisioning to the income statement due to the improved risk profile of credit exposures. Costs were well controlled, with staff costs flat on 2013 due to lower incentive payments, and a 12% increase in other operating costs.
Transactional products and services recorded another successful year, growing revenue by 18% and earnings by 21% to R2 692 million with significant client mandates awarded across all business lines. Cash management, trade finance and investor services all recorded good revenue growth primarily due to a strong performance in the rest of Africa as well as in the more mature South African business.
Global markets operated in an extremely volatile environment during the year but performed well, increasing revenue by 13% and headline earnings by 19% to R3 268 million. Higher levels of activity in money markets, cash equities, structured solutions and foreign exchange all contributed to the good revenue performance. Operating costs were well-controlled despite further investment in electronic platforms to deliver consistent product capabilities for clients.
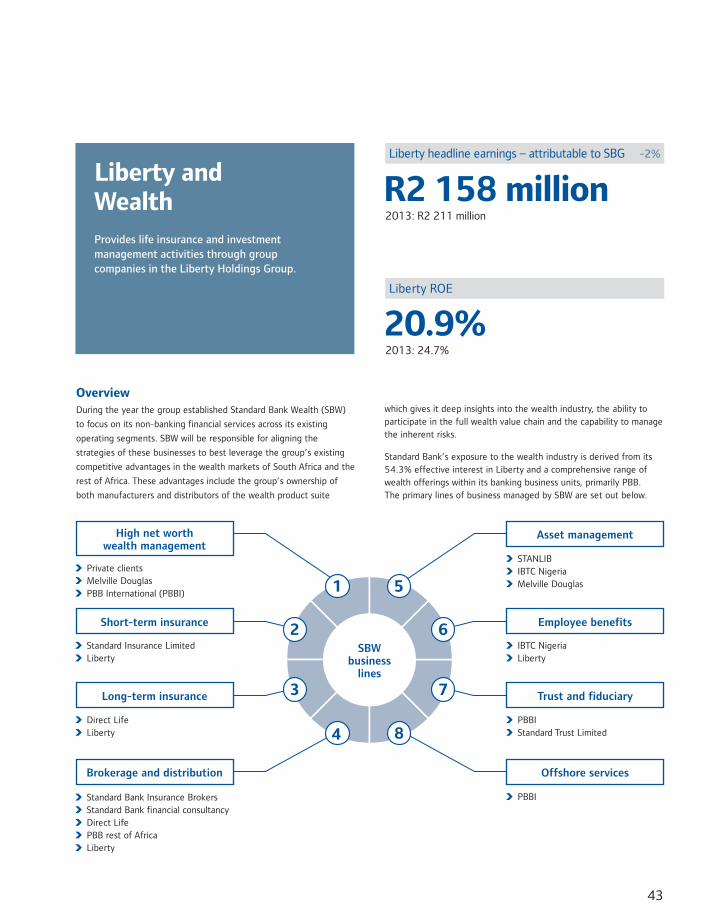
43
Liberty and Wealth R2 158 million
2013: R2 211 million
Liberty headline earnings – attributable to SBG -2%
20.9%2013: 24.7%
Liberty ROE
OverviewDuring the year the group established Standard Bank Wealth (SBW)
to focus on its non-banking financial services across its existing
operating segments. SBW will be responsible for aligning the
strategies of these businesses to best leverage the group’s existing
competitive advantages in the wealth markets of South Africa and the
rest of Africa. These advantages include the group’s ownership of
both manufacturers and distributors of the wealth product suite
Provides life insurance and investment management activities through group companies in the Liberty Holdings Group.
which gives it deep insights into the wealth industry, the ability to participate in the full wealth value chain and the capability to manage the inherent risks.
Standard Bank’s exposure to the wealth industry is derived from its 54.3% effective interest in Liberty and a comprehensive range of wealth offerings within its banking business units, primarily PBB. The primary lines of business managed by SBW are set out below.
Private clients Melville Douglas PBB International (PBBI)
STANLIB IBTC Nigeria Melville Douglas
Standard Insurance Limited Liberty
IBTC Nigeria Liberty
Direct Life Liberty
PBBI Standard Trust Limited
PBBI Standard Bank Insurance Brokers Standard Bank financial consultancy Direct Life PBB rest of Africa Liberty
High net worth wealth management
Asset management
Brokerage and distribution Offshore services
Short-term insurance Employee benefits
Long-term insurance Trust and fiduciary
1
2
3
4
5
6
7
8
SBWbusiness
lines
Standard Bank Group Annual integrated report 2014 44
SBW will manage these businesses under one leadership structure to ensure they receive the appropriate managerial focus and investment to grow at a sufficient rate. SBW will also partner with PBB and CIB to allow the group to compete more effectively through enhanced customer value propositions, underpinned by appropriate risk management. While SBW will enhance the group’s service offerings to the PBB client base and drive additional penetration, it will also attempt to realise the potential that exists between CIB and the wealth businesses. SBW will also be responsible for high net worth wealth management, which is a business serving a segment across all of Standard Bank’s geographies. A small central team of highly skilled executives has been established to strengthen the group’s focus on developing the wealth franchise in partnership with PBB, CIB and Liberty.
The SBW team has conducted a strategy planning process with each of the wealth businesses within Standard Bank. These plans include building additional capacity to grow market share, identifying opportunities for collaboration across the group, providing the investment necessary to grow and respond to changing regulatory requirements, and creating scale to attract the quality of talent capable of moving the businesses forward. Liberty has undergone its own business planning process and has redefined its strategy and business model in line with its aspiration to become more customer-centric.
StrategySBW has a well-defined purpose, vision and strategy that are aligned with those of the group. Our purpose is to build a more prosperous Africa by helping to manage, grow and protect what is important to our customers, with our vision to be the leading provider of financial solutions across insurance, investment, wealth management and advisory services in sub-Saharan Africa. We aim to build successful wealth businesses by focusing on customer-centricity and innovation, collaboration across wealth business units and targeted investments, and creating commercially differentiated and sustainable partnerships with PBB, CIB, Liberty and others. SBW’s strategy is underpinned by understanding wealth-specific risks and developing a framework to mitigate these risks.
Standard Bank’s decision to place more focus on wealth management is supported by the significant business opportunity that exists in its markets. Standard Bank is well-positioned to capture this opportunity given that:
The group has a 28% share of total banking earnings in South Africa but only a 5% share of the earnings of the wealth market. Typically, the profit pool generated by the wealth sector exceeds that of the banking sector. The primary opportunity in the wealth sector in SA therefore lies less in the absolute growth of the market, which is mature, and more in growing market share.
The financial markets in the rest of Africa are less developed than in South Africa, but are demonstrating far greater growth potential, particularly in the wealth-related markets. This is as a result of relatively high rates of economic growth, improving financial literacy and increasing product penetration.
Capturing the growth potential in the rest of AfricaMuch of the wealth opportunity in the rest of Africa is being captured through bancassurance which operates in 14 countries and sells its insurance products primarily to PBB’s banking customer base. While the initial focus has been on personal banking clients (including private clients), SBW is building the necessary skill and capability to serve the upper segments of business banking and, ultimately, the more sophisticated insurance requirements of CIB clients.
The group’s wealth business in Nigeria, which comprises three Stanbic IBTC companies, is the largest pension fund administrator in the country and currently presents a significant wealth opportunity for the group in the rest of Africa.
Under the leadership of SBW, the wealth management businesses are projected to contribute significantly to the group’s future earnings as a result of strategic initiatives to increase market share and capture the growth opportunity in the rest of Africa. In addition to earnings growth, SBW is expected to strengthen shareholder value by achieving earnings stability through enhanced risk management and diversification of revenue, and higher quality earnings due to the higher margin and capital light profile of wealth revenue.
ChallengesRealising this opportunity will not be without its challenges, including the increase in regulatory reform for financial services, multi-jurisdictional compliance issues, growing customer sophistication, intense competition and rapidly advancing technology.
In keeping with the global move to restore faith and stability in the financial sector, a wave of regulatory and legislative reform is impacting the industry and is the most significant of these challenges. While these regulatory changes may appear daunting, there is an opportunity to turn them to our advantage relative to other smaller market participants that may not have the group’s capacity to appropriately reposition the SBW-managed businesses and comply in a more regulated environment.
Importantly, in some instances, regulatory reforms have been catalysts for new opportunities. A good example of this is in Nigeria where legislation was passed requiring companies to provide pensions and group life cover to their employees. Our Nigerian subsidiary seized the opportunity to develop a business which is now the industry leader.
The focus on our wealth services will enable the group to strengthen its capacity to capture these opportunities while managing the risks appropriately and providing the strategic vision and leadership to drive the wealth business. The SBW leadership team will also ensure that the group is able to leverage and benefit from Liberty’s expertise as a pioneer in the domestic insurance and investment industry in response to regulatory reform.
Business unit reviews | Liberty and Wealth continued
Our performance
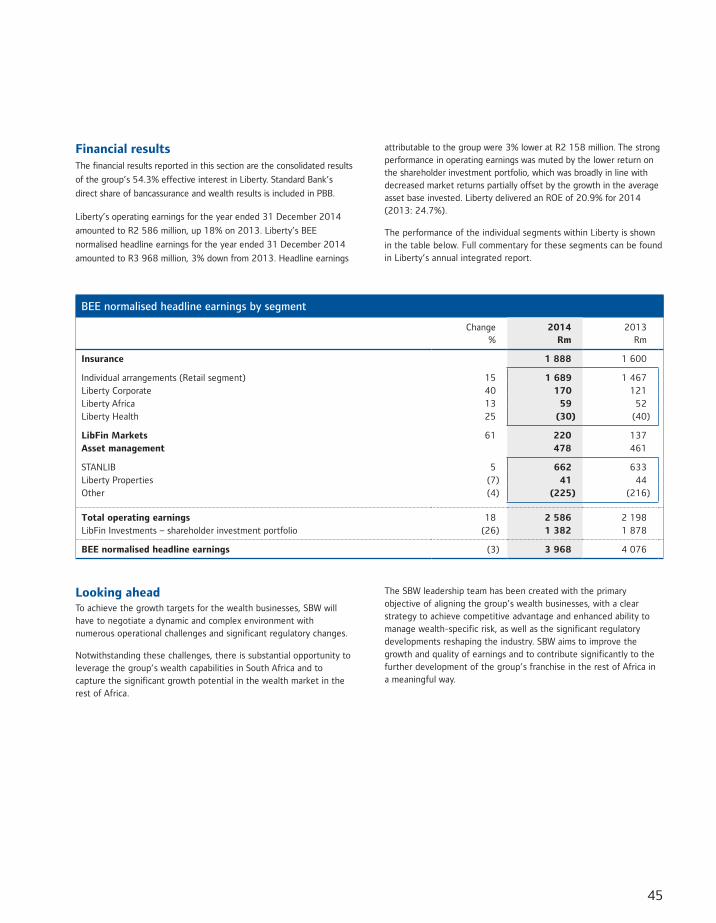
45
Financial resultsThe financial results reported in this section are the consolidated results
of the group’s 54.3% effective interest in Liberty. Standard Bank’s
direct share of bancassurance and wealth results is included in PBB.
Liberty’s operating earnings for the year ended 31 December 2014
amounted to R2 586 million, up 18% on 2013. Liberty’s BEE
normalised headline earnings for the year ended 31 December 2014
amounted to R3 968 million, 3% down from 2013. Headline earnings
attributable to the group were 3% lower at R2 158 million. The strong performance in operating earnings was muted by the lower return on the shareholder investment portfolio, which was broadly in line with decreased market returns partially offset by the growth in the average asset base invested. Liberty delivered an ROE of 20.9% for 2014 (2013: 24.7%).
The performance of the individual segments within Liberty is shown in the table below. Full commentary for these segments can be found in Liberty’s annual integrated report.
BEE normalised headline earnings by segment
Change%
2014Rm
2013Rm
Insurance 1 888 1 600
Individual arrangements (Retail segment) 15 1 689 1 467Liberty Corporate 40 170 121Liberty Africa 13 59 52Liberty Health 25 (30) (40)
LibFin Markets 61 220 137Asset management 478 461
STANLIB 5 662 633Liberty Properties (7) 41 44Other (4) (225) (216)
Total operating earnings 18 2 586 2 198LibFin Investments – shareholder investment portfolio (26) 1 382 1 878
BEE normalised headline earnings (3) 3 968 4 076
Looking aheadTo achieve the growth targets for the wealth businesses, SBW will have to negotiate a dynamic and complex environment with numerous operational challenges and significant regulatory changes.
Notwithstanding these challenges, there is substantial opportunity to leverage the group’s wealth capabilities in South Africa and to capture the significant growth potential in the wealth market in the rest of Africa.
The SBW leadership team has been created with the primary objective of aligning the group’s wealth businesses, with a clear strategy to achieve competitive advantage and enhanced ability to manage wealth-specific risk, as well as the significant regulatory developments reshaping the industry. SBW aims to improve the growth and quality of earnings and to contribute significantly to the further development of the group’s franchise in the rest of Africa in a meaningful way.
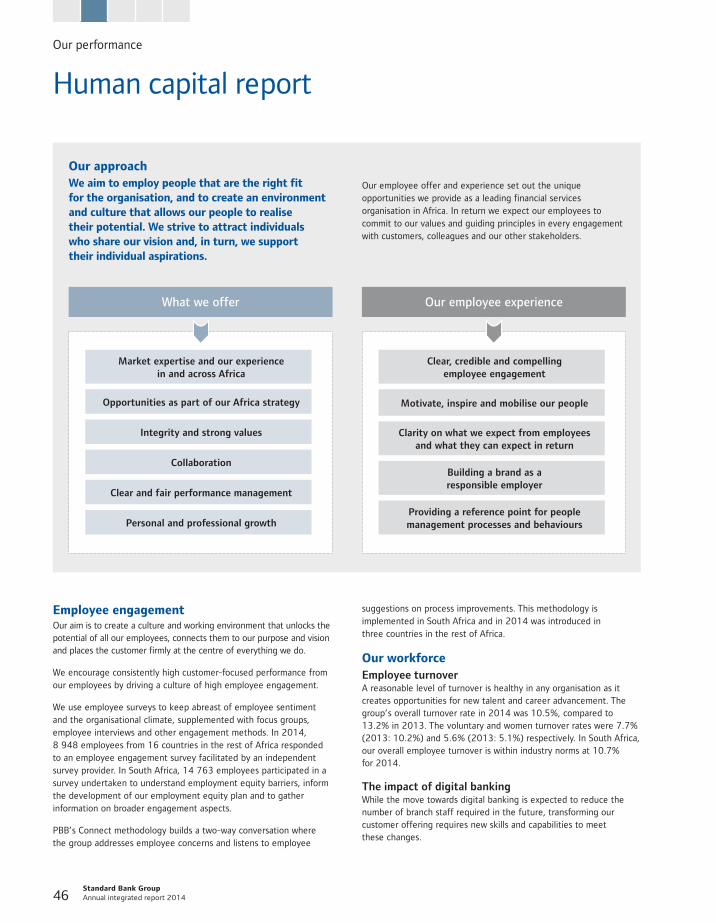
Standard Bank Group Annual integrated report 2014 46
Human capital report
Our approach We aim to employ people that are the right fit for the organisation, and to create an environment and culture that allows our people to realise their potential. We strive to attract individuals who share our vision and, in turn, we support their individual aspirations.
Our employee offer and experience set out the unique opportunities we provide as a leading financial services organisation in Africa. In return we expect our employees to commit to our values and guiding principles in every engagement with customers, colleagues and our other stakeholders.
Employee engagementOur aim is to create a culture and working environment that unlocks the potential of all our employees, connects them to our purpose and vision and places the customer firmly at the centre of everything we do.
We encourage consistently high customer-focused performance from our employees by driving a culture of high employee engagement.
We use employee surveys to keep abreast of employee sentiment and the organisational climate, supplemented with focus groups, employee interviews and other engagement methods. In 2014, 8 948 employees from 16 countries in the rest of Africa responded to an employee engagement survey facilitated by an independent survey provider. In South Africa, 14 763 employees participated in a survey undertaken to understand employment equity barriers, inform the development of our employment equity plan and to gather information on broader engagement aspects.
PBB’s Connect methodology builds a two-way conversation where the group addresses employee concerns and listens to employee
suggestions on process improvements. This methodology is implemented in South Africa and in 2014 was introduced in three countries in the rest of Africa.
Our workforceEmployee turnoverA reasonable level of turnover is healthy in any organisation as it creates opportunities for new talent and career advancement. The group’s overall turnover rate in 2014 was 10.5%, compared to 13.2% in 2013. The voluntary and women turnover rates were 7.7% (2013: 10.2%) and 5.6% (2013: 5.1%) respectively. In South Africa, our overall employee turnover is within industry norms at 10.7% for 2014.
The impact of digital bankingWhile the move towards digital banking is expected to reduce the number of branch staff required in the future, transforming our customer offering requires new skills and capabilities to meet these changes.
What we offer
Market expertise and our experience in and across Africa
Opportunities as part of our Africa strategy
Integrity and strong values
Collaboration
Clear and fair performance management
Personal and professional growth
Our employee experience
Clear, credible and compelling employee engagement
Motivate, inspire and mobilise our people
Clarity on what we expect from employees and what they can expect in return
Building a brand as a responsible employer
Providing a reference point for people management processes and behaviours
Our performance
47
PBB’s transformation programme, which is currently being implemented across Africa, includes job impact assessments, change management initiatives and development solutions to assist our people to build new skills and adapt. Our aim is to reskill staff adversely affected by these changes so we can deploy them in alternative positions.
The sale of the international global markets businessA number of human capital initiatives have been put in place to support the staff transition plans related to the sale of the GMOA business. These initiatives include the delivery of key human capital services, ensuring fit-for-purpose human capital operating models, leadership engagement and identifying and managing staff retention risks. The human capital strategy for ICBC has been defined and is being implemented, while the remaining entities continue to align to the group’s human capital strategies and practices.
Talent resourcingOur talent resourcing function sources and redeploys talent internally and, where required, recruits externally to address identified skills gaps. We develop robust and pragmatic workforce planning scenarios to anticipate skills needs proactively. Each business unit has certain skills gaps which could range from sales skills in specific countries to general management experience in others.
GraduatesOur graduate programmes provide on-the-job experience, assisting graduates to transition into the work environment.
Our graduate programmes are critical to our resourcing strategy as they allow us to proactively develop the required technical capabilities and act as an important source of future leaders for the group.
Programmes range from between 18 to 24 months and each graduate is assigned a mentor and exposed to networking opportunities. Graduates are placed in roles within various areas of the group and where broader skills and understanding of group processes is required, training interventions include secondments to locations outside South Africa.
Graduate programmes are also offered in Angola, Botswana, Kenya, Mozambique and Nigeria.
In 2014, there were 148 (2013: 184) participants on our graduate development programmes, of which 49% (2013: 43%) were women and of the South African complement, 68% (2013: 80%) were black.
Diversity and inclusionWe promote and value diversity as a strategic imperative and strive to eliminate employment practices and processes which may result in unfair discrimination. Our diversity and inclusion statement of intent and guiding principles guide us in this approach, with a number of initiatives in place to assist line managers in managing diverse teams.
Employment equityWe are committed to creating a workforce that better reflects South Africa’s demographics in respect of race and gender. Our new employment equity plan, approved in 2014, sets out strategies and targets for the representation of black (African, Indian and Coloured) people, women and people with disabilities at all occupational levels for 2015 and 2016.
In Namibia, the representation of BEE beneficiaries in junior and middle management stands at 61.4% in terms of the Namibian financial sector code target of 30%. Under the Central Bank of Nigeria’s diversity directive, Stanbic IBTC Bank was required to increase the representation of women on its board of directors and at senior management to 30% and 40% respectively. At December 2014, 18% and 26% of Stanbic IBTC Bank’s board and senior management were women, respectively. Following the March promotion cycle, we expect women in senior management positions to increase to 29%.
Gender equityWe strive to improve the representation of women in areas where they are under-represented and our initiatives to achieve this include development programmes and networking forums. The group gender forum focuses on the critical factors that contribute to women reaching senior management and executive levels and provides a two-way channel of communication. The Women in Leadership Programme aims to teach effective leadership skills to women in middle management roles with the view to moving them into senior management roles. In 2014, 113 women participated in the programme with 22 from the rest of Africa.
Disability managementWe actively recruit and retain people with disabilities by incorporating disability considerations in our human capital processes. In South Africa, our disability forum helps us identify and remedy barriers that employees with a disability may face and we run disability awareness training programmes. We also have a helpline to assist employees with any queries in this regard.
In 2014, we developed disability guidelines for managers to assist them in managing disabilities in the workplace and accommodating our customers with disabilities.
At December 2014, 1.2% (2013: 1.2%) of our South African workforce had declared a disability, verified through our internal processes. Measured as a percentage of our South African workforce, 0.8% (2013: 0.8%) were black employees. Our targets for the total representation of people with disabilities and black people with disabilities are 1.5% and 1.0% of SBSA’s workforce respectively. To assist us in reaching our targets, we work with specialist recruitment agencies that specialise in the placement of people with disabilities.
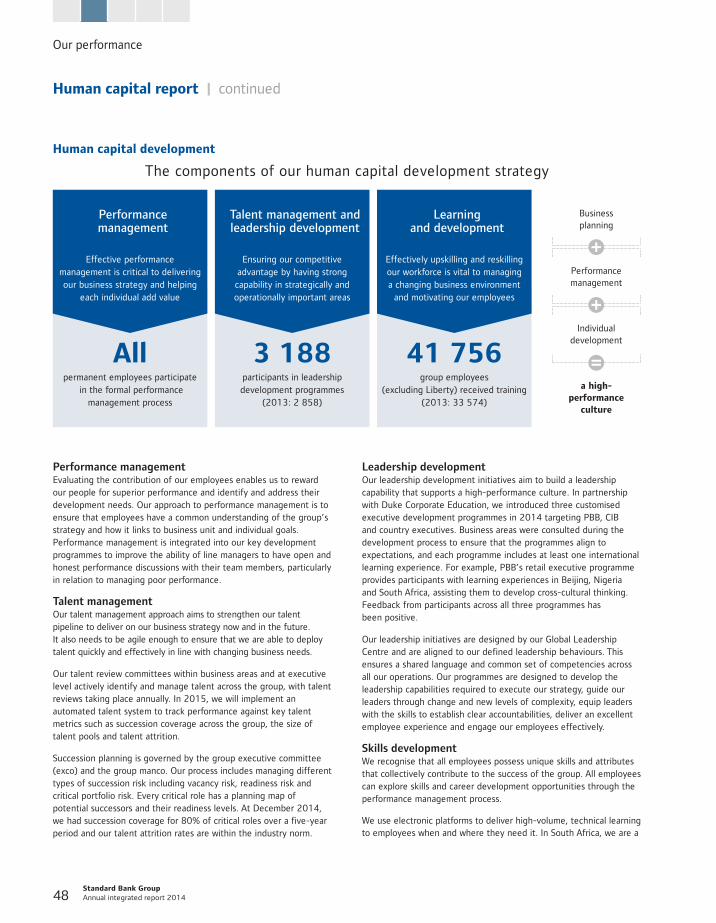
Standard Bank Group Annual integrated report 2014 48
Human capital development
The components of our human capital development strategy
Performance managementEvaluating the contribution of our employees enables us to reward our people for superior performance and identify and address their development needs. Our approach to performance management is to ensure that employees have a common understanding of the group’s strategy and how it links to business unit and individual goals. Performance management is integrated into our key development programmes to improve the ability of line managers to have open and honest performance discussions with their team members, particularly in relation to managing poor performance.
Talent managementOur talent management approach aims to strengthen our talent pipeline to deliver on our business strategy now and in the future. It also needs to be agile enough to ensure that we are able to deploy talent quickly and effectively in line with changing business needs.
Our talent review committees within business areas and at executive level actively identify and manage talent across the group, with talent reviews taking place annually. In 2015, we will implement an automated talent system to track performance against key talent metrics such as succession coverage across the group, the size of talent pools and talent attrition.
Succession planning is governed by the group executive committee (exco) and the group manco. Our process includes managing different types of succession risk including vacancy risk, readiness risk and critical portfolio risk. Every critical role has a planning map of potential successors and their readiness levels. At December 2014, we had succession coverage for 80% of critical roles over a five-year period and our talent attrition rates are within the industry norm.
Leadership developmentOur leadership development initiatives aim to build a leadership capability that supports a high-performance culture. In partnership with Duke Corporate Education, we introduced three customised executive development programmes in 2014 targeting PBB, CIB and country executives. Business areas were consulted during the development process to ensure that the programmes align to expectations, and each programme includes at least one international learning experience. For example, PBB’s retail executive programme provides participants with learning experiences in Beijing, Nigeria and South Africa, assisting them to develop cross-cultural thinking. Feedback from participants across all three programmes has been positive.
Our leadership initiatives are designed by our Global Leadership Centre and are aligned to our defined leadership behaviours. This ensures a shared language and common set of competencies across all our operations. Our programmes are designed to develop the leadership capabilities required to execute our strategy, guide our leaders through change and new levels of complexity, equip leaders with the skills to establish clear accountabilities, deliver an excellent employee experience and engage our employees effectively.
Skills developmentWe recognise that all employees possess unique skills and attributes that collectively contribute to the success of the group. All employees can explore skills and career development opportunities through the performance management process.
We use electronic platforms to deliver high-volume, technical learning to employees when and where they need it. In South Africa, we are a
Human capital report | continued
Performance management
Effective performance management is critical to delivering our business strategy and helping
each individual add value
Allpermanent employees participate
in the formal performance management process
Talent management and leadership development
Ensuring our competitive advantage by having strong capability in strategically and operationally important areas
3 188participants in leadership development programmes
(2013: 2 858)
Learning and development
Effectively upskilling and reskilling our workforce is vital to managing a changing business environment
and motivating our employees
41 756group employees
(excluding Liberty) received training(2013: 33 574)
Business planning
Performance management
Individual development
a high-performance
culture
Our performance
49
Minimum salarySouth Africa does not have an established national minimum wage, however, there is debate on setting a national minimum wage level of around R5 500 a month. We re-examine our entry-level wage annually to ensure that the increase in employee price inflation is considered. Our minimum salary across all employee levels is an annual guaranteed package of R124 740 at 1 March 2015 (up from R115 930 at 1 March 2014), which is comfortably above the debated national minimum wage at around R10 395 a month.
Outside South Africa, we review all minimum salaries and remain in accordance with local market practice and comply with local regulatory requirements.
Recognition programmesBeyond Excellence is a discretionary programme implemented in line with international best practice. It competitively rewards individuals and teams who make a consistent, sustainable and balanced contribution to customers, employees and shareholders.
Employee benefitsWe provide a range of market-competitive benefits to assist in the attraction, motivation and retention of employees. We aim to provide certain core benefits such as retirement benefits, medical aid or insurance benefits and parental leave across the group, however the extent or form of core benefits may differ by operation, driven by costs, local market practice, legislation and culture.
Employee wellnessOur holistic approach to the wellness of our people enables us to manage workplace health risks and to build the resilience of our people by optimising physical health, as well as mental and social wellbeing, so that our employees remain sustainably engaged and productive. Our health and wellness framework is aligned to local and international best practice and aims to balance the rights and needs of the individual with those of the business.
Our priority is to provide access to appropriate health and wellness services for all employees, ensuring that our solutions are relevant in different business areas and countries. We encourage our employees to take responsibility for their health and support them through partnerships with service providers, which give employees access to health screenings, nurse consultations, health-related information while travelling, executive medical assessments, counselling, managerial support and consultation, as well as financial and legal advice. Our wellness initiatives are more mature in our South African business, where 69% of our workforce is based.
We are currently piloting a more robust framework and tools to manage absenteeism due to sickness in South Africa. In 2014, we focused on assisting employees to effectively manage stress and financial wellbeing. Implementation within the rest of Africa varies due to differing business requirements and employee needs. Following the pilot in South Africa, our aim is to implement similar frameworks throughout our banking operations.
banking sector education and training authority (BANKSETA) delivery partner, which means we are able to register our qualifying training programmes with BANKSETA for accreditation.
Our training spend for 2014 amounted to R746 million, 2.6% of staff costs (2013: R638 million and 2.4% of staff costs). Excluding Liberty, a total of 41 756 (2013: 33 574) Standard Bank employees received training during the year of which 23 770 (2013: 19 919) were women. The average hours of training per Standard Bank employee in South Africa was 35.2 hours and in the rest of Africa 22.4 hours.
In South Africa, 60% (2013: 78%) of our training spend was on black employees and 34% (2013: 50%) on black women employees. Of the 27 640 (2013: 27 535) employees trained in South Africa, 74% (2013: 70%) were black employees.
We invest in learnerships for unemployed matriculants and university graduates as part of our contribution to alleviating youth unemployment in South Africa. Our induction programme and integrated learner coaching and support structure helps learners acclimatise to the demands of working life and overcome inadequacies in the education system. Of the 391 learners who started a Standard Bank learnership in 2013, 317 successfully completed their respective programmes in 2014 and 267 were offered employment at Standard Bank (2012 intake: 523 with 479 successful completions and 306 job offers in 2013). We also continued to support the BANKSETA Letsema and Kuyasa learnerships, and in 2014 we offered 120 learners a place on one of these learnerships. From the 2013 intake of learners, we employed 28 of the 105 that successfully completed the programmes with the balance of participants having been supported in obtaining a nationally recognised qualification.
Remuneration and benefitsRemunerationOur remuneration philosophy and practices are designed to adequately motivate and reward performance, and meet developing regulatory requirements and stakeholder expectations, while maintaining market competitiveness and guarding against excessive risk-taking. The group’s salary structures link to our strategic objectives, however, they may vary according to different geographies to comply with local laws and practices.
Refer to the remuneration report for details of our remuneration strategy.
Equity and remunerationWe do not tolerate any form of unfair discrimination. We monitor
income differentials within and across job bands and levels to
ensure that our remuneration practices do not discriminate on
the basis of race, gender or disability. In South Africa, we submit
an annual income differential report covering race and gender
to the Department of Labour, as required by the Employment
Equity Act.
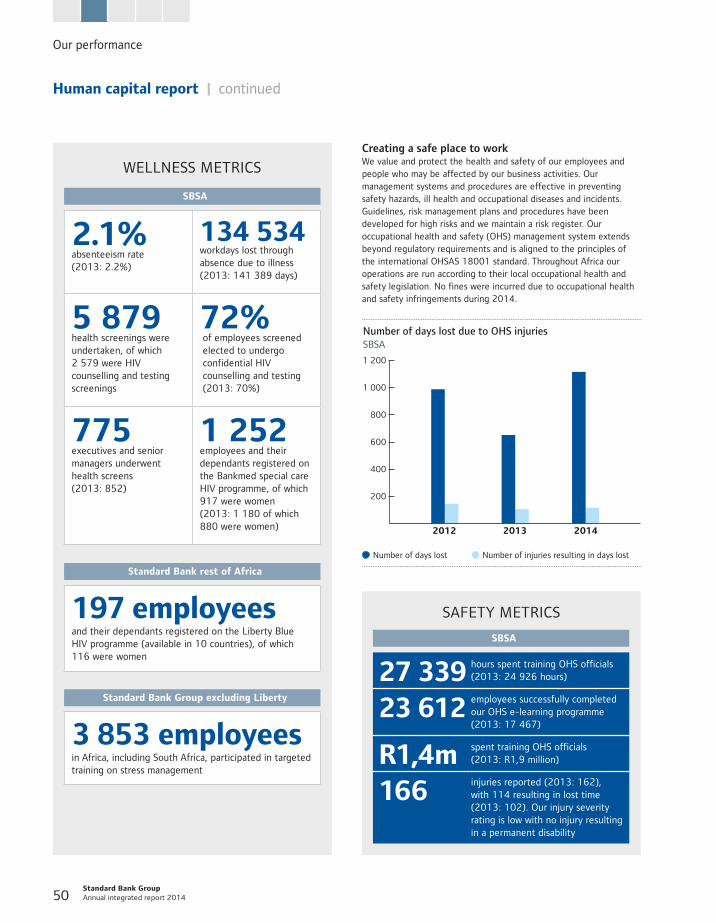
Standard Bank Group Annual integrated report 2014 50
Creating a safe place to workWe value and protect the health and safety of our employees and people who may be affected by our business activities. Our management systems and procedures are effective in preventing safety hazards, ill health and occupational diseases and incidents. Guidelines, risk management plans and procedures have been developed for high risks and we maintain a risk register. Our occupational health and safety (OHS) management system extends beyond regulatory requirements and is aligned to the principles of the international OHSAS 18001 standard. Throughout Africa our operations are run according to their local occupational health and safety legislation. No fines were incurred due to occupational health and safety infringements during 2014.
� Number of days lost � Number of injuries resulting in days lost
SBSA Number of days lost due to OHS injuries
1 200
1 000
800
600
400
200
2013 20142012
Human capital report | continued
WELLNESS METRICS
SBSA
2.1% absenteeism rate (2013: 2.2%)
134 534workdays lost through absence due to illness (2013: 141 389 days)
5 879 health screenings were undertaken, of which 2 579 were HIV counselling and testing screenings
72% of employees screened elected to undergo confidential HIV counselling and testing (2013: 70%)
775 executives and senior managers underwent health screens (2013: 852)
1 252 employees and their dependants registered on the Bankmed special care HIV programme, of which 917 were women (2013: 1 180 of which 880 were women)
Standard Bank rest of Africa
197 employeesand their dependants registered on the Liberty Blue HIV programme (available in 10 countries), of which 116 were women
Standard Bank Group excluding Liberty
3 853 employeesin Africa, including South Africa, participated in targeted training on stress management
SAFETY METRICS
SBSA
27 339 hours spent training OHS officials (2013: 24 926 hours)
23 612 employees successfully completed our OHS e-learning programme (2013: 17 467)
R1,4m spent training OHS officials (2013: R1,9 million)
166 injuries reported (2013: 162), with 114 resulting in lost time (2013: 102). Our injury severity rating is low with no injury resulting in a permanent disability
Our performance
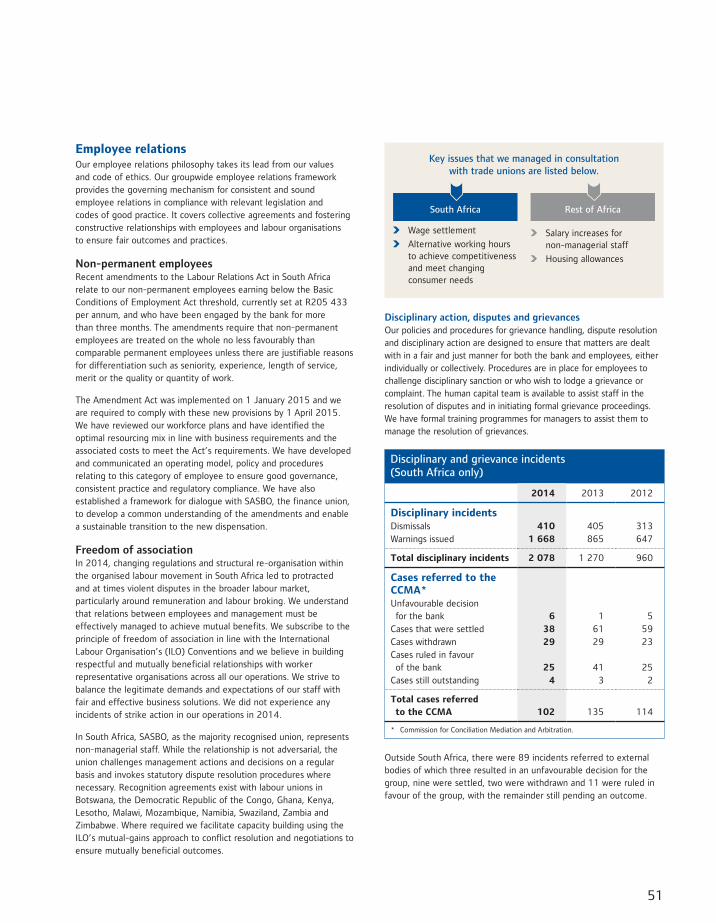
51
Employee relationsOur employee relations philosophy takes its lead from our values and code of ethics. Our groupwide employee relations framework provides the governing mechanism for consistent and sound employee relations in compliance with relevant legislation and codes of good practice. It covers collective agreements and fostering constructive relationships with employees and labour organisations to ensure fair outcomes and practices.
Non-permanent employeesRecent amendments to the Labour Relations Act in South Africa relate to our non-permanent employees earning below the Basic Conditions of Employment Act threshold, currently set at R205 433 per annum, and who have been engaged by the bank for more than three months. The amendments require that non-permanent employees are treated on the whole no less favourably than comparable permanent employees unless there are justifiable reasons for differentiation such as seniority, experience, length of service, merit or the quality or quantity of work.
The Amendment Act was implemented on 1 January 2015 and we are required to comply with these new provisions by 1 April 2015. We have reviewed our workforce plans and have identified the optimal resourcing mix in line with business requirements and the associated costs to meet the Act’s requirements. We have developed and communicated an operating model, policy and procedures relating to this category of employee to ensure good governance, consistent practice and regulatory compliance. We have also established a framework for dialogue with SASBO, the finance union, to develop a common understanding of the amendments and enable a sustainable transition to the new dispensation.
Freedom of associationIn 2014, changing regulations and structural re-organisation within the organised labour movement in South Africa led to protracted and at times violent disputes in the broader labour market, particularly around remuneration and labour broking. We understand that relations between employees and management must be effectively managed to achieve mutual benefits. We subscribe to the principle of freedom of association in line with the International Labour Organisation’s (ILO) Conventions and we believe in building respectful and mutually beneficial relationships with worker representative organisations across all our operations. We strive to balance the legitimate demands and expectations of our staff with fair and effective business solutions. We did not experience any incidents of strike action in our operations in 2014.
In South Africa, SASBO, as the majority recognised union, represents non-managerial staff. While the relationship is not adversarial, the union challenges management actions and decisions on a regular basis and invokes statutory dispute resolution procedures where necessary. Recognition agreements exist with labour unions in Botswana, the Democratic Republic of the Congo, Ghana, Kenya, Lesotho, Malawi, Mozambique, Namibia, Swaziland, Zambia and Zimbabwe. Where required we facilitate capacity building using the ILO’s mutual-gains approach to conflict resolution and negotiations to ensure mutually beneficial outcomes.
Key issues that we managed in consultation with trade unions are listed below.
South Africa
Wage settlement
Alternative working hours to achieve competitiveness and meet changing consumer needs
Rest of Africa
Salary increases for non-managerial staff
Housing allowances
Disciplinary action, disputes and grievancesOur policies and procedures for grievance handling, dispute resolution and disciplinary action are designed to ensure that matters are dealt with in a fair and just manner for both the bank and employees, either individually or collectively. Procedures are in place for employees to challenge disciplinary sanction or who wish to lodge a grievance or complaint. The human capital team is available to assist staff in the resolution of disputes and in initiating formal grievance proceedings. We have formal training programmes for managers to assist them to manage the resolution of grievances.
Disciplinary and grievance incidents (South Africa only)
2014 2013 2012
Disciplinary incidentsDismissals 410 405 313Warnings issued 1 668 865 647
Total disciplinary incidents 2 078 1 270 960
Cases referred to the CCMA*Unfavourable decision for the bank 6 1 5Cases that were settled 38 61 59Cases withdrawn 29 29 23Cases ruled in favour of the bank 25 41 25Cases still outstanding 4 3 2
Total cases referred to the CCMA 102 135 114
* Commission for Conciliation Mediation and Arbitration.
Outside South Africa, there were 89 incidents referred to external bodies of which three resulted in an unfavourable decision for the group, nine were settled, two were withdrawn and 11 were ruled in favour of the group, with the remainder still pending an outcome.
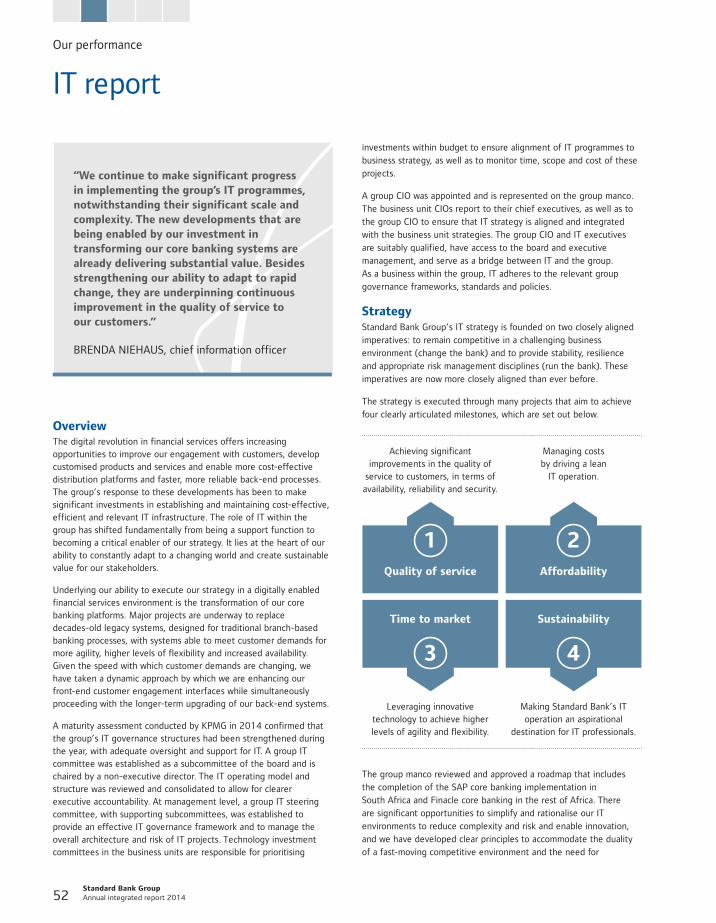
Standard Bank Group Annual integrated report 2014 52
IT report
“We continue to make significant progress in implementing the group’s IT programmes, notwithstanding their significant scale and complexity. The new developments that are being enabled by our investment in transforming our core banking systems are already delivering substantial value. Besides strengthening our ability to adapt to rapid change, they are underpinning continuous improvement in the quality of service to our customers.”
BRENDA NIEHAUS, chief information officer
OverviewThe digital revolution in financial services offers increasing opportunities to improve our engagement with customers, develop customised products and services and enable more cost-effective distribution platforms and faster, more reliable back-end processes. The group’s response to these developments has been to make significant investments in establishing and maintaining cost-effective, efficient and relevant IT infrastructure. The role of IT within the group has shifted fundamentally from being a support function to becoming a critical enabler of our strategy. It lies at the heart of our ability to constantly adapt to a changing world and create sustainable value for our stakeholders.
Underlying our ability to execute our strategy in a digitally enabled financial services environment is the transformation of our core banking platforms. Major projects are underway to replace decades-old legacy systems, designed for traditional branch-based banking processes, with systems able to meet customer demands for more agility, higher levels of flexibility and increased availability. Given the speed with which customer demands are changing, we have taken a dynamic approach by which we are enhancing our front-end customer engagement interfaces while simultaneously proceeding with the longer-term upgrading of our back-end systems.
A maturity assessment conducted by KPMG in 2014 confirmed that the group’s IT governance structures had been strengthened during the year, with adequate oversight and support for IT. A group IT committee was established as a subcommittee of the board and is chaired by a non-executive director. The IT operating model and structure was reviewed and consolidated to allow for clearer executive accountability. At management level, a group IT steering committee, with supporting subcommittees, was established to provide an effective IT governance framework and to manage the overall architecture and risk of IT projects. Technology investment committees in the business units are responsible for prioritising
investments within budget to ensure alignment of IT programmes to business strategy, as well as to monitor time, scope and cost of these projects.
A group CIO was appointed and is represented on the group manco. The business unit CIOs report to their chief executives, as well as to the group CIO to ensure that IT strategy is aligned and integrated with the business unit strategies. The group CIO and IT executives are suitably qualified, have access to the board and executive management, and serve as a bridge between IT and the group. As a business within the group, IT adheres to the relevant group governance frameworks, standards and policies.
StrategyStandard Bank Group’s IT strategy is founded on two closely aligned imperatives: to remain competitive in a challenging business environment (change the bank) and to provide stability, resilience and appropriate risk management disciplines (run the bank). These imperatives are now more closely aligned than ever before.
The strategy is executed through many projects that aim to achieve four clearly articulated milestones, which are set out below.
Achieving significant improvements in the quality of
service to customers, in terms of availability, reliability and security.
Managing costs by driving a lean
IT operation.
Leveraging innovative technology to achieve higher levels of agility and flexibility.
Making Standard Bank’s IT operation an aspirational
destination for IT professionals.
Quality of service
1
Time to market
3
Affordability
2
Sustainability
4
The group manco reviewed and approved a roadmap that includes the completion of the SAP core banking implementation in South Africa and Finacle core banking in the rest of Africa. There are significant opportunities to simplify and rationalise our IT environments to reduce complexity and risk and enable innovation, and we have developed clear principles to accommodate the duality of a fast-moving competitive environment and the need for
Our performance
53
a standardised, stable core. Key to this is remodelling our IT to accommodate social, mobile, data analytics and cloud technologies.
PerformanceWe have made considerable progress in delivering on our plans for large-scale project implementation and productivity improvements by consolidating, standardising and improving the efficiency of IT infrastructure across our customer-facing business units and group functions.
Within PBB SA the first phase of a new customer relationship management solution was rolled out nationally and is being used as a single point to capture all customer-related service requests. The completion of this ‘customer first’ journey is expected in 2015. The replacement of our core banking system is a key enabler of the PBB SA vision and allows us to be agile and responsive to meet the needs of our customers. Tangible progress was made during 2014 in rolling out innovative digital channels and making use of the mobile platform.
In the rest of Africa, the Finacle core banking system has been implemented in Namibia, Nigeria, Uganda, Botswana, Tanzania and most recently, Ghana. In 2014, system upgrades were made in Botswana, Namibia, Nigeria, Tanzania and Uganda to stabilise and optimise existing installations and enable the introduction of digital platforms.
Within CIB, one of our main priorities in 2014 was to enhance our online capabilities across our markets and product lines and we have made good progress in this regard.
By providing integrated, automated, mobile and usable systems to our staff in our human capital, finance, risk and compliance functions, we are rationalising and simplifying our internal processes and fundamentally transforming the way people work within the organisation.
ExpenditureThe costs of transforming our core banking systems are an investment in the significant long-term competitive advantage, value creation ability and sustainability that the new systems will afford the group. A large contributor to the costs is the dual operation of legacy systems and new systems as we migrate customers to the new platform. Following a benchmark of IT performance and costs conducted by McKinsey considerable focus is being placed on improving efficiencies in ‘run the bank’ costs and delivering more for less in ‘change the bank’ costs over the next four years, to bring these costs within benchmarks by 2017.
Our new IT infrastructure represents a significant capitalised software asset on the group’s balance sheet. This asset is amortised on a straight-line basis at rates appropriate to the expected useful life of the asset. The amortisation impact is expected to peak in 2017.
Mitigating risk Our main IT risks include the failure or interruption of critical systems, cybercrime, unauthorised access to systems and the inability to serve our customers’ needs in a timely manner. These risks are mitigated through various controls which are implemented and closely
monitored by management. We continuously review and invest in our security systems and processes to ensure our customers are well protected. Actions to reduce the likelihood of risks materialising are identified and accountabilities for remediation are allocated to management.
Service deliveryWith the introduction of the new mobile banking channels, transactional banking is now a 24/7 service with high customer expectations. Although we met all major service level agreements in 2014, there were some service interruptions, which resulted in media attention and regulatory scrutiny. It is a reality that a certain amount of instability is unavoidable during periods of significant change to IT systems. The total number of critical incidents that occurred across the group in 2014 increased by 3% compared to 2013. The most severe of these incidents was in September 2014, when a mainframe and network outage was experienced which had a significant impact on our customers’ ability to transact. Our response to this interruption confirmed that our business continuity measures are sound and that we have the resilience to recover from major system failures. The group sets recovery and business resumption priorities, and contingency procedures are tested and rehearsed so that interruptions are minimised.
Regulatory environmentAs enablers of business, IT systems are impacted by, and facilitate compliance with, regulatory changes. We have made good progress in implementing IT controls in preparation for the Protection of Personal Information Act (PoPI) and have established an internal programme to assist in meeting the requirements of the TCF regulatory regime. In particular, we are considering the impact on customers of changes in technology, system failures and security incidents.
Looking aheadWe continue to make significant progress in implementing the group’s IT programmes, notwithstanding their significant scale and complexity. The new developments that are being enabled by our investment in transforming our core banking platforms are already delivering substantial value. Besides strengthening our ability to adapt to rapid change, they are underpinning continuous improvement in the quality of service to our customers.
Although these projects will continue to place upward pressure on costs and the risk of operational instability will remain through to the end of 2017, our sound plan and effective governance processes will help to mitigate these realities. The profound long-term benefits of the overhaul in the group’s systems will continue to strengthen our competitiveness, resilience and agility in support of the group’s strategy.
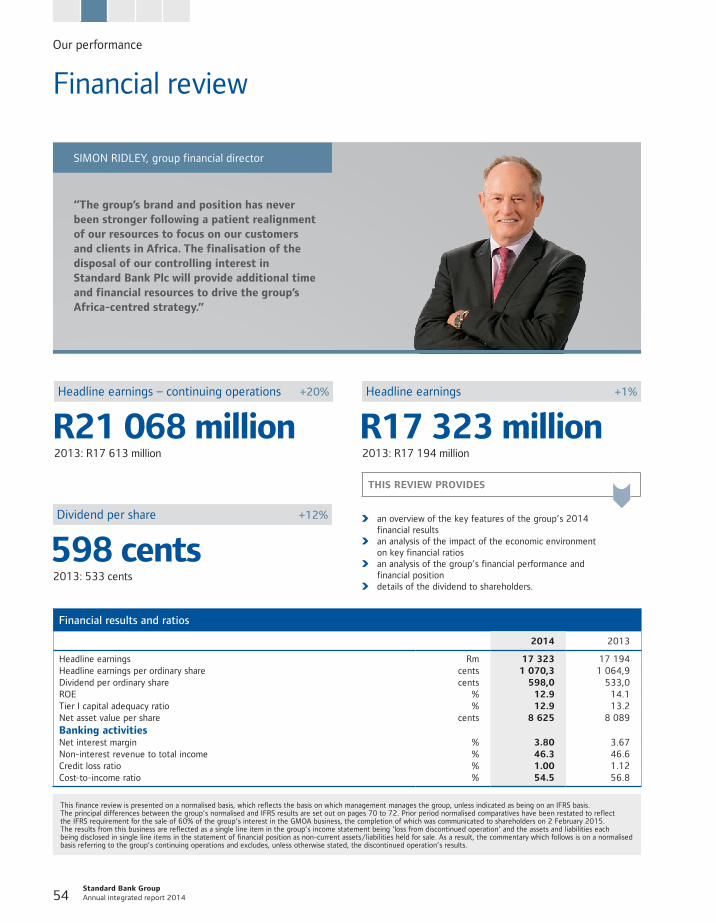
Our performance
Standard Bank Group Annual integrated report 2014 54
Financial review
Financial results and ratios
2014 2013
Headline earnings Rm 17 323 17 194Headline earnings per ordinary share cents 1 070,3 1 064,9Dividend per ordinary share cents 598,0 533,0ROE % 12.9 14.1Tier I capital adequacy ratio % 12.9 13.2Net asset value per share cents 8 625 8 089Banking activitiesNet interest margin % 3.80 3.67Non-interest revenue to total income % 46.3 46.6Credit loss ratio % 1.00 1.12Cost-to-income ratio % 54.5 56.8
“The group’s brand and position has never been stronger following a patient realignment of our resources to focus on our customers and clients in Africa. The finalisation of the disposal of our controlling interest in Standard Bank Plc will provide additional time and financial resources to drive the group’s Africa-centred strategy.”
SIMON RIDLEY, group financial director
This finance review is presented on a normalised basis, which reflects the basis on which management manages the group, unless indicated as being on an IFRS basis. The principal differences between the group’s normalised and IFRS results are set out on pages 70 to 72. Prior period normalised comparatives have been restated to reflect the IFRS requirement for the sale of 60% of the group’s interest in the GMOA business, the completion of which was communicated to shareholders on 2 February 2015. The results from this business are reflected as a single line item in the group’s income statement being ‘loss from discontinued operation’ and the assets and liabilities each being disclosed in single line items in the statement of financial position as non-current assets/liabilities held for sale. As a result, the commentary which follows is on a normalised basis referring to the group’s continuing operations and excludes, unless otherwise stated, the discontinued operation’s results.
R21 068 million2013: R17 613 million
Headline earnings – continuing operations +20%
R17 323 million2013: R17 194 million
Headline earnings +1%
598 cents2013: 533 cents
Dividend per share +12%
THIS REVIEW PROVIDES
an overview of the key features of the group’s 2014 financial results
an analysis of the impact of the economic environment on key financial ratios
an analysis of the group’s financial performance and financial position
details of the dividend to shareholders.
55
Results overviewThe group’s continuing operations’ headline earnings grew by a pleasing 20% to R21 068 million. The group’s discontinued operations’ headline loss increased from R419 million in 2013 to R3 745 million and resulted in the group’s headline earnings increasing by only 1% to R17 323 million. The group’s 2014 results reflect a significant contrast between the results from our discontinued operation (as directed by IFRS) and the results from the rest of the group, styled ‘continuing operations’. IFRS requires that 100% of the results of an operation being sold is reported under discontinued operations, despite the fact that we will retain 40% of this operation. To better show the performance of the entities that the group will continue to hold we have disclosed headline earnings from pro forma continuing operations of R19 570 million which includes 40% of the discontinued operation. This was 12% up on the prior period and can be seen as a more relevant economic view of our continuing operations.
From a continuing operations perspective, the group grew its total income by 15% despite a challenging environment. Income growth was further supported by credit impairments being 2% lower due to the reduction in specific impairments required for corporate loans. Headline earnings per share increased by 1% to 1 070 cents and net asset value per share rose 7%.
The underlying momentum in our businesses across Africa remained strong as our continuing operations delivered strong headline earnings growth of 20%, testament to our commitment to our Africa strategy. The analysis that follows is that of the group’s continuing operations unless indicated otherwise.
Challenges we experienced in 2014Global growth increased over the course of 2014 at a similar pace to 2013 of around 3.3% but this overall growth masked marked growth divergences among major economies. The recovery in the United States was stronger than expected, while economic performance in other developed economies remained weak, specifically in Europe and Japan.
Oil prices in US dollars declined by about 55% in the second half of 2014, due to a combination of unexpected demand weakness in some major economies and the increase in supply into the oil market from non-traditional sources.
Global interest rates remained at multi-year lows and the European Central Bank has now committed itself to quantitative easing in 2015 and 2016 in an effort to boost demand in the Eurozone. The SARB increased interest rates in January 2014 by 50bps and a further 25bps in July, imposing higher costs on indebted households that were partially alleviated by the decline in petrol prices in the final quarter of 2014.
South African GDP growth of approximately 1.5% in 2014, which was significantly below consensus expectations at the beginning of the year, was affected by lost output from strike action in the mining sector in the first quarter of 2014 and slowing growth in personal consumption expenditure. Sub-Saharan African GDP growth of approximately 5% in 2014 matched that of the previous year, supported by infrastructure spending, good agricultural output and
stronger services sectors. There was broad-based output expansion across all the sub-Saharan countries in which the group is invested.
During 2014 the group instituted legal proceedings against several parties with respect to the group’s rights to physical aluminium held in bonded warehouses in China. This is discussed in more detail in the CIB review. Of the USD167 million exposure, USD147 million has been recognised as a valuation loss adjustment.
In addition to the loss on the aluminium repo positions, the group’s discontinued operation incurred an operating loss of R1 674 million. This was mainly as a result of high volatility and dislocation displayed in international markets in the final quarter of 2014, during which time liquidity in asset classes relating to oil and oil producing countries reduced substantially as many participants withdrew from these markets. In addition to R447 million of mainly systems costs required to separate and prepare for sale a global markets business that had been highly integrated within the group.
Financial highlights 2014The disposal of a controlling interest in Standard Bank Plc creates a unique and commercially compelling opportunity for the group and ICBC to partner in global markets, creating a new and larger commodity and financial markets platform and expanding the strategic emphasis for the GMOA business to include a focus on China. The transaction’s disposal proceeds will release a significant amount of capital for the group which can be effectively deployed in furthering the group’s growth strategy in South Africa, and across the continent.
The group’s BEE initiative, Tututwa, commenced in 2004. A key feature of Tutuwa was the 10-year lock-in period, during which time its participants were not permitted to access the underlying equity value in their shares. This lock-in period expired on 31 December 2014 after which participants could elect various options with respect to their shareholding. The Tutuwa initiative has to date created over R10,7 billion in value for its participants.
We continue to make extensive investments in our IT platforms for the future. Continuing to develop and build digital channels to position the group to better serve our customers remains a key focus. While the investment in our IT platforms will place pressure on our costs through amortisation from the time they become available for use, we expect to reap the benefits of more efficient processes in future.
Looking aheadThe group’s medium-term ROE target of between 15% and 18% remains in place and reflects our confidence in the ability of our people to deliver the necessary growth to achieve this target. Although the expiry of the lock-in period for the Tutuwa initiative had no effect on the group’s 2014 normalised financial results, the group’s IFRS results will be affected as participants exit from the initiative, resulting in our IFRS results becoming more closely aligned to our normalised results. Participants’ repayments to the group of their outstanding debt will also result in a release of the empowerment reserve, thereby enhancing the group’s 2015 capital ratios. Refer to page 73 for more details.
Standard Bank Group Annual integrated report 2014 56
Our performance
Tax environment
Since the financial crisis, there has been a marked acceleration in the number and scale of initiatives to collect information regarding all income that resident tax payers earn abroad.
The Organisation for Economic Co-operation and Development (OECD) introduced its action plan on base erosion and profit shifting (BEPS) in 2013 at the request of the G20. Engagement with developing countries has been extensive since the beginning of the project. The BEPS action plan attempts to deliver the largest reform of global taxation seen to date and targets aspects of the global tax system which are perceived to be inadequate. The global tax system was originally designed to prevent corporate profits being taxed twice. The heart of the OECD’s focus is now on preventing cases where profits might inappropriately escape tax or where taxable profits are separated from the location of the activities that generate them.
Operating in Africa, we deal with large volumes of tax policy and tax administration changes as countries
develop laws and processes to secure increased levels of tax revenues. As Africa attracts additional global investment, countries aim to ensure that profits associated with such inflows are taxed appropriately and that the relevant country’s tax base is not eroded.
Transfer pricing is one complex mechanism that is used to ensure that profits are not shifted to lower (or other) tax jurisdictions. Transfer pricing is attracting substantial attention on the continent and revenue authorities in many African jurisdictions are increasing their vigilance in this area by introducing new legislation and employing officials to police the implementation of this legislation.
The group has various processes and policies in place to ensure tax compliance and manage tax risk appropriately. The board remains closely involved in tax matters and supports the group tax strategy and governance standard that outlines our approach to tax.
Business and tax environment
The group makes a valuable contribution to the development and growth of economies in which it operates by paying dividends to our shareholders, salaries to our employees, payments to suppliers, and tax revenues to governments. The group contributes directly to public finances through a wide range of taxes and makes a significant indirect contribution through the taxes paid by our employees and the suppliers that our businesses support.
We also collect other taxes, which include withholding taxes, on behalf of revenue authorities.
We assist tax authorities with their tax administration and collection processes, and support obtaining independent verification of third party data. We support the development of tax policy and are involved in industry forum meetings with revenue authorities to ensure that tax policy objectives are achieved.
Tax policy and risk management
The group strives to optimise its business success in minimising tax risks. This in turn maximises the value we are able to deliver to our shareholders and the communities and governments of the countries in which we operate.
The group tax strategy outlines the framework by which the group’s tax obligations are met from an operational and risk management perspective. We adopt an overarching risk philosophy in relation to tax matters which aims to mitigate any adverse or unexpected financial consequences and protect our reputation.
The group tax governance standard aims to facilitate compliance with the group tax strategy and forms part of the overall framework governing the management of tax matters within the group. The standard is further supported by various supplementary policies that address the taxes across the jurisdictions in which we operate.
We seek to ensure that all intragroup payments are at an arm’s length price. In our dealings with tax authorities, we are committed to fostering transparent and constructive relationships and to ensure accurate, transparent and timely compliance with tax laws.
Our approach to tax
Financial review | continued
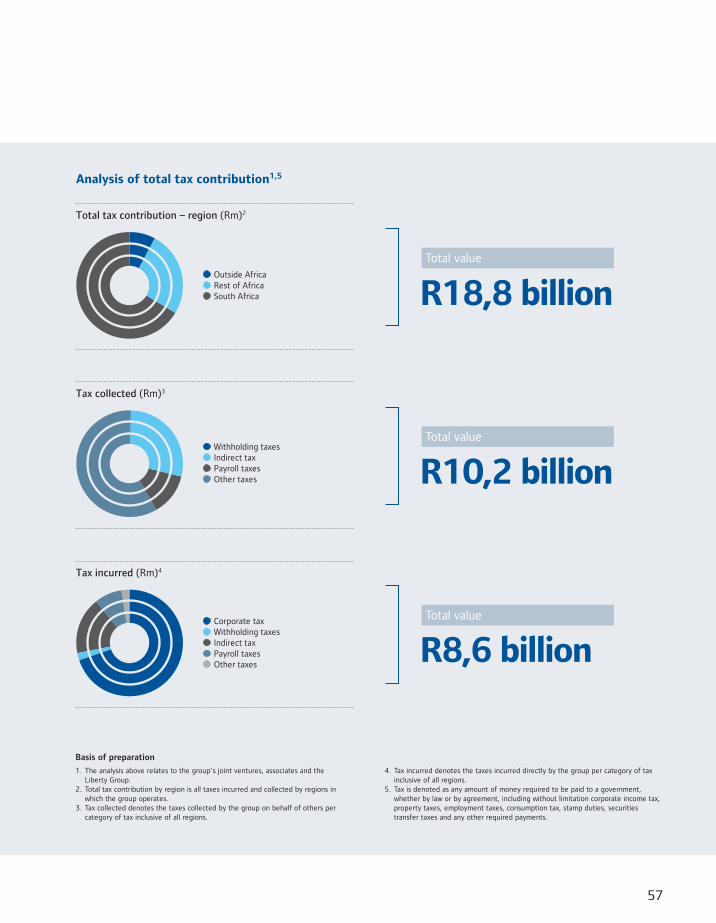
57
Basis of preparation
1. The analysis above relates to the group’s joint ventures, associates and the Liberty Group.
2. Total tax contribution by region is all taxes incurred and collected by regions in which the group operates.
3. Tax collected denotes the taxes collected by the group on behalf of others per category of tax inclusive of all regions.
R8,6 billion
Analysis of total tax contribution1,5
Total tax contribution – region (Rm)2
Tax collected (Rm)3
Tax incurred (Rm)4
� Outside Africa� Rest of Africa� South Africa
� Withholding taxes� Indirect tax� Payroll taxes� Other taxes
� Corporate tax� Withholding taxes� Indirect tax� Payroll taxes� Other taxes
R18,8 billionTotal value
R10,2 billionTotal value
Total value
4. Tax incurred denotes the taxes incurred directly by the group per category of tax inclusive of all regions.
5. Tax is denoted as any amount of money required to be paid to a government, whether by law or by agreement, including without limitation corporate income tax, property taxes, employment taxes, consumption tax, stamp duties, securities transfer taxes and any other required payments.
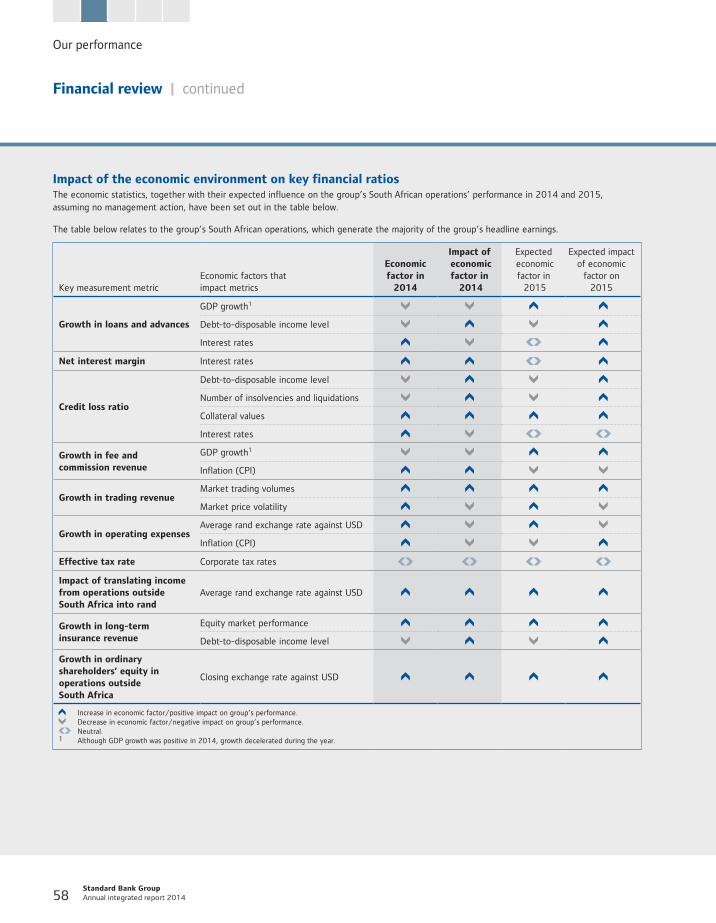
Our performance
Standard Bank Group Annual integrated report 2014 58
Financial review | continued
Impact of the economic environment on key financial ratiosThe economic statistics, together with their expected influence on the group’s South African operations’ performance in 2014 and 2015, assuming no management action, have been set out in the table below.
The table below relates to the group’s South African operations, which generate the majority of the group’s headline earnings.
Key measurement metricEconomic factors that impact metrics
Economic factor in
2014
Impact of economic factor in
2014
Expected economic factor in 2015
Expected impact of economic
factor on 2015
Growth in loans and advances
GDP growth1
Debt-to-disposable income level
Interest rates
Net interest margin Interest rates
Credit loss ratio
Debt-to-disposable income level
Number of insolvencies and liquidations
Collateral values
Interest rates
Growth in fee and commission revenue
GDP growth1
Inflation (CPI)
Growth in trading revenueMarket trading volumes
Market price volatility
Growth in operating expensesAverage rand exchange rate against USD
Inflation (CPI)
Effective tax rate Corporate tax rates
Impact of translating income from operations outside South Africa into rand
Average rand exchange rate against USD
Growth in long-term insurance revenue
Equity market performance
Debt-to-disposable income level
Growth in ordinary shareholders’ equity in operations outside South Africa
Closing exchange rate against USD
Increase in economic factor/positive impact on group’s performance. Decrease in economic factor/negative impact on group’s performance.
Neutral.1 Although GDP growth was positive in 2014, growth decelerated during the year.
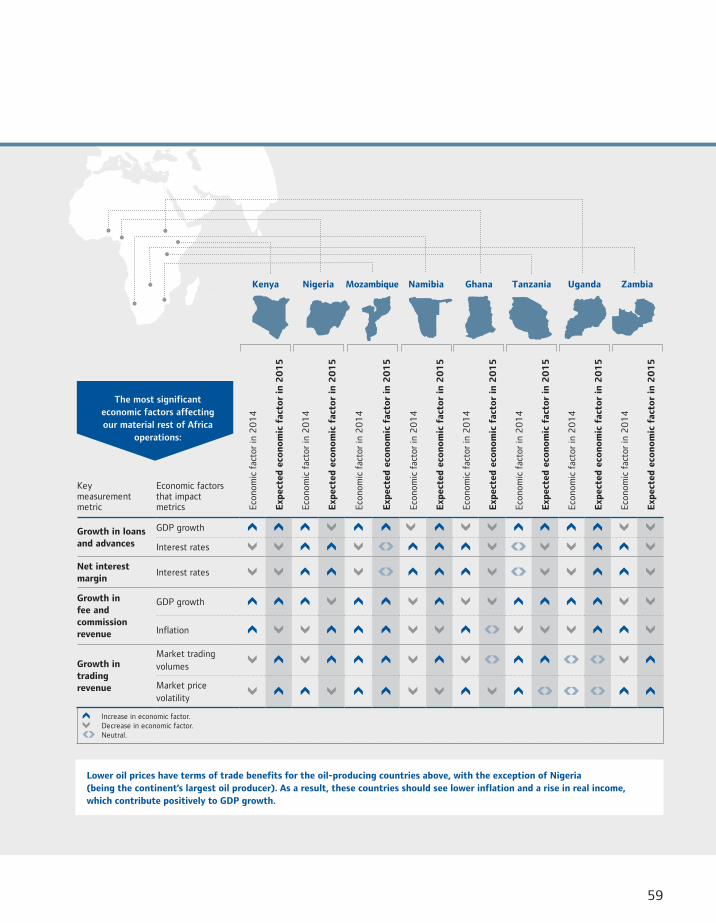
59
Kenya Nigeria Mozambique Namibia Ghana Tanzania Uganda Zambia
Key measurement metric
Economic factors that impact metrics Ec
onom
ic f
acto
r in
20
14
Exp
ecte
d e
con
om
ic f
acto
r in
20
15
Econ
omic
fac
tor
in 2
01
4
Exp
ecte
d e
con
om
ic f
acto
r in
20
15
Econ
omic
fac
tor
in 2
01
4
Exp
ecte
d e
con
om
ic f
acto
r in
20
15
Econ
omic
fac
tor
in 2
01
4
Exp
ecte
d e
con
om
ic f
acto
r in
20
15
Econ
omic
fac
tor
in 2
01
4
Exp
ecte
d e
con
om
ic f
acto
r in
20
15
Econ
omic
fac
tor
in 2
01
4
Exp
ecte
d e
con
om
ic f
acto
r in
20
15
Econ
omic
fac
tor
in 2
01
4
Exp
ecte
d e
con
om
ic f
acto
r in
20
15
Econ
omic
fac
tor
in 2
01
4
Exp
ecte
d e
con
om
ic f
acto
r in
20
15
Growth in loans and advances
GDP growth
Interest rates
Net interest margin
Interest rates
Growth in fee and commission revenue
GDP growth
Inflation
Growth in trading revenue
Market trading volumes
Market price volatility
Increase in economic factor. Decrease in economic factor.
Neutral.
The most significant economic factors affecting our material rest of Africa
operations:
Lower oil prices have terms of trade benefits for the oil-producing countries above, with the exception of Nigeria (being the continent’s largest oil producer). As a result, these countries should see lower inflation and a rise in real income, which contribute positively to GDP growth.
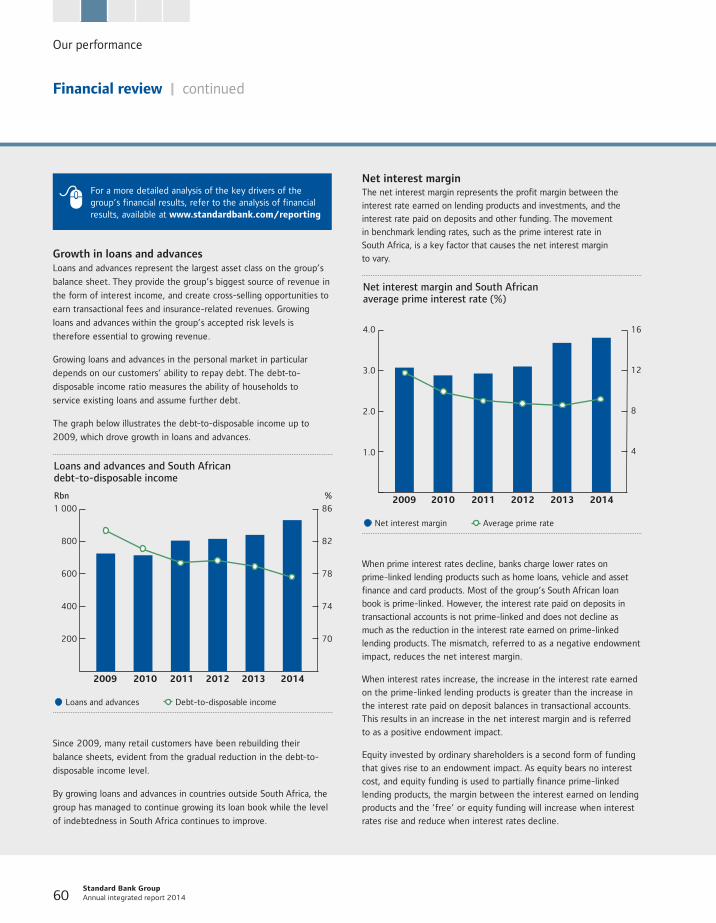
Our performance
Standard Bank Group Annual integrated report 2014 60
Financial review | continued
Growth in loans and advancesLoans and advances represent the largest asset class on the group’s
balance sheet. They provide the group’s biggest source of revenue in
the form of interest income, and create cross-selling opportunities to
earn transactional fees and insurance-related revenues. Growing
loans and advances within the group’s accepted risk levels is
therefore essential to growing revenue.
Growing loans and advances in the personal market in particular
depends on our customers’ ability to repay debt. The debt-to-
disposable income ratio measures the ability of households to
service existing loans and assume further debt.
The graph below illustrates the debt-to-disposable income up to
2009, which drove growth in loans and advances.
2012
Loans and advances and South Africandebt�to�disposable income
1 000
800
600
400
200
2009 2014201320112010
%86
82
78
74
70
Rbn
� Loans and advances � Debt-to-disposable income
Since 2009, many retail customers have been rebuilding their
balance sheets, evident from the gradual reduction in the debt-to-
disposable income level.
By growing loans and advances in countries outside South Africa, the
group has managed to continue growing its loan book while the level
of indebtedness in South Africa continues to improve.
Net interest marginThe net interest margin represents the profit margin between the
interest rate earned on lending products and investments, and the
interest rate paid on deposits and other funding. The movement
in benchmark lending rates, such as the prime interest rate in
South Africa, is a key factor that causes the net interest margin
to vary.
2012
Net interest margin and South Africanaverage prime interest rate (%)
4.0
3.0
2.0
1.0
2009 2014201320112010
16
12
8
4
� Net interest margin � Average prime rate
When prime interest rates decline, banks charge lower rates on
prime-linked lending products such as home loans, vehicle and asset
finance and card products. Most of the group’s South African loan
book is prime-linked. However, the interest rate paid on deposits in
transactional accounts is not prime-linked and does not decline as
much as the reduction in the interest rate earned on prime-linked
lending products. The mismatch, referred to as a negative endowment
impact, reduces the net interest margin.
When interest rates increase, the increase in the interest rate earned
on the prime-linked lending products is greater than the increase in
the interest rate paid on deposit balances in transactional accounts.
This results in an increase in the net interest margin and is referred
to as a positive endowment impact.
Equity invested by ordinary shareholders is a second form of funding
that gives rise to an endowment impact. As equity bears no interest
cost, and equity funding is used to partially finance prime-linked
lending products, the margin between the interest earned on lending
products and the ’free’ or equity funding will increase when interest
rates rise and reduce when interest rates decline.
For a more detailed analysis of the key drivers of the group’s financial results, refer to the analysis of financial results, available at www.standardbank.com/reporting
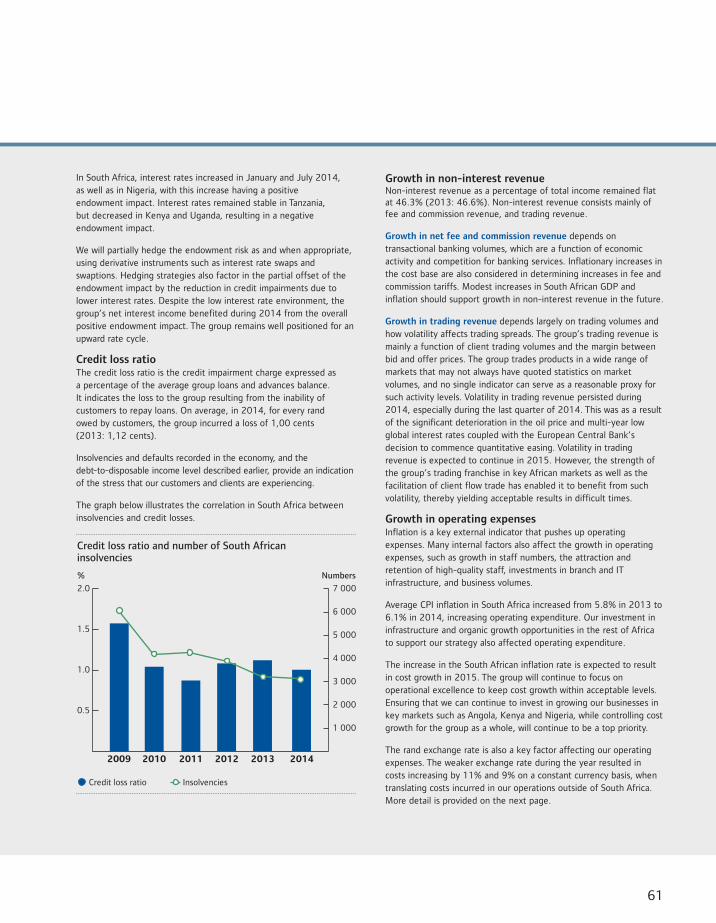
61
Growth in non-interest revenueNon-interest revenue as a percentage of total income remained flat at 46.3% (2013: 46.6%). Non-interest revenue consists mainly of fee and commission revenue, and trading revenue.
Growth in net fee and commission revenue depends on transactional banking volumes, which are a function of economic activity and competition for banking services. Inflationary increases in the cost base are also considered in determining increases in fee and commission tariffs. Modest increases in South African GDP and inflation should support growth in non-interest revenue in the future.
Growth in trading revenue depends largely on trading volumes and how volatility affects trading spreads. The group’s trading revenue is mainly a function of client trading volumes and the margin between bid and offer prices. The group trades products in a wide range of markets that may not always have quoted statistics on market volumes, and no single indicator can serve as a reasonable proxy for such activity levels. Volatility in trading revenue persisted during 2014, especially during the last quarter of 2014. This was as a result of the significant deterioration in the oil price and multi-year low global interest rates coupled with the European Central Bank’s decision to commence quantitative easing. Volatility in trading revenue is expected to continue in 2015. However, the strength of the group’s trading franchise in key African markets as well as the facilitation of client flow trade has enabled it to benefit from such volatility, thereby yielding acceptable results in difficult times.
Growth in operating expensesInflation is a key external indicator that pushes up operating expenses. Many internal factors also affect the growth in operating expenses, such as growth in staff numbers, the attraction and retention of high-quality staff, investments in branch and IT infrastructure, and business volumes.
Average CPI inflation in South Africa increased from 5.8% in 2013 to 6.1% in 2014, increasing operating expenditure. Our investment in infrastructure and organic growth opportunities in the rest of Africa to support our strategy also affected operating expenditure.
The increase in the South African inflation rate is expected to result in cost growth in 2015. The group will continue to focus on operational excellence to keep cost growth within acceptable levels. Ensuring that we can continue to invest in growing our businesses in key markets such as Angola, Kenya and Nigeria, while controlling cost growth for the group as a whole, will continue to be a top priority.
The rand exchange rate is also a key factor affecting our operating expenses. The weaker exchange rate during the year resulted in costs increasing by 11% and 9% on a constant currency basis, when translating costs incurred in our operations outside of South Africa. More detail is provided on the next page.
In South Africa, interest rates increased in January and July 2014, as well as in Nigeria, with this increase having a positive endowment impact. Interest rates remained stable in Tanzania, but decreased in Kenya and Uganda, resulting in a negative endowment impact.
We will partially hedge the endowment risk as and when appropriate, using derivative instruments such as interest rate swaps and swaptions. Hedging strategies also factor in the partial offset of the endowment impact by the reduction in credit impairments due to lower interest rates. Despite the low interest rate environment, the group’s net interest income benefited during 2014 from the overall positive endowment impact. The group remains well positioned for an upward rate cycle.
Credit loss ratioThe credit loss ratio is the credit impairment charge expressed as a percentage of the average group loans and advances balance. It indicates the loss to the group resulting from the inability of customers to repay loans. On average, in 2014, for every rand owed by customers, the group incurred a loss of 1,00 cents (2013: 1,12 cents).
Insolvencies and defaults recorded in the economy, and the debt-to-disposable income level described earlier, provide an indication of the stress that our customers and clients are experiencing.
The graph below illustrates the correlation in South Africa between insolvencies and credit losses.
Credit loss ratio and number of South Africaninsolvencies
2.0
1.5
1.0
0.5
Numbers7 000
6 000
5 000
4 000
3 000
2 000
1 000
%
� Credit loss ratio � Insolvencies
20122009 2014201320112010
Our performance
Standard Bank Group Annual integrated report 2014 62
Financial review | continued
Effective tax rateCorporate tax rates remained unchanged in most of the countries in which the group operates. No significant changes are anticipated in 2015.
Growth in ordinary shareholders’ equity in operations outside South AfricaThe group’s shareholders’ funds are denominated largely in South African rand, with the non-rand based ordinary shareholders’ funds being reflective of our operations outside South Africa. These are denominated largely in US dollars, along with the currencies of other African countries, materially being the Nigerian naira, Kenyan shilling, Zambian kwacha and Ugandan shilling.
Changes in the closing exchange rates, therefore, have an impact on the rand value of the group’s ordinary shareholders’ funds. We hedge this exchange rate risk as and when considered appropriate. In 2014, the combined impact of foreign currency movements, being the group’s FCTR, together with associated hedge gains and losses, resulted in a positive impact on shareholders’ funds of R938 million (2013: R6 billion), all of which is accounted for directly in equity. These gains and losses are recognised in the group’s income statement at the time at which the group’s foreign-based operations are disposed of.
During 2014 the group liquidated several intermediate group companies which resulted in an FCTR gain of R1,2 billion being recognised in the income statement, all of which was excluded from headline earnings.
The closing rand exchange rate also depreciated against the outside Africa operations at a much smaller rate than in the prior year. During 2015 the disposal of the group’s controlling interest in its GMOA business will result in a further material FCTR gain being realised in the income statement.
Translation impact of the rand exchange on income from operations outside South AfricaThe group’s net income from operations outside South Africa is translated into rand at average exchange rates for consolidation purposes. A weaker average rand exchange rate during 2014 resulted in an increase in the rand equivalent of foreign earnings.
Growth in earnings from long-term insuranceLiberty’s earnings are dependent on numerous factors, including policyholder and investor behaviour and growth, which are not analysed here, as well as returns from investments. The performance of the JSE in South Africa has a direct impact on earnings from the insurance operations. The JSE All Share Index grew 8% in 2014, contributing to Liberty’s growth in earnings. In addition, the propensity of customers to continue making insurance payments improved due to sustained management intervention.
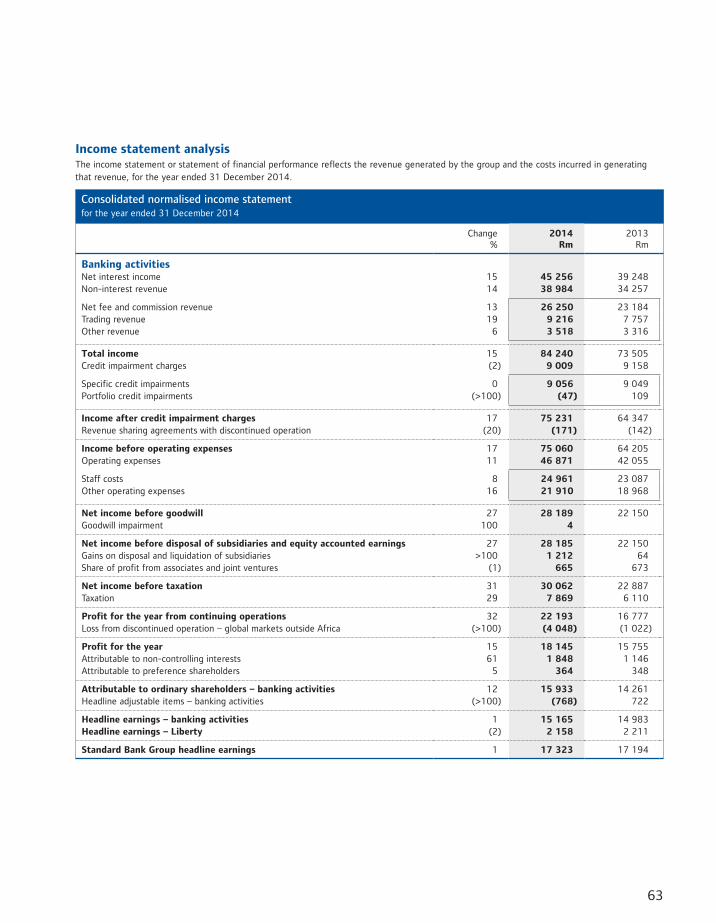
63
Income statement analysis The income statement or statement of financial performance reflects the revenue generated by the group and the costs incurred in generating that revenue, for the year ended 31 December 2014.
Consolidated normalised income statement for the year ended 31 December 2014
Change %
2014 Rm
2013 Rm
Banking activitiesNet interest income 15 45 256 39 248Non-interest revenue 14 38 984 34 257
Net fee and commission revenue 13 26 250 23 184Trading revenue 19 9 216 7 757Other revenue 6 3 518 3 316
Total income 15 84 240 73 505Credit impairment charges (2) 9 009 9 158
Specific credit impairments 0 9 056 9 049Portfolio credit impairments (>100) (47) 109
Income after credit impairment charges 17 75 231 64 347Revenue sharing agreements with discontinued operation (20) (171) (142)
Income before operating expenses 17 75 060 64 205Operating expenses 11 46 871 42 055
Staff costs 8 24 961 23 087Other operating expenses 16 21 910 18 968
Net income before goodwill 27 28 189 22 150Goodwill impairment 100 4
Net income before disposal of subsidiaries and equity accounted earnings 27 28 185 22 150Gains on disposal and liquidation of subsidiaries >100 1 212 64Share of profit from associates and joint ventures (1) 665 673
Net income before taxation 31 30 062 22 887Taxation 29 7 869 6 110
Profit for the year from continuing operations 32 22 193 16 777Loss from discontinued operation – global markets outside Africa (>100) (4 048) (1 022)
Profit for the year 15 18 145 15 755Attributable to non-controlling interests 61 1 848 1 146Attributable to preference shareholders 5 364 348
Attributable to ordinary shareholders – banking activities 12 15 933 14 261Headline adjustable items – banking activities (>100) (768) 722
Headline earnings – banking activities 1 15 165 14 983Headline earnings – Liberty (2) 2 158 2 211
Standard Bank Group headline earnings 1 17 323 17 194
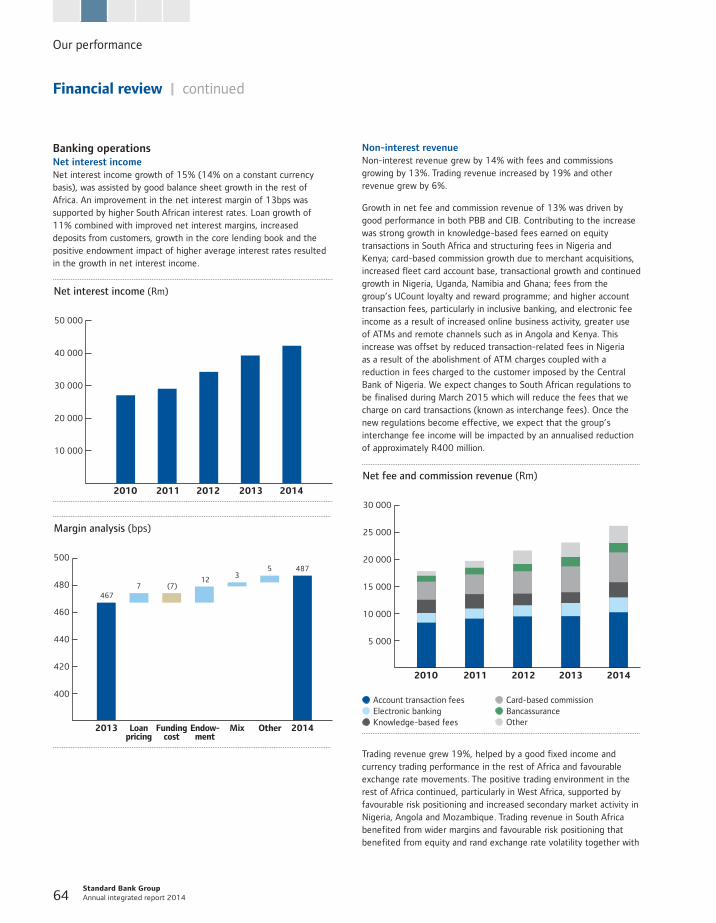
Our performance
Standard Bank Group Annual integrated report 2014 64
Financial review | continued
Non-interest revenueNon-interest revenue grew by 14% with fees and commissions growing by 13%. Trading revenue increased by 19% and other revenue grew by 6%.
Growth in net fee and commission revenue of 13% was driven by good performance in both PBB and CIB. Contributing to the increase was strong growth in knowledge-based fees earned on equity transactions in South Africa and structuring fees in Nigeria and Kenya; card-based commission growth due to merchant acquisitions, increased fleet card account base, transactional growth and continued growth in Nigeria, Uganda, Namibia and Ghana; fees from the group’s UCount loyalty and reward programme; and higher account transaction fees, particularly in inclusive banking, and electronic fee income as a result of increased online business activity, greater use of ATMs and remote channels such as in Angola and Kenya. This increase was offset by reduced transaction-related fees in Nigeria as a result of the abolishment of ATM charges coupled with a reduction in fees charged to the customer imposed by the Central Bank of Nigeria. We expect changes to South African regulations to be finalised during March 2015 which will reduce the fees that we charge on card transactions (known as interchange fees). Once the new regulations become effective, we expect that the group’s interchange fee income will be impacted by an annualised reduction of approximately R400 million.
2010 2012 20132011
30 000
25 000
20 000
15 000
10 000
5 000
� Account transaction fees� Electronic banking� Knowledge-based fees
Net fee and commission revenue (Rm)
� Card-based commission� Bancassurance� Other
2014
Trading revenue grew 19%, helped by a good fixed income and currency trading performance in the rest of Africa and favourable exchange rate movements. The positive trading environment in the rest of Africa continued, particularly in West Africa, supported by favourable risk positioning and increased secondary market activity in Nigeria, Angola and Mozambique. Trading revenue in South Africa benefited from wider margins and favourable risk positioning that benefited from equity and rand exchange rate volatility together with
Banking operationsNet interest incomeNet interest income growth of 15% (14% on a constant currency basis), was assisted by good balance sheet growth in the rest of Africa. An improvement in the net interest margin of 13bps was supported by higher South African interest rates. Loan growth of 11% combined with improved net interest margins, increased deposits from customers, growth in the core lending book and the positive endowment impact of higher average interest rates resulted in the growth in net interest income.
2012 2013 201420112010
Net interest income (Rm)
50 000
40 000
30 000
20 000
10 000
500
480
460
440
420
400
Margin analysis (bps)
2013 Loanpricing
Fundingcost
Endow-ment
Other 2014
7 (7)12
35
Mix
467
487
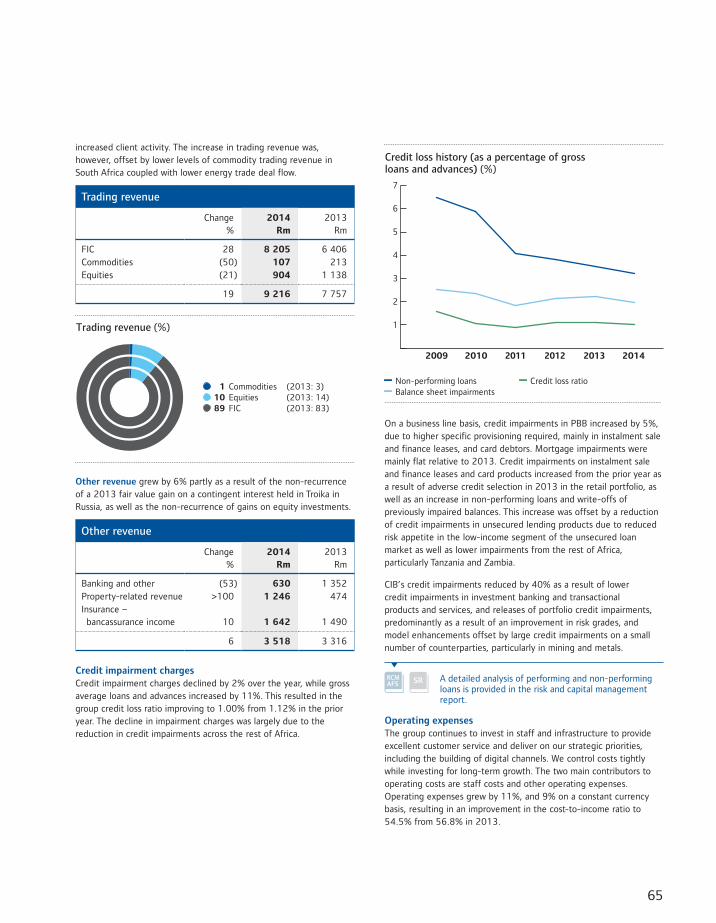
65
increased client activity. The increase in trading revenue was, however, offset by lower levels of commodity trading revenue in South Africa coupled with lower energy trade deal flow.
Trading revenue
Change %
2014 Rm
2013 Rm
FIC 28 8 205 6 406Commodities (50) 107 213Equities (21) 904 1 138
19 9 216 7 757
Trading revenue (%)
� 1 Commodities (2013: 3)� 10 Equities (2013: 14)� 89 FIC (2013: 83)
Other revenue grew by 6% partly as a result of the non-recurrence of a 2013 fair value gain on a contingent interest held in Troika in Russia, as well as the non-recurrence of gains on equity investments.
Other revenue
Change %
2014 Rm
2013 Rm
Banking and other (53) 630 1 352Property-related revenue >100 1 246 474Insurance – bancassurance income 10 1 642 1 490
6 3 518 3 316
Credit impairment chargesCredit impairment charges declined by 2% over the year, while gross average loans and advances increased by 11%. This resulted in the group credit loss ratio improving to 1.00% from 1.12% in the prior year. The decline in impairment charges was largely due to the reduction in credit impairments across the rest of Africa.
7
6
5
4
3
2
1
Credit loss history (as a percentage of grossloans and advances) (%)
2009 2011 2013 20142012
— Non-performing loans — Credit loss ratio— Balance sheet impairments
2010
On a business line basis, credit impairments in PBB increased by 5%, due to higher specific provisioning required, mainly in instalment sale and finance leases, and card debtors. Mortgage impairments were mainly flat relative to 2013. Credit impairments on instalment sale and finance leases and card products increased from the prior year as a result of adverse credit selection in 2013 in the retail portfolio, as well as an increase in non-performing loans and write-offs of previously impaired balances. This increase was offset by a reduction of credit impairments in unsecured lending products due to reduced risk appetite in the low-income segment of the unsecured loan market as well as lower impairments from the rest of Africa, particularly Tanzania and Zambia.
CIB’s credit impairments reduced by 40% as a result of lower credit impairments in investment banking and transactional products and services, and releases of portfolio credit impairments, predominantly as a result of an improvement in risk grades, and model enhancements offset by large credit impairments on a small number of counterparties, particularly in mining and metals.
A detailed analysis of performing and non-performing loans is provided in the risk and capital management report.
Operating expensesThe group continues to invest in staff and infrastructure to provide excellent customer service and deliver on our strategic priorities, including the building of digital channels. We control costs tightly while investing for long-term growth. The two main contributors to operating costs are staff costs and other operating expenses. Operating expenses grew by 11%, and 9% on a constant currency basis, resulting in an improvement in the cost-to-income ratio to 54.5% from 56.8% in 2013.
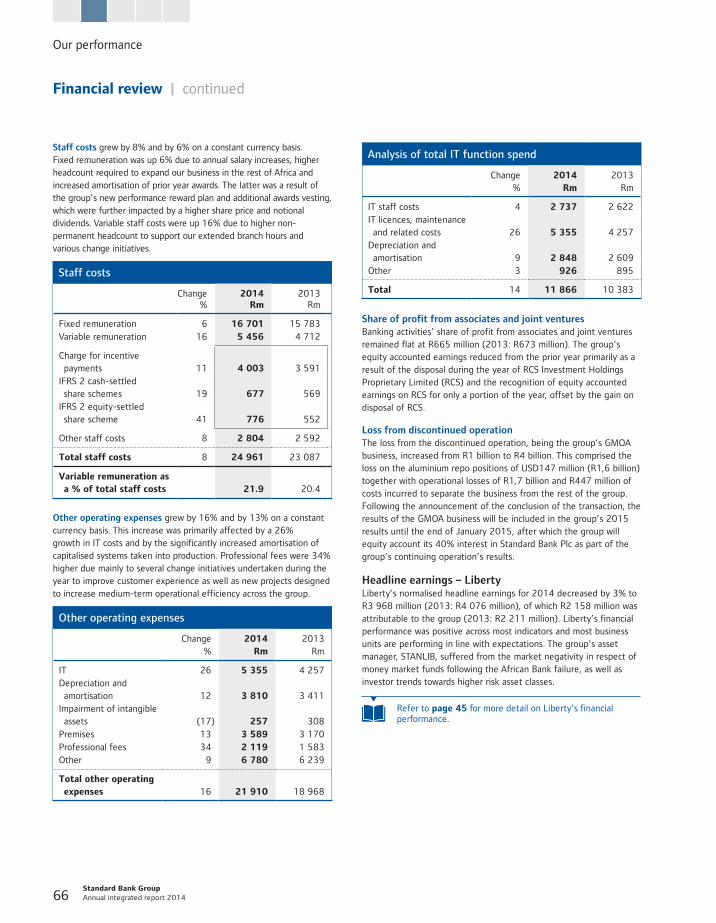
Our performance
Standard Bank Group Annual integrated report 2014 66
Financial review | continued
Staff costs grew by 8% and by 6% on a constant currency basis. Fixed remuneration was up 6% due to annual salary increases, higher headcount required to expand our business in the rest of Africa and increased amortisation of prior year awards. The latter was a result of the group’s new performance reward plan and additional awards vesting, which were further impacted by a higher share price and notional dividends. Variable staff costs were up 16% due to higher non-permanent headcount to support our extended branch hours and various change initiatives.
Staff costs
Change %
2014 Rm
2013 Rm
Fixed remuneration 6 16 701 15 783Variable remuneration 16 5 456 4 712
Charge for incentive payments 11 4 003 3 591IFRS 2 cash-settled share schemes 19 677 569IFRS 2 equity-settled share scheme 41 776 552
Other staff costs 8 2 804 2 592
Total staff costs 8 24 961 23 087
Variable remuneration as a % of total staff costs 21.9 20.4
Other operating expenses grew by 16% and by 13% on a constant currency basis. This increase was primarily affected by a 26% growth in IT costs and by the significantly increased amortisation of capitalised systems taken into production. Professional fees were 34% higher due mainly to several change initiatives undertaken during the year to improve customer experience as well as new projects designed to increase medium-term operational efficiency across the group.
Other operating expenses
Change %
2014 Rm
2013 Rm
IT 26 5 355 4 257Depreciation and amortisation 12 3 810 3 411Impairment of intangible assets (17) 257 308Premises 13 3 589 3 170Professional fees 34 2 119 1 583Other 9 6 780 6 239
Total other operating expenses 16 21 910 18 968
Analysis of total IT function spend
Change %
2014 Rm
2013 Rm
IT staff costs 4 2 737 2 622IT licences, maintenance and related costs 26 5 355 4 257Depreciation and amortisation 9 2 848 2 609Other 3 926 895
Total 14 11 866 10 383
Share of profit from associates and joint venturesBanking activities’ share of profit from associates and joint ventures remained flat at R665 million (2013: R673 million). The group’s equity accounted earnings reduced from the prior year primarily as a result of the disposal during the year of RCS Investment Holdings Proprietary Limited (RCS) and the recognition of equity accounted earnings on RCS for only a portion of the year, offset by the gain on disposal of RCS.
Loss from discontinued operationThe loss from the discontinued operation, being the group’s GMOA business, increased from R1 billion to R4 billion. This comprised the loss on the aluminium repo positions of USD147 million (R1,6 billion) together with operational losses of R1,7 billion and R447 million of costs incurred to separate the business from the rest of the group. Following the announcement of the conclusion of the transaction, the results of the GMOA business will be included in the group’s 2015 results until the end of January 2015, after which the group will equity account its 40% interest in Standard Bank Plc as part of the group’s continuing operation’s results.
Headline earnings – LibertyLiberty’s normalised headline earnings for 2014 decreased by 3% to R3 968 million (2013: R4 076 million), of which R2 158 million was attributable to the group (2013: R2 211 million). Liberty’s financial performance was positive across most indicators and most business units are performing in line with expectations. The group’s asset manager, STANLIB, suffered from the market negativity in respect of money market funds following the African Bank failure, as well as investor trends towards higher risk asset classes.
Refer to page 45 for more detail on Liberty’s financial performance.
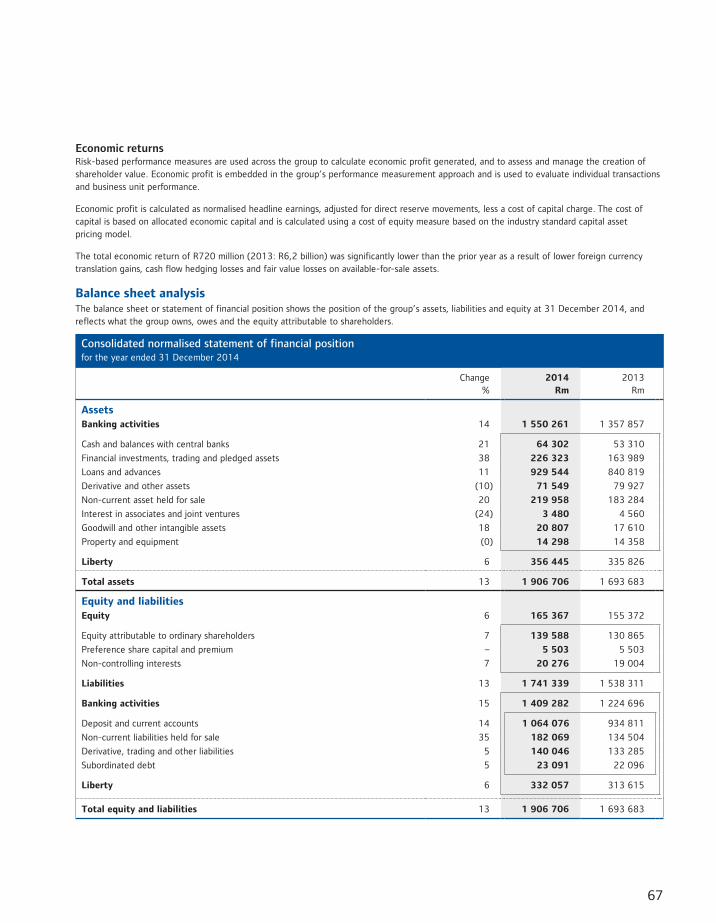
67
Economic returnsRisk-based performance measures are used across the group to calculate economic profit generated, and to assess and manage the creation of shareholder value. Economic profit is embedded in the group’s performance measurement approach and is used to evaluate individual transactions and business unit performance.
Economic profit is calculated as normalised headline earnings, adjusted for direct reserve movements, less a cost of capital charge. The cost of capital is based on allocated economic capital and is calculated using a cost of equity measure based on the industry standard capital asset pricing model.
The total economic return of R720 million (2013: R6,2 billion) was significantly lower than the prior year as a result of lower foreign currency translation gains, cash flow hedging losses and fair value losses on available-for-sale assets.
Balance sheet analysisThe balance sheet or statement of financial position shows the position of the group’s assets, liabilities and equity at 31 December 2014, and reflects what the group owns, owes and the equity attributable to shareholders.
Consolidated normalised statement of financial position for the year ended 31 December 2014
Change %
2014 Rm
2013 Rm
AssetsBanking activities 14 1 550 261 1 357 857
Cash and balances with central banks 21 64 302 53 310
Financial investments, trading and pledged assets 38 226 323 163 989
Loans and advances 11 929 544 840 819
Derivative and other assets (10) 71 549 79 927
Non-current asset held for sale 20 219 958 183 284
Interest in associates and joint ventures (24) 3 480 4 560
Goodwill and other intangible assets 18 20 807 17 610
Property and equipment (0) 14 298 14 358
Liberty 6 356 445 335 826
Total assets 13 1 906 706 1 693 683
Equity and liabilitiesEquity 6 165 367 155 372
Equity attributable to ordinary shareholders 7 139 588 130 865
Preference share capital and premium – 5 503 5 503
Non-controlling interests 7 20 276 19 004
Liabilities 13 1 741 339 1 538 311
Banking activities 15 1 409 282 1 224 696
Deposit and current accounts 14 1 064 076 934 811
Non-current liabilities held for sale 35 182 069 134 504
Derivative, trading and other liabilities 5 140 046 133 285
Subordinated debt 5 23 091 22 096
Liberty 6 332 057 313 615
Total equity and liabilities 13 1 906 706 1 693 683
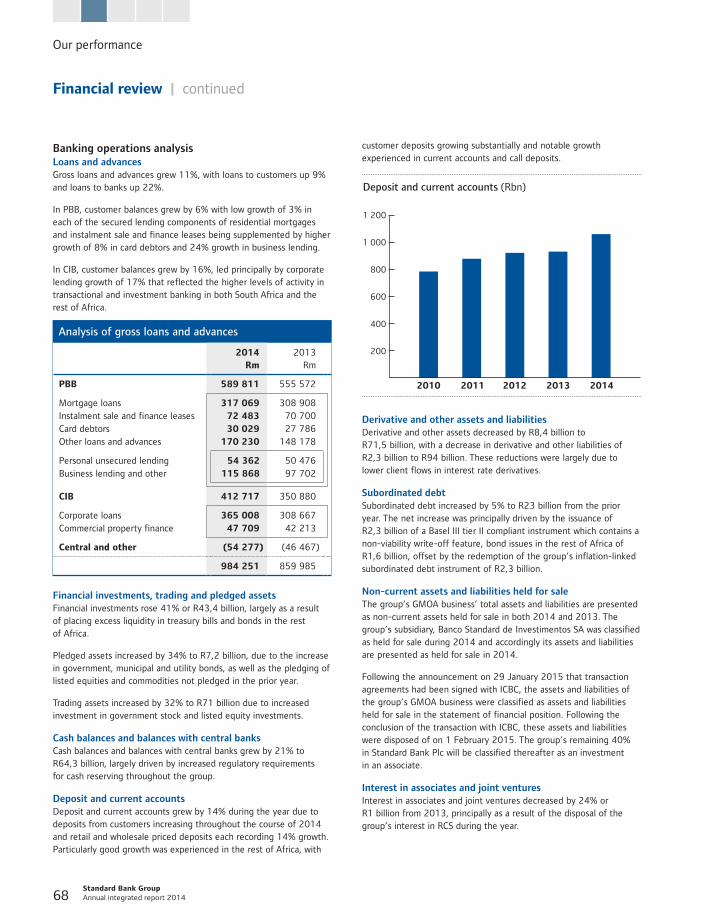
Our performance
Standard Bank Group Annual integrated report 2014 68
Financial review | continued
Banking operations analysisLoans and advancesGross loans and advances grew 11%, with loans to customers up 9% and loans to banks up 22%.
In PBB, customer balances grew by 6% with low growth of 3% in each of the secured lending components of residential mortgages and instalment sale and finance leases being supplemented by higher growth of 8% in card debtors and 24% growth in business lending.
In CIB, customer balances grew by 16%, led principally by corporate lending growth of 17% that reflected the higher levels of activity in transactional and investment banking in both South Africa and the rest of Africa.
Analysis of gross loans and advances
2014 Rm
2013 Rm
PBB 589 811 555 572
Mortgage loans 317 069 308 908Instalment sale and finance leases 72 483 70 700Card debtors 30 029 27 786Other loans and advances 170 230 148 178
Personal unsecured lending 54 362 50 476Business lending and other 115 868 97 702
CIB 412 717 350 880
Corporate loans 365 008 308 667Commercial property finance 47 709 42 213
Central and other (54 277) (46 467)
984 251 859 985
Financial investments, trading and pledged assetsFinancial investments rose 41% or R43,4 billion, largely as a result of placing excess liquidity in treasury bills and bonds in the rest of Africa.
Pledged assets increased by 34% to R7,2 billion, due to the increase in government, municipal and utility bonds, as well as the pledging of listed equities and commodities not pledged in the prior year.
Trading assets increased by 32% to R71 billion due to increased investment in government stock and listed equity investments.
Cash balances and balances with central banksCash balances and balances with central banks grew by 21% to R64,3 billion, largely driven by increased regulatory requirements for cash reserving throughout the group.
Deposit and current accountsDeposit and current accounts grew by 14% during the year due to deposits from customers increasing throughout the course of 2014 and retail and wholesale priced deposits each recording 14% growth. Particularly good growth was experienced in the rest of Africa, with
customer deposits growing substantially and notable growth experienced in current accounts and call deposits.
2012
Deposit and current accounts (Rbn)
1 200
1 000
800
600
400
200
2010 201420132011
Derivative and other assets and liabilitiesDerivative and other assets decreased by R8,4 billion to R71,5 billion, with a decrease in derivative and other liabilities of R2,3 billion to R94 billion. These reductions were largely due to lower client flows in interest rate derivatives.
Subordinated debtSubordinated debt increased by 5% to R23 billion from the prior year. The net increase was principally driven by the issuance of R2,3 billion of a Basel III tier II compliant instrument which contains a non-viability write-off feature, bond issues in the rest of Africa of R1,6 billion, offset by the redemption of the group’s inflation-linked subordinated debt instrument of R2,3 billion.
Non-current assets and liabilities held for saleThe group’s GMOA business’ total assets and liabilities are presented as non-current assets held for sale in both 2014 and 2013. The group’s subsidiary, Banco Standard de Investimentos SA was classified as held for sale during 2014 and accordingly its assets and liabilities are presented as held for sale in 2014.
Following the announcement on 29 January 2015 that transaction agreements had been signed with ICBC, the assets and liabilities of the group’s GMOA business were classified as assets and liabilities held for sale in the statement of financial position. Following the conclusion of the transaction with ICBC, these assets and liabilities were disposed of on 1 February 2015. The group’s remaining 40% in Standard Bank Plc will be classified thereafter as an investment in an associate.
Interest in associates and joint venturesInterest in associates and joint ventures decreased by 24% or R1 billion from 2013, principally as a result of the disposal of the group’s interest in RCS during the year.
69
Goodwill and other intangible assetsGoodwill and other intangible assets increased by 18%, largely due to the capitalisation of development costs on strategic IT projects, including the SAP core banking system in South Africa and Finacle core banking system in the rest of Africa. This was partially offset by impairments in certain software assets.
Trading liabilitiesTrading liabilities increased by R9 billion or 24% due to higher debt-related repurchase transactions and other trading book positions.
Capital, funding and liquidityThe group has maintained its strong capital position with tier I and total capital at 12.9% (2013: 13.2%) and 15.5% (2013: 16.2%) respectively. Rising capital ratios are evident across the global banking industry in response to regulatory pressure, but the group’s current capital ratios and capital target levels are adequate to satisfy increased regulatory requirements.
Deposits from customers increased by 12% through the course of 2014 with retail and wholesale priced deposits each recording 14% and 11% growth respectively. Particularly good growth was experienced in the rest of Africa, with customer deposits growing by 22% and notable growth experienced in current accounts and call deposits.
During 2014, the group maintained its liquidity positions within the approved risk appetite limits. Appropriate liquidity buffers were held in line with regulatory, prudential and internal stress-testing requirements, taking into account the global risk profile and market. The South African financial markets were disrupted temporarily during the second half of 2014 due to the curatorship of African Bank Investments Limited. Our liquidity management systems, processes and frameworks proved to be resilient in the face of these market disruptions.
The group successfully accessed the longer-term funding market during 2014, raising R32,2 billion through a combination of senior and subordinated debt and syndicated loans. Notably, SBSA issued R2,3 billion of the group’s first Basel III compliant tier 2 subordinated debt instruments.
The group maintains adequate levels of highly marketable liquid securities to meet prudential, regulatory and internal stress-testing requirements as protection against unforeseen disruptions in cash flows. Eligible Basel III liquidity coverage ratio (LCR) high quality liquid assets (HQLA) are defined according to the Basel Committee on Banking Supervision (BCBS) January 2013 LCR and liquidity risk monitoring tools framework. In addition to this, management liquidity represents unencumbered marketable securities in addition to eligible Basel III HQLA which would be able to provide significant sources of liquidity in a stress scenario. The group is on track to meet the minimum phased-in Basel III LCR standards.
From 2018, the group will be required to comply with the Basel III net stable funding ratio (NSFR), a metric designed to ensure that the majority of term assets are funded by stable funding sources, such as capital, term borrowings or other stable funds. The final BCBS NSFR framework was issued in October 2014. At present, the local banking industry does not meet the minimum proposed NSFR in full and further available stable funding may have to be raised to fully meet the proposed requirement. Ongoing impact analyses and engagement through BASA and the SARB continue to address this issue.
Ordinary shareholders’ fundsThe group’s ordinary shareholders’ funds grew 6%. Shareholders’ funds deployed outside South Africa are exposed to foreign currency translation movements resulting from the translation of these funds into rand.
The closing rand exchange rate weakened against the dollar to R11,57 (2013: R10,49) resulting in a foreign currency translation gain of R938 million (2013: R6,1 billion), which includes related hedging activities.
DividendsA final dividend of 339 cents per share has been declared, resulting in a total dividend for the year of 598 cents per share. The total dividend reflects an increase of 12% which was in alignment with the increase in the group’s pro forma continuing operations as more fully explained on page 55. The dividend cover ratio on headline earnings decreased from 2.0 to 1.8 times but remained at 2.0 times with respect to pro forma continuing operations. The final dividend was declared as a cash distribution.
Our performance
Standard Bank Group Annual integrated report 2014 70
Explanation of principal differences between normalised and IFRS results Description of normalised adjustmentsThe group’s consolidated financial statements are prepared in accordance with IFRS, its interpretations adopted by the International Accounting Standards Board, the South African Institute of Chartered Accountants (SAICA) Financial Reporting Guides as issued by the Accounting Practices Committee and Financial Reporting Pronouncements as issued by the Financial Reporting Standards Council, the Listings Requirements of the JSE, and the South African Companies Act, 71 of 2008. The following section explains the basis which normalises or adjusts the group’s IFRS results to reflect the group’s view of the economics and legal substance of the following deemed treasury share arrangements (the normalised adjustments):
The group’s Tutuwa initiative
Group shares held by Liberty for the benefit of policyholders
Group share exposures entered into to facilitate client trading activities.
Refer to Liberty’s financial report for an explanation of its normalisation adjustments.
A common element in the deemed treasury share arrangements relates to shares in issue which are deemed by IFRS to be treasury shares. Consequently, the net value of the shares is recognised in equity and the number of shares used for per share calculation purposes is materially lower than the economic substance, resulting in inflated per share ratios. With regard to segmental and product reporting, the normalised adjustments have been made within Liberty, and central and other. The results of the other business units are unaffected.
The normalised results reflect the basis on which management manages the group and is consistent with that reported in the group’s segmental report.
Deemed treasury share adjustmentsTutuwa initiativeThe group concluded its Tutuwa initiative in October 2004 when it sold an effective 10% interest in its South African banking operations to a broad-based grouping of black entities.
The group obtained financing through the issue of perpetual preference shares. These funds were used to subscribe for 8.5% redeemable, cumulative preference shares issued by structured entities (SEs) controlled by the group. These SEs then purchased SBG shares. Subsequently, the SEs containing these shares were sold to black participants. The capital and dividends on the redeemable preference shares issued by the SEs are repayable from future ordinary dividends received, or the proceeds from the disposal of group shares held. As a result of the group’s contingent right to receive its own dividends back in the form of yield and capital on the redeemable preference shares, the subsequent sale of the SEs and consequent delivery of the group shares to the black participants, although legally effected, is not accounted for as a sale. Consequently, the IFRS accounting treatment followed until full redemption or third-party financing is obtained constituted the following:
The redeemable preference shares issued by the SEs and subscribed for by SBG are not recognised as financial assets, but eliminated against equity as a negative empowerment reserve.
The negative empowerment reserve represents SBG shares held by the SEs that are deemed to be treasury shares in terms of IFRS.
Preference dividends accrued but not received, due to cash distributions paid to participants, increase the empowerment reserve.
To the extent that preference dividends are received from the SEs, these are eliminated against the ordinary dividends paid on the group shares held by the SEs.
For purposes of the calculation of EPS, the weighted average number of shares in issue is reduced by the number of shares held by those SEs that have been sold to the black participants. The shares will be restored on full redemption of the preference shares, or to the extent that the preference share capital is financed by a third party.
Perpetual preference shares issued by SBG for the purposes of financing the transaction are classified as equity. Dividends paid on the perpetual preference shares are accounted on declaration and not on an accrual basis.
The normalised adjustment:
recognises a loan asset by reversing the elimination of the redeemable preference shares against equity
accrues for preference dividends receivable on the loan asset within interest income
adds back the number of shares held by the black participants to the weighted number of shares in issue, for purposes of calculating normalised per share ratios
adjusts dividends declared on perpetual preference shares to an accrual basis.
The group obtained external financing in December 2007 and a portion of the Tutuwa participant’s shares were sold to ICBC in March 2008 (with the proceeds thereof being used for the repayment of the preference share liability). This resulted in 24,7 million and 11,0 million shares respectively no longer being deemed to be treasury shares for IFRS purposes.
In May and June 2013, transactions were concluded to refinance part of the group’s funding of its Tutuwa transaction with additional external third-party financing. This resulted in the group’s empowerment reserve decreasing by R1,7 billion and 35,8 million shares no longer being deemed to be treasury shares for IFRS purposes.
The lock-in period for the exercise by the Tutuwa participants of their rights to the SBG shares expired on 31 December 2014. The expiry of the lock-in period had no effect on the group’s financial results for the year ended 31 December 2014.
For further information on the impact of the expiry of the lock-in period, refer to page 73.
Financial review | continued
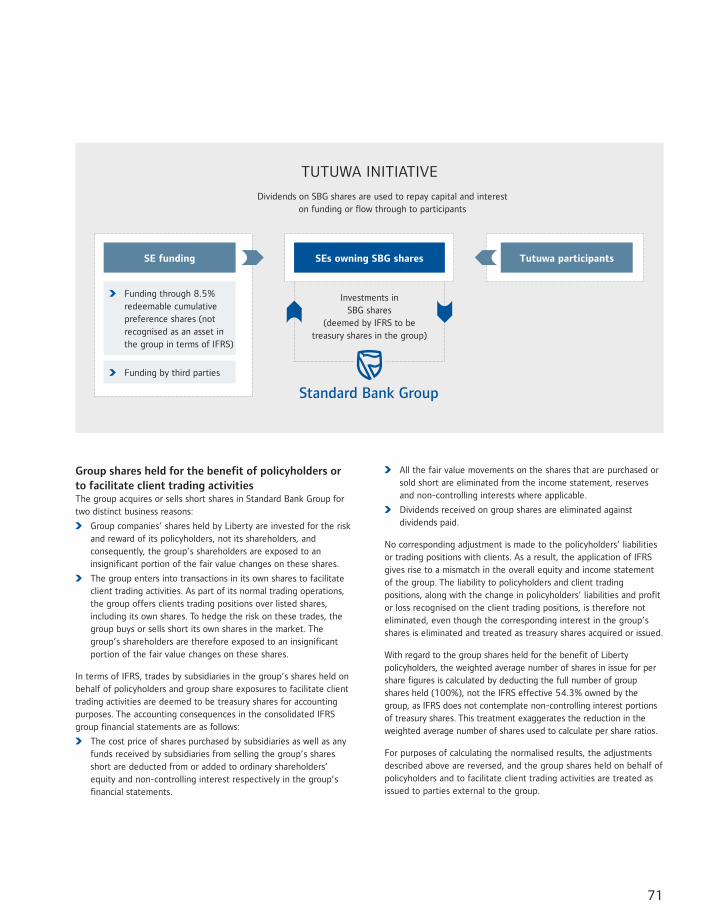
71
Group shares held for the benefit of policyholders or to facilitate client trading activitiesThe group acquires or sells short shares in Standard Bank Group for two distinct business reasons:
Group companies’ shares held by Liberty are invested for the risk and reward of its policyholders, not its shareholders, and consequently, the group’s shareholders are exposed to an insignificant portion of the fair value changes on these shares.
The group enters into transactions in its own shares to facilitate client trading activities. As part of its normal trading operations, the group offers clients trading positions over listed shares, including its own shares. To hedge the risk on these trades, the group buys or sells short its own shares in the market. The group’s shareholders are therefore exposed to an insignificant portion of the fair value changes on these shares.
In terms of IFRS, trades by subsidiaries in the group’s shares held on behalf of policyholders and group share exposures to facilitate client trading activities are deemed to be treasury shares for accounting purposes. The accounting consequences in the consolidated IFRS group financial statements are as follows:
The cost price of shares purchased by subsidiaries as well as any funds received by subsidiaries from selling the group’s shares short are deducted from or added to ordinary shareholders’ equity and non-controlling interest respectively in the group’s financial statements.
All the fair value movements on the shares that are purchased or sold short are eliminated from the income statement, reserves and non-controlling interests where applicable.
Dividends received on group shares are eliminated against dividends paid.
No corresponding adjustment is made to the policyholders’ liabilities or trading positions with clients. As a result, the application of IFRS gives rise to a mismatch in the overall equity and income statement of the group. The liability to policyholders and client trading positions, along with the change in policyholders’ liabilities and profit or loss recognised on the client trading positions, is therefore not eliminated, even though the corresponding interest in the group’s shares is eliminated and treated as treasury shares acquired or issued.
With regard to the group shares held for the benefit of Liberty policyholders, the weighted average number of shares in issue for per share figures is calculated by deducting the full number of group shares held (100%), not the IFRS effective 54.3% owned by the group, as IFRS does not contemplate non-controlling interest portions of treasury shares. This treatment exaggerates the reduction in the weighted average number of shares used to calculate per share ratios.
For purposes of calculating the normalised results, the adjustments described above are reversed, and the group shares held on behalf of policyholders and to facilitate client trading activities are treated as issued to parties external to the group.
TUTUWA INITIATIVE
Dividends on SBG shares are used to repay capital and interest on funding or flow through to participants
SE funding
Funding through 8.5% redeemable cumulative preference shares (not recognised as an asset in the group in terms of IFRS)
Funding by third parties
SEs owning SBG shares Tutuwa participants
Investments in SBG shares
(deemed by IFRS to be treasury shares in the group)
Standard Bank Group
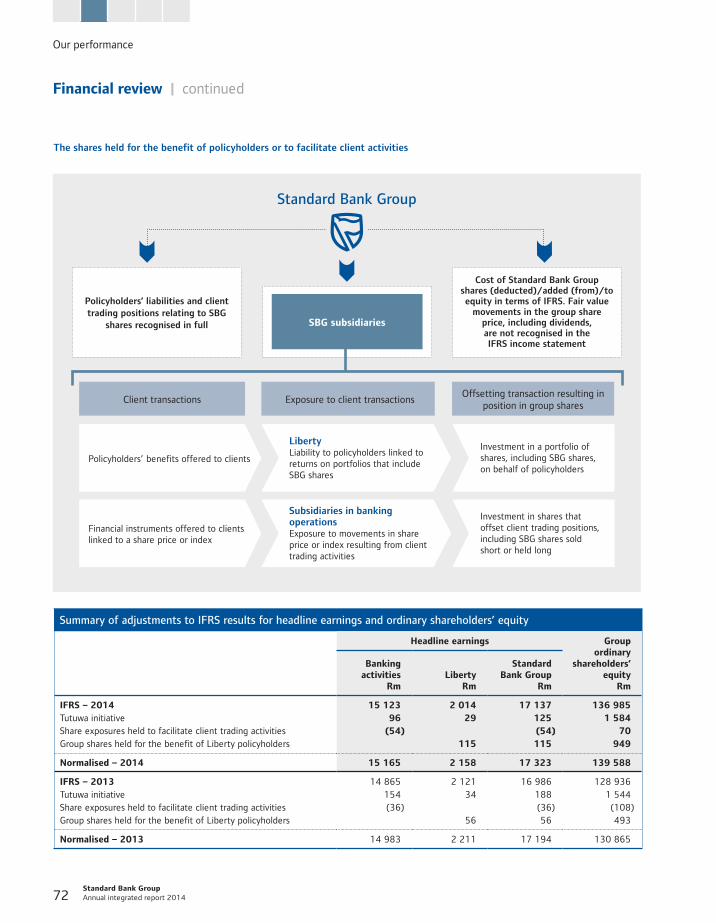
Standard Bank Group Annual integrated report 2014 72
The shares held for the benefit of policyholders or to facilitate client activities
Our performance
Financial review | continued
Summary of adjustments to IFRS results for headline earnings and ordinary shareholders’ equity
Headline earnings Groupordinary
shareholders’ equity
Rm
Banking activities
RmLiberty
Rm
Standard Bank Group
Rm
IFRS – 2014 15 123 2 014 17 137 136 985Tutuwa initiative 96 29 125 1 584Share exposures held to facilitate client trading activities (54) (54) 70Group shares held for the benefit of Liberty policyholders 115 115 949
Normalised – 2014 15 165 2 158 17 323 139 588
IFRS – 2013 14 865 2 121 16 986 128 936Tutuwa initiative 154 34 188 1 544Share exposures held to facilitate client trading activities (36) (36) (108)Group shares held for the benefit of Liberty policyholders 56 56 493
Normalised – 2013 14 983 2 211 17 194 130 865
Standard Bank Group
Policyholders’ liabilities and client trading positions relating to SBG
shares recognised in full SBG subsidiaries
Cost of Standard Bank Group shares (deducted)/added (from)/to equity in terms of IFRS. Fair value
movements in the group share price, including dividends, are not recognised in the IFRS income statement
Client transactions Exposure to client transactionsOffsetting transaction resulting in
position in group shares
Policyholders’ benefits offered to clients
Liberty Liability to policyholders linked to returns on portfolios that include SBG shares
Investment in a portfolio of shares, including SBG shares, on behalf of policyholders
Financial instruments offered to clients linked to a share price or index
Subsidiaries in banking operations Exposure to movements in share price or index resulting from client trading activities
Investment in shares that offset client trading positions, including SBG shares sold short or held long
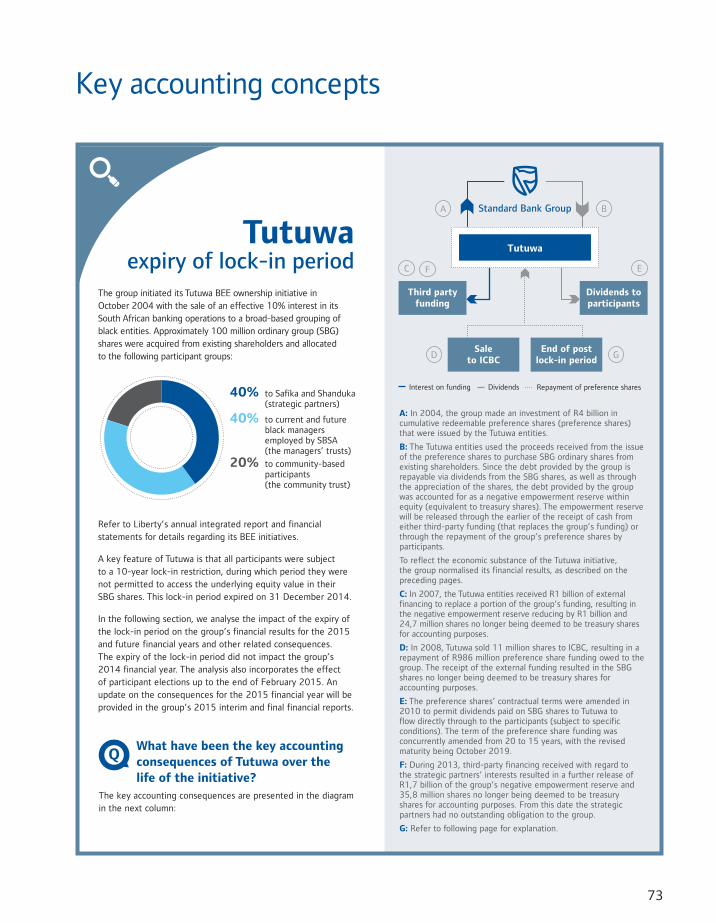
73
Tutuwa expiry of lock-in period
The group initiated its Tutuwa BEE ownership initiative in October 2004 with the sale of an effective 10% interest in its South African banking operations to a broad-based grouping of black entities. Approximately 100 million ordinary group (SBG) shares were acquired from existing shareholders and allocated to the following participant groups:
40%to Safikaand Shanduka(strategicpartners)
40%to current andfuture blackmanagers employedby SBSA (the managers’ trusts)
20%to community-basedparticipants (thecommunity trust)
40% to Safika and Shanduka (strategic partners)
40% to current and future black managers employed by SBSA (the managers’ trusts)
20% to community-based participants (the community trust)
Refer to Liberty’s annual integrated report and financial statements for details regarding its BEE initiatives.
A key feature of Tutuwa is that all participants were subject to a 10-year lock-in restriction, during which period they were not permitted to access the underlying equity value in their SBG shares. This lock-in period expired on 31 December 2014.
In the following section, we analyse the impact of the expiry of the lock-in period on the group’s financial results for the 2015 and future financial years and other related consequences. The expiry of the lock-in period did not impact the group’s 2014 financial year. The analysis also incorporates the effect of participant elections up to the end of February 2015. An update on the consequences for the 2015 financial year will be provided in the group’s 2015 interim and final financial reports.
QWhat have been the key accounting consequences of Tutuwa over the life of the initiative?
The key accounting consequences are presented in the diagram in the next column:
A: In 2004, the group made an investment of R4 billion in cumulative redeemable preference shares (preference shares) that were issued by the Tutuwa entities.
B: The Tutuwa entities used the proceeds received from the issue of the preference shares to purchase SBG ordinary shares from existing shareholders. Since the debt provided by the group is repayable via dividends from the SBG shares, as well as through the appreciation of the shares, the debt provided by the group was accounted for as a negative empowerment reserve within equity (equivalent to treasury shares). The empowerment reserve will be released through the earlier of the receipt of cash from either third-party funding (that replaces the group’s funding) or through the repayment of the group’s preference shares by participants.
To reflect the economic substance of the Tutuwa initiative, the group normalised its financial results, as described on the preceding pages.
C: In 2007, the Tutuwa entities received R1 billion of external financing to replace a portion of the group’s funding, resulting in the negative empowerment reserve reducing by R1 billion and 24,7 million shares no longer being deemed to be treasury shares for accounting purposes.
D: In 2008, Tutuwa sold 11 million shares to ICBC, resulting in a repayment of R986 million preference share funding owed to the group. The receipt of the external funding resulted in the SBG shares no longer being deemed to be treasury shares for accounting purposes.
E: The preference shares’ contractual terms were amended in 2010 to permit dividends paid on SBG shares to Tutuwa to flow directly through to the participants (subject to specific conditions). The term of the preference share funding was concurrently amended from 20 to 15 years, with the revised maturity being October 2019.
F: During 2013, third-party financing received with regard to the strategic partners’ interests resulted in a further release of R1,7 billion of the group’s negative empowerment reserve and 35,8 million shares no longer being deemed to be treasury shares for accounting purposes. From this date the strategic partners had no outstanding obligation to the group.
G: Refer to following page for explanation.
A B
Third party funding
Dividends to participants
Tutuwa
Sale to ICBC
End of post lock-in period
Standard Bank Group
C E
D G
F
Interest on funding Dividends Repayment of preference shares
Key accounting concepts
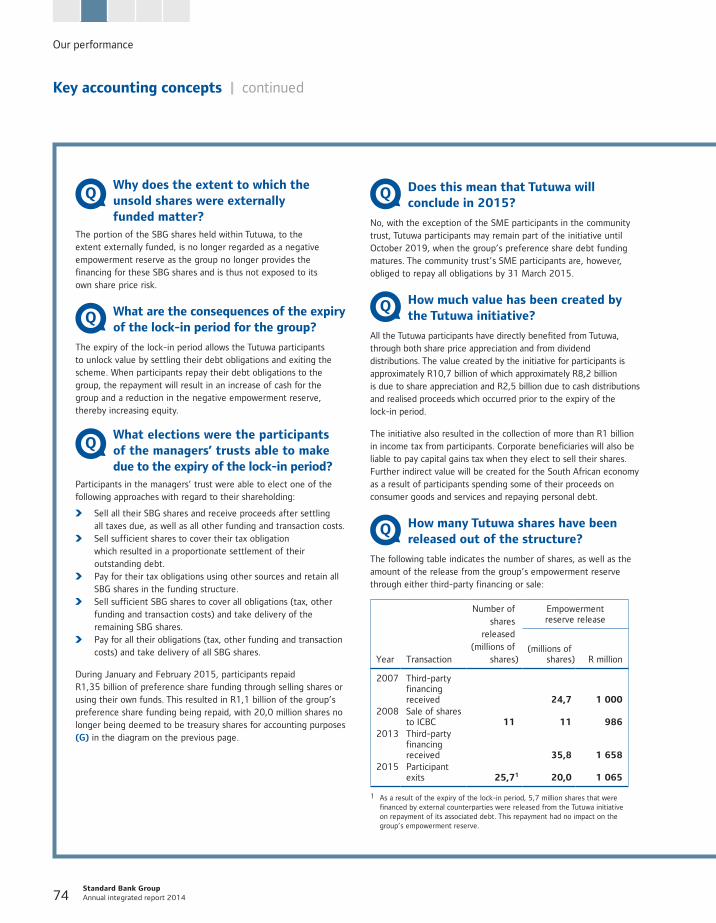
Standard Bank Group Annual integrated report 2014 74
Our performance
Key accounting concepts | continued
Q Does this mean that Tutuwa will conclude in 2015?
No, with the exception of the SME participants in the community trust, Tutuwa participants may remain part of the initiative until October 2019, when the group’s preference share debt funding matures. The community trust’s SME participants are, however, obliged to repay all obligations by 31 March 2015.
Q How much value has been created by the Tutuwa initiative?
All the Tutuwa participants have directly benefited from Tutuwa, through both share price appreciation and from dividend distributions. The value created by the initiative for participants is approximately R10,7 billion of which approximately R8,2 billion is due to share appreciation and R2,5 billion due to cash distributions and realised proceeds which occurred prior to the expiry of the lock-in period.
The initiative also resulted in the collection of more than R1 billion in income tax from participants. Corporate beneficiaries will also be liable to pay capital gains tax when they elect to sell their shares. Further indirect value will be created for the South African economy as a result of participants spending some of their proceeds on consumer goods and services and repaying personal debt.
Q How many Tutuwa shares have been released out of the structure?
The following table indicates the number of shares, as well as the amount of the release from the group’s empowerment reserve through either third-party financing or sale:
Number of shares
released (millions of
shares)
Empowerment reserve release
Year Transaction (millions of
shares) R million
2007 Third-party financing received 24,7 1 000
2008 Sale of shares to ICBC 11 11 986
2013 Third-party financing received 35,8 1 658
2015 Participant exits 25,71 20,0 1 065
1 As a result of the expiry of the lock-in period, 5,7 million shares that were financed by external counterparties were released from the Tutuwa initiative on repayment of its associated debt. This repayment had no impact on the group’s empowerment reserve.
QWhy does the extent to which the unsold shares were externally funded matter?
The portion of the SBG shares held within Tutuwa, to the extent externally funded, is no longer regarded as a negative empowerment reserve as the group no longer provides the financing for these SBG shares and is thus not exposed to its own share price risk.
Q What are the consequences of the expiry of the lock-in period for the group?
The expiry of the lock-in period allows the Tutuwa participants to unlock value by settling their debt obligations and exiting the scheme. When participants repay their debt obligations to the group, the repayment will result in an increase of cash for the group and a reduction in the negative empowerment reserve, thereby increasing equity.
QWhat elections were the participants of the managers’ trusts able to makedue to the expiry of the lock-in period?
Participants in the managers’ trust were able to elect one of the following approaches with regard to their shareholding:
Sell all their SBG shares and receive proceeds after settling all taxes due, as well as all other funding and transaction costs.
Sell sufficient shares to cover their tax obligation which resulted in a proportionate settlement of their outstanding debt.
Pay for their tax obligations using other sources and retain all SBG shares in the funding structure.
Sell sufficient SBG shares to cover all obligations (tax, other funding and transaction costs) and take delivery of the remaining SBG shares.
Pay for all their obligations (tax, other funding and transaction costs) and take delivery of all SBG shares.
During January and February 2015, participants repaid R1,35 billion of preference share funding through selling shares or using their own funds. This resulted in R1,1 billion of the group’s preference share funding being repaid, with 20,0 million shares no longer being deemed to be treasury shares for accounting purposes (G) in the diagram on the previous page.
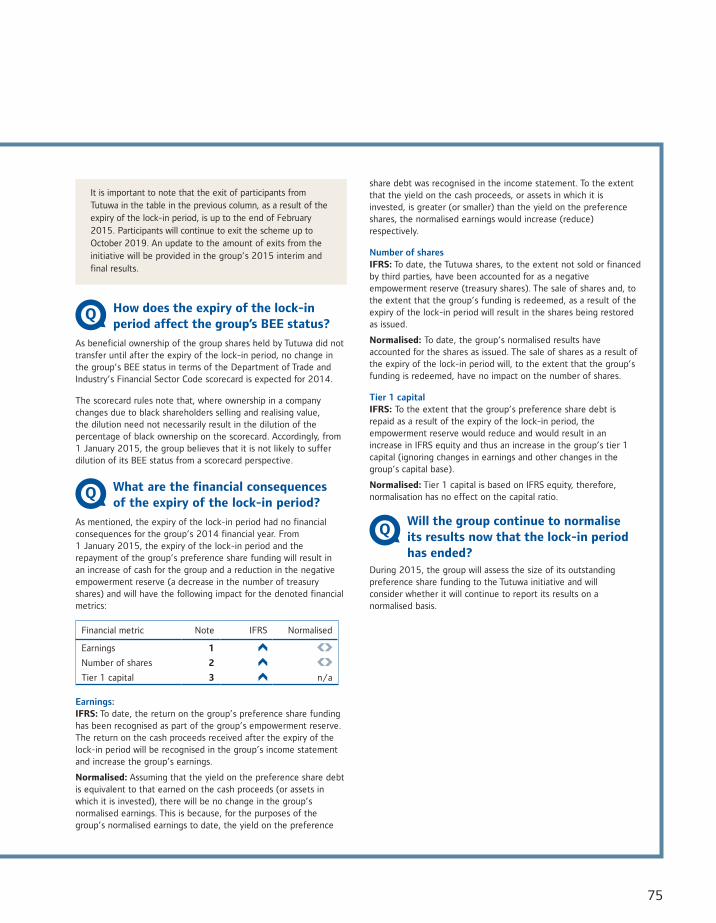
75
It is important to note that the exit of participants from Tutuwa in the table in the previous column, as a result of the expiry of the lock-in period, is up to the end of February 2015. Participants will continue to exit the scheme up to October 2019. An update to the amount of exits from the initiative will be provided in the group’s 2015 interim and final results.
Q How does the expiry of the lock-in period affect the group’s BEE status?
As beneficial ownership of the group shares held by Tutuwa did not transfer until after the expiry of the lock-in period, no change in the group’s BEE status in terms of the Department of Trade and Industry’s Financial Sector Code scorecard is expected for 2014.
The scorecard rules note that, where ownership in a company changes due to black shareholders selling and realising value, the dilution need not necessarily result in the dilution of the percentage of black ownership on the scorecard. Accordingly, from 1 January 2015, the group believes that it is not likely to suffer dilution of its BEE status from a scorecard perspective.
Q What are the financial consequences of the expiry of the lock-in period?
As mentioned, the expiry of the lock-in period had no financial consequences for the group’s 2014 financial year. From 1 January 2015, the expiry of the lock-in period and the repayment of the group’s preference share funding will result in an increase of cash for the group and a reduction in the negative empowerment reserve (a decrease in the number of treasury shares) and will have the following impact for the denoted financial metrics:
Financial metric Note IFRS Normalised
Earnings 1
Number of shares 2
Tier 1 capital 3 n/a
Earnings:IFRS: To date, the return on the group’s preference share funding has been recognised as part of the group’s empowerment reserve. The return on the cash proceeds received after the expiry of the lock-in period will be recognised in the group’s income statement and increase the group’s earnings.
Normalised: Assuming that the yield on the preference share debt is equivalent to that earned on the cash proceeds (or assets in which it is invested), there will be no change in the group’s normalised earnings. This is because, for the purposes of the group’s normalised earnings to date, the yield on the preference
share debt was recognised in the income statement. To the extent that the yield on the cash proceeds, or assets in which it is invested, is greater (or smaller) than the yield on the preference shares, the normalised earnings would increase (reduce) respectively.
Number of sharesIFRS: To date, the Tutuwa shares, to the extent not sold or financed by third parties, have been accounted for as a negative empowerment reserve (treasury shares). The sale of shares and, to the extent that the group’s funding is redeemed, as a result of the expiry of the lock-in period will result in the shares being restored as issued.
Normalised: To date, the group’s normalised results have accounted for the shares as issued. The sale of shares as a result of the expiry of the lock-in period will, to the extent that the group’s funding is redeemed, have no impact on the number of shares.
Tier 1 capitalIFRS: To the extent that the group’s preference share debt is repaid as a result of the expiry of the lock-in period, the empowerment reserve would reduce and would result in an increase in IFRS equity and thus an increase in the group’s tier 1 capital (ignoring changes in earnings and other changes in the group’s capital base).
Normalised: Tier 1 capital is based on IFRS equity, therefore, normalisation has no effect on the capital ratio.
QWill the group continue to normalise its results now that the lock-in period has ended?
During 2015, the group will assess the size of its outstanding preference share funding to the Tutuwa initiative and will consider whether it will continue to report its results on a normalised basis.
Standard Bank Group Annual integrated report 2014 76
Summarised annual financial statements
Our performance
The summary information presented on pages 78 to 83 of this report has been extracted from the audited annual consolidated financial statements which were audited by KPMG Inc. and PricewaterhouseCoopers Inc., who expressed an unmodified opinion.
The annual consolidated financial statements and auditor’s report thereon are available for inspection at the company’s registered office. This report itself is not audited.
The directors of the group take full responsibility for the preparation of the summary information and that the information has been correctly extracted from the underlying consolidated annual financial statements.
The full 2014 annual financial results and related notes can be found in the risk and capital management report and annual financial statements.
Significant accounting policies 76
Condensed consolidated income statement – IFRS 78
Condensed consolidated statement of financial position – IFRS 79
Condensed consolidated statement of other comprehensive income – IFRS 80
Headline earnings – IFRS 81
Financial statistics – IFRS 82
Condensed consolidated statement of cash flows – IFRS 83
Significant accounting policiesBasis of preparationThe group’s annual financial statements are prepared in accordance with IFRS, the SAICA Financial Reporting Guides as issued by the Accounting Practices Committee, Listings Requirements of the JSE, and the South African Companies Act.
Basis of consolidationThe group controls an investee when it has power over the investee; has exposure or rights to variable returns for its involvement with the investee; and has the ability to use its power to affect the returns from its involvement with the investee. Investees are consolidated from the date the group acquires control up to the date that control is lost.
Functional and presentation currencyThe annual financial statements are presented in South African rand (ZAR). All foreign-denominated transactions are recognised at the rate at which the transaction arose and all foreign-denominated balances are translated at the closing exchange rate with any differences recognised in the income statement. The assets and liabilities of the group’s foreign operations are translated into ZAR using the closing exchange rate and the income statement at the average exchange rate. Any resultant exchange differences are recognised in the group’s FCTR.
Financial instrumentsFinancial instruments, which include all financial assets and liabilities, are initially recognised at fair value. Subsequent to initial recognition, financial instruments are measured either at fair value or amortised cost depending on the classification of the financial instrument which takes into account the purpose for which the group acquired or originated the financial instrument, the group’s intention and various other accounting elections.
Non-current assets held for sale, disposal groups and discontinued operation
The accounting treatment for non-current held for sale assets and the group’s discontinued operation is explained in annexure A of the annual financial statements.
IN THIS REPORT:
77
Equity compensation plansThe fair value of equity-settled share options is determined on the grant date and recognised in staff costs over the vesting period with a corresponding increase in the share-based payment reserve. Cash-settled share-based payments are accounted for as liabilities at fair value until settled with the liability being recognised over the vesting period through staff costs.
Revenue and expenditureRevenue is derived substantially from the business of banking and related activities. Interest income and expense are recognised in profit or loss on an accrual basis using the effective interest method for all interest-bearing financial instruments, except for those classified at fair value through profit or loss. Fee and commission revenue are recognised as the related services are performed. Trading revenue comprises all gains and losses from changes in the fair value of trading assets and liabilities. Other revenue typically includes gains and losses on equity instruments designated at fair value through profit or loss, underwriting profit from the group’s short-term insurance operations and related insurance activities.
Policyholder insurance and investment contractsLong-term insurance contracts and investment contracts with discretionary participation features, being discretionary bonuses provided by the group, are valued using actuarial cash flow methodologies in accordance with actuarial guidance requirements. For short-term insurance, premiums are accounted for as income when the risk related to the insurance policy commences and are amortised over the contractual period of risk cover by using an unearned premium provision. A liability adequacy provision is recognised when it is anticipated that the unearned premium is insufficient to cover future claims. Investment contracts without discretionary participation features are accounted for as liabilities at fair value with all changes recognised in the income statement. All of these contracts are reflected as liabilities in the statement of financial position.
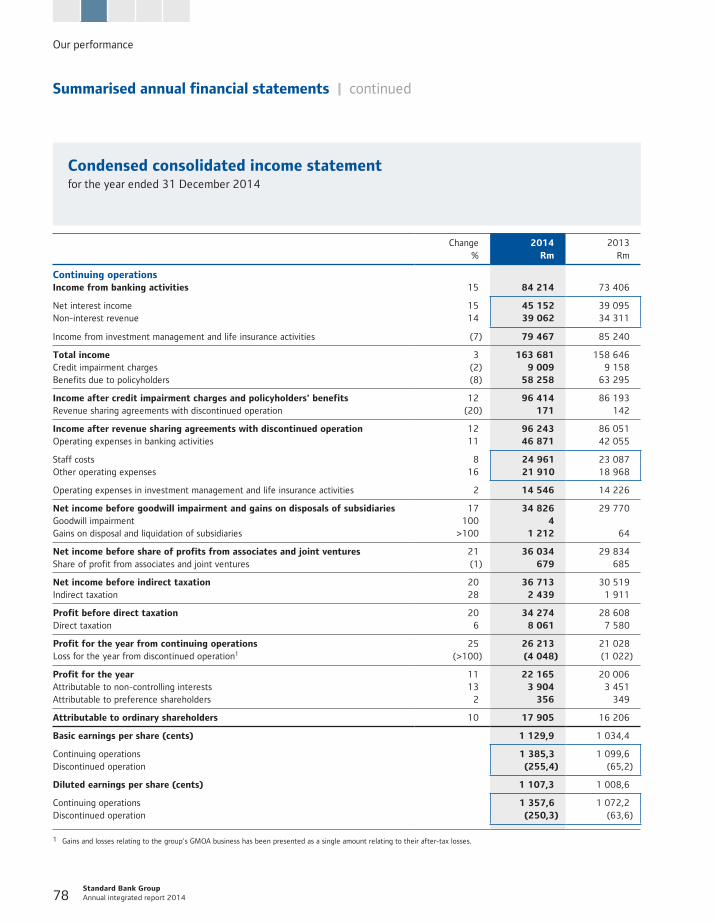
Standard Bank Group Annual integrated report 2014 78
Our performance
Summarised annual financial statements | continued
Condensed consolidated income statementfor the year ended 31 December 2014
Change %
2014Rm
2013 Rm
Continuing operations Income from banking activities 15 84 214 73 406
Net interest income 15 45 152 39 095 Non-interest revenue 14 39 062 34 311
Income from investment management and life insurance activities (7) 79 467 85 240
Total income 3 163 681 158 646 Credit impairment charges (2) 9 009 9 158 Benefits due to policyholders (8) 58 258 63 295
Income after credit impairment charges and policyholders' benefits 12 96 414 86 193 Revenue sharing agreements with discontinued operation (20) 171 142
Income after revenue sharing agreements with discontinued operation 12 96 243 86 051 Operating expenses in banking activities 11 46 871 42 055
Staff costs 8 24 961 23 087 Other operating expenses 16 21 910 18 968
Operating expenses in investment management and life insurance activities 2 14 546 14 226
Net income before goodwill impairment and gains on disposals of subsidiaries 17 34 826 29 770 Goodwill impairment 100 4 Gains on disposal and liquidation of subsidiaries >100 1 212 64
Net income before share of profits from associates and joint ventures 21 36 034 29 834 Share of profit from associates and joint ventures (1) 679 685
Net income before indirect taxation 20 36 713 30 519 Indirect taxation 28 2 439 1 911
Profit before direct taxation 20 34 274 28 608 Direct taxation 6 8 061 7 580
Profit for the year from continuing operations 25 26 213 21 028 Loss for the year from discontinued operation1 (>100) (4 048) (1 022)
Profit for the year 11 22 165 20 006 Attributable to non-controlling interests 13 3 904 3 451 Attributable to preference shareholders 2 356 349
Attributable to ordinary shareholders 10 17 905 16 206
Basic earnings per share (cents) 1 129,9 1 034,4
Continuing operations 1 385,3 1 099,6 Discontinued operation (255,4) (65,2)
Diluted earnings per share (cents) 1 107,3 1 008,6
Continuing operations 1 357,6 1 072,2 Discontinued operation (250,3) (63,6)
1 Gains and losses relating to the group's GMOA business has been presented as a single amount relating to their after-tax losses.
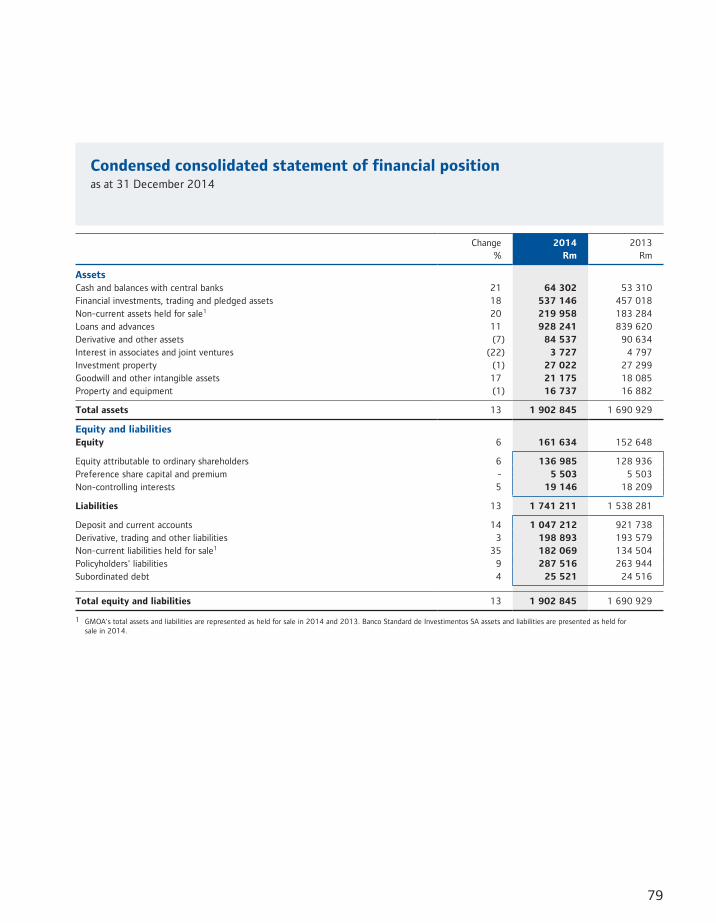
79
Condensed consolidated statement of financial positionas at 31 December 2014
Change %
2014 Rm
2013Rm
Assets Cash and balances with central banks 21 64 302 53 310 Financial investments, trading and pledged assets 18 537 146 457 018 Non-current assets held for sale1 20 219 958 183 284 Loans and advances 11 928 241 839 620 Derivative and other assets (7) 84 537 90 634 Interest in associates and joint ventures (22) 3 727 4 797 Investment property (1) 27 022 27 299 Goodwill and other intangible assets 17 21 175 18 085 Property and equipment (1) 16 737 16 882
Total assets 13 1 902 845 1 690 929
Equity and liabilities Equity 6 161 634 152 648
Equity attributable to ordinary shareholders 6 136 985 128 936 Preference share capital and premium - 5 503 5 503Non-controlling interests 5 19 146 18 209
Liabilities 13 1 741 211 1 538 281
Deposit and current accounts 14 1 047 212 921 738 Derivative, trading and other liabilities 3 198 893 193 579 Non-current liabilities held for sale1 35 182 069 134 504 Policyholders' liabilities 9 287 516 263 944 Subordinated debt 4 25 521 24 516
Total equity and liabilities 13 1 902 845 1 690 929
1 GMOA's total assets and liabilities are represented as held for sale in 2014 and 2013. Banco Standard de Investimentos SA assets and liabilities are presented as held for sale in 2014.
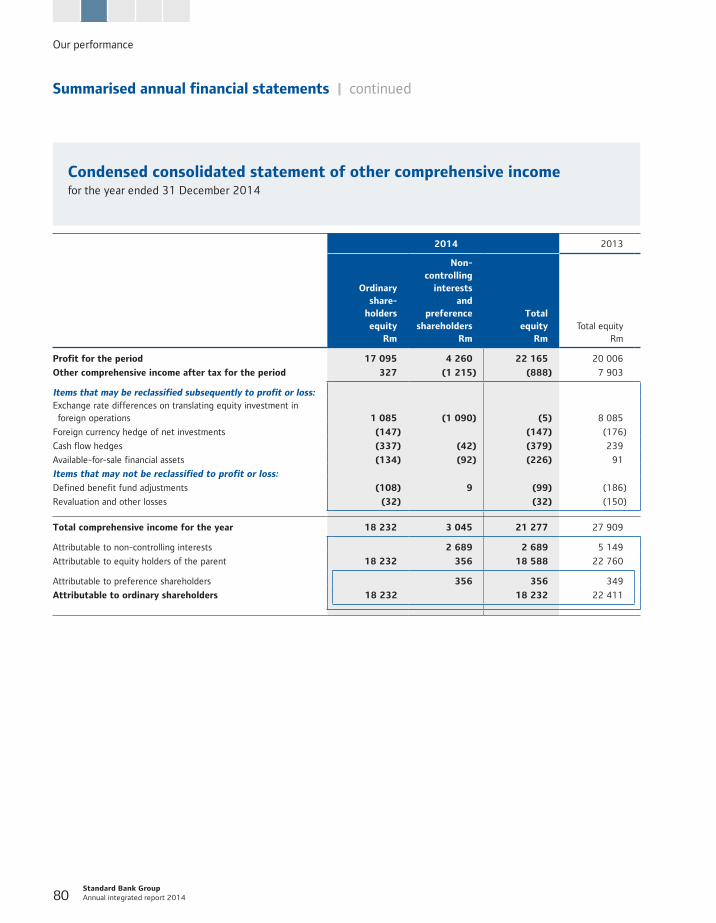
Standard Bank Group Annual integrated report 2014 80
Our performance
Summarised annual financial statements | continued
Condensed consolidated statement of other comprehensive incomefor the year ended 31 December 2014
2014 2013
Ordinary share-holders equity
Rm
Non-controlling
interestsand
preference shareholders
Rm
Total equity
RmTotal equity
Rm
Profit for the period 17 095 4 260 22 165 20 006
Other comprehensive income after tax for the period 327 (1 215) (888) 7 903
Items that may be reclassified subsequently to profit or loss: Exchange rate differences on translating equity investment in foreign operations 1 085 (1 090) (5) 8 085
Foreign currency hedge of net investments (147) (147) (176)
Cash flow hedges (337) (42) (379) 239
Available-for-sale financial assets (134) (92) (226) 91
Items that may not be reclassified to profit or loss:
Defined benefit fund adjustments (108) 9 (99) (186)
Revaluation and other losses (32) (32) (150)
Total comprehensive income for the year 18 232 3 045 21 277 27 909
Attributable to non-controlling interests 2 689 2 689 5 149
Attributable to equity holders of the parent 18 232 356 18 588 22 760
Attributable to preference shareholders 356 356 349
Attributable to ordinary shareholders 18 232 18 232 22 411
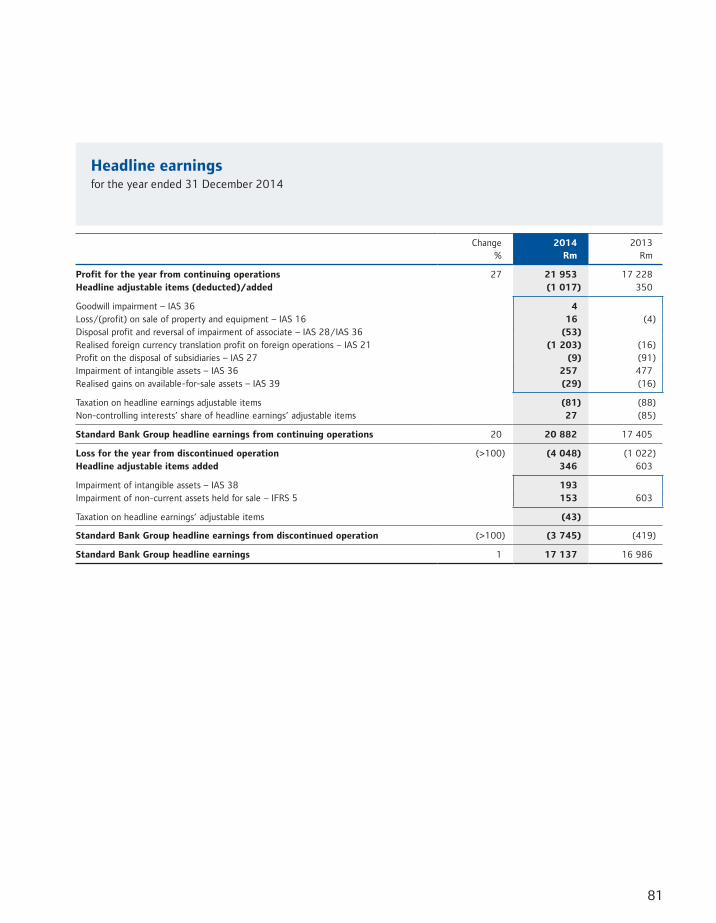
81
Headline earningsfor the year ended 31 December 2014
Change %
2014Rm
2013 Rm
Profit for the year from continuing operations 27 21 953 17 228Headline adjustable items (deducted)/added (1 017) 350
Goodwill impairment – IAS 36 4Loss/(profit) on sale of property and equipment – IAS 16 16 (4) Disposal profit and reversal of impairment of associate – IAS 28/IAS 36 (53) Realised foreign currency translation profit on foreign operations – IAS 21 (1 203) (16)Profit on the disposal of subsidiaries – IAS 27 (9) (91) Impairment of intangible assets – IAS 36 257 477 Realised gains on available-for-sale assets – IAS 39 (29) (16)
Taxation on headline earnings adjustable items (81) (88) Non-controlling interests’ share of headline earnings’ adjustable items 27 (85)
Standard Bank Group headline earnings from continuing operations 20 20 882 17 405
Loss for the year from discontinued operation (>100) (4 048) (1 022) Headline adjustable items added 346 603
Impairment of intangible assets – IAS 38 193Impairment of non-current assets held for sale – IFRS 5 153 603
Taxation on headline earnings’ adjustable items (43)
Standard Bank Group headline earnings from discontinued operation (>100) (3 745) (419)
Standard Bank Group headline earnings 1 17 137 16 986
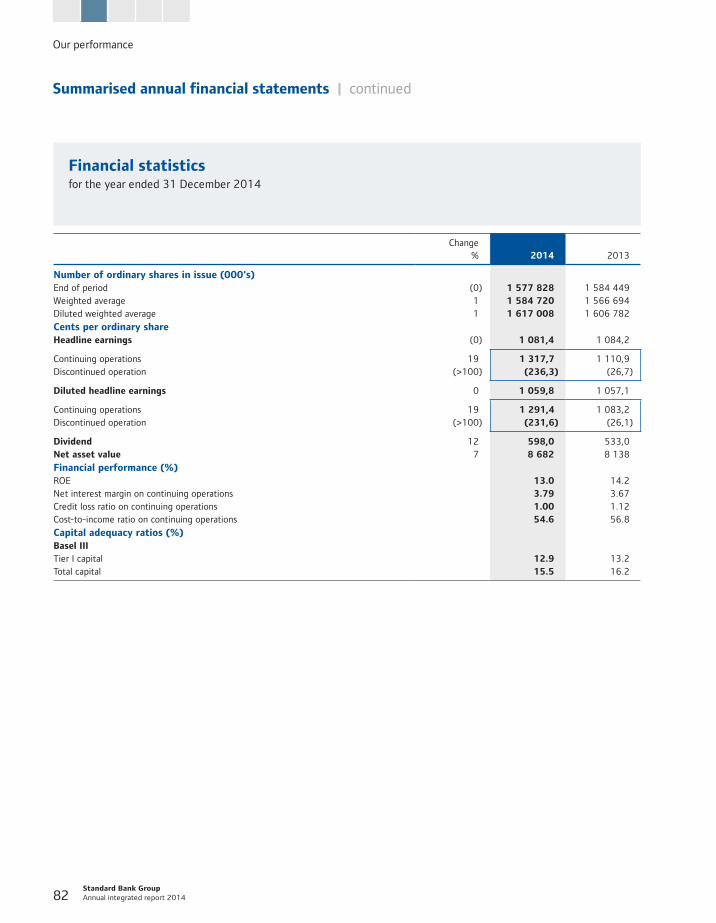
Standard Bank Group Annual integrated report 2014 82
Our performance
Summarised annual financial statements | continued
Financial statisticsfor the year ended 31 December 2014
Change % 2014 2013
Number of ordinary shares in issue (000's) End of period (0) 1 577 828 1 584 449 Weighted average 1 1 584 720 1 566 694 Diluted weighted average 1 1 617 008 1 606 782
Cents per ordinary share Headline earnings (0) 1 081,4 1 084,2
Continuing operations 19 1 317,7 1 110,9 Discontinued operation (>100) (236,3) (26,7)
Diluted headline earnings 0 1 059,8 1 057,1
Continuing operations 19 1 291,4 1 083,2 Discontinued operation (>100) (231,6) (26,1)
Dividend 12 598,0 533,0 Net asset value 7 8 682 8 138
Financial performance (%) ROE 13.0 14.2 Net interest margin on continuing operations 3.79 3.67 Credit loss ratio on continuing operations 1.00 1.12 Cost-to-income ratio on continuing operations 54.6 56.8
Capital adequacy ratios (%) Basel III Tier I capital 12.9 13.2 Total capital 15.5 16.2
83
Condensed consolidated statement of cash flowsfor the year ended 31 December 2014
2014 Rm
2013 Rm
Net cash flows from operating activities 29 654 24 020
Cash flows used in operations (21 943) (9 659) Direct taxation paid (8 070) (7 059) Other operating activities’ cash flows 59 667 40 738
Net cash flows used in investing activities (8 298) (17 345)
Capital expenditure (8 426) (8 143) Other investing activities’ cash flows 128 (9 202)
Net cash flows used in financing activities (10 262) (9 238)
Proceeds from the issue of share capital 14 165 Share buy-backs (613) (343) Release of empowerment reserve 1 676 Net subordinated debt cash flows 1 960 (1 890) Other financing activities’ cash flows (11 623) (8 846)
Effect of exchange rate changes on cash and cash equivalents 2 376 7 987
Net increase in cash and cash equivalents 13 470 5 424 Cash and cash equivalents at beginning of the period 67 409 61 985
Cash and cash equivalents at the end of the period 80 879 67 409
Comprising: Cash and balances with central banks 64 302 53 310 Cash and balances with central banks held for sale 16 577 14 099
Cash and cash equivalents at the end of the period 80 879 67 409
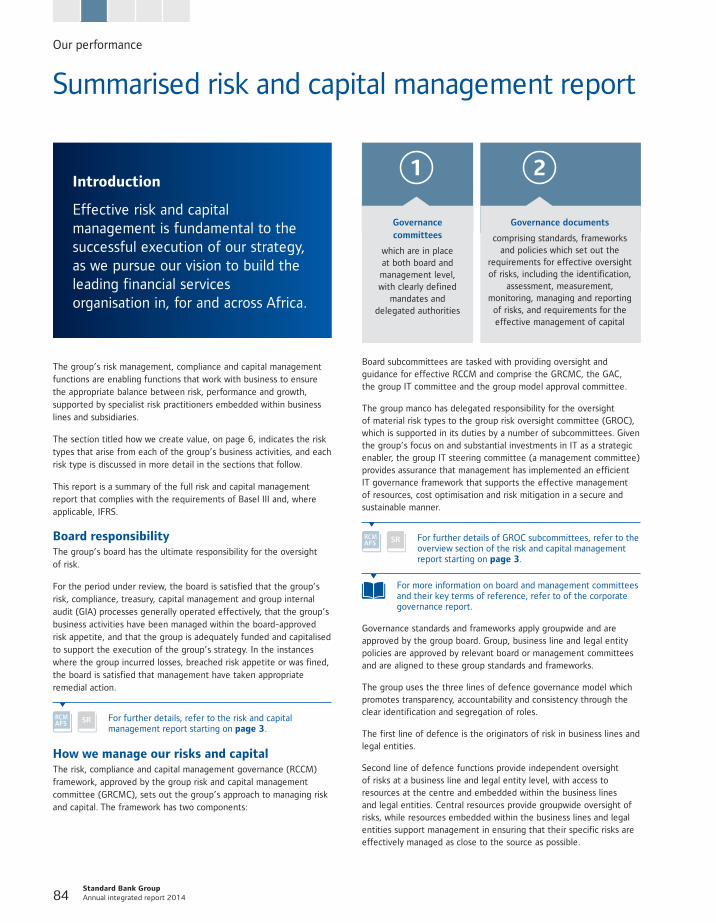
Our performance
Standard Bank Group Annual integrated report 2014 84
Summarised risk and capital management report
Introduction
Effective risk and capital management is fundamental to the successful execution of our strategy, as we pursue our vision to build the leading financial services organisation in, for and across Africa.
The group’s risk management, compliance and capital management functions are enabling functions that work with business to ensure the appropriate balance between risk, performance and growth, supported by specialist risk practitioners embedded within business lines and subsidiaries.
The section titled how we create value, on page 6, indicates the risk types that arise from each of the group’s business activities, and each risk type is discussed in more detail in the sections that follow.
This report is a summary of the full risk and capital management report that complies with the requirements of Basel III and, where applicable, IFRS.
Board responsibilityThe group’s board has the ultimate responsibility for the oversight of risk.
For the period under review, the board is satisfied that the group’s risk, compliance, treasury, capital management and group internal audit (GIA) processes generally operated effectively, that the group’s business activities have been managed within the board-approved risk appetite, and that the group is adequately funded and capitalised to support the execution of the group’s strategy. In the instances where the group incurred losses, breached risk appetite or was fined, the board is satisfied that management have taken appropriate remedial action.
For further details, refer to the risk and capital management report starting on page 3.
How we manage our risks and capitalThe risk, compliance and capital management governance (RCCM) framework, approved by the group risk and capital management committee (GRCMC), sets out the group’s approach to managing risk and capital. The framework has two components:
1
Governance committees
which are in place at both board and management level, with clearly defined
mandates and delegated authorities
2
Governance documents
comprising standards, frameworks and policies which set out the
requirements for effective oversight of risks, including the identification,
assessment, measurement, monitoring, managing and reporting
of risks, and requirements for the effective management of capital
Board subcommittees are tasked with providing oversight and guidance for effective RCCM and comprise the GRCMC, the GAC, the group IT committee and the group model approval committee.
The group manco has delegated responsibility for the oversight of material risk types to the group risk oversight committee (GROC), which is supported in its duties by a number of subcommittees. Given the group’s focus on and substantial investments in IT as a strategic enabler, the group IT steering committee (a management committee) provides assurance that management has implemented an efficient IT governance framework that supports the effective management of resources, cost optimisation and risk mitigation in a secure and sustainable manner.
For further details of GROC subcommittees, refer to the overview section of the risk and capital management report starting on page 3.
For more information on board and management committees and their key terms of reference, refer to of the corporate governance report.
Governance standards and frameworks apply groupwide and are approved by the group board. Group, business line and legal entity policies are approved by relevant board or management committees and are aligned to these group standards and frameworks.
The group uses the three lines of defence governance model which promotes transparency, accountability and consistency through the clear identification and segregation of roles.
The first line of defence is the originators of risk in business lines and legal entities.
Second line of defence functions provide independent oversight of risks at a business line and legal entity level, with access to resources at the centre and embedded within the business lines and legal entities. Central resources provide groupwide oversight of risks, while resources embedded within the business lines and legal entities support management in ensuring that their specific risks are effectively managed as close to the source as possible.
85
GIA is the third line of defence and reports to and operates under a mandate from the GAC. In terms of its mandate, the GIA’s role is to provide independent and objective assurance. The GIA has the authority to independently determine the scope and extent of work to be performed. All GIA employees report functionally to the group chief audit officer and operationally to the management of their legal entity.
How we think about our reputationUpholding our reputation requires that we comply with regulations and rely on our people to act in accordance with our code of ethics. Failures in environmental and social risk management also present significant reputational risk.
Any damage to our reputation can impact our profitability and sustainability as it can lead to a breakdown in trust, confidence or business relationships with customers, investors and other stakeholders, and furthermore, negatively impact our ability to generate new business relationships and access sources of funding.
The group’s crisis management processes are designed to minimise the reputational impact of risk events. Crisis management teams are in place both at executive and business unit level. Part of our crisis management processes is to ensure that the group’s perspective is fairly represented in the media.
The group ethics officer and group chief executives are the formal custodians of the group’s code of ethics.
The code of ethics is available on the group’s website at www.standardbank.com/ethics.aspx
How we deal with regulatory changeOur broad range of products and services and the diverse jurisdictions in which our banking and insurance operations are located, and in which our clients operate, mean that the group is impacted by most of the regulatory changes facing the financial services industry globally. Given the increasing pace and complexity of regulatory changes and the different ways in which countries are implementing these changes, the regulatory and legislative oversight committee, a group risk oversight committee chaired by one of our joint chief executives, continuously assesses the risks and opportunities associated with regulatory change and provides guidance to the group.
Regulatory change has extensive bearing on our day-to-day operations, impacting areas as varied as IT systems, talent management, pricing decisions and product design, as well as decisions around our ethics and culture. This in turn places upward pressure on operating costs.
For more information on other material regulatory developments, refer to annexure A of the risk and capital management report starting on page 105.
Basel III
We remain compliant with the minimum requirements adopted in South Africa in 2013 and are well positioned to comply with the requirements being phased in through to the deadline in 2019.
Credit risk
The group credit loss ratio improved to 1.00% (2013: 1.12%). Our PBB rest of Africa operation performed particularly well.
Funding and liquidity risk
We maintained our liquidity positions within the approved risk appetite and continued to advance our asset liability management capabilities and refine our approach to liquidity and interest rate risk management.
Operational risk
We continued to make progress in implementing the integrated operational risk framework to support the introduction of the advanced measurement approach throughout the group.
Capital management
We remain well capitalised above minimum regulatory capital adequacy requirements. The group issued its first Basel III compliant tier II instruments in 2014, totalling R2,25 billion.
Compliance risk
We assigned oversight responsibility for TCF legislation to the board audit committee and developed internal capacity.
Market risk
Trading book market risk and banking book interest rate risk remained well within approved limits.
Stress testing
The group participated in a stress testing exercise conducted by the International Monetary Fund as part of their South African financial stability assessment programme.
Country risk
The relative concentration of cross-border exposure for the sub-Saharan Africa region continued to increase, consistent with our strategic focus.
Insurance risk
We built capacity for the South African Financial Services Board's upcoming risk-based regulatory requirement for insurance and reinsurance organisations.
RISK HIGHLIGHTS
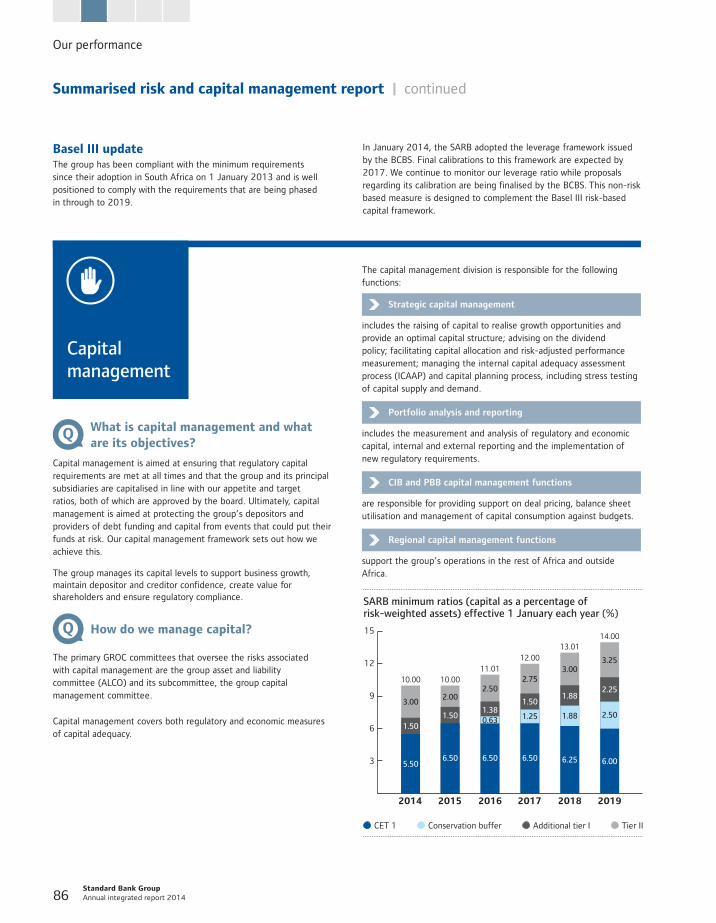
Our performance
Standard Bank Group Annual integrated report 2014 86
Summarised risk and capital management report | continued
Q What is capital management and what are its objectives?
Capital management is aimed at ensuring that regulatory capital requirements are met at all times and that the group and its principal subsidiaries are capitalised in line with our appetite and target ratios, both of which are approved by the board. Ultimately, capital management is aimed at protecting the group’s depositors and providers of debt funding and capital from events that could put their funds at risk. Our capital management framework sets out how we achieve this.
The group manages its capital levels to support business growth, maintain depositor and creditor confidence, create value for shareholders and ensure regulatory compliance.
Q How do we manage capital?
The primary GROC committees that oversee the risks associated with capital management are the group asset and liability committee (ALCO) and its subcommittee, the group capital management committee.
Capital management covers both regulatory and economic measures of capital adequacy.
The capital management division is responsible for the following functions:
Strategic capital management
includes the raising of capital to realise growth opportunities and provide an optimal capital structure; advising on the dividend policy; facilitating capital allocation and risk-adjusted performance measurement; managing the internal capital adequacy assessment process (ICAAP) and capital planning process, including stress testing of capital supply and demand.
Portfolio analysis and reporting
includes the measurement and analysis of regulatory and economic capital, internal and external reporting and the implementation of new regulatory requirements.
CIB and PBB capital management functions
are responsible for providing support on deal pricing, balance sheet utilisation and management of capital consumption against budgets.
Regional capital management functions
support the group’s operations in the rest of Africa and outside Africa.
15
12
9
6
3
� CET 1 � Conservation buffer � Additional tier I � Tier II
SARB minimum ratios (capital as a percentage ofrisk�weighted assets) effective 1 January each year (%)
2014
10.00
3.00
5.50
2015
10.00
2.00
6.50
1.501.50
2019
14.00
3.25
6.00
2.25
2.50
2018
13.01
3.00
6.25
1.88
1.88
2017
12.00
2.75
6.50
1.50
1.25
2016
11.01
2.50
6.50
1.380.63
Capital management
Basel III updateThe group has been compliant with the minimum requirements since their adoption in South Africa on 1 January 2013 and is well positioned to comply with the requirements that are being phased in through to 2019.
In January 2014, the SARB adopted the leverage framework issued by the BCBS. Final calibrations to this framework are expected by 2017. We continue to monitor our leverage ratio while proposals regarding its calibration are being finalised by the BCBS. This non-risk based measure is designed to complement the Basel III risk-based capital framework.
87
Q How is regulatory capital measured?
The main regulatory requirements to be complied with are those specified in the Banks Act and related regulations which are aligned with Basel III.
Regulatory capital adequacy is measured through three risk-based ratios being common equity tier (CET) I, tier I and total capital adequacy. These ratios are a measure of the capital supply relative to the capital demand as measured by the total risk-weighted assets, and are measured against internal targets and regulatory minimum requirements.
The group’s capital supply consists of the following:
CET I: ordinary share capital, share premium retained earnings and qualifying non-controlling interest less impairments, divided by total risk-weighted assets.
Tier I: CET I and qualifying non-controlling interest plus perpetual, non-cumulative instruments with principal loss-absorption features issued under Basel III rules, divided by total risk-weighted assets. Perpetual non-cumulative preference shares issued under Basel I and II are included in tier I capital but are subject to regulatory phase-out requirements over a 10-year period, effective from 1 January 2013.
Total capital adequacy: Tier I plus other items such as the general allowance for credit impairments and subordinated debt with principal loss-absorption features issued under Basel III, divided by total risk-weighted assets. Subordinated debt issued under Basel I and Basel II is subject to regulatory phase-out requirements over 10 years effective from 1 January 2013.
The capital demand is a function of the group’s risk-weighted assets. Risk-weighted assets is calculated by applying risk weights as required in terms of the Banks Act regulations and internally derived risk parameters. The group’s risk-weighted assets consist of both on- and off-balance sheet exposures and cover credit, market and risks.
The group complied with all externally imposed capital requirements during the current and prior year.
The group’s CET I capital, including unappropriated profit, is R113,5 billion as at 31 December 2014 (2013: R105,8 billion). The group’s tier I capital, including unappropriated profit, is R118 billion as at 31 December 2014 (2013: R110,8 billion) and total capital, including unappropriated profit, was R142 billion as at 31 December 2014 (2013: R136,1 billion).
Q What is economic capital measured?
Economic capital covers all material risk types to which the group is exposed, and not just those which attract regulatory capital. The economic capital models also recognise the benefits of diversification within and across risk types and across business lines and legal entities. Economic capital is monitored and allocated centrally, based on usage and performance, in a manner that enhances overall group economic profit and ROE. Economic capital adequacy is the internal basis for measuring and reporting all quantifiable risks on a consistent risk-adjusted basis. The group assesses its economic capital adequacy by measuring its risk profile under both normal and stress conditions.
Economic capital adequacy is incorporated into the group’s ICAAP which covers both quantitative and qualitative capital management processes within the group and includes risk management, capital management and financial planning governance. The quantitative internal assessments of business models are used to assess capital requirements against all risks the group is or may become exposed to, to meet current and future needs and assess resilience under stressed conditions.
Q How did the group perform in terms of capital management during 2014?
The group remains well capitalised above minimum regulatory capital adequacy requirements and internal economic capital targets. The group issued its first Basel III compliant tier II instruments in 2014, totalling R2,25 billion.
Key indicators
2014 2013
CET I capital adequacy ratio % 12.4 12.6Tier I capital adequacy ratio % 12.9 13.2Total capital adequacy ratio % 15.5 16.2Risk-weighted assets Rm 915 213 841 272Economic capital coverage ratio times 1.49 1.63
For further details, refer to the capital management section in the risk and capital management report starting on page 17.
Focus areas in 2015
Provide an optimal capital mix for the group
Ensure adequate positioning to respond to regulatory capital rules under the Basel III phase-in requirements
Optimise financial resource allocation, including capital and liquidity between product lines, trading desks, industry sectors and legal entities to enhance overall economic profit and the group’s ROE
Participate in the BCBS quantitative impact studies to assess the impact of proposed regulatory amendments.
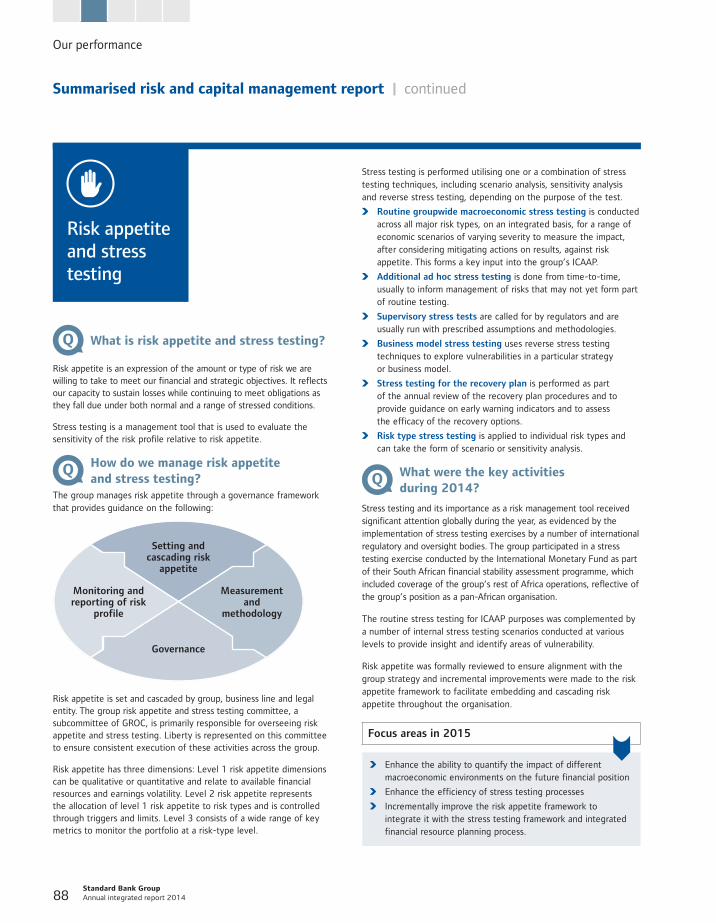
Our performance
Standard Bank Group Annual integrated report 2014 88
Summarised risk and capital management report | continued
Q What is risk appetite and stress testing?
Risk appetite is an expression of the amount or type of risk we are willing to take to meet our financial and strategic objectives. It reflects our capacity to sustain losses while continuing to meet obligations as they fall due under both normal and a range of stressed conditions.
Stress testing is a management tool that is used to evaluate the sensitivity of the risk profile relative to risk appetite.
Q How do we manage risk appetite and stress testing?
The group manages risk appetite through a governance framework that provides guidance on the following:
Setting and cascading risk
appetite
Measurement and
methodology
Governance
Monitoring and reporting of risk
profile
Risk appetite is set and cascaded by group, business line and legal entity. The group risk appetite and stress testing committee, a subcommittee of GROC, is primarily responsible for overseeing risk appetite and stress testing. Liberty is represented on this committee to ensure consistent execution of these activities across the group.
Risk appetite has three dimensions: Level 1 risk appetite dimensions can be qualitative or quantitative and relate to available financial resources and earnings volatility. Level 2 risk appetite represents the allocation of level 1 risk appetite to risk types and is controlled through triggers and limits. Level 3 consists of a wide range of key metrics to monitor the portfolio at a risk-type level.
Stress testing is performed utilising one or a combination of stress testing techniques, including scenario analysis, sensitivity analysis and reverse stress testing, depending on the purpose of the test.
Routine groupwide macroeconomic stress testing is conducted across all major risk types, on an integrated basis, for a range of economic scenarios of varying severity to measure the impact, after considering mitigating actions on results, against risk appetite. This forms a key input into the group’s ICAAP.
Additional ad hoc stress testing is done from time-to-time, usually to inform management of risks that may not yet form part of routine testing.
Supervisory stress tests are called for by regulators and are usually run with prescribed assumptions and methodologies.
Business model stress testing uses reverse stress testing techniques to explore vulnerabilities in a particular strategy or business model.
Stress testing for the recovery plan is performed as part of the annual review of the recovery plan procedures and to provide guidance on early warning indicators and to assess the efficacy of the recovery options.
Risk type stress testing is applied to individual risk types and can take the form of scenario or sensitivity analysis.
Q What were the key activities during 2014?
Stress testing and its importance as a risk management tool received significant attention globally during the year, as evidenced by the implementation of stress testing exercises by a number of international regulatory and oversight bodies. The group participated in a stress testing exercise conducted by the International Monetary Fund as part of their South African financial stability assessment programme, which included coverage of the group’s rest of Africa operations, reflective of the group’s position as a pan-African organisation.
The routine stress testing for ICAAP purposes was complemented by a number of internal stress testing scenarios conducted at various levels to provide insight and identify areas of vulnerability.
Risk appetite was formally reviewed to ensure alignment with the group strategy and incremental improvements were made to the risk appetite framework to facilitate embedding and cascading risk appetite throughout the organisation.
Focus areas in 2015
Enhance the ability to quantify the impact of different macroeconomic environments on the future financial position
Enhance the efficiency of stress testing processes
Incrementally improve the risk appetite framework to integrate it with the stress testing framework and integrated financial resource planning process.
Risk appetite and stress testing
89
Q What is credit risk and how does it arise?
Credit risk is the risk of loss arising from the failure of counterparties to meet their financial or contractual obligations when due. Credit risk comprises counterparty risk (including primary, pre-settlement, issuer and settlement risk) and concentration risk (single counterparty, industry, product, geographic and maturity).
The group’s credit risk arises mainly from wholesale and retail loans and advances, together with the counterparty credit risk arising from derivative and securities financing contracts entered into with our clients and market counterparties.
Q How do we manage credit risk?
The group manages credit risk in accordance with its credit risk and model risk governance standards, which provide for:
maintaining a strong culture of responsible lending and a robust risk policy and control framework
identifying, assessing and measuring credit risk clearly and accurately across the group, from the level of individual facilities up to the total portfolio
defining, implementing and continually re-evaluating our risk appetite under actual and stress conditions
monitoring the group’s credit risk relative to limits
ensuring that there is expert scrutiny and independent approval of credit models, credit risks and their mitigation.
The group’s business lines are primarily responsible for credit risk management. An independent credit risk function is embedded within the business units, which is in turn supported by the overarching group risk function with credit review and monitoring responsibilities.
Q What were the key developments during 2014?
In a year characterised by falling commodity prices, interest rate hikes and a weakening rand, all group credit risk metrics remained within risk appetite.
Net loans and advances increased 11% in 2014 with growth in CIB of 18% and in PBB of 6%.
The group credit loss ratio improved to 1.00% (2013: 1.12%). CIB’s credit loss ratio improved to 0.22% (2013: 0.41%) while PBB improved to 1.41% from 1.47%, with the credit loss ratio for its South African operation deteriorating to 1.53% from 1.45% in 2013, offset by improvements in PBB rest of Africa. The deterioration in the South African metric is attributable to a deteriorating performance in the card, instalment sale and finance lease portfolios, while mortgages improved marginally by 2 basis points (bps) to 0.80%.
Non-performing loans as a percentage of gross loans and advances improved slightly to 3.2% from 3.5% in 2013, with CIB and PBB both improving marginally. The South African PBB home loans book improved while vehicle and asset finance and card deteriorated. In the rest of Africa, the non-performing loan ratio improved.
Key indicators
2014 2013
Credit loss ratio % 1.00 1.12Gross loans and advances Rbn 948 860Gross specific impairment coverage ratio % 44 47Non-performing loans ratio % 3.2 3.5
For further details, refer to the credit risk section in the risk and capital management report starting on page 31.
Focus areas in 2015
Refine the credit risk governance standard and supporting tools to support the group’s credit risk appetite
Apply appropriate and responsible lending criteria to ensure prudent lending practices in line with risk appetite
Streamline and enhance credit risk management processes to enhance efficiencies
Manage concentrations across counterparties, portfolios, industries and geographical regions
Proactively mitigate economic stresses already evident, such as commodity stresses and the electricity load shedding impact on South African corporates
Understand IFRS 9 requirements and prepare for adoption by 2018
Improve risk data aggregation and risk reporting practices.
Credit risk
Our performance
Standard Bank Group Annual integrated report 2014 90
Summarised risk and capital management report | continued
Q What is compliance risk and how does it arise?
Compliance risk is the risk of legal or regulatory sanction, financial loss or damage to reputation that may occur as a result of a failure to comply with laws, regulations, codes of conduct and standards of good practice applicable to our financial services activities. This includes addressing new laws and regulations, as well as amendments to existing laws.
Q How do we manage compliance risk?
The group manages compliance risk in accordance with its compliance governance standard. The compliance function operates independently of business as a second line of defence function.
Our approach to managing compliance risk is proactive as a core risk management activity.
TCF and market conduct are specific focus areas as the South African regulatory framework moves towards the Twin Peaks model of supervision, creating two regulators for the financial sector.
The following sub-risk types are managed as part of compliance risk and include:
Market conduct risk is the risk of inappropriate execution of our business activities negatively impacting on our clients, markets or the group. It includes conduct of business, market integrity, financial inclusion and consumer education. Supervision of market conduct is expected to increase under the Twin Peaks model and we are actively responding to TCF by assigning oversight accountability to the board audit committee.
To manage the risk of money laundering and terrorist financing we subscribe to the principles of the Financial Action Task Force, an intergovernmental body that develops and promotes policies to combat money laundering and terrorist financing. An integrated systems approach is being followed to support surveillance.
We actively manage the legal, regulatory, reputational and operational risks associated with doing business in jurisdictions which, or with clients who, are subject to embargoes or sanctions imposed by competent authorities.
To manage the risks associated with regulatory change, which arise due to the group operating in a highly regulated industry across multiple jurisdictions, we aim to embed regulatory best practice in our operations. Our regulatory advocacy unit assesses the impact of emerging policy and regulation on business.
Occupational health and safety includes any risks to the health and safety of employees from hazards in the workplace or potential exposure to occupational illnesses, which are managed by the occupational health and safety team.
Q What were the key developments and activities during 2014?
The compliance function expanded its resourcing capability to improve sanctions alert and money laundering surveillance, strengthen its business advisory role and embed a culture of compliance across operations.
The development of capacity to support market conduct and TCF, as well as the review of capital solvency requirements under the solvency assessment and management programme, were specific focus areas. Compulsory compliance training was rolled out in the group during the year and all banking operations in Africa were visited by central compliance during the year.
The SARB imposed administrative sanctions and directives on various South African banks. SBSA was fined R60 million. The group’s UK subsidiary, Standard Bank Plc, was fined GBP76 million (R134 million at the time of settlement) by the UK regulator for shortcomings in its application of anti-money laundering procedures and policies.
For further details, refer to the compliance risk section in the risk and capital management report starting on page 63.
Focus areas in 2015
Continue to meet supervisory and legislative expectations, focusing on market conduct, data privacy practices and fostering a culture of compliance
Enhancing automated surveillance capability to extend coverage and improve surveillance capabilities
Assess the implications of digital compliance for market conduct and compliance risk management processes
Revise our approach to compliance training and improve institutional capability.
Compliance risk
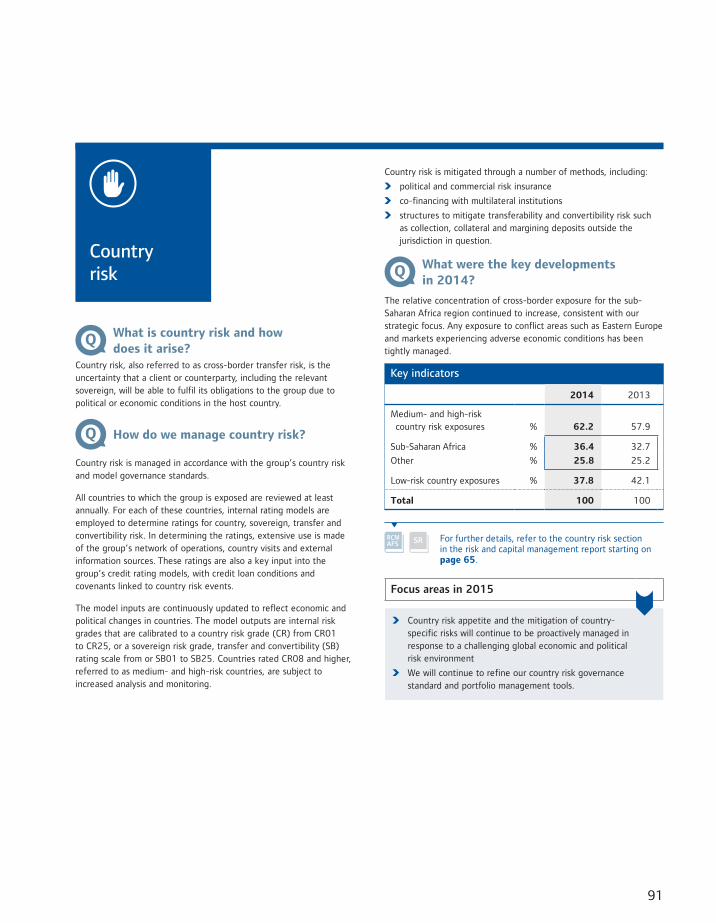
91
Q What is country risk and how does it arise?
Country risk, also referred to as cross-border transfer risk, is the uncertainty that a client or counterparty, including the relevant sovereign, will be able to fulfil its obligations to the group due to political or economic conditions in the host country.
Q How do we manage country risk?
Country risk is managed in accordance with the group’s country risk and model governance standards.
All countries to which the group is exposed are reviewed at least annually. For each of these countries, internal rating models are employed to determine ratings for country, sovereign, transfer and convertibility risk. In determining the ratings, extensive use is made of the group’s network of operations, country visits and external information sources. These ratings are also a key input into the group’s credit rating models, with credit loan conditions and covenants linked to country risk events.
The model inputs are continuously updated to reflect economic and political changes in countries. The model outputs are internal risk grades that are calibrated to a country risk grade (CR) from CR01 to CR25, or a sovereign risk grade, transfer and convertibility (SB) rating scale from or SB01 to SB25. Countries rated CR08 and higher, referred to as medium- and high-risk countries, are subject to increased analysis and monitoring.
Country risk is mitigated through a number of methods, including:
political and commercial risk insurance
co-financing with multilateral institutions
structures to mitigate transferability and convertibility risk such as collection, collateral and margining deposits outside the jurisdiction in question.
Q What were the key developments in 2014?
The relative concentration of cross-border exposure for the sub-Saharan Africa region continued to increase, consistent with our strategic focus. Any exposure to conflict areas such as Eastern Europe and markets experiencing adverse economic conditions has been tightly managed.
Key indicators
2014 2013
Medium- and high-risk country risk exposures % 62.2 57.9
Sub-Saharan Africa % 36.4 32.7
Other % 25.8 25.2
Low-risk country exposures % 37.8 42.1
Total 100 100
For further details, refer to the country risk section in the risk and capital management report starting on page 65.
Focus areas in 2015
Country risk appetite and the mitigation of country- specific risks will continue to be proactively managed in response to a challenging global economic and political risk environment
We will continue to refine our country risk governance standard and portfolio management tools.
Country risk
Our performance
Standard Bank Group Annual integrated report 2014 92
Summarised risk and capital management report | continued
Tactical (shorter-term) liquidity risk management
Structural (long-term) liquidity risk management
Contingency liquidity risk management
manage intra-day liquidity positions
monitor interbank and repo shortage levels
monitor daily cash flow requirements
manage short-term cash flows
manage daily foreign currency liquidity
set deposit rates in accordance with structural and contingent liability requirements.
ensure a structurally sound balance sheet
identify and manage structural liquidity mismatches
determine and apply behavioural profiling
manage long-term cash flows
preserve a diversified funding base
inform term funding requirements
assess foreign currency liquidity exposures
establish liquidity risk appetite
ensure appropriate transfer pricing of liquidity costs.
monitor and manage early warning indicators for liquidity
establish and maintain contingency funding plans
undertake regular liquidity stress testing and scenario analysis
convene liquidity crisis management committees
set liquidity buffer levels in accordance with anticipated stress events
advise diversification of liquidity buffer portfolios.
The group manages liquidity risk as three integrated pillars:
1 2 3
Q What is liquidity risk?
Liquidity risk is the risk that the group, although solvent, cannot maintain or generate sufficient cash resources to meet its payment obligations in full as they fall due, or can only do so at materially disadvantageous terms.
Q How do we manage funding and liquidity risk?
Liquidity risk is managed in accordance with the group’s liquidity risk and model governance standards.
The nature of banking and trading gives rise to continuous exposure to liquidity risk. Illiquidity events may arise where counterparties who provide the group with short-term funding withdraw or do not roll over that funding, or normally liquid assets become illiquid as a result of a generalised disruption in markets.
The group manages liquidity in accordance with applicable regulations and within the group’s risk appetite. The group’s liquidity risk management governance framework supports the measurement and management of liquidity across both the corporate and retail sectors, to ensure that payment obligations can be met by the group’s legal entities under both normal and stressed conditions. Liquidity risk management ensures that the group has the appropriate amount, diversification and tenor of funding and liquidity to support its asset base at all times.
Q What were the key activities and developments in 2014?
The group maintained its liquidity positions within its approved risk appetite. Appropriate liquidity buffers were held in line with regulatory, prudential and internal stress testing requirements, taking into account the global risk profile and market conditions.
The group continued to advance its asset-liability management capabilities and refine its approach to liquidity and interest rate risk management. The internal liquidity risk management framework has evolved to ensure that the group has sufficient liquidity resources to continue operating under a group-specific and industry systemic stress event. The liquidity risk technology framework was updated to support the implementation of relevant new regulations.
The South African markets were temporarily disrupted during 2014 on the back of the curatorship of African Bank Limited, which has resulted in the increase of funding costs for South African banks. The group’s liquidity management systems, processes and frameworks proved resilient in the face of these disruptions.
Funding and liquidity risk
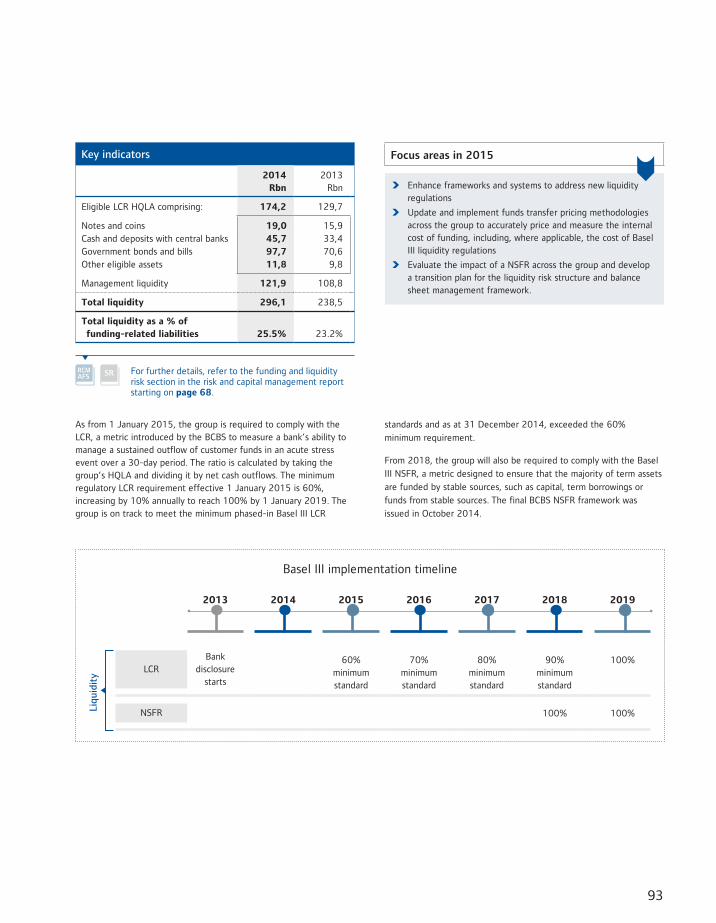
93
Key indicators
2014Rbn
2013Rbn
Eligible LCR HQLA comprising: 174,2 129,7
Notes and coins 19,0 15,9Cash and deposits with central banks 45,7 33,4Government bonds and bills 97,7 70,6Other eligible assets 11,8 9,8
Management liquidity 121,9 108,8
Total liquidity 296,1 238,5
Total liquidity as a % of funding-related liabilities 25.5% 23.2%
For further details, refer to the funding and liquidity risk section in the risk and capital management report starting on page 68.
Focus areas in 2015
Enhance frameworks and systems to address new liquidity regulations
Update and implement funds transfer pricing methodologies across the group to accurately price and measure the internal cost of funding, including, where applicable, the cost of Basel III liquidity regulations
Evaluate the impact of a NSFR across the group and develop a transition plan for the liquidity risk structure and balance sheet management framework.
As from 1 January 2015, the group is required to comply with the LCR, a metric introduced by the BCBS to measure a bank’s ability to manage a sustained outflow of customer funds in an acute stress event over a 30-day period. The ratio is calculated by taking the group’s HQLA and dividing it by net cash outflows. The minimum regulatory LCR requirement effective 1 January 2015 is 60%, increasing by 10% annually to reach 100% by 1 January 2019. The group is on track to meet the minimum phased-in Basel III LCR
standards and as at 31 December 2014, exceeded the 60%
minimum requirement.
From 2018, the group will also be required to comply with the Basel
III NSFR, a metric designed to ensure that the majority of term assets
are funded by stable sources, such as capital, term borrowings or
funds from stable sources. The final BCBS NSFR framework was
issued in October 2014.
Basel III implementation timeline
2013 2014 2015 2016 2017 2018 2019
Liqu
idit
y
LCRBank
disclosure starts
60% minimum standard
70% minimum standard
80% minimum standard
90% minimum standard
100%
NSFR 100% 100%
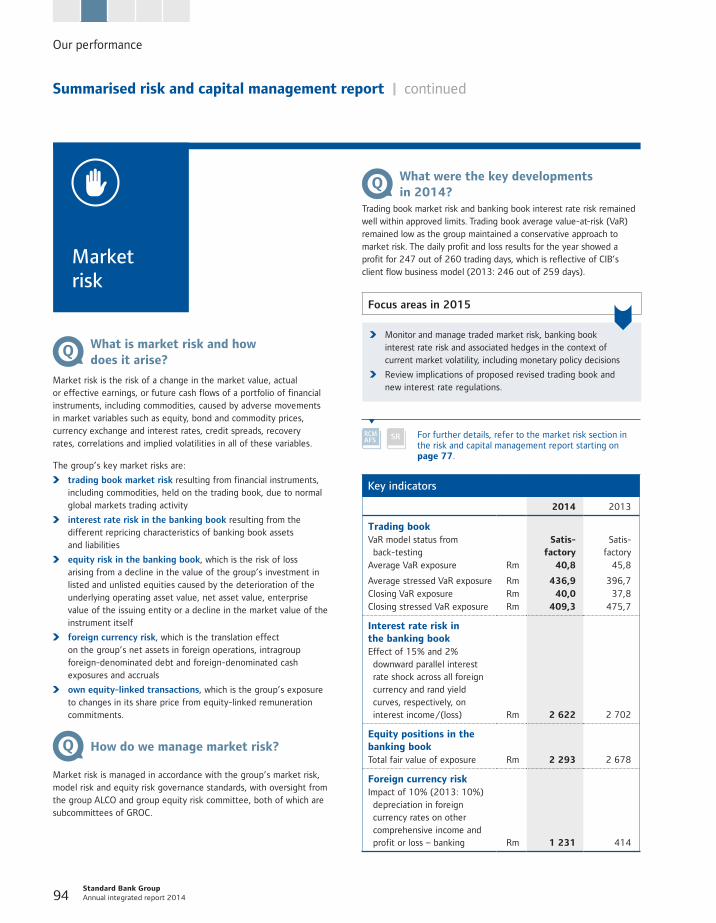
Our performance
Standard Bank Group Annual integrated report 2014 94
Summarised risk and capital management report | continued
Market risk
Q What is market risk and how does it arise?
Market risk is the risk of a change in the market value, actual or effective earnings, or future cash flows of a portfolio of financial instruments, including commodities, caused by adverse movements in market variables such as equity, bond and commodity prices, currency exchange and interest rates, credit spreads, recovery rates, correlations and implied volatilities in all of these variables.
The group’s key market risks are:
trading book market risk resulting from financial instruments, including commodities, held on the trading book, due to normal global markets trading activity
interest rate risk in the banking book resulting from the different repricing characteristics of banking book assets and liabilities
equity risk in the banking book, which is the risk of loss arising from a decline in the value of the group’s investment in listed and unlisted equities caused by the deterioration of the underlying operating asset value, net asset value, enterprise value of the issuing entity or a decline in the market value of the instrument itself
foreign currency risk, which is the translation effect on the group’s net assets in foreign operations, intragroup foreign-denominated debt and foreign-denominated cash exposures and accruals
own equity-linked transactions, which is the group’s exposure to changes in its share price from equity-linked remuneration commitments.
Q How do we manage market risk?
Market risk is managed in accordance with the group’s market risk, model risk and equity risk governance standards, with oversight from the group ALCO and group equity risk committee, both of which are subcommittees of GROC.
Q What were the key developments in 2014?
Trading book market risk and banking book interest rate risk remained well within approved limits. Trading book average value-at-risk (VaR) remained low as the group maintained a conservative approach to market risk. The daily profit and loss results for the year showed a profit for 247 out of 260 trading days, which is reflective of CIB’s client flow business model (2013: 246 out of 259 days).
Focus areas in 2015
Monitor and manage traded market risk, banking book interest rate risk and associated hedges in the context of current market volatility, including monetary policy decisions
Review implications of proposed revised trading book and new interest rate regulations.
For further details, refer to the market risk section in the risk and capital management report starting on page 77.
Key indicators
2014 2013
Trading book VaR model status from back-testing
Satis-factory
Satis-factory
Average VaR exposure Rm 40,8 45,8
Average stressed VaR exposure Rm 436,9 396,7Closing VaR exposure Rm 40,0 37,8Closing stressed VaR exposure Rm 409,3 475,7
Interest rate risk in the banking book Effect of 15% and 2% downward parallel interest rate shock across all foreign currency and rand yield curves, respectively, on interest income/(loss) Rm 2 622 2 702
Equity positions in the banking book Total fair value of exposure Rm 2 293 2 678
Foreign currency risk Impact of 10% (2013: 10%) depreciation in foreign currency rates on other comprehensive income and profit or loss – banking Rm 1 231 414
95
Q What is insurance risk and how does it arise?
Insurance risk is the risk that actual future demographic and related expense experience will differ from that expected and hence that used in measuring policyholder liabilities and in pricing products.
Insurance risk arises due to uncertainty regarding the timing and amount of future cash flows from insurance contracts.
Insurance risk applies to long-term insurance operations housed in Liberty and the short-term insurance operations housed in Liberty Africa and Standard Insurance Limited.
Q How do we manage insurance risk?
Insurance risk is managed in accordance with the group’s long-term and short-term insurance governance standards.
The management of insurance risk is essentially the management of deviations of actual experience from the assumed best estimate of future experience, on which product pricing is based. Insurance risks are managed through processes applied prior to and on acceptance of risks and those applied once the risks are contracted.
For long-term insurance risk, the statutory actuaries, the Liberty group business risk committee and the Liberty chief risk officer (CRO) provide independent oversight of compliance with risk management policies and procedures and the effectiveness of the company’s insurance risk management processes.
All insurance business units are responsible for the day-to-day identification, management and monitoring of insurance risk. Management is also responsible for reporting any material insurance risks, risk events and issues identified to senior management through predefined escalation procedures.
Short-term insurance risk is managed primarily through pricing, product design, investment strategy, risk rating and reinsurance. The underwriting strategy seeks diversity to ensure a balanced portfolio and is based on a large portfolio of similar risks over a large geographical area.
Q What were the key activities in 2014?
The group continued to build capacity for the South African Financial Services Board’s upcoming risk-based regulatory requirement for insurance and reinsurance organisations under the solvency assessment and management (SAM) programme, with the introduction of a number of methodologies and embedding of policies across the business.
A centralised Liberty group reinsurance function was formed and is responsible for the optimisation and monitoring of reinsurance across the Liberty group.
Focus areas in 2015
We will continue to focus on insurance risks across the group and particularly on components of SAM to ensure readiness for implementation in 2016 and cascade risk appetite to business units.
For further details, refer to the insurance risk section in the risk and capital management report starting on page 91.
Insurance risk
Our performance
Standard Bank Group Annual integrated report 2014 96
Summarised risk and capital management report | continued
Operational risk
Q What is operational risk and how does it arise?
Operational risk is the risk of loss resulting from inadequate or failed internal processes, people and systems, or from external events.
Operational risk includes a number of subtypes which are managed and overseen by specialist functions:
model risk
tax risk
legal risk
environmental and social risk
IT and change risk
information risk
cyber risk
compliance risk
financial crime control
physical commodities
Q How do we manage operational risk?
Operational risk is managed in accordance with the operational risk governance framework, which in turn is supplemented by governance standards for the subtypes referred to above.
Operational risk is a natural part of any business activity. Our aim is not to eliminate all exposure to operational risk, as this would not be commercially viable or possible. The group’s approach to managing operational risk is to adopt fit-for-purpose operational risk practices that assist business line management to understand their inherent risks and reduce their risk profile, while maximising their operational performance and efficiency.
The integrated operational risk (IOR) management function is independent from business line management and is part of the second line of defence. It is responsible for:
developing and maintaining the operational risk governance framework
facilitating business’s adoption of the framework, oversight and reporting
challenging the risk profile.
The function proactively analyses root causes, trends and emerging threats, advises on the remediation of potential control weaknesses and recommends best practice solutions.
Individual teams are dedicated to each business line and report to the business unit CRO. IOR also provides dedicated teams to enabling functions such as finance, IT and human capital. These teams work alongside their business areas and facilitate the adoption of the operational risk governance framework. As part of the second line of defence, they also monitor and challenge the business units’ and enabling functions’ management of their operational risk profile.
A central function, based at a group level, provides groupwide oversight and reporting. It is also responsible for developing and maintaining the operational risk governance framework.
Business continuity management identifies potential operational disruptions and provides a basis for planning for the mitigation of disruptions. The group’s framework encompasses emergency response preparedness and crisis management capabilities to manage the business through a crisis to full recovery.
The group buys insurance to mitigate operational risk. This cover is reviewed annually. The group insurance committee oversees a substantial insurance programme. The primary insurance policies in place are the group crime, professional indemnity and group directors’ and officers’ liability insurance policies. The group does not include insurance as a mitigant in the calculation of regulatory capital.
Q What were the key activities and developments in 2014?
The group continued to apply the integrated approach to risk management where financial crime control, information risk and operational risk management are combined into a single IOR management unit.
97
We continue to make progress in implementing the IOR framework to support the introduction of the advanced measurement approach throughout the group. We have also focused on ensuring consistency in the application and design of operational risk tools across the group and we continued to see benefit in fraud awareness initiatives that prove to be an effective deterrent mechanism.
Potential losses arising from external fraud in the base metal repo business in China, which is part of the group’s discontinued operation and under legal privilege, has contributed to an operational risk appetite breach at both a CIB and group level. Risk mitigation is in place, including original legal documentation to support our title over metal in port (USD40 million), as well as a strong external legal opinion supporting an insurance claim of USD129 million.
There was a significant increase in litigation against some of our African businesses, all of which are being defended and none of which are expected to have a material adverse impact on the group. Legal resources were restructured and enhanced to improve the processes and controls to manage legal risks.
Ongoing changes in environmental legislation and regulation combined with increasing enforcement continues to place pressure on screening lending and operational activities.
Focus areas in 2015
Enhance the risk profile methodology to further enable comparisons with risk appetite and tolerance
Scan the operating environment for emerging threats and trends
Promote continuous customer and employee awareness of financial crime
Fight crime through supporting in-country initiatives and through the South African Banking Risk Information Centre
Increase capability of the cyber security operations centre
Enhance legal resourcing capabilities to better service transactions originated outside South Africa
Improve legal network to ensure minimum standards of legal support and more efficient access to resources
Raise environmental and social risk awareness within the group
Improve internal processes to manage environmental and social risks arising from legislation
Increase the understanding of risks and opportunities posed by climate change.
For further details, refer to the operational risk section in the risk and capital management report starting on page 97.
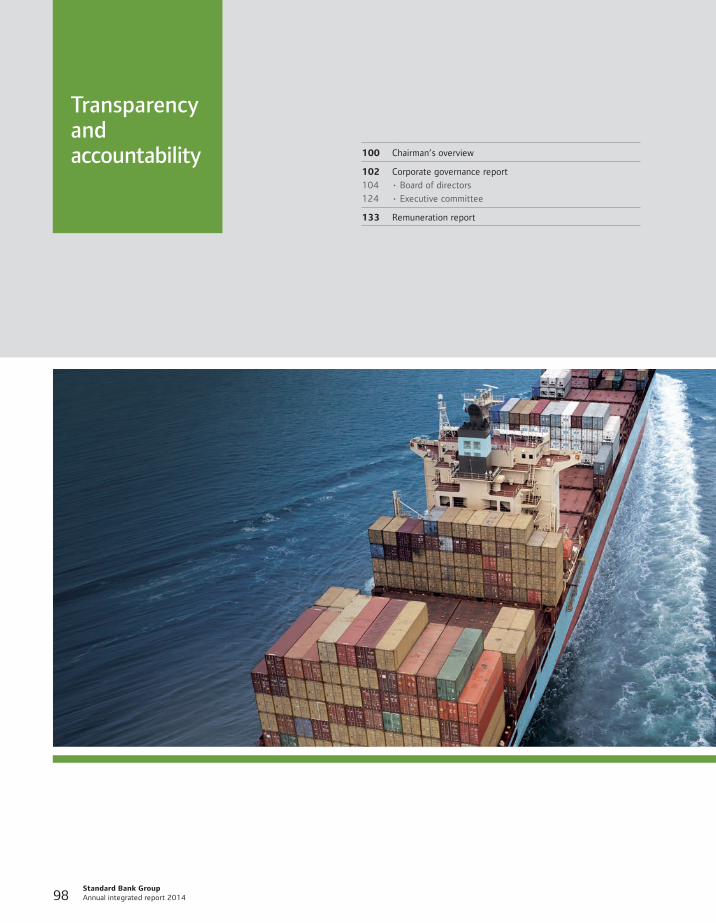
Standard Bank Group Annual integrated report 2014 98
100 Chairman’s overview
102 Corporate governance report
104 • Board of directors
124 • Executive committee
133 Remuneration report
Transparency and accountability
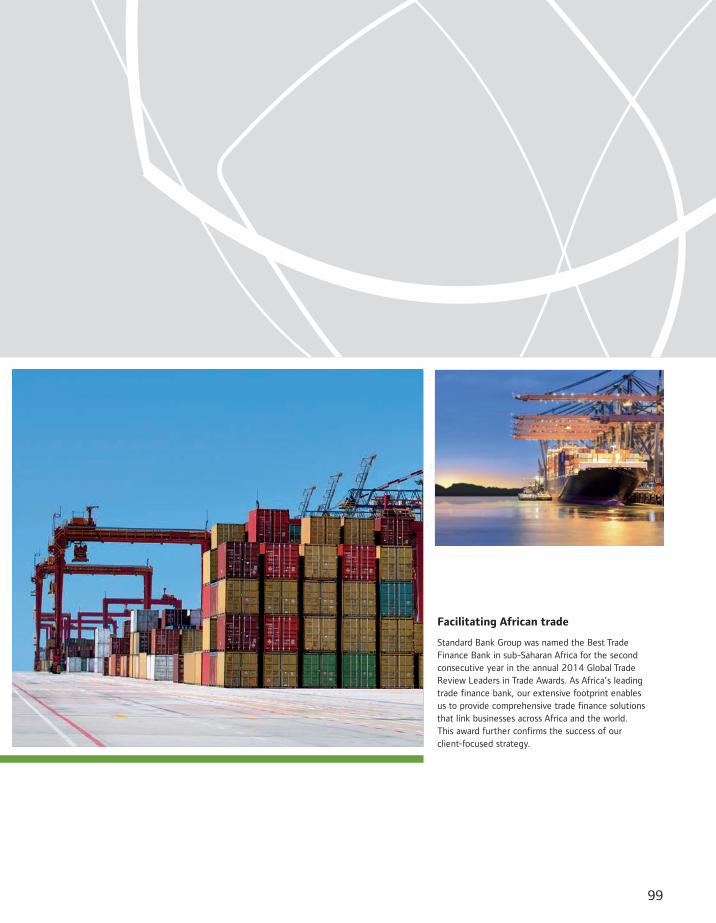
99
Facilitating African trade
Standard Bank Group was named the Best Trade Finance Bank in sub-Saharan Africa for the second consecutive year in the annual 2014 Global Trade Review Leaders in Trade Awards. As Africa’s leading trade finance bank, our extensive footprint enables us to provide comprehensive trade finance solutions that link businesses across Africa and the world. This award further confirms the success of our client-focused strategy.
Transparency and accountability
Standard Bank Group Annual integrated report 2014 100
Chairman’s overview
On behalf of the board, it is my pleasure to present the group’s corporate governance statement for 2014.
The theme of change, and how important it is that the group inculcates an ability to manage it effectively, runs throughout our integrated report for the year. Seeking continuous improvement in relation to a dynamic environment is a feature of this ability and underpins our approach to corporate governance. It is valuable therefore to reflect specifically on the milestones we have attained and the challenges we have considered in our corporate governance journey, and to highlight our focus areas for the year ahead.
The profound changes in the group’s operating environment, and specifically those in respect of regulatory compliance, have significant implications for board composition, the induction and training of directors, and the processes of decision-making. However, one thing remains unchanging – our resolute commitment to operating in an ethical, responsible and accountable manner, giving fair consideration to the legitimate interests and expectations of all our stakeholders.
My chairman’s report, starting on page 24, elaborates more fully on how the changes in the group’s operating environment are impacting how we think about our strategy, performance and people management.
Board changesIn 2013 our focus was on the succession of executive leadership, one of the most critical duties of any board. In the last year we turned our sights to the composition of the board, taking into account the strategy and future needs of the group.
Koosum Kalyan resigned from the board on 3 March 2014. Doug Band, having reached the retirement age as set out in the company’s memorandum of incorporation, retired from the board at the company’s annual general meeting on 29 May 2014. Chris Nissen also retired at the annual general meeting and was not available for re-election. Saki Macozoma, one of the group’s joint deputy chairmen, stepped down from the board on 31 December 2014, having served for over 15 years. The board is grateful for their immense contribution and wise counsel.
Our board succession planning culminated in the appointment of four new independent non-executive directors. Francine-Ann (Fran) du Plessis, André Parker and Swazi Tshabalala were appointed to the board on 14 March 2014. Atedo Peterside con, who has specific experience in doing business in West Africa, was appointed on 22 August 2014. These appointments have provided the depth and diversity of expertise and experience the group requires in line with our strategy to build a leading African financial services organisation. Work is underway to appoint a director with East African business experience.
In addition to these appointments, ICBC changed the nominated directors on the board, thus a total number of six new non-executive directors joined the board in the past year.
Further details on the composition of the board are contained in the corporate governance report on page 104.
Board strategy sessionThe board held its annual strategy review session at the end of September 2014. The date was brought forward by a month to allow the executive team sufficient time to develop a budget for the following year, based on the strategic priorities agreed at this session. The group’s strategy, adopted in 2011 and refreshed in 2014, places Africa at the centre of the group’s purpose and vision. The disposal of a controlling interest in Standard Bank Plc to ICBC was the last significant transaction in repositioning our operations outside Africa in relation to this strategic focus. This has been a complex transaction to close and management continues to implement the terms of the agreement reached with ICBC.
The strategy refresh was debated in detail at the board strategy session. This allowed the board to ensure that, in rearticulating the group strategy, the executive team had taken into account the full range of issues that influence the sustainability of the business and the social, economic and natural context in which we operate. Following a process of consultation with senior executives, the executive team presented the finalised strategy to the board in November 2014. This process has been one of the best examples of the partnership that exists between the board and executive management. Supporting the executive team in aligning the group’s operating model to the intent of the strategy continues to be a focus area for the board. An important aspect of this is to inculcate the
101
effective control. We continue to focus on maintaining the appropriate balance between oversight and compliance while ensuring that this is not at the expense of strategic execution, risk management and growth.
Key challengesThe complexities of managing regulatory compliance and the associated costs are a key challenge for the board given the pace and scale of regulatory change. The board has continued to ensure that there are rigorous processes in place to monitor the group’s compliance with all applicable laws and regulations. We recognise that any potential weaknesses in our compliance management systems pose serious risks to the group’s reputation. The regulatory fines imposed on the group’s entities in the United Kingdom and South Africa have served to underscore the importance of continuously improving the robustness of our processes. Work is underway to ensure that a culture of compliance is embedded across the group.
The board is pleased with the progress we are making in growing our business in the rest of Africa. However, Africa is not a homogenous market, and has a great diversity of regulatory and business requirements. The challenges also differ from jurisdiction to jurisdiction and across cultures. With this in mind, there can be no uniform approach and the board must constantly work to keep abreast of specific developments in these jurisdictions while also ensuring that learnings are shared across the group.
Looking aheadIt is fair to say that we have succeeded in creating a largely new board. This will require that the board finds the balance between ways of working that have served it well in the past, while accommodating fresh perspectives and approaches specifically in the board’s interactions with executive management. This will be a key consideration for the new chairman.
The board’s programme in the year ahead will include further extensive engagements with the leaders of entities of the group in the various jurisdictions across Africa. We will continue to support management in implementing strategy, playing both a monitoring and oversight role while giving space to management for execution.
Finally, I would like to conclude this letter by recording my sincere gratitude to my fellow directors and each and every person in the Standard Bank family whose commitment and dedication continues to propel the group forward.
Africa is our home, and we remain resolute in driving her growth.
Fred Phaswana
Chairman
concept of empowered accountability in the group’s culture. Specifically, this has involved changing decision-making processes to ensure effectiveness and efficiency – where appropriate, accountability has been shifted from committee structures to the individuals who have the requisite line of sight.
Management succession and talent management The culture we build for our people is one of the group’s three guiding principles. Having the right people in the right roles is a critical driver of the group’s performance. Processes have been put in place to ensure continuous engagement between the board and management beyond the group chief executives’ direct reports. In the year under review, the group manco was expanded to ensure that all enabling functions within the group are represented.
The composition of the group executive and management committees starts on page 123 of the corporate governance report.
One of the processes put in place is a quarterly discussion between members of the manco with chairmen of board committees, undertaken approximately a month before committee and board meetings. The objective is to obtain committee chairmen’s input into the preparation of the agenda, discuss any general issues relevant to the committee and developments that are concerning or challenging to management. These engagements also maintain open lines of communication between directors and management in the periods where no meetings are scheduled.
The board, through its directors’ affairs committee, spent time considering talent management processes within the group, as well as individual profiles in relation to all critical roles. The framework in place ensures a consistent approach to talent management across the group, as well as targeted investment in and development of key talent. The board remains satisfied with the depth of the senior management team.
Delegation of authorityApart from the critical role played by the board committees in executing the responsibilities of the board, as well as board-reserved matters set out in the board mandate, the board delegates responsibility for the day-to-day management of the group to the group chief executives according to a carefully considered authority framework.
The board recognises that, while delegating authority is not to abdicate its duties and accountability, respect for the distinction between the board’s responsibilities – setting direction, leadership, oversight and control – and management’s responsibility to run the business, is vital. This is particularly important in the context of a group structure as it ensures that the board does not stand in the way of effective management while at the same time ensuring
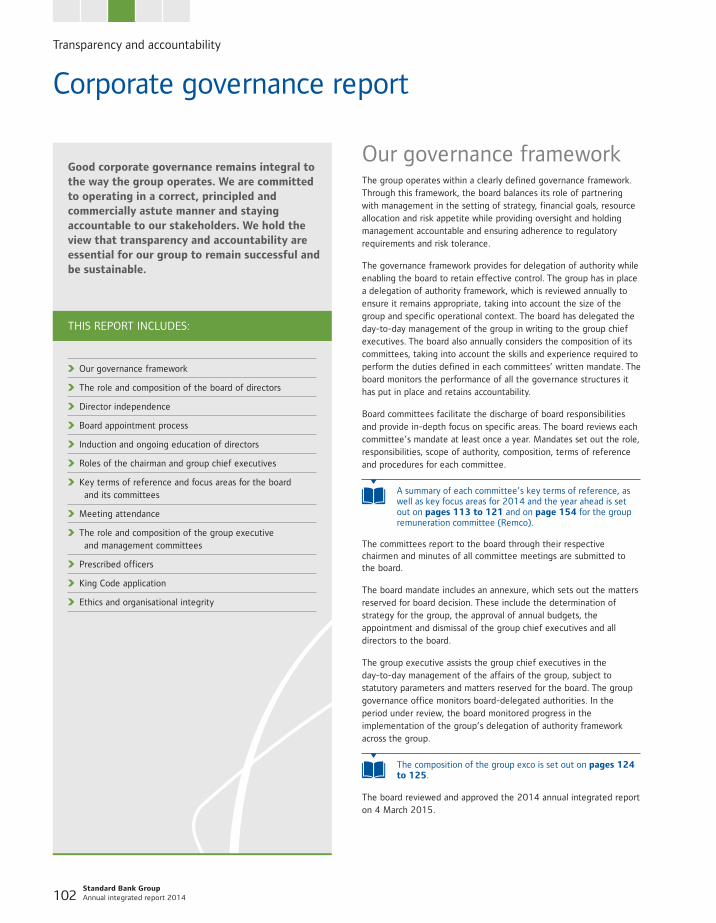
Transparency and accountability
Standard Bank Group Annual integrated report 2014 102
Corporate governance report
Good corporate governance remains integral to the way the group operates. We are committed to operating in a correct, principled and commercially astute manner and staying accountable to our stakeholders. We hold the view that transparency and accountability are essential for our group to remain successful and be sustainable.
Our governance frameworkThe group operates within a clearly defined governance framework. Through this framework, the board balances its role of partnering with management in the setting of strategy, financial goals, resource allocation and risk appetite while providing oversight and holding management accountable and ensuring adherence to regulatory requirements and risk tolerance.
The governance framework provides for delegation of authority while enabling the board to retain effective control. The group has in place a delegation of authority framework, which is reviewed annually to ensure it remains appropriate, taking into account the size of the group and specific operational context. The board has delegated the day-to-day management of the group in writing to the group chief executives. The board also annually considers the composition of its committees, taking into account the skills and experience required to perform the duties defined in each committees’ written mandate. The board monitors the performance of all the governance structures it has put in place and retains accountability.
Board committees facilitate the discharge of board responsibilities and provide in-depth focus on specific areas. The board reviews each committee’s mandate at least once a year. Mandates set out the role, responsibilities, scope of authority, composition, terms of reference and procedures for each committee.
A summary of each committee’s key terms of reference, as well as key focus areas for 2014 and the year ahead is set out on pages 113 to 121 and on page 154 for the group remuneration committee (Remco).
The committees report to the board through their respective chairmen and minutes of all committee meetings are submitted to the board.
The board mandate includes an annexure, which sets out the matters reserved for board decision. These include the determination of strategy for the group, the approval of annual budgets, the appointment and dismissal of the group chief executives and all directors to the board.
The group executive assists the group chief executives in the day-to-day management of the affairs of the group, subject to statutory parameters and matters reserved for the board. The group governance office monitors board-delegated authorities. In the period under review, the board monitored progress in the implementation of the group’s delegation of authority framework across the group.
The composition of the group exco is set out on pages 124 to 125.
The board reviewed and approved the 2014 annual integrated report on 4 March 2015.
Our governance framework
The role and composition of the board of directors
Director independence
Board appointment process
Induction and ongoing education of directors
Roles of the chairman and group chief executives
Key terms of reference and focus areas for the board and its committees
Meeting attendance
The role and composition of the group executive and management committees
Prescribed officers
King Code application
Ethics and organisational integrity
THIS REPORT INCLUDES:
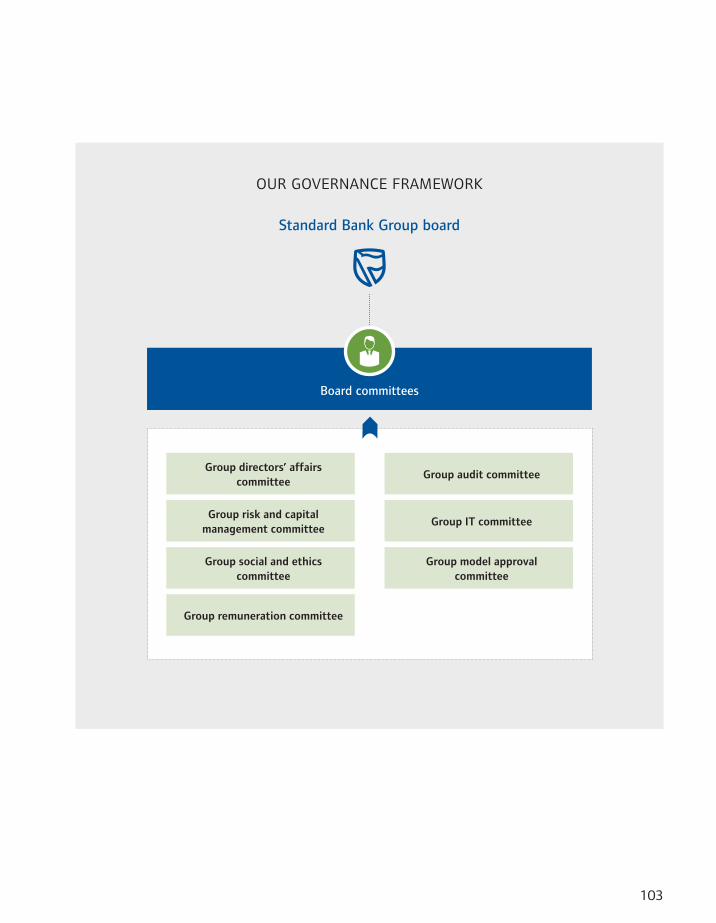
103
Standard Bank Group board
Board committees
Group directors’ affairs committee
Group risk and capital management committee
Group social and ethics committee
Group remuneration committee
Group audit committee
Group IT committee
Group model approval committee
OUR GOVERNANCE FRAMEWORK
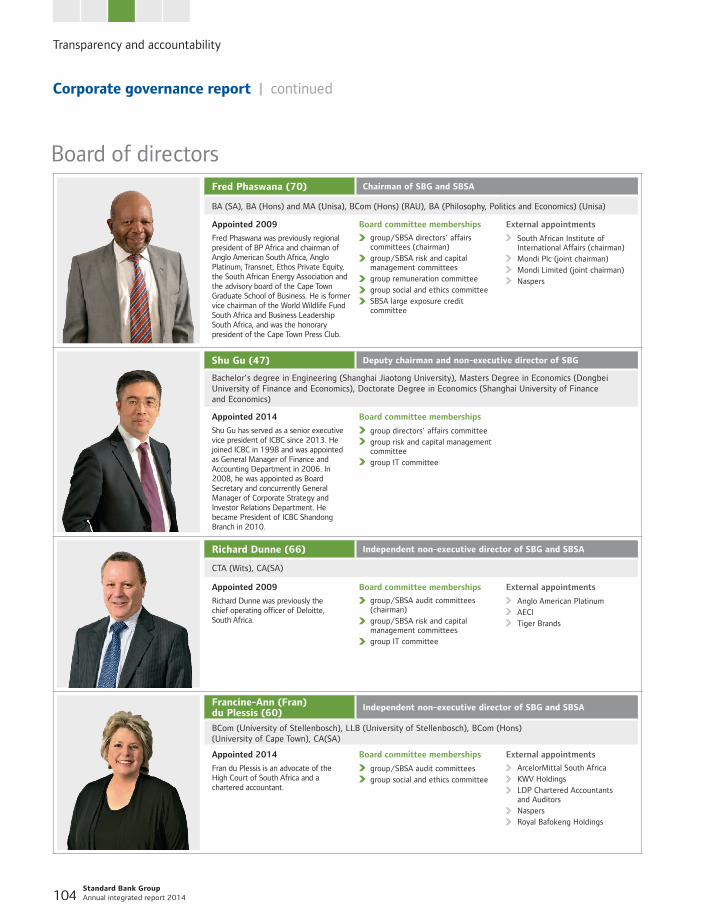
Transparency and accountability
Standard Bank Group Annual integrated report 2014 104
Fred Phaswana (70) Chairman of SBG and SBSA
BA (SA), BA (Hons) and MA (Unisa), BCom (Hons) (RAU), BA (Philosophy, Politics and Economics) (Unisa)
Appointed 2009
Fred Phaswana was previously regional president of BP Africa and chairman of Anglo American South Africa, Anglo Platinum, Transnet, Ethos Private Equity, the South African Energy Association and the advisory board of the Cape Town Graduate School of Business. He is former vice chairman of the World Wildlife Fund South Africa and Business Leadership South Africa, and was the honorary president of the Cape Town Press Club.
Board committee memberships
group/SBSA directors’ affairs committees (chairman)
group/SBSA risk and capital management committees
group remuneration committee
group social and ethics committee
SBSA large exposure credit committee
External appointments
South African Institute of International Affairs (chairman)
Mondi Plc (joint chairman) Mondi Limited (joint chairman) Naspers
Shu Gu (47) Deputy chairman and non-executive director of SBG
Bachelor’s degree in Engineering (Shanghai Jiaotong University), Masters Degree in Economics (Dongbei University of Finance and Economics), Doctorate Degree in Economics (Shanghai University of Finance and Economics)
Appointed 2014
Shu Gu has served as a senior executive vice president of ICBC since 2013. He joined ICBC in 1998 and was appointed as General Manager of Finance and Accounting Department in 2006. In 2008, he was appointed as Board Secretary and concurrently General Manager of Corporate Strategy and Investor Relations Department. He became President of ICBC Shandong Branch in 2010.
Board committee memberships
group directors’ affairs committee group risk and capital management
committee group IT committee
Richard Dunne (66) Independent non-executive director of SBG and SBSA
CTA (Wits), CA(SA)
Appointed 2009
Richard Dunne was previously the chief operating officer of Deloitte, South Africa.
Board committee memberships
group/SBSA audit committees (chairman)
group/SBSA risk and capital management committees
group IT committee
External appointments
Anglo American Platinum AECI Tiger Brands
Francine-Ann (Fran) du Plessis (60)
Independent non-executive director of SBG and SBSA
BCom (University of Stellenbosch), LLB (University of Stellenbosch), BCom (Hons) (University of Cape Town), CA(SA)
Appointed 2014
Fran du Plessis is an advocate of the High Court of South Africa and a chartered accountant.
Board committee memberships
group/SBSA audit committees group social and ethics committee
External appointments
ArcelorMittal South Africa
KWV Holdings
LDP Chartered Accountants and Auditors
Naspers
Royal Bafokeng Holdings
Board of directors
Corporate governance report | continued
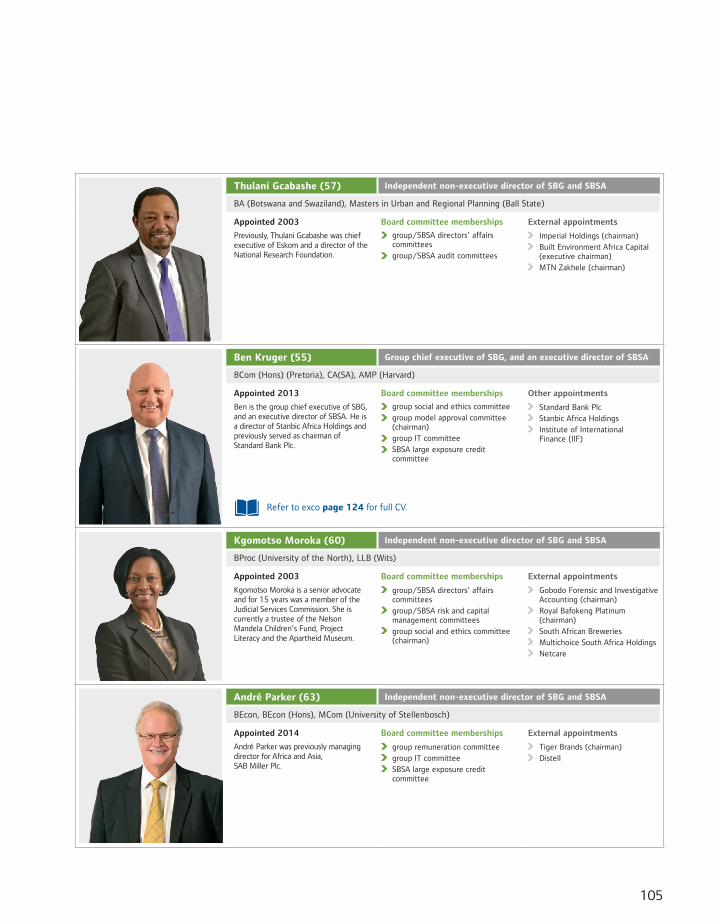
105
Thulani Gcabashe (57) Independent non-executive director of SBG and SBSA
BA (Botswana and Swaziland), Masters in Urban and Regional Planning (Ball State)
Appointed 2003
Previously, Thulani Gcabashe was chief executive of Eskom and a director of the National Research Foundation.
Board committee memberships
group/SBSA directors’ affairs committees
group/SBSA audit committees
External appointments
Imperial Holdings (chairman) Built Environment Africa Capital
(executive chairman) MTN Zakhele (chairman)
Ben Kruger (55) Group chief executive of SBG, and an executive director of SBSA
BCom (Hons) (Pretoria), CA(SA), AMP (Harvard)
Appointed 2013
Ben is the group chief executive of SBG, and an executive director of SBSA. He is a director of Stanbic Africa Holdings and previously served as chairman of Standard Bank Plc.
Board committee memberships
group social and ethics committee
group model approval committee (chairman)
group IT committee
SBSA large exposure credit committee
Other appointments
Standard Bank Plc Stanbic Africa Holdings Institute of International
Finance (IIF)
Kgomotso Moroka (60) Independent non-executive director of SBG and SBSA
BProc (University of the North), LLB (Wits)
Appointed 2003
Kgomotso Moroka is a senior advocate and for 15 years was a member of the Judicial Services Commission. She is currently a trustee of the Nelson Mandela Children’s Fund, Project Literacy and the Apartheid Museum.
Board committee memberships
group/SBSA directors’ affairs committees
group/SBSA risk and capital management committees
group social and ethics committee (chairman)
External appointments
Gobodo Forensic and Investigative Accounting (chairman)
Royal Bafokeng Platinum (chairman)
South African Breweries Multichoice South Africa Holdings Netcare
André Parker (63) Independent non-executive director of SBG and SBSA
BEcon, BEcon (Hons), MCom (University of Stellenbosch)
Appointed 2014
André Parker was previously managing director for Africa and Asia, SAB Miller Plc.
Board committee memberships
group remuneration committee group IT committee SBSA large exposure credit
committee
External appointments
Tiger Brands (chairman) Distell
Refer to exco page 124 for full CV.
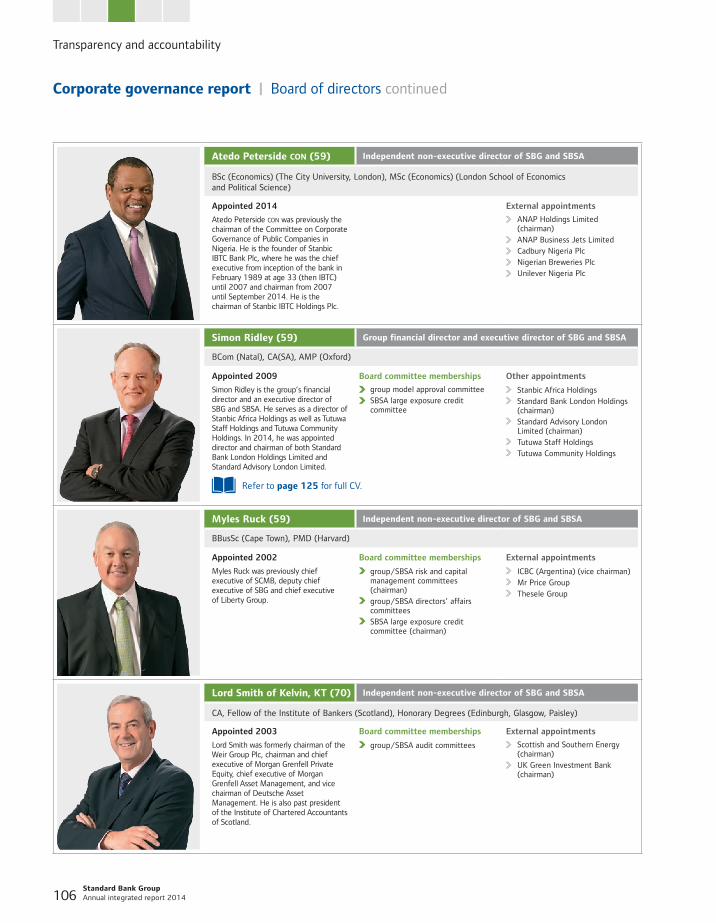
Transparency and accountability
Standard Bank Group Annual integrated report 2014 106
Atedo Peterside CON (59) Independent non-executive director of SBG and SBSA
BSc (Economics) (The City University, London), MSc (Economics) (London School of Economics and Political Science)
Appointed 2014
Atedo Peterside CON was previously the chairman of the Committee on Corporate Governance of Public Companies in Nigeria. He is the founder of Stanbic IBTC Bank Plc, where he was the chief executive from inception of the bank in February 1989 at age 33 (then IBTC) until 2007 and chairman from 2007 until September 2014. He is the chairman of Stanbic IBTC Holdings Plc.
External appointments
ANAP Holdings Limited (chairman)
ANAP Business Jets Limited
Cadbury Nigeria Plc
Nigerian Breweries Plc
Unilever Nigeria Plc
Simon Ridley (59) Group financial director and executive director of SBG and SBSA
BCom (Natal), CA(SA), AMP (Oxford)
Appointed 2009
Simon Ridley is the group’s financial director and an executive director of SBG and SBSA. He serves as a director of Stanbic Africa Holdings as well as Tutuwa Staff Holdings and Tutuwa Community Holdings. In 2014, he was appointed director and chairman of both Standard Bank London Holdings Limited and Standard Advisory London Limited.
Board committee memberships
group model approval committee
SBSA large exposure credit committee
Other appointments
Stanbic Africa Holdings Standard Bank London Holdings
(chairman) Standard Advisory London
Limited (chairman) Tutuwa Staff Holdings Tutuwa Community Holdings
Myles Ruck (59) Independent non-executive director of SBG and SBSA
BBusSc (Cape Town), PMD (Harvard)
Appointed 2002
Myles Ruck was previously chief executive of SCMB, deputy chief executive of SBG and chief executive of Liberty Group.
Board committee memberships
group/SBSA risk and capital management committees (chairman)
group/SBSA directors’ affairs committees
SBSA large exposure credit committee (chairman)
External appointments
ICBC (Argentina) (vice chairman) Mr Price Group Thesele Group
Lord Smith of Kelvin, KT (70) Independent non-executive director of SBG and SBSA
CA, Fellow of the Institute of Bankers (Scotland), Honorary Degrees (Edinburgh, Glasgow, Paisley)
Appointed 2003
Lord Smith was formerly chairman of the Weir Group Plc, chairman and chief executive of Morgan Grenfell Private Equity, chief executive of Morgan Grenfell Asset Management, and vice chairman of Deutsche Asset Management. He is also past president of the Institute of Chartered Accountants of Scotland.
Board committee memberships
group/SBSA audit committees
External appointments
Scottish and Southern Energy (chairman)
UK Green Investment Bank (chairman)
Corporate governance report | Board of directors continued
Refer to page 125 for full CV.
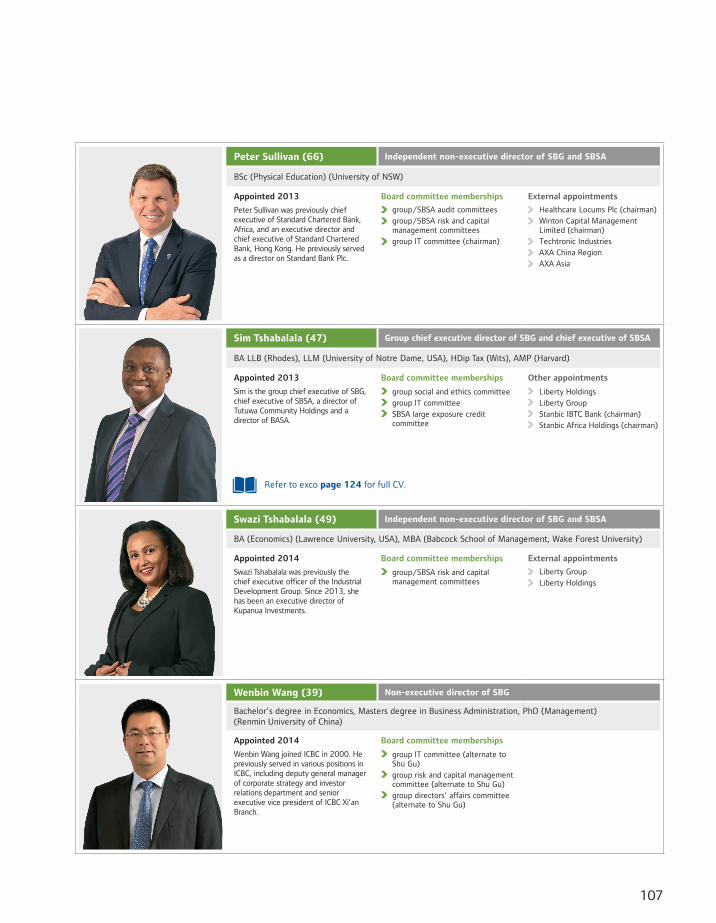
107
Peter Sullivan (66) Independent non-executive director of SBG and SBSA
BSc (Physical Education) (University of NSW)
Appointed 2013
Peter Sullivan was previously chief executive of Standard Chartered Bank, Africa, and an executive director and chief executive of Standard Chartered Bank, Hong Kong. He previously served as a director on Standard Bank Plc.
Board committee memberships
group/SBSA audit committees
group/SBSA risk and capital management committees
group IT committee (chairman)
External appointments
Healthcare Locums Plc (chairman)
Winton Capital Management Limited (chairman)
Techtronic Industries
AXA China Region
AXA Asia
Sim Tshabalala (47) Group chief executive director of SBG and chief executive of SBSA
BA LLB (Rhodes), LLM (University of Notre Dame, USA), HDip Tax (Wits), AMP (Harvard)
Appointed 2013
Sim is the group chief executive of SBG, chief executive of SBSA, a director of Tutuwa Community Holdings and a director of BASA.
Board committee memberships
group social and ethics committee group IT committee SBSA large exposure credit
committee
Other appointments
Liberty Holdings Liberty Group Stanbic IBTC Bank (chairman) Stanbic Africa Holdings (chairman)
Swazi Tshabalala (49) Independent non-executive director of SBG and SBSA
BA (Economics) (Lawrence University, USA), MBA (Babcock School of Management, Wake Forest University)
Appointed 2014
Swazi Tshabalala was previously the chief executive officer of the Industrial Development Group. Since 2013, she has been an executive director of Kupanua Investments.
Board committee memberships
group/SBSA risk and capital management committees
External appointments
Liberty Group
Liberty Holdings
Wenbin Wang (39) Non-executive director of SBG
Bachelor’s degree in Economics, Masters degree in Business Administration, PhD (Management) (Renmin University of China)
Appointed 2014
Wenbin Wang joined ICBC in 2000. He previously served in various positions in ICBC, including deputy general manager of corporate strategy and investor relations department and senior executive vice president of ICBC Xi’an Branch.
Board committee memberships
group IT committee (alternate to Shu Gu)
group risk and capital management committee (alternate to Shu Gu)
group directors’ affairs committee (alternate to Shu Gu)
Refer to exco page 124 for full CV.
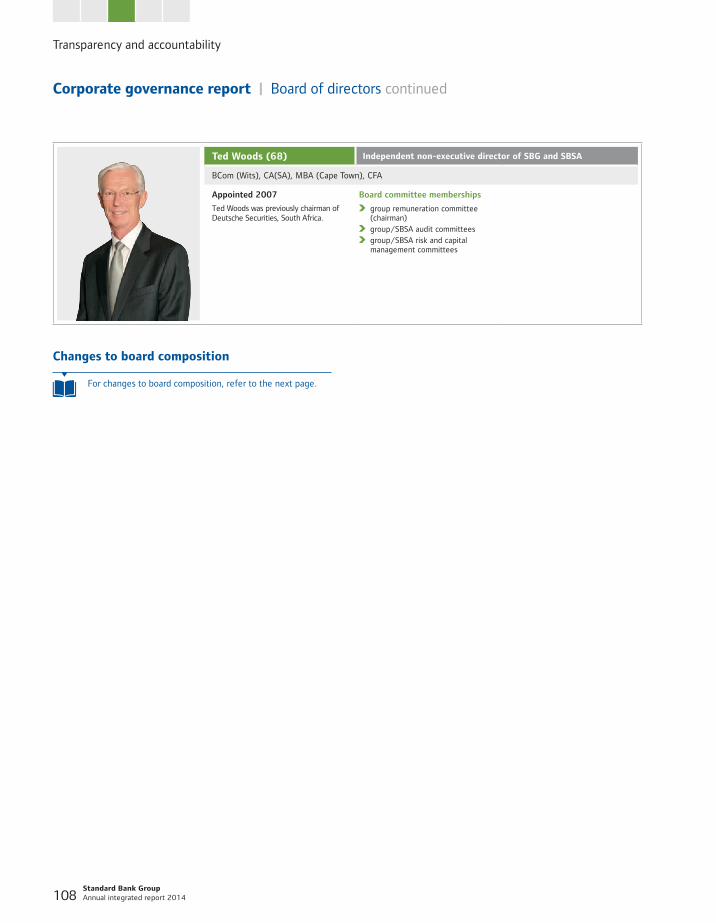
Transparency and accountability
Standard Bank Group Annual integrated report 2014 108
Ted Woods (68) Independent non-executive director of SBG and SBSA
BCom (Wits), CA(SA), MBA (Cape Town), CFA
Appointed 2007
Ted Woods was previously chairman of Deutsche Securities, South Africa.
Board committee memberships
group remuneration committee (chairman)
group/SBSA audit committees group/SBSA risk and capital
management committees
Corporate governance report | Board of directors continued
Changes to board composition
For changes to board composition, refer to the next page.
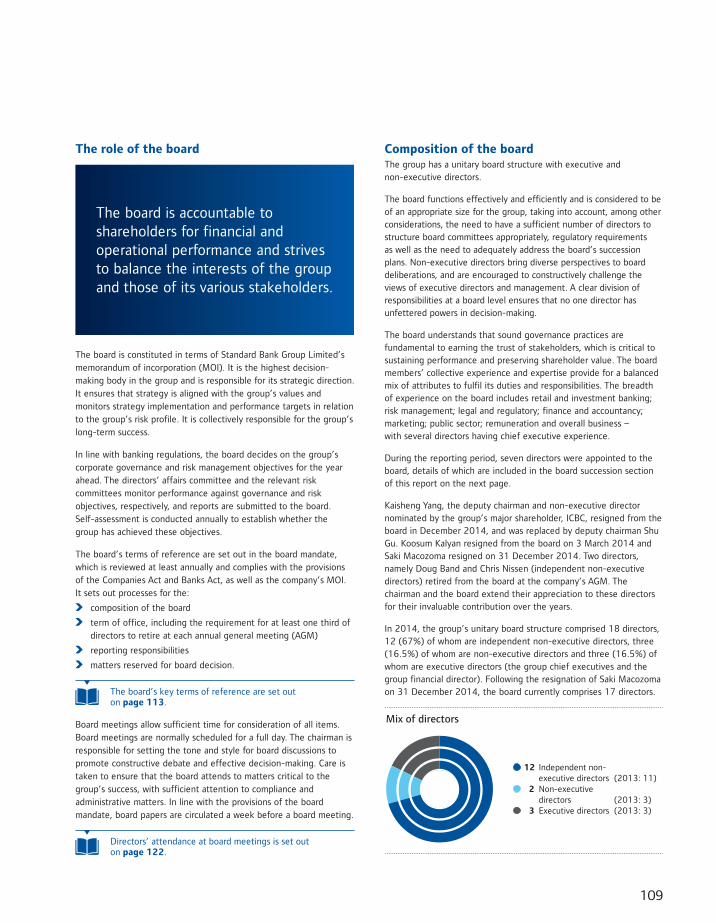
109
The role of the board
The board is accountable to shareholders for financial and operational performance and strives to balance the interests of the group and those of its various stakeholders.
The board is constituted in terms of Standard Bank Group Limited’s memorandum of incorporation (MOI). It is the highest decision-making body in the group and is responsible for its strategic direction. It ensures that strategy is aligned with the group’s values and monitors strategy implementation and performance targets in relation to the group’s risk profile. It is collectively responsible for the group’s long-term success.
In line with banking regulations, the board decides on the group’s corporate governance and risk management objectives for the year ahead. The directors’ affairs committee and the relevant risk committees monitor performance against governance and risk objectives, respectively, and reports are submitted to the board. Self-assessment is conducted annually to establish whether the group has achieved these objectives.
The board’s terms of reference are set out in the board mandate, which is reviewed at least annually and complies with the provisions of the Companies Act and Banks Act, as well as the company’s MOI. It sets out processes for the:
composition of the board
term of office, including the requirement for at least one third of directors to retire at each annual general meeting (AGM)
reporting responsibilities
matters reserved for board decision.
The board’s key terms of reference are set out on page 113.
Board meetings allow sufficient time for consideration of all items. Board meetings are normally scheduled for a full day. The chairman is responsible for setting the tone and style for board discussions to promote constructive debate and effective decision-making. Care is taken to ensure that the board attends to matters critical to the group’s success, with sufficient attention to compliance and administrative matters. In line with the provisions of the board mandate, board papers are circulated a week before a board meeting.
Directors’ attendance at board meetings is set out on page 122.
Composition of the boardThe group has a unitary board structure with executive and non-executive directors.
The board functions effectively and efficiently and is considered to be of an appropriate size for the group, taking into account, among other considerations, the need to have a sufficient number of directors to structure board committees appropriately, regulatory requirements as well as the need to adequately address the board’s succession plans. Non-executive directors bring diverse perspectives to board deliberations, and are encouraged to constructively challenge the views of executive directors and management. A clear division of responsibilities at a board level ensures that no one director has unfettered powers in decision-making.
The board understands that sound governance practices are fundamental to earning the trust of stakeholders, which is critical to sustaining performance and preserving shareholder value. The board members’ collective experience and expertise provide for a balanced mix of attributes to fulfil its duties and responsibilities. The breadth of experience on the board includes retail and investment banking; risk management; legal and regulatory; finance and accountancy; marketing; public sector; remuneration and overall business – with several directors having chief executive experience.
During the reporting period, seven directors were appointed to the board, details of which are included in the board succession section of this report on the next page.
Kaisheng Yang, the deputy chairman and non-executive director nominated by the group’s major shareholder, ICBC, resigned from the board in December 2014, and was replaced by deputy chairman Shu Gu. Koosum Kalyan resigned from the board on 3 March 2014 and Saki Macozoma resigned on 31 December 2014. Two directors, namely Doug Band and Chris Nissen (independent non-executive directors) retired from the board at the company’s AGM. The chairman and the board extend their appreciation to these directors for their invaluable contribution over the years.
In 2014, the group’s unitary board structure comprised 18 directors, 12 (67%) of whom are independent non-executive directors, three (16.5%) of whom are non-executive directors and three (16.5%) of whom are executive directors (the group chief executives and the group financial director). Following the resignation of Saki Macozoma on 31 December 2014, the board currently comprises 17 directors.
Mix of directors
� 12 Independent non- executive directors (2013: 11)� 2 Non-executive directors (2013: 3)� 3 Executive directors (2013: 3)
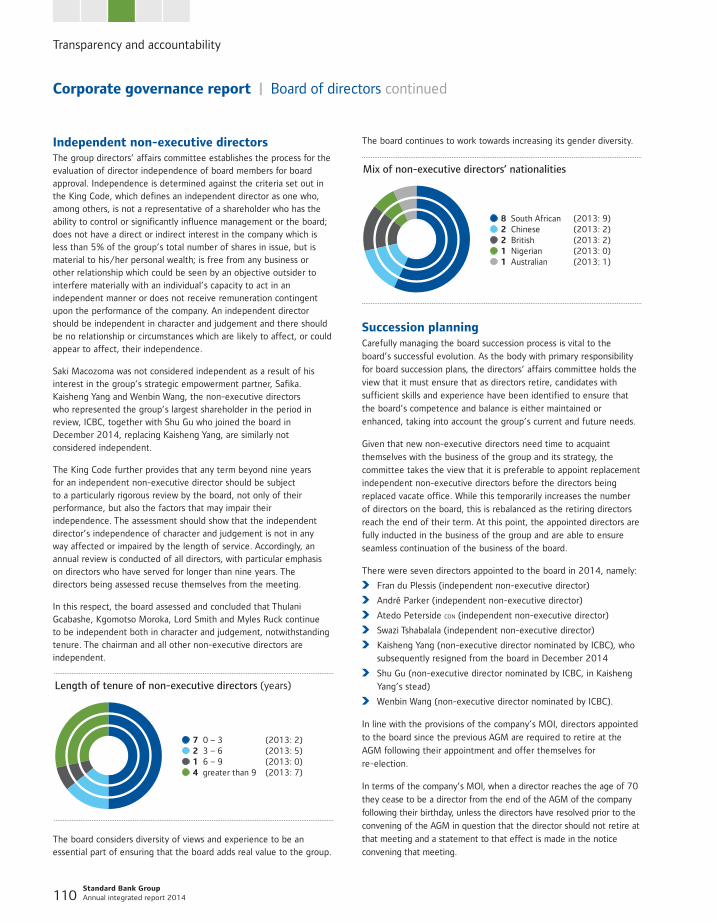
Transparency and accountability
Standard Bank Group Annual integrated report 2014 110
Independent non-executive directorsThe group directors’ affairs committee establishes the process for the evaluation of director independence of board members for board approval. Independence is determined against the criteria set out in the King Code, which defines an independent director as one who, among others, is not a representative of a shareholder who has the ability to control or significantly influence management or the board; does not have a direct or indirect interest in the company which is less than 5% of the group’s total number of shares in issue, but is material to his/her personal wealth; is free from any business or other relationship which could be seen by an objective outsider to interfere materially with an individual’s capacity to act in an independent manner or does not receive remuneration contingent upon the performance of the company. An independent director should be independent in character and judgement and there should be no relationship or circumstances which are likely to affect, or could appear to affect, their independence.
Saki Macozoma was not considered independent as a result of his interest in the group’s strategic empowerment partner, Safika. Kaisheng Yang and Wenbin Wang, the non-executive directors who represented the group’s largest shareholder in the period in review, ICBC, together with Shu Gu who joined the board in December 2014, replacing Kaisheng Yang, are similarly not considered independent.
The King Code further provides that any term beyond nine years for an independent non-executive director should be subject to a particularly rigorous review by the board, not only of their performance, but also the factors that may impair their independence. The assessment should show that the independent director’s independence of character and judgement is not in any way affected or impaired by the length of service. Accordingly, an annual review is conducted of all directors, with particular emphasis on directors who have served for longer than nine years. The directors being assessed recuse themselves from the meeting.
In this respect, the board assessed and concluded that Thulani Gcabashe, Kgomotso Moroka, Lord Smith and Myles Ruck continue to be independent both in character and judgement, notwithstanding tenure. The chairman and all other non-executive directors are independent.
Length of tenure of non�executive directors (years)
� 7 0 – 3 (2013: 2)� 2 3 – 6 (2013: 5)� 1 6 – 9 (2013: 0)� 4 greater than 9 (2013: 7)
The board considers diversity of views and experience to be an essential part of ensuring that the board adds real value to the group.
The board continues to work towards increasing its gender diversity.
Mix of non�executive directors’ nationalities
� 8 South African (2013: 9)� 2 Chinese (2013: 2)� 2 British (2013: 2)� 1 Nigerian (2013: 0)� 1 Australian (2013: 1)
Succession planningCarefully managing the board succession process is vital to the board’s successful evolution. As the body with primary responsibility for board succession plans, the directors’ affairs committee holds the view that it must ensure that as directors retire, candidates with sufficient skills and experience have been identified to ensure that the board’s competence and balance is either maintained or enhanced, taking into account the group’s current and future needs.
Given that new non-executive directors need time to acquaint themselves with the business of the group and its strategy, the committee takes the view that it is preferable to appoint replacement independent non-executive directors before the directors being replaced vacate office. While this temporarily increases the number of directors on the board, this is rebalanced as the retiring directors reach the end of their term. At this point, the appointed directors are fully inducted in the business of the group and are able to ensure seamless continuation of the business of the board.
There were seven directors appointed to the board in 2014, namely:
Fran du Plessis (independent non-executive director)
André Parker (independent non-executive director)
Atedo Peterside con (independent non-executive director)
Swazi Tshabalala (independent non-executive director)
Kaisheng Yang (non-executive director nominated by ICBC), who subsequently resigned from the board in December 2014
Shu Gu (non-executive director nominated by ICBC, in Kaisheng
Yang’s stead)
Wenbin Wang (non-executive director nominated by ICBC).
In line with the provisions of the company’s MOI, directors appointed
to the board since the previous AGM are required to retire at the
AGM following their appointment and offer themselves for
re-election.
In terms of the company’s MOI, when a director reaches the age of 70
they cease to be a director from the end of the AGM of the company
following their birthday, unless the directors have resolved prior to the
convening of the AGM in question that the director should not retire at
that meeting and a statement to that effect is made in the notice
convening that meeting.
Corporate governance report | Board of directors continued
111
Fred Phaswana and Lord Smith have reached the retirement age set in the group’s MOI and will accordingly retire from the board at the group’s AGM.
In addition to managing non-executive director succession, the board considers the strength and development of the senior leadership team. The directors’ affairs committee ensures that the group has adequate executive succession plans. As noted in the chairman’s letter to stakeholders on page 100, the board is satisfied with the depth of the group’s senior leadership team.
Board appointment processAppointments to the board are done in a formal and transparent manner and are a matter for the board as a whole. Directors are nominated by the directors’ affairs committee, which is composed of a majority of independent non-executive directors. A human resources placement agency supports the committee in identifying a broad pool of relevant candidates. In general the attributes of prospective directors include individuals with capacity to think strategically and contribute to the company’s ongoing evolution of strategy, ability to work collaboratively and integrity that is above reproach. Apart from a candidate’s experience, availability and fit, the committee also considers the individual’s other directorships and commitments to ensure that they will have sufficient capacity to discharge their roles. Candidates must also satisfactorily meet the fit and proper test, as required by the Banks Act. The committee also considers appropriate demographic and gender diversity in its assessment.
Suitable candidates are submitted to the board for consideration and appointment in terms of the company’s MOI. A director appointed by the board holds office until the next AGM where they must retire and stand for election by shareholders.
Shareholders are provided with information on directors’ qualifications, experience and other key directorships.
Information on directors presented for election is set out in the notice to members on page 165.
In terms of the nominations and appointments policy, management requires permission to accept external board appointments, which is only granted in exceptional circumstances. This reduces the potential for conflicts of interest and helps ensure that management devotes sufficient time and focus to the business of the group.
Induction and ongoing educationInduction of new directors and ongoing education of directors is the responsibility of the group secretary. The directors’ affairs committee is responsible for monitoring the implementation of director induction and training plans.
On appointment, directors are provided with the group’s governance manual containing all relevant governance information, including the company founding documents, mandates, governance structures, significant reports, relevant legislation and policies. One-on-one meetings and site visits are scheduled with management to introduce new directors to the company and its operations. The remainder of
the induction programme is tailored to the new director’s specific requirements.
To ensure maximum participation in ongoing director training, dates for training are scheduled in advance and form part of the board-approved annual calendar. The directors are kept abreast of applicable legislation and regulations, changes to rules, standards and codes, as well as relevant sector developments that could affect the group and its operations. Ongoing director training topics covered in 2014 included an in-depth review of IT governance, SAP core banking, Twin Peaks, amendments to JSE Listings Requirements, cybercrime facilities, and IFRS 9’s impairment requirements.
Board access to information and resourcesThere is ongoing engagement between executive management and the board. In addition to the executive directors, the company’s prescribed officers, as defined in the Companies Act, attend all board meetings. External auditors are invited to attend GAC, group IT and GRCMC meetings. Directors have unrestricted access to group management and company information, as well as the resources to carry out their duties and responsibilities. This includes access to external specialist advice at the group’s expense, in terms of the board-approved policy on independent professional advice.
Closed sessionsAfter every board meeting, non-executive directors meet without the executive directors present in closed sessions led by the chairman. The sessions commence with the group chief executives present but without other executive directors and prescribed officers, to answer questions or raise any necessary matters.
The primary objective of these sessions is to provide non-executive directors with an opportunity to test thoughts and insights among peers. The chairman, as the primary link between the board and executive management, provides feedback from the closed sessions to the group chief executives.
Conflicts of interest and other commitmentsIn terms of the Companies Act, if a director has a personal financial interest in respect of a matter to be considered at a meeting of the board or knows that a related person has a personal financial interest, the director is obliged to disclose the interest and its general nature, recuse themselves and not take part in the consideration of the matter.
The board is aware of the other commitments of its directors and is satisfied that all directors allocate sufficient time to enable them to discharge their responsibilities effectively. The group secretary maintains a register of directors’ interests, which is tabled at the board annually and any changes are submitted to the board as they occur. The group complies with the provisions of the Companies Act in this regard.
Board evaluationThe chairman is responsible for ensuring that the group has an effective board. Supported by the directors’ affairs committee and group secretary, he ensures that the board’s effectiveness and execution of its mandate is reviewed annually.
Transparency and accountability
Standard Bank Group Annual integrated report 2014 112
Corporate governance report | Board of directors continued
The board and its committees’ performance is assessed in a number of ways. A detailed assessment of each committee and the board’s compliance with all the provisions of the respective mandates is done annually, with the findings reported to the directors’ affairs committee. The group’s external auditors conduct a limited assurance assessment on the review and express an opinion in this regard. During 2014, the board and its committees complied with their mandates.
In addition to this review, external, independent consultants conduct an annual board and committee evaluation focusing on matters that would not necessarily be apparent from an assessment of fulfilment of mandates.
In response to recommendations from the 2013 board evaluation process, the board developed and implemented action plans to address the gaps identified. For example, in response to the findings relating to board oversight in IT, the board constituted a group IT committee, which includes two co-opted independent specialists. In the period under review, the board engaged with executive management from the group’s operations in Kenya, Angola, Nigeria and Ghana. The board conducted deep drills into the operations in these jurisdictions with the engagements led by chief executives and chief financial officers of the entities.
The chairman held one-on-one meetings with individual directors to provide feedback from the peer reviews held and generally discuss performance and development of the individual director.
An exercise was carried out, in consultation with the board, to restructure the board and committees’ agendas, as well as reports presented to these governance structures. The objective was to enhance the flow of meetings and readability of board and committee papers.
Independent consultants were engaged to carry out the board and committee evaluation exercise for 2014. The focus of this review was on identifying areas of continuous improvement for the board and its committees. The report from this exercise was presented to the board at its first scheduled meeting of the year in March 2015.
Separation of the roles of chairman and group chief executivesThe role of chairman is distinct and separate from that of the group chief executives and there is a clear division of responsibilities. The chairman, Fred Phaswana, is an independent non-executive director charged with leading the board, ensuring its effective functioning and setting its agenda, in consultation with the group secretary, the group
chief executives and the directors. He ensures that the board observes the highest standard of integrity and good governance. His duties include facilitating dialogue at board meetings, ensuring proper functioning of the joint group chief executive structure, setting the board’s annual work plan, conveying feedback in a balanced and accurate manner between the board and group chief executives, and assessing the individual performance of directors. The chairman has the respect and confidence of the board, which are vital to the effective performance of his role.
The group chief executives are responsible for fostering a corporate culture that promotes sustainable ethical practices, encourages individual integrity and fulfils social responsibility objectives and imperatives, while ensuring all employees maintain a commercial mind-set. The board holds the group chief executives jointly and severally accountable and responsible for the operational and financial performance of the group. In the period under review, the group chief executives acted within the authority delegated to them by the board.
IT governanceIT governance forms an integral part of the overall corporate governance of the group. In keeping with King III requirements, the board of directors is responsible for ensuring that prudent and reasonable steps have been taken to fulfil its responsibilities for IT governance. To assist the board in fulfilling this obligation, a group IT committee was established and delegated with the authority to ensure the implementation of the IT governance framework (this responsibility had previously been delegated to the GRCMC). The group IT committee, comprising non-executive directors and executive directors, is responsible for overseeing IT governance at a board level and reports to the board through its chairman.
The GRCMC ensures that all risks are adequately addressed through its risk management, monitoring and assurance processes. It considers IT risk as a crucial element of the effective oversight of risk management and places reliance on the group IT committee and integrated operational risk function to provide oversight of the first line of defence risk activities.
IT as it relates to controls, financial reporting and internal audit findings remains the responsibility of the GAC.
The group CIO is a member of the group manco.
For the IT report, please refer to page 52.
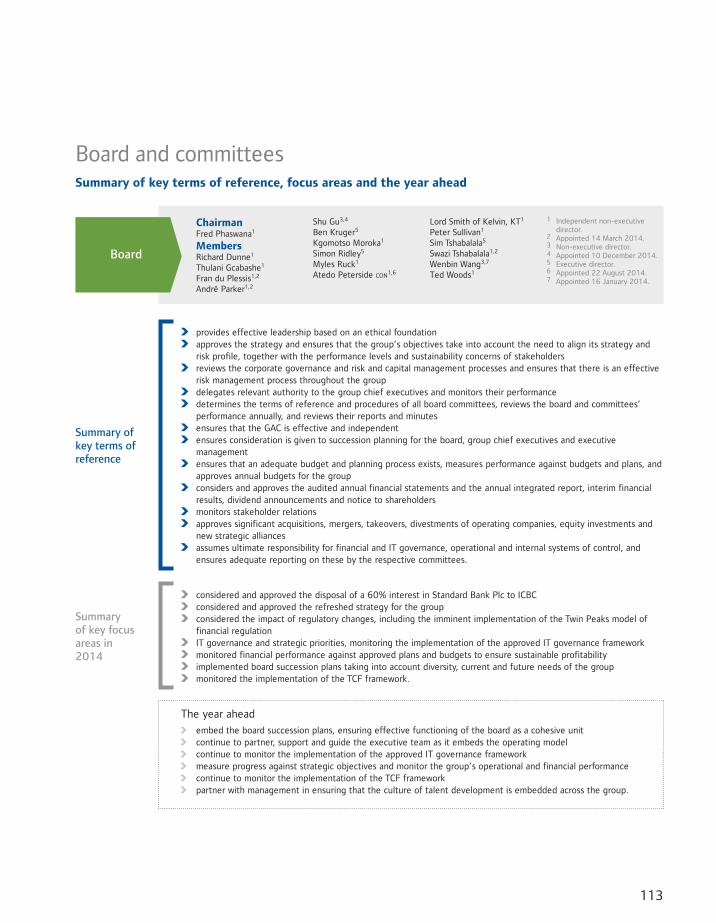
113
Board and committeesSummary of key terms of reference, focus areas and the year ahead
ChairmanFred Phaswana1
MembersRichard Dunne1
Thulani Gcabashe1
Fran du Plessis1,2
André Parker1,2
Shu Gu3,4
Ben Kruger5
Kgomotso Moroka1
Simon Ridley5
Myles Ruck1
Atedo Peterside con1,6
Lord Smith of Kelvin, KT1
Peter Sullivan1
Sim Tshabalala5
Swazi Tshabalala1,2
Wenbin Wang3,7
Ted Woods1
1 Independent non-executive director.
2 Appointed 14 March 2014.3 Non-executive director.4 Appointed 10 December 2014.5 Executive director.6 Appointed 22 August 2014.7 Appointed 16 January 2014.
Summary of key terms of reference
provides effective leadership based on an ethical foundation approves the strategy and ensures that the group’s objectives take into account the need to align its strategy and
risk profile, together with the performance levels and sustainability concerns of stakeholders reviews the corporate governance and risk and capital management processes and ensures that there is an effective
risk management process throughout the group delegates relevant authority to the group chief executives and monitors their performance determines the terms of reference and procedures of all board committees, reviews the board and committees’
performance annually, and reviews their reports and minutes ensures that the GAC is effective and independent ensures consideration is given to succession planning for the board, group chief executives and executive
management ensures that an adequate budget and planning process exists, measures performance against budgets and plans, and
approves annual budgets for the group considers and approves the audited annual financial statements and the annual integrated report, interim financial
results, dividend announcements and notice to shareholders monitors stakeholder relations approves significant acquisitions, mergers, takeovers, divestments of operating companies, equity investments and
new strategic alliances assumes ultimate responsibility for financial and IT governance, operational and internal systems of control, and
ensures adequate reporting on these by the respective committees.
Summary of key focus areas in 2014
considered and approved the disposal of a 60% interest in Standard Bank Plc to ICBC considered and approved the refreshed strategy for the group considered the impact of regulatory changes, including the imminent implementation of the Twin Peaks model of
financial regulation IT governance and strategic priorities, monitoring the implementation of the approved IT governance framework monitored financial performance against approved plans and budgets to ensure sustainable profitability implemented board succession plans taking into account diversity, current and future needs of the group monitored the implementation of the TCF framework.
The year ahead
embed the board succession plans, ensuring effective functioning of the board as a cohesive unit continue to partner, support and guide the executive team as it embeds the operating model continue to monitor the implementation of the approved IT governance framework measure progress against strategic objectives and monitor the group’s operational and financial performance continue to monitor the implementation of the TCF framework partner with management in ensuring that the culture of talent development is embedded across the group.
Board
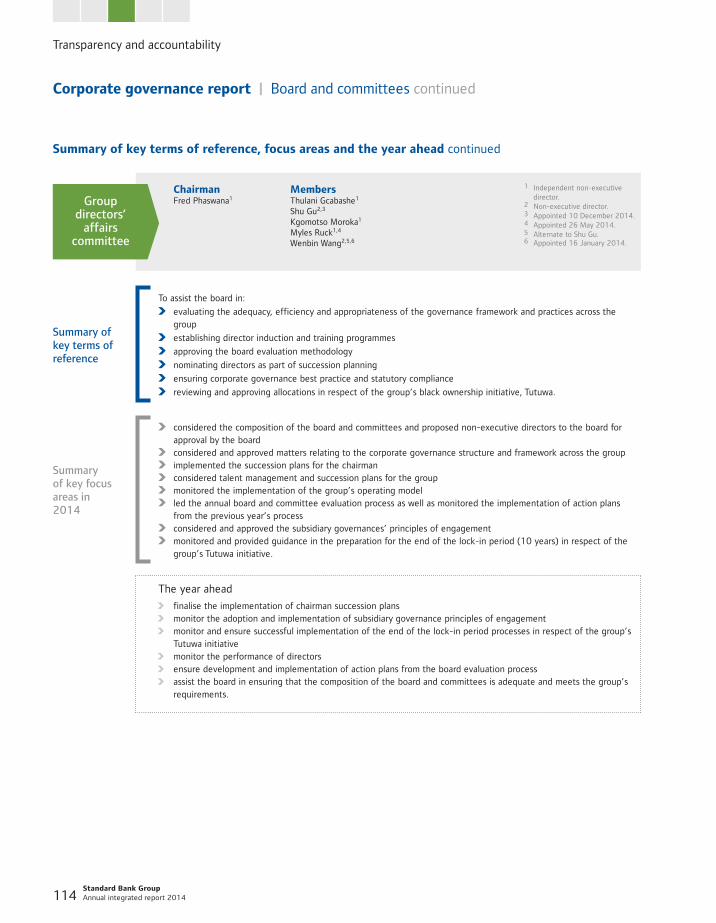
Transparency and accountability
Standard Bank Group Annual integrated report 2014 114
Corporate governance report | Board and committees continued
ChairmanFred Phaswana1
MembersThulani Gcabashe1
Shu Gu2,3
Kgomotso Moroka1
Myles Ruck1,4
Wenbin Wang2,5,6
1 Independent non-executive director.
2 Non-executive director.3 Appointed 10 December 2014.4 Appointed 26 May 2014.5 Alternate to Shu Gu.6 Appointed 16 January 2014.
Summary of key terms of reference
To assist the board in:
evaluating the adequacy, efficiency and appropriateness of the governance framework and practices across the group
establishing director induction and training programmes
approving the board evaluation methodology
nominating directors as part of succession planning
ensuring corporate governance best practice and statutory compliance
reviewing and approving allocations in respect of the group’s black ownership initiative, Tutuwa.
Summary of key focus areas in 2014
considered the composition of the board and committees and proposed non-executive directors to the board for approval by the board
considered and approved matters relating to the corporate governance structure and framework across the group implemented the succession plans for the chairman considered talent management and succession plans for the group monitored the implementation of the group’s operating model led the annual board and committee evaluation process as well as monitored the implementation of action plans
from the previous year’s process considered and approved the subsidiary governances’ principles of engagement monitored and provided guidance in the preparation for the end of the lock-in period (10 years) in respect of the
group’s Tutuwa initiative.
The year ahead
finalise the implementation of chairman succession plans monitor the adoption and implementation of subsidiary governance principles of engagement monitor and ensure successful implementation of the end of the lock-in period processes in respect of the group’s
Tutuwa initiative monitor the performance of directors ensure development and implementation of action plans from the board evaluation process assist the board in ensuring that the composition of the board and committees is adequate and meets the group’s
requirements.
Group directors’
affairs committee
Summary of key terms of reference, focus areas and the year ahead continued
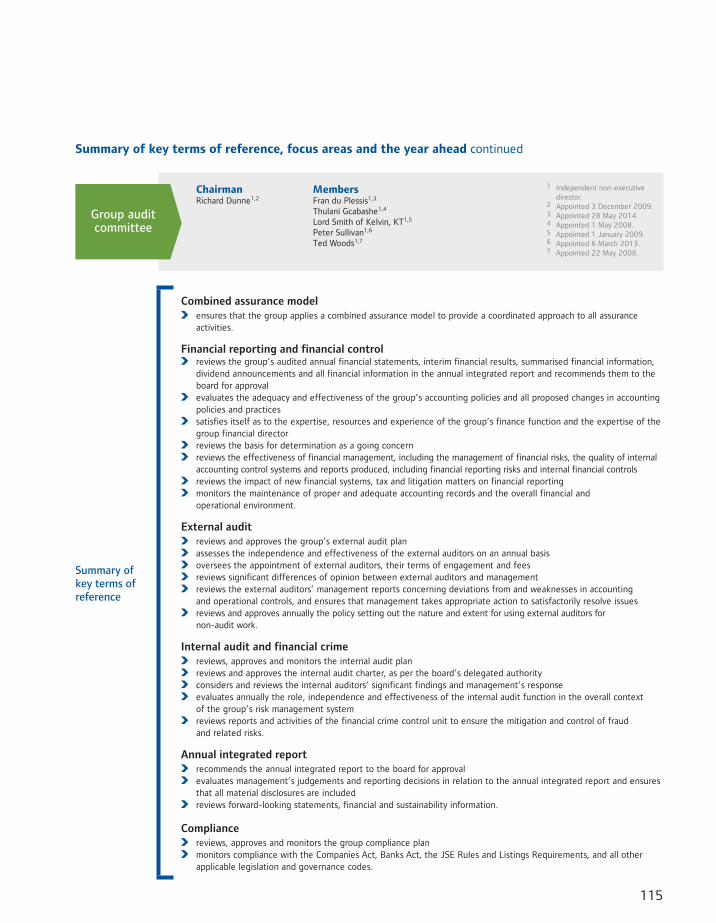
115
ChairmanRichard Dunne1,2
MembersFran du Plessis1,3
Thulani Gcabashe1,4
Lord Smith of Kelvin, KT1,5
Peter Sullivan1,6
Ted Woods1,7
1 Independent non-executive director.
2 Appointed 3 December 2009.3 Appointed 28 May 2014.4 Appointed 1 May 2008.5 Appointed 1 January 2009.6 Appointed 6 March 2013.7 Appointed 22 May 2008.
Summary of key terms of reference
Combined assurance model ensures that the group applies a combined assurance model to provide a coordinated approach to all assurance
activities.
Financial reporting and financial control reviews the group’s audited annual financial statements, interim financial results, summarised financial information,
dividend announcements and all financial information in the annual integrated report and recommends them to the board for approval
evaluates the adequacy and effectiveness of the group’s accounting policies and all proposed changes in accounting policies and practices
satisfies itself as to the expertise, resources and experience of the group’s finance function and the expertise of the group financial director
reviews the basis for determination as a going concern reviews the effectiveness of financial management, including the management of financial risks, the quality of internal
accounting control systems and reports produced, including financial reporting risks and internal financial controls reviews the impact of new financial systems, tax and litigation matters on financial reporting monitors the maintenance of proper and adequate accounting records and the overall financial and
operational environment.
External audit reviews and approves the group’s external audit plan assesses the independence and effectiveness of the external auditors on an annual basis oversees the appointment of external auditors, their terms of engagement and fees reviews significant differences of opinion between external auditors and management reviews the external auditors’ management reports concerning deviations from and weaknesses in accounting
and operational controls, and ensures that management takes appropriate action to satisfactorily resolve issues reviews and approves annually the policy setting out the nature and extent for using external auditors for
non-audit work.
Internal audit and financial crime reviews, approves and monitors the internal audit plan reviews and approves the internal audit charter, as per the board’s delegated authority considers and reviews the internal auditors’ significant findings and management’s response evaluates annually the role, independence and effectiveness of the internal audit function in the overall context
of the group’s risk management system reviews reports and activities of the financial crime control unit to ensure the mitigation and control of fraud
and related risks.
Annual integrated report recommends the annual integrated report to the board for approval evaluates management’s judgements and reporting decisions in relation to the annual integrated report and ensures
that all material disclosures are included reviews forward-looking statements, financial and sustainability information.
Compliance reviews, approves and monitors the group compliance plan monitors compliance with the Companies Act, Banks Act, the JSE Rules and Listings Requirements, and all other
applicable legislation and governance codes.
Group audit committee
Summary of key terms of reference, focus areas and the year ahead continued
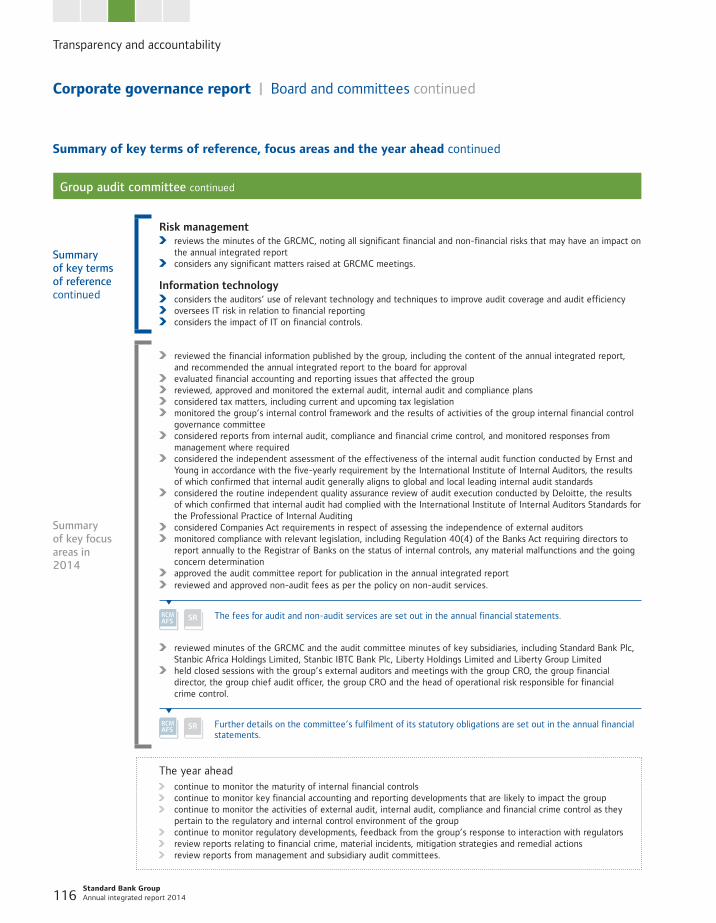
Transparency and accountability
Standard Bank Group Annual integrated report 2014 116
Corporate governance report | Board and committees continued
Group audit committee continued
Summary of key terms of reference, focus areas and the year ahead continued
Summary of key terms of referencecontinued
Risk management reviews the minutes of the GRCMC, noting all significant financial and non-financial risks that may have an impact on
the annual integrated report considers any significant matters raised at GRCMC meetings.
Information technology considers the auditors’ use of relevant technology and techniques to improve audit coverage and audit efficiency oversees IT risk in relation to financial reporting considers the impact of IT on financial controls.
Summary of key focus areas in 2014
reviewed the financial information published by the group, including the content of the annual integrated report, and recommended the annual integrated report to the board for approval
evaluated financial accounting and reporting issues that affected the group reviewed, approved and monitored the external audit, internal audit and compliance plans considered tax matters, including current and upcoming tax legislation monitored the group’s internal control framework and the results of activities of the group internal financial control
governance committee considered reports from internal audit, compliance and financial crime control, and monitored responses from
management where required considered the independent assessment of the effectiveness of the internal audit function conducted by Ernst and
Young in accordance with the five-yearly requirement by the International Institute of Internal Auditors, the results of which confirmed that internal audit generally aligns to global and local leading internal audit standards
considered the routine independent quality assurance review of audit execution conducted by Deloitte, the results of which confirmed that internal audit had complied with the International Institute of Internal Auditors Standards for the Professional Practice of Internal Auditing
considered Companies Act requirements in respect of assessing the independence of external auditors monitored compliance with relevant legislation, including Regulation 40(4) of the Banks Act requiring directors to
report annually to the Registrar of Banks on the status of internal controls, any material malfunctions and the going concern determination
approved the audit committee report for publication in the annual integrated report reviewed and approved non-audit fees as per the policy on non-audit services.
The fees for audit and non-audit services are set out in the annual financial statements.
reviewed minutes of the GRCMC and the audit committee minutes of key subsidiaries, including Standard Bank Plc, Stanbic Africa Holdings Limited, Stanbic IBTC Bank Plc, Liberty Holdings Limited and Liberty Group Limited
held closed sessions with the group’s external auditors and meetings with the group CRO, the group financial director, the group chief audit officer, the group CRO and the head of operational risk responsible for financial crime control.
Further details on the committee’s fulfilment of its statutory obligations are set out in the annual financial statements.
The year ahead continue to monitor the maturity of internal financial controls continue to monitor key financial accounting and reporting developments that are likely to impact the group continue to monitor the activities of external audit, internal audit, compliance and financial crime control as they
pertain to the regulatory and internal control environment of the group continue to monitor regulatory developments, feedback from the group’s response to interaction with regulators review reports relating to financial crime, material incidents, mitigation strategies and remedial actions review reports from management and subsidiary audit committees.
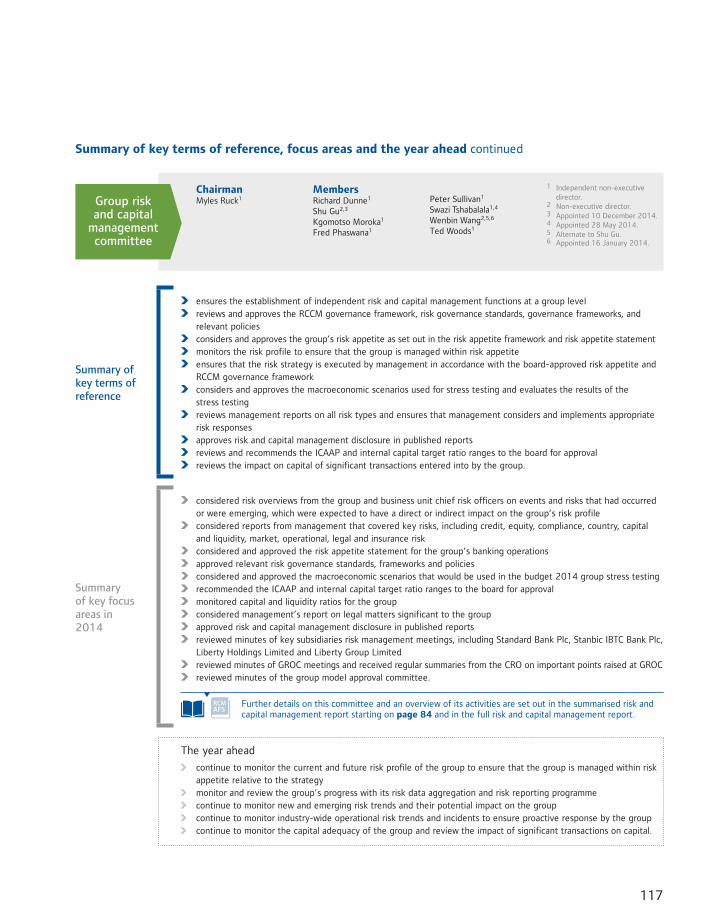
117
ChairmanMyles Ruck1
MembersRichard Dunne1
Shu Gu2,3
Kgomotso Moroka1
Fred Phaswana1
Peter Sullivan1
Swazi Tshabalala1,4
Wenbin Wang2,5,6
Ted Woods1
1 Independent non-executive director.
2 Non-executive director.3 Appointed 10 December 2014.4 Appointed 28 May 2014. 5 Alternate to Shu Gu.6 Appointed 16 January 2014.
Summary of key terms of reference
ensures the establishment of independent risk and capital management functions at a group level reviews and approves the RCCM governance framework, risk governance standards, governance frameworks, and
relevant policies considers and approves the group’s risk appetite as set out in the risk appetite framework and risk appetite statement monitors the risk profile to ensure that the group is managed within risk appetite ensures that the risk strategy is executed by management in accordance with the board-approved risk appetite and
RCCM governance framework considers and approves the macroeconomic scenarios used for stress testing and evaluates the results of the
stress testing reviews management reports on all risk types and ensures that management considers and implements appropriate
risk responses approves risk and capital management disclosure in published reports reviews and recommends the ICAAP and internal capital target ratio ranges to the board for approval reviews the impact on capital of significant transactions entered into by the group.
Summary of key focus areas in 2014
considered risk overviews from the group and business unit chief risk officers on events and risks that had occurred or were emerging, which were expected to have a direct or indirect impact on the group’s risk profile
considered reports from management that covered key risks, including credit, equity, compliance, country, capital and liquidity, market, operational, legal and insurance risk
considered and approved the risk appetite statement for the group’s banking operations approved relevant risk governance standards, frameworks and policies considered and approved the macroeconomic scenarios that would be used in the budget 2014 group stress testing recommended the ICAAP and internal capital target ratio ranges to the board for approval monitored capital and liquidity ratios for the group considered management’s report on legal matters significant to the group approved risk and capital management disclosure in published reports reviewed minutes of key subsidiaries risk management meetings, including Standard Bank Plc, Stanbic IBTC Bank Plc,
Liberty Holdings Limited and Liberty Group Limited reviewed minutes of GROC meetings and received regular summaries from the CRO on important points raised at GROC reviewed minutes of the group model approval committee.
Further details on this committee and an overview of its activities are set out in the summarised risk and capital management report starting on page 84 and in the full risk and capital management report.
The year ahead
continue to monitor the current and future risk profile of the group to ensure that the group is managed within risk appetite relative to the strategy
monitor and review the group’s progress with its risk data aggregation and risk reporting programme continue to monitor new and emerging risk trends and their potential impact on the group continue to monitor industry-wide operational risk trends and incidents to ensure proactive response by the group continue to monitor the capital adequacy of the group and review the impact of significant transactions on capital.
Group risk and capital
management committee
Summary of key terms of reference, focus areas and the year ahead continued
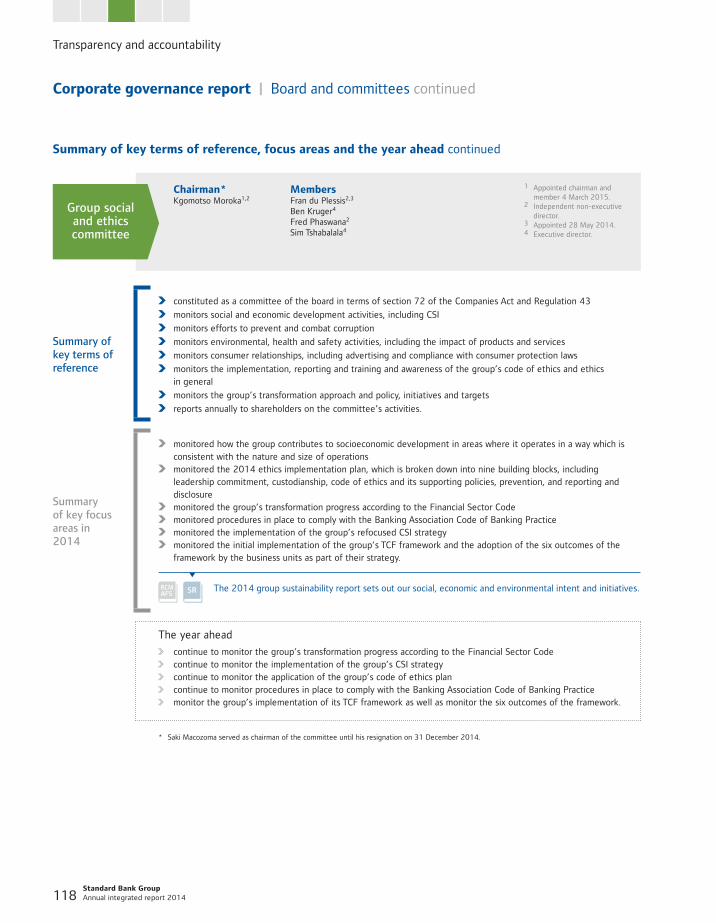
Transparency and accountability
Standard Bank Group Annual integrated report 2014 118
Corporate governance report | Board and committees continued
Chairman*Kgomotso Moroka1,2
MembersFran du Plessis2,3
Ben Kruger4
Fred Phaswana2
Sim Tshabalala4
1 Appointed chairman and member 4 March 2015.
2 Independent non-executive director.
3 Appointed 28 May 2014.4 Executive director.
Summary of key terms of reference
constituted as a committee of the board in terms of section 72 of the Companies Act and Regulation 43
monitors social and economic development activities, including CSI
monitors efforts to prevent and combat corruption
monitors environmental, health and safety activities, including the impact of products and services
monitors consumer relationships, including advertising and compliance with consumer protection laws
monitors the implementation, reporting and training and awareness of the group’s code of ethics and ethics in general
monitors the group’s transformation approach and policy, initiatives and targets
reports annually to shareholders on the committee’s activities.
Summary of key focus areas in 2014
monitored how the group contributes to socioeconomic development in areas where it operates in a way which is consistent with the nature and size of operations
monitored the 2014 ethics implementation plan, which is broken down into nine building blocks, including leadership commitment, custodianship, code of ethics and its supporting policies, prevention, and reporting and disclosure
monitored the group’s transformation progress according to the Financial Sector Code monitored procedures in place to comply with the Banking Association Code of Banking Practice monitored the implementation of the group’s refocused CSI strategy monitored the initial implementation of the group’s TCF framework and the adoption of the six outcomes of the
framework by the business units as part of their strategy.
The 2014 group sustainability report sets out our social, economic and environmental intent and initiatives.
The year ahead
continue to monitor the group’s transformation progress according to the Financial Sector Code continue to monitor the implementation of the group’s CSI strategy continue to monitor the application of the group’s code of ethics plan continue to monitor procedures in place to comply with the Banking Association Code of Banking Practice monitor the group’s implementation of its TCF framework as well as monitor the six outcomes of the framework.
* Saki Macozoma served as chairman of the committee until his resignation on 31 December 2014.
Group social and ethics committee
Summary of key terms of reference, focus areas and the year ahead continued
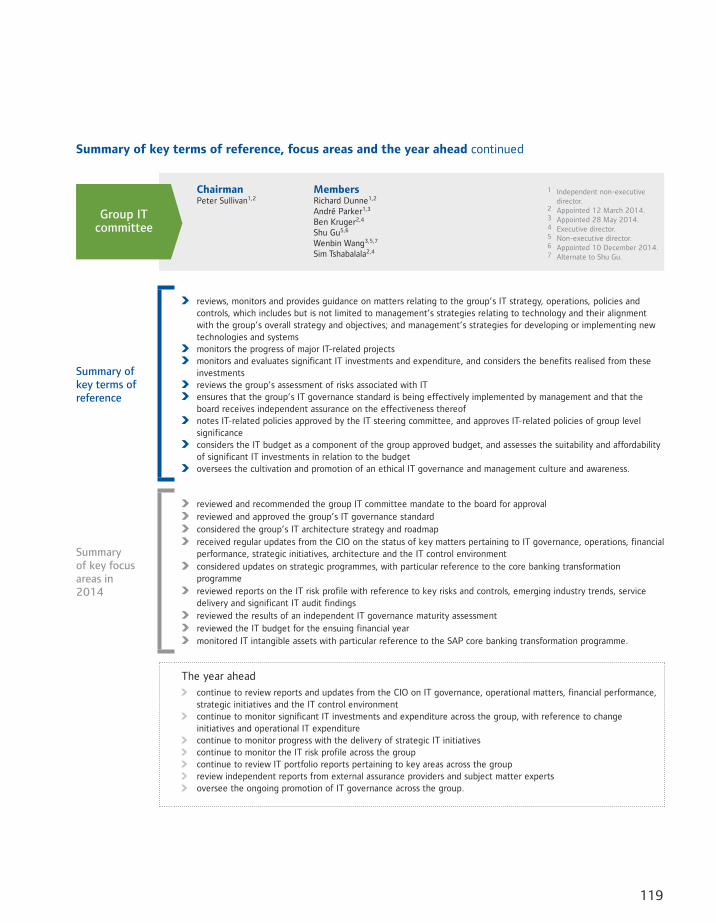
119
ChairmanPeter Sullivan1,2
MembersRichard Dunne1,2
André Parker1,3
Ben Kruger2,4
Shu Gu5,6
Wenbin Wang3,5,7
Sim Tshabalala2,4
1 Independent non-executive director.
2 Appointed 12 March 2014.3 Appointed 28 May 2014.4 Executive director.5 Non-executive director.6 Appointed 10 December 2014.7 Alternate to Shu Gu.
Summary of key terms of reference
reviews, monitors and provides guidance on matters relating to the group’s IT strategy, operations, policies and controls, which includes but is not limited to management’s strategies relating to technology and their alignment with the group’s overall strategy and objectives; and management’s strategies for developing or implementing new technologies and systems
monitors the progress of major IT-related projects monitors and evaluates significant IT investments and expenditure, and considers the benefits realised from these
investments reviews the group’s assessment of risks associated with IT ensures that the group’s IT governance standard is being effectively implemented by management and that the
board receives independent assurance on the effectiveness thereof notes IT-related policies approved by the IT steering committee, and approves IT-related policies of group level
significance considers the IT budget as a component of the group approved budget, and assesses the suitability and affordability
of significant IT investments in relation to the budget oversees the cultivation and promotion of an ethical IT governance and management culture and awareness.
Summary of key focus areas in 2014
reviewed and recommended the group IT committee mandate to the board for approval reviewed and approved the group’s IT governance standard considered the group’s IT architecture strategy and roadmap received regular updates from the CIO on the status of key matters pertaining to IT governance, operations, financial
performance, strategic initiatives, architecture and the IT control environment considered updates on strategic programmes, with particular reference to the core banking transformation
programme reviewed reports on the IT risk profile with reference to key risks and controls, emerging industry trends, service
delivery and significant IT audit findings reviewed the results of an independent IT governance maturity assessment reviewed the IT budget for the ensuing financial year monitored IT intangible assets with particular reference to the SAP core banking transformation programme.
The year ahead
continue to review reports and updates from the CIO on IT governance, operational matters, financial performance, strategic initiatives and the IT control environment
continue to monitor significant IT investments and expenditure across the group, with reference to change initiatives and operational IT expenditure
continue to monitor progress with the delivery of strategic IT initiatives continue to monitor the IT risk profile across the group continue to review IT portfolio reports pertaining to key areas across the group review independent reports from external assurance providers and subject matter experts oversee the ongoing promotion of IT governance across the group.
Group IT committee
Summary of key terms of reference, focus areas and the year ahead continued
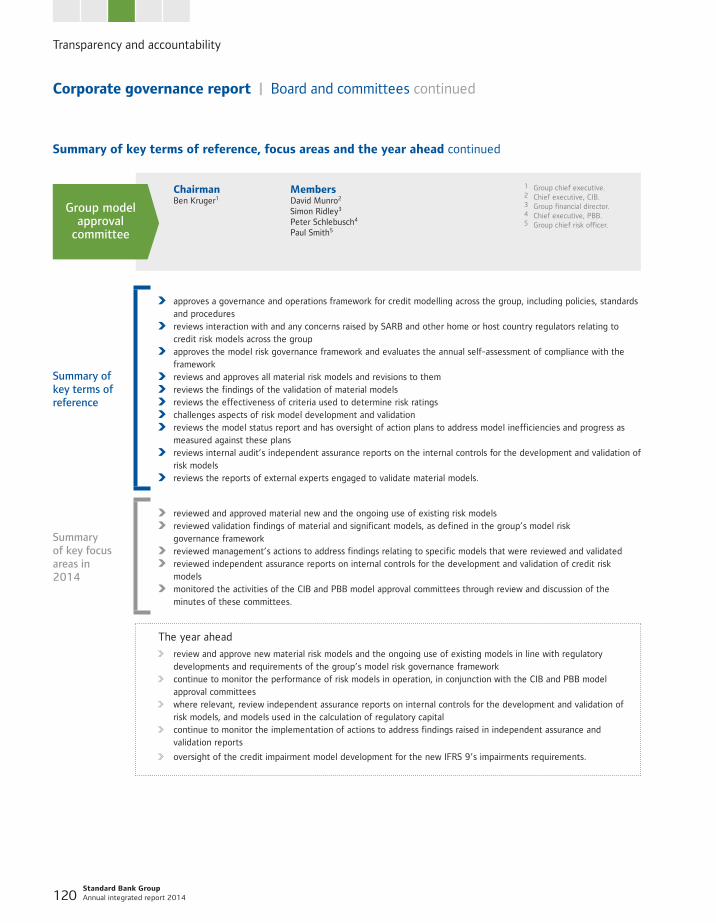
Transparency and accountability
Standard Bank Group Annual integrated report 2014 120
Corporate governance report | Board and committees continued
ChairmanBen Kruger1
MembersDavid Munro2
Simon Ridley3
Peter Schlebusch4
Paul Smith5
1 Group chief executive.2 Chief executive, CIB.3 Group financial director.4 Chief executive, PBB.5 Group chief risk officer.
Summary of key terms of reference
approves a governance and operations framework for credit modelling across the group, including policies, standards and procedures
reviews interaction with and any concerns raised by SARB and other home or host country regulators relating to credit risk models across the group
approves the model risk governance framework and evaluates the annual self-assessment of compliance with the framework
reviews and approves all material risk models and revisions to them reviews the findings of the validation of material models reviews the effectiveness of criteria used to determine risk ratings challenges aspects of risk model development and validation reviews the model status report and has oversight of action plans to address model inefficiencies and progress as
measured against these plans reviews internal audit’s independent assurance reports on the internal controls for the development and validation of
risk models reviews the reports of external experts engaged to validate material models.
Summary of key focus areas in 2014
reviewed and approved material new and the ongoing use of existing risk models reviewed validation findings of material and significant models, as defined in the group’s model risk
governance framework reviewed management’s actions to address findings relating to specific models that were reviewed and validated reviewed independent assurance reports on internal controls for the development and validation of credit risk
models monitored the activities of the CIB and PBB model approval committees through review and discussion of the
minutes of these committees.
The year ahead
review and approve new material risk models and the ongoing use of existing models in line with regulatory developments and requirements of the group’s model risk governance framework
continue to monitor the performance of risk models in operation, in conjunction with the CIB and PBB model approval committees
where relevant, review independent assurance reports on internal controls for the development and validation of risk models, and models used in the calculation of regulatory capital
continue to monitor the implementation of actions to address findings raised in independent assurance and validation reports
oversight of the credit impairment model development for the new IFRS 9’s impairments requirements.
Group model approval
committee
Summary of key terms of reference, focus areas and the year ahead continued
121
ChairmanTed Woods1
MembersAndré Parker1
Fred Phaswana1
1 Independent non-executive director.
The remuneration report, starting on page 133, sets out the terms of reference, work of the Remco in 2014 and focus areas for 2015.
Group remuneration
committee
Summary of key terms of reference, focus areas and the year ahead continued
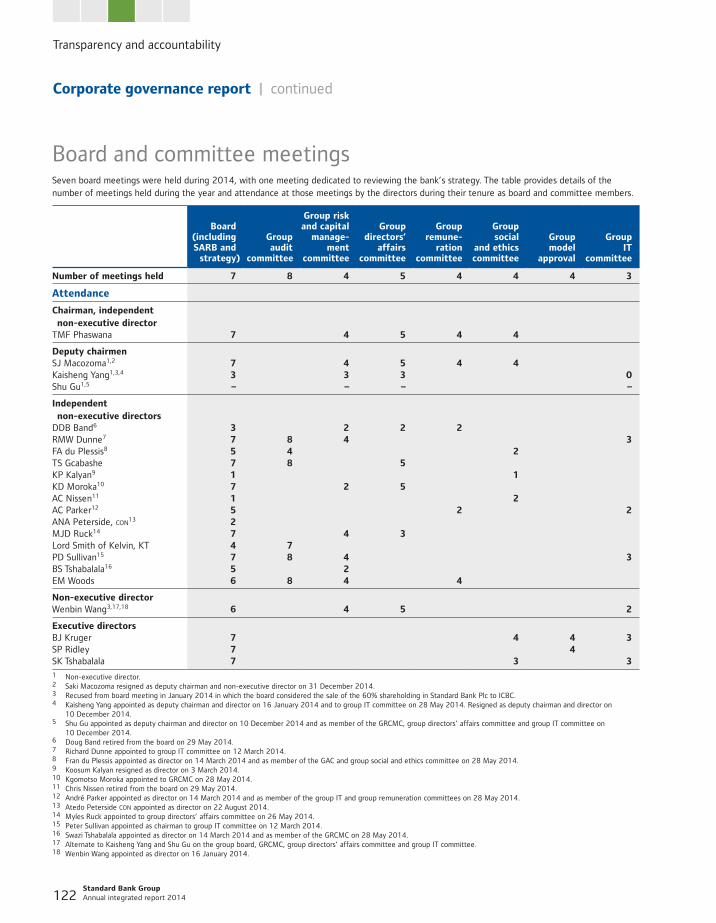
Transparency and accountability
Standard Bank Group Annual integrated report 2014 122
Board and committee meetingsSeven board meetings were held during 2014, with one meeting dedicated to reviewing the bank’s strategy. The table provides details of the number of meetings held during the year and attendance at those meetings by the directors during their tenure as board and committee members.
Board(including SARB and
strategy)
Groupaudit
committee
Group risk and capital
manage-ment
committee
Group directors’
affairs committee
Group remune-
rationcommittee
Group social
and ethics committee
Group model
approval
Group IT
committee
Number of meetings held 7 8 4 5 4 4 4 3
Attendance
Chairman, independent non-executive directorTMF Phaswana 7 4 5 4 4
Deputy chairmenSJ Macozoma1,2 7 4 5 4 4Kaisheng Yang1,3,4 3 3 3 0Shu Gu1,5 – – – –
Independent non-executive directorsDDB Band6 3 2 2 2RMW Dunne7 7 8 4 3FA du Plessis8 5 4 2TS Gcabashe 7 8 5KP Kalyan9 1 1KD Moroka10 7 2 5AC Nissen11 1 2AC Parker12 5 2 2ANA Peterside, con13 2MJD Ruck14 7 4 3Lord Smith of Kelvin, KT 4 7PD Sullivan15 7 8 4 3BS Tshabalala16 5 2EM Woods 6 8 4 4
Non-executive directorWenbin Wang3,17,18 6 4 5 2
Executive directorsBJ Kruger 7 4 4 3SP Ridley 7 4SK Tshabalala 7 3 3
1 Non-executive director.2 Saki Macozoma resigned as deputy chairman and non-executive director on 31 December 2014.3 Recused from board meeting in January 2014 in which the board considered the sale of the 60% shareholding in Standard Bank Plc to ICBC.4 Kaisheng Yang appointed as deputy chairman and director on 16 January 2014 and to group IT committee on 28 May 2014. Resigned as deputy chairman and director on
10 December 2014.5 Shu Gu appointed as deputy chairman and director on 10 December 2014 and as member of the GRCMC, group directors’ affairs committee and group IT committee on
10 December 2014.6 Doug Band retired from the board on 29 May 2014.7 Richard Dunne appointed to group IT committee on 12 March 2014.8 Fran du Plessis appointed as director on 14 March 2014 and as member of the GAC and group social and ethics committee on 28 May 2014.9 Koosum Kalyan resigned as director on 3 March 2014.10 Kgomotso Moroka appointed to GRCMC on 28 May 2014.11 Chris Nissen retired from the board on 29 May 2014.12 André Parker appointed as director on 14 March 2014 and as member of the group IT and group remuneration committees on 28 May 2014.13 Atedo Peterside CON appointed as director on 22 August 2014.14 Myles Ruck appointed to group directors’ affairs committee on 26 May 2014.15 Peter Sullivan appointed as chairman to group IT committee on 12 March 2014.16 Swazi Tshabalala appointed as director on 14 March 2014 and as member of the GRCMC on 28 May 2014.17 Alternate to Kaisheng Yang and Shu Gu on the group board, GRCMC, group directors’ affairs committee and group IT committee.18 Wenbin Wang appointed as director on 16 January 2014.
Corporate governance report | continued
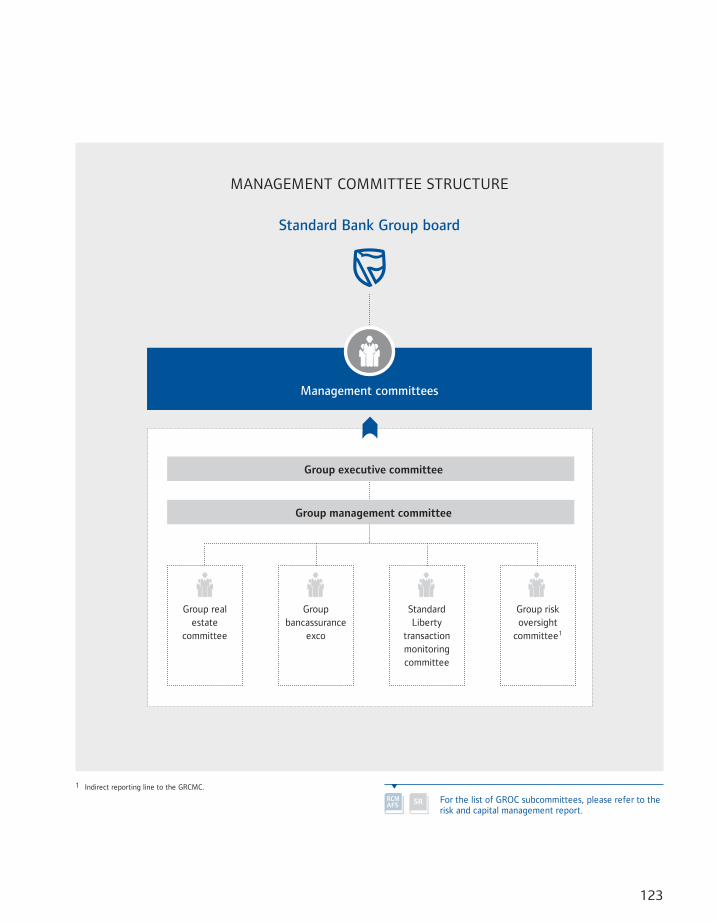
123
For the list of GROC subcommittees, please refer to the risk and capital management report.
Standard Bank Group board
Management committees
Group real estate
committee
Group bancassurance
exco
Standard Liberty
transaction monitoring committee
Group risk oversight
committee1
Group executive committee
Group management committee
1 Indirect reporting line to the GRCMC.
MANAGEMENT COMMITTEE STRUCTURE
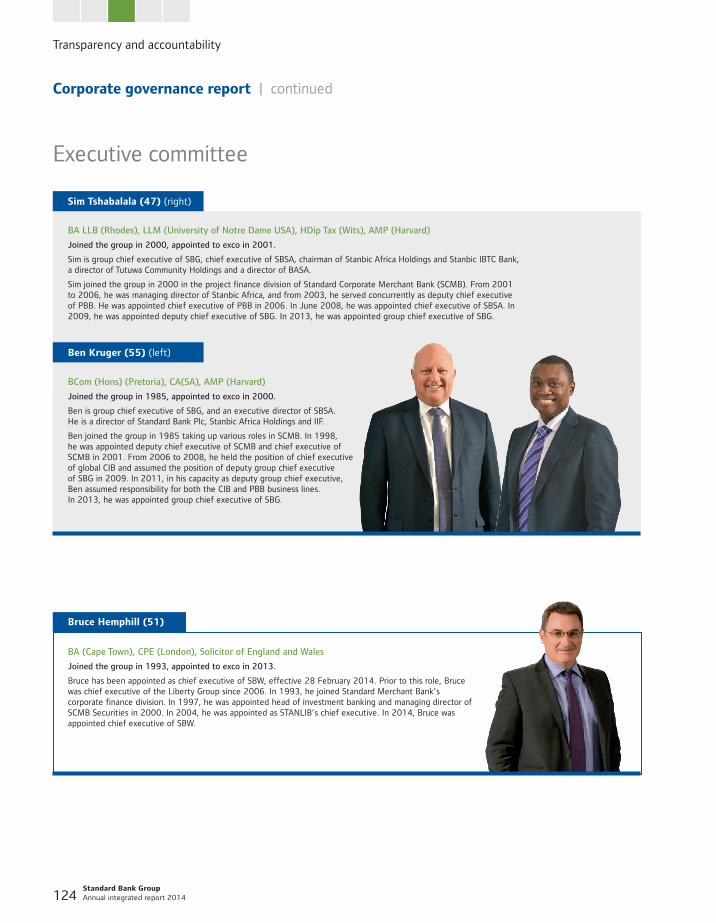
Transparency and accountability
Standard Bank Group Annual integrated report 2014 124
Executive committee
Bruce Hemphill (51)
BA (Cape Town), CPE (London), Solicitor of England and Wales
Joined the group in 1993, appointed to exco in 2013.
Bruce has been appointed as chief executive of SBW, effective 28 February 2014. Prior to this role, Bruce was chief executive of the Liberty Group since 2006. In 1993, he joined Standard Merchant Bank’s corporate finance division. In 1997, he was appointed head of investment banking and managing director of SCMB Securities in 2000. In 2004, he was appointed as STANLIB’s chief executive. In 2014, Bruce was appointed chief executive of SBW.
Corporate governance report | continued
BCom (Hons) (Pretoria), CA(SA), AMP (Harvard)
Joined the group in 1985, appointed to exco in 2000.
Ben is group chief executive of SBG, and an executive director of SBSA. He is a director of Standard Bank Plc, Stanbic Africa Holdings and IIF.
Ben joined the group in 1985 taking up various roles in SCMB. In 1998, he was appointed deputy chief executive of SCMB and chief executive of SCMB in 2001. From 2006 to 2008, he held the position of chief executive of global CIB and assumed the position of deputy group chief executive of SBG in 2009. In 2011, in his capacity as deputy group chief executive, Ben assumed responsibility for both the CIB and PBB business lines. In 2013, he was appointed group chief executive of SBG.
Sim Tshabalala (47) (right)
BA LLB (Rhodes), LLM (University of Notre Dame USA), HDip Tax (Wits), AMP (Harvard)
Joined the group in 2000, appointed to exco in 2001.
Sim is group chief executive of SBG, chief executive of SBSA, chairman of Stanbic Africa Holdings and Stanbic IBTC Bank, a director of Tutuwa Community Holdings and a director of BASA.
Sim joined the group in 2000 in the project finance division of Standard Corporate Merchant Bank (SCMB). From 2001 to 2006, he was managing director of Stanbic Africa, and from 2003, he served concurrently as deputy chief executive of PBB. He was appointed chief executive of PBB in 2006. In June 2008, he was appointed chief executive of SBSA. In 2009, he was appointed deputy chief executive of SBG. In 2013, he was appointed group chief executive of SBG.
Ben Kruger (55) (left)
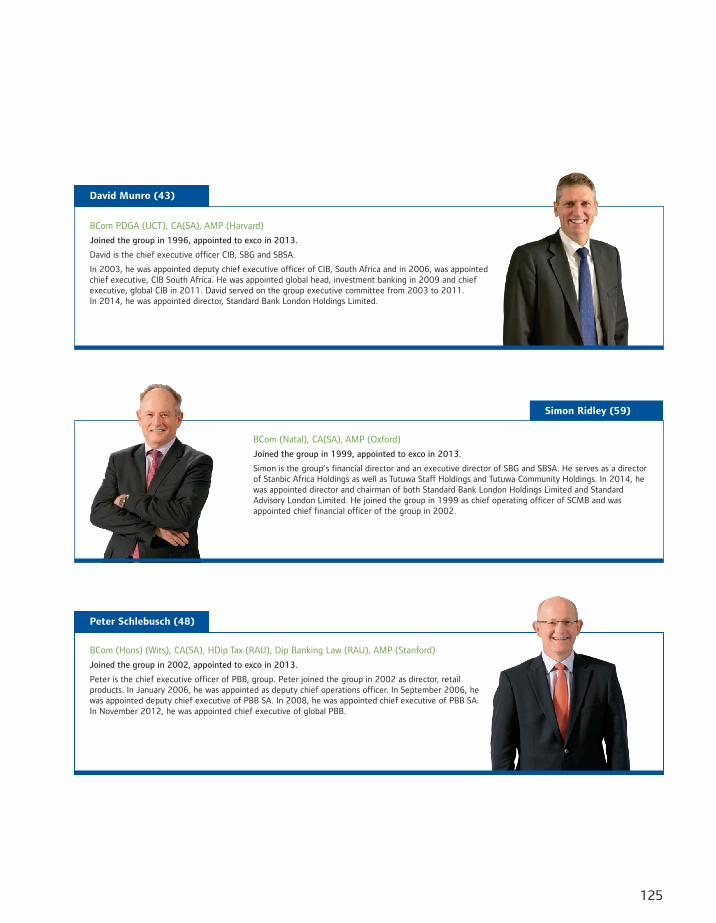
125
David Munro (43)
BCom PDGA (UCT), CA(SA), AMP (Harvard)
Joined the group in 1996, appointed to exco in 2013.
David is the chief executive officer CIB, SBG and SBSA.
In 2003, he was appointed deputy chief executive officer of CIB, South Africa and in 2006, was appointed chief executive, CIB South Africa. He was appointed global head, investment banking in 2009 and chief executive, global CIB in 2011. David served on the group executive committee from 2003 to 2011. In 2014, he was appointed director, Standard Bank London Holdings Limited.
Peter Schlebusch (48)
BCom (Hons) (Wits), CA(SA), HDip Tax (RAU), Dip Banking Law (RAU), AMP (Stanford)
Joined the group in 2002, appointed to exco in 2013.
Peter is the chief executive officer of PBB, group. Peter joined the group in 2002 as director, retail products. In January 2006, he was appointed as deputy chief operations officer. In September 2006, he was appointed deputy chief executive of PBB SA. In 2008, he was appointed chief executive of PBB SA. In November 2012, he was appointed chief executive of global PBB.
Simon Ridley (59)
BCom (Natal), CA(SA), AMP (Oxford)
Joined the group in 1999, appointed to exco in 2013.
Simon is the group’s financial director and an executive director of SBG and SBSA. He serves as a director of Stanbic Africa Holdings as well as Tutuwa Staff Holdings and Tutuwa Community Holdings. In 2014, he was appointed director and chairman of both Standard Bank London Holdings Limited and Standard Advisory London Limited. He joined the group in 1999 as chief operating officer of SCMB and was appointed chief financial officer of the group in 2002.
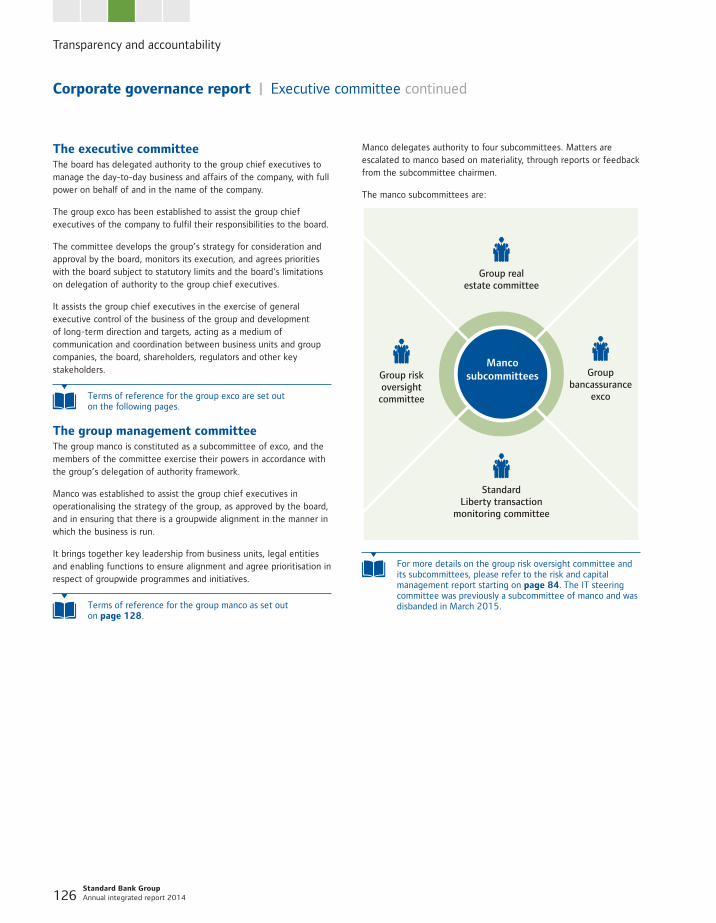
Transparency and accountability
Standard Bank Group Annual integrated report 2014 126
Corporate governance report | Executive committee continued
The executive committeeThe board has delegated authority to the group chief executives to manage the day-to-day business and affairs of the company, with full power on behalf of and in the name of the company.
The group exco has been established to assist the group chief executives of the company to fulfil their responsibilities to the board.
The committee develops the group’s strategy for consideration and approval by the board, monitors its execution, and agrees priorities with the board subject to statutory limits and the board's limitations on delegation of authority to the group chief executives.
It assists the group chief executives in the exercise of general executive control of the business of the group and development of long-term direction and targets, acting as a medium of communication and coordination between business units and group companies, the board, shareholders, regulators and other key stakeholders.
Terms of reference for the group exco are set out on the following pages.
The group management committeeThe group manco is constituted as a subcommittee of exco, and the members of the committee exercise their powers in accordance with the group’s delegation of authority framework.
Manco was established to assist the group chief executives in operationalising the strategy of the group, as approved by the board, and in ensuring that there is a groupwide alignment in the manner in which the business is run.
It brings together key leadership from business units, legal entities and enabling functions to ensure alignment and agree prioritisation in respect of groupwide programmes and initiatives.
Terms of reference for the group manco as set out on page 128.
Manco delegates authority to four subcommittees. Matters are escalated to manco based on materiality, through reports or feedback from the subcommittee chairmen.
The manco subcommittees are:
Manco subcommittees
Group real estate committee
Group risk oversight
committee
Group bancassurance
exco
Standard Liberty transaction
monitoring committee
For more details on the group risk oversight committee and its subcommittees, please refer to the risk and capital management report starting on page 84. The IT steering committee was previously a subcommittee of manco and was disbanded in March 2015.
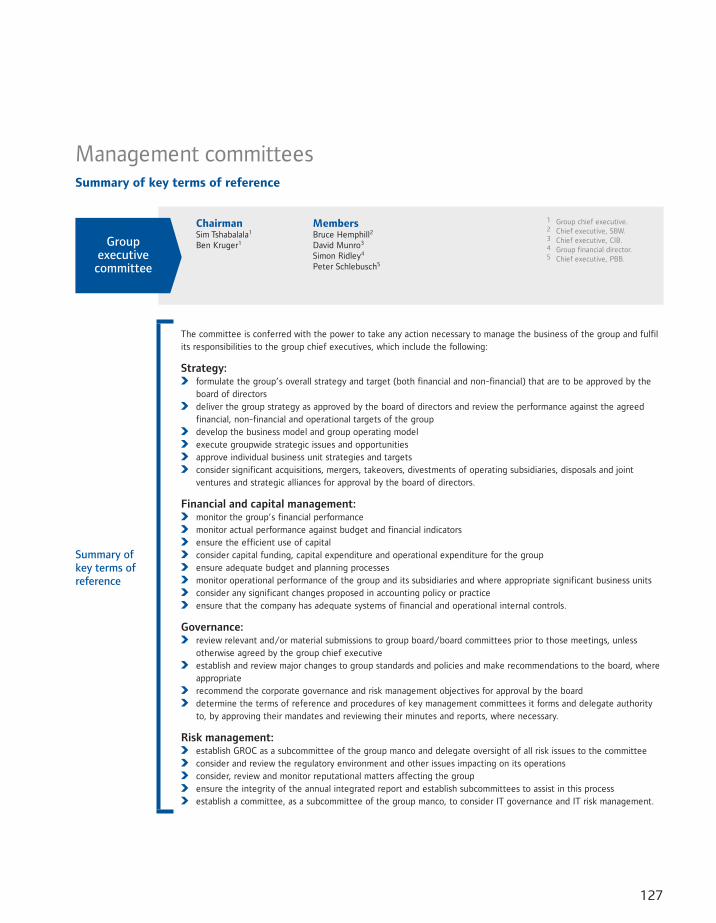
127
ChairmanSim Tshabalala1
Ben Kruger1
MembersBruce Hemphill2
David Munro3
Simon Ridley4
Peter Schlebusch5
1 Group chief executive.2 Chief executive, SBW.3 Chief executive, CIB.4 Group financial director.5 Chief executive, PBB.
Summary of key terms of reference
The committee is conferred with the power to take any action necessary to manage the business of the group and fulfil its responsibilities to the group chief executives, which include the following:
Strategy: formulate the group’s overall strategy and target (both financial and non-financial) that are to be approved by the
board of directors deliver the group strategy as approved by the board of directors and review the performance against the agreed
financial, non-financial and operational targets of the group develop the business model and group operating model execute groupwide strategic issues and opportunities approve individual business unit strategies and targets consider significant acquisitions, mergers, takeovers, divestments of operating subsidiaries, disposals and joint
ventures and strategic alliances for approval by the board of directors.
Financial and capital management: monitor the group’s financial performance monitor actual performance against budget and financial indicators ensure the efficient use of capital consider capital funding, capital expenditure and operational expenditure for the group ensure adequate budget and planning processes monitor operational performance of the group and its subsidiaries and where appropriate significant business units consider any significant changes proposed in accounting policy or practice ensure that the company has adequate systems of financial and operational internal controls.
Governance: review relevant and/or material submissions to group board/board committees prior to those meetings, unless
otherwise agreed by the group chief executive establish and review major changes to group standards and policies and make recommendations to the board, where
appropriate recommend the corporate governance and risk management objectives for approval by the board determine the terms of reference and procedures of key management committees it forms and delegate authority
to, by approving their mandates and reviewing their minutes and reports, where necessary.
Risk management: establish GROC as a subcommittee of the group manco and delegate oversight of all risk issues to the committee consider and review the regulatory environment and other issues impacting on its operations consider, review and monitor reputational matters affecting the group ensure the integrity of the annual integrated report and establish subcommittees to assist in this process establish a committee, as a subcommittee of the group manco, to consider IT governance and IT risk management.
Group executive committee
Management committeesSummary of key terms of reference
Transparency and accountability
Standard Bank Group Annual integrated report 2014 128
Corporate governance report | Management committees continued
Summary of key terms of reference continued
Summary of key terms of referencecontinued
People/transformation: conduct regular talent reviews to ensure attention is given to succession planning, leadership development, pipeline
management and performance development approve all nominations for executive talent development programmes approve transformation targets for SBSA in terms of industry codes, for review by the group social and ethics
committee.
Other: deal with any other matters that may be delegated/referred to group exco by the board via the group
chief executives communicate strategy to the group and be the single voice of leadership set the tone in providing ethical leadership and creating an ethical environment ensure that the group complies with all relevant laws, regulations and corporate governance principles understand and manage key external geographic stakeholders, including clients, regulators, boards and governments consider non-financial matters; best practice; technical and human resources issues consider any other action necessary to manage the group and fulfil its responsibilities to the board within the
corporate governance framework, risk parameters and tolerance levels established by the board from time-to-time.
ChairmanSim Tshabalala1
Ben Kruger1
MembersBruce Hemphill2
Jenny Knott3
Isabel Lawrence4
Funeka Montjane5
David Munro6
Chris Newson7
Brenda Niehaus8
Rod Poole9
Simon Ridley10
Peter Schlebusch11
Ian Sinton12
Paul Smith13
Sharon Taylor14
Nikki Twomey15
Mike White16
1 Group chief executive.2 Chief executive, SBW.3 Strategic advisor to group chief executive.4 Group chief compliance officer.5 Chief executive, PBB SA.6 Chief executive, CIB.7 Chief executive, Standard Bank Africa.8 CIO.9 Chief of staff, CIB.10 Group financial director.11 Chief executive, PBB.12 General council.13 Group CRO.14 Head, human capital.15 Head, marketing and communications.16 Group chief audit officer.
Summary of key terms of reference
The committee is conferred with the power to take any action necessary to manage the business of the group and fulfil its responsibilities to the group chief executives, which include the following:
Strategy and execution: define how the strategy will be executed
determine groupwide strategies to be prioritised for execution
monitor execution
provide input for long-term direction and portfolio decisions.
Group management committee
Group executive committee continued
129
Summary of key terms of reference
Financial and capital management: monitor the group’s financial performance
allocate budget for delivery of agreed priority initiatives
monitor actual performance against budget and financial indicators
ensure the efficient use of capital
consider capital funding, capital expenditure and operational expenditure for the group
ensure adequate budget and planning processes
monitor operational performance of the group and its subsidiaries and, where appropriate, significant business units
ensure that the group has adequate systems of financial and operational internal controls.
Governance: establish and review major changes to group standards and policies and make recommendations to the group exco
and/or board, where appropriate
determine the terms of reference and procedures of key management committees it forms and delegates authority to, by approving their mandates and reviewing their minutes and reports, where necessary.
Risk management: delegate oversight of all risk issues to GROC
consider and review the regulatory environment and other issues impacting on its operations
consider, review and monitor reputational matters affecting the group
establish a committee to consider IT governance and IT risk management.
People/transformation: conduct regular talent reviews to ensure attention is given to succession planning, leadership development, pipeline
management and performance development
approve all nominations for executive talent development programmes
approve transformation targets for SBSA in terms of industry codes, for review by the group social and ethics committee.
Oversight of committees: monitor the progress and performance of subcommittees it establishes
receive recommendations and proposals from these committees.
Other: deal with any other matters that may be delegated/referred to the committee by the group exco
review material and unexpected issues
set the tone in providing ethical leadership and creating an ethical environment
ensure that the company complies with all relevant laws, regulations and corporate governance principles
agree course-correcting measures that require a cross business unit response
understand and manage key external geographic stakeholders, including clients, regulators, boards and governments
consider non-financial matters, best practice, technical and human resources issues
consider any other action necessary to manage the group and fulfil its responsibilities to the board within the corporate governance framework, risk parameters and tolerance levels established by the board from time-to-time.
Summary of key terms of reference continued
Group executive committee continued
Transparency and accountability
Standard Bank Group Annual integrated report 2014 130
General governancePrescribed officersAs set out in the Companies Act regulations, a person is a prescribed officer if such person exercises general executive control over and management of the whole, or a significant portion of, the business and activities of the company or regularly participates to a material degree in the exercise of general executive control over and management of the whole, or significant portion, of the activities of the company. Accordingly, the group directors’ affairs committee confirmed the classification of the group’s prescribed officers as envisaged in the Companies Act. Besides the executive directors, namely group chief executives Ben Kruger, and Sim Tshabalala, and Simon Ridley, group financial director, the company’s prescribed officers are:
David Munro, the chief executive, CIB
Peter Schlebusch, the chief executive, PBB
Bruce Hemphill, the chief executive, SBW.
Disclosure of remuneration for the prescribed officers is contained on page 146.
Governance in our subsidiariesThe group has a governance framework to ensure the application of sound governance practices and the delegation of rights and responsibilities from the group to its key operating subsidiaries. This is in line with the King Code recommendation that a holding company should have a governance framework policy which applies to, and is accepted by, its subsidiary companies ensuring that the same governance principles and beliefs are recognised across the network of subsidiaries. This governance framework becomes the common thread that binds the subsidiaries irrespective of where the entity lies in the group structure. In all jurisdictions, corporate governance developments are monitored on an ongoing basis to ensure that local requirements are met. Achieving this requires a strong core central governance system which feeds into the network. Implementation of the governance framework is at various stages of maturity in the different countries, and the group governance office continues to work with subsidiaries on embedding the framework.
The group structure, including material local and international subsidiaries, is set out in the annual financial statements in annexure A.
Group secretaryThe board is satisfied that an arm’s length relationship exists between it and the group secretary, Zola Stephen, who is not a member of the board or a prescribed officer of the group. In addition to guiding the board on discharging its duties and responsibilities, the group secretary keeps the board abreast of relevant changes in legislation and governance best practice.
To enable the board to function effectively, all directors have full and timely access to information that may be relevant in the proper discharge of their duties. This includes information such as corporate announcements, investor communications and other developments that may affect the group and its operations. All directors have access to the services of the group secretary.
In line with the JSE Listings Requirements, the board has assessed the competence, qualifications and experience of the group secretary and concluded that she is competent to carry out her duties.
The board remains responsible for the appointment and removal of the group secretary.
Ensuring the highest levels of complianceComplying with all applicable legislation, regulations, standards and codes is integral to the group’s culture and imperative to achieving its strategy. The board delegates responsibility for compliance to management, and monitors this through the compliance function. The regulatory and legislative oversight committee assesses the impact of proposed legislation and regulation, and any material regulatory issues are escalated to GROC and the GRCMC.
Oversight of compliance risk management is delegated to the GAC, which reviews and approves the mandate of the group chief compliance officer. The group chief compliance officer provides a quarterly report on the status of compliance risk management in the group and significant areas of non-compliance, as well as providing feedback on interaction with regulators. GIA reviews and audits the group compliance function, as well as the compliance policy and governance standards.
Code of banking practiceStandard Bank is a member of BASA. Endorsed by the members of BASA, the code of banking practice safeguards the interests of consumers. It is based on four key principles: fairness, transparency, accountability and reliability. These principles resonate with the group’s values and will ensure that the Financial Services Board’s TCF framework is met. TCF seeks to create a more meaningful focus on the fair treatment of customers.
An update on the work performed by the group to achieve TCF compliance can be found in the sustainability report.
Codes of conductStandard Bank is regulated by various codes of conduct in terms of the Financial Advisory and Intermediary Services Act 37 of 2002. This act regulates financial service providers who render advice and/or provide intermediary services to clients in relation to certain financial products.
Standard Bank has also adopted BASA’s code for the selling of unsecured credit, which governs the relationship between banks and customers in respect of credit extension. Regular risk reviews are embedded in the credit function and provide the means to regulate credit risk appetite.
King CodeThe group continues to apply the principles of the King Code which adopts an ‘apply or explain’ approach whereby a reasonable explanation for not applying a principle is required. Exceptions and differences to the application of the King Code are monitored and reviewed annually, and the board is satisfied with the group’s compliance in this regard. Instances of non-compliance have been considered and explained below. These instances occurred throughout the reporting year.
Corporate governance report | continued
131
Exceptions to the application of the King Code principles
Principle 2.19 (paragraph 88.7): King III requires disclosure of actual or potential political connections or exposure for directors. The group does not discourage directors from being affiliated to political parties and the board believes this contributes to strengthening South Africa’s democracy. Some of the group’s directors are involved in political parties but are not office bearers of any political party in South Africa.
Principle 2.25 (paragraph 153): The board has considered the King Code requirement that non-executive remuneration should comprise a base fee and an attendance fee per meeting, and has agreed that the current fee structure of a single comprehensive annual fee is more appropriate for the group board and committees. It is the group’s view that the contribution of directors cannot only be judged by attendance at board and committee meetings.
Principle 2.25 (paragraph 173): The King Code requires that options or other conditional share awards should not vest or be exercisable within three years from the date of grant. However, the deferred bonus scheme (DBS), which is settled in Standard Bank equity shares, has an initial vesting period shorter than three years. The average vesting period for deferred bonuses is, however, approximately three years.
Further information on the DBS can be found in the remuneration report, starting on page 140.
Statement of differences to the King Code Principle 7.1 (paragraph 5): The King Code recommends that
the board approve the GIA charter. The board has delegated this
responsibility to the GAC.
Dealing in securitiesThe group is committed to conducting its business professionally and ethically. It has a personal account trading policy and a dealing policy for directors and prescribed officers in place to prohibit directors and employees from trading in securities during closed periods. Closed periods are in effect from 1 June until the publication of the interim results and 1 December until the publication of year end results. Closed periods also include any period where the group is trading under a cautionary announcement.
All directors’ dealings require the prior approval of the chairman, and the group secretary retains a record of all their share dealings and approvals.
Certain nominated employees are prohibited from trading in designated securities due to the price-sensitive information they may obtain in their positions. Compliance with policies is monitored on an ongoing basis and any breaches are dealt with according to the provisions of the policy and the JSE Listings Requirements.
The group has complied with all Listings Requirements and disclosure requirements prescribed by the JSE.
Connecting with our stakeholdersThe group’s relevance to the markets and societies in which it operates depends on continued and meaningful engagement with all stakeholders. Building and maintaining good stakeholder relationships help us manage and respond to expectations, minimise reputational risk and form strong partnerships, all of which support commercial sustainability.
Individual business units undertake stakeholder engagement activities appropriate to their particular areas. At group level, the stakeholder relations unit engages with key stakeholders in the public and private sectors. The stakeholder relations forum comprising business unit managers and executives meet every second month. It is responsible for facilitating a coordinated approach to stakeholder engagement activities across the group, and ensuring that the group communicates a consistent message based on our code, values and strategy.
Board meetings include oversight of stakeholder engagement activities as a standing item. The board receives a quarterly stakeholder engagement report that collates input from the group’s business units and provides an overview of activities across the group.
The investor relations department facilitates regular and pertinent communication with shareholders. The chairman also encourages shareholders to attend the AGM where interaction is welcomed.
Political party contributionsAs part of its commitment to supporting democracy in South Africa, the group makes a financial donation to political parties represented in the National Assembly. In terms of the policy agreed by the board in 2005, the donations are distributed according to a funding formula based on that of the Independent Electoral Commission. In a year when there is a general election, the donation to parties is doubled, to take into account the increased political activity. Parties are required to submit a report to the group outlining how they have used the previous year’s donation.
The policy is reviewed after every general election. In 2010, the board confirmed its commitment to the democracy support programme until 2014. The total allocation to political parties from 2010 to 2014 was R13,5 million, with R4,2 million donated in 2014.
Ethics and organisational integrityCompany values and ethics promote a healthy working environment and sustainably profitable organisation.
The board aims to provide effective and ethical leadership, and ensure that its conduct and that of management is aligned to the group’s values and the code. The board subscribes to the group’s values and the code. The code is designed to empower employees and enable effective decision-making at all levels of the business according to defined ethical principles and values.
The code of ethics is available on the group’s website at www.standardbank.com/ethics.aspx.
Transparency and accountability
Standard Bank Group Annual integrated report 2014 132
Corporate governance report | General governance continued
In ensuring that the group operates ethically, the board uses the inclusive stakeholder model of governance that considers the interests of all the group’s stakeholders.
Refer to the section on responding to our stakeholders on page 16 for further details.
The group is a member of the Ethics Institute of South Africa, which advances the practice of ethics in South Africa and a number of other countries in Africa. The Ethics Institute has certified that the group’s code meets the highest standards of international best practice. The code is aligned with and supported by other group policies and procedures, and supports compliance with the relevant industry regulations and laws.
Information on accessibility, anonymity, processes and the policy relating to the whistle-blowing service was published in all business units and geographical publications during the year. Overall, the group’s financial crime control unit held over 1 589 awareness sessions and 567 disclosures were made to the hotline.
The ethics line contact details are:
Hotline SA only: 0800 113 443Hotfax SA only: 0800 200 796Hotline international: +27 12 543 1547Hotmail international: [email protected]
Liberty has its own code of ethics, policy and ethics line, which is operated by an independent service provider.
The PoPI Act was signed into law in 2013. While a commencement date for PoPI is yet to be decided, organisations will need to be compliant within one year of its commencement. A groupwide regulatory privacy programme is currently underway within Standard Bank to facilitate adherence to privacy requirements in the various jurisdictions in which the group does business, including the PoPI Act.
The group is focused on bringing positive change to the markets in which it operates. As a result, we have a supportive governance framework to enable the highest standards of responsible business practice in our interactions with all our stakeholders.
Management has set up an ethics management framework in which:
the group chief executives and group ethics officer are the formal custodians of the code and are ultimately responsible for ensuring it is applied throughout the group
each business unit has a senior executive (business unit ethics officer) who is responsible for driving awareness of the code and act as a final arbiter in cases where difficult decisions arise
the ethics officer takes responsibility for the internal reporting of ethics-related incidents to management and the board through the group social and ethics committee and GAC
the code is applicable in all countries in which the group has banking operations
ethical incidents are reported through the ethics and fraud hotline, the group financial crime control unit, the human capital department, the ethics mailbox, business unit ethics officers and line managers
an independent service provider operates a confidential and anonymous hotline on behalf of the group – awareness building and training is provided throughout the organisation to ensure employees are aware of the ethics reporting options available to them
the group’s values and code are included in leadership and management training, employee orientation programmes and the employee handbook
in 2014 an ethics e-learning programme was launched for permanent employees, which is also available to non-permanent employees. This training is provided in English, French and Portuguese
values and ethics are incorporated in the group’s performance management approach, where team members hold themselves and each other accountable for following the required values-based behaviours
the most recent review of the code was undertaken in the latter part of 2013 where the principles of the ‘serving our customers’ value were amended to align to TCF regulatory requirements. The revised code of ethics was launched in March 2014. In December 2014, the value ‘guarding against arrogance’ was amended to ‘raising the bar’.
Going concernThe board considers and assesses the group’s status as a going concern in the preparation of the annual financial statements at year end. During the interim reporting period, a similar process is followed. In addition, the board considers the solvency and liquidity requirements in line with the provisions of the Companies Act.
The board’s conclusion regarding the going concern status of the group can be found in the statement of directors’ responsibility for financial reporting.
Sustainability
The sustainability report sets out a detailed analysis of the sustainability performance for the year and can be found at www.standardbank.com/sustainability.
Details on the group’s commitment to transformation can be found in our sustainability report.
133
Remuneration report
OUR REMUNERATION REPORT INCLUDES:
Review of focus areas – 2014 and 2015We continually review our pay practices to align with shareholder interests and to ensure that the practices support our businesses and changes in our operating environment. We actively seek shareholder views and revise our reporting to improve transparency. The growth of our businesses across the African continent will see a shift in focus to pay practices in those markets going forward. We seek to remain competitive and relevant there, where often the talent is scarce. We set practices that take into account local conditions within a group governance framework. Specific focus areas for 2015 are detailed below.
Focus areas and achievements in 2014
The executive performance evaluation process was refined for all prescribed officers.
The new long-term performance-driven share plan – the performance reward plan (PRP) – was launched in March 2014. The PRP is fully conditional on the achievement of specific financial targets.
We engaged with many significant shareholders on the group’s remuneration policy.
The remuneration policy was approved at the AGM held in May 2014, with 84% of shareholders voting in favour of the policy.
Our 2013 remuneration report was placed second in the South African Reward Association’s annual awards.
Inclusion of a six year pay history for all of our executive directors in this report.
Focus areas in 2015
We have established a benefits governance committee and they will focus on reviewing benefits across the African continent.
Making sure that the link between pay and performance is understood.
We will continue to award higher levels of increases to the lowest level of employees.
We will review all our reward and benefits offerings outside Africa to take account of the disposal of the global markets operations in February 2015.
Our people ultimately underpin the successful execution of our strategy. We work to ensure that our pay framework supports the motivation and reward of performance, while at the same time meeting regulatory requirements and stakeholder expectations.
Review of focus areas – 2014 and 2015
Chairman’s letter
Remuneration policy
Remuneration structure
Risk management and remuneration
Disclosure of executive directors’ and prescribed officers’ remuneration
Remco governance
Non-executive directors
Regulatory disclosures
Transparency and accountability
Standard Bank Group Annual integrated report 2014 134
Chairman’s letter
Since the financial crisis in 2008, your board and executive
teams have redefined the group’s vision from that of a financial
institution focused on emerging markets to being the leading
financial services organisation in, for and across Africa.
As part of that reshaping process, we have, in a controlled
manner, disposed of operations in many geographies beyond
Africa and simplified the outside Africa business. The sale of a
majority interest in Standard Bank Plc to ICBC on 1 February
2015 and consequent repositioning of capital is the most
important landmark in this journey of transition.
2014 was a year of deep contrasts. Profit increased by 32% to
R22,2 billion in the banking group excluding Standard Bank Plc.
But Standard Bank Plc delivered a headline earnings loss of
R3,7 billion. A significant downward valuation adjustment in
respect of aluminium collateral held in bonded warehouses in
China was included in that loss. We believe that fraudulent
activities, entirely external to your group, gave rise to this
adjustment and we continue to pursue various alternatives
for recovery of the exposure.
Against this backdrop, accountability and remuneration decisions
were complex. Critical to the Standard Bank Plc transaction was
delivery of a strong, competent team of professionals, including
enablers. For this reason, adequate remuneration for them was
vital in 2014 and we endeavoured to deliver that. With deep
maturity, however, the entire senior leadership of that business
accepted significant reductions in remuneration in light of the
2014 loss.
The impact of the loss in Standard Bank Plc, rippled outward
across CIB and into group leadership. CIB’s continuing business
grew headline earnings by 26%, but its bonus pool increased
minimally. Given these disconnected rates of increase, CIB
leadership worked positively on remuneration, understanding
that short term sacrifices were constructive for the business
in future.
For you as a shareholder, an important principle emerges.
Accountability and remuneration are inextricably linked in
Standard Bank Group. Executives and managers are held to
account transparently for their activities and they take
responsibility for their results. Reward responds to excellence,
but penalises underperformance.
Our most senior leaders share in overall outcomes of the group,
despite their specific responsibilities. The Standard Bank Plc loss
had impacts on the variable remuneration of our prescribed
officers beyond CIB. The prescribed officer variable remuneration
information is set out on pages 147 and 148. In total, the 2014
annual incentive awards for executive directors and prescribed
officers decreased by 30.2%.
The joint-chief executive design in Standard Bank Group, with
no deputies or chief operating officer, is proving to be highly
effective. We hold the two people jointly accountable for
delivering group results. There is no separation when we consider
accountability. Remco’s preferred policy is therefore to apply an
equal-remuneration policy for the joint-chief executives, despite
their leadership of different entities within the group, which
changes with time.
Remco departed in 2014 from its equal-remuneration policy
for the joint-chief executives for a specific reason. Given the
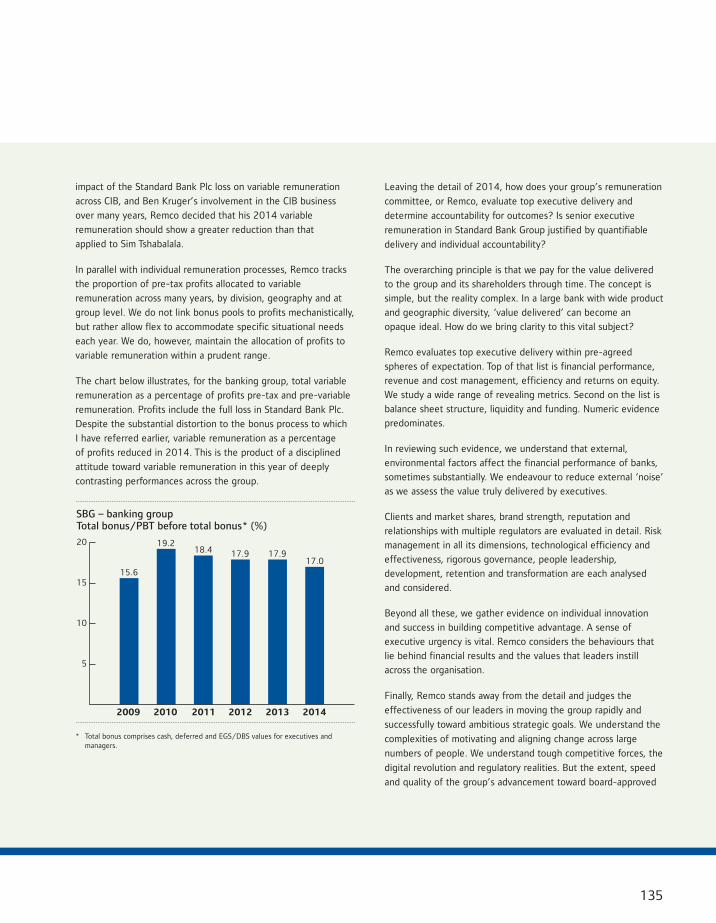
135
Leaving the detail of 2014, how does your group’s remuneration
committee, or Remco, evaluate top executive delivery and
determine accountability for outcomes? Is senior executive
remuneration in Standard Bank Group justified by quantifiable
delivery and individual accountability?
The overarching principle is that we pay for the value delivered
to the group and its shareholders through time. The concept is
simple, but the reality complex. In a large bank with wide product
and geographic diversity, ‘value delivered’ can become an
opaque ideal. How do we bring clarity to this vital subject?
Remco evaluates top executive delivery within pre-agreed
spheres of expectation. Top of that list is financial performance,
revenue and cost management, efficiency and returns on equity.
We study a wide range of revealing metrics. Second on the list is
balance sheet structure, liquidity and funding. Numeric evidence
predominates.
In reviewing such evidence, we understand that external,
environmental factors affect the financial performance of banks,
sometimes substantially. We endeavour to reduce external ‘noise’
as we assess the value truly delivered by executives.
Clients and market shares, brand strength, reputation and
relationships with multiple regulators are evaluated in detail. Risk
management in all its dimensions, technological efficiency and
effectiveness, rigorous governance, people leadership,
development, retention and transformation are each analysed
and considered.
Beyond all these, we gather evidence on individual innovation
and success in building competitive advantage. A sense of
executive urgency is vital. Remco considers the behaviours that
lie behind financial results and the values that leaders instill
across the organisation.
Finally, Remco stands away from the detail and judges the
effectiveness of our leaders in moving the group rapidly and
successfully toward ambitious strategic goals. We understand the
complexities of motivating and aligning change across large
numbers of people. We understand tough competitive forces, the
digital revolution and regulatory realities. But the extent, speed
and quality of the group’s advancement toward board-approved
impact of the Standard Bank Plc loss on variable remuneration
across CIB, and Ben Kruger’s involvement in the CIB business
over many years, Remco decided that his 2014 variable
remuneration should show a greater reduction than that
applied to Sim Tshabalala.
In parallel with individual remuneration processes, Remco tracks
the proportion of pre-tax profits allocated to variable
remuneration across many years, by division, geography and at
group level. We do not link bonus pools to profits mechanistically,
but rather allow flex to accommodate specific situational needs
each year. We do, however, maintain the allocation of profits to
variable remuneration within a prudent range.
The chart below illustrates, for the banking group, total variable
remuneration as a percentage of profits pre-tax and pre-variable
remuneration. Profits include the full loss in Standard Bank Plc.
Despite the substantial distortion to the bonus process to which
I have referred earlier, variable remuneration as a percentage
of profits reduced in 2014. This is the product of a disciplined
attitude toward variable remuneration in this year of deeply
contrasting performances across the group.
2012
SBG – banking groupTotal bonus/PBT before total bonus* (%)
20
15
10
5
2009 2014201320112010
15.6
19.218.4 17.9
17.017.9
* Total bonus comprises cash, deferred and EGS/DBS values for executives and managers.
Transparency and accountability
Standard Bank Group Annual integrated report 2014 136
Chairman's letter | continued
group strategic destinations is a measure of leadership and
consequent remuneration.
This evaluation process by Remco is detailed, thorough, and
carefully designed to yield a relatively clear view of individual
‘value delivered’. Then, standing on that foundation of evidence,
Remco takes decisions on individual remuneration.
Critics of our design ask why we do not use pre-published
financial targets and a formulaic determination of annual
remuneration. This, they say, cuts through the complexities of
assessing ‘value delivered’.
Scorecard-based annual remuneration assumes that only what
can be counted counts. This is correct in the long term from a
shareholder perspective. But, year by year, scorecards overlook
important elements of long-term strategic, structural and human
resource delivery by the bank’s leadership. Few large banks tie
themselves to such a design, and those that do, typically leave
room for remuneration committee over-rides.
Of deeper concern is that formulaic annual remuneration in
banking nourishes a short-term bonus-centric culture. Bonus-
boosting tactics would be favoured. Tilting toward higher risk
business, delaying long-term strategies in favour of short term
benefits, hiring quick-revenue generators rather than building
deep talent, preserving fragmented IT structures and under-
investing in risk, internal audit and compliance are all targets for
bonus-focused executives. Such attitudes cost shareholders,
typically with delayed but substantial impact.
Long-term, strategic thinking is vital in banking, and
remuneration designs must promote this culture. In Standard
Bank Group, for example, the strong earnings growth now
emerging in sub-Saharan Africa, or the installation of world-class
core-banking information technology systems, are consequences
of far-seeing, courageous, resolute leadership through time.
Beyond annual performance measurement, your group’s
Performance Reward Plan, or PRP, is a long-term scheme
designed to align roughly 100 top executives with shareholder
interests. It uses three-year headline earnings growth and return
on equity goals to reward strong, consistent performance on a
rolling basis.
For each annual tranche of PRP awards, Remco considers the
bank’s current situation and then sets vesting thresholds for
average headline earnings growth and average return on equity
over the following three years. Actual outcomes against those
vesting thresholds determine the extent of awards that vest. The
remuneration report that follows explains the design and
operation of the PRP.
Aligning executives with your interests as a shareholder is a
priority for Remco. We require our top executives to build and
maintain personal shareholdings in Standard Bank Group to
specified value levels. In addition, all deferred remuneration
tracks the group share price until vesting.
Your group has crystallised its focus on Africa. Its presence in
20 sub-Saharan African countries is a valuable platform on which
to build. The group’s strategic position has never been stronger.
Furthermore, a great depth and breadth of human capability has
been built across many years. This is business muscle. It is a
critical resource of intelligent, skilled, experienced, clear-
thinking, energetic people who continuously drive growth and
innovation, within clear risk boundaries. Understanding the value
each person delivers, and rewarding them appropriately, is
decisive in building a vibrant, results-orientated organisation
for the benefit of shareholders.
Yours sincerely,
Ted WoodsChairman, remuneration committee
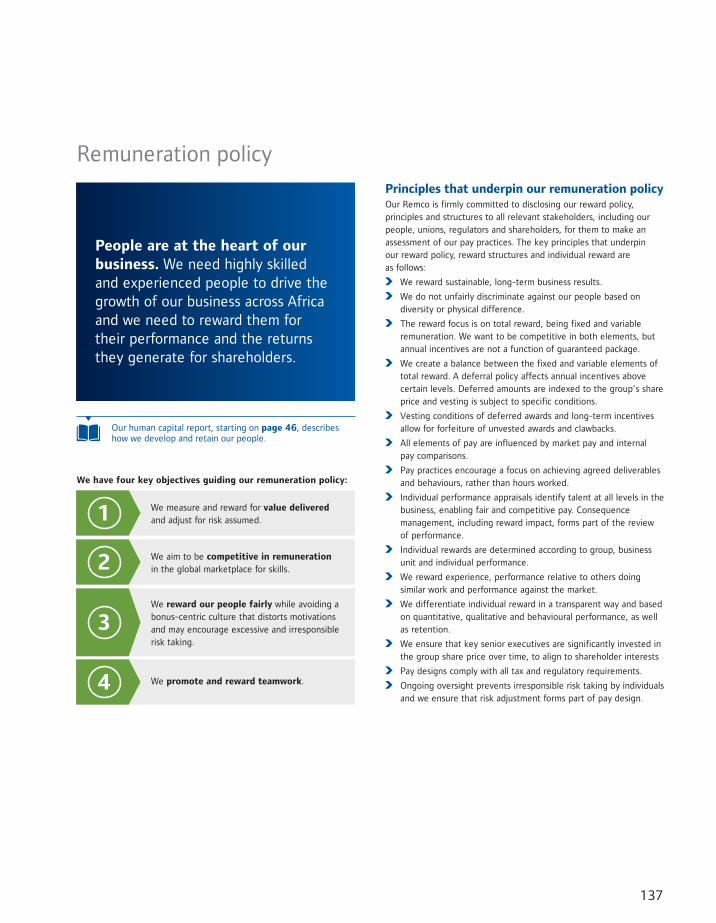
137
Principles that underpin our remuneration policyOur Remco is firmly committed to disclosing our reward policy, principles and structures to all relevant stakeholders, including our people, unions, regulators and shareholders, for them to make an assessment of our pay practices. The key principles that underpin our reward policy, reward structures and individual reward are as follows:
We reward sustainable, long-term business results.
We do not unfairly discriminate against our people based on diversity or physical difference.
The reward focus is on total reward, being fixed and variable remuneration. We want to be competitive in both elements, but annual incentives are not a function of guaranteed package.
We create a balance between the fixed and variable elements of total reward. A deferral policy affects annual incentives above certain levels. Deferred amounts are indexed to the group’s share price and vesting is subject to specific conditions.
Vesting conditions of deferred awards and long-term incentives allow for forfeiture of unvested awards and clawbacks.
All elements of pay are influenced by market pay and internal pay comparisons.
Pay practices encourage a focus on achieving agreed deliverables and behaviours, rather than hours worked.
Individual performance appraisals identify talent at all levels in the business, enabling fair and competitive pay. Consequence management, including reward impact, forms part of the review of performance.
Individual rewards are determined according to group, business unit and individual performance.
We reward experience, performance relative to others doing similar work and performance against the market.
We differentiate individual reward in a transparent way and based on quantitative, qualitative and behavioural performance, as well as retention.
We ensure that key senior executives are significantly invested in the group share price over time, to align to shareholder interests
Pay designs comply with all tax and regulatory requirements.
Ongoing oversight prevents irresponsible risk taking by individuals and we ensure that risk adjustment forms part of pay design.
Our human capital report, starting on page 46, describes how we develop and retain our people.
We have four key objectives guiding our remuneration policy:
Remuneration policy
1 We measure and reward for value delivered and adjust for risk assumed.
2 We aim to be competitive in remuneration in the global marketplace for skills.
3We reward our people fairly while avoiding a bonus-centric culture that distorts motivations and may encourage excessive and irresponsible risk taking.
4 We promote and reward teamwork.
People are at the heart of our business. We need highly skilled and experienced people to drive the growth of our business across Africa and we need to reward them for their performance and the returns they generate for shareholders.
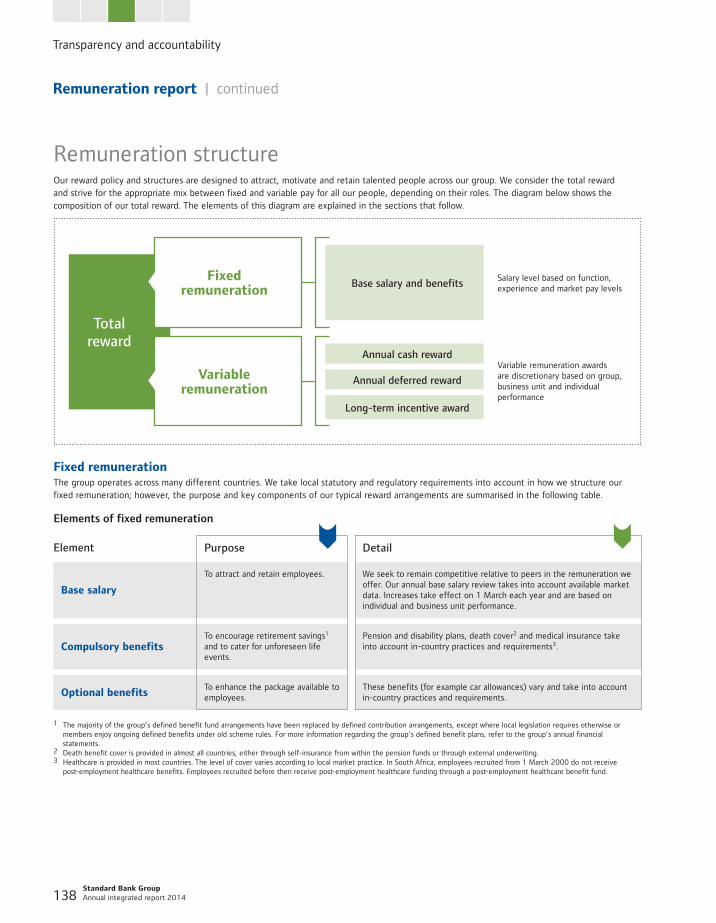
Transparency and accountability
Standard Bank Group Annual integrated report 2014 138
Remuneration structureOur reward policy and structures are designed to attract, motivate and retain talented people across our group. We consider the total reward and strive for the appropriate mix between fixed and variable pay for all our people, depending on their roles. The diagram below shows the composition of our total reward. The elements of this diagram are explained in the sections that follow.
Annual cash reward
Annual deferred reward
Long-term incentive award
Total reward
Variable remuneration
Base salary and benefits Salary level based on function, experience and market pay levels
Variable remuneration awards are discretionary based on group, business unit and individual performance
Fixed remuneration
Fixed remunerationThe group operates across many different countries. We take local statutory and regulatory requirements into account in how we structure our fixed remuneration; however, the purpose and key components of our typical reward arrangements are summarised in the following table.
Elements of fixed remuneration
Element Purpose Detail
Base salary
To attract and retain employees. We seek to remain competitive relative to peers in the remuneration we offer. Our annual base salary review takes into account available market data. Increases take effect on 1 March each year and are based on individual and business unit performance.
Compulsory benefitsTo encourage retirement savings1 and to cater for unforeseen life events.
Pension and disability plans, death cover2 and medical insurance take into account in-country practices and requirements3.
Optional benefitsTo enhance the package available to employees.
These benefits (for example car allowances) vary and take into account in-country practices and requirements.
1 The majority of the group’s defined benefit fund arrangements have been replaced by defined contribution arrangements, except where local legislation requires otherwise or members enjoy ongoing defined benefits under old scheme rules. For more information regarding the group’s defined benefit plans, refer to the group’s annual financial statements.
2 Death benefit cover is provided in almost all countries, either through self-insurance from within the pension funds or through external underwriting.3 Healthcare is provided in most countries. The level of cover varies according to local market practice. In South Africa, employees recruited from 1 March 2000 do not receive
post-employment healthcare benefits. Employees recruited before then receive post-employment healthcare funding through a post-employment healthcare benefit fund.
Remuneration report | continued
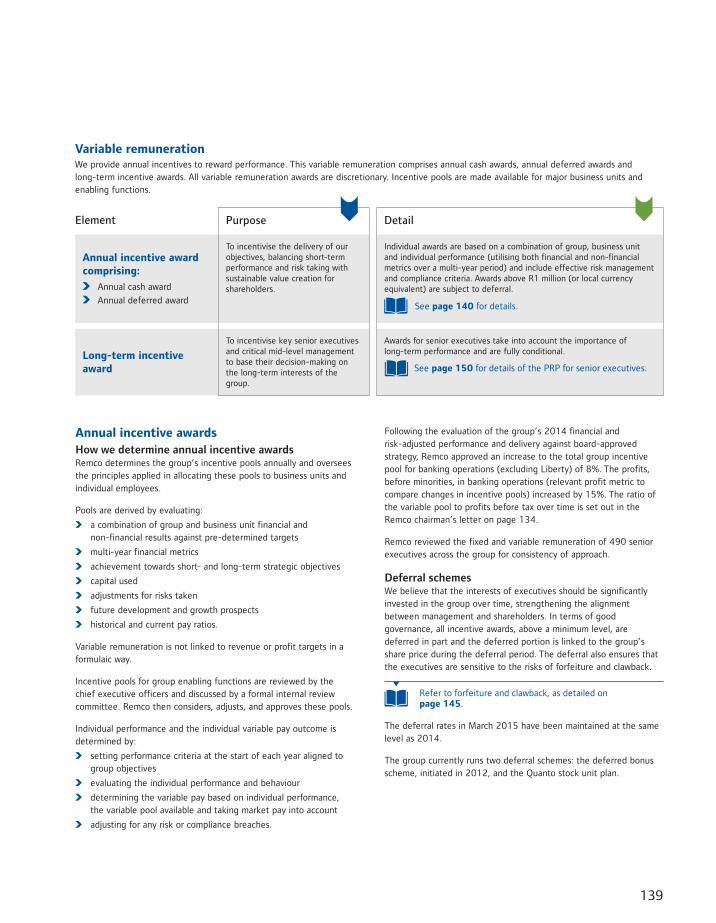
139
Following the evaluation of the group’s 2014 financial and risk-adjusted performance and delivery against board-approved strategy, Remco approved an increase to the total group incentive pool for banking operations (excluding Liberty) of 8%. The profits, before minorities, in banking operations (relevant profit metric to compare changes in incentive pools) increased by 15%. The ratio of the variable pool to profits before tax over time is set out in the Remco chairman’s letter on page 134.
Remco reviewed the fixed and variable remuneration of 490 senior executives across the group for consistency of approach.
Deferral schemesWe believe that the interests of executives should be significantly invested in the group over time, strengthening the alignment between management and shareholders. In terms of good governance, all incentive awards, above a minimum level, are deferred in part and the deferred portion is linked to the group’s share price during the deferral period. The deferral also ensures that the executives are sensitive to the risks of forfeiture and clawback.
Refer to forfeiture and clawback, as detailed on page 145.
The deferral rates in March 2015 have been maintained at the same level as 2014.
The group currently runs two deferral schemes: the deferred bonus scheme, initiated in 2012, and the Quanto stock unit plan.
Annual incentive awardsHow we determine annual incentive awardsRemco determines the group’s incentive pools annually and oversees the principles applied in allocating these pools to business units and individual employees.
Pools are derived by evaluating:
a combination of group and business unit financial and non-financial results against pre-determined targets
multi-year financial metrics
achievement towards short- and long-term strategic objectives
capital used
adjustments for risks taken
future development and growth prospects
historical and current pay ratios.
Variable remuneration is not linked to revenue or profit targets in a formulaic way.
Incentive pools for group enabling functions are reviewed by the chief executive officers and discussed by a formal internal review committee. Remco then considers, adjusts, and approves these pools.
Individual performance and the individual variable pay outcome is determined by:
setting performance criteria at the start of each year aligned to group objectives
evaluating the individual performance and behaviour
determining the variable pay based on individual performance, the variable pool available and taking market pay into account
adjusting for any risk or compliance breaches.
Variable remunerationWe provide annual incentives to reward performance. This variable remuneration comprises annual cash awards, annual deferred awards and long-term incentive awards. All variable remuneration awards are discretionary. Incentive pools are made available for major business units and enabling functions.
Element Purpose Detail
Annual incentive award comprising:
Annual cash award
Annual deferred award
To incentivise the delivery of our objectives, balancing short-term performance and risk taking with sustainable value creation for shareholders.
Individual awards are based on a combination of group, business unit and individual performance (utilising both financial and non-financial metrics over a multi-year period) and include effective risk management and compliance criteria. Awards above R1 million (or local currency equivalent) are subject to deferral.
See page 140 for details.
Long-term incentive award
To incentivise key senior executives and critical mid-level management to base their decision-making on the long-term interests of the group.
Awards for senior executives take into account the importance of long-term performance and are fully conditional.
See page 150 for details of the PRP for senior executives.
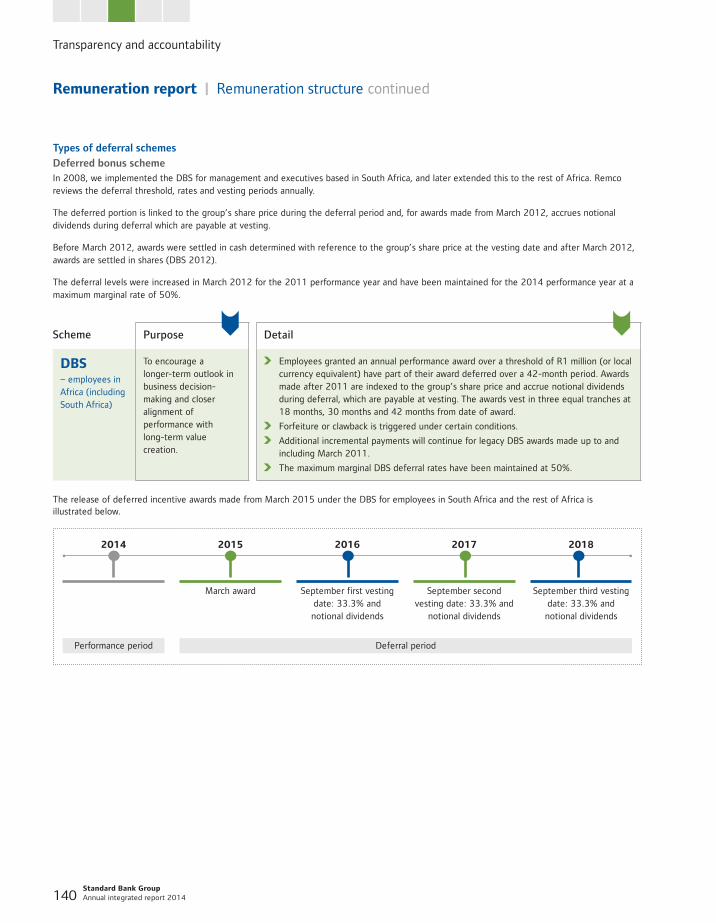
Transparency and accountability
Standard Bank Group Annual integrated report 2014 140
Remuneration report | Remuneration structure continued
Types of deferral schemes
Deferred bonus schemeIn 2008, we implemented the DBS for management and executives based in South Africa, and later extended this to the rest of Africa. Remco reviews the deferral threshold, rates and vesting periods annually.
The deferred portion is linked to the group’s share price during the deferral period and, for awards made from March 2012, accrues notional dividends during deferral which are payable at vesting.
Before March 2012, awards were settled in cash determined with reference to the group’s share price at the vesting date and after March 2012, awards are settled in shares (DBS 2012).
The deferral levels were increased in March 2012 for the 2011 performance year and have been maintained for the 2014 performance year at a maximum marginal rate of 50%.
Scheme Purpose Detail
DBS– employees in Africa (including South Africa)
To encourage a longer-term outlook in business decision-making and closer alignment of performance with long-term value creation.
Employees granted an annual performance award over a threshold of R1 million (or local currency equivalent) have part of their award deferred over a 42-month period. Awards made after 2011 are indexed to the group’s share price and accrue notional dividends during deferral, which are payable at vesting. The awards vest in three equal tranches at 18 months, 30 months and 42 months from date of award.
Forfeiture or clawback is triggered under certain conditions.
Additional incremental payments will continue for legacy DBS awards made up to and including March 2011.
The maximum marginal DBS deferral rates have been maintained at 50%.
The release of deferred incentive awards made from March 2015 under the DBS for employees in South Africa and the rest of Africa is illustrated below.
2014 2015 2016 2017 2018
March award September first vesting date: 33.3% and
notional dividends
September second vesting date: 33.3% and
notional dividends
September third vesting date: 33.3% and
notional dividends
Performance period Deferral period
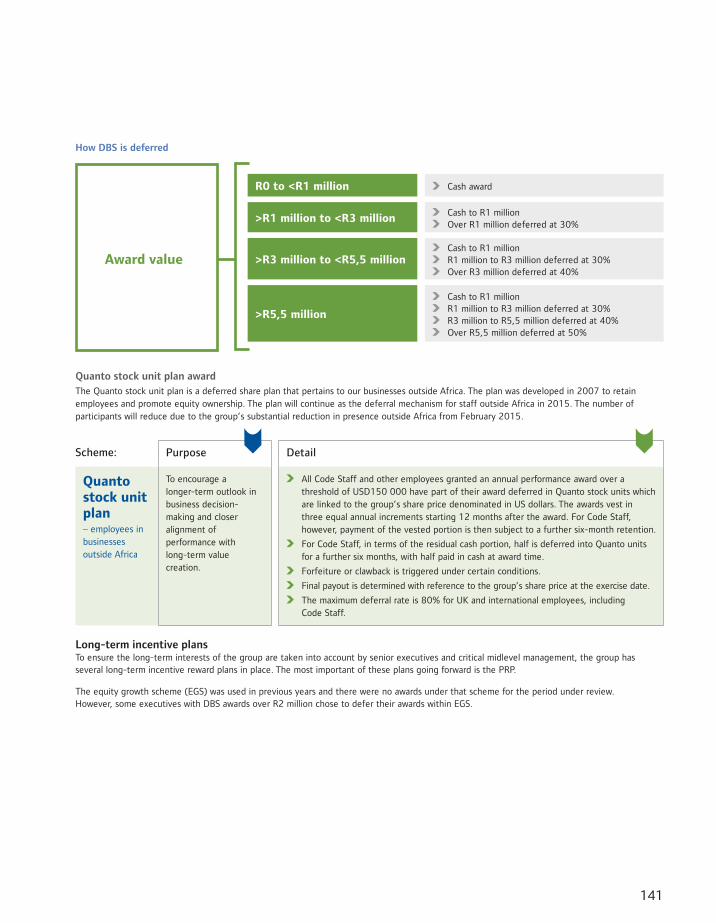
141
How DBS is deferred
R0 to <R1 million Cash award
>R1 million to <R3 million Cash to R1 million Over R1 million deferred at 30%
>R3 million to <R5,5 million Cash to R1 million R1 million to R3 million deferred at 30% Over R3 million deferred at 40%
>R5,5 million
Cash to R1 million R1 million to R3 million deferred at 30% R3 million to R5,5 million deferred at 40% Over R5,5 million deferred at 50%
Award value
Quanto stock unit plan awardThe Quanto stock unit plan is a deferred share plan that pertains to our businesses outside Africa. The plan was developed in 2007 to retain employees and promote equity ownership. The plan will continue as the deferral mechanism for staff outside Africa in 2015. The number of participants will reduce due to the group’s substantial reduction in presence outside Africa from February 2015.
Scheme: Purpose Detail
Quanto stock unit plan– employees in businesses outside Africa
To encourage a longer-term outlook in business decision-making and closer alignment of performance with long-term value creation.
All Code Staff and other employees granted an annual performance award over a threshold of USD150 000 have part of their award deferred in Quanto stock units which are linked to the group’s share price denominated in US dollars. The awards vest in three equal annual increments starting 12 months after the award. For Code Staff, however, payment of the vested portion is then subject to a further six-month retention.
For Code Staff, in terms of the residual cash portion, half is deferred into Quanto units for a further six months, with half paid in cash at award time.
Forfeiture or clawback is triggered under certain conditions.
Final payout is determined with reference to the group’s share price at the exercise date.
The maximum deferral rate is 80% for UK and international employees, including Code Staff.
Long-term incentive plansTo ensure the long-term interests of the group are taken into account by senior executives and critical midlevel management, the group has several long-term incentive reward plans in place. The most important of these plans going forward is the PRP.
The equity growth scheme (EGS) was used in previous years and there were no awards under that scheme for the period under review. However, some executives with DBS awards over R2 million chose to defer their awards within EGS.
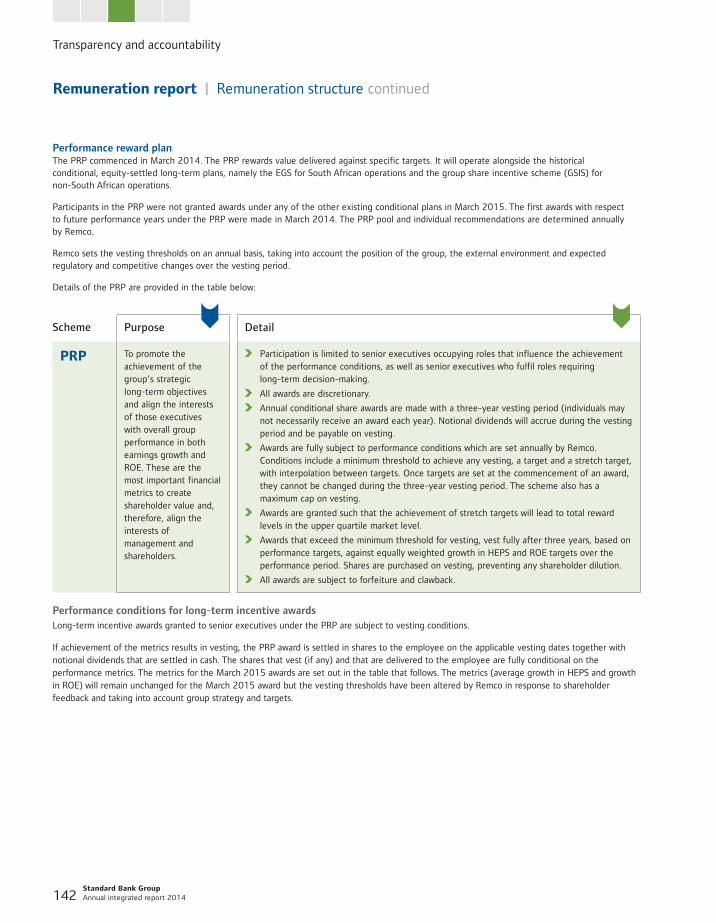
Transparency and accountability
Standard Bank Group Annual integrated report 2014 142
Remuneration report | Remuneration structure continued
Performance reward planThe PRP commenced in March 2014. The PRP rewards value delivered against specific targets. It will operate alongside the historical conditional, equity-settled long-term plans, namely the EGS for South African operations and the group share incentive scheme (GSIS) for non-South African operations.
Participants in the PRP were not granted awards under any of the other existing conditional plans in March 2015. The first awards with respect to future performance years under the PRP were made in March 2014. The PRP pool and individual recommendations are determined annually by Remco.
Remco sets the vesting thresholds on an annual basis, taking into account the position of the group, the external environment and expected regulatory and competitive changes over the vesting period.
Details of the PRP are provided in the table below:
Scheme Purpose Detail
PRP To promote the achievement of the group’s strategic long-term objectives and align the interests of those executives with overall group performance in both earnings growth and ROE. These are the most important financial metrics to create shareholder value and, therefore, align the interests of management and shareholders.
Participation is limited to senior executives occupying roles that influence the achievement of the performance conditions, as well as senior executives who fulfil roles requiring long-term decision-making.
All awards are discretionary.
Annual conditional share awards are made with a three-year vesting period (individuals may not necessarily receive an award each year). Notional dividends will accrue during the vesting period and be payable on vesting.
Awards are fully subject to performance conditions which are set annually by Remco. Conditions include a minimum threshold to achieve any vesting, a target and a stretch target, with interpolation between targets. Once targets are set at the commencement of an award, they cannot be changed during the three-year vesting period. The scheme also has a maximum cap on vesting.
Awards are granted such that the achievement of stretch targets will lead to total reward levels in the upper quartile market level.
Awards that exceed the minimum threshold for vesting, vest fully after three years, based on performance targets, against equally weighted growth in HEPS and ROE targets over the performance period. Shares are purchased on vesting, preventing any shareholder dilution.
All awards are subject to forfeiture and clawback.
Performance conditions for long-term incentive awardsLong-term incentive awards granted to senior executives under the PRP are subject to vesting conditions.
If achievement of the metrics results in vesting, the PRP award is settled in shares to the employee on the applicable vesting dates together with notional dividends that are settled in cash. The shares that vest (if any) and that are delivered to the employee are fully conditional on the performance metrics. The metrics for the March 2015 awards are set out in the table that follows. The metrics (average growth in HEPS and growth in ROE) will remain unchanged for the March 2015 award but the vesting thresholds have been altered by Remco in response to shareholder feedback and taking into account group strategy and targets.
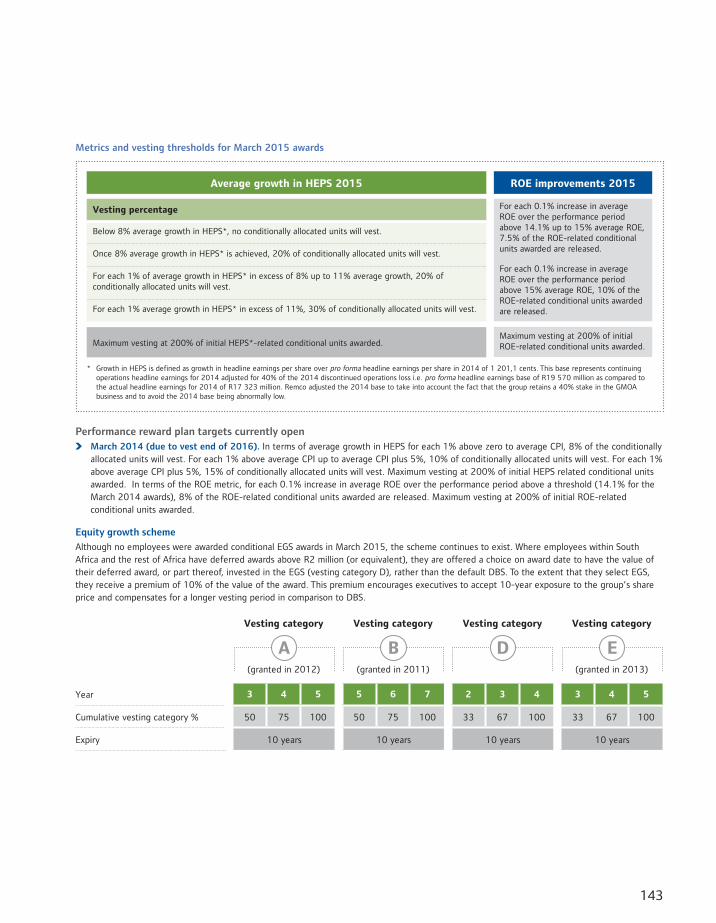
143
Metrics and vesting thresholds for March 2015 awards
Average growth in HEPS 2015 ROE improvements 2015
For each 0.1% increase in average ROE over the performance period above 14.1% up to 15% average ROE, 7.5% of the ROE-related conditional units awarded are released.
For each 0.1% increase in average ROE over the performance period above 15% average ROE, 10% of the ROE-related conditional units awarded are released.
Maximum vesting at 200% of initial ROE-related conditional units awarded.
Vesting percentage
Below 8% average growth in HEPS*, no conditionally allocated units will vest.
Once 8% average growth in HEPS* is achieved, 20% of conditionally allocated units will vest.
For each 1% of average growth in HEPS* in excess of 8% up to 11% average growth, 20% of conditionally allocated units will vest.
For each 1% average growth in HEPS* in excess of 11%, 30% of conditionally allocated units will vest.
Maximum vesting at 200% of initial HEPS*-related conditional units awarded.
* Growth in HEPS is defined as growth in headline earnings per share over pro forma headline earnings per share in 2014 of 1 201,1 cents. This base represents continuing operations headline earnings for 2014 adjusted for 40% of the 2014 discontinued operations loss i.e. pro forma headline earnings base of R19 570 million as compared to the actual headline earnings for 2014 of R17 323 million. Remco adjusted the 2014 base to take into account the fact that the group retains a 40% stake in the GMOA business and to avoid the 2014 base being abnormally low.
Performance reward plan targets currently open March 2014 (due to vest end of 2016). In terms of average growth in HEPS for each 1% above zero to average CPI, 8% of the conditionally
allocated units will vest. For each 1% above average CPI up to average CPI plus 5%, 10% of conditionally allocated units will vest. For each 1% above average CPI plus 5%, 15% of conditionally allocated units will vest. Maximum vesting at 200% of initial HEPS related conditional units awarded. In terms of the ROE metric, for each 0.1% increase in average ROE over the performance period above a threshold (14.1% for the March 2014 awards), 8% of the ROE-related conditional units awarded are released. Maximum vesting at 200% of initial ROE-related conditional units awarded.
Equity growth scheme
Although no employees were awarded conditional EGS awards in March 2015, the scheme continues to exist. Where employees within South Africa and the rest of Africa have deferred awards above R2 million (or equivalent), they are offered a choice on award date to have the value of their deferred award, or part thereof, invested in the EGS (vesting category D), rather than the default DBS. To the extent that they select EGS, they receive a premium of 10% of the value of the award. This premium encourages executives to accept 10-year exposure to the group’s share price and compensates for a longer vesting period in comparison to DBS.
Vesting category Vesting category Vesting category Vesting category
(granted in 2012) (granted in 2011) (granted in 2013)
Year 3 4 5 5 6 7 2 3 4 3 4 5
Cumulative vesting category % 50 75 100 50 75 100 33 67 100 33 67 100
Expiry 10 years 10 years 10 years 10 years
A B D E
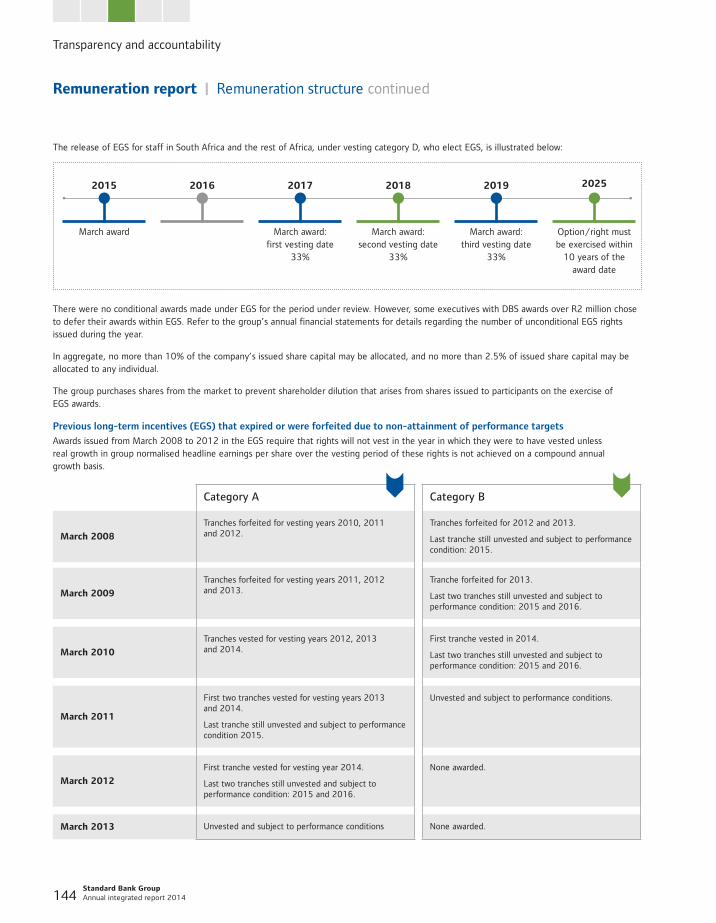
Transparency and accountability
Standard Bank Group Annual integrated report 2014 144
Remuneration report | Remuneration structure continued
The release of EGS for staff in South Africa and the rest of Africa, under vesting category D, who elect EGS, is illustrated below:
2015 2016 2017 2018 2019 2025
March award March award: first vesting date
33%
March award: second vesting date
33%
March award: third vesting date
33%
Option/right must be exercised within
10 years of the award date
There were no conditional awards made under EGS for the period under review. However, some executives with DBS awards over R2 million chose to defer their awards within EGS. Refer to the group’s annual financial statements for details regarding the number of unconditional EGS rights issued during the year.
In aggregate, no more than 10% of the company’s issued share capital may be allocated, and no more than 2.5% of issued share capital may be allocated to any individual.
The group purchases shares from the market to prevent shareholder dilution that arises from shares issued to participants on the exercise of EGS awards.
Previous long-term incentives (EGS) that expired or were forfeited due to non-attainment of performance targets
Awards issued from March 2008 to 2012 in the EGS require that rights will not vest in the year in which they were to have vested unless real growth in group normalised headline earnings per share over the vesting period of these rights is not achieved on a compound annual growth basis.
Category A Category B
March 2008
Tranches forfeited for vesting years 2010, 2011 and 2012.
Tranches forfeited for 2012 and 2013.
Last tranche still unvested and subject to performance condition: 2015.
March 2009
Tranches forfeited for vesting years 2011, 2012 and 2013.
Tranche forfeited for 2013.
Last two tranches still unvested and subject to performance condition: 2015 and 2016.
March 2010
Tranches vested for vesting years 2012, 2013 and 2014.
First tranche vested in 2014.
Last two tranches still unvested and subject to performance condition: 2015 and 2016.
March 2011
First two tranches vested for vesting years 2013 and 2014.
Last tranche still unvested and subject to performance condition 2015.
Unvested and subject to performance conditions.
March 2012
First tranche vested for vesting year 2014.
Last two tranches still unvested and subject to performance condition: 2015 and 2016.
None awarded.
March 2013 Unvested and subject to performance conditions None awarded.
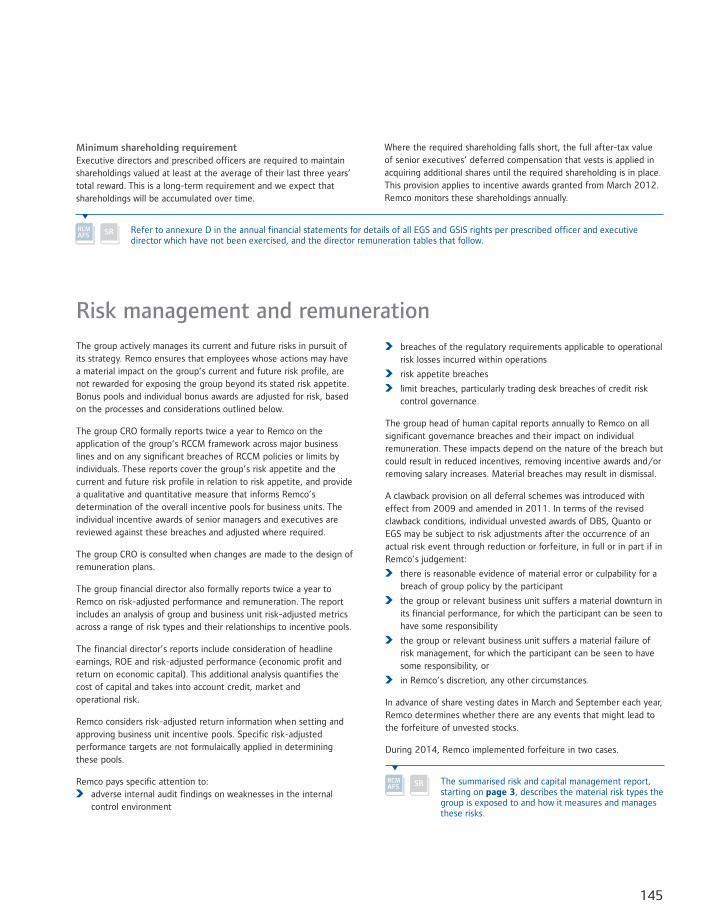
145
Minimum shareholding requirementExecutive directors and prescribed officers are required to maintain shareholdings valued at least at the average of their last three years’ total reward. This is a long-term requirement and we expect that shareholdings will be accumulated over time.
Where the required shareholding falls short, the full after-tax value of senior executives’ deferred compensation that vests is applied in acquiring additional shares until the required shareholding is in place. This provision applies to incentive awards granted from March 2012. Remco monitors these shareholdings annually.
Refer to annexure D in the annual financial statements for details of all EGS and GSIS rights per prescribed officer and executive director which have not been exercised, and the director remuneration tables that follow.
Risk management and remuneration breaches of the regulatory requirements applicable to operational
risk losses incurred within operations
risk appetite breaches
limit breaches, particularly trading desk breaches of credit risk control governance.
The group head of human capital reports annually to Remco on all significant governance breaches and their impact on individual remuneration. These impacts depend on the nature of the breach but could result in reduced incentives, removing incentive awards and/or removing salary increases. Material breaches may result in dismissal.
A clawback provision on all deferral schemes was introduced with effect from 2009 and amended in 2011. In terms of the revised clawback conditions, individual unvested awards of DBS, Quanto or EGS may be subject to risk adjustments after the occurrence of an actual risk event through reduction or forfeiture, in full or in part if in Remco’s judgement:
there is reasonable evidence of material error or culpability for a breach of group policy by the participant
the group or relevant business unit suffers a material downturn in its financial performance, for which the participant can be seen to have some responsibility
the group or relevant business unit suffers a material failure of risk management, for which the participant can be seen to have some responsibility, or
in Remco’s discretion, any other circumstances.
In advance of share vesting dates in March and September each year, Remco determines whether there are any events that might lead to the forfeiture of unvested stocks.
During 2014, Remco implemented forfeiture in two cases.
The summarised risk and capital management report, starting on page 3, describes the material risk types the group is exposed to and how it measures and manages these risks.
The group actively manages its current and future risks in pursuit of its strategy. Remco ensures that employees whose actions may have a material impact on the group’s current and future risk profile, are not rewarded for exposing the group beyond its stated risk appetite. Bonus pools and individual bonus awards are adjusted for risk, based on the processes and considerations outlined below.
The group CRO formally reports twice a year to Remco on the application of the group’s RCCM framework across major business lines and on any significant breaches of RCCM policies or limits by individuals. These reports cover the group’s risk appetite and the current and future risk profile in relation to risk appetite, and provide a qualitative and quantitative measure that informs Remco’s determination of the overall incentive pools for business units. The individual incentive awards of senior managers and executives are reviewed against these breaches and adjusted where required.
The group CRO is consulted when changes are made to the design of remuneration plans.
The group financial director also formally reports twice a year to Remco on risk-adjusted performance and remuneration. The report includes an analysis of group and business unit risk-adjusted metrics across a range of risk types and their relationships to incentive pools.
The financial director’s reports include consideration of headline earnings, ROE and risk-adjusted performance (economic profit and return on economic capital). This additional analysis quantifies the cost of capital and takes into account credit, market and operational risk.
Remco considers risk-adjusted return information when setting and approving business unit incentive pools. Specific risk-adjusted performance targets are not formulaically applied in determining these pools.
Remco pays specific attention to: adverse internal audit findings on weaknesses in the internal
control environment
Transparency and accountability
Standard Bank Group Annual integrated report 2014 146
Remuneration report | continued
Disclosure of executive directors’ and prescribed officers’ remuneration
Remco continuously monitors the correlation between remuneration and profitability over time.
This year the report displays the pay of the executive directors over a 6 year period to demonstrate the variability of pay over time. The other prescribed officers are shown for the period that they have been serving as prescribed officers. Bruce Hemphill has completed his first year running the Wealth business at Standard Bank with the pay reflected in previous years relating to his service as chief executive of Liberty.
Regulatory disclosuresAll regulatory disclosures covered under this section are made in terms of the Companies Act, JSE Listings Requirements, Banks Act, Financial Stability Board Principles for Sound Compensation Practices and the King Code.
Terms of employment for executive directors and prescribed officersThe notice period for the group chief executives, group financial director and prescribed officers is one month. In terms of the group’s MOI, executive directors are not subject to rotational requirements.
Restrictive covenantsExecutive employment contracts include restrictive covenants on poaching of employees or customers. No other restraints are included in contracts.
Retention agreements and paymentsRetention agreements are only entered into in exceptional circumstances. Retention payments have to be repaid should the individual concerned leave within a stipulated period. None of the executive directors or prescribed officers are subject to a retention agreement.
The financial performance for the group in 2014 reflected both very strong performance in the underlying operations of the group and very weak performance in operations which the group has disposed of. This was taken into account in determining the annual incentive awards for executive directors and prescribed officers and this is covered in the Remco chairman’s letter.
Evaluation of executive directors, and prescribed officersWhen Remco assesses the performance of the chief executives, financial director and prescribed officers, we do so in the areas of:
business results and drivers of share price performance which include earnings performance, financial gearing, returns on assets and equity, management of risk assumed, economic cycle, and performance relative to peer group
clients and customers
leadership and people
risk and control
reputation and brand.
Quantitative elements have pre-determined measures. Qualitative elements have strategic objectives. Remco uses judgement in assessing the business and individual performance balancing short and long term objectives over a multi-year time frame. This judgement includes geographic, strategic and business complexity as well as size, competitive intensity and regulatory control.
Performance is not a single score resulting in a pay outcome, but rather is a disciplined but non-formulaic process which Remco believes is appropriate for the diversity and complexity of the business.
Pay is also assessed relative to the external market to ensure levels are competitive and reasonable.
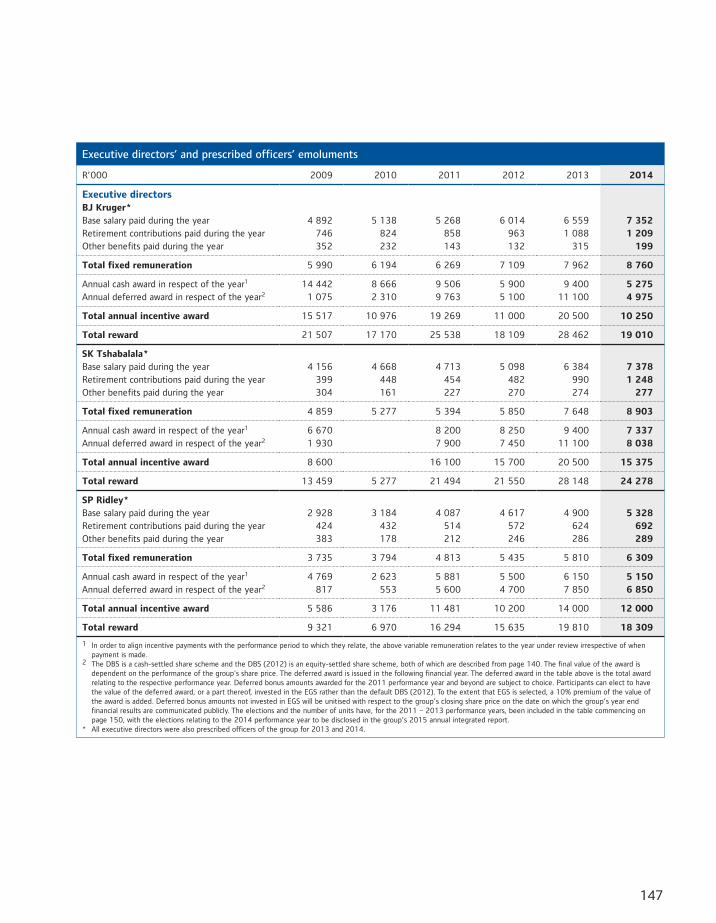
147
Executive directors’ and prescribed officers’ emoluments
R’000 2009 2010 2011 2012 2013 2014
Executive directorsBJ Kruger*Base salary paid during the year 4 892 5 138 5 268 6 014 6 559 7 352Retirement contributions paid during the year 746 824 858 963 1 088 1 209Other benefits paid during the year 352 232 143 132 315 199
Total fixed remuneration 5 990 6 194 6 269 7 109 7 962 8 760
Annual cash award in respect of the year1 14 442 8 666 9 506 5 900 9 400 5 275Annual deferred award in respect of the year2 1 075 2 310 9 763 5 100 11 100 4 975
Total annual incentive award 15 517 10 976 19 269 11 000 20 500 10 250
Total reward 21 507 17 170 25 538 18 109 28 462 19 010
SK Tshabalala*Base salary paid during the year 4 156 4 668 4 713 5 098 6 384 7 378Retirement contributions paid during the year 399 448 454 482 990 1 248Other benefits paid during the year 304 161 227 270 274 277
Total fixed remuneration 4 859 5 277 5 394 5 850 7 648 8 903
Annual cash award in respect of the year1 6 670 8 200 8 250 9 400 7 337Annual deferred award in respect of the year2 1 930 7 900 7 450 11 100 8 038
Total annual incentive award 8 600 16 100 15 700 20 500 15 375
Total reward 13 459 5 277 21 494 21 550 28 148 24 278
SP Ridley*Base salary paid during the year 2 928 3 184 4 087 4 617 4 900 5 328Retirement contributions paid during the year 424 432 514 572 624 692Other benefits paid during the year 383 178 212 246 286 289
Total fixed remuneration 3 735 3 794 4 813 5 435 5 810 6 309
Annual cash award in respect of the year1 4 769 2 623 5 881 5 500 6 150 5 150Annual deferred award in respect of the year2 817 553 5 600 4 700 7 850 6 850
Total annual incentive award 5 586 3 176 11 481 10 200 14 000 12 000
Total reward 9 321 6 970 16 294 15 635 19 810 18 309
1 In order to align incentive payments with the performance period to which they relate, the above variable remuneration relates to the year under review irrespective of when payment is made.
2 The DBS is a cash-settled share scheme and the DBS (2012) is an equity-settled share scheme, both of which are described from page 140. The final value of the award is dependent on the performance of the group's share price. The deferred award is issued in the following financial year. The deferred award in the table above is the total award relating to the respective performance year. Deferred bonus amounts awarded for the 2011 performance year and beyond are subject to choice. Participants can elect to have the value of the deferred award, or a part thereof, invested in the EGS rather than the default DBS (2012). To the extent that EGS is selected, a 10% premium of the value of the award is added. Deferred bonus amounts not invested in EGS will be unitised with respect to the group’s closing share price on the date on which the group’s year end financial results are communicated publicly. The elections and the number of units have, for the 2011 – 2013 performance years, been included in the table commencing on page 150, with the elections relating to the 2014 performance year to be disclosed in the group’s 2015 annual integrated report.
* All executive directors were also prescribed officers of the group for 2013 and 2014.
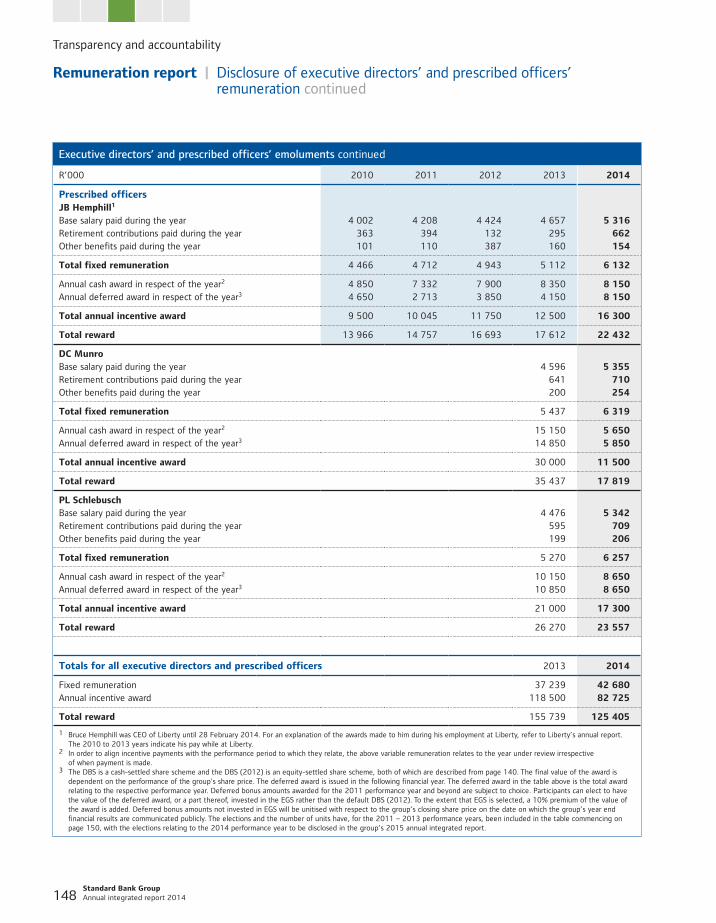
Transparency and accountability
Standard Bank Group Annual integrated report 2014 148
Executive directors’ and prescribed officers’ emoluments continued
R’000 2010 2011 2012 2013 2014
Prescribed officersJB Hemphill1 Base salary paid during the year 4 002 4 208 4 424 4 657 5 316Retirement contributions paid during the year 363 394 132 295 662Other benefits paid during the year 101 110 387 160 154
Total fixed remuneration 4 466 4 712 4 943 5 112 6 132
Annual cash award in respect of the year2 4 850 7 332 7 900 8 350 8 150Annual deferred award in respect of the year3 4 650 2 713 3 850 4 150 8 150
Total annual incentive award 9 500 10 045 11 750 12 500 16 300
Total reward 13 966 14 757 16 693 17 612 22 432
DC MunroBase salary paid during the year 4 596 5 355Retirement contributions paid during the year 641 710Other benefits paid during the year 200 254
Total fixed remuneration 5 437 6 319
Annual cash award in respect of the year2 15 150 5 650Annual deferred award in respect of the year3 14 850 5 850
Total annual incentive award 30 000 11 500
Total reward 35 437 17 819
PL SchlebuschBase salary paid during the year 4 476 5 342Retirement contributions paid during the year 595 709Other benefits paid during the year 199 206
Total fixed remuneration 5 270 6 257
Annual cash award in respect of the year2 10 150 8 650Annual deferred award in respect of the year3 10 850 8 650
Total annual incentive award 21 000 17 300
Total reward 26 270 23 557
Totals for all executive directors and prescribed officers 2013 2014
Fixed remuneration 37 239 42 680Annual incentive award 118 500 82 725
Total reward 155 739 125 405
1 Bruce Hemphill was CEO of Liberty until 28 February 2014. For an explanation of the awards made to him during his employment at Liberty, refer to Liberty’s annual report. The 2010 to 2013 years indicate his pay while at Liberty.
2 In order to align incentive payments with the performance period to which they relate, the above variable remuneration relates to the year under review irrespective of when payment is made.
3 The DBS is a cash-settled share scheme and the DBS (2012) is an equity-settled share scheme, both of which are described from page 140. The final value of the award is dependent on the performance of the group's share price. The deferred award is issued in the following financial year. The deferred award in the table above is the total award relating to the respective performance year. Deferred bonus amounts awarded for the 2011 performance year and beyond are subject to choice. Participants can elect to have the value of the deferred award, or a part thereof, invested in the EGS rather than the default DBS (2012). To the extent that EGS is selected, a 10% premium of the value of the award is added. Deferred bonus amounts not invested in EGS will be unitised with respect to the group’s closing share price on the date on which the group’s year end financial results are communicated publicly. The elections and the number of units have, for the 2011 – 2013 performance years, been included in the table commencing on page 150, with the elections relating to the 2014 performance year to be disclosed in the group’s 2015 annual integrated report.
Remuneration report | Disclosure of executive directors’ and prescribed officers’ remuneration continued
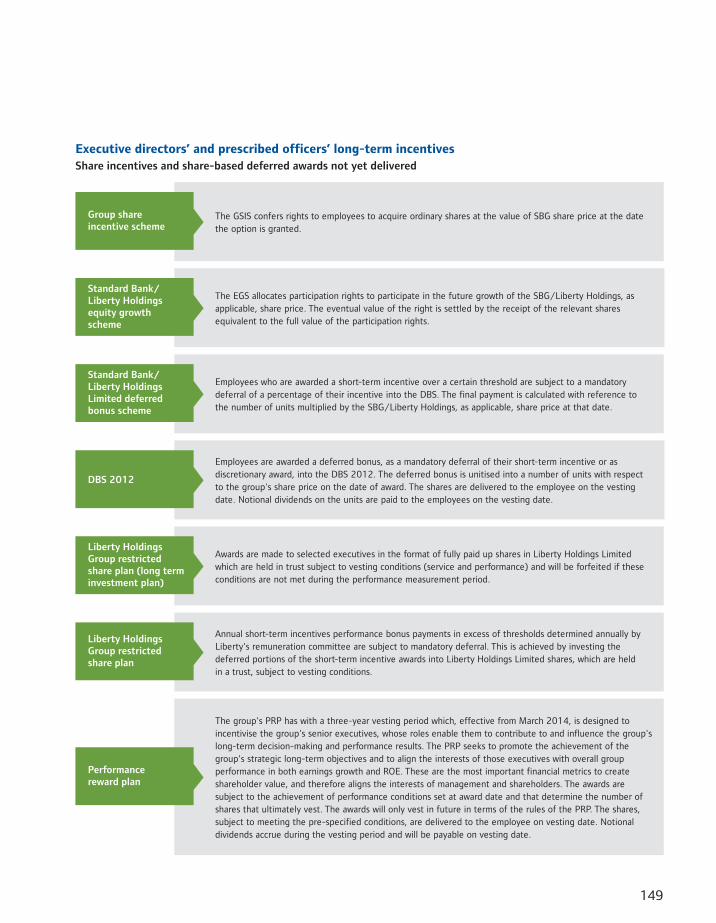
149
Executive directors’ and prescribed officers’ long-term incentivesShare incentives and share-based deferred awards not yet delivered
The GSIS confers rights to employees to acquire ordinary shares at the value of SBG share price at the date the option is granted.
Group share incentive scheme
The EGS allocates participation rights to participate in the future growth of the SBG/Liberty Holdings, as applicable, share price. The eventual value of the right is settled by the receipt of the relevant shares equivalent to the full value of the participation rights.
Standard Bank/Liberty Holdings equity growth scheme
Employees who are awarded a short-term incentive over a certain threshold are subject to a mandatory deferral of a percentage of their incentive into the DBS. The final payment is calculated with reference to the number of units multiplied by the SBG/Liberty Holdings, as applicable, share price at that date.
Standard Bank/Liberty Holdings Limited deferred bonus scheme
Employees are awarded a deferred bonus, as a mandatory deferral of their short-term incentive or as discretionary award, into the DBS 2012. The deferred bonus is unitised into a number of units with respect to the group's share price on the date of award. The shares are delivered to the employee on the vesting date. Notional dividends on the units are paid to the employees on the vesting date.
DBS 2012
Awards are made to selected executives in the format of fully paid up shares in Liberty Holdings Limited which are held in trust subject to vesting conditions (service and performance) and will be forfeited if these conditions are not met during the performance measurement period.
Liberty Holdings Group restricted share plan (long term investment plan)
Annual short-term incentives performance bonus payments in excess of thresholds determined annually by Liberty's remuneration committee are subject to mandatory deferral. This is achieved by investing the deferred portions of the short-term incentive awards into Liberty Holdings Limited shares, which are held in a trust, subject to vesting conditions.
Liberty Holdings Group restricted share plan
The group's PRP has with a three-year vesting period which, effective from March 2014, is designed to incentivise the group's senior executives, whose roles enable them to contribute to and influence the group's long-term decision-making and performance results. The PRP seeks to promote the achievement of the group's strategic long-term objectives and to align the interests of those executives with overall group performance in both earnings growth and ROE. These are the most important financial metrics to create shareholder value, and therefore aligns the interests of management and shareholders. The awards are subject to the achievement of performance conditions set at award date and that determine the number of shares that ultimately vest. The awards will only vest in future in terms of the rules of the PRP. The shares, subject to meeting the pre-specified conditions, are delivered to the employee on vesting date. Notional dividends accrue during the vesting period and will be payable on vesting date.
Performance reward plan
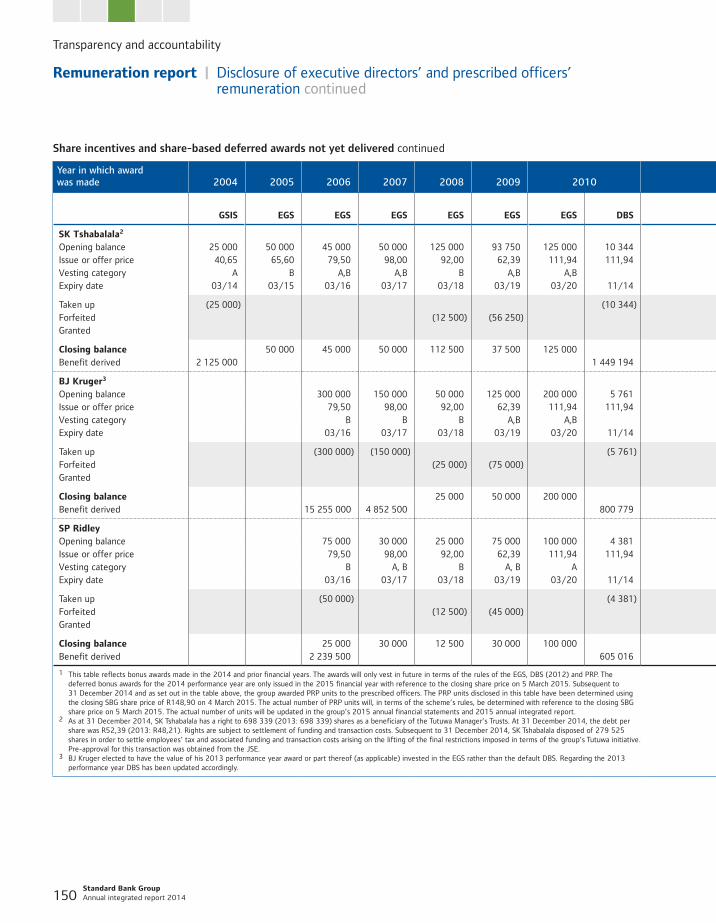
Transparency and accountability
Standard Bank Group Annual integrated report 2014 150
Share incentives and share-based deferred awards not yet delivered continued
Year in which award was made 2004 2005 2006 2007 2008 2009 2010 2011 2012 2013 2014 2015
GSIS EGS EGS EGS EGS EGS EGS DBS EGS DBS EGSDBS
(2012)1 EGSDBS
(2012)1 EGS PRPDBS
(2012)1 PRP
SK Tshabalala2
Opening balance 25 000 50 000 45 000 50 000 125 000 93 750 125 000 10 344 200 000 274 305 302 109 Issue or offer price 40,65 65,60 79,50 98,00 92,00 62,39 111,94 111,94 98,80 108,90 115,51 126,87 126,87 Vesting category A B A,B A,B B A,B A,B A,B A,D E,D Expiry date 03/14 03/15 03/16 03/17 03/18 03/19 03/20 11/14 03/21 03/22 03/23 03/17 09/17
Taken up (25 000) (10 344)Forfeited (12 500) (56 250)Granted 98 500 87 492 67 200
Closing balance 50 000 45 000 50 000 112 500 37 500 125 000 200 000 274 305 302 109 98 500 87 492 67 200 Benefit derived 2 125 000 1 449 194
BJ Kruger3
Opening balance 300 000 150 000 50 000 125 000 200 000 5 761 200 000 23 381 61 471 59 765 56 594 44 153 Issue or offer price 79,50 98,00 92,00 62,39 111,94 111,94 98,80 98,80 108,90 108,90 115,51 115,51 126,87 126,87 Vesting category B B B A,B A,B A,B A E D Expiry date 03/16 03/17 03/18 03/19 03/20 11/14 03/21 11/15 03/22 09/15 03/23 09/16 03/24 03/17
Taken up (300 000) (150 000) (5 761) (23 381) (29 882) (14 717)Forfeited (25 000) (75 000)Granted 316 322 98 500 67 200
Closing balance 25 000 50 000 200 000 200 000 61 471 29 883 56 594 29 436 316 322 98 500 67 200 Benefit derived 15 255 000 4 852 500 800 779 3 249 959 3 921 415 1 931 312
SP RidleyOpening balance 75 000 30 000 25 000 75 000 100 000 4 381 200 000 5 596 36 883 34 283 42 445 40 690 Issue or offer price 79,50 98,00 92,00 62,39 111,94 111,94 98,80 98,80 108,90 108,90 115,51 115,51 126,87 126,87 Vesting category B A, B B A, B A A,B A E Expiry date 03/16 03/17 03/18 03/19 03/20 11/14 03/21 11/15 03/22 09/15 03/23 09/16 03/17 09/17
Taken up (50 000) (4 381) (2 239) (17 141) (13 563)Forfeited (12 500) (45 000)Granted 63 100 61 875 53 700
Closing balance 25 000 30 000 12 500 30 000 100 000 200 000 3 357 36 883 17 142 42 445 27 127 63 100 61 875 53 700 Benefit derived 2 239 500 605 016 311 221 2 249 413 1 779 872
1 This table reflects bonus awards made in the 2014 and prior financial years. The awards will only vest in future in terms of the rules of the EGS, DBS (2012) and PRP. The deferred bonus awards for the 2014 performance year are only issued in the 2015 financial year with reference to the closing share price on 5 March 2015. Subsequent to 31 December 2014 and as set out in the table above, the group awarded PRP units to the prescribed officers. The PRP units disclosed in this table have been determined using the closing SBG share price of R148,90 on 4 March 2015. The actual number of PRP units will, in terms of the scheme’s rules, be determined with reference to the closing SBG share price on 5 March 2015. The actual number of units will be updated in the group’s 2015 annual financial statements and 2015 annual integrated report.
2 As at 31 December 2014, SK Tshabalala has a right to 698 339 (2013: 698 339) shares as a beneficiary of the Tutuwa Manager’s Trusts. At 31 December 2014, the debt per share was R52,39 (2013: R48,21). Rights are subject to settlement of funding and transaction costs. Subsequent to 31 December 2014, SK Tshabalala disposed of 279 525 shares in order to settle employees’ tax and associated funding and transaction costs arising on the lifting of the final restrictions imposed in terms of the group’s Tutuwa initiative. Pre-approval for this transaction was obtained from the JSE.
3 BJ Kruger elected to have the value of his 2013 performance year award or part thereof (as applicable) invested in the EGS rather than the default DBS. Regarding the 2013 performance year DBS has been updated accordingly.
Remuneration report | Disclosure of executive directors’ and prescribed officers’ remuneration continued
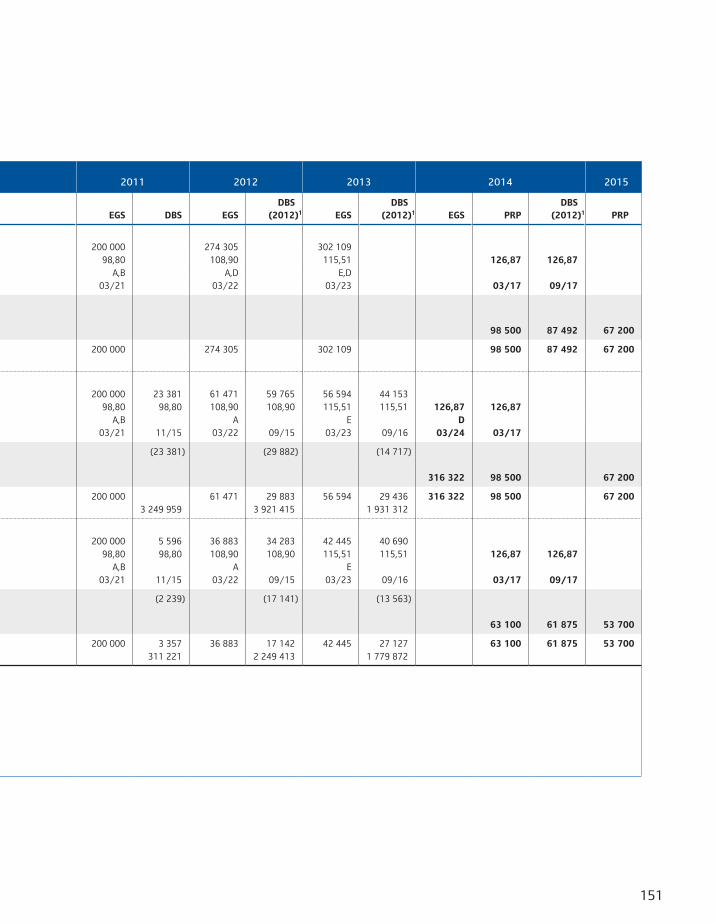
151
Share incentives and share-based deferred awards not yet delivered continued
Year in which award was made 2004 2005 2006 2007 2008 2009 2010 2011 2012 2013 2014 2015
GSIS EGS EGS EGS EGS EGS EGS DBS EGS DBS EGSDBS
(2012)1 EGSDBS
(2012)1 EGS PRPDBS
(2012)1 PRP
SK Tshabalala2
Opening balance 25 000 50 000 45 000 50 000 125 000 93 750 125 000 10 344 200 000 274 305 302 109 Issue or offer price 40,65 65,60 79,50 98,00 92,00 62,39 111,94 111,94 98,80 108,90 115,51 126,87 126,87 Vesting category A B A,B A,B B A,B A,B A,B A,D E,D Expiry date 03/14 03/15 03/16 03/17 03/18 03/19 03/20 11/14 03/21 03/22 03/23 03/17 09/17
Taken up (25 000) (10 344)Forfeited (12 500) (56 250)Granted 98 500 87 492 67 200
Closing balance 50 000 45 000 50 000 112 500 37 500 125 000 200 000 274 305 302 109 98 500 87 492 67 200 Benefit derived 2 125 000 1 449 194
BJ Kruger3
Opening balance 300 000 150 000 50 000 125 000 200 000 5 761 200 000 23 381 61 471 59 765 56 594 44 153 Issue or offer price 79,50 98,00 92,00 62,39 111,94 111,94 98,80 98,80 108,90 108,90 115,51 115,51 126,87 126,87 Vesting category B B B A,B A,B A,B A E D Expiry date 03/16 03/17 03/18 03/19 03/20 11/14 03/21 11/15 03/22 09/15 03/23 09/16 03/24 03/17
Taken up (300 000) (150 000) (5 761) (23 381) (29 882) (14 717)Forfeited (25 000) (75 000)Granted 316 322 98 500 67 200
Closing balance 25 000 50 000 200 000 200 000 61 471 29 883 56 594 29 436 316 322 98 500 67 200 Benefit derived 15 255 000 4 852 500 800 779 3 249 959 3 921 415 1 931 312
SP RidleyOpening balance 75 000 30 000 25 000 75 000 100 000 4 381 200 000 5 596 36 883 34 283 42 445 40 690 Issue or offer price 79,50 98,00 92,00 62,39 111,94 111,94 98,80 98,80 108,90 108,90 115,51 115,51 126,87 126,87 Vesting category B A, B B A, B A A,B A E Expiry date 03/16 03/17 03/18 03/19 03/20 11/14 03/21 11/15 03/22 09/15 03/23 09/16 03/17 09/17
Taken up (50 000) (4 381) (2 239) (17 141) (13 563)Forfeited (12 500) (45 000)Granted 63 100 61 875 53 700
Closing balance 25 000 30 000 12 500 30 000 100 000 200 000 3 357 36 883 17 142 42 445 27 127 63 100 61 875 53 700 Benefit derived 2 239 500 605 016 311 221 2 249 413 1 779 872
1 This table reflects bonus awards made in the 2014 and prior financial years. The awards will only vest in future in terms of the rules of the EGS, DBS (2012) and PRP. The deferred bonus awards for the 2014 performance year are only issued in the 2015 financial year with reference to the closing share price on 5 March 2015. Subsequent to 31 December 2014 and as set out in the table above, the group awarded PRP units to the prescribed officers. The PRP units disclosed in this table have been determined using the closing SBG share price of R148,90 on 4 March 2015. The actual number of PRP units will, in terms of the scheme’s rules, be determined with reference to the closing SBG share price on 5 March 2015. The actual number of units will be updated in the group’s 2015 annual financial statements and 2015 annual integrated report.
2 As at 31 December 2014, SK Tshabalala has a right to 698 339 (2013: 698 339) shares as a beneficiary of the Tutuwa Manager’s Trusts. At 31 December 2014, the debt per share was R52,39 (2013: R48,21). Rights are subject to settlement of funding and transaction costs. Subsequent to 31 December 2014, SK Tshabalala disposed of 279 525 shares in order to settle employees’ tax and associated funding and transaction costs arising on the lifting of the final restrictions imposed in terms of the group’s Tutuwa initiative. Pre-approval for this transaction was obtained from the JSE.
3 BJ Kruger elected to have the value of his 2013 performance year award or part thereof (as applicable) invested in the EGS rather than the default DBS. Regarding the 2013 performance year DBS has been updated accordingly.
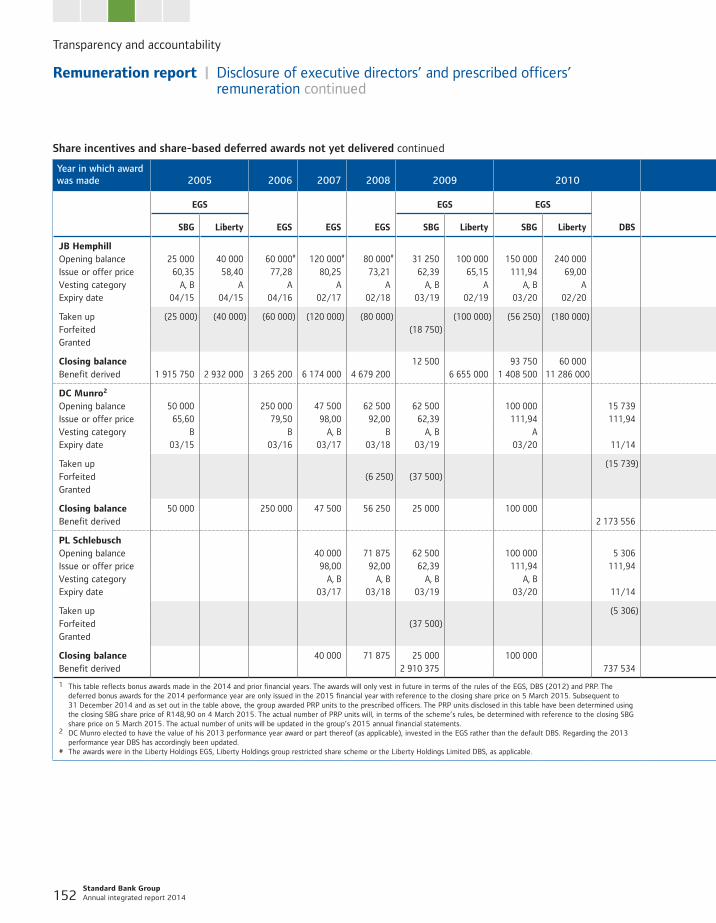
Transparency and accountability
Standard Bank Group Annual integrated report 2014 152
Share incentives and share-based deferred awards not yet delivered continued
Year in which award was made 2005 2006 2007 2008 2009 2010 2011 2012 2013 2014 2015
EGS
EGS EGS EGS
EGS EGS
DBS
EGS
DBS EGSDBS
(2012)1 EGSDBS
(2012)1 EGS PRP
DBS (2012)1
PRPSBG Liberty SBG Liberty SBG Liberty SBG Liberty Liberty SBG
JB HemphillOpening balance 25 000 40 000 60 000# 120 000# 80 000# 31 250 100 000 150 000 240 000 25 000 80 000 15 395# 88 844# 89 655# Issue or offer price 60,35 58,40 77,28 80,25 73,21 62,39 65,15 111,94 69,00 98,80 74,70 74,70 87,90 121,02 126,87 123,39 Vesting category A, B A A A A A, B A A, B A A, B A Expiry date 04/15 04/15 04/16 02/17 02/18 03/19 02/19 03/20 02/20 03/21 02/21 11/15 03/16 03/17 03/17 03/18
Taken up (25 000) (40 000) (60 000) (120 000) (80 000) (100 000) (56 250) (180 000) (6 250) (40 000) (15 395) (33 045) (10 604)Forfeited (18 750)Granted 78 800 109 816 67 200
Closing balance 12 500 93 750 60 000 18 750 40 000 55 799 79 051 78 800 109 816 67 200 Benefit derived 1 915 750 2 932 000 3 265 200 6 174 000 4 679 200 6 655 000 1 408 500 11 286 000 238 625 2 280 000 1 991 004 1 343 929 1 384 670
DC Munro2
Opening balance 50 000 250 000 47 500 62 500 62 500 100 000 15 739 100 000 38 968 61 471 63 264 131 690 50 970 Issue or offer price 65,60 79,50 98,00 92,00 62,39 111,94 111,94 98,80 98,80 108,90 108,90 115,51 115,51 126,87 126,87 126,87 Vesting category B B A, B B A, B A A, B A D,E D Expiry date 03/15 03/16 03/17 03/18 03/19 03/20 11/14 03/21 11/15 03/22 09/15 03/23 09/16 03/24 03/17 09/17
Taken up (15 739) (15 588) (31 631) (16 990)Forfeited (6 250) (37 500)Granted 105 797 78 800 87 787 94 000
Closing balance 50 000 250 000 47 500 56 250 25 000 100 000 100 000 23 380 61 471 31 633 131 690 33 980 105 797 78 800 87 787 94 000 Benefit derived 2 173 556 2 166 732 4 150 936 2 229 598
PL SchlebuschOpening balance 40 000 71 875 62 500 100 000 5 306 100 000 19 858 36 883 35 814 56 594 53 892 Issue or offer price 98,00 92,00 62,39 111,94 111,94 98,80 98,80 108,90 108,90 115,51 115,51 126,87 126,87 Vesting category A, B A, B A, B A, B A, B A E Expiry date 03/17 03/18 03/19 03/20 11/14 03/21 11/15 03/22 09/15 03/23 09/16 03/17 09/17
Taken up (5 306) (7 944) (17 906) (17 964)Forfeited (37 500)Granted 78 800 85 521 67 200
Closing balance 40 000 71 875 25 000 100 000 100 000 11 914 36 883 17 908 56 594 35 928 78 800 85 521 67 200 Benefit derived 2 910 375 737 534 1 104 216 2 349 804 2 357 416
1 This table reflects bonus awards made in the 2014 and prior financial years. The awards will only vest in future in terms of the rules of the EGS, DBS (2012) and PRP. The deferred bonus awards for the 2014 performance year are only issued in the 2015 financial year with reference to the closing share price on 5 March 2015. Subsequent to 31 December 2014 and as set out in the table above, the group awarded PRP units to the prescribed officers. The PRP units disclosed in this table have been determined using the closing SBG share price of R148,90 on 4 March 2015. The actual number of PRP units will, in terms of the scheme’s rules, be determined with reference to the closing SBG share price on 5 March 2015. The actual number of units will be updated in the group’s 2015 annual financial statements.
2 DC Munro elected to have the value of his 2013 performance year award or part thereof (as applicable), invested in the EGS rather than the default DBS. Regarding the 2013 performance year DBS has accordingly been updated.
# The awards were in the Liberty Holdings EGS, Liberty Holdings group restricted share scheme or the Liberty Holdings Limited DBS, as applicable.
Remuneration report | Disclosure of executive directors’ and prescribed officers’ remuneration continued
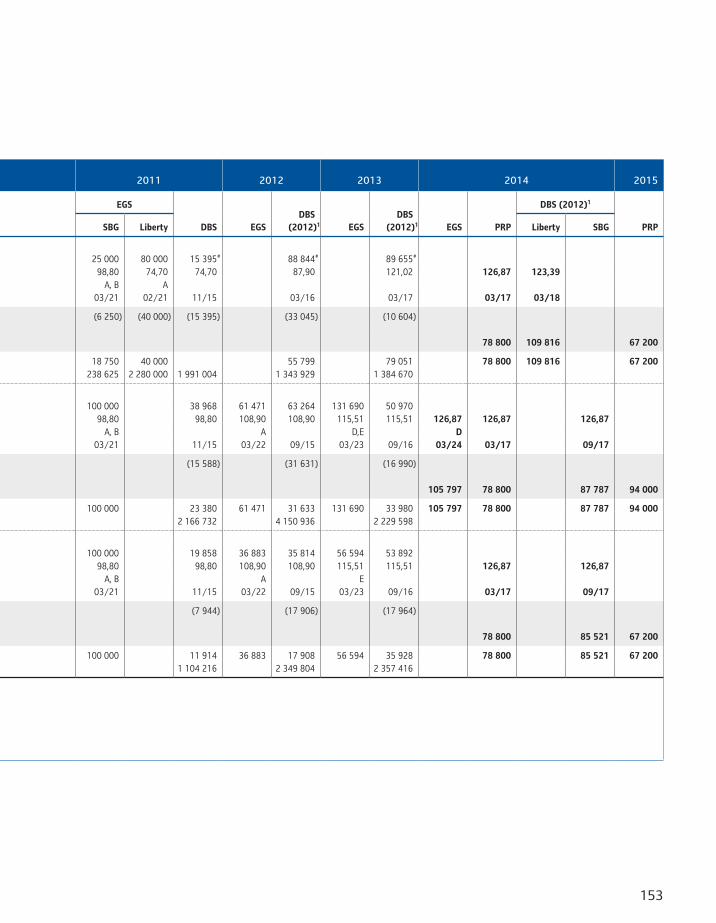
153
Share incentives and share-based deferred awards not yet delivered continued
Year in which award was made 2005 2006 2007 2008 2009 2010 2011 2012 2013 2014 2015
EGS
EGS EGS EGS
EGS EGS
DBS
EGS
DBS EGSDBS
(2012)1 EGSDBS
(2012)1 EGS PRP
DBS (2012)1
PRPSBG Liberty SBG Liberty SBG Liberty SBG Liberty Liberty SBG
JB HemphillOpening balance 25 000 40 000 60 000# 120 000# 80 000# 31 250 100 000 150 000 240 000 25 000 80 000 15 395# 88 844# 89 655# Issue or offer price 60,35 58,40 77,28 80,25 73,21 62,39 65,15 111,94 69,00 98,80 74,70 74,70 87,90 121,02 126,87 123,39 Vesting category A, B A A A A A, B A A, B A A, B A Expiry date 04/15 04/15 04/16 02/17 02/18 03/19 02/19 03/20 02/20 03/21 02/21 11/15 03/16 03/17 03/17 03/18
Taken up (25 000) (40 000) (60 000) (120 000) (80 000) (100 000) (56 250) (180 000) (6 250) (40 000) (15 395) (33 045) (10 604)Forfeited (18 750)Granted 78 800 109 816 67 200
Closing balance 12 500 93 750 60 000 18 750 40 000 55 799 79 051 78 800 109 816 67 200 Benefit derived 1 915 750 2 932 000 3 265 200 6 174 000 4 679 200 6 655 000 1 408 500 11 286 000 238 625 2 280 000 1 991 004 1 343 929 1 384 670
DC Munro2
Opening balance 50 000 250 000 47 500 62 500 62 500 100 000 15 739 100 000 38 968 61 471 63 264 131 690 50 970 Issue or offer price 65,60 79,50 98,00 92,00 62,39 111,94 111,94 98,80 98,80 108,90 108,90 115,51 115,51 126,87 126,87 126,87 Vesting category B B A, B B A, B A A, B A D,E D Expiry date 03/15 03/16 03/17 03/18 03/19 03/20 11/14 03/21 11/15 03/22 09/15 03/23 09/16 03/24 03/17 09/17
Taken up (15 739) (15 588) (31 631) (16 990)Forfeited (6 250) (37 500)Granted 105 797 78 800 87 787 94 000
Closing balance 50 000 250 000 47 500 56 250 25 000 100 000 100 000 23 380 61 471 31 633 131 690 33 980 105 797 78 800 87 787 94 000 Benefit derived 2 173 556 2 166 732 4 150 936 2 229 598
PL SchlebuschOpening balance 40 000 71 875 62 500 100 000 5 306 100 000 19 858 36 883 35 814 56 594 53 892 Issue or offer price 98,00 92,00 62,39 111,94 111,94 98,80 98,80 108,90 108,90 115,51 115,51 126,87 126,87 Vesting category A, B A, B A, B A, B A, B A E Expiry date 03/17 03/18 03/19 03/20 11/14 03/21 11/15 03/22 09/15 03/23 09/16 03/17 09/17
Taken up (5 306) (7 944) (17 906) (17 964)Forfeited (37 500)Granted 78 800 85 521 67 200
Closing balance 40 000 71 875 25 000 100 000 100 000 11 914 36 883 17 908 56 594 35 928 78 800 85 521 67 200 Benefit derived 2 910 375 737 534 1 104 216 2 349 804 2 357 416
1 This table reflects bonus awards made in the 2014 and prior financial years. The awards will only vest in future in terms of the rules of the EGS, DBS (2012) and PRP. The deferred bonus awards for the 2014 performance year are only issued in the 2015 financial year with reference to the closing share price on 5 March 2015. Subsequent to 31 December 2014 and as set out in the table above, the group awarded PRP units to the prescribed officers. The PRP units disclosed in this table have been determined using the closing SBG share price of R148,90 on 4 March 2015. The actual number of PRP units will, in terms of the scheme’s rules, be determined with reference to the closing SBG share price on 5 March 2015. The actual number of units will be updated in the group’s 2015 annual financial statements.
2 DC Munro elected to have the value of his 2013 performance year award or part thereof (as applicable), invested in the EGS rather than the default DBS. Regarding the 2013 performance year DBS has accordingly been updated.
# The awards were in the Liberty Holdings EGS, Liberty Holdings group restricted share scheme or the Liberty Holdings Limited DBS, as applicable.
Transparency and accountability
Standard Bank Group Annual integrated report 2014 154
Remco governanceEffective governance is essential to ensure that the remuneration process is fair and supports the group’s strategy.
Remco mandate Remco comprises a majority of independent non-executive directors and is mandated to:
review and approve the remuneration policy and strategy in the long-term interests of the group
approve general principles relating to terms and conditions of employment contracts
approve terms of employment contracts with key employees of the group
determine remuneration for key executives and propose remuneration for non-executive directors for shareholder approval
review the group chairman’s assessment of the performance of the chief executive officers as a function of setting their remuneration
review the chief executives officers’ assessment of the performance of key executive management
review the guaranteed and variable remuneration for key executives
review and approve all proposals for incentive scheme design and modifications
review incentive schemes to ensure continued alignment with shareholder interests and linkage of reward to performance over the long term
approve criteria and applicable terms for participation in annual incentive bonuses
review performance measures to be used in determining the annual incentive bonuses for all employees
approve recommendations for awards in terms of approved long-term incentive plans
monitor adequacy of other benefits for key executives
monitor compulsory employee benefits applicable at all levels and categories of employees in the group
review and approve general terms and mandates of subsidiary remuneration committees
review and consider reports from subsidiary remuneration committees on changes in remuneration practices or philosophy.
Remco compositionRemco members have no business or other relationships that could materially interfere with their independent judgements. All Remco members are also members of key oversight committees so that they are able to monitor risk trends across the group.
The group chief executives attend meetings by invitation. Other members of executive management are invited to attend from time-to-time to assist the committee in fulfilling its mandate. No one is present when his or her remuneration is discussed.
Refer to page 122 for details of Remco meeting attendance.
Access to information and advisersMembers of Remco can access any information that helps inform their independent judgement on pay. This includes any impact that pay might have on risk, regulation or behaviour.
In 2014, Remco and management used a number of external advisers to benchmark remuneration and benefits across the group. External advisers also gave opinions on remuneration regulations and compliance. Information and guidance was received from PricewaterhouseCoopers (PwC), PwC Remchannel, Global Remuneration Solutions – Mercer, Employment Conditions Abroad, McLagan and Towers Watson. In terms of market comparisons and benchmarking, reviews are made against other major South African, African and international banks and top listed companies.
Remco uses the input from these firms to inform the group’s remuneration philosophy and policy. The board approves Remco’s proposals and, where necessary, submits proposals to shareholders for approval.
Certain specialist business units in the group provide supporting information and documentation relating to matters considered by Remco.
Remuneration report | continued
155
Non-executive directorsIn determining the fees for non-executive directors, the majority of whom are also members of board committees, Remco considers the extent and nature of their responsibilities. It also considers market conditions and reviews comparative remuneration offered by other major South African and international banks and top South African listed companies.
Proposed fees, effective from 1 January 2015, are based on a carefully considered assessment of non-executive directors’ responsibility, including the significant amount of work involved at committee level. The board, and particularly its committees, chairmen and committee members, spend a significant amount of time on in-depth analysis of matters relevant to the group’s performance and regulatory requirements.
FeesNon-executive directors receive fixed fees for service on boards and board committees. There are no contractual arrangements for compensation for loss of office for either executives or non-executive directors. Non-executive directors do not receive annual incentive awards, nor do they participate in any of the group’s long-term incentive schemes. Remco reviews the fees paid to non-executive directors annually and makes recommendations to the board for consideration and shareholder approval.
During 2014, a meeting fee totalling R21,9 million was paid to 14 non-executive directors who were required to attend and participate in the group’s governance structures as part of the board discharging its responsibilities.
The board agreed that the current fee structure of a single annual fee, rather than a retainer and meeting attendance fee, was more appropriate for the group board and committees and in light of the contribution of members. It remains the group’s view that the contribution of directors cannot only be judged by attendance at board and committee meetings. Fees are paid quarterly in arrears, with any increased fee amount only being paid following approval by shareholders.
Terms for non-executive directorsThere is no limitation on the number of times a non-executive director may stand for re-election subject to the maximum age of 70 years. Proposals for re-election are based on individual performance and contribution, which the directors’ affairs committee reviews.
The corporate governance report on page 110 provides a review of the independence of those directors who have served on the board for more than nine years.
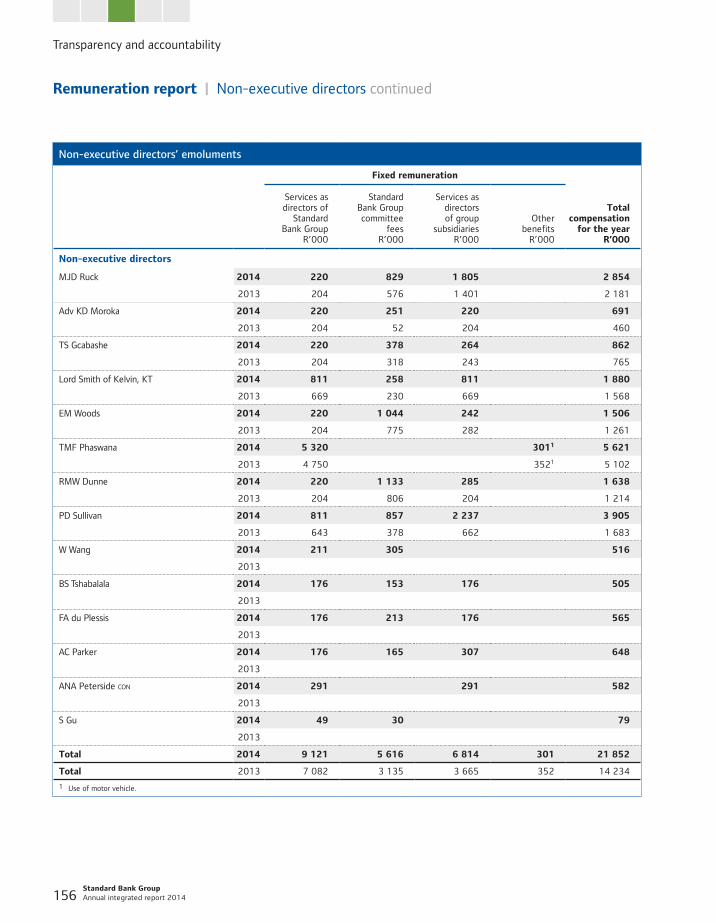
Transparency and accountability
Standard Bank Group Annual integrated report 2014 156
Non-executive directors’ emoluments
Fixed remuneration
Total compensation
for the yearR’000
Services asdirectors of
Standard Bank Group
R’000
Standard Bank Group committee
feesR’000
Services as directors of group
subsidiariesR’000
Other benefits
R’000
Non-executive directors
MJD Ruck 2014 220 829 1 805 2 854
2013 204 576 1 401 2 181
Adv KD Moroka 2014 220 251 220 691
2013 204 52 204 460
TS Gcabashe 2014 220 378 264 862
2013 204 318 243 765
Lord Smith of Kelvin, KT 2014 811 258 811 1 880
2013 669 230 669 1 568
EM Woods 2014 220 1 044 242 1 506
2013 204 775 282 1 261
TMF Phaswana 2014 5 320 3011 5 621
2013 4 750 3521 5 102
RMW Dunne 2014 220 1 133 285 1 638
2013 204 806 204 1 214
PD Sullivan 2014 811 857 2 237 3 905
2013 643 378 662 1 683
W Wang 2014 211 305 516
2013
BS Tshabalala 2014 176 153 176 505
2013
FA du Plessis 2014 176 213 176 565
2013
AC Parker 2014 176 165 307 648
2013
ANA Peterside con 2014 291 291 582
2013
S Gu 2014 49 30 79
2013
Total 2014 9 121 5 616 6 814 301 21 852
Total 2013 7 082 3 135 3 665 352 14 234
1 Use of motor vehicle.
Remuneration report | Non-executive directors continued
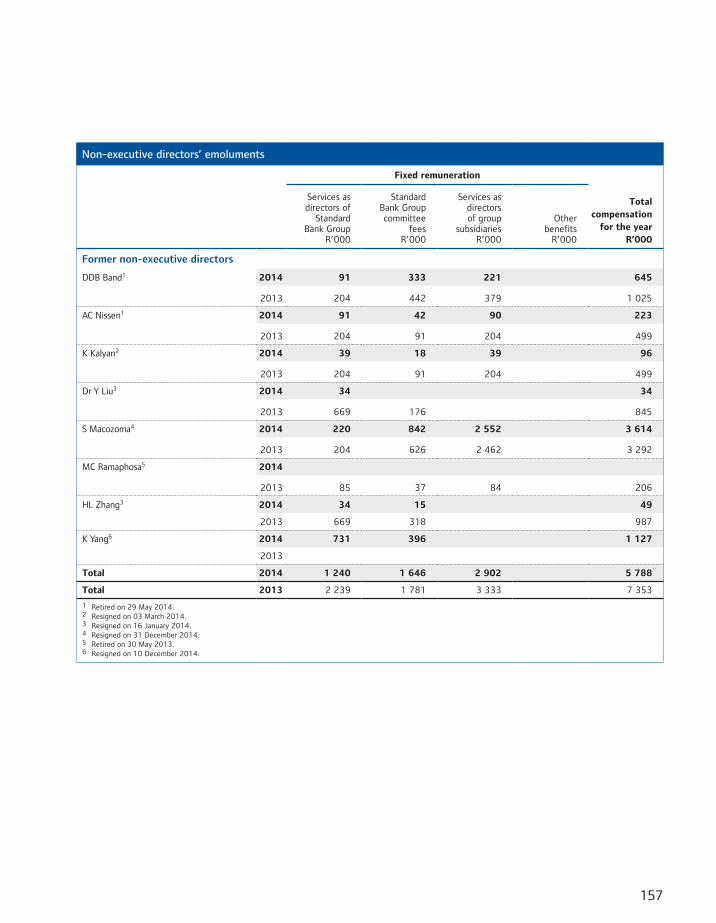
157
Non-executive directors’ emoluments
Fixed remuneration
Total compensation
for the yearR’000
Services asdirectors of
StandardBank Group
R’000
StandardBank Group committee
feesR’000
Services asdirectorsof group
subsidiariesR’000
Otherbenefits
R’000
Former non-executive directors
DDB Band1 2014 91 333 221 645
2013 204 442 379 1 025
AC Nissen1 2014 91 42 90 223
2013 204 91 204 499
K Kalyan2 2014 39 18 39 96
2013 204 91 204 499
Dr Y Liu3 2014 34 34
2013 669 176 845
S Macozoma4 2014 220 842 2 552 3 614
2013 204 626 2 462 3 292
MC Ramaphosa5 2014
2013 85 37 84 206
HL Zhang3 2014 34 15 49
2013 669 318 987
K Yang6 2014 731 396 1 127
2013
Total 2014 1 240 1 646 2 902 5 788
Total 2013 2 239 1 781 3 333 7 353
1 Retired on 29 May 2014.2 Resigned on 03 March 2014.3 Resigned on 16 January 2014.4 Resigned on 31 December 2014.5 Retired on 30 May 2013.6 Resigned on 10 December 2014.
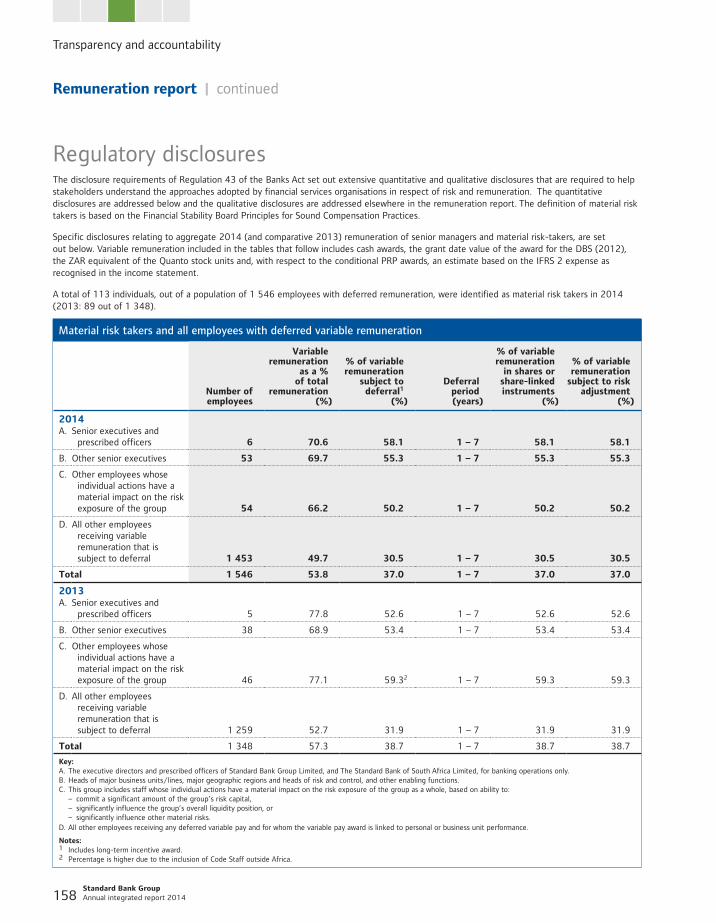
Transparency and accountability
Standard Bank Group Annual integrated report 2014 158
Regulatory disclosuresThe disclosure requirements of Regulation 43 of the Banks Act set out extensive quantitative and qualitative disclosures that are required to help stakeholders understand the approaches adopted by financial services organisations in respect of risk and remuneration. The quantitative disclosures are addressed below and the qualitative disclosures are addressed elsewhere in the remuneration report. The definition of material risk takers is based on the Financial Stability Board Principles for Sound Compensation Practices.
Specific disclosures relating to aggregate 2014 (and comparative 2013) remuneration of senior managers and material risk-takers, are set out below. Variable remuneration included in the tables that follow includes cash awards, the grant date value of the award for the DBS (2012), the ZAR equivalent of the Quanto stock units and, with respect to the conditional PRP awards, an estimate based on the IFRS 2 expense as recognised in the income statement.
A total of 113 individuals, out of a population of 1 546 employees with deferred remuneration, were identified as material risk takers in 2014 (2013: 89 out of 1 348).
Material risk takers and all employees with deferred variable remuneration
Number ofemployees
Variableremuneration
as a %of total
remuneration(%)
% of variable remuneration
subject todeferral1
(%)
Deferral period(years)
% of variableremuneration in shares or
share-linked instruments
(%)
% of variableremuneration
subject to riskadjustment
(%)
2014A. Senior executives and
prescribed officers 6 70.6 58.1 1 – 7 58.1 58.1
B. Other senior executives 53 69.7 55.3 1 – 7 55.3 55.3
C. Other employees whose individual actions have a material impact on the risk exposure of the group 54 66.2 50.2 1 – 7 50.2 50.2
D. All other employees receiving variable remuneration that is subject to deferral 1 453 49.7 30.5 1 – 7 30.5 30.5
Total 1 546 53.8 37.0 1 – 7 37.0 37.0
2013A. Senior executives and
prescribed officers 5 77.8 52.6 1 – 7 52.6 52.6
B. Other senior executives 38 68.9 53.4 1 – 7 53.4 53.4
C. Other employees whose individual actions have a material impact on the risk exposure of the group 46 77.1 59.32 1 – 7 59.3 59.3
D. All other employees receiving variable remuneration that is subject to deferral 1 259 52.7 31.9 1 – 7 31.9 31.9
Total 1 348 57.3 38.7 1 – 7 38.7 38.7
Key:A. The executive directors and prescribed officers of Standard Bank Group Limited, and The Standard Bank of South Africa Limited, for banking operations only.B. Heads of major business units/lines, major geographic regions and heads of risk and control, and other enabling functions.C. This group includes staff whose individual actions have a material impact on the risk exposure of the group as a whole, based on ability to: – commit a significant amount of the group’s risk capital, – significantly influence the group’s overall liquidity position, or – significantly influence other material risks.D. All other employees receiving any deferred variable pay and for whom the variable pay award is linked to personal or business unit performance.
Notes:1 Includes long-term incentive award.2 Percentage is higher due to the inclusion of Code Staff outside Africa.
Remuneration report | continued
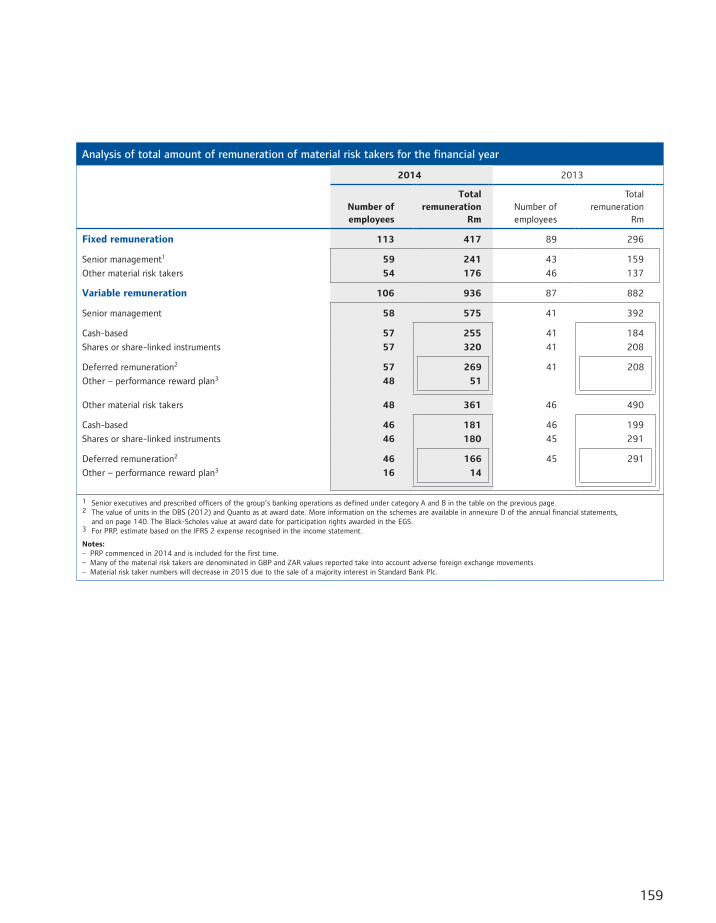
159
Analysis of total amount of remuneration of material risk takers for the financial year
2014 2013
Number ofemployees
Totalremuneration
RmNumber ofemployees
Totalremuneration
Rm
Fixed remuneration 113 417 89 296
Senior management1 59 241 43 159
Other material risk takers 54 176 46 137
Variable remuneration 106 936 87 882
Senior management 58 575 41 392
Cash-based 57 255 41 184
Shares or share-linked instruments 57 320 41 208
Deferred remuneration2 57 269 41 208
Other – performance reward plan3 48 51
Other material risk takers 48 361 46 490
Cash-based 46 181 46 199
Shares or share-linked instruments 46 180 45 291
Deferred remuneration2 46 166 45 291
Other – performance reward plan3 16 14
1 Senior executives and prescribed officers of the group’s banking operations as defined under category A and B in the table on the previous page.2 The value of units in the DBS (2012) and Quanto as at award date. More information on the schemes are available in annexure D of the annual financial statements,
and on page 140. The Black-Scholes value at award date for participation rights awarded in the EGS. 3 For PRP, estimate based on the IFRS 2 expense recognised in the income statement.
Notes:– PRP commenced in 2014 and is included for the first time.– Many of the material risk takers are denominated in GBP and ZAR values reported take into account adverse foreign exchange movements.– Material risk taker numbers will decrease in 2015 due to the sale of a majority interest in Standard Bank Plc.
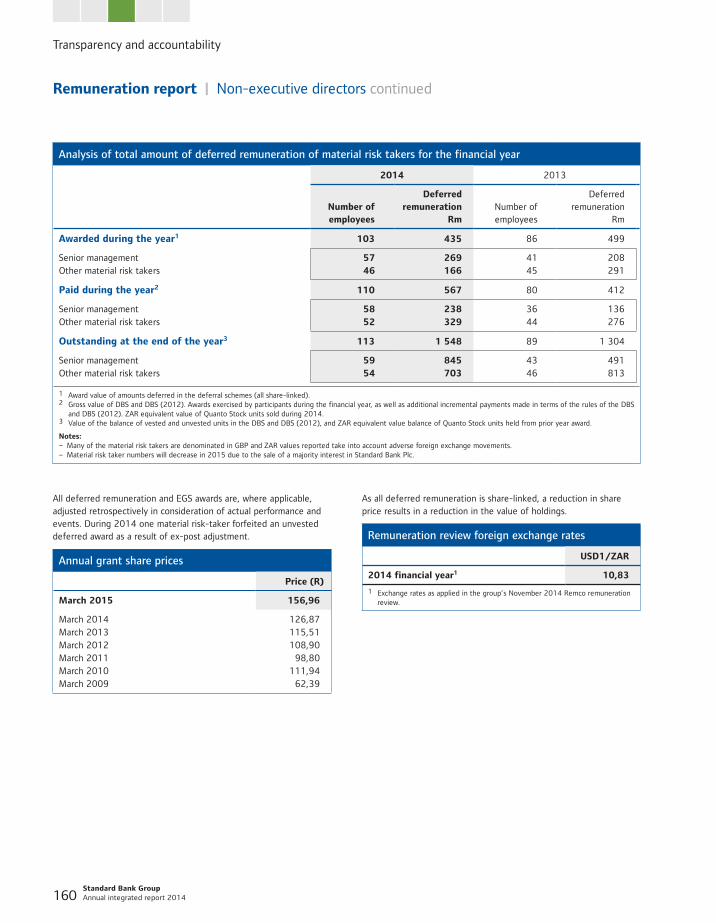
Transparency and accountability
Standard Bank Group Annual integrated report 2014 160
Analysis of total amount of deferred remuneration of material risk takers for the financial year
2014 2013
Number ofemployees
Deferredremuneration
RmNumber ofemployees
Deferredremuneration
Rm
Awarded during the year1 103 435 86 499
Senior management 57 269 41 208Other material risk takers 46 166 45 291
Paid during the year2 110 567 80 412
Senior management 58 238 36 136Other material risk takers 52 329 44 276
Outstanding at the end of the year3 113 1 548 89 1 304
Senior management 59 845 43 491Other material risk takers 54 703 46 813
1 Award value of amounts deferred in the deferral schemes (all share-linked).2 Gross value of DBS and DBS (2012). Awards exercised by participants during the financial year, as well as additional incremental payments made in terms of the rules of the DBS
and DBS (2012). ZAR equivalent value of Quanto Stock units sold during 2014.3 Value of the balance of vested and unvested units in the DBS and DBS (2012), and ZAR equivalent value balance of Quanto Stock units held from prior year award.
Notes:– Many of the material risk takers are denominated in GBP and ZAR values reported take into account adverse foreign exchange movements.– Material risk taker numbers will decrease in 2015 due to the sale of a majority interest in Standard Bank Plc.
Remuneration report | Non-executive directors continued
All deferred remuneration and EGS awards are, where applicable, adjusted retrospectively in consideration of actual performance and events. During 2014 one material risk-taker forfeited an unvested deferred award as a result of ex-post adjustment.
Annual grant share prices
Price (R)
March 2015 156,96
March 2014 126,87March 2013 115,51March 2012 108,90March 2011 98,80March 2010 111,94March 2009 62,39
As all deferred remuneration is share-linked, a reduction in share price results in a reduction in the value of holdings.
Remuneration review foreign exchange rates
USD1/ZAR
2014 financial year1 10,83
1 Exchange rates as applied in the group’s November 2014 Remco remuneration review.
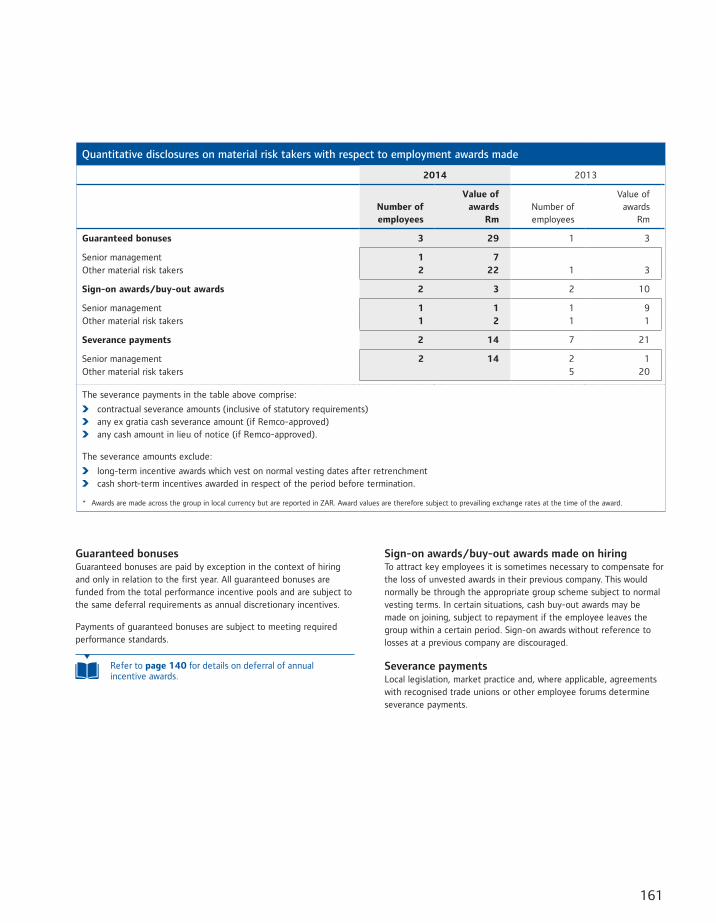
161
Quantitative disclosures on material risk takers with respect to employment awards made
2014 2013
Number of employees
Value ofawards
RmNumber of
employees
Value ofawards
Rm
Guaranteed bonuses 3 29 1 3
Senior management 1 7Other material risk takers 2 22 1 3
Sign-on awards/buy-out awards 2 3 2 10
Senior management 1 1 1 9Other material risk takers 1 2 1 1
Severance payments 2 14 7 21
Senior management 2 14 2 1Other material risk takers 5 20
The severance payments in the table above comprise:
contractual severance amounts (inclusive of statutory requirements) any ex gratia cash severance amount (if Remco-approved) any cash amount in lieu of notice (if Remco-approved).
The severance amounts exclude:
long-term incentive awards which vest on normal vesting dates after retrenchment cash short-term incentives awarded in respect of the period before termination.
* Awards are made across the group in local currency but are reported in ZAR. Award values are therefore subject to prevailing exchange rates at the time of the award.
Guaranteed bonusesGuaranteed bonuses are paid by exception in the context of hiring and only in relation to the first year. All guaranteed bonuses are funded from the total performance incentive pools and are subject to the same deferral requirements as annual discretionary incentives.
Payments of guaranteed bonuses are subject to meeting required performance standards.
Refer to page 140 for details on deferral of annual incentive awards.
Sign-on awards/buy-out awards made on hiringTo attract key employees it is sometimes necessary to compensate for the loss of unvested awards in their previous company. This would normally be through the appropriate group scheme subject to normal vesting terms. In certain situations, cash buy-out awards may be made on joining, subject to repayment if the employee leaves the group within a certain period. Sign-on awards without reference to losses at a previous company are discouraged.
Severance paymentsLocal legislation, market practice and, where applicable, agreements with recognised trade unions or other employee forums determine severance payments.
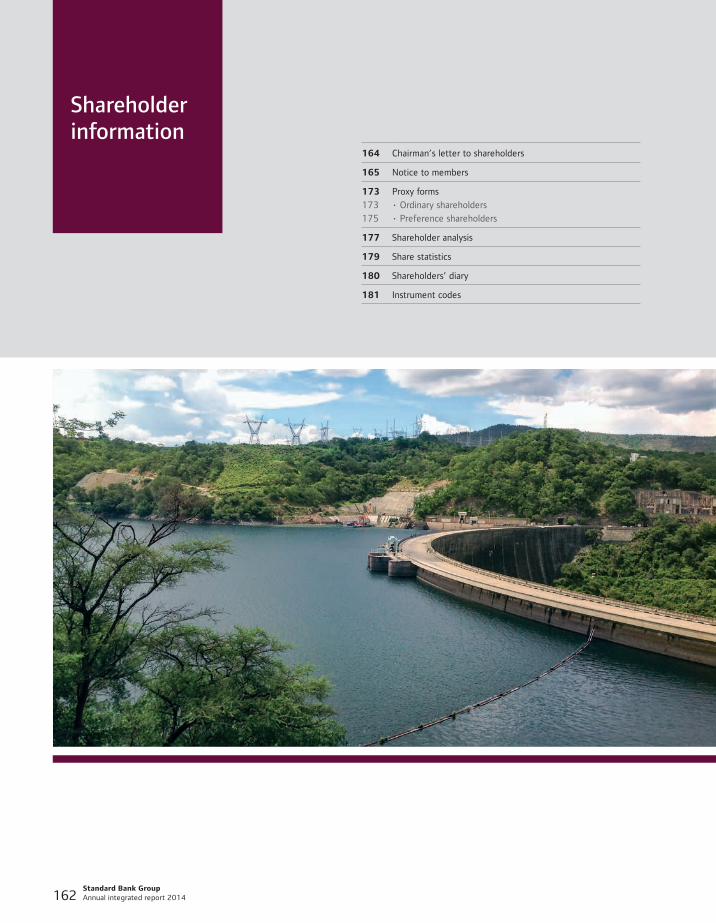
Standard Bank Group Annual integrated report 2014 162
Shareholder information
164 Chairman’s letter to shareholders
165 Notice to members
173 Proxy forms
173 • Ordinary shareholders
175 • Preference shareholders
177 Shareholder analysis
179 Share statistics
180 Shareholders’ diary
181 Instrument codes

163
Enhancing energy security
Standard Bank Namibia was the sole commercial lender who provided a facility to the Zimbabwe Power Corporation (ZPC) for the 300MW extension of the Kariba South Hydro Power Plant. The expansion of the hydro power plant will ensure increased capacity for the ZPC to meet its supply obligations in southern and central Africa. Our presence across jurisdictions and strong relationships with key stakeholders were instrumental in being awarded this deal.
Standard Bank Group Annual integrated report 2014 164
Shareholder information
Chairman’s letter to shareholders
Dear ShareholderI extend an invitation to you to attend the 46th annual general meeting ("AGM") of Standard Bank Group Limited (the company) to be held in the HP de Villiers Auditorium, Ground Floor, Standard Bank Centre, 6 Simmonds Street, Johannesburg on Thursday, 28 May 2015 at 9:00.
This is your opportunity to meet and question members of the Standard Bank Group Limited board regarding the group’s performance for the year ended 31 December 2014.
If you are not able to attend the AGM and hold shares in certificated form or if you have dematerialised your shares and have elected “own-name” registration through a Central Securities Depository Participant (CSDP) or broker, I would urge you to complete and submit the proxy form in accordance with the instructions and return it to the address indicated.
If you are not able to attend the AGM and have dematerialised your shares on STRATE and have not elected “own-name” registration, I would likewise urge you to submit your voting instructions to your CSDP or broker. You will need to contact them regarding their particular cut-off time for votes to be lodged with us.
If you wish to attend the AGM and have dematerialised your shares on STRATE, and you have not elected “own-name” registration, you will have to approach your CSDP or broker to provide you with the necessary authority in terms of the agreement that you have entered into with them.
Explanatory note on resolutions to be tabled at the AGMThe AGM will deal with the following ordinary business:
the group’s consolidated audited financial statements for the year ended 31 December 2014 (including the directors’ report and the audit and risk committee reports) will be presented to shareholders. A summary of the annual financial statements are set out on pages 76 to 83 of the annual integrated report and the complete annual financial statements are set out on the company’s website at www.standardbank.com/reporting (resolution number 1)
the company’s memorandum of incorporation makes provision for the annual retirement of a certain proportion of the board of directors. The directors who retire in terms of this provision and who offer themselves for re-election have their abridged curriculum vitae included in the notice (resolution number 2)
the reappointment of the company’s joint auditors, KPMG Inc. and PricewaterhouseCoopers Inc. (resolution number 3)
resolution 4 provides the directors with the ability to allot and issue ordinary shares up to a maximum of 5% of the ordinary shares in issue at 31 December 2014
the directors’ ability to allot and issue non-redeemable, non-cumulative, non-participating preference shares is contained in the provisions of ordinary resolution 5
to consider and endorse, by way of a non-binding advisory vote, the company’s remuneration policy (resolution number 6).
The following special resolutions will be tabled for consideration at the AGM:
to approve the non-executive directors’ fees in respect of 2015, which have been considered by the group remuneration committee and recommended by the board (resolution number 7)
a renewal of the authority given by shareholders at the previous AGM that will allow the repurchase of the company’s securities by the company or any subsidiary during the course of the year should the directors feel that the circumstances are appropriate. Any repurchases made will be in accordance with the Companies Act, 2008 as amended (“Companies Act”) and the Listings Requirements of the JSE Limited ("Listings Requirements") (resolution number 8)
a general authority by shareholders to permit the repurchase of the company’s non-redeemable preference securities by the company or any subsidiary during the course of the year should the directors feel that the circumstances are appropriate. Any repurchases made will be in accordance with the Companies Act, and the Listings Requirements (resolution number 9)
to give the directors of the company authority to provide financial assistance to any company that is related or inter-related to the company (resolution number 10).
I look forward to welcoming you at the AGM.
Fred PhaswanaChairman
4 March 2015
165
Notice to members
To present the audited annual financial statements for the year ended 31 December 2014, including the reports of the directors and the audit committee.
In order for this resolution to be approved, it must be supported by more than 50% of the voting rights exercised on the resolution.
1 Presentation of the audited annual financial statements
Notice is hereby given that the 46th annual general meeting (“the meeting”) of Standard Bank Group Limited (“Standard Bank Group” or “SBG” or “the company”) will be held in the HP de Villiers Auditorium, Ground Floor, Standard Bank Centre, 6 Simmonds Street, Johannesburg on Thursday 28 May 2015 at 09h00.
The record date on which members must be recorded as such in the register maintained by the transfer secretaries of the company for the purposes of being entitled to attend and vote at the meeting is Friday, 22 May 2015.
The purpose of the meeting is to transact the business set out below, and to consider and, if deemed fit, to pass, with or without modification, the resolutions set out below:
To elect directors in place of those retiring in accordance with the provisions of the company’s memorandum of incorporation.
Richard Dunne, Thulani Gcabashe and Kgomotso Moroka, being eligible, offer themselves for re-election. Fred Phaswana and Lord Smith will retire at the end of this meeting.
Atedo Peterside and Shu Gu, appointed to the board since the previous annual general meeting, are required to retire at the annual general meeting following their appointment and are also eligible for re-election.
Richard Dunne, Thulani Gcabashe, Kgomotso Moroka and Atedo Peterside are independent non-executive directors. Details of the directors offering themselves for re-election are as follows:
2 Re-election of directors
Qualifications: Date of appointment: Other directorships: Committee membership:
2.1Richard Dunne (66)
CTA (Wits) CA(SA) 2009 Anglo American Platinum, AECI, Tiger Brands
Group/SBSA audit committees (chairman), group/SBSA risk and capital management committees, group IT committee
2.2Thulani Gcabashe (57)
BA (Botswana and Swaziland), Masters in Urban and Regional Planning (Ball State)
2003 Imperial Holdings (chairman), Built Environment Africa Capital (executive chairman), MTN Zakhele (chairman)
Group/SBSA directors’ affairs committees, group/SBSA audit committees
2.3Shu Gu (47)
Bachelor’s degree in Engineering (Shanghai Jiaotong University), Masters Degree in Economics (Dongbei University of Finance and Economics), Doctorate degree in Economics (Shanghai University of Finance and Economics)
2014 Group directors’ affairs committee, group risk and capital management committee, group IT committee
Shareholder information
Standard Bank Group Annual integrated report 2014 166
Notice to members | continued
The audit committee has evaluated the performance of KPMG Inc. and PricewaterhouseCoopers Inc. and recommend their reappointment as joint auditors of the company.
3.1 Resolved to reappoint KPMG Inc. as auditors of Standard Bank Group Limited for the year ending 31 December 2015.
3.2 Resolved to reappoint PricewaterhouseCoopers Inc. as auditors of Standard Bank Group Limited for the year ending 31 December 2015.
It is proposed that the aforementioned appointments be made on a joint basis. If either resolution 3.1 or resolution 3.2 is not passed, the resolution passed shall be effective. In order for these resolutions to be approved, each resolution must be supported by more that 50% of the voting rights exercised on the resolution.
3 Reappointment of auditors
“Resolved that the unissued ordinary shares in the authorised share capital of the company be and are hereby placed under the control of the directors of the company who are authorised to issue the ordinary shares at their discretion until the next annual general meeting of the company, subject to the provisions of the Companies Act 2008, as amended or replaced from time-to-time, the Banks Act, No 94 of 1990, as amended and the Listings Requirements of the JSE Limited as amended and subject to the aggregate number of ordinary shares able to be issued in terms of this resolution being limited to five percent (5%) of the number of ordinary shares in issue at 31 December 2014.”
In order for this resolution to be approved, it must be supported by more than 50% of the voting rights exercised on the resolution.
4 Placing the authorised but unissued ordinary shares under the control of the directors
In order for resolution numbers 2.1 to 2.5 to be approved, each resolution must be supported by more than 50% of the voting rights exercised on the resolution.
Qualifications: Date of appointment: Other directorships: Committee membership:
2.4 Kgomotso Moroka (60)
BProc (University of the North), LLB (Wits)
2003 Gobodo Forensic and Investigative Accounting (chairman), Royal Bafokeng Platinum (chairman), South African Breweries, Multichoice South Africa Holdings, Netcare
Group/SBSA directors’ affairs committees, group/SBSA risk and capital management committees, group social and ethics committee (chairman)
2.5Atedo Peterside con (59)
BSc (Economics) (The City University, London), MSc Economics (London School of Economics and Political Science)
2014 Stanbic IBTC Holdings Plc (chairman), ANAP Holdings Limited (chairman), ANAP Business Jets Limited, Cadbury Nigeria Plc, Nigerian Breweries Plc, Unilever Nigeria Plc
2 Re-election of directors continued
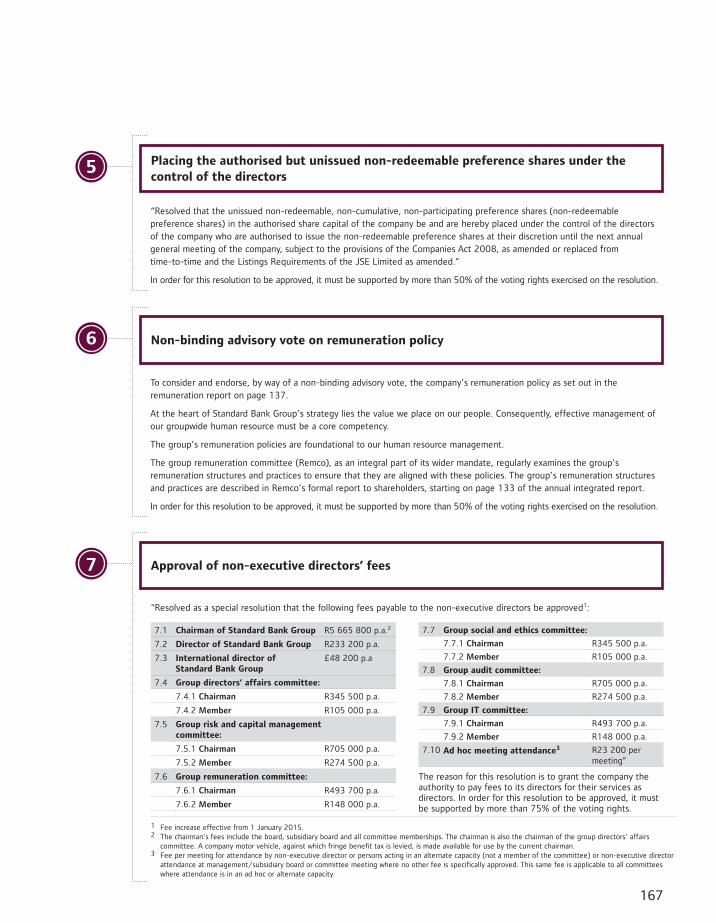
167
“Resolved that the unissued non-redeemable, non-cumulative, non-participating preference shares (non-redeemable preference shares) in the authorised share capital of the company be and are hereby placed under the control of the directors of the company who are authorised to issue the non-redeemable preference shares at their discretion until the next annual general meeting of the company, subject to the provisions of the Companies Act 2008, as amended or replaced from time-to-time and the Listings Requirements of the JSE Limited as amended.”
In order for this resolution to be approved, it must be supported by more than 50% of the voting rights exercised on the resolution.
5 Placing the authorised but unissued non-redeemable preference shares under the control of the directors
To consider and endorse, by way of a non-binding advisory vote, the company’s remuneration policy as set out in the remuneration report on page 137.
At the heart of Standard Bank Group’s strategy lies the value we place on our people. Consequently, effective management of our groupwide human resource must be a core competency.
The group’s remuneration policies are foundational to our human resource management.
The group remuneration committee (Remco), as an integral part of its wider mandate, regularly examines the group’s remuneration structures and practices to ensure that they are aligned with these policies. The group’s remuneration structures and practices are described in Remco’s formal report to shareholders, starting on page 133 of the annual integrated report.
In order for this resolution to be approved, it must be supported by more than 50% of the voting rights exercised on the resolution.
Non-binding advisory vote on remuneration policy6
"Resolved as a special resolution that the following fees payable to the non-executive directors be approved1:
Approval of non-executive directors’ fees7
7.1 Chairman of Standard Bank Group R5 665 800 p.a.2
7.2 Director of Standard Bank Group R233 200 p.a.
7.3 International director of Standard Bank Group
£48 200 p.a
7.4 Group directors’ affairs committee:
7.4.1 Chairman R345 500 p.a.
7.4.2 Member R105 000 p.a.
7.5 Group risk and capital management committee:
7.5.1 Chairman R705 000 p.a.
7.5.2 Member R274 500 p.a.
7.6 Group remuneration committee:
7.6.1 Chairman R493 700 p.a.
7.6.2 Member R148 000 p.a.
7.7 Group social and ethics committee:
7.7.1 Chairman R345 500 p.a.
7.7.2 Member R105 000 p.a.
7.8 Group audit committee:
7.8.1 Chairman R705 000 p.a.
7.8.2 Member R274 500 p.a.
7.9 Group IT committee:
7.9.1 Chairman R493 700 p.a.
7.9.2 Member R148 000 p.a.
7.10 Ad hoc meeting attendance3 R23 200 per meeting”
The reason for this resolution is to grant the company the authority to pay fees to its directors for their services as directors. In order for this resolution to be approved, it must be supported by more than 75% of the voting rights.
1 Fee increase effective from 1 January 2015.2 The chairman’s fees include the board, subsidiary board and all committee memberships. The chairman is also the chairman of the group directors’ affairs
committee. A company motor vehicle, against which fringe benefit tax is levied, is made available for use by the current chairman.3 Fee per meeting for attendance by non-executive director or persons acting in an alternate capacity (not a member of the committee) or non-executive director
attendance at management/subsidiary board or committee meeting where no other fee is specifically approved. This same fee is applicable to all committees where attendance is in an ad hoc or alternate capacity.
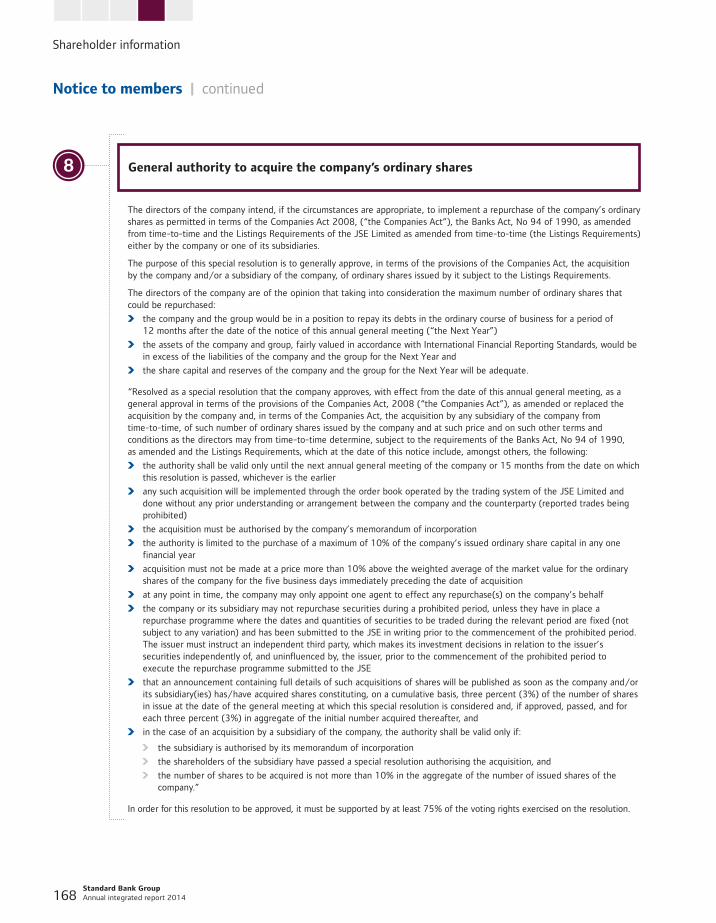
Shareholder information
Standard Bank Group Annual integrated report 2014 168
Notice to members | continued
The directors of the company intend, if the circumstances are appropriate, to implement a repurchase of the company’s ordinary shares as permitted in terms of the Companies Act 2008, (“the Companies Act”), the Banks Act, No 94 of 1990, as amended from time-to-time and the Listings Requirements of the JSE Limited as amended from time-to-time (the Listings Requirements) either by the company or one of its subsidiaries.
The purpose of this special resolution is to generally approve, in terms of the provisions of the Companies Act, the acquisition by the company and/or a subsidiary of the company, of ordinary shares issued by it subject to the Listings Requirements.
The directors of the company are of the opinion that taking into consideration the maximum number of ordinary shares that could be repurchased:
the company and the group would be in a position to repay its debts in the ordinary course of business for a period of 12 months after the date of the notice of this annual general meeting (“the Next Year”)
the assets of the company and group, fairly valued in accordance with International Financial Reporting Standards, would be in excess of the liabilities of the company and the group for the Next Year and
the share capital and reserves of the company and the group for the Next Year will be adequate.
“Resolved as a special resolution that the company approves, with effect from the date of this annual general meeting, as a general approval in terms of the provisions of the Companies Act, 2008 (“the Companies Act”), as amended or replaced the acquisition by the company and, in terms of the Companies Act, the acquisition by any subsidiary of the company from time-to-time, of such number of ordinary shares issued by the company and at such price and on such other terms and conditions as the directors may from time-to-time determine, subject to the requirements of the Banks Act, No 94 of 1990, as amended and the Listings Requirements, which at the date of this notice include, amongst others, the following:
the authority shall be valid only until the next annual general meeting of the company or 15 months from the date on which this resolution is passed, whichever is the earlier
any such acquisition will be implemented through the order book operated by the trading system of the JSE Limited and done without any prior understanding or arrangement between the company and the counterparty (reported trades being prohibited)
the acquisition must be authorised by the company’s memorandum of incorporation
the authority is limited to the purchase of a maximum of 10% of the company’s issued ordinary share capital in any one financial year
acquisition must not be made at a price more than 10% above the weighted average of the market value for the ordinary shares of the company for the five business days immediately preceding the date of acquisition
at any point in time, the company may only appoint one agent to effect any repurchase(s) on the company’s behalf
the company or its subsidiary may not repurchase securities during a prohibited period, unless they have in place a repurchase programme where the dates and quantities of securities to be traded during the relevant period are fixed (not subject to any variation) and has been submitted to the JSE in writing prior to the commencement of the prohibited period. The issuer must instruct an independent third party, which makes its investment decisions in relation to the issuer’s securities independently of, and uninfluenced by, the issuer, prior to the commencement of the prohibited period to execute the repurchase programme submitted to the JSE
that an announcement containing full details of such acquisitions of shares will be published as soon as the company and/or its subsidiary(ies) has/have acquired shares constituting, on a cumulative basis, three percent (3%) of the number of shares in issue at the date of the general meeting at which this special resolution is considered and, if approved, passed, and for each three percent (3%) in aggregate of the initial number acquired thereafter, and
in the case of an acquisition by a subsidiary of the company, the authority shall be valid only if:
the subsidiary is authorised by its memorandum of incorporation
the shareholders of the subsidiary have passed a special resolution authorising the acquisition, and
the number of shares to be acquired is not more than 10% in the aggregate of the number of issued shares of the company.”
In order for this resolution to be approved, it must be supported by at least 75% of the voting rights exercised on the resolution.
8 General authority to acquire the company’s ordinary shares
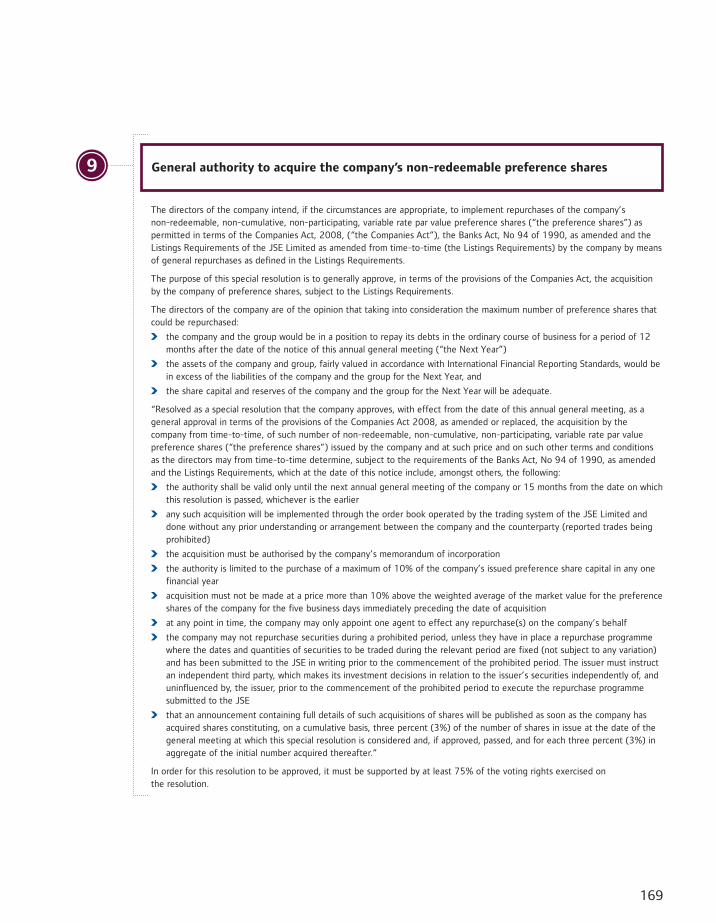
169
The directors of the company intend, if the circumstances are appropriate, to implement repurchases of the company’s non-redeemable, non-cumulative, non-participating, variable rate par value preference shares (“the preference shares”) as permitted in terms of the Companies Act, 2008, (“the Companies Act”), the Banks Act, No 94 of 1990, as amended and the Listings Requirements of the JSE Limited as amended from time-to-time (the Listings Requirements) by the company by means of general repurchases as defined in the Listings Requirements.
The purpose of this special resolution is to generally approve, in terms of the provisions of the Companies Act, the acquisition by the company of preference shares, subject to the Listings Requirements.
The directors of the company are of the opinion that taking into consideration the maximum number of preference shares that could be repurchased:
the company and the group would be in a position to repay its debts in the ordinary course of business for a period of 12 months after the date of the notice of this annual general meeting (“the Next Year”)
the assets of the company and group, fairly valued in accordance with International Financial Reporting Standards, would be in excess of the liabilities of the company and the group for the Next Year, and
the share capital and reserves of the company and the group for the Next Year will be adequate.
“Resolved as a special resolution that the company approves, with effect from the date of this annual general meeting, as a general approval in terms of the provisions of the Companies Act 2008, as amended or replaced, the acquisition by the company from time-to-time, of such number of non-redeemable, non-cumulative, non-participating, variable rate par value preference shares (“the preference shares”) issued by the company and at such price and on such other terms and conditions as the directors may from time-to-time determine, subject to the requirements of the Banks Act, No 94 of 1990, as amended and the Listings Requirements, which at the date of this notice include, amongst others, the following:
the authority shall be valid only until the next annual general meeting of the company or 15 months from the date on which this resolution is passed, whichever is the earlier
any such acquisition will be implemented through the order book operated by the trading system of the JSE Limited and done without any prior understanding or arrangement between the company and the counterparty (reported trades being prohibited)
the acquisition must be authorised by the company’s memorandum of incorporation
the authority is limited to the purchase of a maximum of 10% of the company’s issued preference share capital in any one financial year
acquisition must not be made at a price more than 10% above the weighted average of the market value for the preference shares of the company for the five business days immediately preceding the date of acquisition
at any point in time, the company may only appoint one agent to effect any repurchase(s) on the company’s behalf
the company may not repurchase securities during a prohibited period, unless they have in place a repurchase programme where the dates and quantities of securities to be traded during the relevant period are fixed (not subject to any variation) and has been submitted to the JSE in writing prior to the commencement of the prohibited period. The issuer must instruct an independent third party, which makes its investment decisions in relation to the issuer’s securities independently of, and uninfluenced by, the issuer, prior to the commencement of the prohibited period to execute the repurchase programme submitted to the JSE
that an announcement containing full details of such acquisitions of shares will be published as soon as the company has acquired shares constituting, on a cumulative basis, three percent (3%) of the number of shares in issue at the date of the general meeting at which this special resolution is considered and, if approved, passed, and for each three percent (3%) in aggregate of the initial number acquired thereafter.”
In order for this resolution to be approved, it must be supported by at least 75% of the voting rights exercised on the resolution.
9 General authority to acquire the company’s non-redeemable preference shares
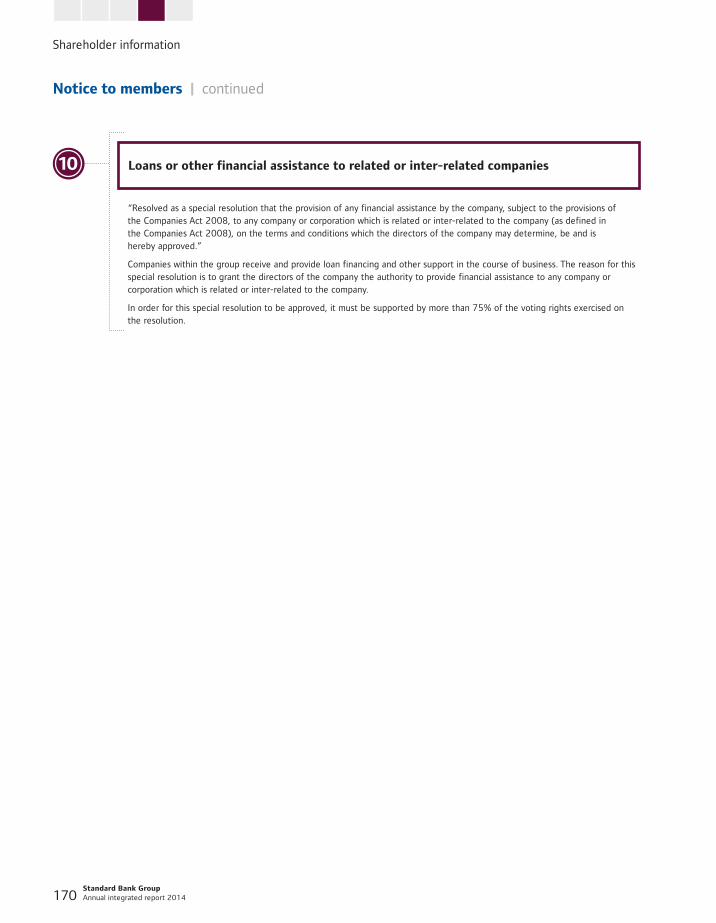
Shareholder information
Standard Bank Group Annual integrated report 2014 170
Notice to members | continued
“Resolved as a special resolution that the provision of any financial assistance by the company, subject to the provisions of the Companies Act 2008, to any company or corporation which is related or inter-related to the company (as defined in the Companies Act 2008), on the terms and conditions which the directors of the company may determine, be and is hereby approved.”
Companies within the group receive and provide loan financing and other support in the course of business. The reason for this special resolution is to grant the directors of the company the authority to provide financial assistance to any company or corporation which is related or inter-related to the company.
In order for this special resolution to be approved, it must be supported by more than 75% of the voting rights exercised on the resolution.
Loans or other financial assistance to related or inter-related companies10
171
Notes in regard to other Listings Requirements applying to resolutions 8 and 9
1. Directors’ responsibility statement The directors, whose names are given on pages 104 to 108 of the annual integrated report, collectively and individually accept full
responsibility for the accuracy of the information given in these notes 1 to 5 and certify that to the best of their knowledge and belief there are no facts that have been omitted which would make any statement in these notes 1 to 5 false or misleading, and that all reasonable enquiries to ascertain such facts have been made and that the notice contains all information required by law and the Listings Requirements.
2. Major shareholders Details of major shareholders of the company are set out on page 177 of the annual integrated report.
3. Share capital of the company Details of the share capital of the company are set out on pages 191 to 196 of the annual financial statements.
4. Material change There has been no material change in the financial or trading position of the company and its subsidiaries since the date of publication of the
company’s annual results on 5 March 2015.
5. Litigation There was a significant increase in litigation against certain of our African businesses, all of which are being defended and none of which are
expected to have a material adverse impact on the group. Legal resources were restructured and enhanced to improve the processes and controls to manage legal risks.
Shareholder information
Standard Bank Group Annual integrated report 2014 172
Standard Bank Group shareholders holding certificated shares and shareholders of the company who have dematerialised their shares and have elected own name registration in the sub-register maintained by the CSDP, may attend, speak and vote at the annual general meeting or may appoint one or more proxies (who need not be shareholders of the company) to attend, participate and vote at the annual general meeting on behalf of such shareholder. A proxy form is attached to this notice of annual general meeting. Duly completed proxy forms must be returned to the transfer secretaries of Standard Bank Group or the registered office of the company to the addresses set out below, to be received by no later than 09h00 on Tuesday, 26 May 2015.
Standard Bank Group shareholders who have dematerialised their shares through a CSDP or broker and who have not elected own name registration in the sub-register maintained by a CSDP and who wish to attend the annual general meeting, should instruct their CSDP or broker to issue them with the necessary authority to attend, or if they do not wish to attend the annual general meeting, they may provide their CSDP or broker with their voting instructions in terms of the custody agreement entered into between such shareholders and their CSDP or broker.
In regard to resolution number 9, the holders of the preference shares shall be entitled to vote. Subject to the provisions of the memorandum of incorporation, the holders of the preference shares shall be entitled to that proportion of the total votes in the company which the aggregate amount of the nominal value of the shares held by such holders bear to the aggregate amount of the nominal value of the ordinary and preference shares issued by the company.
Identification In terms of section 63(1) of the Companies Act 2008, any person attending or participating in the annual general meeting must present reasonably satisfactory identification and the person presiding at the annual general meeting must be reasonably satisfied that the right of any person to participate in and vote whether as a shareholder or as a proxy for a shareholder has been reasonably verified. Acceptable forms of identification include identity documents, driver’s licences and passports.
On behalf of the board
Z StephenGroup secretary
4 March 2015
Registered office
9th Floor, Standard Bank Centre 5 Simmonds Street Johannesburg, 2001 (PO Box 7725, Johannesburg, 2000) Fax: +27 11 636 4207
Transfer secretaries in South Africa
Computershare Investor Services Proprietary Limited Ground Floor, 70 Marshall Street Johannesburg, 2001 (PO Box 61051, Marshalltown, 2107) Fax: +27 11 688 5238
Transfer secretaries in Namibia
Transfer Secretaries Proprietary Limited 4 Robert Mugabe Avenue (Entrance in Burg Street) Windhoek, 9000 (PO Box 2401, Windhoek)
Notice to members | continued
173
Proxy forms – ordinary shareholdersStandard Bank Group Limited
(Registration number 1969/017128/06) (“the company”) JSE share code: SBK NSX share code: SNB ISIN: ZAE000109815
To be completed by certificated ordinary shareholders and dematerialised shareholders with “own name” registrations only.
A shareholder entitled to attend and vote at the annual general meeting is entitled to appoint one or more proxies to attend, speak and vote in his/her stead. A proxy need not be a member of the company.
I/We (Name in block letters)
of (Address in block letters)
being a shareholder(s) and the holder(s) of ordinary shares of 10 cents each and entitled to vote, hereby appoint (see note 1)
1 or, failing him/her
2 or, failing him/her
the chairman of the annual general meeting,
as my/our proxy to vote for me/us and on my/our behalf at the annual general meeting of shareholders to be held at 09h00 on Thursday, 28 May 2015, in the HP de Villiers Auditorium, Standard Bank Centre, 6 Simmonds Street, Johannesburg, and at any adjournment thereof as follows:
Number of votes
For* Against* Abstain*
Ordinary resolution to:1 Adopt audited annual financial statements2 To elect directors:2.1 Richard Dunne2.2 Thulani Gcabashe2.3 Shu Gu2.4 Kgomotso Moroka2.5 Atedo Peterside CON
3 Reappointment of auditors3.1 KPMG Inc.3.2 PricewaterhouseCoopers Inc.4 Place unissued ordinary shares under control of directors5 Place unissued preference shares under control of directors6 Non-binding advisory vote on remuneration policySpecial resolutions to:7 Remuneration: Approve non-executive directors’ fees (2015):7.1 Standard Bank Group chairman7.2 Standard Bank Group director7.3 Standard Bank Group international director7.4 Group Directors’ Affairs Committee7.4.1 Chairman7.4.2 Member7.5 Group Risk and Capital Management Committee7.5.1 Chairman7.5.2 Member7.6 Group Remuneration Committee7.6.1 Chairman7.6.2 Member7.7 Group Social and Ethics Committee7.7.1 Chairman7.7.2 Member7.8 Group Audit Committee7.8.1 Chairman7.8.2 Member7.9 Group IT Committee7.9.1 Chairman7.9.2 Member7.10 Ad hoc meeting attendance8 Grant: General authority to acquire the company’s ordinary shares9 Grant: General authority to acquire the company’s non-redeemable preference shares10 Approve: Loans or other financial assistance to related or inter-related companies
* Insert a cross or tick or number of votes. If no options are marked, the proxy can vote as he/she deems fit.
Signed at on 2015
Signature
Assisted by (where applicable) (state capacity and full name)
Please provide contact details Tel: ( ) Fax: ( )
E-mail:
Shareholder information
Standard Bank Group Annual integrated report 2014 174
Notes to the proxy form: ordinary shares
Please read the notes below:
1. A shareholder may insert the name of a proxy or the names of two alternative proxies of his/her choice in the space provided. The person whose name stands first on the proxy form and who is present at the annual general meeting will be entitled to act as proxy to the exclusion of those whose names follow.
2. To be effective, completed proxy forms must be lodged by not later than 09h00 on Tuesday, 26 May 2015 with either the transfer secretaries or the registered office:
South Africa: Computershare Investor Services Proprietary Limited Ground Floor, 70 Marshall Street Johannesburg, 2001 PO Box 61051, Marshalltown, 2107 Fax number +27 11 688 5238
Registered office: 9th Floor, Standard Bank Centre 5 Simmonds Street, Johannesburg PO Box 7725, Johannesburg, 2000 Fax number +27 11 636 4207
3. The completion and lodging of this form of proxy will not prevent the relevant ordinary shareholder from attending the annual general meeting and speaking and voting in person at the annual general meeting instead of the proxy.
4. The chairman of the annual general meeting may accept or reject any proxy form which is completed and/or received other than in compliance with these notes.
5. The signatories must initial any alteration to this proxy form, other than the deletion of alternatives.
6. Documentary evidence establishing the authority of a person signing the proxy form in a representative capacity must be attached to this proxy form unless previously recorded by the company.
7. Where there are joint holders of ordinary shares:
any one holder may sign the proxy form and
the vote of the senior ordinary shareholder (for that purpose seniority will be determined by the order in which the names of the ordinary shareholders who tender a vote (whether in person or by proxy) appear in the company’s register) will be accepted as to the exclusion of the vote(s) of the other joint shareholders.
8. All beneficial shareholders of ordinary shares who have dematerialised their shares through a CSDP or broker, other than those shareholders who have elected to dematerialise their shares in “own-name” registrations, must provide their CSDP or broker with their voting instructions.
Voting instructions must reach the CSDP or broker in sufficient time to allow the CSDP or broker to advise the company or its transfer secretaries of this instruction by no later than 09h00 on Tuesday, 26 May 2015. We recommend that you contact your CSDP or broker to ascertain their deadline for submission.
If you have dematerialised your shares and wish to attend the meeting in person, you may do so by requesting your CSDP or broker to issue you with a letter of representation in terms of the custody agreement entered into with your CSDP or broker.
Letters of representation must be lodged with the company’s transfer secretaries or at the registered office of the company by no later than 09h00 on Tuesday, 26 May 2015. We recommend that you contact your CSDP or broker to ascertain their deadline for submission.
Shareholders who hold certificated shares and shareholders who have dematerialised their shares in “own-name” registrations, must lodge their completed proxy forms with the company’s transfer secretaries or at the registered office of the company by not later than 09h00 on Tuesday, 26 May 2015.
9. Summary in terms of section 58(8)(b)(i) of the Companies Act, 2008: Section 58(8)(b)(i) provides that if a company supplies a form of instrument for appointing a proxy, the form of proxy supplied by the company for the purpose of appointing a proxy must bear a reasonably prominent summary of the rights established by section 58 of the Companies Act 2008, which summary is set out below:
A shareholder of a company may, at any time, appoint any individual, including an individual who is not a shareholder of that company, as a proxy, among other things, to participate in, and speak and vote at a shareholders’ meeting on behalf of the shareholder.
A shareholder may appoint two or more persons concurrently as proxies, and may appoint more than one proxy to exercise voting rights attached to different securities held by the shareholder.
A proxy may delegate the proxy’s authority to act on behalf of the shareholder to another person.
A proxy appointment must be in writing, dated and signed by the shareholder; and remains valid only until the end of the meeting at which it was intended to be used, unless the proxy appointment is revoked, in which case the proxy appointment will be cancelled with effect from such revocation.
A shareholder may revoke a proxy appointment in writing. A proxy appointment is suspended at any time and to the extent that the shareholder chooses to act directly and in person in the exercise of any rights as a shareholder.
A proxy is entitled to exercise, or abstain from exercising, any voting right of the shareholder without direction.
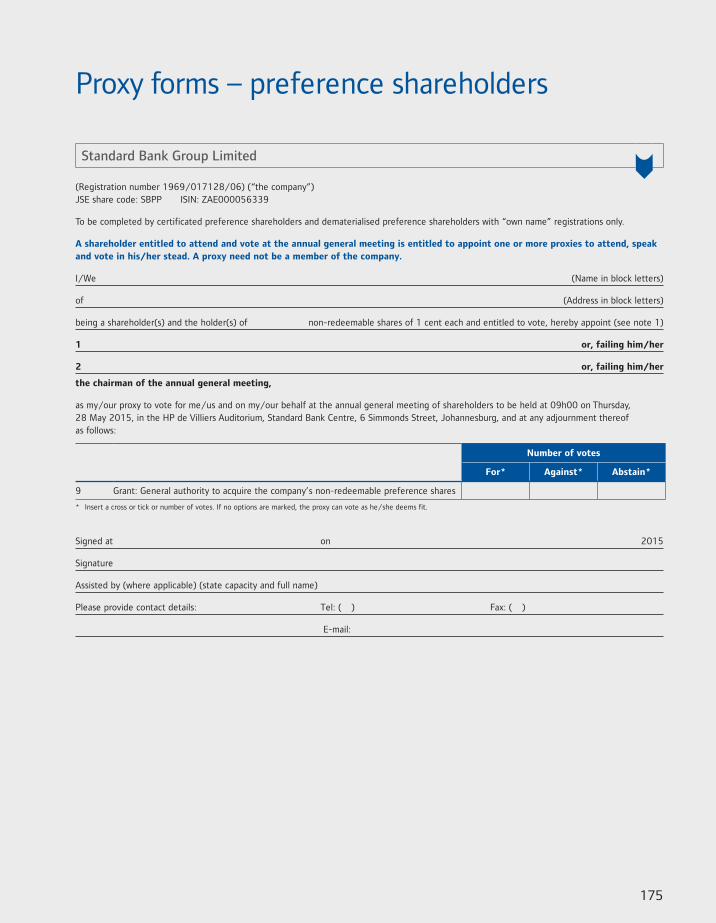
175
Proxy forms – preference shareholders
Standard Bank Group Limited
(Registration number 1969/017128/06) (“the company”) JSE share code: SBPP ISIN: ZAE000056339
To be completed by certificated preference shareholders and dematerialised preference shareholders with “own name” registrations only.
A shareholder entitled to attend and vote at the annual general meeting is entitled to appoint one or more proxies to attend, speak and vote in his/her stead. A proxy need not be a member of the company.
I/We (Name in block letters)
of (Address in block letters)
being a shareholder(s) and the holder(s) of non-redeemable shares of 1 cent each and entitled to vote, hereby appoint (see note 1)
1 or, failing him/her
2 or, failing him/her
the chairman of the annual general meeting,
as my/our proxy to vote for me/us and on my/our behalf at the annual general meeting of shareholders to be held at 09h00 on Thursday, 28 May 2015, in the HP de Villiers Auditorium, Standard Bank Centre, 6 Simmonds Street, Johannesburg, and at any adjournment thereof as follows:
Number of votes
For* Against* Abstain*
9 Grant: General authority to acquire the company’s non-redeemable preference shares
* Insert a cross or tick or number of votes. If no options are marked, the proxy can vote as he/she deems fit.
Signed at on 2015
Signature
Assisted by (where applicable) (state capacity and full name)
Please provide contact details: Tel: ( ) Fax: ( )
E-mail:
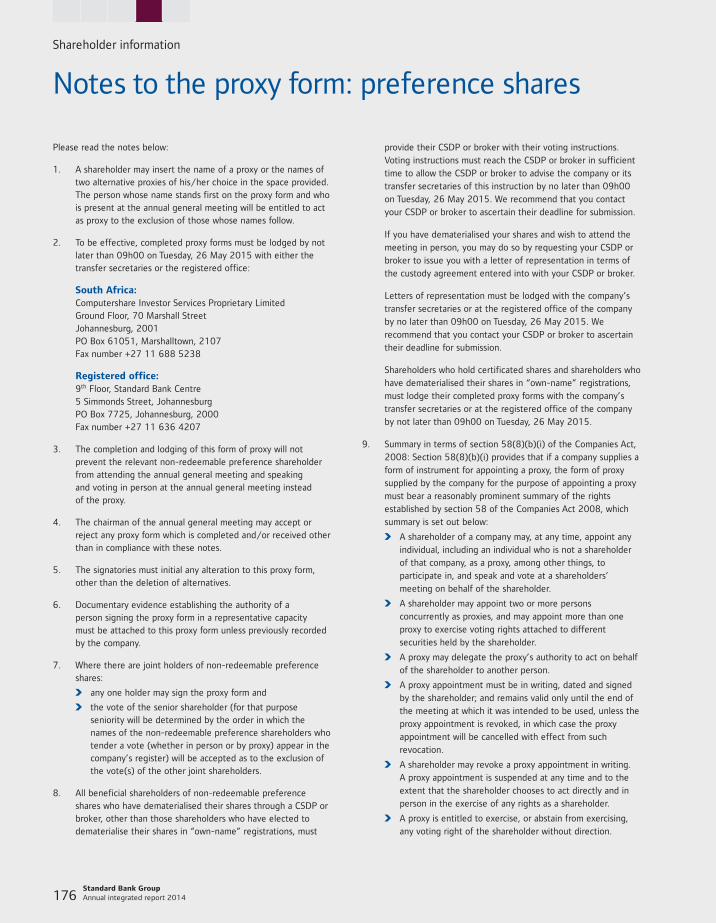
Standard Bank Group Annual integrated report 2014 176
Shareholder information
Notes to the proxy form: preference shares
Please read the notes below:
1. A shareholder may insert the name of a proxy or the names of two alternative proxies of his/her choice in the space provided. The person whose name stands first on the proxy form and who is present at the annual general meeting will be entitled to act as proxy to the exclusion of those whose names follow.
2. To be effective, completed proxy forms must be lodged by not later than 09h00 on Tuesday, 26 May 2015 with either the transfer secretaries or the registered office:
South Africa: Computershare Investor Services Proprietary Limited Ground Floor, 70 Marshall Street Johannesburg, 2001 PO Box 61051, Marshalltown, 2107 Fax number +27 11 688 5238
Registered office: 9th Floor, Standard Bank Centre 5 Simmonds Street, Johannesburg PO Box 7725, Johannesburg, 2000 Fax number +27 11 636 4207
3. The completion and lodging of this form of proxy will not prevent the relevant non-redeemable preference shareholder from attending the annual general meeting and speaking and voting in person at the annual general meeting instead of the proxy.
4. The chairman of the annual general meeting may accept or reject any proxy form which is completed and/or received other than in compliance with these notes.
5. The signatories must initial any alteration to this proxy form, other than the deletion of alternatives.
6. Documentary evidence establishing the authority of a person signing the proxy form in a representative capacity must be attached to this proxy form unless previously recorded by the company.
7. Where there are joint holders of non-redeemable preference shares:
any one holder may sign the proxy form and
the vote of the senior shareholder (for that purpose seniority will be determined by the order in which the names of the non-redeemable preference shareholders who tender a vote (whether in person or by proxy) appear in the company’s register) will be accepted as to the exclusion of the vote(s) of the other joint shareholders.
8. All beneficial shareholders of non-redeemable preference shares who have dematerialised their shares through a CSDP or broker, other than those shareholders who have elected to dematerialise their shares in “own-name” registrations, must
provide their CSDP or broker with their voting instructions. Voting instructions must reach the CSDP or broker in sufficient time to allow the CSDP or broker to advise the company or its transfer secretaries of this instruction by no later than 09h00 on Tuesday, 26 May 2015. We recommend that you contact your CSDP or broker to ascertain their deadline for submission.
If you have dematerialised your shares and wish to attend the meeting in person, you may do so by requesting your CSDP or broker to issue you with a letter of representation in terms of the custody agreement entered into with your CSDP or broker.
Letters of representation must be lodged with the company’s transfer secretaries or at the registered office of the company by no later than 09h00 on Tuesday, 26 May 2015. We recommend that you contact your CSDP or broker to ascertain their deadline for submission.
Shareholders who hold certificated shares and shareholders who have dematerialised their shares in “own-name” registrations, must lodge their completed proxy forms with the company’s transfer secretaries or at the registered office of the company by not later than 09h00 on Tuesday, 26 May 2015.
9. Summary in terms of section 58(8)(b)(i) of the Companies Act, 2008: Section 58(8)(b)(i) provides that if a company supplies a form of instrument for appointing a proxy, the form of proxy supplied by the company for the purpose of appointing a proxy must bear a reasonably prominent summary of the rights established by section 58 of the Companies Act 2008, which summary is set out below:
A shareholder of a company may, at any time, appoint any individual, including an individual who is not a shareholder of that company, as a proxy, among other things, to participate in, and speak and vote at a shareholders’ meeting on behalf of the shareholder.
A shareholder may appoint two or more persons concurrently as proxies, and may appoint more than one proxy to exercise voting rights attached to different securities held by the shareholder.
A proxy may delegate the proxy’s authority to act on behalf of the shareholder to another person.
A proxy appointment must be in writing, dated and signed by the shareholder; and remains valid only until the end of the meeting at which it was intended to be used, unless the proxy appointment is revoked, in which case the proxy appointment will be cancelled with effect from such revocation.
A shareholder may revoke a proxy appointment in writing. A proxy appointment is suspended at any time and to the extent that the shareholder chooses to act directly and in person in the exercise of any rights as a shareholder.
A proxy is entitled to exercise, or abstain from exercising, any voting right of the shareholder without direction.
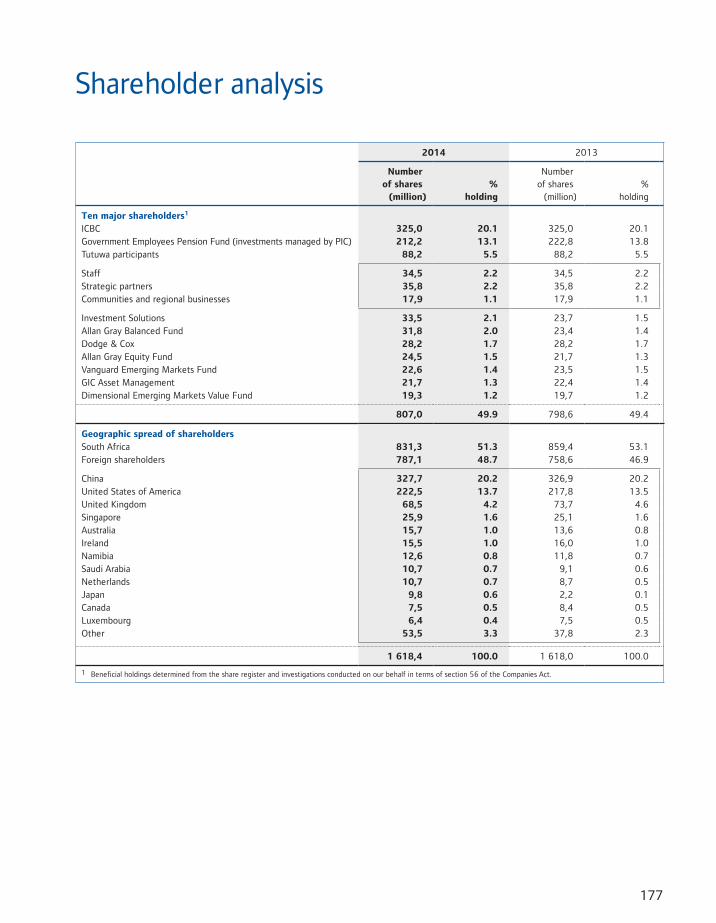
177
Shareholder analysis
2014 2013
Number of shares (million)
%holding
Number of shares (million)
%holding
Ten major shareholders1
ICBC 325,0 20.1 325,0 20.1Government Employees Pension Fund (investments managed by PIC) 212,2 13.1 222,8 13.8Tutuwa participants 88,2 5.5 88,2 5.5
Staff 34,5 2.2 34,5 2.2Strategic partners 35,8 2.2 35,8 2.2Communities and regional businesses 17,9 1.1 17,9 1.1
Investment Solutions 33,5 2.1 23,7 1.5Allan Gray Balanced Fund 31,8 2.0 23,4 1.4Dodge & Cox 28,2 1.7 28,2 1.7Allan Gray Equity Fund 24,5 1.5 21,7 1.3Vanguard Emerging Markets Fund 22,6 1.4 23,5 1.5GIC Asset Management 21,7 1.3 22,4 1.4Dimensional Emerging Markets Value Fund 19,3 1.2 19,7 1.2
807,0 49.9 798,6 49.4
Geographic spread of shareholdersSouth Africa 831,3 51.3 859,4 53.1Foreign shareholders 787,1 48.7 758,6 46.9
China 327,7 20.2 326,9 20.2United States of America 222,5 13.7 217,8 13.5United Kingdom 68,5 4.2 73,7 4.6Singapore 25,9 1.6 25,1 1.6Australia 15,7 1.0 13,6 0.8Ireland 15,5 1.0 16,0 1.0Namibia 12,6 0.8 11,8 0.7Saudi Arabia 10,7 0.7 9,1 0.6Netherlands 10,7 0.7 8,7 0.5Japan 9,8 0.6 2,2 0.1Canada 7,5 0.5 8,4 0.5Luxembourg 6,4 0.4 7,5 0.5Other 53,5 3.3 37,8 2.3
1 618,4 100.0 1 618,0 100.0
1 Beneficial holdings determined from the share register and investigations conducted on our behalf in terms of section 56 of the Companies Act.
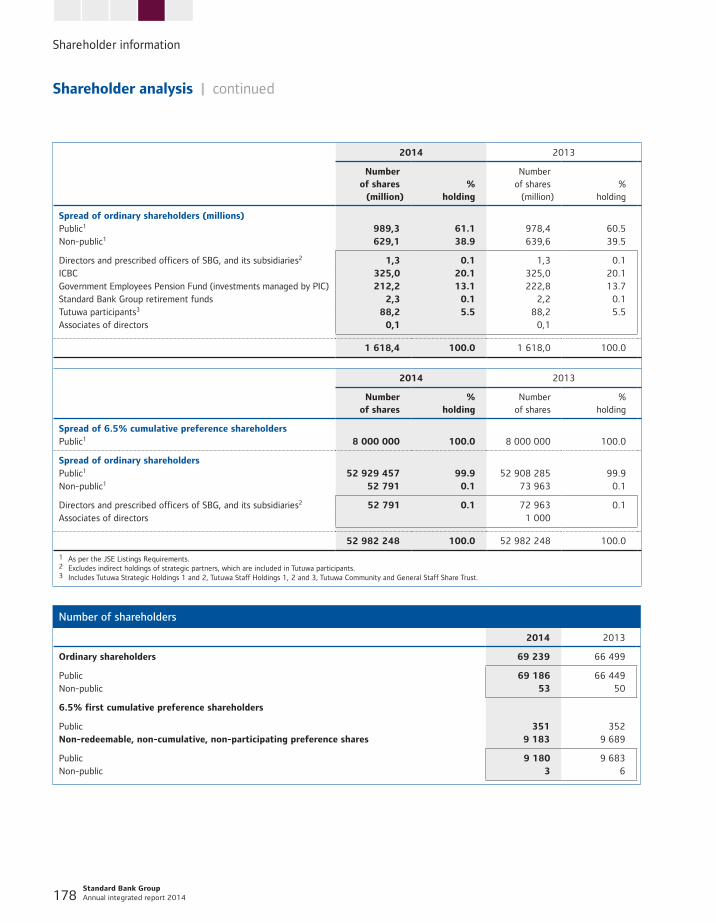
Shareholder information
Standard Bank Group Annual integrated report 2014 178
Shareholder analysis | continued
2014 2013
Number of shares (million)
%holding
Number of shares (million)
%holding
Spread of ordinary shareholders (millions)Public1 989,3 61.1 978,4 60.5Non-public1 629,1 38.9 639,6 39.5
Directors and prescribed officers of SBG, and its subsidiaries2 1,3 0.1 1,3 0.1ICBC 325,0 20.1 325,0 20.1Government Employees Pension Fund (investments managed by PIC) 212,2 13.1 222,8 13.7Standard Bank Group retirement funds 2,3 0.1 2,2 0.1Tutuwa participants3 88,2 5.5 88,2 5.5Associates of directors 0,1 0,1
1 618,4 100.0 1 618,0 100.0
2014 2013
Number of shares
%holding
Number of shares
%holding
Spread of 6.5% cumulative preference shareholdersPublic1 8 000 000 100.0 8 000 000 100.0
Spread of ordinary shareholdersPublic1 52 929 457 99.9 52 908 285 99.9Non-public1 52 791 0.1 73 963 0.1
Directors and prescribed officers of SBG, and its subsidiaries2 52 791 0.1 72 963 0.1Associates of directors 1 000
52 982 248 100.0 52 982 248 100.0
1 As per the JSE Listings Requirements.2 Excludes indirect holdings of strategic partners, which are included in Tutuwa participants.3 Includes Tutuwa Strategic Holdings 1 and 2, Tutuwa Staff Holdings 1, 2 and 3, Tutuwa Community and General Staff Share Trust.
Number of shareholders
2014 2013
Ordinary shareholders 69 239 66 499
Public 69 186 66 449Non-public 53 50
6.5% first cumulative preference shareholders
Public 351 352Non-redeemable, non-cumulative, non-participating preference shares 9 183 9 689
Public 9 180 9 683Non-public 3 6
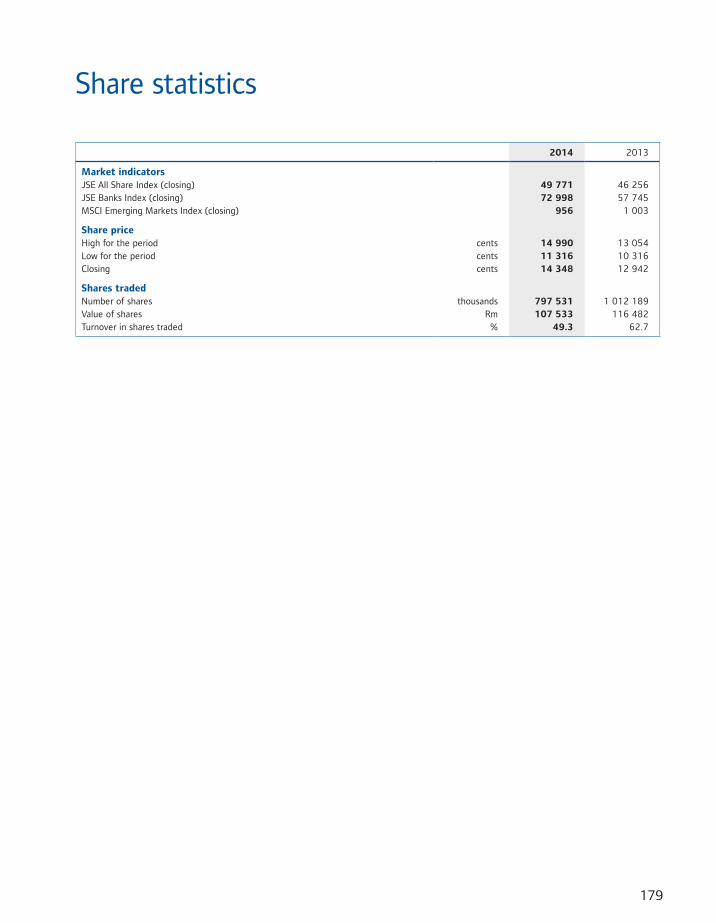
179
Share statistics
2014 2013
Market indicatorsJSE All Share Index (closing) 49 771 46 256JSE Banks Index (closing) 72 998 57 745MSCI Emerging Markets Index (closing) 956 1 003
Share priceHigh for the period cents 14 990 13 054Low for the period cents 11 316 10 316Closing cents 14 348 12 942
Shares tradedNumber of shares thousands 797 531 1 012 189Value of shares Rm 107 533 116 482Turnover in shares traded % 49.3 62.7
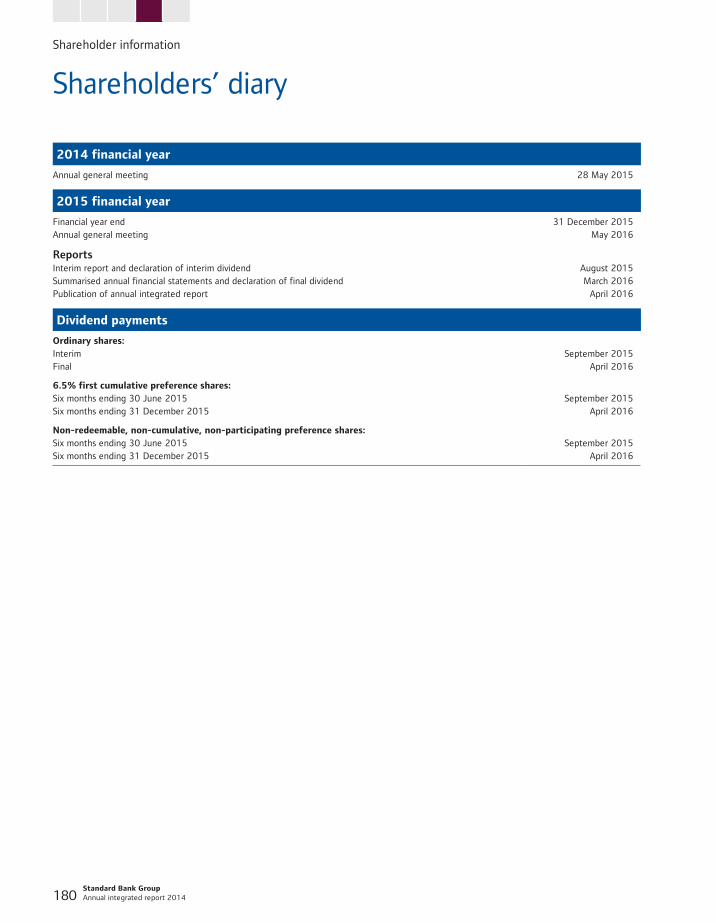
Shareholder information
Standard Bank Group Annual integrated report 2014 180
Shareholders’ diary
2014 financial year
Annual general meeting 28 May 2015
2015 financial year
Financial year end 31 December 2015Annual general meeting May 2016
ReportsInterim report and declaration of interim dividend August 2015Summarised annual financial statements and declaration of final dividend March 2016Publication of annual integrated report April 2016
Dividend payments
Ordinary shares:Interim September 2015Final April 2016
6.5% first cumulative preference shares:Six months ending 30 June 2015 September 2015Six months ending 31 December 2015 April 2016
Non-redeemable, non-cumulative, non-participating preference shares:Six months ending 30 June 2015 September 2015Six months ending 31 December 2015 April 2016
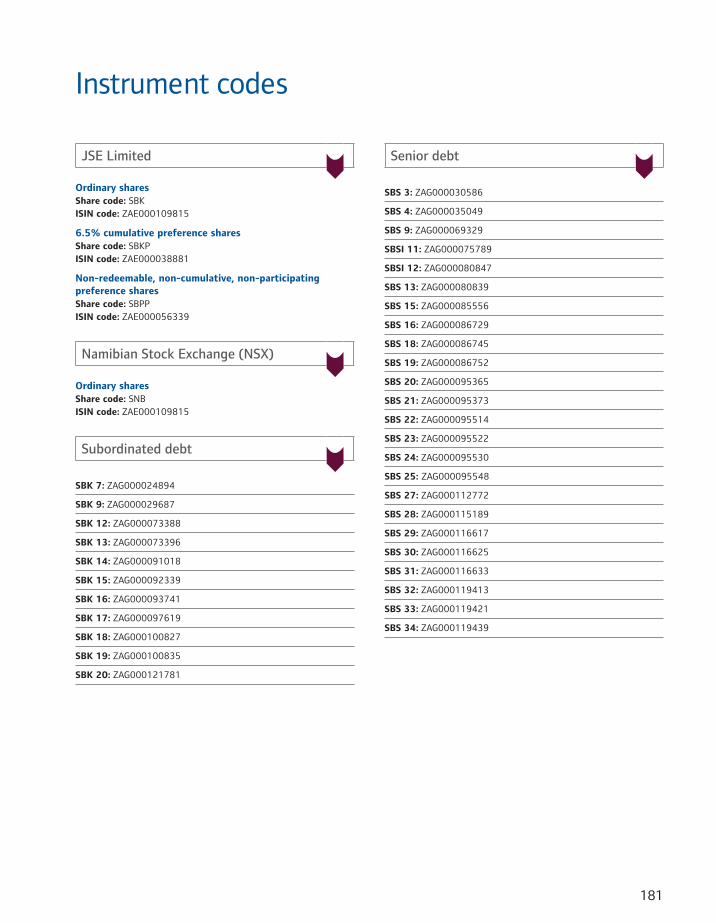
181
Instrument codes
JSE Limited
Ordinary sharesShare code: SBKISIN code: ZAE000109815
6.5% cumulative preference sharesShare code: SBKPISIN code: ZAE000038881
Non-redeemable, non-cumulative, non-participating preference sharesShare code: SBPPISIN code: ZAE000056339
Namibian Stock Exchange (NSX)
Ordinary sharesShare code: SNBISIN code: ZAE000109815
Subordinated debt
SBK 7: ZAG000024894
SBK 9: ZAG000029687
SBK 12: ZAG000073388
SBK 13: ZAG000073396
SBK 14: ZAG000091018
SBK 15: ZAG000092339
SBK 16: ZAG000093741
SBK 17: ZAG000097619
SBK 18: ZAG000100827
SBK 19: ZAG000100835
SBK 20: ZAG000121781
Senior debt
SBS 3: ZAG000030586
SBS 4: ZAG000035049
SBS 9: ZAG000069329
SBSI 11: ZAG000075789
SBSI 12: ZAG000080847
SBS 13: ZAG000080839
SBS 15: ZAG000085556
SBS 16: ZAG000086729
SBS 18: ZAG000086745
SBS 19: ZAG000086752
SBS 20: ZAG000095365
SBS 21: ZAG000095373
SBS 22: ZAG000095514
SBS 23: ZAG000095522
SBS 24: ZAG000095530
SBS 25: ZAG000095548
SBS 27: ZAG000112772
SBS 28: ZAG000115189
SBS 29: ZAG000116617
SBS 30: ZAG000116625
SBS 31: ZAG000116633
SBS 32: ZAG000119413
SBS 33: ZAG000119421
SBS 34: ZAG000119439
Standard Bank Group Annual integrated report 2014 182
184 Directorate of key subsidiaries
185 Credit ratings
186 Financial and other definitions
189 Acronyms and abbreviations
192 International representation
195 Pro forma information
196 Contact details
Additional information
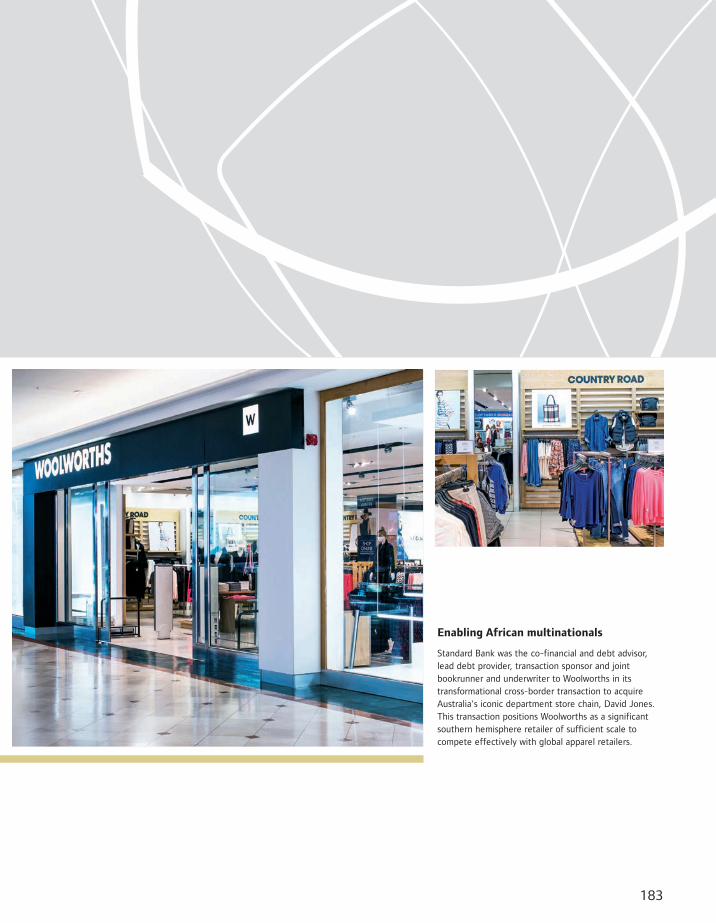
183
Enabling African multinationals
Standard Bank was the co-financial and debt advisor, lead debt provider, transaction sponsor and joint bookrunner and underwriter to Woolworths in its transformational cross-border transaction to acquire Australia's iconic department store chain, David Jones. This transaction positions Woolworths as a significant southern hemisphere retailer of sufficient scale to compete effectively with global apparel retailers.
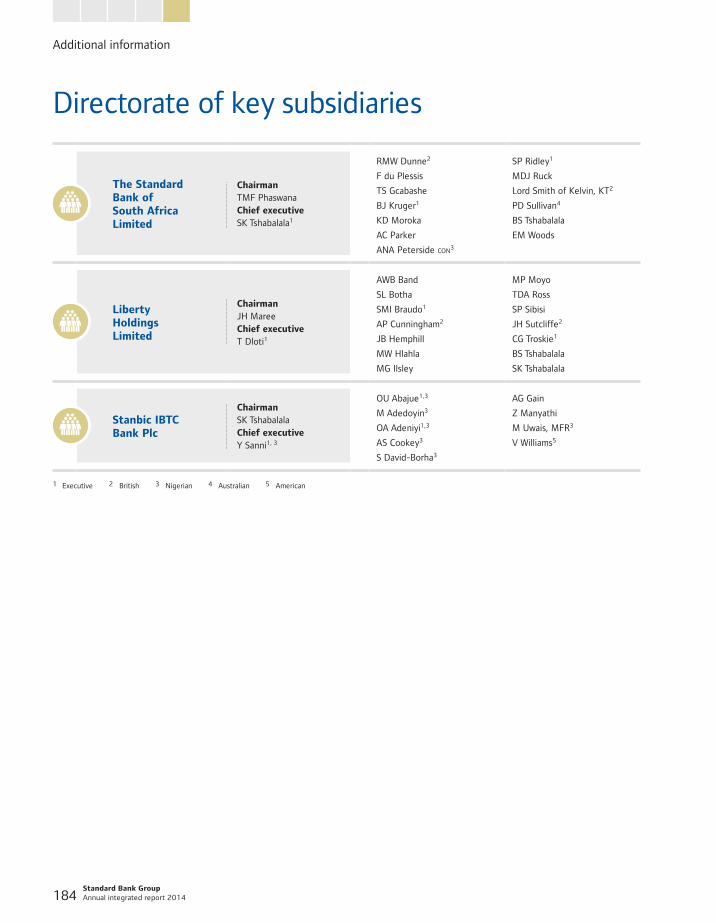
Additional information
Standard Bank Group Annual integrated report 2014 184
Directorate of key subsidiaries
The Standard Bank of South Africa Limited
ChairmanTMF PhaswanaChief executiveSK Tshabalala1
RMW Dunne2 SP Ridley1
F du Plessis MDJ Ruck
TS Gcabashe Lord Smith of Kelvin, KT2
BJ Kruger1 PD Sullivan4
KD Moroka BS Tshabalala
AC Parker EM Woods
ANA Peterside con3
Liberty Holdings Limited
ChairmanJH MareeChief executiveT Dloti1
AWB Band MP Moyo
SL Botha TDA Ross
SMI Braudo1 SP Sibisi
AP Cunningham2 JH Sutcliffe2
JB Hemphill CG Troskie1
MW Hlahla BS Tshabalala
MG Ilsley SK Tshabalala
Stanbic IBTC Bank Plc
ChairmanSK TshabalalaChief executiveY Sanni1, 3
OU Abajue1,3 AG Gain
M Adedoyin3 Z Manyathi
OA Adeniyi1,3 M Uwais, MFR3
AS Cookey3 V Williams5
S David-Borha3
1 Executive 2 British 3 Nigerian 4 Australian 5 American
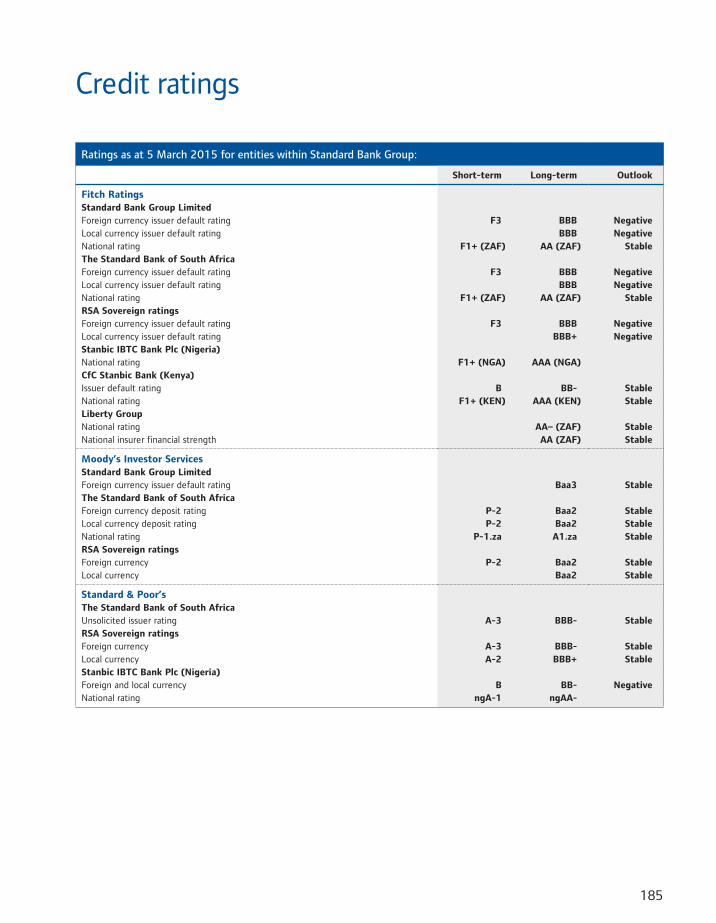
185
Credit ratings
Ratings as at 5 March 2015 for entities within Standard Bank Group:
Short-term Long-term Outlook
Fitch RatingsStandard Bank Group LimitedForeign currency issuer default rating F3 BBB NegativeLocal currency issuer default rating BBB NegativeNational rating F1+ (ZAF) AA (ZAF) StableThe Standard Bank of South AfricaForeign currency issuer default rating F3 BBB NegativeLocal currency issuer default rating BBB NegativeNational rating F1+ (ZAF) AA (ZAF) StableRSA Sovereign ratingsForeign currency issuer default rating F3 BBB NegativeLocal currency issuer default rating BBB+ NegativeStanbic IBTC Bank Plc (Nigeria)National rating F1+ (NGA) AAA (NGA)CfC Stanbic Bank (Kenya)Issuer default rating B BB- StableNational rating F1+ (KEN) AAA (KEN) StableLiberty GroupNational rating AA– (ZAF) StableNational insurer financial strength AA (ZAF) Stable
Moody’s Investor ServicesStandard Bank Group LimitedForeign currency issuer default rating Baa3 StableThe Standard Bank of South AfricaForeign currency deposit rating P-2 Baa2 StableLocal currency deposit rating P-2 Baa2 StableNational rating P-1.za A1.za StableRSA Sovereign ratingsForeign currency P-2 Baa2 StableLocal currency Baa2 Stable
Standard & Poor’sThe Standard Bank of South AfricaUnsolicited issuer rating A-3 BBB- StableRSA Sovereign ratingsForeign currency A-3 BBB- StableLocal currency A-2 BBB+ StableStanbic IBTC Bank Plc (Nigeria)Foreign and local currency B BB- NegativeNational rating ngA-1 ngAA-
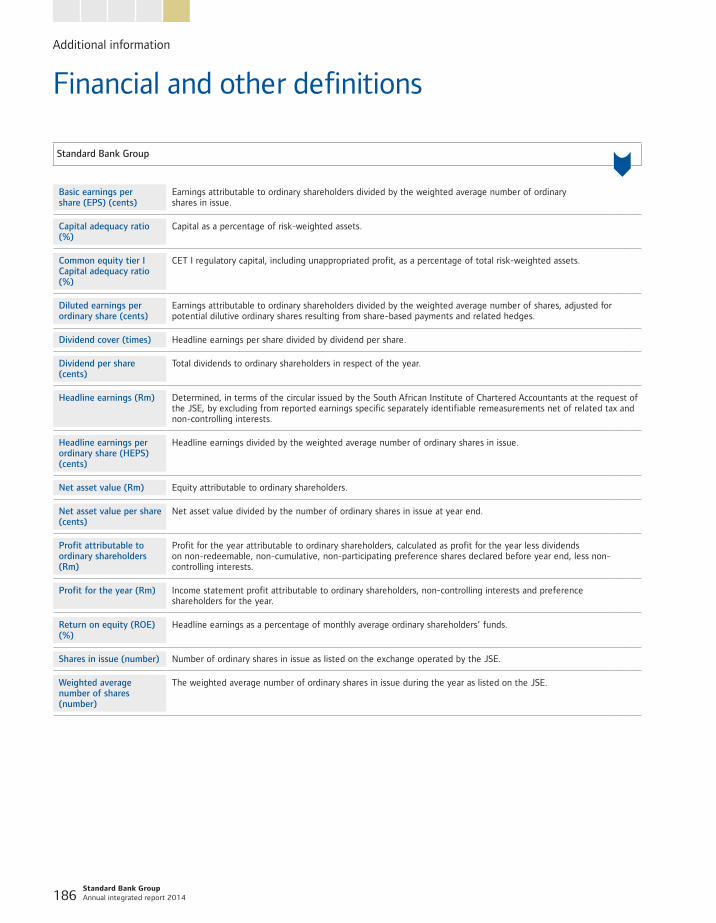
Additional information
Standard Bank Group Annual integrated report 2014 186
Financial and other definitions
Standard Bank Group
Basic earnings per share (EPS) (cents)
Earnings attributable to ordinary shareholders divided by the weighted average number of ordinary shares in issue.
Capital adequacy ratio (%)
Capital as a percentage of risk-weighted assets.
Common equity tier I Capital adequacy ratio (%)
CET I regulatory capital, including unappropriated profit, as a percentage of total risk-weighted assets.
Diluted earnings per ordinary share (cents)
Earnings attributable to ordinary shareholders divided by the weighted average number of shares, adjusted for potential dilutive ordinary shares resulting from share-based payments and related hedges.
Dividend cover (times) Headline earnings per share divided by dividend per share.
Dividend per share (cents)
Total dividends to ordinary shareholders in respect of the year.
Headline earnings (Rm) Determined, in terms of the circular issued by the South African Institute of Chartered Accountants at the request of the JSE, by excluding from reported earnings specific separately identifiable remeasurements net of related tax and non-controlling interests.
Headline earnings per ordinary share (HEPS) (cents)
Headline earnings divided by the weighted average number of ordinary shares in issue.
Net asset value (Rm) Equity attributable to ordinary shareholders.
Net asset value per share (cents)
Net asset value divided by the number of ordinary shares in issue at year end.
Profit attributable to ordinary shareholders (Rm)
Profit for the year attributable to ordinary shareholders, calculated as profit for the year less dividends on non-redeemable, non-cumulative, non-participating preference shares declared before year end, less non-controlling interests.
Profit for the year (Rm) Income statement profit attributable to ordinary shareholders, non-controlling interests and preference shareholders for the year.
Return on equity (ROE) (%)
Headline earnings as a percentage of monthly average ordinary shareholders’ funds.
Shares in issue (number) Number of ordinary shares in issue as listed on the exchange operated by the JSE.
Weighted average number of shares (number)
The weighted average number of ordinary shares in issue during the year as listed on the JSE.
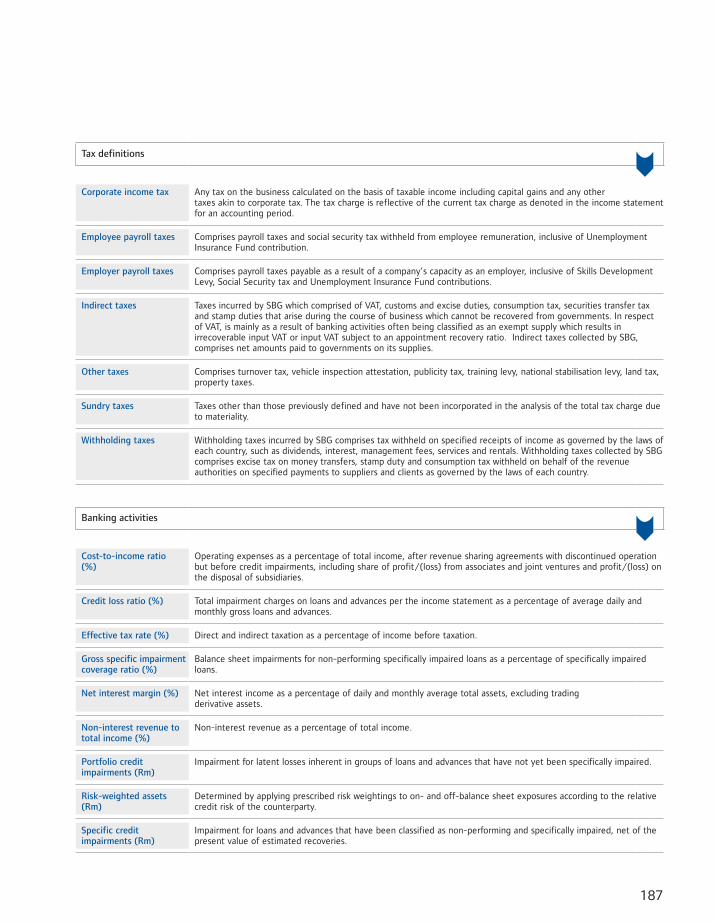
187
Tax definitions
Corporate income tax Any tax on the business calculated on the basis of taxable income including capital gains and any other taxes akin to corporate tax. The tax charge is reflective of the current tax charge as denoted in the income statement for an accounting period.
Employee payroll taxes Comprises payroll taxes and social security tax withheld from employee remuneration, inclusive of Unemployment Insurance Fund contribution.
Employer payroll taxes Comprises payroll taxes payable as a result of a company’s capacity as an employer, inclusive of Skills Development Levy, Social Security tax and Unemployment Insurance Fund contributions.
Indirect taxes Taxes incurred by SBG which comprised of VAT, customs and excise duties, consumption tax, securities transfer tax and stamp duties that arise during the course of business which cannot be recovered from governments. In respect of VAT, is mainly as a result of banking activities often being classified as an exempt supply which results in irrecoverable input VAT or input VAT subject to an appointment recovery ratio. Indirect taxes collected by SBG, comprises net amounts paid to governments on its supplies.
Other taxes Comprises turnover tax, vehicle inspection attestation, publicity tax, training levy, national stabilisation levy, land tax, property taxes.
Sundry taxes Taxes other than those previously defined and have not been incorporated in the analysis of the total tax charge due to materiality.
Withholding taxes Withholding taxes incurred by SBG comprises tax withheld on specified receipts of income as governed by the laws of each country, such as dividends, interest, management fees, services and rentals. Withholding taxes collected by SBG comprises excise tax on money transfers, stamp duty and consumption tax withheld on behalf of the revenue authorities on specified payments to suppliers and clients as governed by the laws of each country.
Banking activities
Cost-to-income ratio (%)
Operating expenses as a percentage of total income, after revenue sharing agreements with discontinued operation but before credit impairments, including share of profit/(loss) from associates and joint ventures and profit/(loss) on the disposal of subsidiaries.
Credit loss ratio (%) Total impairment charges on loans and advances per the income statement as a percentage of average daily and monthly gross loans and advances.
Effective tax rate (%) Direct and indirect taxation as a percentage of income before taxation.
Gross specific impairment coverage ratio (%)
Balance sheet impairments for non-performing specifically impaired loans as a percentage of specifically impaired loans.
Net interest margin (%) Net interest income as a percentage of daily and monthly average total assets, excluding trading derivative assets.
Non-interest revenue to total income (%)
Non-interest revenue as a percentage of total income.
Portfolio credit impairments (Rm)
Impairment for latent losses inherent in groups of loans and advances that have not yet been specifically impaired.
Risk-weighted assets (Rm)
Determined by applying prescribed risk weightings to on- and off-balance sheet exposures according to the relative credit risk of the counterparty.
Specific credit impairments (Rm)
Impairment for loans and advances that have been classified as non-performing and specifically impaired, net of the present value of estimated recoveries.
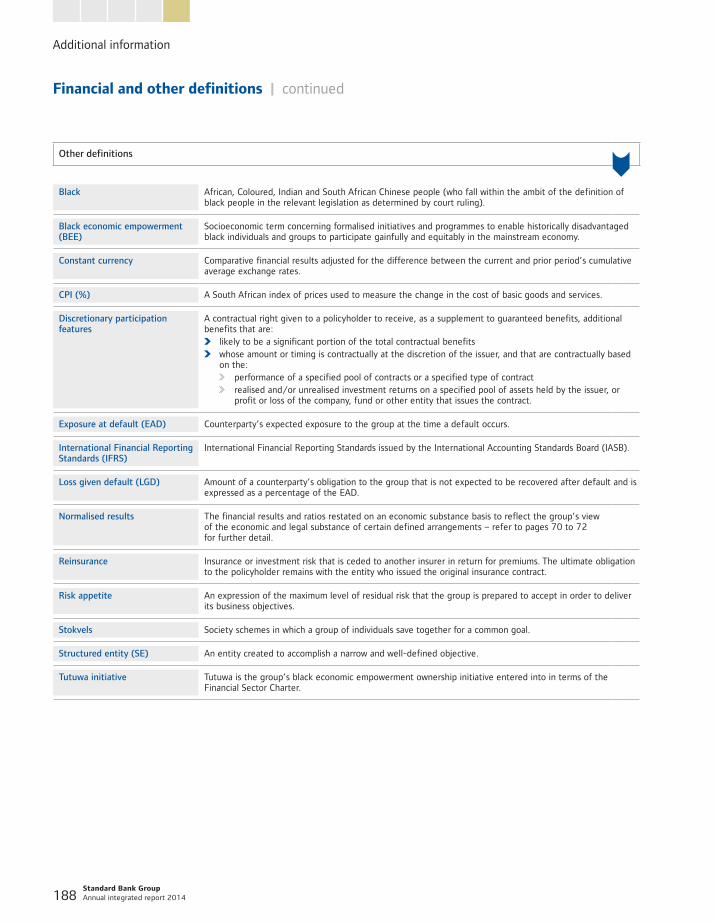
Additional information
Standard Bank Group Annual integrated report 2014 188
Other definitions
Black African, Coloured, Indian and South African Chinese people (who fall within the ambit of the definition of black people in the relevant legislation as determined by court ruling).
Black economic empowerment (BEE)
Socioeconomic term concerning formalised initiatives and programmes to enable historically disadvantaged black individuals and groups to participate gainfully and equitably in the mainstream economy.
Constant currency Comparative financial results adjusted for the difference between the current and prior period’s cumulative average exchange rates.
CPI (%) A South African index of prices used to measure the change in the cost of basic goods and services.
Discretionary participation features
A contractual right given to a policyholder to receive, as a supplement to guaranteed benefits, additional benefits that are:
likely to be a significant portion of the total contractual benefits whose amount or timing is contractually at the discretion of the issuer, and that are contractually based
on the: performance of a specified pool of contracts or a specified type of contract realised and/or unrealised investment returns on a specified pool of assets held by the issuer, or
profit or loss of the company, fund or other entity that issues the contract.
Exposure at default (EAD) Counterparty’s expected exposure to the group at the time a default occurs.
International Financial Reporting Standards (IFRS)
International Financial Reporting Standards issued by the International Accounting Standards Board (IASB).
Loss given default (LGD) Amount of a counterparty’s obligation to the group that is not expected to be recovered after default and is expressed as a percentage of the EAD.
Normalised results The financial results and ratios restated on an economic substance basis to reflect the group’s view of the economic and legal substance of certain defined arrangements – refer to pages 70 to 72 for further detail.
Reinsurance Insurance or investment risk that is ceded to another insurer in return for premiums. The ultimate obligation to the policyholder remains with the entity who issued the original insurance contract.
Risk appetite An expression of the maximum level of residual risk that the group is prepared to accept in order to deliver its business objectives.
Stokvels Society schemes in which a group of individuals save together for a common goal.
Structured entity (SE) An entity created to accomplish a narrow and well-defined objective.
Tutuwa initiative Tutuwa is the group’s black economic empowerment ownership initiative entered into in terms of the Financial Sector Charter.
Financial and other definitions | continued
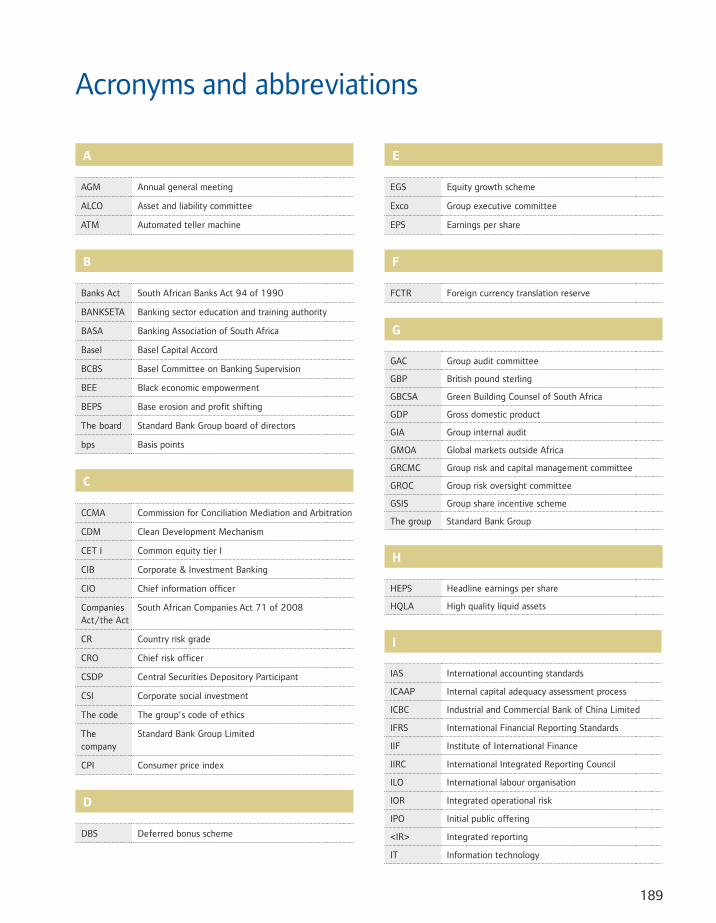
189
Acronyms and abbreviations
A
AGM Annual general meeting
ALCO Asset and liability committee
ATM Automated teller machine
B
Banks Act South African Banks Act 94 of 1990
BANKSETA Banking sector education and training authority
BASA Banking Association of South Africa
Basel Basel Capital Accord
BCBS Basel Committee on Banking Supervision
BEE Black economic empowerment
BEPS Base erosion and profit shifting
The board Standard Bank Group board of directors
bps Basis points
C
CCMA Commission for Conciliation Mediation and Arbitration
CDM Clean Development Mechanism
CET I Common equity tier I
CIB Corporate & Investment Banking
CIO Chief information officer
Companies Act/the Act
South African Companies Act 71 of 2008
CR Country risk grade
CRO Chief risk officer
CSDP Central Securities Depository Participant
CSI Corporate social investment
The code The group’s code of ethics
The company
Standard Bank Group Limited
CPI Consumer price index
D
DBS Deferred bonus scheme
E
EGS Equity growth scheme
Exco Group executive committee
EPS Earnings per share
F
FCTR Foreign currency translation reserve
G
GAC Group audit committee
GBP British pound sterling
GBCSA Green Building Counsel of South Africa
GDP Gross domestic product
GIA Group internal audit
GMOA Global markets outside Africa
GRCMC Group risk and capital management committee
GROC Group risk oversight committee
GSIS Group share incentive scheme
The group Standard Bank Group
H
HEPS Headline earnings per share
HQLA High quality liquid assets
I
IAS International accounting standards
ICAAP Internal capital adequacy assessment process
ICBC Industrial and Commercial Bank of China Limited
IFRS International Financial Reporting Standards
IIF Institute of International Finance
IIRC International Integrated Reporting Council
ILO International labour organisation
IOR Integrated operational risk
IPO Initial public offering
<IR> Integrated reporting
IT Information technology
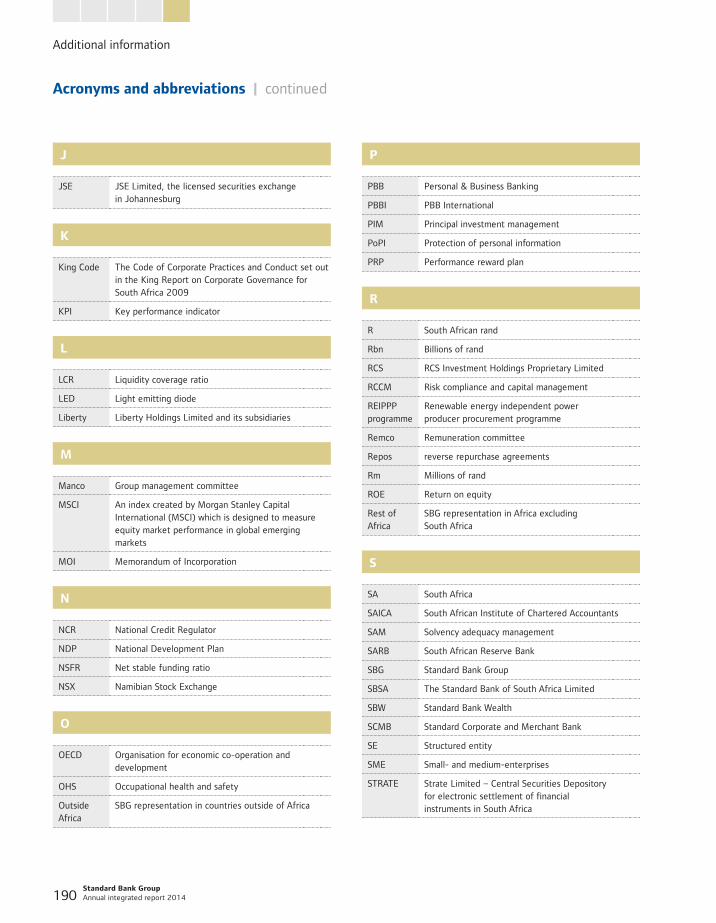
Additional information
Standard Bank Group Annual integrated report 2014 190
J
JSE JSE Limited, the licensed securities exchange in Johannesburg
K
King Code The Code of Corporate Practices and Conduct set out in the King Report on Corporate Governance for South Africa 2009
KPI Key performance indicator
L
LCR Liquidity coverage ratio
LED Light emitting diode
Liberty Liberty Holdings Limited and its subsidiaries
M
Manco Group management committee
MSCI An index created by Morgan Stanley Capital International (MSCI) which is designed to measure equity market performance in global emerging markets
MOI Memorandum of Incorporation
N
NCR National Credit Regulator
NDP National Development Plan
NSFR Net stable funding ratio
NSX Namibian Stock Exchange
O
OECD Organisation for economic co-operation and development
OHS Occupational health and safety
Outside Africa
SBG representation in countries outside of Africa
P
PBB Personal & Business Banking
PBBI PBB International
PIM Principal investment management
PoPI Protection of personal information
PRP Performance reward plan
R
R South African rand
Rbn Billions of rand
RCS RCS Investment Holdings Proprietary Limited
RCCM Risk compliance and capital management
REIPPP programme
Renewable energy independent power producer procurement programme
Remco Remuneration committee
Repos reverse repurchase agreements
Rm Millions of rand
ROE Return on equity
Rest of Africa
SBG representation in Africa excluding South Africa
S
SA South Africa
SAICA South African Institute of Chartered Accountants
SAM Solvency adequacy management
SARB South African Reserve Bank
SBG Standard Bank Group
SBSA The Standard Bank of South Africa Limited
SBW Standard Bank Wealth
SCMB Standard Corporate and Merchant Bank
SE Structured entity
SME Small- and medium-enterprises
STRATE
Strate Limited – Central Securities Depository for electronic settlement of financial instruments in South Africa
Acronyms and abbreviations | continued
191
T
TCF Treating customers fairly
Tier I Primary capital
Tier II Secondary capital
Tutuwa Black economic empowerment ownership initiative
Twin Peaks Financial Sector Regulation Bill
U
UK United Kingdom
USD United States dollar
V
VaR Value-at-risk
Z
ZAR South African rand
ZPC Zimbabwe Power Corporation
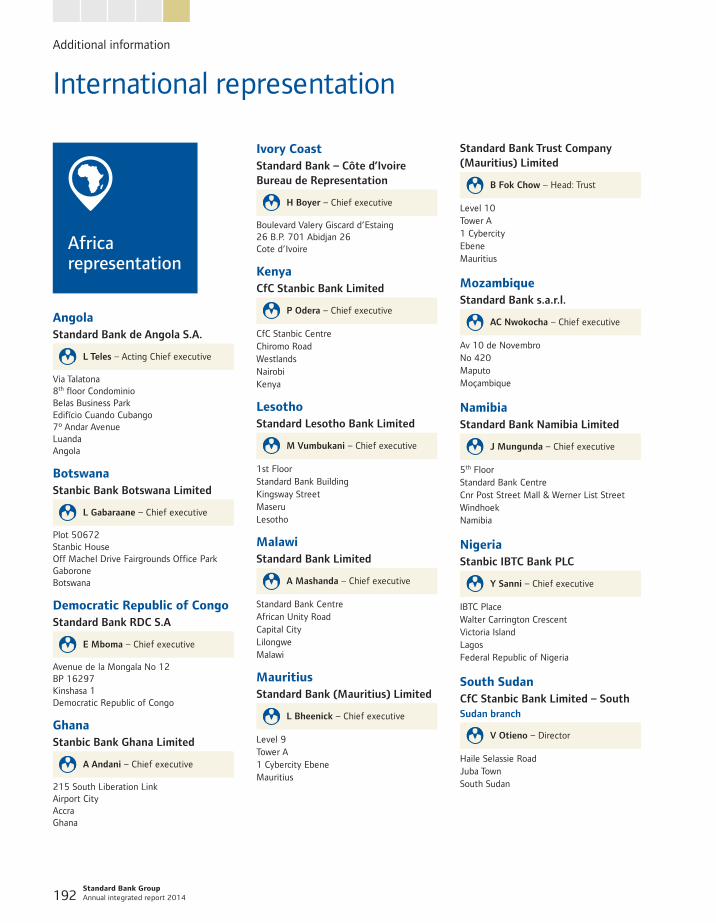
Additional information
Standard Bank Group Annual integrated report 2014 192
Ivory CoastStandard Bank – Côte d’Ivoire Bureau de Representation
H Boyer – Chief executive
Boulevard Valery Giscard d’Estaing26 B.P. 701 Abidjan 26Cote d’Ivoire
KenyaCfC Stanbic Bank Limited
P Odera – Chief executive
CfC Stanbic CentreChiromo RoadWestlandsNairobiKenya
LesothoStandard Lesotho Bank Limited
M Vumbukani – Chief executive
1st FloorStandard Bank BuildingKingsway StreetMaseruLesotho
MalawiStandard Bank Limited
A Mashanda – Chief executive
Standard Bank Centre African Unity Road Capital CityLilongweMalawi
MauritiusStandard Bank (Mauritius) Limited
L Bheenick – Chief executive
Level 9Tower A1 Cybercity EbeneMauritius
International representation
AngolaStandard Bank de Angola S.A.
L Teles – Acting Chief executive
Via Talatona8th floor CondominioBelas Business ParkEdifício Cuando Cubango7º Andar AvenueLuandaAngola
BotswanaStanbic Bank Botswana Limited
L Gabaraane – Chief executive
Plot 50672Stanbic HouseOff Machel Drive Fairgrounds Office Park GaboroneBotswana
Democratic Republic of CongoStandard Bank RDC S.A
E Mboma – Chief executive
Avenue de la Mongala No 12BP 16297Kinshasa 1Democratic Republic of Congo
GhanaStanbic Bank Ghana Limited
A Andani – Chief executive
215 South Liberation LinkAirport CityAccraGhana
Standard Bank Trust Company(Mauritius) Limited
B Fok Chow – Head: Trust
Level 10Tower A1 CybercityEbeneMauritius
MozambiqueStandard Bank s.a.r.l.
AC Nwokocha – Chief executive
Av 10 de Novembro No 420 MaputoMoçambique
NamibiaStandard Bank Namibia Limited
J Mungunda – Chief executive
5th FloorStandard Bank CentreCnr Post Street Mall & Werner List StreetWindhoekNamibia
NigeriaStanbic IBTC Bank PLC
Y Sanni – Chief executive
IBTC PlaceWalter Carrington CrescentVictoria IslandLagosFederal Republic of Nigeria
South SudanCfC Stanbic Bank Limited – SouthSudan branch
V Otieno – Director
Haile Selassie RoadJuba TownSouth Sudan
Africa representation
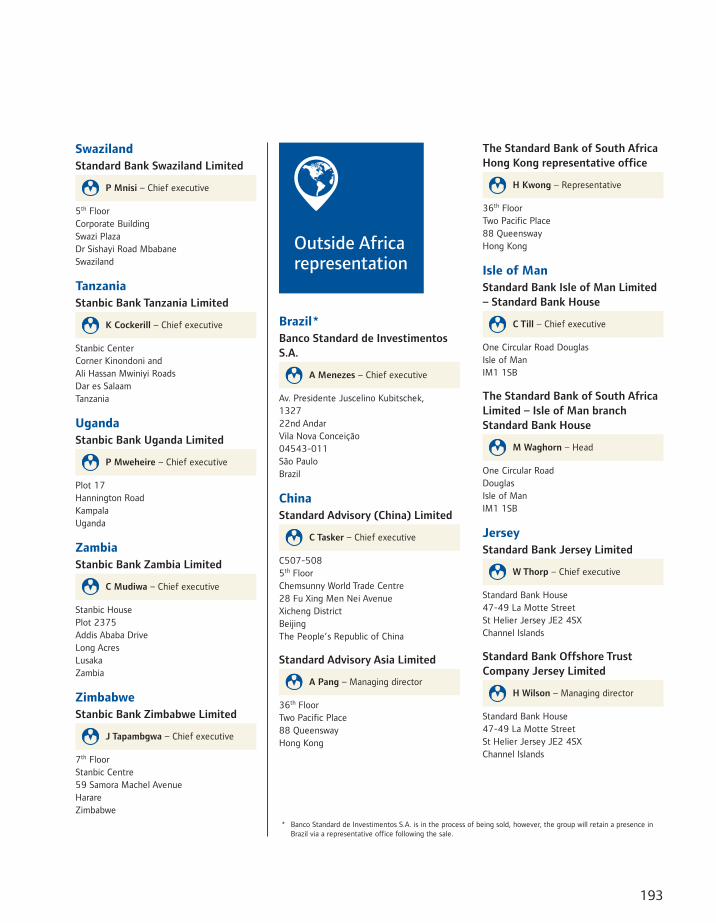
193
The Standard Bank of South Africa Hong Kong representative office
H Kwong – Representative
36th FloorTwo Pacific Place88 QueenswayHong Kong
Isle of ManStandard Bank Isle of Man Limited – Standard Bank House
C Till – Chief executive
One Circular Road DouglasIsle of ManIM1 1SB
The Standard Bank of South Africa Limited – Isle of Man branch Standard Bank House
M Waghorn – Head
One Circular RoadDouglasIsle of ManIM1 1SB
JerseyStandard Bank Jersey Limited
W Thorp – Chief executive
Standard Bank House47-49 La Motte StreetSt Helier Jersey JE2 4SXChannel Islands
Standard Bank Offshore Trust Company Jersey Limited
H Wilson – Managing director
Standard Bank House47-49 La Motte StreetSt Helier Jersey JE2 4SXChannel Islands
SwazilandStandard Bank Swaziland Limited
P Mnisi – Chief executive
5th FloorCorporate BuildingSwazi PlazaDr Sishayi Road MbabaneSwaziland
TanzaniaStanbic Bank Tanzania Limited
K Cockerill – Chief executive
Stanbic CenterCorner Kinondoni and Ali Hassan Mwiniyi RoadsDar es SalaamTanzania
UgandaStanbic Bank Uganda Limited
P Mweheire – Chief executive
Plot 17Hannington RoadKampalaUganda
ZambiaStanbic Bank Zambia Limited
C Mudiwa – Chief executive
Stanbic HousePlot 2375Addis Ababa DriveLong AcresLusakaZambia
ZimbabweStanbic Bank Zimbabwe Limited
J Tapambgwa – Chief executive
7th FloorStanbic Centre59 Samora Machel AvenueHarareZimbabwe
Brazil*Banco Standard de Investimentos S.A.
A Menezes – Chief executive
Av. Presidente Juscelino Kubitschek,132722nd AndarVila Nova Conceição04543-011São PauloBrazil
ChinaStandard Advisory (China) Limited
C Tasker – Chief executive
C507-5085th FloorChemsunny World Trade Centre28 Fu Xing Men Nei AvenueXicheng DistrictBeijingThe People’s Republic of China
Standard Advisory Asia Limited
A Pang – Managing director
36th FloorTwo Pacific Place88 QueenswayHong Kong
Outside Africa representation
* Banco Standard de Investimentos S.A. is in the process of being sold, however, the group will retain a presence in Brazil via a representative office following the sale.
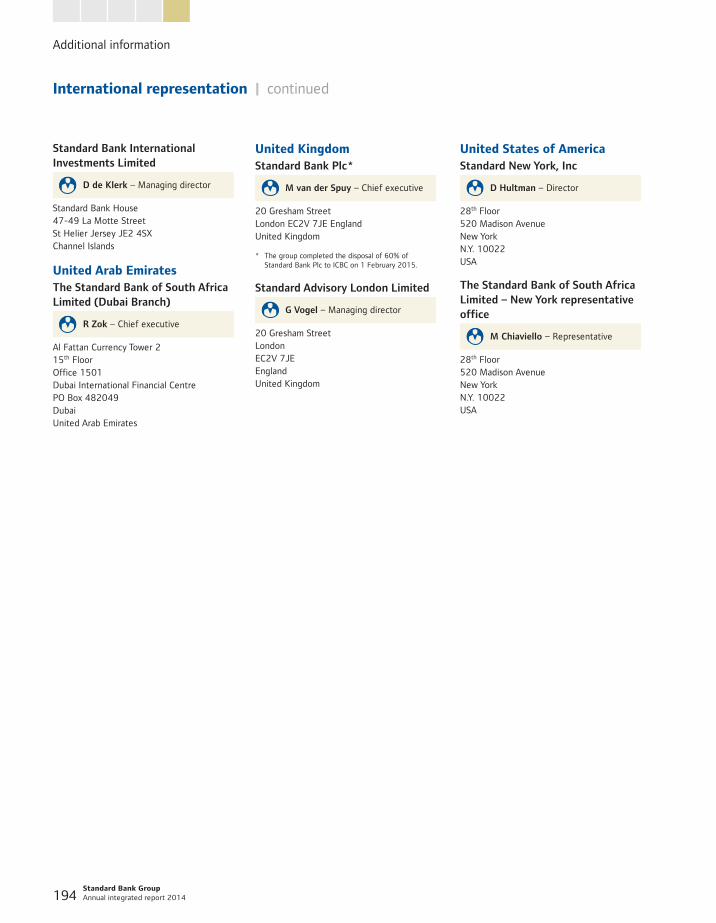
Additional information
Standard Bank Group Annual integrated report 2014 194
Standard Bank International Investments Limited
D de Klerk – Managing director
Standard Bank House47-49 La Motte StreetSt Helier Jersey JE2 4SXChannel Islands
United Arab EmiratesThe Standard Bank of South Africa Limited (Dubai Branch)
R Zok – Chief executive
Al Fattan Currency Tower 215th FloorOffice 1501Dubai International Financial CentrePO Box 482049DubaiUnited Arab Emirates
United KingdomStandard Bank Plc*
M van der Spuy – Chief executive
20 Gresham StreetLondon EC2V 7JE EnglandUnited Kingdom
* The group completed the disposal of 60% of Standard Bank Plc to ICBC on 1 February 2015.
Standard Advisory London Limited
G Vogel – Managing director
20 Gresham StreetLondonEC2V 7JEEnglandUnited Kingdom
United States of AmericaStandard New York, Inc
D Hultman – Director
28th Floor520 Madison AvenueNew YorkN.Y. 10022USA
The Standard Bank of South Africa Limited – New York representative office
M Chiaviello – Representative
28th Floor520 Madison AvenueNew YorkN.Y. 10022USA
International representation | continued
195
The following pro forma financial information is the responsibility of the group’s directors. Because of its nature, the pro forma financial information may not be a fair reflection of the group’s results of operation. The pro forma financial information has been reviewed by the group’s external auditors and their unmodified review report is available for inspection at the company’s registered office.
Constant currency informationThe pro forma constant currency information has been presented to illustrate the impact of changes in currency rates on the group’s results. In determining the change in constant currency terms, the comparative financial reporting period’s results have been adjusted for the difference between the current and prior period’s average exchange rates (determined as the average of the daily exchange rates). The measurement has been performed for each of the group’s material currencies, being the US dollar, Nigerian naira, Kenyan shilling, Zambian kwacha and Ugandan shilling. The following average exchange rates were used in the determination of the pro forma constant currency information:
US dollarNigerian
nairaKenyan shilling
Zambian kwacha
Ugandan shilling
2014 average exchange rate 10,84 0,07 0,12 0,0018 0,0042
2013 average exchange rate 9,64 0,06 0,11 0,0018 0,0037
Group’s continuing operations results including 40% retained interest in the group’s GMOA businessIn the group’s 2014 results, the net loss incurred by the GMOA business has been included in the group’s income statement as a discontinued operation. On 1 February 2015 the group completed the disposal of 60% of GMOA and will thereafter report its retained 40% interest within the group’s continuing operation’s results. In order to illustrate the group’s future continuing operation’s base, the group has disclosed a pro forma continuing operation’s result to include 40% of the discontinued operation’s headline earnings loss.
Continuing operations
Headline earnings as reported
RmAdjustment*
Rm
Headline earnings pro forma
Rm
2014 21 068 (1 498) 19 570
2013 17 613 (168) 17 445
* 40% of headline loss from discontinued operation.
Pro forma information
Additional information
Standard Bank Group Annual integrated report 2014 196
Online
Contact details
Standard Bank Group LimitedRegistration No 1969/017128/06Incorporated in the Republic of South AfricaWebsite: www.standardbank.com
Head: Investor relationsDavid KinseyTel: +27 11 631 3931
Group financial directorSimon RidleyTel: +27 11 636 3756
Group secretaryZola StephenTel: +27 11 631 9106
Registered address9th Floor, Standard Bank Centre5 Simmonds StreetJohannesburg 2001PO Box 7725Johannesburg 2000
Head office switch boardTel: +27 11 636 9111Fax: +27 11 636 4207
Transfer secretaries in South AfricaComputershare Investor Services Proprietary LimitedGround floor, 70 Marshall StreetJohannesburg, 2001PO Box 61051Marshalltown, 2107
Transfer secretaries in NamibiaTransfer Secretaries Proprietary Limited4 Robert Mugabe Avenue(Entrance in Burg Street)WindhoekPO Box 2401Windhoek
DisclaimerThis document contains certain statements that are ‘forward-looking’ with respect to certain of the group’s plans, goals and expectations relating to its future performance, results, strategies and objectives. Words such as “may”, “could”, “will”, “expect”, “intend”, “estimate”, “anticipate”, “aim”, “outlook”, “believe”, “plan”, “seek”, “predict” or similar expressions typically identify forward-looking statements. These forward-looking statements are not statements of fact or guarantees of future performance, results, strategies and objectives, and by their nature, involve risk and uncertainty because they relate to future events and circumstances which are difficult to predict and are beyond the group’s control, including but not limited to, domestic and global economic business conditions, market-related risks such as fluctuations in interest rates and exchange rates, the policies and actions of regulatory authorities (including changes related to capital and solvency requirements), the impact of competition, inflation, deflation, the timing impact and other uncertainties of future acquisitions or combinations within relevant industries, as well as the impact of changes in domestic and global legislation and regulations in the jurisdictions in which the group and its affiliates operate. The group’s actual future performance, results, strategies and objectives may differ materially from the plans, goals and expectations expressed or implied in the forward-looking statements. The group makes no representations or warranty, express or implied, that these forward-looking statements will be achieved and undue reliance should not be placed on such statements. The group undertakes no obligation to update the historical information or forward-looking statements in this document and does not assume responsibility for any loss or damage arising as a result of the reliance by any party thereon.
Website: www.standardbank.com
Please direct all annual report queries and comments to: [email protected] direct all customer-related queries and comments to: [email protected] direct all investor relations queries and comments to: [email protected]

www.standardbank.com