Embed Size (px)
Citation preview
NIST Technical Note 1935
Annual Manufacturing Review
Douglas S. Thomas
This publication is available free of charge from: http://dx.doi.org/10.6028/NIST.TN.1935
NIST Technical Note 1935
Annual Manufacturing Review
Douglas S. Thomas
Applied Economics Office
Engineering Laboratory
October 2016
U.S. Department of Commerce Penny Pritzker, Secretary
National Institute of Standards and Technology
Willie May, Under Secretary of Commerce for Standards and Technology and Director
This publication is available free of charge from: http://dx.doi.org/10.6028/NIST.TN.1935
Certain commercial entities, equipment, or materials may be identified in this
document in order to describe an experimental procedure or concept adequately.
Such identification is not intended to imply recommendation or endorsement by the
National Institute of Standards and Technology, nor is it intended to imply that the
entities, materials, or equipment are necessarily the best available for the purpose.
National Institute of Standards and Technology Technical Note XXX
Natl. Inst. Stand. Technol. Tech. Note 1935, 48 pages (October 2016)
CODEN: NTNOEF
This publication is available free of charge from:
http://dx.doi.org/10.6028/NIST.TN.1935

This
pu
blic
atio
n is
availa
ble
free o
f charg
e fro
m: h
ttp://d
x.d
oi.o
rg/1
0.6
028
/NIS
T.T
N.1
93
5
ii
This
pu
blic
atio
n is
availa
ble
free o
f charg
e fro
m: h
ttp://d
x.d
oi.o
rg/1
0.6
028
/NIS
T.T
N.1
93
5
Preface
This study was conducted by the Applied Economics Office (AEO) in the Engineering
Laboratory (EL) at the National Institute of Standards and Technology (NIST). The
study provides aggregate manufacturing industry data and industry subsector data to
develop a quantitative depiction of the U.S. manufacturing industry.
Disclaimer
Certain trade names and company products are mentioned in the text in order to adequately specify the
technical procedures and equipment used. In no case does such identification imply recommendation or
endorsement by the National Institute of Standards and Technology, nor does it imply that the products are
necessarily the best available for the purpose.
Cover Photographs Credits
At the Paint Shop in Chrysler Group’s Sterling Heights (Mich.) Assembly Plant, a 2015 Chrysler 200
moves through the Underbody Sealing and Underbody Coating station, flipping the vehicle body
completely upside down to seal all appropriate seams and compartments. (2014). This image was used in
accordance with Fiat Chrysler Automobile’s editorial use policy.

iii
This
pu
blic
atio
n is
availa
ble
free o
f charg
e fro
m: h
ttp://d
x.d
oi.o
rg/1
0.6
028
/NIS
T.T
N.1
93
5
iv
This
pu
blic
atio
n is
availa
ble
free o
f charg
e fro
m: h
ttp://d
x.d
oi.o
rg/1
0.6
028
/NIS
T.T
N.1
93
5
Acknowledgements
The authors wish to thank all those who contributed so many excellent ideas and
suggestions for this report. Special appreciation is extended to Simon Frechette,
Katherine Morris, and Dr. Vijay Srinivasan of EL’s Systems Integration Division for
their technical guidance, suggestions, and support. Special appreciation is also extended
to Juan Fung and David Butry of EL’s AEO and to David Pitchure of MML’s
Mechanical Performance Group for their thorough reviews and many insights. The author
also wishes to thank Dr. Nicos Martys, of the Materials and Structural Systems Division
for his review.

v
This
pu
blic
atio
n is
availa
ble
free o
f charg
e fro
m: h
ttp://d
x.d
oi.o
rg/1
0.6
028
/NIS
T.T
N.1
93
5
vi
This
pu
blic
atio
n is
availa
ble
free o
f charg
e fro
m: h
ttp://d
x.d
oi.o
rg/1
0.6
028
/NIS
T.T
N.1
93
5
Table of Contents
PREFACE .................................................................................................................................................. II
ACKNOWLEDGEMENTS ........................................................................................................................... IV
TABLE OF CONTENTS....................................................................................................................... VI
LIST OF FIGURES .............................................................................................................................. VII
LIST OF TABLES ................................................................................................................................ VII
LIST OF ACRONYMS ....................................................................................................................... VIII
EXECUTIVE SUMMARY ............................................................................................................................. 1
1 INTRODUCTION .............................................................................................................................. 5
1.1 BACKGROUND ............................................................................................................................... 5 1.2 PURPOSE…………………………………………………………………………………………………………………………………6 1.3 SCOPE AND APPROACH ................................................................................................................... 6
2 VALUE ADDED ................................................................................................................................. 9
2.1 INTERNATIONAL COMPARISON ......................................................................................................... 9 2.2 DOMESTIC DETAILS ...................................................................................................................... 11
3 MANUFACTURING SUPPLY CHAIN ................................................................................................ 23
4 EMPLOYMENT AND COMPENSATION ........................................................................................... 33
5 INNOVATION AND COMPETITIVENESS .......................................................................................... 39
6 DISCUSSION .................................................................................................................................. 45
vii
This
pu
blic
atio
n is
availa
ble
free o
f charg
e fro
m: h
ttp://d
x.d
oi.o
rg/1
0.6
028
/NIS
T.T
N.1
93
5
List of Figures Figure 2.1: National 25 Year Compound Annual Growth, by Country (1989 to 2014) ................ 10 Figure 2.2: National 5 Year Compound Annual Growth, by Country (2009 to 2014) .................. 10 Figure 2.3: Manufacturing Value Added, Top 10 Manufacturing Countries (1970 to 2014) ....... 11 Figure 2.4: Manufacturing Value Added Per Capita, Top 10 Manufacturing Countries (1970 to
2013) .............................................................................................................................................. 12 Figure 2.5: Manufacturing Per Capita Ranking............................................................................. 12 Figure 2.6: Cumulative Percent Change in Value Added (2009 Chained Dollars) ....................... 17 Figure 2.7: Value Added for Durable Goods by Type (chained dollars), 2006-2015 ................... 18 Figure 2.8: Value Added for Nondurable Goods by Type (chained dollars), 2006-2015 ............. 18 Figure 2.9: Manufacturing Value Added by Subsector (chained dollars) ..................................... 19 Figure 2.10: Value Added for Durable Goods by Type (constant dollars), 2006-2015 ................ 20 Figure 2.11: Value Added for Nondurable Goods by Type (constant dollars), 2006-2015 .......... 20 Figure 2.12: Manufacturing Value Added by Subsector (constant dollars) .................................. 21 Figure 2.13: Construction Put in Place, 2006-2016....................................................................... 22 Figure 3.1: Manufacturing Supply Chain ...................................................................................... 24 Figure 4.1: Cumulative Change in Percent in Manufacturing Employment (Seasonally Adjusted),
2006-2016 ...................................................................................................................................... 35 Figure 4.2: Manufacturing Fatalities and Injuries ......................................................................... 36 Figure 4.3: Average Weekly Hours for All Employees (Seasonally Adjusted) ............................ 37 Figure 4.4: Average Hourly Wages for Manufacturing and Private Industry (Seasonally Adjusted)
....................................................................................................................................................... 37 Figure 4.5: Manufacturing Employee Compensation (Hourly) ..................................................... 38 Figure 5.1: IMD World Competitiveness Rankings for the US .................................................... 41 Figure 5.2: World Economic Forum 2015-2016 Global Competitiveness Index: US Rankings .. 42
List of Tables Table 2-1: Manufacturing Activity by Economic Measure by Subsector ..................................... 14 Table 3-1: Supply Chain Entities and Contributions ..................................................................... 23 Table 3-2: Direct and Indirect Manufacturing Value Added ($millions 2014) ............................. 25 Table 3-3: Top 20 Supply Chain Entities for Selected Manufacturing Subsectors ....................... 27 Table 3-4: Top 20 Occupation Categories for Selected Manufacturing Subsectors...................... 30 Table 4-1: Employment, Annual Survey of Manufactures ............................................................ 33 Table 4-2: Employment by Industry for 2013 and 2014 (Thousands): Current Population Survey
....................................................................................................................................................... 34 Table 4-3: Manufacturing Employment (Thousands): Current Employment Statistics ................ 34 Table 4-4: Fatal Occupational Injuries by Event or Exposure ...................................................... 36 Table 4-5: Total Recordable Cases of Nonfatal Injuries and Illnesses, Private Industry .............. 36 Table 5-1: Patent Applications per Million People ....................................................................... 39 Table 5-2: Research and Development Expenditures as a Percent of GDP .................................. 40 Table 5-3: Researchers per Million People ................................................................................... 40 Table 5-4: Journal Articles per Million People ............................................................................. 41 Table 5-5: US Rank for Indicators used in the World Economic Forum Competitiveness Index 43 Table 5-6: Problematic Factors for Doing Business (16 total possible factors ranked) ................ 44
viii
This
pu
blic
atio
n is
availa
ble
free o
f charg
e fro
m: h
ttp://d
x.d
oi.o
rg/1
0.6
028
/NIS
T.T
N.1
93
5
List of Acronyms
ASM: Annual Survey of Manufactures
BEA: Bureau of Economic Analysis
GDP: Gross Domestic Product
IBRD: International Bank for Reconstruction and Development
IDA: International Development Association
ISIC: International Standard Industrial Classification MAPI: Manufacturers Alliance for Productivity and Innovation NAICS: North American Industry Classification System
NIST: National Institute of Standards and Technology
PPP: Purchasing Power Parity
SIC: Standard Industrial Classification
UNSD: United Nations Statistics Division

ix
This
pu
blic
atio
n is
availa
ble
free o
f charg
e fro
m: h
ttp://d
x.d
oi.o
rg/1
0.6
028
/NIS
T.T
N.1
93
5
1
This
pu
blic
atio
n is
availa
ble
free o
f charg
e fro
m: h
ttp://d
x.d
oi.o
rg/1
0.6
028
/NIS
T.T
N.1
93
5
Executive Summary
The purpose of this report is to track domestic manufacturing activity and its supply chain
in order to develop a quantitative depiction of U.S. manufacturing in the context of the
domestic economy and global industry. This depiction provides change agents, such as
public entities and trade groups that invest in advancing the current state of
manufacturing, insight into the current state and recent trends in US manufacturing. The
report further identifies areas of manufacturing that can have large impacts on costs.
The US remains a major manufacturing nation; however, production and innovation is
increasing rapidly in other countries. US manufacturing was significantly impacted by the
previous recession and has not returned to pre-recession levels of production or
employment. However, between March of 2014 and March of 2015, construction of
manufacturing facilities increased significantly, suggesting a rapid increase in investment
in US manufacturing that slightly exceeds pre-recession levels.
The US has advantages in technological prowess, innovation, productivity, and research
and development; however, education was ranked low in two indices (i.e., IMD World
Competitiveness Index and the World Economic Forum’s Global Competitiveness Index)
and ranked high as being a problematic factor for doing business, which could negatively
impact US advantages in the future. Institutions and institutional framework, which
include crime, regulatory frameworks, country credit rating, and government spending
among other things, was ranked low in two indices. A number of costs were identified as
challenges to US manufacturing, including high labor costs.
An input-output analysis of US manufacturing reveals that management is a significant
cost along with a number of other non-production costs such as wholesale trade. The
number of injuries and the injury rate in US manufacturing has a general downward
trend, benefiting employees; however, manufacturing employee compensation has only
grown slowly in recent years.
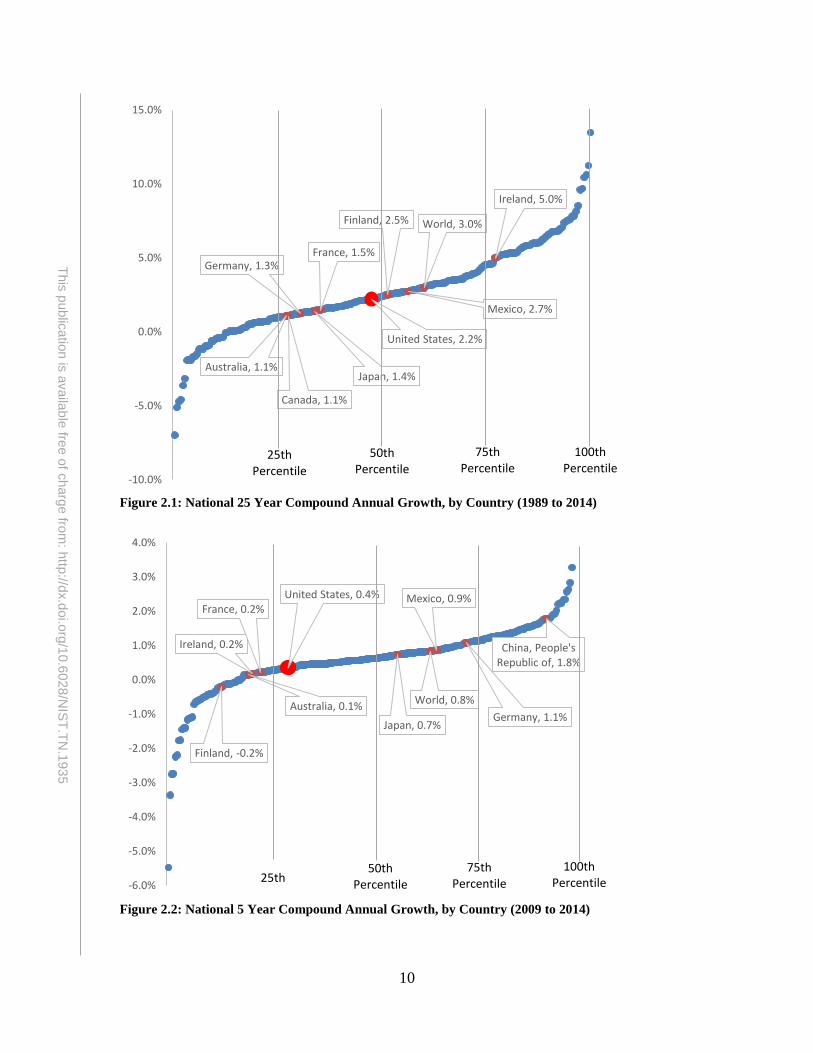
International Comparison – Manufacturing Growth: As seen in Figure 2.1, US
compound real (controlling for inflation) annual growth between 1989 and 2014 (i.e., 25-
year growth) was 2.2 %, which places the US in the 47th percentile of all countries. This
growth exceeded that of Germany, France, Canada, Japan, and Australia; however, it is
slower than the global average (3 %) and that of many emerging economies. As seen in
Figure 2.2, the compound annual growth for the US between 2009 and 2014 (i.e., 5-year
growth) was 0.4 %. This puts the US at the 29th percentile below Japan and Germany.
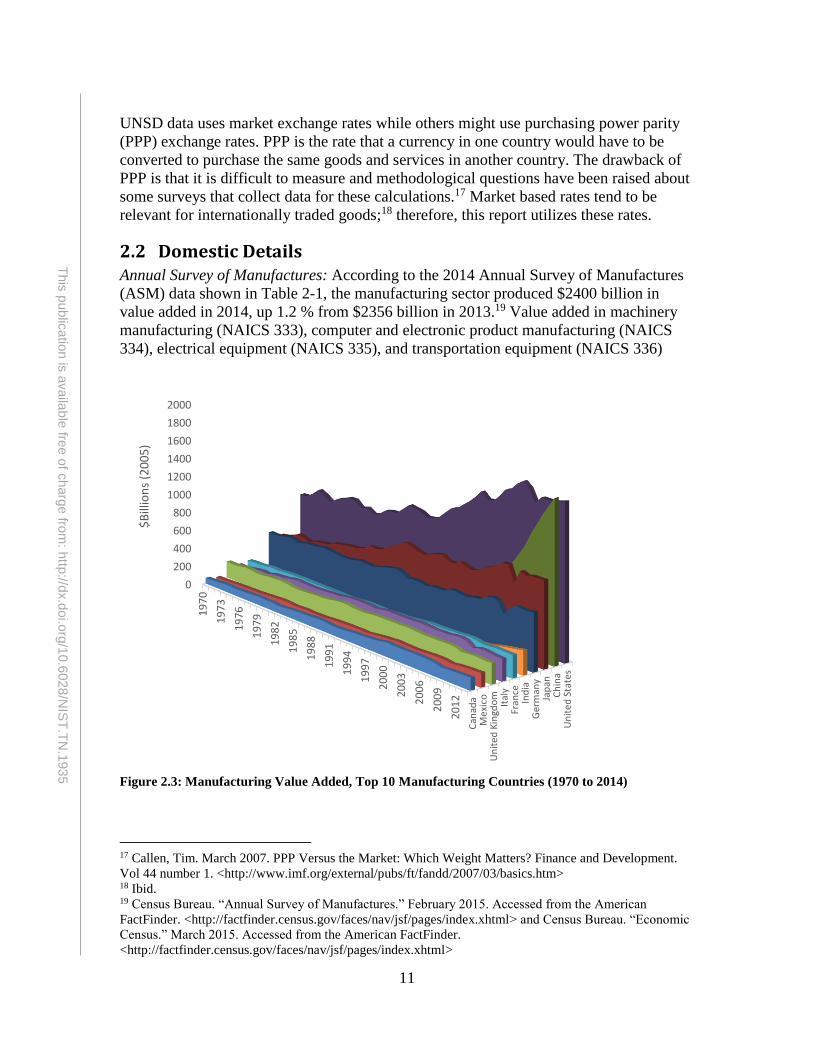
International Comparison – Manufacturing Industry Size: As seen in Figure 2.3, US
manufacturing value added, as measured in constant 2005 dollars, is the second largest
just behind that of China. In current dollars, the US produced $1.8 trillion in
manufacturing valued added while China produced $1.9 trillion. Among the ten largest
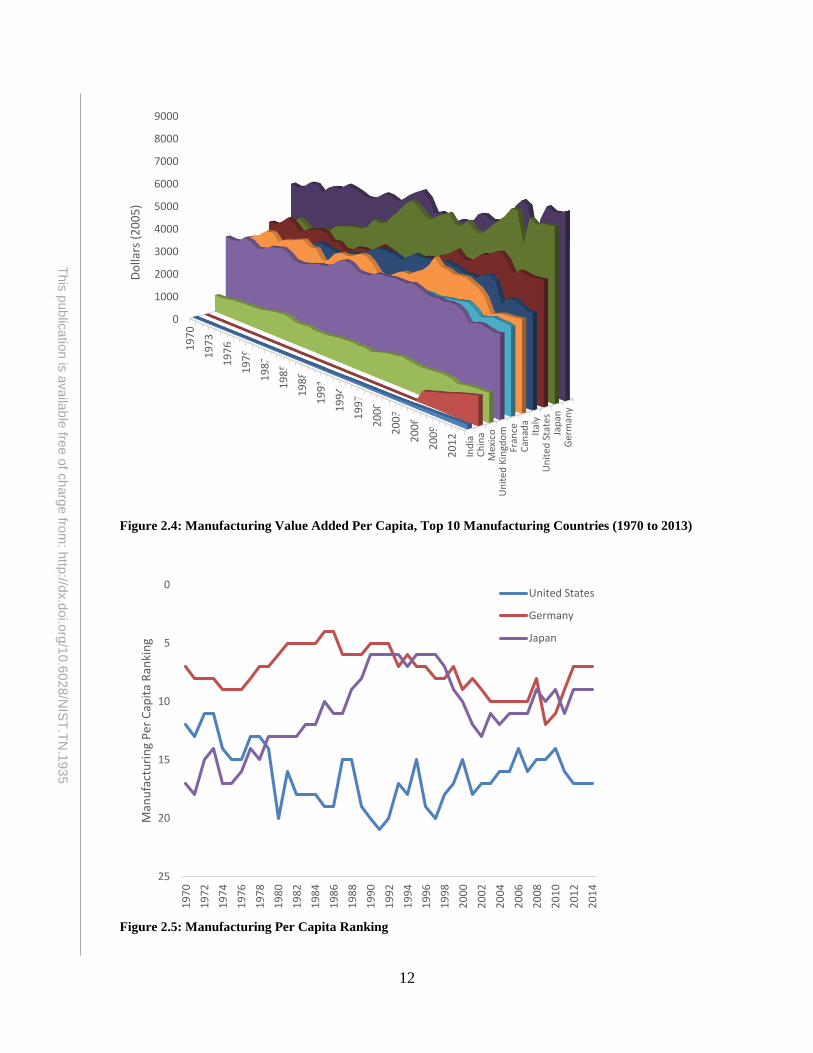
manufacturing countries, the US is the 3rd largest manufacturing value added per capita,
as seen in Figure 2.4. Out of all countries the US ranks 17th, as seen in Figure 2.5.
2
This
pu
blic
atio
n is
availa
ble
free o
f charg
e fro
m: h
ttp://d
x.d
oi.o
rg/1
0.6
028
/NIS
T.T
N.1
93
5
International Comparison – Innovation and Competitiveness: As seen in Table 5-1, the
US ranked 3rd in 2014 in patent applications per million people, which puts it above the
90th percentile. The US ranked 10th in research and development as a percent of GDP in
2012, which puts at the 90th percentile. In terms of researchers per million people, the US
ranked 20th, putting it at the 75th percentile. In journal articles per million people it ranked
21st putting it at the 91st percentile.
The IMD Competitiveness Index ranks the US as 3rd among 60 countries in
competitiveness for conducting business. The US ranks low in public finance, prices, and
fiscal policy, as seen in Figure 5.1.
The Competitive Industrial Performance Index, published by the United Nations
Industrial Development Organization, ranked the US 3rd in its economic performance in
2014. This index assesses an economy’s ability to competitively produce and export
manufactured goods.
The Deloitte Global Manufacturing Competitiveness Index uses a survey of CEOs to rank
countries based on managerial perception. The US was ranked 2nd out of 40 nations.
High-cost labor, high corporate tax rates, and increasing investments outside of the US
were identified as challenges to US industry. Manufacturers indicated that companies
were building high-tech factories in the US due to rising labor costs in China, shipping
costs, and low cost shale gas in the US.
The World Economic Forum’s 2015-2016 Global Competitiveness Report uses 12 items
to assess the competitiveness of 140 economies. As seen in Figure 5.2, the US was
ranked 3rd with low rankings in macroeconomic environment, health and primary
education, and institutions.
Domestic Focus – Types of Goods Produced: The largest manufacturing subsector in the
US is chemical manufacturing followed by computer/electronic products followed by
food, beverage, and tobacco products, as seen in Figure 2.12. The compound annual
growth rate, calculated using the PPI, for these sectors are 0.7 %, 3.6 %, and -0.6 %,
respectively.
Domestic Focus – Economic Recovery: As illustrated in Figure 2.6, manufacturing
declined significantly in 2008 and has nearly returned to its peak level occurring in 2007.
Manufacturing value added declined more than total US GDP, creating a persistent gap.
The result is that first quarter GDP is 10.2 % above its pre-recession peak level while
manufacturing is at 1.1 % below its peak level. Moreover, manufacturing value added has
not returned to pre-recession levels. However, between March of 2014 and March of
2015, manufacturing construction increased 53 %, suggesting a rapid increase in
investment in US manufacturing. This growth is largely due to construction of chemical
manufacturing facilities, but may have reached a plateau, as July 2016 manufacturing
construction is down 6 % from July of the previous year (see Figure 2.13).
3
This
pu
blic
atio
n is
availa
ble
free o
f charg
e fro
m: h
ttp://d
x.d
oi.o
rg/1
0.6
028
/NIS
T.T
N.1
93
5
Between January of 2006 and January of 2010, manufacturing employment declined by
19.4 %, as seen in Figure 4.1. As of July 2016, employment in manufacturing is still
13.4 % below its 2006 level. Moreover, manufacturing employment has not returned to
pre-recession levels.
Domestic Focus – Manufacturing Supply Chain Costs: As seen in Table 3-4, wholesale
trade, the management of companies and enterprises, and oil and gas extraction is a major
supply chain cost for manufacturing as a whole and among selected subsectors. As seen
in Table 3-5, management occupations, business and financial operations, top executives,
operations specialties managers, and business operations specialists occupations are
major labor costs for manufacturing as a whole and among selected subsectors. In 2014,
the US imported approximately 23.1 % of its intermediate imports, as seen in Table 3-3.
As a proportion of output and imports (i.e., a proportion of the total inputs), intermediate
imports represented 13.0 %.
Domestic Focus – Manufacturing Safety and Compensation: As seen in Figure 4.2,
fatalities, injuries, and the injury rate have had an overall downward trend since 2000.
Nonfatal injuries per 100 full-time workers has declined from 9.0 in 2000 to 4.0 in 2014.
As seen in Figure 4.5, employee compensation, which includes benefits, has had a 5-year
compound annual growth of 1 %.

4
This
pu
blic
atio
n is
availa
ble
free o
f charg
e fro
m: h
ttp://d
x.d
oi.o
rg/1
0.6
028
/NIS
T.T
N.1
93
5
5
This
pu
blic
atio
n is
availa
ble
free o
f charg
e fro
m: h
ttp://d
x.d
oi.o
rg/1
0.6
028
/NIS
T.T
N.1
93
5
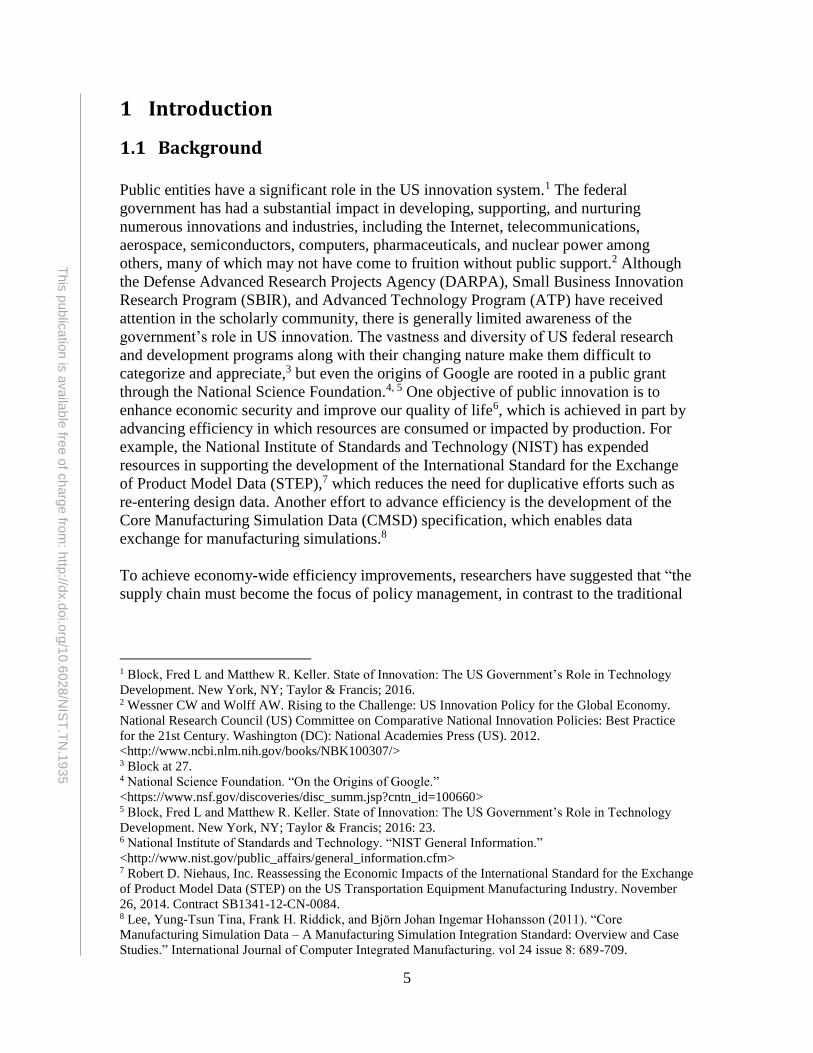
1 Introduction
1.1 Background
Public entities have a significant role in the US innovation system.1 The federal
government has had a substantial impact in developing, supporting, and nurturing
numerous innovations and industries, including the Internet, telecommunications,
aerospace, semiconductors, computers, pharmaceuticals, and nuclear power among
others, many of which may not have come to fruition without public support.2 Although
the Defense Advanced Research Projects Agency (DARPA), Small Business Innovation
Research Program (SBIR), and Advanced Technology Program (ATP) have received
attention in the scholarly community, there is generally limited awareness of the
government’s role in US innovation. The vastness and diversity of US federal research
and development programs along with their changing nature make them difficult to
categorize and appreciate,3 but even the origins of Google are rooted in a public grant
through the National Science Foundation.4, 5 One objective of public innovation is to
enhance economic security and improve our quality of life6, which is achieved in part by
advancing efficiency in which resources are consumed or impacted by production. For
example, the National Institute of Standards and Technology (NIST) has expended
resources in supporting the development of the International Standard for the Exchange
of Product Model Data (STEP),7 which reduces the need for duplicative efforts such as
re-entering design data. Another effort to advance efficiency is the development of the
Core Manufacturing Simulation Data (CMSD) specification, which enables data
exchange for manufacturing simulations.8
To achieve economy-wide efficiency improvements, researchers have suggested that “the
supply chain must become the focus of policy management, in contrast to the traditional
1 Block, Fred L and Matthew R. Keller. State of Innovation: The US Government’s Role in Technology
Development. New York, NY; Taylor & Francis; 2016. 2 Wessner CW and Wolff AW. Rising to the Challenge: US Innovation Policy for the Global Economy.
National Research Council (US) Committee on Comparative National Innovation Policies: Best Practice
for the 21st Century. Washington (DC): National Academies Press (US). 2012.
<http://www.ncbi.nlm.nih.gov/books/NBK100307/> 3 Block at 27. 4 National Science Foundation. “On the Origins of Google.”
<https://www.nsf.gov/discoveries/disc_summ.jsp?cntn_id=100660> 5 Block, Fred L and Matthew R. Keller. State of Innovation: The US Government’s Role in Technology
Development. New York, NY; Taylor & Francis; 2016: 23. 6 National Institute of Standards and Technology. “NIST General Information.”
<http://www.nist.gov/public_affairs/general_information.cfm> 7 Robert D. Niehaus, Inc. Reassessing the Economic Impacts of the International Standard for the Exchange
of Product Model Data (STEP) on the US Transportation Equipment Manufacturing Industry. November
26, 2014. Contract SB1341-12-CN-0084. 8 Lee, Yung-Tsun Tina, Frank H. Riddick, and Björn Johan Ingemar Hohansson (2011). “Core
Manufacturing Simulation Data – A Manufacturing Simulation Integration Standard: Overview and Case
Studies.” International Journal of Computer Integrated Manufacturing. vol 24 issue 8: 689-709.
6
This
pu
blic
atio
n is
availa
ble
free o
f charg
e fro
m: h
ttp://d
x.d
oi.o
rg/1
0.6
028
/NIS
T.T
N.1
93
5
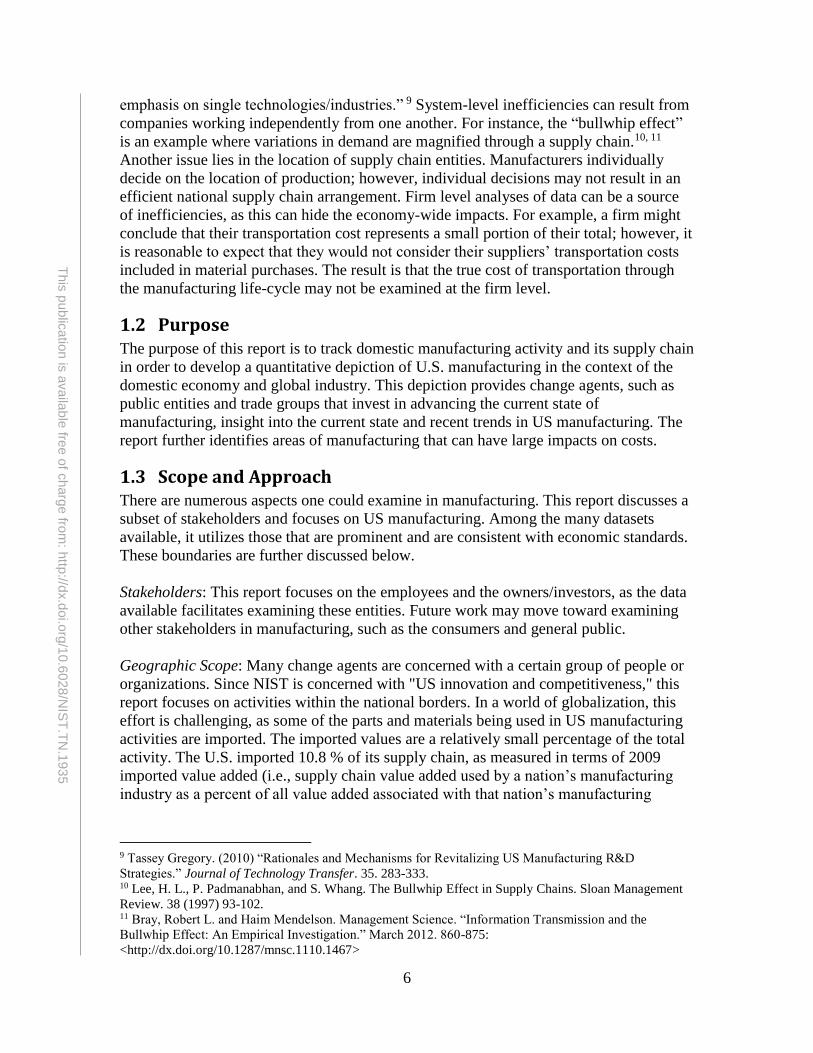
emphasis on single technologies/industries.” 9 System-level inefficiencies can result from
companies working independently from one another. For instance, the “bullwhip effect”
is an example where variations in demand are magnified through a supply chain.10, 11
Another issue lies in the location of supply chain entities. Manufacturers individually
decide on the location of production; however, individual decisions may not result in an
efficient national supply chain arrangement. Firm level analyses of data can be a source
of inefficiencies, as this can hide the economy-wide impacts. For example, a firm might
conclude that their transportation cost represents a small portion of their total; however, it
is reasonable to expect that they would not consider their suppliers’ transportation costs
included in material purchases. The result is that the true cost of transportation through
the manufacturing life-cycle may not be examined at the firm level.
1.2 Purpose The purpose of this report is to track domestic manufacturing activity and its supply chain
in order to develop a quantitative depiction of U.S. manufacturing in the context of the
domestic economy and global industry. This depiction provides change agents, such as
public entities and trade groups that invest in advancing the current state of
manufacturing, insight into the current state and recent trends in US manufacturing. The
report further identifies areas of manufacturing that can have large impacts on costs.
1.3 Scope and Approach There are numerous aspects one could examine in manufacturing. This report discusses a
subset of stakeholders and focuses on US manufacturing. Among the many datasets
available, it utilizes those that are prominent and are consistent with economic standards.
These boundaries are further discussed below.
Stakeholders: This report focuses on the employees and the owners/investors, as the data
available facilitates examining these entities. Future work may move toward examining
other stakeholders in manufacturing, such as the consumers and general public.
Geographic Scope: Many change agents are concerned with a certain group of people or
organizations. Since NIST is concerned with "US innovation and competitiveness," this
report focuses on activities within the national borders. In a world of globalization, this
effort is challenging, as some of the parts and materials being used in US manufacturing
activities are imported. The imported values are a relatively small percentage of the total
activity. The U.S. imported 10.8 % of its supply chain, as measured in terms of 2009
imported value added (i.e., supply chain value added used by a nation’s manufacturing
industry as a percent of all value added associated with that nation’s manufacturing
9 Tassey Gregory. (2010) “Rationales and Mechanisms for Revitalizing US Manufacturing R&D
Strategies.” Journal of Technology Transfer. 35. 283-333. 10 Lee, H. L., P. Padmanabhan, and S. Whang. The Bullwhip Effect in Supply Chains. Sloan Management
Review. 38 (1997) 93-102. 11 Bray, Robert L. and Haim Mendelson. Management Science. “Information Transmission and the
Bullwhip Effect: An Empirical Investigation.” March 2012. 860-875:
<http://dx.doi.org/10.1287/mnsc.1110.1467>
7
This
pu
blic
atio
n is
availa
ble
free o
f charg
e fro
m: h
ttp://d
x.d
oi.o
rg/1
0.6
028
/NIS
T.T
N.1
93
5
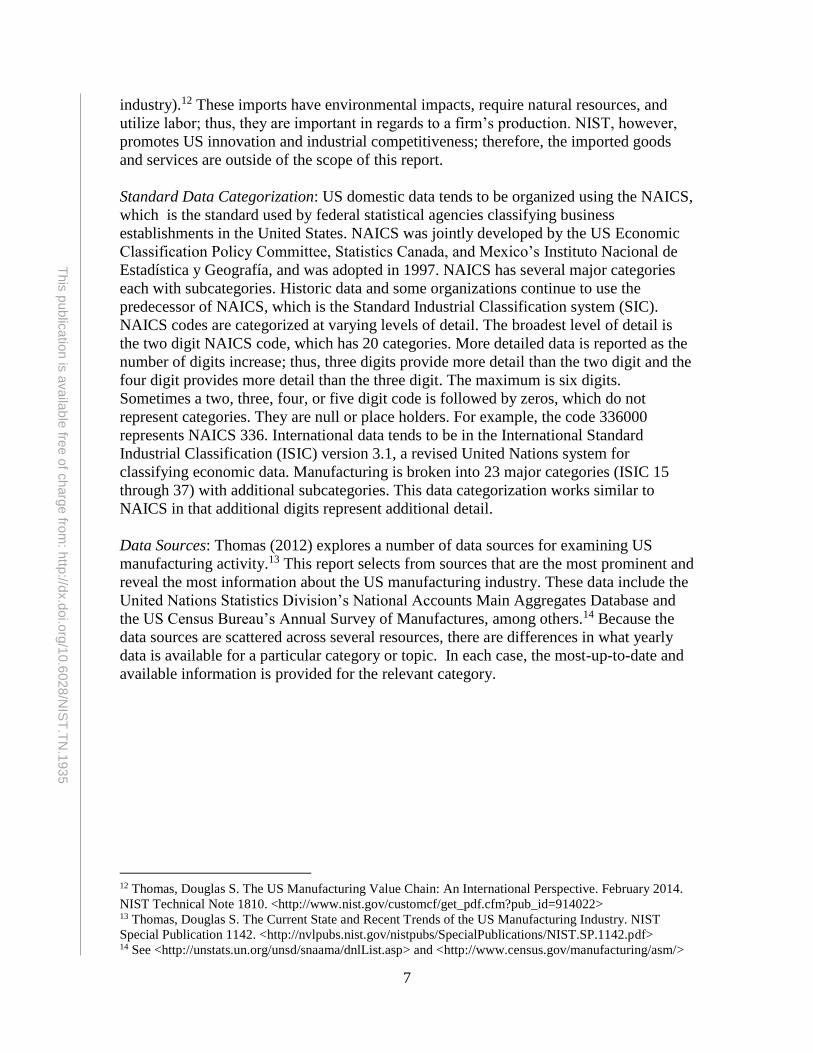
industry).12 These imports have environmental impacts, require natural resources, and
utilize labor; thus, they are important in regards to a firm’s production. NIST, however,
promotes US innovation and industrial competitiveness; therefore, the imported goods
and services are outside of the scope of this report.
Standard Data Categorization: US domestic data tends to be organized using the NAICS,
which is the standard used by federal statistical agencies classifying business
establishments in the United States. NAICS was jointly developed by the US Economic
Classification Policy Committee, Statistics Canada, and Mexico’s Instituto Nacional de
Estadística y Geografía, and was adopted in 1997. NAICS has several major categories
each with subcategories. Historic data and some organizations continue to use the
predecessor of NAICS, which is the Standard Industrial Classification system (SIC).
NAICS codes are categorized at varying levels of detail. The broadest level of detail is
the two digit NAICS code, which has 20 categories. More detailed data is reported as the
number of digits increase; thus, three digits provide more detail than the two digit and the
four digit provides more detail than the three digit. The maximum is six digits.
Sometimes a two, three, four, or five digit code is followed by zeros, which do not
represent categories. They are null or place holders. For example, the code 336000
represents NAICS 336. International data tends to be in the International Standard
Industrial Classification (ISIC) version 3.1, a revised United Nations system for
classifying economic data. Manufacturing is broken into 23 major categories (ISIC 15
through 37) with additional subcategories. This data categorization works similar to
NAICS in that additional digits represent additional detail.
Data Sources: Thomas (2012) explores a number of data sources for examining US
manufacturing activity.13 This report selects from sources that are the most prominent and
reveal the most information about the US manufacturing industry. These data include the
United Nations Statistics Division’s National Accounts Main Aggregates Database and
the US Census Bureau’s Annual Survey of Manufactures, among others.14 Because the
data sources are scattered across several resources, there are differences in what yearly
data is available for a particular category or topic. In each case, the most-up-to-date and
available information is provided for the relevant category.
12 Thomas, Douglas S. The US Manufacturing Value Chain: An International Perspective. February 2014.
NIST Technical Note 1810. <http://www.nist.gov/customcf/get_pdf.cfm?pub_id=914022> 13 Thomas, Douglas S. The Current State and Recent Trends of the US Manufacturing Industry. NIST
Special Publication 1142. <http://nvlpubs.nist.gov/nistpubs/SpecialPublications/NIST.SP.1142.pdf> 14 See <http://unstats.un.org/unsd/snaama/dnlList.asp> and <http://www.census.gov/manufacturing/asm/>

8
This
pu
blic
atio
n is
availa
ble
free o
f charg
e fro
m: h
ttp://d
x.d
oi.o
rg/1
0.6
028
/NIS
T.T
N.1
93
5
9
This
pu
blic
atio
n is
availa
ble
free o
f charg
e fro
m: h
ttp://d
x.d
oi.o
rg/1
0.6
028
/NIS
T.T
N.1
93
5
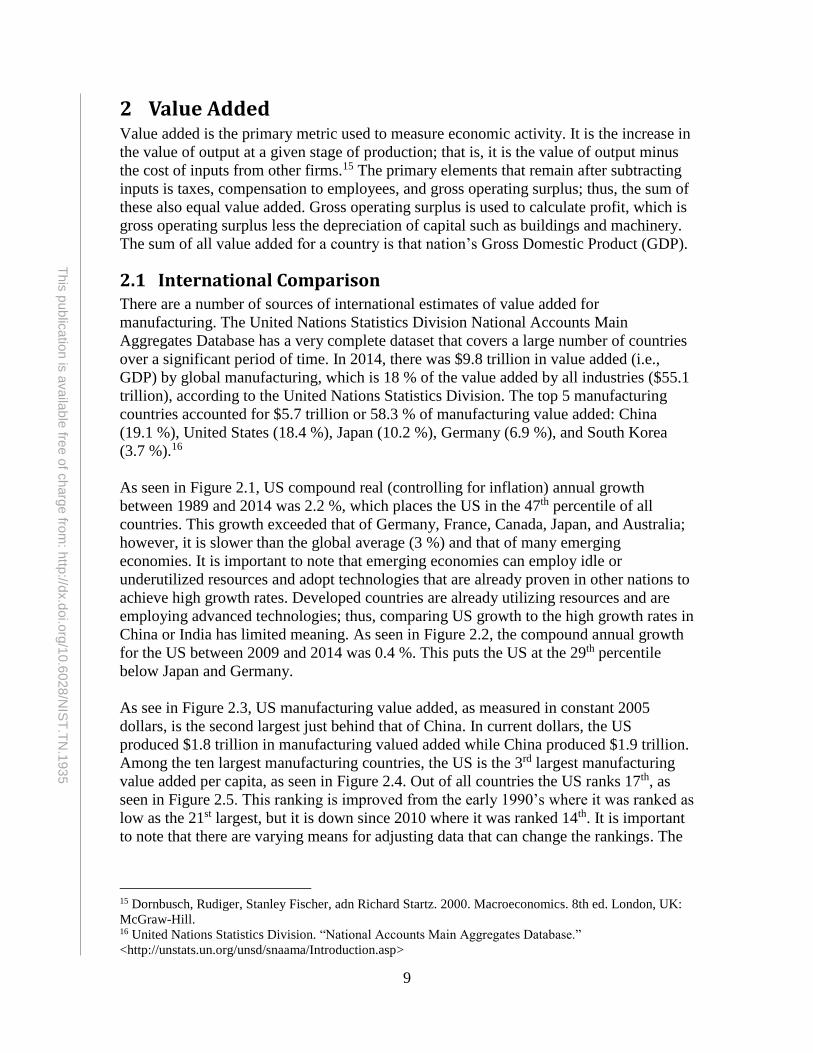
2 Value Added Value added is the primary metric used to measure economic activity. It is the increase in
the value of output at a given stage of production; that is, it is the value of output minus
the cost of inputs from other firms.15 The primary elements that remain after subtracting
inputs is taxes, compensation to employees, and gross operating surplus; thus, the sum of
these also equal value added. Gross operating surplus is used to calculate profit, which is
gross operating surplus less the depreciation of capital such as buildings and machinery.
The sum of all value added for a country is that nation’s Gross Domestic Product (GDP).
2.1 International Comparison There are a number of sources of international estimates of value added for
manufacturing. The United Nations Statistics Division National Accounts Main
Aggregates Database has a very complete dataset that covers a large number of countries
over a significant period of time. In 2014, there was $9.8 trillion in value added (i.e.,
GDP) by global manufacturing, which is 18 % of the value added by all industries ($55.1
trillion), according to the United Nations Statistics Division. The top 5 manufacturing
countries accounted for $5.7 trillion or 58.3 % of manufacturing value added: China
(19.1 %), United States (18.4 %), Japan (10.2 %), Germany (6.9 %), and South Korea
(3.7 %).16
As seen in Figure 2.1, US compound real (controlling for inflation) annual growth
between 1989 and 2014 was 2.2 %, which places the US in the 47th percentile of all
countries. This growth exceeded that of Germany, France, Canada, Japan, and Australia;
however, it is slower than the global average (3 %) and that of many emerging
economies. It is important to note that emerging economies can employ idle or
underutilized resources and adopt technologies that are already proven in other nations to
achieve high growth rates. Developed countries are already utilizing resources and are
employing advanced technologies; thus, comparing US growth to the high growth rates in
China or India has limited meaning. As seen in Figure 2.2, the compound annual growth
for the US between 2009 and 2014 was 0.4 %. This puts the US at the 29th percentile
below Japan and Germany.
As see in Figure 2.3, US manufacturing value added, as measured in constant 2005
dollars, is the second largest just behind that of China. In current dollars, the US
produced $1.8 trillion in manufacturing valued added while China produced $1.9 trillion.
Among the ten largest manufacturing countries, the US is the 3rd largest manufacturing
value added per capita, as seen in Figure 2.4. Out of all countries the US ranks 17th, as
seen in Figure 2.5. This ranking is improved from the early 1990’s where it was ranked as
low as the 21st largest, but it is down since 2010 where it was ranked 14th. It is important
to note that there are varying means for adjusting data that can change the rankings. The
15 Dornbusch, Rudiger, Stanley Fischer, adn Richard Startz. 2000. Macroeconomics. 8th ed. London, UK:
McGraw-Hill. 16 United Nations Statistics Division. “National Accounts Main Aggregates Database.”
<http://unstats.un.org/unsd/snaama/Introduction.asp>
10
This
pu
blic
atio
n is
availa
ble
free o
f charg
e fro
m: h
ttp://d
x.d
oi.o
rg/1
0.6
028
/NIS
T.T
N.1
93
5
Figure 2.1: National 25 Year Compound Annual Growth, by Country (1989 to 2014)
Figure 2.2: National 5 Year Compound Annual Growth, by Country (2009 to 2014)
Australia, 1.1%
Canada, 1.1%
Germany, 1.3%
Japan, 1.4%
France, 1.5%
United States, 2.2%
Finland, 2.5%
Mexico, 2.7%
World, 3.0%
Ireland, 5.0%
-10.0%
-5.0%
0.0%
5.0%
10.0%
15.0%
25th Percentile
50th Percentile
75th Percentile
100th Percentile
Finland, -0.2%
Australia, 0.1%
Ireland, 0.2%
France, 0.2%United States, 0.4%
Japan, 0.7%
World, 0.8%
Mexico, 0.9%
Germany, 1.1%
China, People's Republic of, 1.8%
-6.0%
-5.0%
-4.0%
-3.0%
-2.0%
-1.0%
0.0%
1.0%
2.0%
3.0%
4.0%
25th 50th
Percentile
75th Percentile
100th Percentile
11
This
pu
blic
atio
n is
availa
ble
free o
f charg
e fro
m: h
ttp://d
x.d
oi.o
rg/1
0.6
028
/NIS
T.T
N.1
93
5
Can
ada
Mex
ico
Un
ite
d K
ingd
om
Ital
yFr
ance
Ind
iaG
erm
any
Jap
anC
hin
aU
nit
ed
Sta
tes
0
200
400
600
800
1000
1200
1400
1600
1800
2000
19
70
19
73
19
76
19
79
19
82
19
85
19
88
19
91
19
94
19
97
20
00
20
03
20
06
20
09
20
12
$B
illio
ns
(20
05
)
UNSD data uses market exchange rates while others might use purchasing power parity
(PPP) exchange rates. PPP is the rate that a currency in one country would have to be
converted to purchase the same goods and services in another country. The drawback of
PPP is that it is difficult to measure and methodological questions have been raised about
some surveys that collect data for these calculations.17 Market based rates tend to be
relevant for internationally traded goods;18 therefore, this report utilizes these rates.
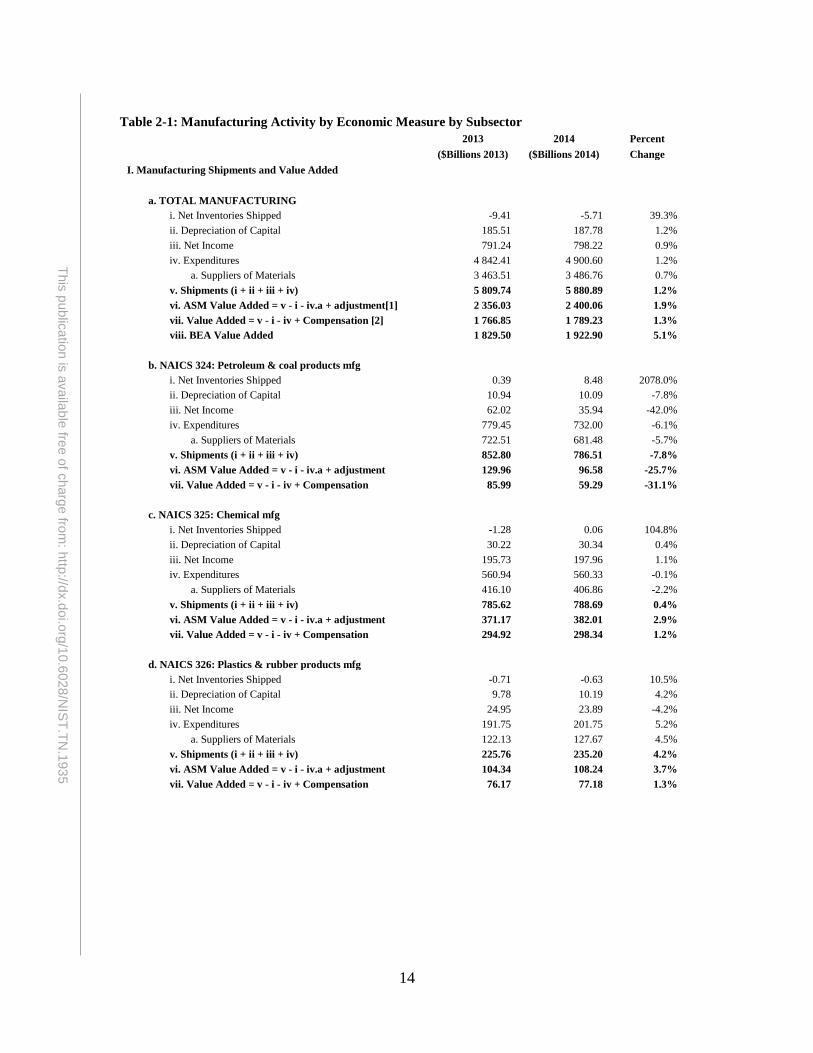
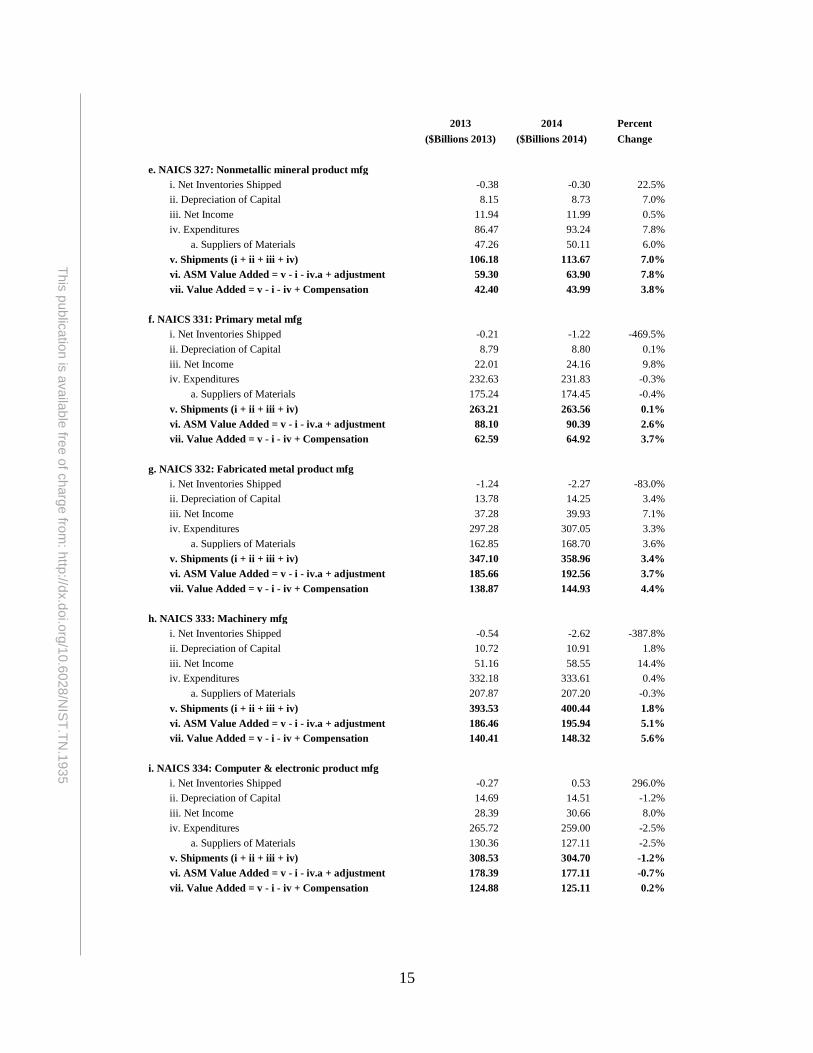
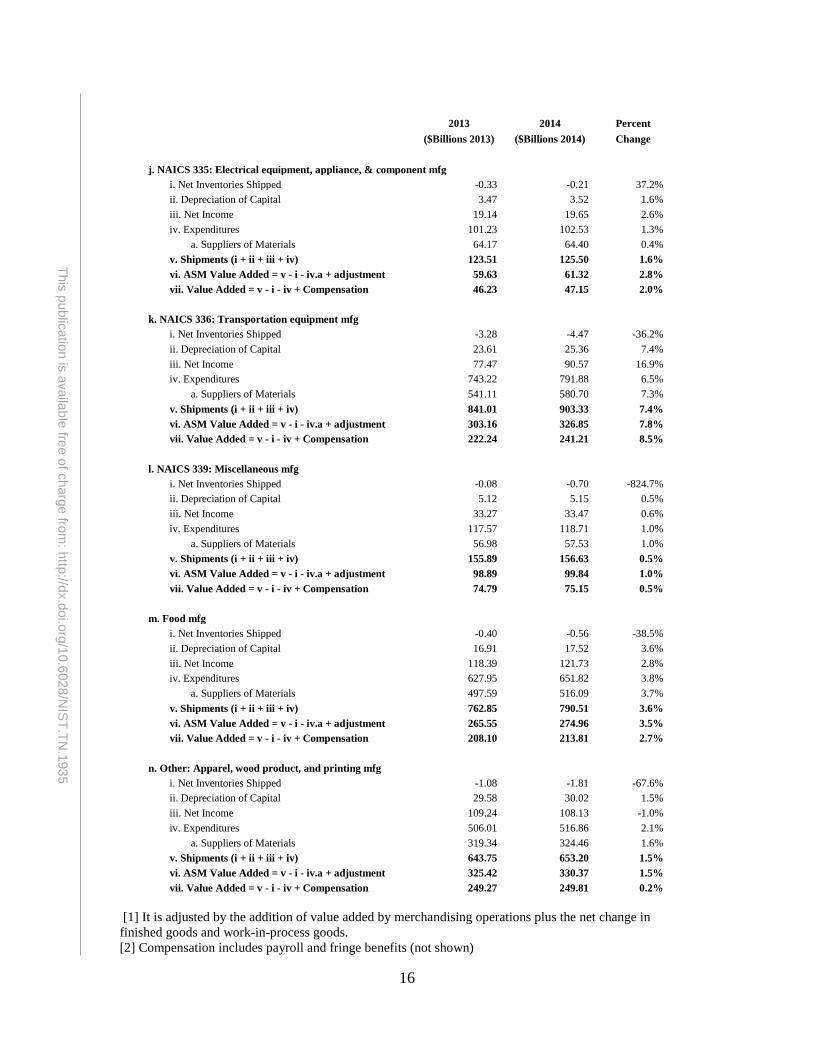
2.2 Domestic Details Annual Survey of Manufactures: According to the 2014 Annual Survey of Manufactures
(ASM) data shown in Table 2-1, the manufacturing sector produced $2400 billion in
value added in 2014, up 1.2 % from $2356 billion in 2013.19 Value added in machinery
manufacturing (NAICS 333), computer and electronic product manufacturing (NAICS
334), electrical equipment (NAICS 335), and transportation equipment (NAICS 336)
Figure 2.3: Manufacturing Value Added, Top 10 Manufacturing Countries (1970 to 2014)
17 Callen, Tim. March 2007. PPP Versus the Market: Which Weight Matters? Finance and Development.
Vol 44 number 1. <http://www.imf.org/external/pubs/ft/fandd/2007/03/basics.htm> 18 Ibid. 19 Census Bureau. “Annual Survey of Manufactures.” February 2015. Accessed from the American
FactFinder. <http://factfinder.census.gov/faces/nav/jsf/pages/index.xhtml> and Census Bureau. “Economic
Census.” March 2015. Accessed from the American FactFinder.
<http://factfinder.census.gov/faces/nav/jsf/pages/index.xhtml>
12
This
pu
blic
atio
n is
availa
ble
free o
f charg
e fro
m: h
ttp://d
x.d
oi.o
rg/1
0.6
028
/NIS
T.T
N.1
93
5
Ind
iaC
hin
aM
exic
oU
nit
ed
Kin
gdo
mFr
ance
Can
ada
Ital
yU
nit
ed
Sta
tes
Jap
anG
erm
any
0
1000
2000
3000
4000
5000
6000
7000
8000
9000
19
70
19
73
19
76
19
79
19
82
19
85
19
88
19
91
19
94
19
97
20
00
20
03
20
06
20
09
20
12
Do
llars
(2
00
5)
Figure 2.4: Manufacturing Value Added Per Capita, Top 10 Manufacturing Countries (1970 to 2013)
Figure 2.5: Manufacturing Per Capita Ranking
0
5
10
15
20
25
19
70
19
72
19
74
19
76
19
78
19
80
19
82
19
84
19
86
19
88
19
90
19
92
19
94
19
96
19
98
20
00
20
02
20
04
20
06
20
08
20
10
20
12
20
14
Man
ufa
ctu
rin
g P
er C
apit
a R
anki
ng
United States
Germany
Japan
13
This
pu
blic
atio
n is
availa
ble
free o
f charg
e fro
m: h
ttp://d
x.d
oi.o
rg/1
0.6
028
/NIS
T.T
N.1
93
5
grew 5.1 %, -0.7 %, 2.8 %, and 7.8 % respectively. Shipments increased 1.2 % over the
same period to a total of $5881 billion. The ASM calculation of value added is equal to
the value of shipments less the cost of materials, supplies, containers, fuel, purchased
electricity, and contract work. It is adjusted by the addition of value added by
merchandising operations plus the net change in finished goods and work-in-process
goods:
𝐴𝑆𝑀 𝑉𝑎𝑙𝑢𝑒 𝐴𝑑𝑑𝑒𝑑 = 𝑠ℎ𝑖𝑝𝑚𝑒𝑛𝑡𝑠 − 𝑛𝑒𝑡 𝑖𝑛𝑣𝑒𝑛𝑡𝑜𝑟𝑖𝑒𝑠 𝑠ℎ𝑖𝑝𝑝𝑒𝑑 −
𝑠𝑢𝑝𝑝𝑙𝑖𝑒𝑟𝑠 𝑜𝑓 𝑚𝑎𝑡𝑒𝑟𝑖𝑎𝑙𝑠 + 𝑚𝑒𝑟𝑐ℎ𝑎𝑛𝑑𝑖𝑠𝑖𝑛𝑔 𝑜𝑝𝑒𝑟𝑎𝑡𝑖𝑜𝑛𝑠
Value added avoids the duplication caused from the use of products of some
establishments as materials. It is important to note that the Bureau of Economic Analysis
(BEA) and the ASM calculate value added differently. The BEA, which follows the more
traditional method, calculates value added as “gross output (sales or receipts and other
operating income, plus inventory change) less intermediate inputs (consumption of goods
and services purchased from other industries or imported).” Moreover, the difference is
that ASM’s calculation of value added includes purchases from other industries such as
mining and construction while BEA’s does not include it. Table 2-1 has both the ASM’s
calculation and a calculation that follows the more traditional approach.
Net income, which could also be referred to as profit, was $798 billion in 2014, which
equates to 16.3 % of expenditures. Net income as a percent of expenditures for machinery
manufacturing (NAICS 333), computer and electronic product manufacturing (NAICS
334), electrical equipment (NAICS 335), and transportation equipment (NAICS 336) was
17.5 %, 11.8 %, 19.2 %, and 11.4 %.
14
This
pu
blic
atio
n is
availa
ble
free o
f charg
e fro
m: h
ttp://d
x.d
oi.o
rg/1
0.6
028
/NIS
T.T
N.1
93
5
Table 2-1: Manufacturing Activity by Economic Measure by Subsector
2013 2014 Percent
($Billions 2013) ($Billions 2014) Change
I. Manufacturing Shipments and Value Added
a. TOTAL MANUFACTURING
i. Net Inventories Shipped -9.41 -5.71 39.3%
ii. Depreciation of Capital 185.51 187.78 1.2%
iii. Net Income 791.24 798.22 0.9%
iv. Expenditures 4 842.41 4 900.60 1.2%
a. Suppliers of Materials 3 463.51 3 486.76 0.7%
v. Shipments (i + ii + iii + iv) 5 809.74 5 880.89 1.2%
vi. ASM Value Added = v - i - iv.a + adjustment[1] 2 356.03 2 400.06 1.9%
vii. Value Added = v - i - iv + Compensation [2] 1 766.85 1 789.23 1.3%
viii. BEA Value Added 1 829.50 1 922.90 5.1%
b. NAICS 324: Petroleum & coal products mfg
i. Net Inventories Shipped 0.39 8.48 2078.0%
ii. Depreciation of Capital 10.94 10.09 -7.8%
iii. Net Income 62.02 35.94 -42.0%
iv. Expenditures 779.45 732.00 -6.1%
a. Suppliers of Materials 722.51 681.48 -5.7%
v. Shipments (i + ii + iii + iv) 852.80 786.51 -7.8%
vi. ASM Value Added = v - i - iv.a + adjustment 129.96 96.58 -25.7%
vii. Value Added = v - i - iv + Compensation 85.99 59.29 -31.1%
c. NAICS 325: Chemical mfg
i. Net Inventories Shipped -1.28 0.06 104.8%
ii. Depreciation of Capital 30.22 30.34 0.4%
iii. Net Income 195.73 197.96 1.1%
iv. Expenditures 560.94 560.33 -0.1%
a. Suppliers of Materials 416.10 406.86 -2.2%
v. Shipments (i + ii + iii + iv) 785.62 788.69 0.4%
vi. ASM Value Added = v - i - iv.a + adjustment 371.17 382.01 2.9%
vii. Value Added = v - i - iv + Compensation 294.92 298.34 1.2%
d. NAICS 326: Plastics & rubber products mfg
i. Net Inventories Shipped -0.71 -0.63 10.5%
ii. Depreciation of Capital 9.78 10.19 4.2%
iii. Net Income 24.95 23.89 -4.2%
iv. Expenditures 191.75 201.75 5.2%
a. Suppliers of Materials 122.13 127.67 4.5%
v. Shipments (i + ii + iii + iv) 225.76 235.20 4.2%
vi. ASM Value Added = v - i - iv.a + adjustment 104.34 108.24 3.7%
vii. Value Added = v - i - iv + Compensation 76.17 77.18 1.3%
15
This
pu
blic
atio
n is
availa
ble
free o
f charg
e fro
m: h
ttp://d
x.d
oi.o
rg/1
0.6
028
/NIS
T.T
N.1
93
5
2013 2014 Percent
($Billions 2013) ($Billions 2014) Change
e. NAICS 327: Nonmetallic mineral product mfg
i. Net Inventories Shipped -0.38 -0.30 22.5%
ii. Depreciation of Capital 8.15 8.73 7.0%
iii. Net Income 11.94 11.99 0.5%
iv. Expenditures 86.47 93.24 7.8%
a. Suppliers of Materials 47.26 50.11 6.0%
v. Shipments (i + ii + iii + iv) 106.18 113.67 7.0%
vi. ASM Value Added = v - i - iv.a + adjustment 59.30 63.90 7.8%
vii. Value Added = v - i - iv + Compensation 42.40 43.99 3.8%
f. NAICS 331: Primary metal mfg
i. Net Inventories Shipped -0.21 -1.22 -469.5%
ii. Depreciation of Capital 8.79 8.80 0.1%
iii. Net Income 22.01 24.16 9.8%
iv. Expenditures 232.63 231.83 -0.3%
a. Suppliers of Materials 175.24 174.45 -0.4%
v. Shipments (i + ii + iii + iv) 263.21 263.56 0.1%
vi. ASM Value Added = v - i - iv.a + adjustment 88.10 90.39 2.6%
vii. Value Added = v - i - iv + Compensation 62.59 64.92 3.7%
g. NAICS 332: Fabricated metal product mfg
i. Net Inventories Shipped -1.24 -2.27 -83.0%
ii. Depreciation of Capital 13.78 14.25 3.4%
iii. Net Income 37.28 39.93 7.1%
iv. Expenditures 297.28 307.05 3.3%
a. Suppliers of Materials 162.85 168.70 3.6%
v. Shipments (i + ii + iii + iv) 347.10 358.96 3.4%
vi. ASM Value Added = v - i - iv.a + adjustment 185.66 192.56 3.7%
vii. Value Added = v - i - iv + Compensation 138.87 144.93 4.4%
h. NAICS 333: Machinery mfg
i. Net Inventories Shipped -0.54 -2.62 -387.8%
ii. Depreciation of Capital 10.72 10.91 1.8%
iii. Net Income 51.16 58.55 14.4%
iv. Expenditures 332.18 333.61 0.4%
a. Suppliers of Materials 207.87 207.20 -0.3%
v. Shipments (i + ii + iii + iv) 393.53 400.44 1.8%
vi. ASM Value Added = v - i - iv.a + adjustment 186.46 195.94 5.1%
vii. Value Added = v - i - iv + Compensation 140.41 148.32 5.6%
i. NAICS 334: Computer & electronic product mfg
i. Net Inventories Shipped -0.27 0.53 296.0%
ii. Depreciation of Capital 14.69 14.51 -1.2%
iii. Net Income 28.39 30.66 8.0%
iv. Expenditures 265.72 259.00 -2.5%
a. Suppliers of Materials 130.36 127.11 -2.5%
v. Shipments (i + ii + iii + iv) 308.53 304.70 -1.2%
vi. ASM Value Added = v - i - iv.a + adjustment 178.39 177.11 -0.7%
vii. Value Added = v - i - iv + Compensation 124.88 125.11 0.2%
16
This
pu
blic
atio
n is
availa
ble
free o
f charg
e fro
m: h
ttp://d
x.d
oi.o
rg/1
0.6
028
/NIS
T.T
N.1
93
5
2013 2014 Percent
($Billions 2013) ($Billions 2014) Change
j. NAICS 335: Electrical equipment, appliance, & component mfg
i. Net Inventories Shipped -0.33 -0.21 37.2%
ii. Depreciation of Capital 3.47 3.52 1.6%
iii. Net Income 19.14 19.65 2.6%
iv. Expenditures 101.23 102.53 1.3%
a. Suppliers of Materials 64.17 64.40 0.4%
v. Shipments (i + ii + iii + iv) 123.51 125.50 1.6%
vi. ASM Value Added = v - i - iv.a + adjustment 59.63 61.32 2.8%
vii. Value Added = v - i - iv + Compensation 46.23 47.15 2.0%
k. NAICS 336: Transportation equipment mfg
i. Net Inventories Shipped -3.28 -4.47 -36.2%
ii. Depreciation of Capital 23.61 25.36 7.4%
iii. Net Income 77.47 90.57 16.9%
iv. Expenditures 743.22 791.88 6.5%
a. Suppliers of Materials 541.11 580.70 7.3%
v. Shipments (i + ii + iii + iv) 841.01 903.33 7.4%
vi. ASM Value Added = v - i - iv.a + adjustment 303.16 326.85 7.8%
vii. Value Added = v - i - iv + Compensation 222.24 241.21 8.5%
l. NAICS 339: Miscellaneous mfg
i. Net Inventories Shipped -0.08 -0.70 -824.7%
ii. Depreciation of Capital 5.12 5.15 0.5%
iii. Net Income 33.27 33.47 0.6%
iv. Expenditures 117.57 118.71 1.0%
a. Suppliers of Materials 56.98 57.53 1.0%
v. Shipments (i + ii + iii + iv) 155.89 156.63 0.5%
vi. ASM Value Added = v - i - iv.a + adjustment 98.89 99.84 1.0%
vii. Value Added = v - i - iv + Compensation 74.79 75.15 0.5%
m. Food mfg
i. Net Inventories Shipped -0.40 -0.56 -38.5%
ii. Depreciation of Capital 16.91 17.52 3.6%
iii. Net Income 118.39 121.73 2.8%
iv. Expenditures 627.95 651.82 3.8%
a. Suppliers of Materials 497.59 516.09 3.7%
v. Shipments (i + ii + iii + iv) 762.85 790.51 3.6%
vi. ASM Value Added = v - i - iv.a + adjustment 265.55 274.96 3.5%
vii. Value Added = v - i - iv + Compensation 208.10 213.81 2.7%
n. Other: Apparel, wood product, and printing mfg
i. Net Inventories Shipped -1.08 -1.81 -67.6%
ii. Depreciation of Capital 29.58 30.02 1.5%
iii. Net Income 109.24 108.13 -1.0%
iv. Expenditures 506.01 516.86 2.1%
a. Suppliers of Materials 319.34 324.46 1.6%
v. Shipments (i + ii + iii + iv) 643.75 653.20 1.5%
vi. ASM Value Added = v - i - iv.a + adjustment 325.42 330.37 1.5%
vii. Value Added = v - i - iv + Compensation 249.27 249.81 0.2%
[1] It is adjusted by the addition of value added by merchandising operations plus the net change in
finished goods and work-in-process goods.
[2] Compensation includes payroll and fringe benefits (not shown)
17
This
pu
blic
atio
n is
availa
ble
free o
f charg
e fro
m: h
ttp://d
x.d
oi.o
rg/1
0.6
028
/NIS
T.T
N.1
93
5
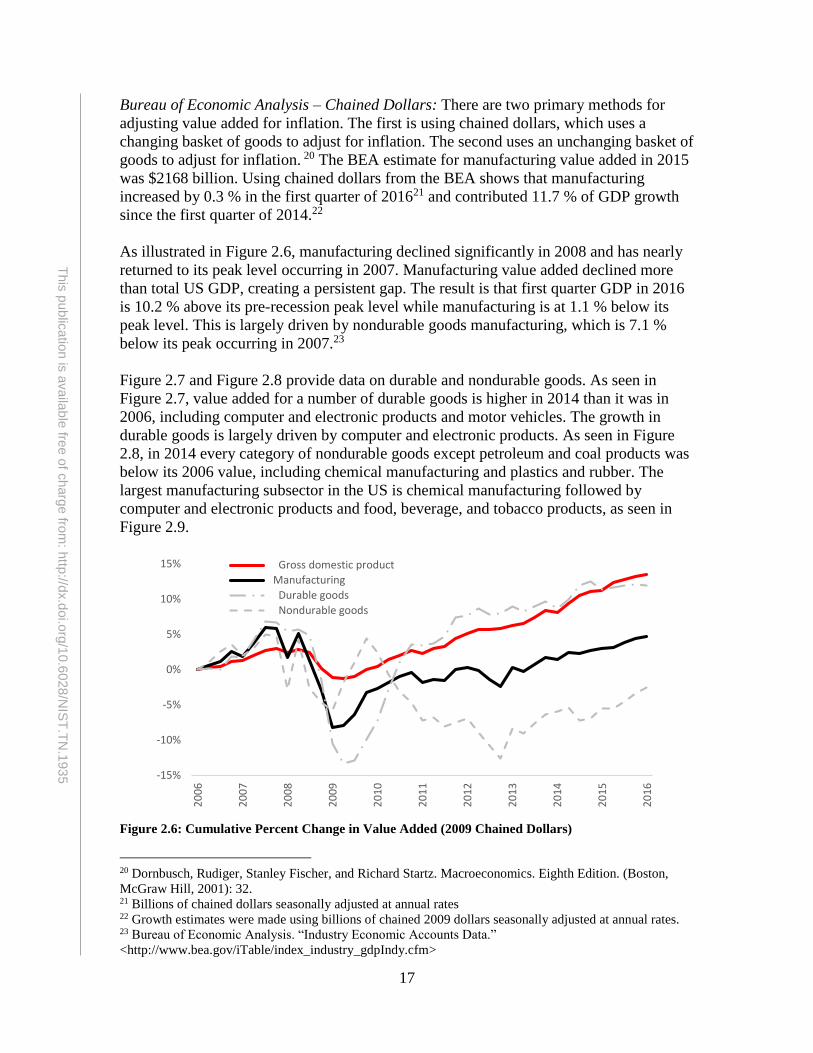
Bureau of Economic Analysis – Chained Dollars: There are two primary methods for
adjusting value added for inflation. The first is using chained dollars, which uses a
changing basket of goods to adjust for inflation. The second uses an unchanging basket of
goods to adjust for inflation. 20 The BEA estimate for manufacturing value added in 2015
was $2168 billion. Using chained dollars from the BEA shows that manufacturing
increased by 0.3 % in the first quarter of 201621 and contributed 11.7 % of GDP growth
since the first quarter of 2014.22
As illustrated in Figure 2.6, manufacturing declined significantly in 2008 and has nearly
returned to its peak level occurring in 2007. Manufacturing value added declined more
than total US GDP, creating a persistent gap. The result is that first quarter GDP in 2016
is 10.2 % above its pre-recession peak level while manufacturing is at 1.1 % below its
peak level. This is largely driven by nondurable goods manufacturing, which is 7.1 %
below its peak occurring in 2007.23
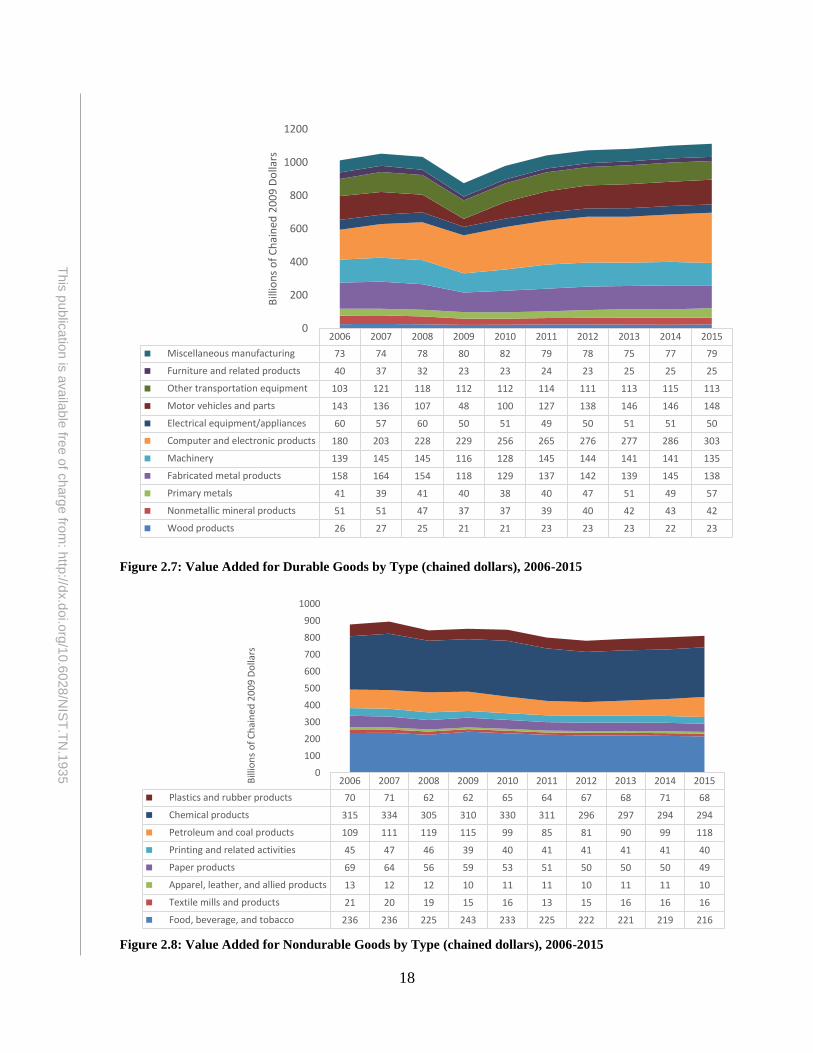
Figure 2.7 and Figure 2.8 provide data on durable and nondurable goods. As seen in
Figure 2.7, value added for a number of durable goods is higher in 2014 than it was in
2006, including computer and electronic products and motor vehicles. The growth in
durable goods is largely driven by computer and electronic products. As seen in Figure
2.8, in 2014 every category of nondurable goods except petroleum and coal products was
below its 2006 value, including chemical manufacturing and plastics and rubber. The
largest manufacturing subsector in the US is chemical manufacturing followed by
computer and electronic products and food, beverage, and tobacco products, as seen in
Figure 2.9.
Figure 2.6: Cumulative Percent Change in Value Added (2009 Chained Dollars)
20 Dornbusch, Rudiger, Stanley Fischer, and Richard Startz. Macroeconomics. Eighth Edition. (Boston,
McGraw Hill, 2001): 32. 21 Billions of chained dollars seasonally adjusted at annual rates 22 Growth estimates were made using billions of chained 2009 dollars seasonally adjusted at annual rates. 23 Bureau of Economic Analysis. “Industry Economic Accounts Data.”
<http://www.bea.gov/iTable/index_industry_gdpIndy.cfm>
-15%
-10%
-5%
0%
5%
10%
15%
20
06
20
07
20
08
20
09
20
10
20
11
20
12
20
13
20
14
20
15
20
16
Gross domestic product
Manufacturing
Durable goods
Nondurable goods
18
This
pu
blic
atio
n is
availa
ble
free o
f charg
e fro
m: h
ttp://d
x.d
oi.o
rg/1
0.6
028
/NIS
T.T
N.1
93
5
Figure 2.7: Value Added for Durable Goods by Type (chained dollars), 2006-2015
Figure 2.8: Value Added for Nondurable Goods by Type (chained dollars), 2006-2015
2006 2007 2008 2009 2010 2011 2012 2013 2014 2015
Miscellaneous manufacturing 73 74 78 80 82 79 78 75 77 79
Furniture and related products 40 37 32 23 23 24 23 25 25 25
Other transportation equipment 103 121 118 112 112 114 111 113 115 113
Motor vehicles and parts 143 136 107 48 100 127 138 146 146 148
Electrical equipment/appliances 60 57 60 50 51 49 50 51 51 50
Computer and electronic products 180 203 228 229 256 265 276 277 286 303
Machinery 139 145 145 116 128 145 144 141 141 135
Fabricated metal products 158 164 154 118 129 137 142 139 145 138
Primary metals 41 39 41 40 38 40 47 51 49 57
Nonmetallic mineral products 51 51 47 37 37 39 40 42 43 42
Wood products 26 27 25 21 21 23 23 23 22 23
0
200
400
600
800
1000
1200
Bill
ion
s o
f C
hai
ned
20
09
Do
llars
2006 2007 2008 2009 2010 2011 2012 2013 2014 2015
Plastics and rubber products 70 71 62 62 65 64 67 68 71 68
Chemical products 315 334 305 310 330 311 296 297 294 294
Petroleum and coal products 109 111 119 115 99 85 81 90 99 118
Printing and related activities 45 47 46 39 40 41 41 41 41 40
Paper products 69 64 56 59 53 51 50 50 50 49
Apparel, leather, and allied products 13 12 12 10 11 11 10 11 11 10
Textile mills and products 21 20 19 15 16 13 15 16 16 16
Food, beverage, and tobacco 236 236 225 243 233 225 222 221 219 216
0
100
200
300
400
500
600
700
800
900
1000
Bill
ion
s o
f C
hai
ned
20
09
Do
llars
19
This
pu
blic
atio
n is
availa
ble
free o
f charg
e fro
m: h
ttp://d
x.d
oi.o
rg/1
0.6
028
/NIS
T.T
N.1
93
5
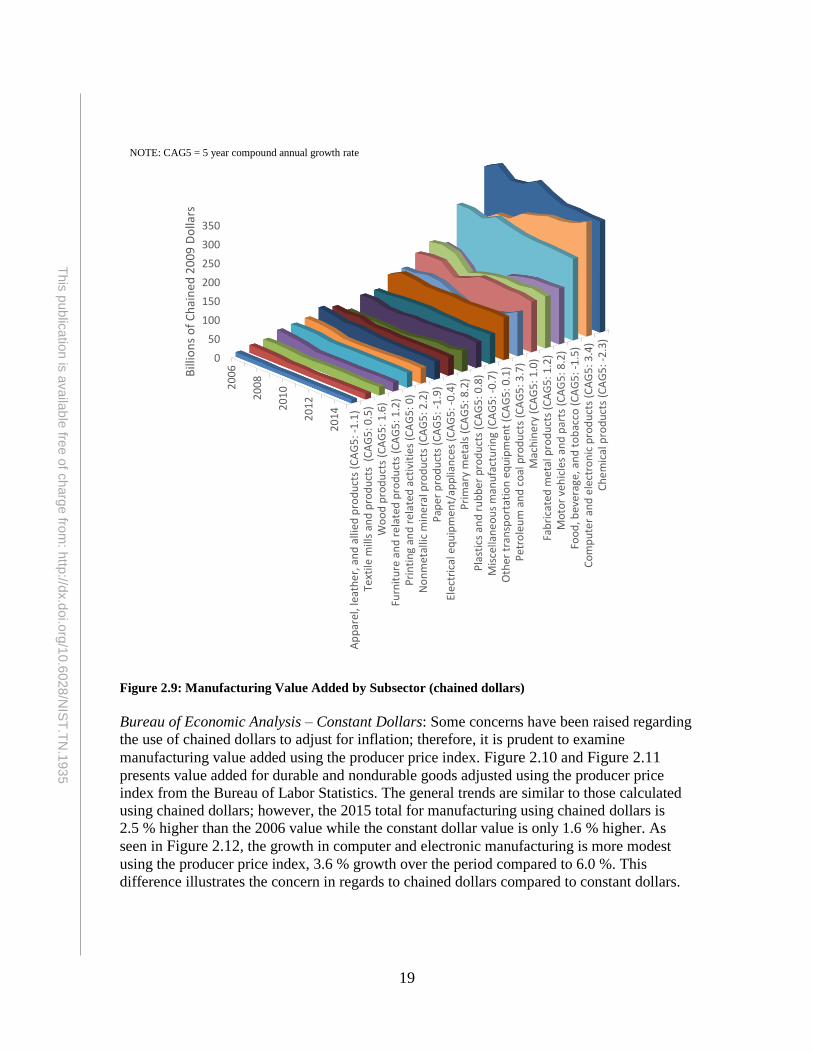
Figure 2.9: Manufacturing Value Added by Subsector (chained dollars)
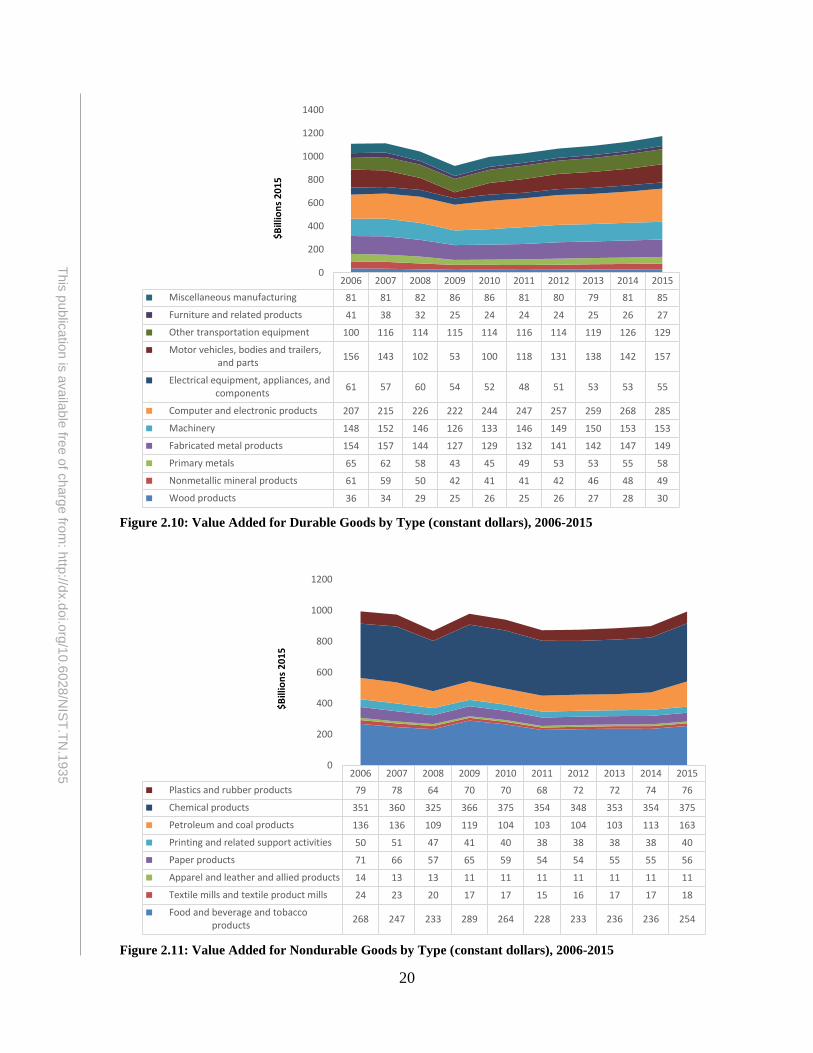
Bureau of Economic Analysis – Constant Dollars: Some concerns have been raised regarding
the use of chained dollars to adjust for inflation; therefore, it is prudent to examine
manufacturing value added using the producer price index. Figure 2.10 and Figure 2.11
presents value added for durable and nondurable goods adjusted using the producer price
index from the Bureau of Labor Statistics. The general trends are similar to those calculated
using chained dollars; however, the 2015 total for manufacturing using chained dollars is
2.5 % higher than the 2006 value while the constant dollar value is only 1.6 % higher. As
seen in Figure 2.12, the growth in computer and electronic manufacturing is more modest
using the producer price index, 3.6 % growth over the period compared to 6.0 %. This
difference illustrates the concern in regards to chained dollars compared to constant dollars.
Ap
par
el, l
eath
er,
an
d a
llied
pro
du
cts
(CA
G5
: -1
.1)
Text
ile m
ills
and
pro
du
cts
(C
AG
5: 0
.5)
Wo
od
pro
du
cts
(CA
G5
: 1.6
)
Fu
rnit
ure
an
d r
ela
ted
pro
du
cts
(CA
G5
: 1.2
)
P
rin
tin
g an
d r
ela
ted
act
ivit
ies
(CA
G5
: 0)
No
nm
etal
lic m
ine
ral p
rod
uct
s (C
AG
5: 2
.2)
Pap
er p
rod
uct
s (C
AG
5: -
1.9
)
El
ectr
ical
eq
uip
men
t/ap
plia
nce
s (C
AG
5: -
0.4
)
P
rim
ary
met
als
(CA
G5
: 8.2
)
P
last
ics
and
ru
bb
er
pro
du
cts
(CA
G5
: 0
.8)
Mis
cella
ne
ou
s m
anu
fact
uri
ng
(CA
G5
: -0
.7)
Oth
er t
ran
spo
rtat
ion
eq
uip
men
t (C
AG
5: 0
.1)
Pet
role
um
an
d c
oal
pro
du
cts
(CA
G5
: 3.7
)
M
ach
iner
y (C
AG
5:
1.0
)
Fa
bri
cate
d m
eta
l pro
du
cts
(CA
G5
: 1.2
)
M
oto
r ve
hic
les
and
par
ts (
CA
G5
: 8.2
)
Fo
od
, bev
erag
e, a
nd
to
bac
co (
CA
G5
: -1
.5)
Co
mp
ute
r an
d e
lect
ron
ic p
rod
uct
s (C
AG
5: 3
.4)
Ch
em
ical
pro
du
cts
(CA
G5
: -2
.3)
0
50
100
150
200
250
300
3502
00
6
20
08
20
10
20
12
20
14
Bill
ion
s o
f C
hai
ned
20
09
Do
llars
NOTE: CAG5 = 5 year compound annual growth rate
20
This
pu
blic
atio
n is
availa
ble
free o
f charg
e fro
m: h
ttp://d
x.d
oi.o
rg/1
0.6
028
/NIS
T.T
N.1
93
5
Figure 2.10: Value Added for Durable Goods by Type (constant dollars), 2006-2015
Figure 2.11: Value Added for Nondurable Goods by Type (constant dollars), 2006-2015
2006 2007 2008 2009 2010 2011 2012 2013 2014 2015
Miscellaneous manufacturing 81 81 82 86 86 81 80 79 81 85
Furniture and related products 41 38 32 25 24 24 24 25 26 27
Other transportation equipment 100 116 114 115 114 116 114 119 126 129
Motor vehicles, bodies and trailers,and parts
156 143 102 53 100 118 131 138 142 157
Electrical equipment, appliances, andcomponents
61 57 60 54 52 48 51 53 53 55
Computer and electronic products 207 215 226 222 244 247 257 259 268 285
Machinery 148 152 146 126 133 146 149 150 153 153
Fabricated metal products 154 157 144 127 129 132 141 142 147 149
Primary metals 65 62 58 43 45 49 53 53 55 58
Nonmetallic mineral products 61 59 50 42 41 41 42 46 48 49
Wood products 36 34 29 25 26 25 26 27 28 30
0
200
400
600
800
1000
1200
1400
$B
illio
ns
20
15
2006 2007 2008 2009 2010 2011 2012 2013 2014 2015
Plastics and rubber products 79 78 64 70 70 68 72 72 74 76
Chemical products 351 360 325 366 375 354 348 353 354 375
Petroleum and coal products 136 136 109 119 104 103 104 103 113 163
Printing and related support activities 50 51 47 41 40 38 38 38 38 40
Paper products 71 66 57 65 59 54 54 55 55 56
Apparel and leather and allied products 14 13 13 11 11 11 11 11 11 11
Textile mills and textile product mills 24 23 20 17 17 15 16 17 17 18
Food and beverage and tobaccoproducts
268 247 233 289 264 228 233 236 236 254
0
200
400
600
800
1000
1200
$B
illio
ns
20
15
21
This
pu
blic
atio
n is
availa
ble
free o
f charg
e fro
m: h
ttp://d
x.d
oi.o
rg/1
0.6
028
/NIS
T.T
N.1
93
5
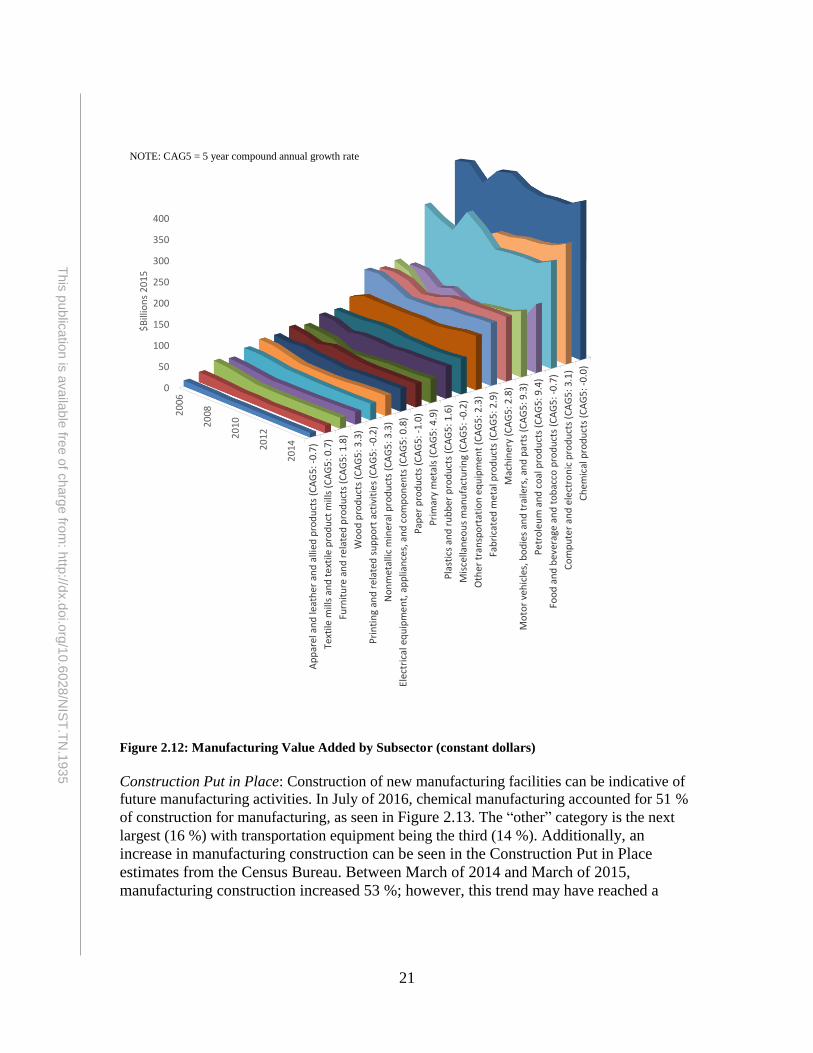
Figure 2.12: Manufacturing Value Added by Subsector (constant dollars)
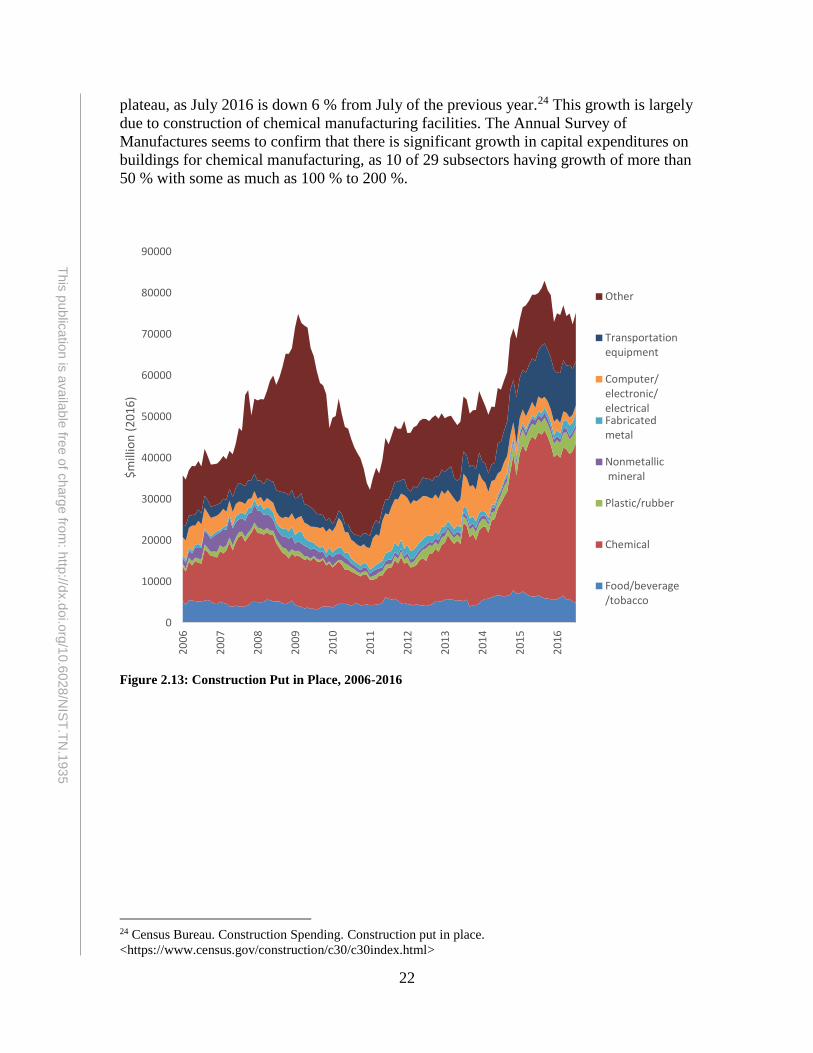
Construction Put in Place: Construction of new manufacturing facilities can be indicative of
future manufacturing activities. In July of 2016, chemical manufacturing accounted for 51 %
of construction for manufacturing, as seen in Figure 2.13. The “other” category is the next
largest (16 %) with transportation equipment being the third (14 %). Additionally, an
increase in manufacturing construction can be seen in the Construction Put in Place
estimates from the Census Bureau. Between March of 2014 and March of 2015,
manufacturing construction increased 53 %; however, this trend may have reached a
Ap
par
el a
nd
leat
her
an
d a
llied
pro
du
cts
(CA
G5:
-0.
7)
Text
ile m
ills
and
te
xtile
pro
du
ct m
ills
(CA
G5
: 0.7
)
Furn
itu
re a
nd
re
late
d p
rod
uct
s (C
AG
5: 1
.8)
Wo
od
pro
du
cts
(CA
G5
: 3.3
)
Pri
nti
ng
and
rel
ated
su
pp
ort
act
ivit
ies
(CA
G5
: -0
.2)
No
nm
etal
lic m
iner
al p
rod
uct
s (C
AG
5: 3
.3)
Elec
tric
al e
qu
ipm
en
t, a
pp
lian
ces,
an
d c
om
po
ne
nts
(C
AG
5: 0
.8)
Pap
er
pro
du
cts
(CA
G5:
-1.
0)
Pri
mar
y m
etal
s (C
AG
5: 4
.9)
Pla
stic
s an
d r
ub
ber
pro
du
cts
(CA
G5
: 1.6
)
Mis
cella
neo
us
man
ufa
ctu
rin
g (C
AG
5: -
0.2
)
Oth
er t
ran
spo
rtat
ion
eq
uip
men
t (C
AG
5: 2
.3)
Fab
rica
ted
met
al p
rod
uct
s (C
AG
5: 2
.9)
Mac
hin
ery
(CA
G5:
2.8
)
Mo
tor
veh
icle
s, b
od
ies
and
tra
ilers
, an
d p
arts
(C
AG
5: 9
.3)
Pe
tro
leu
m a
nd
co
al p
rod
uct
s (C
AG
5: 9
.4)
Foo
d a
nd
bev
erag
e an
d t
ob
acco
pro
du
cts
(CA
G5
: -0
.7)
Co
mp
ute
r an
d e
lect
ron
ic p
rod
uct
s (C
AG
5: 3
.1)
Ch
emic
al p
rod
uct
s (C
AG
5: -
0.0
)
0
50
100
150
200
250
300
350
400
20
06
20
08
20
10
20
12
20
14
$B
illio
ns
20
15
NOTE: CAG5 = 5 year compound annual growth rate
22
This
pu
blic
atio
n is
availa
ble
free o
f charg
e fro
m: h
ttp://d
x.d
oi.o
rg/1
0.6
028
/NIS
T.T
N.1
93
5
plateau, as July 2016 is down 6 % from July of the previous year.24 This growth is largely
due to construction of chemical manufacturing facilities. The Annual Survey of
Manufactures seems to confirm that there is significant growth in capital expenditures on
buildings for chemical manufacturing, as 10 of 29 subsectors having growth of more than
50 % with some as much as 100 % to 200 %.
Figure 2.13: Construction Put in Place, 2006-2016
24 Census Bureau. Construction Spending. Construction put in place.
<https://www.census.gov/construction/c30/c30index.html>
0
10000
20000
30000
40000
50000
60000
70000
80000
90000
20
06
20
07
20
08
20
09
20
10
20
11
20
12
20
13
20
14
20
15
20
16
$m
illio
n (
20
16
)
Other
Transportationequipment
Computer/electronic/electricalFabricatedmetal
Nonmetallic mineral
Plastic/rubber
Chemical
Food/beverage/tobacco
23
This
pu
blic
atio
n is
availa
ble
free o
f charg
e fro
m: h
ttp://d
x.d
oi.o
rg/1
0.6
028
/NIS
T.T
N.1
93
5
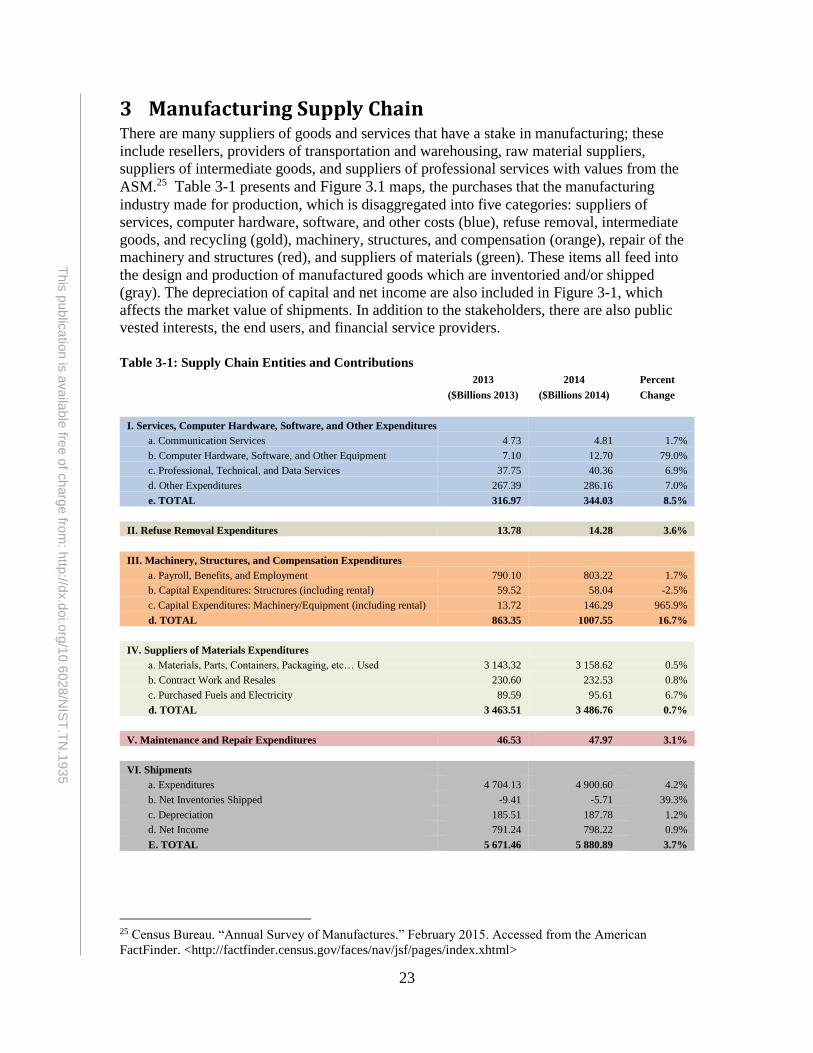
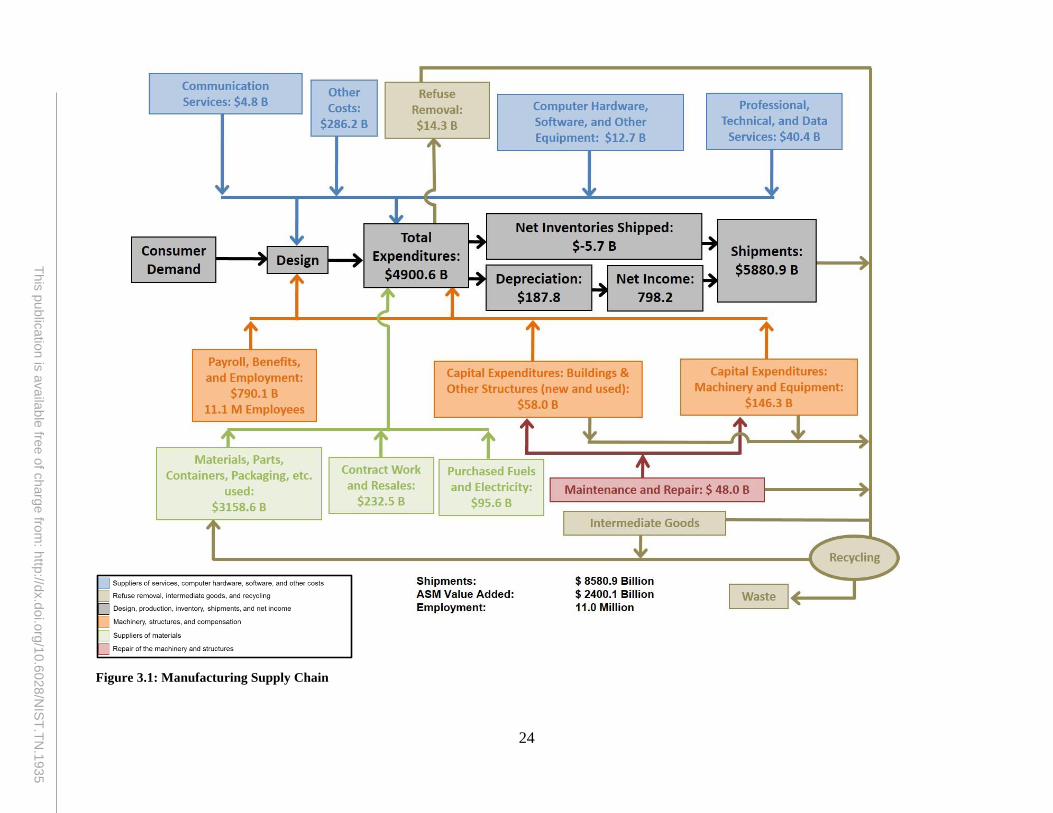
3 Manufacturing Supply Chain There are many suppliers of goods and services that have a stake in manufacturing; these
include resellers, providers of transportation and warehousing, raw material suppliers,
suppliers of intermediate goods, and suppliers of professional services with values from the
ASM.25 Table 3-1 presents and Figure 3.1 maps, the purchases that the manufacturing
industry made for production, which is disaggregated into five categories: suppliers of
services, computer hardware, software, and other costs (blue), refuse removal, intermediate
goods, and recycling (gold), machinery, structures, and compensation (orange), repair of the
machinery and structures (red), and suppliers of materials (green). These items all feed into
the design and production of manufactured goods which are inventoried and/or shipped
(gray). The depreciation of capital and net income are also included in Figure 3-1, which
affects the market value of shipments. In addition to the stakeholders, there are also public
vested interests, the end users, and financial service providers. Table 3-1: Supply Chain Entities and Contributions
2013 2014 Percent
($Billions 2013) ($Billions 2014) Change
I. Services, Computer Hardware, Software, and Other Expenditures
a. Communication Services 4.73 4.81 1.7%
b. Computer Hardware, Software, and Other Equipment 7.10 12.70 79.0%
c. Professional, Technical, and Data Services 37.75 40.36 6.9%
d. Other Expenditures 267.39 286.16 7.0%
e. TOTAL 316.97 344.03 8.5%
II. Refuse Removal Expenditures 13.78 14.28 3.6%
III. Machinery, Structures, and Compensation Expenditures
a. Payroll, Benefits, and Employment 790.10 803.22 1.7%
b. Capital Expenditures: Structures (including rental) 59.52 58.04 -2.5%
c. Capital Expenditures: Machinery/Equipment (including rental) 13.72 146.29 965.9%
d. TOTAL 863.35 1007.55 16.7%
IV. Suppliers of Materials Expenditures
a. Materials, Parts, Containers, Packaging, etc… Used 3 143.32 3 158.62 0.5%
b. Contract Work and Resales 230.60 232.53 0.8%
c. Purchased Fuels and Electricity 89.59 95.61 6.7%
d. TOTAL 3 463.51 3 486.76 0.7%
V. Maintenance and Repair Expenditures 46.53 47.97 3.1%
VI. Shipments
a. Expenditures 4 704.13 4 900.60 4.2%
b. Net Inventories Shipped -9.41 -5.71 39.3%
c. Depreciation 185.51 187.78 1.2%
d. Net Income 791.24 798.22 0.9%
E. TOTAL 5 671.46 5 880.89 3.7%
25 Census Bureau. “Annual Survey of Manufactures.” February 2015. Accessed from the American
FactFinder. <http://factfinder.census.gov/faces/nav/jsf/pages/index.xhtml>
24
This
pu
blic
atio
n is
availa
ble
free o
f charg
e fro
m: h
ttp://d
x.d
oi.o
rg/1
0.6
028
/NIS
T.T
N.1
93
5
Figure 3.1: Manufacturing Supply Chain
25
This
pu
blic
atio
n is
availa
ble
free o
f charg
e fro
m: h
ttp://d
x.d
oi.o
rg/1
0.6
028
/NIS
T.T
N.1
93
5
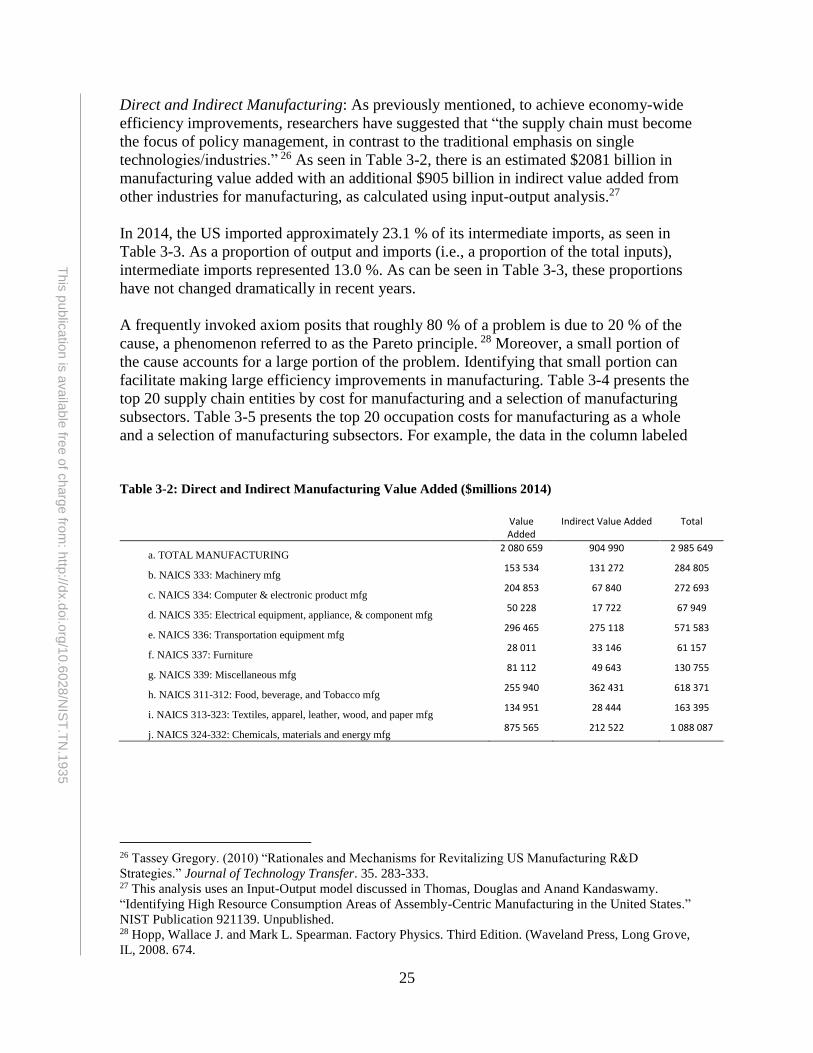
Direct and Indirect Manufacturing: As previously mentioned, to achieve economy-wide
efficiency improvements, researchers have suggested that “the supply chain must become
the focus of policy management, in contrast to the traditional emphasis on single
technologies/industries.” 26 As seen in Table 3-2, there is an estimated $2081 billion in
manufacturing value added with an additional $905 billion in indirect value added from
other industries for manufacturing, as calculated using input-output analysis.27
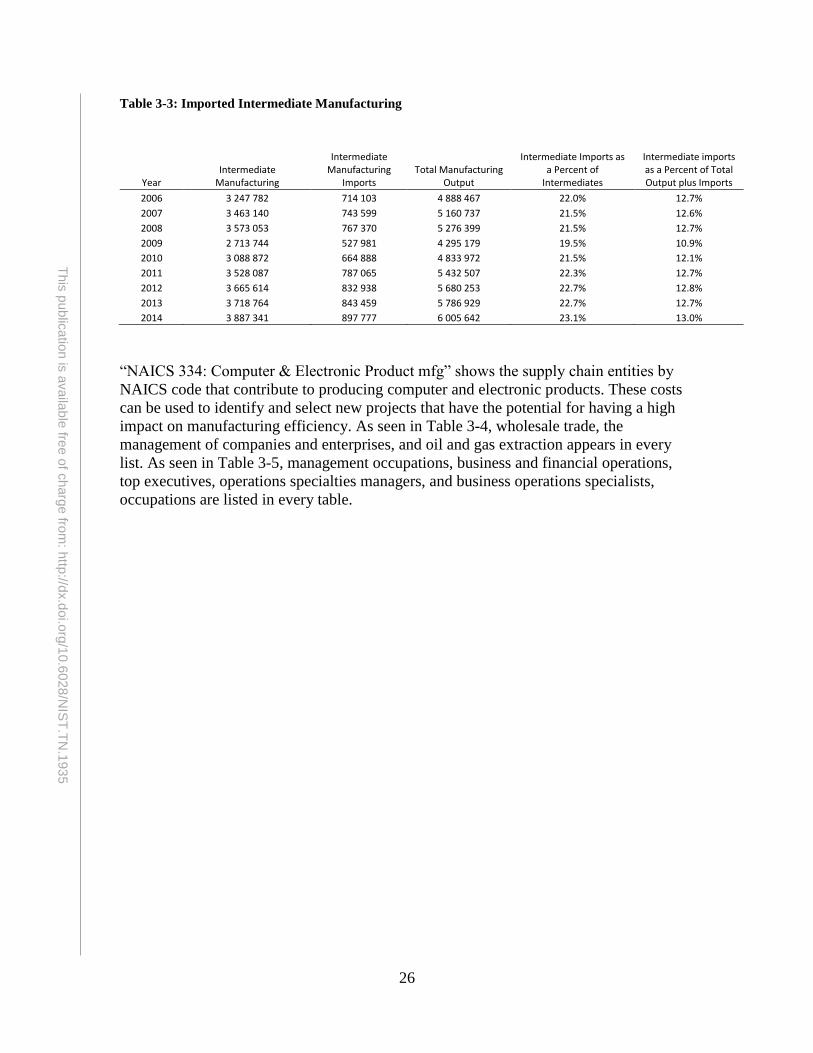
In 2014, the US imported approximately 23.1 % of its intermediate imports, as seen in
Table 3-3. As a proportion of output and imports (i.e., a proportion of the total inputs),
intermediate imports represented 13.0 %. As can be seen in Table 3-3, these proportions
have not changed dramatically in recent years.
A frequently invoked axiom posits that roughly 80 % of a problem is due to 20 % of the
cause, a phenomenon referred to as the Pareto principle. 28 Moreover, a small portion of
the cause accounts for a large portion of the problem. Identifying that small portion can
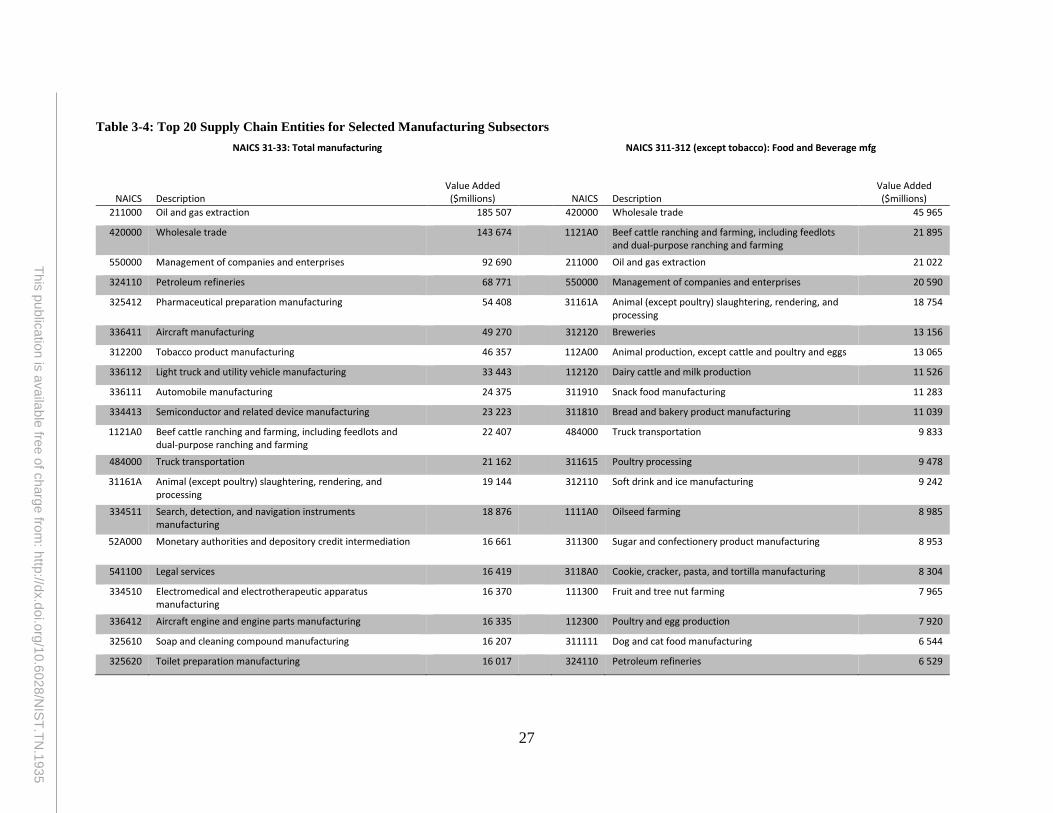
facilitate making large efficiency improvements in manufacturing. Table 3-4 presents the
top 20 supply chain entities by cost for manufacturing and a selection of manufacturing
subsectors. Table 3-5 presents the top 20 occupation costs for manufacturing as a whole
and a selection of manufacturing subsectors. For example, the data in the column labeled
Table 3-2: Direct and Indirect Manufacturing Value Added ($millions 2014)
Value Added
Indirect Value Added Total
a. TOTAL MANUFACTURING 2 080 659 904 990 2 985 649
b. NAICS 333: Machinery mfg 153 534 131 272 284 805
c. NAICS 334: Computer & electronic product mfg 204 853 67 840 272 693
d. NAICS 335: Electrical equipment, appliance, & component mfg 50 228 17 722 67 949
e. NAICS 336: Transportation equipment mfg 296 465 275 118 571 583
f. NAICS 337: Furniture 28 011 33 146 61 157
g. NAICS 339: Miscellaneous mfg 81 112 49 643 130 755
h. NAICS 311-312: Food, beverage, and Tobacco mfg 255 940 362 431 618 371
i. NAICS 313-323: Textiles, apparel, leather, wood, and paper mfg 134 951 28 444 163 395
j. NAICS 324-332: Chemicals, materials and energy mfg 875 565 212 522 1 088 087
26 Tassey Gregory. (2010) “Rationales and Mechanisms for Revitalizing US Manufacturing R&D
Strategies.” Journal of Technology Transfer. 35. 283-333. 27 This analysis uses an Input-Output model discussed in Thomas, Douglas and Anand Kandaswamy.
“Identifying High Resource Consumption Areas of Assembly-Centric Manufacturing in the United States.”
NIST Publication 921139. Unpublished. 28 Hopp, Wallace J. and Mark L. Spearman. Factory Physics. Third Edition. (Waveland Press, Long Grove,
IL, 2008. 674.
26
This
pu
blic
atio
n is
availa
ble
free o
f charg
e fro
m: h
ttp://d
x.d
oi.o
rg/1
0.6
028
/NIS
T.T
N.1
93
5
Table 3-3: Imported Intermediate Manufacturing
Year Intermediate
Manufacturing
Intermediate Manufacturing
Imports Total Manufacturing
Output
Intermediate Imports as a Percent of
Intermediates
Intermediate imports as a Percent of Total Output plus Imports
2006 3 247 782 714 103 4 888 467 22.0% 12.7%
2007 3 463 140 743 599 5 160 737 21.5% 12.6%
2008 3 573 053 767 370 5 276 399 21.5% 12.7%
2009 2 713 744 527 981 4 295 179 19.5% 10.9%
2010 3 088 872 664 888 4 833 972 21.5% 12.1%
2011 3 528 087 787 065 5 432 507 22.3% 12.7%
2012 3 665 614 832 938 5 680 253 22.7% 12.8%
2013 3 718 764 843 459 5 786 929 22.7% 12.7%
2014 3 887 341 897 777 6 005 642 23.1% 13.0%
“NAICS 334: Computer & Electronic Product mfg” shows the supply chain entities by
NAICS code that contribute to producing computer and electronic products. These costs
can be used to identify and select new projects that have the potential for having a high
impact on manufacturing efficiency. As seen in Table 3-4, wholesale trade, the
management of companies and enterprises, and oil and gas extraction appears in every
list. As seen in Table 3-5, management occupations, business and financial operations,
top executives, operations specialties managers, and business operations specialists,
occupations are listed in every table.
27
This
pu
blic
atio
n is
availa
ble
free o
f charg
e fro
m: h
ttp://d
x.d
oi.o
rg/1
0.6
028
/NIS
T.T
N.1
93
5
Table 3-4: Top 20 Supply Chain Entities for Selected Manufacturing Subsectors
NAICS 31-33: Total manufacturing NAICS 311-312 (except tobacco): Food and Beverage mfg
NAICS Description Value Added ($millions) NAICS Description
Value Added ($millions)
211000 Oil and gas extraction 185 507 420000 Wholesale trade 45 965
420000 Wholesale trade 143 674 1121A0 Beef cattle ranching and farming, including feedlots and dual-purpose ranching and farming
21 895
550000 Management of companies and enterprises 92 690 211000 Oil and gas extraction 21 022
324110 Petroleum refineries 68 771 550000 Management of companies and enterprises 20 590
325412 Pharmaceutical preparation manufacturing 54 408 31161A Animal (except poultry) slaughtering, rendering, and processing
18 754
336411 Aircraft manufacturing 49 270 312120 Breweries 13 156
312200 Tobacco product manufacturing 46 357 112A00 Animal production, except cattle and poultry and eggs 13 065
336112 Light truck and utility vehicle manufacturing 33 443 112120 Dairy cattle and milk production 11 526
336111 Automobile manufacturing 24 375 311910 Snack food manufacturing 11 283
334413 Semiconductor and related device manufacturing 23 223 311810 Bread and bakery product manufacturing 11 039
1121A0 Beef cattle ranching and farming, including feedlots and dual-purpose ranching and farming
22 407 484000 Truck transportation 9 833
484000 Truck transportation 21 162 311615 Poultry processing 9 478
31161A Animal (except poultry) slaughtering, rendering, and processing
19 144 312110 Soft drink and ice manufacturing 9 242
334511 Search, detection, and navigation instruments manufacturing
18 876 1111A0 Oilseed farming 8 985
52A000 Monetary authorities and depository credit intermediation 16 661 311300 Sugar and confectionery product manufacturing 8 953
541100 Legal services 16 419 3118A0 Cookie, cracker, pasta, and tortilla manufacturing 8 304
334510 Electromedical and electrotherapeutic apparatus manufacturing
16 370 111300 Fruit and tree nut farming 7 965
336412 Aircraft engine and engine parts manufacturing 16 335 112300 Poultry and egg production 7 920
325610 Soap and cleaning compound manufacturing 16 207 311111 Dog and cat food manufacturing 6 544
325620 Toilet preparation manufacturing 16 017 324110 Petroleum refineries 6 529
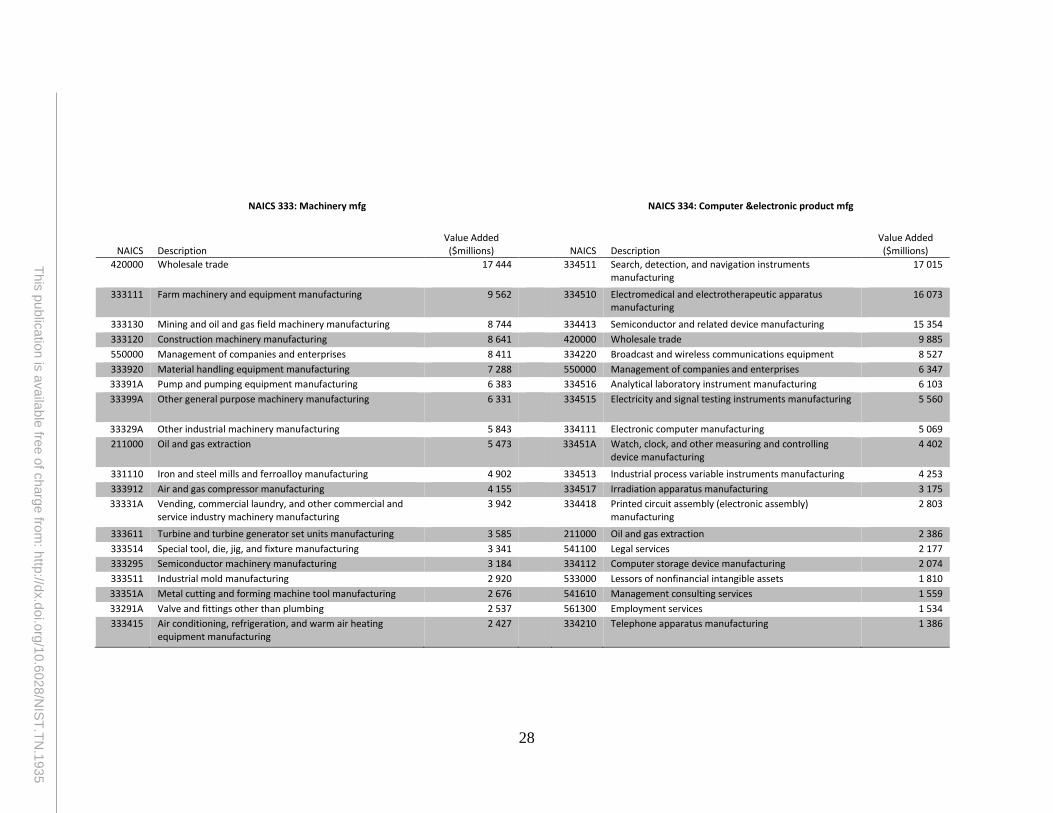
28
This
pu
blic
atio
n is
availa
ble
free o
f charg
e fro
m: h
ttp://d
x.d
oi.o
rg/1
0.6
028
/NIS
T.T
N.1
93
5
NAICS 333: Machinery mfg NAICS 334: Computer &electronic product mfg
NAICS Description Value Added ($millions) NAICS Description
Value Added ($millions)
420000 Wholesale trade 17 444 334511 Search, detection, and navigation instruments manufacturing
17 015
333111 Farm machinery and equipment manufacturing 9 562 334510 Electromedical and electrotherapeutic apparatus manufacturing
16 073
333130 Mining and oil and gas field machinery manufacturing 8 744 334413 Semiconductor and related device manufacturing 15 354
333120 Construction machinery manufacturing 8 641 420000 Wholesale trade 9 885
550000 Management of companies and enterprises 8 411 334220 Broadcast and wireless communications equipment 8 527
333920 Material handling equipment manufacturing 7 288 550000 Management of companies and enterprises 6 347
33391A Pump and pumping equipment manufacturing 6 383 334516 Analytical laboratory instrument manufacturing 6 103
33399A Other general purpose machinery manufacturing 6 331 334515 Electricity and signal testing instruments manufacturing 5 560
33329A Other industrial machinery manufacturing 5 843 334111 Electronic computer manufacturing 5 069
211000 Oil and gas extraction 5 473 33451A Watch, clock, and other measuring and controlling device manufacturing
4 402
331110 Iron and steel mills and ferroalloy manufacturing 4 902 334513 Industrial process variable instruments manufacturing 4 253
333912 Air and gas compressor manufacturing 4 155 334517 Irradiation apparatus manufacturing 3 175
33331A Vending, commercial laundry, and other commercial and service industry machinery manufacturing
3 942 334418 Printed circuit assembly (electronic assembly) manufacturing
2 803
333611 Turbine and turbine generator set units manufacturing 3 585 211000 Oil and gas extraction 2 386
333514 Special tool, die, jig, and fixture manufacturing 3 341 541100 Legal services 2 177
333295 Semiconductor machinery manufacturing 3 184 334112 Computer storage device manufacturing 2 074
333511 Industrial mold manufacturing 2 920 533000 Lessors of nonfinancial intangible assets 1 810
33351A Metal cutting and forming machine tool manufacturing 2 676 541610 Management consulting services 1 559
33291A Valve and fittings other than plumbing 2 537 561300 Employment services 1 534
333415 Air conditioning, refrigeration, and warm air heating equipment manufacturing
2 427 334210 Telephone apparatus manufacturing 1 386
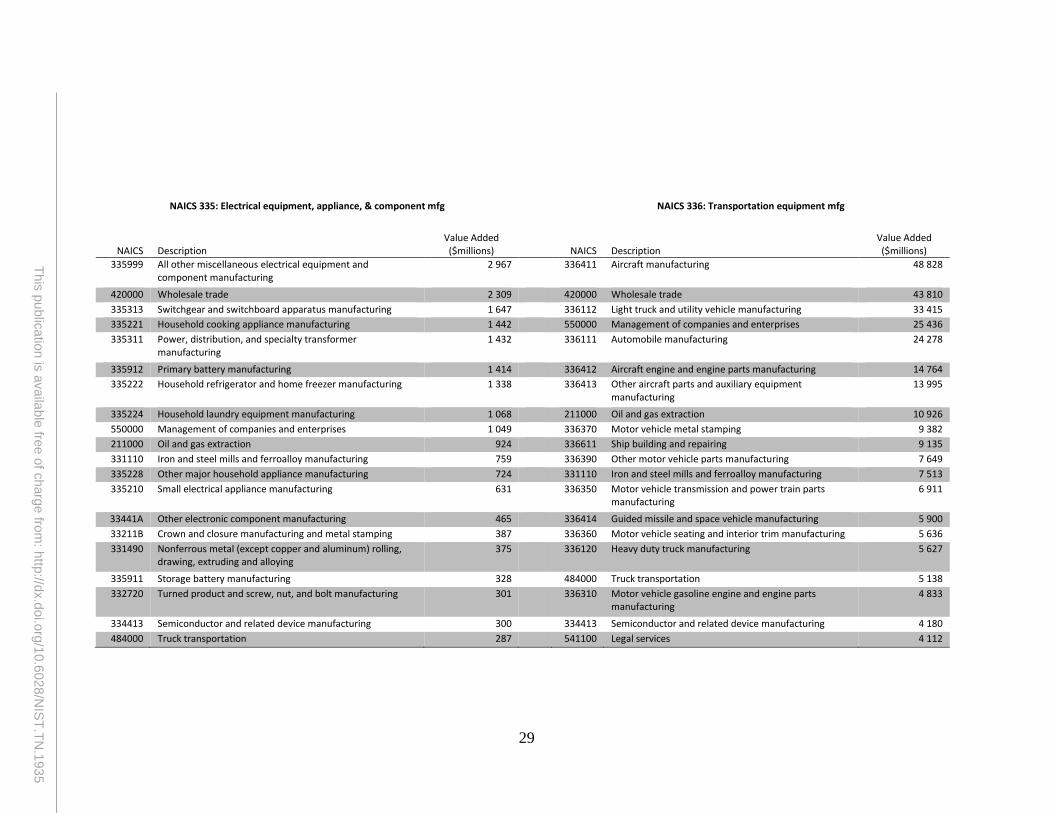
29
This
pu
blic
atio
n is
availa
ble
free o
f charg
e fro
m: h
ttp://d
x.d
oi.o
rg/1
0.6
028
/NIS
T.T
N.1
93
5
NAICS 335: Electrical equipment, appliance, & component mfg NAICS 336: Transportation equipment mfg
NAICS Description Value Added ($millions) NAICS Description
Value Added ($millions)
335999 All other miscellaneous electrical equipment and component manufacturing
2 967 336411 Aircraft manufacturing 48 828
420000 Wholesale trade 2 309 420000 Wholesale trade 43 810
335313 Switchgear and switchboard apparatus manufacturing 1 647 336112 Light truck and utility vehicle manufacturing 33 415
335221 Household cooking appliance manufacturing 1 442 550000 Management of companies and enterprises 25 436
335311 Power, distribution, and specialty transformer manufacturing
1 432 336111 Automobile manufacturing 24 278
335912 Primary battery manufacturing 1 414 336412 Aircraft engine and engine parts manufacturing 14 764
335222 Household refrigerator and home freezer manufacturing 1 338 336413 Other aircraft parts and auxiliary equipment manufacturing
13 995
335224 Household laundry equipment manufacturing 1 068 211000 Oil and gas extraction 10 926
550000 Management of companies and enterprises 1 049 336370 Motor vehicle metal stamping 9 382
211000 Oil and gas extraction 924 336611 Ship building and repairing 9 135
331110 Iron and steel mills and ferroalloy manufacturing 759 336390 Other motor vehicle parts manufacturing 7 649
335228 Other major household appliance manufacturing 724 331110 Iron and steel mills and ferroalloy manufacturing 7 513
335210 Small electrical appliance manufacturing 631 336350 Motor vehicle transmission and power train parts manufacturing
6 911
33441A Other electronic component manufacturing 465 336414 Guided missile and space vehicle manufacturing 5 900
33211B Crown and closure manufacturing and metal stamping 387 336360 Motor vehicle seating and interior trim manufacturing 5 636
331490 Nonferrous metal (except copper and aluminum) rolling, drawing, extruding and alloying
375 336120 Heavy duty truck manufacturing 5 627
335911 Storage battery manufacturing 328 484000 Truck transportation 5 138
332720 Turned product and screw, nut, and bolt manufacturing 301 336310 Motor vehicle gasoline engine and engine parts manufacturing
4 833
334413 Semiconductor and related device manufacturing 300 334413 Semiconductor and related device manufacturing 4 180
484000 Truck transportation 287 541100 Legal services 4 112
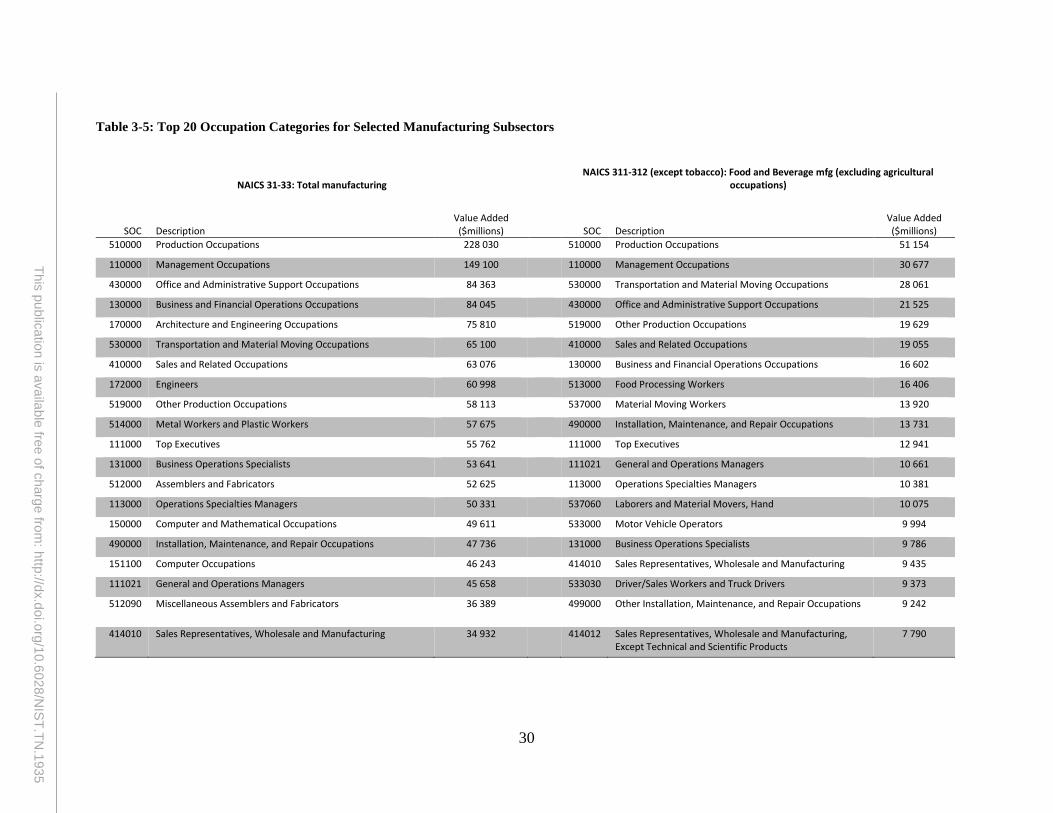
30
This
pu
blic
atio
n is
availa
ble
free o
f charg
e fro
m: h
ttp://d
x.d
oi.o
rg/1
0.6
028
/NIS
T.T
N.1
93
5
Table 3-5: Top 20 Occupation Categories for Selected Manufacturing Subsectors
NAICS 31-33: Total manufacturing NAICS 311-312 (except tobacco): Food and Beverage mfg (excluding agricultural
occupations)
SOC Description Value Added ($millions) SOC Description
Value Added ($millions)
510000 Production Occupations 228 030 510000 Production Occupations 51 154
110000 Management Occupations 149 100 110000 Management Occupations 30 677
430000 Office and Administrative Support Occupations 84 363 530000 Transportation and Material Moving Occupations 28 061
130000 Business and Financial Operations Occupations 84 045 430000 Office and Administrative Support Occupations 21 525
170000 Architecture and Engineering Occupations 75 810 519000 Other Production Occupations 19 629
530000 Transportation and Material Moving Occupations 65 100 410000 Sales and Related Occupations 19 055
410000 Sales and Related Occupations 63 076 130000 Business and Financial Operations Occupations 16 602
172000 Engineers 60 998 513000 Food Processing Workers 16 406
519000 Other Production Occupations 58 113 537000 Material Moving Workers 13 920
514000 Metal Workers and Plastic Workers 57 675 490000 Installation, Maintenance, and Repair Occupations 13 731
111000 Top Executives 55 762 111000 Top Executives 12 941
131000 Business Operations Specialists 53 641 111021 General and Operations Managers 10 661
512000 Assemblers and Fabricators 52 625 113000 Operations Specialties Managers 10 381
113000 Operations Specialties Managers 50 331 537060 Laborers and Material Movers, Hand 10 075
150000 Computer and Mathematical Occupations 49 611 533000 Motor Vehicle Operators 9 994
490000 Installation, Maintenance, and Repair Occupations 47 736 131000 Business Operations Specialists 9 786
151100 Computer Occupations 46 243 414010 Sales Representatives, Wholesale and Manufacturing 9 435
111021 General and Operations Managers 45 658 533030 Driver/Sales Workers and Truck Drivers 9 373
512090 Miscellaneous Assemblers and Fabricators 36 389 499000 Other Installation, Maintenance, and Repair Occupations 9 242
414010 Sales Representatives, Wholesale and Manufacturing 34 932 414012 Sales Representatives, Wholesale and Manufacturing, Except Technical and Scientific Products
7 790
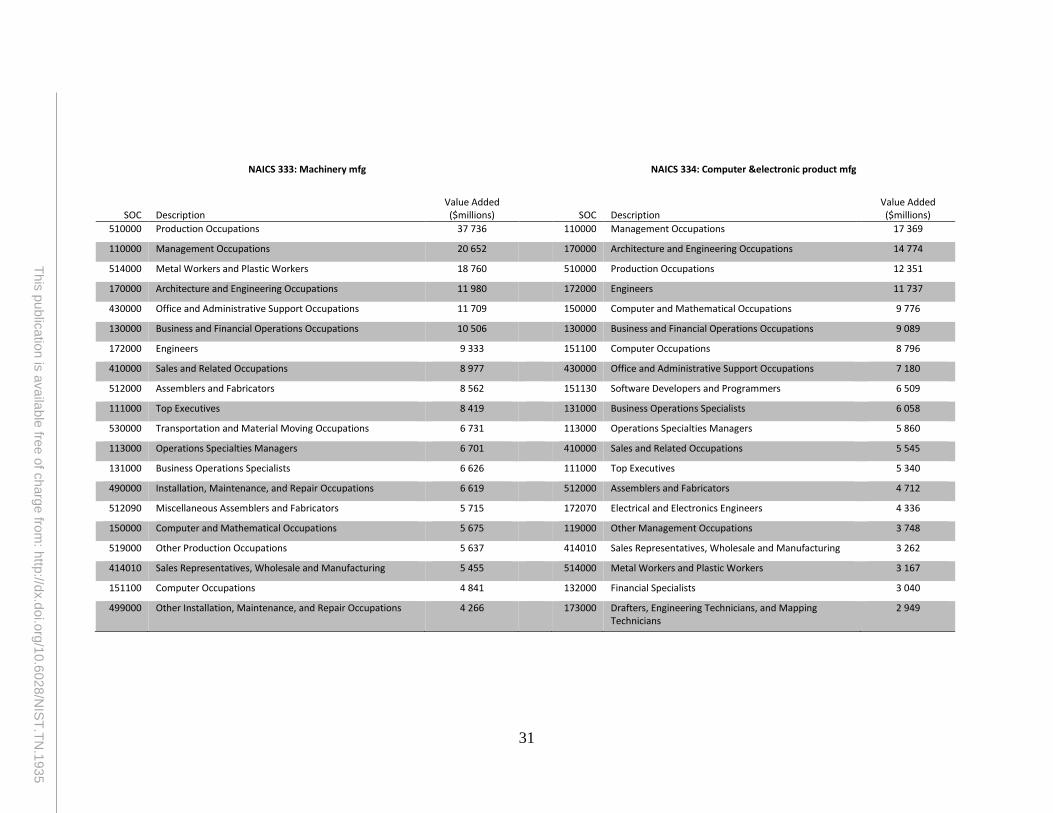
31
This
pu
blic
atio
n is
availa
ble
free o
f charg
e fro
m: h
ttp://d
x.d
oi.o
rg/1
0.6
028
/NIS
T.T
N.1
93
5
NAICS 333: Machinery mfg NAICS 334: Computer &electronic product mfg
SOC Description Value Added ($millions) SOC Description
Value Added ($millions)
510000 Production Occupations 37 736 110000 Management Occupations 17 369
110000 Management Occupations 20 652 170000 Architecture and Engineering Occupations 14 774
514000 Metal Workers and Plastic Workers 18 760 510000 Production Occupations 12 351
170000 Architecture and Engineering Occupations 11 980 172000 Engineers 11 737
430000 Office and Administrative Support Occupations 11 709 150000 Computer and Mathematical Occupations 9 776
130000 Business and Financial Operations Occupations 10 506 130000 Business and Financial Operations Occupations 9 089
172000 Engineers 9 333 151100 Computer Occupations 8 796
410000 Sales and Related Occupations 8 977 430000 Office and Administrative Support Occupations 7 180
512000 Assemblers and Fabricators 8 562 151130 Software Developers and Programmers 6 509
111000 Top Executives 8 419 131000 Business Operations Specialists 6 058
530000 Transportation and Material Moving Occupations 6 731 113000 Operations Specialties Managers 5 860
113000 Operations Specialties Managers 6 701 410000 Sales and Related Occupations 5 545
131000 Business Operations Specialists 6 626 111000 Top Executives 5 340
490000 Installation, Maintenance, and Repair Occupations 6 619 512000 Assemblers and Fabricators 4 712
512090 Miscellaneous Assemblers and Fabricators 5 715 172070 Electrical and Electronics Engineers 4 336
150000 Computer and Mathematical Occupations 5 675 119000 Other Management Occupations 3 748
519000 Other Production Occupations 5 637 414010 Sales Representatives, Wholesale and Manufacturing 3 262
414010 Sales Representatives, Wholesale and Manufacturing 5 455 514000 Metal Workers and Plastic Workers 3 167
151100 Computer Occupations 4 841 132000 Financial Specialists 3 040
499000 Other Installation, Maintenance, and Repair Occupations 4 266 173000 Drafters, Engineering Technicians, and Mapping Technicians
2 949
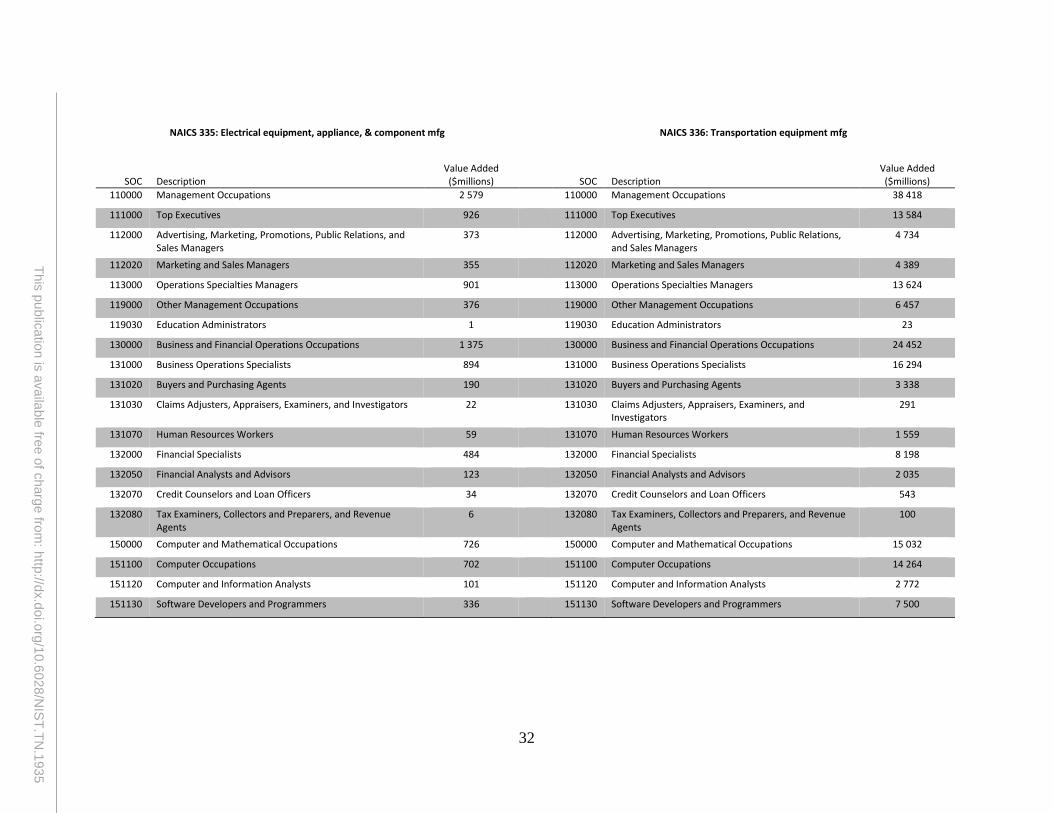
32
This
pu
blic
atio
n is
availa
ble
free o
f charg
e fro
m: h
ttp://d
x.d
oi.o
rg/1
0.6
028
/NIS
T.T
N.1
93
5
NAICS 335: Electrical equipment, appliance, & component mfg NAICS 336: Transportation equipment mfg
SOC Description Value Added ($millions) SOC Description
Value Added ($millions)
110000 Management Occupations 2 579 110000 Management Occupations 38 418
111000 Top Executives 926 111000 Top Executives 13 584
112000 Advertising, Marketing, Promotions, Public Relations, and Sales Managers
373 112000 Advertising, Marketing, Promotions, Public Relations, and Sales Managers
4 734
112020 Marketing and Sales Managers 355 112020 Marketing and Sales Managers 4 389
113000 Operations Specialties Managers 901 113000 Operations Specialties Managers 13 624
119000 Other Management Occupations 376 119000 Other Management Occupations 6 457
119030 Education Administrators 1 119030 Education Administrators 23
130000 Business and Financial Operations Occupations 1 375 130000 Business and Financial Operations Occupations 24 452
131000 Business Operations Specialists 894 131000 Business Operations Specialists 16 294
131020 Buyers and Purchasing Agents 190 131020 Buyers and Purchasing Agents 3 338
131030 Claims Adjusters, Appraisers, Examiners, and Investigators 22 131030 Claims Adjusters, Appraisers, Examiners, and Investigators
291
131070 Human Resources Workers 59 131070 Human Resources Workers 1 559
132000 Financial Specialists 484 132000 Financial Specialists 8 198
132050 Financial Analysts and Advisors 123 132050 Financial Analysts and Advisors 2 035
132070 Credit Counselors and Loan Officers 34 132070 Credit Counselors and Loan Officers 543
132080 Tax Examiners, Collectors and Preparers, and Revenue Agents
6 132080 Tax Examiners, Collectors and Preparers, and Revenue Agents
100
150000 Computer and Mathematical Occupations 726 150000 Computer and Mathematical Occupations 15 032
151100 Computer Occupations 702 151100 Computer Occupations 14 264
151120 Computer and Information Analysts 101 151120 Computer and Information Analysts 2 772
151130 Software Developers and Programmers 336 151130 Software Developers and Programmers 7 500
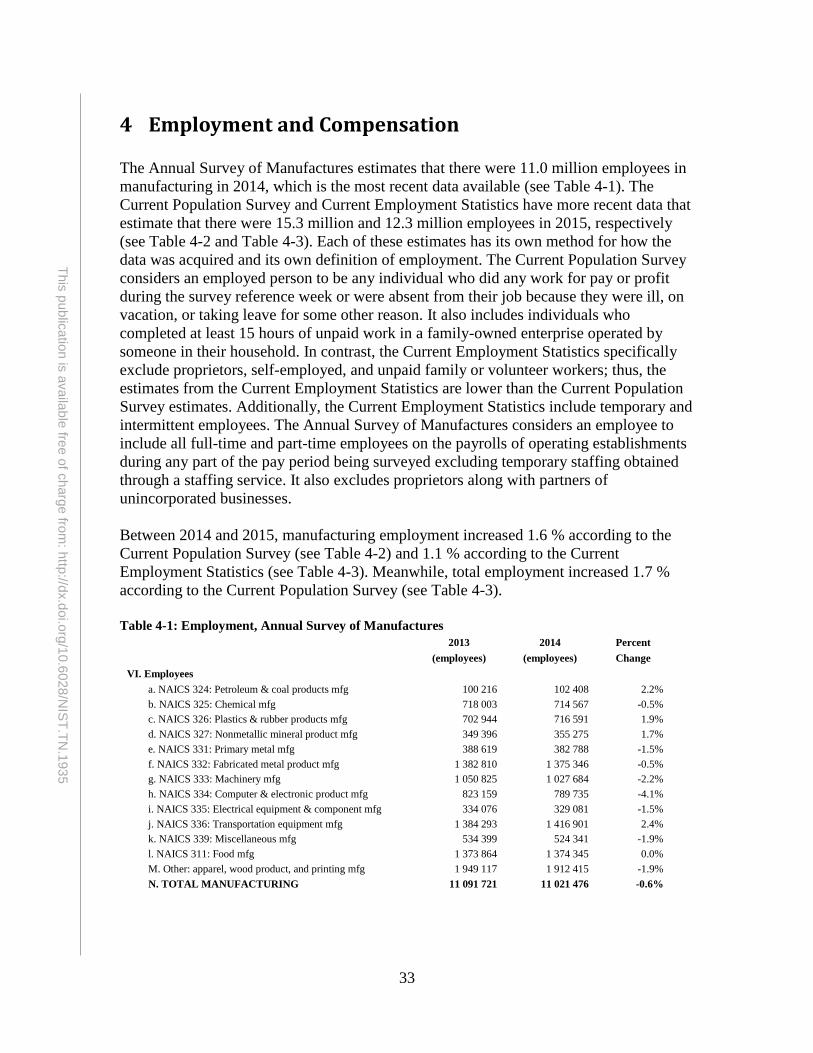
33
This
pu
blic
atio
n is
availa
ble
free o
f charg
e fro
m: h
ttp://d
x.d
oi.o
rg/1
0.6
028
/NIS
T.T
N.1
93
5
4 Employment and Compensation
The Annual Survey of Manufactures estimates that there were 11.0 million employees in
manufacturing in 2014, which is the most recent data available (see Table 4-1). The
Current Population Survey and Current Employment Statistics have more recent data that
estimate that there were 15.3 million and 12.3 million employees in 2015, respectively
(see Table 4-2 and Table 4-3). Each of these estimates has its own method for how the
data was acquired and its own definition of employment. The Current Population Survey
considers an employed person to be any individual who did any work for pay or profit
during the survey reference week or were absent from their job because they were ill, on
vacation, or taking leave for some other reason. It also includes individuals who
completed at least 15 hours of unpaid work in a family-owned enterprise operated by
someone in their household. In contrast, the Current Employment Statistics specifically
exclude proprietors, self-employed, and unpaid family or volunteer workers; thus, the
estimates from the Current Employment Statistics are lower than the Current Population
Survey estimates. Additionally, the Current Employment Statistics include temporary and
intermittent employees. The Annual Survey of Manufactures considers an employee to
include all full-time and part-time employees on the payrolls of operating establishments
during any part of the pay period being surveyed excluding temporary staffing obtained
through a staffing service. It also excludes proprietors along with partners of
unincorporated businesses.
Between 2014 and 2015, manufacturing employment increased 1.6 % according to the
Current Population Survey (see Table 4-2) and 1.1 % according to the Current
Employment Statistics (see Table 4-3). Meanwhile, total employment increased 1.7 %
according to the Current Population Survey (see Table 4-3).
Table 4-1: Employment, Annual Survey of Manufactures
2013 2014 Percent
(employees) (employees) Change
VI. Employees
a. NAICS 324: Petroleum & coal products mfg 100 216 102 408 2.2%
b. NAICS 325: Chemical mfg 718 003 714 567 -0.5%
c. NAICS 326: Plastics & rubber products mfg 702 944 716 591 1.9%
d. NAICS 327: Nonmetallic mineral product mfg 349 396 355 275 1.7%
e. NAICS 331: Primary metal mfg 388 619 382 788 -1.5%
f. NAICS 332: Fabricated metal product mfg 1 382 810 1 375 346 -0.5%
g. NAICS 333: Machinery mfg 1 050 825 1 027 684 -2.2%
h. NAICS 334: Computer & electronic product mfg 823 159 789 735 -4.1%
i. NAICS 335: Electrical equipment & component mfg 334 076 329 081 -1.5%
j. NAICS 336: Transportation equipment mfg 1 384 293 1 416 901 2.4%
k. NAICS 339: Miscellaneous mfg 534 399 524 341 -1.9%
l. NAICS 311: Food mfg 1 373 864 1 374 345 0.0%
M. Other: apparel, wood product, and printing mfg 1 949 117 1 912 415 -1.9%
N. TOTAL MANUFACTURING 11 091 721 11 021 476 -0.6%
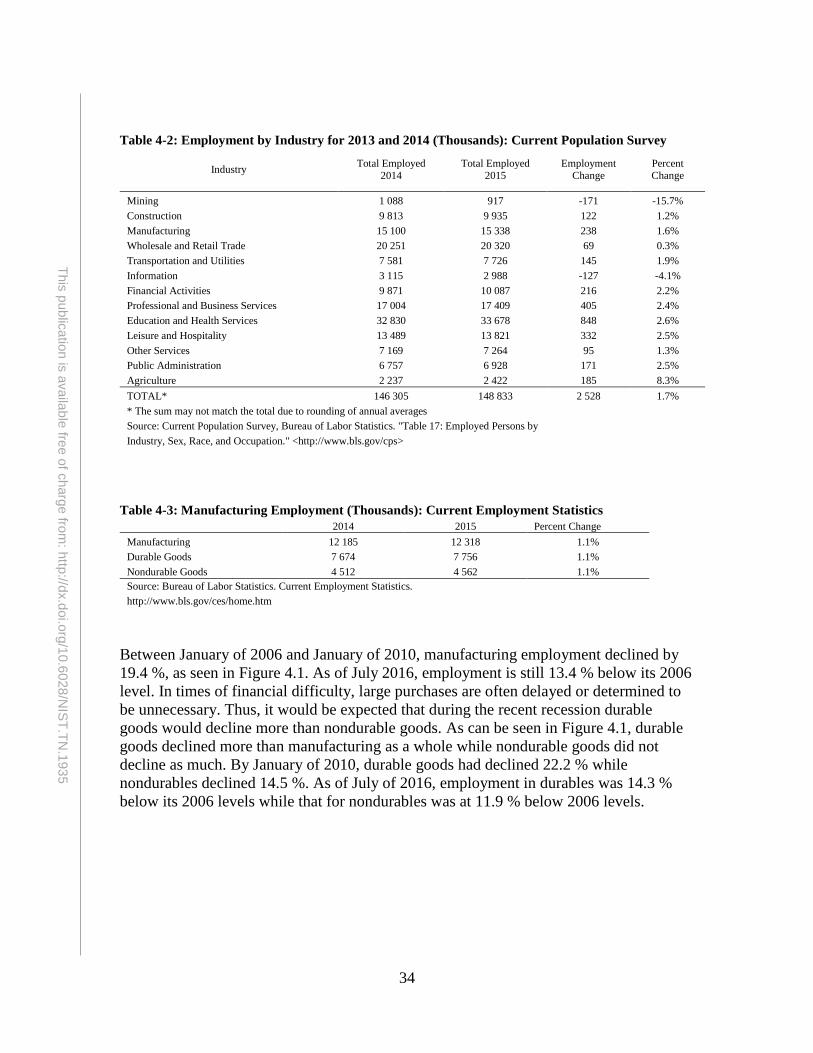
34
This
pu
blic
atio
n is
availa
ble
free o
f charg
e fro
m: h
ttp://d
x.d
oi.o
rg/1
0.6
028
/NIS
T.T
N.1
93
5
Table 4-2: Employment by Industry for 2013 and 2014 (Thousands): Current Population Survey
Industry Total Employed
2014 Total Employed
2015 Employment
Change Percent Change
Mining 1 088 917 -171 -15.7%
Construction 9 813 9 935 122 1.2%
Manufacturing 15 100 15 338 238 1.6%
Wholesale and Retail Trade 20 251 20 320 69 0.3%
Transportation and Utilities 7 581 7 726 145 1.9%
Information 3 115 2 988 -127 -4.1%
Financial Activities 9 871 10 087 216 2.2%
Professional and Business Services 17 004 17 409 405 2.4%
Education and Health Services 32 830 33 678 848 2.6%
Leisure and Hospitality 13 489 13 821 332 2.5%
Other Services 7 169 7 264 95 1.3%
Public Administration 6 757 6 928 171 2.5%
Agriculture 2 237 2 422 185 8.3%
TOTAL* 146 305 148 833 2 528 1.7%
* The sum may not match the total due to rounding of annual averages
Source: Current Population Survey, Bureau of Labor Statistics. "Table 17: Employed Persons by
Industry, Sex, Race, and Occupation." <http://www.bls.gov/cps>
Table 4-3: Manufacturing Employment (Thousands): Current Employment Statistics
2014 2015 Percent Change
Manufacturing 12 185 12 318 1.1%
Durable Goods 7 674 7 756 1.1%
Nondurable Goods 4 512 4 562 1.1%
Source: Bureau of Labor Statistics. Current Employment Statistics.
http://www.bls.gov/ces/home.htm
Between January of 2006 and January of 2010, manufacturing employment declined by
19.4 %, as seen in Figure 4.1. As of July 2016, employment is still 13.4 % below its 2006
level. In times of financial difficulty, large purchases are often delayed or determined to
be unnecessary. Thus, it would be expected that during the recent recession durable
goods would decline more than nondurable goods. As can be seen in Figure 4.1, durable
goods declined more than manufacturing as a whole while nondurable goods did not
decline as much. By January of 2010, durable goods had declined 22.2 % while
nondurables declined 14.5 %. As of July of 2016, employment in durables was 14.3 %
below its 2006 levels while that for nondurables was at 11.9 % below 2006 levels.
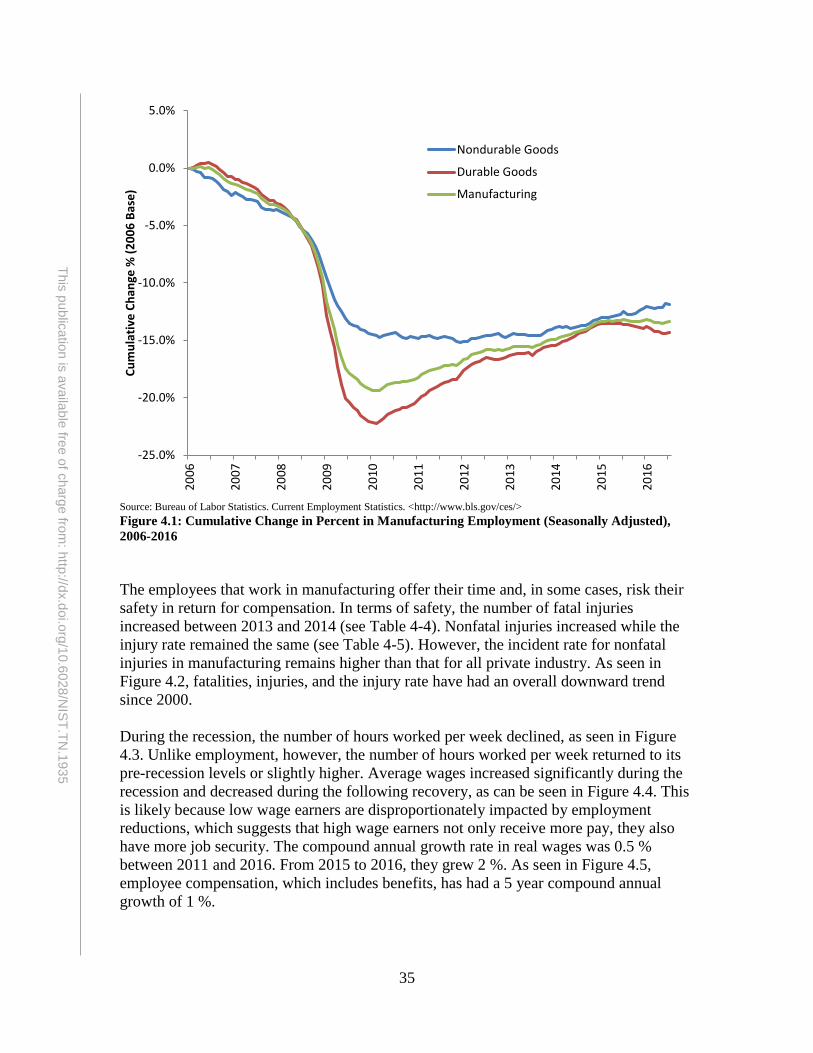
35
This
pu
blic
atio
n is
availa
ble
free o
f charg
e fro
m: h
ttp://d
x.d
oi.o
rg/1
0.6
028
/NIS
T.T
N.1
93
5
Source: Bureau of Labor Statistics. Current Employment Statistics. <http://www.bls.gov/ces/>
Figure 4.1: Cumulative Change in Percent in Manufacturing Employment (Seasonally Adjusted),
2006-2016
The employees that work in manufacturing offer their time and, in some cases, risk their
safety in return for compensation. In terms of safety, the number of fatal injuries
increased between 2013 and 2014 (see Table 4-4). Nonfatal injuries increased while the
injury rate remained the same (see Table 4-5). However, the incident rate for nonfatal
injuries in manufacturing remains higher than that for all private industry. As seen in
Figure 4.2, fatalities, injuries, and the injury rate have had an overall downward trend
since 2000.
During the recession, the number of hours worked per week declined, as seen in Figure
4.3. Unlike employment, however, the number of hours worked per week returned to its
pre-recession levels or slightly higher. Average wages increased significantly during the
recession and decreased during the following recovery, as can be seen in Figure 4.4. This
is likely because low wage earners are disproportionately impacted by employment
reductions, which suggests that high wage earners not only receive more pay, they also
have more job security. The compound annual growth rate in real wages was 0.5 %
between 2011 and 2016. From 2015 to 2016, they grew 2 %. As seen in Figure 4.5,
employee compensation, which includes benefits, has had a 5 year compound annual
growth of 1 %.
-25.0%
-20.0%
-15.0%
-10.0%
-5.0%
0.0%
5.0%
20
06
20
07
20
08
20
09
20
10
20
11
20
12
20
13
20
14
20
15
20
16
Cu
mu
lati
ve C
han
ge %
(2
00
6 B
ase
)
Nondurable Goods
Durable Goods
Manufacturing
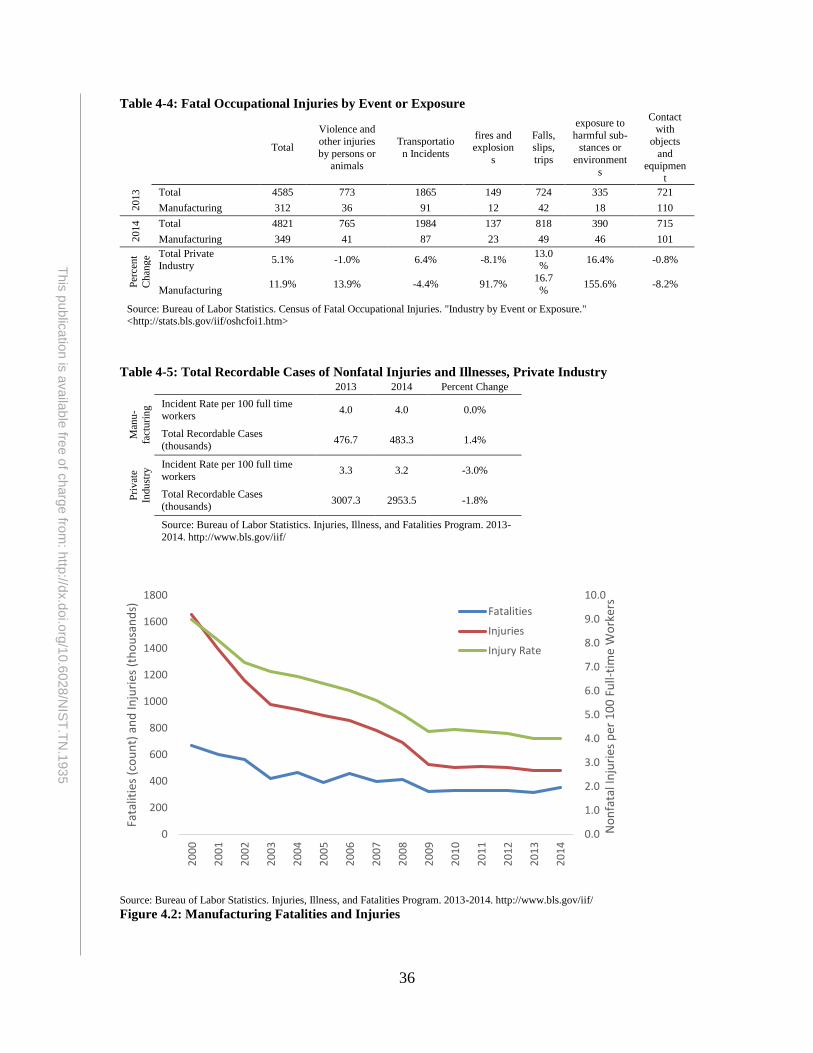
36
This
pu
blic
atio
n is
availa
ble
free o
f charg
e fro
m: h
ttp://d
x.d
oi.o
rg/1
0.6
028
/NIS
T.T
N.1
93
5
Table 4-4: Fatal Occupational Injuries by Event or Exposure
Total
Violence and
other injuries
by persons or animals
Transportatio
n Incidents
fires and explosion
s
Falls, slips,
trips
exposure to
harmful sub-stances or
environment
s
Contact with
objects
and equipmen
t
2013
Total 4585 773 1865 149 724 335 721
Manufacturing 312 36 91 12 42 18 110
2014
Total 4821 765 1984 137 818 390 715
Manufacturing 349 41 87 23 49 46 101
Per
cen
t
Chan
ge Total Private
Industry 5.1% -1.0% 6.4% -8.1%
13.0%
16.4% -0.8%
Manufacturing 11.9% 13.9% -4.4% 91.7%
16.7
% 155.6% -8.2%
Source: Bureau of Labor Statistics. Census of Fatal Occupational Injuries. "Industry by Event or Exposure." <http://stats.bls.gov/iif/oshcfoi1.htm>
Table 4-5: Total Recordable Cases of Nonfatal Injuries and Illnesses, Private Industry
2013 2014 Percent Change
Man
u-
fact
uri
ng Incident Rate per 100 full time
workers 4.0 4.0 0.0%
Total Recordable Cases
(thousands) 476.7 483.3 1.4%
Pri
vat
e
Indu
stry
Incident Rate per 100 full time
workers 3.3 3.2 -3.0%
Total Recordable Cases
(thousands) 3007.3 2953.5 -1.8%
Source: Bureau of Labor Statistics. Injuries, Illness, and Fatalities Program. 2013-
2014. http://www.bls.gov/iif/
Source: Bureau of Labor Statistics. Injuries, Illness, and Fatalities Program. 2013-2014. http://www.bls.gov/iif/
Figure 4.2: Manufacturing Fatalities and Injuries
0.0
1.0
2.0
3.0
4.0
5.0
6.0
7.0
8.0
9.0
10.0
0
200
400
600
800
1000
1200
1400
1600
1800
20
00
20
01
20
02
20
03
20
04
20
05
20
06
20
07
20
08
20
09
20
10
20
11
20
12
20
13
20
14
No
nfa
tal I
nju
ries
per
10
0 F
ull-
tim
e W
ork
ers
Fata
litie
s (c
ou
nt)
an
d In
juri
es (
tho
usa
nd
s) Fatalities
Injuries
Injury Rate
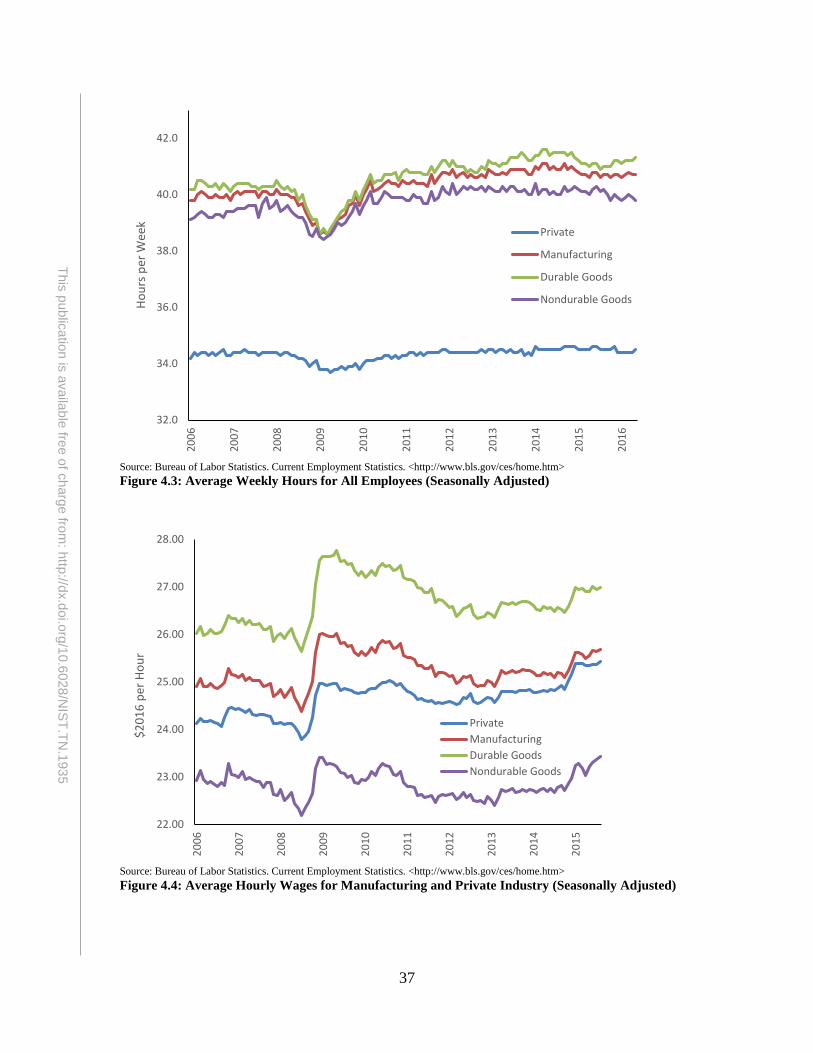
37
This
pu
blic
atio
n is
availa
ble
free o
f charg
e fro
m: h
ttp://d
x.d
oi.o
rg/1
0.6
028
/NIS
T.T
N.1
93
5
Source: Bureau of Labor Statistics. Current Employment Statistics. <http://www.bls.gov/ces/home.htm>
Figure 4.3: Average Weekly Hours for All Employees (Seasonally Adjusted)
Source: Bureau of Labor Statistics. Current Employment Statistics. <http://www.bls.gov/ces/home.htm>
Figure 4.4: Average Hourly Wages for Manufacturing and Private Industry (Seasonally Adjusted)
32.0
34.0
36.0
38.0
40.0
42.0
20
06
20
07
20
08
20
09
20
10
20
11
20
12
20
13
20
14
20
15
20
16
Ho
urs
per
Wee
k
Private
Manufacturing
Durable Goods
Nondurable Goods
22.00
23.00
24.00
25.00
26.00
27.00
28.00
20
06
20
07
20
08
20
09
20
10
20
11
20
12
20
13
20
14
20
15
$2
01
6 p
er H
ou
r
Private
Manufacturing
Durable Goods
Nondurable Goods
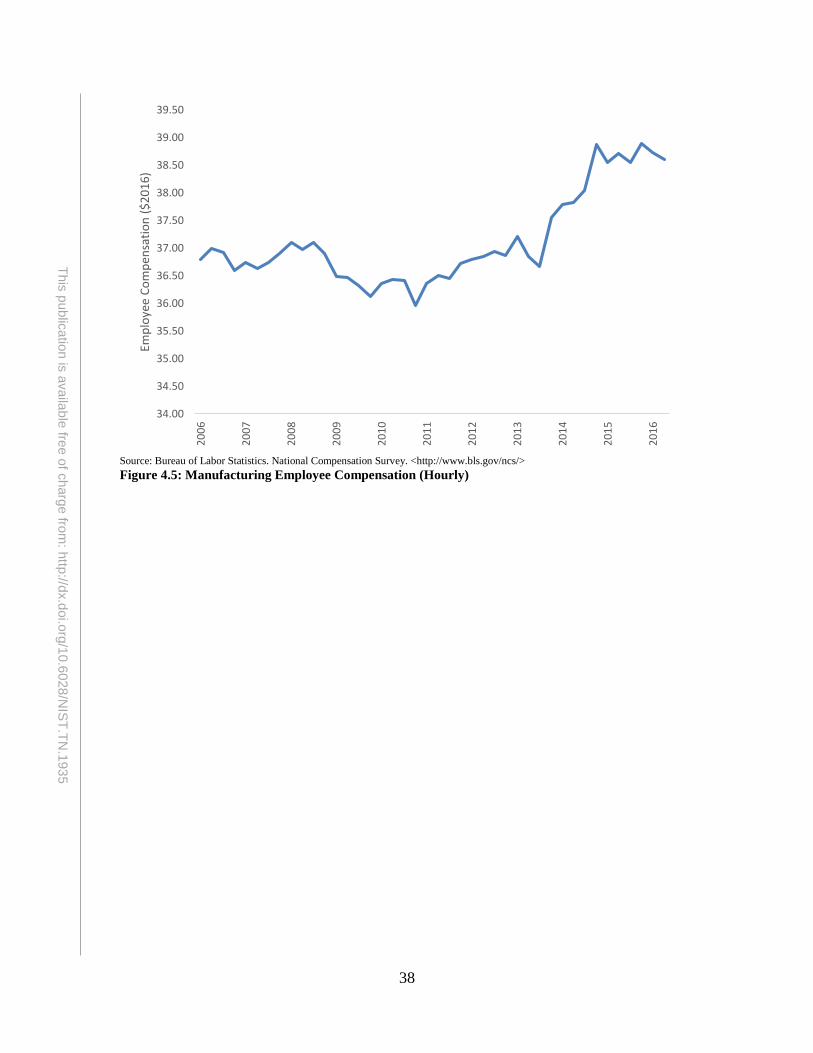
38
This
pu
blic
atio
n is
availa
ble
free o
f charg
e fro
m: h
ttp://d
x.d
oi.o
rg/1
0.6
028
/NIS
T.T
N.1
93
5
Source: Bureau of Labor Statistics. National Compensation Survey. <http://www.bls.gov/ncs/>
Figure 4.5: Manufacturing Employee Compensation (Hourly)
34.00
34.50
35.00
35.50
36.00
36.50
37.00
37.50
38.00
38.50
39.00
39.50
20
06
20
07
20
08
20
09
20
10
20
11
20
12
20
13
20
14
20
15
20
16
Emp
loye
e C
om
pen
sati
on
($
20
16
)
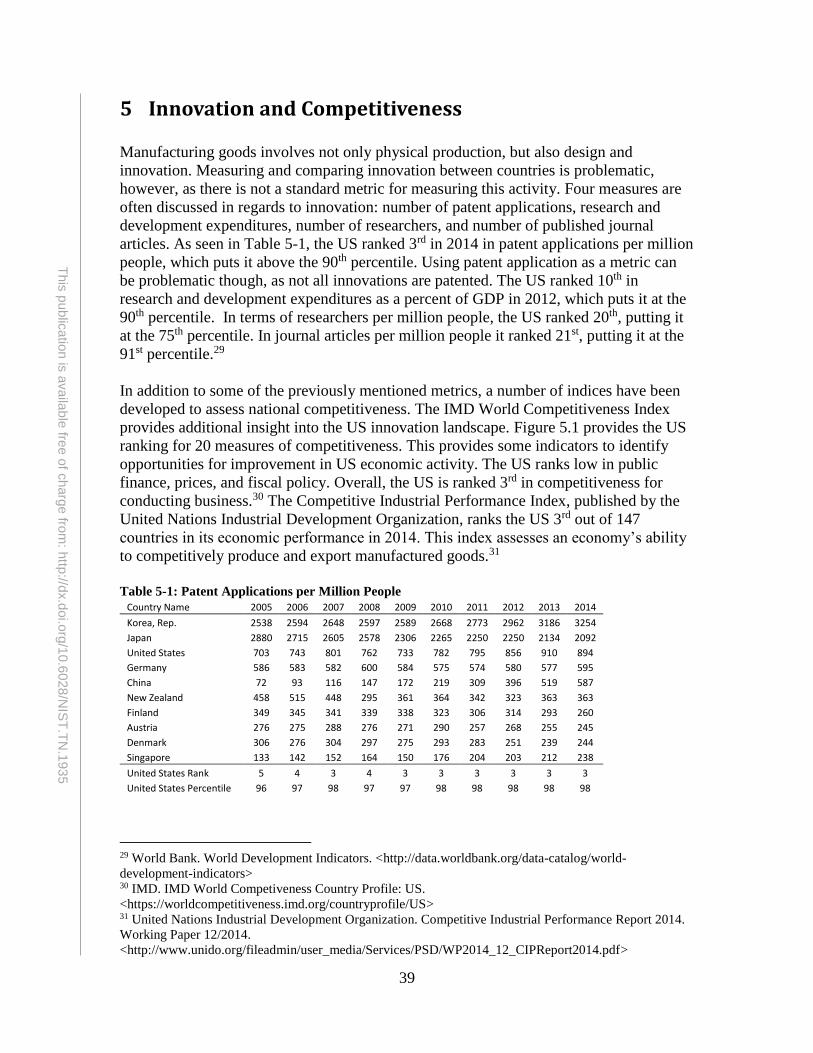
39
This
pu
blic
atio
n is
availa
ble
free o
f charg
e fro
m: h
ttp://d
x.d
oi.o
rg/1
0.6
028
/NIS
T.T
N.1
93
5
5 Innovation and Competitiveness
Manufacturing goods involves not only physical production, but also design and
innovation. Measuring and comparing innovation between countries is problematic,
however, as there is not a standard metric for measuring this activity. Four measures are
often discussed in regards to innovation: number of patent applications, research and
development expenditures, number of researchers, and number of published journal
articles. As seen in Table 5-1, the US ranked 3rd in 2014 in patent applications per million
people, which puts it above the 90th percentile. Using patent application as a metric can
be problematic though, as not all innovations are patented. The US ranked 10th in
research and development expenditures as a percent of GDP in 2012, which puts it at the
90th percentile. In terms of researchers per million people, the US ranked 20th, putting it
at the 75th percentile. In journal articles per million people it ranked 21st, putting it at the
91st percentile.29
In addition to some of the previously mentioned metrics, a number of indices have been
developed to assess national competitiveness. The IMD World Competitiveness Index
provides additional insight into the US innovation landscape. Figure 5.1 provides the US
ranking for 20 measures of competitiveness. This provides some indicators to identify
opportunities for improvement in US economic activity. The US ranks low in public
finance, prices, and fiscal policy. Overall, the US is ranked 3rd in competitiveness for
conducting business.30 The Competitive Industrial Performance Index, published by the
United Nations Industrial Development Organization, ranks the US 3rd out of 147
countries in its economic performance in 2014. This index assesses an economy’s ability
to competitively produce and export manufactured goods.31
Table 5-1: Patent Applications per Million People
Country Name 2005 2006 2007 2008 2009 2010 2011 2012 2013 2014
Korea, Rep. 2538 2594 2648 2597 2589 2668 2773 2962 3186 3254
Japan 2880 2715 2605 2578 2306 2265 2250 2250 2134 2092
United States 703 743 801 762 733 782 795 856 910 894
Germany 586 583 582 600 584 575 574 580 577 595
China 72 93 116 147 172 219 309 396 519 587
New Zealand 458 515 448 295 361 364 342 323 363 363
Finland 349 345 341 339 338 323 306 314 293 260
Austria 276 275 288 276 271 290 257 268 255 245
Denmark 306 276 304 297 275 293 283 251 239 244
Singapore 133 142 152 164 150 176 204 203 212 238
United States Rank 5 4 3 4 3 3 3 3 3 3
United States Percentile 96 97 98 97 97 98 98 98 98 98
29 World Bank. World Development Indicators. <http://data.worldbank.org/data-catalog/world-
development-indicators> 30 IMD. IMD World Competiveness Country Profile: US.
<https://worldcompetitiveness.imd.org/countryprofile/US> 31 United Nations Industrial Development Organization. Competitive Industrial Performance Report 2014.
Working Paper 12/2014.
<http://www.unido.org/fileadmin/user_media/Services/PSD/WP2014_12_CIPReport2014.pdf>
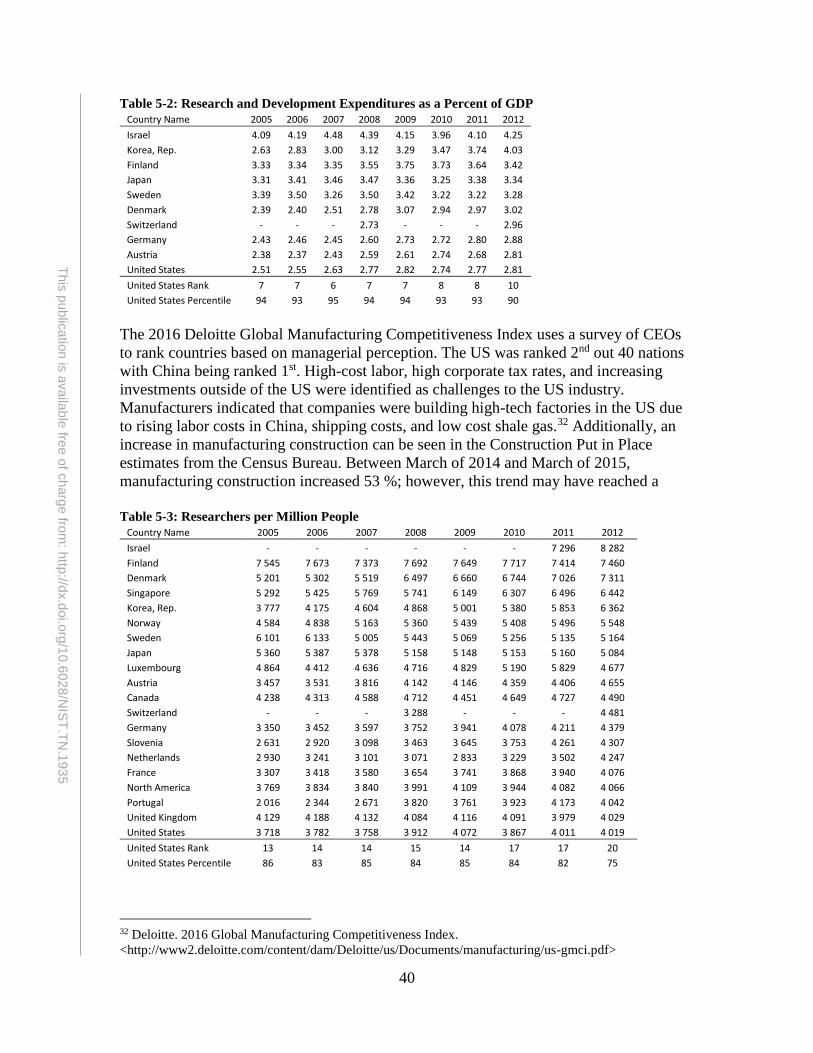
40
This
pu
blic
atio
n is
availa
ble
free o
f charg
e fro
m: h
ttp://d
x.d
oi.o
rg/1
0.6
028
/NIS
T.T
N.1
93
5
Table 5-2: Research and Development Expenditures as a Percent of GDP
Country Name 2005 2006 2007 2008 2009 2010 2011 2012
Israel 4.09 4.19 4.48 4.39 4.15 3.96 4.10 4.25
Korea, Rep. 2.63 2.83 3.00 3.12 3.29 3.47 3.74 4.03
Finland 3.33 3.34 3.35 3.55 3.75 3.73 3.64 3.42
Japan 3.31 3.41 3.46 3.47 3.36 3.25 3.38 3.34
Sweden 3.39 3.50 3.26 3.50 3.42 3.22 3.22 3.28
Denmark 2.39 2.40 2.51 2.78 3.07 2.94 2.97 3.02
Switzerland - - - 2.73 - - - 2.96
Germany 2.43 2.46 2.45 2.60 2.73 2.72 2.80 2.88
Austria 2.38 2.37 2.43 2.59 2.61 2.74 2.68 2.81
United States 2.51 2.55 2.63 2.77 2.82 2.74 2.77 2.81
United States Rank 7 7 6 7 7 8 8 10
United States Percentile 94 93 95 94 94 93 93 90
The 2016 Deloitte Global Manufacturing Competitiveness Index uses a survey of CEOs
to rank countries based on managerial perception. The US was ranked 2nd out 40 nations
with China being ranked 1st. High-cost labor, high corporate tax rates, and increasing
investments outside of the US were identified as challenges to the US industry.
Manufacturers indicated that companies were building high-tech factories in the US due
to rising labor costs in China, shipping costs, and low cost shale gas.32 Additionally, an
increase in manufacturing construction can be seen in the Construction Put in Place
estimates from the Census Bureau. Between March of 2014 and March of 2015,
manufacturing construction increased 53 %; however, this trend may have reached a
Table 5-3: Researchers per Million People
Country Name 2005 2006 2007 2008 2009 2010 2011 2012
Israel - - - - - - 7 296 8 282
Finland 7 545 7 673 7 373 7 692 7 649 7 717 7 414 7 460
Denmark 5 201 5 302 5 519 6 497 6 660 6 744 7 026 7 311
Singapore 5 292 5 425 5 769 5 741 6 149 6 307 6 496 6 442
Korea, Rep. 3 777 4 175 4 604 4 868 5 001 5 380 5 853 6 362
Norway 4 584 4 838 5 163 5 360 5 439 5 408 5 496 5 548
Sweden 6 101 6 133 5 005 5 443 5 069 5 256 5 135 5 164
Japan 5 360 5 387 5 378 5 158 5 148 5 153 5 160 5 084
Luxembourg 4 864 4 412 4 636 4 716 4 829 5 190 5 829 4 677
Austria 3 457 3 531 3 816 4 142 4 146 4 359 4 406 4 655
Canada 4 238 4 313 4 588 4 712 4 451 4 649 4 727 4 490
Switzerland - - - 3 288 - - - 4 481
Germany 3 350 3 452 3 597 3 752 3 941 4 078 4 211 4 379
Slovenia 2 631 2 920 3 098 3 463 3 645 3 753 4 261 4 307
Netherlands 2 930 3 241 3 101 3 071 2 833 3 229 3 502 4 247
France 3 307 3 418 3 580 3 654 3 741 3 868 3 940 4 076
North America 3 769 3 834 3 840 3 991 4 109 3 944 4 082 4 066
Portugal 2 016 2 344 2 671 3 820 3 761 3 923 4 173 4 042
United Kingdom 4 129 4 188 4 132 4 084 4 116 4 091 3 979 4 029
United States 3 718 3 782 3 758 3 912 4 072 3 867 4 011 4 019
United States Rank 13 14 14 15 14 17 17 20
United States Percentile 86 83 85 84 85 84 82 75
32 Deloitte. 2016 Global Manufacturing Competitiveness Index.
<http://www2.deloitte.com/content/dam/Deloitte/us/Documents/manufacturing/us-gmci.pdf>
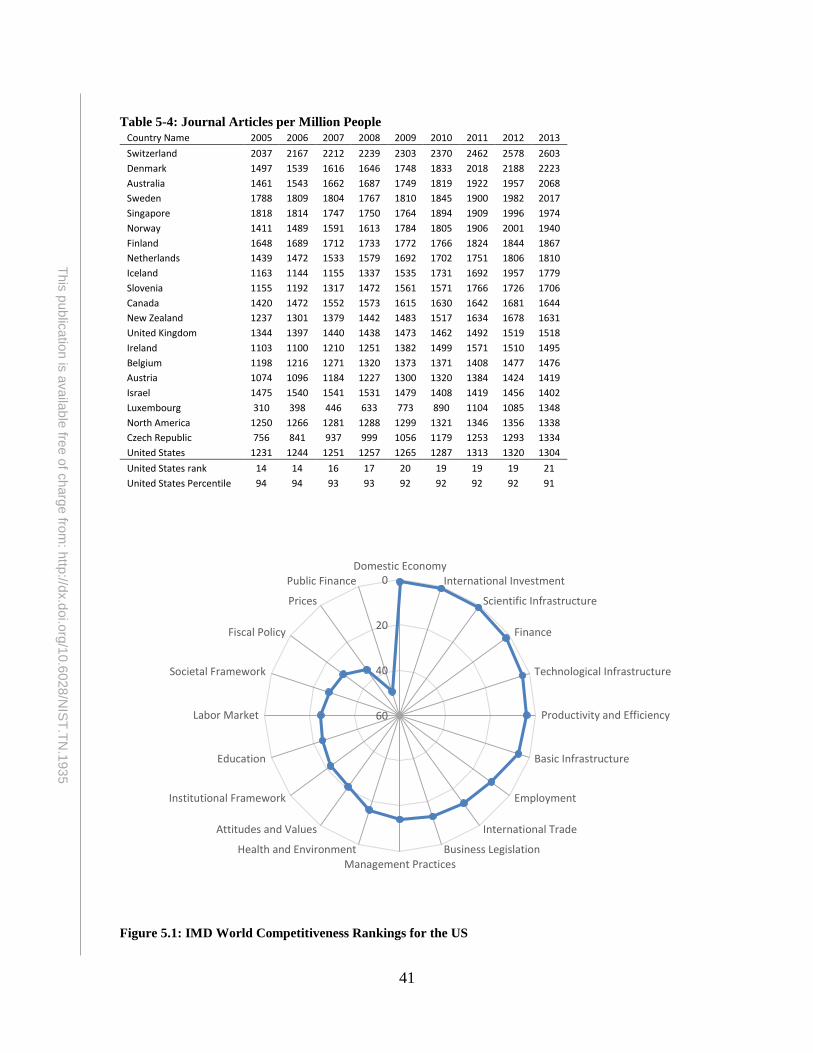
41
This
pu
blic
atio
n is
availa
ble
free o
f charg
e fro
m: h
ttp://d
x.d
oi.o
rg/1
0.6
028
/NIS
T.T
N.1
93
5
Table 5-4: Journal Articles per Million People
Country Name 2005 2006 2007 2008 2009 2010 2011 2012 2013
Switzerland 2037 2167 2212 2239 2303 2370 2462 2578 2603
Denmark 1497 1539 1616 1646 1748 1833 2018 2188 2223
Australia 1461 1543 1662 1687 1749 1819 1922 1957 2068
Sweden 1788 1809 1804 1767 1810 1845 1900 1982 2017
Singapore 1818 1814 1747 1750 1764 1894 1909 1996 1974
Norway 1411 1489 1591 1613 1784 1805 1906 2001 1940
Finland 1648 1689 1712 1733 1772 1766 1824 1844 1867
Netherlands 1439 1472 1533 1579 1692 1702 1751 1806 1810
Iceland 1163 1144 1155 1337 1535 1731 1692 1957 1779
Slovenia 1155 1192 1317 1472 1561 1571 1766 1726 1706
Canada 1420 1472 1552 1573 1615 1630 1642 1681 1644
New Zealand 1237 1301 1379 1442 1483 1517 1634 1678 1631
United Kingdom 1344 1397 1440 1438 1473 1462 1492 1519 1518
Ireland 1103 1100 1210 1251 1382 1499 1571 1510 1495
Belgium 1198 1216 1271 1320 1373 1371 1408 1477 1476
Austria 1074 1096 1184 1227 1300 1320 1384 1424 1419
Israel 1475 1540 1541 1531 1479 1408 1419 1456 1402
Luxembourg 310 398 446 633 773 890 1104 1085 1348
North America 1250 1266 1281 1288 1299 1321 1346 1356 1338
Czech Republic 756 841 937 999 1056 1179 1253 1293 1334
United States 1231 1244 1251 1257 1265 1287 1313 1320 1304
United States rank 14 14 16 17 20 19 19 19 21
United States Percentile 94 94 93 93 92 92 92 92 91
Figure 5.1: IMD World Competitiveness Rankings for the US
0
20
40
60
Domestic EconomyInternational Investment
Scientific Infrastructure
Finance
Technological Infrastructure
Productivity and Efficiency
Basic Infrastructure
Employment
International Trade
Business LegislationManagement Practices
Health and Environment
Attitudes and Values
Institutional Framework
Education
Labor Market
Societal Framework
Fiscal Policy
Prices
Public Finance
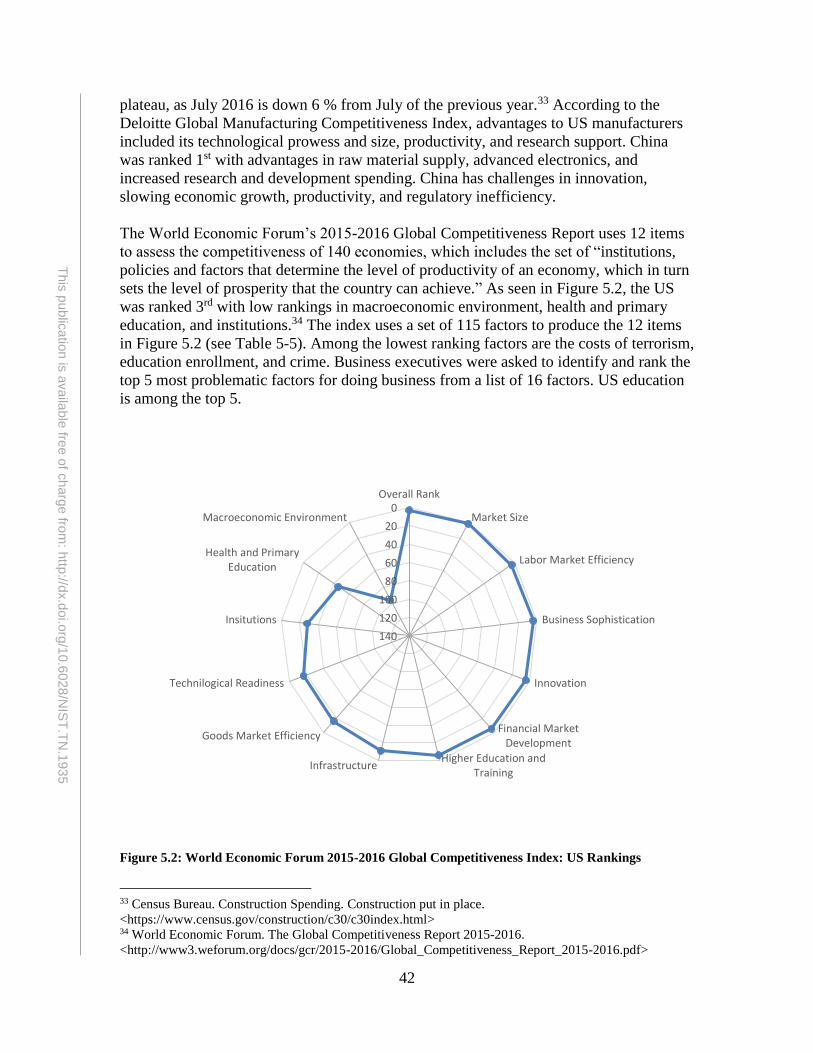
42
This
pu
blic
atio
n is
availa
ble
free o
f charg
e fro
m: h
ttp://d
x.d
oi.o
rg/1
0.6
028
/NIS
T.T
N.1
93
5
plateau, as July 2016 is down 6 % from July of the previous year.33 According to the
Deloitte Global Manufacturing Competitiveness Index, advantages to US manufacturers
included its technological prowess and size, productivity, and research support. China
was ranked 1st with advantages in raw material supply, advanced electronics, and
increased research and development spending. China has challenges in innovation,
slowing economic growth, productivity, and regulatory inefficiency.
The World Economic Forum’s 2015-2016 Global Competitiveness Report uses 12 items
to assess the competitiveness of 140 economies, which includes the set of “institutions,
policies and factors that determine the level of productivity of an economy, which in turn
sets the level of prosperity that the country can achieve.” As seen in Figure 5.2, the US
was ranked 3rd with low rankings in macroeconomic environment, health and primary
education, and institutions.34 The index uses a set of 115 factors to produce the 12 items
in Figure 5.2 (see Table 5-5). Among the lowest ranking factors are the costs of terrorism,
education enrollment, and crime. Business executives were asked to identify and rank the
top 5 most problematic factors for doing business from a list of 16 factors. US education
is among the top 5.
Figure 5.2: World Economic Forum 2015-2016 Global Competitiveness Index: US Rankings
33 Census Bureau. Construction Spending. Construction put in place.
<https://www.census.gov/construction/c30/c30index.html> 34 World Economic Forum. The Global Competitiveness Report 2015-2016.
<http://www3.weforum.org/docs/gcr/2015-2016/Global_Competitiveness_Report_2015-2016.pdf>
0
20
40
60
80
100
120
140
Overall Rank
Market Size
Labor Market Efficiency
Business Sophistication
Innovation
Financial MarketDevelopment
Higher Education andTraining
Infrastructure
Goods Market Efficiency
Technilogical Readiness
Insitutions
Health and PrimaryEducation
Macroeconomic Environment
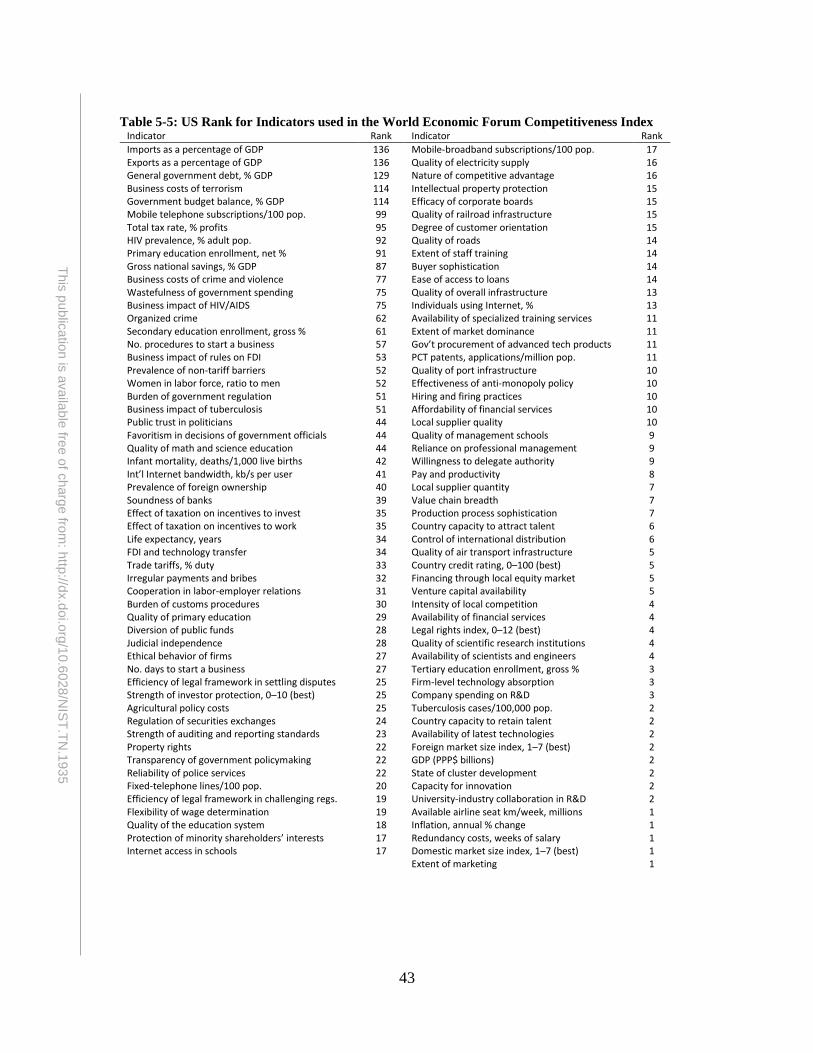
43
This
pu
blic
atio
n is
availa
ble
free o
f charg
e fro
m: h
ttp://d
x.d
oi.o
rg/1
0.6
028
/NIS
T.T
N.1
93
5
Table 5-5: US Rank for Indicators used in the World Economic Forum Competitiveness Index
Indicator Rank Indicator Rank
Imports as a percentage of GDP 136 Mobile-broadband subscriptions/100 pop. 17 Exports as a percentage of GDP 136 Quality of electricity supply 16 General government debt, % GDP 129 Nature of competitive advantage 16 Business costs of terrorism 114 Intellectual property protection 15 Government budget balance, % GDP 114 Efficacy of corporate boards 15 Mobile telephone subscriptions/100 pop. 99 Quality of railroad infrastructure 15 Total tax rate, % profits 95 Degree of customer orientation 15 HIV prevalence, % adult pop. 92 Quality of roads 14 Primary education enrollment, net % 91 Extent of staff training 14 Gross national savings, % GDP 87 Buyer sophistication 14 Business costs of crime and violence 77 Ease of access to loans 14 Wastefulness of government spending 75 Quality of overall infrastructure 13 Business impact of HIV/AIDS 75 Individuals using Internet, % 13 Organized crime 62 Availability of specialized training services 11 Secondary education enrollment, gross % 61 Extent of market dominance 11 No. procedures to start a business 57 Gov’t procurement of advanced tech products 11 Business impact of rules on FDI 53 PCT patents, applications/million pop. 11 Prevalence of non-tariff barriers 52 Quality of port infrastructure 10 Women in labor force, ratio to men 52 Effectiveness of anti-monopoly policy 10 Burden of government regulation 51 Hiring and firing practices 10 Business impact of tuberculosis 51 Affordability of financial services 10 Public trust in politicians 44 Local supplier quality 10 Favoritism in decisions of government officials 44 Quality of management schools 9 Quality of math and science education 44 Reliance on professional management 9 Infant mortality, deaths/1,000 live births 42 Willingness to delegate authority 9 Int’l Internet bandwidth, kb/s per user 41 Pay and productivity 8 Prevalence of foreign ownership 40 Local supplier quantity 7 Soundness of banks 39 Value chain breadth 7 Effect of taxation on incentives to invest 35 Production process sophistication 7 Effect of taxation on incentives to work 35 Country capacity to attract talent 6 Life expectancy, years 34 Control of international distribution 6 FDI and technology transfer 34 Quality of air transport infrastructure 5 Trade tariffs, % duty 33 Country credit rating, 0–100 (best) 5 Irregular payments and bribes 32 Financing through local equity market 5 Cooperation in labor-employer relations 31 Venture capital availability 5 Burden of customs procedures 30 Intensity of local competition 4 Quality of primary education 29 Availability of financial services 4 Diversion of public funds 28 Legal rights index, 0–12 (best) 4 Judicial independence 28 Quality of scientific research institutions 4 Ethical behavior of firms 27 Availability of scientists and engineers 4 No. days to start a business 27 Tertiary education enrollment, gross % 3 Efficiency of legal framework in settling disputes 25 Firm-level technology absorption 3 Strength of investor protection, 0–10 (best) 25 Company spending on R&D 3 Agricultural policy costs 25 Tuberculosis cases/100,000 pop. 2 Regulation of securities exchanges 24 Country capacity to retain talent 2 Strength of auditing and reporting standards 23 Availability of latest technologies 2 Property rights 22 Foreign market size index, 1–7 (best) 2 Transparency of government policymaking 22 GDP (PPP$ billions) 2 Reliability of police services 22 State of cluster development 2 Fixed-telephone lines/100 pop. 20 Capacity for innovation 2 Efficiency of legal framework in challenging regs. 19 University-industry collaboration in R&D 2 Flexibility of wage determination 19 Available airline seat km/week, millions 1 Quality of the education system 18 Inflation, annual % change 1 Protection of minority shareholders’ interests 17 Redundancy costs, weeks of salary 1 Internet access in schools 17 Domestic market size index, 1–7 (best) 1 Extent of marketing 1
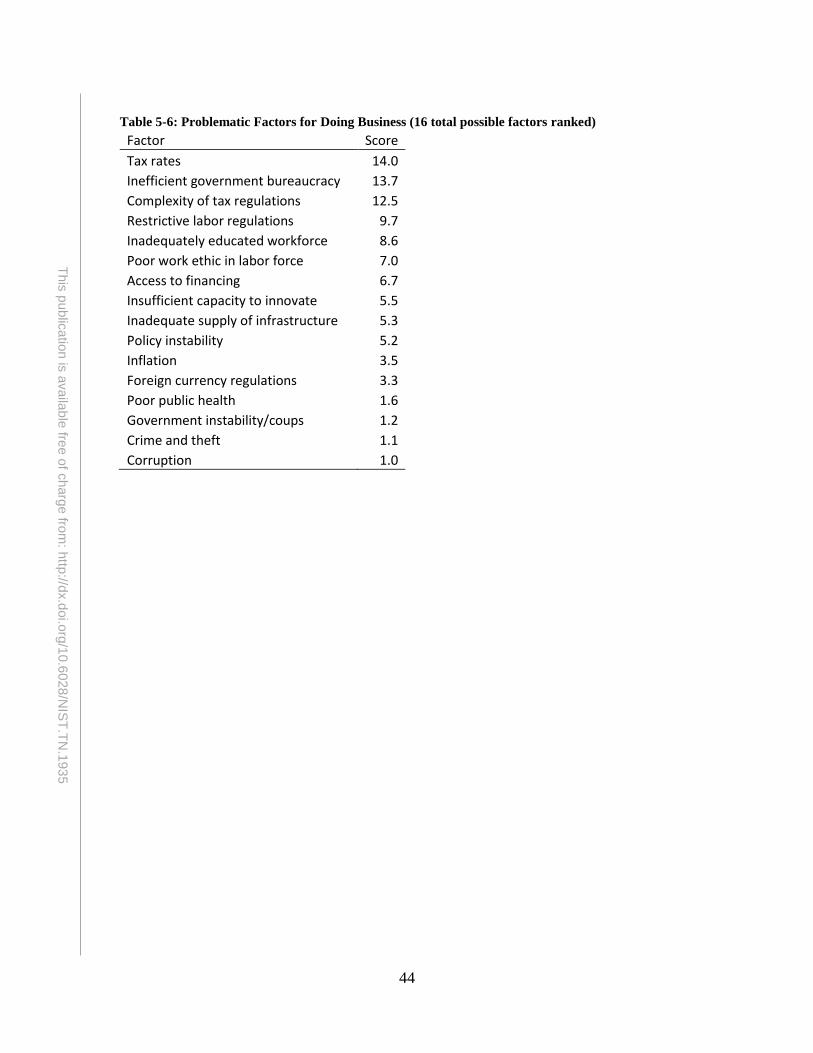
44
This
pu
blic
atio
n is
availa
ble
free o
f charg
e fro
m: h
ttp://d
x.d
oi.o
rg/1
0.6
028
/NIS
T.T
N.1
93
5
Table 5-6: Problematic Factors for Doing Business (16 total possible factors ranked)
Factor Score
Tax rates 14.0
Inefficient government bureaucracy 13.7
Complexity of tax regulations 12.5
Restrictive labor regulations 9.7
Inadequately educated workforce 8.6
Poor work ethic in labor force 7.0
Access to financing 6.7
Insufficient capacity to innovate 5.5
Inadequate supply of infrastructure 5.3
Policy instability 5.2
Inflation 3.5
Foreign currency regulations 3.3
Poor public health 1.6
Government instability/coups 1.2
Crime and theft 1.1
Corruption 1.0
45
This
pu
blic
atio
n is
availa
ble
free o
f charg
e fro
m: h
ttp://d
x.d
oi.o
rg/1
0.6
028
/NIS
T.T
N.1
93
5
6 Discussion
This report provides an overview of the US manufacturing industry. There are three
aspects of U.S. manufacturing that are considered: (1) how the US industry compares to
other countries, (2) the trends in the domestic industry, and (3) the industry trends
compared to those in other countries. According to the 2014 Annual Survey of
Manufactures (ASM), the US manufacturing sector produced $2.4 trillion in value added
in 2014, up 1.9 %. Value added in machinery manufacturing (NAICS 333), computer and
electronic product manufacturing (NAICS 334), electrical equipment (NAICS 335), and
transportation equipment (NAICS 336) grew 5.1 %, -0.7 %, 2.8 %, and 7.8 %
respectively. US compound real (controlling for inflation) annual growth between 1989
and 2014 was 2.2 %, which places the US in the 47th percentile of all countries. This
growth exceeded that of Germany, France, Canada, Japan, and Australia; however, it is
slower than the global average (3 %) and that of many emerging economies. US
manufacturing value added, as measured in constant 2005 dollars, is the second largest
just behind that of China. In current dollars, the US produced $1.8 trillion in
manufacturing valued added while China produced $1.9 trillion. Among the ten largest
manufacturing countries, the US is the 3rd largest manufacturing value added per capita.
The US remains a major manufacturing nation; however, other countries are rising
rapidly. US manufacturing was significantly impacted by the previous recession and, as
of 2016, has not returned to pre-recession levels of production or employment. The US
has advantages in technological prowess, innovation, productivity, and research and
development; however, education was ranked low in two indices (i.e., IMD and World
Economic Forum), which could negatively impact US advantages in the future.
Institutions and institutional framework, which include crime, regulatory frameworks,
country credit rating, and government spending among other things, ranked low in two
indices. A number of costs were identified as challenges to US manufacturing, including
high labor costs, which is likely related to high productivity. Systematic cost analysis of
US manufacturing reveals that management is a significant cost along with a number of
other non-production costs such as wholesale trade. The number of injuries and the injury
rate in US manufacturing has a general downward trend.

46
This
pu
blic
atio
n is
availa
ble
free o
f charg
e fro
m: h
ttp://d
x.d
oi.o
rg/1
0.6
028
/NIS
T.T
N.1
93
5
47
This
pu
blic
atio
n is
availa
ble
free o
f charg
e fro
m: h
ttp://d
x.d
oi.o
rg/1
0.6
028
/NIS
T.T
N.1
93
5
Bibliography
Bureau of Economic Analysis. “Industry Economic Accounts Data.”
<http://www.bea.gov/iTable/index_industry_gdpIndy.cfm>
Bureau of Labor Statistics. Current Employment Statistics.
<http://www.bls.gov/ces/home.htm>
Bureau of Labor Statistics. Census of Fatal Occupational Injuries. "Industry by Event or
Exposure." <http://stats.bls.gov/iif/oshcfoi1.htm>
Bureau of Labor Statistics. Injuries, Illness, and Fatalities Program. 2010-2011.
http://www.bls.gov/iif/
Callen, Tim. March 2007. PPP Versus the Market: Which Weight Matters? Finance and
Development. Vol 44 number 1.
<http://www.imf.org/external/pubs/ft/fandd/2007/03/basics.htm>
Census Bureau. “Annual Survey of Manufactures.” February 2015. Accessed from the
American FactFinder. <http://factfinder.census.gov/faces/nav/jsf/pages/index.xhtml>
Census Bureau. Construction Spending. Construction put in place.
<https://www.census.gov/construction/c30/c30index.html>
Census Bureau. “Economic Census.” March 2015. Accessed from the American
FactFinder. <http://factfinder.census.gov/faces/nav/jsf/pages/index.xhtml>
Current Population Survey, Bureau of Labor Statistics. "Table 17: Employed Persons by
Industry, Sex, Race, and Occupation." <http://www.bls.gov/cps>Dornbusch, Rudiger,
Stanley Fischer, adn Richard Startz. 2000. Macroeconomics. 8th ed. London, UK:
McGraw-Hill.
Deloitte. 2016 Global Manufacturing Competitiveness Index.
<http://www2.deloitte.com/content/dam/Deloitte/us/Documents/manufacturing/us-
gmci.pdf>
IMD. IMD World Competiveness Country Profile: US.
<https://worldcompetitiveness.imd.org/countryprofile/US>
Bureau of Labor Statistics. National Compensation Survey. <http://www.bls.gov/ncs/>
Thomas, Douglas S. The Current State and Recent Trends of the US Manufacturing
Industry. NIST Special Publication 1142.
<http://nvlpubs.nist.gov/nistpubs/SpecialPublications/NIST.SP.1142.pdf>
Thomas, Douglas S. The US Manufacturing Value Chain: An International Perspective.
February 2014. NIST Technical Note 1810.
<http://www.nist.gov/customcf/get_pdf.cfm?pub_id=914022>
48
This
pu
blic
atio
n is
availa
ble
free o
f charg
e fro
m: h
ttp://d
x.d
oi.o
rg/1
0.6
028
/NIS
T.T
N.1
93
5
United Nations Statistics Division. “National Accounts Main Aggregates Database.”
<http://unstats.un.org/unsd/snaama/Introduction.asp>
United Nations Industrial Development Organization. Competitive Industrial
Performance Report 2014. Working Paper 12/2014.
<http://www.unido.org/fileadmin/user_media/Services/PSD/WP2014_12_CIPReport201
4.pdf>
World Bank. World Development Indicators. <http://data.worldbank.org/data-
catalog/world-development-indicators>
World Economic Forum. The Global Competitiveness Report 2015-2016.
<http://www3.weforum.org/docs/gcr/2015-2016/Global_Competitiveness_Report_2015-
2016.pdf>