Embed Size (px)
Citation preview

Market update
Publication Date: 27 November 2018
Annual monitoring update on the postal market
Financial year 2017-18
About this document This report sets out key data and trends in the postal sector for the 2017-18 financial year. The regulatory framework Ofcom put in place in March 2012, and reviewed in March 2017, fulfils our statutory duty of securing a universal postal service, having regard to financial sustainability and efficiency. An effective and on-going monitoring regime remains one of the key safeguards of the regulatory framework, alongside greater pricing freedom for Royal Mail.
This document, together with a broad range of interactive data, constitutes our seventh annual monitoring update on the postal sector. This report covers six key areas: analysis of the letters market; the parcels market consumer and small business experience of postal services; the financial performance and efficiency of Royal Mail’s Reported Business; and Royal Mail’s regulatory compliance. The Reported Business is the part of Royal Mail’s business responsible for the universal service, which requires Royal Mail to collect and deliver letters six days a week and parcels five days a week, at an affordable and uniform price to all UK addresses.

Contents
Section
1. Executive Summary 1
2. Introduction 6
3. Letters 10
4. The parcels market 19
5. Consumer and business experience of postal services 29
6. The financial performance of the Reported Business 48
7. Efficiency of the Reported Business 65
8. Regulatory compliance 72
Annex
A1. Summary of Royal Mail reporting requirements 85

Annual monitoring update on the postal market: Financial year 2017-18
1
1. Executive Summary 1.1 Ofcom has a duty under the Postal Services Act 2011 to secure the provision of a
universal postal service, having regard to its financial sustainability and efficiency.
1.2 Under our regulatory framework we publish an annual monitoring update on the postal market which covers market trends, our view of the financial sustainability of the universal postal service, and Royal Mail’s efficiency. This is our seventh annual update.
1.3 In last year’s monitoring update, we concluded that the universal service was likely to remain financially sustainable in the immediate future, as the financial position and financial health metrics of the Royal Mail Group1 did not indicate any short to medium-term financial health issues, and we noted that Royal Mail has strong incentives to improve its efficiency in future to remain financially sustainable.
1.4 As explained in this update, we remain of the view that the universal postal service is likely to remain financially sustainable in the immediate future. However, this report is published against the backdrop of Royal Mail’s recent half year results and unscheduled trading update to its shareholders, which noted amongst other things that UK productivity performance was significantly below plan in the first half of 2018-19 and that full year performance was expected to be significantly below target.
1.5 Given our view in previous years was that continued progress on efficiency was likely to improve the profitability of the Reported Business (the part of Royal Mail’s business responsible for delivering the universal postal service) and help ensure the financial sustainability of the universal service, this is a concern for us.
1.6 We will continue to monitor these developments closely. As part of our monitoring programme we engage regularly with Royal Mail’s senior management to understand their perspective on the future on the universal service and plans they have in place to address any performance issues within the part of the business responsible for delivering the universal service.
UK letters market
1.7 Addressed letters volumes declined by 5% to 11.1 billion items in 2017-18. This was a similar decrease to last year. Overall letters revenues fell by 6% in real terms to £4,047m in 2017-18, which was one percentage point more than last year’s revenue decline.
1.8 Access mail (mail injected by other providers into Royal Mail’s network for delivery to end customers) accounted for 63% of total addressed letters in 2017-18, up from 61% in 2016-17.
1 We refer to Royal Mail PLC and the group of companies it holds collectively as the Relevant Group or Royal Mail Group.

Annual monitoring update on the postal market: Financial year 2017-18
2
1.9 Royal Mail changed the prices of its retail and access mail products in 2018. For retail products, real terms price increases in 2018 (0.1%) were the same on average (0.1%) than the price increases for 2017 (0.1%). For access mail, real terms price increases in 2018 were 2.1%.2
The parcels market
1.10 Growth in total measured parcel volumes and revenues accelerated in 2017-18. Volumes increased by 11% compared to 2016-17, reaching a total of 2.4 billion items. Total revenues increased by 5% in real terms, a lower rate than the increase in volumes, reaching £9.4 billion, leading to a fall in average unit revenue. In the previous year, the annual growth in parcel volumes and revenues was 7% and 3% respectively.
Consumer and Business Experience of Postal Services
1.11 Our research indicates the majority of residential consumers are satisfied with postal services overall (87%) and Royal Mail (86%), which is broadly similar to figures reported in previous years. Three quarters of residential consumers (77%) are satisfied with the value for money of postal services overall. In addition, more than four in five small and medium-sized enterprises (SMEs) who use Royal Mail (85%) said they were satisfied with the overall service received from Royal Mail, and nearly nine in ten SMEs (88%) using other providers said they were satisfied.
1.12 Our research also shows that residential consumers and SMEs are generally reporting sending post less often than they did two years ago; this trend is in line with prior years. When sending letters, guaranteed delivery, low cost and uniform pricing across the UK were the factors most often rated as important by residential consumers, and guaranteed delivery was most often rated as important by SMEs. Next day delivery was important to a lower percentage of both residential consumers and SMEs. When sending parcels, guaranteed delivery and proof of despatch/delivery were rated as important by a high proportion of respondents in both cases.
Financial performance of the Reported Business
1.13 The earnings before interest and tax (EBIT) margin of the Reported Business3 decreased from 4.6% in 2016-17 to 4.4% in 2017-18, due to a reduction in revenue and a slight increase in people cost. This is below the indicative 5% to 10% range that we consider to be representative of a reasonable commercial rate of return for a financially sustainable universal postal service in the medium to long term.
2 In 2017, there was a real terms price decrease of -0.3%. We have calculated the average price increase differently to how we calculated it last year, to take into account the additional services we have reported on this year. 3 The Reported Business is the part of Royal Mail Group’s business responsible for the universal service.
Annual monitoring update on the postal market: Financial year 2017-18
3
1.14 In 2018, the Pay and Pensions Agreement with CWU took effect, with a positive impact on Royal Mail’s expected pensions contributions. Royal Mail has said that “the overall ongoing annual cash cost of pensions will continue to be around £400m”4 and “this step was necessary to avoid an expected increase in cash contributions to around £1.2 billion per annum – an unaffordable amount”.5
1.15 On 15 November 2018, Royal Mail Group issued its half-year results 2018-19. In line with its trading update on 1 October 2018, Royal Mail stated that letter volumes fell by more than expected, and that expected efficiency gains envisaged at the time of the Pay and Pensions Agreement with CWU had not been achieved. Royal Mail lowered its 2018-19 cost avoidance target from £230m to £100m and expected that the 2018-19 profits for the whole Group would be in the range of £500 million to £550 million for the full year. Royal Mail also announced reviews of its UK network and “of the productivity and efficiency opportunities under our Agreement with CWU”.6
1.16 Our view is that the universal service is likely to remain financially sustainable in the immediate future given that the Reported Business is currently profitable, and the financial position and financial health metrics (including credit rating) of the Royal Mail Group do not indicate any short-term financial health issues.
1.17 However, the longer-term sustainability of the universal service depends on Royal Mail’s ability to grow parcels’ revenues sufficiently to offset letters revenue decline and / or remove costs from the business. As part of our monitoring each year we review Royal Mail’s expectations of future performance to form a view of the medium to long-term outlook of the Reported Business.
1.18 Royal Mail is currently in the process of conducting both a review of its UK network “to develop the blueprint for a modern, optimised, efficient network to deliver letters, parcels and new products”7 and “an assessment of the productivity and efficiency opportunities under [the] Agreement with CWU”.8 It expects to conclude these reviews in early 2019. Until Royal Mail has completed its reviews and used the outputs to inform its annual business planning process, we are unable to form an up-to-date view of the expected performance of the Reported Business over the medium to long term, but expect to have a clearer view in the new year.
1.19 We recognise that until Royal Mail concludes its reviews we have less certainty than in prior years on how Royal Mail plans to meet the various downside scenarios which have the potential to impact the financial sustainability of the universal service over the medium to long-term. These downside risks include increased competition within the
4 Royal Mail Plc, Annual Report and Financial Statements 2017-18, page 4. 5 Royal Mail Plc, Annual Report and Financial Statements 2017-18, page 9. 6 Royal Mail Plc, Results for the Half Year ended 23 September 2018, page 4. https://www.royalmailgroup.com/media/10493/royal-mail-plc-financial-report-for-the-half-year-ended-23-september-2018.pdf 7 Royal Mail Plc, Results for the Half Year ended 23 September 2018, page 4. 8 Ibid, page 4.

Annual monitoring update on the postal market: Financial year 2017-18
4
parcels market and an inability to realise adequate efficiencies. See Sections 6 and 7 for more detail.
Royal Mail’s efficiency
1.20 Royal Mail has strong incentives to improve its efficiency in future to remain financially sustainable. Progress on efficiency is likely to improve the profitability of the Reported Business and help ensure the financial sustainability of the universal service.
1.21 Total costs for the Reported Business reduced by 3% in real terms in 2017-18 (compared with 0.4% in the prior year). However, this reduction in costs is due to several factors including one-off costs, changes in volumes and efficiency savings. PVEO analysis provides a useful measure of efficiency improvements by separately identifying Price, Volume, Efficiency and “Other” (i.e. one-off costs) factors. It indicates an underlying efficiency improvement (excluding transformation costs) of c.2.8% in 2017-18 (against c.2.2% in the prior year). The majority of costs savings in 2017-18 were achieved in non-people costs.
1.22 Royal Mail reduced total gross hours spent by employees in delivery and processing by 0.9% in 2017-18, less than the 1.9% reduction in the prior year. However, average people costs per full time equivalent employee (FTE) increased in the year, while the average revenue per FTE decreased, meaning that people costs increased relative to revenue.
1.23 In the first half of 2018-19, Royal Mail’s performance on efficiency has not matched its expectations. This is a concern for us as we believe that efficiency remains critical to the sustainability of the universal service.
Regulatory compliance
1.24 Royal Mail is subject to safeguard caps on the price of Second Class stamps for letters, large letters, and parcels up to 2kg, to ensure that consumers can access an affordable universal postal service. The caps prevent Royal Mail from increasing prices by more than inflation as measured by CPI.9 Royal Mail’s price rises for 2018-19 complied with these safeguard caps. First Class stamp prices increased in both nominal and real terms in 2018-19 compared with 2016-17, from 65p to 67p in nominal terms 10. Prices fell in real terms for all First Class and Second Class parcel products up to 2kg.
1.25 Overall, Royal Mail’s quality of service performance in 2017-18 dropped from 2016-17, missing several of its regulatory targets in 2017-18. Royal Mail did not meet its First and Second Class national targets as well as its Postcode Area (PCA) target.11 We are currently
9 Consumer Price Index, or CPI, is a measure of inflation and measures changes in the price level of a basket of consumer goods and services purchased by households. 10 The main difference between nominal and real values is that real values are adjusted for inflation, while nominal values are not. 11 The PCA target requires Royal Mail to deliver 91.5% of First Class mail the day after collection from a postbox, Post Office or other collection point to 118 of the 121 postcode areas.
Annual monitoring update on the postal market: Financial year 2017-18
5
investigating Royal Mail’s compliance in 2017-18 and expect to publish our findings by early 2019.
1.26 The number of complaints Royal Mail received rose 10.3% from last year. Although lost items remain the most common cause of complaint, this proportion fell by 3.9 percentage points from last year. The second largest category, denial of receipt, has had the largest increase in proportion of complaints, rising by 3.5 percentage points. We are in dialogue with Royal Mail to understand the reasons behind this increase. In addition, under our regulations, Royal Mail is required to have Alternative Dispute Resolution (ADR) in place if they cannot resolve the complaint.

Annual monitoring update on the postal market: Financial year 2017-18
6
2. Introduction 2.1 Ofcom has a duty under the Postal Services Act 2011 to secure the provision of a
universal postal service, having regard to its financial sustainability and efficiency. The minimum universal service requirements are set by Parliament and require Royal Mail to provide certain postal services at an affordable, uniform price throughout the UK. In light of this duty, our approach to regulating the postal sector was set out in our March 2012 Statement. This included the decision to give Royal Mail greater pricing freedom to enable it to return the universal service to financial sustainability, subject to certain safeguards.
2.2 One of the key safeguards was an effective and on-going monitoring regime to track Royal Mail’s performance, as well as monitoring changes in the postal market. As part of this regime, we committed to publishing an annual monitoring update which sets out key data and trends in the postal sector, focusing on the progress towards securing the provision of a universal service. In our March 2017 statement where we confirmed we would broadly maintain the current regulatory framework until 2022, we said that our on-going monitoring of the postal market remains a key safeguard of our regulatory framework, alongside the Second Class safeguard caps on certain universal service products12 and mandated access regulation.
2.3 This is our last report using data relying on our previous regulatory financial reporting requirements. In December 2017, we issued a statement outlining changes to those requirements.13 This highlighted the importance of the monitoring programme and the need for reporting requirements to be up-to-date, effective and targeted appropriately. In particular, under the new requirements, Royal Mail is required to provide us with granular revenue data extracts from its systems to give us further flexibility to understand the key performance drivers that underpin the profitability of the Reported Business. This new level of granularity came into effect from 26 March 2018 and may feed into our next report due in 2019 where necessary.
2.4 In order to ensure that the regulatory framework continues to work effectively we monitor a range of factors including Royal Mail’s performance on efficiency, quality of service, the financial performance of the universal service network, consumers’ experiences in the postal sector, and competition in parcels and letters.
Measuring the outcomes of the regulatory regime
2.5 This report focuses on the 2017-18 financial year and in particular on:
• The letters market – Section Three • The parcels market – Section Four
12 See the recent publication relating to our Review of Second Class stamp safeguard caps: https://www.ofcom.org.uk/consultations-and-statements/category-1/review-second-class-stamp-safeguard-cap 13 https://www.ofcom.org.uk/__data/assets/pdf_file/0032/108869/financial-reporting-Royal-Mail.pdf

Annual monitoring update on the postal market: Financial year 2017-18
7
• Consumer and business experience of postal services – Section Five • The financial performance of the Reported Business – Section Six • The efficiency of the Reported Business – Section Seven • Compliance with regulation – Section Eight
2.6 We continue to monitor market developments and Royal Mail’s performance in the key areas outlined above.
The wider monitoring programme
2.7 In addition to this annual monitoring update, the aims of which are discussed above, the wider programme includes:
• monitoring potential market developments through requests to industry stakeholders for market specific information, and identifying concerns raised by stakeholders with how the regime is operating;
• regular review of data and indicators for the key areas set out above; and • monitoring developments in other markets internationally.
2.8 Within this report we provide our view of how the regulatory regime is meeting our duty to secure the provision of a universal service by publishing some information on the financial performance of the Reported Business, the part of Royal Mail Group’s business responsible for the universal service. We also highlight compliance with regulatory requirements, market developments in the past year, and postal users’ experience of postal services.
2.9 Royal Mail (along with other postal operators) provides a range of confidential data to us. Although the confidential nature of this data means that we cannot publish it, the data informs our on-going monitoring programme, and is used to identify any potential or emerging problems in relation to the provision of the universal service and wider competition in the postal markets. So that stakeholders are aware of the information we gather, our monitoring data is listed in Annex 1.
Royal Mail is the focus of our monitoring regime
2.10 The focus of our monitoring is Royal Mail, although we undertake our monitoring within the context of the broader postal services market. This is because Royal Mail is currently the only postal business in the UK which operates a network capable of delivering letters and parcels to over 29 million business and household addresses nationwide. As such, it is the designated universal postal service provider.
2.11 Not all of Royal Mail’s business is subject to Ofcom regulation. The parts that are subject to our monitoring regime are known as the ‘Reported Business’, which sits within a group of business units referred to by Royal Mail as “UK Parcels, International and Letters” (UKPIL).

Annual monitoring update on the postal market: Financial year 2017-18
8
2.12 The Reported Business includes all universal services14, as well as other services which are delivered over the universal service network, namely retail bulk mail15 and access products and parcels.
2.13 Although we focus on the financial year 2017-18, in parts we deviate from this time period to include more recent events and price changes, including analysing residential letter and parcel prices (which are typically revised in April and apply for the rest of the financial year) 16, business prices (which are normally revised every January) and developments in the parcel market.17 As part of our regular engagement with Royal Mail’s senior management we are seeking to understand the reasons for the deterioration in recent trading, and management plans to address this.
Presentation of data in this annual monitoring update
2.14 Financial data presented in the annual monitoring update on the postal market is in real terms, unless otherwise stated, except for the revenue and cost data presented in Section 6 which is in line with how it is presented in Royal Mail’s regulatory financial statements.
2.15 Where we discuss absolute or percentage changes, we are referring to comparisons to the previous financial year i.e. 2016-17 to 2017-18 (unless otherwise stated).
2.16 Where we report real terms changes, we have elected to use the Consumer Price Index (CPI) as the basis for our calculations, as has been our custom since the 2014-15 annual monitoring update on the postal market.18 We use the CPI index as at March 2018.19
2.17 The metrics in this update are, unless otherwise stated, consistent with those in our previous two annual monitoring updates on the postal market, published in November 201620 and 201721 respectively (enabling year-on-year comparisons). As mentioned above, while the majority of the analysis in this report focuses on 2017-18, pricing
14 Royal Mail, Universal Service Obligation, https://www.royalmailgroup.com/en/about-us/regulation/how-were-regulated/ 15 Retail bulk mail relates to a range of services provided directly to sending customers by Royal Mail that are subject to volume or presentation discounts. This category represents bulk mail collected and delivered by Royal Mail itself, as opposed to bulk mail delivered by Royal Mail under an access agreement. Access is discussed further in Section 3. 16 For the purposes of clarity, in this report, we analyse residential prices for letters and parcels from March 2018 onwards. 17 For all developments, price rises and areas of interest to this report, outside of Royal Mail’s financial and efficiency analysis (which is based on the financial year 2017-18 in this report), we include the most recent information available to us. This approach is consistent and remains unchanged with our approach in last year’s Annual monitoring report. 18 Ofcom, Annual monitoring update on the postal market - Financial year 2014-15, November 2015, paragraph 2.22, https://www.ofcom.org.uk/__data/assets/pdf_file/0025/56923/annual_monitoring_update_2014-15.pdf. 19 In relation to efficiency calculations, our analysis is based on the change on average monthly CPI across the financial year from April to March making a year-on-year comparison, which is set out in section 7. 20 Ofcom, Annual monitoring update on the postal market – Financial year 2015-16, November 2016, https://www.ofcom.org.uk/__data/assets/pdf_file/0029/94961/2015-16-Annual-Report.pdf. 21 Ofcom, Annual monitoring update on the postal market – Financial year 2016-17, November 2017, https://www.ofcom.org.uk/__data/assets/pdf_file/0019/108082/postal-annual-monitoring-report-2016-2017.pdf.
Annual monitoring update on the postal market: Financial year 2017-18
9
information focuses on the most recent pricing data available (i.e. 2018), which is in line with previous monitoring updates.
2.18 This annual monitoring update comprises of both this report and accompanying interactive data available on the Ofcom website.22 Data presented in the annual monitoring update is available in csv files on the Ofcom website.23
22 Interactive data can be accessed here: https://www.ofcom.org.uk/postal-services/information-for-the-postal-industry/monitoring_reports/interactive-data-2017-18 23 Interactive data can be accessed here: https://www.ofcom.org.uk/postal-services/information-for-the-postal-industry/monitoring_reports/interactive-data-2017-18

Annual monitoring update on the postal market: Financial year 2017-18
10
3. Letters Letters market in the UK
3.1 This section covers recent developments and trends in the end-to-end and access letter markets. In light of the launch of the first industry measurement system for advertising mail (JICMAIL) in January 2018 we also look in more detail at direct mail marketing, before turning to bulk mail pricing in the UK. Direct mail forms one component of bulk mail.
3.2 Bulk mail includes letter, large letter and parcel products that are subject to discounts for factors such as the volume of mail sent, the way the mail has been presented (for example, using specific fonts to make it easier for the machine to read the address), applying machine bar codes, or the level of sortation (i.e. unsorted, low sort and high sort). Beyond advertising mail, other forms of bulk letter mail include publishing mail (e.g. magazines, newsletters) and transactional mail (i.e. bank statements, contracts, bills). Certain letters products (in particular large letters) are also used for fulfilment.
3.3 Finally, we look at the international context, and how postal operators in other European countries are responding to declines in letters volumes.
Figure 3.1 Type of letter mail in the UK
Source: Ofcom
3.4 Together, the letters and large letters mail sector consists of three parts:
• mail collected and delivered by Royal Mail (Royal Mail end-to-end) which consists of both bulk and non-bulk mail;
• mail collected by other operators and delivered by Royal Mail (Royal Mail access); and
Stamped or franked mail
Marketing(e.g. advertising/
direct mail)
Publishing(e.g. newspapers and magazines)
Business (including transactional e.g. bills)
Single pieceItems priced at retail price rate;
used primarily by individual consumers and SMEs
BulkDiscounts for factors such as volumes, presentation,
machine barcodes and level of sortation; used primarily by businesses and public bodies (e.g. councils, NHS and
government departments)
Annual monitoring update on the postal market: Financial year 2017-18
11
• mail collected and delivered by other operators (other operators’ end-to-end).
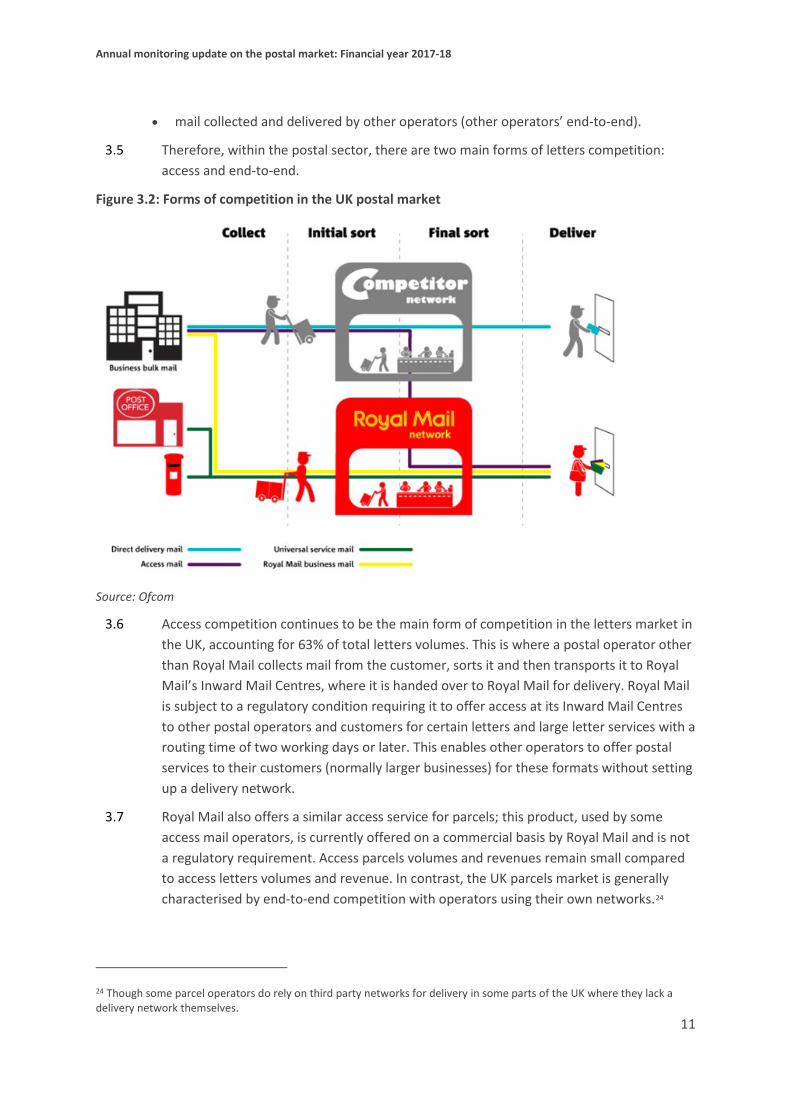
3.5 Therefore, within the postal sector, there are two main forms of letters competition: access and end-to-end.
Figure 3.2: Forms of competition in the UK postal market
Source: Ofcom
3.6 Access competition continues to be the main form of competition in the letters market in the UK, accounting for 63% of total letters volumes. This is where a postal operator other than Royal Mail collects mail from the customer, sorts it and then transports it to Royal Mail’s Inward Mail Centres, where it is handed over to Royal Mail for delivery. Royal Mail is subject to a regulatory condition requiring it to offer access at its Inward Mail Centres to other postal operators and customers for certain letters and large letter services with a routing time of two working days or later. This enables other operators to offer postal services to their customers (normally larger businesses) for these formats without setting up a delivery network.
3.7 Royal Mail also offers a similar access service for parcels; this product, used by some access mail operators, is currently offered on a commercial basis by Royal Mail and is not a regulatory requirement. Access parcels volumes and revenues remain small compared to access letters volumes and revenue. In contrast, the UK parcels market is generally characterised by end-to-end competition with operators using their own networks.24
24 Though some parcel operators do rely on third party networks for delivery in some parts of the UK where they lack a delivery network themselves.
Annual monitoring update on the postal market: Financial year 2017-18
12
3.8 End-to-end competition relies on network competition and does not rely on Royal Mail for collection, sortation or delivery of letters to end customers. The scale of end-to-end competition is small, with no nationwide end-to-end competitor to Royal Mail. A number of more focused operators compete on an end-to-end basis in some localities in the UK, including Bristol and Bath25 and parts of London and the South East,26 as well as some non-urban areas such as parts of rural Cambridgeshire.27 These end-to-end operators collect, sort and deliver letters and large letters.
Letters volumes and revenues
Addressed letters volumes declined by 5% between 2017-18
3.9 Addressed letters volumes (which include letters and large letters) declined by 5% to 11.1 billion items in 2017-18, reflecting continued structural decline in mail. In addition, cyclical factors including business uncertainty and the economic cycle may also have impacted the year-on-year decline; in section 6 we report that Royal Mail attributes the decline in its letter volumes to business uncertainty within the UK as well as continuing e-substitution. The decline was in line with that seen between 2015-16 and 2016-17 which also saw total volumes fall by 5% to 11.6bn.
3.10 Marketing mail forms a significant component of bulk mail and accounted for 27% of reported Royal Mail UKPIL letters revenue in 2017-18.28 In May 2018, the General Data Protection Regulation (GDPR) came into force. The Regulation imposes new obligations on those who collect, store and process personal data. One impact may be a reduction in advertising mail volumes (a downside risk for 2018-19 noted by Royal Mail) due to advertiser caution29 about what is permissible under the GDPR. We note that in its half-year results, Royal Mail gives GDPR as one of the factors behind the decrease in addressed letter volumes, along with ongoing structural decline and business uncertainty.30
3.11 In November 2018, Royal Mail started to accept customer postings for the trial of a product called Partially Addressed Mail, which is mail addressed to a household, rather than an individual.31 This allows advertisers to target direct mail marketing campaigns to potential new customers without the need to use personal data.
25 For example, CFH’s Velopost. 26 For example, Citipost and CMS. 27 For example, Webbs of Leverington which delivers around 1000 letters a day in the Leverington and Wisbech area. See http://www.wisbechstandard.co.uk/news/leverington-newsagent-brian-webb-celebrates-60-years-of-being-in-news-industry-tomorrow-on-his-72nd-birthday-1-5135731 28 Royal Mail, 2017-18 Full Year Results Presentation, 2018, https://www.royalmailgroup.com/media/10049/royal-mail-fy2017-18-analyst-presentation.pdf. 29 See for example https://www.printweek.com/print-week/news/1165214/ad-spend-on-the-up-but-dm-activity-slows. 30 Royal Mail, 2018-19 Half Year Results, 2018, p.15, https://www.royalmailgroup.com/media/10493/royal-mail-plc-financial-report-for-the-half-year-ended-23-september-2018.pdf. 31 https://royalmailwholesale.com/partially-addressed-mail-service-trial
Annual monitoring update on the postal market: Financial year 2017-18
13
3.12 Another key development in relation to advertising mail in 2017-18 was the launch of JICMAIL in January 2018. JICMAIL is the new joint industry committee32 for the measurement of advertising mail in the UK, and it publishes pan-industry data on the quantity and type of advertising mail received by consumers, and how they engage with it. JICMAIL stated that the launch of JICMAIL brings direct mail advertising into line with other media which have their own cross-industry measurement systems and gives advertisers additional data on the effectiveness of direct mail advertising.
3.13 Financial services and the utilities sector are continuing to promote ‘paperless’ services or, in some cases, reducing the frequency of printed communications,33 though Royal Mail has stated that it does not expect the rate of e-substitution to increase.34
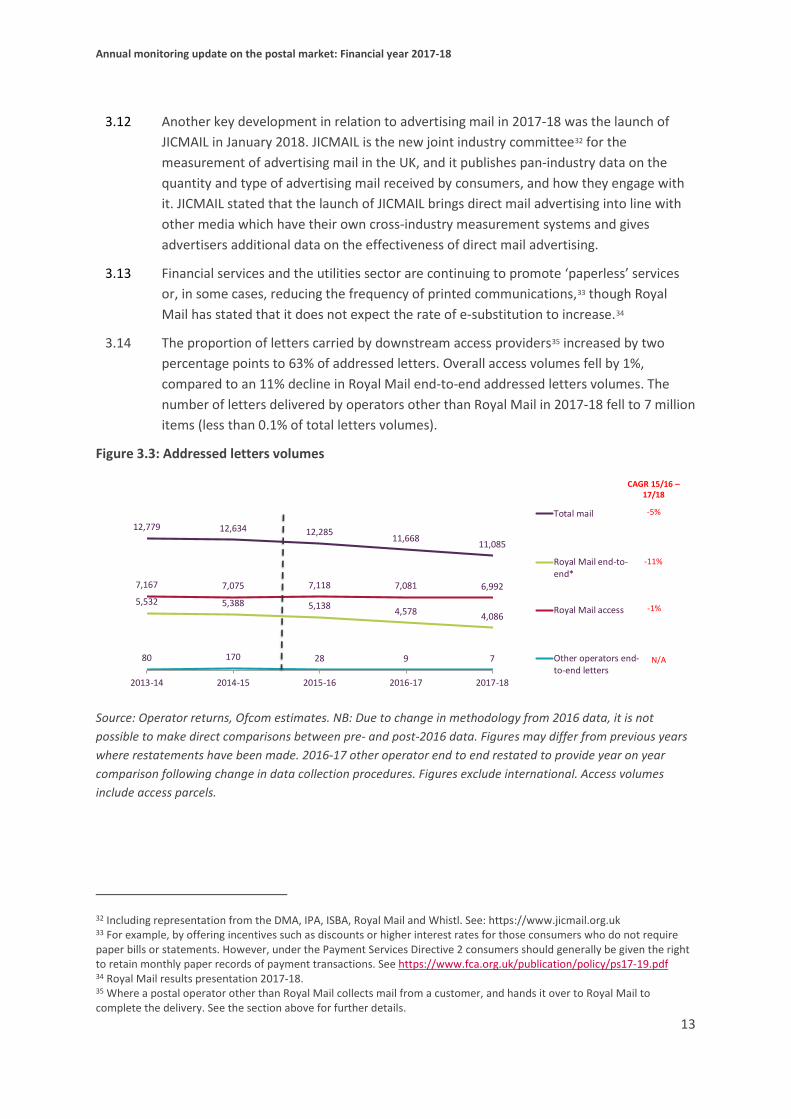
3.14 The proportion of letters carried by downstream access providers35 increased by two percentage points to 63% of addressed letters. Overall access volumes fell by 1%, compared to an 11% decline in Royal Mail end-to-end addressed letters volumes. The number of letters delivered by operators other than Royal Mail in 2017-18 fell to 7 million items (less than 0.1% of total letters volumes).
Figure 3.3: Addressed letters volumes
Source: Operator returns, Ofcom estimates. NB: Due to change in methodology from 2016 data, it is not possible to make direct comparisons between pre- and post-2016 data. Figures may differ from previous years where restatements have been made. 2016-17 other operator end to end restated to provide year on year comparison following change in data collection procedures. Figures exclude international. Access volumes include access parcels.
32 Including representation from the DMA, IPA, ISBA, Royal Mail and Whistl. See: https://www.jicmail.org.uk 33 For example, by offering incentives such as discounts or higher interest rates for those consumers who do not require paper bills or statements. However, under the Payment Services Directive 2 consumers should generally be given the right to retain monthly paper records of payment transactions. See https://www.fca.org.uk/publication/policy/ps17-19.pdf 34 Royal Mail results presentation 2017-18. 35 Where a postal operator other than Royal Mail collects mail from a customer, and hands it over to Royal Mail to complete the delivery. See the section above for further details.
12,779 12,634 12,28511,668 11,085
5,532 5,388 5,138 4,578 4,086
7,167 7,075 7,118 7,081 6,992
80 170 28 9 7
2013-14 2014-15 2015-16 2016-17 2017-18
Total mail
Royal Mail end-to-end*
Royal Mail access
Other operators end-to-end letters
CAGR 15/16 –17/18
-5%
-11%
-1%
N/A

Annual monitoring update on the postal market: Financial year 2017-18
14
Letters revenues fell by 6% in real terms between 2016-17 and 2017-18
3.15 Overall letters revenues fell by 6% in real terms to £4,047m in 2017-18, driven by an 8% real-terms decline in Royal Mail end-to-end letters revenues. Royal Mail access revenues fell by 2% to £1,546m.
3.16 Reported revenues retained by access operators was just under 4% of total reported letter revenues in 2017-18. Those revenues fell by 4% to £159m in 2017. This figure reflects the revenues retained by access operators for the delivery of mail, once payments to other operators (mainly Royal Mail) have been made. We note that access operators may bundle postal services with a range of value-added services such as mailroom management, mail collection, magazine distribution and printing. Revenue from these other services is not reported in the figures below but forms an important part of the revenue mix for some access operators.
Figure 3.4: Addressed letters revenues
Source: Royal Mail Regulatory Financial Statements, operator returns to Ofcom, Ofcom estimates. Adjusted for CPI at March 2018 prices. Royal Mail figures relate to the ‘reported business’. *Royal Mail end-to-end is an Ofcom calculation and refers to Royal Mail total letters revenues, excepting access. Royal Mail access revenues are as per its Regulatory Financial Statements and include a small number of parcels. The effect of this is that Royal Mail’s access revenues are slightly overstated, and its end-to-end revenues are slightly understated. Access revenues from access operators include a proportion of revenues from access parcels. Due to changes in methodology from 2015-16 data it is not possible to make direct comparisons between pre- and post-2016 data. 2016-17 end to end operator revenues and access operator restated to provide year on year comparison following change in data collection procedures in 2017-18.
Annual monitoring update on the postal market: Financial year 2017-18
15
3.17 Letter volume decline appears to be accelerating, with recent announcements from Royal Mail indicating 7% decline in addressed letter volumes in the first half of 2018-19,36 compared with 5% decline in both first half and full year results of 2017-18.
Price trends for retail bulk mail and access customers
Retail bulk mail prices
3.18 Royal Mail and other operators offer a number of products and services to business customers who send larger volumes of mail, which are not within the universal service.
3.19 Mailmark is a barcode service introduced by Royal Mail in November 2013, which offers enhanced services as compared to normal barcodes. In order to encourage users to migrate to Mailmark, Royal Mail has offered this product at a discounted rate compared to other barcode products (i.e. Barcode and OCR). There is also a similar Mailmark product offered for access products.
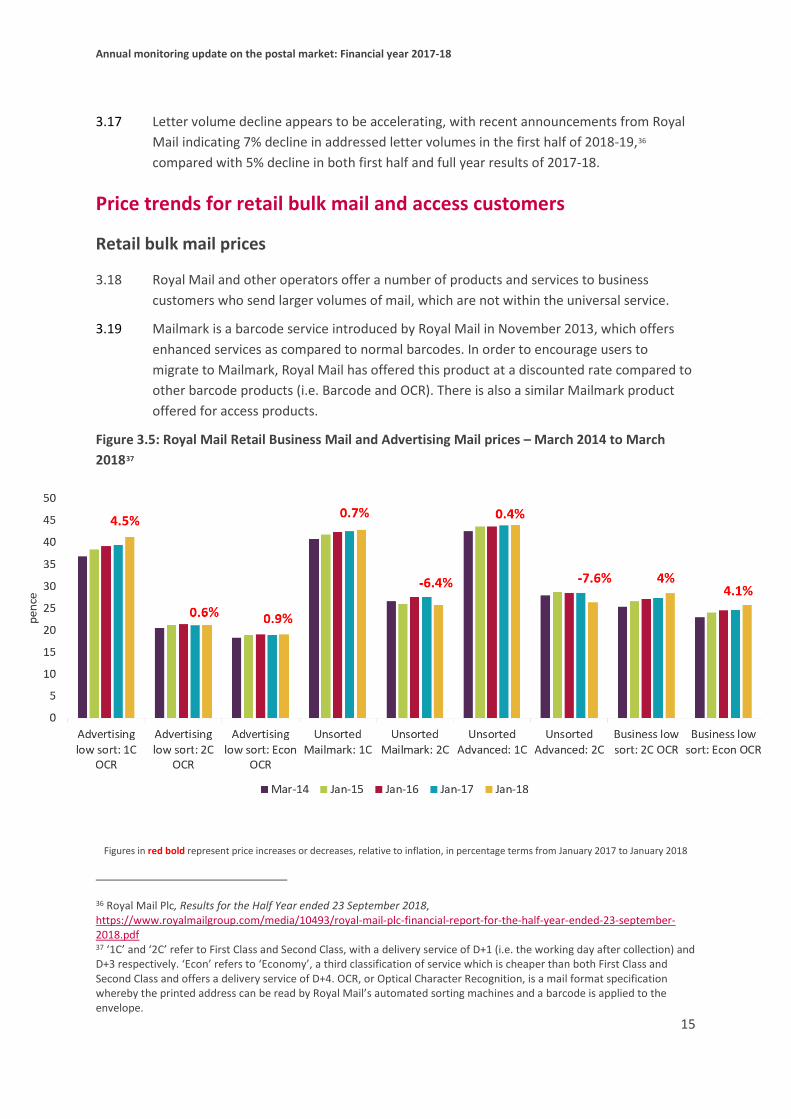
Figure 3.5: Royal Mail Retail Business Mail and Advertising Mail prices – March 2014 to March 201837
Figures in red bold represent price increases or decreases, relative to inflation, in percentage terms from January 2017 to January 2018
36 Royal Mail Plc, Results for the Half Year ended 23 September 2018, https://www.royalmailgroup.com/media/10493/royal-mail-plc-financial-report-for-the-half-year-ended-23-september-2018.pdf 37 ‘1C’ and ‘2C’ refer to First Class and Second Class, with a delivery service of D+1 (i.e. the working day after collection) and D+3 respectively. ‘Econ’ refers to ‘Economy’, a third classification of service which is cheaper than both First Class and Second Class and offers a delivery service of D+4. OCR, or Optical Character Recognition, is a mail format specification whereby the printed address can be read by Royal Mail’s automated sorting machines and a barcode is applied to the envelope.

Annual monitoring update on the postal market: Financial year 2017-18
16
Source: Royal Mail, Ofcom calculation based on maximum discounted prices i.e. 120k+ volume discounts and low sort barcode discount for standard letter sizes. Prices adjusted for CPI.
3.20 Overall, business and advertising mail prices increased in 2018. In real terms, price increases in 2018 were the same on average (0.1%) than the price increases for 2017 (0.1%).
3.21 Low sort Business Mail products increased by 6.6% on average in nominal terms, which represented a real terms price increase of 4.0%.
3.22 There was a price reduction of 4.1% in nominal terms for Unsorted Mailmark Second Class (a 6.4% reduction in real terms), in contrast to the 3.1% increase for an equivalent First Class service in nominal terms (0.7% increase in real terms).
3.23 Page 9 of the interactive data shows historic trends in business and advertising mail prices.38
Access prices
3.24 Royal Mail, under regulatory obligation, is obliged to offer access to its postal network to operators for certain letter and large letter services with a routing time of two working days or later. Figure 3.6 sets out the prices that Royal Mail charges access operators for national access products.
3.25 Royal Mail increased its access prices in January 2018. In real terms, price increases in 2018 were 2.1%, compared to the real terms price decreases for 2016-17 of -0.3%.39 Furthermore we note that further price increases have been announced, which Royal Mail expects to take effect in January 2019.
38 https://www.ofcom.org.uk/postal-services/information-for-the-postal-industry/monitoring_reports/interactive-data-2017-18 39 Last year, we reported that there was a small real terms increase to access mail prices in 2016-17. This year, one of Royal Mail’s access services (Customer Barcode) was discontinued, so we have recalculated last year’s price increases, in line with the services included in this year’s report.

Annual monitoring update on the postal market: Financial year 2017-18
17
Figure 3.6: Royal Mail national access prices – April 2014 to January 201840
Figures in red bold represent price increases or decreases, relative to inflation, in percentage terms from January 2017 to January 2018
Source: Royal Mail, Ofcom calculation based on National access prices, weighing 0-100g. Prices adjusted for CPI.
3.26 The most significant real terms price increases were in the Access 70 OCR and Access 1400 products (both 4.4%), which were greater than the real terms increases for these products in the previous year (0.7% and 0.4% respectively). Royal Mail has retained a price differential between Mailmark and Access 70 OCR products, as it continues to encourage take up of the Mailmark product.
3.27 In early 2015, Royal Mail introduced a provision to the terms of its contract with access operators that increased its flexibility to offer incentive schemes and promotions in
40 The terms ‘Access 70’ and ‘Access 1400’ refer to two different levels of mail sorting which must take place before access mail enters Royal Mail’s network. CBC stands for ‘Customer Barcode’, which is a mail format specification which applies to certain access products. OCR, or Optical Character Recognition, is a mail format specification whereby the printed address can be read by Royal Mail’s automated sorting machines and a barcode is applied to the envelope. CBC services were discontinued in 2018. In future AMRs, we will show trend data for OCR and Mailmark prices only.

Annual monitoring update on the postal market: Financial year 2017-18
18
access products to stimulate mail volume growth. These discounts are not included in Figure 3.6.
3.28 The average real terms price rise for non-advertising access mail (3.7%) was higher than both the prior year (0.5%) and 2016 (1.4%). As with its retail business mail prices, access price increases were lower for advertising mail than non-advertising mail, however overall advertising mail showed a real terms price increase (0.5%) compared to a decrease the prior year (-1.2%).
3.29 Page 10 of the interactive data shows historic trends in access mail prices.41
Reflecting on markets beyond the UK
3.30 As we have previously reported in the International Communications Market Report, letter mail volumes have been in decline across Europe. Between 2013 and 2016 domestic letter mail volumes across the EU, EEA and Switzerland declined by an average 4% each year. Denmark showed the most significant decline at 15%, where the government’s digitisation strategy from 2015 to promote online interactions between citizens and public bodies has contributed to the significant decline in letter volumes. The next highest declines were in the Netherlands, Italy and Norway at 8%; in contrast Germany experienced almost no change in volumes.
3.31 One response to declining letters volumes has been for universal service providers to increase the price of letters products. Between 2013 and 2016, the average price for a domestic priority letter (equivalent to First Class in the UK) increased 40% in nominal terms, with notable increases from 2015 to 2016 driven in particular by changes of 250% in Italy and 171% in Denmark.
3.32 To mitigate the challenges posed by structural decline, universal service providers in Europe are adopting a range of approaches in addition to price increases, including changes to their universal service obligation, restructuring, staff reduction, greater automation and diversification of their products and services, including developing their parcels business to take advantage of the growth in e-commerce.
41 https://www.ofcom.org.uk/postal-services/information-for-the-postal-industry/monitoring_reports/interactive-data-2017-18

Annual monitoring update on the postal market: Financial year 2017-18
19
4. The parcels market 4.1 This section outlines trends in the UK parcels sector for domestic parcels, and inbound
and outbound international parcels.42 We then summarise recent developments in the parcels market.
Collecting information on parcels
4.2 As part of our regular monitoring of the postal sector, we have collected volume and revenue information from parcel operators. This section sets out our analysis of this information. For the purposes of the information presented in this chapter, we have defined a parcel as an addressed postal item that is delivered end-to-end and is:
• larger than a large letter (i.e. an item up to length 353mm, width 250mm, thickness 25mm, and weighs no more than 750g);
• weighs no more than 31.5kg; and • can be lifted by a single average individual without mechanical aids.
4.3 We collected information from all major parcel operators providing UK-wide services. These companies are: The Alternative Parcels Company Limited, Amazon Logistics (encompassing both Amazon Marketplace and Amazon Retail), 43 DHL International Limited (including legacy DHL and UK Mail operations), DPD Group UK Limited, DX (Group) plc, FedEx UK Limited, Hermes Parcelnet Limited, Royal Mail Group Limited including Parcelforce Worldwide, TNT UK Limited, Tuffnells Parcels Express Limited, UPS Limited and Yodel Delivery Network Limited. We have not collected information from operators who offer only same-day delivery services.44
4.4 It is our view that the information we have collected represents the significant majority of UK parcel volumes and revenues carried by national operators. We recognise, however, that the range of operators we have collected information from may differ from other market sizing exercises, and therefore may not be directly comparable.
4.5 Where we state proportions of total volumes and revenues below, the figures presented are (unless otherwise stated) shares of the data collected. All revenue data are presented in real terms.
Parcel volumes and revenues
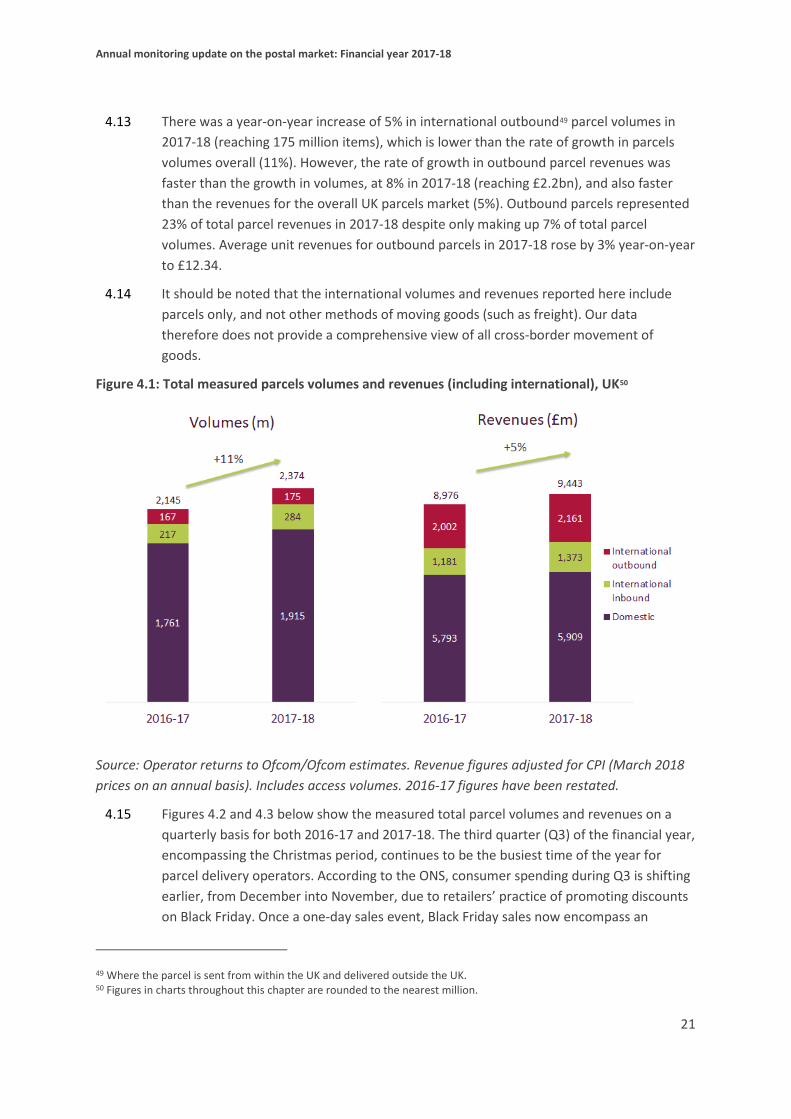
4.6 Growth in total measured parcel volumes and revenues accelerated in 2017-18. Volumes increased by 11% compared to 2016-17, reaching a total of 2.4 billion items. Total
42 International data is collected from operators within the United Kingdom. Ofcom is unable to confirm whether data captured in international outbound includes revenue from external shipping or delivery. 43 Excluding within the hour delivery. 44 The list of operators from whom we collected information is unchanged from the 2016-17 Annual monitoring update on the postal market. UK Mail was acquired by DHL in December 2016 (see paragraph 4.32) and is now listed as part of the latter.

Annual monitoring update on the postal market: Financial year 2017-18
20
revenues increased by 5%, a lower rate than the increase in volumes, reaching £9.4 billion. This is shown in Figure 4.1 below. The rate of growth in parcel volumes and revenues was faster in 2017-18 than in 2016-17, when there was a 7% increase in parcel volumes and a 3% increase in revenues year-on-year (adjusted for CPI).
4.7 Taking all measured UK parcels into account, average unit revenue decreased by 5% year-on-year – from £4.19 in 2016-17 to £3.98 in 2017-18.
4.8 The faster growth in parcel volumes than in parcel revenues may indicate the effect of competition in the UK parcels market on parcel prices. Another explanation for lower growth in revenues than in volumes could be a change in the mix of parcels being delivered by operators with an increase in the proportion of smaller, cheaper parcels, generating lower average unit revenues.
4.9 In 2017-18, measured domestic45 parcel volumes increased by 9% to 1.92 billion items and measured domestic revenues reached over £5.9bn, an increase of 2%. As illustrated in Figure 4.1, domestic parcels continue to make up the majority of parcel volumes and revenues, as in 2016-17.
4.10 While domestic parcels represented 81% of total volumes in 2017-18 (a decrease of 1 percentage point since 2016-17), they only made up 63% of total revenues (a decrease of 2 percentage points since 2016-17). The average unit revenue for a domestic parcel in 2017-18 was £3.09, 6% lower than in 2016-17.
4.11 International inbound46 parcel volumes reached 284 million items in 2017-18, an increase of 30% year-on-year. Inbound parcels made up 12% of total measured volumes and 15% of total measured revenues (an increase of 2 percentage points from 2016-17 in each case). However, inbound revenues did not grow as fast as volumes, meaning that the average unit revenue for inbound parcels decreased from £5.43 to £4.84 (-11%) year-on-year.
4.12 It is possible that the notable year-on-year increase in measured international inbound volumes may reflect a rise in cross-border e-commerce purchases, particularly from China. There has been significant growth in Chinese parcel volumes during 2017: according to the Chinese State Post Bureau, Chinese express delivery firms dispatched around 28% more items globally in 2017 than in the previous year.47 A survey from the International Post Corporation found that Chinese parcels accounted for 34% of all global cross-border parcels in 2017. The same survey found that in 2017, 40% of international e-commerce shoppers in the UK had bought their most recent cross-border purchase from China, with the next highest proportion being purchases from the US at 24%.48
45 Where the parcel is sent and delivered in the UK. 46 Where the parcel is sent from outside the UK and delivered in the UK. 47 https://postandparcel.info/92623/news/infrastructure/chinas-parcel-volumes-hit-40bn-2017/ 48 International Post Corporation, 2018. Cross-border e-commerce shopper survey 2017, page 4; page 13, https://www.ipc.be/sector-data/e-commerce/cross-border-e-commerce-shopper-survey.
Annual monitoring update on the postal market: Financial year 2017-18
21
4.13 There was a year-on-year increase of 5% in international outbound49 parcel volumes in 2017-18 (reaching 175 million items), which is lower than the rate of growth in parcels volumes overall (11%). However, the rate of growth in outbound parcel revenues was faster than the growth in volumes, at 8% in 2017-18 (reaching £2.2bn), and also faster than the revenues for the overall UK parcels market (5%). Outbound parcels represented 23% of total parcel revenues in 2017-18 despite only making up 7% of total parcel volumes. Average unit revenues for outbound parcels in 2017-18 rose by 3% year-on-year to £12.34.
4.14 It should be noted that the international volumes and revenues reported here include parcels only, and not other methods of moving goods (such as freight). Our data therefore does not provide a comprehensive view of all cross-border movement of goods.
Figure 4.1: Total measured parcels volumes and revenues (including international), UK50
Source: Operator returns to Ofcom/Ofcom estimates. Revenue figures adjusted for CPI (March 2018 prices on an annual basis). Includes access volumes. 2016-17 figures have been restated.
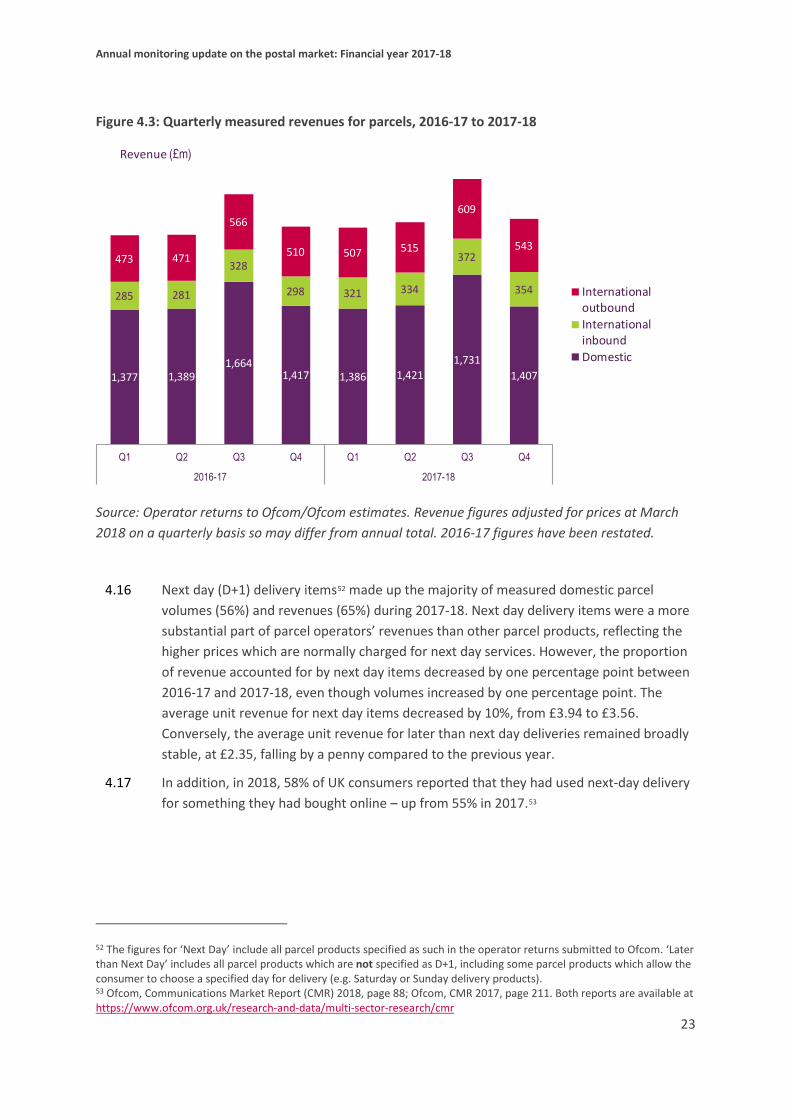
4.15 Figures 4.2 and 4.3 below show the measured total parcel volumes and revenues on a quarterly basis for both 2016-17 and 2017-18. The third quarter (Q3) of the financial year, encompassing the Christmas period, continues to be the busiest time of the year for parcel delivery operators. According to the ONS, consumer spending during Q3 is shifting earlier, from December into November, due to retailers’ practice of promoting discounts on Black Friday. Once a one-day sales event, Black Friday sales now encompass an
49 Where the parcel is sent from within the UK and delivered outside the UK. 50 Figures in charts throughout this chapter are rounded to the nearest million.

Annual monitoring update on the postal market: Financial year 2017-18
22
extended period of retail discounts in late November. The ONS reports that in 2017, the value of online sales increased by 10.2% year-on-year in November and 9.4% in December.51
Figure 4.2: Quarterly measured volumes for parcels, 2016-17 to 2017-18
Source: Operator returns to Ofcom/Ofcom estimates. Includes access volumes. 2016-17 figures have been restated.
51 ONS estimates, seasonally adjusted (by the ONS) to remove systemic variation due to seasonal and other calendar-related effects. https://www.ons.gov.uk/businessindustryandtrade/retailindustry/bulletins/retailsales/november2017; https://www.ons.gov.uk/businessindustryandtrade/retailindustry/bulletins/retailsales/december2017#year-on-year-contributions-to-growth-by-four-main-sectors
405 402
510445 426 452
585
453
52 49
62
55 60 60
87
77 38 39
49
41 41 41
50
43
Q1 Q2 Q3 Q4 Q1 Q2 Q3 Q4
2016-17 2017-18
InternationaloutboundInternationalinboundDomestic
Volumes (m)
Annual monitoring update on the postal market: Financial year 2017-18
23
Figure 4.3: Quarterly measured revenues for parcels, 2016-17 to 2017-18
Source: Operator returns to Ofcom/Ofcom estimates. Revenue figures adjusted for prices at March 2018 on a quarterly basis so may differ from annual total. 2016-17 figures have been restated.
4.16 Next day (D+1) delivery items52 made up the majority of measured domestic parcel volumes (56%) and revenues (65%) during 2017-18. Next day delivery items were a more substantial part of parcel operators’ revenues than other parcel products, reflecting the higher prices which are normally charged for next day services. However, the proportion of revenue accounted for by next day items decreased by one percentage point between 2016-17 and 2017-18, even though volumes increased by one percentage point. The average unit revenue for next day items decreased by 10%, from £3.94 to £3.56. Conversely, the average unit revenue for later than next day deliveries remained broadly stable, at £2.35, falling by a penny compared to the previous year.
4.17 In addition, in 2018, 58% of UK consumers reported that they had used next-day delivery for something they had bought online – up from 55% in 2017.53
52 The figures for ‘Next Day’ include all parcel products specified as such in the operator returns submitted to Ofcom. ‘Later than Next Day’ includes all parcel products which are not specified as D+1, including some parcel products which allow the consumer to choose a specified day for delivery (e.g. Saturday or Sunday delivery products). 53 Ofcom, Communications Market Report (CMR) 2018, page 88; Ofcom, CMR 2017, page 211. Both reports are available at https://www.ofcom.org.uk/research-and-data/multi-sector-research/cmr
1,377 1,3891,664
1,417 1,386 1,4211,731
1,407
285 281
328
298 321 334
372
354
473 471
566
510 507 515
609
543
Q1 Q2 Q3 Q4 Q1 Q2 Q3 Q4
2016-17 2017-18
InternationaloutboundInternationalinboundDomestic
Revenue (£m)

Annual monitoring update on the postal market: Financial year 2017-18
24
Figure 4.4: Domestic parcel volumes and revenues by speed of delivery: 2016-17 and 2017-18
Source: Operator returns to Ofcom/Ofcom estimates. Revenue figures adjusted for CPI. Includes access volumes. 2016-17 figures have been restated.
Table 4.1: Average unit revenue for different parcel products, 2017-18
Delivery type Average Unit Revenue YoY change
All measured parcels £3.98 -5%
Domestic £3.09 -6%
- Next day £3.56 -10%
- Later than next day £2.35 --
International inbound £4.84 -11%
International outbound £12.34 +3%
Developments in the parcels sector
Growing e-commerce
4.18 The growth in parcel volumes and revenues set out above is reflective of the continuing rise of e-commerce in the UK and worldwide. The Office for National Statistics has reported that online sales made up 16.3% of total UK retail sales in 2017, up from 14.7%
965 1,074
795841
1,7611,915
2016-17 2017-18
3,803 3,824
1,876 1,976
113 1105,793 5,909
2016-17 2017-18
Other/Not specified
Later than next day
Next day
Volumes (m) Revenues (£m)
+9%+2%
1<1
Annual monitoring update on the postal market: Financial year 2017-18
25
in 2016 and 12.5% in 2015.54 Meanwhile, the value of online retail sales in the UK increased by 11% in September 2018 compared to September 2017.55 Similarly high growth rates were reported in research from IMRG and Capgemini, which found that the value of UK online retail sales in January 2018 increased by 13.9% year-on-year.56
Investing in new facilities
4.19 Amazon, the largest e-commerce retailer in the UK, has enjoyed a period of sustained growth, with global net sales increasing by 31% in the calendar year 2017.57 Increasing revenues from Amazon’s global online sales have supported Amazon’s investment in UK delivery infrastructure. Amazon has invested over £6.4 billion in this infrastructure since 2010 and currently operates 16 distribution centres, with four further sites set to open before the end of 2018, in Rugby, Bolton, Bristol and Coventry.58
4.20 Other parcel delivery operators are also investing in new infrastructure aimed at increasing their share of e-commerce. In May 2018, UPS opened a new £120m facility at DP World London Gateway Logistics Park. The new facility is located near the mouth of the Thames and is aimed at increasing the capability of UPS in processing cross-border parcels.59 DPD opened a new distribution centre in Nottingham and a depot in Barking in June 2018.60
4.21 Royal Mail has recently conducted trials of a new type of street-level infrastructure providing access to its delivery network: parcel postboxes. Users are able to drop off their parcels in the postbox in much the same way as they would do with a traditional Royal Mail letters postbox, having paid for the postage in advance by printing a label at home and fixing it to the parcel before posting it. The trial took place from 12 August to 5 November 2018 across two UK cities, Northampton and Leicester. Royal Mail launched the trial with the expectation that the new postboxes would be useful for small online retailers, as well as consumers who post a large number of parcels.61 In September 2018, its Parcelforce business began a similar trial when it opened self-service parcel kiosks at three of its UK depots (London Central, Newcastle and Milton Keynes). Much like Royal Mail’s parcel postboxes, the Parcelforce kiosks are targeted at small or occasional online retailers. The kiosks are designed to provide a faster service for customers sending multiple parcels from Parcelforce’s depots by allowing customers to pay for postage in advance.62
54 https://www.ons.gov.uk/businessindustryandtrade/retailindustry/timeseries/j4mc/drsi. 55 ONS estimates, seasonally adjusted (by the ONS) to remove systemic variation due to seasonal and other calendar-related effects. See https://www.ons.gov.uk/businessindustryandtrade/retailindustry/bulletins/retailsales/july2018#toc 56 https://www.imrg.org/data-and-reports/imrg-capgemini-sales-indexes/sales-index-february-2018/. 57 Amazon, Annual Report 2017, page 18. http://phx.corporate-ir.net/External.File?item=UGFyZW50SUQ9NjkyMDIxfENoaWxkSUQ9NDAyOTkyfFR5cGU9MQ==&t=1 58 https://postandparcel.info/97779/news/e-commerce/amazon-uk-services-profits-triple-in-2017/. 59 https://postandparcel.info/96142/news/parcel/ups-officially-opens-120m-london-hub/. 60 https://postandparcel.info/97073/news/parcel/dpd-opens-new-facilities-in-nottingham-and-barking/. 61 https://www.royalmail.com/parcel-postboxes/. 62 https://tamebay.com/2018/08/parcelforce-worldwide-trialling-self-serve-kiosks.html.

Annual monitoring update on the postal market: Financial year 2017-18
26
Improving tracking services
4.22 Several parcel operators have developed their parcel tracking services over recent months. In August 2018, Royal Mail announced enhancements to its tracked parcel services for online retailers, including:
• launching electronic ‘something for you’ notifications (in the form of texts and/or emails) for when a parcel cannot be delivered due to the recipient being absent;
• providing the exact address of a neighbour with whom parcels have been left when a parcel recipient is not at home; and
• offering earlier parcel acceptance scans at all Royal Mail customer service points/delivery offices to enable more accurate real-time tracking.63
4.23 Other parcel operators have invested in new software platforms to improve parcel tracking. In May 2018, DPD added new features to its ‘Your DPD’ app (originally launched in 2016), with the new ‘sent parcels’ function providing push notifications to customers at each stage of delivery.64 Also in May 2018, APC Overnight launched two new services to improve tracking: APC Pin Point and APC Called. APC Pin Point allows customers to view a delivery driver’s location on an online map, while APC Called provides an electronic notification to a customer if they are not present when the delivery arrives, allowing them to re-schedule delivery.65 Meanwhile, Parcelforce has launched a new online dashboard for smartphones, tablets and laptops which offers customers the ability to track multiple deliveries.66 In October 2018, Yodel announced the launch of its ‘Inflight’ service on the Yodel app, allowing customers to track the delivery driver in real-time and to change their delivery options and preferred address up to an hour before the delivery is due.67 Other operators already offer similar services and apps, such as DPD and Hermes.
Price changes
4.24 The following examples detail price changes and offers for residential customers, small businesses and sellers in online marketplaces, and do not refer to bulk contracts.
4.25 In February 2018, Hermes reduced its prices for parcels in some of its parcel weight bands. For instance, the price of a courier collected parcel in the 5-10kg weight band dropped by 17.6%, from £8.49 to £6.99 (including VAT).68 This price change came six months after Hermes’ last set of price reductions, which took place in summer 2017 for a limited period and was reported in Ofcom’s previous Annual Monitoring Update.
63 https://www.royalmailgroup.com/en/press-centre/press-releases/royal-mail-group/royal-mail-enhancing-online-shopping-delivery-experience/. 64 https://postandparcel.info/96482/news/parcel/dpd-launches-in-app-parcel-sending-service/. 65 https://postandparcel.info/96190/news/parcel/apc-overnight-delivers-new-services-to-sme-customers/. 66 https://postandparcel.info/97441/news/innovation/parcelforce-worldwide-launches-new-online-parcels-dashboard/. 67 https://www.yodel.co.uk/news/2018/october/yodel-announces-launch-of-inflight/. 68 https://postandparcel.info/93473/news/parcel/hermes-price-changes/.

Annual monitoring update on the postal market: Financial year 2017-18
27
4.26 Collect Plus, a parcel pick-up and drop-off service based in UK shops which is partnered with Yodel, also announced price reductions for parcels under 2kg in weight in May 2018. The cost of sending economy parcels (3-5 day delivery) decreased from £4.99 to £3.99. Standard parcels (2-day delivery) were reduced from £5.69 to £4.69.69
Merger and acquisition activity
4.27 In September 2018, Royal Mail Group announced that it had bought Dicom Canada, a Canadian parcel delivery company focusing on business-to-business deliveries, for C$360 million (£214 million).70 The purchase was made by Royal Mail’s international parcels business, General Logistics Systems (GLS), and is the latest in a series of acquisitions across a number of countries. In February 2018, GLS bought the Spanish express delivery firm Redyser Transporte, a further expansion of GLS’ capacity in Spain following its purchase of ASM Transporte Urgente in June 2016 (reported in Ofcom’s previous Annual Monitoring Update). Last year we also reported on GLS’ acquisition of Postal Express, a regional overnight parcels operator based in the US, in April 2017.71
4.28 Whistl, the UK’s largest access operator, acquired the Nottinghamshire-based firm Parcelhub, in June 2018. Parcelhub acts as a point of contact between businesses and parcel carriers, offering discounted access to the services offered by those carriers. It also provides a software platform that allows business customers to track and manage the details of delivery for their products. Whistl also acquired Parcelhub’s sister company Mail Workshop, which provides similar services for distributors of print products (i.e. magazines and leaflets).72 These acquisitions form the latest step in Whistl’s long-term strategy to expand further into fulfilment services following the company’s takeover of a similar firm – Prism DM – in August 2017. ‘Fulfilment’ in this context refers to the services purchased by businesses in order to get their items to customers. Fulfilment encompasses delivery, but often also involves other services – such as warehousing and delivery management software. Prism DM was rebranded as ‘Whistl Fulfilment’ in February 2018.73
4.29 Jersey’s postal USO provider, Jersey Post, has also sought to expand its fulfilment operations through its investment in the Southampton-based firm Parcel Monkey in March 2018. Parcel Monkey is a market place which allows parcel senders to compare prices and services provided by multiple third-party parcel operators and allows them to make bookings through the site. This allows senders to work on behalf of retailers to
69 https://postandparcel.info/96282/news/parcel/collectplus-cuts-pricing-for-send-service/. 70 https://uk.reuters.com/article/uk-royal-mail-dicom-canada/royal-mail-buys-into-canada-with-c360-million-courier-deal-idUKKCN1LJ0IQ. 71 Ofcom, 2017. Annual monitoring update on the postal market – Financial year 2016-17, pages 45-46. https://www.ofcom.org.uk/__data/assets/pdf_file/0019/108082/postal-annual-monitoring-report-2016-2017.pdf. 72 https://postandparcel.info/96639/news/e-commerce/whistl-buys-parcelhub-and-mail-workshop/. 73 https://postandparcel.info/93520/news/e-commerce/whistl-rebrands-prism-dm-whistl-fulfilment/.

Annual monitoring update on the postal market: Financial year 2017-18
28
arrange delivery via third-party parcel carriers, while other companies in the group provide warehousing facilities and delivery software solutions.74
4.30 Also in March 2018, FedEx announced that it had bought P2P Mailing Limited, a UK-based company which partners with last-mile postal operators to provide international delivery services to e-commerce clients.75 FedEx paid £92m for P2P Mailing, which was previously owned by the Delivery Group (the owners of letters operators Secured Mail and CMS).76 FedEx’s acquisition reflects the increasing importance of global e-commerce, potentially allowing for greater integration between P2P’s relations with e-commerce clients and FedEx’s last mile delivery capability.
4.31 In July 2018, UK Mail announced that it will rebrand its parcels operations under the name ‘DHL Parcel UK’, in the latest stage of its integration with DHL. UK Mail was acquired by Deutsche Post DHL Group in December 2016. The UK Mail brand will remain unchanged for letter and packet operations.77
4.32 Connect Group, the owners of Pass My Parcel (PMP), announced in June 2018 that they were planning to shut down PMP following a disappointing set of financial results for the group. DHL Group’s UK Mail have since agreed to acquire PMP, with full transition expected by June 2019.78
Summary
4.33 The UK parcels market has grown at a higher rate in 2017-18 than in 2016-17. As in 2016-17 and 2015-16, there was higher growth in volumes than in revenues. The growth in volumes has been stimulated by continuing growth in e-commerce, both in the UK and globally.
4.34 Q3 remains the busiest period of the year for parcel operators accounting for 30% of annual volumes, with a notable increase year-on-year compared to 2016-17 (16%). There is a slight increase in next day deliveries as a proportion of total volumes, but declining average unit revenues.
4.35 E-commerce is stimulating various parcel operators to invest in new infrastructure and new services – especially tracking software – to meet growing consumer demand for these services and gain market share. Some companies have chosen to acquire smaller firms and invest in integrating the range of services they provide to e-commerce retailers. Competition appears to be triggering some operators to lower the prices of certain single piece parcel products, benefiting residential consumers and SMEs.
74 https://postandparcel.info/94719/news/parcel/jersey-post-invests-in-parcel-monkey/. 75 http://p2pmailing.co.uk/about-us/. 76 https://postandparcel.info/94734/news/parcel/fedex-buys-p2p/. 77 https://postandparcel.info/97530/news/post/uk-mail-rebranding-to-dhl-parcel-uk/. 78 https://postandparcel.info/96773/news/e-commerce/pass-my-parcel-to-close/. https://postandparcel.info/97129/news/infrastructure/uk-mail-reportedly-set-to-take-over-pass-my-parcel/.

Annual monitoring update on the postal market: Financial year 2017-18
29
5. Consumer and business experience of postal services Introduction
5.1 In this section, we present data from our ongoing market research programme. We run two separate surveys to track use of and attitudes to post, one focused on residential consumers and the other focused on small and medium enterprise (SME) business customers.79 The data reported here are from the period of Q3 2017 to Q2 2018 reflecting the most up-to-date data we have at the time of publication.
5.2 The data from these surveys are published on our website going back to 2012 when the research programme began.80 The research was briefly paused in 2015, as a review was carried out to consider what additional data it might be necessary for us to obtain in light of changing consumer and business behaviour. Methodological and questionnaire changes at the start of 2016 for the residential tracker mean that data from prior to this time are not directly comparable. Comparisons are made to the same period in 2016-2017 results where relevant.
Residential consumers
5.3 Nearly nine in ten residential consumers are satisfied with Royal Mail (86%) and postal services overall (87%), with dissatisfaction levels at 4% and 3% respectively. Three quarters (77%) are satisfied with the value for money of postal services overall, with 7% dissatisfied. These results are in line with 2016-17. Overall satisfaction with Royal Mail is at a similar level in each of the UK Nations, at 85% in England, 87% in Scotland, 85% in Wales and 89% in Northern Ireland. Satisfaction with the value for money of postal services overall stands at 78% in England, 76% in both Scotland and Wales, and 83% in Northern Ireland.
79 Businesses that have under 250 employees. 80 https://www.ofcom.org.uk/__data/assets/pdf_file/0017/105074/cmr-2017-uk.pdf; our Statistical Release Calendars can be found at https://www.ofcom.org.uk/research-and-data/data/statistics. The residential and business postal tracker data is available from our Statistical Release Calendar on 24 August 2018. Our data files show further information on the results of the survey broken down by categories of customers, for instance by age groups or nations. Examples of results by nations, where relevant, are included in footnote.

Annual monitoring update on the postal market: Financial year 2017-18
30
Figure 5.1: Residential consumers’ satisfaction with postal services
Source: Ofcom Residential Postal Tracker Q3 2017 – Q2 2018 (5,779), Q3 2016-Q2 2017 (6097)
Base: All Respondents
QG2: How satisfied are you overall with the postal services in terms of delivering value for money for sending mail? QG5: How would you rate your overall satisfaction with Royal Mail? QG6: How would you rate your overall satisfaction with postal services? (ALL providers)
5.4 Looking at specific aspects of Royal Mail’s service, residential consumers are most satisfied with items sent reaching their destination (86%), items being delivered intact/ undamaged (85%), the quality of postal delivery to the home (84%) and the delivery
1%
1%
2%
2%
10%
9%
48%
48%
39%
39%
2016/17
2017/18
Don’t know Very dissatisfied Fairly dissatisfied
Neither Fairly satisfied Very satisfied
Overall Satisfaction postal services
87%
76%
NET Satisfied
1%
1%
3%
3%
11%
10%
48%
47%
36%
39%
2016/17
2017/18
Don’t know Very dissatisfied Fairly dissatisfied
Neither Fairly satisfied Very satisfied
86%
76%
NET Satisfied
Overall Satisfaction with Royal Mail
2%
2%
6%
5%
15%
14%
44%
45%
31%
32%
2016/17
2017/18
Don’t know Very dissatisfied Fairly dissatisfied
Neither Fairly satisfied Very satisfied
77%
76%
NET Satisfied
Satisfaction with value for money for sending mail

Annual monitoring update on the postal market: Financial year 2017-18
31
speed (83%).81 This is in line with levels in 2016-2017. Also, in line with 2016-2017, the lowest levels of satisfaction were with the cost of postage (62%), product and service innovation (54%) and easy access to information, for example about complaints procedures (49%).
Figure 5.2: Residential consumers’ satisfaction with specific aspects of Royal Mail’s service
Source: Ofcom Residential Postal Tracker Q3 2017 – Q2 2018 (5,796), Q3 2016-Q2 2017 (6,097)
Base: All Respondents
QG3: How satisfied are you with the following aspects of Royal Mail’s service? (NET: “very satisfied” and “fairly satisfied”)
5.5 About two thirds (67%) of residential consumers think that First Class Stamps represent good value for money, with a lower percentage (58%) thinking that Second Class Stamps are good value. One in five (19%) said that Second Class stamps are poor value, while a lower proportion said this about First Class Stamps (13%). In both cases, perceptions of good value for money is in line with Q3 2016 to Q2 2017 (66% for First Class stamps, and 58% for Second Class stamps).
81 Respondents in Northern Ireland were more likely to be satisfied with the availability of post office branches than respondents in the UK overall (net satisfaction 81% vs 70%), but fewer respondents in Wales are satisfied than respondents in Northern Ireland (67% vs 81%).
49%
54%
62%
70%
74%
78%
83%
84%
85%
86%
49%
57%
59%
71%
74%
78%
82%
84%
84%
85%
Easy access to information
Product and service innovation
Cost of postage
Availability of post office branches
Accessibility of services
Availability of post boxes
Speed of delivery
Quality of postal delivery to your home
Items being delivered intact/undamaged
Items you are sending reaching their destination
2016-17 2017-18

Annual monitoring update on the postal market: Financial year 2017-18
32
Figure 5.3: Residential consumers’ perception of value for money of stamps
Source: Ofcom Residential Postal Tracker
Base: All Respondents Q3 2017 – Q2 2018 (5836), Q3 2016-Q2 2017 (6097)
QF4: A First-Class stamp currently costs 64/65p. How would you rate Royal Mail’s First-Class service in terms of value for money? QF5: A Second-Class stamp currently costs 55/56p. How would you rate Royal Mail’s Second-Class service in terms of value for money?
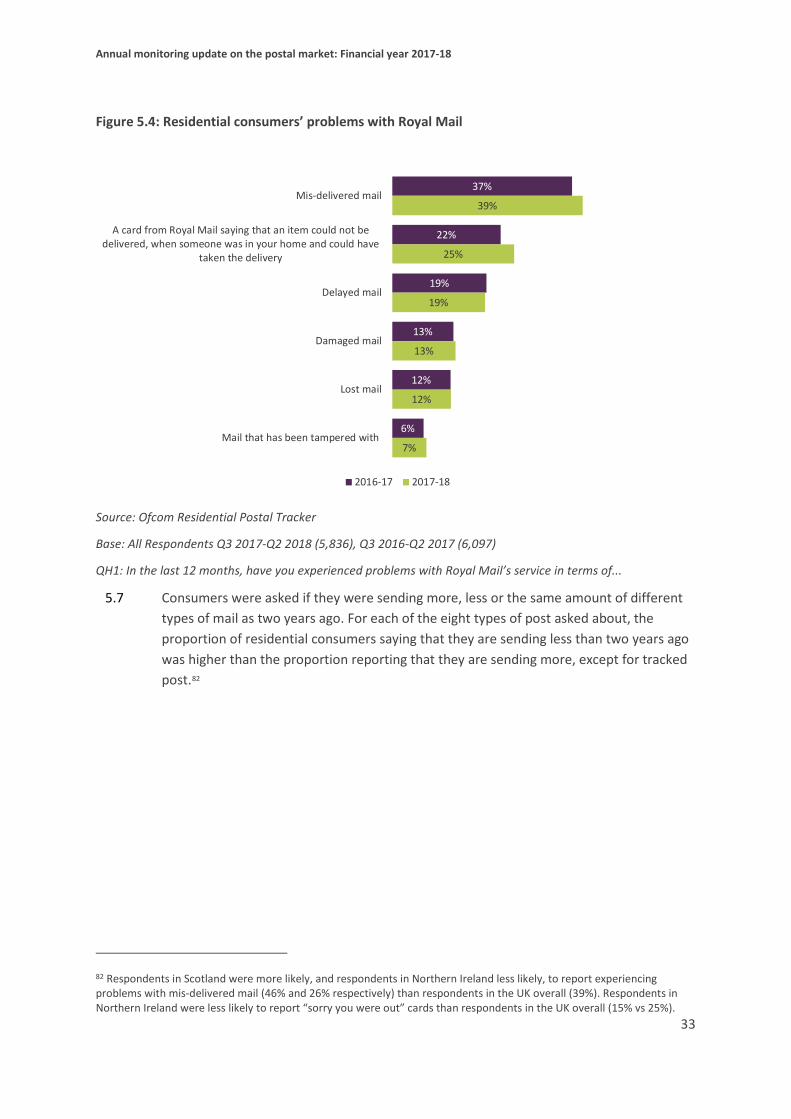
5.6 Respondents were asked whether they had experienced one or more of a range of problems with Royal Mail’s service over the past year. Whilst the majority have not encountered the specific problems asked, consumers reported experiencing similar types of problems to those reported in 2016-2017. Around four in ten (39%) reported mis-delivered mail, while a quarter said they had received a card from Royal Mail saying that an item could not be delivered when someone was at home and could have taken delivery. Around one in five (19%) reported a problem with delayed mail. Reported experience of misdelivered mail is slightly up (39% vs 37%) and of the proportion reporting to have experienced a card from Royal Mail saying an item could not be delivered when someone was in your home also went up from 22% in 2016-17 to 25%.
27%
27%
40%
39%
19%
18%
10%
11%
3%
5%
2017/18
2016/17
NET: Good
67%
66%
58%
58%
22%
23%
36%
35%
21%
21%
14%
14%
5%
6%
2017/18
2016/17
Very good Fairly good Neither good nor poor Fairly poor Very poor
First Class
Second Class
Annual monitoring update on the postal market: Financial year 2017-18
33
Figure 5.4: Residential consumers’ problems with Royal Mail
Source: Ofcom Residential Postal Tracker
Base: All Respondents Q3 2017-Q2 2018 (5,836), Q3 2016-Q2 2017 (6,097)
QH1: In the last 12 months, have you experienced problems with Royal Mail’s service in terms of...
5.7 Consumers were asked if they were sending more, less or the same amount of different types of mail as two years ago. For each of the eight types of post asked about, the proportion of residential consumers saying that they are sending less than two years ago was higher than the proportion reporting that they are sending more, except for tracked post.82
82 Respondents in Scotland were more likely, and respondents in Northern Ireland less likely, to report experiencing problems with mis-delivered mail (46% and 26% respectively) than respondents in the UK overall (39%). Respondents in Northern Ireland were less likely to report “sorry you were out” cards than respondents in the UK overall (15% vs 25%).
37%
22%
19%
13%
12%
6%
39%
25%
19%
13%
12%
7%
Mis-delivered mail
A card from Royal Mail saying that an item could not bedelivered, when someone was in your home and could have
taken the delivery
Delayed mail
Damaged mail
Lost mail
Mail that has been tampered with
2016-17 2017-18

Annual monitoring update on the postal market: Financial year 2017-18
34
Table 5.1: Consumers sending different types of post compared to two years ago
Source: Ofcom Residential Postal Tracker
Base: All Respondents Q3 2017 – Q2 2018(2903)
QD12: Frequency of sending ... compared to two years ago (note this question was asked in alternate months)
5.8 Residential consumers were also asked about the amount of different types of post that they are receiving, compared to two years ago.
5.9 The biggest increase reported was for direct mail, with a third reporting that they are receiving more of this type of mail compared to a fifth receiving less. Increases are also noted for parcels both large and small. A quarter reported receiving more smaller parcels (that will fit through a letter box) compared to just over one in ten (12%) receiving less, whilst 23% reported receiving more larger parcels (that will not fit through a letter box) compared to 14% who say they receive fewer.
5.10 The biggest decreases in mail received are seen in social mail, 6% say they are receiving more invitations, greeting cards and postcards compared to almost three in ten (28%) receiving less than 2 years ago. Similarly, 5% say they are receiving more personal letters than two years ago compared to 35% receiving less. Receipt of transactional mail such as bills/invoices/statements is also perceived to have declined considerably, 12% of respondents reported receiving more of these than two years ago compared to more than a third (36%) who reported that they are receiving less.
Type of mail Sent more(%)
No change
Sent less (%)
Net more/ Less
Invitations/ greeting cards / postcards 9 55 35 -26
Personal letters (e.g. to a friend/ relative) 7 54 38 -31
Formal letters to organisations/ individuals 10 54 35 -25
Payment for bills 7 52 40 -33
Smaller parcels 16 62 20 -4
Larger parcels 15 63 20 -5
Items requiring a signature 14 68 17 -3
Tracking post 18 65 15 +3
Other items not mentioned 2 26 5 -3

Annual monitoring update on the postal market: Financial year 2017-18
35
Table 5.2: Consumers receiving different types of post compared to two years ago
Source: Ofcom Residential Postal Tracker
Base: All respondents in even months Q3 2017-Q2 2018 (n= 2,969),
QE11: Frequency of receiving ... compared to two years ago
5.11 Residential consumers were asked to rate the importance of several different factors when sending letters. Over four in five (83%) said that guaranteed delivery to recipient was “mandatory” or “great to have”, followed by same price to send anywhere within the UK (82%), low cost (81%), and delivery within three days (78%). The option receiving the lowest level of importance attached was a next day delivery option (64%).83 As this is the first time we report these figures broken down in more detail, we have also added the results for last year. This year’s results are broadly in line with the results in 2016-17.
83 Respondents in Northern Ireland were more likely to see fast delivery as a “must have” than respondents in the UK as a whole (42% vs 33%)
Type of mail Received more (%)
No change
Received less (%)
Net change
Invitations/ greeting cards / postcards 6 64 28 -22
Personal letters 5 59 35 -30
Formal letters from known organisations 14 62 23 -9
Bills, invoices and statements 12 51 36 -24
Magazines you subscribe to 6 62 20 -14
Catalogues and brochures 23 50 27 -4
Newsletters, leaflets and promotions from known organisations
25 50 24 +1
Items requiring a signature 20 62 13 +7
Addressed direct mail from unknown organisations 33 45 21 +12
Smaller parcels 25 62 12 +13
Larger parcels 23 62 14 +9

Annual monitoring update on the postal market: Financial year 2017-18
36
Figure 5.5a: Factors rated as important for people when sending letters 2017-18
QD10b. Below, are a list of factors people tell us they consider when sending letters. For each factor, please tell us how important it is to you in choosing a postal provider or service.
Base: all who use Royal Mail for letters or large letters and selected a service 2017-18 (2,903)
Figure 5.5b: Factors rated as important for people when sending letters (2016-17)
23%
38%33%
37% 39% 38% 41%
51%
41%
35% 43%41% 39% 43%
41%
32%
27%
19% 20% 17% 17% 16% 15% 13%
9% 7%4% 3% 2% 4% 4% 3%
Next day deliveryoption
Daily collectionservice
Fast delivery Convenient topost (within 1/2
mile)
Delivery within 3days
Low cost Same price toanywhere in the
UK
Guaranteeddelivery to
recipient's door
Mandatory Great to have Nice to have Not important Negative to me
Net:impt 64% 73% 76% 78% 78% 81% 82% 83%
22%34% 29% 35% 34% 37% 38%
47%
41%
35% 44%40% 41%
44% 42%35%
28%22% 22% 20% 19% 16% 15% 15%
9% 7% 5% 4% 4% 3% 4% 3%
Next daydeliveryoption
Dailycollection
service
Fast delivery Convenient topost (within
1/2 mile)
Deliverywithin 3 days
Low cost Same price toanywhere in
the UK
Guaranteeddelivery torecipient's
door
Mandatory Great to have Nice to have Not important Negative to me
Net:impt 63% 69% 73% 75% 75% 81% 80% 82%

Annual monitoring update on the postal market: Financial year 2017-18
37
QD10b. Below, are a list of factors people tell us they consider when sending letters. For each factor, please tell us how important it is to you in choosing a postal provider or service.
Base: all who use Royal Mail for letters or large letters and selected a service 2016-17 (4,643)
17 (4,643) 2017-18 (2,903) (net mandatory / great to have)
5.12 The same question was asked about sending parcels. A range of factors were rated as “mandatory” or “great to have” by at least seven in ten respondents. The most important factors for parcels are those around knowing the parcel has been sent and arrived within the desired time frame, i.e. proof of postage/ dispatch and guaranteed delivery (both 81%), proof of delivery and guarantee that the parcel will arrive on time (both 78%) and low cost (77%).
5.13 Also, at least six in ten rated convenient options for recipient to accept delivery (64%), loss and convenient options to drop off parcel (63%), insurance against damage (62%), ability to choose next day delivery and daily collection (both at 60%). The options that were rated as the least important were ability to select a specific date/ time for delivery (52%) and convenient options for operator to pick parcel up (46%).84
5.14 Similar to letters, these results are all broadly in line with 2016-17.
Figure 5.6a: Factors rated as important for people when sending parcels (2017-18)
84 Respondents in Wales were more likely to quote the ability to select a time for specific delivery as a mandatory / “must have” factor than UK respondents as a whole (18% vs 13%), and more likely to quote convenient options for operators to collect parcels (16% vs 14% in the UK as a whole).
26% 31% 29%36% 41% 43% 43%
47%44% 48%
42%37% 38% 38%
21% 19% 19% 18% 17% 15% 16%
5% 5% 3% 4% 4% 3% 3%
Fast delivery Same price toanywhere in UK
Low cost Guarantee thatparcel will arrive on
time
Proof of receipt Guaranteed deliveryto recipient's door
Proof ofpostage/dispatch
Mandatory Great to have Nice to have Not important Negative to me
Net:impt 73% 75% 77% 78% 78% 81% 81%

Annual monitoring update on the postal market: Financial year 2017-18
38
Source: Ofcom Residential Postal Tracker Q3 2017 – Q2 2018 (3,331)
Base: Those who have sent a parcel or tracked item/item requiring signature in the past month
QD10a: List of factors people consider when sending parcels... (NET: “mandatory” and “great to have”)
Figure 5.6b: Factors rated as important for people when sending parcels (2017-18)
Source: Ofcom Residential Postal Tracker Q3 2017 – Q2 2018 (3,331)
Base: Those who have sent a parcel or tracked item/item requiring signature in the past month
QD10a: List of factors people consider when sending parcels... (NET: “mandatory” and “great to have”)
5.15 Consumers were also asked about the importance of various factors when choosing a provider for a letter or parcel they will receive. The results show that consumers are concerned with the safe delivery of parcels when choosing a provider to deliver to them. When asked, nine in ten said that the guarantee that the parcel will arrive intact was “mandatory” or “great to have”, followed by guaranteed delivery to my door (86%), guarantee that the parcel will arrive on time (81%) and low cost (80%). The option that received the lowest proportion of these responses was the inclusion of insurance, which was rated as important by just under half of respondents (49%).85 These are similar to the results in 2016-17.
85 Respondents in Wales were more likely to rate nearby collection points as a must have than respondents in the whole of the UK (32% vs 23%)
Net:impt 46% 52% 60% 60% 62% 63% 64% 70%
14% 13% 17% 23% 22% 20% 18%29%
32% 39%43% 37% 40% 43% 46%
41%
32%32%
29% 26%27% 27% 28%
23% 19%
14% 10% 12% 8% 8% 7% 4%
Convenientoptions for
operator pick up
Ability to select aspecific time for
delivery
Ability to choosean express/next
day service
Daily collectionservice
Insurance againstdamage
Convenientoptions for me todrop the parcel
off
Convenientoptions forrecipient to
accept delivery
Ability to trackdelivery
Mandatory Great to have Nice to have Not important Negative to me

Annual monitoring update on the postal market: Financial year 2017-18
39
Figure 5.7a: Factors rated as important for people when choosing delivery for letters/ parcels that they will receive (2017-18)
Source: Ofcom Residential Postal Tracker Q3 2017 – Q2 2018
Base: Those who were required to select a postal/delivery option for letters or goods that were delivered to themselves in the previous month (2528)
QE10b: List of factors people consider when choosing delivery for letters/ parcels that they will receive... (NET: “mandatory” and “great to have”)
34% 32%42%
25% 27%33% 38%
50%63%
42% 45%36%
53% 51%47%
43%
36%
27%
21% 19% 17% 18% 18% 16% 15%11% 8%4% 4% 4% 4% 4% 3% 3% 2% 2%
Ability to trackthe delivery
Option toreschedule if I am
unable to takethe delivery
Proof and detailsof delivery
receipt sent tome if someoneelse receives it
Free delivery Convenientoptions for me to
accept thedelivery
Low cost Guarantee thatthe parcel willarrive on time
Guaranteeddelivery to my
door
Guarantee thatthe parcel willarrive intact
This is mandatory to me This is a 'great to have This is a nice to have This is not important to me This is a negative to me
Net:impt 76% 77% 78% 78% 78% 80% 81% 86% 90%

Annual monitoring update on the postal market: Financial year 2017-18
40
Figure 5.7b: Factors rated as important for people when choosing delivery for letters/ parcels that they will receive (2017-18)
Source: Ofcom Residential Postal Tracker Q3 2017 – Q2 2018
Base: Those who were required to select a postal/delivery option for letters or goods that were delivered to themselves in the previous month (2528) Q3 2016 – Q2 2017 (2,571).
QE10b: List of factors people consider when choosing delivery for letters/ parcels that they will receive... (NET: “mandatory” and “great to have”)
15%13%18%16%23%19%
34%27%30%
34%41%44%50%
44%49%
41%48%45%
34%31%
28%26%23%24%
20%20%18%15%
13%9%7%8%7%4%3%4%
Inclusion ofinsurance
Ability to selectan
evening/weekenddelivery
Ability to choosean express or next
day service
Ability to providea specific time
slot or SMSnotification ofdelivery time
Availability ofnearby collectionpoints in case offailed delivery
Ability to select aspecific date/time
for delivery
Proof ofpostage/dispatch
Fast deliveryKnowledge thatthey will deliver
to a neighbour orsafe place if I amnot available to
take the delivery
This is mandatory to me This is a 'great to have This is a nice to have This is not important to me This is a negative to me
Net:impt 75% 75% 75% 68% 67% 66% 62% 54% 49%

Annual monitoring update on the postal market: Financial year 2017-18
41
Figure 5.7c: Factors rated as important for people when choosing delivery for letters/ parcels that they will receive. Nets: 2016-17, 2017-18
Source: Ofcom Residential Postal Tracker Q3 2017 – Q2 2018 (2528), Q3 2016 – Q2 2017 (2,571).
Base: Those who were required to select a postal/delivery option for letters or goods that were delivered to themselves in the previous month. *Question introduced in Q3 2016
QE10b: List of factors people consider when choosing delivery for letters/ parcels that they will receive... (NET: “mandatory” and “great to have”)
SME consumers
5.16 Similarly to residential consumers, when asked about their satisfaction with the service from their postal provider, over eight in ten SMEs who use Royal Mail (85%) said they were satisfied, compared with a similar proportion of those who use other providers (88%). Overall dissatisfaction was 3% for Royal Mail and 2% for other providers. The overall level of satisfaction with Royal Mail amongst SMEs is higher in 2017-18 than in the previous year (85% vs 81%) while overall satisfaction amongst SMEs using other providers has remained stable at 88%.
49%
54%
62%
66%
67%
68%
75%
75%
75%
76%
77%
78%
78%
78%
80%
81%
86%
90%
53%
58%
64%
66%
69%
69%
74%
75%
75%
74%
74%
78%
80%
77%
80%
81%
86%
89%
Inclusion of insurance
Ability to select an evening/weekend delivery
Ability to choose an express or next day service
Ability to provide a specific time slot or SMS notification of delivery time
Availability of nearby collection points in case of failed delivery
Ability to select a specific date/time for delivery
Proof of postage/dispatch
Fast delivery
Knowledge that they will deliver to a neighbour or safe place if I am not available…
Ability to track the delivery
Option to reschedule if I am unable to take the delivery
Proof and details of delivery receipt sent to me if someone else receives it
Free delivery
Convenient options for me to accept the delivery
Low cost
Guarantee that the parcel will arrive on time
Guaranteed delivery to my door
Guarantee that the parcel will arrive intact
2016/17 2017/18

Annual monitoring update on the postal market: Financial year 2017-18
42
Figure 5.8: SME satisfaction with postal services
Source: Ofcom Business Postal Tracker
Base: All respondents who use Royal Mail Q3 2017 – Q2 2018 (2266), All those who use other providers than RM (445) Q2 2016 – Q2 2017 (1,933), All those who use other providers than RM (434)
QRM2: Thinking generally about the service your organisation receives, how satisfied are you with the overall quality of the services you receive from Royal Mail as a recipient and sender?
QOP1a: Thinking generally about the service you receive as a whole… how would you rate the quality of the services you receive from [QV4 provider]?
5.17 Looking at specific elements of Royal Mail’s service, SMEs are most satisfied with items being delivered intact/ undamaged (87%), delivery consistency/ reliability (82%) and delivery time (77%). Satisfaction is lowest with collection time of items being sent (67%) and price of postage (49%). Though the percentages are higher for most factors than 2016-17, the levels of satisfaction follow the same pattern as the previous year when the highest levels of satisfaction were for items being delivered intact/undamaged (87%), followed by delivery consistency (77%). Satisfaction with collection time of items being sent has seen the biggest year on year increase from 58% in 2016-17 to 67%. The level of satisfaction for cost of postage went up from 44% in 2016-17 to 49%.
48%
48%
37%
40%
12%
8%
3%
2%
Royal Mail
Otherproviders
Very satisfied Fairly satisfied Neither satisfied nor dissatisfied Fairly dissatisfied Very dissatisfied
2017-2018NET:
85%
88%
38%
53%
43%
35%
14%
7%
3%
4%
Royal Mail
Otherproviders
Very satisfied Fairly satisfied Neither satisfied nor dissatisfied Fairly dissatisfied Very dissatisfied
2016-2017NET:
81%
88%

Annual monitoring update on the postal market: Financial year 2017-18
43
Figure 5.9: SME satisfaction with specific elements of Royal Mail’s service
Source: Ofcom Business Postal Tracker
Base: All respondents who use Royal Mail Q3 2017 – Q2 2018 (2266), Q3 2016-Q2 2017 (1933)
QRM3: How would you rate the performance of Royal Mail, as a recipient and sender, in the following areas on a five-point scale where 1 is very dissatisfied and 5 is very satisfied? NET: % fairly/very satisfied
5.18 SMEs were asked whether they had experienced a list of possible problems with Royal Mail in the last six months. Almost nine in ten (87%) reported that they had not experienced any problems. This is a higher proportion than in 2016-2017 (81%) who had no problems with Royal Mail in the prior six months. Where problems were reported, 4% or fewer overall reported that they had experienced specific problems in the past six months.
49%
67%
72%
72%
74%
77%
82%
87%
44%
58%
66%
64%
74%
68%
77%
87%
Price of postage
Collection time of items you are sending
Latest collection time
Collection reliability
Amount / level of lost post sent
Delivery time
Delivery consistency / reliability
Items being delivered intact / undamaged
2016-17 2017-18

Annual monitoring update on the postal market: Financial year 2017-18
44
Figure 5.10: SME problems experienced with Royal Mail
Source: Ofcom Business Postal Tracker Q3 2017 – Q2 2018 (2266), Q3 2016-Q2 2017 (1933)
Base: All respondents who use Royal Mail
QRM4: Have you experienced any problems with your service from Royal Mail (as a sender or recipient of mail) in the last 6 months?
5.19 SMEs were asked to rate the importance of various factors when choosing a provider when sending letters. The most important factors for SMEs are ‘guaranteed delivery’ rated as mandatory / great to have by around two thirds (64%) and ‘convenience of posting items (within half a mile)’ 62%. Also, just under six in ten rated ‘low cost’ (59%) and ‘same price to anywhere in the UK’ (58%) as important factors. The options that received the lowest importance ratings were next day delivery option (50%) and daily collection service (48%). These results are broadly in line with 2016-2017 results.
4%
2%
2%
2%
1%
5%
4%
3%
2%
3%
Amount / level of lost post sent
Delivery consistency / reliability
Lost or late delivery of sent mail
Wrong mail delivered / our maildelivered elsewhere
Delivery time2017-18 2016-17

Annual monitoring update on the postal market: Financial year 2017-18
45
Figure 5.11a: Factors rated as important for SMEs when sending letters
Source: Ofcom Business Postal Tracker
Base: All respondents who use Royal Mail to send letters or large letters and selected a service Q3 2017 – Q2 2018 (1620), Q3 2016-Q2 2017 (1933)
QD10b. Below, are a list of factors people tell us they consider when sending letters. For each factor, please tell us how important it is to you in choosing a postal provider or service. (NET: “mandatory” and “great to have”)
48%
50%
51%
58%
58%
59%
62%
64%
51%
50%
55%
62%
59%
61%
61%
66%
Daily collection service
Next day delivery option
Fast delivery
Delivery within 3 days
Same price to send to anywhere within UK
Low cost
Convenient to post(within 1/2 mile)
Guaranteed delivery
2016-17 2017-18
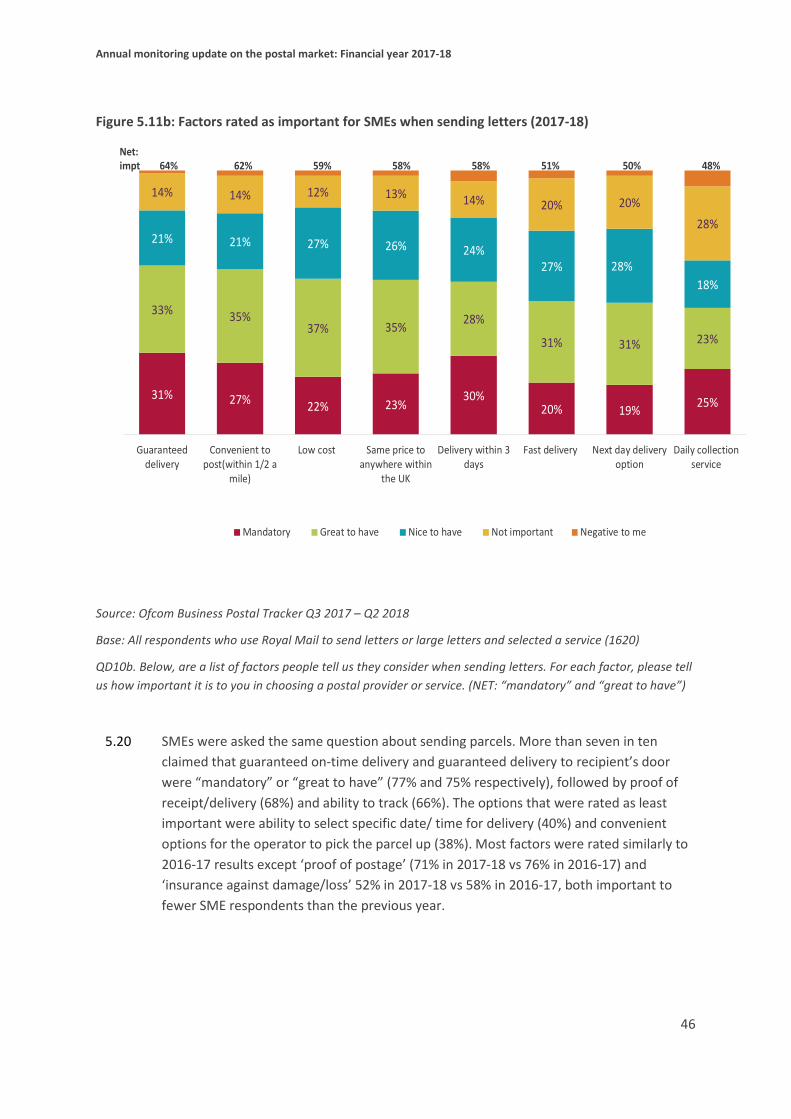
Annual monitoring update on the postal market: Financial year 2017-18
46
Figure 5.11b: Factors rated as important for SMEs when sending letters (2017-18)
Source: Ofcom Business Postal Tracker Q3 2017 – Q2 2018
Base: All respondents who use Royal Mail to send letters or large letters and selected a service (1620)
QD10b. Below, are a list of factors people tell us they consider when sending letters. For each factor, please tell us how important it is to you in choosing a postal provider or service. (NET: “mandatory” and “great to have”)
5.20 SMEs were asked the same question about sending parcels. More than seven in ten claimed that guaranteed on-time delivery and guaranteed delivery to recipient’s door were “mandatory” or “great to have” (77% and 75% respectively), followed by proof of receipt/delivery (68%) and ability to track (66%). The options that were rated as least important were ability to select specific date/ time for delivery (40%) and convenient options for the operator to pick the parcel up (38%). Most factors were rated similarly to 2016-17 results except ‘proof of postage’ (71% in 2017-18 vs 76% in 2016-17) and ‘insurance against damage/loss’ 52% in 2017-18 vs 58% in 2016-17, both important to fewer SME respondents than the previous year.
Net:impt 64% 62% 59% 58% 58% 51% 50% 48%
31% 27% 22% 23%30%
20% 19% 25%
33% 35%37% 35% 28%
31% 31% 23%
21% 21% 27% 26% 24%27% 28%
18%
14% 14% 12% 13% 14% 20% 20%28%
Guaranteeddelivery
Convenient topost(within 1/2 a
mile)
Low cost Same price toanywhere within
the UK
Delivery within 3days
Fast delivery Next day deliveryoption
Daily collectionservice
Mandatory Great to have Nice to have Not important Negative to me

Annual monitoring update on the postal market: Financial year 2017-18
47
Figure 5.12: Factors rated as important for SMEs when sending parcels. Nets: 2016-17, 2017-18
Source: Business Postal Tracker
Base: all using Royal Mail to send parcels and packets Q2 2017-Q3 2018 (673), Q3 2016-Q2 2017 (684)
QD10a. Below, are a list of factors people tell us they consider when sending parcels. For each factor, please tell us how important it is to you in choosing a postal provider or service.
38%
40%
53%
52%
54%
56%
57%
62%
62%
66%
66%
68%
71%
75%
77%
35%
37%
53%
58%
51%
56%
54%
60%
62%
66%
64%
74%
76%
79%
79%
Convenient options for the operator pick parcel up
Ability to select specific date/time for delivery
Daily collection service
Insurance against damage/loss
Convenient options for recipient to accept delivery
Convenient options to drop the parcel off
Ability to choose express or next day service
Same price to send to anywhere within UK
Fast delivery
Low cost
Ability to track
Proof of receipt/delivery
Proof of postage/dispatch
Guaranteed delivery to recipient's door
Guaranteed on-time delivery
2016-172017-18

Annual monitoring update on the postal market: Financial year 2017-18
48
6. The financial performance of the Reported Business
6.1 This section summarises the financial performance of the Reported Business86 for 2017-18 including a five-year trend as well as an update for 2018-19 half year results. We monitor the financial performance of the Reported Business with regard to our duty to ensure the financial sustainability of the universal service, as set out in the March 2012 Statement.87
6.2 We discuss in sequence:
• changes in overall volumes and revenues for the Reported Business, and then by product groups, formats and universal service products, to help us understand what is driving overall revenue and volume changes for the universal service provider;
• changes in the costs of the Reported Business, to understand what progress has been made in relation to cost reduction. This information is also an important input when considering the efficiency of the universal postal service, which is discussed further in Section 7;
• profit margins for the Reported Business; • cash flow and financial health metrics88 of Royal Mail Group, and Royal Mail’s most
recent Viability Statement; • update on recent events based on 2018-19 half year results; and • our view on the financial sustainability of the Reported Business.
6.3 Revenue, prices and cost figures presented in this section are in nominal terms, consistent with Royal Mail’s Regulatory Financial Statements.
86 The Reported Business is a part of Royal Mail’s UK Parcels, International and Letters (UKPIL) business unit but excludes the activities and products of Parcelforce International and Royal Mail Estates Ltd. 87 Ofcom, Securing the Universal Postal Service, March 2012, https://www.ofcom.org.uk/__data/assets/pdf_file/0029/74279/Securing-the-Universal-Postal-Service-statement.pdf. 88 In the Review of the Regulation of Royal Mail 2017 statement, we committed to monitoring the following short to medium term financial health metrics: Funds from operations/net debt, net debt/EBITDA and EBITDA/interest. While we cannot publish forward looking metrics as these rely on Royal Mail’s confidential Business Plan, we can provide historic metrics as an indicator of financial health over the period considered.
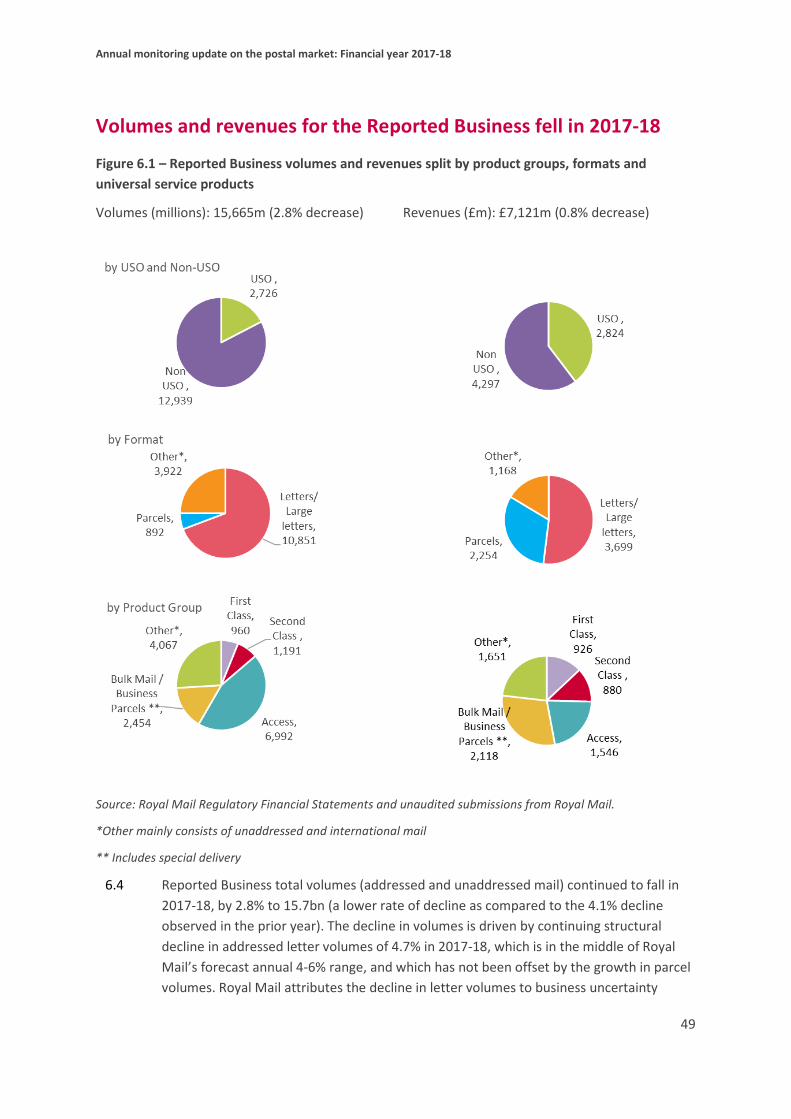
Annual monitoring update on the postal market: Financial year 2017-18
49
Volumes and revenues for the Reported Business fell in 2017-18
Figure 6.1 – Reported Business volumes and revenues split by product groups, formats and universal service products
Volumes (millions): 15,665m (2.8% decrease) Revenues (£m): £7,121m (0.8% decrease)
Source: Royal Mail Regulatory Financial Statements and unaudited submissions from Royal Mail.
*Other mainly consists of unaddressed and international mail
** Includes special delivery
6.4 Reported Business total volumes (addressed and unaddressed mail) continued to fall in 2017-18, by 2.8% to 15.7bn (a lower rate of decline as compared to the 4.1% decline observed in the prior year). The decline in volumes is driven by continuing structural decline in addressed letter volumes of 4.7% in 2017-18, which is in the middle of Royal Mail’s forecast annual 4-6% range, and which has not been offset by the growth in parcel volumes. Royal Mail attributes the decline in letter volumes to business uncertainty

Annual monitoring update on the postal market: Financial year 2017-18
50
within the UK as well as continuing e-substitution. Parcel volumes mainly benefitted from strong performance in account parcels and the new cross-border initiative.89
6.5 Total revenue fell by 0.8% to £7.1bn, as price increases and change in mix towards parcels were not sufficient to offset the effect of volume decline. This is the fourth consecutive year in which overall revenue has fallen, following the period from 2010-11 to 2013-14 when total revenue grew year on year despite volume decline. See Section 2 for more information on prices.
6.6 We discuss below revenues and volumes for each of the splits in Figure 6.1 above (i.e. by product groups, formats and universal service products).
6.7 Letter and parcel price trends are available as part of the interactive data published on the Ofcom website.90
Changes in Reported Business volumes and revenue by universal and non-universal services
6.8 As set out in Section 2, the services within the Reported Business include all universal service products and other products which use the universal service network (for example, retail bulk mail and access).
Figure 6.2: Universal and non-universal services
89 The international cross-border initiative allows Royal Mail to increase traffic in Europe from Asia (mostly China). Traffic arrives through their Heathrow processing plant from customs and clearance for onward travels to Europe. Royal Mail is responsible for paying associated terminal dues to local postal operator. 90 Interactive data can be accessed here: https://www.ofcom.org.uk/postal-services/information-for-the-postal-industry/monitoring_reports/interactive-data-2017-18

Annual monitoring update on the postal market: Financial year 2017-18
51
Source: Royal Mail Regulatory Financial Statements and unaudited submissions from Royal Mail.
6.9 The volumes of both USO and non-USO products (including unaddressed mail) continued to decline. In 2017-18, they declined by 8.4% and 1.5% respectively. This follows the historic trend, where the volume of USO items has been declining at a faster rate than non-USO items. Non-USO volumes mainly consist of access, bulk, international and unaddressed products. The decline in non-USO volumes was primarily driven by a decline in retail bulk mail volumes, while access and international products declined more slowly. Royal Mail has stated decline in UK addressed letter volumes (excluding political parties election mailings) was broadly driven by e-substitution and lower GDP and that they are closely monitoring the economic environment in the UK.91
6.10 The revenues from USO products declined by 3.4% whilst non-USO revenues increased by 0.9% in 2017-18, as price increases in USO products were not sufficient to offset volume decline.
Changes in Reported Business volumes and revenue by product group
6.11 The analysis below focuses on year-on-year trends. Page 12 of the interactive data provides longer historic trends.92
91 Royal Mail Plc, Annual Report and Financial Statements 2017-18, page 8, https://www.royalmailgroup.com/media/10169/royal-mail-group-annual-report-and-accounts-2017-18.pdf. 92 Interactive data can be accessed here: https://www.ofcom.org.uk/postal-services/information-for-the-postal-industry/monitoring_reports/interactive-data-2017-18

Annual monitoring update on the postal market: Financial year 2017-18
52
First Class revenues and volumes
6.12 First Class single piece letter and parcel volumes fell by 7.0% in 2017-18. Royal Mail states this was driven by the financial and economic uncertainty within the UK as well continuing e-substitution strategies. Royal Mail also states that while e-substitution is not expected to increase above the current rate, it remains the biggest cause of volume decline. The 7% decline this year was lower than the prior year decline of 9.5% decline.
6.13 First Class single piece letter and parcel revenues fell by 1.8% in 2017-18, compared to a 4.9% decrease in the prior year. The lower decline compared to prior year was due to lower volume decline offset by 1.6% and 7.5% increases in First Class stamp and meter prices respectively in 2017-18.
Second Class revenues and volumes
6.14 Second Class single piece letter and parcel volumes continued to decline in 2017-18, falling by 8.9% (compared to 5.4% in the previous year). Revenues decreased in 2017-18 by 2.8% compared to a 0.1% increase in the prior year. Increases in Second Class stamp and meter prices of 1.8% and 2.5% respectively have partly offset the higher decline in volumes.
6.15 For the first time in six years, Second Class volumes have declined at a higher rate than First Class volumes. Stamp Letters are driving the higher decline rates in Second Class volumes. Stamp Letters peak around Christmas and this is primarily Second-Class traffic. Royal Mail continue to see declines in these volumes year on year.
Bulk and Access revenues and volumes
6.16 Retail bulk mail (including PPI93) and business parcel volumes declined by 9.0% and revenues increased by 0.4%.94
6.17 Access volumes decreased by 1.2% to 7.0bn items, driven by declining business advertising volumes, downward pressure on average unit revenues (AURs) and change in the mix of access traffic. However, the access price rises in 2017-18 led access revenues to remain in line with previous year revenue at £1.5bn. Access and end-to-end competition is discussed in Section 3.
6.18 Combined access and retail bulk mail volumes declined by 3.4% and revenues increased by 0.2% in 2017-18. The decline in volumes was less than that of the prior year volume decline of 3.8%. The decline in access and retail bulk volumes continues to make up a significant portion of the decline in overall addressed mail (letters and parcels) volumes of 5.0% in 2017-18. It is likely that increased business uncertainty has contributed to lower business advertising spend while some businesses have moved from post and
93 Printed postage impressions. These can be used instead of stamps or franking machines and printed directly onto labels or envelopes. 94 These figures include all Special Delivery items (i.e. they include universal service Special Delivery items as well as contract Special Delivery).

Annual monitoring update on the postal market: Financial year 2017-18
53
other traditional media to digital media advertising which is often seen as “lower cost media” and quicker to market.
Changes in Reported Business volumes and revenue by format
6.19 Below we consider the year-on-year variances in letters and large letters volumes and revenues (including retail and access), other items (including unaddressed and international mail) and parcels (both retail and access).95 Page 11 of the interactive data shows longer-term historic trends.96
Figure 6.3: Letters and large letters and parcels
95 Figures are from unaudited and unpublished submissions provided to Ofcom. Parcel volumes are based on Royal Mail’s definition of parcels and include some fulfilment letters and large letters and are therefore not directly comparable to the parcel market volumes collected by Ofcom and reported in Section 4. Ofcom’s definition of what constitutes a parcel is set out in paragraph 4.2. 96 Interactive data can be accessed here: https://www.ofcom.org.uk/postal-services/information-for-the-postal-industry/monitoring_reports/interactive-data-2017-18

Annual monitoring update on the postal market: Financial year 2017-18
54
Source: Royal Mail Regulatory Financial Statements and unaudited submissions from Royal Mail.
Letters/ large letters revenues and volumes
6.20 Combined letter/large letter volumes reduced by 5.1% in 2017-18 compared to 5.0% in the prior year. As volumes continued to decline at a similar rate, letter and large letter revenues decreased by 3.6% in 2017-18 compared to 3.4% in the prior year. As discussed above, business uncertainty, lower GDP and e-substitution (leading to long term structural decline) are likely to account for declining letter and large letter volume and revenues.
Parcels revenues and volumes
6.21 Reported Business parcel volumes increased by 4.1% in 2017-18 compared to 4.3% in the prior year, while Reported Business parcel revenues grew by 4.9% in 2017-18 compared to 4.4% in the prior year. Royal Mail stated the growth was due to new contracts won with large customers, including e-retailers.97 This was the highest parcel volume growth for Royal Mail since 2013.
Other revenues and volumes
6.22 Other volumes (which mainly consist of unaddressed letters98 and international mail) increased by 2.7% in 2017-18 (compared to a 3.1% decrease in the prior year).
97 Royal Mail Plc, Annual Report and Financial Statements 2017-18, page 2, https://www.royalmailgroup.com/media/10169/royal-mail-group-annual-report-and-accounts-2017-18.pdf. 98 Addressed mail is mail which is either addressed to a specific individual or to a generic recipient (for example, “to the occupier”). All other mail is categorised as unaddressed mail.
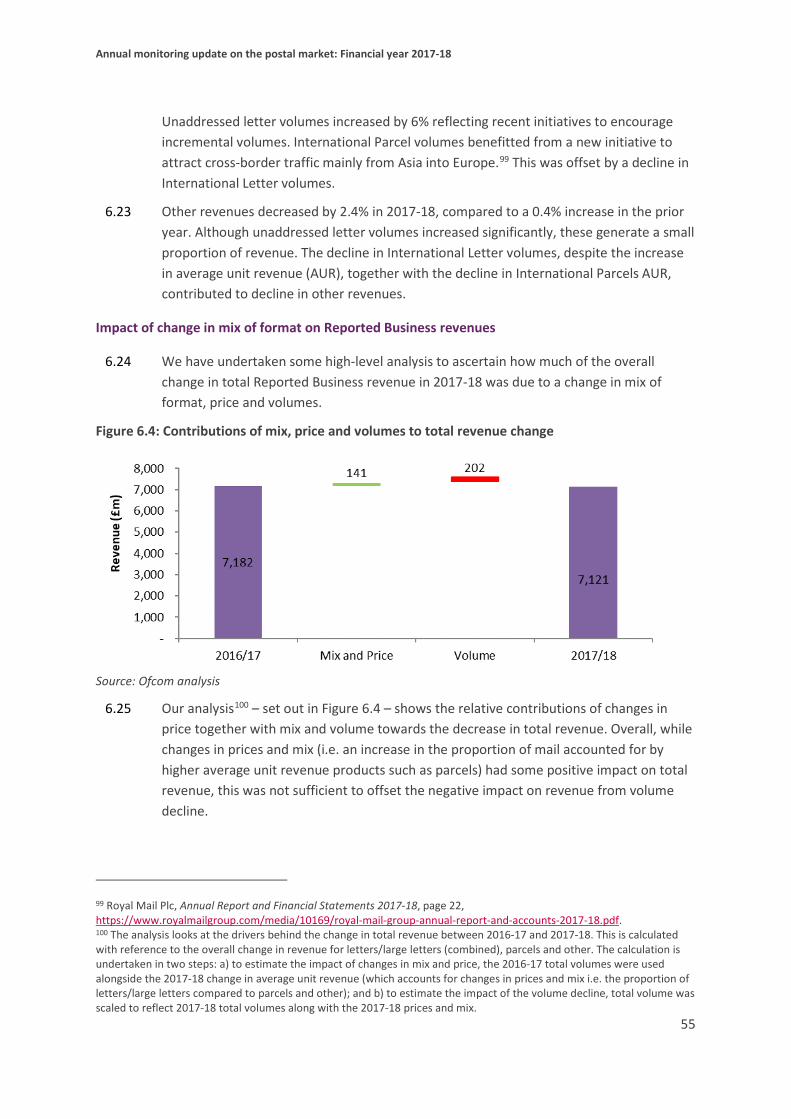
Annual monitoring update on the postal market: Financial year 2017-18
55
Unaddressed letter volumes increased by 6% reflecting recent initiatives to encourage incremental volumes. International Parcel volumes benefitted from a new initiative to attract cross-border traffic mainly from Asia into Europe.99 This was offset by a decline in International Letter volumes.
6.23 Other revenues decreased by 2.4% in 2017-18, compared to a 0.4% increase in the prior year. Although unaddressed letter volumes increased significantly, these generate a small proportion of revenue. The decline in International Letter volumes, despite the increase in average unit revenue (AUR), together with the decline in International Parcels AUR, contributed to decline in other revenues.
Impact of change in mix of format on Reported Business revenues
6.24 We have undertaken some high-level analysis to ascertain how much of the overall change in total Reported Business revenue in 2017-18 was due to a change in mix of format, price and volumes.
Figure 6.4: Contributions of mix, price and volumes to total revenue change
Source: Ofcom analysis
6.25 Our analysis100 – set out in Figure 6.4 – shows the relative contributions of changes in price together with mix and volume towards the decrease in total revenue. Overall, while changes in prices and mix (i.e. an increase in the proportion of mail accounted for by higher average unit revenue products such as parcels) had some positive impact on total revenue, this was not sufficient to offset the negative impact on revenue from volume decline.
99 Royal Mail Plc, Annual Report and Financial Statements 2017-18, page 22, https://www.royalmailgroup.com/media/10169/royal-mail-group-annual-report-and-accounts-2017-18.pdf. 100 The analysis looks at the drivers behind the change in total revenue between 2016-17 and 2017-18. This is calculated with reference to the overall change in revenue for letters/large letters (combined), parcels and other. The calculation is undertaken in two steps: a) to estimate the impact of changes in mix and price, the 2016-17 total volumes were used alongside the 2017-18 change in average unit revenue (which accounts for changes in prices and mix i.e. the proportion of letters/large letters compared to parcels and other); and b) to estimate the impact of the volume decline, total volume was scaled to reflect 2017-18 total volumes along with the 2017-18 prices and mix.

Annual monitoring update on the postal market: Financial year 2017-18
56
Reported Business costs
Figure 6.5: Reported Business costs101
Source: Royal Mail audited regulatory accounts and unpublished submissions from Royal Mail
6.26 Costs, including transformation costs for the Reported Business, fell by 0.6% in 2017-18 to £6.81bn. These costs can be broken down into people costs, non-people costs and transformation costs. The breakdown of costs by these categories is shown in Figure 6.5 and we note that:
• People costs102 – increased by 0.7% to £4.57bn, this is due principally to the accrual of the 5% frontline pay award from October 2017103 and additional apprentice levy104 costs partially offset by gross hours reduction. Gross hours reduction is discussed in more detail in Section 7.
• Non-people costs – decreased by 2.1% to £2.13bn due to terminal dues105 savings; telemetry savings106, lower jet fuel costs, better vehicle hire controls and other savings
101 People costs are adjusted to reflect the cash cost of the defined benefit pension scheme rather than the accounting charge. 102 Adjusted to reflect the cash cost of the defined benefit pension scheme rather than the accounting charge. 103 As part of the Pay and Pension deal agreed on in March 2018, all CWU members will receive a 5% pay rise over an 18-month period, backdated to October 2017, followed by a 2% pay increase from April 2019 and one-hour reduction to the current 39-hour working week from October, subject to trials and a pledge from Royal Mail to move towards a 35-hour week by 2022. 104 As from 6 April 2017, the government introduced an Apprenticeship Levy which is payable by all qualifying UK employers to fund new apprenticeships. This is as a result of the government’s commitment to boosting productivity by investing in human capital. 105 A payment that the destination postal operator is entitled to collect from the dispatching postal operator for the costs incurred to handle the mail from the dispatching postal operator in the destination country. 106 Telemetry is an automated communications process by which measurements and other data are collected at remote or inaccessible points and transmitted to receiving equipment for monitoring. Royal Mail have used telemetry technology to improve the efficiency of their logistics network and promote more efficient driving, this has resulted in diesel cost savings.

Annual monitoring update on the postal market: Financial year 2017-18
57
offset by rise in depreciation costs (due to a higher capital investment in prior year and write-off of assets).
• Transformation costs – decreased by 19.7% to £0.11bn in 2017-18 mainly driven by implementation of projects that were expected to lead to people cost savings (i.e. reduced voluntary redundancies) taking longer than anticipated following the conclusion of the industrial relations dispute in March 2018.
Reported Business profit margin
6.27 In considering the financial sustainability of the universal postal service, we are required to take into account the need for the universal service provider to be able to earn a reasonable commercial rate of return in connection with its provision of the universal service.107 In our March 2012 and 2017 Statements on the postal regulatory framework,
108 we said that an earnings before interest and tax (EBIT) margin range of 5-10% was indicative of a reasonable commercial rate of return.
6.28 In undertaking this analysis, we noted that if the forecast EBIT margin is above 5%, or shows an increasing trend that exceeds 5% over the forecast period, then the indications are that the Reported Business is financially sustainable. If this is not the case – for example if the forecast EBIT margin stays consistently below 5% or has a decreasing trend taking it below 5% – then there may be indications that the universal postal service faces financial sustainability issues in the long term. However, concerns about financial sustainability may not arise if, for example, the EBIT margin goes below 5% for a shorter period due to specific circumstances which may be addressed by Royal Mail without affecting its longer-term financial sustainability.109
6.29 As in the past we refer to our particular measure of EBIT margin, which we use for our financial sustainability assessments, as the financeability EBIT.110
6.30 In the March 2017 Statement111 we confirmed our decision to continue calculating the financeability EBIT margin by deducting transformation costs112 and restating pension costs on a cash basis.113 In 2017-18, the accounting pension rate was 41.1% whereas the
107 Section 29(4) of the Postal Services Act 2011. 108 Ofcom, Review of the Regulation of Royal Mail, March 2017, paragraph 3.60, https://www.ofcom.org.uk/__data/assets/pdf_file/0033/97863/Review-of-the-Regulation-of-Royal-Mail.pdf. 109 Ofcom, Review of the Regulation of Royal Mail, May 2016, A6.92 https://www.ofcom.org.uk/__data/assets/pdf_file/0030/57954/annexes-5-11.pdf. 110 Ibid, paragraph A6.8. 111 Ofcom, Review of the Regulation of Royal Mail, March 2017, paragraph 3.46, https://www.ofcom.org.uk/__data/assets/pdf_file/0033/97863/Review-of-the-Regulation-of-Royal-Mail.pdf. 112 Transformation costs are restructuring or redundancy costs which are likely to recur year-on-year and are not considered to be exceptional costs. Exceptional costs are considered to be large and uncommon (non-recurring) costs. See Ofcom, Securing the Universal Postal Service, March 2012, paragraph 5.41 and footnote 69, https://www.ofcom.org.uk/__data/assets/pdf_file/0029/74279/Securing-the-Universal-Postal-Service-statement.pdf. 113 In the 2014 Review of End-to-End Competition Statement, we said it was appropriate to adjust Royal Mail’s Reported Business EBIT margin to restate pension costs on a cash basis (i.e. the rate the contributions are actually paid at), rather than the rate calculated using the accounting standards. We considered that this methodology takes account of the true cost of pensions and we refer to this EBIT margin measure as the ‘financeability EBIT margin’. See Ofcom, Review of end-to-

Annual monitoring update on the postal market: Financial year 2017-18
58
cash pension rate was 17.1%.114 We have reported on the financeability EBIT margin in each of our annual monitoring updates since 2013-14.115
Figure 6.6: Reported Business financeability EBIT margin
Source: Royal Mail audited regulatory accounts and unpublished submissions from Royal Mail
6.31 Figure 6.6 shows that the 2017-18 financeability EBIT margin fell below the 5% to 10% range,116 and was slightly lower than the prior year margin of 4.6%, at 4.4%. The decline in financeability EBIT margin is due to a reduction in revenue117 and a slight increase in people cost, offset by lower non-people and transformation costs118.
end competition in the postal sector, December 2014, page 15, https://www.ofcom.org.uk/__data/assets/pdf_file/0024/31956/end-to-end.pdf 114 Royal Mail Plc, Annual Report and Financial Statements 2017-18, page 27, https://www.royalmailgroup.com/sites/default/files/Royal%20Mail%20Group%20Annual%20Report%20and%20Accounts%202017-18.pdf. As a result of the introduction of the Defined Benefit Cash Balance Scheme (DBCBS) from 1 April 2018, the IAS 19 pension service charge rate for 2018-19 is projected to decrease to 18.9 per cent and the cash contribution rate will decrease to 15.6 per cent. As a result, the pension charge to cash difference adjustment for 2018-19 is expected to reduce significantly to around £90 million. 115 For more explanation of this approach please see earlier annual monitoring updates, in particular Paragraph 6.6 in the 2014-15 Annual monitoring update on the postal market: https://www.ofcom.org.uk/__data/assets/pdf_file/0025/56923/annual_monitoring_update_2014-15.pdf. 116 The range that we considered in March 2012 and March 2017 to be consistent with a reasonable commercial rate of return for a financially sustainable universal service in the longer term. 117 See “Volumes and revenues for the Reported Business fell in 2017-18” section above for further discussion on revenues. 118 See “Reported Business costs” section above for further discussion on costs.

Annual monitoring update on the postal market: Financial year 2017-18
59
Royal Mail Group’s cash flow
Figure 6.7: Relevant Group free cash flow
Source: Royal Mail Statutory Accounts
* Free cash flow: net cash flow before financing activities (except finance costs paid), less the net cash purchase/sale of financial asset investments, including profit on disposal of properties
** Relates to a one-off disposal of a property in the London property portfolio, separately restated in Royal Mail’s 2015-16 statutory accounts
6.32 Cash flow is also an important component in ensuring the financeability of the universal service. In 2017-18, free cash flow of the Relevant Group rose by 168.9% to c.£0.6bn. The main driver for this was that Royal Mail Group did not make any significant acquisitions of business interests and non-controlling interests in 2017-18119, unlike its strategy in the prior year (the expenditure being down £126m from 2016-17).
6.33 In addition to free cash flow increasing by £353m, Royal Mail Group still had significant undrawn funding facilities (£1.05bn) as at 25 March 2018 which continues to be significant as at September 2018. This cash can be drawn upon depending on business needs.120
Financial health metrics and the viability statement
6.34 In the March 2017 Statement121, we confirmed our decision to supplement the approach we had previously used for assessing whether the provision of the universal service is financially sustainable with consideration of a wider range of financial health metrics and
119 Royal Mail Plc, Annual Report and Financial Statements 2017-18, page 30, https://www.royalmailgroup.com/media/10169/royal-mail-group-annual-report-and-accounts-2017-18.pdf. Acquisition of business interests in the year largely related to the acquisition of Postal Express and Redyser by GLS. The acquisition of business interests in the prior year related to the acquisitions of GSO and ASM by GLS and eCourier by UKPIL. The acquisition of non-controlling interests in the prior year was mainly in respect of the Romec business. 120 Ibid, page 95. 121 Ofcom, Review of the Regulation of Royal Mail, March 2017, paragraph 3.63, https://www.ofcom.org.uk/__data/assets/pdf_file/0033/97863/Review-of-the-Regulation-of-Royal-Mail.pdf.

Annual monitoring update on the postal market: Financial year 2017-18
60
indicators such as Standard & Poor’s (S&P) credit rating, including Funds from Operations (FFO) / Debt, and borrowing covenants assessed at Royal Mail Group level.
6.35 FFO / Debt is one of the key metrics that S&P uses in order to assess the credit worthiness of Royal Mail Group. As part of its assessment, S&P reviews Royal Mail Group’s historical and forecast performance against a number of metrics including FFO / Debt. Royal Mail has also informed us that this is a key metric that it monitors.
6.36 S&P’s latest credit research affirmed Royal Mail Group’s credit rating at BBB as it considered the outlook stable based on Royal Mail Group’s FFO / Debt being above 45% (see Figure 6.8) in an operating environment that will remain difficult.122 S&P believed that the company will have sufficient cash headroom at the current rating level to pursue moderate business diversification opportunities and to mitigate volume risk, which is worsened by its high level of fixed costs. They also considered that Royal Mail will continue to successfully manage its transformation programme and productivity improvements to ensure a sustainable profitability enhancement. S&P categorised Royal Mail Group as modest risk from a financial risk viewpoint as its FFO / Debt percentage was above 60%.123
6.37 The Net Debt / EBITDA and EBITDA / Interest (interest cover) metrics are used as financial covenants relating to Royal Mail Group’s syndicated credit facility. The Net Debt / EBITDA metric helps assess Royal Mail Group’s ability to repay its debts using its operating profits (measured before non-cash elements of depreciation and amortisation). It broadly represents the number of years of annual profit required to repay all of the company’s net debt. The interest cover metric is used to assess how easily Royal Mail Group can pay interest on its outstanding debt. Royal Mail Group’s banking covenants require Net Debt / EBITDA to remain below 3 and its interest cover to remain above 3.5.
6.38 Royal Mail Group passed its banking covenant tests in 2017-18 (as shown in Figure 6.8 below).
122 S&P Ratings Direct, Summary: Royal Mail PLC Ratings Affirmed at ‘BBB/Stable/A-2’ 9 August 2018 – Report available for purchase from S&P. 123 S&P Ratings Direct, Corporate methodology, page 35, https://www.spratings.com/scenario-builder-portlet/pdfs/CorporateMethodology.pdf.

Annual monitoring update on the postal market: Financial year 2017-18
61
Figure 6.8: Financial health metrics
Source: S&P Ratings Direct & Royal Mail Annual Report and Accounts
*S&P make certain adjustments to Royal Mail’s reported net debt. S&P ratings methodology can be found on its website.
** Net debt is adjusted for letters for credit for bank covenant purposes. This differs from S&P’s calculation of net debt.
6.39 In addition to the above health metrics, we stated we would also have regard to Royal Mail Group’s Viability Statement as published in its Annual Report and Financial Statements. Under the 2014 Corporate Governance Code, directors are required to make a statement that they have a reasonable expectation that the company will be able to continue in operation and meet its liabilities as they fall due over the period of their assessment, drawing attention to any qualifications or assumptions as necessary. In order to do this, they must take into account the company’s current position and principal risks.
6.40 In its Annual Report and Financial Statements for the year ended 25 March 2018, Royal Mail Group explained that it stress-tested the key assumptions within its detailed annual forecasts and projected performance over three years and quantified these risks to create a downside scenario. The downside scenario took into account committed capital and expenditure as well as other short-term costs and cash actions which would mitigate

Annual monitoring update on the postal market: Financial year 2017-18
62
the impact of risk (e.g. reducing variable hours and cost of sales; removing discretionary pay; reducing internal investment and suspending acquisitions programme). The downside scenario was tested to determine whether the Group would remain solvent. Based on the results of their analysis, the Directors have a reasonable expectation that the Group will be able to continue in operation and meet its liabilities as they fall due over the period to March 2021.124
Summary of 2017-18 financial performance
6.41 We have reviewed a broad set of financial performance data in this section. In summary, the key trends for the 2017-18 financial year were:
• Reported Business letter / large letter volumes continued to decline, and the rate of decline was slightly higher than prior year (5.1% in 2017-18 vs 5% in 2016-17). Parcel volumes and revenues grew year on year, largely driven by new contract wins in account parcels (4.1% volume increase and 4.9% revenue increase).
• Reported Business revenues continued to decline as the structural decline in letters was not offset by increasing parcels revenue.
• Reported Business costs decreased by 0.6% year-on-year due to a decrease in non-people costs of 2.1% and transformation costs of 19.7%, slightly offset by an increase in people costs of 0.7%. Cost reductions are covered in more detail in Section 7.
• The financeability EBIT margin decreased from 4.6% to 4.4% in 2017-18, due to a reduction in revenue and a slight increase in people cost, offset by lower non-people and transformation costs.
• Free cash flow continued to be positive and grew in 2017-18 to £0.6bn. Royal Mail Group still has access to a further (c. £1.05bn) of funds from its undrawn banking facilities.
• Royal Mail Group’s FFO/ S&P adjusted net debt of 73% in 2017-18 exceeds the 45% threshold which is considered to be stable by S&P. Furthermore, it has passed its banking covenant tests in 2017-18.
Recent events
6.42 We note that the results for the first half of 2018-19 were below expectation for Royal Mail Group. Addressed letter volume (excluding the impact of political parties’ election mailings) declined by 7% because of ongoing structural decline due to e-substitution, business uncertainty and the impact of GDPR (which particularly impacts marketing mail). Royal Mail notes that “businesses continue to replace physical letters with other
124 Royal Mail Plc, Annual Report and Financial Statements 2017-18, page 46.

Annual monitoring update on the postal market: Financial year 2017-18
63
electronic media” and are also “consolidating mailings to reduce costs”. Total letter revenue (including marketing mail) declined by 7%.125
6.43 Furthermore, Royal Mail has reported lower than expected efficiency improvements in the first half of 2018/19. Royal Mail reported gross hours reduction of 0.1% and decline in productivity of 0.2%.126 Full year performance is expected to be significantly below target (target being at upper end of 2 to 3% range). Cost avoidance was also lower than expected at £41m for the first half of 2018/19, resulting in Royal Mail lowering its 2018-19 cost avoidance target from £230m to £100m. Royal Mail expects that the 2018-19 profits for the whole Group would be in the range of £500 million to £550 million for the full year. Royal Mail stated the reasons for poor efficiency included the continued after effects of the industrial dispute, delayed implementation of cost avoidance projects and the complexity involved in implementing elements of the Pensions, Pay and Pipeline Agreement.127
Reported Business financial sustainability
6.44 As explained above, the financeability EBIT margin of the Reported Business was below the 5-10% range in 2017-18 financial year. However, our view is that the universal service is likely to remain financially sustainable in the immediate future. Our key reasons are:
• the Reported Business is currently profitable; and • the financial position and financial health metrics (including credit rating) of Royal Mail
Group do not indicate any short-term financial health issues.
6.45 In our 2017 Annual Monitoring Report we recognised various downside scenarios that had the potential to have a negative impact on the financial sustainability of the universal service. We identified the affordability of the pension scheme as one of the key concerns. Royal Mail closed its Royal Mail Pension Plan to future accrual in its Defined Benefit form on 31 March 2018 with a new Defined Benefit Cash Balance put in place from 1 April 2018 with a commitment to work towards the introduction of a Collective Defined Contribution scheme for all employees. Royal Mail has said that “the overall ongoing annual cash cost of pensions will continue to be around £400m”128 and “this step was necessary to avoid an expected increase in cash contributions to around £1.2 billion per annum – an unaffordable amount”. 129
6.46 After the conclusion of the Pay and Pensions Agreement earlier in the year we expected Royal Mail to be better placed to make efficiency improvements in the short to medium
125 Royal Mail Plc, Results for the half year ended 23 September 2018, page 7, https://www.royalmailgroup.com/media/10493/royal-mail-plc-financial-report-for-the-half-year-ended-23-september-2018.pdf. 126 Royal Mail have refined the calculation of workload since their October trading update, resulting in a change to the productivity performance for the first half of the year. 127 Royal Mail Plc, Results for the half year ended 23 September 2018, page 4. 128 Royal Mail Plc, Annual Report and Financial Statements 2017-18, page 4. 129 Royal Mail Plc, Annual Report and Financial Statements 2017-18, page 9.

Annual monitoring update on the postal market: Financial year 2017-18
64
term compared to recent years. However, Royal Mail’s performance to date in 2018-19, particularly on productivity, has not matched such expectations. Given our view in previous years was that continued progress on efficiency was likely to improve the profitability of the Reported Business and help ensure the financial sustainability of the universal service, this is a concern for us.
6.47 We will continue to monitor these developments closely. As part of our monitoring programme we engage regularly with Royal Mail’s senior management to understand their perspective on the future on the universal service and plans they have in place to address any performance issues within the part of the business responsible for delivering the universal service.
6.48 Following Royal Mail’s trading update in October, in its results for the half year ended 23 September 2018 its CEO stated “it was very disappointing to have to announce in early October our poor UK productivity and cost performance”130 and that Royal Mail was taking actions to address its current performance issues. Royal Mail has strong incentives to improve its efficiency in future to remain financially sustainable. Progress on efficiency is likely to improve the profitability of the Reported Business and help ensure the financial sustainability of the universal service.
6.49 The longer-term sustainability of the universal service is dependent on Royal Mail’s ability to grow parcels’ revenues sufficiently to offset letters revenue decline and / or remove costs from the business. As part of our monitoring each year we review Royal Mail’s expectations of future performance to form a view of the medium- to long-term outlook of the Reported Business.
6.50 Royal Mail, however, is currently in the process of conducting both a review of its UK network “to develop the blueprint for a modern, optimised, efficient network to deliver letters, parcels and new products”131 and “an assessment of the productivity and efficiency opportunities under our Agreement with CWU”. 132 It expects to conclude these reviews in early 2019. Until Royal Mail has completed its reviews and used the outputs to inform its annual business planning process, we are unable to form an up-to-date view of the expected performance of the Reported Business over the medium to long term, but expect to have a clearer view in the new year.
6.51 We recognise that until Royal Mail concludes its reviews we have less certainty than in prior years on how Royal Mail plan to meet the various downside scenarios which have the potential to impact the financial sustainability of the universal service over the medium to long term. These downside risks include increased competition within the parcels market and an inability to realise adequate efficiencies.
130 Ibid, page 4. 131 Royal Mail Plc, Results for the Half Year ended 23 September 2018, page 3 132 Ibid, page 3

Annual monitoring update on the postal market: Financial year 2017-18
65
7. Efficiency of the Reported Business 7.1 In this section, we discuss efficiency covering:
• Why it is an important aspect of our monitoring regime; • Our estimate of Royal Mail’s efficiency performance in 2017-18; • Royal Mail’s views on its efficiency and what it has been doing to improve its efficiency; • Update on recent events based on 2018-19 half year results; and • Our view on the efficiency of the Reported Business.
Efficiency is an important aspect of our monitoring regime
7.2 In discharging our duties in relation to post, the Postal Services Act 2011 requires us to have regard to the need for the provision of a universal service to be financially sustainable, and for it to become efficient within a reasonable period and then remain efficient at all subsequent times.
7.3 In the March 2017 Statement, we concluded that the imposition of price controls or efficiency targets on parts of Royal Mail’s business was not necessary. In reaching our conclusion we considered Royal Mail’s efficiency performance; the incentives on Royal Mail to make further efficiency improvements in future; and our ability to intervene in such circumstances as Royal Mail failing to make sufficient progress on improving its efficiency. We also took into account the challenges Royal Mail faced in the short term, including the need to reach agreement on pay and pension deals, which may affect its ability to make efficiency improvements in the short term. We highlighted the importance of our monitoring regime in providing a safeguard. Hence, efficiency is one of the key areas we assess as part of the monitoring regime.
Indicators of Royal Mail’s efficiency performance
7.4 In the March 2017 Statement, we set out the metrics and framework we proposed to adopt to monitor Royal Mail’s efficiency performance.133 We proposed to use a variety of metrics and adopt Royal Mail’s 2015 Business Plan, on which a lot of our analysis was based, as a reference point to review performance.
7.5 Here we report on our high-level indicators of efficiency; the overall change in real costs, the change in cost excluding the impact of inflation, volume, and one-off costs (PVEO134 analysis), frontline gross hours in delivery and processing, and the ratio of revenue to Full-Time Equivalent (FTE) versus cost to FTE.
133 Ofcom, Review of the Regulation of Royal Mail, March 2017, paragraph 3.90, https://www.ofcom.org.uk/__data/assets/pdf_file/0033/97863/Review-of-the-Regulation-of-Royal-Mail.pdf. 134 “PVEO” analysis identifies cost movements due to inflation (price), volume, efficiency and other (one-off activities). Efficiency is calculated as the residual item once other the other three categories of cost movements have been accounted for.

Annual monitoring update on the postal market: Financial year 2017-18
66
Real cost reduction135
7.6 Real cost reduction shows how Royal Mail has reduced people and non-people costs through implementation of its cost avoidance programme and other initiatives. This provides a high-level view as cost changes due to volume and one-off costs are not adjusted for in this metric of efficiency.
7.7 Figure 7.1 shows that real total costs (excluding transformation costs, to reflect true cost savings) fell by 3.0% in 2017-18 at an aggregate level, which was more than the fall in the prior two financial years of 0.4% and 1.6% in 2016-17 and 2015-16 respectively. The majority of these costs savings were achieved in non-people costs. See Section 6 where this is discussed in further detail.
Figure 7.1: Total real and nominal costs (excluding transformation costs)
Source: Regulatory financial statements and Ofcom analysis
Price, Volume, Efficiency and Other Analysis
7.8 PVEO analysis provides a measure of efficiency by disaggregating movements in total costs136 in terms of price (i.e. inflation) changes, volume effects, efficiencies achieved and other one-off costs.
7.9 Our analysis assumes an inflation index of CPI across all costs. Cost movements due to volume are accounted for on a subset of the total cost base. These correspond to the frontline costs of delivery and processing, payments to Post Office Limited (POL) and international terminal dues. The remainder of cost movements, once one-off items have been accounted for, are assumed to relate to efficiency.
135 Total costs have been adjusted by CPI based on 2013-14 values. Annual CPI change calculated based on average monthly CPI across financial year April to March. 136 Total costs include Reported Business people and non-people (including depreciation) adjusted for cash pension rate and exclude transformation costs.

Annual monitoring update on the postal market: Financial year 2017-18
67
7.10 Our PVEO analysis (Figure 7.2) between 2016-17 and 2017-18 suggests that efficiency achieved in 2017-18 was 2.8% (£189m), which was more than that achieved in 2016-17 (2.2%) and 2015-16 (1.5%).
7.11 The difference between the PVEO view of efficiency of 2.8% and that of the real costs reduction of 3% is largely explained by movement in volumes (demand drivers) of £57m offset by one-off costs relating to the new Apprenticeship Levy costs of £20m in 2017-18.137 These demand drivers and one-off costs are not adjusted for in the real cost view as shown in Figure 7.1 above.
7.12 In 2017-18, Royal Mail spent £26m less on transformation costs than in 2016-17. See Section 6 for discussion on transformation costs.
Figure 7.2: PVEO bridge 2016-17 to 2017-18
Source: Royal Mail Reported Business (figures constructed for regulatory purposes and are unaudited)
*ONS 12-month trailing average CPI figures (April to March)
Frontline gross hours (delivery and processing)
7.13 We analysed the hours paid for by Royal Mail for the key cost areas of its frontline staff, including frontline delivery and frontline processing hours. These are referred to as ‘gross hours’ and include both worked hours and paid absences such as sickness and leave. The gross hours metric captures year-on-year changes in hours worked as a result of volume changes as well as efficiency, both of which are relevant to our analysis.
137 Royal Mail Plc, Annual Report and Financial Statements 2017-18, page 23.
6,847 29 (132)
6,744
190 (57)(189)
22 6,711106 6,817
6,000 6,100 6,200 6,300 6,400 6,500 6,600 6,700 6,800 6,900 7,000
£m
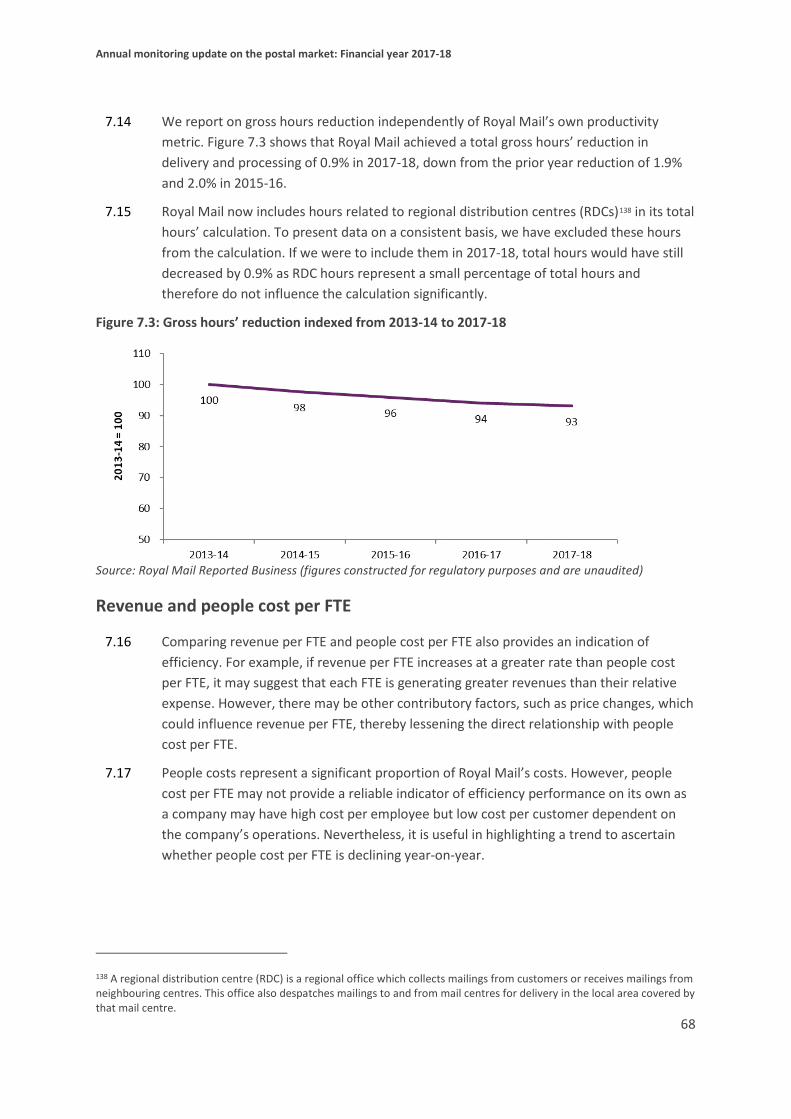
Annual monitoring update on the postal market: Financial year 2017-18
68
7.14 We report on gross hours reduction independently of Royal Mail’s own productivity metric. Figure 7.3 shows that Royal Mail achieved a total gross hours’ reduction in delivery and processing of 0.9% in 2017-18, down from the prior year reduction of 1.9% and 2.0% in 2015-16.
7.15 Royal Mail now includes hours related to regional distribution centres (RDCs)138 in its total hours’ calculation. To present data on a consistent basis, we have excluded these hours from the calculation. If we were to include them in 2017-18, total hours would have still decreased by 0.9% as RDC hours represent a small percentage of total hours and therefore do not influence the calculation significantly.
Figure 7.3: Gross hours’ reduction indexed from 2013-14 to 2017-18
Source: Royal Mail Reported Business (figures constructed for regulatory purposes and are unaudited)
Revenue and people cost per FTE
7.16 Comparing revenue per FTE and people cost per FTE also provides an indication of efficiency. For example, if revenue per FTE increases at a greater rate than people cost per FTE, it may suggest that each FTE is generating greater revenues than their relative expense. However, there may be other contributory factors, such as price changes, which could influence revenue per FTE, thereby lessening the direct relationship with people cost per FTE.
7.17 People costs represent a significant proportion of Royal Mail’s costs. However, people cost per FTE may not provide a reliable indicator of efficiency performance on its own as a company may have high cost per employee but low cost per customer dependent on the company’s operations. Nevertheless, it is useful in highlighting a trend to ascertain whether people cost per FTE is declining year-on-year.
138 A regional distribution centre (RDC) is a regional office which collects mailings from customers or receives mailings from neighbouring centres. This office also despatches mailings to and from mail centres for delivery in the local area covered by that mail centre.
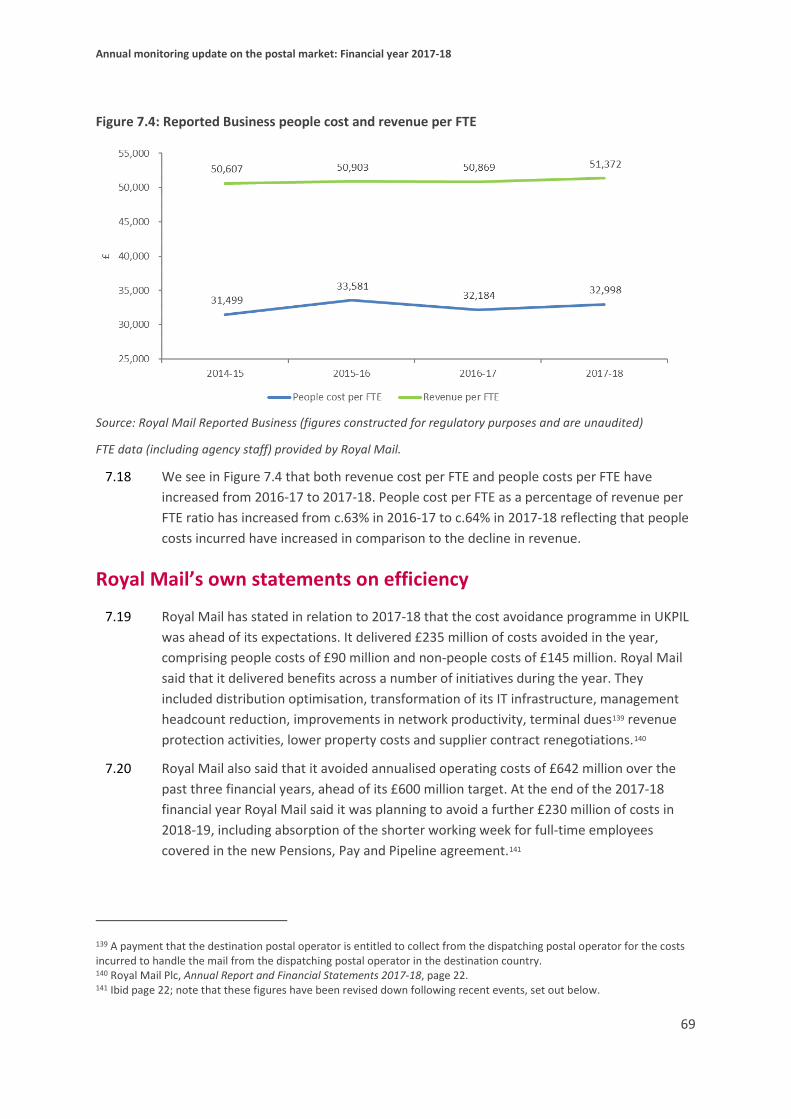
Annual monitoring update on the postal market: Financial year 2017-18
69
Figure 7.4: Reported Business people cost and revenue per FTE
Source: Royal Mail Reported Business (figures constructed for regulatory purposes and are unaudited)
FTE data (including agency staff) provided by Royal Mail.
7.18 We see in Figure 7.4 that both revenue cost per FTE and people costs per FTE have increased from 2016-17 to 2017-18. People cost per FTE as a percentage of revenue per FTE ratio has increased from c.63% in 2016-17 to c.64% in 2017-18 reflecting that people costs incurred have increased in comparison to the decline in revenue.
Royal Mail’s own statements on efficiency
7.19 Royal Mail has stated in relation to 2017-18 that the cost avoidance programme in UKPIL was ahead of its expectations. It delivered £235 million of costs avoided in the year, comprising people costs of £90 million and non-people costs of £145 million. Royal Mail said that it delivered benefits across a number of initiatives during the year. They included distribution optimisation, transformation of its IT infrastructure, management headcount reduction, improvements in network productivity, terminal dues139 revenue protection activities, lower property costs and supplier contract renegotiations.140
7.20 Royal Mail also said that it avoided annualised operating costs of £642 million over the past three financial years, ahead of its £600 million target. At the end of the 2017-18 financial year Royal Mail said it was planning to avoid a further £230 million of costs in 2018-19, including absorption of the shorter working week for full-time employees covered in the new Pensions, Pay and Pipeline agreement.141
139 A payment that the destination postal operator is entitled to collect from the dispatching postal operator for the costs incurred to handle the mail from the dispatching postal operator in the destination country. 140 Royal Mail Plc, Annual Report and Financial Statements 2017-18, page 22. 141 Ibid page 22; note that these figures have been revised down following recent events, set out below.

Annual monitoring update on the postal market: Financial year 2017-18
70
7.21 Royal Mail adopts its own efficiency metric, in its Annual Report and Financial Statements, the method for which differs slightly to Ofcom’s methodology. Royal Mail stated in its Annual Report and Financial Statements that UKPIL collections, processing and delivery productivity improved by 1.0%,142 which was below its target range of 2.0% to 3.0% improvement per annum.143 Royal Mail has made certain changes to the way it calculates its efficiency since the 2015 Business Plan was produced. We note that if productivity were to be calculated on the same basis as that set out in the 2015 Business Plan it would result in a lower number.
Summary of 2017-18 efficiency metrics and rate of improvement
7.22 In summary, the key efficiency trends for the 2017-18 financial year were:
• Total real cost reduction for the Reported Business was 3.0% against 0.4% in the prior year.
• The PVEO analysis indicates an underlying efficiency (excluding transformation costs) of c.2.8% against c.2.2% in the prior year. Efficiency estimated through PVEO analysis also accounts for cost movements due to changes in volumes and one offs.
• Royal Mail reduced total gross hours in delivery and processing by 0.9% in 2017-18, less than the reduction in the prior year.
• People cost per FTE as a percentage of revenue per FTE ratio has increased from c.63% in 2016-17 to c.64% in 2017-18 reflecting that people costs incurred have increased in comparison to the decline in revenue. See Section 6 for detailed revenue and people costs analysis.
• Royal Mail indicated in its 2017-18 Annual Report and Financial Statements that the cost avoidance programme in UKPIL was ahead of their expectations. Royal Mail also said that it avoided annualised operating costs of £642 million over the past three financial years, ahead of their £600 million target.144
7.23 Overall, Royal Mail have made efficiency improvements in 2017-18 which is evidenced in the real cost reduction of 3% in total cost before transformation costs and an underlying efficiency of 2.8% when changes due to volume, inflation and one-off costs are accounted for. This is despite a decline in efficiency metrics specific to people costs i.e. gross hour reduction and people cost per FTE.
Recent events
7.24 Royal Mail has reported lower than expected efficiency improvements in the first half of 2018/19. Hours reduction was reported to be just 0.1%. Further productivity was
142 Productivity can be considered to be the efficiency of the operational activity, for example, how many items are worked in a given amount of time or by an employee. 143 Royal Mail Plc, Annual Report and Financial Statements 2017-18, page 90. 144 Royal Mail Plc, Annual Report and Financial Statements 2017-18, page 22.

Annual monitoring update on the postal market: Financial year 2017-18
71
reported to have declined by 0.2%145 with full year performance expected to be significantly below target (target being at the upper end of the 2-3% range). Cost avoidance was also lower than expected at £41m for the first half of 2018/19, resulting in Royal Mail lowering its 2018-19 cost avoidance target from £230m to £100m. Royal Mail stated the reasons for poor efficiency included the continued after effects of the industrial dispute, delayed implementation of cost avoidance projects and the complexity involved in implementing elements of the Pensions, Pay and Pipeline Agreement.146
Reported Business efficiency
7.25 Royal Mail has strong incentives to improve its efficiency in future to remain financially sustainable. Progress on efficiency is likely to improve the profitability of the Reported Business and help ensure the financial sustainability of the universal service. We continue to believe that efficiency remains critical to the sustainability of the universal service. As part of our ongoing engagement with Royal Mail’s senior management we are seeking to understand their perspective on the future of the universal service and plans they have in place to address any performance issues within the part of the business responsible for delivering the universal service.
145 Royal Mail have refined the calculation of workload since their October trading update, resulting in a change to the productivity performance for the first half of the year. 146 Royal Mail Plc, Results for the half year ended 23 September 2018, page 4.

Annual monitoring update on the postal market: Financial year 2017-18
72
8. Regulatory compliance 8.1 In this section we discuss Royal Mail’s compliance with its regulatory obligations.
8.2 As part of its role as the designated universal service provider, Royal Mail is subject to a set of minimum requirements and service standards in the provision of universal services. These include performance standards for First and Second Class deliveries, maintaining daily delivery (to all UK addresses) and collection (from all access points147) of letters (six days a week) and parcels (five days a week), reporting on the most common causes for complaint and providing services at affordable prices, at a uniform public tariff service to all UK addresses.
8.3 As noted in our March 2012 Statement, in addition to matters relating to Royal Mail’s financial sustainability, we monitor:
a) prices of universal service products, with particular focus on any impact on vulnerable groups and those that rely on postal services. We discuss Royal Mail’s price changes (as well as noting changes to non-price terms) within this section;
b) the quality of service achieved by Royal Mail in the provision of universal services, to ensure that Royal Mail does not degrade quality, for instance in order to reduce costs (rather than reducing costs through improving efficiency). Our March 2012 Statement set out the quality standards that Royal Mail is required to meet to ensure that appropriate levels of universal service performance are maintained for consumers; and
c) the complaint and compensation figures reported annually by Royal Mail.
Pricing of universal services
8.4 In March 2012, Ofcom removed the majority of price controls to give Royal Mail sufficient commercial freedom to enable it to return the universal service to a financially sustainable position. At the same time, we introduced a number of safeguards, including a cap on the price of Second Class stamps (for letters, large letters and parcels less than 2kg),148 so that vulnerable consumers remain able to access a basic universal service.
147 As defined at section 29(11) of the Postal Services Act 2011: “‘access point’ means any box, receptacle or other facility provided for the purpose of receiving postal packets, or any class of postal packets, for onwards transmission by post.” 148 The safeguard cap on Second Class stamps for letters came into effect on 1 April 2012 and can be found in our March 2012 statement, Securing the Universal Postal Service, March 2012, https://www.ofcom.org.uk/__data/assets/pdf_file/0029/74279/Securing-the-Universal-Postal-Service-statement.pdf . The safeguard cap on Second Class stamps for large letters and packets up to 2kg came into effect on 20 July 2012 and was subsequently modified in our March 2013 statement, Safeguard cap for Second Class Large Letters and packets, March 2013, https://www.ofcom.org.uk/__data/assets/pdf_file/0022/50566/statement.pdf.

Annual monitoring update on the postal market: Financial year 2017-18
73
8.5 While the majority of the analysis in this report focuses on 2017-18, the pricing information detailed below focuses on Royal Mail’s pricing announcements for 2018-19, which is in line with previous monitoring updates.
Royal Mail has increased its prices in 2018-19 but parcel prices fell in real terms
8.6 Royal Mail changed its prices for 2018-19 on 26 March 2018. Page 3 of the interactive data shows historic trends in prices for letters and large letters, and page 4 shows historic trends for parcel prices.149
Standard letter stamp and meter prices
8.7 First Class stamp prices rose by 2p to 67p, and meter150 prices rose by 3p to 60p, in nominal terms. This was also an increase in price in real terms in 2018-19. The First Class stamp price rose by 0.6% in real terms, and the meter price rose in real terms by 2.8%, which is a smaller increase than last year.151
8.8 Second Class stamp prices rose by 2p to 58p and meter prices rose by 3p to 44p. This represents a real-terms increase of 1.1% for stamp prices and 4.8% for meter prices, both greater than last year.
Figure 8.1: Standard Letter First and Second Class stamp and meter prices and price rises for 2018-19 (nominal terms)
149 Interactive data can be accessed here: https://www.ofcom.org.uk/postal-services/information-for-the-postal-industry/monitoring_reports/interactive-data-2017-18 150 Metered mail refers to a method of payment or payment channel for Royal Mail services where customers pre-pay for postage and apply an impression to the envelope, label or wrapper using a franking machine licensed by Royal Mail. 151 In 2017-18, the First Class stamp price fell 0.8% and the First Class meter price rose 5.1% (real terms).

Annual monitoring update on the postal market: Financial year 2017-18
74
Source: Royal Mail price lists.152 Prices and price rises for 2017-18 to 2018-19 are in nominal terms.
8.9 Meter prices moved closer to stamp prices this year, as Royal Mail increased meter prices by 1p more than stamp prices. The differential for Second Class letters has decreased to 14p and First Class to 7p (from 15p and 8p respectively in 2017-18).
Large letter stamp and meter prices
8.10 There are four weight steps for large letters: 0-100g, 101-250g, 251-500g and 501-750g. Prices rose in real terms for large letters across all weight steps in 2018-19 compared to the previous year.
8.11 The average First Class stamp price for large letters153 rose in real terms by 2.4% and the average meter price rose by 3.2%. The weighted average price for First Class stamps was £1.19 and for metered mail was £1.17. Across First Class products, compared with last year, the largest nominal price rise was 14p, which applied to metered large letters weighing 501-750g.
8.12 The average Second Class stamp price for large letters rose in real terms by 1.3% and the average meter price rose by 3.4%. The weighted average price for Second Class stamps was 94p and for metered mail was 89p. Across Second Class products, compared with last year, nominal prices rose between 3p and 10p, with the largest price rise of 10p applying to metered large letters weighing 501-750g.
Figure 8.2: Large letter First and Second Class stamp and meter prices and price rises for 2018-19
Large Letter Product Stamp Meter
First Class 0-100g £1.01 3p (3.1% ) £0.95 5p (5.9% )
First Class 101-250g £1.40 10p (7.7% ) £1.31 7p (5.6% )
First Class 251-500g £1.87 13p (7.5% ) £1.74 10p (6.1% )
First Class 501-750g £2.60 8p (3.2% ) £2.44 14p (6.1% )
Second Class 0-100g £0.79 3p (3.9% ) £0.72 4p (5.9% )
Second Class 101-250g £1.26 4p (3.3% ) £1.02 6p (6.3% )
Second Class 251-500g £1.64 6p (3.8% ) £1.33 7p (5.6% )
Second Class 501-750g £2.22 8p (3.7% ) £1.86 10p (5.7% )
152 For price lists see https://www.royalmail.com/sites/default/files/Franking-Wallchart-March-2018-40966280.pdf. For price changes see https://www.royalmail.com/prices2018. 153 We have calculated a weighted average price using 2017-18 volumes across the four weight steps for large letters. To do so, we have taken the volume for each weight step and multiplied this by the price for that weight step. We have then added this result (for each weight step) together and divided it by the total volumes (across each weight step).

Annual monitoring update on the postal market: Financial year 2017-18
75
Source: Royal Mail price lists.154 Prices and price rises for 2017-18 to 2018-19 are in nominal terms.
8.13 For 2018-19, the differential between stamp and meter prices ranges from 6 to36p depending on the type of product and increases with the increase in product size. There is a greater differential between stamp and meter prices for Second Class products, and Royal Mail made greater price increases for meter prices compared to stamp prices for both First and Second Class.
Parcel prices
8.14 Since March 2016, Royal Mail has offered two prices for each parcel product that it provides within the universal service, depending on whether postage is purchased via an online account or at the Post Office. Purchase of parcel postage via an online account is generally 5-10p cheaper than purchase via the Post Office. The price differences can be seen in Figure 5.3 below, along with the price rises for 2017-18 to 2018-19.
Figure 8.3: Royal Mail parcel prices and price rises for 2018-19
Parcel product Post Office price Royal Mail online account price
First Class 0-1kg small £3.45 5p (1.5% ) £3.38 3p (0.9% )
First Class 0-1kg medium £5.75 5p (0.9% ) £5.68 3p (0.5% )
First Class 1-2kg small £5.50 0p (0%) £5.45 0p (0%)
First Class 1-2kg medium £8.95 0p (0%) £8.90 0p (0%)
Second Class 0-1kg small £2.95 5p (1.7% ) £2.85 3p (1.1% )
Second Class 0-1kg medium £5.05 5p (1.0% ) £4.95 3p (0.6% )
Second Class 1-2kg small £2.95 5p (1.7% ) £2.85 3p (1.1% )
Second Class 1-2kg medium £5.05 5p (1.0% ) £4.95 3p (0.6% )
Source: Royal Mail price list, March 2018.155 Prices and price rises for 2017-18 to 2018-19 are in nominal terms.
8.15 In order to ensure a consistent comparison with prior years, we have used Post Office prices in the interactive data accompanying this report.
8.16 In 2018-19, prices fell in real terms for all parcel products up to 2kg, as any price rises were below the 2.4% rate of inflation. Excluding both First Class 1-2kg products, all Post Office parcel prices shown above rose by 5p and online prices rose by 3p. The First Class 1-2kg products remained at the same prices as 2017-18. As in previous years, Second
154 For price lists see https://www.royalmail.com/sites/default/files/Our-prices-2018-effective-26-March-2018-46305575.pdf and https://www.royalmail.com/sites/default/files/Royal--Mail-business-price-guide-mar-2018--40966142.pdf. For price changes see https://www.royalmail.com/prices2018. 155 For price lists see https://www.royalmail.com/sites/default/files/Royal--Mail-business-price-guide-mar-2018--40966142.pdf. For price changes see https://www.royalmail.com/prices2018.

Annual monitoring update on the postal market: Financial year 2017-18
76
Class small and medium parcels up to 2kg are priced by size rather than weight, costing the same in the 0-1kg and 1-2kg weight steps. Excluding where there were no price changes made, the larger reductions in real term prices applied to the online products, particularly heavier and medium sized parcels.
Royal Mail has complied with the safeguard caps in 2018-19
8.17 There are two safeguard caps in place for stamp prices, the cap for Second Class standard letters, and the basket cap for Second Class large letters and small and medium parcels up to 2kg.
8.18 The Second Class standard letter cap is set at 60p for the period 2018-19.156 Royal Mail currently prices standard letters below the level of the cap, at 58p.
8.19 In 2012-13, the level of the basket cap is set at 53% in real terms above 2011-12 prices. The level of the cap has increased by CPI for each year of the control period (the caps expire on 31 March 2019). Royal Mail is currently pricing the products within the basket cap at 29% below the level of the cap. 157
8.20 The safeguard caps are due to expire in March 2019. In March 2017, we concluded that they should be retained as an affordability measure, to ensure that consumers (in particular vulnerable consumers) continue to have access to a universal service at affordable prices.158 We have consulted on the appropriate level of the caps which will apply from April 2019 and are currently considering responses to that consultation prior to the publication of a statement in early 2019.159
We continue to monitor the difference between access and retail bulk prices
8.21 In 2017-18 we have continued to receive quarterly compliance reports from Royal Mail in relation to its margin squeeze control on some of its retail prices for D+2 Letter and Large Letter bulk mail. Royal Mail is required to do this under our Universal Service Provider (USP) Access Condition.160 The control seeks to ensure that the upstream element (i.e. those activities carried out by access operators) of the revenues of these bulk mail services is sufficient to cover the costs of the relevant upstream activities carried out by Royal Mail to provide the services. This is in place so that Royal Mail does not have an unfair competitive advantage relative to the access operators that purchase wholesale access services from Royal Mail to provide bulk mail services in the market. In 2018 we implemented some technical changes to the reporting requirements relating to the
156 The cap is calculated by reference to the 2012-13 cap of 55p plus the relevant CPI inflation rate each year from 2012-13 to 2018-19. 157 The level of the basket cap is calculated using a weighted average. 158 Ofcom, Review of the Regulation of Royal Mail, March 2017, paragraphs 3.178-9, 4.44-6, https://www.ofcom.org.uk/__data/assets/pdf_file/0033/97863/Review-of-the-Regulation-of-Royal-Mail.pdf. 159 Ofcom, Consultation: Review of Second Class stamp safeguard caps, July 2018, https://www.ofcom.org.uk/consultations-and-statements/category-1/review-second-class-stamp-safeguard-cap. 160 Ofcom, USP Access Condition, https://www.ofcom.org.uk/__data/assets/pdf_file/0022/105259/usp-access-condition.pdf

Annual monitoring update on the postal market: Financial year 2017-18
77
margin squeeze control under the USP Access Condition, which makes sure the control remains fit for purpose.161
8.22 We note the recent access tariff announcements which will take effect in early 2019.162 We will be closely monitoring Royal Mail compliance following implementation of the recently announced increase in Royal Mail’s access prices.
We found Royal Mail breached competition rules
8.23 In August 2018, Ofcom found Royal Mail in breach of Section 18 of the Competition Act and Article 102 of the Treaty for the Functioning of the European Union, which prohibits a firm from abusing its dominant position, and imposed a penalty of £50 million. Royal Mail is appealing Ofcom’s finding and penalty to the Competition Appeal Tribunal (CAT).
8.24 Ofcom’s investigation followed a complaint by Whistl about changes Royal Mail made to its wholesale customers' contracts in early 2014, including wholesale price increases it was introducing.
8.25 At the time, Whistl was expanding its business to compete directly with Royal Mail by delivering business letters (known as ‘bulk mail’) to addresses in certain parts of the UK. The contract changes meant that those Royal Mail wholesale customers who wanted to compete with Royal Mail by delivering letters in some parts of the country, such as Whistl, would have to pay higher prices in those areas where they continued to use Royal Mail for delivery. Following notification of these new prices, Whistl suspended plans to extend delivery services to new areas.
Affordability of universal services
8.26 One of the key safeguards in the current regulatory framework is ensuring that universal postal services are affordable. In March 2013 we published a report163 which set out that we considered that universal postal services remained affordable in 2012 and 2013 for both residential consumers (including low income and other vulnerable consumers) and businesses (including small and medium businesses). Since then we have been monitoring the affordability of postal services through the responses to questions in our postal tracker surveys and through reviewing Office for National Statistics (ONS) data.
8.27 We remain of the view that postal services are currently affordable for most residential consumers. As noted in Section 5, 62% of residential consumers surveyed were satisfied
161 Ofcom, Statement on Amendments to USPA Condition, November 2018, https://www.ofcom.org.uk/consultations-and-statements/category-2/post-uspac-margin-squeeze. 162 To comply with ‘margin squeeze’ reporting requirements, Royal Mail prices are published on its website here, showing current prices available up to 1 January 2019, and the incoming prices from 2 January 2019: https://royalmailwholesale.com/price-list. 163 Ofcom, The affordability of universal postal services, 19 March 2013, https://www.ofcom.org.uk/__data/assets/pdf_file/0014/10445/affordability.pdf.
Annual monitoring update on the postal market: Financial year 2017-18
78
with the cost of postage.164 Furthermore, the most recent ONS data shows that weekly household spending on postal services remains very low, as it accounts for approximately 0.12% of total household spend (£554.20 per week). This is despite an increase in spending from the previous year (70p per household per week compared to 60p in previous year, not adjusted for inflation).165
8.28 However, a minority (8%) of respondents to our postal tracker survey reported that they had had to reduce their use of postage stamps to afford essentials like food or heating in the previous three months.166 There is a difference across socioeconomic groups167, with a higher proportion of those in the C2 and DE groups (both 10%) reporting that they had done so compared to those in the AB and C1 groups (7% and 6% respectively). There is also a higher proportion of younger people who reduced their use of postage stamps to afford essentials, with 11% of 16-24 year olds and 25-44 year olds answering ‘yes’ compared to the older respondents.168
8.29 In April 2018, we commissioned a survey of residential consumers relating to their postal expenditure and sending patterns.169 Ten per cent of those surveyed send (or expect to send) fewer letters overall nowadays to save money compared with two years ago in response to recent postage price rises.170 Two per cent of those surveyed said that if their total household cost of sending letters and large letters increased by 10% as a result of price rises they would not send any letters because the price would be unaffordable to them.171
8.30 While we consider that universal service products are currently affordable for most residential consumers, we will continue to monitor respondents’ views regarding affordability. As noted in our review of the affordability of universal postal services in 2013, there are some circumstances where a consumer could be at risk from not being able to afford these services. This reflects very particular circumstances and severe financial hardship and it is likely that consumers in such circumstances would
164 Ofcom residential postal tracker Q3 2017-Q2 2018, QG3_7: “How satisfied are you with the following aspects of Royal Mail’s service? Cost of postage”. 165 ONS, Family spending in the UK: financial year ending 2017, January 2018, https://www.ons.gov.uk/peoplepopulationandcommunity/personalandhouseholdfinances/expenditure/bulletins/familyspendingintheuk/financialyearending2017/relateddata. 166 Ofcom residential postal tracker Q3 2017-Q2 2018, QF1_1: “In the last 3 months have you had to… Reduce your use of postage stamps so that you can afford essentials like food or heating?” 167 For a definition of socioeconomic groups, see Ofcom, Communications Market Report: United Kingdom, 3 August 2017, pages 237-238, https://www.ofcom.org.uk/__data/assets/pdf_file/0017/105074/cmr-2017-uk.pdf. 168 6% of 45-64 year olds, 5% of 65-74 year olds and 4% of 75+ year olds answered ‘yes’ to this question. 169 Ofcom, Residential Omnibus Survey 2018, https://www.ofcom.org.uk/__data/assets/pdf_file/0028/116596/Residential-omnibus-survey.pdf. 170 Ofcom, Residential Omnibus Survey 2018, Q.8 “The price of 1st and 2nd class postage increased recently (standard First-Class postage stamp (67p) and standard 2nd Class postage stamp (58p)). Which of the following statements best describes what effect, if any, recent postage price rises have had on the extent to which you post letters and large letters nowadays, compared with two years ago?” 171 Ofcom, Residential Omnibus Survey 2018, Q.9 “If your total household cost of sending letters and large letters went up by 10% as a result of price rises, which one of the following statements best represents what you would do in response?”

Annual monitoring update on the postal market: Financial year 2017-18
79
unfortunately have concerns about the prices of universal postal services, even at much lower prices.172
8.31 Citizens Advice published a research report in August 2018 about the affordability of redirections.173 Royal Mail provides a redirection service in the UK for consumers moving house, which enables mail to be rerouted to their new address.174 Citizens Advice highlighted that the price of redirections has increased substantially, more than the prices of First and Second Class stamps. According to their research, 21% of consumers found the service too expensive or not worth the money, and 8% of consumers wanted to use redirections but could not afford it.175 Citizens Advice suggested a number of changes including concessionary rates for consumers with low incomes and a change in the cost of mail redirections from a ‘per surname’ to a ‘per household’ basis, the latter of which has been acknowledged by Royal Mail. We have been talking to Citizens Advice and Royal Mail about this issue and will continue to monitor the affordability of this service.
Non-price terms of universal services
8.32 As part of our monitoring regime we also consider the impact of non-price changes to the terms of universal services, which involve changes to Royal Mail’s Postal Schemes.
8.33 Postal Schemes set out the terms and conditions for postal services for consumers and business customers who use Royal Mail’s services but who do not hold an individual contract with Royal Mail. Customers who use stamps, online postage or franking meters to pay for Royal Mail services do so under a Postal Scheme rather than a contractual arrangement. Details of the Postal Schemes are available on Royal Mail’s website.176
8.34 Before making changes to the Schemes, Royal Mail must consult customers and stakeholders, including Ofcom, and the consumer advocacy bodies, including Citizens Advice. This must occur at least one month before the date on which Royal Mail proposes to implement the change.
8.35 During 2017-18, Royal Mail made the following changes to non-price terms:
• Clarification for franking customers regarding the impact of incorrectly segregating First Class and Second Class mail (i.e. where First Class items are found in Second Class
172 Ofcom, The affordability of universal postal services, paragraph 6.3. 173 Citizens Advice, A new redirection? How to make mail redirections fairer and more affordable for consumers, August 2018, https://www.citizensadvice.org.uk/Global/CitizensAdvice/Post%20and%20Telecoms/Mail%20Redirection%20Research%20Report%20FINAL%20-%2016%20August%202018.pdf. 174 Consumers pay an upfront fee, and there are three packages available: £33.99 for up to 3 months, £46.99 for up to 6 months, and £66.99 for up to 12 months. 175 Citizens Advice, A new redirection?, Figure 5. 176 See https://www.royalmail.com/non-contract-terms-and-conditions/.

Annual monitoring update on the postal market: Financial year 2017-18
80
mail they are delivered as Second Class and the difference in price for the lesser service is not refunded).177
8.36 We will continue to monitor the changes that Royal Mail makes to non-price terms of universal services.
Quality of Service
8.37 Royal Mail is subject to annual quality of service (QoS) targets. We monitor its performance against these targets so that we can take prompt and appropriate action, where we consider it necessary to do so, if we identify failures.
8.38 Figure 5.4 summarises Royal Mail’s performance in 2017-18 and, for comparison, 2016-17, against the QoS targets we have set.178 Page 6 of the interactive data shows historic trends for each KPI below.179
Figure 8.4: Quality of Service Summary180
KPI Target 2017/18 Result
2016/17 Result
Change from prior year
First Class delivery 93.0% Items delivered day after collection 91.6% 93.1% ▼
Second Class delivery 98.5% Items delivered within 3 days of collection
98.4% 98.9% ▼
Post Code Area (PCA)181 Target: First Class single piece mail
118/121 PCAs
91.5% items delivered day after collection
72/121 110/121 ▼
PCA Target (with confidence interval)
118/121 PCAs
91.5% items delivered day after collection
96/121 117/121 ▼
177 This was noted in our 2016-17 annual monitoring update but was notified to Ofcom in June 2017 during the 2017-18 financial year. 178 The figures cited in this subsection are taken from the Quality of Service reports submitted to Ofcom by Royal Mail and do not include any adjustments that Royal Mail makes to account for force majeure events, such as very severe weather. 179 Interactive data can be accessed here: https://www.ofcom.org.uk/postal-services/information-for-the-postal-industry/monitoring_reports/interactive-data-2017-18 180 Royal Mail monitors its compliance in relation to quality of service standards using a series of surveys of test mail items. These items are not identifiable to Royal Mail when travelling through its network and the surveys are carried out by a research agency on its behalf. The sampling allows Royal Mail to estimate its delivery performance based on a sample of test items, which can then be extrapolated to estimate the performance across all mailing items. 181 The post code area is the largest geographical postcode unit and forms the initial characters of the alphanumeric UK postcode.
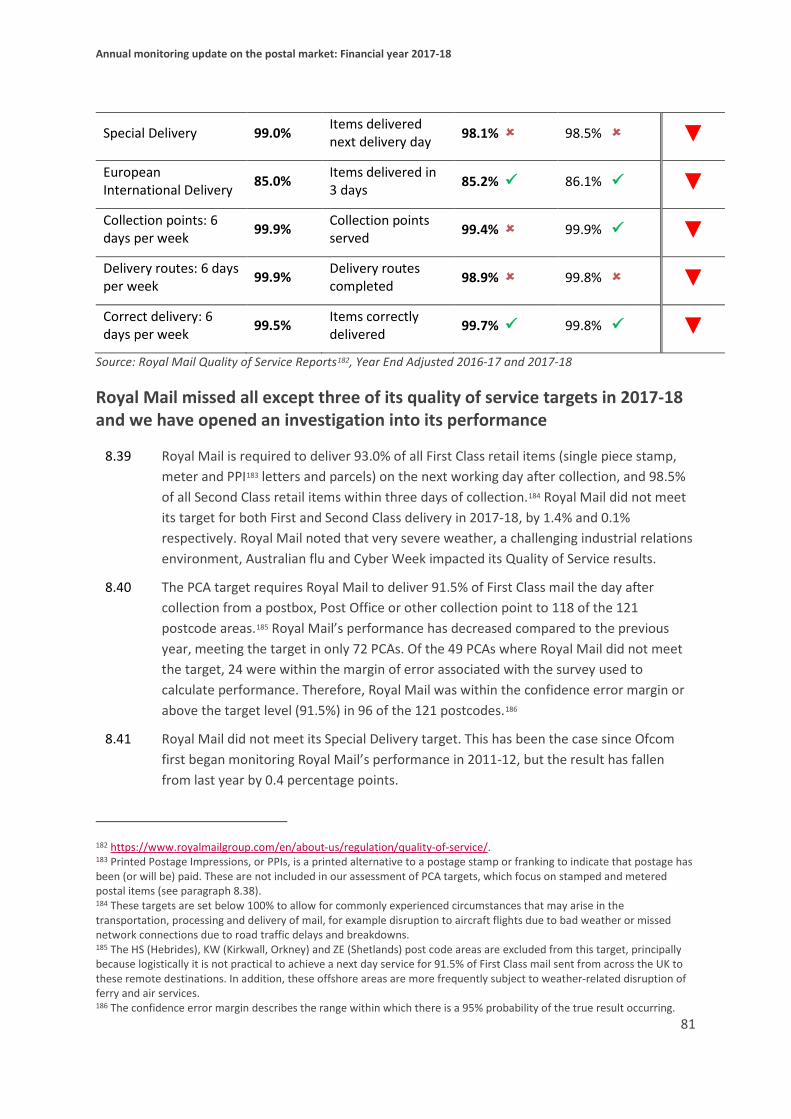
Annual monitoring update on the postal market: Financial year 2017-18
81
Special Delivery 99.0% Items delivered next delivery day 98.1% 98.5% ▼
European International Delivery 85.0% Items delivered in
3 days 85.2% 86.1% ▼ Collection points: 6 days per week 99.9% Collection points
served 99.4% 99.9% ▼ Delivery routes: 6 days per week 99.9% Delivery routes
completed 98.9% 99.8% ▼ Correct delivery: 6 days per week 99.5% Items correctly
delivered 99.7% 99.8% ▼ Source: Royal Mail Quality of Service Reports182, Year End Adjusted 2016-17 and 2017-18
Royal Mail missed all except three of its quality of service targets in 2017-18 and we have opened an investigation into its performance
8.39 Royal Mail is required to deliver 93.0% of all First Class retail items (single piece stamp, meter and PPI183 letters and parcels) on the next working day after collection, and 98.5% of all Second Class retail items within three days of collection.184 Royal Mail did not meet its target for both First and Second Class delivery in 2017-18, by 1.4% and 0.1% respectively. Royal Mail noted that very severe weather, a challenging industrial relations environment, Australian flu and Cyber Week impacted its Quality of Service results.
8.40 The PCA target requires Royal Mail to deliver 91.5% of First Class mail the day after collection from a postbox, Post Office or other collection point to 118 of the 121 postcode areas.185 Royal Mail’s performance has decreased compared to the previous year, meeting the target in only 72 PCAs. Of the 49 PCAs where Royal Mail did not meet the target, 24 were within the margin of error associated with the survey used to calculate performance. Therefore, Royal Mail was within the confidence error margin or above the target level (91.5%) in 96 of the 121 postcodes.186
8.41 Royal Mail did not meet its Special Delivery target. This has been the case since Ofcom first began monitoring Royal Mail’s performance in 2011-12, but the result has fallen from last year by 0.4 percentage points.
182 https://www.royalmailgroup.com/en/about-us/regulation/quality-of-service/. 183 Printed Postage Impressions, or PPIs, is a printed alternative to a postage stamp or franking to indicate that postage has been (or will be) paid. These are not included in our assessment of PCA targets, which focus on stamped and metered postal items (see paragraph 8.38). 184 These targets are set below 100% to allow for commonly experienced circumstances that may arise in the transportation, processing and delivery of mail, for example disruption to aircraft flights due to bad weather or missed network connections due to road traffic delays and breakdowns. 185 The HS (Hebrides), KW (Kirkwall, Orkney) and ZE (Shetlands) post code areas are excluded from this target, principally because logistically it is not practical to achieve a next day service for 91.5% of First Class mail sent from across the UK to these remote destinations. In addition, these offshore areas are more frequently subject to weather-related disruption of ferry and air services. 186 The confidence error margin describes the range within which there is a 95% probability of the true result occurring.

Annual monitoring update on the postal market: Financial year 2017-18
82
8.42 Performance against the European International Delivery target fell for the sixth year in a row, falling from 95% in 2011-12 to 85.2% in 2017-18. It remains above the required performance level of 85%.
8.43 Royal Mail exceeded its requirement to ensure at least 99.5% of items are correctly delivered, achieving 99.7%. It also met the target for completing 99.9% of delivery routes on each working day, a target it has not achieved since 2010-11. However, Royal Mail did not achieve its target to ensure that at least 99.9% of collection points are served each day, achieving 99.4%.
8.44 These QoS targets aim to ensure people receive a good, reliable service from Royal Mail. We closely monitor its performance throughout the year and can take action if it fails to meet these standards. Overall, quality of service performance dropped from 2016-17 to 2017-18. We are currently investigating Royal Mail’s compliance in 2017-18 and expect to publish our findings by early 2019.187
Complaints data
8.45 Ofcom requires Royal Mail, as the universal service provider, to publish an annual report setting out the number of complaints received in each financial year and the amount of compensation paid in relation to those complaints. It is also required to report the top ten categories of complaint.
Complaints
8.46 Page 7 of the interactive data contains the top ten categories of complaint to Royal Mail since 2013-14 in further detail.
187 https://www.ofcom.org.uk/about-ofcom/latest/bulletins/competition-bulletins/open-cases/cw_01221

Annual monitoring update on the postal market: Financial year 2017-18
83
Figure 8.5: Royal Mail’s top ten complaint categories, 2017-18 compared to 2016-17
Source: Royal Mail188
*A P739 form is issued by a postal worker when a customer is not at home, or is otherwise unable to receive an item of mail at the delivery address.
**International Loss was not a category in the top ten in 2016-17 so there is no comparable figure from that year, however we do not expect that complaints in this category amounted to zero.
***Other refers to any complaints that do not fall into the top ten and includes a number of categories (including International Loss in 2016-17).
8.47 Overall complaint volumes increased to over 1 million in 2017-18 and have increased by 10.3% from 2016-17.189 This can be attributed to the continued rise in complaints about denial of receipt,190 P739 failure, delivery procedure errors, damage, and delay, in addition to complaints that fall into other categories. However, complaints about redirection and mis-delivery fell this year compared with 2016-17, by -1.1% and -1.4% respectively. A new category of complaint has been included in the top ten for 2017-18, International Loss, which accounts for 2.1% of complaints.
188 Royal Mail, Annual Consumer Complaints and Compensation Report 2017-18, June 2018, https://www.royalmailgroup.com/media/9998/royal-mail-annual-consumer-complaints-2017-18.pdf. 189 Total complaints in 2017-18 amounted to 1,044,522, up from 946,861 in 2016-17. Complaints numbers for previous years can be found in our interactive data. 190 ‘Denial of receipt’ refers to cases where customers have denied receiving parcels Royal Mail recorded as having been successfully delivered.

Annual monitoring update on the postal market: Financial year 2017-18
84
8.48 Loss continues to account for the highest proportion of complaints (24.6%) but this proportion fell by 3.9 percentage points from last year. The second largest category, denial of receipt, has had the largest increase in proportion of complaints, rising by 3.5 percentage points (9.4% in 2016-17 up to 12.9% in 2017-18). Complaint numbers for denial of receipt increased by 51% year on year, rising from 89,219 to 134,714. We are in dialogue with Royal Mail to understand the reasons behind this increase.
Compensation
8.49 Royal Mail is required to provide compensation on a fair and reasonable basis where a customer experiences loss, delay or damage in relation to certain universal postal services.
8.50 Average compensation paid per complaint continued to rise in 2017-18, but at a slower rate than the previous year at just above 10%. The total number of complaints where compensation was paid fell slightly by -0.1%. Total compensation paid by Royal Mail rose 10.5% from last year, to approximately £7.5 million, reflecting the rise in average compensation per complaint.
8.51 We will continue to examine complaints and compensation data on an on-going basis as part of our monitoring programme.
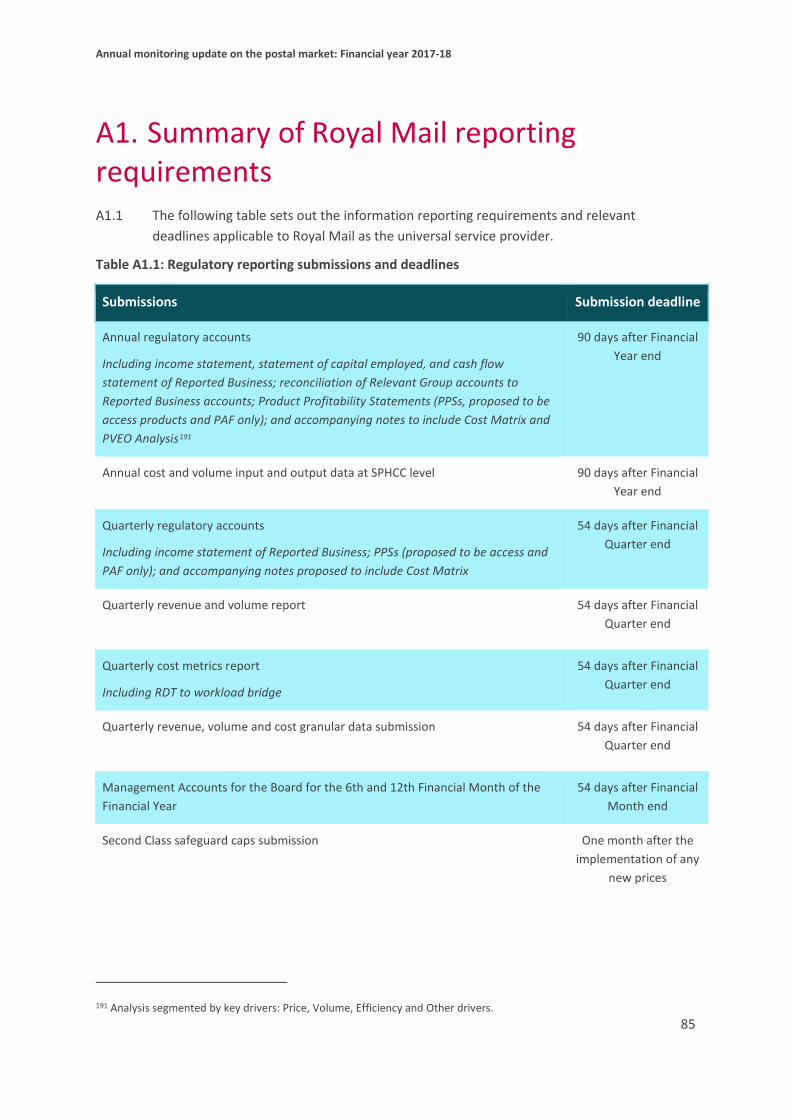
Annual monitoring update on the postal market: Financial year 2017-18
85
A1. Summary of Royal Mail reporting requirements A1.1 The following table sets out the information reporting requirements and relevant
deadlines applicable to Royal Mail as the universal service provider.
Table A1.1: Regulatory reporting submissions and deadlines
Submissions Submission deadline
Annual regulatory accounts
Including income statement, statement of capital employed, and cash flow statement of Reported Business; reconciliation of Relevant Group accounts to Reported Business accounts; Product Profitability Statements (PPSs, proposed to be access products and PAF only); and accompanying notes to include Cost Matrix and PVEO Analysis191
90 days after Financial Year end
Annual cost and volume input and output data at SPHCC level 90 days after Financial Year end
Quarterly regulatory accounts
Including income statement of Reported Business; PPSs (proposed to be access and PAF only); and accompanying notes proposed to include Cost Matrix
54 days after Financial Quarter end
Quarterly revenue and volume report
54 days after Financial Quarter end
Quarterly cost metrics report
Including RDT to workload bridge
54 days after Financial Quarter end
Quarterly revenue, volume and cost granular data submission
54 days after Financial Quarter end
Management Accounts for the Board for the 6th and 12th Financial Month of the Financial Year
54 days after Financial Month end
Second Class safeguard caps submission One month after the implementation of any
new prices
191 Analysis segmented by key drivers: Price, Volume, Efficiency and Other drivers.