Embed Size (px)
Citation preview
NEATH PORT TALBOT COUNTY BOROUGH COUNCIL CYNGOR BWRDEISTREF SIROL CASTELL-NEDD PORT TALBOT
Annual Planning Performance Report
2015-16
Nicola Pearce – Head of Planning and Public Protection
1
PREFACE
As the Cabinet Member for Economic Development and Property Services, I have responsibility for delivering the Planning function within Neath Port Talbot. The contribution of the Planning service to secure the broader regeneration aspirations of the Council cannot be under estimated. Through the adopted Local Development Plan and individual Development Management decisions, we are creating a place where everyone has an equal chance to be healthier, happier, safer and more prosperous. This in turn improves the health and wellbeing of our communities and as such the quality of life for all. Councillor Anthony Taylor Cabinet Member for Economic and Property Services. GEOGRAPHICAL CONTEXT Neath Port Talbot is located on the coast between the City & County of Swansea to the west and the County Borough of Bridgend to the east. We also share boundaries and characteristics with Carmarthenshire, Powys, Rhondda Cynon Taf and the Brecon Beacons National Park. The Authority also forms part of the wider Swansea Bay City region and is the link authority between West and South Wales. Following its designation earlier this year, the County also hosts the largest Enterprise Zone in Wales, the need for which arose from the economic downturn in the steel industry which in turn jeopardised the continued operation of the Port Talbot steelworks which is the biggest employer in the local area. It is anticipated that this designation will boost economic development within the local area which will result in spin off benefits to the wider region. The County Borough has a resident population of 139,800 (Census 2011), covering an area of over 44,217 hectares, the physical characteristics of the County Borough, can be broadly divided into the following two areas; the coastal corridor and the valleys. The coastal corridor encompasses a relatively narrow coastal strip extending around Swansea Bay where the main centres of population, employment and the M4 corridor are located. The main towns and settlements of Neath and Port Talbot continue to be the major focus for house building both by private market and registered social landlords. The valleys are characterised by the attractive landscape setting of river valleys separated by upland plateaus and mountains. They are rural in aspect and contain scattered communities throughout. While the individual valleys have strong individual characteristics and identities, they share common features and problems. Historically large scale house building has predominantly been limited to Pontardawe and the Upper Swansea Valley. Corporate Context As a consequence of the Council’s aim to secure efficiencies in service delivery and associated financial savings the Council has recently restructured some of the regulatory services to increase joint working practices. This resulted in the merger of the

2
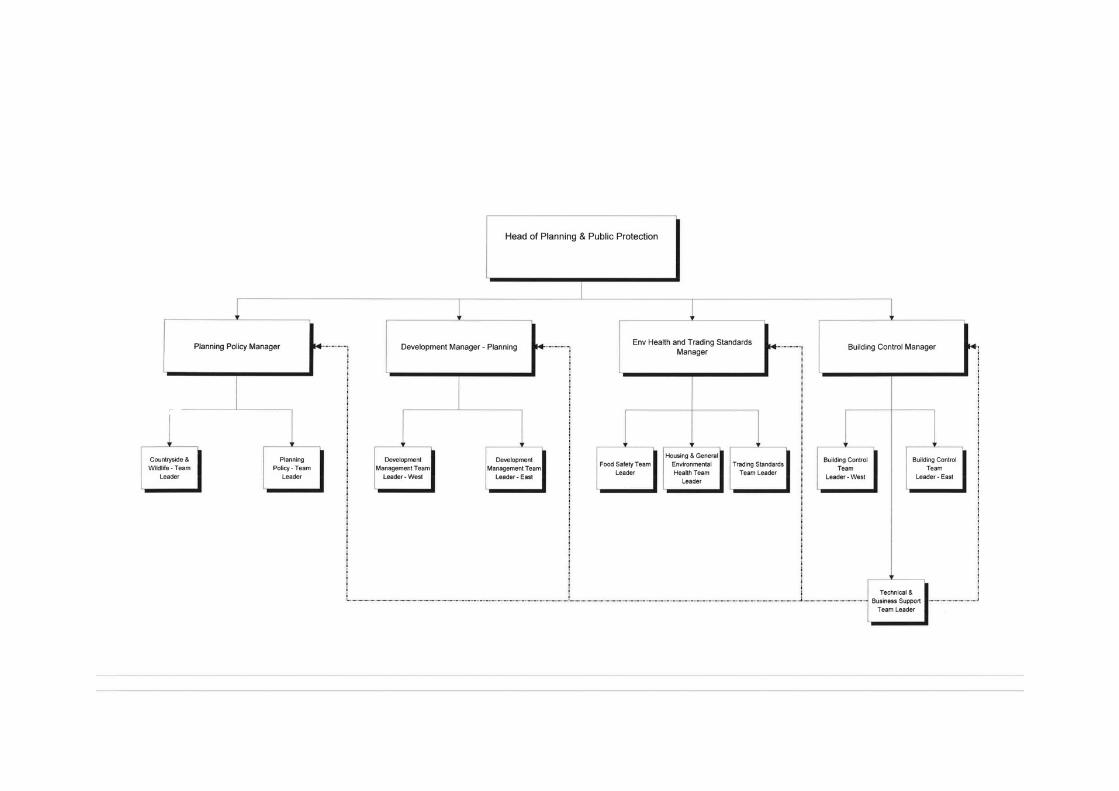
Environmental Health and Trading Standards service into the Planning Service, which was rebranded as the ‘Planning and Public Protection Service’. The merger of these services has provided opportunities to reduce duplicitous work and therefore achieve efficiency savings. It also resulted in an immediate budget saving of £130k. These will be explained in greater detail later in this report. The Planning and Public Protection Service sits within the Environment Directorate which is one of four Directorates within the Council each of which report directly to the Chief Executive. In addition to Planning and Public Protection there are three further Heads of Service within the Environment Directorate which include the Head of Streetcare, Head of Engineering and Transport and the Head of Property and Regeneration. Each of the Four Directorates work towards achieving the following Corporate Priorities: Safer Brighter Futures - To improve outcomes for children in need and children looked after by improving the performance of the Council’s Children and Young People Services Department. Better Schools Brighter Prospects - To raise educational standards and attainment for all young people. Improving Outcomes Improving Lives - To maximise the number of adults who are able to live independently with or without support within the home of their choice within their community. Prosperity for All - To support and invest in our town centres and communities to promote economic growth, regeneration and sustainability to maximise job opportunities and improve access to employment. Reduce, Reuse, Recycle - Increase the percentage of waste recycled and composted. Digital by Choice - To Improve customer / citizen access to services and functions provided by the Council or on behalf of the Council and to improve the efficiency of those services and functions. The Planning and Public Protection Service does not have a specific priority but contributes towards the achievement of all the Corporate Priorities to a greater or lesser extent. Whilst the Planning function sits within a wider service area, this Report will primarily cover the traditional planning functions delivered by Neath Port Talbot Council. The Planning and Public Protection Service As stated above the service has been extended since April 2016 following its merger with the Environmental Health and Trading Standards service. As a consequence of this merger the following structure (to third tier level) was created as follows:
3

4
This enlarged service works collaboratively to secure the following aim: Aim To establish the framework for shaping, creating and delivering quality, safe, healthy and sustainable communities within which to live and thrive. To secure this aim the following vision will be pursued: Vision A pro-active front loaded service where everyone works together to achieve a shared purpose of promoting and creating safe, healthy and sustainable places to work and live in. This will enable us to achieve the corporate priority of securing prosperity for all, better, simpler and cheaper. Values Adopting strong values are key to securing the above aim and vision. This new service aims to work collaboratively to maximise shared knowledge and learning thus improve efficiency. We intend to help each other to secure continuous improvement, improve communication both internally and to our external customers. We will work in an environment of openness, with consistency, transparency, and equality at the heart of all of our operating principles. We will reduce waste within our services concentrating on adding value and doing what matters for all of our customers. The services offered by the traditional Planning Service within that overall structure are as follows: Development Management Planning Applications
The team deal with all applications made under primary and secondary planning legislation including the Town and Country Planning Act 1990 and Town and Country Planning (Listed Buildings and Conservation Areas) Act 1990. The main types of applications dealt with are:-
• Planning Applications (full, outline or ‘reserved matters’) • Listed Building Consent • Conservation Area Consent • Applications for Certificate of Lawful use or Development (Existing and Proposed) • Advertisements • Minerals • Waste • Works to Protected Trees • Hazardous Substances Consent • High Hedges • Hedgerow Removal
Pre-Application Advice
The team provides applicants / developers with a formal, chargeable, pre-application service which places significant importance upon the provision of the best possible advice to a potential

5
developer/applicant before a formal planning application is submitted. Officers seek to promote high quality development and use the pre-application service to front load the development process and therefore speed up the formal planning process.
Enforcement
The Enforcement section deals with complaints in respect of alleged breaches of planning control, which predominately relate to: -
• Undertaking building works without permission, or developing without complying with approved plans
• Failing to comply with condition(s) imposed on a planning permission • Change of use of land or buildings without permission • Untidy Land • Unauthorised work to protected trees
Planning Appeals
If the Council refuses to give planning permission, or grants it subject to conditions, fails to deal with an application within statutory time limits, or issues an enforcement notice, the applicant/alleged offender has a right to appeal to the Planning Inspectorate. Planning Officers within the team deal with all appeals, which can be heard by one of three procedures: - Written Representations; Hearing or Public Inquiry.
Minerals and Waste
The Minerals and Waste service, including all applications mineral works, aftercare and restoration, and monitoring of existing Mineral and Landfill sites is currently provided in conjunction with Officers within the Carmarthenshire County Council under a Service Level Agreement which is reviewed periodically.
Section 106 Agreements
The team is responsible for negotiating and monitoring compliance with all legal agreements made under Section 106 of the Town and Country Planning Act.
Planning Policy Planning Policy comprises the Planning Policy team and Countryside & Wildlife team. The teams cover the following areas of responsibility:
Planning Policy
• Local Development Plan – statutory duties in respect of the preparation, delivery, monitoring and review of the Local Development Plan (LDP). This ensures that development is delivered in a planned and sustainable way in accordance with the agreed corporate priorities and objectives of the Council.
6
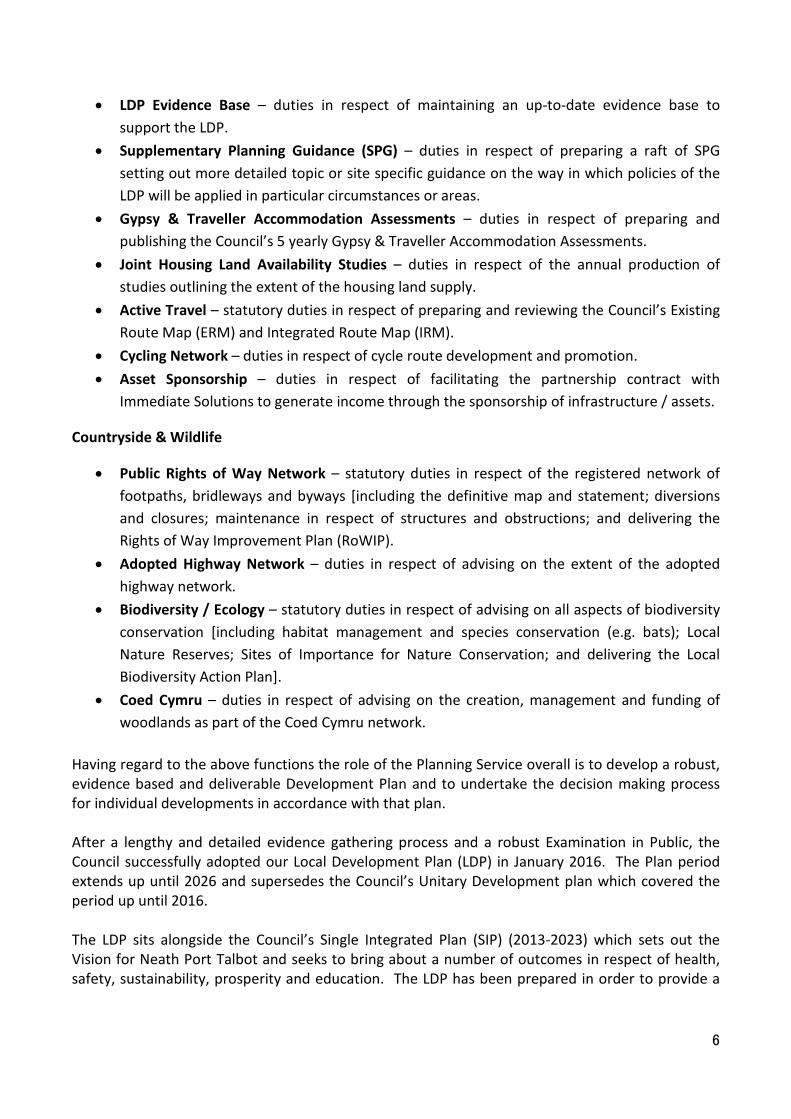
• LDP Evidence Base – duties in respect of maintaining an up-to-date evidence base to support the LDP.
• Supplementary Planning Guidance (SPG) – duties in respect of preparing a raft of SPG setting out more detailed topic or site specific guidance on the way in which policies of the LDP will be applied in particular circumstances or areas.
• Gypsy & Traveller Accommodation Assessments – duties in respect of preparing and publishing the Council’s 5 yearly Gypsy & Traveller Accommodation Assessments.
• Joint Housing Land Availability Studies – duties in respect of the annual production of studies outlining the extent of the housing land supply.
• Active Travel – statutory duties in respect of preparing and reviewing the Council’s Existing Route Map (ERM) and Integrated Route Map (IRM).
• Cycling Network – duties in respect of cycle route development and promotion. • Asset Sponsorship – duties in respect of facilitating the partnership contract with
Immediate Solutions to generate income through the sponsorship of infrastructure / assets.
Countryside & Wildlife
• Public Rights of Way Network – statutory duties in respect of the registered network of footpaths, bridleways and byways [including the definitive map and statement; diversions and closures; maintenance in respect of structures and obstructions; and delivering the Rights of Way Improvement Plan (RoWIP).
• Adopted Highway Network – duties in respect of advising on the extent of the adopted highway network.
• Biodiversity / Ecology – statutory duties in respect of advising on all aspects of biodiversity conservation [including habitat management and species conservation (e.g. bats); Local Nature Reserves; Sites of Importance for Nature Conservation; and delivering the Local Biodiversity Action Plan].
• Coed Cymru – duties in respect of advising on the creation, management and funding of woodlands as part of the Coed Cymru network.
Having regard to the above functions the role of the Planning Service overall is to develop a robust, evidence based and deliverable Development Plan and to undertake the decision making process for individual developments in accordance with that plan. After a lengthy and detailed evidence gathering process and a robust Examination in Public, the Council successfully adopted our Local Development Plan (LDP) in January 2016. The Plan period extends up until 2026 and supersedes the Council’s Unitary Development plan which covered the period up until 2016. The LDP sits alongside the Council’s Single Integrated Plan (SIP) (2013-2023) which sets out the Vision for Neath Port Talbot and seeks to bring about a number of outcomes in respect of health, safety, sustainability, prosperity and education. The LDP has been prepared in order to provide a
7
spatial expression of the land-use implications of the SIP and the LDP Vision in particular complements the Council’s overall vision as set out in the SIP. In addition, there are a range of regional and local strategies and policy statements that provide the framework for the LDP. Some of these key strategies include:
• Joint Transport Plan for South West Wales (2015-2020); • Regional Technical Statement 1st Review (2014); • Shoreline Management Plan (2010); • Swansea Bay City Region (2013); • The Economic Growth Strategy for South West Wales (2013-2030); • Neath Port Talbot Waterfront Regeneration Strategy (2011); • Neath Port Talbot Local Housing Strategy (2015-2020); • Neath Port Talbot Local Biodiversity Action Plan (2014); • Neath Port Talbot Environment Strategy (2008-2026); and • Neath Port Talbot Tourism Development Action Plan (2011-2014).
The LDP encompasses a broad range of social, economic and environmental issues and the Plan’s objectives provide synergy with the Wales Spatial Plan – i.e. building healthy, sustainable communities; promoting a sustainable economy; valuing our environment; achieving sustainable accessibility; and respecting distinctiveness. The LDP seeks to deliver Neath Port Talbot’s role in supporting the wider aims, objectives and aspirations of the City Region. Economy & Employment Employment in the County Borough has a relatively high proportion of jobs in the manufacturing and public sectors and a relatively low proportion in the service sector. The employment base is predominantly located along the coastal corridor where Tata Steel and the Council are the largest employers. In the Valleys, the largest employers relate to the mineral extraction industries with the remainder being employed in small and medium sized enterprises. Significantly more people travel out of the County Borough to access work than those who travel inwards. This work travel pattern reflects the fact that the County Borough is part of the broader Swansea Bay travel to work area. The landbank of industrial land with good access to road, rail and sea performs an important role in the sub-region, as will the University of Swansea Science and Innovation Campus on Fabian Way and the Coed Darcy Urban Village. Transport & Infrastructure The coastal corridor is traversed by the key road and rail infrastructure which underpins the County Borough as a key employment area within the sub-region, providing connections eastwards, via the M4 and rail, to Cardiff and beyond, and westwards to Swansea and to the Midlands via the A465 (T) Heads of the Valleys road. The docks at Port Talbot are also considered an asset to the area providing for both general cargo and deep water facilities for bulk cargo.
8
Natural Resources The County Borough contains mineral resources, both coal and aggregate, which are significant on a UK scale. They are also important both in terms of their contribution to the Welsh economy and more locally in terms of employment. Virtually the whole of the County Borough is underlain by coal resources. Coal has been mined extensively within the area for centuries and has contributed significantly to the creation and sustenance of many of the valley communities. The two major hard rock quarries in the area at Gilfach (Neath) and Cwm Nant Lleici (Pontardawe), supply high specification aggregates to various markets. Due to the extensive upland areas within the County Borough, there is also significant potential for the exploitation of the wind resource. Two of the Strategic Search Areas (SSA E and SSA F) identified by the Welsh Government are predominantly located within the administrative area and following their designation, there has been considerable interest from developers in the area. Historic/landscape setting of the area Heritage The area has a wealth of historical, archaeological and architectural assets, in particular relating to the area's industrial history in coal, iron, steel and copper. It also has many older archaeological remains dating back to pre-Roman times. All of these are important characteristics of the area that provide local distinctiveness. Many, such as Margam Park and the canal network, also provide opportunities for tourism and recreation. The historic heritage of the area is recognised through a range of designations. Within the County Borough there are 2 designated Landscapes of Historic Interest, 6 Historic Parks and Gardens, 6 Conservation Areas, 92 Ancient Monuments and 391 Listed Buildings. Landscape & Ecology Neath Port Talbot has a varied landscape and a number of distinctive habitats ranging from coastal salt marsh and sand dunes through to ancient woodlands and upland areas of purple moor grass. Some of these habitats are of European, National or local importance. Large areas of the County Borough contain conifer plantations and the area also contains important geological features including glaciated valleys and rock formations. The natural heritage of the area is recognised through a range of designations. Within the County Borough there are 20 designated Sites of Special Scientific Interest (SSSIs), 2 National Nature Reserves and 3 Local Nature Reserves. Urban/Rural mix and major settlements. As stated above the County Borough is split into two distinct character areas; The Coastal Corridor which broadly follows the M4 corridor and the Valley Areas which comprise 5 valleys in total.
9
In regard to the major settlements, the LDP has defined a Settlement Hierarchy that identifies those areas which are the most sustainable locations and can more appropriately accommodate growth in terms of their function. Neath, Port Talbot and Pontardawe are identified as the 3 main towns, with Briton Ferry, Skewen, Taibach and Glynneath identified as district centres. The remaining settlements are categorised as either ‘large local centres’, ‘small local centres’, ‘villages’ and ‘dormitory settlements’. Population change and influence on LDP/forthcoming revisions. The level of growth set out in the LDP is based on an economic-led scenario which is aspirational in its approach and aims to maximise job growth within the local economy. In order to address the key issues of the County Borough, wealth creation through job growth is fundamental to achieving the LDP vision. This method has enabled the Authority to forecast how economic changes over the Plan period equate to the requirements for employment land and the number of new homes needed to accommodate the projected total population and required labour supply. This ensures alignment between employment and housing resulting in a more sustainable pattern of development which in turn improves the robustness of the LDP. This approach has used the Welsh Government's 2008 population and household projections and detailed analysis of underlying trends in mortality and fertility rates and average household size. Based on the aspirational scenario of job growth (taking into account the Authority's aspiration to reduce unemployment and increase economic activity rates in line with the Welsh average), the population growth for the area has been driven by the ratio of working age population to total population. It is considered that this approach makes the projections more robust than purely trend-based projections which do not accurately reflect the Authority's aspirations for the area. Based on the projected economic-led growth scenario of 3,850 jobs for the area, the Plan makes provision for an additional 7,800 new residential units, leading to an increase of approximately 7,000 people and a total population of 147,400 by 2026. This approach is aspirational, linked to the local economy and is set to complement the projected growth in economic activity and reduction in average household size in addition to helping meet the need for additional affordable residential units. Budget and associated Implications Given the identified priorities of the Council, funding has been and continues to be prioritised towards delivering/improving services within the Social Services and Education Departments. The additional financial pressures facing the Council, following the collapse of the economy in 2008 and the consequent austerity measures which followed, have had a significant impact upon the Environment Directorate which has seen its budget cut by £18.011 million since 2009/10 and currently stands at £31.458 million which is 13.9% of the Councils net budget. This equates to a 57.3% cut in the Directorate’s budget. The Directorate has also been tasked with securing further savings for 2017/18. To date an additional £1.3 million of proposed savings have been identified
10
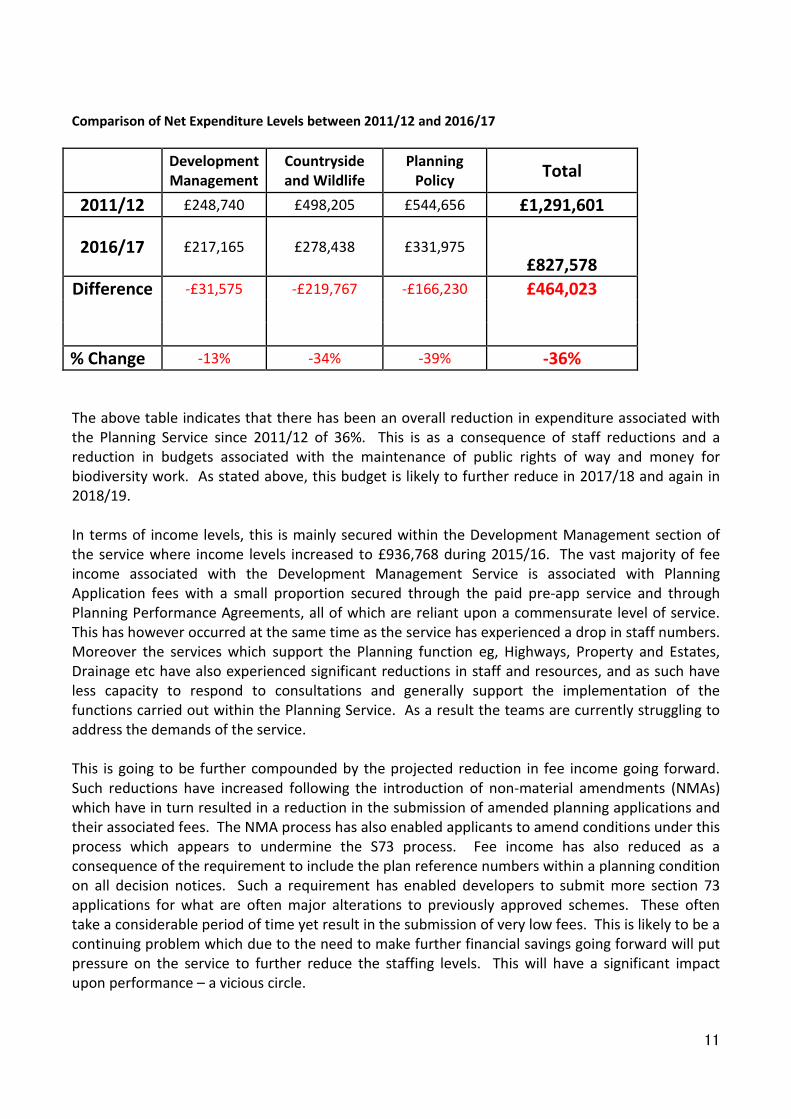
and are out to consultation as part of the Council’s FFP. Such cuts have resulted in a reduction in staff, the cessation of some non-statutory services, the implementation of alternative service delivery models and an increase in fees where local discretion allows. The biggest impact of the budget cuts has been the reduction in staff whereby more than 400 members of staff within the Environment Directorate have left and have not been replaced over the last five years. Whilst the planning service has been sheltered to a certain extent from the majority of the cuts over this period, it has however lost 36.5% of its staff, which have not been replaced within the last 4 years. 33 staff remain in post within both the Planning Policy and Development Management sections (which also includes the countryside and wildlife team) one of which is on a temporary contract. These cuts are on top of the savings the service managed to secure following the implementation of a Systems Thinking Review of Development Management in 2008. This review resulted in a redesign of the service to improve the customer experience and in turn remove waste from the process. Five posts were designed out of the service at that time as a consequence of this review. The success of the Systems Thinking Principles is however reliant upon the continuous measurement of demand, performance and capability. Unfortunately the economic downturn which followed the conclusion of the review has prevented the service from been appropriately resourced to meet the demands of all of our customers. Due to the pressure on the council to make savings, the Service has over the years suffered a loss in specialist skills; in particular skills have been lost in relation to Conservation and design, landscaping, drainage and Minerals. In terms of the latter, given that the Council has one of the largest actively exploited mineral resources in wales, it is not possible to operate without the specialist skills of a mineral planner. Given the lack of available officers in this field, the Council has signed up to a Service Level Agreement with Carmarthenshire Council who now provide all the mineral planning functions on our behalf, albeit the decision making powers are retained by Neath Port Talbot. This is a mutually beneficial arrangement on the grounds that Carmarthenshire is now appropriately funded to maintain a team of officers thus improving the resilience of the team and officers are also able to improve their skills and experience by working on a number of complex and controversial mineral developments within Neath Port Talbot. The Development Management function is a fee earning service and as such the budget associated with this service is based on trend based historical fee income levels, with the shortfall covered by the central revenue budget. There is pressure every year to maximise fee income and thus reduce the need for revenue support to plug the gap. The Planning Policy and Wildlife and Countryside section has very little fee income although grants are sought from various sources to undertake project work relating to active travel, biodiversity and improvements to the rights of way network and work is currently being undertaken to generate income from asset sponsorship activities. Despite the above, the cost of delivering the service far outweighs the levels of income generated. The following chart identifies the overall expenditure levels for each of the services within the planning function both during 2011/12 and during the year 2016/17, thus enabling comparisons to be made over time.
11
Comparison of Net Expenditure Levels between 2011/12 and 2016/17
Development Management
Countryside and Wildlife
Planning Policy Total
2011/12 £248,740 £498,205 £544,656 £1,291,601
2016/17
£217,165
£278,438 £331,975 £827,578
Difference -£31,575 -£219,767 -£166,230 £464,023
% Change -13% -34% -39% -36%
The above table indicates that there has been an overall reduction in expenditure associated with the Planning Service since 2011/12 of 36%. This is as a consequence of staff reductions and a reduction in budgets associated with the maintenance of public rights of way and money for biodiversity work. As stated above, this budget is likely to further reduce in 2017/18 and again in 2018/19. In terms of income levels, this is mainly secured within the Development Management section of the service where income levels increased to £936,768 during 2015/16. The vast majority of fee income associated with the Development Management Service is associated with Planning Application fees with a small proportion secured through the paid pre-app service and through Planning Performance Agreements, all of which are reliant upon a commensurate level of service. This has however occurred at the same time as the service has experienced a drop in staff numbers. Moreover the services which support the Planning function eg, Highways, Property and Estates, Drainage etc have also experienced significant reductions in staff and resources, and as such have less capacity to respond to consultations and generally support the implementation of the functions carried out within the Planning Service. As a result the teams are currently struggling to address the demands of the service. This is going to be further compounded by the projected reduction in fee income going forward. Such reductions have increased following the introduction of non-material amendments (NMAs) which have in turn resulted in a reduction in the submission of amended planning applications and their associated fees. The NMA process has also enabled applicants to amend conditions under this process which appears to undermine the S73 process. Fee income has also reduced as a consequence of the requirement to include the plan reference numbers within a planning condition on all decision notices. Such a requirement has enabled developers to submit more section 73 applications for what are often major alterations to previously approved schemes. These often take a considerable period of time yet result in the submission of very low fees. This is likely to be a continuing problem which due to the need to make further financial savings going forward will put pressure on the service to further reduce the staffing levels. This will have a significant impact upon performance – a vicious circle.
12
In an attempt to address the above, the Service has sought to achieve better joint working following the merger of the service with Environmental Health and Trading Standards. As part of this process it was quickly evident that four separate services were undertaking enforcement activities when dealing with redundant and dilapidated buildings and overgrown land, namely Planning enforcement, Building Control (when the building was deemed to be dangerous), pests and environmental health. As a consequence up to four different officers were addressing one complaint having regard to different pieces of legislation. This not only results in a waste of scarce resources with multiple visits to the same site, but it is also potentially gives mixed messages to the complainant in terms of action which can be taken, ie action may be taken under one piece of legislation but not in relation to another. In response to this, the enforcement of these types of complaints has been assigned to one officer. That officer visits the site and after taking numerous photographs of the site/building takes the complaint through a triage system whereby advice is sought and if necessary action is taken under the most appropriate legislation. This activity has been linked into the Empty Homes Initiative which aims to bring redundant buildings back into beneficial use and will in turn provide much needed homes in sustainable locations and address any blight caused by those properties on that community. This new method of working ensures that rather than painting over the cracks by taking enforcement action in isolation, we are now proactively taking action to deal with the source of the problem and in turn deliver the associated benefits. This is at an early stage but is already resulting in a reduction in staff resources together with an improvement in service delivery to the complainants and the communities within which these redundant buildings are located. In addition to the above we are also looking to invest in the digital by choice agenda by jointly procuring a cheaper and more efficient back office Planning system with the City and County of Swansea. This will enable closer cross boundary working in the future (should there be a political appetite to do so) in addition to securing economies of scale. It is also anticipated that the new back office system will facilitate better remote working which again will improve efficiency. In conjunction with this, a project is currently underway to reduce the size and complexity of officer reports to increase capacity and thereby enable officers to deal with applications more efficiently. This reduction in the size of officer reports will however be supported by officer notes and sketches from site visits which will reinforce the decision making process. Whilst the Planning Policy Team are not normally associated with income generation, our service has diversified and is currently responsible for managing and delivering an Asset Sponsorship Scheme whereby local businesses are able to sponsor various assets owned by the Council. This has to date been largely restricted to roundabout sponsorship but is currently the subject of a pilot scheme to extend the opportunities to other assets including highways verges, gateway signs and street lighting columns. The value of sponsoring our assets must however be balanced against the impact upon visual amenity and the safeguarding of highway and pedestrian safety. The biodiversity officers are also providing income generating services to other sections within the council rather than relying on the procurement of external consultants. This has not only saved the Council in terms of expensive external contracts but also results in the generation of fees to sustain the service going forward. Sickness management is a Mandatory Corporate Measure and there is a requirement for Service managers to reduce sickness levels year on year. As a consequence of the departure of some
13
members of staff, sickness levels within the overall Planning Service has decreased from 459 days (47.29 days per employee) in 2014/15 to 298 days (5.6 days per employee) in 2015/16 which is below the council average. (it should be noted that these figures include staff and sickness levels for the building control and pollution control sections). Sickness levels are a major influence on the ability of the Council to deliver the service as workloads associated with the staff off sick must be covered by the remaining staff. The service is currently experiencing an increase in the number of members of staff who are taking sick as a consequence of increased stress levels. It is likely that this trend will continue due to less staff having to cover an increased and more demanding workload going forward. The level of staff sickness is not the only factor which impacts upon service delivery. The performance charts towards the end of this report indicate that whilst we are generally performing well in dealing with most types of planning applications, there is a significant issue in relation to our performance associated with determining major applications. This is as a consequence of the fact that we only have two senior officers currently able to deal with such applications and they are also dealing with other issues including deputising for their team leaders, running the teams in their absence, organising the delivery of the pre-application process and dealing with the discharge of requirements associated with the Tidal Lagoon and conditions associated with other major applications including wind farms determined prior to the introduction of the DNS process. This is a priority which must be addressed this year and will potentially require a restructure to increase the resource at the senior level. This is however hindered by the restrictions associated with Job Evaluation and budget availability, together with the fact that it will only result in the reorganisation of the Development Management section rather than an increase in its size. Our Local Story In 2015/16 the Authority employed 12.6 FTE Planning Officers within the development Management team who report to a Development Manager. They comprise of 2 Team leaders, 2 Senior Planning officers, 5.6 Planning Officers, 3 assistant planners and 3 enforcement officers 1 of which deals with minerals and waste. During 2015/16 they determined 813 planning applications and investigated 172 enforcement complaints. During this period the Planning Officers and Assistants carried a varied workload as follows: Assistant Planners were allocated an average caseload of 108 applications last year and had an average determination rate of approximately 116 application each over the year Planning Officers were allocated an average caseload of 67 applications last year and had a determination rate of approximately 63 applications over the year. Senior Planning Officers were allocated an average caseload of 25 applications per year and had an average determination rate of approximately 14 applications over the year. It is clear to see from the above figures that the determination levels in relation to senior officers needs to increase. Whilst on the face of it, it would be logical to reduce the number of assistant planners and increase the number of planners and senior planners, this is constrained by the moratorium which is in place in relation to the appointment of external staff and the fact that the
14
expenditure levels of the service cannot increase. Whilst succession planning would suggest that assistant planners are promoted to become planners, the skills base of the candidates and the types of pressure they will be subjected is unlikely to address the issue. It is also noted from the above figures that the workloads carried by the officers appears to be less than that which was identified within a research document commissioned by the Planning Officers Society in 2004. This piece of research confirmed that a reasonable case officer workload should be in the region of 150 applications (not including pre-apps, appeals and other non-planning application related work). However, that research was undertaken some 12 years ago and the complexity of the planning legislation has increased significantly since then. Furthermore, Neath Port Talbot is also in a unique position whereby the Planning service no longer has planning technicians to support it. As a result case officers are required to undertake their own administration of applications including the validation, registration, scanning and indexing of documents on the electronic document management system and preparing files for dispatch post determination. All of this takes time and resources and needs to be considered on top of the case number details. Turning to the Planning Policy section, there are 6 Planning Policy Officers who report to the Planning Policy Manager. The number of staff has reduced since the start of the LDP process by 3FTEs however the responsibilities have increased from being purely planning policy to now extending to include active travel, cycling strategy and asset sponsorship. 2015/16 was a particularly busy year as the team successfully steered the LDP through an EIP concluding with the adoption of the plan in January 2016. Attention was then re-focussed on delivering the associated SPGs, implementing the monitoring regime and concentrating on moving forward with the Integrated Network Map (INM) as required under the Active Travel legislation. Despite the budget pressures and reduction in staff experienced within the service, the Planning Service has secured a number of achievements over the last financial year, which are summarised as follows:
1. In previous years the Development Management section experienced a reduction in performance following a loss of experienced staff. Despite this loss and the lack of replacement staff improvements in performance have been secured especially within the householder development area which secured an average of 95% of applications determined within the statutory period. Overall performance increased to 80% in the final quarter of 2015/16.
2. A priority for last year was to design and implement an improved S106 database and a new protocol to ensure that we improve the monitoring and management of S106 infrastructure and payments to the authority. Whilst work is ongoing on this database, we now have a dedicated officer working on the creation and management of this database which will in turn improve the Councils ability to secure maximum contributions from developers on time and in the right places. This is turn should reduce financial pressures upon the Council.
3. Training for all elected Members has been increased in relation to Planning matters, with bespoke mandatory targeted training for those Members who sit on the Planning Committee. Such training has and will continue to improve the quality of decision making

15
and is especially important given the significant legislative changes which have been introduced in a very short period of time.
4. The introduction of standardised procedures and protocols in relation to the delivery of the Planning Enforcement Service and the Planning Appeals service was identified in the previous business plan as a priority. This has been overtaken by events following the merger of Planning with Environmental Health and trading Standards which enabled the creation of a joined up enforcement service in relation to restricted number of matters. A new protocol and agreed set of procedures is being developed for the remaining planning enforcement responsibilities this year.
5. Planning Performance Agreements (PPAs) were secured for two Nationally Significant Infrastructure Projects (NSIP) which were determined by the Planning Inspectorate within the Council’s boundaries last year. However, one of the schemes related to the proposed power station at TATA steel works which did not progress as the company did not pursue the discharge of the requirements associated with the development which would have delivered the associated funding for the council. The PPA which secured contributions towards the costs of employing a planning officer and covered part of the salary of an ecologist within the service related to the Tidal Lagoon project. A further extension of the Pen-y-Cymoedd Wind farm SLA was also negotiated to secure additional income for the service.
6. Planning agents’ workshops have resumed after a suspension for approximately 18 months. These proved particularly useful to ensure that agents working within the County Borough are aware of all the changes in legislation and as such satisfy our expectations in terms of the quality and validity of new submissions. These workshops will continue to be delivered on a regular basis.
7. The planning application for the mineral development at East Pit was thoroughly assessed and granted planning permission subject to an extensive number of conditions and an alternative S106 agreement. This ensured that the site was not abandoned in an unrestored state which could have had long term adverse visual impacts upon the surrounding area in addition to preventing potential flooding from the void area in an uncontrolled manner. The approval also secured the continued employment of those directly employed on site and those working within the supply chain for a further four years.
8. A cost benefit analysis was undertaken in relation to the enforcement opportunities available to the Council associated with the unrestored state of the former Margam Open Cast coal Site. As a consequence of this a planning application was subsequently submitted for an alternative restoration scheme of the site. This application has received a resolution to grant consent and is waiting for the signing of a section 106 agreement.
9. A new pre-application protocol has been introduced as required by the Welsh Government under the new Planning Act. In addition to this statutory requirement, we have retained and improved our existing pre-application service to provide choice in the level of service available to customers, in addition to giving them the opportunity to continue having confidential discussions with the Council until such a time as a planning application is submitted.

16
10. The Service Level Agreement relating to the provision of a minerals service to the authority by Carmarthenshire Council has been extended to cover enforcement of minerals and waste in addition to scheduled visits, the latter of which has resulted in an increase in income to the Council.
11. Two major Public Inquiries relating to wind farms at Hirfynydd and Mynydd Brombil were determined following considerable officer and consultant input. Whilst the former was successfully defended with the Council securing a partial award of costs against the developer, the latter was allowed and we are currently working on discharging the conditions. A PPA was secured to fund the work associated with assessment of conditions.
12. The Examination in Public (EIP) associated with the Local Development Plan (LDP) was completed and led to only minimal changes to our deposited plan. The LDP was subsequently adopted by the Council on the 27th January 2016. Following its adoption the planning policy officers involved in the preparation and adoption of the LDP were commended by the Chief Planning Officer of the Welsh Government for the quality of the plan, and for their professionalism at all stages of the process.
13. A detailed procedure has been designed to monitor the effectiveness and delivery of the policy aspirations within the recently adopted Local Development Plan. The results of this will feed into the first Annual Monitoring report which is due for submission to the Welsh Government in October 2017 and annually thereafter.
14. Five strategically important SPGs which were essential to support the LDP going forward and which were also essential to assisting access to funding streams for the Property and Regeneration section were drafted and scrutinised within the EIP. These have now been refreshed to take on board the Inspectors report and the adopted version of the LDP.
15. Work commenced on the preparation of a joint Supplementary Planning Guidance (SPG) for Fabian Way through collaborative work with colleagues in the City and County of Swansea. This SPG will help to secure a coordinated approach towards the redevelopment of this strategic corridor, in addition to securing funding through planning obligations which will itself deliver essential infrastructure required to facilitate our collective regeneration aspirations. A draft version has been the subject of extensive public consultation and we are in the process of working with colleagues on Swansea to respond and address the comments received and if necessary update the SPG to reflect such comments.
16. Despite an immensely tight timescale from the Welsh Government and inadequate funding the first Existing Route Map (ERM) for the whole of the County Borough was prepared, consulted upon and submitted to the Welsh Government within the defined timescales. The priority for last year was to concentrate only on the two main settlements of Neath and Port Talbot, however a decision was taken to complete all 11 qualifying settlements within the County Borough. We have since received a letter from the Welsh Government directing us to make minor alterations to our ERM. Whilst this was initially a concern, it has since been established that only 5 authorities had their ERMs accepted, 3 authorities were required to resubmit the entire document while the 14 remaining authorities were required to make some amendments. Work will commence on these minor alterations as a priority going forward as they are required for submission to the Welsh Government by July 2016.
17
17. The management and maintenance regimes associated with our Public Right of Way (PRoW)
network have been redesigned to reflect the relocation of the service from Crynant to the Quays. This secured savings as part of the FFP from accommodation costs, efficiencies and access to plant and machinery. The cessation of contracts with a small number of Community Councils resulted in a number of complaints and concerns that footpaths within urban areas and within the urban fringe would be neglected going forward. Despite these concerns, the maintenance of these paths has been taken on successfully by the Countryside & Wildlife team and following the announcement of a better than expected settlement from the Welsh Government, a sum of £100k was identified for use in the improvement of hard surfacing of a network of regularly used footpaths throughout the County Borough. This will not only improve their accessibility but will also reduce the maintenance liability going forward. Implementation of the project will be undertaken during this financial year.
18. Officers within the Countryside and Wildlife team have been working with other departments to ensure the Local Authority complies with the statutory duty for Biodiversity Conservation under the Natural Environment and Rural Communities Act 2006 and the requirements of other national and European environmental legislation (current and emerging); and contributes towards the delivery of the goals and objective requirements of the Wellbeing of Future Generations (Wales) Act 2015.
These are the most significant achievements secured during 2015/16. In addition to the above, our staff continue to deliver statutory functions despite a decreasing budget for customers who have increasingly higher expectations. This will become gradually worse over the next few years when budgets become even more constrained. Managers within the section are monitoring and trying to boost morale to ensure that sickness levels are maintained at a minimum and performance at a maximum although this is becoming more and more challenging. Priorities going forward There are a number of key priorities and service improvements which have been identified for this year, some of which intend to build upon and continue to improve upon the success secured up until recently. These include the following:
• A comprehensive Enforcement Policy and procedure will be prepared and implemented in relation to complaints about untidy land and buildings in addition to dangerous structures. One system will be delivered by the service which will utilise all legislative powers available (currently used by Environmental Health, Building Control, Planning and Pest control). This will result in a reduction in the number of officers visiting the same site and the complaint being pushed from one service to another. Complaints will therefore be dealt with more efficiently and at less cost to the Council. The existence of a new successful procedure will be the appropriate measure.
• Officer time will be refocused to deliver the schemes forming part of the Vibrant and Viable Places (VVP) Project. The constraints which could prevent schemes from coming forward will be identified at the earliest possible stage and partners will be engaged to
18
identify viable and deliverable solutions to ensure that the schemes are approved having regard to all material planning considerations.
• A new Planning Obligations Supplementary Planning Guidance (SPG) will be prepared in addition to a S106 database. The newly appointed S106 officer will, having regard to the LDP evidence base, prepare a SPG which will clearly identify the expectations of the Council with regard to Planning gain. The new S106 database will enable thorough monitoring of requirements sought and work secured/payments received. Developers will in turn be able to identify the costs associated with bringing developments forward from the start thus allowing them to establish risk levels. The Council will be able to maximise the amount of infrastructure delivered by the private sector and monitor its delivery going forward.
• Unblock the bottlenecks in the Development Management Service and ensure that Senior Officers are involved in providing advice to officers at the earliest possible stage. This will require a re-assessment of the workflow /procedures associated with the Development Management system to reflect the extensive legislative changes which have emerged since July 2015 when the Planning (Wales) Act 2015 received Royal Assent. The objective is to reduce the end to end time associated with the determination of planning applications. It is also proposed to address the need for late changes to proposed schemes especially those associated with major applications as these are currently impacting upon performance measures.
• Continuation of Members training, building upon what has recently been rolled out. A timetable of training will be drawn up to ensure that Members have regular training in subject areas that are necessary to enable them to undertake their planning responsibilities whether it is as a member of the Planning Committee or otherwise. As a consequence, Members will be better informed about legislative change and individual topic areas which are important to the decision making process. This will improve Members understanding of the planning system which is complex and constantly changing and will also improve the quality of decision making.
• The Delegated arrangements and public Speaking protocol will be amended. The amendments will reflect recent changes to legislation in terms of delegated arrangements, while the public speaking protocol will incorporate the concerns/constructive criticism received from elected Members and members of the public in relation to the procedure since it was introduced in November 2014. As a consequence it is anticipated that accountability and the transparency of the Development Management service will improve, and less complaints will be received in relation to the decision making process, albeit it is acknowledged that very few are received at present.
• The programme of works associated with East Pit is maintained. Officers will continue to work closely with the operator of the site and other regulators to ensure that the extraction activities and the restoration scheme remain on target in terms of delivery without impacting upon the surrounding environment and communities over and above that projected at the planning application stage.
• Planning permission for an alternative restoration scheme at the former Margam Open Cast Coal site is approved and work commences in accordance with the approved plans and conditions. The objective is to grant planning permission for an alternative but acceptable restoration scheme which prioritises site safety and security, and commission the Coal Authority to supervise restoration going forward, as the work needs to be undertaken within a restricted period of time and within a finite budget.
19
• Complete work on the six strategically important SPGs required to support the Local Development Plan (LDP). Work has commenced on the preparation of the SPGs. This will continue and will also involve consultation prior to their adoption. The SPGs will be adopted and will provide further clarity to developers and Development Management staff when interpreting policies within the LDP. This will reduce risk and should encourage good quality development within Neath Port Talbot.
• Commence work on seven further SPGs: Port Talbot & Town Centre Development Framework; Open Space & Greenspace; Biodiversity & Geodiversity; Renewable & Low Carbon Energy; Design; The Historic Environment; Development & the Welsh Language. The SPGs will be adopted and will provide further clarity to developers and Development Management staff when interpreting policies within the LDP. This will reduce risk and should encourage good quality development within Neath Port Talbot. The adoption of the SPGs will be the appropriate measure.
• Undertake research in respect of a ‘Biodiversity Compensation Scheme’ to support the planning process feeding into the development of SPG. A draft SPG will be prepared ready for consultation. This will secure longer term opportunities for off-site biodiversity compensation which will speed up the implementation of projects which would otherwise be stalled due to ecological constraints. The adoption of the SPG will be the appropriate measure. Funding secured through RDP LEADER and Natural Resources Wales Competitive Fund to employ a consultant to deliver the project.
• Complete the joint SPG for the regeneration of the Fabian Way corridor. The 8 week consultation exercise was completed on the 25th January 2016. Work is now underway on assessing the representations received and updating the SPG if necessary. The SPG will be adopted by both Neath Port Talbot Council and the City and County of Swansea. It will direct developers to deliver the regeneration aspirations of both councils in addition to securing S106 money to improve essential infrastructure along the corridor.
• Establish systems and procedures for monitoring the performance of the LDP. An outline of the monitoring indicators associated with the policies contained within the EIP was scrutinised and agreed at the Examination in Public. Work needs to commence on establishing a robust framework for collecting evidence to confirm whether or not the policies are working effectively.
• Undertake / publish the annual Joint Housing Land Availability Study (JHLAS). In consultation with the building industry produce a comprehensive review of the amount of available land for housing development.
• Complete the Active Travel Act commitment in relation to the Existing Route Map (ERM) and commence work on the Integrated Network Map (INM). The ERM was submitted to the Welsh Government in January 2016. Further amendments have been requested by the Welsh Government in relation to the justification statements which support some of our routes. Work will then commence on identifying what improvements are required to these routes to enable for their inclusion within the INM.
• Amend the management and maintenance regimes associated with our Public Rights of Way (PRoW) network and commence work on a review of the Rights of Way Improvement Plan (RoWIP. Due to the reduced budgets associated with the maintenance of PRoW there is now greater reliance on the receipt of complaints to inform non-routine maintenance requirements. Following the receipt of one off additional funding in April 2016 a schedule of work to repair and/or resurface PRoW in urban and urban fringe areas has been drawn up and is currently being delivered with the Streetcare section. The additional funding
20
invested into PRoW will improve the quality of our most frequently used routes, which will reduce the number of complaints submitted and will also reduce the maintenance liabilities and costs going forward for these routes. Other funding can then be diverted to the maintenance of other routes and associated structures.
• Support and contribute to regional collaboration initiatives / studies particularly in the light of the new planning regime in Wales and the introduction of Strategic Development Plans (SDPs). Working in partnership with SWW Authorities gathering data / information and collaborating on various projects. The production of ‘larger than local’ projects / assessments / reports which will give strategic direction to developers, however it relies on the cooperation of a number of parties.
• Prepare and publish a plan on how the Authority intends to comply with the new, enhanced biodiversity duty outlined in the Environment (Wales) Act, 2016. The Act places a greater duty on Councils in terms of enhanced biodiversity. NRW have also stopped providing services and is re-directing the responsibility to Councils without additional resources being made available. The plan will need to identify the extent of these emerging duties and protocols will need to be developed to ensure that all services within the Council are complying with this increased duty. Training of all staff will be developed and delivered.
• Extend the sponsorship of council owned assets to secure fee income. An extension of the contract with an existing third party provider is to be pursued to enable for a pilot scheme of sponsorship for our other assets including street-lighting, parks, car parks etc. A full procurement exercise will need to be undertaken to allow us to maximise our potential income generation opportunities.
• Improve upon joint working practices between service area to remove duplication. Work has already commenced on amalgamating enforcement activities previously carried out by different services within the council. This work will now progress to the next level following the appointment of an empty homes officer who will enforce the legislation currently used by Planning, Building Control, Pest Enforcement and Environmental Health to deal with redundant buildings and over grown land to bring buildings and parcels of land back into beneficial use. This will be achieved through a combination of measures with the last resort being an enforced sale. Not only will this result in a net increase in residential accommodation within sustainable locations, but it will also address the blight caused by these buildings and land upon the communities within which they are located. This is also likely to result in cost savings and improved debt recovery to the council as these problem buildings have undoubtedly in the past been the subject of extensive investigations by various sections who have served notices on the land owner and in certain circumstances taken direct action following non-compliance. The sale of the properties will ensure that the council re-coups these costs and reduces the need for the investigations in the first place.
21
WHAT SERVICE USERS THINK
In 2015-16 we conducted a customer satisfaction survey aimed at assessing the views of people that had received a planning application decision during the year.
The survey was sent to 253 people, 12% of whom submitted a whole or partial response. The majority of responses (55%) were from local agents. 32% were from members of the public. 7% of respondents had their most recent planning application refused.
We asked respondents whether they agreed or disagreed with a series of statements about the planning service. They were given the following answer options:
• Strongly agree; • Tend to agree; • Neither agree not disagree; • Tend to disagree; and • Strongly disagree.
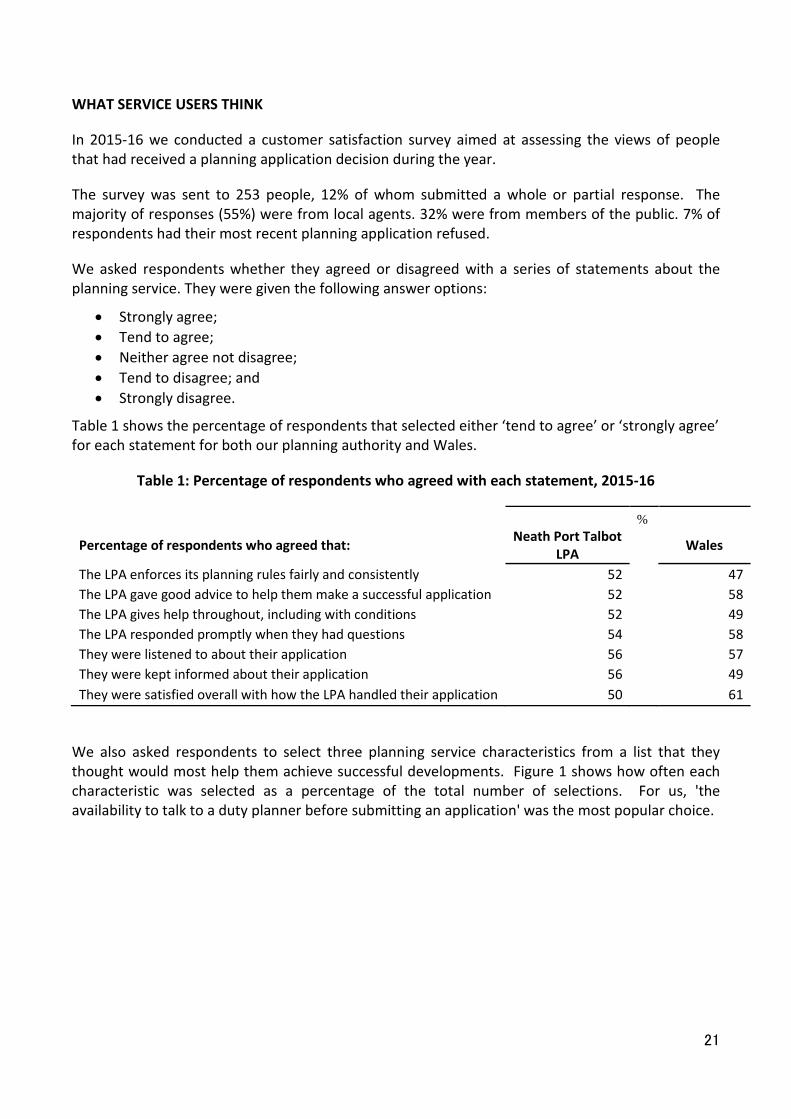
Table 1 shows the percentage of respondents that selected either ‘tend to agree’ or ‘strongly agree’ for each statement for both our planning authority and Wales.
Table 1: Percentage of respondents who agreed with each statement, 2015-16
%
Percentage of respondents who agreed that: Neath Port Talbot LPA
Wales
The LPA enforces its planning rules fairly and consistently 52
47 The LPA gave good advice to help them make a successful application 52
58
The LPA gives help throughout, including with conditions 52
49 The LPA responded promptly when they had questions 54
58
They were listened to about their application 56
57 They were kept informed about their application 56
49
They were satisfied overall with how the LPA handled their application 50 61
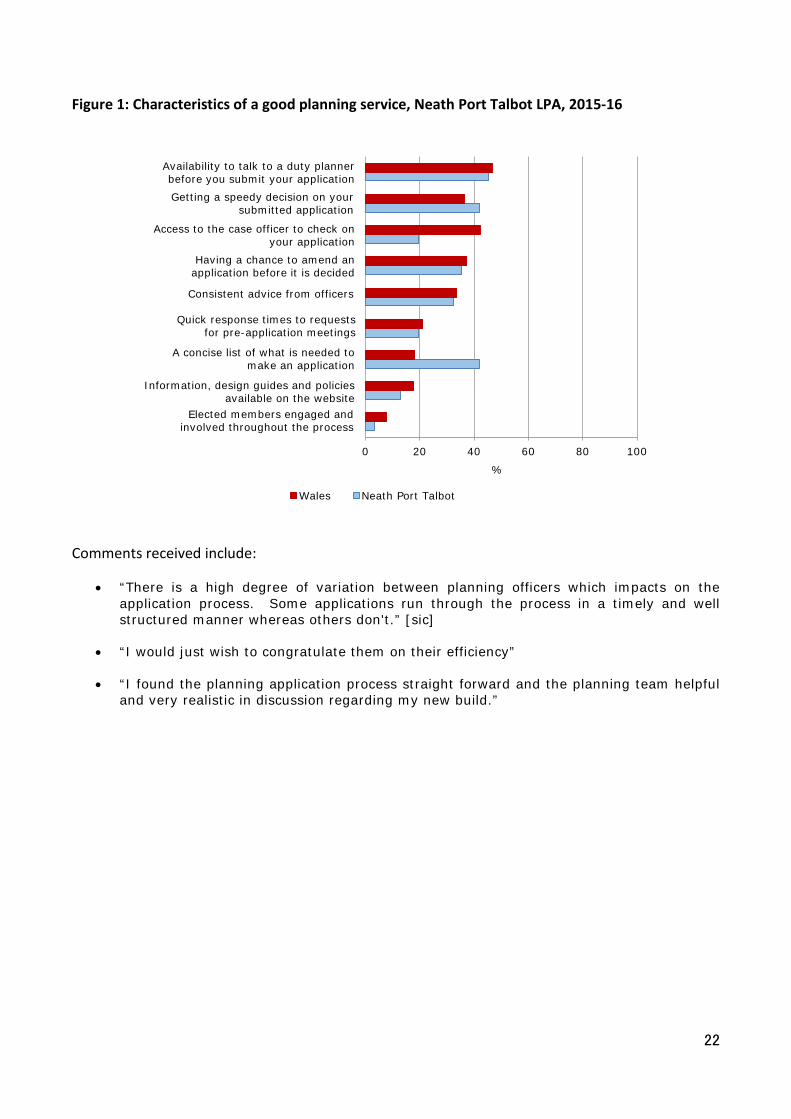
We also asked respondents to select three planning service characteristics from a list that they thought would most help them achieve successful developments. Figure 1 shows how often each characteristic was selected as a percentage of the total number of selections. For us, 'the availability to talk to a duty planner before submitting an application' was the most popular choice.
22
Figure 1: Characteristics of a good planning service, Neath Port Talbot LPA, 2015-16
Comments received include:
• “There is a high degree of variation between planning officers which impacts on the application process. Some applications run through the process in a timely and well structured manner whereas others don't.” [sic]
• “I would just wish to congratulate them on their efficiency”
• “I found the planning application process straight forward and the planning team helpful and very realistic in discussion regarding my new build.”
0 20 40 60 80 100
%
Wales Neath Port Talbot
Availability to talk to a duty planner before you submit your application Getting a speedy decision on your
submitted application
Access to the case officer to check on your application
Having a chance to amend an application before it is decided
Consistent advice from officers
Quick response times to requests for pre-application meetings
A concise list of what is needed to make an application
Information, design guides and policies available on the website
Elected members engaged and involved throughout the process
23
OUR PERFORMANCE 2015-16
This section details our performance in 2015-16. It considers both the Planning Performance Framework indicators and other available data to help paint a comprehensive picture of performance. Where appropriate we make comparisons between our performance and the all Wales picture.
Performance is analysed across the five key aspects of planning service delivery as set out in the Planning Performance Framework: • Plan making; • Efficiency; • Quality; • Engagement; and • Enforcement.
Plan making
As at 31 March 2016, we were one of 22 LPAs that had a current development plan in place.
During the APR period we had 5.5 years of housing land supply identified, making us one of 8 Welsh LPAs with the required 5 years supply.
Efficiency
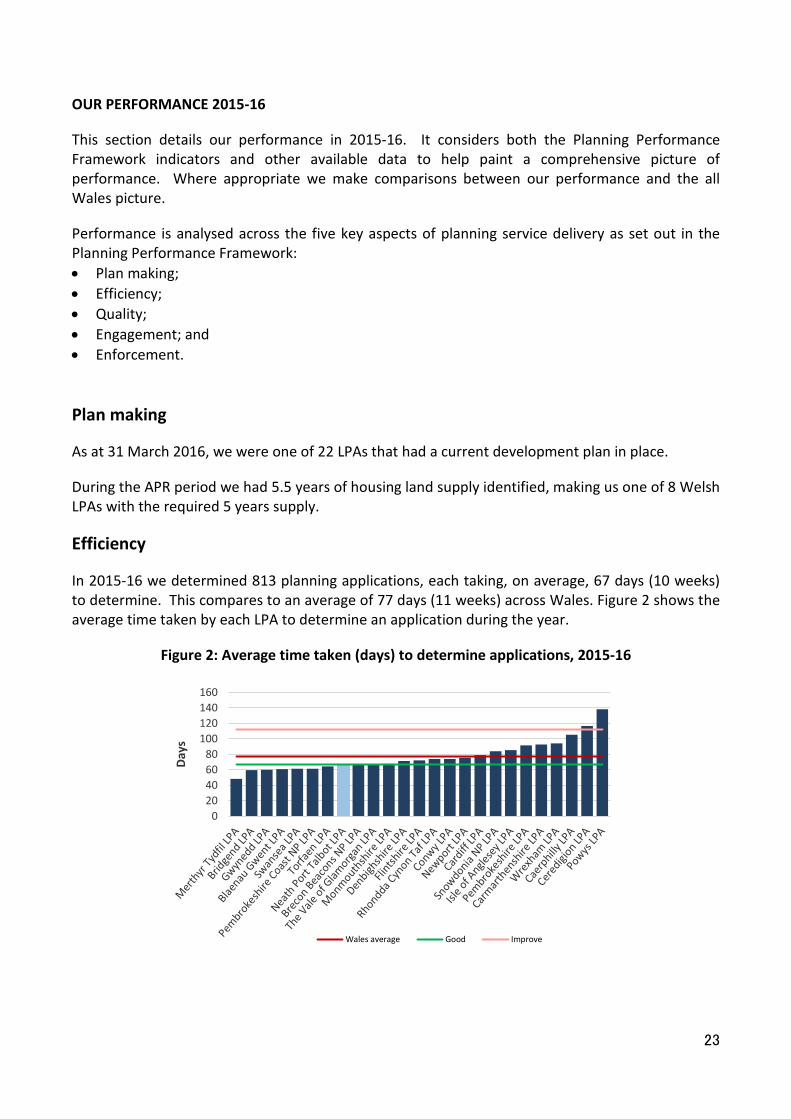
In 2015-16 we determined 813 planning applications, each taking, on average, 67 days (10 weeks) to determine. This compares to an average of 77 days (11 weeks) across Wales. Figure 2 shows the average time taken by each LPA to determine an application during the year.
Figure 2: Average time taken (days) to determine applications, 2015-16
020406080
100120140160
Days
Wales average Good Improve
24
Almost 80% of all planning applications were determined within the required timescales. This compared to 77% across Wales, but was just below the 80% target. Only 8 out of 25 LPAs met the 80% target.
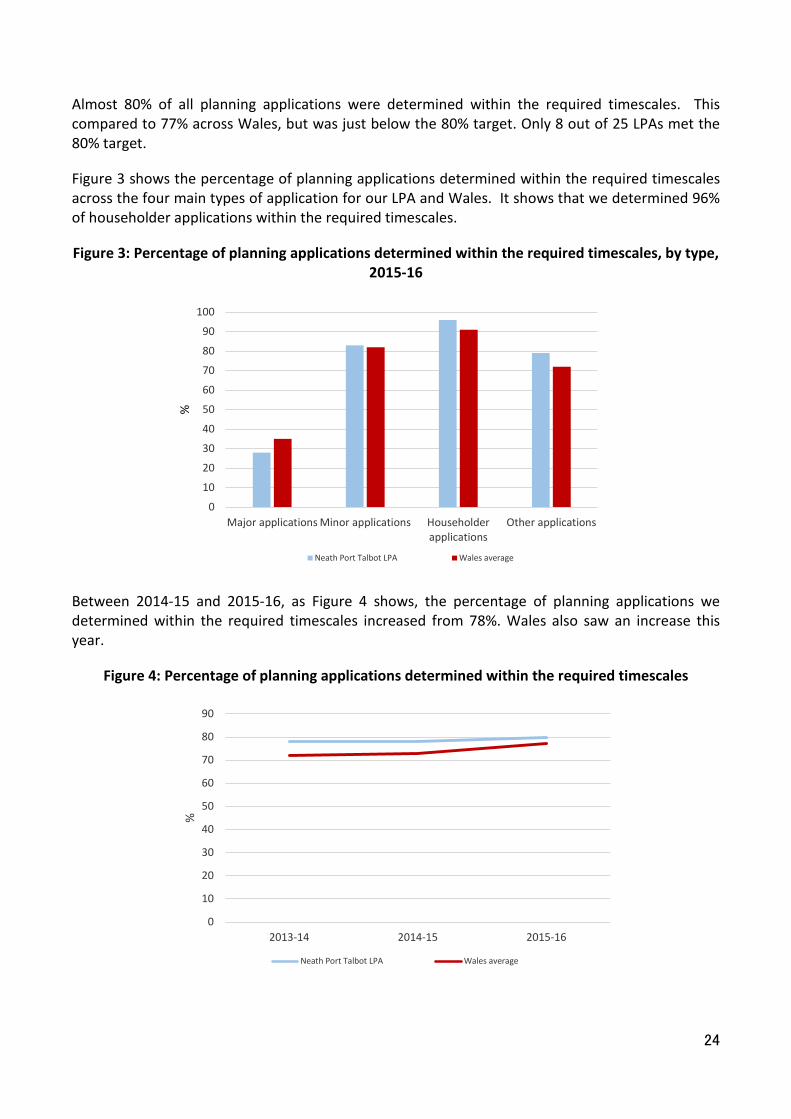
Figure 3 shows the percentage of planning applications determined within the required timescales across the four main types of application for our LPA and Wales. It shows that we determined 96% of householder applications within the required timescales.
Figure 3: Percentage of planning applications determined within the required timescales, by type, 2015-16
Between 2014-15 and 2015-16, as Figure 4 shows, the percentage of planning applications we determined within the required timescales increased from 78%. Wales also saw an increase this year.
Figure 4: Percentage of planning applications determined within the required timescales
0
10
20
30
40
50
60
70
80
90
100
Major applications Minor applications Householderapplications
Other applications
%
Neath Port Talbot LPA Wales average
0
10
20
30
40
50
60
70
80
90
2013-14 2014-15 2015-16
%
Neath Port Talbot LPA Wales average
25
Over the same period: • The number of applications we received decreased; • The number of applications we determined decreased; and • The number of applications we approved decreased.
Major applications
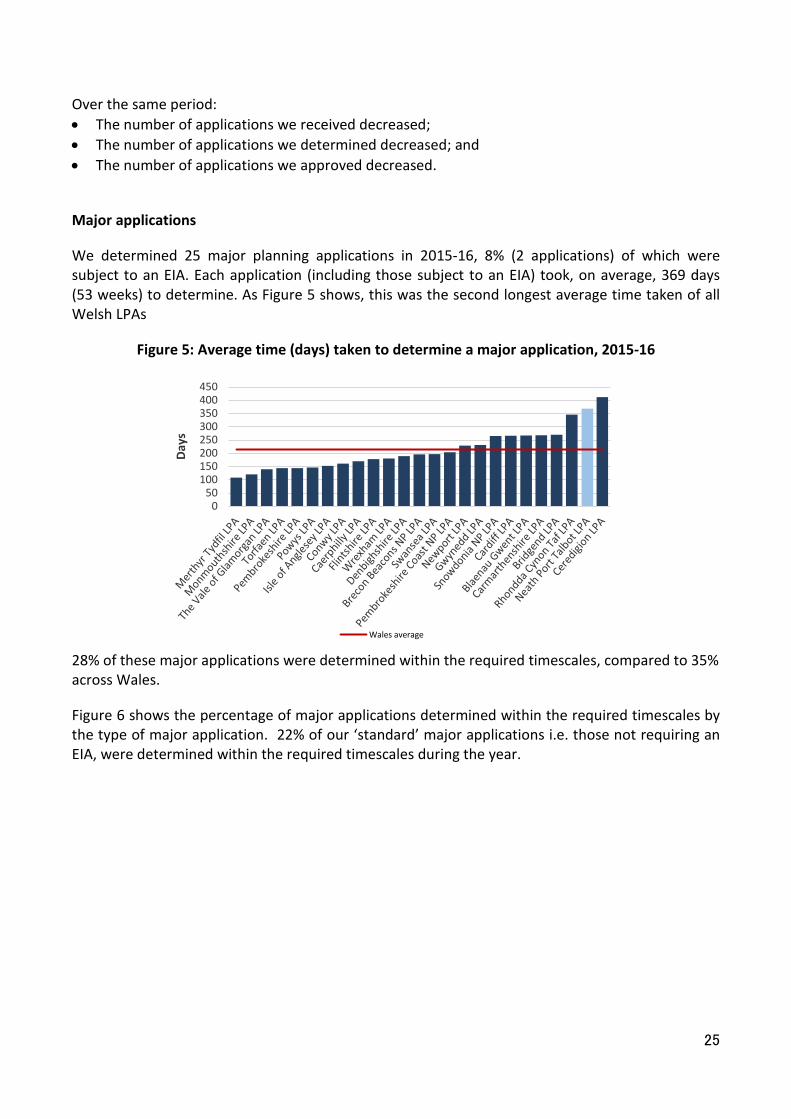
We determined 25 major planning applications in 2015-16, 8% (2 applications) of which were subject to an EIA. Each application (including those subject to an EIA) took, on average, 369 days (53 weeks) to determine. As Figure 5 shows, this was the second longest average time taken of all Welsh LPAs
Figure 5: Average time (days) taken to determine a major application, 2015-16
28% of these major applications were determined within the required timescales, compared to 35% across Wales.
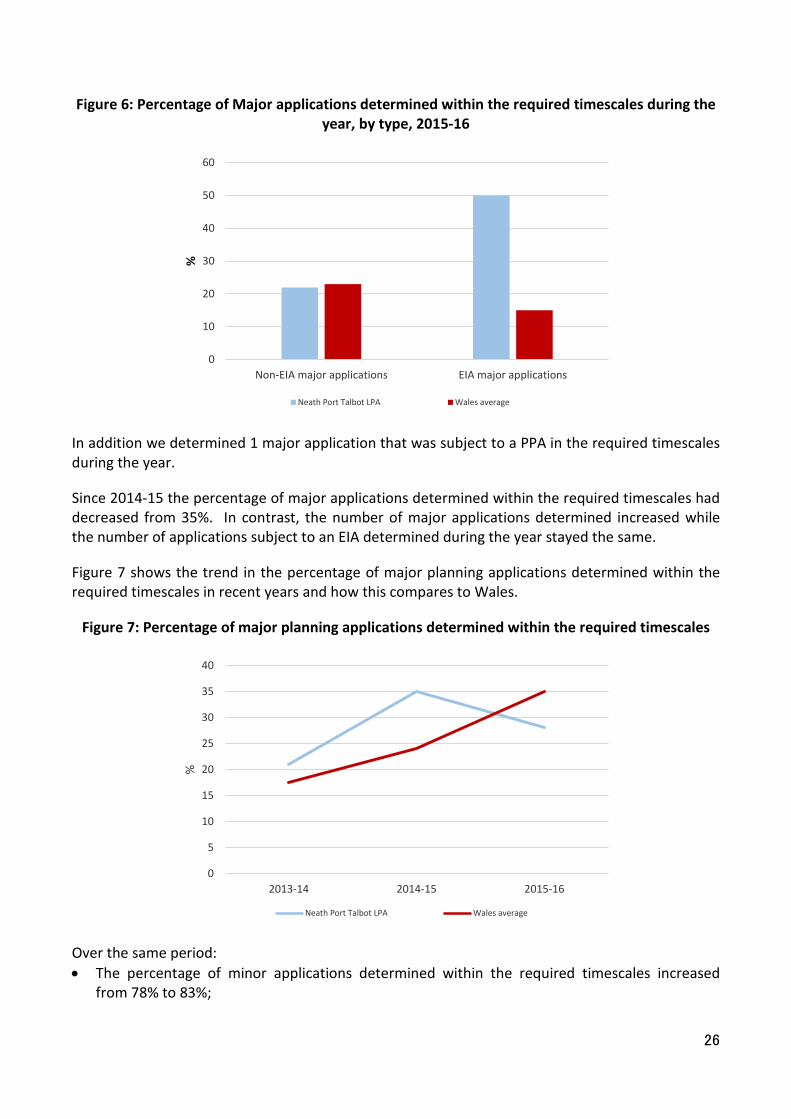
Figure 6 shows the percentage of major applications determined within the required timescales by the type of major application. 22% of our ‘standard’ major applications i.e. those not requiring an EIA, were determined within the required timescales during the year.
050
100150200250300350400450
Days
Wales average
26
Figure 6: Percentage of Major applications determined within the required timescales during the year, by type, 2015-16
In addition we determined 1 major application that was subject to a PPA in the required timescales during the year.
Since 2014-15 the percentage of major applications determined within the required timescales had decreased from 35%. In contrast, the number of major applications determined increased while the number of applications subject to an EIA determined during the year stayed the same.
Figure 7 shows the trend in the percentage of major planning applications determined within the required timescales in recent years and how this compares to Wales.
Figure 7: Percentage of major planning applications determined within the required timescales
Over the same period: • The percentage of minor applications determined within the required timescales increased
from 78% to 83%;
0
10
20
30
40
50
60
Non-EIA major applications EIA major applications
%
Neath Port Talbot LPA Wales average
0
5
10
15
20
25
30
35
40
2013-14 2014-15 2015-16
%
Neath Port Talbot LPA Wales average
27
• The percentage of householder applications determined within the required timescales increased from 88% to 96%; and
• The percentage of other applications determined within required timescales decreased from 80% to 79%.
Quality
In 2015-16, our Planning Committee made 20 planning application decisions during the year, which equated to 2% of all planning applications determined. Across Wales 7% of all planning application decisions were made by planning committee.
15% of these member-made decisions went against officer advice. This compared to 9% of member-made decisions across Wales. This equated to 0.4% of all planning application decisions going against officer advice; 0.6% across Wales.
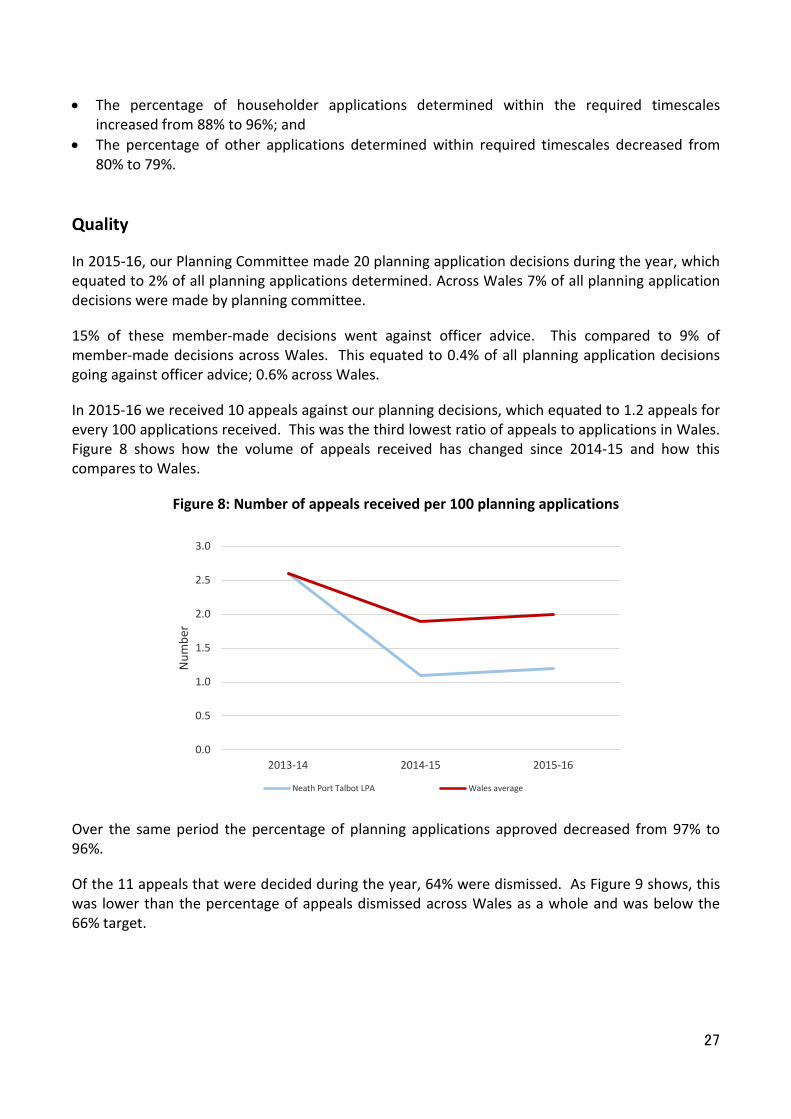
In 2015-16 we received 10 appeals against our planning decisions, which equated to 1.2 appeals for every 100 applications received. This was the third lowest ratio of appeals to applications in Wales. Figure 8 shows how the volume of appeals received has changed since 2014-15 and how this compares to Wales.
Figure 8: Number of appeals received per 100 planning applications
Over the same period the percentage of planning applications approved decreased from 97% to 96%.
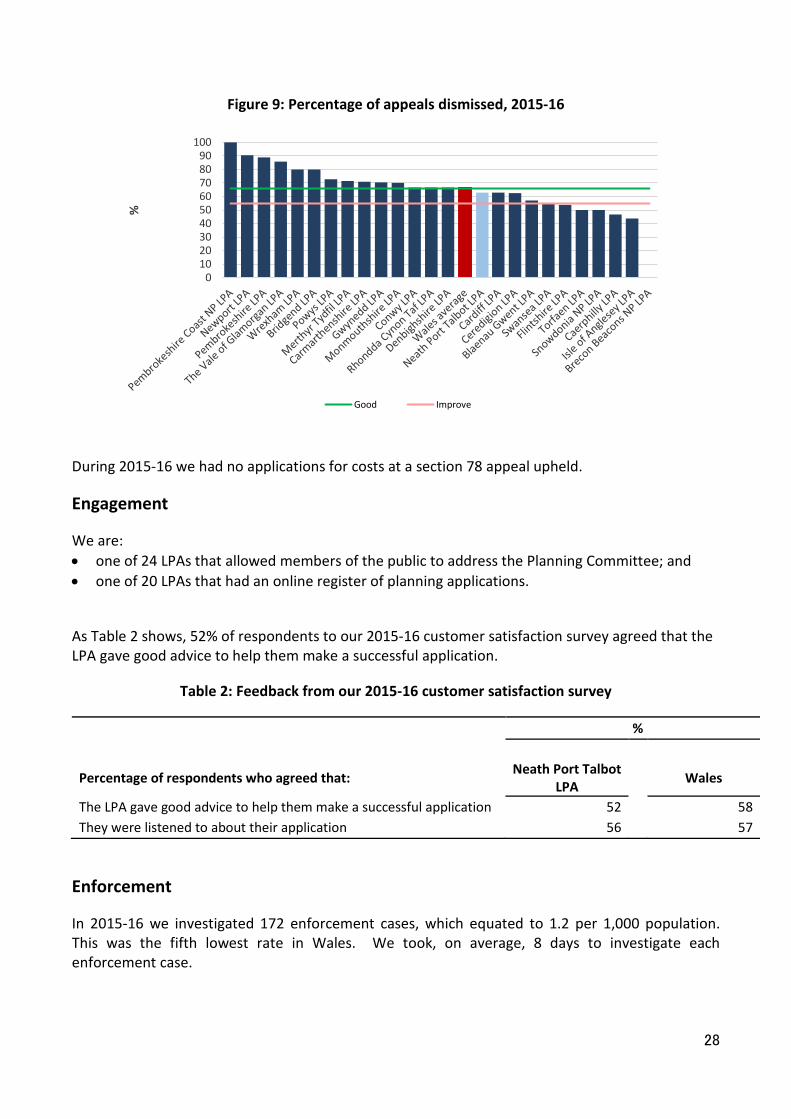
Of the 11 appeals that were decided during the year, 64% were dismissed. As Figure 9 shows, this was lower than the percentage of appeals dismissed across Wales as a whole and was below the 66% target.
0.0
0.5
1.0
1.5
2.0
2.5
3.0
2013-14 2014-15 2015-16
Num
ber
Neath Port Talbot LPA Wales average
28
Figure 9: Percentage of appeals dismissed, 2015-16
During 2015-16 we had no applications for costs at a section 78 appeal upheld.
Engagement
We are: • one of 24 LPAs that allowed members of the public to address the Planning Committee; and • one of 20 LPAs that had an online register of planning applications.
As Table 2 shows, 52% of respondents to our 2015-16 customer satisfaction survey agreed that the LPA gave good advice to help them make a successful application.
Table 2: Feedback from our 2015-16 customer satisfaction survey
%
Percentage of respondents who agreed that: Neath Port Talbot
LPA
Wales
The LPA gave good advice to help them make a successful application 52
58 They were listened to about their application 56 57
Enforcement
In 2015-16 we investigated 172 enforcement cases, which equated to 1.2 per 1,000 population. This was the fifth lowest rate in Wales. We took, on average, 8 days to investigate each enforcement case.
0102030405060708090
100%
Good Improve
29
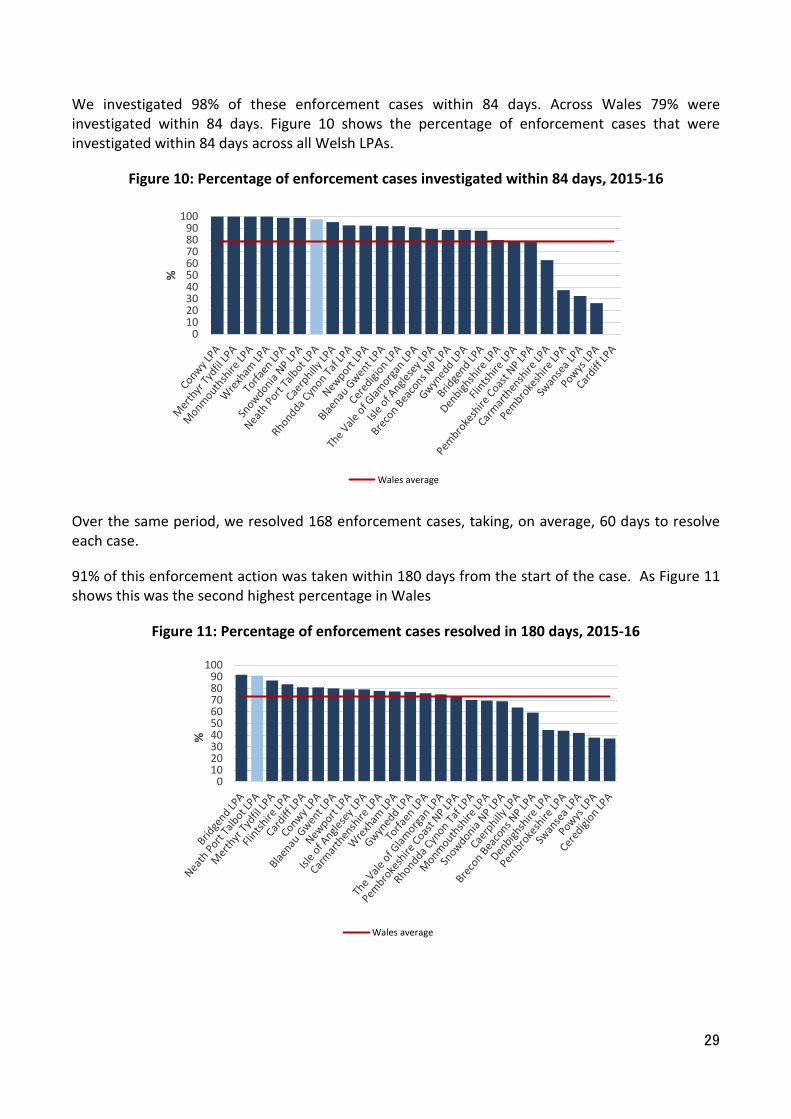
We investigated 98% of these enforcement cases within 84 days. Across Wales 79% were investigated within 84 days. Figure 10 shows the percentage of enforcement cases that were investigated within 84 days across all Welsh LPAs.
Figure 10: Percentage of enforcement cases investigated within 84 days, 2015-16
Over the same period, we resolved 168 enforcement cases, taking, on average, 60 days to resolve each case.
91% of this enforcement action was taken within 180 days from the start of the case. As Figure 11 shows this was the second highest percentage in Wales
Figure 11: Percentage of enforcement cases resolved in 180 days, 2015-16
0102030405060708090
100
%
Wales average
0102030405060708090
100
%
Wales average

30
ANNEX A - PERFORMANCE FRAMEWORK OVERVIEW
MEASURE GOOD FAIR IMPROVE WALES
AVERAGE
Neath Port Talbot LPA LAST YEAR
Neath Port Talbot LPA THIS YEAR
Plan making Is there a current Development Plan in place that is within the plan period? Yes No
Yes Yes Yes
LDP preparation deviation from the dates specified in the original Delivery Agreement, in months <12 13-17 18+ 47 N/A N/A
Annual Monitoring Reports produced following LDP adoption Yes No Yes N/A N/A The local planning authority's current housing land supply in years >5 <5 3.9 2.5 5.5
Efficiency Percentage of "major" applications determined within time periods required Not set Not set Not set 35 35 28
Average time taken to determine "major" applications in days Not set Not set Not set 212.7 79 369 Percentage of all applications determined within time periods required >80 60.1-79.9 <60 76.7 78 80
Average time taken to determine all applications in days <67 67-111 112+ 77.2 55 67 Quality Percentage of Member made decisions against officer advice <5 4.9-8.9 9+ 9.0 6 15 Percentage of appeals dismissed >66 55.1-65.9 <55 66.5 56 66 Applications for costs at Section 78 appeal upheld in the reporting period 0 1 2 0 0 0
Engagement
Does the local planning authority allow members of the public to address the Planning Committee?
Yes No
Yes No
Yes
31
MEASURE GOOD FAIR IMPROVE WALES
AVERAGE
Neath Port Talbot LPA LAST YEAR
Neath Port Talbot LPA THIS YEAR
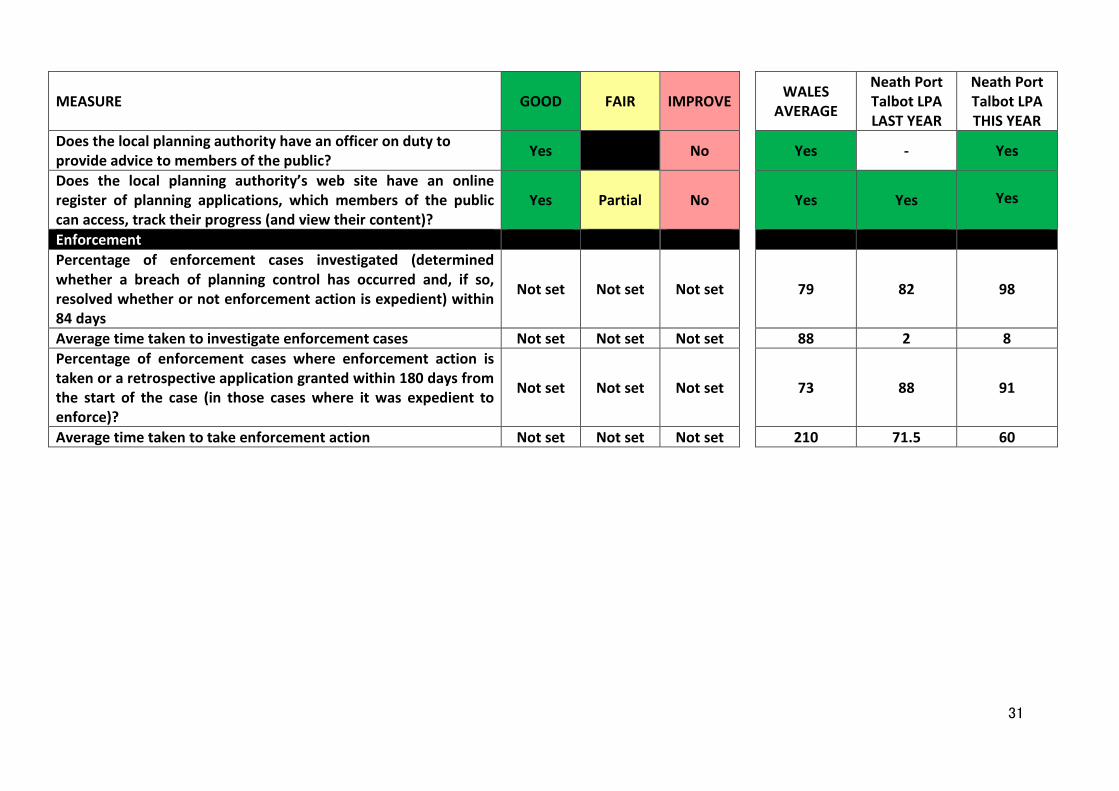
Does the local planning authority have an officer on duty to provide advice to members of the public? Yes No Yes - Yes
Does the local planning authority’s web site have an online register of planning applications, which members of the public can access, track their progress (and view their content)?
Yes Partial No
Yes Yes
Yes
Enforcement Percentage of enforcement cases investigated (determined whether a breach of planning control has occurred and, if so, resolved whether or not enforcement action is expedient) within 84 days
Not set Not set Not set
79 82 98
Average time taken to investigate enforcement cases Not set Not set Not set 88 2 8 Percentage of enforcement cases where enforcement action is taken or a retrospective application granted within 180 days from the start of the case (in those cases where it was expedient to enforce)?
Not set Not set Not set
73 88 91
Average time taken to take enforcement action Not set Not set Not set 210 71.5 60
32
SECTION 1 – PLAN MAKING
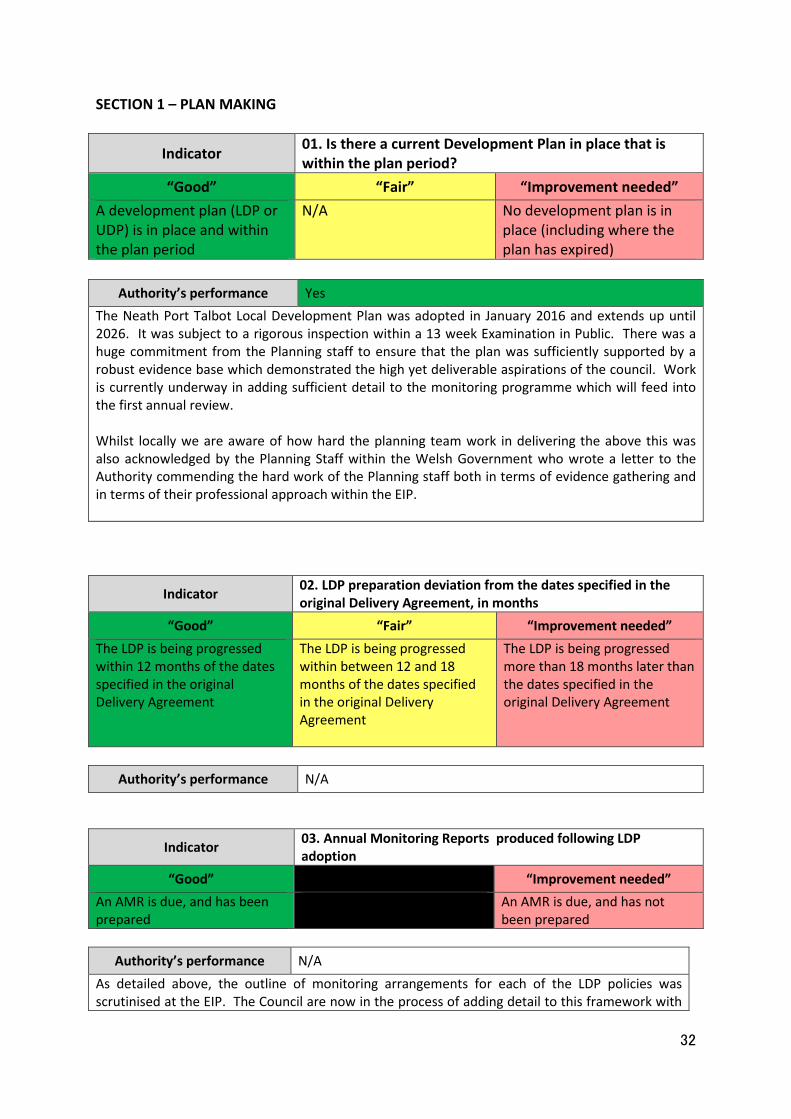
Indicator 01. Is there a current Development Plan in place that is within the plan period?
“Good” “Fair” “Improvement needed” A development plan (LDP or UDP) is in place and within the plan period
N/A No development plan is in place (including where the plan has expired)
Authority’s performance Yes
The Neath Port Talbot Local Development Plan was adopted in January 2016 and extends up until 2026. It was subject to a rigorous inspection within a 13 week Examination in Public. There was a huge commitment from the Planning staff to ensure that the plan was sufficiently supported by a robust evidence base which demonstrated the high yet deliverable aspirations of the council. Work is currently underway in adding sufficient detail to the monitoring programme which will feed into the first annual review. Whilst locally we are aware of how hard the planning team work in delivering the above this was also acknowledged by the Planning Staff within the Welsh Government who wrote a letter to the Authority commending the hard work of the Planning staff both in terms of evidence gathering and in terms of their professional approach within the EIP.
Indicator 02. LDP preparation deviation from the dates specified in the original Delivery Agreement, in months
“Good” “Fair” “Improvement needed” The LDP is being progressed within 12 months of the dates specified in the original Delivery Agreement
The LDP is being progressed within between 12 and 18 months of the dates specified in the original Delivery Agreement
The LDP is being progressed more than 18 months later than the dates specified in the original Delivery Agreement
Authority’s performance N/A
Indicator 03. Annual Monitoring Reports produced following LDP adoption
“Good” “Improvement needed” An AMR is due, and has been prepared
An AMR is due, and has not been prepared
Authority’s performance N/A
As detailed above, the outline of monitoring arrangements for each of the LDP policies was scrutinised at the EIP. The Council are now in the process of adding detail to this framework with
33
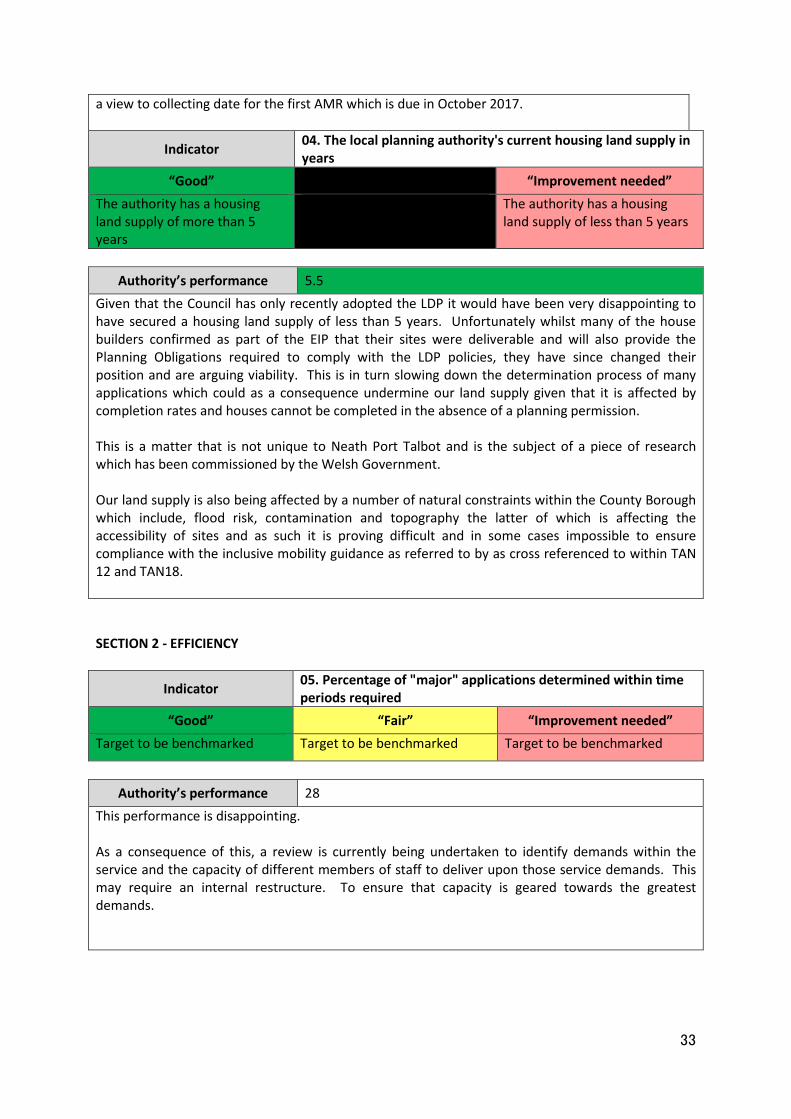
a view to collecting date for the first AMR which is due in October 2017.
Indicator 04. The local planning authority's current housing land supply in years
“Good” “Improvement needed” The authority has a housing land supply of more than 5 years
The authority has a housing land supply of less than 5 years
Authority’s performance 5.5
Given that the Council has only recently adopted the LDP it would have been very disappointing to have secured a housing land supply of less than 5 years. Unfortunately whilst many of the house builders confirmed as part of the EIP that their sites were deliverable and will also provide the Planning Obligations required to comply with the LDP policies, they have since changed their position and are arguing viability. This is in turn slowing down the determination process of many applications which could as a consequence undermine our land supply given that it is affected by completion rates and houses cannot be completed in the absence of a planning permission. This is a matter that is not unique to Neath Port Talbot and is the subject of a piece of research which has been commissioned by the Welsh Government. Our land supply is also being affected by a number of natural constraints within the County Borough which include, flood risk, contamination and topography the latter of which is affecting the accessibility of sites and as such it is proving difficult and in some cases impossible to ensure compliance with the inclusive mobility guidance as referred to by as cross referenced to within TAN 12 and TAN18. SECTION 2 - EFFICIENCY
Indicator 05. Percentage of "major" applications determined within time periods required
“Good” “Fair” “Improvement needed” Target to be benchmarked Target to be benchmarked Target to be benchmarked
Authority’s performance 28
This performance is disappointing. As a consequence of this, a review is currently being undertaken to identify demands within the service and the capacity of different members of staff to deliver upon those service demands. This may require an internal restructure. To ensure that capacity is geared towards the greatest demands.
34
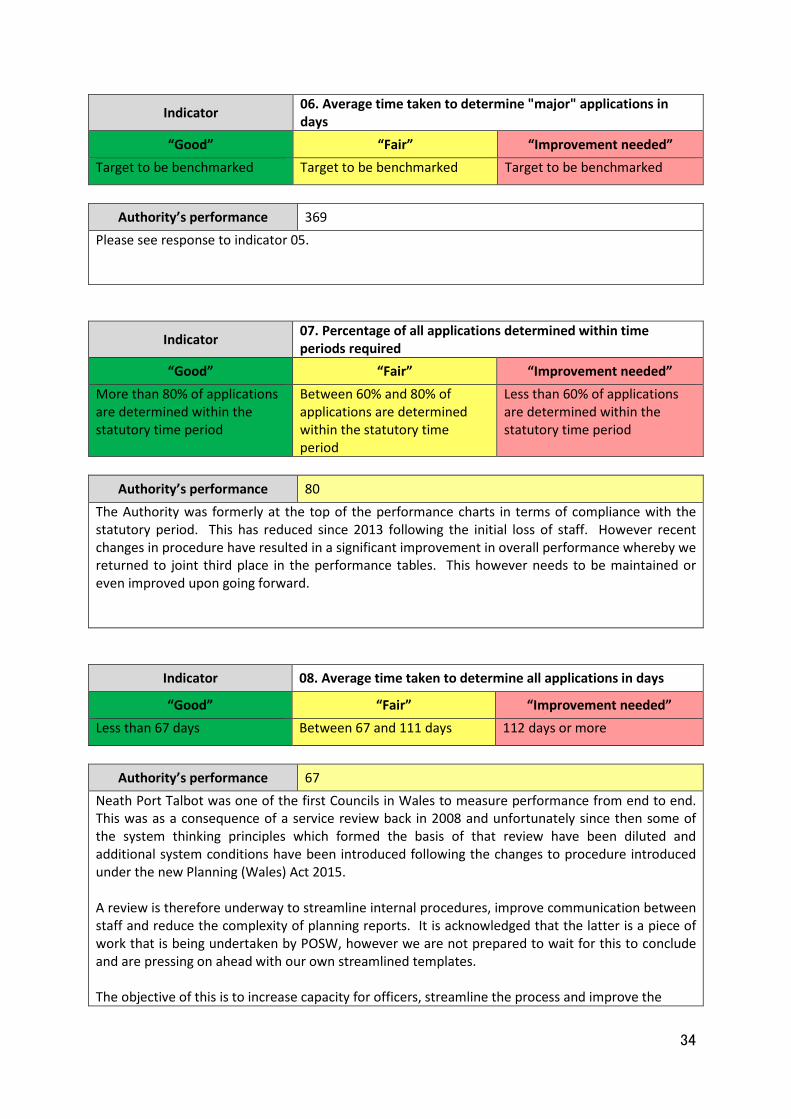
Indicator 06. Average time taken to determine "major" applications in days
“Good” “Fair” “Improvement needed” Target to be benchmarked Target to be benchmarked Target to be benchmarked
Authority’s performance 369
Please see response to indicator 05.
Indicator 07. Percentage of all applications determined within time periods required
“Good” “Fair” “Improvement needed” More than 80% of applications are determined within the statutory time period
Between 60% and 80% of applications are determined within the statutory time period
Less than 60% of applications are determined within the statutory time period
Authority’s performance 80
The Authority was formerly at the top of the performance charts in terms of compliance with the statutory period. This has reduced since 2013 following the initial loss of staff. However recent changes in procedure have resulted in a significant improvement in overall performance whereby we returned to joint third place in the performance tables. This however needs to be maintained or even improved upon going forward.
Indicator 08. Average time taken to determine all applications in days
“Good” “Fair” “Improvement needed” Less than 67 days Between 67 and 111 days 112 days or more
Authority’s performance 67
Neath Port Talbot was one of the first Councils in Wales to measure performance from end to end. This was as a consequence of a service review back in 2008 and unfortunately since then some of the system thinking principles which formed the basis of that review have been diluted and additional system conditions have been introduced following the changes to procedure introduced under the new Planning (Wales) Act 2015. A review is therefore underway to streamline internal procedures, improve communication between staff and reduce the complexity of planning reports. It is acknowledged that the latter is a piece of work that is being undertaken by POSW, however we are not prepared to wait for this to conclude and are pressing on ahead with our own streamlined templates. The objective of this is to increase capacity for officers, streamline the process and improve the
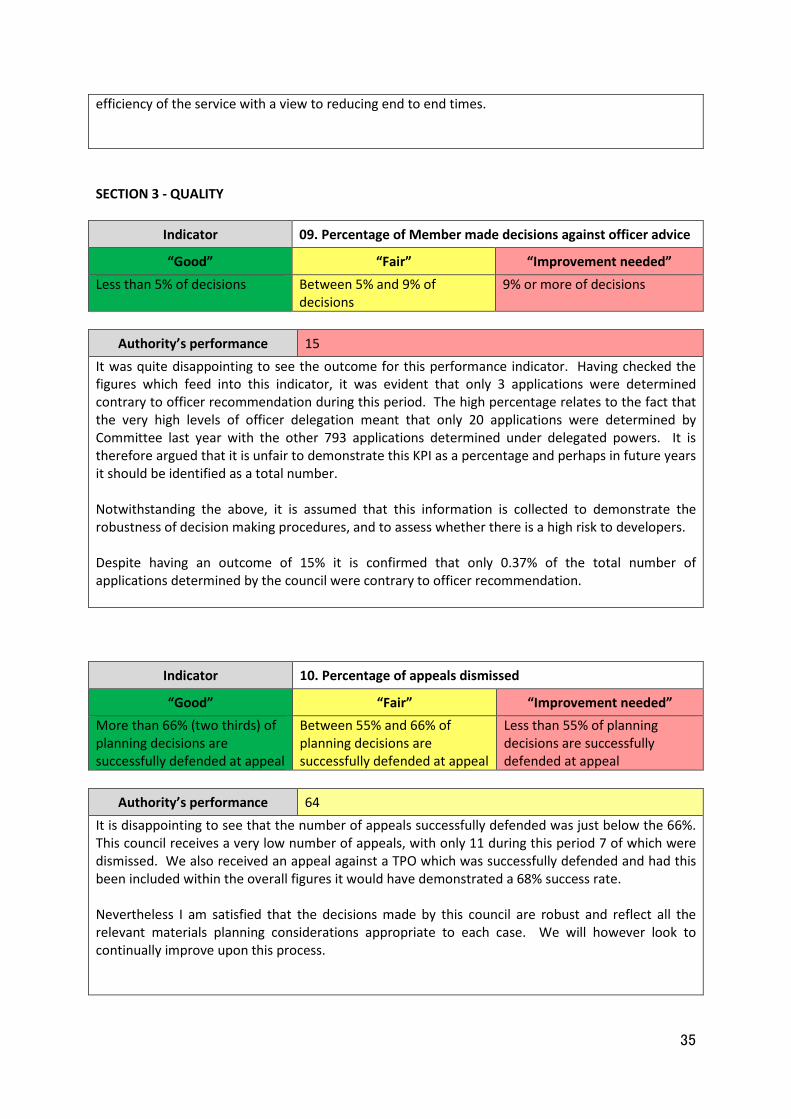
35
efficiency of the service with a view to reducing end to end times. SECTION 3 - QUALITY
Indicator 09. Percentage of Member made decisions against officer advice
“Good” “Fair” “Improvement needed” Less than 5% of decisions Between 5% and 9% of
decisions 9% or more of decisions
Authority’s performance 15
It was quite disappointing to see the outcome for this performance indicator. Having checked the figures which feed into this indicator, it was evident that only 3 applications were determined contrary to officer recommendation during this period. The high percentage relates to the fact that the very high levels of officer delegation meant that only 20 applications were determined by Committee last year with the other 793 applications determined under delegated powers. It is therefore argued that it is unfair to demonstrate this KPI as a percentage and perhaps in future years it should be identified as a total number. Notwithstanding the above, it is assumed that this information is collected to demonstrate the robustness of decision making procedures, and to assess whether there is a high risk to developers. Despite having an outcome of 15% it is confirmed that only 0.37% of the total number of applications determined by the council were contrary to officer recommendation.
Indicator 10. Percentage of appeals dismissed
“Good” “Fair” “Improvement needed” More than 66% (two thirds) of planning decisions are successfully defended at appeal
Between 55% and 66% of planning decisions are successfully defended at appeal
Less than 55% of planning decisions are successfully defended at appeal
Authority’s performance 64
It is disappointing to see that the number of appeals successfully defended was just below the 66%. This council receives a very low number of appeals, with only 11 during this period 7 of which were dismissed. We also received an appeal against a TPO which was successfully defended and had this been included within the overall figures it would have demonstrated a 68% success rate. Nevertheless I am satisfied that the decisions made by this council are robust and reflect all the relevant materials planning considerations appropriate to each case. We will however look to continually improve upon this process.
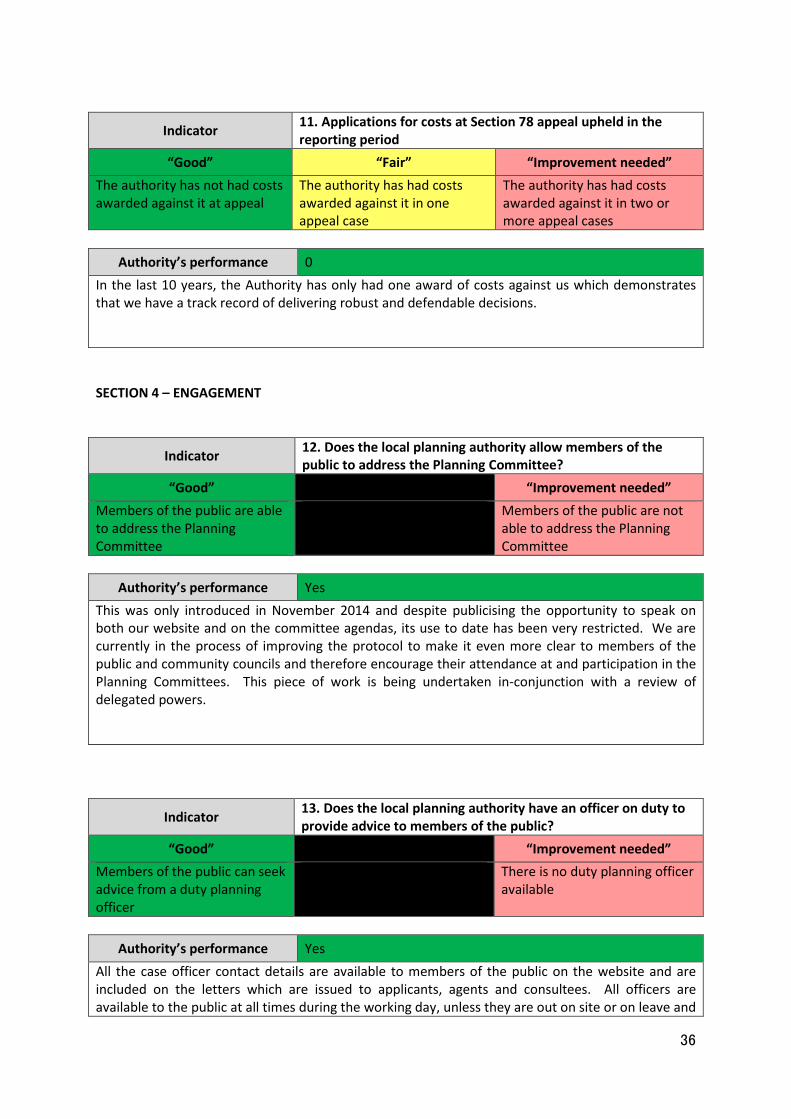
36
Indicator 11. Applications for costs at Section 78 appeal upheld in the reporting period
“Good” “Fair” “Improvement needed” The authority has not had costs awarded against it at appeal
The authority has had costs awarded against it in one appeal case
The authority has had costs awarded against it in two or more appeal cases
Authority’s performance 0
In the last 10 years, the Authority has only had one award of costs against us which demonstrates that we have a track record of delivering robust and defendable decisions. SECTION 4 – ENGAGEMENT
Indicator 12. Does the local planning authority allow members of the public to address the Planning Committee?
“Good” “Improvement needed” Members of the public are able to address the Planning Committee
Members of the public are not able to address the Planning Committee
Authority’s performance Yes
This was only introduced in November 2014 and despite publicising the opportunity to speak on both our website and on the committee agendas, its use to date has been very restricted. We are currently in the process of improving the protocol to make it even more clear to members of the public and community councils and therefore encourage their attendance at and participation in the Planning Committees. This piece of work is being undertaken in-conjunction with a review of delegated powers.
Indicator 13. Does the local planning authority have an officer on duty to provide advice to members of the public?
“Good” “Improvement needed” Members of the public can seek advice from a duty planning officer
There is no duty planning officer available
Authority’s performance Yes
All the case officer contact details are available to members of the public on the website and are included on the letters which are issued to applicants, agents and consultees. All officers are available to the public at all times during the working day, unless they are out on site or on leave and
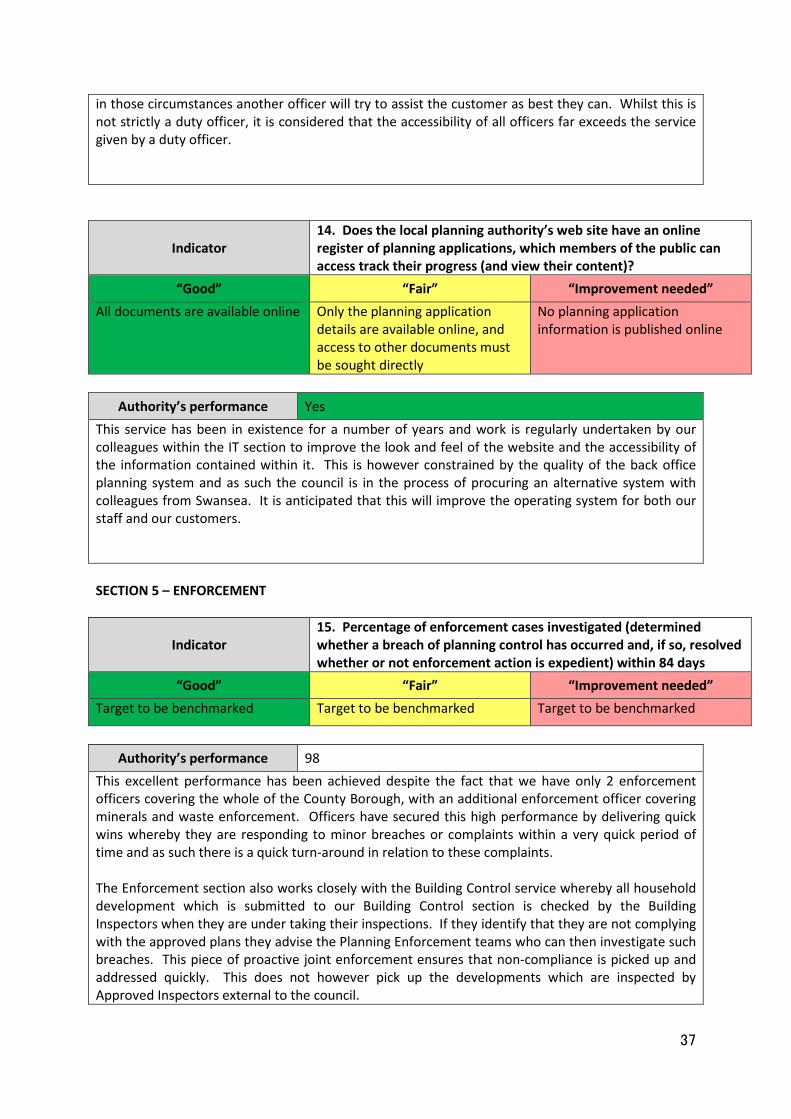
37
in those circumstances another officer will try to assist the customer as best they can. Whilst this is not strictly a duty officer, it is considered that the accessibility of all officers far exceeds the service given by a duty officer.
Indicator 14. Does the local planning authority’s web site have an online register of planning applications, which members of the public can access track their progress (and view their content)?
“Good” “Fair” “Improvement needed” All documents are available online Only the planning application
details are available online, and access to other documents must be sought directly
No planning application information is published online
Authority’s performance Yes
This service has been in existence for a number of years and work is regularly undertaken by our colleagues within the IT section to improve the look and feel of the website and the accessibility of the information contained within it. This is however constrained by the quality of the back office planning system and as such the council is in the process of procuring an alternative system with colleagues from Swansea. It is anticipated that this will improve the operating system for both our staff and our customers. SECTION 5 – ENFORCEMENT
Indicator 15. Percentage of enforcement cases investigated (determined whether a breach of planning control has occurred and, if so, resolved whether or not enforcement action is expedient) within 84 days
“Good” “Fair” “Improvement needed” Target to be benchmarked Target to be benchmarked Target to be benchmarked
Authority’s performance 98
This excellent performance has been achieved despite the fact that we have only 2 enforcement officers covering the whole of the County Borough, with an additional enforcement officer covering minerals and waste enforcement. Officers have secured this high performance by delivering quick wins whereby they are responding to minor breaches or complaints within a very quick period of time and as such there is a quick turn-around in relation to these complaints. The Enforcement section also works closely with the Building Control service whereby all household development which is submitted to our Building Control section is checked by the Building Inspectors when they are under taking their inspections. If they identify that they are not complying with the approved plans they advise the Planning Enforcement teams who can then investigate such breaches. This piece of proactive joint enforcement ensures that non-compliance is picked up and addressed quickly. This does not however pick up the developments which are inspected by Approved Inspectors external to the council.
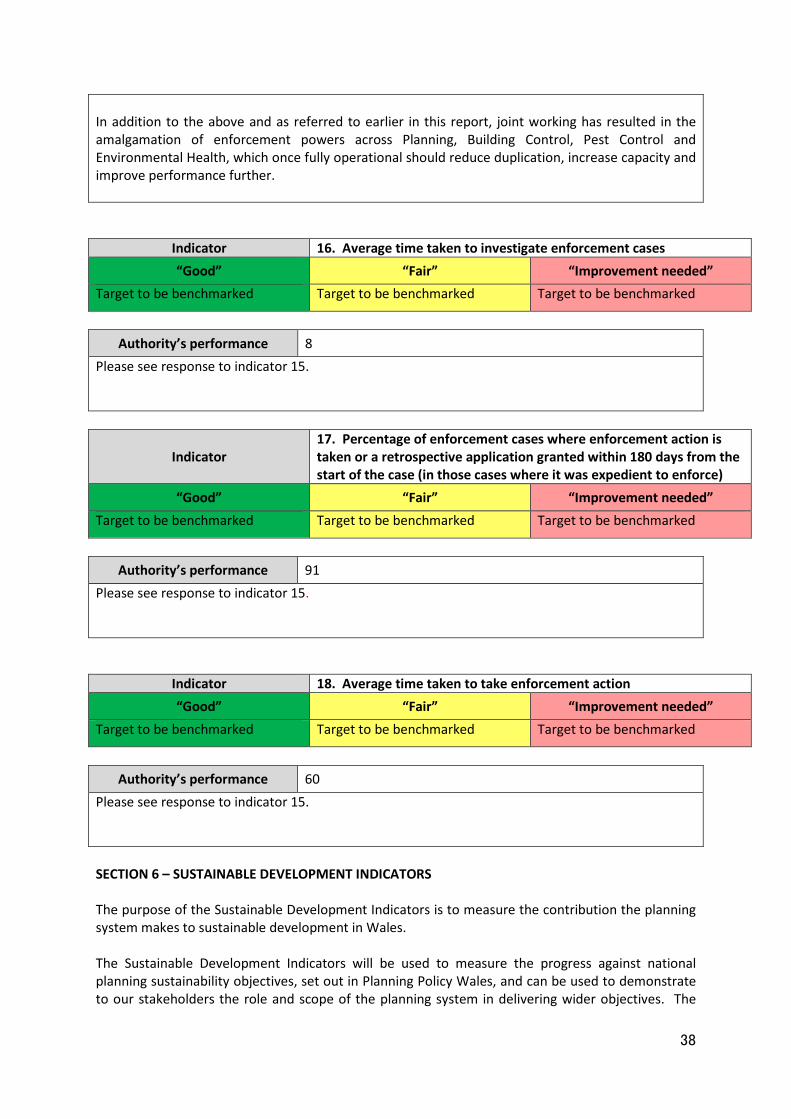
38
In addition to the above and as referred to earlier in this report, joint working has resulted in the amalgamation of enforcement powers across Planning, Building Control, Pest Control and Environmental Health, which once fully operational should reduce duplication, increase capacity and improve performance further.
Indicator 16. Average time taken to investigate enforcement cases “Good” “Fair” “Improvement needed”
Target to be benchmarked Target to be benchmarked Target to be benchmarked
Authority’s performance 8
Please see response to indicator 15.
Indicator 17. Percentage of enforcement cases where enforcement action is taken or a retrospective application granted within 180 days from the start of the case (in those cases where it was expedient to enforce)
“Good” “Fair” “Improvement needed” Target to be benchmarked Target to be benchmarked Target to be benchmarked
Authority’s performance 91
Please see response to indicator 15.
Indicator 18. Average time taken to take enforcement action “Good” “Fair” “Improvement needed”
Target to be benchmarked Target to be benchmarked Target to be benchmarked
Authority’s performance 60
Please see response to indicator 15. SECTION 6 – SUSTAINABLE DEVELOPMENT INDICATORS The purpose of the Sustainable Development Indicators is to measure the contribution the planning system makes to sustainable development in Wales. The Sustainable Development Indicators will be used to measure the progress against national planning sustainability objectives, set out in Planning Policy Wales, and can be used to demonstrate to our stakeholders the role and scope of the planning system in delivering wider objectives. The
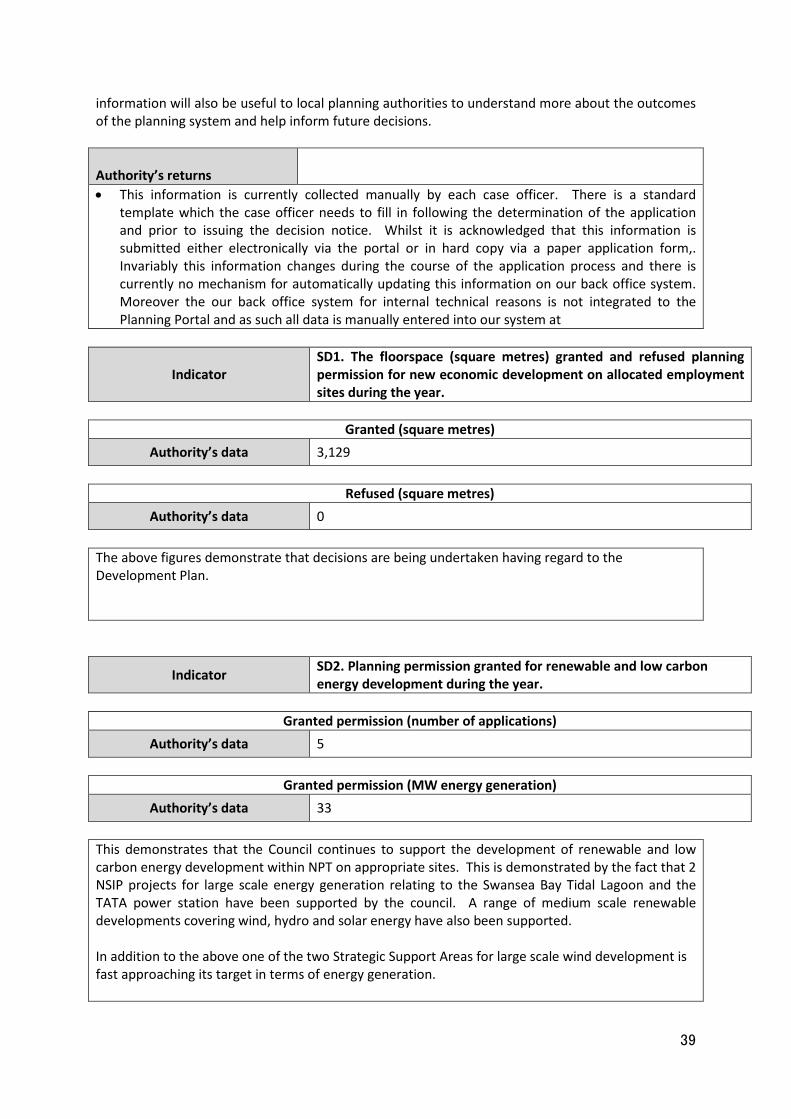
39
information will also be useful to local planning authorities to understand more about the outcomes of the planning system and help inform future decisions. Authority’s returns
• This information is currently collected manually by each case officer. There is a standard template which the case officer needs to fill in following the determination of the application and prior to issuing the decision notice. Whilst it is acknowledged that this information is submitted either electronically via the portal or in hard copy via a paper application form,. Invariably this information changes during the course of the application process and there is currently no mechanism for automatically updating this information on our back office system. Moreover the our back office system for internal technical reasons is not integrated to the Planning Portal and as such all data is manually entered into our system at
Indicator SD1. The floorspace (square metres) granted and refused planning permission for new economic development on allocated employment sites during the year.
Granted (square metres)
Authority’s data 3,129
Refused (square metres) Authority’s data 0
The above figures demonstrate that decisions are being undertaken having regard to the Development Plan.
Indicator SD2. Planning permission granted for renewable and low carbon energy development during the year.
Granted permission (number of applications)
Authority’s data 5
Granted permission (MW energy generation) Authority’s data 33
This demonstrates that the Council continues to support the development of renewable and low carbon energy development within NPT on appropriate sites. This is demonstrated by the fact that 2 NSIP projects for large scale energy generation relating to the Swansea Bay Tidal Lagoon and the TATA power station have been supported by the council. A range of medium scale renewable developments covering wind, hydro and solar energy have also been supported. In addition to the above one of the two Strategic Support Areas for large scale wind development is fast approaching its target in terms of energy generation.
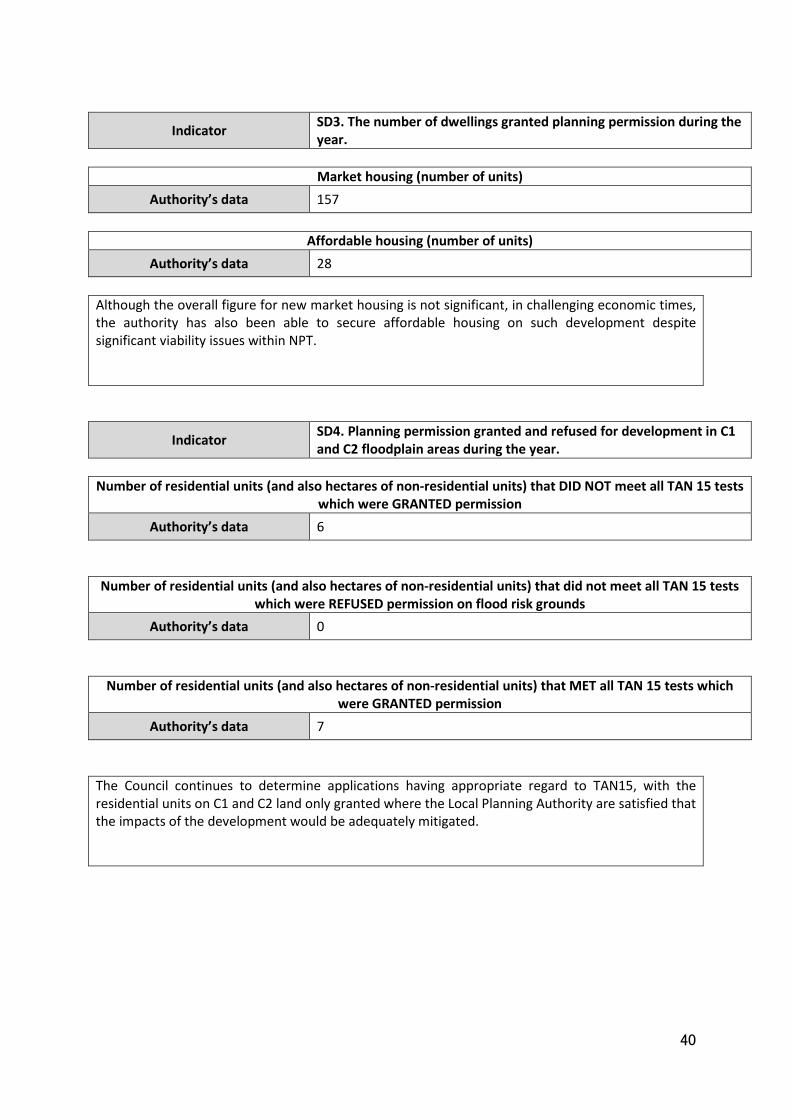
40
Indicator SD3. The number of dwellings granted planning permission during the year.
Market housing (number of units)
Authority’s data 157
Affordable housing (number of units) Authority’s data 28
Although the overall figure for new market housing is not significant, in challenging economic times, the authority has also been able to secure affordable housing on such development despite significant viability issues within NPT.
Indicator SD4. Planning permission granted and refused for development in C1 and C2 floodplain areas during the year.
Number of residential units (and also hectares of non-residential units) that DID NOT meet all TAN 15 tests
which were GRANTED permission Authority’s data 6
Number of residential units (and also hectares of non-residential units) that did not meet all TAN 15 tests
which were REFUSED permission on flood risk grounds Authority’s data 0
Number of residential units (and also hectares of non-residential units) that MET all TAN 15 tests which were GRANTED permission
Authority’s data 7 The Council continues to determine applications having appropriate regard to TAN15, with the residential units on C1 and C2 land only granted where the Local Planning Authority are satisfied that the impacts of the development would be adequately mitigated.
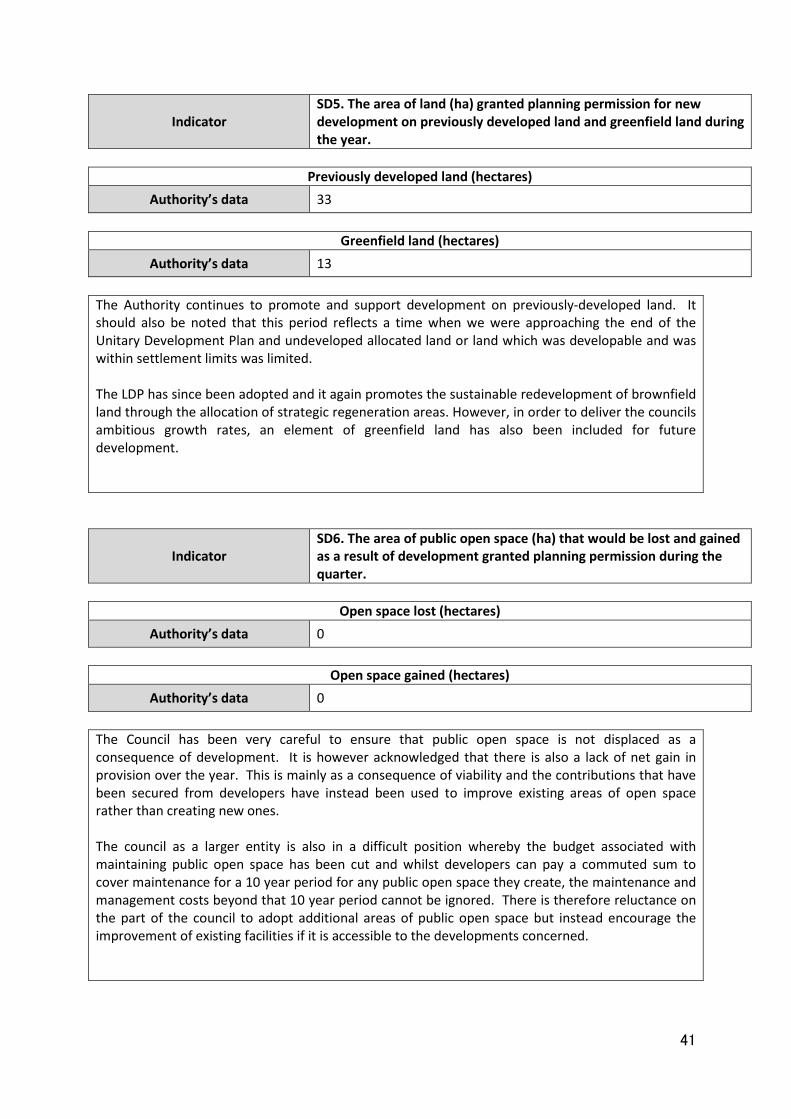
41
Indicator SD5. The area of land (ha) granted planning permission for new development on previously developed land and greenfield land during the year.
Previously developed land (hectares)
Authority’s data 33
Greenfield land (hectares) Authority’s data 13
The Authority continues to promote and support development on previously-developed land. It should also be noted that this period reflects a time when we were approaching the end of the Unitary Development Plan and undeveloped allocated land or land which was developable and was within settlement limits was limited. The LDP has since been adopted and it again promotes the sustainable redevelopment of brownfield land through the allocation of strategic regeneration areas. However, in order to deliver the councils ambitious growth rates, an element of greenfield land has also been included for future development.
Indicator SD6. The area of public open space (ha) that would be lost and gained as a result of development granted planning permission during the quarter.
Open space lost (hectares)
Authority’s data 0
Open space gained (hectares) Authority’s data 0
The Council has been very careful to ensure that public open space is not displaced as a consequence of development. It is however acknowledged that there is also a lack of net gain in provision over the year. This is mainly as a consequence of viability and the contributions that have been secured from developers have instead been used to improve existing areas of open space rather than creating new ones. The council as a larger entity is also in a difficult position whereby the budget associated with maintaining public open space has been cut and whilst developers can pay a commuted sum to cover maintenance for a 10 year period for any public open space they create, the maintenance and management costs beyond that 10 year period cannot be ignored. There is therefore reluctance on the part of the council to adopt additional areas of public open space but instead encourage the improvement of existing facilities if it is accessible to the developments concerned.

42
Indicator SD7. The total financial contributions (£) agreed from new development granted planning permission during the quarter for the provision of community infrastructure.
Gained via Section 106 agreements (£)
Authority’s data 224,140
Gained via Community Infrastructure Levy (£) Authority’s data 0
The council is currently working on an amended Supplementary Planning Guidance document relating to Planning Obligations which clearly indicates new thresholds and formulae to aid calculation of the above. This should reduce/remove uncertainty for developers in relation to the development costs and thus enable them to reflect these costs appropriately within the price they pay for the land. As a result it is anticipated that the contributions will improve going forward. We also now have an officer who is dedicated to the calculation of contributions, the tracking of developments, collection of payments together with monitoring the ongoing expenditure of those payments. This will ensure that the communities affected by developments are benefiting from the contributions negotiated on their behalf.