Embed Size (px)
Citation preview

Annual Progress Report Lower Snake River Compensation Plan
Confederated Tribes of the Umatilla Indian Reservation Evaluation Studies for 1 January 2016 to 31 December 2016
Evaluation of Reestablishing Natural Production of
Spring Chinook Salmon in Lookingglass Creek, Oregon, Using a Local Stock (Catherine Creek)
Carrie Crump, Les Naylor, Andy VanSickle, Brian Startzel-Holt Confederated Tribes of the Umatilla Indian Reservation Department of Natural Resources, Fisheries Program,
Ag Services Building, Room 2 10507 North McAlister Road
Island City, OR 97850 (541) 429-7945/2/6/7
Administered by the United States Fish and Wildlife Service and funded under the Lower Snake River Compensation Plan
CTUIR Project No. 475, FWS Agreement F14AC00013 May 2017
2
TABLE OF CONTENTS 1 Evaluation of Reestablishing Natural Production of Spring Chinook Salmon in Lookingglass Creek, Oregon, Using A Local Stock (Catherine Creek) ............................. 4
1.1 Abstract ............................................................................................................... 4 1.2 Introduction ......................................................................................................... 5 1.3 Program Objectives ............................................................................................. 6 1.4 Study Area .......................................................................................................... 7 1.5 Methods .............................................................................................................. 9 1.5 Results/Discussion ............................................................................................ 14
1.5.1 Adult Abundance .......................................................................................... 14 1.5.1.1 Life History ....................................................................................... 23 1.5.1.2 Productivity ....................................................................................... 25
1.5.2 Juvenile Spring Chinook Salmon .................................................................. 26 1.5.2.1 Abundance ........................................................................................ 26 1.5.2.2 Life History ....................................................................................... 30
1.6 Adaptive Management ...................................................................................... 40 1.7 Summary ........................................................................................................... 42 1.8 Management Plan.............................................................................................. 43
2 Bibliography ............................................................................................................. 44 2.1 Appendices of Water Temperatures and Diurnal Fluctuations ......................... 47 2.2 Appendices of Methods Previously Used ......................................................... 48 2.3 Assistance Provided to LSRCP Cooperators and Other Projects ..................... 51 2.4 Acknowledgments............................................................................................. 53
LIST OF FIGURES
Figure 1. Location of Lookingglass Creek and the Grande Ronde River. ....................................... 6 Figure 2. Lookingglass Creek watershed showing major and minor tributaries. ............................. 8 Figure 3. Lookingglass Hatchery adult trap located at rkm 4.1. ...................................................... 9 Figure 4. Lookingglass Creek section breaks for spawning surveys. Unit 1 is below the weir, while all other units are above the weir. ........................................................................................ 11 Figure 5. Rotary screw trap located at rkm 4.0 on Lookingglass Creek. ....................................... 13 Figure 6. LGC stock spring Chinook salmon total releases above the LH weir, RY 2004-2016. . 16 Figure 7. LGC stock spring Chinook salmon HOR vs NOR releases above the weir, RY 2004-2016. .............................................................................................................................................. 16 Figure 8. LGC stock spring Chinook salmon Male vs Female releases above the LH weir, RY 2004-2016. In 2004, 78 HOR outplants from CC were hauled to LGC and released upstream since there were not enough natural origin returns. These 78 fish were excluded due to a lack of data on sex ratios. ........................................................................................................................... 17 Figure 9. Density map of spring Chinook spawning distribution in LGC by unit, RY 2016. ....... 19 Figure 10. Percentage of Chinook salmon redds observed below the LH weir during the endemic era (RY 1964-1971) and the current reintroduction era (RY 2009-2016). .................................... 21
3
Figure 11. Frequency distribution of NOR FL (mm) of returning adult female spring Chinook for LGC, RY 2007-2016. Data are from known age females. ............................................................. 25 Figure 12. Frequency distribution of HOR FL (mm) for returning adult female spring Chinook for LGC, RY 2007-2016. Data are from known age females. ............................................................. 25 Figure 13. Box plots of fork length (mm) by seasonal group for NOR spring Chinook outmigrants tagged or measured in the LGC screw trap, BY 2014. Error bars indicate minimum and maximum sizes observed by season. ............................................................................................................... 29 Figure 14. Outmigrants/redd and redds above the LH for BY 2004-2014. ................................... 30 Figure 15. Survival probabilities of NOR spring Chinook salmon for summer, fall, winter, and spring groups, BY 2004-2014. ....................................................................................................... 31 Figure 16. Survival probabilities of NOR spring Chinook salmon for summer, fall, winter, and spring groups, BY 2004-2014, with redds on the z axis. ............................................................... 31 Figure 17. Harmonic mean travel time (d) to LGD for LGC NOR spring Chinook salmon summer parr, and , winter, spring outmigrants, BY 2004-2014. ................................................................. 32 Figure 18. Plot of mean percent of fish emigrating and the corresponding mean percent of survival by season, BY 2004-2014. ............................................................................................... 33 Figure 19. Seasonal growth of juvenile spring Chinook salmon captured during monthly sampling for July, August, September at the standard site (rkm 8.9), BY 2005-2014. ................................. 36 Figure 20. Seasonal growth of juvenile spring Chinook salmon captured during the monthly sampling for July, August, September at the footbridge site (rkm 10.5), BY 2005-2014. ............ 37 Figure 21. Snorkel/seining of juvenile spring Chinook parr for the summer parr group in Unit 3U and 3L. ........................................................................................................................................... 38 Figure 22. Circled area indicates the location of fish collection during summer parr group sampling. ........................................................................................................................................ 39 Figure 23. Size of summer parr spring Chinook tagged in early August 2015 (BY 2014) that were recaptured and measured in the screw trap during emigration. ..................................................... 40 Figure 24. LGC section breaks for spawning surveys. The circled area indicated the acquired conservation property slated for restoration work in the future. .................................................... 41 Figure 25. The conservation property recently purchased by CTUIR in 2015. ............................. 42 Figure 26. Average daily water temperature at the LLGC (culvert) site, 2016. ............................ 47 Figure 27. Diurnal fluctuations at the LLGC (culvert) site, 2016. ................................................. 48 Figure 28. Approximately 150 adult lamprey were released into LGC at rkm 6.0 in May of 2016. ....................................................................................................................................................... 52 Figure 29. Location of the 14 lamprey redds observed on spawning surveys, RY 2016. .............. 53 LIST OF TABLES
Table 1. NOR returns to the LH weir for each Run Year (RY), and by completed Brood Year (BY) with age based on fork length. .............................................................................................. 15 Table 2. New redds observed on surveys of LGC by work week and by unit, RY 2016. ............. 18 Table 3. Numbers of spring Chinook salmon redds by unit, RY 2004-2016. Unit 1 is below the weir, all others are above. .............................................................................................................. 20 Table 4. Number of spring Chinook salmon redds per km by unit, RY 2009-2016. ..................... 20
4
Table 5. Population estimates – mean and standard error (SE), redds, and fish/redd of naturally spawning spring Chinook salmon above the LH weir, RY 2004-2016. ........................................ 22 Table 6. Population Estimates, Prespawn Mortality (PSM), and Spawner Estimate for spring Chinook salmon above the LH weir, RY 2004-2016. .................................................................... 23 Table 7. Mean FL (mm) at known age by sex and origin of LGC spring Chinook, RY 2016. ..... 24 Table 8. Mean FL (mm) by stock and origin, RY 2007-2016. ...................................................... 24 Table 9. Complete BY NOR returns, spawners by BY, and Recruits per spawner for LGC NOR spring Chinook salmon, BY 2004-2011. ....................................................................................... 26 Table 10. LGC NOR spring Chinook salmon outmigrant summary, BY 2004-2014. ................... 27 Table 11. Summary of seasonal outmigration of LGC NOR spring Chinook salmon, BY 2004-2014. .............................................................................................................................................. 28 Table 12. Summary of 2004-2009 and 2010-2016 mean FL and survival during low redd years vs high redd years. .............................................................................................................................. 34 Table 13. Seq to LGD and SAR for LGC NOR spring Chinook salmon, BY 2004-2014. ............. 35 Table 14. Current LGC management plan outlined in B1 of the 2008-2017 United States vs Oregon Management Agreement. .................................................................................................. 43 Table 15. Disposition of LGC adult spring Chinook salmon arriving at the LH weir. .................. 44 Table 16. Previous method of calculating population estimates, spawners, and R/S for LGC NOR spring Chinook salmon, 2004-2015. .............................................................................................. 49 Table 17. Previous method of calculating Fish/redd and prespawn mortality for naturally spawning spring Chinook salmon above the LH weir, 2004-2015. ............................................... 50 Table 18. Previous method for calculating Seq to LGD and SAR for LGC NOR spring Chinook salmon, BY 2004-2013. ................................................................................................................. 51 1 EVALUATION OF REESTABLISHING NATURAL PRODUCTION OF SPRING CHINOOK SALMON IN LOOKINGGLASS CREEK, OREGON, USING A LOCAL STOCK (CATHERINE CREEK) 1.1 Abstract The objective of this study is to evaluate the reintroduction of a local hatchery-origin spring Chinook salmon stock in Lookingglass Creek using standard sampling methods for anadromous salmonids in the Columbia River Basin. Total returns to the Lookingglass Hatchery trap in 2016 were 976, of which 350 were natural-origin. Releases above the Lookingglass Hatchery weir totaled 641 and spawning ground surveys yielded 207 redds above the weir, and 144 below. Brood year 2011 recruits per spawner was 0.7 for adults only. We estimated 26,384 (129 outmigrants/redd) brood year 2014 juveniles outmigrated from above Lookingglass Hatchery during migration year 2016. During the fall and winter 2015, 85% of juveniles emigrated, while only 15% emigrated in the spring of 2016. Survival probabilities to Lower Granite Dam ranged from 0.113-0.470 for summer, fall, winter, and spring PIT-tagged groups. Smolt equivalents (outmigrants surviving to Lower Granite Dam) totaled 5,151. Brood year 2011 smolt-to-adult ratio was 4.3 for adults only. Harmonic mean travel time (in days) to
5
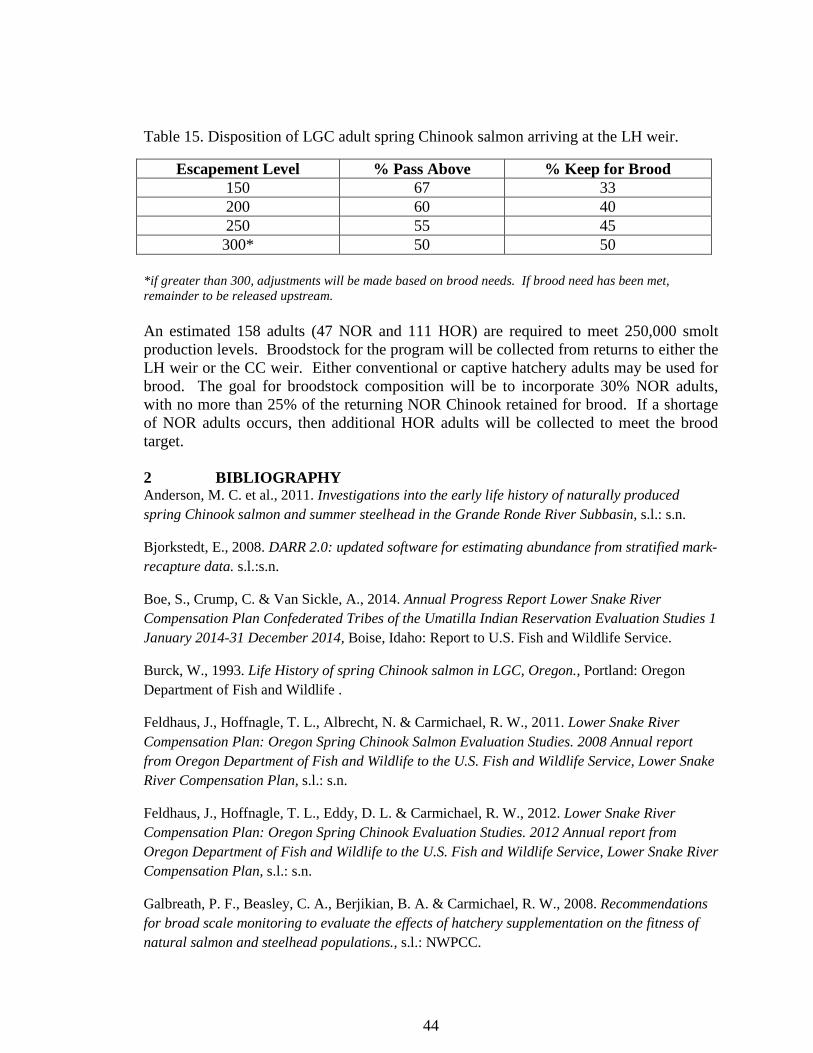
Lower Granite Dam for brood year 2014 was 261, 223, 169, and 43 for summer, fall, winter, and spring groups, respectively. 1.2 Introduction
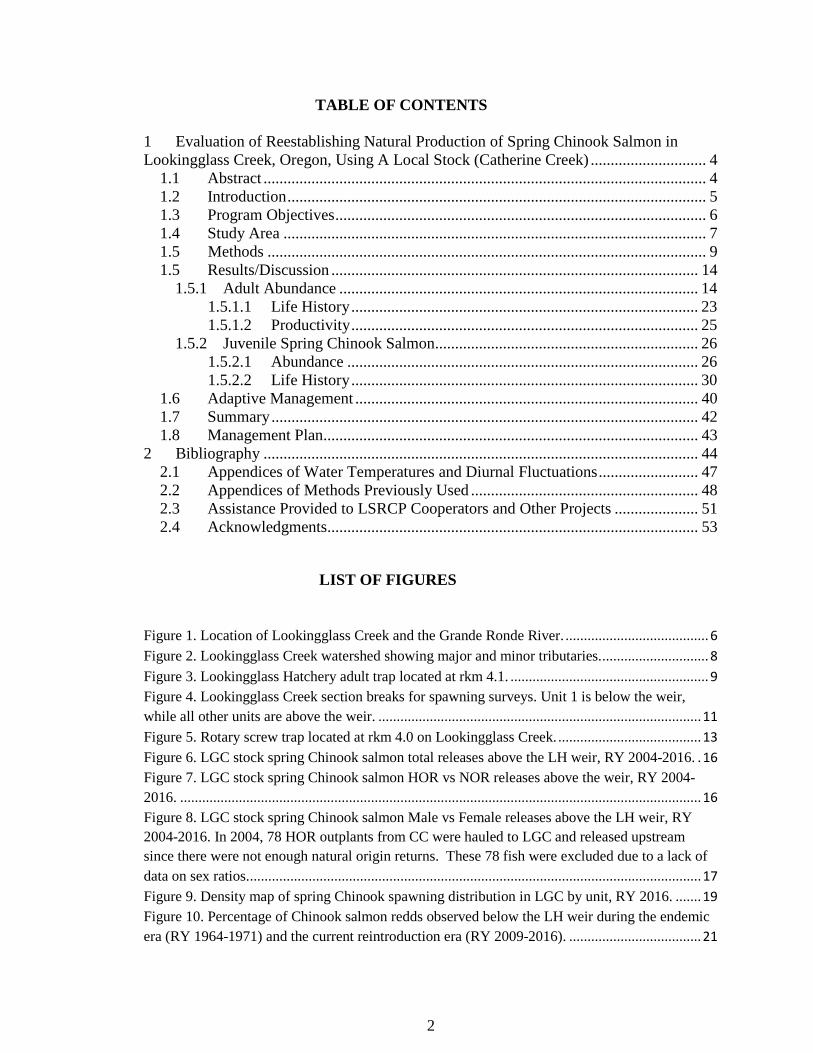
This is the latest in the series of annual progress reports documenting the reintroducing of spring Chinook salmon to Lookingglass Creek, tributary to the Upper Grande Ronde River in the Snake River Basin in northeastern Oregon (Figure 1). Many stocks of anadromous salmon in the Columbia River Basin have experienced severe declines in abundance or become extirpated over the last several decades (Nehlsen, et al., 1991). The endemic Lookingglass Creek (LGC) stock of spring Chinook salmon was extirpated within a few years after establishment of Lookingglass Hatchery (LH) in 1982. The Confederated Tribes of the Umatilla Indian Reservation (CTUIR), along with comanagers Oregon Department of Fish and Wildlife (ODFW) and Nez Perce Tribe (NPT), began work in the early 1990’s to reestablish natural production of spring Chinook salmon in LGC. Several stocks, including remnants of the LGC endemic stock, Imnaha River, Wind River (Washington), Carson Hatchery (Washington), and Rapid River (Idaho) were all used before comanagers settled on Rapid River stock. The Rapid River stock was later replaced with Catherine Creek (CC) captive brood stock (Gee, et al., 2014) progeny as the initial donor stock, since CC stock are native to the Grande Ronde Subbasin and has similar habitat and attributes to LGC. The first CC juvenile hatchery-reared release occurred in September 2001, and the first adult releases above the LH weir occurred in 2004. CC hatchery-origin (HOR) spring Chinook salmon have spawned successfully in nature, produced outmigrants, and these outmigrants have returned as adults to LGC, with the first naturally produced returns occurring in 2007 as jacks. Current management practices include the release of both HOR and natural-origin (NOR) returns to spawn in nature above the LH weir, and the use of both HOR and NOR returns in a conventional brood stock program at LH. Annual reports describing past progress in reestablishing natural production of spring Chinook salmon in LGC are listed in the Literature Cited of this Section.

6
Figure 1. Location of Lookingglass Creek and the Grande Ronde River.
The CTUIR project goals are to evaluate the reintroduction of spring Chinook salmon into LGC using the CC stock, increase tribal harvest, and maintain a gene bank for the CC donor stock. LGC is within the usual and accustomed areas of gathering for the Confederated Tribes of the Umatilla Indian Reservation (CTUIR) under the Treaty of 1855 (Gildemeister, 1998). The CTUIR focuses on reestablishment of the natural population above the LH weir and ODFW on the hatchery component (Feldhaus, et al., 2011). Using the natural component of Lookingglass fish, the CTUIR will study status and trends based on the Viable Salmonid Population metrics of abundance, population growth, spatial distribution and diversity. For abundance metrics we look at total returns of adults, hatchery vs natural proportions, sex ratios, redd counts, and juvenile abundances. Metrics evaluated for population growth include Recruits per Spawner, smolt-to-adult-returns (SAR’s), and juvenile survival to the dams. Spatial distribution includes redd distribution and juvenile rearing. Genetic diversity is studied by looking at genetic tissues and thus relative reproductive success, age structure, migration and spawn timing, and juvenile emigration. All of these metrics will be outlined and discussed in this report. 1.3 Program Objectives
The goal of the LGC Spring Chinook Hatchery Program is to reintroduce spring Chinook into LGC using the CC stock to support tributary harvest, natural population restoration, and maintenance of a gene bank for the CC stock (ODFW, 2011).
7
Program specific objectives stated in the Hatchery and Genetic Management Plan (HGMP) for the LGC program include: 1. .. Restore and maintain viable naturally spawning populations of Chinook
salmon in LGC. 2. .. Contribute to recreational, commercial and tribal fisheries in the mainstem
Columbia River consistent with agreed abundance based harvest rate schedules established in the 2008 – 2017 U.S. vs. Oregon Management Agreement.
3. .. Establish adequate broodstock to meet annual production goals. 4. .. Establish a consistent total return of Chinook salmon that meets the LSRCP
mitigation goal. There are no LSRCP or Tribal Recovery Plan (TRP) hatchery and natural adult return goals identified specifically for LGC. However, LSRCP does have a specific spring/summer Chinook goal of 58,700 hatchery adults for the Snake River and 5,820 hatchery adults into the Grande Ronde Basin. The TRP return goal for the Grande Ronde Basin is 16,000 adults.
5. .. Re-establish historic tribal and recreational fisheries. 6. .. Minimize impacts of hatchery programs on other indigenous species. 7. .. Operate the hatchery program so that the genetic and life history
characteristics of hatchery fish mimic those of natural fish, while achieving mitigation goals.
This project is guided by the Confederated Tribes of the Umatilla Indian Reservation (CTUIR) Department of Natural Resources (DNR) Mission Statement (Jones, et al., 2008) “To protect, restore, and enhance the First Foods - water, salmon, deer, cous and huckleberry – for the perpetual cultural, economic and sovereign benefit of the CTUIR. We will accomplish this using traditional ecological and cultural knowledge and science to inform: 1) population and habitat management goals and actions; and 2) natural resource policies and regulatory mechanisms. and the CTUIR Department of Natural Resources, Research, Monitoring and Evaluation Mission Statement: “We will accomplish (CTUIR DNR Mission Statement) by using traditional ecological and cultural knowledge and science to inform: 1) population and habitat management goals and actions, and 2) natural resource policies and regulatory mechanisms.” 1.4 Study Area Lookingglass Creek originates at Langdon Lake in the Blue Mountains of northeast Oregon at an elevation of 1,484 m above sea level. Gradient is approximately 3% and flow is to the southeast for 25 river km (rkm) through a relatively steep walled canyon within the Umatilla National Forest. The creek then flows through private land with a comparatively wider floodplain for approximately 2.7 km before entering again a narrow canyon down to the Grande Ronde River at rkm 137 (718 m above sea level). A 27-year
8
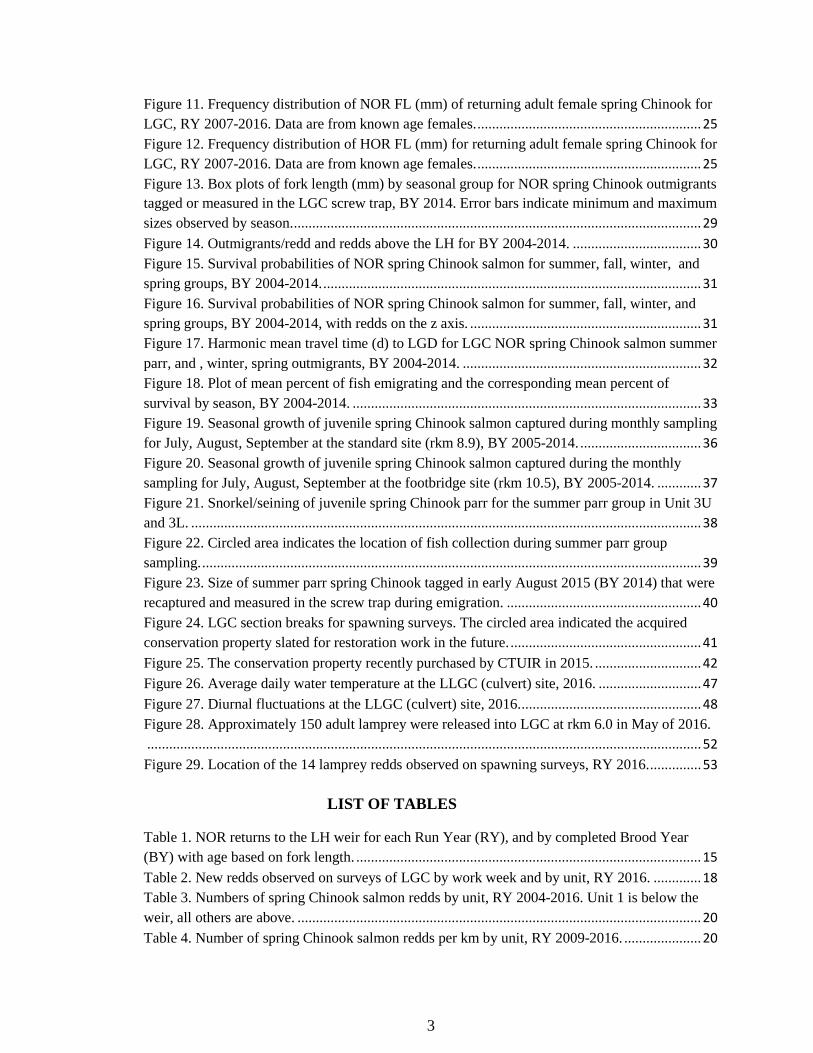
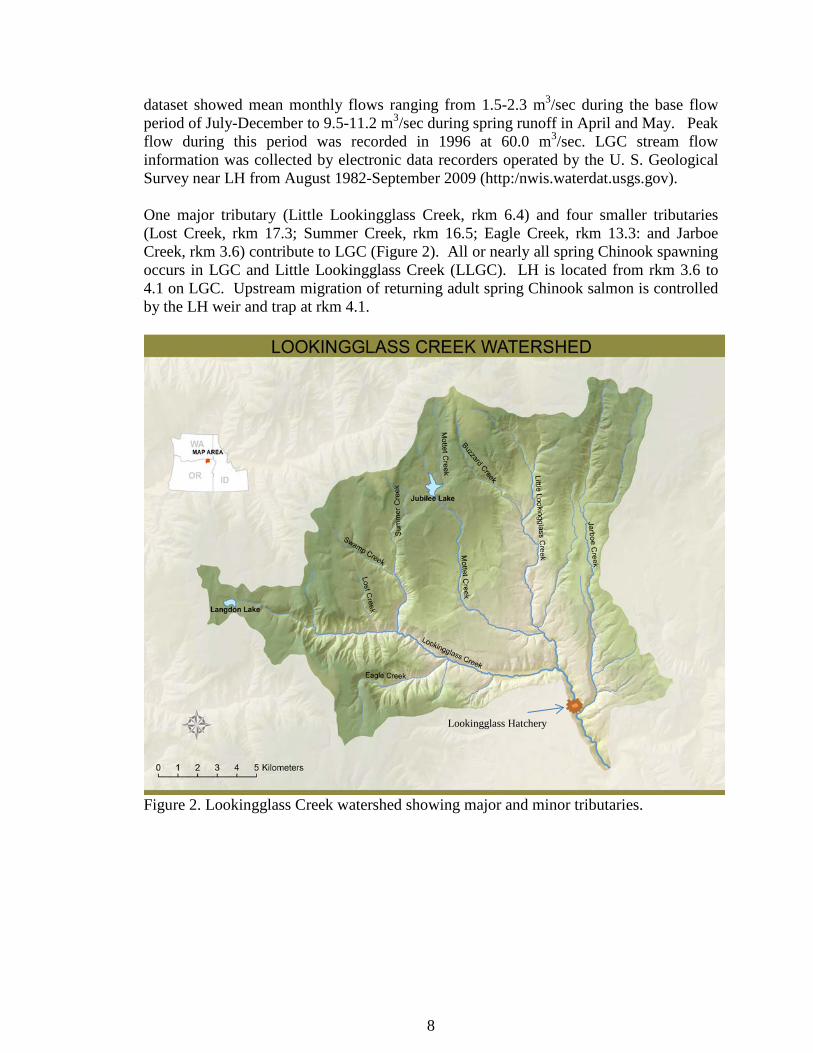
dataset showed mean monthly flows ranging from 1.5-2.3 m3/sec during the base flow period of July-December to 9.5-11.2 m3/sec during spring runoff in April and May. Peak flow during this period was recorded in 1996 at 60.0 m3/sec. LGC stream flow information was collected by electronic data recorders operated by the U. S. Geological Survey near LH from August 1982-September 2009 (http:/nwis.waterdat.usgs.gov). One major tributary (Little Lookingglass Creek, rkm 6.4) and four smaller tributaries (Lost Creek, rkm 17.3; Summer Creek, rkm 16.5; Eagle Creek, rkm 13.3: and Jarboe Creek, rkm 3.6) contribute to LGC (Figure 2). All or nearly all spring Chinook spawning occurs in LGC and Little Lookingglass Creek (LLGC). LH is located from rkm 3.6 to 4.1 on LGC. Upstream migration of returning adult spring Chinook salmon is controlled by the LH weir and trap at rkm 4.1.
Figure 2. Lookingglass Creek watershed showing major and minor tributaries.
Lookingglass Hatchery
9
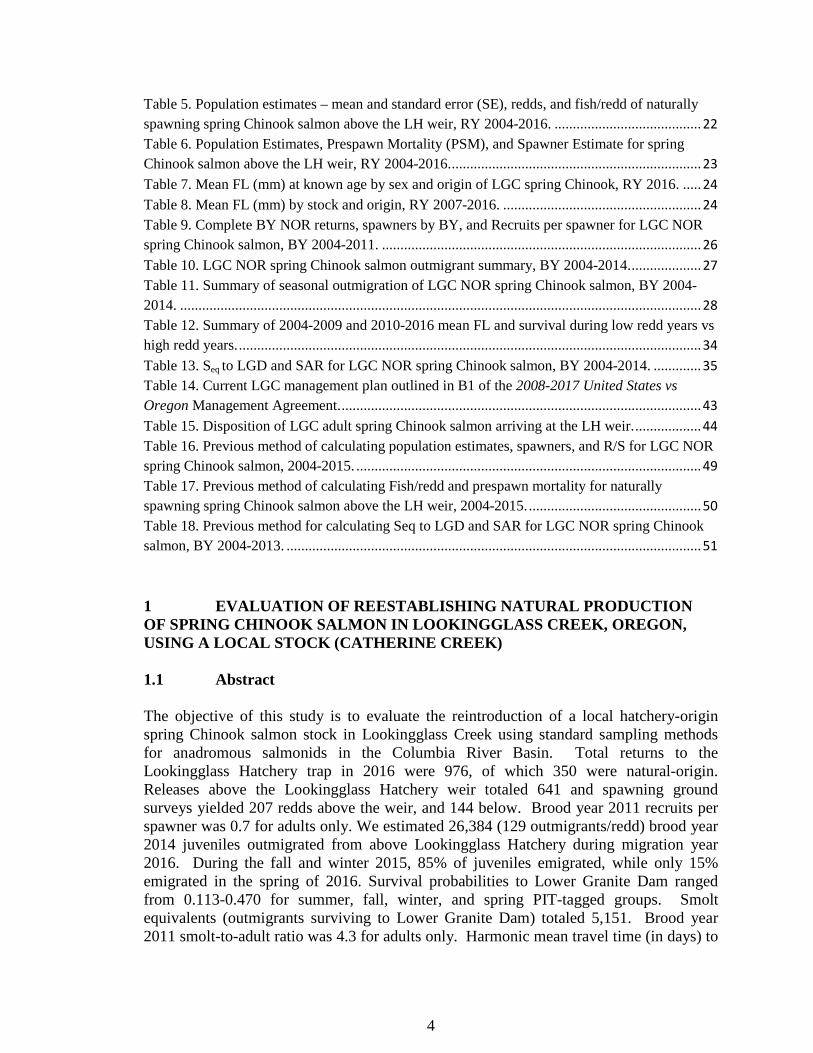
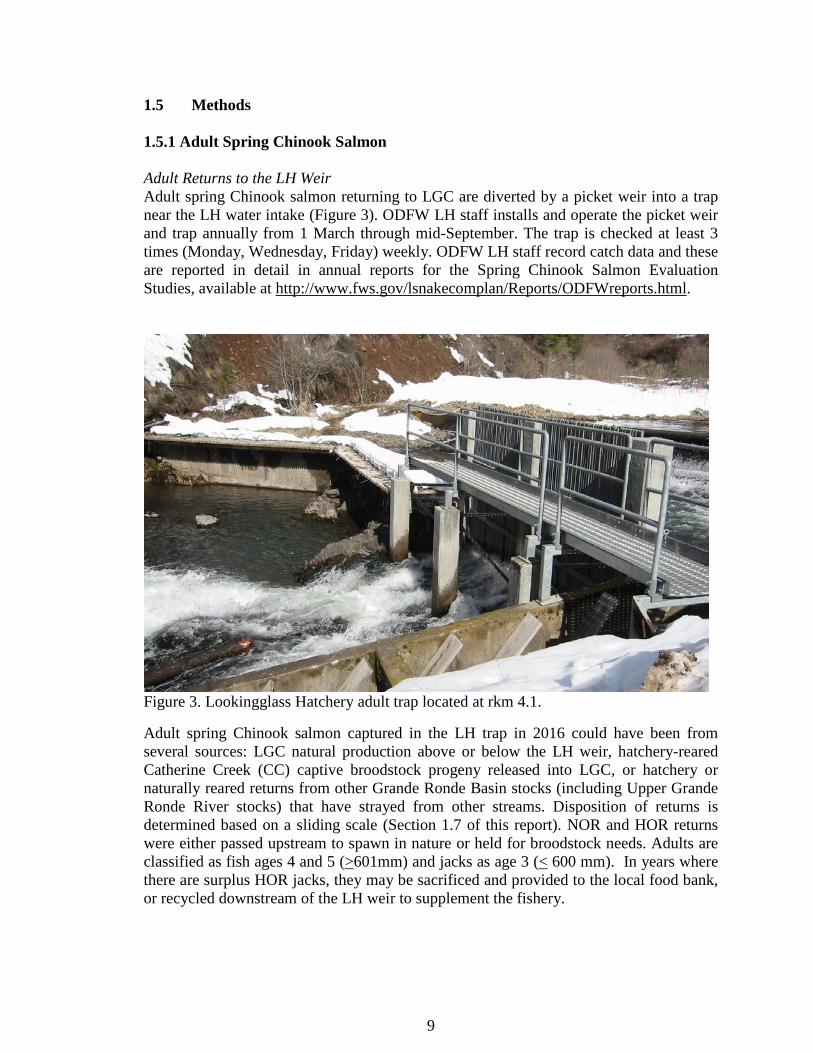
1.5 Methods 1.5.1 Adult Spring Chinook Salmon Adult Returns to the LH Weir Adult spring Chinook salmon returning to LGC are diverted by a picket weir into a trap near the LH water intake (Figure 3). ODFW LH staff installs and operate the picket weir and trap annually from 1 March through mid-September. The trap is checked at least 3 times (Monday, Wednesday, Friday) weekly. ODFW LH staff record catch data and these are reported in detail in annual reports for the Spring Chinook Salmon Evaluation Studies, available at http://www.fws.gov/lsnakecomplan/Reports/ODFWreports.html.
Figure 3. Lookingglass Hatchery adult trap located at rkm 4.1.
Adult spring Chinook salmon captured in the LH trap in 2016 could have been from several sources: LGC natural production above or below the LH weir, hatchery-reared Catherine Creek (CC) captive broodstock progeny released into LGC, or hatchery or naturally reared returns from other Grande Ronde Basin stocks (including Upper Grande Ronde River stocks) that have strayed from other streams. Disposition of returns is determined based on a sliding scale (Section 1.7 of this report). NOR and HOR returns were either passed upstream to spawn in nature or held for broodstock needs. Adults are classified as fish ages 4 and 5 (>601mm) and jacks as age 3 (< 600 mm). In years where there are surplus HOR jacks, they may be sacrificed and provided to the local food bank, or recycled downstream of the LH weir to supplement the fishery.
10
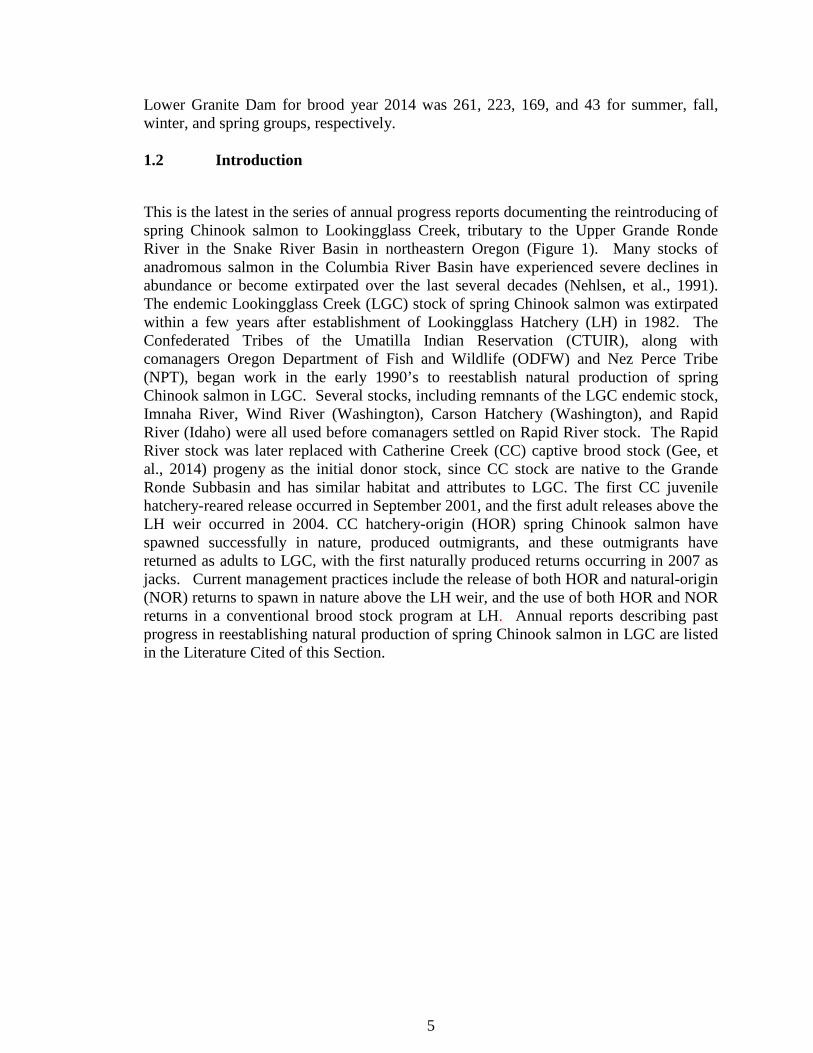
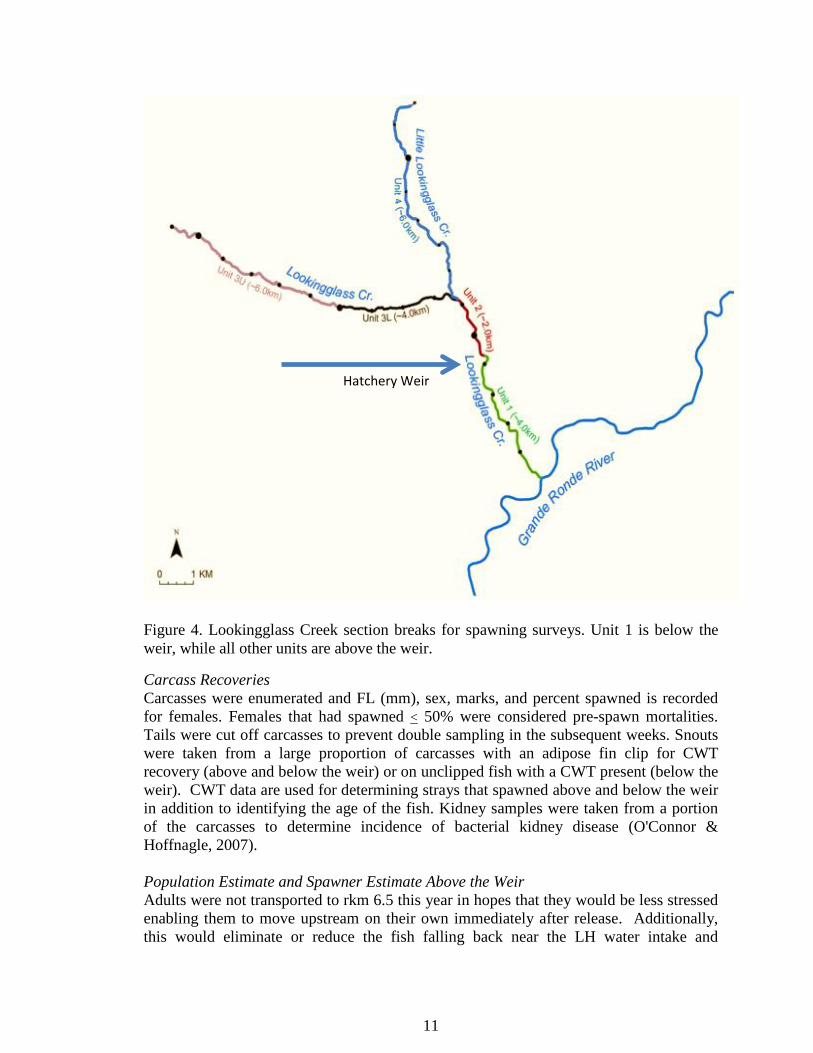
Releases Above the LH Weir In 2016, fish were released either .25 rkm upstream of the LH weir, or released just upstream of the LH water intake building. All fish released above the weir were measured (mm FL), sexed, scanned for PIT tag, and a small amount of tissue from the right opercle was removed with a round paper punch and placed in Rite in the Rain envelopes for later genetic analysis. The presence or absence of these opercle punches were also used to distinguish any spawners above the weir that were not handled at the trap and for estimating the spawning population. Scales were collected and used to make age determinations for a portion of the NOR returns passed above the weir. Ages for a portion of the HOR returns were determined by Coded Wire Tag (CWT) data from the Regional Mark Information System (RMIS) database maintained by the Pacific States Marine Fisheries Commission (http://www.rmpc.org/). Spawning Ground Surveys Spawning ground surveys (Parker, et al., 1995) were conducted during August-September 2016 to assess natural spawning. Several pre-spawn mortality surveys are also conducted in July and early August to collect carcass information and determine when the first redd is observed. Surveys were conducted in all 5 stream units weekly after the first redd was observed (Figure 4). Only completed redds were counted (Lofy & McLean, 1995) flagged, and a GPS point taken to eliminate double counting.
11
Figure 4. Lookingglass Creek section breaks for spawning surveys. Unit 1 is below the weir, while all other units are above the weir.
Carcass Recoveries Carcasses were enumerated and FL (mm), sex, marks, and percent spawned is recorded for females. Females that had spawned < 50% were considered pre-spawn mortalities. Tails were cut off carcasses to prevent double sampling in the subsequent weeks. Snouts were taken from a large proportion of carcasses with an adipose fin clip for CWT recovery (above and below the weir) or on unclipped fish with a CWT present (below the weir). CWT data are used for determining strays that spawned above and below the weir in addition to identifying the age of the fish. Kidney samples were taken from a portion of the carcasses to determine incidence of bacterial kidney disease (O'Connor & Hoffnagle, 2007). Population Estimate and Spawner Estimate Above the Weir Adults were not transported to rkm 6.5 this year in hopes that they would be less stressed enabling them to move upstream on their own immediately after release. Additionally, this would eliminate or reduce the fish falling back near the LH water intake and
Hatchery Weir
12
becoming stuck between the concrete wall and the pickets. However, fish still fell back, and at the same rate. We counted 93 fish that had to be “flushed” back downstream of the weir after they had been captured at the trap. For determining the population estimate, these 93 flushed fish were removed from the total numbers of fish released above the weir. Population estimates of spawners above the LH weir were made for fish ≤ 600 mm FL (jacks) and ≥ 601mm (age 4, 5 adults) using the Chapman modification of the Petersen method (Ricker, 1975). The standard error of the mean was calculated as follows:
M=Number of marked fish released above the weir, n=Number of carcasses recovered above the weir, R=Number of punched/marked carcasses recovered The spawner estimate above the weir was obtained by multiplying the percent of female pre-spawn mortality recoveries (those <50% spawned out) on spawning ground surveys to the population estimate above the weir. Recruits/Spawner Recruits per spawner is calculated by dividing the total number of spawners (HOR and NOR) estimated to be above the weir for a given BY, by the total number of NOR offspring returning to LGC for the completed BY. 1.5.2 Juvenile Spring Chinook Salmon Outmigrants We operated a 1.52 m diameter rotary screw trap at rkm 4.0 on LGC, which is 0.1 rkm below the LH adult trap. The rotary trap captures outmigrating naturally-produced juvenile spring Chinook salmon, as well as O. mykiss, dace, sculpin, and bull trout (Figure 5). Trap operation was suspended during high spring freshets, midsummer during low flows when temperatures were high and also when iced up in winter. Except for the spring freshet, these are periods when historically there have been few outmigrants. We made no attempt to estimate outmigrants during these periods. The trap was checked three times per week or more frequently if catches or flows were high. All outmigrants were identified, counted, examined for external marks, and scanned for PIT tags. A portion of these were also PIT tagged, measured (nearest mm FL), and weighed (nearest 0.1 g) each week. Only Chinook over 60mm were PIT tagged and used for trap efficiency estimates. Fish were PIT tagged using a 10 ml hand held syringe, while inserting the tag on the belly of the fish (PIT Tag Steering Committee, 1999). These PIT tagged fish were released about 100m above the trap. All other fish (counted, measured, recaptures, fry, precocials) are released below the trap.

13
Figure 5. Rotary screw trap located at rkm 4.0 on Lookingglass Creek.
Outmigrant Estimate We used DARR 2.9.1 (Bjorkstedt, 2008) to estimate the numbers of outmigrants. DARR 2.9.1 uses stratified mark-recapture data and pools strata with similar capture probabilities. Darr calculates an estimate by using the total number of first time captures, the total number of marked individuals, and the recaptures of those marked fish over the migration period. We used the “one trap” and “no prior pooling of strata” options available in Darr. Outmigrants collected at the screw trap could be distinguished into brood years based on marks or size. Some BY 2014 fry or small parr were caught during January-June of 2015 and were not marked or used in trap efficiency or outmigration estimates. The fall group of NOR BY 2014 fish was caught, PIT-tagged and released from 1 July-30 September 2015, the winter group from 1 October-31 December 2015, and the spring 2016 group from 1 January-30 June 2016. Metrics are described by Hesse et al. (2006) and correspond to the basic categories of abundance, productivity, and diversity for viable salmonid populations (McElhany, et al., 2000). Survival Estimates We estimated survival, capture probability, and travel time using the Pacific States Marine Fisheries Commission PIT tag database at http://www.ptagis.org/ and PitPro (Westhagen & Skalski, 2009). We used the standard configuration in PitPro, excluded the *.rcp file, and included the *.mrt file. Observation sites, in downstream order, were Lower Granite Dam, Little Goose Dam, Ice Harbor Dam, Lower Monumental Dam, McNary Dam, John Day Dam, The Dalles, Bonneville Dam, and the Estuary Towed Array (Juvenile). Bonneville Dam was used as the last recapture site. Smolt equivalents
14
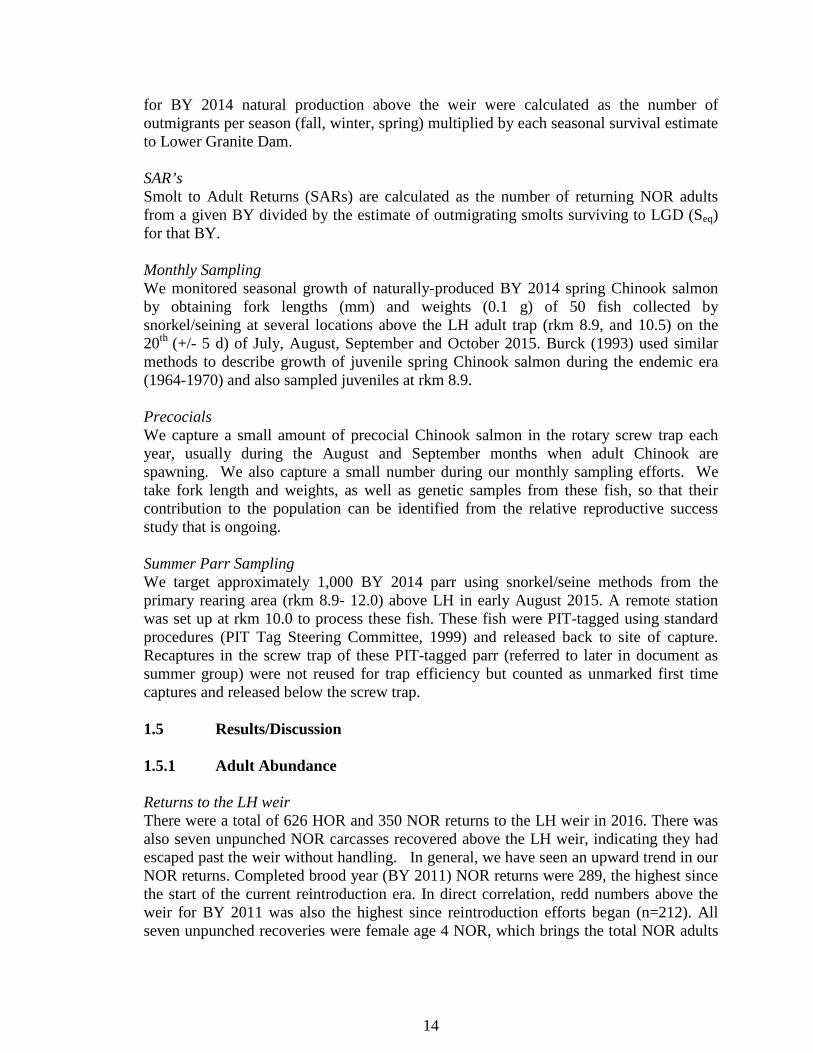
for BY 2014 natural production above the weir were calculated as the number of outmigrants per season (fall, winter, spring) multiplied by each seasonal survival estimate to Lower Granite Dam. SAR’s Smolt to Adult Returns (SARs) are calculated as the number of returning NOR adults from a given BY divided by the estimate of outmigrating smolts surviving to LGD (Seq) for that BY. Monthly Sampling We monitored seasonal growth of naturally-produced BY 2014 spring Chinook salmon by obtaining fork lengths (mm) and weights (0.1 g) of 50 fish collected by snorkel/seining at several locations above the LH adult trap (rkm 8.9, and 10.5) on the 20th
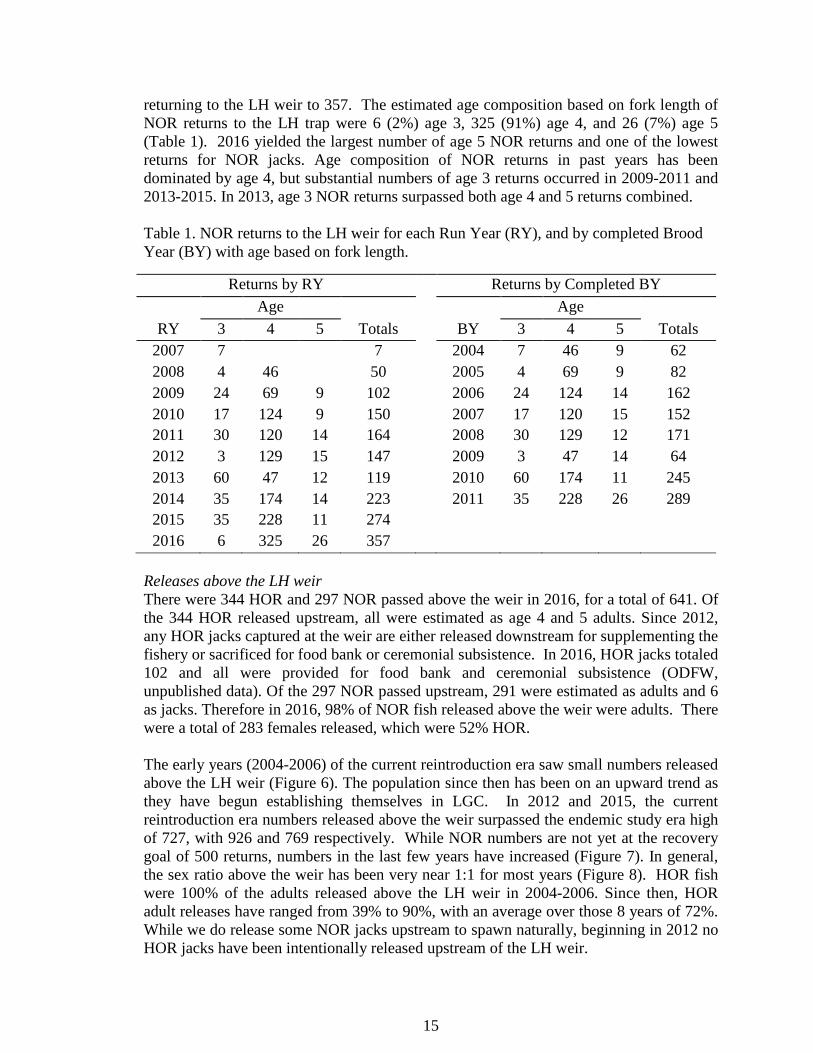
(+/- 5 d) of July, August, September and October 2015. Burck (1993) used similar methods to describe growth of juvenile spring Chinook salmon during the endemic era (1964-1970) and also sampled juveniles at rkm 8.9. Precocials We capture a small amount of precocial Chinook salmon in the rotary screw trap each year, usually during the August and September months when adult Chinook are spawning. We also capture a small number during our monthly sampling efforts. We take fork length and weights, as well as genetic samples from these fish, so that their contribution to the population can be identified from the relative reproductive success study that is ongoing. Summer Parr Sampling We target approximately 1,000 BY 2014 parr using snorkel/seine methods from the primary rearing area (rkm 8.9- 12.0) above LH in early August 2015. A remote station was set up at rkm 10.0 to process these fish. These fish were PIT-tagged using standard procedures (PIT Tag Steering Committee, 1999) and released back to site of capture. Recaptures in the screw trap of these PIT-tagged parr (referred to later in document as summer group) were not reused for trap efficiency but counted as unmarked first time captures and released below the screw trap. 1.5 Results/Discussion 1.5.1 Adult Abundance Returns to the LH weir There were a total of 626 HOR and 350 NOR returns to the LH weir in 2016. There was also seven unpunched NOR carcasses recovered above the LH weir, indicating they had escaped past the weir without handling. In general, we have seen an upward trend in our NOR returns. Completed brood year (BY 2011) NOR returns were 289, the highest since the start of the current reintroduction era. In direct correlation, redd numbers above the weir for BY 2011 was also the highest since reintroduction efforts began (n=212). All seven unpunched recoveries were female age 4 NOR, which brings the total NOR adults
15
returning to the LH weir to 357. The estimated age composition based on fork length of NOR returns to the LH trap were 6 (2%) age 3, 325 (91%) age 4, and 26 (7%) age 5 (Table 1). 2016 yielded the largest number of age 5 NOR returns and one of the lowest returns for NOR jacks. Age composition of NOR returns in past years has been dominated by age 4, but substantial numbers of age 3 returns occurred in 2009-2011 and 2013-2015. In 2013, age 3 NOR returns surpassed both age 4 and 5 returns combined. Table 1. NOR returns to the LH weir for each Run Year (RY), and by completed Brood Year (BY) with age based on fork length.
Returns by RY Returns by Completed BY Age Age
RY 3 4 5 Totals BY 3 4 5 Totals 2007 7 7 2004 7 46 9 62 2008 4 46 50 2005 4 69 9 82 2009 24 69 9 102 2006 24 124 14 162 2010 17 124 9 150 2007 17 120 15 152 2011 30 120 14 164 2008 30 129 12 171 2012 3 129 15 147 2009 3 47 14 64 2013 60 47 12 119 2010 60 174 11 245 2014 35 174 14 223 2011 35 228 26 289 2015 35 228 11 274 2016 6 325 26 357
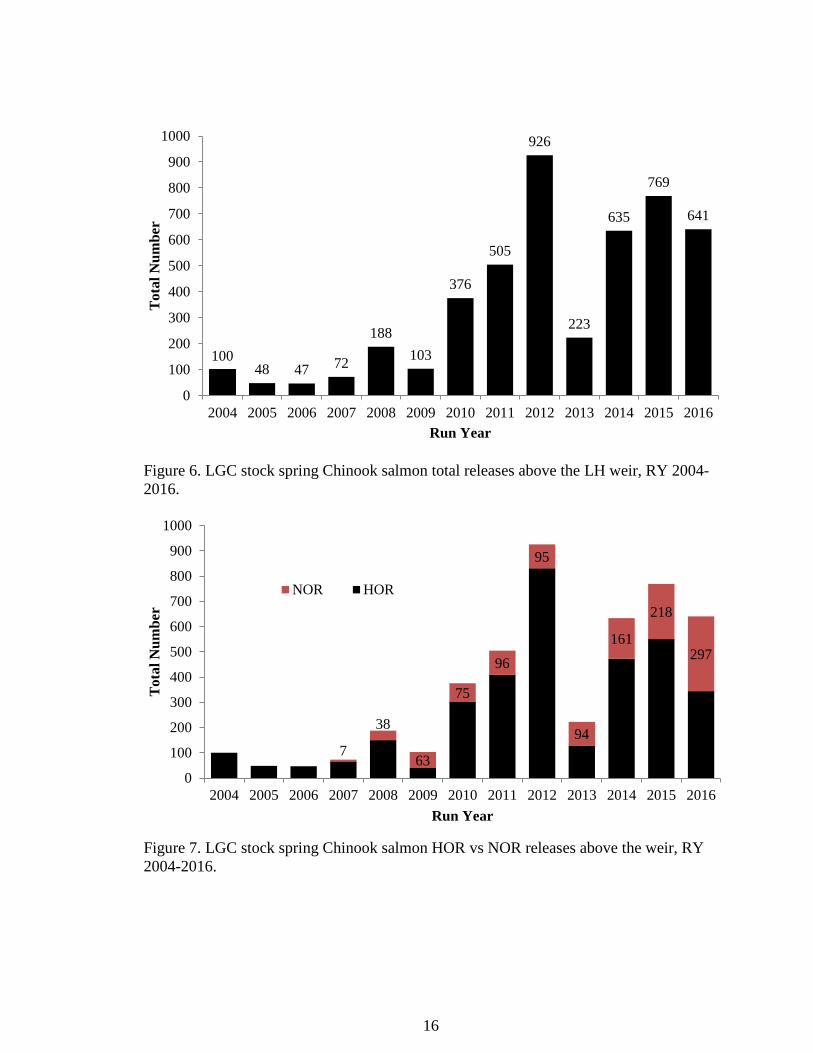
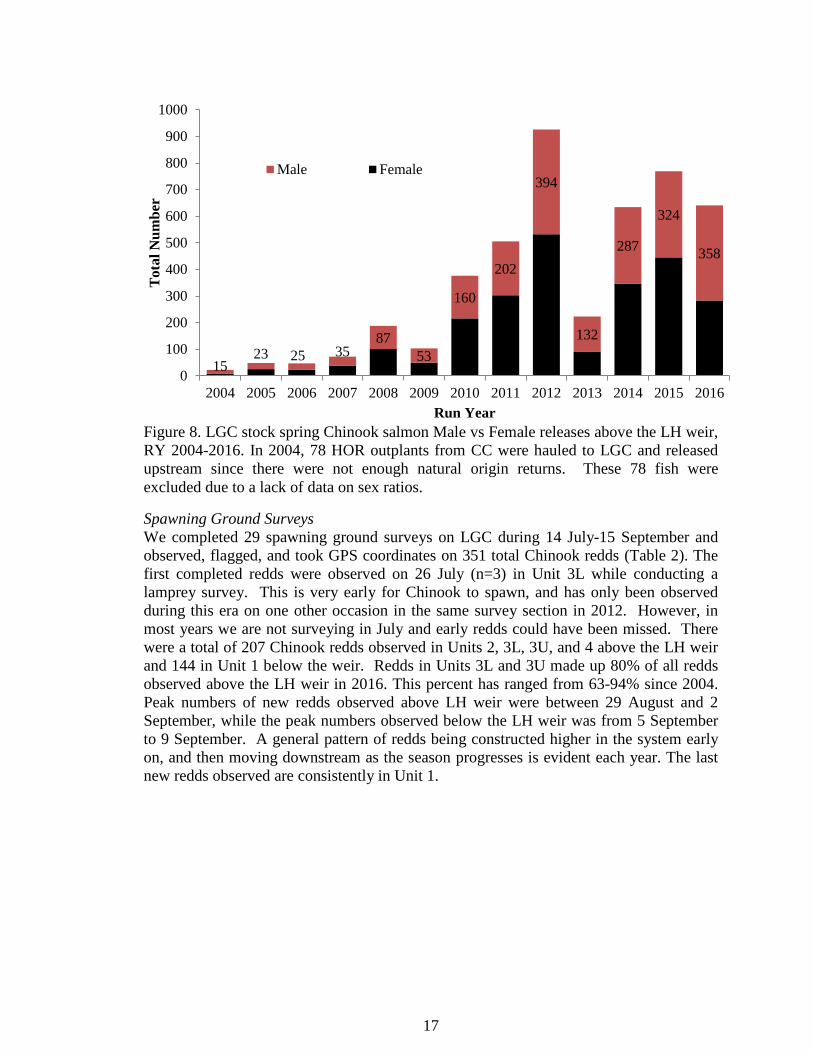
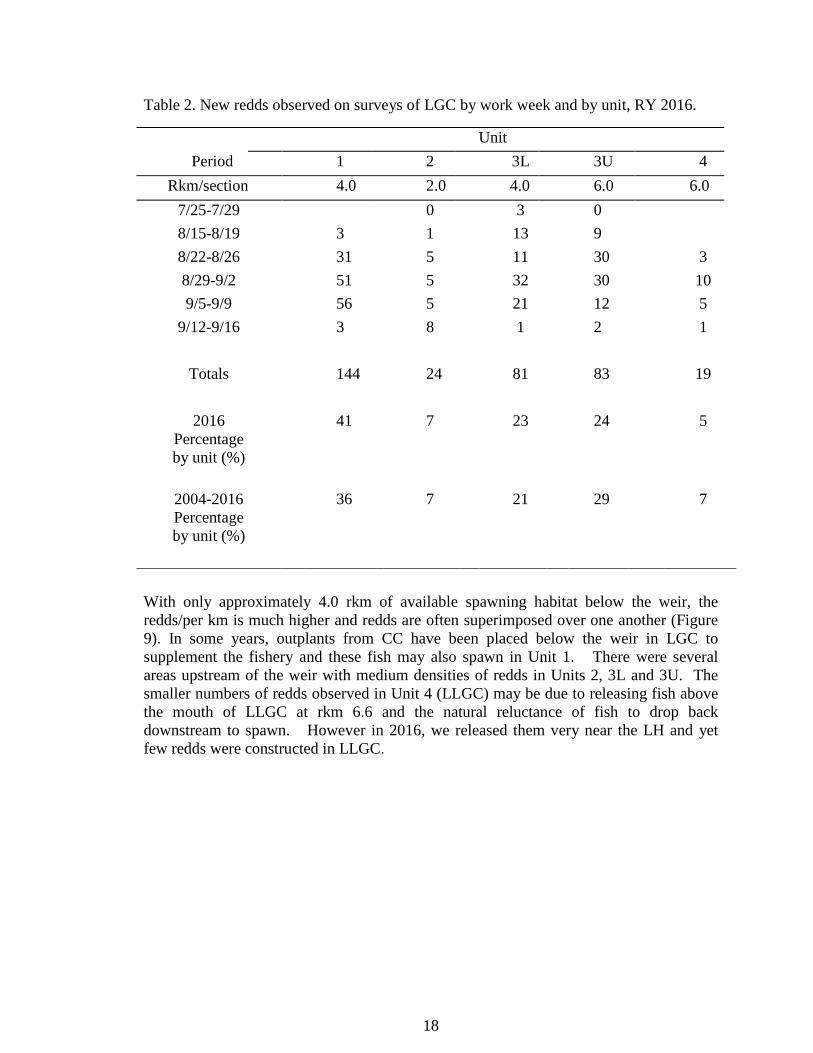
Releases above the LH weir There were 344 HOR and 297 NOR passed above the weir in 2016, for a total of 641. Of the 344 HOR released upstream, all were estimated as age 4 and 5 adults. Since 2012, any HOR jacks captured at the weir are either released downstream for supplementing the fishery or sacrificed for food bank or ceremonial subsistence. In 2016, HOR jacks totaled 102 and all were provided for food bank and ceremonial subsistence (ODFW, unpublished data). Of the 297 NOR passed upstream, 291 were estimated as adults and 6 as jacks. Therefore in 2016, 98% of NOR fish released above the weir were adults. There were a total of 283 females released, which were 52% HOR. The early years (2004-2006) of the current reintroduction era saw small numbers released above the LH weir (Figure 6). The population since then has been on an upward trend as they have begun establishing themselves in LGC. In 2012 and 2015, the current reintroduction era numbers released above the weir surpassed the endemic study era high of 727, with 926 and 769 respectively. While NOR numbers are not yet at the recovery goal of 500 returns, numbers in the last few years have increased (Figure 7). In general, the sex ratio above the weir has been very near 1:1 for most years (Figure 8). HOR fish were 100% of the adults released above the LH weir in 2004-2006. Since then, HOR adult releases have ranged from 39% to 90%, with an average over those 8 years of 72%. While we do release some NOR jacks upstream to spawn naturally, beginning in 2012 no HOR jacks have been intentionally released upstream of the LH weir.
16
Figure 6. LGC stock spring Chinook salmon total releases above the LH weir, RY 2004-2016.
Figure 7. LGC stock spring Chinook salmon HOR vs NOR releases above the weir, RY 2004-2016.
100 48 47 72
188 103
376
505
926
223
635
769
641
0
100
200
300
400
500
600
700
800
900
1000
2004 2005 2006 2007 2008 2009 2010 2011 2012 2013 2014 2015 2016
Tot
al N
umbe
r
Run Year
7
38
63
75
96
95
94
161
218
297
0
100
200
300
400
500
600
700
800
900
1000
2004 2005 2006 2007 2008 2009 2010 2011 2012 2013 2014 2015 2016
Tot
al N
umbe
r
Run Year
NOR HOR
17
Figure 8. LGC stock spring Chinook salmon Male vs Female releases above the LH weir, RY 2004-2016. In 2004, 78 HOR outplants from CC were hauled to LGC and released upstream since there were not enough natural origin returns. These 78 fish were excluded due to a lack of data on sex ratios.
Spawning Ground Surveys We completed 29 spawning ground surveys on LGC during 14 July-15 September and observed, flagged, and took GPS coordinates on 351 total Chinook redds (Table 2). The first completed redds were observed on 26 July (n=3) in Unit 3L while conducting a lamprey survey. This is very early for Chinook to spawn, and has only been observed during this era on one other occasion in the same survey section in 2012. However, in most years we are not surveying in July and early redds could have been missed. There were a total of 207 Chinook redds observed in Units 2, 3L, 3U, and 4 above the LH weir and 144 in Unit 1 below the weir. Redds in Units 3L and 3U made up 80% of all redds observed above the LH weir in 2016. This percent has ranged from 63-94% since 2004. Peak numbers of new redds observed above LH weir were between 29 August and 2 September, while the peak numbers observed below the LH weir was from 5 September to 9 September. A general pattern of redds being constructed higher in the system early on, and then moving downstream as the season progresses is evident each year. The last new redds observed are consistently in Unit 1.
15 23 25 35
87 53
160
202
394
132
287
324
358
0
100
200
300
400
500
600
700
800
900
1000
2004 2005 2006 2007 2008 2009 2010 2011 2012 2013 2014 2015 2016
Tot
al N
umbe
r
Run Year
Male Female
18
Table 2. New redds observed on surveys of LGC by work week and by unit, RY 2016.
Unit Period 1 2 3L 3U 4
Rkm/section 4.0 2.0 4.0 6.0 6.0 7/25-7/29 0 3 0 8/15-8/19 3 1 13 9 8/22-8/26 31 5 11 30 3 8/29-9/2 51 5 32 30 10 9/5-9/9 56 5 21 12 5
9/12-9/16 3 8 1 2 1
Totals 144 24 81 83 19
2016 Percentage by unit (%)
41 7 23 24 5
2004-2016 Percentage by unit (%)
36 7 21 29 7
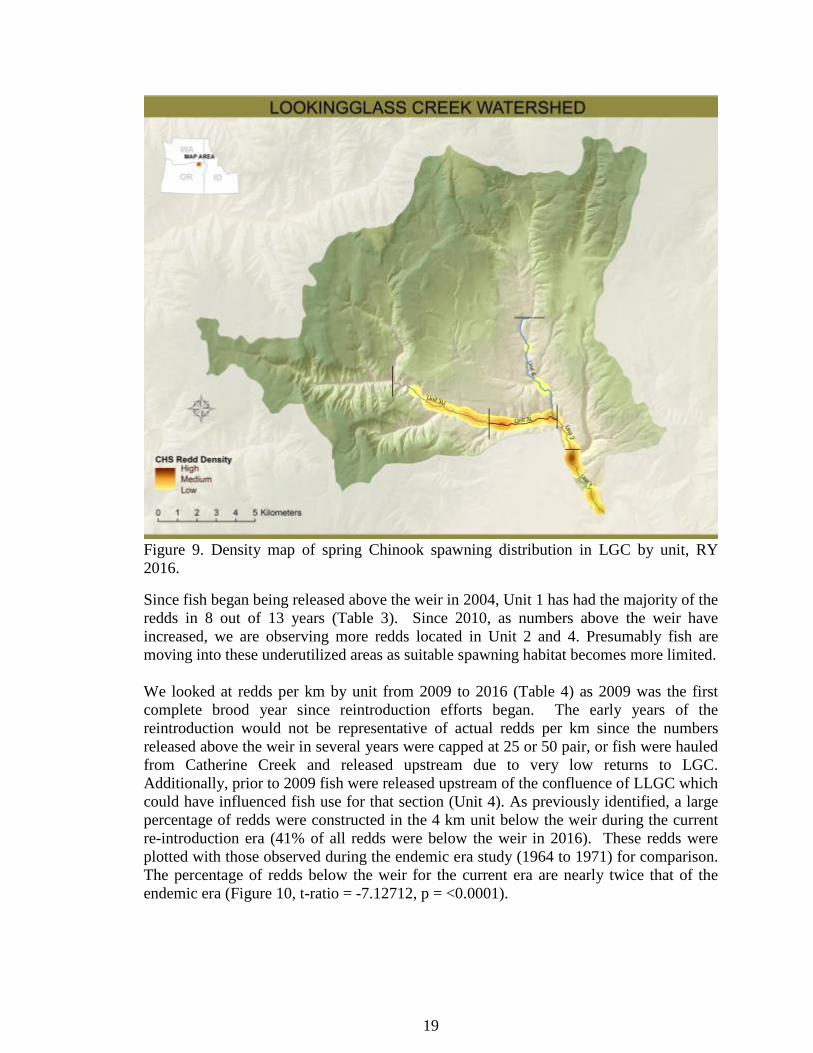
With only approximately 4.0 rkm of available spawning habitat below the weir, the redds/per km is much higher and redds are often superimposed over one another (Figure 9). In some years, outplants from CC have been placed below the weir in LGC to supplement the fishery and these fish may also spawn in Unit 1. There were several areas upstream of the weir with medium densities of redds in Units 2, 3L and 3U. The smaller numbers of redds observed in Unit 4 (LLGC) may be due to releasing fish above the mouth of LLGC at rkm 6.6 and the natural reluctance of fish to drop back downstream to spawn. However in 2016, we released them very near the LH and yet few redds were constructed in LLGC.
19
Figure 9. Density map of spring Chinook spawning distribution in LGC by unit, RY 2016.
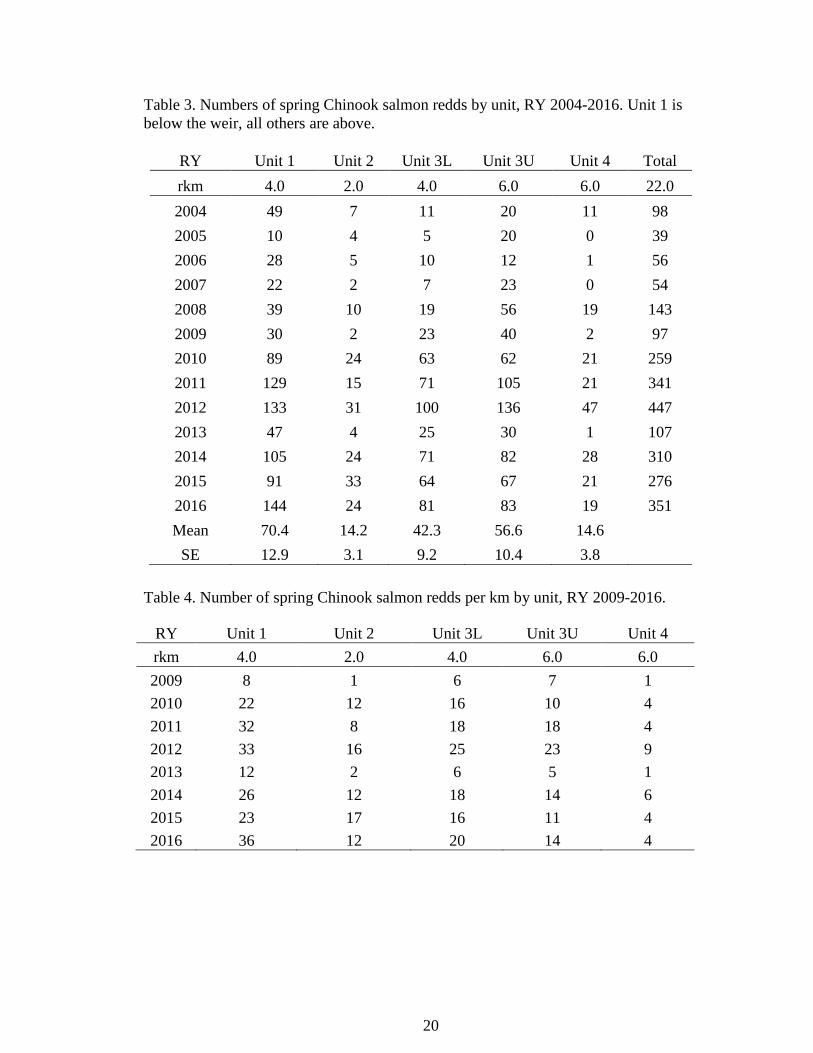
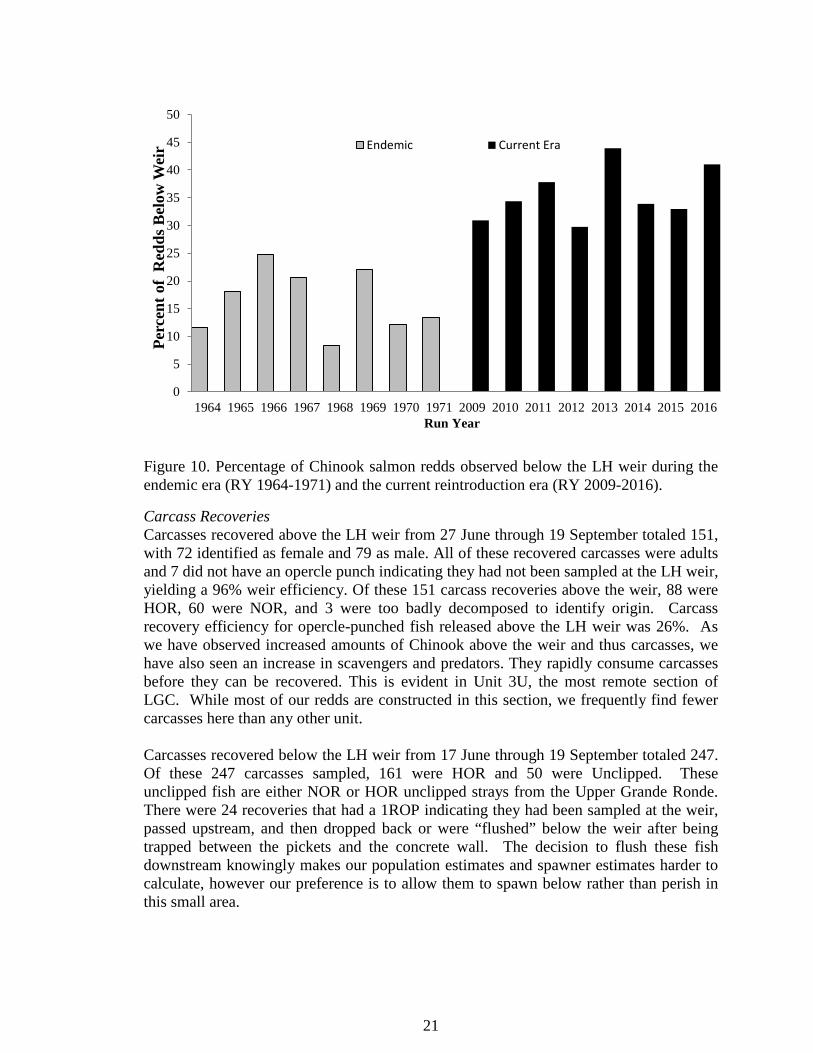
Since fish began being released above the weir in 2004, Unit 1 has had the majority of the redds in 8 out of 13 years (Table 3). Since 2010, as numbers above the weir have increased, we are observing more redds located in Unit 2 and 4. Presumably fish are moving into these underutilized areas as suitable spawning habitat becomes more limited. We looked at redds per km by unit from 2009 to 2016 (Table 4) as 2009 was the first complete brood year since reintroduction efforts began. The early years of the reintroduction would not be representative of actual redds per km since the numbers released above the weir in several years were capped at 25 or 50 pair, or fish were hauled from Catherine Creek and released upstream due to very low returns to LGC. Additionally, prior to 2009 fish were released upstream of the confluence of LLGC which could have influenced fish use for that section (Unit 4). As previously identified, a large percentage of redds were constructed in the 4 km unit below the weir during the current re-introduction era (41% of all redds were below the weir in 2016). These redds were plotted with those observed during the endemic era study (1964 to 1971) for comparison. The percentage of redds below the weir for the current era are nearly twice that of the endemic era (Figure 10, t-ratio = -7.12712, p = <0.0001).
20
Table 3. Numbers of spring Chinook salmon redds by unit, RY 2004-2016. Unit 1 is below the weir, all others are above.
RY Unit 1 Unit 2 Unit 3L Unit 3U Unit 4 Total rkm 4.0 2.0 4.0 6.0 6.0 22.0 2004 49 7 11 20 11 98 2005 10 4 5 20 0 39 2006 28 5 10 12 1 56 2007 22 2 7 23 0 54 2008 39 10 19 56 19 143 2009 30 2 23 40 2 97 2010 89 24 63 62 21 259 2011 129 15 71 105 21 341 2012 133 31 100 136 47 447 2013 47 4 25 30 1 107 2014 105 24 71 82 28 310 2015 91 33 64 67 21 276 2016 144 24 81 83 19 351 Mean 70.4 14.2 42.3 56.6 14.6
SE 12.9 3.1 9.2 10.4 3.8
Table 4. Number of spring Chinook salmon redds per km by unit, RY 2009-2016.
RY Unit 1 Unit 2 Unit 3L Unit 3U Unit 4 rkm 4.0 2.0 4.0 6.0 6.0 2009 8 1 6 7 1 2010 22 12 16 10 4 2011 32 8 18 18 4 2012 33 16 25 23 9 2013 12 2 6 5 1 2014 26 12 18 14 6 2015 23 17 16 11 4 2016 36 12 20 14 4
21
Figure 10. Percentage of Chinook salmon redds observed below the LH weir during the endemic era (RY 1964-1971) and the current reintroduction era (RY 2009-2016).
Carcass Recoveries Carcasses recovered above the LH weir from 27 June through 19 September totaled 151, with 72 identified as female and 79 as male. All of these recovered carcasses were adults and 7 did not have an opercle punch indicating they had not been sampled at the LH weir, yielding a 96% weir efficiency. Of these 151 carcass recoveries above the weir, 88 were HOR, 60 were NOR, and 3 were too badly decomposed to identify origin. Carcass recovery efficiency for opercle-punched fish released above the LH weir was 26%. As we have observed increased amounts of Chinook above the weir and thus carcasses, we have also seen an increase in scavengers and predators. They rapidly consume carcasses before they can be recovered. This is evident in Unit 3U, the most remote section of LGC. While most of our redds are constructed in this section, we frequently find fewer carcasses here than any other unit. Carcasses recovered below the LH weir from 17 June through 19 September totaled 247. Of these 247 carcasses sampled, 161 were HOR and 50 were Unclipped. These unclipped fish are either NOR or HOR unclipped strays from the Upper Grande Ronde. There were 24 recoveries that had a 1ROP indicating they had been sampled at the weir, passed upstream, and then dropped back or were “flushed” below the weir after being trapped between the pickets and the concrete wall. The decision to flush these fish downstream knowingly makes our population estimates and spawner estimates harder to calculate, however our preference is to allow them to spawn below rather than perish in this small area.
0
5
10
15
20
25
30
35
40
45
50
1964 1965 1966 1967 1968 1969 1970 1971 2009 2010 2011 2012 2013 2014 2015 2016
Perc
ent o
f R
edds
Bel
ow W
eir
Run Year
Endemic Current Era
22
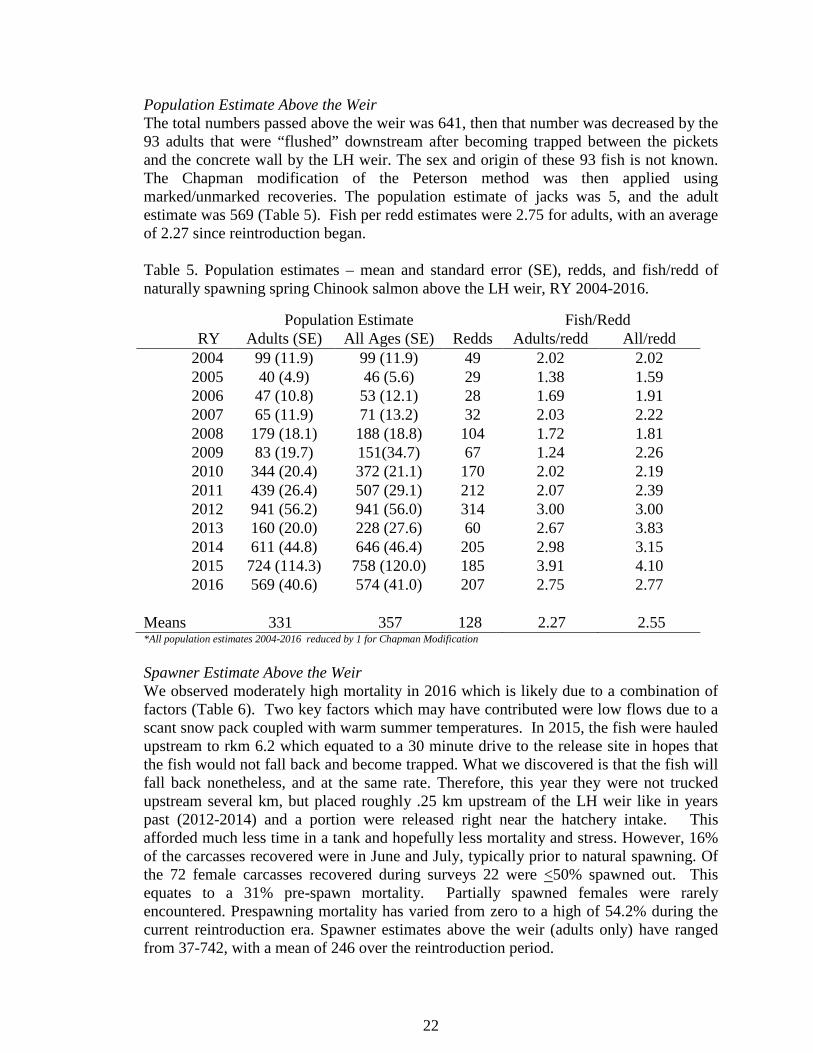
Population Estimate Above the Weir The total numbers passed above the weir was 641, then that number was decreased by the 93 adults that were “flushed” downstream after becoming trapped between the pickets and the concrete wall by the LH weir. The sex and origin of these 93 fish is not known. The Chapman modification of the Peterson method was then applied using marked/unmarked recoveries. The population estimate of jacks was 5, and the adult estimate was 569 (Table 5). Fish per redd estimates were 2.75 for adults, with an average of 2.27 since reintroduction began. Table 5. Population estimates – mean and standard error (SE), redds, and fish/redd of naturally spawning spring Chinook salmon above the LH weir, RY 2004-2016.
Population Estimate Fish/Redd RY Adults (SE) All Ages (SE) Redds Adults/redd All/redd
2004 99 (11.9) 99 (11.9) 49 2.02 2.02 2005 40 (4.9) 46 (5.6) 29 1.38 1.59 2006 47 (10.8) 53 (12.1) 28 1.69 1.91 2007 65 (11.9) 71 (13.2) 32 2.03 2.22 2008 179 (18.1) 188 (18.8) 104 1.72 1.81 2009 83 (19.7) 151(34.7) 67 1.24 2.26 2010 344 (20.4) 372 (21.1) 170 2.02 2.19 2011 439 (26.4) 507 (29.1) 212 2.07 2.39 2012 941 (56.2) 941 (56.0) 314 3.00 3.00 2013 160 (20.0) 228 (27.6) 60 2.67 3.83 2014 611 (44.8) 646 (46.4) 205 2.98 3.15 2015 724 (114.3) 758 (120.0) 185 3.91 4.10 2016 569 (40.6) 574 (41.0) 207 2.75 2.77
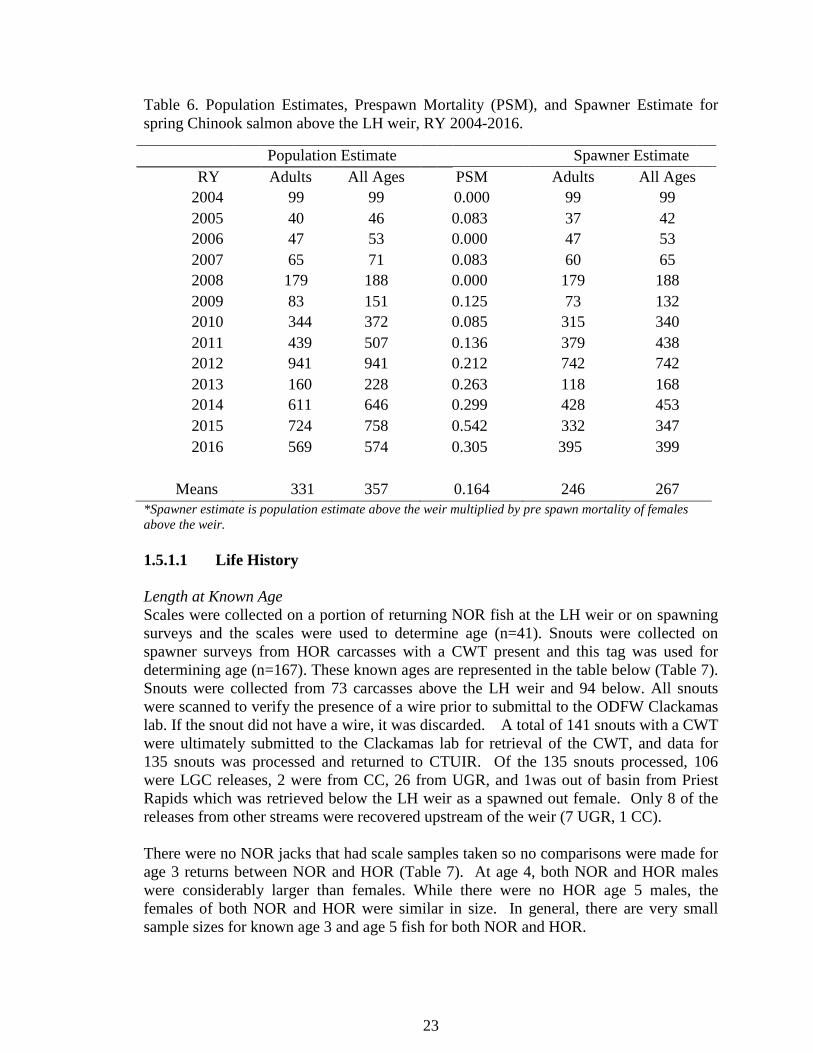
Means 331 357 128 2.27 2.55 *All population estimates 2004-2016 reduced by 1 for Chapman Modification Spawner Estimate Above the Weir We observed moderately high mortality in 2016 which is likely due to a combination of factors (Table 6). Two key factors which may have contributed were low flows due to a scant snow pack coupled with warm summer temperatures. In 2015, the fish were hauled upstream to rkm 6.2 which equated to a 30 minute drive to the release site in hopes that the fish would not fall back and become trapped. What we discovered is that the fish will fall back nonetheless, and at the same rate. Therefore, this year they were not trucked upstream several km, but placed roughly .25 km upstream of the LH weir like in years past (2012-2014) and a portion were released right near the hatchery intake. This afforded much less time in a tank and hopefully less mortality and stress. However, 16% of the carcasses recovered were in June and July, typically prior to natural spawning. Of the 72 female carcasses recovered during surveys 22 were <50% spawned out. This equates to a 31% pre-spawn mortality. Partially spawned females were rarely encountered. Prespawning mortality has varied from zero to a high of 54.2% during the current reintroduction era. Spawner estimates above the weir (adults only) have ranged from 37-742, with a mean of 246 over the reintroduction period.
23
Table 6. Population Estimates, Prespawn Mortality (PSM), and Spawner Estimate for spring Chinook salmon above the LH weir, RY 2004-2016.
Population Estimate Spawner Estimate RY Adults All Ages PSM Adults All Ages
2004 99 99 0.000 99 99 2005 40 46 0.083 37 42 2006 47 53 0.000 47 53 2007 65 71 0.083 60 65 2008 179 188 0.000 179 188 2009 83 151 0.125 73 132 2010 344 372 0.085 315 340 2011 439 507 0.136 379 438 2012 941 941 0.212 742 742 2013 160 228 0.263 118 168 2014 611 646 0.299 428 453 2015 724 758 0.542 332 347 2016 569 574 0.305 395 399
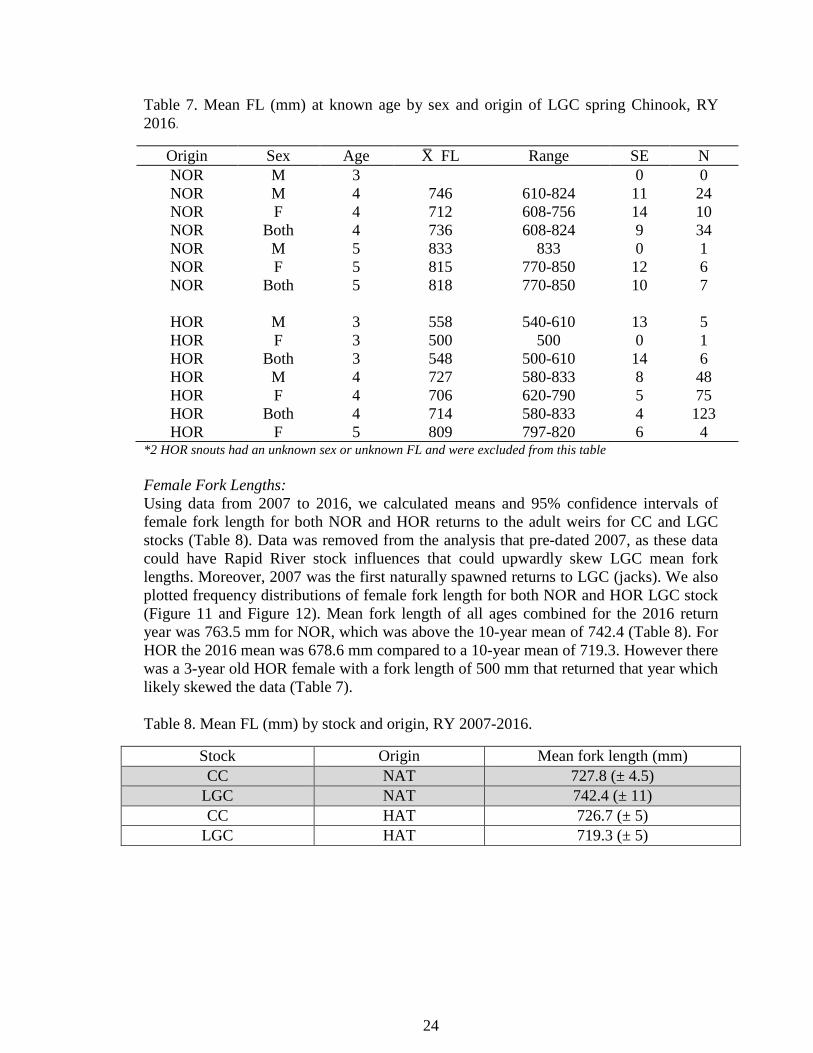
Means 331 357 0.164 246 267 *Spawner estimate is population estimate above the weir multiplied by pre spawn mortality of females above the weir. 1.5.1.1 Life History Length at Known Age Scales were collected on a portion of returning NOR fish at the LH weir or on spawning surveys and the scales were used to determine age (n=41). Snouts were collected on spawner surveys from HOR carcasses with a CWT present and this tag was used for determining age (n=167). These known ages are represented in the table below (Table 7). Snouts were collected from 73 carcasses above the LH weir and 94 below. All snouts were scanned to verify the presence of a wire prior to submittal to the ODFW Clackamas lab. If the snout did not have a wire, it was discarded. A total of 141 snouts with a CWT were ultimately submitted to the Clackamas lab for retrieval of the CWT, and data for 135 snouts was processed and returned to CTUIR. Of the 135 snouts processed, 106 were LGC releases, 2 were from CC, 26 from UGR, and 1was out of basin from Priest Rapids which was retrieved below the LH weir as a spawned out female. Only 8 of the releases from other streams were recovered upstream of the weir (7 UGR, 1 CC). There were no NOR jacks that had scale samples taken so no comparisons were made for age 3 returns between NOR and HOR (Table 7). At age 4, both NOR and HOR males were considerably larger than females. While there were no HOR age 5 males, the females of both NOR and HOR were similar in size. In general, there are very small sample sizes for known age 3 and age 5 fish for both NOR and HOR.
24
Table 7. Mean FL (mm) at known age by sex and origin of LGC spring Chinook, RY 2016.
Origin Sex Age X̄ FL Range SE N NOR M 3 0 0 NOR M 4 746 610-824 11 24 NOR F 4 712 608-756 14 10 NOR Both 4 736 608-824 9 34 NOR M 5 833 833 0 1 NOR F 5 815 770-850 12 6 NOR Both 5 818 770-850 10 7
HOR M 3 558 540-610 13 5 HOR F 3 500 500 0 1 HOR Both 3 548 500-610 14 6 HOR M 4 727 580-833 8 48 HOR F 4 706 620-790 5 75 HOR Both 4 714 580-833 4 123 HOR F 5 809 797-820 6 4
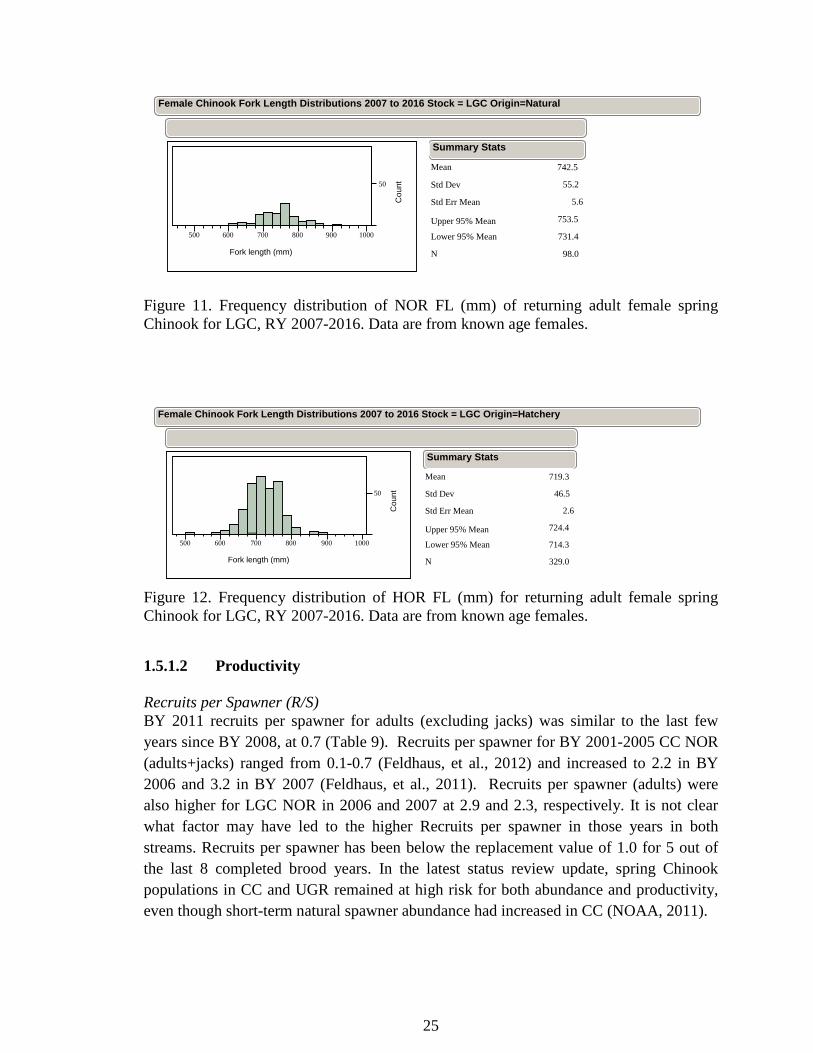
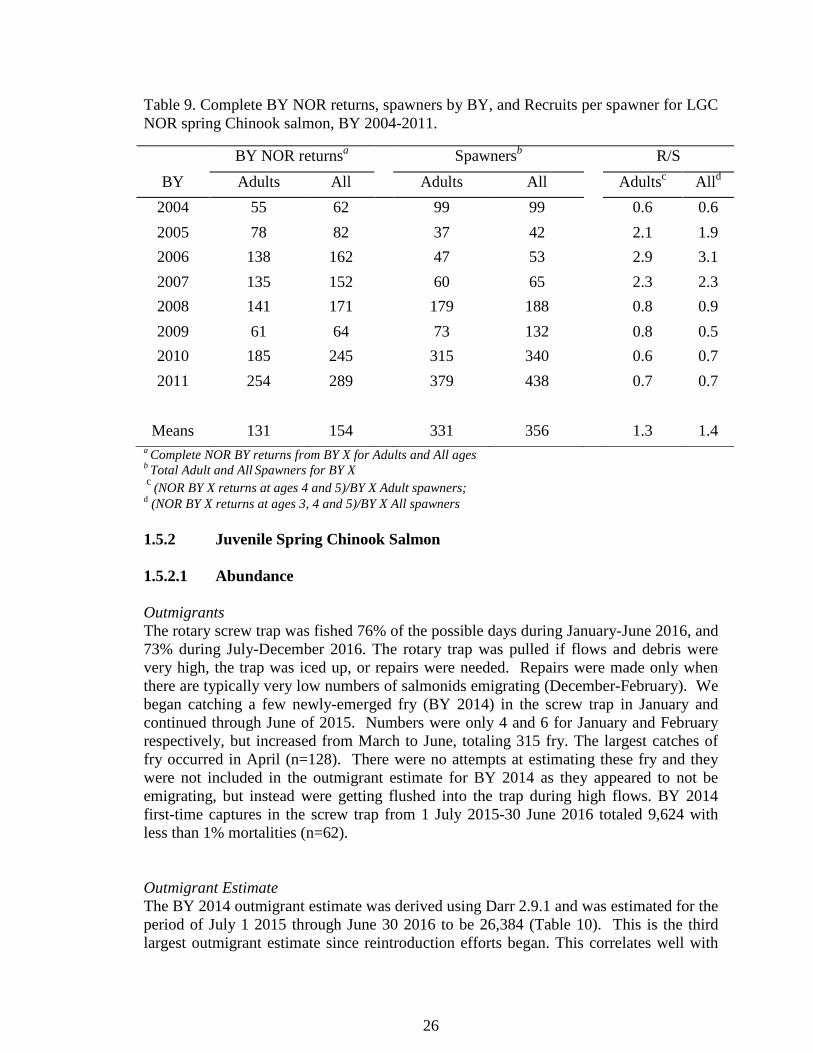
*2 HOR snouts had an unknown sex or unknown FL and were excluded from this table Female Fork Lengths: Using data from 2007 to 2016, we calculated means and 95% confidence intervals of female fork length for both NOR and HOR returns to the adult weirs for CC and LGC stocks (Table 8). Data was removed from the analysis that pre-dated 2007, as these data could have Rapid River stock influences that could upwardly skew LGC mean fork lengths. Moreover, 2007 was the first naturally spawned returns to LGC (jacks). We also plotted frequency distributions of female fork length for both NOR and HOR LGC stock (Figure 11 and Figure 12). Mean fork length of all ages combined for the 2016 return year was 763.5 mm for NOR, which was above the 10-year mean of 742.4 (Table 8). For HOR the 2016 mean was 678.6 mm compared to a 10-year mean of 719.3. However there was a 3-year old HOR female with a fork length of 500 mm that returned that year which likely skewed the data (Table 7). Table 8. Mean FL (mm) by stock and origin, RY 2007-2016.
Stock Origin Mean fork length (mm) CC NAT 727.8 (± 4.5)
LGC NAT 742.4 (± 11) CC HAT 726.7 (± 5)
LGC HAT 719.3 (± 5)
25
Figure 11. Frequency distribution of NOR FL (mm) of returning adult female spring Chinook for LGC, RY 2007-2016. Data are from known age females.
Figure 12. Frequency distribution of HOR FL (mm) for returning adult female spring Chinook for LGC, RY 2007-2016. Data are from known age females.
1.5.1.2 Productivity Recruits per Spawner (R/S) BY 2011 recruits per spawner for adults (excluding jacks) was similar to the last few years since BY 2008, at 0.7 (Table 9). Recruits per spawner for BY 2001-2005 CC NOR (adults+jacks) ranged from 0.1-0.7 (Feldhaus, et al., 2012) and increased to 2.2 in BY 2006 and 3.2 in BY 2007 (Feldhaus, et al., 2011). Recruits per spawner (adults) were also higher for LGC NOR in 2006 and 2007 at 2.9 and 2.3, respectively. It is not clear what factor may have led to the higher Recruits per spawner in those years in both streams. Recruits per spawner has been below the replacement value of 1.0 for 5 out of the last 8 completed brood years. In the latest status review update, spring Chinook populations in CC and UGR remained at high risk for both abundance and productivity, even though short-term natural spawner abundance had increased in CC (NOAA, 2011).
50
Cou
nt
500 600 700 800 900 1000
Fork length (mm)
Mean
Std Dev
Std Err Mean
Upper 95% Mean
Lower 95% Mean
N
742.5
55.2
5.6
753.5
731.4
98.0
Summary Stats
Female Chinook Fork Length Distributions 2007 to 2016 Stock = LGC Origin=Natural
50
Cou
nt
500 600 700 800 900 1000
Fork length (mm)
Mean
Std Dev
Std Err Mean
Upper 95% Mean
Lower 95% Mean
N
719.3
46.5
2.6
724.4
714.3
329.0
Summary Stats
Female Chinook Fork Length Distributions 2007 to 2016 Stock = LGC Origin=Hatchery
26
Table 9. Complete BY NOR returns, spawners by BY, and Recruits per spawner for LGC NOR spring Chinook salmon, BY 2004-2011.
BY NOR returnsa Spawnersb R/S BY Adults All Adults All Adultsc Alld
2004 55 62 99 99 0.6 0.6 2005 78 82 37 42 2.1 1.9 2006 138 162 47 53 2.9 3.1 2007 135 152 60 65 2.3 2.3 2008 141 171 179 188 0.8 0.9 2009 61 64 73 132 0.8 0.5 2010 185 245 315 340 0.6 0.7 2011 254 289 379 438 0.7 0.7
Means 131 154 331 356 1.3 1.4
a Complete NOR BY returns from BY X for Adults and All ages b Total Adult and All Spawners for BY X c (NOR BY X returns at ages 4 and 5)/BY X Adult spawners; d (NOR BY X returns at ages 3, 4 and 5)/BY X All spawners 1.5.2 Juvenile Spring Chinook Salmon 1.5.2.1 Abundance Outmigrants The rotary screw trap was fished 76% of the possible days during January-June 2016, and 73% during July-December 2016. The rotary trap was pulled if flows and debris were very high, the trap was iced up, or repairs were needed. Repairs were made only when there are typically very low numbers of salmonids emigrating (December-February). We began catching a few newly-emerged fry (BY 2014) in the screw trap in January and continued through June of 2015. Numbers were only 4 and 6 for January and February respectively, but increased from March to June, totaling 315 fry. The largest catches of fry occurred in April (n=128). There were no attempts at estimating these fry and they were not included in the outmigrant estimate for BY 2014 as they appeared to not be emigrating, but instead were getting flushed into the trap during high flows. BY 2014 first-time captures in the screw trap from 1 July 2015-30 June 2016 totaled 9,624 with less than 1% mortalities (n=62). Outmigrant Estimate The BY 2014 outmigrant estimate was derived using Darr 2.9.1 and was estimated for the period of July 1 2015 through June 30 2016 to be 26,384 (Table 10). This is the third largest outmigrant estimate since reintroduction efforts began. This correlates well with
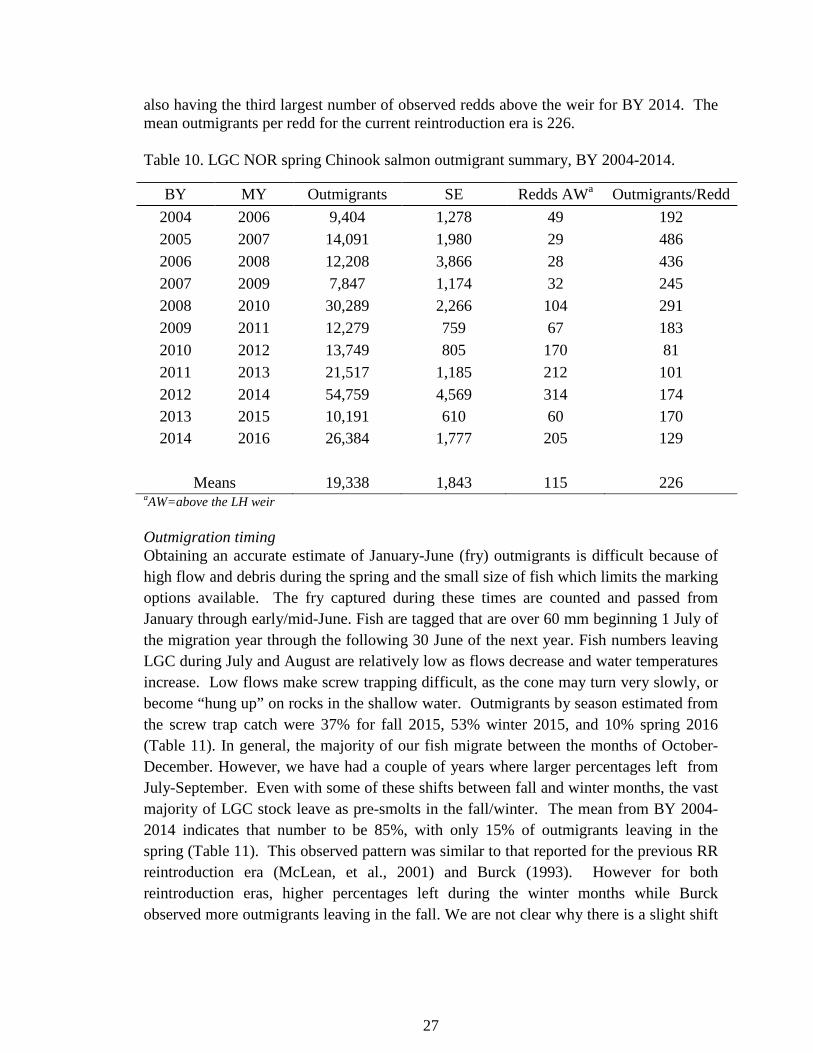
27
also having the third largest number of observed redds above the weir for BY 2014. The mean outmigrants per redd for the current reintroduction era is 226. Table 10. LGC NOR spring Chinook salmon outmigrant summary, BY 2004-2014.
BY MY Outmigrants SE Redds AWa Outmigrants/Redd 2004 2006 9,404 1,278 49 192 2005 2007 14,091 1,980 29 486 2006 2008 12,208 3,866 28 436 2007 2009 7,847 1,174 32 245 2008 2010 30,289 2,266 104 291 2009 2011 12,279 759 67 183 2010 2012 13,749 805 170 81 2011 2013 21,517 1,185 212 101 2012 2014 54,759 4,569 314 174 2013 2015 10,191 610 60 170 2014 2016 26,384 1,777 205 129
Means 19,338 1,843 115 226
aAW=above the LH weir Outmigration timing Obtaining an accurate estimate of January-June (fry) outmigrants is difficult because of high flow and debris during the spring and the small size of fish which limits the marking options available. The fry captured during these times are counted and passed from January through early/mid-June. Fish are tagged that are over 60 mm beginning 1 July of the migration year through the following 30 June of the next year. Fish numbers leaving LGC during July and August are relatively low as flows decrease and water temperatures increase. Low flows make screw trapping difficult, as the cone may turn very slowly, or become “hung up” on rocks in the shallow water. Outmigrants by season estimated from the screw trap catch were 37% for fall 2015, 53% winter 2015, and 10% spring 2016 (Table 11). In general, the majority of our fish migrate between the months of October-December. However, we have had a couple of years where larger percentages left from July-September. Even with some of these shifts between fall and winter months, the vast majority of LGC stock leave as pre-smolts in the fall/winter. The mean from BY 2004-2014 indicates that number to be 85%, with only 15% of outmigrants leaving in the spring (Table 11). This observed pattern was similar to that reported for the previous RR reintroduction era (McLean, et al., 2001) and Burck (1993). However for both reintroduction eras, higher percentages left during the winter months while Burck observed more outmigrants leaving in the fall. We are not clear why there is a slight shift
28
in outmigration timing. A similar pattern of most outmigrants leaving as presmolts during fall/winter occurs for CC outmigrants, our donor stock (Anderson, et al., 2011).
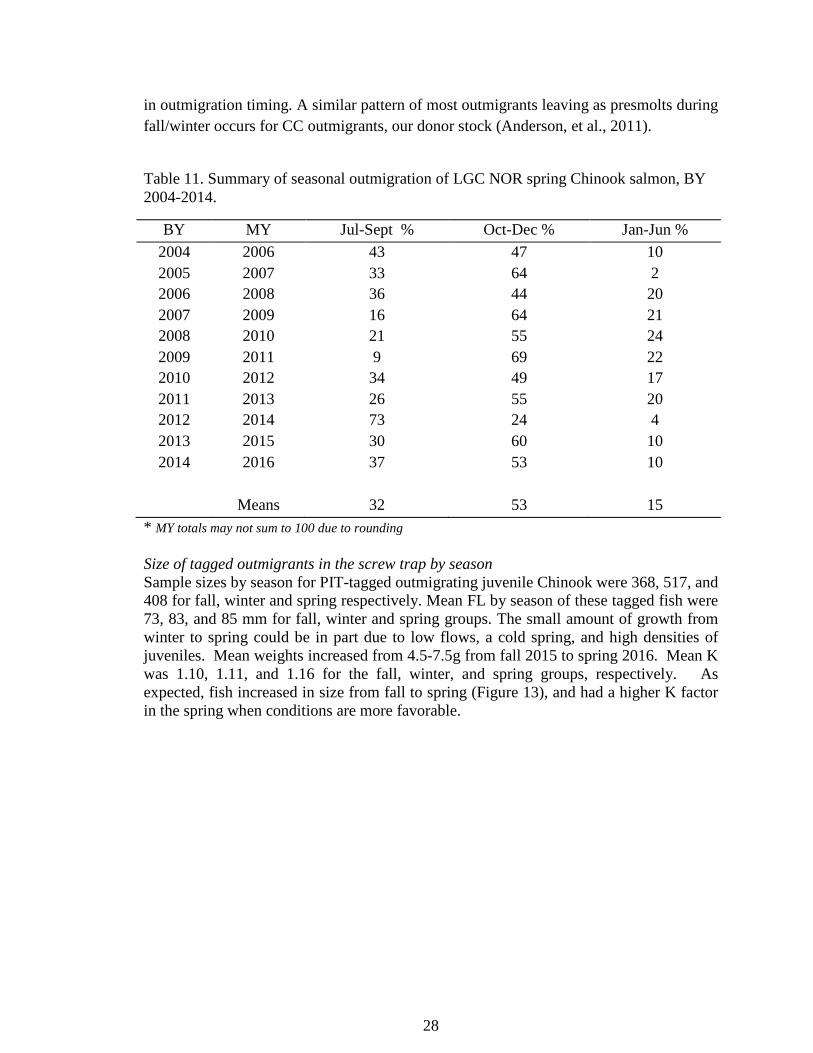
Table 11. Summary of seasonal outmigration of LGC NOR spring Chinook salmon, BY 2004-2014.
BY MY Jul-Sept % Oct-Dec % Jan-Jun % 2004 2006 43 47 10 2005 2007 33 64 2 2006 2008 36 44 20 2007 2009 16 64 21 2008 2010 21 55 24 2009 2011 9 69 22 2010 2012 34 49 17 2011 2013 26 55 20 2012 2014 73 24 4 2013 2015 30 60 10 2014 2016 37 53 10
Means 32 53 15
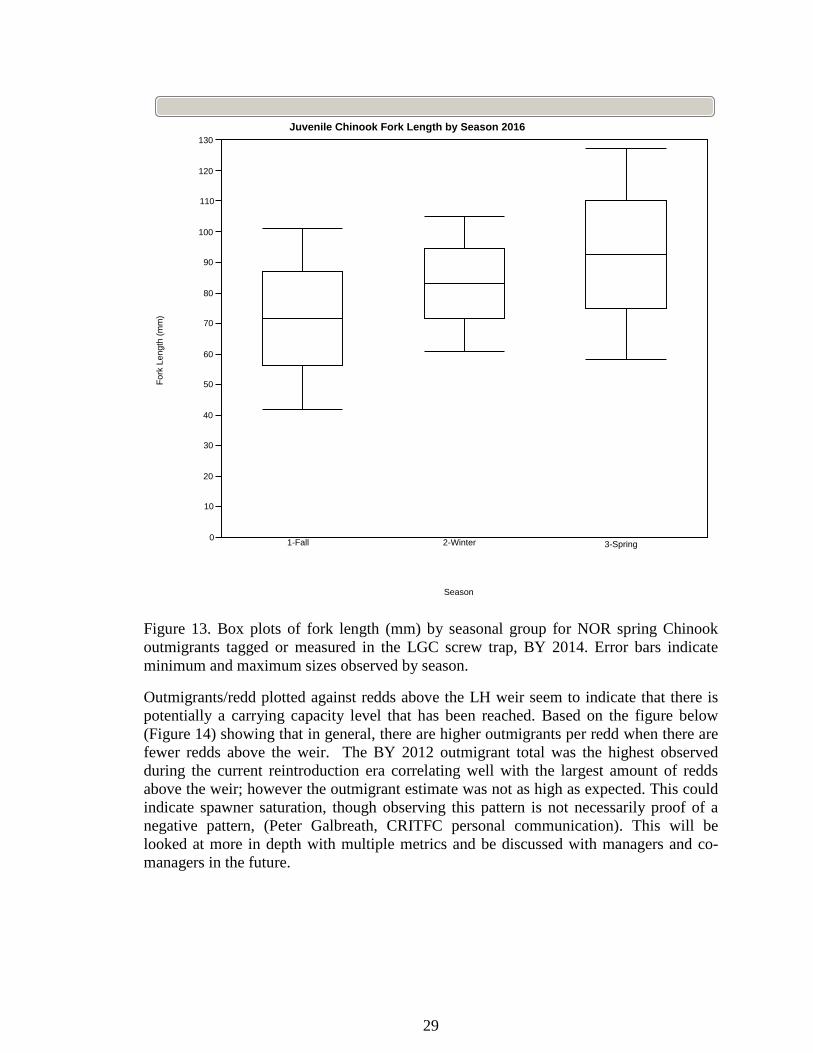
* MY totals may not sum to 100 due to rounding Size of tagged outmigrants in the screw trap by season Sample sizes by season for PIT-tagged outmigrating juvenile Chinook were 368, 517, and 408 for fall, winter and spring respectively. Mean FL by season of these tagged fish were 73, 83, and 85 mm for fall, winter and spring groups. The small amount of growth from winter to spring could be in part due to low flows, a cold spring, and high densities of juveniles. Mean weights increased from 4.5-7.5g from fall 2015 to spring 2016. Mean K was 1.10, 1.11, and 1.16 for the fall, winter, and spring groups, respectively. As expected, fish increased in size from fall to spring (Figure 13), and had a higher K factor in the spring when conditions are more favorable.
29
Figure 13. Box plots of fork length (mm) by seasonal group for NOR spring Chinook outmigrants tagged or measured in the LGC screw trap, BY 2014. Error bars indicate minimum and maximum sizes observed by season.
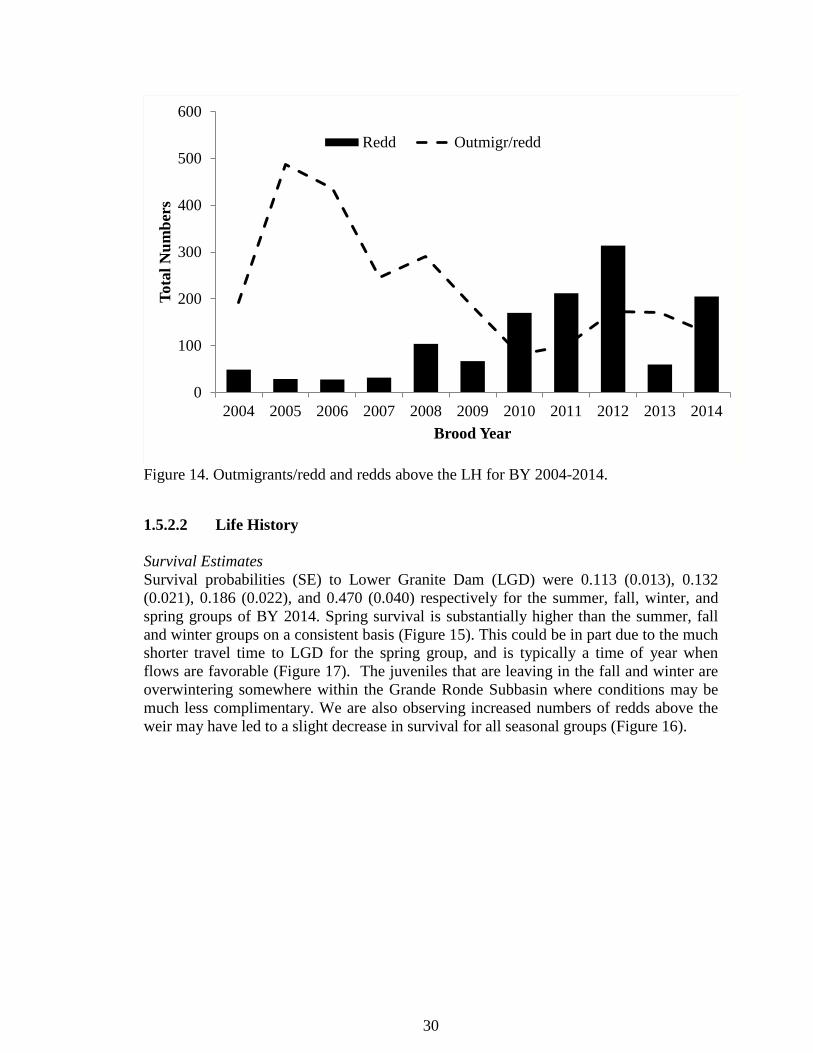
Outmigrants/redd plotted against redds above the LH weir seem to indicate that there is potentially a carrying capacity level that has been reached. Based on the figure below (Figure 14) showing that in general, there are higher outmigrants per redd when there are fewer redds above the weir. The BY 2012 outmigrant total was the highest observed during the current reintroduction era correlating well with the largest amount of redds above the weir; however the outmigrant estimate was not as high as expected. This could indicate spawner saturation, though observing this pattern is not necessarily proof of a negative pattern, (Peter Galbreath, CRITFC personal communication). This will be looked at more in depth with multiple metrics and be discussed with managers and co-managers in the future.
Juvenile Chinook Fork Length by Season 2016
Season
1-Fall 2-Winter 3-Spring
Fork
Len
gth
(mm
)
0
10
20
30
40
50
60
70
80
90
100
110
120
130
30
Figure 14. Outmigrants/redd and redds above the LH for BY 2004-2014.
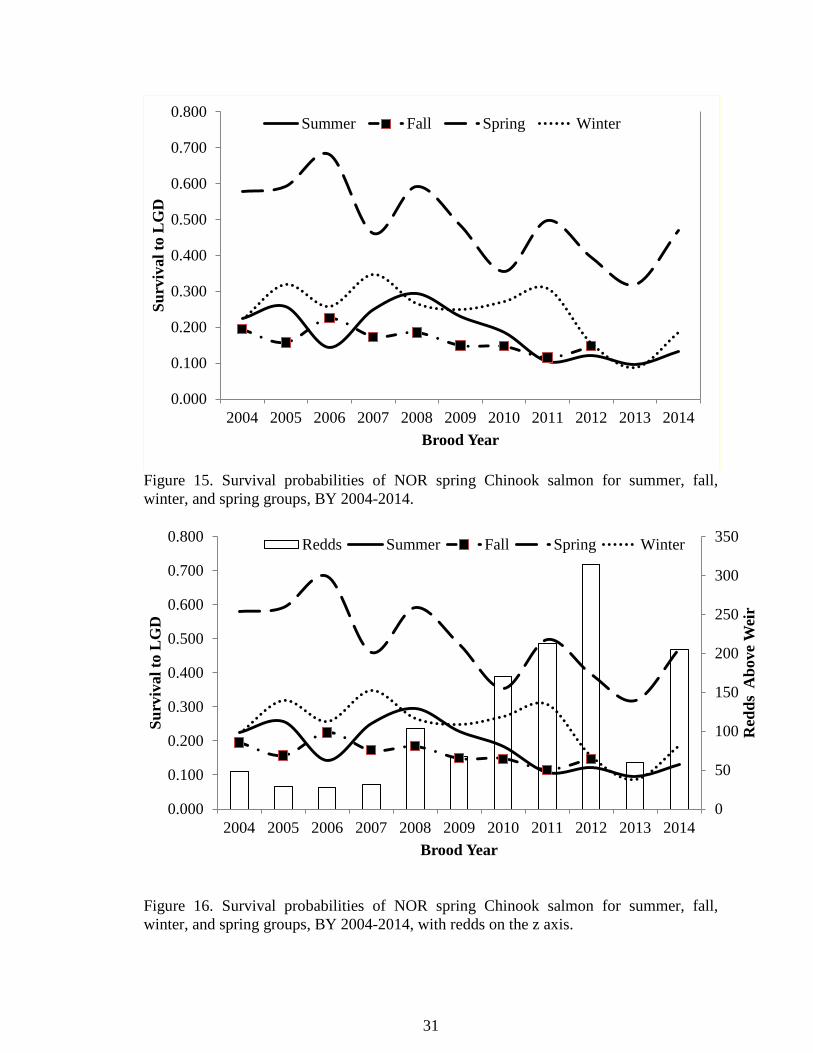
1.5.2.2 Life History Survival Estimates Survival probabilities (SE) to Lower Granite Dam (LGD) were 0.113 (0.013), 0.132 (0.021), 0.186 (0.022), and 0.470 (0.040) respectively for the summer, fall, winter, and spring groups of BY 2014. Spring survival is substantially higher than the summer, fall and winter groups on a consistent basis (Figure 15). This could be in part due to the much shorter travel time to LGD for the spring group, and is typically a time of year when flows are favorable (Figure 17). The juveniles that are leaving in the fall and winter are overwintering somewhere within the Grande Ronde Subbasin where conditions may be much less complimentary. We are also observing increased numbers of redds above the weir may have led to a slight decrease in survival for all seasonal groups (Figure 16).
0
100
200
300
400
500
600
2004 2005 2006 2007 2008 2009 2010 2011 2012 2013 2014
Tota
l Num
bers
Brood Year
Redd Outmigr/redd
31
Figure 15. Survival probabilities of NOR spring Chinook salmon for summer, fall, winter, and spring groups, BY 2004-2014.
Figure 16. Survival probabilities of NOR spring Chinook salmon for summer, fall, winter, and spring groups, BY 2004-2014, with redds on the z axis.
0.000
0.100
0.200
0.300
0.400
0.500
0.600
0.700
0.800
2004 2005 2006 2007 2008 2009 2010 2011 2012 2013 2014
Surv
ival
to L
GD
Brood Year
Summer Fall Spring Winter
0
50
100
150
200
250
300
350
0.000
0.100
0.200
0.300
0.400
0.500
0.600
0.700
0.800
2004 2005 2006 2007 2008 2009 2010 2011 2012 2013 2014
Red
ds A
bove
Wei
r
Surv
ival
to L
GD
Brood Year
Redds Summer Fall Spring Winter
32
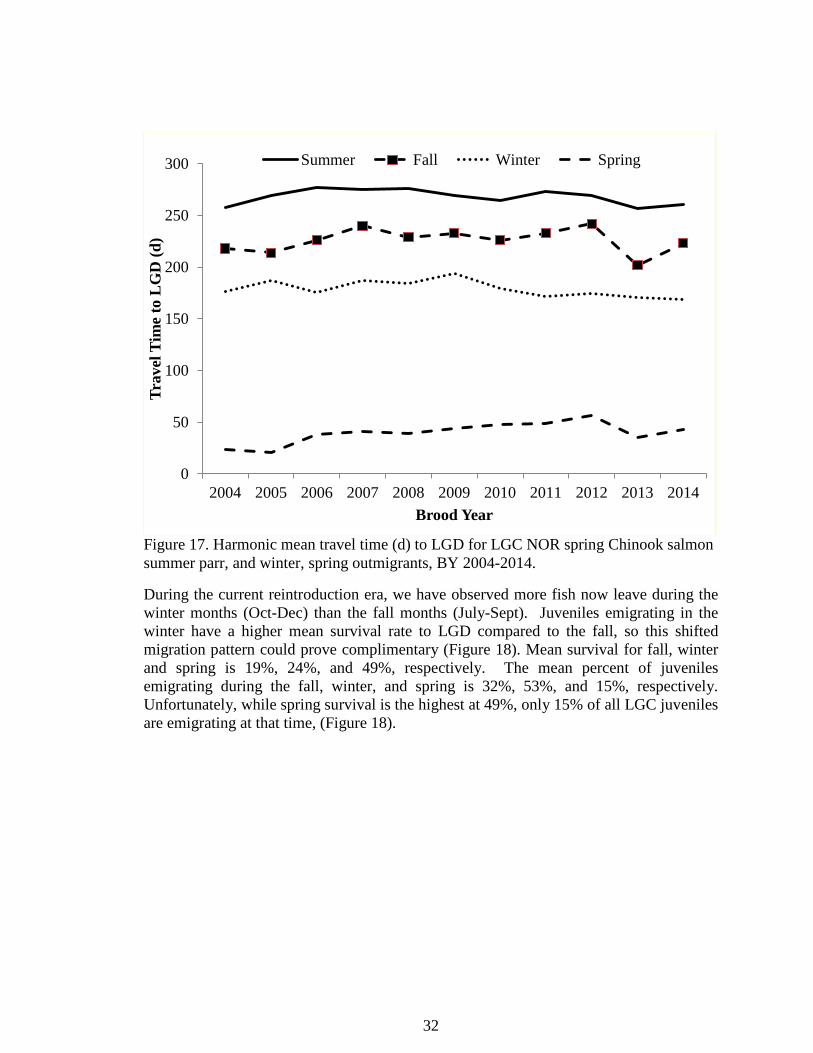
Figure 17. Harmonic mean travel time (d) to LGD for LGC NOR spring Chinook salmon summer parr, and winter, spring outmigrants, BY 2004-2014.
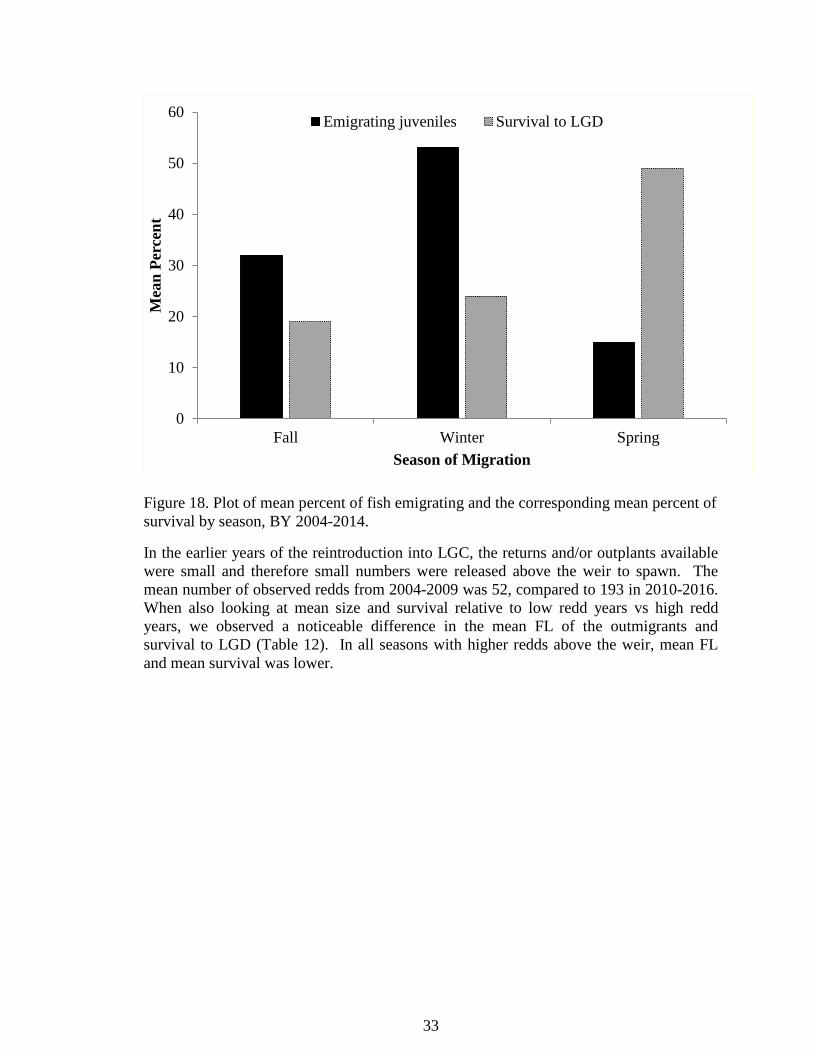
During the current reintroduction era, we have observed more fish now leave during the winter months (Oct-Dec) than the fall months (July-Sept). Juveniles emigrating in the winter have a higher mean survival rate to LGD compared to the fall, so this shifted migration pattern could prove complimentary (Figure 18). Mean survival for fall, winter and spring is 19%, 24%, and 49%, respectively. The mean percent of juveniles emigrating during the fall, winter, and spring is 32%, 53%, and 15%, respectively. Unfortunately, while spring survival is the highest at 49%, only 15% of all LGC juveniles are emigrating at that time, (Figure 18).
0
50
100
150
200
250
300
2004 2005 2006 2007 2008 2009 2010 2011 2012 2013 2014
Trav
el T
ime
to L
GD
(d)
Brood Year
Summer Fall Winter Spring
33
Figure 18. Plot of mean percent of fish emigrating and the corresponding mean percent of survival by season, BY 2004-2014.
In the earlier years of the reintroduction into LGC, the returns and/or outplants available were small and therefore small numbers were released above the weir to spawn. The mean number of observed redds from 2004-2009 was 52, compared to 193 in 2010-2016. When also looking at mean size and survival relative to low redd years vs high redd years, we observed a noticeable difference in the mean FL of the outmigrants and survival to LGD (Table 12). In all seasons with higher redds above the weir, mean FL and mean survival was lower.
0
10
20
30
40
50
60
Fall Winter Spring
Mea
n Pe
rcen
t
Season of Migration
Emigrating juveniles Survival to LGD
34
Table 12. Summary of 2004-2009 and 2010-2016 mean FL and survival during low redd years vs high redd years.
Year Season Mean Redds Mean FL Mean Survival 2004-2009 Summer 52 72 0.18 2010-2016 193 69 0.13
2004-2009 Fall 52 80 0.23 2010-2016 193 73 0.13
2004-2009 Winter 52 89 0.28 2010-2016 193 84 0.20
2004-2009 Spring 52 97 0.56 2010-2016 193 89 0.41 Smolt Equivalent Estimate Smolt equivalent (Seq) estimates (outmigrants for each group surviving to LGD) for fall 2015, winter 2015 and spring 2016 were 1,292, 2,582, and 1,277, respectively. This equated to a BY 2014 total of 5,151. BY 2014 Seq was above the mean for the current era, however Seq/spawner was well below the mean (Table 13). Seq /spawner since 2010 has ranged between 9 and 16. Why Seq /spawner was consistently higher prior to 2010 is unclear. Smolt to Adult Return BY 2011 NOR SARs were above the BY 2004-2011 means. The BY 2004-2011 adult only mean of 3.2% is at the low end of the 2-6% range and below the 4% average recovery objectives for Snake River Chinook and steelhead (NWPCC , 2014).

35
Table 13. Seq to LGD and SAR for LGC NOR spring Chinook salmon, BY 2004-2014.
NOR BY returns SAR (%) BY All Adult Seq Seq/spawnera Allb Adultsc
2004 62 55 2,446 24 2.5 2.2 2005 82 78 4,280 116 1.9 1.8 2006 162 138 3,669 78 4.4 3.8 2007 152 135 2,784 46 5.5 4.8 2008 171 141 10,620 59 1.6 1.3 2009 64 61 3,671 50 1.7 1.7 2010 245 185 3,319 11 7.4 5.6 2011 289 254 5,925 16 4.9 4.3 2012 7,596 10 2013 *1,152 10 2014 5,151 12
Mean 153 131 4,946 39 3.7 3.2
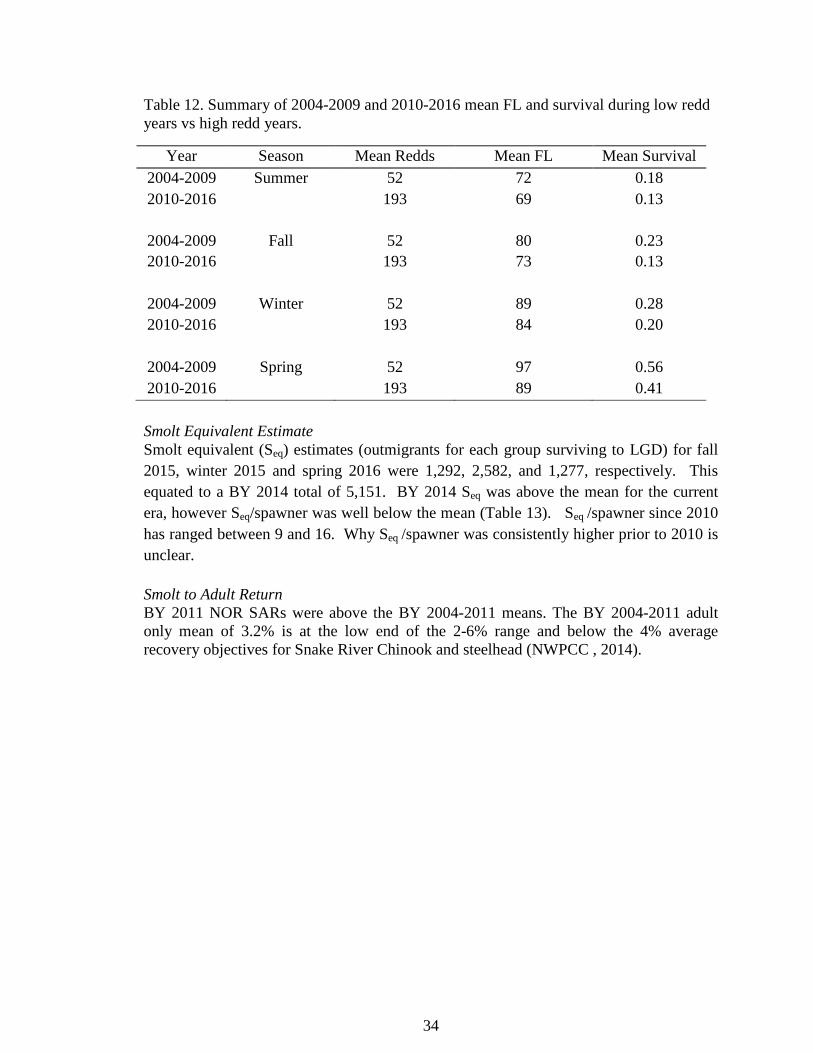
a Seq/Adult spawners from Table 9 b (NOR BY X returns All ages)/Seq BY X c (NOR BY X returns at ages 4 and 5)/Seq BY X *Caveat for 2015, Smolt equivalent low due to spill and low detects at LGD caused by uncharacteristically low flows that MY. Monthly sampling The section of LGC known as 3L (formerly Nielson’s property) has been purchased by the CTUIR and has future restoration work planned to restore the floodplain. This work is slated for implementation in the near future, possibly as early as 2018. This section contains the “standard site” that has been sampled consistently during the endemic era, the RR reintroduction era, and currently with the LGC stock (Boe, et al., 2014). The standard site (rkm 8.9) in the future may be used as the “treatment” location and the upstream site at the section break of 3U/ 3L at the footbridge (rkm 10.5) used as the “control” while we evaluate habitat usage before, during, and after in stream work is completed. Each month around the 20th (July, August, September) we attempt to capture 50 fish using snorkel/seine methods at both of these sites. We typically are not able to snorkel for parr in June due to higher spring flows coupled with small size of the fish and the risks of handling and anesthetizing them at that size. BY 2014 parr sampled totaled 115 in July, 103 in August and 79 in September 2015. Mean FL increased in a generally linear pattern from July-September at both sites, as expected. For BY 2014 parr at the standard site, mean fork length for July, August, and September was 70.5 mm, 79.3 mm, and 84.2 mm, respectively. For BY 2014 parr at the footbridge site (rkm 10.5), mean fork length for July, August, and September was 63.8 mm, 73.0 mm, 78.3 mm, and respectively. Parr sampled at the upstream footbridge site were smaller than at the standard site, likely due to colder water temperatures. At the standard site (rkm 8.9), the average FL for BY 2005-2014 in July, August, September was 68 mm, 77mm, and 84
36
mm, respectively (Figure 19). During the month of September, fish have begun to move lower in the system and we often do not meet our goal of 50 fish at either site.
Figure 19. Seasonal growth of juvenile spring Chinook salmon captured during monthly sampling for July, August, September at the standard site (rkm 8.9), BY 2005-2014.
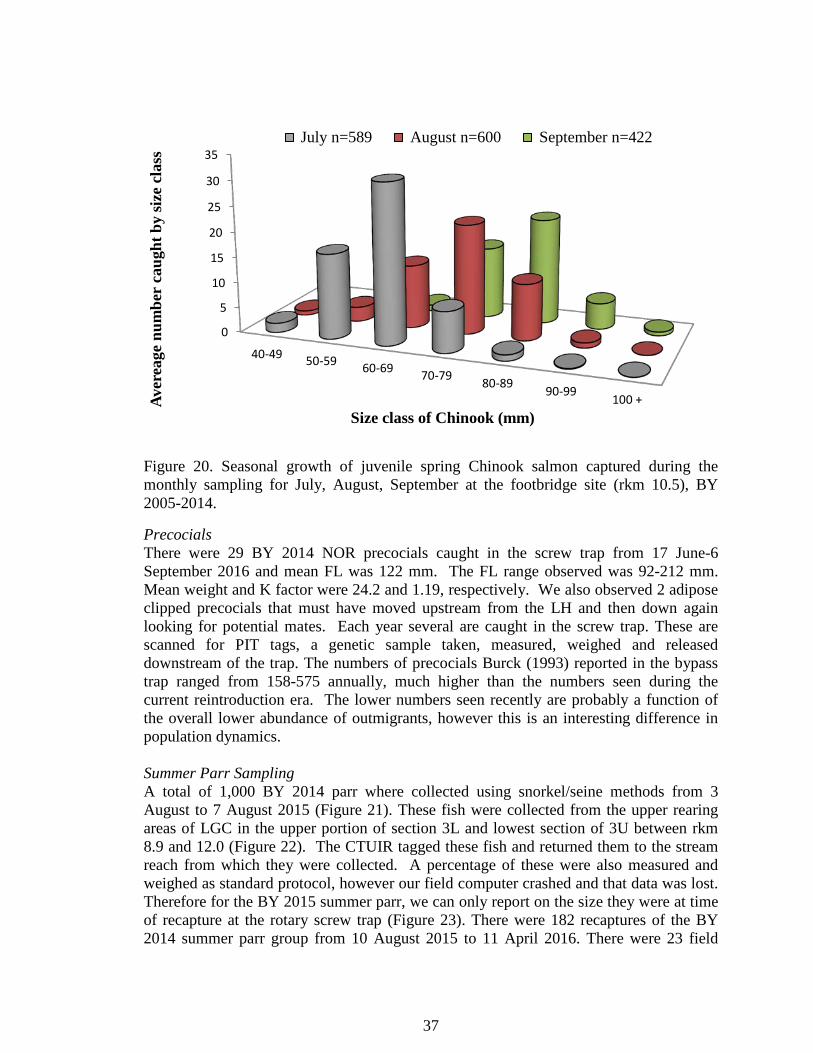
At the footbridge site (rkm 10.5) the average FL for BY 2005-2014 in July, August, September was 63 mm, 73 mm, and 82 mm, respectively. There was much more variability a few kilometers upstream at the footbridge site, with much smaller fish observed in August and September and a much wider area of overlap between months (Figure 20).
0.0
5.0
10.0
15.0
20.0
25.0
30.0
40-4950-59
60-6970-79
80-8990-99
>99
Aver
age
num
ber
caug
ht b
y si
ze c
lass
Size class of Chinook (mm)
July (n=609) August (n= 526) September (n =398)
37
Figure 20. Seasonal growth of juvenile spring Chinook salmon captured during the monthly sampling for July, August, September at the footbridge site (rkm 10.5), BY 2005-2014.
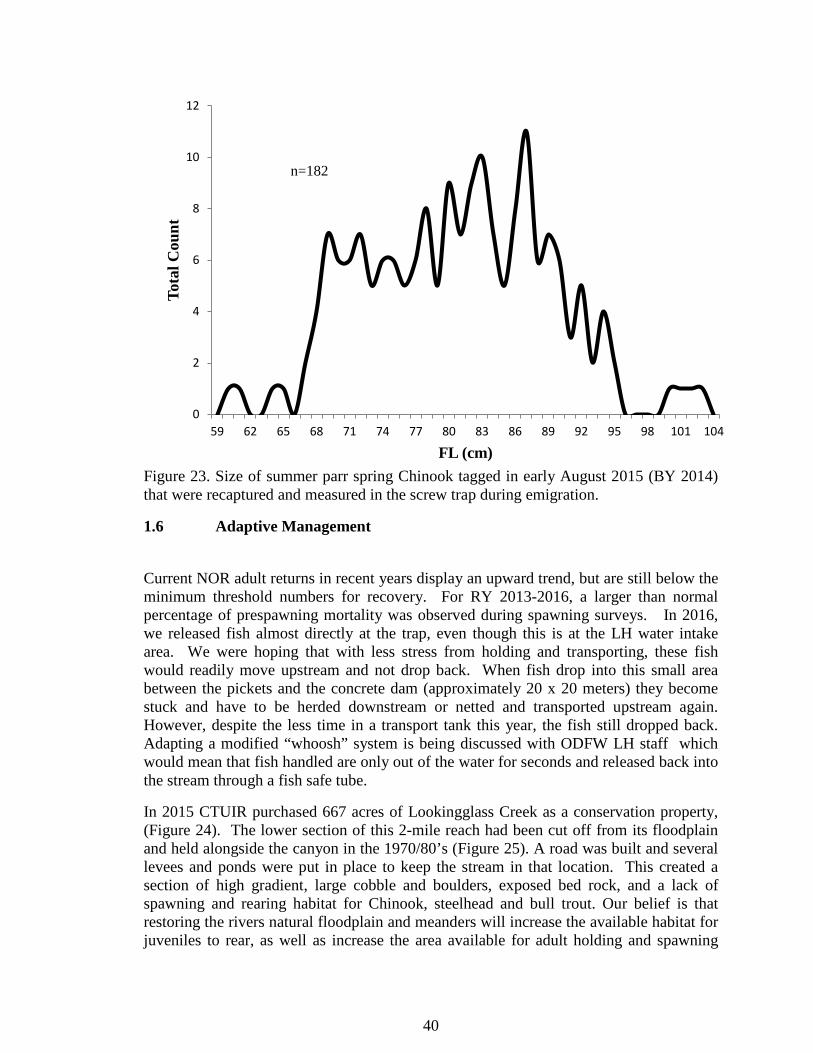
Precocials There were 29 BY 2014 NOR precocials caught in the screw trap from 17 June-6 September 2016 and mean FL was 122 mm. The FL range observed was 92-212 mm. Mean weight and K factor were 24.2 and 1.19, respectively. We also observed 2 adipose clipped precocials that must have moved upstream from the LH and then down again looking for potential mates. Each year several are caught in the screw trap. These are scanned for PIT tags, a genetic sample taken, measured, weighed and released downstream of the trap. The numbers of precocials Burck (1993) reported in the bypass trap ranged from 158-575 annually, much higher than the numbers seen during the current reintroduction era. The lower numbers seen recently are probably a function of the overall lower abundance of outmigrants, however this is an interesting difference in population dynamics. Summer Parr Sampling A total of 1,000 BY 2014 parr where collected using snorkel/seine methods from 3 August to 7 August 2015 (Figure 21). These fish were collected from the upper rearing areas of LGC in the upper portion of section 3L and lowest section of 3U between rkm 8.9 and 12.0 (Figure 22). The CTUIR tagged these fish and returned them to the stream reach from which they were collected. A percentage of these were also measured and weighed as standard protocol, however our field computer crashed and that data was lost. Therefore for the BY 2015 summer parr, we can only report on the size they were at time of recapture at the rotary screw trap (Figure 23). There were 182 recaptures of the BY 2014 summer parr group from 10 August 2015 to 11 April 2016. There were 23 field
0
5
10
15
20
25
30
35
40-49 50-59 60-69 70-79 80-89 90-99 100 +Aver
eage
num
ber
caug
ht b
y si
ze c
lass
Size class of Chinook (mm)
July n=589 August n=600 September n=422

38
group Chinook that were re-captured in August immediately following tagging and release (13%). The vast majority were captured in September, October and November at 45, 45, and 32, respectively. This movement corresponded to the rest of the fall/winter natural outmigration of parr captured in the screw trap.
Figure 21. Snorkel/seining of juvenile spring Chinook parr for the summer parr group in Unit 3U and 3L.

39
Figure 22. Circled area indicates the location of fish collection during summer parr group sampling.
40
Figure 23. Size of summer parr spring Chinook tagged in early August 2015 (BY 2014) that were recaptured and measured in the screw trap during emigration.
1.6 Adaptive Management
Current NOR adult returns in recent years display an upward trend, but are still below the minimum threshold numbers for recovery. For RY 2013-2016, a larger than normal percentage of prespawning mortality was observed during spawning surveys. In 2016, we released fish almost directly at the trap, even though this is at the LH water intake area. We were hoping that with less stress from holding and transporting, these fish would readily move upstream and not drop back. When fish drop into this small area between the pickets and the concrete dam (approximately 20 x 20 meters) they become stuck and have to be herded downstream or netted and transported upstream again. However, despite the less time in a transport tank this year, the fish still dropped back. Adapting a modified “whoosh” system is being discussed with ODFW LH staff which would mean that fish handled are only out of the water for seconds and released back into the stream through a fish safe tube.
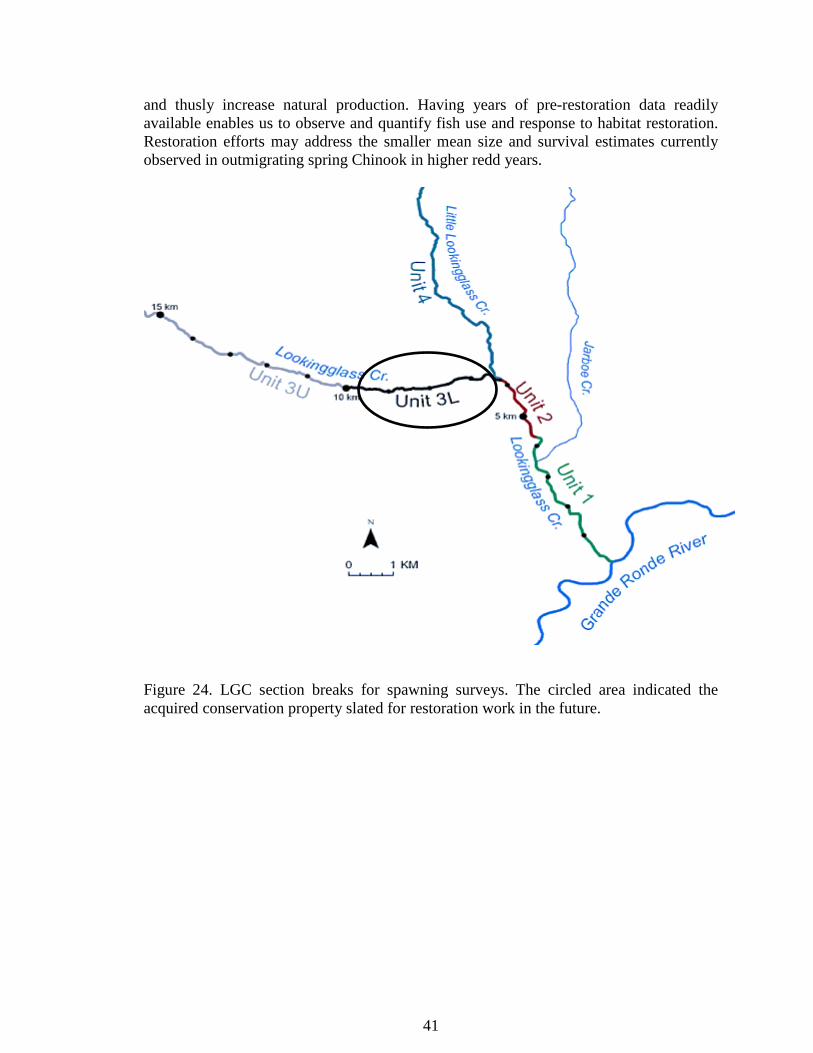
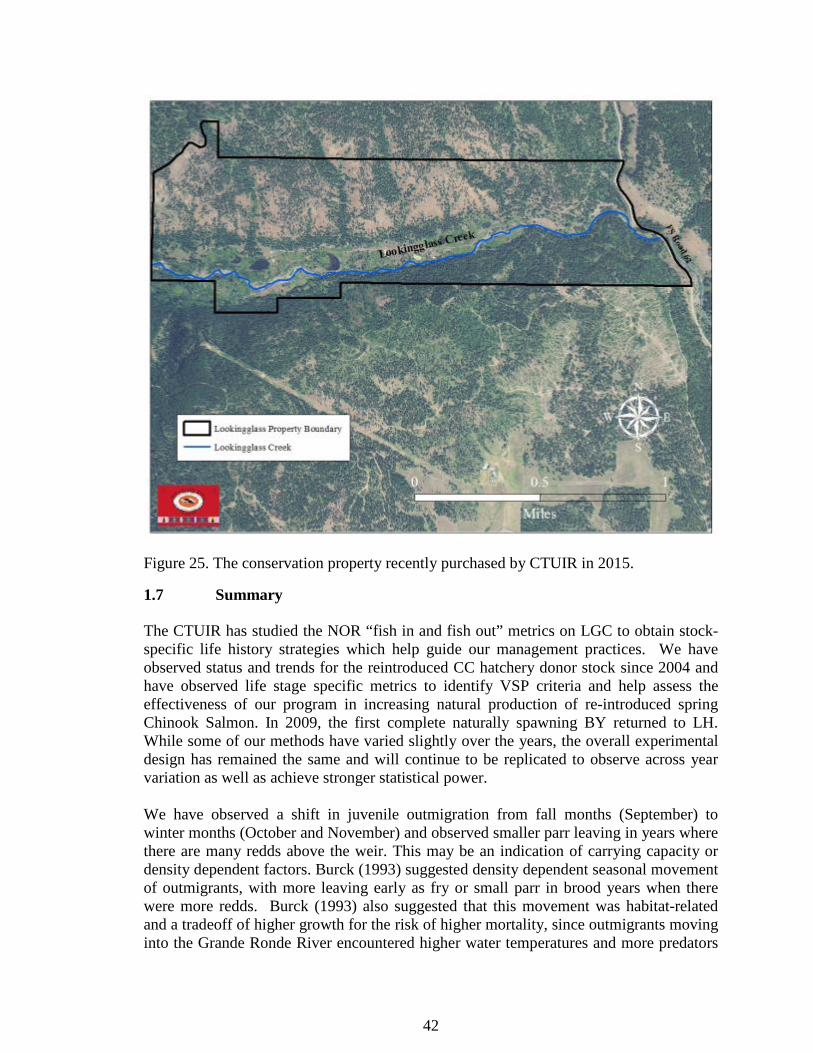
In 2015 CTUIR purchased 667 acres of Lookingglass Creek as a conservation property, (Figure 24). The lower section of this 2-mile reach had been cut off from its floodplain and held alongside the canyon in the 1970/80’s (Figure 25). A road was built and several levees and ponds were put in place to keep the stream in that location. This created a section of high gradient, large cobble and boulders, exposed bed rock, and a lack of spawning and rearing habitat for Chinook, steelhead and bull trout. Our belief is that restoring the rivers natural floodplain and meanders will increase the available habitat for juveniles to rear, as well as increase the area available for adult holding and spawning
0
2
4
6
8
10
12
59 62 65 68 71 74 77 80 83 86 89 92 95 98 101 104
Tota
l Cou
nt
FL (cm)
n=182
41
and thusly increase natural production. Having years of pre-restoration data readily available enables us to observe and quantify fish use and response to habitat restoration. Restoration efforts may address the smaller mean size and survival estimates currently observed in outmigrating spring Chinook in higher redd years.
Figure 24. LGC section breaks for spawning surveys. The circled area indicated the acquired conservation property slated for restoration work in the future.
42
Figure 25. The conservation property recently purchased by CTUIR in 2015.
1.7 Summary The CTUIR has studied the NOR “fish in and fish out” metrics on LGC to obtain stock-specific life history strategies which help guide our management practices. We have observed status and trends for the reintroduced CC hatchery donor stock since 2004 and have observed life stage specific metrics to identify VSP criteria and help assess the effectiveness of our program in increasing natural production of re-introduced spring Chinook Salmon. In 2009, the first complete naturally spawning BY returned to LH. While some of our methods have varied slightly over the years, the overall experimental design has remained the same and will continue to be replicated to observe across year variation as well as achieve stronger statistical power. We have observed a shift in juvenile outmigration from fall months (September) to winter months (October and November) and observed smaller parr leaving in years where there are many redds above the weir. This may be an indication of carrying capacity or density dependent factors. Burck (1993) suggested density dependent seasonal movement of outmigrants, with more leaving early as fry or small parr in brood years when there were more redds. Burck (1993) also suggested that this movement was habitat-related and a tradeoff of higher growth for the risk of higher mortality, since outmigrants moving into the Grande Ronde River encountered higher water temperatures and more predators
43
and competitors. The purchasing of the (formerly) Nielson property will provide CTUIR the opportunity to reconnect the stream with its floodplain, increase sinuosity by removing the stream from its simplified alignment, and increase habitat capacity within a 2-mile section. Our ongoing re-introduction evaluation provides us data that can also be used to investigate the effects of this restoration. Metrics observed will include redd distribution/timing, outmigration timing/quantity, differences in condition factor of outmigrating fish, and survival of outmigrants compared to pre-restoration levels. In general, during the evaluation period of 2004 – 2016 we have observed an increasing trend in the number of adults returning to LGC which has provided tribal harvest for the last seven consecutive years. There has also been an increase in the number of NOR returns to LGC, steady survival estimates of emigrating juveniles to LGD, and consistent R/S and SAR’s. A sustained improvement in productivity will be needed to rebuild and maintain a naturally reproducing population above the LH weir. It is unlikely that without the continued HOR component to this program that the NOR would be able to self-propagate and increase each year, as well as provide tribal harvest. 1.8 Management Plan The goal of the LGC spring Chinook hatchery program is to reintroduce spring Chinook into LGC using CC stock to support tributary harvest, natural population restoration, and maintenance of a gene bank for the CC stock. Current production targets for CC and LGC production, per the 2008-2017 United States v. Oregon Management Agreement are outlined in Table 14. Table 14. Current LGC management plan outlined in B1 of the 2008-2017 United States vs Oregon Management Agreement.
Release
Site
Rearing Facility
Stock
Life
Stage
Target Release Number
Primary Program Purpose
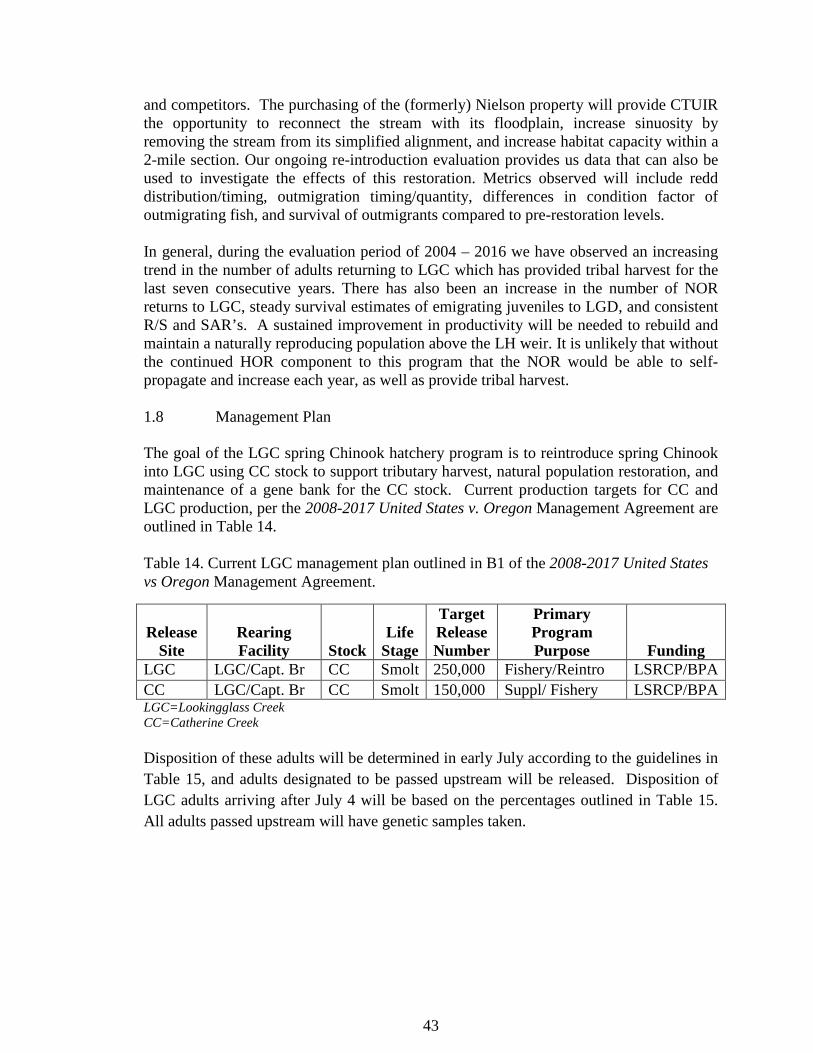
Funding LGC LGC/Capt. Br CC Smolt 250,000 Fishery/Reintro LSRCP/BPA CC LGC/Capt. Br CC Smolt 150,000 Suppl/ Fishery LSRCP/BPA LGC=Lookingglass Creek CC=Catherine Creek Disposition of these adults will be determined in early July according to the guidelines in Table 15, and adults designated to be passed upstream will be released. Disposition of LGC adults arriving after July 4 will be based on the percentages outlined in Table 15. All adults passed upstream will have genetic samples taken.
44
Table 15. Disposition of LGC adult spring Chinook salmon arriving at the LH weir.
Escapement Level % Pass Above % Keep for Brood 150 67 33 200 60 40 250 55 45 300* 50 50
*if greater than 300, adjustments will be made based on brood needs. If brood need has been met, remainder to be released upstream. An estimated 158 adults (47 NOR and 111 HOR) are required to meet 250,000 smolt production levels. Broodstock for the program will be collected from returns to either the LH weir or the CC weir. Either conventional or captive hatchery adults may be used for brood. The goal for broodstock composition will be to incorporate 30% NOR adults, with no more than 25% of the returning NOR Chinook retained for brood. If a shortage of NOR adults occurs, then additional HOR adults will be collected to meet the brood target. 2 BIBLIOGRAPHY Anderson, M. C. et al., 2011. Investigations into the early life history of naturally produced spring Chinook salmon and summer steelhead in the Grande Ronde River Subbasin, s.l.: s.n.
Bjorkstedt, E., 2008. DARR 2.0: updated software for estimating abundance from stratified mark-recapture data. s.l.:s.n.
Boe, S., Crump, C. & Van Sickle, A., 2014. Annual Progress Report Lower Snake River Compensation Plan Confederated Tribes of the Umatilla Indian Reservation Evaluation Studies 1 January 2014-31 December 2014, Boise, Idaho: Report to U.S. Fish and Wildlife Service.
Burck, W., 1993. Life History of spring Chinook salmon in LGC, Oregon., Portland: Oregon Department of Fish and Wildlife .
Feldhaus, J., Hoffnagle, T. L., Albrecht, N. & Carmichael, R. W., 2011. Lower Snake River Compensation Plan: Oregon Spring Chinook Salmon Evaluation Studies. 2008 Annual report from Oregon Department of Fish and Wildlife to the U.S. Fish and Wildlife Service, Lower Snake River Compensation Plan, s.l.: s.n.
Feldhaus, J., Hoffnagle, T. L., Eddy, D. L. & Carmichael, R. W., 2012. Lower Snake River Compensation Plan: Oregon Spring Chinook Evaluation Studies. 2012 Annual report from Oregon Department of Fish and Wildlife to the U.S. Fish and Wildlife Service, Lower Snake River Compensation Plan, s.l.: s.n.
Galbreath, P. F., Beasley, C. A., Berjikian, B. A. & Carmichael, R. W., 2008. Recommendations for broad scale monitoring to evaluate the effects of hatchery supplementation on the fitness of natural salmon and steelhead populations., s.l.: NWPCC.

45
Gee, S. L., Hoffnagle, T. L. & Onjukka, S., 2014. Grande Ronde Basin Spring Chinook Salmon Captive Broodstock and Safety Net Program, La Grande, Oregon: Oregon Department of Fish and Wildlife.
Gildemeister, J., 1998. Watershed history, Middle and Upper Grande Ronde River Subbasins, Northeast Oregon. Report to Oregon Department of Enviromental Quality, U.S. Enviromental Protection Agency, and Confederated Tribes of the Umatilla Indian Reservation, La Grande, Oregon: s.n.
Hesse, J. A., Harbeck, J. R. & Carmichael, R. W., 2006. Monitoring and evaluation plan for Northeast Oregon hatchery Imnaha and Grande Ronde Subbasin spring Chinook salmon, s.l.: Report prepared for Bonneville Power Administration.
Jones, K. L. et al., 2008. Umatilla River Vision, Pendleton: s.n.
Lofy, P. T. & McLean, M. L., 1995. Lower Snake River Compensation Plan Confederated Tribes of the Umatilla Indian Reservation Evaluation Studies Annual Progress Report. 1 January-31 December 1994. Report to U.S. Fish and Wildlife Service, Boise, Idaho. Contract #14-48-0001-94517, s.l.: s.n.
McElhany, P. et al., 2000. Viable salmonid populations and the recovery of evolutionarily significant units, s.l.: S. Department of Commerce.
McLean, M. L., Seeger, R. & Lofy, P. T., 2001. Lower Snake River Compensation Plan Confederated Tribes of the Umatilla Indian Reservation Evaluation Studies Annual Progress Report 1 Jaunuary-31 December 2001, Boise, Idaho: Report to U.S. Fish and Wildlife Service.
Nehlsen, W., Williams, J. E. & Lichatowich, J. A., 1991. Pacific salmon at the crossroads: stocks at risk from California, Oregon, Idaho, and Washington.. Fisheries Bulletin.
NOAA, 2011. Status review update for Pacific salmon and steelhead listed under the Endangered Species Act: Pacific Northwest. s.l.:U.S. Department of Commerce.
NWPCC , 2014. 2014 Columbia Basin Fish and Wildlife Program. [Online] Available at: Available at https://www.nwcouncil/fw/
O'Connor, G. & Hoffnagle, T. L., 2007. Use of ELISA to monitor bacterial kidney disease in naturally spawning salmon. Issue 77, pp. 137-142.
ODFW, 2011. Hatchery and Genetic Management Plan. s.l.:s.n.
Parker, S. J., Keefe, M. & Carmichael, R. W., 1995. Annual progress report, Oregon Department of Fish and Wildlife, to the Lower Snake River Compensation Plan, U.S. Fish and Wildlife Service, Boise, Idaho: s.n.
PIT Tag Steering Committee, 1999. PIT Tag Marking Procedures Manual. Ver. 2.0 ed. s.l.:Columbia Basin Fish and Wildlife Authority, Portland, Oregon.

46
Ricker, W. E., 1975. Computations and interpretation of biological statistics of fish populations, s.l.: Bulletin of the Fisheries Research Board of Canada 191.
Westhagen, P. & Skalski, J. R., 2009. Program PitPro 4.0. Seattle: Columbia Basin Research, University of Washington.
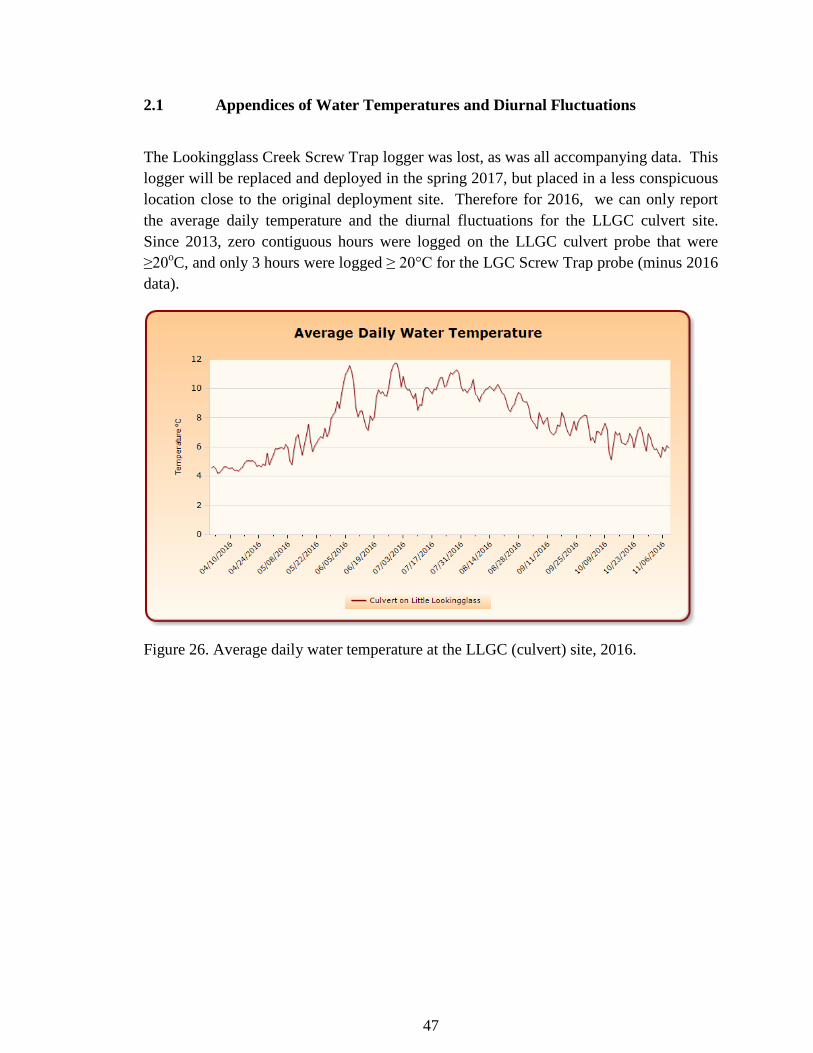
47
2.1 Appendices of Water Temperatures and Diurnal Fluctuations
The Lookingglass Creek Screw Trap logger was lost, as was all accompanying data. This logger will be replaced and deployed in the spring 2017, but placed in a less conspicuous location close to the original deployment site. Therefore for 2016, we can only report the average daily temperature and the diurnal fluctuations for the LLGC culvert site. Since 2013, zero contiguous hours were logged on the LLGC culvert probe that were ≥20oC, and only 3 hours were logged ≥ 20°C for the LGC Screw Trap probe (minus 2016 data).
Figure 26. Average daily water temperature at the LLGC (culvert) site, 2016.
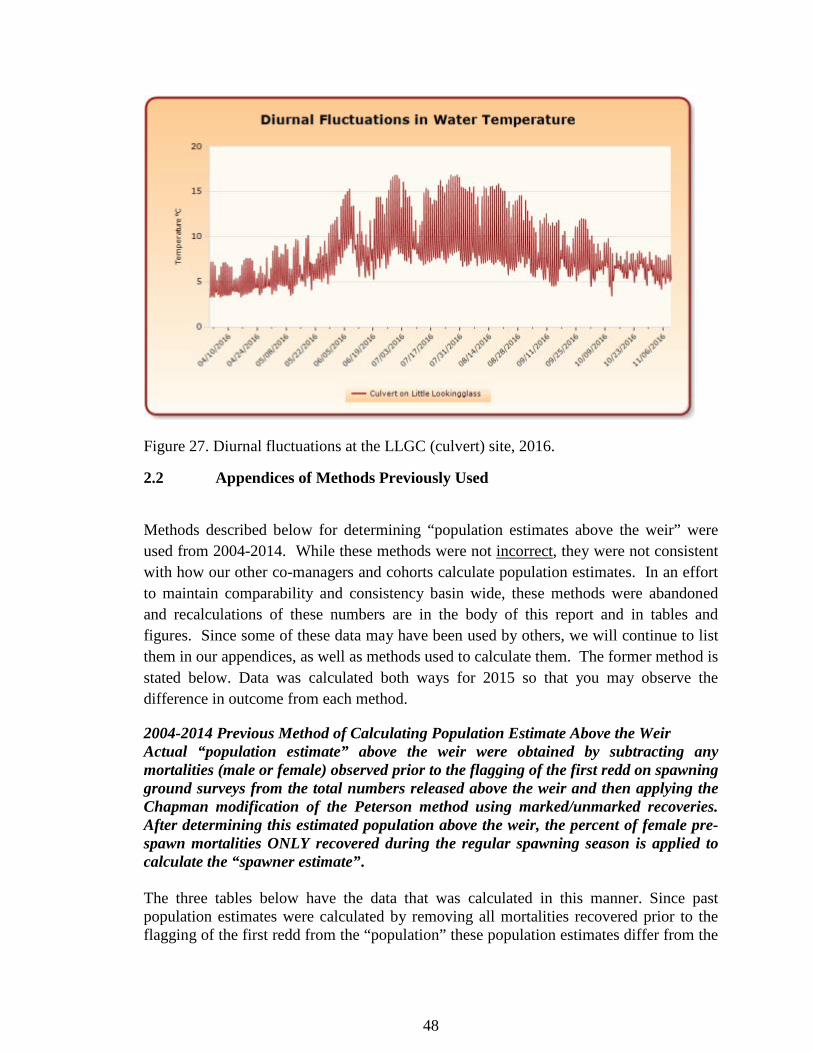
48
Figure 27. Diurnal fluctuations at the LLGC (culvert) site, 2016.
2.2 Appendices of Methods Previously Used
Methods described below for determining “population estimates above the weir” were used from 2004-2014. While these methods were not incorrect, they were not consistent with how our other co-managers and cohorts calculate population estimates. In an effort to maintain comparability and consistency basin wide, these methods were abandoned and recalculations of these numbers are in the body of this report and in tables and figures. Since some of these data may have been used by others, we will continue to list them in our appendices, as well as methods used to calculate them. The former method is stated below. Data was calculated both ways for 2015 so that you may observe the difference in outcome from each method.
2004-2014 Previous Method of Calculating Population Estimate Above the Weir Actual “population estimate” above the weir were obtained by subtracting any mortalities (male or female) observed prior to the flagging of the first redd on spawning ground surveys from the total numbers released above the weir and then applying the Chapman modification of the Peterson method using marked/unmarked recoveries. After determining this estimated population above the weir, the percent of female pre-spawn mortalities ONLY recovered during the regular spawning season is applied to calculate the “spawner estimate”. The three tables below have the data that was calculated in this manner. Since past population estimates were calculated by removing all mortalities recovered prior to the flagging of the first redd from the “population” these population estimates differ from the
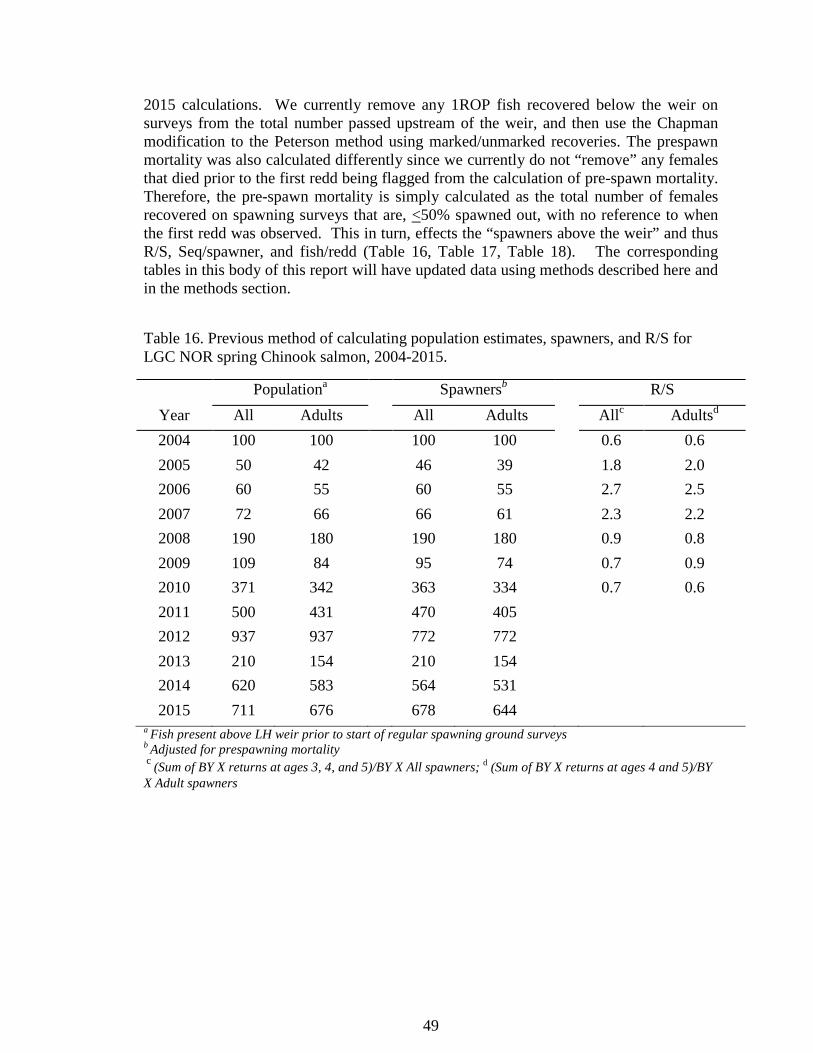
49
2015 calculations. We currently remove any 1ROP fish recovered below the weir on surveys from the total number passed upstream of the weir, and then use the Chapman modification to the Peterson method using marked/unmarked recoveries. The prespawn mortality was also calculated differently since we currently do not “remove” any females that died prior to the first redd being flagged from the calculation of pre-spawn mortality. Therefore, the pre-spawn mortality is simply calculated as the total number of females recovered on spawning surveys that are, <50% spawned out, with no reference to when the first redd was observed. This in turn, effects the “spawners above the weir” and thus R/S, Seq/spawner, and fish/redd (Table 16, Table 17, Table 18). The corresponding tables in this body of this report will have updated data using methods described here and in the methods section.
Table 16. Previous method of calculating population estimates, spawners, and R/S for LGC NOR spring Chinook salmon, 2004-2015.
Populationa Spawnersb R/S Year All Adults All Adults Allc Adultsd 2004 100 100 100 100 0.6 0.6 2005 50 42 46 39 1.8 2.0 2006 60 55 60 55 2.7 2.5 2007 72 66 66 61 2.3 2.2 2008 190 180 190 180 0.9 0.8 2009 109 84 95 74 0.7 0.9 2010 371 342 363 334 0.7 0.6 2011 500 431 470 405 2012 937 937 772 772 2013 210 154 210 154 2014 620 583 564 531 2015 711 676 678 644
a Fish present above LH weir prior to start of regular spawning ground surveys b Adjusted for prespawning mortality c (Sum of BY X returns at ages 3, 4, and 5)/BY X All spawners; d (Sum of BY X returns at ages 4 and 5)/BY X Adult spawners
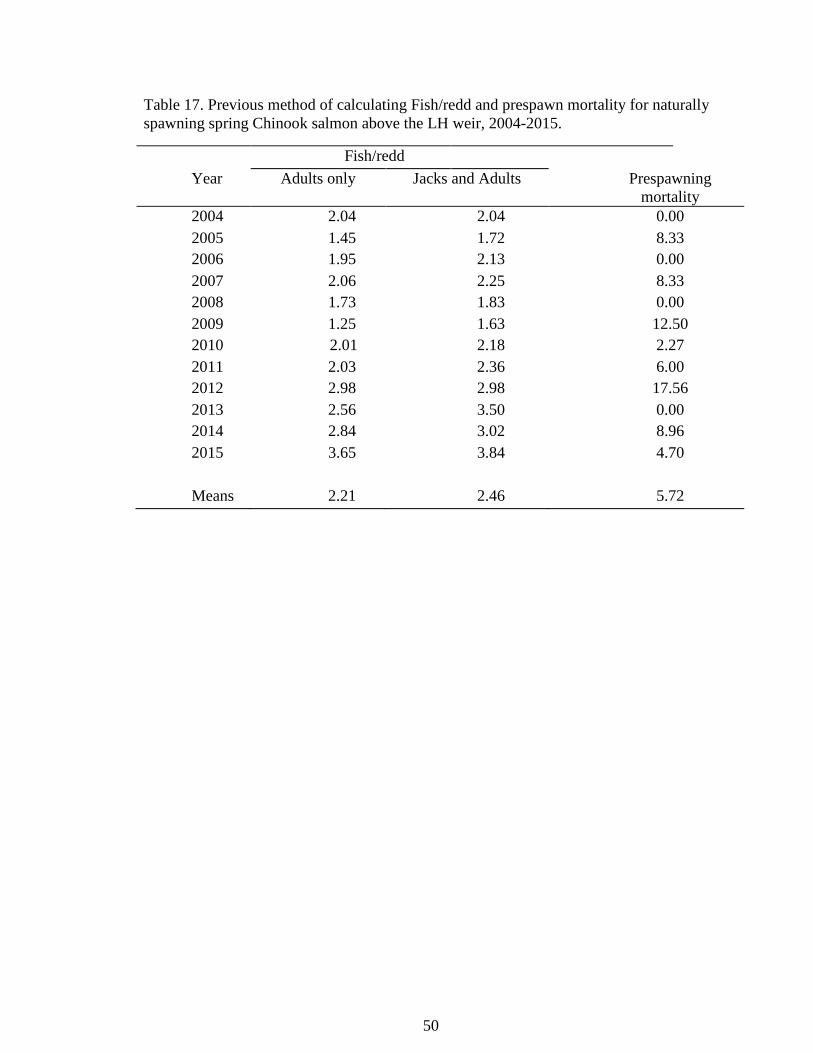
50
Table 17. Previous method of calculating Fish/redd and prespawn mortality for naturally spawning spring Chinook salmon above the LH weir, 2004-2015.
Fish/redd Year Adults only Jacks and Adults Prespawning
mortality 2004 2.04 2.04 0.00 2005 1.45 1.72 8.33 2006 1.95 2.13 0.00 2007 2.06 2.25 8.33 2008 1.73 1.83 0.00 2009 1.25 1.63 12.50 2010 2.01 2.18 2.27 2011 2.03 2.36 6.00 2012 2.98 2.98 17.56 2013 2.56 3.50 0.00 2014 2.84 3.02 8.96 2015 3.65 3.84 4.70 Means 2.21 2.46 5.72
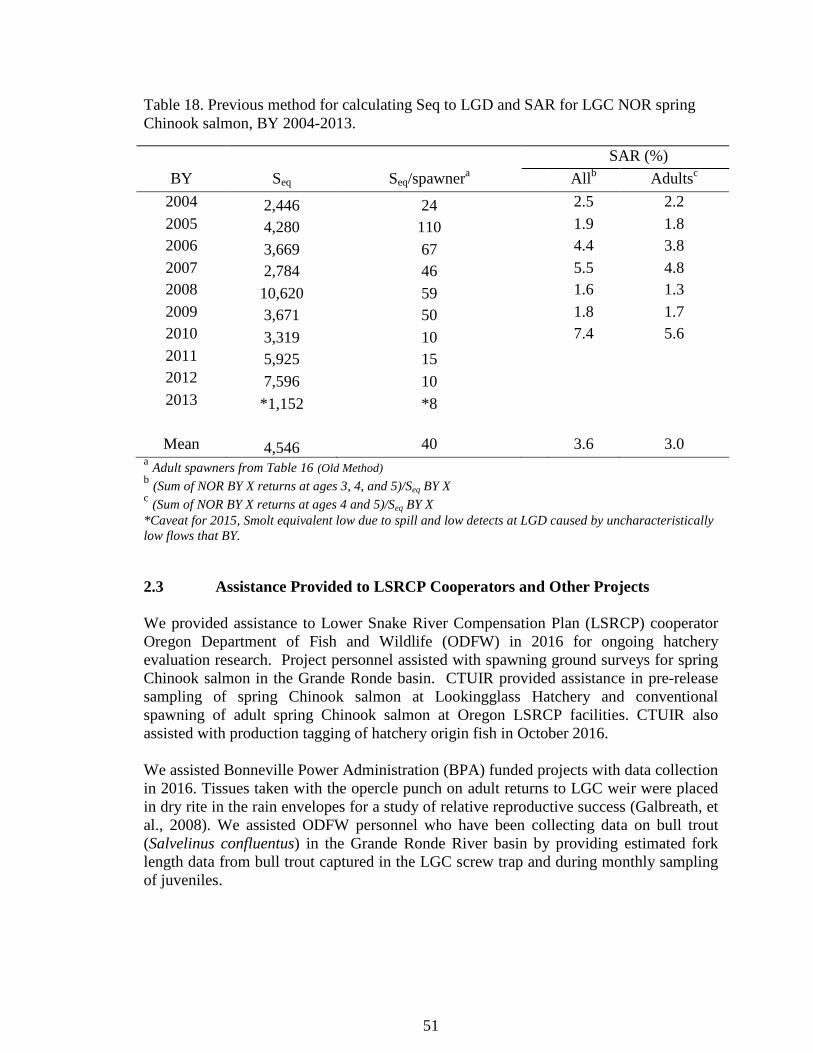
51
Table 18. Previous method for calculating Seq to LGD and SAR for LGC NOR spring Chinook salmon, BY 2004-2013.
SAR (%) BY Seq Seq/spawnera Allb Adultsc
2004 2,446 24 2.5 2.2 2005 4,280 110 1.9 1.8 2006 3,669 67 4.4 3.8 2007 2,784 46 5.5 4.8 2008 10,620 59 1.6 1.3 2009 3,671 50 1.8 1.7 2010 3,319 10 7.4 5.6 2011 5,925 15 2012 7,596 10 2013 *1,152 *8
Mean 4,546 40 3.6 3.0
a Adult spawners from Table 16 (Old Method) b (Sum of NOR BY X returns at ages 3, 4, and 5)/Seq BY X c (Sum of NOR BY X returns at ages 4 and 5)/Seq BY X *Caveat for 2015, Smolt equivalent low due to spill and low detects at LGD caused by uncharacteristically low flows that BY.
2.3 Assistance Provided to LSRCP Cooperators and Other Projects We provided assistance to Lower Snake River Compensation Plan (LSRCP) cooperator Oregon Department of Fish and Wildlife (ODFW) in 2016 for ongoing hatchery evaluation research. Project personnel assisted with spawning ground surveys for spring Chinook salmon in the Grande Ronde basin. CTUIR provided assistance in pre-release sampling of spring Chinook salmon at Lookingglass Hatchery and conventional spawning of adult spring Chinook salmon at Oregon LSRCP facilities. CTUIR also assisted with production tagging of hatchery origin fish in October 2016. We assisted Bonneville Power Administration (BPA) funded projects with data collection in 2016. Tissues taken with the opercle punch on adult returns to LGC weir were placed in dry rite in the rain envelopes for a study of relative reproductive success (Galbreath, et al., 2008). We assisted ODFW personnel who have been collecting data on bull trout (Salvelinus confluentus) in the Grande Ronde River basin by providing estimated fork length data from bull trout captured in the LGC screw trap and during monthly sampling of juveniles.

52
Lamprey Releases In May 2016, approximately 150 adult lamprey were transplanted into LGC in Unit 3L (Figure 28). There will be annual releases of lamprey each year as long as supply is available. This is of great historical and cultural significance to the CTUIR. Lamprey have never been released into LGC, however, there is documentation that they were present here over 50 years ago (Burck, 1993). Lamprey tend to spawn in the summer months of June and July, so 5 surveys were completed to observe them. These surveys occurred in conjunction with annual pre-spawn mortality surveys for spring Chinook salmon. We counted 14 completed lamprey redds during these surveys on Unit 3U and 3L (Figure 29). The observed lamprey redds were counted in areas where we currently see large numbers of Chinook redds also. No surveys were conducted on LLGC due to the release location being upstream of the confluence of LGC and LLGC. Staff from CTUIR in Umatilla conducted a survey on LGC to help teach us how to identify what a lamprey redd looks like.
Figure 28. Approximately 150 adult lamprey were released into LGC at rkm 6.0 in May of 2016.
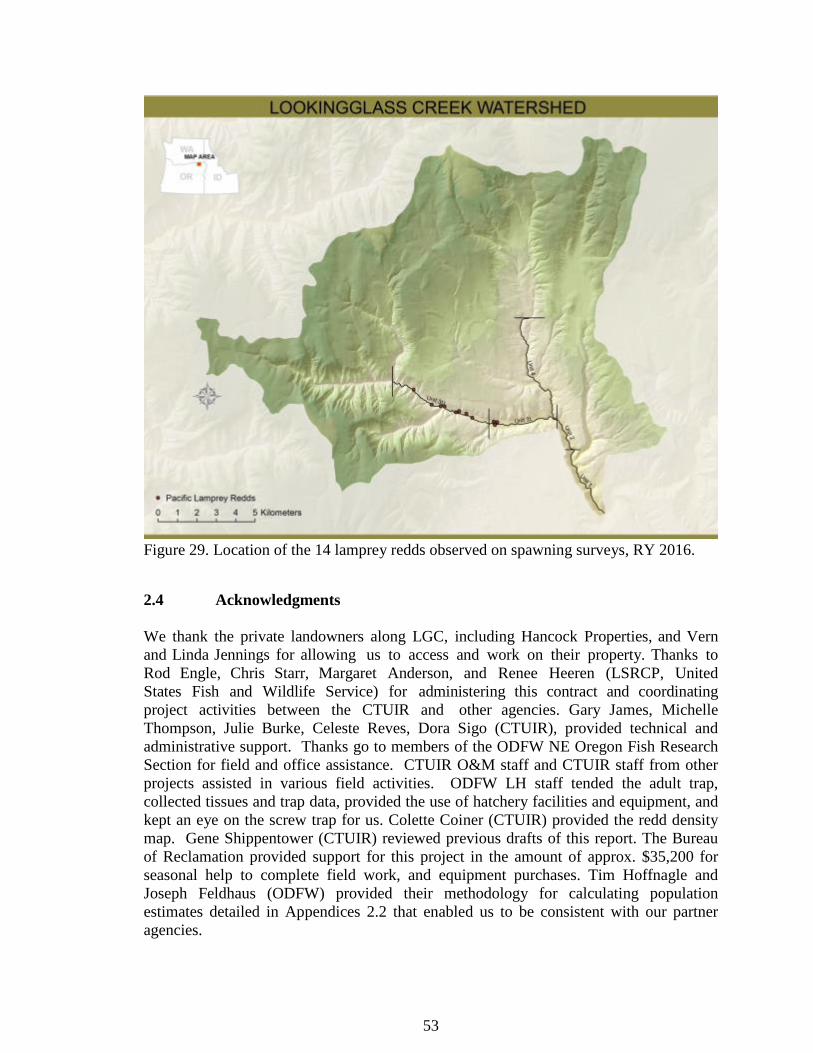
53
Figure 29. Location of the 14 lamprey redds observed on spawning surveys, RY 2016.
2.4 Acknowledgments We thank the private landowners along LGC, including Hancock Properties, and Vern and Linda Jennings for allowing us to access and work on their property. Thanks to Rod Engle, Chris Starr, Margaret Anderson, and Renee Heeren (LSRCP, United States Fish and Wildlife Service) for administering this contract and coordinating project activities between the CTUIR and other agencies. Gary James, Michelle Thompson, Julie Burke, Celeste Reves, Dora Sigo (CTUIR), provided technical and administrative support. Thanks go to members of the ODFW NE Oregon Fish Research Section for field and office assistance. CTUIR O&M staff and CTUIR staff from other projects assisted in various field activities. ODFW LH staff tended the adult trap, collected tissues and trap data, provided the use of hatchery facilities and equipment, and kept an eye on the screw trap for us. Colette Coiner (CTUIR) provided the redd density map. Gene Shippentower (CTUIR) reviewed previous drafts of this report. The Bureau of Reclamation provided support for this project in the amount of approx. $35,200 for seasonal help to complete field work, and equipment purchases. Tim Hoffnagle and Joseph Feldhaus (ODFW) provided their methodology for calculating population estimates detailed in Appendices 2.2 that enabled us to be consistent with our partner agencies.


![Nafarroako Gobernuaren hizkuntza politika. Plan …...1.5.1 Aukerak landu eta gizarteratu [35] 1.5.1.1 Haur eta gaztetxoen hizkuntza portaeretan eragiteko estrategiak landu eta garatu](https://img.pdfslide.net/doc/110x75/5f5564e0f2a1e005b3383e29/nafarroako-gobernuaren-hizkuntza-politika-plan-151-aukerak-landu-eta-gizarteratu.jpg)