Embed Size (px)
Citation preview
v
ANNUALFINANCIAL
RESULTS
PRESENTATIONfor the year ended
31 December 2016

v
Disclaimer 2
The operational and financial information on which any outlook or forecast statements are based has not been reviewed norreported on by the external auditors. These forward-looking statements are based on management’s current beliefs andexpectations and are subject to uncertainty and changes in circumstances. The forward-looking statements involve risks that mayaffect the group’s operational and financial information. Exxaro undertakes no obligation to update or reverse any forward-lookingstatements, whether as a result of new information or future developments.
Where relevant, comments exclude transactions which make the results not comparable. These exclusions are the responsibility ofthe group's board of directors and have been presented to illustrate the impact of these transactions on the core operations’performance and hence may not fairly present the group’s financial position, changes in equity, results of operations or cash flows.These exclusions have not been reviewed nor reported on by the group’s external auditors.
vv
Presentation format
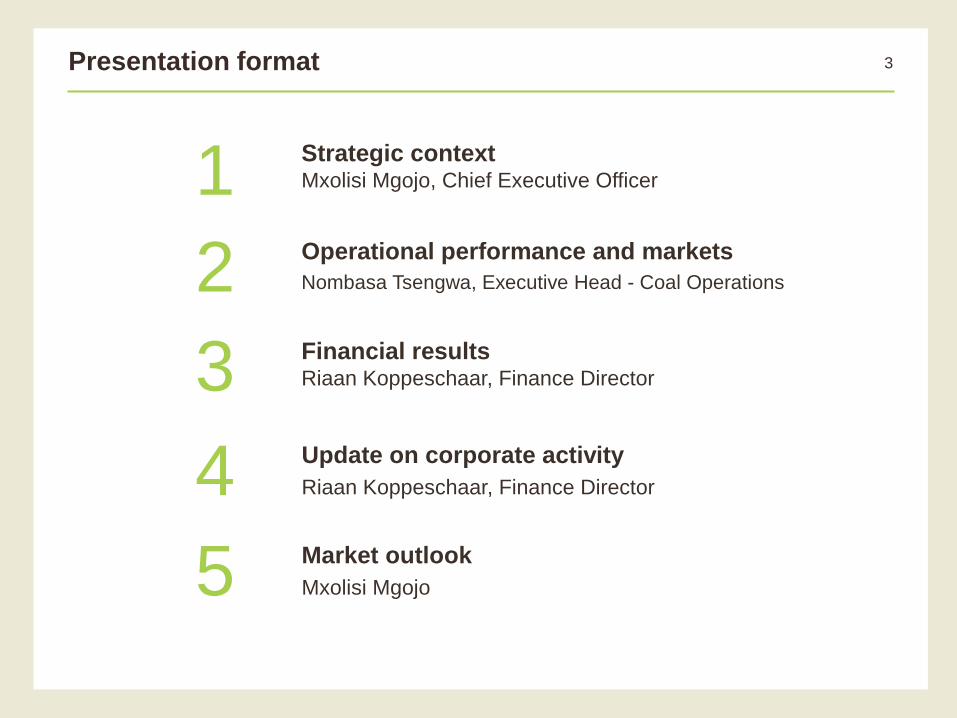
Strategic contextMxolisi Mgojo, Chief Executive Officer1
Financial resultsRiaan Koppeschaar, Finance Director3
Operational performance and markets
Nombasa Tsengwa, Executive Head - Coal Operations2
Update on corporate activity
Riaan Koppeschaar, Finance Director4
3
Market outlook
Mxolisi Mgojo5

v
Strategic contextMxolisi Mgojo1

v
FY16 – market recovery but uncertainty remains 5
• Seaborne coal and iron price
recovery supporting
restructuring efforts
• Share price recovered to a high
of R89/share as at 31 Dec 2016
from a low of R39/share in mid-
Dec 2015
• Significant changes in global
political & economic landscape –
BREXIT referendum, US interest
rates & European elections
• RSA real GDP growth for FY16
at 0.4% from 1.26% in FY15
• Continuing uncertainty of policy
environment on black economic
empowerment
Index: 1 January 2016 = 100

v
FY16 – all round robust performance for the year
FY16 FY15
Second year of zero
fatalities
• Fatalities = zero
• LTIFR = 0.09
Fatalities = zero
47%
Strategy delivering
improved operational
performance –
production and cost
• Export volumes at 7,9Mt
• Core NOP at R4,9bn
27%
46%
Improved market
conditions evidenced in
equity portfolio
• Income contribution from
equity-accounted
investments of R2,4bn
>100%
Returning cash to
shareholders
• HEPS of 1 302 cps
• Final dividend of 410 cps
185%
382%
6

v
• IRR and NPV
differentiated
• Prioritise capex for growth
- Secure coal volume
growth
- Cleaner energy
opportunities
• Prudent debt management
• Refinanced R8bn debt
facilities
• Maintained dividend
distribution policy
• Disposed Mayoko iron ore
project
• Evaluating Tronox and
SIOC shareholding
• Robust coal portfolio –
evaluating possible non-
core assets
• Black Mountain, Moranbah
and Chifeng – initiated
disposal process
• Efficiency improvements
through Operational
Excellence
• Cost saving from Exxaro
Improvement Project
• Drive innovation through
digitised platform
• Coal product placement
through Market Excellence
• BEE unwind & replacement
in process
Structure for resilience
FY16 – delivering on priorities to ensure a resilient business 7
Minimise costs, maximise operational output and optimise portfolio
Portfolio
improvement
Capital
allocation

v
8
• Compliant with mining regulations in respect of BB-BEE
• Structure is compliant with current
proposed amendments to BB-
BEE equity requirements
in mining sector
• Fully compliant with contractual obligations to Eskom in respect of its BB-BEE
• Being black controlled is a competitive
advantage and strategic lever in South
Africa
• Clear, neat and non-burdensome
black equity control creates
strategic options
beyond metals and
mining
• Utilise strategic
partnership with BEE
investors to drive growth in:
- Coal opportunities
- Cennergi
- Other energy opportunities
• Essential that Exxaro
maintains value of
investments:
- SIOC
- SA Mineral Sands
- Cennergi
Exxaro’s strategy of sustainable empowerment
Compliance
in a regulated
sector1
Maintaining
commercial
sustainability
of the
business
Protecting
and
delivering
value on
investments
Equipping
Exxaro for
growth
2
3 4
Ongoing empowerment critical to preserving and creating shareholder value
Refer to: slide 51 for detail on BBBEE composition of consortium

v
Operational performance and marketsNombasa Tsengwa2

v
0.29
0.19 0.19 0.17
0.09
FY12 FY13 FY14 FY15 FY16
Target
0.15
Target
0.21
2
1
FY12 FY13 FY14 FY15 FY16
Reportable fatalities
LTIFR
Safety and health
• No fatalities
• LTIFR* improved by 47% to 0.09 against
FY15
• Routine assessment of occupational and
chronic diseases to actively manage
Key environmental risks
• Climate change
- Alignment to COP21 agreement continues
• Water stewardship
- Water intensity improved by 13%
- Matla and NBC water treatment plants
ramped up
Community
• 99.2% of the approved R48,6m for SLP
LED** projects and corporate commitments
spent
• Highest spend in Focus areas:
- Education: 43%
- Skills Development: 18%
- Sports & Recreation: 12%
SHEC – established a foundation for sustainable development 10
-47%
Refer to: slide 35 for detailed community development expenditure* Lost time injury frequency rate ** Local economic development

v
27.8 27.9 28.5 33.7 34.941.2 39.2
13.3 12.0 12.09.3 7.9
8.5 8.10.3 0.9 1.2 0.6
FY12 FY13 FY14 FY15 FY16 FY17* FY18*
Commercial Tied Buy-ins
Continuing growth in coal production and sales volumes 11
Total coal production (Mt)
-2%
23.0 23.5 24.2 28.0 28.0 31.5 32.6
13.3 12.1 12.09.3 7.9
8.5 8.13.9 4.5 5.3 6.2 7.97.4 7.0
FY12 FY13 FY14 FY15 FY16 FY17* FY18*
Domestic Tied Export
Total coal sales (Mt)
+1%
Tonnages movement (Mt)
FY16
vs
FY15
Production Sales
Reduction due to
closure(2,4) (2,6)
─ Arnot (1,4) (1,4)
─ Inyanda (1,0) (1,2)
Increase due to
addition2,5 2,5
─ ECC
(FY16 vs 4 months FY15)2,5 2,5
Refer to slides 36,37,38 and 39 for detailed statistics*Based on latest internal forecast
v
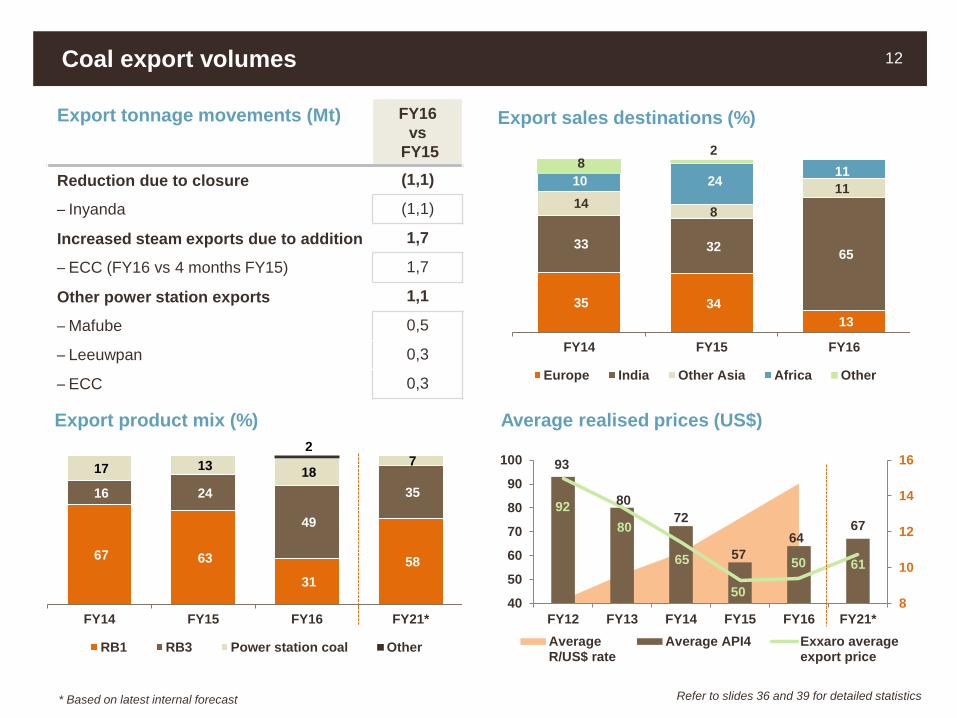
Coal export volumes 12
Average realised prices (US$)
Export tonnage movements (Mt) FY16
vs
FY15
Reduction due to closure (1,1)
─ Inyanda (1,1)
Increased steam exports due to addition 1,7
─ ECC (FY16 vs 4 months FY15) 1,7
Other power station exports 1,1
─ Mafube 0,5
─ Leeuwpan 0,3
─ ECC 0,3
93
80
72
57
6467
92
80
65
50
50 61
8
10
12
14
16
FY12 FY13 FY14 FY15 FY16 FY21*
40
50
60
70
80
90
100
AverageR/US$ rate
Average API4 Exxaro averageexport price
67 63
31
58
16 24
49
35
17 13 18
7 2
FY14 FY15 FY16 FY21*
RB1 RB3 Power station coal Other
Export product mix (%)
35 34
13
33 32 65
14 8
11 10 24
11 8
2
FY14 FY15 FY16
Europe India Other Asia Africa Other
Export sales destinations (%)
* Based on latest internal forecast Refer to slides 36 and 39 for detailed statistics
v
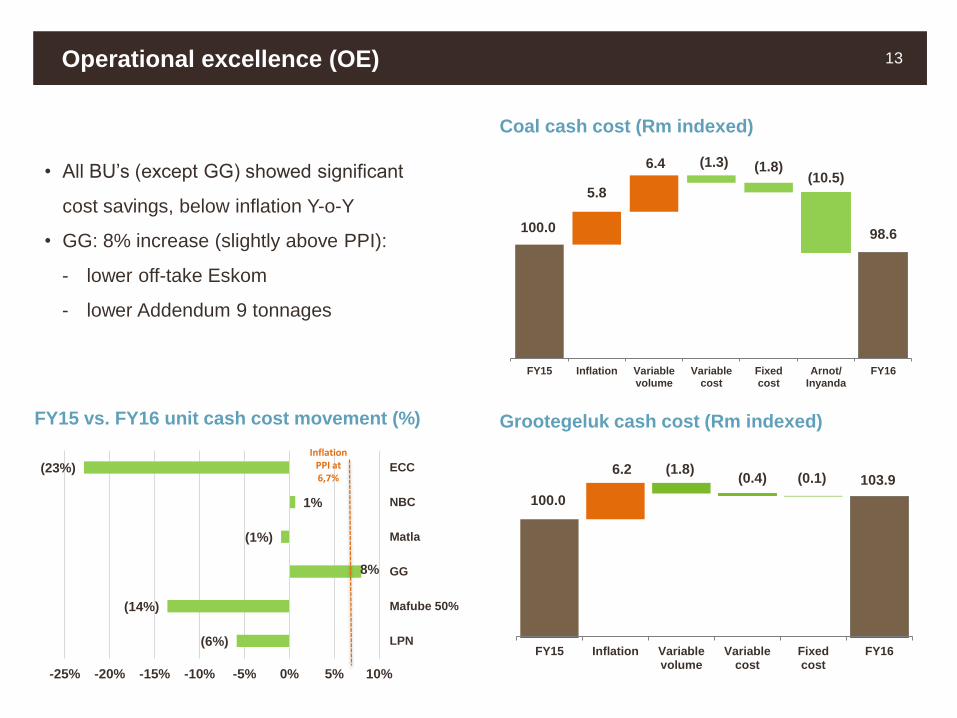
Operational excellence (OE) 13
100.0
5.8
6.4 (1.3) (1.8)(10.5)
98.6
FY15 Inflation Variablevolume
Variablecost
Fixedcost
Arnot/Inyanda
FY16
Coal cash cost (Rm indexed)
100.0
6.2 (1.8)(0.4) (0.1) 103.9
FY15 Inflation Variablevolume
Variablecost
Fixedcost
FY16
Grootegeluk cash cost (Rm indexed)FY15 vs. FY16 unit cash cost movement (%)
• All BU’s (except GG) showed significant
cost savings, below inflation Y-o-Y
• GG: 8% increase (slightly above PPI):
- lower off-take Eskom
- lower Addendum 9 tonnages
(6%)
(14%)
8%
(1%)
1%
(23%)
-25% -20% -15% -10% -5% 0% 5% 10%
LPN
Mafube 50%
GG
Matla
NBC
ECC
Inflation PPI at 6,7%
v
Coal projects will drive growth* 14
GG6 phase 2
• Capex: R4,8bn
• Product: 2,7Mtpa of semi soft coking coal
• 1st production: FY20
Belfast
• Capex: R3,2bn
• Product: 2,7Mtpa of thermal coal
• 1st production: 4Q19
Thabametsi phase 1
• Capex: R2,8bn
• Product: 3,9Mtpa of thermal coal
• 1st production: FY20
• Thabametsi IPP – notice to proceed granted
Matla Mine 1 Relocation
• Capex: R1,7bn
• 1st production: 3Q19
Rapid load out station
• Capex: R1,3bn
• Load capacity: 12Mtpa
• 1st production: 2Q19
Grootegeluk Discard Inpit Phase 2
• Capex: R0,6bn
* Based on latest internal forecast Refer to slide 41 for detailed project schedule

v0
1,000
2,000
3,000
4,000
FY16 FY17* FY18* FY19* FY20* FY21*
…and growth capex adequately provided 15
Waterberg 312 738 2,363 2,747 1,782 -
Other 55 489 1,124 513 874 18
Total 367 1,227 3,487 3,260 2,656 18
Previous
guidance496 2,094 3,537 2,295 887
0
1,000
2,000
3,000
4,000
FY16 FY17* FY18* FY19* FY20* FY21*
1,940 2,652 2,030 1,620 1,460 2,145
440 931 543 511 462 479
2,380 3,583 2,573 2,131 1,922 2,624
2,232 2,381 2,038 1,333 986
Sustaining capital profile (Rm)Expansion capital profile (Rm)
Refer to slide 42 for additional detail*Based on latest internal forecast

v
Financial resultsRiaan Koppeschaar3
v
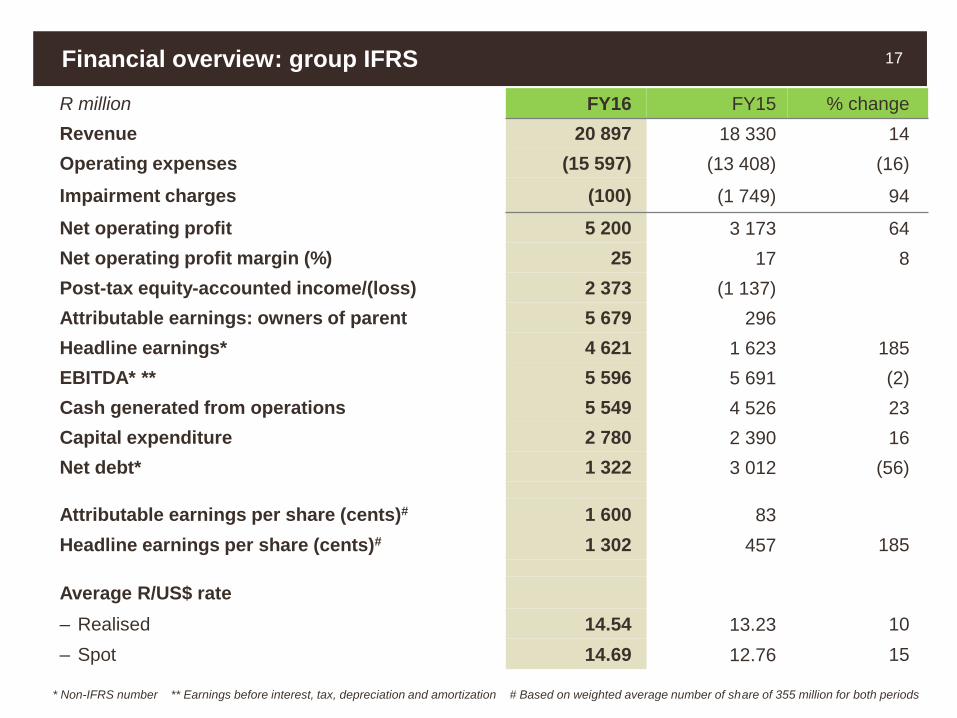
Financial overview: group IFRS 17
R million FY16 FY15 % change
Revenue 20 897 18 330 14
Operating expenses (15 597) (13 408) (16)
Impairment charges (100) (1 749) 94
Net operating profit 5 200 3 173 64
Net operating profit margin (%) 25 17 8
Post-tax equity-accounted income/(loss) 2 373 (1 137)
Attributable earnings: owners of parent 5 679 296
Headline earnings* 4 621 1 623 185
EBITDA* ** 5 596 5 691 (2)
Cash generated from operations 5 549 4 526 23
Capital expenditure 2 780 2 390 16
Net debt* 1 322 3 012 (56)
Attributable earnings per share (cents)# 1 600 83
Headline earnings per share (cents)# 1 302 457 185
Average R/US$ rate
– Realised 14.54 13.23 10
– Spot 14.69 12.76 15
* Non-IFRS number ** Earnings before interest, tax, depreciation and amortization # Based on weighted average number of share of 355 million for both periods

v
R million FY16 FY15
Coal 248 (1 722)
– Sale of core assets 303
– Impairment charges (1 749)
– (Loss)/gain on disposal of other non-core assets and VSPs (55) 27
Ferrous 579 94
– Mayoko iron ore project 670 11
– Impairment charges (100)
– Gain on disposal of other non-core assets and VSPs 9 83
Other (568) 1 411
– ECC contingent consideration adjustment (445)
– Foreign exchange gains: TCSA acquisition price and liquidation of foreign entities 1 759
– Loss on disposal of other non-core assets, VSPs and other (123) (348)
Non-core adjustment impact on net operating profit 259 (217)
Tax on items with impact on net operating profit 40 28
Post-tax equity-accounted income/(loss) 207 (1 025)
– SIOC 192 (863)
– RBCT 35
– Mafube (15)
– Tronox (5) (162)
Total non-core adjustment impact on attributable earnings 506 (1 214)
Financial overview: non-core adjustments 18
v
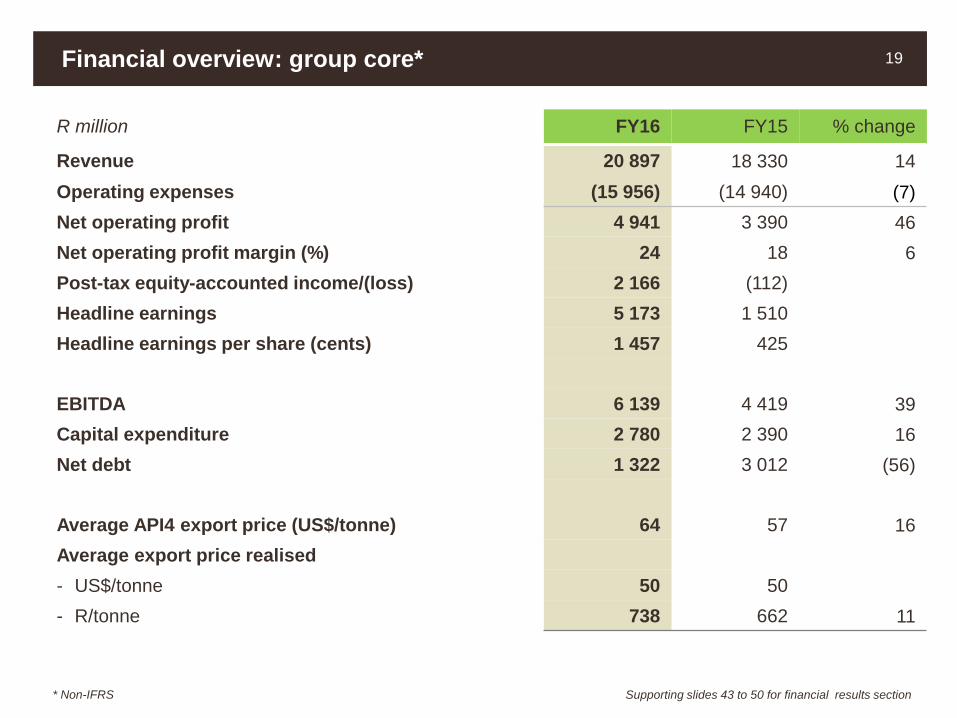
R million FY16 FY15 % change
Revenue 20 897 18 330 14
Operating expenses (15 956) (14 940) (7)
Net operating profit 4 941 3 390 46
Net operating profit margin (%) 24 18 6
Post-tax equity-accounted income/(loss) 2 166 (112)
Headline earnings 5 173 1 510
Headline earnings per share (cents) 1 457 425
EBITDA 6 139 4 419 39
Capital expenditure 2 780 2 390 16
Net debt 1 322 3 012 (56)
Average API4 export price (US$/tonne) 64 57 16
Average export price realised
- US$/tonne 50 50
- R/tonne 738 662 11
Financial overview: group core* 19
Supporting slides 43 to 50 for financial results section * Non-IFRS
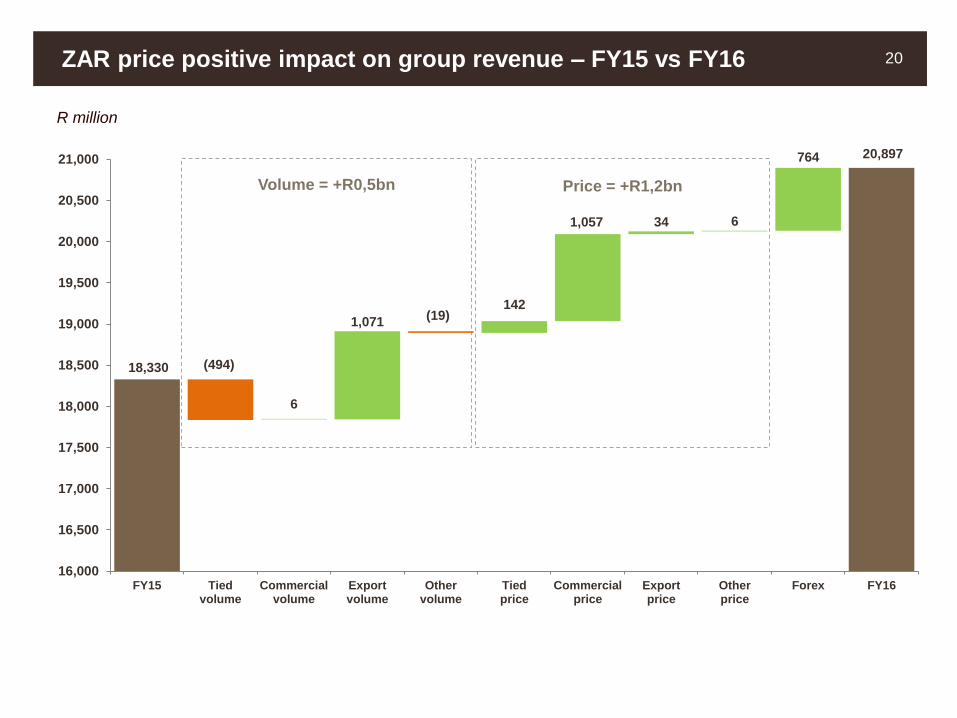
v18,330 (494)
6
1,071(19)
142
1,057 34 6
764 20,897
16,000
16,500
17,000
17,500
18,000
18,500
19,000
19,500
20,000
20,500
21,000
FY15 Tiedvolume
Commercialvolume
Exportvolume
Othervolume
Tiedprice
Commercialprice
Exportprice
Otherprice
Forex FY16
Price = +R1,2bnVolume = +R0,5bn
R million
ZAR price positive impact on group revenue – FY15 vs FY16 20

v
3 173217 3 390 (384) 332 (379)
943 (64)
955
450 (302)
4 941259 5 200
…translating into group net operating profit: core – FY15 vs FY16 21
IFRS
FY15
Non-core
items
Core
FY15Inflation Forex Rehab Price Volume Cost ECC Inyanda
Core
FY16
Non-core
items
IFRS
FY16
Coal 2 574 1 722 4 296 (342) 13 (375) 931 (70) 317 450 (302) 4 918 248 5 166
Ferrous (306) (94) (400) (7) 24 1 12 (1) 357 (13) 579 566
Other 905 (1 411) (506) (35) 295 (5) 7 281 36 (568) (532)
3 173 217 3 390 (384) 332 (379) 943 (64) 955 450 (302) 4 941 259 5 200
Outside
management
control
Inside
management
control
R million

v
Attributable earnings: core 22
R million FY16 FY15 % change
Net operating profit 4 941 3 390 46
Net financing cost (628) (668) 6
Income from other investments 1
Post-tax equity-accounted income/(loss) 2 166 (112)
• SIOC 2 224 967 130
• Tronox (379) (1 341) 72
• Mafube 253 253
• Cennergi 3 (53) 106
• Black Mountain 100 64 56
• RBCT (35) (4)
• SDCT 2
Tax (1 294) (1 130) (15)
Non-controlling interests (12) 29 (141)
Attributable earnings: owners of parent 5 173 1 510
Attributable earnings per share (cents) 1 457 425
Supporting slides 43 to 50 for financial results section
v
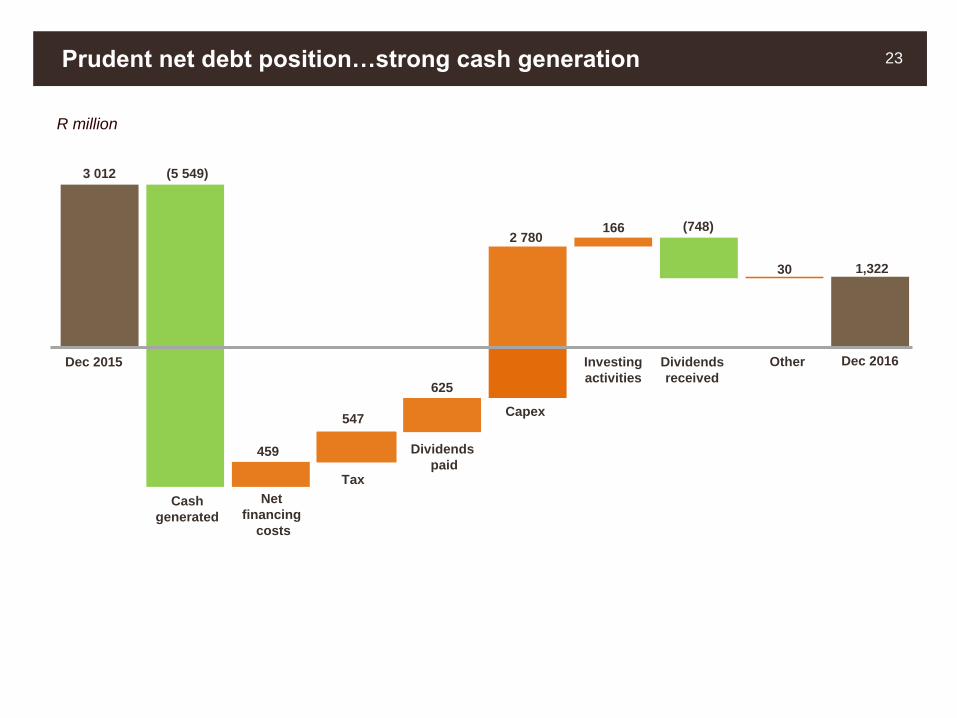
3 012 (5 549)
459
547
625
2 780166 (748)
30 1,322
Prudent net debt position…strong cash generation 23
Dec 2015
Cash
generated
Net
financing
costs
Dividends
paidTax
Capex
Investing
activities
Dividends
received
Other Dec 2016
R million

v
…supporting dividend distribution to shareholders 24
Total
dividend
Final
dividend
Interim
dividend
31 Dec
2016
31 Dec
2016
30 Jun
2016
Attributable earnings per share* (cents) 1 457 1 133 324
Dividend declared per share (cents) 500 410 90
Dividend cover* (times) 3,2 2,9 3,5
Dividend declared (Rm) 1 610 1 289 321
• BEE Holdco 653 486 167
• Anglo 32 32
• Public 911 792 119
• Employee empowerment (Mpower 2012) 14 11 3
* Adjusted for non-cash non-core items Supporting slides 43 to 50 for financial results section
v
Update on corporate activityRiaan Koppeschaar4
v
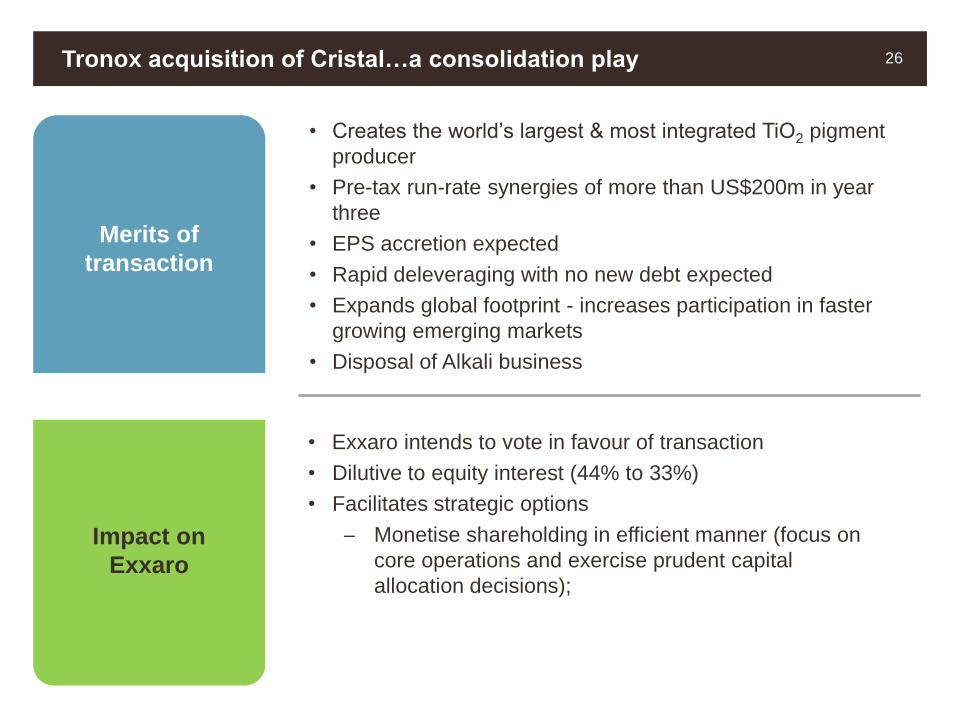
Merits of
transaction
Tronox acquisition of Cristal…a consolidation play 26
• Creates the world’s largest & most integrated TiO2 pigment
producer
• Pre-tax run-rate synergies of more than US$200m in year
three
• EPS accretion expected
• Rapid deleveraging with no new debt expected
• Expands global footprint - increases participation in faster
growing emerging markets
• Disposal of Alkali business
• Exxaro intends to vote in favour of transaction
• Dilutive to equity interest (44% to 33%)
• Facilitates strategic options
─ Monetise shareholding in efficient manner (focus on
core operations and exercise prudent capital
allocation decisions);
Impact on
Exxaro

v
Replacement BEE Transaction…sustainable black ownership 27
Implementation
agreement
signed
Initial terms
announcement
made
Anglo American and
MS333 market
placement
MS333
specific
repurchase
Agreement of
Replacement BEE
Transaction and unwind
Implementation
of Replacement
BEE Transaction
and unwind
Where we are now:
21 Nov
2016
22 Nov
2016
1 Dec
2016
20 Jan
2017
9 Mar
201730 Apr
2017
31 Jul
2017
v
Replacement BEE Transaction...sustainable black ownership (cont’d) 28
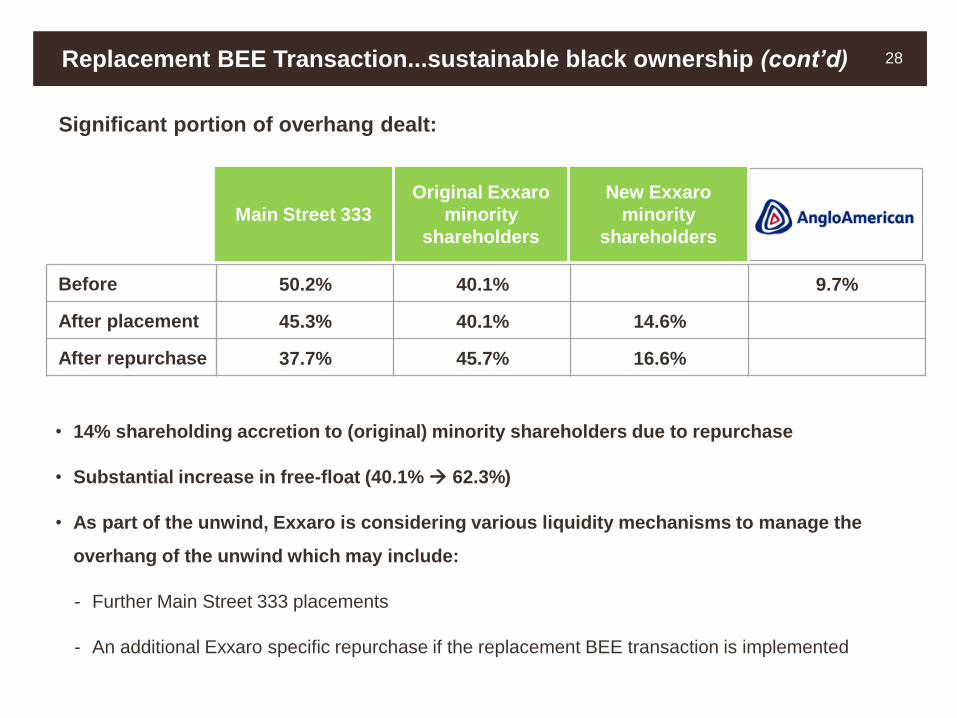
Significant portion of overhang dealt:
• 14% shareholding accretion to (original) minority shareholders due to repurchase
• Substantial increase in free-float (40.1% 62.3%)
• As part of the unwind, Exxaro is considering various liquidity mechanisms to manage the
overhang of the unwind which may include:
- Further Main Street 333 placements
- An additional Exxaro specific repurchase if the replacement BEE transaction is implemented
Before 50.2% 40.1% 9.7%
After placement 45.3% 40.1% 14.6%
After repurchase 37.7% 45.7% 16.6%
Original Exxaro
minority
shareholders
Main Street 333
New Exxaro
minority
shareholders
v
Replacement BEE Transaction…sustainable black ownership (cont’d) 29
Empowerment at listed level strongly preferred:
• Strategic BEE partner retains significant influence in Exxaro
• Allows existing shareholders to reinvest in a liquid instrument
• Enables third party funding of transaction on share cover
• Transparent valuation
Empowerment at subsidiary level is not efficient:
• Will require group restructure
• Will impair group’s borrowing ability
• Administrative and governance burden
• Cost likely to be higher:
- reduced third party funding;
- reduced BEE equity (if any); and
- transaction to occur at coal fair value
v
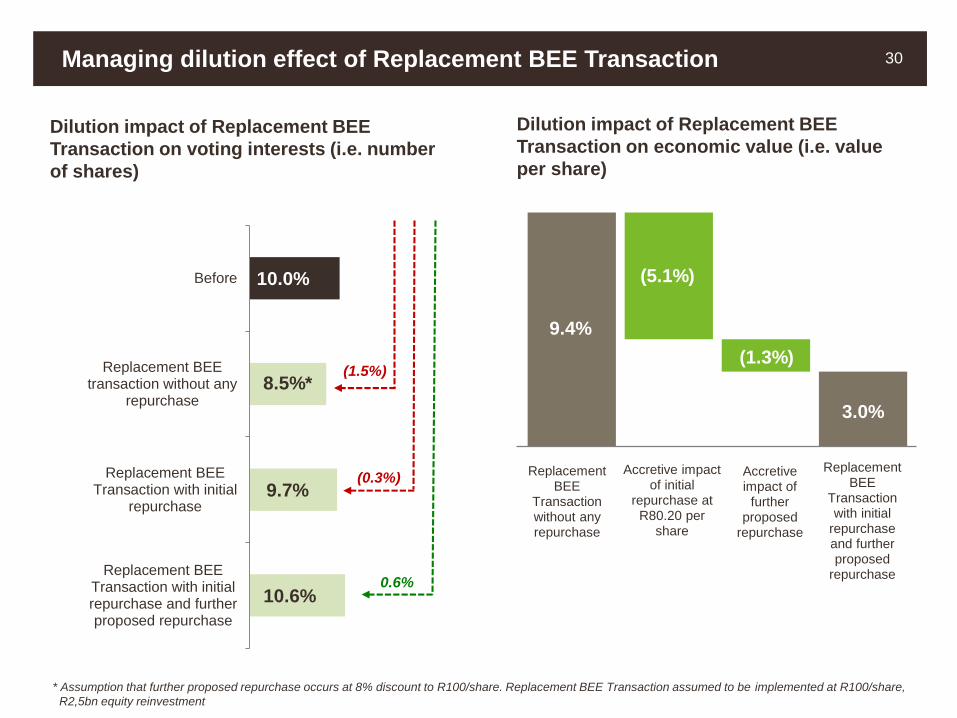
Managing dilution effect of Replacement BEE Transaction 30
10.6%
9.7%
8.5%*
10.0%
Replacement BEETransaction with initialrepurchase and furtherproposed repurchase
Replacement BEETransaction with initial
repurchase
Replacement BEEtransaction without any
repurchase
Before
(1.5%)
(0.3%)
0.6%
Dilution impact of Replacement BEE
Transaction on voting interests (i.e. number
of shares)
Dilution impact of Replacement BEE
Transaction on economic value (i.e. value
per share)
Replacement BEE
Transaction without any repurchase
Accretive impact of initial
repurchase at R80.20 per
share
Accretive impact of
further proposed
repurchase
Replacement BEE
Transaction with initial
repurchase and further proposed
repurchase
9.4%
(5.1%)
(1.3%)
3.0%
* Assumption that further proposed repurchase occurs at 8% discount to R100/share. Replacement BEE Transaction assumed to be implemented at R100/share,
R2,5bn equity reinvestment

v
OutlookMxolisi Mgojo5

v
Market Outlook for 2017 32
• Supportive market conditions in coal expected
• Expected improvement in the coal business
• Volatile Rand exchange rate against the US dollar expected
• Investment portfolio (SIOC and Tronox) expected to be positively influenced by a
favourable price outlook

v
Thank you
33

v
Additional information
v
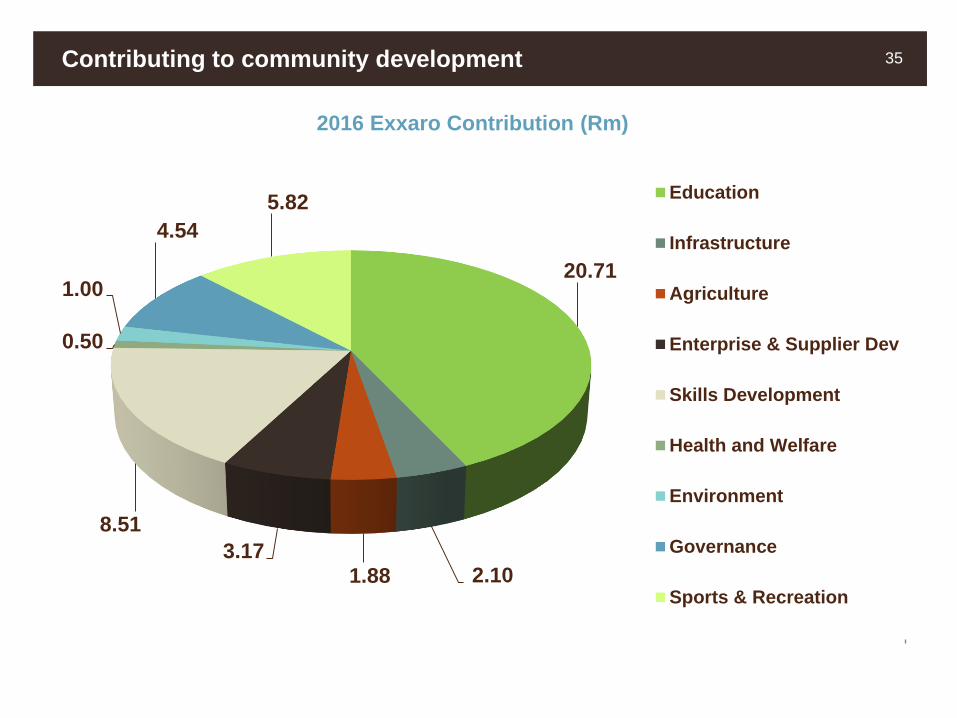
Contributing to community development 35
20.71
2.10 1.88 3.17
8.51
0.50
1.00
4.54
5.82
2016 Exxaro Contribution (Rm)
Education
Infrastructure
Agriculture
Enterprise & Supplier Dev
Skills Development
Health and Welfare
Environment
Governance
Sports & Recreation

v
Sales to Eskom 31 483 33 377 29 922 33 484 33 942
• Grootegeluk 15 306 19 521 18 914 22 105 25 122
• Matla 10 368 7 869 7 893 8 512 8 118
• NBC 2 531 2 732 2 699 2 867 702
• Leeuwpan 1 838 1 854 416
• Arnot 1 440 1 401
Other domestic sales 3 078 2 587 4 709 5 254 5 245
Exports 5 291 6 182 7 858 7 410 7 029
Total thermal coal sales 39 852 42 146 42 489 46 148 46 216
Thermal coal volumes 36
'000 tonnes FY14 FY15 FY16 FY17 FY18
Production 38 217 41 100 40 811 47 217 44 817
• Grootegeluk 16 719 21 637 20 616 26 028 26 995
• Matla 10 374 7 859 7 900 8 530 8 135
• ECC* 1 365 3 904 4 050 4 026
• Leeuwpan 4 107 3 786 3 774 3 806 4 094
• NBC 2 602 2 870 2 857 3 127 627
• Mafube** 1 342 1 147 1 760 1 676 940
• Arnot 1 440 1 401
• Inyanda 1 633 1 035
Buy-ins** 860 1 222 606
Total thermal production (including buy-ins) 39 077 42 322 41 417 47 217 44 817
* Included for four months in FY15 ** Reclassified Mafube production which was previously reported under buy-ins to Exxaro production

v
Metallurgical coal volumes 37
'000 tonnes FY14 FY15 FY16 FY17 FY18
Production 2 274 1 856 1 985 2 451 2 458
• Grootegeluk 2 120 1 856 1 985 2 451 2 458
• Tshikondeni 154
Sales 1 689 1 341 1 298 1 296 1 453
• Domestic 1 689 1 341 1 298 1 296 1 453

v
* FY17 and FY18 based on latest internal forecast ** Other consisted of Tshikondeni, Inyanda, NCC, ECC, Mafube and Reductants
Domestic market sales volumes per mine 38
17.0 17.3 18.2
22.3 21.825.0
28.2
10.9 10.110.4
7.9 7.9
8.5
8.1
2.1 1.61.4
1.43.4
3.33.2
2.9
2.8
2.9
3.0
2.32.6
2.52.7
3.0
3.0
0.9
0.70.8
0.60.2
0.6
0.8 0.6
0
5
10
15
20
25
30
35
40
45
FY12 FY13 FY14 FY15 FY16 FY17* FY18*
Grootegeluk Matla Arnot Leeuwpan NBC Other**
Million tonnes

v
* FY17 and FY18 based on latest internal forecast ** Buy-ins and inventory
Export market sales volumes per mine 39
0.3 0.5 0.8 0.8 1.0 0.9 1.10.70.6
0.80.4
1.0 1.41.51.5
3.53.6
3.5
0.6 0.5
1.51.6 1.3
1.11.1
1.21.4
1.1
1.71.5 0.9
-0.2
1.0
1.3
0.6
-1
0
1
2
3
4
5
6
7
8
9
FY12 FY13 FY14 FY15 FY16 FY17* FY18*
Leeuwpan Grootegeluk ECC NCC Inyanda Mafube Other**
Million tonnes
v
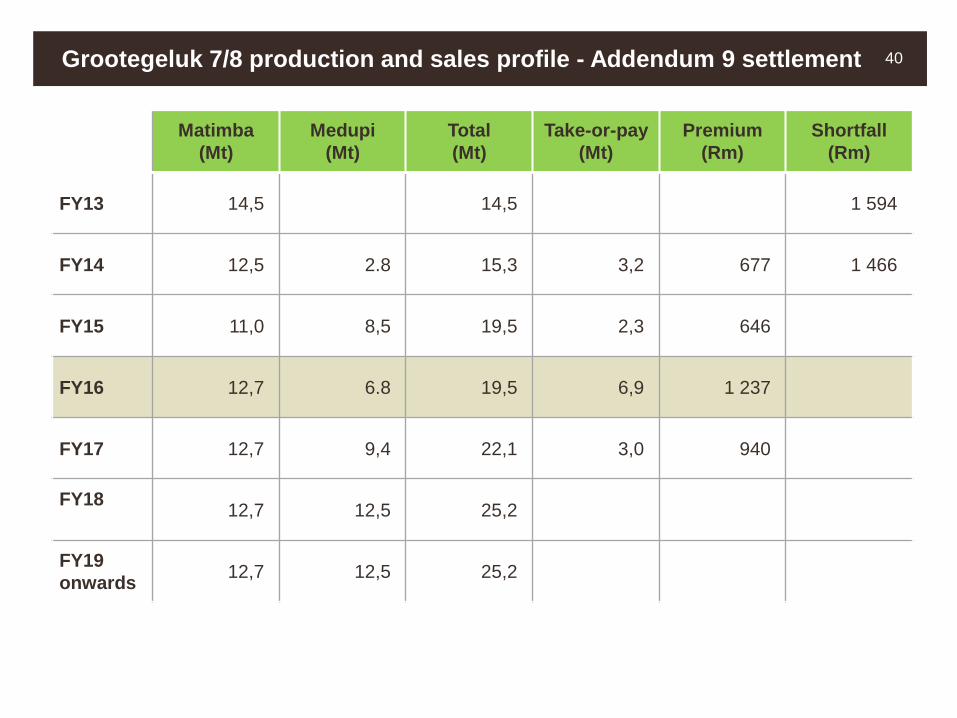
Grootegeluk 7/8 production and sales profile - Addendum 9 settlement 40
Matimba
(Mt)
Medupi
(Mt)
Total
(Mt)
Take-or-pay
(Mt)
Premium
(Rm)
Shortfall
(Rm)
FY13 14,5 14,5 1 594
FY14 12,5 2.8 15,3 3,2 677 1 466
FY15 11,0 8,5 19,5 2,3 646
FY16 12,7 6.8 19,5 6,9 1 237
FY17 12,7 9,4 22,1 3,0 940
FY1812,7 12,5 25,2
FY19
onwards12,7 12,5 25,2

v
Coal mega projects* 41
1H17 • GG6 phase 2 investment decision expected 1Q17
• Belfast rezoning appeal outcome expected 2Q17
• Thabametsi mine phase 1 construction expected to commence
2Q17
• Matla Mine 1 Relocation – awaiting Eskom funding approval
• GG rapid load out station construction continues
• Grootegeluk Discard Inpit Project Phase 2 – construction continues
2H17 • GG6 phase 2 construction expected to commence 3Q17
• Belfast construction expected to commence 3Q17
• Thabametsi mine phase 1 – construction continues. Notice to
proceed for full construction expected 4Q17 by Department of
Energy
• GG rapid load out station construction continues
• Grootegeluk Discard Inpit phase 2 – project completion expected
4Q17
FY18 • GG6 phase 2 construction continues
• Belfast construction continues
• Thabametsi mine phase 1 construction continues
• GG rapid load out station construction continues
FY19 • GG6 phase 2 construction continues
• Belfast first production 4Q19
• Thabametsi mine phase 1 construction continues
• Matla Mine 1 Relocation 1st production 3Q19
• GG rapid loud out station commissioning 2Q19
GG6 phase 2
• Capex: R4,8bn
• Product: 2,7Mtpa of semi soft coking coal
• 1st production: FY20
Belfast
• Capex: R3,2bn
• Product: 2,7Mtpa of thermal coal
• 1st production: 4Q19
Thabametsi phase 1
• Capex: R2,8bn
• Product: 3,9Mtpa of thermal coal
• 1st production: FY20
Matla Mine 1 Relocation
• Capex: R1,7bn
• 1st production: 3Q19
Rapid load out station
• Capex: R1,3bn
• Load capacity: 12Mtpa
• 1st production: 2Q19
GG Discard Inpit Phase 2
• Capex: R0,6bn
* Based on latest internal forecast

v
Capital expenditure: coal 42
R millionActual Forecast*
FY15 FY16 FY17 FY18 FY19 FY20 FY21
Sustaining 1,597 2,380 3,583 2,573 2,131 1,922 2,624
– GG load out station 8 76 543 375 301 - -
– GG trucks, shovels and stacker
reclaimers
833 596 1,080 355 558 520 817
– GG backfill phase 2 115 400 200 - - - -
– GG other 401 868 829 1,300 761 940 1,328
– Leeuwpan OI reserve - 86 303 73 48 9 -
– ECC 82 200 300 227 305 175 197
– Other operations 158 154 328 243 158 278 282
Expansion 716 367 1,227 3,487 3,260 2,656 18
– GMEP 226
– GG6 phase 2 12 125 521 1,805 1,443 899 -
– Other GG 370 184 150 - - - -
– Thabametsi phase 1 1 3 67 558 1,304 883 -
– Belfast 85 55 489 1,124 513 874 18
– Other 22
Total coal capital expenditure 2,313 2,747 4,810 6,060 5,391 4,578 2,642
– Waterberg 1,966 2,252 3,390 4,393 4,367 3,242 2,145
– Other 347 495 1,420 1,667 1,024 1,336 497
Previous guidance 2,728 4,475 5,575 3,628 1,873

v
R million FY16 FY15
EBITDA (core) 6 139 4 419
• Fair value adjustment of contingent consideration (445)
• Voluntary severance packages and termination costs (98) (408)
• Foreign exchange gains: TCSA acquisition price and liquidation of foreign entities 1 759
• Partial reversal of previous write-off of financial assets at Mayoko 11
• Other (90)
EBITDA 5 596 5 691
• Unrealised foreign exchange and other fair value movements 17 (1 479)
• Fair value contingent consideration 445
• Provisions raised 898 (69)
• Impairment or write-down of receivable 39 77
• Indemnification asset movement (56)
• Share-based payment expense 269 137
• Transaction cost amortised 5 5
• Other unrealised foreign exchange movements (36) 411
• Cost recovery of tied mines not yet received and other (895) (353)
Cash generated before working capital movements 6 282 4 420
Cash generated before working capital movements vs EBITDA 43

v
R million FY16 FY15 % change
Depreciation and amortisation
Coal 1 084 951 14
• Tied operations 12 24 (50)
• Commercial operations 1 072 927 16
Ferrous 7 11 (36)
• FerroAlloys 7 7
• Other 4
Other 107 67 60
Total depreciation and amortisation 1 198 1 029 16
Group depreciation, amortisation and EBITDA: core 44
EBITDA
Coal 6 002 5 247 14
• Tied operations 238 267 (11)
• Commercial operations 5 764 4 980 16
Ferrous (6) (389) 98
• Iron ore (66) (391) 83
• FerroAlloys 32 20 60
• Other 28 (18)
Other 143 (439) 133
Total EBITDA 6 139 4 419 39

v
2 159 (134)2 025 (181)
(79)
1 236126 (298)
87 2 916125 3 041
Group net operating profit: core - 1H16 vs 2H16 45
Outside
management
control
Within
management
control
IFRS
1H16
Non-
core
items
Core
1H16Inflation Forex Price Volume Cost Rehab
Core
2H16
Non-
core
items
IFRS
2H16
Coal 2 232 (188) 2 044 (162) (1) 1 269 48 (408) 84 2 874 60 2 934
Ferrous (52) (1) (53) (3) (3) (33) 95 35 2 40 578 618
Other (21) 55 34 (16) (75) (17) 75 1 2 (513) (511)
2 159 (134) 2 025 (181) (79) 1 236 126 (298) 87 2 916 125 3 041
R million
v
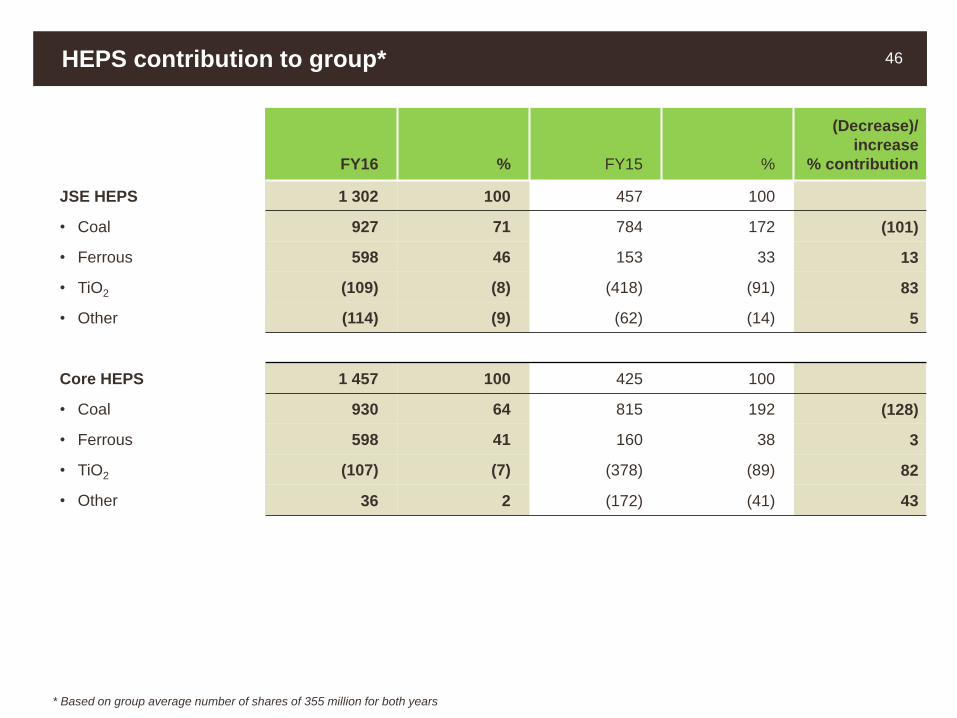
HEPS contribution to group* 46
FY16 % FY15 %
(Decrease)/
increase
% contribution
JSE HEPS 1 302 100 457 100
• Coal 927 71 784 172 (101)
• Ferrous 598 46 153 33 13
• TiO2 (109) (8) (418) (91) 83
• Other (114) (9) (62) (14) 5
Core HEPS 1 457 100 425 100
• Coal 930 64 815 192 (128)
• Ferrous 598 41 160 38 3
• TiO2 (107) (7) (378) (89) 82
• Other 36 2 (172) (41) 43
* Based on group average number of shares of 355 million for both years
v
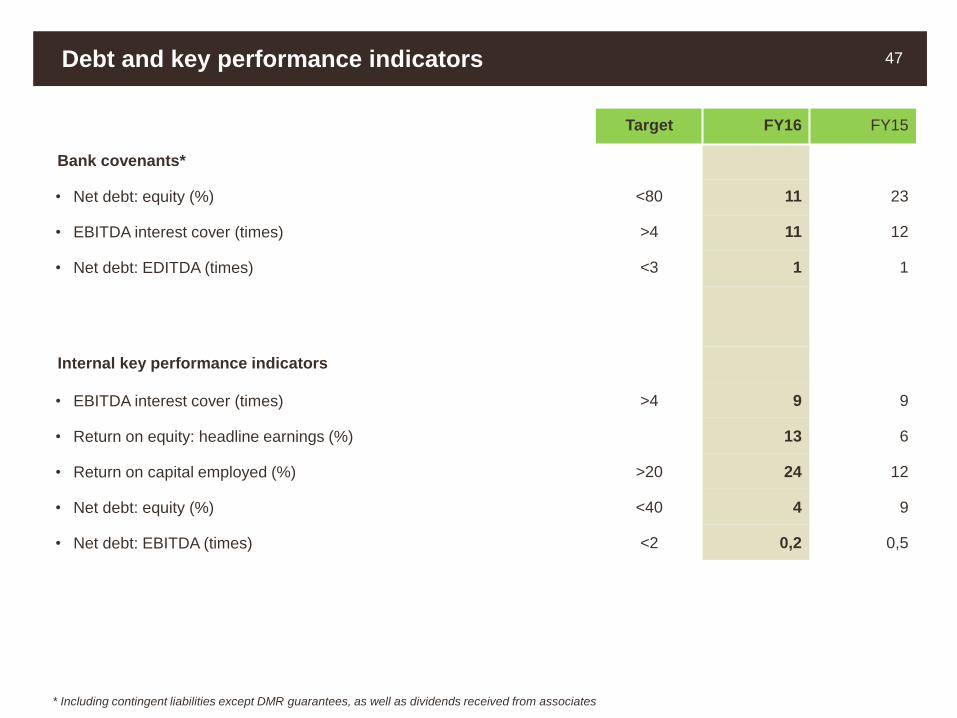
Debt and key performance indicators 47
Target FY16 FY15
Bank covenants*
• Net debt: equity (%) <80 11 23
• EBITDA interest cover (times) >4 11 12
• Net debt: EDITDA (times) <3 1 1
Internal key performance indicators
• EBITDA interest cover (times) >4 9 9
• Return on equity: headline earnings (%) 13 6
• Return on capital employed (%) >20 24 12
• Net debt: equity (%) <40 4 9
• Net debt: EBITDA (times) <2 0,2 0,5
* Including contingent liabilities except DMR guarantees, as well as dividends received from associates

v
Capital funding structure 48
Maturity profile of debt
Repayment year 6 505
FY17 503
FY18 5
FY19 514
FY20 (9)
FY21 onward 5 492
Facilities available
DrawnUndrawn/
committed
Undrawn/
unissued
Term loan and revolving facility* 5 500 2 500
DMTN** programme 1 000 4 000
Interest bearing borrowings 6 500
Finance lease liabilities 49
Capitalised transaction costs (44)
Total interest bearing borrowings 6 505
– current 503
– non-current 6 002
Net cash and cash equivalents (5 183)
Net debt 1 322
R million
* Excludes additional R2bn accordion option ** Domestic medium-term note

v
ECC contingent consideration 49
API4 coal price range
(US$/tonne)
Deferred
payments
(US$m)
Expected
coal price
(US$/tonne)*
Discount
factor of 3%
Fair value
adjustment
(US$m)
Net present
value of the fair
value
adjustment
(US$m)
Year Minimum Maximum
FY16 60 80 25 64,38 1,00 5,48 5,48
FY17 60 80 25 75,00 0,97 18,75 18,13
FY18 60 90 25 65,12 0,93 4,27 3,99
FY19 60 90 35 67,45 0,90 8,69 7,85
Total 110 35,45
Total ZAR** 483
Payable January 2017 75
Payable beyond 2017 408
* Based on latest internal forecast ** Assuming closing US$ exchange rate of R13.63 at 31 December 2016
v
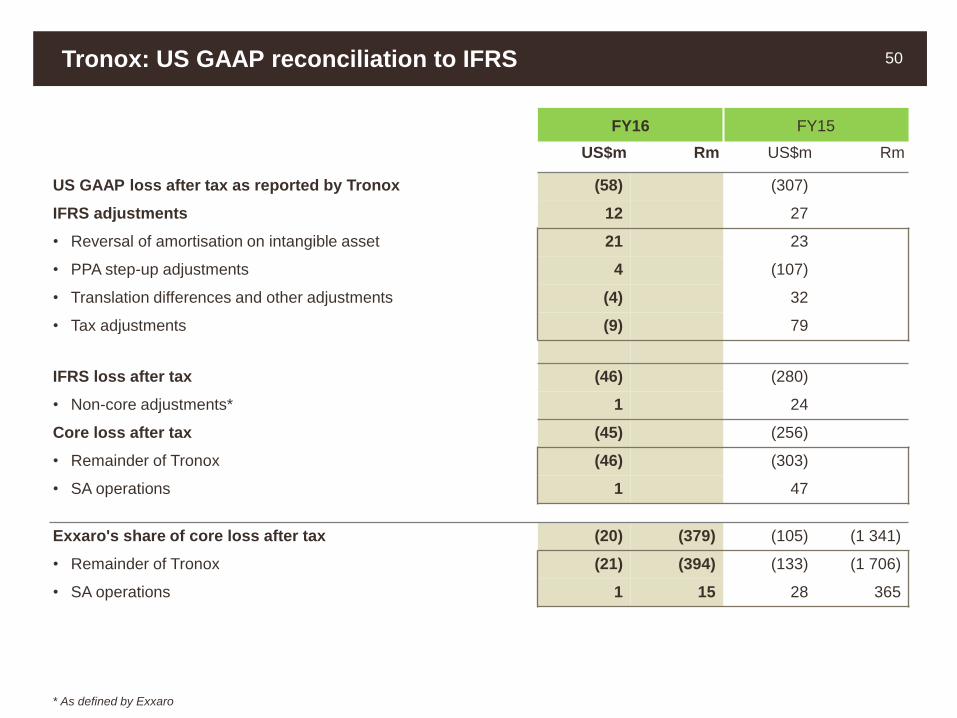
Tronox: US GAAP reconciliation to IFRS 50
FY16 FY15
US$m Rm US$m Rm
US GAAP loss after tax as reported by Tronox (58) (307)
IFRS adjustments 12 27
• Reversal of amortisation on intangible asset 21 23
• PPA step-up adjustments 4 (107)
• Translation differences and other adjustments (4) 32
• Tax adjustments (9) 79
IFRS loss after tax (46) (280)
• Non-core adjustments* 1 24
Core loss after tax (45) (256)
• Remainder of Tronox (46) (303)
• SA operations 1 47
Exxaro's share of core loss after tax (20) (379) (105) (1 341)
• Remainder of Tronox (21) (394) (133) (1 706)
• SA operations 1 15 28 365
* As defined by Exxaro
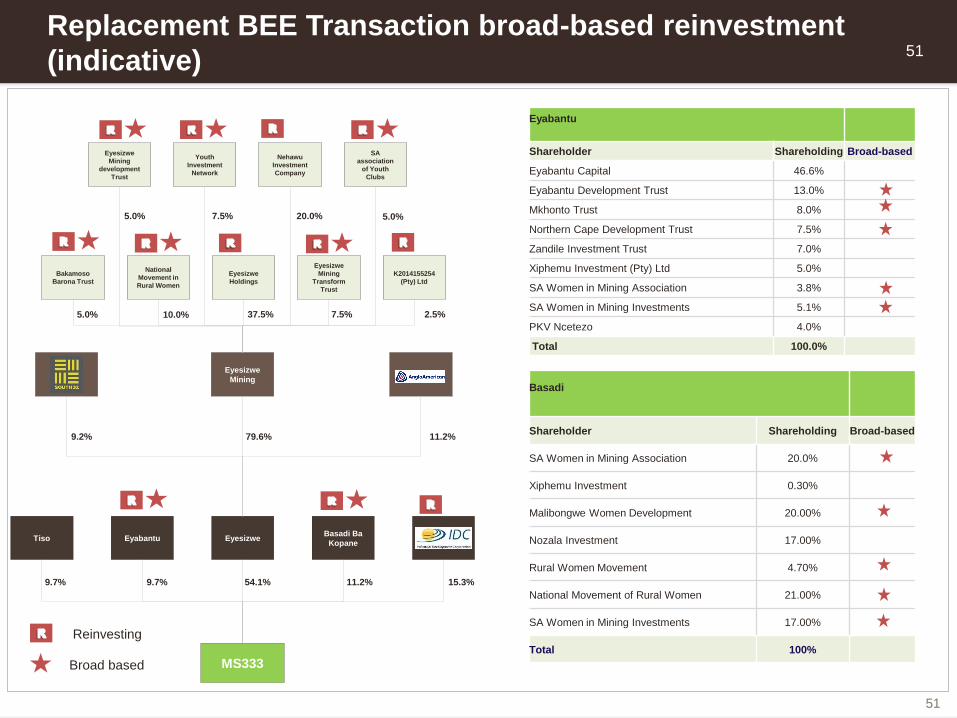
51
Replacement BEE Transaction broad-based reinvestment
(indicative)
EyabantuBasadi Ba
KopaneEyesizweTiso
15.3%11.2%54.1%9.7%9.7%
AngEyesizwe
Mining
11.2%79.6%9.2%
MS333
K2014155254
(Pty) Ltd
Bakamoso
Barona Trust
National
Movement in
Rural Women
Eyesizwe
Holdings
Eyesizwe
Mining
Transform
Trust
SA
association
of Youth
Clubs
Eyesizwe
Mining
development
Trust
Youth
Investment
Network
Nehawu
Investment
Company
37.5%5.0%
5.0%
10.0%
7.5% 20.0%
7.5%
5.0%
2.5%
Eyabantu
Shareholder Shareholding Broad-based
Eyabantu Capital 46.6%
Eyabantu Development Trust 13.0%
Mkhonto Trust 8.0%
Northern Cape Development Trust 7.5%
Zandile Investment Trust 7.0%
Xiphemu Investment (Pty) Ltd 5.0%
SA Women in Mining Association 3.8%
SA Women in Mining Investments 5.1%
PKV Ncetezo 4.0%
Total 100.0%
Basadi
Shareholder Shareholding Broad-based
SA Women in Mining Association 20.0%
Xiphemu Investment 0.30%
Malibongwe Women Development 20.00%
Nozala Investment 17.00%
Rural Women Movement 4.70%
National Movement of Rural Women 21.00%
SA Women in Mining Investments 17.00%
Total 100%
Reinvesting
Broad based
51
v
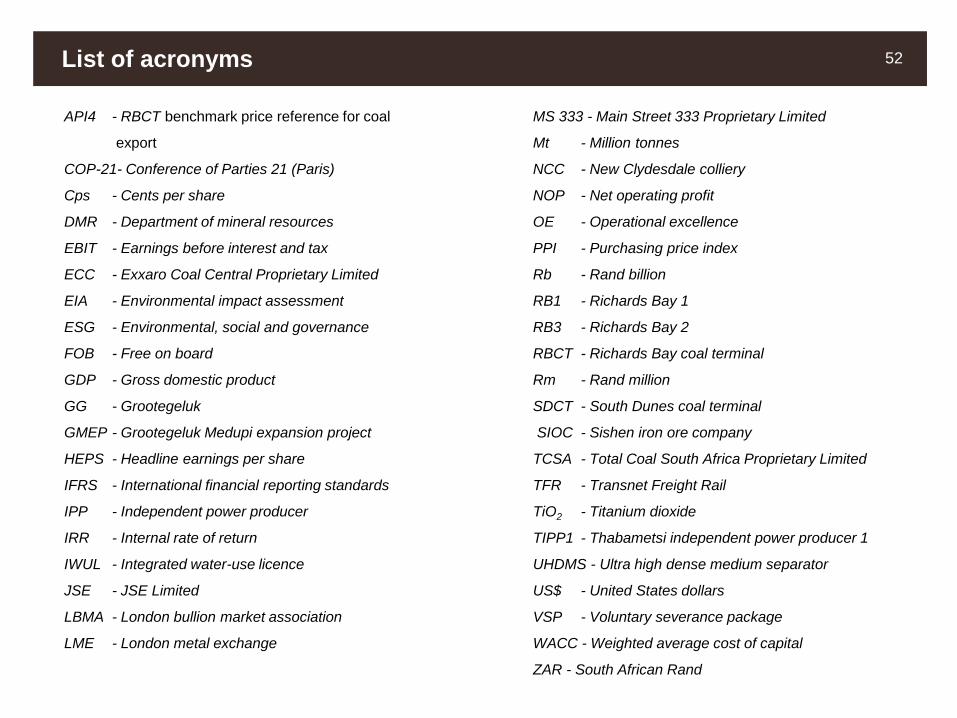
List of acronyms 52
API4 - RBCT benchmark price reference for coal
export
COP-21- Conference of Parties 21 (Paris)
Cps - Cents per share
DMR - Department of mineral resources
EBIT - Earnings before interest and tax
ECC - Exxaro Coal Central Proprietary Limited
EIA - Environmental impact assessment
ESG - Environmental, social and governance
FOB - Free on board
GDP - Gross domestic product
GG - Grootegeluk
GMEP - Grootegeluk Medupi expansion project
HEPS - Headline earnings per share
IFRS - International financial reporting standards
IPP - Independent power producer
IRR - Internal rate of return
IWUL - Integrated water-use licence
JSE - JSE Limited
LBMA - London bullion market association
LME - London metal exchange
MS 333 - Main Street 333 Proprietary Limited
Mt - Million tonnes
NCC - New Clydesdale colliery
NOP - Net operating profit
OE - Operational excellence
PPI - Purchasing price index
Rb - Rand billion
RB1 - Richards Bay 1
RB3 - Richards Bay 2
RBCT - Richards Bay coal terminal
Rm - Rand million
SDCT - South Dunes coal terminal
SIOC - Sishen iron ore company
TCSA - Total Coal South Africa Proprietary Limited
TFR - Transnet Freight Rail
TiO2 - Titanium dioxide
TIPP1 - Thabametsi independent power producer 1
UHDMS - Ultra high dense medium separator
US$ - United States dollars
VSP - Voluntary severance package
WACC - Weighted average cost of capital
ZAR - South African Rand