Embed Size (px)
Citation preview

PRSP
ANNUAL PROGRESS REPORT FY 2004-05
PRSP Secretariat - Finance Division Government of Pakistan
September 2005

2
Table of Contents Section1 Summary 3 Section 2 Introduction 5 Section 3 An Overview of Macroeconomic Indicators 6 3.1 Growth in Agriculture Sector 7 3.2 Manufacturing Sector 8 3.3 Inflation 9 3.4 Fiscal Situation 9 3.5 Current Account Balance 10 3.6 Investment and Savings 10
Section 4 An Analysis of Pro-Poor Budgetary Expenditures 10 4.1 Provincial Pattern of PRSP Expenditures 14 4.2 Sector-wise Analysis of PRSP Expenditures 15 4.2.1 Education 15 4.2.2 Health 17 4.2.3 Rural Electrification 19 Section 5 Non Budgetary Expenditures 19 Section 6 Monitoring the PRSP Intermediate Indicators 21
6.1 Education Sector 21 6.2 Health Sector 26 6.3 Land Distribution 28
Section 7 PRSP and Social Sector Performance 29 7.1 Education Sector 30 7.2 Literacy 37
7.3 Health Sector 40 7.4 Basic Services 46 7.5 Housing Sector 47
Section 8 Employment 49 Section 9 Special Programs/Schemes for Poverty Reduction 52 9.1 Khushaal Pakistan Program 52 9.2 Pakistan Baitul Mal 53 Section 10 Way Forward 55

3
1. Summary 1.1 This fourth annual report has endeavoured to evaluate the progress toward PRSP realization since the inception of I-PRSP in 2001-02. During this period Pakistan’s GDP growth has exhibited a consistent upward trend. During the fiscal year 2005 a high growth rate has been experienced. The FY05 has a special significance for PRSP monitoring as the CWIQ component of a new data series of Pakistan Social and Living Standard Measurement (PSLM) survey has been released. Social indicators as identified in PSLM survey assisted the appraisal and comparative analysis of PRSP output indicators during the period 2001-02 to 2004-05. 1.2 PRSP expenditures for FY05 stood at Rs. 316.2 billion, which indicate an increase of 21% in FY 05 over FY 04. All Provinces and Federal areas have also increased their PRSP expenditures in FY 05 compared to FY 04. PRSP expenditures as percentage of GDP also increased from 3.8% in FY 02 to 4.83% in FY 05. The PRSP expenditure during FY05 was utilized in roads, highways and bridges, water supply and sanitation, education, health, irrigation, land reclamation, rural electrification, administration of justice and law & order. Further, the amount of non-budgetary transfers through micro-credit, EOBI and Pakistan Bait-ul-Mal increased by 38% between FY 04 and FY 05 and increased to Rs. 10,930 million. 1.3 Pakistan’s two-third population’s livelihood is directly or indirectly dependent on the sectors of agriculture and manufacturing. By and large progress in these two sectors has immense implications due to their potential. During FY05 agriculture sector saw a growth rate of 7.5%, which is the highest in the last decade. Manufacturing sector also surpassed the PRSP target of 4.9 % for the FY 05. Presently the large scale manufacturing with a growth rate of 15.6% during FY 05 is higher than the average growth rate of the last three decades. 1.4 A high priority of PRSP is investment for development of human capital to defy poverty. Concurrently it is also critical towards accomplishment of Millennium Development Goals. The Education sector results during the year depict that nearly all teachers in public, primary and middle schools are trained. The number of functional primary and middle public schools did show a marginal decline in FY04 over FY03. Gross Enrolment Rate (GER) and Net Enrolment Rate (NER) at primary level showed an inspiring increase in FY 05 relative to FY 04. There is 5% increase in the middle level GER in FY 05 over FY 04; where the middle level NER increased marginally Gender disparity has declined in GER at primary level. Over time the role of private sector in primary education has increased. The last three years have witnessed eight percentage points increase in overall literacy from 45% in 2001-02 to 53% in 2004-05. The progress in reducing the literacy gap either between rural and urban areas or between genders in both areas has been marginal. 1.5 The results of Health sector indicate that TT-I and TT-II immunization coverage for pregnant women increased in FY 05 over FY 04. With targeted population coverage of 71% during the FY 05, the Lady Health Workers Program continues to emerge as a success legend in the health sector. The percentage of population with access to ‘tap water’ has also increased overtime. Further the emerging trends for FY 05 reflect that a large portion of ailing people consulted a hospital, private doctor or dispensary. The PSLM survey for the first time included the household perception of their economic condition. Almost half of the households both in rural and urban areas

4
perceived unchanged economic situation during the year 2004-05. There has been a modest decline in the unemployment rate between 2001-02 and 2003-04.
1.6 The development challenges for Pakistan include sustaining an accelerated economic growth, reducing poverty, providing essential social and economic services and infrastructure to poor, creating job opportunities and improving governance. Social sector progress in Pakistan during the preceding four years has been considerable. There is still a lot more to accomplish for reducing the gender gaps in literacy and enrollments, providing better health facilities and access to safe drinking water. The process of land distribution to the landless households also needs to be accelerated to shore up efforts in alleviation of rural poverty in Pakistan.

5
POVERTY REDUCTION STRATEGY PAPER: ANNUAL PROGRESS REPORT 2004-05
2 Introduction
2.1 This is the fourth Annual Progress Report (16th quarterly report) since the release of Interim Poverty Reduction Strategy Paper (IPRSP) in November 2001. The PRSP is based on broad principles of engendering growth, investment in human resource development, bringing improvement in the governance, targeting the poor through public policy interventions and providing safety nets to the vulnerable; with an overarching goal to ameliorate human development and social protection. The two pronged strategy comprising well-targeted anti-poverty outlays and social safety transfers are essential elements of its comprehensive poverty reduction strategy. The reform agenda unfolded in December 1999 set the future direction that continued during the last four years. The elected government inducted after the elections of October 2002 has shown its resolve to continue the reform process. The strong political commitment has not only ensured the continuity of reforms but has enabled institutionalization of the reform framework.
2.2 In this report, the progress in Poverty Reduction Strategy Paper (PRSP) indicators during the fiscal year 2004-05 (FY05) has been assessed. The regular monitoring shows that Pakistan has managed to increase the pro-poor expenditures gradually from 3.8% of GDP in 2001-02 to 4.83% in 2004-05. During this period, it has also made sound progress in the PRSP intermediate indicators, particularly in those related to the health and education sectors. For monitoring the progress in outcome indicators, PRSP has relied primarily on the Pakistan Integrated Households Survey (PIHS). The results of the latest PIHS are expected by end December 2005.
2.3 The FY05 has a special significance for PRSP monitoring; the CWIQ1 component of a new data series Pakistan Social and Living Standard Measurement (PSLM) survey, carried out in 2004-05, has been released. It provides data on social indicators which have enabled to assess the progress in PRSP output indicators between the 2001/02 and 2004/05 period. In terms of representativeness and definition of different variables, the PSLM survey-CWIQ is comparable with the earlier rounds of the PIHS. To make the present report more consistent, data on macro-economic indicators, pro-poor expenditures and others indicators have been discussed for the whole PRSP period, 2001/02 to 2004/05. Where possible, PRSP targets for the FY05 have also been discussed.
2.4 During the last four years, the growth of Pakistan’s economy continued to accelerate, while maintaining macro economic stability. Real GDP growth increased from 3.1% in FY02 to 8.4% in FY05 - surpassed the PRSP target by 2.6 percentage points for the FY05. Consistency in economic policies has contributed to this stability. After six years of extensive efforts through the reform of the tax system and tax administration, Pakistan has succeeded in attaining fiscal stability. Under Khushaal Pakistan Program-I, allocation of funds has increased from Rs. 845 million in FY03 to Rs 2830 million in FY 05. In FY05, 5613 development schemes were approved under this program. Micro-credit disbursement has also increased over time. The impressive growth performance, increased expenditures on the pro-poor sectors, development
1 Core Welfare Indicator Questionnaire

6
programs and micro-credit availability during the recent period have contributed in arresting the rising trends in unemployment as well as poverty.
2.5 This report has been divided into nine sections. Section 3 shows an overview of the economy during the past four years. PRSP budgetary expenditures are discussed in Section 4. PRSP non-budgetary expenditures are given in Section 5 while the next Section throws light on intermediate indicators. Section 7 discusses the major findings of the PSLM 2004-05. Employment situation in 2003-04 is discussed in Section 8. Section 9 discusses briefly the Special Programs for Poverty Reduction and Way Forward is given in section 10.
3 An Overview of Macroeconomic Indicators2 3.1 The first pillar of the PRSP is accelerating economic growth while maintaining macroeconomic stability. It is therefore pertinent here to review briefly the economic situation over the past four years. The Government has taken several steps in this direction. For example, the financial sector reforms in Pakistan have moved forward. In particular, the banking sector has become far more competitive. The Government is at present focusing on second generation reforms in the sectors to strengthen the financial markets infrastructure including consolidation of legal framework, strengthening regulations specifically for micro and SMEs, enhancing skills of the regulators in risk management technique for banks and NBFIs, strengthening market surveillance, improving credit information services and expanding electronic clearing and payment services.
3.2 In the agriculture sector, diversification and value addition in agricultural commodities have become the main drivers of government policies and programs. In the light of WTO General Council framework agreement, Pakistan is examining trade positions with its trading partners, examining questions that deal with the negative impact of other countries policies on its products and those relating to Pakistan’s own trade barriers. To make markets efficient and products competitive, supply chains are being developed for strategic commodities.
3.3 Privatization is moving ahead at a fast pace. In June 2005, the sale of a 26% stake and management control of PTCL took place, the largest transaction in Pakistan’s privatization program. The transaction amounted to US$ 2.6 billion (or 2.25% of FY05 GDP). During FY 05, the following important transactions occurred:
(a) Public offer (10%) of Pakistan Petroleum Ltd in July 2004; (b) Bidding for 73% shares of Karachi Electric Supply Corporation (KESC) on
February 4, 2005; Government accepted the highest bid. (c) Public offer (20%) of Kot Addu Power Company on February 21, 2005. (d) Bidding for 51% share and management control of National Refinery Ltd on
May 31, 2005. The Privatization Commission received the highest offer of Rs.16.4 billion from the Attock Oil Group, which was approved by the CCOP on June 7, 2005.
(e) Bidding for Pak Arab Fertilizer took place on May 14, 2005. The Privatization Commission received highest offer of Rs.14.125 billion at Rs.190.10 per share from the consortium of Reliance Export under the umbrella of Fatima
2 This section relies largely on annual and quarterly reports of the State Bank of Pakistan and Economic Survey 2004-05.

7
Group and Arif Habib Group. The highest bid was also approved by the CCOP on May 16, 2005.
3.4 Consistency in policies has led to high economic growth and macroeconomic stability. Table 1 presents trends in the macroeconomic indicators along with PRSP projection for the FY05. Because of strong economic fundamentals, Pakistan’s economy has gathered greater momentum during the FY 05. Acceleration in growth accompanied by a sharp pick up in industrial production, a strong upsurge in investment and a further strengthening of the external balance of payments have been the hallmarks of this year’s performance. The pre-payment of high cost external debt, the strategic re-entry into the international capital markets through the floatation of a Eurobond, SUKUK and the re-basing of Pakistan’s national accounts have been the other stellar occurrences of the last two years.
3.5 During this fiscal year, Pakistan succeeded in attaining a higher than targeted growth in real GDP, powered by high growth in large-scale manufacturing and a continuing robust performance in services, a strong rebound in investment, particularly in private sector investment owing to a rare confluence of various positive developments on the economic scene and an investment-friendly interest rate environment; an unprecedented increase in credit to the private sector; sharp increases in the consumption of electricity and gas reflecting rising levels of economic activity; on target tax collection; a buoyant stock market with an all-time high aggregate market capitalization; a double-digit growth in exports and imports; workers’ remittances maintaining their momentum; a continued accumulation of foreign exchange reserves and stability in the exchange rate and a successful return to the international capital markets through the floatation of a Eurobond.
3.6 The growth momentum of the economy continued to accelerate over the past four years with real GDP growth rising from 3.1% in 2001-02 to 8.4% in 2004-05. As noted earlier, this real GDP growth in FY05 surpassed the PRSP target by 2.6 percentage points. The sector-wise situation is discussed below while more details can be obtained from the Economic Survey FY05.
3.1 Growth in Agriculture Sector 3.7 In FY05, agriculture growth was 7.5%- the highest in the last decade. Cotton accounted for half of the total agriculture growth – an unprecedented increase in cotton production (14.6 million bales) during FY05. Increase in the production of wheat and rice crops during FY05 was 8.3% and 2.9% respectively. Water availability, favourable weather and easy access to farm credit are among the major factors that contributed in the high agriculture growth. Not only crops benefited from the available institutional credit but the livestock sub-sector also benefited from special credit schemes.
Table 1: Trends in Macroeconomic Indicators** PRSP Projected*
2001-02 2002-03 2003-04 2004-05 2004-05 Agriculture -0.1 4.1 2.2 7.6 4.3 Manufacturing 4.5 6.9 14.1 12.5 7.6 Large Scale Manufacturing 3.5 7.2 18.2 15.6 8.5 Small and Household 7.5 7.5 6.2 6.3 5.3 Services Sector 4.8 5.3 6 7.9 - Real GDP Growth Rate 3.1 4.8 6.4 8.4 5.8

8
Inflation (CPI Growth) 3.5 3.1 4.6 9.3 4 GDP at Market Price (Billion Rs) 4,402 4,823 5,533 6,548 4,875 As % of GDP Investment 16.8 16.9 17.3 16.8 17 Fixed Investment 15.5 15.3 15.6 15.3 15.5 Public 4.2 4 4.8 4.4 6 Private 11.3 11.3 10.8 10.9 9.5 National Savings 18.6 20.8 18.7 15.6 19.5 Foreign Savings -1.9 -3.8 -1.4 1.2 2.5
* See Table 5.1 in ‘Accelerating Economic Growth and Reducing Poverty: The Road Ahead’, Poverty Reduction Strategy Paper.
** Pakistan Economic Survey 2004-05 3.8 Regarding the trends in agriculture growth, Table 1 shows a negative growth in FY02 due to water shortages. However, there was a resurgence in agricultural growth to 4.1% in FY03 when the productivity of major crops increased and prices of many agricultural products also increased. In FY03, agriculture growth incorporated strong contribution by both crops and livestock in contrast to FY02 when the crop sub-sector had witnessed a decline. During FY04, agriculture sector witnessed a modest growth of 2.2% due to adverse natural vagaries. Almost all sub-sectors contributed in this slow growth with only minor crops registering a small recovery. However, higher crop prices helped mitigate the impact of weak growth in aggregate crop production on farm incomes.
3.9 High agricultural growth of FY05 is likely to contribute in poverty reduction particularly in rural areas. There are several reasons for this anticipation. About two-thirds of the total population live in rural areas and depend, directly or indirectly, on the agriculture sector for their livelihood. The agriculture sector, which accounts for nearly 23% of the national income, provides employment to 42% of the total employed labor force. It also provides raw material for the industrial sector, notably textile industry- the largest industrial sub-sector of the economy.
3.2 Manufacturing sector 3.10 The manufacturing sector witnessed some decline in growth during FY05 over FY04, but surpassed the PRSP target by 4.9 percentage points (Table 1). Large Scale Manufacturing (LSM) accounts for 69.5% of overall manufacturing. The LSM witnessed an upward trend in growth from FY02 to FY04. In FY04, LSM growth of 18.2% was highest in the last three decades. The LSM growth declined to 15.6% in July-May FY05 but is still substantially higher than average growth of 9.6% during FY02-FY04. Various factors including accommodative monetary policy, financial discipline, consistency and continuity in policies, strengthening of domestic demand, continuously improving macroeconomic environment, a stable exchange rate and continued global economic expansion fueling domestic export growth are responsible for sustained higher growth in LSM. The main contributors to LSM growth in July-May FY05 over the corresponding period in FY04 are textiles (25.5%), petroleum products (9.3%), non-metallic minerals (16.8%), automobiles (32.4%), fertilizers (29.7%), electronics (45.3%) and engineering items (19.6%). This pattern of growth shows that the increase in LSM production was broad-based.
9
3.11 Industrial and trade policies have been historically uniform for all scales of enterprises which did not cater to the specific needs of the Small and Medium Enterprises (SMEs). The SME sector provides low cost employment opportunities, thus alleviating poverty. It also helps boost exports. The SME sector provides resilience to the economy from global economic fluctuations that the large business enterprises are unable to respond quickly. Table 1 shows that Small and Household sector grew by 7.5%, 7.5%, 6.2% and 6.3% during FY02, FY03, FY04 and FY05 respectively. The growth of this sector in FY05 surpassed the PRSP target by 0.9 percentage points. The development strategy for SME by SMEDA focuses on 7 priority sectors, which include gems and jewellery, dairy and agro-processing, fisheries, furniture, sports goods, light engineering, marble and granite. These sectors have been selected with the intention of developing sector strategies and proposing regulatory reforms to stimulate growth on the sole criterion of SME presence. 3.12 In the past the growth of SMEs has mainly been hampered by the non-availability of credit. Realizing this constraint the Government has opened two specialized banks for micro credit namely the SME and Khushali Bank (disbursement by Khushali bank is discussed later in this report). The SME Bank was established on 1st January 2002 with the primary objective of providing financial assistance and business support to SMEs. A large number of SMEs are being financed under its program lending scheme namely “Hunarmand Pakistan Scheme” in such businesses as fan manufacturing, cutlery manufacturing, surgical instruments, doctors and dentist clinic, women entrepreneurs, CNG stations, auto looms, auto parts manufacturing, furniture manufacturing and motorcycle rickshaws. 3.3 Inflation 3.13 The Consumer Price Index after declining in FY03 compared to FY02, registered an upward trend in the following years; in FY05 inflation stood at 9.3% against the PRSP target of 4%. It is the result of rising aggregate demand, shortages of essential food items, rising house rents and high oil prices and accommodative monetary policy. Non-food inflation increased by 7.1%, while the core inflation increased by 7.6% during FY05 as compared to 3.7% in FY04. Money supply (M2) increased by 16.98% during FY05. An important contributor to the jump to the aggregate demand during FY05 was the record growth in bank credit to private sector which increased by 31% to Rs 390 billion in FY05. The tightening of monetary policy in April 2005 will ensure that core inflation will gradually be contained at significantly lower levels. The non-core components of CPI inflation will need to be addressed more through administrative rather than monetary policy measures. 3.4 Fiscal Situation 3.14 After six years of extensive efforts through the reform of the tax system and tax administration Pakistan has succeeded in attaining fiscal stability. The fiscal deficit increased to 3.2% of GDP in FY05 compared to 2.3% of GDP in FY04 on account of a substantial loss in revenue under Petroleum Development Levy (PDL). The primary balance (total revenue minus total non-interest expenditure) has remained in surplus for the last many years. The public debt burden has also registered a sharp decline in recent years and is fast moving towards a sustainable level.

10
3.5 Current Account Balance 3.15 The current account deficit, excluding official transfers, stood at US$ 1774 million during FY05 against a surplus of US$ 1300 million during the same period in FY04. Deterioration in current account emerges from a sharp rise in the trade and services account deficits during FY05 mainly owing to a rise in imports (both oil and machinery) and other import related charges (e.g. shipment charges). In addition the Saudi Oil facility, under which there was an inflow of US$ 302 million in FY04, was no longer available. In the long term, however, rising investment in machinery and inputs should be reflected in higher export earnings as well as import substitution. 3.6 Investment and Savings 3.16 Investment level as percentage of GDP remained more or less stable over the past four years. A decline of 0.3 percentage points in fixed investment as percentage of GDP is caused by decline in public investment which declined from 4.8% in FY04 to 4.4% in FY05. Private investment as percentage of GDP rose marginally from 10.8% in FY04 to 10.9% in FY05 (Table 1). A marginal decline in fixed investment and a sharp increase in economic growth indicates rise in efficiency of capital. National savings, which had reached 20.8% of GDP in FY03, witnessed a 3.1 percentage points decline during FY05 over FY04. Foreign savings increased to 1.2% of GDP in FY05. There was high double digit growth in exports and imports, worker’s remittances maintained their momentum, a continued accumulation of foreign exchange reserves and stability in exchange rate and a sharp decline in public and external debt burden during FY05. 4 An Analysis of Pro-Poor Budgetary Expenditures 4.1 It goes without saying that monitoring and evaluation of the qualitative as well as quantitative aspects of these expenditures are central to the PRSP process; and the government has attached critical importance towards their regular monitoring, analysis and transparency. It is hoped that the government’s pro-poor initiatives would not only encourage greater participation and ownership in development initiatives but would also promote greater accountability and better outcomes. Since the initiation of I-PRSP in 2001, pro-poor expenditures on 17 sectors have been reported regularly on a quarterly basis. Complete data for the last two years is given in Annexure 1. This section gives an overview of the expenditures incurred during the last five years and Table 2 presents data on PRSP development, current and total expenditures, as well as their percentages to GDP. The PRSP total expenditures have increased over time in nominal terms as well as percentage to GDP. The PRSP actual expenditures and as percentage of GDP (both current and development) have surpassed the projected expenditures for the FY05. The PRSP development expenditures as percentage of GDP have doubled during the past four years from 0.86% in FY02 to 1.72% in FY05. This increase in development expenditures shows that PRSP expenditures have been better allocated over time. The PRSP current expenditures as percentage of GDP increased from 2.95% in FY02 to 3.4% in FY03 but declined over the last two years due to a relatively larger increase in the development expenditures in FY04 and FY05.

11
Table 2: PRSP Development and Current Expenditures 2001-02 to 2004-05 PRSP Expenditures (Rs Million) PRSP Expenditures as % of GDP
Year Development Current Total Development Current Total 2001-02 37,638 129,642 167,280 0.86 2.95 3.8 2002-03 44,208 164,320 208,528 0.92 3.41 4.32 2003-04 78,983 182,318 261,301 1.43 3.30 4.72 2004-05 112,635 203,608 316,243 1.72 3.11 4.83 2004-05 (projected) 85,000 193,025 278,025 1.30 2.95 4.25 Note : GDP (mp) at current factor cost for FY02, FY03, FY04 and FY05 in million Rs amounts to 4401699, 4822842, 5532663 and 6547590, respectively. These figures are taken from the Economic Survey FY05 4.2 In FY05 the PRSP actual expenditures exceeded the projected expenditures by Rs 38,218 million reflecting Government’s serious efforts to alleviate poverty. Figure 1 shows that the PRSP actual expenditures as percentage of GDP (4.83%) surpassed the projected expenditure as percentage of GDP (4.25%) in FY05. The sectors in which actual pro-poor expenditures exceeded the projected expenditures include roads, highways and bridges, water supply and sanitation, education, natural calamities, irrigation, rural development, rural electrification, low cost housing and law and order. The sectors in which actual pro-poor expenditures were less than the budgeted expenditures during FY05 include health, population planning, social security and welfare, land reclamation, food subsidies, food support program, Tawana Pakistan and administration of justice (Table 3).
Figure 1: PRSP Targeted and Actual Expenditures as % of GDP, 2004-05
2.00
3.00
4.00
5.00
Target Actual
Exp
endi
ture
s as
% o
f GD
P

12
Table 3: Actual Expenditures as % of Projected Expenditures During FY05 (Million Rs)
Sectors Projected FY05
Actual FY05
Actual Expenditure as % of Projected Expenditures
Projected as % of GDP
Actual as % of GDP
Roads, highways & bridges 16,575 35,181 212.25 0.25 0.54 Water supply and sanitation 4,875 6,538 134.11 0.07 0.10 Education 102,375 116,873 114.16 1.56 1.78 Health 36,075 31,426 87.11 0.55 0.48 Population Planning 4,875 4,578 93.91 0.07 0.07 Social security & welfare 3,900 2,030 52.05 0.06 0.03 Natural Calamities 488 922 188.93 0.01 0.01 Irrigation 32,370 37,871 116.99 0.49 0.58 Land reclamation 2,438 2,111 86.59 0.04 0.03 Rural development 7,228 15,369 212.63 0.11 0.23 Rural electrification 1,000 4,354 435.36 0.02 0.07 Food subsidies 14,625 5,359 36.64 0.22 0.08 Food support program 3,900 2,703 69.31 0.06 0.04 Tawana Pakistan 500 78 15.60 0.01 0.00 Low cost housing 0 318 - 0.00 0.00 Administration of justice 3,413 3,116 91.30 0.05 0.05 Law and order 43,388 47,416 109.28 0.66 0.72 Total 278,025 316,243 113.75 4.25 4.83
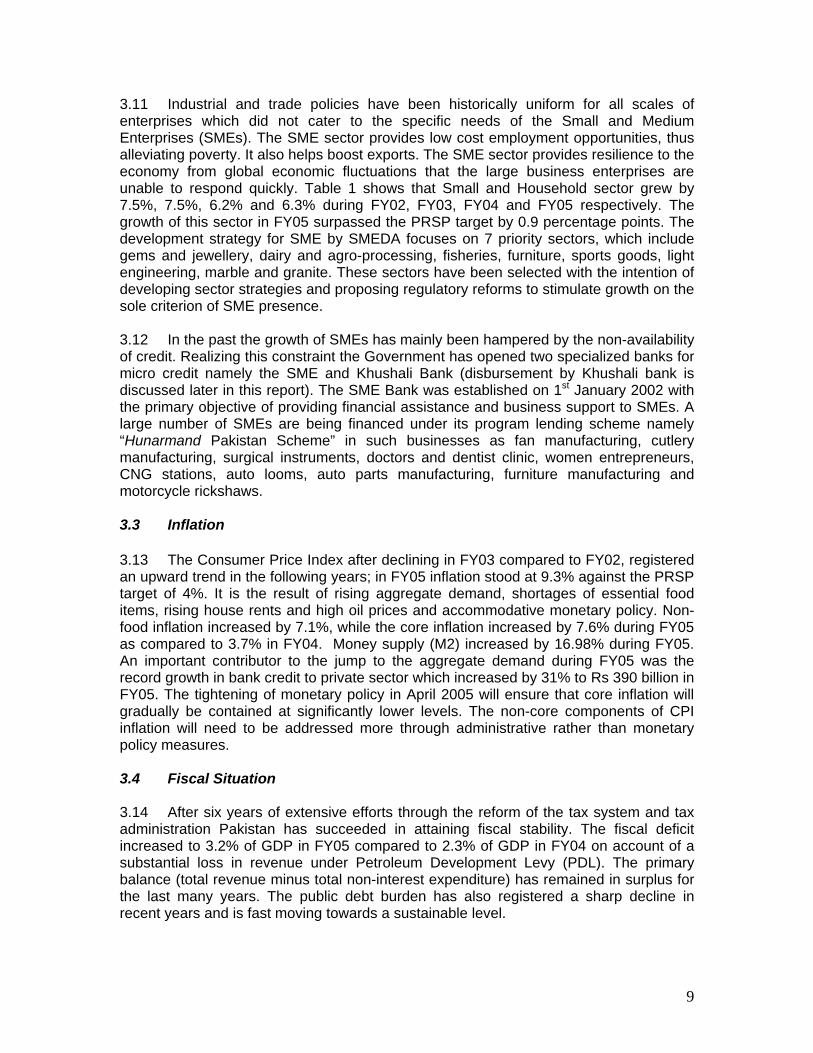
4.3 The PRSP expenditures as percentage of GDP have shown an upward trend over the past four years (2001-02: 3.8%, 2002-03: 4.32%, 2003-04: 4.72%, 2004-05: 4.83%). The sectors where PRSP expenditures as percentage of GDP surpassed those in FY04 include roads, highways and bridges, education, irrigation, rural electrification, administration of justice and law and order (Table 4). For water supply and sanitation and natural calamities the PRSP expenditures as percentage of GDP remained the same in FY05 as in FY04. In the remaining sectors PRSP expenditures as percentage of GDP declined in FY05 as compared to FY04. The primary reason behind this decline is high GDP growth in FY05 which resulted in a GDP of Rs 6547 billion and hence reduced the ratios with the GDP.
4.4 The overall PRSP expenditures have shown a respectable increase of 24.7%, 25.3% and 21.0% for FY03 over FY02, FY04 over FY03 and FY05 over FY04, respectively (Table 5). During FY05 PRSP expenditures stood at Rs 316,243 million recording an increase of Rs 54,942 million compared to FY04. An increase in expenditures occurred in all pro-poor expenditures between FY05 and FY04 except in population planning, social security & welfare, rural development, food subsidies, food support program, Tawana Pakistan and low cost housing, which witnessed a decline of 2.4%, 51.0%, 17.4%, 37.1%, 3.6%, 86.8% and 24.8% respectively between FY05 and FY04.
13
Table 4: Budgetary Poverty Related Expenditures by Sectors as % of GDP
Expenditures as % of GDP 2001-02 2002-03 2003-04 2004-05
Roads, highways & bridges 0.14 0.27 0.41 0.54 Water supply and sanitation 0.11 0.07 0.10 0.10 Education 1.51 1.63 1.77 1.78 Health 0.44 0.46 0.49 0.48 Population Planning 0.03 0.06 0.08 0.07 Social security & welfare 0.08 0.03 0.07 0.03 Natural Calamities 0.00 0.01 0.01 0.01 Irrigation 0.23 0.32 0.41 0.58 Land reclamation 0.04 0.04 0.04 0.03 Rural development 0.28 0.35 0.34 0.23 Rural electrification 0.00 0.00 0.03 0.07 Food subsidies 0.13 0.23 0.15 0.08 Food support program 0.05 0.04 0.05 0.04 Tawana Pakistan 0.02 0.02 0.01 0.00 Low cost housing 0.00 0.00 0.01 0.00 Administration of justice 0.05 0.05 0.04 0.05 Law and order 0.70 0.75 0.71 0.72 Total 3.80 4.32 4.72 4.83 GDP (mp) at current factor cost for FY02, FY03, FY04 and FY05 in million Rs amounts to 4401699, 4822842, 5532663 and 6547590, respectively. These figures are taken from the Economic Survey FY05.
Table 5: Budgetary Poverty Related Expenditures by Sectors, 2001-2005 Expenditures (million Rs) % Change
Sectors 2001-02 2002-03 2003-04 2004-05
2002-03 /2001-02
2003-04 /2002-03
2004-05 /2003-04
Roads, highways & bridges 6,340 13,145 22,746 35,181 107.33 73.04 54.67 Water supply and sanitation 4,644 3,421 5,799 6,538 -26.34 69.51 12.74 Education 66,290 78,447 97,697 116,873 18.34 24.54 19.63 Health 19,211 22,368 27,009 31,426 16.43 20.75 16.35 Population Planning 1,331 3,120 4,689 4,578 134.41 50.29 -2.37 Social security & welfare 3,664 1,301 4,144 2,030 -64.49 218.52 -51.01 Natural Calamities 189 410 529 922 116.93 29.02 74.29 Irrigation 10,133 15,535 22,506 37,871 53.31 44.87 68.27 Land reclamation 1,838 1,733 2,016 2,111 -5.71 16.33 4.71 Rural development 12,325 16,883 18,607 15,369 36.98 10.21 -17.40 Rural electrification 0 0 1,422 4,354 - - 206.16 Food subsidies 5,513 10,859 8,513 5,359 96.97 -21.60 -37.05 Food support program 2,017 2,017 2,804 2,703 0.00 39.02 -3.60 Tawana Pakistan 800 800 590 78 0.00 -26.25 -86.78 Low cost housing 0 0 423 318 - - -24.82 Administration of justice 1,981 2,196 2,437 3,116 10.85 10.97 27.86 Law and order 31,004 36,293 39,370 47,416 17.06 8.48 20.44 Total 167,280 208,528 261,301 316,243 24.66 25.31 21.03

14
4.1 Provincial Patterns of PRSP Expenditures 4.5 The highest increase is observed in PRSP expenditures by the Federal Government at 34% which is 13% percentage points higher compared to the overall increase in the pro-poor expenditures in 2004-05. There is an increase of 19% in PRSP expenditures in Punjab and NWFP provinces in the outgoing fiscal year. Sindh province witnessed an increase of 16% in pro-poor expenditures in FY05 relative to FY04 while Balochistan experienced an increase of 7% in the PRSP expenditures during FY05 over that in FY04 which is the lowest compared to other provinces. The largest change in FY05 compared to FY04 in PRSP expenditures in the Federal Government was observed in rural electrification (206%), in Punjab in water supply and sanitation (196%), in Sindh in natural calamities (310%), in NWFP in social security & welfare (54%) and in Balochistan in natural calamities (457%).
4.6 Investment in education and health sectors as well as water supply and sanitation is critical for development of human capital and is a priority to assist poor people to get out of the vicious circle of poverty. Table 6 shows that change in education expenditures between FY05 and FY04 is double digit in all provinces and substantially high at 44% in expenditure by the Federal Government. Change in health expenditures in FY05 relative to FY04 is highest in NWFP at 42% and lowest in Balochistan at 3%. The expenditures on water supply and sanitation increased considerably in Punjab and NWFP but declined in Sindh and Balochistan between FY05 and FY04. Punjab is the only province which incurred expenditure under the head of low cost housing during the last two fiscal years and it declined by 25% in FY05 over FY04.
Table 6: PRSP Change in Expenditures between 2004-05 and 2003-04 by Sector and Province Sectors Federal Punjab Sindh NWFP Balochistan Pakistan Roads, highways & bridges 59.08 72.21 101.51 0.73 7.00 54.67 Water supply and sanitation -4.48 196.43 -11.76 41.75 -15.89 12.74 Education 44.44 13.08 13.44 20.29 12.15 19.63 Health 21.44 9.38 19.49 41.90 2.80 16.35 Population Planning -0.29 15.97 4.67 -98.32 -0.65 -2.37 Social security & welfare -74.57 29.53 7.53 54.21 21.17 -51.01 Natural Calamities 0.52 -23.81 310.31 - 457.14 74.29 Irrigation 136.71 31.88 33.98 25.02 10.51 68.27 Land reclamation 55.56 22.73 3.38 - - 4.71 Rural development 8.69 -7.55 -70.94 -5.24 2.68 -17.40 Rural electrification 206.16 - - - - 206.16 Food subsidies -53.72 -25.00 0.00 28.57 - -37.05 Food support program 5.33 -5.39 -9.38 3.01 12.24 -3.60 Tawana Pakistan -86.78 - - - - -86.78 Low cost housing - -24.82 - - - -24.82 Administration of justice 80.67 15.79 20.90 17.88 48.73 27.86 Law and order 19.10 24.07 15.51 29.33 16.99 20.44 Total 34.38 18.60 16.23 19.19 6.75 21.03

15
4.2 Sector-wise Analysis of PRSP Expenditures 4.2.1 Education 4.7 The Education Sector Reform (ESR) is integrated with Millennium Development Goals (MDG) which targets to achieve universal primary education by 2015 and plays a fundamental role in promoting literacy. The Gross Enrolment Rate (GER) at primary level has substantially improved between 2001-02 and 2004-05 indicating that Government investment in primary education is bearing fruit. For a detailed analysis, please see the section 6. 4.8 The expenditures on primary education increased by 14% between FY04 and FY05 (Table 7). Increase in spending on secondary education was 21% in FY03 over FY02, 14% in FY04 over FY03 and 16% in FY05 over FY04. Spending on general university and college education declined by 4% in FY05/FY04 while expenditure on professional/technical universities increased by 170% during this period. It is commendable to see an increase of 24% in expenditures on teacher and vocational training in FY05 over FY04 as it would be helpful in reducing youth unemployment which is presently high in the country. 4.9 The expenditures on primary and secondary education increased in all provinces and the Federal Government except Balochistan between FY05 and FY04. Balochistan has the lowest Gross Enrolment Rate at primary as well as middle level in 2004-05. To improve GER at primary and secondary level in Balochistan, there is an urgent need to increase public spending on primary education in Balochistan.
Table 7: Percentage Change in PRSP Education Expenditures by Sectors
Sectors Fiscal Year Federal Punjab Sindh NWFP Balochistan Pakistan2002-03/2001-02 -52.36 18.05 -4.85 26.49 -4.77 6.24 2003-04/2002-03 1.00 49.16 10.99 8.37 15.35 31.36 Primary Education 2004-05/2003-04 111.25 8.32 13.00 22.86 -1.43 13.84 2002-03/2001-02 23.22 10.51 52.59 19.42 -3.53 21.17 2003-04/2002-03 1.58 18.98 11.91 8.17 27.56 13.86 Secondary Education 2004-05/2003-04 24.11 14.18 16.21 28.98 -7.57 16.93
2002-03/2001-02 106.27 22.67 5.75 59.93 20.00 57.73 2003-04/2002-03 28.73 3.10 17.78 0.00 0.27 18.47
General University/ College Education
2004-05/2003-04 -18.43 22.01 22.62 4.80 4.21 -3.57
2002-03/2001-02 10.06 -20.75 6.50 17.74 47.52 6.07 2003-04/2002-03 29.85 30.89 3.62 7.63 25.48 21.08
Professional/Technical Universities
2004-05/2003-04 320.30 -0.72 31.57 24.36 23.76 170.85 2002-03/2001-02 -69.99 -17.60 -43.66 26.32 54.27 -43.07 2003-04/2002-03 -90.49 126.43 4.17 66.67 -36.81 25.22 Teacher and Vocational
Training 2004-05/2003-04 591.49 12.66 -7.09 -22.50 3.92 24.84 2002-03/2001-02 265.03 50.23 -22.20 218.31 74.73 89.40 2003-04/2002-03 22.02 122.93 88.29 -58.89 81.29 40.65 Other Educational
Institutions 2004-05/2003-04 -12.59 46.08 -9.85 -55.62 62.33 12.47

16
4.10 The share of expenditure on primary schooling in total education expenditure in FY02, FY03, FY04 and FY05 was 33%, 42%, 44% and 42% respectively, implying that the largest proportion of expenditures are incurred on primary education in Pakistan (Table 8). The second largest proportion of expenditures had been incurred on secondary education over the last four years. During 2001-02 to 2004-05 the smallest proportion of education expenditure has been spent on teacher and vocational training which needs to be increased as vocational training imparts skills and hence generates employment. Distribution of education expenditure by provinces is similar to the pattern of overall expenditures. However the largest proportion of the federal education expenditure was allocated for general university/colleges during FY02 to FY04 and for professional, technical and university education during FY05. 4.11 The development expenditure as percentage of total education expenditure increased every year during the past four years. During FY02, FY03, FY04 and FY05 the development education expenditure stood at 8.3%, 9.6%, 15.6% and 17.4% of the total development expenditure respectively (Figure 2). The Federal Government spent the largest proportion of education expenditure on development (44%) in FY05 while Sindh province spent the lowest proportion (2.6%). Table 8: Percentage Distribution of Education Expenditures by Province and Level of Education 2001-02 to 2004-05 Federal Punjab Sindh NWFP Balochistan Pakistan 2001-02 Primary Education 9.09 56.41 46.62 35.52 36.75 32.65 Secondary Education 10.78 24.90 32.25 32.32 28.32 28.51 General University/ College Education 49.16 9.75 9.34 6.78 8.43 19.94 Professional/Technical Universities 14.24 2.68 5.73 7.17 4.79 7.10 Teacher and Vocational Training 3.61 2.48 0.70 0.33 7.07 2.83 Other Educational Institutions 13.12 3.77 5.37 17.88 14.64 8.97 Total 100.00 100.00 100.00 100.00 100.00 100.00 2002-03 Primary Education 8.79 57.54 45.72 41.55 36.75 42.40 Secondary Education 11.94 24.27 33.81 35.73 28.32 25.81 General University/ College Education 47.36 9.98 8.33 7.16 8.43 16.19 Professional/Technical Universities 12.49 1.67 5.65 4.28 4.79 5.08 Teacher and Vocational Training 3.34 2.42 0.77 0.20 7.07 2.18 Other Educational Institutions 16.08 4.11 5.73 11.07 14.64 8.33 Total 100.00 100.00 100.00 100.00 100.00 100.00 2003-04 Primary Education 7.83 60.14 43.08 44.88 34.88 44.32 Secondary Education 10.25 21.35 32.61 38.52 29.66 24.00 General University/ College Education 50.81 7.30 8.26 7.14 6.83 15.27 Professional/Technical Universities 13.49 1.25 5.41 4.60 5.41 4.86 Teacher and Vocational Training 0.27 3.41 0.70 0.33 1.96 1.88 Other Educational Institutions 17.34 6.56 9.94 4.54 21.25 9.66 Total 100.00 100.00 100.00 100.00 100.00 100.00 2004-05 Primary Education 11.46 57.60 42.91 45.84 30.66 42.18 Secondary Education 8.81 21.56 33.41 41.30 24.44 23.46 General University/ College Education 28.70 7.88 8.93 6.22 6.35 12.31

17
Professional/Technical Universities 39.26 1.09 6.28 4.75 5.97 11.00 Teacher and Vocational Training 1.28 3.39 0.57 0.22 1.81 1.97 Other Educational Institutions 10.50 8.47 7.90 1.67 30.76 9.09 Total 100.00 100.00 100.00 100.00 100.00 100.00 Note: For FY02 and FY03 data are taken from the annual PRSP progress report for the year 2003-04
Figure 2: Development Education Expenditure as % of Total Education Expenditure
01020304050
Federa
l
Punjab
Sindh
NWFP
Baloch
istan
Pakist
an
% 2001-022002-032003-042004-05
4.2.2 Health 4.12 The health policy gives relatively more importance to preventive measures. The health expenditures on preventive measures increased to 40% in FY05 over FY04. Except for Punjab all provinces recorded an increase in expenditures on preventive measures in FY05 relative to FY04 (Table 9). However the largest proportion of health expenditure was spent on general hospital and clinics during the past four years (Table 10). The Federal Government has been spending the largest proportion of health expenditure on preventive measures during the last four years. 4.13 Figure 3 shows that development health expenditure as percentage of total health expenditure during FY02, FY03, FY04 and FY05 stood at 13%, 15.7%, 20.6% and 21.2% respectively, a considerable increase over time. The Federal Government spent a substantial amount of 43%, 51.6%, 55.5% and 51.4% on health development expenditure relative to total health expenditure during FY02, FY03, FY04 and FY05 respectively. The development health expenditure as percentage of total health expenditure is lowest for Sindh (7.3%) in FY05.
Table 9: Percentage Change in PRSP Health Expenditures by Sectors Fiscal Year Federal Punjab Sindh NWFP Balochistan Pakistan
2002-03/2001-02 7.28 24.97 4.87 10.82 -8.72 14.53 2003-04/2002-03 33.93 22.96 25.48 0.87 -3.05 21.08 General Hospital and
Clinics 2004-05/2003-04 9.64 7.35 2.67 44.73 48.75 11.99
Mother & Child 2002-03/2001-02 0 41.94 0 -8.33 -71.43 3.39

18
2003-04/2002-03 0 20.45 0 9.09 -50 13.11 2004-05/2003-04 0.00 -97.96 - 8.33 1450.00 -23.08 2002-03/2001-02 30.42 92.86 6.28 9.3 84.68 28.43 2003-04/2002-03 4.43 125.93 -19.55 18.09 114.63 9.99 Health Facilities and
Preventive Measures 2004-05/2003-04 38.27 -18.05 187.23 47.75 2.47 39.69 2002-03/2001-02 43.91 15.32 -16.92 23.35 5.11 14.91 2003-04/2002-03 -5.59 17.5 60.65 47.57 12.01 16.6 Other Health Facilities 2004-05/2003-04 -4.46 33.20 141.48 22.70 -32.00 14.96
Note: For FY02 and FY03 data are taken from the annual PRSP progress report for the year 2003-04 Table 10: Percentage Distribution of Health Expenditure by Province and Sector 2001-02 to 2004-05 Federal Punjab Sindh NWFP Balochistan Total 2001-02 General Hospitals and Clinics 41.90 86.60 81.90 87.50 45.40 71.80 Mother & Child 0.04 0.45 0.00 0.44 0.25 0.25 Health Facilities and Preventive Measures 48.00 0.60 10.00 3.20 12.90 15.00 Other Health Facilities 10.10 12.30 8.10 8.80 41.40 13.00 Total 100.00 100.00 100.00 100.00 100.00 100.00 2002-03 General Hospitals and Clinics 41.00 87.10 81.40 86.30 45.40 72.10 Mother & Child 0.04 0.47 0.00 0.49 0.25 0.27 Health Facilities and Preventive Measures 47.20 0.60 12.90 4.10 12.90 15.00 Other Health Facilities 11.80 11.90 5.70 9.10 41.40 12.60 Total 100.00 100.00 100.00 100.00 100.00 100.00 2003-04 General Hospitals and Clinics 43.75 87.71 89.37 82.22 32.34 72.29 Mother & Child 0.03 0.43 0.00 0.50 0.09 0.24 Health Facilities and Preventive Measures 46.17 1.16 4.36 4.62 21.13 14.67 Other Health Facilities 10.05 10.71 6.26 12.66 46.44 12.80 Total 100.00 100.00 100.00 100.00 100.00 100.00 2004-05 General Hospitals and Clinics 39.50 86.09 76.80 83.86 46.79 69.58 Mother & Child 0.02 0.01 0.06 0.38 1.43 0.16 Health Facilities and Preventive Measures 52.57 0.87 10.49 4.81 21.06 17.62 Other Health Facilities 7.91 13.04 12.66 10.95 30.72 12.64 Total 100.00 100.00 100.00 100.00 100.00 100.00Note: For FY02 and FY03 data are taken from the annual PRSP progress report for the year 2003-04

19
Figure 3: Development Health Expenditures as % of Total Health Expenditures
0102030405060
Federal
Punjab
Sindh
NWFP
Baloch
istan
Pakist
an
% 2001-022002-032003-042004-05
4.2.3 Rural Electrification 4.14 Low population densities and limited demand for electricity, along with high capital costs for expanding the network to rural areas, makes rural electrification unattractive. There is an increase of 206% in rural electrification expenditure in FY05 over FY04, reflecting Government’s priority to expand electricity supply to all rural areas. This increase in investment in rural electrification resulted in 74% of rural population using electricity for lighting as given in the PSLM 2004-05. Under rural electrification program 15,000 villages will be electrified during 2003-04 to 2005-06 period. It will facilitate; (a) the establishment of agro-based and cottage industries which will help in economic uplift, poverty alleviation and job opportunities, (b) the improvement in the living standard of rural population utilizing electric appliances and access to television, (c) the increased pumping of sub-soil water for domestic and agricultural purposes that will enhance productivity, (d) the provision of support to rural women in terms of labour, and (e) the reduction in rural/urban inequities and slowing down of the migration of rural population to urban areas.
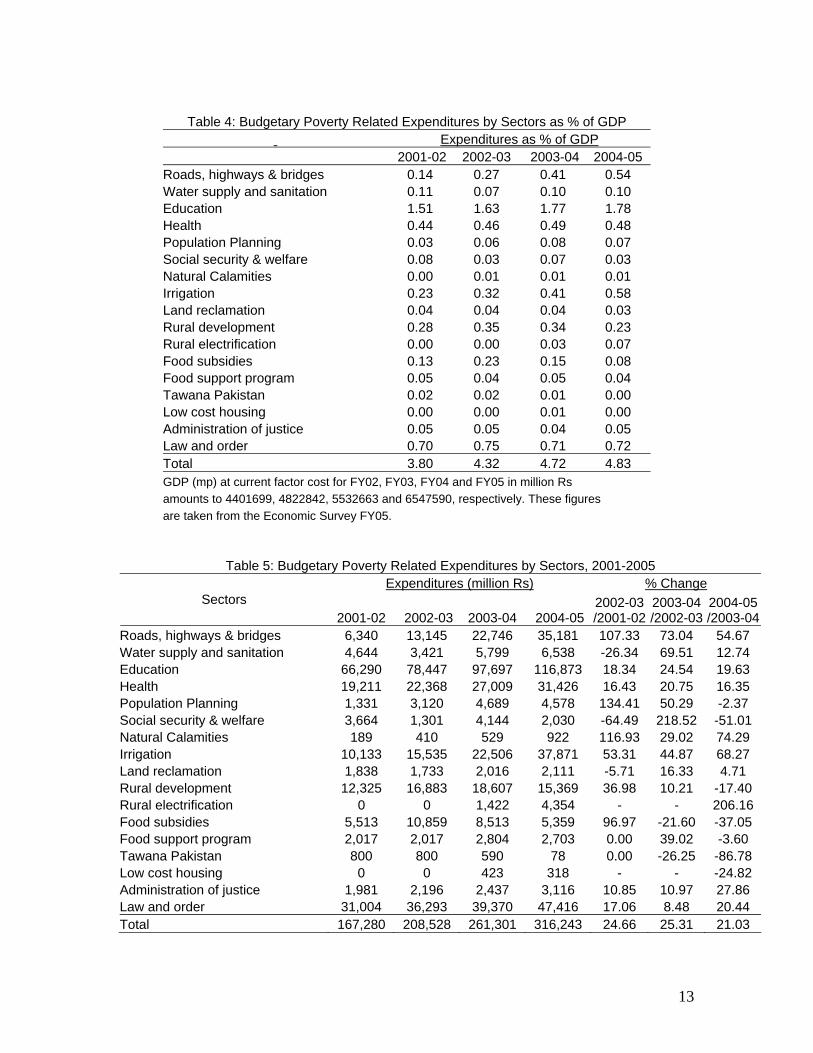
5 Non-Budgetary Transfers 5.1 The fourth Pillar of the PRSP is about ‘bringing the poor and vulnerable and backward regions into the mainstream of development and to make progress in reducing existing inequalities’. Zakat, Bait-ul-Mal, EOBI and micro-credit are main instruments to assist the needy. Under the non-budgetary transfers, PRSP monitors the disbursement to the poor through zakat, Bait-ul-Mal, EOBI and micro-credit. Zakat disbursement data for FY05 is available only for two provinces: Sindh and Balochistan. It has been included in Table 11 but has not been discussed in the text. The amount of total transfers (excluding zakat) through credit, EOBI and Pakistan Bait-ul-mal (PBM) increased by 38% between FY04 and FY05 reaching Rs 10930 million in FY05 (Table 11). The largest increase, however, has been witnessed in micro-credit disbursement. The PRSP reports the disbursement of micro-credit through Khushali Bank, Pakistan Poverty Alleviation Fund (PPAF) and Zarai Taraqiati Bank Ltd (ZTBL). Micro-credit disbursement through these three sources has increased approximately 5 -1/2 time from Rs. 1049 million in FY02 to Rs. 5727 million in FY05. The number of beneficiaries has also increased from 100,000 in FY02 to 470,000 in FY05.
20
Table 11: Non-budgetary Transfers and Beneficiaries Program Disbursement/beneficiaries 2001-02 2002-03 2003-04 2004-05Zakat (for Sindh and NWFP only) Amount disbursed (million Rs) 5,254 8,009 5,330 1,604 Total beneficiaries (000) 1,710 1,754 1,639 501 Pakistan Bait-ul-Mal (only FSP) Amount disbursed - - 3,159 3270 Households (000) - - 1,614 1,671 EOBI Amount disbursed (million Rs) 1,366 1,523 1,742 1,933 Total beneficiaries (000) 227 332 115 121 Credit Amount disbursed (million Rs) 1,049 2,518 3,034 5,727 Total beneficiaries (000) 100 216 286 470 All Programs (Excluding Zakat) Amount disbursed (million Rs) 2,415 4,041 7,935 10,930 Total beneficiaries (000) 327 548 2,015 2,262 All Programs (Including Zakat) Amount disbursed (million Rs) 7,669 12,050 13,265 12,534 Total beneficiaries (000) 2,037 2,302 3,654 2,763
Figure 4: Share in Credit Disbursement 2004-05
ZTBL1%
Khushali Bank40%
PPAF59%
5.2 Despite a rise in disbursement of micro-credit by ZTBL, it remains the smallest of the three institutional sources of micro-credit (Figure 4). In FY05, 59% of the total micro-credit disbursement was through the PPAF while the share of Khushali Bank was around 40%. More than one-third (36%) of borrowers in the PPAF disbursement during the FY05 were females while the corresponding percentage was 22% for the Khushali Bank. Access to micro-credit seems to be one of major factors contributing to household well-being (see Box 1 for the PPAF).
5.3 Disbursement through Employees Old Age Benefit Institute (EOBI) increased by 11% to Rs 1.9 billion during FY05 over FY04, whereas the number of beneficiaries during the same period increased by 6% to 121,357 beneficiaries.
5.4 The overall disbursement through PBM increased marginally from Rs 3.16 billion in FY04 to Rs 3.27 billion in FY05. The PBM disburses mainly to the needy under the following programs and schemes: Food Support Program (FSP), Individual Financial Assistance (IFA), Institutional Rehabilitation through Civil Society Wing (CSW), National Centre for Rehabilitation of Child Labour (NCRCL), Vocational Training Institutes/Dastakari Schools (VTIs) and Management Information System (MIS).

21
Box 1: Pakistan Poverty Alleviation Fund (PPAF) _ Taking Integrated Approach to Scale
To comprehensively address the issue of poverty, PPAF launched a pilot project in Dhok Tabark Shaheed village in 2003 to test an integrated area development approach. One of the partner organizations of PPAF – National Rural Support Programme (NRSP) was asked to prepare and implement an integrated upgrading plan for Dhok Tabark Shaheed with active participation of the community. PPAF provided grant funding of Rs 3.1 million, which was matched by community contribution of Rs 0.8 million. The plan has since been implemented and the community is successfully maintaining the facilities built. Major physical infrastructure components include safe drinking water supply, household latrines, small bore sewerage, street surfacing, wastewater collection, treatment and disposal. A community managed informal school was established where around 100 students are enrolled and a basic health unit was set up to cater to the health needs of village. Micro credit has also been given to 40 entrepreneurs who have acquired additional livestock and revitalized their family business. Enormous social benefits generated through this pilot project paved the way for PPAF to start replication of this approach by scaling up this intervention to 300 projects under Integrated Area Development Program (IAUP). This program is one of the major initiatives in phase-II of PPAF, which constitutes around 25% of the total infrastructure portfolio. Source: Poverty Line, a quarterly newsletter of Pakistan Poverty Alleviation Fund (Vol 2, No.3)
6 Monitoring the PRSP Intermediate Indicators
6.1 Education Sector
6.1.1 A Brief Review of Programs in the Education Sector
6.1 Investment in human capital is an integral component of the PRSP (pillar 3). To improve access to and quality of education many programs are under implementation at the federal and provincial levels. The Ministry of Education (MoE) has launched many programs in Federal schools including provision of free education up till matriculation, grants/stipends to girl students and female teachers and introduction of English language teaching from class 1 in all Federal Schools. All primary schools in the Federal areas are being converted to co-educational institutions and all new primary schools are required to have a ratio of 60 girls to 40 boys and 70% female teachers to 30% male teachers with the aim to reduce gender disparities.
6.2 To improve quality of education the MoE has formed Curriculum Council that is mandated to review the curriculum every five years. The Council will consist of private sector representatives. Under the National Education Assessment System a baseline for measurement of learning outcomes has been developed at the primary level where achievements in numeracy, literacy and life skills can be measured. An examination

22
board in the private sector has been established to improve the quality of examinations and to set an example for public sector examination boards.
6.3 The Federal Government has formed a National Technical and Vocational Training Authority which is governed by council of ministers consisting of Education, Labour, Industries and Finance and the MoE. It will be responsible for developing the plan for vocational and technical education in the country to respond to economic and social challenges being faced in Pakistan with inadequate or inappropriate skills entering the job market. 6.4 The National Education Foundation has launched the pilot education voucher scheme. It will provide different incentives such as vouchers to support direct costs of schooling (tuition fee, student fund) and will also pilot other incentives such as stipends/scholarships and support for costs such as stationary, bags and food. Over the course of the scheme, education vouchers will be provided to approximately 10,000 students/parents in the target areas. For selection of eligible children criteria have been developed and include orphans/children of widows, children of daily wages, poor farmers, peasants, household servants and working children.
6.1.2 Functional schools 6.5 Table 12 reports the number of functional public schools for Pakistan and provinces for FY02, FY03, FY04 and FY05. Overall the number of primary and middle public schools increased by 1% and 4% respectively in FY03 compared to FY02 whereas they declined marginally in FY04. The estimated number of functional public schools (148280) in FY05 is 5,544 less than the PRSP target (given by the Ministry of Education) of 153,824 for FY05. The situation over the years is similar in Punjab, except that number of estimated primary public schools has declined marginally in FY05 compared to FY04. Punjab being the most populous province has the largest number of pubic primary and middle schools - 58,442 in FY05. In Sindh province, there was no change in the number of functional public primary schools during FY04 compared to FY03. In NWFP the number of estimated primary and middle public schools for FY05 depicts a decline relative to FY04. It is difficult to explain this expected decline. The estimated number of functional public primary and middle schools reflect an increase of 1% and 5% respectively in FY05 compared to FY04 in Balochistan.
6.1.3 Posts Filled Against Sanctioned Posts in Public Schools 6.6 The actual posts filled against sanctioned posts are almost 100% for primary level in NWFP, Balochistan and FATA in 2003-04 (Table 13). The actual posts filled against sanctioned posts at primary level stood at 87% in Punjab. The same indicator for middle level is lowest in Punjab at 79% and highest in FATA at 96%.
6.1.4 Trained Teachers in Public Schools 6.7 Table 13 gives data on percentage of trained teachers in primary and middle schools in 2003-04. Almost all teachers in public primary and middle schools are trained indicating that the quality of education imparted in public primary and middle school is likely to improve over time.

23
6.1.5 Basic Facilities in Public Schools 6.8 Table 14 shows that the proportion of public schools with basic facilities i.e. water, latrine, electricity and boundary walls is reasonably high in Islamabad and FATA. However, the proportion of public schools with basic facilities is quite dismal in other provinces and overall in Pakistan. This demands for increase in the level of investment in public primary and middle schools so that they can be equipped with basic facilities.
Table 12: Number of Functional Public Schools Region/Province Year Primary Middle Total
2001-02 (A) 133,116 13,200 146,316 2002-03 (A) 134,027 13,736 147,763 2003-04 (A) 133,952 13,668 147,620 Pakistan
2004-05 (E) 134,370 13,902 148,280 2001-02 (A) 52,035 6,579 58,614 2002-03 (A) 51,995 6,875 58,870 2003-04 (A) 51,698 6,801 58,499 Punjab
2004-05 (E) 51,530 6,912 58,442 2001-02 (A) 39,176 2,240 41,416 2002-03 (A) 40,121 2,373 42,494 2003-04 (A) 40,121 2,373 42,494 Sindh
2004-05 (E) 40,594 2,440 43,034 2001-02 (A) 22,573 2,076 24,649 2002-03 (A) 21,992 2,055 24,047 2003-04 (A) 21,993 2,053 24,046 NWFP
2004-05 (E) 21,703 2,042 23,745 2001-02 (A) 9,913 696 10,609 2002-03 (A) 9,893 764 10,657 2003-04 (A) 10,087 774 10,861 Balochistan
2004-05 (E) 10,174 813 10,987 2001-02 (A) 4,376 989 5,365 2002-03 (A) 4,376 989 5,365 2003-04 (A) 4,374 988 5,362 AJK
2004-05 (E) 4,373 988 5,361 2001-02 (A) 1,126 202 1,328 2002-03 (A) 1,231 221 1,452 2003-04 (A) 1,231 221 1,452 FANA
2004-05 (E) 1,284 231 1,515 2001-02 (A) 3,695 371 4,066 2002-03 (A) 4,202 407 4,609 2003-04 (A) 4,238 404 4,642 FATA
2004-05 (A) 3,509 404 3,913 2001-02 (A) 222 47 269 2002-03 (A) 217 52 269 2003-04 (A) 210 54 264 Islamabad
2004-05 (A) 209 54 263 A= Actual data E= Estimated data Note: Mosque schools are included in primary schools

24
Table 13: Actual Posts Filled Against Sanctioned Posts and Percentage of Trained Teachers (%) 2003-04
Actual Posts Filled AgainstRegion/Province Level Sanctioned Posts %
Percentage of Trained Teachers
Male Female Total Male Female Total Pakistan Primary NA NA NA 98.66 98.73 98.68 Middle NA NA NA 99.21 99.22 99.22 Total NA NA NA 98.78 98.88 98.82 Punjab Primary 86.66 87.32 86.94 100.00 100.00 100.00 Middle 81.83 77.86 79.61 100.00 100.00 100.00 Total 85.35 83.65 84.55 100.00 100 100 Sindh Primary NA NA NA 96.59 95.93 96.4 Middle NA NA NA 95.46 96.89 96.1 Total NA NA NA 96.51 96.06 96.37 NWFP Primary 98.00 95.38 97.12 NA NA NA Middle 88.08 73.76 83.12 NA NA NA Total 96.14 91.14 94.46 NA NA NA Balochistan Primary 97.92 96.56 97.53 100 100.00 100.00 Middle 91.17 85.76 89.48 100.00 100.00 100.00 Total 95.59 92.51 94.68 100 100 100 AJK Primary NA NA NA 96.56 87.43 92.7 Middle NA NA NA 95.84 91.73 93.91 Total NA NA NA 96.2 89.78 93.33 FANA Primary NA NA NA 100.00 100 100 Middle NA NA NA 100.00 100 100 Total NA NA NA 100.00 100 100 FATA Primary 99.65 99.17 99.47 94.64 97.68 95.82 Middle 96.79 95.06 96.33 97.68 98.81 97.97 Total 98.82 98.40 98.67 95.51 97.88 96.35 Islamabad Primary NA NA NA 99.57 99.79 99.73 Middle NA NA NA 100.00 99.75 99.84 Total NA NA NA 99.71 99.78 99.76
Table 14: Proportion of Public Schools with Basic Facilities Region/ Province Level Water (%) Latrine (%) Electricity (%) B-Wall (%)
2003-2004 (A) Primary 53 42 26 45 Middle 71 64 59 61 Total 54 44 29 472004-05 (E) Primary 54 43 27 46 Middle 74 66 61 63
Pakistan
Total 56 45 30 482003-2004 (A) Primary 78 47 35 55 Middle 94 66 78 71 Total 80 49 40 57
Punjab
2004-05 (E) Primary 80 48 37 57

25
Middle 97 69 81 74 Total 82 51 42 592003-2004 (A) Primary 39 36 14 35 Middle 45 49 27 49 Total 39 36 14 362004-05 (E) Primary 40 37 14 36 Middle 47 51 28 51
Sindh
Total 40 38 15 372003-2004 (A) Primary 45 55 33 55 Middle 56 76 53 57 Total 46 57 35 552004-05 (E) Primary 47 56 34 57 Middle 59 79 55 60
NWFP
Total 48 58 36 572003-2004 (A) Primary 13 18 11 26 Middle 36 49 31 58 Total 48 20 12 282004-05 (E) Primary 13 19 11 27 Middle 37 51 33 60
Balochistan
Total 15 21 13 292003-2004 (A) Primary 35 31 12 8 Middle 49 66 35 17 Total 38 38 17 102004-05 (E) Primary 36 32 13 9 Middle 51 69 36 17
AJK
Total 39 39 17 102003-2004 (A) Primary 36 38 14 29 Middle 9 56 28 51 Total 39 41 16 322004-05 (E) Primary 37 39 15 30 Middle 58 58 29 53
FANA
Total 41 42 17 332003-2004 (A) Primary 36 42 46 53 Middle 54 70 71 83 Total 38 44 48 552004-05 (E) Primary 38 43 48 54 Middle 56 73 74 86
FATA
Total 39 45 50 572003-2004 (A) Primary 90 91 92 93 Middle 87 87 100 85 Total 90 90 94 912004-05 (E) Primary 93 94 95 96 Middle 90 90 104 89
Islamabad
Total 93 93 97 94

26
6.2 Health Sector 6.2.1 A Brief Review of Programs in Health Sector 6.9 The Ministry of Health has prepared a draft plan of action for strengthening Public Health Surveillance System. The first year program envisages undertaking need assessment studies, creating organization structures and reviewing the legislative framework for disease notification. In FY05-06 a legislative framework for mandatory disease notification, public health emergencies and vital registration will be developed and presented to Pakistan’s legislative body. 6.10 The Government of Pakistan has expanded the TB DOTS program through the public sector facilities. The population coverage has increased though the case detection remains low. The TB program has been made a five year program to expand TB case detection from 43% to 70% by expanding its partnership with the private sector. During FY05-06, the program will sign contract with at least 3 non-state providers to expand TB DOTS. Measles ranks first in terms of morbidity and mortality among the immunizable diseases. The Expanded Program on Immunization (EPI) has developed a comprehensive strategy for measles mortality reduction, including strengthening routine immunization, introduction of second dose of measles vaccine into the EPI program and supplement immunization activities targeting susceptible age cohort. During FY05-06, measles mortality reduction program will undertake piloting of measles campaign in 4-6 districts for children 9 months to 15 years old and achieve at least 80% coverage. 6.11 The Malaria Control Program in collaboration with NGO partnership will enhance the pace of implementation of use of Insecticide Treated Bed Nets (ITN) in 11 malaria endemic districts. During FY05-06 the coverage of ITNs will increase from close to 0% to 10% in the targeted districts. Steps are being undertaken for functional integration of population and health services at the FLCF level. The plan is to locate the Population Welfare Outlets in the Basic Health Units of the District Department of Health. There is some progress in this regard in all provinces but the implementation is slow. The population program provides contraceptives to health sector; however, regular supply has been affected by different pricing policies in health and population. The Ministry of Health has prepared and approved micronutrient plan of action which envisages phased expansion of universal salt iodization program by 2008.
6.2.2 Monitoring Health Indicators Immunization 6.12 Table 15 shows immunization (TT-1 and TT-2) coverage for pregnant women during FY04 and FY05. TT-I immunization coverage increased marginally from 40% in FY04 to 42% in FY05, whereas TT-II immunization coverage also increased marginally from 43% in FY04 to 44% in FY05. There is a substantial increase in TT-I (34%) and TT-II (44%) coverage in FATA during FY05 over FY04 which is commendable. There is a large increase in TT-I and TT-II coverage in AJK and ICT during FY05 relative to FY04. There is a decline in TT-I and TT-II coverage in NWFP, FANA and CDA in FY05 compared to FY04.
6.13 The coverage of DPT-3/OPV-3 immunization of children increased by 3 percentage points to 70% in FY05 over FY04 (Table 16). The biggest increase in immunization coverage of DPT-3/OPV-3 took place in ICT (30%) and largest decline (46%) in immunization coverage occurred in CDA in FY05 over FY04.

27
Table 15: TT- Immunization Coverage for Pregnant Women 2003-04 2004-05
TT-ImmunizationTT-
Immunization TT-1 TT2+ TT-1 TT2+
Province/Region
Target Population (+4.1% Pop) Cov% Cov%
Target Population (+4.1% Pop) Cov% Cov%
Punjab 3,426,281 45 47 3,508,680 46 47 Sindh 1,392,722 40 49 1,426,182 43 48 NWFP 870,842 29 30 891,762 26 26 FATA 133,701 22 23 136,914 56 67 Balochistan 325,518 23 31 333,336 23 30 AJK 139,148 41 42 142,494 55 55 FANA 40,699 24 30 41,676 17 18 ICT 26,515 20 15 12,978 40 31 CDA 18,102 39 133 36,606 18 67 Others - - - - Pakistan 6,373,528 40 43 6,530,628 42 44
Table 16: DPT-3/OPV-3 Coverage of Children (0-11 Months of Age) % Region/Province 2003-04 2004-05 Punjab 66 70 Sindh 72 71 NWFP 69 75 FATA 62 70 Balochistan 51 51 AJK 83 92 FANA 53 39 ICT 26 56 CDA 84 38 Pakistan 67 70
6.2.3 Lady Health Workers 6.14 Lady Health Workers (LHWs) program was designed in the early 1990s with an objective to provide basic community services to all rural and poor urban areas in Pakistan. It appears to be a success story in the health sector. A LHW registers approximately 200 households or 1000 individuals in her community to whom she offers a range of preventive services including family planning. Details were given in Q-1 FY05 PRSP report. Population covered by Lady Health Workers (LHW) increased by 5 percentage points to 54% in FY05 relative to FY04. There was an increase of 2% and 6% in urban rural coverage of LHWs respectively in FY05 over FY04. The targeted population covered by LHWs stood at 71% in FY05.

28
Table 17: Coverage of Lady Health Workers (LHWs)
Projected 2004
Population Covered by
LHWs in 2004 (%) Projected 2005
Population Covered by
LHWs in 2005 (%)
Total Population 148,000,000 49.55 151,000,000 54.17 Urban Population 49,522,280 36.18 50,526,110 38.27 Rural Population 98,477,720 56.27 100,473,890 62.17 Target Population 114,820,072 63.86 115,631,723 70.74
6.15 There are a total of 85,942 LHWs in FY05 of which 19% serve in urban areas and the remaining 81% work in rural areas (Table 18). As urban areas have much better access and quality of health facilities thus the need of LHW is more in rural areas than in urban areas. About 52% of LHWs have been appointed in Punjab, 21% in Sindh, 14% in NWFP and 6% in Balochistan in FY05. It is worth noting that in FY05, more than 10,000 LHWs were deployed in the field mainly in rural Punjab. Rural NWFP and rural Sindh have also witnessed an increase in the number of LHWs. However, rural and urban areas in Balochistan observed a decline in the number of LHWs.
Table 18: Number of Lady Health Workers* 2003-04 2004-05
Province Urban Rural Total Urban Rural Total Punjab 7,602 29,049 36,651 7,384 37,950 45,334 Sindh 6,746 11,633 18,379 6,220 11,951 18,171 NWFP 1,569 8,758 10,327 1,536 10,358 11,894 Balochistan 840 4,532 5,372 745 4,420 5,165 AJK 178 2,185 2,363 176 2,253 2,429 FANA 117 1,090 1,207 184 1,063 1,247 FATA 0 878 878 0 1,414 1,414 ICT 58 248 306 51 237 288 Total 17,110 58,373 75,483 16,296 69,646 85,942 * Includes LHWs who are under training.
6.4 Land Distribution 6.16 The Government has designed a program to distribute the state land among the rural landless households. An estimated 2.7 million acres of state land is available for distribution. During FY02 and FY05, about 61,317 acres of land has been distributed, implying that 2.6 million acres of state land is still available for distribution. Data presented in Table 19 shows that during FY05 only 384 acres of land was distributed to 51 beneficiaries in Punjab implying that on average 7.5 acres of land was distributed per beneficiary. Poor people can benefit from this land if they have access to credit to timely arrange the agricultural inputs. During FY04 3,452 acres of land was distributed to 354 beneficiaries. Major state land distribution took place in FY02 when 49,980 acres of land

29
was distributed to 2694 beneficiaries. There is a need to speed up the process of land distribution to the landless households which can assist in poverty alleviation in the rural areas.
Table 19: State Land Distribution by Number of Beneficiaries in Each Province 2001-02 2002-03 2003-04 2004-05
Province Acres of
Land Beneficiaries
(number)
Acres of
Land Beneficiaries
(number)
Acres of
Land Beneficiaries
(number)
Acres of
Land Beneficiaries
(number) Punjab 15,878 1,386 3,260 330 3,452 354 384 51 Sindh 11,394 1,127 4,241 490 0 0 0 0 NWFP 17,619 24 0 0 0 0 0 0 Balochistan 5,089 157 0 0 0 0 0 0 Total 49,980 2,694 7,501 820 3,452 354 384 51 7 PRSP and Social Sector Performance 7.1 One of the priorities in the PRSP is to improve the delivery system while gradually increasing pro-poor expenditures. In the past even when the growth led to strong poverty reduction concomitant improvements in social sector indicators did not follow. Too few public resources had been devoted towards human development and other pro-poor services. Moreover resources have often been managed poorly. Improving social outcomes is therefore as much an issue of increasing resources, as that of appropriately targeting and improving the efficacy of spending through improved governance. Results of the PSLM survey- CWIQ have enabled, for the first time after the initiation of the PRSP process in 2001, to assess the social sector performance. The PSLM, a new data series of the Federal Bureau of Statistics (FBS), has two integrated but stand alone components. The first is the CWIQ methodology based PSLM, with a large sample of more than 76,520 households (27144 rural and 49376 urban), representative at the district level (see Box 2). This component has collected data on the social sector indicators including education, health, water-supply and housing sectors, and also the utilization of basic services. The second component of the PSLM is designed to provide data on household consumption expenditures commonly used for poverty estimation. It will be representative at the national and province levels and its results are likely to be available at the end of this year. This section has used the PSLM survey-CWIQ component to see the progress in social sector with a special reference to the PRSP and MDG targets. The PSLM survey-CWIQ results have been compared with the PIHS 2001-02.3
3 In terms of representativeness as well as definition of different indicators, the PIHS is comparable with the PSLM survey-CWIQ.

30
Box 2: SAMPLING METHODLOGY OF THE PSLM SURVEY-CWIQ Sample Design: A two-stage stratified sample design has been adopted in the PSLM survey-CWIQ. Sample Size : Keeping in view the objectives of the survey the sample size for the four provinces has been fixed at 76520 households comprising 5204 sample villages/enumeration blocks which is expected to produce reliable results at the district level. Selection of Primary Sampling Units (PSUs): Villages and enumeration blocks in urban and rural areas respectively have been taken PSUs. The sampled PSUs have been selected from strata/sub-strata with PPS method of sampling technique. Selection of Secondary Sampling Units (SSUs): Households within sample PSUs have been taken as SSUs. A specified number of households i.e. 16 and 12 from each sample PSU of rural & urban area have been selected respectively using systematic sampling technique with a random start. Questionnaires Used Household and Facility At both individual and household level, the PSLM survey-CWIQ collects information on a wide range of topics using an integrated questionnaire. The questionnaire comprises a number of different sections each of which looks at a particular aspect of household behavior or welfare. The data collected under Round I include education, health, immunization, diarrhoea, its treatment, pre and post-natal care, housing conditions and access to basic services and amenities. Information on utilization of Health and Educational facilities in rural PSUs has also been collected. Data collection technique and definitions adopted for different indicators in PSLM survey are similar as adopted in PIHS
7.1 Education Sector 7.1.1 Primary Schooling 7.2 For primary-level schooling two measures are commonly used: Gross Enrolment Rate (GER) and Net Enrolment Rate (NER). The primary-level GER for children 5-9 years old, excluding katchi class, according to the PIHS, was 72% in 2001-02. It is worth clarifying that the PRSP has used a high base-year GER, 83% for the 2000-01 period, based on the data from the Ministry of Education. PRSP projected the GRE as 100% by 2004-05 (Table 20). However, in the I-PRSP the base-year data was reported from two sources: PIHS 1998-99 and Ministry of Education (EFA) 2000-01. In this section, PIHS 2001-02 results have been compared with the findings of the PSLM survey-CWIQ.
7.3 The efforts of the public and privates sectors have resulted in an increase in education expenditure during the last four years (see Section 3); at the same time primary-level enrolment rates have increased. The PSLM survey-CWIQ results are encouraging in many dimensions; the overall increase in primary school GER is impressive, from 72% in 2001-02 to 86% in 2004-05. In urban areas, GER is impressive in all provinces, ranging from 84% in Balochistan to 108% in Punjab. In rural areas, Punjab has made a marked progress particularly in female GER which increased from 61% in 2001-02 to 82% in 2004-05. This progress has been modest in NWFP; it has been slow in Balochistan as well as Sindh. In rural Balochistan, for example, female GER could increase only marginally from 38% in 2001-2 to 41% in 2004-05 (Figure 5).

31
Table 20: Gross Enrolment Rate at the Primary Level (Age 5-9) By Province & Region (Excluding Katchi Class)
2001-02 PIHS 2004-05 PSLM Region and Province Male Female Both Male Female Both
Urban Areas 94 87 91 107 100 104 Punjab 95 93 94 111 108 110 Sindh 91 78 84 103 94 99 NWFP 100 86 93 100 84 92 Balochistan 98 75 88 101 86 94 Rural Areas 80 52 66 89 68 79 Punjab 80 61 70 96 82 89 Sindh 69 37 53 70 44 58 NWFP 96 52 74 92 62 78 Balochistan 73 38 57 79 41 61 Overall 83 61 72 94 77 86 Punjab 84 69 76 100 89 95 Sindh 76 51 63 84 65 75 NWFP 97 56 77 93 65 80 Balochistan 77 44 62 83 49 67 For PRSP baseline year 2000-01; GER for male: 94%, for female: 68% and for both: 83%. PRSP GER projection for 2005-06; for male:114%, for female:94% and for both:104%. Source: PSLM 2004-05, Pakistan Millenium Development Goals Report 2004 and Accelerating Economic Growth and Reducing Poverty: The Road Ahead, Poverty Reduction Strategy Paper, 2003
76
95
63
7577
80
62
6772
86
0
10
20
30
40
50
60
70
80
90
100
Punjab Sindh NWFP Balochistan Pakistan
Figure 5: Overall Change in GER-Primary (FY 2002 Vs FY 2005) 2001-022004-05

32
7.4 Gender disparity in education is one of major challenges in Pakistan. Table 21 and graph 6 show an overall decline in gender gap in GER at the primary level; from 22% in 2001-02 to 17% in 2004-05. This decline was due to relatively greater increase in female GER than in male GER between the 2001-02 and 2004-05 period. Gender disparity in GER at primary level declined in all provinces except in Balochistan where it increased by one percentage point. Punjab province has the lowest gender disparity at 11% and Balochistan has the highest gender disparity at 34%. Gender disparity in urban areas remained the same at 7% during 2001-02 and 2004-05 because male and female GER increased by the same proportion (13%).
Table 21: Gender Gap in GER at the Primary Level (Age 5-9)
Region and Province 1998-99
PIHS 2001-02
PIHS 2004-05 PSLM
Urban Areas 3 7 7 Punjab -6 2 3 Sindh 12 13 9 NWFP 14 14 16 Balochistan 22 23 15 Rural Areas 25 28 21 Punjab 21 19 14 Sindh 26 32 26 NWFP 33 44 30 Balochistan 35 35 38 Overall 19 22 17 Punjab 14 15 11 Sindh 21 25 19 NWFP 30 41 28 Balochistan 33 33 34 Source: PSLM 2004-05
Figure 6: Overall Gender Gap-GER Primary (1998-99to 2004-05)
3
25
19
7
28
22
7
2117
0
5
10
15
20
25
30
Urban Rural Pakistan
1998-992001-022004-05
7.5 It is encouraging that gender gap in GER at primary level in rural areas has declined by 7 percentage points between 2001-02 and 2004-05 (Table 22). This decline is due to relatively greater increase in female GER than in male GER. Punjab province has the lowest gender gap in urban as well as in rural areas in 1998-99, 2001-02 and 2004-05.
33
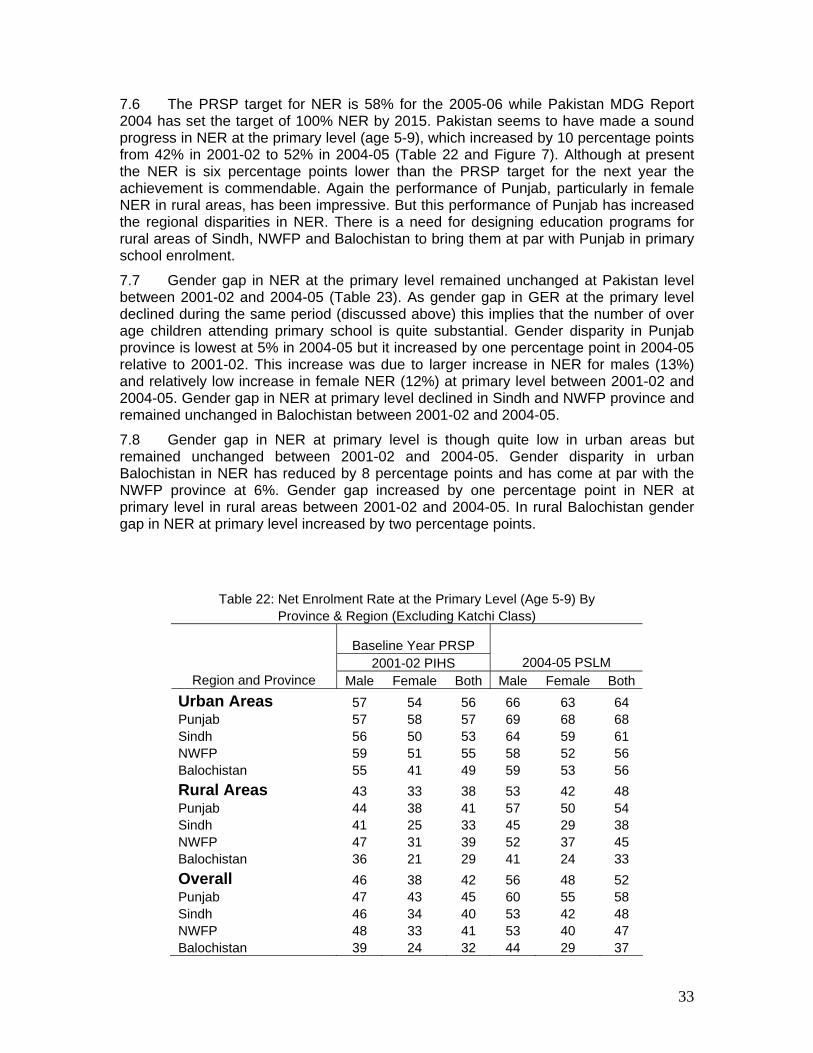
7.6 The PRSP target for NER is 58% for the 2005-06 while Pakistan MDG Report 2004 has set the target of 100% NER by 2015. Pakistan seems to have made a sound progress in NER at the primary level (age 5-9), which increased by 10 percentage points from 42% in 2001-02 to 52% in 2004-05 (Table 22 and Figure 7). Although at present the NER is six percentage points lower than the PRSP target for the next year the achievement is commendable. Again the performance of Punjab, particularly in female NER in rural areas, has been impressive. But this performance of Punjab has increased the regional disparities in NER. There is a need for designing education programs for rural areas of Sindh, NWFP and Balochistan to bring them at par with Punjab in primary school enrolment.
7.7 Gender gap in NER at the primary level remained unchanged at Pakistan level between 2001-02 and 2004-05 (Table 23). As gender gap in GER at the primary level declined during the same period (discussed above) this implies that the number of over age children attending primary school is quite substantial. Gender disparity in Punjab province is lowest at 5% in 2004-05 but it increased by one percentage point in 2004-05 relative to 2001-02. This increase was due to larger increase in NER for males (13%) and relatively low increase in female NER (12%) at primary level between 2001-02 and 2004-05. Gender gap in NER at primary level declined in Sindh and NWFP province and remained unchanged in Balochistan between 2001-02 and 2004-05.
7.8 Gender gap in NER at primary level is though quite low in urban areas but remained unchanged between 2001-02 and 2004-05. Gender disparity in urban Balochistan in NER has reduced by 8 percentage points and has come at par with the NWFP province at 6%. Gender gap increased by one percentage point in NER at primary level in rural areas between 2001-02 and 2004-05. In rural Balochistan gender gap in NER at primary level increased by two percentage points.
Table 22: Net Enrolment Rate at the Primary Level (Age 5-9) By Province & Region (Excluding Katchi Class)
Baseline Year PRSP 2001-02 PIHS 2004-05 PSLM
Region and Province Male Female Both Male Female Both Urban Areas 57 54 56 66 63 64 Punjab 57 58 57 69 68 68 Sindh 56 50 53 64 59 61 NWFP 59 51 55 58 52 56 Balochistan 55 41 49 59 53 56 Rural Areas 43 33 38 53 42 48 Punjab 44 38 41 57 50 54 Sindh 41 25 33 45 29 38 NWFP 47 31 39 52 37 45 Balochistan 36 21 29 41 24 33 Overall 46 38 42 56 48 52 Punjab 47 43 45 60 55 58 Sindh 46 34 40 53 42 48 NWFP 48 33 41 53 40 47 Balochistan 39 24 32 44 29 37

34
MDG baseline year 1990-91 NER overall; 46% PRSP projected NER 2005-06 overall; 58% MDG target for NER 2015 overall; 100%
Source: PSLM 2004-05, Pakistan Millennium Development Goals Report 2004 and Accelerating Economic Growth and Reducing Poverty: The Road Ahead, Poverty Reduction Strategy Paper, 2003 Notes: 1. Net Enrolment Rate: [Number of children aged 5-9 years attending primary level (classes (1-5)) divided by number of children aged 5-9 years] multiplied by 100. Enrolment in katchi class is excluded. 2. Numerator of NER: Raised sum of all individuals aged 5-9 years who report currently attending primary level. 3. Denominator of NER: Raised sum of all individuals aged 5-9 years who respond to the relevant questions.
Figure 7: Urban/Rural NER-Primary Level (2001-02 vs 2004-05)
56
38
42
64
48
52
0 10 20 30 40 50 60 70
Urban
Rural
Pakistan2004-05
2001-02
Table 23: Gender Gap in NER at the Primary Level (Age 5-9)
Region and Province 1998-99
PIHS 2001-02
PIHS 2004-05 PSLM
Urban Areas 2 3 3 Punjab -3 -1 1 Sindh 6 6 5 NWFP 10 8 6 Balochistan 7 14 6 Rural Areas 13 10 11 Punjab 9 6 7 Sindh 16 16 16 NWFP 18 16 15 Balochistan 17 15 17 Overall 10 8 8 Punjab 7 4 5 Sindh 12 12 11 NWFP 17 15 13 Balochistan 16 15 15 Source: PSLM 2004-05

35
7.1.2 Increasing Role of Private Sector in Primary Education 7.9 The role of private sector in primary education has increased over time. Out of the total primary level GER of 86% in 2004-05 the government school GER has been computed as 62%. In other words private school GER was 24% in 2004-05. The government school GER increased by 15% between 2001-02 and 2004-05 while the private school GER increased by 33% during this period. It suggests that new enrolment has taken place in both types of schools, public as well as private. On the other hand relatively greater increase in private school GER suggests some shifting of children from public to private schools. Consequently between 2001-02 and 2004-05, the overall share of government school enrolment in the total primary-level enrolment decreased from 74% to 72%.
7.10 In urban areas approximately half of the total primary enrolment is currently in private schools and it has marginally declined from 49% in 2001-02 to 48% in 2004-05 (Figure 8). However, in rural areas private school enrolment as percentage of total primary enrolment increased from 15% in 2001-02 to 18% in 2004-05 suggesting that, in rural areas where majority of the poor live, public schools remain the main source for primary education. This is true for all provinces, although in rural Punjab approximately one-quarter (23%) of the enrolled children are presently in private schools.
7.1.3 Middle and Secondary education 7.11 PRSP projected the middle-level GER as 49.5% in 2004-05. The middle-level GER has increased from 41% in 2001-02 to 46% in 2004-05 (Figure 9). The increase was the same for both male and female. There is a large gap between urban and rural areas in the middle-level GER - 64% and 38% respectively. Net enrolment rates at the middle-level are much lower than GER (Figure 10). This is due to the large number of overage children that are enrolled in these classes. The middle-level NER increased only marginally from 16% in 2001-02 to 18% in 2004-05. At the matric level, GER stands at 44% and net enrolment at 11% with a wide gender gap (Figures 11 and 12). Middle and matric-level enrolments can be enhanced by upgrading the existing primary- and middle-level schools to the next higher level. It would increase the school accessibility particularly for girls in low income households (For the efforts of Punjab government to increase enrolment of girls, see Box 3).
Figure 8: Primary Enrolment in Government Schools as % of Total Primary Enrolment
0 20 40 60 80
100
Male Female Both Male Female Both
2001-02 PIHS 2004-05 PSLM
% Urban Areas: Rural Areas
Overall

36
Figure 10: NER at the Middle Level (Pakistan)
0 5
10 15 20 25
1998-99 PIHS 2001-02 PIHS 2004-05 PSLM
% BothMaleFemale
Figure 11: GER at the Matric Level (Pakistan)
0 10 20 30 40 50 60
Pakistan Punjab Sindh NWFP Balochistan
% 1998-99 PIHS
2001-02 PIHS
2004-05 PSLM
Figure 12: NER at the Matric Level (Pakistan)
0 2 4 6 8 10 12 14
Pakistan Punjab Sindh NWFP Balochistan
% 1998-99 PIHS2001-02 PIHS2004-05 PSLM
Figure 9: GER at the Middle Level (Pakistan)
0 10 20 30 40 50 60
PRSP Baseline
Year 2000- 01
PIHS 2001-02
PSLM2004-05
PRSPTarget
2005-06
% Male
Female Both

37
Box 3: Punjab Education Sector Reforms Program The Punjab Government in January 2004 under its Education Sector Reform Programme (PESRP) launched a stipend programme for the girl students of classes VI, VII and VIII in 15 low literacy districts in Punjab. The initiative aimed at improving enrolment and retention rate and reducing gender discrepancy in the provision of education. The programme monitoring and implementation unit, after completion of two quarterly stipend cycles initiated a third party validation for stipend disbursement process in October 2004. The validation proved that the school headmistresses are aware of the eligibility criteria, followed the guidelines and the stipend assessment has been transparent. The eligible girl students fully met attendance criteria and actually received stipends. The delivery mechanism through post office as a whole was found to be effective and efficient. Overall 91.3% of the current stipend students confirmed receipt of the stipend for the second cycle. The stipend program as a whole has achieved its objectives. However, there is a need to review the steps involved, redesign the roles, streamline the management structure and to decentralize the activities involved in such a way that stipend cycle from assessment to disbursement does not cross over the next quarter. The coordination between the EDO and the post office and monitoring of disbursement process needs to be strengthened. The stipend disbursement process should also include a periodic review mechanism at the level of EDO and District Postal Officials.
7.2 Literacy 7.12 Literacy rate (10 years and older) though has increased substantially from 16.7% in 1961 to 53% in 2004-05. It is still below the PRSP target of 58% for 2004-05. The MDG target is to increase it to 88% by 2015. The last three years have witnessed 8 percentage point increase in overall literacy from 45% in 2001-02 to 53% in 2004-05 (Figure 13). In the rural areas literacy increased from 36% in 2001-02 to 41% in 2004-05 whereas the corresponding increase in the urban areas was from 64% to 71% (Figure 14). Male literacy increased from 58% in 2001-02 to 65% in 2004-05 while the corresponding increase in female literacy was from 32% to 40%. Female literacy rates vary from only 13% in Balochistan to 35% in Punjab and during the 2001-02 and 2004-05 period, Balochistan and Sindh could increase it by only 2% and 4% respectively (Table 24). Female literacy should be the focus of social sector policy because it has a great potential to be a key factor in achieving MDG targets.

38
64
71
36
44
45
53
0 10 20 30 40 50 60 70 80
Urban
Rural
Pakistan
Figure 14: Literate Population (2001-02 vs 2004-05) 2004-052001-02
2004-52001-02
2004-052001-02
2004-052001-02
Table 24: Literacy Rates: Population 10 Years and Older (%) Region and
Province Male Female Both Male Female Both Urban Areas 72 56 64 78 62 71 Punjab 71 60 66 78 66 72 Sindh 74 54 64 80 62 72 NWFP 70 41 56 75 47 61 Balochistan 71 36 54 74 42 60 Rural Areas 51 21 36 58 29 44 Punjab 51 26 38 59 35 47 Sindh 51 14 33 56 18 38 NWFP 55 16 35 61 23 41 Balochistan 49 11 32 47 13 32 Overall 58 32 45 65 40 53 Punjab 57 36 47 65 44 55 Sindh 60 31 46 68 41 56 NWFP 57 20 38 64 26 45 Balochistan 53 15 36 52 19 37
Figure 13: Literacy Rate (%) Pakistan
0 10 20 30 40 50 60 70
1961 1972 1981 1998 1998-99 2001-022004-05
% Both Sexes
Male
Female

39
7.13 Gender disparity in literacy was lowest in 1961 at 18%; it increased to 28% in 1998-99. Since then there is a declining trend. However, the more recent decline is only marginal; from 26% in 2001-02 to 25% in 2004-05 (Figure 15 and Table 25). At present, gender disparity is lower in urban areas (16%) than in rural areas (29%). In fact, there was no real progress in reducing the literacy gap either between rural and urban areas or between the genders in both areas. The explanation of this gap rests with girls not being sent to schools for a variety of reasons like distance of school from home, assistance in domestic work or other cultural obstacles. According to Participatory Poverty Assessment (PPA) 2003 in the Northern Areas poor households consider investing in girls’ education pointless as they would get married and move to another house. There is a need to bring a change in this attitude. There is no doubt that the current literacy level of 53% is far from the MDG target of 88% by 2015. Increase in primary school enrolment, as shown earlier, would certainly contribute in enhancing the literacy levels in Pakistan. However, the backlog of adult illiterates, particularly female; requires more resources and programs for adult literacy.
Figure 15: Gender Gap Literacy (above age 10 Yrs)
1819 19 252628
05
101520253035
1961 1972 1981 1999 2002 2005
UrbanRuralPakistan
Table 25: Gender Gap in Literacy (Age 10 Years and Above) Region and Province
Census 1961
Census 1972
Census 1981
1998-99 PIHS
2001-02 PIHS
2004-05 PSLM
Urban Areas 23.6 19 18 17 16 16 Punjab - - - 13 11 12 Sindh - - - 21 20 18 NWFP - - - 26 29 28 Balochistan - - - 33 35 32 Rural Areas 15.8 17.9 18.9 32 30 29 Punjab - - - 28 25 24 Sindh - - - 38 37 38 NWFP - - - 38 39 38 Balochistan - - - 39 38 34 Pakistan 18 19 19 28 26 25 Punjab - - - 23 21 21 Sindh - - - 30 29 27 NWFP - - - 36 37 38 Balochistan - - - 38 38 33 Source: PSLM 2004-05 &Population of Pakistan: An Analysis of 1998 Population and Housing Census

40
7.3 Health Sector 7.14 The PSLM survey-CWIQ provides useful information on self-reported morbidity, use of health services, child immunization coverage, use of ORS during the diarrhea episode, pre- and post-natal care and drinking water supply and sanitation. Some of these indicators are discussed below.
7.3.1 Immunization 7.15 Immunization has a positive impact on reduction in child malnutrition as well as mortality. Full immunization of a child includes eight recommended vaccines – BCG, DPT1, DPT2, DPT3, Polio1, Polio2, Polio3 and measles. In the PSLM survey-CWIQ, data on child immunization was collected using two methods, ‘recall’ and ‘record’. Both methods show a considerable increase in immunization coverage during the 2001-02 and 2004-05 period. At least one immunization, based on ‘recall’ method, increased from 74% in 2001-02 to 83 % in 2004-05. Based on this method full immunization has increased from 53% in 2001-02 to 77% in 2004-05. The increase (in full immunization) is particularly impressive in rural areas, from 46% in 2001-02 to 72% in 2004-05 (Table 26 and Figure 16). Under the ‘record’ method, respondents were asked to show the immunization cards to write down the information. As expected, under this method full immunization rate is quite low, 49% in 2004-05 compared to 77% under the ‘recall’ method. However, there has been an improvement in record-based immunization rate, from only 27% in 2001-02 to 49% in 2004-05.
7.16 According to the EPI/CDD Cell (NIH) data, 88% of the target population (children 0-11 months old) had BCG vaccination during the FY05. The percentage of target population vaccinated against polio, hepatitis and measles was lower than the BCG. Table 16 shows a modest increase in child immunization DP-III over time. Similarly, coverage of women immunization (TT) has also gradually increased during the last four years (Table 15).
7.17 Increase in the immunization coverage in Pakistan, particularly of children, seems to be a success story. At present, the full immunization (recall method) is close to the PRSP target for the 2004-05 period. MDG target is more than 90% by 2015. Sustainability in the immunization programs as well as on-going awareness campaign can help achieve the MDG targets. It would result in reduction in child mortality as well as malnutrition.
Figure 16: Percent of Children Aged 12-23 Months Immunized
0 20 40 60 80
100
1998-99PIHS
2001-02PIHS
2004-05PSLM
% Based on Recall Based on Record

41
Table 26: Percent of Children Aged 12-23 Months Immunized Based on Recall and Record Method Fully Immunized
2001-02 PIHS 2004-05 PSLM Region and Province Male Female Both Male Female Both
Urban Areas 70 71 70 86 87 87 Punjab 72 80 76 89 89 89 Sindh 66 63 64 86 87 87 NWFP 81 57 70 84 86 85 Balochistan 34 37 36 80 77 79 Rural Areas 48 45 46 73 71 72 Punjab 52 50 51 82 80 81 Sindh 39 26 33 64 60 62 NWFP 52 57 55 74 72 73 Balochistan 22 21 22 57 54 55 Pakistan 53 52 53 78 77 77 Punjab 57 58 57 85 84 84 Sindh 49 40 45 74 72 73 NWFP 56 57 57 77 76 76 Balochistan 24 24 24 64 60 62 Proportion of fully immunized children, MDG baseline year 1990-91; 75% Proportion of fully immunized children, PRSP baseline year 2000-01; 53% Proportion of fully immunized children, PRSP target 2005-06; 82% Proportion of fully immunized children, MDG target 2015; >90% *PRSP targets and Baseline Year are given in MDG Report 2004 Source: PSLM 2004-05, Pakistan Millennium Development Goals Report 2004
7.3.2 Pre- and post-natal care 7.18 High maternal mortality in Pakistan can be reduced through quality prenatal care. The PSLM survey- CWIQ shows that the proportion of married women who had given birth during the last three years and had attended at least one pre-natal consultation has increased from 35% in 2001- 02 to 50% in 2004-05 (Table 27 and Figure 17). The attendance rate was much higher in urban areas (66%) than in rural areas (40%). The increase in attendance rate was impressive in rural areas, from 26% in 2001-02 to 40% in 2004-05. This increase has been witnessed in rural areas of all provinces, although there is a considerable gap in attendance rate between the provinces. Punjab overall has the highest attendance rate and Balochistan the lowest. Compared to pre-natal, the post-natal consultation rate is low, 23% in 2004-05. However, considerable improvement has been witnessed during the last three years, from only 9% in 2001-02 to 23% in 2004-05. Urban areas have higher rates than the rural areas.

42
Table 27: Percentage of Pregnant Women Visiting Health Facility for Pre-and Post-Natal Consultation Region/ Province 2001-02 PIHS 2004-05 PSLM Urban Rural Overall Urban Rural Overall Pre-Natal Consultation Pakistan 63 26 35 66 40 50 Punjab 64 31 40 67 47 56 Sindh 68 22 38 74 40 55 NWFP 45 19 22 51 35 39 Balochistan 45 16 21 57 27 35 Post-natal consultation Pakistan 16 6 9 34 16 23 Punjab 15 8 10 32 17 23 Sindh 19 6 10 41 16 27 NWFP 8 4 4 29 17 21 Balochistan 16 5 7 32 10 16 Source: PSLM 2004-05
6640 5063
26 35
0
10
20
30
40
50
60
70
Urban Rural Overall 2001-02
2004-05
Figure 17: Pre-Natal Consultation (2001-02Vs 2004-05) 2001-022004-0566
4050
7.3.3 Sources of drinking water 7.19 Access to safe drinking water, an indicator of the PRSP and MDG, is top of agenda of the present government. The PRSP definition of safe drinking water includes ‘tap water’, ‘hand pumps’ and ‘motor pumps’ inside or outside house as the clean sources of drinking water. Based on this definition, 86% of households in the country (94% in urban areas and 80% in rural areas) had access to clean drinking water in 2001-02 (Table 28 and Figures 18-19). The PRSP projection for the access to clean drinking water for the 2004-05 was 89% (96% in urban areas and 83% in rural areas). According to the PSLM survey-CWIQ this access has rather declined, particularly in rural areas, from 80% in 2001-02 to 76% in 2004-05. This decline was primarily due to 17% reduction in the use of ‘hand pumps’ as the source of drinking water in rural areas. It is encouraging to see that 13% of these households were able to switch from ‘hand pumps’ to ‘tap water’ which is probably better source of drinking water than the former. However the data also show that 4% of rural households which used to depend on ‘hand pumps’ had to switch to low quality sources of drinking water such as rivers, ponds etc during the last three years.

43
7.20 Moreover, a considerable proportion of households in Balochistan (69%) and NWFP (44%) still get drinking water from dug wells, rivers, ponds etc. The last three years have seen an improvement in enhancing the access of rural households of these provinces to ‘tap water’, but more targeted interventions are required to reduce the use of river or pond water. It is encouraging to see that the access to clean drinking water is universal (97%) in rural Punjab and quite satisfactory in Sindh (81%). But there is a need to ensure that good quality water is being provided through three main sources of drinking water – ‘tap water’, ‘hand pump’ and ‘motor pump’.
Table 28: Main sources of Drinking Water in Pakistan (Percentage Distribution)
2001-02 PIHS 2004-05 PSLM Pakistan Urban Rural Overall Urban Rural Overall
Population with Access to Clean Drinking Water * 94 80 86 95 76 84 Tap water 58 10 25 60 23 39 Hand pump 14 56 44 13 39 27 Motor pump 22 14 17 22 14 18 Dug well 2 10 7 2 9 6 Other 3 10 7 3 16 10 Total 100 100 100 100 100 100 Percentage of population with access to piped water, MDG baseline year 1990-91; 53% Percentage of population with access to clean drinking water, PRSP baseline year 2001-02; urban: 95%, rural:80%, overall: 86% Percentage of population with access to clean drinking water, PRSP target 2005-06, urban:97%, rural:84% and overall:90% Percentage of population with access to piped water, MDG target 2015; 93% *Sum of tap water, hand pump and motor pump Source: PSLM 2004-05, Pakistan MDG Report 2004 and PRSP, 2003
Figure 18: Main Source of Drinking Water (PSLM 2004-05)
Other10%
Dug Well6%
Motor Pump18%
Hand Pump27%
Tap Water39%
Figure 19: Main Source of Drinking Water (PIHS 2001-02)
Others7%
Dug Well7%
Motor Pump17%Hand
Pump44%
Tap Water25%

44
7.3.4 Utilization of Health Services 7.21 The PSLM survey-CWIQ provides information on the use of different types of health services during the recent self-reported illness, diarrhoea episode among children and pre-natal and post-natal consultation by married women who had given birth during the last three years.
7.22 The overall incidence of self-reported illness during the two weeks preceding the survey was 7 percent with no major difference between male and female or rural and urban areas. This incidence among children was almost double (13%). Special questions were asked about the incidence of diarrhea among the children during the month preceding the survey and it was 16 percent according to the PSLM survey-CWIQ with no major regional or gender differences. During the recent episode of reported illness, including diarrhea, consultation of a health practitioner was almost universal at more than 90 percent.
7.23 The largest proportion (67% overall, 71.5% urban areas and 64.3% rural areas) of sick people consulted a private doctor/dispensary/hospital. Around one-fifth of the sick population consulted a public dispensary/hospital in urban as well as rural areas. A very small proportion of the sick population consulted other health providers such as RHC/BHC, hakeem/herbalist and homeopath. However, in the NWFP province a relatively larger proportion of sick people consulted a chemist/pharmacy, according to the PSLM survey-CWIQ (Table 29). In case of diarrhea among children, it is encouraging to see a considerable increase in the use of ORS, an effective way of preventing dehydration. This increase is more profound in rural areas (25%) than in urban areas (21%). The PSLM survey-CWIQ does not show a difference in the use of ORS between rural and urban areas. No gender difference was also found (Table 30). More than two-thirds of children suffering from diarrhea consulted private doctors/hospitals. The use of public dispensary/hospital for diarrhea treatment has declined by 6% between 2001-02 and 2004-05. This decline was higher in the rural areas than in the urban areas. Only a small proportion of respondents reported the use of RHC/BHU, LHW, LHV/Nurse, chemist or hakeem/homeopath/herbalist for diarrahoea treatment. The Government has designed program to strengthen the services provided in BHUs (see Box 4).
Table 29: Percentage Distribution of Health Consultations in Past Two Weeks By Type of Health Provider/Consulted during 2004-05
Region/ practitioner
Private/ Dispensary/
Hospital
Public Dispensary/Hospital RHC/BHU
Hakeem/Herbalist
Homeopath
Chemist/Pharmacy
Siana/Siani Other
Urban Areas 71.50 20.47 0.52 1.76 1.54 3.10 1.01 0.11 Punjab 73.50 15.42 0.26 3.09 2.28 3.91 1.37 0.18 Sindh 78.93 17.79 0.75 0.75 0.96 0.14 0.65 0.03 NWFP 55.81 31.31 0.39 0.67 1.44 9.13 1.09 0.16 Balochistan 56.47 40.68 1.20 0.99 0.10 0.13 0.43 0.00 Rural Areas 64.31 20.68 3.50 2.32 0.60 6.89 1.36 0.35 Punjab 71.08 15.27 1.20 4.74 1.22 3.85 2.28 0.35 Sindh 76.29 18.71 3.23 0.53 0.16 0.28 0.52 0.29 NWFP 51.73 21.73 3.60 1.15 0.44 19.90 1.13 0.32 Balochistan 47.57 37.51 10.21 2.13 0.17 0.69 1.20 0.51 Pakistan 67.40 20.59 2.22 2.08 1.00 5.26 1.21 0.24 Punjab 72.27 15.34 0.74 3.93 1.74 3.88 1.83 0.27

45
Sindh 77.60 18.25 2.00 0.64 0.56 0.21 0.58 0.16 NWFP 52.92 24.53 2.66 1.01 0.73 16.75 1.12 0.28 Balochistan 50.34 38.50 7.41 1.77 0.15 0.52 0.96 0.35
Source: PSLM 2004-05
Table 30: Type of Practitioner Consulted for Diarrhoea Treatment Percentage of Diarrhoea Cases
Region and Practioner 1998-99 PIHS 2001-02 PIHS 2004-05 PSLM Private Dispensary/Hospital 54 59 68 Govt Hospital/Dispensary 24 21 15 RHC/BHC 3 3 5 LHW 0 1 1 LHV/Nurse - - 0 Chemist/Pharmacy 9 10 6 Hakeem/Homeopath/Herbalist 6 4 3 Other 3 2 1 Source: PSLM 2004-05 Box 4: Chief Minister’s Initiative on Primary Health Care in Rahim Yar Khan The Chief Minister’s Initiative (2003) on Primary Health Care (CMIPHC) is an innovative effort in the Rahim Yar Khan district in Punjab aimed at improving the delivery of Primary Health Care (PHC) by strengthening the services provided in Basic Health Units (BHUs). There are some 5,290 BHUs in Pakistan and they treat very few patients. For the improvement of BHU services and to restore the confidence of the community, the CIMPHC involved partnering with an NGO, Punjab Rural Support Program (PJRSP), to strengthen the management. The PJRSP formed clusters of three BHUs managed by a medical officer in charge, whose salary was 150% higher than the Government standard, improved the physical condition of the BHUs and recruited district managers on contract at market rates who were thus more accountable. It aimed to improve the supply of drugs available in the BHUs without increasing budget. On the other hand health education session in the community, interactive health sessions with students and teachers and screening of students in local schools were introduced. PJRSP was provided with the same budget as had been allocated the year before to run the BHUs. An independent evaluation of the CMIPHC has been carried out in districts Rahim Yar Khan. The evaluation used a retrospective, controlled, before and after design with a nearby and similar district, Bahawalpur. Evaluation is as follows: CMIPHC resulted in an improvement in BHUs utilization, patient satisfaction, physical condition of the BHUs and out of pocket expenditure for BHU services. These improvements were accomplished at significantly lower cost per visit than in Bahawalpur. However, the quality of care, drug availability and accessibility for remote communities is poor in both districts. Coverage of preventive interventions also remained inadequate in both districts. On those aspects of PHC that PJRSP focused on, it made reasonable progress.

46
7.24 The proportion of married women who attended at least one pre- and post-natal consultation has been reported earlier. The three most commonly consulted sources for pre-natal care were private hospital/clinic, government hospital/clinic and home trained birth attendants (TBA) (Table 31). However, there seems to be either a data reporting problem or a serious concern regarding the health services delivery in the public sector. The PIHS data for 1998-99 and 2001-02 show that around 40% of women attended some government facilities such as hospitals, clinic, RHC or BHU for pre-natal consultation. The PSLM survey- CWIQ has shown a decline to 25% in 2004-05 with a corresponding increase in pre-natal consultation from TBAs and LHWs. It is hard to explain this rapid reduction in pre-natal consultation from public hospitals, clinics and RHCs. As in the case of pre-natal care the three most commonly cited sources of post-natal care in both rural and urban areas were private hospitals/clinic, government hospital/clinic, and home TBA.
Table 31: Health Facilities Used for Pre-Natal Consultation 2001-02 PIHS 2004-05 PSLM
Person/Facility Consulted Urban Rural Both Urban Rural Both Home TBA 3 5 4 10 16 13 Home LHW 1 4 3 5 10 7 Home LHV 1 4 3 4 7 6 Home Doctor 1 1 1 6 4 5 Govt Hospital/RHC/BHC/BHU 41 42 42 25 25 25 Private Hospital/Clinic 49 37 43 49 34 42 Other 2 7 5 1 4 2 Total 100 100 100 100 100 100 Source: PSLM 2004-05
7.4 Satisfaction from Basic Services 7.25 The PSLM survey-CWIQ has for the first time generated information on the satisfaction from schooling, health facilities, family planning, veterinary hospital, agriculture and police. The percentage of people satisfied with schools in Pakistan stood at 59.84% in 2004-05 (Table 32). The highest level of satisfaction from schooling (67%) has been found in the NWFP while the lowest level of satisfaction (48%) is in Balochistan. The level of satisfaction from schooling is higher in urban areas compared to rural areas, indicating better quality of schools in urban areas. The percentage of population satisfied with Basic Health Units stood at 36% in 2004-05, which is alarmingly low. The level of satisfaction from services of Basic Health Unit at provincial level is at more or less similar level except NWFP where this level is relatively high (52%). The level of satisfaction in rural areas from the services of Basic Health Unit is higher than in urban areas.

47
Table 32: Household Satisfaction By Facilities and Services Use (%) Facilities and Services Use Region and
Province Basic Health Unit School Urban Area 29.36 66.38 Punjab 20.47 67.63 Sindh 31.35 61.57 NWFP 58.78 72.98 Balochistan 36.67 66.71 Rural Areas 40.96 54.85 Punjab 38.89 59.11 Sindh 40.98 47.87 NWFP 48.76 64.70 Balochistan 36.62 40.89 Overall 35.94 59.84 Punjab 30.04 63.20 Sindh 36.33 54.49 NWFP 51.92 67.31 Balochistan 36.64 48.29
7.5 Housing Sector 7.26 There are 87% households in Pakistan who own a dwelling in 2004-05. At the provincial level, households which own dwelling stood at 87% in Punjab and Sindh, 83% in NWFP and 91% in Balochistan. The percentage of houses owned in the rural areas (93%) is quite high than in the urban areas (78%) in 2004-05 (Table 33). The percentage of households which used RCC/RBC for roof stood at 39% in 2004-05. Majority of households (50%) used wood/bamboo for construction of roof. In the rural areas only 15% households used RCC/RBC for construction of roof where as in urban areas 51% roofs are made of RCC/RBC material. At the provincial level Sindh (38%) province has the highest percentage of houses with this roof material and Balochistan has the lowest percentage with roofs of RCC/BCC (10%). The situation is similar in the urban areas. However, in rural areas Punjab and NWFP have the highest proportion (17%) of houses with this roof material and again Balochistan has the lowest (3%) proportion of houses with roofs made of RCC/RBC.
7.27 According to the PSLM survey-CWIQ, there are 24% dwelling units with one room and 69% housing units with 2-4 rooms during 2004-05. In rural areas the proportion of dwelling with one room (27%) are greater than in urban areas (20%).
7.28 Electricity has become a necessity of life. In Pakistan in 2004-05 there are 84% households who use electricity for lighting. At the provincial level NWFP province has the highest proportion of households (90%) and Balochistan has the lowest proportion of households (62%) which use electricity for lighting. In urban areas there are 96% households and in rural areas there are 74% households which use electricity for lighting the remaining households use gas/oil or candle for lighting.

48
Table 33: Distribution of Household Statistics %
Region and Province
Owned Households
RCC/RBC Used for
Roof
Housing Units with One Room
% Households Using Electricity for Lighting
Urban Areas 78.43 50.71 19.91 96.4 Punjab 80.89 46.89 22.47 96.7 Sindh 77.51 62.68 19.12 95.29 NWFP 71.33 52.56 16.4 98.3 Balochistan 76.32 26.63 11.02 95.89 Rural Areas 92.79 14.88 27.47 74.27 Punjab 93.26 17.41 26.85 82.11 Sindh 92.63 15.2 41.66 66.36 NWFP 89.36 17.46 19.24 86.74 Balochistan 96.25 3.45 16.31 47.82 Pakistan 86.57 39.39 24.2 83.85 Punjab 87.32 31.56 24.75 89.12 Sindh 87.33 38.16 30.76 80.35 NWFP 83.69 28.54 18.35 90.39 Balochistan 90.53 10.1 14.79 61.6 Source: PSLM 2004-05
7.6 Changes in Economic Condition: Household Perception 7.29 The PSLM survey-CWIQ 2004-05 has asked for the first time a qualitative question from households about the change in their economic situation during the year preceding the survey. An answer to this question is not a substitute to the poverty estimates based on income or consumption data. However it does provide useful insights. In both rural and urban areas half of the households perceived no change in their economic situation during the year preceding the 2004-05 PSLM survey-CWIQ. However 27% of households in urban areas and 23% in rural areas reported an improvement in their economic situation compared to last year (Table 34 and Figure 20). Proportionately more households in Punjab and NWFP reported improvement in their well-being than households in the other two provinces, Sindh and Balochistan. One-quarter of rural households reported worsening of their economic situation in the one-year period, suggesting they have not benefited from the high agriculture growth.
Table 34: Percentage Distribution of Household By Perception of the Economic Situation
of the Household Compared to the Year Before 2004-05 Economic Situation of the Household
Region and Province
Much Worse Worse Same Better
Much Better Don't Know Total
Urban Area 3.59 18.73 50.51 23.97 2.71 0.49 100 Punjab 3.06 18.24 48.37 26.75 3.08 0.49 100 Sindh 4.16 18.41 52.99 21.43 2.64 0.38 100 NWFP 5.36 23.85 44.88 23.32 2.13 0.45 100 Balochistan 2.25 15.42 63.95 16.1 1.36 0.93 100 100

49
Rural Areas 4.49 20.66 52.27 20.42 1.81 0.36 100 Punjab 3.54 19.33 50.78 23.63 2.47 0.26 100 Sindh 6.24 22.61 58.09 11.9 0.93 0.23 100 NWFP 4.81 23.06 41.24 28.28 2.2 0.41 100 Balochistan 3.88 18.05 61.61 14.83 0.81 0.81 100 100
Overall 4.1 19.82 51.51 21.957 2.2 0.41 100 Punjab 3.31 18.81 49.62 25.13 2.76 0.37 100 Sindh 5.23 20.58 55.63 16.51 1.76 0.28 100 NWFP 4.99 23.31 42.39 26.71 2.18 0.42 100 Balochistan 3.42 17.3 62.28 15.19 0.97 0.85 100
Source: PSLM 2004-05
Figure 20: Percentage House Hold Perception of Eco. Situation (PSLM 04-05)
0.412.2
21.957
51.51
19.82
4.1
0
10
20
30
40
50
60
Much Worse Worse Same Better Much Better Don’t Know
8 Employment 8.1 It is well recognized that employment plays a central role in poverty reduction. Open unemployment in Pakistan increased from 4.7 percent in 1992-93 to more than 8 percent in 2001-02. This is the period when overall poverty also increased. However, the impressive growth performance during the last two years is likely to have contributed in arresting the rising trends in unemployment as well as poverty. Results of the 2003-04 Labor Force Survey (LFS), the main data source for employment in Pakistan, have been published. These results show a modest decline in the unemployment rate between the 2001-02 and 2003-04 period. For the purpose of monitoring the progress in labor market indicators, PRSP has identified two indicators: ‘unemployment rate’ and ‘total employed labor force’.4 Besides a discussion on these two indicators, this section has used the 2003-04 LFS results to review briefly the role of informal sector in employment.
4 Unemployment rate is defined as the percentage of unemployed labour force to the total labour force.

50
8.1 Employed Labor Force
8.2 The LFS computes the labor force by multiplying the crude activity rate with the total population. The former increased from 29.6 percent in 2001-02 to 30.4 percent in 2003-04. During this period an increase has also been witnessed in total population of the country. The total labor force therefore increased from 43 million in 2001-02 to 45 million in 2003-04. Table 15 shows that the number of employed persons has also increased from 38.88 million in 2001-02 to 41.75 million in 2003-04. This increase has been noted across the board irrespective of gender, area and province (see Labor Force Survey, 2003-04). The number of unemployed has reduced from 3.51 million in 2001-02 to 3.48 million in 2003-04 (Table 35).
Table: 35 Civilian labor force, employed and unemployed in Pakistan
(in million) 1999-00 2001-02 2003-04
Labor Force 39.4 42.39 45.23
Employed 36.32 38.88 41.75
Unemployed 3.08 3.51 3.48 Source: Labor Force Survey 2001-02 and 2003-04
7.2 Unemployment 8.3 Overall unemployment rate has decreased from 8.3 percent in 2001-02 to 7.7 percent in 2003-04, due, mainly, to steeper decline in women’s unemployment from 17 percent to 13 percent during the inter-survey period. Among male, this decline was nominal; from 6.7 percent to 6.6 percent. Change in the unemployment rates varies between rural and urban areas (Table 36). Female unemployment rate declined in rural as well as urban areas while for male a modest decline was observed in only rural areas but in urban areas the rate in fact increased from 7.9 percent in 2001-02 to 8.4 percent in 2003-04. How these changes can be explained? First take the decline in female unemployment in both rural and urban areas. This decline could be due to two reasons; female were able to get job opportunities or they withdrew from the labour force mainly because of ‘discourage phenomenon’. But female participation in the labour force increased considerably between 2001-02 and 2003-04 in rural areas, and there was a modest decline of 0.6 percentage point in urban areas (Table 37). It thus appears that female unemployment reduced primarily due to expansion in job opportunities for females. Micro-finance facilities focusing women particularly in rural areas may be the major contributing factor for reduction in female unemployment rate. The rise in male unemployment rate in urban areas is a serious concern.
8.4 Figures 21 and 22 compare age-specific unemployment rates among male and female for 2001-02 and 2003-04 period. Women’s unemployment has consistently been on the decline across the constituent age intervals. Men’s unemployment rate increased for youth, 20-24 years old, and for those aged 40 years and older. Men in these age groups may be particularly targeted for self-employment through micro-finance and skill training.

51
Table 36: Unemployment rate by gender and rural-urban areas Region 2001-02 2003-04 Total Male Female Total Male Female Rural 7.6 6.1 14.2 6.7 5.7 10.9 Urban 9.8 7.9 24.2 9.7 8.4 19.8 All areas 8.3 6.7 16.5 7.7 6.6 12.8 Source: Labour Force Survey, 2003-04
Table 37: Refined activity (participation) rates by rural and urban areas 2001-02 2003-04
Improved Participation Rate
Improved Participation Rate
Province/Area
Total Male Female
Total Female
Total Male Female
Total Female
Pakistan 43.3 70.3 14.4 54.7 37.7 43.7 70.6 15.9 55.3 39.3 Rural 45.2 72.2 16.8 60.09 48.7 46.3 72.6 19.5 62.9 52.7 Urban 39.9 66.9 10 43 16.4 39.2 67.1 9.4 41.7 14.5 Source: Labour Force Survey, 2003-04
Figure 21: Unemployment rate (both sex) by age groups, 2001-02 and 2003-04
01020
10-14
20-24
30-34
40-44
50-54 60
+
Age groups (years)
%un
empl
oyed
2001-02
2003-04
`
Figure 22: Unemployment among male by age groups, 2001-02 and 2003-04
01020
10-
20-
30-
40-
50-
60+
Age group (year)
%un
empl
oym
ent r
ate
2001-022003-04
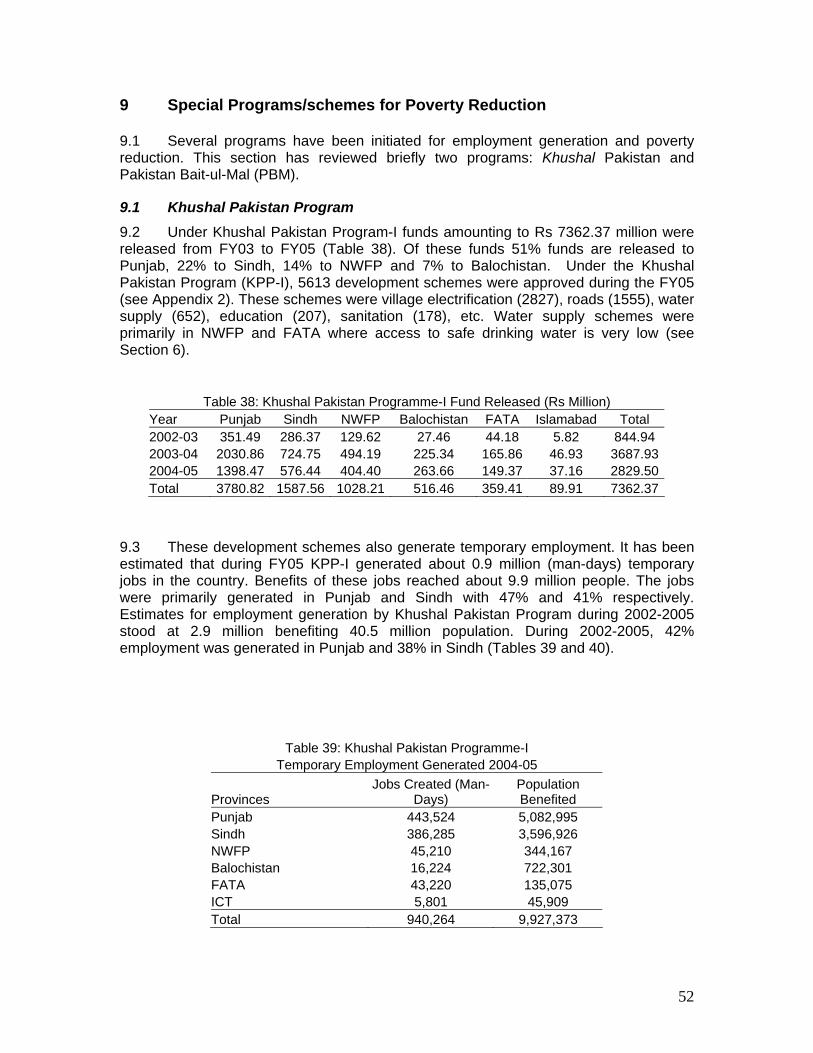
52
9 Special Programs/schemes for Poverty Reduction 9.1 Several programs have been initiated for employment generation and poverty reduction. This section has reviewed briefly two programs: Khushal Pakistan and Pakistan Bait-ul-Mal (PBM).
9.1 Khushal Pakistan Program 9.2 Under Khushal Pakistan Program-I funds amounting to Rs 7362.37 million were released from FY03 to FY05 (Table 38). Of these funds 51% funds are released to Punjab, 22% to Sindh, 14% to NWFP and 7% to Balochistan. Under the Khushal Pakistan Program (KPP-I), 5613 development schemes were approved during the FY05 (see Appendix 2). These schemes were village electrification (2827), roads (1555), water supply (652), education (207), sanitation (178), etc. Water supply schemes were primarily in NWFP and FATA where access to safe drinking water is very low (see Section 6).
Table 38: Khushal Pakistan Programme-I Fund Released (Rs Million)
Year Punjab Sindh NWFP Balochistan FATA Islamabad Total 2002-03 351.49 286.37 129.62 27.46 44.18 5.82 844.94 2003-04 2030.86 724.75 494.19 225.34 165.86 46.93 3687.932004-05 1398.47 576.44 404.40 263.66 149.37 37.16 2829.50Total 3780.82 1587.56 1028.21 516.46 359.41 89.91 7362.37
9.3 These development schemes also generate temporary employment. It has been estimated that during FY05 KPP-I generated about 0.9 million (man-days) temporary jobs in the country. Benefits of these jobs reached about 9.9 million people. The jobs were primarily generated in Punjab and Sindh with 47% and 41% respectively. Estimates for employment generation by Khushal Pakistan Program during 2002-2005 stood at 2.9 million benefiting 40.5 million population. During 2002-2005, 42% employment was generated in Punjab and 38% in Sindh (Tables 39 and 40).
Table 39: Khushal Pakistan Programme-I Temporary Employment Generated 2004-05
Provinces Jobs Created (Man-
Days) Population Benefited
Punjab 443,524 5,082,995 Sindh 386,285 3,596,926 NWFP 45,210 344,167 Balochistan 16,224 722,301 FATA 43,220 135,075 ICT 5,801 45,909 Total 940,264 9,927,373

53
Table 40: Khushal Pakistan Programme-I
Year 2002-2005 Employment Generated Population Benefited Punjab 1,246,525 17,894,380 Sindh 1,126,758 12,023,863 NWFP 410,613 8,418,466 Balochistan 57,332 978,465 FATA 85,424 1,107,259 Islamabad 15,778 113,889 2,942,430 40,536,322
9.2 Pakistan Bait-ul-Mal 9.2.1 Food Support Program (FSP) 9.4 The Food Support Program (FSP) was launched in August 2000 with an annual budget of Rs 2.5 billion. Initially the program was for two years, but has been further extended because of its efficacy and appeal to target communities. It includes food subsidy for the poor and is the largest in scope and dimension as noted earlier among the PBM welfare projects. Food Support Program Steering Committees have been constituted at Federal, Provincial, Regional and District levels for implementation and monitoring of all programs. Beneficiaries are identified and approved by the District Food Support Steering Committee. Details of disbursement and beneficiaries are given in Table 41. The total disbursement declined from Rs. 2804 million in FY04 to Rs. 2703 million in FY05. However, the disbursement in FY05 was much more than the amount disbursed in FY02. Annually about 1.1 million have benefited from the FSP (Table 41).
Table 41: Pakistan Bait-ul-Mal Food Support Program Disbursement in Rs Million and Beneficiaries in Number
2001-02 2002-03 2003-04 2004-05 Province/Region Beneficiaries DisbursementBeneficiariesDisbursementBeneficiariesDisbursement BeneficiariesDisbursement
Punjab 544,868 1,090 563,508 1,127 565,418 1,428 557,150 1,351 Sindh 239,454 479 232,907 466 239,014 629 233,904 570 NWFP & FATA 227,753 456 215,245 430 217,012 499 214,440 514 Balochistan 45,475 91 44,816 90 42,507 98 46,119 110 ICT, AJK & N. Areas 58,048 116 60,796 122 60,619 150 61,988 158 Total 1,115,598 2,231 1,117,272 2,235 1,124,570 2,804 1,113,601 2,703 9.2.2 Individual Financial Assistance (IFA) 9.5 The PBM provides financial assistance in the shape of stipends for education for deserving students with brilliant academic record, rehabilitation and medical treatment to the destitute, needy widows, orphans, invalids and infirm irrespective of their gender, caste, creed or race. At present PBM is providing financial assistance to 30,043 deserving beneficiaries. During FY05, Rs 348 million were disbursed (Table 42). Since inception an amount of Rs 1,088 million has been disbursed among 1,999,676 beneficiaries. IFA has four components. Under IFA General the eligible applicants will be provided financial assistance up to Rs 30,000 for their subsistence and rehabilitation. During FY05, an amount of Rs 105 million was disbursed among 133,824 beneficiaries under this category. Under IFA Medical treatment for major ailments likes cancer, heart disease, hepatitis, tuberculosis, vital organ surgeries and expensive general treatment is

54
provided to poor patients up to a maximum of Rs 300,000/-. The amount of expenditure on treatment hospital charges is remitted to Government hospital for the applicant patient. During FY05 Rs 210 million was disbursed to 36,285 beneficiaries. Under IFA education deserving and brilliant students are paid education stipends in accordance with prescribed fees of Government institutions including technical training at recognized polytechnic institutes. Under this head Rs 15.9 million was disbursed to 26,309 beneficiaries in FY05. Under IFA Rehabilitation assistance is provided up to a maximum of Rs 40,000 to make poor people self reliant and rehabilitated socially in general and financially in particular. An amount of Rs 17 million was disbursed for rehabilitation to 7874 beneficiaries in FY05.
Table 42: Pakistan Bait-Ul-Mal (PBM) 2003-04 2004-05
Projects Disbursement
(Rs million) Households Disbursement
(Rs million) HouseholdsFood Support Programme 2,804 1,124,570 2,703 1,113,601 Individual Financial Assistance 222 21,230 348 30,043 National Centres for Rehabilitation of Child Labour 80 9,060 112 11,040 Vocational Training Centres 10 2,286 24 9,212 Institutional Rehabilitation (Grant in aid to NGOs) 43 456,965 83 506,880 Total Disbursement Under All Projects 3,159 1,614,111 3,270 1,670,776
9.2.3 Institutional Rehabilitation through Civil Society Wing (CSW) 9.6 The PBM provides resources to NGOs having following services: a) institutional support to orphans, disabled, abandoned destitute women, aged, children and juvenile; b) institutional care of aged, particularly in rural areas with need of eye care; and (c) innovative pilot rehabilitation projects. Table 42 shows that in FY05, Rs 82.84 million was disbursed among NGOs covering 506,880 households. 9.2.4 National Centres for Rehabilitation of Child Labour (NCRCL) 9.7 The PBM has a proactive child labour rehabilitation policy. Children are weaned away from hazardous labour (brick kiln, carpet, mining, tannery, construction, glass bangle, domestic work, begging, agriculture etc) and enrolled in PBM centres for rehabilitation, where they are provided free education, clothing, footwear and stipend @ Rs 10 per day on attendance basis. Parents of these children are also paid Rs 300 per month as subsistence allowance for their wage compensation.
9.8 The current strength of NCRCL centers is 101 (Punjab 40, Sindh 25, NWFP & FATA 19, Balochistan 11, ICT/AJK & NAs 6). There are 11,040 students benefiting from primary education in NCRCL centers. There are 4254 students who had passed out from these centres and 3912 have been admitted in Government schools for further education. Since inception Rs 396 million has been incurred under this head.
9.2.5 Vocational Training Institutes/Dastkari Schools (VTIs) 9.9 The PBM has established 74 Vocational Training Institutes (VTIs) countrywide since 1995 (Punjab 38, Sindh 10, NWFP & FATA 9, Balochistan 5, ICT/AJK and NA 12),

55
with annual budget of Rs 0.925 million per centre. These centres have been established with a view to give training in a variety of skills to widows, orphans and poor girls so that they can earn their livelihood. At present 9212 students benefit from these centres. Since inception an amount of Rs 47 million has been incurred on VTIs. During FY05 Rs 24 million were disbursed to 9,212 households. 9.2.6 Management Information System (MIS) 9.10 Through MIS a database of the poorest people (for FSP only) has been compiled. This is the only available computerized information of people living below the poverty line which can be helpful for formulating other poverty alleviation programs as well. 9.2.7 Model Project 9.11 During FY04, one centre in each province/region has been diversified with annual budget of Rs 3 million per centre where training in different skills according to the requirement of the area and modern computer knowledge is imparted. 9.2.8 New Projects 9.12 In 2004, PBM, Health Department, Government of Punjab and Jinnah Hospital, signed a Memorandum of Understanding for construction of reconstructive surgery centre in Lahore. PBM shall bear the cost of construction up to Rs 150 million. Construction of building shall be completed in the next two years. Construction work has been commenced since July 2005. 9.13 PBM has approved a project named Drug & Diagnostic Centre to be established in NWFP. The PBM shall bear the cost of construction up to Rs 150 to 200 million. On signing of MoU a proper feasibility report will be prepared and construction of building will be completed in the next 2 years. 10 Way Forward
10.1 Since the finalization of PRSP in December 2003, various new pro-poor initiatives have been undertaken by the government, GDP has been re-based, results of recently conducted Pakistan Social and Living Standards Measurements Survey (PSLM) are now available and Khushaal Pakistan Program 2 has been launched etc. The three years rolling Plan given in the PRSP is to complete in June 2006. As shown earlier, PRSP has used the PIHS 2001-02 data for its baseline. With the availability of PSLM survey-CWIQ 2004-05 findings, PRSP baselines as well as targets are required to be revised. Poverty estimates based on the HIES-type consumption module included in the PSLM survey are likely to be available by the end of this year. Poverty trends need to be incorporated in the revised PRSP to reflect changes in strategies and programs. The national accounts have been re-based from 1980-81 to 1999-2000. As a result of re-basing, coverage of data has engulfed a new range of products, enterprises and economic activities such as, courier services, travel agencies, mobile phones etc. The coverage of manufacturing items has been increased. The size of the overall GDP in 1999-2000 increased by 19.5 percent, agriculture by 18.5 percent, industries by 18.0 percent and services by 20.8 percent over the old base. The re-based national accounts

56
need to be reflected in the revised PRSP. Recent developments in the economy, such as high GDP growth and macroeconomic stability, have resulted in changes or shifts in policy priorities, which will be reflected in the revised PRSP. There are several capacity challenges for PRSP implementation particularly in the lower levels of government. These challenges will be addressed in the revised PRSP. There are gaps in certain areas such as gender and environment. The new PRSP will fill these gaps. Finally, the revised PRSP will be a MDG-based rolling plan. 10.2 All these measures now entail revision of PRSP. The PRSP Secretariat in the Ministry of Finance has initiated work to prepare the PRSP 2 which will cater for the period 2006-09. The achievement of the Millennium Development Goals (MDGs) has added a new dimension to the policy matrix. This new policy document will be MDGs based and it will be finalized by end June 2006.

ANNEX 1 PRSP Budgetary Expenditures (2004-05 / 2003-04) (Rs. Millions) 2004-05 (Provisional) 2003-04 (June Final)
Federal Punjab Sindh NWFP Balochist. Total Federal Punjab Sindh NWFP Balochist. TOTAL
Roads highways, & Bridges 2,480 17,283 7,728 2,219 5,471 35,181 1,559 10,036 3,835 2,203 5,113 22,746
Current 2,480 2,206 391 55 339 5,471 1,559 2,427 346 122 110 4,564 Development 0 15,077 7,337 2,164 5,132 29,710 0 7,609 3,489 2,081 5,003 18,182 Water Supply & Sanitation 469 1,826 1,118 601 2,524 6,538 491 616 1,267 424 3,001 5,799
Current 469 80 215 347 949 2,060 150 43 488 304 502 1,487 Development 0 1,746 903 254 1,575 4,478 341 573 779 120 2,499 4,312 Education 25,412 50,581 20,641 14,397 5,842 116,873 17,594 44,729 18,196 11,969 5,209 97,697 Current 14,250 43,647 20,110 13,573 5,001 96,581 10,446 38,137 17,889 11,370 4,573 82,415 Development 11,162 6,934 531 824 841 20,292 7,148 6,592 307 599 636 15,282 Primary Education 2,911 29,137 8,858 6,600 1,791 49,297 1,378 26,898 7,839 5,372 1,817 43,304 Current 2,896 23,667 8,827 6,111 1,791 43,292 1,300 20,960 7,790 5,042 1,817 36,909 Development 15 5,470 31 489 0 6,005 78 5,938 49 330 0 6,395 Secondary Education 2,239 10,905 6,896 5,946 1,428 27,414 1,804 9,551 5,934 4,610 1,545 23,444 Current 1,887 10,155 6,790 5,722 1,428 25,982 1,662 9,244 5,880 4,499 1,545 22,830 Development 352 750 106 224 0 1,432 142 307 54 111 0 614 General Univesrities, Colleges, & Institutes 7,292 3,986 1,843 895 371 14,387 8,940 3,267 1,503 854 356 14,920
Current 6,724 3,619 1,720 846 371 13,280 4,029 3,150 1,477 804 356 9,816 Development 568 367 123 49 0 1,107 4,911 117 26 50 0 5,104 Professional & Technical Universities, Colleges & Institutes
9,978 553 1,296 684 349 12,860 2,374 557 985 550 282 4,748
Current 874 526 1,116 629 349 3,494 1,793 537 864 510 282 3,986

58
Development 9,104 27 180 55 0 9,366 581 20 121 40 0 762 Teacher & Vocational Training 325 1,717 118 31 106 2,297 47 1,524 127 40 102 1,840
Current 298 1,687 107 27 106 2,225 24 1,524 106 31 102 1,787 Development 27 30 11 4 0 72 23 0 21 9 0 53 Others 2,667 4,283 1,630 241 1,797 10,618 3,051 2,932 1,808 543 1,107 9,441 Current 1,571 3,993 1,550 238 956 8,308 1,638 2,722 1,772 484 471 7,087 Development 1,096 290 80 3 841 2,310 1,413 210 36 59 636 2,354 Health 8,117 12,587 5,150 3,407 2,165 31,426 6,684 11,508 4,310 2,401 2,106 27,009 Current 3,944 11,414 4,776 2,870 1,773 24,777 2,975 10,908 3,715 2,315 1,528 21,441 Development 4,173 1,173 374 537 392 6,649 3,709 600 595 86 578 5,568 General Hospitals & Clinics 3,206 10,836 3,955 2,857 1,013 21,867 2,924 10,094 3,852 1,974 681 19,525
Current 2,768 9,717 3,954 2,401 1,013 19,853 2,382 9,524 3,426 1,933 681 17,946 Development 438 1,119 1 456 0 2,014 542 570 426 41 0 1,579 Mother & Child Health 2 1 3 13 31 50 2 49 0 12 2 65 Current 2 1 3 13 31 50 2 49 0 12 2 65 Development 0 0 0 0 0 0 0 0 0 0 0 0 Health Facilities & Preventive Measures 4,267 109 540 164 456 5,536 3,086 133 188 111 445 3,963
Current 691 108 355 93 80 1,327 146 103 78 86 97 510 Development 3,576 1 185 71 376 4,209 2,940 30 110 25 348 3,453 Others 642 1,641 652 373 665 3,973 672 1,232 270 304 978 3,456 Current 483 1,588 464 363 649 3,547 445 1,232 211 284 748 2,920 Development 159 53 188 10 16 426 227 0 59 20 230 536 Population Planning 3,106 799 516 4 153 4,578 3,115 689 493 238 154 4,689 Current 366 0 0 3 152 521 105 0 0 4 151 260 Development 2,740 799 516 1 1 4,057 3,010 689 493 234 3 4,429 Social Security & Social Welfare 806 636 257 165 166 2,030 3,170 491 239 107 137 4,144
Current 523 515 257 138 119 1,552 2,997 454 238 82 109 3,880

59
Development 283 121 0 27 47 478 173 37 1 25 28 264 Natural Calamities & Other Disasters 385 32 398 68 39 922 383 42 97 0 7 529
Irrigation 20,182 7,285 5,189 1,294 3,921 37,871 8,526 5,524 3,873 1,035 3,548 22,506 Current 1,152 3,960 2,563 799 2,896 11,370 101 3,748 2,181 782 2,342 9,154 Development 19,030 3,325 2,626 495 1,025 26,501 8,425 1,776 1,692 253 1,206 13,352 Land Reclamation 42 81 1,988 0 0 2,111 27 66 1,923 0 0 2,016 Rural Development* 713 10,316 973 2,025 1,342 15,369 656 11,159 3,348 2,137 1,307 18,607 Current 164 3,039 343 321 420 4,287 49 4,718 1,992 172 221 7,152 Development 549 7,277 630 1,704 922 11,082 607 6,441 1,356 1,965 1,086 11,455 Law and Order 16,664 14,567 9,510 3,700 2,975 47,416 13,992 11,741 8,233 2,861 2,543 39,370 Low Cost Housing 0 318 0 0 0 318 0 0 0 0 0 0 Justice Admn 542 1,217 642 422 293 3,116 300 1,051 531 358 197 2,437 Food Subsidies 2,459 1,500 500 900 0 5,359 5,313 2,000 500 700 0 8,513 Food Support Program 158 1,351 570 514 110 2,703 150 1,428 629 499 98 2,804 Tawana Pakistan 78 78 590 590 Village Electrification^^ 4,354 4,354 1,422 1,422 GRAND TOTAL 85,967 120,379 55,180 29,716 25,001 316,243 63,972 101,080 47,474 24,932 23,420 260,878 * In case of Punjab, includes DERA and TMAs, While in case of Sindh it includes DERA ^^ Federal Releases to Mo Water & Power and WAPDA

Annex 2: Khushal Pakistan Programme-I (KPP-I)
Number of Schemes Approved Under Each Category for 2004-05
Province Road Electrification Gas Telephone Education Health Water Supply Sanitation Bulldozers Total Schemes
Punjab 847 1,419 78 1 25 15 30 97 1 2,513 Sindh 218 330 19 2 105 19 17 27 2 739 NWFP 347 722 9 - 15 1 159 29 8 1,290 Balochistan 68 261 - - 40 5 79 22 15 490 FATA 51 74 - - 15 19 360 1 - 520 ICT 24 21 - - 7 - 7 2 - 61
Total 1,555 2,827 106 3 207 59 652 178 26 5,613
W.R.S 196 190 26 - 19 16 24 24 - 495 Minority 26 24 1 - 4 9 9 7 - 80