Embed Size (px)
Citation preview

Sava Group
Renewed for the Future
ANNUAL REPORT 2 0 14

Renewed for the Future

Annual report for Sava d.d. and annual report for the Sava Group
Report by the Supervisory Board of Sava d.d.
Independent auditor’s report for Sava d.d. and independent auditor’s report for the Sava Group
ANNUAL REPORT 2 0 14

INTRODUCTION
BUSINESS ANALYSIS
1. Major data and indicators 8
2. Major data about Sava d.d. 9
3. Presentation of the Sava Group and the company Sava d.d. 10
4. Overview of major events 12
Major events in the period January – December 2014 12
Major events after the accounting period 13
5. Report by the President of the Management Board 14
6. Management and governing bodies 16
7. Report by the Supervisory Board 18
8. Corporate governance system 25
9. Statement on Corporate Governance 29
1. Signing of the annual report and its constituent parts for 34 Sava d.d. and the Sava Group for 2014
2. Sava d.d. as a going-concern entity 35
3. The Sava share and ownership structure with the financial 37 calendar for 2015
4. General economic trends 43
5. Business operations of the Sava Group 45
5.1 Explanations about the consolidated income statement 45
5.2 Explanations about the consolidated statement of financial position 49
5.3 Investments 51
5.4 Employees in the Sava Group 51
6. Business operations of Sava d.d 53
6.1 Explanations about the income statement 53
6.2 Explanations about the balance sheet 59
6.3 Employees 61
7. Outlook for 2015 62
TABLE OF CONTENTS
7
33

FINANCIAL REPORT
1. Financial statements of the Sava Group with notes in accordance 66 with International Financial Reporting Standards as adopted by the EU
1.1 Consolidated financial statements of the Sava Group in accordance 66
with International Financial Reporting Standards as adopted by the EU
1.2 Composition of the Sava Group and data about the operations 74
of subsidiaries and associated companies in 2014
1.3 Notes to the financial statements of the Sava Group in accordance 77
with International Financial Reporting Standards as adopted by the EU
1.4 Statement of Management Responsibility for the Sava Group 138
1.5 Independent auditor`s report for the Sava Group 139
2. Financial statements of Sava d.d. with notes in accordance 142 with Slovene Accounting Standards
2.1 Financial statements of Sava d.d. in accordance
with Slovene Accounting Standards 142
2.2 Notes to the financial statements of Sava d.d. 152
2.3 Financial risk management for Sava d.d 158
2.4 Breakdown and notes to the financial statements of Sava d.d. 160
2.5 Other disclosures 178
2.6 Statement of Management Responsibility for Sava d.d. 190
2.7 Independent auditor’s report for Sava d.d. 191
Contact persons
65
194

Renewed for the Future

INTRODUCTION

AN
NU
AL
REPO
RT 2
014
8
Intr
oduc
tion
CONSOLIDATED INCOME STATEMENT 2010 2011 2012 2013 2014
Sales 176.7 193.8 192.2 67.2 63.0
Revenues generated in foreign markets 83.7 101.8 105.3 0.0 0.0
Total pre-tax profit / loss -105.1 -169.1 -93.4 -45.7 -36.0
Net profit / loss -99.9 -157.2 -99.3 -55.6 -47.0
EBITDA 20.9 19.8 24.0 9.6 9.5
CONSOLIDATED STATEMENT OF FINANCIAL POSITION 31 Dec. 2010 31 Dec. 2011 31 Dec. 2012 31 Dec. 2013 31 Dec. 2014
Balance sheet total 760.8 611.3 480.9 326.2 285.5
Long-term assets 643.2 491.8 349.9 290.6 255.0
Short-term assets 117.6 119.5 131.0 35.6 30.5
Equity capital 323.3 165.8 67.3 16.2 -21.2
Long-term liabilities 232.8 81.4 70.2 66.2 57.9
Short-term liabilities 204.7 364.1 343.4 243.8 248.8
Investments in property, plant and equipment 6.4 6.3 5.9 5.5 4.7
INDICATORS
Net earnings / loss per share - € -50.0 -78.7 -49.7 -27.8 -23.5
Equity / balance sheet total - % 42 27 14 5 negative
Liquidity (short-term assets / short-term liabilities) -%
57 33 38 15 12
SHARE
Book value - € 161.1 82.2 32.9 7.5 negative
Market value - € 89.5 12.0 3.4 0.2 0.5
Dividend paid per a share - € 3.2 0.0 0.0 0.0 0.0
NUMBER OF EMPLOYEES
State at 31 December 2,286 2,256 2,107 973 1,003
MAJOR DATA AND INDICATORS 1•
Sava Group according to International Financial Reporting Standards (€ million)

Intr
oduc
tion
A
NN
UA
L RE
PORT
201
4
9
Company: Sava, družba za upravljanje in financiranje, d.d.
Abbreviated name: Sava, d.d.
Head office: Dunajska cesta 152, 1000 Ljubljana, Slovenia
Telephone: +386 4 206 5510
Telefax: +386 4 206 6446
E-mail: [email protected]
Website: www.sava.si
Management Board
President of the Management Board:
Matej Narat
Member of the Management Board:
Aleš Aberšek (as of 28 January 2014) Andrej Andoljšek (until 27 January 2014)
Chairman of the Supervisory Board:
Miran Kraševec (as of 17 July 2014) Aleš Skok (until 16 May 2014)
Deputy Chairman of the Supervisory Board:
Robert Ličen, MSc (as of 17 July 2014) Miran Kraševec (until 17 July 2014)
Registration number: 5111358
VAT-ID No.: SI75105284
Main activity: activity of holding companies
Court registry: 26 April 1996 at Kranj District Court, Srg No. 96/00267
Share capital at 31 December 2014: €14,060,594.51
No. of shares: 2,006,987 ordinary personal no-par value shares with share designation SAVA
Share listing: Ljubljana Stock Exchange d.d., stock exchange listing
MAJOR DATA ABOUT SAVA D.D.
2•

AN
NU
AL
REPO
RT 2
014
10
Intr
oduc
tion
PRESENTATION OF THE SAVA GROUP AND THE COMPANY SAVA D.D.
3•
The Sava Group deals with Finance and Tourism operations. The Finance business takes place within Sava d.d. Its main tasks are to optimise the value of individual investments, provide support to financing the operations of Sava d.d. and take care of the assets of the Sava Group. The mainstay of Tourism is the company Sava Turizem d.d., which is the greatest tourist services provider in Slovenia. It includes six destinations (Sava Hotels Bled, Spa 3000 – Moravske Toplice, Spa Ptuj, Health Resort Radenci, Spa Lendava and Spa Banovci) under the umbrella brand Sava Hotels & Resorts, which offer high-end healthcare and wellness services, active leisure time and conference tourism throughout the year.
A smaller part of the Sava Group includes also financial investments, which after an extensive di-vesting process and withdrawal from Real Estate, Rubber Manufacturing and Energy Management are still included in the investment portfolio but do not belong to the core activities of Finance or Tourism.
Organisation chart of the Sava Group with major investments of Sava d.d.
The chart shows the major investments of Sava d.d. with equity holdings at 31 December 2014. The list of all
subsidised and associated companies included in the Sava Group is available in the financial reports, chapter 1.2.
Composition of the Sava Group and the data on operations of the subsidised and associated companies in 2014
on page 74.
* The companies owned by Sava Turizem d.d.
** The company is a 100% owner of Istrabenz Turizem d.d.
MAJOR INVESTMENTS
Gorenjska banka. d.d., Kranj (44.07%)
Alpen.SI, equity sub-fund (39.95%)
TOURISM
DIVISION
FINANCE
DIVISION
MAJOR INVESTMENTS
Sava Turizem d.d., Ljubljana (99.05%)
OTHER
INVESTMENTS
SAVA d.d.
Cardial d.o.o., Ljubljana (85.00%)*
Sava Zdravstvo d.o.o., Ljubljana (100.00%)*
Sava TMC d.o.o., Ljubljana (100.00%)*
Hoteli Bernardin d.d., Portorož (9.15%)
Istrabenz d.d., Koper (16.32%)**

Intr
oduc
tion
A
NN
UA
L RE
PORT
201
4
11
Sava, družba za upravljanje in financiranje, d.d. is the management centre of the Sava Group. The management of Sava d.d. is responsible for strategic supervision over the Group and management of investment portfolio, while the management teams of daughter companies are responsible for operative operations of the respective companies.
The role of the Sava Group’s Directorate is to ensure a quality and efficient corporate management system and strategic supervision over individual Group’s companies, enforce Sava Group’s poli-cies and supervise other companies, in which Sava d.d. holds equity investments. The professional services provide a basis for decision-making process of the Management Board and report to the Management Board on the implementation of policies and decisions adopted by the Management Board.
Organisation chart of Sava, d.d.
Corporate Communications
Legal Office
Finance
Controlling
Internal Audit
Accounting, Planning & Analysis
Management Board of Sava d.d.
President of the Management Board:Matej Narat
Member of the Management BoardAleš Aberšek
Sava Group’s DirectorateDirector: Milan Marinič

AN
NU
AL
REPO
RT 2
014
12
Intr
oduc
tion
OVERVIEW OF MAJOR EVENTS 4•
Major events in the period January – December 2014
JANUARY
As one of the Supervisory Board members of Goren-
jska banka d.d., Andrej Andoljšek temporarily takes
over managing of this associated company of
Sava d.d. For the time of his absence, the Supervi-
sory Board of Sava d.d. appoints Aleš Aberšek from
among its members as a Management Board mem-
ber of Sava d.d.
Gorenjska banka d.d. submits a restructuring plan
and produces measures for covering a possible cap-
ital shortfall, which – as shown by the December
stress tests – could appear in the event of extreme
circumstances or under an unfavourable macroeco-
nomic scenario.
Healthcare centres at destinations of Sava Hotels &
Resorts are redesigned, which facilitates implemen-
tation of strategic activities aimed at upgrading the
healthcare business.
FEBRUARY
As capital increase through non-cash contributions
failed, a simplified compulsory settlement procedure
begins in the associated company NFD Holding d.d.
Sava Turizem d.d. finalises the acquisition of the
Ljubljana-based company Cardial d.o.o., thereby
becoming an 85% owner of this modern specialist
outpatients clinic.
MARCH
The Supervisory Board of Sava d.d. deals with and
endorses the audited annual reports of the Sava
Group and Sava d.d. for 2013.
APRIL
On 29 April 2014, the 20th regular Shareholders’
Meeting of the joint-stock company Sava d.d. takes
place in the hotel Livada Prestige in Moravske Toplice.
Shareholders support all the resolutions proposed in
the call by the Management Board and Supervisory
Board of Sava d.d. by a 99% majority of capital pres-
ent. No counter-proposals or announced challenging
actions take place at the Shareholders’ Meeting.
MAY
By entering the resolution adopted by the Share-
holder’s Meeting in the court register, the share
capital of Sava d.d reduced from the amount of
€25,441,851.48 to the amount of €14,060,594.51.
The share capital reduction is carried out with the
unchanged number of shares, after which the attrib-
utable amount of each share in the share capital after
reduction amounts to €7.006.
At the 12th regular Supervisory Board meeting of
Sava d.d., the Chairman of the Supervisory Board,
Aleš Skok, resigns from the Chairman and member
of the Supervisory Board position due to his leaving
abroad.

Intr
oduc
tion
A
NN
UA
L RE
PORT
201
4
13
JUNE
Sava d.d. receives purchase consideration totall-
ing €2,478 thousand for selling 4,766 shares of He-
lios d.d.
JULY
At its 13th meeting, the Supervisory Board of Sava
d.d. appoints Miran Kraševec as the new Chairman
and Robert Ličen, MSc, as the Deputy Chairman of
the Supervisory Board. The Supervisory Board fur-
ther becomes acquainted with appointing Jasmina
Kovačič as a member of the Supervisory Board – em-
ployee representative of Sava d.d.
AUGUST
The management Board of Sava d.d. makes the Su-
pervisory Board acquainted with the course of prepa-
rations of the new strategy of business and financial
restructuring.
NOVEMBER
The Master Restructuring Agreement on financial lia-
bilities of Sava d.d. expires.
To assure equal treatment of all creditors, protect
their interest and asset, Sava d.d. files a proposal
for initiating preventive restructuring proceedings in
accordance with the Financial Operations, Insolven-
cy Proceedings and Compulsory Dissolution Act (the
ZFPPIPP Act) at the District Court in Ljubljana. The
consent for initiating the proceedings is granted by
the lending banks and BAMC, whose receivables, as
required by law, exceed 30% of total receivables due
from Sava d.d.
DECEMBER
The court issues the decision on initiating the preven-
tive restructuring proceedings of the company Sava
d.d. The confirmed initiation of preventive restruc-
turing proceedings enables further steps towards re-
payment of financial receivables, achieving synergetic
effects in the Tourism division, optimisation of opera-
tions of the renewed Sava Group and preventing the
risk of selling-off the assets.
Major events after the accounting period
JANUARY
Sava d.d. divests the company Energetika Črnomelj
d.o.o., based on which it definitely withdraws from
the energy business.

AN
NU
AL
REPO
RT 2
014
14
Intr
oduc
tion
REPORT BY THE PRESIDENT OF THE MANAGEMENT BOARD
5•
Dear shareholders and business partners of Sava,
In 2014, when we were still challenged with difficult and uncertain conditions of the economic environment, we have reached several turning points on our path towards the renewal of the Sava Group.
We implemented the three-year restructuring
strategy until 2014 whose goal was to establish the
conditions for improved performance and suitable
starting basis for enhancing the Group’s assets. We
consolidated the assets of the Sava Group by selling
businesses not connected with strategic activities of
Sava d.d. We fulfilled the commitment on further
cost optimisation; in 2014, costs lagged 6% behind
the plan and were 50% lower than in the previous
year. We provided liquidity of Sava d.d. and met the
obligations arising from the Master Restructuring
Agreement.
The Master Restructuring Agreement entered into
by Sava d.d. in July 2013 expired at the end of No-
vember 2014. Already at the beginning of 2014,
the management of Sava d.d. initiated formal dis-
cussions with the largest debt-holders regarding fu-
ture operations, outlooks and development of the
Sava Group, also reflecting some macroeconomic
structural changes related to operations of the new-
ly established DUTB d.d. (Bank Assets Management
Company).
You, our creditors, already approved of our work
in the past and our vision, and expressed your con-
fidence by granting consent to filing a proposal for
initiating preventive restructuring proceedings
in accordance with the Financial Operations, Insol-
vency Proceedings, and Compulsory Dissolution Act
(ZFPPIPP Act). Pursuant to the provisions of the ZF-
PPIPP Act, the consent to initiating the proceedings
was granted by creditor banks and DUTB d.d. whose
receivables due from the company exceed 30% of
total financial receivables, meaning that the condi-
tions upon filing the proposal for initiating preven-
tive restructuring proceedings for Sava d.d. were
formally met. The court approved preventive restruc-
turing proceedings on 2 December 2014, which in
conformity with the ZFPPIP Act gives the company
time to reach a new agreement on financial liabilities
restructuring with creditors within the legally defined
terms. The confirmed initiation of preventive restruc-
turing proceedings thus enables making further steps
towards repayment of financial receivables, achiev-
ing synergetic effects in Tourism, optimising the op-
erations of the renewed Sava Group, and preventing
the risk of selling-off the assets.
You, our shareholders, expressed your confidence
in our work at the Shareholders’ Meeting when you
supported all the resolutions proposed by the Man-
agement Board and Supervisory Board by more than
a 99% majority. You further provided your support
to our proposal on share capital reduction from
€25,441,851.48 to the amount of €14,060,594.51.
The purpose of share capital reduction was to cover
the loss from the previous financial year. None coun-
ter-proposals or announced challenging actions took
place.

Intr
oduc
tion
A
NN
UA
L RE
PORT
201
4
15
The amount of the loss of Sava d.d. totalling €48.0
million in 2014 was influenced by impairments of fi-
nancial investments amounting to €31.1 million. The
highest impairment was the impairment of financial
investment in Gorenjska banka d.d. amounting to
€26.6 million. A high loss was the reason for appear-
ance of the negative capital totalling €23.5 million.
The 2014 operating result at the Group’s level was
substantially worsened by impairments of assets to-
talling €31.0 million and reversal of deferred tax re-
ceivables amounting to €10.9 million. In 2014, the
Sava Group companies generated sales revenues of
€63.0 million, mainly referring to achievements of
the Tourism division. The Group made a net loss of
€47.0 million, which caused a negative Group’s cap-
ital value totalling €21.2 million.
When evaluating business results of 2014 and the
past three years, the extremely demanding basis prior
to the start of strategic activities implementation for
Sava Group’s renewal should be taken into account.
Considering the achieved goals, we are following the
envisaged path and enter 2015 with two core oper-
ations, Tourism and Finance, and are ready to take
the next development step which chiefly opens up
new opportunities in development of Sava’s tourism
business, also through implementing the synergies
among the companies, in which Sava d.d. holds a
significant ownership stake. As far as investments in
the Finance division are concerned, Sava d.d. will sup-
port the implementation of development strategy of
Gorenjska banka d.d. for the period 2015-2019 and
will withdraw from its other investments in a suit-
able manner. In pursuing these goals, a successful
performance of preventive restructuring proceedings
and further restructuring of financial liabilities will be
of key importance. We will continue to reduce in-
debtedness, improve the balance sheet structure and
optimise operations.
With your support, dear shareholders, creditors, partners and Supervisory Board members, we shall create the conditions for sustainable operations in the long run and enhanced asset value of the company.
I sincerely thank you for your trust.
Matej Narat
President of the Management Board, Sava d.d.

AN
NU
AL
REPO
RT 2
014
16
Intr
oduc
tion
MANAGEMENT AND GOVERNING BODIES
6•
Management Board of Sava d.d.:
Matej Narat, President of the
Management Board
• MSc (Economics), born in 1967,
• responsible for managing and supervision
of the Group, organisation, risk management,
HR, controlling and corporate communications,
• membership of Supervisory Boards:
– Sava Turizem d.d., Ljubljana, Chairman
of the Supervisory Board,
– Hoteli Bernardin, d.d., Portorož, member of the
Supervisory Board,
• other functions and memberships:
– member of the Council at the Faculty
of Economics in Ljubljana,
– member of the Slovenian Directors’
Association.
Supervisory Board of Sava d.d.:
SHAREHOLDER REPRESENTATIVES
Miran Kraševec, Chairman
• graduate in High Administrative School, born in
1954,
• Director of Marina Portorož, d.d.,
• Director of Adriafin, d.o.o., Portorož,
Robert Ličen, MSc, Deputy Chairman
• MBA, born in 1967,
• Director of Profit plus, d.o.o., Ljubljana
• Chairman of the supervisory board of
DARS, d.d.
Aleš Aberšek, Member of the
Management Board
• BSc (Economics), born in 1977,
• responsible for finance, accounting, law, internal
audit and business development,
• membership of Supervisory Boards:
– Alpen Invest, d.d., Ljubljana, member
of the Management Board,
• other functions and memberships:
– member of the Slovenian Directors’
Association.
Andrej Andoljšek was a member of the Management
Board until 27 January 2014. On 28 January 2014,
Aleš Aberšek was appointed a temporary member
of the Management Board; his temporary mandate
as a Management Board member expired on 17 July
2014, after which he was appointed a member of
the Management Board, term of his office being until
31 March 2016.

Intr
oduc
tion
A
NN
UA
L RE
PORT
201
4
17
Roman Ambrož
• BSc (Economics), born in 1959,
• Member of the Management Board of
Alpen Invest, d.d., Ljubljana,
• Chairman of the Supervisory Board of
Melamin, d.d., Kočevje,
Rok Ponikvar
• BSc (Economics), born in 1972,
• General Director of Slorest, d.o.o., Ljubljana
• Chairman of the Supervisory Board of Terme
Topolšica, d.d., Topolšica
Miro Medvešek
• BSc (Economics), born in 1964,
• Director of Svetovanje M, d.o.o., Ljubljana,
• Executive Director of Commerce d.d., Ljubljana
• member of the Supervisory Board of
Intereuropa, d.d., Koper
EMPLOYEE REPRESENTATIVES
Jasmina Kovačič
• BSc (Economics), born in 1980
• Associate Professional, Finance at Sava, d.d.
Lučka Pogačnik
• BSc (Economics), born in 1965,
• Assistant Manager, Accounting, Plan & Analysis
at Sava, d.d.
Gregor Rovanšek
• BSc (Economics), certified internal auditor, MBA
• Manager, Controlling at Sava, d.d.
• member of the Supervisory Board of Gorenjska
banka, d.d., Kranj
Aleš Skok was Chairman of the Supervisory Board until 16 May 2014, when he resigned from the position of
Chairman and member of the Supervisor Board due to his leaving abroad. On 17 July 2014 Miran Kraševec was
appointed as the new Chairman and Robert Ličen, MSc, as the Deputy Chairman of the Supervisory Board. On 15
July 2014, Jasmina Kovačič was appointed as a new member – employee representative of the Supervisory Board
of Sava d.d.

AN
NU
AL
REPO
RT 2
014
18
Intr
oduc
tion
REPORT BY THE SUPERVISORY BOARD 7•
Dear shareholders,
The Supervisory Board of Sava d.d. carefully examined the operations of Sava d.d. and the Sava Group in the 2014 business year. Within the powers conferred and in accordance with the statutory provisions, the Supervisory Board Rules and good business practice, the Supervisory Board exercised a substantive and formal supervision over the activities carried out by the Management Board.
Composition of the Supervisory BoardThe composition of the Supervisory Board changed in the course of 2014.
SHAREHOLDER REPRESENTATIVE
• Miran Kraševec
Deputy Chairman until 17 July 2014
Chairman as of 17 July 2014
• Robert Ličen, MSc,
Deputy Chairman as of 17 July 2014
• Roman Ambrož
• Miro Medvešek
• Rok Ponikvar
• Aleš Skok
Member and Chairman until 16 May 2014
EMPLOYEE REPRESENTATIVES
• Lučka Pogačnik
• Gregor Rovanšek
• Aleš Aberšek
Member until 28 January 2014
• Jasmina Kovačič,
Member as of 17 July 2014

Intr
oduc
tion
A
NN
UA
L RE
PORT
201
4
19
Activities of the Supervisory Board
In 2014, the Supervisory Board held five regular
meetings, which took place on 26 March, 16 May,
17 July, 28 August and 8 December and had one
correspondence meeting on 28 January 2014. It
especially concentrated on monitoring the activities
associated with renewing the Sava Group with em-
phasis on business cost rationalisations, provision of
liquidity and solvency of Sava d.d., and fulfilment of
commitments defined by the Master Restructuring
Agreement.
Besides dealing with and adopting the business plan
and reports on regular operations of Sava d.d. and
the Sava Group, it also addressed the strategic busi-
ness plan formulated by Sava Turizem d.d. for health-
care business until 2018. The Supervisory Board care-
fully dealt with the past business events, which might
lead to damages or other unlawful actions.
It made decisions on personnel changes in the Man-
agement Board of Sava d.d. and the composition of
the Supervisory Board. In the correspondence meet-
ing held on 28 January 2014, it was briefed about
a temporary appointing of the then member of the
Management Board of Sava d.d., Andrej Andoljšek,
to the position of the President of the Management
Board of Gorenjska banka d.d. For the time of An-
drej Andoljšek’s absence, the Supervisory Board of
Sava d.d. appointed Aleš Aberšek from among its
In addition to the abovementioned, the Supervisory Board in 2014 also dealt with and:
• became acquainted with the report by the audit commission on the 2013 annual report,
• endorsed the annual reports of Sava d.d. and the Sava Group for 2013,
• adopted the Report by the Supervisory Board on the results of examining the audited 2013 annual report of
the company Sava d.d. and the audited 2013 consolidated annual report of the Sava Group,
• became acquainted with the report by the personnel and audit commission for 2013,
• proposed the Shareholders’ Meeting to grant discharge from liability to the Management Board and Supervi-
sory Board for the work performed in 2013,
• proposed the Shareholders’ Meeting to appoint Deloitte revizija d.o.o. as the auditor of the financial state-
ments of Sava d.d. and the Sava Group for 2014,
members as a temporary member of the Manage-
ment Board of Sava d.d. in accordance with the sec-
ond paragraph of Article 273 of the Companies Act.
On the day of being appointed a temporary member
of the Management Board of Sava d.d., Aleš Aberšek
assumed all work tasks of the absent Management
Board member and managed the company joint-
ly with Matej Narat, President of the Management
Board of Sava d.d. Having noted the written letter
of resignation by Andrej Andoljšek, based on which
he had irrevocably resigned from the position of the
Management Board member of Sava d.d., the Super-
visory Board appointed Aleš Aberšek a member of
the Management Board of Sava d.d. on 17 July 2014
with the term of office until 31 March 2016.
On 16 May 2014, the Supervisory Board was made
acquainted with resignation of Aleš Skok from the
Supervisory Board chairman and member positions.
After his resignation, the Deputy Chairman of the Su-
pervisory Board Miran Kraševec exercised the function
of the Supervisory Board Chairman until appointing a
new Chairman as provided by the rules of procedure.
On 17 July 2014, Miran Kraševec was appointed the
Chairman of the Supervisory Board and Robert Ličen,
MSc, the Deputy Chairman. Jasmina Kovačič became
a member of the Supervisory Board – employee rep-
resentative.

AN
NU
AL
REPO
RT 2
014
20
Intr
oduc
tion
• proposed the Shareholders’ Meeting to adopt a resolution on reducing the share capital, which read:“The share capital of the company shall reduce from the present amount of €25,441,851.48 by the amount of €11,381,256.97, after which it amounts to €14,060,594.51. A simplified reduction in the share capital is carried out according to Article 379 of the Companies Act-1. The purpose of reducing the company’s share capital is to cover the loss from the previous business year. The share capital is reduced on the basis of the au-dited financial statements as at 31 December 2013. Since the share capital of the company is distributed into 2,006,987 ordinary personal no-par value shares, the attributable amount of each share in the share capital is reduced due to share capital reduction. As the attributable amount of each share in the share capital after its reduction amounts to €7.006, the reduction is carried out without aggregating the shares and with the un-changed number of shares, respectively. Owing to a simplified reduction in the share capital, the Shareholders' Meeting adopts an amendment to the Article 3.1 of the Articles of Association as follows: 3.1. The company's share capital amounts to €14,060,594.51.
• adopted the Statement of Compliance with the Corporate Governance Code for Public Joint-Stock Companies,
• appointed Jasmina Kovačič a member of the personnel commission,
• became acquainted with the business plan of Sava d.d. and the Sava Group for 2015,
• confirmed the calendar of Supervisory Board meetings and financial calendar for 2015.
Work of the Supervisory Board commissions
Two commissions operate within the Supervisory
Board: the audit commission whose tasks are defined
by Article 280 of the Companies Act, and the per-
sonnel commission that operates in accordance with
Article 13 of the Supervisory Board Rules and whose
members deal with the matters associated with ap-
pointing of the Management Board and remuner-
ations of the management and supervisory bodies.
Both commissions regularly briefed the Supervisory
Board on their work.
In 2014, the audit commission, which in accordance
with Article 279 of the Companies Act-1 is obligato-
ry for joint-stock companies, met once a quarter. It
held its meetings on 25 March, 15 May, 27 August
and 4 December. The meetings were attended by the
commission chairman Robert Ličen, MSc, and the
members Roman Ambrož and Gregor Rovanšek, as
well as the external member Janko Gedrih. Within its
scope of work, the audit commission addressed the
areas defined by Article 280 of the Companies Act-1.
It devoted much attention to monitoring the financial
reporting procedures, efficiency of internal controls,
risk management systems and supervised the integ-
rity of financial information. It actively performed its
role in procedures connected with the preparation of
the annual report and cooperated with the external
auditor. The commission had an in-depth discussion
with the auditor at the meeting, on the occasion of
which the auditor presented his opinion on financial
statements and the auditing procedure. The external
auditor also attended the Supervisory Board meeting
in March 2014, when the annual report was adopted
and the Shareholders’ Meeting of Sava d.d. in April
2014.
Personnel commission met three times in 2014: on
24 January, 26 March and 17 July. It consisted of
the commission chairman Miran Kraševec, member
Rok Ponikvar, member Aleš Skok until 16 May 2014,
member Jasmina Kovačič as of 17 July 2014. The
commission was briefed on appointing Andrej An-
doljšek, the Management Board member of Sava d.d.
a temporary member of the Management Board of
Gorenjska banka d.d., and the fact that for the period
of a temporary member function in the Management
Board of Gorenjska banka d.d., his Management
Board member office at Sava d.d. was suspended. In
accordance with the second paragraph of Article 273
of the Companies Act-1 the personnel commission

Intr
oduc
tion
A
NN
UA
L RE
PORT
201
4
21
proposed the Supervisory Board to appoint Aleš Aberšek a temporary Management Board member of Sava d.d. It became acquainted with the letter of resignation by the Management Board member of Sava d.d. Andrej Andoljšek, based on which he irrevocably resigned from the Management Board
member of Sava d.d. position on 20 June 2014. Based on his work in the recent years, the commis-sion proposed the Supervisory Board to appoint Aleš Aberšek a Management Board member with the term of office from 17 July 2014 to 31 March 2016 .
Business performance in 2014
INTRODUCTORY EXPLANATION
The largest operations of the Sava Group in 2014 were management of financial investments of Sava d.d., with its major investment in the banking sector, and Tourism. The exacting economic environment affect-ed the performance of the Sava Group companies in 2014. In Tourism, which generates almost total sales revenues of the Group, the planned sale was not en-tirely achieved, which was due to bad weather in the summer months, stricter conditions imposed by the health insurance company in the field of concession healthcare, certain outdated accommodation capaci- ties and loss of revenues, especially in the Russian mar-ket. Owing to cost rationalisations, the loss of revenues was successfully compensated and Tourism ended the financial year 2014 with a profit of €1.0 million.
Impairments of financial investments, the highest one with €26.7 million being the one in Gorenjska banka d.d., led to a loss of the Group amounting to €47.0 million, and, as a consequence, the Group’s equity re-duced to a negative value of €21.2 million.
The Master Restructuring Agreement for financial li-abilities of Sava d.d. expired on 30 November 2014. On 26 November 2014, Sava d.d. filed a proposal for initiating preventive restructuring proceedings under Article 44 b of the ZFPPIPP Act. On 2 December 2014, the court issued the decision on initiating preventive restructuring proceedings.
BUSINESS OPERATIONS OF THE SAVA GROUP
The Sava Group made a net loss of €47.0 million in 2014. The biggest share of loss was due to impair-ments of financial investments and impairments of real property in total amount of €31.0 million, and a reversal of deferred tax receivables amounting to €10.9 million:
• impairment of financial investments in the shares of Gorenjska banka d.d. amounting to €26.7 mil-lion,
• impairment of investment property and invento-ries in real property in the Real Estate companies amounting to €2.6 million,
• impairment of securities available for sale amount-ing to €0.8 million,
• other impairments of assets amounting to €0.9 million,
• reversal of deferred tax receivables amounting to €10.9 million.
The balance sheet total of the Sava Group com-panies amounted to €285.5 million at 31 December 2014, and was €40.8 million or 12% below the value at the end of 2013. The net decrease was mainly due to the performed impairments, lower investments if compared to the accounted for depreciation and the sale of financial investments available for sale.
Financial investments had a 34% share in the assets structure, property, plant and equipment a 55% and other assets (inventories, operating receivables, granted loans and others) had an 11% share.
The parent company Sava d.d. had a negative cap-ital of €23.5 million at 31 December 2014, thereby affecting the capital of the Sava Group, which at 31 December 2014 was negative amounting to €21.2 million. The liabilities of the Sava Group thus exceed-ed the assets value of the Group by €21.2 million.
In 2014, the companies of the Sava Group repaid a
sum of €7.9 million to financial creditors.

AN
NU
AL
REPO
RT 2
014
22
Intr
oduc
tion
BUSINESS OPERATIONS OF SAVA D.D.
In 2014, Sava d.d. carried on a comprehensive
reorganisation. Operating expenses achieved €3.6
million and compared year-on-year they were lower
by 50%, and 6% lower than planned.
Sava d.d. made a net loss of €48.0 million in 2014.
The major part of loss was due to impairments of
financial investments totalling €31.1 million and a
reversal of deferred tax receivables totalling €10.9
million:
• impairment of financial investment in the shares
of Gorenjska banka d.d. amounting to €26.6 mil-
lion,
• impairment of investments and granted loans in
subsidiaries amounting to €3.2 million,
• impairment of long-term securities available for
sale amounting to €0.8 million,
• impairment of investments and granted loans in NFD Holding d.d. amounting to €0.5 million,
• reversal of deferred tax receivables amounting to €10.9 million.
The balance sheet total of Sava d.d. amounted to €211.2 million at 31 December 2014 and was €37.2 million or 15% lower than at the end of 2013.
The biggest, i.e. a 90% share, in the assets structure had long-term financial investments. Granted loans had a 6% share and other assets a 4% share.
At 31 December 2014, Sava d.d. had a negative capi-tal totalling €23.5 million. Its liabilities thus exceeded the assets value of the company by €23.5 million.
In 2014, Sava d.d. settled its liabilities in accordance with the Master Restructuring Agreement.
Intr
oduc
tion
A
NN
UA
L RE
PORT
201
4
23
Auditor’s report
The Supervisory Board became acquainted with the
auditor’s reports and established that the auditor is-
sued qualified opinions for Sava d.d. and the Sava
Group.
The auditor also presented his views to the Super-
visory Board and participated in the meeting of the
audit commission of the Supervisory Board.
The qualified opinions for Sava d.d. and the Sava
Group have been based on:
a) Limitation of Scope - Financial Expenses from
Impairments:
In 2013, the auditor’s reports in connection with
the evaluation of financial investment in Gorenjska
banka d.d. were modified. The Management Board
prepared an estimate of the recoverable amount of
investment as at 31 December 2014. The full effect
of the impairment was recorded as financial expense
in 2014. The auditors were unable to satisfy them-
selves as to what amount of determined impairment
of the quoted investment should have been recorded
in 2013 and what amount should have been record-
ed in 2014.
b) Limitations of Scope – Deferred Tax:
In 2013, the auditor’s reports on deferred tax were
modified. In 2014, the Management Board impaired
deferred tax receivables and the total amount of im-
pairment was recorded in 2014. The auditors were
unable to satisfy themselves as to what amount of
the performed impairment should have been record-
ed in 2013 and what amount should have been re-
corded in 2014.
The auditor explained that assets and liabilities of the
controlling company Sava d.d. and the Sava Group
at 31 December 2014 were suitably presented. As to
its substance, the qualified opinion refers to auditors’
inability to satisfy themselves as to what amount of
impairments performed in 2014 should have been
recorded in the past, comparison financial year, and
what amount in the current financial year.
As regards the emphasis of matter - a going concern,
in respect of which the opinion is not modified, it
was explained that the risks were suitably presented
and disclosed in the annual report.
As regards the emphasis of matter – contingent lia-
bilities, in respect of which the opinion is not mod-
ified, it was explained that a long-lasting process in
connection with resolving the initiated denationali-
sation claims was expected, which is why it is not
possible to estimate or project the probability for set-
tlement of liabilities. The conditions for recognition
of provisions have therefore not been met.
The Supervisory Board determines that the auditor’s
report contains the constituents prescribed in para-
graph 2 of Article 57 of the Companies Act-1. The
auditor has confirmed that the financial reports have
been produced in accordance with Slovene Account-
ing Standards, the accounting policies of the compa-
ny and by employing corresponding provisions of In-
ternational Financial Reporting Standards as adopted
by the EU.

AN
NU
AL
REPO
RT 2
014
24
Intr
oduc
tion
Reviewing the work of the Management Board and Supervisory Board
The work of both bodies and their mutual coopera-tion was performed in accordance with the statutory provisions, the rules of the Ljubljana Stock Exchange, Supervisory Board Rules and good business practice of a two-tier corporate governance system.
The Supervisory Board establishes that in 2014 the Management Board of Sava d.d. provided suitable information regularly and timely, thereby providing a basis for a quality exercising of the supervisory function. The materials were prepared professionally and accurately, and structured in a transparent man-ner, which enabled ongoing monitoring of business performance of Sava d.d. and the Sava Group with emphasis on the implementation of restructuring strategy. The Supervisory Board members were well prepared for the meetings; they participated con-structively and adopted decisions for the benefit of the company.
Considering the starting point of Sava d.d. prior to adopting the restructuring strategy of the Sava Group in 2011, and certain macroeconomic and structur-al changes in connection with the operation of the newly-established DUTB d.d. (BAMC), the Supervi-sory Board evaluates the work of the Management Board as successful. The management of Sava d.d. efficiently performed strategic activities in the course of 2014, which along with the optimisation of op-erating costs at Sava d.d. and a regular fulfilment of all commitments in connection with the Master Restructuring Agreement, provided a suitable basis for initiating preventive restructuring proceedings in accordance with the Financial Operations, Insolven-cy Proceedings and Compulsory Dissolution Act (the ZFPPIPP Act). The Supervisory Board is thus of opin-ion that a successful implementation of preventive restructuring proceedings presents the fundamental step towards a sustainable long-term business and the enhanced value of the company’s assets, which is in the interest of creditors and other stakeholders of the company Sava d.d.
Endorsing the annual report and consolidated annual report for 2014
At its 16th meeting held on 25 March 2015, the Su-
pervisory Board dealt with and endorsed both annual
reports for 2014 in the presence of a certified auditor.
The Supervisory Board gives a positive opinion on the
independent auditor’s reports on the financial state-
ments of Sava d.d. and the Sava Group, and endors-
es without comment the annual report of Sava d.d.
for 2014 and the consolidated annual report of the
Sava Group for 2014.
Miran Kraševec
Chairman of the Supervisory Board
Ljubljana, 25 March 2015

Intr
oduc
tion
A
NN
UA
L RE
PORT
201
4
25
CORPORATE GOVERNANCE SYSTEM 8•
A two-tier system of corporate governance in Sava Group companies
Managing of Sava d.d. is conducted according to a
two-tier system, according to which the company is
managed by the Management Board, its operations be-
ing supervised by the Supervisory Board. The companies
Sava Turizem d.d. are managed in the same manner.
Sava d.d. strives for employing a simplified and stand-
ardised governance process of the Group’s compa-
nies. The governance process is based on making
decisions by the Shareholders’ Meeting, the super-vision over business processes and efficient man-agement of the companies. None of Sava Group companies employs a one-tier system of corporate governance. At Sava d.d. and its subsidiaries, the corporate governance system is based on legal pro-visions, the rules of the Ljubljana Stock Exchange, in-ternal organisational regulations and books of rules, and in compliance with the good business practices.
Shareholders’ Meeting of Sava d.d.
Shareholders of Sava d.d. exercise their rights in
connection with the company at the Shareholders’
Meeting. The convening of the Shareholders’ Meet-
ing is governed by the Articles of Association of Sava
d.d. and the legislation. As a rule, the Management
Board of Sava d.d. convenes the Shareholders’ Meet-
ing once a year. It can be attended by all sharehold-
ers and their proxies or representatives, respectively,
who announce their participation in writing in due
time. The call for the Shareholders’ Meeting is an-
nounced at least 30 days before the Meeting, in the
newspaper Finance, the electronic information sys-
tem of the Ljubljana Stock Exchange d.d. – SEOnet,
and the company website at www.sava.si. The com-
pany website provides access to the materials with
the proposed resolutions.
62.40% of total company’s capital with voting right
attended the 2014 Shareholders’ Meeting. The pro-
portion of voting right of the first five major sharehold-
ers present at the Shareholders’ Meeting amounted
to 48.75% as follows: Kapitalska družba d.d. 18.71%,
Slovenska odškodninska družba d.d. 11.06%, Finetol
d. d. – under receivership 7.19%, Merkur d. d. 6.72%
and NFD 1 equity sub-fund 5.07%.
By a high, more than a 99% majority of capital pres-
ent, shareholders supported all the resolutions pro-
posed in the Call by the Management Board and
Supervisory Board of Sava d.d. There were no coun-
ter-proposals or announced challenging actions at
the Shareholders’ Meeting.
At the Shareholder’s Meeting, shareholders unani-
mously, by 99.99% of cast votes, elected the bodies of
the Shareholders’ Meeting. They were made acquaint-
ed with the audited annual reports of Sava d.d. and the
Sava Group for 2013 and the Report from the Supervi-
sory Board for 2013. They passed a resolution on grant-
ing discharge from liability to the Management Board
(by 99.95% of cast votes) and a resolution on granting
discharge from liability to the Supervisory Board (by
99.93% of cast votes), thereby approving of the work
of these two bodies in 2013. By 99.83% of cast votes,
shareholders passed a resolution on the company’s
share capital reduction from the then €25,441,851.48
to €14,060,594.51. The Shareholders’ Meeting passed
the resolution on appointing Deloitte revizija d.o.o.,
Ljubljana, the auditor of the financial statements of
Sava d.d. and the Sava Group for 2014. The resolu-
tion was passed by 99.92% of cast votes.

AN
NU
AL
REPO
RT 2
014
26
Intr
oduc
tion
Supervisory Board of Sava d.d.
As specified by the Articles of Association of the joint-stock company Sava d.d., the Supervisory Board is composed of nine members at the most. Six mem-bers are elected by the Shareholders' Meeting, while three members are elected by the Workers' Coun-cil in accordance with the Worker Participation in Management Act. In 2014, after appointing the Supervisory Board member Aleš Aberšek a tempo-rary Management Board member of Sava d.d. (28 January 2014), the Supervisory Board acted as an eight-member team. After Aleš Skok resigned from the Supervisory Board chairman and member posi-tion (16 May 2014), the Supervisory Board consisted of seven members until 15 July 2014 when Jasmina Kovačič was appointed a Supervisory Board member – employee representative, after which the Supervi-sory Board consisted of eight members again. The Supervisory Board members are elected for a four year term with a re-election option. The term of of-fice of the present Supervisory Board members ex-pires on 28 June 2016, except for Robert Ličen, MSc, who was elected at the 2011 Shareholders’ Meeting
(his term of office shall be until 9 June 2015) and Miro Medvešek, who was elected at the 2013 Share-holders’ Meeting (his term of office shall be until 30 April 2017).
The Articles of Association of the company and the book of procedures concerning the work of the Supervisory Board define the method of work, convening meetings and other issues of impor-tance for the work of the Supervisory Board of Sava d.d. The legislation and book of procedures of the Supervisory Board define that the Supervisory Board shall meet at least once every quarter. In 2014, the Supervisory Board met at six meetings, five of which were regular and one was a correspondence meeting. The dealt with topics and resolutions of significance are presented in the Report by the Su-pervisory Board. With the exception of one meeting when one member was absent with permission, all other Supervisory Board members were present at all meetings.
Management Board of Sava d.d.
Management Board members are appointed by the
Supervisory Board. The present Management Board
consists of two members. The President of the Man-
agement Board is Matej Narat, his term of office
being from 31 March 2011 until 31 March 2016.
Until 27 January 2014 Andrej Andoljšek was a Man-
agement Board member, who at that time was ap-
pointed a temporary Management Board member of
Gorenjska banka d.d. Instead of him, Aleš Aberšek
was appointed a temporary Management Board
member on 28 January 2014. After Andrej Andoljšek
submitted a written irrevocable letter of resignation
from the Management Board member position at
Sava d.d., Aleš Aberšek was appointed a Manage-
ment Board member of Sava d.d. on 17 July 2014,
his term of office shall expire on 31 March 2016.
The Management Board manages Sava d.d. and
does business for the benefit of the company, auton-
omously and at their own responsibility. The number
of Management Board members and their areas of
work and mandates are defined by the resolution
from the Supervisory Board and form a constituent
part of the rules of procedures for the Management
Board. The company is represented by two Manage-
ment Board members jointly or one member of the
Management Board jointly with a procurator. The
procurators of Sava d.d. are Milan Marinič and Petra
Sever. The Management Board has to obtain consent
from the Supervisory Board for certain decisions or
transactions; such cases include acquisition, disposal
or encumbrance of equity holdings in excess of 20%
of the share capital of Sava d.d.

Intr
oduc
tion
A
NN
UA
L RE
PORT
201
4
27
Directorate for Sava Group’s management
The Sava Group Directorate began to operate on 1 October 2011. It is conducted by the Director, Senior Assistant to the Management Board and procurator of Sava d.d. Milan Marinič. The Directorate’s goal is to assure a quality and efficient corporate govern-ance system and strategic supervision over the Sava Group. The Group Directorate involves all profession-al services of Sava d.d. in its work.
The Sava Group Directorate assures:
• The preparation of documents and policies for managing the subsidised and associated compa-nies and other equity investments.
• Professional assistance in pursuing and directing the work of supervisory and other bodies of indi-vidual Group companies.
• Monitoring and supervision over the implementa-
tion of the adopted policies.
Sava d.d. implements its governing role through su-pervisory boards, administrative boards and various commissions, as follows:
• In the subsidiaries, the Management Board im-plements its ownership-based management role by making decisions as a sole partner and by set-ting out the policies for the work of supervisory board members.
• In the associated companies, the Management Board ensures their professional consulting assis-tance to the supervisory board members of the respective companies who are employed with the Sava Group.
• In other companies, in which Sava holds an equity stake and are neither subsidised nor associated, the Management Board of Sava d.d. appoints their proxy prior to the AGMs’ of these companies to participate in the meeting. Before these supervi-sory board meetings take place, the Management
Board provides their professional consulting assis-tance to the members of the supervisory boards
who are employed with the Sava Group.
The Directorate is responsible for the preparation of
expert basis for a decision-making process by the
Management Board in connection with implement-
ing the governing role of Sava d.d. For this purpose,
the Directorate also coordinates the activities of oth-
er professional services. In its weekly meetings, the
Management Board of Sava d.d. regularly monitors
how are managed the subsidiaries and associated
companies of the Sava Group as well as other equi-
ty investments held by Sava d.d. The Management
Board of Sava d.d. appoints the members of Sava
d.d.’s managerial teams in the management and
governing bodies of Sava Group companies who
have suitable knowledge about the operations of a
particular company.
Managing the subsidised and associated companies of the Sava Group, and other equity investments of Sava d.d.
Internal audit
The mission of the internal audit involves judging
and evaluating management as well as executive
and information processes aimed at appropriate risk
management. Internal audit is directly responsible
to the Management Board of Sava d.d. The organi-
sational independence of internal audit and its pro-
fessional approach enable that its influence is en-
forced in all Sava Group companies and at all levels
of operations. Internal auditors continually enhance
their knowledge and design the auditing methodol-
ogy in accordance with the international standards
of professional internal audit practice. When select-
ing the projects for the annual internal audit plan,
internal audit ensues from the strategic policies of
the Sava Group and considers risks that could affect
achievement of strategic goals. Owing to a compre-
hensive review of Sava Group’s operations, internal
audit assesses the risk impact on the operations and

AN
NU
AL
REPO
RT 2
014
28
Intr
oduc
tion
External audit
The auditing company Deloitte revizija d.o.o was selected for auditing the financial statements of the joint stock company Sava d.d. and the majority of its subsidiaries. The Shareholders’ Meeting of Sava d.d. approves of appointing the auditor every year. In the preparation of a proposal, the company considers the recommendations by the Corporate Governance
Code on changing the responsible auditor or key au-diting partner of the same auditing company at least every five years. The businesses of Sava d.d. with the audit company Deloitte revizija d.o.o. are disclosed in the financial section of the annual report and in the notes to the financial statements of the company and the Group.
Internal controls and risk management system in connection with financial reporting
The Management Board of Sava d.d. is responsible for the operation of internal control system and su-pervision of its efficiency. The purpose of internal control system of the Sava Group is to assure that company or Group assets are secured, and busi-ness events correctly performed and documented. The existing structure of the internal control system includes, among other things, the established pol-icies and procedures, the function of internal audit performance and the selection and training of com-petent specialists. In the Sava Group, standardised accounting policies apply, which are detailed in the
accounting regulations of the companies. The regu-lations precisely define the duties and responsibilities of individual accounting operations, their monitor-ing and supervision. In this manner, a standardised approach to recording business events, procedures standardisation and an in-depth employee expertise are assured. The use of a standardised central man-agement information system supports the system of monthly monitoring and internal financial reporting on business, of which the Supervisory Board is being briefed too, and it enables a timely response to any deviations or changes.
the probability as to the occurrence of risks. Based on this assessment, priority areas are selected to be addressed and the goals defined to be accomplished in the audits. The annual plan of internal audit is confirmed by the Management Board, whereas the audit commission of the Supervisory Board is ac-quainted with it too. In 2014, audits were carried
out with a particular focus on risk management in connection with certain business functions, process-es and monitoring business performance and effi-ciency of companies. In 2015, the activities of the Internal Audit will focus on risk management of key business functions and processes in the Sava Group companies.
Business transparency and communication
A professional support to managing communication
on major aspects of Sava Group’s operation is pro-
vided by corporate communications, which closely
cooperates with the Management Board and other
professional services and management teams in the
subsidiaries. The goal of Sava d.d. is to establish a dia-
logue and ensure quality information to shareholders
and other stakeholders in compliance with the legis-
lation and rules of the Ljubljana Stock Exchange d.d.
Information about the operations of the Sava Group
and Sava d.d. and all more significant resolutions
adopted by the Supervisory Board are announced in
the stock exchange information system SEOnet, on
the company’s website at www.sava.si, and in cas-
es stipulated by law also in the newspaper Finance.
Sava d.d. releases the information that might affect
business decisions made by investors or the interest-
ed public on an ongoing basis, and regularly commu-
nicates with the media.

Intr
oduc
tion
A
NN
UA
L RE
PORT
201
4
29
STATEMENT ON CORPORATE GOVERNANCE
The corporate governance system at Sava d.d. provides guidelines for directing and supervising the company and its subsidiaries. It defines the distribution of rights and responsibilities among the governing bodies and sets rules and procedures for making decisions on corporate issues. Fur-thermore, it provides a framework for setting, achieving and monitoring the implementation of business goals and establishes the values, the principles and the standards of honest and responsible decision-making process and handling in all aspects of our business.
The corporate governance system is a tool for accomplishing long-term strategic goals of Sava d.d. and the manner in which the Management Board and Supervisory Board of Sava d.d. perform their responsibility towards shareholders and other stakeholders of the company. The management and supervisory bodies of Sava d.d. and its subsidiaries strive for modern principles of governance and management, and its full compliance with the advanced domestic and foreign practices.
1. Explanations in accordance with the Companies Act
Based on the 5th paragraph of Article 70 of the Companies Act, which defines the minimum contents of the State-
ment on Corporate Governance, Sava d.d. gives the following explanations:
1.1 Description of main characteristics of the internal control and risk management systems in the company in connection with the financial reporting procedure.
The internal control and risk management systems in
connection with the financial reporting by Sava d.d.
incorporates the policy and procedures, which ena-
ble a timely, true and fair reporting on the financial
position, movement of assets and liabilities and the
operating result of Sava d.d. and the Sava Group.
The internal control system is presented in the 2014
annual report of the Sava Group and Sava d.d., in
chapter Corporate Governance System.
1.2 Significant direct and indirect holdership of the company’s securities in the sense of achieving a qualified stake, as stipulated by the act regulating take-overs.
The data about achieving a qualified stake as stipu-
lated by the Take-overs Act is announced on an on-
going basis in the electronic information system of
the Ljubljana Stock Exchange, and furnished to the
Securities Market Agency. As at 31 December 2014,
direct qualified stakes as stipulated by the Take-overs
Act in Sava d.d. are held by: Kapitalska družba d.d.,
Ljubljana (qualified stake 18.7% or 375,542 shares),
Slovenski državni holding d.d., Ljubljana (11.1% or
222,029 shares), Finetol d.d. – under receivership,
Škofja vas (6.9% or 137,796 shares), Merkur d.d. –
under receivership, Kranj (6.5% or 130,598 shares),
Alpen.SI, equity sub-fund, Ljubljana, Ljubljana (5.1%
or 101,702 shares).
9•

AN
NU
AL
REPO
RT 2
014
30
Intr
oduc
tion
1.3 Explanation about any holder of securi-ties which assure special control rights.
Individual shareholders of Sava d.d. have no spe-
cial control rights based on the ownership of Sava
shares.
1.4 Explanations about all limitations in vot-ing rights.
The shareholders of Sava d.d. have no limitations in
exercising their voting rights.
1.5 Company regulations on appointing and replacing members of the management and supervisory bodies and changes in the Arti-cles of Association.
Company regulations do not separately govern the
appointment or replacement of members in the
management and supervisory bodies and amend-
ments to the Articles of Association. The applicable
legislation is applied in full.
1.6 Proxies of management board members, especially those for the issue or purchase of treasury shares.
In 2014, Sava d.d. did not have any proxies for the
issuance or purchase of treasury shares.
1.7 Operation of company Shareholders’ Meeting and its key responsibilities.
In 2014, the Shareholders’ Meeting met once. The
responsibilities of the Shareholders’ Meeting are stip-
ulated by law and exercised as set out in the stand-
ing orders of the Shareholders’ Meeting and by the
chairperson of the Shareholders’ Meeting. The voting
procedure in the Shareholders’ Meeting is minutely
described in the annual report of the Sava Group and
the company Sava d.d. for the year 2014, in chapter
Corporate Governance System.
1.8 Data on the composition and operation of management and supervisory bodies and their commissions.
A comprehensive presentation of the management
and supervisory bodies and their commissions is giv-
en in the annual report of the Sava Group and the
company Sava d.d. for 2014 in chapters Manage-
ment and governing bodies; Report by the Supervi-
sory Board; Corporate Governance System.
2. Statement of Compliance with the Corporate Governance Code for Public Joint-Stock Companies
The company Sava d.d. gives below the Statement of Compliance with the Corporate Governance Code for Public
Joint-Stock Companies (hereafter Code).The Statement of Compliance with the Corporate Governance Code refers
to the period between the former and the present statement, i.e. to the period from 18 March 2014 to 25 March
2015. The statement forms a constituent part of the 2014 annual report, which provides a comprehensive pres-
entation of the corporate governance system of the Sava Group and the company Sava d.d. In the quoted period,
Sava d.d. followed the provisions of the Code in the latest variant adopted on 8 December 2009. The entire Code
text is available on the website of the Ljubljana Stock Exchange (www.ljse.si).

Intr
oduc
tion
A
NN
UA
L RE
PORT
201
4
31
The Management Board and the Supervisory Board
of the company declare that the joint stock company
Sava d.d. respects the provisions of the Code except
in cases where it deviates from the Code, for which
the following explanations are given:
Recommendation under item 8.2: In its rules of pro-
cedure, the supervisory board sets the scope of topics
and timeframes to be observed by the management
board in its periodic informing of the supervisory
board. The communicated data enable supervisory
board members to make an objective and balanced
assessment of the company's financial position. The
management board provides written notices to the
supervisory board at least once per quarter. Provided
adequate protection and information security are en-
sured, such notices may be e-mailed. The documents
needed by supervisory board members to make qual-
ity decisions are made available to them or to the
supervisory board committees in due time.
Based on a special resolution, the Supervisory Board
defines the set of topics and timeframes with a special
order to be observed by the Management Board in its
periodic informing. The Supervisory Board adapts the
content of this resolution to the economic situation
in the company and the Sava Group. The Supervisory
Board is of opinion that it is not necessary to define
the content and timeframes in the rules of procedure
instead of in the resolution.
Recommendation under item 10.2: The president of
the supervisory board ensures that the procedures
related to preparatory work, consultations, adopting
of resolutions and decision taking are precisely ad-
hered to. The agenda for a supervisory board meet-
ing consists of items to be discussed at the meeting.
The agenda also specifies whether an item and corre-
sponding materials are of an informative nature only
or whether actual decisions are to be adopted on
their basis (adopted report, consent or authorization
granted to the management board, etc.).
Provided that the members receive adequate materi-
als and have sufficient time for quality decision-mak-
ing about the added agenda item, the supervisory
board may add additional items to the agenda on
the spot, by a simple majority vote. The rules of pro-
cedure of the Supervisory Board of Sava d.d. define
that an additional item can only be added on the
agenda in agreement by all Supervisory Board mem-
bers.
The statement will be accessible on the website of
the Ljubljana Stock Exchange at www.ljse.si, and
the company’s website at www.sava.si as of the an-
nouncement date.
Management Board and
Supervisory Board of Sava d.d.
Ljubljana, 25 March 2015

Renewed for the Future

BUSINESS ANALYSIS

Busi
ness
ana
lysi
sA
NN
UA
L RE
PORT
201
4
34
SIGNING OF THE ANNUAL REPORT AND ITS CONSTITUENT PARTS FOR SAVA D.D. AND THE SAVA GROUPFOR 2014
1•
The President and the member of the Management Board of Sava d.d. hereby confirm to be ac-quainted with the content of constituent parts of the annual report of Sava d.d. and the Sava Group for 2014, and thus the entire annual report of Sava d.d. and the Sava Group for 2014. The annual report is herewith adopted and confirmed with respective signatures.
Ljubljana, 17 March 2015
Aleš Aberšek
Member of the Management Board
Matej Narat
President of the Management Board

Busi
ness
ana
lysi
sA
NN
UA
L RE
PORT
201
4
35
SAVA D.D. AS A GOING-CONCERN ENTITY 2•
Business strategy of the company with activities and duration until 2014
Sava d.d. adopted its business strategy for the pe-riod from 2012 until 2014. The strategy was based on consolidation of the Sava Group’s assets through divestments of non-core divisions of Sava d.d. (real estate, rubber and energy division), cost optimisa-tion and liquidity preservation. Divestments were defined as one of the key milestones of the strategy, since they would reflect in an immediate delever-age of Sava d.d. and also the Sava Group. Decrease of indebtedness was crucial in the given economic conditions, in which Sava d.d. and the Sava Group companies were operating at that time. At its regular meeting, the Supervisory Board of Sava d.d. unani-mously approved the strategy.
In order to meet the defined milestones of the strat-egy, Real Estate division was divested in 2012, fol-lowed by divestment of Rubber Manufacturing and Energy management divisions in 2013 and 2014, respectively. The key milestone, namely the sale of Rubber Manufacturing, which at that time was one of the largest domestic sale transactions, was the
fundamental condition that creditor banks partici-pated in restructuring of financial liabilities. The Mas-ter Restructuring Agreements on Sava d.d. as well as on Sava Turizem d.d. were simultaneously signed in July 2013. The Master Restructuring Agreement on Sava Turizem d.d. was signed for a period of five years (until August 2018), while the agreement with Sava d.d. was concluded until the end of November 2014.
After executing all the necessary and vital disposals of non-core divisions (comprising different individ-ual entities), Tourism and Finance remain the core divisions within the Sava Group. The key financial investments in both divisions are Sava Turizem d.d., Hoteli Bernardin d.d., Istrabenz d.d. (owner of Istrabenz Turizem d.d.), Gorenjska banka d.d. and Alpen.SI (mutual fund). In all of them, Sava holds im-portant ownership stakes and has its representatives in supervisory bodies. Those (remaining) assets also constitute the basis for a new business strategy for the forthcoming years.
Sava d.d. is undergoing preventive restructuring proceedings
Restructuring of financial liabilities (in addition to as-
sets consolidation) was one of the major elements
of the past business strategy of Sava d.d. As the
Master Restructuring Agreement on Sava d.d. ex-
pired at the end of November 2014, the manage-
ment of Sava d.d. initiated formal discussions with
the largest debt-holders regarding future operations,
outlooks of the company and the development of
the Group, also reflecting some macroeconomic
structural changes related to operations of the new-
ly established DUTB d.d. (Bank Assets Management
Company). Discussions were already initiated at the
beginning of 2014 and taking place throughout the
past year. Basic strategic options were prepared and
presented to creditor banks of Sava d.d.
Strategic options underlined the necessary activities
related to regular operations of Sava d.d. and opera-
tions of the two remaining divisions, namely Tourism
and Finance. Tourism division was defined as a core
division in terms of generating revenues and provid-
ing positive results from operations (EBITDA, EBITDA
margin), driven from further consolidation and uti-
lizing intra-Group synergies. On the other hand, the Financial division, comprising Gorenjska banka d.d.

Busi
ness
ana
lysi
sA
NN
UA
L RE
PORT
201
4
36
Glance into the future activities and operations of the company
In the light of preventive restructuring proceedings, two important facts should be considered: the legal timeframe and gaining support for the proposed restructuring plan. The financial restructuring plan, which is one of the principal tasks within the proceed-ings, has to be approved by creditors whose financial receivables exceed 75% of total financial receivables due from the company. After all preconditions are met, the plan has to be approved by the court, too. The restructuring period is legally defined and shall be between three to five years, during which time the company has to pursue the milestones and policies defined in the financial restructuring plan.
The restructuring proposal is derived from the pro-posed strategic options, its principal goals being development and improvement of operations of the Tourism division and seeking business synergies among and across tourism companies, in which Sava d.d. holds significant ownership stakes. Furthermore, the focus will be on development of healthcare services, which perfectly complement the existing tourism services offer. Performing the planned activities associated with the development
of this strategic business, Sava’s Turizem will further consolidate its leading position as the largest domes-tic tourism services provider. The investments of the Finance division, on the other hand, present the most appropriate possibilities for divesting and needed de-leverage of the company. The latter will be reflected in a stable company’s balance sheet, while the activities towards further operating costs decrease will contrib-ute to the improved and sustainable operations in the long run.
With the needed creditors’ support, already ex-pressed in November 2014 by voting for the initiation of preventive restructuring proceedings, the compa-ny undergoing a business and financial restructuring will – as it has so far – further reduce indebtedness, improve balance sheet structure and its operations. The final result of the mentioned activities under the presented proceedings will reflect in sustainable long-term operations that will further enhance the assets value of the company, which is in the interest of creditors and also other stakeholders of Sava d.d.
and Alpen.SI (with the investments listed on the stock exchange prevailing), was considered to be one of the most suitable possibilities in terms of dispos-als and necessary deleverage of Sava d.d. The latter would result in a more sustainable debt structure, improved balance sheet structure and liquidity of the company. Along with the proposed asset manage-ment activities, further operational optimisation on the cost side was envisaged to assure sustainable fu-ture operations of the company.
On 26 November 2014, the Management Board of Sava d.d. filed a proposal for initiating preventive restructuring proceedings according to the Financial Operations, Insolvency Proceedings, and Compulso-ry Dissolution Act (ZFPPIPP Act) at Ljubljana District Court. The proposal for initiating the proceedings was filed in order to assure equal treatment of all creditors, protection of their interests and assets in accordance with the ZFPPIPP Act. Pursuant to the provisions of the ZFPPIPP Act, the consent to
initiating the proceedings was granted by credi-tor banks and DUTB d.d. whose receivables due from the company exceed 30% of total receiv-ables, meaning that the conditions upon filing the proposal on initiating preventive restructur-ing proceedings for Sava d.d. were formally met.
The court approved preventive restructuring pro-ceedings on 2 December 2014, which in conformity with the ZFPPIP Act gives the company time to reach a new agreement on financial liabilities restructuring with creditors within the legally defined terms. The confirmed initiation of preventive restructuring pro-ceedings thus enables making further steps towards repayment of financial receivables, achieving syner-getic effects in Tourism, optimising the operations of the renewed Sava Group, and preventing the risk of
selling-off the assets

Busi
ness
ana
lysi
sA
NN
UA
L RE
PORT
201
4
37
3•THE SAVA SHARE AND OWNERSHIP STRUCTURE
In 2014, the Sava share value moved between €0.21 and €1.55. At the end of 2014, the average price per share amounted to €0.48, meaning it rose by €0.25 compared to the end of 2013.
Movement of the Sava share The range of value, in which the Sava share moved,
reached the highest point at €1.55 and the lowest at
€0.21. A gradual recovery of domestic economy was
observed in 2014, and, as a consequence, investor con-
fidence in domestic capital market enhanced. In 2014,
liquidity of the Slovene capital market grew by 75%
compared to 2013.
Market capitalisationAt the end of 2014, the market capitalisation of Sava
shares amounted to €1 million and was higher than at
the end of 2013. The market capitalisation of all shares
on the Ljubljana Stock Exchange amounted to €6.2
billion at the end of 2014, which was a 20% increase on
the value at the end of 2013.
Jan Feb Mar Apr May Jun Jul Aug Sep Oct Nov Dec
3
2
1
0
Share price (€) Turnover (€ thousand)
5
0
Movement of the Sava share price in 2014
Sava turnover
Sava share price

Busi
ness
ana
lysi
sA
NN
UA
L RE
PORT
201
4
38
Ownership structureOn 31 December 2014, Sava d.d. had 13,691 share-
holders entered in the register book, which ranks it
among the larger Slovene listed public joint stock com-
panies. The stock of domestic shareholders amounted
to 95.7% and that of foreign shareholders to 4.3%. In
comparison with the end of 2013, the stock of foreign
shareholders did not change. The majority of foreign
shareholders originate from Great Britain, the United
States of America, Germany, Croatia and Austria. The
proportion of legal entities represented 77.9% and
that of private individuals 22.1% of company share-
holders. The ten major shareholders own 63.91% of
total company equity.
Ownership structure by category at 31 December 2014 (%)
22.1%
95.7% 77.9%
4.3%
Domestic shareholders
Foreign shareholders
Legal entities
Private individuals
10 major shareholders % shareholding No. of shares
KAPITALSKA DRUŽBA D.D. 18.71% 375,542SDH d.d. 11.06% 222,029FINETOL d.d. - under receivership 6.87% 137,796MERKUR d.d. - under receivership 6.51% 130,598Alpen.SI, mixed flexible sub-fund 5.07% 101,702NFD HOLDING d.d. 4.33% 86,915PROBANKA d.d. 3.97% 79,582GB d.d., Kranj 2.81% 56,475TCK d.o.o. 2.61% 52,459FORTICAP LTD 1.97% 39,500Total 10 major shareholders 63.91% 1,282,598Sava, d.d., (treasury shares) 1.52% 30,541Other shareholders 34.57% 693,848TOTAL 100.00% 2,006,987
* in conformity with conversion of Slovenska odškodninska družba d.d. (SOD d.d.) into Slovenski državni holding d.d. (SDH d.d.).
The most recent information on the ownership structure of Sava d.d. is available on the Sava homepage
at http://sava.si/Shareholder Relations.html.
10 major shareholders at 31 December 2014

Busi
ness
ana
lysi
sA
NN
UA
L RE
PORT
201
4
39
Management Board and Supervisory Board members who own Sava shares
Management Board members PositionNo. of shares 31 Dec. 2013 % shareholding
No. of shares 31 Dec. 2014 % shareholding
Matej Narat President 117 0.006% 117 0.006%
Aleš Aberšek* Member - - 18 0.001%
Total 117 0.006% 135 0.007%
Supervisory Board members PositionNo. of shares 31 Dec. 2013 % shareholding
No. of shares 31 Dec. 2014 % shareholding
Aleš Aberšek* Member 18 0.001% - -
Gregor Rovanšek Member 3 0.000% 3 0.000%
Total 21 0.001% 3 0.000%
Total Management and Supervisory Board members 138 0.007% 138 0.007%
* He carried out the Supervisory Board member office until 28 January 2014 when he was appointed a temporary Management Board member. In accordance with the 2nd paragraph of Article 273 of the Companies Act-1, his term of office as a tempo-rary Management Board member expired on 17 July 2014 and on the very same day he was appointed a Management Board member with the term of office from 17 July 2014 to 31 March 2016.
Management Board and Supervisory Board members who own Sava shares
At the end of 2014, the members of the Management Board and Supervisory Board of Sava d.d. held 138 Sava shares, representing 0.007% of total company’s capital. In comparison with the end of 2013, the balance did not change.

Busi
ness
ana
lysi
sA
NN
UA
L RE
PORT
201
4
40
Key data on the Sava share
2010 2011 2012 2013 2014
No. of shares at period end (No. of shares) 2,006,987 2,006,987 2,006,987 2,006,987 2,006,987
Market capitalisation at period end (€ million) 179.6 24.1 6.8 0.5 1.0
Share book value (€) 161.1 82.2 32.9 7.5 -11.1
Share price
- highest (€) 250.0 95.0 13.0 5.4 1.6
- lowest (€) 88.0 12.0 3.2 0.1 0.2
- at period end (€) 89.5 12.0 3.4 0.2 0.5
Average daily liquidity (€ thousand) 58.2 5.9 3.4 0.7 0.5
Average daily trading with shares (No. of shares) 308 133 572 272 711
Net earnings per share (€) -50.0 -78.7 -49.7 -27.9 -23.5
Dividend per share (€) 3.2 - - - -
Share of dividend in net profit (%) -6.4 - - - -
Total amount of dividends paid (€ million) 6.4 - - - -
Share yield (%) -59.2 -86.6 -71.7 -93.2 108.7
- dividend yield (%) 3.6 - - - -
- capital yield (%) -62.7 -86.6 -71.7 -93.2 108.7
Price-Earnings ratio (P / E ratio)
- highest -1.2 -0.3 -0.2 -0.1
- lowest -0.2 -0.1 0.0 0.0
- at period end -0.2 -0.1 0.0 0.0
Price-to-Book ratio (P / B ratio) (%) 56 15 10 3 -4
Explanations for key data computation for the Sava share:
• Book value of the share: the equity of the Sava Group without minority interest divided with the weighted
average number of ordinary shares excluding treasury shares.
• Net earnings per share: the net result belonging to Sava d.d. divided with the weighted average number of
ordinary shares excluding treasury shares.
• Share of dividends in net profit: dividend per share divided with net earnings per share
• Dividend yield: dividend per share divided with the share market price on the last trading day of the year.
• Capital yield: relative change in the market price of the Sava share at the end of the year with regard to the
share market price at the beginning of the year.
• Market capitalisation: multiple of the number of Sava shares and the market price of the share on the last
day of the year.
• The Price-Earnings ratio (P/E): the Sava share market price on the last day of the year (or the highest and
lowest market price in the calendar year) divided with earnings per share.
• The Price-to-Book ratio (P/B): the Sava share market price on the last day of the year divided with the share
book value at the end of the year.

Busi
ness
ana
lysi
sA
NN
UA
L RE
PORT
201
4
41
Further data on the share
Stock Exchange Share name Issuer’s code
Ljubljana Stock Exchange SAVA SAVISIN- International Securities Identification Number SI0031108457
Share book value
The book value of the Sava share at 31 December 2014 amounted to -€11.1. When calculating the book value,
the number of treasury shares is deducted from total number of shares.
Risk associated with the investment in the Sava share
Such risks are due to:
• Factors of systematic risk-taking characteristic
of all securities listed on the Ljubljana Stock Ex-
change d.d. such as changed conditions in the
issuer’s business, changes in tax legislation and
regulations relating to the securities market, and
force majeure.
Cross links with other companies
Referring to the criteria defined in the Corporate Governance Code for Public Joint-Stock Companies, Sava d.d. was cross-linked at the end of December 2014, as follows:
• In Gorenjska banka d.d. it had a 44.07% equity
stake, whereas Gorenjska banka had a 2.81% eq-
uity stake in Sava d.d.
• Factors of non-systematic risk-taking that are
connected with the operations of each individual
company (investment, interest, solvency and for-
eign exchange risk).
• In the company NFD Holding d.d. - under receiv-
ership, it had a 24.65% equity stake, whereas
NFD Holding d.d. had a 4.33% equity stake in
Sava d.d.
Approved capital and conditional increase in share capital
The Articles of Association of Sava d.d. do not include any provisions in this regard.

Busi
ness
ana
lysi
sA
NN
UA
L RE
PORT
201
4
42
Financial calendar of Sava d.d. for 2015
TYPE OF ANNOUNCEMENT PLANNED DATE OF ANNOUNCEMENT*
Audited annual report of the Sava Group and Sava d.d. for 2014 Friday, 27 March 2015
Statement of Compliance with the Corporate Governance Code for Public Joint-Stock Companies
Friday, 27 March 2015
Call of the 21st regular Shareholders’ Meeting of Sava d.d. Friday, 27 March 2015
21st regular Shareholders’ Meeting of Sava d.d. Tuesday, 28 April 2015
Resolutions of the 21st regular Shareholders’ Meeting of Sava d.d. Tuesday, 28 April 2015
Business report and unaudited financial statements of the Sava Group and Sava d.d. for the period January–March 2015
Friday, 22 May 2015
Business report and unaudited financial statements of the Sava Group and Sava d.d. for the period January–June 2015
Friday, 28 August 2015
Business report and unaudited financial statements of the Sava Group and Sava d.d. for the period January–September 2015
Friday, 20 November 2015
* The quoted dates are those planned. Should the planned dates be changed, this will be notified in due course on the company’s website (www.sava.si).
Periodic announcements and other price sensitive information are published on the website of the Ljubljana Stock
Exchange via the SEO-net system at www.ljse.si and on the company’s website at www.sava.si, and in cases
stipulated by the company’s Articles of Association also in the Finance newspaper.
Contact person and further information
INFORMATION ON DIVIDEND PAYMENTS
Kaja Terlikar, Associate Professional, Finance
e-mail: [email protected]
Tel: +386 4 206 63 46
FURTHER INFORMATION FOR SHAREHOLDERS IS AVAILABLE:
• on the company’s website: www.sava.si
• e-mail: info@sava
Busi
ness
ana
lysi
sA
NN
UA
L RE
PORT
201
4
43
GENERAL ECONOMIC TRENDS 4•
In 2014, economic growth in Slovenia amounted to 2.6%, which is above the average of the Euro region (1.5%).
When most major trading partners show weak economic activity, a slight growth in industrial production in Slovenia is observed which enhances exporters’ competitiveness and preserves strong contribution of net exports to GDP growth.
Improved circumstances in the economy, however, are not reflected in inflation, as consumers due to great loss of purchasing power during the crisis still behave cautiously and spend less, while com-panies do not face price or cost pressures. This preserves the basic inflation in Slovenia at a low level and also below the average of the euro zone. The average annual inflation in Slovenia measured with HICP amounts to 0.4% in 2014, which is the lowest value since the HICP indicator has been calculated. Lower prices of food, energy and durable goods greatly contributed to reducing infla-tion, while services made a positive contribution.
Owing to consolidation of economy growth (mostly due to favourable exports dynamics and improved circumstances in labour market), the macroeconomic circumstances in Slovenia have been improving. A moderate growth in salaries is expected along with a slight increase in consumers’ spending. Nevertheless, risk to GDP growth in 2015 exists as the estimates of the expected economic growth in major trading partners are being decreased, while domestic consumption could be negatively affected by new consolidation measures (reducing funding of employees and interim consumption, planned increases in certain taxes, etc.). Implementation of the planned fiscal con-solidation and reduction of high government budget debt represent the main challenge in the fiscal area.

Busi
ness
ana
lysi
sA
NN
UA
L RE
PORT
201
4
44
Financial markets
The process of bank consolidation that started in 2013
significantly contributed to risk minimisation in the
banking system. Capital adequacy and liquidity of banks
improved substantially, while credit risk continue to
remain significant and high (risk stabilisation through
management of unprofitable receivables and activities
in the area of companies’ restructuring). Revenue risk
of banks is rising due to low interest rates, balance
sheet shrinkage, adverseness to taking credit risks, in-
creased financing of companies abroad and in the cap-
ital markets, and due to a greater banks’ orientation
to government bonds. On the other hand, refinancing
risk and macroeconomic risk banks are exposed to are
decreasing. In 2014, the downward trend in approving
loans to companies stopped; however, it is still strongly
negative. The negative dynamics is still noticed in the
field of consumer credits to households, while housing
loans increase at a positive annual growth rate. Through
strengthening economic growth in Slovenia, also the
macroeconomic risks of banks are reducing.
Developments in the economy were mirrored in the
domestic capital market, too. At the end of 2014, the
SBI TOP index reached the value of 784.12 points and
was by 19.6% higher than at the end of 2013 when it
stood at 655.66 points. Total value of turnover made
with financial instruments on the Ljubljana Stock Ex-
change amounted to €686.3 million in 2014, €608.1
million of which were due to turnover with shares of
publicly listed companies, meaning a 75.2% increase
on the 2013 value. Market capitalisation of financial in-
struments on the Ljubljana Stock Exchange amounted
to €23.7 billion at the end of 2013, (investment funds
are not included), which is by 24.1% more than at the
end of 2013 (of which market capitalisation of bonds
amounted to €17.5 billion and mainly increased due to
issue of bonds by DUTB and additional issues of bonds
and treasury bills by the Republic of Slovenia for financ-
ing measures aimed at banks’ stability.)
Tourism
World tourism generates 9% of the world’s GDP. For
2014, it is expected to grow by 4.3% and until 2024
by 4.2% annually. World tourism growth in 2014 was
chiefly due to recovery of the economy and, as a conse-
quence, a boost in consumption.
Tourism business in Slovenia generates 12.8% GDP and
is expected to grow by 2.4% in 2014 and until 2024 at a
3.4% annual growth rate. According to the data by the
Statistical Office of the Republic of Slovenia, total num-
ber of tourist arrivals increased by 4% with regard to
the previous year, at which a 1% decrease in arrivals by
domestic guests and a 6% increase in arrivals by foreign
guests were marked. In 2014, total number of over-
nights was approximately the same as in 2013, at which
domestic tourists made by 4% less overnights and with
foreign tourist this figure increased by 1%.
In accordance with the adopted Strategy of Slovene
Tourism Development 2012-2016, tourism is becoming
one of the leading businesses of the Slovenian economy
and thus makes a significant contribution to achieving
development goals of Slovenia. It is planned to en-
hance the volume of Slovenian tourism business (annual
growth of 2% in number of overnights, 4% in num-
ber of tourist, 6%-8% in revenues arising from travel
exports) by performing the activities for improvement
of business conditions for tourism, among other things
also through the Slovenian Public Agency for Entrepre-
neurship, Innovation, Development, Investment and
Tourism.

Busi
ness
ana
lysi
sA
NN
UA
L RE
PORT
201
4
45
BUSINESS OPERATIONS OF THE SAVA GROUP
5•
The biggest operations of the Sava Group in 2014 were management of finance investments of Sava d.d. with its major investments in the banking sector and mutual fund Alpen.SI, and Tourism.
In 2014, the companies of the Sava Group generated sales revenues amounting to €63.0 million, the major part of which referred to the Tourism division. In this year too, the operating result of the Sava Group was significantly influenced by impairments amounting to €31.0 million and a reversal of deferred tax receivables amounting to €10.9 million. A net loss of €47.0 million was made, which caused a negative value of capital totalling €21.2 million.
The Master Restructuring Agreement on Sava d.d. expired on 30 November 2014. On 2 Decem-ber 2014, Sava d.d. filed with the Ljubljana District Court the Proposal for initiating preventive restructuring proceedings according to Article 44 b of the ZFPPIPP Act. On 2 December 2014, the court issued the Decision on initiating preventive restructuring proceedings.
5.1 Explanations about the consolidated income statement
Business performance information with year-on-year comparison analyses considers the current Sava Group’s composi-
tion. The income statement of the Sava Group thus shows the actually generated values in 2013.
SALES REVENUES
In 2014, sales revenues of €63.0 million were generated by the Sava Group companies; they were 6% down on
the same period last year and lagged 3% behind the planned values. The major part of revenues was generated
by the Tourism companies.
The Tourism division companies generated sales revenues of €62.3 million, which was at last year’s level. Com-
pared to the business plan these were 4% lower than planned as a result of bad weather conditions during the
summer months, stricter conditions imposed by health insurance companies in the field of concession healthcare
services, the outdated accommodation capacities, fierce competition and loss of revenues in the Russian market.

Busi
ness
ana
lysi
sA
NN
UA
L RE
PORT
201
4
46
2010 2011 2012 2013 2014
Sales revenues of the Sava Group from 2010 to 2014 (€ million)
176.7193.8 192.2
67.2 63.0
Note:
Until inclusive of 2012, Rubber Manufacturing companies, which in 2013 were divested, were included in the Sava Group.
OTHER OPERATING REVENUES
Other operating revenues amounting to €2.0 million
chiefly included revenues from reversing the unused
provisions, government grants and revenues from
collected impaired receivables.
OPERATING EXPENSES
Operating expenses of the Sava Group amounting to
€66.2 million were 17% lower than in the same pe-
riod last year and exceeded the plan by 1%. The de-
viations were due to impairments of real property in
the Real Estate division. Cost of goods, materials and
services had a 49% share, labour cost a 33%, depre-
ciation an 11%, write-offs a 5% and other operating
expenses a 2% share in the cost structure.
Tourism made operating revenues of €60.0 million
and in year-on-year comparison they were down by
9% as a result of cost rationalisation. Operating ex-
penses were 2% lower than planned.
Operating expenses in the parent company Sava d.d.
amounted to €3.6 million; they were 50% lower than
last year and 6% below the plan.
The Real Estate companies made operating expens-
es of €2.6 million, which chiefly referred to the un-
planned impairments of real property.
OPERATING LOSS (EBIT)
In 2014, operating loss of the Sava Group companies
amounted to €1.2 million, which was by €6.5 million
better than in the same period last year. In compar-
ison with the planned values the operating loss was
higher by €2.4 million, the deviation being due to
impairments of real properties.
Tourism generated an operating profit of €3.8 mil-
lion. The operating business improved by €6.1 mil-
lion compared to the past year. As a result of cost
rationalisations, the Tourism companies managed to
compensate a loss in revenues and to enhance the
operating profit.
Sava d.d. made a loss from operations totalling €2.5
million.
In the companies of other operations the operating
loss amounted to €2.5 million and was due to im-
pairments of real property.

Busi
ness
ana
lysi
sA
NN
UA
L RE
PORT
201
4
47
-10
-5
0
5
10
15
20
25
30
2010 2011 2012 2013 2014
EBITDA and EBIT in the Sava Group from 2010 to 2014 (€ million)
EBITDA – earnings before interest, taxes, depreciation and amortisation
EBIT – earnings before interest and taxes
EBITDAEBIT
FINANCIAL REVENUES
Financial revenues were mainly realised at Sava d.d.
and amounted to €3.0 million. Compared to the
same period last year when Rubber Manufacturing
was divested they were down by €13.8 million.
FINANCIAL EXPENSES
Financial expenses of €10.7 million were €6 million
lower than in the same period last year. They includ-
ed interest expenses amounting to €9.4 million, im-
pairments totalling €0.8 million and other financial
expenses of €0.5 million.
NET FINANCIAL EXPENSES
Net financial expenses amounted to €7.6 million.
NET EXPENSES OF THE ASSOCIATED COMPANIES
Impairments of financial investments in the associ-
ated companies amounted to €27.2 million and in-
cluded:
• Impairment of financial investment in Gorenjska
banka, d.d. totalling €26.7 million. Impairment
was carried out on the basis of the evaluation pre-
pared by a certified auditor to the value of €406
for a share.
• Impairment of financial investment and loan
granted to NFD Holding d.d. totalling €0.5 mil-
lion.
PRE-TAX LOSS
A total pre-tax loss of €36.0 million was made.
Pre-tax loss structure (€ million)
2010 2011 2012 2013 2014
Profit from operations, net of write-offs 5.5 5.8 10.4 1.5 1.8
Financial result, net of impairments -20.1 -25.5 -18.4 4.2 -6.8
Profit/loss of associates, net of impairments 2.6 10.9 0 0 0
Impairments of assets through profit or loss -93.1 -160.3 -85.4 -51.4 -31.0
PRE-TAX LOSS -105.1 -169.1 -93.4 -45.7 -36.0

Busi
ness
ana
lysi
sA
NN
UA
L RE
PORT
201
4
48
INCOME TAX
A tax of €10.9 million deteriorated the operating
result of the Group in 2014 and it mainly referred
to a reversal of deferred tax receivables. In addition
to ordinary changes, deferred tax receivables of €9.4
million were entirely eliminated at Sava d.d.
NET LOSS OF THE SAVA GROUP
In 2014, the Sava Group made a net loss of €47.0
million, while the net loss per share amounted to
€23.5. The greatest share in loss had impairments
of financial investments and real property totalling
€31.0 million.
Sava d.d. ended 2014 with a loss totalling €48.0 mil-
lion, whereas Tourism generated a net profit of €1.0
million.
2010 2011 2012 2013 2014
Net loss of the Sava Group from 2010 to 2014 (€ million)
-99.9
-157.2
-99.3
-55.6 -47.0
Income statement of the Sava Group by quarter of 2014 (€ thousand)
JAN-MAR 2014 APR-JUN 2014 JUL-SEP 2014 OCT-DEC 2014
Net sales revenues from goods sold and services rendered 11,997 16,398 19,787 14,815
Change in inventories 0 -15 15 20
Other operating revenues 332 504 546 580
Operating revenues 12,329 16,887 20,348 15,415
Cost of goods, materials and services -7,299 -7,831 -8,740 -8,835
Labour cost -5,331 -5,354 -5,287 -5,748
Depreciation and amortisation -1,915 -1,903 -1,874 -1,903
Write-offs -146 -38 -122 -2,762
Other operating expense -352 -169 -288 -310
Operating expenses -15,043 -15,295 -16,311 -19,558
Profit /loss from operations -2,714 1,592 4,037 -4,143
Financial revenues 457 1,199 14 1,347
Financial expenses -2,745 -2,562 -2,377 -2,979
Net financial revenues / expenses -2,288 -1,363 -2,363 -1,632
Net revenues / expenses of associates 0 0 0 -27,155
Pre-tax profit / loss -5,002 229 1,674 -32,930
Income tax -72 -1,200 0 -9,662
Net profit/ loss for the year -5,074 -971 1,674 -42,592
Busi
ness
ana
lysi
sA
NN
UA
L RE
PORT
201
4
49
5.2 Explanations about the consolidated statement of financial position
BALANCE SHEET TOTAL, ASSETS AND LIABILITIES STRUCTURE
At 31 December 2014, the balance sheet total of the
Sava Group companies amounted to €285.5 million
and was by €40.8 million or 12% lower than at the
end of 2013. The net decrease of the balance sheet
total was mainly due to the performed impairments,
lower investments compared to the accounted-for
depreciation and selling of financial investments
available for sale.
Financial investments had a 34 % share in the assets
structure, property, plant and equipment a 55%, oth-
er assets (inventories, operating receivables, granted
loans and other) had an 11% share. The assets value
of the Sava Group was by €21.2 million lower than
its liabilities.
At 31 December 2014, the controlling company
Sava d.d. had a negative capital of €23.5 million
influencing also the capital of the Sava Group, which
at 31 December 2014 was negative totalling €21.2
million. The liabilities of the Sava Group thus sur-
passed its assets by 21.2 million.
ASSETS
The following major changes in the assets of the
Sava Group took place in 2014:
• The value of real property, plant and equipment
amounted to €149.7 million at 31 December
2014 and compared to the end of the previous
year it decreased by €3.7 million in net terms.
A depreciation of €7.6 million was accounted for,
while investments were entirely realised in Tourism
to the amount of €4.7 million.
• At 31 December 2014, investment property
achieved the value of €6.6 million and compared
to the end of the previous year it decreased by
€1.7 million net terms. A deprecation of €0.2 mil-
lion was accounted for and impairments of €1.5
million were carried out.
• The value of investments in the associated com-
panies, which at 31 December 2014 amounted
to €59.1 million, decreased by €26.7 million in
comparison with the end of the previous year. The
decrease was due to:
– Impairment of financial investment in the shares
of Gorenjska banka d.d. totalling €26.7 million
to €406 for a share.
– Final impairment of financial investment in NFD
Holding d.d. in a minimum amount.
• The value of long-term securities available for sale
amounted to €38.4 million at 31 December 2014,
€34.1 million of which were due to the invest-
ment in Alpen.SI. The net increase by €7.0 million
referred to:
– Sale totalling €3.1 million.
– Impairments through profit or loss totalling €0.8
million.
– A positive revaluation to fair value through profit
or loss totalling €10.9 million.
• The value of deferred tax receivables decreased
to zero value in 2014. In the controlling compa-
ny Sava d.d., the existing deferred tax receivables
totalling €10.9 million were entirely eliminated,
which deteriorated the 2014 operating result.
• Assets for sale (and on the liabilities side also lia-
bilities for sale), which at 31 December 2014 were
shown at €0.4 million, referred to the assets of the
subsidiary Energetika Črnomelj d.o.o., for which
the sale transaction took place in January 2015.

Busi
ness
ana
lysi
sA
NN
UA
L RE
PORT
201
4
50
• At 31 December 2014, inventories were shown to
the amount of €3.2 million and compared to the
end of the past year they reduced by €1.1 million.
The decrease was due to additional impairments
of real property inventory in a real estate company
in Croatia.
• The value of operating and other receivables
and granted loans, which at 31 December 2014
amounted to €25.7 million, was by €4.5 million
lower than at the end of the past year. The net
decrease was mainly due to repayment of granted
loans.
Assets structure of the Sava Group from 2010 to 2014 (€ million)
Property, plant and equipment, and investment
property
Investments in associates
Long-term securities
Other assets
Total assets
31 Dec. 2010 238.6 319.1 67.2 135.9 760.8
31 Dec. 2011 225.2 199.8 41.2 145.1 611.3
31 Dec. 2012 171.8 121.6 36.6 150.9 480.9
31 Dec. 2013 161.8 86.2 31.4 46.8 326.2
31 Dec. 2014 156.3 59.5 38.4 31.3 285.5
CAPITAL AND LIABILITIES
The following major changes took place in liabilities in 2014:
• Capital was negative at 31 December 2014 and
totalled €21.2 million; compared to the previous
year it was lower by €37.4 million due to:
– A loss of the Group totalling €47.0 million.
– Fair value reserves increased by €9.2 million in
net terms as a result of positive movements in
the stock exchange prices.
– Other changes of €0.4 million referred to the
change in minority interest and the change in
the amount of capital of Sava d.d. resulting from
a reversal of obsolete liabilities for dividend pay-
ments.
• Long-term debts amounted to €58.0 million at 31
December 2014 and compared to the end of the
previous year they decreased by €8.3 million. The
following changes took place in 2014:
– Financial liabilities decreased by €8.5 million due
to transfer to short-term financial liabilities.
– Net decrease of provisions and accrued govern-
ment grants totalling €0.7 million.
– Increase of deferred tax liabilities amounting to
€0.9 million.

Busi
ness
ana
lysi
sA
NN
UA
L RE
PORT
201
4
51
• At 31 December 2014, short-term debts amount-
ed to €248.8 million and were by €4.9 million
lower than at the end of the previous year. The
following changes took place in 2014:
– Increase of financial liabilities amounting to €8.5
million due to transfer from long-term loans.
– Decrease of financial liabilities amounting to
€7.9 million due to repayment of liabilities to
financial creditors.
– Increase of operating liabilities and accruals in
net amount of €4.4 million, mainly due to the
increased liabilities arising from deferred inter-
ests.
– Net other negative changes amounted to €0.1
million.
• The value of total obtained long-term loans and
short-term financial liabilities of the Sava Group
companies amounted to €272.7 million at 31 De-
cember 2014, which was €8.5 million less than at
the end of 2013.
5.3 Investments
The Sava Group made investments totalling €4.7 million in 2014, which were entirely realised in the Tourism division.
Investments were made in energy efficiency, environmentally-related safety requirements, guest satisfaction and intro-
duction of new themes at destinations.
5.4 Employees in the Sava Group
At 31 December 2014, the Sava Group employed 1,003 associates, or 30 more than at the end of 2013. Tourism
employed 98% of all employees in the Sava Group.
In the companies of the Sava Group, 990 employees on average were employed in 2014, while in the same period
last year there were 1,129 employees.
Liabilities structure of the Sava Group from 2010 to 2014 (€ million)
Capital Long-term liabilities
Short-term liabilities
Total capital and liabilities
31 Dec. 2010 323.3 232.8 204.7 760.8
31 Dec. 2011 165.8 81.4 364.1 611.3
31 Dec. 2012 67.3 70.2 343.4 480.9
31Dec. 2013 16.2 66.2 243.8 326.2
31Dec. 2014 -21.2 57.9 248.8 285.5

Busi
ness
ana
lysi
sA
NN
UA
L RE
PORT
201
4
52
Number of employees in the Sava Group companies
2014 2013At
31 Dec. 2014Average
in yearAt
31 Dec. 2013Average
in year
Sava, d.d., družba za upravljanje in financiranje, Ljubljana 17 19 20 26
TOURISM 986 971 939 1,044
SAVA TURIZEM d.d., Ljubljana 976 963 939 1,044
- Sava Zdravstvo d.o.o., Ljubljana (owned by Sava Turizem d.d.) 0 0 0 0
- Sava TMC d.o.o., Ljubljana (owned by Sava Turizem d.d.) 2 1 0 0
- Cardial d.o.o., Ljubljana (owned by Sava Turizem d.d.) 8 7 0 0
REAL ESTATE 0 0 0 0
SAVA NEPREMIČNINE d.o.o., Ljubljana 0 0 0 0
SAVA NOVA d.o.o., Zagreb 0 0 0 0
OTHER OPERATIONS 0 0 14 59
GIP SAVA KRANJ d.o.o., Ruma, Serbia 0 0 0 0
Sava IT d.o.o., Ljubljana 0 0 14 17
ENSA BH d.o.o., Srbac 0 0 0 42
TOTAL SAVA GROUP 1,003 990 973 1,129
Educational structure of employees in the Sava Group companies
Employees – classification by level of education Sava Group
1st level – incomplete primary school 4
2nd level – primary school 88
3rd level – up to 2 years vocational education 13
4th level – at least 3 years of vocational education 306
5th level – secondary education 331
6th level – post-secondary specialist education 89
7th level – higher specialist and university education 165
8th and 9th level – Masters’ and PhDs 7
Total 1,003
Age structure of employees at 31 December 2014
Employees – classification by age Sava Group
Up to 20 0
From 20 to 30 years 195
From 30 to 40 years 290
From 40 to 50 years 297
From 50 to 60 years 215
More than 60 years 6
Total 1,003
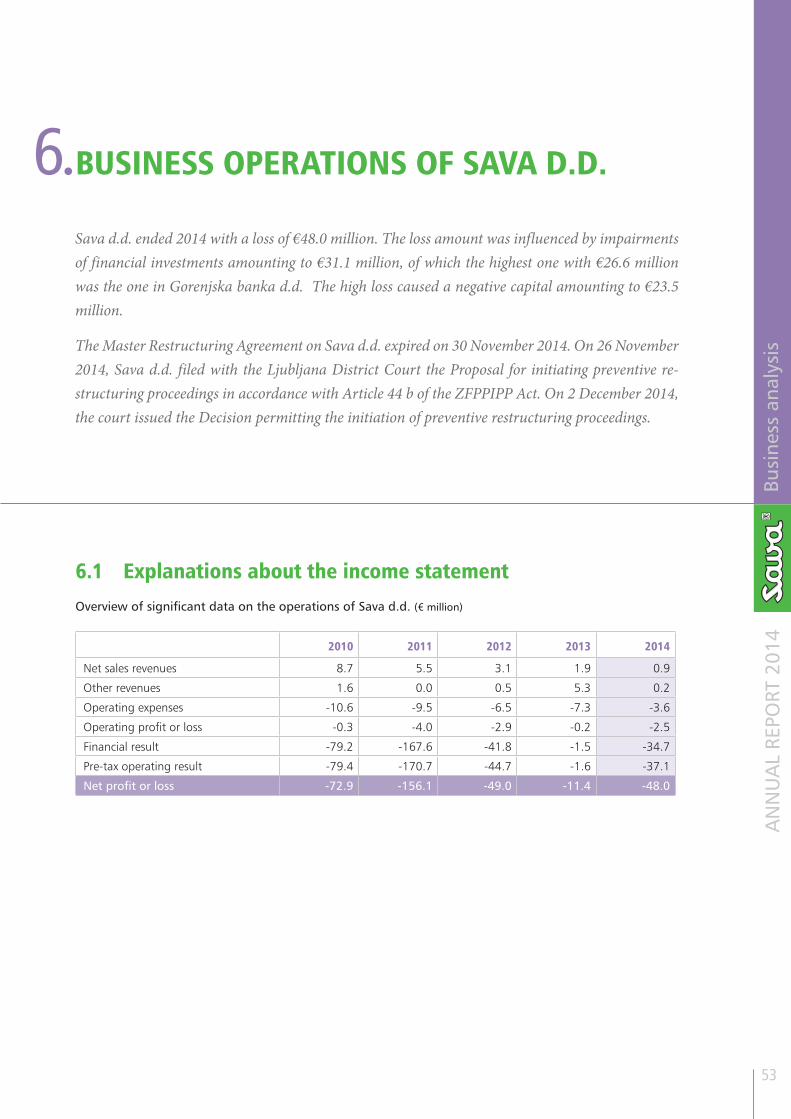
Busi
ness
ana
lysi
sA
NN
UA
L RE
PORT
201
4
53
BUSINESS OPERATIONS OF SAVA D.D. 6•
Sava d.d. ended 2014 with a loss of €48.0 million. The loss amount was influenced by impairments of financial investments amounting to €31.1 million, of which the highest one with €26.6 million was the one in Gorenjska banka d.d. The high loss caused a negative capital amounting to €23.5 million.
The Master Restructuring Agreement on Sava d.d. expired on 30 November 2014. On 26 November 2014, Sava d.d. filed with the Ljubljana District Court the Proposal for initiating preventive re-structuring proceedings in accordance with Article 44 b of the ZFPPIPP Act. On 2 December 2014, the court issued the Decision permitting the initiation of preventive restructuring proceedings.
6.1 Explanations about the income statementOverview of significant data on the operations of Sava d.d. (€ million)
2010 2011 2012 2013 2014
Net sales revenues 8.7 5.5 3.1 1.9 0.9
Other revenues 1.6 0.0 0.5 5.3 0.2
Operating expenses -10.6 -9.5 -6.5 -7.3 -3.6
Operating profit or loss -0.3 -4.0 -2.9 -0.2 -2.5
Financial result -79.2 -167.6 -41.8 -1.5 -34.7
Pre-tax operating result -79.4 -170.7 -44.7 -1.6 -37.1
Net profit or loss -72.9 -156.1 -49.0 -11.4 -48.0

Busi
ness
ana
lysi
sA
NN
UA
L RE
PORT
201
4
54
2010 2011 2012 2013 2014
Participation rate of equity - in %Equity / liabilities
42.4 21.4 10.8 6.1 -11.1
Participation rate of long-term financing - in %Total equity and long-term liabilities (incl. provisions and deferred taxes) and long-term accruals and deferrals / liabilities
74.3 32.2 21.9 6.2 -10.6
Operating fixed assets rate - in %Fixed assets and investment property / assets
4.4 3.7 4.3 1.0 1.2
Long-term investment rate -in %Total fixed assets and long-term accruals and deferrals, investment property, long-term financial investments and long-term operating receivables / assets
86.4 89.4 78.1 91.6 90.7
Equity of fixed operating assets ratioEquity/ fixed assets and investment property
9.6 5.7 2.5 5.8 -9.6
Acid test ratioLiquid assets / short-term liabilities
0.0 0.0 0.0 0.0 0.0
Quick ratioTotal liquid assets, short-term receivables and short-term financial investments / short-term liabilities
0.5 0.1 0.1 0.1 0.1
Current ratioShort-term assets / short-term liabilities
0.5 0.2 0.3 0.1 0.1
Operating efficiency ratioOperating revenues / operating expenses
0.4 0.1 0.2 1.0 0.1
Net return on equity ratioNet profit for financial year / average equity (less net operating results for the year)
-22.0 -64.7 -56.2 -35.4 -242.2
Dividends to share capital ratioTotal dividends paid in financial year / average share capital
7.7 0.0 0.0 0.0 0.0
Operations indicators for Sava d.d.

Busi
ness
ana
lysi
sA
NN
UA
L RE
PORT
201
4
55
JAN-MAR 2014
APR-JUN 2014
JUL-SEP 2014
OCT-DEC 2014
1. NET SALES REVENUES 236 205 247 242
a) Revenues in domestic market 236 205 246 241.6
To group enterprises 141 110 164 144.3
To associated companies 0 3 2 0.3
To others 95 92 81 97
b) Revenues in foreign market 0 0 1 0.5
To group enterprises 0 0 1 0.5
To associated companies 0 0 0 0
To others 0 0 0 0
2. CHANGE IN THE VALUE OF INVENTORIES OF PRODUCTS AND WORK IN PROGRESS
0 0 0 0
3. CAPITALISED OWN PRODUCTS AND/OR SERVICES 0 0 0 0
4. OTHER OPERATING REVENUES (with operating revenues from revaluation adjustment)
0 1 0 183
5. COST OF MERCHANDISE, MATERIALS AND SERVICES -515 -214 -308 -749
a) Cost of merchandise and material sold and cost of material used
-15 -10 -11 -10
b) Cost of services -500 -204 -297 -739
6. LABOUR COST -481 -261 -296 -635
a) Salaries and wages -266 -244 -245 -267
b) Social security cost (pension insurance cost shown separately)
-51 -52 -43 -46
- Social security cost -21 -23 -18 -19
- Pension insurance cost -30 -29 -25 -27
c) Other labour cost -164 35 -8 -322
7. AMORTISATION AND DEPRECIATION EXPENSE, WRITE-OFFS -30 -29 -28 -66
a) Amortisation -30 -29 -28 -28
b) Operating expenses from revaluation of intangible and tangible fixed assets 0 0 0 -19
c) Operating expenses from revaluation of current assets 0 0 0 -19
8. OTHER OPERATING EXPENSES -102 102 -12 -1
9. LOSS FROM OPERATIONS -892 -196 -398 -1,026
10. OTHER FINANCIAL REVENUES FROM SHARES 283 1,025 5 36
a) Financial revenues from shares in group enterprises 0 0 0 0
b) Financial revenues from shares in associated companies 0 0 0 0
c) Financial revenues from shares in other entities 283 1,025 5 17
č) Financial revenues from other investments 0 0 0 19
Income statement of Sava d.d. by quarter in 2014 (€ thousand)

Busi
ness
ana
lysi
sA
NN
UA
L RE
PORT
201
4
56
JAN-MAR 2014
APR-JUN 2014
JUL-SEP 2014
OCT-DEC 2014
11. FINANCIAL REVENUES FROM GRANTED LOANS 194 184 137 1,232
a) Financial revenues from loans granted to group enterprises 73 73 98 67
b) Financial revenues from loans granted to other entities 121 112 38 1,165
12. FINANCIAL REVENUES FROM OPERATING RECEIVABLES 14 13 14 156
a) Financial revenues from operating receivables due from group enterprises
13 13 13 13
b) Financial revenues from operating receivables due from other entities
1 0 1 143
13. FINANCIAL EXPENSES FROM IMPAIRMENTS AND WRITE-OFFS IN FINANCIAL INVESTMENTS -431 -64 -183 -30,460
14. FINANCIAL EXPENSES FROM FINANCIAL LIABILITIES -1,659 -1,733 -1,718 -1,750
a) Financial expenses from borrowings obtained from group enterprises
-29 -29 -29 -31
b) Financial expenses from borrowings obtained from banks -1,408 -1,418 -1,420 -1,479
c) Financial expenses from issued bonds -196 -198 -201 -196
d) Financial expenses from other financial liabilities -26 -88 -67 -45
15. FINANCIAL EXPENSES FROM OPERATING LIABILITIES 0 0 0 0
a) Financial expenses from operating liabilities to group enterprises
0 0 0 0
b) Financial expenses from trade payables and bill payables 0 0 0 0
c) Financial expenses from other operating liabilities 0 0 0 0
16. OTHER REVENUES 0 12 46 117
17. OTHER EXPENSES 0 0 -4 -38
18. INCOME TAX 0 0 0 0
19. DEFERRED TAX -72 -1,200 0 -9,602
20. NET PROFIT/LOSS FOR THE ACCOUNTING PERIOD -2,563 -1,959 -2,101 -41,335

Busi
ness
ana
lysi
sA
NN
UA
L RE
PORT
201
4
57
OPERATING REVENUES
• Operating revenues amounted to €1.1 million and
included net sales revenues totalling €0.9 million
and other operating revenues totalling €0.2 mil-
lion.
• Net sales revenues were 8% higher than planned
and lagged 50% behind the last year’s result when
also the trademark was sold under divesting Rub-
ber Manufacturing.
• 40% of net sales revenues were made in relation
to the partners outside of the Group and 60% re-
ferred to services sold by Sava d.d. to the compa-
nies within the Group.
• Other operating revenues were significantly lower
than last year when the hotel real property in the
Tourism was sold.
OPERATING EXPENSES
• These amounted to €3.6 million and lagged 6%
behind the plan.
• Compared to the same period last year they were
down by 50%, not considering the last year’s im-
pairments they were down by 32%.
• In 2014, the company employed 18.56 associates
on average; labour cost amounted to €1.6 million
and was at last year’s level.
• Cost of services had a 49% share, labour cost a
46%, and depreciation and other expenses a 5%
share in operating expenses structure.
OPERATING PROFIT OR LOSS
• An operating loss of €2.5 million was made.
• A loss of €0.2 million was made in 2013; its
amount was influenced by the proceeds from sale
of real property amounting to €5.3 million. Not
considering the stated one-time revenues, the
operating loss in 2013 would have amounted to
€5.4 million.
FINANCIAL RESULT
• The net financial result of Sava d.d. was negative
and amounted to €34.7 million.
• Financial revenues arising from investments in se-
curities available for sale were generated to the
amount of €1.3 million and chiefly referred to
gains on sale of investments.
• Unplanned impairments of financial investments
amounted to €31.1 million and referred to the fol-
lowing investments:
– Gorenjska banka d.d. amounting to €26.6 mil-
lion: impairment was carried out on the basis of
the estimated value prepared by a certified eval-
uator. The mean estimated value amounted to
€406 for a share.
– Investments and loans in connection with sub-
sidiaries amounting to €3.2 million.
– Other investments totalling €1.3 million.
• Interest on granted loans amounting to €1.7 mil-
lion referred to loans granted to subsidiaries and
approved short-term loans to the bank.
• Interests on the obtained bank loans totalled €6.9
million and were computed by using the interest
rate agreed in the Master Restructuring Agree-
ment. This amounted to 3.0%; interests at 1.0%
fell due for payment monthly and were paid reg-
ularly, the remaining 2.0% fell due for payment at
the end of November 2014. As of the expiration
of the Master Restructuring Agreement until the
end of the year, a 3% interest rate on tax cost and
liability was considered in the financial accounts.
Payment of outstanding liabilities arising from the
loan principals, interest accruing and other financial
liabilities will be dealt with under preventive restruc-
turing proceedings, which based on the court’s deci-
sion, was initiated on 2 December 2014.

Busi
ness
ana
lysi
sA
NN
UA
L RE
PORT
201
4
58
Financial result
Financial result
Financial result
Financial result
Financial revenues
Financial expenses
Financial result
2010 2011 2012 2013 JAN - DEC 2014
Dividends 29.3 11.3 8.1 0.1 0.0 0.0 0.0
Sale of Rubber Manufacturing 0.0 0.0 0.0 23.5 0.0 0.0 0.0
Securities 0.8 1.6 0.5 0.1 1.3 0.0 1.3
Impairments of financial investments
-95.0 -158.1 -34.5 -19.0 0.0 -31.1 -31.1
Interests -12.9 -16.1 -15.8 -7.4 1.7 -6.9 -5.2
Other -1.4 -6.3 -0.1 1.2 0.3 0.0 0.3
Total -79.2 -167.6 -41.8 -1.5 3.3 -38.0 -34.7
Financial result by type of activity (€ million)
TOTAL PRE-TAX LOSS
A total pre-tax loss made by Sava d.d. in 2014
amounted to €37.1 million. Its amount was mainly
influenced by impairments of financial investments
totalling €31.1 million.
INCOME TAX
Sava d.d. had no income tax liability accounted for
in 2014.
At the end of 2013, deferred tax receivables were
shown at €10.9 million. In 2014, they were reduced
by €1.5 million due to selling impaired securities and
a final reversal – impairment of the remaining de-
ferred tax receivables totalling €9.4 million was also
carried out.
NET LOSS
Sava d.d. made a net loss of €48.0 million in 2014.
It is higher than total pre-tax loss, which was due to
a reversal of deferred tax receivables amounting to
€10.9 million.
Accumulated loss (€ million)
Net operating result Jan-Dec 2014 -48.4
Other changes 0.6
Accumulated loss at 31 Dec. 2014 -47.4
At the 20th Shareholders’ Meeting held on 29 April
2014, a resolution on a simplified reduction of share
capital was adopted. In terms of its substance, a share
capital reduction totalling €11.4 million was ear-
marked for covering total loss of 2013. The share
capital of the company thus amounted to €14.1 mil-
lion at 31 December 2014.
A loss of €48.0 million was made in 2014. Oth-
er changes amounting to €0.6 million referred to
transfer of obsolete liabilities for dividend payment
to corresponding capital items. Already when com-
piling the 2014 annual report, this amount was used
for covering the current loss so that the accumulat-
ed loss amounted to €47.4 million at 31 December
2014.

Busi
ness
ana
lysi
sA
NN
UA
L RE
PORT
201
4
59
6.2 Explanations about the balance sheet
BALANCE SHEET TOTAL
It amounted to €211.2 million and compared to the
end of 2013, it decreased by €37.2 million or 15%.
ASSETS STRUCTURE
The largest share in the assets structure had long-
term financial investments with 90%. Granted loans
had a 6% and other assets a 4% share.
The following significant changes took place in the
assets structure in 2014:
• In the structure of long-term financial invest-
ments shown to the amount of €189.1 million
and by €24.8 million lower than at the end of the
past year, the following significant changes took
place in 2014:
– The value of shares and stakes in Group’s com-
panies decreased by €1.7 million, which referred
to impairment of investment in a Real Estate
company.
– The value of investments in the associated
companies decreased by €26.6 million, which
referred to impairment of investment in Goren-
jska banka d.d. The basis for carrying out the
impairment was the evaluation made by a cer-
tified evaluator, in which the mean value of the
share was ascertained at €406 (2013: €588 for
a share).
– The value of other shares and stakes increased
by €6.9 million in net terms, €3.1 million of
which were due to disposals generating a profit
of €1.3 million and €10.0 million were due to a
net positive effect from revaluation to fair value.
– Long-term approved loans totalling €3.4 million
were transferred to short-term granted loans.
• Deferred tax receivables amounting to €10.9
million were entirely reversed and debited the
2014 operating result.
• Short-term financial investments totalling €14.7
million were by €1.3 million lower than at the end
of the past year:
– An increase of €3.4 million was due to transfer
from long-term granted loans.
– A decrease of €4.9 million chiefly arose from re-
payment of loans to banks.
Assets structure of Sava d.d. from 2010 to 2014 (€ million)
Property, plant and
equipment, and investment
property
Long-term financial
investments and assets
for sale
Short-term financial
investments
Other assets
Total assets
31 Dec. 2010 24.8 450.8 70.1 18.3 564.0
31 Dec. 2011 15.3 348.2 19.6 26.9 410.0
31 Dec. 2012 15.1 294.8 13.1 25.3 348.3
31 Dec. 2013 2.6 213.9 16.0 15.8 248.3
31 Dec. 2014 2.5 189.1 14.7 4.9 211.2

Busi
ness
ana
lysi
sA
NN
UA
L RE
PORT
201
4
60
LIABILITIES STRUCTURE
• The capital of Sava d.d. was negative amounting
to €23.5 million and thus by €38.6 million lower
than at the end of the previous year. The following
changes took place in capital:
– A loss of €48.0 million was made.
– Revaluation reserve increased by €8.8 million.
– Obsolete liabilities arising from dividend pay-
ments to shareholders amounting to €0.6 mil-
lion were transferred to capital reserves and
retained net profit from previous years. Already
upon compiling the annual report these were
used for covering the 2014 loss.
• Short-term financial liabilities amounting to
€222.5 million decreased by €4.3 million com-
pared to the end of the previous year, mainly due
to repayment of financial liabilities and, to a lesser
extent, also due to reversing liabilities for dividend
payment. The liabilities arising from loans obtained
by Sava d.d. were secured by pledging the assets
of Sava d.d. and subsidiaries worth €222.4 million
at 31 December 2014.
Liabilities structure of Sava d.d. from 2010 to 2014 (€ million)
Capital Long-term liabilities
Short-term liabilities
Other liabilities
Total liabilities
31 Dec. 2010 239.1 179.7 144.2 1.0 564.0
31 Dec. 2011 87.7 44.0 276.8 1.5 410.0
31 Dec. 2012 37.7 38.4 270.7 1.5 348.3
31 Dec. 2013 15.1 0.2 232.1 0.9 248.3
31 Dec. 2014 -23.5 1.0 233.5 0.2 211.2
The Master Restructuring Agreement on Sava d.d.
expired on 30 November 2014. On 26 November
2014 Sava d.d. filed with the Ljubljana District Court
the Proposal for initiating preventive restructuring
proceedings according to Article 44b of the ZFPPIPP
Act. On 2 December 2014, the court issued the De-
cision permitting the initiation of preventive restruc-
turing proceedings.
• Other liabilities totalling €12.2 million referred
to:
– Short-term operating liabilities totalling €9.2
million, which increased due to deferred inter-
ests under the Master Restructuring Agreement.
– Deferred tax liabilities totalling €1.0 million.
– Short-term accrued costs and deferred revenues
totalling €1.9 million, which included short-term
accrued costs in connection with the business
and financial reorganisation of the company, de-
ferred interests and various other accrued costs.
– Long-term provisions for retirement amounts
and jubilee benefits totalling €0.1 million.

Busi
ness
ana
lysi
sA
NN
UA
L RE
PORT
201
4
61
6.3 Employees
NUMBER OF EMPLOYEES AT 31 DECEMBER 2014
At 31 December 2014, Sava d.d. employed 17 as-
sociates; in comparison with the end of 2013 their
number was down by 3 associates.
In 2014, Sava d.d. employed 18.56 associates on av-
erage or 7.8 fewer than in 2013.
2014 – number 2014 – share 2013 – number 2013 – share
20-30 1 6 % 1 5 %
31-40 9 53 % 9 45 %
41-50 4 24 % 7 35 %
51-60 2 12 % 2 10 %
More than 60 1 6 % 1 5 %
Total 17 100 % 20 100 %
Age structure of employees at 31 December 2014
Level of education Number – 2014 Number – 2014
5th level – secondary education 1 1
6th level – post-secondary specialist education 2 2
7th a-level – higher specialist education 0 0
7th b-level – university degree 13 16
8th level – Masters’ degree 1 1
9th level - PhD 0 0
Skupaj 17 20
Educational structure of employees at 31 December 2014

Busi
ness
ana
lysi
sA
NN
UA
L RE
PORT
201
4
62
OUTLOOK FOR 2015 7•
In 2015, Sava d.d. will continue to carry out the active management policy, which is based on a clear division of responsibilities and competences, while supporting the implementation of the strategic policies defined by the Group.
The Master Restructuring Agreement on Sava d.d. expired on 30 November 2014. On 26 November 2014, Sava d.d. filed the Proposal for initiating preventive restructuring proceedings according to the Article 44 b of the ZFPPIPP Act with Ljubljana District Court. On 2 December 2014, the court issued the Decision on initiating preventive restructuring proceedings.
The fact that Sava d.d. is undergoing preventive restructuring proceedings will not influence the operations of subsidiaries, which will continue to carry out the activities for business improvement.
The 2015 business plan in figures (€ million)
Sava d.d. Subsidiaries Sava Group
Sales revenues 0.8 65.4 65.6
Net profit / loss from operations -3.5 1.9 -1.4
Balance sheet total 205.2 179.9 278.6
Capital -27.0 97.1 -22.7
Employee number 16 1,015 1,031
Investments 0 6.1 6.1

Busi
ness
ana
lysi
sA
NN
UA
L RE
PORT
201
4
63
The 2015 business plan of the Sava Group thus in-
cludes the following major elements from the re-
structuring strategy:
• Further optimisation of operations in the parent
company Sava d.d.
• Further improvement in Tourism business as a stra-
tegic activity with emphasis on business growth
and seeking further synergies.
• Consolidation of financial assets.
• Continued activities in connection with strategic
development of investments in tourism sector.
• Preservation of financial investments value in the
banking sector.
• Divestment of non-strategic assets.
• Provision of suitable liquidity.
The major substantive starting points of the 2015
business plan for the Sava Group are as follows:
• Successfully completed preventive restructuring
proceedings in the parent company Sava d.d. and
further restructuring of financial liabilities agreed
upon with all financial creditors.
• Along with further optimisation of operative busi-
ness, Sava d.d. will carry on with the activities for
preservation of investment value in the banking
sector and consolidation of financial assets, espe-
cially in Tourism, as well as divestments of non-
core assets in 2015.
• Based on the improved forecasts about economic
environment, and focusing on intense marketing
of healthcare services and winning new markets,
Sava Turizem d.d. as the mainstay of the Tourism
division will improve sales and thus operative per-
formance.
• The generated cash flow from operations of sub-
sidiaries will be sufficient for covering financial
expenses, planned investments and repayment of
loans’ principals in compliance with the amortiza-
tion schedule.

Renewed for the Future

FINANCIAL REPORT

Fina
ncia
l rep
ort
AN
NU
AL
REPO
RT 2
014
66
FINANCIAL STATEMENTS OF THE SAVA GROUP WITH NOTES IN ACCORDANCE WITH INTERNATIONAL FINANCIAL REPORTING STANDARDS AS ADOPTED BY THE EU
1•
1.1 Consolidated financial statements of the Sava Group with notes in accordance with International Financial Reporting Standards as adopted by the EU
Consolidated statement of financial position (€ thousand)
Notes 31 Dec. 2014 31 Dec. 2013
ASSETS
Property, plant and equipment 1.3.9. 149,705 153,358
Intangible assets 1.3.10. 729 405
Investment property 1.3.11. 6,637 8,355
Investments in associates 1.3.12. 59,511 86,217
Long-term securities available for sale 1.3.13. 38,392 31,426
Long-term loans 1.3.14. 40 41
Deferred tax receivables 1.3.15. 0 10,806
Long-term assets 255,014 290,608
Assets for sale 1.3.8. 410 0
Inventories 1.3.16. 3,182 4,265
Operating and other receivables 1.3.17. 7,295 5,544
Current tax receivable 0 0
Short-term financial investments 0 0
Granted loans 1.3.18. 18,388 24,594
Cash and cash equivalent 1.3.19. 1,205 1,239
Short-term assets 30,480 35,642
Assets 285,494 326,250

Fina
ncia
l rep
ort
AN
NU
AL
REPO
RT 2
014
67
FINANCIAL STATEMENTS OF THE SAVA GROUP WITH NOTES IN ACCORDANCE WITH INTERNATIONAL FINANCIAL REPORTING STANDARDS AS ADOPTED BY THE EU
Notes 31 Dec. 2014 31 Dec. 2013
CAPITAL AND LIABILITIES
Issued capital 14,061 25,442
Share premium 0 0
Reserves 4,977 4,977
Fair value reserve 10,298 1,068
Treasury shares -4,977 -4,977
Translation reserve 0 0
Retained net profit / loss -46,516 -11,500
Total equity attributable to equity holders of the parent -22,157 15,010
Minority interest 931 1,166
Capital 1.3.20. -21,226 16,176
Long-term provisions 1.3.21. 2,642 2,961
Deferred government grants 1.3.22. 8,753 9,068
Obtained long-term loans 1.3.23. 45,678 54,216
Long-term operating liabilities 0 0
Deferred tax liabilities 1.3.15. 884 0
Long-term liabilities 57,957 66,245
Liabilities for sale 1.3.8. 410 0
Short-term financial liabilities 1.3.23. 226,976 226,890
Short-term operating liabilities 1.3.24. 16,986 13,055
Short-term costs and accrued revenues 1.3.25. 4,391 3,884
Short-term liabilities 248,763 243,829
Total liabilities 306,720 310,074
Total equity and liabilities 285,494 326,250
The notes form an integral part of these financial statements and should be read in conjunction with them.

Fina
ncia
l rep
ort
AN
NU
AL
REPO
RT 2
014
68
Notes 2014 2013
Revenues from goods sold and services rendered 1.3.26. 62,997 67,221
Change in inventories of products and work in progress 20 0
Other operating revenue 1.3.27. 1,962 4,673
Operating revenues 64,979 71,894
Cost of goods, materials and services 1.3.28. -32,705 -36,450
Labour cost 1.3.29. -21,720 -24,220
Depreciation and amortisation -7,595 -8,060
Other write-offs 1.3.30. -3,068 -9,269
Other operating expenses 1.3.31. -1,119 -1,666
Operating expenses -66,208 -79,665
Operating profit / loss -1,229 -7,771
Financial revenues 3,017 16,844
Financial expenses -10,663 -16,665
Net financial revenues/ expenses 1.3.32. -7,646 179
Share in profit of associates 0 0
Share in loss of associates 0 0
Impairments of financial investments in associates -27,155 -38,139
Net expense from associates 1.3.33. -27,155 -38,139
Pre-tax loss -36,030 -45,731
Tax 1.3.34. -10,934 -9,827
Net loss for the period -46,964 -55,558
Net loss for the year attributable to:
Equity holders of the parent -46,960 -55,569
Minority interest -4 11
Net loss for the period -46,964 -55,558
Basic loss per share (€) -23.53 -27.85
Diluted loss per share (€) -23.53 -27.85
The notes form an integral part of these financial statements and should be read in conjunction with them.
Consolidated income statement (€ thousand)

Fina
ncia
l rep
ort
AN
NU
AL
REPO
RT 2
014
69
Notes 2014 2013
Net loss for the period -46,964 -55,558
Other comprehensive income
- Change in fair value of available-for-sale financial assets 1.3.13. 10,923 -727
- Deferred tax on change in fair value of available-for-sale financial assets 1.3.15. -987 55
- Change in fair value of investments in associates transferred to profit or loss 1.3.12. 0 5,604
- Change in fair value of available-for-sale financial assets transferred to profit or loss 1.3.13. -1,312 -73
- Deferred tax on change in fair value of available-for-sale financial assets transferred to profit or loss 1.3.15. 201 11
- Actuarial gains / losses on defined benefit pension plans 444 -20
- Deferred tax on actuarial gains / losses on defined benefit pension plans -38 0
Other comprehensive income for the period, net of deferred tax 9,230 4,850
Total comprehensive income for the period -37,734 -50,708
Total comprehensive income for the period attributable to:
Equity holders of the parent -37,730 -50,719
Minority interest -4 11
Total comprehensive income for the period -37,734 -50,708
The notes form an integral part of these financial statements and should be read in conjunction with them.
Consolidated statement of other comprehensive income (€ thousand)

Fina
ncia
l rep
ort
AN
NU
AL
REPO
RT 2
014
70
Notes 2014 2013
CASH FLOWS FROM OPERATING ACTIVITIES
Net profit / loss -46,964 -55,558
Adjustments for:
Depreciation of property, plant and equipment 1.3.9. 7,304 7,730
Amortisation of intangible assets 1.3.10. 108 129
Depreciation of investment property 1.3.11. 183 201
Write-off and impairments of property, plant and equipment 1.3.9. 16 2,799
Impairments of inventories 1.3.16. 1,088 1,167
Impairments of receivables 1.3.17. 412 2,557
Write-offs and impairments of intangible assets 1.3.10. 0 35
Loss at disposal of intangible assets 1.3.10. 0 10
Proceeds from sale of intangible assets 1.3.10. 0 -46
Write-off and impairment of investment property 1.3.11. 1,534 2,543
Impairment of financial investments 1.3.13. 840 3,967
Impairments of investments in associates 1.3.12. 26,705 37,414
Proceeds from sale of property, plant and equipment 1.3.27. -40 -115
Loss at disposal of property, plant and equipment 1.3.30. 1 159
Proceeds from sale of investment property 1.3.27. 0 -1,033
Loss from sale of investment property 19 0
Foreign currency translation difference 0 0
Proceeds from sale of securities 1.3.32. -1,312 -73
Dividends and share in profit received 1.3.32. -25 -86
Share in loss of associates 0 0
Foreign exchange difference 12 0
Impairment of loans granted to associates 1.3.33. 449 725
Impairments of assets available for sale 261 0
Interest expense 1.3.32. 9,418 11,700
Interest revenue 1.3.32. -1,672 -979
Income tax liability / receivable 1.3.34. 10,934 9,827
Income from operations prior to change in operating equity and provisions 9,271 23,073
Change in long-term receivables 1.3.14., 1.3.15. 10,806 -1,319
Change in short-term receivables 1.3.17 -856 -21,684
Change in inventories 1.3.16. -6 -38
Change in short-term operating liabilities 1.3.24. -10,925 -6,654
Change in long-term operating liabilities -1,242 0
Change in provisions 1.3.21. 125 40
Change in government grants 1.3.22. -138 -530
Acquired cash in operations 7,035 -7,112
Paid income tax 1.3.34. -69 -50
Net cash flow from operations 6,966 -7,162
Consolidated cash flow statement (€ thousand)

Fina
ncia
l rep
ort
AN
NU
AL
REPO
RT 2
014
71
Notes 2014 2013
CASH FLOW FROM INVESTMENT ACTIVITIES
Purchase of property, plant and equipment 1.3.9. -4,803 -5,351
Proceeds from sale of property, plant and equipment 68 6,389
Purchase of intangible assets 1.3.10. -191 -12
Proceeds from sale of intangible assets 1.3.10. 5 44
Purchase of investment property 1.3.11. -23 -76
Proceeds from sale of investment property 6 3,190
Proceeds from sale of subsidiaries 1.3.11. 0 79,800
Purchase of subsidiaries -350 0
Proceeds from repaid loans 11,197 3,981
Expenses for granted loans -4,907 -9,792
Purchase of long-term securities 1.3.13. -11 -142
Proceeds from sale of long-term securities 3,128 698
Other dividends and shares in profit 1.3.32. 25 86
Received interests 309 855
Net cash flow from investment activities 4,453 83,228
CASH FLOWS IN FINANCING ACTIVITIES
Other changes in capital 0 -460
Expenses for obtained long-term loans -15 0
Proceeds from obtained short-term loans 6 0
Expenses for obtained short-term loans -6,589 -64,372
Expenses for dividends of Group's shareholders 0 0
Paid interests -4,821 -10,546
Net cash flow from financing activities -11,419 -75,378
Net increase or decrease in cash and cash equivalents 0 688
Cash and cash equivalents at year begin 1,239 551
Cash and cash equivalents from companies for sale -34 0
Cash and cash equivalents at beginning of the period 1,205 1,239
The notes form an integral part of these financial statements and should be read in conjunction with them.

Fina
ncia
l rep
ort
AN
NU
AL
REPO
RT 2
014
72
Issued capital
Share premium Reserves
Reserves for
treasury shares
Reserves for fair value of financial assets
Reserves from a change
in the value of financial investments in associated companies
Treasury shares
Net profit/loss for the
financial year
Retained net profit /
loss
Capital attributed to owners
of the controlling
interest
Non-con-trolling interest Total
Balance at 31 Dec. 2012 83,751 0 0 4,977 1,822 -5,604 -4,977 -99,181 84,940 65,728 1,568 67,296
Total comprehensive income
Loss for the year 0 0 0 0 0 0 0 -55,569 0 -55,569 11 -55,558
Other comprehensive income 0 0 0 0 -754 5,604 0 0 0 4,850 0 4,850
Items not to be reclassified to profit or loss
0 0 0 0 -20 0 0 0 0 -20 0 0
Change in fair value of available-for-sale financial assets
0 0 0 0 -727 0 0 0 0 -727 -727
Deferred tax on change in fair value of available-for-sale financial assets
0 0 0 0 55 0 0 0 0 55 0 55
Change in fair value of investments in associates
0 0 0 0 0 5,604 0 0 0 5,604 0 5,604
Change in fair value of available-for-sale financial assets transfer-red to profit or loss
0 0 0 0 -73 0 0 0 0 -73 0 -73
Deferred tax on change in fair value of available-for-sale financial assets transferred to profit or loss
0 0 0 0 11 0 0 0 0 11 0 11
Total comprehensive income 0 0 0 0 -754 5,604 0 -55,569 0 -50,719 11 -50,708
Transfer of net loss of the previous year in the retained
0 0 0 0 0 0 0 99,181 -99,181 0 0 0
Acquisition of treasury shares 0 0 0 0 0 0 0 0 0 0
Decrease in minority interest due to sale of companies
0 0 0 0 0 0 0 0 0 0 -415 -415
Increase in minority interest due to change in ownership of the company
0 0 0 0 0 0 0 0 0 0 2 2
Total transactions with owners recorded in capital
0 0 0 0 0 0 0 99,181 -99,181 0 -413 -413
Changes in capital 0
Covering a loss -58,309 0 0 0 0 0 0 0 58,309 0 0 0
Total changes in capital -58,309 0 0 0 0 0 0 0 58,309 0 0 0
Balance at 31 Dec. 2013 25,442 0 0 4,977 1,068 0 -4,977 -55,569 44,069 15,010 1,166 16,176
Consolidated statement of changes in equity (€ thousand)

Fina
ncia
l rep
ort
AN
NU
AL
REPO
RT 2
014
73
Consolidated statement of changes in equity (€ thousand)
Issued capital
Share premium Reserves
Reserves for
treasury shares
Reserves for fair value of financial assets
Reserves from a change
in the value of financial investments in associated companies
Treasury shares
Net profit/loss for the
financial year
Retained net profit /
loss
Capital attributed to owners
of the controlling
interest
Non-con-trolling interest Total
Balance at 31 Dec. 2013 25,442 0 0 4,977 1,068 0 -4,977 -55,569 44,069 15,010 1,166 16,176
Total comprehensive income
Profit / loss for the year 0 0 0 0 0 0 0 -46,960 0 -46,960 -4 -46,964
Other comprehensive income 0 0 0 0 9,230 0 0 0 0 9,230 0 9,230
Items not to be reclassified to profit or loss
0 0 0 0 406 0 0 0 0 406 0 406
Change in fair value of available-for-sale financial assets
0 0 0 10,923 0 0 0 0 10,923 0 10,923
Deferred tax on change in fair value of available-for-sale financial assets
0 0 0 0 -987 0 0 0 -987 0 -987
Change in fair value of available-for-sale financial assets transfer-red to profit or loss
0 0 0 0 -1,312 0 0 0 -1,312 0 -1,312
Deferred tax on change in fair value of available-for-sale financial assets transferred to profit or loss
0 0 0 0 201 0 0 0 201 0 201
Total comprehensive income 0 0 0 0 9,230 0 0 -46,960 0 -37,730 -4 -37,734
Transfer of net loss of the past year to retained net profit
0 0 0 0 0 0 0 55,569 -55,569 0 0 0
Increase of minority interest due to purchase of companies
0 0 0 0 0 0 0 0 0 0 20 20
Decrease in minority interest due to disposal of companies
0 0 0 0 0 0 0 0 0 0 -254 -254
Total transactions with owners recorded in capital
0 0 0 0 0 0 0 55,569 -55,569 0 -234 -234
Changes in capital 0
Covering a loss -11,381 0 0 0 0 0 0 563 11,381 563 0 0
Other changes in capital 0 0 0 0 0 0 0 0 0 0 3 3
Total changes in capital -11,381 0 0 0 0 0 0 563 11,381 563 3 566
Balance at 31 Dec. 2014 14,061 0 0 4,977 10,298 0 -4,977 -46,397 -119 -22,158 931 -21,226

Fina
ncia
l rep
ort
AN
NU
AL
REPO
RT 2
014
74
1.2 Composition of the Sava Group and data about the operations of subsidiaries and associates in 2014
At 31 December 2014, the Sava Group consisted of 9 companies: the parent company Sava d.d. and 8 subsidi-
aries. The financial statements of all these companies are included in the consolidated financial statements of the
Sava Group. In all companies, the capital and control rights are in accord.
List of companies that besides the parent company Sava d.d. are included in the Sava Group, with a comparison of ownership stakes as at 31 December 2014 and 31 December 2013
% ownership 31 Dec. 2014
% ownership 31 Dec. 2013
Change % 2014
TOURISM
SAVA TURIZEM d.d., Ljubljana 99.05% 99.05% 0.00%
Cardial d.o.o., Ljubljana (owned by Sava Turizem d.d.)* 85.00% 0.00% 85.00%
Sava Zdravstvo d.o.o., Ljubljana (owned by Sava Turizem 100.00% 100.00% 0.00%
Sava TMC d.o.o., Ljubljana (owned by Sava Turizem d.d.) 100.00% 100.00% 0.00%
REAL ESTATE
SAVA NEPREMIČNINE d.o.o., Kranj 100.00% 100.00% 0.00%
SAVA NOVA d.o.o., Zagreb, Croatia 100.00% 100.00% 0.00%
OTHER OPERATIONS
GIP SAVA KRANJ d.o.o., Ruma, Serbia 100.00% 100.00% 0.00%
ENERGETIKA ČRNOMELJ d.o.o., Ljubljana** 50.68% 50.68% 0.00%
SAVA IT d.o.o., Ljubljana 100.00% 100.00% 0.00%
* In February 2014, Sava Turizem d.d. acquired an 85% share in Cardial d.o.o.
** At 31 December 2014, the share in Energetika Črnomelj d.o.o. was recognised as available for sale and actually sold on 7 January 2015.

Fina
ncia
l rep
ort
AN
NU
AL
REPO
RT 2
014
75
ASSOCIATED COMPANIES OF THE SAVA GROUP
List of associated companies and a comparison of ownership stakes as at 31 December 2014 and 31 December 2013
% ownership 31 Dec. 2014
% ownership 31 Dec. 2013
Change in % of ownership
in 2014
Controlling stake*
31 Dec. 2014
SAVA, d.d., družba za upravljanje in financiranje, Kranj - as a parent company
- Gorenjska banka d.d., Kranj** 44.07% 44.07% 0.00% 48.82%
- NFD Holding d.d., Ljubljana*** 24.65% 24.65% 0.00% 24.65%
SAVA TURIZEM d.d. - as a parent company
- Gorenjska banka d.d., Kranj 0.16% 0.16% 0.00% 0.17%
* The controlling stake is calculated as a ratio between the number of shares owned by Sava d.d. and total number of shares issued by the associated company less treasury shares.
** 34,287 shares (10.35%) of Gorenjska banka d.d., Kranj, is under fiduciary ownership of Abanka Vipa d.d, which saves them in favour of holders of the SA03 bonds issued by Sava d.d. as collateral for liabilities arising from bonds.
In accordance with IFRS Gorenjska banka d.d. has been included in the consolidated financial statements as an associated company on the equity accounting basis.
***On 6 January 2015, bankruptcy proceedings were instituted against NFD Holding d.d., Ljubljana.
.Capital of associated companies at 31 December 2014 and operating profit/loss of associated companies in 2014 (€ thousand):
The stated data for Gorenjska banka d.d. for 2014 has not been audited and was publicly announced.
On 6 January 2015, bankruptcy proceedings were instituted against NFD Holding d.d, Ljubljana.
Associated company / head officeCapital value 31 Dec. 2014
Operating profit/loss 2014
Gorenjska banka d.d., Bleiweisova 1, 4000 Kranj 187,000 2,000
NFD Holding d.d., Trdinova 4, Ljubljana *** ***
*** On 6 January 2015, bankruptcy proceedings were instituted against NFD Holding d.d, Ljubljana.
Capital of associated companies at 31 December 2013 and operating profit/loss of associated companies in 2013 (€ thousand):
The stated data for 2013 was audited.
Associated company / head officeCapital value 31 Dec. 2013
Operating profit/loss 2013
Gorenjska banka d.d., Bleiweisova 1, 4000 Kranj 165,712 -115,600
NFD Holding d.d., Trdinova 4, Ljubljana -15,709 -11,310

Fina
ncia
l rep
ort
AN
NU
AL
REPO
RT 2
014
76
Sales revenues of subsidiaries in 2014, capital of subsidiaries at 31 December 2014 and operating profit/loss of subsidiaries in 2014 (€ thousand):
Company / head officeSales revenues
Jan-Dec 2014
Capital value
31 Dec. 2014
Operating profit/loss
Jan-Dec 2014
TOURISM 64,248 95,660 1,055
SAVA TMC d.o.o., Dunajska cesta 152, 1000 Ljubljana 1,713 1,117 549
Sava Turizem d.d., Dunajska cesta 152, 1000 Ljubljana 61,610 94,388 483
Cardial d.o.o., Zaloška cesta 69 1000 Ljubljana 925 147 23
Sava Zdravstvo d.o.o., Dunajska cesta 152, 1000 Ljubljana 0 7 0
REAL ESTATE 7 -853 -2,863
SAVA NEPREMIČNINE d.o.o., Dunajska cesta 152, 1000 Ljubljana 3 2,165 -1,558
SAVA NOVA d.o.o., Fra Filipa Grabovca 14, 10000 Zagreb, Croatia 4 -3,018 -1,305
OTHER OPERATIONS 293 927 -61
GIP SAVA KRANJ d.o.o., Industrijski put bb, 22400 Ruma, Serbia 10 1 -4
Sava IT d.o.o., Dunajska cesta 152, 1000 Ljubljana 5 410 -21
ENERGETIKA ČRNOMELJ d.o.o., Dunajska cesta 152, 1000 Ljubljana* 278 515 -36
SUBSIDIARIES TOTAL 64,547 95,733 -1,869
* Energetika Črnomelj d.o.o., which was sold in January 2015, has been included in the consolidated financial statements only through profit or loss; assets and liabilities in the consolidated statement of financial positions are shown under Assets and liabilities for sale.
Sales revenues of subsidiaries in 2013, capital of subsidiaries at 31 December 2013 and operating profit/loss of subsidiaries in 2013 (€ thousand):
Company / head officeSales revenues
Jan-Dec 2013
Capital value 31
Dec. 2013
Operating profit/loss
Jan-Dec 2013
TOURISM 64,169 94,058 1,027
SAVA TMC d.o.o., Dunajska cesta 152, 1000 Ljubljana 1,640 567 509
Sava Turizem d.d., Dunajska cesta 152, 1000 Ljubljana 61,916 93,483 670
Sava Golf d.o.o., Dunajska cesta 152, 1000 Ljubljana 614 0 -153
Sava Zdravstvo d.o.o., Dunajska cesta 152, 1000 Ljubljana 0 7 0
REAL ESTATE 0 1,976 -4,081
SAVA NEPREMIČNINE d.o.o., Dunajska cesta 152, 1000 Ljubljana 0 3,723 -2,717
SAVA NOVA d.o.o., Fra Filipa Grabovca 14, 10000 Zagreb, Croatia 0 -1,747 -1,364
OTHER OPERATIONS 4,183 988 -102
GIP SAVA KRANJ d.o.o., Industrijski put bb, 22400 Ruma, Serbia 29 5 2
Sava IT d.o.o., Dunajska cesta 152, 1000 Ljubljana 1,662 431 2
ENERGETIKA ČRNOMELJ d.o.o., Dunajska cesta 152, 1000 Ljubljana 344 552 3
ENSA BH d.o.o., Prijeblezi BB, 78429 Srbac, Bosnia and Herzegovina 2,148 0 -109
SUBSIDIARIES TOTAL 68,352 97,022 -3,156

Fina
ncia
l rep
ort
AN
NU
AL
REPO
RT 2
014
77
1.3.1 The reporting company
The controlling company Sava d.d. is domiciled in Dunajska cesta 152, 1000 Ljubljana. The consolidated financial
statements of the Sava Group, which include the controlling company Sava d.d., its subsidiaries, and the interests
in the associated companies, have been drawn for the financial year ending on 31 December 2014. Financial
statements have been produced under the going concern assumption.
1.3 Notes to the financial statements of the Sava Group in accordance with International Financial Reporting Standards as adopted by the EU
1.3.2 Basis of preparation
a) Statement of compliance
The consolidated financial statements have been pre-
pared in accordance with the International Financial
Reporting Standards as adopted by the EU, and in
compliance with the IFRICs as adopted by the Inter-
national Accounting Standards Board (IASB), and
with the Companies Act.
The Management Board approved the issue of finan-
cial statements on 10 March 2015.
b) Basis of measurement
The consolidated financial statements are prepared on
the historical cost basis except for the financial instru-
ments classified as available for sale and derivative fi-
nancial instruments that are stated at their fair values.
The methods applied in fair value measurement are
described under paragraph 1.3.4. below.
c) Functional and presentation currency
The consolidated financial statements are presented in
euro, which is the functional currency of the company.
All financial information is presented in euro, round-
ed to the nearest thousand. When adding together,
minor differences can appear due to rounding off.
The Sava Group companies, which have their head
office outside of Slovenia, use the following curren-
cies: HRK, RSD.
d) Application of estimates and assumptions
The preparation of financial statements requires
management to make judgments, estimates and as-
sumptions that affect the application of accounting
policies and reported amounts of assets and liabili-
ties, income and expenses. Actual results may differ
from these estimates.
The estimates and underlying assumptions are re-
viewed on an ongoing basis. Revisions to accounting
estimates are recognised in the period in which the
estimate is revised and for all future periods which
the revision affects.
The data about important estimates of uncertainties
and critical judgments, which the management pre-
pared in the process of implementing the accounting
policies and which have the strongest effect on the
amounts in financial statements, are described in the
following paragraphs:
• 1.3.21. Provisions
• 1.3.37. Contingent liabilities
• 1.3.12., 1.3.13. Evaluation of financial instruments

Fina
ncia
l rep
ort
AN
NU
AL
REPO
RT 2
014
78
1.3.3 Significant accounting policies
The companies in the Sava Group have consistently applied the determined accounting policies for all the
periods shown in the enclosed consolidated financial statements.
a) Basis of consolidation
BUSINESS COMBINATIONS
In 2014, an 85% share in Cardial d.o.o. was acquired; the investment value amounted to €350 thousand. The equity value of the company on the acquisition day amounted to €124 thousand. The remaining 15% share is the company’s own stake of.
COMPOSITION OF THE SAVA GROUP
The Sava Group includes the parent company Sava d.d., 8 subsidiaries, and 2 associated companies. The financial statements of the mentioned subsidiaries are entirely included in the Group’s consolidated financial statements, whereas in the case of the associated companies, the equity accounting method is considered at the annual level, i.e. the attributable profit or loss is added to the financial result of the Group, and equity revaluation adjustment is attributed to the equity of the Group. The parent company and subsidiaries prepare separate financial state-ments in accordance with SAS, whereas adjustments to IFRSs as adopted by the EU are carried out for purpose of consolidation.
SUBSIDIARIES
Subsidiaries are the entities controlled by Sava d.d. Control exists when the parent company has the power to govern the financial and operating policies of an entity so as to obtain benefits from its activities. In assessing con-trol, the existence and effect of voting rights are considered, which at that time can be exercised or exchanged, as well as the actual control in steering the company in terms of finance and business. In all subsidiaries the capital and controlling stakes are in accord.
The financial statements of subsidiaries are included in the consolidated financial statements from the date that control commences until the date that control ceases.
Accounting policies of subsidiaries are adapted to the policies of the Sava Group. Losses that refer to non-con-trolling interests in a subsidiary are reallocated under non-controlling interest even if this item later shows a negative balance.
ASSOCIATED COMPANIES
Associated companies are those entities in which the Sava Group has a significant influence, but not controlling influence, over the financial and operating policies. At initial recognition, investments are measured at fair value which equals the trading (acquisition) value; in the continuation the equity method is used. The consolidated financial statements include the Sava Group’s share of the total recognised gains or losses, and equity revaluation adjustments of the associated companies on an equity accounting basis, from the date that significant influence commences until the date that significant influence ceases. When the Group’s share of losses exceeds its interest in an associate, the value of such investment is reduced to nil and recognition of further losses is discontinued except to the extent that a company is liable for settling certain obligations on behalf of an associated company.
The capital and controlling rights are not in accord in all associated companies (explanation is given under 1.2). Any additional impairment of investments in the bank is ascertained on the basis of an evaluation prepared by a certified company evaluator.

Fina
ncia
l rep
ort
AN
NU
AL
REPO
RT 2
014
79
TRANSACTION ELIMINATED ON CONSOLIDATION
Intra-group balances of receivables and liabilities, and any unrealised gains and losses or income and expenses
arising from transactions within the Sava Group are eliminated in preparing the consolidated financial state-
ments. Unrealised losses are eliminated in the same way as unrealised gains, but only to the extent that there is
no evidence of impairment.
b) Foreign currency
FOREIGN CURRENCY TRANSACTIONS
Transactions in foreign currencies are translated to the functional currency at the reference exchange rate of the
ECB ruling at the date of the transaction. Monetary assets and liabilities denominated in foreign currencies at the
reporting date are translated to the functional currency at the reference exchange rate of the ECB ruling at that
date. Foreign exchange gains / losses present differences between the repayment value in functional currency at
the beginning of the period adjusted by the amount of effective interest and payments during the period and the
repayment value in foreign currency calculated at the reference exchange rate of the ECB at the period end. The
foreign exchange gains/losses arising on translation are recognised in the income statement.
Non-monetary assets and liabilities denominated in foreign currencies that are stated at original value are translat-
ed to the functional currency at the reference exchange rate of the ECB ruling at the transaction date. Non-mon-
etary assets and liabilities denominated in foreign currencies that are stated at fair value are translated to Euro at
the reference exchange rate of the ECB ruling at the date the fair value was determined.
Foreign exchange gains/losses arising from the retranslation are recognised in the income statement, which is not
the case with gains/losses arising from the calculation of capital instruments available for sale, or non-financial
liability determined as a cash-flow hedge against risk, which is recognised directly in equity.
FOREIGN OPERATIONS
The assets and liabilities of foreign operations including goodwill and fair value revaluation adjustments upon
consolidating are translated to Euro at the reference exchange rate of the ECB ruling at the balance sheet date.
The revenues and expenses of foreign operations are translated to Euro at rates ruling at the dates of transaction.
Foreign exchange gains/losses arising on retranslation are recognised in other comprehensive income as a trans-
lation reserve in equity. In the case of a subsidiary, which is not wholly owned, a suitable proportionate share of
translation reserve is reallocated under the non-controlling share. At eliminating a foreign operation, the transla-
tion reserve amount is transferred in the income statement.
c) Financial instruments
c 1) Non-derivative financial instruments
Non-derivative financial instruments include investments in equity and debtor’s securities, operating and other re-
ceivables, cash and cash equivalents, received and granted loans, operating and other liabilities. Non-derivative fi-
nancial instruments are initially recognised at fair value increased by costs, which directly relate to the transaction.
Fina
ncia
l rep
ort
AN
NU
AL
REPO
RT 2
014
80
Non-derivative financial instruments are recognised if the group becomes a party to the contractual provisions of
the instrument. The recognition of financial assets is eliminated when contractual rights of the group towards the
cash flows expire or the financial instrument is transferred to another party including risks and benefits. Purchases
and sales carried out in an ordinary way are accounted for on the day when the group obliges itself to purchase
or sell an asset. The recognition of financial liabilities is eliminated when the contractual liabilities of the group
are expired, terminated or interrupted.
Financial assets and liabilities are offset and net amount is shown in the balance sheet if and only if the group
has a legal right to either settle the net amount or cash in the asset, and to settle its liability at the same time.
Loans and receivables
At initial recognition loans are recognised at fair value, after initial recognition they are recognised at their repay-
ment value, any difference between the original and amortised cost is recognised in the income statement in the
repayment period. The method of effective interest rate is applied.
At their initial recognition the operating receivables are shown in the amounts that arise from the corresponding
documents on condition that they will be paid. As a rule, receivables are measured at amortised cost using the
method of effective interest rates. Short-term operating receivables are not discounted on the balance sheet date.
If impartial evidence exists that a receivable recognised at amortised cost resulted in a loss due to impairment, the
loss is measured as a difference between the carrying amount of a receivable and the expected cashable value and
is recognised in the income statement.
Receivables, which are assumed not be settled within the due term and in the total amount, respectively, are
considered doubtful and, if a court procedure has already begun, disputable.
Cash and cash equivalents
Cash and cash equivalents comprise cash on hand, on transaction accounts and call deposits. Overdrafts on trans-
action accounts with banks subject to settlement on call and being a component of managing monetary assets
in the Group are included under cash and cash equivalents in the cash flow statement.
Financial assets available for sale
Non-current securities are located in the Group and classified under financial assets available for sale. They com-
prise investments in shares of listed companies, shares and stakes of unlisted companies and investments in mu-
tual funds. More than 99% of these assets are located in the parent company Sava d.d.
The available-for-sale financial assets are initially measured at fair value on the day of acquisition. Subsequent
to initial recognition, they are measured at market value: share bid price at balance sheet date for listed financial
instruments; in the case of unlisted financial instruments, the evidence for a needed impairment is determined at
least once a year.
Any changes in fair value and foreign exchange losses/gains in capital instruments available for sale are shown in
other comprehensive income. A loss due to impairment is recognised in profit or loss. In reversing the recognised
investment, the cumulative gains and losses shown in other comprehensive income for the period are transferred
to profit or loss.

Fina
ncia
l rep
ort
AN
NU
AL
REPO
RT 2
014
81
If a decrease in fair value of a financial asset available for sale was recognised directly as a negative revaluation
reserve and there exists impartial evidence that the asset is impaired over a long-term period, the impairment is
recognised in the income statement as a financial expense. It is considered that impartial evidence for the exami-
nation of a financial investment exists when the fair value of the financial asset on the balance sheet date is 20%
lower than the cost value of the financial asset. The examination of the impairment of the financial asset is carried
out separately for each investment or group of investments.
Non-derivative financial liabilities
The Group initially recognises debt securities issued and subordinated liabilities on the date that they are origi-
nated. All other financial liabilities are recognised initially on the trade date at which the Group becomes a party
to the contractual provisions of the instrument. The Group derecognises a financial liability when its contractual
obligations are discharged or cancelled or expired. Financial assets and liabilities are offset and the net amount
presented in the statement of financial position when, and only when, the Group has a legal right to offset the
amounts and intends either to settle them on a net basis or to realise the asset and settle the liability simulta-
neously. The Group has the following non-derivative financial liabilities: issued bonds, loans and credits, trade
payables and receivables. Such financial liabilities are initially recognised at fair value plus any directly attributable
transaction costs. Subsequent to initial recognition these financial liabilities are measured at amortised cost using
the effective interest method.
C 2) Derivative financial instruments
The Group does not hold or issue any derivative financial instruments for trading purposes.
The Group used derivative financial instruments to hedge its interest rate risk exposure.
Derivative financial instruments are initially recognised at fair value; costs related to a transaction are recognised
in profit or loss upon its appearance. After initial recognition, derivative financial instruments are measured at fair
value, while related changes are recognised in the income statement.
Cash flow hedging
Changes in fair value of a derivative financial instrument determined to hedge its exposure to risk are recognised
directly in profit or loss.
If the hedging instrument no longer meets the criteria for hedge accounting, it expires or is sold, terminated,
exercised, hedge accounting is discontinued.
Hedging against risks
With derivative financial instruments, which hedge monetary assets and liabilities in a foreign currency, hedging
against risk is not performed. Changes in the fair value of derivative financial instruments are recognised in the
income statement as part of foreign exchange gains and losses.
Fina
ncia
l rep
ort
AN
NU
AL
REPO
RT 2
014
82
CAPITAL
Total capital of a company is its liability towards its owners, which falls due for payment if the company discontin-
ues its operation. It is determined on the basis of the sums invested by the owners, and the sums that appeared
during operations and belong to the owners. It is decreased by loss from operations, repurchased own shares
and withdrawals (payments). Total capital comprises share capital, capital reserves, revenue reserves, retained net
profit, fair value reserve and own shares as a deductible item.
Ordinary no-par value shares
Incremental costs directly attributable to the issue of ordinary shares and share options are recognised as a de-
duction from equity.
Repurchase of treasury shares
Repurchase of treasury shares is shown as a deduction from total equity.
Dividends
Dividends are recognised in the financial statements of the Group in the period in which the Shareholders’ Meet-
ing adopts a resolution on dividend payment.
Net earnings per share
Share capital of the Group is divided in ordinary nominal no-par value shares therefore the Group shows the basic
earnings per share. The basic earnings per share is calculated by dividing the profit or loss attributable to ordinary
shareholders by the weighted average number of ordinary shares outstanding in the financial year.
Diluted net earnings per share equal the basic net earnings per share as the Group has no preferential shares or
exchangeable bonds available. The number of issued shares did not change during the year.
d) Property, plant and equipment
Recognition and measurement
Items of property, plant and equipment are stated at cost less accumulated depreciation and impairment losses.
Value at cost includes costs that are directly attributed to the purchase of an asset. The cost includes cost of
materials, direct labour costs and other costs directly attributed to its putting into intended use, and costs of
dismantling and removing property, plant and equipment and restoring the site at which they are located, as well
as capitalised borrowing costs. Costs may also include transfers from other comprehensive income of any gain or
loss on qualifying cash flow hedges of foreign currency purchases of property, plant and equipment.
When parts of property, plant and equipment have different useful lives, they are accounted for as separate items
of property, plant and equipment. The Group companies determine at least once a year whether there exists
evidence for any impairment.

Fina
ncia
l rep
ort
AN
NU
AL
REPO
RT 2
014
83
TRANSFER OF PROPERTY FROM TANGIBLE FIXED ASSETS TO INVESTMENT PROPERTY
If an owner-occupied property changes to an investment property, this property is measured at its fair value and
reclassified as investment property. The gain which appears in the repeated measurement is recognised in profit
or loss to the extent the gain reverses a previous impairment loss on the specific property, with any remaining
gain recognised in other comprehensive income and presented in the revaluation reserve in equity. Any loss is
recognised in other comprehensive income and presented in the revaluation reserve to the extent that an amount
had previously been included in the revaluation reserve relating to the specific property, with any remaining loss
recognised immediately in profit or loss, while the loss is recognised directly in the income statement.
SUBSEQUENT COSTS
The group recognises in the carrying amount of an item of property, plant and equipment the cost of replacing
part of such an item when that cost is incurred if it is probable that the future economic benefits embodied with
the item will flow to the Group and the cost of the item can be measured reliably. All other costs are recognised
in the income statement as an expense as incurred.
DEPRECIATION
Depreciation is calculated and recognised in the income statement on a straight-line basis over the estimated
useful lives of each part of an item of property, plant and equipment. Land is not depreciated. The suitability of
the method and useful lives are reviewed on the day of reporting.
Estimated useful lives are as follows:
2014 2013
Manufacturing building - 25 to 80 years
Hotels, commercial buildings, warehouses 20 to 71 years 20 to 71 years
Office buildings 25 to 40 years 25 to 40 years
Manufacturing equipment in rubber manufacturing - 4 to 20 years
Hotel furnishings 5 to 20 years 5 to 20 years
Computer equipment 2 to 5 years 2 to 5 years
Other equipment 6 to 20 years 6 to 20 years
In the preceding year of 2013, a change of depreciation rates in Tourism companies took place as follows:
1. Buildings – depreciation rates between 1.4% and 5.0%.
2. Infrastructure – depreciation rates between 1.4% and 5.0%.
3. Landscaping and recreational surfaces – depreciation rates between 1.4% and 3.0%.
The impact of the deprecation rates change in 2013 in terms of value is detailed in paragraph 1.3.9.

Fina
ncia
l rep
ort
AN
NU
AL
REPO
RT 2
014
84
e) Intangible assets
GOODWILL
Goodwill represents amounts arising on acquisition of subsidiaries, associated companies and joint ventures and
refers to a surplus or difference between the acquisition cost and share of the group in net fair value of ascer-
tained assets, liabilities and contingent liabilities of the acquired company.
Subsequent measurement
Goodwill is measured at cost less any accumulated impairment losses. In respect of equity accounted for invest-
ments, the carrying amount of goodwill is included in the carrying amount of the investment, and an impairment
loss on such an investment is neither allocated to any asset, nor goodwill that forms part of the carrying amount
of the equity accounted investment.
RESEARCH AND DEVELOPMENT
Expenditure on research activities, undertaken with the prospect of gaining new scientific or technical knowledge
and understanding, is recognised in the income statement as incurred.
OTHER INTANGIBLE ASSETS
Other intangible assets that are acquired by the Group and have finite useful lives are measured at cost less accu-
mulated amortisation and accumulated impairment losses.
SUBSEQUENT EXPENDITURE
Subsequent expenditure is capitalised only when it increases the future economic benefits embodied in the spe-
cific asset to which it relates. All other expenditures are recognised in profit or loss as incurred.
AMORTISATION
Amortisation is recognised in profit or loss on a straight-line basis over the estimated useful lives of intangible
assets, other than goodwill, from the date they are available for use. The estimated useful lives for the current
and comparative periods for computer software and other patents and licences amount to ten years.
f) Investment property
Investment properties are properties which are held either to earn rental income or for long-term investment
appreciation or for both. For evaluating investment properties the cost model is applied. Investment property is
initially measured at cost, which includes purchase price and costs that can be attributed to the purchase such as
legal fees, tax on property transfer and other transaction costs.
When it should be decided whether an asset is an investment property or property, plant and equipment, the
asset is an investment property if more than 20% of its total value is used as held to earn rental income.
Depreciation is accounted for on a straight-line basis over the estimated useful lives of each part of an item of
property, plant and equipment. Land is not depreciated.
The useful lives for investment property are the same as for property, plant and equipment.

Fina
ncia
l rep
ort
AN
NU
AL
REPO
RT 2
014
85
g) Inventories of real properties
Inventories are stated at the lower of cost and net realisable value. Net realisable value is the estimated selling
price in the ordinary course of business, less the estimated costs of completion and selling expenses.
The inventories of Real Estate also include interest expense on loans hired for a specific project.
h) Impairment of assets
Financial assets
Financial asset is considered impaired when impartial evidence exists, which shows that the expected future cash
flows from this asset is decreased as a result of one or several events that can be reliably measured.
Impairment loss in relation to financial assets stated at payment value is calculated as the difference between the
net value of an asset and the future expected cash flows, discounted at an originally valid interest rate. Impair-
ment loss is recognised in the income statement.
Impairment loss related to a financial asset intended for sale is accounted for at its present fair value. The cumula-
tive impairment loss recognised in other comprehensive income and stated in the fair value reserve is transferred
to profit or loss. The cumulative loss that is removed from other comprehensive income and recognised in profit
or loss is the difference between the acquisition cost and the current fair value less any impairment loss previously
recognised in profit or loss.
If, in a subsequent period, the fair value of an impaired available-for-sale debt security increases and the increase
can be related objectively to an event occurring after the impairment loss was recognised in profit and loss, then
the impairment loss is reversed, with the amount of the reversal recognised in profit or loss. Any subsequent
recovery in the fair value of an impaired available-for-sale equity security is recognised in other comprehensive
income for the period.
With an important financial asset, an impairment estimate is performed individually. The impairment estimate of
other financial assets is carried out collectively with regard to their common characteristic in risk exposure.
Non-financial assets
The carrying amounts of the Group’s non-financial assets other than investment property, inventories and de-
ferred tax assets, are reviewed at each reporting date to determine whether there is an indication of impairment.
If any such indication exists, then the asset’s recoverable amount is estimated. For goodwill and intangible assets
that have indefinite useful lives or that are not yet available for use, the recoverable amount is estimated each
year at the reporting time.
Impairment of assets or cash-generating items is recognised when its carrying amount exceeds its recoverable
value. A cash generating unit is the smallest group of assets which generates financial inflows that to a great ex-
tent do not depend on financial inflows from other assets or groups of assets. Impairment is stated in the income
statement. Loss recognised in a cash-generating unit arising from an impairment is classified so as to first reduce
the carrying amount of the goodwill allocated to the cash-generating unit, and then on other assets of the unit
(group of units) in proportion to the carrying amount of each item in the group.
The recoverable amount of an asset or a cash-generating unit is the greater of their fair values in use or fair value
less selling costs. In assessing value in use, the estimated future cash flows are discounted to their present value
using a pre-tax discount rate that reflects current market assessments of the time value of money and the risks
specific to the asset. Impairment is stated in the income statement.

Fina
ncia
l rep
ort
AN
NU
AL
REPO
RT 2
014
86
i) Employee benefits
Liabilities for short-term employee benefits are measured without discounting and stated under expenses as work
in connection with definite short-term benefits is done.
j) Provisions
A provision is recognised if the Group has a present legal or constructive obligation as a result of a past event,
which is measurable, and it is probable that an outflow of economic benefits will be required to settle the ob-
ligation. Provisions are determined by discounting the expected future cash flows at a pre-tax rate that reflects
current market assessments of the time value of money and, where appropriate, the risks specific to the liability.
Warranties for products and services
A provision for warranties is recognised when the underlying products or services are sold. The provision is based
on historical warranty data and considering all possible outcomes with regard to their probability.
Provisions for retirement amounts and employee jubilee benefits
As stipulated by law, collective agreement and internal regulations the Group is committed to pay employee ju-
bilee benefits and retirement amounts, for which long-term provisions are formed. No other liabilities associated
with pensions exist.
Provisions are formed for employees in those countries where a legal obligation for payment of retirement amounts
and jubilee benefits exists and that in the amount of the estimated future payments of retirement amounts and
jubilee benefits discounted at the balance sheet date. The calculation includes expenses of retirement amounts
and costs of all expected jubilee benefits until retirement. In calculating, the certified actuary considered the
project unit method. Actuarial gains or actuarial losses from the current operations are entirely recognised in the
income statement when ascertained.
Provisions for reorganisation
Provisions for reorganisation include direct costs of reorganisation and refer to severance pay to employees in
connection with the changed organisational structure of companies.
Provisions for lawsuits
Provisions for lawsuits are formed when legal proceeding begins. The amount of provisions for law suits is deter-
mined in consideration of the estimated outcome of an individual claim.
k) Government grants
Government grants are recognised in financial statements as deferred revenue when they are received and when
there is a reasonable assurance that the conditions attaching to them will be complied with. Grants are recog-
nised strictly as revenues in the periods, in which expenses arise to be compensated with the obtained grants.
Grants that compensate the Group for the cost of an asset are strictly recognised in the income statement as other
operating income on a systematic basis over the useful life of the asset.
Fina
ncia
l rep
ort
AN
NU
AL
REPO
RT 2
014
87
l) Revenues
GOODS SOLD
Revenue from goods sold is recognised at fair value of received payment or receivable less paybacks and dis-
counts, rebates for further sale and quantity discounts. Revenue is shown when the buyer has assumed all sig-
nificant risks and rewards of ownership and there exists a certainty regarding the recovery of the consideration
due, associated costs or the possible return of goods or products and when the Group ceases to make further
decisions about sold products.
Transfer of risks and rewards depends on individual provisions of the sale contract. When selling goods a trans-
fer is performed when the goods arrive in a customer’s warehouse, and in certain international consignments a
transfer is performed when the goods are loaded on a truck.
SERVICES RENDERED
Revenue from services rendered is recognised in the income statement with regard to the stage of completion to
date. The stage of completion is assessed by surveys of work performed. Revenue from services in the Tourism di-
vision is recognised as a service is rendered. When revenue from a tourist arrangement relates to two accounting
periods, they are deferred with regard to the number of days in each individual accounting period.
RENTAL INCOME
Rental income from investment property is recognised in the income statement on a straight line basis over the
term of the lease.
m) Finance income and finance costs
Finance income comprises interest income on funds invested, dividend income, gains on disposal of availa-
ble-for-sale financial assets, foreign exchange gains and gains arising from instruments for hedging against risk,
which are recognised in the income statement. Interest income is recognised as it arises by using the effective
interest rate method. Dividend income is recognised in the income statement on the data when the shareholder’s
right for payment is established.
Finance costs comprise interest expense on borrowings, expenses from the disposal of available-for-sale financial
assets, foreign exchange loss, impairment losses in the value of financial assets and losses arising from hedging
against risk, which are recognised in the income statement. The expense of lease payments is recognised in the
income statement using the effective interest rate method except those, which are attributed to intangible and
tangible assets under construction or preparation.

Fina
ncia
l rep
ort
AN
NU
AL
REPO
RT 2
014
88
n) Income tax
Income tax on the profit or loss for the year comprises current and deferred tax. Income tax is recognised in the
income statement except to the extent that it relates to items recognised directly in equity, in which case it is
recognised in equity.
Current tax is the expected tax payable on the taxable income for the year, using tax rates enacted or substantially
enacted at the balance sheet date, and any adjustment to tax payable in respect of previous years.
Deferred tax is provided using the balance sheet liability method, providing for temporary differences between
the carrying amounts of assets and liabilities for financial reporting purposes and the amounts used for taxation
purposes. The amount of deferred tax provided is based on the expected manner of realisation or settlement of
the carrying amount of assets and liabilities, using tax rates enacted or substantively enacted at the balance sheet
date.
A deferred tax asset is recognised only to the extent that it is probable that future taxable profits will be available
against which the asset can be utilised. Deferred tax assets are reduced to the extent that it is no longer probable
that the related tax benefit will be realised.
o) Segment reporting
A segment is a component of the Group that engages either in business activities from which it may earn revenues
and incur expenses. For operating segments discrete financial information is available. All operating segments’
operating results are reviewed regularly by the Management Board of Sava d.d. to make decisions about resourc-
es to be allocated to the segment and to assess the Sava Group’s performance.
p) Standards and interpretations effective in the present period
In the present period, the following standards, updates in the existing standards and explanations apply that were
issued by the International Accounting Standards Board and adopted by the EU:
• IFRS 10 - Consolidated Financial Statements; adopted by the EU on 11 December 2012 (effective for
annual periods beginning on or after 1 January 2014).
• IFRS 11 – Joint Arrangements; adopted by the EU on 11 December 2012 (effective for annual periods
beginning on or after 1 January 2014).
• IFRS 12 – Disclosure of Interests in Other Entities; adopted by the EU on 11 December 2012 (effective
for annual periods beginning on or after 1 January 2014)
• IAS 27 (amended in 2011) – Separate Financial Statements; adopted by the EU on 11 December 2012
(effective for annual periods beginning on or after 1 January 2014).
• IAS 28 (amended in 2011) – Investments in Associates and Joint Ventures; adopted by the EU on 11
December 2012 (effective for annual periods beginning on or after 1 January 2014).

Fina
ncia
l rep
ort
AN
NU
AL
REPO
RT 2
014
89
• Amended IFRS 10 – Consolidated Financial Statements, IFRS 11 – Joint Arrangements, and IFRS 12 –
Disclosures of Interests in Other Entities; recommendations for transition as adopted by the EU on 4
April 2013 (effective for annual periods beginning on or after 1 January 2014).
• Amended IFRS 10 – Consolidated Financial Statements, IFRS 12 – Disclosure of Interests in Other Enti-
ties, and IAS 27 (as amended in 2011) – Separated Financial Statements, Investment Entities; adopted
by the EU on 20 November 2013 (effective for annual periods beginning on or after 1 January 2014).
• Amended IAS 32 – Financial Instruments: Presentation; offsetting financial assets and liabilities as
adopted by the EU on 13 December 2012 (effective for annual periods beginning on or after 1 January
2014).
• Amended IAS 36 – Impairment of Assets; recoverable amount disclosures for non-financial assets, as
adopted by the EU on 19 December 2013 (effective for annual periods beginning on or after 1 January
2014).
• Amended IAS 39 – Financial Instruments: Recognition and Measurement; renovation of derivative
financial instruments and further applying of hedge accounting requirements as adopted by the EU on 19
December 2013 (effective for annual periods beginning on or after 1 January 2014).
Adopting these amendments to the existing standards did not lead to any changes in the accounting policy of
the company.
q) Standards and explanations issued by the IASB but and adopted by the EU but not yet effective
On the date of approving these financial statements, the following standards, amendments to the existing stand-
ards and explanation were issued by IASB and adopted by the EU but are not yet effective:
• Amendments to various standards – Annual Improvements to IFRS 2010-2012 Cycle; they ensue from
the IFRS annual improvement process (IFRS 2, IFRS 3, IFRS 8, IFRS 13, IAS 16, IAS 24 and IAS 38) mainly
with the intention of elimination inconsistencies and interpretations of texts adopted by the EU on 17
December 2014 (amendments are effective for annual periods beginning on or after 1 February 2015).
• Amendments to various standards – Annual Improvements to IFRS 2011-2013 Cycle; they ensue from
the IFRS annual improvement process (IFRS 1, IFRS 3, IFRS 13, IAS 40) mainly with the intention of elimi-
nation inconsistencies and interpretations of texts adopted by the EU on 18 December 2014 (amendments
are effective for annual periods beginning on or after 1 January 2015).
• Amended IAS 19 – Employee Benefits – Defined Benefit Plans: Employee Contributions; adopted by the
EU on 17 December 2014 (effective for annual periods beginning on or after 1 February 2015).
• IFRIC 21 – Levies; adopted by the EU on 13 June 2014 (effective for annual periods beginning on or after
17 June 2014).

Fina
ncia
l rep
ort
AN
NU
AL
REPO
RT 2
014
90
r) Standards and explanations issued by the IASB but not yet adopted by the EU
Currently, the IFRS as adopted by the EU, do not significantly differ from the regulations adopted by the IASB,
with the exception of the following standards, amendments to the existing standards and explanations, which on
10 March 2015 were not yet endorsed for use in the EU:
• IFRS 9 – Financial Instruments (effective for annual periods beginning on or after 1 January 2018).
• IFRS 14 – Regulatory Deferral Accounts (effective for annual periods beginning on or after 1 January
2016).
• IFRS 15 – Revenue from Contracts with Customers (effective for annual periods beginning on or after
1 January 2017).
• Amendments to IFRS 10 – Consolidated Financial Statements and IAS 28 – Investments in Associates
and Joint Ventures; sale or contribution of assets between investor and its associated company or joint
venture (effective for annual periods beginning on or after 1 January 2016).
• Amendments to IFRS 10 – Consolidated Financial Statements, IFRS 12 – Disclosure of Interests in
Other Entities, and IAS 28 – Investments in Associates and Joint Ventures – Investment companies:
exceptions in consolidation (effective for annual periods beginning on or after 1 January 2016).
• Amendments to IFRS 11 – Joint Arrangements; accounting acquisition of shares in joint venture (effec-
tive for annual periods beginning on or after 1 January 2016).
• Amendments to IAS 1 – Presentation of Financial Statement; initiative for disclosures (effective for an-
nual periods beginning on or after 1 January 2016).
• Amendments to IAS 16 – Property, Plant and Equipment and IAS 38 –Intangible Assets; explanation
of acceptable depreciation methods (effective for annual periods beginning on or after 1 January 2016).
• Amendments to IAS 16 – Property, Plant and Equipment and IAS 41 – Agriculture; Agriculture: Living
plants (effective for annual periods beginning on or after 1 January 2016), Amendments to IAS 27 –
Separate Financial Statements; equity method in separate financial statements (effective for annual peri-
ods beginning on or after 1 January 2016).
• Amendments to various standards – Annual Improvements to IFRS 2012-2014 Cycle, they ensue
from the IFRS annual improvement process (IFRS 5, IFRS 7, IFRS 19 and IAS 34), mainly with the intention
of elimination inconsistencies and interpretations (effective for annual periods beginning on or after 1
January 2016).
The company anticipates that introducing these standards, amendments to the existing standards, and explana-
tions will not significantly influence the financial statements of the company during the initial use period.
At the same time, the accounting of hedging against risk in relation to a portfolio of financial assets and liabilities
whose principles the EU has not adopted yet, remains unregulated.
The company estimates that accounting of hedging against risk in relation to a portfolio of financial assets and
liabilities in accordance with the IAS 39 – Financial Instruments: Recognition and Measurement would not
have a significant impact on the financial statements of the company if they had been applied on the balance
sheet date.

Fina
ncia
l rep
ort
AN
NU
AL
REPO
RT 2
014
91
1.3.4 Determination of fair values
In view of the accounting policies applied in the Group and the breakdowns, it is required to determine the fair
value of both financial and non-financial assets and liabilities. The Group determined fair values of individual
groups of assets for measuring and reporting purposes in accordance with the methods described below. Where
additional explanations in respect of assumptions for the determination of fair values are required, these are
mentioned in the notes to individual items of assets or liabilities of the Group.
PROPERTY, PLANT AND EQUIPMENT
The fair value of property, plant and equipment is their market value. The market value of property is the estimat-
ed amount for which a property can be exchanged on the date of valuation between a willing buyer and a willing
seller in an arm’s length transaction wherein the parties had each acted knowledgeably and willingly. The market
value of plant, equipment, fixtures and fittings is based on the quoted prices for similar items.
INTANGIBLE ASSETS
The fair value of patents and trademarks is based on the discounted estimated royalty payments that have been
avoided as a result of the patent or trademark being owned. The fair value of customer relationships acquired in
a business combination is determined using the multi-period excess earnings method, whereby the subject asset
is valued after deducting a fair return on all other assets that are part of creating the related cash flows.
The fair value of other intangible assets is based on the discounted cash flows expected to be derived from the
use and eventual sale of assets.
INVESTMENT PROPERTY
The fair value is based on market values, which equals the estimated value for which a property can be exchanged
on the date of valuation between a willing buyer and a willing seller in an arm’s length transaction wherein the
parties had each acted knowledgeably and willingly.
In the absence of current prices in the active market, the valuations are prepared by considering the aggregate
of the expected cash flows from renting out the property. A yield that reflects the specific risks is applied in the
calculation of property value on the basis of discounted net cash flows at the annual level.
Valuations reflect the type of tenants actually in occupation or responsible for meeting lease commitments or
likely to be in occupation after letting vacant accommodation, and general perception of their creditworthiness,
furthermore the allocation of maintenance and insurance between the Group and the lessee, and the remaining
economic life of the property. When rent reviews or lease renewals are pending with anticipated revisionary in-
creases, it is assumed that all notices, and when appropriate counter-notices, have been served validly and within
the appropriate time.

Fina
ncia
l rep
ort
AN
NU
AL
REPO
RT 2
014
92
INVENTORIES
The fair value of inventories is determined based on the estimated selling price in the ordinary course of business
less the estimated costs of completion and sale, and a reasonable profit margin based on the effort required to
complete and sell the inventories.
INVESTMENTS IN EQUITY AND DEBT SECURITIES
The fair value of financial instruments classified as held for trading and available for sale is their quoted closing
bid price at the reporting date. The fair value of shares and stakes which are not listed is examined on the market.
If fair value cannot be estimated, at least signs of possibly needed impairments are checked.
OPERATING AND OTHER RECEIVABLES
The fair value of operating and other receivables, except construction work in progress whose maturity is longer
than one year, is calculated as the current value of future cash flows discounted at the market interest rate to date.
DERIVATIVES
The fair value of interest rate swaps is based on broker quotes. Those quotes are tested for reasonableness by dis-
counting estimated future cash flows based on the terms and maturity of each contract and using market interest
rates for similar instruments at the measurement date.
NON-DERIVATIVE FINANCIAL LIABILITIES
For reporting purpose, the fair value is calculated considering the current value of future payments of the principal
and interest discounted at the market interest rate on the day of reporting. For financing leases the market rate
of interest is determined by reference to similar lease agreements.
As disclosed in item 1.3.23. Sava d.d. is undergoing preventive restructuring proceedings. The Master Restructur-
ing Agreement entered into by Sava d.d. expired, the new conditions for financing will be agreed with financial
creditors in preventive restructuring proceedings. Upon endorsing the annual report the loans are unregulated
and it is not clear under what conditions the liabilities will be settled. For this reason, their fair value could not
be ascertained.
PREPARATION OF THE CASH FLOW STATEMENT
The cash flow statement has been prepared by considering the data from the income statement for the period
January-December 2014 (for the past period January-December 2013), the balance sheet data at 31 December
2014 and 31 December 2013 (for the past period 31 December 2013 and 31 December 2012) and other required
data. The cash flow statement excludes the more important values which are not connected with revenues and
expenses.

Fina
ncia
l rep
ort
AN
NU
AL
REPO
RT 2
014
93
1.3.5 Financial risk management
In the Sava Group, we examine and analyse economic circumstances and regularly monitor the exposure to vari-
ous risks and take measures for their managing. In 2014, the Sava Group was exposed to the following financial
risks:
• Risk of change in fair value (price risk)
• Credit risk
• Solvency risk
• Interest rate risk
• Foreign exchange risk
• Guarantees and sureties
• Capital management
In the continuation, we present the risk management policy and the exposure of Sava Group companies to
individual types of financial risks. Further quantitative disclosures are included in the notes to the consolidated
statements.
RISK MANAGEMENT POLICY
Risk management is carried out centrally in the parent company of the Sava Group. The policies are established
to identify and analyse the risks that the Group’s companies face in their day-to-day business. Based on the per-
formed analyses, appropriate limits and controls are defined. Considering the set limits, risks are monitored and
verified. Through continual training and considering the applicable standards and procedures in relation to risk
management, the Group’s companies strive for developing an organised and constructive environment, in which
all employees are aware of their roles and obligations.
RISK OF A FAIR VALUE CHANGE (PRICE RISK)
The risk of a change in fair value is one of the most important risks of the Sava Group as it is associated with
achieving the planned return on financial assets and it impacts the implementation of the outlined strategy. Risks
in connection with fair value changes are decreased through diversifying the investment portfolio and active su-
pervision over the companies’ operations, in which the parent company holds major equity holdings.
Considering the uncertain market circumstances, the risk of a change in fair value remains high in the Sava Group.
CREDIT RISK
This involves the risk that a customer engaged in an agreement on a financial instrument will not meet its ob-
ligations, thus causing the company a financial loss. Credit risk is directly connected with commercial risk and
presents a danger that trade receivables or receivables due from other business partners will be settled with a
delay or not at all.

Fina
ncia
l rep
ort
AN
NU
AL
REPO
RT 2
014
94
For this purpose, we devote special attention to customer solvency. We regularly monitor debts to be collected and
due receivables, maturity of receivables and movements of average payment terms. To decrease exposure to this
risk we make use of the customer rating system to supervise bad payers and carry out ongoing compensations.
Measures to minimise credit risk exposure rely on our own in-depth customer rating and insurance estimates.
The greatest share of the increased credit risk in Sava d.d. is due to transactions made in the past with NFD Hold-
ing d.d. On 6 January 2015, bankruptcy proceedings were initiated against the mentioned company.
Given the business events described above, the credit risk remains high in the Sava Group.
SOLVENCY RISK
This involves the risk that a company may not meet its financial obligations in due time. Owing to continued
adverse economic situation, the circumstances in money markets remained difficult, meaning that access to ad-
ditional liquid means was aggravated.
In 2014, the Sava Group devoted much attention to provision of liquidity in companies, regular settling of finan-
cial liabilities and further realisation of the activities defined in the long-term strategy for the period until 2014.
After having sold financial investments in 2012 and 2013 (divesting real estate business, rubber manufacturing
and the major part of energy business), financial investments of the parent company were further divested in
2014. Owing to divesting financial investments and regular settlement of financial liabilities, the Group’s financial
liabilities were down by €8 million compared to the end of 2013.
All Group companies carry out measures aimed at improving the operative business by introducing cost rational-
isations, activities for cash flow strengthening and other measures for increasing the operating profit.
The Master Restructuring Agreement and thus a moratorium on payment of the principal expired at the end of
November 2014, as of the beginning of December the company is in the preventive restructuring proceedings.
Due to the pending procedures in connection with the preventive restructuring of the parent company, the sol-
vency risk remains high in the Sava Group.
INTEREST RATE RISK
Interest rate risk involves the risk that the value of financial instruments and cost of contracting debts will change
as a result of the changed market interest rates. At the end of November 2014, the Master Restructuring Agree-
ment entered into by Sava d.d. expired. With the expiration of the MRA on 30 November 2014 and the initiated
preventive restructuring proceedings on 2 December 2014, the exposure to interest rate risk increased, as the
company has not yet agreed on the conditions for financial liabilities restructuring. The Master Restructuring
Agreement that Sava Turizem d.d. made with lending banks expires in 2018. The interest rate based on the agree-
ment made amounts to EURIBOR + 5% for the entire period. In 2014, the EURIBOR interest rate remained low
and no significant growth is expected for 2015.
Given the facts described above, it is estimated that the Sava Group is strongly exposed to interest rate risk.

Fina
ncia
l rep
ort
AN
NU
AL
REPO
RT 2
014
95
EXCHANGE RATE RISK
Exchange rate risk involves a risk of losing economic benefits due to changes in the foreign currency exchange
rates. The Sava Group mainly does business in the Euro Zone; therefore we estimate that the Sava Group is not
strongly exposed to exchange rate risk.
GUARANTEES AND SURETIES
In accordance with the policy, the Sava Group companies offered financial guarantees and sureties for hired loans
mainly to the subsidiaries within the Group until recently. Owing to restructuring of financial liabilities and the
commitments in this connection, the possibilities for issuing guarantees and sureties are rather limited and in the
case of the parent company they were deferred until 31 December 2014. Issued guarantees and sureties referred
to transactions made before the restructuring procedure and amounted to €3.9 million at 31 December 2014 (at
the end of 2013: €4.2 million).
CAPITAL MANAGEMENT
An adequate capital structure assures investor, creditor and market confidence, and sustainable development of
the Sava Group. As part of the initiated preventive restructuring proceedings, Sava d.d. will prepare a plan for
business and financial restructuring, which like the previous business strategy will be based on financial restruc-
turing of liabilities, further consolidation of financial assets and cost rationalisations of operations. Based on the
planned activities, the capital structure of the Group is expected to improve.
Sava d.d. has no employee stock option scheme. The regulatory bodies do not have any capital requirements
towards the parent company or subsidiaries of the Sava Group.
The Group’s debt to adjusted capital ratio was as follows (€ thousand):
2014 2013
1. Total liabilities 306,720 310,074
2. Less: cash and cash equivalents -1,205 -1,239
3. Net debts (1. – 2.) 305,515 308,835
4. Total equity -21,226 16,176
5. Less/plus: amounts accumulated in equity relating to cash flow hedges 0 0
6. Adjusted capital (4.+5.) -21,226 16,176
7. Debt to adjusted capital ratio at 31 Dec. (3./6.) negative 19.09

Fina
ncia
l rep
ort
AN
NU
AL
REPO
RT 2
014
96
1.3.6 Segment reporting
The Sava Group reports by operating segment. The basic reporting form, which arises from the strategic business
units, is founded on the internal organisational structure and management of the Group. Internal management
reports are regularly reviewed by the company management teams and the Management Board of Sava d.d.
The prices of transfers among segments are measured on a pure business basis. The performance of individual
segments is measured at profit or loss of the segment before the corporate income tax.
Financial results, assets and liabilities by segment include items that can be attributed directly to the segment,
which is provided by a suitable legal in formal organisational structure of the Group.
Operating segments
The Sava Group consists of the following operating segments:
• Investment Finance division (Sava d.d.)
• Tourism division
• Real Estate division
• Other Operations
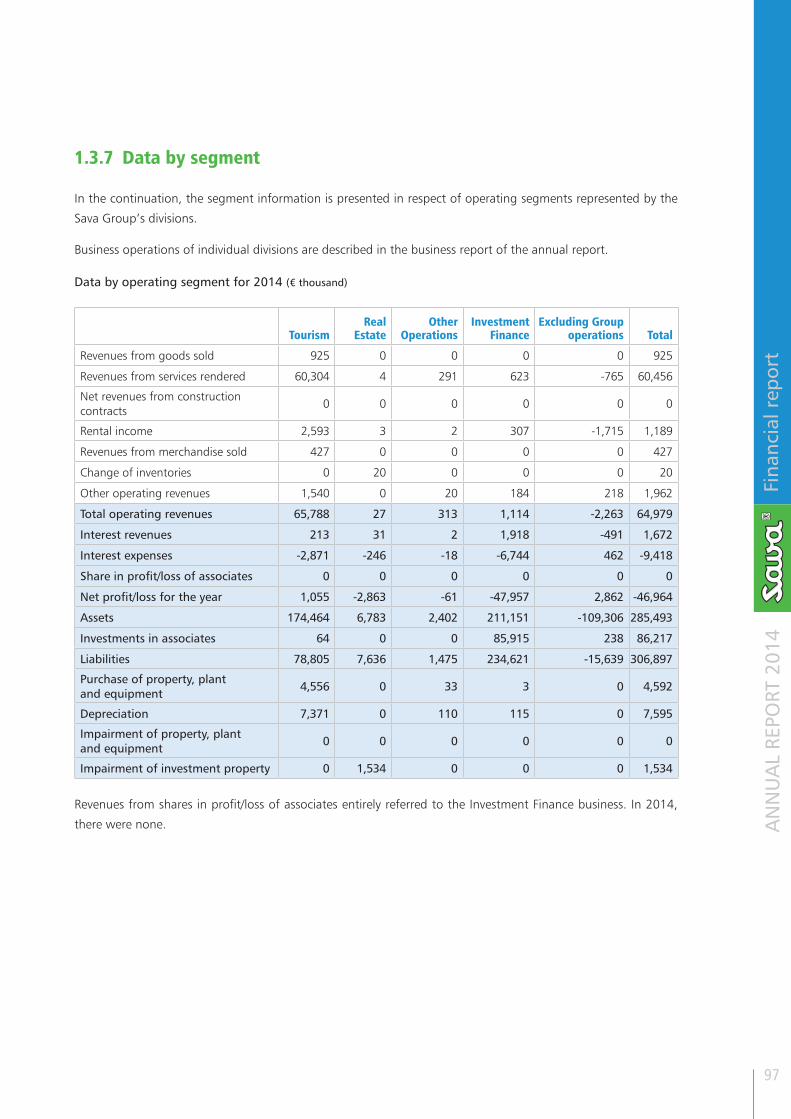
Fina
ncia
l rep
ort
AN
NU
AL
REPO
RT 2
014
97
1.3.7 Data by segment
In the continuation, the segment information is presented in respect of operating segments represented by the
Sava Group’s divisions.
Business operations of individual divisions are described in the business report of the annual report.
Data by operating segment for 2014 (€ thousand)
TourismReal
EstateOther
Operations Investment
FinanceExcluding Group
operations Total
Revenues from goods sold 925 0 0 0 0 925
Revenues from services rendered 60,304 4 291 623 -765 60,456
Net revenues from construction contracts
0 0 0 0 0 0
Rental income 2,593 3 2 307 -1,715 1,189
Revenues from merchandise sold 427 0 0 0 0 427
Change of inventories 0 20 0 0 0 20
Other operating revenues 1,540 0 20 184 218 1,962
Total operating revenues 65,788 27 313 1,114 -2,263 64,979
Interest revenues 213 31 2 1,918 -491 1,672
Interest expenses -2,871 -246 -18 -6,744 462 -9,418
Share in profit/loss of associates 0 0 0 0 0 0
Net profit/loss for the year 1,055 -2,863 -61 -47,957 2,862 -46,964
Assets 174,464 6,783 2,402 211,151 -109,306 285,493
Investments in associates 64 0 0 85,915 238 86,217
Liabilities 78,805 7,636 1,475 234,621 -15,639 306,897
Purchase of property, plant and equipment
4,556 0 33 3 0 4,592
Depreciation 7,371 0 110 115 0 7,595
Impairment of property, plant and equipment
0 0 0 0 0 0
Impairment of investment property 0 1,534 0 0 0 1,534
Revenues from shares in profit/loss of associates entirely referred to the Investment Finance business. In 2014,
there were none.

Fina
ncia
l rep
ort
AN
NU
AL
REPO
RT 2
014
98
Data by operating segment for 2013 (€ thousand)
TourismReal
EstateOther
OperationsInvestment
FinanceExcluding Group
operations Total
Revenues from goods sold 0 0 2,148 0 0 2,148
Revenues from services rendered 60,962 0 2,035 1,432 -1,266 63,163
Net revenues from construction contracts
0 0 0 0 0 0
Rental income 2,720 0 0 426 -1,723 1,423
Revenues from merchandise sold 488 0 0 0 0 488
Change of inventories 0 0 0 0 0 0
Other operating revenues 1,338 0 182 5,264 -2,111 4,673
Total operating revenues 65,508 0 4,365 7,122 -5,100 71,895
Interest revenues 377 44 2 994 -438 979
Interest expenses -3,159 -207 -83 -8,690 439 -11,700
Share in profit/loss of associates 0 0 0 0 0 0
Net profit/loss for the year 1,027 -4,081 -102 -11,381 -41,020 -55,558
Assets 177,259 9,437 2,168 248,317 -110,931 326,250
Investments in associates 64 0 0 85,915 238 86,217
Liabilities 83,201 7,461 1,180 233,200 -14,968 310,075
Purchase of property, plant and equipment
5,199 0 9 130 0 5,338
Depreciation 7,711 0 225 124 0 8,060
Impairment of property, plant and equipment
2,758 0 17 0 0 2,775
Impairment of investment property 0 2,543 0 0 0 2,543
Revenues from shares in profit/loss of associates entirely referred to the Investment Finance business. In 2013,
there were none.
Data about sales revenues by region (€ thousand)
Slovenia Other EU countries Other Total
2014 62,987 1 9 62,997
2013 65,040 0 2,181 67,221
The assets are not segmented by region due to the fact that the carrying amount of assets referring to the com-
panies in Slovenia represented 99.9% of total Group’s assets (2013: 99.9%).
Sales revenues to the biggest customer of the Sava Group, i.e. a customer of Tourism, amounted to €1,436 thou-
sand in 2014 (2013: a customer of Tourism division: €1,919 thousand).

Fina
ncia
l rep
ort
AN
NU
AL
REPO
RT 2
014
99
1.3.8 Discontinued business, assets and liabilities for sale, acquisitions and disposals of equity stakes in subsidiaries
YEAR 2014
a) Explanation in connection with the acquisition of an 85% share of Cardial d.o.o.
In February 2014, Sava Turizem d.d. acquired an 85% share in Cardial d.o.o. The investment value amounted to
€350 thousand; the company’s equity value amounted to €124 thousand. The remaining 15% share represented
the company’s own share.
b) Explanation in connection with divesting a 50.68% share of Energetika Črnomelj d.o.o.
In 2014, Sava d.d. finalised negotiations with Petrol d.d. on selling a 50.68% share of Energetika Črnomelj d.o.o.
The agreement was reached and executed in January 2015. Total value of assets of the sold company amounted
to €1,324 thousand at 31 December 2014, while total equity value of the company amounted to €515 thousand,
and the share attributable to Sava d.d. €261 thousand. Sava d.d. entirely impaired this financial investments al-
ready in the past years, no price difference was thus achieved at selling.
Information on values in the income statement and statement of financial position of the company of Energetika Črnomelj d.o.o. at 31 December 2014 (prior to the sale) (€ thousand)
2014 2013
Revenues from goods sold and services rendered 278 344
Change of inventories 0 0
Other revenues 20 20
Cost of goods, materials and services -207 -225
Labour cost -0 -0
Amortisation and depreciation expense and write-offs -108 -125
Other operating expenses -1 -5
Financial and other revenues 5 0
Financial expenses -24 -7
Tax -0 -0
Net operating profit / loss for the financial year -36 3

Fina
ncia
l rep
ort
AN
NU
AL
REPO
RT 2
014
100
Information on values in the income statement and statement of financial position of the company of Energetika Črnomelj d.o.o. at 31 December 2014 (prior to the sale) (€ thousand)
31 Dec. 2014
Excluded in consolidation
31 Dec. 2014
Transfer to available for sale
31 Dec. 2014 31 Dec. 2013
Property, plant and equipment 1,234 -868 366 1,340
Intangible fixed assets 0 0 0 0
Investment property 0 0 0 0
Long-term financial investments 0 0 0 0
Long-term loans and receivables 0 0 0 0
Deferred tax receivables 0 0 0 0
Inventories 0 0 0 0
Operating and other receivables 56 -28 28 93
Granted loans 0 0 0 0
Cash and cash equivalents 34 -17 17 4
Assets 1,324 -914 410 1,437
Capital 515 -515 0 551
Provisions 177 -90 87 196
Obtained long-term loans 442 -224 218 461
Long-term operating liabilities 0 0 0 0
Deferred tax liabilities 0 0 0 0
Obtained short-term loans 89 -45 44 60
Short-term operating liabilities 82 -31 51 142
Short-term provisions 19 -10 9 27
Capital and liabilities 1,324 -914 410 1,437

Fina
ncia
l rep
ort
AN
NU
AL
REPO
RT 2
014
101
YEAR 2013
a) Explanation in connection with the procedure and realisation of selling the companies of Rubber Manufacturing with the Foreign Trade Network
• The object of the sale was a 100% share of Savatech d.o.o., Kranj with its daughter companies, a 60%
share of Savapro d.o.o., Kranj and the Sava trademark in the part referring to the production process in
Savatech, d.o.o.
• The primary goal of the sale was to maximise purchase consideration to reduce debts of Sava d.d., and the
secondary goal was to preserve this business as a whole and keep the production in Kranj.
• The sale procedure took place in several phases, during which strategic and financial investors were invited
to participate.
• Besides the Management Board members of Sava d.d. and management of Savatech d.o.o., the process
was conducted also by financial advisors of EquityGate Advisors and legal counsellors of the law firm
Jadek&Pensa.
• The best bidder was the Czech rubber manufacturing group ČGS a.s. which was selected as a strategic
partner, the agreement on selling the business was signed on 25 October 2012.
• The conditions for effecting purchase consideration defined in the agreement were met on 8 January
2013, on which day total purchase consideration was effected. The procedure of selling Rubber Manufac-
turing was thus formally finished.
• The purchase consideration for a 100% share of Savatech d.o.o. amounted to €69,400 thousand. The
amount of €49,300 thousand was used for repayment of loans to banks, €4,932 thousand for closing the
liabilities that Sava d.d. had to Rubber Manufacturing, €15,168 thousand was put on the escrow account
at the notary. In this transaction, Sava d.d. generated a profit of €24,302 thousand.
• The purchase consideration for a 60% share of Savapro d.o.o. amounted to €1,000 thousand and was
entirely settled. In this transaction, Sava d.d. made a loss of €794 thousand.
b) Explanation in connection with selling the Energy Management company
• The object of the sale was a 100% share of Ensa BH, d.o.o., Srbac, Bosnia and Herzegovina.
• In 2013, Sava d.d. sold the share of the company without generating a price difference.
• The financial investment in Ensa BH d.o.o. amounted to €3,751 thousand, until inclusive of 2012 the
investment was impaired in total amount.

Fina
ncia
l rep
ort
AN
NU
AL
REPO
RT 2
014
102
Information on values in the income statement of Ensa BH d.o.o., Srbac (€ thousand)
Jan-Sep 2013 Jan-Dec 2012
Revenues from products sold and services rendered 2,148 2,589Changes of inventories 13 -755Other revenues 0 37Cost of goods, material and services -1,861 -2,167Labour cost -268 -312Amortisation and depreciation expense, write-offs -67 -135Other operating expenses 0 -5Financial and other revenues 0 901Financial expenses -37 -155Tax 0 0Net operating profit for the year -72 -2
Information on values in the statement of financial position of Ensa BH d.o.o., Srbac (€ thousand)
30 Sept. 2013 31 Dec. 2012
Property, plant and equipment 1,834 1,926
Intangible fixed assets 2 3
Investment property 0 0
Long-term financial investments 0 0
Long-term loans and receivables 0 0
Deferred tax receivables 0 0
Inventories 457 476
Operating and other receivables 320 239
Granted loans 32 77
Cash and cash equivalents 6 40
Assets 2,651 2,761
Capital 697 756
Provisions 0 2
Obtained long-term loans 73 170
Long-term operating liabilities 0 0
Deferred tax liability 0 0
Obtained short-term loans 662 808
Short-term operating liabilities 1,219 1,025
Short-term provisions 0 0
Capital and liabilities 2,651 2,761

Fina
ncia
l rep
ort
AN
NU
AL
REPO
RT 2
014
103
c) Explanation on divesting Sava Golf d.o.o.
• The object of the sale was a 100% share of Sava Turizem d.d. in Sava Golf d.o.o.
• Sava Golf d.o.o. was established in order to divest the Bled golf course.
• On the transaction date, Sava Golf d.o.o. had a balance sheet total of €5,442 thousand, tangible fixed
assets worth €5,420 thousand and other assets of €22 thousand available. The value of capital amounted
to €3,598 thousand and liabilities to €1,844 thousand.
• Sava Turizem d.d. generated a profit of €5,402 thousand at selling the investment.
d) Introduction of bankruptcy proceedings against Energetika d.o.o.
On 30 May 2013, a petition for institution of bankruptcy proceedings against the company Energetika, družba
za naložbe in upravljanje z energijo d.o.o. was filed at the Kranj District Court. By the decision of the Court, bank-
ruptcy proceedings were instituted on 5 August 2013.
At 31 December 2012, Energetika d.o.o. disposed of the balance sheet total of €174 thousand. It had a negative
capital of €428 thousand, its structure including the uncovered losses of €1,308 thousand. On the day of insti-
tuting the bankruptcy proceedings, which at 31 December 2014 was not finalised yet, the ownership of Sava d.d.
in this company ceased.
e) Other changes
Owing to their minimum values, the financial investments in Sava Ensa dooel., Skopje and Bramir d.o.o., Mostar
were transferred under securities available for sale. For this reason, they were excluded from consolidated finan-
cial statements. All relations with the mentioned companies were settled in the financial statements of Sava d.d.
Sava Ensa doel. had assets of €342 thousand, liabilities of €337 thousand and capital of €5 thousand available.
The company is not operative. In connection with the financial investment in this company, Sava d.d. made a
loss of €5 thousand already 2012. The company is being dissolved. We estimate that Sava d.d. is not exposed to
potential liabilities risk in connection with Sava Ensa dooel.
Bramir d.o.o. had assets of €1,477 thousand, liabilities of €1,600 thousand and negative capital of €123 thou-
sand available. The major part of assets and liabilities was transferred to Ensa BH d.o.o. in the final phase of selling
the same. In connection with the financial investment in this company, Sava d.d. suffered a loss of €10 thousand
already in 2012. The company is being dissolved. We estimate that Sava d.d. is not exposed to potential liabilities
risk in connection with Bramir d.o.o.

Fina
ncia
l rep
ort
AN
NU
AL
REPO
RT 2
014
104
1.3.9 Property, plant and equipment
Movement of property, plant and equipment of the Sava Group for 2014 (€ thousand)
Land BuildingsPlant and
machineryOther
equipmentPPE under
construction
Advances for obtaining
tangible fixed assets Total
COST VALUE
Balance at 1 Jan. 2014 20,427 225,525 44,578 12,313 993 13 303,849
Purchase 0 604 963 257 2,769 223 4,816
Increase in advance payment 0 0 0 0 0 0 0
Decrease in advance payments
0 0 0 0 0 -13 -13
Decrease in advance payment from the current year
0 0 0 0 0 0 0
Put in use 0 1,431 221 163 -1,814 0 0
Transfer to assets for sale -53 -293 -1,654 0 0 0 -2,000
Increase due to acquisition 0 0 0 641 0 0 641
Transfers 0 281 0 0 -281 0 0
Decrease due to sale 0 0 -81 0 0 0 -81
Decrease due to sale of a subsidiary 0 0 0 0 0 0 0
Write-offs 0 0 -780 -90 0 0 -870
Impairment 0 0 0 0 0 0 0
Balance at 31 Dec. 2014 20,374 227,548 43,247 13,283 1,667 223 306,342
ACCUMULATED DEPRECIATION
Balance at 1 Jan. 2014 0 -104,964 -33,763 -11,765 0 0 -150,491
Purchase, increase 0 0 0 0 0 0 0
Put in use 0 0 0 0 0 0 0
Transfer to assets for sale 0 63 702 0 0 0 765
Increase due to acquisitions 0 0 0 -512 0 0 -512
Transfers 0 0 0 0 0 0 0
Decrease due to sale 0 0 52 0 0 0 52
Decrease due to spin-off 0 0 0 0 0 0 0
Write-offs 0 0 766 88 0 0 854
Impairment 0 0 0 0 0 0 0
Depreciation 0 -4,475 -2,604 -225 0 0 -7,304
Balance at 31 Dec. 2014 0 -109,376 -34,846 -12,414 0 0 -156,636
CARRYING AMOUNT
Balance at 1 Jan. 2014 20,427 120,561 10,816 548 993 13 153,358
Balance at 31 Dec. 2014 20,374 118,172 8,401 869 1,667 223 149,706

Fina
ncia
l rep
ort
AN
NU
AL
REPO
RT 2
014
105
Movement of property, plant and equipment of the Sava Group for 2013 (€ thousand)
Land BuildingsPlant and
machineryOther
equipmentPPE under
construction
Advances for obtaining
tangible fixed assets Total
COST VALUE
Balance at 1 Jan. 2013 21,047 231,772 50,708 12,488 173 0 316,188
Purchase 306 1,227 847 48 2,911 13 5,351
Increase in advance payment 0 0 0 0 0 0 0
Decrease in advance payments 0 0 0 0 0 0 0
Decrease in advance payment from the current year 0 0 0 0 0 0
Put in use 0 0 0 0 0 0
Transfers 0 2,023 67 0 -2,090 0 0
Decrease due to sale 0 -13 -727 -12 0 0 -753
Decrease due to spin-off -549 -7,057 -4,489 -8 0 0 -12,103
Write-offs 0 -6 -920 -199 0 0 -1,126
Impairment -377 -2,422 -907 -3 0 0 -3,709
Balance at 31 Dec. 2013 20,427 225,525 44,578 12,313 993 13 303,848
ACCUMULATED DEPRECIATION
Balance at 1 Jan. 2013 0 -104,106 -35,291 -11,821 0 0 -151,217
Purchase, increase 0 0 0 0 0 0 0
Put in use 0 0 0 0 0 0 0
Transfers 0 0 0 0 0 0 0
Decrease due to sale 0 2 652 9 0 0 662
Decrease due to spin-off 0 3,210 2,551 0 0 0 5,760
Write-offs 0 1 896 205 0 0 1,102
Impairment 0 418 515 0 0 0 933
Depreciation 0 -4,489 -3,084 -158 0 0 -7,730
Balance at 31 Dec. 2013 0 -104,963 -33,762 -11,765 0 0 -150,490
CARRYING AMOUNT
Balance at 1 Jan. 2013 21,046 127,667 15,416 667 173 0 164,969
Balance at 31 Dec. 2013 20,427 120,561 10,816 548 993 13 153,358
The data on the impaired assets value is given under 1.3.30.

Fina
ncia
l rep
ort
AN
NU
AL
REPO
RT 2
014
106
In 2013, when the project of real property listing and its status took place, it was established in the companies of
Tourism that certain deprecation rates by destination differed and were high considering the condition of build-
ings, infrastructure and recreational surfaces. For this reason, the expected service life was estimated, thereby
considering normal use and maintenance of buildings. Based on the stated facts, a decision was made to change
the depreciation rates as follows:
• Buildings - considering the condition and use of buildings, the suitable depreciation rate amounts between
1.4 and 5.0%.
• Infrastructure – the condition of infrastructure enables a normal use at the foreseen changed depreciation
rate between 1.4 and 5.0%.
• Outer surfaces and recreational surfaces – their condition enables a normal use at the foreseen changed
depreciation rate between 1.4 and 3.0%.
The revaluation effect in the period from 1 January to 31 December 2013 represented depreciation expenses that
were lower by €336 thousand.
Overview of mortgage values at 31 December 2014 (€ thousand)
Carrying amount of mortgaged assets
Mortgage value on real property
Sava d.d.* 1,411 1,411
Sava Nepremičnine d.o.o.** 1,260 7,000
Sava Turizem d.d. 93,728 49,086
SAVA TMC d.o.o. 4,335 10,606
Total 100,734 68,103
* The book value of mortgages in Sava d.d. totalling €1,411 thousand referred to investment property. ** The book value of mortgages in Sava Nepremičnine d.o.o. totalling €1,260 thousand referred to investment property.
Overview of mortgage values at 31 December 2013 (€ thousand)
Carrying amount of mortgaged assets
Mortgage value on real property
Sava d.d.* 1,466 1,466
Sava Nepremičnine d.o.o. 2,359 7,000
Sava Turizem d.d. 93,111 51,952
Total 96,936 60,418
* The value of mortgages in Sava d.d. totalling €1,466 thousand referred to investment property. ** The value of mortgages in Sava Nepremičnine d.o.o. totalling €2,359 thousand referred to investment property.
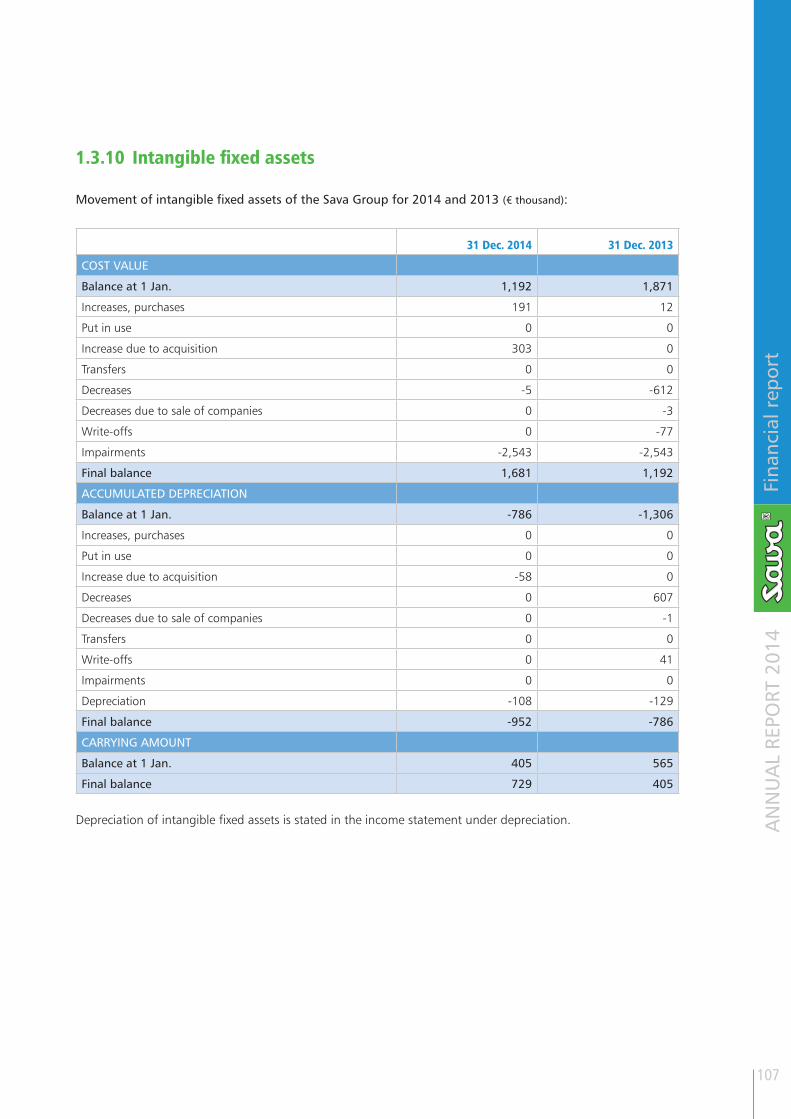
Fina
ncia
l rep
ort
AN
NU
AL
REPO
RT 2
014
107
1.3.10 Intangible fixed assets
Movement of intangible fixed assets of the Sava Group for 2014 and 2013 (€ thousand):
31 Dec. 2014 31 Dec. 2013
COST VALUE
Balance at 1 Jan. 1,192 1,871
Increases, purchases 191 12
Put in use 0 0
Increase due to acquisition 303 0
Transfers 0 0
Decreases -5 -612
Decreases due to sale of companies 0 -3
Write-offs 0 -77
Impairments -2,543 -2,543
Final balance 1,681 1,192
ACCUMULATED DEPRECIATION
Balance at 1 Jan. -786 -1,306
Increases, purchases 0 0
Put in use 0 0
Increase due to acquisition -58 0
Decreases 0 607
Decreases due to sale of companies 0 -1
Transfers 0 0
Write-offs 0 41
Impairments 0 0
Depreciation -108 -129
Final balance -952 -786
CARRYING AMOUNT
Balance at 1 Jan. 405 565
Final balance 729 405
Depreciation of intangible fixed assets is stated in the income statement under depreciation.

Fina
ncia
l rep
ort
AN
NU
AL
REPO
RT 2
014
108
1.3.11 Investment property
Movement of investment property of the Sava Group for 2014 (€ thousand):
Land - investment property
Buildings - investment property Total
COST VALUE
Balance at 1 Jan. 2014 4,909 8,819 13,729
Purchases, increase 0 23 23
Transfer 0 1 1
Decrease due to sale -25 0 -25
Balance at 31 Dec. 2014 4,884 8,844 13,728
ACCUMULATED DEPRECIATION
Balance at 1 Jan. 2014 0 -5,374 -5,374
Impairment -1,534 0 -1,534
Depreciation 0 -183 -183
Balance at 31 Dec. 2014 -1,534 -5,557 -7,091
CARRYING AMOUNT
Balance at 1 Jan. 2014 4,909 3,446 8,355
Balance at 31 Dec. 2014 3,350 3,287 6,637
Based on fair value estimate of investment property made by using comparable data accessible on the market, we
estimated that fair value of investment property did not significantly deviate from the book values.
The value of mortgages in Sava d.d. shown under 1.3.9. included also a mortgage placed on investment property
totalling €1,411 thousand.
The value of mortgages in Sava Nepremičnine, d.o.o., shown under item 1.3.9., includes a mortgage on invest-
ment property whose book value amounted to €1,260 thousand. The amount of placed mortgages on invest-
ment property amounted to €7,000 thousand, which at 31 December 2014 was also the balance of unpaid loans.
The real property Perovo whose book value amounted to €979 thousand is additionally encumbered with a land
debt totalling €2,485 thousand.
With the investment property put in lease, revenues of €1,189 thousand (2013: €1,423 thousand) and expenses
of €458 thousand (2013: €582 thousand) were generated. With investment property not put in lease, expenses
of €37 thousand (2013: €136 thousand) were shown.

Fina
ncia
l rep
ort
AN
NU
AL
REPO
RT 2
014
109
Movement of investment property of the Sava Group for 2013 (€ thousand):
Land - investment property
Buildings - investment property Total
COST VALUE
Balance at 1 Jan. 2013 3,309 8,755 12,065
Purchase, increase 0 76 76
Transfer 6,316 0 6,316
Decrease due to sale -2,173 -11 -2,184
Impairment -2,543 0 -2,543
Balance at 31 Dec. 2013 4,909 8,819 13,729
ACCUMULATED DEPRECIATION
Balance at 1 Jan. 2013 0 -5,199 -5,199
Increase due to revaluation 0 27 27
Depreciation 0 -201 -201
Balance at 31 Dec. 2013 0 -5,374 -5,374
CARRYING AMOUNT 3,309 3,556 6,865
Balance at 1 Jan. 2013 4,909 3,446 8,355
Balance at 31 Dec. 2013 3,350 3,287 6,637
Based on fair value estimate of investment property made by using comparable data accessible on the market, we
estimated that fair value of investment property did not significantly deviate from the book values.
The value of mortgages in Sava d.d. shown under 1.3.9. includes also a mortgage placed on investment property
totalling €1,466 thousand.
The book value of investment property in Sava Nepremičnine d.o.o., placed as security for liabilities arising from
loan contracts amounted to €2,359 thousand. The amount of placed mortgages on investment property totalled
€7,000 thousand, representing the balance of unpaid loans as at 31 December 2013. The real property Perovo
with the book value of €1,414 thousand is additionally encumbered with a land debt totalling €2,485 thousand.
With investment property put in lease, revenues of €1,423 thousand and expenses of €582 thousand were gen-
erated. With investment property not put in lease, expenses of €136 thousand were shown.

Fina
ncia
l rep
ort
AN
NU
AL
REPO
RT 2
014
110
1.3.12 Investments in the associated companies
The companies of the Sava Group had shares in the following associated companies (€ thousand):
% shareholding 31 Dec. 2014
% shareholding 31 Dec. 2013
Value of financial investments
31 Dec. 2014 31 Dec. 2013
Gorenjska banka, d. d., Kranj 44.23 44.23 59,511 86,188
NFD Holding, d.d., Ljubljana 24.65 24.65 0 29
Total 59,511 86,217
Additional explanations:
34,287 shares of Gorenjska banka d.d., Kranj is under a fiduciary ownership of Abanka Vipa d.d., which saves
them in favour of the holders of SA03 bonds issued by Sava d.d. as collateral for the liabilities arising from the
bonds.
A proposal for initiating bankruptcy proceedings against NFD Holding d.d. was filed on 6 January 2015.
Year 2013: Based on the decision by the Bank of Slovenia of 17 December 2013 on introducing urgent measures,
total qualifying liabilities of the bank including the share capital of Abanka expired on 18 December 2013. On
the very same day, corresponding entries were carried out in the court register, while the existing shares were
cancelled from the central registry of dematerialised securities run by the KDD d.d. Prior to this change, Sava d.d.
held 1,715,841 ABKN shares representing 23.8311% of total issue of Abanka shares. After cancellation of the
ABKN shares Sava d.d. no longer holds any Abanka shares.
Movement of investments in the associated companies (€ thousand):
2014 2013
Initial balance 86,217 121,585
Acquisitions 0 0
Reversal of equity revaluation adjustment 0 5,604
Attributable profits 0 0
Paid dividends 0 0
Sales 0 -3,558
Attributable losses 0 0
Impairments -26,706 -37,414
Final balance 59,511 86,217

Fina
ncia
l rep
ort
AN
NU
AL
REPO
RT 2
014
111
Significant financial data about the company Gorenjska banka d.d., Kranj (€ thousand)
2014 2013
Assets n.d. 1,560,886
Liabilities and provisions n.d. 1,395,174
Capital 187,000 165,712
Revenues n.d. 75,667
Net profit / loss 2,000 -115,600
Comprehensive income for the financial year after tax n.d. -123,187
The data for 2013 was audited. The stated unaudited data for 2014 was publicly announced.
Significant financial data about the company NFD Holding d.d., Ljubljana Ljubljana (€ thousand)
2014 2013
Assets n.d. 54,958
Liabilities and provisions n.d. 66,268
Capital n.d. -11,310
Revenues n.d. 531
Net profit / loss n.d. -15,709
Comprehensive income for the financial year after tax n.d. -12,026
The data for 2013 was audited. The 2014 data is not accessible.
OTHER EXPLANATIONS IN CONNECTION WITH THE ASSOCIATED COMPANIES
Gorenjska banka, d.d., Kranj
A 44.23% shareholding of Gorenjska banka d.d. showed the value of €59,511thousand in the consolidated
financial statements of the Sava Group. Compared to the end of the previous year, the value reduced by €26,677
thousand, which was due to impairment of the investment in Gorenjska banka d.d., based on the evaluation
prepared by a certified evaluator. At 31 December 2014, the share price amounted to €406 (2013: €588).
Sava d.d. pledged 139,480 shares of Gorenjska banka d.d. for the obtained loans, issued bonds and obtained
loan of a subsidiary. The book value of pledged shares amounted to €56,629 thousand
Information about the evaluation of a 44.07% equity holding of Gorenjska banka d.d. for financial report-
ing purpose at 31 December 2014
An evaluation report for a 44.07% equity holding of Gorenjska banka d.d. at 31 December 2014 was produced
for financial reporting purpose. A certified company evaluator licensed with the Slovene Audit Institute carried
out the evaluation.
Gorenjska banka d.d. was evaluated based on the current value of the expected free cash flow (value in use) and
the method of market comparisons (fair value decreased by selling costs). The following documents were used
in the evaluation: the operations projections prepared on the basis of the past operating results; estimates of
financial statements for 2014; business plans for the period 2015- 2019; publicly announced strategic basis for
action and policies of the company; explanations given by the company’s management board; analyses of the
macroeconomic environment and the industry.

Fina
ncia
l rep
ort
AN
NU
AL
REPO
RT 2
014
112
The following assumptions were used in the value computation: a going-concern entity; a 10% minority owner
discount; a 10% discount for shortage of marketability; a 12.30% required return on capital; a 2% growth in
normalised cash flow.
The fair value computation decreased by selling costs considered the following assumptions: a going-concern
entity; P/B multiplication factor between 0.69 and 0.79 (listed companies); a 5% discount for shortage of market-
ability; adjustment by a control premium 18.75%; selling cost estimate 2%.
The final resolution on recoverable amount evaluation was made based on fair value decreased by selling cost in
the span from €378 for a share to €434 for a share, with the mean value at €406 for a share.
The final resolution on recoverable amount evaluation was made based on fair value decreased by selling cost in
the range between €378 for a share and €434 for a share, with the mean value at €406 for a share.
NFD HOLDING D.D., LJUBLJANA
The value of a 24.65% stake in NFD Holding d.d., Ljubljana, was additionally impaired by €29 thousand due to
introducing bankruptcy proceedings on 6 January 2015. At 31 December 2014, the investment had zero value.
Disclosures in connection with the composition of the Sava Group, share in capital, amount of capital and oper-
ating result of the associates are presented in the financial report of the annual report of the Sava Group.
1.3.13 Long-term securities available for sale
The value of other stakes and shares totalled €38,392 thousand (2013: €31,426 thousand) and in comparison
with the previous year it was higher by 22%.
At 31 December 2014, securities available for sale were valued at fair value. The net positive effect of revalua-
tion amounted to €10,083 thousand (2013: a net negative effect of €4,673 thousand), of which impairments
through profit or loss amounted to €840 thousand (2013: €3,967 thousand) and a net amount of €10,923
thousand was due to increasing the financial investments value through equity revaluation adjustment (2013: a
net decrease of €706 thousand).
Securities available for sale whose book value amounted to €3,128 thousand were sold in 2014, at which a profit
of €1.311 thousand was generated. The majority of purchase consideration was earmarked for loan repayments
to banks.
Types of long-term securities (€ thousand):
31 Dec. 2014 31 Dec. 2013
Shares of listed companies 946 3,604
Shares and stakes of unlisted companies 3,323 3,823
Alpen.SI, mixed flexible sub-fund 34,123 23,999
Total 38,392 31,426
The value of investment in Alpen.SI (renaming of NFD 1, mutual fund) amounted to €34,123 thousand (2013:
€23,999 thousand). The fair value was ascertained by using the stock exchange price announced on the last day
of accounting period and compared to the previous year, it rose considerably.

Fina
ncia
l rep
ort
AN
NU
AL
REPO
RT 2
014
113
Despite a 39.95% ownership stake, the investment in Alpen.SI is considered as available for sale and not as an
associated company. The company is managed by a management company, in which Sava d.d. holds no owner-
ship stake. The Supervisory Board of the company solely supervises the fund’s operations. In 2011, the company
restructured from a close investment fund into an open mutual fund, after which Sava d.d. became the owner of
a certain share of mutual fund’s coupons and has no influence on its management.
A total, 39.95%, share in Alpen.SI is pledged for the loans obtained by Sava d.d. The book value of pledged in-
vestment amounts to €34,123 thousand.
The value of other shares and stakes amounted to €4,269 thousand (2013: €7,427 thousand), and included
1,468,221 shares of Hoteli Bernardin, 13,500 shares of Kompas Bled, 4,987 shares of Pokojninska Družba A, and
13,638 shares of Jubmes banka; they were pledged for the loans obtained by Sava d.d. The book value of pledged
shares amounted to €3,275 thousand.
Movement of long-term securities (€ thousand):
2014 2013
Balance at 1 Jan. 31,426 36,582
Acquisitions 11 142
Increase with non-cash contributions 0 0
Transfers 0 0
Change to fair value 10,923 -706
Disposals - at cost value -3,128 -625
Impairments -840 -3,967
Final balance 38,392 31,426
1.3.14 Long-term loans and long-term operating receivables
31 Dec. 2014 31 Dec. 2013
Granted long-term loans 1 2
Other long-term operating receivables 39 39
Total 40 41
Maturity of long-term loans (€ thousand):
31 Dec. 2014 31 Dec. 2013From
1 to 5 yearsMore than
5 yearsFrom
1 to 5 yearsMore than
5 years
Granted long-term loans 1 0 2 0
Other long-term operating receivables 39 0 39 0
Total 40 0 41 0

Fina
ncia
l rep
ort
AN
NU
AL
REPO
RT 2
014
114
Movement of long-term loans (€ thousand)
2014 2013
Balance at 1 Jan. 41 20
Newly formed loans 0 0
Transfer 0 39
Decrease -1 -7
Repayments 0 -10
Impairment 0 0
Final balance 39 41
1.3.15 Deferred tax liabilities / receivables
Deferred tax liabilities were formed in the value of €884 thousand (2013: deferred tax receivables of €10,806
thousand).
Deferred tax liabilities /receivables referred to the following items (€ thousand):
31 Dec. 2014 31 Dec. 2013
Receivables/liabilities – revaluation of securities to fair value -997 10,664
Receivables – provisions acc. to actuarial calculation, disputes 113 142
Total -884 10,806
The major changes took place at Sava d.d., in which deferred tax receivables were shown to the amount of
€10,874 thousand at the end of 2013. In 2014, these reduced by €1,488 thousand due to the sale of impaired
securities available for sale. The remaining deferred tax receivables were additionally impaired by €9,386 thou-
sand. All changes were made through profit or loss. At 31 December 2014, Sava d.d. did not show any deferred
tax receivables.
Movement of deferred tax liabilities / receivables (€ thousand):
31 Dec. 2014 31 Dec. 2013
Balance at 1 Jan. 10,806 19,293
Change of deferred tax liabilities – through profit or loss -10,865 -9,777
Change of receivables for provisions for retirement amounts 9 9
Final reversal of receivables through profit or loss -9,386 0
Decrease of receivables due to sale or discontinued ownership of securities- through profit or loss -1,488 -9,786
Change of deferred tax liabilities – in other comprehensive income -825 1,506
Change of liabilities from revaluation of securities to fair value -787 1,091
Other changes of liabilities -38 415
Transfer 0 -216
Final balance -884 10,806
The amount of the not accounted for deferred tax receivables arising from tax losses of the Sava Group companies
by using a 17% tax rate amounted to €55,360 thousand at 31 December 2014.

Fina
ncia
l rep
ort
AN
NU
AL
REPO
RT 2
014
115
1.3.16 Inventories
Gross value 31 Dec. 2014
Write-offs in the year 2014
Net value 31 Dec. 2014
Net value 31 Dec. 2013
Material 552 0 552 613
Finished products 66 0 66 0
Merchandise 77 0 77 73
Unfinished construction projects 3,576 -1,088 2,488 3,578
Total 4,270 -1,088 3,182 4,265
In 2014, a further value adjustment was formed in Sava Nova d.o.o., Zagreb amounting to €1,088 thousand
(2013: €1,167 thousand). A mortgage was placed on inventories of Sava Nova d.o.o., Zagreb. The book value of
inventories amounted to €1,034 thousand. The balance of not yet repaid loan principal, which was secured by
placing mortgage on inventories, amounted to €703 thousand. Civil procedure in connection with cashing in of
collateral is in progress.
1.3.17 Short-term operating and other receivables (€ thousand)
31 Dec. 2014 31 Dec. 2013
Trade receivables 3,038 2,687
Receivables temporary not charged 818 843
Receivables due from associates 2,754 1,348
Advances paid 26 0
Receivables for VAT and other taxes 389 418
Other receivables 271 248
Total 7,294 5,544
In 2014, the Sava Group companies formed an additional value adjustment in trade receivables totalling €412
thousand (2013: €684 thousand) through profit or loss. In chapter on risks the value adjustment of €441 thou-
sand was shown. The difference totalling €29 thousand referred to incorporating a new company in the Group
and a transfer of the already formed revaluation from a subsidiary to companies out of the Group.
1.3.18 Short-term granted loans (€ thousand)
31 Dec. 2014 31 Dec. 2013
Short-term granted loans 18,388 24,594
Short-term portion of long-term loans 0 0
Total 18,388 24,594
The gross amount of the loan Sava d.d. granted to NFD Holding d.d. amounted to €17,806 thousand, the
balance of value adjustment to €10,483 thousand and the net value of receivable amounted to €7,323 thousand.

Fina
ncia
l rep
ort
AN
NU
AL
REPO
RT 2
014
116
In comparison with the end of the previous year, the balance of loans granted to NFD Holding d.d. was decreased
by €449 thousand, due to an additional impairment of loan calculated from the estimated suitability of received
collateral.
The loans approved to NFD Holding (net of €7,323 thousand) and interests (€2,754 thousand) shown under
operating receivables are insured with the bills of exchange and securities, which include 9,154,192 shares of
Hoteli Bernardin, 346,243 shares Alpen.SI fund, 647,318 shares of Istrabenz, 166,484 shares of Melamin, 56,839
shares of Finetol, 5,806 shares of Krka, 893 shares of Petrol, and 32,936 shares of Sava. With all the mentioned
shares Sava d.d. is partly the first-entered lien holder, and partly the second-entered lien holder. The estimated
value of securities pledged as security amounted to €10,077 thousand.
During the valid restructuring agreement for financial liabilities of NFD Holding d.d. the loans were bearing in-
terest at a 2.7% interest rate, as of the expiration of financial restructuring agreement they bear interest as per
contractual default interest rate. The bankruptcy proceedings against NFD Holding d.d. were introduced on 6
January 2015.
The receivables due from NFD Holding d.d. have been entirely pledged as security to lending banks.
The remaining short-term granted loans totalling €11,065 thousand mainly referred to bank deposits at interest
rates from 0.15% to 3.0%.
1.3.19 Cash and cash equivalents (€ thousand)
31 Dec. 2014 31 Dec. 2013
Cash on hand and transaction accounts 1,205 1,239
Total 1,205 1,239
Cash and cash equivalents totalling €1,205 thousand (2013: €1,239 thousand) referred to assets on account
1.3.20 Equity capital and reserves
At 31 December 2014, the capital value of the Sava Group was negative and amounted to €21,226 thousand
(2013: positive value of €16,176 thousand) and it was by €37,402 thousand lower than at the end of the previ-
ous year. The negative Group’s capital value was due to a loss in the parent company, which in 2014 amounted
to €47,957 thousand, while its negative capital amounted to €23,470 thousand.
SHARE CAPITAL
The approved share capital totally paid in amounted to €14,061 thousand at 31 December 2014. It reduced by
€11,381 thousand compared to the previous year. At the 20th Shareholders’ Meeting of Sava d.d. a resolution
on a simplified share capital reduction amounting to €11,381 thousand was adopted to cover the accumulated
loss as per 31 December 2013.
Capital is divided into 2,006,987 ordinary personal no-par value shares. The shareholders are entitled to a divi-
dend in accordance with the resolution adopted by the Shareholders’ Meeting. The ownership structure and its
changes are described in chapter - The Sava share and ownership structure.
The balance and movement of equity is clear from the statement in changes of equity.
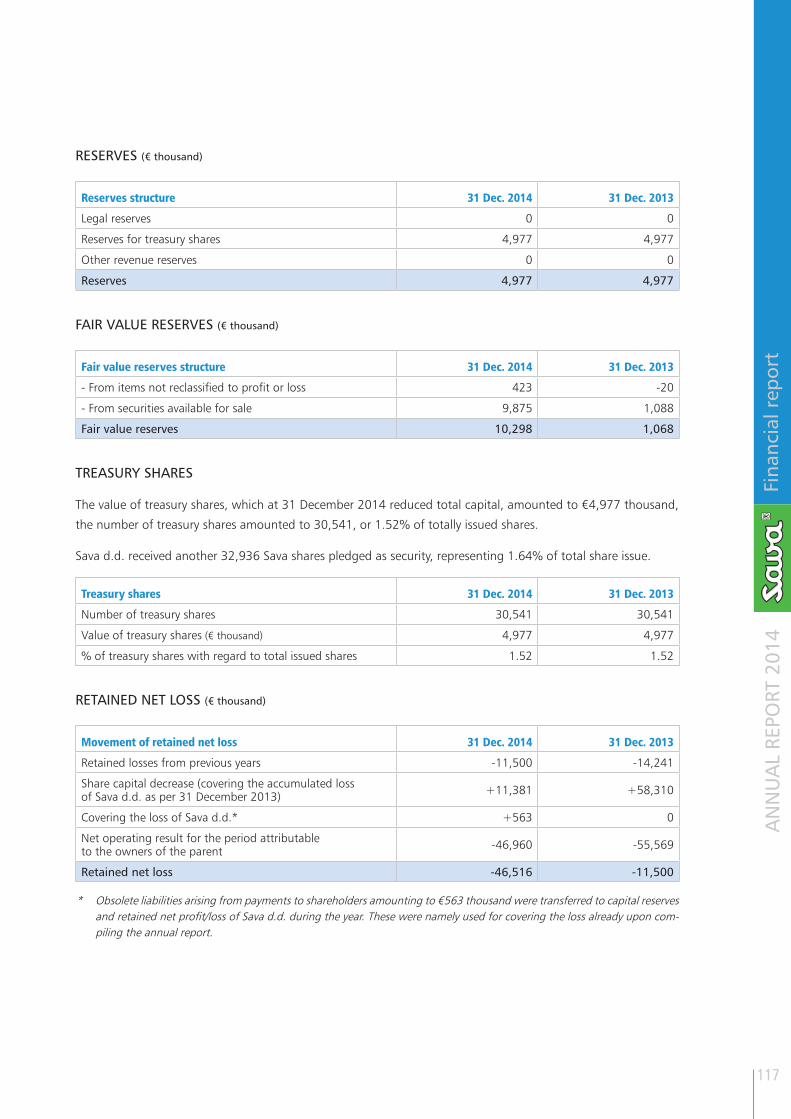
Fina
ncia
l rep
ort
AN
NU
AL
REPO
RT 2
014
117
RESERVES (€ thousand)
Reserves structure 31 Dec. 2014 31 Dec. 2013
Legal reserves 0 0
Reserves for treasury shares 4,977 4,977
Other revenue reserves 0 0
Reserves 4,977 4,977
FAIR VALUE RESERVES (€ thousand)
Fair value reserves structure 31 Dec. 2014 31 Dec. 2013
- From items not reclassified to profit or loss 423 -20
- From securities available for sale 9,875 1,088
Fair value reserves 10,298 1,068
TREASURY SHARES
The value of treasury shares, which at 31 December 2014 reduced total capital, amounted to €4,977 thousand,
the number of treasury shares amounted to 30,541, or 1.52% of totally issued shares.
Sava d.d. received another 32,936 Sava shares pledged as security, representing 1.64% of total share issue.
Treasury shares 31 Dec. 2014 31 Dec. 2013
Number of treasury shares 30,541 30,541
Value of treasury shares (€ thousand) 4,977 4,977
% of treasury shares with regard to total issued shares 1.52 1.52
RETAINED NET LOSS (€ thousand)
Movement of retained net loss 31 Dec. 2014 31 Dec. 2013
Retained losses from previous years -11,500 -14,241
Share capital decrease (covering the accumulated loss of Sava d.d. as per 31 December 2013) +11,381 +58,310
Covering the loss of Sava d.d.* +563 0
Net operating result for the period attributable to the owners of the parent -46,960 -55,569
Retained net loss -46,516 -11,500
* Obsolete liabilities arising from payments to shareholders amounting to €563 thousand were transferred to capital reserves and retained net profit/loss of Sava d.d. during the year. These were namely used for covering the loss already upon com-piling the annual report.

Fina
ncia
l rep
ort
AN
NU
AL
REPO
RT 2
014
118
NET LOSS PER SHARE
Share capital is divided into 2,006,987 ordinary personal no-par value shares that all have voting right and are
freely transferrable. All shares are wholly paid in. The company has no bonds available to be converted into shares.
Weighted average number of shares
2014 2013
Total number of shares 2,006,987 2,006,987
Less treasury shares -30,541 -30,541
Weighted average number of shares 1,995,423 1,995,423
NET LOSS ATTRIBUTABLE TO ORDINARY SHARES
2014 2013
Net profit/loss for the year (€ thousand) -46,964 -55,558
Net profit /loss for the year attributable to the owners of the parent (€ thousand)
-46,960 -55,569
Weighted average number of ordinary shares 1,995,423 1,995,423
Basic net loss per share (€) -23.53 -27.85
The diluted net loss per share equals the basic net loss per share, since capital is composed of ordinary shares.
The appropriation of profit is only possible within the amount determined in accordance with Slovene legislation.
The legislation regulates that a parent company may distribute the accumulated profit as determined in the sep-
arate financial statements compiled in accordance with Slovene Accounting Standards. At 31 December 2014,
Sava d.d. showed the uncovered loss of €47,394 thousand, whereas at 31 December 2013 the uncovered loss
amounted to €11,381 thousand.
(€ thousand)
2014 2013
Retained loss for the financial year for the Sava Group, according to IFRS as adopted by the EU -46,516 -11,500
Accumulated loss of Sava d.d. for the financial year, according to SAS -47,394 -11,381
Non-distributable difference - -

Fina
ncia
l rep
ort
AN
NU
AL
REPO
RT 2
014
119
MINORITY INTEREST, CAPITAL AND PROFIT
The share of minority interest, attributable capital and profit for the subsidiaries is calculated indirectly, through
the ownership of the parent company.
In 2014, minority interest decreased by €235 thousand; it increased by €14 thousand due to the attributable
profit and decreased by €249 thousand due to disposal of companies.
Minority interest attributable to the following companies (€ thousand):
Minority interestCapital attributable to minority interest
Profit attributable to minority interest
31 Dec. 2014 31 Dec. 2013 31 Dec. 2014 31 Dec. 2013 31 Dec. 2014 31 Dec. 2013
Sava Turizem d.d. 0.95 % 0.95 % 897 888 5 6
Sava TMC d.o.o. 0.95 % 0.95 % 11 6 5 4
Sava Zdravstvo d.o.o. 0.95 % 0.95 % 0 0 0 0
Cardial, d.o.o. 15.00 % 0.00 % 23 0 4 0
Energetika Črnomelj d.o.o., Ljubljana 0.00 % 49.32 % 0 272 -18 1
Total 931 1,166 -4 11
1.3.21 Provisions (€ thousand)
Balance 1 Jan. 2014 Formation Cancellation Use
Balance 31 Dec. 2014
Provisions for retirement amounts and similar liabilities 1,783 67 -324 -97 1,430
Provisions for lawsuits and other claims 60 55 0 -13 102
Warranties 30 0 0 0 30
Other 1,088 0 0 -8 1,080
Total 2,961 122 -324 -117 2,642
The accrued liabilities to employees included liabilities for retirement amounts and jubilee benefits. Owing to a
reduced employee number a recalculation was carried out for the employees at Sava d.d. In the case of Sava
Turizem d.d., the actuary calculation was made at 31 December 2014, which was based on the following assump-
tions: retirement amounts, jubilee benefits in accordance with the provisions of the collective and individual work
contracts, a 1.5% annual increase in salaries, retirement amounts and jubilee benefits, employee fluctuation, the
selected discount rate at 3.315% annually, representing a two-year average of interest rate on long-term bonds
issued by the Republic of Slovenia.
Provisions for lawsuits and other claims were formed after consulting lawyers, who estimated the outcome of
lawsuits filed and other claims.
Other provisions referred to provisions formed for a potential loss in real property inventories at Sava Nova d.o.o.
placed as collateral for the bank loan by a legal entity outside of the Group. Civil procedure is in progress.
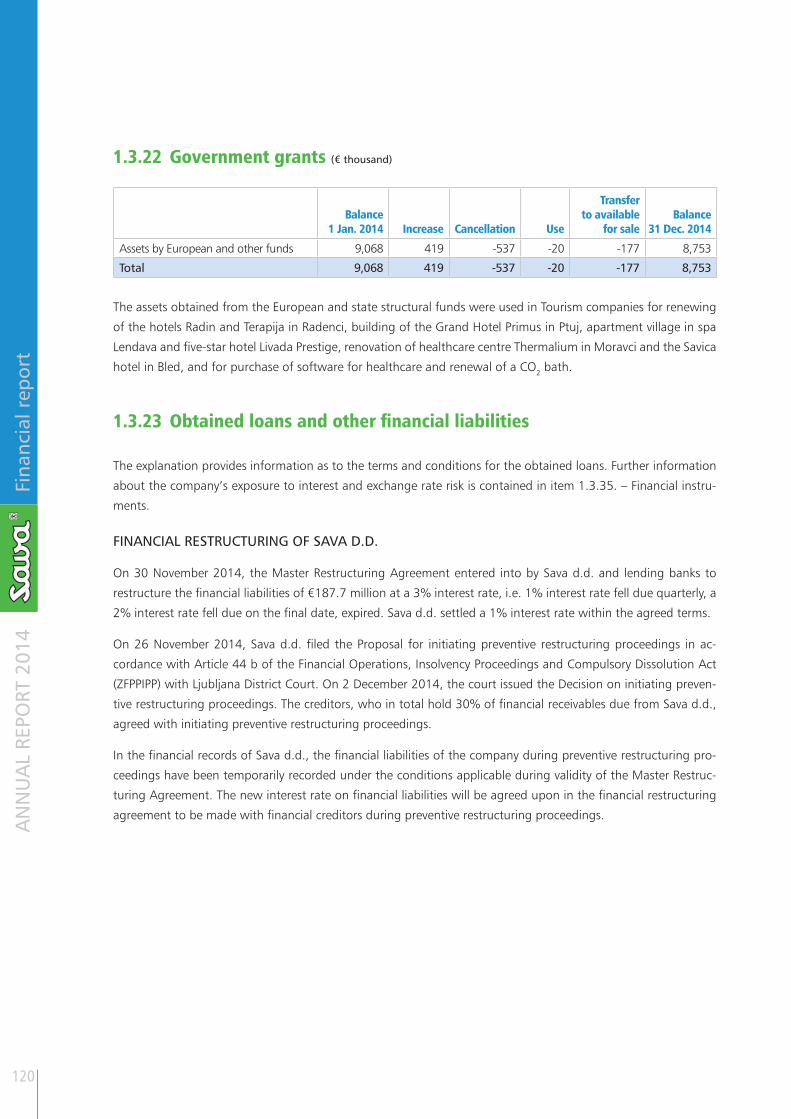
Fina
ncia
l rep
ort
AN
NU
AL
REPO
RT 2
014
120
1.3.22 Government grants (€ thousand)
Balance 1 Jan. 2014 Increase Cancellation Use
Transfer to available
for saleBalance
31 Dec. 2014
Assets by European and other funds 9,068 419 -537 -20 -177 8,753
Total 9,068 419 -537 -20 -177 8,753
The assets obtained from the European and state structural funds were used in Tourism companies for renewing
of the hotels Radin and Terapija in Radenci, building of the Grand Hotel Primus in Ptuj, apartment village in spa
Lendava and five-star hotel Livada Prestige, renovation of healthcare centre Thermalium in Moravci and the Savica
hotel in Bled, and for purchase of software for healthcare and renewal of a CO2 bath.
1.3.23 Obtained loans and other financial liabilities
The explanation provides information as to the terms and conditions for the obtained loans. Further information
about the company’s exposure to interest and exchange rate risk is contained in item 1.3.35. – Financial instru-
ments.
FINANCIAL RESTRUCTURING OF SAVA D.D.
On 30 November 2014, the Master Restructuring Agreement entered into by Sava d.d. and lending banks to
restructure the financial liabilities of €187.7 million at a 3% interest rate, i.e. 1% interest rate fell due quarterly, a
2% interest rate fell due on the final date, expired. Sava d.d. settled a 1% interest rate within the agreed terms.
On 26 November 2014, Sava d.d. filed the Proposal for initiating preventive restructuring proceedings in ac-
cordance with Article 44 b of the Financial Operations, Insolvency Proceedings and Compulsory Dissolution Act
(ZFPPIPP) with Ljubljana District Court. On 2 December 2014, the court issued the Decision on initiating preven-
tive restructuring proceedings. The creditors, who in total hold 30% of financial receivables due from Sava d.d.,
agreed with initiating preventive restructuring proceedings.
In the financial records of Sava d.d., the financial liabilities of the company during preventive restructuring pro-
ceedings have been temporarily recorded under the conditions applicable during validity of the Master Restruc-
turing Agreement. The new interest rate on financial liabilities will be agreed upon in the financial restructuring
agreement to be made with financial creditors during preventive restructuring proceedings.

Fina
ncia
l rep
ort
AN
NU
AL
REPO
RT 2
014
121
Overview of financial liabilities of the Sava Group (€ thousand)
31 Dec. 2014 31 Dec. 2013
LONG-TERM LOANS
Loans with domestic banks 41,974 54,197
Loans with foreign banks 0 0
Loans with banks total 41,974 54,197
Long-term liabilities originating from bonds 0 0
Loans with other entities 3,704 19
Total long-term loans 45,678 54,216
Short-term financial liabilities
Short-term part in long-term loans with banks 105,482 107,596
Short-term loans with domestic banks 87,599 80,018
Short-term loans with foreign banks 0 3,501
Total short-term loans with banks 193,082 191,116
Short-term liabilities originating from bonds 26,515 26,515
Short-term loans with other entities 6,498 6,517
Liabilities for dividend payments 150 709
Liabilities for interest rate swaps 732 2,034
Total short-term financial liabilities 226,976 226,890
Total obtained loans and other financial liabilities 272,655 281,106
Short-term liabilities arising from bonds amounted to €26,515 thousand (2013: €26,515 thousand). Total nomi-
nal value of the bond issuance amounted to €26,500 thousand; during the issuance procedure in 2009, another
€15 thousand were paid in on account of the submitted binding bids. After expiration of the Master Restruc-
turing Agreement, the liabilities arising from bonds were included in financial receivables, based on which the
decision on initiating the preventive restructuring proceedings was issued. The bonds are secured with 34,287
shares of Gorenjska banka d.d. The book value of pledged shares amounts to €13,921 thousand.
Effective 24 November 2014, the SA03 bonds were withdrawn from the stock exchange market – Bonds Seg-
ment. The last trading day with the SA03 bonds was on 21 November 2014.

Fina
ncia
l rep
ort
AN
NU
AL
REPO
RT 2
014
122
Terms and conditions for loans (31 Dec. 2014)
Long- and short-term loans Interest rate (% p.a.)
Maturity of last instalment Type of collateral
Loans with associated companies
6M EURIBOR + 5.0 3.0*
2014** 2018
bill of exchange, mortgage, pledge of securities, assignment of claims (deposit and business account, part of operating receivables)
Loans with domestic banks***
1M EURIBOR + 5.0 3M EURIBOR + 5.0 6M EURIBOR + 5.0 3.0*
2014** 2017 2018
bill of exchange, surety, letter of comfort, mortgage, pledge of securities, pledge of business stake, assignment of claims (deposit and business account, part of operating receivables)
Other TOM + 1.6 to 2.10 3M EURIBOR + 0.35 to 0.5 3.0
2014** - 2025 bill of exchange, mortgage, bank guarantee, pledge of securities
Note:
* Interest rate 3% p.a. valid until the expiration of the MRA entered into by Sava d.d. (at the end of November 2014). Since the beginning of December 2014, Sava d.d. is undergoing preventive restructuring proceedings, during which the
future interest rate will be agreed upon in the preparation of the financial restructuring agreement.
** Maturity of the last instalment was shown in compliance with the expiration of the financial restructuring agreement (at the end of November 2014). Since the beginning of December 2014, Sava d.d. is undergoing preventive restructuring proceedings.
*** Loans with domestic banks include loans of the Sava Group raised with NLB d.d., Nova KBM d.d. and Abanka Vipa d.d., whose receivables due from the Sava Group are transferred to DUTB d.d. (Bank Asset Management Company).
Maturity of long-term loans (€ thousand)
31 Dec. 2014 31 Dec. 2013
Between 1 and 2 years 8,360 4,162
Between 2 and 5 years 35,059 43,057
More than 5 years 2,259 6,997
Total 45,678 54,216
Classification of loans with regard to the fixed and variable interest rate (€ thousand)
Fixed interest rate Variable interest rate Total
Long-term loans 0 45,679 45,679
Short-term loans 217,740 8,357 226,098
Total 217,740 54,036 271,776
Total short-term financial liabilities amounted to €226,976 thousand (2013: €226,890 thousand). The difference
to the amount of short-term loans totalling €882 thousand (2013: €2,744 thousand) referred to financial lia-
bilities arising from the unpaid dividends to shareholders of Sava d.d. and Sava Turizem d.d. Bled totalling €150
thousand and short-term financial liabilities from interest rate swaps totalling €732 thousand.
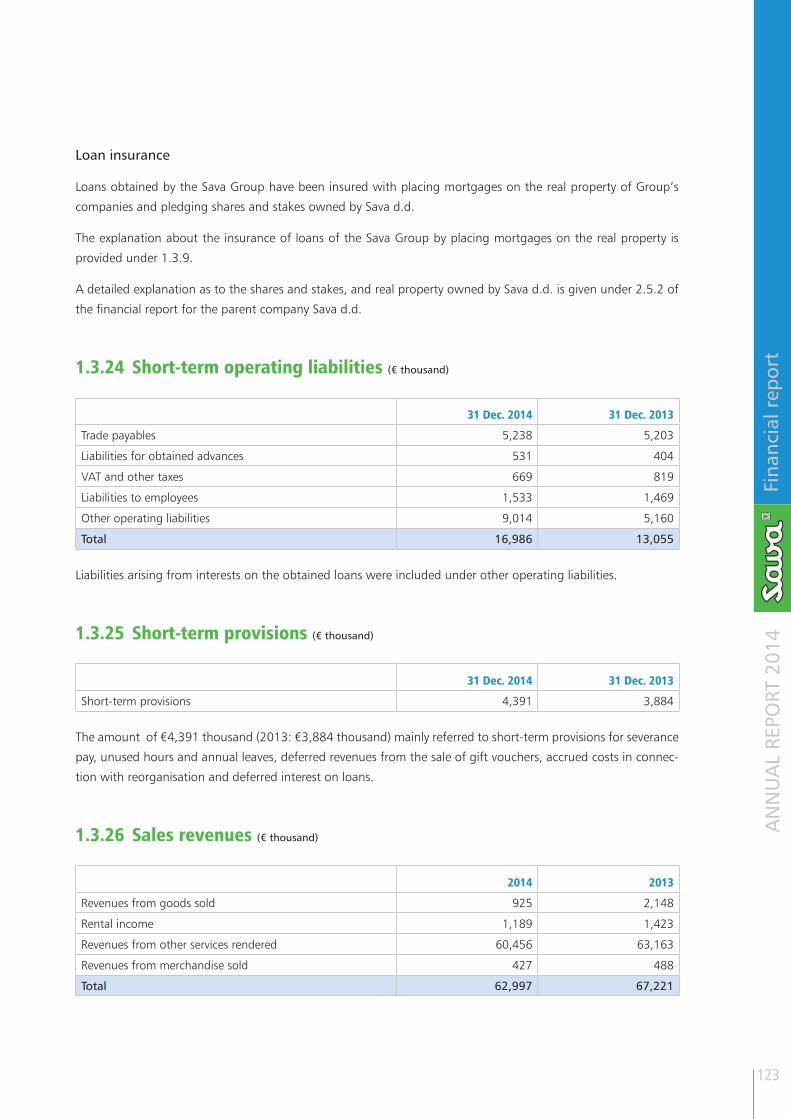
Fina
ncia
l rep
ort
AN
NU
AL
REPO
RT 2
014
123
Loan insurance
Loans obtained by the Sava Group have been insured with placing mortgages on the real property of Group’s
companies and pledging shares and stakes owned by Sava d.d.
The explanation about the insurance of loans of the Sava Group by placing mortgages on the real property is
provided under 1.3.9.
A detailed explanation as to the shares and stakes, and real property owned by Sava d.d. is given under 2.5.2 of
the financial report for the parent company Sava d.d.
1.3.24 Short-term operating liabilities (€ thousand)
31 Dec. 2014 31 Dec. 2013
Trade payables 5,238 5,203
Liabilities for obtained advances 531 404
VAT and other taxes 669 819
Liabilities to employees 1,533 1,469
Other operating liabilities 9,014 5,160
Total 16,986 13,055
Liabilities arising from interests on the obtained loans were included under other operating liabilities.
1.3.25 Short-term provisions (€ thousand)
31 Dec. 2014 31 Dec. 2013
Short-term provisions 4,391 3,884
The amount of €4,391 thousand (2013: €3,884 thousand) mainly referred to short-term provisions for severance
pay, unused hours and annual leaves, deferred revenues from the sale of gift vouchers, accrued costs in connec-
tion with reorganisation and deferred interest on loans.
1.3.26 Sales revenues (€ thousand)
2014 2013
Revenues from goods sold 925 2,148
Rental income 1,189 1,423
Revenues from other services rendered 60,456 63,163
Revenues from merchandise sold 427 488
Total 62,997 67,221

Fina
ncia
l rep
ort
AN
NU
AL
REPO
RT 2
014
124
1.3.27 Other operating revenues (€ thousand)
2014 2013
Reversal of unused provisions 325 245
Income from government grants 20 530
Income from government incentives 736 0
Proceeds from sale of property, plant and equipment 40 115
Proceeds from sale of investment property 0 1,033
Proceeds from sale of intangible fixed assets 0 46
Other operating revenues 841 2,704
Total 1,962 4,673
Other operating revenues mainly referred to a reversal of impairments of current assets formed in the past.
1.3.28 Cost by functional group (€ thousand)
2014 2013
Manufacturing costs of products sold and services 47,384 50,185
Selling costs 4,608 4,468
Cost of general overheads 14,197 25,012
Total 66,189 79,665
Manufacturing costs of sold products and services referred to direct costs in Tourism.
1.3.29 Labour cost (€ thousand)
2014 2013
Wages and salaries 15,665 18,044
Social security cost 2,541 2,862
Other labour cost 3,515 3,314
Total 21,720 24,220
Other labour cost included paid employee holiday allowance, other compensations in accordance with the collec-
tive agreement (meals and commuting to and from work).
In 2014, 990 employees were employed on average (2013: 1,129 employees).

Fina
ncia
l rep
ort
AN
NU
AL
REPO
RT 2
014
125
1.3.30 Amortisation and depreciation expense, write-offs (€ thousand)
2014 2013
Property, plant and equipment - impairment 0 2,775
Property, plant and equipment - write-offs 15 24
Property, plant and equipment - loss from sale 1 159
Intangible fixed assets – loss from sale 0 10
Intangible fixed assets - write-offs 0 35
Investment property - impairment 1,534 2,543
Investment property – loss from sale 19 0
Inventories 1,088 1,167
Receivables 412 2,557
Total 3,068 9,269
Overview of book values of investment property impaired in 2014 (€ thousand)
Type of assetBook value
before impairment ImpairmentBook value
at 31 Dec. 2014
Land Kamnik – Perovo 1,414 -435 979
Land Tacen 1,385 -391 994
Land Izola 974 -708 266
Total investment property 3,773 -1,534 2,239
Overview of book values of real property and investment property impaired in 2013 (€ thousand)
Type of assetBook value
before impairment ImpairmentBook value
at 31 Dec. 2013
Hotel Primus Ptuj 15,933 -2,370 13,563
Golf course Livada 3,248 -388 2,860
Miscellaneous 17 -17 0
Total real property 18,607 -2,775 15,832
Land Kamnik – Perovo 2,500 -1,086 1,414
Land Tacen 2,000 -615 1,385
Land Izola 1,816 -842 974
Total investment property 6,316 -2,543 3,773
Explanations on impairment of inventories and receivables
In 2014, the inventory of real property was impaired amounting to €1,088 thousand (2013: €1,167 thousand).
An impairment based on the estimated marketability of real property inventory took place in a company in Croatia.
In 2014, the receivables of €412 thousand (2013: €2,557 thousand) were impaired through profit or loss, which
mainly referred to Tourism companies. The chapter on risks shows a value adjustment amounting to €441 thou-
sand. The difference of €29 thousand referred to incorporating a new company in the Group and a transfer of
the already formed value adjustment from a subsidiary to the companies outside of the Group.

Fina
ncia
l rep
ort
AN
NU
AL
REPO
RT 2
014
126
1.3.31 Other operating expenses (€ thousand)
2014 2013
Formed long-term provisions 0 361
Other operating expenses 1,119 1,305
Total 1,119 1,666
Other operating expenses mainly referred to contributions for the use of urban land, compensations for obtaining
various permits and payments of water fees.
Other data about costs (€ thousand)
2014 2013
Research and development cost 0 0
Direct operating cost of investment property 495 718
- Rent-generating 458 582
- Revenue non-generating 37 136
1.3.32 Net financial revenues / expenses (€ thousand)
2014 2013
Net gain on disposal of financial assets 1,312 14,249
Income from dividends and shares in profit 25 86
Interest revenue 1,672 979
Foreign exchange gains 0 296
Other 6 1,235
Financial revenues 3,016 16,844
Interest expenses -9,418 -11,700
Impairment of financial investments available for sale -840 -3,967
Impairment of granted loans -13 0
Foreign exchange losses -133 0
Impairment of assets available for sale -261 0
Other 1 -997
Financial expenses -10,664 -16,665
Net revenues / expenses -7,648 179
Impairments of financial investments available for sale shown at €840 thousand (2013: €3,967 thousand) were
entirely due to a decline in the fair value of listed and unlisted securities.

Fina
ncia
l rep
ort
AN
NU
AL
REPO
RT 2
014
127
1.3.33 Net expenses of the associated companies
Net expenses of the associated companies totalling €27,154 thousand (2013: €38,139 thousand entirely referred
to impairments.
Overview of impairments of financial investments in the associated companies (€ thousand)
2014 2013
Financial investment in Gorenjska banka d.d. -26,677 -27,585
Financial investment in Abanka Vipa d.d. 0 -9,609
Financial investment in NFD Holding d.d. -29 -220
Loan granted to NFD Holding d.d. -449 -725
Total -27,154 -38,139
1.3.34 Corporate income tax
Tax on profit recognised in profit or loss (€ thousand)
2014 2013
Assessed tax in the current year
- For the current year -69 -50
- Adjustment for the past years 0 0
Total -69 -50
Deferred tax
- Newly arisen and withdrawn temporary differences -10,865 -9,777
Total -10,865 -9,777
Tax to the debit of profit or loss -10,934 -9,827
Comparison between the actual and calculated tax rate (€ thousand)
Tax rate 2014 Tax rate 2013
Pre-tax profit in accordance with IFRSs -35,951 -45,731
Income tax by applying the official rate 17.0% -6,112 17.0% -7,774
Tax rate effect in foreign operations 0.0% 1 0.0% 0
Tax non-deductible expenses -15.2% 5,464 -8.6% 3,951
Tax-free revenues -4.2% 1,499 38.8% -17,747
Changed tax base due to transition to the new accounting method resulting from past changes in the accounting policies 0.0% 0 0.0% 0
Tax reliefs not recognised in profit or loss 0.2% -75 0.0% 0
Effect by companies operating with a loss and effect of losses in consolidation -28.3% 10,157 -68.6% 31,397
Effective tax rate -30.4% 10,934 -21.5% 9,827

Fina
ncia
l rep
ort
AN
NU
AL
REPO
RT 2
014
128
1.3.35 Financial instruments
FINANCIAL RISKS
A standardised appearance of all companies with the banks and a uniform interest rate policy within the Group
are determined at the Group level. Financial risk management is systematically carried out via the parent com-
pany Sava d.d., while management teams of individual companies are responsible for proper management and
elimination of risks.
Foreign exchange risk
The Sava Group mainly does business in the Euro Zone. No derivative instruments were used in 2014 to hedge
against foreign exchange risks. Considering the volume of foreign currency transactions, the foreign exchange
risk is estimated as low.
Overview of values in connection with foreign exchange risk (€ thousand)
31 Dec. 2014 31 Dec. 2013
Total in € EUR USD CHF
Other currencies
Total in € EUR USD CHF
Other currencies
Trade receivables 3,038 3,038 0 0 0 2,686 2,694 0 0 0
Insured bank loans -209,025 -209,025 0 0 0 -201,442 -190,161 0 0 0
Loans from associates -26,031 -26,030 0 0 0 -43,869 -43,869 0 0 0
Bonds -26,515 -26,515 0 0 0 -26,515 -26,515 0 0 0
Trade payables and other liabilities
-16,986 -16,971 0 -6 -10 -13,055 -14,628 0 0 -54
Other received loans -10,348 -10,347 0 0 -1 -7,230 -7,230 0 0 0
Gross exposure of balance sheet -285,867 -285,849 0 -6 -11 -289,425 -279,644 0 0 -54
Sales planned for the following period
65,638 65,638 0 0 0 1,874 1,874 0 0 0
Purchases planned for the following period
-31,898 -31,898 0 0 0 4,608 4,608 0 0 0
Gross exposure 33,740 33,740 0 0 0 6,482 6,482 0 0 0
Net exposure -252,127 -252,109 0 -6 -11 -282,943 -273,162 0 0 -54
Interest rate risk
Sava Turizem d.d. concluded the restructuring agreement for its financial liabilities with lending banks; the agree-
ment expires in 2018, the agreed interest during this period being EURIBOR + 5%. The EURIBOR interest rate
remained low in 2014 and no significant growth is expected in 2015. At the end of November 2014, the Master
Restructuring Agreement on Sava d.d. expired. Upon expiration of the MRA on 30 November 2014 and the initi-
ated preventive restructuring proceedings on 2 December 2014, the exposure and the risk of the changed interest
rate increased, as the company has not yet agreed on the conditions for financial liabilities restructuring.

Fina
ncia
l rep
ort
AN
NU
AL
REPO
RT 2
014
129
To hedge against interest rate risk in connection with the change of the reference interest rate EURIBOR, Sava d.d.
had a derivative financial instrument for interest rate hedging with validity until April 2015. Total nominal value
of the instrument amounted to €2 million at the end of 2014. The net value of interest rate swaps as a difference
between receivables and liabilities is negative and amounts to €732 thousand at the end of 2014 (€2,034 thou-
sand at the end of 2013).
The market interest rate risk is high due to the currently pending procedures in the presented and uncertain eco-
nomic circumstances
Interest rate risk management by using interest rate swaps (€ thousand)
31 Dec. 2014 Book valueContracted cash flows
6 months or less
6 – 12 months
1 – 2 years
2 – 5 years
More than 5 years
Interest rate swaps
Assets 0 0 0 0 0 0 0
Liabilities -732 -732 -732 0 0 0 0
Total -732 -732 -732 0 0 0 0
31 Dec. 2013 Book valueContracted cash flows
6 months or less
6 – 12 months
1 – 2 years
2 – 5 years
More than 5 years
Interest rate swaps
Assets 0 0 0 0 0 0 0
Liabilities -2,034 -2,034 -400 -800 -834 0 0
Total -2,034 -2,034 -400 -800 -834 0 0
Solvency risk
In 2014, the Sava Group mostly focused on further provision of liquidity, regular settlement of financial liabilities
and further realisation of the activities defined in the long-term business strategy until 2014. After a larger divest-
ment of financial investments in 2012 and 2013 (divestment of real estate, rubber manufacturing and the major
part of energy business), financial investments of the parent company continued to be sold in 2014. Owing to
a regular repayment of financial liabilities and disposal of financial investments of the parent company, financial
liabilities of the Group further reduced and that by €8 million compared to the end of 2013. All Group companies
carry out measures that aim at improving the operating business through cost rationalisations, performance of
activities for strengthening the cash flows and other measures for increasing profit from operations. At the end
of November 2014, the Master Restructurings Agreement of the parent company and thus a moratorium on
repayment of the principal expired, and the company has been undergoing preventive restructuring proceedings
since the beginning of December.
Due to the currently pending procedures the solvency risk remains high in the Sava Group.

Fina
ncia
l rep
ort
AN
NU
AL
REPO
RT 2
014
130
Overview of values in connection with solvency risk (€ thousand)
31 Dec. 2014Book value
Contracted cash flows
6 months or less
6 – 12 months
1 – 2 years
2 – 5 years
More than 5 years
Non-derivative financial liabilities 288,909 -289,908 -231,860 -8,161 -4,352 -41,499 -4,037
Insured bank loans (excluding associates)
209,025 -209,123 -161,500 -1,813 -3,337 -38,639 -3,834
Trade payables and other liabilities 16,986 -16,986 -16,986 0 0 0 0
Loans from associated companies 26,031 -26,046 -25,660 -13 -57 -316 0
Bonds 26,515 -27,369 -27,369 0 0 0 0
Other financial liabilities 10,348 -10,380 -340 -6,335 -958 -2,544 -203
Overdrafts on bank accounts 0 0 0 0 0 0 0
Liabilities from financial leasing 4 -4 -4 0 0 0 0
Derivative financial liabilities 732 -732 -732 0 0 0 0
Interest rate swaps used as risk hedging instruments 732 -732 -732 0 0 0 0
Total 289,641 -290,640 -232,591 -8,161 -4,352 -41,499 -4,037
31 Dec. 2013Book value
Contracted cash flows
6 months or less
6 – 12 months
1 – 2 years
2 – 5 years
More than 5 years
Non-derivative financial liabilities 292,126 -290,952 -16,851 -237,086 -9,341 -27,674 0
Insured bank loans (excluding associates)
201,442 -208,382 -4,979 -172,183 -8,494 -22,726 0
Trade payables and other liabilities 13,055 -13,057 -9,849 -3,201 -7 0 0
Loans from associated companies 43,869 -34,669 -628 -28,260 -833 -4,948 0
Bonds 26,515 -27,540 -131 -27,409 0 0 0
Other financial liabilities 7,230 -7,288 -1,259 -6,029 0 0 0
Overdrafts on bank accounts 0 0 0 0 0 0 0
Liabilities from financial leasing 15 -15 -4 -4 -7 0 0
Derivative financial liabilities 2,034 -2,034 -400 -800 -834 0 0
Interest rate swaps used as risk hedging instruments 2,034 -2,034 -400 -800 -834 0 0
Total 294,160 -292,986 -17,251 -237,886 -10,175 -27,674 0
Credit risk
This is reduced by using a standardised policy of monitoring the credit ability of our customers and other business
partners. To decrease exposure to this risk we make use of the customer rating system to supervise bad payers and
carry out on-going compensations. The measures for minimising credit risk exposure rely on our own in-depth
customer ratings and obtained collaterals.

Fina
ncia
l rep
ort
AN
NU
AL
REPO
RT 2
014
131
Trade receivables by territory (€ thousand)
31 Dec. 2014 31 Dec. 2013
Slovenia 2,716 2,130
Other EU countries 89 461
Other 233 95
Total 3,038 2,686
Balance and movement of value adjustments in trade receivables (€ thousand)
2014 2013
Initial balance 1,865 1,639
Increase in value adjustment 441 684
Decreases in value adjustment -1,072 -459
Final balance 1,234 1,865
Age structure of trade receivables (€ thousand)
31 Dec. 2014 31 Dec. 2013
Gross receivables Impairment
Net receivables
Gross receivables Impairment
Net receivables
Not past due 2,373 16 2,357 1,845 0 1,845
Past due 0 - 30 days 405 8 397 290 0 290
Past due 31 - 120 days 412 30 382 554 0 554
Past due more than 120 days 1,082 1,180 -98 1,862 1,864 -2
Total 4,272 1,234 3,037 4,550 1,864 2,686
SENSITIVITY ANALYSIS FOR FINANCIAL RISK
Sensitivity analysis for interest rate change
Owing to the expiration of the major part of restructured liabilities of the Group at the end of November 2014
and not yet finalised preventive restructuring proceedings for Sava d.d., the exposure to the change of interest
rate increased again.
Liabilities arising from loans of the parent company Sava d.d. have an 80% share in total loan liabilities of the Sava
Group and are subject to preventive restructuring proceedings. The remaining portion of loan liabilities refers to
Tourism and is tied to the EURIBOR interest rate, at which a 3-month and a 6-monh EURIBOR have the greatest
share. In 2014, the reference interest rate was low, similar to 2013, and no significant increase is expected for
2015.
The credit portfolio is still strongly sensitive to the change of interest rates. Considering the indebtedness of the
Sava Group at the end of 2014, the annual interest expense would change by €1,378 thousand if interest rate
increased by 50 basis points.

Fina
ncia
l rep
ort
AN
NU
AL
REPO
RT 2
014
132
Sensitivity analysis for enhanced indebtedness
At the end of 2014, the Sava Group had short- and long-term financial liabilities from raised loans amounting
to €271 million. Certain commitments were made under financial liabilities restructuring in view of indebtedness
volume, due to which the Group is not strongly exposed to changes arising from the increased indebtedness
volume.
Sensitivity analysis for exchange rate change
Sava Group companies have the majority of business tied to the domestic currency. For this reason, the company
is not strongly exposed to exchange rate changes.
1.3.36 Fair values of financial instruments
Fair values of financial instruments (€ thousand)
31 Dec. 2014 31 Dec. 2014 31 Dec. 2013 31 Dec. 2013
Book value Fair value Book value Fair value
Securities available for sale 38,392 38,392 31,426 31,426
Assets for sale 410 410 0 0
Other long-term receivables 39 39 39 39
Short-term receivables 5,544 5,544 5,544 5,544
Granted loans 18,389 18,389 24,596 24,596
Cash and cash equivalents 1,205 1,205 1,239 1,239
Long-term loans at fixed interest rate 0 note* -16 -16
Issued bonds at fixed interest rate -26,515 note* -26,515 -5,303
Long-term loans at variable interest rate -45,679 note* -54,200 -54,200
Liabilities for sale 410 410 0 0
Long-term operating liabilities 0 0 0 0
Short-term loans -226,098 note* -224,146 -224,146
Derivative financial instruments – interest rate swaps -732 -732 -2,034 -2,034
Liabilities for dividends -150 -150 -709 -709
Short-term operating liabilities 16,986 16,986 13,055 13,055
* As disclosed in item 1.3.23. Sava d.d. is undergoing preventive restructuring proceedings. The Master Restructuring Agreement entered into by Sava d.d. expired, the new conditions for financing will be agreed with financial creditors during preventive restructuring proceedings. Upon endorsing the annual report the loans are unregulated and it is not clear under what conditions the liabilities will be settled. For this reason, their fair value could not be ascertained.

Fina
ncia
l rep
ort
AN
NU
AL
REPO
RT 2
014
133
Fair value hierarchy
Financial instruments valued at fair value are classified in three levels:
• Level 1: assets or liabilities at stock exchange price on the last day of the accounting period.
• Level 2: assets or liabilities that are not classified as Level 1, their value being determined directly or indi-
rectly based on the market data.
• Level 3: assets or liabilities whose value cannot be obtained from the market data.
Classification of financial instruments with regard to the fair value computation (€ thousand)
31 Dec. 2014 31 Dec. 2013
Total Level 1 Level 2 Level 3 Total Level 1 Level 2 Level 3
Securities available for sale 38,392 946 34,123 3,323 31,426 3,604 23,999 3,823
Derivative financial instruments - assets 0 0 0 0 0 0 0 0
Derivative financial instruments - liabilities -732 0 -732 0 -2,034 0 -2,034 0
Total 37,660 946 33,391 3,323 29,392 3,604 21,965 3,823
1.3.37 Contingent liabilities
At 31 December 2014, contingent liabilities of Sava Group companies amounted to €236 thousand (2013: €194
thousand). Denationalisation claims are explained under 1.3.41.
1.3.38 Related parties
Related parties include subsidiaries and associates, members of supervisory boards, management board of the
parent company and Group’s subsidiaries, and their closer family members.
a) Relations with the subsidiaries
Business relations between Sava Group companies mainly refer to the mutually provided services - rentals of
property and equipment, use of trademark, and services provided by the professional services.
Business among related parties is performed under the same conditions as valid in an ordinary arm’s length
transaction.
For loans of subsidiaries obtained from banks, which in the consolidated financial statements are shown as liabili-
ties to banks, the guarantees were issued by Sava d.d., which at 31 December 2014 amounted to €460 thousand
(2013: €494 thousand) and 3,610 shares of Gorenjska banka d.d. were pledged worth €1,466 thousand. For
the loan, which Sava d.d. raised with the bank, a guarantee by Sava Turizem d.d. totalling €5,000 thousand was
issued, the loan balance at 31 December 2014 amounted to €3,455 thousand (2013: €3,501 thousand).

Fina
ncia
l rep
ort
AN
NU
AL
REPO
RT 2
014
134
b) Relations with the associated companies
Gorenjska banka d.d., Kranj
Ownership of the Sava share 2014 2013
Number of Sava d.d. shares owned by Gorenjska banka d.d. 56,475 56,475
Ownership stake of Gorenjska banka in Sava d.d. 2.81% 2.81%
The companies in the Sava Group raised loans with Gorenjska banka d.d. Terms and conditions for these transac-
tions equal those effective for other companies with a similar rating.
Overview of transactions with Gorenjska banka d.d.
31 Dec. 2014 31 Dec. 2013
Balance of obtained loans at 1 Jan. 26,397 41,063
Raising new loans 0 0
Repayment of loans -366 -14,666
Exchange rate differences 0 0
Final balance of loans obtained 26,031 26,397
Final balance of deposits made 940 1,872
Interest rates on loans obtained from Gorenjska banka d.d. are: 6-month EURIBOR + 5.0% and a fixed 3.0%
interest rate. Until the expiration of the agreement on financial liabilities restructuring (end of November 2014)
a fixed 3% interest rate applied to the parent company Sava d.d. Owing to preventive restructuring proceedings
being in progress since the beginning of December, a new interest rate on loans of the parent company is to be
defined in the agreement or financial restructuring plan. Deposits made at Gorenjska banka d.d. bear interest at
0.15% to 0.70%
Overview of operating receivables and liabilities with Gorenjska banka d.d. (€ thousand)
31 Dec. 2014 31 Dec. 2013
Long-term operating receivables to associates 0 0
Short-term operating receivables to associates 1 9
Total operating receivables 1 9
Long-term operating liabilities to associates 0 0
Short-term operating liabilities to associates 1,000 447
Total operating liabilities 1,000 447

Fina
ncia
l rep
ort
AN
NU
AL
REPO
RT 2
014
135
Overview of financial revenues and expenses with Gorenjska banka d.d. (€ thousand)
2014 2013
Financial revenues from loans granted to associates 27 83
Financial revenues from operating receivables due from associates 0 0
Total financial revenues 27 83
Financial expenses from loans obtained from associates 777 908
Financial expenses from operating receivables due from associates 0 0
Total financial expenses 777 908
NFD HOLDING D.D., LJUBLJANA – ON 6 JANUARY 2015 BANKRUPTCY PROCEEDINGS WERE INSTITUTED AGAINST THE COMPANY
• The balance of receivables due from NFD Holding d.d. arising from the granted loans amounted to €17,806
thousand at 31 December 2014 (2013: €17,806 thousand).
• Operating receivables arising from interests on loans were shown at €2,754 thousand at 31 December
2014 (2013: €1,348 thousand).
• Interest revenues amounted to €1,421 thousand in 2014 (2013: €441 thousand).
c) Relations with natural persons
Related natural persons own 138 shares of the parent company Sava d.d., representing 0.007% of ownership in
total.
Ownership of the Sava share at 31 December 2014:
2014 2013
Management Board members of Sava d.d. 135 0.007 %
Closer family members of Sava d.d. Management Board members 0 0.000 %
Supervisory Board members of Sava d.d. 3 0.000 %
Managers in subsidiaries 0 0.000 %
Supervisory Board members in subsidiaries 0 0.000 %
Total 138 0.007 %
Gross remunerations in 2014 (€ thousand)
31 Dec. 2014 31 Dec. 2013
Management Board and management team members in Group companies 725 963
Other employees with management contracts in Group companies 6,402 7,017
Supervisory Board members in Group companies 199 207

Fina
ncia
l rep
ort
AN
NU
AL
REPO
RT 2
014
136
Receivables of Group companies due from related persons
At 31 December 2014, the Sava Group companies showed no receivables due from related natural persons.
Liabilities of Sava Group companies to related persons
At 31 December 2014, the Sava Group companies showed liabilities to related persons arising from monthly
salaries for December 2014, paid in January 2015. The amount does not deviate from ordinary interim payments.
Detailed disclosures of remunerations of the Management Board of Sava d.d. are shown under item 2.5.7. of the
financial report of the annual report of Sava d.d.
1.3.39 Disclosing business with auditors (€ thousand)
2014 2013
Cost of auditing the annual report 72 93
Cost of other auditing services 0 36
Cost of tax consulting 0 0
Other non-auditing services 7 11
Total 79 140
1.3.40 Events after the balance sheet date
Events taking place after the balance sheet date are described in the business report of the annual report. The
nature of these events does not influence the consolidated financial statements.

Fina
ncia
l rep
ort
AN
NU
AL
REPO
RT 2
014
137
1.3.41 Explanation in connection with the denationalisation claims in Sava Turizem d.d.
a) Denationalisation claim Höhn-Šarič
Zdravilišče Radenci d.o.o. is one of the parties in the Höhn-Šarič denationalisation procedure. The applicants of
the denationalisation claim require a part of the property within the health resort to be returned. On the basis of
a proposal for issuance of a temporary order, the property which is the subject of the procedure, was separated
out from the ownership restructuring of the company until the denationalisation procedure is finished, therefore
Sava Turizem d.d. keeps this property under off-balance.
In 2012, the Administrative unit Gornja Radgona issued a denationalisation order for the nationalised company
Zdravilišče Slatina Radenci, Hoehn and Comp., public trading company in Radenci, based on which the request
for denationalisation of the nationalised company Kuranstalt Sauberbrun Radein Aktiengesellschaft with the
share of 48 %, owned by Wilhemina Hoehn Šarič was rejected. The party filing the denationalisation request filed
an appeal through the proxy, which the competent Ministry rejected and confirmed the decision made by the
first-instance administrative body. The parties filing the request appealed against the decision by the second-in-
stance body, the issue is still pending at the administrative court. On 3 September 2014, the administrative unit
Gornja Radgona issued also the decision, based on which it rejected the request for denationalisation with regard
to a 48% share owned by Ante Šarič. An appeal was filed against the decision.
At the Novo mesto District Court a non-contentious proceedings on returning the seized assets in accordance
with Article 145 ZIKS is in progress, at which the parties filing the request demand a 48% share of assets claimed
to be seized from Dr Ante Šarič. On 19 June 2013, the first-instance court decided to reject the proposal for re-
turning the assets. The first-instance court’s decision is legally binding (decision by the Higher Court in Ljubljana
of 19 March 2014). A revision as an extraordinary legal remedy was filed against the decision, the Supreme Court
of the Republic of Slovenia has not yet decided about the matter.
Due to the complexity of legal and actual issues, the outcome of denationalisation procedure cannot be predicted
in this phase, which is why any future liabilities of the company arising thereof cannot be estimated.
In years past, the company Sava Turizem d.d. entirely renovated one of its facilities, which is subject to a dena-
tionalisation procedure. This facility was excluded from the ownership restructuring until the completion of the
denationalisation procedure. The company management estimates that once the procedure is complete, it will
repurchase the remaining part of the property.
b) Denationalisation claim – Dermastja
The subject of the denationalisation claim is a one-third stake in the old Park hotel. The temporary order was filed
in after term expiration, therefore a temporary order was not issued, and the administrative body decided that
claimants were not entitled to returning ownership stake in kind. The claimant, and claimants who subsequently
entered a dispute, filed in a complaint against the resolution concerning the privatisation at the Administrative
Court, which rejected it. The complaint was then filed at the Supreme Court, which has not yet made a decision
regarding this matter. The Management Board of the company estimates that claimants will fail in their litigation
procedure.

Fina
ncia
l rep
ort
AN
NU
AL
REPO
RT 2
014
138
1.4 Statement of Management Responsibility for the Sava Group
The Management Board confirms the consolidated financial statements of the Sava Group for the year ending on
31 December 2014.
The Management Board confirms that when drawing up the consolidated financial statements the corresponding
accounting policies were consistently applied, and that the consolidated report gives a true and fair view of the
company’s assets and operating results for 2014.
The Management Board is responsible for the proper managing of its accounting procedures, establishing, op-
eration and maintaining internal control in relation to the preparation and fair presentation of the financial
statements, which do not contain any material misstatements originating from fraud or error, and for adopting
suitable measures to secure assets and other funds. The Management Board confirms herewith that the financial
statements and the notes have been produced under the assumption of going concern for the companies within
the Group and in compliance with the relevant legislation and International Financial Reporting Standards as
adopted by the European Union.
Aleš Aberšek Matej Narat Member of the President of the Management Board Management Board
Ljubljana, 10 March 2015

Fina
ncia
l rep
ort
AN
NU
AL
REPO
RT 2
014
139
1.5 Independent auditor’s report for the Sava Group

Fina
ncia
l rep
ort
AN
NU
AL
REPO
RT 2
014
140

Fina
ncia
l rep
ort
AN
NU
AL
REPO
RT 2
014
141

Fina
ncia
l rep
ort
AN
NU
AL
REPO
RT 2
014
142
Notes 31 Dec. 2014 31 Dec. 2013
ASSETS
A. FIXED ASSETS 191,546 227,374
I. INTANGIBLE FIXED ASSETS AND LONG-TERM DEFERRED COSTS AND ACCRUED REVENUES 2.4.1. 22 25
1. Long-term industrial property rights 22 25
2. Goodwill 0 0
3. Advances for intangible fixed assets 0 0
4. Long-term deferred development costs 0 0
5. Other long-term deferred costs and accrued revenues 0 0
II. TANGIBLE FIXED ASSETS 2.4.2. 167 244
1. Land and buildings 0 0
a) Land 0 0
b) Buildings 0 0
2. Plant and machinery 103 159
3. Other equipment 64 85
4. Tangible fixed assets under construction 0 0
a) Tangible fixed assets under construction and manufacture 0 0
b) Advances for tangible fixed assets 0 0
III. INVESTMENT PROPERTY 2.4.3. 2,276 2,362
1. Leased to subsidiaries 0 0
2. Leased to other companies 1,797 1,858
3. Not leased 479 504
IV. LONG-TERM FINANCIAL INVESTMENTS 2.4.4. 189,081 213,869
1. Long-term financial investments except loans 189,081 210,492
a) Shares and stakes in Group companies 91,492 93,234
b) Shares and stakes in associates 59,300 85,915
c) Other shares and stakes 38,289 31,343
č) Other long-term financial investments 0 0
2. Long-term loans 0 3,377
a) Long-term loans to Group companies 0 3,377
b) Long-term loans to other entities 0 0
c) Long-term unpaid called-up capital 0 0
FINANCIAL STATEMENTS OF SAVA D.D. WITH NOTES IN ACCORDANCE WITH SLOVENE ACCOUNTING STANDARDS
2•
2.1 Financial statements of Sava d.d. in accordance with Slovene Accounting Standards
Balance sheet of Sava d.d. at 31 December 2014 (€ thousand)

Fina
ncia
l rep
ort
AN
NU
AL
REPO
RT 2
014
143
FINANCIAL STATEMENTS OF SAVA D.D. WITH NOTES IN ACCORDANCE WITH SLOVENE ACCOUNTING STANDARDS
Notes 31 Dec. 2014 31 Dec. 2013
V. LONG-TERM OPERATING RECEIVABLES 0 0
1. Long-term operating receivables to Group companies 0 0
2. Long-term operating trade receivables 0 0
3. Long-term receivables to other entities 0 0
VI. DEFERRED TAX RECEIVABLES 2.4.5., 2.4.29. 0 10,874
B. SHORT-TERM ASSETS 19,602 20,886
I. ASSETS (GROUPS FOR DISPOSAL) FOR SALE 0 0
II. INVENTORIES 0 0
1. Material 0 0
2. Work in process 0 0
3. Products and merchandise 0 0
4. Advances for inventories 0 0
III. SHORT-TERM FINANCIAL INVESTMENTS 2.4.6. 14,684 16,010
1. Short-term financial investments except loans 0 0
a) Shares and stakes in Group companies 0 0
b) Other shares and stakes 0 0
c) Other short-term financial investments 0 0
2. Short-term loans 14,684 16,010
a) Short-term loans to Group companies 4,860 1,356
b) Short-term loans to other entities 9,824 14,654
c) Short-term unpaid called-up capital 0 0
IV. SHORT-TERM OPERATING RECEIVABLES 2.4.7. 4,860 4,649
1. Short-term operating liabilities to Group companies 2,000 3,207
2. Short-term trade receivables 83 60
3. Short-term operating receivables to other entities 2,777 1,382
V. CASH AND CASH EQUIVALENTS 2.4.8. 58 227
1. Cash on hand and accounts 58 227
2. Short-term deposits 0 0
a) Short-term deposits in subsidiaries 0 0
b) Short-term deposits in associates 0 0
c) Short-term deposits in other entities 0 0
C. SHORT-TERM DEFERRED COSTS AND ACCRUED REVENUES 3 57
ASSETS TOTAL 211,151 248,317

Fina
ncia
l rep
ort
AN
NU
AL
REPO
RT 2
014
144
Notes 31 Dec. 2014 31 Dec. 2013
LIABILITIES
A. CAPITAL 2.4.9. -23,470 15,117
I. CALLED-UP CAPITAL 14,061 25,442
1. Share capital 14,061 25,442
2. Uncalled capital (as a deductible item) 0 0
II. CAPITAL RESERVES 0 0
III. REVENUE RESERVES 0 0
1. Legal reserves 0 0
2. Reserves for treasury shares and own business stakes 4,977 4,977
3. Treasury shares and own business shares (as a deductible item) -4,977 -4,977
4. Statutory reserves 0 0
5. Other revenue reserves 0 0
IV. REVALUATION RESERVE 9,864 1,056
- From tangible fixed assets 0 0
- From intangible fixed assets 0 0
- From long-term financial investments 9,864 1,056
- From short-term financial investments 0 0
V. RETAINED NET PROFIT OR LOSS FROM PREVIOUS PERIODS 0 0
VI. NET PROFIT OR LOSS FOR THE FINANCIAL YEAR -47,394 -11,381
B. PROVISIONS AND LONG-TERM ACCRUED COSTS AND DEFERRED REVENUES 2.4.11. 101 117
1. Provisions for pensions and similar liabilities 100 117
2. Other provisions 0 0
3. Long-term accrued costs and deferred revenues 1 0

Fina
ncia
l rep
ort
AN
NU
AL
REPO
RT 2
014
145
Notes 31 Dec. 2014 31 Dec. 2013
C. LONG-TERM LIABILITIES 2.4.13. 1,000 231
I. LONG-TERM FINANCIAL LIABILITIES 0 15
1. Long-term financial liabilities to Group companies 0 0
2. Long-term financial liabilities to banks 0 0
3. Long-term financial liabilities arising from bonds 0 0
4. Other long-term financial liabilities 0 15
II. LONG-TERM OPERATING LIABILITIES 0 0
1. Long-term operating liabilities to Group companies 0 0
2. Long-term trade payables 0 0
3. Long-term bills payables 0 0
4. Long-term operating liabilities arising from advances 0 0
5. Other long-term operating liabilities 0 0
III. DEFERRED TAX LIABILITIES 2.4.29. 1,000 216
Č. SHORT-TERM LIABILITIES 2.4.14. 231,630 232,145
I. LIABILITIES INCLUDED IN GROUPS FOR DISPOSAL 0 0
II. SHORT-TERM FINANCIAL LIABILITIES 222,452 226,796
1. Short-term financial liabilities to Group companies 3,835 3,835
2. Short-term financial liabilities to banks 185,224 187,702
3. Short-term liabilities arising from bonds 26,515 26,515
4. Other short-term financial liabilities 6,878 8,744
III. SHORT-TERM OPERATING LIABILITIES 9,178 5,349
1. Short-term operating liabilities to Group companies 156 99
2. Short-term trade payables 90 137
3. Short-term bills payables 0 0
4. Short-term operating liabilities arising from advances 52 30
5. Other short-term operating liabilities 8,880 5,083
E. SHORT-TERM ACCRUED COSTS AND DEFERRED REVENUES 2.4.15. 1,890 707
TOTAL LIABILITIES 211,151 248,317
The notes form an integral part of these financial statements and should be read in conjunction with them.

Fina
ncia
l rep
ort
AN
NU
AL
REPO
RT 2
014
146
Notes 2014 2013
1. NET SALES REVENUES 2.4.16. 930 1,858
a) Revenues in domestic market 929 1,073
To Group companies 559 710
To associated companies 5 0
To others 365 363
b) Revenues in foreign market 1 785
To Group companies 1 27
To associated companies 0 0
To others 0 758
2. CHANGE IN THE VALUE OF INVENTORIES OF PRODUCTS AND WORK IN PROGRESS 0 0
3. CAPITALISED OWN PRODUCTS AND SERVICES 0 0
4. OTHER OPERATING REVENUES (with operating revenues from revaluation adjustment) 2.4.17. 184 5,264
5. COST OF MERCHANDISE, MATERIALS AND SERVICES 2.4.19. -1,786 -3,455
a) Cost of merchandise and material sold and cost of material used -46 -73
b) Cost of services -1,740 -3,382
6. LABOUR COST 2.4.20. -1,673 -1,699
a) Salaries and wages -1,022 -1,373
b) Social security cost -192 -254
- Social security cost -81 -104
- Pension insurance cost -111 -150
c) Other labour cost -459 -72
7. AMORTISATION AND DEPRECIATION EXPENSE, WRITE-OFFS 2.4.21. -153 -2,038
a) Depreciation -115 -124
b) Operating expenses from revaluation of intangible and tangible fixed assets
-19 0
c) Operating expenses from revaluation of current assets -19 -1,914
8. OTHER OPERATING EXPENSES -13 -85
9. LOSS FROM OPERATIONS -2,511 -155
10. OTHER FINANCIAL REVENUES FROM SHARES 2.4.22. 1,349 25,610
a) Financial revenues from shares in Group companies 0 24,302
b) Financial revenues from shares in associated companies 0 0
c) Financial revenues from shares in other entities 1,330 150
č) Financial revenues from other investments 19 1,158
11.FINANCIAL REVENUES FROM GRANTED LOANS 2.4.23. 1,747 1,277
a) Financial revenues from loans granted to Group companies 311 281
b) Financial revenues from loans granted to other entities 1,436 996
12. FINANCIAL REVENUES FROM OPERATING RECEIVABLES 2.4.24. 197 14
a) Financial revenues from operating receivables due from Group companies 52 13
b) Financial revenues from operating receivables due from other entities
145 1
Income statement of Sava d.d. for the period January – December 2014 (€ thousand)

Fina
ncia
l rep
ort
AN
NU
AL
REPO
RT 2
014
147
Notes 2014 2013
13. FINANCIAL EXPENSES FROM IMPAIRMENTS AND WRITE-OFFS IN FINANCIAL INVESTMENTS 2.4.25. -31,138 -19,730
14. FINANCIAL EXPENSES FROM FINANCIAL LIABILITIES 2.4.26. -6,860 -8,691
a) Financial expenses from borrowings obtained from Group companies -118 -146
b) Financial expenses from borrowings obtained from banks -5,725 -6,512
c) Financial expenses from issued bonds -791 -1,280
d) Financial expenses from other financial liabilities -226 -753
15. FINANCIAL EXPENSES FROM OPERATING LIABILITIES 0 0
a) Financial expenses from operating liabilities to Group companies 0 0
b) Financial expenses from trade payables and bill payables 0 0
c) Financial expenses from other operating liabilities 0 0
16. OTHER REVENUES 2.4.27. 175 96
17. OTHER EXPENSES 2.4.27. -42 -7
18. INCOME TAX 2.4.28. 0 0
19. DEFERRED TAX 2.4.5., 2.4.29. -10,874 -9,795
20. NET PROFIT/LOSS FOR THE ACCOUNTING PERIOD -47,957 -11,381
The notes form an integral part of these financial statements and should be read in conjunction with them.
Statement of other comprehensive income of Sava d.d. for the period January – December 2014 (€ thousand)
2014 2013
Net loss for the period -47,957 -11,381
Other comprehensive income:
Items that may be classified to profit or loss:
- Change of fair value of available-for-sale financial assets 10,903 -716
- Deferred tax from change in fair value of available-for-sale financial assets -984 54
- Change in fair value of investments in associated companies 0 0
- Change of fair value of available-for-sale financial assets transferred to profit or loss -1,312 -11,583
- Deferred tax from a change of fair value of available-for-sale financial assets transferred to profit or loss
201 1,038
- Deferred tax 0 -25
Other comprehensive income for the period, net of deferred tax in the period 8,808 -11,232
Total comprehensive income for the period -39,149 -22,613

Fina
ncia
l rep
ort
AN
NU
AL
REPO
RT 2
014
148
2014 2013
A. Cash flows from operating activities
a) Net profit/loss for the financial year -47,957 -11,381
Pre-tax profit/loss -37,083 -1,586
Profit tax and other taxes not included in operating expenses -10,874 -9,795
b) Adjustments for 35,034 -3,566
Depreciation 115 124
Operating revenues from revaluation in connection with items of investing and financing activities
-2 -5,211
Operating expenses from revaluation in connection with items of investing and financing activities
19 0
Financial revenues excluding financial revenues from operating receivables -3,096 -26,900
Financial expenses excluding financial expenses from operating liabilities 37,998 28,421
c) Change in net current assets (and accruals, deferrals, provisions and deferred tax receivables and liabilities) of balance sheet items 11,319 24,592
Opening minus closing operating receivables 59 18,667
Opening minus closing deferred costs and accrued revenues 54 -37
Opening minus closing deferred tax receivables 10,874 9,795
Opening minus closing assets (groups for disposal) for sale 0 0
Opening minus closing inventories 0 0
Closing minus opening operating liabilities -834 -1,487
Closing minus opening accrued costs and deferred revenues and provisions 1,167 -708
Closing minus opening deferred tax liabilities 0 -1,638
č) Surplus in inflows from operating activities or surplus of outflows from operating activities (a+b+c) -1,604 9,644
Cash flow statement of Sava d.d. for the period January – December 2014 (€ thousand)

Fina
ncia
l rep
ort
AN
NU
AL
REPO
RT 2
014
149
2014 2013
B. Cash flows from investing activities
a) Inflows from investing activities 12,949 31,967
Revenues from received interests and shares in profit in relation to investing activities 40 1,424
Revenues from disposal of intangible fixed assets 0 0
Revenues from disposal of tangible fixed assets 31 11
Revenues from disposal of investment property 6 2,299
Revenues from disposal of long-term financial investments 3,128 2,781
Revenues from disposal of short-term financial investments 9,744 25,452
b) Outflows from investing activities -5,522 -32,325
Expenses for purchase of intangible fixed assets 0 -8
Expenses for purchase of tangible fixed assets -3 -130
Expenses for purchase of investment property 0 0
Expenses for purchase of long-term financial investments -11 -4,210
Expenses for purchase of short-term financial investments -5,508 -27,977
c) Surplus in inflows from investing activities or surplus in outflows from investing activities (a+b) 7,427 -358
C. Cash flows from financing activities
a) Inflows from financing activities 0 7,204
Revenues from paid-in capital 0 0
Revenues from increase in long-term financial liabilities 0 0
Revenues from increase in short-term financial liabilities 0 7,204
b) Outflows from financing activities -5,993 -16,267
Expenses for interests relating to financing -2,197 -7,509
Expenses for return of capital 0 0
Expenses for repayment of long-term financial liabilities -15 -1,269
Expenses for repayment of short-term financial liabilities -3,781 -7,490
Expenses for payment of dividends and other shares in profit 0 0
c) Surplus in inflows from financing activities or surplus in outflows from financing activities (a+b) -5,993 -9,063
Č. Cash and cash equivalents at end of period 58 227
a) Net increase in cash and cash equivalents (sum of Ač, Bc and Cc) -169 224
b) Cash and cash equivalents at beginning of period 227 3

Fina
ncia
l rep
ort
AN
NU
AL
REPO
RT 2
014
150
Called-up capital
I
Capital reserves
IIRevenue reserves
III
Reval-uation reserve
IV
Retained net profit/loss from
previous periodsV
Net profit/loss for the financial year
VI
Share capital
Uncalled capital (as a
deductible item)
Capital reserves
Legal reserves
Reserves for
treasury shares
and own business stakes
Treasury shares
and own business
stakes (as a deductible
item)Statutory reserves
Other revenue reserves
Reval-uation reserve
Retained net
profitRetained net loss
Net profit for the
financial year
Net loss
for the financial
yearTotal
capital
I/1 I/2 II III/1 III/2 III/3 III/4 III/5 IV V/1 V/2 VI/1 VI/2
A.1. BALANCE AT 31 Dec. 2013 25,442 0 0 0 4,977 -4,977 0 0 1,056 0 0 0 -11,381 15,117
A.2. INITIAL BALANCE AT 1 Jan. 2014 25,442 0 0 0 4,977 -4,977 0 0 1,056 0 0 0 -11,381 15,117
B.1. Changes in equity - transactions with owners
0 0 0 0 0 0 0 0 0 0 0 0 0 0
B.2. Total comprehensive income for the period
0 0 0 0 0 0 0 0 8,808 0 0 0 -47,957 -39,149
a) Entry of net profit/loss for the period
0 0 0 0 0 0 0 0 0 0 0 0 -47,957 -47,957
d) Change in fair value of available-for-sale financial assets
0 0 0 0 0 0 0 0 10,903 0 0 0 0 10,903
e) Deferred tax from a change in fair value of available for-sale financial assets
0 0 0 0 0 0 0 0 -984 0 0 0 0 -984
f) Change in fair value of available-for-sale financial assets transferred to profit or loss
0 0 0 0 0 0 0 0 -1,312 0 0 0 0 -1,312
g) Deferred tax from a change in fair value of available- for-sale financial assets transferred to profit or loss
0 0 0 0 0 0 0 0 201 0 0 0 0 201
h) Other components of comprehensive income for the period
0 0 0 0 0 0 0 0 0 0 0 0 0 0
B.3. Changes within equity -11,381 0 0 0 0 0 0 0 0 0 0 0 11,944 563
a) Allocation of the remaining net profit part for the comparative period to other capital components
0 0 0 0 0 0 0 0 0 0 -11,381 0 11,381 0
č) Settling a loss as a deductible capital component
-11,381 0 0 0 0 0 0 -65 0 -498 11,381 0 563 0
f) Other changes within equity 0 0 0 0 0 0 0 65 0 498 0 0 0 563
C. END BALANCE at 31 Dec. 2014 14,061 0 0 0 4,977 -4,977 0 0 9,864 0 0 0 -47,394 -23,470
Statement of changes in equity of Sava d.d. for the period from 31 December 2013 to 31 December 2014 (€ thousand)

Fina
ncia
l rep
ort
AN
NU
AL
REPO
RT 2
014
151
Called-up capital
I
Capital reserves
IIRevenue reserves
III
Reval-uation reserve
IV
Retained net profit/loss from
previous periodsV
Net profit/loss for the financial year
VI
Share capital
Uncalled capital (as a
deductible item)
Capital reserves
Legal reserves
Reserves for
treasury shares
and own business stakes
Treasury shares
and own business
stakes (as a deductible
item)Statutory reserves
Other revenue reserves
Reval-uation reserve
Retained net
profit
Retained net loss
Net profit for the
financial year
Net loss
for the financial
yearTotal
capital
I/1 I/2 II III/1 III/2 III/3 III/4 III/5 IV V/1 V/2 VI/1 VI/2
A.1. BALANCE at 31 Dec. 2012 83,751 0 0 0 4,977 -4,977 0 0 12,288 0 -9,274 0 -49,036 37,729
A.2. INITIAL BALANCE at 1 Jan. 2013 83,751 0 0 0 4,977 -4,977 0 0 12,288 0 -9,274 0 -49,036 37,729
B.1. Changes in equity - transactions with owners
0 0 0 0 0 0 0 0 0 0 0 0 0 0
B.2. Total comprehensive income for the period
0 0 0 0 0 0 0 0 -11,232 0 0 0 -11,381 -22,613
a) Entry of net profit/loss for the period
0 0 0 0 0 0 0 0 0 0 0 0 -11,381 -11,381
d) Change in fair value of available-for-sale financial assets
0 0 0 0 0 0 0 0 -716 0 0 0 0 -716
e) Deferred tax from a change in fair value of available for-sale financial assets
0 0 0 0 0 0 0 0 54 0 0 0 0 54
f) Change in fair value of available- for-sale financial assets transferred to profit or loss
0 0 0 0 0 0 0 0 -11,583 0 0 0 0 -11,583
g) Deferred tax from a change in fair value of available- for-sale financial assets transferred to profit or loss
0 0 0 0 0 0 0 0 1,038 0 0 0 0 1,038
h) Other components of comprehensive income for the period
0 0 0 0 0 0 0 0 -25 0 0 0 0 -25
B.3. Changes within equity -58,310 0 0 0 0 0 0 0 0 0 9,274 0 49,036 0
a) Allocation of the remaining net profit part for the comparative period to other capital components
0 0 0 0 0 0 0 0 0 0 -49,036 0 49,036 0
č) Settling a loss as a deductible capital item
58,310 0 0 0 0 0 58,310 0 0
C.END BALANCE at 31 Dec. 2013 25,442 0 0 0 4,977 -4,977 0 0 1,056 0 0 0 -11,381 15,117
Calculation of the accumulated loss for Sava d.d. at 31 December 2014 (€ thousand)
Disclosure is requested by the Companies Act.
31 Dec. 2014 31 Dec. 2013
NET PROFIT OR LOSS FOR THE ACCOUNTING PERIOD -47,957 -11,381
Retained loss at 1 Jan. -11,381 -58,310
Other changes 11,944 58,310
Accumulated loss at the end of the accounting period -47,394 -11,381
Statement of changes in equity of Sava d.d. for the period from 31 December 2012 to 31 December 2013 (€ thousand)

Fina
ncia
l rep
ort
AN
NU
AL
REPO
RT 2
014
152
2.2 Notes to the financial statements of Sava d.d.
2.2.1 Basis for drawing the financial statements
REPORTING COMPANY
Sava d.d., Družba za upravljanje in financiranje,
Dunajska cesta 152, 1000 Ljubljana, is the con-
trolling company of the Sava Group. The financial
statements of Sava d.d. have been drawn up for the
period ending on 31 December 2014. The owner-
ship structure of Sava d.d. is explained in the chapter
about the Sava share and ownership structure, which
forms a part of the business annual report. Finan-
cial statements have been produced under the going
concern assumption.
The annual report can be accessed on the company’s
website at www.sava.si.
STATEMENT OF COMPLIANCE
Financial statements have been prepared in accord-
ance with Slovene Accounting Standards, which had
been issued by the Slovene Institute of Auditors.
The Management Board approved the issue of finan-
cial statements on 3 March 2015.
FUNCTIONAL CURRENCY
Financial statements are presented in Euro currency,
which as of 1 January 2007 has been the functional
currency of the company. The financial information is
presented in euros, rounded to one thousand units.
When adding together, minor differences can appear
due to rounding up.
CHANGES IN ACCOUNTING POLICIES
In 2014, no changes in the accounting policies took
place.
FOREIGN CURRENCY TRANSACTIONS
Transactions in foreign currencies are translated to
the functional currency at the reference exchange
rate of the ECB ruling at the transaction date.
Monetary assets and liabilities denominated in for-
eign currencies at the balance sheet date are trans-
lated to the functional currency at the reference
exchange rate of the ECB ruling at last day of the
accounting period. Foreign exchange gains/losses
present differences between the repayment value in
functional currency at the beginning of the period
adjusted by the amount of effective interest and pay-
ments during the period and the repayment value in
foreign currency calculated at the reference exchange
rate of ECB at the period end. Foreign exchange loss-
es/gains are recognised in the income statement.
Non-monetary assets and liabilities that are measured
at original value in foreign currency are translated to
functional currency at the reference exchange rate of
the ECB ruling at the transaction date. Non-mone-
tary items and liabilities shown in foreign currency
and measured at fair value are translated to euros at
the reference exchange rate of ECB ruling at the day
when fair value is determined.
Foreign exchange losses/gains are recognised in the
income statement.

Fina
ncia
l rep
ort
AN
NU
AL
REPO
RT 2
014
153
2.2.2 Significant accounting policies
INTANGIBLE ASSETS
Intangible fixed assets have their useful lives defined.
They are measured at cost less depreciation adjust-
ment and accumulated losses due to impairment.
Cost also includes import and non-refundable pur-
chasing taxes, as well as interest on loans for acqui-
sition of an intangible fixed asset until it is placed in
service for use.
TANGIBLE FIXED ASSETS
Tangible fixed assets are stated at cost less depreci-
ation adjustment and accumulated loss due to im-
pairment.
At initial recognition a tangible fixed asset is valued at
cost. The cost includes its purchase expense, import
and non-refundable purchasing taxes and expenses,
which can be attributed directly to its placement in
service for the intended use, especially expenses for
its transport and installation and estimated cost of its
dismantling, removal and restoration. Costs are in-
creased due to the interests on loans for acquiring a
tangible fixed asset until it is placed in service for use.
Those parts of tangible fixed assets that have differ-
ent useful lives are calculated as individual fixed as-
sets.
SUBSEQUENT EXPENDITURES IN CONNEC-TION WITH TANGIBLE FIXED ASSETS
Subsequent expenditures in connection with a tan-
gible fixed asset increase its cost value if the future
economic benefits embodied in the assets are higher
than originally estimated.
Repairs of or maintaining tangible fixed assets are
intended for renewing or preserving the future eco-
nomic benefits expected on the basis of the originally
estimated level of asset efficiency. They are recog-
nised as expenses when incurred.
INVESTMENT PROPERTY
Investment property is property which is held either
to earn rental income or for capital appreciation or
both. Investment property is not intended for the
manufacture of products, supply of goods, provid-
ing services or for office purposes like tangible fixed
assets. Investment property is also not intended for
short-term sale.
When an investment property becomes owner-occu-
pied, it is reclassified as property, fixtures and fittings.
Investment property is stated at the cost value model
less depreciation adjustment and accumulated loss
due to impairment.
For the needs of disclosure the fair value of invest-
ment properties is ascertained.

Fina
ncia
l rep
ort
AN
NU
AL
REPO
RT 2
014
154
DEPRECIATION
The carrying amount of a tangible fixed asset, in-
tangible fixed asset and investment property is de-
creased through depreciation.
We use the method of depreciation on a straight-line
basis considering thereby the useful life of an asset.
Land is not depreciated. The remaining value of a
tangible fixed asset is not assessed.
Intangible fixed asset, tangible fixed asset and invest-
ment property start to be depreciated on the first day
of the next month when it is available for use.
Depreciation rates are based on useful lives of assets and amount to in percentage:
Current year Past year
Intangible fixed assets from 10.0 to 20.0 from 10.0 to 20.0
Buildings from 2.0 to 5.0 from 2.0 to 5.0
Plant and machinery from 5.0 to 33.3 from 5.0 to 33.3
The useful lives of investment property equal those
valid for property of the same kind which is kept as
tangible fixed assets.
IMPAIRMENT OF INTANGIBLE ASSETS, TANGIBLE FIXED ASSETS AND INVESTMENT PROPERTY
At least once a year the company examines the re-
maining carrying amount of intangible assets, tangi-
ble assets and investment property in order to ascer-
tain whether they are impaired. If they are impaired,
the recoverable value of the asset is estimated.
Impairment of assets or cash-generating items is rec-
ognised when its carrying amount exceeds its recov-
erable value. A cash-generating unit is the smallest
group of assets which generates financial inflows
that to a great extent do not depend on financial
inflows from other assets or groups of assets. Impair-
ment is stated in the income statement. Loss recog-
nised in a cash-generating unit arising from impair-
ment is allocated to other assets of the unit (group of
units) in proportion to the carrying amount of each
item in the group.
The recoverable amount of an asset or a cash-gener-
ating unit is the greater of their fair values in use or
fair value less selling costs. In assessing value in use,
the estimated future cash flows are discounted to
their present value using a pre-tax discount rate that
reflects current market assessments of the time value
of money and the risks specific to the asset.
FINANCIAL INVESTMENTS
In the balance sheet, financial investments are stated
as long- and short-term financial investments. Long-
term financial investments are those which are in
possession for more than one year, and are not held
for trading.
Financial investment in capital, proprietary securities
of other companies or debtor’s securities of other
companies or the state as well as approved loans are
initially recognised at the cost of purchase, which
equals the paid sum of money or its equivalents.
In the financial statements, long-term financial in-
vestment in subsidiaries and associates are valued at
cost. In the parent company, the associates are val-
ued at cost and checked at least once a year wheth-
er indication for impairment exists. The impairment
estimate is based on the examination of recoverable
value, i.e. verifying the value in use (estimate of dis-
counted cash flows) and fair value; the recoverable
value is the higher of both.

Fina
ncia
l rep
ort
AN
NU
AL
REPO
RT 2
014
155
With regard to the purpose of their acquisition the
investments in debtor and proprietary securities are
dealt with as available for sale. They are divided into
investments in shares of listed companies, invest-
ments in shares and stakes of unlisted companies
and investments in mutual funds. These financial in-
struments are recognised or reversed on the transac-
tion day. The fair value of listed securities available for
sale equals the bid price of these shares on the bal-
ance sheet date. The fair value of shares and stakes
of companies which are not listed is ascertained by
checking at least once a year whether indication for
impairment exists.
The fair value of securities available for sale is assessed
at least every three months, the last evaluation was
carried out on 31 December 2014. The change in fair
value is recognised in capital as a revaluation reserve.
If a decrease in the fair value of a financial instrument
available for sale was recognised directly as a neg-
ative revaluation reserve and there exists impartial
evidence that the asset is permanently impaired, the
impairment is recognised in the income statement as
a financial expense. It is considered that impartial ev-
idence for the examination of a financial investment
exists when the fair value of the financial asset on
the balance sheet date is 20% lower than the cost
value of the financial asset (a significant decrease)
and when the decrease is long-lasting. The examina-
tion of the impairment in the financial asset is car-
ried out separately for each investment or group of
investments.
The fair value of an interest swap is the estimated
amount that the company would receive or pay upon
suspending the interest rate swap at the balance
sheet date, considering thereby current interest rate
and current borrowing power of swap participants.
RECEIVABLES
At their initial recognition, receivables of all types
are shown in the amounts that arise from the corre-
sponding documents on condition that they will be
paid. The original receivables can later be increased,
or irrespective of payment or any other settlement,
decreased by every amount, which is proven by an
agreement.
The advances in the balance sheet are shown in rela-
tion with things they refer to.
Receivables, which are assumed not be settled within
the due term and in the total amount, respectively,
are considered doubtful and, if a court procedure has
already begun, disputable.
The revaluation adjustments in receivables are
formed as follows:
• a 100% adjustment in all sued receivables and
receivables filed in a bankruptcy proceedings and
obligatory enforcement proceedings; and
• a 100% adjustment for receivables which accord-
ing to the best professional judgement are doubt-
ful and the outcome of law suit is uncertain due to
customer insolvency.
CASH AND CASH EQUIVALENTS
Cash and cash equivalents comprise cash balances
on transaction accounts.
CAPITAL
Total capital of a company is its liability towards its
owners, which falls due if the company discontinues
its operation. It is determined on the basis of the
amounts invested by the owners, and the amounts
that appeared during operation and belong to the
owners. It is decreased by the loss from operations,
repurchased own shares and withdrawals (pay-
ments). The total capital comprises share capital,
capital reserves, revenue reserves, retained net prof-
it, fair value reserve and own shares as a deductible
item.

Fina
ncia
l rep
ort
AN
NU
AL
REPO
RT 2
014
156
LONG-TERM AND SHORT-TERM PROVISIONS
Provisions are recognised if a company due to a past
event has legal or indirect liabilities that can be relia-
bly estimated and it is likely that to settle the liability
an outflow of assets which assure economic benefits
will be required. The amount of provision is defined
by discounting the expected future cash flows using
a pre-tax discount rate that reflects current market
assessments of the time value of money and the risks
specific to the liability.
In accordance with the legal regulations, collective
agreement and internal book of rules, the compa-
ny is obliged to pay employee jubilee benefits and
retirement amounts, for which it forms long-term
provisions in the amount of the estimated future
payments of retirement amounts and jubilee benefits
discounted at the balance sheet date. There are no
other retirement liabilities.
Provisions for the reorganisation refer to costs and
the estimate of liabilities associated with risk due to
preventive restructuring proceedings.
Government grants are recognised in financial state-
ments as deferred revenue when received and there
is a reasonable assurance that it will comply with the
conditions attaching to it. Grants that compensate
for expenses incurred are recognised as revenue on
a systematic basis in the same periods in which the
expenses are incurred. Grants are strictly recognised
in the income statement as other operating income
on a systematic basis over the useful life of the asset.
LIABILITIES
Liabilities are financial or operating, short-term or
long-term.
All liabilities are initially recognised with the amounts
arising from the corresponding documents about
their appearance, which prove the receipt of cash or
redemption of any operating liability.
Long-term liabilities are further increased by imput-
ed interests or decreased by repaid amounts and
any other settlements, agreed upon with a creditor.
The book value of long-term liabilities equals their
original value decreased by repayment of the prin-
cipal and transfers under short-term liabilities until
the need for a revaluation adjustment of long-term
debts appears.
The book value of short-term liabilities equals their
original value adjusted by their increases or decreases
as agreed upon with the creditors until the need for
their revaluation adjustment appears.
Short-term and long-term liabilities of all kinds are
initially shown with the amounts which arise from
the corresponding documents on condition that the
creditors request their repayment. The liabilities are
later increased with imputed yields (interests, other
compensations), about which an agreement is made
with the creditor. Liabilities are decreased by repaid
amounts and any other settlements in agreement
with the creditor.
When measuring long-term liabilities, the company
follows the policy that the interest rate being agreed
upon does not considerably differ from the effective
interest rate if the difference is not more than one
percentage point.
Fina
ncia
l rep
ort
AN
NU
AL
REPO
RT 2
014
157
SHORT-TERM ACCRUALS AND DEFERRALS
Short-term accruals and deferrals include receivables
and other assets and liabilities that are anticipated to
appear within a year and whose appearance is prob-
able and their size reliably estimated. Receivables and
liabilities relate to the known and not yet known le-
gal entities or natural persons towards whom actual
receivables and debts will then appear, while assets
include products and services to their debit.
Deferred costs and accrued revenues include short-
term accrued revenues and short-term deferred
costs. Accrued costs and deferred revenues include
short-term deferred revenues and short-term accrued
cost.
RECOGNITION OF REVENUES
Revenues are recognised if the enhancement of eco-
nomic benefits in the accounting period is connected
with an increase in an asset or a decrease in a lia-
bility and such an increase could be reliably meas-
ured. Revenues are recognised when it is legitimate
to expect they will result in earnings if these were not
already implemented at their appearance.
Operating revenues
Revenues from services rendered are recognised in
the income statement with regard to the level of the
completeness of a transaction on the reporting date.
The level of completeness is estimated with a survey
of the work performed.
Revenues from rents from investment property are
recognised in expenses on a straight line basis during
the rent period.
Revenues from received subsidies or endowments
are measured in amounts that are approved for this
purpose.
Operating revenues from revaluation arise upon the
disposal of tangible fixed assets, intangible fixed as-
sets and investment property as surpluses of their
selling value over their carrying amount.
Financial revenues
Financial revenues include interest revenues from in-vestments, revenues from dividends, revenues arising from disposal of financial assets available for sale, foreign exchange gains and proceeds from hedging instruments when they are recognised in the income statement. Interest revenues are recognised as they arise by using an effective interest rate method. Rev-enues from dividends are recognised in the income statement in the period when the Shareholders’ Meeting adopts a resolution about dividend payment.
Other revenues
Other revenues consist of extraordinary items; they appear in actually incurred amounts.
INCOME TAX AND DEFERRED TAX
Income tax on the profit or loss for the financial year comprises current and deferred tax. Income tax is rec-ognised in the income statement except to the extent that it relates to items recognised directly in equity, in which case it is recognised in equity.
Current tax is the expected tax payable on the tax-able income for the year, using tax rates enacted or substantially enacted at the balance sheet date, and any adjustment to tax payable in respect of previous years.
Deferred tax is provided using the balance sheet li-ability method, providing for temporary differences between the carrying amounts of assets and liabili-ties for financial reporting purposes and the amounts used for taxation reporting purposes. The amount of deferred tax provided is based on the expected manner of realisation or settlement of the carrying amount of assets and liabilities, using tax rates en-acted or substantively enacted at the balance sheet date.
A deferred tax receivable is recognised only to the ex-tent that it is probable that future taxable profits will be available against which the asset can be utilised. Deferred tax assets are reduced to the extent that it is no longer probable that the related tax relief will
be realised.

Fina
ncia
l rep
ort
AN
NU
AL
REPO
RT 2
014
158
NET EARNINGS / LOSS PER SHARE
The share capital of the company is divided into or-
dinary personal no-par value shares; therefore the
company states the basic earnings per share. The ba-
sic earnings of the share are calculated so as to divide
profit or loss with the weighted number of ordinary
shares in the business year.
The diluted net earnings / loss per share equal the
basic net earnings per share as the company is not in
possession of any preference shares or exchangeable
bonds. There were no changes in the number of is-
sued shares during the year.
CRITERIA OF IMPORTANCE FOR DISCLOSURES
The company states the accounting policies at least
for the assets and liabilities whose value exceeds 10%
cent of the value of assets or liabilities at the balance
sheet date.
The company discloses an individual asset or debt at
least for those exceeding 10% of the balance sheet
total. Lower amounts are disclosed when the com-
pany evaluates them of importance for a fair view of
its business.
DRAWING UP A CASH FLOW STATEMENT
The cash flow statement has been prepared in ac-
cordance with SAS 26 - Variant II. It has been pre-
pared by considering the data from the income state-
ment for the period January-December 2014 (for the
past period January-December 2013), the balance
sheet data at 31 December 2014 and 31 December
2013 (for the past period 31 December 2013 and 31
December 2012), and other required data. The cash
flow statement excludes the values not connected
with revenues and expenses.
2.3 Financial risk management for Sava d.d.
Sava d.d. is exposed to the following financial risks:
RISK OF A CHANGE IN THE FAIR VALUE OF ASSETS (PRICE RISK)
Risk of a change in the fair value is the risk that the
company will suffer a loss of economic benefits due
to a change in the financial asset value. This risk is
one of the critical risks Sava d.d. is exposed to as it
is strongly connected with achieving the planned
return and implementation of the outlined strategy.
Risk of fair value changes is reduced through diversi-
fying the investment portfolio and active supervision
over the operations of the companies, in which Sava
d.d. holds a significant equity share.
In these uncertain economic circumstances, the risk
of changes in fair value of the assets remains high.
INTEREST RATE RISK
This involves a risk that the value of financial instru-
ment and costs of contracting debt will fluctuate
due to changes in the market interest rates. Owing
to the expiration of the master restructuring agree-
ment on 30 November 2014 and the introduction of
preventive restructuring proceedings on 2 December
2014, the exposure to the change of interest rates
increased, as the company has not yet agreed the
conditions for restructuring its financial liabilities.
In the presented uncertain economic circumstances,
the risk of changes in the market interest rate is high.

Fina
ncia
l rep
ort
AN
NU
AL
REPO
RT 2
014
159
CREDIT RISK
This involves a risk that a customer engaged in a busi-
ness relationship will not meet its obligations and will
cause the company to make a financial loss. Credit
risk is directly connected with commercial risk and
presents a danger that trade receivables or receiva-
bles due from other business partners will be settled
with delay or not at all. Sava d.d. generates a part
of its revenues in doing business with its subsidiaries
where the risk for non-payment is low. Special at-
tention is devoted to solvency of customers out of
the Group. The major part of the increased credit risk
Sava d.d. is exposed to is due to loan transactions
made with NFD Holding d.d. in the past, against
which bankruptcy proceedings were initiated on 6
January 2015.
Considering the described business events, we esti-
mate credit risk for Sava d.d. as high.
SOLVENCY RISK
This involves a risk that a company will not be able
to fulfil its financial liabilities in due time. The agree-
ment for restructuring of financial liabilities of Sava
d.d. and thus a moratorium on repayment of the
principals expired at the end of November 2014, as
of the beginning of December the company is under-
going preventive restructuring proceedings.
Owing to the current pending procedures, the sol-
vency risk for Sava d.d. remains high.
FOREIGN CURRENCY RISK
This involves a risk of losing economic benefits due to
the changes in the foreign currency exchange rates.
Sava d.d. mainly does business in the Euro Zone,
therefore this risk is considered low in the company.
MANAGEMENT OF CAPITAL
As part of the initiated preventive restructuring pro-
ceedings, Sava d.d. will prepare a new financial re-
structuring plan, which, similar to the preceding
business strategy, will be based on restructuring of
financial liabilities and divesting of certain financial
investments. On the basis of the planned activities,
the capital structure is expected to improve.
Sava d.d. has no programme of granting stock op-
tions to its employees.
Regulatory bodies do not have any capital require-
ments towards the parent company or subsidiaries in
the Sava Group.

Fina
ncia
l rep
ort
AN
NU
AL
REPO
RT 2
014
160
2.4 Breakdown and notes to the financial statements of Sava d.d.
2.4.1 Intangible fixed assets and long-term deferred costs and accrued revenues
In 2014, depreciation of intangible fixed assets amounted to €3 thousand.
Movement of intangible fixed assets and long-term deferred costs and accrued revenues (€ thousand)
Property rights
Cost value
Long-term deferred
development costs
Investments in acquired rights
to industrial property and other rights
Advances for intangible long-term
assets
Goodwill of acquired company
Other long-term
deferred costs and accrued
revenues Total
Balance at 1 Jan. 2014 0 27 0 0 0 27
Increases, purchases 0 0 0 0 0 0
Decreases 0 0 0 0 0 0
Balance at 31 Dec. 2014 0 27 0 0 0 27
VALUE ADJUSTMENT
Balance at 1 Jan. 2014 0 -2 0 0 0 -2
Decrease 0 0 0 0 0 0
Depreciation 0 -3 0 0 0 -3
Balance at 31 Dec. 2014 0 -5 0 0 0 -5
CARRYING AMOUNT
Balance at 1 Jan. 2014 0 25 0 0 0 25
Balance at 31 Dec. 2014 0 22 0 0 0 22

Fina
ncia
l rep
ort
AN
NU
AL
REPO
RT 2
014
161
2.4.2 Tangible fixed assets
The value of tangible fixed assets amounting to €167
thousand at the end of 2014 (2013: €244 thousand)
was lower than at the end of 2013, mostly due to
selling the construction land and the accounted for
depreciation. Minimum investments were carried out
by using own finance sources, which is why the cost
of borrowings did not increase the value of tangible
fixed assets.
In 2014, the depreciation of tangible fixed assets was
accounted for to the amount of €51 thousand.
Movement of tangible fixed assets (€ thousand)
Cost value Land BuildingsPlant and machinery
Other equipment
Tangible fixed assets under
construction and manufacture
Advances for tangible fixed assets Total
Balance at 1 Jan. 2014 0 0 236 106 0 0 342
Purchase, increases 0 0 3 0 0 0 3
Decrease 0 0 -48 0 0 0 -48
Write-offs 0 0 -44 -1 0 0 -45
Balance at 31 Dec. 2014 0 0 147 105 0 0 252
VALUE ADJUSTMENT
Balance at 1 Jan. 2014 0 0 -77 -21 0 0 -98
Decrease 0 0 19 0 0 0 19
Write-offs 0 0 44 1 0 0 45
Depreciation 0 0 -30 -21 0 0 -51
Balance at 31 Dec. 2014 0 0 -44 -41 0 0 -85
CARRYING AMOUNT
Balance at 1 Jan. 2014 0 0 159 85 0 0 244
Balance at 31 Dec. 2014 0 0 103 64 0 0 167

Fina
ncia
l rep
ort
AN
NU
AL
REPO
RT 2
014
162
2.4.3 Investment property
The value of investment property amounted to
€2,276 thousand (2013: €2,362 thousand) and did
not change significantly compared to the previous
year. Investment property of the book value €1,797
thousand was leased out. The biggest part referred
to the BTC warehouse facility (Šmartinska 152, Lju-
bljana), measuring 3,974 sq. m and the associated
land.
On the BTC real property in Ljubljana whose book
value amounted to €1,411 thousand, a mortgage
for a long-term syndicated loan is placed. At 31 De-
cember 2014, the unpaid loan balance amounted to
€94,969 thousand.
Based on market comparisons it is estimated that the
fair value of investment property does not signifi-
cantly deviate from the book values.
Revenues of €305 thousand and expenses of €141
thousand were generated in leasing out the invest-
ment property. Expenses of €25 thousand were
shown in relation to the investment property not
leased out.
In 2014, depreciation of investment property was ac-
counted for in the value of €61 thousand.
Cost value Land-investment property Buildings-investment property Total
Balance at 1 Jan. 2014 1,184 4,528 5,712
Purchase, increase 0 0 0
Decrease due to disposal -25 0 -25
Balance at 31 Dec. 2014 1,159 4,528 5,687
VALUE ADJUSTMENT
Balance at 1 Jan. 2014 0 -3,350 -3,350
Decrease due to disposal 0 0 0
Depreciation 0 -61 -61
Balance at 31 Dec. 2014 0 -3,411 -3,411
CARRYING AMOUNT
Balance at 1 Jan. 2014 1,184 1,178 2,362
Balance at 31 Dec. 2014 1,159 1,117 2,276
Movement of investment property (€ thousand)

Fina
ncia
l rep
ort
AN
NU
AL
REPO
RT 2
014
163
2.4.4 Long-term financial investments
Long-term financial investments amounting to
€189,081 thousand (2013: €213,869 thousand)
represented 90% of the balance sheet total. In com-
parison with the previous year, their value reduced by
€24,788 thousand in net terms, i.e. it reduced due
to the performed impairments and increased due to
rising stock exchange prices of securities available for
sale.
a) Shares and stakes in Sava Group companies
Shares and stakes in Sava Group companies totalled
€91,492 thousand (2013: €93,234 thousand) and
were down by €1,742 thousand compared to the
end of the previous year due to the additional im-
pairments of the financial investment in a Real Estate
company.
The entire ownership stake of Sava Turizem d.d. was
pledged for the loans obtained by Sava d.d., its book
value amounting to €88,960 thousand. The entire
ownership stake in the company Sava Nepremičnine
d.o.o. was pledged for the loans obtained by Sava
TMC d.o.o., the book value of which amounted to
€2,165 thousand.
Disclosures in connection with the composition of the
Sava Group, share in capital, amount of capital and
operating result of the subsidiaries are presented in
the financial report of the annual report of the Sava
Group.
b) Shares and stakes in the associated companies
The value of shares and stakes in the associat-
ed companies totalled €59,300 thousand (2013:
€85,915 thousand) and due to the additional im-
pairments it was by €26,615 thousand lower than
at the end of the previous year; €26,586 thou-
sand of the amount referred to impairment of the
investment in Gorenjska banka d.d., and the
rest amounting to €29 thousand referred to the
final impairment of financial investment in NFD
Holding d.d. The amount shown at 31 December
2014 thus entirely referred to the financial invest-
ment in the shares of Gorenjska banka d.d.
- The value of a 44.07% equity holding of Gorenjska
banka d.d. amounted to €59,300 thousand (2013:
€85,886 thousand). A decrease of €26,586 thou-
sand was due to impairment carried out on the basis
of the evaluation prepared by a certified appraiser. At
31 December 2014, the book value of financial in-
vestment in Gorenjska banka d.d. amounted to €406
for a share (2013: €588 for a share).
Sava d.d. pledged 139,480 shares of Gorenjska ban-
ka d.d. for the obtained loans, issued bonds and a
loan obtained by a subsidiary. The book value of the
pledged shares amounted to €56,629 thousand
Information about the evaluation of a 44.07% equity holding of Gorenjska banka d.d. for financial reporting purpose at 31 December 2014
An evaluation report for a 44.07% equity holding of
Gorenjska banka d.d. as at 31 December 2014 was
produced for financial reporting purpose. A certified
company evaluator licensed with the Slovene Audit
Institute carried out the evaluation.
Gorenjska banka d.d. was evaluated based on the
current value of the expected free cash flow (value
in use) and the method of market comparisons (fair
value decreased by selling costs). The following doc-
uments were used in the evaluation: the operations
projections prepared on the basis of the past operat-
ing results; estimate of financial statements for 2014;
business plans for the period 2015- 2019; publicly
announced strategic basis for action and policies of
the company; explanations given by the company’s
management board; analyses of the macroeconomic
environment and the industry.

Fina
ncia
l rep
ort
AN
NU
AL
REPO
RT 2
014
164
The following assumptions were used in the value
computation: a going-concern entity; a 10% minor-
ity owner discount; a 10% discount for shortage of
marketability; a 12.30% required return on capital; a
2 % growth in normalised cash flow.
The fair value computation decreased by selling costs
considered the following assumptions: a going-con-
cern entity; P/B multiplication factor between 0.69
and 0.79 (listed companies); a 5% discount for short-
age of marketability; adjustment by a control premi-
um 18.75%; selling cost estimate 2%.
The final resolution on recoverable amount evalua-
tion was made based on fair value decreased by sell-
ing cost in the span from €378 for a share to €434
for a share, with the mean value at €406 for a share.
Information about the evaluation of a 44.07% equity holding of Gorenjska banka d.d. for the financial reporting purpose at 31 December 2013
An evaluation report for a 44.07% equity holding
of Gorenjska banka d.d. at 31 December 2013 was
produced for financial reporting purpose. A certified
company evaluator licensed with the Slovene Audit
Institute carried out the evaluation.
In computing the equity holding value of Gorenjska
banka d.d., the value in use was estimated using the
method of current value of the expected free cash
flow and the evaluated fair value decreased by sell-
ing cost and using the method of market compar-
isons. The following assumptions were considered:
unchanged operations and going concern; business
projections were produced based on the past per-
formance results, the 2014 business plans, publicly
announced platform for action and policies of the
company, explanations given by the company’s man-
agement board, analyses of macroeconomic envi-
ronment and the industry. As of 2013, an amount
of profit is retained in the company every year that
ensures preserving Tier 1 at the level of 11.5%. As
per the evaluation date, capital was adapted by a
surplus capital amount, minority owner discount at
5%, shortage of marketability at 5%, required return
on capital at 14.29%, and growth in normalised cash
flow at 2%.
The final resolution on recoverable amount evalua-
tion was made based on the value in use in the range
from €549 to €602 for a share, with the mean value
at €585 for a share.
At 31 December 2013, Sava d.d. held 146,060 shares
of Gorenjska banka d.d., valued at €588 for a share.
The stated value lies within the evaluated range.
- As of the end of 2013, Abanka Vipa d.d. has no
longer been under the ownership pf Sava d.d. Based
on the decision by the Bank of Slovenia on intro-
ducing urgent measures, which was adopted on 17
December 2013, total bank’s qualifying liabilities
including the share capital of Abanka Vipa d.d., ex-
pired on 18 December 2013. On the same day, the
corresponding entries were made in the court’s regis-
ter; consequently, the existent shares were cancelled
from the Central Securities Depository. Already at 31
December 2013, Sava d.d. thus no longer held this
bank’s shares, based on which the final impairment
of the investment was included in the 2013 income
statement.
- Due to initiation of bankruptcy proceedings
against NFD Holding d.d., Ljubljana on 6 January
2015, the value of a 24.65% stake in this company,
was additionally impaired by €29 thousand, there-
fore the investment had zero value at 31 December
2014.
Disclosures in connection with the composition of
the Sava Group, share in capital, amount of capital
and operating result of the associated companies are
presented in the financial report of the annual report
of the Sava Group.

Fina
ncia
l rep
ort
AN
NU
AL
REPO
RT 2
014
165
c) Other shares and stakes
Other shares and stakes totalling €38,289 thousand
(2013: €31,343 thousand) were by €6,946 thou-
sand higher than in the previous year. Other shares
and stakes included listed securities available for sale
totalling €843 thousand (2013: €3,521 thousand),
unlisted securities available for sale totalling €3,323
thousand (2013:3,823 thousand), and investments
in a mutual fund totalling €34,123 thousand (2013:
€23,999 thousand).
At 31 December 2014, securities available for sale
were valued at fair value; the net positive effect from
revaluation amounted to €10,063 thousand (2013:
net negative effect of €4,681 thousand), €840 thou-
sand of which (2013: 3,964 thousand) were impair-
ments through profit or loss, while net increase in
the value of financial investments totalling €10,903
thousand (2013: a decrease of €717 thousand) was
shown in equity revaluation adjustments.
In 2014, securities available for sale were sold, their
book value amounting to €3,128 thousand. A profit
of €1,311 thousand was generated in sale. The ma-
jor part of purchase consideration was earmarked for
loan repayments to banks.
The value of investment in Alpen.SI (renaming of
NFD 1, mutual fund) amounted to €34,123 thou-
sand (2013: €23,999 thousand). Fair value was as-
certained by using the stock exchange price on the
last day of the accounting period, which in com-
parison with the same period last year considerably
increased.
Despite a 39.95% ownership stake, the investment in
Alpen.SI is considered as available for sale and not as
an associated company. The company is managed by
the management company, in which Sava d.d. has
no ownership stake. The Supervisory Board of the
company solely supervises the fund operation. Fur-
thermore, it restructured from a closed mutual fund
to an open mutual fund in 2011, after which Sava
d.d. became the owner of a certain number of mutu-
al fund coupons and has no influence on managing
the fund whatsoever.
The total - 39.95% - share in Alpen.SI was pledged
for the loans obtained by Sava d.d. The book value
of pledged shares amounted to €34,123 thousand.
The value of other shares and stakes amounted to
€4,166 thousand (2013: €7,344 thousand), and in-
cluded 1,468,221 shares of Hoteli Bernardin 13,500
shares of Kompas Bled, 4,987 shares of Pokojninska
Družba A, 13,638 shares of Jubmes Banka, pledged
for the loans obtained by Sava d.d. The book value of
pledged shares amounted to €3,275 thousand.
Types of securities available for sale (€ thousand)
31 Dec. 2014 31 Dec. 2013
Shares of listed companies 843 3,521
Shares and stakes of unlisted companies 3,323 3,823
Mutual funds 34,123 23,999
Total 38,289 31,343

Fina
ncia
l rep
ort
AN
NU
AL
REPO
RT 2
014
166
d) Long-term loans to Group companies
Long-term loans to Sava Group companies amounting to €3,377 thousand at the end of 2013 were transferred
under short-term loans in 2014.
Movement of long-term financial investments (€ thousand)
Long-term financial investments, excluding loans Long-term loans
Stocks and shares
in Group companies
Stocks and shares in
associates
Other stocks
and shares
Other long-term
financial investments
Total long-term
financial investments,
excluding loans
Long-term loans to
Group companies
Long-term loans to
other entities
Long-term unpaid
called-up capital
Total long-term
loans
Total long-term
financial investments
GROSS VALUE
Balance at 1 Jan. 2014 105,385 109,587 111,980 0 326,952 3,377 0 0 3,377 330,329
Purchase, increase 0 0 11 0 11 0 0 0 0 11
Decrease 0 0 -12,813 0 -12,813 0 0 0 0 -12,813
Transfers -329 0 0 0 -329 -3,377 0 0 -3,377 -3,706
Write-off 0 0 -40,924 0 -40,924 0 0 0 0 -40,924
Revaluation 0 0 10,903 0 10,903 0 0 0 0 10,903
Balance at 31 Dec. 2014 105,056 109,587 69,157 0 283,800 0 0 0 0 283,800
VALUE ADJUSTMENT
Balance at 1 Jan. 2014 -12,150 -23,672 -80,637 0 -116,459 0 0 0 0 -116,459
Decrease 0 0 9,685 0 9,685 0 0 0 0 9,685
Transfers 329 0 0 0 329 0 0 0 0 329
Write-off 0 0 40,924 0 40,924 0 0 0 0 40,924
Revaluation -1,742 -26,615 -840 0 -29,197 0 0 0 0 -29,197
Balance at 31 Dec. 2014 -13,564 -50,287 -30,868 0 -94,719 0 0 0 0 -94,719
NET VALUE
Balance at 1 Jan. 2014 93,234 85,915 31,343 0 210,492 3,377 0 0 3,377 213,869
Balance at 31 Dec. 2014 91,492 59,300 38,289 0 189,081 0 0 0 0 189,081

Fina
ncia
l rep
ort
AN
NU
AL
REPO
RT 2
014
167
31 Dec. 2014 31 Dec. 2013
Balance at 1 Jan. 10,874 20,669
Decrease in receivables due to sale of securities – through profit or loss -1,488 -9,753
Final reversal of receivables - through profit or loss -9,386 0
Other changes - through profit or loss 0 -33
Final balance 0 10,874
Deferred tax receivables arising from a tax loss were not accounted for. The amount of the not-accounted for deferred tax receivables arising from a tax loss of Sava d.d. by using a 17% tax rate amounted to €49,614 thou-sand at 31 December 2014.
2.4.5 Deferred tax receivables
At the end of 2013, deferred tax receivables were shown in the amount of €10,874 thousand. In 2014, they reduced by €1,488 thousand as a result of sell-ing the impaired securities. Another impairment of
the remaining deferred tax receivables took place which amounted to €9,386 thousand. All changes were carried out through profit or loss. At 31 De-cember 2014, Sava d.d. thus showed no deferred tax receivables.
Movement of deferred tax receivables (€ thousand)
2.4.6 Short-term financial investments
The value of short-term financial investments to-
talling €14,684 thousand (2013: €16,010 thousand)
was by €1,326 thousand lower than in the previ-
ous year. The amount entirely referred to short-term
loans as follows:
• Short-term loans to Group companies totalling
€4,860 thousand are insured with bills of ex-
change, the interest rate being 3%.
• Short-term loan to Energetika Črnomelj d.o.o. to-
talling €531 thousand, which was disposed at the
beginning of 2015, the loan was repaid.
• Short-term deposits made in banks totalling
€1,970 thousand, which were entirely pledged as
security to creditor banks.
• Granted loans to other entities – NFD Holding
d.d.: in total gross amount of €17,806 thousand,
the balance of formed value adjustment at 31 De-
cember 2014 totalled €10,483 thousand, the net
shown value of receivable amounted to €7,323
thousand.
Compared to the end of the previous year, the
balance of loans granted to NFD Holding d.d. was
decreased by €449 thousand due to an additional impairment of loans calculated on the basis of suita-bility of received collaterals.
The loans granted to NFD Holding (net €7,323 thou-sand) and interests (€2,754 thousand), shown un-der operating receivables, are insured with bills of exchange and securities, which include 9,154,192 shares of Hoteli Bernardin, 346,243 shares of Alpen.SI fund, 647,318 shares of Istrabenz, 166,484 shares of Melamin, 56,839 shares of Finetol, 5,806 shares of Krka, 893 shares of Petrol and 32,936 shares of Sava. With all the mentioned shares, Sava d.d. is partly the first-entered lien-holder and partly the second-en-tered lien-holder. The estimated value of securities received in pledge amounts to €10,077 thousand.
For the time of valid restructuring procedure for fi-nancial liabilities of NFD Holding d.d., the loans were bearing interest at a 2.70% interest rate, as of the ex-piration of the restructuring agreement the loans are bearing interest at the agreed default interest rate. On 6 January 2015, bankruptcy proceedings were in-itiated against NFD Holding d.d.
Receivables due from NFD Holding d.d. have been en-tirely pledged as security to creditor banks.

Fina
ncia
l rep
ort
AN
NU
AL
REPO
RT 2
014
168
2.4.7 Short-term operating receivables
Short-term operating receivables of €4,860 thousand
(2013: €4,649 thousand) did not change significant-
ly if compared to the previous year. They referred to:
• Receivables from sale of services due from Sava
Group companies totalling €1,756 thousand.
Total 31 Dec. 2014 Due Not due
IV) Short-term operating receivables 4,860 4,529 330
1. Short-term receivables due from Group companies 2,000 1,718 282
2. Short-term trade receivables 83 46 37
3. Short-term operating liabilities to other entities 2,777 2,764 12
The balance and movement of revaluation of receivables as well as their maturity are shown in chapter 2.5.3.
Financial instruments – financial risks.
• Receivables arising from interests on granted loans totalling €2,754 thousand.
• Receivables arising from interest on granted loans due from the Sava Group companies totalling €171 thousand.
• The remaining amount of €179 thousand referred
to various other receivables.
Short-term operating receivables by maturity (€ thousand)
2.4.8 Cash and cash equivalents
Cash amounting to €58 thousand (2013: €227 thousand) referred to assets on business account, which are en-
tirely pledged as security to creditor banks.
2.4.9 Capital
The value of capital of Sava d.d. at 31 December
2014 was negative amounting to €23,470 thousand
(2013: a positive value of €15,117 thousand) and
was by €38,587 thousand lower than at the end of
the previous year. The following changes in capital
took place in 2014:
• A loss in the accounting period was generated to
the amount of €47,957 thousand.
• Revaluation reserve from long-term financial in-
vestments increased by €8,808 thousand.
• During the year the obsolete liabilities for payment
of dividends to shareholders totalling €563 thou-
sand were transferred under capital reserves and
retained net profit from previous years. They were
used for covering the loss already upon compiling
the annual report.
At the 20th Shareholders’ Meeting of Sava d.d., a de-
cision on a simplified share capital reduction amount-
ing to €11,381 thousand was adopted to cover the
accumulated loss shown at 31 December 2013. The
share capital of the company thus amounted to
€14,061 thousand at 31 December 2014.

Fina
ncia
l rep
ort
AN
NU
AL
REPO
RT 2
014
169
RESERVES FOR OWN SHARES WITHIN OTHER REVENUE RESERVES
At 31 December 2014, reserves for own shares
amounted to €4,977 thousand, the number of own
shares totalled 30,541, representing 1.52% of total
issue of shares. No changes occurred in 2014 with
regard to the end of 2013.
Sava d.d. received another 32,936 Sava shares as
security, representing 1.64% of totally issued shares.
REVALUATION RESERVE FROM LONG-TERM FINANCIAL INVESTMENTS
At 31 December 2014, the revaluation reserve from
long-term financial investments amounted to €9,864
thousand (2013: €1,056 thousand) and included:
• A positive revaluation reserve from securities
available for sale amounting to €9,864 thousand
(2013: €1,056 thousand).
• No negative revaluation reserve from securities
available for sale (2013: 0).
2.4.10 Paid dividends, weighted average number of shares and net loss per share
PAYMENT OF DIVIDENDS
The share capital is divided in
2,006,987 ordinary personal no-
par value shares, which all have
voting rights and are freely trans-
ferable. All shares have been
paid in full. The company has no
bonds for conversion to shares.
Weighted average number of shares
31 Dec. 2014 31 Dec.2013
No. of all shares at 1 Jan. 2,006,987 2,006,987
Own shares -30,541 -30,541
Weighted average number of shares at 31 Dec. 1,995,423 1,995,423
Net loss attributable to shares
31 Dec. 2014 31 Dec.2013
Net loss for the financial year (€ thousand) -47,957 -11,381
Weighted average number of shares 1,995,423 1,995,423
Basic net loss per share (in €) -24.03 -5.70
The diluted net loss per share equalled the net loss per share as capital
consists of ordinary shares only.

Fina
ncia
l rep
ort
AN
NU
AL
REPO
RT 2
014
170
2.4.11 Provisions and long-term accrued costs and deferred revenues
The value of provisions and long-term accrued costs and deferred revenues totalling €101 thousand (2013: €117
thousand) referred to provisions for retirement amounts and jubilee benefits.
The actuarial calculation was prepared as per 31 December 2012 and a recalculation was made at 31 December
2014, which considered the reduced employee number.
Provisions for retirement amounts and similar obligations
Other provisions
Long-term accrued costs and deferred revenues Total
Balance at 1 Jan. 2014 117 0 0 117
Newly formed provisions 0 0 1 1
Cancellation of provisions -16 0 0 -16
Use of provisions -1 0 0 -1
Balance at 31 Dec. 2014 100 0 1 101
Movement of provisions and long-term accrued costs and deferred revenues (€ thousand)
2.4.12 Preventive restructuring of Sava d.d.
On 30 November 2014, the Master Restructuring
Agreement, entered into by Sava d.d. and lending
banks on restructuring financial liabilities of €187.7
million at a 3% interest rate, i.e. 1% interest rate fell
due quarterly, a 2% interest rate fell due on the final
date. Sava d.d. settled the 1% interest rate within the
agreed terms.
On 26 November 2014, Sava d.d. filed the Proposal
for initiating preventive restructuring proceedings in
accordance with Article 44 b of the Financial Oper-
ations, Insolvency Proceedings and Compulsory Dis-
solution Act (ZFPPIPP) with Ljubljana District Court.
On 2 December 2014, the court issued the Decision
on initiating preventive restructuring proceedings.
The creditors, who in total held 30% of financial
receivables due from Sava d.d., agreed with initiating
preventive restructuring proceedings.
In the financial records of Sava d.d., the financial li-
abilities of the company during preventive restruc-
turing proceedings have been temporarily recorded
under the conditions applicable during validity of the
Master Restructuring Agreement. The new interest
rate on financial liabilities will be agreed upon in the
financial restructuring agreement to be made with
financial creditors during preventive restructuring
proceedings.

Fina
ncia
l rep
ort
AN
NU
AL
REPO
RT 2
014
171
2.4.13 Long-term liabilities
At 31 December 2014, the company showed long-term liabilities of €1,000 thousand (2013: €231 thousand),
which entirely referred to deferred tax liabilities.
LONG-TERM FINANCIAL LIABILITIES
Movement of long-term financial liabilities (€ thousand)
31 Dec. 2014 31 Dec. 2013
Balance at 1 Jan. 15 37,078
Loan repayments in the year -15 -8
Transfer to a short-term portion at period end 0 -37,055
Final balance 0 15
DEFERRED TAX LIABILITIES
Deferred tax liabilities totalling €1,000 thousand (2013: €216 thousand) were formed in connection with evalu-
ating financial investments at fair value; they were accounted for at a 17% tax rate.
Movement of deferred tax liabilities (€ thousand)
31 Dec. 2014 31 Dec. 2013
Balance at 1 Jan. 216 1.283
Increase in liabilities due to revaluation of securities to fair value - in other comprehensive income 984 11
Decrease in liabilities due to revaluation of securities to fair value - in other comprehensive income 0 -65
Decrease in liabilities due to sale of securities- in other comprehensive income -200 -1,038
Other changes - in other comprehensive income 0 25
Final balance 1,000 216

Fina
ncia
l rep
ort
AN
NU
AL
REPO
RT 2
014
172
2.4.14 Short-term liabilities
Short-term liabilities totalling €231,630 thousand
(2013: €232,145 thousand) did not change signifi-
cantly compared to the previous year.
A detailed explanation about the value of assets of
Sava d.d., put as collateral for the obtained short-term
loans is given in chapter 2.5.2.
SHORT-TERM FINANCIAL LIABILITIES
Short-term financial liabilities to Group companies
totalling €3,835 thousand (2013: €3,835 thousand)
did not change with regard to the same previous
period.
Short-term financial liabilities to banks amounting
to €185,224 thousand) (2013: €187,702 thousand)
were €2,478 thousand lower than at the end of the
previous year. The amount referred to the repayment
of loans to the lending banks.
Short-term loans are hired with the banks in Slovenia.
Short-term liabilities arising from bonds are shown
in the value of €26,515 thousand (2013: €26,515
thousand). Total nominal value of the bonds issue
amounted to €26,500 thousand, during the issue
procedure in 2009 another €15 thousand were paid
in based on the placed binding bids. After expiration
of the Master Restructuring Agreement, liabilities aris-
ing from bonds have been included under financial
receivables, based on which the decision on initiation
of preventive restructuring proceedings was issued.
Liabilities are secured with 34,287 shares of Goren-
jska banka d.d. The book value of the pledged bonds
amounts to €13,921 thousand.
On 24 November 2014, the SA03 bonds were with-
drawn from the stock exchange markets – bonds seg-
ment. The last trading day with the SA03 bonds was
on 21 November 2014.
Other short-term financial liabilities totalling
€6,878 thousand (2013: €8,744 thousand) included:
• The loan of €6,000 thousand obtained from A
Pokojninska družba d.d. (2013: €6,000 thousand),
which is secured by placing a mortgage on the
real property of Grand Hotel Toplice with the Pan-
orama restaurant and the hotel building Savica.
• Liabilities from hedging against interest rate risk
totalling €732 thousand (2013: €2,034 thousand).
• Liabilities for the unpaid dividends totalling €146
thousand (2013: €709 thousand).
Overview of loans outside of the Group, either at fixed or variable interest rate (€ thousand)
Fixed interest rate Variable interest rate Total
Long-term loans 0 0 0
Short-term loans 191,224 0 191,224
Total 191,224 0 191,224
SHORT-TERM OPERATING LIABILITIES
Total short-term liabilities recognised at €9,178
thousand (2013: €5,349 thousand) mainly referred
to interest liabilities arising from bank loans and the
remaining liabilities arising from the call option con-
tract; the latter are secured by placing a land debt on
the real property Perovo owned by Sava Nepremič-
nine d.o.o.
The stated liabilities are included under financial re-
ceivables, based on which the decision on initiating
financial restructuring was issued.
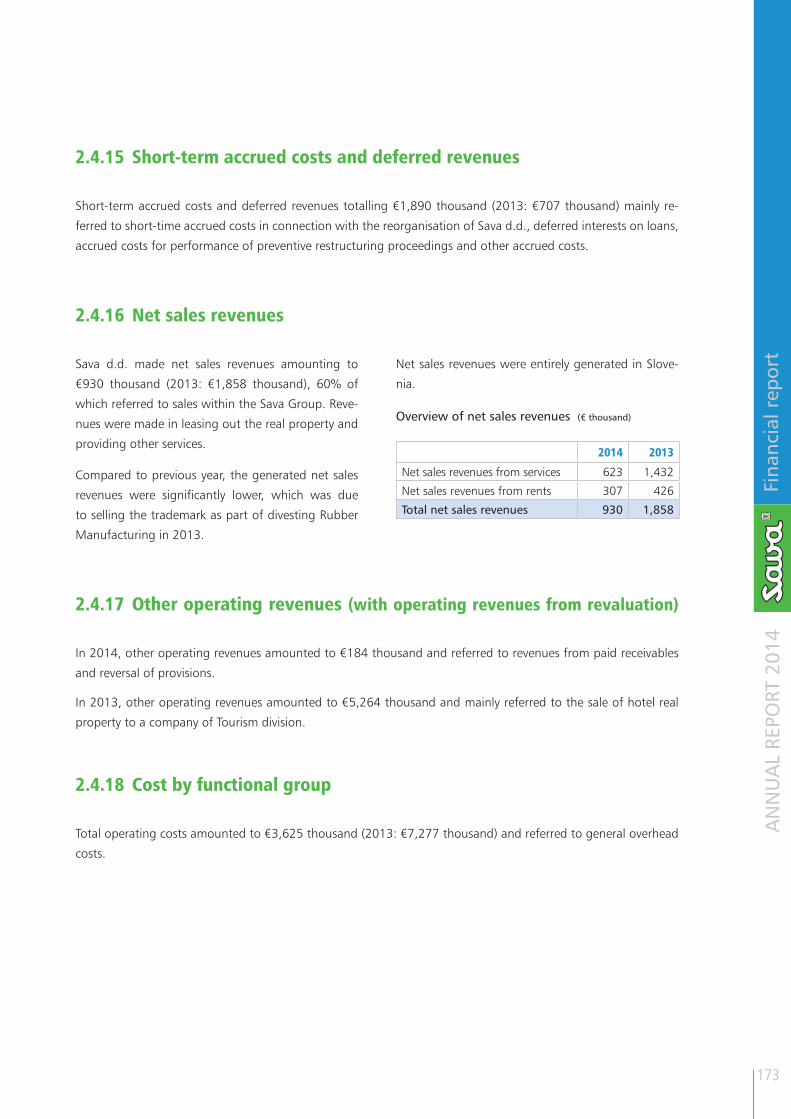
Fina
ncia
l rep
ort
AN
NU
AL
REPO
RT 2
014
173
2.4.15 Short-term accrued costs and deferred revenues
Short-term accrued costs and deferred revenues totalling €1,890 thousand (2013: €707 thousand) mainly re-
ferred to short-time accrued costs in connection with the reorganisation of Sava d.d., deferred interests on loans,
accrued costs for performance of preventive restructuring proceedings and other accrued costs.
2.4.16 Net sales revenues
Sava d.d. made net sales revenues amounting to
€930 thousand (2013: €1,858 thousand), 60% of
which referred to sales within the Sava Group. Reve-
nues were made in leasing out the real property and
providing other services.
Compared to previous year, the generated net sales
revenues were significantly lower, which was due
to selling the trademark as part of divesting Rubber
Manufacturing in 2013.
Net sales revenues were entirely generated in Slove-
nia.
Overview of net sales revenues (€ thousand)
2014 2013
Net sales revenues from services 623 1,432
Net sales revenues from rents 307 426
Total net sales revenues 930 1,858
2.4.17 Other operating revenues (with operating revenues from revaluation)
In 2014, other operating revenues amounted to €184 thousand and referred to revenues from paid receivables
and reversal of provisions.
In 2013, other operating revenues amounted to €5,264 thousand and mainly referred to the sale of hotel real
property to a company of Tourism division.
2.4.18 Cost by functional group
Total operating costs amounted to €3,625 thousand (2013: €7,277 thousand) and referred to general overhead
costs.

Fina
ncia
l rep
ort
AN
NU
AL
REPO
RT 2
014
174
2.4.20 Labour cost
Labour cost of €1,673 thousand (2013: €1,699
thousand) had a 46% share in the operating expens-
es structure.
Labour cost include the accounted for premiums for
additional pension insurance totalling €15 thousand.
2.4.21 Amortisation, depreciation expense and write-offs
Amortisation and depreciation expense, write-offs totalled €153 thousand (2013: €2,038 thousand) and were
significantly higher than in the same period last year; they referred to depreciation and impairment of receivables.
2.4.22 Financial revenues from stakes
Financial revenues from stakes totalled €1,349 thousand (2013: €25,610 thousand – divesting Rubber Manufac-
turing) and included proceeds from disposal of financial investments and other financial revenues of lower values.
Overview of cost of goods, materials and service by type of cost (€ thousand)
2014 2013
Cost of material 46 73
Cost of transportation services 9 7
Cost of maintenance services 56 79
Cost of rents 170 243
Refunds to employees 11 12
Cost of payment transactions, bank services and insurance premiums 73 295
Cost of intellectual and personal services 754 2,049
Cost of fairs, advertising and office allowances 59 112
Cost of other services 608 585
Total 1,786 3,455
2.4.19 Cost of goods, material and services
Cost of goods, materials and services had a 49% share in the operating expenses structure. They amounted to
€1,786 thousand (2013: €3,455 thousand) and compared to the same period last year, when they amounted to
€3,455 thousand, they reduced by 48%.
At 31 December 2014, Sava d.d. employed 17 asso-
ciates (20 employees at 31 December 2013), while
the average number of employees based on working
hours amounted to 18.56 employees in 2014 (2013:
26.36).

Fina
ncia
l rep
ort
AN
NU
AL
REPO
RT 2
014
175
2.4.23 Financial revenues from granted loans
Financial revenues from loans amounting to €1,747 thousand (2013: €1,277 thousand) included revenues from
loans granted to Group’s companies amounting to €311 thousand and financial revenues from loans granted to
other entities amounting to €1,436 thousand.
In total financial revenues from granted loans, the amount of €1,421 thousand was generated in relation to the
associated company - bank (2013: €444 thousand).
2.4.24 Financial revenues from operating receivables
Financial revenues from operating receivables amounted to €197 thousand (2013: €14 thousand) and mainly
referred to interests.
2.4.25 Financial expenses from impairments and write-offs of financial investments
Financial expenses from impairments and write-offs of financial investments amounting to €31,138 thousand
(2013: €19,730 thousand) were significantly higher than in the same period last year. They included:
2.4.26 Financial expenses from financial liabilities
Financial expenses from financial liabilities totalling €6,860 thousand (2013: €8,691 thousand) were down by
21% on the same period last year and included:
• Impairment of financial investment in Gorenjs-
ka banka d.d. amounting to €26,586 thousand
(2013: 0).
• Impairment of investments and granted loans in
the subsidiaries totalling €3,222 thousand (2013:
4,407 thousand).
• Interest expenses arising from financial liabilities
until the expiration of the Master Restructuring
Agreement amounting to €6,220 thousand.
• Interest expenses arising from financial liabilities
as of receiving the decision on initiating preven-
tive restructuring proceedings amounting to €477
thousand.
• Impairment of investment and loans granted to
NFD Holding d.d. amounting to €478 thousand
(2013: €10,554 thousand, €9,609 thousand of
which were due to final impairment of the invest-
ment in Abanka Vipa).
• Impairment of long-term securities available for
sale and loss in sale of investments amounting to
€853 thousand (2013: €4,769 thousand).
• Other financial expenses amounting to €163
thousand.
A sum of €791 thousand (2013: €1,514 thousand)
of financial expenses referred to the associated com-
pany – bank.

Fina
ncia
l rep
ort
AN
NU
AL
REPO
RT 2
014
176
2.4.27 Corporate income tax
For 2014, Sava d.d. had no corporate income tax
payable.
The expenses, which are not tax deductible, included
revaluation of long-term financial investments, re-
valuation of receivables, loans and other expenses,
which under the Corporate Income Tax Act are not
tax deductible.
In 2014, Sava d.d. did not use any tax reliefs as a tax
loss was shown.
2014 2014 2013 2013
Tax rate Amount Tax rate Amount
Pre-tax profit -37,083 -1,586
Tax on profit applying the official rate 17% -6,304 17% -270
Effect by tax rates in other countries 0 0
Amounts having a negative impact on tax base 31,404 22,283
- Amount from revenue increase to the level of tax-deductible revenues 0 1
- Amount from expense decrease to the level of tax-deductible expenses 31,394 21,670
- Amount of expense for which tax was withheld 0 0
- Any other amounts having impact on tax base increase 10 612
Effect of increase in tax rate on special profits 0 0
Amounts having positive effect on tax base 51,814 159,117
- Amount from revenue decrease to the level of tax-deductible revenues 304 12,272
- Amount from expense increase to the level of tax-deductible expenses 51,510 146,845
- Any other amounts having impact on tax base decrease (e.g. amount of revenues for which tax was already withheld) 0 0
Changed tax base due to transition to a new accounting method resulting from changes of accounting policy 0 0
Tax reliefs
- Used, having effect on tax liability decrease 0 0
- Remaining, to be used in the following years 0 18
Tax loss
- Used, having effect on tax liability decrease 0 0
- Originating from the current year – to be used in the following years 57,493 138,420
Adjustments for previous years 0 0
TAX ASSESSED FOR THE CURRENT YEAR 0.0% 0 0.0% 0
Increase/decrease of deferred tax 10,874 9,795
TAX IN THE INCOME STATEMENT -29.3% 10,874 -617.6% 9,795
Comparison between the actual and the computed tax rate (€ thousand)
As at 31 December 2014, Sava d.d. stated the un-
used tax loss amounting to €291,847 thousand and
a sum of €40 thousand of other unutilised tax reliefs.
At the end of 2013, deferred tax receivables amount-
ed to €10,874 thousand. In 2014, they reduced by
€1,488 thousand. An impairment of remaining de-
ferred tax receivables was additionally carried out
amounting to €9,386 thousand. All changes were
carried out through the income statement. At 31
December 2014, Sava d.d. thus did not show any
deferred tax receivables.

Fina
ncia
l rep
ort
AN
NU
AL
REPO
RT 2
014
177
2.4.28 Other revenues and other expenses
Other revenues amounting to €175 thousand (2013: €96 thousand) originated from a reversal of past liability
and obtained tax refunds.
Other expenses amounting to €42 thousand (2013: €7 thousand) mainly referred to balancing of VAT in connec-
tion with a deductible share.
2.4.29 Overview of deferred tax receivables and liabilities
Overview of deferred tax receivables and liabilities (€ thousand)
31 Dec. 2014 Receivables Liabilities Net
Financial investments 0 1,000 -1,000
Total 0 1,000 -1,000
31 Dec. 2013 Receivables Liabilities Net
Financial investments 10,874 216 10,658
Total 10,874 216 10,658
2.4.30 Shares in profit
The Shareholder’s Meeting did not approve any shares in profits.

Fina
ncia
l rep
ort
AN
NU
AL
REPO
RT 2
014
178
2.5 Other disclosures
2.5.1 Contingent assets, contingent liabilities and mortgages
The item mortgages totalling €1,412 thousand
showed the book value of investment property,
pledged for the obtained loan.
93% of the issued guarantees and sureties amount-
ing to €495 thousand referred to the loans obtained
by the subsidiaries in the Sava Group.
Interest rate swaps totalling €2,000 thousand repre-
sented a contracting value of the collateral made for
the portfolio of obtained loans.
Liabilities based on contractual provisions amounting
to €201 thousand referred to the assumed guaran-
tees arising from factoring.
The pledge of securities amounting to €185,152
thousand, see for a detailed explanation under 2.5.2.
The pledge of other assets amounting to €22,588
thousand represented the balance of a receivable
due from NFD Holding and balance of assets on ac-
counts.
Overview of the off-balance sheet (€ thousand)
31 Dec. 2014 31 Dec. 2013
Mortgages 1,412 1,466
Issued guarantees 495 688
Interest rate swaps 2,000 6,000
Liabilities under the contractual provisions 201 0
Pledge of securities 185,152 204,982
Other – pledge of assets 22,588 21,538
Total 211,847 234,674

Fina
ncia
l rep
ort
AN
NU
AL
REPO
RT 2
014
179
2.5.2 Pledged assets for the obtained long-term and short-term loans of Sava d.d. at 31 December 2014
At 31 December 2014, Sava d.d. showed financial liabilities arising from the loans obtained out of the Sava
Group amounting to €217,739 thousand and other financial liabilities amounting to €1,574 thousand. For these
loans, own assets amounting to €207,685 thousand and the assets of the subsidiaries amounting to €14,686
thousand were pledged. Sava d.d. pledged the assets amounting to €1,466 thousand for the loans raised by the
subsidiaries.
Breakdown of financial liabilities of Sava d.d. arising from the loans obtained out of the Sava Group (€ thousand)
Type of financial liabilityLong-term
financial liabilitiesShort-term
financial liabilitiesTotal
financial liabilities
- To the associated banks (GB) 0 25,631 25,631
- To other banks 0 159,593 159,593
- To other partners 0 6,000 6,000
- From issued bonds 0 26,515 26,515
Total 0 217,739 217,739
Pledged assets of Sava Turizem d.d. and Sava TMC d.o.o. for the loans obtained by Sava d.d. (€ thousand)
Type of asset Book value of pledge
Mortgages on real property owned by Sava Turizem d.d.
- Family hotel Savica with the associated land 4,645
Mortgages on real property owned by Sava TMC d.o.o.
- Grand Hotel Toplice and Panorama Restaurant 9,062
TOTAL VALUE OF PLEDGED ASSETS 13,707
Breakdown of pledged assets of Sava d.d. by type of assets for the loans obtained by Sava d.d. (€ thousand)
Type of assets Book value of pledge
Pledged assets:
- Pledged shares of companies owned by Sava d.d. 182,987
- Pledged stakes in companies owned by Sava d.d. 2,165
- Pledged real property owned by Sava d.d. 1,411
- Pledged assets – business account (GB) and escrow account (NLB) 2,028
- Pledged assets – receivables NFD 20,560
TOTAL PLEDGED VALUE OF ASSETS OF SAVA D.D. 209,151
BALANCE SHEET TOTAL OF SAVA D.D. AT 31 DEC. 2014 211,151
Share of pledged assets in the balance sheet total 99.1 %

Fina
ncia
l rep
ort
AN
NU
AL
REPO
RT 2
014
180
Breakdown of pledged shares by type
Type of assets
Available number
of shares
Number of shares
pledged for loans of Sava
d.d.
Number of shares pledged
for loans of subsidiaries and other liabilities
Number of
unpledged shares
Book value of pledge -
€ thousand
Pledged shares:
- Alpen.SI (previously NF1N) 37,498,152 37,498,152 0 0 34,123
- Shares of Gorenjska banka - GBKR 146,060 135,870 3,610 6,580 56,629
- Shares of Hoteli Bernardin - HBPN 1,468,221 1,468,221 0 0 2,320
- Shares of Sava Turizem - SHBR 39,308,317 39,308,317 0 0 88,960
- Shares of Kompas Hoteli Bled - KHIR 13,500 13,500 0 0 115
- Shares of Pokojninska družba A - PDAR 4,987 4,987 0 0 594
- Shares of Jubmes banka - JBMN 13,638 9,874 0 3,764 692
Total value of pledged shares 182,987
Breakdown of pledged stakes by type
Type of assets
Available percentage
of ownership
Percentage of ownership
pledged for loans
of Sava d.d.
Percentage of ownership
pledged for loans of subsidiaries
Percentage of unpledged
ownership
Book value
of pledge - € thousand
Pledged shares:
- Sava Nepremičnine 100.00% 0.0 % 100 % 0.0 % 2,165
Total value of pledged shares 2,165
Mortgages on the real property owned by Sava d.d. (€ thousand)
Type of assets Book value of pledge
Mortgages on real property
- Real property BTC, Ljubljana 1,411
Total value of pledged real property 1,411
Loan debt for other liabilities of Sava d.d. created on the real property owned by Sava Nepremičnine d.o.o. (€ thousand)
Type of assets Book value of pledge
Land debt on real property owned by Sava Nepremičnine d.o.o.
- Land Perovo 979
Total value of pledged real property 979

Fina
ncia
l rep
ort
AN
NU
AL
REPO
RT 2
014
181
2.5.3 Financial instruments – financial risks
FOREIGN EXCHANGE RISK
Sava d.d. does business in euros only.
INTEREST RATE RISK
To hedge against interest rate risk, Sava d.d. has a derived financial instrument concluded in the period financed
at EURIBOR interest rate, the validity being until April 2015. Total nominal value of transaction amounted to €2
million at the end of 2014. Net value of interest rate swaps as a difference between receivables and liabilities
is negative and totalled €732 thousand at the end of 2014 (at the end of 2013: negative €2,034 thousand).
Considering the pending preventive restructuring proceedings, interest rate risk remains high.
Interest rate management at Sava d.d. using a financial instrument (€ thousand)
31 Dec. 2014 Book valueContracted cash flows
6 months or less
6 – 12 months
1 – 2 years
2 – 5 years
More than 5
Interest rate swaps
Assets 0 0 0 0 0 0 0
Liabilities -732 -732 -732 0 0 0 0
Total -732 -732 -732 0 0 0 0
31 Dec. 2013
Interest rate swaps
Assets 0 0 0 0 0 0 0
Liabilities -2,034 -2,034 -400 -800 -834 0 0
Total -2,034 -2,034 -400 -800 -834 0 0

Fina
ncia
l rep
ort
AN
NU
AL
REPO
RT 2
014
182
SOLVENCY RISK
Overview of solvency risk (€ thousand)
31 Dec. 2014Book value
Contracted cash flows
6 months or less
6 – 12 months
1 – 2 years
2 – 5 years
More than 5 years
Non-derivative financial liabilities 230,898 -232,042 -225,956 -6,087 0 0 0
Secured bank loans (excluding associated companies) 159,593 -159,692 -159,692 0 0 0 0
Loans from Group companies 3,835 -3,982 -3,982 0 0 0 0
Trade payables and other liabilities 9,178 -9,178 -9,178 0 0 0 0
Borrowings from associated companies 25,631 -25,647 -25,647 0 0 0 0
Bonds 26,515 -27,369 -27,369 0 0 0 0
Other financial liabilities 6,146 -6,174 -87 -6,087 0 0 0
Overdrafts on bank accounts 0 0 0 0 0 0 0
Liabilities from financial leasing 0 0 0 0 0 0 0
Derivative financial liabilities 732 -732 -732 0 0 0 0
Interest rate swaps for hedging against risk 732 -732 -732 0 0 0 0
Total 231,630 -232,774 -226,688 -6,087 0 0 0
31 Dec. 2013
Non-derivative financial liabilities 230,126 -240,401 -3,926 -236,468 -7 0 0
Secured bank loans 161,728 -168,668 -733 -167,936 0 0 0
Loans from Group companies 3,835 -4,006 -19 -3,987 0 0 0
Trade payables and other liabilities 5,349 -5,349 -2,089 -3,260 0 0 0
Borrowings from associated companies 25,974 -28,055 -211 -27,844 0 0 0
Bonds 26,515 -27,540 -131 -27,409 0 0 0
Other financial liabilities 6,710 -6,768 -739 -6,029 0 0 0
Overdrafts on bank accounts 0 0 0 0 0 0 0
Liabilities from financial leasing 15 -15 -4 -4 -7 0 0
Derivative financial liabilities 2,034 -2,034 -400 -800 -834 0 0
Interest rate swaps for hedging against risk 2,034 -2,034 -400 -800 -834 0 0
Total 232,160 -242,435 -4,326 -237,268 -841 0 0

Fina
ncia
l rep
ort
AN
NU
AL
REPO
RT 2
014
183
CREDIT RISK
Overview of trade receivables by territory (€ thousand)
Book value
31 Dec. 2014 31 Dec. 2013
Slovenia 1,913 1,848
Other EU countries 170 1,419
Other 0 0
Total 2,083 3,267
Overview of balance and movement of value adjustment in trade receivables (€ thousand)
2014 2013
Balance at 1 Jan. 160 138
Increased value adjustment 19 68
Decreased value adjustment -137 -47
Final balance 42 160
Age structure of trade receivables (€ thousand)
31 Dec. 2014 31 Dec. 2013
Gross receivables Impairment
Net receivables
Gross receivables Impairment
Net receivables
Not past due 318 0 318 3,238 0 3,238
Past due 0 - 30 days 1,756 0 1,756 19 0 19
Past due 31 - 120 days 9 0 9 9 0 9
Past due more than 120 days 42 42 0 160 160 0
Total 2,125 42 2,083 3,427 160 3,267
SENSITIVITY ANALYSIS FOR FINANCIAL RISKS
Sensitivity analysis for the interest rate change
A moratorium on repayment of the principals arising
from all financial liabilities Sava d.d. expired on 30
November 2014; Sava d.d. will therefore try to agree
on financial restructuring plan or agreement with
all financial creditors under equal conditions. Since
preventive restructuring proceedings have not been
concluded yet, sensitivity to the change of interest
rates is high.
If the interest rate changes by 50 basis points, the
annual interest expense will change by €1,123 thou-
sand taking into account indebtedness of Sava d.d.
at the end of 2014.
Sensitivity analysis for the increased indebtedness
At the end of 2014, Sava d.d. had short-term finan-
cial liabilities arising from the principals of raised
loans and issued bonds amounting to €221.6
million. Owing to current preventive restructuring
proceedings and contractual provisions of the previ-
ously applicable restructuring agreement, sensitivity
to debt increase is low.
Sensitivity analysis for the changes of for-eign currency value
Sava d.d. has the majority of its assets tied to do-
mestic currency; for this reason, the company is not
strongly exposed to the changes of the value of for-
eign currencies.

Fina
ncia
l rep
ort
AN
NU
AL
REPO
RT 2
014
184
2.5.4 Estimating fair values
SECURITIES AVAILABLE FOR SALE
The fair value of listed securities available for sale
equals the announced standard bid market price at
the balance sheet date. The fair value of shares and
stakes of unlisted companies equals the cost value
less any impairment based on checking for any indi-
cations of impairment.
GRANTED AND OBTAINED LOANS
The fair value is estimated as a discounted value of
the expected cash flows from the principal and in-
terests, whereby the effective interest rate equals the
contracting interest rate, which is variable.
ISSUED BONDS
The fair value of issued bonds was ascertained at
the end of 2013 by using the stock exchange price
achieved in the bonds listing on the Ljubljana Stock
Exchange. On 24 November 2014, the SA03 bonds
were withdrawn from the stock exchange market as
total liabilities arising from these bonds fell due.
SHORT-TERM RECEIVABLES AND LIABILITIES
For receivables and liabilities with a remaining life of
less than one year, the notional value is deemed to
reflect fair value.
Fair values of financial instruments (€ thousand)
31 Dec. 2014 31 Dec. 2013
Book value Fair value Book value Fair value
Securities available for sale 38,288 38,288 31,343 31,343
Long-term receivables 0 0 0 0
Short-term receivables 6,153 6,153 4,649 4,649
Granted loans 14,685 14,685 19,387 19,387
Cash and cash equivalents 58 58 227 227
Long-term loans 0 0 15 15
Issued bonds 26,515 note* 26,515 5,303
Short-term loans 222,452 note* 226,796 226,796
Short-term operating liabilities 9,179 9,179 5,349 5,349
* As disclosed in item 2.4.12., Sava d.d. is undergoing preventive restructuring proceedings. The Master Restructuring Agreement entered into by Sava d.d. expired, the new conditions for financing will be agreed upon with financial credi-tors during the course of preventive restructuring proceedings. At the time of endorsing the annual report, the loans are unregulated and it is not clear under what conditions the liabilities will be settled. This is why their fair value could not be ascertained.

Fina
ncia
l rep
ort
AN
NU
AL
REPO
RT 2
014
185
2.5.5 Hierarchy of fair values
In terms of hierarchy, financial instruments valued at
fair value are classified at three levels:
• Level 1: assets or liabilities at stock exchange price
on the last day of accounting period.
• Level 2: assets or liabilities not classified as level 1;
their value is defined directly or indirectly based
on the market data.
• Level 3: assets or liabilities whose value cannot be
obtained from the market data.
Hierarchy of financial instruments considering computation of their fair value (€ thousand)
31 Dec. 2014 31 Dec. 2013
Total Level 1 Level 2 Level 3 Total Level 1 Level 2 Level 3
Value of securities available for sale 38,289 843 34,123 3,323 31,343 3,521 23,999 3,823
Derivative financial instruments assets 0 0 0 0 0 0 0 0
Derivative financial instruments liabilities -732 0 -732 0 -2,034 0 -2,034 0
Total 37,557 843 33,391 3,323 29,309 3,521 21,965 3,823
2.5.6 Converting capital by means of living
Share capital % growthCalculated
effectOperating profit/loss
decreased by a calculation
CAPITAL ….. calculation for growth in the cost of living 14,061 0.20% 28 -47,985

Fina
ncia
l rep
ort
AN
NU
AL
REPO
RT 2
014
186
2.5.7 Related parties
Related parties include subsidised and associated companies, Supervisory Board and Management Board members, and their closer family members.
RELATIONS AMONG COMPANIES IN THE SAVA GROUP
Business relations between Sava d.d. and its subsid-iaries relate to:
• Provided services, which include use of brand name, and services provided by the professional services.
• Financial operations in connection with granted and obtained loans.
Transactions among the Sava Group companies are performed under the same conditions as valid in an ordinary arm’s length transaction. At 31 December 2014, the data on capital of subsidiaries, operating income and net operating result of subsidiaries for 2014 is disclosed in the Notes to the financial state-ments of the Sava Group.
RELATIONS WITH THE ASSOCIATED COMPANIES
At 31 December 2014, Gorenjska banka d.d. and NFD Holding d.d. are the associated companies of Sava d.d. Since 6 January 2015, NFD Holding d.d.
has been in bankruptcy proceedings.
Ownership of the Sava share:
31 Dec. 2014 31 Dec. 2013
No. of Sava d.d. shares owned by Gorenjska banka d.d. 56,475 56,475
Ownership stake of Gorenjska banka d.d. in Sava d.d. 2.81% 2.81%
Transactions with Gorenjska banka d.d. – obtained loans and deposits:
31 Dec. 2014 31 Dec. 2013
Balance of received loans at 1 Jan. 25,974 35,537
Raising new loans 0 0
Repayment of loans -343 -9,563
Balance of obtained loans at period end 25,631 25,974
Balance of deposits at period end 0 0
Other transactions with Gorenjska banka d.d.:
• Operating receivables due from Gorenjska banka d.d. at 31 December 2014 were none (2013: 0).
• In doing business with Gorenjska banka d.d. in 2014, no interest revenues from deposits were generated (2013: €46 thousand). Interest expens-es totalled €791 thousand (2013: €909 thou-sand).
• The balance of short-term operating liabilities arising from interests to Gorenjska banka d.d. amounted to €997 thousand at 31 December 2014 (31 December 2013: €444 thousand).
• In doing business with Gorenjska Banka d.d. in 2014, financial revenues from operating receiv-ables amounted to €2 thousand (2013: 0). Fi-nancial expenses from payment transaction fees amounted to €8 thousand (2013: €17 thousand).
GORENJSKA BANKA d.d., Kranj
Sava d.d. raises loans with Gorenjska banka d.d. Terms and conditions for these transactions equal those effective
for other companies with a similar rating.
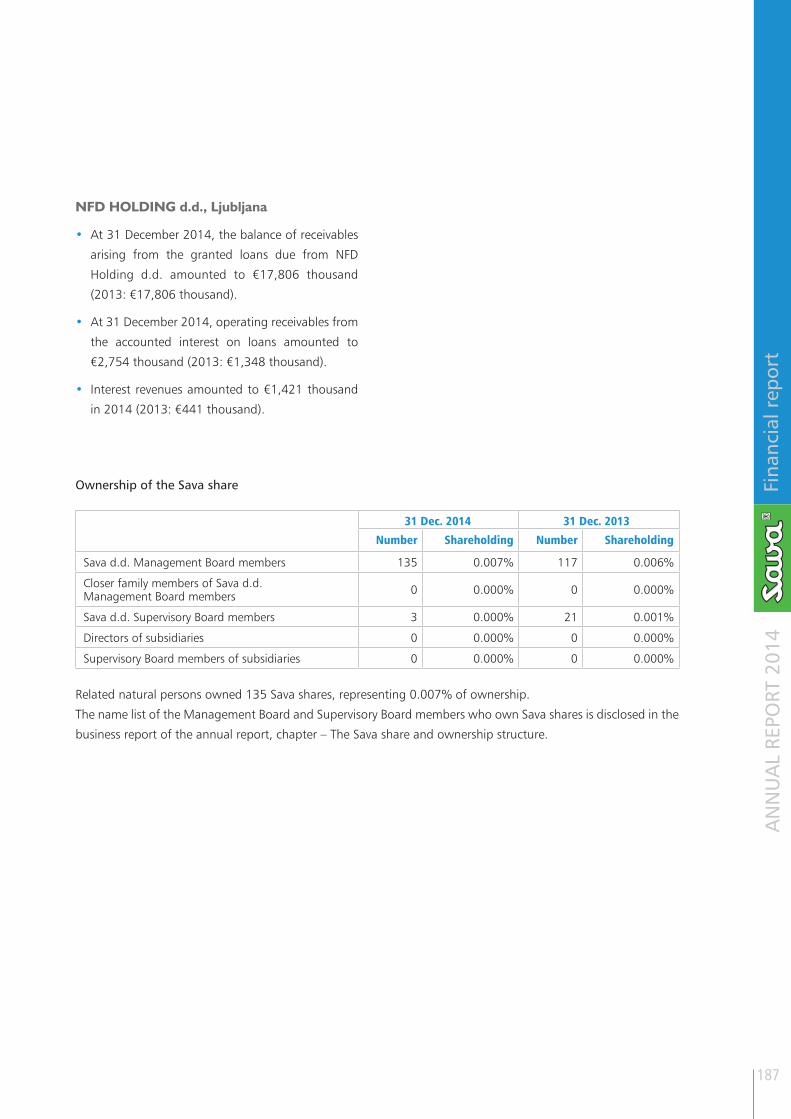
Fina
ncia
l rep
ort
AN
NU
AL
REPO
RT 2
014
187
NFD HOLDING d.d., Ljubljana
• At 31 December 2014, the balance of receivables
arising from the granted loans due from NFD
Holding d.d. amounted to €17,806 thousand
(2013: €17,806 thousand).
• At 31 December 2014, operating receivables from
the accounted interest on loans amounted to
€2,754 thousand (2013: €1,348 thousand).
• Interest revenues amounted to €1,421 thousand
in 2014 (2013: €441 thousand).
Ownership of the Sava share
31 Dec. 2014 31 Dec. 2013
Number Shareholding Number Shareholding
Sava d.d. Management Board members 135 0.007% 117 0.006%
Closer family members of Sava d.d. Management Board members 0 0.000% 0 0.000%
Sava d.d. Supervisory Board members 3 0.000% 21 0.001%
Directors of subsidiaries 0 0.000% 0 0.000%
Supervisory Board members of subsidiaries 0 0.000% 0 0.000%
Related natural persons owned 135 Sava shares, representing 0.007% of ownership.
The name list of the Management Board and Supervisory Board members who own Sava shares is disclosed in the
business report of the annual report, chapter – The Sava share and ownership structure.

Fina
ncia
l rep
ort
AN
NU
AL
REPO
RT 2
014
188
Data about the group of persons – Management Board (€ thousand)
Gro
ss r
emun
erat
ions
fr
om s
alar
ies
Gro
ss r
emun
erat
ions
fr
om b
onus
es
Gro
ss r
emun
erat
ions
fr
om r
ewar
ds
Gro
ss r
emun
erat
ions
fr
om e
xpen
se r
efun
ds
Gro
ss r
emun
erat
ions
fr
om in
sura
nce
pr
emiu
ms
Gro
ss r
emun
erat
ions
fr
om o
ther
pay
men
ts
Gro
ss r
emun
erat
ions
fr
om c
arry
ing
out
task
s in
sub
sidi
arie
s
Tota
l gro
ss r
emun
era-
tion
s
Tota
l net
re
mun
erat
ions
Matej Narat, President of the Management Board
180 0 0 1.75 8 4 17 210 92
Aleš Aberšek, Member of the Management Board as of 28 January 2014
104 9 0 1.51 1 4 0 120 55
Andrej Andoljšek, Member of the Management Board until 27 January 2014
24 0 0 0.66 1 1 1 28 12
Total 308 9 0 3.92 10 9 17 357 160
In 2014, gross remunerations of the Management Board members amounted to €357 thousand (2013: €526
thousand). The amount was composed of gross remunerations from salaries, bonuses, insurance premiums, ex-
pense refunds and other remunerations, and payments for carrying out tasks in the subsidiaries. In 2014, their net
remunerations amounted to €160 thousand (2013: €231 thousand) or 45% of gross remuneration.
Data about the group of persons – other employees with individual contracts of employment
Eight employees (2013: 10) had individual contracts
of employment in 2014, their gross remunerations
amounting to €617 thousand in 2014 (2013: €1,006
thousand). The amount was composed of gross re-
munerations from salaries, rewards, severance pay,
and other remunerations, €5 thousand of which
were travel expenses refunds.
As at 31 December 2014, Sava d.d. showed no re-
ceivables due from the associates employed under
individual work contracts.
Data about the group of persons – Supervisory Board and its commissions
Gross remunerations of Supervisory Board and Su-
pervisory Board commissions members amounted to
€126 thousand in 2014 (2013: €130 thousand). The
amount included attendance fees and payment for
performance of duties.

Fina
ncia
l rep
ort
AN
NU
AL
REPO
RT 2
014
189
Overview of remunerations of Sava d.d. Supervisory Board members (€ thousand)
Attendance fees
Payment for performance
of duties Expense refunds Total
Aleš Skok Chairman of the Supervisory Board until 16 May 2014 2 10 0.00 12
Miran Kraševec Chairman of the Supervisory Board as of 17 July 2014 4 15 0.00 19
Roman Ambrož Member–shareholder representative 2 12 0.00 14
Robert Ličen, MSc Member–shareholder representative 3 13 0.00 16
Miro Medvešček Member–shareholder representative 2 12 0.00 14
Rok Ponikvar Member–shareholder representative 3 12 0.00 15
Aleš Aberšek Member–employee representative 0 2 0.00 2
Lučka Pogačnik Member–employee representative 1 12 0.00 13
Gregor Rovanšek Member–employee representative 3 12 0.00 15
Jasmina Kovačič Member–employee representative 1 4 0.00 5
Janko Gedrih Audit commission member 1 0 0.00 1
Total 22 104 0.00 126
2.5.8 Disclosure of business with the selected auditor
According to the contract made with Deloitte revizija d.o.o. the contractual value of auditing the separate finan-
cial statements of Sava d.d. and the consolidated financial statements of the Sava Group for 2014 amounts to
€29 thousand, while the cost of other non-auditing services amounted to €7 thousand.
2.5.9 Influence by events after the balance sheet date on financial statements of Sava d.d.
Important events that appeared after the balance sheet date are disclosed in the business report of the annual
report. The nature of these events does not affect the balance of assets and liabilities shown in the financial state-
ments of Sava d.d. for 2014, or the going-concern assumption.

Fina
ncia
l rep
ort
AN
NU
AL
REPO
RT 2
014
190
2.6 Statement of Management Responsibility for Sava d.d.
The Management Board of Sava d.d., Ljubljana, confirms the financial statements of the company Sava d.d. for
the period ending on 31 December 2014, which have been prepared in accordance with Slovene Accounting
Standards.
The Management Board confirms that when drawing up the financial statements the corresponding accounting
policies were consistently applied, the accounting estimates were elaborated according to the principle of pru-
dence and good management, and the report gives a true and fair view of the company’s assets and business
results in 2014.
The Management Board is responsible for the proper managing of its accounting procedures, establishing, oper-
ation and maintaining internal control in relation to the preparation and fair presentation of financial statements,
which do not contain any material misstatements originating from a fraud or error, and for adopting suitable
measures for securing assets and other funds. The Management Board confirms herewith that the financial state-
ments and notes have been produced under the going-concern assumption and in compliance with the relevant
legislation and Slovene Accounting Standards.
Ljubljana, 3 March 2015
Aleš Aberšek
Member of the Management Board
Matej Narat
President of the Management Board
Fina
ncia
l rep
ort
AN
NU
AL
REPO
RT 2
014
191
2.7 Independent auditor’s report for Sava d.d.

Fina
ncia
l rep
ort
AN
NU
AL
REPO
RT 2
014
192

Fina
ncia
l rep
ort
AN
NU
AL
REPO
RT 2
014
193

Sava d.d.Dunajska cesta 152
1000 Ljubljana, Slovenia
Tel: +386 4 206 55 10
Fax: +386 4 206 64 46
www.sava.si
Management Board
Matej Narat, President
Tel: +386 4 206 52 15
Aleš Aberšek, Member
Tel: +386 4 206 56 90
CONTACT PERSONS
Milan Marinič, Senior Assistant
to the Management Board, Director
of the Sava Group’s Directorate, Procurator
Tel: +386 4 206 53 10
Professional services
FINANCE
Jasmina Kovačič, Associate Professional
Tel: +386 4 206 51 39
CONTROLLING
Gregor Rovanšek, Manager
Tel: +386 4 206 53 93
INTERNAL AUDIT
Andrej Jaklič, Manager
Tel: +386 4 206 51 46
LEGAL OFFICE
Petra Sever, Procurator
Tel: +386 4 206 64 86
ACCOUNTING, PLANNING & ANALYSIS
Mojca Globočnik, Manager
Tel: +386 4 206 56 01
CORPORATE COMMUNICATIONS
Gregor Pirc, Coordinator
Tel: +386 4 206 51 71
Con
tact
per
sons
AN
NU
AL
REPO
RT 2
014
194

AN
NU
AL
REPO
RT 2
014
195

Annual Report 2014
Sava d.d.
Dunajska cesta 152 1000 Ljubljana
Tel: +386 4 206 55 10Fax: +386 4 206 64 46http://www.sava.si