Embed Size (px)
Citation preview
Annual Repor t 2005 Nexans Norway AS
exans
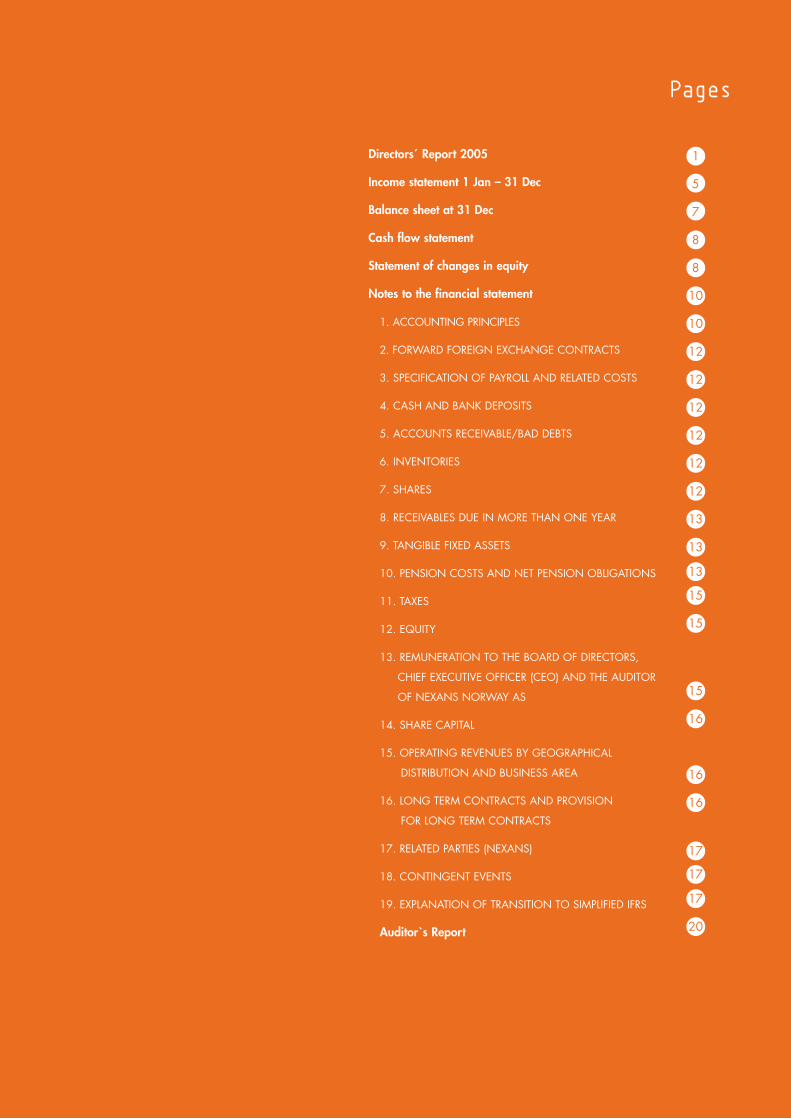
Directors´ Report 2005
Income statement 1 Jan – 31 Dec
Balance sheet at 31 Dec
Cash flow statement
Statement of changes in equity
Notes to the financial statement
1. ACCOUNTING PRINCIPLES
2. FORWARD FOREIGN EXCHANGE CONTRACTS
3. SPECIFICATION OF PAYROLL AND RELATED COSTS
4. CASH AND BANK DEPOSITS
5. ACCOUNTS RECEIVABLE/BAD DEBTS
6. INVENTORIES
7. SHARES
8. RECEIVABLES DUE IN MORE THAN ONE YEAR
9. TANGIBLE FIXED ASSETS
10. PENSION COSTS AND NET PENSION OBLIGATIONS
11. TAXES
12. EQUITY
13. REMUNERATION TO THE BOARD OF DIRECTORS,
CHIEF EXECUTIVE OFFICER (CEO) AND THE AUDITOR
OF NEXANS NORWAY AS
14. SHARE CAPITAL
15. OPERATING REVENUES BY GEOGRAPHICAL
DISTRIBUTION AND BUSINESS AREA
16. LONG TERM CONTRACTS AND PROVISION
FOR LONG TERM CONTRACTS
17. RELATED PARTIES (NEXANS)
18. CONTINGENT EVENTS
19. EXPLANATION OF TRANSITION TO SIMPLIFIED IFRS
Auditor`s Report
Pages
1
5
7
8
8
10
10
12
12
12
12
12
12
13
13
15
15
16
16
17
17
20
15
16
13
17
Who would have thought the solution to our challenges 1000 metres below sea-level was to be found in the Swiss mountains?

At the slide edge on the Storegga Slide in the Ormen Lange field the seabed is steeper than the Holmenkollen ski jump. This makes burying pipes and cables difficult. We were given the assignment by Hydro and sought and found inspiration for a solution to the problem in a Swiss forestry machine. Our new dredging machine, the Spider, has sensors on all moving parts, displays digital 3D images of the seabed that are 100% accurate and is capable of moving rocks of up to 2.7 tonnes in weight.
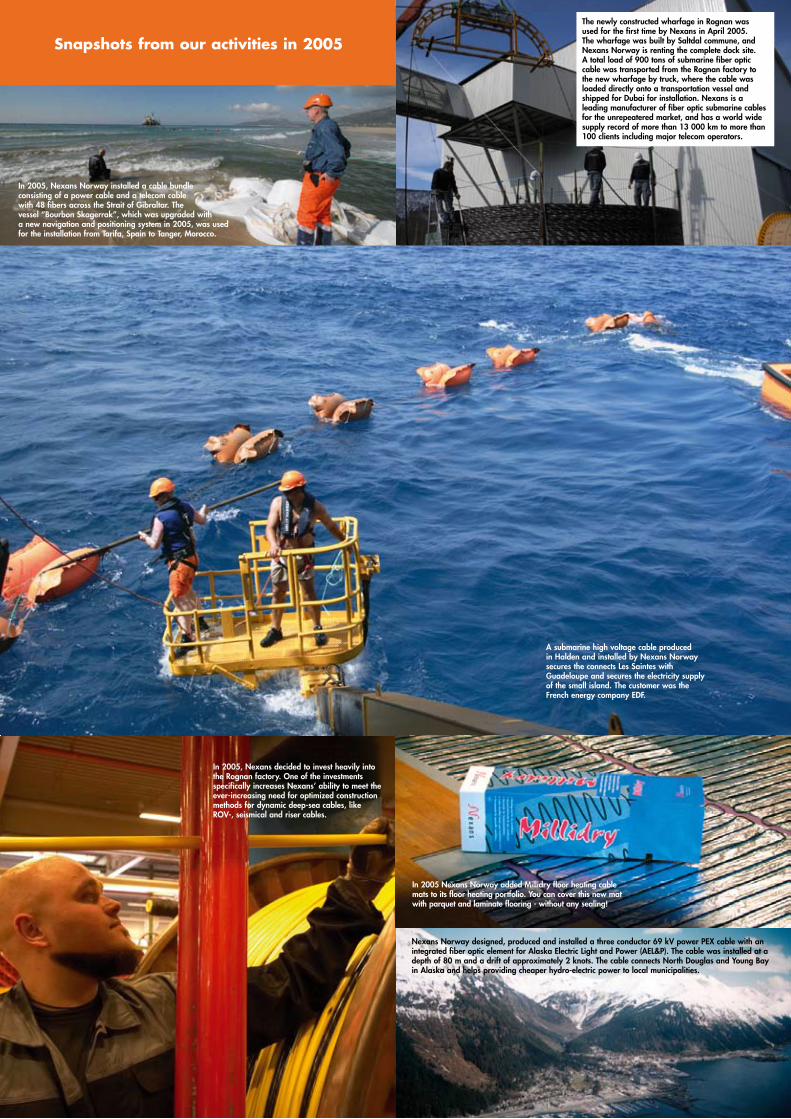
Snapshotsfromouractivitiesin2005
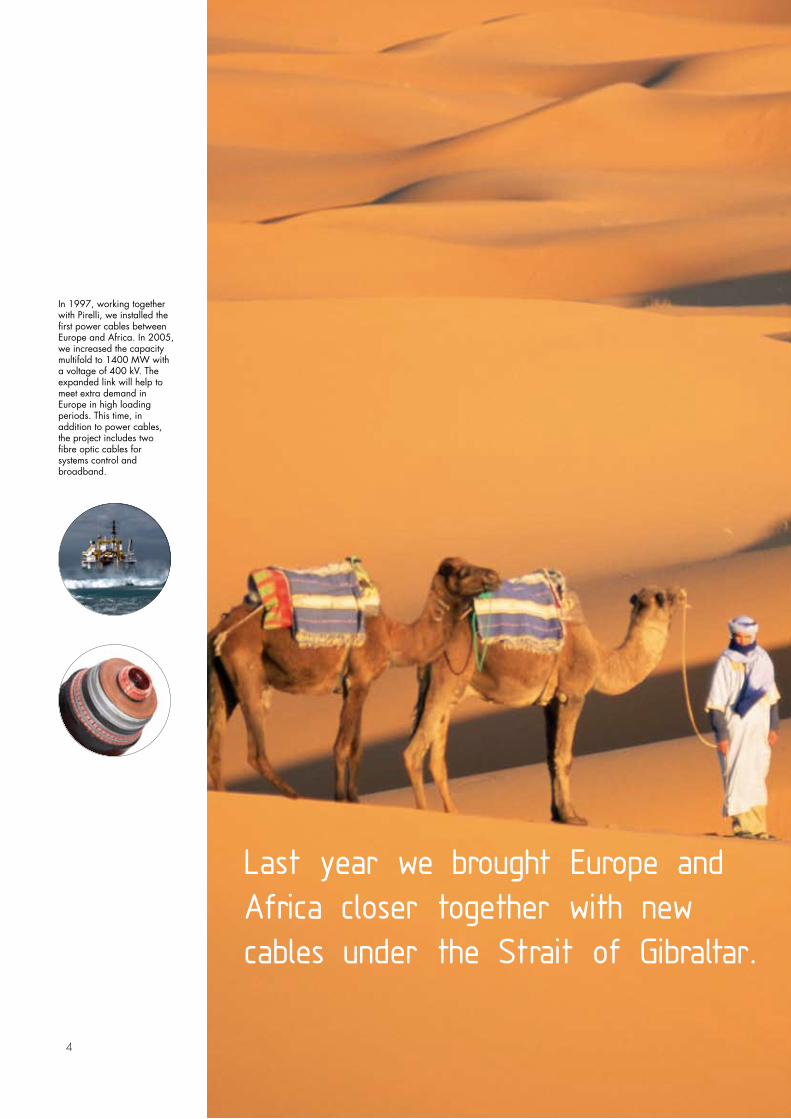
In 2005, Nexans Norway installed a cable bundle consisting of a power cable and a telecom cable with 48 fibers across the Strait of Gibraltar. The vessel “Bourbon Skagerrak”, which was upgraded with a new navigation and positioning system in 2005, was used for the installation from Tarifa, Spain to Tanger, Morocco.
A submarine high voltage cable producedin Halden and installed by Nexans Norwaysecures the connects Les Saintes withGuadeloupe and secures the electricity supplyof the small island. The customer was theFrench energy company EDF.
In 2005 Nexans Norway added Millidry floor heating cable mats to its floor heating portfolio. You can cover this new mat with parquet and laminate flooring - without any sealing!
Nexans Norway designed, produced and installed a three conductor 69 kV power PEX cable with an integrated fiber optic element for Alaska Electric Light and Power (AEL&P). The cable was installed at a depth of 80 m and a drift of approximately 2 knots. The cable connects North Douglas and Young Bay in Alaska and helps providing cheaper hydro-electric power to local municipalities.
In 2005, Nexans decided to invest heavily into the Rognan factory. One of the investments specifically increases Nexans’ ability to meet the ever-increasing need for optimized construction methods for dynamic deep-sea cables, like ROV-, seismical and riser cables.
The newly constructed wharfage in Rognan was used for the first time by Nexans in April 2005. The wharfage was built by Saltdal commune, and Nexans Norway is renting the complete dock site. A total load of 900 tons of submarine fiber optic cable was transported from the Rognan factory to the new wharfage by truck, where the cable was loaded directly onto a transportation vessel and shipped for Dubai for installation. Nexans is a leading manufacturer of fiber optic submarine cables for the unrepeatered market, and has a world wide supply record of more than 13 000 km to more than 100 clients including major telecom operators.
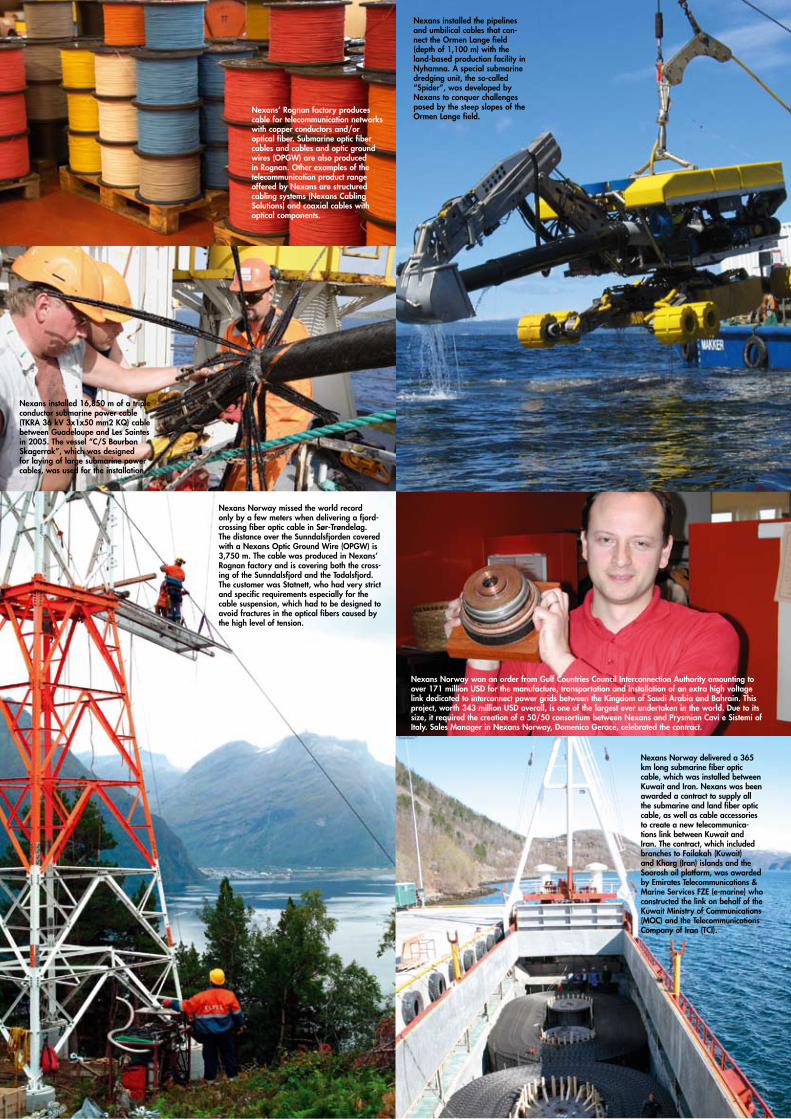
Nexans’ Rognan factory produces cable for telecommunication networks with copper conductors and/or optical fiber. Submarine optic fiber cables and cables and optic ground wires (OPGW) are also produced in Rognan. Other examples of the telecommunication product range offered by Nexans are structured cabling systems (Nexans Cabling Solutions) and coaxial cables with optical components.
Nexans installed the pipelines and umbilical cables that con-nect the Ormen Lange field (depth of 1,100 m) with the land-based production facility in Nyhamna. A special submarine dredging unit, the so-called “Spider”, was developed by Nexans to conquer challenges posed by the steep slopes of the Ormen Lange field.
Nexans installed 16,850 m of a triple conductor submarine power cable (TKRA 36 kV 3x1x50 mm2 KQ) cable between Guadeloupe and Les Saintes in 2005. The vessel “C/S Bourbon Skagerrak”, which was designed for laying of large submarine power cables, was used for the installation.
Nexans Norway missed the world record only by a few meters when delivering a fjord-crossing fiber optic cable in Sør-Trøndelag. The distance over the Sunndalsfjorden covered with a Nexans Optic Ground Wire (OPGW) is 3,750 m. The cable was produced in Nexans’ Rognan factory and is covering both the cross-ing of the Sunndalsfjord and the Todalsfjord. The customer was Statnett, who had very strict and specific requirements especially for the cable suspension, which had to be designed to avoid fractures in the optical fibers caused by the high level of tension.
Nexans Norway delivered a 365 km long submarine fiber optic cable, which was installed between Kuwait and Iran. Nexans was been awarded a contract to supply all the submarine and land fiber optic cable, as well as cable accessories to create a new telecommunica-tions link between Kuwait and Iran. The contract, which included branches to Failakah (Kuwait) and Kharg (Iran) islands and the Soorosh oil platform, was awarded by Emirates Telecommunications & Marine Services FZE (e-marine) who constructed the link on behalf of the Kuwait Ministry of Communications (MOC) and the Telecommunications Company of Iran (TCI).
Nexans Norway won an order from Gulf Countries Council Interconnection Authority amounting to over 171 million USD for the manufacture, transportation and installation of an extra high voltage link dedicated to interconnect power grids between the Kingdom of Saudi Arabia and Bahrain. This project, worth 343 million USD overall, is one of the largest ever undertaken in the world. Due to its size, it required the creation of a 50/50 consortium between Nexans and Prysmian Cavi e Sistemi of Italy. Sales Manager in Nexans Norway, Domenico Gerace, celebrated the contract.
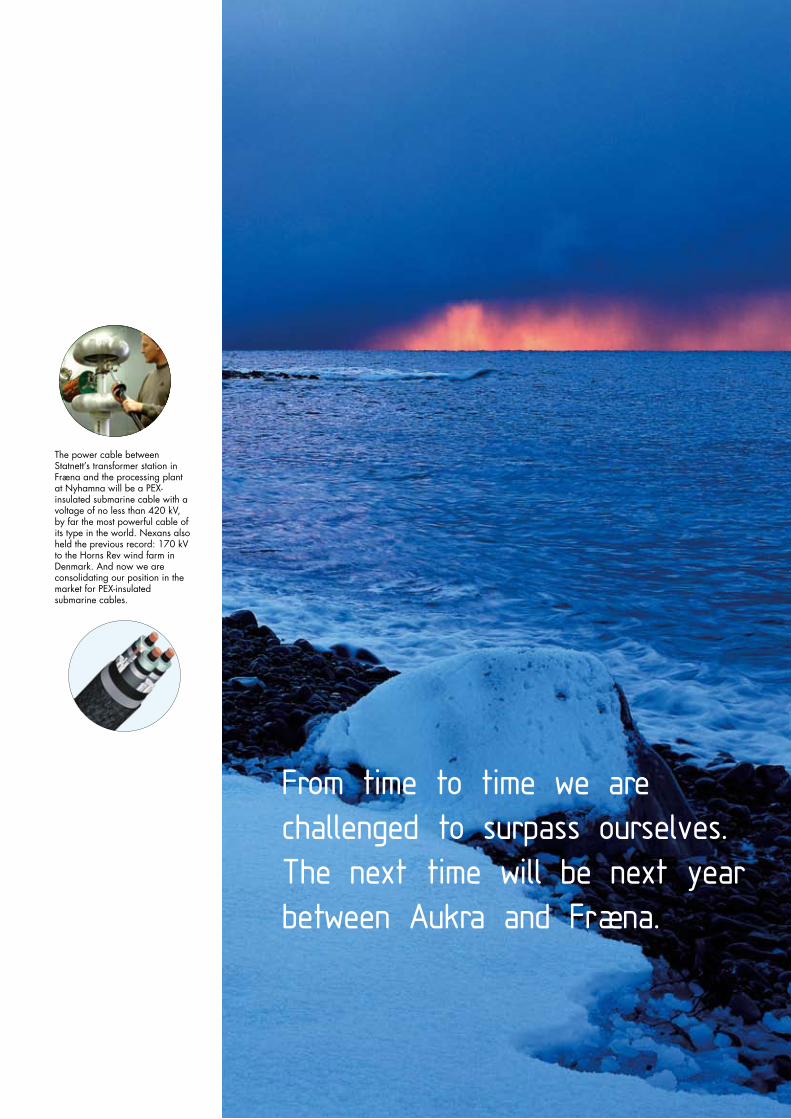
The power cable between Statnett’s transformer station in Fræna and the processing plant at Nyhamna will be a PEX-insulated submarine cable with a voltage of no less than 420 kV, by far the most powerful cable of its type in the world. Nexans also held the previous record: 170 kV to the Horns Rev wind farm in Denmark. And now we are consolidating our position in the market for PEX-insulated submarine cables.
From time to time we are challenged to surpass ourselves.The next time will be next year between Aukra and Fræna.
�
Directors´ Report 2005
The Directors´ Report
Nexans Norway AS is part of the French Nexans group – one of the world’s largest cable manufacturers and the company is a wholly owned subsidiary of Nexans Participations SA in Paris.
Until 29 August 2005, Nexans Distribusjon AS was a wholly-owned subsidiary of Nexans Norway. As a conse-quence of a corporate decision to divest non-core business, all the shares in Nexans Distribusjon AS were sold to Ahlsell Norge AS.
Nexans Norway AS develops, manufactures and markets sub-marine, land and offshore cables for power and telecom-munication transmission.
Nexans Norway AS is organised in two divisions, the Energy Division and the Building and Telecom Cable Division. The company’s plants are located in Namsos, Rognan, Karmøy, Halden and Langhus. Nexans Norway’s head office is in Oslo.
Nexans Norway posted ope-rating revenues of NOK 2,828 million in 2005 compared to NOK 2,376 million in 2004, an increase of 19%.
The company’s order backlog reached all time high in 2005 with major new contracts signed in Gulf of Mexico, Nigeria, Saudi-Arabia, Bahrain, Qatar, the Netherlands, Greece, Thailand, Norway and the North Sea.
The company foresees conti-nued growth in the cable market in the years to come,
especially within high voltage submarine cables, medium voltage land cables, offshore cables and submarine installa-tion.
In 2005 major investment pro-grams were undertaken in the factories in Halden, Rognan and Namsos to modernise the facilities and increase produc-tion capacity.
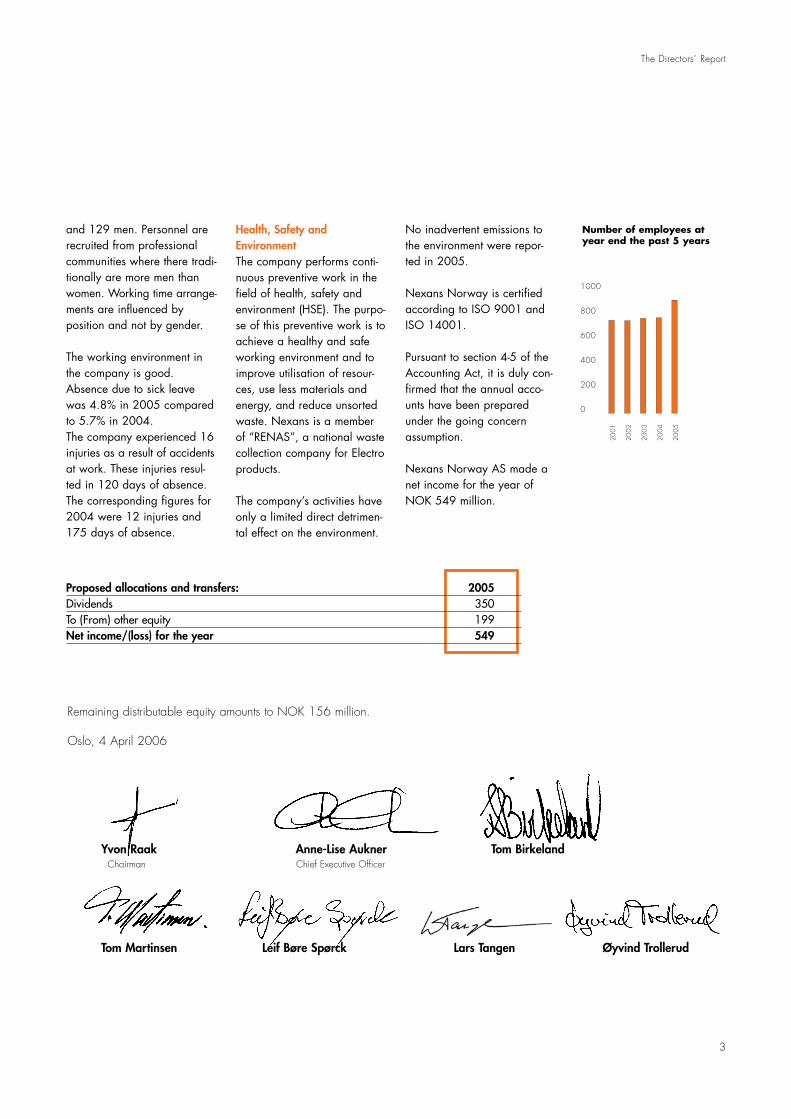
In order to meet the increased demand for the company’s products and services, the number of employees was increased by 139 persons (18%).
Nexans Norway has chartered the specialized cable laying and construction vessel “Bourbon Skagerrak” for three years in order to enhance the company’s role as a turnkey systems supplier and installation contractor.
Market The high voltage segment of the energy cable market conti-nued to grow in 2005. Among the largest projects undertaken in 2005 were the submarine links between Spain and Morocco and bet-ween Corfu and Greece main-land. Nexans also supplied submarine cables to the Barrow Windmill farm in the UK.
The market for special cables to the oil and gas industry
remained on the same level as in 2004. Supplies were made to installations in the Gulf of Mexico and the North Sea.
The market for submarine installation and services increased substantially compa-red to the previous year. In addition to installation of its own and other cable manu-facturers’ cables, Nexans Norway performed major trenching and dredging work in the North Sea and in Australia.
The demand for medium volta-ge cables increased through-out the year both in the domestic market and in selec-ted export markets abroad, while the low voltage market remained relatively stable. The market for telecommunica-tion cables improved some-what compared to the previ-ous year, mainly due to increased domestic demand and supplies of niche products to the oil and gas industry.
In the telecom submarine cable sector, Nexans Norway supplied cables for the link between Kuwait and Iran. Financial Results 2005 Nexans Norway AS has from 2005 decided to implement the accounting principles of the Nexans group also in pre-paration of its Norwegian financial statements. The finan-
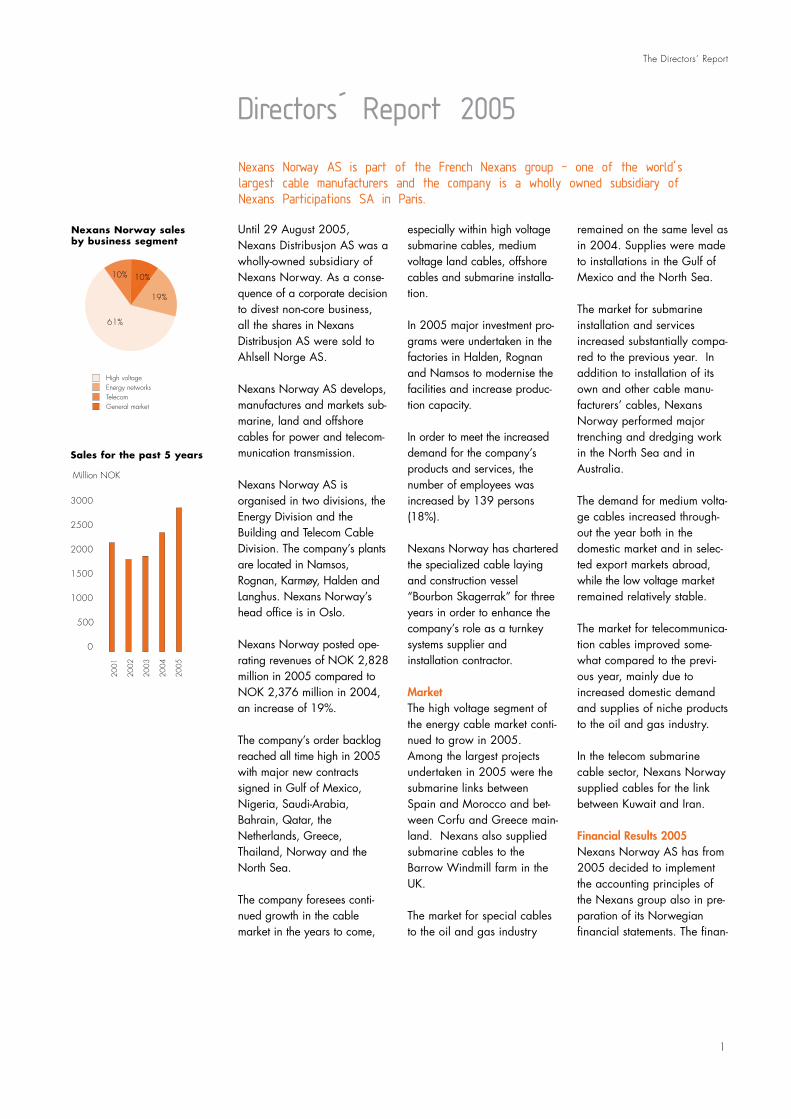
�0%�0%
6�%
�9%
Nexans Norway sales by business segment
High voltage Energy networksTelecom General market
3000
2500
2000
�500
�000
500
0
200�
2002
2003
2004
2005
Sales for the past 5 years
Million NOK
2
cial statements are therefore presented according to simplified IFRS.
Operating revenues for Nexans Norway totalled NOK 2,828 million in 2005 compared to NOK 2,376 mil-lion in 2004, an increase of 19%. The company’s export revenues totalled NOK 1,590 million, an increase of 22% compared to the previous year.
Sales for all product lines increased compared to last year, except building cables which remain stable.
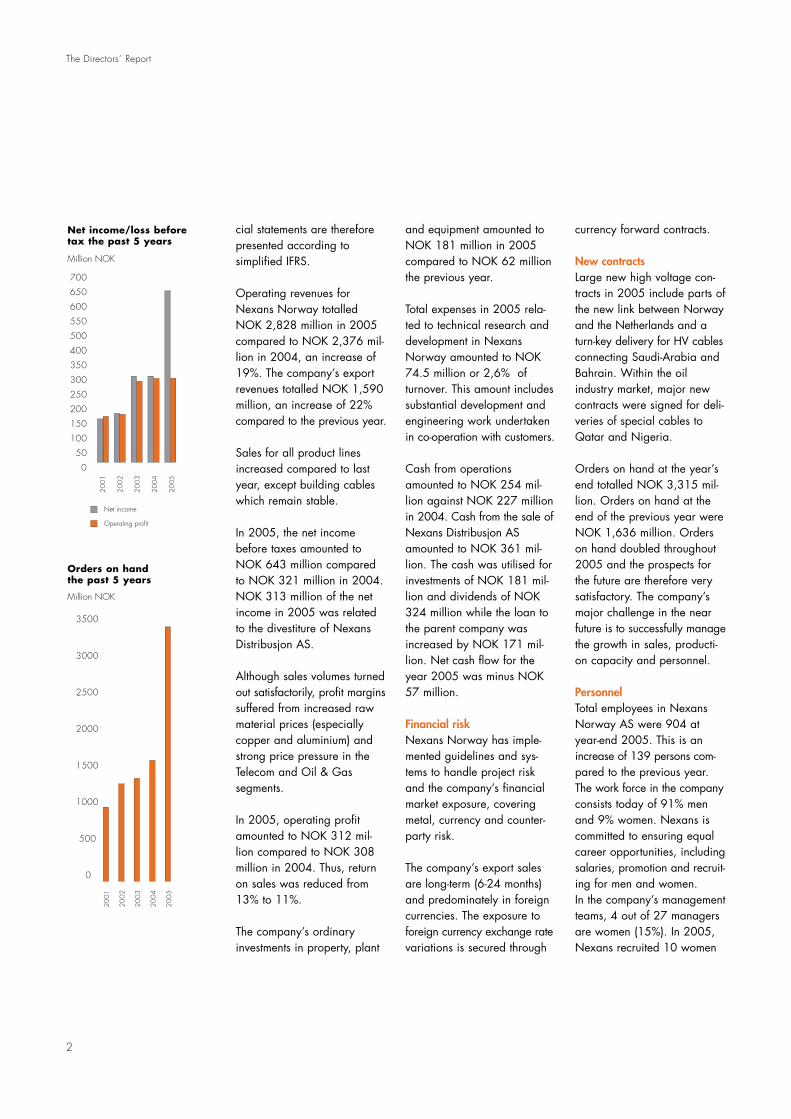
In 2005, the net income before taxes amounted to NOK 643 million compared to NOK 321 million in 2004. NOK 313 million of the net income in 2005 was related to the divestiture of Nexans Distribusjon AS.
Although sales volumes turned out satisfactorily, profit margins suffered from increased raw material prices (especially copper and aluminium) and strong price pressure in the Telecom and Oil & Gas segments.
In 2005, operating profit amounted to NOK 312 mil-lion compared to NOK 308 million in 2004. Thus, return on sales was reduced from 13% to 11%.
The company’s ordinary investments in property, plant
and equipment amounted to NOK 181 million in 2005 compared to NOK 62 million the previous year.
Total expenses in 2005 rela-ted to technical research and development in Nexans Norway amounted to NOK 74.5 million or 2,6% of turnover. This amount includes substantial development and engineering work undertaken in co-operation with customers.
Cash from operations amounted to NOK 254 mil-lion against NOK 227 million in 2004. Cash from the sale of Nexans Distribusjon AS amounted to NOK 361 mil-lion. The cash was utilised for investments of NOK 181 mil-lion and dividends of NOK 324 million while the loan to the parent company was increased by NOK 171 mil-lion. Net cash flow for the year 2005 was minus NOK 57 million.
Financial riskNexans Norway has imple-mented guidelines and sys-tems to handle project risk and the company’s financial market exposure, covering metal, currency and counter-party risk.
The company’s export sales are long-term (6-24 months) and predominately in foreign currencies. The exposure to foreign currency exchange rate variations is secured through
currency forward contracts.
New contracts Large new high voltage con-tracts in 2005 include parts of the new link between Norway and the Netherlands and a turn-key delivery for HV cables connecting Saudi-Arabia and Bahrain. Within the oil industry market, major new contracts were signed for deli-veries of special cables to Qatar and Nigeria.
Orders on hand at the year’s end totalled NOK 3,315 mil-lion. Orders on hand at the end of the previous year were NOK 1,636 million. Orders on hand doubled throughout 2005 and the prospects for the future are therefore very satisfactory. The company’s major challenge in the near future is to successfully manage the growth in sales, producti-on capacity and personnel.
PersonnelTotal employees in Nexans Norway AS were 904 at year-end 2005. This is an increase of 139 persons com-pared to the previous year. The work force in the company consists today of 91% men and 9% women. Nexans is committed to ensuring equal career opportunities, including salaries, promotion and recruit-ing for men and women. In the company’s management teams, 4 out of 27 managers are women (15%). In 2005, Nexans recruited 10 women
The Directors´ Report
Net income/loss before tax the past 5 years
20
0�
20
02
20
03
20
04
20
05
3500
3000
2500
2000
�500
�000
500
0
20
0�
20
02
20
03
20
04
20
05
Orders on hand the past 5 years
Million NOK
Net income
700
650
600
550
500
400
350
300
250
200
�50
�00
50
0
Million NOK
Operating profit
3
The Directors´ Report
Oslo, 4 April 2006
and 129 men. Personnel are recruited from professional communities where there tradi-tionally are more men than women. Working time arrange-ments are influenced by position and not by gender.
The working environment in the company is good. Absence due to sick leave was 4.8% in 2005 compared to 5.7% in 2004. The company experienced 16 injuries as a result of accidents at work. These injuries resul-ted in 120 days of absence. The corresponding figures for 2004 were 12 injuries and 175 days of absence.
Health, Safety and Environment The company performs conti-nuous preventive work in the field of health, safety and environment (HSE). The purpo-se of this preventive work is to achieve a healthy and safe working environment and to improve utilisation of resour-ces, use less materials and energy, and reduce unsorted waste. Nexans is a member of “RENAS”, a national waste collection company for Electro products.
The company’s activities have only a limited direct detrimen-tal effect on the environment.
No inadvertent emissions to the environment were repor-ted in 2005.
Nexans Norway is certified according to ISO 9001 and ISO 14001.
Pursuant to section 4-5 of the Accounting Act, it is duly con-firmed that the annual acco-unts have been prepared under the going concern assumption. Nexans Norway AS made a net income for the year of NOK 549 million.
Proposed allocations and transfers: 2005Dividends 350 To (From) other equity 199 Net income/(loss) for the year 549
Remaining distributable equity amounts to NOK �56 million.
20
0�
20
02
20
03
20
04
20
05
Number of employees atyear end the past 5 years
�000
800
600
400
200
0
Yvon Raak Anne-Lise Aukner Tom Birkeland Chairman Chief Executive Officer
Tom Martinsen Leif Børe Spørck Lars Tangen Øyvind Trollerud
4
In 1997, working together with Pirelli, we installed the first power cables between Europe and Africa. In 2005, we increased the capacity multifold to 1400 MW with a voltage of 400 kV. The expanded link will help to meet extra demand in Europe in high loading periods. This time, in addition to power cables, the project includes two fibre optic cables for systems control and broadband.
Last year we brought Europe and Africa closer together with new cables under the Strait of Gibraltar.

5
Income statement 1 Jan – 31 Dec
NOK million Nexans Norway AS
Note 2004 2005 Operating revenues 15,16,17 2 376 2 828 Changes in work in progress and finished goods (12) (117)Raw materials and consumables 17 1 265 1 646 Payroll and related cost 3, 10 460 534 Other operating expenses 5 310 427 Depreciation of fixed assets 9 45 50 Reversal of write-down 9 - (24)Operating expenses 2 068 2 516 Operating profit 308 312 Interest income from associated companies 17 7 8 Other interest income 6 2 Interest expense to associated companies 17 - (1)Other interest expense (3) (1)Gain from sales of shares in subsidiary 7 - 313 Net exchange gain/loss 3 10 Net financial items 13 331 Profit before tax 321 643 Taxes 11 (92) (94)Net profit for the year 229 549 Proposed dividends 254 350
The following notes are an integrated part of the financial statement.
�
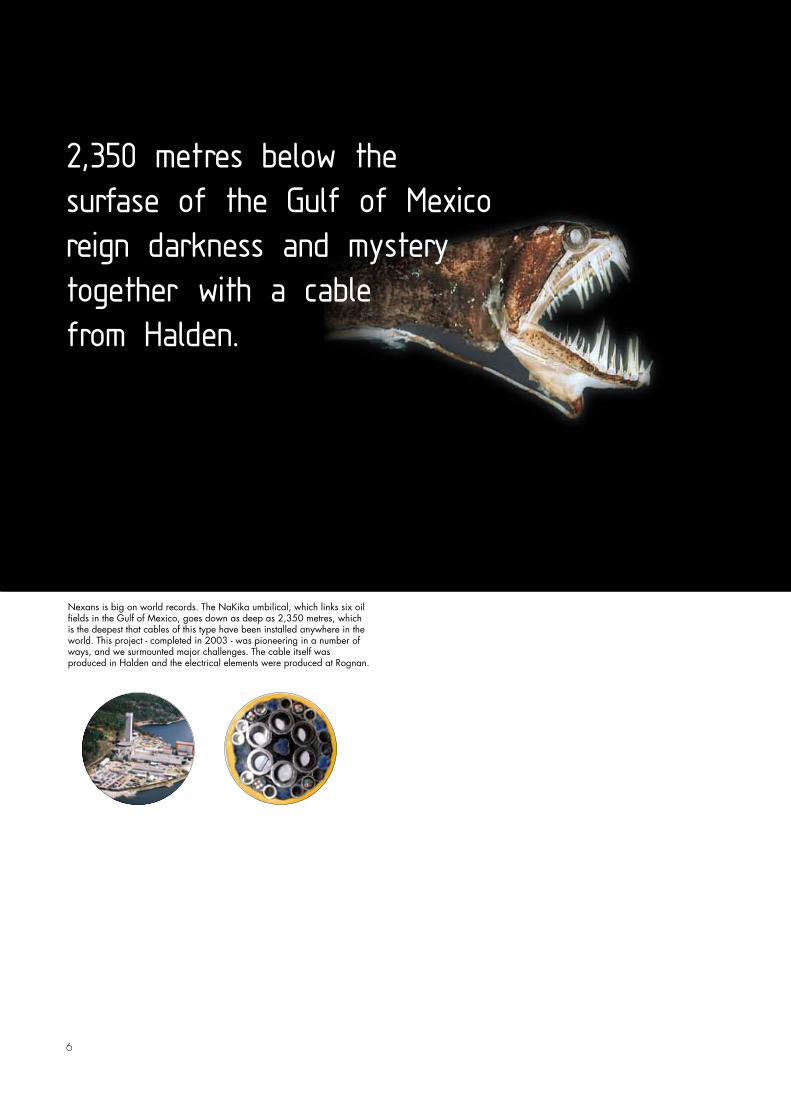
Nexans is big on world records. The NaKika umbilical, which links six oil fields in the Gulf of Mexico, goes down as deep as 2,350 metres, which is the deepest that cables of this type have been installed anywhere in the world. This project - completed in 2003 - was pioneering in a number of ways, and we surmounted major challenges. The cable itself was produced in Halden and the electrical elements were produced at Rognan.
2,350 metres below the surfase of the Gulf of Mexico reign darkness and mystery together with a cable from Halden.
7
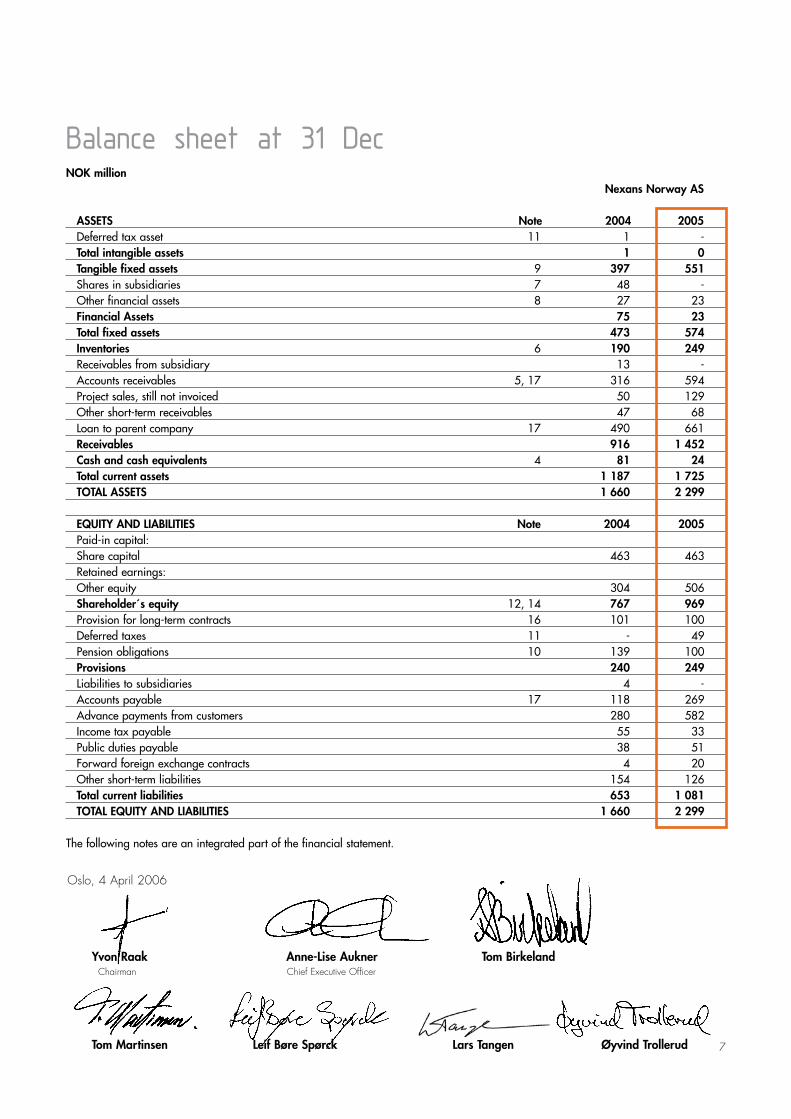
Balance sheet at 31 DecNOK million Nexans Norway AS
ASSETS Note 2004 2005 Deferred tax asset 11 1 - Total intangible assets 1 0 Tangible fixed assets 9 397 551 Shares in subsidiaries 7 48 - Other financial assets 8 27 23 Financial Assets 75 23 Total fixed assets 473 574 Inventories 6 190 249 Receivables from subsidiary 13 - Accounts receivables 5, 17 316 594 Project sales, still not invoiced 50 129 Other short-term receivables 47 68 Loan to parent company 17 490 661 Receivables 916 1 452 Cash and cash equivalents 4 81 24 Total current assets 1 187 1 725 TOTAL ASSETS 1 660 2 299 EQUITY AND LIABILITIES Note 2004 2005 Paid-in capital: Share capital 463 463 Retained earnings: Other equity 304 506 Shareholder´s equity 12, 14 767 969 Provision for long-term contracts 16 101 100 Deferred taxes 11 - 49 Pension obligations 10 139 100 Provisions 240 249 Liabilities to subsidiaries 4 - Accounts payable 17 118 269 Advance payments from customers 280 582 Income tax payable 55 33 Public duties payable 38 51 Forward foreign exchange contracts 4 20 Other short-term liabilities 154 126 Total current liabilities 653 1 081 TOTAL EQUITY AND LIABILITIES 1 660 2 299
The following notes are an integrated part of the financial statement.
Oslo, 4 April 2006
Yvon Raak Anne-Lise Aukner Tom Birkeland Chairman Chief Executive Officer
Tom Martinsen Leif Børe Spørck Lars Tangen Øyvind Trollerud
8
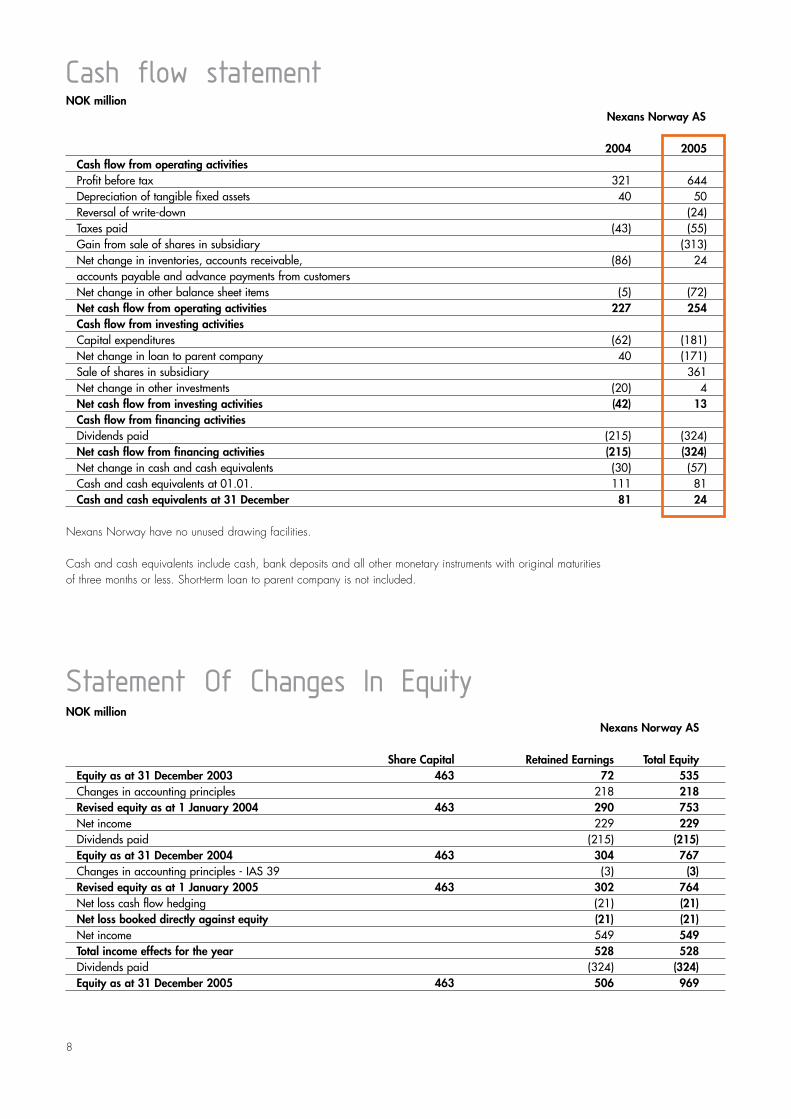
Cash flow statementNOK million Nexans Norway AS
2004 2005 Cash flow from operating activities Profit before tax 321 644 Depreciation of tangible fixed assets 40 50 Reversal of write-down (24) Taxes paid (43) (55) Gain from sale of shares in subsidiary (313) Net change in inventories, accounts receivable, (86) 24 accounts payable and advance payments from customers Net change in other balance sheet items (5) (72) Net cash flow from operating activities 227 254 Cash flow from investing activities Capital expenditures (62) (181) Net change in loan to parent company 40 (171) Sale of shares in subsidiary 361 Net change in other investments (20) 4 Net cash flow from investing activities (42) 13 Cash flow from financing activities Dividends paid (215) (324) Net cash flow from financing activities (215) (324) Net change in cash and cash equivalents (30) (57) Cash and cash equivalents at 01.01. 111 81 Cash and cash equivalents at 31 December 81 24 Nexans Norway have no unused drawing facilities. Cash and cash equivalents include cash, bank deposits and all other monetary instruments with original maturities of three months or less. Short-term loan to parent company is not included.
Statement Of Changes In EquityNOK million Nexans Norway AS
Share Capital Retained Earnings Total Equity Equity as at 31 December 2003 463 72 535 Changes in accounting principles 218 218 Revised equity as at 1 January 2004 463 290 753 Net income 229 229 Dividends paid (215) (215) Equity as at 31 December 2004 463 304 767 Changes in accounting principles - IAS 39 (3) (3) Revised equity as at 1 January 2005 463 302 764 Net loss cash flow hedging (21) (21) Net loss booked directly against equity (21) (21) Net income 549 549 Total income effects for the year 528 528 Dividends paid (324) (324) Equity as at 31 December 2005 463 506 969

9
The climate at the site of Exxon’s prestigious oil and gas project on Sakhalin Island off the east coast of Russia is anything but hospitable. The ground freezes to a depth of many metres during the winter and there are heat waves in summer. Nexans is supplying fibre cables to the project, and this unique climate forced us to think creatively. The solution that we eventually came up with is capable of withstanding pressure of 500 kilos over a length of 10 cm and can be used in extreme conditions of all types.
A 70 degree temperature span on Sakhalin Island called for new ideas from Rognan.
�0
Notes To The Financial Statement
1 ACCOUNTING PRINCIPLES
The annual report is prepared accord-ing to simplified IFRS in accordance with the Norwegian Accounting Act § 3-9. Comparative figures for 2004 are restated accordingly, except for the effects of hedging instruments, which are implemented from 2005. The ac-counts are based on historic cost, except for hedging instruments (derivatives) which are appraised at real value.
Changes in accounting principlesThe following changes in the principlesare made as a consequence of require-ments in the accounting standards.• IFRS 2 Share-based Payment: Alltransactions involving share-based pay-ments are to be booked at market value. Market value at the time of allot-ment is calculated by using an option pricing model, and is accrued over the vesting period.
• IFRS 2 is compulsory for annual reports starting on or after 1 January 2005. The company has however decid-ed to implement IFRS 2 for the 2004 accounts. According to the transition policies costs are booked only on options alloted after 7 November 2002 and which where not fully vested as at 31 December 2003.
The implementation of IFRS 2 has caus-ed a reduction of other retained earn-ings as of 1 January 2004 of NOK 81.576. Increased salaries and wages have caused a reduction in this year net income of NOK 403.200 (2004: 144.641).
Revenue recognitionFor long-term contracts, revenue is recognized under the percentage of completion method. This means that the accumulated share of the estimated final profit is recognized based on the per-centage of completion. The percentage of completion is based on completed production. Provisions are made for guarantee work and other uncertainties. In the case of contracts that are expect-ed to show a loss, the estimated loss is entered in its entirety as a cost.
HedgingHedgings are made in connection withlong-term projects with a cash flow inforeign currency. The expected cash flow is hedged when a binding agree-ment is signed for the project.
The company criterion to classify a derivative as a hedging instrument is as follows:
(1) the hedging is expected to be veryeffective because it counteracts changes in market value or cash flows of an identified asset. A hedging efficiencywithin the scope of 80-125% is expected,(2) the efficiency of the hedging is relia-bly measurable,(3) there is adequate documentation atthe entering of the hedging to show that the hedging is very efficient,(4) for cash flow hedging, the futuretransaction must be very probable,(5) the hedging is evaluated on a run-ning basis and has proven to be very efficient in the reporting periods the hedging is meant to cover.
Cash flow hedgingThe spot element in the forward foreignexchange contracts is pointed out ashedging instrument in relation to changes in income and expenses related to long-term projects.
Changes in the market value of a hedg-ing instrument which satisfies the require-ments to be very efficient cash flow hedging are booked directly against the equity. The ineffective part of the hedging instrument is booked in the income statement.
If the hedged cash flow results in book-ing of an asset or liability, all prior gains or losses booked directly against equity are transferred from equity and included in the first-time measurement of the asset or liability. For other cash flow hedges, gains or losses directly booked agaist equity are transferred to the inco-me statement in the same period as the cash flow making up the hedged object booked in the result.
When a hedging instrument stops to bevery efficient, the booking of the hedging is terminated prospectively.
In this case, the cumulative gain or losson a hedging instrument booked directly against the equity, will be reversed when the hedged transaction actually happens.
If the hedged transaction is no longer expected to happend any prior cumula-tive gain or loss on the hedging instru-ment booked directly against the equity will be reversed and booked in the income statement.
Financial instrumentsAccording to IAS 39, Financial instru-ments:Recognition and Measurement, financial instruments are classified in the follow-ing categories: held-to-maturity and available-for-sale. Financial instruments with fixed or determinable cashflows and a fixed maturity that the company has the positive intention and ability to hold to maturity are classified as held-to-maturity investments. At the balance sheet date, the company has no investments classified as held-to-maturity investments.
All other financial instruments that are available for sale are presented as cur-rent assets if the management has decid-ed to sell the instrument within 12 months of the balance sheet date.
All purchases and sales of financial instruments are recognised on the trans-action date. The transaction costs are included in the cost price.
Financial instruments that are classifiedas available for sale and at fair valuethrough profit or loss are carried at fair value as observed in the market at the balance sheet date, with no deduction for costs relating to the sale.
The gain or loss resulting from changesin the fair value of financial investmentsclassified as available for sale are recognised directly in equity until the investment has been disposed of. The accumulated gain or loss on the financial
��
instrument that has previously been recognised in equity will then be revers-ed and the gain or loss will be recognis-ed in the income statement.
Changes in the fair value of financialinstruments classified as financial instru-ments at fair value through profit or loss are recognised in the income statement and included in the net financial inco-me/expenses.
Investments held to maturity are carriedat amortised cost.
TaxesTaxes in the income statement are com-prised of payable tax and change in deferred tax/deferred tax asset. Deferred tax/deferred tax asset is calcu-lated using 28% based on tax increas-ing and tax reducing differences be- tween the carrying values of assets and liabilities for financial reporting, and their tax basis, which are considered temporary in nature.
Deferred tax asset is recorded in the balance sheet to the extent that it is more likely than not that the tax asset will be utilised.
Classification of balance sheet itemsCurrent assets and current liabilitiesinclude balances due within one yearand items connected with the operating cycle. Other items are classified asfixed assets/long-term liabilities.
Assets and liabilities in foreign currencyReceivables and debts in foreign curren-cy are valued at the exchange rate at year-end. To the extent that revenues and costs on long-term contracts arehedged by forward sales or purchasesof foreign currency, the income state-ment and balance sheet items are con-verted to the forward rate.
InventoriesInventories, including work in progress, are valued at the lower of cost and fair value less costs to sell after provisions for obsolete inventories. The fair value less costs to sell is the estimated selling price in the ordinary course of business,
less the estimated cost of completion and estimated costs necessary to make the sale. Inventories are measured using the weighted average principle. Finished goods and work in progress include variable costs and fixed costs that can be allocated to goods based on normal capacity. Obsolete inventori-es have been fully recognised as impair-ment losses.
Fixed assetsFixed assets are valued at cost and re-duced with cumulative amortisation and depreciation.When assets are sold, the cost and acumulative amortisation and depreciation are reversed in the acco-unts, and any gain or loss from the sale is booked in the income statement.
The cost for the asset is the purchase price, including fees and taxes and direct purchasing costs related to putting the asset in a condition ready to be used. Expenses occuring after the asset is taken into use, like repairs and maintenance, are normally booked as costs in the income statement. If incres-ed profitability can be shown as a result of repair and maintenance, the cost of this will be booked in the balance sheet as a capital expenditure. Depreciation is calculated using the linear method over the following periods:
Buildings 20-30 yearsMachinery and equipment 10-30 yearsFurniture, fixtures and vehicles 3-10 years
The depreciation period and method is assessed yearly in order to secure that the method and the period used is in accordance with the economic realities for the asset. Equivalent assessment is made for the scrap value. Plant under construction is classified as fixed asset and is booked including costs related to the asset. Depreciation is not started until the asset is ready for use.
Trade receivablesTrade receivables and other receivables are booked at face value less deduction for loss in value.
Leasing - operational leasingFor operational leasing agreements, the leasing payment is an operating cost that is apportioned systematically over the leasing period. The company does not have leasing agreements which can be considered as financial leasing.
Cash flow analysisThe cash flow analysis is drawn up inline with the indirect method.
Research and developmentAll research expenditures are expensed as incurred. Development costs are capitalized if the costs fulfil defined requirements for capitalization. Capitalization assumes that the intangi-ble asset, which is being developed, can be identified and shown that it is probable that the development work is successful, and that future economic advantages linked to the intangible asset will accrue to the company. At the end of 2005, no expenses are fulfilling the requirements for capitalization.
Pension costs and commitmentsNet pension costs comprises service cost, interest cost, expected return on pension plan asset and the profit or loss effects of changes in estimates and changes in pension plans.
Net pension plan assets and pension obligations are recorded as long-term receivable or long-term liability in the Balance Sheet.
Estimate deviations which exceed 10% of the higher of gross pension obligation and pension plan asset will, together with changes in pension plans, be distributed over the average remaining working life of our employees.
�2
2 FORWARD FOREIGN EXCHANGE CONTRACTS
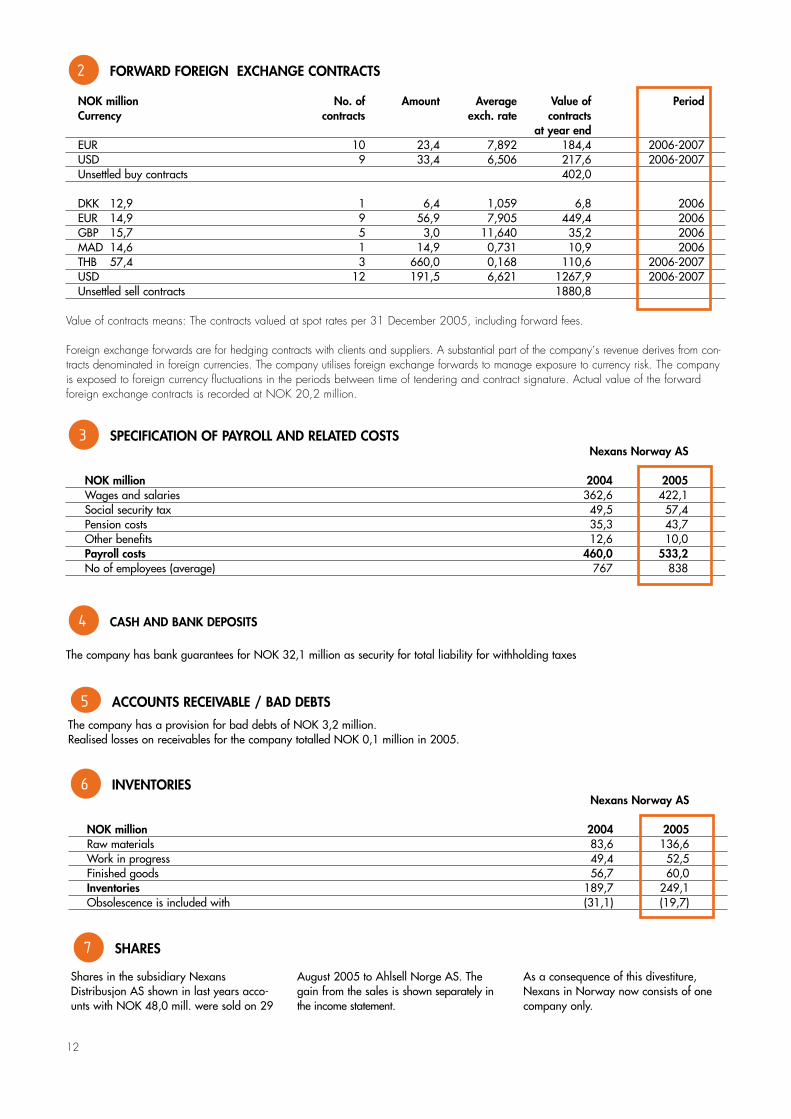
NOK million No. of Amount Average Value of Period Currency contracts exch. rate contracts at year end EUR 10 23,4 7,892 184,4 2006-2007 USD 9 33,4 6,506 217,6 2006-2007 Unsettled buy contracts 402,0
DKK 12,9 1 6,4 1,059 6,8 2006 EUR 14,9 9 56,9 7,905 449,4 2006 GBP 15,7 5 3,0 11,640 35,2 2006 MAD 14,6 1 14,9 0,731 10,9 2006 THB 57,4 3 660,0 0,168 110,6 2006-2007 USD 12 191,5 6,621 1267,9 2006-2007 Unsettled sell contracts 1880,8 Value of contracts means: The contracts valued at spot rates per 3� December 2005, including forward fees. Foreign exchange forwards are for hedging contracts with clients and suppliers. A substantial part of the company´s revenue derives from con-tracts denominated in foreign currencies. The company utilises foreign exchange forwards to manage exposure to currency risk. The company is exposed to foreign currency fluctuations in the periods between time of tendering and contract signature. Actual value of the forward foreign exchange contracts is recorded at NOK 20,2 million.
3 SPECIFICATION OF PAYROLL AND RELATED COSTS Nexans Norway AS
NOK million 2004 2005 Wages and salaries 362,6 422,1 Social security tax 49,5 57,4 Pension costs 35,3 43,7 Other benefits 12,6 10,0 Payroll costs 460,0 533,2 No of employees (average) 767 838
4 CASH AND BANK DEPOSITS
The company has bank guarantees for NOK 32,1 million as security for total liability for withholding taxes
6 INVENTORIES Nexans Norway AS
NOK million 2004 2005 Raw materials 83,6 136,6 Work in progress 49,4 52,5 Finished goods 56,7 60,0 Inventories 189,7 249,1 Obsolescence is included with (31,1) (19,7)
5 ACCOUNTS RECEIVABLE / BAD DEBTS
The company has a provision for bad debts of NOK 3,2 million. Realised losses on receivables for the company totalled NOK 0,1 million in 2005.
7 SHARES Shares in the subsidiary Nexans Distribusjon AS shown in last years acco-unts with NOK 48,0 mill. were sold on 29
August 2005 to Ahlsell Norge AS. The gain from the sales is shown separately in the income statement.
As a consequence of this divestiture, Nexans in Norway now consists of one company only.
�3
8 RECEIVABLES DUE IN MORE THAN ONE YEAR Nexans Norway AS
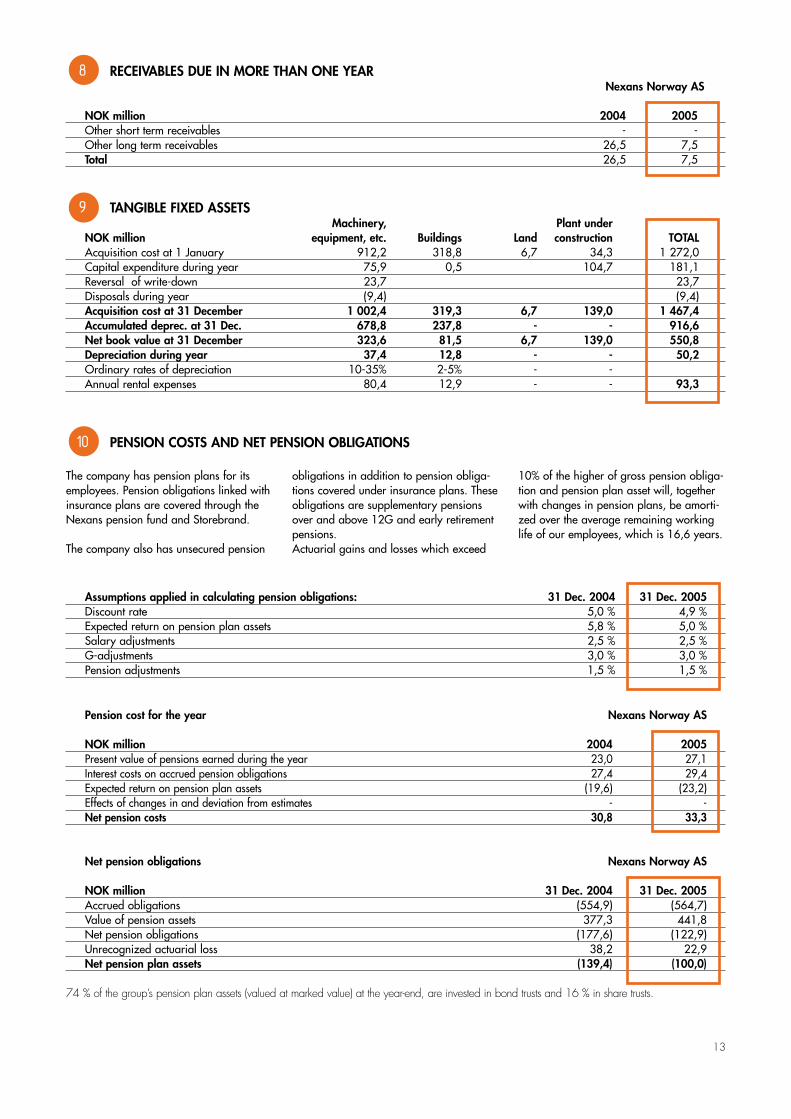
NOK million 2004 2005 Other short term receivables - - Other long term receivables 26,5 7,5 Total 26,5 7,5
9 TANGIBLE FIXED ASSETS Machinery, Plant under NOK million equipment, etc. Buildings Land construction TOTAL Acquisition cost at 1 January 912,2 318,8 6,7 34,3 1 272,0 Capital expenditure during year 75,9 0,5 104,7 181,1 Reversal of write-down 23,7 23,7 Disposals during year (9,4) (9,4) Acquisition cost at 31 December 1 002,4 319,3 6,7 139,0 1 467,4 Accumulated deprec. at 31 Dec. 678,8 237,8 - - 916,6 Net book value at 31 December 323,6 81,5 6,7 139,0 550,8 Depreciation during year 37,4 12,8 - - 50,2 Ordinary rates of depreciation 10-35% 2-5% - - Annual rental expenses 80,4 12,9 - - 93,3
10 PENSION COSTS AND NET PENSION OBLIGATIONS
The company has pension plans for its employees. Pension obligations linked with insurance plans are covered through the Nexans pension fund and Storebrand. The company also has unsecured pension
obligations in addition to pension obliga-tions covered under insurance plans. These obligations are supplementary pensions over and above 12G and early retirement pensions. Actuarial gains and losses which exceed
10% of the higher of gross pension obliga-tion and pension plan asset will, together with changes in pension plans, be amorti-zed over the average remaining working life of our employees, which is 16,6 years.
Assumptions applied in calculating pension obligations: 31 Dec. 2004 31 Dec. 2005 Discount rate 5,0 % 4,9 % Expected return on pension plan assets 5,8 % 5,0 % Salary adjustments 2,5 % 2,5 % G-adjustments 3,0 % 3,0 % Pension adjustments 1,5 % 1,5 %
Pension cost for the year Nexans Norway AS
NOK million 2004 2005 Present value of pensions earned during the year 23,0 27,1 Interest costs on accrued pension obligations 27,4 29,4 Expected return on pension plan assets (19,6) (23,2) Effects of changes in and deviation from estimates - - Net pension costs 30,8 33,3 Net pension obligations Nexans Norway AS
NOK million 31 Dec. 2004 31 Dec. 2005 Accrued obligations (554,9) (564,7) Value of pension assets 377,3 441,8 Net pension obligations (177,6) (122,9) Unrecognized actuarial loss 38,2 22,9 Net pension plan assets (139,4) (100,0) 74 % of the group’s pension plan assets (valued at marked value) at the year-end, are invested in bond trusts and �6 % in share trusts.

�4
As far back as in the 1930s we installed heating cables in Oslo Cathedral, so it is true to say that we have extensive experience in installing concealed heating sources in old buildings. In addition to the temple in Beijing we have installed ice-free gutters and downpipes in the Kremlin, heating for flats in Mongolia and ice-free truck paths in Pennsylvania. Our Langhus plant is an international centre of competence in the development and production of heating cables. We supply cables to no fewer than 32 countries.
Advanced Norwegian technology is exported all over the world – in the form of heating cables from Langhus.
�5
11 TAXES Temporary differences Nexans Norway AS
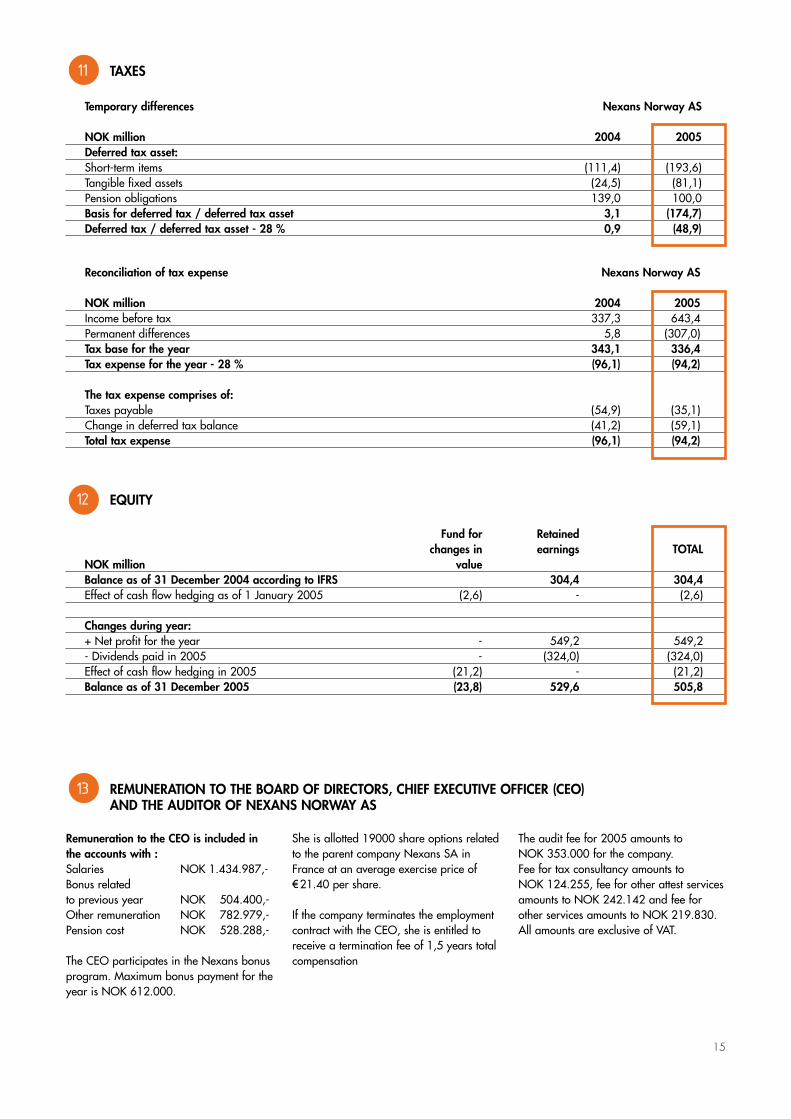
NOK million 2004 2005 Deferred tax asset: Short-term items (111,4) (193,6) Tangible fixed assets (24,5) (81,1) Pension obligations 139,0 100,0 Basis for deferred tax / deferred tax asset 3,1 (174,7) Deferred tax / deferred tax asset - 28 % 0,9 (48,9)
Reconciliation of tax expense Nexans Norway AS
NOK million 2004 2005 Income before tax 337,3 643,4 Permanent differences 5,8 (307,0) Tax base for the year 343,1 336,4 Tax expense for the year - 28 % (96,1) (94,2) The tax expense comprises of: Taxes payable (54,9) (35,1) Change in deferred tax balance (41,2) (59,1) Total tax expense (96,1) (94,2)
12 EQUITY
Fund for Retained changes in earnings TOTAL NOK million value Balance as of 31 December 2004 according to IFRS 304,4 304,4 Effect of cash flow hedging as of 1 January 2005 (2,6) - (2,6) Changes during year: + Net profit for the year - 549,2 549,2 - Dividends paid in 2005 - (324,0) (324,0) Effect of cash flow hedging in 2005 (21,2) - (21,2) Balance as of 31 December 2005 (23,8) 529,6 505,8
13 REMUNERATION TO THE BOARD OF DIRECTORS, CHIEF EXECUTIVE OFFICER (CEO) AND THE AUDITOR OF NEXANS NORWAY AS
Remuneration to the CEO is included in the accounts with : Salaries NOK 1.434.987,-Bonus related to previous year NOK 504.400,-Other remuneration NOK 782.979,-Pension cost NOK 528.288,-
The CEO participates in the Nexans bonus program. Maximum bonus payment for the year is NOK 612.000.
She is allotted 19000 share options related to the parent company Nexans SA in France at an average exercise price of €
21.40 per share.
If the company terminates the employment contract with the CEO, she is entitled to receive a termination fee of 1,5 years total compensation
The audit fee for 2005 amounts to NOK 353.000 for the company.Fee for tax consultancy amounts to NOK 124.255, fee for other attest services amounts to NOK 242.142 and fee for other services amounts to NOK 219.830.All amounts are exclusive of VAT.
16
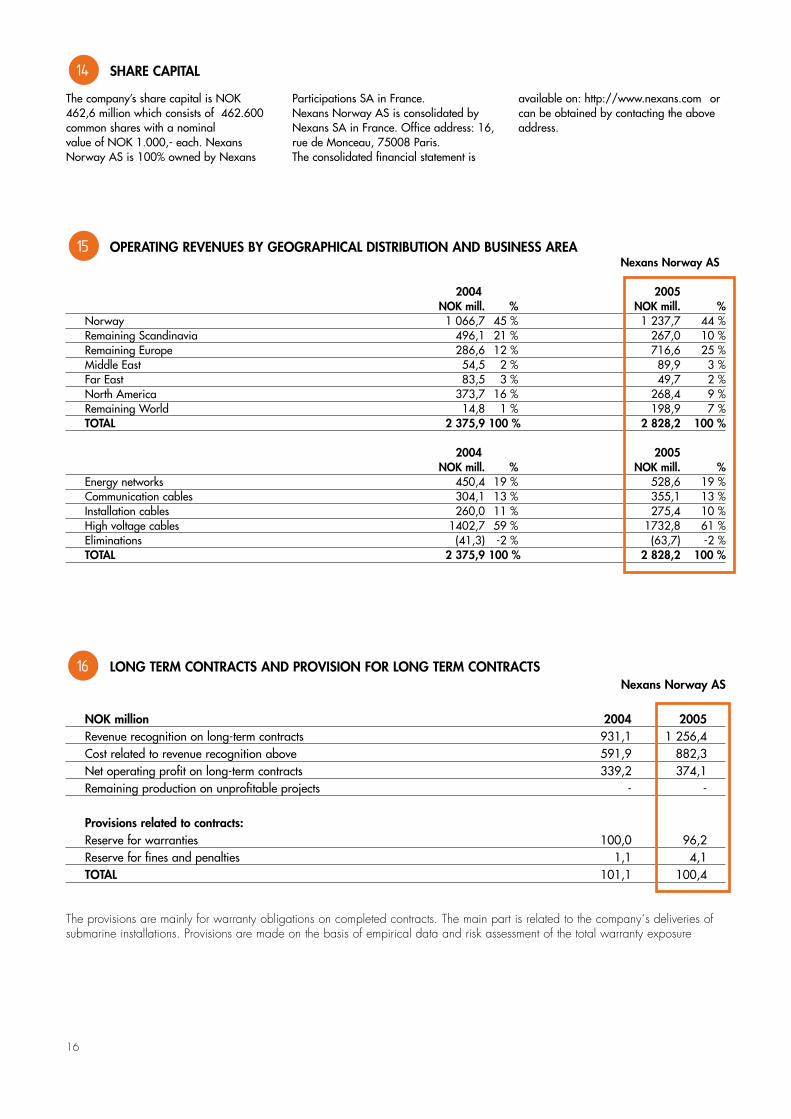
16 LONGTERMCONTRACTSANDPROVISIONFORLONGTERMCONTRACTS NexansNorwayAS
NOKmillion 2004 2005 Revenuerecognitiononlong-termcontracts 931,1 1256,4 Costrelatedtorevenuerecognitionabove 591,9 882,3 Netoperatingprofitonlong-termcontracts 339,2 374,1 Remainingproductiononunprofitableprojects - - Provisionsrelatedtocontracts: Reserveforwarranties 100,0 96,2 Reserveforfinesandpenalties 1,1 4,1 TOTAL 101,1 100,4
The provisions are mainly for warranty obligations on completed contracts. The main part is related to the company´s deliveries of submarine installations. Provisions are made on the basis of empirical data and risk assessment of the total warranty exposure
14 SHARECAPITAL
Thecompany’ssharecapitalisNOK462,6millionwhichconsistsof462.600commonshareswithanominalvalueofNOK1.000,-each.NexansNorwayASis100%ownedbyNexans
ParticipationsSAinFrance. NexansNorwayASisconsolidatedbyNexansSAinFrance.Officeaddress:16,ruedeMonceau,75008Paris.Theconsolidatedfinancialstatementis
availableon:http://www.nexans.com orcanbeobtainedbycontactingtheaboveaddress.
15 OPERATINGREVENUESBYGEOGRAPHICALDISTRIBUTIONANDBUSINESSAREA NexansNorwayAS
2004 2005 NOKmill. % NOKmill. % Norway 1066,7 45% 1237,7 44% RemainingScandinavia 496,1 21% 267,0 10% RemainingEurope 286,6 12% 716,6 25% MiddleEast 54,5 2% 89,9 3% FarEast 83,5 3% 49,7 2% NorthAmerica 373,7 16% 268,4 9% RemainingWorld 14,8 1% 198,9 7% TOTAL 2375,9100% 2828,2 100%
2004 2005 NOKmill. % NOKmill. % Energynetworks 450,4 19% 528,6 19% Communicationcables 304,1 13% 355,1 13% Installationcables 260,0 11% 275,4 10% Highvoltagecables 1402,7 59% 1732,8 61% Eliminations (41,3) -2% (63,7) -2% TOTAL 2375,9100% 2828,2 100%
�7
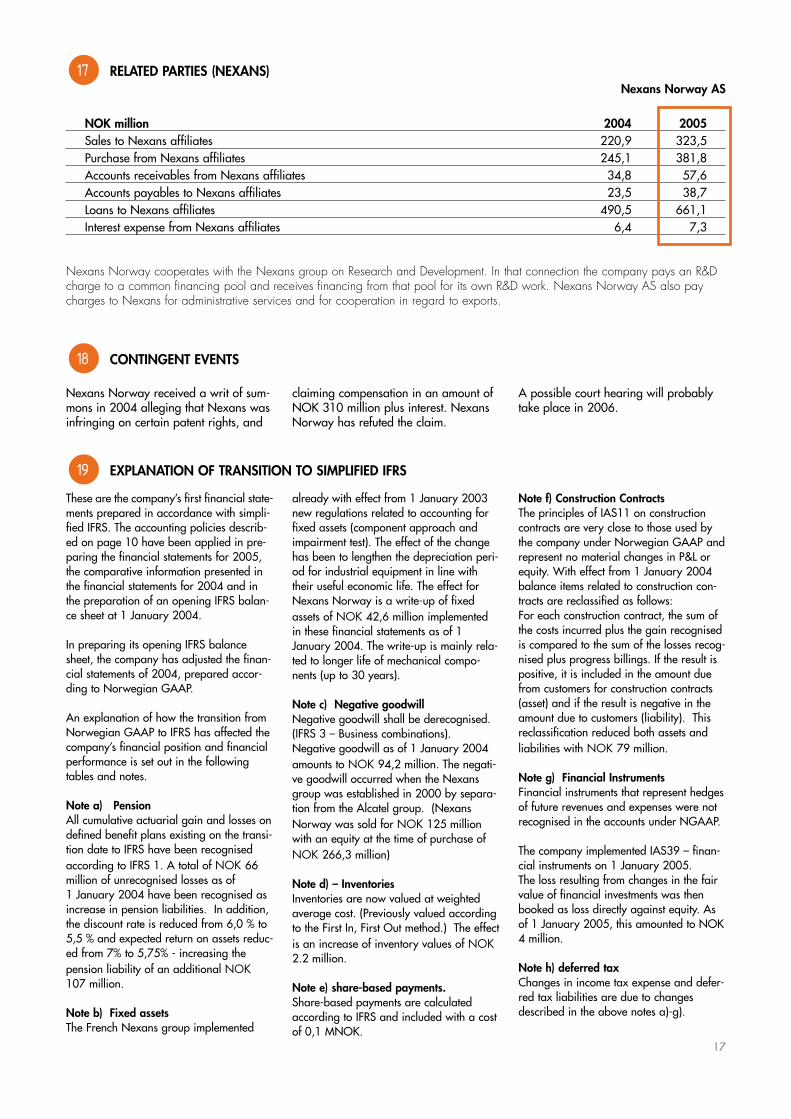
17 RELATED PARTIES (NEXANS) Nexans Norway AS
NOK million 2004 2005 Sales to Nexans affiliates 220,9 323,5 Purchase from Nexans affiliates 245,1 381,8 Accounts receivables from Nexans affiliates 34,8 57,6 Accounts payables to Nexans affiliates 23,5 38,7 Loans to Nexans affiliates 490,5 661,1 Interest expense from Nexans affiliates 6,4 7,3
Nexans Norway cooperates with the Nexans group on Research and Development. In that connection the company pays an R&D charge to a common financing pool and receives financing from that pool for its own R&D work. Nexans Norway AS also pay charges to Nexans for administrative services and for cooperation in regard to exports.
18 CONTINGENT EVENTS
Nexans Norway received a writ of sum-mons in 2004 alleging that Nexans was infringing on certain patent rights, and
claiming compensation in an amount of NOK 310 million plus interest. Nexans Norway has refuted the claim.
A possible court hearing will probably take place in 2006.
19 EXPLANATION OF TRANSITION TO SIMPLIFIED IFRS
These are the company’s first financial state-ments prepared in accordance with simpli-fied IFRS. The accounting policies describ-ed on page 10 have been applied in pre-paring the financial statements for 2005, the comparative information presented in the financial statements for 2004 and in the preparation of an opening IFRS balan-ce sheet at 1 January 2004.
In preparing its opening IFRS balance sheet, the company has adjusted the finan-cial statements of 2004, prepared accor-ding to Norwegian GAAP.
An explanation of how the transition from Norwegian GAAP to IFRS has affected the company’s financial position and financial performance is set out in the following tables and notes.
Note a) PensionAll cumulative actuarial gain and losses on defined benefit plans existing on the transi-tion date to IFRS have been recognised according to IFRS 1. A total of NOK 66 million of unrecognised losses as of 1 January 2004 have been recognised as increase in pension liabilities. In addition, the discount rate is reduced from 6,0 % to 5,5 % and expected return on assets reduc-ed from 7% to 5,75% - increasing the pension liability of an additional NOK 107 million.
Note b) Fixed assetsThe French Nexans group implemented
already with effect from 1 January 2003 new regulations related to accounting for fixed assets (component approach and impairment test). The effect of the change has been to lengthen the depreciation peri-od for industrial equipment in line with their useful economic life. The effect for Nexans Norway is a write-up of fixed assets of NOK 42,6 million implemented in these financial statements as of 1 January 2004. The write-up is mainly rela-ted to longer life of mechanical compo-nents (up to 30 years).
Note c) Negative goodwillNegative goodwill shall be derecognised. (IFRS 3 – Business combinations).Negative goodwill as of 1 January 2004 amounts to NOK 94,2 million. The negati-ve goodwill occurred when the Nexans group was established in 2000 by separa-tion from the Alcatel group. (Nexans Norway was sold for NOK 125 million with an equity at the time of purchase of NOK 266,3 million) Note d) – Inventories Inventories are now valued at weighted average cost. (Previously valued according to the First In, First Out method.) The effect is an increase of inventory values of NOK 2.2 million.
Note e) share-based payments. Share-based payments are calculated according to IFRS and included with a cost of 0,1 MNOK.
Note f) Construction ContractsThe principles of IAS11 on construction contracts are very close to those used by the company under Norwegian GAAP and represent no material changes in P&L or equity. With effect from 1 January 2004 balance items related to construction con-tracts are reclassified as follows: For each construction contract, the sum of the costs incurred plus the gain recognised is compared to the sum of the losses recog-nised plus progress billings. If the result is positive, it is included in the amount due from customers for construction contracts (asset) and if the result is negative in the amount due to customers (liability). This reclassification reduced both assets and liabilities with NOK 79 million.
Note g) Financial InstrumentsFinancial instruments that represent hedges of future revenues and expenses were not recognised in the accounts under NGAAP.
The company implemented IAS39 – finan-cial instruments on 1 January 2005.The loss resulting from changes in the fair value of financial investments was then booked as loss directly against equity. As of 1 January 2005, this amounted to NOK 4 million.
Note h) deferred tax Changes in income tax expense and defer-red tax liabilities are due to changes described in the above notes a)-g).
�8
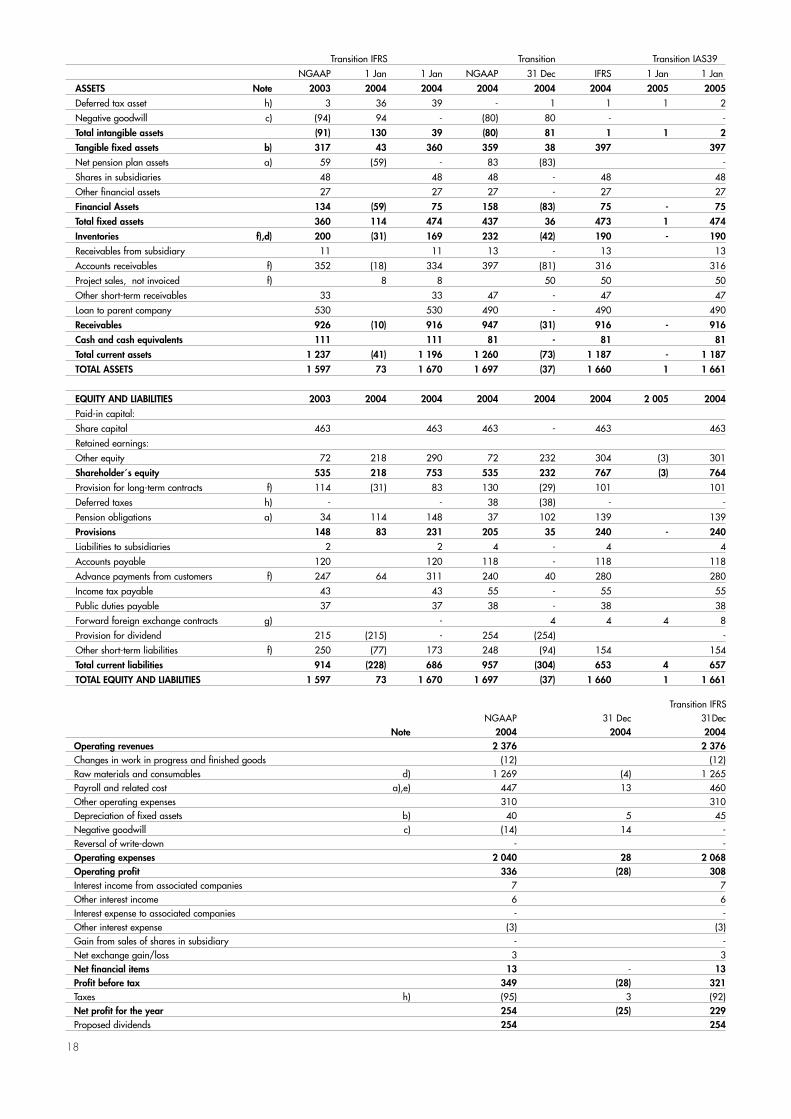
Transition IFRS Transition Transition IAS39
NGAAP 1 Jan 1 Jan NGAAP 31 Dec IFRS 1 Jan 1 Jan
ASSETS Note 2003 2004 2004 2004 2004 2004 2005 2005
Deferred tax asset h) 3 36 39 - 1 1 1 2
Negative goodwill c) (94) 94 - (80) 80 - -
Total intangible assets (91) 130 39 (80) 81 1 1 2
Tangible fixed assets b) 317 43 360 359 38 397 397
Net pension plan assets a) 59 (59) - 83 (83) -
Shares in subsidiaries 48 48 48 - 48 48
Other financial assets 27 27 27 - 27 27
Financial Assets 134 (59) 75 158 (83) 75 - 75
Total fixed assets 360 114 474 437 36 473 1 474
Inventories f),d) 200 (31) 169 232 (42) 190 - 190
Receivables from subsidiary 11 11 13 - 13 13
Accounts receivables f) 352 (18) 334 397 (81) 316 316
Project sales, not invoiced f) 8 8 50 50 50
Other short-term receivables 33 33 47 - 47 47
Loan to parent company 530 530 490 - 490 490
Receivables 926 (10) 916 947 (31) 916 - 916
Cash and cash equivalents 111 111 81 - 81 81
Total current assets 1 237 (41) 1 196 1 260 (73) 1 187 - 1 187
TOTAL ASSETS 1 597 73 1 670 1 697 (37) 1 660 1 1 661
EQUITY AND LIABILITIES 2003 2004 2004 2004 2004 2004 2 005 2004
Paid-in capital:
Share capital 463 463 463 - 463 463
Retained earnings:
Other equity 72 218 290 72 232 304 (3) 301
Shareholder´s equity 535 218 753 535 232 767 (3) 764
Provision for long-term contracts f) 114 (31) 83 130 (29) 101 101
Deferred taxes h) - - 38 (38) - -
Pension obligations a) 34 114 148 37 102 139 139
Provisions 148 83 231 205 35 240 - 240
Liabilities to subsidiaries 2 2 4 - 4 4
Accounts payable 120 120 118 - 118 118
Advance payments from customers f) 247 64 311 240 40 280 280
Income tax payable 43 43 55 - 55 55
Public duties payable 37 37 38 - 38 38
Forward foreign exchange contracts g) - 4 4 4 8
Provision for dividend 215 (215) - 254 (254) -
Other short-term liabilities f) 250 (77) 173 248 (94) 154 154
Total current liabilities 914 (228) 686 957 (304) 653 4 657
TOTAL EQUITY AND LIABILITIES 1 597 73 1 670 1 697 (37) 1 660 1 1 661
Transition IFRS 15 NGAAP 31 Dec 31 Dec Note 2004 2004 2004 Operating revenues 2 376 2 376 Changes in work in progress and finished goods (12) (12) Raw materials and consumables d) 1 269 (4) 1 265 Payroll and related cost a),e) 447 13 460 Other operating expenses 310 310 Depreciation of fixed assets b) 40 5 45 Negative goodwill c) (14) 14 - Reversal of write-down - - Operating expenses 2 040 28 2 068 Operating profit 336 (28) 308 Interest income from associated companies 7 7 Other interest income 6 6 Interest expense to associated companies - - Other interest expense (3) (3) Gain from sales of shares in subsidiary - - Net exchange gain/loss 3 3 Net financial items 13 - 13 Profit before tax 349 (28) 321 Taxes h) (95) 3 (92) Net profit for the year 254 (25) 229 Proposed dividends 254 254
�9
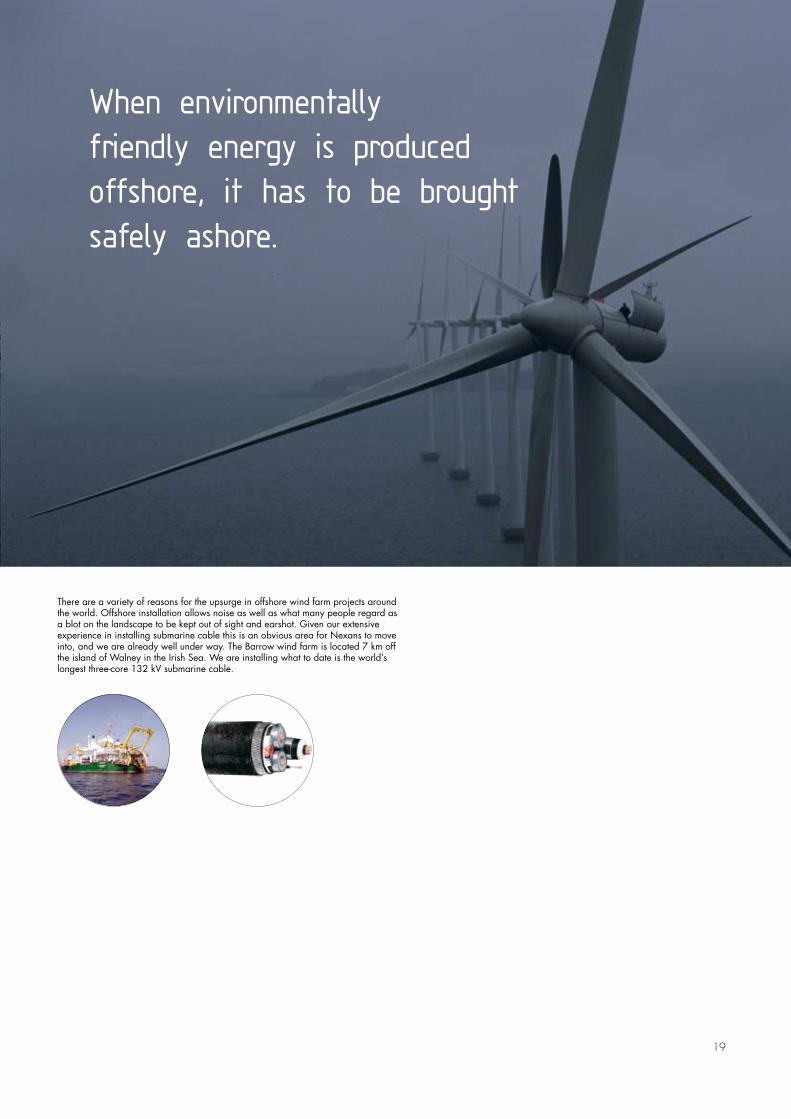
There are a variety of reasons for the upsurge in offshore wind farm projects around the world. Offshore installation allows noise as well as what many people regard as a blot on the landscape to be kept out of sight and earshot. Given our extensive experience in installing submarine cable this is an obvious area for Nexans to move into, and we are already well under way. The Barrow wind farm is located 7 km off the island of Walney in the Irish Sea. We are installing what to date is the world’s longest three-core 132 kV submarine cable.
When environmentally friendly energy is produced offshore, it has to be brought safely ashore.
20

Nexans Norway AS, Innspurten 9, P.O.Box 6450 Etterstad, 0605 Oslo, NORWAY. Tel: +47 22 88 61 00, fax +47 22 88 61 01.
www.nexans.no
scan
pa
rtner Trondheim
00
64
Foto: Jørn Adde, N
exans, Getty Im
ages, Photolibrary. Trykkpartner Lade
exansGlobal expert in cables and cabling systems