Embed Size (px)
Citation preview

A n n u a l R e p o r t 2 0 0 8

“As we celebrate our 150th anniversary in 2009, Innovation Delivered is
more than our new brand tagline. It is our way of doing business in more
than 90 countries around the world. These two words capture the heart
and soul of Diebold.
“Innovation – in both technology and services – leads the way, and
Delivered is all about successful execution and customer satisfaction. With
the economic environment challenging all of us to work differently, we
have an unprecedented opportunity to optimize convenience, efficiency
and security for our customers. Our timing is ideal – Innovation Delivered
is our springboard for moving forward.”— Thomas W. Swidarski
President and Chief Executive Officer
Celebrating 150 years
of innovation

18721859 1871
1
1881
To our fellow shareholdersMy annual letter to shareholders is a time to look back on our performance during the past
12 months, and assess how we are positioned to capitalize on opportunities in the future. As
I reflect on the past year, one main thought stands out loud and clear -- and it should give you
confidence and make all of our associates very proud:
Diebold today is a stronger company than it was a year ago.
• We’re a stronger company because we once again increased customer loyalty.
• We’re a stronger company because we further improved on-time delivery
and product quality.
• We’re a stronger company because we increased our profit margins, operating income,
earnings and cash flow while strengthening our financial controls.
We faced many obstacles in 2008, including a challenging economic environment and
uncertainty among our financial institution customers. But at the end of the day – or to be more
precise, the year – we addressed the issues and emerged as a stronger, more efficient and more
profitable company.
2009 looks to be equally challenging. But we face it with a strong resolve and financial
strength, knowing that during the last 150 years we have created the products, services and
technology required for success in today’s competitive environment. What’s more, throughout
our company we have a values system focused on the customer, a shared commitment to
developing creative solutions, and a culture that prizes imagination, promotes integrity and
doesn’t accept being second best. This is why we are introducing in 2009 a new brand tagline
that captures the heart and soul of our company: Innovation Delivered. These two words
perfectly meld our 150-year history of innovation with our strategic focus for the future.
Our Strategic Roadmap
The progress we have made – and continue to make – is due in large part to our relentless
devotion to achieving Diebold’s strategic roadmap. During the past three years, this roadmap
drove us to undertake a number of operational and supply chain initiatives – initiatives designed
to increase customer loyalty, improve productivity, streamline processes, enhance efficiency and
decrease costs.
Diebold founded
in Cincinnati, Ohio
More than 800 Diebold safes
survive Great Chicago Fire
Diebold moves operations
to Canton, Ohio
First recorded
international sale –
Diebold builds safe for
the President of Mexico

The results of these efforts are clear. We achieved our initial goal of cutting costs by $100 million and are
now driving to cut another $100 million – with $70 million to be achieved by the middle of 2010. More broadly
– and more importantly – we have put in place the infrastructure, processes and culture to drive continuous
improvement across our business. This is how we will thrive and win in an increasingly competitive global
marketplace.
Expanding Services Opportunities
The centerpiece of our business strategy is the continued growth of our service and advanced services
businesses. Currently, service and advanced services account for more than half of our annual revenue. Given
the size of the global services market, it’s clear that there is great potential for growth in this area.
It all starts with helping our customers succeed. In today’s diffi cult environment, our fi nancial customers
are looking for solutions that both enhance the value of their prime asset – the retail banking channel –
and also help to improve productivity and decrease costs. They recognize automated teller machine (ATM)
networks are critical components in their ability to serve retail customers. But they also know the importance
of allocating their resources most productively.
Increasingly, fi nancial institutions will turn to outsourcing solutions providers to solve this paradox. And
that’s the focus of our fi nancial self-service strategy: We leverage our existing strengths to help customers
manage all aspects of their ATM networks, and in doing so, we provide the services that enable fi nancial
institutions to offer more to their customers at a lower cost.
During 2008, we saw solid growth in our outsourcing solutions, or Diebold Integrated Services®, because
of burgeoning customer demand and our market leadership. Our outsourcing solutions – through which
we provide software, hardware and services – are meeting with broad customer acceptance because they
provide fi nancial institutions with access to the latest, cutting-edge technology and comprehensive support,
while minimizing upfront capital expenses. And in 2009 for the third consecutive year, Diebold was named
one of the world’s top 100 outsourcing service providers by the International Association of Outsourcing
Professionals™– ranked well ahead of the nearest industry competitor.
Leadership in a Global Marketplace
At Diebold, we recognize our marketplace is global, and we have been working for some time to capture the
potential in high-growth markets abroad such as in Brazil, Russia, India and China. In Russia, for example,
we’re assisting Moscow-based Master Bank to transform its ATM channel into a currency-exchange network.
In China, we grew revenue more than 20 percent year over year, with major customer wins that included
Agricultural Bank of China. We were also selected by the Bank of China as the ATM provider for Beijing
Olympics facilities this past summer. During 2008, Thailand’s largest bank, Bangkok Bank Public Company
2
Diebold establishes the industry’s
fi rst nationwide service division
1915 1936Diebold begins developing
armor plate for military vehicles
Diebold expands its product line
by acquiring companies that
specialize in products such as
rotary and visible fi les, and index
and microfi lming systems
Eliot Ness, former crime fi ghter
of “The Untouchables” fame,
serves as chairman of the board
1944 –51
Diebold_08AR_001_004.indd 2 3/5/09 11:11:06 AM

Limited, purchased more than 1,000 of our Opteva® ATMs. Nigeria’s Union Bank also selected our hardware,
software and services offerings.
Latin America, and more specifically Brazil, continues to be an area of significant opportunity for Diebold.
Banco do Brasil, the largest financial institution in Brazil, has chosen Diebold to provide more than 5,400 ATMs
and check dispensers, enabling the financial institution to expand its reach to new and existing customers at
its branches in all Brazilian states, as well as through new retail locations. Also during the year, we partnered
with Brazil’s Caixa Econômica Federal in one of the largest ATM sales agreements in history – nearly 10,000
full-function units.
Developing a New Portfolio of Opportunities
An important dimension to our strategy for 2009 and beyond is expanding our deposit automation solutions,
both hardware and software, that help customers improve the operation of their self-service networks.
Check imaging, for example, is not only a regulatory compliance imperative, but a significant potential driver
of cost savings. Our Diebold ImageWay® check-imaging solution fulfills an industry-wide demand for cutting-
edge technologies that enhance efficiencies. Similarly, our new rapid processing capability enables financial
institutions to expedite bulk note and check deposits at any time of the day or night, improving security
and enhancing convenience at the ATM. Since 2007, we have increased shipments of deposit automation
solutions by more than 50 percent.
As one measure of the increasing scope and scale of our software offerings, we were proud to note in
2008 that Diebold received seven patents related to Agilis® branch network software. The patents protect
the unique features of Agilis’ Campaign Office™ suite, which can transform ATMs into revenue-generating
business tools by delivering one-to-one marketing messages to customers at the ATM.
Strengthening Our Security Capabilities
If there’s one single transaction that characterizes the progress we made in 2008, it’s surely the United
States Postal Service’s selection of Diebold to implement a multi-site, technologically advanced video security
program. This deal underscores how we have successfully elevated our presence and our security integration
capabilities beyond financial services into entirely new markets, opening up new avenues of opportunity.
As we move forward, we intend to build on this success. We are developing security enterprise risk
management solutions to help our customers with everyday challenges and regulatory requirements by
leveraging our expertise in information technology systems. For example, we are in the early phases of
introducing energy management solutions that can control and monitor heating, ventilation, air conditioning
and lighting for our customers. With our broad solutions portfolio, our goal is to further diversify and penetrate
key markets such as government, commercial and retail, while adding value for customers.
3
24-hour-a-day
Customer
Response Center
(1-800-DIEBOLD)
begins operation
1984Diebold enters the drive-up banking and
electrical alarm systems businesses through
purchase of O.B. McClintock, Minneapolis
1947 1964Diebold listed
on the New York
Stock Exchange
under the
symbol “DBD”
Computer-controlled security
and surveillance systems offered
1970Futura Automatic
Banking System
provides teller
services around
the clock

4
Modular Delivery System family of ATMs
introduced, allowing new technologies
to be added as developed
1985 1991InterBold, joint venture
between Diebold and IBM,
introduces i Series® ATMs
150 years
of innovation Diebold constructs three vaults
to protect Charters of Freedom
2001
Continued Operational Improvements
The scope and scale of the operational improvements we made during the past three years are substantial.
And it’s not just because of the significant cost savings we are realizing today or the additional savings we
intend to realize in 2009 and beyond. It’s really more about the wholesale improvements made in all areas of our
business – from responding to customer requests to manufacturing ATMs, from developing software to training
our service team.
Today, for example, when we develop new solutions, we have a cross-functional team of people who all work
together. Hardware engineers, software engineers, design, procurement, manufacturing, marketing, sales and
all other parts of the organization participate collaboratively in the development process. And with testing and
trialing proceeding along parallel lines, the end result is better quality, less cost and faster time to market. It’s an
approach we like and have worked hard to instill across our business, and it’s one that we will continue to improve
upon in the years ahead.
2009 Outlook
As I mentioned at the outset of this letter, 2009 will be challenging for the economy, the financial system,
the banking industry and our company. But Diebold possesses many strengths – our people, our culture, our
technology, our commitment to innovation, our strong customer relationships, our broad portfolio of solutions
and our financial strength. We believe these strengths, refined during our 150 years in business, will enable us to
thrive in this difficult economic environment. Reflecting the confidence our board and management have in
Diebold, we increased our dividend for the 56th consecutive year in early 2009.
Our focus during 2009 will be to continue refining and leveraging these strengths to enhance our leadership
position as a provider of integrated self-service and security solutions around the world. The trends driving
customer demand for our offerings are deep and powerful, and our goal is to capture opportunities for profitable
growth. Just as important is our commitment to sustaining an environment of financial control consciousness
as we continue to improve our financial systems, processes and procedures with proper controls that drive
efficiency, accuracy and timeliness in our accounting and financial reporting.
I would like to express my thanks for the ongoing counsel and support of our board of directors and our
business partners around the world. To all of our Diebold associates, a special word of appreciation for the terrific
job you do every day. To our shareholders, thank you for your continued support.
Sincerely,
Thomas W. Swidarski
President and Chief Executive Officer

UNITED STATES SECURITIES AND EXCHANGE COMMISSIONWashington, D.C. 20549
F O R M 10 - K
¥ ANNUAL REPORT PURSUANT TO SECTION 13 OR 15(D)
OF THE SECURITIES EXCHANGE ACT OF 1934
For the fiscal year ended December 31, 2008OR
n TRANSITION REPORT PURSUANT TO SECTION 13 OR 15(D)
OF THE SECURITIES EXCHANGE ACT OF 1934
For the transition period from toCommission file number 1-4879
Diebold, Incorporated(Exact name of Registrant as specified in its charter)
Ohio 34-0183970
(State or other jurisdiction ofincorporation or organization)
(IRS Employer Identification Number)
5995 Mayfair Road,
P.O. Box 3077, North Canton, Ohio
(Address of principalexecutive offices)
44720-8077
(Zip Code)
REGISTRANT’S TELEPHONE NUMBER, INCLUDING AREA CODE: (330) 490-4000
SECURITIES REGISTERED PURSUANT TO SECTION 12(B) OF THE ACT:
Title of each class Name of each exchange on which registered:
Common Shares $1.25 Par Value New York Stock Exchange
SECURITIES REGISTERED PURSUANT TO SECTION 12(G) OF THE ACT:
None
Indicate by check mark if the registrant is a well-known seasoned issuer, as defined in Rule 405 of the Securities Act. Yes n No ¥
Indicate by check mark if the registrant is not required to file reports pursuant to Section 13 or 15(d) of the ExchangeAct. Yes n No ¥
Indicate by check mark whether the registrant (1) has filed all reports required to be filed by Section 13 or 15(d) of the SecuritiesExchange Act of 1934 during the preceding 12 months (or for such shorter period that the Registrant was required to file such reports), and(2) has been subject to such filing requirements for the past 90 days. Yes ¥ No n
Indicate by check mark if disclosure of delinquent filers pursuant to Item 405 of Regulation S-K is not contained herein, and will not becontained, to the best of registrant’s knowledge, in definitive proxy or information statements incorporated by reference in Part III of thisForm 10-K or any amendment to this Form 10-K. n
Indicate by check mark whether the registrant is a large accelerated filer, an accelerated filer, a non-accelerated filer, or a smallerreporting company. See the definitions of “large accelerated filer,” “accelerated filer” and “smaller reporting company” in Rule 12b-2 of theExchange Act. (Check one):
Large accelerated Filer ¥ Accelerated Filer n Non-accelerated filer n Smaller reporting company n
Indicate by check mark whether the registrant is a shell company (as defined in Rule 12b-2 of the Exchange Act). Yes n No ¥
State the aggregate market value of the voting and non-voting common equity held by non-affiliates of the registrant as of June 30,2008, the last business day of the registrant’s most recently completed second fiscal quarter. The aggregate market value was computedby using the closing price on the New York Stock Exchange on June 30, 2008 of $35.58 per share.
Common Shares, Par Value $1.25 per Share $2,321,224,755
Indicate the number of shares outstanding of each of the registrant’s classes of common stock, as of the latest practicable date.
Class
Common Shares $1.25 Par ValueOutstanding at February 13, 2009
66,187,798
DOCUMENTS INCORPORATED BY REFERENCE
Listed hereunder are the documents, portions of which are incorporated by reference, and the parts of this Form 10-K into which suchportions are incorporated:
(1) Diebold, Incorporated Proxy Statement for 2009 Annual Meeting of Shareholders to be held on April 23, 2009, portions of which areincorporated by reference into Part III of this Form 10-K.

TABLE OF CONTENTS
PART I 3
ITEM 1: BUSINESS 3
ITEM 1A: RISK FACTORS 6
ITEM 1B: UNRESOLVED STAFF COMMENTS 14
ITEM 2: PROPERTIES 14
ITEM 3: LEGAL PROCEEDINGS 14
ITEM 4: SUBMISSION OF MATTERS TO A VOTE OF SECURITY HOLDERS 16
PART II 17
ITEM 5: MARKET FOR REGISTRANT’S COMMON EQUITY, RELATED STOCKHOLDER MATTERS AND
ISSUER PURCHASES OF EQUITY SECURITIES 17
ITEM 6: SELECTED FINANCIAL DATA 19
ITEM 7: MANAGEMENT’S DISCUSSION AND ANALYSIS OF FINANCIAL CONDITION AND RESULTS OF
OPERATIONS 20
ITEM 7A: QUANTITATIVE AND QUALITATIVE DISCLOSURES ABOUT MARKET RISK 40
ITEM 8: FINANCIAL STATEMENTS AND SUPPLEMENTARY DATA 41
ITEM 9: CHANGES IN AND DISAGREEMENTS WITH ACCOUNTANTS ON ACCOUNTING AND FINANCIAL
DISCLOSURE 86
ITEM 9A: CONTROLS AND PROCEDURES 86
ITEM 9B: OTHER INFORMATION 90
PART III 91
ITEM 10: DIRECTORS, EXECUTIVE OFFICERS AND CORPORATE GOVERNANCE 91
ITEM 11: EXECUTIVE COMPENSATION 92
ITEM 12: SECURITY OWNERSHIP OF CERTAIN BENEFICIAL OWNERS AND MANAGEMENT AND RELATED
STOCKHOLDER MATTERS 92
ITEM 13: CERTAIN RELATIONSHIPS AND RELATED TRANSACTIONS, AND DIRECTOR INDEPENDENCE 92
ITEM 14: PRINCIPAL ACCOUNTANT FEES AND SERVICES 92
PART IV 93
ITEM 15: EXHIBITS AND FINANCIAL STATEMENT SCHEDULES 93
SIGNATURES 96
EXHIBIT INDEX 99

PART I
ITEM 1: BUSINESS(Dollars in thousands)
GENERAL
Diebold, Incorporated (collectively with its subsidiaries, the Company) was incorporated under the laws of the state of Ohio in
August 1876, succeeding a proprietorship established in 1859.
The Company develops, manufactures, sells and services self-service transaction systems, electronic and physical security
systems, software and various products used to equip bank facilities and voting equipment. The Company’s primary customers
include banks and financial institutions, as well as public libraries, government agencies, utilities and various retail outlets. Sales of
systems and equipment are made directly to customers by the Company’s sales personnel and by manufacturers’ representatives
and distributors globally. The sales and support organization works closely with customers and their consultants to analyze and
fulfill the customers’ needs.
The Company’s vision is, “To be recognized as the essential partner in creating and implementing ideas that optimize
convenience, efficiency and security.” This vision is the guiding principle behind the Company’s transformation of becoming a
more services-oriented company. Today, service comprises more than 50 percent of the Company’s revenue and the Company
expects that this percentage will grow over time as the Company’s integrated services business continues to gain traction in the
marketplace. Financial institutions are eager to reduce costs and optimize management and productivity of their ATM (automated
teller machine) channels — and as a result they are increasingly exploring outsourced solutions. The Company remains uniquely
positioned to provide the infrastructure necessary to manage all aspects of an ATM network — hardware, software, maintenance,
transaction processing, patch management and cash management — through its integrated product and services offerings.
We are people-oriented, not product-oriented. We strive to be an essential partner to our customers, not a seller. Our
products and services enhance our customers’ businesses. This reflects our commitment to solving each customer’s individual
needs. In 2008, the Company remained focused on five key priorities: increase customer loyalty; improve quality; strengthen the
supply chain; enhance communications and teamwork and rebuild profitability. The Company met or exceeded its targets within
each of these priorities through a number of operational and supply chain initiatives designed to increase customer satisfaction,
improve productivity, streamline processes, enhance efficiency and decrease costs.
PRODUCT AND SERVICE SOLUTIONS
The Company has three product and service solutions: Self-Service Solutions, Security Solutions and Election Systems.
Financial information for the product and service solutions can be found in Note 19 to the Consolidated Financial Statements,
which is incorporated herein by reference. In 2008, 2007 and 2006, the Company’s sales of products and services related to its
financial self-service and security solutions accounted for 95.1, 97.8 and 92.0 percent, respectively, of consolidated net sales.
Self-Service Solutions
Self-service is technology that empowers people worldwide to access services when, where and how they may choose. One
popular example is the automated teller machine (ATM). The Company offers an integrated line of self-service technologies and
services, including comprehensive ATM outsourcing, ATM security and fraud, ImageWay» ATM check imaging, RemoteTellerTM
system and teller cash automation. The Company is a leading global supplier of ATMs and related services and holds the leading
market position in many countries around the world.
Self-Service Hardware
The Company offers a wide variety of self-service solutions. Self-service products include a full range of ATMs including
increasing deposit automation technology, cash dispensers, check-cashing machines, bulk cash recyclers and bulk check
deposit technology.
3. . . . . . .
Self-Service Software
The Company offers software solutions consisting of multiple applications that process events and transactions. These
solutions are delivered on the appropriate platform, allowing the Company to meet customer requirements while adding new
functionality in a cost-effective manner.
Self-Service Support and Managed Services
From analysis and consulting to monitoring and repair, the Company provides value and support to its customers every step of
the way. Services include installation and ongoing maintenance of our products, OpteView» remote services, branch
transformation and distribution channel consulting. Outsourced and managed services include remote monitoring, trouble-
shooting for self-service customers, transaction processing, currency management, maintenance services and full support
via person to person or online communication.
Integrated Self-Service Solutions
Each unique solution may include hardware, software, services or a combination of all three components. The Company
provides value to its customers by offering a comprehensive array of integrated services and support. The Company’s service
organization provides strategic analysis and planning of new systems, systems integration, architectural engineering,
consulting, and project management that encompass all facets of a successful financial self-service implementation.
Security Solutions
From the safes and vaults that the Company first manufactured in 1859, to the full range of advanced security offerings it
provides today, the Company’s integrated security solutions contain best-in-class products and award-winning services for its
customers’ unique needs. The Company provides its customers with the latest technological advances to better protect their
assets, improve their workflow and increase their return on investment. These solutions are backed with experienced global
sales, installation and service teams. The Company is a global leader in providing physical and electronic security systems as well
as facility transaction products that integrate security, software and assisted-service transactions, providing total security systems
solutions to financial, retail, commercial and government markets.
Physical Security and Facility Products
The Company provides security solutions and facility products, including in-store bank branches, pneumatic tube systems for
drive-up lanes, vaults, safes, depositories, bullet-resistive items, teller-assist systems, cash-handling automation, plus a
global service organization that supports Diebold and non-Diebold security products.
Electronic Security Products
The Company provides a broad range of security products including digital surveillance, card systems, biometric technol-
ogies, alarms and remote monitoring and diagnostics.
Integrated Security Solutions
The Company provides global sales, service, installation, project management and monitoring of original equipment
manufacturer (OEM) electronic security products to financial, government, retail and commercial customers.
Election Systems
The Company, through its wholly-owned subsidiaries Premier Election Solutions, Inc. (PESI) and Procomp Industria Eletronica
S.A. (in Brazil), is a provider of voting equipment and related products. The Company provides elections equipment, software,
training, support, installation and maintenance. The election systems contracts contain multiple deliverable elements and custom
terms and conditions.
OPERATIONS
The principal raw materials used by the Company are steel, plastics, and electronic parts and components, which are
purchased from various major suppliers. These materials and components are generally available in ample quantity at this time.
4. . . . . . .
The Company’s operating results and the amount and timing of revenue are affected by numerous factors including
production schedules, customer priorities, sales volume and sales mix. During the past several years, the Company has
dramatically changed the focus of its self-service business to that of a total solutions and integrated services approach. The
value of unfilled orders is not as meaningful an indicator of future revenues due to the significant portion of revenues derived from
the Company’s growing service-based business, for which order information is not available. Therefore, the Company believes
that backlog information is not material to an understanding of its business.
The Company carries working capital mainly related to trade receivables and inventories. Inventories, generally, are only
manufactured as orders are received from customers. The Company’s normal and customary payment terms are net 30 days from
date of invoice. The Company generally does not offer extended payment terms. The Company’s government customers
represent a small portion of the Company’s business. Domestically, with the exception of PESI, the Company’s contracts with its
government customers do not contain fiscal funding clauses. In the event that such a clause exists, revenue would not be
recognizable until the funding clause was satisfied. Internationally, contracts with Brazil’s government are subject to a twenty-five
percent quantity adjustment prior to purchasing any raw materials under the contracted purchasing schedule. In general, with the
exception of PESI, the Company recognizes revenue for delivered elements only when the fair values of delivered and undelivered
elements are known, uncertainties regarding customer acceptance are resolved and there are no customer-negotiated refunds or
return rights affecting the revenue recognized for the delivered elements.
SEGMENTS AND FINANCIAL INFORMATION ABOUT GEOGRAPHIC AREAS
The Company’s segments are comprised of its three main sales channels: Diebold North America (DNA), Diebold Interna-
tional (DI) and Election Systems (ES) & Other. The DNA segment sells financial and retail systems, and also services financial and
retail systems, in the United States and Canada. The DI segment sells and services financial and retail systems over the remainder
of the globe through wholly-owned subsidiaries, majority-owned joint ventures and independent distributors in every major
country throughout Europe, the Middle East, Africa, Latin America and in the Asia Pacific region (excluding Japan and Korea).The
ES & Other segment includes the operating results of PESI and the voting and lottery related business in Brazil. Segment financial
information can be found in Note 19 to the Consolidated Financial Statements, which is incorporated herein by reference.
Sales to customers outside the United States in relation to total consolidated net sales continued to trend upward and were
$1,603,963 or 50.6 percent in 2008, $1,417,574 or 48.1 percent in 2007 and $1,354,878 or 46.4 percent in 2006.
Property, plant and equipment, at cost, located in the United States totaled $437,524, $424,657 and $398,425 as of
December 31, 2008, 2007 and 2006, respectively, and property, plant and equipment, at cost, located outside the United States
totaled $142,427, $151,139 and $152,072 as of December 31, 2008, 2007 and 2006, respectively.
Additional financial information regarding the Company’s international operations is included in Note 19 to the Consolidated
Financial Statements, which is incorporated herein by reference.
The Company’s non-U.S. operations are subject to normal international business risks not generally applicable to domestic
business. These risks include currency fluctuation, new and different legal and regulatory requirements in local jurisdictions,
political and economic changes and disruptions, tariffs or other barriers, potentially adverse tax consequences and difficulties in
staffing and managing foreign operations.
COMPETITION
All phases of the Company’s business are highly competitive. Some of the Company’s products are in competition directly
with similar products and others competing with alternative products having similar uses or producing similar results. The
Company believes, based upon outside independent industry surveys, that it is a leading manufacturer of self-service systems in
the United States and is also a market leader internationally. In the area of automated transaction systems, the Company
competes on a global basis primarily with NCR Corporation and Wincor-Nixdorf. On a regional basis, the Company competes with
many other hardware and software companies such as Grg Equipment Co. in Asia Pacific and Itautec in Latin America. In serving
the security products market for the financial services industry, the Company competes with national, regional and local security
5. . . . . . .
companies. Of these competitors, some compete in only one or two product lines, while others sell a broader spectrum of
products competing with the Company. The unavailability of comparative sales information and the large variety of individual
products make it difficult to give reasonable estimates of the Company’s competitive ranking in or share of the market in its
security product fields of activity. However, the Company is ranked as one of the top integrators in the security market.
In the election systems market, the Company provides product solutions and support for customers within the United States
and Brazil. Competition in this market is typically from a variety of hardware, software and service companies.
RESEARCH, DEVELOPMENT AND ENGINEERING
In order to meet customers’ growing demand for self-service and security technologies faster, the Company is focused on
delivering innovation to its customers by continuing to invest in technology solutions that enable customers to reduce costs and
improve efficiency. Expenditures for research, development and engineering initiatives were $79,070, $73,950 and $71,625 in
2008, 2007 and 2006, respectively. Opteva» ATMs are designed with leading technology to meet our customers’ growing deposit
automation needs and provide maximum value. All full function Opteva ATMs support intelligent check and automated cash
deposits. Key features include check imaging with intelligent depository moduleTM and bulk document intelligent depository
modules.
PATENTS, TRADEMARKS, LICENSES
The Company owns patents, trademarks and licenses relating to certain products in the United States and internationally.
While the Company regards these as items of importance, it does not deem its business as a whole, or any industry segment, to
be materially dependent upon any one item or group of items.
ENVIRONMENTAL
Compliance with federal, state and local environmental protection laws during 2008 had no material effect upon the
Company’s business, financial condition or results of operations.
EMPLOYEES
At December 31, 2008, the Company employed 16,658 associates globally. The Company’s service staff is one of the
financial industry’s largest, with professionals in more than 600 locations and representation in nearly 90 countries worldwide.
AVAILABLE INFORMATION
This annual report on Form 10-K, quarterly reports on Form 10-Q, current reports on Form 8-K and any amendments to those
reports are available, free of charge, on or through the Company’s website, www.diebold.com, as soon as practicable after such
material is electronically filed with or furnished to the SEC. Additionally, these reports can be furnished free of charge to
shareholders upon written request to Diebold Global Communications at the corporate address, or call +1 330 490-3790 or [800]
766-5859. The public may read and copy any materials that we file with the SEC at the SEC’s Public Reference Room at
100 F Street, N.E., Room 1580, Washington, D.C. 20549. You may obtain information on the operation of the Public Reference
Room by calling the SEC at 1-800-SEC-0330. The SEC maintains an internet site that contains reports, proxy and information
statements, and other information regarding issuers that file electronically with the SEC at www.sec.gov.
ITEM 1A: RISK FACTORSThe following are certain risk factors that could affect our business, financial condition, operating results and cash flows.
These risk factors should be considered in connection with evaluating the forward-looking statements contained in this annual
report on Form 10-K because they could cause actual results to differ materially from those expressed in any forward-looking
statement. The risk factors highlighted below are not the only ones we face. If any of these events actually occur, our business,
financial condition, operating results or cash flows could be negatively affected.
6. . . . . . .

We caution the reader to keep these risk factors in mind and refrain from attributing undue certainty to any forward-looking
statements which speak only as of the date of this annual report.
Demand for and supply of our products and services may be adversely affected by numerous factors, some of which we cannot
predict or control. This could adversely affect our operating results.
Numerous factors may affect the demand for and supply of our products and services, including:
• changes in the market acceptance of our products and services;
• customer and competitor consolidation;
• changes in customer preferences;
• declines in general economic conditions;
• changes in environmental regulations that would limit our ability to sell products and services in specific markets; and
• macro-economic factors affecting banks, credit unions and other financial institutions may lead to cost-cutting efforts by
customers, which could cause us to lose current or potential customers or achieve less revenue per customer.
If any of these factors occur, the demand for and supply of our products and services could suffer, and this would adversely
affect our results of operations.
Increased raw material and energy costs could reduce our income.
The primary raw materials in our financial self-service, security and election systems product and service solutions are steel,
plastics and electronic parts and components. The majority of our raw materials are purchased from various local, regional and
global suppliers pursuant to long-term supply contracts. However, the price of these materials can fluctuate under these contracts
in tandem with the pricing of raw materials.
In addition, energy prices, particularly petroleum prices, are cost drivers for our business. In recent years, the price of
petroleum has been highly volatile, particularly due to the unstable political conditions in the Persian Gulf and increasing
international demand from emerging markets. Any increase in the costs of energy would also increase our transportation costs.
Although we attempt to pass on higher raw material and energy costs to our customers, given the competitive markets in which
we operate, it is often not possible to do this.
Our business may be affected by general economic conditions and uncertainty that may cause customers to defer or cancel sales
commitments previously made.
Recent economic difficulties in the United States credit markets and the global markets have led to an economic recession in
some or all of the markets in which we operate. A recession or even the risk of a potential recession may be sufficient reason for
customers to delay, defer or cancel purchase decisions, including decisions previously made. Under difficult economic conditions,
customers may seek to reduce discretionary spending by forgoing purchases of our products and services. This risk is magnified
for capital goods purchases such as ATMs and physical security products. As a result of economic conditions and other factors,
financial institutions have failed and may continue to fail resulting in a loss of current or potential customers, or deferred or
cancelled sales orders. Any customer delays or cancellations could materially affect our level of revenue and operating results.
Our sales and operating results are sensitive to global economic conditions and cyclicality, and could be adversely affected during
economic downturns.
Demand for our products is affected by general economic conditions and the business conditions of the industries in which
we sell our products and services. The business of most of our customers, particularly our financial institution and election
systems customers, is, to varying degrees, cyclical and has historically experienced periodic downturns. Any future downturns in
general economic conditions could adversely affect the demand for our products and services, and our sales and operating results.
In addition, downturns in our customer’s industries, even during periods of strong general economic conditions, could adversely
affect our sales and operating results. As a result of economic conditions and other factors, financial institutions have failed and
7. . . . . . .

may continue to fail resulting in a loss of current or potential customers, or cause them to defer or cancel sales orders. Additionally,
the unstable political conditions in the Persian Gulf could lead to further financial, economic and political instability, and this could
lead to an additional deterioration in general economic conditions.
We may be unable to achieve, or may be delayed in achieving, our cost-cutting initiatives, and this may adversely affect our oper-
ating results and cash flow.
We have launched a number of cost-cutting initiatives, including restructuring initiatives, to improve operating efficiencies
and reduce operating costs. Although we are anticipating a substantial amount of annual cost savings associated with these cost-
cutting initiatives, we may be unable to sustain the cost savings that we have achieved. In addition, if we are unable to achieve, or
have any unexpected delays in achieving additional cost savings, our results of operations and cash flow may be adversely
affected. Even if we meet the goals pursuant to these initiatives, we may not receive the expected financial benefits of these
initiatives.
We face competition that could adversely affect our sales and financial condition.
All phases of our business are highly competitive. Some of our products are in direct competition with similar or alternative
products provided by our competitors. We encounter competition in price, delivery, service, performance, product innovation,
product recognition and quality.
Because of the potential for consolidation in any market, our competitors may become larger, which could make them more
efficient and permit them to be more price-competitive. Increased size could also permit them to operate in wider geographic
areas and enhance their abilities in other areas such as research and development and customer service. As a result, this could
also reduce our profitability.
Our competitors can be expected to continue to develop and introduce new and enhanced products. This could cause a
decline in market acceptance of our products. In addition, our competitors could cause a reduction in the prices for some of our
products as a result of intensified price competition. Also, we may be unable to effectively anticipate and react to new entrants in
the marketplace competing with our products.
Competitive pressures can also result in the loss of major customers. An inability to compete successfully could have an
adverse effect on our operating results, financial condition and cash flows in any given period.
In international markets, we compete with local service providers that may have competitive advantages.
In a number of international markets, especially those in Asia Pacific and Latin America, we face substantial competition from
local service providers that offer competing products and services. Some of these companies may have a dominant market share
in their territories and may be owned by local stakeholders. This could give them a competitive advantage. Local providers of
competing products and services may also have a substantial advantage in attracting customers in their country due to more
established branding in that country, greater knowledge with respect to the tastes and preferences of customers residing in that
country and/or their focus on a single market. Further, the local providers may have greater regulatory and operational flexibility
since we are subject to both U.S. and foreign regulatory requirements.
Because our operations are conducted worldwide, they are affected by risks of doing business abroad.
We generate a significant percentage of revenue from sales and service operations conducted outside the United States.
Revenue from international operations amounted to approximately 50.6 percent in 2008, 48.1 percent in 2007 and 46.4 percent in
2006 of total revenue during these respective periods.
Accordingly, international operations are subject to the risks of doing business abroad, including the following:
• fluctuations in currency exchange rates;
• transportation delays and interruptions;
• political and economic instability and disruptions;
8. . . . . . .

• restrictions on the transfer of funds;
• the imposition of duties and tariffs;
• import and export controls;
• changes in governmental policies and regulatory environments;
• labor unrest and current and changing regulatory environments;
• the uncertainty of product acceptance by different cultures;
• the risks of divergent business expectations or cultural incompatibility inherent in establishing joint ventures with foreign
partners;
• difficulties in staffing and managing multi-national operations;
• limitations on the ability to enforce legal rights and remedies;
• reduced protection for intellectual property rights in some countries; and
• potentially adverse tax consequences.
Any of these events could have an adverse effect on our international operations by reducing the demand for our products or
decreasing the prices at which we can sell our products, thereby, adversely affecting our financial condition or operating results.
We may not be able to continue to operate in compliance with applicable customs, currency exchange control regulations, transfer
pricing regulations or any other laws or regulations to which we may be subject. In addition, these laws or regulations may be
modified in the future, and we may not be able to operate in compliance with those modifications.
We may expand operations into international markets in which we may have limited experience or rely on business partners.
We continually look to expand our products and services into international markets. We have currently developed, through
joint ventures, strategic investments, subsidiaries and branch offices, sales and service offerings in over 90 countries outside of
the United States. As we expand into new international markets, we will have only limited experience in marketing and operating
products and services in such markets. In other instances, we may rely on the efforts and abilities of foreign business partners in
such markets. Certain international markets may be slower than domestic markets in adopting our products and services, and our
operations in international markets may not develop at a rate that supports our level of investment.
The failure of governments to certify election systems products may hinder our growth and harm our business.
Our election system products must go through rigorous federal and state certification processes in order for them to be sold
in various states. As a result, there is a risk that our products will not be certified for use or will be decertified. Our election systems
products could also be subject to differing and inconsistent laws, regulations and certification requirements which could adversely
affect our business, financial condition and operating results. As a result, we may find it necessary to eliminate, modify or cancel
components of our services, and this could result in additional development costs and the possible loss of revenue. Future
legislative changes or other changes in law could also have an adverse effect on our business, financial condition and operating
results.
Our election systems products might not achieve market acceptance, which could adversely affect our growth.
Because of the political nature of our election systems business, various individuals and advocacy groups may raise
challenges, including legal challenges, in the media and elsewhere, about the reliability and security of our election systems
products and services. Our election systems business is vulnerable to these types of challenges because the electronic election
systems industry is emerging.
9. . . . . . .

Our ability to grow will depend on the extent to which potential customers accept our products. This acceptance may be
limited by:
• the failure of prospective customers to conclude that our products are valuable and should be used;
• the reluctance of prospective customers to replace their existing solutions with our products; and
• marketing efforts of our competitors.
Furthermore, adverse publicity, whether directed at our products or a competitor’s products due to processing errors or other
system failures, could adversely affect the electronic election systems industry as a whole, and this would have an adverse effect
on our business, financial condition and operating results. In addition, these efforts may adversely affect our relations with our
election systems customers.
We are currently subject to shareholder class action litigation, the unfavorable outcome of which might have a material adverse
effect on our financial condition, operating results and cash flow.
A number of shareholder class action lawsuits have been filed against us and certain current and former officers and directors
alleging violations of the federal securities laws and breaches of fiduciary duties with respect to our 401(k) savings plan. The
securities class action was dismissed and the court entered a judgment in favor of the defendants in August 2008, but the
plaintiffs have appealed the court’s decision. We believe that these lawsuits are without merit, and we intend to vigorously defend
against these claims. We cannot, however, determine with certainty the outcome or resolution of these claims or any future
related claims, or the timing for their resolution. In addition to the expense and burden incurred in defending this litigation and any
damages that we may suffer, management’s efforts and attention may be diverted from the ordinary business operations in order
to address these claims. If the final resolution of this litigation is unfavorable, our financial condition, operating results and cash
flows could be materially affected.
Any failure to manage acquisitions, divestitures and other significant transactions successfully could harm our operating results,
business and prospects.
As part of our business strategy, we frequently engage in discussions with third parties regarding possible investments,
acquisitions, strategic alliances, joint ventures, divestitures and outsourcing arrangements, and we enter into agreements relating
to such extraordinary transactions in order to further our business objectives. In order to pursue this strategy successfully, we
must identify suitable candidates, successfully complete extraordinary transactions, some of which may be large and complex,
and manage post-closing issues such as the integration of acquired companies or employees. Integration and other risks of
extraordinary transactions can be more pronounced in larger and more complicated transactions, or if multiple transactions are
pursued simultaneously. If we fail to identify and successfully complete extraordinary transactions that further our strategic
objectives, we may be required to expend resources to develop products and technology internally. This may put us at a
competitive disadvantage, and we may be adversely affected by negative market perceptions any of which may have a material
adverse effect on our revenue, gross margin and profitability.
Integration issues are complex, time-consuming and expensive and, without proper planning and implementation, could
significantly disrupt our business. The challenges involved in integration include:
• combining product offerings and entering into new markets in which we are not experienced;
• convincing customers and distributors that the transaction will not diminish client service standards or business focus,
preventing customers and distributors from deferring purchasing decisions or switching to other suppliers (which could
result in additional obligations to address customer uncertainty), and coordinating sales, marketing and distribution efforts;
• consolidating and rationalizing corporate information technology infrastructure, which may include multiple legacy systems
from various acquisitions and integrating software code;
• minimizing the diversion of management attention from ongoing business concerns;
10. . . . . . .

• persuading employees that business cultures are compatible, maintaining employee morale and retaining key employees,
integrating employees into the Company, correctly estimating employee benefit costs and implementing restructuring
programs;
• coordinating and combining administrative, manufacturing, research and development and other operations, subsidiaries,
facilities and relationships with third parties in accordance with local laws and other obligations while maintaining adequate
standards, controls and procedures; and
• achieving savings from supply chain and administration integration.
We evaluate and enter into extraordinary transactions on an ongoing basis. We may not fully realize all of the anticipated
benefits of any transaction, and the timeframe for achieving benefits of a transaction may depend partially upon the actions of
employees, suppliers or other third parties. In addition, the pricing and other terms of our contracts for extraordinary transactions
require us to make estimates and assumptions at the time we enter into these contracts, and, during the course of our due
diligence, we may not identify all of the factors necessary to estimate costs accurately. Any increased or unexpected costs,
unanticipated delays or failure to achieve contractual obligations could make these agreements less profitable or unprofitable.
Managing extraordinary transactions requires varying levels of management resources, which may divert our attention from
other business operations. These extraordinary transactions could result in significant costs and expenses and charges to
earnings, including those related to severance pay, early retirement costs, employee benefit costs, asset impairment charges,
charges from the elimination of duplicative facilities and contracts, in-process research and development charges, inventory
adjustments, assumed litigation and other liabilities, legal, accounting and financial advisory fees, and required payments to
executive officers and key employees under retention plans. Moreover, we could incur additional depreciation and amortization
expense over the useful lives of certain assets acquired in connection with extraordinary transactions, and, to the extent that the
value of goodwill or intangible assets with indefinite lives acquired in connection with an extraordinary transaction becomes
impaired, we may be required to incur additional material charges relating to the impairment of those assets. In order to complete
an acquisition, we may issue common stock, potentially creating dilution for existing shareholders, or borrow funds, affecting our
financial condition and potentially our credit ratings. Any prior or future downgrades in our credit rating associated with an
acquisition could adversely affect our ability to borrow and result in more restrictive borrowing terms. In addition, our effective tax
rate on an ongoing basis is uncertain, and extraordinary transactions could impact our effective tax rate. We also may experience
risks relating to the challenges and costs of closing an extraordinary transaction and the risk that an announced extraordinary
transaction may not close. As a result, any completed, pending or future transactions may contribute to financial results that differ
from the investment community’s expectations.
System security risks and systems integration issues could disrupt our internal operations or services provided to customers, and
any such disruption could adversely affect revenue, increase costs, and harm our reputation and stock price.
Experienced computer programmers and hackers may be able to penetrate our network security and misappropriate
confidential information or that of third parties, create system disruptions or cause shutdowns. As a result, we could incur
significant expenses in addressing problems created by network security breaches. Moreover, we could lose existing or potential
customers, or incur significant expenses in connection with customers’ system failures. In addition, sophisticated hardware and
operating system software and applications that we produce or procure from third parties may contain defects in design or
manufacture, including “bugs” and other problems that could unexpectedly interfere with the operation of the system. The costs
to eliminate or alleviate security problems, viruses and bugs could be significant, and the efforts to address these problems could
result in interruptions, delays or cessation of service that could impede sales, manufacturing, distribution or other critical
functions.
Portions of our information technology infrastructure also may experience interruptions, delays or cessations of service or
produce errors in connection with systems integration or migration work that takes place from time to time. We may not be
successful in implementing new systems, and transitioning data and other aspects of the process could be expensive, time
consuming, disruptive and resource-intensive. Such disruptions could adversely impact the ability to fulfill orders and interrupt
11. . . . . . .

other processes. Delayed sales, lower margins or lost customers resulting from these disruptions could adversely affect financial
results, stock price and reputation.
Our inability to attract, retain and motivate key employees could harm current and future operations.
In order to be successful, we must attract, retain and motivate executives and other key employees, including those in
managerial, professional, administrative, technical, sales, marketing and information technology support positions. We also must
keep employees focused on our strategies and goals. Hiring and retaining qualified executives, engineers and qualified sales
representatives are critical to our future, and competition for experienced employees in these areas can be intense. The failure to
hire or loss of key employees could have a significant impact on our operations.
We may not be able to generate sufficient cash flows to fund our operations and make adequate capital investments.
Our cash flows from operations depend primarily on sales and service margins. To develop new product and service
technologies, support future growth, achieve operating efficiencies and maintain product quality, we must make significant capital
investments in manufacturing technology, facilities and capital equipment, research and development, and product and service
technology. In addition to cash provided from operations, we have from time to time utilized external sources of financing.
Depending upon general market conditions or other factors, we may not be able to generate sufficient cash flows to fund our
operations and make adequate capital investments. In addition, due to the recent economic downturn there has been a tightening
of the credit markets, which may limit our ability to obtain alternative sources of cash to fund our operations.
New product developments may be unsuccessful.
We are constantly looking to develop new products and services that complement or leverage the underlying design or
process technology of our traditional product and service offerings. We make significant investments in product and service
technologies and anticipate expending significant resources for new product development over the next several years. There can
be no assurance that our product development efforts will be successful, that we will be able to cost effectively manufacture
these new products, that we will be able to successfully market these products or that margins generated from sales of these
products will recover costs of development efforts.
An adverse determination that our products or manufacturing processes infringe the intellectual property rights of others could
have a materially adverse effect on our business, operating results or financial condition.
As is common in any high technology industry, others have asserted from time to time, and may also do so in the future, that
our products or manufacturing processes infringe their intellectual property rights. A court determination that our products or
manufacturing processes infringe the intellectual property rights of others could result in significant liability and/or require us to
make material changes to our products and/or manufacturing processes. We are unable to predict the outcome of assertions of
infringement made against us. Any of the foregoing could have a materially adverse effect on our business, operating results or
financial condition.
Anti-takeover provisions could make it more difficult for a third party to acquire us.
Certain provisions of our charter documents, including provisions limiting the ability of shareholders to raise matters at a
meeting of shareholders without giving advance notice and permitting cumulative voting, may make it more difficult for a third
party to gain control of our Board of Directors and may have the effect of delaying or preventing changes in our control or
management. This could have an adverse effect on the market price of our common stock. Additionally, Ohio corporate law
provides that certain notice and informational filings and special shareholder meeting and voting procedures must be followed
prior to consummation of a proposed “control share acquisition,” as defined in the Ohio Revised Code. Assuming compliance with
the prescribed notice and information filings, a proposed control share acquisition may be made only if, at a special meeting of
shareholders, the acquisition is approved by both a majority of our voting power represented at the meeting and a majority of the
voting power remaining after excluding the combined voting power of the “interested shares,” as defined in the Ohio Revised
Code. The application of these provisions of the Ohio Revised Code also could have the effect of delaying or preventing a change
of control.
12. . . . . . .

Any SEC investigation and Department of Justice investigation could result in substantial costs to defend enforcement or other
related actions that could have a materially adverse effect on our business, operating results or financial condition.
We have incurred substantial expenses for legal and accounting services due to the SEC and the U.S. Department of Justice
(DOJ) investigations. We could incur substantial additional costs to defend and resolve litigation or other governmental inves-
tigations or proceedings arising out of, or related to, the completed investigations. In addition, we could be exposed to
enforcement or other actions with respect to these matters by the SEC’s Division of Enforcement or the DOJ.
In addition, these activities have diverted the attention of management from the conduct of our business. The diversion of
resources to address issues arising out of the investigations may harm our business, operating results and financial condition in
the future.
Our ability to maintain effective internal control over financial reporting may be insufficient to allow us to accurately report our
financial results or prevent fraud, and this could cause our financial statements to become materially misleading and adversely
affect the trading price of our common stock.
We require effective internal control over financial reporting in order to provide reasonable assurance with respect to our
financial reports and to effectively prevent fraud. Internal control over financial reporting may not prevent or detect misstatements
because of its inherent limitations, including the possibility of human error, the circumvention or overriding of controls, or fraud.
Therefore, even effective internal controls can provide only reasonable assurance with respect to the preparation and fair
presentation of financial statements. If we cannot provide reasonable assurance with respect to our financial statements and
effectively prevent fraud, our financial statements could become materially misleading which could adversely affect the trading
price of our common stock.
Management determined that, in certain instances, misapplication of accounting principles generally accepted in the United
States (US GAAP) reflected a material weakness in our internal control over financial reporting. Our material weaknesses could
harm stockholder and business confidence in our financial reporting, our ability to obtain financing and other aspects of our
business. We have enhanced, and continue to enhance, our internal controls in order to remediate the material weaknesses.
Implementing new internal controls and testing the internal control framework will require the dedication of additional resources,
management time and expense. If we fail to establish and maintain the adequacy of our internal control over financial reporting,
including any failure to implement required new or improved controls, or if we experience difficulties in their implementation, our
business, financial condition and operating results could be harmed.
Any material weakness or unsuccessful remediation could affect investor confidence in the accuracy and completeness of
our financial statements. As a result, our ability to obtain any additional financing, or additional financing on favorable terms, could
be materially and adversely affected. This, in turn, could materially and adversely affect our business, financial condition and the
market value of our securities and require us to incur additional costs to improve our internal control systems and procedures. In
addition, perceptions of the Company among customers, lenders, investors, securities analysts and others could also be
adversely affected.
We can give no assurances that the measures we have taken to date, or any future measures we may take, will remediate the
material weaknesses identified or that any additional material weaknesses will not arise in the future due to our failure to
implement and maintain adequate internal control over financial reporting. In addition, even if we are successful in strengthening
our controls and procedures, those controls and procedures may not be adequate to prevent or identify irregularities or ensure the
fair presentation of our financial statements included in our periodic reports filed with the SEC.
Low investment performance by our domestic pension plan assets may require us to increase our pension liability and expense,
which may require us to fund a portion of our pension obligations and divert funds from other potential uses.
We sponsor several defined benefit pension plans which cover certain eligible employees. Our pension expense and required
contributions to our pension plans are directly affected by the value of plan assets, the projected rate of return on plan assets, the
actual rate of return on plan assets and the actuarial assumptions we use to measure the defined benefit pension plan obligations.
13. . . . . . .

Due to the significant market downturn occurring in 2008, the funded status of our pension plans has declined and actual
asset returns were below the assumed rate of return used to determine pension expense. If plan assets continue to perform
below expectations, future pension expense will increase. Further, as a result of the global economic instability, our pension plan
investment portfolio has recently incurred greater volatility.
We establish the discount rate used to determine the present value of the projected and accumulated benefit obligations at
the end of each year based upon the available market rates for high quality, fixed income investments. We match the projected
cash flows of our pension plans against those generated by high-quality corporate bonds. The yield of the resulting bond portfolio
provides a basis for the selected discount rate. An increase in the discount rate would reduce the future pension expense and,
conversely, a decrease in the discount rate would increase the future pension expense.
Based on current guidelines, assumptions and estimates, including stock market prices and interest rates, we anticipate that
we will make a cash contribution of approximately $12 million to $15 million to our pension plans in 2009. Changes in the current
assumptions and estimates could result in a contribution in years beyond 2009 that is greater than the projected 2009 contribution
required. We cannot predict whether changing market or economic conditions, regulatory changes or other factors will further
increase our pension expenses or funding obligations, diverting funds we would otherwise apply to other uses.
ITEM 1B: UNRESOLVED STAFF COMMENTS
None.
ITEM 2: PROPERTIES
The Company’s corporate offices are located in North Canton, Ohio. The Company owns manufacturing facilities in Canton,
Ohio, Lynchburg, Virginia, and Lexington, North Carolina. The Company also has manufacturing facilities in Belgium, Brazil, China,
Hungary and India. The Company has selling, service and administrative offices in the following locations: throughout the United
States, and in Australia, Austria, Barbados, Belgium, Belize, Brazil, Canada, Chile, China, Colombia, Costa Rica, Czech Republic,
Dominican Republic, Ecuador, El Salvador, France, Greece, Guatemala, Haiti, Honduras, Hong Kong, Hungary, India, Indonesia,
Italy, Malaysia, Mexico, Namibia, Netherlands, New Zealand, Nicaragua, Panama, Paraguay, Peru, Philippines, Portugal, Poland,
Romania, Russia, Singapore, Slovakia, South Africa, Spain, Switzerland, Taiwan, Thailand, Turkey, the United Arab Emirates, the
United Kingdom, Uruguay, Venezuela and Vietnam. The Company leases a majority of the selling, service and administrative
offices under operating lease agreements.
The Company considers that its properties are generally in good condition, are well maintained, and are generally suitable and
adequate to carry on the Company’s business.
ITEM 3: LEGAL PROCEEDINGS
At December 31, 2008, the Company was a party to several lawsuits that were incurred in the normal course of business,
none of which individually or in the aggregate is considered material by management in relation to the Company’s financial position
or results of operations. In management’s opinion, the Company’s Consolidated Financial Statements would not be materially
affected by the outcome of any present legal proceedings, commitments, or asserted claims.
In addition to the routine legal proceedings noted above, the Company has been served with various lawsuits, filed against it
and certain current and former officers and directors, by shareholders and participants in the Company’s 401(k) savings plan,
alleging violations of the federal securities laws and breaches of fiduciary duties with respect to the 401(k) plan. These complaints
seek compensatory damages in unspecified amounts, fees and expenses related to such lawsuits and the granting of
14. . . . . . .

extraordinary equitable and/or injunctive relief. For each of these lawsuits, the date each complaint was filed, the name of the
plaintiff and the federal court in which such lawsuit is pending are as follows:
• Konkol v. Diebold Inc., et al., No. 5:05CV2873 (N.D. Ohio, filed December 13, 2005).
• Ziolkowski v. Diebold Inc., et al., No. 5:05CV2912 (N.D. Ohio, filed December 16, 2005).
• New Jersey Carpenter’s Pension Fund v. Diebold, Inc., No. 5:06CV40 (N.D. Ohio, filed January 6, 2006).
• Rein v. Diebold, Inc., et al., No. 5:06CV296 (N.D. Ohio, filed February 9, 2006).
• Graham v. Diebold, Inc., et al., No. 5:05CV2997 (N.D. Ohio, filed December 30, 2005).
• McDermott v. Diebold, Inc., et al., No. 5:06CV170 (N.D. Ohio, filed January 24, 2006).
• Barnett v. Diebold, Inc., et al., No. 5:06CV361 (N.D. Ohio, filed February 15, 2006).
• Farrell v. Diebold, Inc., et al., No. 5:06CV307 (N.D. Ohio, filed February 8, 2006).
• Forbes v. Diebold, Inc., et al., No. 5:06CV324 (N.D. Ohio, filed February 10, 2006).
• Gromek v. Diebold, Inc., et al., No. 5:06CV579 (N.D. Ohio, filed March 14, 2006).
The Konkol, Ziolkowski, New Jersey Carpenter’s Pension Fund, Rein and Graham cases, which allege violations of the federal
securities laws, have been consolidated into a single proceeding. The McDermott, Barnett, Farrell, Forbes and Gromek cases,
which allege breaches of fiduciary duties under the Employee Retirement Income Security Act of 1974 with respect to the 401(k)
plan, likewise have been consolidated into a single proceeding. The Company and the individual defendants deny the allegations
made against them, regard them as without merit, and intend to defend themselves vigorously. On August 22, 2008, the court
dismissed the consolidated amended complaint in the consolidated securities litigation and entered a judgment in favor of the
defendants. On September 16, 2008, the plaintiffs in the consolidated securities litigation filed a notice of appeal with the
U.S. Court of Appeals for the Sixth Circuit.
The Company, including certain of its subsidiaries, filed a lawsuit on May 30, 2008 (Premier Election Solutions, Inc., et al. v.
Board of Elections of Cuyahoga County, et al., Case No. 08-CV-05-7841, (Franklin Cty. Ct Common Pleas)) against the Board of
Elections of Cuyahoga County, Ohio, the Board of County Commissioners of Cuyahoga County, Ohio, (collectively, the County),
and Ohio Secretary of State Jennifer Brunner (Secretary) regarding several Ohio contracts under which the Company provided
voting equipment and related services to the State of Ohio and a number of its counties. The lawsuit was precipitated by the
County’s threats to sue the Company for unspecified damages. The complaint seeks a declaration that the Company met its
contractual obligations. In response, on July 15, 2008, the County filed an answer and counterclaim alleging that the voting system
was defective and seeking declaratory relief and unspecified damages under several theories of recovery. In addition, the County
is trying to pierce the Company’s “corporate veil” and hold Diebold, Incorporated directly liable for acts and omission alleged to
have been committed by its subsidiaries (even though Diebold, Incorporated is not a party of the contracts.) The Secretary has also
filed an answer and counterclaim seeking declaratory relief and unspecified damages under several theories of recovery. The
Butler County Board of Elections has joined in, and incorporated by reference, the Secretary’s counterclaim. The Company has not
yet responded to the counterclaims.
The Company has filed motions to dismiss and for more definite statement of the counterclaims. The motions are fully briefed
and are awaiting a decision by the court. The Secretary has also added ten Ohio counties as additional defendants, claiming that
those counties also experienced problems with the voting systems, but many of those counties have moved for dismissal.
Management is unable to determine the financial statement impact, if any, of the federal securities class action, the 401(k)
class action and the electronic voting systems action.
The Company was informed during the first quarter of 2006 that the staff of the SEC had begun an informal inquiry relating to
the Company’s revenue recognition policy. In the second quarter of 2006, the Company was informed that the SEC’s inquiry had
been converted to a formal, non-public investigation. In the fourth quarter of 2007, the Company also learned that the DOJ had
15. . . . . . .

begun a parallel investigation. The Company is continuing to cooperate with the government in connection with these inves-
tigations. The Company cannot predict the length, scope or results of the investigations, or the impact, if any, on its results of
operations.
ITEM 4: SUBMISSION OF MATTERS TO A VOTE OF SECURITY HOLDERSThe Company’s annual meeting of shareholders was held November 12, 2008. At the meeting, the following actions were
taken:
1. The ten nominees for director were elected by the following votes:
For Withheld
Louis V. Bockius III 53,622,656 6,445,112
Phillip R. Cox 46,543,977 13,523,791
Richard L. Crandall 53,912,122 6,155,646
Gale S. Fitzgerald 47,262,269 12,805,499
Phillip B. Lassiter 45,502,168 14,565,600
John N. Lauer 45,441,405 14,626,363
Eric J. Roorda 53,897,386 6,170,382
Thomas W. Swidarski 58,640,517 1,427,251
Henry D.G. Wallace 52,120,361 7,947,407
Alan J. Weber 53,887,143 6,180,625
2. Ratification of appointment of KPMG as the Company’s independent registered public accounting firm for the fiscal year
ending December 31, 2008 was approved by the following vote:
For Against Abstained
57,394,762 2,466,490 206,516
16. . . . . . .

PART II
ITEM 5: MARKET FOR REGISTRANT’S COMMON EQUITY, RELATED STOCK-HOLDER MATTERS AND ISSUER PURCHASES OF EQUITYSECURITIES
The common shares of the Company are listed on the New York Stock Exchange with a symbol of DBD. The price ranges of
common shares of the Company for the periods indicated below are as follows:
High Low High Low High Low
2008 2007 2006
1st Quarter $39.30 $23.07 $48.42 $42.50 $43.84 $36.40
2nd Quarter 40.44 35.44 52.70 47.25 46.35 39.15
3rd Quarter 39.81 30.60 54.50 42.49 44.90 36.93
4th Quarter 34.47 22.50 45.90 28.32 47.13 41.41
Full Year $40.44 $22.50 $54.50 $28.32 $47.13 $36.40
There were approximately 75,397 shareholders at December 31, 2008, which includes an estimated number of shareholders
who have shares held in their accounts by banks, brokers, and trustees for benefit plans and the agent for the dividend
reinvestment plan.
On the basis of amounts paid and declared, the annualized quarterly dividends per share were $1.00, $0.94 and $0.86 in 2008,
2007 and 2006, respectively.
Information concerning the Company’s share repurchases made during the fourth quarter of 2008:
Period
Total Numberof Shares
Purchased(1)Average PricePaid Per Share
Total Number ofShares Purchased as
Part of PubliclyAnnounced Plans
Maximum Number ofShares that May YetBe Purchased Under
the Plans(2)
October 3,194 $33.34 — 2,926,500
November — — — 2,926,500
December — — — 2,926,500
Total 3,194 $33.34 — 2,926,500
(1) Includes 3,194 shares surrendered or deemed surrendered to the Company in connection with the Company’s stock-based compensation plans.
(2) The total number of shares repurchased as part of the publicly announced share repurchase plan was 9,073,500 as of December 31, 2008. The plan was approved
by the Board of Directors in April 1997 and authorized the repurchase of up to two million shares. The plan was amended in June 2004 to authorize the repurchase of
an additional two million shares, and was further amended in August and December 2005 to authorize the repurchase of an additional six million shares. On
February 14, 2007, the Board of Directors approved an increase in the Company’s share repurchase program by authorizing the repurchase of up to an additional two
million of the Company’s outstanding common shares. The plan has no expiration date.
17. . . . . . .

PERFORMANCE GRAPH
Set forth below is a line graph comparing the yearly percentage change in the cumulative shareholder return, which includes
the reinvestment of cash dividends, of the Company’s common shares with the cumulative total return of (i) the S&P 500 index,
(ii) the S&P Midcap 400 index, and (iii) a Custom Composite Index (28 stocks) made up of companies selected by the Company
based on similarity to the Company’s line of business and similar market capitalization. The comparison covers the five-year period
starting December 31, 2003 and ended December 31, 2008. The comparisons in this graph are required by rules promulgated by
the SEC and are not intended to forecast future performance of the Company’s common shares.
COMPARISON OF 5 YEAR CUMULATIVE TOTAL RETURN*
Among Diebold, Inc., The S&P 500 Index,
The S&P Midcap 400 Index And A Custom Composite Index (28 Stocks)
$0
$20
$40
$60
$80
$100
$120
$140
$160
$180
$200
12/03 12/04 12/05 12/06 12/07 12/08
Diebold, Inc. S&P 500 S&P Midcap 400 Custom Composite Index (28 Stocks)
$0
$20
$40
$60
$80
$100
$120
$140
$160
$180
$200
12/03 12/04 12/05 12/06 12/07 12/08
Diebold, Inc. S&P 500 S&P Midcap 400 Custom Composite Index (28 Stocks)
* $100 invested on 12/31/03 in stock & index-including reinvestment of dividends.
Fiscal year ending December 31.
Copyright˝ 2009 S&P, a division of The McGraw-Hill Companies Inc. All rights reserved.
As of December 31, 2008, the Custom Composite Index included 28 stocks as follows: Affiliated Computer Services Inc.; Ametek Inc.; Benchmark Electronics Inc.;
Cooper Industries Limited; Corning Inc.; Crane Company; Deluxe Corp.; Donaldson Company Inc.; Dover Corp.; Fiserv Inc.; FMC Technologies Inc.; Harris Corp.;
Hubbell Inc.; International Game Technology; Lennox International Inc.; Mettler Toledo International Inc.; NCR Corp.; Pall Corp.; Perkinelmer Inc.; Pitney-Bowes Inc.;
Rockwell Automation Inc.; Rockwell Collins Inc.; Sauer Danfoss Inc.; Teleflex Inc.; Thermo Fisher Scientific Inc.; Thomas & Betts Corp.; Unisys Corp.; and Varian
Medical Systems Inc.
18. . . . . . .

ITEM 6: SELECTED FINANCIAL DATAThe following table should be read in conjunction with “Part II — Item 7 — Management’s Discussion and Analysis of
Financial Condition and Results of Operations” and “Part II — Item 8 — Financial Statements and Supplementary Data.”
2008 2007 2006 2005 2004(1)
Year ended December 31,
(In millions, except per share data)
Results of operations
Net sales $3,170 $2,947 $2,921 $2,569 $2,388Cost of sales 2,375 2,265 2,186 1,919 1,715
Gross profit 795 682 735 650 673
Income from continuing operations, net of tax 102 45 109 95 177(Loss) income from discontinued operations, net of tax (13) (5) (4) 7 2
Net Income $ 89 $ 40 $ 105 $ 102 $ 179
Basic earnings per common share:
Income from continuing operations $ 1.54 $ 0.68 $ 1.63 $ 1.34 $ 2.46(Loss) income from discontinued operations (0.20) (0.08) (0.06) 0.11 0.03
Net Income $ 1.34 $ 0.60 $ 1.57 $ 1.45 $ 2.49
Diluted earnings per common share:
Income from continuing operations $ 1.52 $ 0.67 $ 1.62 $ 1.33 $ 2.43(Loss) income from discontinued operations (0.19) (0.08) (0.07) 0.10 0.03
Net Income $ 1.33 $ 0.59 $ 1.55 $ 1.43 $ 2.46
Number of weighted-average shares outstanding
Basic shares 66 66 67 71 72Diluted shares 66 67 67 71 73Dividends
Common dividends paid $ 67 $ 62 $ 58 $ 58 $ 54Common dividends paid per share $ 1.00 $ 0.94 $ 0.86 $ 0.82 $ 0.74Consolidated balance sheet data
(as of period end)Current assets $1,614 $1,594 $1,658 $1,528 $1,291Current liabilities 735 701 746 728 853Net working capital 879 893 912 800 438Property, plant and equipment, net 204 220 208 226 219Total long-term liabilities 856 779 816 568 140Total assets 2,538 2,595 2,560 2,341 2,119Shareholders’ equity 947 1,115 998 1,045 1,126
(1) The data for the year ended December 31, 2004 is derived from unaudited financial statements.
19. . . . . . .

MANAGEMENT’S DISCUSSION AND ANALYSIS OF FINANCIAL CONDITION AND
RESULTS OF OPERATIONS as of December 31, 2008
(Unaudited)
(in thousands, except per share amounts)
ITEM 7: MANAGEMENT’S DISCUSSION AND ANALYSIS OF FINANCIALCONDITION AND RESULTS OF OPERATIONS
OVERVIEW
The MD&A is provided as a supplement and should be read in conjunction with the Consolidated Financial Statements and
accompanying Notes that appear elsewhere in this annual report.
Introduction
Diebold, Incorporated is a global leader in providing integrated self-service delivery and security systems and services to the
financial, retail, commercial and government markets. Founded in 1859, and celebrating 150 years of innovation in 2009, the
Company today has more than 16,000 employees with representation in nearly 90 countries worldwide.
During the past three years, the Company’s management continued to execute against its strategic roadmap developed in
2006 to strengthen operations and build a strong foundation for future success in its two core lines of business: financial self-
service and security solutions. This roadmap was built around five key priorities: increase customer loyalty; improve quality;
strengthen the supply chain; enhance communications and teamwork; and rebuild profitability. In 2008, the Company met or
exceeded its targets within each of these priorities through a number of operational and supply chain initiatives designed to
increase customer satisfaction, improve productivity, streamline processes, enhance efficiency and decrease costs. As a result, in
2008, income from continuing operations was $101,537 or $1.52 per share, up 126 percent and 127 percent, respectively, from
2007. Total revenue in 2008 was $3,170,080 up 8 percent from 2007.
In connection with the Company’s filing of the restated financial statements, the Company incurred significant legal, audit and
consultation fees during 2007 and 2008. In addition, the Company incurred advisory fees in 2008 as a result of the withdrawal of
the unsolicited takeover bid from United Technologies Corp.
Looking ahead to 2009, management has positioned the Company well to withstand the challenges of a very difficult global
economy. The turmoil in the financial industry, in particular, may take some time to subside, but the Company is in a unique
position to deliver value to its customers by enabling them to reduce costs and improve efficiency. Based on its solid performance
in 2008, the Company believes demand for financial self-service solutions remains relatively stable. However, demand in the
security business is being affected by weak new bank branch construction and retail store openings in the United States. Also, the
Company will focus on remediation of its material weaknesses in its internal controls. Management estimates the total cost for
remediation efforts to be approximately $3,000, which includes $2,400 of consultation fees and $600 of internal costs, including
software purchases.
Vision and strategy
The Company’s vision is, “To be recognized as the essential partner in creating and implementing ideas that optimize
convenience, efficiency and security.” This vision is the guiding principle behind the Company’s transformation of becoming a
more services-oriented Company. Today, service comprises more than 50 percent of the Company’s revenue, and the Company
expects that this percentage will grow over time as the Company’s integrated services business continues to gain traction in the
marketplace. For example, financial institutions are eager to reduce costs and optimize management and productivity of their ATM
channels — and they are increasingly exploring outsourced solutions. The Company remains uniquely positioned to provide the
infrastructure necessary to manage all aspects of an ATM network — hardware, software, maintenance, transaction processing,
patch management and cash management — through its integrated product and services offerings.
20. . . . . . .

Another area of focus within the financial self-service business is broadening the Company’s deposit automation solutions
set, including check imaging, envelope-free currency acceptance, teller automation, payment and document imaging solutions.
For example, check imaging is not only a regulatory compliance imperative for financial institutions but a significant potential driver
of cost-savings. The Company’s ImageWay» check-imaging solution fulfills an industry-wide demand for cutting-edge technol-
ogies that enhance efficiencies. In 2008, the Company solidified its competitive position in deposit automation technology with an
increase in shipments of deposit automation solutions by more than 50 percent from 2007 and expanded its solutions set with the
launch of a bulk check deposit capability. And in 2009, a new bulk cash acceptor will be rolled out later in the year.
Within the security business, the Company is diversifying by expanding and enhancing service offerings in its financial,
government, commercial and retail markets. A critical area of focus is bringing thought leadership to customers while becoming a
long-term business partner in the key growth areas of internet protocol security solutions, credential management, enterprise
security integration and expanded integrated solutions. One new customer relationship that characterizes the progress made in
2008 is the United States Postal Service’s selection of the Company to implement a multi-site, technologically-advanced security
program. This relationship underscores the Company’s commitment to elevate its presence and security integration capabilities
beyond the financial market, opening up new avenues of opportunity. For example, the Company is in the early phases of
introducing an energy management solution that can control and monitor heating, ventilation, air conditioning and lighting for its
customers. This is another value-added service that can help relieve customers of the every-day challenges in managing their
facilities while also reducing their costs and increasing environmental efficiency.
The focus during 2009 will be to continue to enhance and diversify the Company’s offerings, realize synergies where sensible
and make prudent decisions — taking swift action wherever necessary to capture profitable growth opportunities.
The Company continues to face a variety of challenges and opportunities in responding to customer needs within the election
systems market. While the company fully supports the subsidiary, Premier Election Solutions, it continues to pursue strategic
alternatives to ownership of the subsidiary.
Cost savings initiatives
In 2006, the Company launched the SmartBusiness (SB) 100 initiative to deliver $100,000 in cost savings by the end of 2008.
This key milestone was achieved in November 2008 with significant progress made in areas such as rationalization of product
development, streamlining procurement, realigning the Company’s manufacturing footprint and improving logistics.
In September 2008, the Company announced a new goal to achieve an additional $100,000 in cost savings called SB 200 with
a goal of eliminating $70,000 by the middle of 2010 and the remainder to be eliminated by the end of 2011. More specifically, as
part of cost saving initiatives, during 2008, the Company transitioned from four global Opteva manufacturing plants to two based in
China and Hungary, further reduced redundancy and waste across the supply chain, rationalized its U.S. warehouse network from
89 down to three major distribution centers, and initiated a product optimization and simplification program. In addition, the
Company exited unprofitable business segments in Japan and Europe as well as reduced its global workforce by more than
800 full-time positions.
The Company is committed to making the strategic decisions that not only streamline operations, but also enhance its ability
to serve its customers. The Company remains confident in the ability to continue to execute on cost-reduction initiatives,
delivering solutions that help improve customers’ businesses and creating shareholder value.
The Company incurred significant restructuring charges in 2008 and 2007 related to severance and reorganization costs from
the previously announced reduction in the Company’s global workforce. In addition, during the fourth quarter of 2008, the
Company decided to discontinue its enterprise security operations in the Europe, Middle East and Africa (EMEA) region. As a
21. . . . . . .
MANAGEMENT’S DISCUSSION AND ANALYSIS OF FINANCIAL CONDITION AND
RESULTS OF OPERATIONS as of December 31, 2008 (Continued)
(Unaudited)
(in thousands, except per share amounts)

result, the Company recorded an impairment charge of $16,658 related to previously recorded goodwill and certain intangible
assets. In addition, the Company incurred severance expenses and other charges incidental to the closure of $1,734 in 2008.
These charges, along with the results of operations of this enterprise security business, are included in loss from discontinued
operations, net of tax, in the Company’s Consolidated Statements of Operations for the years ended December 31, 2008, 2007
and 2006. The Company anticipates incurring additional charges associated with this closure of approximately $2,200 during 2009.
The following discussion of the Company’s financial condition and results of operations provide information that will assist in
understanding the financial statements and the changes in certain key items in those financial statements.
The business drivers of the Company’s future performance include several factors that include, but are not limited to:
• timing of a self-service upgrade and/or replacement cycle in mature markets such as the United States;
• high levels of deployment growth for new self-service products in emerging markets, such as Asia Pacific;
• demand for new service offerings, including outsourcing or operating a network of ATMs; and
• demand beyond expectations for security products and services for the financial, retail and government sectors.
22. . . . . . .
MANAGEMENT’S DISCUSSION AND ANALYSIS OF FINANCIAL CONDITION AND
RESULTS OF OPERATIONS as of December 31, 2008 (Continued)
(Unaudited)
(in thousands, except per share amounts)

The table below presents the changes in comparative financial data for the years ended December 31, 2008, 2007 and 2006.
Comments on significant year-to-year fluctuations follow the table. The following discussion should be read in conjunction with
the Consolidated Financial Statements and the accompanying Notes that appear elsewhere in this annual report.
Dollars% of
Net Sales%
Change Dollars% of
Net Sales%
Change Dollars% of
Net Sales
2008 2007 2006
Year ended December 31,
(In thousands, except percentages)
Net sales
Products $1,562,948 49.3 9.3 $1,429,646 48.5 (4.8) $1,500,998 51.4
Services 1,607,132 50.7 5.9 1,517,835 51.5 6.9 1,419,976 48.6
3,170,080 100.0 7.6 2,947,481 100.0 0.9 2,920,974 100.0
Cost of sales
Products 1,145,225 36.1 7.0 1,070,286 36.3 1.2 1,057,375 36.2
Services 1,230,239 38.8 2.9 1,195,286 40.6 5.9 1,128,428 38.6
2,375,464 74.9 4.9 2,265,572 76.9 3.6 2,185,803 74.8
Gross profit 794,616 25.1 16.5 681,909 23.1 (7.2) 735,171 25.2
Selling and administrative expenses 534,486 16.9 15.4 463,354 15.7 1.3 457,267 15.7
Research, development and
engineering expense 79,070 2.5 6.9 73,950 2.5 3.2 71,625 2.5
Impairment of assets 4,376 0.1 (90.6) 46,319 1.6 139.5 19,337 0.7
Loss (gain) on sale of assets, net 403 0.0 (106.3) (6,392) (0.2) (2,048.8) 328 0.0
618,335 19.5 7.1 577,231 19.6 5.2 548,557 18.8
Operating profit 176,281 5.6 68.4 104,678 3.6 (43.9) 186,614 6.4
Other expense, net (28,906) (0.9) 85.6 (15,575) (0.5) (15.0) (18,324) (0.6)
Minority interest (8,413) (0.3) 0.6 (8,365) (0.3) 29.6 (6,452) (0.2)
Income from continuing operations
before taxes 138,962 4.4 72.1 80,738 2.7 (50.1) 161,838 5.5
Taxes on income 37,425 1.2 4.5 35,797 1.2 (32.4) 52,916 1.8
Income from continuing operations 101,537 3.2 125.9 44,941 1.5 (58.7) 108,922 3.7
Loss from discontinued
operations — net of tax (12,954) (0.4) 139.9 (5,400) (0.2) 23.6 (4,370) (0.1)
Net income $ 88,583 2.8 124.0 $ 39,541 1.3 (62.2) $ 104,552 3.6
23. . . . . . .
MANAGEMENT’S DISCUSSION AND ANALYSIS OF FINANCIAL CONDITION AND
RESULTS OF OPERATIONS as of December 31, 2008 (Continued)
(Unaudited)
(in thousands, except per share amounts)

RESULTS OF OPERATIONS
2008 Comparison with 2007
Net Sales
The following table represents information regarding our net sales for the years ended December 31, 2008 and 2007:
2008 2007 $ Change % Change
Year endedDecember 31,
Net sales $3,170,080 $2,947,481 $222,599 7.6
The increase in net sales included a net positive currency impact of approximately $48,205. Financial self-service revenue in
2008 increased by $169,456 or 8.2 percent over 2007. Within the geographic areas, there was particularly strong growth in the
Americas of $125,051 and Asia Pacific of $68,226. The increase in the Americas was due to higher revenue in Brazil of $90,300 in
relation to several large orders as well as positive currency impact of 8.7 percent. The Asia Pacific increase was due to higher
volume, with approximately two-thirds of the total growth coming from China and with additional contributions from India and
Thailand. Security solutions revenue decreased by $37,262 or 4.6 percent for 2008. Weakness in the banking segment accounted
for much of the year-over-year decrease. In addition, security revenue was impacted by reduced spending by major customers in
the retail market. However, the government and commercial security business, in total, was up slightly for the year. Election
systems/lottery net sales of $154,108 increased by $90,405 or 141.9 percent compared to 2007. The year-over-year increase was
related to increases in voting equipment revenue of $90,670, with Brazil accounting for two-thirds of the growth. The Brazilian
lottery systems revenue of $4,308 was down $265 from 2007.
Gross Profit
The following table represents information regarding our gross profit for the years ended December 31, 2008 and 2007:
2008 2007$ Change/
% Point Change % Change
Year endedDecember 31,
Gross profit $794,616 $681,909 $112,707 16.5
Gross profit margin 25.1% 23.1% 2.0
Product gross margin was 26.7 percent in 2008 compared to 25.1 percent in 2007. Product gross margin was adversely
impacted by $15,982 of restructuring charges in 2008 and $27,349 in 2007. The 2007 restructuring charges were primarily related
to the closure of the manufacturing plant in Cassis, France. In addition, product gross margin for 2008 was positively affected by
the Brazilian election systems business and increased profitability in the U.S. election systems business, despite an inventory
write down of $12,969 in 2008 compared to $3,713 in 2007. Benefits realized from cost savings initiatives were partially offset by
unfavorable sales mix within North America, higher steel and commodity costs, and price erosion in certain international markets.
Service gross margin for 2008 was 23.5 percent compared with 21.3 percent for 2007. Service gross margin was adversely
affected by $9,663 of restructuring charges in 2008 and $1,319 in 2007. The increase in service gross margin reflects savings from
our cost savings initiatives, productivity and efficiency gains, and improved product quality. These gains came despite significant
year-over-year increases in fuel costs.
24. . . . . . .
MANAGEMENT’S DISCUSSION AND ANALYSIS OF FINANCIAL CONDITION AND
RESULTS OF OPERATIONS as of December 31, 2008 (Continued)
(Unaudited)
(in thousands, except per share amounts)

Operating Expenses
The following table represents information regarding our operating expenses for the years ended December 31, 2008 and
2007:
2008 2007 $ Change % Change
Year endedDecember 31,
Selling and administrative expense $534,486 $463,354 $ 71,132 15.4
Research, development, and engineering expense 79,070 73,950 5,120 6.9
Impairment of assets 4,376 46,319 (41,943) (90.6)
Loss (gain) on sale of assets, net 403 (6,392) 6,795 (106.3)
Total operating expenses $618,335 $577,231 $ 41,104 7.1
Selling and administrative expense was adversely impacted by $11,780 of restructuring charges in 2008 compared to $1,299
of restructuring charges in 2007. In addition, selling and administrative expenses were adversely affected by non-routine
expenses of $45,145 in 2008 and $7,288 in 2007. These non-routine expenses consisted of legal, audit and consultation fees,
primarily related to the internal review of other accounting items, restatement of financial statements and the ongoing SEC and
DOJ investigations and related advisory fees. Included in the non-routine expenses for 2008 was a $13,500 fee owed to financial
advisor Goldman Sachs as a result of the withdrawal of the unsolicited takeover bid from United Technologies Corp. Selling and
administrative expense in 2008 was also unfavorably impacted by a weakening of the U.S. dollar. Finally, in 2007, the Company
reduced the reserve for the election systems trade receivable mainly related to two counties in California by $10,090, due to
payments received. Research, development and engineering expense for both 2008 and 2007 were 2.5 percent of net sales.
Restructuring charges of $63 were included in research, development and engineering expense for 2007 as compared to $3,712
of restructuring charges in 2008 related to product development rationalization. The Company incurred a charge of $4,376 for the
impairment of intangible assets related to the 2004 acquisition of TFE Technology Holdings, a maintenance provider of network
and hardware service solutions to federal and state government agencies and commercial firms. The impairment of assets in 2007
was a non-cash charge of $46,319 related to the goodwill impairment for PESI. The gain on sale of assets for 2007 of $6,392 was
related to the sale of the Company’s manufacturing facility in Cassis, France, of which $6,438 was associated with the Company’s
restructuring initiatives. Restructuring charges of $435 were included in the loss/(gain) on sale of assets in 2008.
Operating Profit
The following table represents information regarding our operating profit for the years ended December 31, 2008 and 2007:
2008 2007$ Change/
% Point Change % Change
Year endedDecember 31,
Operating profit $176,281 $104,678 $71,603 68.4
Operating profit margin 5.6% 3.6% 2.0
The increase in operating profit resulted from the Brazilian election systems business, higher revenue and profitability in the
U.S. and international service markets, and lower expense related to the goodwill impairment for PESI of $46,319 in 2007. This
was partially offset by the increase in non-routine expenses as well as higher restructuring charges.
25. . . . . . .
MANAGEMENT’S DISCUSSION AND ANALYSIS OF FINANCIAL CONDITION AND
RESULTS OF OPERATIONS as of December 31, 2008 (Continued)
(Unaudited)
(in thousands, except per share amounts)

Other Income (Expense) and Minority Interest
The following table represents information regarding our other income (expense) and minority interest for the years ended
December 31, 2008 and 2007:
2008 2007$ Change/
% Point Change % Change
Year endedDecember 31,
Investment income $ 25,228 $ 22,489 $ 2,739 12.2
Interest expense (45,247) (42,200) (3,047) 7.2
Miscellaneous, net (8,887) 4,136 (13,023) (314.9)
Other income (expense) $(28,906) $(15,575) $(13,331) 85.6
Percentage of net sales (0.9) (0.5) (0.4)
Minority interest $ (8,413) $ (8,365) $ (48) 0.6
The change in miscellaneous income/(expense) between years was due to moving from a foreign exchange gain in 2007 of
$1,587 to a foreign exchange loss in 2008 of $9,341.
Income from Continuing Operations
The following table represents information regarding our income from continuing operations for the years ended Decem-
ber 31, 2008 and 2007:
2008 2007$ Change/
% Point Change % Change
Year endedDecember 31,
Income from continuing operations $101,537 $44,941 $56,596 125.9
Percent of net sales 3.2 1.5 1.7
Effective tax rate 26.9% 44.3% (17.4)
The increase in income from continuing operations was related to the Brazilian election systems business, lower expense
related to the impairment of assets, and a more favorable tax rate. This was partially offset by an unfavorable change in foreign
exchange gain/(loss) between years within other income (expense). The decrease in the 2008 effective tax rate is attributable to
an increase in foreign earnings in jurisdictions with lower effective tax rates. Additionally, in 2007, the Company had a significant
goodwill impairment that negatively impacted the 2007 effective tax rate by 20 percent.
Loss from Discontinued Operations
The following table represents information regarding our loss from discontinuedoperations for the years ended December 31,
2008 and 2007:
2008 2007$ Change/
% Point Change % Change
Year endedDecember 31,
Loss from discontinued operations, net of tax $(12,954) $(5,400) $(7,554) 139.9
Percent of net sales (0.4) (0.2) (0.2)
26. . . . . . .
MANAGEMENT’S DISCUSSION AND ANALYSIS OF FINANCIAL CONDITION AND
RESULTS OF OPERATIONS as of December 31, 2008 (Continued)
(Unaudited)
(in thousands, except per share amounts)

Discontinued operations in the EMEA based enterprise security business negatively impacted net income. This business was
not achieving an acceptable level of profitability and therefore, the operations were closed entirely. Included in the 2008
discontinued operations was a non-cash pre-tax asset impairment charge of $16,658.
Net Income
The following table represents information regarding our net income for the years ended December 31, 2008 and 2007:
2008 2007$ Change/
% Point Change % Change
Year endedDecember 31,
Net income $88,583 $39,541 $49,042 124.0
Percent of net sales 2.8 1.3 1.5
Based on the results from continuing and discontinued operations discussed above, the Company reported net income of
$88,583 and $39,541 for the years ended December 31, 2008 and 2007.
Segment Revenue and Operating Profit Summary
DNA net sales of $1,535,989 for 2008 decreased $7,066 or 0.5 percent from 2007 net sales of $1,543,055. The decrease in
DNA net sales was due to decreased revenue from the security solutions product and service offerings. DI net sales of $1,479,983
for 2008 increased by $139,260 or 10.4 percent over 2007 net sales of $1,340,723. The increase in DI net sales was due to
revenue growth across most international markets, led by growth of $90,300 in Brazil and $62,714 in Asia Pacific. ES & Other net
sales of $154,108 for 2008 increased $90,405 or 141.9 percent over 2007 net sales of $63,703. The increase was due to higher
Brazilian voting revenue of $61,560 and U.S.-based election systems revenue of $29,110. Revenue from lottery systems was
$4,308 for 2008, a decrease of $265 over 2007.
DNA operating profit for 2008 decreased by $26,054 or 23.1 percent compared to 2007. Operating profit was unfavorably
affected by higher non-routine expenses, workforce optimization restructuring charges, and increased commodity costs. This
was partially offset by higher service profitability and the Company’s ongoing cost reduction efforts. DI operating profit for 2008
increased by $32,727 or 62.2 percent compared to 2007. The increase was due to higher volume in Brazil and China as a result of
several large orders. Operating profit for ES & Other increased by $64,930, moving from an operating loss of $60,890 in 2007 to an
operating profit of $4,040 in 2008. The increase resulted from the goodwill impairment for PESI of $46,319, which occurred in
2007, and higher revenue in the Brazilian election systems business in 2008. In 2007, the Company reduced the reserve for the
election systems trade receivable related to two counties in California by $10,090, primarily due to payments received.
Refer to Note 19 to the Consolidated Financial Statements for further details of segment revenue and operating profit.
2007 Comparison with 2006
Net Sales
The following table represents information regarding our net sales for the years ended December 31, 2007 and 2006:
2007 2006 $ Change % Change
Year endedDecember 31,
Net sales $2,947,481 $2,920,974 $26,507 0.9
27. . . . . . .
MANAGEMENT’S DISCUSSION AND ANALYSIS OF FINANCIAL CONDITION AND
RESULTS OF OPERATIONS as of December 31, 2008 (Continued)
(Unaudited)
(in thousands, except per share amounts)

The increase in net sales included a net positive currency impact of approximately $98,589. Financial self-service revenue in
2007 increased by $132,486 or 6.8 percent over 2006, due to solid growth in the international market segments and a weakening
of the U.S. dollar, which accounted for 4.6 percent of the growth. Security solutions revenue increased by $63,609 or 8.5 percent
for 2007. Election systems/lottery net sales of $63,703 decreased by $169,588 or 72.7 percent compared to 2006. The year-over-
year decline was related to decreases in both voting equipment revenue of $137,723 and decreased Brazilian lottery systems
revenue of $31,865.
Gross Profit
The following table represents information regarding our gross profit for the years ended December 31, 2007 and 2006:
2007 2006$ Change/
% Point Change % Change
Year endedDecember 31,
Gross profit $681,909 $735,171 $(53,262) (7.2)
Gross profit margin 23.1% 25.2% (2.1)
Product gross margin was 25.1 percent in 2007 compared to 29.6 percent in 2006. Product gross margin was adversely
impacted by $27,349 of restructuring charges in 2007 compared to $3,299 of restructuring charges in 2006. The 2007
restructuring charges were primarily related to the closure of the manufacturing plant in Cassis, France. In addition, product
gross margin was adversely affected by lower election systems/lottery revenue and decreased profitability in the U.S. election
systems business in 2007 compared to 2006 which included an inventory write down of $3,713 in 2007. Service gross margin for
2007 was 21.3 percent compared with 20.5 percent for 2006. The increase in service gross margin was due to higher revenue and
profitability in DNA, which was partly attributable to a decrease in restructuring charges of $2,640 from 2006 to 2007.
Operating Expenses
The following table represents information regarding our operating expenses for the years ended December 31, 2007 and
2006:
2007 2006 $ Change % Change
Year endedDecember 31,
Selling and administrative expense $463,354 $457,267 $ 6,087 1.3
Research, development, and engineering expense 73,950 71,625 2,325 3.2
Impairment of assets 46,319 19,337 26,982 139.5
(Gain) loss on sale of assets, net (6,392) 328 (6,720) N/M
Total operating expenses $577,231 $548,557 $28,674 5.2
Selling and administrative expense for 2007 was 15.7 percent of net sales, flat from 15.7 percent for 2006. Selling and
administrative expense included $1,299 of restructuring charges in 2007 compared to $14,866 of restructuring charges in 2006
associated with the termination of the information technology outsourcing agreement, realignment of global service, and
relocation of the Company’s European headquarters. In addition, non-routine expenses of $7,288, which consisted of legal,
audit and consultation fees related to the internal review of other accounting items, restatement of financial statements and the
ongoing SEC and DOJ investigations and related advisory fees, adversely impacted 2007 compared with $791 of similar expenses
28. . . . . . .
MANAGEMENT’S DISCUSSION AND ANALYSIS OF FINANCIAL CONDITION AND
RESULTS OF OPERATIONS as of December 31, 2008 (Continued)
(Unaudited)
(in thousands, except per share amounts)

for 2006. Selling and administrative expense in 2007 was also unfavorably impacted by a weakening of the U.S. dollar and
incremental spend related to acquisitions. In 2007, the Company reduced the reserve for the election systems trade receivable
related to two counties in California by approximately $10,090 due to payments received. Research, development and engineering
expense for 2007 was 2.5 percent of net sales as compared to 2.5 percent in 2006. Restructuring charges of $63 were included in
research, development and engineering expense for 2007 as compared to $4,950 of restructuring charges in 2006 related to
product development rationalization. The impairment of assets in 2007 was a non-cash charge of $46,319 related to the goodwill
impairment for PESI. In 2006, the non-cash charge of $19,337 related to the impairment of a portion of the costs previously
capitalized relative to the Company’s enterprise resource planning system implementation. The gain on sale of assets for 2007 of
$6,392 was related to the sale of the Company’s manufacturing facility in Cassis, France, of which $6,438 was associated with the
Company’s restructuring initiatives.
Operating Profit
The following table represents information regarding our operating profit for the years ended December 31, 2007 and 2006:
2007 2006$ Change/
% Point Change % Change
Year endedDecember 31,
Operating profit $104,678 $186,614 $(81,936) (43.9)
Operating profit margin 3.6% 6.4% (2.8)
The decrease in operating profit resulted from lower election systems/lottery revenue, decreased profitability in the
U.S. election systems business in 2007 compared to 2006, and higher expense related to the impairment of assets. Additional
contributing factors were increased operating expenses resulting from a weakening of the U.S. dollar and incremental spend
related to acquisitions. Restructuring charges of $23,592 or 0.8 percent of net sales related to the closure of the manufacturing
plant in Cassis, France, adversely affected the operating profit in 2007 compared to $27,074 or 0.9 percent of net sales for in 2006.
The 2006 restructuring charges were associated with the consolidation of global research and development and other service
consolidations, termination of the information technology outsourcing agreement, relocation of the Company’s European
headquarters, realignment of the Company’s global manufacturing operations and product development rationalization. In
addition, non-routine expenses as described previously of $7,288 or 0.2 percent of net sales affected the operating profit in
2007 compared to $791 for 2006.
29. . . . . . .
MANAGEMENT’S DISCUSSION AND ANALYSIS OF FINANCIAL CONDITION AND
RESULTS OF OPERATIONS as of December 31, 2008 (Continued)
(Unaudited)
(in thousands, except per share amounts)
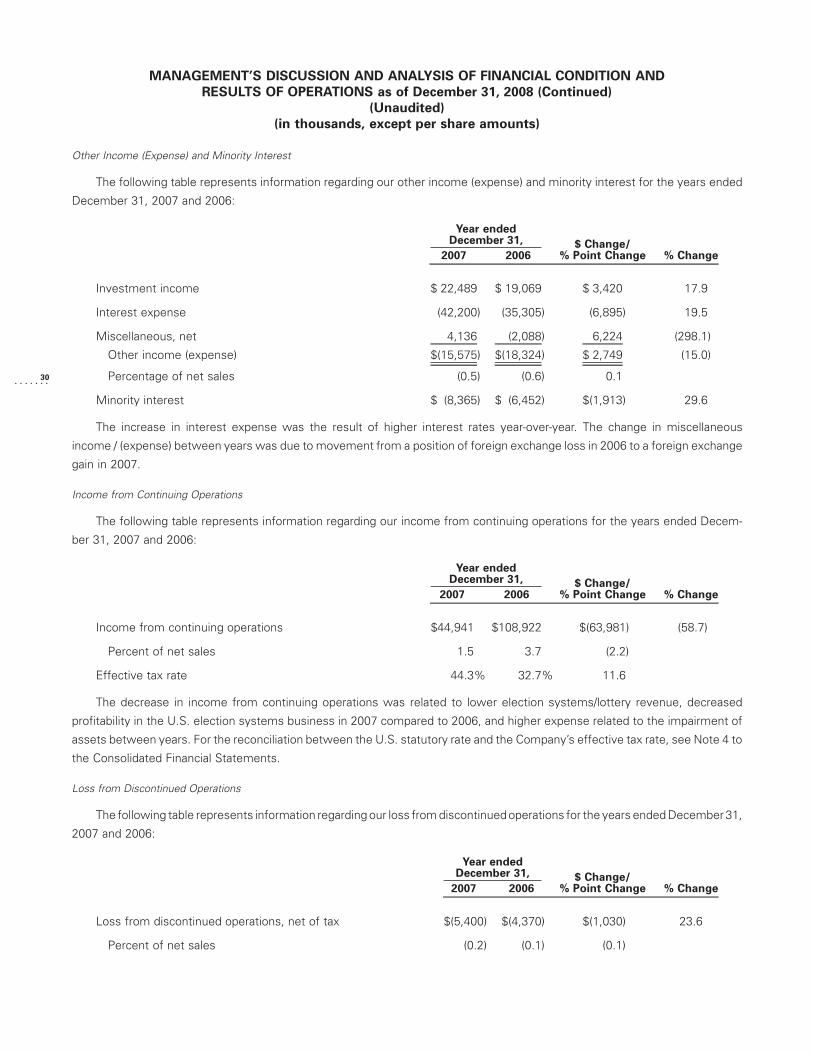
Other Income (Expense) and Minority Interest
The following table represents information regarding our other income (expense) and minority interest for the years ended
December 31, 2007 and 2006:
2007 2006$ Change/
% Point Change % Change
Year endedDecember 31,
Investment income $ 22,489 $ 19,069 $ 3,420 17.9
Interest expense (42,200) (35,305) (6,895) 19.5
Miscellaneous, net 4,136 (2,088) 6,224 (298.1)
Other income (expense) $(15,575) $(18,324) $ 2,749 (15.0)
Percentage of net sales (0.5) (0.6) 0.1
Minority interest $ (8,365) $ (6,452) $(1,913) 29.6
The increase in interest expense was the result of higher interest rates year-over-year. The change in miscellaneous
income / (expense) between years was due to movement from a position of foreign exchange loss in 2006 to a foreign exchange
gain in 2007.
Income from Continuing Operations
The following table represents information regarding our income from continuing operations for the years ended Decem-
ber 31, 2007 and 2006:
2007 2006$ Change/
% Point Change % Change
Year endedDecember 31,
Income from continuing operations $44,941 $108,922 $(63,981) (58.7)
Percent of net sales 1.5 3.7 (2.2)
Effective tax rate 44.3% 32.7% 11.6
The decrease in income from continuing operations was related to lower election systems/lottery revenue, decreased
profitability in the U.S. election systems business in 2007 compared to 2006, and higher expense related to the impairment of
assets between years. For the reconciliation between the U.S. statutory rate and the Company’s effective tax rate, see Note 4 to
the Consolidated Financial Statements.
Loss from Discontinued Operations
The following table represents information regarding our loss from discontinuedoperations for the years ended December 31,
2007 and 2006:
2007 2006$ Change/
% Point Change % Change
Year endedDecember 31,
Loss from discontinued operations, net of tax $(5,400) $(4,370) $(1,030) 23.6
Percent of net sales (0.2) (0.1) (0.1)
30. . . . . . .
MANAGEMENT’S DISCUSSION AND ANALYSIS OF FINANCIAL CONDITION AND
RESULTS OF OPERATIONS as of December 31, 2008 (Continued)
(Unaudited)
(in thousands, except per share amounts)

Discontinued operations in the EMEA based enterprise security business negatively impacted net income, moving from a
loss of $4,370 net of tax in 2006 to a loss net of tax of $5,400 in 2007. This business was not achieving an acceptable level of
profitability and therefore the operations were closed entirely in 2008.
Net Income
The following table represents information regarding our net income for the years ended December 31, 2007 and 2006:
2007 2006$ Change/
% Point Change % Change
Year endedDecember 31,
Net income $39,541 $104,552 $(65,011) (62.2)
Percent of net sales 1.3 3.6 (2.3)
Based on the results from continuing and discontinued operations discussed above, the Company reported net income of
$39,541 and $104,552 for the years ended December 31, 2007 and 2006.
Segment Revenue and Operating Profit Summary
DNA net sales of $1,543,055 for 2007 increased $23,386 or 1.5 percent over 2006 net sales of $1,519,669. The increase in
DNA net sales was due to increased revenue from the security solutions product and service offerings. DI net sales of $1,340,723
for 2007 increased by $172,709 or 14.8 percent over 2006 net sales of $1,168,014. The increase in DI net sales was due to
revenue growth across all international markets, led by growth of $51,560 in EMEA and $46,910 in Asia Pacific. ES & Other net
sales of $63,703 for 2007 decreased $169,588 or 72.7 percent compared to 2006. The decrease was due to decreases in Brazilian
voting revenue of $24,728 and U.S.-based election systems revenue of $112,995, as political debates over electronic voting
negatively impacted the U.S. election systems business, resulting in decreased sales of election systems products. Revenue
from lottery systems was $4,573 for 2007, a decrease of $31,865 over 2006.
DNA operating profit for 2007 decreased by $6,796 or 5.7 percent compared to 2006. The decrease was due to higher
operating expenses consisting of incremental spend related to acquisitions as well as higher non-routine expenses associated
with the legal, audit and consultation fees for the internal review of other accounting items, restatement of financial statements,
and the ongoing SEC and DOJ investigations and related advisory fees. DI operating profit for 2007 increased by $25,974 or
97.6 percent compared to 2006. The increase was due to strong financial self-service revenue growth and increased profitability.
The improvement was partially offset by an increase in restructuring charges from 2006 to 2007 of $3,949 and higher non-routine
expenses previously mentioned. Operating profit for ES & Other decreased by $101,114, moving from an operating profit of
$40,224 in 2006 to an operating loss of $60,890 in 2007. The decrease in ES & Other operating profit resulted from the goodwill
impairment for PESI of $46,319 in 2007 and lower revenue associated with the sales of election systems/lottery products and
services. In 2007, the Company reduced the reserve for the election systems trade receivable related to two counties in California
by approximately $10,090 due to payments received.
Refer to Note 19 to the Consolidated Financial Statements for further details of segment revenue and operating profit.
LIQUIDITY AND CAPITAL RESOURCES
Capital resources are obtained from income retained in the business, borrowings under the Company’s senior notes,
committed and uncommitted credit facilities, long-term industrial revenue bonds, and operating and capital leasing arrangements.
Refer to Notes 9 and 10 to the Consolidated Financial Statements regarding information on outstanding and available credit
31. . . . . . .
MANAGEMENT’S DISCUSSION AND ANALYSIS OF FINANCIAL CONDITION AND
RESULTS OF OPERATIONS as of December 31, 2008 (Continued)
(Unaudited)
(in thousands, except per share amounts)

facilities, senior notes and bonds. Management expects that the Company’s capital resources will be sufficient to finance planned
working capital needs, investments in facilities or equipment, and the purchase of the Company’s shares for at least the next
12 months. Part of the Company’s growth strategy is to pursue strategic acquisitions. The Company has made acquisitions in the
past and intends to make acquisitions in the future. The Company intends to finance any future acquisitions with either cash
provided from operations, borrowings under available credit facilities, proceeds from debt or equity offerings and/or the issuance
of common shares.
The following table summarizes the results of our Consolidated Statement of Cash Flows for the years ended December 31,
2008, 2007 and 2006:
2008 2007 2006
Year ended December 31,
Net cash flow provided (used) by:
Operating activities $ 284,691 150,260 $ 232,926
Investing activities (142,484) (80,370) (171,324)
Financing activities (87,689) (135,276) (23,774)
Effect of exchange rate changes on cash and cash equivalents (19,416) 17,752 5,747
Net increase (decrease) in cash and cash equivalents $ 35,102 $ (47,634) $ 43,575
During 2008, the Company generated $284,691 in cash from operating activities, an increase of $134,431 or 89.5 percent
from 2007. Cash flows from operating activities are generated primarily from operating income and controlling the components of
working capital. The primary reasons for the increase were the $49,042 increase in net income, a $30,149 increase in accounts
payable and a $175,832 net change in certain other assets and liabilities, offset by a lower decrease of $110,316 in trade
receivables, a $62,605 increase in inventory and a $41,943 decrease in asset impairments. The change in certain other assets and
liabilities was primarily the result of a $16,000 increase in accruals for legal, audit and consultation fees, an $11,100 increase in
warranty reserves, a $10,600 increase in restructuring accruals, an $11,976 change in notes receivable collections, net, as well as
increases in VAT taxes and freight accruals as a result of increased product revenue and a $70,661 foreign currency translation
impact on certain assets and liabilities. The decrease in trade receivables was $10,633 in 2008 compared to $120,949 in 2007 as a
result of continued focus on cash collections. However, there were lower fourth quarter sales and accounts receivable levels in
2008 compared to 2007. Days sales outstanding was 45 days at December 31, 2008 compared to 46 days at December 31, 2007.
The movement in inventory is largely due to foreign currency translation impact. The Company impaired $4,376 of intangible
assets in 2008 continuing operations related to previously acquired customer contracts compared to $46,319 in 2007 related to
PESI goodwill.
Net cash used for investing activities was $142,484 in 2008, an increase of $62,114 or 77.3 percent over 2007. The Company
had net purchases of investments in 2008 of $53,681 compared to net proceeds from maturities of investments in 2007 of $6,845.
Also, the Company’s capital expenditures increased by $14,673 in 2008 compared to 2007, largely due to investments in
information technology systems that help focus in improving operational efficiency. This increase was offset by a decrease of
$13,661 in payments for acquisitions, moving from $18,122 in 2007 for three domestic acquisitions and earn-out payments to
$4,461 in 2008 for earn-out payments related to prior acquisitions.
Net cash used for financing activities was $87,689 in 2008, a decrease of $47,587 or 35.2 percent over 2007. The Company
had net repayments of $17,771 in 2008 compared to net repayments of $64,059 in 2007. Also, the Company paid $18,236 to
32. . . . . . .
MANAGEMENT’S DISCUSSION AND ANALYSIS OF FINANCIAL CONDITION AND
RESULTS OF OPERATIONS as of December 31, 2008 (Continued)
(Unaudited)
(in thousands, except per share amounts)

minority interest holders, offset by issuance of common shares of $8,544 in 2007 and paid $3,523 to minority interest holders in
2008.
The following table summarizes the Company’s approximate obligations and commitments to make future payments under
contractual obligations as of December 31, 2008:
TotalLess Than
1 Year 1-3 Years 3-5 YearsMore Than
5 Years
Payment Due by period
Operating lease obligations $ 218,582 $ 66,058 $ 89,679 $ 38,200 $ 24,645
Industrial development revenue bonds 11,900 — — — 11,900
Notes payable 605,184 10,596 294,588 75,000 225,000
Interest on bonds and notes payable(1) 156,519 29,414 41,192 37,818 48,095
Purchase commitments 19,488 11,403 8,085 — —
$1,011,673 $117,471 $433,544 $151,018 $309,640
(1) Amounts represent estimated contractual interest payments on outstanding bonds and notes payable. Rates in effect as of December 31, 2008 are used for
variable rate debt.
The Company also has uncertain tax positions of $9,009 recorded in accordance with Financial Accounting Standards Board
(FASB) Interpretation No. 48, Accounting for Uncertainty in Income Taxes — an interpretation of FASB Statement No. 109
(FIN 48), for which there is a high degree of uncertainty as to the expected timing of payments.
The Company expects to contribute $12,000 to $15,000 to its pension plans in the year ended December 31, 2009.
In March 2006, the Company issued senior notes in an aggregate principal amount of $300,000. The maturity dates of the
senior notes are staggered, with $75,000, $175,000 and $50,000 becoming due in 2013, 2016 and 2018, respectively. The
Company used $270,000 of the net proceeds from this offering to repay notes payable under its revolving credit facility and used
the remaining $30,000 in operations. See Note 9 to the Consolidated Financial Statements for further information. The Company
does not participate in transactions that facilitate off-balance sheet arrangements.
The Company has a credit facility with borrowing limits of $509,665, ($300,000 and c150,000, translated), at December 31,
2008. Under the terms of the credit facility agreement, the Company has the ability to increase the borrowing limits an additional
$150,000. This facility expires on April 27, 2010. The Company intends to begin the renewal process in the second half of 2009.
The private placement investors and financial institutions continue to express support in meeting the credit needs of the
Company. The Company believes that its financial position and its strong relationships with its credit group should help facilitate
the renewal process, though there can be no assurance that the Company will be able to renew the credit facility on commercially
acceptable terms. As of December 31, 2008, $294,588 was outstanding under the Company’s credit facility and $215,077 was
available for borrowing.
The average interest rate on the Company’s bank credit lines was 3.90 percent, 5.46 percent and 4.66 percent for the years
ended December 31, 2008, 2007 and 2006, respectively. Interest on financing charged to expense for the years ended December
31 was $30,137, $33,077 and $34,883 for 2008, 2007 and 2006, respectively.
The Company’s financing agreements contain various restrictive financial covenants, including net debt to capitalization and
net interest coverage ratios. As of December 31, 2008, the Company was in compliance with the financial covenants in our debt
agreements.
33. . . . . . .
MANAGEMENT’S DISCUSSION AND ANALYSIS OF FINANCIAL CONDITION AND
RESULTS OF OPERATIONS as of December 31, 2008 (Continued)
(Unaudited)
(in thousands, except per share amounts)

CRITICAL ACCOUNTING POLICIES AND ESTIMATES
Management’s discussion and analysis of the Company’s financial condition and results of operations are based upon the
Company’s Consolidated Financial Statements. The Consolidated Financial Statements of the Company are prepared in confor-
mity with accounting principles generally accepted in the United States of America. The preparation of the accompanying
Consolidated Financial Statements in conformity with accounting principles generally accepted in the United States of America
requires management to make estimates and assumptions about future events. These estimates and the underlying assumptions
affect the amounts of assets and liabilities reported, disclosures about contingent assets and liabilities and reported amounts of
revenues and expenses. Such estimates include the value of purchase consideration, valuation of trade receivables, inventories,
goodwill, intangible assets, other long-lived assets, legal contingencies, guarantee obligations, indemnifications and assumptions
used in the calculation of income taxes, pension and postretirement benefits and customer incentives, among others. These
estimates and assumptions are based on management’s best estimates and judgment. Management evaluates its estimates and
assumptions on an ongoing basis using historical experience and other factors, including the current economic difficulties in the
United States credit markets and the global markets. Management monitors the economic condition and other factors and will
adjust such estimates and assumptions when facts and circumstances dictate. Illiquid credit markets, volatile foreign currency
and equity, and declines in the global economic environment have combined to increase the uncertainty inherent in such
estimates and assumptions. As future events and their effects cannot be determined with precision, actual results could differ
significantly from these estimates. Changes in those estimates resulting from continuing changes in the economic environment
will be reflected in the financial statements in future periods.
The Company’s significant accounting policies are described in Note 1 to the Consolidated Financial Statements. Manage-
ment believes that, of its significant accounting policies, its policies concerning revenue recognition, allowances for doubtful
accounts, inventories, goodwill, and pensions and postretirement benefits are the most critical because they are affected
significantly by judgments, assumptions and estimates. Additional information regarding these policies is included below.
Revenue Recognition The Company’s revenue recognition policy is consistent with the requirements of Statement of
Position 97-2, Software Revenue Recognition (SOP 97-2), and Staff Accounting Bulletin 104 (SAB 104). In general, the Company
records revenue when it is realized, or realizable and earned. The Company considers revenue to be realized, or realizable and
earned, when the following revenue recognition requirements are met: persuasive evidence of an arrangement exists, which is a
customer contract; the products or services have been accepted by the customer via delivery or installation acceptance; the sales
price is fixed or determinable within the contract; and collectability is probable.
For product sales, the Company determines that the earnings process is complete when title, risk of loss and the right to use
equipment has transferred to the customer. Within the North America business segment, this occurs upon customer acceptance.
Where the Company is contractually responsible for installation, customer acceptance occurs upon completion of the installation
of all items at a job site and the Company’s demonstration that the items are in operable condition. Where items are contractually
only delivered to a customer, revenue recognition of these items is upon shipment or delivery to a customer location depending on
the terms in the contract. Within the International business segment, customer acceptance is upon the earlier of delivery or
completion of the installation depending on the terms in the contract with the customer. The Company has the following revenue
streams related to sales to its customers:
Self-Service Product & Service Revenue Self-service products pertain to ATMs. Included within the ATM is software,
which operates the ATM. The related software is considered more than incidental to the equipment as a whole. Revenue is
recognized in accordance with SOP 97-2. The Company also provides service contracts on ATMs.
34. . . . . . .
MANAGEMENT’S DISCUSSION AND ANALYSIS OF FINANCIAL CONDITION AND
RESULTS OF OPERATIONS as of December 31, 2008 (Continued)
(Unaudited)
(in thousands, except per share amounts)

Service contracts typically cover a 12-month period and can begin at any given month during the year after the standard
90-day warranty period expires. The service provided under warranty is significantly limited as compared to those offered under
service contracts. Further, warranty is not considered a separate element of the sale. The Company’s warranty covers only
replacement of parts inclusive of labor. Service contracts are tailored to meet the individual needs of each customer. Service
contracts provide additional services beyond those covered under the warranty, and usually include preventative maintenance
service, cleaning, supplies stocking and cash handling, all of which are not essential to the functionality of the equipment. For sales
of service contracts, where the service contract is the only element of the sale, revenue is recognized ratably over the life of the
contract period. In contracts that involve multiple-element arrangements, amounts deferred for services are determined based
upon vendor specific objective evidence of the fair value of the elements as prescribed in SOP 97-2. The Company determines fair
value of deliverables within a multiple element arrangement based on the price charged when each element is sold separately.
Physical Security & Facility Revenue The Company’s Physical Security and Facility Products division designs and
manufactures several of the Company’s financial service solutions offerings, including the RemoteTellerTM System (RTS). The
business unit also develops vaults, safe deposit boxes and safes, drive-up banking equipment and a host of other banking facilities
products. Revenue on sales of the products described above is recognized when the four revenue recognition requirements of
SAB 104 have been met.
Election Systems Revenue The Company, through its wholly-owned subsidiaries, PESI and Procomp Industria Eletronica
S.A. , offers voting equipment. Election systems revenue consists of election equipment, software, training, support, installation
and maintenance. The election equipment and software components are included in product revenue. The training, support,
installation and maintenance components are included in service revenue. The election systems contracts contain multiple
deliverable elements and custom terms and conditions. Revenue on election systems contracts is recognized in accordance with
SOP 97-2. The Company recognizes revenue for delivered elements only when the fair value of undelivered elements are known,
uncertainties regarding customer acceptance are resolved and there are no customer-negotiated refund or return rights affecting
the revenue recognized for delivered elements. The Company determines fair value of deliverables within a multiple-element
arrangement based on the price charged when each element is sold separately. Some contracts may contain discounts and, as
such, revenue is recognized using the residual value method of allocation of revenue to the product and service components of
contracts.
Integrated Security Solutions Revenue Diebold Integrated Security Solutions provides global sales, service, installation,
project management and monitoring of OEM electronic security products to financial, government, retail and commercial
customers. These solutions provide the Company’s customers a single-source solution to their electronic security needs.
Revenue is recognized in accordance with SAB 104. Revenue on sales of the products described above is recognized upon
shipment, installation or customer acceptance of the product as defined in the customer contract. In contracts that involve
multiple-element arrangements, amounts deferred for services are determined based upon the fair value of the elements as
prescribed in EITF 00-21, Accounting for Revenue Arrangements with Multiple Deliverables.
Software Solutions & Service Revenue The Company offers software solutions consisting of multiple applications that
process events and transactions (networking software) along with the related server. Sales of networking software represent
software solutions to customers that allow them to network various different vendors’ ATMs onto one network and revenue is
recognized in accordance with SOP 97-2.
Included within service revenue is revenue from software support agreements, which are typically 12 months in duration and
pertain to networking software. For sales of software support agreements, where the agreement is the only element of the sale,
revenue is recognized ratably over the life of the contract period. In contracts that involve multiple-element arrangements,
35. . . . . . .
MANAGEMENT’S DISCUSSION AND ANALYSIS OF FINANCIAL CONDITION AND
RESULTS OF OPERATIONS as of December 31, 2008 (Continued)
(Unaudited)
(in thousands, except per share amounts)

amounts deferred for support are determined based upon vendor specific objective evidence of the fair value of the elements as
prescribed in SOP 97-2.
Allowances for Doubtful Accounts The Company evaluates the collectibility of accounts receivable based on (1) a
percentage of sales, which is based on historical loss experience and current trends, are reserved for uncollectible accounts
as sales occur throughout the year and (2) periodic adjustments for known events such as specific customer circumstances and
changes in the aging of accounts receivable balances. Since the Company’s receivable balance is concentrated primarily in the
financial and government sectors, an economic downturn in these sectors could result in higher than expected credit losses.
Inventories The Company primarily values inventories at the lower of cost or market applied on a first-in, first-out (FIFO)
basis, with the notable exceptions of Brazil and PESI that value inventory using the average cost method, which approximates
FIFO. At each reporting period, the Company identifies and writes down its excess and obsolete inventory to its net realizable
value based on forecasted usage, orders and inventory aging. With the development of new products, the Company also
rationalizes its product offerings and will write down discontinued product to the lower of cost or net realizable value.
Goodwill Goodwill is the cost in excess of the net assets of acquired businesses. The Company tests all existing goodwill at
least annually for impairment using the fair value approach on a “reporting unit” basis in accordance with SFAS 142, Goodwill and
Other Intangible Assets. The Company’s reporting units are defined as Domestic and Canada, Brazil, Latin America, Asia Pacific,
EMEA and Election Systems. The Company uses the discounted cash flow method and the guideline company method for
determining the fair value of its reporting units. As required by SFAS 142, the determination of implied fair value of the goodwill for
a particular reporting unit is the excess of the fair value of a reporting unit over the amounts assigned to its assets and liabilities in
the same manner as the allocation in a business combination. Implied fair value goodwill is determined as the excess of the fair
value of the reporting unit over the fair value of its assets and liabilities. The Company’s fair value model uses inputs such as
estimated future segment performance. The Company uses the most current information available and performs the annual
impairment analysis as of November 30 each year. However, actual circumstances could differ significantly from assumptions and
estimates made and could result in future goodwill impairment. The Company tests for impairment between annual tests if an
event occurs or circumstances change that would more likely than not reduce the carrying value of a reporting unit below its
reported amount.
Pensions and Postretirement Benefits Annual net periodic expense and benefit liabilities under the Company’s defined
benefit plans are determined on an actuarial basis. Assumptions used in the actuarial calculations have a significant impact on plan
obligations and expense. Annually, management and the investment committee of the Board of Directors review the actual
experience compared with the more significant assumptions used and make adjustments to the assumptions, if warranted. The
healthcare trend rates are reviewed with the actuaries based upon the results of their review of claims experience. The expected
long-term rate of return on plan assets is determined using the plans’ current asset allocation and their expected rates of return
based on a geometric averaging over 20 years. The discount rate is determined by analyzing the average return of high-quality (i.e.,
AA-rated) fixed-income investments and the year-over-year comparison of certain widely used benchmark indices as of the
measurement date. The rate of compensation increase assumptions reflects the Company’s long-term actual experience and
future and near-term outlook. Pension benefits are funded through deposits with trustees. The market-related value of plan assets
is calculated under an adjusted market value method in order to determine the Company’s net periodic benefit obligation. The
value is determined by adjusting the fair value of assets to reflect the investment gains and losses (i.e., the difference between the
actual investment return and the expected investment return on the market-related value of assets) during each of the last five
years at the rate of 20 percent per year.
36. . . . . . .
MANAGEMENT’S DISCUSSION AND ANALYSIS OF FINANCIAL CONDITION AND
RESULTS OF OPERATIONS as of December 31, 2008 (Continued)
(Unaudited)
(in thousands, except per share amounts)

Postretirement benefits are not funded and the Company’s policy is to pay these benefits as they become due. The following
table represents assumed health care cost trend rates at December 31, 2008 and 2007, respectively.
2008 2007
December 31,
Healthcare cost trend rate assumed for next year 9.00% 7.57%
Rate to which the cost trend rate is assumed to decline (the ultimate trend rate) 4.20% 5.00%
Year that rate reaches ultimate trend rate 2099 2014
The healthcare trend rates are reviewed with the actuaries based upon the results of their review of claims experience. In
2007, the Company used healthcare cost trends of 7.14 percent in 2008 reducing linearly to 5 percent in 2014 for medical benefits
and 10 percent in 2008 reducing linearly to 5 percent in 2014 for prescription drug benefits. In 2008, the Company used healthcare
cost trends of 9 percent in 2009, decreasing to an ultimate trend of 4.2 percent in 2099 for both medical and prescription drug
benefits using the Society of Actuaries Long Term Trend Model with assumptions based on the 2008 Medicare Trustees’
projections. Assumed healthcare cost trend rates have a significant effect on the amounts reported for the healthcare plans. A
one-percentage-point change in assumed healthcare cost trend rates would have the following effects:
One-Percentage-Point Increase
One-Percentage-Point Decrease
Effect on total of service and interest cost $ 80 $ (72)
Effect on postretirement benefit obligation $1,118 $(1,009)
In accordance with SFAS 158, Employers’ Accounting for Defined Pension and Other Postretirement Plans, the Company
recognizes the funded status of each of its plans in the consolidated balance sheet. Amortization of unrecognized net gain or loss
resulting from experience different from that assumed and from changes in assumptions (excluding asset gains and losses not yet
reflected in market-related value) is included as a component of net periodic benefit cost for a year if, as of the beginning of the
year, that unrecognized net gain or loss exceeds five percent of the greater of the projected benefit obligation or the market-related
value of plan assets. If amortization is required, the amortization is that excess divided by the average remaining service period of
participating employees expected to receive benefits under the plan.
RECENT ACCOUNTING PRONOUNCEMENTS
Financial Accounting Standards Board Staff Position No. 132(R)-1 In December 2008, the Financial Accounting
Standards Board (FASB) issued FSP No. 132(R)-1, Employers’ Disclosures about Postretirement Benefit Plan Assets, which
amends the FASB Statement No. 132 (revised 2003), Employers’ Disclosures about Pensions and Other Postretirement Benefits.
FSP No. 132(R)-1 provides guidance on an employer’s disclosures about plan assets of a defined benefit pension or other
postretirement plan. It requires companies to disclose more information about how investment allocation decisions are made,
major categories of plan assets, including concentrations of risk and fair-value measurements, and the fair-value techniques and
inputs used to measure plan assets. FSP No. 132(R)-1 is effective for fiscal years ending after December 15, 2009.
Emerging Issues Task Force Issue No. 03-6-1 In June 2008, the FASB issued Financial Accounting Standards Board Staff
Position (FSP) Emerging Task Force (EITF) No. 03-6-1, Determining Whether Instruments Granted in Share-Based Payment
Transactions Are Participating Securities. Under the FSP, unvested share-based payment awards that contain rights to receive
nonforfeitable dividends (whether paid or unpaid) are participating securities, and should be included in the two-class method of
37. . . . . . .
MANAGEMENT’S DISCUSSION AND ANALYSIS OF FINANCIAL CONDITION AND
RESULTS OF OPERATIONS as of December 31, 2008 (Continued)
(Unaudited)
(in thousands, except per share amounts)

computing earnings per share. The FSP is effective for fiscal years beginning after December 15, 2008, and interim periods within
those years. The adoption of FSP EITF No. 03-6-1 will not have a material impact on our Consolidated Financial Statements.
Statement of Financial Accounting Standards No. 162 In May 2008, the FASB issued Statement of Financial Accounting
Standards (SFAS) No. 162 (SFAS 162), The Hierarchy of Generally Accepted Accounting Principles. SFAS 162 identifies the
sources of accounting principles used in the preparation of financial statements of nongovernmental entities that are presented in
conformity with generally accepted accounting principles (the US GAAP hierarchy). SFAS 162 became effective November 15,
2008. The Company does not expect the adoption of SFAS 162 to have a material effect on the Company’s financial position,
results of operations or liquidity.
Financial Accounting Standards Board Staff Position No. 142-3 In April 2008, the FASB issued FSP No. 142-3,
Determination of the Useful Life of Intangible Assets, which amends the list of factors an entity should consider in developing
renewal or extension assumptions used in determining the useful life of recognized intangible assets under SFAS No. 142,
Goodwill and Other Intangible Assets. The position applies to intangible assets that are acquired individually or with a group of
other assets and both intangible assets acquired in business combinations and asset acquisitions. FSP No. 142-3 is effective for
financial statements issued for the fiscal years beginning after December 15, 2008, and interim periods within those fiscal years.
The Company is in the process of determining the effect that adoption of FSP No. 142-3 will have on its Consolidated Financial
Statements.
Statement of Financial Accounting Standards No. 161 In March 2008, the FASB issued SFAS No. 161 (SFAS 161),
Disclosures about Derivatives Instruments and Hedging Activities — an amendment of FASB Statement No. 133. SFAS 161
applies to all entities and requires specified disclosures for derivative instruments and related hedged items accounted for under
SFAS 133, Accounting for Derivative Instruments and Hedging Activities (SFAS 133). SFAS 161 amends and expands SFAS 133’s
existing disclosure requirements to provide financial statement users with a better understanding of how and why an entity uses
derivatives, how derivative instruments and related hedged items are accounted for under SFAS 133, and how derivative
instruments and related hedged items affect an entity’s financial position, financial performance and cash flows. SFAS 161 is
effective for fiscal years and interim periods beginning after November 15, 2008. The adoption of SFAS 161 is not expected to
have a material impact on the Company’s financial position, results of operations or liquidity.
Statement of Financial Accounting Standards No. 160 In December 2007, the FASB issued SFAS No. 160 (SFAS 160),
Non-controlling Interests in Consolidated Financial Statements — an Amendment of ARB 51. SFAS 160 applies to all entities that
have an outstanding non-controlling interest in one or more subsidiaries or that deconsolidate a subsidiary. Under SFAS 160, non-
controlling interests in a subsidiary that are currently recorded within “mezzanine” (or temporary) equity or as a liability will be
included in the equity section of the balance sheet. In addition, this statement requires expanded disclosures in the financial
statements that clearly identify and distinguish between the interests of the parent’s owners and the interest of the non-
controlling owners of the subsidiary.
SFAS 160 is effective for fiscal years and interim periods within those fiscal years, beginning on or after December 15, 2008.
Application of SFAS 160’s disclosure requirements is retroactive. The Company is in the process of determining the effects that
adoption of SFAS 160 will have on its Consolidated Financial Statements.
Statement of Financial Accounting Standards No. 141(R) In December 2007, the FASB issued SFAS 141 (revised 2007)
(SFAS 141(R)), Business Combinations, which amends the accounting and reporting requirements for business combinations.
SFAS 141(R) places greater reliance on fair value information, requiring more acquired assets and liabilities to be measured at fair
value as of the acquisition date. The pronouncement also requires acquisition-related transaction and restructuring costs to be
expensed rather than treated as a capitalized cost of acquisition. SFAS 141(R) is effective for fiscal years beginning on or after
38. . . . . . .
MANAGEMENT’S DISCUSSION AND ANALYSIS OF FINANCIAL CONDITION AND
RESULTS OF OPERATIONS as of December 31, 2008 (Continued)
(Unaudited)
(in thousands, except per share amounts)

December 15, 2008 and the Company will implement its requirements in future business combinations. The Company does not
expect the adoption of SFAS 141(R) to have a material impact on the Company’s historical financial position, results of operations
or liquidity.
FORWARD-LOOKING STATEMENT DISCLOSURE
In this annual report on Form 10-K, statements that are not reported financial results or other historical information are
“forward-looking statements” within the meaning of the Private Securities Litigation Reform Act of 1995. Forward-looking
statements give current expectations or forecasts of future events and are not guarantees of future performance. These forward-
looking statements relate to, among other things, the Company’s future operating performance, the Company’s share of new and
existing markets, the Company’s short- and long-term revenue and earnings growth rates, the Company’s implementation of cost-
reduction initiatives and measures to improve pricing, including the optimization of the Company’s manufacturing capacity, and
the ongoing SEC and DOJ investigations. The use of the words “will,” “believes,” “anticipates,” “expects,” “intends” and
similar expressions is intended to identify forward-looking statements that have been made and may in the future be made by or
on behalf of the Company.
Although the Company believes that these forward-looking statements are based upon reasonable assumptions regarding,
among other things, the economy, its knowledge of its business, and on key performance indicators that impact the Company,
these forward-looking statements involve risks, uncertainties and other factors that may cause actual results to differ materially
from those expressed in or implied by the forward-looking statements. The Company is not obligated to update forward-looking
statements, whether as a result of new information, future events or otherwise, except as otherwise required by law.
Readers are cautioned not to place undue reliance on these forward-looking statements, which speak only as of the date
hereof. Some of the risks, uncertainties and other factors that could cause actual results to differ materially from those expressed
in or implied by the forward-looking statements include, but are not limited to:
• the results of the SEC and DOJ investigations;
• competitive pressures, including pricing pressures and technological developments;
• changes in the Company’s relationships with customers, suppliers, distributors and/or partners in its business ventures;
• changes in political, economic or other factors such as currency exchange rates, inflation rates, recessionary or expansive
trends, taxes and regulations and laws affecting the worldwide business in each of the Company’s operations, including
Brazil, where a significant portion of the Company’s revenue is derived;
• the effects of the sub-prime mortgage crisis and the disruptions in the financial markets, including the bankruptcies,
restructurings or consolidations of financial institutions, which could reduce our customer base and/or adversely affect our
customers’ ability to make capital expenditures, as well as adversely impact the availability and cost of credit;
• acceptance of the Company’s product and technology introductions in the marketplace;
• the amount of cash and non-cash charges in connection with the planned closure of the Company’s Newark, Ohio facility,
and the closure of the Company’s EMEA-based enterprise security operations;
• unanticipated litigation, claims or assessments;
• variations in consumer demand for financial self-service technologies, products and services;
39. . . . . . .
MANAGEMENT’S DISCUSSION AND ANALYSIS OF FINANCIAL CONDITION AND
RESULTS OF OPERATIONS as of December 31, 2008 (Continued)
(Unaudited)
(in thousands, except per share amounts)

• challenges raised about reliability and security of the Company’s election systems products, including the risk that such
products will not be certified for use or will be decertified;
• changes in laws regarding the Company’s election systems products and services;
• potential security violations to the Company’s information technology systems;
• the investment performance of our pension plan assets, which could require us to increase our pension contributions;
• the Company’s ability to successfully execute its strategy related to the elections systems business
• the Company’s ability to achieve benefits from its cost-reduction initiatives and other strategic changes; and
• the risk factors described above under “Item 1A. Risk Factors.”
ITEM 7A: QUANTITATIVE AND QUALITATIVE DISCLOSURES ABOUT MARKETRISK
(Dollars in thousands)
The Company is exposed to foreign currency exchange rate risk inherent in its international operations denominated in
currencies other than the U.S. dollar. A hypothetical 10 percent movement in the applicable foreign exchange rates would have
resulted in a an increase or decrease in 2008 and 2007 year-to-date operating profit of approximately $12,197 and $7,038,
respectively. The sensitivity model assumes an instantaneous, parallel shift in the foreign currency exchange rates. Exchange
rates rarely move in the same direction. The assumption that exchange rates change in an instantaneous or parallel fashion may
overstate the impact of changing exchange rates on amounts denominated in a foreign currency.
The Company’s risk-management strategy uses derivative financial instruments such as forwards to hedge certain foreign
currency exposures. The intent is to offset gains and losses that occur on the underlying exposures, with gains and losses on the
derivative contracts hedging these exposures. The Company does not enter into derivatives for trading purposes. The Company’s
primary exposures to foreign exchange risk are movements in the euro/dollar, pound/dollar, dollar/yuan, dollar/forint, and dollar/real
rates. There were no significant changes in the Company’s foreign exchange risks in 2008 compared with 2007.
The Company manages interest rate risk with the use of variable rate borrowings under its committed and uncommitted
credit facilities and interest rate swaps. Variable rate borrowings under the credit facilities totaled $306,488 and $328,164 at
December 31, 2008 and 2007, respectively, of which $50,000 was effectively converted to fixed rate using interest rate swaps. A
one percentage point increase or decrease in interest rates would have resulted in an increase or decrease in interest expense of
approximately $3,052 and $2,406 for 2008 and 2007, respectively, including the impact of the swap agreements. The Company’s
primary exposure to interest rate risk is movements in the London Interbank Offered Rate (LIBOR), which is consistent with prior
periods. As discussed in Note 9 to the Consolidated Financial Statements, the Company hedged $200,000 of the fixed rate
borrowings under its private placement agreement, which was treated as a cash flow hedge. This reduced the effective interest
rate by 14 basis points from 5.50 to 5.36 percent.
40. . . . . . .
MANAGEMENT’S DISCUSSION AND ANALYSIS OF FINANCIAL CONDITION AND
RESULTS OF OPERATIONS as of December 31, 2008 (Continued)
(Unaudited)
(in thousands, except per share amounts)

ITEM 8: FINANCIAL STATEMENTS AND SUPPLEMENTARY DATA
INDEX TO CONSOLIDATED FINANCIAL STATEMENTS
Financial Statements:
Reports of Independent Registered Public Accounting Firm 42
Consolidated Balance Sheets as of December 31, 2008 and December 31, 2007 45
Consolidated Statements of Income for the years ended December 31, 2008, December 31, 2007 and December 31,
2006 46
Consolidated Statements of Shareholders’ Equity for the years ended December 31, 2008, December 31, 2007 and
December 31, 2006 47
Consolidated Statements of Cash Flows for the years ended December 31, 2008, December 31, 2007 and
December 31, 2006 48
Notes to Consolidated Financial Statements 49
Financial Statement Schedule:
Schedule II — Valuation of Qualifying Accounts for the years ended December 31, 2008, December 31, 2007 and
December 31, 2006 98
All other schedules are omitted because they are not applicable.
41. . . . . . .

Report of Independent Registered Public Accounting Firm
The Board of Directors and Shareholders
Diebold, Incorporated:
We have audited the accompanying consolidated balance sheets of Diebold, Incorporated and subsidiaries (the Company) as
of December 31, 2008 and 2007, and the related consolidated statements of income, shareholders’ equity, and cash flows for
each of the years in the three-year period ended December 31, 2008. In connection with our audits of the consolidated financial
statements we have also audited the financial statement schedule, Schedule II “Valuation and Qualifying Accounts”. These
consolidated financial statements and the financial statement schedule are the responsibility of the Company’s management. Our
responsibility is to express an opinion on these consolidated financial statements and the financial statement schedule based on
our audits.
We conducted our audits in accordance with the standards of the Public Company Accounting Oversight Board (United
States). Those standards require that we plan and perform the audit to obtain reasonable assurance about whether the financial
statements are free of material misstatement. An audit includes examining, on a test basis, evidence supporting the amounts and
disclosures in the financial statements. An audit also includes assessing the accounting principles used and significant estimates
made by management, as well as evaluating the overall financial statement presentation. We believe that our audits provide a
reasonable basis for our opinion.
In our opinion, the consolidated financial statements referred to above present fairly, in all material respects, the financial
position of Diebold, Incorporated and subsidiaries as of December 31, 2008 and 2007, and the results of their operations and their
cash flows for each of the years in the three-year period ended December 31, 2008, in conformity with U.S. generally accepted
accounting principles. Also, in our opinion, the related financial statement schedule, when considered in relation to the basic
consolidated financial statements taken as a whole, presents fairly, in all material respects, the information set forth therein.
As discussed in Note 1 to the consolidated financial statements, the Company adopted Emerging Issues Task Force (EITF)
Issue No. 06-10, Accounting for Collateral Assignment Split-Dollar Life Insurance, and EITF Issue No. 06-4, Accounting for
Deferred Compensation and Post Retirement Benefit Aspects of Endorsement Split-Dollar Life Insurance Arrangements,
effective January 1, 2008.
As discussed in Note 4 to the consolidated financial statements, the Company adopted the provisions of Statement of
Financial Accounting Standards Board Interpretation No. 48, Accounting for Uncertainty in Income Taxes — an interpretation of
FASB Standard No. 109, effective January 1, 2007.
As discussed in Note 11 to the consolidated financial statements, the Company adopted the measurement date provisions of
Statement of Financial Accounting Standards No. 158, Employers’ Accounting for Defined Benefit Pension and Other Postre-
tirement Plans, effective January 1, 2008.
As discussed in Note 18 to the consolidated financial statements, the Company adopted the provisions of Statement of
Financial Accounting Standards No. 157, Fair Value Measurements, effective January 1, 2008.
We also have audited, in accordance with the standards of the Public Company Accounting Oversight Board (United States),
the Company’s internal control over financial reporting as of December 31, 2008, based on criteria established in Internal
Control — Integrated Framework issued by the Committee of Sponsoring Organizations of the Treadway Commission (COSO),
and our report dated February 27, 2009 expressed an adverse opinion on the effectiveness of the Company’s internal control over
financial reporting.
/s/ KPMG
Cleveland, Ohio
February 27, 2009
42. . . . . . .

Report of Independent Registered Public Accounting Firm
The Board of Directors and Shareholders
Diebold, Incorporated:
We have audited Diebold, Incorporated and Subsidiaries’ (the Company) internal control over financial reporting as of
December 31, 2008, based on criteria established in Internal Control — Integrated Framework issued by the Committee of
Sponsoring Organizations of the Treadway Commission (COSO). The Company’s management is responsible for maintaining
effective internal control over financial reporting and for its assessment of the effectiveness of internal control over financial
reporting, included in the accompanying Management’s Report on Internal Control over Financial Reporting appearing under
Item 9A(b) of the Company’s December 31, 2008 annual report on Form 10-K. Our responsibility is to express an opinion on the
Company’s internal control over financial reporting based on our audit.
We conducted our audit in accordance with the standards of the Public Company Accounting Oversight Board (United
States). Those standards require that we plan and perform the audit to obtain reasonable assurance about whether effective
internal control over financial reporting was maintained in all material respects. Our audit included obtaining an understanding of
internal control over financial reporting, assessing the risk that a material weakness exists, and testing and evaluating the design
and operating effectiveness of internal control based on the assessed risk. Our audit also included performing such other
procedures as we considered necessary in the circumstances. We believe that our audit provides a reasonable basis for our
opinion.
A company’s internal control over financial reporting is a process designed to provide reasonable assurance regarding the
reliability of financial reporting and the preparation of financial statements for external purposes in accordance with generally
accepted accounting principles. A company’s internal control over financial reporting includes those policies and procedures that
(1) pertain to the maintenance of records that, in reasonable detail, accurately and fairly reflect the transactions and dispositions of
the assets of the company; (2) provide reasonable assurance that transactions are recorded as necessary to permit preparation of
financial statements in accordance with generally accepted accounting principles, and that receipts and expenditures of the
company are being made only in accordance with authorizations of management and directors of the company; and (3) provide
reasonable assurance regarding prevention or timely detection of unauthorized acquisition, use, or disposition of the company’s
assets that could have a material effect on the financial statements.
Because of its inherent limitations, internal control over financial reporting may not prevent or detect misstatements. Also,
projections of any evaluation of effectiveness to future periods are subject to the risk that controls may become inadequate
because of changes in conditions, or that the degree of compliance with the policies or procedures may deteriorate.
A material weakness is a deficiency, or a combination of deficiencies, in internal control over financial reporting, such that
there is a reasonable possibility that a material misstatement of the company’s annual or interim financial statements will not be
prevented or detected on a timely basis. Material weaknesses related to the Company’s selection, application and communication
of accounting policies; monitoring; manual journal entries; contractual agreements; and account reconciliations have been
identified and included in Management’s Report on Internal Control over Financial Reporting appearing under Item 9A(b) of the
Company’s December 31, 2008 annual report on Form 10-K. These material weaknesses were considered in determining the
nature, timing, and extent of audit tests applied in our audit of the 2008 consolidated financial statements, and this report does not
affect our report dated February 27, 2009, which expressed an unqualified opinion on those consolidated financial statements.
43. . . . . . .

In our opinion, because of the effect of the aforementioned material weaknesses on the achievement of the objectives of the
control criteria, the Company has not maintained effective internal control over financial reporting as of December 31, 2008, based
on criteria established in Internal Control — Integrated Framework issued by the Committee of Sponsoring Organizations of the
Treadway Commission.
/s/ KPMG
Cleveland, Ohio
February 27, 2009
44. . . . . . .

DIEBOLD, INCORPORATED AND SUBSIDIARIES
CONSOLIDATED BALANCE SHEETS
(in thousands, except share amounts)
2008 2007
December 31,
ASSETS
Current assets
Cash and cash equivalents $ 241,436 $ 206,334Short-term investments 121,387 104,976Trade receivables, less allowances for doubtful accounts of $25,060 for 2008 and $33,707
for 2007 447,079 494,911Inventories 540,971 533,619Deferred income taxes 95,086 80,443Prepaid expenses 42,909 46,347Other current assets 125,250 127,500
Total current assets 1,614,118 1,594,130
Securities and other investments 70,914 75,227Property, plant and equipment at cost 579,951 575,796
Less accumulated depreciation and amortization 376,357 355,740
Property, plant and equipment, net 203,594 220,056Goodwill 408,303 465,484Deferred income taxes 69,698 —Other assets 171,309 239,827
Total assets $2,537,936 $2,594,724
LIABILITIES AND SHAREHOLDERS’ EQUITY
Current liabilities
Notes payable $ 10,596 $ 14,807Accounts payable 195,483 170,632Deferred revenue 195,164 251,657Payroll and benefits liabilities 75,215 76,995Other current liabilities 258,939 186,956
Total Current Liabilities 735,397 701,047
Notes payable — long term 594,588 609,264Pensions and other benefits 131,792 36,708Postretirement and other benefits 32,857 29,417Deferred income taxes 35,307 39,393Other long-term liabilities 43,737 50,304Minority interest 17,657 13,757
Shareholders’ equity
Preferred shares, no par value, 1,000,000 authorized shares, none issued — —Common shares, 125,000,000 authorized shares, 75,801,434 and 75,579,237 issued shares,
66,114,560, and 65,965,749 outstanding shares, respectively 94,752 94,474Additional capital 278,135 261,364Retained earnings 1,054,873 1,036,824Treasury shares, at cost (9,686,874 and 9,613,488 shares, respectively) (408,235) (406,182)Accumulated other comprehensive (loss) gain (72,924) 128,354
Total shareholders’ equity 946,601 1,114,834
Total liabilities and shareholders’ equity $2,537,936 $2,594,724
See accompanying Notes to Consolidated Financial Statements.
45. . . . . . .

DIEBOLD, INCORPORATED AND SUBSIDIARIES
CONSOLIDATED STATEMENTS OF INCOME
(in thousands, except per share amounts)
2008 2007 2006
Year Ended December 31,
Net sales
Products $1,562,948 $1,429,646 $1,500,998Services 1,607,132 1,517,835 1,419,976
3,170,080 2,947,481 2,920,974
Cost of sales
Products 1,145,225 1,070,286 1,057,375Services 1,230,239 1,195,286 1,128,428
2,375,464 2,265,572 2,185,803
Gross profit 794,616 681,909 735,171Selling and administrative expense 534,486 463,354 457,267Research, development and engineering expense 79,070 73,950 71,625Impairment of assets 4,376 46,319 19,337Loss (gain) on sale of assets, net 403 (6,392) 328
618,335 577,231 548,557
Operating profit 176,281 104,678 186,614Other income (expense)
Investment income 25,228 22,489 19,069Interest expense (45,247) (42,200) (35,305)Miscellaneous, net (8,887) 4,136 (2,088)
Minority interest (8,413) (8,365) (6,452)
Income from continuing operations before taxes 138,962 80,738 161,838Taxes on income 37,425 35,797 52,916
Income from continuing operations 101,537 44,941 108,922Loss from discontinued operations, net of tax (12,954) (5,400) (4,370)
Net income $ 88,583 $ 39,541 $ 104,552
Basic weighted-average shares outstanding 66,081 65,841 66,669Diluted weighted-average shares outstanding 66,492 66,673 67,253Basic earnings per share:
Net income from continuing operations $ 1.54 $ 0.68 $ 1.63Loss from discontinued operations $ (0.20) $ (0.08) $ (0.06)
Net income $ 1.34 $ 0.60 $ 1.57
Diluted earnings per share:
Net income from continuing operations $ 1.52 $ 0.67 $ 1.62Loss from discontinued operations $ (0.19) $ (0.08) $ (0.07)
Net income $ 1.33 $ 0.59 $ 1.55
See accompanying Notes to Consolidated Financial Statements.
46. . . . . . .

DIEBOLD, INCORPORATED AND SUBSIDIARIES
CONSOLIDATED STATEMENTS OF SHAREHOLDERS’ EQUITY
(in thousands)
Number Par Value
Additional
Capital
Retained
Earnings
Treasury
Shares
Comprehensive
(Loss) Income
Accumulated
Other
Comprehensive
(Loss) Income Other Total
Common Shares
Balance, January 1, 2006 74,726,031 $93,408 $198,619 $1,013,137 $(256,336) $ (3,781) $(287) $1,044,760
Net income 104,552 $ 104,552 104,552
Translation adjustment 50,246 50,246Hedges 2,428 2,428Pensions (637) (637)
Other comprehensive income 52,037 52,037
Comprehensive income $ 156,589
Stock options exercised 336,085 420 10,703 11,123Restricted stock units issued 4,635 6 (6) —Performance shares issued 5,800 7 (7) —Other share-based compensation 73,111 91 1,881 1,972Tax benefit from employee stock plans 1,198 1,198SFAS No. 123(R) reclass 4,807 287 5,094SFAS No. 158 adoption, net (35,624) (35,624)Share-based compensation expense 17,195 17,195Colombia acquisition 816 2,592 3,408DIMS acquisition 36 905 941Dividends declared and paid (57,964) (57,964)Treasury shares (150,259) (150,259)
Balance, December 31, 2006 75,145,662 $93,932 $235,242 $1,059,725 $(403,098) $ 12,632 $ — $ 998,433
Net income 39,541 $ 39,541 39,541
Translation adjustment 88,508 88,508Hedges (1,962) (1,962)Pensions 29,176 29,176
Other comprehensive income 115,722 115,722
Comprehensive income $ 155,263
Stock options exercised 241,365 302 8,252 8,554Restricted shares 8,620 11 295 306Restricted stock units issued 84,865 106 (106) —Performance shares issued 98,725 123 2,500 2,623Tax benefit from employee stock plans 1,399 1,399Share-based compensation expense 13,782 13,782Dividends declared and paid (62,442) (62,442)Treasury shares (3,084) (3,084)
Balance, December 31, 2007 75,579,237 $94,474 $261,364 $1,036,824 $(406,182) $ 128,354 $ — $1,114,834
Pension beginning retained earnings adjustment (Note 11) (1,387) (1,387)Split-dollar life insurance beginning retained earnings adjustment
(Note 1) (2,584) (2,584)
Net income 88,583 $ 88,583 88,583
Translation adjustment (99,689) (99,689)Hedges (4,910) (4,910)Pensions (96,679) (96,679)
Other comprehensive loss (201,278) (201,278)
Comprehensive loss $(112,695)
Stock options exercised 665 1 16 17Restricted shares 121,985 152 5,861 6,013Restricted stock units issued 49,526 62 (62) —Performance shares issued 50,021 63 719 782Tax expense from employee stock plans (2,122) (2,122)Share-based compensation expense 12,189 12,189Colombia acquisition earnout 170 230 400Dividends declared and paid (66,563) (66,563)Treasury shares (2,283) (2,283)
Balance, December 31, 2008 75,801,434 $94,752 $278,135 $1,054,873 $(408,235) $ (72,924) $ — $ 946,601
See accompanying Notes to Consolidated Financial Statements.
47. . . . . . .

DIEBOLD, INCORPORATED AND SUBSIDIARIES
CONSOLIDATED STATEMENTS OF CASH FLOWS
(in thousands)
2008 2007 2006
Year Ended December 31,
Cash flow from operating activities:
Net income $ 88,583 $ 39,541 $ 104,552Adjustments to reconcile net income to cash provided by operating activities:
Loss from discontinued operations 12,954 5,400 4,370Minority interest 8,413 8,365 6,452Depreciation and amortization 80,470 69,397 70,726Share-based compensation 12,189 13,782 17,195Excess tax benefits from share-based compensation (168) (917) (890)Deferred income taxes (12,547) (7,250) (23,592)Impairment of asset 4,376 46,319 19,337Loss (gain) on sale of assets, net 403 (6,392) 328
Cash provided (used) by changes in certain assets and liabilities:Trade receivables 10,633 120,949 46,109Inventories (53,650) 8,955 (4,258)Prepaid expenses 1,183 (10,256) (13,323)Other current assets (14,706) (20,055) (1,493)Accounts payable 36,480 6,331 (36,031)Deferred revenue (49,668) (89,921) 33,691Pension and postretirement benefits (2,900) (20,802) 14,038Certain other assets and liabilities 162,646 (13,186) (4,285)
Net cash provided by operating activities 284,691 150,260 232,926
Cash flow from investing activities:
Payments for acquisitions, net of cash acquired (4,461) (18,122) (74,320)Proceeds from maturities of investments 303,410 57,433 79,304Payments for purchases of investments (357,091) (50,588) (124,648)Proceeds from sale of fixed assets 42 3,242 6,442Capital expenditures (57,932) (43,259) (38,514)Increase in certain other assets (26,452) (29,076) (19,588)
Net cash used by investing activities (142,484) (80,370) (171,324)
Cash flow from financing activities:
Dividends paid (66,563) (62,442) (57,964)Notes payable borrowings 606,269 720,299 1,664,986Notes payable repayments (624,040) (784,358) (1,492,658)Distribution of affiliates’ earnings to minority interest holder (3,523) (18,236) (716)Excess tax benefits from share-based compensation 168 917 890Issuance of common shares — 8,544 9,745Repurchase of common shares — — (148,057)
Net cash used by financing activities (87,689) (135,276) (23,774)
Effect of exchange rate changes on cash (19,416) 17,752 5,747Increase (decrease) in cash and cash equivalents 35,102 (47,634) 43,575Cash and cash equivalents at the beginning of the year 206,334 253,968 210,393
Cash and cash equivalents at the end of the year $ 241,436 $ 206,334 $ 253,968
Cash paid for:
Income taxes $ 42,154 $ 53,176 $ 43,065Interest $ 30,747 $ 32,706 $ 33,235
See accompanying Notes to Consolidated Financial Statements.
48. . . . . . .

DIEBOLD INCORPORATED AND SUBSIDIARIES
FORM 10-K as of December 31, 2008
NOTES TO CONSOLIDATED FINANCIAL STATEMENTS
(in thousands, except per share amounts)
NOTE 1: SUMMARY OF SIGNIFICANT ACCOUNTING POLICIES
Principles of Consolidation The Consolidated Financial Statements include the accounts of Diebold, Incorporated and its
wholly and majority owned subsidiaries (collectively, the Company). All significant intercompany accounts and transactions have
been eliminated.
Use of Estimates in Preparation of Consolidated Financial Statements The preparation of the accompanying Consol-
idated Financial Statements in conformity with accounting principles generally accepted in the United States of America requires
management to make estimates and assumptions about future events. These estimates and the underlying assumptions affect
the amounts of assets and liabilities reported, disclosures about contingent assets and liabilities, and reported amounts of
revenues and expenses. Such estimates include the value of purchase consideration, valuation of trade receivables, inventories,
goodwill, intangible assets, and other long-lived assets, legal contingencies, guarantee obligations, indemnifications, and
assumptions used in the calculation of income taxes, pension and other postretirement benefits, and customer incentives,
among others. These estimates and assumptions are based on management’s best estimates and judgment. Management
evaluates its estimates and assumptions on an ongoing basis using historical experience and other factors, including the current
economic difficulties in the United States credit markets and the global markets. Management monitors the economic condition
and other factors and will adjust such estimates and assumptions when facts and circumstances dictate. Illiquid credit markets,
volatile foreign currency and equity, and declines in the global economic environment have combined to increase the uncertainty
inherent in such estimates and assumptions. As future events and their effects cannot be determined with precision, actual
results could differ significantly from these estimates. Changes in those estimates resulting from continuing changes in the
economic environment will be reflected in the financial statements in future periods.
International Operations The financial statements of the Company’s Diebold International (DI) operations are measured
using local currencies as their functional currencies, with the exception of Venezuela, Argentina, Barbados, Ecuador, El Salvador
and Panama, which are measured using the U.S. dollar as their functional currency. The Company translates the assets and
liabilities of its non-U.S. subsidiaries at the exchange rates in effect at year end and the results of operations at the average rate
throughout the year. The translation adjustments are recorded directly as a separate component of shareholders’ equity, while
transaction gains (losses) are included in net income. Sales to customers outside the United States approximated 50.6 percent in
2008, 48.1 percent of net sales in 2007 and 46.4 percent of net sales in 2006.
Reclassifications During 2008, the Company reclassified deferred product revenue for which it has not received payment as
a reduction in trade receivables, net. In accordance with Statement of Financial Accounting Standards No. 154, Accounting
Changes and Error Corrections, prior year amounts of deferred revenue and trade receivables have been adjusted to conform to
current year classification. As a result of applying the accounting change retrospectively, deferred product revenue of $49,591 as
of December 31, 2007, has been reclassified to reduce trade receivables, net in the Consolidated Balance Sheets. There was no
impact of the accounting change on previously reported cash flows from operations, income from operations, net income or
earnings per share of each prior period.
The Company has reclassified the presentation of certain prior-year information to conform to the current presentation,
including the above reclassification of trade receivables, net.
Revenue Recognition The Company’s revenue recognition policy is consistent with the requirements of Statement of
Position 97-2, Software Revenue Recognition (SOP 97-2), and Staff Accounting Bulletin 104 (SAB 104). In general, the Company
records revenue when it is realized, or realizable and earned. The Company considers revenue to be realized, or realizable and
earned, when the following revenue recognition requirements are met: persuasive evidence of an arrangement exists, which is a
customer contract; the products or services have been accepted by the customer via delivery or installation acceptance; the sales
49. . . . . . .

price is fixed or determinable within the contract; and collectability is probable. For product sales, the Company determines that
the earnings process is complete when title, risk of loss and the right to use equipment has transferred to the customer. Within the
Diebold North America (DNA) business segment, this occurs upon customer acceptance. Where the Company is contractually
responsible for installation, customer acceptance occurs upon completion of the installation of all items at a job site and the
Company’s demonstration that the items are in operable condition. Where items are contractually only delivered to a customer,
revenue recognition of these items is upon shipment or delivery to a customer location depending on the terms in the contract.
Within the DI business segment, customer acceptance is upon the earlier of delivery or completion of the installation depending
on the terms in the contract with the customer. The Company has the following revenue streams related to sales to its customers:
Self-Service Product & Service Revenue Self-service products pertain to ATMs. Included within the ATM is software,
which operates the ATM. The related software is considered more than incidental to the equipment as a whole. Revenue is
recognized in accordance with SOP 97-2. The Company also provides service contracts on ATMs.
Service contracts typically cover a 12-month period and can begin at any given month during the year after the standard
90-day warranty period expires. The service provided under warranty is significantly limited as compared to those offered under
service contracts. Further, warranty is not considered a separate element of the sale. The Company’s warranty covers only
replacement of parts inclusive of labor. Service contracts are tailored to meet the individual needs of each customer. Service
contracts provide additional services beyond those covered under the warranty, and usually include preventative maintenance
service, cleaning, supplies stocking and cash handling, all of which are not essential to the functionality of the equipment. For sales
of service contracts, where the service contract is the only element of the sale, revenue is recognized ratably over the life of the
contract period. In contracts that involve multiple-element arrangements, amounts deferred for services are determined based
upon vendor specific objective evidence of the fair value of the elements as prescribed in SOP 97-2. The Company determines fair
value of deliverables within a multiple element arrangement based on the price charged when each element is sold separately.
Physical Security & Facility Revenue The Company’s Physical Security and Facility Products division designs and
manufactures several of the Company’s financial service solutions offerings, including the RemoteTellerTM System (RTS). The
business unit also develops vaults, safe deposit boxes and safes, drive-up banking equipment and a host of other banking facilities
products. Revenue on sales of the products described above is recognized when the four revenue recognition requirements of
SAB 104 have been met.
Election Systems Revenue The Company, through its wholly owned subsidiaries, Premier Election Solutions, Inc. (PESI)
and Amazonia Industria Eletronica S.A. Procomp, offers voting equipment. Election systems revenue consists of election
equipment, software, training, support, installation and maintenance. The election equipment and software components are
included in product revenue. The training, support, installation and maintenance components are included in service revenue. The
election systems contracts contain multiple deliverable elements and custom terms and conditions. Revenue on election systems
contracts is recognized in accordance with SOP 97-2. The Company recognizes revenue for delivered elements only when the fair
values of undelivered elements are known, uncertainties regarding customer acceptance are resolved and there are no customer-
negotiated refund or return rights affecting the revenue recognized for delivered elements. The Company determines fair value of
deliverables within a multiple element arrangement based on the price charged when each element is sold separately. Some
contracts may contain discounts and, as such, revenue is recognized using the residual value method of allocation of revenue to
the product and service components of contracts.
Integrated Security Solutions Revenue Diebold Integrated Security Solutions provides global sales, service, installation,
project management and monitoring of original equipment manufacturer (OEM) electronic security products to financial,
government, retail and commercial customers. These solutions provide the Company’s customers a single-source solution to
50. . . . . . .
DIEBOLD INCORPORATED AND SUBSIDIARIES
FORM 10-K as of December 31, 2008
NOTES TO CONSOLIDATED FINANCIAL STATEMENTS (Continued)
(in thousands, except per share amounts)

their electronic security needs. Revenue is recognized in accordance with SAB 104. Revenue on sales of the products described
above is recognized upon shipment, installation or customer acceptance of the product as defined in the customer contract. In
contracts that involve multiple-element arrangements, amounts deferred for services are determined based upon the fair value of
the elements as prescribed in EITF 00-21, Accounting for Revenue Arrangements with Multiple Deliverables.
Software Solutions & Service Revenue The Company offers software solutions consisting of multiple applications that
process events and transactions (networking software) along with the related server. Sales of networking software represent
software solutions to customers that allow them to network various different vendors’ ATMs onto one network and revenue is
recognized in accordance with SOP 97-2.
Included within service revenue is revenue from software support agreements, which are typically 12 months in duration and
pertain to networking software. For sales of software support agreements, where the agreement is the only element of the sale,
revenue is recognized ratably over the life of the contract period. In contracts that involve multiple-element arrangements,
amounts deferred for support are determined based upon vendor specific objective evidence of the fair value of the elements as
prescribed in SOP 97-2.
Depreciation and Amortization Depreciation of property, plant and equipment is computed using the straight-line method
for financial statement purposes. Accelerated methods of depreciation are used for federal income tax purposes. Amortization of
leasehold improvements is based upon the shorter of original terms of the lease or life of the improvement. Repairs and
maintenance are expensed as incurred. Amortization of the Company’s other long-term assets such as its amortizable intangible
assets and capitalized computer software is computed using the straight-line method over the life of the asset.
Advertising Costs Advertising costs are expensed as incurred and were $14,417, $15,232 and $13,663 in 2008, 2007 and
2006, respectively.
Shipping and Handling Costs The Company recognizes shipping and handling fees billed when products are shipped or
delivered to a customer, and includes such amounts in net sales. Third-party freight payments are recorded in cost of sales.
Share-Based Compensation The Company accounts for share-based compensation arrangements, including stock options,
restricted stock units (RSUs) and performance shares, in accordance with Statement of Financial Accounting Standards (SFAS)
No. 123 (revised 2004), Share-Based Payment (SFAS 123R), which requires companies to recognize in the statement of income
the grant-date fair value of stock awards issued to employees and directors.
Taxes on Income In accordance with SFAS 109, deferred taxes are provided on an asset and liability method, whereby
deferred tax assets are recognized for deductible temporary differences and operating loss carryforwards and deferred tax
liabilities are recognized for taxable temporary differences. Deferred tax assets are reduced by a valuation allowance when, in the
opinion of management, it is more likely than not that some portion or all of the deferred tax assets will not be realized. Deferred
tax assets and liabilities are adjusted for the effects of changes in tax laws and rates on the date of enactment.
Sales Tax The Company collects sales taxes from customers and accounts for sales taxes on a net basis, in accordance with
EITF Issue No. 06-03.
Cash Equivalents The Company considers all highly liquid investments with original maturities of three months or less at the
time of purchase to be cash equivalents.
Financial Instruments The carrying amount of cash and cash equivalents, trade receivables and accounts payable,
approximated their fair value because of the relatively short maturity of these instruments. The Company’s risk-management
strategy uses derivative financial instruments such as forwards to hedge certain foreign currency exposures and interest rate
51. . . . . . .
DIEBOLD INCORPORATED AND SUBSIDIARIES
FORM 10-K as of December 31, 2008
NOTES TO CONSOLIDATED FINANCIAL STATEMENTS (Continued)
(in thousands, except per share amounts)

swaps to manage interest rate risk. The intent is to offset gains and losses that occur on the underlying exposures, with gains and
losses on the derivative contracts hedging these exposures. The Company does not enter into derivatives for trading purposes
and accounts for its derivative financial instruments in accordance with SFAS No. 133, Accounting for Derivative Instruments and
Hedging Activities. The Company recognizes all derivatives on the balance sheet at fair value. Changes in the fair values of
derivatives that are not designated as hedges are recognized in earnings. If the derivative is designated and qualifies as a hedge,
depending on the nature of the hedge, changes in the fair value of the derivatives are either offset against the change in the
hedged assets or liabilities through earnings or recognized in other comprehensive income until the hedged item is recognized in
earnings.
Allowances for Doubtful Accounts The concentration of credit risk in the Company’s trade receivables with respect to
financial and government customers is largely mitigated by the Company’s credit evaluation process and the geographical
dispersion of sales transactions from a large number of individual customers. The Company maintains allowances for potential
credit losses, and such losses have been minimal and within management’s expectations. Since the Company’s receivable
balance is concentrated primarily in the financial and government sectors, an economic downturn in these sectors could result in
higher than expected credit losses. The Company evaluates the collectability of accounts receivable based on (1) a percentage of
sales, which is based on historical loss experience and current trends, are reserved for uncollectible accounts as sales occur
throughout the year and (2) periodic adjustments for known events such as specific customer circumstances and changes in the
aging of accounts receivable balances.
Inventories The Company primarily values inventories at the lower of cost or market applied on a first-in, first-out (FIFO)
basis, with the notable exceptions of Brazil and PESI that value inventory using the average cost method, which approximates
FIFO. At each reporting period, the Company identifies and writes down its excess and obsolete inventory to its net realizable
value based on forecasted usage, orders and inventory aging. With the development of new products, the Company also
rationalizes its product offerings and will write down discontinued product to the lower of cost or net realizable value.
Deferred Revenue Deferred revenue is recorded for any services that are billed to customers prior to revenue being
realizable related to the service being provided. In addition, deferred revenue is recorded for any goods that are billed to and
collected from customers prior to revenue being recognized.
Split-Dollar Life Insurance On January 1, 2008, the Company adopted Emerging Issues Task Force (EITF) Issue No. 06-10,
Accounting for Collateral Assignment Split-Dollar Life Insurance, which applies to entities that participate in collateral assignment
split-dollar life insurance arrangements that extend into an employee’s retirement period (often referred to as “key person” life
insurance) and EITF Issue No. 06-4, Accounting for Deferred Compensation and Post Retirement Benefit Aspects of Endorsement
Split-Dollar Life Insurance Arrangements, which applies to life insurance arrangements that provide an employee with a specified
benefit that is not limited to the employee’s active service period. EITF Issue No. 06-10 requires employers to recognize a liability
for the postretirement obligation associated with a collateral assignment arrangement if, based on an agreement with an
employee, the employer has agreed to maintain a life insurance policy during the postretirement period or to provide a death
benefit. EITF Issue No. 06-4 requires employers to recognize a liability and related compensation costs for future benefits that
extend to postretirement periods. The adoption of these EITFs had a cumulative effect to beginning retained earnings of a
reduction of $2,584.
Goodwill Goodwill is the cost in excess of the net assets of acquired businesses. The Company tests all existing goodwill at
least annually for impairment using the fair value approach on a “reporting unit” basis in accordance with SFAS No. 142
(SFAS 142), Goodwill and Other Intangible Assets. The Company’s reporting units are defined as Domestic and Canada, Brazil,
Latin America, Asia Pacific, EMEA and Election Systems. The Company uses the discounted cash flow method and the guideline
52. . . . . . .
DIEBOLD INCORPORATED AND SUBSIDIARIES
FORM 10-K as of December 31, 2008
NOTES TO CONSOLIDATED FINANCIAL STATEMENTS (Continued)
(in thousands, except per share amounts)

company method for determining the fair value of its reporting units. As required by SFAS No. 142, the determination of implied
fair value of the goodwill for a particular reporting unit is the excess of the fair value of a reporting unit over the amounts assigned
to its assets and liabilities in the same manner as the allocation in a business combination. Implied fair value goodwill is determined
as the excess of the fair value of the reporting unit over the fair value of its assets and liabilities. The Company’s fair value model
uses inputs such as estimated future segment performance. The Company uses the most current information available and
performs the annual impairment analysis as of November 30 each year. However, actual circumstances could differ significantly
from assumptions and estimates made and could result in future goodwill impairment. The Company tests for impairment
between annual tests if an event occurs or circumstances change that would more likely than not reduce the carrying value of a
reporting unit below its reported amount.
The annual goodwill impairment test for 2008 resulted in no impairment. However, the Company’s fourth quarter decision to
close its security business in the EMEA region resulted in an impairment of $13,171 to the Domestic and Canada reporting unit
goodwill. This impairment charge is shown in the Company’s loss from discontinued operations. Upon initial acquisition, the
goodwill related to the EMEA security business was classified within the Company’s Domestic and Canada reporting unit for
goodwill impairment testing. The annual goodwill impairment test for 2007 resulted in an impairment charge of $46,319 related to
the Elections Systems reporting unit goodwill and represented the carrying value of PESI’s goodwill.
The changes in carrying amounts of goodwill for the years ended December 31, 2008 and 2007 are summarized as follows:
DNA DI ES & Other Total
Balance at January 1, 2007 $ 99,799 $314,176 $ 45,379 $459,354
Goodwill of acquired businesses & purchase accounting adjustments 10,556 1,472 940 12,968
Impairment loss — — (46,319) (46,319)
Currency translation adjustment 1,444 38,037 — 39,481
Balance at December 31, 2007 111,799 353,685 — 465,484
Goodwill of acquired businesses & purchase accounting adjustments 4,320 758 — 5,078
Impairment loss (13,171) — — (13,171)
Currency translation adjustment (6,583) (42,505) — (49,088)
Balance at December 31, 2008 $ 96,365 $311,938 $ — $408,303
Other Assets Included in other assets are net capitalized computer software development costs of $52,668 and $47,300 as
of December 31, 2008 and 2007, respectively. Amortization expense on capitalized software was $14,332, $11,556 and $11,500
for 2008, 2007 and 2006, respectively. Other long-term assets also consist of finance receivables, customer demonstration
equipment, patents, trademarks and other intangible assets. Where applicable, other assets are stated at cost and, if applicable,
are amortized ratably over the relevant contract period or the estimated life of the assets. Impairment of long-lived assets is
recognized when events or changes in circumstances indicate that the carrying amount of the asset may not be recoverable. If the
expected future undiscounted cash flows are less than the carrying amount of the asset, an impairment loss is recognized at that
time to reduce the asset to the lower of its fair value or its net book value in accordance with SFAS No. 144 (SFAS 144), Accounting
for the Impairment of Long-Lived Assets. For the year ended December 31, 2008, the Company impaired $4,376 of intangible
assets in continuing operations of the DNA segment and $3,487 of intangible assets within loss from discontinued operations.
Pensions and Postretirement Benefits Annual net periodic expense and benefit liabilities under the Company’s defined
benefit plans are determined on an actuarial basis. Assumptions used in the actuarial calculations have a significant impact on plan
obligations and expense. Annually, management and the Investment Committee of the Board of Directors review the actual
53. . . . . . .
DIEBOLD INCORPORATED AND SUBSIDIARIES
FORM 10-K as of December 31, 2008
NOTES TO CONSOLIDATED FINANCIAL STATEMENTS (Continued)
(in thousands, except per share amounts)

experience compared with the more significant assumptions used and make adjustments to the assumptions, if warranted. The
healthcare trend rates are reviewed with the actuaries based upon the results of their review of claims experience. The expected
long-term rate of return on plan assets is determined using the plans’ current asset allocation and their expected rates of return
based on a geometric averaging over 20 years. The discount rate is determined by analyzing the average return of high-quality (i.e.,
AA-rated) fixed-income investments and the year-over-year comparison of certain widely used benchmark indices as of the
measurement date. The rate of compensation increase assumptions reflects the Company’s long-term actual experience and
future and near-term outlook. Pension benefits are funded through deposits with trustees. The market-related value of plan assets
is calculated under an adjusted market value method in order to determine the Company’s net periodic benefit obligation. The
value is determined by adjusting the fair value of assets to reflect the investment gains and losses (i.e., the difference between the
actual investment return and the expected investment return on the market-related value of assets) during each of the last five
years at the rate of 20 percent per year. Postretirement benefits are not funded and the Company’s policy is to pay these benefits
as they become due.
In accordance with SFAS 158, Employers’ Accounting for Defined Pension and Other Postretirement Plans, the Company
recognizes the funded status of each of its plans in the Consolidated Balance Sheet. Amortization of unrecognized net gain or loss
resulting from experience different from that assumed and from changes in assumptions (excluding asset gains and losses not yet
reflected in market-related value) is included as a component of net periodic benefit cost for a year if, as of the beginning of the
year, that unrecognized net gain or loss exceeds five percent of the greater of the projected benefit obligation or the market-related
value of plan assets. If amortization is required, the amortization is that excess divided by the average remaining service period of
participating employees expected to receive benefits under the plan.
Comprehensive (Loss) Income The Company displays comprehensive (loss) income in the Consolidated Statements of
Shareholders’ Equity and accumulated other comprehensive (loss) income separately from retained earnings and additional capital
in the Consolidated Balance Sheets and Statements of Shareholders’ Equity. Items considered to be other comprehensive (loss)
income include adjustments made for foreign currency translation (under SFAS No. 52) pensions, net of tax (under SFAS No. 87
and SFAS No. 158) and hedging activities (under SFAS No. 133).
Accumulated other comprehensive (loss) income consists of the following:
2008 2007 2006
Year Ended December 31,
Translation adjustment $ 38,319 $138,008 $ 49,500
Realized and unrealized (losses) gains on hedges (2,877) 2,033 3,995
Pensions less accumulated taxes of ($64,573), ($6,213), and ($23,812),
respectively (108,366) (11,687) (40,863)
Total accumulated other comprehensive (loss) income $ (72,924) $128,354 $ 12,632
Translation Adjustments Translation adjustments are not booked net of tax. Those adjustments are accounted for under the
indefinite reversal criterion of APB Opinion No. 23, Accounting for Income Taxes — Special Areas.
54. . . . . . .
DIEBOLD INCORPORATED AND SUBSIDIARIES
FORM 10-K as of December 31, 2008
NOTES TO CONSOLIDATED FINANCIAL STATEMENTS (Continued)
(in thousands, except per share amounts)

NOTE 2: EARNINGS PER SHARE
The following data show the amounts used in computing earnings per share and the effect on the weighted-average number
of shares of dilutive potential common stock:
2008 2007 2006
December 31,
Numerator:
Income used in basic and diluted earnings per share:
Income from continuing operations — net of tax $101,537 $44,941 $108,922
Loss from discontinued operations — net of tax (12,954) (5,400) (4,370)
Net income $ 88,583 $39,541 $104,552
Denominator:
Weighted-average number of common shares used in basic earnings per share 66,081 65,841 66,669
Effect of dilutive shares 411 832 584
Weighted-average number of common shares and dilutive potential common shares
used in diluted earnings per share 66,492 66,673 67,253
Basic earnings per share:
Income from continuing operations — net of tax $ 1.54 $ 0.68 $ 1.63
Loss from discontinued operations — net of tax (0.20) (0.08) (0.06)
Net income $ 1.34 $ 0.60 $ 1.57
Diluted earnings per share:
Income from continuing operations — net of tax $ 1.52 $ 0.67 $ 1.62
Loss from discontinued operations — net of tax (0.19) (0.08) (0.07)
Net income $ 1.33 $ 0.59 $ 1.55
Anti-dilutive shares not used in calculating diluted weighted-average shares 2,469 1,141 976
NOTE 3: SHARE-BASED COMPENSATION AND EQUITY
DIVIDENDS
On the basis of amounts declared and paid, the annualized quarterly dividends per share were $1.00, $0.94 and $0.86 for the
years ended December 31, 2008, 2007 and 2006, respectively.
EMPLOYEE SHARE-BASED COMPENSATION
Stock options, restricted stock units (RSUs), restricted shares and performance shares have been issued to officers and other
management employees under the Company’s 1991 Equity and Performance Incentive Plan, as amended and restated (1991
Plan). The stock options generally vest over a four- or five-year period and have a maturity of ten years from the issuance date.
Option exercise prices equal the closing price of the Company’s common stock on the date of grant. RSUs provide for the issuance
of a share of the Company’s common stock at no cost to the holder and generally vest after three to seven years. During the
vesting period, employees are paid the cash equivalent of dividends on RSUs. Unvested RSUs are forfeited upon termination
unless the Board of Directors determines otherwise. Performance shares are granted based on certain management objectives,
55. . . . . . .
DIEBOLD INCORPORATED AND SUBSIDIARIES
FORM 10-K as of December 31, 2008
NOTES TO CONSOLIDATED FINANCIAL STATEMENTS (Continued)
(in thousands, except per share amounts)

as determined by the Board of Directors each year. Each performance share earned entitles the holder to one common share. The
performance share objectives are generally calculated over a three-year period and no shares are granted unless certain
management threshold objectives are met. To cover the exercise and/or vesting of its share-based payments, the Company
generally issues new shares from its authorized, unissued share pool. The number of common shares that may be issued pursuant
to the 1991 Plan was 4,730 of which 663 shares were available for issuance at December 31, 2008.
The Company recognizes costs resulting from all share-based payment transactions in the financial statements, including
stock options, RSUs and performance shares, based on the fair market value of the award as of the grant date. The Company
adopted SFAS 123(R) using the modified prospective application method of adoption, which requires the Company to record
compensation cost related to unvested stock awards as of December 31, 2005 by recognizing the unamortized grant date fair
value of these awards over the remaining requisite periods of those awards with no change in historical reported earnings. Awards
granted after December 31, 2005 are valued at fair value in accordance with provisions of SFAS 123(R) and recognized on a
straight-line basis over the requisite periods of each award. The Company estimated forfeiture rates for the year ended
December 31, 2008 based on its historical experience.
The estimated fair value of the options granted during 2008 and prior years was calculated using a Black-Scholes option
pricing model. The following summarizes the assumptions used in the Black-Scholes model for the years ended December 31,
2008, 2007 and 2006:
2008 2007 2006
December 31,
Expected life (in years) 5-7 6 3-6
Weighted-average volatility 27% 28% 33%
Risk-free interest rate 2.71 – 3.14% 3.64 – 4.72% 4.55 – 5.11%
Expected dividend yield 1.97 – 1.86% 1.63% 1.58 – 1.63%
The Black-Scholes model incorporates assumptions to value share-based awards. The risk-free rate of interest is based on a
zero-coupon U.S. government instrument over the expected life of the equity instrument. Expected volatility is based on historical
volatility of the price of the Company’s common stock. The Company uses historical data estimate option exercise timing within
the valuation model. Separate groups of employees that have similar historical exercise behavior with regard to option exercise
timing and forfeiture rates are considered separately for valuation and attribution purposes.
As of December 31, 2008, unrecognized compensation cost of $4,818 for stock options, $5,893 for RSUs and $4,280 for
performance shares is expected to be recognized over a weighted-average period of approximately 2.6, 1.9 and 1.2 years,
respectively.
56. . . . . . .
DIEBOLD INCORPORATED AND SUBSIDIARIES
FORM 10-K as of December 31, 2008
NOTES TO CONSOLIDATED FINANCIAL STATEMENTS (Continued)
(in thousands, except per share amounts)

Share-based compensation was recognized as a component of selling and administrative expenses. The following table
summarizes the components of the Company’s share-based compensation programs recorded as expense:
2008 2007 2006
December 31,
Stock Options:
Pre-tax compensation expense $ 3,371 $ 4,908 $ 7,242
Tax benefit (1,247) (1,816) (2,680)
Stock option expense, net of tax $ 2,124 $ 3,092 $ 4,562
RSUs:
Pre-tax compensation expense $ 3,683 $ 3,827 $ 5,075
Tax benefit (1,363) (1,416) (1,878)
RSU expense, net of tax $ 2,320 $ 2,411 $ 3,197
Restricted Shares:
Pre-tax compensation expense $ 7 $ 93 $ 188
Tax benefit (3) (34) (70)
Restricted share expense, net of tax $ 4 $ 59 $ 118
Performance Shares:
Pre-tax compensation expense $ 4,267 $ 4,383 $ 4,690
Tax benefit (1,579) (1,622) (1,735)
Performance share expense, net of tax $ 2,688 $ 2,761 $ 2,955
Deferred Shares:
Pre-tax compensation expense $ 861 $ 571 $ —
Tax benefit (319) (211) —
Deferred share expense, net of tax $ 542 $ 360 $ —
Total Share-Based Compensation:
Pre-tax compensation expense $12,189 $13,782 $17,195
Tax benefit (4,511) (5,099) (6,363)
Total share-based compensation, net of tax $ 7,678 $ 8,683 $10,832
57. . . . . . .
DIEBOLD INCORPORATED AND SUBSIDIARIES
FORM 10-K as of December 31, 2008
NOTES TO CONSOLIDATED FINANCIAL STATEMENTS (Continued)
(in thousands, except per share amounts)

Options outstanding and exercisable under the 1991 Plan as of December 31, 2008 and changes during the year ended were
as follows:
Number of SharesWeighted-Average
Exercise Price
Weighted-AverageRemaining
Contractual TermAggregate Intrinsic
Value(1)
(per share) (in years)
Outstanding at January 1,
2008 2,884 $41.56
Options expired or forfeited (291) $44.47
Options exercised — —
Options granted 336 $25.53
Outstanding at December 31,
2008 2,929 $39.43 5 $1,344
Options exercisable at
December 31, 2008 2,166 $40.60 4 $ 498
(1) The aggregate intrinsic value represents the total pre-tax intrinsic value (the difference between the Company’s closing stock price on the last trading day of the year
in 2008 and the exercise price, multiplied by the number of “in-the-money” options) that would have been received by the option holders had all option holders
exercised their options on December 31, 2008. The amount of aggregate intrinsic value will change based on the fair market value of the Company’s common stock.
The aggregate intrinsic value of options exercised for the years ended December 31, 2008, 2007 and 2006 was $0, $3,475
and $3,424, respectively. The weighted-average grant-date fair value of stock options granted for the years ended December 31,
2008, 2007 and 2006 was $6.61, $14.06 and $13.15, respectively. Total fair value of stock options vested for the years ended
December 31, 2008, 2007 and 2006 was $27,954, $27,243 and $24,754, respectively. Exercise of options during the year ended
December 31, 2008 and 2007 resulted in cash receipts of $0 and $8,544, respectively. The tax (expense)/benefit during the years
ended December 31, 2008 and 2007 related to the exercise of employee stock options were $(2,122) and $311, respectively.
The following table summarizes information on unvested RSUs:
RSUs: Number of Shares
Weighted-AverageGrant-Date Fair
Value
(per share)
Unvested at January 1, 2008 325 $45.14
Forfeited (22) 40.61
Vested (48) 54.55
Granted 134 28.13
Unvested at December 31, 2008 389 $38.36
The weighted average grant date fair value of RSUs granted for the years ended December 31, 2008, 2007 and 2006 was
$28.13, $47.17 and $39.45, respectively. The aggregate intrinsic value of RSUs vested during the years ended December 31,
2008, 2007 and 2006 was $2,627, $3,998 and $382, respectively.
58. . . . . . .
DIEBOLD INCORPORATED AND SUBSIDIARIES
FORM 10-K as of December 31, 2008
NOTES TO CONSOLIDATED FINANCIAL STATEMENTS (Continued)
(in thousands, except per share amounts)
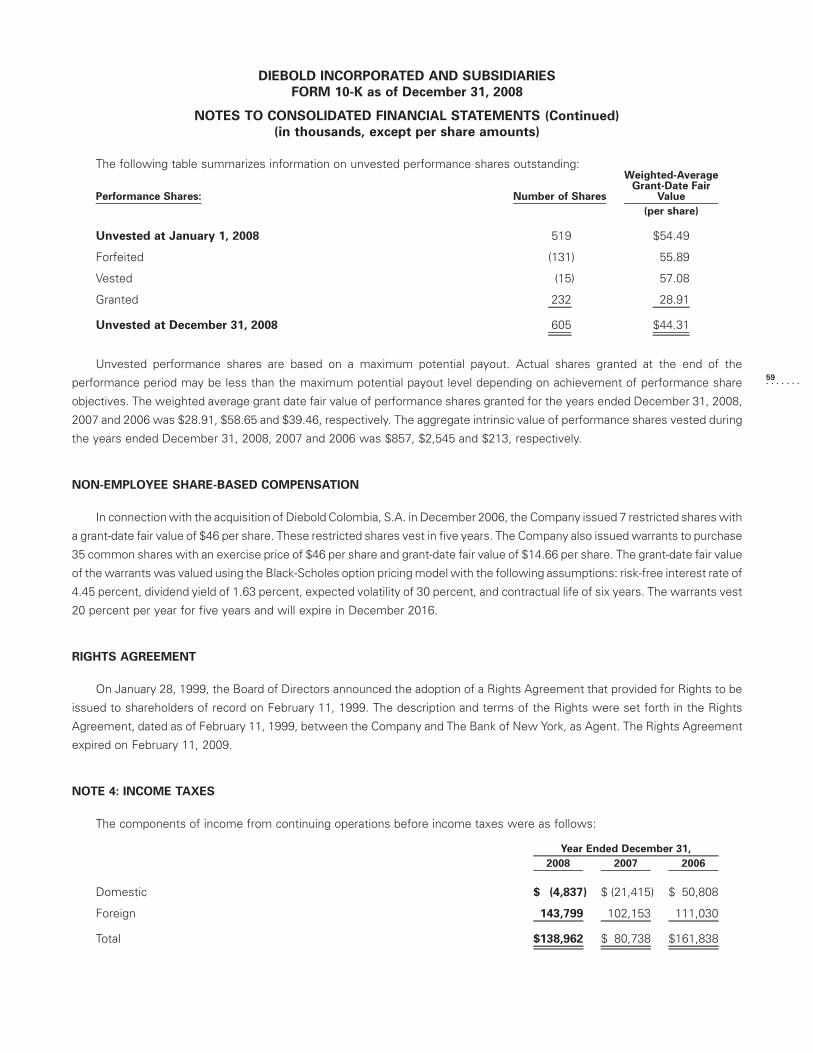
The following table summarizes information on unvested performance shares outstanding:
Performance Shares: Number of Shares
Weighted-AverageGrant-Date Fair
Value
(per share)
Unvested at January 1, 2008 519 $54.49
Forfeited (131) 55.89
Vested (15) 57.08
Granted 232 28.91
Unvested at December 31, 2008 605 $44.31
Unvested performance shares are based on a maximum potential payout. Actual shares granted at the end of the
performance period may be less than the maximum potential payout level depending on achievement of performance share
objectives. The weighted average grant date fair value of performance shares granted for the years ended December 31, 2008,
2007 and 2006 was $28.91, $58.65 and $39.46, respectively. The aggregate intrinsic value of performance shares vested during
the years ended December 31, 2008, 2007 and 2006 was $857, $2,545 and $213, respectively.
NON-EMPLOYEE SHARE-BASED COMPENSATION
In connection with the acquisition of Diebold Colombia, S.A. in December 2006, the Company issued 7 restricted shares with
a grant-date fair value of $46 per share. These restricted shares vest in five years. The Company also issued warrants to purchase
35 common shares with an exercise price of $46 per share and grant-date fair value of $14.66 per share. The grant-date fair value
of the warrants was valued using the Black-Scholes option pricing model with the following assumptions: risk-free interest rate of
4.45 percent, dividend yield of 1.63 percent, expected volatility of 30 percent, and contractual life of six years. The warrants vest
20 percent per year for five years and will expire in December 2016.
RIGHTS AGREEMENT
On January 28, 1999, the Board of Directors announced the adoption of a Rights Agreement that provided for Rights to be
issued to shareholders of record on February 11, 1999. The description and terms of the Rights were set forth in the Rights
Agreement, dated as of February 11, 1999, between the Company and The Bank of New York, as Agent. The Rights Agreement
expired on February 11, 2009.
NOTE 4: INCOME TAXES
The components of income from continuing operations before income taxes were as follows:
2008 2007 2006
Year Ended December 31,
Domestic $ (4,837) $ (21,415) $ 50,808
Foreign 143,799 102,153 111,030
Total $138,962 $ 80,738 $161,838
59. . . . . . .
DIEBOLD INCORPORATED AND SUBSIDIARIES
FORM 10-K as of December 31, 2008
NOTES TO CONSOLIDATED FINANCIAL STATEMENTS (Continued)
(in thousands, except per share amounts)

Income tax expense (benefit) from continuing operations is comprised of the following components:
2008 2007 2006
Year Ended December 31,
Current:U.S. Federal $ 21,073 $ 8,021 $14,886Foreign 38,441 30,862 33,863State and local 4,560 1,527 5,623
Total current $ 64,074 $40,410 $54,372Deferred:U.S. Federal $(27,172) $ (9,500) $ (75)Foreign 45 2,298 (671)State and local 478 2,589 (710)
Total deferred $(26,649) $ (4,613) $ (1,456)
Total income tax expense $ 37,425 $35,797 $52,916
In addition to the income tax expenses listed above for the years ended December 31, 2008, 2007 and 2006, income tax
(benefit) expense allocated directly to shareholders’ equity for the same periods were $(55,782), $16,144, and $(23,497),
respectively. Income tax benefit allocated to discontinued operations for the year ended December 31, 2008 was $(10,045).
A reconciliation of the U.S. statutory tax rate and the effective tax rate for continuing operations is as follows:
2008 2007 2006
Year EndedDecember 31,
Statutory tax rate 35.0% 35.0% 35.0%State and local income taxes, net of federal tax benefit 2.3 2.4 2.3Foreign income taxes (6.9) 0.9 (2.4)Accrual adjustments 4.6 0.1 0.1U.S. taxed foreign income (4.3) (4.6) 1.0Subsidiary losses (1.1) (11.0) (2.7)Goodwill impairment — 20.0 —Other (2.7) 1.5 (0.6)
Effective tax rate 26.9% 44.3% 32.7%
Effective January 1, 2007, the Company adopted FIN 48, which prescribes a recognition threshold and measurement
attribute for the recognition and measurement of a tax position taken, or expected to be taken, in a tax return.
60. . . . . . .
DIEBOLD INCORPORATED AND SUBSIDIARIES
FORM 10-K as of December 31, 2008
NOTES TO CONSOLIDATED FINANCIAL STATEMENTS (Continued)
(in thousands, except per share amounts)

Details of the unrecognized tax benefits are as follows:
2008 2007
Balance at January 1 $10,714 $ 9,020Increases related to prior year tax positions 531 —Decreases related to prior year tax positions (1,381) (1,231)Increases related to current year tax positions 1,539 4,631Decreases related to current year tax positions — —Settlements (2,368) (1,706)Reduction due to lapse of applicable statute of limitations (26) —
Balance at December 31 $ 9,009 $10,714
The entire amount of unrecognized tax benefits, if recognized, would affect the Company’s effective tax rate.
The Company classifies interest expense and penalties related to the underpayment of income taxes in the financial
statements as income tax expense. Consistent with the treatment of interest expense, the Company accrues interest income on
overpayments of income taxes where applicable and classifies interest income as a reduction of income tax expense in the
financial statements. As of December 31, 2008 and 2007, accrued interest and penalties related to unrecognized tax benefits
totaled approximately $3,149 and $2,474.
The Company does not anticipate a significant change to the total amount of unrecognized tax benefits within the next
12 months. The expected timing of payments cannot be determined with any degree of certainty.
At December 31, 2008, the Company is under audit by the IRS for tax years ending December 31, 2007, 2006 and 2005. All
federal tax years prior to 2002 are closed by statute. The Company is subject to tax examination in various U.S. state jurisdictions
for tax years 2003 to the present, as well as various foreign jurisdictions for tax years 1997 to the present.
61. . . . . . .
DIEBOLD INCORPORATED AND SUBSIDIARIES
FORM 10-K as of December 31, 2008
NOTES TO CONSOLIDATED FINANCIAL STATEMENTS (Continued)
(in thousands, except per share amounts)

Deferred income taxes reflect the net tax effects of temporary differences between the carrying amount of assets and
liabilities for financial reporting purposes and the amounts used for income tax purposes. Significant components of the
Company’s deferred tax assets and liabilities are as follows:
2008 2007
December 31,
Deferred Tax Assets:
Postretirement benefits $ 7,799 $ 7,663Accrued expenses 31,303 20,352Warranty accrual 12,012 5,287Deferred compensation 16,984 17,488Bad debts 7,916 10,988Inventory 18,575 14,454Deferred revenue 19,144 20,974Pension 41,935 (6,533)Research and development credit 3,170 —Foreign tax credit 20,550 16,299Net operating loss carryforward 114,902 89,083State deferred taxes 12,329 6,597Other 10,160 10,218
316,779 212,870Valuation allowance (97,188) (85,429)
Net deferred tax assets $219,591 $127,441
Deferred Tax Liabilities:
Property, plant and equipment 15,287 5,615Goodwill 47,193 55,447Finance receivables 6,660 6,828Software capitalized 4,310 3,558Partnership income 15,445 13,084Other 1,219 1,859
Net deferred tax liabilities 90,114 86,391
Net deferred tax asset $129,477 $ 41,050
At December 31, 2008, the Company’s domestic and international subsidiaries had deferred tax assets relating to net
operating loss (NOL) carryforwards of $114,902. Of these NOL carryforwards, $66,208 expires at various times between 2009
and 2028. The remaining NOL carryforwards of approximately $48,694 do not expire. The Company has a valuation allowance to
reflect the estimated amount of deferred tax assets that, more likely than not, will not be realized. The valuation allowance relates
primarily to certain international and state NOLs. The net change in total valuation allowance for the years ended December 31,
2008 and 2007 was an increase of $11,759 and $32,167, respectively.
A determination of the unrecognized deferred tax liability on undistributed earnings of non-U.S. subsidiaries and investments
in foreign unconsolidated affiliates is not practicable. However, no liability for U.S. income taxes on such undistributed earnings
has been provided because it is the Company’s policy to reinvest these earnings indefinitely in operations outside the United
States.
62. . . . . . .
DIEBOLD INCORPORATED AND SUBSIDIARIES
FORM 10-K as of December 31, 2008
NOTES TO CONSOLIDATED FINANCIAL STATEMENTS (Continued)
(in thousands, except per share amounts)

NOTE 5: INVESTMENTS
As of December 31, 2008 and 2007, the Company had $121,387 and $104,976, respectively, of short-term securities and
other investments and $70,914 and $75,227, respectively, of long-term securities and other investments. The Company’s
investments in certificates of deposit are recorded at cost, which approximates fair value due to their short term nature and lack of
volatility. Deposits with banks and money market funds, classified as short-term investments, include accrued interest. The
Company’s investments consist of the following:
2008 2007
December 31,
Cash surrender value of insurance contracts $ 62,934 $ 61,171Rabbi trust 7,984 13,492Certificates of deposit 117,026 104,976Other 4,357 564
Total securities and other investments $192,301 $180,203
NOTE 6: FINANCE RECEIVABLES
The components of finance receivables for the net investment in sales-type leases are as follows:
2008 2007
December 31,
Total minimum lease receivable $47,885 $40,157Estimated unguaranteed residual values 4,558 2,594
52,443 42,751Less:Unearned interest income (5,164) (3,406)Unearned residuals (1,133) (649)
(6,297) (4,055)
Total(1) $46,146 $38,696
(1) Finance receivables include $7,971 and $11,655 for the years ended December 31, 2008 and 2007, respectively, of receivables owned by Diebold OLTP Systems.
The company owns fifty-percent of Diebold OLTP Systems, which is consolidated.
Future minimum lease receivables due from customers under sales-type leases as of December 31, 2008 are as follows:
SalesType Leases
2009 $13,2572010 17,6652011 8,2522012 5,7612013 2,473Thereafter 477
$47,885
63. . . . . . .
DIEBOLD INCORPORATED AND SUBSIDIARIES
FORM 10-K as of December 31, 2008
NOTES TO CONSOLIDATED FINANCIAL STATEMENTS (Continued)
(in thousands, except per share amounts)

NOTE 7: INVENTORIES
Major classes of inventories at December 31 are summarized as follows:
2008 2007
December 31,
Finished goods $276,439 $252,729Service parts 144,742 152,039Work in process 54,752 64,414Raw materials 65,038 64,437
Total inventories $540,971 $533,619
The Company had a write down of inventory of $12,969 in 2008 and $3,713 in 2007, related to select equipment within PESI.
NOTE 8: PROPERTY, PLANT AND EQUIPMENT
The following is a summary of property, plant and equipment, at cost less accumulated depreciation and amortization, at
December 31:
EstimatedUseful Life
(years) 2008 2007
December 31,
Land and land improvements 0-15 $ 6,178 $ 6,230Buildings and building equipment 15 59,230 57,809Machinery, tools and equipment 5-12 107,918 103,359Leasehold improvements 10 20,811 19,201Computer equipment 3-5 75,869 87,984Computer software 5-10 150,387 137,509Furniture and fixtures 5-8 72,486 73,531Tooling 3-5 76,228 73,320Construction in progress 10,844 16,853
Total property plant and equipment 579,951 575,796Less accumulated depreciation and amortization 376,357 355,740
Total property plant and equipment, net $203,594 $220,056
During 2008, 2007 and 2006, depreciation expense, computed on a straight-line basis over the estimated useful lives of the
related assets, was $55,295, $45,549 and $45,695, respectively.
64. . . . . . .
DIEBOLD INCORPORATED AND SUBSIDIARIES
FORM 10-K as of December 31, 2008
NOTES TO CONSOLIDATED FINANCIAL STATEMENTS (Continued)
(in thousands, except per share amounts)

NOTE 9: NOTES PAYABLE
The notes payable balances as of December 31 were as follows:
2008 2007
December 31,
Notes payable — current:Revolving foreign currency loans(1) $ 8,084 $ 7,473Revolving U.S. dollar loans 2,512 7,334
$ 10,596 $ 14,807
Notes payable — long term:Revolving euro loans(2) $ 49,588 $ 99,264Revolving U.S. dollar loans 245,000 210,000Senior notes 300,000 300,000
$594,588 $609,264
Total notes payable $605,184 $624,071
(1) Indian rupees (INR) 394,519 borrowings translated at the applicable December 31, 2008 spot rate; INR 177,390 borrowing translated at the applicable December 31,
2007 spot rate.
(2) c35,476 borrowing translated at the applicable December 31, 2008 spot rate; c68,045 borrowing translated at the applicable December 31, 2007 spot rate.
The Company has a credit facility with borrowing limits of $509,665, ($300,000 and c150,000, translated) at December 31,
2008. Under the terms of the credit facility agreement, the Company has the ability to increase the borrowing limits by $150,000.
This facility expires on April 27, 2010. As of December 31, 2008, $294,588 was outstanding under the Company’s credit facility and
$215,077 was available for borrowing.
In March 2006, the Company issued senior notes in an aggregate principal amount of $300,000 with a weighted average fixed
interest rate of 5.50 percent. The maturity dates of the senior notes are staggered, with $75,000, $175,000 and $50,000 becoming
due in 2013, 2016 and 2018, respectively. Additionally, the Company entered into a derivative transaction to hedge interest rate
risk on $200,000 of the senior notes, which was treated as a cash flow hedge. This reduced the effective interest rate by 14 basis
points from 5.50 to 5.36 percent.
The amount of committed loans at December 31, 2008 that remained available was $55,000 and c114,523 ($160,077
translated). In addition to the committed lines of credit, $37,500, 28,000 Brazilian real ($11,981 translated), and 34,072 Indian
rupees ($698 translated) in uncommitted lines of credit were available as of December 31, 2008.
The average interest rate on the Company’s bank credit lines was 3.90 percent, 5.46 percent and 4.66 percent for the years
ended December 31, 2008, 2007 and 2006, respectively. Interest charged to expense for the years ended December 31, 2008,
2007 and 2006 was $30,137, $33,077 and $34,883, respectively.
Maturities of notes payable as of December 31, 2008 are as follows: $10,596 in 2009, $294,588 in 2010, $75,000 in 2013 and
$225,000 thereafter.
The Company’s financing agreements contain various restrictive financial covenants, including net debt to capitalization and
net interest coverage ratios. As of December 31, 2008, the Company was in compliance with the financial covenants in our debt
agreements.
65. . . . . . .
DIEBOLD INCORPORATED AND SUBSIDIARIES
FORM 10-K as of December 31, 2008
NOTES TO CONSOLIDATED FINANCIAL STATEMENTS (Continued)
(in thousands, except per share amounts)

NOTE 10: OTHER LONG-TERM LIABILITIES
Included in other long-term liabilities are bonds payable. Bonds payable at December 31 consist of the following:
2008 2007
December 31,
Industrial development revenue bond due January 1, 2017 $ 4,400 $ 4,400
Industrial development revenue bond due June 1, 2017 7,500 7,500
Total long-term bonds payable $11,900 $11,900
In 1997, industrial development revenue bonds were issued on behalf of the Company. The proceeds from the bond
issuances were used to construct new manufacturing facilities in the United States. The Company guaranteed the payments of
principal and interest on the bonds by obtaining letters of credit. Each industrial development revenue bond carries a variable
interest rate, which is reset weekly by the remarketing agents. The average interest rate on the bonds was 2.66 percent,
3.73 percent and 3.55 percent for the years ended December 31, 2008, 2007 and 2006, respectively. Interest on the bonds
charged to expense for the years ended December 31, 2008, 2007 and 2006 was $329, $446 and $432, respectively. As of
December 31, 2008, the Company was in compliance with the financial covenants of its loan agreements and believes the
financial covenants will not restrict its future operations.
NOTE 11: BENEFIT PLANS
Qualified Pension Benefits Plans that cover salaried employees provide pension benefits based on the employee’s
compensation during the ten years before retirement. The Company’s funding policy for salaried plans is to contribute annually
based on actuarial projections and applicable regulations. Plans covering hourly employees and union members generally provide
benefits of stated amounts for each year of service. The Company’s funding policy for hourly plans is to make at least the minimum
annual contributions required by applicable regulations. Employees of the Company’s operations in countries outside of the United
States participate to varying degrees in local pension plans, which in the aggregate are not significant. In addition to these plans,
union employees in one of the Company’s U.S. manufacturing facilities participate in the International Union of Electronic,
Electrical, Salaried, Machine and Furniture Workers-Communications Workers of America (IUE-CWA) multi-employer pension
fund. Pension expense related to the multi-employer pension plan was $202, $214 and $431 for the years ended December 31,
2008, 2007 and 2006, respectively.
Supplemental Executive Retirement Benefits The Company has non-qualified pension plans to provide supplemental
retirement benefits to certain officers. Benefits are payable at retirement based upon a percentage of the participant’s com-
pensation, as defined.
Other Benefits In addition to providing pension benefits, the Company provides healthcare and life insurance benefits
(referred to as Other Benefits) for certain retired employees. Eligible employees may be entitled to these benefits based upon
years of service with the Company, age at retirement and collective bargaining agreements. Currently, the Company has made no
commitments to increase these benefits for existing retirees or for employees who may become eligible for these benefits in the
future. Currently there are no plan assets and the Company funds the benefits as the claims are paid. The postretirement benefit
obligation was determined by application of the terms of medical and life insurance plans together with relevant actuarial
assumptions and healthcare cost trend rates.
66. . . . . . .
DIEBOLD INCORPORATED AND SUBSIDIARIES
FORM 10-K as of December 31, 2008
NOTES TO CONSOLIDATED FINANCIAL STATEMENTS (Continued)
(in thousands, except per share amounts)

Prior to 2008, the Company used a September 30 measurement date to report its pension and other benefits at fiscal year-
end. In accordance with SFAS No. 158 (SFAS 158), Employers’ Accounting for Defined Benefit Pension and Other Postretirement
Plans — an amendment of FASB Statements No, 87, 88, 106 and 132(R), the Company remeasured its plan assets and benefit
obligations on January 1, 2008 in order to transition to a fiscal year-end measurement date. This resulted in a cumulative beginning
of year adjustment to retained earnings of $1,092 for Pension Benefits and $295 for Other Benefits.
The following tables set forth the change in benefit obligation, change in plan assets, funded status, Consolidated Balance
Sheet presentation and net periodic benefit cost for the Company’s defined benefit pension plans and other benefits at
December 31:
2008 2007 2008 2007
December 31,
Pension Benefits
December 31,
Other Benefits
Change in benefit obligation
Benefit obligation at beginning of year $ 435,070 $426,791 $ 19,972 $ 23,395
Service cost 12,335 11,429 3 6
Interest cost 35,046 25,592 1,526 1,358
Amendments — 276 — —
Actuarial loss (gain) 937 (11,674) (46) (2,531)
Plan participants’ contributions — — 159 206
Benefits paid (22,185) (17,011) (3,278) (2,462)
Curtailments (39) (514) — —
Other (33) 181 235 —
Benefit obligation at end of year $ 461,131 $435,070 $ 18,571 $ 19,972
Change in plan assets
Fair value of plan assets at beginning of year $ 453,085 $397,766 $ — $ —
Actual return on plan assets (111,040) 60,900 — —
Employer contributions 7,473 11,430 3,119 2,256
Plan participant contributions — — 159 206
Benefits paid (22,185) (17,011) (3,278) (2,462)
Fair value of plan assets at end of year $ 327,333 $453,085 $ — $ —
67. . . . . . .
DIEBOLD INCORPORATED AND SUBSIDIARIES
FORM 10-K as of December 31, 2008
NOTES TO CONSOLIDATED FINANCIAL STATEMENTS (Continued)
(in thousands, except per share amounts)

2008 2007 2008 2007
December 31,
Pension Benefits
December 31,
Other Benefits
Funded status
Funded status $(133,798) $ 18,015 $(18,571) $(19,972)
Unrecognized net actuarial loss 168,246 12,739 5,779 6,375
Unrecognized prior service cost (benefit) 1,915 2,433 (3,001) (3,647)
Prepaid (accrued) pension cost $ 36,363 $ 33,187 $(15,793) $(17,244)
Amounts recognized in Balance Sheets
Noncurrent assets $ — $ 57,917 $ — $ —
Current liabilities (2,725) (2,690) (1,931) (2,191)
Noncurrent liabilities(1) (131,073) (37,212) (16,640) (17,781)
Accumulated other comprehensive income 170,161 15,172 2,778 2,728
Net amount recognized $ 36,363 $ 33,187 $(15,793) $(17,244)
(1) Included in the Consolidated Balance Sheets in Pensions and other benefits and Postretirement and other benefits are international benefit liabilities.
2008 2007 2006 2008 2007 2006
December 31,
Pension Benefits
December 31,
Other Benefits
Components of net periodic benefit cost
Service cost $ 9,839 $ 11,429 $ 11,179 $ 2 $ 6 $ 8
Interest cost 28,046 25,592 23,045 1,221 1,358 1,294
Expected return on plan assets (35,747) (33,008) (30,995) — — —
Amortization of prior service cost(1) 381 614 765 (517) (516) (532)
Recognized net actuarial loss 804 4,033 4,552 432 731 792
Special termination benefits — — — — — (74)
Curtailment gain (52) (489) — — — —
Net periodic pension benefit cost $ 3,271 $ 8,171 $ 8,546 $1,138 $1,579 $1,488
(1) The annual amortization of pension benefits prior service costs is determined as the increase in projected benefit obligation due to the plan change divided by the
average remaining service period of participating employees expected to receive benefits under the plan.
68. . . . . . .
DIEBOLD INCORPORATED AND SUBSIDIARIES
FORM 10-K as of December 31, 2008
NOTES TO CONSOLIDATED FINANCIAL STATEMENTS (Continued)
(in thousands, except per share amounts)

The following table represents information for pension plans with an accumulated benefit obligation in excess of plan assets
for the year ended December 31, 2008 and 2007, respectively:
2008 2007
December 31,
Projected benefit obligation $461,131 $39,901
Accumulated benefit obligation 415,648 37,562
Fair value of plan assets 327,333 —
The accumulated benefit obligation for all defined benefit pension plans was $415,648 and $390,279 at December 31, 2008
and 2007, respectively.
The following table represents the weighted-average assumptions used to determine benefit obligations at December 31,
2008 and 2007, respectively.
2008 2007 2008 2007
December 31,
Pension Benefits
December 31,
Other Benefits
Assumptions
Discount rate 6.41% 6.50% 6.41% 6.50%
Rate of compensation increase 3.25% 3.50%
The following table represents the weighted-average assumptions used to determine periodic benefit cost at December 31,
2008 and 2007, respectively.
2008 2007 2008 2007
December 31,
Pension Benefits
December 31,
Other Benefits
Assumptions
Discount rate 6.63% 6.13% 6.63% 6.13%
Expected long-term return on plan assets 8.50% 8.75%
Rate of compensation increase 3.50% 3.00%
The expected long-term rate of return on plan assets is primarily determined using the plan’s current asset allocation and its
expected rates of return based on a geometric averaging over 20 years. The Company also considers information provided by its
investment consultant, a survey of other companies using a December 31 measurement date and the Company’s historical asset
performance in determining the expected long-term rate of return. The discount rate was determined with the assistance of a
third-party using cash-flow bond matching analysis. The rate of compensation increase assumptions reflects the Company’s long-
term actual experience and future and near-term outlook. Pension benefits are funded through deposits with trustees. The
market-related value of plan assets is calculated under an adjusted market-value method. The value is determined by adjusting the
fair value of assets to reflect the investment gains and losses (i.e., the difference between the actual investment return and the
expected investment return on the market-related value of assets) during each of the last five years at the rate of 20 percent per
year.
69. . . . . . .
DIEBOLD INCORPORATED AND SUBSIDIARIES
FORM 10-K as of December 31, 2008
NOTES TO CONSOLIDATED FINANCIAL STATEMENTS (Continued)
(in thousands, except per share amounts)
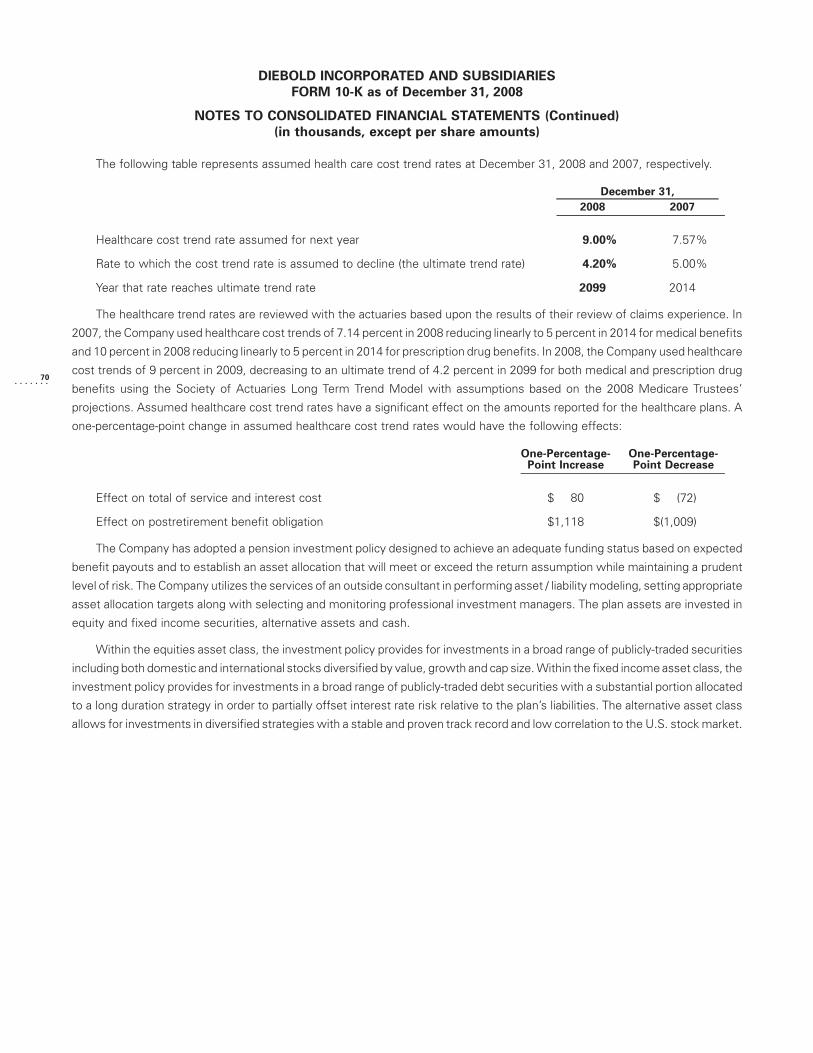
The following table represents assumed health care cost trend rates at December 31, 2008 and 2007, respectively.
2008 2007
December 31,
Healthcare cost trend rate assumed for next year 9.00% 7.57%
Rate to which the cost trend rate is assumed to decline (the ultimate trend rate) 4.20% 5.00%
Year that rate reaches ultimate trend rate 2099 2014
The healthcare trend rates are reviewed with the actuaries based upon the results of their review of claims experience. In
2007, the Company used healthcare cost trends of 7.14 percent in 2008 reducing linearly to 5 percent in 2014 for medical benefits
and 10 percent in 2008 reducing linearly to 5 percent in 2014 for prescription drug benefits. In 2008, the Company used healthcare
cost trends of 9 percent in 2009, decreasing to an ultimate trend of 4.2 percent in 2099 for both medical and prescription drug
benefits using the Society of Actuaries Long Term Trend Model with assumptions based on the 2008 Medicare Trustees’
projections. Assumed healthcare cost trend rates have a significant effect on the amounts reported for the healthcare plans. A
one-percentage-point change in assumed healthcare cost trend rates would have the following effects:
One-Percentage-Point Increase
One-Percentage-Point Decrease
Effect on total of service and interest cost $ 80 $ (72)
Effect on postretirement benefit obligation $1,118 $(1,009)
The Company has adopted a pension investment policy designed to achieve an adequate funding status based on expected
benefit payouts and to establish an asset allocation that will meet or exceed the return assumption while maintaining a prudent
level of risk. The Company utilizes the services of an outside consultant in performing asset / liability modeling, setting appropriate
asset allocation targets along with selecting and monitoring professional investment managers. The plan assets are invested in
equity and fixed income securities, alternative assets and cash.
Within the equities asset class, the investment policy provides for investments in a broad range of publicly-traded securities
including both domestic and international stocks diversified by value, growth and cap size. Within the fixed income asset class, the
investment policy provides for investments in a broad range of publicly-traded debt securities with a substantial portion allocated
to a long duration strategy in order to partially offset interest rate risk relative to the plan’s liabilities. The alternative asset class
allows for investments in diversified strategies with a stable and proven track record and low correlation to the U.S. stock market.
70. . . . . . .
DIEBOLD INCORPORATED AND SUBSIDIARIES
FORM 10-K as of December 31, 2008
NOTES TO CONSOLIDATED FINANCIAL STATEMENTS (Continued)
(in thousands, except per share amounts)

The following table summarizes the Company’s target mixes for these asset classes in 2009, which are readjusted at least
quarterly within a defined range, and the Company’s pension plan asset allocation as of December 31, 2008 and 2007:
Asset Category 2009 2008 2007
TargetAllocation
Percentage of Pension Plan,Assets at December 31,
Equity securities 50% 50% 62%
Debt securities 35% 40% 32%
Real estate 5% 0% 0%
Other 10% 10% 6%
Total 100% 100% 100%
The following table represents the amortization amounts expected to be recognized during 2009:
PensionBenefits
OtherBenefits
Amount of net prior service cost/(credit) $ 271 $(517)
Amount of net loss 3,345 442
The Company contributed $6,784 to its pension plans, including contributions to the nonqualified plan, and $2,516 to its other
postretirement benefit plan in the year ended December 31, 2008. Also, the Company expects to contribute $14,812 to its
pension plans, including the nonqualified plan, and $1,993 to its other postretirement benefit plan in the year ended December 31,
2009.
Benefit PaymentsPensionBenefits
Other Benefitsbefore
MedicarePart D Subsidy
Other Benefitsafter MedicarePart D Subsidy
2009 $ 18,861 $2,251 $1,993
2010 20,169 2,199 1,936
2011 21,556 2,193 1,934
2012 23,467 2,146 1,890
2013 25,244 2,091 1,842
2014 — 2018 156,353 9,240 8,170
Retirement Savings Plan The Company offers an employee 401(k) savings plan (Savings Plan) to encourage eligible
employees to save on a regular basis by payroll deductions. Effective July 1, 2003, a new enhanced benefit to the Savings Plan
became effective. All new salaried employees hired on or after July 1, 2003 are provided with an employer basic matching
contribution in the amount of 100 percent of the first three percent of eligible pay and 60 percent of the next three percent of
eligible pay. This new enhanced benefit is in lieu of participation in the pension plan for salaried employees. For employees hired
prior to July 1, 2003, the Company matched 60 percent of participating employees’ first three percent of contributions and
40 percent of participating employees’ next three percent of contributions. Total Company match was $12,510, $11,608 and
$9,939 for the years ended December 31, 2008, 2007 and 2006, respectively.
Deferred Compensation Plans The Company has deferred compensation plans that enable certain employees to defer
receipt of a portion of their compensation and non-employee directors to defer receipt of director fees at the participants’
discretion.
71. . . . . . .
DIEBOLD INCORPORATED AND SUBSIDIARIES
FORM 10-K as of December 31, 2008
NOTES TO CONSOLIDATED FINANCIAL STATEMENTS (Continued)
(in thousands, except per share amounts)

NOTE 12: LEASES
The Company’s future minimum lease payments due under operating leases for real estate, vehicles and other equipment in
effect at December 31, 2008 are as follows:
Year Total Real Estate Equipment
2009 $ 66,058 $ 24,465 $ 41,593
2010 52,050 21,416 30,634
2011 37,629 17,665 19,964
2012 23,261 14,478 8,783
2013 14,939 12,443 2,496
Thereafter 24,645 24,645 —
$218,582 $115,112 $103,470
Under lease agreements that contain escalating rent provisions, lease expense is recorded on a straight-line basis over the
lease term. Rental expense under all lease agreements amounted to approximately $84,708, $83,588 and $81,019 for the years
ended December 31, 2008, 2007 and 2006, respectively.
NOTE 13: GUARANTEES AND PRODUCT WARRANTIES
In connection with the construction of certain manufacturing facilities, the Company guaranteed repayment of principal and
interest on variable-rate industrial development revenue bonds by obtaining letters of credit. The bonds were issued with a 20-year
original term and are scheduled to mature in 2017. At December 31, 2008, the carrying value of the liability was $11,900.
The Company provides its global operations guarantees and standby letters of credit through various financial institutions to
suppliers, regulatory agencies and insurance providers. If the Company is not able to make payment, the suppliers, regulatory
agencies and insurance providers may draw on the pertinent bank. At December 31, 2008, the maximum future payment
obligations relative to these various guarantees totaled $61,615, of which $19,528 represented standby letters of credit to
insurance providers, and no associated liability was recorded. At December 31, 2007, the maximum future payment obligations
relative to these various guarantees totaled $65,592, of which $22,663 represented standby letters of credit to insurance
providers, and no associated liability was recorded.
The Company provides its customers a standard manufacturer’s warranty and records, at the time of the sale, a corre-
sponding estimated liability for potential warranty costs. Estimated future obligations due to warranty claims are based upon
72. . . . . . .
DIEBOLD INCORPORATED AND SUBSIDIARIES
FORM 10-K as of December 31, 2008
NOTES TO CONSOLIDATED FINANCIAL STATEMENTS (Continued)
(in thousands, except per share amounts)

historical factors such as labor rates, average repair time, travel time, number of service calls per machine and cost of replacement
parts. Changes in the Company’s warranty liability balance are illustrated in the following table:
Warranty liability 2008 2007
December 31,
Balance at January 1 $ 26,494 $ 22,511
Current period accruals 49,689 33,463
Current period settlements (33,174) (29,480)
Balance at December 31 $ 43,009 $ 26,494
NOTE 14: COMMITMENTS AND CONTINGENCIES
At December 31, 2008, the Company had purchase commitments for materials through contract manufacturing agreements
at negotiated prices totaling $19,488.
At December 31, 2008, the Company was a party to several lawsuits that were incurred in the normal course of business,
none of which individually or in the aggregate is considered material by management in relation to the Company’s financial position
or results of operations. In management’s opinion, the Consolidated Financial Statements would not be materially affected by the
outcome of any present legal proceedings, commitments or asserted claims.
In addition to the routine legal proceedings noted above, the Company has been served with various lawsuits, filed against it
and certain current and former officers and directors, by shareholders and participants in the Company’s Savings Plan, alleging
violations of the federal securities laws and breaches of fiduciary duties with respect to the 401(k) plan. These complaints seek
compensatory damages in an unspecific amount, fees and expenses related to such lawsuits and the granting of extraordinary
equitable and/or injunctive relief. The cases alleging violations of the federal securities laws have been consolidated into a single
proceeding. The cases alleging breaches of fiduciary duties under the Employee Retirement Income Security Act of 1974 with
respect to the 401(k) plan likewise have been consolidated into a single proceeding. The Company and the individual defendants
deny the allegations made against them, regard them as without merit, and intend to defend themselves vigorously. On
August 22, 2008, the court dismissed the consolidated amended complaint in the consolidated securities litigation and entered a
judgment in favor of the defendants; however, on September 16, 2008, the plaintiffs filed a notice of appeal.
The Company, including certain of its subsidiaries, filed a lawsuit on May 30, 2008 against the Board of Elections of Cuyahoga
County, Ohio, the Board of County Commissioners of Cuyahoga County, Ohio, (collectively, the County), and Ohio Secretary of
State Jennifer Brunner (Secretary) regarding several Ohio contracts under which the Company provided electronic voting systems
and related services to the State of Ohio and a number of its counties. The complaint seeks a declaration that the Company met its
contractual obligations. In response, both the County and the Secretary have filed answers and counterclaims seeking declaratory
relief and unspecified damages under several theories of recovery. The Butler County Board of Elections has joined in, and
incorporated by reference, the Secretary’s counterclaim. The Secretary has also added ten Ohio counties as additional defen-
dants, claiming that those counties also experienced problems with the voting systems, but many of those counties have moved
for dismissal. The Company has not yet responded to the counterclaims.
Management is unable to determine the financial statement impact, if any, of the federal securities class action, the 401(k)
class action and the derivative actions as of December 31, 2008.
73. . . . . . .
DIEBOLD INCORPORATED AND SUBSIDIARIES
FORM 10-K as of December 31, 2008
NOTES TO CONSOLIDATED FINANCIAL STATEMENTS (Continued)
(in thousands, except per share amounts)

The Company was informed during the first quarter of 2006 that the staff of the SEC had begun an informal inquiry relating to
the Company’s revenue recognition policy. In the second quarter of 2006, the Company was informed that the SEC’s inquiry had
been converted to a formal, non-public investigation. In the fourth quarter of 2007, the Company also learned that the Department
of Justice (DOJ) had begun a parallel investigation. The Company is continuing to cooperate with the government in connection
with these investigations. The Company cannot predict the length, scope or results of the investigations, or the impact, if any, on
its results of operations.
NOTE 15: ACQUISITIONS
The following mergers and acquisitions were accounted for as purchase business combinations and, accordingly, the
purchase price has been or will be allocated to identifiable tangible and intangible assets acquired and liabilities assumed, based
upon their respective fair values, with the excess allocated to goodwill. Results of operations from the date of acquisition of these
companies are included in the condensed consolidated statements of operations of the Company.
In February 2008, the Company formed a partnership, D&G Centroamerica, S. de R.L. (D&G), based in Costa Rica with an
initial investment of approximately $6,423. The Company owns 51 percent of the partnership. The minority partner of D&G was
previously used by the Company as a distributor in Central America. Goodwill and other intangibles, net of amortization, resulting
from the acquisition amounted to approximately $731 and $5,686, respectively, as of December 31, 2008. D&G is included as part
of the Company’s DI segment.
In January 2007, the Company acquired Brixlogic, Inc. (Brixlogic) based in San Mateo, California for approximately $8,349.
Brixlogic is a software development firm previously used by the Company for various software development projects. Other
intangibles, net of amortization, resulting from the acquisition amounted to approximately $6,665 as of December 31, 2008.
Brixlogic is included as part of the Company’s DNA segment.
NOTE 16: DERIVATIVE INSTRUMENTS AND HEDGING ACTIVITIES
The Company uses derivatives to mitigate the negative economic consequences associated with the fluctuations in
currencies and interest rates. SFAS No. 133, (SFAS 133) Accounting for Derivative Instruments and Hedging Activities, requires
that all derivative instruments be recorded on the balance sheet at fair value and that the changes in the fair value be recognized
currently in earnings unless specific hedge accounting criteria are met. Special accounting for qualifying hedges allows derivative
gains and losses to be reflected in the income statement together with the hedged exposure, and requires that a company
formally document, designate and assess the effectiveness of transactions that receive hedge accounting treatment. The
Company does not enter into any speculative positions with regard to derivative instruments.
FOREIGN EXCHANGE
Non-Designated Hedges A substantial portion of the Company’s operations and revenues are international. As a result,
changes in foreign exchange rates can create substantial foreign exchange gains and losses from the revaluation of non-functional
currency monetary assets and liabilities. The Company’s policy allows the use of foreign exchange forward contracts with
maturities of up to 24 months to mitigate the impact of currency fluctuations on those foreign currency asset and liability balances.
The Company elected not to apply hedge accounting to its foreign exchange forward contracts under SFAS 133. Thus, derivative
gains/losses offset revaluation gains/losses in other income (expense).
Net Investment Hedges The Company has international subsidiaries with assets in excess of liabilities that generate the risk
of cumulative translation adjustments within other comprehensive income. The Company uses derivatives to manage potential
74. . . . . . .
DIEBOLD INCORPORATED AND SUBSIDIARIES
FORM 10-K as of December 31, 2008
NOTES TO CONSOLIDATED FINANCIAL STATEMENTS (Continued)
(in thousands, except per share amounts)

adverse changes in value of its net investments in Brazil and South Africa. The Company’s policy is to selectively enter into foreign
exchange forward contracts with variable maturities documented as net investment hedges to offset certain net investment
exchange rate movements. The Company calculates each hedge’s effectiveness quarterly by comparing the cumulative change in
the forward contract to the cumulative change in the hedged portion of the net investment on a forward to forward basis. Changes
in value that are deemed effective are accumulated in other comprehensive income where they will remain until they are
reclassified to income together with the gain or loss on the entire investment upon substantial liquidation of the subsidiary. During
the year ended December 31, 2008, a gain of $10,718 was recorded in other comprehensive income related to net investment
hedges.
INTEREST RATE
Cash Flow Hedges The Company has variable rate debt and is subject to fluctuations in interest related cash flows due to
changes in market interest rates. The Company’s policy allows derivative instruments designated as cash flow hedges which fix a
portion of future variable-rate interest expense. The Company has executed two pay-fixed receive-variable interest rate swaps to
hedge against changes in the LIBOR benchmark interest rate on a portion of the companies’ LIBOR-based credit facility.
The Company calculates each hedge’s effectiveness quarterly by comparing the cumulative change in the interest rate swaps
to the cumulative change in hypothetical interest rate swaps with critical terms that match the credit facility. Changes in value that
are deemed effective are accumulated in other comprehensive income and reclassified to interest expense when the hedged
interest is accrued. There was no ineffectiveness from over-performance of the interest rate swaps recorded in interest expense
in 2008. Should it become probable that the Company’s variable rate borrowings will not occur, the gains or losses on the related
cash flow hedges will be reclassified from other comprehensive income to interest expense.
In December 2005 and January 2006, the Company executed pre-issuance cash flow hedges by entering into receive-variable
and pay-fixed interest rate swaps related to the anticipated debt issuance in March 2006. Amounts previously recorded in other
comprehensive income related to the pre-issuance cash flow hedges will continue to be reclassified to income on a straight-line
basis through February 2016.
The following table summarizes the impact of interest rate cash flow hedges on other comprehensive (loss) income (pre-tax)
in 2008:
Interest Rate Hedge
January 1, 2008 $ 1,670
Net change on cash flow hedge (4,278)
Reclassification to interest expense (269)
December 31, 2008 $(2,877)
The Company anticipates reclassifying $1,321 from other comprehensive income to interest expense within the next
12 months.
75. . . . . . .
DIEBOLD INCORPORATED AND SUBSIDIARIES
FORM 10-K as of December 31, 2008
NOTES TO CONSOLIDATED FINANCIAL STATEMENTS (Continued)
(in thousands, except per share amounts)

NOTE 17: RESTRUCTURING CHARGES
The following table summarizes the Company’s restructuring charges by plan for the years ended December 31, 2008, 2007
and 2006:
2008 2007 2006
Year Ended December 31,
DCM Plan $ 3,247 $19,977 $ —
Germany Plan 6,024 3,224 —
RIF Plan 21,222 — —
Newark Plan 9,125 — —
Global R&D Plan — — 12,474
Other 1,954 391 14,503
Total $41,572 $23,592 $26,977
Diebold Cassis Manufacturing (DCM) Plan
During the first quarter of 2006, the Company announced a plan (DCM plan) to close its production facility in Cassis, France in
an effort to optimize its global manufacturing operations. As of December 31, 2008, the Company anticipates remaining total costs
related to the closure of this facility to be approximately $700. For the year ended December 31, 2008, the Company incurred
$3,247 through product cost of sales. The accrual balance as of December 31, 2008 was immaterial to the Company.
76. . . . . . .
DIEBOLD INCORPORATED AND SUBSIDIARIES
FORM 10-K as of December 31, 2008
NOTES TO CONSOLIDATED FINANCIAL STATEMENTS (Continued)
(in thousands, except per share amounts)

There were no restructuring expenses related to the Company’s Diebold Election Systems (ES) & Other operating segment
during the year ended December 31, 2008 for the DCM Plan. Restructuring expenses for the DCM Plan are presented in the
following table:
DNA DI
Total amount expected to be incurred
Employee severance costs $ — $18,889
Other(1) 886 10,608
Total expected costs $ 886 $29,497
Gain on sale of building — (6,438)
Total net expected costs $ 886 $23,059
Amount incurred during the year ended December 31, 2008
Employee severance costs $ — $ 1,644
Other(1) 886 717
Total costs $ 886 $ 2,361
Amount incurred to date under the plan
Employee severance costs $ — $18,524
Other(1) 886 10,252
Total costs incurred to date $ 886 $28,776
Gain on sale of building — (6,438)
Total net costs incurred to date $ 886 $22,338
(1) Other costs include legal and contract termination fees, asset impairment costs, and costs to transfer usable inventory and equipment.
Germany Plan
During the third quarter of 2007, the Company announced a plan (Germany plan) to downsize its operations in Germany in an
effort to remove excess capacity. During the first quarter of 2008, the plan was modified to initiate a full closure of operations in
Germany in light of further declines in sales opportunities resulting from a fully mature market. For the year ended December 31,
2008, the Company incurred total restructuring charges of $6,024: $1,772 through product cost of sales, $2,769 through service
cost of sales, $1,509 through selling and administrative and ($26) through (gain)/loss on sale of assets, net. As of December 31,
2008, the Company does not anticipate incurring any additional costs in relation to this plan and the accrual balance as of
December 31, 2008 was immaterial to the Company.
77. . . . . . .
DIEBOLD INCORPORATED AND SUBSIDIARIES
FORM 10-K as of December 31, 2008
NOTES TO CONSOLIDATED FINANCIAL STATEMENTS (Continued)
(in thousands, except per share amounts)

There were no restructuring expenses related to the Company’s ES & Other operating segment during the year ended
December 31, 2008 for the Germany Plan. Restructuring expenses for the Germany Plan are presented in the following table:
DNA DI
Total amount expected to be incurredEmployee severance costs $ — $3,657Other(1) 466 5,125
Total expected costs $ 466 $8,782
Amount incurred during the year ended December 31, 2008Employee severance costs $ — $2,638Other(1) 466 2,920
Total costs $ 466 $5,558
Amount incurred to date under the planEmployee severance costs $ — $3,657Other(1) 466 5,125
Total costs incurred to date $ 466 $8,782
(1) Other costs include consulting and legal fees, contract termination fees and asset impairment costs
Reduction-In-Force (RIF) Plan
During the first quarter of 2008, the Company announced a plan to reduce its global workforce (RIF plan), including
consolidation of certain international facilities, in an effort to optimize overall operational performance. As of December 31, 2008,
the Company anticipates remaining total costs of approximately $1,400 to be incurred through the end of the second quarter of
2009. For the year ended December 31, 2008 the company incurred total restructuring charges of $21,222: $1,208 through
product cost of sales, $6,608 through service cost of sales, $9,694 through selling and administrative and $3,712 through research
and development. Restructuring expenses for the RIF Plan are presented in the following table:
DNA DI ES & Other
Total amount expected to be incurredEmployee severance costs $4,616 $13,390 $ 663Other(1) — 3,951 —
Total expected costs $4,616 $17,341 $ 663
Amount incurred during the year ended December 31, 2008Employee severance costs $4,616 $13,390 $ 663Other(1) — 2,553 —
Total costs $4,616 $15,943 $ 663
Amount incurred to date under the planEmployee severance costs $4,616 $13,390 $ 663Other(1) — 2,553 —
Total costs incurred to date $4,616 $15,943 $ 663
(1) Other costs include legal fees, contract termination fees and asset impairment costs
78. . . . . . .
DIEBOLD INCORPORATED AND SUBSIDIARIES
FORM 10-K as of December 31, 2008
NOTES TO CONSOLIDATED FINANCIAL STATEMENTS (Continued)
(in thousands, except per share amounts)

The restructuring accrual related to the RIF plan is presented in the following table:
BalanceJanuary 1, 2008
LiabilitiesIncurred
LiabilitiesPaid/Settled
BalanceDec 31, 2008
Employee severance costs $ — $18,669 $10,964 $7,705
Other — 2,553 571 1,982
Total $ — $21,222 $11,535 $9,687
Newark Plan
During the second quarter of 2008, the Company announced a plan (Newark plan) to close its manufacturing facility in
Newark, Ohio as part of its continued focus on its strategic global manufacturing realignment. As of December 31, 2008, the
Company anticipates remaining total costs related to the closure of this facility to be approximately $1,300. The Company
anticipates the closure of this facility to be substantially complete by the end of the first quarter of 2009. For the year ended
December 31, 2008, the Company incurred $9,125 through product cost of sales.
There were no restructuring expenses related to the Company’s DI and ES & Other operating segments during the year
ended December 31, 2008 for the Newark Plan. Restructuring expenses for the Newark Plan are presented in the following table:
DNA
Total amount expected to be incurred
Employee severance costs $ 1,318
Other(1) 9,107
Total expected costs $10,425
Amount incurred during the year ended December 31, 2008
Employee severance costs $ 968
Other(1) 8,157
Total costs $ 9,125
Amount incurred to date under the plan
Employee severance costs $ 968
Other(1) 8,157
Total costs incurred to date $ 9,125
(1) Other costs include pension obligation.
The restructuring accrual related to the Newark plan is presented in the following table:
BalanceJanuary 1, 2008
LiabilitiesIncurred
LiabilitiesPaid/Settled
BalanceDec 31, 2008
Employee severance costs $ — $ 968 $ 366 $ 602
Other — 8,157 1,422 6,735
Total $ — $9,125 $1,788 $7,337
79. . . . . . .
DIEBOLD INCORPORATED AND SUBSIDIARIES
FORM 10-K as of December 31, 2008
NOTES TO CONSOLIDATED FINANCIAL STATEMENTS (Continued)
(in thousands, except per share amounts)

Global R&D Plan
During 2006, the Company initiated a restructuring plan related to realignment of its global research and development efforts
(R&D plan). Total pre-tax costs incurred during 2006 related to the R&D plan were $12,474. The Company incurred $1,085 in its
DNA segment, $11,358 in its DI segment and $31 in its ES & Other segment. The income statement line in which these charges
are included is $55 in product cost of sales, $3,959 in service cost of sales, $4,380 in selling and administrative, $3,950 in research
and development and $130 in other income and expense.
Other Restructuring Charges
During 2008, the Company incurred total other restructuring charges of $1,954: $630 through product cost of sales, $286
through service cost of sales, $577 through selling and administrative and $461 through (gain)/loss on sale of assets, net. Of these
charges, $574 was incurred in the DNA segment and $1,380 was incurred in the DI segment.
During 2007, the Company incurred total other restructuring charges of $391 in the DI segment selling and administrative
expenses. During 2006, the Company incurred restructuring charges related to the termination of an IToutsourcing agreement of
$7,000, realignment of the Company’s global manufacturing operations of $3,017, relocation of its European headquarters of
$3,486 and product development rationalization of $1,000. The Company incurred $5,672 in its DNA segment, $8,286 in its DI
segment and $545 in its ES & Other segment. The income statement line in which these charges are included is $3,244 in product
cost of sales, $10,486 in selling and administrative and the remainder in research and development and other income and
expense.
Other Charges
The Company incurred legal, consultation, audit and financial advisory fees (collectively referred to as non-routine expenses)
of $45,145 for the year ended December 31, 2008 related to the filing of the restated financial statements and the unsolicited
takeover bid from United Technologies Corp. As of December 31, 2008 the accrual balance for these non-routine expenses was
approximately $18,000. The Company incurred legal, audit and financial advisory fees of $7,288 and $791 for the years ended
December 31, 2007 and 2006, respectively, related to the filing of the restated financial statements.
NOTE 18: FAIR VALUE OF ASSETS AND LIABILITIES
Effective January 1, 2008, the Company adopted SFAS No. 157 (SFAS 157), Fair Value Measurements for its financial assets
and liabilities, as required. In February 2008, the FASB issued FASB Staff Position No. 157-2, which deferred the effective date of
SFAS 157 for nonfinancial assets and liabilities except for those recognized or disclosed on a recurring basis. SFAS 157 establishes
a common definition for fair value to be applied to US GAAP guidance requiring the use of fair value, establishes a framework for
measuring fair value, and expands disclosure requirements about such fair value measurements. The standard does not require
any new fair value measurements, but rather applies to all other accounting pronouncements that require or permit fair value
measurements.
The Company adopted SFAS 157 on January 1, 2008 with respect to financial assets and financial liabilities that are measured
at fair value within the Consolidated Financial Statements and deferred the adoption for non-financial assets and non-financial
liabilities until January 1, 2009. Accordingly, the provisions of SFAS 157 were not applied to long-lived assets and goodwill and
other intangible assets measured for impairment testing purposes.
80. . . . . . .
DIEBOLD INCORPORATED AND SUBSIDIARIES
FORM 10-K as of December 31, 2008
NOTES TO CONSOLIDATED FINANCIAL STATEMENTS (Continued)
(in thousands, except per share amounts)

The hierarchy that prioritizes the inputs to valuation techniques used to measure fair value is divided into three levels:
• Level 1 — Unadjusted quoted prices in active markets for identical assets or liabilities.
• Level 2 — Unadjusted quoted prices in active markets for similar assets or liabilities, unadjusted quoted prices for identical
or similar assets or liabilities in markets that are not active or inputs, other than quoted prices in active markets, that are
observable either directly or indirectly.
• Level 3 — Unobservable inputs for which there is little or no market data.
The Company measures its financial assets and liabilities using one or more of the following three valuation techniques
outlined in SFAS 157:
• Market approach — Prices and other relevant information generated by market transactions involving identical or com-
parable assets or liabilities.
• Cost approach — Amount that would be required to replace the service capacity of an asset (replacement cost).
• Income approach — Techniques to convert future amounts to a single present amount based upon market expectations.
The Company has no financial assets or liabilities for which fair value was measured using Level 3 inputs. Assets and liabilities
subject to fair value measurement are as follows:
Fair Value as ofDecember 31,
2008
Quoted Prices inActive Markets
for IdenticalAssets
(Level 1)
SignificantOther
ObservableInputs
(Level 2)
Fair Value Measurements atReporting Date Using
Assets
Short-term investments $117,026 $117,026 $ —
Foreign exchange forward contracts 4,361 — 4,361
Deferred compensation 7,984 7,984 —
Total $129,371 $125,010 $4,361
Liabilities
Foreign exchange forward contracts $ 1,350 $ — $1,350
Interest rate swaps 5,228 — 5,228
Total $ 6,578 $ — $6,578
Short-Term Investments The Company has investments in certificates of deposit that are recorded at cost, which
approximates fair value due to their short term nature and lack of volatility.
Deferred Compensation Plan The fair value of the Company’s deferred compensation plan is valued using the market
approach. The deferred compensation plan is a mix of money market, fixed income and equity funds managed by Vanguard.
Foreign Exchange Forward Contracts A substantial portion of the Company’s operations and revenues are international. As
a result, changes in foreign exchange rates can create substantial foreign exchange gains and losses from the revaluation of non-
functional currency monetary assets and liabilities. The foreign exchange contracts are valued using the market approach based
on observable market transactions of forward rates.
81. . . . . . .
DIEBOLD INCORPORATED AND SUBSIDIARIES
FORM 10-K as of December 31, 2008
NOTES TO CONSOLIDATED FINANCIAL STATEMENTS (Continued)
(in thousands, except per share amounts)

Interest Rate Swaps The Company has variable rate debt and is subject to fluctuations in interest related cash flows due to
changes in market interest rates. The Company’s policy allows derivative instruments designated as cash flow hedges which fix a
portion of future variable-rate interest expense. The Company has executed two pay-fixed receive-variable plain vanilla interest
rate swaps to hedge against changes in the London Interbank Offered Rate (LIBOR) benchmark interest rate on a portion of the
Company’s LIBOR- based credit facility. The fair value of the swap is determined using the income approach and is calculated
based on LIBOR rates at the reporting date.
NOTE 19: SEGMENT INFORMATION
The Company’s segments are comprised of its three main sales channels: DNA, DI and ES & Other. These sales channels are
evaluated based on revenue from customers and operating profit contribution to the total corporation. The reconciliation between
segment information and the Consolidated Financial Statements is disclosed. Revenue summaries by geographic area and
product and service solutions are also disclosed. All income and expense items below operating profit are not allocated to the
segments and are not disclosed.
The DNA segment sells and services financial and retail systems in the United States and Canada. The DI segment sells and
services financial and retail systems over the remainder of the globe. The ES & Other segment includes the operating results of
PESI and the voting and lottery related business in Brazil. Each of the sales channels buys the goods it sells from the Company’s
manufacturing plants or through external suppliers. Intercompany sales between legal entities are eliminated in consolidation and
intersegment revenue is not significant. Each year, intercompany pricing is agreed upon which drives sales channel operating
profit contribution. As permitted under SFAS No. 131, Disclosures about Segments of an Enterprise and Related Information,
certain information not routinely used in the management of these segments, information not allocated back to the segments or
information that is impractical to report is not shown. Items not allocated are as follows: interest income, interest expense, equity
in the net income of investees accounted for by the equity method, income tax expense or benefit, and other non-current assets.
82. . . . . . .
DIEBOLD INCORPORATED AND SUBSIDIARIES
FORM 10-K as of December 31, 2008
NOTES TO CONSOLIDATED FINANCIAL STATEMENTS (Continued)
(in thousands, except per share amounts)

The following table represents information regarding our segment information for the years ended December 31, 2008, 2007
and 2006:
SEGMENT INFORMATION BY CHANNEL
DNA DI ES & Other Total
2008
Customer revenues $1,535,989 $1,479,983 $154,108 $3,170,080
Operating profit 86,936 85,305 4,040 176,281
Capital expenditures 23,232 33,126 1,574 57,932
Depreciation 23,768 28,445 3,082 55,295
Property, plant and equipment, at cost 426,818 139,142 13,991 579,951
Total assets 1,197,572 1,258,206 82,158 2,537,936
2007
Customer revenues $1,543,055 $1,340,723 $ 63,703 $2,947,481
Operating profit (loss) 112,990 52,578 (60,890) 104,678
Capital expenditures 13,569 26,348 3,342 43,259
Depreciation 26,612 18,015 922 45,549
Property, plant and equipment, at cost 415,798 147,141 12,857 575,796
Total assets 1,167,782 1,333,815 93,127 2,594,724
2006
Customer revenues $1,519,669 $1,168,014 $233,291 $2,920,974
Operating profit 119,786 26,604 40,224 186,614
Capital expenditures 18,354 17,785 2,375 38,514
Depreciation 28,634 16,256 805 45,695
Property, plant and equipment, at cost 398,010 147,079 5,408 550,497
Total assets 1,117,286 1,245,117 198,114 2,560,517
83. . . . . . .
DIEBOLD INCORPORATED AND SUBSIDIARIES
FORM 10-K as of December 31, 2008
NOTES TO CONSOLIDATED FINANCIAL STATEMENTS (Continued)
(in thousands, except per share amounts)

The following table represents information regarding our revenue by geographic region and by product and service solution
for the years ended December 31, 2008, 2007 and 2006:
2008 2007 2006
December 31,
Revenue Summary by Geographic Area
The Americas $2,299,588 $2,115,293 $2,187,256
Asia Pacific 400,558 337,844 290,934
Europe, Middle East and Africa 469,934 494,344 442,784
Total revenue $3,170,080 $2,947,481 $2,920,974
Total Revenue International vs. Domestic
International $1,603,963 $1,417,574 $1,354,878
Percentage of total revenue 50.6% 48.1% 46.4%
Domestic 1,566,117 1,529,907 1,566,096
Percentage of total revenue 49.4% 51.9% 53.6%
Total revenue $3,170,080 $2,947,481 $2,920,974
Revenue Summary by Product and Service Solution
Financial Self-Service:
Products $1,127,120 $1,050,960 $ 995,422
Services 1,113,450 1,020,154 943,206
Total Financial Self-Service 2,240,570 2,071,114 1,938,628
Security Solutions
Products 319,493 345,841 322,953
Services 455,909 466,823 426,102
Total Security Solutions 775,402 812,664 749,055
Total Financial Self-Service & Security 3,015,972 2,883,778 2,687,683
Election systems/lottery 154,108 63,703 233,291
Total revenue $3,170,080 $2,947,481 $2,920,974
The Company had no customers that accounted for more than 10 percent of total net sales in 2008, 2007 and 2006.
NOTE 20: DISCONTINUED OPERATIONS
During the fourth quarter of 2008, the Company decided to discontinue its enterprise security operations in the EMEA region.
As a result, the Company recorded a pre-tax impairment charge of $16,658 related to previously recorded goodwill and certain
intangible assets. In addition, the Company incurred severance expenses and other charges incidental to the closure of $1,734 in
2008. These charges, along with the results of operations of this enterprise security business, are included in loss from
discontinued operations, net of tax of $12,954, $5,400, and $4,370, respectively, in the Company’s Consolidated Statements of
Operations for the years ended December 31, 2008, 2007 and 2006. The Company anticipates incurring additional charges
associated with this closure of approximately $2,200 during 2009.
84. . . . . . .
DIEBOLD INCORPORATED AND SUBSIDIARIES
FORM 10-K as of December 31, 2008
NOTES TO CONSOLIDATED FINANCIAL STATEMENTS (Continued)
(in thousands, except per share amounts)

NOTE 21: QUARTERLY FINANCIAL INFORMATION (UNAUDITED)
Unaudited Quarterly Results — The following table presents selected unaudited Consolidated Statements of Income data for
each quarter for the year ended December 31, 2008 and 2007:
2008 2007 2008 2007 2008 2007 2008 2007
First Quarter Second Quarter Third Quarter Fourth Quarter
Year Ended December 31,
Net sales $691,908 $641,201 $768,677 $689,782 $886,532 $736,459 $822,963 $880,039
Gross profit 172,361 129,117 192,955 163,294 232,982 176,262 196,318 213,236
Income (loss) from continuing
operations 14,403 2,193 29,242 20,605 47,447 29,018 10,445 (6,875)
Loss from discontinued
operations (608) (559) (2,028) (787) (931) (869) (9,387) (3,185)
Net income (loss) $ 13,795 $ 1,634 $ 27,214 $ 19,818 $ 46,516 $ 28,149 $ 1,058 $ (10,060)
Basic earnings per share:
Income from continuing
operations $ 0.22 $ 0.03 $ 0.44 $ 0.31 $ 0.72 $ 0.44 $ 0.16 $ (0.10)
Loss from discontinued
operations (0.01) (0.01) (0.03) (0.01) (0.02) (0.01) (0.14) (0.05)
Net income (loss) $ 0.21 $ 0.02 $ 0.41 $ 0.30 $ 0.70 $ 0.43 $ 0.02 $ (0.15)
Diluted earnings per share:
Income from continuing
operations $ 0.22 $ 0.03 $ 0.44 $ 0.31 $ 0.71 $ 0.43 $ 0.15 $ (0.10)
Loss from discontinued
operations (0.01) (0.01) (0.03) (0.01) (0.01) (0.01) (0.14) (0.05)
Net income (loss) $ 0.21 $ 0.02 $ 0.41 $ 0.30 $ 0.70 $ 0.42 $ 0.01 $ (0.15)
Basic weighted-average shares
outstanding 66,018 65,673 66,101 65,793 66,101 65,926 66,106 65,966
Diluted weighted-average shares
outstanding 66,306 66,468 66,765 66,829 66,758 66,985 66,651 66,513
Included in the fourth quarter 2008 income from continuing operations is a prior period adjustment of $4,877 related to the
Company’s deferred tax accounts.
85. . . . . . .
DIEBOLD INCORPORATED AND SUBSIDIARIES
FORM 10-K as of December 31, 2008
NOTES TO CONSOLIDATED FINANCIAL STATEMENTS (Continued)
(in thousands, except per share amounts)

ITEM 9: CHANGES IN AND DISAGREEMENTS WITH ACCOUNTANTS ONACCOUNTING AND FINANCIAL DISCLOSURE
Not applicable.
ITEM 9A: CONTROLS AND PROCEDURESThis annual report includes the certifications of our chief executive officer (CEO) and chief financial officer (CFO) required by
Rule 13a-14 of the Exchange Act. See Exhibits 31.1 and 31.2. This Item 9A includes information concerning the controls and
control evaluations referred to in those certifications.
INTRODUCTION
During 2008, management spent considerable time and resources performing extensive and additional analyses and
substantive procedures to support the audit process to complete five sets of financial statements for each of the periods from
the second quarter 2007 through the second quarter 2008 to become a current filer with the SEC. In light of these efforts,
management was unable to remediate all of the material weaknesses; however, we continue to invest significant time and
resources to engage in actions to remediate weaknesses in our internal control over financial reporting. Based on the extensive
and additional analyses and substantive procedures performed by management that are designed to facilitate the reliability of
financial reporting but that are not part of the internal control over financial reporting, management believes that the Consolidated
Financial Statements fairly present, in all material respects, the Company’s financial position, results of operations and cash flows
as of the dates, and for the periods, presented, in conformity with US GAAP.
A) DISCLOSURE CONTROLS AND PROCEDURES
Disclosure controls and procedures (as defined in Rules 13a-15(e) and 15d-15(e) promulgated under the Exchange Act) are
designed to ensure that information required to be disclosed in the reports filed or submitted under the Exchange Act is recorded,
processed, summarized and reported within the time periods specified in the SEC’s rules and forms and that such information is
accumulated and communicated to management, including the CEO and CFO as appropriate, to allow timely decisions regarding
required disclosures.
In connection with the preparation of this annual report, the Company’s management, under the supervision and with the
participation of the CEO and CFO, conducted an evaluation of disclosure controls and procedures, including the remedial actions
described below, as of the end of the period covered by this report. Based on that evaluation, certain material weaknesses in
internal control over financial reporting, as discussed in detail below and disclosed in previous filings, have not been remediated.
As a result, the CEO and CFO concluded that the Company’s disclosure controls and procedures were not effective as of
December 31, 2008. As described in detail throughout this Item 9A, we continue to take actions to remediate material
weaknesses in our internal control over financial reporting.
We continue to use our management certification process to identify matters that might require disclosure and to encourage
accountability with respect to the accuracy of our disclosures in order to strengthen our disclosure controls and procedures. Our
process requires multiple levels of management to provide sub-certifications, all of which are aggregated and reported to the CEO
and CFO for assessment prior to the filing of the quarterly Consolidated Financial Statements. We utilized this process in preparing
this annual report.
B) MANAGEMENT’S REPORT ON INTERNAL CONTROL OVER FINANCIAL REPORTING
Management, under the supervision of the CEO and CFO, is responsible for establishing and maintaining adequate internal
control over financial reporting. Internal control over financial reporting, as defined in Rules 13a-15(f) and 15d-15(f) promulgated
under the Exchange Act, is a process designed by, or under the supervision of, the CEO and CFO and effected by the Board of
Directors, management and other personnel to provide reasonable assurance regarding the reliability of financial reporting and the
86. . . . . . .

preparation of financial statements for external reporting purposes in accordance with US GAAP. Internal control over financial
reporting includes those policies and procedures that:
• pertain to the maintenance of records that, in reasonable detail, accurately and fairly reflect the transactions and
dispositions of the assets of the Company;
• provide reasonable assurance that transactions are recorded as necessary to permit preparation of Consolidated Financial
Statements in accordance with US GAAP;
• provide reasonable assurance that receipts and expenditures of the Company are being made only in accordance with
appropriate authorization of management and the board of directors; and
• provide reasonable assurance regarding prevention or timely detection of unauthorized acquisition, use or disposition of the
Company’s assets that could have a material effect on the Consolidated Financial Statements.
Internal control over financial reporting has inherent limitations because it is a process that involves human diligence and
compliance and is subject to lapses in judgment and breakdowns resulting from human failures. Internal control over financial
reporting can also be circumvented by collusion or improper override. Because of such limitations, there is a risk that material
misstatements will not be prevented or detected on a timely basis by internal control over financial reporting. However, these
inherent limitations are known features of the financial reporting process. Therefore, it is possible to design into the process
safeguards to reduce, though not eliminate the risk.
A material weakness is defined by the SEC as being a deficiency, or a combination of deficiencies, in internal control over
financial reporting, such that there is a reasonable possibility that a material misstatement of the Company’s annual or interim
financial statements will not be prevented or detected on a timely basis.
In connection with the preparation of this annual report, management, under the supervision and with the participation of our
CEO and CFO, conducted an evaluation of the effectiveness of our internal control over financial reporting as of December 31,
2008 based on the criteria established in the Committee of Sponsoring Organizations of the Treadway Commission (COSO). Our
assessment identified material weaknesses, as described below; therefore, management has concluded that our internal control
over financial reporting was not effective as of December 31, 2008.
Management identified the following control deficiencies as of December 31, 2008 that constituted material weaknesses:
Selection, Application and Communication of Accounting Policies: The Company did not have effective controls over
compliance with accounting policies and procedures. In addition, the Company did not effectively communicate accounting
policies to the Company’s personnel for consistent application. This entity-level control over financial reporting contributed to
other material weaknesses disclosed herein.
Monitoring: The Company did not maintain effective monitoring control activities over balance sheet analytical controls
operated by business unit personnel designed to detect breakdowns in controls and errors that could be material in the financial
statements.
Manual Journal Entries: The Company did not maintain effective controls over manual journal entries. Specifically, the
retention of proper supporting documentation as well as managerial review and approval procedures, which are designed to
validate the completeness, accuracy and appropriateness of the entries recorded in the accounting records, were not operating
effectively. Further, the Company did not have sufficient monitoring activities in place to detect when controls over manual journal
entries were not operating effectively.
Contractual Agreements: The Company did not maintain effective controls over non-routine contractual agreements and/or
related supporting information with financial reporting implications. Specifically, there is no standard process to ensure the review
and analysis of the accounting impact of non-routine contractual agreements in a timely manner by accounting personnel.
Account Reconciliations: The Company’s controls over account reconciliation controls were not operating effectively.
Specifically, the issues that occurred in various accounts involved the Company personnel not taking the steps necessary for
an adequate reconciliation in accordance with the Company’s policy. Among some of the issues noted were associates not
maintaining supporting documentation, performance of the account reconciliation not occurring timely and/or management
87. . . . . . .

review and approval of the reconciliation not occurring timely. In addition, the Company did not have sufficient monitoring activities
in place to timely detect when controls over account reconciliations were not operating effectively.
These material weaknesses resulted in material errors in the Company’s historical financial statements. These material errors
were corrected by management prior to the issuance of the Company’s consolidated financial statements for the applicable
periods.
KPMG LLP, the Company’s independent registered public accounting firm, has issued an auditor’s report on management’s
assessment of the effectiveness of the Company’s internal control over financial reporting as of December 31, 2008. This report is
included at page 42 of this annual report and is incorporated by reference in this Item 9A.
C) CHANGES IN INTERNAL CONTROL OVER FINANCIAL REPORTING
As previously disclosed under “Item 9A — Controls and Procedures” in our annual report for the year ended December, 31,
2007, management concluded that our internal control over financial reporting was not effective based on the material
weaknesses identified. Management has worked on remediation efforts since the filing of that annual report on September 30,
2008.
During the quarter ended December 31, 2008, management completed the following changes in our internal control over
financial reporting related to our six previously reported material weaknesses.
Control Environment: As of December 31, 2008, the Company’s management has sufficient evidence to conclude that the
previously disclosed material weakness in the control environment has been fully remediated. Commencing in 2006 and through
the date of the filing of this annual report, senior executives have implemented and executed activities designed to communicate
and establish an effective culture and tone necessary to support the Company’s control environment. The remediation of this
weakness has been addressed with all levels of associates within the Company. In order to reinforce an environment of strong
consciousness and the appropriate culture within the Company to assure consistent application of accounting policies, adherence
with US GAAP, and the importance of internal control over financial reporting, management has developed and executed ongoing
policies for specific and targeted communications involving the executive leadership and the Board of Directors. These com-
munications have been focused on setting the tone and highlighting the requirements and expectations for all employees related
to financial reporting controls compliance, personnel responsibilities, processes and avenues for reporting suspected violations of
the Company’s Code of Conduct, and mechanisms to answer questions and address potential concerns. In addition, the
Company’s executives have attended and will continue to attend educational courses that focus on setting the proper tone at the
top, executive fiduciary responsibilities and duties relating to financial reporting and controls.
During the quarter ended December 31, 2008, changes in our internal control over financial reporting occurred related to the
following five material weaknesses which continue to exist as of December 31, 2008:
Selection, Application and Communication of Accounting Policies: Management made personnel changes in the accounting
and financial reporting functions. Actions were taken, related to appropriate remedial actions with respect to certain employees,
including terminations, reassignments, reprimands, increased supervision, and the imposition of financial penalties in the form of
compensation adjustments. In addition, management continued to enhance its accounting and finance organization personnel to
better align individuals with job responsibilities commensurate with skill-sets, experience, and capabilities. The Company
evaluated and made changes to the structure of the finance department, to further align and segregate, where necessary,
the responsibilities within the accounting, financial reporting, planning and forecasting functions. In addition, the Company
recruited additional qualified senior accounting personnel, and in December 2008 hired a Vice President responsible for Corporate
Accounting, Compliance and External Reporting, and has continued to design and implement retention programs to assure that
personnel with this background and experience can be retained. Management also implemented select training programs that are
designed to assure that the Company’s personnel have knowledge, experience and training in the application of US GAAP
commensurate with the Company’s financial reporting requirements.
Monitoring: Management has enhanced its accounting and finance control processes and structure to facilitate completion of
detailed analytical reviews of the consolidated balance sheet at a financial statement line item level. This process is designed to
88. . . . . . .

supplement other control processes, such as review and approval of manual journal entries and account reconciliations, to validate
the accuracy of reported amounts. As of December 31, 2008, at each of the Company’s global entities, management has
established a new monitoring control process that includes the completion of a detailed analytical review by related finance
management at a level of precision that would detect errors in the financial statements that could be material. This process
includes an additional review by the applicable division chief financial officer as well as a review by corporate accounting and
finance management. The process includes a review to identify inconsistencies in application of US GAAP, reporting misclassi-
fications of balances, and/or validates that variances in balance sheet accounts are consistent with fluctuations in related income
statement accounts.
Manual Journal Entries: Management implemented policies and procedures to manually monitor compliance with its global
journal entry accounting policy, which governs requirements for support, review and approval of manual journal entries.
Compliance with this policy continues to be rigorously tested on a regular basis by the internal audit group. The Company’s
policy was established to provide the requirements to global associates related to the supporting documentation, and accuracy
and completeness of manual journal entries, and implemented authorization levels for the approval of manual journal entries that
includes the review of certain material manual journal entries by the Vice President — Corporate Controller and/or CFO.
Contractual Agreements: Management has begun to develop a more standardized process for monitoring, updating, and
disseminating non-routine contractual agreements to facilitate a complete and timely review by appropriate accounting and other
relevant personnel.
Account Reconciliations: Management implemented policies and procedures to manually monitor compliance with its global
account reconciliation policy, which governs requirements for content, format, and review and approval of account reconciliations.
Compliance with this policy continues to be rigorously tested on a regular basis by the internal audit group. The Company’s policy
was established to provide the requirements to global associates related to the supporting documentation, and accuracy and
completeness of account reconciliations. Management has begun implementing a global account reconciliation database and
compliance monitoring tool related to existence, completeness, accuracy and retention of account reconciliations. As of
December 31, 2008, all balance sheet account reconciliations prepared related to the U.S.-based portion of the North America
business unit are monitored utilizing this tool. In the fourth quarter of 2008, setup efforts began related to the deployment of this
compliance monitoring tool for Canada, Mexico and substantially all entities in the Company’s Europe, Middle East and Africa
business unit.
D) REMEDIATION STEPS TO ADDRESS MATERIAL WEAKNESSES
Management is committed to remediating our material weaknesses in a timely fashion. Our Sarbanes-Oxley compliance
function is responsible for helping to monitor our short-term and long-term remediation plans. In addition, we have assigned an
executive owner to direct the necessary remedial changes to the overall design of our internal control over financial reporting and
to address the root causes of our material weaknesses. Our leadership team is committed to achieving and maintaining a strong
control environment, high ethical standards and financial reporting integrity. This commitment will continue to be communicated
to and reinforced with our associates.
Our remediation efforts, outlined below, are intended to address the identified material weaknesses in internal control over
financial reporting.
The Company’s management believes the remediation measures described below will remediate the identified control
deficiencies and strengthen the Company’s internal control over financial reporting. As management continues to evaluate and
work to improve its internal control over financial reporting, it may be determined that additional measures must be taken to
address control deficiencies or it may be determined that the Company needs to modify, or in appropriate circumstances not to
complete, certain of the remediation measures described below.
Selection, Application and Communication of Accounting Policies: In December 2008, management began drafting a policy to
clarify requirements related to proper revenue recognition to facilitate global compliance with its existing revenue recognition
policy. It is planned that this policy will be finalized and published by March 31, 2009. At this time, the Company anticipates that the
89. . . . . . .

remediation efforts related to certain other accounting policies, including training, will be fully implemented globally by the quarter
ending June 30, 2009.
Monitoring: As noted above, management has enhanced its accounting and finance processes and structure to facilitate
completion of detailed analytical reviews of the consolidated balance sheet at a financial statement line item level. This process
starts with the completion of a detailed analytical review at each of the Company’s global entities, and includes several managerial
reviews at a level of precision that is designed to detect errors in the financial statements that could be material. In the opinion of
management, these remedial actions were not in place for a sufficient amount of time in the fourth quarter of 2008 to conclude
that the new control procedures were operating effectively as of December 31, 2008. The Company anticipates that the
remediation efforts will be fully implemented in the first quarter ending March 31, 2009. This will allow the Company sufficient
time to test the ongoing design and operating effectiveness of these controls.
Manual Journal Entries: Management is planning the utilization of systematic application controls for journal entry approvals
within its global accounting close process. In addition, as part of our standard period end financial closing procedures, manage-
ment will continue to enhance the monitoring process and controls related to manual journal entry by continuing to conduct proper
managerial reviews and approvals of the completeness, accuracy, and appropriateness of the entries recorded in the accounting
records. At this time, the Company anticipates that the remediation efforts will be fully implemented globally by the end of 2009.
Contractual Agreements: Management continues to evaluate and enhance controls to develop a more formalized process for
monitoring, updating, and disseminating non-routine contractual agreements to facilitate a complete and timely review by
accounting personnel. Additional controls include the implementation of a global contractual agreement database to facilitate
management’s review and accounting evaluation related to existence, completeness, approval, and retention of global contractual
agreements amongst the various departments. At this time, the Company anticipates that the remediation efforts will be fully
implemented globally by the quarter ending June 30, 2009.
Account Reconciliations: As mentioned above, in December 2007, management began implementing a global account
reconciliation compliance monitoring tool related to existence, completeness, accuracy and retention of account reconciliations.
As of December 31, 2008, all balance sheet account reconciliations prepared for the U.S.-based portion of the North America
business unit are monitored utilizing this tool. In the fourth quarter of 2008, setup efforts related to the deployment of this
compliance monitoring tool has begun for the following entities: Canada, Mexico and substantially all entities in the Company’s
Europe, Middle East and Africa business unit. At this time, the Company anticipates that the remediation efforts will be fully
implemented globally by the end of 2009. In the meantime, management utilizes manual monitoring processes to ensure that
reconciliations are completed, reviewed and approved in a timely fashion.
The five material weaknesses identified by management and discussed above are not fully remediated as of the date of the
filing of this annual report. Substantive procedures that are not a component of our internal control over financial reporting have
been performed by the Company in consultation with external accounting advisors to ensure the underlying transactions within
this annual report are supported and the financial statements are fairly stated as of the date of the filing of this annual report. Under
the direction of the Audit Committee, management has developed a detailed plan and timetable for the implementation of the
above-referenced remedial measures, and will monitor their implementation. In addition, under the direction of the Audit
Committee, management will continue to review and make necessary changes to the overall design of our internal control over
financial reporting, as well as policies and procedures to improve the overall effectiveness of our internal control over financial
reporting.
Management estimates the total cost for remediation efforts to be approximately $3.0 million, which includes $2.4 million of
consultation fees and $0.6 million of internal costs, including software purchases.
ITEM 9B: OTHER INFORMATION
None.
90. . . . . . .

PART IIIITEM 10: DIRECTORS, EXECUTIVE OFFICERS AND CORPORATE
GOVERNANCEInformation with respect to directors of the Company, including the audit committee and the designated audit committee
financial experts, is included in the Company’s proxy statement for the 2009 Annual Meeting of Shareholders (“2009 Annual
Meeting”) and is incorporated herein by reference. Information with respect to any material changes to the procedures by which
security holders may recommend nominees to the Company’s board of directors is included in the Company’s proxy statement for
the 2009 Annual Meeting and is incorporated herein by reference. The following table summarizes information regarding
executive officers of the Company:Name, Age, Title and Year Elected to Present Office Other Positions Held Last Five Years
Thomas W. Swidarski — 50President and Chief Executive OfficerYear elected: 2005
Oct-Dec 2005: President and Chief Operating Officer; 2001-2005: Senior Vice President, Financial Self-Service Group
Kevin J. Krakora — 53Executive Vice President and Chief Financial OfficerYear elected: 2006
2005-2006: Vice President and Chief Financial Officer; 2001-2005: Vice President and Corporate Controller
George S. Mayes, Jr. — 50Executive Vice President, Global OperationsYear elected: 2008
2006-Apr 2008: Senior Vice President, Supply ChainManagement; 2005-2006: Vice President, Global SupplyChain Management; 2002-2004: Chief Operating Officer,Tinnerman Palnut Engineered Products, Inc.
David Bucci — 57Senior Vice President, Customer Solutions GroupYear elected: 2001
James L. M. Chen — 48Senior Vice President, EMEA/AP DivisionsYear elected: 2007
2006-Feb 2007: Vice President, EMEA/AP Divisions; 1998-2006: Vice President and Managing Director Asia/Pacific
Charles E. Ducey, Jr. — 53Senior Vice President, Global Development and ServicesYear elected: 2006
2005-Jan 2006: Vice President, Global Development andServices; 2001-2005: Vice President, Customer ServiceSolutions Diebold North America
Dennis M. Moriarty — 56Senior Vice President, Global Security DivisionYear elected: 2006
2001-2006: Vice President, Global Security Division
Warren W. Dettinger — 55Vice President and General CounselYear elected: 2008
Dec 2004-Apr 2008: Vice President, General Counsel andSecretary; 1987-2004: Vice President and General Counsel
Sean F. Forrester — 44Vice President and Chief Information OfficerYear elected: 2007
Dec 2006-Sept 2007: Vice President, InformationTechnology; Mar-Dec 2006: Vice President, InformationTechnology, SPX Corp. Test & Measurement Group; 2005-2006: Corporate Director IT Planning & Governance, DanaCorp.; 2002-2005: Heavy Vehicle Group — SBU ITDirector/Division CIO, Dana Corp.
Chad F. Hesse — 36Corporate Counsel and SecretaryYear elected: 2008
2004-Apr 2008: Corporate Counsel and Assistant Secretary;2002-2004: Associate Attorney, Hahn, Loeser & Parks LLP
M. Scott Hunter — 47Vice President, Chief Tax OfficerYear elected: 2006
Jan-Apr 2006: Vice President, Tax; 2004-Jan 2006: SeniorTax Director; 2003-2004: Director, Tax
John D. Kristoff — 41Vice President, Chief Communications OfficerYear elected: 2006
2005-2006: Vice President, Corporate Communications andInvestor Relations; 2004-2005: Vice President, InvestorRelations; 2001-2004: Director, Global Communications
Timothy J. McDannold — 46Vice President and TreasurerYear elected: 2007
2000-2007: Vice President and Assistant Treasurer
91. . . . . . .

Name, Age, Title and Year Elected to Present Office Other Positions Held Last Five Years
Leslie A. Pierce — 45Vice President and Corporate ControllerYear elected: 2007
Mar 2006-May 2007: Vice President, Accounting,Compliance and External Reporting; 1999-Mar 2006:Manager, Special Projects
Sheila M. Rutt — 40Vice President, Chief Human Resources OfficerYear elected: 2005
2002-2005: Vice President, Global Human Resources
Robert J. Warren — 62Vice President, Corporate Development and FinanceYear elected: 2007
1990-Jul 2007: Vice President and Treasurer
There is no family relationship, either by blood, marriage or adoption, between any of the executive officers of the Company.
CODE OF ETHICS
All of the directors, executive officers and employees of the Company are required to comply with certain policies and
protocols concerning business ethics and conduct, which we refer to as our Business Ethics Policy. The Business Ethics Policy
applies not only to the Company, but also to all of those domestic and international companies in which the Company owns or
controls a majority interest. The Business Ethics Policy describes certain responsibilities that the directors, executive officers and
employees have to the Company, to each other and to the Company’s global partners and communities including, but not limited
to, compliance with laws, conflicts of interest, intellectual property and the protection of confidential information. The Business
Ethics Policy is available on the Company’s web site at http://www.diebold.com or by written request to the Corporate Secretary.
SECTION 16(A) BENEFICIAL OWNERSHIP REPORTING COMPLIANCE
Information with respect to Section 16(a) Beneficial Ownership Reporting Compliance is included in the Company’s proxy
statement for the 2009 Annual Meeting and is incorporated herein by reference.
ITEM 11: EXECUTIVE COMPENSATIONInformation with respect to executive officer and director’s compensation is included in the Company’s proxy statement for
the 2009 Annual Meeting and is incorporated herein by reference. Information with respect to compensation committee
interlocks and insider participation and the compensation committee report is included in the Company’s proxy statement for
the 2009 Annual Meeting and is incorporated herein by reference.
ITEM 12: SECURITY OWNERSHIP OF CERTAIN BENEFICIAL OWNERS ANDMANAGEMENT AND RELATED STOCKHOLDER MATTERS
Information with respect to security ownership of certain beneficial owners and management and equity compensation plan
information is included in the Company’s proxy statement for the 2009 Annual Meeting and is incorporated herein by reference.
ITEM 13: CERTAIN RELATIONSHIPS AND RELATED TRANSACTIONS, ANDDIRECTOR INDEPENDENCE
Information with respect to certain relationships and related transactions and director independence is included in the
Company’s proxy statement for the 2009 Annual Meeting and is incorporated herein by reference.
ITEM 14: PRINCIPAL ACCOUNTANT FEES AND SERVICESInformation with respect to principal accountant fees and services is included in the Company’s proxy statement for the 2009
Annual Meeting and is incorporated herein by reference.
92. . . . . . .

PART IVITEM 15: EXHIBITS AND FINANCIAL STATEMENT SCHEDULES
(a) 1. Documents filed as a part of this annual report.
• Consolidated Balance Sheets at December 31, 2008 and 2007
• Consolidated Statements of Income for the Years Ended December 31, 2008, 2007 and 2006
• Consolidated Statements of Shareholders’ Equity for the Years Ended December 31, 2008, 2007 and 2006
• Consolidated Statements of Cash Flows for the Years Ended December 31, 2008, 2007 and 2006
• Notes to Consolidated Financial Statements
• Reports of Independent Registered Public Accounting Firm
(a) 2. Financial statement schedule
The following report and schedule are included in this Part IV, and are found in this annual report:
• Report of Independent Registered Public Accounting Firm, and
• Valuation and Qualifying Accounts.
All other schedules are omitted, as the required information is inapplicable or the information is presented in the Consolidated
Financial Statements or related notes.
(a) 3. Exhibits
3.1(i) Amended and Restated Articles of Incorporation of Diebold, Incorporated — incorporated by reference toExhibit 3.1(i) to Registrant’s Annual Report on Form 10-K for the year ended December 31, 1994 (CommissionFile No. 1-4879)
3.1(ii) Amended and Restated Code of Regulations — incorporated by reference to Exhibit 3.1(ii) to Registrant’s QuarterlyReport on Form 10-Q for the quarter ended March 31, 2007 of Diebold, Incorporated (Commission File No. 1-4879)
3.2 Certificate of Amendment by Shareholders to Amended Articles of Incorporation of Diebold, Incorporated —incorporated by reference to Exhibit 3.2 to Registrant’s Form 10-Q for the quarter ended March 31, 1996(Commission File No. 1-4879)
3.3 Certificate of Amendment to Amended Articles of Incorporation of Diebold, Incorporated — incorporated byreference to Exhibit 3.3 to Registrant’s Form 10-K for the year ended December 31, 1998 (Commission FileNo. 1-4879)
4.1 Rights Agreement dated as of February 11, 1999 between Diebold, Incorporated and The Bank of New York —incorporated by reference to Exhibit 4.1 to Registrant’s Registration Statement on Form 8-A, filed on February 2, 1999(Commission File No. 1-4879)
*10.1 Form of Amended and Restated Employment Agreement*10.5(i) Supplemental Employee Retirement Plan I as amended and restated January 1, 2008*10.5(ii) Supplemental Employee Retirement Plan II as amended and restated July 1, 2002 — incorporated by reference to
Exhibit 10.5(ii) to Registrant’s Form 10-Q for the quarter ended September 30, 2002 (Commission File No. 1-4879)*10.5(iii) Pension Restoration Supplemental Executive Retirement Plan*10.5(iv) Pension Supplemental Executive Retirement Plan*10.5(v) 401(k) Restoration Supplemental Executive Retirement Plan*10.5(vi) 401(k) Supplemental Executive Retirement Plan*10.7(i) 1985 Deferred Compensation Plan for Directors of Diebold, Incorporated — incorporated by reference to Exhibit 10.7
to Registrant’s Annual Report on Form 10-K for the year ended December 31, 1992 (Commission File No. 1-4879)*10.7(ii) Amendment No. 1 to the Amended and Restated 1985 Deferred Compensation Plan for Directors of Diebold,
Incorporated — incorporated by reference to Exhibit 10.7 (ii) to Registrant’s Form 10-Q for the quarter endedMarch 31, 1998 (Commission File No. 1-4879)
*10.7(iii) Amendment No. 2 to the Amended and Restated 1985 Deferred Compensation Plan for Directors of Diebold,Incorporated — incorporated by reference to Exhibit 10.7 (ii) to Registrant’s Form 10-Q for the quarter endedMarch 31, 2003 (Commission File No. 1-4879)
93. . . . . . .

*10.7(iv) Deferred Compensation Plan No. 2 for Directors of Diebold, Incorporated*10.8(i) 1991 Equity and Performance Incentive Plan as Amended and Restated as of February 7, 2001 — incorporated by
reference to Exhibit 4(a) to Form S-8 Registration Statement No. 333-60578*10.8(ii) Amendment No. 1 to the 1991 Equity and Performance Incentive Plan as Amended and Restated as of February 7,
2001 — incorporated by reference to Exhibit 10.8 (ii) to Registrant’s Form 10-Q for the quarter ended March 31, 2004(Commission File No. 1-4879)
*10.8(iii) Amendment No. 2 to the 1991 Equity and Performance Incentive Plan as Amended and Restated as of February 7,2001 — incorporated by reference to Exhibit 10.8 (iii) to Registrant’s Form 10-Q for the quarter ended March 31, 2004(Commission File No. 1-4879)
*10.8(iv) Amendment No. 3 to the 1991 Equity and Performance Incentive Plan as Amended and Restated as of February 7,2001 — incorporated by reference to Exhibit 10.8 (iv) to Registrant’s Form 10-Q for the quarter ended June 30, 2004(Commission File No. 1-4879)
*10.9 Long-Term Executive Incentive Plan — incorporated by reference to Exhibit 10.9 to Registrant’s Annual Report onForm 10-K for the year ended December 31, 1993 (Commission File No. 1-4879)
*10.10 Deferred Incentive Compensation Plan No. 2*10.11 Annual Incentive Plan — incorporated by reference to Exhibit 10.11 to Registrant’s Annual Report on Form 10-K for
the year ended December 31, 2000 (Commission File No. 1-4879)*10.13(i) Forms of Deferred Compensation Agreement and Amendment No. 1 to Deferred Compensation Agreement —
incorporated by reference to Exhibit 10.13 to Registrant’s Annual Report on Form 10-K for the year endedDecember 31, 1996 (Commission File No. 1-4879)
*10.13(ii) Section 162(m) Deferred Compensation Agreement (as amended and restated January 29, 1998) — incorporated byreference to Exhibit 10.13 (ii) to Registrant’s Form 10-Q for the quarter ended March 31, 1998 (Commission FileNo. 1-4879)
*10.14 Deferral of Stock Option Gains Plan — incorporated by reference to Exhibit 10.14 to the Registrant’s Annual Report onForm 10-K for the year ended December 31, 1998 (Commission File No. 1-4879)
10.17(i) Amended and Restated Loan Agreement dated as of April 30, 2003 among Diebold, Incorporated, the SubsidiaryBorrowers, the Lenders and Bank One, N.A. — incorporated by reference to Exhibit 10.17 to Registrant’s Form 10-Qfor the quarter ended June 30, 2003 (Commission File No. 1-4879)
10.17(ii) First Amendment to Loan Agreement, dated as of April 28, 2004 among Diebold, Incorporated, the SubsidiaryBorrowers, the Lenders and Bank One, N.A. — incorporated by reference to Exhibit 10.17 (ii) to Registrant’sForm 10-Q for the quarter ended June 30, 2004 (Commission File No. 1-4879)
10.17(iii) Second Amendment to Loan Agreement, dated as of April 27, 2005 among Diebold, Incorporated, the SubsidiaryBorrowers, the Lenders and JPMorgan Chase Bank N.A. (successor by merger to Bank One, N.A.) — incorporated byreference to Exhibit 10.1 to Registrant’s Form 8-K filed on May 3, 2005 (Commission File No. 1-4879)
10.17(iv) Third Amendment to Loan Agreement, dated as of November 16, 2005 among Diebold, Incorporated, the SubsidiaryBorrowers, the Lenders and JPMorgan Chase Bank N.A. (successor by merger to Bank One, N.A.) — incorporated byreference to Exhibit 10.1 to Registrant’s Form 8-K filed on November 22, 2005 (Commission File No. 1-4879)
10.17(v) Fourth Amendment to Loan Agreement, dated November 27, 2006 among Diebold, Incorporated, the SubsidiaryBorrowers, the Lenders and JPMorgan Chase Bank N.A. — incorporated by reference to Exhibit 10.17(v) toRegistrant’s Form 10-K for the year ended December 31, 2006. (successor by merger to Bank One, N.A.)(Commission File No. 1-4879)
10.20(i) Transfer and Administration Agreement, dated as of March 30, 2001 by and among DCC Funding LLC, Diebold CreditCorporation, Diebold, Incorporated, Receivables Capital Corporation and Bank of America, National Association andthe financial institutions from time to time parties thereto— incorporated by reference to Exhibit 10.20(i) toRegistrant’s Form 10-Q for the quarter ended March 31, 2001 (Commission File No. 1-4879)
10.20(ii) Amendment No. 1 to the Transfer and Administration Agreement, dated as of May 2001, by and among DCC FundingLLC, Diebold Credit Corporation, Diebold, Incorporated, Receivables Capital Corporation and Bank of America,National Association and the financial institutions from time to time parties thereto — incorporated by reference toExhibit 10.20 (ii) to Registrant’s Form 10-Q for the quarter ended March, 31, 2001 (Commission File No. 1-4879)
*10.22 Form of Non-Qualified Stock Option Agreement — incorporated by reference to Exhibit 10.22 to Registrant’sQuarterly Report on Form 10-Q for the quarter ended March 31, 2007 (Commission File No. 1-4879)
*10.23 Form of Restricted Share Agreement — incorporated by reference to Exhibit 10.2 to Registrant’s Form 8-K filed onFebruary 16, 2005 (Commission File No. 1-4879)
*10.24 Form of RSU Agreement
94. . . . . . .

*10.25 Form of Performance Share Agreement*10.26 Diebold, Incorporated Annual Cash Bonus Plan — incorporated by reference to Exhibit A to Registrants’ Proxy
Statement on Schedule 14A filed on March 16, 2005 (Commission File No. 1-4879)10.27 Form of Note Purchase Agreement — incorporated by reference to Exhibit 10.1 to Registrant’s Form 8-K filed on
March 8, 2006 (Commission File No. 1-4879)*10.28 Amended and Restated Employment Agreement between Diebold, Incorporated and Thomas W. Swidarski, as
amended as of December 29, 2008*10.29 Amended and Restated Employment [Change in Control] Agreement between Diebold, Incorporated and Thomas W.
Swidarski, as amended as of December 29, 2008*10.30 Form of Deferred Shares Agreement21.1 Subsidiaries of the Registrant as of December 31, 200823.1 Consent of Independent Registered Public Accounting Firm24.1 Power of Attorney31.1 Certification of Chief Executive Officer Pursuant to Section 302 of the Sarbanes-Oxley Act of 200231.2 Certification of Chief Financial Officer Pursuant to Section 302 of the Sarbanes-Oxley Act of 200232.1 Certification of Principal Executive Officer Pursuant to Section 906 of the Sarbanes-Oxley Act of 2002, 18 U.S.C.
Section 135032.2 Certification of Principal Financial Officer Pursuant to Section 906 of the Sarbanes-Oxley Act of 2002, 18 U.S.C.
Section 1350
* Reflects management contract or other compensatory arrangement required to be filed as an exhibit pursuant to Item 15(b) of
this annual report.
(b) Refer to this Form 10-K for an index of exhibits.
95. . . . . . .

SIGNATURES
Pursuant to the requirements of Section 13 or 15(d) of the Securities Exchange Act of 1934, the Registrant has duly caused
this report to be signed on its behalf by the undersigned, thereunto duly authorized.
DIEBOLD, INCORPORATED
Date: February 27, 2009 By: /s/ THOMAS W. SWIDARSKI
Thomas W. Swidarski
President and Chief Executive Officer
Pursuant to the requirements of the Securities Exchange Act of 1934, this report has been signed below by the following
persons on behalf of the Registrant and in the capacities and on the dates indicated.Signature Title Date
/s/ THOMAS W. SWIDARSKI
Thomas W. SwidarskiPresident, Chief Executive Officer and Director(Principal Executive Officer)
February 27, 2009
/s/ KEVIN J. KRAKORA
Kevin J. KrakoraExecutive Vice President and Chief FinancialOfficer (Principal Financial Officer)
February 27, 2009
/s/ LESLIE A. PIERCE
Leslie A. PierceVice President and Corporate Controller(Principal Accounting Officer)
February 27, 2009
*Phillip R. Cox
Director February 27, 2009
/s/ LOUIS V. BOCKIUS IIILouis V. Bockius III
Director February 27, 2009
/s/ RICHARD L. CRANDALL
Richard L. CrandallDirector February 27, 2009
*Gale S. Fitzgerald
Director February 27, 2009
*Phillip B. Lassiter
Director February 27, 2009
*John N. Lauer
Director February 27, 2009
/s/ ERIC J. ROORDA
Eric J. RoordaDirector February 27, 2009
/s/ HENRY D.G. WALLACE
Henry D.G. WallaceDirector February 27, 2009
96. . . . . . .

Signature Title Date
/s/ ALAN J. WEBER
Alan J. WeberDirector February 27, 2009
* The undersigned, by signing his name hereto, does sign and execute this Annual Report on Form 10-K pursuant tothe Powers of Attorney executed by the above-named officers and directors of the Registrant and filed with theSecurities and Exchange Commission on behalf of such officers and directors.
Date: February 27, 2009 *By: /s/ KEVIN J. KRAKORA
Kevin J. Krakora, Attorney-in-Fact
97. . . . . . .
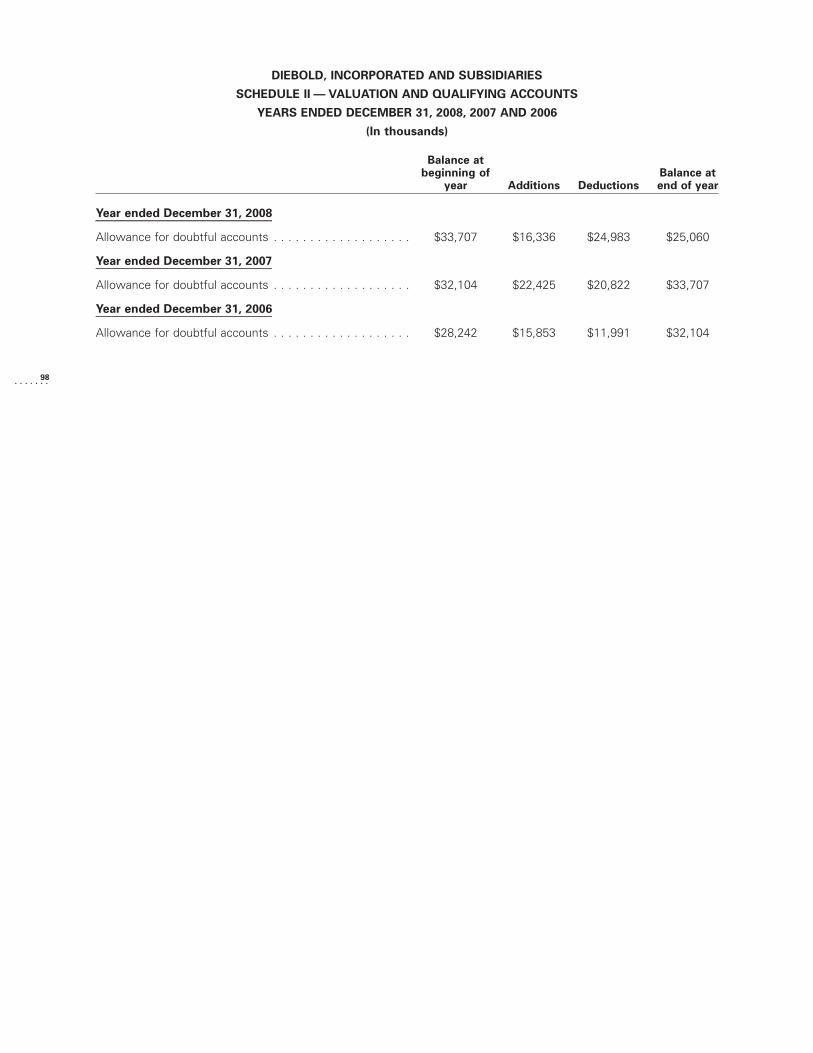
DIEBOLD, INCORPORATED AND SUBSIDIARIES
SCHEDULE II — VALUATION AND QUALIFYING ACCOUNTS
YEARS ENDED DECEMBER 31, 2008, 2007 AND 2006
(In thousands)
Balance atbeginning of
year Additions DeductionsBalance atend of year
Year ended December 31, 2008
Allowance for doubtful accounts . . . . . . . . . . . . . . . . . . . $33,707 $16,336 $24,983 $25,060
Year ended December 31, 2007
Allowance for doubtful accounts . . . . . . . . . . . . . . . . . . . $32,104 $22,425 $20,822 $33,707
Year ended December 31, 2006
Allowance for doubtful accounts . . . . . . . . . . . . . . . . . . . $28,242 $15,853 $11,991 $32,104
98. . . . . . .

EXHIBIT INDEX
EXHIBIT NO. DOCUMENT DESCRIPTION
10.1 Form of Amended and Restated Employment Agreement
10.5(i) Supplemental Employee Retirement Plan I as amended and restated January 1, 2008
10.5(iii) Pension Restoration Supplemental Executive Retirement Plan
10.5(iv) Pension Supplemental Executive Retirement Plan
10.5(v) 401(k) Restoration Supplemental Executive Retirement Plan
10.5(vi) 401(k) Supplemental Executive Retirement Plan
10.7(iv) Deferred Compensation Plan No. 2 for Directors of Diebold, Incorporated
10.10 Deferred Incentive Compensation Plan No. 2
10.24 Form of RSU Agreement
10.25 Form of Performance Share Agreement
10.28 Amended and Restated Employment Agreement between Diebold, Incorporated and Thomas W. Swidarski, as
amended as of December 29, 2008
10.29 Amended and Restated Employment [Change in Control] Agreement between Diebold, Incorporated and Thomas
W. Swidarski, as amended as of December 29, 2008
10.30 Form of Deferred Shares Agreement
21.1 Significant Subsidiaries of the Registrant
23.1 Consent of Independent Registered Public Accounting Firm
24.1 Power of Attorney
31.1 Certification of Chief Executive Officer Pursuant to Section 302 of the Sarbanes-Oxley Act of 2002
31.2 Certification of Chief Financial Officer Pursuant to Section 302 of the Sarbanes-Oxley Act of 2002
32.1 Certification of Chief Executive Officer Pursuant to Section 906 of the Sarbanes-Oxley Act of 2002, 18 U.S.C.
Section 1350
32.2 Certification of Chief Financial Officer Pursuant to Section 906 of the Sarbanes-Oxley Act of 2002, 18 U.S.C.
Section 1350
99. . . . . . .

EXHIBIT 21.1LIST OF SIGNIFICANT SUBSIDIARIES
The following are the subsidiaries of the Registrant included in the Registrant’s Consolidated Financial Statements at
December 31, 2008. Other subsidiaries are not listed because such subsidiaries are inactive. Subsidiaries are listed alphabetically
under either the domestic or international categories.
DomesticJurisdiction underwhich organized
Percent of voting securitiesowned by Registrant
Data Information Management Systems, Inc. California 100%
DBD Investment Management Company Delaware 100%
Diebold Actcom Security Systems, Inc. Delaware 100%
Diebold Australia Holding Company, Inc. Delaware 100%
Diebold Enterprise Security Systems, Inc. New York 100%
Diebold Eras, Incorporated Ohio 100%
Diebold Finance Company, Inc. Delaware 100%(1)
Diebold Fire Services, Inc. Delaware 100%
Diebold Fire Services (Virginia), Inc. Virginia 100%
Diebold Global Finance Corporation Delaware 100%
Diebold Holding Company, Inc. Delaware 100%
Diebold Information and Security Systems, LLC Delaware 100%
Diebold Investment Company Delaware 100%
Diebold Latin America Holding Company, LLC Delaware 100%
Diebold Mexico Holding Company, Inc. Delaware 100%
Diebold Midwest Manufacturing, Inc. Delaware 100%
Diebold Self-Service Systems New York 100%(2)
Diebold Southeast Manufacturing, Inc. Delaware 100%(3)
Diebold SST Holding Company, Inc. Delaware 100%
FirstLine, Inc. California 100%
Maintenance Acquisition Company No. 1, LLC Delaware 100%
Diebold Software Solutions, Inc. Delaware 100%
Premier Election Solutions, Inc. Delaware 100%(10)
VDM Holding Company, Inc. Delaware 100%
Verdi & Associates, Inc. New York 100%
InternationalJurisdiction underwhich organized
Percent of voting securitiesowned by Registrant
Bitelco Diebold Chile Limitada Chile 100%(24)
C.R. Panama, Inc. Panama 100%(14)
Cable Print N.V. Belgium 100%
Cardinal Brothers Consulting Pty. Ltd. Australia 100%(9)
Caribbean Self Service and Security LTD. Barbados 50%(13)
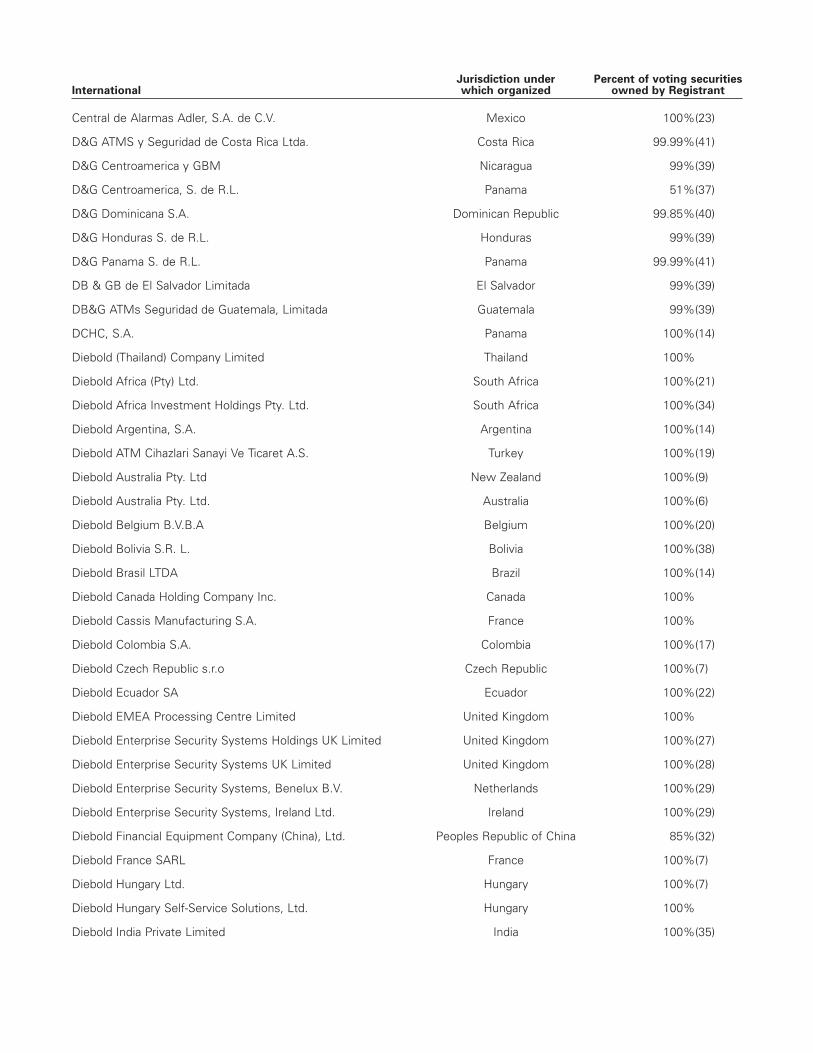
InternationalJurisdiction underwhich organized
Percent of voting securitiesowned by Registrant
Central de Alarmas Adler, S.A. de C.V. Mexico 100%(23)
D&G ATMS y Seguridad de Costa Rica Ltda. Costa Rica 99.99%(41)
D&G Centroamerica y GBM Nicaragua 99%(39)
D&G Centroamerica, S. de R.L. Panama 51%(37)
D&G Dominicana S.A. Dominican Republic 99.85%(40)
D&G Honduras S. de R.L. Honduras 99%(39)
D&G Panama S. de R.L. Panama 99.99%(41)
DB & GB de El Salvador Limitada El Salvador 99%(39)
DB&G ATMs Seguridad de Guatemala, Limitada Guatemala 99%(39)
DCHC, S.A. Panama 100%(14)
Diebold (Thailand) Company Limited Thailand 100%
Diebold Africa (Pty) Ltd. South Africa 100%(21)
Diebold Africa Investment Holdings Pty. Ltd. South Africa 100%(34)
Diebold Argentina, S.A. Argentina 100%(14)
Diebold ATM Cihazlari Sanayi Ve Ticaret A.S. Turkey 100%(19)
Diebold Australia Pty. Ltd New Zealand 100%(9)
Diebold Australia Pty. Ltd. Australia 100%(6)
Diebold Belgium B.V.B.A Belgium 100%(20)
Diebold Bolivia S.R. L. Bolivia 100%(38)
Diebold Brasil LTDA Brazil 100%(14)
Diebold Canada Holding Company Inc. Canada 100%
Diebold Cassis Manufacturing S.A. France 100%
Diebold Colombia S.A. Colombia 100%(17)
Diebold Czech Republic s.r.o Czech Republic 100%(7)
Diebold Ecuador SA Ecuador 100%(22)
Diebold EMEA Processing Centre Limited United Kingdom 100%
Diebold Enterprise Security Systems Holdings UK Limited United Kingdom 100%(27)
Diebold Enterprise Security Systems UK Limited United Kingdom 100%(28)
Diebold Enterprise Security Systems, Benelux B.V. Netherlands 100%(29)
Diebold Enterprise Security Systems, Ireland Ltd. Ireland 100%(29)
Diebold Financial Equipment Company (China), Ltd. Peoples Republic of China 85%(32)
Diebold France SARL France 100%(7)
Diebold Hungary Ltd. Hungary 100%(7)
Diebold Hungary Self-Service Solutions, Ltd. Hungary 100%
Diebold India Private Limited India 100%(35)

InternationalJurisdiction underwhich organized
Percent of voting securitiesowned by Registrant
Diebold International Limited United Kingdom 100%(7)
Diebold Italia S.p.A. Italy 100%(16)
Diebold Mexico, S.A. de C.V. Mexico 100%(4)
Diebold Netherlands B.V. Netherlands 100%(7)
Diebold OLTP Systems, C.A. Venezuela 50%(13)
Diebold Osterreich Selbstbedienungssysteme GmbH Austria 100%(7)
Diebold Pacific, Limited Hong Kong 100%
Diebold Panama, Inc. Panama 100%(14)
Diebold Paraguay S.A. Paraguay 100%(24)
Diebold Peru S.r.l Peru 100%(14)
Diebold Philippines, Inc. Philippines 100%(36)
Diebold Physical Security Pty. Ltd. Australia 100%(9)
Diebold Poland S.p. z.o.o. Poland 100%(7)
Diebold Portugal — Solucoes de Automatizacao, Limitada Portugal 100%(7)
Diebold Security Systems Limited United Kingdom 100%(26)
Diebold Selbstbedienyngssysteme (Schweiz) GmbH Switzerland 100%(7)
Diebold Self Service Solutions Limited Liability Company Switzerland 100%(18)
Diebold Self-Service CIS Ltd. Russia 100%(7)
Diebold Singapore Pte. Ltd. Singapore 100%
Diebold Slovakia s.r.o. Slovakia 100%(7)
Diebold Software Services Private Limited India 100%(11)
Diebold Software Solutions UK Ltd. United Kingdom 100%(12)
Diebold South Africa (Pty) Ltd. South Africa 75%(33)
Diebold Spain, S.L. Spain 100%(25)
Diebold Switzerland Holding Company, LLC Switzerland 100%(18)
Diebold Systems Private Limited India 100%
Diebold Uruguay S.A. Uruguay 100%(14)
Diebold — Corp Systems Sdn. Bhd. Malaysia 100%
J.J.F. Panama, Inc. Panama 100%(14)
P.T. Diebold Indonesia Indonesia 100%(8)
Premier Election Solutions Canada ULC Canada 100%
Procomp Amazonia Industria Eletronica S.A. Brazil 100%(15)
Procomp Industria Eletronica LTDA Brazil 100%(31)

InternationalJurisdiction underwhich organized
Percent of voting securitiesowned by Registrant
SIAB (HK) Limited Hong Kong 100%(5)
Sound Security Pty Ltd. Australia 100%(9)
The Diebold Company of Canada, Ltd. Canada 100%
(1) 100 percent of voting securities are owned by Diebold Investment Company, which is 100 percent owned byRegistrant.
(2) 70 percent of partnership interest is owned by Diebold Holding Company, Inc., which is 100 percent owned byRegistrant, while the remaining 30 percent partnership interest is owned by Diebold SST Holding Company, Inc.,which is 100 percent owned by Registrant.
(3) 100 percent of voting securities are owned by Diebold Midwest Manufacturing, Inc., which is 100 percentowned by Registrant.
(4) 100 percent of voting securities are owned by Diebold Mexico Holding Company, Inc., which is 100 percentowned by Registrant.
(5) 100 percent of voting securities are owned by Diebold Self-Service Systems, which is 70 percent owned byDiebold Holding Company, Inc. and 30 percent owned by Diebold SST Holding Company, Inc., both of which are100 percent owned by Registrant.
(6) 100 percent of voting securities are owned by Diebold Australia Holding Company, Inc., which is 100 percentowned by Registrant.
(7) 100 percent of voting securities are owned by Diebold Self-Service Solutions Limited Liability Company, whichis 95 percent owned by Registrant and 5 percent owned by Diebold Holding Company, Inc., which is 100 percentowned by Registrant.
(8) 88.89 percent of voting securities are owned by Registrant, and 11.11 percent of voting securities are owned byDiebold Pacific, Limited, which is 100 percent owned by Registrant.
(9) 100 percent of voting securities are owned by Diebold Australia Pty. Ltd., which is 100 percent owned byDiebold Australia Holding Company, Inc., which is 100 percent owned by Registrant.
(10) 100 percent of voting securities are owned by Premier Election Solutions Canada ULC, which is 100 percentowned by Registrant.
(11) 99.99 percent of voting securities are owned by Diebold Self-Service Solutions Limited Liability Company, whichis 95 percent owned by Registrant and 5 percent owned by Diebold Holding Company, Inc., which is 100 percentowned by Registrant, while the remaining .01 percent of voting securities is owned by Registrant.
(12) 100 percent of voting securities are owned by Diebold Software Solutions, Inc., which is 100 percent owned byRegistrant.
(13) 50 percent of voting securities are owned by Diebold Latin America Holding Company, LLC, which is 100 percentowned by Registrant.
(14) 100 percent of voting securities are owned by Diebold Latin America Holding Company, LLC, which is100 percent owned by Registrant.
(15) 100 percent of voting securities are owned by Diebold Brasil LTDA, which is 100 percent owned by Diebold LatinAmerica Holding Company, LLC, which is 100 percent owned by Registrant.
(16) 100 percent of voting securities are owned by Diebold International Limited, which is 100 percent owned byDiebold Self-Service Solutions Limited Liability Company, which is 95 percent owned by Registrant and5 percent owned by Diebold Holding Company, Inc., which is 100 percent owned by Registrant.
(17) 21.44 percent of voting securities are owned by Diebold Latin America Holding Company, LLC, which is100 percent owned by Registrant; 16.78 percent of voting securities are owned by Diebold Panama, Inc., whichis 100 percent owned by Diebold Latin America Holding Company, Inc., which is 100 percent owned byRegistrant; 16.78 percent of voting securities are owned by DCHC SA, which is 100 percent owned by DieboldLatin America Holding Company, LLC, which is 100 percent owned by Registrant; 13.5 percent of votingsecurities are owned by J.J.F. Panama, Inc, which is 100 percent owned by Diebold Latin America HoldingCompany, LLC, which is 100 percent owned by Registrant; and the remaining 31.5 percent of voting securities

are owned by C.R. Panama, Inc., which is 100 percent owned by Diebold Latin America Holding Company, LLC,which is 100 percent owned by Registrant.
(18) 95 percent of voting securities are owned by Registrant, while 5 percent of voting securities are owned byDiebold Holding Company, Inc., which is 100 percent owned by Registrant.
(19) 50 percent of voting securities are owned by Diebold Netherlands B.V., which is 100 percent owned by DieboldSelf-Service Solutions Limited Liability Company, while the remaining 50 percent of voting securities are ownedby Diebold Self-Service Solutions Limited Liability Company, which is 95 percent owned by Registrant and5 percent owned by Diebold Holding Company, Inc., which is 100 percent owned by Registrant.
(20) 10 percent of voting securities are owned by Diebold Selbstbedienungssysteme GmbH, which is 100 percentowned by Diebold Self Service Solutions Limited Liability Company, while the remaining 90 percent of votingsecurities are owned by Diebold Self -Service Solutions Limited Liability Company, which is 95 percent ownedby Registrant and 5 percent owned by Diebold Holding Company, Inc., which is 100 percent owned byRegistrant.
(21) 100 percent of voting securities are owned by Diebold Africa Investment Holdings Pty. Ltd., which is 100 percentowned by Diebold Switzerland Holding Company, LLC (refer to 18 for ownership).
(22) 99.99 percent of voting securities are owned by Diebold Colombia SA (refer to 17 for ownership), while theremaining 0.01 percent of voting securities are owned by Diebold Latin America Holding Company, Inc., which is100 percent owned by Registrant.
(23) .01 percent of voting securities are owned by Registrant, while 99.99 percent of voting securities are owned byImpexa LLC, which is 100 percent owned by Diebold Mexico Holding Company, Inc., which is 100 percentowned by Registrant.
(24) 1 percent of voting securities are owned by Registrant, while 99 percent of voting securities are owned byDiebold Latin America Holding Company, LLC, which is 100 percent owned by Registrant.
(25) 100 percent of voting securities are owned by VDM Holding Company, Inc., which is 100 percent owned byRegistrant.
(26) 100 percent of voting securities are owned by Diebold Enterprise Security Systems, Inc., which is 100 percentowned by Registrant.
(27) 100 percent of voting securities are owned by Diebold Security Systems Limited, which is 100 percent ownedby Diebold Enterprise Security Systems, Inc., which is 100 percent owned by Registrant.
(28) 100 percent of voting securities are owned by Diebold Enterprise Security Systems Holdings UK Limited, whichis 100 percent owned by Diebold Security Systems Limited, which is 100 percent owned by Diebold EnterpriseSecurity Systems, Inc., which is 100 percent owned by Registrant.
(29) 100 percent of voting securities are owned by Diebold Enterprise Security Systems UK Limited (refer to 28 forownership).
(30) 100 percent of voting securities are owned by Diebold Brazil Services Holding Company ULC, which is100 percent owned by Registrant.
(31) 100 percent of voting securities are owned by Diebold Brazil Servicios e Participacoes Limitada, which is100 percent owned by Diebold Brazil Services Holding Company ULC, which is 100 percent owned byRegistrant.
(32) 85 percent of voting securities are owned by Diebold Switzerland Holding Company, LLC (refer to 18 forownership).
(33) 75 percent of voting securities are owned by Diebold Africa Investment Holdings Pty. Ltd., which is 100 percentowned by Diebold Switzerland Holding Company, LLC (refer to 18 for ownership).
(34) 100 percent of voting securities are owned by Diebold Switzerland Holding Company, LLC (refer to 18 forownership).
(35) 95.45 percent of voting securities are owned by Registrant, while 4.55 percent of voting securities are owned byDiebold Holding Company Inc., which is 100 percent owned by Registrant.
(36) 100 percent of voting securities are owned by Diebold (Thailand) Company Limited, which is 100 percent ownedby Registrant.
(37) 51 percent of voting securities are owned by Diebold Latin America Holding Company, Inc., which is 100 percentowned by Registrant.

(38) 60 percent of voting securities are owned by Diebold Columbia, S.A. (refer to 17 for ownership) and 40 percentowned by Diebold Peru, S.r.L. (refer to 14 for ownership).
(39) 99 percent of voting securities are owned by D&G Centroamerica, S. de R. L. (refer to 37 for ownership).(40) 99.85 percent of voting securities are owned by D&G Centroamerica, S. de R. L. (refer to 37 for ownership).(41) 99.99 percent of voting securities are owned by D&G Centroamerica, S. de R. L. (refer to 37 for ownership).

Exhibit 23.1
Consent of Independent Registered Public Accounting Firm
The Board of Directors
Diebold, Incorporated:
We consent to the incorporation by reference in the registration statements (Nos. 33-32960, 33-39988, 33-55452, 33-54677,
33-54675, 333-32187 and 333-60578) on Form S-8 of Diebold, Incorporated, of our reports dated February 27, 2009, with respect
to the consolidated balance sheets of Diebold, Incorporated and subsidiaries as of December 31, 2008 and 2007, and the related
consolidated statements of income, shareholders’ equity, and cash flows for each of the years in the three-year period ended
December 31, 2008, and the related financial statement schedule, and the effectiveness of internal control over financial reporting
as of December 31, 2008, which reports appear in the December 31, 2008 annual report on Form 10-K of Diebold, Incorporated
and subsidiaries.
Our report on the consolidated financial statements refers to the adoption of the provisions Emerging Issues Task Force
(EITF) Issue No. 06-10, Accounting for Collateral Assignment Split-Dollar Life Insurance, and EITF Issue No. 06-4, Accounting for
Deferred Compensation and Post Retirement Benefit Aspects of Endorsement Split-Dollar Life Insurance Arrangements,
effective January 1, 2008, Statement of Financial Accounting Standards Board Interpretation No. 48, Accounting for Uncertainty
in Income Taxes — an interpretation of FASB Standard No. 109, effective January 1, 2007, Statement of Financial Accounting
Standards No. 158, Employers’ Accounting for Defined Benefit Pension and Other Postretirement Plans, effective January 1,
2008, and Statement of Financial Accounting Standards No. 157, Fair Value Measurements , effective January 1, 2008.
Our report dated February 27, 2009, on the effectiveness of internal control over financial reporting as of December 31, 2008,
expresses our opinion that Diebold, Incorporated and subsidiaries did not maintain effective internal control over financial
reporting as of December 31, 2008, because of the effects of material weaknesses on the achievement of the objectives of the
control criteria and contains an explanatory paragraph that states material weaknesses related to Diebold, Incorporated and
subsidiaries’ selection, application and communication of accounting policies; monitoring; manual journal entries; contractual
agreements; and account reconciliations have been identified and included in Management’s Report on Internal Control over
Financial Reporting appearing under Item 9A(b) of Diebold, Incorporated and subsidiaries’ December 31, 2008 annual report on
Form 10-K.
/s/ KPMG
Cleveland, Ohio
February 27, 2009

EXHIBIT 31.1
DIEBOLD, INCORPORATED AND SUBSIDIARIES
CERTIFICATION OF THE CHIEF EXECUTIVE OFFICER
PURSUANT TO SECTION 302 OF THE SARBANES-OXLEY ACT OF 2002
I, Thomas W. Swidarski, certify that:
1) I have reviewed this annual report on Form 10-K of Diebold, Incorporated;
2) Based on my knowledge, this report does not contain any untrue statement of a material fact or omit to state a materialfact necessary to make the statements made, in light of the circumstances under which such statements were made, notmisleading with respect to the period covered by this report;
3) Based on my knowledge, the financial statements, and other financial information included in this report, fairly present inall material respects the financial condition, results of operations and cash flows of the registrant as of, and for, the periodspresented in this report;
4) The registrant’s other certifying officer and I are responsible for establishing and maintaining disclosure controls andprocedures (as defined in Exchange Act Rules 13a-15(e) and 15d-15(e)) and internal control over financial reporting (asdefined in Exchange Act Rules 13a-15(f) and 15d-15(f)) for the registrant and have:
a) designed such disclosure controls and procedures, or caused such disclosure controls and procedures to be designedunder our supervision, to ensure that material information relating to the registrant, including its consolidatedsubsidiaries, is made known to us by others within those entities, particularly during the period in which this reportis being prepared;
b) designed such internal control over financial reporting, or caused such internal control over financial reporting to bedesigned under our supervision, to provide reasonable assurance regarding the reliability of financial reporting and thepreparation of financial statements for external purposes in accordance with generally accepted accounting principles;
c) evaluated the effectiveness of the registrant’s disclosure controls and procedures and presented in this report ourconclusions about the effectiveness of the disclosure controls and procedures, as of the end of the period covered bythis report based on such evaluation; and
d) disclosed in this report any change in the registrant’s internal control over financial reporting that occurred during theregistrant’s most recent fiscal quarter (the registrant’s fourth fiscal quarter in the case of an annual report) that hasmaterially affected, or is reasonably likely to materially affect, the registrant’s internal control over financialreporting; and
5) The registrant’s other certifying officer and I have disclosed, based on our most recent evaluation of internal control overfinancial reporting, to the registrant’s auditors and the audit committee of registrant’s board of directors (or personsperforming the equivalent functions):
a) all significant deficiencies and material weaknesses in the design or operation of internal control over financialreporting which are reasonably likely to adversely affect the registrant’s ability to record, process, summarize andreport financial information; and
b) any fraud, whether or not material, that involves management or other employees who have a significant role in theregistrant’s internal control over financial reporting.
Date: February 27, 2009
By: /s/ THOMAS W. SWIDARSKI
Thomas W. SwidarskiPresident and Chief Executive Officer(Principal Executive Officer)

EXHIBIT 31.2
DIEBOLD, INCORPORATED AND SUBSIDIARIES
CERTIFICATION OF THE CHIEF FINANCIAL OFFICER
PURSUANT TO SECTION 302 OF THE SARBANES-OXLEY ACT OF 2002
I, Kevin J. Krakora, certify that:
1) I have reviewed this annual report on Form 10-K of Diebold, Incorporated;
2) Based on my knowledge, this report does not contain any untrue statement of a material fact or omit to state a materialfact necessary to make the statements made, in light of the circumstances under which such statements were made, notmisleading with respect to the period covered by this report;
3) Based on my knowledge, the financial statements, and other financial information included in this report, fairly present inall material respects the financial condition, results of operations and cash flows of the registrant as of, and for, the periodspresented in this report;
4) The registrant’s other certifying officer and I are responsible for establishing and maintaining disclosure controls andprocedures (as defined in Exchange Act Rules 13a-15(e) and 15d-15(e)) and internal control over financial reporting (asdefined in Exchange Act Rules 13a-15(f) and 15d-15(f)) for the registrant and have:
a) designed such disclosure controls and procedures, or caused such disclosure controls and procedures to be designedunder our supervision, to ensure that material information relating to the registrant, including its consolidatedsubsidiaries, is made known to us by others within those entities, particularly during the period in which this reportis being prepared;
b) designed such internal control over financial reporting, or caused such internal control over financial reporting to bedesigned under our supervision, to provide reasonable assurance regarding the reliability of financial reporting and thepreparation of financial statements for external purposes in accordance with generally accepted accounting principles;
c) evaluated the effectiveness of the registrant’s disclosure controls and procedures and presented in this report ourconclusions about the effectiveness of the disclosure controls and procedures, as of the end of the period covered bythis report based on such evaluation; and
d) disclosed in this report any change in the registrant’s internal control over financial reporting that occurred during theregistrant’s most recent fiscal quarter (the registrant’s fourth fiscal quarter in the case of an annual report) that hasmaterially affected, or is reasonably likely to materially affect, the registrant’s internal control over financialreporting; and
5) The registrant’s other certifying officer and I have disclosed, based on our most recent evaluation of internal control over
financial reporting, to the registrant’s auditors and the audit committee of registrant’s board of directors (or persons
performing the equivalent functions):
a) all significant deficiencies and material weaknesses in the design or operation of internal control over financial reportingwhich are reasonably likely to adversely affect the registrant’s ability to record, process, summarize and report financialinformation; and
b) any fraud, whether or not material, that involves management or other employees who have a significant role in theregistrant’s internal control over financial reporting.
Date: February 27, 2009
By: /s/ KEVIN J. KRAKORA
Kevin J. KrakoraExecutive Vice President and Chief Financial Officer(Principal Financial Officer)

EXHIBIT 32.1
DIEBOLD, INCORPORATED AND SUBSIDIARIES
CERTIFICATION OF THE CHIEF EXECUTIVE OFFICER PURSUANT TO SECTION 906 OF THE
SARBANES-OXLEY ACT OF 2002, 18 U.S.C. SECTION 1350
In connection with the Annual Report on Form 10-K of Diebold, Incorporated and subsidiaries (the Company) for the year ended
December 31, 2008 as filed with the Securities and Exchange Commission on the date hereof (the Report), I, Thomas W.
Swidarski, President and Chief Executive Officer of the Company, certify, pursuant to Section 906 of the Sarbanes-Oxley Act of
2002, 18 U.S.C. Section 1350, that, to my knowledge:
1) The Report fully complies with the requirements of Section 13(a) or 15(d) of the Securities Exchange Act of 1934; and
2) The information contained in the Report fairly presents, in all material respects, the financial condition and results of
operations of the Company as of the dates and for the periods expressed in the Report.
/s/ THOMAS W. SWIDARSKI
Thomas W. Swidarski
President and Chief Executive Officer
(Principal Executive Officer)
February 27, 2009
EXHIBIT 32.2
DIEBOLD, INCORPORATED AND SUBSIDIARIES
CERTIFICATION OF THE CHIEF FINANCIAL OFFICER PURSUANT TO SECTION 906 OF THE
SARBANES-OXLEY ACT OF 2002, 18 U.S.C. SECTION 1350
In connection with the Annual Report on Form 10-K of Diebold, Incorporated and subsidiaries (the Company) for the year ended
December 31, 2008 as filed with the Securities and Exchange Commission on the date hereof (the Report), I, Kevin J. Krakora,
Executive Vice President and Chief Financial Officer of the Company, certify, pursuant to Section 906 of the Sarbanes-Oxley Act of
2002, 18 U.S.C. Section 1350, that, to my knowledge:
1) The Report fully complies with the requirements of Section 13(a) or 15(d) of the Securities Exchange Act of 1934; and
2) The information contained in the Report fairly presents, in all material respects, the financial condition and results of
operations of the Company as of the dates and for the periods expressed in the Report.
/s/ KEVIN J. KRAKORA
Kevin J. Krakora
Executive Vice President and Chief Financial Officer
(Principal Financial Officer)
February 27, 2009

OTHER INFORMATION
The Company has included as Exhibit 31 to its Annual Report on Form 10-K for fiscal year 2008 filed with the
Securities and Exchange Commission certificates of the Chief Executive Officer and Chief Financial Officer of
the Company certifying the quality of the Company’s public disclosure, and the Company has submitted to
the New York Stock Exchange a certificate of the Chief Executive Officer of the Company certifying that he is
not aware of any violation by the Company of New York Stock Exchange corporate governance standards.

Directors
Louis V. Bockius III 2,3
Retired Chairman, Bocko Incorporated North Canton, Ohio (Plastic Injection Molding) Director since 1978
Phillip R. Cox 1,4
President and Chief Executive Officer, Cox Financial Corporation Cincinnati, Ohio (Financial Planning and
Wealth Management Services) Director since 2005
Richard L. Crandall 2,4
Non-executive Chairman of the Board, Novell, Inc. Waltham, Massachusetts (Information Technology
Management Software) Director since 1996
Gale S. Fitzgerald 1,3
Director, TranSpend, Inc. Bernardsville, New Jersey (Total Spend Optimization) Director since 1999
Phillip B. Lassiter 1,3
Retired Chairman of the Board and Chief Executive Officer,
Ambac Financial Group, Inc. New York, New York (Financial Guarantee Insurance
Holding Company) Director since 1995
John N. Lauer 1,3
Non-executive Chairman of the Board, Diebold, IncorporatedCanton, Ohio Retired Chairman of the Board, Oglebay Norton Co. Cleveland, Ohio (Industrial Minerals) Director since 1992
Eric J. Roorda 2,4
Former Chairman, Procomp Amazônia Indústria
Eletronica, S.A. São Paulo, Brazil (Banking and Electoral Automation;
subsidiary of Diebold) Director since 2001
Thomas W. Swidarski
President and Chief Executive Officer, Diebold, Incorporated Canton, Ohio Director since 2005
Henry D. G. Wallace 2,4
Former Group Vice President and Chief Financial Officer,
Ford Motor Company Detroit, Michigan (Automotive Industry) Director since 2003
Alan J. Weber 2,4
Chief Executive Officer, Weber Group LLC Greenwich, Connecticut (Investment Consulting)Director since 2005
1 Member of the Compensation Committee2 Member of the Audit Committee3 Member of the Board Governance Committee4 Member of the Investment Committee
Officers
Thomas W. Swidarski
President and Chief Executive Officer
Kevin J. Krakora
Executive Vice President and Chief Financial Officer
George S. Mayes, Jr.
Executive Vice President, Global Operations
David Bucci
Senior Vice President, Customer Solutions Group
James L. M. Chen
Senior Vice President, EMEA/AP Divisions
Charles E. Ducey, Jr.
Senior Vice President, Global Development and Services
Dennis M. Moriarty
Senior Vice President, Global Security Division
Warren W. Dettinger
Vice President and General Counsel
Sean F. Forrester
Vice President and Chief Information Officer
Chad F. Hesse
Corporate Secretary
M. Scott Hunter
Vice President, Chief Tax Officer
John D. Kristoff
Vice President, Chief Communications Officer
Timothy J. McDannold
Vice President and Treasurer
Leslie A. Pierce
Vice President and Corporate Controller
Sheila M. Rutt
Vice President, Chief Human Resources Officer
Robert J. Warren
Vice President, Corporate Development and Finance
Directors and Officers

Corporate Offices
Diebold, Incorporated5995 Mayfair RoadP.O. Box 3077North Canton, Ohio, USA 44720-8077+1 330-490-4000www.diebold.com
Stock Exchange
The company’s common shares are listed under the symbol DBD on the New York Stock Exchange.
Transfer Agent And Registrar
BNY Mellon Shareowner Services866-242-7752 or +1 201-680-6685E-mail: [email protected] site: www.bnymellon.com/shareowner/isd
General Correspondence:P.O. Box 358015Pittsburgh, PA, USA 15252-8015
Or Overnight Delivery:500 Ross Street, 6th FloorPittsburgh, PA, USA 15219
Dividend Reinvestment/Optional Cash:Dividend Reinvestment DepartmentP.O. Box 358035Pittsburgh, PA, USA 15252-8035
Publications
Our annual report on Form 10-K, quarterly reports on Form 10-Q, current reports on Form 8-K and all amendments to those reports are available, free of charge, on or through the Web site, www.diebold.com, as soon as reasonably practicable after such material is electronically filed with or furnished to the Securities and Exchange Commission. Additionally, these reports can be furnished free of charge to shareholders upon written request to Diebold Corporate Communications and Investor Relations at the corporate address, or call +1 330-490-3790 or 800-766-5859.
Information Sources
Communications concerning share transfer, lost certificates or dividends should be directed to the transfer agent. Investors, financial analysts and media may contact the following at the corporate address:
Christopher J. Bast, CPA, CTPDirector, Investor Relations+1 330-490-6908E-mail: [email protected]
Michael JacobsenSr. Director, Corporate Communications+1 330-490-3796E-mail: [email protected]
Direct Purchase, Sale And
Dividend Reinvestment Plan
BuyDIRECTSM, a direct stock purchase and sale plan administered by BNY Mellon Shareowner Services, offers current and prospective shareholders a convenient alter-native for buying and selling Diebold shares. Once enrolled in the plan, shareholders may elect to make optional cash investments.
For first-time share purchase by nonregistered holders, the minimum initial investment amount is $500. The minimum amount for subsequent investments is $50. The maximum investment is $10,000 per month.
Shareholders may also choose to reinvest the dividends paid on shares of Diebold Common Stock through the plan.
Some fees may apply. For more information, contact BNY Mellon Shareowner Services (see addresses in opposite column) or visit Diebold’s Web site at www.diebold.com.
Annual Meeting
The next meeting of shareholders will take place at 10:00 a.m. ET on April 23, 2009, at the Sheraton Suites, 1989 Front Street, Cuyahoga Falls, Ohio 44221. A proxy statement and form of proxy is available for shareholders to review on or about March 10. The company’s independent auditors will be in attendance to respond to appropriate questions.
Price Ranges of Common Shares2008 2007 2006
HIGH LOW HIGH LOW HIGH LOW
First Quarter $39.30 $23.07 $48.42 $42.50 $43.84 $36.40Second Quarter 40.44 35.44 52.70 47.25 46.35 39.15Third Quarter 39.81 30.60 54.50 42.49 44.90 36.93Fourth Quarter 34.47 22.50 45.90 28.32 47.13 41.41Full Year 40.44 22.50 54.50 28.32 47.13 36.40
Shareholder Information
Forward-Looking StatementsCertain statements in this annual report, particularly the statements made by management and those that are not historical facts, are “forward-looking statements” within the meaning of the Private Securities Litigation Reform Act of 1995. Forward-looking statements give current expectations or forecasts of future events. They are not guarantees of future performance and are subject to risks and uncertainties, many of which are beyond the control of Diebold. Some of the risks, uncertainties and other factors that could cause actual results to differ materially from those expressed in or implied by the forward-looking statements are detailed in the company’s 2008 Annual Report on Form 10-K. A copy of that Form, which is on file with the Securities and Exchange Commission and is available at www.diebold.com or upon request, is included in this report.

Diebold unveils Opteva®, a new family
of ATMs supported by Agilis® software
2003 2009 Diebold announces
56th consecutive annual
dividend increase
2008United States Postal Service
chooses Diebold to implement
nationwide security program
2002 Diebold releases Agilis®
software as a standard
platform for ATMs
For 150 years, Diebold has created the
products, services and technology to
be a global leader in integrated self-
service, security and service solutions.
We take great pride in our longevity
and accomplishments, and believe
the best is yet to come. One hundred
and fifty years of innovation is just the
beginning; welcome to the era of
Innovation Delivered.
www.diebold.com/150

Diebold, Incorporated
5995 Mayfair Road
P.O. Box 3077
North Canton, Ohio 44720-8077
USA
w w w. d i e b o l d . c o m