Embed Size (px)
Citation preview

ANNUAL REPORT
2009
Wyoming Game and Fish Department


1
Septemb The HonGovernorCapitol BCheyenn Dear Gov In accordthe Gameof the Ga
We appreWhile thour agenagency w Sincerely Clifford KWyoming
er 9, 2009
orable Daver, State of W
Building ne, WY 8200
vernor Freud
dance with Se and Fish Dame and Fish
eciate your shere are manncy has expeworkforce an
y,
Kirk, Presidg Game and
WYOMIN
5400 Pho
e FreudenthaWyoming
02
denthal:
Section 23-1Department’sh Commissio
support on thny challengeerienced in tnd an enlight
dent d Fish Comm
G GAME A
Bishop Blvd. one: (307) 777-4
Web site: ht
al
1-503 of Wys 2009 Annuon and cover
he many issus facing us, the past yeatened public.
mission
AND FISH D
Cheyenne, W
4600 Fax: (307) 7
ttp://gf.state.wy.u
yoming Statual Report. rs the period
ues facing wI would enc
ar. These su.
DEPARTMEN
WY 82006 777-4610
us
utes, it is mThe report w
d July 1, 200
wildlife and wcourage youuccesses are
NT
GODA
DIST
COCLEDCLAAJEMIFR
my pleasure twas prepare
08 through Ju
wildlife habu to note thee the produc
OVERNOR AVE FREUDENTHA
RECTOR TEVE K. FERRELL
OMMISSIONERS LIFFORD KIRK – PrD MIGNERY – Vice LARK ALLAN ARON CLARK ERRY GALLES IKE HEALY RED LINDZEY
to present tod at the direune 30, 2009
itat in Wyome many succts of a dedi
AL
esident President
o you ection 9.
ming. cesses cated


2009 ANNUAL REPORT
Wyoming Game and Fish Department

2009 ANNUAL REPORT Table of Contents
PAGE
Commissioner Message to the Governor ........................................................................................... Message from the Director............................................................................................................... i Director’s Office and Commission Photographs ........................................................................... iii Organizational Chart ........................................................................................................................v Director’s Summary ...................................................................................................................... vii INTRODUCTION AND DIVISION REPORTS Introduction ..........................................................................................................................1 Fiscal Division .....................................................................................................................3 Fish Division ........................................................................................................................5 Services Division .................................................................................................................9 Wildlife Division ...............................................................................................................13 PROGRAM-LEVEL REPORTS Aquatic Wildlife Management ...........................................................................................19 Bird Farms .........................................................................................................................24 Conservation Education .....................................................................................................26 Conservation Engineering ..................................................................................................30 Customer Services .............................................................................................................34 Department Administration ...............................................................................................41 External Research ..............................................................................................................47 Feedgrounds .......................................................................................................................49 Financial Management .......................................................................................................52 Habitat ................................................................................................................................58 Habitat and Access Management .......................................................................................68 Habitat Protection ..............................................................................................................75 Information ........................................................................................................................78 Information Technology ....................................................................................................82 Legislatively Mandated Expenses ......................................................................................93 Personnel Management ......................................................................................................95 Property Rights (Lands) Management ...............................................................................98 Regional Information and Education Specialist ..............................................................104 Regional and Terrestrial Wildlife Management ..............................................................110 Specialized Statewide Law Enforcement .........................................................................115 Statewide Terrestrial Wildlife Management ..............................................................120 Strategic Management .....................................................................................................135 Support Facilities and Personnel ......................................................................................138 Wildlife Health Laboratory Services ...............................................................................141

APPENDIX A INDIVIDUAL MANAGEMENT REPORTS BIG GAME Pronghorn ............................................................................................................ A-1 Elk ....................................................................................................................... A-2 Mule Deer ........................................................................................................... A-3 White-tailed Deer ................................................................................................ A-4 Moose .................................................................................................................. A-5 Bighorn Sheep ..................................................................................................... A-6 Rocky Mountain Goat ......................................................................................... A-7 Bison ................................................................................................................... A-8 TROPHY GAME Black Bear ........................................................................................................... A-9 Grizzly Bear ...................................................................................................... A-10 Mountain Lion .................................................................................................. A-11 SMALL GAME
Cottontail........................................................................................................... A-13 Snowshoe Hare ................................................................................................. A-14 Squirrel .............................................................................................................. A-15
UPLAND GAME
Pheasant ............................................................................................................ A-17 Gray Partridge ................................................................................................... A-18 Chukar ............................................................................................................... A-19 Sage Grouse ...................................................................................................... A-20 Sharp-tailed Grouse .......................................................................................... A-21 Blue Grouse ...................................................................................................... A-22 Ruffed Grouse ................................................................................................... A-23 Mourning Dove ................................................................................................. A-24 Turkey ............................................................................................................... A-25
WATERFOWL
Duck .................................................................................................................. A-27 Goose ................................................................................................................ A-28 Sandhill Crane ................................................................................................... A-29 Rail, Snipe, Coot ............................................................................................... A-30
FISHERIES
Sport Fisheries .................................................................................................. A-31 Commercial Fisheries ....................................................................................... A-32
FURBEARERS
Bobcat ............................................................................................................... A-33 Other Furbearers ............................................................................................... A-34
RAPTORS..................................................................................................................... A-35

NONGAME AND NON-LICENSED USES PROGRAMS ........................................ A-37 APPENDIX B HUNTER AND ANGLER EXPENDITURES
Summary of 2007 Expenditures by Hunters and Anglers ...................................B-1 Restitution Values of Game Animals ..................................................................B-3
APPENDIX C BUDGET AND FINANCIAL SUMMARIES
FY 2010 Budget Summary .................................................................................C-1 Detail Budget, Strategic Plan (Excluding Reimbursement Projects and Mitigation) ......................................................................................C-2 WGF Commission FY 10 Budget – Trust Fund Projects ...................................C-4 Maintenance and Operations (FY 87-FY 10) ......................................................C-6 Statement of Assets, Liabilities and Fund Balances ............................................C-7 Statement of Revenue and Expenditures .............................................................C-8 Schedule of Expenditures by Strategic Plan Objectives ......................................C-9 Statewide Five-Year Comparison of License Sales ...........................................C-10 Expenditure Allocations by Program .................................................................C-15 Revenue Collected by Species.......................................................................... .C-17 Agency Expenditure by Species......................... .............................................. C-18 Agency Expenditures by Program Basis Five-Year History .............................C-19 Agency Expenditures by Activity Basis ............................................................C-22 Landowner Coupons and Damage Claims .........................................................C-26
REFERENCES ..................................................................................................................................


i
A Message from the Director
Wyoming has some of the most impressive wildlife populations and habitats anywhere. These include vast grassland prairies, sagebrush communities, pristine alpine habitats, crystal-clear streams, and so much more. In Wyoming, wildlife is all around us. From virtually any community in the state, you can take a short drive outside town and find pronghorn, elk, deer, and other big game species, not to mention hundreds of avian species, small game, fish, and other wildlife. Ensuring that our wildlife and their habitats remain healthy is no small challenge. But the Wyoming Game and Fish Commission and Wyoming Game and Fish Department remain committed to this mission. Fiscal Year 2009 was another challenging year for the Commission and the Department. Wyoming’s wildlife continues to face a variety of challenges. You will read about many of those challenges in this report, as well as many of the accomplishments we have made towards our mission. You will also find financial information, species summaries, and progress reports for each of the divisions and major programs administered by the Department. Fiscal Year 2009 was my first full year as Director of the Wyoming Game and Fish Department. I spent much of my time this year traveling the state, meeting hundreds of wildlife stakeholders, and learning more about the unique issues that face Wyoming’s wildlife and people. I have always been struck by the rugged beauty of the state, its abundance of wildlife, and the friendliness of its people. Now I am also struck by the passion folks in this state have for their wildlife and their outdoor traditions. It is an honor to serve the people of Wyoming and lead this agency in fulfilling its mission of conserving wildlife and serving people. Sincerely, Steve K. Ferrell Director

ii

Governor Dave Freudenthal
Steve K. Ferrell Director
John Emmerich Deputy Director
Gregg Arthur Deputy Director
iii

COMMISSION
Michael Healy Rancher from Worland. Represents Park, Big Horn, Hot Springs and Washakie counties.
Ronald “Jerry” Galles Business owner from Casper. Represents Converse, Natrona and Fremont counties.
Clark Allan Deputy County Attorney in Teton County from Jackson. Represents Teton, Sublette, Lincoln and Uinta counties.
Clifford Kirk Commission President
Banker from Gillette. Represents Sheridan, Johnson and Campbell counties.
Fred Lindzey Retired Biologist. Professor Emeritus, University of Wyoming, from Laramie. Member of Governor’s Brucellosis Tack Force. Represents Sweetwater, Carbon and Albany counties.
Aaron Clark Retired from Wheatland. Represents Platte, Goshen and Laramie counties.
Ed Mignery Commission Vice President
Retired Electric Utility Engineer from Sundance. Represents Crook, Wes-ton and Niobrara counties.
iv

v

vi

vii
Director’s Summary Headquarters Remodel/Addition Project The WGFD began the project to construct an addition to the Cheyenne Headquarters building and renovate much of the existing structure. The $14.5 million project is scheduled for completion in late 2010. The new addition will provide much needed storage, office, and meeting space as well as a new public entrance and support center, license sales area, gift store, and interpretive displays. Approximately half of Cheyenne office personnel are in a temporary location until construction is completed. All license sales and dealings with the general public are being conducted from this temporary facility. Funding for this important project was provided by Governor Freudenthal and the Wyoming Legislature. Wolves The status of wolves in the northern Rocky Mountains has been unpredictable and frustrating. Wolves in Wyoming remain protected under the Endangered Species Act, though they have been delisted in Idaho and Montana. Wyoming has filed a brief in District Court challenging the U.S. Fish and Wildlife Service’s rejection of Wyoming’s wolf management plan and not delisting wolves in Wyoming. Current federal population estimates put the wolf population at around 1,650 animals in the Northern Rocky Mountain region, including more than 300 in Wyoming. At this time, the federal government has management authority for wolves in the state. The only responsibility of the WGFD under state law involves investigating depredation claims and reimbursing ranchers for depredations in Wyoming’s Trophy Game Management Area. Grizzly Bears The grizzly bear was removed from the federal list of threatened and endangered species in 2007. This summer, that delisting was overturned by federal court action. At present, the U.S. Fish and Wildlife Service has management authority for grizzly bears in the Greater Yellowstone Area, and it is unclear what federal or state action might be taken regarding grizzly bear status. Given the current situation, Wyoming is considering what its long-term role will be if grizzly bears remain listed. In 2009, the Yellowstone population of grizzly bears was estimated at 579 animals, continuing a long-term growth rate of 2 to 7 percent annually. Grizzly bears continue to expand their range and are now occupying new areas in the Wyoming Range, Snake River Range, Upper Wind River Range, and Owl Creek Mountains. Efforts continue to improve methods for estimating the population size of the Yellowstone grizzly bear population. Current estimates are considered quite conservative. Sage Grouse The 2008 Wyoming Legislature approved $2.83 million for ongoing and expanded sage grouse efforts. One million of this budget was a one-time appropriation to complete a statewide sagebrush mapping effort by the University of Wyoming Geographic Information Services Center and the United States Geological Survey. The final product should be available for use by early 2010. The entire sage grouse program is now funded by general fund appropriations.

viii
A statewide sage grouse implementation team, formed in 2007 by the Governor’s Office, continues to develop policy recommendations and statewide conservation efforts and promote collaborative management and planning from a state level. The Directors Office has also been organizing a multi-state, multi-entity sage grouse/wind development research collaborative. The goal of this effort is to initiate a collaborative industry, agency and academia research program to assess the impacts of wind power development on the behavior and population dynamics of sage grouse at multiple study sites in several western states that have sage grouse and wind development potential. Legislative Efforts The WGFD actively tracked 31 bills, one resolution and monitored 66 bills for a total of 98 pieces of legislation during the 2009 session of the Wyoming State Legislature. Seventeen bills and one resolution supporting the WGFD mission were signed into law. Twelve bills tracked died, including six bills dealing with wolf management and two dealing with instream flow water rights. The following summarizes a few of the significant outcomes from this session: With respect to improving safety of the WGFD’s aerial survey work and marking structures that obstruct flight, a bill was passed that requires all structures associated with the development or study of wind powered electric generation, “met towers”, that are over 50 feet in height to be marked so the structure is recognizable in clear air during daylight hours from a distance not less than 2,000 feet. Due to enabling legislation passed in 2009, the Wyoming Game and Fish Commission approved a regulation to control the collection of shed antlers and horns of big game animals on public land west of the Continental Divide following a series of public meetings. The regulation was enacted to minimize potential harassment or disturbance of big game animals on winter range. Under the regulation, antlers can be gathered from April 30 to January 1. The regulation will not affect most winter ranges in Teton County, where the majority of winter ranges are already off limits from December through April. Utah and Colorado have similar regulations. The Game and Fish Trapping bill also passed, giving the Wyoming Game and Fish Commission authority to promulgate rules and regulations establishing specifications for snares, breakaway weights, location of breakaway devices, loop size and anchors for trapping and snaring of furbearing and predatory animals. This bill will allow the Commission to change certain requirements as needed to adapt to changing technologies, techniques, or other circumstances to better minimize “non-target” wildlife mortality. Several other bills supporting the WGFD’s mission were passed and are related to Game and Fish immunocontraceptives; dogs chasing wildlife; Game and Fish penalties; exemptions for purchase of conservation stamps for individuals holding Game and Fish pioneer licenses; complimentary hunting licenses; Recreational Safety Act amendments; internet hunting; feral livestock; bighorn sheep ewe and lamb licenses; federal natural resources policy account; intentional feeding of elk; and landowner coupon redemption.
ix
Leadership Development and Workforce Planning The WGFD continues to invest in the future of the agency through its Leadership Development program. During 2009, the Department conducted two concurrent phases of this program—Leadership Development 1 and Leadership Development 2. Two WGFD personnel also participated in the National Conservation Leadership Institute, an intensive national program that prepares individuals for leadership positions in the conservation field. The Department also developed a new career website, as a result of recommendations from a Leadership Development Action Team. The website now provides information about the WGFD and types of positions and careers available with the agency. The WGFD developed a workforce planning document to help guide strategic efforts for dealing with a substantial amount of personnel changes over the next several years. Aquatic Invasive Species The WGFD is continuing its educational efforts to make boaters and anglers aware of the potential impacts from Aquatic Invasive Species, such as zebra and quagga mussels. The agency continues to produce brochures, web pages, and other educational items and distributes these widely around the state. The 2010-2011 fishing regulations also contain a section on the threat of Aquatic Invasive Species. WGFD staff has been working with the Wyoming Legislature’s Travel, Recreation, Wildlife and Cultural Resources Interim Joint Committee to educate them about the threats from Aquatic Invasive Species and to potentially introduce legislation in the 2010 legislative session specific to this issue. Online License Sales For several years, the WGFD has been accepting limited quota hunting license applications online. This year, more than 60 percent of all applications were submitted online. Beginning in fall of 2009, WGFD also began selling a variety of stamps and hunting and fishing licenses on line. These include antelope, deer, fall turkey, bird/small game, black bear, mountain lion, and fishing. Conservation stamps and pheasant and elk management stamps are also available. These new online license selling tools are helping the Department better meet the needs of its customers. Brucellosis The Department continues to implement all of the wildlife-related recommendations of the Governor’s Brucellosis Coordination Team, including research, management, and education. WGFD personnel worked with other agencies to create a new website devoted to information about brucellosis. The site can be found at http://wyomingbrucellosis.com. The Department also is continuing several research projects to understand more about how brucellosis can be managed in wildlife and how the potential transmission of the disease from wildlife to cattle can be minimized.

x
Hunter and Angler Recruitment and Retention Throughout the nation, the number of active hunters and anglers is declining. Because sportsmen have traditionally been the backbone of conservation efforts and funding, this trend has potentially severe implications for state fish and wildlife agencies. During this fiscal year, the Department placed additional emphasis on recruiting new hunters and anglers, and retaining existing hunters and anglers. Working with our partners in state and federal agencies, non-governmental organizations, and others, the WGFD is looking at ways we can get more people out in the fields, rivers, lakes, and woods. Energy Development It is still unclear what effects wind energy development will have on wildlife in Wyoming. The Wyoming Game and Fish Commission is concerned that an increase in development of energy resources could have potential negative effects on wildlife and on hunter access. Because of this, the Commission drafted a resolution confirming their position that access should not be lost in the face of wind development. The resolution also confirms the Commission’s commitment to work with land management agencies, local law enforcement, and wind energy companies to reduce and report damage to wind turbine generators caused by vandals. WGFD also prepared and distributed a document for public review: “Wind energy issues: Impacts and Mitigation for Wildlife in Wyoming.” The document provides recommendations to developers for assessing impacts to wildlife from wind energy projects, for collecting data, and for mitigating effects on wildlife. Final adoption of the recommendations is scheduled for March 2010. State Wildlife Action Plan Wyoming’s State Wildlife Action Plan (SWAP) is being revised and will be presented for approval to the Commission in July 2010 and to the U.S. Fish and Wildlife Service by October 1, 2010. The 2010 SWAP will be organized at three levels. At the statewide level, information specifying threats and conservation actions associated with the five greatest conservation challenges will be presented. Leading wildlife challenges were identified as energy development, rural subdivision and development, invasive species, disruption of historic disturbance regimes, and climate change. At the habitat level, the state has been divided into ten terrestrial habitats and six aquatic basins. Information about the conservation designations, life histories, threats, research, conservation actions, and monitoring for all Wyoming’s Species of Greatest Conservation Need (SGCN) will be available within species accounts.
A SWAP Inter-agency Advisory Team was set up to facilitate external communications and meet the inter-agency coordinated requirement for SWAPs. A quarterly electronic newsletter was created to increase internal and external awareness about SWAP activities and the 2010 revision process.

INTRODUCTION
DIVISION REPORT NARRATIVES


1
INTRODUCTION This report covers the progress and financial status of the Wyoming Game and Fish Department during Fiscal Year 2009. The information documents progress toward objectives stated in the Wyoming Game and Fish Department’s Four-Year Plan (FY 07-FY 11), September 2007. During calendar year 2009 a total of 3,531,820 hunting and fishing recreation days were provided to the public. Based on hunting and fishing expenditure surveys conducted in Wyoming, since 2006, hunters, anglers, and trappers expended approximately $684,109,000 in pursuit of their sport. At the end of the period covered by this report (June 30, 2009), the Department was comprised of 404 permanent full-time employees and 103 temporary or seasonal workers. A summary of Department activities by respective division follows.

2

3
FISCAL DIVISION Rich Reynders, Chief
In FY 09 the Fiscal Division continued focusing on the evolution of the Department’s licensing processes to a fully automated Internet based system, with goal of further improving customer service and expanding licensing information. Additionally, the Department neared completion to upgrade its internal financial systems, allowing migration to an SQL database for improved processing and reporting. The Division oversees all financial operations of the Department, including budget development, financial reporting, accounts payable, purchasing, asset management, federal funds (grant) management, contract management, revenue collection and licensing. Additionally, the Division is responsible for the operation and maintenance of various automated systems for licensing, revenue reporting, cost accounting, vehicle management, credit card payments and other accounts payables, landowner coupons and time reporting. In FY 09, the Fiscal Division, working with Services Division IT personnel, continued the upgrade of its licensing systems. With the migration of limited quota application processing from the mainframe to in-house servers utilizing dot.net programming and SQL databases put into production in the previous year, the focus in FY 09 was to complete the electronic licensing system (ELS) for license selling agents (LSAs). While regional offices and some pilot LSAs had begun using the Internet based system late in FY 08, the majority of agents came on-line in FY 09. This involved extensive training and customer contacts in the first several months of the fiscal year as the first leftover doe fawn licenses (limited quota) became available through ELS in August 2008. Work continued throughout the year as more and more agents came on-line and the system was fine-tuned to improve system efficiencies and offer enhancements based on LSA recommendations. Work continued throughout the year on upgrading the system to allow for the elimination of the leftover draw in FY 10 and providing for Internet sales of all licenses by late summer 2009. Expanded use of the Internet for license and preference point applications continued throughout FY 09, with approximately two-thirds of all individuals applying through the Internet for the FY 09 application period. This allowed a substantial reduction in the number of temporary employees hired to process the 268,000 applications submitted during the year. Growth in both Internet applications and Internet license sales is anticipated to continue over the next year. In FY 10, we will focus on developing standard user accessible reports and improving user ability to extract Ad hoc information from all licensing systems to provide improved information for audits, statistical modeling and trend analysis. In the accounting area, the Department continued to work on automating its cost accounting system, putting phase I into production by November 2008. The new system allowed for enhanced reporting and more timely information as the new system is SQL based, allowing for more flexibility than available in the previous system. In FY 2010, we will focus on converting historic data along with completing phase II, which will allow the cost accounting system to capture in-kind information and automate the grant

4
billing process. The Division also completed the resolution process with US Fish and Wildlife Service (USFWS) on audit findings from previous audit periods. While the Department participates in the annual single audit conducted by auditors hired through the State Auditor’s office, Wyoming should not be scheduled for a USFWS audit again until 2012. The Division also made several appearances before the legislature and legislative committees regarding funding and licensing issues. For the 2009-2010 biennium the Department’s general funds were expanded to allow for two additional programs, wolf management and the Comprehensive Wildlife Management Strategy (CWCS), now known as the State Wildlife Action Plan (SWAP), in addition to previously funded programs, vet services and sage grouse. However, in the 2009 Legislative session, funding for the wolf management program was reduced by approximately 50 percent as wolf management in Wyoming was returned to USFWS, with the Department’s role modified to damage investigation and payment of damage claims only. In May 2009, at the request of the Governor’s office, the Department along with all other state agencies, was required to submit cost reduction plans to allow for a 5 percent general budget reduction for the 2009-2010 biennium. The Department’s reduction plan was approved, effective July 1. This 5 percent reduction will also be required for the 2011-2012 biennium budget. Additionally, the Division continues to prepare the Commission budget, which is developed on an annual basis and presented to the Commission for review and authorization each April. The number of grants that the Division administers has continued to grow, with the Department now receiving approximately 25 percent of its revenue from federal, state and private grants. The Department receives grants from more than ten federal agencies (U.S. Fish and Wildlife Service, USDA Forest Service, Bureau of Land Management, Bureau of Reclamation, Natural Resource Conservation Service, U.S. Coast Guard, Department of Homeland Security, Environmental Protection Agency, U.S. Geological Survey, USDA APHIS) in addition to a number of state and local government entities and not-for-profit organizations. An important new source of grant funds in the last two years has been the Wyoming Wildlife and Natural Resource Trust, a state agency, whose board reviews and approves grant applications for wildlife projects, and has provided funding to the Department in addition to other conservation entities, such as local conservation districts. During FY 09, approximately $350,000 was transferred from this entity to the Department for work completed on wildlife projects.

5
FISH DIVISION Mike Stone, Chief
The Fish Division is responsible for management of all aquatic wildlife including fish, mollusks, crustaceans, amphibians and reptiles. We continue to strive to meet the dual purpose of conserving native species and maintaining high quality, sportfishing opportunities. The improved snow packs and spring rains experienced last year continued through most of FY 09. With a second consecutive, above average water year river and reservoir conditions finally began to show improvement in the Laramie River, North Platte River and South Platte River basins. Consequently, we expect improved fisheries production and better fishing in future years. A major public information and legislative initiative was launched for aquatic invasive species (AIS) this year. Our initial efforts were intended to develop public and legislative awareness of this daunting ecological concern. Consequently, future legislative options to halt or reduce the spread of AIS was one of the interim study topics chosen by the joint Travel, Recreation, Wildlife and Cultural Resources Committee. While public awareness can be the most effective method to combat the spread of invasive species, legislative and statutory directions could greatly aid or change the manner in which the department and the state addresses AIS in the future. Aquatic habitat projects completed this year included shared-agency projects such as diversion rehabilitation projects in the Sheridan Region, beaver transplants, design of projects like the Kendrick fish bypass project on Clear Creek near Buffalo, Bureau of Land Management (BLM) and U.S. Forest Service (USFS) management planning assistance, watershed inventories and habitat assessments, major monitoring efforts, fish passage investigations, an educational fish passage tour, research projects with the University of Wyoming and Colorado State University and other habitat projects. The aquatic habitat section played a major role in completing the revision of the department’s Strategic Habitat Plan (SHP) in FY 09. Each of the regional habitat biologists was responsible for identifying habitat priority areas and describing issues, values and needed actions that served as the foundation for the plan. This effort will serve to direct our future habitat project funding and direct our activities towards the most pressing aquatic habitat needs. Significant effort went into providing habitat protection for the Little Mountain Ecosystem where aquatic habitat personnel were instrumental in developing sound resource strategies that greatly aided a crucial public awareness and involvement campaign. Also in western Wyoming, aquatic habitat monitoring data and science oversight were provided to the Wyoming Landscape Conservation Initiative to guide this regional and national effort. The downturn in the national economy and natural gas development in the northeast and southwestern parts of the state did afford some relief

6
from the frenetic demands for information needed to avoid or mitigate impacts from energy development. Several key conservation easements were gained as a result of aquatic habitat personnel working with Lands Section by providing local representation and negotiation assistance. One of the great strengths of the habitat program is development of partnerships and collaborative efforts with private landowners, land management agencies, private industry and conservation organizations. Section personnel spend considerable time on these partnerships and continue to write grants and receive funds from a wide variety of sources, including state, federal, conservation organizations, private and corporate donors. We expect this trend to continue in the future. Aquatic habitat section planning continued toward developing a distinct fish passage program and included development of program goals and objectives. A separate budget for this program was developed and approved. Meanwhile we continue to seek approval for hiring the personnel needed to make this a successful program. The section’s fish passage efforts included working with a contractor to develop preliminary designs and approaches for screening diversions and improving passage for nearly a dozen locations. Through our fish passage grants program we provided funding to conservation districts that completed passageways at seven different diversion dam locations. Angler participation declined by more than 10 percent this year after experiencing several years of very modest increases. Nearly 2,268,000 angler days were estimated based on license sales. The significant decline was attributed to the first full year of the fishing license fee increase, gasoline prices at historically high prices and the continued effects of drought on our sport fisheries. Historically we have seen license purchases and angling participation rebound within two years after a significant license fee increase. Because we experienced two consecutive high water years, we expect sport fisheries and anglers to respond favorably over the next several years. Aquatic wildlife, sport fish and herptile surveys were conducted at near record levels this past year. For stream and lake surveys, we conducted more than 635 surveys to evaluate species conservation and sport fisheries purposes. Sampling intensity was higher than normal because of increased activity for native species, especially species of greatest conservation need (SGCN). In the southwest portion of the state, potential impact to native herptiles by both wind and natural gas development were concerns we began to better assess in FY 09. Also, completion of the report documenting current status and management needs for roundtail chub, bluehead sucker and flannelmouth sucker prompted us to intensify our conservation efforts for these 3 species native to the Green River. Most of our increased survey and assessment activity for SGCN was fueled by funds from either the Governors Endangered Species Office or General Fund appropriations. We continued to make progress rewriting our basic planning documents, Basin Management Plans (BMP) this year. Completion of the SHP revision has provided us with the ability to more fully integrate our habitat priorities and elements into the BMPs.

7
Likewise, when the State Wildlife Action Plan (SWAP) is revised next year, we will be able to more easily incorporate species conservation elements into each BMP. This will then give us a scientific basis for prioritizing and directing our native species surveys. Intensive population estimates were conducted on sections of all of our major rivers and many smaller streams. Population trend analysis is crucial for evaluating our fish management program. Evaluations at LaBarge Creek demonstrated our stocking program is successfully restoring Colorado River following the highly successful stream treatment project. For our large reservoirs we continue to monitor our fish stocking programs and effectiveness of our fishing regulations. The trend for stocking larger trout to avoid predation by illegally introduced, piscivorous fishes has intensified our management efforts on many reservoirs across the state. In FY 09, illegally stocked walleye were discovered in Buffalo Bill Reservoir. These seriously jeopardize the trout fishery in the reservoir and the North Fork Shoshone River that have long been self-sustaining. Over the last five years, our Fish Culture Section has stocked an average of 314,000 pounds of fish annually. In FY 09 we stocked 296,359 pounds of fish. Besides trout, salmon and grayling raised in Wyoming facilities, we also stocked over one million walleye, hybrid sunfish, channel catfish, largemouth bass, northern pike, and shovelnose sturgeon. Of note were the more than 900,000 walleye fingerling stocked in Wyoming waters. These along with all the other cool water fishes stocked this year were received from out-of-state sources that provided the fingerlings in trade for Wyoming trout eggs. Fish stocking efforts were hindered statewide because our facilities at Wigwam and Tensleep continued to be plagued by the presence of Myxobolus cerebralis (MC), the organism causing whirling disease. The contamination of one water supply by MC at Wigwam caused us to greatly reduce rainbow trout production. Loss of the hatchery at Ten Sleep led to reduced production and flexibility for stocking time and size; the effects were statewide. We were successful in our request for General Fund, supplemental funding needed to renovate Ten Sleep water supplies and facilities; construction is set to start in FY10. While pounds are easily tracked or measured the real measure is the quality of the fish stocked. We continue to emphasize fish quality by not overstocking facilities and by incorporating modern fish health practices that stress optimum not maximum production levels. New rearing units at Dubois, Wigwam and Speas continue to be evaluated to determine ultimate production levels. As we gain experience with these modern facilities, we will continue to incrementally increase production but not at the cost of fish quality or health. FY 09 also saw continued progress towards completion of the major renovations of Speas Rearing Station and Story Hatchery. Once complete, production at Speas is anticipated to more than double by FY11. The Story Hatchery brood stock facilities will greatly improve fish health, rearing and spawning conditions for the lake trout, brook trout, rainbow trout, and golden trout. Early successes toward the development of a golden trout brood stock held at Story was noteworthy for FY 09 and will be an emerging story over the next three to four years. We have struggled for 12 years to develop a reliable and

8
economic brood stock for our golden trout fishery needs. The success experienced with our captive golden trout brood stock at Story has been a very big, but pleasant surprise.

9
SERVICES DIVISION John Kennedy, Chief
The Services Division is committed to achieving the Department’s mission by increasing public awareness of all Wyoming’s wildlife issues, strengthening support for the Department, conserving and enhancing wildlife habitat, providing increased access for recreational opportunities, maintaining healthy wildlife populations, and providing technical support critical to the success of the Department. The Division is administered by the Division Chief, Assistant Division Chief for Habitat/Technical Support, and Assistant Division Chief for Information & Education. The Assistant Division Chiefs are responsible for the administration of nine work units through two distinct sections. The Division’s Habitat/Technical Support Section includes Lands Administration (acquisition program); Conservation Engineering; Game and Fish Laboratory; Habitat & Access Maintenance; and Information Technology/GIS. The Information & Education Section includes: Conservation Education; Regional Information & Education (I&E); Information/Publications; and the Customer Service (Telephone Information) Center. During FY 09, the Services Division Administration continued to focus on providing consistent leadership and improving communications within the Division and between the Division and other work units in the agency. Priorities for each work unit in the Division continue to be established through formal planning processes that involve all work units in the agency. The Division Administrators and Program Supervisors continued to attend other division and regional coordination meetings to improve communications, discuss priorities and expectations, and communicate management strategies specific to the Division. Division Administration will continue to focus on improving internal communications and developing priorities that are responsive to the other work units and consistent with the Director’s goals/objectives and the agency’s mission.
FY 09 Services Division Administration priorities: • Continue to recruit and promote the best-qualified candidates for positions within the
Division; administration will be directly involved in all hiring processes. • Work with the regions, Property Rights Team, and Commission on high-priority
access projects and conservation easements; continue with acquisition process improvements.
• Continue work with the Fiscal Division on the ELS Online Licensing System. • Improve agency credibility and public support through information, education, and
outreach. • Work with the Property Rights Team and Commission on proactive fee title and less
than fee title land acquisitions. • Further define the Public Information Officer role and responsibilities. • Implement goals, objectives, and strategies of the Strategic Habitat Plan. • Continue work on Department television programs and/or documentaries. • Improve processes and individual work unit performance in the Division. • Coordinate major conservation education efforts and agency programs, including the
Hunting and Fishing Heritage Exposition (Expo).

10
• Participate on committees of the Association of Fish and Wildlife Agencies and Western Association of Fish and Wildlife Agencies.
• Develop and implement hunter and angler recruitment and retention programs. During FY 09, Services Division Administration accomplished several major projects, including: • Coordination with the Director’s Office, other division administrators and the regions
to discuss and establish priorities for Services Division Administration and all work units in the Division.
• Work with the regions, Property Rights Team, and Commission to further streamline the process for acquiring fee title and less than fee title property rights; coordinated and facilitated Property Rights Team meetings on a regular basis.
• Completed Information and Education work planning/prioritization processes and established priorities; continued work to improve coordination and communications among all the I&E work units through the I&E Leadership Team.
• Continued to coordinate and implement strategic information/media plans for a variety of high-priority issues, including: the agency’s mission, funding constraints, chronic wasting disease, brucellosis, wolves, grizzly bears, and energy development.
• Developed alternative funding proposals and plans for capital construction projects, including additional work on the Cheyenne HQ renovation and expansion project.
• Continued to represent the Commission on the Board of Outfitters and Professional Guides.
• Implemented our Human Dimensions Program to help all divisions better understand public opinions, attitudes, and knowledge regarding wildlife issues, including issues related to mule deer management, elk management, aquatic invasive species, and alternative funding.
• Initiated work to develop a hunter and angler recruitment and retention program. • Designed a comprehensive communications strategy to raise awareness about the
threat of aquatic invasive species in Wyoming. • Produced a series of TV shows examining important wildlife issues in the State;
Wyoming Wildlife TV aired for nine months, from fall through spring 2008-09 across Wyoming and all episodes are now available to view on the Department’s web site.
During FY 09, the Division’s Habitat/Technical Support Section accomplished several major projects, including: • The IT/GIS Branch continued direct involvement on State IT committees that are
responsible for the oversight, policy development, and overall IT business processes for all State government; migrated the network systems at the Cheyenne HQ to a server farm for improved performance, security, and implementation of our critical business systems; continued to provide substantial support to the development of the agency’s ELS Online Licensing System; continued GIS support for implementing the agency’s Strategic Habitat Plan and State Wildlife Action Plan and the Western Governors’ Association Renewable Energy Zones Project; and, with new legislation, the GIS section developed a electronic Meteorological (MET) Tower application, in coordination with the WYDOT, to track the location of MET towers throughout the State for low-flying aircraft safety reasons.

11
• The Conservation Engineering Branch completed the final design, bidding, and contracting for the Cheyenne HQ addition/renovation project and completed all work associated with establishing the South Greeley office; completed boundary surveys at several wildlife habitat management areas (WHMAs), public access areas (PAAs), and conservation easement areas; and prepared and secured over 3,000 signs for wildlife habitat management areas, public access areas, and PLPW program areas.
• The Habitat and Access Branch, in cooperation with the Bureau of Land Management, installed six water guzzlers for wildlife; enhanced wildlife habitat on the Whiskey Basin WHMA; converted wind-powered pumps to solar-powered pumps at three wells on the Daley WHMA for more cost effective and efficient water distribution for wildlife; and worked on public access areas throughout the State to address encroachments and enhance public access.
• The Habitat and Access Maintenance Branch continued management oversight on the Commission’s WHMAs and Public Access Areas, which includes the maintenance of fences, comfort stations, car barriers, cattle guards, signs, wetlands, irrigated land, boat ramps, bridges, roads, and parking areas, and completed annual maintenance work on the Department’s 22 feedgrounds.
• The Game and Fish Lab’s forensic program established and is successfully utilizing DNA sequencing for species identification in forensic and biological cases and implemented a new procedure that identifies the presence of epizootic eiptheliotrophic disease virus in trout.
• The Lands Administration Program completed acquisitions at the Philbrick Parking Access Easement, Big Muddy Pond Parking Access Easement, Acme Parking Access Easement, the Wakely Public Access Area, and at the Springer/Bump Sullivan WHMA, and worked on several high-priority conservation easements throughout the State.
During FY 09, the Division’s I&E Section accomplished several major projects, including: • Implemented new processes for establishing I&E program priorities that are
consistent with the Director’s goals and objectives and the Department’s mission. The division’s I&E Leadership Team continued to work on improving communications and coordinating work plans among all the I&E work units.
• The Conservation Education Program continued work on several important programs and activities, including Hunter Education (includeing bowhunter education), Hunter Education Instructor Academy, Wyoming Hunter Mentor Program, 4-H shooting sports, Cooperative North American Shotgunning Education Program (CONSEP), shooting workshops, Becoming an Outdoors Woman, Youth Conservation Camp, aquatic education programs, Wild Times publication, Outdoor Recreation Education Opportunities (O.R.E.O.), Project WILD, Archery in the Schools, kids fishing clinics, aquatic invasive species education and outreach, hunter and angler recruitment and retention, and the Expo. During the 2009 Expo, 8,120 students and teachers attended from around the State.
• The Regional I&E Program implemented regional I&E work plans that were responsive to the agency’s priorities; assisted the Conservation Education Program with the Expo, Hunter Education, Project WILD, WILD About O.R.E.O. youth and

12
teacher camps, 4-H shooting sports, and aquatic education programs throughout the State.
• The Regional I&E Program assisted the Wildlife and Fish Divisions on important projects, including bear, lion and wolf education seminars, and public information meetings and other activities focus on aquatic invasive species.
• Wyoming Wildlife magazine ran a series of articles examining the history, current state, and future of the North American Model of Wildlife Conservation and the Wyoming Wildlife News is running a series on important individuals involved in the development of the North American Model.
• The Telephone Information Center answered over 89,000 calls from hunters and anglers; Alternative Enterprises had product sales that generated a net profit of $40,000; and the mailroom incorporated new processes and software that saved the agency over $9,000 in postage costs within six months of use.

13
WILDLIFE DIVISION Jay Lawson, Chief
The Wildlife Division is responsible for the management of terrestrial wildlife, human/wildlife conflict management, wildlife law enforcement and watercraft safety. The division is committed to the agency mission statement, “Conserving Wildlife, Serving People.” During FY 09, there was a significant increase in precipitation over the previous decade. Habitat conditions showed a corresponding improvement, but it will take consecutive years of moisture to achieve anything approaching true recovery. In particular, major browse species such as true mountain mahogany, antelope bitterbrush and Wyoming big sagebrush were able to produce substantial leader growth, and this was reflected in improved mule deer and pronghorn fawn survival. Significant emphasis was placed on implementation of the Wyoming Mule Deer Initiative (MDI) during FY 09. Accomplishments within the initiative include:
Two priority herd units were selected by the Department to develop detailed herd unit management plans per the MDI.
Wyoming Range Herd: • February, 2009 – Finalized an “Action Plan” outlining specific challenges
and needs and established a timeline of events and tasks needed to complete a management plan.
• Winter, 2009 – Completed a “Public Attitude” survey specific to the Wyoming Range.
• Habitat Assessment – Conducted by the Teton Science School. Completed inventory of 108,972 acres of the planned 180,489. Concurrent development of draft project proposals.
• Nugget Canyon underpasses – Completed. More than 6,000 mule deer passed through in the spring migration of 2009.
Platte Valley Herd:
• Summer, 2009 – Completed an “Action Plan” similar to that for the Wyoming Range outlining specific challenges and needs to complete a herd unit management plan.
• Winter, 2009 – Completed a “sightability” survey to better estimate wintering deer population in this DAU.
• Planning an “attitude survey” to be completed winter of 2009/2010. • Habitat Assessment – Conducted by the Teton Science School.
Completed inventory of 183,809 acres in the southern portion of the herd unit. Concurrent development of draft project proposals.
• Developing a proposal in coordination with WYDOT to develop two overpasses for migrating wildlife on Interstate 80 (Halleck Ridge and Arlington).

14
Sage grouse continue to receive a high level of management emphasis. In September 2007, an implementation team made up of representatives from federal and state agencies, conservation groups, industry and landowners this team presented the Governor with a list of recommendations they believed would contribute to the stabilization of sage-grouse populations and long-term conservation of sagebrush habitat in Wyoming. These efforts would preclude the need for the U.S. Fish and Wildlife Service to list sage-grouse as threatened or endangered. Accomplishments during FY 09 include:
• At the top of the list of recommendations was extensive statewide mapping of sage grouse habitats and habitat enhancement efforts. These mapping efforts have so far resulted in a sage grouse density and sage grouse core management area maps. A second effort conducted primarily by the Wyoming Geographic Information Science Center (WyGISC) mapped sagebrush habitats throughout Wyoming.
• The legislature approved funds for the local working group process and sage grouse projects. Over the course of two project application periods, 30 projects were approved.
• Coordinated with the Western Association of Fish and Wildlife Agencies (WAFWA) on request for information from the U.S. Fish and Wildlife Service regarding its decision of “not warranted” for listing greater sage grouse as threatened or endangered under the Endangered Species Act.
The division continued to implement the recommendations of the Governor’s Brucellosis Coordination Team. This included the fourth year of the elk test and removal project. Human/wildlife conflict management continues to be a major part of division operations. During FY 09, a total of 155 damage claims were processed, resulting in payments totaling $443,450.08, department prevention costs of $665,170, and costs related to investigating, processing and handling damage claims totaling $585,723. Human conflicts with large carnivores continue to increase as these predators expand in both distribution and abundance. In an effort to enhance training in this area, the division hosted a WAFWA-sanctioned workshop focused on dealing with the media when humans are attacked by large carnivores. The workshop was attended by many state and provincial representatives, and feedback was extremely positive. Research efforts during FY 09 included the following:
• Absaroka Elk/Wolf Study – A Wyoming Cooperative Research Unit (Coop) proposal looking at the relationships between wolves and elk distributions in the Cody area.
• Absaroka Elk Ecology Study – A Coop proposal looking at elk ecology and movements in the Cody region outside Yellowstone National Park.

15
• Nugget Canyon Monitoring – A study documenting the use of new underpasses installed in the Kemmerer area. Cameras are used to record species of use and numbers.
• Muddy Creek Elk Study – A Coop study comparing habitat use patterns in feedground and nonfeedground elk. It is being conducted in the Pinedale Region.
• Chronic Wasting Disease (CWD) and its effect on white-tailed deer populations in central Wyoming - This long-term study is designed to understand the population effects of CWD on white-tailed deer.
• Fortification Elk – This study, conducted by the University of Wyoming for the Bureau of Land Management, looks at the Fortification Elk herd’s habitat use and movements to gain knowledge of the potential effects of gas development.
• Resource Selection, Seasonal Distribution, Movement and Recruitment of Bighorn Sheep in the Teton Range of Northwest Wyoming - The overall goal of this research project is to understanding how and why bighorn sheep use the Teton landscape. Bighorn Sheep monitoring continued on the Devil’s Canyon and Laramie Peak bighorn sheep herds.
• Jackson Moose Study – This is designed to evaluate the relationship between habitat and population performance in the Jackson moose population.
• Brucellosis Studies - Several research projects are underway, including determining effects of the disease on elk populations and ways to reduce the prevalence and risk of transmission to livestock.
Species of Greatest Conservation Need (SGCN) received substantially more attention during FY 09, including:
• Assessment of Wildlife Vulnerability to Energy Development (AWVED) – This study refines the range and distribution maps for Species of Greatest Conservation Needs (SGCN) in Wyoming and estimates the effects of energy development on them. Draft maps have been developed and are being reviewed by species specialists.
• Influence of energy development on non-game sagebrush birds with a focus on sagebrush birds that are SGCN – Survey sites have been established and initial surveys were conducted in 2008 and 2009. The diversity and abundance patterns in relation to energy development intensity are being evaluated.
• Evaluation of Ferruginous hawk population status and trends – Documented population densities of nesting Ferruginous hawks and other raptor species in four widely scattered study areas and evaluated changes since the 1978 original baseline data.
• Developed methods for inventories of pygmy rabbits in sagebrush habitats – Collected tissue and pellet samples for pygmy rabbits and cottontails. Microsatellite primers were developed to allow for genetic analyses to verify pygmy rabbits during field surveys.
• The Department has been working with Wyoming Audubon on a long-term monitoring program to determine the distribution, breeding status and abundance trends for avian SGCNs.

16
• Other mammalian surveys include work with black-footed ferrets, swift fox, and Prebles Jumping mouse.
The Wyoming Game and Fish Department developed a state wolf management program in accordance with Wyoming Statutes and Commission regulations upon official delisting of wolves by the U.S. Fish and Wildlife Service. The Department’s program consisted of three wolf management specialists stationed in Cody, Lander and Pinedale and a wolf program coordinator stationed in Jackson. Upon relisting, the program was reduced from a comprehensive wolf management program with four full-time employees (FTE’s) to a wolf damage investigation/compensation program with only a single FTE stationed in Pinedale. Regional personnel and personnel from the Trophy Game Conflict Resolution program assisted with the investigation and compensation of wolf damage. Department personnel investigated 22 wolf damage situations, in which claims were filed. The Commission reimbursed claimants for a total of $105,691.92 based upon recommendations from the Department for confirmed livestock depredations and missing animals in accordance with the formula for missing livestock as provided for in Commission Regulation Chapter 28, Regulation Governing Big or Trophy Game Animal or Game Bird Damage Claims. A major false oath investigation was completed by the investigative unit during FY 09. By cross-referencing license databases from other states, the unit identified dozens of suspects who were obtaining Wyoming resident big game licenses by fraudulent means. Dozens of prosecutions are currently underway or have been completed, with most suspects pleading guilty. Law enforcement task forces were employed to address areas with chronic violations. Those included:
• Pinedale Region - Mule Deer Winter Range – Poaching • Glendo Reservoir – Memorial Day weekend – Fishing and watercraft enforcement • Glendo Reservoir – 4th of July – Fishing and watercraft enforcement • Bear River Divide HMA – Additional fall enforcement • Flaming Gorge Reservoir – Focused enforcement efforts • Whiskey Unit/Antler Rendezvous – Winter range closure violations • Platte Valley Patrol – Saratoga elk protection efforts
The Private Lands Public Wildlife Access program continues to provide quality hunting and fishing access through the Hunter Management Area (HMA) and Walk-in Area (WIA) programs. With the addition of four new HMAs, the program grew from 888,752 private acres in 2008 to 917,438 acres in 2009. The new HMAs include DeSmet north of Buffalo, Little V-H east of Thermopolis, McFarland northeast of Medicine Bow, and Beer Mug north of Medicine Bow. The WIA program increased in acreage during 2009 to 701,087 private acres compared to 653,106 in 2008. The Walk-in Fishing Area Program increased from 272 lake acres in 2008 to 4,891 acres in 2009, while stream miles decreased from 96.7 to 84.9 miles. Lake acres increased significantly due to the enrollment of Wyoming Water Commission lands surrounding High Savery Reservoir in the Little Snake River drainage.

17
The HMA online permission slip system continues to be popular, with just over 1,700 individuals applying for or receiving permission within the first day of application. Improvements to the system have enhanced efficiently and distribution of permission slips. In summary, the Wildlife Division addressed all major issues during FY 09, and the majority of divisional goals and objectives were completed thanks to an extremely dedicated and hard-working group of employees.

18

PROGRAM-LEVEL REPORTS


19
Program: Aquatic Wildlife Management Division: Fish Mission: Conserve and enhance all aquatic wildlife, reptiles, amphibians and their habitats for current and future generations. We will provide diverse, quality fisheries resources and angling opportunities. Program Facts: The Aquatic Wildlife Management program is made up of seven sub-programs, listed below with number of staff and 2009 (FY 09) budget: Sub-programs # FTEs* 2009 Annual Budget Fish Hatcheries and Rearing Stations 39.6 $4,825,006 Regional Aquatic Wildlife Mgmt. 34.5 2,959,384 Boating Access 0.0 1,189,000 Statewide Aquatic Wildlife Mgmt. 5.5 441,844 Fish Spawning 2.7 289,650 Fish Distribution 0.0 168,475 Fish Wyoming** 0.0 100,000 TOTAL 82.3 $9,973,359 * Includes permanent, contract, and temporary positions authorized in FY 09 budget. Any positions added during the budget cycle require Wyoming Game and Fish Commission authorization or must be funded from supplemental grants. ** One time funding for FY 09 from License Recoupment The Aquatic Wildlife program is located across the state in eight regional offices, Cheyenne headquarters, and ten remotely located fish hatcheries and rearing stations. Primary Functions of the Aquatic Wildlife Management Program: • Conserve and enhance all aquatic wildlife, amphibians and reptiles by
scientifically assessing populations at both local and watershed levels, control exotic species where necessary, and where ecologically and economically feasible reintroduce native species into suitable habitats in order to conserve these taxa for future generations.
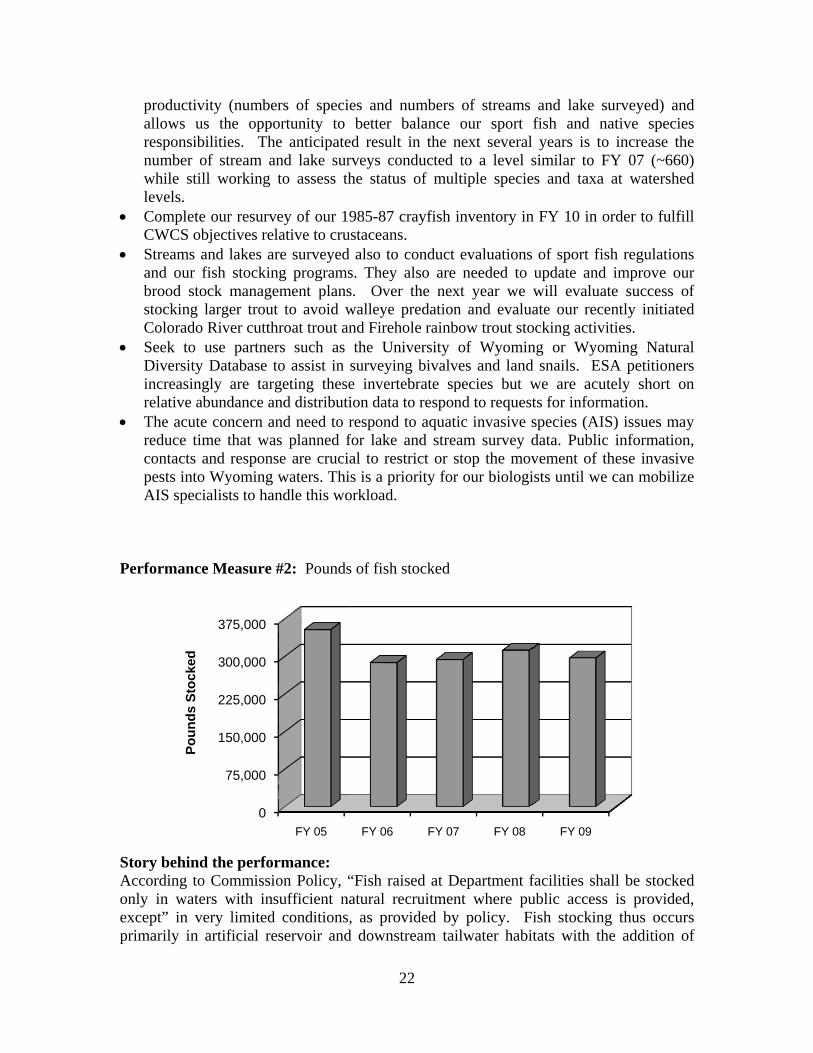
• Provide diverse, quality fisheries resources and angling opportunities through a system of fish management that attempts to first manage wild fisheries where possible, but relies upon an evaluation-based fish-stocking program. The program meets angler desires by stocking salmonids (trout, grayling and Kokanee) that come from egg sources within Wyoming and are reared using modern fish culture practices. Non-salmonid (walleye, bass, catfish, etc.) fisheries are maintained through trades of excess eggs with federal and other state agencies. Our efforts will balance the productive capacity of habitats with public desires.

Perfo
StoryThe qlakescondineed Our sfisher In FYthan becauNaturconceactiviCompLaramevaluassesEndaincreFlamaddit IntensampGreyfishesfishereffici The pBasin
ormance Me
y Behind thquality of W, rivers andition of fisheto change m
survey stratery evaluation
Y 09, a totalthe five-yea
use of increral gas fieldern for the ity. We conprehensive mie, Green Ruate habitatsments than
angered Speased activity
ming Gorge ional survey
nsive populapling site wers, Hoback, Ws. We continries. The enhiency as wel
primary mann Manageme
Num
ber o
f Sur
veys
C
ompl
eted
easure #1:
e Last YearWyoming’s fd streams. eries. Until
management egy now inclns for our sp
l of 637 strear average ased activityd developmthree specientinued to sWildlife CoRiver, Bear,t and popn previouslyecies Officey. Also, illeand Fonten
y work this y
ation estimatre conductedWind, Bighonue to emphhanced watel as afforded
nagement pent Plans (B
0
100
200
300
400
500
600
700
FY 0
Number of s
r of Performfisheries is Stream andrecently, suapproaches,
ludes more iport fish and
eams and laof 592 survy for native
ment and potes of fish nasurvey for onservation , North and pulation coy conductede and Geneegal fish intnelle reserv
year.
tes that requd most notaborn, Shoshon
hasize fish ster conditionsd better acce
lans guidingBMPs). The
05 FY 06
20
stream and l
mance: a direct refl
d lake surveurveys have , primarily fointensive surnative speci
akes were suveys per ye species. intential impaative to the native specStrategy (CSouth Platte
onditions cd inventorieseral Fund atroductions ivoirs, and i
uire multiplbly on the Nne and Tongtocking evals helped impess for samp
g fisheries mnew plans s
6 FY 07
ake surveys
lection of theys are conbeen targete
for native andrveys that emies.
urveyed. Thear. Samplin the southwact to nativ
Green Riveies of conc
CWCS) for e river basin
concurrently,s. Funding appropriationin the Greein Buffalo
le electrofishNorth Platte,
gue rivers foluations for prove our sapling our maj
managementshould provi
FY 08
completed
he quality ofnducted to ded towards ed introducedmphasize wa
his is substaning intensitywest portione herptiles er caused an
cern as identhe Big Ho
ns. These su, more cothrough the
ns fueled mn and Big SBill Reserv
hing passes Green, Bearor both wildour major re
ampling effejor rivers and
t survey woide better co
FY 09
f Wyoming’determine thevaluating thd sport fisheatershed-leve
ntially highey was highen of the state
and elevaten increase i
ntified in thorn, Powde
urveys tend tomprehensive Governor’much of thSandy rivervoir require
through onr, Snake, Sald and stockeeservoir spoctiveness and reservoirs.
ork are calleommunicatio
’s he he s. el
er er e.
ed in he er, to ve ’s he s,
ed
ne lt, ed rt
nd .
ed on

21
with our public and other agencies. But we will continue to use our surveys as a primary tool to evaluate the management goals identified in the plans. What has been accomplished: The Aquatic Assessment Crew (AAC) was fully staffed for nine months of FY 09, which greatly added to our ability to accomplish our scheduled work. Consequently the AAC completed 17 percent of the total surveys noted for FY 09. Previously we had noted the need to maintain this crew at full strength in order to meet our stream and lake survey goals. During the last quarter of the year it was necessary to redirect the work of one AAC biologist to the pressing concern of Aquatic Invasive Species (AIS) legislation and coordination. Further gains in surveys completed this year may have been higher had this temporary duty assignment not interfered with the FY 09 work plan. Modification of the basin plans began in earnest in FY 08; substantial progress was made in FY 09, nearly one half of the 111 plans have been revised statewide. We are on schedule to complete most of the plans in FY 10. Revision of the Strategic Habitat Plan (SHP) was completed this year. As a consequence, we can more fully integrate SHP habitat priorities into the BMPs. Having SHP and CWCS elements in each BMP provides a scientific basis for prioritizing and directing our native species surveys. Other factors such as potential effects from energy development in the northeast and southwest portions of the state may also serve to redirect much of our effort in order that we can conduct investigations that address impact avoidance and mitigation. Often these are areas where we have little if any baseline data but have very high diversity for species of concern. In order to meet data needs that were identified for aquatic species in the CWCS, the Department continually surveys streams and lakes. Surveys are typically to gather base-line inventory or trend monitoring data. The purpose of the CWCS is to gather information sufficient to make better conservation-status assessments and help direct efforts to prevent species of greatest conservation need (SGCN) being listed under the federal Endangered Species Act (ESA). This year the addition of two additional funding sources helped to greatly to accelerate the pace of our investigations for many of our SGCN. The Department continues to work with the Wyoming Cooperative Research Unit (Coop) to meet continuing research needs. In FY 09, the Coop Unit completed three fisheries studies and initiated an aquatic gastropod study. Coop Unit staffing reductions and the pending retirement of senior Coop staff, the Coop precluded initiation of new projects. Consequently, we continued to collaborate with Colorado State University in FY 09 by initiating a research project on hornyhead chubs in the Laramie River basin. What we propose to improve performance in the next two years: • Maintaining a full complement of staff working for the AAC continues to be crucial if
we are to continue to work towards meeting our survey goals. When the AAC is at full staff our performance increases substantially in terms of our sampling
pralrenuwle
• CC
• SanbrstC
• SDinre
• TrecopA
Perfo
StoryAccoonly excepprima
roductivity llows us thesponsibilitieumber of st
while still wevels.
Complete ourCWCS object
treams and nd our fish rood stock tocking larg
Colorado Riveek to use
Diversity Datncreasingly elative abund
The acute coneduce time tontacts and ests into Wy
AIS specialis
ormance Me
y behind theording to Co
in waters wpt” in very arily in artif
7
15
22
30
37
Poun
ds S
tock
ed
(numbers ohe opportunes. The antream and la
working to a
r resurvey otives relativelakes are sustocking prmanagemen
ger trout to aver cutthroat
partners sutabase to asare targetindance and dincern and nthat was plaresponse ar
yoming watets to handle
easure #2:
e performanommission Pwith insufficlimited conficial reserv
0
75,000
50,000
25,000
00,000
75,000
FY
f species annity to betteticipated resake surveysssess the st
f our 1985-8e to crustace
urveyed alsorograms. Thnt plans. Oavoid walleytrout and Fi
uch as the sist in surve
ng these invistribution deed to respoanned for lare crucial to ers. This is athis workloa
Pounds of fi
nce: Policy, “Fishcient natura
nditions, as poir and dow
Y 05 FY
22
nd numbers er balance sult in the n conducted
tatus of mul
87 crayfish ieans. to conduct
hey also are Over the nex
ye predationirehole rainbUniversity
eying bivalvvertebrate spdata to responond to aquatake and stre
restrict or sa priority forad.
ish stocked
h raised at Dal recruitmenprovided by
wnstream tai
06 FY 07
of streams our sport
next severalto a level s
ltiple specie
inventory in
evaluationsneeded to
xt year we n and evaluabow trout stoof Wyomin
ves and landpecies but wnd to requestic invasive sam survey dstop the movr our biologi
Department fnt where puy policy. Filwater habi
7 FY 08
and lake sufish and na years is tosimilar to F
es and taxa
n FY 10 in o
of sport fisupdate and will evaluatate our rece
ocking activing or Wyomd snails. ESwe are acutts for informspecies (AISdata. Publicvement of thists until we
facilities shaublic access ish stockingtats with th
FY 09
urveyed) anative specie
o increase thFY 07 (~660
at watershe
order to fulfi
sh regulationimprove ou
te success oently initiateities. ming Natura
SA petitionertely short o
mation. S) issues ma informationhese invasivcan mobiliz
all be stockeis provided
g thus occurhe addition o
nd es he 0) ed
ill
ns ur of ed
al rs
on
ay n, ve ze
ed d, rs of
23
restoration stocking in native cutthroat trout drainages. Fish stocking is the culmination of a process that begins with egg taking from captive and wild brood stocks (egg sources) and ends with the stocking of the right strain or type of fish into waters at the scheduled time and size. We meet our trout, salmon (kokanee) and grayling needs in state. We also receive, in trade for surplus grayling and trout eggs; warm or cool water sport fishes not available in Wyoming. The eggs are hatched and reared at one of ten facilities and then stocked using our distribution trucks/system. In FY09 a total of 296,359 pounds of trout, kokanee and grayling were stocked from Wyoming facilities. Despite major disruptions at two of our facilities we nearly met our five-year average of 316,885 pounds. At Wigwam Rearing Station annual production was reduced from an average of 35,000 pounds annually to 5,200 pounds due to Myxobolus cerebralis (Mc) infected spring water sources. Meanwhile the Ten Sleep was closed to fish production due to Mc infected spring water sources for the entire year. Also, construction at Speas Rearing Station forced a small reduction in production but when completed the Speas expansion is expected to nearly double production at Speas by FY 11; a smaller increase is anticipated in FY 10. Warm or cool water sport fishes not available in Wyoming are received in trade for surplus grayling and trout eggs. This year we stocked eight coolwater and warmwater fish species including: bluegill, sunfish hybrids (bluegill x green sunfish), channel catfish, largemouth bass, northern pike, shovelnose sturgeon, and walleye. These totaled 1,175,175 fish with the majority being 906,080 walleye fingerlings stocked to maintain quality of our walleye sport fisheries. All statewide stocking requests were assessed and reallocated throughout the system to offset the production losses. While pounds are easily tracked or measured, the quality of the fish stocked continues to be emphasized. This is done by not overstocking facilities and incorporating modern fish health practices that stress optimum not maximum production levels. New rearing units at Dubois, Wigwam and Speas are carefully being evaluated to determine ultimate production levels. Emphasis of the stocking program is to release high quality fish for the greatest return when stocking to improve sport fisheries or to restore native trout fisheries. Although adjustments were needed to address the whirling disease losses, the Fish Culture sub-program continues to meet the program’s internal goal of producing +/- 10 percent of the requests made from regional aquatic wildlife managers. What we propose to improve performance in the next two years: • Renovation of Speas Rearing Station, accomplished through Legislative funding, is
scheduled for completion by October 2009. Although rearing capacity assessments of the new rearing continue, fish production is anticipated to increase from 110,000 pounds to approximately 250,000 pounds in the next two years under a protected environment with improved rearing conditions.
• Funded by the Legislature, the renovation of the Story Hatchery brood stock facilities are projected for completion by November 2009. These improvements will reduce

24
fish health issues; improve rearing and spawning condition for the lake trout, brook trout, rainbow trout, and golden trout.
• A complete renovation of the Ten Sleep hatchery is scheduled within this period to remove the whirling disease threat and protect the native Yellowstone cutthroat brood stock. The major capital facility project is a reality through Legislative funding and is anticipated for completion by September 2010.
• Whirling disease exposure is also an issue with the Wigwam Rearing Station spring water supplies, cutting fish production in half and threatening Colorado River cutthroat restoration. Further evaluations to determine the source of the disease are scheduled during this period with improvements scheduled in the near future to eradicate the parasite.
• A new fish hatchery building at Speas Rearing Station is anticipated for completion during the next two years for essential small fish production to meet increased production for statewide stocking.
• An extensive capital facility infrastructure is maintained and required to meet stocking responsibilities and maintain captive brood stock populations. Further evaluations are planned for the existing fish rearing and support facilities/equipment to set management priorities for FY 11 – FY 20 under new priorities to augment accomplishments achieved over the previous ten year plan. Planning will emphasize developing a progressive sub-program to meet needs thirty years into the future.
• Continue to maintain and further develop captive brood stocks of native cutthroat species in protective refuges.
• Continue to incorporate and maintain high genetic integrity in brood stocks and broaden the scope and sources of our wild genetic sources of native and introduced trout species internally to maintain a disease free supply for the sub-program.
• Continue to seek and evaluate technological methods that allow more efficient use of available water at fish culture facilities. In conjunction with technology, incorporate proactive techniques to reduce the presence of bacterial coldwater disease and address possible biosecurity issues from other fish health and aquatic invasive species threats.
• Update existing data generating and fish production database management systems to improve record keeping and communications.
Program: Bird Farms Division: Wildlife Mission: Enhance pheasant hunting opportunity in Wyoming. Program Facts: The Bird Farms Program is made up of one major sub-program, listed below with the number of staff and 2009 (FY 09) budget. Sub-program # FTEs* 2009 Annual Budget Bird Farms 5.4 $ 760,479

* IncAny Comm Bird Prim• E
re Perfoprogr
StoryDue pheasan imcondidemaSheriand ssnowpersoefficieach in thsuppl Betw31,362008privapriva
cludes permapositions a
mission auth
farm faciliti
mary FunctioEnhance pheelease of hig
ormance Meram will wor
y behind theto continue
sant huntingmportant partitions and stand into the idan facility survival is
wstorms and onnel coordiency of birdyear. The ve southeastelemented by
ween 2004 a67, with the , was higher
ate lands enroate lands whe
29,00
29,50
30,00
30,50
31,00
31,50
Num
ber o
f Phe
asan
ts
anent, contraadded durinhorization or
es are locate
on of the Bieasant huntgh quality ph
easure #1: rk to release
e performaned loss of pg, pheasants bt of the hunttable or increfuture. Phesince 1937 related to wexcessive he
dinate releasd distributionvast majorityern part of
y releases fro
and 2008, thaverage beinr than the avolled in the Pere landown
00
00
00
00
00
00
2004
act and tempng the budgr must be fun
ed in Sherida
rd Farm Pring opportu
heasants.
Number of p25,000 phea
nce: pheasant habeing produers’ “bag” ineasing demaeasants haveand the Yod
weather coneat that may se schedulen during the y of Wyominthe state.
om the Depar
he number ng 30,795 ph
verage at 31,Private Landers allow pu
2005
25
porary positiget cycle rnded from su
an and Yode
rogram: unity in Wy
pheasants reasants each y
abitat in Wyuced at the Dn recent yearand for pheae been prodder facility s
nditions inclslow the gro
es with regmonths of Ong’s pheasanEstablished rtment’s Dow
of pheasantheasants. T,327. Birds ds Public Wiublic hunting
2006Calendar Year
ions authorirequire Wyoupplemental
er.
oming throu
eleased annuyear).
yoming andDepartment Brs. Continui
asant huntingduced for recsince 1963. luding losseowth of you
gional persoOctober, Novnt hunting opheasants t
wnar and Sh
ts released The number r
were releasildlife (PLPW
g access.
2007
ized in the Foming Gamgrants.
ugh the prod
ally (Person
d increased Bird Farms hing drought,g will result creational hu Annual bir
es from occung pheasantonnel to mvember and Doccurs in Gothroughout theridan Bird
ranged fromreleased in ced on DeparW) Access p
2008
FY 09 budgetme and Fish
duction and
nnel with this
demand fohave become poor habitain continuedunting at thed production
casional hailts. Bird farm
maximize theDecember o
oshen Countythe state areFarms.
m 29,926 tocalendar yeartment landsprogram, and
t. h
s
r e
at d e n l, m e f y e
o ar s, d

26
What has been accomplished: Personnel at Sheridan Bird Farm continued with pen upgrades, improved the irrigation system at the bird farm to maximize efficiency and did substantial tree trimming to protect electrical lines and bird pens. Personnel assist region personnel with check stations, chronic wasting disease monitoring and fish spawning projects. Downar Bird Farm personnel were involved with facility upgrades, ongoing habitat projects on local Wildlife Habitat Management Areas, local extension services and involvement with a local Coordinated Resource Management (CRM) weed management project. Personnel also help the PLPW program with signing and guzzler maintenance. What we propose to improve performance in the next two years: • Personnel at the Bird Farms will continue to seek the most cost effective and
efficient methods of rearing pheasants. • Efforts are being made to improve the genetics of the pheasants being raised to
ensure a quality product will be available for hunting. • The existing facilities are at maximum production at this time. Personnel will explore
all avenues to continue this production level. Program: Conservation Education Division: Services Mission: Provide learning and participation opportunities relating to wildlife management, both aquatic and terrestrial, wildlife conservation, wildlife related skills and lawful and ethical behavior. Program Facts: The Conservation Education program is made up of two major sub-programs, listed below with number of staff and FY 09 budget: Sub-program #FTEs* 2009 Annual Budget Hunter Education 1.0 $159,527 Conservation Education 5.0 417,392 TOTAL 6.0 $576,919 *Includes permanent and contract positions authorized in FY 09 budget. Any positions added during the budget cycle require Wyoming Game and Fish Commission authorization or must be funded from supplemental grants. These programs do require statewide responsibilities, travel and assistance from Regional personnel. This program is located in the Department Headquarters Office in Cheyenne.

Prim• P
skhu
• Cpr
Perfopeoplprogrpeopl
StoryEducWorkWork
mary FunctioProvide learnkills, and as unters engag
Create awarractices of w
ormance Mle reached aram will worle).
y behind theational oppo
kshops, Wildkshops, Fish
0
50
100
150
200
250
300
350
0
10,000
20,000
30,000
40,000
50,000
60,000
70,000
ons of the Cning and parequired by
ge in ethical,eness in you
wildlife and t
easure #1: annually thrrk to provide
Cons
Con
e performanortunities ard about Outing Clinics h
FY 05
FY 05
Conservationarticipation State Statut
, lawful and uth and adulttheir habitats
Number of rough Consee at least 20
servation E
nservation E
nce: re offered ondoor Recreaheld statewid
FY 06
FY 06
27
n Educationopportunit
e, we continsafe actionsts of the imps within thei
educational ervation Edu0 conservati
Education O
Education P
n an annual ation Educatde, OREO Y
FY 07
FY 07
n Program: ties to youth nue to offer hs. portance for ir specific ec
opportunitieucation effoion educatio
Opportunitie
Participants
basis in thetion OpportuYouth Camp
FY 08 F
FY 08
and adults i
hunter educa
the planned cosystems.
es offered anorts (Personnn opportunit
es
s
e form of Punities (ORE, Becoming
FY 09
FY 09
in outdoor ation so that
managemen
nd number onel from thities to 20,00
Project WILDEO) EducatoAn Outdoor
nt
of is
00
D or rs

28
Woman Workshops, Hunter Education classes, writing and distribution of Wyoming Wildlife Wild Times publication to schools, shotgun clinics, Hunter Education courses, the Wyoming Hunting and Fishing Heritage Exposition (Expo), and various Conservation Education programs offered in schools and other venues. These programs are aimed at a variety of audiences, including youth, adults, new and experienced sportsmen, women, and others. The number of educational opportunities are limited due to the number of personnel, conflicting schedules, workloads, new and on-going wildlife related issues, number of volunteers, and budget restrictions; however the staff and volunteer instructors were able to maintain the number of program opportunities in FY 09. In FY 09, there were 322 program opportunities available, which was an increase of two program opportunity numbers from the average of 254 programs offered annually since FY 05. This increase occurred because we had staff willing to step-up to fulfill the vacancies left by one FTE who retired. The number of participants in FY 09 was 61,664, which is above the three year average of 53,302 participants a year. This occurred because staff worked to promote and improve program options for participants, thus number of participants per program increased. For example, in FY 06 there were 40 participants for the Becoming An Outdoors Woman program and in FY 09 there were 50 participants. As another example, in FY 05 there were 10,592 Expo participants and with increased promotion and school recruitment, the attendance at Expo has steadily increased to an average of 13,000 since FY 06. Continued increase in program participation indicates that the quality of the programs remains high. Program opportunities vary a great deal. Some opportunities, such as the Expo, reach large numbers of people for a limited amount of time and with a limited amount of information. Other programs, like Youth Conservation Camp and Becoming An Outdoors Woman, reach smaller audiences for a longer period with more comprehensive information and presentations. Further, our educational efforts must be flexible and dynamic to meet the ever-changing needs of our constituents. The institution of a comprehensive Hunter Education Newsletter is getting more interest and participation in the Hunter Education program, classes, and workshops is increasing. The distribution of the Wyoming Wildlife Wild Times magazine has been on a steady increase since FY 05 as more schools and educators are exposed to our programs and resources, there are now 8,465 magazines distributed statewide every quarter. What we propose to improve performance in the next two years: • Continue to evaluate programs to meet the participation needs of the public,
recognizing the numbers alone are not an indication of an effective educational program.
• Continue to modify programs to incorporate the Department’s priorities. • Continue to evaluate the Hunter Education program to provide effective instruction
and offer a new Hunter Education Instructor Academy to solidify the program. • Continue to collaborate with conservation organizations, Department of Education,
local, state and federal agencies and natural resource agencies, community organizations, businesses and individuals to build effective educational programs.
• When we are back to full staff, we will be able to offer more programs for participants.
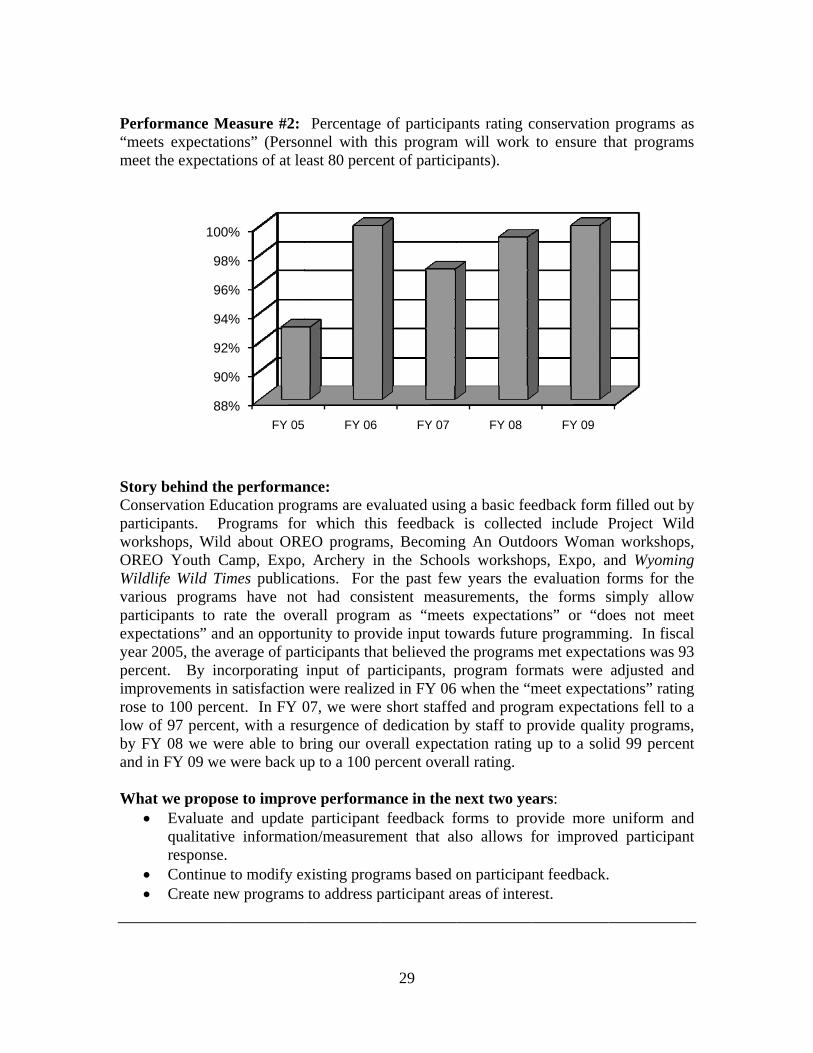
Perfo“meemeet
StoryConsparticworkOREWildlvarioparticexpecyear 2perceimprorose tlow oby FYand in Wha
•
• •
ormance Mets expectati
the expectat
y behind theervation Educipants. Pr
kshops, WildO Youth Clife Wild Timus programcipants to rctations” and2005, the av
ent. By incovements in to 100 perceof 97 percenY 08 we wen FY 09 we
at we proposEvaluate qualitativresponse. Continue Create ne
88
90
92
94
96
98
100
Measure #2: ons” (Persotions of at le
e performanucation progrograms ford about ORE
Camp, Expo,mes publica
ms have notrate the oved an opportu
verage of parcorporating satisfaction
ent. In FY 0nt, with a resere able to bwere back u
se to improvand update e informatio
to modify exw programs
%
%
%
%
%
%
%
FY 05
Percentageonnel with theast 80 perce
nce: grams are evr which thiEO program, Archery in
ations. For tt had consierall programunity to provrticipants thainput of pa
n were realiz07, we weresurgence of bring our ovup to a 100 p
ve performaparticipant
on/measurem
xisting progto address p
FY 06
29
e of participahis programent of partici
valuated usinis feedback
ms, Becominn the Schoothe past fewistent measm as “meetvide input toat believed tharticipants, ped in FY 06
e short staffededication b
verall expectpercent overa
ance in the nfeedback f
ment that al
rams based oparticipant ar
FY 07
ants rating cm will work ipants).
ng a basic feeis collecte
ng An Outdools workshow years the urements, tts expectatio
owards futurehe programsprogram for when the “m
ed and progrby staff to ptation rating all rating.
next two yeforms to prolso allows f
on participanreas of inter
FY 08
conservationto ensure th
edback formed include Poors Womanps, Expo, aevaluation f
the forms sons” or “doe programms met expectarmats were meet expectaram expectatprovide qual
up to a soli
ars: ovide more for improve
nt feedback.est.
FY 09
n programs ahat program
m filled out bProject Wiln workshopand Wyominforms for thsimply allowoes not mee
ming. In fiscaations was 9adjusted anations” ratintions fell to ity programid 99 percen
uniform aned participan
as ms
by ld s,
ng he w et al
93 nd ng
a s, nt
nd nt

30
Program: Conservation Engineering Division: Services Mission: Provide engineering technical support to aid in conserving wildlife and providing access with the public. Program Facts: The Conservation Engineering program is made up of one major sub-program, listed below with number of staff and 2009 (FY 09) budget:
Sub-program # FTEs* 2009 Annual Budget
Conservation Engineering 8.0 $ 648,263 * Includes permanent positions authorized in FY 09 budget. Any positions added during the budget cycle require Wyoming Game and Fish Commission authorization or must be funded from supplemental grants. This program consists of Engineering, Surveying, and Drafting and is located in the Department Headquarters Office in Cheyenne. Primary Functions of the Conservation Engineering Program: • Engineering technical support is provided through engineering, surveying, and
drafting to maintain the Department’s physical structure of offices, housing, hatcheries, research facilities and Wildlife Habitat Management Areas, boating access facilities, and Public Access Areas often using private sector consultants.
• Engineering technical support is provided by acting as caretaker of the Department’s water rights statewide and routinely making water rights filings for new permits, alterations, or research problems that arise.
• Engineering technical support is provided by the Drafting section for the Department’s statewide signage with design, purchase, and coordination with field personnel and Wyoming Department of Transportation in the installation of said signs.
• Engineering technical support is provided through the Drafting section in most of the Department’s mapping, including herd unit maps, floating access, public access, and maintaining the Department’s land status maps.
• Engineering technical support is provided through the Survey section for boundary surveys of all Commission-owned properties.
• Engineering technical support for all major new construction projects is provided through the Civil Engineer for design, bid, and construction management using in-house professionals and private sector consulting firms.
• Engineering technical support through the Drafting section provides many types of displays for all Divisions and some outside agencies for use at various functions such as Commission meetings, the Hunting and Fishing Heritage Exposition, Private Lands Public Wildlife, court displays, and public meetings.

Perfocourtat leprofe
StoryAnnuThe s14 Dservictheir ConsemplprogrRegioHunta smaand tconsibelievsatisfmark Wha• W
Cpis
ormance Mteousness aneast 80% oessionalism r
y behind theually, the Intsurvey provi
Department pces to the exinternal clie
ervation Enoyees and uram has exponal Office ring and Fishall core of sthe workloadistent, qualifved to havfaction ratesk, with satisfa
at we proposWith a full Conservation
ositive signss reflected i
Measure #1nd professionof employereceived).
e performanternal Clientides the oppoprograms. Ixternal clientents.
ngineering pltimately, wperienced anrenovations,hing Heritagspecialists, pd. Since FYfied staff aloe improved
s in FY 07, faction levels
se to improvyear under
n Engineerings of transitioin the FY 0
0
20
40
60
80
100%
Em
ploy
ees
Satis
fied
1: Percentnalism (Persees are sat
nce: t Satisfactionortunity for eIn many rests depends o
provides a wildlife and fi
n increase i the Private
ge Expositionperformance
Y08, Conservong with a fd employee
the five-yes in FY 09 re
ve performar the changg was able tning into im
08 satisfacti
FY 05 FY
31
t of emploonnel with ttisfied with
n survey is employees tospects, the aon the ability
service to fisheries enthin workloadLands Publi
n (Expo) adde is greatly avation Enginfirm, custom
satisfactionear average eaching 91 p
ance in the nge of leaderto implemen
mproving couon ratings o
Y 06 FY 0
oyees satisfthis program
h the level
distributed to measure th
ability of they of employe
wildlife anhusiasts whod including ic Wildlife (ded to routinaffected by neering has h
mer-friendly ln. Other thahas remaine
percent.
next two yership with
nt some adapurteousness aof 90.9 perc
07 FY 08
fied with tm will work t
of courte
to Departmehe overall pee Departmenees to satisfy
d fisheries o enjoy the rmajor hatchPLPW) Progne projects. the number had a full coleadership ban a slight ed above th
ars: a new Chi
ptive changesand professiocent and th
FY 09
the level oto ensure tha
eousness an
ent personneerformance ont to providy the needs o
managemenesource. Th
hery projectgram, and thConsisting oof personne
omplement obase, which i
decrease ihe 80 percen
ief Enginees and showeonalism. Thie FY09 90.
of at
nd
el. of de of
nt he s,
he of el of is in nt
er, ed is .7

pasCb
Perfoand t70%
StoryAnnuThe s14 Dservictheir Constwo Dpositiwith provirate istaff Wha• W
inp0ti
ercent satisfssistant eng
Conservatione sustained o
ormance Mtimeliness prof employee
y behind theually, the Intsurvey provi
Department pces to the exinternal clie
ervation EngDraftsmen oions, Conserother empl
ided. With aindicates thanoticed effo
at we proposWith a full con the Conerformance 7, 86.3 percimeliness for
% E
mpl
oyee
s Sa
tisfie
d
faction ratingineer as wn Engineeringor increased
Measure #2: rovided (Peres are satisfi
e performanternal Clientides the oppoprograms. Ixternal clientents.
gineering repover the last rvation Engloyees and a five-year aat Departmerts towards a
se to improvomplement onservation Eare apparent
cent in FY 0r and attentiv
0
20
40
60
80
100
FY 0
ng by Deparwell as cong staff, a higabove this y
Percent ofrsonnel withed with the l
nce: t Satisfactionortunity for eIn many rests depends o
placed the Cseveral yearineering hassubsequentl
average of 7ent employeattention and
ve performaof employeesEngineering t over the la
08 and 82.6 veness to cli
05 FY 06
32
rtment emplnsistent andgh level of peyear’s effort
f employees h this progralevel of atten
n survey is employees tospects, the aon the ability
Chief Enginers. With news improved ly the atten
77.9 percent,ees who inted timeliness.
ance in the ns on board a
program, ast several yepercent in F
ients as well
FY 07
loyees. Withd improved erformance .
satisfied wam will worntion and tim
distributed to measure th
ability of they of employe
eer, Assistanw, qualifiedour relation
ntion and ti, the FY 09, eract with C.
next two yeand with a ne
immediateears with ratFY 09. Redoas maintain
FY 08 F
h the additicommunic
in this area i
with the leverk to ensure
meliness prov
to Departmehe overall pee Departmenees to satisfy
nt Engineer, d employees nship and coimeliness of86.3 percen
Conservation
ars: ew direction strides intings of 66 poubling of e
ning qualified
FY 09
ion of a newation amonis expected t
l of attentioe that at leasvided).
ent personneerformance ont to providy the needs o
Surveyor annow in thes
ommunicatiof the servicnt satisfaction Engineerin
in leadershin improvinpercent in FYefforts toward, responsibl
w ng to
on st
el. of de of
nd se on ce on ng
ip ng Y rd le

antw
Perfo(Perssatisf
StoryAnnuThe s14 Dservictheir FolloEnginfocusincreindicratingFY 0perce Wha• T
recowst
nd responsivwo years.
ormance Monnel with
fied with the
y behind theually, the Intsurvey provi
Department pces to the exinternal clie
owing a decneering servs on customased over 2ating that thg satisfaction09, satisfactent.
at we proposThe current esponsivenesonsistent pat
with attendantay current w
0
20
40
60
80
100
% E
mpl
oyee
s Sa
tisfie
d
ve employee
Measure #3:this program
e services pro
e performanternal Clientides the oppoprograms. Ixternal clientents.
cline in thevices, a concer service. W2 percent frhey were san in FY 08. ion at 84.9
se to improvstaff coupless to our clieth. In additi
nce and partiwith conserv
0
0
0
0
0
0
FY 05
es is expecte
: Percent m will workovided).
nce: t Satisfactionortunity for eIn many rests depends o
e percent ocerted effortWith this rerom the prioatisfied with While therepercent rem
ve performaed with impents’ needs ion, continuiicipation in n
vation engine
FY 06
33
ed to be refl
of employek to ensure
n survey is employees tospects, the aon the ability
of employeet was made aligning of
or year, fromh services pre was a slighmains well
ance in the nproved commis expected ting educationnational orgaeering trends
FY 07
flected in im
ees satisfied that at leas
distributed to measure th
ability of they of employe
es satisfied in FY 08 bfocus, the p
m 67 percentrovided to 8ht dip in thisabove the
next two yemunication, to lift this pen of the proanizations ws.
FY 08
mprovement o
with servit 75% of em
to Departmehe overall pee Departmenees to satisfy
with the by program epercentage ot of employ86 percent os performancfive year av
ars: diligent wo
erformance ogram’s profwill augment
FY 09
over the nex
ces providemployees ar
ent personneerformance ont to providy the needs o
Conservatioemployees t
of satisfactioees in FY 0of employeece measure iverage of 8
ork ethic anmeasure on
fessional staft the ability t
xt
ed re
el. of de of
on to on 07 es in 81
nd a ff to

34
Program: Customer Services Division: Services Mission: To effectively respond to customer requests and provide guidance to hunters, anglers, and non-consumptive users. Program Facts: The Customer Services program is made up of five sub-programs, listed below with number of staff and 2009 (FY 09) budget: Sub-programs # FTEs* 2008 Annual Budget Supervisor 1.0 $0
Telephone Information Center 4.5 Telecommunications Services 0.5 0 Alternative Enterprises 1.5 0 Mailroom 1.0 718,632 TOTAL 10.0 $ 1,011,524
* Includes permanent and contract positions authorized in FY 09 budget. Any positions added during the budget cycle require Wyoming Game and Fish Commission authorization or must be funded from supplemental grants. This Customer Services program is located in the Department Headquarters Office in Cheyenne. Primary Functions of the Customer Service Program: • Serve external customers by providing regulation and other agency information via
telephone and mailings. • Serve internal customers by providing telecommunications, mailroom and staffing
assistance. • Serve people and wildlife by offering products and publications that generate
revenue that contribute to the support of Department programs.

Perfowill mconta
StoryThe respothe cualso mincom The vElectas licdecreinacc In FYnew ponlinMoreapplifrom The scall vless bdays.desk
Nm
bero
fCon
tact
s
ormance Mmaintain theacts: 10,000
y behind theDepartment
onsibilities arustomer. Thmade in perming calls vo
volume of ctronic Licenscense applicaease in staffcessibility an
Y 09, we sawprocedure o
ne with an ope and morecations and the Departm
sub-programvolume has bbusiness hou It has beenduring these
0
20,000
40,000
60,000
80,000
100,000
120,000
Num
ber o
f Con
tact
s
Measure #1: e capacity anmailings and
e performan's license isre complex. hese contactsrson and via olume. The
customers hsing. The cuation deadlinfing levels, nd the custom
w a decreasof mailing poption to cone customersother inform
ment.
m continued been easily aur staffing ann and will ce times.
0
0
0
0
0
0
0
FY 05
Volume of nd infrastrucd 65,000 pho
nce: ssuance pro A main po
s are typicalmail. Volumail request
has increaserrent staff isnes and wheas expected
mer satisfact
e in mailingostcards to p
ntact the Cuss are direc
mation. Calls
providing sabsorbed, yend IPOS userontinue to b
FY 06
Ma
35
f customer cocture neededone calls per
cess, associint of contacly done by t
ume is trackets are tracke
d from the s overburdenen license drd, decreasedtion level dro
gs. This is pprior year apstomer Servicted to the s were also g
support for Iet the strain rs inability tbe necessary
FY 07
ilings Ph
ontacts (Perd to address r year).
iated statutect serves as atelephone alted through A
ed using a da
prior averaned with callrawing resuld the incomop.
partially becapplicants enice Center (C
Departmengenerated by
IPOS Help Dis extended
to contact agy to have IT
FY 08
one Calls
sonnel with at least 75,0
es, regulatioan importanthough manyAvaya's weeatabase.
age likely dus during peats are made
ming call vo
ause of the Dncouraging thCSC) to req
nt’s websitey various cor
Desk suppohour staffin
gency duringT personnel s
FY09
this program000 custome
ns and othet resource foy contacts arekly report o
ue in part tak times, suc
available. Aolume due t
Department’hem to appl
quest mailinge to retrievrrespondence
rt. The smang resulting ig high volumstaff the hel
m er
er or re of
to ch A to
’s ly g. ve es
all in
me lp

Most1. A2. H3. R4. D5. F6. W7. A8. H9. G Sinceannuamanaconsi Wha• C
wexth
• WInwpr
Perfohandlhandl
StoryCurreThe ethe T
t calls are cuApplication pHunt area demRequest for reDrawing resu
ishing informWatercraft reAlternative EHunter SafetyGeneral regul
e FY 05, thal number oaged 11,000iderably whi
at we proposContinue to sways to meexpect that cheir informat
We will advonformation T
website changrovide feedb
ormance Mled (Personnle at least 40
y behind theently, one cemployee's mTelecommun
Num
ber o
f Req
uest
s
urrently relateprocedure mand, land segulations, a
ults mation lated questio
Enterprise ordy informationlations
he average aof phone cal0 mailings ich is due to
se to improvserve our cuet the changhanges will tion.
ocate for the Technology ges will alloback to IT to
Measure #2nel with thi00 telecomm
e performanustomer sermain duties nications Li
360
380
400
420
440
460
480
FY
ed to:
status and haapplications
ons ders n
annual numblls has beenand over redirecting c
ve performastomers via ing needs oalso evolve
customer by(IT) section
ow efficiencyo facilitate pr
: Numbers program w
munication re
nce: rvice employare serving
iaison, this
Y 06 FY
36
arvest inform
ber of mailin 85,650. In89,000 phocustomers to
ance in the ntelephone a
of our custome in the man
y continuing n to optimizy in assistingroductive ch
r of Departwill maintaiequests from
yee staffs thas the custoemployee
Y 07 F
mation
ings has been FY 09, theone calls. To the website
next two yend mailings mers. As tnner in whic
to proactiveze customerg customers
hanges.
tmental telein the capac
m Department
his sub-progomer serviceserves as th
FY 08 F
en 12,850. e Customer The mailinge.
ars: while seeki
technology ach our custo
ely communr benefit. Anavigate the
ecommunicatcity and infrt employees
gram as parte center leadhe point of
FY09
The averagService staf
gs are dow
ing additionaadvances, womers receiv
icate with thAwareness oe website an
tion requestrastructure tper year).
t-time dutied worker. Af contact fo
ge ff
wn
al we ve
he of nd
ts to
s. As or

Depaall tethe pathe ceThe mgenerThe Cheyservicof UdecreTechn In FYwas 4Inform
Wha• O
soa swprpb
Perfoprogr
artment empllecommunicast due to thellular indusmain types oral inquiries,main PBX
yenne where ce needs of t
Understandineased signifinology Divi
Y 09, the num464. The numation, ITD
at we proposOn-going traioftware to inperson onsi
witch. Therogrammingick up groueen complet
ormance Mram will wor
Num
ber P
rodu
cts
Sold
loyees, Inforcation relatedhe rapid pacestry moves aof calls are ce, disconnectiswitch is oWYDOT te
the switch. g (MOU) wcantly and thsion for tele
mber of telecumber of TCD via state TP
se to improvining of the ncrease the ate with the a
ese minor cg some extenups. Due to ted as of July
Measure #3: rk to sell at l
01,0002,0003,0004,0005,0006,0007,0008,0009,000
10,000
F
rmation Tecd issues. The of the celluway from suell phone upions, and seron-site at thelecommunicThe Departmwith WYDOhe liaison cocommunicat
communicat1’s submittePX network
ve performaTelecommu
ability of theaccess and thchanges inclnsion moveshigh volum
y 2009.
Number of least 8,000 p
FY 05 FY 0
37
chnology Divhis sub-progular environmupport of anapgrades, replrvice and rephe Departmecation staff iment utilizesOT. In theontacts outsition needs.
tion requestsed to the Depwas 276.
ance in the nunications Le Departmenhe knowledglude activatis, changing
me of incom
f products soproducts per
06 FY 07
vision (ITD)gram has beement. This ialog cellularacements, ppair calls forent of Tranis devoted tos their staff ae past year,de vendors t
s (TC1) frompartment of A
next two yeiaison on A
nt to be morege to make ming and deatelephone d
ming calls in
old to customyear).
FY 08
), and privaten relied on is expected tr service. lan or billingr landlines. sportation (o programmas part of a M, the WYDthrough thei
m DepartmenAdministrati
ars: vaya Site A
e self-sufficieminor changeactivating edisplays, cov
FY 09, trai
mers (Person
FY09
te vendors fomore than i
to continue a
g changes,
(WYDOT) iming and otheMemorandum
DOT role har Informatio
nt employeesion and
Administratioent by havines in the PBXxisting linever paths anining has no
nnel with thi
or in as
in er m as on
s
on ng X s,
nd ot
is

38
Story behind the performance: The products offered by Alternative Enterprise (AE) feature the logo "Wyoming's Wildlife Worth the Watching" and the Departments new "Official Gear" line introduced in FY 06. The distribution of products help promote the Department's brand as well as build awareness and approval of the Department's mission and work while providing an opportunity for all persons to financially contribute to the Department's conservation efforts. The products sold relate to wildlife, the Department, and its programs, so the number of products sold is an indication of how successful this program is at promoting the Department to the public. The products are sold above cost so an increase in number of products sold will also reflect in the profit generated. The target market includes residents, nonresidents, consumptive and non-consumptive users. The profit generated by product sales is used exclusively for habitat restoration and conservation, hunting and fishing access and other wildlife programs. Since FY 04, the average number of products sold annually was 8,558. In FY 09, the number of products sold in was 8,464. Advertisement in the Department’s monthly magazine continues to generate sales. The product sales section is continuing work on the “Official Gear” logo. The Department’s product selection process will broaden once we have a trademarked logo to seek alternative vendors. In FY 09, the online store generated over $50,000 in gross sales from 1046 orders. During the year over twenty new products were introduced. What we propose to improve performance in the next two years: • Identify new products to increase sales and promote the Department brand. • Products are currently available at the Headquarters in Cheyenne and the Lander
Regional office. We intend to have the products available at regional offices and initiate the opportunity for License Selling agents to sell our products in their stores.
• Identify stipulations for affiliate programs and explore tracking methods • Accommodate for additional staffing and secure permanent status for current staff
when sales increase by 50 percent.

Perfoinformleast
StoryThe CDepaDepainformbe ac
AnnumembThe sDepainterahandlrequewho wnumbthat bsampthat uresidePrefewas s73.0 Whilcallerby CS
ormance Mmation need80% of the p
y behind theCustomer S
artment untilartment and mation given
ccurate, curre
ually, the Exbers of the psurvey proviartment progacted with tled. These ests and assiwere satisfieber of residebetween FY
ple: 68 resideutilized the sents is like
erence Point slightly highpercent of re nonresiders respond toSC staff.
%Pu
blic
Satis
fied
Measure #4: ds are handlepublic are sa
e performanervice Centel they meet the Departmn to huntersent and comm
xternal Cliepublic who hides the opp
grams. Sincthe CSC staneeds often
istance in filed ranged froents who uti
Y 02-FY 04, ents vs. 160 services surpely due to
System. Inher among nresidents annts typicallyo media rep
0
20
40
60
80
100
% P
ublic
Sat
isfie
d
Percent of ed (Personnatisfied with
nce: er staff is o
a warden oment’s credib and anglersmunicated in
ent Satisfacthad purchaseportunity for e FY 05, anaff were satn included qlling out the om 71.8 perilize the CSCmore nonrenonresidentpassed the nquestions a
n regard to snonresidents nd 89.4 percy require as
ports or issue
FY 05 F
39
f general pubel with this how their in
ften the onlor biologist bility are fors by the custn a professio
tion survey ed hunting athe public t
n average oftisfied with questions reapplication.
rcent (FY 08C services iesidents utilits). Beginninnumber of nassociated watisfaction lin each yea
cent nonresidssistance files that surpa
Y 06 FY
blic that areprogram wi
nformation n
ly contact thin the field
rmed as a retomer serviconal manner
is distributend fishing lito measure tf 82.8 percen
how their elated to dr. Annually,
8) to 89.0 pers compared ized our serng in FY 05onresidents.
with the imlevels, the pear, and FY 0dents indicalling out theass the gene
07 FY 08
satisfied will work to eneeds are han
he customer d. Their opesult of the ce representa.
ed to randoicenses the pthe performant of the puinformation
rawing oddsthe percent
rcent (FY 07to nonresid
rvices (annu5, the numbe This incre
mplementatioercent of pe
09 was no exating they weir applicatieral informat
8 FY09
with how theensure that andled).
has with thpinion of thcontact. Thative needs t
omly selecteprevious yeaance of selec
ublic who han needs wers, applicatioof the publi
7). When thdents, we final average o
er of residentase in use b
on of a newople satisfiexception wit
were satisfiedions, residention provide
ir at
he he he to
ed ar. ct ad re on ic he nd of ts
by w ed th d. nt ed

We sWhilcustosystem Perfoproviare sa
StoryMailrapprothous115,0the relargeobtainlabele AnnuThe s14 Dhad in Wha• C
d• C AppeA necompsuppo
see an overae the CSC
omers are unm, which in
ormance Mided (Personatisfied with
y behind theroom servicoximately 1.sands of UP000 licenses esident and st annual inned new mer and clean
ually, the Intsurvey provi
Department pnteracted wi
at we proposContinue ong
elivery and rCross-train cu
endix A. Neew performapleting varioort to variou
1
% E
mpl
oyee
s Sa
tisfie
d
ll increase instaff can ha
nable to get astructs via re
Measure #5:nnel in this ph the services
e performances are pro2 million pieS or Fed Exwere mailenonresident
ndividual mamailroom equ
sing softwar
ternal Clientides the oppoprograms. Sith Mailroom
se to improvgoing discusreduce costsustomer serv
w proposedance measuous mailingus sections w
0
20
40
60
80
00
FY 05
n satisfactioandle approan available ecording to w
Percent oprogram wils provided b
nce: ovided by eces of incomx packages, ed using thet deer and aailing this wuipment incre.
t Satisfactionortunity for eSince FY 05m personnel w
ve performassions with s. vice employe
d performanure proposed projects th
within the De
5 FY 06
40
on in FY 09.oximately 50
representatiwait for next
of employeell work to eny the mailro
one FTE ming and oupriority and department
antelope licework unit hancluding a n
n survey is employees to
5, an averagewere satisfie
ance in the nPostal Serv
ees to provid
nce Measured in FY 07hroughout thepartment. T
FY 07
. This is like00 calls per ive resultingt available a
es satisfied nsure that atoom).
who is reutgoing mail d express mats inserting menses and rendles. Also
new inserting
distributed to measure the of 84.1 peed with the s
next two yevice represen
de mailroom
e 7 is currenthe year, the
The assistanc
FY 08
ely due to stday, during
g in long waiagent.
with mailrot least 75% o
esponsible each year.
ail. In FY 0machine. Thsident elk li
o in FY 09 tg machine,
to Departmehe overall peercent of emservices prov
ars: ntatives to i
m backup
tly being ee CSC prov
ce has long b
FY09
taffing levelg high peakits in the “Q
oom serviceof employee
for handlinThis include
09, more thahe mailing oicenses is ththe mailroom
and addres
ent personneerformance o
mployees whvided.
improve ma
valuated. Bvides needebeen provide
s. ks
Q”
es es
ng es an of he m ss
el. of ho
ail
By ed ed

41
but previously not tracked. We proposed introducing a new performance measure to track this effort by the number of man-hours serving internal customers. By recording man-hours worked on other projects a clear picture will develop on whether there is room to solicit more projects or simply determine whether the staffing levels affect the Department in ways other than "dropped calls". It is important to note that during FY 07 the Department mailroom was added to the Customer Services Section. This performance measure may overlap the mailroom performance measures since the CSC is cross-trained in mailroom duties in addition to working closely to complete projects. This performance measure will not be implemented due to new mailroom equipment that allows for projects to be completed mainly in the mailroom rather than the CSC. Program: Department Administration Division: Office of the Director Mission: Provide leadership for wildlife conservation in Wyoming. Program Facts: The Department Administration program is made up of three major subprograms, listed below with number of staff and 2009 (FY 09) budget: Sub-program #FTEs* 2009 Annual Budget
Office of the Director 5.0 $ 787,813 Commission 0.8 108,970 Division Administration 17.2 2,228,345 Policy and Development 2.0 215,583 Wildlife Heritage Foundation 0 332,065 TOTAL 25.0 $ 3,672,776
*Includes permanent, contract and temporary positions authorized in the FY 09 budget. Any positions added during the budget cycle require Wyoming Game and Fish Commission authorization or must be funded from supplemental grants. This program is located in the Department Headquarters Office in Cheyenne. Primary Functions of the Department Administration program: • Provide leadership for wildlife conservation in Wyoming by establishing strategic
direction, empowering people, aligning Department programs and systems, and modeling high personal and professional integrity.
• Serve people by advocating for wildlife, coordinating with entities and representing the people of Wyoming as stewards of their wildlife resources.
• Provide policy-level support for wildlife by implementing the policies and decisions of the Wyoming Game and Fish Commission regarding wildlife and wildlife habitat

mco
Perfoprogrcourt StoryTheseFY 0least they intera Internreceivgraph(all d
Wha
•
management,onflict mana
ormance Meram will worteousness an
y behind thee data are ta
09, 45 percenone subproginteracted wacted with P
nal constituved from theh above sumdivisions) and
at we proposContinue professionAdministrimportant
% E
mpl
oyee
s Sa
tisfie
d
, including sagement, res
easure #1: Irk to ensure
nd profession
e performanaken from thnt of WGFDgram within
with Wildlifeolicy and De
uent satisface Departmen
mmarizes med Policy and
se to improvmonitoring
nal treatmenration prograt as an indica
60
70
80
90
100
FY
scientific daearch, habita
Internal satisthat at least
nalism provid
nce: he Strategic
D employees this programe Administraevelopment.
ction with tnt Administrean scores od Developme
ve performag internal cnt they receam. This valator of profe
Y 05 FY
42
ata collectioat conservati
sfaction with85% of empded).
c Internal Cl indicated thm. The largeation. Only
the courteouration prograof the Directent subprogr
ance in the nconstituent eive from sluable measuessional lead
06 FY 0
on, law enfoion and wild
h performancployees are s
lient Surveyhat they hadest percentaabout six pe
us and profam is high attors Office, rams.
next two yesatisfaction
subprogramsure of consti
dership.
07 FY 08
orcement, wdlife health s
ce (Personnesatisfied with
y conducted d some interage (33 perceercent indica
fessional tret 87 percent Division A
ars: n of the cos within theituent satisfa
8 FY 09
ildlife/humaservices.
el with this h the level o
annually. Iaction with aent) indicateated that the
eatment thein FY09. Th
Administratio
ourteous ane Departmenaction is
an
f
In at ed ey
ey he on
nd nt

StoryInternDepaemplDepaOffic TheseFY 0least they intera Wha• C
thvpr
Performawith this pwith the l
y behind thenal constitueartment Admoyees indic
artment Admce, Division a
e data are ta09, 45 percen
one subproginteracted wacted with P
at we proposContinue mohey receive faluable merofessional l
% E
mpl
oyee
s Sa
tisfie
d
ance Measuprogram wilevel of atten
e performanent satisfactiministration cating that tministration. administrati
aken from thnt of WGFDgram within
with Wildlifeolicy and De
se to improvnitoring intefrom subpro
easure of cleadership.
60
70
80
90
100
FY
ure #2: Internll work to enntion and tim
nce: ion with theprogram re
they were The graph aon (all divis
he StrategicD employees
this programe Administraevelopment.
ve performaernal constitograms withiconstituent
05 FY 0
43
nal satisfactinsure that at meliness prov
e attention anemained gosatisfied wiabove summions) and Po
c Internal Cl indicated thm. The largeation. Only
ance in the ntuent satisfain the Deparsatisfaction
06 FY 0
ion with perleast 85% ofvided).
nd timelinesood in FY ith the atte
marizes meanolicy and De
lient Surveyhat they hadest percentaabout six pe
next two yeaction of thertment Adm
is importa
7 FY 08
formance (Pf employees
ss they recei09, with 82ntion and tn scores of
evelopment s
y conducted d some interage (33 perceercent indica
ars: e attention an
ministration pant as an
8 FY 09
Personnel are satisfied
ived from th2 percent otimeliness othe Director
subprograms
annually. Iaction with aent) indicateated that the
nd timelinesprogram. Thi
indicator o
d
he of of rs s.
In at ed ey
ss is of

PerfoprogrDepa
StoryApprdroppthe tudirect Curredetermare oleadeof thethe D Wha• C
opsy
• Cwin
• D
%Em
ploy
ees
Satis
fied
ormance Meram will worartment’s ove
y behind theroval of theped some in urbulent nattion of the a
ent approvalmine the Der soon will b
ers. More pree number of
Department is
at we proposContinue to f
f the agencyeople to carystems of co
Continue impwhich identifn the WGFD
Develop succ
60
70
80
90
100
% E
mpl
oyee
s Sa
tisfie
d
easure #3: Irk to ensure erall coordin
e performan DepartmenFY 09 to 77
ture of wildagency is soli
l of overall epartment’s fbe eligible fecisely, the af existing leas developing
se to improvfocus on may, includingrry out thei
ompensation plementationfies, prepare
D. cession plans
FY 05
Internal satisthat at least
nation and di
nce: nt’s overall 7 percent. Wdlife conserid.
Departmentfuture directfor retiremenagency mustaders who wg workforce/
ve performaintaining the
g providing r responsibiand perform
n of the Dees and provid
s, especially
FY 06
44
sfaction with70% of empirection).
direction, aWith stable lervation in W
t direction rtion. Most ofnt. The probt develop m
will be eligib/succession p
ance in the ne integrity aa clear sens
ilities as demance reviewepartment’s des incentiv
for leadersh
FY 07
h performancployees are s
as expressedeadership an
Wyoming, co
remains highf the current
blem is not sany leaders le to retire aplans.
next two yend respect ese of overalfined and im
w. Leadership
ves for the n
hip positions
FY 08
ce (Personnesatisfied with
d by WGFDnd clear direonfidence in
h, but futuret leadership osimply that oat the same
at the same t
ars: essential to tll direction, mplementing
p Developmenext generati
s within the D
FY 09
el with this h the
D employeection, despitn the overa
e leaders wiof the agencof developintime becaus
time. Furthe
the leadershiempowerin
g appropriat
ent Programion of leader
Department.
s, te
all
ill cy ng se er,
ip ng te
m, rs
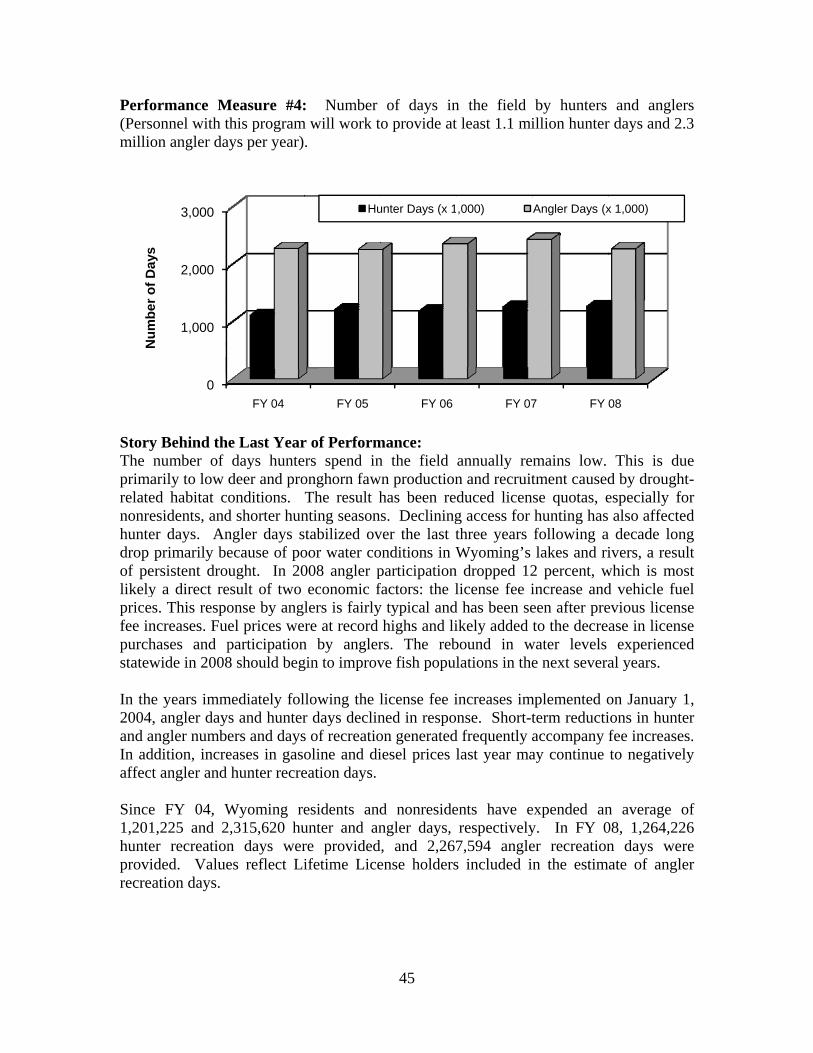
Perfo(Persmillio
StoryThe primarelatenonrehuntedrop of pelikelypricefee inpurchstatew In the2004and aIn adaffect Since1,201hunteprovirecre
Num
bero
fDay
s
ormance Monnel with ton angler da
y Behind thnumber of arily to low ed habitat coesidents, ander days. Anprimarily be
ersistent drouy a direct res. This responcreases. Fuehases and pwide in 2008
e years imm, angler day
angler numbeddition, incret angler and
e FY 04, W1,225 and 2er recreationided. Valueation days.
0
1,000
2,000
3,000
Num
ber o
f Day
s
Measure #4:this programays per year)
e Last Yeardays huntedeer and proonditions. d shorter hunngler days secause of pought. In 20
esult of two onse by angel prices weparticipation8 should beg
mediately fols and hunterers and dayseases in gasohunter recre
Wyoming re2,315,620 hun days weres reflect Li
FY 04
: Number m will work t
.
r of Performers spend inonghorn fawThe result h
nting seasonstabilized ovoor water co008 angler peconomic flers is fairlyre at record
n by anglergin to improv
llowing the lr days declins of recreatiooline and dieation days.
esidents andunter and anre providedifetime Lice
FY 05
Hu
45
of days into provide at
mance: n the field
wn productionhas been res. Declining
ver the last tonditions in Wparticipationfactors: the ly typical and
highs and lirs. The rebve fish popul
license fee ined in respoon generatediesel prices l
d nonresidengler days,
d, and 2,267ense holders
FY 06
unter Days (x 1
n the field t least 1.1 mi
annually ren and recruitduced liceng access for three years Wyoming’s
n dropped 12license fee i
d has been seikely added bound in wlations in the
increases imnse. Short-t
d frequently alast year ma
ents have erespectively7,594 angles included i
FY 07
,000)
by hunters illion hunter
mains low. tment causedse quotas, ehunting hasfollowing alakes and ri
2 percent, wincrease andeen after preto the decre
water levels e next severa
mplemented oterm reductiaccompany ay continue
expended any. In FY 0er recreationn the estim
7 FY
Angler Days (x
and anglerr days and 2.
This is dud by droughespecially fo also affecte
a decade lonivers, a resu
which is mosd vehicle fueevious licensase in licens
experienceal years.
on January 1ions in huntefee increaseto negativel
n average o08, 1,264,22n days werate of angle
08
x 1,000)
rs .3
ue t-or ed ng ult st el se se ed
1, er s. ly
of 26 re er

46
What has been accomplished: Hunting and fishing access is being addressed through the Department’s Private Lands Public Wildlife (PLPW) Access Program. The Department continues to encourage participation by both recreationalists and private landowners. Acres enrolled in the Walk-in Hunting areas increased by 20.5 percent from 544,415 private acres in 2007 to 655,973 in 2008. Access provided through Hunter Management areas increased by 5.86 percent from 839,539 private acres in 2007 to 888,752 acres in 2008. Walk-in fishing areas declined slightly to 272 lake/pond acres and 96 stream/river miles. The PLPW Access Program is an important strategy for increasing hunting and fishing access to private and landlocked public land. In addition to private land, the PLPW Access Program also provided access to approximately 1.5 million acres of public land that was located within or behind private land enrolled in the program. Funding for the PLPW program is provided in the existing Department budget. The Department will continue to explore options for maintaining or enhancing hunting and fishing access to private lands. In FY 08, we continued to concentrate on extending and modifying existing boating access developments to ensure continued access to reservoirs affected by low water elevations. Major repair of aging roads, parking areas and comfort stations was another major work item for our boating access program. Our Fish Wyoming program assisted in enhancing angler access to the Wind River in Dubois, Platte River in Casper and at Gray Reef, the Shoshone River in Cody and several Forest Service fishing ponds. The Department continues to manage wildlife populations as needed through elk feedgrounds, fish hatcheries and bird farms. Veterinary Services’ efforts to address terrestrial wildlife diseases were approved, as were funds to prevent whirling disease in two fish culture facilities. These improvements to fish culture facilities are expected to lead to advancement in disease prevention techniques and allow for greater flexibility in the stocking trout both in numbers and size in order to meet angler needs. What we propose to improve performance in next two years: Hydrologic drought that reduced water levels in our streams and rivers over the last several years was moderated this past year. While one year of good water conditions does not break a prolonged decade-long dry spell, it should improve angling opportunities in future years as fish populations respond over the next several years. The completion of several major hatchery and rearing station restorations and enlargements should improve our capacity to stock our artificial impoundments. In combination with improved water conditions this increased capacity should serve to increase angler success rates and angler participation. Changes in private land ownership, which is affecting public access, the primary and secondary effects of mineral development, and changes in societal interests are also compounding the problem. The Department will continue to encourage hunting and fishing recruitment, seek ways to maintain and increase access, improve habitat and advertise the opportunities Wyoming offers. Economic factors have for now replaced environmental conditions as the single greatest factor influencing angler participation.

Prog Divis Miss Progassocand ipersoWyom
Prim• C
thingrby
PerforeseaReseaDepa
StoryThe Dimprocosts reseaReseapriori
gram: Exter
sion: Office
ion: Condu
gram Factsciated with tindependent
onnel but byming Coope
Sub-progrExternal R
mary FunctioConduct resehat require n cooperatioraduate study fish and w
ormance March conductarch Unit (P
artment empl
y behind theDepartment ove future m
associated arch projectsarch Unit (itized by Fi
%Em
ploy
ees
Satis
fied
rnal Research
e of the Direc
uct timely, ap
s: Scientificthe Wyomint researcher
y agreement, erative Fish a
ram Research/ Co
ons of the Eearch to prorigorous, sc
on with thedents to condwildlife mana
Measure #1: ted by or oPersonnel wloyees are sa
e performanis responsib
management with condu
s in cooperCoop Unit)ish and Wil
0
20
40
60
80
100
FY
% E
mpl
oyee
s Sa
tisfie
d
h
ctor
pplied resear
c investigatng Cooperatis. The ex$40,000 pe
and Wildlife
oop
External Resovide answecientific stue Departmeduct researchagers.
Departmenoverseen by
with this proatisfied with
nce: ble for develof Wyomin
ucting researration with and other ldlife Divisi
05 FY 0
47
rch on fish an
tions are tyve Fish andternal resea
er year is usee Research U
# FTEs 0
search Progers to wildlidy by develoent, hiring h that is des
nt employeey the Wyomogram will w the quality
loping propong’s wildlife rch, Departmthe Wyomresearchers
ions for fun
6 FY 07
nd wildlife m
ypically cod Wildlife Rearch programed to help fu
Unit; listed be
2009 $
gram: ife managemoping researand overse
signed to hav
e satisfactionming Cooperwork to ensof research c
osals for appresources.
ment personing Cooper. These pr
nding. With
FY 08
management
nducted byesearch Unitm funds nound adminiselow is the 2
9 Annual Bu$ 417,085
ment questirch proposalseeing researve immediat
n with the qrative Fish ure that at conducted or
plied researcHowever, w
nnel developrative Fish roposals areh the except
FY 09
t issues.
y researchert, universitie
o Departmenstration of th2009 budget
dget
ons or issues and budgetrchers and/ote applicatio
quality of thand Wildlifleast 80% or overseen).
ch projects twith increasep the applieand Wildlif
e ranked antion of som
rs es nt he :
es ts or on
he fe of
to ed ed fe nd me

48
wildlife veterinary research, all Department research is outsourced to the Coop Unit, universities and other contracted researchers. Therefore, we rigorously seek qualified researchers to assist us with our research questions. Typically, the majority of the research funding has gone to funding researchers hired or directed by the Coop Unit. Annually, the Department evaluates the research product in terms of quality, especially whether the research product is applicable to current wildlife management questions and in fact addressed the wildlife management questions posed in our proposals. This evaluation is conducted via the Internal Client Satisfaction survey, which is distributed to Department personnel. Starting with the FY 03 survey, two separate questions were created to recognize the distinction between quality and quantity. Since FY 05, an average of 83 percent of Department employees who had interacted with the members of the Coop Unit were satisfied with the quality of research conducted or completed. The percentage was highest in FY 05 (90 percent) and lowest in FY 09 (73 percent). Some discontent regarding reduced capacity due to staffing challenges may have caused this perception regarding quality of work accomplished. In the past several years, Coop Unit staffing has been reduced to Assistant Leader specializing in big game research and the Unit Leader that in preparation for retirement accepted no new fisheries research projects. To address some pressing species diversity issues, the Coop hired an Academic Research Professional to increase capacity for nongame research. Subsequently the budget for FY 09 shows an additional $40,000 to support this increased capacity. Average employee satisfaction with quantity of research conducted was 79 percent for FY 05-FY 09. In FY 09, 73 percent of Department employees were satisfied with the quantity of research conducted or completed. Actually, the quantity and diversity of research conducted in FY09 was vastly greater than in the past several years. However there may be a perceived lack of satisfaction because our selection process greatly increased the number of project proposals. While we increased the overall number of research projects, there were many that were not selected perhaps leading to some discontent. Also some dissatisfaction was evident due to declining capacity for fisheries research at the Coop. Indeed, it was necessary to go outside Wyoming to meet our applied, fisheries research needs in FY 08 and FY 09. What has been accomplished: In FY 09 we continued the Jackson Moose project (phase 2) to identify movement patterns of moose adjacent to US Highway 287/26. Moose sporting GPS-enabled collars will help us better identify mitigation measures for highway projects. Another moose study in the Jackson Region was initiated this year to evaluate the nutritional content of willow communities used by moose as aid in understanding what part nutrition may play in recent population declines. Also started this year was a three-year study to evaluate Teton Range Big Horn Sheep winter range losses. Year three of a five-year wild turkey study in the Black Hills was continued in an effort to determine how gobbler mortality may vary according to different hunting season structures. Ongoing too was the Absaroka Front Elk Study that is evaluating habitat, seasonal range and migration patterns. In

49
combination with the Absaroka Wolf Study, managers should be better able to adjust elk management practices in the future. Additionally the Coop initiated the following projects: small mammal distribution study in southwest Wyoming sagebrush habitats; a study to identify influences of energy development on non-game sagebrush birds, a survey for pocket gophers in southwest Wyoming; a methods study for inventorying pygmy rabbits at the landscape scale, and an assessment of the vulnerability of wildlife to energy development. In FY 09, the Coop Unit completed three fisheries studies and initiated an aquatic gastropod study. Coop Unit staffing reductions and the pending retirement of senior Coop staff, the Coop precluded initiation of new projects. Consequently, we continued to collaborate with Colorado State University in FY 09 by initiating a research project on hornyhead chubs in the Laramie River basin. What we propose to improve performance in the next two years: • Seek to recover funding needed for applied research in the fields of native species of
concern, wildlife diseases, big game, game bird and sport fisheries. • Support and assist efforts to refill the Assistant Leader for Fisheries in the Coop in
FY 10. • Maintain increased capacity by seeking funding through General Appropriations or
Governors Endangered Species Office in FY11 and FY12. Much of this additional funding will be used to contract additional research through the Wyoming Cooperative Fish and Wildlife Research Unit, University of Wyoming, Colorado State University and other entities. Virtually all of this work should increase our capacity to address concerns addressed in the Comprehensive Wildlife Conservation Strategy.
Program: Feedgrounds Division: Wildlife Mission: To maintain Commission population objectives and control elk distribution in an effort to minimize conflicts with human land uses. Program Facts: The Feedgrounds program operates 22 feedgrounds and is made up of one sub-program, listed below with number of staff and fiscal year 2009 (FY 09) budget: Sub-program # FTEs* 2009 Annual Budget
Feedgrounds 2.0 $ 2,124,865 This program is uniquely organized in that it is statewide, but located in the Pinedale Region. Personnel are assigned in Pinedale and Etna. The program is supervised by the Pinedale Regional Wildlife Supervisor.

* Incthe bfunde Prim• M
supre
Perfoprogr
StoryElk fconflexposnativrangeperceWyomby hi Abou34 yefor elVentroperaMarcfeedg
cludes permaudget cycle ed from supp
mary FunctioMaintain elkupplementalersonal propeduce opport
ormance Mram will wor
y behind thefeedgrounds licts with agsure to Bruce ranges to es without centage of thming constitgh elk numb
ut 16,534 elkear average, lk on state ore valley duations in thech 11, 2009 grounds has
13,00
13,50
14,00
14,50
15,00
15,50
16,00
16,50
17,00
17,50
Num
ber o
f Elk
anent positiorequire Wyo
plemental gr
on of the Fek populatiol feed. Suppperty and atunities of di
Measure #1: rk to feed at
e performanhave been
griculture, scellosis beca
developmeconflict. De total elk ptuents are acbers that are
k were fed da result of gperated feede to mild sne Gros Vent
and was ins ranged be
0
0
0
0
0
0
0
0
0
0
2004-200
ons authorizeoming Gamerants.
eedground Pon objectiveplemental feassist in theisease transm
Number ofleast 14,934
nce: an importanuch as dam
ause of comment significa
During most population,
ccustomed topossible bec
during the wgrowing elk pdgrounds butnow conditiotre valley thn operation etween 13,0
5 2005-2006
50
ed in FY 09 e and Fish C
Program: es and con
eeding will ae preventionmission.
f elk attendin4 elk).
nt managememage to stor
mingling, deantly impact
winters, elkwhile nativ
o the increascause of feed
winter of 200populations.t an estimate
ons. Only onhis season. for 30 days041 elk (w
2006-2007Winter
budget. AnCommission
ntrol elk diassist in the n of commin
ng feedgrou
ent tool sinced hay and eep snow act the ability k feedgrounde ranges sued elk huntinding.
8-2009. Th This woulded 1,928 elkne feedgrounAlkali bega
s. The numwinter 2002
2007-2008 2
ny positions authorizatio
istribution prevention ngling with
unds (Person
ce the early feedlines, r
ccumulationsof elk to u
ds maintain upport relativng opportun
his is 2,858 md have been
k were not fend, Alkali, ban feeding o
mber of elk 2-2003) and
2008-2009
added durinon or must b
by providinof damage tlivestock t
nnel from thi
1900s. Elrisk of cattls, and loss outilize nativa significan
vely few elknities afforde
more than tha record yea
ed in the Grobegan feedinoperations oattending th
d 17,140 el
ng be
ng to to
is
lk le of ve nt k. ed
he ar os ng on he
lk

51
(2005/06). In order to reduce damage/commingling conflicts and prevent excessive starvation, about 80 percent of the all elk in the region were fed.
Western Wyoming has been under the influence of drought conditions for the past 12-19 years. Winter conditions during 2008-2009 started out mild and allowed for delayed feeding start dates on several feedgrounds. Heavy snows did not arrive until the first week in March and continued into early to mid April. Overall, the feeding season was 90 days in length. This is second shortest feeding season since 1976-77 and is 35 days less than the average feeding season of 125 days. This can be attributed to the later starting dates on many of the feedgrounds and the short feeding season in the Gros Ventre valley. With the Gros Ventre valley feedgrounds removed, the feeding season was 103 days. Wolves chase elk from and between feedgrounds. These factors can influence the number of elk counted on feedgrounds and/or fed. Twelve of the 22 feedgrounds had elk numbers in excess of the individual quotas. Eight of 22 feedgrounds were under the individual quota. Fall Creek elk herd unit (EHU) feedgrounds and Piney EHU feedgrounds are 1,500 and 811 elk over feedground objective respectively. Between 73 percent and 84 percent of the elk in the region are fed each year. This is because adequate native range is not available. These elk are fed at select locations that allow them to be attracted to feedgrounds. Feeding at these locations assists in keeping the elk away from potential commingling/damage situations. While elk attend feedgrounds, they are fed adequate hay (quantity and quality) to reduce starvation. Public acceptance for elk mortality on feedgrounds is low. Long-term average mortality from all causes does not exceed 1.5 percent on all feedgrounds combined. Mortality resulting from old age, hunter crippling, wolf predation, vaccination, and elk trapping cannot be prevented by feedground management techniques. Other causes of mortality (goring, some diseases, malnutrition) may be related to feedground management. Feedground managers should utilize available techniques to minimize those causes of mortality that may be attributed to feedground management. Percent winter mortality for 2008-2009 was 0.7 percent. In addition to helping support elk population numbers and hunting opportunities in northwest Wyoming, elk attendance on feedgrounds provides an opportunity to vaccinate elk for Brucellosis and reduce conflict with private landowners. During winter 2008-2009, 97 percent (n=2,985) of elk calves on feedgrounds were ballistically vaccinated with Strain 19. This was the first year that all three feedgrounds in the Pinedale EHU (Muddy Creek, Fall Creek, and Scab Creek) were excluded from vaccination operations due to the test and removal program (for further details, see Wildlife Health and Laboratory Services program). What has been accomplished: • The overall average feeding season was 90 days, thirty-five days shorter than average
125 days. • 80 percent of the elk attended feedgrounds, 5% less than last season. • Mortality was less than one percent.

52
• Wolves caused elk mortality at five of the 22 feedgrounds. There were 10 elk documented by elk feeders to have been killed by wolves.
What we propose to improve performance in the next two years: • Continue to work with terrestrial wildlife biologists and game wardens during their
winter survey effort to obtain accurate feedground counts to compare to elk counted on native ranges.
• Direct elk feeders during the annual fall orientation briefing to record all deaths and to attempt to determine the cause of death. Continuing to document and identify the major causes of winter elk mortality on feedgrounds is helpful in addressing public concerns and helps feedground personnel improve management efforts, thus resulting in more productive feeding efforts.
• Keep the public informed of situations that may lead to unfavorable public opinion. Feedground personnel, game wardens, and terrestrial wildlife biologists need to be aware of situations that have the potential of causing public concern and take the lead in developing a media approach.
• Be prepared to quickly notify and work with the Department’s Veterinary Services program if disease issues are causing unexpected numbers of elk to die.
• Forest Park and Green River Lake feedgrounds do not serve to prevent damage and commingling with livestock. Their sole purpose is to prevent excessive winter elk losses. Feeding strategies can be adjusted at these locations to feed less hay to save on feeding costs and reduce potential intra-specific disease transmission.
• The “Target Feedground Management” plan was implemented on feedgrounds with decreased damage/commingling risk for the second year. These feedgrounds included Green River Lakes, Soda Lake, Fall Creek, Bench Corral, Gros Ventre and Forest Park. This plan shows potential to decrease hay consumption, in the spring, in areas with decreased snow depths.
Program: Financial Management Division: Fiscal Division Mission: Ensure accountability of all Department assets to the Department’s publics, including financial compliance with federal and state requirements and assist in management planning and decision-making by providing financial information.

53
Program Facts: The Financial Management Program is listed below with number of staff and 2009 (FY 09) budget: Sub-programs # FTEs* 2009 Annual Budget Revenue Collection & Licensing** 21.2 $ 1,874,967 Asset Management 2.5 508,560 Disbursements 4.0 276,216 Financial Systems 1.5 157,125 TOTAL 29.2 $ 2,816,868 *Includes permanent, contract and temporary positions authorized in the FY 2009 budget. Any positions added during the budget cycle require Wyoming Game and Fish Commission authorization or must be funded from supplemental grants. **Includes one ¾ fiscal specialist position. This program is located in the Department Headquarters Office in Cheyenne. Primary Functions of the Financial Management Program: • We ensure accountability and compliance by being responsible for billing,
collecting, and accounting for all Department revenues and administering the systems to accommodate administration of all Department revenues including issuance of personal hunting and fishing licenses, permits, tags and stamps, watercraft registration, commercial hatchery, taxidermist and bird farm licenses, and federal, state, local and private grants and donations, to include receipts in excess of $59 million annually. In addition, we initiate, review and process in excess of 50,000 payment transactions in accordance with state requirements.
• We ensure accountability and compliance by maintaining and updating the financial records of all Department fixed assets to include personal property (vehicles, office and shop equipment, leasehold improvements) and real property (buildings, infrastructure, land improvements).
• We assist in Department management planning and decision-making by developing and monitoring the Department’s annual budget to ensure compliance with state requirements. In addition, we provide monthly and annual financial reports to agency personnel and external publics.

PerfoDepopaymwork
ormance Mositing Licenments are proking days).
35
40
45
50
(thou
sand
s)
0246
(day
s)
$-
$10.0
$20.0
$30.0
$40.0
$50.0
$ (in
mill
ions
)
Measure #1nse Draw reocessed with
5
0
5
0
FY 05
# of P
0246
FY 05
to pro
-
00
00
00
00
00
FY 05
Li
1: Timelineeceipts (Perhin four wor
FY 06 F
Payment Tra
FY 06 FY
Average # ocess payme
`
FY 06
icense Rece
54
ess of Procrsonnel withrking days a
FY 07 FY 0
ansactions
Y 07 FY 08
of daysnt transaction
FY 07 FY
eipts Deposit
cessing Payh this progrand receipts
08 FY 09
8 FY 09
ns
Y 08 FY 09
ted
yment Tranram will wo
are process
9
sactions anork to ensursed within 1
nd re 0

StoryIn FYtransaexperday totakesreguland ethe ti It applevel empl In thappliapplilicenseconoapplito thtransadecrereducapproTreastime from an effunds Wha• In
in
y behind theY 2009, afteactions stabirience any po just under between si
latory requirexternal automeliness of
pears that ththat howev
oyee turnove
e area of recations, as ications receses was dowomic downtucation proce
he decrease actions moreased from $ce the numoximately ssurer’s officeto deposit futhe Departm
ffective balas received.
at we proposn the area onterface to re
0
5
10
15
20
# of
day
s
e performaner a two-yeilized and repersonnel tur
four days beix months arements, budomated finantransaction p
he Disbursemver, is only er.
eceipts, the Lnternet appl
eived by thewn slightly,urn, the numessing remai
in manual re efficient$20 million
mber of temix FTE’s, we to under fo
funds from Fment receiviancing betw
se to improvof disbursemeduce entry
0
5
0
5
0
FY 05
Average
nce: ar increase
emained relarnover, allowetween receiand a year dget structuncial systemprocessing.
ments sectionsustainable
License Dralications clime Departmen, with the p
mber of prefined relative
applicationtly. Actuato $12 mill
mporary pewhile cuttinour days. ThFY 06. At ting mail to h
ween number
ve performaments, in thtime for rev
FY 06
e # of Days to
55
in transactiatively constawing procesipt and compfor new pe
ure, Departms, employee
n in FY 09 pwith the cu
aw section smbed from 5nt. While thprimary decference poinely constant ns, the licenal deposits lion, allowinersonnel furng the numhis change rthis time, it having fundsr of personn
ance in the ne fall of 20
venue refund
FY 07 Fyear
o Process Lice
on volume, ant. Additio
ssing time topletion of pa
ersonnel to lment personn
turnover ha
processed inurrent volum
saw a third 50 percent tohe total numcrease from
nt purchases at just over nsing sectiofrom manu
ng the Licenrther from
mber of dayreflects a 400appears thats processed nel required
next two ye009, the Depds for the ma
FY 08 FY
ense Receipt
the numberonally, the seo decrease bayment translearn state nel contacts as a significa
nformation atme of transac
year decreao over 67 pember of app
nonresidenincreased so268,000. H
on was ablual license nse Draw se
ten to an ys from ma0 percent redt the four daby the Statewith intere
ars: partment wiajority of lic
Y 09
ts
r of paymenection did no
by over half sactions. As statutory anand interna
ant impact o
t an optimumctions and n
ase in manuaercent of totaplications font due to tho that overaHowever, due to proces
applicationection to bot
average oail receipt tduction in thay turnaroune Treasurer iest earned o
ill initiate acense refund
nt ot a it
nd al
on
m no
al al or he all ue ss ns th of to he nd is
on
an s.

Wnud
• Incoh
PerfoDepamoreerrors
StoryBeginapproin itsgoat, reduc
We are also umber of paata or errorsn the Licensontinue to inelp to reduce
ormance Martment corre than 1/10 s).
y behind thenning in FYoved by the s license dra
deer, antelced data en
looking at ayment docum. se Draw arencrease, althoe the need fo
easure #2: Nection of errof one perc
e performanY 07, the licWyoming G
aw process. lope, elk, tuntry requirem
200220240260280300
(thou
sand
s)
2
4
6
8
10
(cor
rect
ions
)
expanding fments that m
ea, we anticiough at a sloor temporary
Number of Erors (Personncent of custo
nce: cense draw
Game and FiFirst, Intern
urkey and bments for m
FY 05 FY
# of A
0
20
40
60
80
00
FY 05 F
#
56
fiscal traininmust be corre
ipate that thower rate thay personnel f
External Cunel with thisomer licens
section, in sh Commissnet applicati
bison licensemanual licen
Y 06 FY 07
Applications
FY 06 FY 07
# of Key Pun
`
ng for field ected prior to
he volume oan in the lastfor data entry
ustomer Lices program wie inquiries
accordance sion, incorpoions for limies were initnses. Addi
FY 08 FY 09
Processed
FY 08 FY 0
ch Errors
personnel to entry due t
f internet apt two years, y.
ense Inquirieill work to eresults from
with regulaorated two mited quota mtiated, whichitionally, th
9
09
to reduce thto incomplet
pplicants wiwhich shoul
es resulting iensure that n
m Departmen
atory changemajor changemoose, sheeph resulted i
he period fo
he te
ill ld
in no nt
es es p, in or

prefeinnovmontresporealizproceAdditDepaslightout ocondu157,0earliehunticapabfor hu Wha• C
ru• E
h• A
enin
PerfoFinanwhenOutco
rence pointvations helpeth window (Jonse to theszed. With leessing applitionally, du
artment errort increase frf the 268,00ucted well 000 applicater than any ting trips. Tbility for purunters.
at we proposContinue to unning the d
Encourage apas edits to he
Annually revnhancementncorporate th
ormance Mncial Managn Courtesy, ome Internal
4.200
4.300
4.400
4.500
4.600
4.700
4.800
1 (P
oor)
5
(Exc
elle
nt)
t purchases ed to reduceJanuary 1 – e changes, ss manual apications wa
ue to the drs was reducrom the prio00 applicatioin advance tions) condutime in the l
The replacemrchase of lef
se to improvperform qua
draw and issupplicants throelp reduce eiew suggestis to improvhose enhance
Measure #3:gement (Pers
Timeliness,l Client Sati
0
0
0
0
0
0
0
FY05
Inte
was change the volume
May 31) duseveral benpplications, as cut by ecreased voced significar year. Howns received of the pub
ucted prior last twenty yment of the ftover licens
ve performaality controluing licensesough media rrors made bions by bothve the Depaements that
: Employesonnel with , and Effectsfaction Sur
FY06
ernal Custom
57
ed to July e of manual uring which efits to boththe number approximat
olume of mantly in FY wever, total by the Depa
blished drawto June 20t
years, allowileftover dra
ses by July 7
ance in the nl by reviews and mailing
by applicanth license appartment’s weare cost effe
ee satisfactithis program
tiveness arervey).
FY07 F
mer Satisfact
1 through applicationsdraw applic
h the Deparand cost of
tely 400 pmanual appli
08; howeveDepartment
artment. Addw dates with
th, with resuing licenseeaw in July w7th further im
next two yeing all appl
gs to apply ths in complet
plicants and eb pages foective and ap
on with serm will work
e measured
FY08 FY0
tion
September. s received ducations are prtment and f temporary ercent fromications, theer, in FY 09t errors wereditionally, a
h the largesults availabls more timewith the on
mproved cust
ars: lications ent
hrough the Inting applicatDepartment
or license appplicant frien
rvice level k to achieveby the ann
09
C
T
A
These twuring the fivprocessed. Ihunters werpersonnel fo
m FY 2006e number o9 there was e less than 7ll draws wert draw (ovele to hunter
e to plan then-line internetomer servic
tered prior t
nternet whictions. personnel o
pplicants anndly.
provided be at least a nual Strategi
Courtesy
Timeliness
Accuracy
wo ve In re or 6. of a
70 re er rs ir et ce
to
ch
on nd
by 4 ic

58
Story behind the performance: The Fiscal Division is responsible for providing customer service to Department employees while insuring compliance with federal and state requirements. Additionally, it must interface its financial systems with those mandated by the State Auditor, State Personnel, State Purchasing and the State Budget Office. Accordingly, much of the Division’s ability to meet the needs of agency personnel is dependent on the directives of these other entities while still ensuring that the agency’s financial records provide accountability and auditability. To meet these objectives, the Division believes that its primary focus should be on courtesy to individuals, timeliness of information and ability to answer questions (completeness), as these items are indicative of the service level that all of the employees within the Division are providing. The above graph is a composite (mean) of the individual results of the four sub-programs. While the Department was able to improve in the area of transactions timeliness, there was a slight decline in recognized in accuracy of information and courtesy. This may be due, at least in part, to having vacancies in two of the four sections, remain open during the latter half of the fiscal year, which affected existing employees’ ability to research and accurately answer questions. Additionally, the licensing section in FY 09 began utilizing a completely new licensing system for both external license selling agents and regional offices and for the first several months, there was a steep learning curve associated with these major changes Based on the satisfaction survey, FY 09, however continued to show satisfaction levels still between very good and good. Accordingly, we continue to believe that an indicator of “4 “or above (good) on a 1 to 5 satisfaction scale demonstrates that an acceptable level of service is being provided, while still being cost efficient. What we propose to improve performance in the next two years: • We propose to continue to maintain service levels where employees can be provided
assistance in a timely, complete and courteous manner. This was a challenge in FY 09 due to major changes in the License area, which while resulting in significant customer enhancements, did have some growing pains, in addition to continued changes with State Accounting system managed by the State Auditor’s office that delayed some transaction processing and report availability. However, increasing availability to online information for regional administrative personnel has assisted those individuals in answering questions by field personnel and we will continue to work on making more online information available to all personnel and to expand training to field personnel, especially through video conferencing, a cost effective alternative to extensive travel.
Program: Habitat Division: Fish and Wildlife Mission: Holistically manage, preserve, restore and/or improve habitat to enhance and sustain Wyoming’s fish and wildlife populations for current and future generations.

59
Program Facts: The Department Habitat program is made up of three major sub-programs, listed below with number of staff and 2009 (FY 09) budget: Sub-programs # FTEs* 2009 Annual Budget Terrestrial Habitat Management 14.7 $ 1,970,369 Aquatic Habitat Management 12.4 1,340,843 Water Management 2.6 245,883 TOTAL 29.7 $ 3,557,095 * Includes permanent, contract and temporary positions authorized in FY 09 budget. Any positions added during the budget cycle require Wyoming Game and Fish Commission authorization or must be funded from supplemental grants. The Habitat program formerly included the Habitat and Access Management sub-program (Strategic Plan FY 04-FY 07, November 2003). While this sub-program has since been removed, the Habitat program has incorporated the Water Management sub-program (formerly a sub-program in Aquatic Wildlife Management program). The Habitat program has statewide responsibilities. Permanent personnel are located in Buffalo (1), Casper (3), Cheyenne (4) Cody (3), Green River (2), Jackson (2), Lander (2), Laramie (3), Pinedale (2) and Sheridan (2). Primary Functions of the Habitat Program: • Manage, preserve and restore habitat for long-term sustainable management of
fish and wildlife populations by inventorying wildlife habitat conditions, determining where conditions are limiting, and plan and implement projects at watershed and landscape scales in order to conserve and restore habitat quality. This is accomplished by integrating various land uses while involving the general public, private landowners and land management agencies.
• Increase fish and wildlife based recreation through habitat enhancements that
increase productivity of fish and wildlife populations by designing and implementing habitat improvement projects in cooperation with private landowners and/or public land managers.

Perfohabitwildlcomp
StoryThis of thpersoHabitlandotrackthe pannuaperfoSHP Trackprogrand rbetteractivi WhaIn FYaddreover persoprivamanypersorequiEnvir
ormance Mat goals comlife within prplete at least
y behind themeasure of
he Departmeonnel develotat Plan (SHowners, landed individua
performance al and mon
ormance apprAccomplish
king of perforam success restoration er able to mities.
at has been aY 09, 81 peessing habitaFY 08 (89 p
onnel and thate landowney of the pronnel controired documeronment Po
% H
abita
t C
onse
rvat
ion/
Res
tora
tion
Activ
ities
Com
plet
ed
Measure #1:mpleted thatriority areas 70 percent o
e performanhabitat present terrestri
op work schHP) addressind managemeally and repo
goals compnthly activiraisal evalua
hments Repo
ormance goaand quality
fforts for larmeasure suc
accomplisheercent (161 at conservatpercent com
he time requers, federal arojects not ol and incluents to conolicy Act (
0
20
40
60
80
100
FY
Activ
ities
Com
plet
ed
Terrestriat addressed and/or habi
of planned a
nce: servation or ial habitat p
hedules and ng priority arent agencies orted collectpleted for tity highlighations as relaort for calend
als improvesy over time, rge-scale lanccess and q
ed: completed
tion or restompletion) and
ired for trainand state lancompleted
uded weathnduct activi(NEPA) do
Y 05 FY 0
60
al Habitat Mhabitat cons
itat types (Peactivities).
restoration personnel. performancereas and oppand conser
tively in termthe fiscal yeht reports, ated to the adar year 200
s the Departsometimes
ndscapes proquality of h
of 200 planoration activd the long-tening and dend managemor impleme
her, outside ities on fedocuments, o
06 FY 07
Managementservation or ersonnel in t
goals is tiedPrior to e
e goals consportunities torvation groupms of accomear. Informdaily activi
annual work 8.
tments’ abilidecades, fo
ojects. In thihabitat pres
nned) of theities were c
erm average eveloping woment agencieented were partner fun
deral lands, other admin
FY 08
t – Percent restoration
this program
d to the accoeach fiscal sistent with o collaborateps. These g
mplishing a pmation is coity reports, schedules an
ity to measur long-term is way the Dervation an
e terrestrial ompleted. is largely duorking relaties, and othe
largely bending or co
such as, nistrative p
FY 09
of terrestriaactivities fo
m will work t
omplishmentyear, habitathe Strategi
e with privatgoals are thepercentage oompiled from
and annuand the annua
ure the habitaconservatio
Department ind restoratio
habitat goalThe decreasue to: 1) newionships witr partners; 2
eyond habitaompletion othe Nationa
priorities an
al or to
ts at ic te en of m al al
at on is
on
ls se w th 2) at of al
nd

61
timelines, and an insufficient number of personnel; 3) additional time requirements for updating the SHP; and 4) last, but probably most importantly, completing 30 unplanned projects defined as those requiring approximately three or more days of effort by section personnel, with partners resulting in a total of 191 projects completed and on-going for FY 09. A partial list of accomplishments by terrestrial habitat personnel during FY 09 is discussed below. Six landscape area projects using satellite imagery land cover classification encompassing parts of the Sheridan, Lander, Casper and Cody Regions and a statewide sagebrush mapping effort were completed. Several hundred private landowners were assisted resulting in 116 on-the-ground habitat extension projects. These projects were accomplished by section personnel working with partners and preparing and soliciting many grants applications from outside sources, including Wyoming Wildlife and Natural Resource Trust, Wyoming Governor’s Big Game License Coalition, Rocky Mountain Elk Foundation, Foundation for North American Wild Sheep, Natural Resource Conservation Service (NRCS) Farm Bill Programs, Water for Wildlife Foundation, Bowhunters of Wyoming, Pheasants Forever, U.S. Fish and Wildlife Service Private Lands Program and Landowner Incentive Program (LIP), the Wyoming Governor’s Sage Grouse Fund, private landowners and private and corporate donors among others. Terrestrial section personnel developed and administered 25 Department trust fund projects, and were directly involved with applications involving 44 grants and assisted on administration of funds on another 23 projects. Many of the terrestrial habitat projects include development of grazing management plans, working on various internal and external working groups and partnerships, habitat improvement efforts (prescribed fire, herbicide applications, mechanical treatments, fence removal/modifications, seeding, water developments, etc.), wildlife environmental reviews, assisting with large land cover identification and classifications, Bureau of Land Management (BLM) Resource Management Plan revisions, U.S. Forest Service (USFS) plan revisions, as well as, assistance on various habitat related research projects. Finally, recognizing the importance of habitat improvements implemented, personnel annually collect data to document and monitor the number of acres and stream miles inventoried, document results of management activities, and annual big game forage and shrub utilization on more than 250 transects. Terrestrial section personnel expect the number of projects completed in the coming year to be similar. Habitat biologists have and continue to loss some productivity relative to implementation of SHP goals and projects due to the increasing requests to assist in the mitigation of habitats disturbed from energy development, BLM Resource Management Plan activities and Forest Service Plan activities and revisions, NRCS 2008 Farm Bill and internal Department administrative requests. Besides reducing time available for planning and implementing on-the-ground habitat management and enhancement projects, biologists have had less time to seek funding and develop partnerships with landowners and land managers.

Wha• Im
prinp
• InprTApreN
• Esuprhp
• Dbp
• Cador
Perfohabitprioriprogr
at we proposmplement thriority habitncrease wildartnerships wn synchronyroposals to
Trust, WyomAgriculture F
artners. Theestoration pr
NEPA, invenEvaluate secupervisor prropose addiabitat bioloositions with
Develop a hottlenecks, ersonnel trai
Consider comddress both r #2 and it w
ormance Mat goals comity habitat tram will wor
1
% E
hanc
emen
t Goa
ls C
ompl
eted
se to improvhe recently tat areas an
dlife populatwith other agy with the D
submit for ming LandsFarm Bill
ese additionarojects. Util
ntories and asction personroposal for itional fieldogist technich various enthabitat projhelp identiining and asmbining permeasures, a
would somew
Measure #2:mpleted thattypes to imprk to comple
0
20
40
60
80
100
FY 05
ve performacompleted
nd priority htions. Fundgencies, privDepartment
funding to cape ConseProgram, c
al funds willlize the Diressessments tnnel structurDepartment
d personnel cians, and tities. ect implemfy project sistance. rformance mare often diffwhat reduce p
Terrestriat address haprove the quete at least 70
5 FY 06
62
ance in the nCommissio
habitats delding is provivate landownbudget procthe Wyomi
ervation Inionservation l allow for thector’s Officto prepare larre and worconsideratiresources sinvestigate
mentation mimprovemen
measures nuficult to sepapersonnel tra
al Habitat Mabitat enhancuantity or q0 percent of
FY 07
next two yeon approvedlineated in tided in existners and concess, continuing Wildlifetiative Teamgroups an
he funding oce additionarge shelf-reark load, deion, and consuch additio
and propo
mapping pront procedur
umber #1 anarate and caacking and r
Managementcements wit
quality of wf planned act
FY 08 F
ars: d Departmethe SHP toting budgetsnservation grue to develoe and Naturm, U.S. De
nd other funof more conal funding toady projects.velop a mintinue to invonal interns,se addition
cess to addres and for
nd #2 as mategorize intoreporting tim
t – Percent thin priority ildlife (Pers
tivities).
FY 09
ent’s SHP i maintain o
s and througroups. op additionaral Resourceepartment onding sourcservation ano accomplis. id-level fielvestigate an, longer-termal cost-shar
dress projecr Departmen
many projecto measure #
me.
of terrestriaareas and/o
sonnel in thi
in or gh
al es of ce nd sh
ld nd m re
ct nt
ts #1
al or is

63
Story behind the performance: This measure of habitat enhancement goals is tied to the annual accomplishments of Department terrestrial habitat personnel. Prior to each fiscal year, habitat personnel develop work schedules and performance goals consistent with the Strategic Habitat Plan (SHP) addressing priority areas and opportunities to collaborate with private landowners, land management agencies and conservation groups. These goals are then tracked individually and reported collectively in terms of accomplishing a percentage of the performance goals completed for the fiscal year. Information is compiled from annual and monthly activity highlight reports, daily activity reports, and annual performance appraisal evaluations as related to the annual work schedules and the annual SHP Accomplishment Report for calendar year 2008. Tracking of performance goals improves the Departments’ ability to measure the habitat program success and quality of habitat treatments over time for long-term enhancement efforts. In this way the Department is better able to measure success and quality of habitat enhancement activities. What has been accomplished: In FY 09, 83 percent (62 completed of 75 planned) of the terrestrial habitat goals that addressed habitat enhancement activities were completed. The decrease over FY 08 (89 percent completion) and the long-term average is largely due to: 1) new personnel and the time required for training and developing working relationships with private landowners, federal and state land management agencies, and other partners; 2) many of the projects not completed or implemented were largely beyond habitat personnel control and included weather, outside partner funding or completion of required documents to conduct activities on federal lands, such as, the NEPA documents, other administrative priorities and timelines, and an insufficient number of personnel; 3) additional time requirements for updating the SHP; and 4) last, but probably most importantly, completing 45 unplanned projects defined as those requiring approximately three or more days of effort by Section personnel, with partners resulting in a total of 107 projects completed and on-going for FY 09. A few examples of habitat enhancement related performance goals are discussed below. During FY 09 personnel completed or assisted in the completion of over 9,000 acres of prescribed fire, tree removal, using mechanical methods on approximately 4,800 acres in aspen, juniper and riparian habitats, used herbicides on roughly 8,400 acres to control salt cedar and Russian olive, cheatgrass and to thin overly dense sagebrush communities, planted over 7,500 trees and shrubs, directly developed habitat enhancement projects with 116 private landowner, and completed a habitat assessment with management recommendations for moose on over 100,000 acres in the Pinedale area and roughly 200,000 acres of habitat assessment with management recommendations for mule deer in the Upper Platte Valley and along the Piney Front on the Wyoming Range among many other habitat enhancement activities. Habitat biologists have and continue to loss some productivity relative to implementation of SHP goals and projects due to the increasing requests to assist in the mitigation of

habitand FDepaimplehave mana Wha• Im
prinp
• InprTApreN
• Esuprhp
• Dbp
• Cmw
Perfohabitwork
ats disturbedForest Servi
artment admementing onhad less tim
agers.
at we proposmplement thriority habitncrease wildartnerships wn synchronyroposals to
Trust, WyomAgriculture F
artners. Theestoration pr
NEPA, invenEvaluate secupervisor prropose addiabitat bioloositions with
Develop a hottlenecks, ersonnel trai
Consider commeasures, arewould somew
ormance Mat enhancem
k to complete
% W
ater
shed
En
hanc
emen
t/Res
tora
tion
Goa
ls C
ompl
eted
d from energice Plan act
ministrative rn-the-groundme to seek f
se to improvhe recently tat areas an
dlife populatwith other agy with the D
submit for ming LandsFarm Bill
ese additionarojects. Util
ntories and asction personroposal for itional fieldogist technich various enthabitat projhelp identiining and as
mbining perfoe often difficwhat reduce p
Measure #3: ment activitie at least 75 p
60
65
70
75
80
85
FY 0
gy developmtivities and
requests. Bed habitat mafunding and
ve performacompleted
nd priority htions. Fundgencies, privDepartment
funding to cape ConseProgram, c
al funds willlize the Diressessments tnnel structurDepartment
d personnel cians, and tities. ect implemfy project sistance.
formance mecult to separapersonnel tra
Aquatic Haies accomplpercent of p
5 FY 06
64
ment, BLM Rrevisions, N
esides reducanagement a
develop par
ance in the nCommissio
habitats delding is provivate landownbudget procthe Wyomi
ervation Inionservation l allow for thector’s Officto prepare larre and worconsideratiresources sinvestigate
mentation mimprovemen
easures #1 anate and categacking and r
abitat – Percished annualanned activ
FY 07
Resource MaNRCS 2008cing time avand enhancertnerships w
next two yeon approvedlineated in tided in existners and concess, continuing Wildlifetiative Teamgroups an
he funding oce additionarge shelf-reark load, deion, and consuch additio
and propo
mapping pront procedur
nd #2 as mangorize into mreporting tim
centage of wally (Personnvities).
FY 08
anagement P8 Farm Bill vailable for ment projec
with landown
ars: d Departmethe SHP toting budgetsnservation grue to develoe and Naturm, U.S. De
nd other funof more conal funding toady projects.velop a mintinue to invonal interns,se addition
cess to addres and for
ny projects ameasure #1 ome.
watershed renel in this p
FY 09
Plan activitieand interna
planning ancts, biologistners and lan
ent’s SHP i maintain o
s and througroups. op additionaral Resourceepartment onding sourcservation ano accomplis. id-level fielvestigate an, longer-termal cost-shar
dress projecr Departmen
address both or #2 and it
estoration anprogram wi
es al
nd ts
nd
in or gh
al es of ce nd sh
ld nd m re
ct nt
nd ill

65
Story behind the performance: The Aquatic Habitat Section implemented 88 out of 140 planned habitat projects in FY 09 (63 percent). An additional 18 unplanned projects were implemented for a total of 106 projects accomplished. In FY 08, 137 projects were accomplished. The decrease from FY 08 is primarily due to lack of personnel. Thirteen projects were not completed in the Casper Region where the Aquatic Habitat Biologist (AHAB) position was vacant for the entire fiscal year. Efforts to reclassify the position to a fish passage coordinator were stymied by Executive Order 2009 – 3. Another ten projects were not completed in the Cody Region as the regional AHAB focused on completing fish passage projects. The Department’s 2008 Annual report on Strategic Habitat Plan accomplishments highlights some of the habitat projects. Fish Division work plans and progress reports for calendar years 2008 and 2009 provide additional details about aquatic habitat project plans and progress for FY 09. Aquatic habitat projects completed include shared agency projects such as diversion rehabilitation projects in the Sheridan Region, beaver transplants, design of projects like the Kendrick fish bypass project on Clear Creek near Buffalo, BLM and USFS management planning assistance, watershed inventories and habitat assessments, major monitoring efforts, fish passage investigations, an educational fish passage tour, research projects with the University of Wyoming and Colorado State University and other habitat projects. Unplanned projects included providing habitat extension to private landowners including the planning, design or implementation of habitat projects. Providing expert consultations on nine Army Corp of Engineers permit applications was another significant activity, especially in the Jackson Region. Finally, in association with revision of the Department’s Strategic Habitat Plan, each of the regional habitat biologists identified habitat priority areas and described issues, values and needed actions. Significant aquatic habitat personnel effort went into providing habitat protection for the Little Mountain Ecosystem by providing information to federal and state agencies and the public regarding effects associated with development and leasing proposals. Aquatic habitat monitoring data and science oversight were provided to the Wyoming Landscape Conservation Initiative. Assistance was also provided to Lands Section in negotiating a conservation easement. Aquatic section personnel developed or administered 11 Department trust fund projects, were directly involved with applications involving 22 grants and assisted on administration of funds on another 15 projects. One of the great strengths of the habitat program is development of partnerships and collaborative efforts with private landowners, land management agencies, private industry and non-governmental organizations (NGOs). Section personnel spend considerable time on these partnerships and continue to write grants and receive funds from a variety of other sources, including state, federal, NGOs, and private and corporate donors. We expect this trend to continue in the future.

66
Aquatic habitat section planning continued toward developing a distinct fish passage program and included development of program goals and objectives. A separate budget for FY 10 was developed and approved. The nascent program remains without permanent assigned staffing however. The section’s fish passage efforts included working with a contractor to develop preliminary designs and approaches for screening diversions and improving passage in 1) Bear Creek on the Department’s Spence Moriarty Wildlife Habitat Unit, 2) South Fork Shoshone River, 3) Bitter Creek Sidon Canal, 4) Harmony Ditch on the Nowood River, 5) Suez Canal on the Nowood River, and 6) Corbett Dam on the Shoshone River. A second diversion ditch on Trout Creek, tributary to North Fork Shoshone River was screened and plans were developed to install a third screen. Populating a database for storing and prioritizing passage issues on waterways throughout the state remains a significant activity and an AWEC employee has been pursuing this in priority drainages statewide. Further fish passage work included several fish passage investigations (e.g. Clear Creek, East Fork Wind River, Bear Creek) and the administration of block grants to the Lake DeSmet Conservation District and the Sheridan County Conservation District to rehabilitate and provide fish passage at seven diversion structures. What has been accomplished: The Wyoming Game and Fish Commission adopted the revised SHP in January 2010 under the direction of the Habitat Technical Advisory Group. This took considerable time and effort by personnel in the Aquatic and Terrestrial Habitat Sections who coordinated the effort at the Regional level. The revised SHP designated new priority areas in each of the management regions and includes “crucial” areas essential for conservation of important species and communities and “enhancement” areas, which represent places where work should be conducted to manage or improve aquatic wildlife habitat. The crucial areas are being identified on the basis of values such as critical habitats and will communicate to the public where it is important to invest conservation effort and resources. The enhancement areas will indicate where we estimate we can effectively pursue projects to maintain or enhance wildlife habitat over the next five-year period. The revised SHP also included State Wildlife Action Plans areas with the priority areas delineated. Implementation and the success of this plan depend on cooperation with land management agencies, NGOs, the public and private landowners. Although major projects are scheduled annually, completion is limited by insufficient number of personnel and time to meet the demands and opportunities. The primary limiting factors identified in completing on-the-ground efforts is the lack of adequate personnel to address habitat issues, particularly with the vast and intensive energy development activities, increasing administrative duties being assigned to field personnel and obtaining permits and getting federal agencies to complete National Environmental Policy Act required Environmental Assessments. There continues to be an insufficient number of aquatic habitat personnel to address the long-term habitat needs of Wyoming’s wildlife. What we propose to improve performance in the next two years: With renewed focus on priority wildlife habitats under the revised SHP, section personnel will work with land management agencies, private landowners and funding partners to conserve and manage wildlife habitats that are crucial for maintaining populations of

aquathabitfocusFedermaintwith ConsSHP enhanGamegoingdevelproje Persofrom GameLandadditOne pdevotvacanimpo Perfoapplifile a
StoryOne oinstrethe isegmthat awere
tic wildlife at related cos on those thral LIP fundtain and/or cutthroat tr
ervation Initpriority hab
nce internal e and Fish g major foculoping addi
ects.
onnel will cthe Wyomi
e License Cdowner Incenion, the Deppossible appted to fish pnt aquatic rtant habitat
ormance Mcations for i
at least three
y behind theof the primaeam flow wainterrelation
ments. This are filed wit
filed. The
# of
App
licat
ions
File
d
for the presonservation hat deal withding, Departm
improve harout waters tiative progrbitat area necoordinationDepartmentus. Last, buitional partn
ontinue to dng Wildlife
Coalition, Untive Programpartment conproach woulpassage. Stafhabitat biolt projects.
Measure #4:instream flowinstream flo
e performanary responsibater rights. Tship betweemeasure sh
th the State e lack of fili
0
1
2
3
4
5
FY 05
sent and futactions from
h aspen, wetment person
abitats for spand prairie
ram in westeeeds too andn and commt habitat maut not least,nerships an
develop largand Natural
U.S. Fish anms, and the ntinues to ind be to partiffing the aqulogist positi
: Water Mw water righ
ow water righ
nce: bilities of WThe applicaten physicalows the numEngineers Oing activity
5 FY 06
67
ture. The Dm the State tland, ripariannel are initipecies of gre stream syern Wyomind will contin
munication ananagement a, we will cond expand
ge-scale prol Resource Tnd Wildlife Wyoming C
nvestigate waially fund anuatic habitations will b
Managementhts filed (Pehts applicati
Water Managetions are thel habitat anmber of instOffice. In F
was a cons
FY 07
Department Wildlife Ac
an and streamating agreemreatest consystems. Th
ng will addrenue to be a nd efficient dand enhanceontinue to fo
collaborativ
oposals and Trust, and W
Service StaConservationays to increan additional t section’s fbe crucial f
t/Instream Fersonnel in thons per year
ement is thee culminationnd hydrologtream flow
FY 09, no insequence of
FY 08
continues tction Plans,m, habitats. ments with lervation neehe Wyominess many of
major focudelivery of t
ement prograocus on maive habitat
applicationsWyoming Goate Wildlifen Landscapease engineerNRCS engi
fish passage for implem
Flow – Thehis programr).
filing of apn of many ygy of indivwater rights
nstream flowf the need to
FY 09
to implemen with speciaFinally, witandowners ted associate
ng Landscapthe identifies. Efforts tthe Wyominam is an onintaining anmanagemen
s for fundinovernor’s Bie Grants ane Initiative. Iring capacityineer positioprogram an
menting man
e number om will work t
pplications foyears studyinvidual streams application
w water righto address th
nt al th to ed pe ed to ng n-nd nt
ng ig nd In y. on nd ny
of to
or ng m ns ts
he

68
backlog of field studies that had developed during the transition of personnel over the past two years. Data analyses, detailed reports and instream flow application materials for nine new instream flow segments were completed by late summer 2009 and will be followed by at least two more filings in mid-winter 2010. What we propose to improve performance in the next two years: • Continue to work closely with regional personnel in all Divisions and assist them
with their water right and management decisions to make certain the water use maintains and protects the water rights and overall property rights of the Game and Fish Commission.
• Public awareness of instream flow and water management issues is lacking; we will continue to provide information regarding the benefits of instream flows to the general public and private landowners via articles and presentations. Section personnel were involved in department efforts to improve messaging via the department’s web site. Efforts will be made to improve the section’s web page to help visitors to the site better understand the accomplishments and challenges faced by this section.
• The instream flow biologist position has been filled and training will continue to improve the performance of the person in that position.
Program: Habitat and Access Management Division: Services Mission: Manage and protect Commission property rights for the benefit of the Commission, Department and people of Wyoming. Wildlife Habitat Management and Public Access Areas are managed in a cost-effective and efficient manner while technical knowledge and habitat development services are provided to the Department.
Program Facts: The Habitat and Access Management program manages and administers Wildlife Habitat Management Areas and Public Access Areas for the Wyoming Game and Fish Department. In addition, the branch will complete project requests for other divisions within any single fiscal year. Listed below are the number of staff and 2009 (FY 09) budget: Sub-program # FTEs* 2009 Annual Budget
Habitat and Access Management 25.0 $ 3,030,605 * Includes permanent, contract and temporary positions authorized in FY 09 budget. Any positions added during the budget cycle require Wyoming Game and Fish Commission authorization or must be funded from supplemental grants. The program is located statewide with personnel in Jackson, Pinedale, Cody, Lovell, Sheridan, Laramie, Yoder, Lander, Dubois and Casper.

Prim• O
Cpimpuonco
• Orithre
• PwDw
• Ose
Perfoprogr
StoryThe pManaPAAdevelyear adminachie
mary FunctioOn behalf ofCommission
eople of Wmproving wublic by pron Wildlife Honservation
On behalf oights for thhrough proviesource on P
Provide techworking on Department’swithin the staOperate in aector contrac
ormance Mram will wor
y behind theprogram is ragement Ares are managloped for eain an attempnistering and
eved is cons
0
20
40
60
80
100
% A
chie
ved
ons of the Hf the Wyomproperty r
Wyoming bywildlife habitoviding for sHabitat Manand public r
of the Comhe benefit oiding for saf
Public Acceshnical know
project res Strategic Hate. a cost-effeccts and traine
Measure #1: rk to achieve
e performanresponsible eas (WHMAged accordi
ach individupt to addressd managing idered to be
0
0
0
0
0
0
FY 05
Habitat and ming Game arights for thy facilitatingtat on Wildlsafe and reasagement Arrecreation onmission, wef the Commfe and reasonss Areas. wledge and equests, whHabitat Plan
ctive and efed Departme
Percent of e at least 85%
nce: for administ
As) and 184 Ping to the Mal area. Ths major anticthe WHMA
e excellent b
FY 06
69
Access Manand Fish Co
he benefit ofg wildlife colife Habitat sonable publeas while mn those landse manage amission, Denable public
developmehich, consen and increa
fficient manent crews.
work plan e% of their w
tering and mPublic AcceManaged Lahe work plancipated need
As and PAAsbecause the
FY 07
nagement Pommission, f the Commonservation Managemen
lic recreationmaintaining as. and protectpartment a
c access and
ent serviceserve wildlifase public r
nner throug
elements achwork plan elem
managing 36ess Areas (PAand and Acns are develds and requirs. The percemajority of
FY 08
Program: we manage
mission, Depthrough co
nt Areas. Wn of the wilda balance bet
t Commissiand people
recreation o
to the Depfe habitat recreational
gh the balan
hieved (Persments).
6 unique WiAAs). The Wccess Summoped prior trements of thent of work pf priorities a
FY 09
e and protecartment annserving anWe serve thdlife resourctween habita
ion propertof Wyomin
of the wildlif
partment bthrough thopportunitie
nce of privat
sonnel in thi
ldlife HabitaWHMAs an
mary (MLASto each fiscahe MLAS foplan elementand necessar
ct nd nd he ce at
ty ng fe
by he es
te
is
at nd S) al or ts ry

servicconsireasofirst iNumplan icancethe laworkproduperso Wha• C
st• C
emwadpr
• CTb
• Inm
Perfoprogr
StoryThe progrcompthey
ces (86 peristent for theons that a higis the prograerous higheris completedeled or delayast three yeak plan elemeuctivity due onnel.
at we proposConcentrate otability, integ
Complete themployees w
will provide tddition, the reparation.
Continue effoThe program
est possible ncrease com
meetings to c
ormance Meram will wor
y behind theHabitat andrams within pleted yearlyare broken
50
60
70
80
90
100
% R
eque
sts
Com
plet
ed
rcent) are bee last five ygher percentam addresser priority Ded, and therefyed. Finally
ars. This hasents becauseto extensive
se to improvon hiring angrity and sere procedure
with their jobtask guidancmanuals wiThe procedu
forts to workm must stay f
wildlife habmmunication clarify operat
easure #2: rk to comple
e performand Access pro
the Departmy. In order to
into three c
FY 05 F
eing providyears and 20tage of works Departmenepartment prfore some eley the progras impacted the of open pe training re
ve performand promotinrvices providmanuals, w
b responsibilce through dill contain a ure manuals k on Departflexible to c
bitat and recrefforts withtional priorit
Percent of pete at least 95
nce: ogram is re
ment. On avo track, schecategories: i
FY 06 FY
70
ded. As illu009 was no k plan elemnt priorities rojects (projements initia
am has had he ability of positions, loequirements,
ance in the nng quality pded by the pr
which were ilities, duties
detailed desccalendar ofshould be co
tment prioricontinue to reational opp
h Division adties.
project reque5% of reque
equested to verage, 125 (edule and cominformal, m
07 FY 08
ustrated aboexception. ents are notforemost an
ject requestsally plannedsubstantial t
f all programost time to , and a steep
next two yeersonnel to rogram. nitiated in 2
s and tasks. criptions of tf deadlines tompleted byties and notprovide the portunities pdministration
ests completeested projects
assist or pr(95 percent)mplete the r
moderate and
8 FY 09
ove, this haHowever, t
achieved annd not progrs) develop ad within the wturnover of
m personnel trecruiting ep learning c
ars: help with t
2005 to guid The proced
techniques ato facilitate
y May of 201t just prograpeople of W
possible. n by schedul
ed (Personnes).
rovide servic of these reqequests (pro
d major proj
% infor
% mod
% majo
s been fairlthere are twnnually. Tham prioritie
after the worwork plan aremployees ito accomplisefforts, lowecurve for new
the long-term
de, and assisdure manual
and duties. Iplanning an
10. am prioritieWyoming th
ling quarterl
el in this
ces for othequests will boject requestsject request
rmal completed
erate completed
or completed
ly wo he s. rk re in sh er w
m
st ls In nd
s. he
ly
er be s) s.

71
Informal requests take less than two employee days to complete, moderate project requests will take up to ten employee days to complete and major projects are projects which require more than ten employee days. The vast majorities of requests are major and address the Department’s Strategic Habitat Plan. The project requests are for assistance or services that only this program can provide within the Department. Project requests vary from large-scale habitat manipulation projects, such as aspen and sagebrush treatments, to minor heavy equipment work on a hatchery. The percent of project requests completed has been fairly consistent and considered “very good” within the constraints of manpower and budget capacity. The percent of project requests completed has been consistent between 2002 and 2009 with an average of 91.5 percent of all informal, 96.5 percent of moderate and 93.8 percent of all major projects requests being completed. Results for 2009 varied minimally from this average with 94 percent of informal, 96 percent of moderate and 98 percent of major project requests being completed within the year. However, there are three reasons that a higher percentage of project requests are not completed. The first is the program addresses Department priorities foremost and not individual program priorities. It is extremely important for the program to stay flexible in order to accommodate Department priority projects that may develop after the initial project requests are scheduled. Second, in order to accommodate as many project requests as possible, schedules are developed utilizing 100 percent of all possible personnel time. If a project request is delayed, canceled or changed by the requestor, it affects the percent of project requests completed. The final reason is personnel turnover. The program has had substantial turnover of employees in the last three years. This has resulted in impacting all program personnel’s ability to complete projects because of open positions, lost time to recruiting efforts, lower productivity due to extensive training requirements and a steep learning curve for new personnel. What we propose to improve performance in the next two years: • Concentrate on hiring and promoting quality personnel to help with the long-term
stability, integrity and services provided by the program. • Continue to work closely with terrestrial and aquatic habitat sections to receive more
complete information for project requests so that the percentage delayed, canceled or changed by the requestor is decreased.
• Continue efforts to work on Department priorities and not just program priorities. The program must stay flexible to continue to provide the people of Wyoming the best possible wildlife habitat and recreational opportunities possible.
• Complete the procedure manuals, which were initiated in 2005 to guide, and assist employees with their job responsibilities, duties and tasks. The procedure manuals will provide task guidance through detailed descriptions of techniques and duties. In addition, the manuals will contain a calendar of deadlines to facilitate planning and preparation. The procedure manuals should be completed by May of 2010.
• Increase communication efforts with Division administration by scheduling quarterly meetings to clarify operational priorities.

Perfothe mand Psatisf
StoryAnnuThe s14 Dservictheir annualicensthe pe The mthe ewithithat wis 83receivmaintWHM09. I86.1 pare bemplnot ashoulwith state,Depa
% S
atis
fied
ormance Memanagement Public Accesfaction of at
y behind theually, the Intsurvey provi
Department pces to the exinternal cli
ally to randoses the previerformance
majority of Wfforts of the
in the state. were satisfie percent. Aved slowly taining facil
MAs and PAInternal satipercent), and
believed to oyees about
always underld be better numerous st
, the majoriartment or b
0
20
40
60
80
100
FY
easure #3: and mainten
ss Areas (Perleast 75% an
e performanternal Clientides the oppoprograms. Ixternal clientients. Similaomly selecteious year. Tof selected D
Wyoming ree DepartmenThe averag
d with the mAverage per
increasing lities such a
AAs – with a isfaction wad then in FYbe a result the program
rstand manacommunica
tate and fedity of publiby another a
Y 05 FY
Percent of pnance of facirsonnel in thnd an extern
nce: t Satisfactionortunity for eIn many rests depends oarly, the Exed members The survey pDepartment p
esidents, nonnt on provid
ge percentagemaintenance rcent of satimarks amon
as roads, resstarting poin
as slowly imY 09 dipped t
of an incrm. Howeveragement objeated to the peral agenciec is confusagency. A
Y 06 FY
72
public and Dilities on Wihis program wnal satisfactio
n survey is employees tospects, the aon the abilityxternal Clienof the publirovides the oprograms.
n-residents anding opportue of Departmof facilities sfied publicng the publstrooms, parnt of 65.5 pe
mproving froto 81.1 perc
reased effortr, the generalectives on Wpublic and wes providing ed as to whigh turnov
Y 07 FY
epartment emldlife Habitawill work toon rate of at
distributed to measure th
ability of they of employent Satisfactic who purchopportunity
nd Departmunities to acment employon Departm
c is 68.6 perlic for its erking areas, ercent in FYm FY 05 toent. The impt to commul public or D
WHMAs or within the Drecreational
whether the ver rate with
Y 08 FY
mployees saat Managemo achieve an
least 65%).
to Departmehe overall pee Departmenees to satisfyion survey ihased huntinfor the publ
ent employeccess huntingyees in the l
ment land andrcent. The
efforts on msigns and f
Y 05 to 73.3 po FY 08 (78proved markunicate withDepartment ePAAs. Tho
Department. l opportunitiarea is manhin the pers
Y 09
atisfied with ment Areas
internal
ent personneerformance ont to providy the needs ois distribute
ng and fishinlic to measur
ees appreciatg and fishinast five year
d access areaprogram ha
managing anfences on thpercent in FY8.6 percent tks up to FY0h Departmenemployees dose objective
In additionies across thnaged by thsonnel of th
% SatisfieInternal
% SatisfieExternal
el. of de of ed ng re
te ng rs as as nd he Y to 08 nt do es n, he he he
ed
ed

branchire a Wha• W
eaDorE
• AththDfrdef
• Cst
• Cemwadpr
DataWhilthe pmethinves Perfo(Pers80%)
ch also affecand train mo
at we proposWith the comach area w
Department pr PAA. Th
Education ProAn increasedhrough signihe state. In
Department’srom other aristribution offort in Octo
Concentrate otability, integ
Complete themployees w
will provide tddition, the reparation.
a developmee the public
public is comod to surve
stigated and h
ormance Meonnel in this).
% E
mpl
oyee
s Sa
tisfie
d
cts the overaode for the la
se to improvmpletion of
will be bettepersonnel anhis will be dogram.
d effort will ing and map
addition, a s Informatioreas manage
of the first sober of 2011on hiring angrity and sere procedure
with their jobtask guidancmanuals wiThe procedu
ent agenda: c survey prommenting oey only thehopefully im
easure #4: s program w
0
20
40
60
80
100
FY
all condition ast several ye
ve performathe Manage
er defined. nd the publicdone in coop
be made tos. Area entrdistinctive
n and Educed by differsigns compl. nd promotinrvices providmanuals, w
b responsibilce through dill contain a ure manuals
ovides valuabon areas, whe public thamplemented
Percent of ewill work to a
Y 05 FY 06
73
of the areasears.
ance in the ned Land Ac An effor
c on the manperation with
o better defirances and slook will beation Prograrent agencieeted in July
ng quality pded by the pr
which were ilities, duties
detailed desccalendar ofshould be co
ble informathich are noat actually uin 2010.
employees saachieve an em
6 FY 07
s. The branc
next two yeccess Summrt will be inagement obh the Depar
ine Departmsigns will bee developedam to differes. This effy of 2009 an
ersonnel to rogram. nitiated in 2
s and tasks. criptions of tf deadlines tompleted by
tion, there ist managed utilizes Dep
atisfied with mployee sati
FY 08 FY
ch has been
ars: mary, the ma
implementedbjectives of ertment’s Info
ment WHMAe standardized in conjuncentiate Depa
fort is on gond the comp
help with t
2005 to guid The proced
techniques ato facilitate
y May of 201
s a high proby the Dep
partment are
the servicesisfaction rate
Y 09
in a constan
anagement od to educateach WHMA
formation an
As and PAAed throughouction with thartment areaoing with thpletion of th
the long-term
de, and assisdure manual
and duties. Iplanning an
10.
obability thapartment. Aeas is being
s provided e of at least
nt
of te A
nd
As ut he as he he
m
st ls In nd
at A g

74
Story behind the performance: Annually, the Internal Client Satisfaction survey is distributed to Department personnel. The survey provides the opportunity for employees to measure the overall performance of 14 Department programs. In many respects, the ability of the Department to provide services to the external clients depends on the ability of employees to satisfy the needs of their internal clients. The program prides itself on addressing Department priorities, while striving to provide the best service to the wildlife resource, public and the Department. The program could easily be inundated by working on only the assigned duties (management and maintenance of WHMAs and PAAs) but feels that it should be flexible and constantly striving to address Department priorities. The program accomplishes this by providing technical knowledge and development services to the rest of the Department through project requests. The majority of assistance is for habitat development projects that address the Strategic Habitat Plan. Only 15 percent of the program’s efforts are project requests and this performance measure relates to that 15 percent. There are problems in that some project requests are poorly designed, delayed or canceled by the requestor. It has been extremely difficult to address additional project requests with the personnel turnover that has been associated with this program. Both of these conditions directly relates to the satisfaction of the program by other Department personnel. The overall average of Department personnel satisfied with the program’s services in the last five years is 89 percent. In FY 09, 90.4 percent of Department personnel were satisfied. What we propose to improve performance in the next two years: • Concentrate on hiring and promoting quality personnel to help with the long-term
stability, integrity and services provided by the program. • Complete the procedure manuals, which were initiated in 2005 to guide, and assist
employees with their job responsibilities, duties and tasks. The procedure manuals will provide task guidance through detailed descriptions of techniques and duties. In addition, the manuals will contain a calendar of deadlines to facilitate planning and preparation. The procedure manuals should be completed by May of 2010.
• Continue to work closely with terrestrial and aquatic habitat sections to receive more complete information for project requests so that the percentage delayed, canceled or changed by the requestor is decreased.
• Continue efforts to work on Department priorities and not just program priorities. The program must remain flexible to continue to provide the public the best possible wildlife habitat and recreational opportunities possible.
• Educate Department employees on program priorities and limitations through presentations and discussions at FY 10 and FY 11 Wildlife, Fish and Services Supervisors meeting and at the region Coordination Team meetings.
Data development agenda: While the percent satisfaction is important data, future internal survey will be modified to be more specific to employee satisfaction of the handling and completion of project requests. Therefore, the future data should relate to project requests.

75
Program: Habitat Protection Division: Office of the Director Mission: Coordinate reviews and evaluations of land use plans and projects within our agency and with other agencies, and develop and negotiate planning and mitigation strategies. Program Facts: The Habitat Protection program is made up of one major sub-program, listed below with number of staff and 2009 (FY 09) budget: Sub-program # FTEs 2009 Annual Budget
Habitat Protection program 7.0 $ 577,150 This program is located in the Department Headquarters Office in Cheyenne. Primary Functions of the Habitat Protection program: • Coordinate Department review and evaluation of land use plans, projects, policies,
and activities that affect fish, wildlife, and their habitats, and make recommendations consistent with Department and Commission policies, position statements, and habitat protection strategies.
• Develop and negotiate planning and mitigation strategies regarding energy development.
• Participate and monitor federal and state agency land management plans. Performance Measure #1: Performance Appraisals
Story behind the performance:
0
20
40
60
80
100
FY 05 FY 06 FY 07 FY 08 FY 09
% M
eets
or
Exc
eeds
E
xpec
tatio
ns

76
The Department is responsible for conserving over 800 species of fish and wildlife for the benefit of the citizens of Wyoming. Most of the management focus for maintaining viable populations of these species depends on availability of suitable habitat. The Department actively manages only a very small percentage of that habitat, and thus a large part of our responsibility toward maintaining and supporting our citizens’ fish and wildlife resource entails advising the land use actions of other parties so that negative impacts on species and habitats can be avoided, minimized, or mitigated, and positive effects are supported and enhanced. Review and evaluation of land use actions, active liaison with other parties that have authorities and roles in those actions, formulation of strategies to minimize negative impacts, and active negotiation to assure implementation of those strategies are key action items of the Department. Support of these functions by the Office of the Director is necessary for their successful implementation, and performance appraisals of program personnel are the key Department measure of the success of the program. The performance appraisals include items that the Office of the Director uses to describe and reflect program effectiveness with other agencies, based on their awareness of our relationship and positive communication with those agencies. These include performance standards #1 (policies, procedures, and planning), #3 (teamwork), #5 (quantity), #7 (communication), and #11 (program organization and output). An average rating of “meets expectations” or “exceeds expectations” for the three professional positions within Habitat Protection Program will indicate satisfactory performance in addressing the primary functions of the program. Since FY 05, the three professional positions have consistently had a score of 100 percent, indicating that all categories met or exceeded expectations. What we propose to maintain performance in the next two years: • As new federal land development decisions are made Habitat Protection continues to
monitor and provide adaptive recommendations to agencies as cooperators. Additional training in teamwork, communication negotiation and problem solving will be required. Additional personnel may be necessary to adequately evaluate the numerous energy-related plans that will be prepared in the near future, provide meaningful input to lead agencies, and formulate and negotiate development plans that minimize impacts to fish and wildlife.
Data development agenda: The Office of the Director’s evaluation of the effectiveness of the program’s input into land use actions through the use of performance standards in performance appraisals is necessarily qualitative, as the influence of our input on eventual management decisions is very difficult to quantify. However, the need does exist for a more definitive feedback on the value and effectiveness of our input to other parties in influencing land use decisions regarding fish and wildlife habitat. This would allow the Department to focus on and provide the most effective input.

77
0
20
40
60
80
FY05 FY06 FY07 FY08 FY09
Performance Measure #2: Percent of employees satisfied with program’s process to make assignments, obtain comments and recommendations, and provide feedback/assistance
Story behind the performance: The ability to adequately conserve fish and wildlife for the citizens of Wyoming requires input on many land use actions from a number of Department personnel throughout the state. The process of effectively and efficiently disseminating information about land use actions, gathering and collating input, and providing Department recommendations regarding the fish and wildlife resources requires a streamlined and effective system of communication among Department personnel. The effectiveness of this system is best determined by the people who work with it. Thus, the Department’s Internal Client Satisfaction survey is used as a measure of that effectiveness. Distributed annually to Department personnel, the internal survey provides the opportunity for employees to measure the overall performance of 14 Department programs. Specific to the Habitat Protection program, the question “How satisfied were you with the process that the Habitat Protection program staff uses to make assignments, obtain comments and recommendations, and provide feedback/assistance?” is a direct measure of the satisfaction and workability of program process within the Department. In FY 09, 30 percent of Department employees had interacted with the Habitat Protection program and responded to the question. Seventy-six percent were satisfied with program’s process, 14 percent were neutral, 10 percent were somewhat dissatisfied. Since FY 05, an average of 64 percent of Department employees that had interacted with the Habitat Protection program and responded to the question were satisfied with the program’s process to make assignments, obtain comments and recommendations, and provide feedback/assistance. Among all five years, the percentage was lowest in FY 07. The reason for this decline in employee satisfaction was likely due to additional work loads associated with the federal planning process, especially the federal energy planning process. Because of employee input not previously required prior to the current energy boom, additional work has been delegated to Department personnel, many of who are already taxed in their duties. What we propose to improve performance in the next two years:

78
• Continue using the internal survey to gauge the level of satisfaction among Department personnel with our current process of providing input into land use actions.
• Encourage additional comments from field personnel and staff in the internal survey to improve feedback and effectiveness of the internal survey information.
• Meet with the Coordinators and Supervisors during statewide meetings to receive feedback on improvement issues.
• Improve the Decision Support Services infrastructure. Program: Information Division: Services Mission: Disseminate information to promote public understanding and support for wildlife, wildlife habitat, wildlife conservation and the Department’s management programs. Program Facts: The Information program is made up of two major sub-programs, listed below with number of staff and 2009 (FY 09) budget: Sub-programs #FTEs* 2009 Annual Budget
Information 4.0 $ 118,843 Publications 5.0 450,632
TOTAL 9.0 $ 569,475
* Includes permanent positions authorized in FY 09 budget. Any positions added during the budget cycle require Wyoming Game and Fish Commission authorization or must be funded from supplemental grants. The Information program includes the following sub-programs: Information and Publications. This program is located in the Department Headquarters Office in Cheyenne. Primary Functions of the Information Program: • Disseminate information to promote public understanding and support for
wildlife, wildlife habitat, and wildlife conservation through audio, video, print and other media, and personal contact with constituents. These efforts to provide wildlife-related information facilitate the development of informed support for Department programs.
• Encourage involvement and cooperation of the Department’s management programs through proactive outreach strategies, including three external publications that encourage interest in wildlife and wildlife habitat and provide information on current Department management practices. These publications, provided consistently

thD
• Sth
Perfoannouprodu
StoryThe newsprogrthe Dthe pr WeekcableannouDepaWeb approexpos Print list anWyomstatioDepa
hroughout tDepartment p
erve peoplehe news med
ormance Muncements auce at least 3
y behind theInformation. The weram. Radio
Department Wrogram, reac
kly televisioe stations, reuncements a
artment's telesite, signifi
opriate, the vsure to this e
news releasnd traditionaming house
ons and paartment’s We
# of
New
s/Pu
blic
Ser
vice
A
nnou
ncem
ents
Pro
duce
d
he fiscal yprograms. e by providindia.
Measure #1:and print new300 news rel
e performan program pekly radio stories are p
Web site. Cuching an aud
on news progaching an auair on approevision newicantly increvideo news sexpanding ar
se packets aral mail to eaholds. The
articipating eb site.
050
100150200250300350400450500
20
year, facilita
ng wildlife,
Number ws releases pleases and pu
nce: produces and
program inproduced in durrently, appdience of mo
grams air onudience of mximately nin
ws features aeasing the restories are crrea.
re prepared aach of Wyome packet is license ven
004 2005
79
ate the dev
hunting and
of radio neproduced (Peublic service
d distributesncludes a 1digital formaproximately ore than 100,
n two Wyommore than 15ne Wyomingand radio sheach and auross-referenc
and distributming’s 43 loc
also distribndors. Th
5 2006
Calendar Yea
velopment o
d fishing rel
ews, televisiersonnel in te announcem
s weekly pr0-minute, 3at and are av17 radio stat
,000 each we
ming and on50,000 weekg and two o
hows are posudience thesced with prin
ted weekly vcal newspaputed to the
he packet c
2007
ar
of informed
ated informa
ion news, pthis program
ments per yea
rint, radio a3-minute anvailable for dtions aroundeek.
ne Nebraska kly. Video pout-of-state ssted on the se news sount news stori
via an e-maiers, represenAssociated
can be vie
2008
support fo
ation throug
public servicm will work tar).
and televisiond 30-secondownload vid the state us
network anpublic servicstations. Thdepartment’
urces. Wheries, providin
il distributionting 175,00
d Press, radiewed on th
or
gh
ce to
on nd ia se
nd ce he ’s re ng
on 00 io he

80
The average information dissemination for the last five years is 407 individual print, radio or television news releases or public service announcements distributed. In 2008, the number of news and public service announcements distributed was 488. This number is just slightly higher than the 477 distributed in 2007. The number of news releases distributed fluctuates depending on the issues and challenges the Department faces each year. The slight increase in 2008 is likely due to an expanded topic base and an improved work planning process implemented through the Department's annual information and education strategic planning sessions. While the Information work unit distributes a great deal of the Department’s news and information, it is not the only work unit or division developing news. One challenge is to coordinate our public outreach efforts with other work units within the Department to ensure the Department maintains a consistent position on issues and covers all issues efficiently. One significant change during 2008 involved reassigning some duties and responsibilities within these work units. Some staff that were devoted to news release writing and media relations were reassigned to devote more time to publications, which struggles under a very heavy workload. Some of the key issues and events addressed through news, radio and television stories in FY 09 included the delisting and subsequent relisting of wolves in the northern Rocky Mountains, news about the launch of the Department’s new Electronic Licensing Service, Department activities related to brucellosis and CWD management, reminders about application deadlines and regulation changes, and promotion of the Hunting and Fishing Heritage Expo and other Department activities. What we propose to improve performance in the next two years: • Continue efforts in strategic media planning to identify the most efficient use of staff,
resources and medium to disseminate information to the external public. • Expand web-based video distribution. This is a cost-effective way to increase the
reach of our video news programs and feature videos. Investigate alternative distribution methods, such as podcasting, and secure funding for marketing to make more customers aware of these new features.
• Continue to monitor workloads and adjust duties and responsibilities as necessary to ensure efficient use of resources.
• Redesign the Department Web site, which should help improve information distribution and customer service.

PerfoWyomactive
StoryThe magatabloand daveraaware Wyomenthuwith Gamealso t Wyomenthulengthdepth Thesetheir commpubli The ayearsBecau
ormance Mming Wildlife subscriptio
y behind thePublications
azine a monid newspapedistribution age of 4,800 eness of Dep
ming Wildlifusiasts. Thesections on e and Fish othrough subs
ming Wildliusiasts who hier feature
h analysis of
e two publicown cost.
municated toication produ
average paids is 35,976 puse of a lac
3
3
3
3
3
3
3
3
3
Ann
ual A
vera
ge P
aid
Subs
crip
tions
Measure #2:fe News (Perons to these t
e performans sub-prograthly, 4-colorer. Averageof the Newsubscribers
partmental a
fe News’s tae focus of thfish and wiloffices, licenscriptions.
ife magazinmay or maarticles than
f wildlife spe
cations are th. New subo as large anuction.
d subscriptioper year. Subck of fundin
30,000
31,000
32,000
33,000
34,000
35,000
36,000
37,000
38,000
2
: Paid subrsonnel in thtwo publicat
nce: am producer publication monthly rea
ws is approx. Both publi
and wildlife n
arget audienhe News is hldlife managnse selling a
ne’s target ay not be acn the News oecies, habitat
he only Depabscribers ennd as wide a
ons for bothbscriptions f
ng, no resear
2003 20
81
bscriptions ohis program wtions).
es two regun; and Wyomadership for
ximately 30,0cations are tnews and iss
nce is sportshunting, fish
gement. Theagents and o
audience ctive hunter
or our weeklyt or issues.
artment publnsure the Dbase as pos
h the Newsfor 2008 werch has been
004 200Calenda
of Wyomingwill work to
ular publicatming Wildlifr the magazin000 per issutools used bysues.
smen and whing and trape News is disother vendo
is largely rs or anglery news relea
lic relations Department’ssible and m
and the maere slightly an conducted
05 2006ar Year
g Wildlife mo maintain at
tions: Wyomfe News, a sne was moreue, includiny the Depart
women and opping informstributed freeors across W
wildlife ads. The ma
ases to provi
tools that de’s message
maximize the
gazine overabove averaon subscrip
6 2007
magazine ant least 35,00
ming Wildlifsemi-monthle than 31,00g a per-issutment to rais
other outdoomation, alone of charge a
Wyoming, an
dvocates angazine offeride a more in
efray much os are beinefficiency o
r the last fivage at 36,983ption renewa
nd 00
fe ly 00 ue se
or ng at
nd
nd rs n-
of ng of
ve 3. al

82
rates or potential subscriber interest, making it difficult to pinpoint the reasons for varied subscription rates from year to year. The Publications work unit relies on some freelance articles and photographs for the Wyoming Wildlife magazine and Wyoming Wildlife News, resulting in increased costs related to purchasing articles and photos, and an out-of-date photo file. Additionally, there is a need for additional funds for a survey tool to understand readers’ desires and opinions, and marketing funds to increase circulation. What we propose to improve performance in the next two years: • Create and maintain a web presence for both publications. A web presence would
further increase visibility of the magazine and expand the potential subscriber base. The Department's Web site remains a cost-effective marketing tool to increase readership and subscribers.
• Cross-promote all publications and outreach efforts to increase visibility and expand potential subscriber base. Articles, photographs and teasers for both publications will appear in the e-newsletter. Wherever possible, print and radio news releases should include mention of Wyoming Wildlife magazine and Wyoming Wildlife News.
• Given adequate funding, implement a readership survey to assess current subscriber satisfaction and demographics of both Wyoming Wildlife magazine and Wyoming Wildlife News. This will provide the Department with baseline data on our readership and give hard data to determine how adjusting the focus, content, delivery or price of either publication will affect current readership.
Appendix A. New proposed performance measures:
• With the creation of the e-newsletter, the Department has an additional information tool to disseminate information. Subscription rates for the e-newsletter are easily tracked, and should serve as a future outcome measure for the Information sub-program.
Program: Information Technology Division: Services Mission: Provide high quality, secure technology solutions, services and support to the Wyoming Game and Fish Department and external constituents to allow for sound fiscal and management decisions. Program Facts: The Information Technology program is made up of one major sub-program, listed below with number of staff and 2009 (FY 09) budget: Sub-program # FTEs* 2009 Annual Budget
Information Technology 19.0 $ 2,858,675

83
* Includes permanent, contract and temporary positions authorized in FY 09 budget. Any positions added during the budget cycle require Wyoming Game and Fish Commission authorization or must be funded from supplemental grants. Payroll for three FTEs and one AWEC position was funded in FY 08 out of the Electronic License Service budget. Funding for these positions was transferred to the IT budget in FY 09. Payroll for the AWEC GIS Analyst position was funded in FY 08 with SWG monies. Funding for this position was transferred to the 601A CWCS 09-10 General Fund budget and the position remains as a GIS support position within the GIS Section of the Information Technology program. The Information Technology sub-program was previously referred to as the Management Information Services sub-program. The current program is made up of administration and three sections: Application Development, Operations and Support, and Geographic Information Systems. This program is located in the Department Headquarters Office in Cheyenne. Primary Functions of the Information Technology Program: • Provide high quality, secure technology solutions to the Department that support
the overall mission and empower personnel to achieve completion of their workload through the use of technology in a successful, efficient, timely and cost effective manner.
• Provide services and support to ensure data integrity and security. • Provide support to external constituents by providing and supporting an Internet
hardware and software framework to facilitate better Department communication with our constituents and to provide a means for dynamic interaction between the Department and the general public.
• Facilitate sound fiscal decisions by evaluating technology to identify the best solution to a given problem, challenge, or situation and leverage Information Technology network architecture, hardware and software to identify opportunities for cost savings.
• Facilitate sound management decisions by developing and maintaining Department data standards and applications to support Department-wide centralization of data; identifying and developing technical options for resolving application or system problems; researching new technology and making recommendations on the adoption of new methods or the acquisition of new technical hardware and software tools to improve agency operations; and monitoring emerging technologies to effectively evaluate opportunities to improve current agency operations by incorporating or migrating to viable new hardware, software, and technology implementations.

Perfo(Perscourtand tiservic
ormance Monnel in this
teously and pimeliness ofces provided
%Em
ploy
ees
Satis
fied
% E
mpl
oyee
s Sa
tisfie
d
Measure #1:s program wprofessionalf services, and).
Level
Level
0
20
40
60
80
100
F
% E
mpl
oyee
s Sa
tisfie
d
0
20
40
60
80
100
FY
: Percent will work to e
ly, at least 7nd at least 75
of courteous
of attention
FY 05 FY 0
Y 05 FY 06
84
of employeensure that a75% of empl5% of emplo
sness and pro
and timeline
6 FY 07
6 FY 07
ees satisfiedat least 85% loyees are saoyees are sat
ofessionalism
ess:
FY 08 F
FY 08 F
d with IT/Gof employe
atisfied withtisfied with
m:
FY 09
FY 09
GIS programees are treateh the attentiothe quality o
m ed on of

StorySinceelectrinformOrigiDepaand cvarietemploperaevery In 19combBrancof labinto tIT/GIApplsubsepersolocatidevicWyomapproalso rangi To mmaint
y behind thee the mid-1ronic informmation bothinally, speciartment persocomputerizety of tasks oyees. As tations, a broy level of the
996, the Gbined with Ich. Then in bor, and stattwo distinct IS Branch isication Devections are onal computeions throughces located ming; develoximately 70responsible
ing from prin
make effecttain a thorou
%Em
ploy
ees
Satis
fied
Quality
e performan1970s, the mation systeh among eific computeonnel wrote d equipmen
that can bthis capacityoad array ofe Departmen
Geographic IInformation early 2004,
tewide IT Gsubsectionss now made
velopment, responsible ers located ihout Wyomat Departm
loping and s0 layers of st
for procurenters to digit
tive technough understa
0
20
40
60
80
100
FY
% E
mpl
oyee
s Sa
tisfie
d
y of services
nce: Department
ems and neemployees aer expertise their own co
nt have beenbe performey has grownf responsibi
nt’s hierarchy
Information Technologydue to the inovernance in with a sepa
e up of threeand GIS), for managi
in the headqming, and 2ment offices supporting 6tatewide GISement and stal cameras,
logy strateganding of the
Y 05 FY 06
85
s:
t has utilizetworks to and betweewas not ne
omputer appn used to exed by indiv
n and permeailities has dy.
Systems (y (IT) to foncreased wonitiatives, tharate supervie separate sin addition ing 30 phys
quarters offic30 Internet and license
64 mission cS data and asupport of GPS units a
gy recomme Departmen
6 FY 07
ed both cofacilitate thn employeecessary and
plications. Sxpand and evidual emplated every feveloped th
(GIS) Sectioorm what isorkload, an inhe IT portionisor over eacubsections (
to branch sical serversce, eight reg
Point-of-Sae selling agecritical applissociated GIa wide rang
and all relate
mendations, nt’s goals, ob
FY 08 F
omputers anhe efficient es and out
many technince that timenhance theoyees and/o
facet of the Dhat must be
on was orgs now calledncreasingly cn of this brach. With thi(Operations
administrats, 8 virtual
gional officesale system ent locationications; andIS applicatioge of periphd software.
IT/GIS perbjectives, an
FY 09
nd associateexchange oside entitienically savv
me, computere volume anor groups oDepartment’addressed a
ganizationalld the IT/GIclear divisio
anch was splis change, thand Supportion. Thesservers, 50
s, and remottouch scree
ns throughoud maintaininons. They arheral device
rsonnel musd methods b
ed of s.
vy rs
nd of ’s at
ly IS on lit he rt, se 00 te en ut ng re es
st by

86
which the Department’s various programs intend to reach these. Continual changes to the environment in which the applications operate (interfaces to other applications, changes to hardware, software, and operating systems; new data from users) requires a dedicated team of informed operations specialists, application developers, and GIS analysts working cooperatively to maintain and improve these systems. System and service failures can rapidly impact large numbers of customers, suppliers, and internal staff. Network outages, server failures, e-mail downtime, and broken desktop computers can significantly reduce the productivity of the entire Department. Thus, reduced or failed service of even one day can influence employee perception of the IT/GIS program, especially if this occurs during critical work periods. Conversely, when the operations team is executing effectively and achieving the most success, it is invisible since the technology is performing as employees expect. An example of this was seen in July of 2004 and July of 2005 when serving up Big Game License Draw results via our Internet Website. While systems had been running seamlessly throughout the years, they were not able to handle a significant increase in traffic generated by hunters and outfitters looking for draw results. This contributed to an overload of phone calls to the Department Telephone Information Center, resulting in unsatisfied internal and external customers. Since that time, IT personnel conducted extensive research, testing and revamping of our systems and telecommunications lines in order to make this application stable for 2006. This work, along with re-writing the License Draw Results Application using Microsoft .NET technologies, has significantly enhanced the performance of this system, resulting in significant application up time especially during critical big game license application periods. This improved customer satisfaction and has illustrated that the entire Department Internet site needs to be rewritten in the same technologies to permanently resolve this issue. In addition to this work, the Application Development Section developed a new Online License purchasing system to allow sports persons to purchase most non-carcass coupon license types via the Internet. Licenses requiring a carcass coupon are printed out of the Cheyenne headquarters facility and mailed to the sportsperson, while other license types are printed directly on the sportsperson’s home computer. Since the launch in July 2009, this system has sold over 19,000 license types, and of those sales, 82 percent have been purchased by non-residents. Many enhancements were made to the on-line Big Game License Application System, which allows sportspersons to apply for the big game license drawings via the Internet. This year we have processed 263,080 applications; of those, 72 percent were taken online. This is roughly a 12 percent gain over last year. The Application Development Section also enhanced and streamlined the Internet Point of Sale system, which services over 175 license selling agents throughout Wyoming. With these enhancements and technology upgrades, all licensing systems performed

87
strongly during our high volume days with no down time. 547,378 items have been sold through this system, resulting in $11,270,289 in revenue to date. This is a 51 percent increase in the number of items sold compared to last year. IT/GIS Branch personnel continue to face challenges with integrating and centralizing many Department computer applications, specifically related to keeping them running. This challenge came with a large number of applications originally developed by Department employees and ultimately integrated into a centralized system. Several employees still want to retain the ability to make changes to these applications, many of which have caused the applications to fail and warranted someone within IT/GIS to troubleshoot and fix the problems. Not only has this reduced customer satisfaction with applications not working, but these situations take a considerable amount of IT support time that could be put towards helping to improve customer satisfaction by developing new applications. In addition to system failures, the IT help desk and IT governance (the rules and regulations under which an IT department functions and a mechanism put in place to ensure compliance with those rules and regulations) are large drivers of internal customer satisfaction. The help desk interacts with Department personnel on a constant basis and there are few, if any other entities within the Department that regularly interact with and impact virtually every employee daily. Response time, courtesy of the representative, level of follow-up/follow-through, and resolution speed are all factors that drive customer satisfaction. Similar to service failure, a single mistake by IT/GIS personnel can impact the reputation of the entire program because of the potential actual and perceived ramifications of the error. Several other areas that affect the user base include user administration, capacity planning, disaster recovery, and security. When looking at the IT Operations Section, which houses the IT help desk, 82.9 percent of the respondents indicated satisfaction with services provided, down from 92.6 percent in the previous year. We believe several initiatives this year account for this drop in percentage. We assumed all extended-hours technical support for the Internet Point-of-Sale System, which includes 230 touch screen devices located at Department offices and license selling agent locations throughout Wyoming. This has undoubtedly impacted our ability to respond to agency requests for technical service as rapidly as was possible prior to this change. In addition, we upgraded our business suite software from Microsoft Office 2000 to Microsoft Office 2007, which created a slight to significant learning curve for various personnel throughout the Department. We also tightened network security and implemented Windows Vista as the operating system for new computers and laptops beginning this fiscal year. This was done in an effort to put the Department in compliance with State of Wyoming IT policy, to improve previous software licensing/installation issues, and to further prevent malicious code propagating throughout our systems. In removing the ability to add and remove software and

88
independently manage their machines however, we believe this has negatively impacted the overall satisfaction of several Department personnel. Regarding the IT governance aspect, during the 2002 budget session the Wyoming Legislature created a state Chief Information Officer Position and we began to see significant affects to the Department beginning in 2003. With this position came a statewide Information Technology Governance Structure, which began implementation of centralized common IT services throughout state government and included technology procurement. This process has also required a significant amount of effort and time commitment, especially for the Department IT Manager, which in turn has reduced time available to address Department specific IT issues. This, along with agency conformance to the statewide governance structure and accompanying changes in IT policy and technology procurement methods (initially driven by this initiative) has undoubtedly had a negative impact on Department employee satisfaction in quality of services in previous years. We anticipate that this will continue to require a large amount of time in order to ensure that Department interests are considered throughout the IT Governance Structure. Another factor that has affected customer satisfaction since early 2003 is an Electronic Licensing Service (ELS) we have been developing in conjunction with Fiscal Division and an outside contractor. Aside from mission critical applications, this project has been the number one priority for IT Administration and the Development and Operations Subsections within our branch. The time and effort dedicated to this project has resulted in many other Department projects being placed on hold until this work is completed and this has undoubtedly had an effect on internal customer satisfaction. While the Application Development Section has been working on various smaller projects as they are able, we have seen a slight decrease in internal customer satisfaction and believe that this is partially related to Department personnel wanting more of their applications completed. A total of 91.4 percent of the respondents indicated satisfaction with the attention and timeliness provided, compared to 94.7 percent the previous year; while 89.4 percent of the respondents indicated satisfaction with the overall services provided, down from 93.5 percent in the previous year. A similar effort driving customer satisfaction can be seen in the centralization and reduced fragmentation of GIS work throughout the Department. We are beginning to see less negative reactions towards this initiative, specifically with resistance to centralizing GIS data and applications. This may be due to individuals beginning to see value in collaboration benefits of centralized data. A GIS Working Group was created to help address agency-wide GIS consolidation and has already seen successes with recent budget approval to begin building the framework for this project. At the end of FY 08, the paperwork to officially transfer a vacant position to the GIS Section was initiated. This position will facilitate the centralization of geospatial data, advance the concept of a Department enterprise GIS program, and contribute to ongoing technical support of the program’s end-users. Due to economic downturn, this position has been frozen at this time, which will continue to delay building the framework for this project.

89
At the same time, Department-wide demand for GIS work has continued to rise significantly over the past year. Examples of these demands include assignments to the Wyoming Landscape Conservation Initiative's Data Committee (WLCI) and the Western Wildlife Habitat Council’s Western Renewable Energy Zones State Wildlife Task Group, a product of the Western Governors Association. As more efforts have been initiated to address concerns associated with species and their habitats (WLCI, sage grouse implementation recommendations, Comprehensive Wildlife Conservation Strategy revision and implementation, Strategic Habitat Plan revision, etc.), all of which base data needs, analyses and products on GIS technologies, such impacts have increased. With these additional Department priorities, our ability to address projects and activities planned at an earlier date have been delayed as priorities are reevaluated, thus customer perceptions of our service in this area have declined as predicted. Annually, the Internal Client Satisfaction survey is distributed to Department personnel. The survey provides the opportunity for employees to measure the overall performance of 14 Department programs. Since FY 05, the average percent of employees satisfied with the level of courteousness and professionalism in the IT/GIS Branch was 88.2 percent, the level of satisfaction with attention and timeliness was 80.0 percent, and satisfaction with quality of services provided was 83.5 percent. In FY 09, the level of satisfaction for courteousness and professionalism was 88.1 percent, 82.2 percent for attention and timeliness, and 84.0 percent for quality of services provided. We expect that splitting the IT portion of this branch into two distinct subsections continues to be a primary cause for the increase in employee satisfaction beginning in 2005 and reflected in the FY 09 survey results. By implementing this organizational change, we have spread out the day-to-day administrative workload and subsection supervisors now oversee the routine efforts within their work units. This has enhanced our ability to regularly address user requirements and allowed more time for branch evaluation, communications, planning, administration, and focus on customer service throughout the IT/GIS Branch, thus helping us to provide better service to our customers and increase employee satisfaction. What we propose to do to improve performance in the next two years: • Continue refinement of our problem tracking system to further identify trends in an
effort to increase the capability of the team to correct problems and minimize potential for recurrence, thereby lowering overall IT support costs in the future. We have now implemented this in the IT/GIS Branch and plan to gradually expand the use of this software to other entities throughout the Department. Our ability to accomplish this expansion will be largely dependent on time allocated to bringing up the new ELS Internet Point-of-Sale system, which has been given our number one priority.
• Define and document the application architecture (the description of all software applications and how they interface with each other) in order to prioritize applications, maintenance and development on a Department-wide basis.
• Rewrite the Department Internet site in Microsoft .NET technologies to permanently improve performance, especially during critical use times.
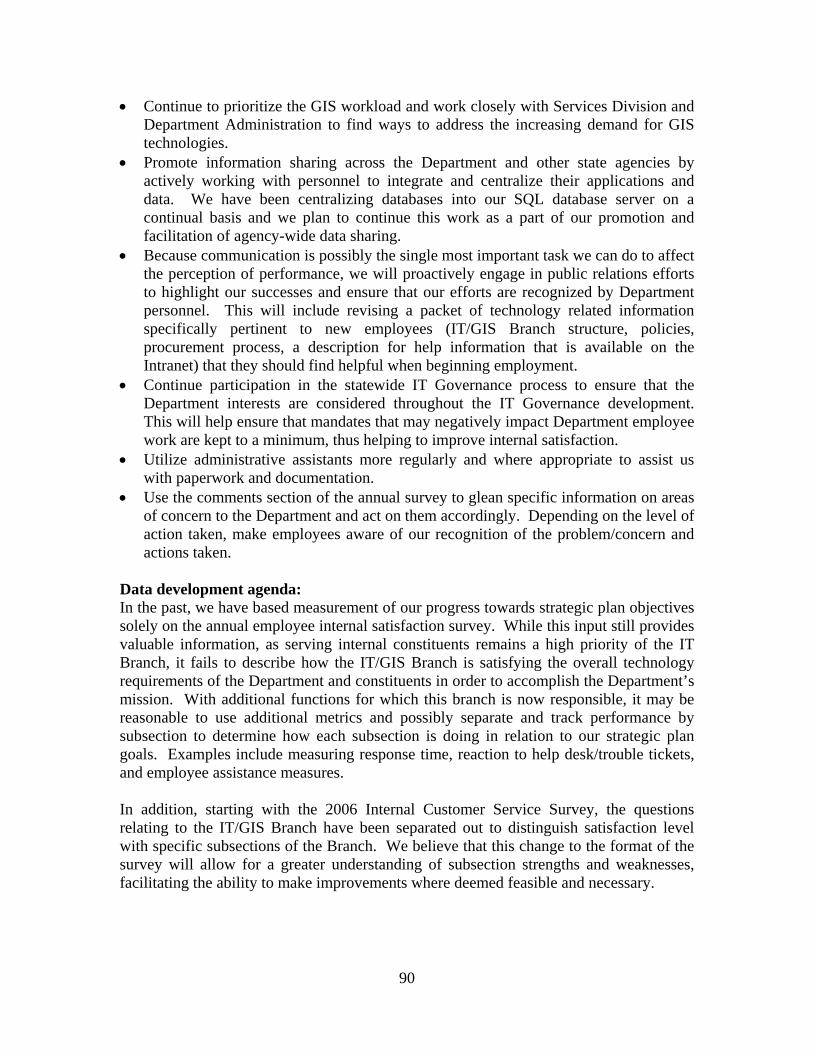
90
• Continue to prioritize the GIS workload and work closely with Services Division and Department Administration to find ways to address the increasing demand for GIS technologies.
• Promote information sharing across the Department and other state agencies by actively working with personnel to integrate and centralize their applications and data. We have been centralizing databases into our SQL database server on a continual basis and we plan to continue this work as a part of our promotion and facilitation of agency-wide data sharing.
• Because communication is possibly the single most important task we can do to affect the perception of performance, we will proactively engage in public relations efforts to highlight our successes and ensure that our efforts are recognized by Department personnel. This will include revising a packet of technology related information specifically pertinent to new employees (IT/GIS Branch structure, policies, procurement process, a description for help information that is available on the Intranet) that they should find helpful when beginning employment.
• Continue participation in the statewide IT Governance process to ensure that the Department interests are considered throughout the IT Governance development. This will help ensure that mandates that may negatively impact Department employee work are kept to a minimum, thus helping to improve internal satisfaction.
• Utilize administrative assistants more regularly and where appropriate to assist us with paperwork and documentation.
• Use the comments section of the annual survey to glean specific information on areas of concern to the Department and act on them accordingly. Depending on the level of action taken, make employees aware of our recognition of the problem/concern and actions taken.
Data development agenda: In the past, we have based measurement of our progress towards strategic plan objectives solely on the annual employee internal satisfaction survey. While this input still provides valuable information, as serving internal constituents remains a high priority of the IT Branch, it fails to describe how the IT/GIS Branch is satisfying the overall technology requirements of the Department and constituents in order to accomplish the Department’s mission. With additional functions for which this branch is now responsible, it may be reasonable to use additional metrics and possibly separate and track performance by subsection to determine how each subsection is doing in relation to our strategic plan goals. Examples include measuring response time, reaction to help desk/trouble tickets, and employee assistance measures. In addition, starting with the 2006 Internal Customer Service Survey, the questions relating to the IT/GIS Branch have been separated out to distinguish satisfaction level with specific subsections of the Branch. We believe that this change to the format of the survey will allow for a greater understanding of subsection strengths and weaknesses, facilitating the ability to make improvements where deemed feasible and necessary.

Perfo(Perssatisf
Story
InitiaDepato thi$500)incontechntechnincre Over of gafor spersoto acoverwfor st To adearly ChiefDepatechn As sehad d2002
ormance Monnel in th
fied with the
y behind the
ally driven bartment centris, Departme) without an
nvenience tonology budgenology throuased signific
time, technoathering and haring of p
onnel have bccomplish thwhelming fotandardizatio
ddress thesein 2000. Th
fs and the artment technologies.
een in the gdeclined fromBudget Ses
%E
lS
tifi
d
Measure #2: his program e computer e
e performan
by the stateralized technent employe
ny kind of ov individuals et has been t
ughout the acantly over t
ology has evstoring data
programs anbecome accuheir work, teor the limitedon has becom
e issues, the his working Information
hnology pur
graph abovem 2005. Wsion, the Wy
0
20
40
60
80
FY
% E
mpl
oyee
s Sa
tisfie
d
Percent ofwill work
quipment pr
nce:
ewide Infornology budgees were at versight. Wwithin the D
to allow admagency and tthe past seve
volved and ba on local PCnd data acroustomed to puechnical supd number ofme essential
Informationgroup is ma
n Technologrchases and
, employee We believe th
yoming Leg
Y 05 FY 06
91
f employeesto ensure t
rovided).
rmation Teceting and prliberty to p
While this chaDepartment, ministration to manage teral years.
become increCs and netwoss the entirurchasing th
pport of thef support perfor all techn
n Technologade up of onegy Managed make de
satisfaction here are two
gislature crea
6 FY 07
s satisfied wthat at least
chnology Gorocurement iurchase anyange in polithe ongoingthe ability toechnology e
easingly morworks has als
re Departmhe technologse various trsonnel in thnologies thro
gy Oversighte Deputy Dirr, who mecisions rega
with availao main reasoated a state C
FY 08 FY
with computt 70% of em
overnance Sin October oy technologycy may be c
g purpose ofo oversee thexpenditures
re complex. so changed went. While
gy they deemtechnologieshe IT Branchoughout the D
t Committeerector, Assiset quarterlyarding the
able computons for thisChief Inform
Y 09
er equipmenmployees ar
Structure, thf 2003. Prio
y item (undeconsidered af a centralizee direction o
s, which hav
The practicwith the neee Departmenmed necessars has becomh, thus a neeDepartment.
e was createstant Divisioy to approv
direction o
er equipmen. During th
mation Office
nt re
he or er an ed of ve
ce ed nt ry
me ed .
ed on ve of
nt he er

92
position and we began to see significant affects to the Department beginning in 2003. With this position came a statewide Information Technology Governance Structure, which began implementation of centralized common IT services throughout state government and included technology procurement. This process has also required a significant amount of effort and time commitment, especially for the Department IT Manager, which in turn has reduced time available to address Department specific IT issues. This, along with agency conformance to the statewide governance structure and accompanying changes in IT policy and technology procurement methods undoubtedly had a negative impact on Department employee satisfaction related to computer equipment. The IT Manager, along with Services Division administration and IT/GIS Branch personnel has taken a proactive approach to further educate Department personnel on the technology budgeting and procurement process and result has been an increase in satisfaction in this area through 2008. We have found that technology procurement greatly influences internal customer satisfaction. Since FY 05, the average percent of employees satisfied with the computer equipment provided was 67.9 percent. In FY 09, based on the number of people that responded to the specific question, the level of satisfaction was 66.5 percent, which is down from 70.5 percent last year. Though technology procurement is largely based on budget and standardization and will fluctuate year to year based on evolving technologies, we believe that through persistent evaluation and improvement of our processes for Department employees to get necessary technologies, along with regular communication regarding their needs, we may be able to increase employee satisfaction should continue to increase in this area. Mobility, or the ability to accomplish job tasks, use e-mail for communications, and remain in touch with the office while on the road is becoming more of a norm for the workforce, not only in the Department but in public and private sectors worldwide. We have seen a significant demand for this type of technology during the past fiscal year as well. While the upcoming workforce is becoming increasingly imbedded in these types of technologies, they are expensive to maintain. With a variety of available technologies and associates costs, we have been very conservative in implementing a cost-effective solution, which we believe has contributed to a decline in employee satisfaction in this area. We intend to continue to evaluate upcoming technologies and to work on a solution to provide these types of technologies in the future. What we propose to do to improve performance in the next two years: • Help guide agency IT investment priorities by continuing to work with the IT
Oversight Committee on the direction of technologies and accompanying budget. • Continue to communicate with Department employees through individual
discussions, regular attendance at regional team meetings, and various other avenues to keep abreast of employee technology needs, as well as work to help them understand technology procurement methodologies and procedures. Through better communication, we hope to improve overall employee satisfaction related to equipment needed to do their work.

93
• Continue working with the Department GIS Working Group, which consists of representatives from Services, Fish and Wildlife Divisions to compile recommendations by which Department administration can address increasing future GIS demands. This group developed an initial plan to begin eliminating fragmentation of GIS work. We have budget approval to purchase servers, software and licenses to begin implementation of this plan. A vacant position was transferred to the GIS Section in FY09 to implement centralization of geospatial data and to contribute to development of an enterprise GIS program.
• Continue to prioritize the GIS workload and work closely with Services Division and Department Administration to find ways to address the increasing demand for GIS technologies.
• Continue to evaluate, purchase and implement improvements to the Department network infrastructure to facilitate better Department internal communication and to provide a means for dynamic interaction between the Department and the general public.
• Continue to evaluate mobile technologies and to work on a solution to provide these types of technologies to the Department in the future
Program: Legislatively Mandated Expenses Division: Fiscal Division Mission: Ensure funding availability and statutory compliance on those programs in which the Department is required to earmark funds to meet Wyoming statutory provisions. Program Facts: The Legislatively Mandated Expenses program is listed below with the 2009 budget: Sub-Program #FTE’s 2009 Annual Budget Damage Claims 0 $ 500,000 Landowner Coupons 0 805,000 Retiree Assessment 0 81,720 Salec 0 299,924 TOTAL $1,686,644 This program is administered in the Department Headquarters Office in Cheyenne. Primary Function of the Legislatively Mandated Expenses Program: • Ensure funding availability and statutory compliance by establishing and
monitoring specific budgets and processing all payments that are required for these programs in accordance with Wyoming state statutory and/or regulatory requirements.

Perfoannuaalloca Storypercestate for cBudgHowedollarwherWhetamou$830last twincreseasoWyomsigniffor ancoupoas theof oth Whabasedmoraproje
ormance Mal paymentsated in the D
y behind thent, from $1Budget offi
cost allocatioget office begever, normalrs, whereas e additional ther this mount of cost a,000. Additwo years duase in the la
on. The Depming Deparficant varianny one 12 mons, peace oe payment aher state age
at we propod on concuatorium on cects that bene
(thou
sand
s)
Measuremen (Personnel
Department’s
he perform.5 million in
ice, with theon, which hgan assessinlly these costhe majoritycosts do not
oratorium wiallocation, iftionally, lan
ue to both inandowner cpartment conrtment of Tnces from ye
month periodofficer retireamounts are encies.
se to improurrence of tost allocatioefit wildlife
0500
1000150020002500
2005
t #1: Comin this prog
s budget to c
mance: Betwn FY 04 to e approval ohad increaseng this chargsts are chargy of federal ft result in adill continue f charged th
ndowner coucreased doe oupon rate ntinues to ex
Transportatioear to year in
d. The paymee assessmeneither set by
ove performthe Governoon, which wienthusiasts,
5 2006
(fis
Legislatively
94
mmission appram will wo
cover payme
ween 2004 $1.73 milliof the Govern
ed to over $e to Wyomined to allow a
funds the Dedditional fun
beyond 201he Departmeupon paymen
fawn deer afrom $13 to
xperience a ton for the sn the amounents reflectent, cost allocy legislation,
mance in theor and Legill allow therather than o
2007 200
scal years)
y Mandated
proved budgork to ensureents for these
and 2007, on in FY 07nor’s office,$600,000 anng Game anagencies to c
epartment recnds being aw10 is not knent in FY 10nts have incand antelopeo $16 effecttime lag in resalec systemnt of paymend above—da
cation and sa, regulation
e next two gislature is e Departmenon administr
08 2009
Costs
get is suffice that sufficie expenses).
these costs . However,, discontinuennually by Fnd Fish in thecapture addiceives are fo
warded to thenown at this0, would becreased 28 pe license issutive by the 2eceiving bill
m, which hants made in amage claimalec are non or are pass-t
years: Thehoping to
nt to use thosrative overhe
Budg
Paym
cient to meeient funds ar
escalated 1, in 2008, thed the chargFY 06. The mid 1990’itional federaormula basede Departmens time, as th in excess o
percent in thuance and th2008 huntinlings from thas resulted i
this categorms, landowne
discretionarthrough cost
e Departmencontinue thse savings oead.
get
ments
et re
6 he ge he s. al d,
nt. he of he he ng he in ry er ry ts
nt, he on

Prog Divis MissrecruComm Proglisted
This Prim• F
Panad
• Dred
Perfoand pempl
gram: Perso
sion: Office
ion: Instituitment and rmission, Dep
gram Facts: d below with
Sub-progrPersonnel
program is l
mary FunctioFacilitate re
ersonnel Mnalysis, bendvice and ge
Develop anecommendateveloped wi
ormance Mprofessionalioyees are tre
1
% E
mpl
oyee
s Sa
tisfie
d
onnel Manag
e of the Direc
tute and admretention of partment and
The Personh number of
ram l Manageme
located in th
ons of the Pcruitment a
Management nefit adminiseneral counsnd maintation and impith employee
Measure #1: ism (Personneated courteo
0%
20%
40%
60%
80%
100%
FY 0
gement
ctor
minister poeffective and Citizens of
nnel Managestaff and 200
# FTEsent 4
e Departmen
Personnel Mand retentio
conducts stration, payel to employain effectiplementatione and manag
Percent of nel in this pously and pr
05 FY 06
95
licies, procend productivef Wyoming.
ement progra08-2009 (FY
s
nt Headquart
Management on of effectrecruitment
yroll serviceyees and admive and n of policiesgerial input.
employees program willrofessionally
FY 07
edures and e employees
am is made uY 09) budget
2009 A$19
ters Office i
Program: tive and pr
activities, s, discipline
ministrators oproductive
, procedures
satisfied witl work to eny).
FY 08 FY
programs ts to meet the
up of one subt:
Annual Budg99,105
n Cheyenne
roductive emtraining, c
e guidance, of the Depare employes, programs
th level of cnsure that at
Y 09
that facilitate needs of th
b-program,
get
.
mployees, bcompensatiorule and law
rtment. ees througand practice
courteousnesleast 95% o
te he
by on w
gh es
ss of

StoryAnnuThe s14 Dservictheir A totindicsatisfPersoaveraManaFor Fand p PersoemplProvirespeeffect Wha• C
pref
• Twem
Perfotimelempl
y behind theually, the Insurvey provi
Department pces to the exinternal clie
tal of 80.5 pated they hfaction withonnel Managage of 97.4 pagement staFY 09, 96.4 professionall
onnel Manaoyees can oiding profesect to the indtiveness and
at we proposContinue to
rofessional fforts impac
The Personnewith managemployees an
ormance Mliness providoyees are sa
% E
mpl
oyee
s Sa
tisfie
d
e performanternal Clienides the oppoprograms. Ixternal clientents.
percent of alhad interacteh the courtegement progrpercent of Dff were satipercent of
ly.
agement’s monly be met ssional courtdividual empd productivit
se to improvmonitor inttreatment tot this measuel Managemment object
nd managem
Measure #2: ded (Personnatisfied with
0%
20%
40%
60%
80%
100%
FY
nce: nt Satisfactioortunity for eIn many rests depends o
ll permanented with Perseous and pram is one o
Department eisfied with tall responde
mission to if employee
teous treatmployee and iy.
ve performaernal constio determine
urement. ment section tives in orde
ment.
Percent of nel in this prthe level of
Y 05 FY 06
96
on survey is employees tospects, the aon the ability
t employeessonnel Man
professional of the highesemployees wthe level of ents indicate
recruit andes and admi
ment is a criis believed t
ance in the nituent satisfae how impro
will work ter to provid
f employees rogram willattention and
6 FY 07
distributed o measure th
ability of they of employe
s who were nagement sta
treatment st in the Dep
who had interf courteousned they had
d retain efinistrators feitical factor o weigh hea
next two yeaction in thoved comm
o become mde more com
satisfied wi work to end timeliness
FY 08
to permanehe overall pee Departmenees to satisfy
surveyed anaff. Internathey receiv
partment. Sinracted with t
ness and probeen treated
ffective andeel valued a
in conveyinavily in over
ars: he area of cmunication a
more strategimprehensive
ith level of nsure that at provided).
FY 09
ent personneerformance ont to providy the needs o
nd respondedal constituen
ved from thnce FY05, athe Personne
ofessionalismd courteousl
d productivnd respectedng value anrall employe
courteous annd educatio
ically aligneassistance t
attention anleast 90% o
el. of de of
d, nt he an el
m. ly
ve d.
nd ee
nd on
ed to
nd of

StoryA totindicsatisfManaof 95Manathey w An erespobehav Emplthey empl Wha• C
ti• In
anre
• Eimem
Perfo(Perssatisf
y behind thetal of 80.5 pated they hfaction with agement pro5.1 percent agement stafwere satisfie
effective andonses to queviors.
loyees who, can expect oyee’s produ
at we proposContinue to mimeliness thencreased usend informatecruitment a
Expanded usmplemented mployees an
ormance Monnel in th
fied with the
0%
20
40
60
80
100%
% E
mlo
yees
Sat
isfie
d
e performanpercent of alhad interacte
the level ofogram is one
of Departmff were satised with the l
d productivestions in k
through expfrom Personuctivity and
se to improvmonitor leveey received ies of web bation will beannouncemenes of techno
to better nd administra
Measure #3:his program e services pro
%
%
%
%
%
%
FY 05
nce: ll permanented with Persf attention a
e of the highment emplosfied. For Fevel of atten
ve workforceeping with
perience, devnnel Manageeffectivenes
ve performaels of internin regard to tased technol
e pursued. nts, training ology withinprovide timators.
: Percent will work
ovided).
FY 06
97
t employeessonnel Manand timelinehest in the Doyees who FY 09, 93.2 ntion and tim
e relies on h the self-pr
velop a confement realizss.
ance in the nnal constituentheir contactlogy to delivThis will band applican
n the Personmely deliver
of employeto ensure t
FY 07
s who were nagement staess they receepartment. had interacpercent of
meliness.
timely recrescribed ex
fidence in theze significan
next two yent satisfactiots with Persover Personnbe specific nt selection.nnel Managry of infor
ees satisfied that at least
FY 08
surveyed anaff. Internaeived from tSince FY 0
cted with thall responde
eipt of infoxpectations i
e attention ant positive im
ars: on with the onnel Managnel Managemto the areas
ement workrmation and
with servit 90% of em
FY 09
nd respondedal constituenthe Personne5, an averaghe Personneents indicate
ormation anin their wor
and timelinesmpacts in th
attention angement staffment products of vacanc
k unit will bd services t
ces providemployees ar
d, nt el ge el ed
nd rk
ss he
nd f. ts
cy
be to
ed re

98
Story behind the performance: A total of 80.5 percent of all permanent employees who were surveyed and responded indicated they had interacted with Personnel Management staff. Internal constituent satisfaction with the services they received from the Personnel Management program in FY 09 was 92 percent. Since FY 05, an average of 94.6 percent of Department employees who had interacted with the Personnel Management staff were satisfied with the services provided. What we propose to improve performance in the next two years: • Continue to monitor levels of internal constituent satisfaction with the services they
receive from the Personnel Management Staff to insure, at a minimum, the current high level of satisfaction with service delivery.
• Improvements in the use of technology for delivery of services will be implemented in the next two years. This includes videoconference training for a number of subjects that are required such as defensive driving, supervisor performance appraisal training and sexual harassment prevention. Reduced travel time and ease of attendance for employees will be achieved through this improvement.
• Human Resource Manager will attend various Department employee meetings to obtain direct feedback on service delivered by the Personnel Management work unit.
Program: Property Rights (Lands) Management Division: Services/Wildlife Mission: To administer and monitor currently owned Wyoming Game and Fish Commission property rights. To acquire property rights to restore and conserve habitat to enhance and sustain wildlife populations now and in the future. To acquire property rights, provide public access and public recreation, such as hunting and fishing access on private and landlocked public land. Program Facts: The Property Rights Management program is made up of two major sub-programs, listed below with number of staff and 2009 (FY 09) budgets. Sub-programs #FTEs* 2009 Annual Budget
Property Rights (Lands) Admin. ** 3.0 $ 754,668 PLPW Access Sub-Program 7.4 1,494,681 ***
TOTAL 10.4 $ 2,249,349
* Includes permanent, contract and temporary positions. ** Includes Property Rights Administration and Strategic Habitat Plan.
*** Includes personnel, operations and easement payments. Property Rights Administration sub-program is located in Services Division and is based out of the Department Headquarters in Cheyenne. The Private Lands Public Wildlife

(PLPCasp Prim• A
exisasgu
• Mp
• Aimheari
• Amla
PerfoMana(Perssatisfsatisf
StoryProgrWyominternand p
W) Access er Regional
mary FunctioAdminister xpertise to Sssues and wssurance thauidelines an
Monitor Comossible encro
Acquire promplementatiabitat qualiasements, leights, and by
Acquire promaintaining aands through
ormance Magement peronnel in th
fied with thfied with the
y behind theram staff inming Game nal constitueproviding inf
5
6
7
8
9
10
% E
mpl
oyee
s Sa
tisfie
d
sub-programOffice.
ons of the PCommissio
Staff and Cowe address at all real p
nd policies. mmission poachments aoperty righon of the Sity should beases, and agy seeking funoperty rightand enhancih Hunter Ma
easure #1: Prsonnel’s att
his program he attention/e services pro
e performannteracts withand Fish Co
ents focus onformation. T
0
0
0
0
0
0
FY 05
Atten
m is located
Property Rigon propertyommission m
requests foproperty righ
property rigand provide rhts to restoStrategic Habe preservegreements, bnding partnets which prng public h
anagement an
Percent of etention, timewill work
/timeliness ovided).
nce: h Regional ommission mn the programThe final out
FY 06
ntion/Timeliness
99
in the Wild
ghts Managy rights bymembers on or assistanchts issues fo
ghts by annrecommenda
ore and conabitat Plan
ed through by acquiring ers. rovide publiunting and nd Walk-in A
employees saeliness, and to ensure tprovided an
personnel, members in tm’s service atcome of com
FY 07
s Services
dlife Division
ement Progy providingall real pro
e and inforfollow state
nual physicaations for Conserve habto identify fee title acpublic acce
ic access anfishing acceAreas.
atisfied withservice on
that at leastnd at least
Departmentthe implemenand timelinempleting any
FY 08
n and is bas
gram: g support aperty rights rmation. Band federal
l inspectionommission a
bitat by asswildlife ha
cquisitions, ess and publi
nd public ress on privat
h Property RDepartment
t 70% of em75% of em
t administrantation of pr
ess in compley assigned p
FY 09
sed out of th
and technicamanagemen
By providinl laws, rule
ns to evaluataction. isting in thabitats wherconservatio
ic recreation
recreation bte and publi
Rights (Landst assignmentmployees armployees ar
ation and throjects. Theseting project
project can b
he
al nt ng s,
te
he re on ns
by ic
s) ts re re
he se ts
be

contincontr AnnuThe s14 Dservictheir Of repercesatisfthis s Wha• C
ad• C
re• C• C
uow
Perfocriticamouwill whabit
ngent on introl of the Pro
ually, the Intsurvey provi
Department pces to the exinternal clie
espondents went indicatedfied by the astaff provide
at we proposContinue to dministration
Continue to aecreation.
Continue to idContinue real
se(s) and powned or adm
ormance Mcal habitat acunt of publicwork to ensuat and acces
0
10
20
30
40
50
60
% P
ublic
Sat
isfie
d
ternal and exoperty Right
ternal Clientides the oppoprograms. Inxternal clientents.
who interacd they had beattention andd.
se to improvimprove
n and Commaddress prio
dentify fundl property inotential encrministered la
Measure #2: cquired in thc and recreaure that at less acquired b
Amo
FY 05
xternal politis Administra
t Satisfactionortunity for en many respts depends o
ted with theeen treated cd timeliness
ve performacommunica
mission memority acquisit
ding partnersnspections anroachments ands or water
Percentagee state and th
ation access east 45% of by the Depar
ount of Habitat
FY 06
100
ics and fundiation staff m
n survey is employees topects, the abon the ability
e Property Rcourteously aprovided an
ance in the nations with
mbers on projtion of habit
s. nd monitorinthat may cars.
e of general he percentagacquired in
f the public artment).
Acquired
FY 07
ing constrainmembers.
distributed to measure thbility of the
y of employe
Rights Manand professiond 84.2 were
next two yeRegional
ject status antat and publ
ng to ensureause loss of
public satisge of generathe state (P
are satisfied
Amount of A
FY 08
nts, which ar
to Departmehe overall pee Departmenees to satisfy
nagement peonally, 82.8
e satisfied by
ars: personnel,
nd implemenlic access fo
compliancef control of
sfied with thal public satisPersonnel in
with the am
Access Acquire
FY 09
re outside th
ent personneerformance ont to providy the needs o
rsonnel, 90.percent wer
y the service
Departmenntation. or fishing an
e of permitteCommission
he amount osfied with ththis program
mount of bot
ed
he
el. of de of
.7 re es
nt
nd
ed n-
of he m th

StoryThe W244,0popuCommriversamouinformnonre With satisfsatisfthe gyearsof haevery Wha• C
prti
• Cfi
• C• C
uow
Perfo(Persmilliofishin
Acr
es
y behind theWyoming G000 acres oflations and mission hass around theunt of habitamation is coesidents who
regards to tfied. In regafied. Given general publis. These conabitat and acy year.
at we proposContinue wit
roviding tecitle acquisitio
Continue withishing and re
Continue to idContinue real
se(s) and powned or adm
ormance Meonnel in thison acres of png access to
Number of
0
200,000
400,000
600,000
800,000
1,000,000
Acr
es
e performanGame and Fisf federal, stprovides pu
s acquired pe state. The pat available follected in ano purchased
the amount ards to the athe narrow ric satisfactio
nsistent resulccess that th
se to improvh implemen
chnical expeons, conservh implementecreation. dentify fundl property inotential encrministered la
easure #3: s program wprivate land, at least 100
f Private Hun
2004
nce: sh Commissate and priv
ublic access permanent pperformancefor wildlife an annual surhunting and
of habitat acamount of arange in satison will ever lts may be dhe Property
ve performantation of theertise to convation easemtation of Com
ding partnersnspections anroachments ands or water
Hunting andwill work to m
public fishinstream mile
nting Acres i
2005
101
sion owns 16vate lands, wand recreatiublic access
e measures thand the amourvey that is dd fishing licen
cquired, 55.access acquisfaction levebe much hig
due in part toRights (Lan
ance in the ne Departmennserve and e
ments, leases,mmission pr
s. nd monitorinthat may cars.
d fishing accmaintain pubng access tos).
in Hunter M
2006 2
65,470 acreswhich conseion. In addis to over 12he general punt of publicdistributed rnses in the p
3 percent ofired, 56.9 peels across thegher than ino lack of famnds) Manag
next two yent’s Strategienhance wil, and agreemriorities in ac
ng to ensureause loss of
cess to privatblic hunting o at least 273
Management a
2007 200
s and adminierve and suition, the Ga21 miles of
public’s attituc access in tandomly to
previous yea
f the sampleercent of the years, it is
ndicated overmiliarity witgement prog
ars: ic Habitat Pldlife habitat
ments. cquiring pub
compliancef control of
te and publicaccess to at lake acres,
and Walk-in
08
isters anothestain wildlifame and Fisf streams anude about ththe state. Thiresidents anr.
ed public wahe public wa
doubtful thar the last fivth the volumgram acquire
lan (SHP) bt through fe
blic access fo
e of permitteCommission
c land least 1.25 and public
n Areas.
HMAWIAH
er fe sh nd he is
nd
as as at ve
me es
by ee
or
ed n-

StoryIn 20WildlAccehuntefield areas In adincremana WhaThe WalkFishinis: Fishinin eitAccedonatremai CombPLPWthe faout fo
Acr
es a
nd M
iles
Numb
y behind the001, the Wylife (PLPW)ss Program
er and anglerbiologists a to hunt and
ddition to pasing coope
agement of w
at has been aenrollment
k-in Huntingng stream mHunter Manng lake acrether a Walk-ss Yes fundtions collectin fairly con
bined with W Access Prall 2008/sprior increased
0
50
100
150
200
250
300
2
ber of Fishin
e performanyoming Gam) Access Proworks with
r access ontoand wardens,d fish.
roviding receration betwewildlife; and
accomplishein each pro
g, 653,106 amiles, 96 milnagement, 7es, 276 acres-in or Hunterds. During ted by the D
nstant, as lon
public landsrogram proving 2009 huopportunity
2004 20
ng Acres and
nce: me and Fish ogram as a h Wyomingo private and, the PLPW
creational aeen the Depdecreasing
ed: ogram for 20acres; Walkles. The ave751,444 acrs; and Walkr Manageme2008, easem
Department. ng as, Access
s that were vided approxunting seasony.
005 2006
102
d Stream Mil
Commissiopermanent p’s private lad landlocked
Access Pro
ccess, the Ppartment, lanagriculture d
008 were: H-in Fishing erage enrollmres; Walk-in
k-in Fishing ent Area is dment payme The numb
s Yes fundin
associated ximately 3.1ns. Fishing
6 2007
les in Walk-i
on adopted tpart of the Dandowners td public landogram contin
PLPW Accendowners andamage thro
Hunter Manlake acres,
ment in eachn Hunting, stream mile
dependent onents almost ber of acres ng levels are
with the en1 million acr
opportunitie
2008
in Fishing A
the Private LDepartment.to maintain ds. With thenues to prov
ess Programnd the publiugh harvest.
nagement, 85287 acres;
h program fo549,795 acs, 91 miles. n the amounreached theand stream maintained.
nrolled privares of huntines are contin
Lake Strea
Areas.
Lands Publi The PLPWand enhanc
e assistance ovide extensiv
m assists witc; populatio.
50,802 acresand Walk-i
for 2004-200cres; Walk-i
Enrollmennt of available Access Yemiles shoul
.
ate lands, thng access fonually sough
Acresam miles
ic W ce of ve
th on
s; in 08 in nt le es ld
he or ht
Wha• P
an• P
em• P• P
alo
Perfoopporprogrgameprogr
StoryThis harveAcceview numbcan d WhaThe sdata, perce2006)SatisfrecordetermAcce
1
Perc
enta
ge S
atis
fied
at we proposLPW staff nglers by woLPW staff mployees foLPW will coLPW will clleviate the ffered to De
ormance Mrtunity provrams. (Persoe hunters arrams).
y behind theis a relativ
est surveys. ss Program.the Hunter
ber of areas adedicate to an
at has been asatisfaction wsatisfaction
ent in 2006);); and elk, 7faction withrd-book animmine that oss Program
50
60
70
80
90
00
20
se to improvwill continu
orking with Lwill contin
or increased aontinue to evcontinue to workload o
epartment pe
Measure # 4vided by thonnel in thisre satisfied
e performanvely new pe
The harvest. After threr Managemeand acres prn area/lando
accomplishewith the PLPrates are: an
; deer, 73.1270.71 percenh a hunting mal to havingoverall; satisarea and has
006
ve performaue to encouLicense Sellnue to fostassistance wvaluate new pursue an a
on current emrsonnel, land
: Percent ofhe PLPW Ws program w
with the h
nce: rformance mt surveys areee years of dent and Walrovided has powner.
ed: PW Access ntelope, 86.22 percent in nt in 2008 (7experience cg a place to sfaction is hs remained re
2007
103
ance in the nurage Accesling Agents ater cooperat
with the progrfunding sou
additional remployees andowners, an
f Big GameWalk-In Ar
will work to hunting opp
measure thae providing data, the reslk-in Area pput a strain o
Program rem2 percent in 22008 (72.83
72.76 percencan mean a go. From th
high amongselatively con
20
next two yess Yes donaand an advertive relationram.
urces. egional PLPnd improve d the genera
e Hunters Sarea and Huensure that portunities p
at was startedata of huntsults are posprograms. Aon the amoun
mains high. 2008 (87.34 3 percent in nt in 2007 an
variety of the three yearst big gamenstant each y
08
ars: ations from rtising progrnships with
W access cthe quantity
al public.
atisfied withunter Managat least 75 pprovided by
ed with the ter satisfactiositive about A steady innt of time ea
The 2008 hpercent in 22007 and 73nd 68.9 percthings from rs of inform
e hunters usyear.
Antelo
Deer
Elk
hunters anram.
h Departmen
oordinator ty of service
h the huntingement Arepercent of biy the PLPW
2006 hunteon the PLPWhow hunter
ncrease in thach employe
harvest surve2007 and 87.3.1 percent icent in 2006
harvesting mation, we casing a PLPW
pe
nd
nt
to es
ng ea ig W
er W rs he ee
ey .3 in ). a
an W
104
What we propose to improve performance in the next two years: • PLPW staff will be conducting comprehensive surveys on hunters/anglers,
participating landowners, and Department employees to determine program satisfaction.
• PLPW staff will continue to foster cooperative relationships with Department employees for increased assistance with program.
• PLPW will continue to pursue an additional Regional PLPW Access Coordinator position to provide adequate coverage of State.
Appendix A. New proposed performance measure: In addition to direct assignment of projects from Department administration, the Lands Administration sub-program receives numerous requests for information and assistance on current projects as well as historical information regarding past property rights transactions and data. Requests come from regional Department personnel, other government agencies, private landowners, realtors, appraisers, lawyers, private sector companies and others. With the increase of mineral development in the state, additional demands will be placed on the sub-program to address requests for the use(s) and occupancy of Commission-owned or administered lands, which will also create an increased need to monitor for compliance and encroachments. Mitigation for loss of habitat due to future mineral development will increase the program’s workload in providing technical expertise to Department personnel. The amount of services supplied to address additional assignments and provide information may serve as another appropriate performance measure in the future. Program: Regional Information and Education Specialist Division: Services Mission: Work cooperatively with Department personnel to increase understanding and appreciation of Wyoming’s wildlife resources. Provide media outreach and wildlife conservation education programs for students, teachers, and other citizens of Wyoming.
Program Facts: The Regional Information and Education Specialist program consists of a single sub-program, listed below with staff numbers and 2009 (FY 09) budget:
Sub-program # FTEs* 2009 Annual Budget
Regional Information & Education 7.0 $ 638,138
* Includes permanent positions authorized in FY 09 budget. Any positions added during the budget cycle require Wyoming Game and Fish Commission authorization or must be funded from supplemental grants. This program is located statewide. One Regional Information and Education Specialist (RIES) is assigned to seven Department’s regional offices. The Jackson position is
105
assigned to both the Jackson and Pinedale regional offices. The Laramie position has divided responsibilities: primarily that of Supervisor of the RIES work unit, and a shared responsibility for Laramie RIES functions. Primary Functions of the Regional Information and Education Specialist Program: • Work cooperatively with Department personnel to increase understanding and
appreciation of Wyoming’s wildlife resources by providing information and education support to other branches within the Services Division and other divisions within the Department. The RIES program supports the Department’s Information program by contributing to the E-newsletter, Wyoming Wildlife News, Wyoming Wildlife Magazine, and the weekly Department news release packet. Each RIES also maintains a regional web page. The RIES program assists the Conservation Education program through the instruction of traditional hunter education courses, internet field days and the Hunter Education New Instructor Academy. It also assists with Becoming an Outdoors Woman, WILD About OREO (Outdoor Recreation Education Opportunities) teacher and youth conservation camps, youth fishing and hunting days, the annual Hunting and Fishing Heritage Exposition (EXPO), 4-H Shooting Sports state shoot and Wyoming's Wildlife Worth the Watching interpretive projects.
• Provide regional and statewide media outreach by developing and distributing news releases, conducting media tours designed to provide the media and public with detailed information on important issues facing wildlife, conducting radio programs, conducting radio and television interviews, and television and streaming video public service announcements.
• Provide regional wildlife conservation education programs through presentations and hands-on workshops to students, civic groups, conservation groups and others.
Major Accomplishments for FY 09: 1) Incorporated information and education outreach priorities from staff and the regions
into regional I&E work plans and successfully addressed these priorities throughout the year.
2) Created a grizzly bear management web page. The page is updated each Monday with information provided by the Large Predator Management Section, Human-Bear Conflict Management Section, and the Regional Information and Education Specialist work unit.
3) Assisted the Conservation Education program with Wyoming Hunting and Fishing Heritage EXPO, Hunter Education, New Hunter Education Instructor Workshop, Project WILD, WILD About OREO youth and teacher camps, 4-H Shooting Sports state shoot and aquatic education programs throughout the state.
4) Assisted both Wildlife and Fish Division personnel with community education projects. RIES personnel worked with Wildlife Division statewide bear management personnel to organize and publicize Living in Bear, Lion and Wolf Country seminars. These seminars were attended by over 300 people in nine Wyoming communities around the state. RIES personnel worked with regional Fish Division supervisors to coordinate and conduct 30 public information meetings statewide. Additional news

106
releases, radio programs and public presentations were also used to raise awareness of this important issue.
5) Took on a more prominent role as contributors to the Department's E-newsletter, Wyoming Wildlife magazine and Wyoming Wildlife News.
6) Facilitated the Sunlight-Crandall Elk working group. The group came together to work with the Department to explore and recommend possible solutions to address declining bull elk and calf elk numbers in a portion of the Clarks Fork elk herd unit.
7) Facilitated the Web Page Improvement Team and served as a team member. The group was tasked with providing recommendations to Staff for website restructure and improvements.
8) Certified one regional as an instructor in the 7-Habits of Highly Effective People Signature Program; he coordinated and taught two classes.
Performance Measure #1: Percent of employees satisfied with information and education services provided. (Personnel in this program will work to ensure at least 80% of employees are satisfied with the information and education services provided).
0
20
40
60
80
100
FY 05 FY 06 FY 07 FY 08 FY 09
% E
mpl
oyee
s S
atis
fied
Story behind the performance: The Regional Information and Education Specialists are responsible for working collaboratively with Department personnel both statewide and in their respective region. The Department’s Internal Client Survey is conducted annually to assess the level of satisfaction Department personnel have with various aspects of RIES work duties. Specifically, the survey asks respondents to rate their level of satisfaction with services provided by RIES in particular regions. The survey is voluntary and typically does not represent all those who request and receive services. Each year, survey recipients are asked to identify their level of satisfaction with the services provided by each of the seven RIES. On average, where each employee's response receives equal weight, 83.5 percent of employees were satisfied with the services provided by I&E Specialists. Where each region received equal weight, percent

107
of satisfied personnel with specific regional Specialists ranged from 72.7 percent to 97.7 percent. Annually, Department personnel are asked to identify and prioritize regional issues requiring information and education outreach. These priorities, in conjunction with statewide priorities established by staff, are used as the basis for the development of detailed RIES work plans. Works plans are discussed and reviewed at the Regional Leadership Team (RLT) level and help to identify monthly work tasks for regional personnel. On average, where each employee’s response receives equal weight, 79 percent of employees were satisfied with the I&E Specialists ability to address regional priorities. Where each region received equal weight, percent of satisfied personnel with specific regional Specialists ranged from 68 percent to 93.8 percent. What we propose to improve performance in the next two years: • Continue to communicate monthly with the Regional Information and Education
Specialist supervisor through teleconferencing to ascertain Divisional directives and planning goals.
• Continue to request in January and/or February of each year, a prioritized list of statewide issue related outcomes from Department Staff and Divisional I&E priorities within each region to be used in creating detailed work plans.
• Participate in an all I&E program planning meeting to review I&E priorities and implement the most effective communications outreach when disseminating messages to Wyoming citizens and non-resident customers.
• Annually update regional personnel at RLT meetings on Internal Client Survey results.
• Acknowledge actions by RIES staff to address regional issues that were/were not accomplished monthly. This will be accomplished by copying RLT core team with each RIES monthly summary currently provided to the RIES lead worker.
• Supervisor of the RIES work unit will attend as many RLT meetings as possible to provide opportunities for work unit updates at the regional level and accept feedback on RIES work unit performance.

108
Performance Measure #2: Number of media interviews, news releases, radio programs, radio interviews, and television public service announcements provided (Personnel in this program will work to produce at least 800 interviews, news releases, radio programs and interviews, and television public service announcements each year).
0
200
400
600
800
1000
1200
FY 05 FY 06 FY 07 FY 08 FY 09
Num
ber
of M
edia
Effo
rts
Story behind the performance: Many issues affect Wyoming’s wildlife. In holding with the Department’s mission of serving people, it is important to keep the state’s citizens informed of these various issues. This is done through a variety of communications programs and activities. With the implementation of formal work plans and subsequent discussion within the Information & Education leadership team, additional effort is put into the development of media outreach using common tools such as news releases, meeting announcements, public service announcements, interviews and on-site media field trips. This effort is primarily focused on identified Department, Division, and Regional information and education priorities. The Laramie position serves the dual function of being both the Laramie Region RIES and also being the statewide supervisor of the RIES work unit. Although media outreach efforts from this position are not expected to be similar in performance to those of the other regions, a strategy was implemented in an attempt to improve regional satisfaction. What we propose to improve performance in the next two years: • The Laramie Regional I&E Specialist will continue to seek assistance with local
media outreach responsibilities from the work units of the Information Branch. • Continue to use the monthly record spreadsheet to improve RIES record keeping. • Continue to improve regional work plans to focus on Department information and
education priorities and link our accomplishments to the Services Division monthly reporting process.
• Purchase digital recording equipment to enable the RIES’ to attach MP3 audio files for radio when distributing electronic news articles.

109
• Pursue in-service training opportunities to improve media outreach skills. • Utilize the I&E Leadership Team to coordinate work schedules each spring and to
facilitate completion of other priorities that come up throughout the year. • Meet annually with regional media representatives to discuss information distribution
efforts and media needs and/or requests. Maintain updated regional media Newsgroup e-mail lists for each region.
Performance Measure #3: Number of wildlife conservation education programs (Personnel in this program will work to provide at least 50 education programs per year).
0
100
200
300
400
500
FY 05 FY 06 FY 07 FY 08 FY 09
Num
ber
of C
on.
Ed.
Pro
gram
s
Story behind the performance: The regional information and education specialists work collaboratively with Education Branch personnel to provide conservation education programs to the public. Those programs include traditional Hunter Education courses and Internet field days, New Hunter Instructor Academy, Aquatic Education, Becoming An Outdoors Woman Workshop, WILD About OREO Teacher and Youth camps, Project WILD workshops, Staying Safe in Bear, Lion, and Wolf Country seminars, Wyoming Hunting and Fishing Heritage EXPO, Youth Fishing Clinics, and 4-H Outdoor Skills Competition. The regional information and education specialists provide outdoor skills training, field trips, tours of Department education centers, and conservation education programs to primary and secondary schools and colleges, civic clubs, and conservation groups within their respective regions. Several regions have focused their attention on hunter and angler recruitment. This has undoubtedly increased the number of conservation education programs provided. Another reason for this year’s increase is the statewide effort put into the Aquatic Invasive Species information outreach program. What we propose to improve performance in the next two years: • Each regional will use a monthly record spreadsheet to improve RIES record keeping.

110
• Meet with the Conservation Education program personnel and Aquatic Invasive Species program coordinator each winter/spring to plan outreach efforts and coordinate work schedules.
• Balance work unit information outreach and conservation education outreach in annual RIES work plans.
• Actively seek opportunities to provide educational outreach specific to Department information and education priorities.
Program: Regional Terrestrial Wildlife Management Division: Wildlife Mission: Coordinate management of terrestrial wildlife and enforce laws and regulations to ensure long-term health and viability of terrestrial wildlife for the people of Wyoming, while providing recreational opportunity and minimizing conflicts. Program Facts: The Regional Terrestrial Wildlife Management program is made up of three major sub-programs, listed below with the number of staff and 2009 (FY 09) budget. Sub-programs # FTEs* 2009 Annual Budget Regional Terrestrial Wildlife Administration 11.1 $ 1,600,749 ** Regional Terrestrial Wildlife Biologists 27 3,003,887 Regional Game Wardens 54 5,991,711 TOTAL 92.1 $ 10,596,347 * Includes permanent positions authorized in FY 09 budget. Any positions added during the budget cycle require Wyoming Game and Fish Commission authorization or must be funded from supplemental grants. ** Does not include federal cost share dollars (50 percent) that support eight wildlife technician positions. The sub-programs that comprise the Regional Terrestrial Wildlife Management program were previously part of the Terrestrial Wildlife Management program (Strategic Plan FY 04-FY 07, November 2003). The Regional Terrestrial Wildlife Management program is located statewide. Primary Functions of the Regional Terrestrial Wildlife Management Program: • Coordinate management of terrestrial wildlife, to collect and analyze data, ensure
big game management strategies are designed to achieve population objectives, review projects with potential to impact wildlife and their habitats, coordinate with other state and federal agencies and to educate, inform, and seek public input on

wre
• EsanSstco
Perfoobjecgame
StoryWhilWyomgamelicensregiowildlprongbisonHuntJob C Huntfor mdesig
wildlife manaegional objec
Enforce lawafety, informecessity, anupport, traintate laws, reomplaints.
ormance Mctive (Persone herds are w
y Behind the the Depaming, manye species. Ise sales for nal terrestria
life adminisghorn, whiten. Values aing Season
Completion R
ing seasons managing bigned to mana
Perc
ent o
f Her
d U
nits
(%)
agement issuctives and go
ws and regum and educd to addresning and leaegulations, a
Measure #1: nnel in this
within + 10 p
e Last Yearartment is rey of our conIn addition, those specieal wildlife btration. Th
e-tailed deerare based oRecommendReports (200
and harvestg and trophage herds for
0
5
10
15
20
25
30
2004
ues. Supporoals are beinulations to cate the pubs wildlife d
adership are and to addre
Percent of program wi
percent of the
r of Performesponsible fstituents aremost of the
es. Managembiologists, rehe species ir, mule deer,n individuadation Summ08).
t quotas devhy game sper population
4 2005
111
rt, training ang met.
ensure viabblic about w
damage and provided to
ess wildlife
big game hll work to ee population
mance: for managin
e focused one Departmement of thes
egional gameincluded in , elk, moose
al species vamaries (2004
veloped by thecies. Huntobjectives a
2006
Biological Y
and leadershi
ble wildlife wildlife lawwildlife/hum
o ensure the damage and
erds within ensure that an objective).
ng over 800n the managnt’s annual se species ise wardens an
this perfore, bighorn shalues taken 4-2008) and
he Departmting seasonsand desired m
2007
Year
ip are provid
populationws, regulatioman conflicefficient en
d wildlife/hu
10 percent oat least 30 p
0 species ogement of bi
income is s the responsnd the regiormance meaheep, mountfrom annuafrom the fi
ment are the ps and harvemale to fema
2008
ded to ensur
s and publions and thet complaint
nforcement ouman conflic
of populatiopercent of bi
of wildlife iig and trophderived fromsibility of thnal terrestriaasure includtain goat, anal Big Gamnal big gam
primary toolst quotas arale ratios.
re
ic ir s. of ct
on ig
in hy m he al de nd me me
ls re

112
Lack of hunter access to some hunt areas, especially in eastern Wyoming, limits the Department’s ability to obtain desired harvest levels, which often allows herds to grow beyond their population objectives. Outside factors such as access, weather and disease affect the Department’s ability to maintain terrestrial wildlife populations at historic levels. Even when the drought breaks, it will take several years for habitat conditions to improve enough to allow many herds to move towards objective, as it is not possible to reach objective in a single year. Weather conditions (drought, severe winters) limit productivity of many deer and pronghorn herds, and many of these herds remain below objective. The Department currently manages some herds below objective because of the effects the drought and other factors have had on habitat conditions. Elk populations are, in general, above objective despite the increased cow harvest in recent years and despite brucellosis in some western Wyoming herds. Landscape-scale habitat improvements to benefit big game and other species are needed in many areas and could be funded under the Wyoming Wildlife and Natural Resource Trust, the Wyoming Governor’s Big Game License Coalition, and other sources. Since 2004, an average of 25.8 percent of big game herds across Wyoming were within 10 percent of the population objectives. In 2008 the percentage was 23.2 percent, and the number has ranged from 23.2 percent to 28 percent. Of the total 151 big game herds in Wyoming in 2008, 35 herds (23.2 percent) were at objective (+/- 10 percent), 46 (30.5 percent) were above objective, 39 (25.8 percent) were below objective, and 31 herds (20.5 percent) had incomplete data. Values reported in the graph above differ slightly from what was reported in the 2005 Strategic Plan. These former values did not include bison and excluded herds from the total that had incomplete data. What has been accomplished: The Department began implementing the Strategic Habitat Plan (SHP), including incorporating nongame priority areas with those previously identified for big game. The revised SHP was adopted by the Wyoming Game and Fish Commission in 2009. Personnel continue to emphasize habitat management and habitat condition monitoring to federal land management agencies and to the public. The Department informs land management agencies and landowners of habitat improvement priorities and as resources are available, encourages joint collaboration on projects. Implementation of the SHP depends upon the cooperation of land management agencies and private landowners. The Department employs habitat biologists in each region and habitat extension biologists in eastern Wyoming that focus on habitat monitoring and improvements on both public and private lands. Much of their effort pertains to big game, and funding from the many sources is being pooled to address priorities in the SHP. Wildlife Division personnel continued to apply for habitat improvement funds from a variety of sources, including the Wyoming Wildlife and Natural Resource Trust, the Wyoming Governor’s

Big Gprogr Big actividiseaRecenmoos$1.62feedgimplerecom WhaRecoat redDepaharveparts The Dto im PerfoTotalprogr
StoryEnforof terlaw e1970manaupdat
Game Licensrams.
game diseaities as they
ase in muchntly, carotidse. Funding2 million in grounds to reement the fmmended by
at we proposmmendationduced levelsartment also ests. Access
of the stateDepartment
mprove acces
ormance Ml cases enteram will wor
y behind thercing wildlifrrestrial and enforcement’s. Beginn
agement systted. A ne
se Coalition,
se surveillay pertain toh of easternd artery wormg for the DepFY 09. In F
educe the prfive-year tesy the Govern
se to improvns for big gas, which can
promotes hs continues . Access femaintains ths to hunting
Measure #2: ered annuallrk to enter at
e performanfe and wateraquatic wild
t reporting sning in 1996tem (CMS),w case man
0
1,000
2,000
3,000
4,000
5,000
Num
ber o
f Vio
latio
ns
, many non-
ance and reo brucellosisn Wyoming m, Eleophorpartment’s V
FY 09, the Drevalence of st and slaugnor’s Brucell
ve performaame populatin be supporthunter accesto be an im
ees and outfihe Private Lafor the gene
Number ofly into the t least 4,250
nce: rcraft safety dlife managesystems hav6, records b, but the sys
nagement sy
2004 20
113
government
search conts in northw
continue tris, has becoVeterinary SDepartment
brucellosis ghter pilot plosis Coordin
ance in nextions, especiated by drougss to private
mpediment toitters controands Public eral public.
f law enforccase manag reports into
statutes and ement. Formve been usebegan to bestem was qustem (CMS2
005 2006Calendar Y
tal organizat
tinue to be west Wyomito expand iome a conceServices procontinued toin elk. The
project in thnation team.
t two years:ally deer andght-stressed e lands in oo managemelling access Wildlife Ac
cement invegement systeo the case ma
regulations mal attempts d by the De entered inuite cumbers2) went onli
2007 20Year
ions (NGOs
high prioriing and chrncrementallyern in weste
ogram was ao vaccinate oDepartment
he Pinedale
d pronghornrangeland h
order to obtent of big gare addition
ccess program
stigation repem). (Persoanagement sy
is an integraat case man
Department snto a compusome to useine in May
008
), and federa
ities. Thesronic wastiny each yeaern Wyominapproximatelon the state’t continues telk herd, a
n, will be kephabitats. Thtain adequatame herds inal problemm in an effo
ports (LIERonnel in thiystem.)
al componennagement ansince the latuterized case and to keeof 2007. It i
al
se ng ar. ng ly ’s to as
pt he te in s. rt
s, is
nt nd te se ep is

morenew closestatew Commanimof seenforthe nuenfor Wha• S
in• T
Dan
Wha• C
to• C
em• C
li• W
W Perfoyear iprogr
user-friendlsystem allow
ed cases statwide cases a
mon violatioal, over limi
eason, and farcement persumber of vircement such
at has been aeveral comp
nformation hThe location Department’snd the applic
at we proposContinue to eo ensure enfo
Continue to merging enf
Continue to icense inform
Work with thWindows VIS
ormance Min accordancram will wor
% o
f Dam
age
Cla
ims
ly and has dws enforcemtewide. Indi
are uploaded
ons include fits of big ga
failure to prosonnel discoolations disch as watercra
accomplisheparisons of Whave been coof the link t
s home pagecation more
se to improvevaluate the lorcement neuse a task
forcement isscompare da
mation on a rhe technologySTA and inc
Measure #3: ce with Wyork to ensure
0
20
40
60
80
100
F
gPr
oces
sed
Prop
erly
data-entry pament personnividual caseto the indiv
fishing withame or fish, ovide propervered 5,384 covered in 2aft.
ed: Wildlife Violompleted. o the Stop Pe. The new readily acce
ve performalocation andeds are beinforce appro
sues. ta in the Wroutine basisy division tocludes the de
The percenoming statutethat 100% o
FY 04 FY 0
114
arameters to nel and SAL
es are downidual during
hout a licensetrespass, shor safety equviolations.
2007. Compl
lator Compa
Poaching prolocation has
essible.
ance in the nd duties of gang addressedoach to add
Wildlife Violas. o develop a Cesired enhanc
ntage of dames and Commof damage cl
05 FY 06
assist in preLECS dispa
nloaded to thg a one-step s
e, failure to oot from theuipment on w
This is a 10liance rates w
act data with
ogram applics made the p
next two yeame wardens.
dress chronic
ator Compa
CMS programcements of C
mage claims mission regulaims are pro
FY 07
eventing entratch to have he main syssynchronizat
tag a big ore road, take watercraft.
0.5 percent dwere up in s
and Departm
cation was chprogram mo
ars: s and wildlif
c, high prof
act data with
m that is comCMS2.
received/prulations (Perocessed acco
FY 08
ry errors. Thaccess to a
stem and thtion process
r trophy gambig game ouIn 2008 law
decrease fromsome areas o
ment license
hanged to thore prominen
fe technician
file or newl
h Departmen
mpatible wit
rocessed eacrsonnel in thiordingly).
he all he .
me ut w m of
e
he nt
ns
ly
nt
th
ch is

115
Story behind the performance: Wyoming statutes require that the Department, through regional terrestrial wildlife personnel, address damages by big game, trophy game and game birds. Addressing damage is completed by several methods including providing damage prevention materials, moving or removing the offending wildlife, setting seasons to reduce the number of animals in an area, doing habitat improvement projects or paying monetary compensation for damages caused by the wildlife. Damage prevention and evaluation work by regional terrestrial wildlife personnel varies statewide and is greatly influenced by species present and environmental conditions. Since FY 04, 100 percent of all damage claims received are processed each year in accordance with Wyoming statutes and Commission regulations. Damage claim numbers fluctuate yearly based on many factors including weather severity, drought, population levels and mitigation measures by the Department. What has been accomplished: Considerable efforts were made by Department personnel to prevent damage including hazing, zon guns, providing materials for stackyard fences, relocating trophy game animals, increasing harvest, depredation seasons, and as a last resort, “kill” permits. Department personnel continue to work to educate landowners and process damage claims. What we propose to improve performance in the next two years: Continue to work with landowners to mitigate damages by providing damage materials, moving or removing the offending animals, educating landowners, and processing damage claims. Program: Specialized Statewide Law Enforcement Division: Wildlife Mission: To provide support for Boating Safety and Stop Poaching programs throughout the state. To provide for specialized wildlife law enforcement investigations, issuance of permits and record keeping to all wildlife regions.
Program Facts: The Specialized Statewide Law Enforcement program is made up of two major sub-programs, listed below with number of staff and 2009 (FY 09) budget: Sub-programs # FTEs* 2009 Annual Budget Law Enforcement Administration & Boating Safety 3.0 $ 442,187** Law Enforcement Investigative Unit 7.0 683,886 TOTAL 10.0 $ 1,126,073
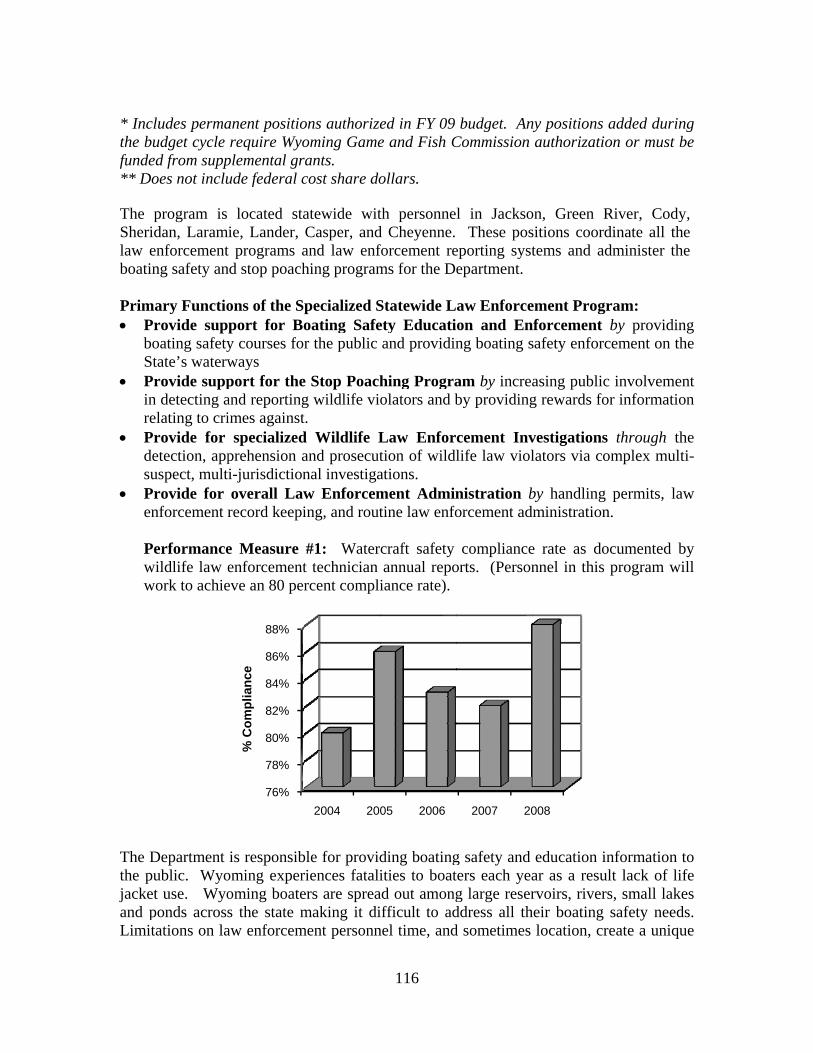
* Incthe bfunde** Do The Sherilaw eboatin Prim• P
bS
• Pinre
• Pdsu
• Pen Pww
The Dthe pjackeand pLimit
cludes permaudget cycle ed from suppoes not inclu
program is idan, Laramenforcementng safety an
mary FunctioProvide sup
oating safetytate’s waterw
Provide suppn detecting aelating to cri
Provide for etection, appuspect, mult
Provide for nforcement r
Performancewildlife law ework to achie
Department public. Wyoet use. Wyoponds acrosstations on la
anent positiorequire Wyo
plemental grude federal c
located staie, Lander, t programs and stop poach
ons of the Sport for Boy courses forways port for theand reportingimes against
specializedprehension ai-jurisdictionoverall Lawrecord keepi
e Measure enforcementeve an 80 per
is responsiboming experoming boates the state maw enforcem
76%
78%
80%
82%
84%
86%
88%
% C
ompl
ianc
e
ons authorizeoming Gamerants. cost share do
atewide witCasper, andand law enfhing program
pecialized Soating Safer the public
e Stop Poachg wildlife viot. d Wildlife Land prosecutnal investigaw Enforceming, and rout
#1: Watert technician rcent compli
ble for providriences fataliers are spreamaking it di
ment personn
2004 200
116
ed in FY 09 e and Fish C
ollars.
th personned Cheyenne. forcement rems for the D
Statewide Lety Educatiand providin
hing Prograolators and b
Law Enfortion of wildlations. ment Admintine law enfo
craft safety annual repoiance rate).
ding boatingities to boat
ad out amongifficult to adnel time, and
05 2006
budget. AnCommission
l in Jackso These pos
eporting systepartment.
aw Enforceon and Enng boating s
am by increaby providing
cement Invlife law viol
nistration borcement ad
complianceorts. (Person
g safety and ters each yeag large reserddress all thd sometimes
2007 20
ny positions authorizatio
on, Green Rsitions coordtems and ad
ement Progrnforcement safety enforc
asing publicg rewards fo
vestigations lators via co
by handling dministration
e rate as donnel in this
education inar as a resulrvoirs, rivers
heir boating location, cr
008
added durinon or must b
River, Codydinate all thedminister the
ram: by providin
cement on th
c involvemenor informatio
through thomplex mult
permits, lawn.
ocumented bprogram wi
nformation tlt lack of lifs, small lakesafety need
reate a uniqu
ng be
y, e e
ng he
nt on
he ti-
w
by ill
to fe es s.
ue

117
situation in addressing boating safety and education on a statewide basis. Responsibility for educating the public about boating safety, and the enforcement of boating safety laws and regulations, lies with the regional game wardens, trainees, wildlife technicians, and wildlife administration. During FY 09, up to seven wildlife technicians each spent approximately five man-months of time on watercraft safety and enforcement duties. Funding is received annually from the U.S. Coast Guard to assist with this effort. Since 2004 the average compliance rate has been 84 percent. The highest compliance rate was achieved in 2008 with an 88 percent compliance rate and 2004 had the lowest compliance rate with 80 percent. The watercraft regulations with the lowest compliance rate for 2008, in order of prevalence, were: fail to provide life jackets, fail to provide throwable flotation device, fail to provide fire extinguisher, registration and numbering violations, and fail to operate watercraft in accordance with buoys or markers. What has been accomplished: • Three wildlife technicians were hired and assigned to watercraft enforcement. • Two wildlife technicians received training at the Marine Patrol Officer Course in
Charleston, South Carolina. The U.S. Coast Guard operates the facility and provides the instructors and curriculum.
• Two Game Wardens attended a boat accident investigation class. This class is facilitated through the U.S. Coast Guard, NASBLA (National Association of Boating Law Administrators).
• The renewal of one boating Internet education curriculum program was approved. The other three Internet courses were not due for renewal approval in 2008. The Department continues to provide the Boating Basics correspondence course.
• Special permit authorization letters were issued for seven watercraft events. The events included such things as regattas, parades, and portable ski courses. The boating safety of both the participants and the public was evaluated before granting any request.
• Enforcement officers spent a total of 7,307 hours on boating safety. This includes time spent on law enforcement, safety and education programs, and search and rescue events.
• Officer responded to and investigated eleven accidents. What we propose to improve performance in the next two years: • Continue to increase the availability of boating safety courses to the public by
utilizing Internet course providers. • Continue to administer a proactive boating safety program through public service
announcements, boating education courses, and enforcement programs. • Coordination with U.S. Coast Guard to continue funding provided for the
Department’s recreational boating safety program. • Annual evaluations are conducted on our boating safety program to maximize our
education and enforcement efforts. Wildlife Technicians compile annual reports and statistics covering their boating season enforcement efforts.
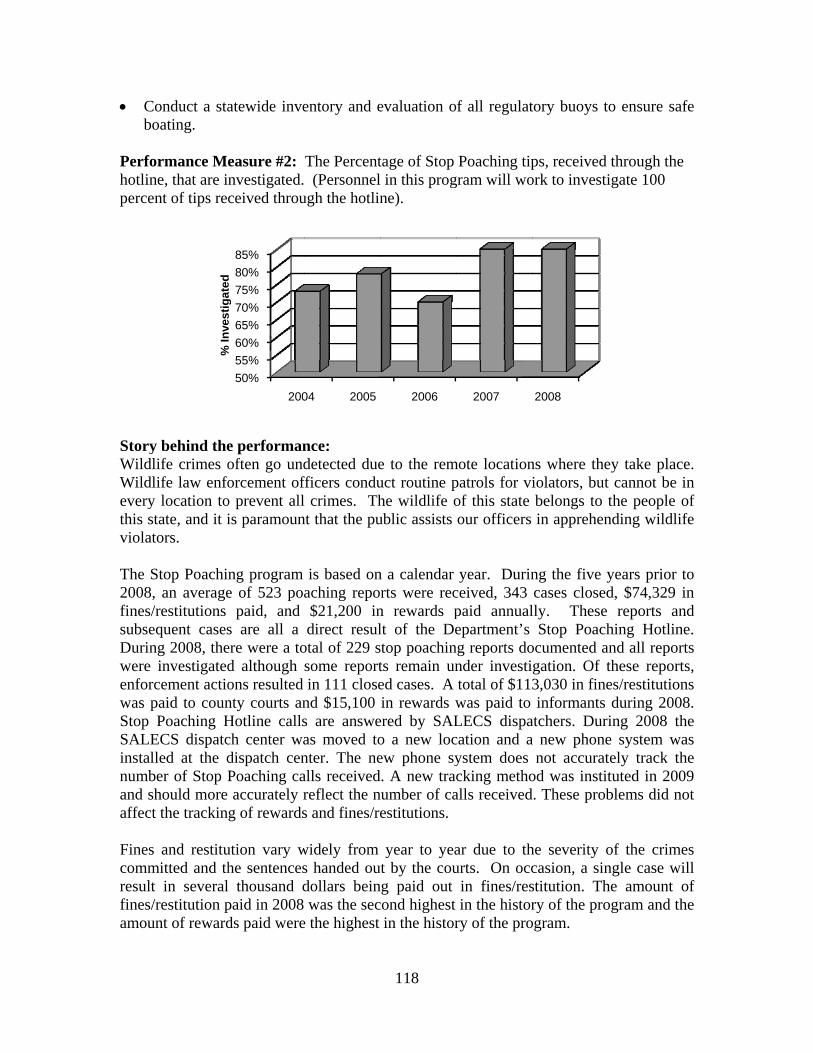
• Cb
Perfohotlinperce
StoryWildlWildleverythis sviolat The S2008fines/subseDurinwere enforwas pStop SALEinstalnumband saffect Finescommresultfines/amou
Conduct a staoating.
ormance Mene, that are inent of tips rec
y behind thelife crimes olife law enfo
y location tostate, and it itors.
Stop Poachin, an average/restitutions equent casesng 2008, the
investigatedrcement actiopaid to counPoaching H
ECS dispatclled at the dber of Stop Pshould more t the trackin
s and restitumitted and tht in several/restitution punt of reward
%In
vest
igat
ed
atewide inve
easure #2: nvestigated.ceived throu
e performanoften go und
forcement ofo prevent allis paramoun
ng program e of 523 poa
paid, and s are all a ere were a tod although ons resulted nty courts anHotline callsch center wadispatch cenPoaching caaccurately r
g of rewards
ution vary whe sentencesl thousand dpaid in 2008 ds paid were
50%55%60%65%70%75%80%85%
200
% In
vest
igat
ed
entory and e
The Percent (Personnel
ugh the hotlin
nce: detected duefficers condul crimes. Thnt that the pu
is based onaching repo$21,200 indirect resul
otal of 229 ssome reportin 111 close
nd $15,100 s are answeas moved tonter. The nealls receivedreflect the ns and fines/re
widely from s handed oudollars beinwas the sec
e the highest
04 2005
118
evaluation o
tage of Stop l in this progne).
e to the remuct routine phe wildlife oublic assists
n a calendar rts were rec
n rewards plt of the Destop poachints remain uned cases. A in rewards w
ered by SALo a new locew phone syd. A new tracnumber of caestitutions.
year to yeaut by the coung paid out cond highest
in the histor
2006
f all regulat
Poaching tipgram will wo
mote locationpatrols for viof this state our officers
year. Durinceived, 343 paid annualepartment’s
ng reports donder investitotal of $113was paid to LECS dispacation and aystem does cking metho
alls received
ar due to thurts. On occ
in fines/resin the histor
ry of the pro
2007
tory buoys t
ps, received ork to investi
ns where theiolators, butbelongs to tin apprehen
ng the five ycases closed
lly. These Stop Poach
ocumented agation. Of t3,030 in fineinformants
atchers. Duria new phone
not accuratod was institd. These prob
he severity ocasion, a sinstitution. Thry of the pro
ogram.
2008
o ensure saf
through the igate 100
ey take placet cannot be ithe people o
nding wildlif
years prior td, $74,329 i
reports anhing Hotline
and all reportthese reportes/restitutionduring 2008ing 2008 the system wately track thtuted in 200blems did no
of the crimengle case wihe amount oogram and th
fe
e. in of fe
to in nd e. ts s,
ns 8. he as he 09 ot
es ill of he

Wha• A
pr• D
w• T
Dan
Wha• C
v• C
th• C
Ditan
• Mca
• Ean
Perfoinves70 pe
StoryThe InvesInvessuper
at has been aA wide varie
romote awarDecals advertwildlife divisThe location Department’snd the applic
at we proposContinue to p
iolators. Continue to ahose people w
Continue to Department vtems will agand toll-free h
Monitor the alls are bein
Ensure that thnd the Stop P
ormance Mstigations byercent of thei
y behind theLaw Enfor
stigators stastigator positrvised by on
% H
ours
on
Inve
stig
atio
ns
accomplishety of promoreness of thetising the neion vehiclesof the link t
s home pagecation more
se to improvprovide a 24
approve monwho turn in
increase avehicles advain be purchhotline. SALECS trag accuratelyhe Stop PoacPoaching we
Measure #3y the Investigir time work
e performanrcement Invationed at otion has bee
ne supervisor
0%
20%
40%
60%
80%
100%
FY
ed: otional itemse program. ew Stop Poas. o the Stop Pe. The new readily acce
ve performa4-hour infor
netary rewarwildlife violawareness vertising thehased and di
acking systey documentedching toll-freeb link appe
3: Percentgative Unit.
king on inves
nce: vestigative or near regen vacant forr/investigato
05 FY 06
119
s were purch
ching phone
Poaching prolocation has
essible.
ance in the nrmation hotl
rds and to prlators. of this proe Stop Poacstributed to
em of the Sd. ee number, oar on all Com
tage of tim (Personnelstigations).
Unit is comgional officer most of th
or stationed a
6 FY 07
hased and di
e number are
ogram applics made the p
next two yeline for the
rovide certif
ogram throuching phoneadvertise the
Stop Poachin
out of state lommission R
me spent onl in this pro
mprised of es. Howevehis Fiscal repat the Caspe
FY 08
istributed to
e being place
cation was chprogram mo
ars: public to re
ficates of app
ugh tailgatee number. e Stop Poach
ng Hotline t
ong distanceegulation bo
n law enfogram will w
six full-timr, the Pineporting year.er Regional O
FY 09
the public t
ed on all new
hanged to thore prominen
eport wildlif
preciation fo
e decals oPromotiona
hing program
o ensure tha
e number, ooklets.
orcement/caswork to spen
me Wildlifedale/Jackson. The Unit iOffice. Uni
to
w
he nt
fe
or
on al m
at
se nd
fe n s it

120
members operate with unmarked vehicles and typically out of uniform. Personnel are equipped with modern evidence, surveillance, tracking, and other equipment. The Unit initiates many cases, but the bulk of cases are referred from District Wardens and other sources. The Unit conducts investigations that are generally complex, long-term wildlife violation cases utilizing specialized methods and equipment and beyond the time commitment Wardens can devote. Cases may be overt or covert in nature and are selected based on established priorities.
The Unit also carries a large “assisted” caseload. They assist Wardens from Wyoming as well as other jurisdictions including the U.S. Fish and Wildlife Service. Most of these cases take a great deal of time and can be active for several years. Each case may contain many defendants and many charges/violations. The Unit also has a large number of cases that are not worked due to time constraints and priorities.
Since FY 05, an average of 6,020 investigative hours were completed annually. In FY 09, the Unit was involved in hundreds of cases of all sizes and spent 7,470 hours investigating cases. Several undercover cases have also been worked. What has been accomplished: • Five Wildlife Investigators and one Investigator Supervisor were able to spend 7,470
hours working to solve wildlife crime. • Many cases have progressed including several covert cases. • Investigators have received more training to accomplish their work assignments. What we propose to improve performance in the next two years: • Continue to aggressively investigate wildlife violations. • Develop and utilize innovative techniques and technology to assist with our mission. • The Unit will seek updated surveillance equipment for investigations and provide
training to investigators in information technology based crime and the latest in information technology forensics. The Unit will also work with the electronic licensing program in this regard.
• Continue to evaluate Investigator duties and focus on major investigations thru supervision and quarterly Investigative Unit meetings.
• Fill the vacant Pinedale/Jackson Investigator position when the hiring freeze is lifted. Program: Statewide Terrestrial Wildlife Management Division: Wildlife Mission: Lead specialized, statewide conservation and management of native terrestrial wildlife species, and assist with regional management of resident game species.

121
Program Facts: The Statewide Terrestrial Wildlife Management program is made up of seven major sub-programs, listed below with number of staff and 2009 (FY 09) budget.
Sub-programs # FTEs* 2009 Annual Budget Biological Services 6.3 $ 905,846 Terrestrial Nongame 9.7 844,904 Migratory Game Bird (Waterfowl) 1.0 170,166 Trophy Game Mgmt. & Research 4.0 375,135 Trophy Game Conflict Resolution 6.0 536,075 Sage-Grouse Conservation 2.0 1,416,065 Predator Management 0.0 100,000
TOTAL 29.0 $4,348,191 * Includes permanent and contract positions authorized in FY 09 budget. Any positions added during the budget cycle require Wyoming Game and Fish Commission authorization or must be funded from supplemental grants. The sub-programs that comprise the Statewide Terrestrial Wildlife Management program were previously part of the Terrestrial Wildlife Management program (Strategic Plan FY 04-FY 07, November 2003). The Migratory Game Bird sub-program was previously referred to as the Waterfowl sub-program. The Trophy Game Management and Research sub-program was previously referred to as the Trophy Game sub-program. In addition, the Sage-Grouse Conservation sub-program was created and added as it’s own sub-program. This program has statewide responsibilities that are based in various locations throughout the state. Primary Functions of the Statewide Terrestrial Wildlife Management Program: • Assist with recovery and conservation of species that are threatened, endangered
or in greatest conservation need by developing and implementing plans and strategies, providing technical and financial assistance, collecting data, coordinating with other agencies and organizations, and conducting research.
• Participate in statewide terrestrial wildlife management by providing policy, data and environmental analyses, planning and evaluation, data collection, and trophy game conflict resolution; by compiling and administering statewide management data; and by representing the division or agency in multi-disciplinary and multi-organization conservation and management efforts.
• Contribute to harvest management of game species by conducting annual harvest surveys, compiling and analyzing harvest information; making recommendations on harvest strategies; and interstate coordination.
• Serve internal and external customers by providing and interpreting data, disseminating information about wildlife and its management, and providing additional related services.

Perfo(Perseleme
StoryThe nmeaselemeelemeworkservic Over of 97majorpercecompbeen priorilatitu
In FYpreseWildlfor vprojeThe Cand dStratedraft
ormance Monnel in thients which a
y behind thenumber of mure of Biolents have raents have ra
k elements aces to the De
the past fiv
7 percent of r work plan
ent) were cpletion of the
a challengeity assignme
ude in their a
Y 09, signifientation on slife (TRW)
various purpects, and comCheyenne Sdocument reegic Plan thaof that plan
% W
ork
Plan
Ele
men
ts A
chie
ved
(Bio
. Ser
vice
s)
Measures #1:s program w
are planned f
e performanmajor and mlogical Servanged betweanged betweare selected epartment an
ve years, theits major welements w
completed. e strategic we because thents delegat
annual schedu
ficant unplansage grouse Committee,oses, develompleting pe
Staff Biologieviews againat he and a mis now close
60
65
70
75
80
85
90
95
100
FY 0
: Biologicalwill work tofor a single y
nce: minor work vices’ annuaeen 18 (FY en 16 (FY 0based on th
nd to externa
Biological work plan elewere complet
The only wetland plan.he section fted to it eacules in antic
nned work ecaptive rear
, preparing coping a newending itemsist was requn this year. multi-disciple to complet
05 FY 06
122
l Services - complete ayear).
plan elemenal performan08) and 21
04 and FY 0he importanal customers
Services subements. In ted, and 16 major work Accomplisfaces a numch year. Thcipation of th
elements incring for the compilations
w process fos assigned touired to cont
Significant linary group tion.
FY 07
Major workat least 95 pe
nts achievednce. In re(FY 05) an
09) and 19 (nce of theses.
b-program hFY 09, 95 pof the 16 mk plan elemshing all of th
mber of unplhe section’s hese unplann
luded helpinlegislature’
s of big gamor identifyino the sectiotinue helping
progress whave been t
FY 08
k plan elemeercent of the
d continue toecent years, nnually, and(FY 05) anne particular
has completepercent (18
minor work ement not ahe elements lanned, urgepersonnel i
ned assignme
ng develop as Travel, Re
me managemng and selecon by the adg with polic
was made ontrying to dev
FY 09
ents achievee major wor
o be the solmajor wor
d minor wornually. Thesproducts an
ed an averagof 19) of th
elements (10achieved wa
has routinelent or higheinclude soments.
a PowerPoinecreation an
ment statisticcting researcdministrationcy, regulation the Wetlanvelop, and th
ed rk
le rk rk se nd
ge he 00 as ly er
me
nt nd cs ch n.
on nd he

123
The major and minor work plan elements identified annually constitute a large percentage of, but not all, the duties and tasks for which the section is responsible. The major work plan elements listed are, for the most part, not expendable. Each is important to someone, and in some cases, is significant to a broad range of internal and external customers. What has been accomplished: The major work plan elements for FY 09 were: conduct big and trophy game harvest surveys; conduct small and upland game harvest surveys; produce and distribute annual harvest survey reports, big game job completion reports and other special reports for the division; provide information and assistance to the local public regarding urban and injured wildlife situations; coordinate Convention on International Trade of Endangered Species (CITES) tagging of harvested bobcats and prepare the annual CITES bobcat tagging and population analysis report; supervise the nongame and migratory game bird programs; provide technical assistance to the division and Department administrations; prepare the Commission season setting notebook; prepare the weather appendix for the big game job completion reports; assist with preparation of the Department’s annual report; represent the Department on flyway council technical committees; compile black bear and mountain lion harvest data and maintain the hunt area quota hotlines; manage statewide population and harvest databases; participate on the Habitat Advisory Technical Group, including review and ranking of proposals for funding and revision of the State Wildlife Action Plan (SWAP) for species of greatest conservation need; review big game hunting season proposals; fiscal planning and administration; participate in interstate sage grouse conservation planning; participate in the wind energy task force development of mitigation recommendations; and develop the state wetland strategic plan. The minor work plan elements for FY 09 included: maintain herd unit files; continue preparing legacy harvest survey reports for posting on the intranet; assist regions with wildlife surveys, hunter check stations and chronic wasting disease surveillance; order and distribute supplies for tooth sampling in some big game herds; format and print documents; interagency coordination; fulfill Wildlife Observation System (WOS) report requests; policy and other analyses; document review and comment; represent the agency on the Wyoming Natural Diversity Database Advisory Board and Wyoming Landscape Conservation Initiative; interagency coordination and outreach; intra-agency committees (Mule Deer Working Group, Pronghorn Working Group); develop databases and fulfill data requests; maintain bird banding records and administer the agency’s banding permit; coordinate mourning dove coo count surveys; and assist other work units. What we propose to improve performance in the next two years: • The section will continue to plan work schedules of section personnel to accomplish
the tasks we can anticipate and accommodate unplanned assignments. • Finalize the long-standing technical issues with the in-house harvest survey (harvest
survey select) software so those surveys can be conducted efficiently. These issues are being addressed and plan to have them resolved in the next few months.

• O
DataWhilsuccesub-pinterneffortthe spropoof saServi As a servicour oexplatechnlast fto thehas bmeas Perfoachiemajor
StoryThis plan harveTechnHunt
Orient and tra
a developmee the numbess, it does nprogram welnal and extert, but not ofsub-programosed to deteratisfaction wices.
secondary ces receivedown, internaain responsenical assistanfew years’ ine performan
been used theures that bet
ormance Meved (Personr work elem
y behind thesub-programelements fo
est surveys,nical Comm, budget pre
% W
ork
Plan
Ele
men
ts
Achi
eved
(Mig
rato
ry G
ame
Bid
)
ain new emp
ent agenda: ber of worknot address tll, which is rnal customef effect. Al
m’s performarmine annua
with the inf
measure, ind. This latteral purposes. es related tonce. Questionternal satisfnce measure e preceding tter represen
Measures #2nnel in this
ments which a
e performanm was formor the Migra hunting re
mittee functieparation, dis
6065707580859095
100
FY
Bird
)
ployees in tw
k elements the primary,providing i
ers. The nulthough no sance, by neally through formation an
nternal clientr measure co The inform
o the satisfaons about thfaction surveof satisfactiseveral year
nt the broad r
2: Migratprogram wi
are planned f
nce: erly called “atory Game egulation reions and ressemination
Y 05 FY 0
124
wo positions
achieved an, overarchinginformation,
umber of worsingle perforcessity onlythe Internal
nd technical
ts could be ould be trackmation gatheaction questihe section’s eys. At somion rather thrs. The sectiresponsibilit
tory Game ill work to for a single y
“Waterfowl Bird sub-pr
ecommendatesponsibilitieof informati
06 FY 07
created by v
nnually prog function o assistance rk elements rmance meay one must l Client Satil assistance
queried regked primarilered about tion associateperformanc
me point, thehan the workion will contties of the su
Bird - Majcomplete atyear).
Managemenrogram incltions, Centres, Bump-Sion, advocat
FY 08
vacancies thi
ovides someof the Biologand technicachieved is
asure adequabe selected
sfaction Surprovided b
garding the ly by the subhis second med with infoe have been section cank elements tinue efforts
ub-program.
ajor work pt least 75 p
nt”. Major ude: popularal and Pacullivan Manting protecti
FY 09
is summer.
e measure ogical Servicecal support t
a measure oately portrayd. We havrvey the leveby Biologica
timeliness ob-program fomeasure maormation an
n asked in thn now conveachieved tha
s to determin
plan elementercent of th
annual woration surveycific Flywanaged Gooson/mitigatio
of es to of ys ve el al
of or ay nd he rt at ne
ts he
rk s,
ay se on

125
of migratory game bird habitat, annual completion reports, and management of goose nesting structures. Annual work plan elements are identified by program personnel prior to the fiscal year. The number of major work plan elements achieved has been the sole measure of the sub-program’s performance. Work plan elements reflect primarily the duties within the mission of the sub-program and are vital to manage migratory game birds at state and interstate scales. Since FY 05, the Migratory Game Bird Management sub-program completed an average of 80 percent of its annual major work plan elements. In FY 09, 80 percent (eight of 10) of the major annual work plan elements (and 90 percent of the minor work plan elements) were completed. Of the 10 major work plan elements listed, one was not attainable due to drought and lack of water in Bump-Sullivan Reservoir. The other element not achieved was completion of the annual job completion report (JCR) in a timely manner. Duties for the Pacific Flyway are divided among the Central Flyway Migratory Game Bird Biologist, Jackson Nongame Biologist and the Alpine Staff Biologist. The Central Waterfowl Biologist and the Nongame Biologist conduct migratory game bird surveys. The Alpine Staff Biologist represents the Department at the Pacific Flyway Technical Committee meetings and is responsible for recommending migratory game bird seasons in the Pacific Flyway in collaboration with the Central Flyway Migratory Game Bird Biologist. In FY 09, the priority of banding was reduced, resulting in no banding of migratory game birds. The Migratory Game Bird Section is providing financial support to help fund the preseason duck banding effort being carried out in the Central Flyway. Another priority is to maintain and evaluate over 800 goose nesting structures throughout the state. In response to reductions in personnel and funding, and considering the breeding population of Canada geese in Wyoming has increased 32 percent over the past 20 years, the Department is evaluating the need and ability to annually replace bedding and maintain the structures. Less effective structures, which geese don’t regularly nest on, are being eliminated where possible. The Migratory Game Bird Section participates in cooperative annual surveys to estimate waterfowl populations and provides information necessary for setting waterfowl seasons. These surveys include the September crane, mid-winter waterfowl, and Canada goose breeding surveys. In addition, a goose molting survey is conducted every fifth year. The Migratory Game Bird Section remains strongly involved in migratory game bird management, development and revision of management plans for the various migratory game bird populations, and annual season setting in both the Central and Pacific Flyways. These processes require representatives from Wyoming to participate in the Flyway Technical Committee meetings held in December/January, March and July.

126
The Migratory Game Bird Section is also directly or indirectly involved in the management of migratory nongame birds in the two Flyways. For example, the section has been increasingly involved with trumpeter swan management. What has been accomplished: The Migratory Game Bird Biologist coordinated surveys to collect waterfowl and sandhill crane harvest and population data, analyzed the data, prepared recommendations for the migratory game bird hunting seasons, and represented the Department at the Central Flyway Technical Committee meetings. The Alpine Staff Biologist represented the Department at the Pacific Flyway Technical Committee meetings and, in collaboration with the Central Flyway Migratory Game Bird Biologist, recommended migratory game bird seasons in the Pacific Flyway. The Central Flyway Migratory Game Bird Biologist participated in the Central Flyway Wingbee. The Migratory Game Bird Section participated in cooperative annual surveys to estimate migratory game bird populations and provide information necessary for setting hunting seasons. These surveys are done in cooperation with the U.S. Fish and Wildlife Service and included mourning dove, September crane, mid-winter waterfowl, and Canada goose breeding surveys. The Migratory Game Bird Section remains strongly involved in Central and Pacific Flyway administrative processes including migratory game bird management, development and revision of management plans, and setting annual hunting seasons. These processes require attendance at the Flyway Technical Committee meetings in December/January, March and July. The goose nesting structure database was updated with current information. The 2008 annual completion report was written and filed with Biological Services. Information and data were provided in response to all inquiries. The annual budget was prepared and funding support to the Central Flyway preseason duck banding effort was provided, which banded ducks in North Dakota during FY 09. Another spring light goose hunting season was conducted under the Arctic Tundra Habitat Emergency Conservation Act in the Central Flyway portion of the state. The Section advocated conservation of migratory game bird habitat through its involvement in the Intermountain West and Northern Great Plains Joint Ventures, and participation in the Statewide Wetland Strategy working group. The Section made additional headway with the breeding duck density project. Database and spreadsheet capabilities were used to rank breeding duck densities obtained from past breeding duck surveys in Wyoming. The results were depicted in geographic information system (GIS) format.

127
The Alpine Staff Biologist and Jackson Nongame Biologist worked with the Pacific Flyway Study Group to complete revision of the Rocky Mountain Population (RMP) trumpeter swan management plan. What we propose to improve performance in the next two years: • Prioritize work elements; some work simply will not get done due to staffing
limitations and other demands. • Improve coordination and communication with other Department personnel whose
duties may have some bearing on goals and objectives of the Migratory Game Bird Section, and with those personnel who are occasionally requested to assist with surveys, banding, and other functions.
• Submit a request for a student intern semi-annually. • Investigate other pathways to increase technical and clerical assistance. • Continue to justify the need for another full-time Migratory Game Bird biologist to
cover the western (Pacific Flyway) portion of the state. • Continue to plan work schedules to accomplish those tasks we can anticipate and
accommodate unplanned assignments, possibly by not completing some of the less critical work plan elements.
Data development agenda: While the number of work elements achieved annually is not an ideal measure of success, it seems to provide the most workable single measure of success given the diversity of duties within the sub-program. An alternative would be the number of (hunter) annual recreation days associated with migratory game birds. However, there are many things that influence that number, including bird reproduction and survival in other parts of the continent, weather during the migration period and changes in the federal regulatory frameworks, which are beyond the influence of the Migratory Game Bird sub-program personnel. As well, the number of recreation days is only one of the outputs that might be important to the external customers of this sub-program. We will continue to investigate better performance measures for the sub-program.

Perfoin thiwhich
StoryThis informall of MajopopucolonRecoand ain easdissemplannmajor A limcontinmanaworkthe nulistinGovebeen Howeaddit Wha• A
C
ormance Mis program wh are planne
y behind thesub-program
mation on of the major w
or work plan lation trends
nial nesting wrds committ
associated hastern Wyommination of
ning to assistr elements.
mited numbenue to be t
agement conk that needs tumber of spg has greatly
ernor’ budgeextremely
ever, the lonional perman
at has been aAs outlined inCWCS the b
% W
ork
Plan
Ele
men
ts
easure #3: will work to
ed for a singl
e performanm is responver 300 spe
work plan ele
elements ins of bald eagwater birds; tee; black-foabitats; black
ming; compleinformationt with implem
er of elementhe focus. ncerns and tto be accom
pecies proposy increased wet along with
helpful fong-term effenent personn
accomplishen Appendix bird and ma
0
20
40
60
80
100
FY
Achi
eved
(Non
gam
e)
Nongame –o complete le year).
nce: nsible for mcies of birdsements ident
clude strateggles, peregrincoordination
ooted ferret rk-tailed prairtion of State
n. Grasslandmentation of
nts that can bFunding withe strategy
mplished and sed for listinworkloads. h Federal apr initiating
ectiveness ofnel and the s
ed: VII of the S
ammal inve
Y 05 FY
128
– Major worat least 95
monitoring, s and 100 sptified prior to
gy administrne falcons, trn of Partnersreintroductiorie dog survee Wildlife Grd ecosystem mf the State's
be reasonablll never be consistentlywork that c
ng and the nNew state fu
ppropriationsnew proje
f additional short-term or
State Wildlifntory and m
06 FY 07
rk plan elempercent of t
managemenpecies of mao the fiscal y
ration and plrumpeter sws in Flight anon and moniteys; swift forants projectmonitoring aWildlife Ac
ly completedsufficient t
y faces a laran be accom
need to workfunding froms such as Stects throughfunding is l
r inconsisten
fe Action Plamonitoring p
7 FY 08
ments achievethe major w
nt and dissammals. As year were ac
lanning; monwans, commond Wyomingtoring; invenox surveys; rts, and reporand managemtion Plan we
d with existito address arge discrepa
mplished. Thk on many ofm the generaltate Wildlifeh grants anlimited by rent nature of f
an (SWAP),plan was co
FY 09
ed (Personnework element
emination oin years pas
ccomplished
nitoring on loons, g Bird ntory of bats aptor survey
rts and ment ere added as
ing personneall species oancy betweehe increase if these beforl fund and the Grants havnd contractestrictions ofunding.
, formerly thontinued an
el ts
of st .
ys
el or en in re he ve s.
on
he nd

129
includes several levels of monitoring intensity. In FY 09, annual monitoring of population trends was conducted on species such as the bald eagle, common loon, long-billed curlew, upland sandpiper, peregrine falcon, trumpeter swan, and black-footed ferret. Species with baseline data and repeated surveys every three to five years were surveyed and included American bittern and other colonial waterbirds, black-tailed prairie dog, several species of bats, and swift fox. Monitoring efforts that serve as a coarse filter for early detection of birds that may need to be included in Wyoming’s species of greatest conservation need (SGCN) list continued. This effort included 63 roadside breeding bird survey routes, 168 point count transects, and several riparian transects and one banding station. Baseline surveys for boreal owls, the yellow-billed cuckoo, and three-toed and black-backed woodpeckers initiated.
• As identified in the SWAP, recovery efforts for the black-footed ferret continued and in FY 09 included habitat mapping and monitoring a portion of the ferret population (582 personnel hours were extended toward conducting spotlight surveys that identified over 104 individual ferrets with mark recapture efforts estimating 239 ferrets in the 20,000 acre study area); Extrapolating this estimate of ferrets in the study area to the distribution of ferrets in adjacent habitats provides an estimate of 500 – 1,000 ferrets.
• Progress continued on the Department’s Green River Basin Trumpeter Swan Summer Habitat Planning Project (State Wildlife Grant 2003-2004) to develop habitat for the expanding population. Four swan wetland habitat projects on private lands in the Green River basin were completed in FY 09. A number of additional wetland project proposals were reviewed that could benefit swans.
• Along with the new funding sources, the necessary planning and administration allowed for the initiation of numerous grants and contracts to collect more baseline information on: sagebrush bird and mammal obligates, nesting raptors in the Wyoming Range, expanded statewide grid sampling for birds, initiating a monitoring program for important bird areas, an evaluation of the ferruginous hawk population status, Wyoming pocket gopher, pygmy rabbits, Preble’s meadow jumping mouse and baseline inventories of small mammals in Thunder Basin.
• During FY 09, most of the previous 10 Landowner Incentive Program (LIP) funded projects were completed; however, the Shirley Basin I project was delayed but will be completed by 1 December 2009. Some vegetation and species monitoring on all of the projects were implemented.
• An additional five LIP projects were implemented. Four of the new projects are black-tailed prairie dog incentives that will help conserve 487 acres (197 hectare) of ecologically important prairie dog colonies in the Thunder Basin, a Department priority habitat area, and contribute to the Department’s objectives of maintaining population numbers of black-tailed prairie dogs, and improving grassland habitat heterogeneity. These projects will benefit several SGCN, including the burrowing owl, mountain plover, and ferruginous hawk.
• The fifth project treated 3,270 acres (1,323 hectares) of sagebrush habitats located near active sage grouse leks, and implemented an innovative dormant season grazing program to create quality nesting habitat for Greater sage grouse and underrepresented habitats for sagebrush obligate SGCN.
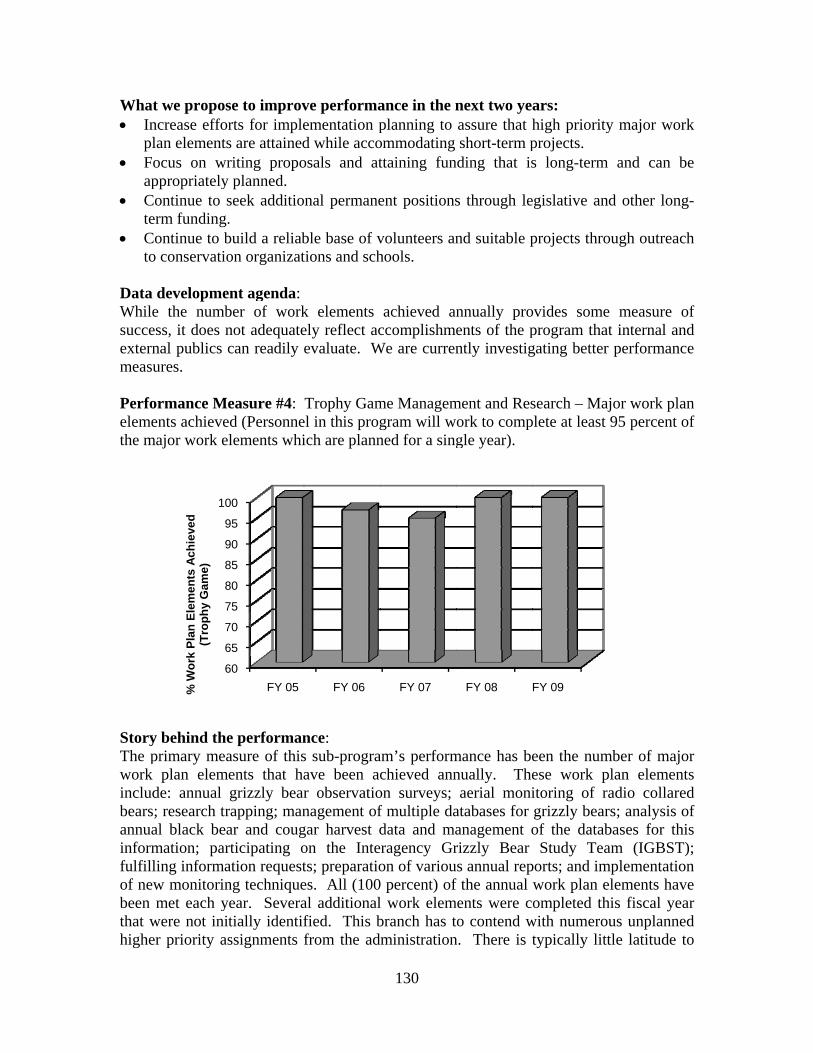
Wha• In
p• F
ap• C
te• C
to
DataWhilsucceexternmeas
Perfoelemethe m
StoryThe pworkinclubearsannuainformfulfilof nebeen that whighe
at we proposncrease efforlan elementsocus on wrppropriately
Continue to serm funding.
Continue to bo conservatio
a developmee the numbess, it does nnal publics cures.
ormance Ments achieve
major work e
y behind theprimary mea
k plan elemde: annual
s; research tral black beamation; parling informa
ew monitorinmet each y
were not inier priority as
6
6
7
7
8
8
9
9
10
% W
ork
Plan
Ele
men
ts A
chie
ved
(Tro
phy
Gam
e)
se to improvrts for imples are attainedriting propo
y planned. seek additio. build a reliabon organizat
ent agenda: ber of worknot adequatecan readily e
easure #4: ed (Personnelements whi
e performanasure of thisents that hagrizzly bear
rapping; manar and cougrticipating oation requestng techniqueyear. Severatially identifssignments f
60
65
70
75
80
85
90
95
00
FY 05
ve performaementation pd while accoosals and at
nal permane
ble base of vtions and sch
k elements ely reflect acevaluate. W
Trophy Gamel in this progich are plann
nce: s sub-prograave been acr observationagement ofgar harvest don the Intets; preparatioes. All (100al additionalfied. This bfrom the ad
FY 06
130
ance in the nplanning to ommodating ttaining fun
ent positions
volunteers anhools.
achieved anccomplishme
We are curren
me Managemgram will wned for a sing
am’s performchieved ann
on surveys; f multiple dadata and ma
eragency Gron of variou
0 percent) of l work elembranch has tdministration
FY 07
next two yeassure that hshort-term p
nding that is
s through le
nd suitable p
nnually proents of the pntly investig
ment and Resork to compgle year).
mance has benually. Theaerial moni
atabases for anagement orizzly Bear
us annual repf the annual
ments were co contend w
n. There is t
FY 08
ars: high priorityprojects. s long-term
egislative an
projects thro
ovides someprogram thatgating better
search – Majplete at least
een the numese work pitoring of ragrizzly bearof the datab
Study Teaports; and imwork plan eompleted th
with numeroutypically litt
FY 09
y major wor
and can b
d other long
ough outreac
e measure ot internal an
r performanc
jor work pla95 percent o
mber of majoplan elementadio collarers; analysis obases for thiam (IGBST
mplementatioelements havhis fiscal yeaus unplannetle latitude t
rk
be
g-
ch
of nd ce
an of
or ts
ed of is );
on ve ar ed to
131
adjust section personnel’s assignments. While we do anticipate several unplanned events annually, the frequency and number cannot be predicted. What has been accomplished: • Management/Research trapping of grizzly and black bears. • Conduct aerial monitoring of radio collared grizzly bears. • Coordinate and conduct observation flights. • Manage database for telemetry flights. • Conduct numerous information and education programs. • Manage black bear and mountain lion harvest databases and prepare annual harvest
summaries. • Represented the Department at Regional and National meetings for black bears and
cougars. • Assisted with cougar conflict resolution and capture issues. • Initiated development of a new aging guided for black bears. • Participated in the IGBST, Yellowstone Grizzly Coordinating Committee (YGCC),
and Interagency Grizzly Bear Committee (IGBC) committees. • Sampled two black bear den sites per ongoing fecundity study. • Conducted remote sensing camera operations to document grizzly bear distribution.
Prepared annual report on findings. • Initiated study to update distribution data for grizzly bears. • Prepared chapters for annual IGBST Report. • Obtained additional funding through the Yellowstone Grizzly Bear Conservation
Strategy to assist with data collection, nuisance management, and information and education efforts.
• Represented the Department on Western Association of Fish and Wildlife Agencies (WAFWA) meetings to revise cougar management guidelines. Authored several chapters.
• Completed all reporting requirements for Federal Section 6 and Conservation Strategy funding.
• Continued to develop internal hunting regulations for grizzly bears. • Continue to coordinate with Idaho and Montana for allocating discretionary grizzly
bear mortality. • Prepared two research proposals for cougars. • Prepared one research proposal for black bears. • Provided comments and edited several research proposals for trophy game species.
What we propose to improve performance in the next two years: • Continue to meet with regions related to black bear and cougar management issues. • Continue development of draft hunting regulations for grizzly bears. • Continue to develop allocation process for grizzly bear hunting allocations. • Explore options for annual reporting of grizzly bear data.

DataBecauto detprogras a pperfopublinew continfound Perfoprogr
StoryAs ofknowotheronce.leks c The Wa minrequimalesknowtrendoccupnumbdistur(subdactiviWyom
a developmeuse of the ditermine a sinram’s annuaperformance
ormance of ics, which isstrategic planue and willd.
ormance Mram will wor
y behind thef the spring
wn occupied r agencies, v. This is the checked in th
Wyoming Gnimum of 1ires knowleds attending
wn, new leksds has increpied leks, asbers of inarbance and fdivisions, roaity. These imming.
2
4
6
8
10
% o
f lek
s su
rvey
ed
ent agenda: iversity of tangle alternat
al performane measure. Tthe sub-prog
s a fundamenanning effortl supplant th
Measure 5: rk to survey
e performanof 2009 (ensage grouse
volunteers asame percenhe previous
Greater Sage ,650 known
dge of the lothe leks eac are discove
eased dramas well as the
active and ufragmentatioads, power lmpacts are b
0%
0%
0%
0%
0%
0%
2004
asks this subte performance, the SectiThe number gram that wntal criteriont. Investiga
he current on
Percentageat least 75 p
nce: nd of biologe leks. Depaand consultantage of leks10 years (bi
Grouse Conn occupied location of alch year. Wered each yeaatically since proportionunoccupied on primarilylines, gas webeing increas
4 2005
132
-program is nce measure ion will conof work ele
would be apn for establi
ation into mene with some
e of known percent of the
gical year 20artment pers
ants, surveyes checked as ological yea
nservation Plleks. Monitl or most lek
While it is prar. The effo
ce 1998 andn of leks sur
leks is iny associated wells, compresingly docum
2006Biological Y
expected to that satisfac
ntinue to useements achiepparent or imishing perforeasures that ething more
leks surveye known sag
008) there wsonnel, togeed 78 percethe previous
ars 1998-200
lan (2003) estoring sage ks along wit
resumed the ort to monitod therefore,rveyed has i
ncreasing duwith increasssor stationsmented and
2007Year
perform andctorily represe work elemeeved does nomportant tormance measatisfy this appropriate
yed. (Persoge grouse lek
were approxither with pe
ent of these s year. The
07) averaged
stablished angrouse poputh the averaglocation of
or sage grou the numbeincreased. Hue to contising human s, etc.) and tquantified b
2008
d the inabilitsents the subents achieveot address th many of it
asures for thicriterion wiif one can b
onnel in thiks).
imately 1,99ersonnel from
leks at leasproportion o
d 73 percent.
n objective oulation trendge number o
f most leks ise populatioer of knowHowever, thinued habitainfrastructurthe associateby research i
ty b-ed he ts is ill be
is
98 m st of
of ds of is
on wn he at re ed in

133
The Wyoming Greater Sage Grouse Conservation Plan (2003) also established an objective of an average “count” of 28 males/lek, not to fall below 10 males/lek during cyclical lows. The average number of male sage grouse observed on leks also indicates population trend if the number of leks is stable. From biological years 1999-2003 the number of known occupied leks increased due to increased monitoring effort. At the same time the average number of males observed decreased, in large part to drought, but also due to increasing disturbance and fragmentation associated with natural gas development. In biological years 2004-2005, the average number of males/lek increased due to timely spring precipitation that resulted in a large hatch and high survival of chicks. Most of the increase occurred in habitats relatively undeveloped with human infrastructure. The return of drought conditions in calendar years 2006 and 2007 resulted in declining sage grouse numbers over the last three years. In the spring of 2009, the average number of males on “count” leks was 26, down from 46 in the spring of 2006. In December 2007 a federal District Court judge ruled the U.S. Fish and Wildlife Service must reconsider its 2005 decision of “not warranted” for listing greater sage grouse as threatened or endangered under the Endangered Species Act. The Service delayed a status decision pending publication of a refereed volume of sage grouse information scheduled for publication in mid-2009. In June 2009 the judge ruled the Service must complete their review by February 26, 2010. Wyoming and the other western states occupied by sage grouse have worked individually and together via the Western Association of Fish & Wildlife Agencies (WAFWA) to provide the Service with the information it needs to conduct this review. What has been accomplished: • In an unprecedented move to coordinate sage grouse conservation efforts across the
state and thereby help preclude the need for the Service to list greater sage grouse as threatened or endangered, Gov. Dave Freudenthal released an Executive Order on Aug. 1, 2008 that directs state agencies to work to maintain and enhance greater sage grouse habitat in Wyoming. The focus of this effort is the maintenance and enhancement of those sage grouse habitats and populations within the “Core Population Areas” identified in 2007 by the Governor’s Sage Grouse Implementation Team. Implementation of the Executive Order and core area management concept has resulted in state and federal agency policy and stipulation changes, modifications of projects being implemented by the oil and gas industry and curtailment or modification of some wind energy developments.
• The eight local sage grouse working groups established in 2004 completed preparation of their respective conservation plans in 2006 and 2007. The plans are currently being implemented utilizing Wyoming General Fund appropriations ($2.6 million) together with other public and private funding sources. To date, approximately 100 individual projects have been implemented to benefit sage grouse ranging from on-the-ground habitat improvements, applied research, monitoring, and public outreach. While the recent sage grouse population trends cannot be attributed to these projects, long-term monitoring will ultimately measure their effectiveness. Additional projects will be implemented over the coming biennium as a result of new General Fund appropriations.

• Asapinin
Wha• W
trgrgrT
• Timan
• Sefloen
DataWhilpopuestimto dev Also,outsidDepaFeder Perfo(Pers
Annual job cage grouse planning areanterpretationnformation in
at we proposWhile weatherends in Wyrouse and throup plans a
Team. The departmmprove accund utilizing ttatewide sagffort will gocations thanhancement
a developmee the numblation trend
mate. Effortsvelop better
, almost all ode the super
artment empral agencies
ormance Monnel in this
1
Res
pons
e Pe
rcen
tage
ompletion repopulation sas along withn and distrn Wyoming
se to improver events anyoming’s saheir habitats and the recom
ent’s sage guracy of thethe data. ge grouse sgreatly enhaat would .
ent agenda: ber of occu
d informations are underwpopulation e
of the ultimarvision of thloyees outsiand branche
easure #6: s program w
6065707580859095
100
2004
eports for sastatus and mh a statewidribution of.
ve performand the natioage grouse pwill continu
mmendation
grouse datab data and ef
easonal habance managor would
upied leks n, it does nway within testimation te
ate performahis programide the chaies of governm
Trophy Gamwill respond t
2005
134
age grouse wmanagement de analysis. Tf sage gro
ance in the non’s energy population, ue via imple
ns of the Gov
base will befficiency of
bitat mappingement of s
not benefi
and averagnot provide the WAFWAechniques.
ance of this m. These en
n-of-commament, corpor
me Conflict Mto 95 percent
2006Calendar Year
were prepareupdates fromThese docum
ouse popula
next two yepolicy will efforts to p
ementation overnor’s Sag
e revised anf those collec
ng is underwsage grouseit from ha
ge males/leka statistical
A Sage-grou
sub-programntities includand of this prations, and
Management of trophy g
2007 2
ed. These rem the eight ments aid ination and
ars: greatly dete
proactively of the eight le Grouse Im
nd upgradedcting, enteri
way. The ree by better abitat prote
k provides lly defensibluse Technica
m is dependede a cadre oprogram, oththe weather
nt – Conflict game/human
008
ports providconservatio
n the analysimanagemen
ermine futurmanage saglocal workin
mplementatio
d in order ting, reportin
esults of thiindentifyin
ction and/o
sage grousle populatioal Committe
ent on entitieof volunteerher State anr.
response ratn conflicts).
de on s, nt
re ge ng on
to ng
is ng or
se on ee
es s,
nd
te

135
Story behind the performance: The measure of this sub-program’s performance has been the response rate to the number of reported conflicts between trophy game animals and humans. Actions involved in responding to trophy game conflicts vary by incident type and severity, but may include relocating animals, removing animals, preventative measures, education, monitoring, investigation, or no action. Since 2004, the Trophy Game Conflict Management Section has responded to an average of 94 percent of the conflicts reported by the public. Some conflicts are reported well beyond the time when a response is appropriate and are only logged in the database. Because the section spends a great deal of time responding to conflicts, the number and nature of which are difficult to predict, personnel allow for a certain amount of uncommitted time in their annual work schedules, especially during the black and grizzly bear non-denning period. The number of conflicts managed annually constitutes a large percentage of, but not all, the duties and tasks for which the section is responsible. What has been accomplished: The section responded to 95.5 percent (n=210) of reported (n=220) conflicts between humans and black bears, grizzly bears, gray wolves, and mountain lions during the reporting period. The section investigated, managed or mitigated all conflicts where a response was appropriate. Some conflicts are reported long after the incident making a site response unnecessary. What we propose to improve performance in the next two years: • Continue to respond to and manage the majority of conflicts reported by the public. • Accommodate unplanned assignments. Data development agenda: We will continue to track the trend in number and types of conflicts as an index to response demand. The conflict Management sub-program will determine its effectiveness by calculating the percentage of reported conflict situations responded to by section personnel. Program: Strategic Management Division: Services Mission: Facilitate the Department’s ability to make informed wildlife conservation decisions through improved future planning efforts and management effectiveness.

Progprogr
*Incladdedautho This Prim• F
dom
• Fdtounpu
Perfo(Perssatisf
StoryThe Sthe Dand trepor
gram Facts:ram, listed b
Sub-progrStrategic
ludes permand during thorization or m
program is l
mary FunctioFacilitate thdecisions thr
f strategic pmeasure progFacilitate thdecisions thro natural resonderstand aublicly supp
ormance Monnel in th
fied with the
y behind theStrategic Ma
Department ttrend forecarting on the
0
20
40
60
80
100
% E
mpl
oyee
s Sa
tisfie
d
: The Stratelow with nu
ram Managemen
nent and conhe budget must be fund
located in th
ons of the She Departmrough improvplans, we imgress in achiehe Departmrough improvource-related
a diverse grported manag
Measure #1:his program e services pro
e performananagement Cto measure pasting. The SDepartment
FY 05
tegic Managumber of sta
# FTEnt 1.0
ntract positicycle requ
ded from sup
e Departmen
trategic Mament’s abilived future p
mprove the Deving them.
ment’s abilived managed issues, weroup of stakgement decis
: Percent will work
ovided).
nce: Coordinator (public satisfaSMC also aStrategic Pl
FY 06
136
gement progaff and 2009
Es*
ons authorizuire Wyompplemental g
nt Headquart
anagement Pity to mak
planning effoDepartment’
ity to makement effecti improve thekeholders, tsions.
of employeto ensure t
(SMC) workaction, Depaassists manalan. In FY 0
FY 07
gram is mad9 (FY 09) bu
2009 A$13
zed in FY 0ming Game grants.
ters Office i
Program: ke informedorts. By assi’s ability to
ke informediveness. Bye Departmenhus leading
ees satisfied that at least
ks closely wartment effecagement wit08, several c
FY 08
de up of ondget:
Annual Budg33,676
9 budget. Aand Fish
n Cheyenne
d wildlife cisting in the determine p
d wildlife cy applying sont’s ability tog to more i
with servit 85% of em
with other divctiveness, puh the creati
changes took
FY 09
ne major sub
get
Any positionCommissio
.
conservatiodevelopmen
priorities an
conservatioocial scienceo identify annformed an
ces providemployees ar
visions withiublic supporion of annuak place in thi
b-
ns on
on nt nd
on es nd nd
ed re
in rt, al is

137
position. A new employee was hired to the position and it was moved to the Services Division. It was also modified to include the title of Human Dimensions Coordinator, which is the component of the position that handles the public involvement and input mentioned above. Receiving feedback from Departmental personnel regarding these services is critical in maintaining high quality products that meet the needs of the Department, and ultimately the demands of the public the Department serves. Annually, the Internal Client Satisfaction survey is distributed to Department personnel. The survey provides the opportunity for employees to measure the overall performance of 14 Department programs. In many respects, the ability of the Department to provide services to the external clients depends on the ability of employees to satisfy the needs of their internal clients. Since FY 05, an average of 87 percent of Department employees who had interacted with the Strategic Management Coordinator and who responded to the question were satisfied with the services provided. The number of employees rating satisfaction with services provided has continued to rise since FY 05. During FY 09, 31 percent of employees who responded to the survey indicated that they had interacted with the SMC, and of those, 90.7 percent indicated that they were satisfied with the services provided. Human dimensions projects involving collaboration with field personnel and personnel at the Cheyenne headquarters has allowed the SMC to become better acquainted with many Departmental programs and functions. Acclimation to the Department along with the continuation of the process, implemented in FY 08, for prioritizing human dimensions projects through communication with each division and the Director’s office may have contributed to the increase in satisfaction with services. In addition, a percentage of this position’s time in FY 08 was designated toward assistance in coordinating the Department’s Leadership Development Program. In FY 09, these duties were transferred to the Personnel Management program, which allowed for more time to be spent on human dimensions and strategic management projects.
Similar increasing trends in results were found in survey questions about (1) attention and timeliness and (2) courteousness and professionalism. For FY 09, satisfaction with the level of courteousness and professionalism displayed by the Strategic Management Coordinator rose to 97.7 percent. Satisfaction with attention and timeliness increased from 91.4 percent in FY 08 to 96.4 percent in FY 09. Both of these measures had higher five-year averages than the average of satisfaction with services provided. The similarity in trend reflects the inter-relatedness of the questions and the influence that major workloads can have on the perceived performance of personnel. What we propose to improve performance in the next two years: • Continue to create a prioritized list of projects for each year, created jointly with
Department administration. Work with Division administration to ensure practical timelines and priorities based on workload constraints. When other tasks are assigned that were not originally on the prioritized list, examine their level of importance and reevaluate the list. Should it be determined that the proposed task not be a priority, in a timely and professional manner, clearly explain to requesting personnel the thought

138
process behind the decision. This effort should maintain communication between the Strategic Management Coordinator and Department personnel.
• Continue to work with Division personnel to refine the process of submitting and compiling necessary information for both the Department’s Strategic Plan and Annual Report. By doing so, communication with the Strategic Management Coordinator should be improved, adding to internal customer satisfaction both with that facet of collaboration and with timeliness of this service.
• Further identify the purview of the Strategic Management Coordinator to clarify the duties inherent to the position as well as anticipated time spent on each of the categories of duty in order to aid in the prioritization of project and recurring Departmental needs.
Program: Support Facilities and Personnel Division: Fiscal and Services Division Mission: Provide adequate administrative support services and workspace for Cheyenne headquarters and regional office personnel in Department facilities. Program Facts: The Support Facilities and Personnel Program is listed below with number of staff and 2009 budget: Sub-programs # FTEs* 2009 Annual Budget
Regional Office Management 19.5 $ 1,288,619 Headquarters and Regional Office Buildings 2.5 1,206,323
TOTAL 22.0 $ 2,494,942 *Includes permanent, contract and temporary positions authorized in the FY 2009 budget. Any positions added during the budget cycle require Wyoming Game and Fish Commission authorization or must be funded from supplemental grants. This program is located in eight regional office locations statewide plus the Department Headquarters Office in Cheyenne. Primary Functions of the Support Facilities and Personnel Program: • Ensure administrative support levels at regional facilities to provide adequate
clerical, logistical and financial services for field personnel so that their primary functions can be satisfactorily completed.
• Ensure that office environments are adequate for Department employees by ensuring routine maintenance is performed and adequate office space is provided so employees can accomplish their primary job functions.

139
Performance Measure #1: Employee satisfaction with level of regional office management support (Personnel in this program will work to achieve a score of at least 4).
Story behind the performance: Regional office managers continued to be tasked with new challenges in FY 09 as the new point of sale licensing system put into place in the previous year was enhanced to now offer the majority of licenses issued by the Department. Additionally, a change in the regulation relating to boating registration expanded the role of regional offices as they now took on responsibilities for not only boat renewals, but for new boat registrations and transfers in their region. In the past, all boating transactions, other than renewals were only able to be handled through the Cheyenne headquarters office. Fortunately, regional offices did not experience turnover in permanent personnel, a key factor in predicting customer satisfaction and accordingly, overall satisfaction with regional office satisfaction increased slightly. Annually, the Internal Client Satisfaction Survey is distributed to permanent personnel. The survey provides the opportunity for employees to measure the overall performance of Department programs. In many respects, the ability of the Department to provide services to the external clients depends on the ability of employees to satisfy the needs of their internal clients. Overall in FY 09, the regional offices received a score of 4.5 on a scale of 5 (excellent) to 1 (poor) based on employee satisfaction with the level of regional office management support. The highest score 4.7 was received by the Laramie region and the lowest score 4.1 was received by the Casper offices. Based on these survey results, the majority of regional office personnel are highly satisfied with the service levels provided by administrative personnel in their offices.
1.002.003.004.005.00
Exce
llent
(5)
Poor
(1)
Regional offices
Employee Satisfaction
FY 2005FY 2006FY 2007FY 2008FY 2009

140
What we propose to improve performance in the next two years: • Ongoing regional team meetings with all divisions represented and with attendance
from staff level personnel on an as needed basis will help to insure that all employees housed in the regional offices are being provided the level of support necessary for them to accomplish the administrative and fiscal functions within their positions.
• Regional office managers can best handle workloads if administrators review and shift priorities, if needed, on an ongoing basis so that office managers can accommodate the level of support required.
Performance Measure #2: Employee satisfaction with the workspace provided by the facility in which employees are housed (Personnel working with this program will work to ensure that each facility receives a rating of at least 4).
Story behind the performance: During FY 08, with the assistance of legislative funding, the Department was able to finally replace the Pinedale regional office with a new and larger complex that previously housed the federal agency, Bureau of Land Management. Accordingly, the only regional office in which satisfaction level is poor (2.48) is in the Cody office At this time, all regional offices, with the exception of Cody, have either been replaced or had some type of upgrade made in the past twenty years. The Cody office, built in 1978, has limited storage and office space and with the addition of personnel in the trophy game conflict resolution area in recent years, the facility no longer has adequate space for all personnel working out of the region. Accordingly, at this time, it is the only regional office facility that personnel experienced overall dissatisfaction, due to overcrowding in the facility. Additionally, satisfaction in the Laramie region also decreased, to a level between neutral
1.001.502.002.503.003.504.004.505.00
Exce
llent
(5)
Poor
(1)
Regional Office Facilities
Employee Satisfaction
FY 2005
FY 2006
FY 2007
FY 2008
FY 2009

141
and good (3.79). This is another office, where all available space has been converted to offices and common areas, other than for license sales, are relatively nonexistent. It is believed that satisfaction levels at offices are directly proportional to the newness of the facility and amount of workspace provided employees. Annually, the Internal Client Satisfaction Survey is distributed to permanent personnel. The survey provides the opportunity for employees to measure the overall performance of Department programs. In many respects, the ability of the Department to provide services to the external clients depends on the ability of employees to satisfy the needs of their internal clients. Overall in FY 09 the regional offices received a score of 4.2 on a scale of 5 (excellent) to 1 (poor) based on employee satisfaction with the workspace provided by the facility in which they are housed, a slight increase from 4.1 in FY 08. The highest score 4.79 was received by the Jackson area, which has the newest facility, the lowest score 2.5, was received by the Cody region. While the Cheyenne headquarters facility is not listed in the overall satisfaction surveys above, approximately 55 percent of the personnel were satisfied with the facility, while another 45percentwere dissatisfied. This actual satisfaction increase may be attributed to the beginning of construction on expansion and renovation of the existing facility, funded by a $14 million Legislative appropriation which included movement of approximately 40percentof headquarters personnel to a temporary offsite location during the construction phase. What we propose to improve performance in the next two years: • Due to the State of Wyoming’s financial downturn, no general fund capital
construction requests were included for submission to the 2010 legislative session. However, the Department has re-prioritized its future capital construction needs and Cody is at the fore front of that list
• The Department will be looking into in the next year, evaluating space needs at both the Cody and Laramie office and developing a plan, that may include future general fund capital construction requests for one or both of these facilities. The Department wants to insure that any evaluation considers location as it relates to meeting customer needs, in addition to adequate office and storage space.
Program: Wildlife Health and Laboratory Services Division: Services and Wildlife Mission: Use advanced technology and laboratory procedures to enhance and protect the integrity of Wyoming’s fish and wildlife resources.
142
Program Facts: The Wildlife Health and Laboratory Services program is made up of two major sub-programs, listed below with number of staff and 2009 (FY 09) budget: Sub-programs # FTEs* 2009 Annual Budget Laboratory Services 8.0 ** $ 660,061 Veterinary Services 15.0 *** 1,879,104 TOTAL 23.0 $ 2,539,165 * Includes permanent, contract and temporary positions authorized in the FY 09 budget. ** Management Specialist is shared with Veterinary Services and is counted as one-half. *** Five of these positions are federally funded; the rest of the budget is paid for by general appropriations. The Laboratory Services sub-program was previously referred to as the Game and Fish Laboratory sub-program (Strategic Plan FY 04-FY 07, November 2003). Laboratory Services is located on the University of Wyoming campus. The Laboratory section of Veterinary Services is located at the Wyoming State Veterinary Lab. The headquarters and research unit is located at the Tom Thorne and Beth Williams Wildlife Research Unit at Sybille and numerous brucellosis biologists are located in Pinedale and Jackson. Primary Functions of the Wildlife Health and Laboratory Services Program: • Enhance and protect the integrity of Wyoming’s fish and wildlife resources by
monitoring, diagnosing, and reporting on diseases and implementing disease control measures for wildlife and fish species the Department has statutory authority to regulate.
• Enhance and protect the integrity of Wyoming’s fish and wildlife resources through laboratory research, propagation, confinement, and confiscation facilities.
• Enhance and protect the integrity of Wyoming's fish and wildlife resources by providing timely and accurate information and essential laboratory and technological support in the areas of tooth aging, fish health, and wildlife forensics.

Perfo(Perstreatewith the se
ormance Monnel in thi
ed in a courtthe attentionervices prov
80
85
90
95
100
% E
mpl
oyee
s Sa
tisfie
d
80
85
90
95
100
% E
mpl
oyee
s Sa
tisfie
d
easure #1: is program teous and prn and timelinided).
0
5
0
5
0
FY 05
Level of C
Fi
0
5
0
5
0
FY 05
Leve
Percent of ewill work tofessional mness provide
FY 06 FY
Courteousnes
sh Health F
FY 06 F
el of Attentio
Fish Health
143
employees sato ensure at
manner, 90 pd, and 90 pe
Y 07 FY 08
ss and Profe
Forensics To
FY 07 FY
on and Time
Forensics
atisfied witht least 90 ppercent of emercent of emp
8 FY 09
essionalism
ooth Aging
08 FY 09
liness
Tooth Aging
h Laboratoryercent of em
mployees wilployees are
9
y sub-programmployees arll be satisfiesatisfied wit
m re ed th

StoryAnnuproviprogrexternclientfaciliquestHealt As mof efservicand hmaintthrouparasdiseain WFinalart laspeci In FYspeci“somFish the Templperce
y behind theually, the Intiding employrams. In mnal clients dts. For greitate the abtions relatedth, Forensics
most all of ouffectiveness ces to biologhunters are atains and im
ugh annual insitic diseasesase preventio
Wyoming, wlly, Forensicaboratory anaies, gender id
Y 09, amongific question
mewhat satisfHealth, 92.3
Tooth Aging.oyees were
ent with Fish
1
% E
mpl
oyee
s Sa
tisfie
d
e performanternal Clientyees the opp
many respectdepends on teater undersility to mak
d to the Labs, and Tooth
ur clients areof the Lab
gists. The Dalso made awmproves the nspections as of fish. Bon program ihich aids in
cs aids in thealysis of eviddentification
g respondenns, a total offied” with th3 percent wi. When aske
either “verh Health, an
80
85
90
95
100
FY 05
nce: t Satisfactionportunity to s, the abilitythe ability ofstanding of ke improveboratory subh Aging.
e internal, thboratory. Tepartment u
ware of the aquality of fi
and vigilant By minimiziincreases then overall sae convictiondentiary item
n, minimum
nts who had f 100 percenhe level of ith Wildlife ed about thery satisfied”
nd 85.7 perc
FY 06
Qua
Fish Health
144
n survey is measure they of the Def employees f subsection ments wher
b-program ar
his survey is The Laboratouses this infoage of harvesish health inattention to ing the spree number ofatisfaction o
n of suspectems in the formnumber of a
interacted wnt of emplocourteousneForensics, a
level of atte” or “somecent were sa
FY 07
lity of Servic
Forensics
distributed te overall perepartment to
to satisfy thstrengths a
re deemed re divided i
one of the mory provide
ormation for sted animalsn the hatcherthe preventi
ead and impf wild and spof the publied poachers m of serolog
animals and m
with personnoyees were eess and profand 88.5 peention and tiewhat satisfiatisfied with
FY 08 FY
ces
Tooth Aging
to Departmeformance of provide ser
he needs of tand weaknefeasible andinto three se
most importas big gamevaluable po
s. The Fish Hries and wildion of bacterpact of fish port fishing ic with the by providin
gical and DNmatching.
nel and respeither “very fessionalism rcent were simeliness, 91fied” with F Tooth Agin
Y 09
ent personnef Departmenrvices to thetheir internaesses and tod necessaryections: Fish
ant indicatore tooth aginopulation datHealth sectiod populationrial, viral andiseases, thopportunitieDepartmen
ng state of thNA testing fo
ponded to thsatisfied” oexhibited b
satisfied wit1.6 percent oForensics, 9ng. Of thos
el nt e
al o
y, h
rs ng ta
on ns nd he es nt. he or
he or by th of 94 se

145
who had interacted with the Laboratory personnel, 92.8 percent of employees were either “very satisfied” or “somewhat satisfied” with the quality of services offered by Forensics, 98 percent with Fish Health, and 76.4 percent satisfied with Tooth Aging. What has been accomplished: The overall satisfaction in all three areas questioned for all three sections of the laboratory is 91 percent. This would indicate that a large majority of our customers are happy with the services provided by the laboratory; this however is a decrease from last year’s score of 95 percent. This decrease in total score could be because this is the busiest year the laboratory has ever had and the laboratory was not fully staffed for a majority of the fiscal year. With a 62 percent increase in the overall workload of the laboratory; cases had a slower turnaround time than is traditionally seen. The lowest score when internal customers were asked if they were treated courteously and professionally was 88.5 percent. The lowest score when asked about the level of attention and timeliness was 85.7 percent. Fish health was the only section that saw an increase in satisfaction for “Services Provided”. The other two subsections saw a decrease in the level of satisfaction. What we propose to improve performance in the next two years: • The laboratory was down one to two people for most of the fiscal year. This made it
difficult to keep up with a workload that increased over sixty percent from the last fiscal year. The best way for the laboratory to increase performance will be to hire new personnel and begin the training process. As the vacant positions are highly skilled positions, it may take several years before everyone is completely trained in their positions. This will significantly decrease turn-around time for analysis. The salary in the Tooth Aging Coordinator position was dropped several levels during this fiscal year making it more difficult to attract and maintain quality individuals. To improve the performance of big game aging, an attempt will be made to increase this salary to its former level. We propose to attempt to maintain a full staff as this has a great deal to do with customer satisfaction.
• Two new molecular biology viral confirmatory tests are currently being optimized. • The forensic section of the laboratory will attempt to bring wolf DNA analysis on-
line during the next fiscal year.

PerfomaintHealt
ormance Mtain the capth samples, a
Numbe
1
20
4060
80100120
5
10
15
20
25
Measure #2: acity to receand 800 Too
er of sample
0
200
400
600
800
1000
FY 0
0000
000000
000000000
FY 05
0
500
000
500
000
500
FY 05
Laboratoreive and prooth Aging sam
es received
5 FY 06
5 FY 06
5 FY 06
146
ry Productivocess at leasmples).
d:
FY 07
Forensics
FY 07
Fish Health
FY 07
Tooth Agin
vity (Personnst 650 Foren
FY 08 F
FY 08
FY 08 F
ng
nel in this pnsic samples
FY 09
FY 09
FY 09
program wi, 11,500 Fis
ill sh

StoryThe efficiproceand vinspethe la Law sectiocarcacase. to theawaresubmnumbthe avfor foat 93
Numbe
y behind thenumber of iency and efedures and pvaried personections, whicast 10 years d
enforcemenon. Sampleasses, hides,
For a numbe Forensic Se of the ca
missions actuber of items verage comporensic analy requests. A
0
5000
10000
15000
20000
25000
30000
50100150200250300
er of tests p
e performansamples su
ffectiveness protocols andnnel/sectionch are set bydue to the lim
nt personneles come in t
horns, clothber of years Section of thapabilities oually decreasincreased an
plexity of eayses, the num
Additional sa
0
0
0
0
0
0
0
FY 05
0000000000000000000
FY 05
performed:
nce: ubmitted to
of the Labod as we becos in the Dep
y regulation mited numbe
l submit thethe form of hing, arrowsthere was a he Laboratof the lab. sed, resultinnd the numbach case incrmber of caseample submi
FY 06
FY 06
147
the Laboratoratory. As wome more efpartment. Thand thus haer of water s
e majority oevidence, in
s, bows, cansteady incre
ory as more The excep
ng in fewer tber of tests inreased. Othees was at an ission and te
FY 07
Forensics
FY 07
Fish Health
tory is somwe increase fficient, we che exception
ave remainedsources in W
of samples rncluding, bu
ns, or knivesease in the nu
law enforcetion was FYtests performncreased draer than FY 0
all time higests conduct
FY 08
FY 08
mewhat correthe number can be of sern to this is Fd relatively c
Wyoming.
received in ut not limite in a suspecumber of iteement persoY 04 and Fmed. Durinamatically, in06, which hagh for the forted in this se
FY 09
FY 09
elated to thand types o
rvice to morFish Hatcherconstant ove
the Forensied to, antlercted poachinms submitte
onnel becamFY 08 whe
ng FY 09, thndicating tha
ad 94 requestrensic sectioection shoul
he of re ry er
ic s,
ng ed
me en he at ts
on ld

148
indicate an increase in assistance with law enforcement. If more poachers are prosecuted, there will be a greater awareness of the capabilities of the lab by the general public. In this manner, we can assist the resource through deterrence, allowing the resources to be protected for the legitimate hunter. The majority of fish health samples submitted to the Laboratory come from inspections conducted by Fish Health Section personnel at state and private hatcheries, as well as fish from feral spawning operations. These samples most often consist of kidney, spleen, ovarian or seminal samples, and fish heads. A number of fish are also submitted for necropsies or diagnostic analysis following die-offs or when fish become sick in a culture situation. The frequency of regulatory fish health inspections is set by Wyoming Game and Fish Commission Chapter 10 regulations and the Fish Health Section of the American Fisheries Society (AFS) sets sample size numbers. The number of hatchery inspections in Wyoming continues to remain relatively constant due the limited availability of water sources for state hatcheries and the restrictive commercial market for private hatcheries. In most instances, the number of tests conducted is directly correlated to the number of samples received in the Fish Health section. The number of diagnostic cases was nearly identical this year compared to last year; 64 for FY 09 compared to 65 in FY 08. This is a 54 percent increase from two years ago when only 42 diagnostic cases were submitted to the laboratory. The number of diagnostic cases will remain high due to hatchery renovations, imposed stocking restrictions resulting from the presence of the whirling disease parasite at several of the hatcheries and due to some hatcheries incrementally increasing their stock densities to compensate for statewide fish production losses. As part of the disease prevention program, Wyoming Game and Fish regulations require that all hatcheries have a certificate of disease free status prior to receiving approval for public or private stocking. This disease prevention program is essential to maintaining healthy fish populations in the state. It should be noted that numerous tests are performed on each sample in both the Fish Health section and the Forensic section. The number of tests performed, is dependent on the sample type and the requested analysis by the submitting officer or biologist. This flexibility in analysis accounts for the variability in the number of tests performed annually. The number of samples submitted to the Tooth Aging section of the Laboratory is equal to the number of test performed; therefore, the first figure comprises both statistics. Hunters and Department biologists submit these samples. Only critical herd units/species are still being analyzed in the Laboratory. What has been accomplished: The forensic section of the laboratory has brought DNA sequencing on-line in the laboratory which allows for species identification of difficult to identify samples or species. The fish health section has also brought a new molecular diagnostic test on-line for epizootic epitheliotropic disease (EED) virus. This virus is not a prohibited pathogen

but hvirus proceanalyWyomonly Wha• T
cawd
• Wac
• CLjoarprpr
• CDanut
• ASStrse
• A Perfoon 22vacci
has been knois difficult
edures. Theyzed for theming withoubeen detecte
at we proposThe Laboratoalled the “D
will be acceponations.
Will continuection in rega
Continue to Laboratory point coordinare continualrocedures wrocedures of
Continued edDepartment wnd will imptilization of
Additional dection of theociety’s Sta
rained, they everal additi
Additional an
ormance M2 of 23 elk feinate at least
20
40
60
80
100
% E
lk C
alve
s Va
ccin
ated
wn to cause, and in mo addition of presence out having eved in Lake T
se to improvory has set
Donation Funpted in law e
e to work wiard to the finwork on ex
personnel anation meetinlly evaluatewill then bften result inducation of will result inrove the quthe capabilitisease confie Laboratoryandards. Onwill work w
ional molecunalysis in the
easure #3: eedgrounds it 95 percent o
2004-2005
e die-offs of ost cases, imf this new teof this virusver caused a
Trout and one
ve performaup an accound for the Aenforcement
ith UC Davinds of EED vxpanding mnd Wildlife ngs with ageed and fease brought
n expanded uall new fishn more knowality of samties at the labirmation tesy, following nce a new with the Forular procedure area of toot
Percent of in western Wof elk calves
2005-2006
149
Lake Trout mpossible tost has result. It has bea disease isse population
ance in the nunt/fund wit
Advancemencases, and o
s and fish stvirus positive
more open liand Fish Dncy staff. R
sibility studion-line in
use of the Lah culture anwledge of th
mple submissaboratory. sts will be the current Aquatic Anrensic Progrres. th aging is b
elk calves bWyoming (Ps that use W
2006-2007Winter
in other stato detect withted in severaeen detectedsue. Before
n of Rainbow
next two yeth the Wild
nt of Wildlifoutside agen
taff on determe fish in the ines of com
Division persequests for nies initiatedthe Labora
aboratory sernd law enforhe laboratorsion and wil
brought on-guidelines o
nimal Healthram Manage
being pursue
ballistically versonnel in t
WGFD feedgr
2007-2008 2
tes and popuh traditionaal hundred sd in numeroue this year, tw trout.
ars: life Heritag
fe Forensics”ncies will be
mining the bstate hatche
mmunication sonnel by hnew technic
d if neededatory. Theservices by fiercement perry sampling ll facilitate b
-line in the of the Amerih Inspector er to validat
d.
vaccinated wthis programrounds).
2008-2009
ulations. Thil cell culturamples beinus species ithe virus ha
e Foundatio”. Donatione solicited fo
best course oery system.
between thhaving annuaal procedure. These newe changes ild personnelsonnel in threquirementbetter overa
Fish Healtican Fisherieis hired an
te and updat
with Strain 1m will work t
is re ng in ad
on ns or
of
he al es w in l. he ts
all
th es nd te
9 to

150
Story behind the performance: The Brucellosis-Feedground-Habitat (BFH) program was created in 1989 as an integrated approach to control brucellosis in free-ranging elk associated with feedgrounds. This approach combines four ongoing Department programs (feedground vaccination, feedground management, habitat enhancement, and elk/cattle separation) with the ultimate goal of eliminating brucellosis in elk and maintaining spatial and temporal separation of elk and cattle during potential brucellosis transmission periods. In controlled studies, vaccination with Brucella abortus strain 19 was shown to reduce abortion rates in elk. Ballistic strain 19 vaccination in elk was initiated in 1985 at the Greys River Feedground, and was expanded over the next 17 years to 22 of 23 feedgrounds, which include state operated feedgrounds and the National Elk Refuge (NER). Dell Creek feedground elk have never been vaccinated, as this population serves as a control to measure efficacy (via brucellosis seroprevalence) of the strain 19 vaccination program. This performance measure examines vaccination efforts in 22 distinct areas. During the height of elk feedground attendance of each winter (typically early February), elk are classified by age (calves/juveniles, cows, spike bulls, branch-antler bulls). A maximum number of juvenile elk are vaccinated on 22 of 23 feedgrounds annually. Biodegradable bullets composed of hydroxypropylcellulose and calcium carbonate and loaded with lyophilized strain 19 vaccine are ballistically implanted into the large muscle mass of the hindquarter, which dissolve within several hours. The percentages displayed in the graph above are based on the number of calves classified. Approximately 79,837 elk calves have been vaccinated to date. Vaccination efforts have resulted in over 89 percent calf coverage over the past five years. Some feedgrounds, such as Soda Lake, Bench Corral, and those in the Gros Ventre drainage, have poor elk attendance during light to moderate severity winters due to availability of native foraging opportunities. Elk must be concentrated on feed lines for the vaccination program to be effective. Thus, recent year’s vaccination coverage should be considered the maximum and increased effort will not increase percent of calves vaccinated. Efforts since winter 2004-2005 have yielded very high percent vaccinations with the exception of the 2006-2007 winter, when feedground attendance was low due to decreased snow coverage and increased forage availability on adjacent winter ranges. Typically, deep snow conditions results in greater tolerance of elk to disturbances associated with the vaccination effort. During winter 2008-2009, winter conditions were moderate, which facilitated 93 percent of all elk calves attending feedgrounds to be vaccinated. What has been accomplished: Strain 19 calfhood vaccination was again successful this winter with a majority of the feedgrounds reporting 100 percent calfhood coverage. Many feedgrounds reported over 100 percent coverage, which suggests yearling females were boosted at several areas.

Vaccas feeof 3,7 WhaAlthovaccimeasfunctequip DataThe pinformmethefficatransmtransmdeterm Perfosubmand r
StoryOver shiftsmajorstandfor thundercompOver than less t
ination was eding did no798 calves w
at we proposough winter ination efforure, BFH p
tioning condpment is deli
a developmpercent of emation to dod. Howeveacious in remission amomitters has bmine abortio
ormance Mmitted for labreport finding
y behind thethe past ni
s in its role ar changes w
dard brucellohe differentirtaken by thplete brucell
the past nina month. D
than 12 hour
Leng
th o
f Tim
e (w
eeks
)
not conductot commencewere vaccina
se to improvconditions
rts, and arepersonnel wdition and woivered promp
ment agendaelk calves vdocument ther, the succeeducing the ong elk and been expandon preventio
Measure #4:boratory testigs within fou
e performanine years, thand duties w
was the decisosis serologiiation of fiehe Laboratorlosis serologne years, the
During test anrs.
0
2
4
6
8
10
12
19
g(
)
ted on feedge until Marc
ated on 16 fe
ve performaand availab
e likely thewill continueork closely wptly when co
a: vaccinated fohe success essful delive
occurrencefrom elk to
ded to vaccion rates affor
Completeing (Personnur weeks of
nce: he Wildlife within the Wsion to do “inic tests. In ld strain and
ry to significgy panel fore reporting tind slaughter
999 2001
151
grounds in thh, and only edgrounds d
ance in the nility of nativ primary fa
e to maintaiwith Feedgroonditions are
or those claof the strai
ery of the vae of brucello cattle. Cuinated and nrded by strai
e and rapid nel in this prsubmission)
Disease LabWyoming Gam
n-house" tesconjunction d vaccine stcantly decrer feedgroundime has beenoperations,
2003
Calendar Yea
he Gros Vencontinued fo
during winter
next two yeve forage afactors influein vaccinatiound persone most condu
assified on fin 19-vaccin
accine does nosis in elk,
urrent researcnon-vaccinatn 19 in mark
analysis anrogram will ).
boratory hasme and Fish sting for bru
with this, atrain antibodase the repod and hunten reduced frserologic re
2005 2
r
ntre drainagor several wr 2008-2009
ars: ffect elk tolencing this on equipme
nnel to ensurucive for vac
feedgrounds nation prognot ensure th, specificallch using vagted feedgrouked elk.
nd reportingwork to ana
s undergoneDepartment
ucellosis usina cELISA wdies. Theseorting time aer-killed elk rom over onesults must b
2007
ge this winteweeks. A tota9.
erance of thperformanc
ent in propere vaccinatioccination.
is importanram deliverhe program iy brucellosiginal implan
unds to bette
g of samplealyze sample
e some majot. One of thng the federa
was developee assays werand provide
surveillancene year to lesbe returned i
er, al
he ce er on
nt ry is is nt er
es es
or he al ed re a
e. ss in

152
In 2003, the Wildlife Disease Laboratory also adopted in-house testing for chronic wasting disease. Testing for this disease was traditionally conducted by the Wyoming State Veterinary Laboratory, but extended reporting times of six months or more made management actions impossible. Analysis for chronic wasting disease are now generally completed and reported in less than three weeks. What has been accomplished: • The reduced reporting timeframe for brucellosis diagnostics by implementation of an
interactive database was scrapped due to the high cost of development. • Over the past year, the laboratory has instituted a quality control measure to track
serology results and samples. This was accomplished by utilizing barcodes and the current database. Results thus far have been very positive with improved accuracy in reporting and cataloging of storage.
• Through the budget process, the laboratory has submitted a request for two permanent positions to the legislature.
• The implementation of fee–for-service with the Wyoming State Veterinary Laboratory (WSVL) has been moderately successful. While the Wyoming Game & Fish Department is now paying for diagnostics, which has improved our relationship with WSVL, our case turn-around time has not been significantly improved. The mean final reporting time is between four and eight weeks, some cases are much, much longer. The WSVL has experienced a shortage of pathologists for the past two years, which has had a marked effect on case completion.
What we propose to improve performance in the next two years: • During FY 09 the Laboratory plans to continue the procedure implementation for
quality control and tracking of diagnostic serum samples by modification to the current labeling and tracking system.
• If the request for permanent positions is unsuccessful in the 2008 legislative session, the laboratory will continue efforts to convert contract positions to permanent to aid in the retention of competent and efficient Laboratory personnel.
• The Wyoming State Veterinary Laboratory is now in the process of hiring two new pathologists. It is anticipated this addition of personnel will result in a significant reduction in the amount of time necessary for diagnostic results to be made available to the Department case coordinator, and thus, a significant reduction in the amount of time between submission of the case and delivery of the final report. Dr. Cynthia Tate will be responsible for tracking the number of days between submission of a clinical case by a biologist and delivery of a final report.

APPENDIX A:
INDIVIDUAL MANAGEMENT PROGRAMS


BIG GAME
Pronghorn
Elk Mule Deer
White-tailed Deer Moose
Bighorn Sheep Rocky Mountain Goat
Bison


A-1
PRONGHORN
2008: Population: 526,805a Licenses Sold: 69,159 Population Objective: 461,950b License Revenue: $ 6,960,158 Harvest: 53,849 All Other Agency Revenue*: $ 3,412,777 Hunters: 56,009 Total Program Revenue: $10,372,935 Success Rate: 96% Program Costs: $ 3,451,229 Recreation Days: 184,208 Hunter Expenditures: 1 $22,773,136 Days/Animal: 3.4 Cost Dept. Per Animal: $ 64 Economic Return per Animal: $ 423 aStatewide population was calculated from 41 of 44 pronghorn herds. Population estimates for the other 3 herds were not available. bStatewide population objective calculated from 43 of 44 pronghorn herds. There is no objective for 1 herd. In 2008, Wyoming’s total statewide pronghorn population for the herds for which we have estimates was 526,805 animals compared to the objective of 461,950. The estimated state population declined 6% from 2007 to 2008, but remains 14% above objective, mainly because of mild winters with low mortality, hunter access limitations and the Department’s inability to issue sufficient licenses to obtain harvests that will control the species. Better precipitation during the growing season in the past couple of years has improved forage, but we don’t know whether this is temporary or signals a longer term turn-around in previous drought conditions. Poor range quality and extensive loss of habitat from escalating mineral development are of great concern to managers. The Department continues to monitor habitat condition, recommend improvements where necessary, seek mitigation of habitat lost to development, and promote hunting seasons that move the population toward the objective. The Department increased license quotas in 2002-2008 in an attempt to reduce the number of animals, however access continues to be the primary impediment to attaining adequate harvests. The Department continues to work to improve hunter access through efforts such as the Private Lands Public Wildlife program. The 2008 harvest of 53,849 animals was a 4% and 18% increase over the 2007 and 2006 harvests, respectively. Hunter effort increased slightly to 3.4 days per animal harvested, slightly above the five-year average (3.3 days/animal).
Five-year trends in Wyoming's pronghorn program. Harvest, recreation and licenses issued are by calendar year. Revenue and costs are by fiscal year.
Year
Harvest
Rec.Days
Success
Days/Animal
Lic.Sold
Lic.Rev. ($)
Mgmt. Costs ($)
Hunter ($)Expend.1
2004 36,383 113,577 96% 3.1 44,850 4,756,674 3,025,576 12,214,009
2005 39,526 132,625 93% 3.4 51,430 4,931,280 2,881,194 14,860,450
2006 45,615 151,874 96% 3.3 58,456 5,266,144 3,167,032 17,527,792
2007 51,883 169,419 98% 3.3 65,322 5,898,677 3,785,765 20,139,242
2008 53,849 184,208 96% 3.4 69,159 6,960,158 3,451,229 22,773,1361The 2004 calculations were derived from the report, Wyoming Resident and Nonresident Deer, Elk and Antelope Hunter Expenditure Survey, 2004. Data for this survey were collected during the 2003 season. Hunter Expenditure in 2004 was calculated from the 2003 cost per day expenditure, corrected for inflation using the Consumer Price Index (2003 per day expenditure x 1.033 = 2004 per day expenditure, 2003 per day expenditure x 1.068 = 2005 per day expenditure). 2005 Hunter expenditure was calculated from the 2005 cost per day expenditure, corrected for inflation using the Consumer Price Index (2005 per day expenditure x 1.03). 2006, 2007 and 2008 Hunter expenditure was calculated from the previous year’s Hunter expenditure corrected for inflation using the Consumer Price Index (2006 was 1.03, 2007 was 1.03, 2008 was 1.04). *Includes allocated application fees, conservation stamp revenue, federal/other grants, and interest earned on Department cash balances.

A-2
ELK 2008: Population: 93,354a Licenses Sold: 60,626 Population Objective: 83,640 License Revenue: $ 8,697,113 Harvest: 20,941 All Other Agency Revenue*: $ 5,711,261 Hunters: 52,163 Total Program Revenue: $ 14,408,374 Success Rate: 40% Program Costs: $ 13,942,785 Recreation Days: 395,534 Hunter Expenditures: 1 $38,905,578 Days/Animal: 18.9 Cost Dept. Per Animal: $ 666 Economic Return per Animal: $ 1,858 aStatewide population was calculated from 25 of 35 elk herds. Population estimates for the other 10 herds were not available. The Department continues to manage to reduce Wyoming’s elk numbers. The total population of the herds with estimates declined by two percent in 2008 and is now 12 percent above the statewide objective of 83,640 animals. The harvest decreased seven percent from 2007 to 2008 and was below the five-year average (21,221). Hunter success decreased in 2008 to 40 percent and was slightly below the five-year average (41 percent). Hunter effort (days/animal) increased from 2007 to 2008, and the 2008 effort value was above the five-year average (17.8 days/animal). Overall, management strategies will continue to focus on decreasing the statewide population, however some herds are at objective and will be managed for their current numbers. Access continues to impede obtaining adequate harvest in many herds. The Department will continue to work to improve hunter access and to find other ways to promote greater harvests.
Five-year trends in Wyoming's elk program. Harvest, recreation and licenses issued are by calendar year. Revenue and costs are by fiscal year.
Year
Harvest
Rec. Days
Success
Days/Animal
Lic.Sold
Lic.Rev. ($)
Mgmt. Costs ($)
Hunter ($)Expend.1
2004 21,252 380,219 41% 17.9 58,182 7,733,361 8,833,834 32,802,943
2005 19,708 365,256 39% 18.5 56,550 7,565,022 10,789,073 32,562,491
2006 21,680 360,463 43% 16.6 57,682 7,677,240 11,183,083 33,099,252
2007 22,523 387,973 43% 17.2 59,348 8,203,437 12,415,185 36,694,098
2008 20,941 395,534 40% 18.9 60,626 8,697,113 13,942,785 38,905,5781 The 2004 calculations were derived from the report, Wyoming Resident and Nonresident Deer, Elk and Antelope Hunter Expenditure Survey, 2004. Data for this survey were collected during the 2003 season. Hunter Expenditure in 2004 was calculated from the 2003 cost per day expenditure, corrected for inflation using the Consumer Price Index (2003 per day expenditure x 1.033 = 2004 per day expenditure, 2003 per day expenditure x 1.068 = 2005 per day expenditure). 2005 Hunter expenditure was calculated from the 2005 cost per day expenditure, corrected for inflation using the Consumer Price Index (2005 per day expenditure x 1.03). 2006, 2007 and 2008 Hunter expenditure was calculated from the previous year’s Hunter expenditure corrected for inflation using the Consumer Price Index (2006 was 1.03, 2007 was 1.03, 2008 was 1.04). *Includes allocated application fees, conservation stamp revenue, federal/other grants, general funds ($807,048) and interest earned on Department cash balances.

A-3
MULE DEER
2008: Population: 480,561a Licenses Sold: 1 89,540 Population Objective: 564,650b License Revenue: 1 $ 10,664,751 Harvest: 36,338 All Other Agency Revenue*: $ 4,778,821 Hunters: 62,739 Total Program Revenue: $ 15,443,572 Success Rate: 58% Program Costs: $ 6,250,194 Recreation Days: 319,504 Hunter Expenditures: 2 $ 34,427,777 Days/Animal: 8.8 Cost Dept. Per Animal: $ 172 Economic Return per Animal: $ 947
aStatewide population was calculated from 36 of 39 mule deer herds. Population estimates for the other 3 herds were not available. bStatewide population objective calculated from 38 of 39 mule deer herds. There is no objective for 1 herd. Wyoming’s mule deer population declined 9 percent from 2007 to 2008 and is now approximately 85 percent of the statewide objective. There is continuing concern about poor range conditions and their effect on reproduction and survival. In the past couple of years, precipitation during the growing season improved, at least temporarily ending drought conditions and improving forage plant production. The Department will continue to monitor habitats and recommend improvements where necessary. Field personnel wish to keep some herds at levels lower than their objectives to lessen the impacts of deer on drought-depleted browse plants until we can determine if the recent improvement in moisture conditions is going to continue, however the public would like more deer and is resisting further decreases.
Harvest and hunter success decreased in 2008. The 2008 harvest is below the five-year average of 37,902, and the 58 percent success rate is below its five-year average (60 percent). Hunter effort increased in 2008, and the 2008 value is approximately ½ day above the five-year average (8.3 days/animal). The Department has been working to address access and habitat issues through its Private Lands Public Wildlife program, habitat improvement projects and strong advocacy for mitigation of impacts related to mineral extraction. However, the greatest improvement in habitat conditions will come with continued favorable moisture conditions.
Five-year trends in Wyoming's mule deer program. Harvest, recreation and licenses issued are by calendar year. Revenue and costs are by fiscal year.
Year
Harvest
Rec. Days
Success
Days/Animal
Lic.Sold1
Lic.Rev. ($)1*
Mgmt. Costs ($)
Hunter ($)Expend.2
2004 36,733 299,922 58% 8.2 82,049 9,520,324 4,735,670 28,343,737
2005 35,266 307,256 57% 8.7 84,533 9,482,629 * 4,813,400 30,007,186
2006 40,067 313,402 62% 7.8 88,405 9,319,734 5,145,752 31,525,638
2007 41,106 328,020 63% 8.0 91,014 9,387,890 5,819,403 33,985,970
2008 36,338 319,504 58% 8.8 89,540 10,664,751 6,250,194 34,427,7771 Includes both mule deer and white-tailed deer. 2 The 2004 calculations were derived from the report, Wyoming Resident and Nonresident Deer, Elk and Antelope Hunter Expenditure Survey, 2004. Data for this survey were collected during the 2003 season. Hunter expenditure in 2004 was calculated from the 2003 cost per day expenditure, corrected for inflation using the Consumer Price Index (2003 per day expenditure x 1.033 = 2004 per day expenditure, 2003 per day expenditure x 1.068 = 2005 per day expenditure). 2006, 2007 and 2008 Hunter expenditure was calculated from the previous year’s Hunter expenditure corrected for inflation using the Consumer Price Index (2006 was 1.03, 2007 was 1.03 , 2008 was 1.04). *Includes allocated application fees, conservation stamp revenue, federal/other grants, general funds (68,894) and interest earned on Department cash balances.

A-4
WHITE-TAILED DEER 2008: Population: 57,027a Licenses Sold: 1 89,540 Population Objective: 52,000b License Revenue: 1 $ 10,664,751 Harvest: 14,792 All Other Agency Revenue*: $ 4,778,821 Hunters: 26,143 Total Program Revenue: $ 15,443,572 Success Rate: 57% Program Costs: $ 560,517 Recreation Days: 112,457 Hunter Expenditures: 2 $ 12,164,651 Days/Animal: 7.6 Cost Dept. Per Animal: $ 38 Economic Return per Animal: $ 822 aStatewide population was calculated from 2 of 5 white-tailed deer herds. Population estimates for the other 3 herds were not available. bStatewide population objective calculated from 3 of 5 white-tailed deer herds. There is no objective for 2 herds. It is difficult to collect data on Wyoming’s white-tailed deer populations because of the habitats in which the species lives and its secretive behavior. So, determining population characteristics and trends is generally not possible; the estimate provided here is based on only some of the herds. Most white-tailed deer inhabit private lands in eastern Wyoming and the riparian areas of major watercourses there and in other parts of the state. In both cases, access for hunting has become difficult to obtain and is often expensive. This adds to the difficulty of managing white-tailed deer. Management throughout the state is primarily dictated by local perceptions of deer numbers and by landowner tolerances. The white-tailed deer is an undesirable species to some landowners and hunters due to depredation issues and the perception that it displaces mule deer, however it has generally gained status equal to other big game species overall in the state. The 2008 white-tailed deer harvest was six percent higher than the 2007 harvest, and 13 percent higher than the five-year average (13,134). Hunter numbers increased five percent from 2007 and six percent from 2006. Hunter success increased slightly in 2008 and was above the five-year average (54%).
Five-year trends in Wyoming's white-tailed deer program. Harvest, recreation and licenses issued are by calendar year. Revenue and costs are by fiscal year.
Year
Harvest
Rec. Days
Success
Days/Animal
Lic.Sold1
Lic.Rev. ($)1
Mgmt. Costs ($)
Hunter ($)Expend.2
2004 10,733 82,083 49% 7.6 82,049 9,520,324 412,043 7,790,860
2005 12,333 97,416 52% 7.9 84,533 * 9,482,629 * 520,579 9,550,710
2006 13,858 107,181 56% 7.7 88,405* 9,319,734* 456,980 10,823,317
2007 13,955 113,668 56% 8.1 91,014 9,387,890 411,374 11,822,737
2008 14,792 112,457 57% 7.6 89,540 10,664,751 560,517 12,164,651 1 Includes both mule deer and white-tailed deer.
2 The 2004 calculations were derived from the report, Wyoming Resident and Nonresident Deer, Elk and Antelope Hunter Expenditure Survey, 2004. Data for this survey were collected during the 2003 season. Hunter expenditure in 2004 was calculated from the 2003 cost per day expenditure, corrected for inflation using the Consumer Price Index (2003 per day expenditure x 1.033 = 2004 per day expenditure, 2003 per day expenditure x 1.068 = 2005 per day expenditure). 2006, 2007 and 2008 Hunter expenditure was calculated from the previous year’s Hunter expenditure corrected for inflation using the Consumer Price Index (2006 was 1.03, 2007 was 1.03, 2008 was 1.04). *Includes allocated application fees, conservation stamp revenue, federal/other grants, and interest earned on Department cash balances.

A-5
MOOSE 2008: Population: 7,697a Licenses Sold: 715 Population Objective: 13,820b License Revenue: $ 151,056 Harvest: 611 All Other Agency Revenue*: $ 683,416 Hunters: 709 Total Program Revenue: $ 834,472 Success Rate: 86% Program Costs: $ 819,010 Recreation Days: 5,060 Hunter Expenditures: 1 $ 722,697 Days/Animal: 8.3 Cost Dept. Per Animal: $ 1,340 Economic Return per Animal: $ 1,183 aStatewide population was calculated from 6 of 10 moose herds. Population estimates for the other 4 herds were not available. bStatewide population objective calculated from 9 of 10 moose herds. There is no objective for 1 herd. Although Wyoming’s largest moose populations are in the west and northwest of the state, moose occur in other areas. The species inhabits the Bighorn Mountains; and it has expanded into the mountain ranges of south central Wyoming from an introduced population in northern Colorado, which is providing additional viewing and hunting opportunities.
Management strategies for moose in Wyoming are quite conservative, and as a result, success rates have traditionally been excellent for those hunters fortunate enough to draw a license. The restriction against harvesting a cow moose accompanied by a calf was in effect again in the 2008 hunting season, continuing a trend that is now over a decade old. This restriction has improved calf survival, which has the potential to increase hunting opportunities. However, recent declines in moose numbers in northwest Wyoming for reasons that have yet to be fully understood have resulted in significant license quota reductions over the past several years. Harvest declined nine percent from 2007 to 2008, hunter success remained relatively stable and hunter effort increased. The 2008 hunter success was slightly below average (87 percent), and hunter effort was above average (7.2 days/animal). Permit quotas for western hunt areas will be reduced again in 2009 in response to low population estimates.
Five-year trends in Wyoming's moose program. Harvest, recreation and licenses issued are by calendar year. Revenue and costs are by fiscal year.
Year
Harvest
Rec. Days
Success
Days/Animal
Lic.Sold
Lic.Rev. ($)
Mgmt. Costs ($)
Hunter ($)Expend.1
2004 770 5,026 84% 6.5 927 218,524 1,004,466 638,793
2005 682 4,673 88% 6.9 798 214,029 928,822 604,914
2006 636 4,729 87% 7.4 768 174,694 699,814 630,528
2007 669 4,674 89% 7.0 769 201,665 1,022,124 641,891
2008 611 5,060 86% 8.3 715 151,056 819,010 722,6971 The 2003 calculations were derived from the report, Hunting and Trapping Expenditures in Wyoming During the 2001 Season, 2002 using average per day expenditures. Hunter expenditure was calculated from the 2001 cost per day expenditure, corrected for inflation using the Consumer Price Index (2001 per day expenditure x 1.043 = 2003 per day expenditure, 2001 per day expenditure x 1.078 = 2004 per day expenditure, 2001 per day expenditure x 1.115 = 2005 per day expenditure). 2006, 2007 and 2008 Hunter expenditure was calculated from the previous year’s Hunter expenditure corrected for inflation using the Consumer Price Index (2006 was 1.03, 2007 was 1.03, 2008 was 1.04). *Includes allocated application fees, conservation stamp revenue, federal/other grants, and interest earned on Department cash balances.
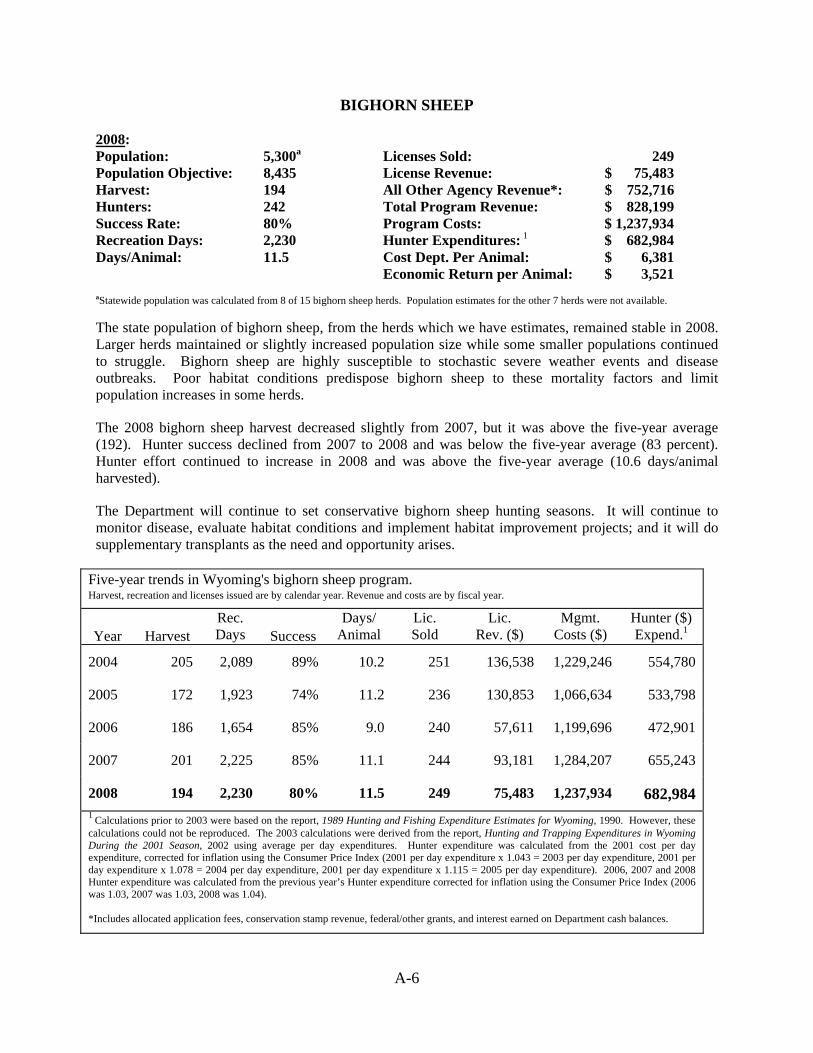
A-6
BIGHORN SHEEP 2008: Population: 5,300a Licenses Sold: 249 Population Objective: 8,435 License Revenue: $ 75,483 Harvest: 194 All Other Agency Revenue*: $ 752,716 Hunters: 242 Total Program Revenue: $ 828,199 Success Rate: 80% Program Costs: $ 1,237,934 Recreation Days: 2,230 Hunter Expenditures: 1 $ 682,984 Days/Animal: 11.5 Cost Dept. Per Animal: $ 6,381 Economic Return per Animal: $ 3,521 aStatewide population was calculated from 8 of 15 bighorn sheep herds. Population estimates for the other 7 herds were not available. The state population of bighorn sheep, from the herds which we have estimates, remained stable in 2008. Larger herds maintained or slightly increased population size while some smaller populations continued to struggle. Bighorn sheep are highly susceptible to stochastic severe weather events and disease outbreaks. Poor habitat conditions predispose bighorn sheep to these mortality factors and limit population increases in some herds.
The 2008 bighorn sheep harvest decreased slightly from 2007, but it was above the five-year average (192). Hunter success declined from 2007 to 2008 and was below the five-year average (83 percent). Hunter effort continued to increase in 2008 and was above the five-year average (10.6 days/animal harvested).
The Department will continue to set conservative bighorn sheep hunting seasons. It will continue to monitor disease, evaluate habitat conditions and implement habitat improvement projects; and it will do supplementary transplants as the need and opportunity arises.
Five-year trends in Wyoming's bighorn sheep program. Harvest, recreation and licenses issued are by calendar year. Revenue and costs are by fiscal year.
Year
Harvest
Rec. Days
Success
Days/Animal
Lic.Sold
Lic.Rev. ($)
Mgmt. Costs ($)
Hunter ($)Expend.1
2004 205 2,089 89% 10.2 251 136,538 1,229,246 554,780
2005 172 1,923 74% 11.2 236 130,853 1,066,634 533,798
2006 186 1,654 85% 9.0 240 57,611 1,199,696 472,901
2007 201 2,225 85% 11.1 244 93,181 1,284,207 655,243
2008 194 2,230 80% 11.5 249 75,483 1,237,934 682,9841 Calculations prior to 2003 were based on the report, 1989 Hunting and Fishing Expenditure Estimates for Wyoming, 1990. However, these calculations could not be reproduced. The 2003 calculations were derived from the report, Hunting and Trapping Expenditures in Wyoming During the 2001 Season, 2002 using average per day expenditures. Hunter expenditure was calculated from the 2001 cost per day expenditure, corrected for inflation using the Consumer Price Index (2001 per day expenditure x 1.043 = 2003 per day expenditure, 2001 per day expenditure x 1.078 = 2004 per day expenditure, 2001 per day expenditure x 1.115 = 2005 per day expenditure). 2006, 2007 and 2008 Hunter expenditure was calculated from the previous year’s Hunter expenditure corrected for inflation using the Consumer Price Index (2006 was 1.03, 2007 was 1.03, 2008 was 1.04). *Includes allocated application fees, conservation stamp revenue, federal/other grants, and interest earned on Department cash balances.

A-7
ROCKY MOUNTAIN GOAT 2008: Population: 285 Licenses Sold: 20 Population Objective: 250 License Revenue: $ (9,161) Harvest: 18 All Other Agency Revenue*: $ 23,893 Hunters: 18 Total Program Revenue: $ 14,732 Success Rate: 100% Program Costs: $ 86,302 Recreation Days: 87 Hunter Expenditures: 1 $ 30,994 Days/Animal: 4.8 Cost Dept. Per Animal: $ 4,795 Economic Return per Animal: $ 1,722 Mountain goats inhabit some of the most rugged and remote areas in northwest Wyoming. Successful transplant operations in Montana and Idaho years ago resulted in mountain goat populations that extended into Wyoming. The Department manages these populations as the Beartooth (northwest of Cody) and Palisades (southwest of Jackson) Herds.
Prior to 1999, only the Beartooth Herd was hunted. The Palisades population increased to a point where it has been able to sustain a limited annual harvest since that year. The Department will continue to closely monitor both populations and will continue to set a hunting season the small populations can support.
Five-year trends in Wyoming's Rocky Mountain goat program. Harvest, recreation and licenses issued are by calendar year. Revenue and costs are by fiscal year.
Year
Harvest
Rec. Days
Success
Days/Animal
Lic.Sold
Lic.Rev. ($)
Mgmt. Costs ($)
Hunter ($)Expend.1
2004 15 61 100% 5 16 10,500 68,613 20,551
2005 19 51 100% 3.2 20 10,520 35,806 16,467
2006 20 69 100% 3.4 20 (7,914) 59,229 22,947
2007 19 113 95% 5.9 20 (5,101) 48,575 38,708
2008 18 87 100% 4.8 20 (9,161) 86,302 30,9941 Calculations prior to 2003 were based on the report, 1989 Hunting and Fishing Expenditure Estimates for Wyoming, 1990. However, these calculations could not be reproduced. The 2003 calculations were derived from the report, Hunting and Trapping Expenditures in Wyoming During the 2001 Season, 2002 using average per day expenditures. Hunter expenditure was calculated from the 2001 cost per day expenditure, corrected for inflation using the Consumer Price Index (2001 per day expenditure x 1.043 = 2003 per day expenditure, 2001 per day expenditure x 1.078 = 2004 per day expenditure, 2001 per day expenditure x 1.115 = 2005 per day expenditure). 2006, 2007 and 2008 Hunter expenditure was calculated from the previous year’s Hunter expenditure corrected for inflation using the Consumer Price Index (2006 was 1.03, 2007 was 1.03, 2008 was 1.04). *Includes allocated application fees, conservation stamp revenue, federal/other grants, and interest earned on Department cash balances.

A-8
BISON 2008 Population: 898 Licenses Sold: 307 Population Objective: 500 License Revenue: $ 180,681 Harvest: 258 All Other Agency Revenue*: $ 87,238 Hunters: 307 Total Program Revenue: $ 267,919 Success Rate: 84% Program Costs: $ 216,062 Recreation Days: 2,223 Hunter Expenditures: 1 $ 403,862 Days/Animal: 8.6 Cost Dept. Per Animal: $ 837 Economic Return per Animal: $ 1,565 The bison population in the Jackson Herd increased steadily in the past to a size far greater than is reasonable for the Jackson valley in its current state of development. The post-harvest objective for this herd is 500 bison. From 2000 to 2006, the population increased 89 percent. However, the population declined slightly but steadily in recent years due to our ability to increase harvests. Harvest increased eight percent from 2007 to 2008 and 17 percent since 2006. The Department shares management responsibility of the Jackson Herd with the National Elk Refuge (NER), Grand Teton National Park and the Bridger-Teton National Forest. Bison of the Jackson Herd spend summers in and around Grand Teton National Park, and most spend winters on the NER, so it has been difficult to obtain an adequate harvest until recent improvements in hunting limitations. Hunting opportunity and the potential for a larger annual harvest increased considerably in 2007 with the inclusion of a significant portion of the NER in the area where bison hunting is allowed. The participation rate increased again (to 307) in 2008. With improved notification and public awareness about better success due to improved hunting access, we hope to have participation rates closer to 90 percent (350 hunters) in future years and to have harvests that will help decrease the population to its objective. Bison harvest decreased three percent from 2007 to 2008. Hunter success in 2008 decreased substantially (12%), and was above the five-year average (81.1 percent). Hunter effort was 8.6 days/bison harvested, which is a substantial increase from 3.1 days/bison harvested in 2007 and is above the average (6.8 days/bison harvested). Social and political concerns continue to influence management of the bison herd.
Five-year trends in Wyoming’s bison program. Harvest, recreation and licenses issued are by calendar year. Revenue and costs are by fiscal year.
Year Harvest Rec. Days Success Days/
AnimalLic.Sold
Lic.Rev. ($)
ProgramCosts ($)
2004 31 100 59.6% 10.5 52 24,173 33,162
2005 36 270 73.5% 6.8 49 23,219 15,728
2006 48 273 92.3% 5.0 52 30,732 21,928
2007 267 824 96.0% 3.1 277 125,315 336,837
2008 258 2,223 84.0% 8.6 307 180,681 216,062 1 Calculations prior to 2003 were based on the report, 1989 Hunting and Fishing Expenditure Estimates for Wyoming, 1990. However, these calculations could not be reproduced. The 2003 calculations were derived from the report, Hunting and Trapping Expenditures in Wyoming During the 2001 Season, 2002 using average per day expenditures. Hunter expenditure was calculated from the 2001 cost per day expenditure, corrected for inflation using the Consumer Price Index (2001 per day expenditure x 1.043 = 2003 per day expenditure, 2001 per day expenditure x 1.078 = 2004 per day expenditure, 2001 per day expenditure x 1.115 = 2005 per day expenditure). 2006, 2007 and 2008 Hunter expenditure was calculated from the previous year’s Hunter expenditure corrected for inflation using the Consumer Price Index (2006 was 1.03, 2007 was 1.03, 2008 was 1.04). *Includes allocated application fees, conservation stamp revenue, federal/other grants, general funds ($59,092) and interest earned on Department cash balances.

TROPHY GAME
Black Bear
Grizzly Bear Mountain Lion


A-9
BLACK BEAR 2008: Population: Not available Licenses Sold: 3,257 Population Objective: Not available License Revenue: $ 244,631 Harvest: 393 All Other Agency Revenue*: $ 90,016 Hunters: 2,235 Total Program Revenue: $ 334,647 Success Rate: 18% Program Costs: $ 682,477 Recreation Days: 21,577 Hunter Expenditures: 1 $ 1,647,427 Days/Animal: 54.9 Cost Dept. Per Animal: $ 1,737 Economic Return per Animal: $ 4,192 Black bears occupy all the major mountain ranges of Wyoming, with the exception of the Black Hills. Most black bears are found in the northwestern part of the state, the Bighorn Mountains and the mountains of south central Wyoming. Black bears are hunted in Wyoming during the spring and fall. Successful bear hunters are required to report bear harvest to a Department game warden, wildlife biologist or regional office within three days of the harvest. Accurate harvest information is vital to management of black bears in Wyoming since other forms of data are hard to collect. The 2008 harvest increased substantially (38%) from 2007. Quotas have been increased in recent years to address increasing bear/human and bear/livestock conflicts and the perception the statewide population is growing. Bear/human conflicts are most often a result of the bears’ attraction or habituation to human related foods. Drought or ill-timed precipitation during the growing season have affected bear food sources, which exacerbates the problem of bears seeking access to human related foods and coming into conflict. The 2008 hunter success rate was higher than the previous year and above the five-year average of 14 percent. The 2008 hunter effort decreased and was below the average (69.3 days/animal harvested).
Five-year trends in Wyoming's black bear program. Harvest, recreation and licenses issued are by calendar year. Revenue and costs are by fiscal year.
Year
Harvest
Rec. Days
Success
Days/Animal
Lic.Sold
Lic.Revenue
($)
Mgmt. Costs ($)
Hunter ($)Expend.1
2004 294 22,471 13% 76.4 2,949 171,414 480,138 1,505,337
2005 277 21,043 12% 76.0 2,904 174,576 482,313 1,456,180
2006 280 18,570 14% 66.3 2,986 191,889 283,438 1,323,599
2007 285 20,768 13% 72.9 3,252 201,341 1,076,992 1,524,672
2008 393 21,577 18% 54.9 3,257 244,631 682,477 1,647,4271 The 2003 calculations were derived from the report, Hunting and Trapping Expenditures in Wyoming During the 2001 Season, 2002 using average per day expenditures. Hunter expenditure was calculated from the 2001 cost per day expenditure, corrected for inflation using the Consumer Price Index (2001 per day expenditure x 1.043 = 2003 per day expenditure, 2001 per day expenditure x 1.078 = 2004 per day expenditure, 2001 per day expenditure x 1.115 = 2005 per day expenditure). 2006, 2007 and 2008 Hunter expenditure was calculated from the previous year’s Hunter expenditure corrected for inflation using the Consumer Price Index (2006 was 1.03, 2007 was 1.03, 2008 was 1.04). *Includes allocated application fees, conservation stamp revenue, federal/other grants, and interest earned on Department cash balances.

A-10
GRIZZLY BEAR OBJECTIVES: To meet those parameters identified in the Conservation Strategy for the Grizzly Bear in the Yellowstone Area. To maintain at least 7,229 square miles of occupied grizzly bear habitat. To obtain the informed consent of all potentially affected interests in structuring the population objectives, management strategies, and regulations. The distribution of the Yellowstone grizzly bear population includes much of northwest Wyoming, mainly Yellowstone National Park and the Caribou-Targhee, Bridger-Teton, and Shoshone National Forests. The Yellowstone population was removed from ‘threatened’ status under the Endangered Species Act in 2007. That population is now being managed according to state management plans developed by Wyoming, Montana and Idaho and approved by the U. S. Fish and Wildlife Service. The Yellowstone Ecosystem Subcommittee, which was responsible for recovery, has been replaced by the Yellowstone Grizzly Coordinating Committee, which will coordinate management according to the state plans and the population’s conservation strategy. A means to determine annual allowable sport harvest (in addition to agency conflict removals) has been established, and Wyoming is developing hunting strategies. The Department will continue to participate in all aspects of management of this population, including monitoring and conflict resolution.
Five-year trends in Wyoming’s grizzly bear program. Fiscal Year Management Costs ($)
FY 2005 1,048,088
FY 2006 1,237,122
FY 2007 1,182,214
FY 2008 1,359,017
FY 2009 1,746,787

A-11
MOUNTAIN LION 2008: Population: Not available Licenses Sold: 1,759 Population Objective: Not available License Revenue: $ 89,267 Harvest: 212 All Other Agency Revenue*: $ 49,399 Hunters: 1,211 Total Program Revenue: $ 138,666 Success Rate: 18% Program Costs: $ 517,806 Recreation Days: 13,236 Hunter Expenditures: 2 $ 2,401,901 Days/Animal: 62.4 Cost Dept. Per Animal: $ 2,442 Economic Return per Animal: $ 11,330 The mountain lion is distributed throughout much of the state and has been managed as a trophy game species in Wyoming since 1974. It prefers rugged foothills and mountainous terrain, which provide cover, den sites and suitable prey bases. The mountain lion is an opportunistic predator that occupies established and well-defended territories. The mountain lion has been managed in Wyoming through annual mortality quotas. When a hunt area harvest quota is reached, the area is closed for the remainder of the season. The state mountain lion management plan approved by the Wyoming Game and Fish Commission in 2007 and implemented by the Department describes a ‘sink/stable/source areas’ strategy for managing mountain lions across the state in the future. The 2008 mountain lion harvest was 7% and 14% higher than 2007 and 2006, respectively. Hunter effort in 2008 increased 13% (62.4 days/lion) from 2007 (55.3 days/lion) and 1791% (3.3 days/lion) from 2006. This drastic change is primarily due to a change in the way effort is calculated. Until 2007, effort was calculated for only successful legal hunters completing the mandatory check of their harvested animal. Beginning in 2007, effort of all hunters is estimated annually from the results of a harvest survey of all mountain lion hunters.
Five-year trends in Wyoming's mountain lion program. Harvest, recreation and licenses issued are by calendar year. Revenue and costs are by fiscal year.
Year
Harvest
Rec. Days
Success1 Days/Animal
LicensesSold
LicenseRevenue ($)
Mgmt. Costs ($)
HunterExpend. ($)2, 3
2004 181 --- 12% --- 1,530 67,161 335,197 100,858
2005 175 --- 11% --- 1,548 71,706 393,315 100,821
2006 186 --- 12% --- 1,553 68,542 444,845 104,015
2007 198 10,944 19% 55.3 1680 78,958 399,474 1,909,594
2008 212 13,236 18% 62.4 1759 89,267 517,806 2,401,9011 Calculations prior to 2007 were based on the number of licenses sold. 2 The 2003 calculations were based on the report, Hunting and Trapping Expenditures in Wyoming During the 2001 Season, 2002 using average per day expenditures. Hunter expenditure for 2004 was calculated from the 2003 estimate, with inflation corrected for by using the Consumer Price Index (2003 per day expenditure x 1.033 = 2004 per day expenditure, 2003 per day expenditure x 1.068 = 2005 per day expenditure). 2006, 2007 and 2008 Hunter expenditure was calculated from the previous year’s Hunter expenditure corrected for inflation using the Consumer Price Index (2006 was 1.03, 2007 was 1.03, 2008 was 1.04). 3 From 2000-2006, recreation days were not estimated in the harvest survey; therefore, hunter expenditures for these years were recalculated to reflect the change. *Includes allocated application fees, conservation stamp revenue, federal/other grants, and interest earned on Department cash balances.

A-12

SMALL GAME
Cottontail
Snowshoe Hare Squirrel

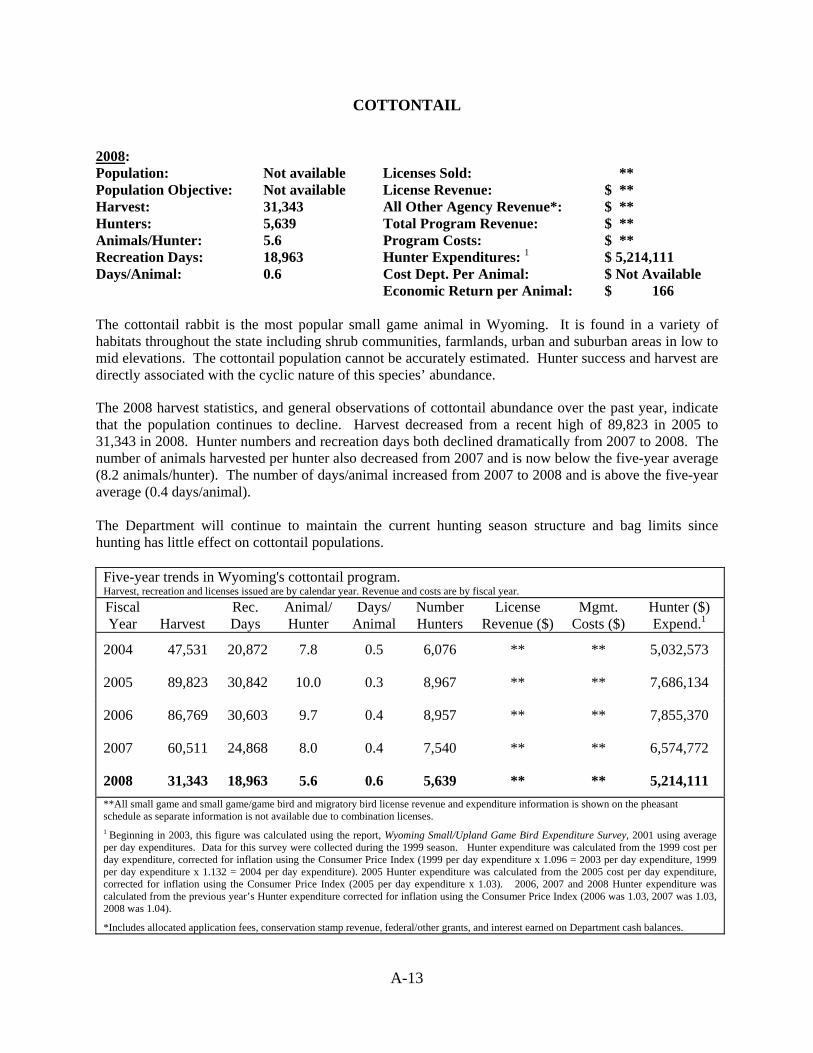
A-13
COTTONTAIL 2008: Population: Not available Licenses Sold: **
Population Objective: Not available License Revenue: $ ** Harvest: 31,343 All Other Agency Revenue*: $ ** Hunters: 5,639 Total Program Revenue: $ ** Animals/Hunter: 5.6 Program Costs: $ ** Recreation Days: 18,963 Hunter Expenditures: 1 $ 5,214,111 Days/Animal: 0.6 Cost Dept. Per Animal: $ Not Available Economic Return per Animal: $ 166 The cottontail rabbit is the most popular small game animal in Wyoming. It is found in a variety of habitats throughout the state including shrub communities, farmlands, urban and suburban areas in low to mid elevations. The cottontail population cannot be accurately estimated. Hunter success and harvest are directly associated with the cyclic nature of this species’ abundance.
The 2008 harvest statistics, and general observations of cottontail abundance over the past year, indicate that the population continues to decline. Harvest decreased from a recent high of 89,823 in 2005 to 31,343 in 2008. Hunter numbers and recreation days both declined dramatically from 2007 to 2008. The number of animals harvested per hunter also decreased from 2007 and is now below the five-year average (8.2 animals/hunter). The number of days/animal increased from 2007 to 2008 and is above the five-year average (0.4 days/animal). The Department will continue to maintain the current hunting season structure and bag limits since hunting has little effect on cottontail populations.
Five-year trends in Wyoming's cottontail program. Harvest, recreation and licenses issued are by calendar year. Revenue and costs are by fiscal year.Fiscal Year
Harvest
Rec. Days
Animal/ Hunter
Days/ Animal
Number Hunters
License Revenue ($)
Mgmt. Costs ($)
Hunter ($) Expend.1
2004 47,531 20,872 7.8 0.5 6,076 ** ** 5,032,573
2005 89,823 30,842 10.0 0.3 8,967 ** ** 7,686,134
2006 86,769 30,603 9.7 0.4 8,957 ** ** 7,855,370
2007 60,511 24,868 8.0 0.4 7,540 ** ** 6,574,772
2008 31,343 18,963 5.6 0.6 5,639 ** ** 5,214,111 **All small game and small game/game bird and migratory bird license revenue and expenditure information is shown on the pheasant schedule as separate information is not available due to combination licenses. 1 Beginning in 2003, this figure was calculated using the report, Wyoming Small/Upland Game Bird Expenditure Survey, 2001 using average per day expenditures. Data for this survey were collected during the 1999 season. Hunter expenditure was calculated from the 1999 cost per day expenditure, corrected for inflation using the Consumer Price Index (1999 per day expenditure x 1.096 = 2003 per day expenditure, 1999 per day expenditure x 1.132 = 2004 per day expenditure). 2005 Hunter expenditure was calculated from the 2005 cost per day expenditure, corrected for inflation using the Consumer Price Index (2005 per day expenditure x 1.03). 2006, 2007 and 2008 Hunter expenditure was calculated from the previous year’s Hunter expenditure corrected for inflation using the Consumer Price Index (2006 was 1.03, 2007 was 1.03, 2008 was 1.04). *Includes allocated application fees, conservation stamp revenue, federal/other grants, and interest earned on Department cash balances.

A-14
SNOWSHOE HARE 2008: Population: Not available Licenses Sold: **
Population Objective: Not available License Revenue: $ ** Harvest: 390 All Other Agency Revenue*: $ ** Hunters: 230 Total Program Revenue: $ ** Animals/Hunter: 1.7 Program Costs: $ ** Recreation Days: 1,885 Hunter Expenditures: 1 $ 518,304 Days/Animal: 4.8 Cost Dept. Per Animal: $ Not Available Economic Return per Animal: $ 1,329 The snowshoe hare is distributed throughout most of the mountain conifer forests of the state. Snowshoe hare hunting is not as popular as other small game hunting, and most snowshoes are likely taken incidentally during big game seasons. Snowshoe hare populations are cyclic, and hunter participation and harvest appear to follow population trends. During most years, fluctuations of hare populations are not consistent across the state; peak snowshoe harvest varies from region to region. The snowshoe harvest increased from 2007, but was below the five-year average (485 animals). Fewer hunters harvested snowshoe hares at a higher rate than in 2007 and invested slightly less effort. The number of hares harvested per hunter in 2008 was slightly below the five-year average (1.8 animals/hunter), and the 2008 effort rate was above average (3.1 days/animal).
Five-year trends in Wyoming's snowshoe hare program. Harvest, recreation and licenses issued are by calendar year. Revenue and costs are by fiscal year.Fiscal Year
Harvest
Rec. Days
Animal/ Hunter
Days/ Animal
Number Hunters
License Revenue ($)
Mgmt. Costs ($)
Hunter ($) Expend.1
2004 343 1,004 1.0 2.9 347 ** ** 242,080
2005 703 815 2.9 1.2 239 ** ** 203,106
2006 660 999 1.9 1.5 349 ** ** 256,429
2007 328 1,633 1.3 5.0 257 ** ** 431,743
2008 390 1,885 1.7 4.8 230 ** ** 518,304 **All small game and small game/game bird and migratory bird license revenue and expenditure information is shown on the pheasant schedule as separate information is not available due to combination licenses. 1 Beginning in 2003, this figure was calculated using the report, Wyoming Small/Upland Game Bird Expenditure Survey, 2001 using average per day expenditures. Data for this survey were collected during the 1999 season. Hunter expenditure was calculated from the 1999 cost per day expenditure, corrected for inflation using the Consumer Price Index (1999 per day expenditure x 1.096 = 2003 per day expenditure, 1999 per day expenditure x 1.132 = 2004 per day expenditure). 2005 Hunter expenditure was calculated from the 2005 cost per day expenditure, corrected for inflation using the Consumer Price Index (2005 per day expenditure x 1.03). 2006, 2007 and 2008 Hunter expenditure was calculated from the previous year’s Hunter expenditure corrected for inflation using the Consumer Price Index (2006 was 1.03, 2007 was 1.03, 2008 was 1.04). *Includes allocated application fees, conservation stamp revenue, federal/other grants, and interest earned on Department cash balances.
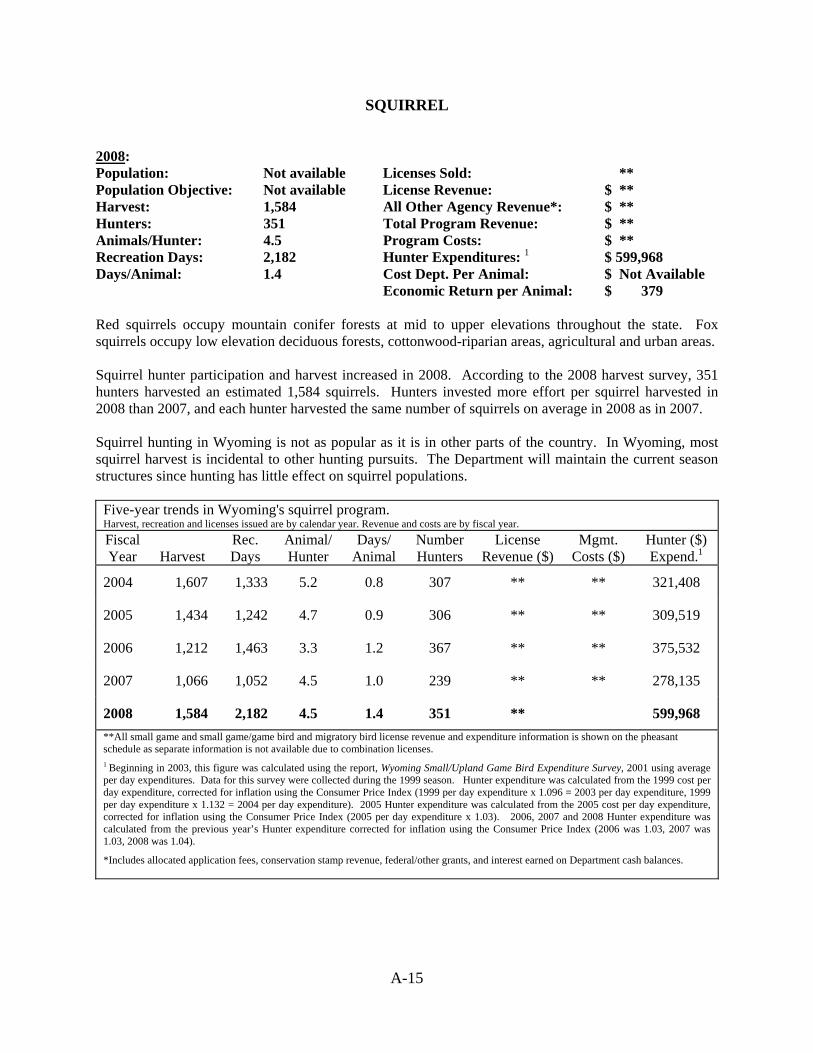
A-15
SQUIRREL 2008: Population: Not available Licenses Sold: ** Population Objective: Not available License Revenue: $ ** Harvest: 1,584 All Other Agency Revenue*: $ ** Hunters: 351 Total Program Revenue: $ ** Animals/Hunter: 4.5 Program Costs: $ ** Recreation Days: 2,182 Hunter Expenditures: 1 $ 599,968 Days/Animal: 1.4 Cost Dept. Per Animal: $ Not Available Economic Return per Animal: $ 379 Red squirrels occupy mountain conifer forests at mid to upper elevations throughout the state. Fox squirrels occupy low elevation deciduous forests, cottonwood-riparian areas, agricultural and urban areas. Squirrel hunter participation and harvest increased in 2008. According to the 2008 harvest survey, 351 hunters harvested an estimated 1,584 squirrels. Hunters invested more effort per squirrel harvested in 2008 than 2007, and each hunter harvested the same number of squirrels on average in 2008 as in 2007. Squirrel hunting in Wyoming is not as popular as it is in other parts of the country. In Wyoming, most squirrel harvest is incidental to other hunting pursuits. The Department will maintain the current season structures since hunting has little effect on squirrel populations.
Five-year trends in Wyoming's squirrel program. Harvest, recreation and licenses issued are by calendar year. Revenue and costs are by fiscal year.Fiscal Year
Harvest
Rec. Days
Animal/ Hunter
Days/ Animal
Number Hunters
License Revenue ($)
Mgmt. Costs ($)
Hunter ($) Expend.1
2004 1,607 1,333 5.2 0.8 307 ** ** 321,408
2005 1,434 1,242 4.7 0.9 306 ** ** 309,519
2006 1,212 1,463 3.3 1.2 367 ** ** 375,532
2007 1,066 1,052 4.5 1.0 239 ** ** 278,135
2008 1,584 2,182 4.5 1.4 351 ** 599,968 **All small game and small game/game bird and migratory bird license revenue and expenditure information is shown on the pheasant schedule as separate information is not available due to combination licenses. 1 Beginning in 2003, this figure was calculated using the report, Wyoming Small/Upland Game Bird Expenditure Survey, 2001 using average per day expenditures. Data for this survey were collected during the 1999 season. Hunter expenditure was calculated from the 1999 cost per day expenditure, corrected for inflation using the Consumer Price Index (1999 per day expenditure x 1.096 = 2003 per day expenditure, 1999 per day expenditure x 1.132 = 2004 per day expenditure). 2005 Hunter expenditure was calculated from the 2005 cost per day expenditure, corrected for inflation using the Consumer Price Index (2005 per day expenditure x 1.03). 2006, 2007 and 2008 Hunter expenditure was calculated from the previous year’s Hunter expenditure corrected for inflation using the Consumer Price Index (2006 was 1.03, 2007 was 1.03, 2008 was 1.04). *Includes allocated application fees, conservation stamp revenue, federal/other grants, and interest earned on Department cash balances.

A-16

UPLAND GAME
Pheasant
Gray Partridge Chukar
Sage Grouse Sharp-Tailed Grouse
Blue Grouse Ruffed Grouse
Mourning Dove Turkey


A-17
PHEASANT 2008: Population: Not available Licenses Sold: 26,234
Population Objective: Not available License Revenue: $ 656,241 Harvest: 42,359 All Other Agency Revenue*: $ 1,219,150 Hunters: 9,888 Total Program Revenue: $ 1,875,391 Bird/Hunter: 4.3 Program Costs: $ 5,035,168 Recreation Days: 37,938 Hunter Expenditures: 1 $ 10,431,522 Days/Bird: 0.9 Cost Dept. Per Bird: $ 119 Economic Return per Bird: $ 246 The pheasant is not as abundant in Wyoming as it is in neighboring states, but there are many opportunities to hunt this popular upland game bird in eastern and north central Wyoming. Weather and habitat conditions are the primary influences on most of the state’s pheasant populations. Pheasant hunting has improved considerably with the implementation and expansion of Wyoming’s Walk-In Access Program, which has opened thousands of acres of private lands to hunting since its inception. The majority of Wyoming’s pheasant hunting occurs in Goshen County, but there are other opportunities near Riverton, in the Bighorn Basin and in the Sheridan area. Established pheasant populations are supplemented by releases from the Department’s Downar and Sheridan Bird Farms. The 2008 pheasant season continued a decline in recreation days and number of hunters from a high in 2005, while harvest stablilized. Hunter effort has remained fairly constant since 2004. Hunter success was similar in 2007 and 2008 and was one bird per hunter below a recent high in 2005. The 2008 harvest rate was below average (4.5 birds/hunter) while hunter effort rate was average (0.9 days/bird).
Five-year trends in Wyoming's pheasant program. Harvest, recreation and licenses issued are by calendar year. Revenue and costs are by fiscal year.Fiscal Year
Harvest
Rec. Days
Bird/ Hunter
Days/ Bird
Number Hunters
License Revenue
($)
Mgmt. Costs ($)
Hunter ($) Expend.1
2004 34,322 28,691 4.6 0.8 7,529 ** ** 6,917,859
2005 65,979 51,253 5.2 0.8 12,573 ** ** 12,772,760
2006 46,164 40,322 4.2 0.9 11,017 ** ** 10,350,105
2007 42,333 39,245 4.2 0.9 10,186 594,597 2,587,351 10,375,863
2008 42,359 37,938 4.3 0.9 9,888 656,241 5,035,168 10,431,522**All small game and small game/game bird and migratory bird license revenue and expenditure information (excepting sage grouse) is shown on the pheasant schedule as separate information is not available due to combination licenses. 1 Beginning in 2003, this figure was calculated using the report, Wyoming Small/Upland Game Bird Expenditure Survey, 2001 using average per day expenditures. Data for this survey were collected during the 1999 season. Hunter expenditure was calculated from the 1999 cost per day expenditure, corrected for inflation using the Consumer Price Index (1999 per day expenditure x 1.096 = 2003 per day expenditure, 1999 per day expenditure x 1.132 = 2004 per day expenditure). 2005 Hunter expenditure was calculated from the 2005 cost per day expenditure, corrected for inflation using the Consumer Price Index (2005 per day expenditure x 1.03). 2006, 2007 and 2008 Hunter expenditure was calculated from the previous year’s Hunter expenditure corrected for inflation using the Consumer Price Index (2006 was 1.03, 2007 was 1.03, 2008 was 1.04). *Includes allocated application fees, conservation stamp revenue, federal/other grants, and interest earned on Department cash balances.
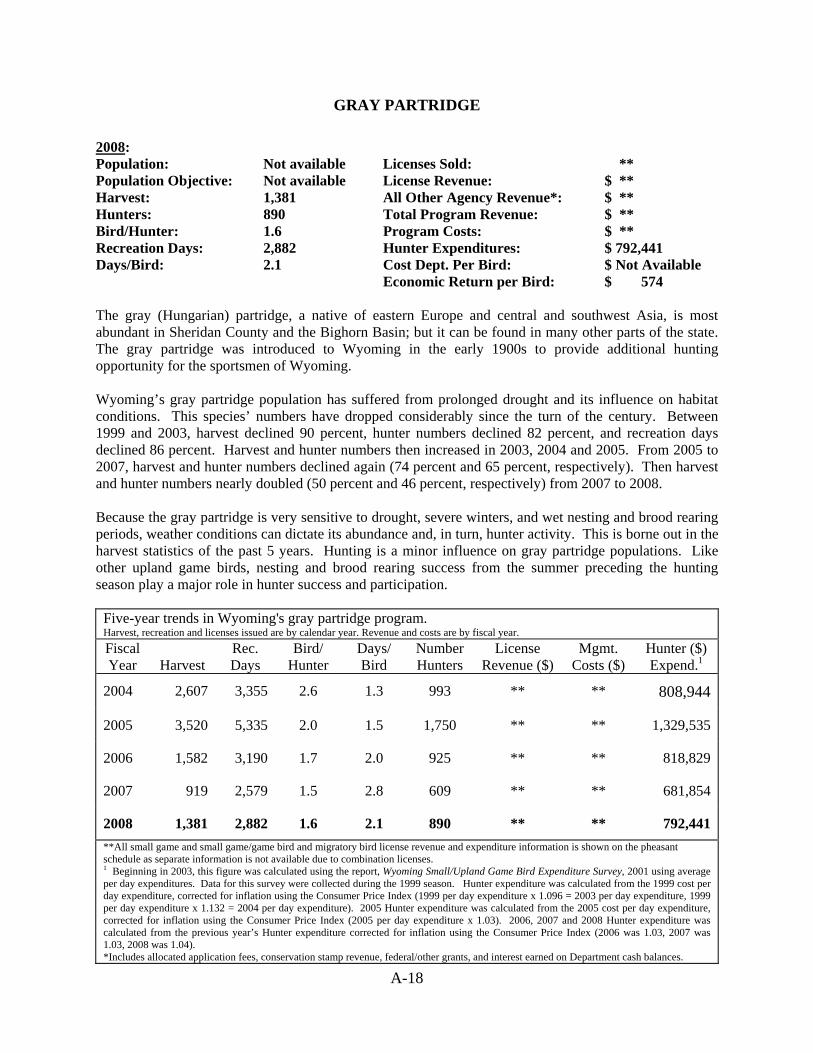
A-18
GRAY PARTRIDGE 2008: Population: Not available Licenses Sold: ** Population Objective: Not available License Revenue: $ ** Harvest: 1,381 All Other Agency Revenue*: $ ** Hunters: 890 Total Program Revenue: $ ** Bird/Hunter: 1.6 Program Costs: $ ** Recreation Days: 2,882 Hunter Expenditures: $ 792,441 Days/Bird: 2.1 Cost Dept. Per Bird: $ Not Available Economic Return per Bird: $ 574 The gray (Hungarian) partridge, a native of eastern Europe and central and southwest Asia, is most abundant in Sheridan County and the Bighorn Basin; but it can be found in many other parts of the state. The gray partridge was introduced to Wyoming in the early 1900s to provide additional hunting opportunity for the sportsmen of Wyoming. Wyoming’s gray partridge population has suffered from prolonged drought and its influence on habitat conditions. This species’ numbers have dropped considerably since the turn of the century. Between 1999 and 2003, harvest declined 90 percent, hunter numbers declined 82 percent, and recreation days declined 86 percent. Harvest and hunter numbers then increased in 2003, 2004 and 2005. From 2005 to 2007, harvest and hunter numbers declined again (74 percent and 65 percent, respectively). Then harvest and hunter numbers nearly doubled (50 percent and 46 percent, respectively) from 2007 to 2008. Because the gray partridge is very sensitive to drought, severe winters, and wet nesting and brood rearing periods, weather conditions can dictate its abundance and, in turn, hunter activity. This is borne out in the harvest statistics of the past 5 years. Hunting is a minor influence on gray partridge populations. Like other upland game birds, nesting and brood rearing success from the summer preceding the hunting season play a major role in hunter success and participation.
Five-year trends in Wyoming's gray partridge program. Harvest, recreation and licenses issued are by calendar year. Revenue and costs are by fiscal year.Fiscal Year
Harvest
Rec. Days
Bird/ Hunter
Days/ Bird
Number Hunters
License Revenue ($)
Mgmt. Costs ($)
Hunter ($) Expend.1
2004 2,607 3,355 2.6 1.3 993 ** ** 808,944
2005 3,520 5,335 2.0 1.5 1,750 ** ** 1,329,535
2006 1,582 3,190 1.7 2.0 925 ** ** 818,829
2007 919 2,579 1.5 2.8 609 ** ** 681,854
2008 1,381 2,882 1.6 2.1 890 ** ** 792,441**All small game and small game/game bird and migratory bird license revenue and expenditure information is shown on the pheasant schedule as separate information is not available due to combination licenses. 1 Beginning in 2003, this figure was calculated using the report, Wyoming Small/Upland Game Bird Expenditure Survey, 2001 using average per day expenditures. Data for this survey were collected during the 1999 season. Hunter expenditure was calculated from the 1999 cost per day expenditure, corrected for inflation using the Consumer Price Index (1999 per day expenditure x 1.096 = 2003 per day expenditure, 1999 per day expenditure x 1.132 = 2004 per day expenditure). 2005 Hunter expenditure was calculated from the 2005 cost per day expenditure, corrected for inflation using the Consumer Price Index (2005 per day expenditure x 1.03). 2006, 2007 and 2008 Hunter expenditure was calculated from the previous year’s Hunter expenditure corrected for inflation using the Consumer Price Index (2006 was 1.03, 2007 was 1.03, 2008 was 1.04). *Includes allocated application fees, conservation stamp revenue, federal/other grants, and interest earned on Department cash balances.

A-19
CHUKAR 2008: Population: Not available Licenses Sold: ** Population Objective: Not available License Revenue: $ ** Harvest: 7,900 All Other Agency Revenue*: $ ** Hunters: 2,156 Total Program Revenue: $ ** Bird/Hunter: 3.7 Program Costs: $ ** Recreation Days: 7,292 Hunter Expenditures: $ 2,005,025 Days/Bird: 0.9 Cost Dept. Per Bird: $ Not Available Economic Return per Bird: $ 254 The chukar partridge, which is native to Europe and Asia, was first released in Wyoming in the 1930s. Small populations of chukars are scattered throughout Wyoming in rocky, steep habitats; but the largest concentrations are found in the Bighorn Basin. The chukar harvest declined 10 percent in 2004, almost tripled in 2005 for reasons that are not understood, then decreased 24 percent in 2006 and another eight percent in 2007. Harvest increased four percent from 2007 to 2008. Hunter numbers increased 20 percent from 2007 to 2008, and recreation days increased 19 percent from 2007 to 2008. The result for 2008 was a harvest per hunter that was below average (3.9 birds/hunter) and an effort rate that equaled the average (0.9 days/bird). Because the chukar is very sensitive to drought and severe winters, weather conditions can dictate its abundance and the resulting hunter interest. Hunting seems to play a minor role in chukar abundance. Like other upland game birds, nesting and brood rearing success from the summer preceding the hunting season play a major role in hunter success and participation.
Five-year trends in Wyoming's chukar program. Harvest, recreation and licenses issued are by calendar year. Revenue and costs are by fiscal year.
Fiscal Year
Harvest
Rec. Days
Bird/ Hunter
Days/ Bird
Number Hunters
License Revenue ($)
Mgmt. Costs ($)
Hunter ($) Expend.1
2004 3,715 4,347 2.8 1.2 1,327 ** ** 1,048,131
2005 10,909 8,302 4.4 0.8 2,465 ** ** 2,068,941
2006 8,315 6,558 4.2 0.8 1,963 ** ** 1,683,348
2007 7,609 6,121 4.2 0.8 1,795 ** ** 1,618,312
2008 7,900 7,292 3.7 0.9 2,156 ** ** 2,005,025**All small game and small game/game bird and migratory bird license revenue and expenditure information is shown on the pheasant schedule as separate information is not available due to combination licenses. 1 Beginning in 2003, this figure was calculated using the report, Wyoming Small/Upland Game Bird Expenditure Survey, 2001 using average per day expenditures. Data for this survey were collected during the 1999 season. Hunter expenditure was calculated from the 1999 cost per day expenditure, corrected for inflation using the Consumer Price Index (1999 per day expenditure x 1.096 = 2003 per day expenditure, 1999 per day expenditure x 1.132 = 2004 per day expenditure). 2005 Hunter expenditure was calculated from the 2005 cost per day expenditure, corrected for inflation using the Consumer Price Index (2005 per day expenditure x 1.03). 2006, 2007 and 2008 Hunter expenditure was calculated from the previous year’s Hunter expenditure corrected for inflation using the Consumer Price Index (2006 was 1.03, 2007 was 1.03, 2008 was 1.04). *Includes allocated application fees, conservation stamp revenue, federal/other grants, and interest earned on Department cash balances.

A-20
SAGE GROUSE 2008: Population: Not available Licenses Sold: Population Objective: Not available License Revenue: $ Harvest: 10,303 All Other Agency Revenue*: $ 1,243,523 Hunters: 4,747 Total Program Revenue: $ 1,243,523 Bird/Hunter: 2.2 Program Costs: $ 3,375,155 Recreation Days: 10,065 Hunter Expenditures: $ 2,767,496 Days/Bird: 1.0 Cost Dept. Per Bird: $ 328 Economic Return per Bird: $ 269 Depressed sage grouse populations have been a concern for states within the historic range of the species since sharp declines were detected in the early 1990s. Wyoming’s sage grouse populations are considered to be below historic levels, but have increased in the past few years due to favorable weather conditions and the response of habitats to these conditions. Sage grouse continue to sustain the light harvest allowed by conservative season structures. Harvest has little effect on sage grouse populations compared to the influence of habitat loss and condition. However, since 1995, sage grouse seasons have been shortened and have opened later in the year to protect hens with broods. Closures have been in effect in parts of the state since 2000 to protect small populations in isolated, severely degraded habitats or where West Nile Virus caused significant declines in sage-grouse numbers in the Powder River Basin. Sage grouse seasons were again conservative in 2008. The 2008 harvest, hunter numbers and recreation days decreased slightly from 2007 (1 percent, 8 percent and 6 percent, respectively). Harvest rate increased from 2007 to 2008, while effort remained stable. Harvest rate was below the five-year average (2.3 birds/hunter), and hunter effort was average (1.0 days/bird). The Department is involved in interstate sage grouse conservation efforts. It will continue to monitor sage grouse populations, press for minimization and mitigation of environmental impacts in sagebrush habitats, and try to improve habitat conditions throughout the state.
Five-year trends in Wyoming's sage grouse program. Harvest, recreation and licenses issued are by calendar year. Revenue and costs are by fiscal year.Fiscal Year
Harvest
Rec. Days
Bird/ Hunter
Days/ Bird
Number Hunters
License Revenue ($)
Mgmt. Costs ($)
Hunter ($) Expend.1
2004 11,783 13,296 2.2 1.1 5,436 ** ** 3,205,878
2005 13,176 12,176 2.5 0.9 5,231 ** ** 3,034,381
2006 12,920 11,981 2.4 0.9 5,412 ** ** 3,075,359
2007 10,378 10,699 2.0 1.0 5,180 ** 2,536,600 2,828,675
2008 10,303 10,065 2.2 1.0 4,747 ** 3,375,155 2,767,496**All small game and small game/game bird and migratory bird license revenue is shown on the pheasant schedule as separate information is not available due to combination licenses. Expenditures for sage grouse include $531,192 in general funds. 1Beginning in 2003, this figure was calculated using the report, Wyoming Small/Upland Game Bird Expenditure Survey, 2001 using average per day expenditures. Data for this survey were collected during the 1999 season. Hunter expenditure was calculated from the 1999 cost per day expenditure, corrected for inflation using the Consumer Price Index (1999 per day expenditure x 1.096 = 2003 per day expenditure, 1999 per day expenditure x 1.132 = 2004 per day expenditure). 2005 Hunter expenditure was calculated from the 2005 cost per day expenditure, corrected for inflation using the Consumer Price Index (2005 per day expenditure x 1.03). 2006, 2007 and 2008 Hunter expenditure was calculated from the previous year’s Hunter expenditure corrected for inflation using the Consumer Price Index (2006 was 1.03, 2007 was 1.03, 2008 was 1.04). *Includes allocated application fees, conservation stamp revenue, federal/other grants, and interest earned on Department cash balances.

A-21
SHARP-TAILED GROUSE 2008: Population: Not available Licenses Sold: ** Population Objective: Not available License Revenue: $ ** Harvest: 1,900 All Other Agency Revenue*: $ ** Hunters: 940 Total Program Revenue: $ ** Bird/Hunter: 2.0 Program Costs: $ ** Recreation Days: 3,374 Hunter Expenditures: $ 927,723 Days/Bird: 1.8 Cost Dept. Per Bird: $ Not Available Economic Return per Bird: $ 488 Sharp-tailed grouse occur primarily in eastern Wyoming. Thousands of acres of marginal farmlands in the state were converted to wildlife habitat that benefit sharp-tailed grouse beginning in the mid 1980s as part of the Conservation Reserve Program. And, the Department’s Walk-In Access Program, begun in 1998, has greatly improved sharp-tailed grouse hunting opportunities. Several consecutive years of drought, followed by very favorable moisture conditions in recent years have affected the state’s sharp-tailed grouse population. The harvest has fluctuated over the past five years, and it increased 20 percent from 2007 to 2008. The harvest in recent years is much lower than it was near the turn of the century. The 2008 harvest was 84 percent less than the 2000 harvest and 52 percent less than the 2001 harvest. The number of hunters and recreation days increased from 2007 to 2008 (18 percent and 15 percent, respectively). The success rate and hunter effort remained stable in 2008, equaling the five-year averages (2.0 birds/hunter and 1.8 days/bird, respectively).
Five-year trends in Wyoming's sharp-tailed grouse program. Harvest, recreation and licenses issued are by calendar year. Revenue and costs are by fiscal year.Fiscal Year
Harvest
Rec. Days
Bird/ Hunter
Days/ Bird
Number Hunters
License Revenue ($)
Mgmt. Costs ($)
Hunter ($) Expend.1
2004 1,429 3,686 1.5 2.6 959 ** ** 888,754
2005 2,712 3,729 2.4 1.4 1,128 ** ** 929,304
2006 2,337 3,502 2.1 1.5 1,124 ** ** 898,915
2007 1,589 2,936 2.0 1.8 800 ** ** 776,240
2008 1,900 3,374 2.0 1.8 940 ** ** 927,723 **All small game and small game/game bird and migratory bird license revenue and expenditure information is shown on the pheasant schedule as separate information is not available due to combination licenses. 1 Beginning in 2003, this figure was calculated using the report, Wyoming Small/Upland Game Bird Expenditure Survey, 2001 using average per day expenditures. Data for this survey were collected during the 1999 season. Hunter expenditure was calculated from the 1999 cost per day expenditure, corrected for inflation using the Consumer Price Index (1999 per day expenditure x 1.096 = 2003 per day expenditure, 1999 per day expenditure x 1.132 = 2004 per day expenditure). 2005 Hunter expenditure was calculated from the 2005 cost per day expenditure, corrected for inflation using the Consumer Price Index (2005 per day expenditure x 1.03). 2006, 2007 and 2008 Hunter expenditure was calculated from the previous year’s Hunter expenditure corrected for inflation using the Consumer Price Index (2006 was 1.03, 2007 was 1.03, 2008 was 1.04). *Includes allocated application fees, conservation stamp revenue, federal/other grants, and interest earned on Department cash balances.

A-22
BLUE GROUSE 2008: Population: Not available Licenses Sold: ** Population Objective: Not available License Revenue: $ ** Harvest: 8,611 All Other Agency Revenue*: $ ** Hunters: 3,581 Total Program Revenue: $ ** Bird/Hunter: 2.4 Program Costs: $ ** Recreation Days: 14,396 Hunter Expenditures: $ 3,958,358 Days/Bird: 1.7 Cost Dept. Per Bird: $ Not Available Economic Return per Bird: $ 460 Blue grouse occupy most of Wyoming’s mountain conifer habitats, except for the Black Hills in the northeast corner of the state. They winter among conifers and migrate to lower altitudes with more open cover for the spring and summer. The Department maintains liberal hunting seasons and harvest limitations since hunting has little influence on blue grouse populations. Blue grouse numbers fluctuate primarily due to natural factors such as weather events and, to some degree, land management practices. The extensive conifer beetle outbreaks occurring throughout the state are expected to have a significant effect on blue grouse in the future. Following an increase in 2007, blue grouse harvest declined in 2008. Hunter numbers and recreation days also declined. The 2008 harvest was 17 percent lower than in 2007, and the 2008 hunter numbers were 21 percent lower than in 2007. The 2008 harvest rate and effort rates remained stable from 2007. The harvest rate was average (2.4 birds/hunter), and the effort rate was slightly above the five-year average (1.6 days/bird).
Five-year trends in Wyoming's blue grouse program. Harvest, recreation and licenses issued are by calendar year. Revenue and costs are by fiscal year.Fiscal Year
Harvest
Rec. Days
Bird/ Hunter
Days/ Bird
Number Hunters
License Revenue ($)
Mgmt. Costs ($)
Hunter ($) Expend.1
2004 12,550 20,176 2.4 1.6 5,290 ** ** 4,864,756
2005 13,076 19,782 2.6 1.5 4,986 ** ** 4,929,872
2006 9,324 17,134 2.3 1.8 4,051 ** ** 4,398,063
2007 10,384 16,620 2.3 1.6 4,523 ** ** 4,394,110
2008 8,611 14,396 2.4 1.7 3,581 ** ** 3,958,358 **All small game and small game/game bird and migratory bird license revenue and expenditure information is shown on the pheasant schedule as separate information is not available due to combination licenses. 1 Beginning in 2003, this figure was calculated using the report, Wyoming Small/Upland Game Bird Expenditure Survey, 2001 using average per day expenditures. Data for this survey were collected during the 1999 season. Hunter expenditure was calculated from the 1999 cost per day expenditure, corrected for inflation using the Consumer Price Index (1999 per day expenditure x 1.096 = 2003 per day expenditure, 1999 per day expenditure x 1.132 = 2004 per day expenditure). 2005 Hunter expenditure was calculated from the 2005 cost per day expenditure, corrected for inflation using the Consumer Price Index (2005 per day expenditure x 1.03). 2006, 2007 and 2008 Hunter expenditure was calculated from the previous year’s Hunter expenditure corrected for inflation using the Consumer Price Index (2006 was 1.03, 2007 was 1.03, 2008 was 1.04). *Includes allocated application fees, conservation stamp revenue, federal/other grants, and interest earned on Department cash balances.
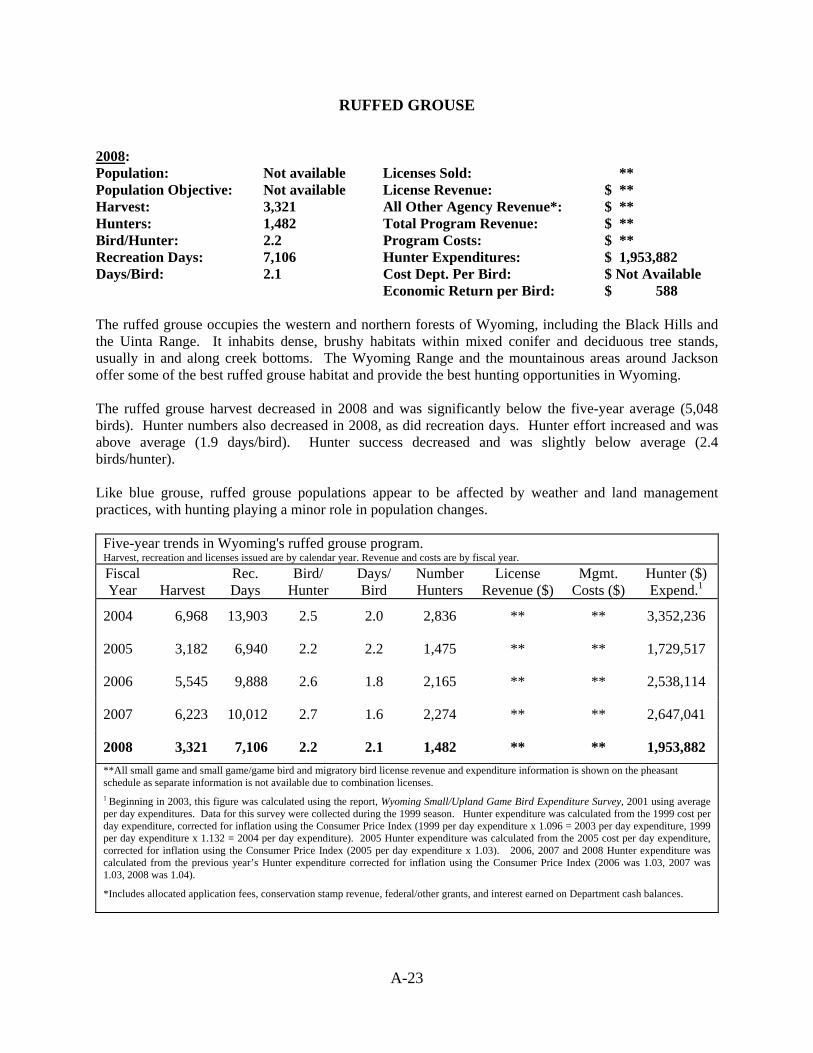
A-23
RUFFED GROUSE 2008: Population: Not available Licenses Sold: ** Population Objective: Not available License Revenue: $ ** Harvest: 3,321 All Other Agency Revenue*: $ ** Hunters: 1,482 Total Program Revenue: $ ** Bird/Hunter: 2.2 Program Costs: $ ** Recreation Days: 7,106 Hunter Expenditures: $ 1,953,882 Days/Bird: 2.1 Cost Dept. Per Bird: $ Not Available Economic Return per Bird: $ 588 The ruffed grouse occupies the western and northern forests of Wyoming, including the Black Hills and the Uinta Range. It inhabits dense, brushy habitats within mixed conifer and deciduous tree stands, usually in and along creek bottoms. The Wyoming Range and the mountainous areas around Jackson offer some of the best ruffed grouse habitat and provide the best hunting opportunities in Wyoming. The ruffed grouse harvest decreased in 2008 and was significantly below the five-year average (5,048 birds). Hunter numbers also decreased in 2008, as did recreation days. Hunter effort increased and was above average (1.9 days/bird). Hunter success decreased and was slightly below average (2.4 birds/hunter). Like blue grouse, ruffed grouse populations appear to be affected by weather and land management practices, with hunting playing a minor role in population changes.
Five-year trends in Wyoming's ruffed grouse program. Harvest, recreation and licenses issued are by calendar year. Revenue and costs are by fiscal year.Fiscal Year
Harvest
Rec. Days
Bird/ Hunter
Days/ Bird
Number Hunters
License Revenue ($)
Mgmt. Costs ($)
Hunter ($) Expend.1
2004 6,968 13,903 2.5 2.0 2,836 ** ** 3,352,236
2005 3,182 6,940 2.2 2.2 1,475 ** ** 1,729,517
2006 5,545 9,888 2.6 1.8 2,165 ** ** 2,538,114
2007 6,223 10,012 2.7 1.6 2,274 ** ** 2,647,041
2008 3,321 7,106 2.2 2.1 1,482 ** ** 1,953,882 **All small game and small game/game bird and migratory bird license revenue and expenditure information is shown on the pheasant schedule as separate information is not available due to combination licenses. 1 Beginning in 2003, this figure was calculated using the report, Wyoming Small/Upland Game Bird Expenditure Survey, 2001 using average per day expenditures. Data for this survey were collected during the 1999 season. Hunter expenditure was calculated from the 1999 cost per day expenditure, corrected for inflation using the Consumer Price Index (1999 per day expenditure x 1.096 = 2003 per day expenditure, 1999 per day expenditure x 1.132 = 2004 per day expenditure). 2005 Hunter expenditure was calculated from the 2005 cost per day expenditure, corrected for inflation using the Consumer Price Index (2005 per day expenditure x 1.03). 2006, 2007 and 2008 Hunter expenditure was calculated from the previous year’s Hunter expenditure corrected for inflation using the Consumer Price Index (2006 was 1.03, 2007 was 1.03, 2008 was 1.04). *Includes allocated application fees, conservation stamp revenue, federal/other grants, and interest earned on Department cash balances.

A-24
MOURNING DOVE
2008: Population: Not available Licenses Sold: ** Population Objective: Not available License Revenue: $ ** Harvest: 29,994 All Other Agency Revenue*: $ ** Hunters: 2,315 Total Program Revenue: $ ** Bird/Hunter: 13.0 Program Costs: $ ** Recreation Days: 7,482 Hunter Expenditures: $ 2,057,269 Days/Bird: 0.2 Cost Dept. Per Bird: $ Not Available Economic Return per Bird: $ 69 The mourning dove is the most abundant and widespread game bird in North America. More mourning doves are harvested throughout the country than all other game birds combined. The mourning dove occupies a wide variety of native habitats in Wyoming, as well as farmlands and urban areas. The Wyoming mourning dove harvest decreased 18 percent in 2008. Hunter numbers decreased slightly, and recreation days decreased (about 9 percent). The 2008 harvest rate was below the five-year average, and effort rate was average (13.8 birds/hunter and 0.2 days/bird, respectively). Mourning dove harvest in Wyoming can be greatly reduced when cold weather in late August and early September causes early migration. Mourning dove hunting seasons are set at the national level by the U.S. Fish and Wildlife Service in accordance with the Migratory Bird Treaty. Concern over the decline in morning dove populations based on annual surveys has prompted the U.S. Fish and Wildlife Service to initiate efforts with the states throughout the Flyway system to develop a Morning Dove Strategic Harvest Management Plan. The plan will establish hunting season frameworks based on different population levels as determined through annual population surveys. To date seasons have generally been liberal since harvest was thought to have little impact on dove populations. Changes in habitat are thought to have the most impact on dove populations.
Five-year trends in Wyoming's mourning dove program.
Fiscal Year
Harvest
Rec. Days
Bird/ Hunter
Days/ Bird
Number Hunters
License Revenue ($)
Mgmt. Costs ($)
Hunter ($) Expend.1
2004 32,142 7,645 13.0 0.2 2,471 ** ** 1,843,332
2005 44,280 9,080 13.9 0.2 3,194 ** ** 2,262,827
2006 32,807 7,141 13.3 0.2 2,461 ** ** 1,832,997
2007 36,670 8,256 15.6 0.2 2,351 ** ** 2,182,778
2008 29,994 7,482 13.0 0.2 2,315 ** ** 2,057,269 **All small game and small game/game bird and migratory bird license revenue and expenditure information is shown on the pheasant schedule as separate information is not available due to combination licenses. 1 Beginning in 2003, this figure was calculated using the report, Wyoming Small/Upland Game Bird Expenditure Survey, 2001 using average per day expenditures. Data for this survey were collected during the 1999 season. Hunter expenditure was calculated from the 1999 cost per day expenditure, corrected for inflation using the Consumer Price Index (1999 per day expenditure x 1.096 = 2003 per day expenditure, 1999 per day expenditure x 1.132 = 2004 per day expenditure). 2005 Hunter expenditure was calculated from the 2005 cost per day expenditure, corrected for inflation using the Consumer Price Index (2005 per day expenditure x 1.03). 2006, 2007 and 2008 Hunter expenditure was calculated from the previous year’s Hunter expenditure corrected for inflation using the Consumer Price Index (2006 was 1.03, 2007 was 1.03, 2008 was 1.04). *Includes allocated application fees, conservation stamp revenue, federal/other grants, and interest earned on Department cash balances.

A-25
TURKEY 2008: Population: Not available Licenses Sold: 8,915 Population Objective: Not available License Revenue: $ 242,609 Harvest: 5,125 All Other Agency Revenue*: $ 222,379 Hunters: 7,581 Total Program Revenue: $ 464,988 Bird/Hunter: 0.7 Program Costs: $ 298,506 Recreation Days: 20,950 Hunter Expenditures: $ 5,761,552 Days/Bird: 4.1 Cost Dept. Per Bird: $ 58 Economic Return per Bird: $ 1,124 The wild turkey was originally introduced to Wyoming in 1935 when New Mexico traded nine hens and six gobblers of the Merriam’s subspecies to Wyoming in exchange for sage-grouse. Those first birds were released near Laramie Peak. Until recently, the Merriam’s has been the predominant subspecies in the state. Turkeys are found primarily in the southeastern, northeastern and north-central portions of Wyoming in riparian habitats, on private land and in low elevation conifer habitats. Wild turkey translocations and favorable winter weather over the past decade have resulted in an abundance of turkeys spread over most habitats in the state that will support them. Recent introductions of the Rio Grande subspecies to riparian habitats have further expanded the species’ presence. The turkey harvest increased 10 percent, while hunter numbers decreased 5 percent from 2007 to 2008. As the turkey population in Wyoming has increased under the generally favorable weather regime of the past several years, managers have increased the number of hunt areas with general instead of limited quota licenses. As a result, hunter opportunity and harvest have increased.
Five-year trends in Wyoming's turkey program. Harvest, recreation and licenses issued are by calendar year. Revenue and costs are by fiscal year.
Fiscal Year
Harvest
Rec. Days
Bird/ Hunter
Days/ Bird
Number Hunters
License Revenue ($)
Mgmt. Costs ($)
Hunter ($) Expend.1
2004 3,956 22,238 0.6 5.6 7,094 180,837 304,936 5,358,017
2005 3,855 21,536 0.6 5.6 6,833 183,947 253,273 5,368,003
2006 3,986 20,519 0.6 5.1 6,904 190,192 211,984 5,267,944
2007 4,674 21,042 0.6 4.5 7,945 219,072 325,686 5,564,283
2008 5125 20,930 0.7 4.1 7,581 242,609 298,506 5,761,552
1 Beginning in 2003, this figure was calculated using the report, Wyoming Small/Upland Game Bird Expenditure Survey, 2001 using average per day expenditures. Hunter expenditure for 2004 and 2005 were calculated from the 2003 estimate, with inflation corrected for by using the Consumer Price Index (2003 per day expenditure x 1.033 = 2004 per day expenditure, 2003 per day expenditure x 1.068 = 2005 per day expenditure). 2005 Hunter expenditure was calculated from the 2005 cost per day expenditure, corrected for inflation using the Consumer Price Index (2005 per day expenditure x 1.03). 2006, 2007 and 2008 Hunter expenditure was calculated from the previous year’s Hunter expenditure corrected for inflation using the Consumer Price Index (2006 was 1.03, 2007 was 1.03, 2008 was 1.04). *Includes allocated application fees, conservation stamp revenue, federal/other grants, and interest earned on Department cash balances.

A-26

WATERFOWL
Duck Goose
Sandhill Crane Rail, Snipe, Coot


A-27
DUCK 2008: Population: Not available Licenses Sold: ** Population Objective: Not available License Revenue: $ ** Harvest: 53,158 All Other Agency Revenue*: $ ** Hunters: 6,081 Total Program Revenue: $ ** Bird/Hunter: 8.7 Program Costs: $ ** Recreation Days: 33,331 Hunter Expenditures: $ 9,164,770 Days/Bird: 0.6 Cost Dept. Per Bird: $ Not Available Economic Return per Bird: $ 172 Wyoming supports a variety of duck species throughout the year. Ducks migrate to and through the state along the Central and Pacific Flyways. They occupy most habitats in Wyoming where water is present in good quantity and quality. Drought conditions prevailed in Wyoming up until the last couple of years which created comparatively poor breeding conditions and fall recruitment. Spring water conditions were variable but generally improved recently in the core breeding range of the Canadian prairie provinces and northern prairie states. Consequently, duck population surveys in the traditional survey area indicate the numbers of most duck species have increased and in 2008 were approximately 10% above the long-term average. Hunter numbers, harvest and recreation days decreased significantly in 2008. The 2008 harvest rate was near the five-year average (8.8 birds/hunter), while hunter effort was average (0.6 days/bird).
The Department remains concerned about the degradation and loss of wetlands, other duck habitats and about the status of some duck species. The Department will continue to work with private landowners, other government agencies and conservation organizations to improve habitat conditions for ducks and to increase the amount of habitat available to them.
Five-year trends in Wyoming's duck program. Harvest, recreation and licenses issued are by calendar year. Revenue and costs are by fiscal year.Fiscal Year
Harvest
Rec. Days
Bird/ Hunter
Days/Bird
Number Hunters
License Revenue ($)
Mgmt. Costs ($)
Hunter ($) Expend.1
2004 50,804 32,175 9.3 0.6 5,471 ** ** 7,757,907
2005 72,368 48,039 9.0 0.7 8,072 ** ** 11,971,799
2006 55,545 33,834 8.0 0.6 6,910 ** ** 8,684,724
2007 68,478 39,057 9.1 0.6 7,550 ** ** 10,326,159
2008 53,158 33,331 8.7 0.6 6,081 ** ** 9,164,770**All small game and small game/game bird and migratory bird license revenue and expenditure information is shown on the pheasant schedule as separate information is not available due to combination licenses. 1 Beginning in 2003, this figure was calculated using the report, Wyoming Small/Upland Game Bird Expenditure Survey, 2001 using average per day expenditures. Data for this survey were collected during the 1999 season. Hunter expenditure was calculated from the 1999 cost per day expenditure, corrected for inflation using the Consumer Price Index (1999 per day expenditure x 1.096 = 2003 per day expenditure, 1999 per day expenditure x 1.132 = 2004 per day expenditure,). 2005 Hunter expenditure was calculated from the 2005 cost per day expenditure, corrected for inflation using the Consumer Price Index (2005 per day expenditure x 1.03). 2006, 2007 and 2008 Hunter expenditure was calculated from the previous year’s Hunter expenditure corrected for inflation using the Consumer Price Index (2006 was 1.03, 2007 was 1.03, 2008 was 1.04). *Includes allocated application fees, conservation stamp revenue, federal/other grants, and interest earned on Department cash balances.

A-28
GOOSE 2008: Population: Not available Licenses Sold: ** Population Objective: Not available License Revenue: $ ** Harvest: 33,460 All Other Agency Revenue*: $ ** Hunters: 6,079 Total Program Revenue: $ ** Bird/Hunter: 5.5 Program Costs: $ ** Recreation Days: 32,039 Hunter Expenditures: $ 8,809,519 Days/Bird: 1.0 Cost Dept. Per Bird: $ Not Available Economic Return per Bird: $ 263 Goose hunting in Wyoming continued to be excellent through the drought years around the turn of the century and through the last couple wet years. Harvest of migratory populations of Canada geese depends upon winter weather patterns, which can affect the timing and extent of the migration and the number of birds available to hunters in Wyoming. Canada geese traditionally have provided most of the goose hunting in the state, but the increasing lesser snow goose population and liberalization of hunting opportunities to address its increase have provided hunters with more recreation, especially in late winter and early spring during the Light Goose Conservation Order seasons.
The goose harvest has fluctuated over the past 5 years, ranging from a high in 2005 of 55,678 to a low in 2007 of 19,511. The 2008 harvest increased 71 percent from 2007. Recreation days increased ten percent, while hunter success was above and effort rate was below the five-year average (4.7 birds/hunter and 1.2 days/bird, respectively). Liberal season lengths and bag limits designed to lower goose populations continue to afford hunters abundant harvest opportunities. Liberal seasons will continue, especially the late season Conservation Order for snow and other light geese, as the flyway councils attempt to lower populations to protect important nesting areas from overuse of sensitive forage plants.
Five-year trends in Wyoming's goose program. Harvest, recreation and licenses issued are by calendar year. Revenue and costs are by fiscal year.Fiscal Year
Harvest
Rec. Days
Bird/ Hunter
Days/ Bird
Number Hunters
License Revenue ($)
Mgmt. Costs ($)
Hunter ($) Expend.1
2004 25,938 28,241 5.0 1.1 5,204 ** ** 6,809,357
2005 55,678 50,406 6.4 0.9 8,729 ** ** 12,561,679
2006 22,748 29,522 3.6 1.3 6,344 ** ** 7,577,893
2007 19,511 29,036 3.2 1.5 6,019 ** ** 7,676,738
2008 33,460 32,039 5.5 1.0 6,079 ** ** 8,809,519**All small game and small game/game bird and migratory bird license revenue and expenditure information is shown on the pheasant schedule as separate information is not available due to combination licenses. 1 Beginning in 2003, this figure was calculated using the report, Wyoming Small/Upland Game Bird Expenditure Survey, 2001 using average per day expenditures. Data for this survey were collected during the 1999 season. Hunter expenditure was calculated from the 1999 cost per day expenditure, corrected for inflation using the Consumer Price Index (1999 per day expenditure x 1.096 = 2003 per day expenditure, 1999 per day expenditure x 1.132 = 2004 per day expenditure,). 2005 Hunter expenditure was calculated from the 2005 cost per day expenditure, corrected for inflation using the Consumer Price Index (2005 per day expenditure x 1.03). 2006, 2007 and 2008 Hunter expenditure was calculated from the previous year’s Hunter expenditure corrected for inflation using the Consumer Price Index (2006 was 1.03, 2007 was 1.03, 2008 was 1.04). *Includes allocated application fees, conservation stamp revenue, federal/other grants, and interest earned on Department cash balances.

A-29
SANDHILL CRANE 2008: Population: Not available Licenses Sold: ** Population Objective: Not available License Revenue: $ ** Harvest: 162 All Other Agency Revenue*: $ ** Hunters: 281 Total Program Revenue: $ ** Bird/Hunter: 0.6 Program Costs: $ ** Recreation Days: 562 Hunter Expenditures: $ 154,528 Days/Bird: 3.5 Cost Dept. Per Bird: $ Not Available Economic Return per Bird: $ 954 Two populations of the sandhill crane are found in Wyoming: the Rocky Mountain Greater Sandhill Crane and the Mid-Continent Sandhill Crane. The sandhill crane is managed in cooperation with various western states and the federal government. Most crane harvest occurs in the western part of Wyoming. The Rocky Mountain Population of Sandhill Cranes has increased in size with above average recruitment in the past few years. The Mid-Continent Population of Sandhill Cranes has been relatively stable since the early 1980s, but increased slightly over the past five years. Allowable permit numbers are based on a formula using estimated population from fall staging counts and recruitment within the individual flyways, and these permit quotas determine harvest levels.
In the 2008 season, hunters and harvest increased from the previous year (by 32 percent and 17 percent, respectively). The success rate remained stable from 2007 to 2008, equaling the five-year average. Hunter effort was above average in 2008 (3.3 days/animal harvested).
Five-year trends in Wyoming's Sandhill Crane program. Harvest, recreation and licenses issued are by calendar year. Revenue and costs are by fiscal year.Fiscal Year
Harvest
Rec. Days
Bird/ Hunter
Days/ Bird
Number Hunters
License Revenue ($)
Mgmt. Costs ($)1
Hunter ($) Expend.2
2004 124 343 0.7 2.8 174 ** ** 82,703
2005 116 430 0.6 3.7 196 ** ** 107,160
2006 194 687 0.6 3.5 305 ** ** 176,343
2007 138 418 0.6 3.0 213 ** ** 110,513
2008 162 562 0.6 3.5 281 ** ** 154,528**All small game and small game/game bird and migratory bird license revenue and expenditure information is shown on the pheasant schedule as separate information is not available due to combination licenses. 1 Management costs are for both greater and lesser Sandhill crane. 2 Beginning in 2003, this figure was calculated using the report, Wyoming Small/Upland Game Bird Expenditure Survey, 2001 using average per day expenditures. Data for this survey were collected during the 1999 season. Hunter expenditure was calculated from the 1999 cost per day expenditure, corrected for inflation using the Consumer Price Index (1999 per day expenditure x 1.096 = 2003, 1999 per day expenditure x 1.132 = 2004 per day expenditure). 2005 Hunter expenditure was calculated from the 2005 cost per day expenditure, corrected for inflation using the Consumer Price Index (2005 per day expenditure x 1.03). 2006, 2007 and 2008 Hunter expenditure was calculated from the previous year’s Hunter expenditure corrected for inflation using the Consumer Price Index (2006 was 1.03, 2007 was 1.03, 2008 was 1.04). *Includes allocated application fees, conservation stamp revenue, federal/other grants, and interest earned on Department cash balances.

A-30
RAIL, SNIPE, AND COOT 2008: Population: Not available Licenses Sold: ** Population Objective: Not available License Revenue: $ ** Harvest: 621 All Other Agency Revenue*: $ ** Hunters: 400 Total Program Revenue: $ ** Bird/Hunter: 1.6 Program Costs: $ ** Recreation Days: 1,365 Hunter Expenditures: $ 375,323 Days/Bird: 2.2 Cost Dept. Per Bird: $ Not Available Economic Return per Bird: $ 604 Rail, snipe, and coot are harvested in both the Central and Pacific Flyways in Wyoming. Since these birds are not highly valued as game species or as food sources, the demand is low. Generally, these species are taken incidental to hunting other migratory and upland game birds.
Five-year trends in Wyoming's rail, snipe and coot program. Harvest, recreation and licenses issued are by calendar year. Revenue and costs are by fiscal year.Fiscal Year
Harvest
Rec. Days
Birds/ Hunter
Days/ Bird
Number Hunters
License Revenue ($)
Mgmt. Costs ($)
Hunter ($) Expend.1
2004 505 1,036 2.0 2.1 250 ** ** 249,796
2005 759 1,349 1.7 1.8 440 ** ** 336,184
2006 1,243 1,207 3.6 1.0 346 ** ** 309,820
2007 1,006 1,412 3.7 1.4 273 ** ** 373,314
2008 621 1,365 1.6 2.2 400 ** ** 375,323**All small game and small game/game bird and migratory bird license revenue and expenditure information is shown on the pheasant schedule as separate information is not available due to combination licenses. 1 Beginning in 2003, this figure was calculated using the report, Wyoming Small/Upland Game Bird Expenditure Survey, 2001 using average per day expenditures. Data for this survey were collected during the 1999 season. Hunter expenditure was calculated from the 1999 cost per day expenditure, corrected for inflation using the Consumer Price Index (1999 per day expenditure x 1.096 = 2003, 1999 per day expenditure x 1.132 = 2004 per day expenditure). 2005 Hunter expenditure was calculated from the 2005 cost per day expenditure, corrected for inflation using the Consumer Price Index (2005 per day expenditure x 1.03). 2006, 2007 and 2008 Hunter expenditure was calculated from the previous year’s Hunter expenditure corrected for inflation using the Consumer Price Index (2006 was 1.03, 2007 was 1.03, 2008 was 1.04). *Includes allocated application fees, conservation stamp revenue, federal/other grants, and interest earned on Department cash balances. ** Because program costs were negligible, they are included with other waterfowl management costs.

FISHERIES
Sport Fisheries
Commercial Fisheries

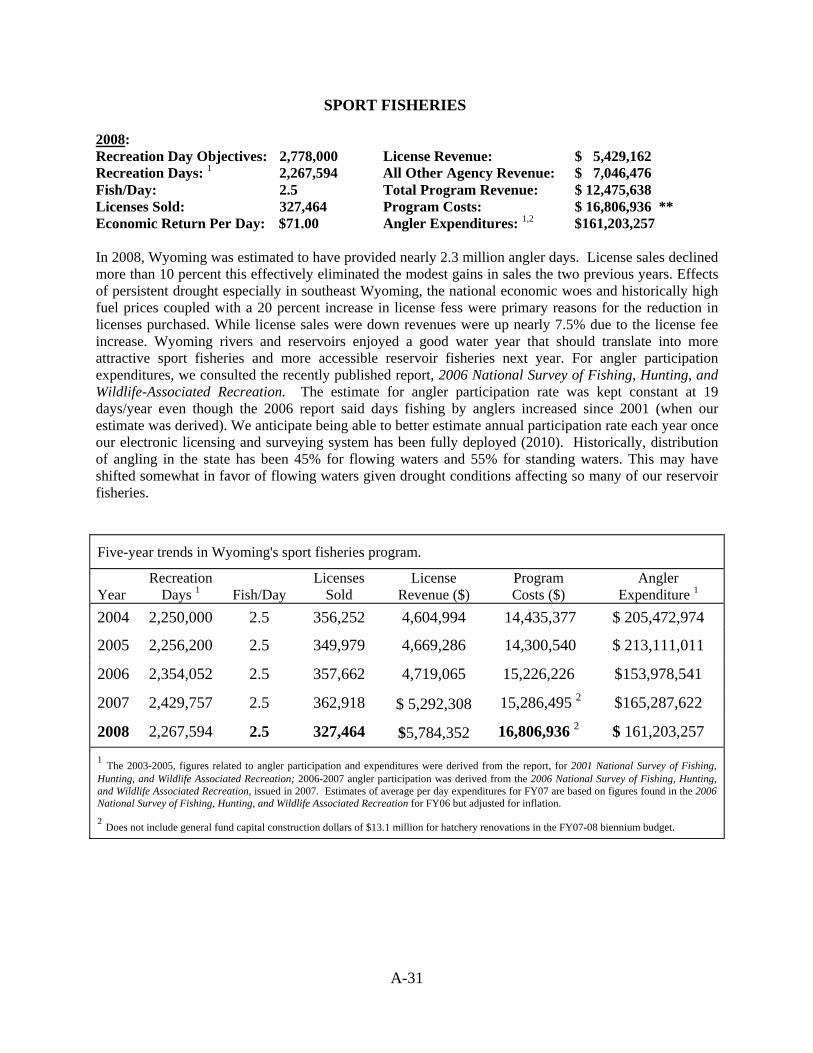
A-31
SPORT FISHERIES 2008: Recreation Day Objectives: 2,778,000 License Revenue: $ 5,429,162 Recreation Days: 1 2,267,594 All Other Agency Revenue: $ 7,046,476 Fish/Day: 2.5 Total Program Revenue: $ 12,475,638 Licenses Sold: 327,464 Program Costs: $ 16,806,936 ** Economic Return Per Day: $71.00 Angler Expenditures: 1,2 $161,203,257 In 2008, Wyoming was estimated to have provided nearly 2.3 million angler days. License sales declined more than 10 percent this effectively eliminated the modest gains in sales the two previous years. Effects of persistent drought especially in southeast Wyoming, the national economic woes and historically high fuel prices coupled with a 20 percent increase in license fess were primary reasons for the reduction in licenses purchased. While license sales were down revenues were up nearly 7.5% due to the license fee increase. Wyoming rivers and reservoirs enjoyed a good water year that should translate into more attractive sport fisheries and more accessible reservoir fisheries next year. For angler participation expenditures, we consulted the recently published report, 2006 National Survey of Fishing, Hunting, and Wildlife-Associated Recreation. The estimate for angler participation rate was kept constant at 19 days/year even though the 2006 report said days fishing by anglers increased since 2001 (when our estimate was derived). We anticipate being able to better estimate annual participation rate each year once our electronic licensing and surveying system has been fully deployed (2010). Historically, distribution of angling in the state has been 45% for flowing waters and 55% for standing waters. This may have shifted somewhat in favor of flowing waters given drought conditions affecting so many of our reservoir fisheries.
Five-year trends in Wyoming's sport fisheries program.
Year
Recreation Days 1
Fish/Day
Licenses Sold
License Revenue ($)
Program Costs ($)
Angler Expenditure 1
2004 2,250,000 2.5 356,252 4,604,994 14,435,377 $ 205,472,974
2005 2,256,200 2.5 349,979 4,669,286 14,300,540 $ 213,111,011
2006 2,354,052 2.5 357,662 4,719,065 15,226,226 $153,978,541
2007 2,429,757 2.5 362,918 $ 5,292,308 15,286,495 2 $165,287,622
2008 2,267,594 2.5 327,464 $5,784,352 16,806,936 2 $ 161,203,257 1 The 2003-2005, figures related to angler participation and expenditures were derived from the report, for 2001 National Survey of Fishing, Hunting, and Wildlife Associated Recreation; 2006-2007 angler participation was derived from the 2006 National Survey of Fishing, Hunting, and Wildlife Associated Recreation, issued in 2007. Estimates of average per day expenditures for FY07 are based on figures found in the 2006 National Survey of Fishing, Hunting, and Wildlife Associated Recreation for FY06 but adjusted for inflation. 2 Does not include general fund capital construction dollars of $13.1 million for hatchery renovations in the FY07-08 biennium budget.

A-32
COMMERCIAL FISHERIES Objectives: The statewide objective for the program is to provide licensing, monitoring, and extension services for minnow seiners, private bait dealers, commercial hatcheries, and private fishing preserves. 2008: License Sold 884 License Revenue: $14,880 All Other Agency revenue: $ 3,581 Total Program Revenue**: $ 18,461 Program Costs: $33,103 Live baitfish and seining permits continue to show a very gradual upward trend over the last four years. Licenses or permits sold for commercial fisheries interests during 2008 included: 73 fishing preserves, 11 commercial fish hatcheries, 697 seining, and 63 live bait dealers. Overall interest in seining and dealing in live baitfish is increasing. Despite a 20 percent fee increase sales of both seining and live baitfish licenses increased by more than 9 and 12 percent respectively.
Five-year trends in Wyoming's commercial fisheries program.
Year
Licenses Sold
License Revenue ($)
Program Costs ($)
2004 705 $ 20,959 $ 43,615
2005 754 $ 23,894 $ 57,201
2006 765 $ 27,481 $ 38,195
2007 778 $ 23,853 $ 36,040
2008 884 $ 14,880 $33,103 ** Includes allocated application fees, conservation stamp revenue, federal/other grants, and interest earned on Game and Fish cash balances.

FURBEARERS
Bobcat Other Furbearers


A-33
BOBCAT 2008: Bobcat Harvest1: 2,978 Licenses Sold 4: 1,850 Bobcat Trappers3: 513 License Revenue: $ 80,006 Bobcats per Trappers2: 5.8 Other Agency Revenue*: $ 49,727 Recreation Days: NA Total Program Revenue: $ 129,733 Days/Animal: NA Program Costs: $ 337,402 Benefits to the State: 5 $ 16,252,938 Cost Dept. Per Animal: $ Not Available Economic Return per Animal: $ Not Available Bobcat harvest data comes from two sources: information collected as part of the Convention on International Trade of Endangered Species (CITES) requirements for bobcat pelt tagging and the WGFD furbearer harvest survey. The Department relies on agency personnel who tag bobcats with CITES tags to collect information on age and sex of each bobcat and on effort values. This information is available for the annual CITES report and for Department use. It most accurately reflects harvest. The furbearer trapper survey provides alternate estimates since it includes all trappers, including those that are unsuccessful. The number of licenses sold and the bobcat harvest increased dramatically from 2002 to 2006, probably reflecting the increase in bobcat numbers and the value of pelts. Harvest and the number of trappers dropped in 2008. However, the harvest rate (number of bobcats/trapper) increased in 2008.
Five-year trends in Wyoming's furbearer program.
Bobcat Statistics Entire Furbearer Program Fiscal Year
Reported Harvest1
Bobcats/ Trapper2
Number Trappers3
Licenses Sold4
License Rev. ($)
Program Costs ($)
Benefits to the State ($)5
2004 3,120 7.3 425 1,454 59,031 267,776 11,516,695
2005 3,179 6.8 468 1,496 57,369 310,444 11,911,980
2006 3,617 7.2 499 1,623 61,448 404,019 13,310,921
2007 3,036 4.8 639 1,844 79,546 665,669 15,577,140
2008 2,978 5.8 513 1,850 80,006 337,402 16,252,9381 The number of bobcats tagged in Wyoming. 2 The number of bobcats per successful trapper. 3 The number of trappers who had bobcats tagged. 4 The total number of furbearer licenses sold. 5 The 2003 calculations were based on the report, Hunting and Trapping Expenditures in Wyoming During the 2001 Season, 2002 using average per day expenditures. Hunter expenditure was calculated from the 2001 season cost per day expenditure, corrected for inflation using the Consumer Price Index (2001 per day expenditure x 1.043 = 2003 per day expenditure, 2001 per day expenditure x 1.078 = 2004 per day expenditure,). 2005 Hunter expenditure was calculated from the 2005 cost per day expenditure, corrected for inflation using the Consumer Price Index (2005 per day expenditure x 1.03). 2006, 2007 and 2008 Hunter expenditure was calculated from the previous year’s Hunter expenditure corrected for inflation using the Consumer Price Index (2006 was 1.03, 2007 was 1.03, 2008 was 1.04) . *Includes allocated application fees, conservation stamp revenue, federal/other grants, and interest earned on Department cash balances.

A-34
OTHER FURBEARERS 2008: Furbearer Harvest: 28,476 Licenses Sold 2: 1,850 Furbearer Trappers1: 1,101 License Revenue: $ 80,006 Furbearers per Trapper: 25.9 Other Agency Revenue*: $ 49,727 Recreation Days: NA Total Program Revenue: $ 129,733 Days/Animal: NA Program Costs: $ 379,951 Benefits to the State: 3 $ 16,252,938 Cost Dept. Per Animal: $ Not Available Economic Return per Animal: $ Not Available Besides bobcat, there is a variety of other fur bearing species in Wyoming. Coyote, red fox, beaver, muskrat, mink, badger, raccoon, striped skunk, weasel, and marten are the most commonly harvested species. Furbearer harvest levels are determined by fur prices and by species abundance. These factors, combined with harvest quotas (where used), ensure that trapping has little impact on furbearer populations. Due to the poor response rate for the annual furbearer harvest survey over a period of years, the Department discontinued it in 2002. It was simplified, restructured and reinstated in 2005 to collect only number of harvested animals. From that, animals/trapper can be calculated.
Five-year trends in Wyoming's furbearer program.
Other Furbearer Statistics Entire Furbearer Program Fiscal Year
Reported Harvest
Furbearers/ Trapper
Number Trappers1
Licenses Sold2
License Rev. ($)
Program Costs ($)
Benefits to the State ($)3
2004 --- --- --- --- --- --- ---
2005 27,761 45.6 623 1,496 57,369 310,444 11,911,980
2006 35,809 37.8 947 1,623 61,448 404,019 13,310,921
2007 31,439 33.0 953 1,844 79,546 605,669 15,577,140
2008 28,476 25.9 1,101 1,850 80,006 379,951 16,252,9381 includes bobcat trappers. 2 The total number of furbearer licenses sold. 3 The 2003 calculations were based on the report, Hunting and Trapping Expenditures in Wyoming During the 2001 Season, 2002 using average per day expenditures. Hunter expenditure was calculated from the 2001 season cost per day expenditure, corrected for inflation using the Consumer Price Index (2001 per day expenditure x 1.043 = 2003 per day expenditure, 2001 per day expenditure x 1.078 = 2004 per day expenditure). 2005 Hunter expenditure was calculated from the 2005 cost per day expenditure, corrected for inflation using the Consumer Price Index (2005 per day expenditure x 1.03). 2006, 2007 and 2008 Hunter expenditure was calculated from the previous year’s Hunter expenditure corrected for inflation using the Consumer Price Index (2006 was 1.03, 2007 was 1.03, 2008 was 1.04). *Includes allocated application fees, conservation stamp revenue, federal/other grants, and interest earned on Department cash balances.

RAPTORS


A-35
RAPTORS OBJECTIVES: To provide a harvest, through capture, of 50 raptors annually. To maintain a harvest success rate of 50 percent, based on capture permits issued. There are approximately 31 species of raptors known or thought to occur within Wyoming’s borders. Raptors include hawks, owls, eagles, and vultures. Some species are present only seasonally, and densities vary with climatic conditions and prey abundance. In calendar year 2008, ten resident licenses were issued and five birds were captured, for a capture success rate of 50 percent. Twenty-nine nonresident licenses were issued and 22 birds were captured, for a capture success rate of 76 percent. In total, 27 raptors were captured in Wyoming for use in falconry for an overall success rate of 69 percent, which is above the average (48 percent). Although the number of birds captured in 2008 is about 1/2 of the objective, the success rate is higher than the objective.
Five-year trends in Wyoming’s Raptor Program Harvest, recreation and licenses issued are by calendar year. Revenue and costs are by fiscal year.
Fiscal Year
Capture
Success1
Licenses Sold2
License Revenue ($)
Program Costs ($)
2004 16 48% 33 5,674 133,707
2005 13 31% 41 5,292 128,083
2006 16 47% 34 5,279 104,928
2007 15 45% 33 7,242 165,296
2008 27 69% 39 3,486 362,577 1Based on capture licenses sold. 2Includes permits to hunt with falcon.

A-36

NON-GAME PROGRAMS
AND NON-LICENSED USES


A-37
NONGAME PROGRAMS AND NON-LICENSED USES OF WILDLIFE The nongame program includes planning, information and education, environmental commenting, inventories, and monitoring specifically for a large variety of terrestrial species. Many of these are Species of Greatest Conservation Need, such as black-tailed prairie dog, swift fox, common loon, harlequin duck, ferruginous hawk, merlin, colonial nesting water birds, long-billed curlew, mountain plover, and several bat species. Also included under this heading are programs for sensitive species, such as trumpeter swan, bald eagle, peregrine falcon, black-footed ferret, wolverine, and lynx. The bald eagle and the peregrine falcon were recovered and had Endangered Species Act protections removed (they were delisted) in 2007. The other sensitive species are either federally listed as threatened or endangered, or national political pressures are pressing for listing. All continue to require special management attention and intensive restoration efforts. The Nongame Section participates in and coordinates monitoring of many species as part of broader efforts, such as the Breeding Bird Survey, Monitoring Avian Productivity and Survival Survey, and small mammal surveys. Nongame personnel are also involved in many committees and working groups that coordinate interstate and intrastate planning and implementation efforts to maintain wildlife diversity. The Nongame Section has been, and will continue to be, intensively involved in the implementation of the Wyoming Comprehensive Wildlife Conservation Strategy, which is now called the State Wildlife Action Plan (SWAP). The SWAP now, for the most part, directs the section’s inventory monitoring and survey activities. In the spring of 2007, the Department received $1.3 million from the Governor’s office and $609,000 from the legislature for the biennium starting in FY 09 for SWAP implementation. This will supplement significantly the federal State Wildlife Grant funds we receive annually and will allow us to accelerate surveys and research on aquatic and terrestrial Species of Greatest Conservation Need. The SWAP is being revised so it can be submitted to the U. S. Fish and Wildlife Service in 2010 according to the state’s five-year revision schedule. In 2008, non-consumptive users spent approximately $410,663,760 in Wyoming based on the 2006 National Survey of Fishing, Hunting, and Wildlife-Associated Recreation, with inflation corrected for by using the Consumer Price Index. The number of recreation days, 3,009,000, listed for 2006-2007 is carried forward from the 2006 National Survey of Fishing, Hunting, And Wildlife-Associated Recreation. The Department’s “Wyoming’s Wildlife – Worth the Watching®” program has provided economic support for nongame, habitat, and non-consumptive projects. Department interpretive sites include the Tom Thorne/Beth Williams Wildlife Research Center at Sybille, Sheridan Visitor Center, Story Fish Hatchery, and Lander Visitor Center. Other interpretive efforts include signing at highway rest areas, cooperative Department/U.S. Forest Service signing, exhibits, nature trails on Department lands, The Wildlife Heritage Expo, and cooperative projects with some municipalities. In addition, wildlife-viewing guides have been developed, and a variety of publications have been produced to inform and educate the public about nongame wildlife. Interactive educational programs include: Project WILD, O.R.E.O. (Outdoor Recreation Education Opportunities), BOW (Becoming and Outdoor Woman). Beginning in 2003, a percentage of the proceeds from the sale of big game licenses the Governor donates to conservation groups for fund raising are being made available for nongame programs in the state.

A-38
Trends in Wyoming's non-licensed uses of wildlife program.
Year Recreation Days Non-consumptive Users’ Expenditures ($)
20041
3,924,000
285,595,618
20051
3,924,000
295,398,065
20062
3,009,000
394,869,000
20072
3,009,000
406,715,070
20082
3,009,000
410,663,760 1 The number of recreation days and expenditures are reflective of those found in the report, 2001 National Survey of Fishing, Hunting, and Wildlife Associated Recreation, issued in 2003. Non-consumptive users’ expenditure was calculated from the 2001 survey, with inflation corrected for by using the Consumer Price Index (2001 expenditure x 1.024 = 2002 expenditure, 2001 expenditure x 1.043 = 2003 expenditure, 2001 expenditure x 1.078 = 2004 expenditure, 2001 expenditure x 1.115 = 2005 expenditure). 2 The number of recreation days and expenditures for 2006 and 2007 are reflective of those found in the report 2006 National Survey of Fishing, Hunting and Wildlife Associate Recreation, issued in 2008. Non-consumptive users’ expenditure was calculated from the 2006 survey, with inflation corrected for by using the Consumer Price Index (2006 expenditure x 1.03 = 2007 expenditures; 2006 expenditure x 1.04 = 2008 expenditures).

APPENDIX B:
HUNTER AND ANGLER EXPENDITURE
Estimates of 2008 Expenditures in Wyoming
by Hunters and Anglers
Restitution Values of Game Animals


LICENSE HARVEST HUNTERS SUCCESS RECREATION DAYS/ LICENSES LICENSE TOTAL HUNTERRATE DAYS ANIMAL ISSUED SALES 1 EXPENDITURES 2
ANTELOPERESIDENT 20,638 23,035 89.6% 78,573 3.8 28,569 $786,265 $9,713,767NONRESIDENT 33,211 32,974 100.7% 105,635 3.2 40,590 $6,173,893 $13,059,369
MULE DEERRESIDENT 19,589 37,579 52.1% 208,504 10.6 56,035 $1,835,846 $22,467,103NONRESIDENT 16,749 25,160 66.6% 111,000 6.6 33,505 $8,828,905 $11,960,674
WHITE-TAILED DEERRESIDENT 9,050 16,818 53.8% 81,574 9.0 ------ ------ $8,823,988NONRESIDENT 5,742 9,325 61.6% 30,883 5.4 ------ ------ $3,340,663
ELKRESIDENT 16,471 42,633 38.6% 334,361 20.3 50,449 $2,367,750 $32,888,470NONRESIDENT 4,470 9,530 46.9% 61,173 13.7 10,177 $6,329,363 $6,017,108
MOOSERESIDENT 502 584 86.0% 4,314 8.6 586 $41,072 $616,149NONRESIDENT 109 125 87.2% 746 6.8 129 $109,984 $106,548
BIGHORN SHEEPRESIDENT 141 178 79.2% 1,799 12.8 183 $9,504 $550,981NONRESIDENT 53 64 82.8% 431 8.1 66 $65,979 $132,003
ROCKY MTN GOAT RESIDENT 13 13 100.0% 66 5.1 15 -$1,332 $23,512NONRESIDENT 5 5 100.0% 21 4.2 5 -$7,829 $7,481
BISONRESIDENT 233 279 83.5% 2,106 9.0 279 $111,214 $382,606
NONRESIDENT 25 28 89.3% 117 4.7 28 $69,467 $21,256
BLACK BEARRESIDENT 313 1,966 15.9% 19,697 62.9 2,962 $135,817 $1,503,887NONRESIDENT 80 269 29.7% 1,880 23.5 295 $108,814 $143,540
MOUNTAIN LIONRESIDENT 138 1,093 12.6% 12,603 91.3 1,631 $45,849 $2,287,032NONRESIDENT 74 118 62.7% 633 8.6 128 $43,418 $114,869
TURKEYRESIDENT 3,777 5,890 64.1% 16,757 4.4 7,007 $145,705 $4,608,417NONRESIDENT 1,368 1,601 85.4% 4,193 3.1 1,908 $96,904 $1,153,135
SECTION TOTAL 132,751 209,267 63.4% 1,077,066 8.1 234,547 27,296,588 119,922,559RESIDENT TOTAL 70,865 130,068 54.5% 760,354 10.7 147,716 5,477,690 83,865,913NONRESIDENT TOTAL 61,886 79,199 78.1% 316,712 5.1 86,831 21,818,898 36,056,646
SUMMARY OF 2008 CALENDAR YEAR HARVEST, LICENSE SALES AND EXPENDITURES IN WYOMINGBY HUNTERS AND ANGLERS
B-1

LICENSE HARVEST HUNTERS SUCCESS RECREATION DAYS/ LICENSES LICENSE TOTAL HUNTERRATE DAYS ANIMAL ISSUED SALES 1 EXPENDITURES 2
COTTONTAIL 31,343 5,639 555.8% 18,963 0.6 ------ ------ $5,214,111SNOWSHOE HARE 390 230 169.6% 1,885 4.8 ------ ------ $518,304SQUIRREL 1,584 351 451.3% 2,182 1.4 ------ ------ $599,968
SECTION TOTAL 33,317 6,220 535.6% 23,030 0.7 ------ ------ 6,332,383
LICENSE HARVEST HUNTERS SUCCESS RECREATION DAYS/ LICENSES LICENSE TOTAL HUNTERRATE DAYS ANIMAL ISSUED SALES 1 EXPENDITURES 2
PHEASANT 42,359 9,888 428.4% 37,938 0.9 26,234 $656,241 $10,431,522GRAY PARTRIDGE 1,381 890 155.2% 2,882 2.1 ------ ------ $792,441CHUKAR 7,900 2,156 366.4% 7,292 0.9 ------ ------ $2,005,025SAGE GROUSE 10,303 4,747 217.0% 10,065 1.0 ------ ------ $2,767,496SHARP-TAILED GROUSE 1,900 940 202.1% 3,374 1.8 ------ ------ $927,723BLUE GROUSE 8,611 3,581 240.5% 14,396 1.7 ------ ------ $3,958,358RUFFED GROUSE 3,321 1,482 224.1% 7,106 2.1 ------ ------ $1,953,882MOURNING DOVE 29,994 2,315 1295.6% 7,482 0.2 ------ ------ $2,057,269DUCK 53,158 6,081 874.2% 33,331 0.6 ------ ------ $9,164,770GOOSE 33,460 6,079 550.4% 32,039 1.0 ------ ------ $8,809,519SANDHILL CRANE 162 281 57.7% 562 3.5 ------ ------ $154,528RAIL 36 80 45.0% 391 10.9 ------ ------ $107,510SNIPE 403 175 230.3% 612 1.5 ------ ------ $168,277COOT 182 145 125.5% 362 2.0 ------ ------ $99,536
RAPTOR 27 39 69.2% ------ ------ $3,486 ------
SECTION TOTAL 193,197 38,879 496.9% 157,832 0.8 26,234 659,727 43,397,858
LICENSE HARVEST HUNTERS SUCCESS RECREATION DAYS/ LICENSES LICENSE TOTAL ANGLERRATE DAYS ANIMAL ISSUED SALES 1 EXPENDITURES 2
SPORT FISHING ------ ------ 0.0% 2,267,594 ------ 315,849 $5,429,162 $161,203,257
COMMERCIAL ------ ------ ------ ------ ------ 147 $14,880 ------
LICENSE HARVEST3 HUNTERS4 SUCCESS RECREATION DAYS/ LICENSES LICENSE TOTAL TRAPPERRATE4 DAYS ANIMAL ISSUED 5 SALES 5 EXPENDITURES5
BOBCAT 2,978 513 580.5% No Data No Data 0 0 $16,252,938OTHER FURBEARERS 28,476 1,101 2586.4% No Data No Data 1,850 80,006 ------
SECTION TOTAL 31,454 1,614 1948.8% No Data No Data 1,850 80,006 16,252,938
SUMMARYTOTALS 390,719 255,980 1,257,928 262,631 28,036,321 185,905,737
1License Sales figures will vary slightly from Statement of Revenue and Expenditures due to timing differences between subsidiary and general ledger reporting.2Total Hunter and Angler Expenditure figures do not include license sales.3Only successful bobcat trappers surveyed.4Bobcat trappers only.
* License sales and license revenue information related to all small game, upland game bird, and migratory game birds is presented under the pheasant schedule as separate information cannot be reliably generated due to combination licenses.
5All trappers, Derived from Hunting and Trapping Expenditures in Wyoming in the 2001 Season, 2002
SUMMARY OF 2008 CALENDAR YEAR HARVEST, LICENSE SALES AND EXPENDITURES IN WYOMINGBY HUNTERS AND ANGLERS
B-2
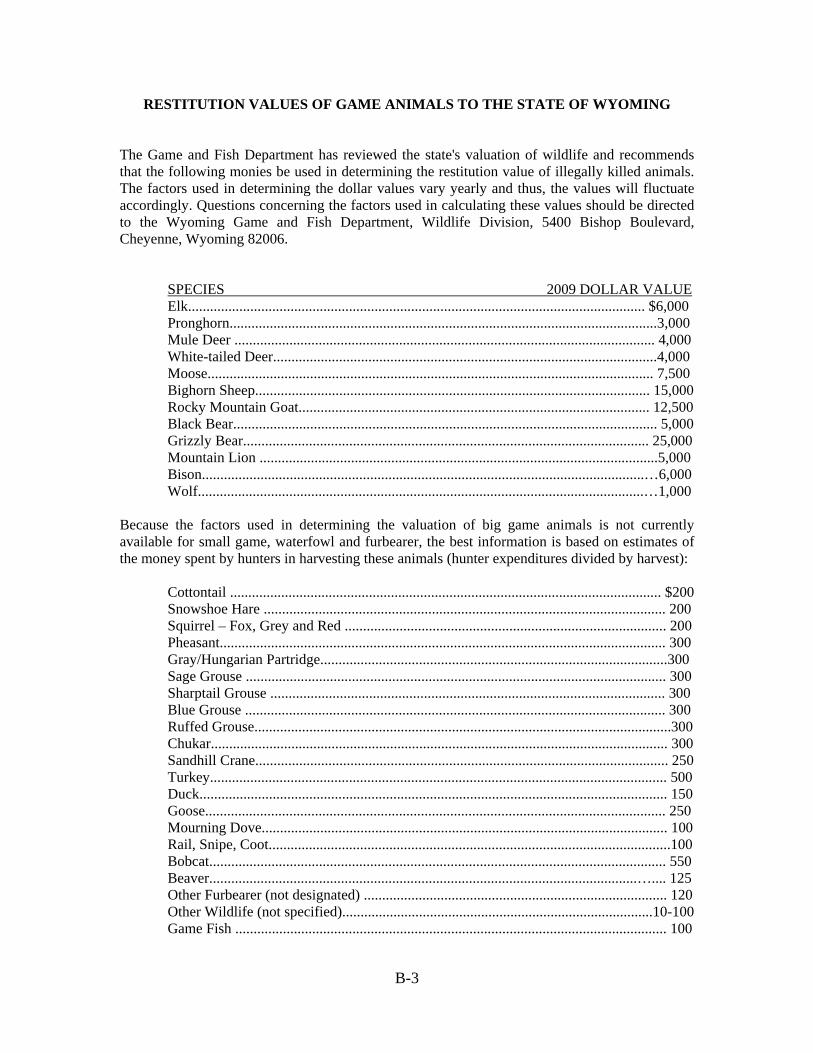
B-3
RESTITUTION VALUES OF GAME ANIMALS TO THE STATE OF WYOMING The Game and Fish Department has reviewed the state's valuation of wildlife and recommends that the following monies be used in determining the restitution value of illegally killed animals. The factors used in determining the dollar values vary yearly and thus, the values will fluctuate accordingly. Questions concerning the factors used in calculating these values should be directed to the Wyoming Game and Fish Department, Wildlife Division, 5400 Bishop Boulevard, Cheyenne, Wyoming 82006.
SPECIES 2009 DOLLAR VALUE Elk............................................................................................................................. $6,000 Pronghorn.....................................................................................................................3,000 Mule Deer ................................................................................................................... 4,000 White-tailed Deer.........................................................................................................4,000 Moose.......................................................................................................................... 7,500 Bighorn Sheep............................................................................................................ 15,000 Rocky Mountain Goat................................................................................................ 12,500 Black Bear.................................................................................................................... 5,000 Grizzly Bear............................................................................................................... 25,000 Mountain Lion .............................................................................................................5,000 Bison.........................................................................................................................…6,000 Wolf..........................................................................................................................…1,000
Because the factors used in determining the valuation of big game animals is not currently available for small game, waterfowl and furbearer, the best information is based on estimates of the money spent by hunters in harvesting these animals (hunter expenditures divided by harvest):
Cottontail ...................................................................................................................... $200 Snowshoe Hare .............................................................................................................. 200 Squirrel – Fox, Grey and Red ........................................................................................ 200 Pheasant.......................................................................................................................... 300 Gray/Hungarian Partridge...............................................................................................300 Sage Grouse ................................................................................................................... 300 Sharptail Grouse ............................................................................................................ 300 Blue Grouse ................................................................................................................... 300 Ruffed Grouse..................................................................................................................300 Chukar............................................................................................................................. 300 Sandhill Crane................................................................................................................. 250 Turkey............................................................................................................................. 500 Duck................................................................................................................................ 150 Goose.............................................................................................................................. 250 Mourning Dove............................................................................................................... 100 Rail, Snipe, Coot..............................................................................................................100 Bobcat............................................................................................................................. 550 Beaver.....................................................................................................................….... 125 Other Furbearer (not designated) ................................................................................... 120 Other Wildlife (not specified).....................................................................................10-100 Game Fish ...................................................................................................................... 100

B-4

APPENDIX C:
BUDGETARY AND FINANCIAL SUMMARIES


FY 10 BUDGET SUMMARY
MAINTENANCE & OPERATIONS Director ........................................... $2,839,390Fiscal Services ........................................... 4,408,915Services(1) ........................................... 13,614,186Fish (2) ........................................... 12,343,072Wildlife ........................................... 26,238,664
TOTAL M&O 59,444,227
COUPONS ........................................... 800,000EARLY RETIREMENT ........................................... 75,000DAMAGE ........................................... 500,000COST ALLOCATION ...........................................SALECS ........................................... 277,200ACCESS EASEMENTS ........................................... 850,000PROPERTY RIGHTS ........................................... 975,500NONRECURRING PROJECTS(2) 1,351,409WILDLIFE TRUST ........................................... 1,183,962STATE WILDLIFE GRANTS …………………………… 877,450LANDOWNER INCENTIVE TIER I ……………………… 152,212 REIMBURSED CONTRACTS ........................................... 3,587,007
FY 10 BUDGET (approved July 2009 Commission) 70,073,967
AUTHORIZED CARRYOVER 6,564,092
AMOUNT AUTHORIZED FOR FY 10 SPENDING* 76,638,059
(1) does not include FY 09-10 capital construction appropriation awarded to the State Department of Administration of $19 million in construction funds for renovation and expansion of the Cheyenne headquarters building & Tensleep hatchery Does include unexpended balance of the biennial appropriation for the general fund vet services, wolf management, sage grouse management and implementation of the comprehensive wildlife conservation strategy involving sensitive and nongame species
(2) funding for these projects was made possible by the 2008 Legislative appropriation to the State Auditor to reimburse the Department for free and reduced priced licenses required by previous legislation. This funding source is not being used for recurring costs, as it is subject to biennial legislative appropriation. Additional funding has also been made available by the current moratorium on the Department's payment of cost allocation
C-1

FY 10 DETAIL BUDGETSTRATEGIC PLAN
(EXCLUDING COMPETITIVE REIMB PROJECTS )
FY 09 % CHNG
OFFICE OF THE DIRECTOR
ADMINISTRATION 887,062 787,813 13%COOPERATIVE RESEARCH 728,496 557,085 31%PERSONNEL 488,862 437,799 12%STATEWIDE HABITAT PROTECTION 474,633 483,320 -2%WY HERITAGE FOUNDATION 282,065 332,065 -15%POLICY DEVELOPMENT 175,090 215,583 -19%COMMISSION 112,307 108,970 3%CWCS COORDINATOR 90,756 114,452 -21%
sub-total 3,239,271 - 3,037,087 7%
FISCAL AND ADMIN SERVICES
REVENUE COLLECTION 1,895,945 1,874,967 1%LEGISLATED EXPENSES 1,652,200 1,686,644 -2%REGIONAL OFFICE MANAGEMENT 1,324,023 1,288,619 3%ASSET MANAGEMENT 556,932 508,560 10%ADMINISTRATION 300,635 286,775 5%ACCOUNTS PAYABLE 254,910 276,216 -8%FINANCIAL SYSTEMS 149,616 157,125 -5%
sub-total 6,134,261 6,078,906 1%
SERVICES
HABITAT ACCESS & MAINTENANCE 3,342,594 3,049,702 10%MANAGMENT INFO SYSTEMS 2,998,191 2,859,063 5%PROPERTY RIGHTS 2,174,930 1,090,551 99%HEADQUARTERS & SUPP FACILITIES 1,357,605 1,206,323 13%PUBLICATIONS 798,733 743,766 7%CONSERVATION ENGINEERING 663,965 649,039 2%REGIONAL I/E 658,250 638,138 3%MAIL SERVICES 654,856 655,591 0%GAME & FISH LABORATORY 604,794 705,634 -14%ADMINISTRATION 600,843 555,750 8%CUSTOMER OUTREACH & INFO 574,070 547,518 5%CONSERVATION EDUCATION 557,944 559,600 0%CUSTOMER SERVICES 331,475 364,675 -9%HUNTER EDUCATION 180,960 169,373 7%STRATEGIC MANAGEMENT 133,198 133,676 0% sub-total 15,632,408 - 13,928,399 12%
FY 10
C-2

FY 10 DETAIL BUDGETSTRATEGIC PLAN
(EXCLUDING COMPETITIVE REIMB PROJECTS )
FY 09 % CHNG FY 10
FISH DIVISION
HATCHERIES & REARING STATIONS 4,813,533 4,868,565 -1%REG AQUATIC WILDLIFE MNGT 3,085,763 3,569,920 -14%AQUATIC HABITAT MNGT 1,294,154 1,343,709 -4%BOATING ACCESS 1,254,250 1,189,500 5%CWCS 636,307 262,860 142%ADMINISTRATION 494,767 459,045 8%STATEWIDE WIDLIFE MNGT 362,867 443,927 -18%FISH PASSAGE 316,664 FISH SPAWNING 295,781 290,787 2%WATER MNGT 273,240 246,429 11%AQUATIC INVASIVE SPECIES 217,251 FISH DISTRIBUTION 120,174 174,067 -31%FISH WYOMING 50,000 100,000 -50% subtotal 13,214,751 - 12,948,809 2%
WILDLIFE DIVISION
REGIONAL GAME WARDENS 6,316,931 6,063,688 4%REGIONAL TERRESTERIAL BIOLOGISTS 3,113,761 3,064,723 2%WILDLIFE FEEDING 2,323,446 2,603,041 -11%TERRESTERIAL HABITAT 2,008,286 1,974,988 2%REGIONAL WILDLIFE SUPERVISORS 1,987,429 1,617,427 23%VETERINARY SERVICES 1,879,104 1,879,104 0%PROPERTY RIGHTS (ACCESS YES AMDIN) 1,500,658 1,497,938 0%SAGE GROUSE MNGT 1,416,065 1,416,065 0%TROPHY GAME & CONFLICT RESOLUTION 1,144,741 1,035,809 11%BIOLOGICAL SERVICES 971,063 907,066 7%ADMINISTRATION 940,608 926,775 1%C WCS (TERRESTRIAL NONGAME) 870,167 844,904 3%STATEWIDE WLDLFE ENFORCEMENT 730,609 688,634 6%BIRD FARMS 685,596 766,514 -11%WOLF MANAGEMENT 557,547 557,547 0%BOATING SAFETY & INVEST ADMIN 433,342 442,859 -2%WATERFOWL 154,897 170,472 -9%PREDATOR MANAGEMENT 100,000 100,000 0%
sub-total 27,134,250 - 26,557,554 2%
BUDGETS ON A STRATEGIC BASIS 65,354,941$ -$ 62,550,755$ 4%
C-3

WYOMING GAME AND FISH COMMISSION FY 10 BUDGET - Projects
WILDLIFE TRUST FUND PROJECTS:HABITAT PROJECTS & GRANTS Bates Creek Watershed Restoration* 35,000$ Beaver Wetland Resotration 2,500 Currant Creeek Fencing Project 55,000 Currant Creek Ranch Conservation Easement 75,000 Currant Creek Ranch state land lease 3,832 Dennison Meadow Vegative & Irrigation Rehab 10,000 Diamond Creek Wetland Restoration 5,000 Fontenelle Creek Willow burn 5,000 Greys River Aspen Inventory 7,000 Kendrick Dam Bypass Channel 45,400 Lander Front Mule Deer Habitat Imprvmnt 20,000 Laramie River Restoration project 60,000 Lost Creek Crucial Winter Range Enhancement 7,500 McGinnis Diamond H Ranch Conservation Easement 90,000 Moose Habitat Analysis Contract* 35,000 Muddy Creek Alamosa Gulch Water Development 25,000 North Laramie Range Habitat restoration 30,000 Pennock MT WHMA Meadown Enhancement 20,000 Peterson Conservation Easement 56,000 Platte Valley Mule Deer Habitat Analysis 41,900 Ranch/Farm Wildlife Habitat Improvement (WHIP) 100,000 Renner Russian Olive Removal 3,000 Roy Roath Grazing Management Assistance* 28,000 Sand Mesa Salt Cedar Control 20,000 Sommers Grindstone Conservation Easement 100,000 South Park WHMA Wetland 7,500 South Tongue River Stream Restoration 25,000 Springer & Table Mt Wetlands Restoration 40,000 Upper Crow Creek Spawning & Migration 18,000 Upper Green Fencing Intiative 50,000 Wyoming Front Aspen Treatment* 50,000 Wyoming Range Mule Deer Habitat Assessment* 40,000 Yellowtail CRM Invasive Plant Mngt* 30,000 habitat projects 1,140,632$
CONSERVATION EDUCATION(WORTH THE WATCHING) PROJECTS
Bear Resistant Product testing 3,000 Bear Aware Traveling Library display 4,500 Bear Conflict Public Outreach 5,000 Green River CC Interpretative Signs 3,000 Mule Deer documentary 10,000 Powder River Winter Wildlife Closure signs 3,830 Wyoming fishing Guide 10,000 Winter Range Education 4,000 educational projects 43,330
TOTAL DEPARTMENT TRUST PROJECTS 1,183,962$
C-4

WYOMING GAME AND FISH COMMISSION FY 10 BUDGET - Projects
WILDLIFE TRUST FUND PROJECTS:
STATE WILDLIFE GRANT PROJECTS: Amphibian Reptile Monitoring* 82,561 Cutthroat Trout Assessment related to Climate Change** 58,677 Raptor Inventory* 54,167 Avian Best Practices Management 15,000 Cutthroat Conservation * 79,154 Forest Bat Surveys* 73,327 Horny Heat Chub** 63,580 Leatherside Chub Abundance & Distribution 23,119 Little Snake River Cutthroat* 73,619 Lodge pole beetle assessment* 65,153 NE/SE Prairie Streams Survey* 114,994 Nutritional condition of Moose Browse** 26,265 River Otter Monitoring ** 58,401 Roundtail Chub * ** 7,805 SGCN GIS * 40,293 Swift Fox Monitoring 41,335 TOTAL DEPARTMENT FY 10 State Wildlife Projects 877,450$
SPECIAL NONRECURRING PROJECTS FROM NEW FY 10 FUNDING SOURCES:
Aquatic & Terrestrial Project Pre-development 200,000 Big Horn Moose coop project** 120,000 Casper office historic document displays* 15,000 Casper Reservior Boat replacement 90,000 Fish Wyoming grants * 50,000 Glendo Facility Renovation 220,000 Green River Baggs Migration Corridor Monitoring 24,517 High Definition Cameras 123,392 North Platte Float Map 6,500 PIT tag reading stations 12,000 Property Right Acquistion 300,000 Whiskey Mountain Conservation Camp Reparis 50,000 WHMA Fence & irrigation Improvements 140,000 TOTAL DEPARTMENT FY 10 Special Projects 1,351,409$
* ongoing projects**work being performed by the UW coop unit
(License recoupment fees & cost allocation moratorium reduction)
C-5

C-6
MAINTENANCE & OPERATIONS BUDGETS (FY 87 - FY 10) (Does not include Enhancements, Trust Projects, Property Rights, Capital Facilities, General Funds or Reimbursed Projects)
FY 87 $19,913,441 Game Division 7,483,347 Fish Division 4,451,347 HATS Division 2,843,805 Communications Division 1,538,464 Fiscal Division 2,359,229 Administration Division 1,236,638 Coupons 750,000 Damage 500,000 FY 88 $21,040,674 Game Division 7,381,078 Fish Division 4,602,523 HATS Division 2,920,979 Communications Division 1,553,215 Fiscal Division 1,436,749 Administration Division 702,834 Agency Common 1,193,296 Coupons 750,000 Damage 500,000 FY 89 $20,465,981 Game Division 7,576,046 Fish Division 4,146,592 HATS Division 2,540,610 I&E Services Division 1,583,581 Adm. & Fiscal Svcs. Div. 1,337,388 Office of Director 689,602 Agency Common 1,217,162 Coupons 750,000 Damage 500,000 Early Retirement 125,000 Damage 500,000 FY 90 $20,533,195 Game Division 8,084,170 Fish Division 4,406,561 HATS Division 2,693,910 I&E Services Division 1,661,592 Adm. & Fiscal Svcs. Div. 1,329,610 Office of Director 708,133 Agency Common 474,219 Coupons 550,000 Damage 500,000 Early Retirement 125,000 FY 91 $22,518,236 Game Division 8,711,427 Fish Division 4,787,533 HATS Division 2,876,190 I&E Services Division 1,941,699 Adm. & Fiscal Svcs. Div. 1,383,147 Office of Director 746,640 Agency Common 876,600 Coupons 600,000 Damage 500,000 Early Retirement 95,000 FY 92 $27,073,153
Game Division 9,893,600 Fish Division 5,708,203 HATS Division 4,035,772 I&E Services Division 2,723,179 Fiscal Services Division 2,469,238 Office of Director 942,412 Coupons 600,000 Damage 500,000 Early Retirement 200,749
FY 93 $29,674,362 Game Division 10,561,574 Fish Division 6,124,559 HATS Division 4,114,019 I&E Services Division 3,253,794 Fiscal Services Division 2,377,512 Office of Director 1,632,904 Coupons 860,000 Damage 500,000 Early Retirement 250,000
FY 94 $30,946,580 Game Division 10,423,261 Fish Division 6,185,826 HATS Division 4,539,758 I&E Services Division 3,568,632 Fiscal Services Division 2,996,836 Office of Director 1,687,267 Coupons 750,000 Early Retirement 295,000 FY 95 $30,672,321 Wildlife Division 10,126,225 Fish Division 6,187,409 HATS Division 4,195,529 I&E Services Division 3,204,102 Fiscal Services Division 2,692,088 Office of Director 1,956,424 Coupons 650,000 Early Retirement 150,000 Damage 500,000 Cost Allocation 300,000 SALECS 217,000 Salary Contingency 493,544 FY 96 $31,402,001 Wildlife Division 10,288,181 Fish Division 6,803,683 HATS Division 4,587,011 I&E Services Division 3,504,112 Fiscal Services Division 3,018,908 Office of Director 1,249,286 Coupons 600,000 Early Retirement 333,820 Damage 500,000 Cost Allocation 300,000 FY96 (Continued)
SALECS 217,000 FY 97 $30,484,636 Wildlife Division 11,479,769 Fish Division 6,255,709 Services Division 7,033,623 Fiscal Services Division 2,780,604 Office of Director 984,931 Coupons 560,000 Early Retirement 378,000 Damage 500,000 Cost Allocation 300,000 SALECS 212,000 FY 98 $33,776,380 Wildlife Division 12,747,313 Fish Division 6,755,891 Services Division 7,332,429 Fiscal Services Division 3,097,432 Office of Director 1,822,313 Coupons 602,000 Early Retirement 369,002 Damage 500,000 Cost Allocation 330,000 SALECS 220,000
FY 99 $33,582,267 Wildlife Division 12,155,687 Fish Division 7,017,794 Services Division 7,615,445 Fiscal Services Division 3,025,520 Office of Director 1,824,772 Coupons 515,000 Early Retirement 358,249 Damage 500,000 Cost Allocation 342,200 SALECS 227,600 FY 00 $36,238,774 Wildlife Division 12,970,024 Fish Division 8,377,249 Services Division 7,765,569 Fiscal Services Division 3,297,221 Office of Director 1,860,511 Coupons 515,000 Early Retirement 325,600 Damage 500,000 Cost Allocation 400,000 SALECS 227,600 FY 01 $36,571,119 Wildlife Division 12,900,839 Fish Division 8,617,707 Services Division 7,884,777 Fiscal Services Division 3,355,319 Office of Director 1,917,494 FY 01 (Continued)
Coupons 515,000 Early Retirement 305,000 Damage 500,000 Cost Allocation 350,000 SALECS 224,000 FY 02 $39,727,021 Wildlife Division 14,047,986 Fish Division 9,107,324 Services Division 8,982,248 Fiscal Services Division 3,648,879 Office of Director 2,081,384 Coupons 475,000 Early Retirement 262,200 Damage 500,000 Cost Allocation 370,000 SALECS 252,000 FY 03 $40,545,447 Wildlife Division 14,843,001 Fish Division 8,856,919 Services Division 9,015,519 Fiscal Services Division 3,904,386 Office of Director 2,165,017 Coupons 450,000 Early Retirement 208,605 Damage 500,000 Cost Allocation 350,000 SALECS 252,000 FY 04 $39,572,909 Wildlife Division 14,520,159 Fish Division 8,780,831 Services Division 8,921,007 Fiscal Services 3,622,015 Office of Director 2,002,835 Coupons 400,000 Early Retirement 164,062 Damage 500,000 Cost Allocation 410,000 SALECS 252,000 FY 05 $40,720,306 Wildlife Division 14,890,882 Fish Division 8,979,167 Services Division 9,426,638 Fiscal Services 3,569,888 Office of Director 2,031,455 Coupons 500,000 Early Retirement 138,276 Damage 500,000 Cost Allocation 432,000 SALECS 252,000 FY 06 44,624,002 Wildlife Division 44,624,002 FY 06 (Continued)
Fish Division 17,962,143 Services Division 9,294,901 Fiscal Services 9,670,901 Office of Director 2,059,320 Coupons 500,000 Early Retirement 105,274 Damage 500,000 Cost Allocation 600,000 SALECS 252,000 FY 07 $47,208,311 Wildlife Division 18,735,410 Fish Division 9,769,631 Services Division 10,615,365 Fiscal Services 3,958,939 Office of Director 2,051,522 Coupons 535,000 Early Retirement 90,444 Damage 500,000 Cost Allocation 700,000 SALECS 252,000 FY 08 $49,468,992 Wildlife Division 18,339,800 Fish Division 10,628,900 Services Division 12,087,871 Fiscal Services 4,343,886 Office of the Director 2,590,603 Coupons 595,000 Early Retirement 82,932 Damage 500,000 Cost Allocation 0 SALECS 300,000 FY 09 $53,148,847 Wildlife Division 19,477,936 Fish Division 11,773,488 Services Division 13,118,109 Fiscal Services 4,276,173 Office of the Director 2,771,497 Coupons 850,000 Early Retirement 81,720 Damage 500,000 Cost Allocation 0 SALECS 299,924 FY 10 $55,202,787
Wildlife Division 20,607,884 Fish Division 12,080,212 Services Division 13,614,186 Fiscal Services 4,408,915 Office of the Director 2,839,390 Coupons 800,000 Early Retirement 75,000 Damage 500,000 Cost Allocation 0 SALECS 277,200

ARISING FROM CASH TRANSACTIONS % CHNGAS OF JUNE 30, 2009 FY 06 to
2009 2008 2007 2006 FY 09ASSETS:
PETTY CASH 16,975$ 16,775$ 14,750$ 14,750$ 15% CASH - OPERATIONS 35,961,959 32,483,346 27,044,138 22,658,283 59% CASH- WLDLFE TRUST INTEREST 2,527,220 2,404,418 2,019,654 1,630,155 55% CASH- ACCESS FUND 1,422,646 1,180,744 1,012,033 957,866 49% 39,928,800 36,085,283 30,090,575 25,261,054 58%
CASH - WLDLFE TRUST CORPUS 21,835,713 20,967,536 20,203,311 19,473,876 12% CASH- LIFETIME LICENSE FUND 3,724,308 3,528,154 3,053,705 2,748,685 35% CASH-ALTERNATIVE ENTERPRISES 50,000 50,371 50,000 50,013 0% CASH - APPS/LICENSES IN PROCESS 14,108,188 15,420,043 13,653,774 13,221,845 7% RETURNED CHECKS 2,280 1,523 3,234 8,001 -72% TOTAL ASSETS 79,649,289 76,052,910 67,054,599 60,763,474 31%
LIABILITIES:
VOUCHERS PAYABLE 260 290 260 251,390 -100% LICENSE AGENT BONDS 100,000 100,000 100,000 100,000 0% COURT ORDERED RESTITUTION 82,290 71,171 31,671 40,534 103% UNREALIZED INVESTMENT INCOME 328,461 UNDISTRIBURED DRAW/APPS PENDIN 14,108,188 15,420,043 13,653,774 13,221,845 7% RESTRICTED FEDERAL FUNDS 59,516 55 0 64,431 -8% OTHER DEFERRED REVENUE 192,143 245,050 187,424 208,907 -8% TOTAL LIABILITIES 14,870,858 15,836,609 13,973,129 13,887,107 7%
FUND BALANCE:
RESTRICTED OUTSTANDING ENCUMBERANCES 6,464,993 6,221,348 4,371,988 4,321,386 50% WLDLFE TRUST FUND CORPUS 21,835,713 20,967,536 20,203,311 19,473,876 12% WLD TRUST FUND INTEREST 2,064,330 2,014,893 1,731,104 1,511,912 37% ACCESS FUND CORPUS 1,422,646 1,162,044 993,333 933,591 52% LIFETIME LICENSE FUND 3,724,308 3,528,154 3,053,705 2,748,685 35% ALTERNATIVE ENTERPRISES 50,000 50,371 50,000 50,013 0%
UNRESTRICTED G&F OPERATING FUND 29,216,441 26,271,955 22,678,029 17,836,904 64% TOTAL FUND BALANCE 64,778,431 60,216,301 53,081,470 46,876,367 38% TOTAL LIABILITIES AND FUND BALANCE
79,649,289 76,052,910 67,054,599 60,763,474 31%
SCHEDULE OF ASSETS, LIABILITIES, AND FUND BALANCES (G&F funds only)
C-7

SCHEDULE OF REVENUE AND EXPENDITURES ARISING FROM CASH TRANSACTIONS
EXPENDABLE FUNDS %PR CHREVENUE RECEIVED FY 08Hunting & Fish Lic@ 33,472,862$ 29,816,382$ 12% Preference Points 3,672,193 3,400,091 8%Conservation Stamps 809,404 667,213 21%Boating Registration 433,255 368,395 18%Pooled Interest Opr 1,997,298 2,540,385 -21%Pooled Interest Trt 939,713 1,266,673 -26%Income from Inv&Land 89,265 108,665 -18%Nonfederal Grants 989,207 1,077,200 -8%Application Fees 1,878,010 2,039,731 -8%Publication Sales 192,441 152,037 27%Access Yes c-stamp/donations 908,509 846,268 7%Federal Aid & Grants 13,285,857 13,409,982 -1%General Funds 3,560,520 1,515,397 135%License Recoupment (gen funds) 640,361 1,100,000 -42%Other Items 56,158 75,425 -26%
TOTAL REVENUE EARNED 62,925,053 58,383,844 8%
EXPENDITURES MADEMaintenance & OpsOffice of Director 2,403,618 2,066,779 16%Fiscal Division 3,673,716 3,522,576 4%Services Division 11,322,302 10,919,330 4%Fish Division 9,485,761 8,585,858 10%Wildlife Division 21,991,264 18,568,570 18%
TOTAL M&O EXPENSES 48,876,661 43,663,113 12%
Access Payments 643,573 710,801 -9%Trust Projects 764,785 782,455 -2%Legislated Expenses 1,167,373 1,038,206 12%Carryover M/0 /Trust FD 2,735,074 1,909,855 43%
TOTAL OPERATING EXP 54,187,466 48,104,430 13%
Licensing Project 0 459,020 -100%Reimbursable Contracts 2,926,103 2,160,165 35% State Wildlife Grants 502,763 593,462 -15%LIP Tier I Grants 124,197 108,406 15%Property Rights 285,000 67,303 323%Capital Facilities (administrative) 0 224,204Special Nonrecurring Projects 262,578 503,397Carryover 1,418,058 515,232 175%
TOTAL NONOP EXPENDTRS 5,518,699 4,631,189 19%
TOTAL EXPENDITURES 59,706,165 52,735,619 13%DEFICIT OF REV OVER EXP $3,218,888 $5,648,225 -43%
All Department revenue is recognized above excepting: 1)$433,874 in lifetime license sales & interest earned on those licenses(W.S. provides that the corpus of the lifetime license fund cannot be spent, but up to 6% of the corpus balance may be transferred annually to the Game and Fish Operating fund;
2)$ 1/2 or $57,098 of lifetime conservation stamps and 37 1/2% of the c-stamp ($809,404) revenue deposited in the wildlife trust fund;W.S. provides the corpus cannot be spent, but interest earned may be used for operations 3)access donations of $149,833 which are deposited into an access fund & are budgeted and spent in the year following receipt; they can only be used for purchasing nonfee title access easements;
4) and $40,866 (net profit on a cash basis for revenue of $123,789 & expenses of $82,923) from sale of promotional products and publications.
All Department expenditures, excepting capital construction costs, included in a Legislative appropriation andpaid directly by the Department of Administration and Information Construction Management Division, are shown
FROM EXPENDABLE FUNDS FOR THE PERIOD ENDED JUNE 30, 2009
C-8

SCHEDULE OF EXPENDITURES BY STRATEGIC PLAN OBJECTIVESFOR THE YEAR ENDED June 30, 2009
Game &Fish
OpertngFund
WildlifeTrust Fund
Accessfund
NonrecurringProjects
State Wld Grnts &
LIP I
100% funded ThirdParty
Grants
Sub-Total Agencyfunding
Generalfund (non
capitalconstructn)
TotalAgency
Expenditures%
ExpdAQUATIC WILDLIFE MNGT 4,095,779$ 170,980$ 305,370$ 8,840$ 4,580,969$ 4,580,969$ 7.66%BIRD FARMS 708,535 1,301 709,836 709,836 1.19%COOPERATIVE RESEARCH 252,912 124,552 76,909 454,373 454,373 0.76%CONSERVATION ENGNING 550,882 550,882 550,882 0.92%SWAP(CWCS) 95,437 524,931 620,368 641,343 1,261,711 2.11%DEPARTMENT ADMIN 3,085,460 3,085,460 3,085,460 5.16%EDUCATION 513,658 31,631 7,300 119,143 671,732 671,732 1.12%FEEDGROUNDS 2,436,353 15,642 2,451,995 2,451,995 4.10%FINANCIAL MANAGEMENT 2,344,561 63,439 520 2,408,520 2,408,520 4.03%FISH CULTURE^ 4,642,746 4,642,746 4,642,746 7.77%HABITAT ^ 5,177,806 697,168 60,758 876,270 6,812,002 6,812,002 11.39%INFORMATION 1,735,376 50,000 1,785,376 1,785,376 2.99%LEGISLATED EXPENSES(2) 1,344,406 1,344,406 1,344,406 2.25%CUSTOMER SERVICES 298,487 298,487 298,487 0.50%MANAGEMENT INFO SYSTEMS 2,554,420 2,554,420 2,554,420 4.27%PERSONNEL MANAGEMENT 394,158 394,158 394,158 0.66%PROPERTY RIGHTS 1,856,264 217,710 644,373 584,705 214,323 3,517,375 3,517,375 5.88%REGIONAL INFORMATION/ED 616,390 616,390 616,390 1.03%SPECIALIZED LAW ENFORCMNT 1,042,990 222,975 1,265,965 1,265,965 2.12%STRATEGIC MNGT 383,754 383,754 383,754 0.64%SUPPORT FACILITIES/PERSNL 2,213,815 2,213,815 2,213,815 3.70%TERRESTRIAL WLD MNGT 12,421,999 10,893 120,484 391,218 12,944,594 1,643,865 14,588,459 24.40%WILDLIFE HABITAT PRCTCN 436,402 393,741 830,143 830,143 1.39%WILDLIFE HEALTH & LAB SVCS 579,208 20,665 338,332 938,205 1,275,312 2,213,517 3.70%
- - TTL DEPT OBJECTIVES 49,781,798 946,509 644,373 969,095 626,960 3,107,236 56,075,971 3,560,520 59,636,491 99.74%
Alternative Enterprises 82,922 82,922 82,922 0.14%Electronic Licensing Project 69,674 69,674 69,674 0.12%
TOTAL AMT SPENT FY09 49,934,394 946,509 644,373 969,095 626,960 3,107,236 56,228,567 3,560,520 59,789,087 100.00%
C-9

STATEWIDE FIVE-YEAR COMPARISON OF LICENSE SALES
BIG GAME LICENSES PRICE 2004 2005 2006 2007 2008 Resident Antelope $26.00 13,013 Resident Antelope $27.00 13,811 14,453 15,247 Resident Antelope $33.00 17,331 Resident Youth Antelope $15.00 2,218 2,285 2,328 2,296 2,582 Resident Doe/Fawn Antelope $24.00 4,357 Resident Doe/Fawn Antelope $19.00 4,788 5,923 6,723 Resident Doe/Fawn Antelope $22.00 7,455 Resident Youth Doe/Fawn Antelope $14.00 548 525 630 671 766 Pioneer Antelope $2.00 300 296 259 204 192 Pioneer Doe/Fawn Antelope $2.00 59 54 66 51 48 Pioneer Heritage Antelope $16.00 108 114 140 157 Pioneer Heritage Antelope $20.00 160 Pioneer Heritage Doe/Fawn Antelope $15.00 20 17 27 29 Pioneer Heritage Doe/Fawn Antelope $18.00 35
TOTALS 20,623 21,890 23,826 25,378 28,569 Nonres Special Antelope $425.00 1,455 Nonres Special Antelope $426.00 1,498 761 647 Nonres Special Antelope $512.00 662 NonRes Special Antelope w/Preference Point $456.00 860 1,044 NonRes Special Antelope w/Preference Point $542.00 1,003 NonRes Antelope w/Preference Point $256.00 2,039 3,094 NonRes Antelope w/Preference Point $302.00 2,807 NonRes Antelope Yth w/Preference Point $120.00 226 329 293 Nonres Antelope $225.00 13,399 Nonres Antelope $226.00 14,478 13,242 13,972 Nonres Antelope $272.00 13,733 Nonres Youth Antelope $110.00 830 931 809 799 788 Nonres Doe/Fawn Antelope $60.00 7,955 Nonres Doe/Fawn Antelope $29.00 11,913 15,725 18,959 Nonres Doe/Fawn Antelope $34.00 19,981 Nonres Youth Doe/Fawn Antelope $30.00 588 Nonres Youth Doe/Fawn Antelope $19.00 720 968 1,100 1,323
TOTALS 24,227 29,540 34,630 39,944 40,590TOTAL ANTELOPE LICENSES 44,850 51,430 58,456 65,322 69,159 Resident Bighorn Sheep $95.00 187 Resident Bighorn Sheep $96.00 174 179 183 Resident Bighorn Sheep $117.00 183 Nonresident Bighorn Sheep $1,900.00 64 Nonresident Bighorn Sheep $1,901.00 62 61 61 Nonresident Bighorn Sheep $2,252.00 66TOTAL BIGHORN SHEEP LICENSES 251 236 240 244 249 Resident Deer $30.00 39,596 Resident Deer $31.00 38,591 39,887 40,969 Resident Deer $38.00 41,621 Resident Deer Military Combat $0.00 11 10 6 Resident Youth Deer $15.00 5,414 5,353 5,455 5,327 5,206 Resident Doe/Fawn Deer $24.00 4,233 Resident Doe/Fawn Deer $19.00 5,479 6,728 7,529 Resident Doe/Fawn Deer $22.00 7,732 Resident Youth Doe/Fawn Deer $14.00 435 514 627 646 807 Pioneer Deer $2.00 628 554 461 390 339 Pioneer Doe/Fawn Deer $2.00 46 36 45 52 62 Pioneer Heritage Deer $19.00 138 157 172 200 Pioneer Heritage Deer $23.00 229 Pioneer Heritage Doe/Fawn Deer $15.00 19 11 15 21 Pioneer Heritage Doe/Fawn Deer $18.00 33
TOTALS 50,509 50,695 53,401 55,144 56,035 Nonres Special Deer $460.00 3,278 Nonres Special Deer $461.00 2,948 1,414 1,342 Nonres Special Deer $552.00 1,406 NonRes Deer Special w/Preference Point $501.00 1,314 1,376 NonRes Deer Special w/Preference Point $592.00 1,468 NonRes Deer w/Preference Point $301.00 3,168 3,789 NonRes Deer w/Preference Point $352.00 4,309 NonRes Deer Yth w/Preference Point $120.00 200 216 272 Nonresident Deer $260.00 24,076 Nonresident Deer $261.00 24,569 21,011 20,103 Nonresident Deer $312.00 17,846 Nonresident Youth Deer $110.00 1,042 1,158 972 873 834 Nonresident Doe/Fawn Deer $60.00 2,950
C-10

STATEWIDE FIVE-YEAR COMPARISON OF LICENSE SALES
Nonresident Doe/Fawn Deer $29.00 4,915 6,569 7,812 Nonresident Doe/Fawn Deer $34.00 6,926 Nonresident Youth Doe/Fawn Deer $30.00 194 Nonresident Youth Doe/Fawn Deer $19.00 248 356 359 444
TOTALS 31,540 33,838 35,004 35,870 33,505TOTAL DEER LICENSES 82,049 84,533 88,405 91,014 89,540 Resident Elk $42.00 38,357 Resident Elk $43.00 37,192 38,055 38,707 Resident Elk $52.00 38,575 Resident Elk Military Combat $0.00 9 7 5 Resident Youth Elk $25.00 3,969 3,801 3,777 3,838 3,697 Depredation Resident Elk $42.00 91 Depredation Resident Youth Elk $25.00 9 Pioneer Elk $5.00 695 573 529 447 372 Resident Cow/Calf Elk $36.00 4,038 4,229 4,687 5,260 Resident Cow/Calf Elk $43.00 6,783 Resident Yth Cow/Calf Elk $20.00 297 326 318 370 521 Pioneer Cow/Calf Elk $5.00 62 52 48 54 59 Pioneer Heritage Elk $27.00 243 294 330 369 Pioneer Heritage Elk $32.00 372 Pioneer Heritage Cow/Calf Elk $23.00 30 26 34 46 Pioneer Heritage Cow/Calf Elk $27.00 65
TOTALS 47,791 46,493 47,787 49,098 50,449 Nonres Special Elk/Fishing $880.00 2,783 Nonres Special Elk/Fishing $881.00 2,785 716 556 Nonres Special Elk/Fishing $1,057.00 669 NonRes Elk Yth w/Preference Point $285.00 90 84 NonRes Elk Yth w/Preference Point $325.00 70 NonRes Elk Special w/Preference Point $931.00 2,069 2,253 NonRes Elk Special w/Preference Point $1,107.00 1,855 NonRes Elk w/Preference Point $531.00 1,920 2,900 NonRes Elk w/Preference Point $627.00 2,824 Nonres Elk & Fishing $480.00 5,757 Nonres Elk & Fishing $481.00 5,536 3,513 2,762 Nonres Elk & Fishing $577.00 2,699 Nonres Youth Elk/Fishing $275.00 154 151 111 83 79 Nonres Cow/Calf Elk $240.00 1,636 1,538 1,441 1,565 Nonres Cow/Calf Elk $288.00 1,874 Nonres Youth Cow/Calf Elk $100.00 61 47 55 77 93
TOTALS 10,391 10,057 9,895 10,286 10,177TOTAL ELK LICENSES 58,182 56,550 57,682 59,384 60,626 Resident Moose $90.00 777 Resident Moose $91.00 669 636 640 Resident Moose $112.00 586 Nonresident Moose $1,200.00 150 Nonresident Moose $1,201.00 129 132 129 Nonresident Moose $1,402.00 129TOTAL MOOSE LICENSES 927 798 768 769 715 Resident Mountain Goat $100.00 12 Resident Mountain Goat $101.00 15 15 15 Resident Mountain Goat $122.00 15 Nonres Mountain Goat $1,800.00 4 Nonres Mountain Goat $1,801.00 5 5 5 Nonres Mountain Goat $2,152.00 5TOTAL MOUNTAIN GOAT LICENSES 16 20 20 20 20
COMMERCIAL LICENSES PRICE 2004 2005 2006 2007 2008 Comm’l Fish Hatchery $150.00 12 Comm’l Fish Hatchery $151.00 14 13 14 Comm’l Fish Hatchery $182.00 11 Deal in Live Bait $55.00 65 Deal in Live Bait $56.00 56 57 55 Deal in Live Bait $67.00 63 Fishing Preserve $110.00 62 Fishing Preserve $111.00 72 73 77 Fishing Preserve $132.00 73 Resident Fur Dealer $42.00 13 Resident Fur Dealer $43.00 11 14 11 Resident Fur Dealer $52.00 16 Nonresident Fur Dealer $230.00 9 Nonresident Fur Dealer $231.00 10 10 11
C-11

STATEWIDE FIVE-YEAR COMPARISON OF LICENSE SALES
Nonresident Fur Dealer $277.00 13 Game Bird Farm $110.00 117 Game Bird Farm $111.00 115 105 105 Game Bird Farm $132.00 111 Seine or Trap Fish License $15.00 566 Seine or Trap Fish License $16.00 612 622 632 Seine or Trap Fish License $20.00 697 Resident Taxidermist $55.00 168 Resident Taxidermist $56.00 163 161 171 Resident Taxidermist $67.00 179 Nonresident Taxidermist $600.00 4 Nonresident Taxidermist $601.00 5 6 4 Nonresident Taxidermist $702.00 4TOTAL COMMERCIAL LICENSES 1,016 1,058 1,061 1,080 1,167FUR BEARING/TRAP LICENSES PRICE 2004 2005 2006 2007 2008 Res Fur Bearing Trap $35.00 1,310 Res Fur Bearing Trap $36.00 1,347 1,466 1,653 Res Fur Bearing Trap $44.00 1,685 Res Youth Fur Bear Trap $6.00 113 110 115 136 117 Nonres Fur Bearing Trap $200.00 31 Nonres Fur Bearing Trap $201.00 39 42 55 Nonres Fur Bearing Trap $242.00 48TOTAL FUR BEARING/TRAPPING LICENSES 1,454 1,496 1,623 1,844 1,850
GAME BIRD/SML GAME LICENSES: PRICE 2004 2005 2006 2007 2008 Res Bird/Small Game Annual $18.00 10,189 Res Bird/Small Game Annual $19.00 10,278 10,622 9,997 Res Bird/Small Game Annual $24.00 8,691 Res Daily Bird/Small Game $6.00 1,155 Res Daily Bird/Small Game $7.00 1,108 1,019 1,026 Res Daily Bird/Small Game $9.00 957 Res Bird/Small Game Military Combat $0.00 6 5 Nonres Bird/Small Game Annual $60.00 1,824 Nonres Bird/Small Game Annual $61.00 1,868 2,054 2,050 Nonres Bird/Small Game Annual $72.00 1,879 Nonres Daily Bird/Small Game $15.00 5,107 Nonres Daily Bird/Small Game $16.00 6,203 6,752 6,233 Nonres Daily Bird/Small Game $20.00 5,195 Nonres Youth Bird/Small Game Annual $40.00 80 106 111 101 128TOTAL COMBINATION LICENSES 18,355 19,563 20,564 19,412 16,850GAME BIRD LICENSES: PRICE 2004 2005 2006 2007 2008 Resident Game Bird $12.00 8,024 Resident Game Bird $13.00 7,767 7,350 7,375 Resident Game Bird $16.00 7,553TOTAL GAME BIRD LICENSES 8,024 7,767 7,350 7,375 7,553SMALL GAME LICENSES: PRICE 2004 2005 2006 2007 2008 Resident Small Game $12.00 1,971 Resident Small Game $13.00 2,142 2,009 2,031 Resident Small Game $16.00 1,831TOTAL SMALL GAME LICENSES 1,971 2,142 2,009 2,031 1,831TURKEY LICENSES: PRICE 2004 2005 2006 2007 2008 Resident Spring Turkey $12.00 4,188 Resident Spring Turkey $13.00 4,165 4,148 4,302 Resident Spring Turkey $16.00 4,358 Resident Fall Turkey $12.00 2,230 Resident Fall Turkey $13.00 1,818 1,941 2,427 Resident Fall Turkey $16.00 2,649
TOTALS 6,418 5,983 6,089 6,729 7,007 Nonres Spring Turkey $60.00 1,414 Nonres Spring Turkey $61.00 1,545 1,567 1,497 Nonres Spring Turkey $72.00 1,412 Nonres Fall Turkey $60.00 572 Nonres Fall Turkey $61.00 432 490 507 Nonres Fall Turkey $72.00 496
TOTALS 1,986 1,977 2,057 2,004 1,908TOTAL TURKEY LICENSES 8,404 7,960 8,146 8,733 8,915
C-12

STATEWIDE FIVE-YEAR COMPARISON OF LICENSE SALES
GAME FISH LICENSES: PRICE 2004 2005 2006 2007 2008 Resident Fishing Annual $18.00 73,541 Resident Fishing Annual $19.00 72,932 75,872 77,087 Resident Fishing Annual $24.00 73,489 Resident Youth Fishing Annual $3.00 6,368 6,255 6,440 6,327 6,101 Resident Daily Fish $3.00 39,862 Resident Daily Fish $4.00 40,427 39,759 40,953 Resident Daily Fish $6.00 36,192 Resident Daily Fish Military Combat $0.00 8 12 6
TOTALS 119,771 119,614 122,079 124,379 115,788 Nonres Fishing Annual $75.00 14,033 Nonres Fishing Annual $76.00 13,842 14,579 15,479 Nonres Fishing Annual $92.00 12,466 Nonres Youth Fish Annual $15.00 3,554 3,371 3,673 3,707 3,417 Nonres Daily Fishing $6.00 Nonres Daily Fishing $10.00 218,894 Nonres Daily Fishing $11.00 213,152 217,331 219,353 Nonres Daily Fishing $14.00 183,481
TOTALS 236,481 230,365 235,583 238,539 199,364TOTAL FISHING LICENSES 356,252 349,979 357,662 362,918 315,152
LIFETIME LICENSES: PRICE 2004 2005 2006 2007 2008 Bird/Fish/Small Game $400.00 121 Bird/Fish/Small Game $401.00 100 121 299 Bird/Fish/Small Game $482.00 97 Fishing $250.00 74 Fishing $251.00 70 114 233 Fishing $302.00 68 Bird/Fish/Small Game & Conservation Stamp $550.00 195 Bird/Fish/Small Game & Conservation Stamp $551.50 289 358 783 Bird/Fish/Small Game & Conservation Stamp $662.50 313 Bird/Small Game $250.00 23 Bird/Small Game $251.00 21 23 38 Bird/Small Game $302.00 10 Bird/Small Game & Conservation Stamp $400.00 3 Bird/Small Game & Conservation Stamp $401.50 3 3 19 Bird/Small Game & Conservation Stamp $482.50 11 Fishing/Conservation Stamp $400.00 129 Fishing/Conservation Stamp $401.50 157 208 464 Fishing/Conservation Stamp $482.50 253 Conservation Stamp $150.00 79 Conservation Stamp $150.50 86 105 232 Conservation Stamp $180.50 131TOTAL LIFETIME LICENSES 624 726 932 2,068 883
OTHER LICENSES: PRICE 2004 2005 2006 2007 2008 Resident Archery $12.00 10,836 Resident Archery $13.00 11,144 12,223 12,986 Resident Archery $16.00 13,723 Nonresident Archery $24.00 3,254 Nonresident Archery $25.00 3,362 3,871 4,170 Nonresident Archery $30.00 4,364TOTAL ARCHERY LICENSES 14,090 14,506 16,094 17,156 18,087 Res License to Capture Falcon $30.00 17 Res License to Capture Falcon $31.00 19 17 17 Res License to Capture Falcon $38.00 10 Nonres Lic to Capture Falcon $200.00 16 Nonres Lic to Capture Falcon $201.00 22 16 16 Nonres Lic to Capture Falcon $242.00 29 License to Hunt with Falcon $12.00 85 License to Hunt with Falcon $13.00 99 92 86 License to Hunt with Falcon $16.00 75 License to Capture Fur Bearing Animal $15.00 2 License to Capture Fur Bearing Animal $16.00 1 2 1 License to Capture Fur Bearing Animal $20.00 1 Disabled Hunter Companion Permit $5.00 74 73 69 96 97 Duplicate with Coupon $3.00 1,010 Duplicate with Coupon $4.00 1,077 1,070 1,159 Duplicate with Coupon $5.00 1,618
C-13

STATEWIDE FIVE-YEAR COMPARISON OF LICENSE SALES
Duplicate without Coupon $3.00 109 Duplicate without Coupon $4.00 127 159 138 Duplicate without Coupon $5.00 151 Duplicate Multi-Purpose $3.00 753 Duplicate Multi-Purpose $4.00 750 828 862 Duplicate Multi-Purpose $5.00 1,127 Duplicate Commercial $3.00 1 Duplicate Commercial $4.00 1 1 12 Duplicate Commercial $5.00 4 Duplicate Lifetime $4.00 174 233 263 Duplicate Lifetime $5.00 248TOTAL OTHER LICENSES 2,067 2,343 2,487 2,650 3,360PERMITS: PRICE 2004 2005 2006 2007 2008 Goose Special Management Permit $10.00 21 Goose Special Management Permit $12.50 Pheasant Special Mgmnt Permit $10.00 6,010 5,995 5,926 Pheasant Special Mgmnt Permit $10.50 5,555 Pheasant Special Mgmnt Permit $12.50 5,591 Conservation Order Special Mgmt Permit $10.00 249 Conservation Order Special Mgmt Permit $10.50 272 206 208 Conservation Order Special Mgmt Permit $12.50 228TOTAL PERMITS 6,280 6,267 6,132 5,763 5,819STAMPS AND TAGS: PRICE 2004 2005 2006 2007 2008 Conservation Stamps $10.00 168,992 Conservation Stamps $10.50 169,573 176,043 180,410 Conservation Stamps $12.50 172,586 Elk Special Management Stamp $10.00 15,308 Elk Special Management Stamp $10.50 14,397 14,064 13,695 Elk Special Management Stamp $12.50 13,523 Wildlife Damage Management Stamp $10.00 320 365 275 141 249 Reciprocity Stamps $10.00 6,616 7,098 7,049 7,400 8,230 Interstate Game Tags $5.00 15,829 15,181 16,367 17,227 Interstate Game Tags $8.00 15,834TOTAL STAMPS AND TAGS 207,065 206,614 213,798 218,873 210,422TROPHY GAME LICENSES: PRICE 2004 2005 2006 2007 2008 Resident Black Bear $36.00 2,702 Resident Black Bear $37.00 2,651 2,724 2,968 Resident Black Bear $45.00 2,962 Nonres Black Bear $300.00 247 Nonres Black Bear $301.00 253 262 284 Nonres Black Bear $362.00 295TOTAL BLACK BEAR LICENSES 2,949 2,904 2,986 3,252 3,257 Resident Mountain Lion $24.00 1,396 Resident Mountain Lion $25.00 1,423 1,441 1,548 Resident Mountain Lion $30.00 1,631 Resident Additional Mountain Lion $15.00 3 Resident Additional Mountain Lion $16.00 3 3 3 Nonres Mountain Lion $300.00 130 Nonres Mountain Lion $301.00 122 109 129 Nonres Mountain Lion $362.00 128 Nonres Additional Mountain Lion $75.00 1TOTAL MOUNTAIN LION LICENSES 1,530 1,548 1,553 1,680 1,759WILD BISON LICENSES: PRICE 2004 2005 2006 2007 2008 Resident Wild Bison $330.00 48 Resident Wild Bison $331.00 45 44 257 Resident Wild Bison $402.00 279 Nonresident Wild Bison $2,100.00 4 Nonresident Wild Bison $2,101.00 4 8 20 Nonresident Wild Bison $2,502.00 28TOTAL BISON LICENSES: 52 49 52 277 307
2004 2005 2006 2007 2008GRAND TOTAL LICENSES: 816,408 818,489 848,020 871,865 817,521
HIP PERMITS ISSUED: Total 9,710 (6,978 manual permits issued; 2,732 issued via internet)
C-14

EXPENDITURE ALLOCATIONS FY PROGRAM -- FY 09
COSTS BEFORE GEN'L WILDLIFE COSTS AFTERCODE PROGRAM ALLOCATION ALLOCATION* ALLOCATION
AA GENERAL WILDLIFE 11,401,857
BC ANTELOPE 2,786,903 664,326 3,451,229
BD ELK 11,258,944 2,683,841 13,942,785
BE ROCKY MOUNTAIN SHEEP 999,645 238,289 1,237,934
BF MOOSE 661,359 157,651 819,010
BG ROCKY MOUNTAIN GOAT 69,690 16,612 86,302
BJ MOUNTAIN LION 418,134 99,672 517,806
BK BLACK BEAR 551,107 131,370 682,477
BL GRIZZLY BEAR 1,410,549 336,238 1,746,787
BM MULE DEER 5,047,097 1,203,097 6,250,194
BN WHITE-TAILED DEER 452,623 107,894 560,517
BP BISON 174,472 41,590 216,062
BW WOLF 885,653 211,117 1,096,770
CA SMALL GAME 40,597 9,677 50,274
CB GAME BIRDS 273 65 338
CC PHEASANTS 2,265,492 540,035 2,805,527
CF TURKEY 241,047 57,459 298,506
CG PARTRIDGE 1,068 255 1,323 CR BLUE/RUFFED GROUSE 6,671 1,590 8,261 CT SAGE GROUSE 2,725,473 649,682 3,375,155 CV SHARPTAILED GROUSE 25,878 6,169 32,047
DB GEESE 845,290 201,495 1,046,785
DC DUCKS 191,730 45,703 237,433
DD SWANS 508,819 121,289 630,108
DE DOVES 40,529 9,661 50,190
DF CRANES 139,604 33,278 172,882
FX SPORT FISH 13,571,776 3,235,160 16,806,936
HB BOBCAT/LYNX 272,456 64,946 337,402
C-15

EXPENDITURE ALLOCATIONS FY PROGRAM -- FY 09
COSTS BEFORE GEN'L WILDLIFE COSTS AFTERCODE PROGRAM ALLOCATION ALLOCATION* ALLOCATION
HC BEAVER 34,359 8,190 42,549
MB COMMERCIAL FISHERIES 26,731 6,372 33,103
NA NONGAME MAMMALS 348,913 83,172 432,085
NB NONGAME BIRDS 422,058 100,608 522,666
NC RAPTORS 292,785 69,792 362,577
ND NONGAME FISH 384,087 91,556 475,643
NE AMPHIBIANS/REPTILES 281,703 67,151 348,854
NF PREDATORY BIRDS 2,976 709 3,685 NH PEREGRINE FALCON 67,274 16,036 83,310 NJ BALD EAGLE 28,644 6,828 35,472
NK BLACK FOOTED FERRET 221,474 52,794 274,268
NL CANADIAN LYNX 5,576 1,329 6,905
NM PREBLES MEADOW MOUSE 2,449 584 3,033
NP PREDATORY MAMMALS 30,840 7,351 38,191
NR BLACK TAILED PRAR DOG 21,431 5,109 26,540
NS WHITE TAILED PRAR DOG 56,349 13,432 69,781
NW WYOMING TOAD 9,564 2,280 11,844
NX EXOTIC GAME 1,682 401 2,083
ZZ NONWILDLIFE 555,456 555,456
TOTAL PROGRAM COSTS 59,789,087 11,401,857 59,789,087 *Most costs for the Office of Director, Fiscal Services, Services(including remodeling and maintenance of regional office buildings, and Information/Education programs such as Wyoming wildlife magazine, information services, visitor centers, educational programs,etc. are included in General Wildlife and allocated on a percentage basis to specific department programs.
C-16

ELK23%
BEAR1%
MT LION0%
SGGBMB5% Turkey
1%
T/E species1% OTHER
5%
WGF Revenue Collected by Species FY09(includes general fund noncapital
construction )
C-17
DEER25%
ANTELOPE16%
FISH20%
MOOSE, SH,GOAT3%
0%
ELK DEER ANTELOPE FISH MOOSE, SH,GOAT BEAR MT LION SGGBMB Turkey T/E species OTHER

ELK23%
DEER11%
SMALL GAME/GAME BIRD11%
MIGRATORY BIRD4% T/E
6%OTHER
5%
WGF Expenditures by Species - FY 09 (includes general fund non capital construction)
11%
ANTELOPE6%
FISH28%MOOSE, SH,GOA
T4%
BLACK BEAR1%
MT LION1%

EXPENDITURE ALLOCATIONS BY PROGRAM - Five-Year History (Includes General Wildlife Allocation)
PROGRAM 2005 % 2,006 % 2,007 % 2,008 % 2,009 % Antelope 3,025,576 7.16% 2,881,194 6.40% 3,167,032 6.67% 3,785,765 7.16% 3,451,229 5.77%
Elk 8,833,834 20.92% 10,789,073 23.98% 11,183,083 23.56% 12,415,185 23.47% 13,942,785 23.32%
Rocky Mountain Sheep 1,229,246 2.91% 1,066,634 2.37% 1,199,696 2.53% 1,284,207 2.43% 1,237,934 2.07%
Moose 1,004,466 2.38% 928,822 2.06% 699,814 1.47% 1,022,129 1.93% 819,010 1.37%
Rocky Mountain Goat 68,613 0.16% 35,806 0.08% 59,229 0.12% 48,575 0.09% 86,302 0.14%
Mountain Lion 335,197 0.79% 393,315 0.87% 444,845 0.94% 399,474 0.76% 517,806 0.87%
Black Bear 480,138 1.14% 482,313 1.07% 522,166 1.10% 1,076,992 2.04% 682,477 1.14%
Grizzly Bear 1,048,088 2.48% 1,237,122 2.75% 1,182,214 2.49% 1,359,017 2.57% 1,746,787 2.92%
Mule Deer 4,735,670 11.21% 4,813,400 10.70% 5,145,752 10.84% 5,819,403 11.00% 6,250,196 10.45%
White-tailed Deer 412,043 0.98% 520,579 1.16% 456,980 0.96% 411,374 0.78% 560,517 0.94%
Bison 33,162 0.08% 15,728 0.03% 21,928 0.05% 336,837 0.64% 216,062 0.36%
Wolf 498,312 1.18% 186,925 0.42% 406,597 0.86% 966,111 1.83% 1,096,770 1.83%
Small Game 62,989 0.15% 83,452 0.19% 95,689 0.20% 63,398 0.12% 50,274 0.08%
Game Birds 915 0.00% 885 0.00% 4,403 0.01% 1,925 0.00% 338 0.00%
Pheasants 936,535 2.22% 924,601 2.06% 1,049,837 2.21% 1,081,735 2.05% 2,805,527 4.69%
Turkey 304,936 0.72% 253,273 0.56% 211,984 0.45% 325,686 0.62% 298,506 0.50%
Partridge 2,102 0.00% 2,158 0.00% 2,464 0.01% 421 0.00% 1,323 0.00%
Blue/Ruffed Grouse 16,577 0.04% 16,611 0.04% 36,226 0.08% 11,228 0.02% 8,261 0.01%
Sage Grouse 1,395,137 3.30% 1,985,053 4.41% 2,247,751 4.74% 2,536,600 4.80% 3,375,155 5.65%

EXPENDITURE ALLOCATIONS BY PROGRAM - Five-Year History (Includes General Wildlife Allocation)
PROGRAM 2005 % 2,006 % 2,007 % 2,008 % 2,009 % Sharp-Tailed Grouse 26,713 0.06% 25,211 0.06% 25,630 0.05% 37,840 0.07% 32,047 0.05%
Geese 602,585 1.43% 866,266 1.93% 656,724 1.38% 531,811 1.01% 1,046,785 1.75%
Ducks 62,430 0.15% 98,893 0.22% 343,937 0.72% 225,079 0.43% 237,433 0.40%
Swans 129,526 0.31% 180,166 0.40% 146,297 0.31% 306,190 0.58% 630,108 1.05%
Doves 96,222 0.23% 70,904 0.16% 69,344 0.15% 144,777 0.27% 50,190 0.08%
Cranes 77,044 0.18% 56,979 0.13% 105,790 0.22% 182,947 0.35% 172,882 0.29%
Sport Fish 14,435,377 34.18% 14,300,540 31.78% 15,226,226 32.08% 15,286,495 28.90% 16,806,936 28.11%
Bobcat/Lynx 222,287 0.53% 301,166 0.67% 382,423 0.81% 551,070 1.04% 337,402 0.56%
Beaver 45,489 0.11% 9,278 0.02% 21,596 0.05% 54,599 0.10% 42,549 0.07%
Commercial Fisheries 43,615 0.10% 57,201 0.13% 38,195 0.08% 36,040 0.07% 33,103 0.06%
Nongame Mammals 235,140 0.56% 290,541 0.65% 241,600 0.51% 380,567 0.72% 432,085 0.72%
Nongame Birds 228,277 0.54% 322,229 0.72% 312,312 0.66% 535,644 1.01% 522,666 0.87%
Raptors 133,707 0.32% 128,083 0.28% 104,928 0.22% 165,296 0.31% 362,577 0.61%
Nongame Fish 298,081 0.71% 397,787 0.88% 359,073 0.76% 381,811 0.72% 475,643 0.80%
Amphibians/Reptiles 162,745 0.39% 236,282 0.53% 342,471 0.72% 153,371 0.29% 348,854 0.58%
Predatory Birds 2,818 0.01% 6,374 0.01% 1,782 0.00% 1,234 0.00% 3,685 0.01%
Peregrine Falcon 87,545 0.21% 61,929 0.14% 30,092 0.06% 30,089 0.06% 83,310 0.14%
Bald Eagle 40,725 0.10% 14,030 0.03% 23,210 0.05% 40,138 0.08% 35,472 0.06%
Black-Footed Ferret 115,837 0.27% 258,023 0.57% 241,312 0.51% 158,585 0.30% 274,268 0.46%

EXPENDITURE ALLOCATIONS BY PROGRAM - Five-Year History (Includes General Wildlife Allocation)
PROGRAM 2005 % 2,006 % 2,007 % 2,008 % 2,009 % Canadian Lynx 2,262 0.01% 17,428 0.04% 7,020 0.01% 4,634 0.01% 6,905 0.01%
Prebles Jumping Mouse 164 0.00% 0.00% 303 0.00% 3,033 0.01%
Predatory Mammals 62,334 0.15% 86,157 0.19% 39,830 0.08% 28,609 0.05% 38,191 0.06%
Black-Tailed Prairie Dog 60,362 0.14% 49,795 0.11% 18,116 0.04% 4,792 0.01% 26,540 0.04%
White-Tailed Prairie Dog 4,720 0.01% 17,273 0.04% 69,989 0.15% 90,565 0.17% 69,781 0.12%
Wyoming Toad 702 0.00% 1,135 0.00% 56 0.00% 6,991 0.01% 11,844 0.02%
Exotic Game 99,471 0.24% 8,942 0.02% 1,526 0.00% 3,137 0.01% 2,083 0.00%
Nonwildlife 529,280 1.25% 512,834 1.14% 518,486 1.09% 605,449 1.14% 555,456 0.93%
TOTAL PROGRAM COSTS 42,228,830 100.00% 44,992,554 100.00% 47,465,655 100.00% 52,894,125 100.00% 59,789,087 100.00%

ALL AGENCY EXPENDITURES ON AN ACTIVITY BASIS
2005 2006* 2007 2008 2009#num ACTIVITY DESCRIPTION AMT % AMT % AMT % AMT % AMT %001 Legal research 174 0.00 9,016 0.02 86,453 0.16 3975 0.01 822 0.00002 Legal briefs 105 0.00 2,044 0.00 367 0.00003 Legal pleadings 4,171 0.01 5,730 0.01 1963 0.00004 Legal - court appearances 78 0.00 1,053 0.00 2,065 0.00 667 0.00005 Legal conferences
051 Fee Title Acq-Aquatic Habitat 200 0.00 555 0.00 4678 0.01 3,219 0.01052 Fee Title Acq- Rip Habitat 5,045 0.01 3,090 0.01 410 0.00 60925 0.10 87,880 0.15053 Fee Title Acq- Ter Habitat 15,650 0.03 30,307 0.06 17,809 0.03 14031 0.02 1,019,111 1.70054 Fee Title Acq- Boat Access 325 0.00 340 0.00 99 0.00 382 0.00055 Fee Title Acq- Public Access 2,855 0.01 2,073 0.00 1537 0.00 2,229 0.00056 Fee Title Acq- Dept Facilities 12,904 0.03 8,888 0.02 9,764 0.02 20345 0.03 174,283 0.29061 Non-Fee Title- Aquatic Habitat 3,283 0.01 57,722 0.12 12,513 0.02 4733 0.01 5,726 0.01062 Non-Fee Title- Rip Habitat 4,274 0.01 6,628 0.01 4,666 0.01 1523 0.00 2,514 0.00063 Non-Fee Title- Ter Habitat 50,683 0.11 73,214 0.15 170,695 0.32 376547 0.63 594,874 0.99064 Non-Fee Title- Boat Access 4,527 0.01 82,818 0.17 7,591 0.01 19212 0.03 1,693 0.00065 Non-Fee Title-Public Access 574,139 1.28 647,368 1.36 724,999 1.37 733097 1.23 762,538 1.28066 Non-Fee Title-Dept Facilities 3,871 0.01 2,504 0.01 1,277 0.00 954 0.00 1,697 0.00
100 Administration 5,674,710 12.61 6,164,379 12.99 5,259,402 9.94 6280257 10.50 7,142,528 11.95105 Clerical 905,987 2.01 937,430 1.97 935,541 1.77 1479359 2.47 1,493,730 2.50110 License Sales & Accounting 1,159,805 2.58 1,801,258 3.79 1,884,575 3.56 1591740 2.66 1,201,886 2.01114 Product Sales & Alt Funding 125,090 0.28 135,714 0.29 111,520 0.21 156933 0.26 85,937 0.14115 Fiscal 752,326 1.67 682,333 1.44 957,358 1.81 642581 1.07 664,842 1.11121 Management Planning 787,240 1.75 914,539 1.93 985,114 1.86 1040850 1.74 1,115,303 1.87122 Strategic Planning 243,581 0.54 178,605 0.38 181,769 0.34 150925 0.25 160,643 0.27125 Procurement & Inventory 301,150 0.67 595,744 1.26 613,888 1.16 585887 0.98 1,658,148 2.77130 Regulations 148,651 0.33 171,630 0.36 256,174 0.48 309986 0.52 264,317 0.44132 Season Setting 105,999 0.24 110,127 0.23 170,457 0.32 129201 0.22 101,056 0.17135 Grant-in-Aid Administration 85,585 0.19 88,345 0.19 131,548 0.25 99956 0.17 94,985 0.16140 Inter-Agency communications 649,293 1.44 758,520 1.60 775,247 1.47 1015319 1.70 1,054,948 1.76141 Mngt Info Systems(LE & LIC) 604,632 1.34 287,154 0.60 761,018 1.44 358852 0.60 413,399 0.69142 Mngt Info Systems(other) 107,888 0.24 99,585 0.21 117,686 0.22 74906 0.13 98,927 0.17143 Mngt Info Systems-Hdw/Soft 339,690 0.76 578,691 1.22 704,773 1.33 1681623 2.81 797,229 1.33

2005 2006* 2007 2008 2009#num ACTIVITY DESCRIPTION AMT % AMT % AMT % AMT % AMT %145 Intra-Agency Communications 989,670 2.20 1,147,356 2.42 1,107,658 2.09 1294577 2.17 1,287,943 2.15149 Commuting Mileage 6,254 0.01 8,901 0.02 28,051 0.05 5773 0.01 5,627 0.01
150 Hunter Safety 163,725 0.36 136,839 0.29 147,237 0.28 143046 0.24 125,633 0.21155 Conservation Education 220,450 0.49 235,521 0.50 263,145 0.50 401628 0.67 617,313 1.03156 Aquatic Education 84,323 0.19 70,733 0.15 62,512 0.12 84229 0.14 82,266 0.14158 Mass Media Presentations 100,740 0.22 123,196 0.26 179,868 0.34 297595 0.50 246,388 0.41160 Public Contacts 1,381,499 3.07 1,410,750 2.97 1,463,855 2.77 1488869 2.49 1,553,368 2.60165 Info Documents & Displays 774,396 1.72 881,366 1.86 1,002,211 1.89 1080718 1.81 984,884 1.65170 Wyo Wildlife Magazine 499,757 1.11 487,433 1.03 504,920 0.95 552468 0.92 502,393 0.84175 Extension Service 56,679 0.13 70,974 0.15 45,974 0.09 50214 0.08 64,143 0.11180 In-Service Training 1,175,375 2.61 1,104,752 2.33 1,140,475 2.16 1239054 2.07 1,417,849 2.37181 Instructional Training 84,545 0.19 76,244 0.16 105,577 0.20 84815 0.14 115,612 0.19
201 Habitat Dvmt on Priv Land 2,927 0.01 19,559 0.04 38,953 0.07 103114 0.17 135,083 0.23210 Department Facility Dev 570,197 1.27 1,196,816 2.52 449,807 0.85 876887 1.47 412,484 0.69231 Wldlife Rearing Facility Dev 329,293 0.73 145,604 0.31 955,513 1.81 232450 0.39 457,901 0.77232 Watering Facility Dev 398,592 0.89 110,860 0.23 50,116 0.09 107282 0.18 27,174 0.05233 Motor Boat Access Dev 1,006,647 2.24 512,878 1.08 752,051 1.42 444024 0.74 848,540 1.42234 Stream Habitat Develpmnt 124,115 0.28 79,038 0.17 99,741 0.19 51371 0.09 141,659 0.24235 Reservoir/Lake Habitat Dev 7,799 0.02 18,713 0.04 15,804 0.03 29995 0.05 14,561 0.02236 Impoundment Development 959 0.00 2,197 0.00 3,553 0.01 2201 0.00 2,907 0.00236 NEPA Development 8,413 0.02 45,491 0.10 4,778 0.01 773 0.00237 Fish Passage Development 16239 0.03 160,428 0.27240 Riparian Habitat Dev 42,955 0.10 32,706 0.07 22,232 0.04 39399 0.07 50,996 0.09250 Terrestrial Habitat Dev 11,364 0.03 27,157 0.06 83,340 0.16 98508 0.16 114,272 0.19260 Public Facility Development 227,243 0.51 16,834 0.04 8,736 0.02 9659 0.02 101,563 0.17270 Cropland Development 537 0.00 3,981 0.01 229 0.00 143 0.00280 Transport Facility Dev 1,762 0.00 538 0.00 814 0.00290 Fence Construction 5,113 0.01 27,274 0.06 75,691 0.14 30513 0.05 22,151 0.04299 Other Misc Public Dev 898 0.00 666 0.00 1,153 0.00 2689 0.00 2,390 0.00300 Routine Enforcement 1,423,828 3.16 1,568,165 3.30 1,559,401 2.95 1584988 2.65 1,515,515 2.53310 Enforcement Investigations 592,248 1.32 544,815 1.15 603,164 1.14 773373 1.29 724,163 1.21320 Enforcement Administration 374,954 0.83 237,380 0.50 297,714 0.56 369856 0.62 379,140 0.63
401 Habitat Mntn on Priv Land 784 0.00 6,064 0.01 8,930 0.02 1186 0.00 373,544 0.62

2005 2006* 2007 2008 2009#num ACTIVITY DESCRIPTION AMT % AMT % AMT % AMT % AMT %410 Facility Maintenance 1,652,729 3.67 1,566,001 3.30 1,793,027 3.39 2085069 3.49 2,238,895 3.74420 Equipment Maintenance 357,077 0.79 398,714 0.84 399,252 0.75 381161 0.64 422,299 0.71422 Equine Maintenance 33,804 39,291 0.07 47191 0.08 70,752 0.12430 Aquatic Habitat Maintenance 81,180 0.18 36,447 0.08 177,662 0.34 23398 0.04 45,802 0.08433 Motor Boat Access Site Main 146,413 0.33 99,495 0.21 93,843 0.18 114864 0.19 100,016 0.17440 Riparian Habitat Maintenance 122,602 0.27 116,778 0.25 198,506 0.38 90149 0.15 116,118 0.19450 Terrestrial Habitat Main 156,014 0.35 144,416 0.30 158,053 0.30 420905 0.70 315,330 0.53451 Noxious Vegetation Control 52,585 0.12 53,897 0.11 186,628 0.35 205785 0.34 234,035 0.39452 Livestock Grazing 30,416 0.07 50,604 0.11 84,375 0.16 71317 0.12 81,986 0.14453 Permanent Cover/Food Patch 229,061 0.51 237,945 0.50 141,188 0.27 214003 0.36 318,770 0.53454 Veg Cover Mngt- Presc Burns 68,746 0.15 85,188 0.18 34,937 0.07 91721 0.15 120,708 0.20455 Veg Cov Mngt- Mech Tmnt 41,264 0.09 120,442 0.25 220,470 0.42 401539 0.67 405,071 0.68456 Veg Cov Mngt- Chem Tmnt 19,068 0.04 19,104 0.04 3,087 0.01 57195 0.10 55,115 0.09457 Watering Facility Maintenance 5,786 0.01 31,821 0.07 28,051 0.05 44553 0.07 25,027 0.04458 Cropland Maintenance 35,103 0.08 25,409 0.05 64,412 0.12 98128 0.16 34,908 0.06460 Public Access Maintenance 379,748 0.84 413,238 0.87 494,165 0.93 621554 1.04 642,766 1.08480 Transport Facility Maintenance 125,044 0.28 119,707 0.25 201,776 0.38 150817 0.25 197,400 0.33490 Fence Maintenance 303,191 0.67 235,000 0.50 267,774 0.51 379114 0.63 488,712 0.82
510 Habitat & Populations Evaluation 1,070,372 2.38 1,225,037 2.58 1,236,518 2.34 1497508 2.50 1,620,143 2.71511 Habitat Inventory 640,914 1.42 741,166 1.56 519,546 0.98 618817 1.04 1,046,856 1.75512 Fish & Wldlfe Population Studies 1,864,803 4.14 2,229,737 4.70 2,227,926 4.21 2523070 4.22 3,019,588 5.05513 Fish Passage Investigations 182809 0.31 230,259 0.39514 NonG&F Habitat/Pop Eval 114,841 0.26 86,085 0.18 6,922 0.01 12697 0.02 14,354 0.02520 Public Use Inventory 1,014,561 2.25 1,031,969 2.17 1,035,300 1.96 1070335 1.79 1,176,448 1.97530 Resource Reconnaissance 143,118 0.32 168,939 0.36 136,522 0.26 159280 0.27 193,484 0.32540 Environmental Protection 565,290 1.26 532,926 1.12 533,276 1.01 636770 1.07 1,008,783 1.69551 Disease Investigation 798,141 1.77 1,133,900 2.39 1,086,516 2.05 1155153 1.93 1,523,211 2.55553 Life History/Ecology Investigatio 198,801 0.44 248,220 0.52 528,062 1.00 320493 0.54 474,818 0.79554 NonGame Life History Inv 3,848 5,313 0.01 318 0.00 363 0.00571 Economic Investigation 166 360 0.00576 Investigation of Techniques 85,608 0.19 90,774 0.19 77,095 0.15 80105 0.13 20,392 0.03577 Artificial Propagation Investigatio 4,147 0.01 1,693 0.00 1,107 0.00 839 0.00 701 0.00580 Water rights Admin 6,037 0.01 37832 0.06 36,989 0.06
610 Fish & Wildife Control 443,474 0.99 463,126 0.98 440,666 0.83 392463 0.66 319,131 0.53

2005 2006* 2007 2008 2009#num ACTIVITY DESCRIPTION AMT % AMT % AMT % AMT % AMT %620 Damage Prevention 445,704 0.99 614,737 1.30 598,673 1.13 710817 1.19 660,256 1.10630 Damage Claims 793,767 1.76 926,066 1.95 972,426 1.84 1018265 1.70 1,399,694 2.34
710 Fish & Wldlfe Rearing 1,488,404 3.31 1,691,014 3.56 1,681,710 3.18 1958366 3.28 1,983,743 3.32712 Fish Egg Collection 196,880 0.44 196,117 0.41 205,370 0.39 217295 0.36 224,199 0.37715 Wildlife Stocking-Restoration 6,666 0.01 6,086 0.01 16,118 0.03 18033 0.03 18,451 0.03716 Wildlife Stocking-Maintenance 237,640 0.53 243,657 0.51 198,316 0.37 303138 0.51 224,552 0.38717 Wildlife Stocking-Put&Take 103,412 0.23 110,869 0.23 123,919 0.23 124369 0.21 132,332 0.22718 Wildlife Stocking-New Species E 294 0.00 673 0.00 1,770 0.00 5529 0.01 18,157 0.03720 Wildlife Feeding 1,325,159 2.95 1,010,609 2.13 1,359,412 2.57 1435278 2.40 2,240,909 3.75730 Trapping & Transplanting 33,761 0.08 93,223 0.20 194,844 0.37 28198 0.05 23,345 0.04
810 Paid Leave-Military, Admin 136,757 0.30 136,501 0.29 112,834 0.21 231161 0.39 237,917 0.40811 Paid Leave-Annual 1,642,387 3.65 1,632,214 3.44 1,670,143 3.16 1966350 3.29 2,143,834 3.59812 Paid Leave-Sick 372,426 0.83 380,110 0.80 400,002 0.76 558215 0.93 596,400 1.00813 Paid Leave-Comp Time Off 232,398 0.52 134,461 0.28 107,715 0.20 119597 0.20 123,114 0.21814 Paid Leave-Holiday 704,033 1.56 742,358 1.56 787,773 1.49 938081 1.57 1,014,357 1.70815 Paid Leave - Bee Time 78,302 107,189 0.20 94310 0.16 67,456 0.11816 Paid Leave - Personal Day 3,058 60,315 0.11 73740 0.12 88,552 0.15830 Employee Moving 33,311 0.07 25,889 0.05 50,574 0.10 25783 0.04 55,450 0.09
900 Boating Enforcement 251,676 0.56 258,270 0.54 249,879 0.47 330160 0.55 234,217 0.39905 Boating Accident Invest 1,976 0.00 5,979 0.01 10,045 0.02 907 0.00 17,173 0.03910 Boating Certificate & Sales 43,070 0.10 47,088 0.10 51,847 0.10 85863 0.14 86,022 0.14915 Boating Administration 52,412 0.12 88,781 0.19 77,008 0.15 78767 0.13 65,746 0.11920 Boating Education 20,070 0.04 13,904 0.03 11,363 0.02 16082 0.03 22,514 0.04925 Search & Rescue 4,323 0.01 4,420 0.01 4,416 0.01 6923 0.01 3,290 0.01930 Local Law Enforcement Assistan 9,041 0.02 8,786 0.02 9,522 0.02 8609 0.01 9,193 0.02935 Boating Buoy Maintenance 3,578 0.01 6,414 0.01 3,742 0.01 5624 0.01 5,037 0.01940 Boating Equip/Supp Proc 691 0.00 782 0.00 282 0.00 5786 0.01 1,069 0.00
TOTAL 42,228,139 94 44,991,772 95 47,465,655 90 52,894,124 88 59,789,087 100
*includes general fund expenditures of $1,590,323 in fy 07 for vet services and sage grouse program

C-26
FIVE-YEAR COMPARISON OF LANDOWNER COUPONS AND DAMAGE CLAIMS
BY FISCAL YEAR FY LANDOWNER
COUPONS % CHANGE DAMAGE
CLAIMS % CHANGE
2004 418,000 6.54% 242,677 .64% 2005 511,953 22.48% 182,426 -24.83% 2006 558,454 9.08% 229,926 26.04% 2007 605,891 8.49% 253,096 10.08% 2008 627,640 3.59% 259,760 2.63% 2009 774,640 23.42% 326,241 25.59%

REFERENCES Responsive Management. 1998. Wyoming 1997 hunting expenditures. Wyoming Game
and Fish Department. Responsive Management, Harrisonburg, VA. _____. 2001. Wyoming small game/upland game bird expenditure survey. Wyoming
Game and Fish Department. Responsive Management, Harrisonburg, VA. _____. 2002. Hunting and trapping expenditures in Wyoming during the 2001 season.
Wyoming Game and Fish Department. Responsive Management, Harrisonburg, VA.
_____. 2004. Wyoming resident and nonresident deer, elk, and antelope hunter
expenditure survey. Wyoming Game and Fish Department. Responsive Management, Harrisonburg, VA.
University of Wyoming, Department of Geography and Recreation. 1990. Hunting and
fishing expenditure estimates for Wyoming, 1989. Wyoming Game and Fish Department. Department of Geography and Recreation. 141 pp.
2008 U.S. Department of the Interior, Fish and Wildlife Service and U.S. Department of
Commerce, U.S. Census Bureau. 2006 National Survey of Fishing, Hunting, and Wildlife-Associated Recreation: Wyoming. 91 pp.
Wyoming Game and Fish Department 2007 Job Completion Reports. _____. 2008 License Sales Data. _____. 2009. 2008 Annual Report of Big and Trophy Game Harvest. 298 pp. _____. 2009. 2008 Annual Report of Small and Upland Game Harvest. 96 pp. Wyoming Game and Fish Department 2009 Internal Client Satisfaction Survey Report. Wyoming Game and Fish Department 2009 External Strategic Plan Survey Report.

A-37
NONGAME PROGRAMS AND NON-LICENSED USES OF WILDLIFE The nongame program includes planning, information and education, environmental commenting, inventories, and monitoring specifically for a large variety of terrestrial species. Many of these are Species of Greatest Conservation Need, such as black-tailed prairie dog, swift fox, common loon, harlequin duck, ferruginous hawk, merlin, colonial nesting water birds, long-billed curlew, mountain plover, and several bat species. Also included under this heading are programs for sensitive species, such as trumpeter swan, bald eagle, peregrine falcon, black-footed ferret, wolverine, and lynx. The bald eagle and the peregrine falcon were recovered and had Endangered Species Act protections removed (they were delisted) in 2007. The other sensitive species are either federally listed as threatened or endangered, or national political pressures are pressing for listing. All continue to require special management attention and intensive restoration efforts. The Nongame Section participates in and coordinates monitoring of many species as part of broader efforts, such as the Breeding Bird Survey, Monitoring Avian Productivity and Survival Survey, and small mammal surveys. Nongame personnel are also involved in many committees and working groups that coordinate interstate and intrastate planning and implementation efforts to maintain wildlife diversity. The Nongame Section has been, and will continue to be, intensively involved in the implementation of the Wyoming Comprehensive Wildlife Conservation Strategy, which is now called the State Wildlife Action Plan (SWAP). The SWAP now, for the most part, directs the section’s inventory monitoring and survey activities. In the spring of 2007, the Department received $1.3 million from the Governor’s office and $609,000 from the legislature for the biennium starting in FY 09 for SWAP implementation. This will supplement significantly the federal State Wildlife Grant funds we receive annually and will allow us to accelerate surveys and research on aquatic and terrestrial Species of Greatest Conservation Need. The SWAP is being revised so it can be submitted to the U. S. Fish and Wildlife Service in 2010 according to the state’s five-year revision schedule. In 2008, non-consumptive users spent approximately $410,663,760 in Wyoming based on the 2006 National Survey of Fishing, Hunting, and Wildlife-Associated Recreation, with inflation corrected for by using the Consumer Price Index. The number of recreation days, 3,009,000, listed for 2006-2007 is carried forward from the 2006 National Survey of Fishing, Hunting, And Wildlife-Associated Recreation. The Department’s “Wyoming’s Wildlife – Worth the Watching®” program has provided economic support for nongame, habitat, and non-consumptive projects. Department interpretive sites include the Tom Thorne/Beth Williams Wildlife Research Center at Sybille, Sheridan Visitor Center, Story Fish Hatchery, and Lander Visitor Center. Other interpretive efforts include signing at highway rest areas, cooperative Department/U.S. Forest Service signing, exhibits, nature trails on Department lands, The Wildlife Heritage Expo, and cooperative projects with some municipalities. In addition, wildlife-viewing guides have been developed, and a variety of publications have been produced to inform and educate the public about nongame wildlife. Interactive educational programs include: Project WILD, O.R.E.O. (Outdoor Recreation Education Opportunities), BOW (Becoming and Outdoor Woman). Beginning in 2003, a percentage of the proceeds from the sale of big game licenses the Governor donates to conservation groups for fund raising are being made available for nongame programs in the state.

A-38
Trends in Wyoming's non-licensed uses of wildlife program.
Year Recreation Days Non-consumptive Users’ Expenditures ($)
20041
3,924,000
285,595,618
20051
3,924,000
295,398,065
20062
3,009,000
394,869,000
20072
3,009,000
406,715,070
20082
3,009,000
410,663,760 1 The number of recreation days and expenditures are reflective of those found in the report, 2001 National Survey of Fishing, Hunting, and Wildlife Associated Recreation, issued in 2003. Non-consumptive users’ expenditure was calculated from the 2001 survey, with inflation corrected for by using the Consumer Price Index (2001 expenditure x 1.024 = 2002 expenditure, 2001 expenditure x 1.043 = 2003 expenditure, 2001 expenditure x 1.078 = 2004 expenditure, 2001 expenditure x 1.115 = 2005 expenditure). 2 The number of recreation days and expenditures for 2006 and 2007 are reflective of those found in the report 2006 National Survey of Fishing, Hunting and Wildlife Associate Recreation, issued in 2008. Non-consumptive users’ expenditure was calculated from the 2006 survey, with inflation corrected for by using the Consumer Price Index (2006 expenditure x 1.03 = 2007 expenditures; 2006 expenditure x 1.04 = 2008 expenditures).

13
WILDLIFE DIVISION Jay Lawson, Chief
The Wildlife Division is responsible for the management of terrestrial wildlife, human/wildlife conflict management, wildlife law enforcement and watercraft safety. The division is committed to the agency mission statement, “Conserving Wildlife, Serving People.” During FY 09, there was a significant increase in precipitation over the previous decade. Habitat conditions showed a corresponding improvement, but it will take consecutive years of moisture to achieve anything approaching true recovery. In particular, major browse species such as true mountain mahogany, antelope bitterbrush and Wyoming big sagebrush were able to produce substantial leader growth, and this was reflected in improved mule deer and pronghorn fawn survival. Significant emphasis was placed on implementation of the Wyoming Mule Deer Initiative (MDI) during FY 09. Accomplishments within the initiative include:
Two priority herd units were selected by the Department to develop detailed herd unit management plans per the MDI.
Wyoming Range Herd: • February, 2009 – Finalized an “Action Plan” outlining specific challenges
and needs and established a timeline of events and tasks needed to complete a management plan.
• Winter, 2009 – Completed a “Public Attitude” survey specific to the Wyoming Range.
• Habitat Assessment – Conducted by the Teton Science School. Completed inventory of 108,972 acres of the planned 180,489. Concurrent development of draft project proposals.
• Nugget Canyon underpasses – Completed. More than 6,000 mule deer passed through in the spring migration of 2009.
Platte Valley Herd:
• Summer, 2009 – Completed an “Action Plan” similar to that for the Wyoming Range outlining specific challenges and needs to complete a herd unit management plan.
• Winter, 2009 – Completed a “sightability” survey to better estimate wintering deer population in this DAU.
• Planning an “attitude survey” to be completed winter of 2009/2010. • Habitat Assessment – Conducted by the Teton Science School.
Completed inventory of 183,809 acres in the southern portion of the herd unit. Concurrent development of draft project proposals.
• Developing a proposal in coordination with WYDOT to develop two overpasses for migrating wildlife on Interstate 80 (Halleck Ridge and Arlington).

14
Sage grouse continue to receive a high level of management emphasis. In September 2007, an implementation team made up of representatives from federal and state agencies, conservation groups, industry and landowners this team presented the Governor with a list of recommendations they believed would contribute to the stabilization of sage-grouse populations and long-term conservation of sagebrush habitat in Wyoming. These efforts would preclude the need for the U.S. Fish and Wildlife Service to list sage-grouse as threatened or endangered. Accomplishments during FY 09 include:
• At the top of the list of recommendations was extensive statewide mapping of sage grouse habitats and habitat enhancement efforts. These mapping efforts have so far resulted in a sage grouse density and sage grouse core management area maps. A second effort conducted primarily by the Wyoming Geographic Information Science Center (WyGISC) mapped sagebrush habitats throughout Wyoming.
• The legislature approved funds for the local working group process and sage grouse projects. Over the course of two project application periods, 30 projects were approved.
• Coordinated with the Western Association of Fish and Wildlife Agencies (WAFWA) on request for information from the U.S. Fish and Wildlife Service regarding its decision of “not warranted” for listing greater sage grouse as threatened or endangered under the Endangered Species Act.
The division continued to implement the recommendations of the Governor’s Brucellosis Coordination Team. This included the fourth year of the elk test and removal project. Human/wildlife conflict management continues to be a major part of division operations. During FY 09, a total of 155 damage claims were processed, resulting in payments totaling $443,450.08, department prevention costs of $665,170, and costs related to investigating, processing and handling damage claims totaling $585,723. Human conflicts with large carnivores continue to increase as these predators expand in both distribution and abundance. In an effort to enhance training in this area, the division hosted a WAFWA-sanctioned workshop focused on dealing with the media when humans are attacked by large carnivores. The workshop was attended by many state and provincial representatives, and feedback was extremely positive. Research efforts during FY 09 included the following:
• Absaroka Elk/Wolf Study – A Wyoming Cooperative Research Unit (Coop) proposal looking at the relationships between wolves and elk distributions in the Cody area.
• Absaroka Elk Ecology Study – A Coop proposal looking at elk ecology and movements in the Cody region outside Yellowstone National Park.

15
• Nugget Canyon Monitoring – A study documenting the use of new underpasses installed in the Kemmerer area. Cameras are used to record species of use and numbers.
• Muddy Creek Elk Study – A Coop study comparing habitat use patterns in feedground and nonfeedground elk. It is being conducted in the Pinedale Region.
• Chronic Wasting Disease (CWD) and its effect on white-tailed deer populations in central Wyoming - This long-term study is designed to understand the population effects of CWD on white-tailed deer.
• Fortification Elk – This study, conducted by the University of Wyoming for the Bureau of Land Management, looks at the Fortification Elk herd’s habitat use and movements to gain knowledge of the potential effects of gas development.
• Resource Selection, Seasonal Distribution, Movement and Recruitment of Bighorn Sheep in the Teton Range of Northwest Wyoming - The overall goal of this research project is to understanding how and why bighorn sheep use the Teton landscape. Bighorn Sheep monitoring continued on the Devil’s Canyon and Laramie Peak bighorn sheep herds.
• Jackson Moose Study – This is designed to evaluate the relationship between habitat and population performance in the Jackson moose population.
• Brucellosis Studies - Several research projects are underway, including determining effects of the disease on elk populations and ways to reduce the prevalence and risk of transmission to livestock.
Species of Greatest Conservation Need (SGCN) received substantially more attention during FY 09, including:
• Assessment of Wildlife Vulnerability to Energy Development (AWVED) – This study refines the range and distribution maps for Species of Greatest Conservation Needs (SGCN) in Wyoming and estimates the effects of energy development on them. Draft maps have been developed and are being reviewed by species specialists.
• Influence of energy development on non-game sagebrush birds with a focus on sagebrush birds that are SGCN – Survey sites have been established and initial surveys were conducted in 2008 and 2009. The diversity and abundance patterns in relation to energy development intensity are being evaluated.
• Evaluation of Ferruginous hawk population status and trends – Documented population densities of nesting Ferruginous hawks and other raptor species in four widely scattered study areas and evaluated changes since the 1978 original baseline data.
• Developed methods for inventories of pygmy rabbits in sagebrush habitats – Collected tissue and pellet samples for pygmy rabbits and cottontails. Microsatellite primers were developed to allow for genetic analyses to verify pygmy rabbits during field surveys.
• The Department has been working with Wyoming Audubon on a long-term monitoring program to determine the distribution, breeding status and abundance trends for avian SGCNs.

16
• Other mammalian surveys include work with black-footed ferrets, swift fox, and Prebles Jumping mouse.
The Wyoming Game and Fish Department developed a state wolf management program in accordance with Wyoming Statutes and Commission regulations upon official delisting of wolves by the U.S. Fish and Wildlife Service. The Department’s program consisted of three wolf management specialists stationed in Cody, Lander and Pinedale and a wolf program coordinator stationed in Jackson. Upon relisting, the program was reduced from a comprehensive wolf management program with four full-time employees (FTE’s) to a wolf damage investigation/compensation program with only a single FTE stationed in Pinedale. Regional personnel and personnel from the Trophy Game Conflict Resolution program assisted with the investigation and compensation of wolf damage. Department personnel investigated 22 wolf damage situations, in which claims were filed. The Commission reimbursed claimants for a total of $105,691.92 based upon recommendations from the Department for confirmed livestock depredations and missing animals in accordance with the formula for missing livestock as provided for in Commission Regulation Chapter 28, Regulation Governing Big or Trophy Game Animal or Game Bird Damage Claims. A major false oath investigation was completed by the investigative unit during FY 09. By cross-referencing license databases from other states, the unit identified dozens of suspects who were obtaining Wyoming resident big game licenses by fraudulent means. Dozens of prosecutions are currently underway or have been completed, with most suspects pleading guilty. Law enforcement task forces were employed to address areas with chronic violations. Those included:
• Pinedale Region - Mule Deer Winter Range – Poaching • Glendo Reservoir – Memorial Day weekend – Fishing and watercraft enforcement • Glendo Reservoir – 4th of July – Fishing and watercraft enforcement • Bear River Divide HMA – Additional fall enforcement • Flaming Gorge Reservoir – Focused enforcement efforts • Whiskey Unit/Antler Rendezvous – Winter range closure violations • Platte Valley Patrol – Saratoga elk protection efforts
The Private Lands Public Wildlife Access program continues to provide quality hunting and fishing access through the Hunter Management Area (HMA) and Walk-in Area (WIA) programs. With the addition of four new HMAs, the program grew from 888,752 private acres in 2008 to 917,438 acres in 2009. The new HMAs include DeSmet north of Buffalo, Little V-H east of Thermopolis, McFarland northeast of Medicine Bow, and Beer Mug north of Medicine Bow. The WIA program increased in acreage during 2009 to 701,087 private acres compared to 653,106 in 2008. The Walk-in Fishing Area Program increased from 272 lake acres in 2008 to 4,891 acres in 2009, while stream miles decreased from 96.7 to 84.9 miles. Lake acres increased significantly due to the enrollment of Wyoming Water Commission lands surrounding High Savery Reservoir in the Little Snake River drainage.

17
The HMA online permission slip system continues to be popular, with just over 1,700 individuals applying for or receiving permission within the first day of application. Improvements to the system have enhanced efficiently and distribution of permission slips. In summary, the Wildlife Division addressed all major issues during FY 09, and the majority of divisional goals and objectives were completed thanks to an extremely dedicated and hard-working group of employees.

18

PROGRAM-LEVEL REPORTS


19
Program: Aquatic Wildlife Management Division: Fish Mission: Conserve and enhance all aquatic wildlife, reptiles, amphibians and their habitats for current and future generations. We will provide diverse, quality fisheries resources and angling opportunities. Program Facts: The Aquatic Wildlife Management program is made up of seven sub-programs, listed below with number of staff and 2009 (FY 09) budget: Sub-programs # FTEs* 2009 Annual Budget Fish Hatcheries and Rearing Stations 39.6 $4,825,006 Regional Aquatic Wildlife Mgmt. 34.5 2,959,384 Boating Access 0.0 1,189,000 Statewide Aquatic Wildlife Mgmt. 5.5 441,844 Fish Spawning 2.7 289,650 Fish Distribution 0.0 168,475 Fish Wyoming** 0.0 100,000 TOTAL 82.3 $9,973,359 * Includes permanent, contract, and temporary positions authorized in FY 09 budget. Any positions added during the budget cycle require Wyoming Game and Fish Commission authorization or must be funded from supplemental grants. ** One time funding for FY 09 from License Recoupment The Aquatic Wildlife program is located across the state in eight regional offices, Cheyenne headquarters, and ten remotely located fish hatcheries and rearing stations. Primary Functions of the Aquatic Wildlife Management Program: • Conserve and enhance all aquatic wildlife, amphibians and reptiles by
scientifically assessing populations at both local and watershed levels, control exotic species where necessary, and where ecologically and economically feasible reintroduce native species into suitable habitats in order to conserve these taxa for future generations.
• Provide diverse, quality fisheries resources and angling opportunities through a system of fish management that attempts to first manage wild fisheries where possible, but relies upon an evaluation-based fish-stocking program. The program meets angler desires by stocking salmonids (trout, grayling and Kokanee) that come from egg sources within Wyoming and are reared using modern fish culture practices. Non-salmonid (walleye, bass, catfish, etc.) fisheries are maintained through trades of excess eggs with federal and other state agencies. Our efforts will balance the productive capacity of habitats with public desires.

Perfo
StoryThe qlakescondineed Our sfisher In FYthan becauNaturconceactiviCompLaramevaluassesEndaincreFlamaddit IntensampGreyfishesfishereffici The pBasin
ormance Me
y Behind thquality of W, rivers andition of fisheto change m
survey stratery evaluation
Y 09, a totalthe five-yea
use of increral gas fieldern for the ity. We conprehensive mie, Green Ruate habitatsments than
angered Speased activity
ming Gorge ional survey
nsive populapling site wers, Hoback, Ws. We continries. The enhiency as wel
primary mann Manageme
Num
ber o
f Sur
veys
C
ompl
eted
easure #1:
e Last YearWyoming’s fd streams. eries. Until
management egy now inclns for our sp
l of 637 strear average ased activityd developmthree specientinued to sWildlife CoRiver, Bear,t and popn previouslyecies Officey. Also, illeand Fonten
y work this y
ation estimatre conductedWind, Bighonue to emphhanced watel as afforded
nagement pent Plans (B
0
100
200
300
400
500
600
700
FY 0
Number of s
r of Performfisheries is Stream andrecently, suapproaches,
ludes more iport fish and
eams and laof 592 survy for native
ment and potes of fish nasurvey for onservation , North and pulation coy conductede and Geneegal fish intnelle reserv
year.
tes that requd most notaborn, Shoshon
hasize fish ster conditionsd better acce
lans guidingBMPs). The
05 FY 06
20
stream and l
mance: a direct refl
d lake surveurveys have , primarily fointensive surnative speci
akes were suveys per ye species. intential impaative to the native specStrategy (CSouth Platte
onditions cd inventorieseral Fund atroductions ivoirs, and i
uire multiplbly on the Nne and Tongtocking evals helped impess for samp
g fisheries mnew plans s
6 FY 07
ake surveys
lection of theys are conbeen targete
for native andrveys that emies.
urveyed. Thear. Samplin the southwact to nativ
Green Riveies of conc
CWCS) for e river basin
concurrently,s. Funding appropriationin the Greein Buffalo
le electrofishNorth Platte,
gue rivers foluations for prove our sapling our maj
managementshould provi
FY 08
completed
he quality ofnducted to ded towards ed introducedmphasize wa
his is substaning intensitywest portione herptiles er caused an
cern as identhe Big Ho
ns. These su, more cothrough the
ns fueled mn and Big SBill Reserv
hing passes Green, Bearor both wildour major re
ampling effejor rivers and
t survey woide better co
FY 09
f Wyoming’determine thevaluating thd sport fisheatershed-leve
ntially highey was highen of the state
and elevaten increase i
ntified in thorn, Powde
urveys tend tomprehensive Governor’much of thSandy rivervoir require
through onr, Snake, Sald and stockeeservoir spoctiveness and reservoirs.
ork are calleommunicatio
’s he he s. el
er er e.
ed in he er, to ve ’s he s,
ed
ne lt, ed rt
nd .
ed on

21
with our public and other agencies. But we will continue to use our surveys as a primary tool to evaluate the management goals identified in the plans. What has been accomplished: The Aquatic Assessment Crew (AAC) was fully staffed for nine months of FY 09, which greatly added to our ability to accomplish our scheduled work. Consequently the AAC completed 17 percent of the total surveys noted for FY 09. Previously we had noted the need to maintain this crew at full strength in order to meet our stream and lake survey goals. During the last quarter of the year it was necessary to redirect the work of one AAC biologist to the pressing concern of Aquatic Invasive Species (AIS) legislation and coordination. Further gains in surveys completed this year may have been higher had this temporary duty assignment not interfered with the FY 09 work plan. Modification of the basin plans began in earnest in FY 08; substantial progress was made in FY 09, nearly one half of the 111 plans have been revised statewide. We are on schedule to complete most of the plans in FY 10. Revision of the Strategic Habitat Plan (SHP) was completed this year. As a consequence, we can more fully integrate SHP habitat priorities into the BMPs. Having SHP and CWCS elements in each BMP provides a scientific basis for prioritizing and directing our native species surveys. Other factors such as potential effects from energy development in the northeast and southwest portions of the state may also serve to redirect much of our effort in order that we can conduct investigations that address impact avoidance and mitigation. Often these are areas where we have little if any baseline data but have very high diversity for species of concern. In order to meet data needs that were identified for aquatic species in the CWCS, the Department continually surveys streams and lakes. Surveys are typically to gather base-line inventory or trend monitoring data. The purpose of the CWCS is to gather information sufficient to make better conservation-status assessments and help direct efforts to prevent species of greatest conservation need (SGCN) being listed under the federal Endangered Species Act (ESA). This year the addition of two additional funding sources helped to greatly to accelerate the pace of our investigations for many of our SGCN. The Department continues to work with the Wyoming Cooperative Research Unit (Coop) to meet continuing research needs. In FY 09, the Coop Unit completed three fisheries studies and initiated an aquatic gastropod study. Coop Unit staffing reductions and the pending retirement of senior Coop staff, the Coop precluded initiation of new projects. Consequently, we continued to collaborate with Colorado State University in FY 09 by initiating a research project on hornyhead chubs in the Laramie River basin.

Wha • M
wfupralrenuwle
• CC
• SanbrstC
• SDinre
• TrecopA
Perfo
at we propos
Maintaining awe are to conull staff ouroductivity llows us thesponsibilitieumber of st
while still wevels.
Complete ourCWCS object
treams and nd our fish rood stock tocking larg
Colorado Riveek to use
Diversity Datncreasingly elative abund
The acute coneduce time tontacts and ests into Wy
AIS specialis
ormance Me
7
15
22
30
37
Poun
ds S
tock
ed
se to improv
a full complentinue to wour performa(numbers o
he opportunes. The antream and la
working to a
r resurvey otives relativelakes are sustocking prmanagemen
ger trout to aver cutthroat
partners sutabase to asare targetindance and dincern and nthat was plaresponse ar
yoming watets to handle
easure #2:
0
75,000
50,000
25,000
00,000
75,000
FY
ve performa
ement of staork towards ance increaf species an
nity to betteticipated resake surveysssess the st
f our 1985-8e to crustace
urveyed alsorograms. Thnt plans. Oavoid walleytrout and Fi
uch as the sist in surve
ng these invistribution deed to respoanned for lare crucial to ers. This is athis workloa
Pounds of fi
Y 05 FY
22
ance in the n
aff working fmeeting ou
ases substannd numbers er balance sult in the n conducted
tatus of mul
87 crayfish ieans. to conduct
hey also are Over the nex
ye predationirehole rainbUniversity
eying bivalvvertebrate spdata to responond to aquatake and stre
restrict or sa priority forad.
ish stocked
06 FY 07
next two ye
for the AACur survey goantially in t
of streams our sport
next severalto a level s
ltiple specie
inventory in
evaluationsneeded to
xt year we n and evaluabow trout stoof Wyomin
ves and landpecies but wnd to requestic invasive sam survey dstop the movr our biologi
7 FY 08
ars:
continues toals. When thterms of oand lake su
fish and na years is tosimilar to F
es and taxa
n FY 10 in o
of sport fisupdate and will evaluatate our rece
ocking activing or Wyomd snails. ESwe are acutts for informspecies (AISdata. Publicvement of thists until we
FY 09
o be crucial he AAC is a
our samplinurveyed) anative specie
o increase thFY 07 (~660
at watershe
order to fulfi
sh regulationimprove ou
te success oently initiateities. ming Natura
SA petitionertely short o
mation. S) issues ma informationhese invasivcan mobiliz
if at
ng nd es he 0) ed
ill
ns ur of ed
al rs
on
ay n, ve ze

23
Story behind the performance: According to Commission Policy, “Fish raised at Department facilities shall be stocked only in waters with insufficient natural recruitment where public access is provided, except” in very limited conditions, as provided by policy. Fish stocking thus occurs primarily in artificial reservoir and downstream tailwater habitats with the addition of restoration stocking in native cutthroat trout drainages. Fish stocking is the culmination of a process that begins with egg taking from captive and wild brood stocks (egg sources) and ends with the stocking of the right strain or type of fish into waters at the scheduled time and size. We meet our trout, salmon (kokanee) and grayling needs in state. We also receive, in trade for surplus grayling and trout eggs; warm or cool water sport fishes not available in Wyoming. The eggs are hatched and reared at one of ten facilities and then stocked using our distribution trucks/system. In FY09 a total of 296,359 pounds of trout, kokanee and grayling were stocked from Wyoming facilities. Despite major disruptions at two of our facilities we nearly met our five-year average of 316,885 pounds. At Wigwam Rearing Station annual production was reduced from an average of 35,000 pounds annually to 5,200 pounds due to Myxobolus cerebralis (Mc) infected spring water sources. Meanwhile the Ten Sleep was closed to fish production due to Mc infected spring water sources for the entire year. Also, construction at Speas Rearing Station forced a small reduction in production but when completed the Speas expansion is expected to nearly double production at Speas by FY 11; a smaller increase is anticipated in FY 10. Warm or cool water sport fishes not available in Wyoming are received in trade for surplus grayling and trout eggs. This year we stocked eight coolwater and warmwater fish species including: bluegill, sunfish hybrids (bluegill x green sunfish), channel catfish, largemouth bass, northern pike, shovelnose sturgeon, and walleye. These totaled 1,175,175 fish with the majority being 906,080 walleye fingerlings stocked to maintain quality of our walleye sport fisheries. All statewide stocking requests were assessed and reallocated throughout the system to offset the production losses. While pounds are easily tracked or measured, the quality of the fish stocked continues to be emphasized. This is done by not overstocking facilities and incorporating modern fish health practices that stress optimum not maximum production levels. New rearing units at Dubois, Wigwam and Speas are carefully being evaluated to determine ultimate production levels. Emphasis of the stocking program is to release high quality fish for the greatest return when stocking to improve sport fisheries or to restore native trout fisheries. Although adjustments were needed to address the whirling disease losses, the Fish Culture sub-program continues to meet the program’s internal goal of producing +/- 10 percent of the requests made from regional aquatic wildlife managers. What we propose to improve performance in the next two years: • Renovation of Speas Rearing Station, accomplished through Legislative funding, is
scheduled for completion by October 2009. Although rearing capacity assessments of

24
the new rearing continue, fish production is anticipated to increase from 110,000 pounds to approximately 250,000 pounds in the next two years under a protected environment with improved rearing conditions.
• Funded by the Legislature, the renovation of the Story Hatchery brood stock facilities are projected for completion by November 2009. These improvements will reduce fish health issues; improve rearing and spawning condition for the lake trout, brook trout, rainbow trout, and golden trout.
• A complete renovation of the Ten Sleep hatchery is scheduled within this period to remove the whirling disease threat and protect the native Yellowstone cutthroat brood stock. The major capital facility project is a reality through Legislative funding and is anticipated for completion by September 2010.
• Whirling disease exposure is also an issue with the Wigwam Rearing Station spring water supplies, cutting fish production in half and threatening Colorado River cutthroat restoration. Further evaluations to determine the source of the disease are scheduled during this period with improvements scheduled in the near future to eradicate the parasite.
• A new fish hatchery building at Speas Rearing Station is anticipated for completion during the next two years for essential small fish production to meet increased production for statewide stocking.
• An extensive capital facility infrastructure is maintained and required to meet stocking responsibilities and maintain captive brood stock populations. Further evaluations are planned for the existing fish rearing and support facilities/equipment to set management priorities for FY 11 – FY 20 under new priorities to augment accomplishments achieved over the previous ten year plan. Planning will emphasize developing a progressive sub-program to meet needs thirty years into the future.
• Continue to maintain and further develop captive brood stocks of native cutthroat species in protective refuges.
• Continue to incorporate and maintain high genetic integrity in brood stocks and broaden the scope and sources of our wild genetic sources of native and introduced trout species internally to maintain a disease free supply for the sub-program.
• Continue to seek and evaluate technological methods that allow more efficient use of available water at fish culture facilities. In conjunction with technology, incorporate proactive techniques to reduce the presence of bacterial coldwater disease and address possible biosecurity issues from other fish health and aquatic invasive species threats.
• Update existing data generating and fish production database management systems to improve record keeping and communications.
Program: Bird Farms Division: Wildlife Mission: Enhance pheasant hunting opportunity in Wyoming.

Progbelow * IncAny Comm Bird Prim• E
re Perfoprogr
StoryDue pheasan imcondidemaSheriand ssnowpersoefficieach in thsuppl
gram Facts: w with the nu
Sub-progrBird Farm
cludes permapositions a
mission auth
farm faciliti
mary FunctioEnhance pheelease of hig
ormance Meram will wor
y behind theto continue
sant huntingmportant partitions and stand into the idan facility survival is
wstorms and onnel coordiency of birdyear. The ve southeastelemented by
29,00
29,50
30,00
30,50
31,00
31,50
Num
ber o
f Phe
asan
ts
The Bird Fumber of sta
ram ms
anent, contraadded durinhorization or
es are locate
on of the Bieasant huntgh quality ph
easure #1: rk to release
e performaned loss of pg, pheasants bt of the hunttable or increfuture. Phesince 1937 related to wexcessive he
dinate releasd distributionvast majorityern part of
y releases fro
00
00
00
00
00
00
2004
Farms Prograaff and 2009
# FTEs5.4
act and tempng the budgr must be fun
ed in Sherida
rd Farm Pring opportu
heasants.
Number of p25,000 phea
nce: pheasant habeing produers’ “bag” ineasing demaeasants haveand the Yod
weather coneat that may se schedulen during the y of Wyominthe state.
om the Depar
2005
25
am is made (FY 09) bud
s*
porary positiget cycle rnded from su
an and Yode
rogram: unity in Wy
pheasants reasants each y
abitat in Wyuced at the Dn recent yearand for pheae been prodder facility s
nditions inclslow the gro
es with regmonths of Ong’s pheasanEstablished rtment’s Dow
2006Calendar Year
up of one mdget.
2009 A$ 7
ions authorirequire Wyoupplemental
er.
oming throu
eleased annuyear).
yoming andDepartment Brs. Continui
asant huntingduced for recsince 1963. luding losseowth of you
gional persoOctober, Novnt hunting opheasants t
wnar and Sh
2007
major sub-pro
Annual Budg760,479
ized in the Foming Gamgrants.
ugh the prod
ally (Person
d increased Bird Farms hing drought,g will result creational hu Annual bir
es from occung pheasantonnel to mvember and Doccurs in Gothroughout theridan Bird
2008
ogram, listed
get
FY 09 budgetme and Fish
duction and
nnel with this
demand fohave become poor habitain continuedunting at thed production
casional hailts. Bird farm
maximize theDecember o
oshen Countythe state areFarms.
d
t. h
s
r e
at d e n l, m e f y e

26
Between 2004 and 2008, the number of pheasants released ranged from 29,926 to 31,367, with the average being 30,795 pheasants. The number released in calendar year 2008, was higher than the average at 31,327. Birds were released on Department lands, private lands enrolled in the Private Lands Public Wildlife (PLPW) Access program, and private lands where landowners allow public hunting access. What has been accomplished: Personnel at Sheridan Bird Farm continued with pen upgrades, improved the irrigation system at the bird farm to maximize efficiency and did substantial tree trimming to protect electrical lines and bird pens. Personnel assist region personnel with check stations, chronic wasting disease monitoring and fish spawning projects. Downar Bird Farm personnel were involved with facility upgrades, ongoing habitat projects on local Wildlife Habitat Management Areas, local extension services and involvement with a local Coordinated Resource Management (CRM) weed management project. Personnel also help the PLPW program with signing and guzzler maintenance. What we propose to improve performance in the next two years: • Personnel at the Bird Farms will continue to seek the most cost effective and
efficient methods of rearing pheasants. • Efforts are being made to improve the genetics of the pheasants being raised to
ensure a quality product will be available for hunting. • The existing facilities are at maximum production at this time. Personnel will explore
all avenues to continue this production level. Program: Conservation Education Division: Services Mission: Provide learning and participation opportunities relating to wildlife management, both aquatic and terrestrial, wildlife conservation, wildlife related skills and lawful and ethical behavior. Program Facts: The Conservation Education program is made up of two major sub-programs, listed below with number of staff and FY 09 budget: Sub-program #FTEs* 2009 Annual Budget Hunter Education 1.0 $159,527 Conservation Education 5.0 417,392 TOTAL 6.0 $576,919

*Incladdedauthostatew This Prim• P
skhu
• Cpr
Perfopeoplprogrpeopl
ludes permad during torization or wide respons
program is l
mary FunctioProvide learnkills, and as unters engag
Create awarractices of w
ormance Mle reached aram will worle).
0
50
100
150
200
250
300
350
0
10,000
20,000
30,000
40,000
50,000
60,000
70,000
nent and cothe budget must be funsibilities, tra
located in th
ons of the Cning and parequired by
ge in ethical,eness in you
wildlife and t
easure #1: annually thrrk to provide
Cons
Con
FY 05
FY 05
ontract positcycle requ
nded from suavel and assi
e Departmen
Conservationarticipation State Statut
, lawful and uth and adulttheir habitats
Number of rough Consee at least 20
servation E
nservation E
FY 06
FY 06
27
ions authoriuire Wyomupplemental istance from
nt Headquart
n Educationopportunit
e, we continsafe actionsts of the imps within thei
educational ervation Edu0 conservati
Education O
Education P
FY 07
FY 07
ized in FY 0ing Game grants. Th
m Regional p
ters Office i
n Program: ties to youth nue to offer hs. portance for ir specific ec
opportunitieucation effoion educatio
Opportunitie
Participants
FY 08 F
FY 08
09 budget. Aand Fish
ese programersonnel.
n Cheyenne
and adults i
hunter educa
the planned cosystems.
es offered anorts (Personnn opportunit
es
s
FY 09
FY 09
Any positionCommissio
ms do requir
.
in outdoor ation so that
managemen
nd number onel from thities to 20,00
ns on re
nt
of is
00

28
Story behind the performance: Educational opportunities are offered on an annual basis in the form of Project WILD Workshops, Wild about Outdoor Recreation Education Opportunities (OREO) Educator Workshops, Fishing Clinics held statewide, OREO Youth Camp, Becoming An Outdoors Woman Workshops, Hunter Education classes, writing and distribution of Wyoming Wildlife Wild Times publication to schools, shotgun clinics, Hunter Education courses, the Wyoming Hunting and Fishing Heritage Exposition (Expo), and various Conservation Education programs offered in schools and other venues. These programs are aimed at a variety of audiences, including youth, adults, new and experienced sportsmen, women, and others. The number of educational opportunities are limited due to the number of personnel, conflicting schedules, workloads, new and on-going wildlife related issues, number of volunteers, and budget restrictions; however the staff and volunteer instructors were able to maintain the number of program opportunities in FY 09. In FY 09, there were 322 program opportunities available, which was an increase of two program opportunity numbers from the average of 254 programs offered annually since FY 05. This increase occurred because we had staff willing to step-up to fulfill the vacancies left by one FTE who retired. The number of participants in FY 09 was 61,664, which is above the three year average of 53,302 participants a year. This occurred because staff worked to promote and improve program options for participants, thus number of participants per program increased. For example, in FY 06 there were 40 participants for the Becoming An Outdoors Woman program and in FY 09 there were 50 participants. As another example, in FY 05 there were 10,592 Expo participants and with increased promotion and school recruitment, the attendance at Expo has steadily increased to an average of 13,000 since FY 06. Continued increase in program participation indicates that the quality of the programs remains high. Program opportunities vary a great deal. Some opportunities, such as the Expo, reach large numbers of people for a limited amount of time and with a limited amount of information. Other programs, like Youth Conservation Camp and Becoming An Outdoors Woman, reach smaller audiences for a longer period with more comprehensive information and presentations. Further, our educational efforts must be flexible and dynamic to meet the ever-changing needs of our constituents. The institution of a comprehensive Hunter Education Newsletter is getting more interest and participation in the Hunter Education program, classes, and workshops is increasing. The distribution of the Wyoming Wildlife Wild Times magazine has been on a steady increase since FY 05 as more schools and educators are exposed to our programs and resources, there are now 8,465 magazines distributed statewide every quarter. What we propose to improve performance in the next two years: • Continue to evaluate programs to meet the participation needs of the public,
recognizing the numbers alone are not an indication of an effective educational program.
• Continue to modify programs to incorporate the Department’s priorities. • Continue to evaluate the Hunter Education program to provide effective instruction
and offer a new Hunter Education Instructor Academy to solidify the program.

• Cloor
• Wp
Perfo“meemeet
StoryConsparticworkOREWildlvarioparticexpecyear 2perceimprorose tlow oby FYand in
Continue to cocal, state rganizations
When we ararticipants.
ormance Mets expectati
the expectat
y behind theervation Educipants. Pr
kshops, WildO Youth Clife Wild Timus programcipants to rctations” and2005, the av
ent. By incovements in to 100 perceof 97 percenY 08 we wen FY 09 we
88
90
92
94
96
98
100
collaborate and federa
s, businessesre back to
Measure #2: ons” (Persotions of at le
e performanucation progrograms ford about ORE
Camp, Expo,mes publica
ms have notrate the oved an opportu
verage of parcorporating satisfaction
ent. In FY 0nt, with a resere able to bwere back u
%
%
%
%
%
%
%
FY 05
with conseral agencies s and individ
full staff,
Percentageonnel with theast 80 perce
nce: grams are evr which thiEO program, Archery in
ations. For tt had consierall programunity to provrticipants thainput of pa
n were realiz07, we weresurgence of bring our ovup to a 100 p
FY 06
29
rvation organand natur
duals to buildwe will be
e of participahis programent of partici
valuated usinis feedback
ms, Becominn the Schoothe past fewistent measm as “meetvide input toat believed tharticipants, ped in FY 06
e short staffededication b
verall expectpercent overa
FY 07
nizations, Dral resourced effective ede able to o
ants rating cm will work ipants).
ng a basic feeis collecte
ng An Outdools workshow years the urements, tts expectatio
owards futurehe programsprogram for when the “m
ed and progrby staff to ptation rating all rating.
FY 08
Department oe agencies,ducational pffer more p
conservationto ensure th
edback formed include Poors Womanps, Expo, aevaluation f
the forms sons” or “doe programms met expectarmats were meet expectaram expectatprovide qual
up to a soli
FY 09
of Education, communitprograms. programs fo
n programs ahat program
m filled out bProject Wiln workshopand Wyominforms for thsimply allowoes not mee
ming. In fiscaations was 9adjusted anations” ratintions fell to ity programid 99 percen
n, ty
or
as ms
by ld s,
ng he w et al
93 nd ng
a s, nt

30
What we propose to improve performance in the next two years: • Evaluate and update participant feedback forms to provide more uniform and
qualitative information/measurement that also allows for improved participant response.
• Continue to modify existing programs based on participant feedback. • Create new programs to address participant areas of interest.
Program: Conservation Engineering Division: Services Mission: Provide engineering technical support to aid in conserving wildlife and providing access with the public. Program Facts: The Conservation Engineering program is made up of one major sub-program, listed below with number of staff and 2009 (FY 09) budget:
Sub-program # FTEs* 2009 Annual Budget
Conservation Engineering 8.0 $ 648,263 * Includes permanent positions authorized in FY 09 budget. Any positions added during the budget cycle require Wyoming Game and Fish Commission authorization or must be funded from supplemental grants. This program consists of Engineering, Surveying, and Drafting and is located in the Department Headquarters Office in Cheyenne. Primary Functions of the Conservation Engineering Program: • Engineering technical support is provided through engineering, surveying, and
drafting to maintain the Department’s physical structure of offices, housing, hatcheries, research facilities and Wildlife Habitat Management Areas, boating access facilities, and Public Access Areas often using private sector consultants.
• Engineering technical support is provided by acting as caretaker of the Department’s water rights statewide and routinely making water rights filings for new permits, alterations, or research problems that arise.
• Engineering technical support is provided by the Drafting section for the Department’s statewide signage with design, purchase, and coordination with field personnel and Wyoming Department of Transportation in the installation of said signs.
• Engineering technical support is provided through the Drafting section in most of the Department’s mapping, including herd unit maps, floating access, public access, and maintaining the Department’s land status maps.
• Engineering technical support is provided through the Survey section for boundary surveys of all Commission-owned properties.

• Ethh
• EdasP
Perfocourtat leprofe
StoryAnnuThe s14 Dservictheir ConsemplprogrRegioHunta smaand tconsi
Engineering hrough the Couse profess
Engineering isplays for as Commissioublic Wildli
ormance Mteousness aneast 80% oessionalism r
y behind theually, the Intsurvey provi
Department pces to the exinternal clie
ervation Enoyees and uram has exponal Office ring and Fishall core of sthe workloadistent, qualif
technical sCivil Enginesionals and ptechnical su
all Divisionson meetings,ife, court dis
Measure #1nd professionof employereceived).
e performanternal Clientides the oppoprograms. Ixternal clientents.
ngineering pltimately, wperienced anrenovations,hing Heritagspecialists, pd. Since FYfied staff alo
0
20
40
60
80
100
% E
mpl
oyee
s Sa
tisfie
d
support for eer for desigprivate sectoupport thro
s and some o, the Hunting
splays, and p
1: Percentnalism (Persees are sat
nce: t Satisfactionortunity for eIn many rests depends o
provides a wildlife and fi
n increase i the Private
ge Expositionperformance
Y08, Conservong with a f
FY 05 FY
31
all major negn, bid, and
or consultingough the Draoutside ageng and Fishin
public meetin
t of emploonnel with ttisfied with
n survey is employees tospects, the aon the ability
service to fisheries enthin workloadLands Publi
n (Expo) adde is greatly avation Enginfirm, custom
Y 06 FY 0
ew construcd constructiog firms. afting sectioncies for use
ng Heritage Engs.
oyees satisfthis program
h the level
distributed to measure th
ability of they of employe
wildlife anhusiasts whod including ic Wildlife (ded to routinaffected by neering has h
mer-friendly l
07 FY 08
ction projecton managem
n provides mat various fu
Exposition, P
fied with tm will work t
of courte
to Departmehe overall pee Departmenees to satisfy
d fisheries o enjoy the rmajor hatchPLPW) Progne projects. the number had a full coleadership b
FY 09
ts is providement using in
many types ounctions sucPrivate Land
the level oto ensure tha
eousness an
ent personneerformance ont to providy the needs o
managemenesource. Th
hery projectgram, and thConsisting oof personne
omplement obase, which i
ed n-
of ch ds
of at
nd
el. of de of
nt he s,
he of el of is

believsatisfmark Wha• W
CpispasCb
Perfoand t70%
StoryAnnuThe s14 Dservictheir Constwo Dpositiwith provi
ved to havfaction ratesk, with satisfa
at we proposWith a full Conservation
ositive signss reflected iercent satisfssistant eng
Conservatione sustained o
ormance Mtimeliness prof employee
y behind theually, the Intsurvey provi
Department pces to the exinternal clie
ervation EngDraftsmen oions, Conserother empl
ided. With a
% E
mpl
oyee
s Sa
tisfie
d
e improveds in FY 07, faction levels
se to improvyear under
n Engineerings of transitioin the FY 0faction ratingineer as wn Engineeringor increased
Measure #2: rovided (Peres are satisfi
e performanternal Clientides the oppoprograms. Ixternal clientents.
gineering repover the last rvation Engloyees and a five-year a
0
20
40
60
80
100
FY 0
d employee the five-ye
s in FY 09 re
ve performar the changg was able tning into im
08 satisfacting by Deparwell as cong staff, a higabove this y
Percent ofrsonnel withed with the l
nce: t Satisfactionortunity for eIn many rests depends o
placed the Cseveral yearineering hassubsequentl
average of 7
05 FY 06
32
satisfactionear average eaching 91 p
ance in the nge of leaderto implemen
mproving couon ratings ortment emplnsistent andgh level of peyear’s effort
f employees h this progralevel of atten
n survey is employees tospects, the aon the ability
Chief Enginers. With news improved ly the atten
77.9 percent,
FY 07
n. Other thahas remaine
percent.
next two yership with
nt some adapurteousness aof 90.9 percloyees. With
d improved erformance .
satisfied wam will worntion and tim
distributed to measure th
ability of they of employe
eer, Assistanw, qualifiedour relation
ntion and ti, the FY 09,
FY 08 F
an a slight ed above th
ars: a new Chi
ptive changesand professiocent and thh the additi
communicin this area i
with the leverk to ensure
meliness prov
to Departmehe overall pee Departmenees to satisfy
nt Engineer, d employees nship and coimeliness of86.3 percen
FY 09
decrease ihe 80 percen
ief Enginees and showeonalism. Thie FY09 90.ion of a newation amonis expected t
l of attentioe that at leasvided).
ent personneerformance ont to providy the needs o
Surveyor annow in thes
ommunicatiof the servicnt satisfactio
in nt
er, ed is .7 w
ng to
on st
el. of de of
nd se on ce on

rate istaff Wha• W
inp0tiantw
Perfo(Perssatisf
StoryAnnuThe s14 Dservictheir FolloEnginfocusincreindicratingFY 0perce
indicates thanoticed effo
at we proposWith a full con the Conerformance 7, 86.3 percimeliness fornd responsivwo years.
ormance Monnel with
fied with the
y behind theually, the Intsurvey provi
Department pces to the exinternal clie
owing a decneering servs on customased over 2ating that thg satisfaction09, satisfactent.
0
20
40
60
80
100
% E
mpl
oyee
s Sa
tisfie
d
at Departmerts towards a
se to improvomplement onservation Eare apparent
cent in FY 0r and attentivve employee
Measure #3:this program
e services pro
e performanternal Clientides the oppoprograms. Ixternal clientents.
cline in thevices, a concer service. W2 percent frhey were san in FY 08. ion at 84.9
0
0
0
0
0
0
FY 05
ent employeattention and
ve performaof employeesEngineering t over the la
08 and 82.6 veness to clies is expecte
: Percent m will workovided).
nce: t Satisfactionortunity for eIn many rests depends o
e percent ocerted effortWith this rerom the prioatisfied with While therepercent rem
FY 06
33
ees who inted timeliness.
ance in the ns on board a
program, ast several yepercent in F
ients as well ed to be refl
of employek to ensure
n survey is employees tospects, the aon the ability
of employeet was made aligning of
or year, fromh services pre was a slighmains well
FY 07
eract with C.
next two yeand with a ne
immediateears with ratFY 09. Redoas maintain
flected in im
ees satisfied that at leas
distributed to measure th
ability of they of employe
es satisfied in FY 08 bfocus, the p
m 67 percentrovided to 8ht dip in thisabove the
FY 08
Conservation
ars: ew direction strides intings of 66 poubling of e
ning qualifiedmprovement o
with servit 75% of em
to Departmehe overall pee Departmenees to satisfy
with the by program epercentage ot of employ86 percent os performancfive year av
FY 09
n Engineerin
in leadershin improvinpercent in FYefforts toward, responsiblover the nex
ces providemployees ar
ent personneerformance ont to providy the needs o
Conservatioemployees t
of satisfactioees in FY 0of employeece measure iverage of 8
ng
ip ng Y rd le xt
ed re
el. of de of
on to on 07 es in 81

34
What we propose to improve performance in the next two years: • The current staff coupled with improved communication, diligent work ethic and
responsiveness to our clients’ needs is expected to lift this performance measure on a consistent path. In addition, continuing education of the program’s professional staff with attendance and participation in national organizations will augment the ability to stay current with conservation engineering trends.
Program: Customer Services Division: Services Mission: To effectively respond to customer requests and provide guidance to hunters, anglers, and non-consumptive users. Program Facts: The Customer Services program is made up of five sub-programs, listed below with number of staff and 2009 (FY 09) budget: Sub-programs # FTEs* 2008 Annual Budget Supervisor 1.0 $0
Telephone Information Center 4.5 Telecommunications Services 0.5 0 Alternative Enterprises 1.5 0 Mailroom 1.0 718,632 TOTAL 10.0 $ 1,011,524
* Includes permanent and contract positions authorized in FY 09 budget. Any positions added during the budget cycle require Wyoming Game and Fish Commission authorization or must be funded from supplemental grants. This Customer Services program is located in the Department Headquarters Office in Cheyenne. Primary Functions of the Customer Service Program: • Serve external customers by providing regulation and other agency information via
telephone and mailings. • Serve internal customers by providing telecommunications, mailroom and staffing
assistance. • Serve people and wildlife by offering products and publications that generate
revenue that contribute to the support of Department programs.

Perfowill mconta
StoryThe respothe cualso mincom The vElectas licdecreinacc In FYnew ponlinMoreapplifrom The scall vless bdays.desk
Nm
bero
fCon
tact
s
ormance Mmaintain theacts: 10,000
y behind theDepartment
onsibilities arustomer. Thmade in perming calls vo
volume of ctronic Licenscense applicaease in staffcessibility an
Y 09, we sawprocedure o
ne with an ope and morecations and the Departm
sub-programvolume has bbusiness hou It has beenduring these
0
20,000
40,000
60,000
80,000
100,000
120,000
Num
ber o
f Con
tact
s
Measure #1: e capacity anmailings and
e performan's license isre complex. hese contactsrson and via olume. The
customers hsing. The cuation deadlinfing levels, nd the custom
w a decreasof mailing poption to cone customersother inform
ment.
m continued been easily aur staffing ann and will ce times.
0
0
0
0
0
0
0
FY 05
Volume of nd infrastrucd 65,000 pho
nce: ssuance pro A main po
s are typicalmail. Volumail request
has increaserrent staff isnes and wheas expected
mer satisfact
e in mailingostcards to p
ntact the Cuss are direc
mation. Calls
providing sabsorbed, yend IPOS userontinue to b
FY 06
Ma
35
f customer cocture neededone calls per
cess, associint of contacly done by t
ume is trackets are tracke
d from the s overburdenen license drd, decreasedtion level dro
gs. This is pprior year apstomer Servicted to the s were also g
support for Iet the strain rs inability tbe necessary
FY 07
ilings Ph
ontacts (Perd to address r year).
iated statutect serves as atelephone alted through A
ed using a da
prior averaned with callrawing resuld the incomop.
partially becapplicants enice Center (C
Departmengenerated by
IPOS Help Dis extended
to contact agy to have IT
FY 08
one Calls
sonnel with at least 75,0
es, regulatioan importanthough manyAvaya's weeatabase.
age likely dus during peats are made
ming call vo
ause of the Dncouraging thCSC) to req
nt’s websitey various cor
Desk suppohour staffin
gency duringT personnel s
FY09
this program000 custome
ns and othet resource foy contacts arekly report o
ue in part tak times, suc
available. Aolume due t
Department’hem to appl
quest mailinge to retrievrrespondence
rt. The smang resulting ig high volumstaff the hel
m er
er or re of
to ch A to
’s ly g. ve es
all in
me lp

Most1. A2. H3. R4. D5. F6. W7. A8. H9. G Sinceannuamanaconsi Wha• C
wexth
• WInwpr
Perfohandlhandl
StoryCurreThe e
t calls are cuApplication pHunt area demRequest for reDrawing resu
ishing informWatercraft reAlternative EHunter SafetyGeneral regul
e FY 05, thal number oaged 11,000iderably whi
at we proposContinue to sways to meexpect that cheir informat
We will advonformation T
website changrovide feedb
ormance Mled (Personnle at least 40
y behind theently, one cemployee's m
Num
ber o
f Req
uest
s
urrently relateprocedure mand, land segulations, a
ults mation lated questio
Enterprise ordy informationlations
he average aof phone cal0 mailings ich is due to
se to improvserve our cuet the changhanges will tion.
ocate for the Technology ges will alloback to IT to
Measure #2nel with thi00 telecomm
e performanustomer sermain duties
360
380
400
420
440
460
480
FY
ed to:
status and haapplications
ons ders n
annual numblls has beenand over redirecting c
ve performastomers via ing needs oalso evolve
customer by(IT) section
ow efficiencyo facilitate pr
: Numbers program w
munication re
nce: rvice employare serving
Y 06 FY
36
arvest inform
ber of mailin 85,650. In89,000 phocustomers to
ance in the ntelephone a
of our custome in the man
y continuing n to optimizy in assistingroductive ch
r of Departwill maintaiequests from
yee staffs thas the custo
Y 07 F
mation
ings has been FY 09, theone calls. To the website
next two yend mailings mers. As tnner in whic
to proactiveze customerg customers
hanges.
tmental telein the capac
m Department
his sub-progomer service
FY 08 F
en 12,850. e Customer The mailinge.
ars: while seeki
technology ach our custo
ely communr benefit. Anavigate the
ecommunicatcity and infrt employees
gram as parte center lead
FY09
The averagService staf
gs are dow
ing additionaadvances, womers receiv
icate with thAwareness oe website an
tion requestrastructure tper year).
t-time dutied worker. A
ge ff
wn
al we ve
he of nd
ts to
s. As

the TDepaall tethe pathe ceThe mgenerThe Cheyservicof UdecreTechn In FYwas 4Inform
Wha • O
soa swprpb
Perfoprogr
Telecommunartment empllecommunicast due to thellular indusmain types oral inquiries,main PBX
yenne where ce needs of t
Understandineased signifinology Divi
Y 09, the num464. The numation, ITD
at we propos
On-going traioftware to inperson onsi
witch. Therogrammingick up groueen complet
ormance Mram will wor
Num
ber P
rodu
cts
Sold
nications Liloyees, Inforcation relatedhe rapid pacestry moves aof calls are ce, disconnectiswitch is oWYDOT te
the switch. g (MOU) wcantly and thsion for tele
mber of telecumber of TCD via state TP
se to improv
ining of the ncrease the ate with the a
ese minor cg some extenups. Due to ted as of July
Measure #3: rk to sell at l
01,0002,0003,0004,0005,0006,0007,0008,0009,000
10,000
F
iaison, this rmation Tecd issues. The of the celluway from suell phone upions, and seron-site at thelecommunicThe Departmwith WYDOhe liaison cocommunicat
communicat1’s submittePX network
ve performa
Telecommuability of theaccess and thchanges inclnsion moveshigh volum
y 2009.
Number of least 8,000 p
FY 05 FY 0
37
employee chnology Divhis sub-progular environmupport of anapgrades, replrvice and rephe Departmecation staff iment utilizesOT. In theontacts outsition needs.
tion requestsed to the Depwas 276.
ance in the n
unications Le Departmenhe knowledglude activatis, changing
me of incom
f products soproducts per
06 FY 07
serves as thvision (ITD)gram has beement. This ialog cellularacements, ppair calls forent of Tranis devoted tos their staff ae past year,de vendors t
s (TC1) frompartment of A
next two ye
iaison on Ant to be morege to make ming and deatelephone d
ming calls in
old to customyear).
FY 08
he point of), and privaten relied on is expected tr service. lan or billingr landlines. sportation (o programmas part of a M, the WYDthrough thei
m DepartmenAdministrati
ars:
vaya Site Ae self-sufficieminor changeactivating edisplays, cov
FY 09, trai
mers (Person
FY09
f contact fote vendors fomore than i
to continue a
g changes,
(WYDOT) iming and otheMemorandum
DOT role har Informatio
nt employeesion and
Administratioent by havines in the PBXxisting linever paths anining has no
nnel with thi
or or in as
in er m as on
s
on ng X s,
nd ot
is

38
Story behind the performance: The products offered by Alternative Enterprise (AE) feature the logo "Wyoming's Wildlife Worth the Watching" and the Departments new "Official Gear" line introduced in FY 06. The distribution of products help promote the Department's brand as well as build awareness and approval of the Department's mission and work while providing an opportunity for all persons to financially contribute to the Department's conservation efforts. The products sold relate to wildlife, the Department, and its programs, so the number of products sold is an indication of how successful this program is at promoting the Department to the public. The products are sold above cost so an increase in number of products sold will also reflect in the profit generated. The target market includes residents, nonresidents, consumptive and non-consumptive users. The profit generated by product sales is used exclusively for habitat restoration and conservation, hunting and fishing access and other wildlife programs. Since FY 04, the average number of products sold annually was 8,558. In FY 09, the number of products sold in was 8,464. Advertisement in the Department’s monthly magazine continues to generate sales. The product sales section is continuing work on the “Official Gear” logo. The Department’s product selection process will broaden once we have a trademarked logo to seek alternative vendors. In FY 09, the online store generated over $50,000 in gross sales from 1046 orders. During the year over twenty new products were introduced. What we propose to improve performance in the next two years: • Identify new products to increase sales and promote the Department brand. • Products are currently available at the Headquarters in Cheyenne and the Lander
Regional office. We intend to have the products available at regional offices and initiate the opportunity for License Selling agents to sell our products in their stores.
• Identify stipulations for affiliate programs and explore tracking methods • Accommodate for additional staffing and secure permanent status for current staff
when sales increase by 50 percent.

Perfoinformleast
StoryThe CDepaDepainformbe ac
AnnumembThe sDepainterahandlrequewho wnumbthat bsampthat uresidePrefewas s73.0 Whilcallerby CS
ormance Mmation need80% of the p
y behind theCustomer Seartment untilartment and tmation given
ccurate, curre
ually, the Exbers of the psurvey proviartment progacted with tled. These ests and assiwere satisfieber of residebetween FY
ple: 68 resideutilized the sents is like
erence Point slightly highpercent of re nonresiders respond toSC staff.
%Pu
blic
Satis
fied
Measure #4: ds are handlepublic are sa
e performanervice Center they meet athe Departmn to hunters ent and comm
xternal Cliepublic who hides the opp
grams. Sincthe CSC staneeds often
istance in filed ranged froents who uti
Y 02-FY 04, ents vs. 160 services surpely due to
System. Inher among nresidents annts typicallyo media rep
0
20
40
60
80
100
% P
ublic
Sat
isfie
d
Percent of ed (Personnatisfied with
nce: r staff is ofte
a warden or bment’s credib
and anglers municated in
ent Satisfacthad purchaseportunity for e FY 05, anaff were satn included qlling out the om 71.8 perilize the CSCmore nonrenonresidentpassed the nquestions a
n regard to snonresidents nd 89.4 percy require as
ports or issue
FY 05 F
39
f general pubel with this how their in
en the only cbiologist in tility are formby the custo
n a professio
tion survey ed hunting athe public t
n average oftisfied with questions reapplication.
rcent (FY 08C services iesidents utilits). Beginninnumber of nassociated watisfaction lin each yea
cent nonresidssistance files that surpa
Y 06 FY
blic that areprogram wi
nformation n
contact the cthe field. Thmed as a resuomer serviceonal manner
is distributend fishing lito measure tf 82.8 percen
how their elated to dr. Annually,
8) to 89.0 pers compared ized our serng in FY 05onresidents.
with the imlevels, the pear, and FY 0dents indicalling out theass the gene
07 FY 08
satisfied will work to eneeds are han
customer hasheir opinion ult of the cone representat.
ed to randoicenses the pthe performant of the puinformation
rawing oddsthe percent
rcent (FY 07to nonresid
rvices (annu5, the numbe This incre
mplementatioercent of pe
09 was no exating they weir applicatieral informat
8 FY09
with how theensure that andled).
s with the of the ntact. The ive needs to
omly selecteprevious yeaance of selec
ublic who han needs wers, applicatioof the publi
7). When thdents, we final average o
er of residentase in use b
on of a newople satisfiexception wit
were satisfiedions, residention provide
ir at
ed ar. ct ad re on ic he nd of ts
by w ed th d. nt ed

We sWhilcustosystem Perfoproviare sa
StoryMailrapprothous115,0the relargeobtainlabele AnnuThe s14 Dhad in Wha• C
d• C AppeA necompsuppo
see an overae the CSC
omers are unm, which in
ormance Mided (Personatisfied with
y behind theroom servicoximately 1.sands of UP000 licenses esident and st annual inned new mer and clean
ually, the Intsurvey provi
Department pnteracted wi
at we proposContinue ong
elivery and rCross-train cu
endix A. Neew performapleting varioort to variou
1
% E
mpl
oyee
s Sa
tisfie
d
ll increase instaff can ha
nable to get astructs via re
Measure #5:nnel in this ph the services
e performances are pro2 million pieS or Fed Exwere mailenonresident
ndividual mamailroom equ
sing softwar
ternal Clientides the oppoprograms. Sith Mailroom
se to improvgoing discusreduce costsustomer serv
w proposedance measuous mailingus sections w
0
20
40
60
80
00
FY 05
n satisfactioandle approan available ecording to w
Percent oprogram wils provided b
nce: ovided by eces of incomx packages, ed using thet deer and aailing this wuipment incre.
t Satisfactionortunity for eSince FY 05m personnel w
ve performassions with s. vice employe
d performanure proposed projects th
within the De
5 FY 06
40
on in FY 09.oximately 50
representatiwait for next
of employeell work to eny the mailro
one FTE ming and oupriority and department
antelope licework unit hancluding a n
n survey is employees to
5, an averagewere satisfie
ance in the nPostal Serv
ees to provid
nce Measured in FY 07hroughout thepartment. T
FY 07
. This is like00 calls per ive resultingt available a
es satisfied nsure that atoom).
who is reutgoing mail d express mats inserting menses and rendles. Also
new inserting
distributed to measure the of 84.1 peed with the s
next two yevice represen
de mailroom
e 7 is currenthe year, the
The assistanc
FY 08
ely due to stday, during
g in long waiagent.
with mailrot least 75% o
esponsible each year.
ail. In FY 0machine. Thsident elk li
o in FY 09 tg machine,
to Departmehe overall peercent of emservices prov
ars: ntatives to i
m backup
tly being ee CSC prov
ce has long b
FY09
taffing levelg high peakits in the “Q
oom serviceof employee
for handlinThis include
09, more thahe mailing oicenses is ththe mailroom
and addres
ent personneerformance o
mployees whvided.
improve ma
valuated. Bvides needebeen provide
s. ks
Q”
es es
ng es an of he m ss
el. of ho
ail
By ed ed

41
but previously not tracked. We proposed introducing a new performance measure to track this effort by the number of man-hours serving internal customers. By recording man-hours worked on other projects a clear picture will develop on whether there is room to solicit more projects or simply determine whether the staffing levels affect the Department in ways other than "dropped calls". It is important to note that during FY 07 the Department mailroom was added to the Customer Services Section. This performance measure may overlap the mailroom performance measures since the CSC is cross-trained in mailroom duties in addition to working closely to complete projects. This performance measure will not be implemented due to new mailroom equipment that allows for projects to be completed mainly in the mailroom rather than the CSC. Program: Department Administration Division: Office of the Director Mission: Provide leadership for wildlife conservation in Wyoming. Program Facts: The Department Administration program is made up of three major subprograms, listed below with number of staff and 2009 (FY 09) budget: Sub-program #FTEs* 2009 Annual Budget
Office of the Director 5.0 $ 787,813 Commission 0.8 108,970 Division Administration 17.2 2,228,345 Policy and Development 2.0 215,583 Wildlife Heritage Foundation 0 332,065 TOTAL 25.0 $ 3,672,776
*Includes permanent, contract and temporary positions authorized in the FY 09 budget. Any positions added during the budget cycle require Wyoming Game and Fish Commission authorization or must be funded from supplemental grants. This program is located in the Department Headquarters Office in Cheyenne. Primary Functions of the Department Administration program: • Provide leadership for wildlife conservation in Wyoming by establishing strategic
direction, empowering people, aligning Department programs and systems, and modeling high personal and professional integrity.
• Serve people by advocating for wildlife, coordinating with entities and representing the people of Wyoming as stewards of their wildlife resources.
• Provide policy-level support for wildlife by implementing the policies and decisions of the Wyoming Game and Fish Commission regarding wildlife and wildlife habitat

mco
Perfoprogrcourt StoryTheseFY 0least they intera Internreceivgraph(all d
Wha
• prAim
management,onflict mana
ormance Meram will worteousness an
y behind thee data are ta
09, 45 percenone subproginteracted wacted with P
nal constitueved from theh above sumdivisions) and
at we proposContinue
rofessional Administratiomportant
% E
mpl
oyee
s Sa
tisfie
d
, including sagement, res
easure #1: Irk to ensure
nd profession
e performanaken from thnt of WGFDgram within
with Wildlifeolicy and De
ent satisfactie Departmen
mmarizes mead Policy and
se to improvmonitoring
treatment on program
as a
60
70
80
90
100
FY
scientific daearch, habita
Internal satisthat at least
nalism provid
nce: he Strategic
D employees this programe Administraevelopment.
on with the nt Administran scores of d Developme
ve performag internal cthey receiv
m. This valan indi
Y 05 FY
42
ata collectioat conservati
sfaction with85% of empded).
c Internal Cl indicated thm. The largeation. Only
courteous anration prograthe Director
ent subprogr
ance in the nconstituent
ve from suluable meascator o
06 FY 0
on, law enfoion and wild
h performancployees are s
lient Surveyhat they hadest percentaabout six pe
nd professionam is high atrs Office, Dirams.
next two yesatisfaction
ubprograms sure of coof prof
07 FY 08
orcement, wdlife health s
ce (Personnesatisfied with
y conducted d some interage (33 perceercent indica
nal treatment 91 percent iivision Adm
ars: n of the co
within the nstituent sa
fessional
8 FY 09
ildlife/humaservices.
el with this h the level o
annually. Iaction with aent) indicateated that the
nt they in FY09. Th
ministration
ourteous anDepartmen
atisfaction ileadership
an
f
In at ed ey
he
nd nt is p.

Pthle
StoryInternDepaemplDepaOffic TheseFY 0least they intera Wha• C
thvpr
Performancehis program evel of attent
y behind thenal constitueartment Admoyees indic
artment Admce, Division a
e data are ta09, 45 percen
one subproginteracted wacted with P
at we proposContinue mohey receive faluable merofessional l
% E
mpl
oyee
s Sa
tisfie
d
e Measure will work totion and tim
e performanent satisfactiministration cating that tministration. administrati
aken from thnt of WGFDgram within
with Wildlifeolicy and De
se to improvnitoring intefrom subpro
easure of cleadership.
60
70
80
90
100
FY
#2: Internalo ensure thateliness prov
nce: ion with theprogram re
they were The graph aon (all divis
he StrategicD employees
this programe Administraevelopment.
ve performaernal constitograms withiconstituent
05 FY 0
43
l satisfactiont at least 85%
vided).
e attention anemained gosatisfied wiabove summions) and Po
c Internal Cl indicated thm. The largeation. Only
ance in the ntuent satisfain the Deparsatisfaction
06 FY 0
n with perfo% of employ
nd timelinesood in FY ith the atte
marizes meanolicy and De
lient Surveyhat they hadest percentaabout six pe
next two yeaction of thertment Adm
is importa
7 FY 08
ormance (Peyees are satis
ss they recei09, with 82ntion and tn scores of
evelopment s
y conducted d some interage (33 perceercent indica
ars: e attention an
ministration pant as an
8 FY 09
ersonnel witsfied with th
ived from th2 percent otimeliness othe Director
subprograms
annually. Iaction with aent) indicateated that the
nd timelinesprogram. Thi
indicator o
th he
he of of rs s.
In at ed ey
ss is of

PerfoprogrDepa
StoryApprdroppthe tudirect Curredetermare oleadeof thethe D Wha• C
opsy
• Cwin
• D
%Em
ploy
ees
Satis
fied
ormance Meram will worartment’s ove
y behind theroval of theped some in urbulent nattion of the a
ent approvalmine the Der soon will b
ers. More pree number of
Department is
at we proposContinue to f
f the agencyeople to carystems of co
Continue impwhich identifn the WGFD
Develop succ
60
70
80
90
100
% E
mpl
oyee
s Sa
tisfie
d
easure #3: Irk to ensure erall coordin
e performan DepartmenFY 09 to 77
ture of wildagency is soli
l of overall epartment’s fbe eligible fecisely, the af existing leas developing
se to improvfocus on may, includingrry out thei
ompensation plementationfies, prepare
D. cession plans
FY 05
Internal satisthat at least
nation and di
nce: nt’s overall 7 percent. Wdlife conserid.
Departmentfuture directfor retiremenagency mustaders who wg workforce/
ve performaintaining the
g providing r responsibiand perform
n of the Dees and provid
s, especially
FY 06
44
sfaction with70% of empirection).
direction, aWith stable lervation in W
t direction rtion. Most ofnt. The probt develop m
will be eligib/succession p
ance in the ne integrity aa clear sens
ilities as demance reviewepartment’s des incentiv
for leadersh
FY 07
h performancployees are s
as expressedeadership an
Wyoming, co
remains highf the current
blem is not sany leaders le to retire aplans.
next two yend respect ese of overalfined and im
w. Leadership
ves for the n
hip positions
FY 08
ce (Personnesatisfied with
d by WGFDnd clear direonfidence in
h, but futuret leadership osimply that oat the same
at the same t
ars: essential to tll direction, mplementing
p Developmenext generati
s within the D
FY 09
el with this h the
D employeection, despitn the overa
e leaders wiof the agencof developintime becaus
time. Furthe
the leadershiempowerin
g appropriat
ent Programion of leader
Department.
s, te
all
ill cy ng se er,
ip ng te
m, rs

Perfo(Persmillio
StoryThe primarelatenonrehuntedrop of pelikelypricefee inpurchstatew In the2004and aIn adaffect Since1,201hunteprovirecre
Num
bero
fDay
s
ormance Monnel with ton angler da
y Behind thnumber of arily to low ed habitat coesidents, ander days. Anprimarily be
ersistent drouy a direct res. This responcreases. Fuehases and pwide in 2008
e years imm, angler day
angler numbeddition, incret angler and
e FY 04, Wy1,225 and 2,3er recreationided. Valuesation days.
0
1,000
2,000
3,000
Num
ber o
f Day
s
Measure #4:this programays per year)
e Last Yeardays huntedeer and proonditions. d shorter hunngler days secause of pought. In 20
esult of two onse by angel prices weparticipation8 should beg
mediately fols and hunterers and dayseases in gasohunter recre
yoming resid315,620 hun
n days were ps reflect Life
FY 04
: Number m will work t
.
r of Performers spend inonghorn fawThe result h
nting seasonstabilized ovoor water co008 angler peconomic flers is fairlyre at record
n by anglergin to improv
llowing the lr days declins of recreatiooline and dieation days.
dents and nonnter and anglprovided, anetime Licens
FY 05
Hu
45
of days into provide at
mance: n the field
wn productionhas been res. Declining
ver the last tonditions in Wparticipationfactors: the ly typical and
highs and lirs. The rebve fish popul
license fee ined in respoon generatediesel prices l
nresidents haler days, respd 2,267,594 se holders in
FY 06
unter Days (x 1
n the field t least 1.1 mi
annually ren and recruitduced liceng access for three years Wyoming’s
n dropped 12license fee i
d has been seikely added bound in wlations in the
increases imnse. Short-t
d frequently alast year ma
ave expendepectively. Inangler recre
ncluded in th
FY 07
,000)
by hunters illion hunter
mains low. tment causedse quotas, ehunting hasfollowing alakes and ri
2 percent, wincrease andeen after preto the decre
water levels e next severa
mplemented oterm reductiaccompany ay continue
ed an averagn FY 08, 1,2eation days w
he estimate o
7 FY
Angler Days (x
and anglerr days and 2.
This is dud by droughespecially fo also affecte
a decade lonivers, a resu
which is mosd vehicle fueevious licensase in licens
experienceal years.
on January 1ions in huntefee increaseto negativel
e of 264,226 were f angler
08
x 1,000)
rs .3
ue t-or ed ng ult st el se se ed
1, er s. ly

46
What has been accomplished: Declining hunting and fishing access is being addressed through the Department’s Private Lands Public Wildlife (PLPW) Access Program. The Department continues to encourage participation by both recreationalists and private landowners. Acres enrolled in the Walk-in Hunting areas increased by 20.5 percent from 544,415 private acres in 2007 to 655,973 in 2008. Access provided through Hunter Management areas increased by 5.86 percent from 839,539 private acres in 2007 to 888,752 acres in 2008. Walk-in fishing areas declined slightly to 272 lake/pond acres and 96 stream/river miles. The PLPW Access Program is an important strategy for increasing hunting and fishing access to private and landlocked public land. In addition to private land, the PLPW Access Program also provided access to approximately 1.5 million acres of public land that was located within or behind private land enrolled in the program. Funding for the PLPW program is provided in the existing Department budget. The Department will continue to explore options for maintaining or enhancing hunting and fishing access to private lands. In FY 08, we continued to concentrate on extending and modifying existing boating access developments to ensure continued access to reservoirs affected by low water elevations. Major repair of aging roads, parking areas and comfort stations was another major work item for our boating access program. Our Fish Wyoming program assisted in enhancing angler access to the Wind River in Dubois, Platte River in Casper and at Gray Reef, the Shoshone River in Cody and several Forest Service fishing ponds. The Department continues to manage wildlife populations as needed through elk feedgrounds, fish hatcheries and bird farms. Veterinary Services’ efforts to address terrestrial wildlife diseases were approved, as were funds to prevent whirling disease in two fish culture facilities. These improvements to fish culture facilities are expected to lead to advancement in disease prevention techniques and allow for greater flexibility in the stocking trout both in numbers and size in order to meet angler needs. What we propose to improve performance in next two years: Hydrologic drought that reduced water levels in our streams and rivers over the last several years was moderated this past year. While one year of good water conditions does not break a prolonged decade-long dry spell, it should improve angling opportunities in future years as fish populations respond over the next several years. The completion of several major hatchery and rearing station restorations and enlargements should improve our capacity to stock our artificial impoundments. In combination with improved water conditions this increased capacity should serve to increase angler success rates and angler participation. Changes in private land ownership, which is affecting public access, the primary and secondary effects of mineral development, and changes in societal interests are also compounding the problem. The Department will continue to encourage hunting and fishing recruitment, seek ways to maintain and increase access, improve habitat and advertise the opportunities Wyoming offers. Economic factors have for now replaced environmental conditions as the single greatest factor influencing angler participation.

Prog Divis Miss Progassocand ipersoWyom
Prim• C
thingrby
PerforeseaReseaDepa
StoryThe Dimprocosts reseaResea
gram: Exter
sion: Office
ion: Condu
gram Factsciated with tindependent
onnel but byming Coope
Sub-progrExternal R
mary FunctioConduct resehat require n cooperatioraduate study fish and w
ormance March conductarch Unit (P
artment empl
y behind theDepartment ove future m
associated arch projectsarch Unit (
%Em
ploy
ees
Satis
fied
rnal Research
e of the Direc
uct timely, ap
s: Scientificthe Wyomint researcher
y agreement, erative Fish a
ram Research/ Co
ons of the Eearch to prorigorous, sc
on with thedents to condwildlife mana
Measure #1: ted by or oPersonnel wloyees are sa
e performanis responsib
management with condu
s in cooperCoop Unit)
0
20
40
60
80
100
FY
% E
mpl
oyee
s Sa
tisfie
d
h
ctor
pplied resear
c investigatng Cooperatis. The ex$40,000 pe
and Wildlife
oop
External Resovide answecientific stue Departmeduct researchagers.
Departmenoverseen by
with this proatisfied with
nce: ble for develof Wyomin
ucting researration with and other
05 FY 0
47
rch on fish an
tions are tyve Fish andternal resea
er year is usee Research U
# FTEs 0
search Progers to wildlidy by develoent, hiring h that is des
nt employeey the Wyomogram will w the quality
loping propong’s wildlife rch, Departmthe Wyomresearchers
6 FY 07
nd wildlife m
ypically cod Wildlife Rearch programed to help fu
Unit; listed be
2009 $
gram: ife managemoping researand overse
signed to hav
e satisfactionming Cooperwork to ensof research c
osals for appresources.
ment personing Cooper. These pr
FY 08
management
nducted byesearch Unitm funds nound adminiselow is the 2
9 Annual Bu$ 417,085
ment questirch proposalseeing researve immediat
n with the qrative Fish ure that at conducted or
plied researcHowever, w
nnel developrative Fish roposals are
FY 09
t issues.
y researchert, universitie
o Departmenstration of th2009 budget
dget
ons or issues and budgetrchers and/ote applicatio
quality of thand Wildlifleast 80% or overseen).
ch projects twith increasep the applieand Wildlif
e ranked an
rs es nt he :
es ts or on
he fe of
to ed ed fe nd

48
prioritized by Fish and Wildlife Divisions for funding. With the exception of some wildlife veterinary research, all Department research is outsourced to the Coop Unit, universities and other contracted researchers. Therefore, we rigorously seek qualified researchers to assist us with our research questions. Typically, the majority of the research funding has gone to funding researchers hired or directed by the Coop Unit. Annually, the Department evaluates the research product in terms of quality, especially whether the research product is applicable to current wildlife management questions and in fact addressed the wildlife management questions posed in our proposals. This evaluation is conducted via the Internal Client Satisfaction survey, which is distributed to Department personnel. Starting with the FY 03 survey, two separate questions were created to recognize the distinction between quality and quantity. Since FY 05, an average of 83 percent of Department employees who had interacted with the members of the Coop Unit were satisfied with the quality of research conducted or completed. The percentage was highest in FY 05 (90 percent) and lowest in FY 09 (73 percent). Some discontent regarding reduced capacity due to staffing challenges may have caused this perception regarding quality of work accomplished. In the past several years, Coop Unit staffing has been reduced to Assistant Leader specializing in big game research and the Unit Leader that in preparation for retirement accepted no new fisheries research projects. To address some pressing species diversity issues, the Coop hired an Academic Research Professional to increase capacity for nongame research. Subsequently the budget for FY 09 shows an additional $40,000 to support this increased capacity. Average employee satisfaction with quantity of research conducted was 79 percent for FY 05-FY 09. In FY 09, 73 percent of Department employees were satisfied with the quantity of research conducted or completed. Actually, the quantity and diversity of research conducted in FY09 was vastly greater than in the past several years. However there may be a perceived lack of satisfaction because our selection process greatly increased the number of project proposals. While we increased the overall number of research projects, there were many that were not selected perhaps leading to some discontent. Also some dissatisfaction was evident due to declining capacity for fisheries research at the Coop. Indeed, it was necessary to go outside Wyoming to meet our applied, fisheries research needs in FY 08 and FY 09. What has been accomplished: In FY 09 we continued the Jackson Moose project (phase 2) to identify movement patterns of moose adjacent to US Highway 287/26. Moose sporting GPS-enabled collars will help us better identify mitigation measures for highway projects. Another moose study in the Jackson Region was initiated this year to evaluate the nutritional content of willow communities used by moose as aid in understanding what part nutrition may play in recent population declines. Also started this year was a three-year study to evaluate Teton Range Big Horn Sheep winter range losses. Year three of a five-year wild turkey study in the Black Hills was continued in an effort to determine how gobbler mortality

49
may vary according to different hunting season structures. Ongoing too was the Absaroka Front Elk Study that is evaluating habitat, seasonal range and migration patterns. In combination with the Absaroka Wolf Study, managers should be better able to adjust elk management practices in the future. Additionally the Coop initiated the following projects: small mammal distribution study in southwest Wyoming sagebrush habitats; a study to identify influences of energy development on non-game sagebrush birds, a survey for pocket gophers in southwest Wyoming; a methods study for inventorying pygmy rabbits at the landscape scale, and an assessment of the vulnerability of wildlife to energy development. In FY 09, the Coop Unit completed three fisheries studies and initiated an aquatic gastropod study. Coop Unit staffing reductions and the pending retirement of senior Coop staff, the Coop precluded initiation of new projects. Consequently, we continued to collaborate with Colorado State University in FY 09 by initiating a research project on hornyhead chubs in the Laramie River basin. What we propose to improve performance in the next two years: • Seek to recover funding needed for applied research in the fields of native species of
concern, wildlife diseases, big game, game bird and sport fisheries. • Support and assist efforts to refill the Assistant Leader for Fisheries in the Coop in
FY 10. • Maintain increased capacity by seeking funding through General Appropriations or
Governors Endangered Species Office in FY11 and FY12. Much of this additional funding will be used to contract additional research through the Wyoming Cooperative Fish and Wildlife Research Unit, University of Wyoming, Colorado State University and other entities. Virtually all of this work should increase our capacity to address concerns addressed in the Comprehensive Wildlife Conservation Strategy.
Program: Feedgrounds Division: Wildlife Mission Statement: To maintain Commission population objectives and control elk distribution in an effort to minimize conflicts with human land uses. Program Facts: The Feedgrounds program operates 22 feedgrounds and is made up of one sub-program, listed below with number of staff and fiscal year 2009 (FY 09) budget: Sub-program # FTEs* 2009 Annual Budget
Feedgrounds 2.0 $ 2,124,865

This RegioPined * Incthe bfunde Prim• M
supre
Perfoprogr
StoryElk fconflexposnativrangeperceWyomby hi Abou34 yefor el
program is on. Personndale Regiona
cludes permaudget cycle ed from supp
mary FunctioMaintain elkupplementalersonal propeduce opport
ormance Mram will wor
y behind thefeedgrounds licts with agsure to Bruce ranges to es without centage of thming constitgh elk numb
ut 16,534 elkear average, lk on state o
13,00
13,50
14,00
14,50
15,00
15,50
16,00
16,50
17,00
17,50
Num
ber o
f Elk
uniquely ornel are assignal Wildlife S
anent positiorequire Wyo
plemental gr
on of the Fek populatiol feed. Suppperty and atunities of di
Measure #1: rk to feed at
e performanhave been
griculture, scellosis beca
developmeconflict. De total elk ptuents are acbers that are
k were fed da result of gperated feed
0
0
0
0
0
0
0
0
0
0
2004-200
rganized in ned in Pined
Supervisor.
ons authorizeoming Gamerants.
eedground Pon objectiveplemental feassist in theisease transm
Number ofleast 14,934
nce: an importanuch as dam
ause of comment significa
During most population,
ccustomed topossible bec
during the wgrowing elk pdgrounds but
5 2005-2006
50
that it is stadale and Etn
ed in FY 09 e and Fish C
Program: es and con
eeding will ae preventionmission.
f elk attendin4 elk).
nt managememage to stor
mingling, deantly impact
winters, elkwhile nativ
o the increascause of feed
winter of 200populations.t an estimate
2006-2007Winter
atewide, butna. The prog
budget. AnCommission
ntrol elk diassist in the n of commin
ng feedgrou
ent tool sinced hay and eep snow act the ability k feedgrounde ranges sued elk huntinding.
8-2009. Th This woulded 1,928 elk
2007-2008 2
t located in gram is supe
ny positions authorizatio
istribution prevention ngling with
unds (Person
ce the early feedlines, r
ccumulationsof elk to u
ds maintain upport relativng opportun
his is 2,858 md have been
k were not fe
2008-2009
the Pinedalervised by th
added durinon or must b
by providinof damage tlivestock t
nnel from thi
1900s. Elrisk of cattls, and loss outilize nativa significan
vely few elknities afforde
more than tha record yea
ed in the Gro
le he
ng be
ng to to
is
lk le of ve nt k. ed
he ar os

51
Ventre valley due to mild snow conditions. Only one feedground, Alkali, began feeding operations in the Gros Ventre valley this season. Alkali began feeding operations on March 11, 2009 and was in operation for 30 days. The number of elk attending the
feedgrounds has ranged between 13,041 elk (winter 2002-2003) and 17,140 elk (2005/06). In order to reduce damage/commingling conflicts and prevent excessive starvation, about 80 percent of the all elk in the region were fed.
Western Wyoming has been under the influence of drought conditions for the past 12-19 years. Winter conditions during 2008-2009 started out mild and allowed for delayed feeding start dates on several feedgrounds. Heavy snows did not arrive until the first week in March and continued into early to mid April. Overall, the feeding season was 90 days in length. This is second shortest feeding season since 1976-77 and is 35 days less than the average feeding season of 125 days. This can be attributed to the later starting dates on many of the feedgrounds and the short feeding season in the Gros Ventre valley. With the Gros Ventre valley feedgrounds removed, the feeding season was 103 days. Wolves chase elk from and between feedgrounds. These factors can influence the number of elk counted on feedgrounds and/or fed. Twelve of the 22 feedgrounds had elk numbers in excess of the individual quotas. Eight of 22 feedgrounds were under the individual quota. Fall Creek elk herd unit (EHU) feedgrounds and Piney EHU feedgrounds are 1,500 and 811 elk over feedground objective respectively. Between 73 percent and 84 percent of the elk in the region are fed each year. This is because adequate native range is not available. These elk are fed at select locations that allow them to be attracted to feedgrounds. Feeding at these locations assists in keeping the elk away from potential commingling/damage situations. While elk attend feedgrounds, they are fed adequate hay (quantity and quality) to reduce starvation. Public acceptance for elk mortality on feedgrounds is low. Long-term average mortality from all causes does not exceed 1.5 percent on all feedgrounds combined. Mortality resulting from old age, hunter crippling, wolf predation, vaccination, and elk trapping cannot be prevented by feedground management techniques. Other causes of mortality (goring, some diseases, malnutrition) may be related to feedground management. Feedground managers should utilize available techniques to minimize those causes of mortality that may be attributed to feedground management. Percent winter mortality for 2008-2009 was 0.7 percent. In addition to helping support elk population numbers and hunting opportunities in northwest Wyoming, elk attendance on feedgrounds provides an opportunity to vaccinate elk for Brucellosis and reduce conflict with private landowners. During winter 2008-2009, 97 percent (n=2,985) of elk calves on feedgrounds were ballistically vaccinated with Strain 19. This was the first year that all three feedgrounds in the Pinedale EHU (Muddy Creek, Fall Creek, and Scab Creek) were excluded from vaccination operations due to the test and removal program (for further details, see Wildlife Health and Laboratory Services program).

52
What has been accomplished: • The overall average feeding season was 90 days, thirty-five days shorter than average
125 days. • 80 percent of the elk attended feedgrounds, 5% less than last season. • Mortality was less than one percent. • Wolves caused elk mortality at five of the 22 feedgrounds. There were 10 elk
documented by elk feeders to have been killed by wolves. What we propose to improve performance in the next two years: • Continue to work with terrestrial wildlife biologists and game wardens during their
winter survey effort to obtain accurate feedground counts to compare to elk counted on native ranges.
• Direct elk feeders during the annual fall orientation briefing to record all deaths and to attempt to determine the cause of death. Continuing to document and identify the major causes of winter elk mortality on feedgrounds is helpful in addressing public concerns and helps feedground personnel improve management efforts, thus resulting in more productive feeding efforts.
• Keep the public informed of situations that may lead to unfavorable public opinion. Feedground personnel, game wardens, and terrestrial wildlife biologists need to be aware of situations that have the potential of causing public concern and take the lead in developing a media approach.
• Be prepared to quickly notify and work with the Department’s Veterinary Services program if disease issues are causing unexpected numbers of elk to die.
• Forest Park and Green River Lake feedgrounds do not serve to prevent damage and commingling with livestock. Their sole purpose is to prevent excessive winter elk losses. Feeding strategies can be adjusted at these locations to feed less hay to save on feeding costs and reduce potential intra-specific disease transmission.
• The “Target Feedground Management” plan was implemented on feedgrounds with decreased damage/commingling risk for the second year. These feedgrounds included Green River Lakes, Soda Lake, Fall Creek, Bench Corral, Gros Ventre and Forest Park. This plan shows potential to decrease hay consumption, in the spring, in areas with decreased snow depths.
Program: Financial Management Division: Fiscal Division Mission: Ensure accountability of all Department assets to the Department’s publics, including financial compliance with federal and state requirements and assist in management planning and decision-making by providing financial information.

53
Program Facts: The Financial Management Program is listed below with number of staff and 2009 (FY 09) budget: Sub-programs # FTEs* 2009 Annual Budget Revenue Collection & Licensing** 21.2 $ 1,874,967 Asset Management 2.5 508,560 Disbursements 4.0 276,216 Financial Systems 1.5 157,125 TOTAL 29.2 $ 2,816,868 *Includes permanent, contract and temporary positions authorized in the FY 2009 budget. Any positions added during the budget cycle require Wyoming Game and Fish Commission authorization or must be funded from supplemental grants. **Includes one ¾ fiscal specialist position. This program is located in the Department Headquarters Office in Cheyenne. Primary Functions of the Financial Management Program: • We ensure accountability and compliance by being responsible for billing,
collecting, and accounting for all Department revenues and administering the systems to accommodate administration of all Department revenues including issuance of personal hunting and fishing licenses, permits, tags and stamps, watercraft registration, commercial hatchery, taxidermist and bird farm licenses, and federal, state, local and private grants and donations, to include receipts in excess of $59 million annually. In addition, we initiate, review and process in excess of 50,000 payment transactions in accordance with state requirements.
• We ensure accountability and compliance by maintaining and updating the financial records of all Department fixed assets to include personal property (vehicles, office and shop equipment, leasehold improvements) and real property (buildings, infrastructure, land improvements).
• We assist in Department management planning and decision-making by developing and monitoring the Department’s annual budget to ensure compliance with state requirements. In addition, we provide monthly and annual financial reports to agency personnel and external publics.

PerfoDepopaymwork
ormance Mositing Licenments are proking days).
35
40
45
50
(thou
sand
s)
0246
(day
s)
$-
$10.0
$20.0
$30.0
$40.0
$50.0
$ (in
mill
ions
)
Measure #1nse Draw reocessed with
5
0
5
0
FY 05
# of P
0246
FY 05
to pro
-
00
00
00
00
00
FY 05
Li
1: Timelineeceipts (Perhin four wor
FY 06 F
Payment Tra
FY 06 FY
Average # ocess payme
`
FY 06
icense Rece
54
ess of Procrsonnel withrking days a
FY 07 FY 0
ansactions
Y 07 FY 08
of daysnt transaction
FY 07 FY
eipts Deposit
cessing Payh this progrand receipts
08 FY 09
8 FY 09
ns
Y 08 FY 09
ted
yment Tranram will wo
are process
9
sactions anork to ensursed within 1
nd re 0

StoryIn FYtransaexperday totakesreguland ethe ti It applevel empl In thappliapplilicenseconoapplito thtransadecrereducapproTreastime from an effunds Wha• In
in
y behind theY 2009, afteactions stabirience any po just under between si
latory requirexternal automeliness of
pears that ththat howev
oyee turnove
e area of recations, as ications receses was dowomic downtucation proce
he decrease actions moreased from $ce the numoximately ssurer’s officeto deposit futhe Departm
ffective balas received.
at we proposn the area onterface to re
0
5
10
15
20
# of
day
s
e performaner a two-yeilized and repersonnel tur
four days beix months arements, budomated finantransaction p
he Disbursemver, is only er.
eceipts, the Lnternet appl
eived by thewn slightly,urn, the numessing remai
in manual re efficient$20 million
mber of temix FTE’s, we to under fo
funds from Fment receiviancing betw
se to improvof disbursemeduce entry
0
5
0
5
0
FY 05
Average
nce: ar increase
emained relarnover, allowetween receiand a year dget structuncial systemprocessing.
ments sectionsustainable
License Dralications clime Departmen, with the p
mber of prefined relative
applicationtly. Actuato $12 mill
mporary pewhile cuttinour days. ThFY 06. At ting mail to h
ween number
ve performaments, in thtime for rev
FY 06
e # of Days to
55
in transactiatively constawing procesipt and compfor new pe
ure, Departms, employee
n in FY 09 pwith the cu
aw section smbed from 5nt. While thprimary decference poinely constant ns, the licenal deposits lion, allowinersonnel furng the numhis change rthis time, it having fundsr of personn
ance in the ne fall of 20
venue refund
FY 07 Fyear
o Process Lice
on volume, ant. Additio
ssing time topletion of pa
ersonnel to lment personn
turnover ha
processed inurrent volum
saw a third 50 percent tohe total numcrease from
nt purchases at just over nsing sectiofrom manu
ng the Licenrther from
mber of dayreflects a 400appears thats processed nel required
next two ye009, the Depds for the ma
FY 08 FY
ense Receipt
the numberonally, the seo decrease bayment translearn state nel contacts as a significa
nformation atme of transac
year decreao over 67 pember of app
nonresidenincreased so268,000. H
on was ablual license nse Draw se
ten to an ys from ma0 percent redt the four daby the Statewith intere
ars: partment wiajority of lic
Y 09
ts
r of paymenection did no
by over half sactions. As statutory anand interna
ant impact o
t an optimumctions and n
ase in manuaercent of totaplications font due to tho that overaHowever, due to proces
applicationection to bot
average oail receipt tduction in thay turnaroune Treasurer iest earned o
ill initiate acense refund
nt ot a it
nd al
on
m no
al al or he all ue ss ns th of to he nd is
on
an s.

Wnud
• Incoh
PerfoDepamoreerrors
StoryBeginapproin itsgoat, reduc
We are also umber of paata or errorsn the Licensontinue to inelp to reduce
ormance Martment corre than 1/10 s).
y behind thenning in FYoved by the s license dra
deer, antelced data en
looking at ayment docum. se Draw arencrease, althoe the need fo
easure #2: Nection of errof one perc
e performanY 07, the licWyoming G
aw process. lope, elk, tuntry requirem
200220240260280300
(thou
sand
s)
2
4
6
8
10
(cor
rect
ions
)
expanding fments that m
ea, we anticiough at a sloor temporary
Number of Erors (Personncent of custo
nce: cense draw
Game and FiFirst, Intern
urkey and bments for m
FY 05 FY
# of A
0
20
40
60
80
00
FY 05 F
#
56
fiscal traininmust be corre
ipate that thower rate thay personnel f
External Cunel with thisomer licens
section, in sh Commissnet applicati
bison licensemanual licen
Y 06 FY 07
Applications
FY 06 FY 07
# of Key Pun
`
ng for field ected prior to
he volume oan in the lastfor data entry
ustomer Lices program wie inquiries
accordance sion, incorpoions for limies were initnses. Addi
FY 08 FY 09
Processed
FY 08 FY 0
ch Errors
personnel to entry due t
f internet apt two years, y.
ense Inquirieill work to eresults from
with regulaorated two mited quota mtiated, whichitionally, th
9
09
to reduce thto incomplet
pplicants wiwhich shoul
es resulting iensure that n
m Departmen
atory changemajor changemoose, sheeph resulted i
he period fo
he te
ill ld
in no nt
es es p, in or

prefeinnovmontresporealizproceAdditDepaslightout ocondu157,0earliehunticapabfor hu Wha• C
ru• E
h• A
enin
PerfoFinanwhenOutco
rence pointvations helpeth window (Jonse to theszed. With leessing applitionally, du
artment errort increase frf the 268,00ucted well 000 applicater than any ting trips. Tbility for purunters.
at we proposContinue to unning the d
Encourage apas edits to he
Annually revnhancementncorporate th
ormance Mncial Managn Courtesy, ome Internal
4.200
4.300
4.400
4.500
4.600
4.700
4.800
1 (P
oor)
5
(Exc
elle
nt)
t purchases ed to reduceJanuary 1 – e changes, ss manual apications wa
ue to the drs was reducrom the prio00 applicatioin advance tions) condutime in the l
The replacemrchase of lef
se to improvperform qua
draw and issupplicants throelp reduce eiew suggestis to improvhose enhance
Measure #3:gement (Pers
Timeliness,l Client Sati
0
0
0
0
0
0
0
FY05
Inte
was change the volume
May 31) duseveral benpplications, as cut by ecreased voced significar year. Howns received of the pub
ucted prior last twenty yment of the ftover licens
ve performaality controluing licensesough media rrors made bions by bothve the Depaements that
: Employesonnel with , and Effectsfaction Sur
FY06
ernal Custom
57
ed to July e of manual uring which efits to boththe number approximat
olume of mantly in FY wever, total by the Depa
blished drawto June 20t
years, allowileftover dra
ses by July 7
ance in the nl by reviews and mailing
by applicanth license appartment’s weare cost effe
ee satisfactithis program
tiveness arervey).
FY07 F
mer Satisfact
1 through applicationsdraw applic
h the Deparand cost of
tely 400 pmanual appli
08; howeveDepartment
artment. Addw dates with
th, with resuing licenseeaw in July w7th further im
next two yeing all appl
gs to apply ths in complet
plicants and eb pages foective and ap
on with serm will work
e measured
FY08 FY0
tion
September. s received ducations are prtment and f temporary ercent fromications, theer, in FY 09t errors wereditionally, a
h the largesults availabls more timewith the on
mproved cust
ars: lications ent
hrough the Inting applicatDepartment
or license appplicant frien
rvice level k to achieveby the ann
09
C
T
A
These twuring the fivprocessed. Ihunters werpersonnel fo
m FY 2006e number o9 there was e less than 7ll draws wert draw (ovele to hunter
e to plan then-line internetomer servic
tered prior t
nternet whictions. personnel o
pplicants anndly.
provided be at least a nual Strategi
Courtesy
Timeliness
Accuracy
wo ve In re or 6. of a
70 re er rs ir et ce
to
ch
on nd
by 4 ic

58
Story behind the performance: The Fiscal Division is responsible for providing customer service to Department employees while insuring compliance with federal and state requirements. Additionally, it must interface its financial systems with those mandated by the State Auditor, State Personnel, State Purchasing and the State Budget Office. Accordingly, much of the Division’s ability to meet the needs of agency personnel is dependent on the directives of these other entities while still ensuring that the agency’s financial records provide accountability and auditability. To meet these objectives, the Division believes that its primary focus should be on courtesy to individuals, timeliness of information and ability to answer questions (completeness), as these items are indicative of the service level that all of the employees within the Division are providing. The above graph is a composite (mean) of the individual results of the four sub-programs. While the Department was able to improve in the area of transactions timeliness, there was a slight decline in recognized in accuracy of information and courtesy. This may be due, at least in part, to having vacancies in two of the four sections, remain open during the latter half of the fiscal year, which affected existing employees’ ability to research and accurately answer questions. Additionally, the licensing section in FY 09 began utilizing a completely new licensing system for both external license selling agents and regional offices and for the first several months, there was a steep learning curve associated with these major changes Based on the satisfaction survey, FY 09, however continued to show satisfaction levels still between very good and good. Accordingly, we continue to believe that an indicator of “4 “or above (good) on a 1 to 5 satisfaction scale demonstrates that an acceptable level of service is being provided, while still being cost efficient. What we propose to improve performance in the next two years: • We propose to continue to maintain service levels where employees can be provided
assistance in a timely, complete and courteous manner. This was a challenge in FY 09 due to major changes in the License area, which while resulting in significant customer enhancements, did have some growing pains, in addition to continued changes with State Accounting system managed by the State Auditor’s office that delayed some transaction processing and report availability. However, increasing availability to online information for regional administrative personnel has assisted those individuals in answering questions by field personnel and we will continue to work on making more online information available to all personnel and to expand training to field personnel, especially through video conferencing, a cost effective alternative to extensive travel.
Program: Habitat Division: Fish and Wildlife Mission: Holistically manage, preserve, restore and/or improve habitat to enhance and sustain Wyoming’s fish and wildlife populations for current and future generations.

59
Program Facts: The Department Habitat program is made up of three major sub-programs, listed below with number of staff and 2009 (FY 09) budget: Sub-programs # FTEs* 2009 Annual Budget Terrestrial Habitat Management 14.7 $ 1,970,369 Aquatic Habitat Management 12.4 1,340,843 Water Management 2.6 245,883 TOTAL 29.7 $ 3,557,095 * Includes permanent, contract and temporary positions authorized in FY 09 budget. Any positions added during the budget cycle require Wyoming Game and Fish Commission authorization or must be funded from supplemental grants. The Habitat program formerly included the Habitat and Access Management sub-program (Strategic Plan FY 04-FY 07, November 2003). While this sub-program has since been removed, the Habitat program has incorporated the Water Management sub-program (formerly a sub-program in Aquatic Wildlife Management program). The Habitat program has statewide responsibilities. Permanent personnel are located in Buffalo (1), Casper (3), Cheyenne (4) Cody (3), Green River (2), Jackson (2), Lander (2), Laramie (3), Pinedale (2) and Sheridan (2). Primary Functions of the Habitat Program: • Manage, preserve and restore habitat for long-term sustainable management of
fish and wildlife populations by inventorying wildlife habitat conditions, determining where conditions are limiting, and plan and implement projects at watershed and landscape scales in order to conserve and restore habitat quality. This is accomplished by integrating various land uses while involving the general public, private landowners and land management agencies.
• Increase fish and wildlife based recreation through habitat enhancements that
increase productivity of fish and wildlife populations by designing and implementing habitat improvement projects in cooperation with private landowners and/or public land managers.

Perfohabitwildlcomp
StoryThis of thpersoHabitlandotrackthe pannuaperfoSHP Trackprogrand rbetteractivi WhaIn FYaddreover persoprivamanypersorequiEnvir
ormance Mat goals comlife within prplete at least
y behind themeasure of
he Departmeonnel develotat Plan (SHowners, landed individua
performance al and mon
ormance apprAccomplish
king of perforam success restoration er able to mities.
at has been aY 09, 81 peessing habitaFY 08 (89 p
onnel and thate landowney of the pronnel controired documeronment Po
% H
abita
t C
onse
rvat
ion/
Res
tora
tion
Activ
ities
Com
plet
ed
Measure #1:mpleted thatriority areas 70 percent o
e performanhabitat present terrestri
op work schHP) addressind managemeally and repo
goals compnthly activiraisal evalua
hments Repo
ormance goaand quality
fforts for larmeasure suc
accomplisheercent (161 at conservatpercent com
he time requers, federal arojects not ol and incluents to conolicy Act (
0
20
40
60
80
100
FY
Activ
ities
Com
plet
ed
Terrestriat addressed and/or habi
of planned a
nce: servation or ial habitat p
hedules and ng priority arent agencies orted collectpleted for tity highlighations as relaort for calend
als improvesy over time, rge-scale lanccess and q
ed: completed
tion or restompletion) and
ired for trainand state lancompleted
uded weathnduct activi(NEPA) do
Y 05 FY 0

APPENDIX A:
INDIVIDUAL MANAGEMENT PROGRAMS


BIG GAME
Pronghorn
Elk Mule Deer
White-tailed Deer Moose
Bighorn Sheep Rocky Mountain Goat
Bison


A-1
PRONGHORN
2008: Population: 526,805a Licenses Sold: 69,159 Population Objective: 461,950b License Revenue: $ 6,960,158 Harvest: 53,849 All Other Agency Revenue*: $ 3,412,777 Hunters: 56,009 Total Program Revenue: $10,372,935 Success Rate: 96% Program Costs: $ 3,451,229 Recreation Days: 184,208 Hunter Expenditures: 1 $22,773,136 Days/Animal: 3.4 Cost Dept. Per Animal: $ 64 Economic Return per Animal: $ 423 aStatewide population was calculated from 41 of 44 pronghorn herds. Population estimates for the other 3 herds were not available. bStatewide population objective calculated from 43 of 44 pronghorn herds. There is no objective for 1 herd. In 2008, Wyoming’s total statewide pronghorn population for the herds for which we have estimates was 526,805 animals compared to the objective of 461,950. The estimated state population declined 6% from 2007 to 2008, but remains 14% above objective, mainly because of mild winters with low mortality, hunter access limitations and the Department’s inability to issue sufficient licenses to obtain harvests that will control the species. Better precipitation during the growing season in the past couple of years has improved forage, but we don’t know whether this is temporary or signals a longer term turn-around in previous drought conditions. Poor range quality and extensive loss of habitat from escalating mineral development are of great concern to managers. The Department continues to monitor habitat condition, recommend improvements where necessary, seek mitigation of habitat lost to development, and promote hunting seasons that move the population toward the objective. The Department increased license quotas in 2002-2008 in an attempt to reduce the number of animals, however access continues to be the primary impediment to attaining adequate harvests. The Department continues to work to improve hunter access through efforts such as the Private Lands Public Wildlife program. The 2008 harvest of 53,849 animals was a 4% and 18% increase over the 2007 and 2006 harvests, respectively. Hunter effort increased slightly to 3.4 days per animal harvested, slightly above the five-year average (3.3 days/animal).
Five-year trends in Wyoming's pronghorn program. Harvest, recreation and licenses issued are by calendar year. Revenue and costs are by fiscal year.
Year
Harvest
Rec.Days
Success
Days/Animal
Lic.Sold
Lic.Rev. ($)
Mgmt. Costs ($)
Hunter ($)Expend.1
2004 36,383 113,577 96% 3.1 44,850 4,756,674 3,025,576 12,214,009
2005 39,526 132,625 93% 3.4 51,430 4,931,280 2,881,194 14,860,450
2006 45,615 151,874 96% 3.3 58,456 5,266,144 3,167,032 17,527,792
2007 51,883 169,419 98% 3.3 65,322 5,898,677 3,785,765 20,139,242
2008 53,849 184,208 96% 3.4 69,159 6,960,158 3,451,229 22,773,1361The 2004 calculations were derived from the report, Wyoming Resident and Nonresident Deer, Elk and Antelope Hunter Expenditure Survey, 2004. Data for this survey were collected during the 2003 season. Hunter Expenditure in 2004 was calculated from the 2003 cost per day expenditure, corrected for inflation using the Consumer Price Index (2003 per day expenditure x 1.033 = 2004 per day expenditure, 2003 per day expenditure x 1.068 = 2005 per day expenditure). 2005 Hunter expenditure was calculated from the 2005 cost per day expenditure, corrected for inflation using the Consumer Price Index (2005 per day expenditure x 1.03). 2006, 2007 and 2008 Hunter expenditure was calculated from the previous year’s Hunter expenditure corrected for inflation using the Consumer Price Index (2006 was 1.03, 2007 was 1.03, 2008 was 1.04). *Includes allocated application fees, conservation stamp revenue, federal/other grants, and interest earned on Department cash balances.

A-2
ELK 2008: Population: 93,354a Licenses Sold: 60,626 Population Objective: 83,640 License Revenue: $ 8,697,113 Harvest: 20,941 All Other Agency Revenue*: $ 5,711,261 Hunters: 52,163 Total Program Revenue: $ 14,408,374 Success Rate: 40% Program Costs: $ 13,942,785 Recreation Days: 395,534 Hunter Expenditures: 1 $38,905,578 Days/Animal: 18.9 Cost Dept. Per Animal: $ 666 Economic Return per Animal: $ 1,858 aStatewide population was calculated from 25 of 35 elk herds. Population estimates for the other 10 herds were not available. The Department continues to manage to reduce Wyoming’s elk numbers. The total population of the herds with estimates declined by two percent in 2008 and is now 12 percent above the statewide objective of 83,640 animals. The harvest decreased seven percent from 2007 to 2008 and was below the five-year average (21,221). Hunter success decreased in 2008 to 40 percent and was slightly below the five-year average (41 percent). Hunter effort (days/animal) increased from 2007 to 2008, and the 2008 effort value was above the five-year average (17.8 days/animal). Overall, management strategies will continue to focus on decreasing the statewide population, however some herds are at objective and will be managed for their current numbers. Access continues to impede obtaining adequate harvest in many herds. The Department will continue to work to improve hunter access and to find other ways to promote greater harvests.
Five-year trends in Wyoming's elk program. Harvest, recreation and licenses issued are by calendar year. Revenue and costs are by fiscal year.
Year
Harvest
Rec. Days
Success
Days/Animal
Lic.Sold
Lic.Rev. ($)
Mgmt. Costs ($)
Hunter ($)Expend.1
2004 21,252 380,219 41% 17.9 58,182 7,733,361 8,833,834 32,802,943
2005 19,708 365,256 39% 18.5 56,550 7,565,022 10,789,073 32,562,491
2006 21,680 360,463 43% 16.6 57,682 7,677,240 11,183,083 33,099,252
2007 22,523 387,973 43% 17.2 59,348 8,203,437 12,415,185 36,694,098
2008 20,941 395,534 40% 18.9 60,626 8,697,113 13,942,785 38,905,5781 The 2004 calculations were derived from the report, Wyoming Resident and Nonresident Deer, Elk and Antelope Hunter Expenditure Survey, 2004. Data for this survey were collected during the 2003 season. Hunter Expenditure in 2004 was calculated from the 2003 cost per day expenditure, corrected for inflation using the Consumer Price Index (2003 per day expenditure x 1.033 = 2004 per day expenditure, 2003 per day expenditure x 1.068 = 2005 per day expenditure). 2005 Hunter expenditure was calculated from the 2005 cost per day expenditure, corrected for inflation using the Consumer Price Index (2005 per day expenditure x 1.03). 2006, 2007 and 2008 Hunter expenditure was calculated from the previous year’s Hunter expenditure corrected for inflation using the Consumer Price Index (2006 was 1.03, 2007 was 1.03, 2008 was 1.04). *Includes allocated application fees, conservation stamp revenue, federal/other grants, general funds ($807,048) and interest earned on Department cash balances.

A-3
MULE DEER
2008: Population: 480,561a Licenses Sold: 1 89,540 Population Objective: 564,650b License Revenue: 1 $ 10,664,751 Harvest: 36,338 All Other Agency Revenue*: $ 4,778,821 Hunters: 62,739 Total Program Revenue: $ 15,443,572 Success Rate: 58% Program Costs: $ 6,250,194 Recreation Days: 319,504 Hunter Expenditures: 2 $ 34,427,777 Days/Animal: 8.8 Cost Dept. Per Animal: $ 172 Economic Return per Animal: $ 947
aStatewide population was calculated from 36 of 39 mule deer herds. Population estimates for the other 3 herds were not available. bStatewide population objective calculated from 38 of 39 mule deer herds. There is no objective for 1 herd. Wyoming’s mule deer population declined 9 percent from 2007 to 2008 and is now approximately 85 percent of the statewide objective. There is continuing concern about poor range conditions and their effect on reproduction and survival. In the past couple of years, precipitation during the growing season improved, at least temporarily ending drought conditions and improving forage plant production. The Department will continue to monitor habitats and recommend improvements where necessary. Field personnel wish to keep some herds at levels lower than their objectives to lessen the impacts of deer on drought-depleted browse plants until we can determine if the recent improvement in moisture conditions is going to continue, however the public would like more deer and is resisting further decreases.
Harvest and hunter success decreased in 2008. The 2008 harvest is below the five-year average of 37,902, and the 58 percent success rate is below its five-year average (60 percent). Hunter effort increased in 2008, and the 2008 value is approximately ½ day above the five-year average (8.3 days/animal). The Department has been working to address access and habitat issues through its Private Lands Public Wildlife program, habitat improvement projects and strong advocacy for mitigation of impacts related to mineral extraction. However, the greatest improvement in habitat conditions will come with continued favorable moisture conditions.
Five-year trends in Wyoming's mule deer program. Harvest, recreation and licenses issued are by calendar year. Revenue and costs are by fiscal year.
Year
Harvest
Rec. Days
Success
Days/Animal
Lic.Sold1
Lic.Rev. ($)1*
Mgmt. Costs ($)
Hunter ($)Expend.2
2004 36,733 299,922 58% 8.2 82,049 9,520,324 4,735,670 28,343,737
2005 35,266 307,256 57% 8.7 84,533 9,482,629 * 4,813,400 30,007,186
2006 40,067 313,402 62% 7.8 88,405 9,319,734 5,145,752 31,525,638
2007 41,106 328,020 63% 8.0 91,014 9,387,890 5,819,403 33,985,970
2008 36,338 319,504 58% 8.8 89,540 10,664,751 6,250,194 34,427,7771 Includes both mule deer and white-tailed deer. 2 The 2004 calculations were derived from the report, Wyoming Resident and Nonresident Deer, Elk and Antelope Hunter Expenditure Survey, 2004. Data for this survey were collected during the 2003 season. Hunter expenditure in 2004 was calculated from the 2003 cost per day expenditure, corrected for inflation using the Consumer Price Index (2003 per day expenditure x 1.033 = 2004 per day expenditure, 2003 per day expenditure x 1.068 = 2005 per day expenditure). 2006, 2007 and 2008 Hunter expenditure was calculated from the previous year’s Hunter expenditure corrected for inflation using the Consumer Price Index (2006 was 1.03, 2007 was 1.03 , 2008 was 1.04). *Includes allocated application fees, conservation stamp revenue, federal/other grants, general funds (68,894) and interest earned on Department cash balances.

A-4
WHITE-TAILED DEER 2008: Population: 57,027a Licenses Sold: 1 89,540 Population Objective: 52,000b License Revenue: 1 $ 10,664,751 Harvest: 14,792 All Other Agency Revenue*: $ 4,778,821 Hunters: 26,143 Total Program Revenue: $ 15,443,572 Success Rate: 57% Program Costs: $ 560,517 Recreation Days: 112,457 Hunter Expenditures: 2 $ 12,164,651 Days/Animal: 7.6 Cost Dept. Per Animal: $ 38 Economic Return per Animal: $ 822 aStatewide population was calculated from 2 of 5 white-tailed deer herds. Population estimates for the other 3 herds were not available. bStatewide population objective calculated from 3 of 5 white-tailed deer herds. There is no objective for 2 herds. It is difficult to collect data on Wyoming’s white-tailed deer populations because of the habitats in which the species lives and its secretive behavior. So, determining population characteristics and trends is generally not possible; the estimate provided here is based on only some of the herds. Most white-tailed deer inhabit private lands in eastern Wyoming and the riparian areas of major watercourses there and in other parts of the state. In both cases, access for hunting has become difficult to obtain and is often expensive. This adds to the difficulty of managing white-tailed deer. Management throughout the state is primarily dictated by local perceptions of deer numbers and by landowner tolerances. The white-tailed deer is an undesirable species to some landowners and hunters due to depredation issues and the perception that it displaces mule deer, however it has generally gained status equal to other big game species overall in the state. The 2008 white-tailed deer harvest was six percent higher than the 2007 harvest, and 13 percent higher than the five-year average (13,134). Hunter numbers increased five percent from 2007 and six percent from 2006. Hunter success increased slightly in 2008 and was above the five-year average (54%).
Five-year trends in Wyoming's white-tailed deer program. Harvest, recreation and licenses issued are by calendar year. Revenue and costs are by fiscal year.
Year
Harvest
Rec. Days
Success
Days/Animal
Lic.Sold1
Lic.Rev. ($)1
Mgmt. Costs ($)
Hunter ($)Expend.2
2004 10,733 82,083 49% 7.6 82,049 9,520,324 412,043 7,790,860
2005 12,333 97,416 52% 7.9 84,533 * 9,482,629 * 520,579 9,550,710
2006 13,858 107,181 56% 7.7 88,405* 9,319,734* 456,980 10,823,317
2007 13,955 113,668 56% 8.1 91,014 9,387,890 411,374 11,822,737
2008 14,792 112,457 57% 7.6 89,540 10,664,751 560,517 12,164,651 1 Includes both mule deer and white-tailed deer.
2 The 2004 calculations were derived from the report, Wyoming Resident and Nonresident Deer, Elk and Antelope Hunter Expenditure Survey, 2004. Data for this survey were collected during the 2003 season. Hunter expenditure in 2004 was calculated from the 2003 cost per day expenditure, corrected for inflation using the Consumer Price Index (2003 per day expenditure x 1.033 = 2004 per day expenditure, 2003 per day expenditure x 1.068 = 2005 per day expenditure). 2006, 2007 and 2008 Hunter expenditure was calculated from the previous year’s Hunter expenditure corrected for inflation using the Consumer Price Index (2006 was 1.03, 2007 was 1.03, 2008 was 1.04). *Includes allocated application fees, conservation stamp revenue, federal/other grants, and interest earned on Department cash balances.

A-5
MOOSE 2008: Population: 7,697a Licenses Sold: 715 Population Objective: 13,820b License Revenue: $ 151,056 Harvest: 611 All Other Agency Revenue*: $ 683,416 Hunters: 709 Total Program Revenue: $ 834,472 Success Rate: 86% Program Costs: $ 819,010 Recreation Days: 5,060 Hunter Expenditures: 1 $ 722,697 Days/Animal: 8.3 Cost Dept. Per Animal: $ 1,340 Economic Return per Animal: $ 1,183 aStatewide population was calculated from 6 of 10 moose herds. Population estimates for the other 4 herds were not available. bStatewide population objective calculated from 9 of 10 moose herds. There is no objective for 1 herd. Although Wyoming’s largest moose populations are in the west and northwest of the state, moose occur in other areas. The species inhabits the Bighorn Mountains; and it has expanded into the mountain ranges of south central Wyoming from an introduced population in northern Colorado, which is providing additional viewing and hunting opportunities.
Management strategies for moose in Wyoming are quite conservative, and as a result, success rates have traditionally been excellent for those hunters fortunate enough to draw a license. The restriction against harvesting a cow moose accompanied by a calf was in effect again in the 2008 hunting season, continuing a trend that is now over a decade old. This restriction has improved calf survival, which has the potential to increase hunting opportunities. However, recent declines in moose numbers in northwest Wyoming for reasons that have yet to be fully understood have resulted in significant license quota reductions over the past several years. Harvest declined nine percent from 2007 to 2008, hunter success remained relatively stable and hunter effort increased. The 2008 hunter success was slightly below average (87 percent), and hunter effort was above average (7.2 days/animal). Permit quotas for western hunt areas will be reduced again in 2009 in response to low population estimates.
Five-year trends in Wyoming's moose program. Harvest, recreation and licenses issued are by calendar year. Revenue and costs are by fiscal year.
Year
Harvest
Rec. Days
Success
Days/Animal
Lic.Sold
Lic.Rev. ($)
Mgmt. Costs ($)
Hunter ($)Expend.1
2004 770 5,026 84% 6.5 927 218,524 1,004,466 638,793
2005 682 4,673 88% 6.9 798 214,029 928,822 604,914
2006 636 4,729 87% 7.4 768 174,694 699,814 630,528
2007 669 4,674 89% 7.0 769 201,665 1,022,124 641,891
2008 611 5,060 86% 8.3 715 151,056 819,010 722,6971 The 2003 calculations were derived from the report, Hunting and Trapping Expenditures in Wyoming During the 2001 Season, 2002 using average per day expenditures. Hunter expenditure was calculated from the 2001 cost per day expenditure, corrected for inflation using the Consumer Price Index (2001 per day expenditure x 1.043 = 2003 per day expenditure, 2001 per day expenditure x 1.078 = 2004 per day expenditure, 2001 per day expenditure x 1.115 = 2005 per day expenditure). 2006, 2007 and 2008 Hunter expenditure was calculated from the previous year’s Hunter expenditure corrected for inflation using the Consumer Price Index (2006 was 1.03, 2007 was 1.03, 2008 was 1.04). *Includes allocated application fees, conservation stamp revenue, federal/other grants, and interest earned on Department cash balances.

A-6
BIGHORN SHEEP 2008: Population: 5,300a Licenses Sold: 249 Population Objective: 8,435 License Revenue: $ 75,483 Harvest: 194 All Other Agency Revenue*: $ 752,716 Hunters: 242 Total Program Revenue: $ 828,199 Success Rate: 80% Program Costs: $ 1,237,934 Recreation Days: 2,230 Hunter Expenditures: 1 $ 682,984 Days/Animal: 11.5 Cost Dept. Per Animal: $ 6,381 Economic Return per Animal: $ 3,521 aStatewide population was calculated from 8 of 15 bighorn sheep herds. Population estimates for the other 7 herds were not available. The state population of bighorn sheep, from the herds which we have estimates, remained stable in 2008. Larger herds maintained or slightly increased population size while some smaller populations continued to struggle. Bighorn sheep are highly susceptible to stochastic severe weather events and disease outbreaks. Poor habitat conditions predispose bighorn sheep to these mortality factors and limit population increases in some herds.
The 2008 bighorn sheep harvest decreased slightly from 2007, but it was above the five-year average (192). Hunter success declined from 2007 to 2008 and was below the five-year average (83 percent). Hunter effort continued to increase in 2008 and was above the five-year average (10.6 days/animal harvested).
The Department will continue to set conservative bighorn sheep hunting seasons. It will continue to monitor disease, evaluate habitat conditions and implement habitat improvement projects; and it will do supplementary transplants as the need and opportunity arises.
Five-year trends in Wyoming's bighorn sheep program. Harvest, recreation and licenses issued are by calendar year. Revenue and costs are by fiscal year.
Year
Harvest
Rec. Days
Success
Days/Animal
Lic.Sold
Lic.Rev. ($)
Mgmt. Costs ($)
Hunter ($)Expend.1
2004 205 2,089 89% 10.2 251 136,538 1,229,246 554,780
2005 172 1,923 74% 11.2 236 130,853 1,066,634 533,798
2006 186 1,654 85% 9.0 240 57,611 1,199,696 472,901
2007 201 2,225 85% 11.1 244 93,181 1,284,207 655,243
2008 194 2,230 80% 11.5 249 75,483 1,237,934 682,9841 Calculations prior to 2003 were based on the report, 1989 Hunting and Fishing Expenditure Estimates for Wyoming, 1990. However, these calculations could not be reproduced. The 2003 calculations were derived from the report, Hunting and Trapping Expenditures in Wyoming During the 2001 Season, 2002 using average per day expenditures. Hunter expenditure was calculated from the 2001 cost per day expenditure, corrected for inflation using the Consumer Price Index (2001 per day expenditure x 1.043 = 2003 per day expenditure, 2001 per day expenditure x 1.078 = 2004 per day expenditure, 2001 per day expenditure x 1.115 = 2005 per day expenditure). 2006, 2007 and 2008 Hunter expenditure was calculated from the previous year’s Hunter expenditure corrected for inflation using the Consumer Price Index (2006 was 1.03, 2007 was 1.03, 2008 was 1.04). *Includes allocated application fees, conservation stamp revenue, federal/other grants, and interest earned on Department cash balances.

A-7
ROCKY MOUNTAIN GOAT 2008: Population: 285 Licenses Sold: 20 Population Objective: 250 License Revenue: $ (9,161) Harvest: 18 All Other Agency Revenue*: $ 23,893 Hunters: 18 Total Program Revenue: $ 14,732 Success Rate: 100% Program Costs: $ 86,302 Recreation Days: 87 Hunter Expenditures: 1 $ 30,994 Days/Animal: 4.8 Cost Dept. Per Animal: $ 4,795 Economic Return per Animal: $ 1,722 Mountain goats inhabit some of the most rugged and remote areas in northwest Wyoming. Successful transplant operations in Montana and Idaho years ago resulted in mountain goat populations that extended into Wyoming. The Department manages these populations as the Beartooth (northwest of Cody) and Palisades (southwest of Jackson) Herds.
Prior to 1999, only the Beartooth Herd was hunted. The Palisades population increased to a point where it has been able to sustain a limited annual harvest since that year. The Department will continue to closely monitor both populations and will continue to set a hunting season the small populations can support.
Five-year trends in Wyoming's Rocky Mountain goat program. Harvest, recreation and licenses issued are by calendar year. Revenue and costs are by fiscal year.
Year
Harvest
Rec. Days
Success
Days/Animal
Lic.Sold
Lic.Rev. ($)
Mgmt. Costs ($)
Hunter ($)Expend.1
2004 15 61 100% 5 16 10,500 68,613 20,551
2005 19 51 100% 3.2 20 10,520 35,806 16,467
2006 20 69 100% 3.4 20 (7,914) 59,229 22,947
2007 19 113 95% 5.9 20 (5,101) 48,575 38,708
2008 18 87 100% 4.8 20 (9,161) 86,302 30,9941 Calculations prior to 2003 were based on the report, 1989 Hunting and Fishing Expenditure Estimates for Wyoming, 1990. However, these calculations could not be reproduced. The 2003 calculations were derived from the report, Hunting and Trapping Expenditures in Wyoming During the 2001 Season, 2002 using average per day expenditures. Hunter expenditure was calculated from the 2001 cost per day expenditure, corrected for inflation using the Consumer Price Index (2001 per day expenditure x 1.043 = 2003 per day expenditure, 2001 per day expenditure x 1.078 = 2004 per day expenditure, 2001 per day expenditure x 1.115 = 2005 per day expenditure). 2006, 2007 and 2008 Hunter expenditure was calculated from the previous year’s Hunter expenditure corrected for inflation using the Consumer Price Index (2006 was 1.03, 2007 was 1.03, 2008 was 1.04). *Includes allocated application fees, conservation stamp revenue, federal/other grants, and interest earned on Department cash balances.

A-8
BISON 2008 Population: 898 Licenses Sold: 307 Population Objective: 500 License Revenue: $ 180,681 Harvest: 258 All Other Agency Revenue*: $ 87,238 Hunters: 307 Total Program Revenue: $ 267,919 Success Rate: 84% Program Costs: $ 216,062 Recreation Days: 2,223 Hunter Expenditures: 1 $ 403,862 Days/Animal: 8.6 Cost Dept. Per Animal: $ 837 Economic Return per Animal: $ 1,565 The bison population in the Jackson Herd increased steadily in the past to a size far greater than is reasonable for the Jackson valley in its current state of development. The post-harvest objective for this herd is 500 bison. From 2000 to 2006, the population increased 89 percent. However, the population declined slightly but steadily in recent years due to our ability to increase harvests. Harvest increased eight percent from 2007 to 2008 and 17 percent since 2006. The Department shares management responsibility of the Jackson Herd with the National Elk Refuge (NER), Grand Teton National Park and the Bridger-Teton National Forest. Bison of the Jackson Herd spend summers in and around Grand Teton National Park, and most spend winters on the NER, so it has been difficult to obtain an adequate harvest until recent improvements in hunting limitations. Hunting opportunity and the potential for a larger annual harvest increased considerably in 2007 with the inclusion of a significant portion of the NER in the area where bison hunting is allowed. The participation rate increased again (to 307) in 2008. With improved notification and public awareness about better success due to improved hunting access, we hope to have participation rates closer to 90 percent (350 hunters) in future years and to have harvests that will help decrease the population to its objective. Bison harvest decreased three percent from 2007 to 2008. Hunter success in 2008 decreased substantially (12%), and was above the five-year average (81.1 percent). Hunter effort was 8.6 days/bison harvested, which is a substantial increase from 3.1 days/bison harvested in 2007 and is above the average (6.8 days/bison harvested). Social and political concerns continue to influence management of the bison herd.
Five-year trends in Wyoming’s bison program. Harvest, recreation and licenses issued are by calendar year. Revenue and costs are by fiscal year.
Year Harvest Rec. Days Success Days/
AnimalLic.Sold
Lic.Rev. ($)
ProgramCosts ($)
2004 31 100 59.6% 10.5 52 24,173 33,162
2005 36 270 73.5% 6.8 49 23,219 15,728
2006 48 273 92.3% 5.0 52 30,732 21,928
2007 267 824 96.0% 3.1 277 125,315 336,837
2008 258 2,223 84.0% 8.6 307 180,681 216,062 1 Calculations prior to 2003 were based on the report, 1989 Hunting and Fishing Expenditure Estimates for Wyoming, 1990. However, these calculations could not be reproduced. The 2003 calculations were derived from the report, Hunting and Trapping Expenditures in Wyoming During the 2001 Season, 2002 using average per day expenditures. Hunter expenditure was calculated from the 2001 cost per day expenditure, corrected for inflation using the Consumer Price Index (2001 per day expenditure x 1.043 = 2003 per day expenditure, 2001 per day expenditure x 1.078 = 2004 per day expenditure, 2001 per day expenditure x 1.115 = 2005 per day expenditure). 2006, 2007 and 2008 Hunter expenditure was calculated from the previous year’s Hunter expenditure corrected for inflation using the Consumer Price Index (2006 was 1.03, 2007 was 1.03, 2008 was 1.04). *Includes allocated application fees, conservation stamp revenue, federal/other grants, general funds ($59,092) and interest earned on Department cash balances.

TROPHY GAME
Black Bear
Grizzly Bear Mountain Lion


A-9
BLACK BEAR 2008: Population: Not available Licenses Sold: 3,257 Population Objective: Not available License Revenue: $ 244,631 Harvest: 393 All Other Agency Revenue*: $ 90,016 Hunters: 2,235 Total Program Revenue: $ 334,647 Success Rate: 18% Program Costs: $ 682,477 Recreation Days: 21,577 Hunter Expenditures: 1 $ 1,647,427 Days/Animal: 54.9 Cost Dept. Per Animal: $ 1,737 Economic Return per Animal: $ 4,192 Black bears occupy all the major mountain ranges of Wyoming, with the exception of the Black Hills. Most black bears are found in the northwestern part of the state, the Bighorn Mountains and the mountains of south central Wyoming. Black bears are hunted in Wyoming during the spring and fall. Successful bear hunters are required to report bear harvest to a Department game warden, wildlife biologist or regional office within three days of the harvest. Accurate harvest information is vital to management of black bears in Wyoming since other forms of data are hard to collect. The 2008 harvest increased substantially (38%) from 2007. Quotas have been increased in recent years to address increasing bear/human and bear/livestock conflicts and the perception the statewide population is growing. Bear/human conflicts are most often a result of the bears’ attraction or habituation to human related foods. Drought or ill-timed precipitation during the growing season have affected bear food sources, which exacerbates the problem of bears seeking access to human related foods and coming into conflict. The 2008 hunter success rate was higher than the previous year and above the five-year average of 14 percent. The 2008 hunter effort decreased and was below the average (69.3 days/animal harvested).
Five-year trends in Wyoming's black bear program. Harvest, recreation and licenses issued are by calendar year. Revenue and costs are by fiscal year.
Year
Harvest
Rec. Days
Success
Days/Animal
Lic.Sold
Lic.Revenue
($)
Mgmt. Costs ($)
Hunter ($)Expend.1
2004 294 22,471 13% 76.4 2,949 171,414 480,138 1,505,337
2005 277 21,043 12% 76.0 2,904 174,576 482,313 1,456,180
2006 280 18,570 14% 66.3 2,986 191,889 283,438 1,323,599
2007 285 20,768 13% 72.9 3,252 201,341 1,076,992 1,524,672
2008 393 21,577 18% 54.9 3,257 244,631 682,477 1,647,4271 The 2003 calculations were derived from the report, Hunting and Trapping Expenditures in Wyoming During the 2001 Season, 2002 using average per day expenditures. Hunter expenditure was calculated from the 2001 cost per day expenditure, corrected for inflation using the Consumer Price Index (2001 per day expenditure x 1.043 = 2003 per day expenditure, 2001 per day expenditure x 1.078 = 2004 per day expenditure, 2001 per day expenditure x 1.115 = 2005 per day expenditure). 2006, 2007 and 2008 Hunter expenditure was calculated from the previous year’s Hunter expenditure corrected for inflation using the Consumer Price Index (2006 was 1.03, 2007 was 1.03, 2008 was 1.04). *Includes allocated application fees, conservation stamp revenue, federal/other grants, and interest earned on Department cash balances.

A-10
GRIZZLY BEAR OBJECTIVES: To meet those parameters identified in the Conservation Strategy for the Grizzly Bear in the Yellowstone Area. To maintain at least 7,229 square miles of occupied grizzly bear habitat. To obtain the informed consent of all potentially affected interests in structuring the population objectives, management strategies, and regulations. The distribution of the Yellowstone grizzly bear population includes much of northwest Wyoming, mainly Yellowstone National Park and the Caribou-Targhee, Bridger-Teton, and Shoshone National Forests. The Yellowstone population was removed from ‘threatened’ status under the Endangered Species Act in 2007. That population is now being managed according to state management plans developed by Wyoming, Montana and Idaho and approved by the U. S. Fish and Wildlife Service. The Yellowstone Ecosystem Subcommittee, which was responsible for recovery, has been replaced by the Yellowstone Grizzly Coordinating Committee, which will coordinate management according to the state plans and the population’s conservation strategy. A means to determine annual allowable sport harvest (in addition to agency conflict removals) has been established, and Wyoming is developing hunting strategies. The Department will continue to participate in all aspects of management of this population, including monitoring and conflict resolution.
Five-year trends in Wyoming’s grizzly bear program. Fiscal Year Management Costs ($)
FY 2005 1,048,088
FY 2006 1,237,122
FY 2007 1,182,214
FY 2008 1,359,017
FY 2009 1,746,787

A-11
MOUNTAIN LION 2008: Population: Not available Licenses Sold: 1,759 Population Objective: Not available License Revenue: $ 89,267 Harvest: 212 All Other Agency Revenue*: $ 49,399 Hunters: 1,211 Total Program Revenue: $ 138,666 Success Rate: 18% Program Costs: $ 517,806 Recreation Days: 13,236 Hunter Expenditures: 2 $ 2,401,901 Days/Animal: 62.4 Cost Dept. Per Animal: $ 2,442 Economic Return per Animal: $ 11,330 The mountain lion is distributed throughout much of the state and has been managed as a trophy game species in Wyoming since 1974. It prefers rugged foothills and mountainous terrain, which provide cover, den sites and suitable prey bases. The mountain lion is an opportunistic predator that occupies established and well-defended territories. The mountain lion has been managed in Wyoming through annual mortality quotas. When a hunt area harvest quota is reached, the area is closed for the remainder of the season. The state mountain lion management plan approved by the Wyoming Game and Fish Commission in 2007 and implemented by the Department describes a ‘sink/stable/source areas’ strategy for managing mountain lions across the state in the future. The 2008 mountain lion harvest was 7% and 14% higher than 2007 and 2006, respectively. Hunter effort in 2008 increased 13% (62.4 days/lion) from 2007 (55.3 days/lion) and 1791% (3.3 days/lion) from 2006. This drastic change is primarily due to a change in the way effort is calculated. Until 2007, effort was calculated for only successful legal hunters completing the mandatory check of their harvested animal. Beginning in 2007, effort of all hunters is estimated annually from the results of a harvest survey of all mountain lion hunters.
Five-year trends in Wyoming's mountain lion program. Harvest, recreation and licenses issued are by calendar year. Revenue and costs are by fiscal year.
Year
Harvest
Rec. Days
Success1 Days/Animal
LicensesSold
LicenseRevenue ($)
Mgmt. Costs ($)
HunterExpend. ($)2, 3
2004 181 --- 12% --- 1,530 67,161 335,197 100,858
2005 175 --- 11% --- 1,548 71,706 393,315 100,821
2006 186 --- 12% --- 1,553 68,542 444,845 104,015
2007 198 10,944 19% 55.3 1680 78,958 399,474 1,909,594
2008 212 13,236 18% 62.4 1759 89,267 517,806 2,401,9011 Calculations prior to 2007 were based on the number of licenses sold. 2 The 2003 calculations were based on the report, Hunting and Trapping Expenditures in Wyoming During the 2001 Season, 2002 using average per day expenditures. Hunter expenditure for 2004 was calculated from the 2003 estimate, with inflation corrected for by using the Consumer Price Index (2003 per day expenditure x 1.033 = 2004 per day expenditure, 2003 per day expenditure x 1.068 = 2005 per day expenditure). 2006, 2007 and 2008 Hunter expenditure was calculated from the previous year’s Hunter expenditure corrected for inflation using the Consumer Price Index (2006 was 1.03, 2007 was 1.03, 2008 was 1.04). 3 From 2000-2006, recreation days were not estimated in the harvest survey; therefore, hunter expenditures for these years were recalculated to reflect the change. *Includes allocated application fees, conservation stamp revenue, federal/other grants, and interest earned on Department cash balances.

A-12

SMALL GAME
Cottontail
Snowshoe Hare Squirrel


A-13
COTTONTAIL 2008: Population: Not available Licenses Sold: **
Population Objective: Not available License Revenue: $ ** Harvest: 31,343 All Other Agency Revenue*: $ ** Hunters: 5,639 Total Program Revenue: $ ** Animals/Hunter: 5.6 Program Costs: $ ** Recreation Days: 18,963 Hunter Expenditures: 1 $ 5,214,111 Days/Animal: 0.6 Cost Dept. Per Animal: $ Not Available Economic Return per Animal: $ 166 The cottontail rabbit is the most popular small game animal in Wyoming. It is found in a variety of habitats throughout the state including shrub communities, farmlands, urban and suburban areas in low to mid elevations. The cottontail population cannot be accurately estimated. Hunter success and harvest are directly associated with the cyclic nature of this species’ abundance.
The 2008 harvest statistics, and general observations of cottontail abundance over the past year, indicate that the population continues to decline. Harvest decreased from a recent high of 89,823 in 2005 to 31,343 in 2008. Hunter numbers and recreation days both declined dramatically from 2007 to 2008. The number of animals harvested per hunter also decreased from 2007 and is now below the five-year average (8.2 animals/hunter). The number of days/animal increased from 2007 to 2008 and is above the five-year average (0.4 days/animal). The Department will continue to maintain the current hunting season structure and bag limits since hunting has little effect on cottontail populations.
Five-year trends in Wyoming's cottontail program. Harvest, recreation and licenses issued are by calendar year. Revenue and costs are by fiscal year.Fiscal Year
Harvest
Rec. Days
Animal/ Hunter
Days/ Animal
Number Hunters
License Revenue ($)
Mgmt. Costs ($)
Hunter ($) Expend.1
2004 47,531 20,872 7.8 0.5 6,076 ** ** 5,032,573
2005 89,823 30,842 10.0 0.3 8,967 ** ** 7,686,134
2006 86,769 30,603 9.7 0.4 8,957 ** ** 7,855,370
2007 60,511 24,868 8.0 0.4 7,540 ** ** 6,574,772
2008 31,343 18,963 5.6 0.6 5,639 ** ** 5,214,111 **All small game and small game/game bird and migratory bird license revenue and expenditure information is shown on the pheasant schedule as separate information is not available due to combination licenses. 1 Beginning in 2003, this figure was calculated using the report, Wyoming Small/Upland Game Bird Expenditure Survey, 2001 using average per day expenditures. Data for this survey were collected during the 1999 season. Hunter expenditure was calculated from the 1999 cost per day expenditure, corrected for inflation using the Consumer Price Index (1999 per day expenditure x 1.096 = 2003 per day expenditure, 1999 per day expenditure x 1.132 = 2004 per day expenditure). 2005 Hunter expenditure was calculated from the 2005 cost per day expenditure, corrected for inflation using the Consumer Price Index (2005 per day expenditure x 1.03). 2006, 2007 and 2008 Hunter expenditure was calculated from the previous year’s Hunter expenditure corrected for inflation using the Consumer Price Index (2006 was 1.03, 2007 was 1.03, 2008 was 1.04). *Includes allocated application fees, conservation stamp revenue, federal/other grants, and interest earned on Department cash balances.

A-14
SNOWSHOE HAREs 2008: Population: Not available Licenses Sold: **
Population Objective: Not available License Revenue: $ ** Harvest: 390 All Other Agency Revenue*: $ ** Hunters: 230 Total Program Revenue: $ ** Animals/Hunter: 1.7 Program Costs: $ ** Recreation Days: 1,885 Hunter Expenditures: 1 $ 518,304 Days/Animal: 4.8 Cost Dept. Per Animal: $ Not Available Economic Return per Animal: $ 1,329 The snowshoe hare is distributed throughout most of the mountain conifer forests of the state. Snowshoe hare hunting is not as popular as other small game hunting, and most snowshoes are likely taken incidentally during big game seasons. Snowshoe hare populations are cyclic, and hunter participation and harvest appear to follow population trends. During most years, fluctuations of hare populations are not consistent across the state; peak snowshoe harvest varies from region to region. The snowshoe harvest increased from 2007, but was below the five-year average (485 animals). Fewer hunters harvested snowshoe hares at a higher rate than in 2007 and invested slightly less effort. The number of hares harvested per hunter in 2008 was slightly below the five-year average (1.8 animals/hunter), and the 2008 effort rate was above average (3.1 days/animal).
Five-year trends in Wyoming's snowshoe hare program. Harvest, recreation and licenses issued are by calendar year. Revenue and costs are by fiscal year.Fiscal Year
Harvest
Rec. Days
Animal/ Hunter
Days/ Animal
Number Hunters
License Revenue ($)
Mgmt. Costs ($)
Hunter ($) Expend.1
2004 343 1,004 1.0 2.9 347 ** ** 242,080
2005 703 815 2.9 1.2 239 ** ** 203,106
2006 660 999 1.9 1.5 349 ** ** 256,429
2007 328 1,633 1.3 5.0 257 ** ** 431,743
2008 390 1,885 1.7 4.8 230 ** ** 518,304 **All small game and small game/game bird and migratory bird license revenue and expenditure information is shown on the pheasant schedule as separate information is not available due to combination licenses. 1 Beginning in 2003, this figure was calculated using the report, Wyoming Small/Upland Game Bird Expenditure Survey, 2001 using average per day expenditures. Data for this survey were collected during the 1999 season. Hunter expenditure was calculated from the 1999 cost per day expenditure, corrected for inflation using the Consumer Price Index (1999 per day expenditure x 1.096 = 2003 per day expenditure, 1999 per day expenditure x 1.132 = 2004 per day expenditure). 2005 Hunter expenditure was calculated from the 2005 cost per day expenditure, corrected for inflation using the Consumer Price Index (2005 per day expenditure x 1.03). 2006, 2007 and 2008 Hunter expenditure was calculated from the previous year’s Hunter expenditure corrected for inflation using the Consumer Price Index (2006 was 1.03, 2007 was 1.03, 2008 was 1.04). *Includes allocated application fees, conservation stamp revenue, federal/other grants, and interest earned on Department cash balances.

A-15
SQUIRREL 2008: Population: Not available Licenses Sold: ** Population Objective: Not available License Revenue: $ ** Harvest: 1,584 All Other Agency Revenue*: $ ** Hunters: 351 Total Program Revenue: $ ** Animals/Hunter: 4.5 Program Costs: $ ** Recreation Days: 2,182 Hunter Expenditures: 1 $ 599,968 Days/Animal: 1.4 Cost Dept. Per Animal: $ Not Available Economic Return per Animal: $ 379 Red squirrels occupy mountain conifer forests at mid to upper elevations throughout the state. Fox squirrels occupy low elevation deciduous forests, cottonwood-riparian areas, agricultural and urban areas. Squirrel hunter participation and harvest increased in 2008. According to the 2008 harvest survey, 351 hunters harvested an estimated 1,584 squirrels. Hunters invested more effort per squirrel harvested in 2008 than 2007, and each hunter harvested the same number of squirrels on average in 2008 as in 2007. Squirrel hunting in Wyoming is not as popular as it is in other parts of the country. In Wyoming, most squirrel harvest is incidental to other hunting pursuits. The Department will maintain the current season structures since hunting has little effect on squirrel populations.
Five-year trends in Wyoming's squirrel program. Harvest, recreation and licenses issued are by calendar year. Revenue and costs are by fiscal year.Fiscal Year
Harvest
Rec. Days
Animal/ Hunter
Days/ Animal
Number Hunters
License Revenue ($)
Mgmt. Costs ($)
Hunter ($) Expend.1
2004 1,607 1,333 5.2 0.8 307 ** ** 321,408
2005 1,434 1,242 4.7 0.9 306 ** ** 309,519
2006 1,212 1,463 3.3 1.2 367 ** ** 375,532
2007 1,066 1,052 4.5 1.0 239 ** ** 278,135
2008 1,584 2,182 4.5 1.4 351 ** 599,968 **All small game and small game/game bird and migratory bird license revenue and expenditure information is shown on the pheasant schedule as separate information is not available due to combination licenses. 1 Beginning in 2003, this figure was calculated using the report, Wyoming Small/Upland Game Bird Expenditure Survey, 2001 using average per day expenditures. Data for this survey were collected during the 1999 season. Hunter expenditure was calculated from the 1999 cost per day expenditure, corrected for inflation using the Consumer Price Index (1999 per day expenditure x 1.096 = 2003 per day expenditure, 1999 per day expenditure x 1.132 = 2004 per day expenditure). 2005 Hunter expenditure was calculated from the 2005 cost per day expenditure, corrected for inflation using the Consumer Price Index (2005 per day expenditure x 1.03). 2006, 2007 and 2008 Hunter expenditure was calculated from the previous year’s Hunter expenditure corrected for inflation using the Consumer Price Index (2006 was 1.03, 2007 was 1.03, 2008 was 1.04). *Includes allocated application fees, conservation stamp revenue, federal/other grants, and interest earned on Department cash balances.

A-16

2009 ANNUAL REPORT
Wyoming Game and Fish Department


UPLAND GAME
Pheasant
Gray Partridge Chukar
Sage Grouse Sharp-Tailed Grouse
Blue Grouse Ruffed Grouse
Mourning Dove Turkey


A-17
PHEASANT 2008: Population: Not available Licenses Sold: 26,234
Population Objective: Not available License Revenue: $ 656,241 Harvest: 42,359 All Other Agency Revenue*: $ 1,219,150 Hunters: 9,888 Total Program Revenue: $ 1,875,391 Bird/Hunter: 4.3 Program Costs: $ 5,035,168 Recreation Days: 37,938 Hunter Expenditures: 1 $ 10,431,522 Days/Bird: 0.9 Cost Dept. Per Bird: $ 119 Economic Return per Bird: $ 246 The pheasant is not as abundant in Wyoming as it is in neighboring states, but there are many opportunities to hunt this popular upland game bird in eastern and north central Wyoming. Weather and habitat conditions are the primary influences on most of the state’s pheasant populations. Pheasant hunting has improved considerably with the implementation and expansion of Wyoming’s Walk-In Access Program, which has opened thousands of acres of private lands to hunting since its inception. The majority of Wyoming’s pheasant hunting occurs in Goshen County, but there are other opportunities near Riverton, in the Bighorn Basin and in the Sheridan area. Established pheasant populations are supplemented by releases from the Department’s Downar and Sheridan Bird Farms. The 2008 pheasant season continued a decline in recreation days and number of hunters from a high in 2005, while harvest stablilized. Hunter effort has remained fairly constant since 2004. Hunter success was similar in 2007 and 2008 and was one bird per hunter below a recent high in 2005. The 2008 harvest rate was below average (4.5 birds/hunter) while hunter effort rate was average (0.9 days/bird).
Five-year trends in Wyoming's pheasant program. Harvest, recreation and licenses issued are by calendar year. Revenue and costs are by fiscal year.Fiscal Year
Harvest
Rec. Days
Bird/ Hunter
Days/ Bird
Number Hunters
License Revenue
($)
Mgmt. Costs ($)
Hunter ($) Expend.1
2004 34,322 28,691 4.6 0.8 7,529 ** ** 6,917,859
2005 65,979 51,253 5.2 0.8 12,573 ** ** 12,772,760
2006 46,164 40,322 4.2 0.9 11,017 ** ** 10,350,105
2007 42,333 39,245 4.2 0.9 10,186 594,597 2,587,351 10,375,863
2008 42,359 37,938 4.3 0.9 9,888 656,241 5,035,168 10,431,522**All small game and small game/game bird and migratory bird license revenue and expenditure information (excepting sage grouse) is shown on the pheasant schedule as separate information is not available due to combination licenses. 1 Beginning in 2003, this figure was calculated using the report, Wyoming Small/Upland Game Bird Expenditure Survey, 2001 using average per day expenditures. Data for this survey were collected during the 1999 season. Hunter expenditure was calculated from the 1999 cost per day expenditure, corrected for inflation using the Consumer Price Index (1999 per day expenditure x 1.096 = 2003 per day expenditure, 1999 per day expenditure x 1.132 = 2004 per day expenditure). 2005 Hunter expenditure was calculated from the 2005 cost per day expenditure, corrected for inflation using the Consumer Price Index (2005 per day expenditure x 1.03). 2006, 2007 and 2008 Hunter expenditure was calculated from the previous year’s Hunter expenditure corrected for inflation using the Consumer Price Index (2006 was 1.03, 2007 was 1.03, 2008 was 1.04). *Includes allocated application fees, conservation stamp revenue, federal/other grants, and interest earned on Department cash balances.

A-18
GRAY PARTRIDGE 2008: Population: Not available Licenses Sold: ** Population Objective: Not available License Revenue: $ ** Harvest: 1,381 All Other Agency Revenue*: $ ** Hunters: 890 Total Program Revenue: $ ** Bird/Hunter: 1.6 Program Costs: $ ** Recreation Days: 2,882 Hunter Expenditures: $ 792,441 Days/Bird: 2.1 Cost Dept. Per Bird: $ Not Available Economic Return per Bird: $ 574 The gray (Hungarian) partridge, a native of eastern Europe and central and southwest Asia, is most abundant in Sheridan County and the Bighorn Basin; but it can be found in many other parts of the state. The gray partridge was introduced to Wyoming in the early 1900s to provide additional hunting opportunity for the sportsmen of Wyoming. Wyoming’s gray partridge population has suffered from prolonged drought and its influence on habitat conditions. This species’ numbers have dropped considerably since the turn of the century. Between 1999 and 2003, harvest declined 90 percent, hunter numbers declined 82 percent, and recreation days declined 86 percent. Harvest and hunter numbers then increased in 2003, 2004 and 2005. From 2005 to 2007, harvest and hunter numbers declined again (74 percent and 65 percent, respectively). Then harvest and hunter numbers nearly doubled (50 percent and 46 percent, respectively) from 2007 to 2008. Because the gray partridge is very sensitive to drought, severe winters, and wet nesting and brood rearing periods, weather conditions can dictate its abundance and, in turn, hunter activity. This is borne out in the harvest statistics of the past 5 years. Hunting is a minor influence on gray partridge populations. Like other upland game birds, nesting and brood rearing success from the summer preceding the hunting season play a major role in hunter success and participation.
Five-year trends in Wyoming's gray partridge program. Harvest, recreation and licenses issued are by calendar year. Revenue and costs are by fiscal year.Fiscal Year
Harvest
Rec. Days
Bird/ Hunter
Days/ Bird
Number Hunters
License Revenue ($)
Mgmt. Costs ($)
Hunter ($) Expend.1
2004 2,607 3,355 2.6 1.3 993 ** ** 808,944
2005 3,520 5,335 2.0 1.5 1,750 ** ** 1,329,535
2006 1,582 3,190 1.7 2.0 925 ** ** 818,829
2007 919 2,579 1.5 2.8 609 ** ** 681,854
2008 1,381 2,882 1.6 2.1 890 ** ** 792,441**All small game and small game/game bird and migratory bird license revenue and expenditure information is shown on the pheasant schedule as separate information is not available due to combination licenses. 1 Beginning in 2003, this figure was calculated using the report, Wyoming Small/Upland Game Bird Expenditure Survey, 2001 using average per day expenditures. Data for this survey were collected during the 1999 season. Hunter expenditure was calculated from the 1999 cost per day expenditure, corrected for inflation using the Consumer Price Index (1999 per day expenditure x 1.096 = 2003 per day expenditure, 1999 per day expenditure x 1.132 = 2004 per day expenditure). 2005 Hunter expenditure was calculated from the 2005 cost per day expenditure, corrected for inflation using the Consumer Price Index (2005 per day expenditure x 1.03). 2006, 2007 and 2008 Hunter expenditure was calculated from the previous year’s Hunter expenditure corrected for inflation using the Consumer Price Index (2006 was 1.03, 2007 was 1.03, 2008 was 1.04). *Includes allocated application fees, conservation stamp revenue, federal/other grants, and interest earned on Department cash balances.

A-19
CHUKAR 2008: Population: Not available Licenses Sold: ** Population Objective: Not available License Revenue: $ ** Harvest: 7,900 All Other Agency Revenue*: $ ** Hunters: 2,156 Total Program Revenue: $ ** Bird/Hunter: 3.7 Program Costs: $ ** Recreation Days: 7,292 Hunter Expenditures: $ 2,005,025 Days/Bird: 0.9 Cost Dept. Per Bird: $ Not Available Economic Return per Bird: $ 254 The chukar partridge, which is native to Europe and Asia, was first released in Wyoming in the 1930s. Small populations of chukars are scattered throughout Wyoming in rocky, steep habitats; but the largest concentrations are found in the Bighorn Basin. The chukar harvest declined 10 percent in 2004, almost tripled in 2005 for reasons that are not understood, then decreased 24 percent in 2006 and another eight percent in 2007. Harvest increased four percent from 2007 to 2008. Hunter numbers increased 20 percent from 2007 to 2008, and recreation days increased 19 percent from 2007 to 2008. The result for 2008 was a harvest per hunter that was below average (3.9 birds/hunter) and an effort rate that equaled the average (0.9 days/bird). Because the chukar is very sensitive to drought and severe winters, weather conditions can dictate its abundance and the resulting hunter interest. Hunting seems to play a minor role in chukar abundance. Like other upland game birds, nesting and brood rearing success from the summer preceding the hunting season play a major role in hunter success and participation.
Five-year trends in Wyoming's chukar program. Harvest, recreation and licenses issued are by calendar year. Revenue and costs are by fiscal year.
Fiscal Year
Harvest
Rec. Days
Bird/ Hunter
Days/ Bird
Number Hunters
License Revenue ($)
Mgmt. Costs ($)
Hunter ($) Expend.1
2004 3,715 4,347 2.8 1.2 1,327 ** ** 1,048,131
2005 10,909 8,302 4.4 0.8 2,465 ** ** 2,068,941
2006 8,315 6,558 4.2 0.8 1,963 ** ** 1,683,348
2007 7,609 6,121 4.2 0.8 1,795 ** ** 1,618,312
2008 7,900 7,292 3.7 0.9 2,156 ** ** 2,005,025**All small game and small game/game bird and migratory bird license revenue and expenditure information is shown on the pheasant schedule as separate information is not available due to combination licenses. 1 Beginning in 2003, this figure was calculated using the report, Wyoming Small/Upland Game Bird Expenditure Survey, 2001 using average per day expenditures. Data for this survey were collected during the 1999 season. Hunter expenditure was calculated from the 1999 cost per day expenditure, corrected for inflation using the Consumer Price Index (1999 per day expenditure x 1.096 = 2003 per day expenditure, 1999 per day expenditure x 1.132 = 2004 per day expenditure). 2005 Hunter expenditure was calculated from the 2005 cost per day expenditure, corrected for inflation using the Consumer Price Index (2005 per day expenditure x 1.03). 2006, 2007 and 2008 Hunter expenditure was calculated from the previous year’s Hunter expenditure corrected for inflation using the Consumer Price Index (2006 was 1.03, 2007 was 1.03, 2008 was 1.04). *Includes allocated application fees, conservation stamp revenue, federal/other grants, and interest earned on Department cash balances.

A-20
SAGE-GROUSE 2008: Population: Not available Licenses Sold: Population Objective: Not available License Revenue: $ Harvest: 10,303 All Other Agency Revenue*: $ 1,243,523 Hunters: 4,747 Total Program Revenue: $ 1,243,523 Bird/Hunter: 2.2 Program Costs: $ 3,375,155 Recreation Days: 10,065 Hunter Expenditures: $ 2,767,496 Days/Bird: 1.0 Cost Dept. Per Bird: $ 328 Economic Return per Bird: $ 269 Depressed sage-grouse populations have been a concern for states within the historic range of the species since sharp declines were detected in the early 1990s. Wyoming’s sage-grouse populations are considered to be below historic levels, but have increased in the past few years due to favorable weather conditions and the response of habitats to these conditions. Sage-grouse continue to sustain the light harvest allowed by conservative season structures. Harvest has little effect on sage-grouse populations compared to the influence of habitat loss and condition. However, since 1995, sage-grouse seasons have been shortened and have opened later in the year to protect hens with broods. Closures have been in effect in parts of the state since 2000 to protect small populations in isolated, severely degraded habitats or where West Nile Virus caused significant declines in sage-grouse numbers in the Powder River Basin. Sage-grouse seasons were again conservative in 2008. The 2008 harvest, hunter numbers and recreation days decreased slightly from 2007 (1 percent, 8 percent and 6 percent, respectively). Harvest rate increased from 2007 to 2008, while effort remained stable. Harvest rate was below the five-year average (2.3 birds/hunter), and hunter effort was average (1.0 days/bird). The Department is involved in interstate sage-grouse conservation efforts. It will continue to monitor sage-grouse populations, press for minimization and mitigation of environmental impacts in sagebrush habitats, and try to improve habitat conditions throughout the state.
Five-year trends in Wyoming's sage grouse program. Harvest, recreation and licenses issued are by calendar year. Revenue and costs are by fiscal year.Fiscal Year
Harvest
Rec. Days
Bird/ Hunter
Days/ Bird
Number Hunters
License Revenue ($)
Mgmt. Costs ($)
Hunter ($) Expend.1
2004 11,783 13,296 2.2 1.1 5,436 ** ** 3,205,878
2005 13,176 12,176 2.5 0.9 5,231 ** ** 3,034,381
2006 12,920 11,981 2.4 0.9 5,412 ** ** 3,075,359
2007 10,378 10,699 2.0 1.0 5,180 ** 2,536,600 2,828,675
2008 10,303 10,065 2.2 1.0 4,747 ** 3,375,155 2,767,496**All small game and small game/game bird and migratory bird license revenue is shown on the pheasant schedule as separate information is not available due to combination licenses. Expenditures for sage grouse include $531,192 in general funds. 1Beginning in 2003, this figure was calculated using the report, Wyoming Small/Upland Game Bird Expenditure Survey, 2001 using average per day expenditures. Data for this survey were collected during the 1999 season. Hunter expenditure was calculated from the 1999 cost per day expenditure, corrected for inflation using the Consumer Price Index (1999 per day expenditure x 1.096 = 2003 per day expenditure, 1999 per day expenditure x 1.132 = 2004 per day expenditure). 2005 Hunter expenditure was calculated from the 2005 cost per day expenditure, corrected for inflation using the Consumer Price Index (2005 per day expenditure x 1.03). 2006, 2007 and 2008 Hunter expenditure was calculated from the previous year’s Hunter expenditure corrected for inflation using the Consumer Price Index (2006 was 1.03, 2007 was 1.03, 2008 was 1.04). *Includes allocated application fees, conservation stamp revenue, federal/other grants, and interest earned on Department cash balances.

A-21
SHARP-TAILED GROUSE 2008: Population: Not available Licenses Sold: ** Population Objective: Not available License Revenue: $ ** Harvest: 1,900 All Other Agency Revenue*: $ ** Hunters: 940 Total Program Revenue: $ ** Bird/Hunter: 2.0 Program Costs: $ ** Recreation Days: 3,374 Hunter Expenditures: $ 927,723 Days/Bird: 1.8 Cost Dept. Per Bird: $ Not Available Economic Return per Bird: $ 488 Sharp-tailed grouse occur primarily in eastern Wyoming. Thousands of acres of marginal farmlands in the state were converted to wildlife habitat that benefit sharp-tailed grouse beginning in the mid 1980s as part of the Conservation Reserve Program. And, the Department’s Walk-In Access Program, begun in 1998, has greatly improved sharp-tailed grouse hunting opportunities. Several consecutive years of drought, followed by very favorable moisture conditions in recent years have affected the state’s sharp-tailed grouse population. The harvest has fluctuated over the past five years, and it increased 20 percent from 2007 to 2008. The harvest in recent years is much lower than it was near the turn of the century. The 2008 harvest was 84 percent less than the 2000 harvest and 52 percent less than the 2001 harvest. The number of hunters and recreation days increased from 2007 to 2008 (18 percent and 15 percent, respectively). The success rate and hunter effort remained stable in 2008, equaling the five-year averages (2.0 birds/hunter and 1.8 days/bird, respectively).
Five-year trends in Wyoming's sharp-tailed grouse program. Harvest, recreation and licenses issued are by calendar year. Revenue and costs are by fiscal year.Fiscal Year
Harvest
Rec. Days
Bird/ Hunter
Days/ Bird
Number Hunters
License Revenue ($)
Mgmt. Costs ($)
Hunter ($) Expend.1
2004 1,429 3,686 1.5 2.6 959 ** ** 888,754
2005 2,712 3,729 2.4 1.4 1,128 ** ** 929,304
2006 2,337 3,502 2.1 1.5 1,124 ** ** 898,915
2007 1,589 2,936 2.0 1.8 800 ** ** 776,240
2008 1,900 3,374 2.0 1.8 940 ** ** 927,723 **All small game and small game/game bird and migratory bird license revenue and expenditure information is shown on the pheasant schedule as separate information is not available due to combination licenses. 1 Beginning in 2003, this figure was calculated using the report, Wyoming Small/Upland Game Bird Expenditure Survey, 2001 using average per day expenditures. Data for this survey were collected during the 1999 season. Hunter expenditure was calculated from the 1999 cost per day expenditure, corrected for inflation using the Consumer Price Index (1999 per day expenditure x 1.096 = 2003 per day expenditure, 1999 per day expenditure x 1.132 = 2004 per day expenditure). 2005 Hunter expenditure was calculated from the 2005 cost per day expenditure, corrected for inflation using the Consumer Price Index (2005 per day expenditure x 1.03). 2006, 2007 and 2008 Hunter expenditure was calculated from the previous year’s Hunter expenditure corrected for inflation using the Consumer Price Index (2006 was 1.03, 2007 was 1.03, 2008 was 1.04). *Includes allocated application fees, conservation stamp revenue, federal/other grants, and interest earned on Department cash balances.

A-22
BLUE GROUSE 2008: Population: Not available Licenses Sold: ** Population Objective: Not available License Revenue: $ ** Harvest: 8,611 All Other Agency Revenue*: $ ** Hunters: 3,581 Total Program Revenue: $ ** Bird/Hunter: 2.4 Program Costs: $ ** Recreation Days: 14,396 Hunter Expenditures: $ 3,958,358 Days/Bird: 1.7 Cost Dept. Per Bird: $ Not Available Economic Return per Bird: $ 460 Blue grouse occupy most of Wyoming’s mountain conifer habitats, except for the Black Hills in the northeast corner of the state. They winter among conifers and migrate to lower altitudes with more open cover for the spring and summer. The Department maintains liberal hunting seasons and harvest limitations since hunting has little influence on blue grouse populations. Blue grouse numbers fluctuate primarily due to natural factors such as weather events and, to some degree, land management practices. The extensive conifer beetle outbreaks occurring throughout the state are expected to have a significant effect on blue grouse in the future. Following an increase in 2007, blue grouse harvest declined in 2008. Hunter numbers and recreation days also declined. The 2008 harvest was 17 percent lower than in 2007, and the 2008 hunter numbers were 21 percent lower than in 2007. The 2008 harvest rate and effort rates remained stable from 2007. The harvest rate was average (2.4 birds/hunter), and the effort rate was slightly above the five-year average (1.6 days/bird).
Five-year trends in Wyoming's blue grouse program. Harvest, recreation and licenses issued are by calendar year. Revenue and costs are by fiscal year.Fiscal Year
Harvest
Rec. Days
Bird/ Hunter
Days/ Bird
Number Hunters
License Revenue ($)
Mgmt. Costs ($)
Hunter ($) Expend.1
2004 12,550 20,176 2.4 1.6 5,290 ** ** 4,864,756
2005 13,076 19,782 2.6 1.5 4,986 ** ** 4,929,872
2006 9,324 17,134 2.3 1.8 4,051 ** ** 4,398,063
2007 10,384 16,620 2.3 1.6 4,523 ** ** 4,394,110
2008 8,611 14,396 2.4 1.7 3,581 ** ** 3,958,358 **All small game and small game/game bird and migratory bird license revenue and expenditure information is shown on the pheasant schedule as separate information is not available due to combination licenses. 1 Beginning in 2003, this figure was calculated using the report, Wyoming Small/Upland Game Bird Expenditure Survey, 2001 using average per day expenditures. Data for this survey were collected during the 1999 season. Hunter expenditure was calculated from the 1999 cost per day expenditure, corrected for inflation using the Consumer Price Index (1999 per day expenditure x 1.096 = 2003 per day expenditure, 1999 per day expenditure x 1.132 = 2004 per day expenditure). 2005 Hunter expenditure was calculated from the 2005 cost per day expenditure, corrected for inflation using the Consumer Price Index (2005 per day expenditure x 1.03). 2006, 2007 and 2008 Hunter expenditure was calculated from the previous year’s Hunter expenditure corrected for inflation using the Consumer Price Index (2006 was 1.03, 2007 was 1.03, 2008 was 1.04). *Includes allocated application fees, conservation stamp revenue, federal/other grants, and interest earned on Department cash balances.

A-23
RUFFED GROUSE 2008: Population: Not available Licenses Sold: ** Population Objective: Not available License Revenue: $ ** Harvest: 3,321 All Other Agency Revenue*: $ ** Hunters: 1,482 Total Program Revenue: $ ** Bird/Hunter: 2.2 Program Costs: $ ** Recreation Days: 7,106 Hunter Expenditures: $ 1,953,882 Days/Bird: 2.1 Cost Dept. Per Bird: $ Not Available Economic Return per Bird: $ 588 The ruffed grouse occupies the western and northern forests of Wyoming, including the Black Hills and the Uinta Range. It inhabits dense, brushy habitats within mixed conifer and deciduous tree stands, usually in and along creek bottoms. The Wyoming Range and the mountainous areas around Jackson offer some of the best ruffed grouse habitat and provide the best hunting opportunities in Wyoming. The ruffed grouse harvest decreased in 2008 and was significantly below the five-year average (5,048 birds). Hunter numbers also decreased in 2008, as did recreation days. Hunter effort increased and was above average (1.9 days/bird). Hunter success decreased and was slightly below average (2.4 birds/hunter). Like blue grouse, ruffed grouse populations appear to be affected by weather and land management practices, with hunting playing a minor role in population changes.
Five-year trends in Wyoming's ruffed grouse program. Harvest, recreation and licenses issued are by calendar year. Revenue and costs are by fiscal year.Fiscal Year
Harvest
Rec. Days
Bird/ Hunter
Days/ Bird
Number Hunters
License Revenue ($)
Mgmt. Costs ($)
Hunter ($) Expend.1
2004 6,968 13,903 2.5 2.0 2,836 ** ** 3,352,236
2005 3,182 6,940 2.2 2.2 1,475 ** ** 1,729,517
2006 5,545 9,888 2.6 1.8 2,165 ** ** 2,538,114
2007 6,223 10,012 2.7 1.6 2,274 ** ** 2,647,041
2008 3,321 7,106 2.2 2.1 1,482 ** ** 1,953,882 **All small game and small game/game bird and migratory bird license revenue and expenditure information is shown on the pheasant schedule as separate information is not available due to combination licenses. 1 Beginning in 2003, this figure was calculated using the report, Wyoming Small/Upland Game Bird Expenditure Survey, 2001 using average per day expenditures. Data for this survey were collected during the 1999 season. Hunter expenditure was calculated from the 1999 cost per day expenditure, corrected for inflation using the Consumer Price Index (1999 per day expenditure x 1.096 = 2003 per day expenditure, 1999 per day expenditure x 1.132 = 2004 per day expenditure). 2005 Hunter expenditure was calculated from the 2005 cost per day expenditure, corrected for inflation using the Consumer Price Index (2005 per day expenditure x 1.03). 2006, 2007 and 2008 Hunter expenditure was calculated from the previous year’s Hunter expenditure corrected for inflation using the Consumer Price Index (2006 was 1.03, 2007 was 1.03, 2008 was 1.04). *Includes allocated application fees, conservation stamp revenue, federal/other grants, and interest earned on Department cash balances.

A-24
MOURNING DOVE
2008: Population: Not available Licenses Sold: ** Population Objective: Not available License Revenue: $ ** Harvest: 29,994 All Other Agency Revenue*: $ ** Hunters: 2,315 Total Program Revenue: $ ** Bird/Hunter: 13.0 Program Costs: $ ** Recreation Days: 7,482 Hunter Expenditures: $ 2,057,269 Days/Bird: 0.2 Cost Dept. Per Bird: $ Not Available Economic Return per Bird: $ 69 The mourning dove is the most abundant and widespread game bird in North America. More mourning doves are harvested throughout the country than all other game birds combined. The mourning dove occupies a wide variety of native habitats in Wyoming, as well as farmlands and urban areas. The Wyoming mourning dove harvest decreased 18 percent in 2008. Hunter numbers decreased slightly, and recreation days decreased (about 9 percent). The 2008 harvest rate was below the five-year average, and effort rate was average (13.8 birds/hunter and 0.2 days/bird, respectively). Mourning dove harvest in Wyoming can be greatly reduced when cold weather in late August and early September causes early migration. Mourning dove hunting seasons are set at the national level by the U.S. Fish and Wildlife Service in accordance with the Migratory Bird Treaty. Concern over the decline in morning dove populations based on annual surveys has prompted the U.S. Fish and Wildlife Service to initiate efforts with the states throughout the Flyway system to develop a Morning Dove Strategic Harvest Management Plan. The plan will establish hunting season frameworks based on different population levels as determined through annual population surveys. To date seasons have generally been liberal since harvest was thought to have little impact on dove populations. Changes in habitat are thought to have the most impact on dove populations.
Five-year trends in Wyoming's mourning dove program.
Fiscal Year
Harvest
Rec. Days
Bird/ Hunter
Days/ Bird
Number Hunters
License Revenue ($)
Mgmt. Costs ($)
Hunter ($) Expend.1
2004 32,142 7,645 13.0 0.2 2,471 ** ** 1,843,332
2005 44,280 9,080 13.9 0.2 3,194 ** ** 2,262,827
2006 32,807 7,141 13.3 0.2 2,461 ** ** 1,832,997
2007 36,670 8,256 15.6 0.2 2,351 ** ** 2,182,778
2008 29,994 7,482 13.0 0.2 2,315 ** ** 2,057,269 **All small game and small game/game bird and migratory bird license revenue and expenditure information is shown on the pheasant schedule as separate information is not available due to combination licenses. 1 Beginning in 2003, this figure was calculated using the report, Wyoming Small/Upland Game Bird Expenditure Survey, 2001 using average per day expenditures. Data for this survey were collected during the 1999 season. Hunter expenditure was calculated from the 1999 cost per day expenditure, corrected for inflation using the Consumer Price Index (1999 per day expenditure x 1.096 = 2003 per day expenditure, 1999 per day expenditure x 1.132 = 2004 per day expenditure). 2005 Hunter expenditure was calculated from the 2005 cost per day expenditure, corrected for inflation using the Consumer Price Index (2005 per day expenditure x 1.03). 2006, 2007 and 2008 Hunter expenditure was calculated from the previous year’s Hunter expenditure corrected for inflation using the Consumer Price Index (2006 was 1.03, 2007 was 1.03, 2008 was 1.04). *Includes allocated application fees, conservation stamp revenue, federal/other grants, and interest earned on Department cash balances.

A-25
TURKEY 2008: Population: Not available Licenses Sold: 8,915 Population Objective: Not available License Revenue: $ 242,609 Harvest: 5,125 All Other Agency Revenue*: $ 222,379 Hunters: 7,581 Total Program Revenue: $ 464,988 Bird/Hunter: 0.7 Program Costs: $ 298,506 Recreation Days: 20,950 Hunter Expenditures: $ 5,761,552 Days/Bird: 4.1 Cost Dept. Per Bird: $ 58 Economic Return per Bird: $ 1,124 The wild turkey was originally introduced to Wyoming in 1935 when New Mexico traded nine hens and six gobblers of the Merriam’s subspecies to Wyoming in exchange for sage-grouse. Those first birds were released near Laramie Peak. Until recently, the Merriam’s has been the predominant subspecies in the state. Turkeys are found primarily in the southeastern, northeastern and north-central portions of Wyoming in riparian habitats, on private land and in low elevation conifer habitats. Wild turkey translocations and favorable winter weather over the past decade have resulted in an abundance of turkeys spread over most habitats in the state that will support them. Recent introductions of the Rio Grande subspecies to riparian habitats have further expanded the species’ presence. The turkey harvest increased 10 percent, while hunter numbers decreased 5 percent from 2007 to 2008. As the turkey population in Wyoming has increased under the generally favorable weather regime of the past several years, managers have increased the number of hunt areas with general instead of limited quota licenses. As a result, hunter opportunity and harvest have increased.
Five-year trends in Wyoming's turkey program. Harvest, recreation and licenses issued are by calendar year. Revenue and costs are by fiscal year.
Fiscal Year
Harvest
Rec. Days
Bird/ Hunter
Days/ Bird
Number Hunters
License Revenue ($)
Mgmt. Costs ($)
Hunter ($) Expend.1
2004 3,956 22,238 0.6 5.6 7,094 180,837 304,936 5,358,017
2005 3,855 21,536 0.6 5.6 6,833 183,947 253,273 5,368,003
2006 3,986 20,519 0.6 5.1 6,904 190,192 211,984 5,267,944
2007 4,674 21,042 0.6 4.5 7,945 219,072 325,686 5,564,283
2008 5125 20,930 0.7 4.1 7,581 242,609 298,506 5,761,552
1 Beginning in 2003, this figure was calculated using the report, Wyoming Small/Upland Game Bird Expenditure Survey, 2001 using average per day expenditures. Hunter expenditure for 2004 and 2005 were calculated from the 2003 estimate, with inflation corrected for by using the Consumer Price Index (2003 per day expenditure x 1.033 = 2004 per day expenditure, 2003 per day expenditure x 1.068 = 2005 per day expenditure). 2005 Hunter expenditure was calculated from the 2005 cost per day expenditure, corrected for inflation using the Consumer Price Index (2005 per day expenditure x 1.03). 2006, 2007 and 2008 Hunter expenditure was calculated from the previous year’s Hunter expenditure corrected for inflation using the Consumer Price Index (2006 was 1.03, 2007 was 1.03, 2008 was 1.04). *Includes allocated application fees, conservation stamp revenue, federal/other grants, and interest earned on Department cash balances.

A-26

WATERFOWL
Duck Goose
Sandhill Crane Rail, Snipe, Coot


A-27
DUCK 2008: Population: Not available Licenses Sold: ** Population Objective: Not available License Revenue: $ ** Harvest: 53,158 All Other Agency Revenue*: $ ** Hunters: 6,081 Total Program Revenue: $ ** Bird/Hunter: 8.7 Program Costs: $ ** Recreation Days: 33,331 Hunter Expenditures: $ 9,164,770 Days/Bird: 0.6 Cost Dept. Per Bird: $ Not Available Economic Return per Bird: $ 172 Wyoming supports a variety of duck species throughout the year. Ducks migrate to and through the state along the Central and Pacific Flyways. They occupy most habitats in Wyoming where water is present in good quantity and quality. Drought conditions prevailed in Wyoming up until the last couple of years which created comparatively poor breeding conditions and fall recruitment. Spring water conditions were variable but generally improved recently in the core breeding range of the Canadian prairie provinces and northern prairie states. Consequently, duck population surveys in the traditional survey area indicate the numbers of most duck species have increased and in 2008 were approximately 10% above the long-term average. Hunter numbers, harvest and recreation days decreased significantly in 2008. The 2008 harvest rate was near the five-year average (8.8 birds/hunter), while hunter effort was average (0.6 days/bird).
The Department remains concerned about the degradation and loss of wetlands, other duck habitats and about the status of some duck species. The Department will continue to work with private landowners, other government agencies and conservation organizations to improve habitat conditions for ducks and to increase the amount of habitat available to them.
Five-year trends in Wyoming's duck program. Harvest, recreation and licenses issued are by calendar year. Revenue and costs are by fiscal year.Fiscal Year
Harvest
Rec. Days
Bird/ Hunter
Days/Bird
Number Hunters
License Revenue ($)
Mgmt. Costs ($)
Hunter ($) Expend.1
2004 50,804 32,175 9.3 0.6 5,471 ** ** 7,757,907
2005 72,368 48,039 9.0 0.7 8,072 ** ** 11,971,799
2006 55,545 33,834 8.0 0.6 6,910 ** ** 8,684,724
2007 68,478 39,057 9.1 0.6 7,550 ** ** 10,326,159
2008 53,158 33,331 8.7 0.6 6,081 ** ** 9,164,770**All small game and small game/game bird and migratory bird license revenue and expenditure information is shown on the pheasant schedule as separate information is not available due to combination licenses. 1 Beginning in 2003, this figure was calculated using the report, Wyoming Small/Upland Game Bird Expenditure Survey, 2001 using average per day expenditures. Data for this survey were collected during the 1999 season. Hunter expenditure was calculated from the 1999 cost per day expenditure, corrected for inflation using the Consumer Price Index (1999 per day expenditure x 1.096 = 2003 per day expenditure, 1999 per day expenditure x 1.132 = 2004 per day expenditure,). 2005 Hunter expenditure was calculated from the 2005 cost per day expenditure, corrected for inflation using the Consumer Price Index (2005 per day expenditure x 1.03). 2006, 2007 and 2008 Hunter expenditure was calculated from the previous year’s Hunter expenditure corrected for inflation using the Consumer Price Index (2006 was 1.03, 2007 was 1.03, 2008 was 1.04). *Includes allocated application fees, conservation stamp revenue, federal/other grants, and interest earned on Department cash balances.

A-28
GOOSE 2008: Population: Not available Licenses Sold: ** Population Objective: Not available License Revenue: $ ** Harvest: 33,460 All Other Agency Revenue*: $ ** Hunters: 6,079 Total Program Revenue: $ ** Bird/Hunter: 5.5 Program Costs: $ ** Recreation Days: 32,039 Hunter Expenditures: $ 8,809,519 Days/Bird: 1.0 Cost Dept. Per Bird: $ Not Available Economic Return per Bird: $ 263 Goose hunting in Wyoming continued to be excellent through the drought years around the turn of the century and through the last couple wet years. Harvest of migratory populations of Canada geese depends upon winter weather patterns, which can affect the timing and extent of the migration and the number of birds available to hunters in Wyoming. Canada geese traditionally have provided most of the goose hunting in the state, but the increasing lesser snow goose population and liberalization of hunting opportunities to address its increase have provided hunters with more recreation, especially in late winter and early spring during the Light Goose Conservation Order seasons.
The goose harvest has fluctuated over the past 5 years, ranging from a high in 2005 of 55,678 to a low in 2007 of 19,511. The 2008 harvest increased 71 percent from 2007. Recreation days increased ten percent, while hunter success was above and effort rate was below the five-year average (4.7 birds/hunter and 1.2 days/bird, respectively). Liberal season lengths and bag limits designed to lower goose populations continue to afford hunters abundant harvest opportunities. Liberal seasons will continue, especially the late season Conservation Order for snow and other light geese, as the flyway councils attempt to lower populations to protect important nesting areas from overuse of sensitive forage plants.
Five-year trends in Wyoming's goose program. Harvest, recreation and licenses issued are by calendar year. Revenue and costs are by fiscal year.Fiscal Year
Harvest
Rec. Days
Bird/ Hunter
Days/ Bird
Number Hunters
License Revenue ($)
Mgmt. Costs ($)
Hunter ($) Expend.1
2004 25,938 28,241 5.0 1.1 5,204 ** ** 6,809,357
2005 55,678 50,406 6.4 0.9 8,729 ** ** 12,561,679
2006 22,748 29,522 3.6 1.3 6,344 ** ** 7,577,893
2007 19,511 29,036 3.2 1.5 6,019 ** ** 7,676,738
2008 33,460 32,039 5.5 1.0 6,079 ** ** 8,809,519**All small game and small game/game bird and migratory bird license revenue and expenditure information is shown on the pheasant schedule as separate information is not available due to combination licenses. 1 Beginning in 2003, this figure was calculated using the report, Wyoming Small/Upland Game Bird Expenditure Survey, 2001 using average per day expenditures. Data for this survey were collected during the 1999 season. Hunter expenditure was calculated from the 1999 cost per day expenditure, corrected for inflation using the Consumer Price Index (1999 per day expenditure x 1.096 = 2003 per day expenditure, 1999 per day expenditure x 1.132 = 2004 per day expenditure,). 2005 Hunter expenditure was calculated from the 2005 cost per day expenditure, corrected for inflation using the Consumer Price Index (2005 per day expenditure x 1.03). 2006, 2007 and 2008 Hunter expenditure was calculated from the previous year’s Hunter expenditure corrected for inflation using the Consumer Price Index (2006 was 1.03, 2007 was 1.03, 2008 was 1.04). *Includes allocated application fees, conservation stamp revenue, federal/other grants, and interest earned on Department cash balances.

A-29
SANDHILL CRANE 2008: Population: Not available Licenses Sold: ** Population Objective: Not available License Revenue: $ ** Harvest: 162 All Other Agency Revenue*: $ ** Hunters: 281 Total Program Revenue: $ ** Bird/Hunter: 0.6 Program Costs: $ ** Recreation Days: 562 Hunter Expenditures: $ 154,528 Days/Bird: 3.5 Cost Dept. Per Bird: $ Not Available Economic Return per Bird: $ 954 Two populations of the sandhill crane are found in Wyoming: the Rocky Mountain Greater Sandhill Crane and the Mid-Continent Sandhill Crane. The sandhill crane is managed in cooperation with various western states and the federal government. Most crane harvest occurs in the western part of Wyoming. The Rocky Mountain Population of Sandhill Cranes has increased in size with above average recruitment in the past few years. The Mid-Continent Population of Sandhill Cranes has been relatively stable since the early 1980s, but increased slightly over the past five years. Allowable permit numbers are based on a formula using estimated population from fall staging counts and recruitment within the individual flyways, and these permit quotas determine harvest levels.
In the 2008 season, hunters and harvest increased from the previous year (by 32 percent and 17 percent, respectively). The success rate remained stable from 2007 to 2008, equaling the five-year average. Hunter effort was above average in 2008 (3.3 days/animal harvested).
Five-year trends in Wyoming's Sandhill Crane program. Harvest, recreation and licenses issued are by calendar year. Revenue and costs are by fiscal year.Fiscal Year
Harvest
Rec. Days
Bird/ Hunter
Days/ Bird
Number Hunters
License Revenue ($)
Mgmt. Costs ($)1
Hunter ($) Expend.2
2004 124 343 0.7 2.8 174 ** ** 82,703
2005 116 430 0.6 3.7 196 ** ** 107,160
2006 194 687 0.6 3.5 305 ** ** 176,343
2007 138 418 0.6 3.0 213 ** ** 110,513
2008 162 562 0.6 3.5 281 ** ** 154,528**All small game and small game/game bird and migratory bird license revenue and expenditure information is shown on the pheasant schedule as separate information is not available due to combination licenses. 1 Management costs are for both greater and lesser Sandhill crane. 2 Beginning in 2003, this figure was calculated using the report, Wyoming Small/Upland Game Bird Expenditure Survey, 2001 using average per day expenditures. Data for this survey were collected during the 1999 season. Hunter expenditure was calculated from the 1999 cost per day expenditure, corrected for inflation using the Consumer Price Index (1999 per day expenditure x 1.096 = 2003, 1999 per day expenditure x 1.132 = 2004 per day expenditure). 2005 Hunter expenditure was calculated from the 2005 cost per day expenditure, corrected for inflation using the Consumer Price Index (2005 per day expenditure x 1.03). 2006, 2007 and 2008 Hunter expenditure was calculated from the previous year’s Hunter expenditure corrected for inflation using the Consumer Price Index (2006 was 1.03, 2007 was 1.03, 2008 was 1.04). *Includes allocated application fees, conservation stamp revenue, federal/other grants, and interest earned on Department cash balances.

A-30
RAIL, SNIPE, AND COOT 2008: Population: Not available Licenses Sold: ** Population Objective: Not available License Revenue: $ ** Harvest: 621 All Other Agency Revenue*: $ ** Hunters: 400 Total Program Revenue: $ ** Bird/Hunter: 1.6 Program Costs: $ ** Recreation Days: 1,365 Hunter Expenditures: $ 375,323 Days/Bird: 2.2 Cost Dept. Per Bird: $ Not Available Economic Return per Bird: $ 604 Rail, snipe, and coot are harvested in both the Central and Pacific Flyways in Wyoming. Since these birds are not highly valued as game species or as food sources, the demand is low. Generally, these species are taken incidental to hunting other migratory and upland game birds.
Five-year trends in Wyoming's rail, snipe and coot program. Harvest, recreation and licenses issued are by calendar year. Revenue and costs are by fiscal year.Fiscal Year
Harvest
Rec. Days
Birds/ Hunter
Days/ Bird
Number Hunters
License Revenue ($)
Mgmt. Costs ($)
Hunter ($) Expend.1
2004 505 1,036 2.0 2.1 250 ** ** 249,796
2005 759 1,349 1.7 1.8 440 ** ** 336,184
2006 1,243 1,207 3.6 1.0 346 ** ** 309,820
2007 1,006 1,412 3.7 1.4 273 ** ** 373,314
2008 621 1,365 1.6 2.2 400 ** ** 375,323**All small game and small game/game bird and migratory bird license revenue and expenditure information is shown on the pheasant schedule as separate information is not available due to combination licenses. 1 Beginning in 2003, this figure was calculated using the report, Wyoming Small/Upland Game Bird Expenditure Survey, 2001 using average per day expenditures. Data for this survey were collected during the 1999 season. Hunter expenditure was calculated from the 1999 cost per day expenditure, corrected for inflation using the Consumer Price Index (1999 per day expenditure x 1.096 = 2003, 1999 per day expenditure x 1.132 = 2004 per day expenditure). 2005 Hunter expenditure was calculated from the 2005 cost per day expenditure, corrected for inflation using the Consumer Price Index (2005 per day expenditure x 1.03). 2006, 2007 and 2008 Hunter expenditure was calculated from the previous year’s Hunter expenditure corrected for inflation using the Consumer Price Index (2006 was 1.03, 2007 was 1.03, 2008 was 1.04). *Includes allocated application fees, conservation stamp revenue, federal/other grants, and interest earned on Department cash balances. ** Because program costs were negligible, they are included with other waterfowl management costs.

FISHERIES
Sport Fisheries
Commercial Fisheries


A-31
SPORT FISHERIES 2008: Recreation Day Objectives: 2,778,000 License Revenue: $ 5,429,162 Recreation Days: 1 2,267,594 All Other Agency Revenue: $ 7,046,476 Fish/Day: 2.5 Total Program Revenue: $ 12,475,638 Licenses Sold: 327,464 Program Costs: $ 16,806,936 ** Economic Return Per Day: $71.00 Angler Expenditures: 1,2 $161,203,257 In 2008, Wyoming was estimated to have provided nearly 2.3 million angler days. License sales declined more than 10 percent this effectively eliminated the modest gains in sales the two previous years. Effects of persistent drought especially in southeast Wyoming, the national economic woes and historically high fuel prices coupled with a 20 percent increase in license fess were primary reasons for the reduction in licenses purchased. While license sales were down revenues were up nearly 7.5% due to the license fee increase. Wyoming rivers and reservoirs enjoyed a good water year that should translate into more attractive sport fisheries and more accessible reservoir fisheries next year. For angler participation expenditures, we consulted the recently published report, 2006 National Survey of Fishing, Hunting, and Wildlife-Associated Recreation. The estimate for angler participation rate was kept constant at 19 days/year even though the 2006 report said days fishing by anglers increased since 2001 (when our estimate was derived). We anticipate being able to better estimate annual participation rate each year once our electronic licensing and surveying system has been fully deployed (2010). Historically, distribution of angling in the state has been 45% for flowing waters and 55% for standing waters. This may have shifted somewhat in favor of flowing waters given drought conditions affecting so many of our reservoir fisheries.
Five-year trends in Wyoming's sport fisheries program.
Year
Recreation Days 1
Fish/Day
Licenses Sold
License Revenue ($)
Program Costs ($)
Angler Expenditure 1
2004 2,250,000 2.5 356,252 4,604,994 14,435,377 $ 205,472,974
2005 2,256,200 2.5 349,979 4,669,286 14,300,540 $ 213,111,011
2006 2,354,052 2.5 357,662 4,719,065 15,226,226 $153,978,541
2007 2,429,757 2.5 362,918 $ 5,292,308 15,286,495 2 $165,287,622
2008 2,267,594 2.5 327,464 $5,784,352 16,806,936 2 $ 161,203,257 1 The 2003-2005, figures related to angler participation and expenditures were derived from the report, for 2001 National Survey of Fishing, Hunting, and Wildlife Associated Recreation; 2006-2007 angler participation was derived from the 2006 National Survey of Fishing, Hunting, and Wildlife Associated Recreation, issued in 2007. Estimates of average per day expenditures for FY07 are based on figures found in the 2006 National Survey of Fishing, Hunting, and Wildlife Associated Recreation for FY06 but adjusted for inflation. 2 Does not include general fund capital construction dollars of $13.1 million for hatchery renovations in the FY07-08 biennium budget.

A-32
COMMERCIAL FISHERIES Objectives: The statewide objective for the program is to provide licensing, monitoring, and extension services for minnow seiners, private bait dealers, commercial hatcheries, and private fishing preserves. 2008: License Sold 884 License Revenue: $14,880 All Other Agency revenue: $ 3,581 Total Program Revenue**: $ 18,461 Program Costs: $33,103 Live baitfish and seining permits continue to show a very gradual upward trend over the last four years. Licenses or permits sold for commercial fisheries interests during 2008 included: 73 fishing preserves, 11 commercial fish hatcheries, 697 seining, and 63 live bait dealers. Overall interest in seining and dealing in live baitfish is increasing. Despite a 20 percent fee increase sales of both seining and live baitfish licenses increased by more than 9 and 12 percent respectively.
Five-year trends in Wyoming's commercial fisheries program.
Year
Licenses Sold
License Revenue ($)
Program Costs ($)
2004 705 $ 20,959 $ 43,615
2005 754 $ 23,894 $ 57,201
2006 765 $ 27,481 $ 38,195
2007 778 $ 23,853 $ 36,040
2008 884 $ 14,880 $33,103 ** Includes allocated application fees, conservation stamp revenue, federal/other grants, and interest earned on Game and Fish cash balances.

FURBEARERS
Bobcat Other Furbearers


A-33
BOBCAT 2008: Bobcat Harvest1: 2,978 Licenses Sold 4: 1,850 Bobcat Trappers3: 513 License Revenue: $ 80,006 Bobcats per Trappers2: 5.8 Other Agency Revenue*: $ 49,727 Recreation Days: NA Total Program Revenue: $ 129,733 Days/Animal: NA Program Costs: $ 337,402 Benefits to the State: 5 $ 16,252,938 Cost Dept. Per Animal: $ Not Available Economic Return per Animal: $ Not Available Bobcat harvest data comes from two sources: information collected as part of the Convention on International Trade of Endangered Species (CITES) requirements for bobcat pelt tagging and the WGFD furbearer harvest survey. The Department relies on agency personnel who tag bobcats with CITES tags to collect information on age and sex of each bobcat and on effort values. This information is available for the annual CITES report and for Department use. It most accurately reflects harvest. The furbearer trapper survey provides alternate estimates since it includes all trappers, including those that are unsuccessful. The number of licenses sold and the bobcat harvest increased dramatically from 2002 to 2006, probably reflecting the increase in bobcat numbers and the value of pelts. Harvest and the number of trappers dropped in 2008. However, the harvest rate (number of bobcats/trapper) increased in 2008.
Five-year trends in Wyoming's furbearer program.
Bobcat Statistics Entire Furbearer Program Fiscal Year
Reported Harvest1
Bobcats/ Trapper2
Number Trappers3
Licenses Sold4
License Rev. ($)
Program Costs ($)
Benefits to the State ($)5
2004 3,120 7.3 425 1,454 59,031 267,776 11,516,695
2005 3,179 6.8 468 1,496 57,369 310,444 11,911,980
2006 3,617 7.2 499 1,623 61,448 404,019 13,310,921
2007 3,036 4.8 639 1,844 79,546 665,669 15,577,140
2008 2,978 5.8 513 1,850 80,006 337,402 16,252,9381 The number of bobcats tagged in Wyoming. 2 The number of bobcats per successful trapper. 3 The number of trappers who had bobcats tagged. 4 The total number of furbearer licenses sold. 5 The 2003 calculations were based on the report, Hunting and Trapping Expenditures in Wyoming During the 2001 Season, 2002 using average per day expenditures. Hunter expenditure was calculated from the 2001 season cost per day expenditure, corrected for inflation using the Consumer Price Index (2001 per day expenditure x 1.043 = 2003 per day expenditure, 2001 per day expenditure x 1.078 = 2004 per day expenditure,). 2005 Hunter expenditure was calculated from the 2005 cost per day expenditure, corrected for inflation using the Consumer Price Index (2005 per day expenditure x 1.03). 2006, 2007 and 2008 Hunter expenditure was calculated from the previous year’s Hunter expenditure corrected for inflation using the Consumer Price Index (2006 was 1.03, 2007 was 1.03, 2008 was 1.04) . *Includes allocated application fees, conservation stamp revenue, federal/other grants, and interest earned on Department cash balances.

A-34
OTHER FURBEARERS 2008: Furbearer Harvest: 28,476 Licenses Sold 2: 1,850 Furbearer Trappers1: 1,101 License Revenue: $ 80,006 Furbearers per Trapper: 25.9 Other Agency Revenue*: $ 49,727 Recreation Days: NA Total Program Revenue: $ 129,733 Days/Animal: NA Program Costs: $ 379,951 Benefits to the State: 3 $ 16,252,938 Cost Dept. Per Animal: $ Not Available Economic Return per Animal: $ Not Available Besides bobcat, there is a variety of other fur bearing species in Wyoming. Coyote, red fox, beaver, muskrat, mink, badger, raccoon, striped skunk, weasel, and marten are the most commonly harvested species. Furbearer harvest levels are determined by fur prices and by species abundance. These factors, combined with harvest quotas (where used), ensure that trapping has little impact on furbearer populations. Due to the poor response rate for the annual furbearer harvest survey over a period of years, the Department discontinued it in 2002. It was simplified, restructured and reinstated in 2005 to collect only number of harvested animals. From that, animals/trapper can be calculated.
Five-year trends in Wyoming's furbearer program.
Other Furbearer Statistics Entire Furbearer Program Fiscal Year
Reported Harvest
Furbearers/ Trapper
Number Trappers1
Licenses Sold2
License Rev. ($)
Program Costs ($)
Benefits to the State ($)3
2004 --- --- --- --- --- --- ---
2005 27,761 45.6 623 1,496 57,369 310,444 11,911,980
2006 35,809 37.8 947 1,623 61,448 404,019 13,310,921
2007 31,439 33.0 953 1,844 79,546 605,669 15,577,140
2008 28,476 25.9 1,101 1,850 80,006 379,951 16,252,9381 includes bobcat trappers. 2 The total number of furbearer licenses sold. 3 The 2003 calculations were based on the report, Hunting and Trapping Expenditures in Wyoming During the 2001 Season, 2002 using average per day expenditures. Hunter expenditure was calculated from the 2001 season cost per day expenditure, corrected for inflation using the Consumer Price Index (2001 per day expenditure x 1.043 = 2003 per day expenditure, 2001 per day expenditure x 1.078 = 2004 per day expenditure). 2005 Hunter expenditure was calculated from the 2005 cost per day expenditure, corrected for inflation using the Consumer Price Index (2005 per day expenditure x 1.03). 2006, 2007 and 2008 Hunter expenditure was calculated from the previous year’s Hunter expenditure corrected for inflation using the Consumer Price Index (2006 was 1.03, 2007 was 1.03, 2008 was 1.04). *Includes allocated application fees, conservation stamp revenue, federal/other grants, and interest earned on Department cash balances.

RAPTORS


A-35
RAPTORS OBJECTIVES: To provide a harvest, through capture, of 50 raptors annually. To maintain a harvest success rate of 50 percent, based on capture permits issued. There are approximately 31 species of raptors known or thought to occur within Wyoming’s borders. Raptors include hawks, owls, eagles, and vultures. Some species are present only seasonally, and densities vary with climatic conditions and prey abundance. In calendar year 2008, ten resident licenses were issued and five birds were captured, for a capture success rate of 50 percent. Twenty-nine nonresident licenses were issued and 22 birds were captured, for a capture success rate of 76 percent. In total, 27 raptors were captured in Wyoming for use in falconry for an overall success rate of 69 percent, which is above the average (48 percent). Although the number of birds captured in 2008 is about 1/2 of the objective, the success rate is higher than the objective.
Five-year trends in Wyoming’s Raptor Program Harvest, recreation and licenses issued are by calendar year. Revenue and costs are by fiscal year.
Fiscal Year
Capture
Success1
Licenses Sold2
License Revenue ($)
Program Costs ($)
2004 16 48% 33 5,674 133,707
2005 13 31% 41 5,292 128,083
2006 16 47% 34 5,279 104,928
2007 15 45% 33 7,242 165,296
2008 27 69% 39 3,486 362,577 1Based on capture licenses sold. 2Includes permits to hunt with falcon.

A-36

Governor Dave Freudenthal
Steve K. Ferrell Director
John Emmerich Deputy Director
Gregg Arthur Deputy Director
iii

COMMISSION
Michael Healy Rancher from Worland. Represents Park, Big Horn, Hot Springs and Washakie counties.
Ronald “Jerry” Galles Business owner from Casper. Represents Converse, Natrona and Fremont counties.
Clark Allen Deputy County Attorney in Teton County from Jackson. Represents Teton, Sublette, Lincoln and Uinta counties.
Clifford Kirk Commission President
Banker from Gillette. Represents Sheridan, Johnson and Campbell counties.
Fred Lindzey Retired Biologist. Professor Emeritus, University of Wyoming, from Laramie. Member of Governor’s Brucellosis Tack Force. Represents Sweetwater, Carbon and Albany counties.
Aaron Clark Retired from Wheatland. Represents Platte, Goshen and Laramie counties.
Ed Mignery Commission Vice President
Retired Electric Utility Engineer from Sundance. Represents Crook, Wes-ton and Niobrara counties.
iv

NON-GAME PROGRAMS
AND NON-LICENSED USES


INTRODUCTION
DIVISION REPORT NARRATIVES


1
INTRODUCTION This report covers the progress and financial status of the Wyoming Game and Fish Department during Fiscal Year 2009. The information documents progress toward objectives stated in the Wyoming Game and Fish Department’s Four-Year Plan (FY 07-FY 11), September 2007. During calendar year 2009 a total of 3,531,820 hunting and fishing recreation days were provided to the public. Based on hunting and fishing expenditure surveys conducted in Wyoming, since 2006, hunters, anglers, and trappers expended approximately $684,109,000 in pursuit of their sport. At the end of the period covered by this report (June 30, 2009), the Department was comprised of 404 permanent full-time employees and 103 temporary or seasonal workers. A summary of Department activities by respective division follows.

2

3
FISCAL DIVISION Rich Reynders, Chief
In FY 09 the Fiscal Division continued focusing on the evolution of the Department’s licensing processes to a fully automated Internet based system, with goal of further improving customer service and expanding licensing information. Additionally, the Department neared completion to upgrade its internal financial systems, allowing migration to an SQL database for improved processing and reporting. The Division oversees all financial operations of the Department, including budget development, financial reporting, accounts payable, purchasing, asset management, federal funds (grant) management, contract management, revenue collection and licensing. Additionally, the Division is responsible for the operation and maintenance of various automated systems for licensing, revenue reporting, cost accounting, vehicle management, credit card payments and other accounts payables, landowner coupons and time reporting. In FY 09, the Fiscal Division, working with Services Division IT personnel, continued the upgrade of its licensing systems. With the migration of limited quota application processing from the mainframe to in-house servers utilizing dot.net programming and SQL databases put into production in the previous year, the focus in FY 09 was to complete the electronic licensing system (ELS) for license selling agents (LSA’s). While regional offices and some pilot LSA’s had begun using the Internet based system late in FY 08, the majority of agents came on-line in FY 09. This involved extensive training and customer contacts in the first several months of the fiscal year as the first leftover doe fawn licenses (limited quota) became available through ELS in August 2008. Work continued throughout the year as more and more agents came on-line and the system was fine-tuned to improve system efficiencies and offer enhancements based on LSA recommendations. Work continued throughout the year on upgrading the system to allow for the elimination of the leftover draw in FY10 and providing for Internet sales of all licenses by late summer 2009. Expanded use of the Internet for license and preference point applications continued throughout FY 09, with approximately two-thirds of all individuals applying through the Internet for the FY 09 application period. This allowed a substantial reduction in the number of temporary employees hired to process the 268,000 applications submitted during the year. Growth in both Internet applications and Internet license sales is anticipated to continue over the next year. FY 10 will focus on developing standard user accessible reports and improving user ability to extract Ad hoc information from all licensing systems to provide improved information for audits, statistical modeling and trend analysis. In the accounting area, the Department continued to work on automating its cost accounting system, putting phase I into production by November 2008. The new system allowed for enhanced reporting and more timely information as the new system is SQL based, allowing for more flexibility than available in the previous system. FY 2010 will focus on converting historic data along with completing phase II, which will allow the cost accounting system to capture in-kind information and automate the grant billing

4
process. The Division also completed the resolution process with US Fish and Wildlife Service (USFWS) on audit findings from previous audit periods. While the Department participates in the annual single audit conducted by auditors hired through the State Auditor’s office, Wyoming should not be scheduled for a USFWS audit again until 2012. The Division also made several appearances before the legislature and legislative committees regarding funding and licensing issues. For the 2009-2010 biennium the Department’s general funds were expanded to allow for two additional programs, wolf management and the Comprehensive Wildlife Management Strategy (CWCS), now known as the State Wildlife Action Plan (SWAP), in addition to previously funded programs, vet services and sage grouse. However, in the 2009 Legislative session, funding for the wolf management program was reduced by approximately 50 percent as wolf management in Wyoming was returned to USFWS, with the Department’s role modified to damage investigation and payment of damage claims only. In May 2009, at the request of the Governor’s office, the Department along with all other state agencies, was required to submit cost reduction plans to allow for a 5 percent general budget reduction for the 2009-2010 biennium. The Department’s reduction plan was approved, effective July 1. This 5 percent reduction will also be required for the 2011-2012 biennium budget. Additionally, the Division continues to prepare the Commission budget, which is developed on an annual basis and presented to the Commission for review and authorization each April. The number of grants that the Division administers has continued to grow, with the Department now receiving approximately 25 percent of its revenue from federal, state and private grants. The Department receives grants from more than ten federal agencies (U.S. Fish and Wildlife Service, USDA Forest Service, Bureau of Land Management, Bureau of Reclamation, Natural Resource Conservation Service, U.S. Coast Guard, Department of Homeland Security, Environmental Protection Agency, U.S. Geological Survey, USDA APHIS) in addition to a number of state and local government entities and not-for-profit organizations. An important new source of grant funds in the last two years has been the Wyoming Wildlife and Natural Resource Trust, a state agency, whose board reviews and approves grant applications for wildlife projects, and has provided funding to the Department in addition to other conservation entities, such as local conservation districts. During FY 09, approximately $350,000 was transferred from this entity to the Department for work completed on wildlife projects. In summary, the Fiscal Division is the primary source of financial information for the Department and the point of contact for all internal and external state government financial audits.

5
FISH DIVISION Mike Stone, Chief
The Fish Division is responsible for management of all aquatic wildlife including fish, mollusks, crustaceans, amphibians and reptiles. We continue to strive to meet the dual purpose of conserving native species and maintaining high quality, sportfishing opportunities. The improved snow packs and spring rains experienced last year continued through most of FY 09. With a second consecutive, above average water year river and reservoir conditions finally began to show improvement in the Laramie River, North Platte River and South Platte River basins. Consequently, we expect improved fisheries production and better fishing in future years. A major public information and legislative initiative was launched for aquatic invasive species (AIS) this year. Our initial efforts were intended to develop public and legislative awareness of this daunting ecological concern. Consequently, future legislative options to halt or reduce the spread of AIS was one of the interim study topics chosen by the joint Travel, Recreation, Wildlife and Cultural Resources Committee. While public awareness can be the most effective method to combat the spread of invasive species, legislative and statutory directions could greatly aid or change the manner in which the department and the state addresses AIS in the future. Aquatic habitat projects completed this year included shared-agency projects such as diversion rehabilitation projects in the Sheridan Region, beaver transplants, design of projects like the Kendrick fish bypass project on Clear Creek near Buffalo, Bureau of Land Management (BLM) and U.S. Forest Service (USFS) management planning assistance, watershed inventories and habitat assessments, major monitoring efforts, fish passage investigations, an educational fish passage tour, research projects with the University of Wyoming and Colorado State University and other habitat projects. The aquatic habitat section played a major role in completing the revision of the department’s Strategic Habitat Plan (SHP) in FY 09. Each of the regional habitat biologists was responsible for identifying habitat priority areas and describing issues, values and needed actions that served as the foundation for the plan. This effort will serve to direct our future habitat project funding and direct our activities towards the most pressing aquatic habitat needs. Significant effort went into providing habitat protection for the Little Mountain Ecosystem where aquatic habitat personnel were instrumental in developing sound resource strategies that greatly aided a crucial public awareness and involvement campaign. Also in western Wyoming, aquatic habitat monitoring data and science oversight were provided to the Wyoming Landscape Conservation Initiative to guide this regional and national effort. The downturn in the national economy and natural gas development in the northeast and southwestern parts of the state did afford some relief

6
from the frenetic demands for information needed to avoid or mitigate impacts from energy development. Several key conservation easements were gained as a result of aquatic habitat personnel working with Lands Section by providing local representation and negotiation assistance. One of the great strengths of the habitat program is development of partnerships and collaborative efforts with private landowners, land management agencies, private industry and conservation organizations. Section personnel spend considerable time on these partnerships and continue to write grants and receive funds from a wide variety of sources, including state, federal, conservation organizations, private and corporate donors. We expect this trend to continue in the future. Aquatic habitat section planning continued toward developing a distinct fish passage program and included development of program goals and objectives. A separate budget for this program was developed and approved. Meanwhile we continue to seek approval for hiring the personnel needed to make this a successful program. The section’s fish passage efforts included working with a contractor to develop preliminary designs and approaches for screening diversions and improving passage for nearly a dozen locations. Through our fish passage grants program we provided funding to conservation districts that completed passageways at seven different diversion dam locations. Angler participation declined by more than 10 percent this year after experiencing several years of very modest increases. Nearly 2,268,000 angler days were estimated based on license sales. The significant decline was attributed to the first full year of the fishing license fee increase, gasoline prices at historically high prices and the continued effects of drought on our sport fisheries. Historically we have seen license purchases and angling participation rebound within two years after a significant license fee increase. Because we experienced two consecutive high water years, we expect sport fisheries and anglers to respond favorably over the next several years. Aquatic wildlife, sport fish and herptile surveys were conducted at near record levels this past year. For stream and lake surveys, we conducted more than 635 surveys to evaluate species conservation and sport fisheries purposes. Sampling intensity was higher than normal because of increased activity for native species, especially species of greatest conservation need (SGCN). In the southwest portion of the state, potential impact to native herptiles by both wind and natural gas development were concerns we began to better assess in FY 09. Also, completion of the report documenting current status and management needs for roundtail chub, bluehead sucker and flannelmouth sucker prompted us to intensify our conservation efforts for these 3 species native to the Green River. Most of our increased survey and assessment activity for SGCN was fueled by funds from either the Governors Endangered Species Office or General Fund appropriations. We continued to make progress rewriting our basic planning documents, Basin Management Plans (BMP) this year. Completion of the SHP revision has provided us with the ability to more fully integrate our habitat priorities and elements into the BMPs.

7
Likewise, when the State Wildlife Action Plan (SWAP) is revised next year, we will be able to more easily incorporate species conservation elements into each BMP. This will then give us a scientific basis for prioritizing and directing our native species surveys. Intensive population estimates were conducted on sections of all of our major rivers and many smaller streams. Population trend analysis is crucial for evaluating our fish management program. Evaluations at LaBarge Creek demonstrated our stocking program is successfully restoring Colorado River following the highly successful stream treatment project. For our large reservoirs we continue to monitor our fish stocking programs and effectiveness of our fishing regulations. The trend for stocking larger trout to avoid predation by illegally introduced, piscivorous fishes has intensified our management efforts on many reservoirs across the state. In FY 09, illegally stocked walleye were discovered in Buffalo Bill Reservoir. These seriously jeopardize the trout fishery in the reservoir and the North Fork Shoshone River that have long been self-sustaining. Over the last five years, our Fish Culture Section has stocked an average of 314,000 pounds of fish annually. In FY 09 we stocked 296,359 pounds of fish. Besides trout, salmon and grayling raised in Wyoming facilities, we also stocked over one million walleye, hybrid sunfish, channel catfish, largemouth bass, northern pike, and shovelnose sturgeon. Of note were the more than 900,000 walleye fingerling stocked in Wyoming waters. These along with all the other cool water fishes stocked this year were received from out-of-state sources that provided the fingerlings in trade for Wyoming trout eggs. Fish stocking efforts were hindered statewide because our facilities at Wigwam and Tensleep continued to be plagued by the presence of Myxobolus cerebralis (MC), the organism causing whirling disease. The contamination of one water supply by MC at Wigwam caused us to greatly reduce rainbow trout production. Loss of the hatchery at Ten Sleep led to reduced production and flexibility for stocking time and size; the effects were statewide. We were successful in our request for General Fund, supplemental funding needed to renovate Ten Sleep water supplies and facilities; construction is set to start in FY10. While pounds are easily tracked or measured the real measure is the quality of the fish stocked. We continue to emphasize fish quality by not overstocking facilities and by incorporating modern fish health practices that stress optimum not maximum production levels. New rearing units at Dubois, Wigwam and Speas continue to be evaluated to determine ultimate production levels. As we gain experience with these modern facilities, we will continue to incrementally increase production but not at the cost of fish quality or health. FY 09 also saw continued progress towards completion of the major renovations of Speas Rearing Station and Story Hatchery. Once complete, production at Speas is anticipated to more than double by FY11. The Story Hatchery brood stock facilities will greatly improve fish health, rearing and spawning conditions for the lake trout, brook trout, rainbow trout, and golden trout. Early successes toward the development of a golden trout brood stock held at Story was noteworthy for FY 09 and will be an emerging story over the next three to four years. We have struggled for 12 years to develop a reliable and

8
economic brood stock for our golden trout fishery needs. The success experienced with our captive golden trout brood stock at Story has been a very big, but pleasant surprise.

9
SERVICES DIVISION John Kennedy, Chief
The Services Division is committed to achieving the Department’s mission by increasing public awareness of all Wyoming’s wildlife issues, strengthening support for the Department, conserving and enhancing wildlife habitat, providing increased access for recreational opportunities, maintaining healthy wildlife populations, and providing technical support critical to the success of the Department. The Division is administered by the Division Chief, Assistant Division Chief for Habitat/Technical Support, and Assistant Division Chief for Information & Education. The Assistant Division Chiefs are responsible for the administration of nine work units through two distinct sections. The Division’s Habitat/Technical Support Section includes Lands Administration (acquisition program); Conservation Engineering; Game and Fish Laboratory; Habitat & Access Maintenance; and Information Technology/GIS. The Information & Education Section includes: Conservation Education; Regional Information & Education (I&E); Information/Publications; and the Customer Service (Telephone Information) Center. During FY 09, the Services Division Administration continued to focus on providing consistent leadership and improving communications within the Division and between the Division and other work units in the agency. Priorities for each work unit in the Division continue to be established through formal planning processes that involve all work units in the agency. The Division Administrators and Program Supervisors continued to attend other division and regional coordination meetings to improve communications, discuss priorities and expectations, and communicate management strategies specific to the Division. Division Administration will continue to focus on improving internal communications and developing priorities that are responsive to the other work units and consistent with the Director’s goals/objectives and the agency’s mission.
FY 09 Services Division Administration priorities: • Continue to recruit and promote the best-qualified candidates for positions within the
Division; administration will be directly involved in all hiring processes. • Work with the regions, Property Rights Team, and Commission on high-priority
access projects and conservation easements; continue with acquisition process improvements.
• Continue work with the Fiscal Division on the ELS Online Licensing System. • Improve agency credibility and public support through information, education, and
outreach. • Work with the Property Rights Team and Commission on proactive fee title and less
than fee title land acquisitions. • Further define the Public Information Officer role and responsibilities. • Implement goals, objectives, and strategies of the Strategic Habitat Plan. • Continue work on Department television programs and/or documentaries. • Improve processes and individual work unit performance in the Division. • Coordinate major conservation education efforts and agency programs, including the
Hunting and Fishing Heritage Exposition (Expo).

10
• Participate on committees of the Association of Fish and Wildlife Agencies and Western Association of Fish and Wildlife Agencies.
• Develop and implement hunter and angler recruitment and retention programs. During FY 09, Services Division Administration accomplished several major projects, including: • Coordination with the Director’s Office, other division administrators and the regions
to discuss and establish priorities for Services Division Administration and all work units in the Division.
• Work with the regions, Property Rights Team, and Commission to further streamline the process for acquiring fee title and less than fee title property rights; coordinated and facilitated Property Rights Team meetings on a regular basis.
• Completed Information and Education work planning/prioritization processes and established priorities; continued work to improve coordination and communications among all the I&E work units through the I&E Leadership Team.
• Continued to coordinate and implement strategic information/media plans for a variety of high-priority issues, including: the agency’s mission, funding constraints, chronic wasting disease, brucellosis, wolves, grizzly bears, and energy development.
• Developed alternative funding proposals and plans for capital construction projects, including additional work on the Cheyenne HQ renovation and expansion project.
• Continued to represent the Commission on the Board of Outfitters and Professional Guides.
• Implemented our Human Dimensions Program to help all divisions better understand public opinions, attitudes, and knowledge regarding wildlife issues, including issues related to mule deer management, elk management, aquatic invasive species, and alternative funding.
• Initiated work to develop a hunter and angler recruitment and retention program. • Designed a comprehensive communications strategy to raise awareness about the
threat of aquatic invasive species in Wyoming. • Produced a series of TV shows examining important wildlife issues in the State;
Wyoming Wildlife TV aired for nine months, from fall through spring 2008-09 across Wyoming and all episodes are now available to view on the Department’s web site.
During FY 09, the Division’s Habitat/Technical Support Section accomplished several major projects, including: • The IT/GIS Branch continued direct involvement on State IT committees that are
responsible for the oversight, policy development, and overall IT business processes for all State government; migrated the network systems at the Cheyenne HQ to a server farm for improved performance, security, and implementation of our critical business systems; continued to provide substantial support to the development of the agency’s ELS Online Licensing System; continued GIS support for implementing the agency’s Strategic Habitat Plan and State Wildlife Action Plan and the Western Governors’ Association Renewable Energy Zones Project; and, with new legislation, the GIS section developed a electronic Meteorological (MET) Tower application, in coordination with the WYDOT, to track the location of MET towers throughout the State for low-flying aircraft safety reasons.

11
• The Conservation Engineering Branch completed the final design, bidding, and contracting for the Cheyenne HQ addition/renovation project and completed all work associated with establishing the South Greeley office; completed boundary surveys at several wildlife habitat management areas (WHMAs), public access areas (PAAs), and conservation easement areas; and prepared and secured over 3,000 signs for wildlife habitat management areas, public access areas, and PLPW program areas.
• The Habitat and Access Branch, in cooperation with the Bureau of Land Management, installed six water guzzlers for wildlife; enhanced wildlife habitat on the Whiskey Basin WHMA; converted wind-powered pumps to solar-powered pumps at three wells on the Daley WHMA for more cost effective and efficient water distribution for wildlife; and worked on public access areas throughout the State to address encroachments and enhance public access.
• The Habitat and Access Maintenance Branch continued management oversight on the Commission’s WHMAs and Public Access Areas, which includes the maintenance of fences, comfort stations, car barriers, cattle guards, signs, wetlands, irrigated land, boat ramps, bridges, roads, and parking areas, and completed annual maintenance work on the Department’s 22 feedgrounds.
• The Game and Fish Lab’s forensic program established and is successfully utilizing DNA sequencing for species identification in forensic and biological cases and implemented a new procedure that identifies the presence of epizootic eiptheliotrophic disease virus in trout.
• The Lands Administration Program completed acquisitions at the Philbrick Parking Access Easement, Big Muddy Pond Parking Access Easement, Acme Parking Access Easement, the Wakely Public Access Area, and at the Springer/Bump Sullivan WHMA, and worked on several high-priority conservation easements throughout the State.
During FY 08, the Division’s I&E Section accomplished several major projects, including: • Implemented new processes for establishing I&E program priorities that are
consistent with the Director’s goals and objectives and the Department’s mission. The division’s I&E Leadership Team continued to work on improving communications and coordinating work plans among all the I&E work units.
• The Conservation Education Program continued work on several important programs and activities, including Hunter Education (includeing bowhunter education), Hunter Education Instructor Academy, Wyoming Hunter Mentor Program, 4-H shooting sports, Cooperative North American Shotgunning Education Program (CONSEP), shooting workshops, Becoming an Outdoors Woman, Youth Conservation Camp, aquatic education programs, Wild Times publication, Outdoor Recreation Education Opportunities (O.R.E.O.), Project WILD, Archery in the Schools, kids fishing clinics, aquatic invasive species education and outreach, hunter and angler recruitment and retention, and the Expo. During the 2009 Expo, 8,120 students and teachers attended from around the State.
• The Regional I&E Program implemented regional I&E work plans that were responsive to the agency’s priorities; assisted the Conservation Education Program with the Expo, Hunter Education, Project WILD, WILD About O.R.E.O. youth and

12
teacher camps, 4-H shooting sports, and aquatic education programs throughout the State.
• The Regional I&E Program assisted the Wildlife and Fish Divisions on important projects, including bear, lion and wolf education seminars, and public information meetings and other activities focus on aquatic invasive species.
• Wyoming Wildlife magazine ran a series of articles examining the history, current state, and future of the North American Model of Wildlife Conservation and the Wyoming Wildlife News is running a series on important individuals involved in the development of the North American Model.
• The Telephone Information Center answered over 89,000 calls from hunters and anglers; Alternative Enterprises had product sales that generated a net profit of $40,000; and the mailroom incorporated new processes and software that saved the agency over $9,000 in postage costs within six months of use.