Embed Size (px)
Citation preview
Annual Report 2009/10
Parliamentary paper
B.28

Office of the Auditor-General PO Box 3928, Wellington 6140
Telephone: (04) 917 1500 Facsimile: (04) 917 1549
Email: [email protected] Website: www.oag.govt.nz
ISSN 1179-8963 (print)
ISSN 1179-8971 (online)
Presented to the House of Representatives as required by section 37 of the Public Audit Act 2001.
October 2010
Annual Report for the year ended 30 June 2010

3Contents
Auditor-General’s overview 5
Part 1 – Background 11
Nature and scope of the Auditor-General’s functions 12
Main measures and standards for achieving our outcomes 13
Evaluating our service performance, its impact, and its cost-effectiveness 16
Part 2 – Our output classes, performance measures, and targets
(including Statement of service performance) 19
Audit and assurance services 20
Supporting accountability to Parliament 44
Performance audits and inquiries 51
Part 3 – Organisational health and capability 67
Part 4 – Risk management 77
Report of the Audit and Risk Committee 81
Part 5 – Financial statements 2009/10 82
Appendices
1 – Summary of reports on performance audits and other studies published in 2009/10 115
2 – Entities audited under section 19 of the Public Audit Act 2001 127
3 – Public entities not audited by the Auditor-General 129
4 – Approach and method used for our stakeholder feedback interviews and
client surveys 131
5 – Senior management 133
6 – Directory of offices 135
Figures
1 – Summary of our outcomes, our outputs, and our strategy 13
2 – Main measures and standards for achieving our outcomes 14
3 – Actual performance against impact measures and standards for output
class: Audit and assurance services 23
4 – Audits completed on time 26
5 – Qualified audit reports issued 29
6 – Acceptance of Audit New Zealand’s management report recommendations 30
7 – Actual performance against output delivery measures and standards for output
class: Audit and assurance services 31
8 – Audits outstanding at 30 June 33
9 – Management reports issued within six weeks 35
10 – Analysis of movements in audit fees 38
11 – Financial performance of output class: Audit and assurance services 39
12 – Actual performance against impact measure and standard for
output: Parliamentary services 45
13 – Stakeholder feedback on Parliamentary services impact 45
4
14 – Actual performance against output delivery measures and standards for
output: Parliamentary services 46
15 – Stakeholder feedback on Parliamentary services outputs 47
16 – Actual performance against impact measure and standard for
output: Controller function 49
17 – Actual performance against output delivery measures and standards for
output: Controller function 50
18 – Financial performance of output class: Supporting accountability to Parliament 50
19 – Actual performance against impact measure and standard for
output: Performance audits 52
20 – Actual performance against output delivery measures and standards for
output: Performance audits 54
21 – Performance audits, other studies, and major inquiries completed in 2009/10 55
22 – Progress with completion of our 2009/10 annual plan 56
23 – Stakeholder satisfaction with the quality and usefulness of our reports 58
24 – Actual performance against impact measure and standard for output: Inquiries 61
25 – Actual performance against output delivery measures and standards for output:
Inquiries 62
26 – Summary of requests for inquiries dealt with during 2009/10 63
27 – Financial performance of output class: Performance audits and inquiries 66
28 – Our operating model 68
29 – Staff numbers, functions, and turnover 70
30 – Staff experience and training 70
31 – Staff diversity 72
32 – Staff survey results 73
33 – Sick leave 73
34 – Financial performance indicators for the year ended 30 June 2010 75
5Auditor-General’s overview
I am pleased to present my first annual
report as Auditor-General. I started my
term in October 2009, and have found a
well-run Office carrying out its statutory
role of completing financial audits
and public reporting to Parliament.
The Office’s spirit and collegiality, its
commitment to quality and shared
values, and the inclusive culture and
openness to debate are among the
strengths that I remember from my
earlier years working in the Office, and
I am pleased that those attributes have
endured.
My staff and contracted audit service providers can be proud of their efforts
throughout the year, having achieved good results in the auditing and reporting of
public sector performance.
Public sector audits in 2009/10
Financial reporting standards in the public sector
Despite the stabilising of generally accepted accounting practice (GAAP), we
continue to be concerned about the cost and appropriateness for the public
sector of New Zealand equivalents to International Financial Reporting Standards.
During the year, we have contributed to the reviews being carried out by the
Ministry of Economic Development (MED) and the Accounting Standards Review
Board. The outcome of these reviews is very important for future financial
reporting in New Zealand. A principle proposed by the MED’s review, with which I
agree, is that every public entity should continue to be required to present annual
reports that comply with GAAP.
Timeliness of annual reporting
A significant achievement for which I wish to thank Audit New Zealand and my
other contracted audit service providers has been continued improvement in the
number of audit reports issued on time. For 2009/10, audits issued on time again
improved, to 88%. On taking up my position, I was concerned about the increasing
number of audits in arrears (which peaked at 453 at 30 June 2008) – a concern
shared by my leadership team. I have set a goal to significantly reduce the backlog
6
Auditor-General’s overview
and, at 30 June 2010, the number of audits in arrears has reduced to 313, and
the percentage of arrears due to inaction on our part has also reduced during the
last two years. This improving trend largely reflects the collective efforts of all my
auditors to better manage audit arrears. There is still progress needed to clear this
backlog of audits, and I am pleased that a credible start has been made.
Service performance and cost-effectiveness
The reporting of service performance is challenging, and I see many people
across the public sector making significant efforts to raise the quality of their
organisations’ reporting.
As an Office, we are keen to play our part in ensuring that public entities’ external
reports are meaningful and useful to their readers, providing a basis for assessing
the cost-effectiveness of public services. Many of our annual audits encompass
attesting to service performance achievements. To better play our part, we have
revised my standard that sets expectations of auditors in attesting to service
performance information. Progressively in the next three years, we will attest to
the appropriateness of the information disclosed.
During 2009/10, for the first time, we graded service performance information
and associated systems and controls within our financial review advice to select
committees on government departments and Crown entities. We also carried
out development and training with our local government auditors in preparation
for local authority audit opinions that will be issued under our revised standard
during 2010/11.
This work is challenging us as an Office, and we are looking to relate more with
preparers of service performance information to understand and resolve issues.
My general sense is that our increased focus in this area is helping us to better
understand public entities and bring more insight into our work about their
operations and their longer-term performance and financial management issues.
Auckland
The amalgamation of eight local authorities into one “super” council on 1
November 2010 is a huge exercise, with major implications for the whole country.
While the new Auckland Council is yet to come into existence, our preparations
during 2009/10 for its advent were well under way. Our immediate effort is
focused on the audit of Auckland Council’s unique Planning Document, which
is due to be in place by 1 November 2010. Our efforts are also focused on the
16-month dissolution/termination audits of entities that cease to exist on 31
October 2010 as part of the Auckland reform process.
7
Auditor-General’s overview
Audit allocation and fees
In recent years, international demands for changes to auditing and accounting
standards and the mobility of the audit workforce have continued to affect us as
part of the international audit community. As a consequence, there continues to
be upward pressure on audit fees. I am committed to ensuring that audit fees are
reasonable while having regard to the requirements on me to meet professional
standards and the broader expectations of my statutory mandate.
I am equally committed to ensuring that the Office responds to the wider calls for
the public sector to offer value for money and is transparent about audit fees. We
are exploring how we can do even more in this regard.
My initial discussions with auditors and leaders in the public sector led me to
initiate a review of the model that the Office uses to allocate audits, to ensure that
the principles used encourage audit quality while also ensuring that audits are
cost-effective and facilitate transparent reallocation of audits when warranted.
Public reportingReporting on public sector performance to the public of New Zealand through the
presentation of reports to Parliament is the unique audit role of this Office. It is
important that these reports deal with matters of significance that can improve
our public sector and/or provide assurance about public entities’ performance.
During the year, we published 20 major reports – 11 performance audits, seven
inquiries, and two other studies – in addition to reports on the results of our
audits in central and local government. These reports are listed in Appendix 1 and
are available on our website. They cover such diverse topics as special education,
aged care, ministerial expenses, forecast demand for drinking water, conflicts of
interest, and civil aviation. The feedback I have personally received, as well as that
provided through our stakeholder feedback interviews and client surveys, confirms
that our reports are helping to improve the public sector.
The increasing demand for us to carry out inquiries that we have observed in
earlier years has continued and, within this, there has been a significant growth
in the number of major and sensitive inquiries, from 13 in the previous year to
21 this year. We will continue to consider how best to resource and manage our
ongoing inquiries work.
Each of our reports draws on the collective knowledge and experience of the
people in this Office, and represent a significant body of work by the teams
responsible for producing each report. I appreciate the efforts of everyone who
8
Auditor-General’s overview
has contributed to the 20 major reports, and thank them for the contribution they
have made to improving accountability in, and ultimately the performance of, the
public sector.
The journey ahead There is no question that the Auditor-General’s role and vision to improve public
sector performance are of heightened importance to New Zealand at present.
Although the economy is improving and most Kiwi households have managed
to ride out the global recession, there has been a major, lasting effect on core
government. We are experiencing a level of national debt that will see the
country’s Budget in deficit for the early part of my term as Auditor-General. There
is a strong drive for value for money, with the public sector looking to do more
with the same or less, and there is greater concern about achieving cost-effective
performance, while safeguarding public assets and services.
In this environment, public entities and their stakeholders increasingly expect
answers and insights that are authoritative and timely. I expect the Office to be in
touch with the realities of the world within which we operate, to provide answers
and insights, and to be flexible when we need to be. We will be looking to adapt
our ways of working to issue results when the matter is current and in a form
suiting the audience, so that our work has the best chance of having a positive
influence. We are looking to build on a strong base of audit information and
provide more sectoral information and opinions that are of value across the public
sector.
Concluding commentsFirst, I would like to extend my thanks to the Deputy Auditor-General, Phillippa
Smith. Phillippa shouldered the responsibility for stewardship and care of the
Office before I started my term and during the first few weeks in which I got to
know the Office. As my Deputy, she provides me with invaluable support and I,
along with the staff of the Office, were pleased to be able to congratulate her on
her reappointment in June 2010 for a second five-year term as Deputy-Auditor
General.
I acknowledge my predecessor, Kevin Brady, as most of the achievements this year
were initiated during his term of office. I wish Kevin all the best in his retirement.
9
Auditor-General’s overview
The Office, as part of the public sector, faces a challenging year in which the wider
economic environment means that we must focus on being even more effective
and insightful about the opportunities for improvement in the public sector. I am
proud of the contribution the Office has made in 2009/10, and am confident that
we have a strong basis for continuing to make that contribution.
I would like to again thank the staff of the Office and our wider community
of contracted audit service providers for their efforts during the year and
congratulate them on their achievements. With their support, I look forward to
the challenges and opportunities of 2010/11.
Lyn Provost
Controller and Auditor-General
30 September 2010


11
Part 1Background
Part 1 Background
12
Nature and scope of the Auditor-General’s functionsThe Controller and Auditor-General (the Auditor-General) is an Officer of
Parliament and is independent of executive government and Parliament in
discharging the functions of the statutory office, but answerable to Parliament for
her stewardship of the public resources entrusted to her.
The Auditor-General is the auditor of all public entities in New Zealand – a total
of about 4000 public entities. Public entities are accountable to Parliament for
their use of the public resources and powers that Parliament has conferred on
them. Parliament has also legislated to require independent assurance that public
entities are operating, and accounting for their performance, in keeping with
Parliament’s intentions. This includes the need for independent assurance of
local government. Local authorities are accountable to the public for the activities
they fund through locally raised revenue. As an Officer of Parliament, the Auditor-
General provides this independent assurance to both Parliament and the public.
The Public Audit Act 2001 sets out the mandate and responsibilities of the
Auditor-General. It provides for the Auditor-General to examine and provide
independent assurance to Parliament and the public on matters of authority,
waste, probity, performance, and accountability. The Auditor-General’s legislative
mandate is confined to public entities, in respect of which the Auditor-General:
• must carry out requirements of the Public Audit Act 2001 and other statutes
(such as the Public Finance Act 1989 and Local Government Act 2002, which
set out accountability responsibilities of public entities);
• may carry out services of a kind that it is reasonable and appropriate for an
auditor to perform; and
• must limit her examination to the extent to which activities are being carried
out effectively and efficiently in a manner consistent with policy to which the
public entity is required to adhere.
The output classes and outputs of the Auditor-General reflect her legislative audit
mandate to provide independent advice and assurance. They are:
• audit and assurance services;
• supporting accountability to Parliament (services to Parliament and the
Controller function); and
• performance audits and inquiries.
The audit work carried out and the resulting assurance helps public entities to
improve their use of, and account to Parliament and the public for their use of,
their public resources and powers.
The work of the Auditor-General is carried out by staff in two business units –
the Office of the Auditor-General (OAG) and Audit New Zealand, supported by
BackgroundPart 1
13
a shared team of corporate services staff – and by contracted auditors from the
private sector. We refer to these collective resources as “the Office”.
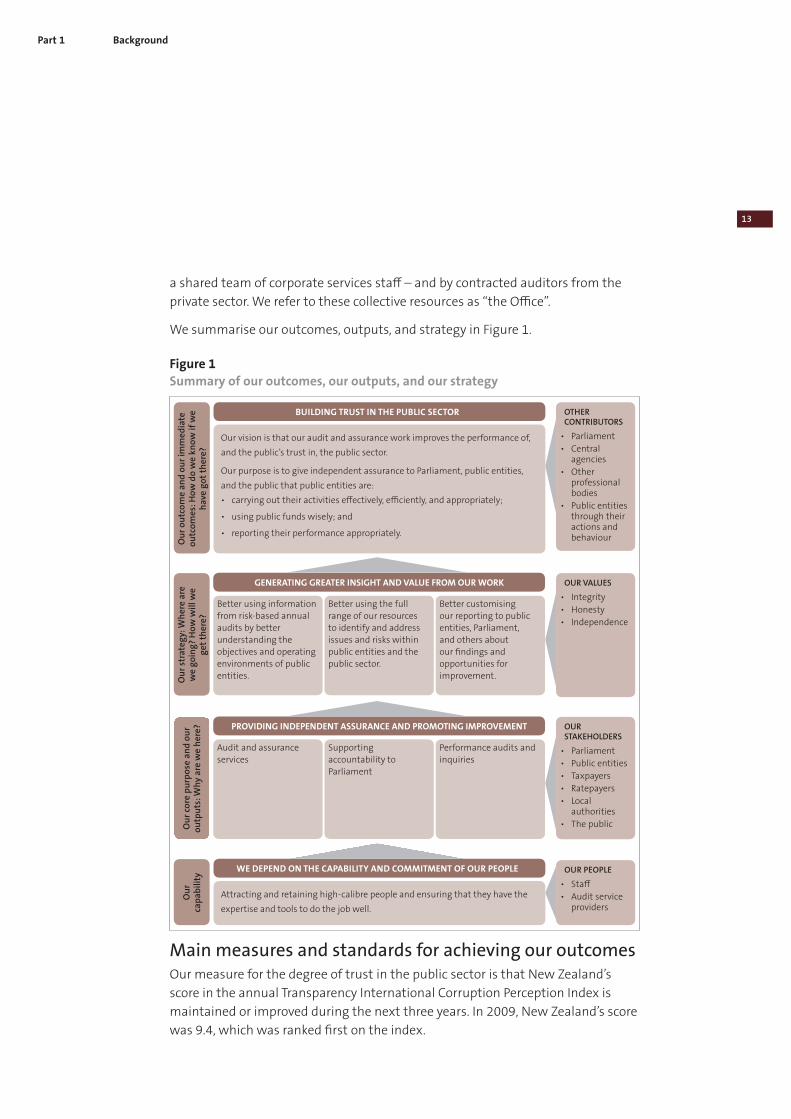
We summarise our outcomes, outputs, and strategy in Figure 1.
Figure 1
Summary of our outcomes, our outputs, and our strategy
Ou
r o
utc
om
e a
nd
ou
r im
med
iate
o
utc
om
es: H
ow
do
we
kno
w if
we
hav
e g
ot
ther
e?
Our vision is that our audit and assurance work improves the performance of,
and the public’s trust in, the public sector.
Our purpose is to give independent assurance to Parliament, public entities,
and the public that public entities are:
• carrying out their activities effectively, efficiently, and appropriately;
• using public funds wisely; and
• reporting their performance appropriately.
BUILDING TRUST IN THE PUBLIC SECTOR OTHER CONTRIBUTORS
• Parliament
• Central agencies
• Other professional bodies
• Public entities through their actions and behaviour
Ou
r st
rate
gy:
Wh
ere
are
w
e g
oin
g?
Ho
w w
ill w
e
get
th
ere?
GENERATING GREATER INSIGHT AND VALUE FROM OUR WORK OUR VALUES
• Integrity
• Honesty
• Independence
Better using information from risk-based annual audits by better understanding the objectives and operating environments of public entities.
Better using the full range of our resources to identify and address issues and risks within public entities and the public sector.
Better customising our reporting to public entities, Parliament, and others about our findings and opportunities for improvement.
Ou
r co
re p
urp
ose
an
d o
ur
ou
tpu
ts: W
hy
are
we
her
e? PROVIDING INDEPENDENT ASSURANCE AND PROMOTING IMPROVEMENT OUR STAKEHOLDERS
• Parliament
• Public entities
• Taxpayers
• Ratepayers
• Local authorities
• The public
Audit and assurance services
Supporting accountability to Parliament
Performance audits and inquiries
Attracting and retaining high-calibre people and ensuring that they have the
expertise and tools to do the job well.
WE DEPEND ON THE CAPABILITY AND COMMITMENT OF OUR PEOPLE OUR PEOPLE
• Staff
• Audit service providers
Ou
r
cap
ab
ilit
y
Main measures and standards for achieving our outcomesOur measure for the degree of trust in the public sector is that New Zealand’s
score in the annual Transparency International Corruption Perception Index is
maintained or improved during the next three years. In 2009, New Zealand’s score
was 9.4, which was ranked first on the index.
Part 1 Background
14
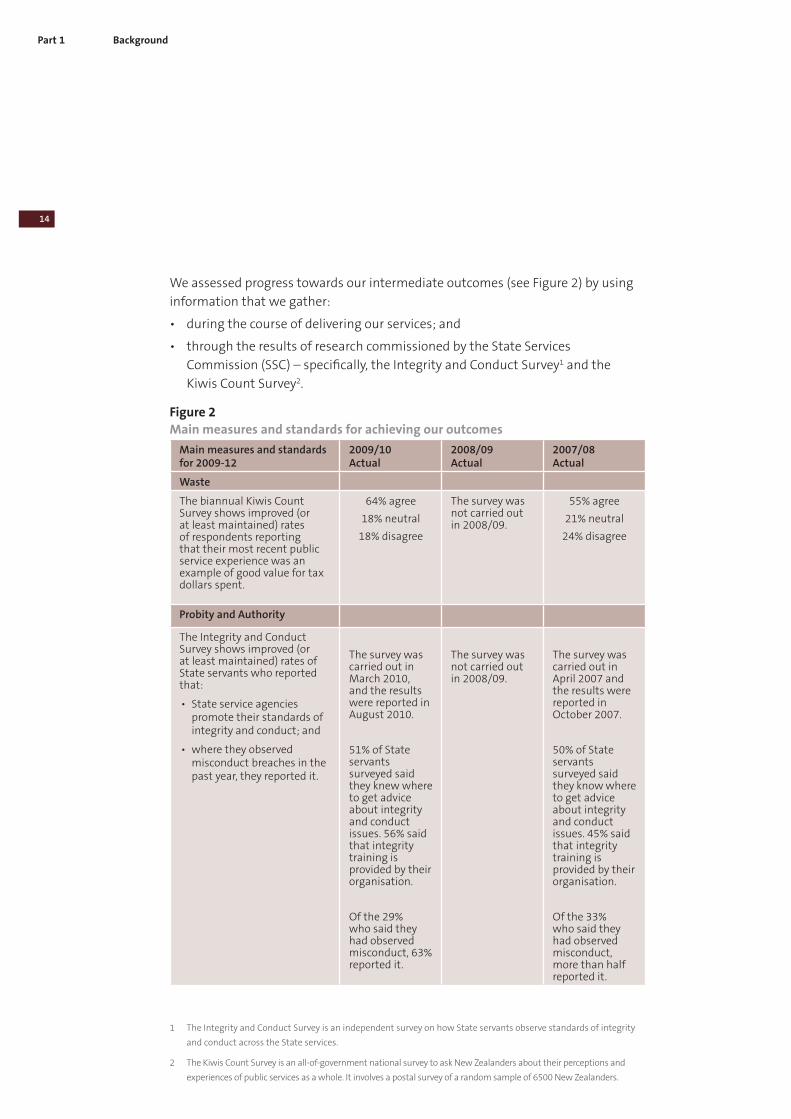
We assessed progress towards our intermediate outcomes (see Figure 2) by using
information that we gather:
• during the course of delivering our services; and
• through the results of research commissioned by the State Services
Commission (SSC) – specifically, the Integrity and Conduct Survey1 and the
Kiwis Count Survey2.
Figure 2
Main measures and standards for achieving our outcomes
Main measures and standards for 2009-12
2009/10 Actual
2008/09 Actual
2007/08 Actual
Waste
The biannual Kiwis Count Survey shows improved (or at least maintained) rates of respondents reporting that their most recent public service experience was an example of good value for tax dollars spent.
64% agree
18% neutral
18% disagree
The survey was not carried out in 2008/09.
55% agree
21% neutral
24% disagree
Probity and Authority
The Integrity and Conduct Survey shows improved (or at least maintained) rates of State servants who reported that:
• State service agencies promote their standards of integrity and conduct; and
• where they observed misconduct breaches in the past year, they reported it.
The survey was carried out in March 2010, and the results were reported in August 2010.
51% of State servants surveyed said they knew where to get advice about integrity and conduct issues. 56% said that integrity training is provided by their organisation.
Of the 29% who said they had observed misconduct, 63% reported it.
The survey was not carried out in 2008/09.
The survey was carried out in April 2007 and the results were reported in October 2007.
50% of State servants surveyed said they know where to get advice about integrity and conduct issues. 45% said that integrity training is provided by their organisation.
Of the 33% who said they had observed misconduct, more than half reported it.
1 The Integrity and Conduct Survey is an independent survey on how State servants observe standards of integrity
and conduct across the State services.
2 The Kiwis Count Survey is an all-of-government national survey to ask New Zealanders about their perceptions and
experiences of public services as a whole. It involves a postal survey of a random sample of 6500 New Zealanders.
BackgroundPart 1
15
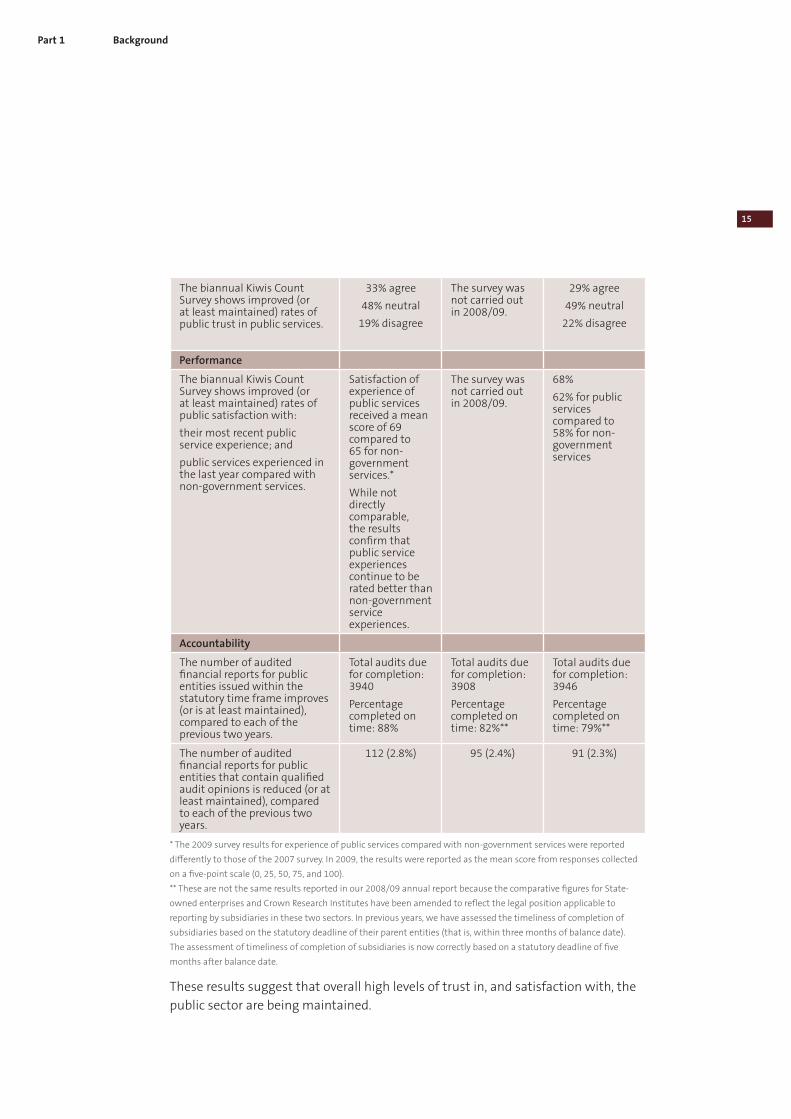
The biannual Kiwis Count Survey shows improved (or at least maintained) rates of public trust in public services.
33% agree
48% neutral
19% disagree
The survey was not carried out in 2008/09.
29% agree
49% neutral
22% disagree
Performance
The biannual Kiwis Count Survey shows improved (or at least maintained) rates of public satisfaction with:
their most recent public service experience; and
public services experienced in the last year compared with non-government services.
Satisfaction of experience of public services received a mean score of 69 compared to 65 for non-government services.*
While not directly comparable, the results confirm that public service experiences continue to be rated better than non-government service experiences.
The survey was not carried out in 2008/09.
68%
62% for public services compared to 58% for non-government services
Accountability
The number of audited financial reports for public entities issued within the statutory time frame improves (or is at least maintained), compared to each of the previous two years.
Total audits due for completion: 3940
Percentage completed on time: 88%
Total audits due for completion: 3908
Percentage completed on time: 82%**
Total audits due for completion: 3946
Percentage completed on time: 79%**
The number of audited financial reports for public entities that contain qualified audit opinions is reduced (or at least maintained), compared to each of the previous two years.
112 (2.8%) 95 (2.4%) 91 (2.3%)
* The 2009 survey results for experience of public services compared with non-government services were reported
differently to those of the 2007 survey. In 2009, the results were reported as the mean score from responses collected
on a five-point scale (0, 25, 50, 75, and 100).
** These are not the same results reported in our 2008/09 annual report because the comparative figures for State-
owned enterprises and Crown Research Institutes have been amended to reflect the legal position applicable to
reporting by subsidiaries in these two sectors. In previous years, we have assessed the timeliness of completion of
subsidiaries based on the statutory deadline of their parent entities (that is, within three months of balance date).
The assessment of timeliness of completion of subsidiaries is now correctly based on a statutory deadline of five
months after balance date.
These results suggest that overall high levels of trust in, and satisfaction with, the
public sector are being maintained.
Part 1 Background
16
Evaluating our service performance, its impact, and its cost-effectivenessIn the statement of service performance (Part 2 on pages 19-66), we set out our
performance measures and standards and results, which we use to consider
whether our work has had a positive effect on the public sector.
Our annual audit and other assurance work suggest that the quality of financial
reporting and management in the public sector is being maintained, as the
percentage of audit reports being issued on time improved to 88% (compared to
82% in 2008/09 and 79% in 2007/08). At 2.8%, the percentage of audit reports
being qualified was also similar to previous years. We think the improving trend in
the number of audit report being issued on time largely reflects the settling in of
New Zealand equivalents to International Financial Reporting Standards (NZ IFRS)
and the collective efforts of our auditors to better manage audit arrears.
We were encouraged to see last year’s acceptance of Audit New Zealand’s
recommendations in annual audit management reports to public entities of 79%
maintained in 2009/10.
Our assessments of central government entities’ management control
environment and financial information systems and control showed slight
improvement against the previous year. We graded service performance
information and associated systems and controls for the first time under
our revised standard as part of the 2008/09 audits carried out in 2009/10.
Performance measures and our audit work on these have been a focus for the
Office.
We maintained or exceeded the majority of our Audit and assurance services
performance expectations. We are particularly pleased to see a significant
reduction in the overall level of audit arrears compared with the prior year’s
position (313 compared to 429). We are also seeing a slow decline in the arrears
that are due to our inaction, and expect this trend to continue as we continue to
reduce the overall level of arrears.
Our high level of timeliness in issuing management reports to entities – 93% –
was maintained over the last three years while we continued to deliver quality
audits. This was confirmed by our quality assurance reviews and the increase in
levels of client satisfaction from 80% last year to 83% for 2009/10.
Reflecting the economic environment, changes in audit fees due to charge-out
rate increases were largely held in 2009/10. The annual independent review of our
processes again confirmed the probity and objectivity of the methods and systems
BackgroundPart 1
17
that we use to allocate and tender audits, and monitor the reasonableness of
audit fees. We have initiated a review of our audit allocation model to ensure that
the principles used encourage audit quality while ensuring that audits are cost-
effective.
Audit fee revenue and other income was higher than forecast, due to our
higher level of completion of audit arrears and increases to fee and overhead
contribution revenue being higher than budgeted because of changes in audit
hours.
Our Supporting accountability to Parliament and Performance audits and inquiries
results also suggest that our work is achieving its desired effect. We surveyed
select committee members, who said that our advice assists them in their
Estimates examinations and financial reviews, with all select committee members
surveyed agreeing that the Office’s work helps build and maintain public trust in
the effectiveness and efficiency of the public sector.
We also followed up on recommendations we made in our reports on
performance audits and inquiries, to understand and confirm that public entities
had taken action in response to those recommendations.
Ratings by select committee members for the quality and usefulness of advice
remained at 86%, with all members agreeing that the Office was proactive in
alerting their committee to significant issues. 90% of our stakeholders agreed
that our staff have an excellent understanding of their sectors. The results of the
stakeholder feedback interviews are pleasing, as they show the Office continuing
to play an important part in supporting accountability to Parliament, while
increasing the number of advisory reports we provide to Parliament.
For our performance audits, our indicators suggest that we maintained
the number produced as well as the quality of reports and the underlying
methodology for their preparation. We received improved stakeholder ratings
compared with the previous two years for the usefulness of our performance
audits, while ratings for the quality of our performance audit reports dropped to
80% in 2009/10 from 100% the year before, falling just below our target of 85%.
We again observed a trend of increasing numbers of inquiries and, within this, the
complexity and profile of inquiries. Given that major inquiries require senior staff
involvement, it is pleasing that we have managed to maintain the flow of routine
inquiry work.
For 2009/10, our revenue was higher than forecast, as we sought revenue for
certain inquiries that were specifically requested by entities concerning matters
related to their own decision-making and management practices.
Part 1 Background
18
Overall, our total expenditure was lower than budgeted. This was partly due
to timing of professional development and reprioritisation of the performance
audit programme. We also sought to make business improvement savings in
general administrative costs, including through less recruitment due to lower staff
turnover, lower IT costs arising from contract reviews, and travel savings.
We conclude that the Office has generally achieved its performance intentions,
and that our work has had a positive impact for the public sector.

19
Part 2Our output classes, performance measures, and targets (including Statement of service performance)
Part 2 Our output classes, performance measures, and targets (including Statement of service performance)
20
Our output classes and the outputs within those classes are:
• Audit and assurance services
• Supporting accountability to Parliament
– Parliamentary services
– Controller function
• Performance audits and inquiries
– Performance audits
– Inquiries.
Audit and assurance services
Background and context
In 2009/10, annual audits and other assurance services accounted for 87% of our
total expenditure. The major portion of the output class relates to annual audits
of public entities that are required by statute to be carried out.
The main purpose of an annual audit is to provide independent assurance about
the fair disclosure of the financial information – and, in many instances non-
financial information – within a public entity’s annual report. An audit involves a
range of procedures, tests, and management and governance enquiries to support
our opinion.
There are two main products from an annual audit:
• the audit report; and
• the management report.
For some public entities, there is also a financial review report.
The audit report is addressed to the readers of the financial statements and,
where applicable, of the service performance information. It provides the auditor’s
independent opinion (the audit opinion) on whether the financial statements
(and, where applicable, the service performance information) fairly reflect the
public entity’s financial performance and position. If the financial statements
fairly reflect the public entity’s financial performance and position (and, where
applicable, the service performance information), the auditor will issue an audit
report with an unqualified opinion. However, if the auditor identifies a material
misstatement in the financial statements or service performance information, the
auditor will issue a qualified opinion.
Part 2 Our output classes, performance measures, and targets (including Statement of service performance)
21
The management report is addressed to the governing body or the senior
management of public entities. It sets out any significant issues identified by the
auditor during the audit and provides recommendations for improving the public
entity’s controls, systems, and processes.
Where public entities are subject to financial review by a select committee,
we also report the results of annual audits to responsible Ministers and select
committees. The report includes a grading for public entities, based on our
assessment of their management control environment, and financial (and service
performance, where required) systems and controls.
In carrying out annual audits, auditors consider matters of authority, probity,
performance, waste, and accountability. Where appropriate, they make
recommendations for improvements to the governors and managers of public
entities. We also use our annual audits to gather information and knowledge
about public entities to assist us in advising Parliament and other stakeholders
and to help determine the work we do in our performance audits, inquiries, and
good practice guides.
Key processes supporting annual audits
Delivery of annual audits is supported by several key processes, including:
• appointing auditors and monitoring audit fees;
• setting the Auditor-General’s Auditing Standards;
• maintaining auditor independence; and
• quality assurance.
Appointing auditors and monitoring audit fees
The Auditor-General appoints auditors to carry out the annual audits of all public
entities. These auditors are appointed from a group of about 50 audit service
providers. The group includes Audit New Zealand and private sector accounting
firms, which range from the four major chartered accounting firms to sole
practitioners. Most audits are allocated directly to an auditor, but from time to
time an auditor is appointed to carry out an audit after a competitive tender.
Because we mainly use an allocation model, we monitor audit fees at the point of
negotiation between the appointed auditor and the public entity. We also provide
a comparative analysis to help resolve any concerns about proposed audit fees.
Our objective in monitoring fees is to ensure that fees are reasonable in that they
are based on:
Part 2 Our output classes, performance measures, and targets (including Statement of service performance)
22
• realistic hours (that is, hours that reflect the nature and extent of work
required);
• an appropriate audit team mix; and
• charge-out rates that are in line with market rates.
We aim for fees that are fair to the public entities and also provide a fair return to
the auditors for the work required by them to meet the Auditor-General’s Auditing
Standards.
During 2009/10, the Auditor-General appointed or reappointed auditors (except
where a change of auditor was made within the same audit service provider)
to conduct audits of 2456 schools and 392 other public entities and their
subsidiaries.
Setting the Auditor-General’s Auditing Standards
Section 23 of the Public Audit Act 2001 requires the auditing standards
of the Auditor-General to be published, by way of a report to the House of
Representatives, “at least once every 3 years”. The Auditor-General’s Auditing
Standards were most recently published in May 2008. These standards are
available on our website (www.oag.govt.nz).
Section 23 also requires each annual report of the Auditor-General to include a
description of any significant changes made to the standards during the year.
During 2009/10, we updated only Auditing Standard 1: Reporting to the OAG
(AG-1), to clarify the requirements for appointed auditors to electronically report
the results of annual audits to the OAG.
Work is currently under way to incorporate into the Auditor-General’s Auditing
Standards any changes considered necessary in respect of a new set of auditing
standards that have been progressively introduced by the New Zealand Institute
of Chartered Accountants for application in New Zealand (New Zealand
equivalents to International Standards on Auditing). We intend to issue updated
Auditor-General’s Auditing Standards later this calendar year, which will be earlier
than the next scheduled publication date of May 2011.
Maintaining auditor independence
High independence standards are set for both the Auditor-General’s employees
and appointed auditors from private sector accounting firms. Compliance with
these standards is monitored regularly. Any threats to auditor independence
that were identified during the year were subject to mitigation actions that the
Auditor-General considered appropriate to either eliminate the threats or reduce
them to an acceptable level.
Part 2 Our output classes, performance measures, and targets (including Statement of service performance)
23
Quality assurance
We carry out quality assurance reviews of appointed auditors to ensure that they
have complied with the relevant professional standards, as well as the Auditor-
General’s own published auditing standards. We aim to review the performance
of each of our appointed auditors at least once every three years. There are five
levels of quality assurance rating, assessed using the reviewers’ overall judgement
of the quality of the audit work carried out. The five levels are “excellent”, “very
good”, “good”, “satisfactory”, and “re-review”.
We also carry out reviews of each firm’s quality control systems that are designed
to provide assurance over the organisational factors that affect audit quality.
These reviews are carried out on a risk basis.
Main impact measures and standards
We report a range of impact measures and standards (see Figure 3 table and
graphs), which are designed to help gauge the impact of our annual audits and
other audits and assurance services.
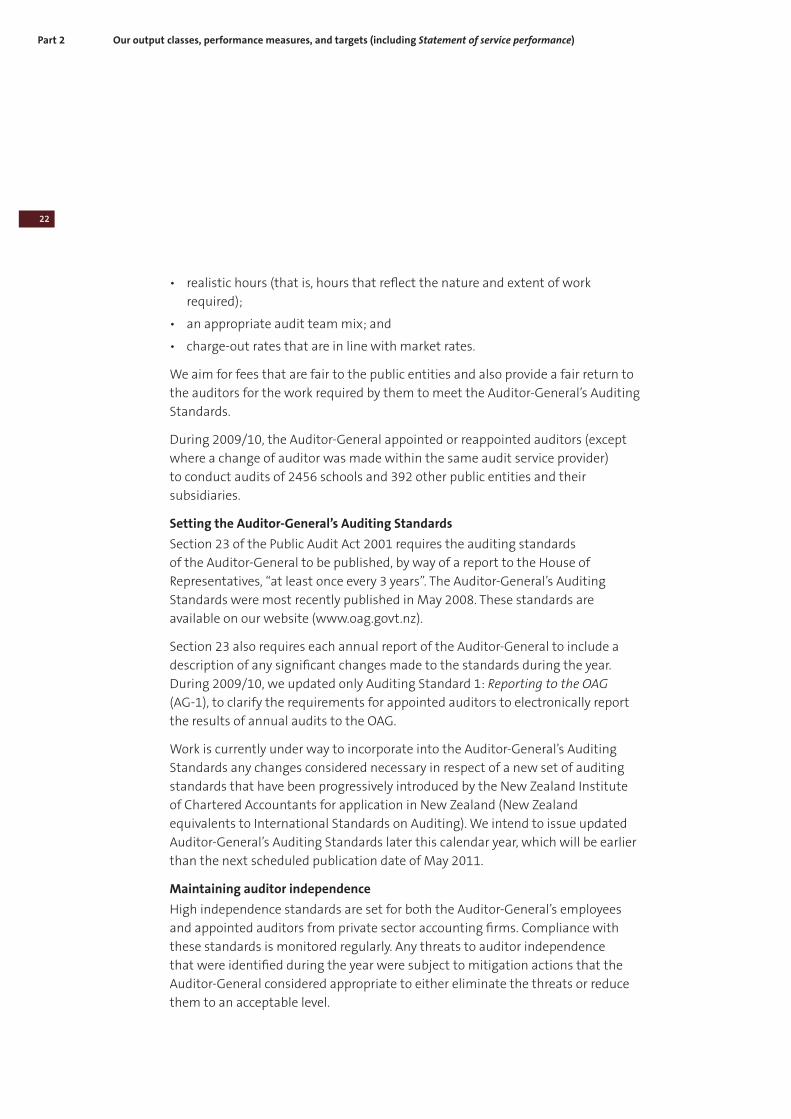
Figure 3
Actual performance against impact measures and standards for output class:
Audit and assurance services
2009/10 forecast main impact measures and standards
2009/10 Actual
2008/09 Actual
2007/08 Actual
The number of audited financial reports issued for public entities within the statutory timeframe is improved (or at least maintained), compared to each of the previous two years.a
Total audits due for completion in year: 3940
On time: 88%
Total audits due for completion in year: 3908
On time: 82%b
Total audits due for completion in year: 3946
On time: 79%b
The number of audited financial reports for public entities that contain qualified audit opinions is reduced (or at least maintained), compared to each of the previous two years.
Total qualified opinions: 112 (2.8%)
Total qualified opinions: 95 (2.4%)
Total qualified opinions: 91 (2.3%)
Public entities’ acceptance of Audit New Zealand’sc management report recommendations is improved (or at least maintained), measured against each of the previous two years.
Accepted: 79%
Rejected: 10%
Noted, under consideration or not responded to: 11%
Accepted: 79%
Rejected: 11%
Noted, under consideration, or not responded to: 10%
Accepted: 72%
Rejected: 4%
Noted, under consideration, or not responded to: 24%
Part 2 Our output classes, performance measures, and targets (including Statement of service performance)
24
2006/07
% o
f a
ll e
nti
tie
s
0%
10%
20%
30%
40%
50%
60%
Very good Good Needs Poor
improvement
2008/092007/08
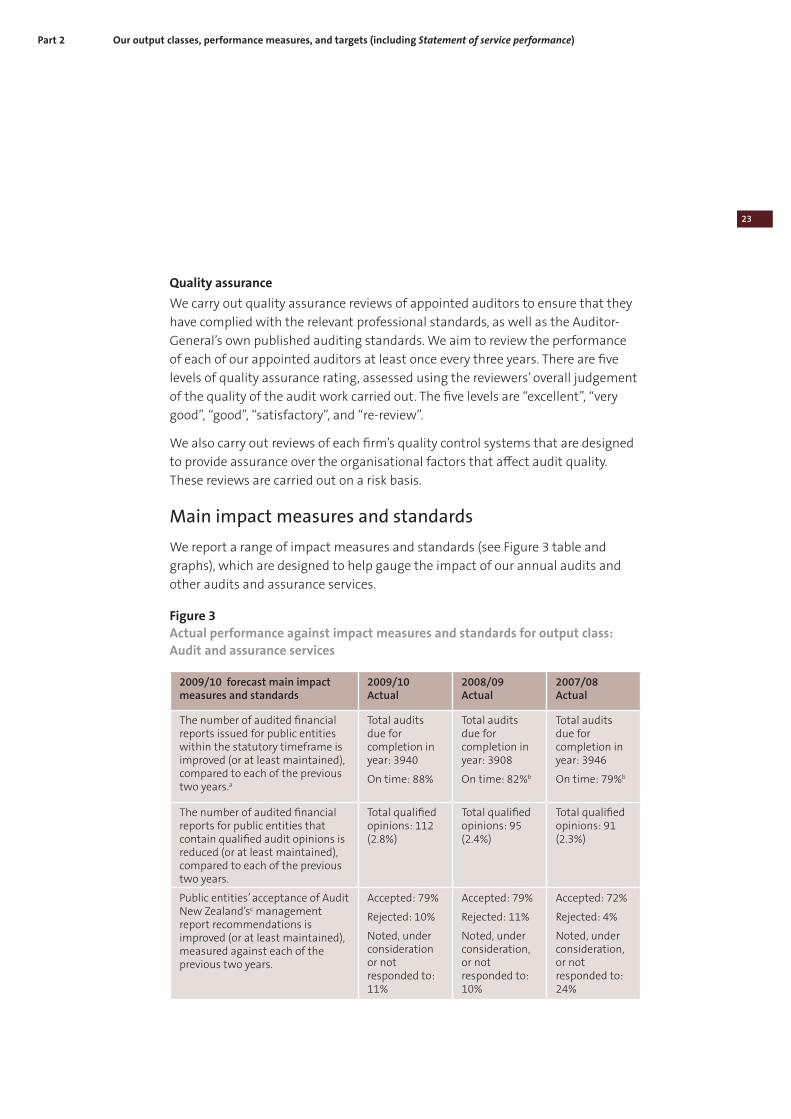
2009/10 forecast main impact measures and standards
2009/10 Actual
2008/09 Actual
2007/08 Actual
Central government entities’ management control environment, and financial information and service performanced information systems and controls are improved (or at least maintained), measured against each of the previous two years.
See graphs below
See graphs below
See graphs below
a Audits may not have been completed for several different reasons, including that the entity has not produced
financial statements for audit, that the audit of the previous year’s financial statements has not been completed (and
must be audited first), that there are delays on the part of the entity in responding to audit queries, that the audit
is under way but the financial statements have not been available to us for more than 30 days, and that the audit is
complete and waiting for the entity’s governing body to adopt the financial statements.b These are not the same results as those reported in our 2008/09 annual report because the comparative figures for
State-owned Enterprises and Crown Research Institutes have been amended to reflect the legal position applicable
to reporting by subsidiaries in these two sectors. In previous years, we have assessed the timeliness of completion of
subsidiaries based on the statutory deadline of their parent entities (that is, within three months of balance date).
The assessment of timeliness of completion of subsidiaries is now correctly based on a statutory deadline of five
months after balance date.c In future, we plan to report on public entities’ acceptance of management report recommendations from our range
of audit service providers, rather than just Audit New Zealand.d Service performance information and associated systems and controls were graded for the first time under the new
framework as part of the 2008/09 audits carried out in 2009/10; comparative results are therefore not available for
prior years.
Management control environment – grades for 2006/07 to 2008/09, as percentages
Part 2 Our output classes, performance measures, and targets (including Statement of service performance)
25
2006/07
% o
f a
ll e
nti
tie
s
0%
10%
20%
30%
40%
50%
60%
80%
70%
Very good Good Needs Poor
improvement
2008/092007/08
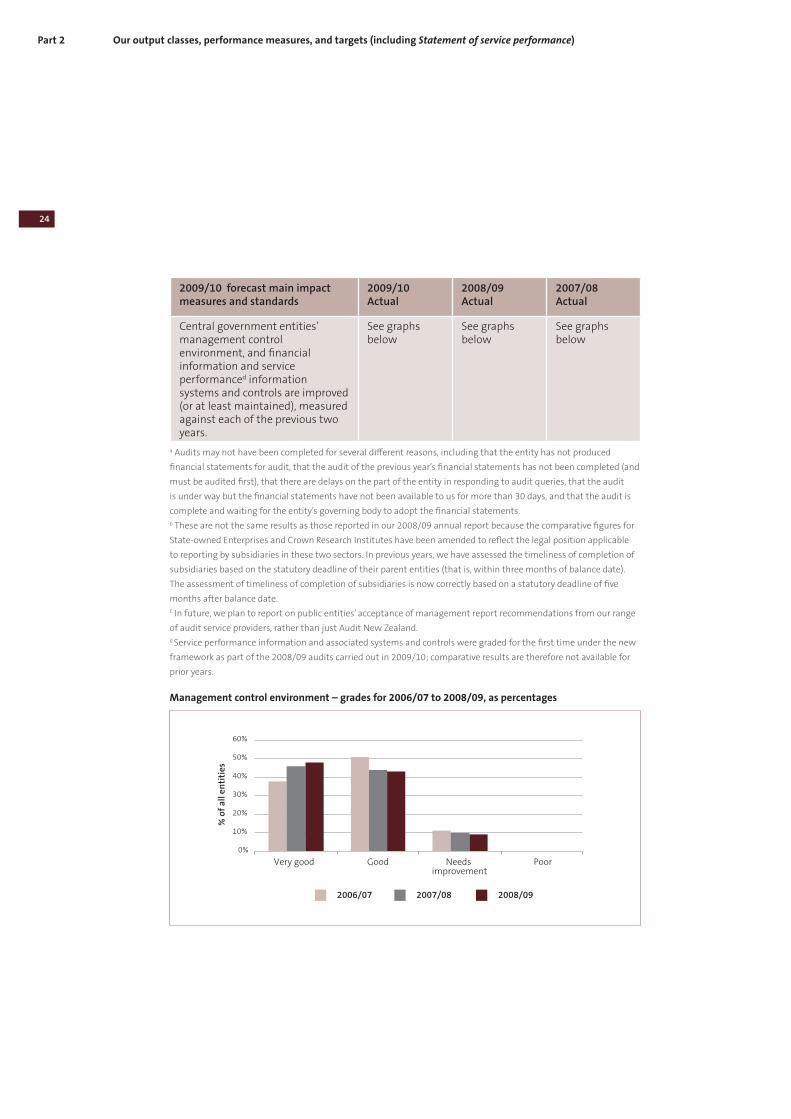
Financial information systems and controls – grades for 2006/07 to 2008/09, as percentages
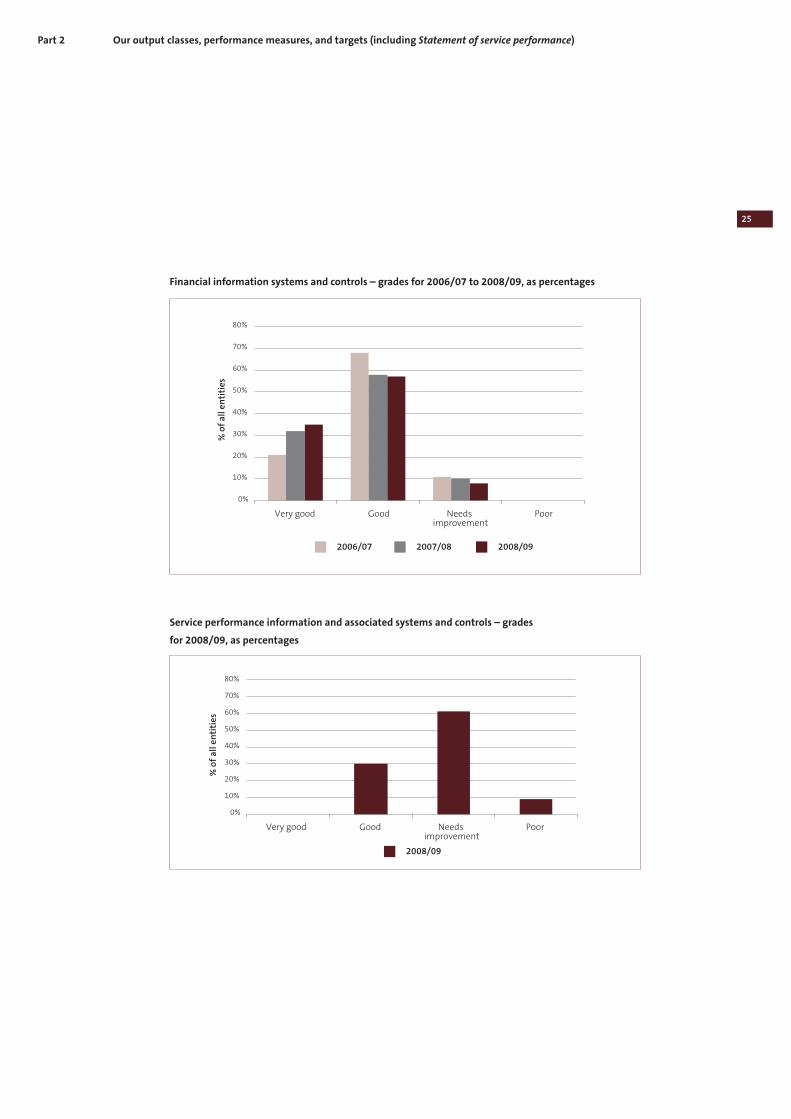
Service performance information and associated systems and controls – grades
for 2008/09, as percentages
% o
f a
ll e
nti
tie
s
0%
10%
20%
30%
40%
50%
60%
80%
70%
Very good Good Needs Poor
improvement
2008/09
Part 2 Our output classes, performance measures, and targets (including Statement of service performance)
26
Overall comments on the impact of our annual audits and other audits and assurance services
We are generally pleased with the trends in our impact measures and standards
as follows:
• an increasing percentage of audited financial statements being completed
within statutory deadlines;
• a low percentage of qualified audit opinions being maintained;
• a high percentage of acceptance by public entities of our recommendations for
improvement being maintained;
• a high percentage of “good” and “very good” grades assigned to public entities’
systems and controls being maintained.
Detailed comments on the impact measures
Completion of audited financial statements within statutory deadlines
An important aspect of the performance of public entities is issuing audited
financial statements within statutory timeframes so that those interested in the
accountability of public entities receive our audit assurance as soon as possible
after the year end.
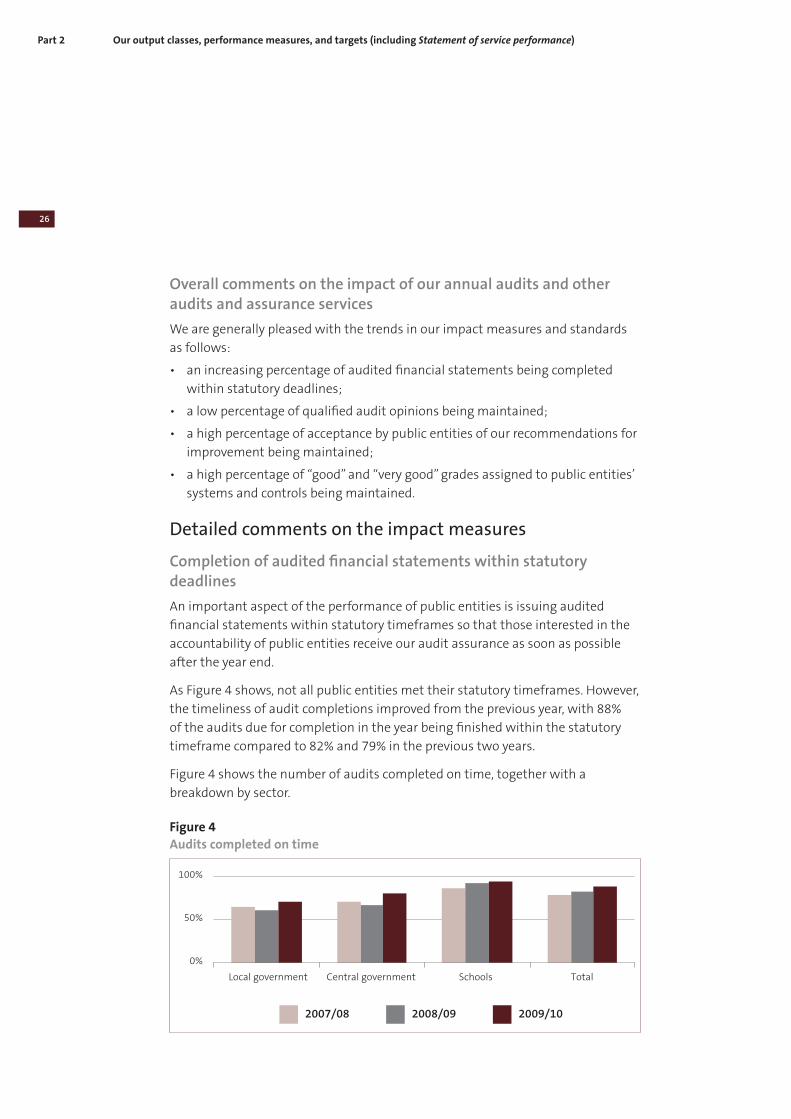
As Figure 4 shows, not all public entities met their statutory timeframes. However,
the timeliness of audit completions improved from the previous year, with 88%
of the audits due for completion in the year being finished within the statutory
timeframe compared to 82% and 79% in the previous two years.
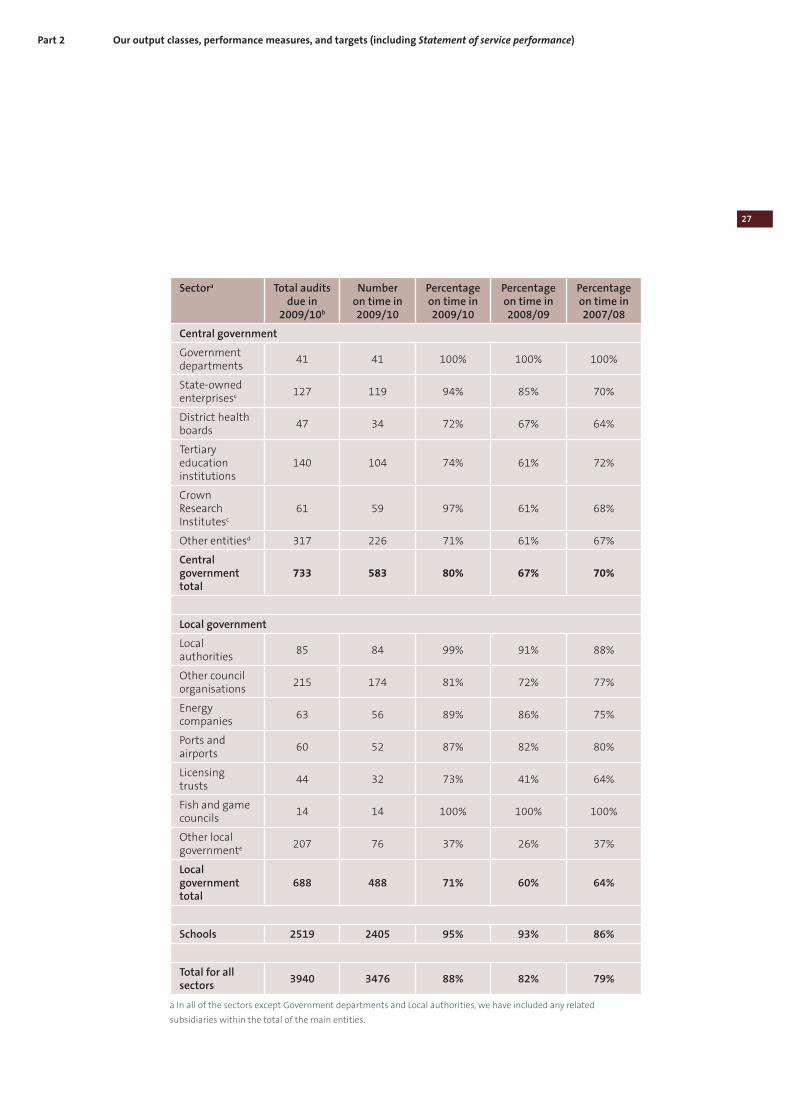
Figure 4 shows the number of audits completed on time, together with a
breakdown by sector.
Figure 4
Audits completed on time
2007/08
0%
50%
100%
Local government Central government Schools Total
2009/102008/09
Part 2 Our output classes, performance measures, and targets (including Statement of service performance)
27
Sectora Total audits due in
2009/10b
Number on time in 2009/10
Percentage on time in 2009/10
Percentage on time in 2008/09
Percentage on time in 2007/08
Central government
Government departments
41 41 100% 100% 100%
State-owned enterprisesc 127 119 94% 85% 70%
District health boards
47 34 72% 67% 64%
Tertiary education institutions
140 104 74% 61% 72%
Crown Research Institutesc
61 59 97% 61% 68%
Other entitiesd 317 226 71% 61% 67%
Central government total
733 583 80% 67% 70%
Local government
Local authorities
85 84 99% 91% 88%
Other council organisations
215 174 81% 72% 77%
Energy companies
63 56 89% 86% 75%
Ports and airports
60 52 87% 82% 80%
Licensing trusts
44 32 73% 41% 64%
Fish and game councils
14 14 100% 100% 100%
Other local governmente 207 76 37% 26% 37%
Local government total
688 488 71% 60% 64%
Schools 2519 2405 95% 93% 86%
Total for all sectors
3940 3476 88% 82% 79%
a In all of the sectors except Government departments and Local authorities, we have included any related
subsidiaries within the total of the main entities.
Part 2 Our output classes, performance measures, and targets (including Statement of service performance)
28
b “Total audits due” is the number of audits in each sector which had an expected completion date between 1 July
2009 and 30 June 2010.
c The comparative figures for State-owned enterprises and Crown Research Institutes have been amended to reflect
the legal position applicable to reporting by subsidiaries in these two sectors. In previous years, we have assessed the
timeliness of completion of subsidiaries based on the statutory deadline of their parent entities (that is, within three
months of balance date). The assessment of timeliness of completion of subsidiaries is now correctly based on a
statutory deadline of five months after balance date.
d The “Other entities” group in the central government sector includes Māori Trust Boards, Rural Education Activity
Programmes, section 19 audits, subsidiaries of government departments, crown entities not separately identified,
crown agents, and miscellaneous other central government entities.
e The “Other local government” group includes Administering Bodies, Domain and Reserve Boards, Public Hall Boards
and Cemeteries.
Central government sector
In the central government sector, delays in completing subsidiary audits are
the main reason for the overall number of audits not completed on time. Over
the past year, we have worked with our appointed auditors to ensure that
subsidiary audits are completed in a timely way. It is therefore pleasing to see
the increase in the number of audits completed on time, particularly in the
State-owned enterprise and Crown Research Institute sectors. We will continue
to work with our appointed auditors in the year ahead to further improve the
timely completion of audits, particularly in the district health board and tertiary
education institution sectors.
Local government sector
In the local government sector, there has also been an improvement in audits
completed on time.
As noted in last year’s annual report, the effect of diverting resources to the
triennial audit of LTCCPs in 2008/09 contributed to a low clearance of annual
audits within statutory timeframes. There was no such pressure in 2009/10. As a
result, there was a substantial improvement in the number of audits in the local
government sector being completed within the statutory timeframe compared
with the previous two years.
Schools sector
The majority of the public entities subject to audit by the Auditor-General are
schools. We aim to complete over 90% of school audits within the statutory
timeframe and 99% within 12 months of balance date. The statutory date for
school audits is 31 May, only a month before the end of our reporting year, so
there will always be a reasonable number of school audits in arrears at 30 June.
Part 2 Our output classes, performance measures, and targets (including Statement of service performance)
29
We are pleased to report that, in 2009/10, we managed to achieve a higher level
of performance than in any previous year, with more than 95% of audits being
completed by the statutory deadline and more than 99% being completed within
12 months of balance date.
Results of our annual audit opinions
There are three types of qualified audit opinions – a disclaimer of opinion, an
adverse opinion, and an “except for” opinion.
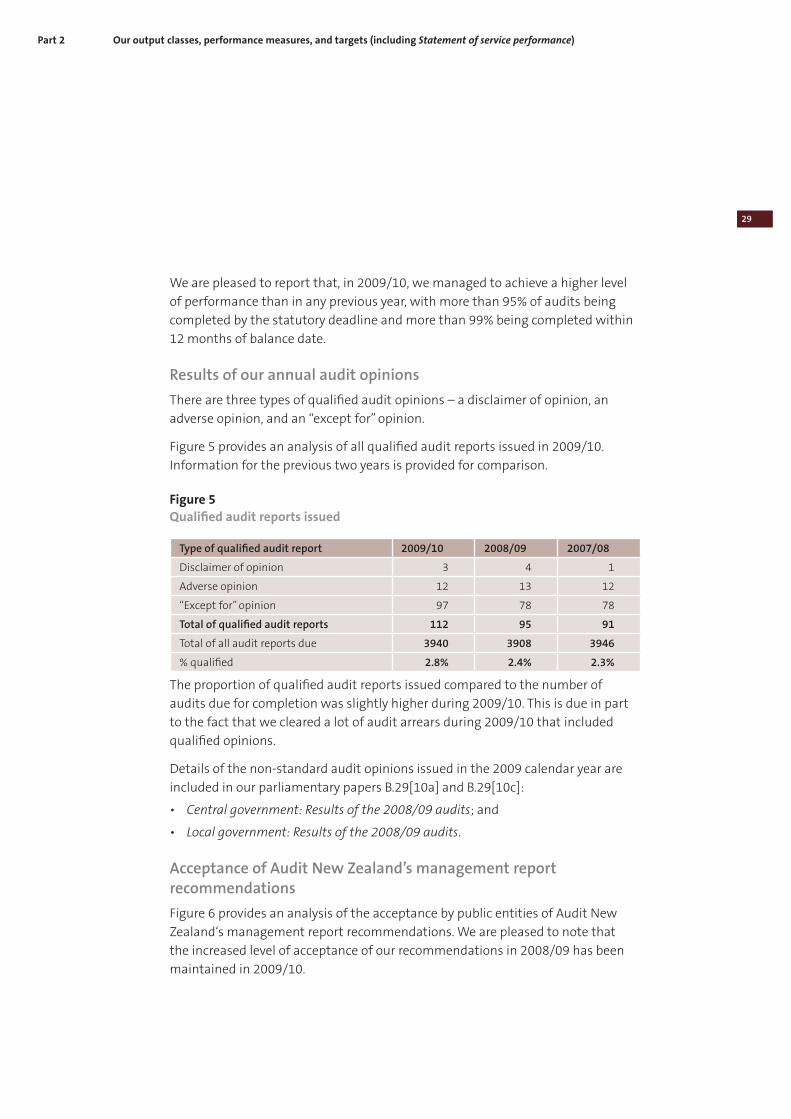
Figure 5 provides an analysis of all qualified audit reports issued in 2009/10.
Information for the previous two years is provided for comparison.
Figure 5
Qualified audit reports issued
Type of qualified audit report 2009/10 2008/09 2007/08
Disclaimer of opinion 3 4 1
Adverse opinion 12 13 12
“Except for” opinion 97 78 78
Total of qualified audit reports 112 95 91
Total of all audit reports due 3940 3908 3946
% qualified 2.8% 2.4% 2.3%
The proportion of qualified audit reports issued compared to the number of
audits due for completion was slightly higher during 2009/10. This is due in part
to the fact that we cleared a lot of audit arrears during 2009/10 that included
qualified opinions.
Details of the non-standard audit opinions issued in the 2009 calendar year are
included in our parliamentary papers B.29[10a] and B.29[10c]:
• Central government: Results of the 2008/09 audits; and
• Local government: Results of the 2008/09 audits.
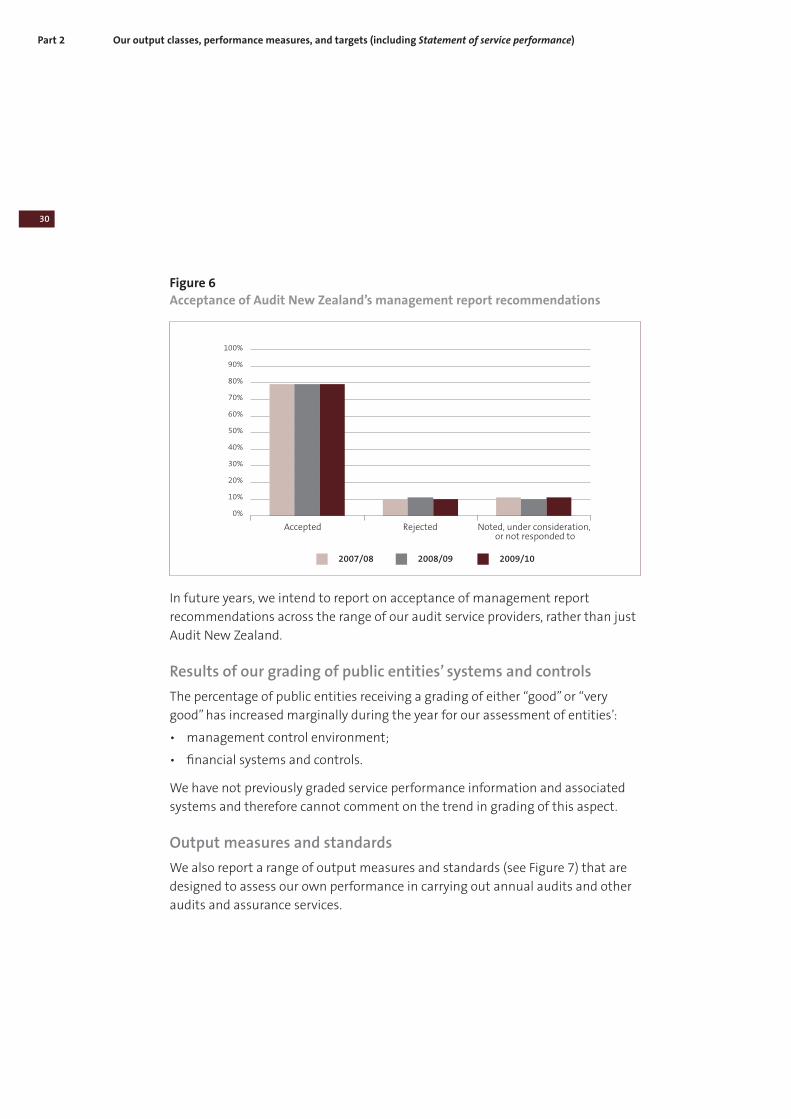
Acceptance of Audit New Zealand’s management report recommendations
Figure 6 provides an analysis of the acceptance by public entities of Audit New
Zealand‘s management report recommendations. We are pleased to note that
the increased level of acceptance of our recommendations in 2008/09 has been
maintained in 2009/10.
Part 2 Our output classes, performance measures, and targets (including Statement of service performance)
30
Figure 6
Acceptance of Audit New Zealand’s management report recommendations
In future years, we intend to report on acceptance of management report
recommendations across the range of our audit service providers, rather than just
Audit New Zealand.
Results of our grading of public entities’ systems and controls
The percentage of public entities receiving a grading of either “good” or “very
good” has increased marginally during the year for our assessment of entities’:
• management control environment;
• financial systems and controls.
We have not previously graded service performance information and associated
systems and therefore cannot comment on the trend in grading of this aspect.
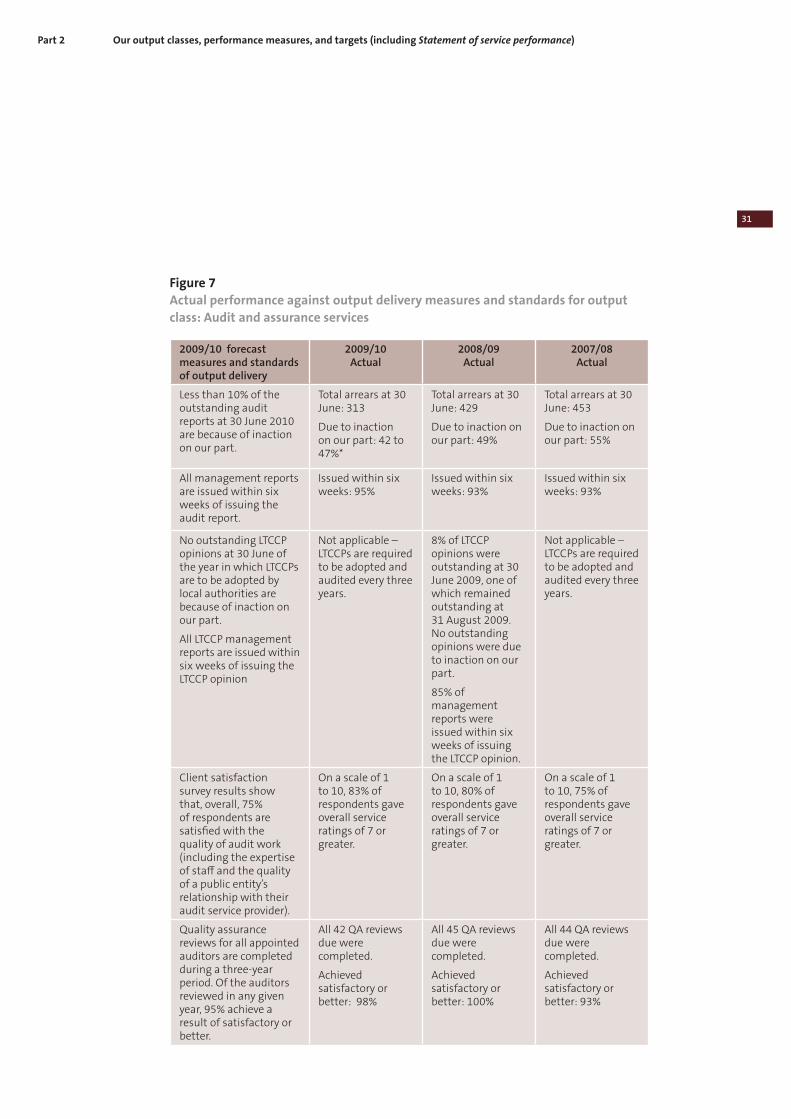
Output measures and standards
We also report a range of output measures and standards (see Figure 7) that are
designed to assess our own performance in carrying out annual audits and other
audits and assurance services.
2007/08
0%
10%
20%
30%
40%
50%
60%
80%
90%
100%
70%
Accepted Rejected Noted, under consideration,
or not responded to
2009/102008/09
Part 2 Our output classes, performance measures, and targets (including Statement of service performance)
31
Figure 7
Actual performance against output delivery measures and standards for output
class: Audit and assurance services
2009/10 forecast measures and standards of output delivery
2009/10 Actual
2008/09 Actual
2007/08 Actual
Less than 10% of the outstanding audit reports at 30 June 2010 are because of inaction on our part.
Total arrears at 30 June: 313
Due to inaction on our part: 42 to 47%*
Total arrears at 30 June: 429
Due to inaction on our part: 49%
Total arrears at 30 June: 453
Due to inaction on our part: 55%
All management reports are issued within six weeks of issuing the audit report.
Issued within six weeks: 95%
Issued within six weeks: 93%
Issued within six weeks: 93%
No outstanding LTCCP opinions at 30 June of the year in which LTCCPs are to be adopted by local authorities are because of inaction on our part.
All LTCCP management reports are issued within six weeks of issuing the LTCCP opinion
Not applicable – LTCCPs are required to be adopted and audited every three years.
8% of LTCCP opinions were outstanding at 30 June 2009, one of which remained outstanding at 31 August 2009. No outstanding opinions were due to inaction on our part.
85% of management reports were issued within six weeks of issuing the LTCCP opinion.
Not applicable – LTCCPs are required to be adopted and audited every three years.
Client satisfaction survey results show that, overall, 75% of respondents are satisfied with the quality of audit work (including the expertise of staff and the quality of a public entity’s relationship with their audit service provider).
On a scale of 1 to 10, 83% of respondents gave overall service ratings of 7 or greater.
On a scale of 1 to 10, 80% of respondents gave overall service ratings of 7 or greater.
On a scale of 1 to 10, 75% of respondents gave overall service ratings of 7 or greater.
Quality assurance reviews for all appointed auditors are completed during a three-year period. Of the auditors reviewed in any given year, 95% achieve a result of satisfactory or better.
All 42 QA reviews due were completed.
Achieved satisfactory or better: 98%
All 45 QA reviews due were completed.
Achieved satisfactory or better: 100%
All 44 QA reviews due were completed.
Achieved satisfactory or better: 93%
Part 2 Our output classes, performance measures, and targets (including Statement of service performance)
32
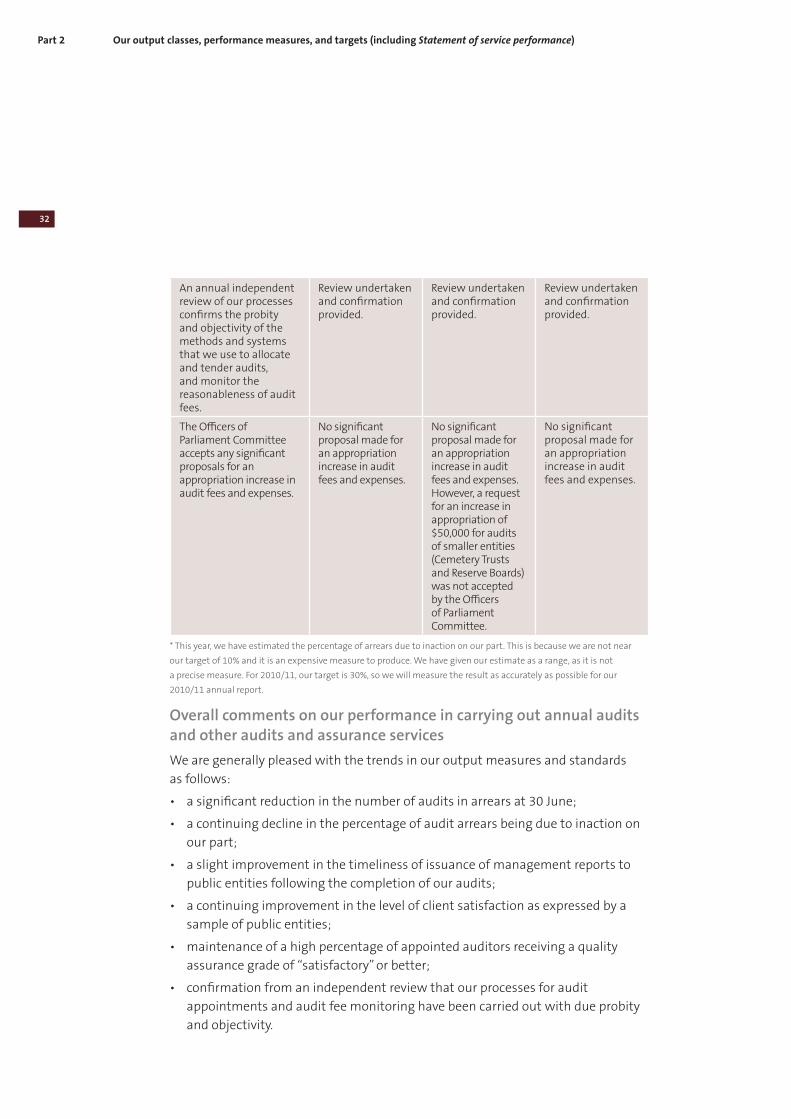
An annual independent review of our processes confirms the probity and objectivity of the methods and systems that we use to allocate and tender audits, and monitor the reasonableness of audit fees.
Review undertaken and confirmation provided.
Review undertaken and confirmation provided.
Review undertaken and confirmation provided.
The Officers of Parliament Committee accepts any significant proposals for an appropriation increase in audit fees and expenses.
No significant proposal made for an appropriation increase in audit fees and expenses.
No significant proposal made for an appropriation increase in audit fees and expenses. However, a request for an increase in appropriation of $50,000 for audits of smaller entities (Cemetery Trusts and Reserve Boards) was not accepted by the Officers of Parliament Committee.
No significant proposal made for an appropriation increase in audit fees and expenses.
* This year, we have estimated the percentage of arrears due to inaction on our part. This is because we are not near
our target of 10% and it is an expensive measure to produce. We have given our estimate as a range, as it is not
a precise measure. For 2010/11, our target is 30%, so we will measure the result as accurately as possible for our
2010/11 annual report.
Overall comments on our performance in carrying out annual audits and other audits and assurance services
We are generally pleased with the trends in our output measures and standards
as follows:
• a significant reduction in the number of audits in arrears at 30 June;
• a continuing decline in the percentage of audit arrears being due to inaction on
our part;
• a slight improvement in the timeliness of issuance of management reports to
public entities following the completion of our audits;
• a continuing improvement in the level of client satisfaction as expressed by a
sample of public entities;
• maintenance of a high percentage of appointed auditors receiving a quality
assurance grade of “satisfactory” or better;
• confirmation from an independent review that our processes for audit
appointments and audit fee monitoring have been carried out with due probity
and objectivity.
Part 2 Our output classes, performance measures, and targets (including Statement of service performance)
33
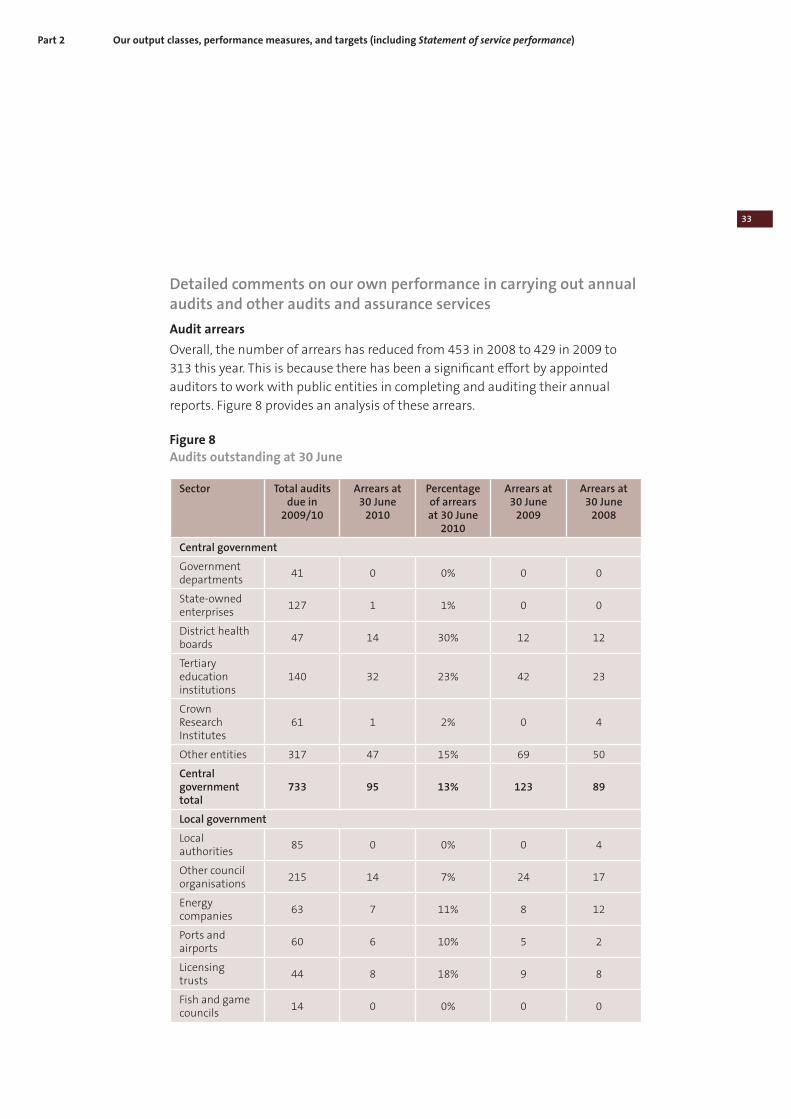
Detailed comments on our own performance in carrying out annual audits and other audits and assurance services
Audit arrears
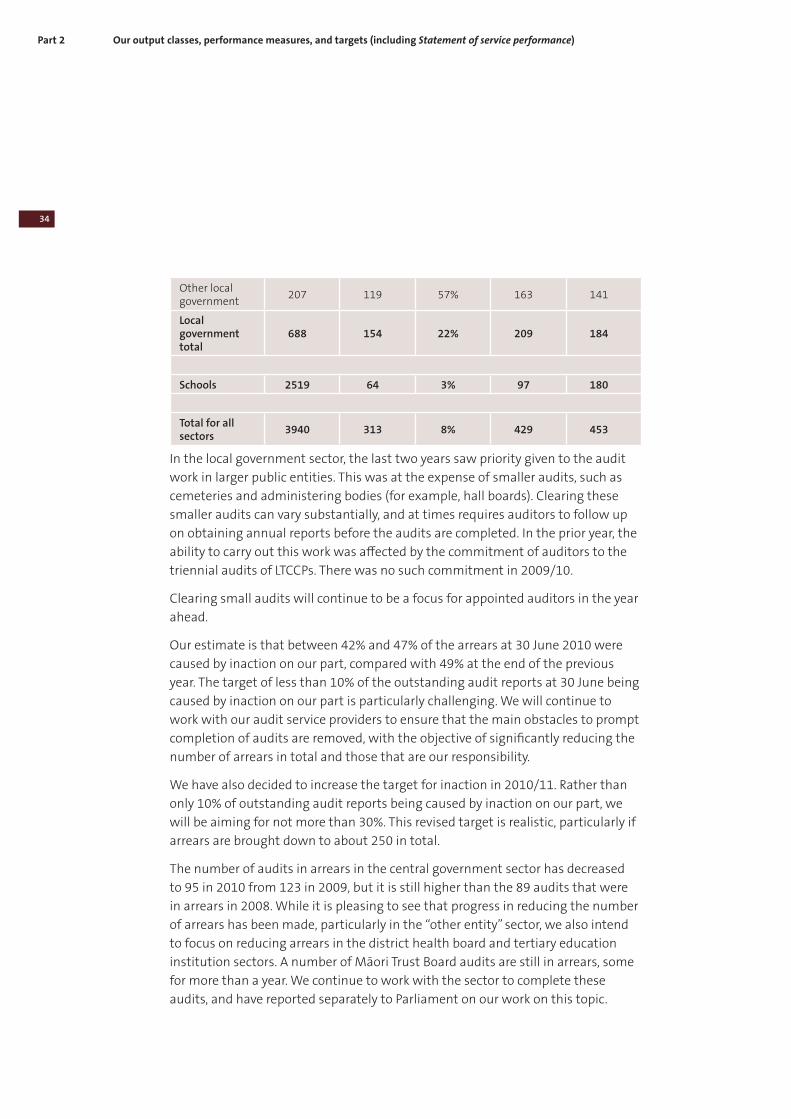
Overall, the number of arrears has reduced from 453 in 2008 to 429 in 2009 to
313 this year. This is because there has been a significant effort by appointed
auditors to work with public entities in completing and auditing their annual
reports. Figure 8 provides an analysis of these arrears.
Figure 8
Audits outstanding at 30 June
Sector Total audits due in
2009/10
Arrears at 30 June
2010
Percentage of arrears at 30 June
2010
Arrears at 30 June
2009
Arrears at 30 June
2008
Central government
Government departments
41 0 0% 0 0
State-owned enterprises
127 1 1% 0 0
District health boards
47 14 30% 12 12
Tertiary education institutions
140 32 23% 42 23
Crown Research Institutes
61 1 2% 0 4
Other entities 317 47 15% 69 50
Central government total
733 95 13% 123 89
Local government
Local authorities
85 0 0% 0 4
Other council organisations
215 14 7% 24 17
Energy companies
63 7 11% 8 12
Ports and airports
60 6 10% 5 2
Licensing trusts
44 8 18% 9 8
Fish and game councils
14 0 0% 0 0
Part 2 Our output classes, performance measures, and targets (including Statement of service performance)
34
Other local government
207 119 57% 163 141
Local government total
688 154 22% 209 184
Schools 2519 64 3% 97 180
Total for all sectors
3940 313 8% 429 453
In the local government sector, the last two years saw priority given to the audit
work in larger public entities. This was at the expense of smaller audits, such as
cemeteries and administering bodies (for example, hall boards). Clearing these
smaller audits can vary substantially, and at times requires auditors to follow up
on obtaining annual reports before the audits are completed. In the prior year, the
ability to carry out this work was affected by the commitment of auditors to the
triennial audits of LTCCPs. There was no such commitment in 2009/10.
Clearing small audits will continue to be a focus for appointed auditors in the year
ahead.
Our estimate is that between 42% and 47% of the arrears at 30 June 2010 were
caused by inaction on our part, compared with 49% at the end of the previous
year. The target of less than 10% of the outstanding audit reports at 30 June being
caused by inaction on our part is particularly challenging. We will continue to
work with our audit service providers to ensure that the main obstacles to prompt
completion of audits are removed, with the objective of significantly reducing the
number of arrears in total and those that are our responsibility.
We have also decided to increase the target for inaction in 2010/11. Rather than
only 10% of outstanding audit reports being caused by inaction on our part, we
will be aiming for not more than 30%. This revised target is realistic, particularly if
arrears are brought down to about 250 in total.
The number of audits in arrears in the central government sector has decreased
to 95 in 2010 from 123 in 2009, but it is still higher than the 89 audits that were
in arrears in 2008. While it is pleasing to see that progress in reducing the number
of arrears has been made, particularly in the “other entity” sector, we also intend
to focus on reducing arrears in the district health board and tertiary education
institution sectors. A number of Māori Trust Board audits are still in arrears, some
for more than a year. We continue to work with the sector to complete these
audits, and have reported separately to Parliament on our work on this topic.
Part 2 Our output classes, performance measures, and targets (including Statement of service performance)
35
The number of audits in arrears in the local government sector has decreased to
154 in 2010 from 209 in 2009. This reflects the clearance of a number of arrears of
small audits in this sector such as cemeteries and administering bodies.
The number of school audits outstanding at 30 June 2010 was the lowest on
record for the end of our reporting period. We estimate that no more than 10%
of the school arrears at 30 June 2010 were caused by inaction on the part of the
appointed auditor or ourselves.
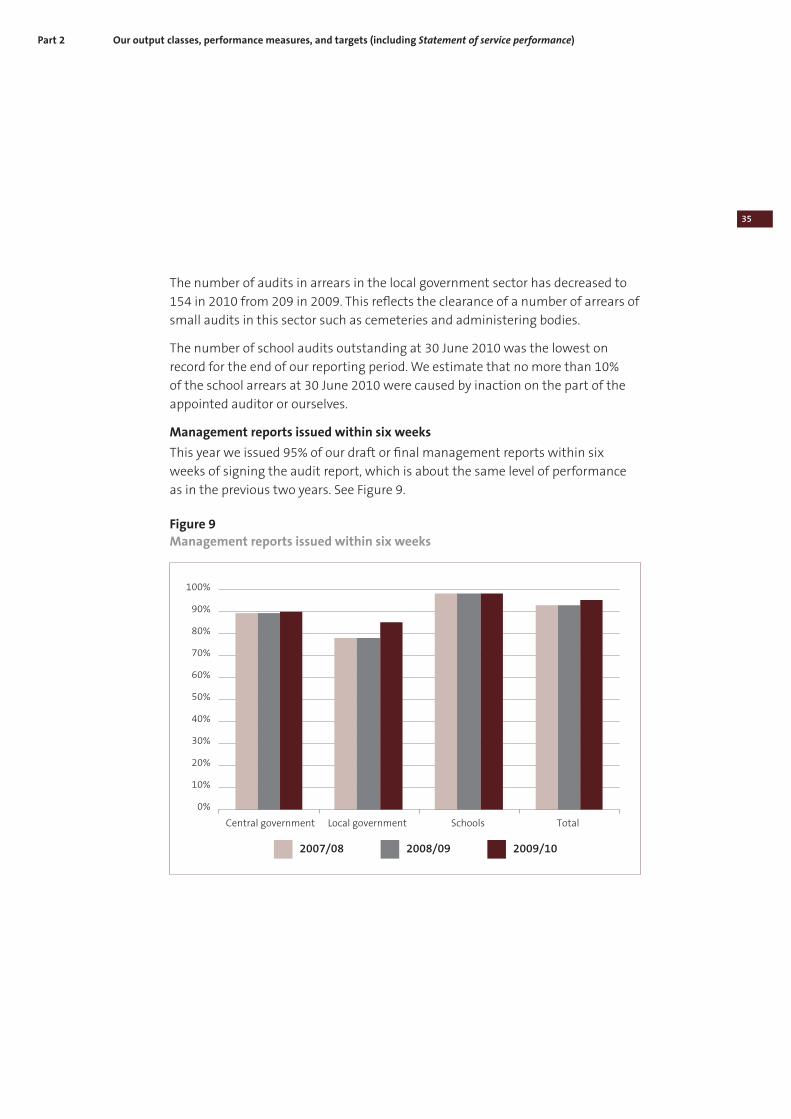
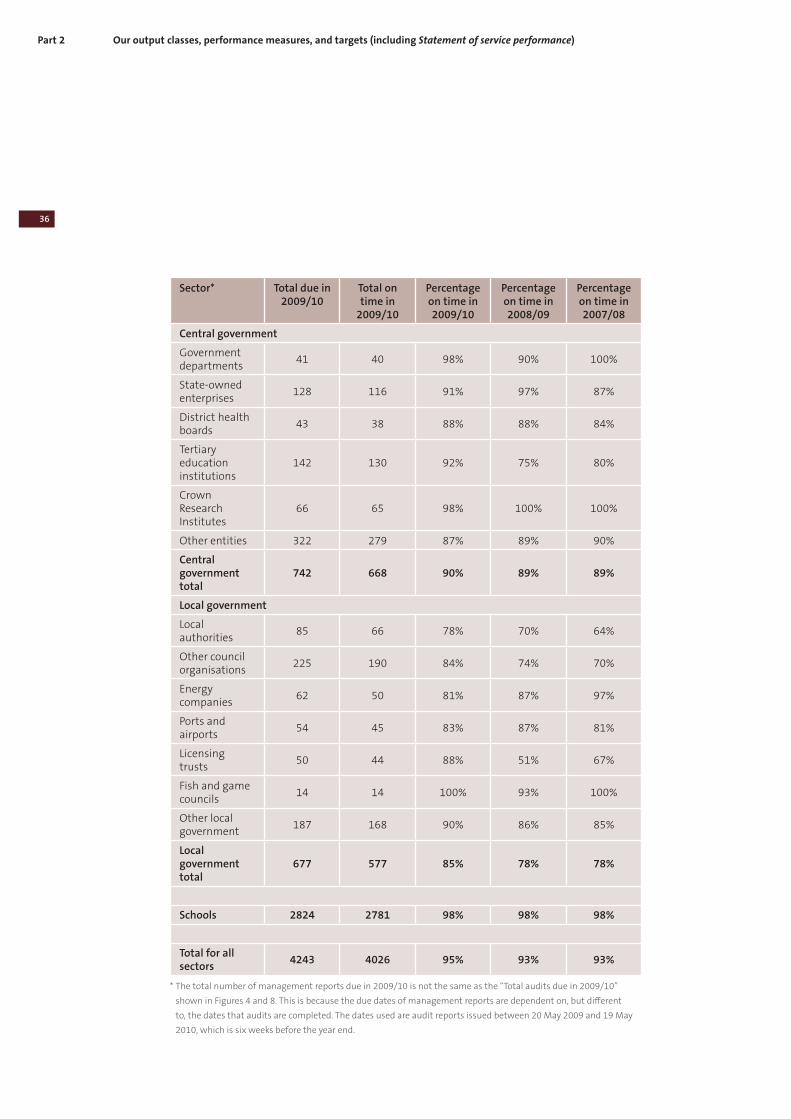
Management reports issued within six weeks
This year we issued 95% of our draft or final management reports within six
weeks of signing the audit report, which is about the same level of performance
as in the previous two years. See Figure 9.
Figure 9
Management reports issued within six weeks
2007/08
0%
10%
20%
30%
40%
50%
60%
70%
80%
90%
100%
Central government Local government Schools Total
2009/102008/09
Part 2 Our output classes, performance measures, and targets (including Statement of service performance)
36
Sector* Total due in 2009/10
Total on time in
2009/10
Percentage on time in 2009/10
Percentage on time in 2008/09
Percentage on time in 2007/08
Central government
Government departments
41 40 98% 90% 100%
State-owned enterprises
128 116 91% 97% 87%
District health boards
43 38 88% 88% 84%
Tertiary education institutions
142 130 92% 75% 80%
Crown Research Institutes
66 65 98% 100% 100%
Other entities 322 279 87% 89% 90%
Central government total
742 668 90% 89% 89%
Local government
Local authorities
85 66 78% 70% 64%
Other council organisations
225 190 84% 74% 70%
Energy companies
62 50 81% 87% 97%
Ports and airports
54 45 83% 87% 81%
Licensing trusts
50 44 88% 51% 67%
Fish and game councils
14 14 100% 93% 100%
Other local government
187 168 90% 86% 85%
Local government total
677 577 85% 78% 78%
Schools 2824 2781 98% 98% 98%
Total for all sectors
4243 4026 95% 93% 93%
* The total number of management reports due in 2009/10 is not the same as the “Total audits due in 2009/10”
shown in Figures 4 and 8. This is because the due dates of management reports are dependent on, but different
to, the dates that audits are completed. The dates used are audit reports issued between 20 May 2009 and 19 May
2010, which is six weeks before the year end.
Part 2 Our output classes, performance measures, and targets (including Statement of service performance)
37
We did not achieve our target of issuing all management reports within six weeks
of issuing the audit report. However, our achievement rate of 95% was similar to
the previous two years. The completion rate on the schools sector remained high
at 98%. In the central and local government sectors, our completion rates were
90% and 85% respectively.
In the central government sector, while there has been an improvement in the
number of management letters issued on time in the government department
and tertiary education institution sectors, it is disappointing not to see an
improvement in performance in other sectors. This is clearly an area that needs
improvement, and we will work with appointed auditors to ensure that they fulfil
their reporting obligations in a timely manner.
Consistent with the improvement in audits completed within statutory
timeframes, there has also been an improvement in the percentage of
management reports issued to public entities within six weeks in the local
government sector. Again, this is a reflection of resources being diverted in
prior years to the triennial audit of LTCCPs. We see this area as one that needs
improvement and we will continue to follow this up with our auditors.
Client satisfaction survey
The results of our client satisfaction survey continue to exceed our target of
75% of respondents rating service as 7 or greater on a scale of 1 to 10. The client
satisfaction survey resulted in an overall satisfaction rating of 83%, compared with
80% in 2008/09 and 78% in 2007/08. We intend to continue to focus our efforts
on improving those areas identified by public entities as needing to improve,
including:
• improving sector knowledge and understanding across audit teams;
• improving relationships with governing bodies;
• improving lead times and timeframes for audit work;
• being competitive on costs, particularly for smaller entities; and
• minimising the effect of staff turnover.
Quality assurance reviews
Our quality assurance reviews of appointed auditors continue to show generally
pleasing results. Of those auditors subject to quality assurance review during the
year, 98% achieved a grade of “satisfactory” or better against our target of 95%.
Part 2 Our output classes, performance measures, and targets (including Statement of service performance)
38
We will continue to focus on raising the general quality of audits performed on
behalf of the Auditor-General.
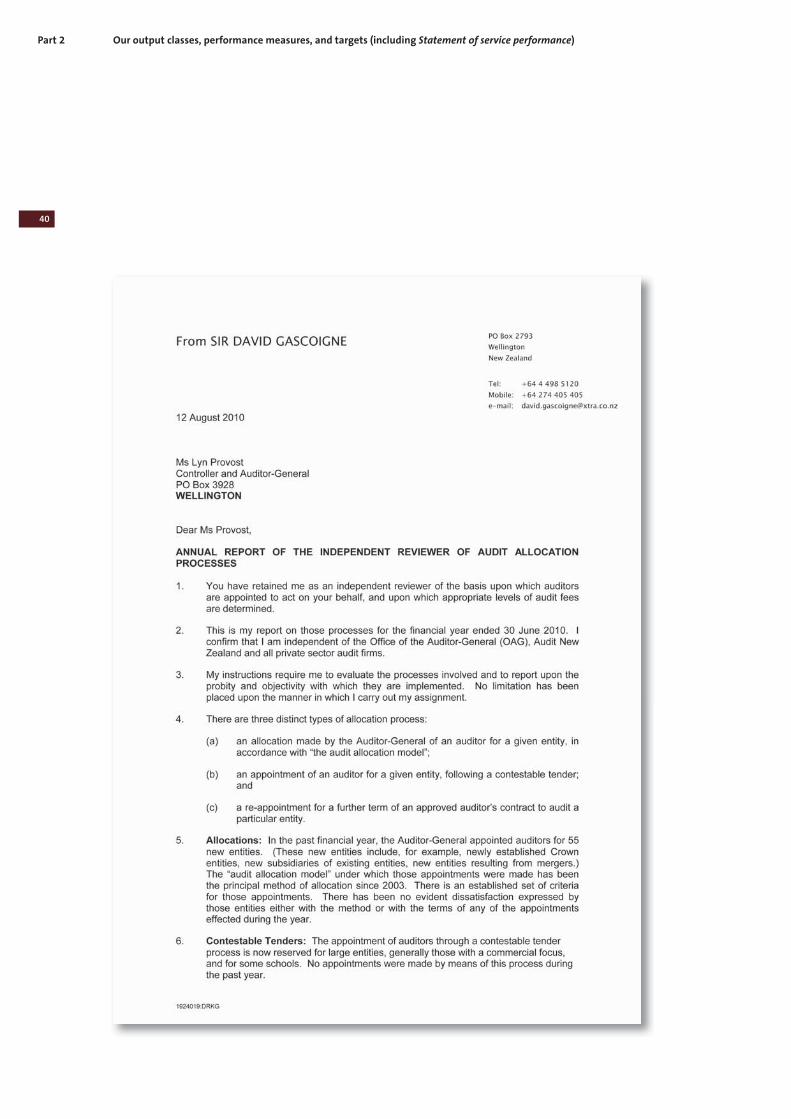
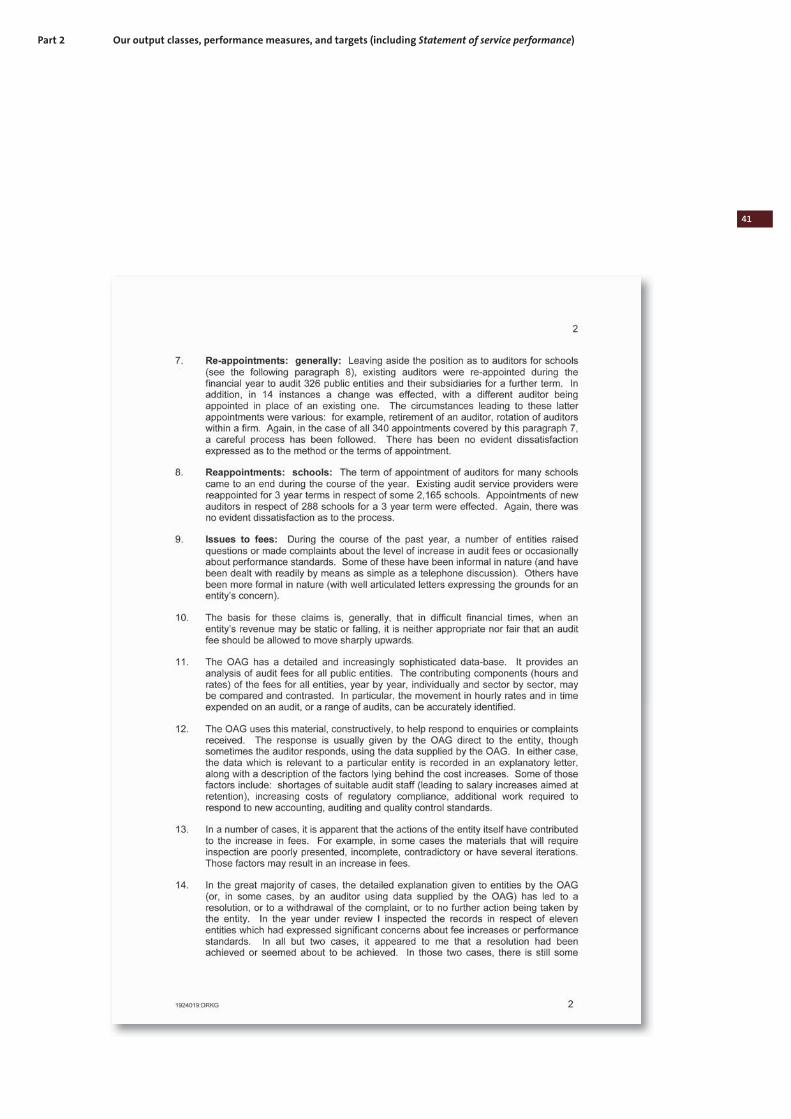
Independent review of audit allocation and fee setting and monitoring
Our independent reviewer has again assessed our audit allocation and fee-setting
and monitoring systems (the full report is included at pages 40-43). The reviewer
concluded that the processes for allocating audits in the public sector and for
setting fees in the financial year to 30 June 2010 have been carried out with due
probity and objectivity.
During 2010/11, we intend to carry out a comprehensive review of the allocation
of audits among the Auditor-General’s audit service providers, including Audit
New Zealand. We expect that this will result in some audits being reallocated
between audit service providers. Where a change is proposed, we will consult with
those public entities affected.
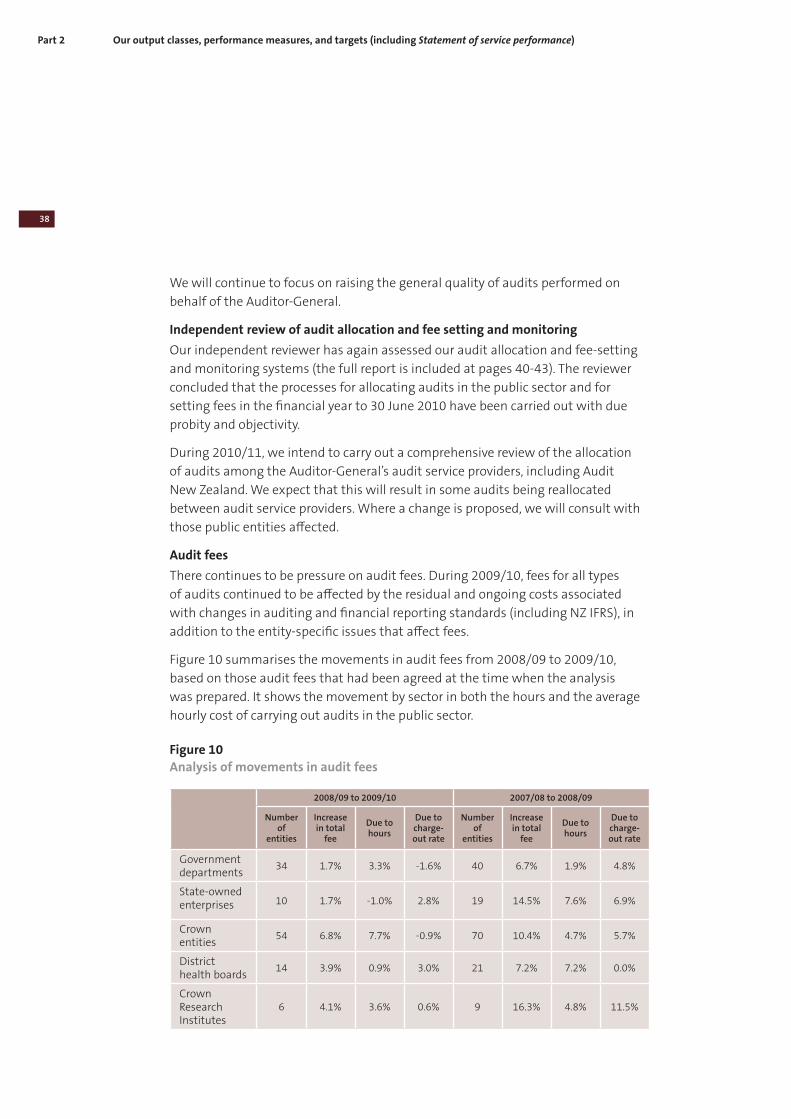
Audit fees
There continues to be pressure on audit fees. During 2009/10, fees for all types
of audits continued to be affected by the residual and ongoing costs associated
with changes in auditing and financial reporting standards (including NZ IFRS), in
addition to the entity-specific issues that affect fees.
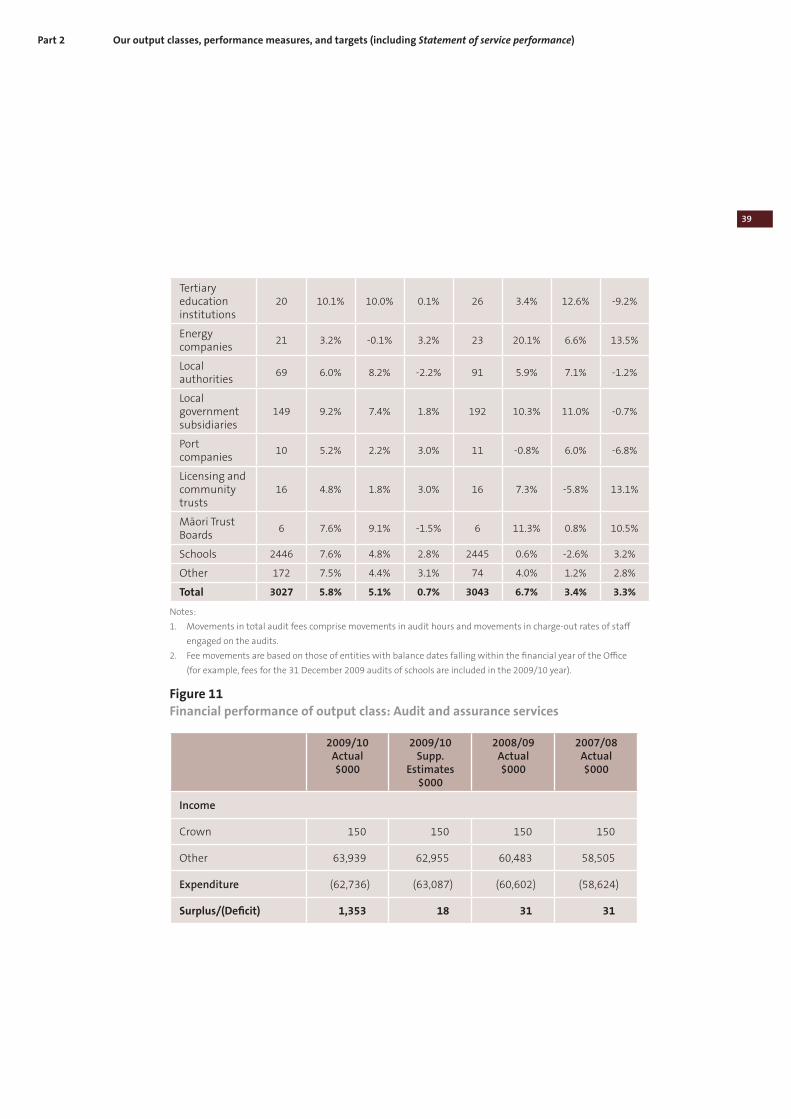
Figure 10 summarises the movements in audit fees from 2008/09 to 2009/10,
based on those audit fees that had been agreed at the time when the analysis
was prepared. It shows the movement by sector in both the hours and the average
hourly cost of carrying out audits in the public sector.
Figure 10
Analysis of movements in audit fees
2008/09 to 2009/10 2007/08 to 2008/09
Number of
entities
Increase in total
fee
Due to hours
Due to charge-out rate
Number of
entities
Increase in total
fee
Due to hours
Due to charge-out rate
Government departments
34 1.7% 3.3% -1.6% 40 6.7% 1.9% 4.8%
State-owned enterprises 10 1.7% -1.0% 2.8% 19 14.5% 7.6% 6.9%
Crown entities
54 6.8% 7.7% -0.9% 70 10.4% 4.7% 5.7%
District health boards
14 3.9% 0.9% 3.0% 21 7.2% 7.2% 0.0%
Crown Research Institutes
6 4.1% 3.6% 0.6% 9 16.3% 4.8% 11.5%
Part 2 Our output classes, performance measures, and targets (including Statement of service performance)
39
Tertiary education institutions
20 10.1% 10.0% 0.1% 26 3.4% 12.6% -9.2%
Energy companies
21 3.2% -0.1% 3.2% 23 20.1% 6.6% 13.5%
Local authorities
69 6.0% 8.2% -2.2% 91 5.9% 7.1% -1.2%
Local government subsidiaries
149 9.2% 7.4% 1.8% 192 10.3% 11.0% -0.7%
Port companies
10 5.2% 2.2% 3.0% 11 -0.8% 6.0% -6.8%
Licensing and community trusts
16 4.8% 1.8% 3.0% 16 7.3% -5.8% 13.1%
Māori Trust Boards
6 7.6% 9.1% -1.5% 6 11.3% 0.8% 10.5%
Schools 2446 7.6% 4.8% 2.8% 2445 0.6% -2.6% 3.2%
Other 172 7.5% 4.4% 3.1% 74 4.0% 1.2% 2.8%
Total 3027 5.8% 5.1% 0.7% 3043 6.7% 3.4% 3.3%
Notes:
1. Movements in total audit fees comprise movements in audit hours and movements in charge-out rates of staff
engaged on the audits.
2. Fee movements are based on those of entities with balance dates falling within the financial year of the Office
(for example, fees for the 31 December 2009 audits of schools are included in the 2009/10 year).
Figure 11
Financial performance of output class: Audit and assurance services
2009/10 Actual $000
2009/10 Supp.
Estimates $000
2008/09 Actual $000
2007/08 Actual $000
Income
Crown 150 150 150 150
Other 63,939 62,955 60,483 58,505
Expenditure (62,736) (63,087) (60,602) (58,624)
Surplus/(Deficit) 1,353 18 31 31
Part 2 Our output classes, performance measures, and targets (including Statement of service performance)
40
Part 2 Our output classes, performance measures, and targets (including Statement of service performance)
41
Part 2 Our output classes, performance measures, and targets (including Statement of service performance)
42
Part 2 Our output classes, performance measures, and targets (including Statement of service performance)
43
Part 2 Our output classes, performance measures, and targets (including Statement of service performance)
44 Supporting accountability to Parliament
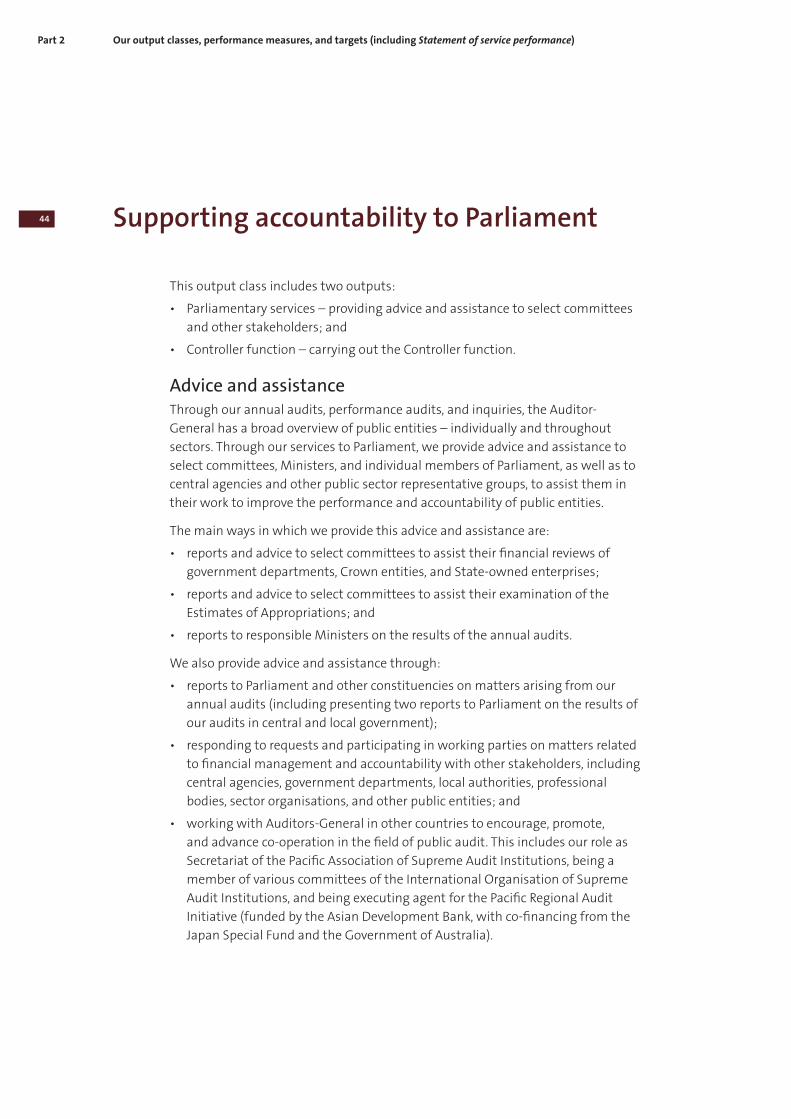
This output class includes two outputs:
• Parliamentary services – providing advice and assistance to select committees
and other stakeholders; and
• Controller function – carrying out the Controller function.
Advice and assistanceThrough our annual audits, performance audits, and inquiries, the Auditor-
General has a broad overview of public entities – individually and throughout
sectors. Through our services to Parliament, we provide advice and assistance to
select committees, Ministers, and individual members of Parliament, as well as to
central agencies and other public sector representative groups, to assist them in
their work to improve the performance and accountability of public entities.
The main ways in which we provide this advice and assistance are:
• reports and advice to select committees to assist their financial reviews of
government departments, Crown entities, and State-owned enterprises;
• reports and advice to select committees to assist their examination of the
Estimates of Appropriations; and
• reports to responsible Ministers on the results of the annual audits.
We also provide advice and assistance through:
• reports to Parliament and other constituencies on matters arising from our
annual audits (including presenting two reports to Parliament on the results of
our audits in central and local government);
• responding to requests and participating in working parties on matters related
to financial management and accountability with other stakeholders, including
central agencies, government departments, local authorities, professional
bodies, sector organisations, and other public entities; and
• working with Auditors-General in other countries to encourage, promote,
and advance co-operation in the field of public audit. This includes our role as
Secretariat of the Pacific Association of Supreme Audit Institutions, being a
member of various committees of the International Organisation of Supreme
Audit Institutions, and being executing agent for the Pacific Regional Audit
Initiative (funded by the Asian Development Bank, with co-financing from the
Japan Special Fund and the Government of Australia).
Part 2 Our output classes, performance measures, and targets (including Statement of service performance)
45
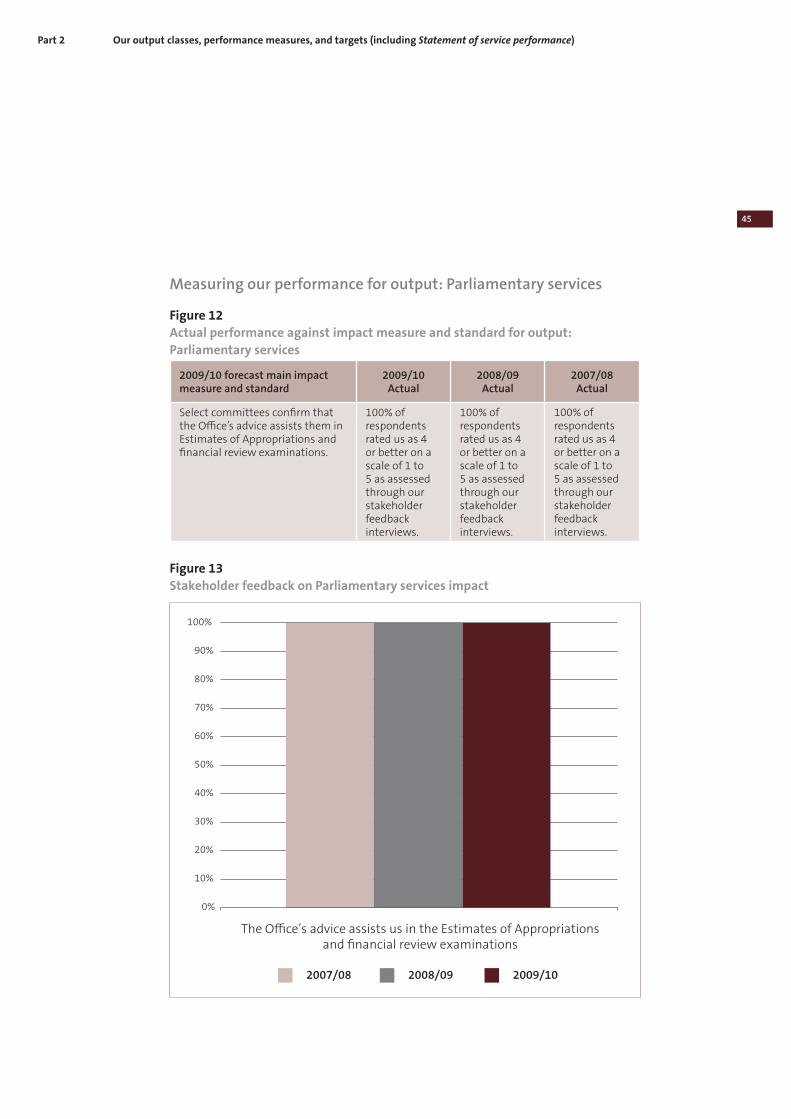
Measuring our performance for output: Parliamentary services
Figure 12
Actual performance against impact measure and standard for output:
Parliamentary services
2009/10 forecast main impact measure and standard
2009/10 Actual
2008/09 Actual
2007/08 Actual
Select committees confirm that the Office’s advice assists them in Estimates of Appropriations and financial review examinations.
100% of respondents rated us as 4 or better on a scale of 1 to 5 as assessed through our stakeholder feedback interviews.
100% of respondents rated us as 4 or better on a scale of 1 to 5 as assessed through our stakeholder feedback interviews.
100% of respondents rated us as 4 or better on a scale of 1 to 5 as assessed through our stakeholder feedback interviews.
Figure 13
Stakeholder feedback on Parliamentary services impact
2007/08
0%
10%
20%
30%
40%
50%
60%
70%
80%
90%
100%
The Office’s advice assists us in the Estimates of Appropriations
and financial review examinations
2009/102008/09
Part 2 Our output classes, performance measures, and targets (including Statement of service performance)
46
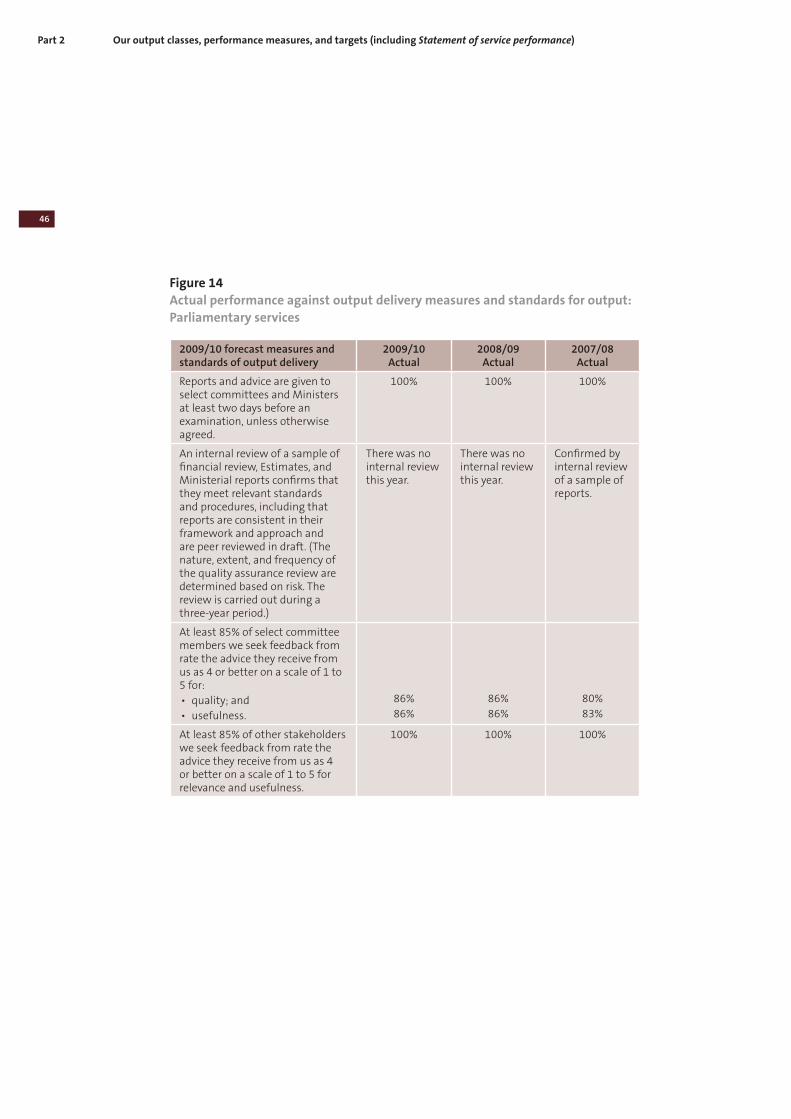
Figure 14
Actual performance against output delivery measures and standards for output:
Parliamentary services
2009/10 forecast measures and standards of output delivery
2009/10 Actual
2008/09 Actual
2007/08 Actual
Reports and advice are given to select committees and Ministers at least two days before an examination, unless otherwise agreed.
100% 100% 100%
An internal review of a sample of financial review, Estimates, and Ministerial reports confirms that they meet relevant standards and procedures, including that reports are consistent in their framework and approach and are peer reviewed in draft. (The nature, extent, and frequency of the quality assurance review are determined based on risk. The review is carried out during a three-year period.)
There was no internal review this year.
There was no internal review this year.
Confirmed by internal review of a sample of reports.
At least 85% of select committee members we seek feedback from rate the advice they receive from us as 4 or better on a scale of 1 to 5 for:
• quality; and
• usefulness.
86%
86%
86%
86%
80%
83%
At least 85% of other stakeholders we seek feedback from rate the advice they receive from us as 4 or better on a scale of 1 to 5 for relevance and usefulness.
100% 100% 100%
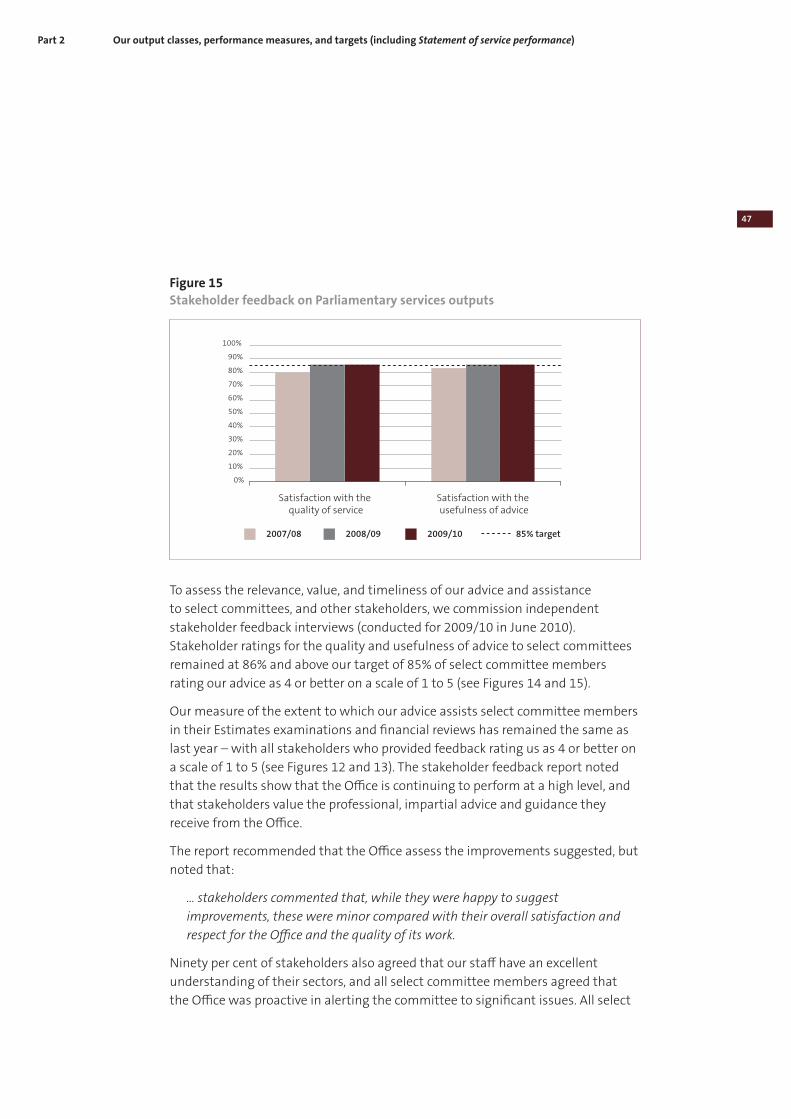
Part 2 Our output classes, performance measures, and targets (including Statement of service performance)
47
Figure 15
Stakeholder feedback on Parliamentary services outputs
2007/08
0%
10%
20%
30%
40%
50%
60%
70%
80%
90%
100%
Satisfaction with the Satisfaction with the
quality of service usefulness of advice
2009/10 85% target2008/09
To assess the relevance, value, and timeliness of our advice and assistance
to select committees, and other stakeholders, we commission independent
stakeholder feedback interviews (conducted for 2009/10 in June 2010).
Stakeholder ratings for the quality and usefulness of advice to select committees
remained at 86% and above our target of 85% of select committee members
rating our advice as 4 or better on a scale of 1 to 5 (see Figures 14 and 15).
Our measure of the extent to which our advice assists select committee members
in their Estimates examinations and financial reviews has remained the same as
last year – with all stakeholders who provided feedback rating us as 4 or better on
a scale of 1 to 5 (see Figures 12 and 13). The stakeholder feedback report noted
that the results show that the Office is continuing to perform at a high level, and
that stakeholders value the professional, impartial advice and guidance they
receive from the Office.
The report recommended that the Office assess the improvements suggested, but
noted that:
… stakeholders commented that, while they were happy to suggest
improvements, these were minor compared with their overall satisfaction and
respect for the Office and the quality of its work.
Ninety per cent of stakeholders also agreed that our staff have an excellent
understanding of their sectors, and all select committee members agreed that
the Office was proactive in alerting the committee to significant issues. All select
Part 2 Our output classes, performance measures, and targets (including Statement of service performance)
48
committee members also agreed that the Office’s work helps build and maintain
public trust in the effectiveness and efficiency of the public sector.
The Auditor-General visited all select committee chairpersons soon after her
appointment and received similar feedback about what select committees value
about the work we do for Parliament. Suggestions for improvement provided to
the Auditor-General were similar to those reflected in the stakeholder feedback
interviews (discussed below).
The results of the stakeholder feedback study are pleasing, as they show that the
Office plays an important part in supporting accountability to Parliament. It is
also pleasing that we have sustained these results when there continues to be an
increase in the number of advisory reports we provide to Parliament.
The improvements suggested by stakeholders include encouraging the Office to
look for ways to provide benchmarking information in its advice, being clear about
the significance of issues, making the oral presentations shorter and sharper, and
considering how the Office can play a greater part in the financial review process.
Select committees also recognise that the Office has to maintain its independence
while carrying out its advisory role.
In 2010/11, we are planning to review the various advisory products we prepare
for select committees to ensure that the reports are targeted, relevant, and useful,
and that we continue to play our part to the fullest extent in helping Parliament
hold the Executive to account.
Controller functionThe Controller function of the Controller and Auditor-General provides
independent assurance to Parliament that expenses and capital expenditure of
departments and Offices of Parliament have been incurred for purposes that are
lawful, and within the scope, amount, and period of the appropriation or other
authority.
The OAG and appointed auditors carry out standard operating procedures to give
effect to the Controller function in keeping with the Auditor-General’s auditing
standards and the Memorandum of Understanding with the Treasury. This
involves reviewing the monthly reports provided by the Treasury, and advising the
Treasury of any issues arising and the action to be taken.
Each year, we report to Parliament on the significant issues arising from operation
of the Controller function.
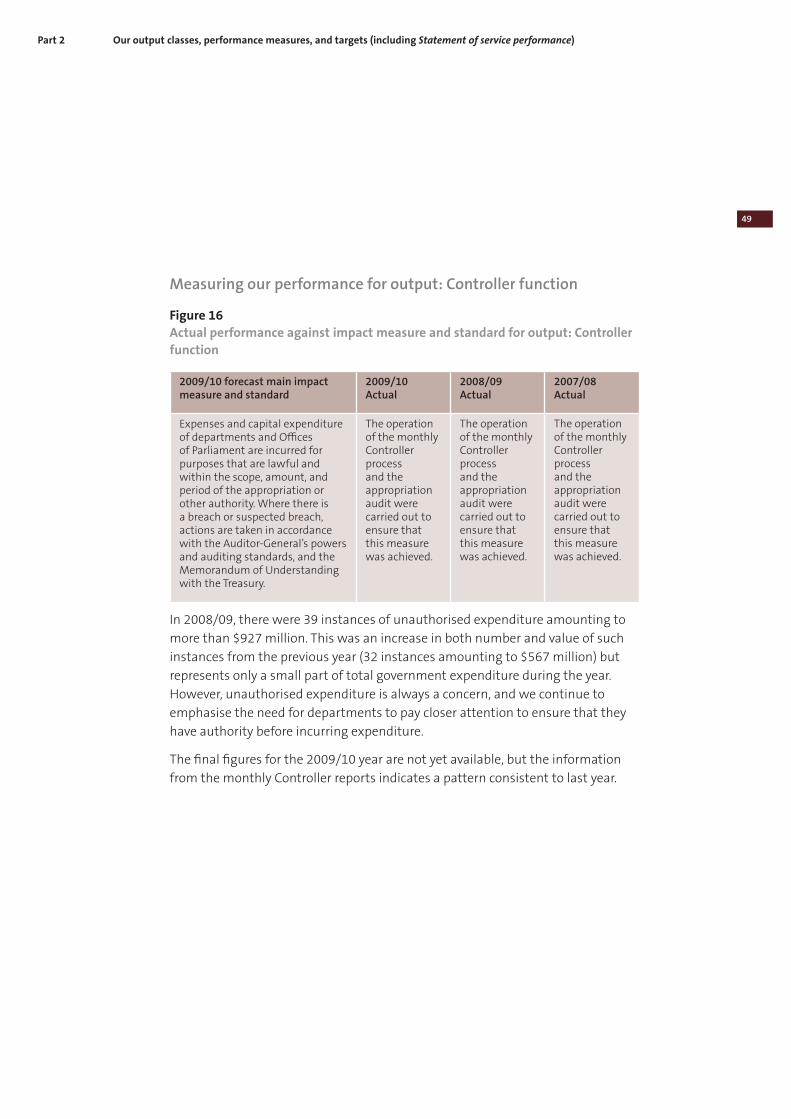
Part 2 Our output classes, performance measures, and targets (including Statement of service performance)
49
Measuring our performance for output: Controller function
Figure 16
Actual performance against impact measure and standard for output: Controller
function
2009/10 forecast main impact measure and standard
2009/10 Actual
2008/09 Actual
2007/08 Actual
Expenses and capital expenditure of departments and Offices of Parliament are incurred for purposes that are lawful and within the scope, amount, and period of the appropriation or other authority. Where there is a breach or suspected breach, actions are taken in accordance with the Auditor-General’s powers and auditing standards, and the Memorandum of Understanding with the Treasury.
The operation of the monthly Controller process and the appropriation audit were carried out to ensure that this measure was achieved.
The operation of the monthly Controller process and the appropriation audit were carried out to ensure that this measure was achieved.
The operation of the monthly Controller process and the appropriation audit were carried out to ensure that this measure was achieved.
In 2008/09, there were 39 instances of unauthorised expenditure amounting to
more than $927 million. This was an increase in both number and value of such
instances from the previous year (32 instances amounting to $567 million) but
represents only a small part of total government expenditure during the year.
However, unauthorised expenditure is always a concern, and we continue to
emphasise the need for departments to pay closer attention to ensure that they
have authority before incurring expenditure.
The final figures for the 2009/10 year are not yet available, but the information
from the monthly Controller reports indicates a pattern consistent to last year.
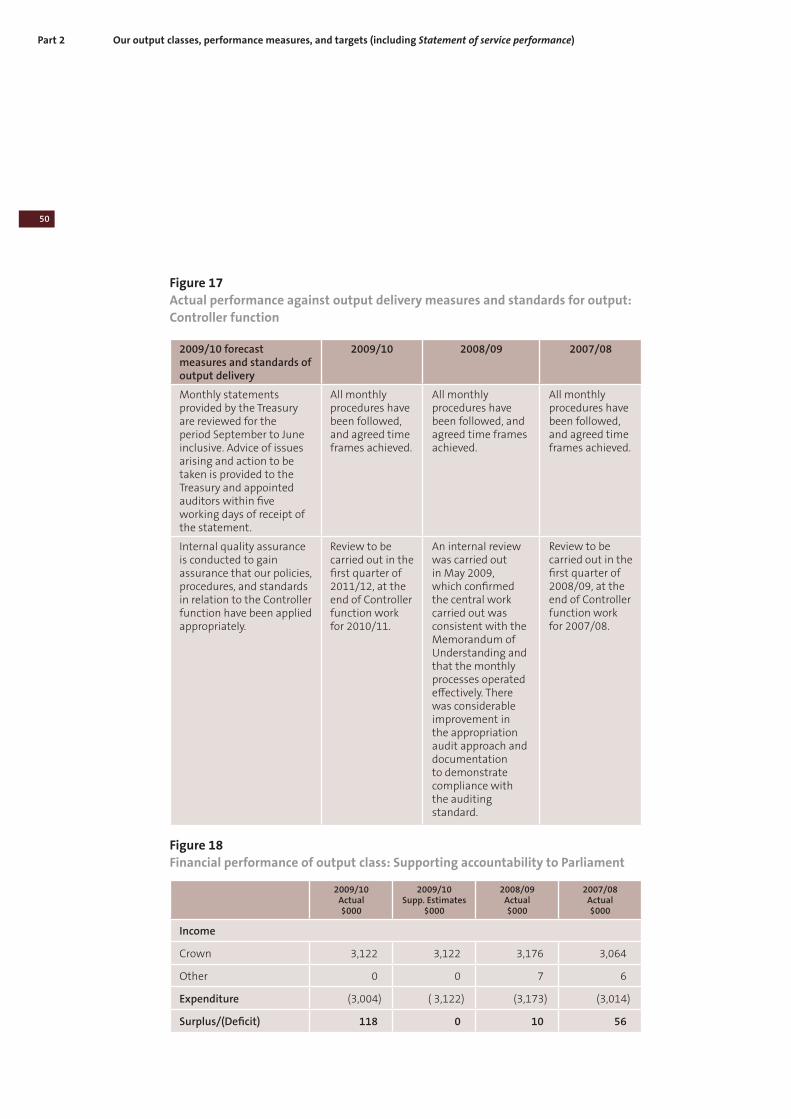
Part 2 Our output classes, performance measures, and targets (including Statement of service performance)
50
Figure 17
Actual performance against output delivery measures and standards for output:
Controller function
2009/10 forecast measures and standards of output delivery
2009/10 2008/09 2007/08
Monthly statements provided by the Treasury are reviewed for the period September to June inclusive. Advice of issues arising and action to be taken is provided to the Treasury and appointed auditors within five working days of receipt of the statement.
All monthly procedures have been followed, and agreed time frames achieved.
All monthly procedures have been followed, and agreed time frames achieved.
All monthly procedures have been followed, and agreed time frames achieved.
Internal quality assurance is conducted to gain assurance that our policies, procedures, and standards in relation to the Controller function have been applied appropriately.
Review to be carried out in the first quarter of 2011/12, at the end of Controller function work for 2010/11.
An internal review was carried out in May 2009, which confirmed the central work carried out was consistent with the Memorandum of Understanding and that the monthly processes operated effectively. There was considerable improvement in the appropriation audit approach and documentation to demonstrate compliance with the auditing standard.
Review to be carried out in the first quarter of 2008/09, at the end of Controller function work for 2007/08.
Figure 18
Financial performance of output class: Supporting accountability to Parliament
2009/10 Actual $000
2009/10 Supp. Estimates
$000
2008/09 Actual $000
2007/08 Actual $000
Income
Crown 3,122 3,122 3,176 3,064
Other 0 0 7 6
Expenditure (3,004) ( 3,122) (3,173) (3,014)
Surplus/(Deficit) 118 0 10 56
Part 2 Our output classes, performance measures, and targets (including Statement of service performance)
51Performance audits and inquiries
This output class includes two outputs:
• Performance audits – reporting to Parliament and other constituencies on
matters arising from performance audits and other studies, including good
practice guides; and
• Inquiries – carrying out, and reporting on, inquiries relating to central and local
government entities.
Performance audits, other studies and inquiriesThe Public Audit Act 2001 provides the Auditor-General with the discretion to
carry out performance audits, other studies, and inquiries to examine matters
concerning a public entity’s use of resources, including:
• the extent to which activities are carried out effectively and efficiently;
• compliance with statutory obligations;
• any acts or omissions to determine whether waste has resulted or may result;
and
• any act or omission showing or appearing to show a lack of probity or financial
prudence by a public entity or its members, office holders, or employees.
The Auditor-General must also respond to requests for approvals in relation
to pecuniary interest questions regulated by the Local Authorities (Members’
Interests) Act 1968.
Performance audits, other studies, and inquiries allow the Auditor-General to
consider and provide advice about issues of accountability, performance, waste,
probity, and authority in greater depth than is appropriate within the statutory
scope of an annual audit. Other studies include good practice guides and
discussion papers.
Effective, efficient, and accountable public entities that operate within their
authority and according to high ethical standards are the foundation for trust
in the public sector. Therefore, the intended impacts of the appropriation are as
shown in Figure 19.
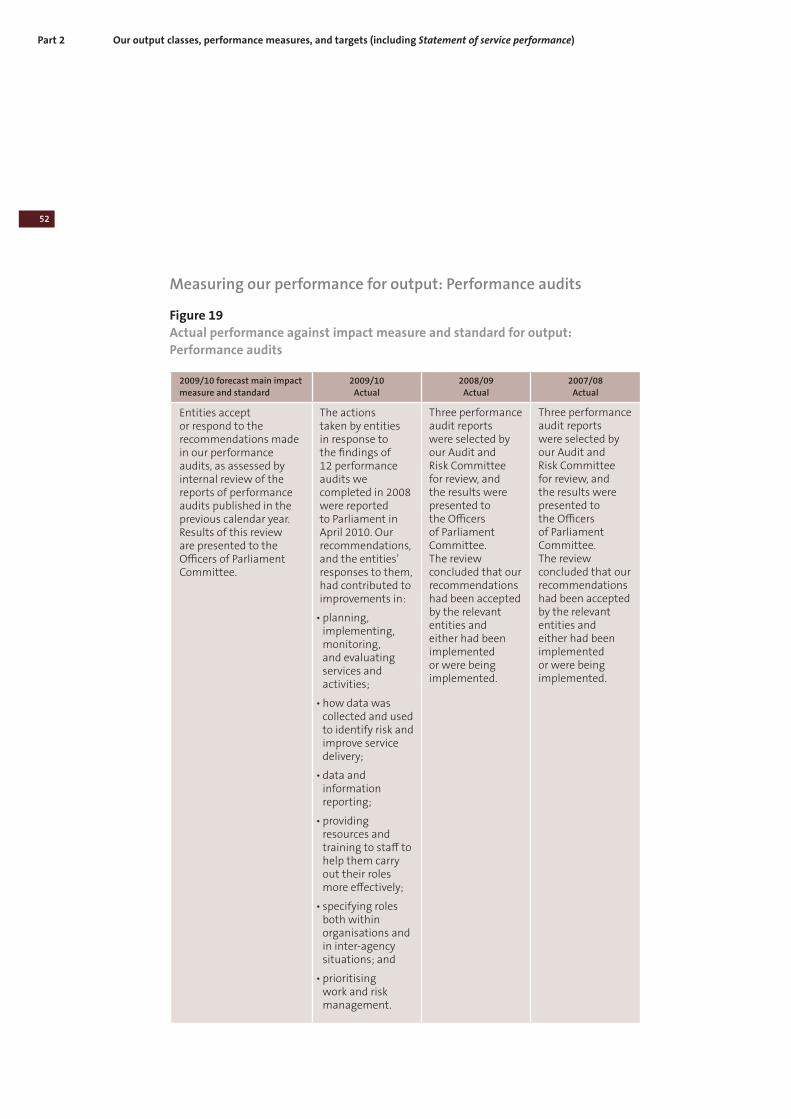
Part 2 Our output classes, performance measures, and targets (including Statement of service performance)
52
Measuring our performance for output: Performance audits
Figure 19
Actual performance against impact measure and standard for output:
Performance audits
2009/10 forecast main impact measure and standard
2009/10 Actual
2008/09 Actual
2007/08 Actual
Entities accept or respond to the recommendations made in our performance audits, as assessed by internal review of the reports of performance audits published in the previous calendar year. Results of this review are presented to the Officers of Parliament Committee.
The actions taken by entities in response to the findings of 12 performance audits we completed in 2008 were reported to Parliament in April 2010. Our recommendations, and the entities’ responses to them, had contributed to improvements in:
• planning, implementing, monitoring, and evaluating services and activities;
• how data was collected and used to identify risk and improve service delivery;
• data and information reporting;
• providing resources and training to staff to help them carry out their roles more effectively;
• specifying roles both within organisations and in inter-agency situations; and
• prioritising work and risk management.
Three performance audit reports were selected by our Audit and Risk Committee for review, and the results were presented to the Officers of Parliament Committee. The review concluded that our recommendations had been accepted by the relevant entities and either had been implemented or were being implemented.
Three performance audit reports were selected by our Audit and Risk Committee for review, and the results were presented to the Officers of Parliament Committee. The review concluded that our recommendations had been accepted by the relevant entities and either had been implemented or were being implemented.
Part 2 Our output classes, performance measures, and targets (including Statement of service performance)
53
Performance audits and other studies A performance audit is a significant and in-depth audit covering issues of
effectiveness and efficiency. It provides Parliament with assurance about
specific issues or programmes and how well these are managed by the relevant
public entity or entities. We also do other studies that may result in published
good practice guidance on topical issues of public sector accountability and
performance to assist public entities to better manage these issues.
Core areas of interest for the Auditor-General include:
• major public investment or liability management (focusing on the New
Zealand Debt Management Office, Accident Compensation Corporation, New
Zealand Superannuation Fund, Government Superannuation Fund, Earthquake
Commission, and Student Loans Scheme);
• major public revenue management or generation (focusing on the Inland
Revenue Department and New Zealand Customs Service);
• major asset management or infrastructure spending or management (focusing
on health, correctional facilities, education, defence, conservation, transport,
housing, and energy);
• major public expenditure, including service delivery expenditure (focusing on
health, education, and social security and welfare); and
• local government (focusing on major asset management, infrastructure
expenditure, delivery of services, and amalgamation of the Auckland councils).
Results of major and significant inquiries are also often reported to Parliament.
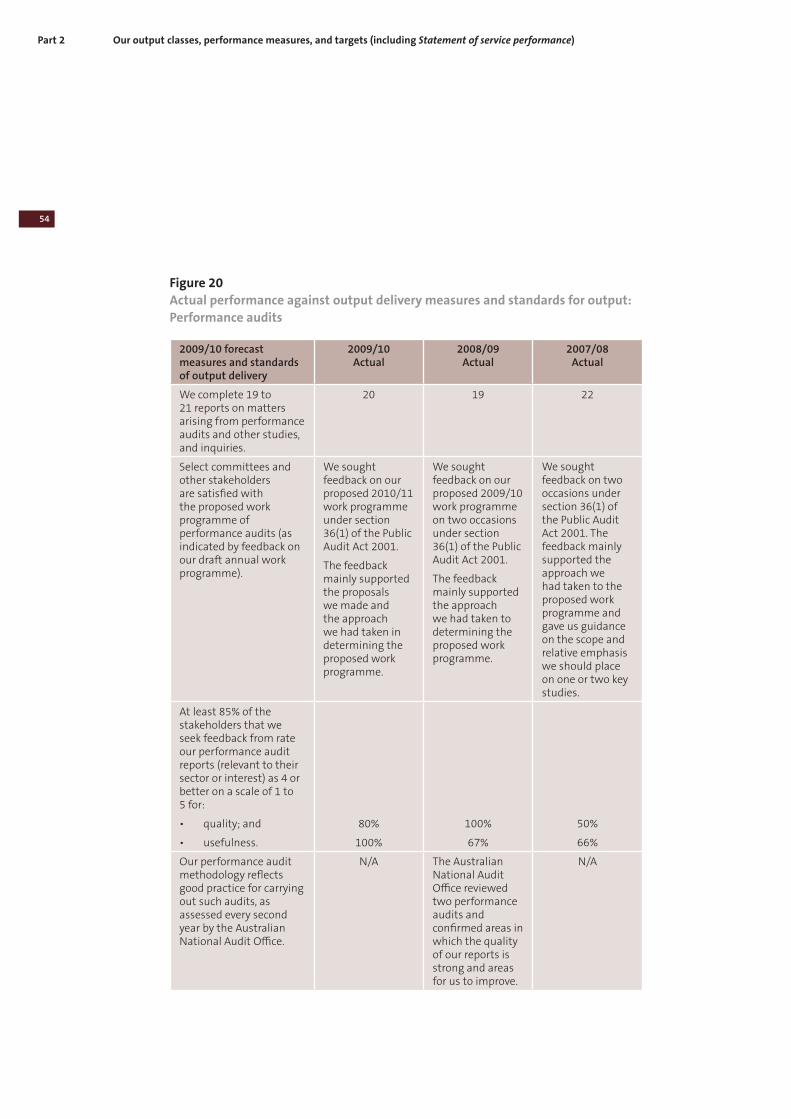
Part 2 Our output classes, performance measures, and targets (including Statement of service performance)
54
Figure 20
Actual performance against output delivery measures and standards for output:
Performance audits
2009/10 forecast measures and standards of output delivery
2009/10 Actual
2008/09 Actual
2007/08 Actual
We complete 19 to 21 reports on matters arising from performance audits and other studies, and inquiries.
20 19 22
Select committees and other stakeholders are satisfied with the proposed work programme of performance audits (as indicated by feedback on our draft annual work programme).
We sought feedback on our proposed 2010/11 work programme under section 36(1) of the Public Audit Act 2001.
The feedback mainly supported the proposals we made and the approach we had taken in determining the proposed work programme.
We sought feedback on our proposed 2009/10 work programme on two occasions under section 36(1) of the Public Audit Act 2001.
The feedback mainly supported the approach we had taken to determining the proposed work programme.
We sought feedback on two occasions under section 36(1) of the Public Audit Act 2001. The feedback mainly supported the approach we had taken to the proposed work programme and gave us guidance on the scope and relative emphasis we should place on one or two key studies.
At least 85% of the stakeholders that we seek feedback from rate our performance audit reports (relevant to their sector or interest) as 4 or better on a scale of 1 to 5 for:
• quality; and
• usefulness.
80%
100%
100%
67%
50%
66%
Our performance audit methodology reflects good practice for carrying out such audits, as assessed every second year by the Australian National Audit Office.
N/A The Australian National Audit Office reviewed two performance audits and confirmed areas in which the quality of our reports is strong and areas for us to improve.
N/A
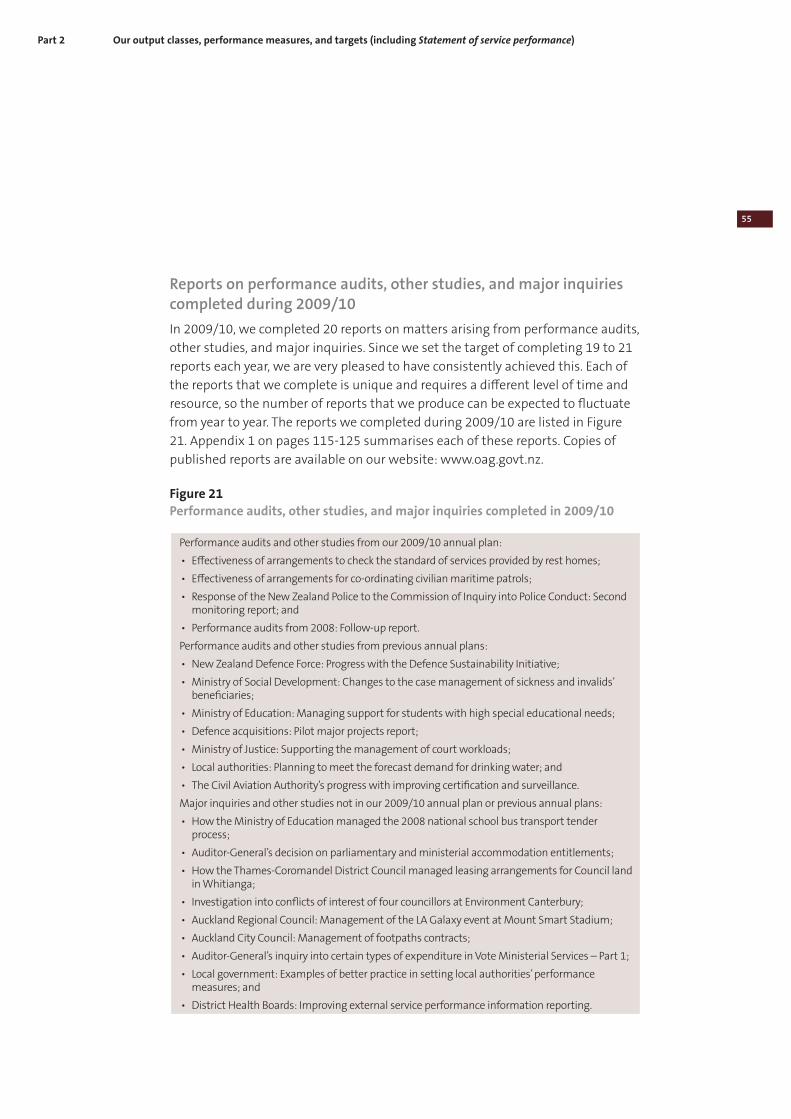
Part 2 Our output classes, performance measures, and targets (including Statement of service performance)
55
Reports on performance audits, other studies, and major inquiries completed during 2009/10
In 2009/10, we completed 20 reports on matters arising from performance audits,
other studies, and major inquiries. Since we set the target of completing 19 to 21
reports each year, we are very pleased to have consistently achieved this. Each of
the reports that we complete is unique and requires a different level of time and
resource, so the number of reports that we produce can be expected to fluctuate
from year to year. The reports we completed during 2009/10 are listed in Figure
21. Appendix 1 on pages 115-125 summarises each of these reports. Copies of
published reports are available on our website: www.oag.govt.nz.
Figure 21
Performance audits, other studies, and major inquiries completed in 2009/10
Performance audits and other studies from our 2009/10 annual plan:
• Effectiveness of arrangements to check the standard of services provided by rest homes;
• Effectiveness of arrangements for co-ordinating civilian maritime patrols;
• Response of the New Zealand Police to the Commission of Inquiry into Police Conduct: Second monitoring report; and
• Performance audits from 2008: Follow-up report.
Performance audits and other studies from previous annual plans:
• New Zealand Defence Force: Progress with the Defence Sustainability Initiative;
• Ministry of Social Development: Changes to the case management of sickness and invalids’ beneficiaries;
• Ministry of Education: Managing support for students with high special educational needs;
• Defence acquisitions: Pilot major projects report;
• Ministry of Justice: Supporting the management of court workloads;
• Local authorities: Planning to meet the forecast demand for drinking water; and
• The Civil Aviation Authority’s progress with improving certification and surveillance.
Major inquiries and other studies not in our 2009/10 annual plan or previous annual plans:
• How the Ministry of Education managed the 2008 national school bus transport tender process;
• Auditor-General’s decision on parliamentary and ministerial accommodation entitlements;
• How the Thames-Coromandel District Council managed leasing arrangements for Council land in Whitianga;
• Investigation into conflicts of interest of four councillors at Environment Canterbury;
• Auckland Regional Council: Management of the LA Galaxy event at Mount Smart Stadium;
• Auckland City Council: Management of footpaths contracts;
• Auditor-General’s inquiry into certain types of expenditure in Vote Ministerial Services – Part 1;
• Local government: Examples of better practice in setting local authorities’ performance measures; and
• District Health Boards: Improving external service performance information reporting.
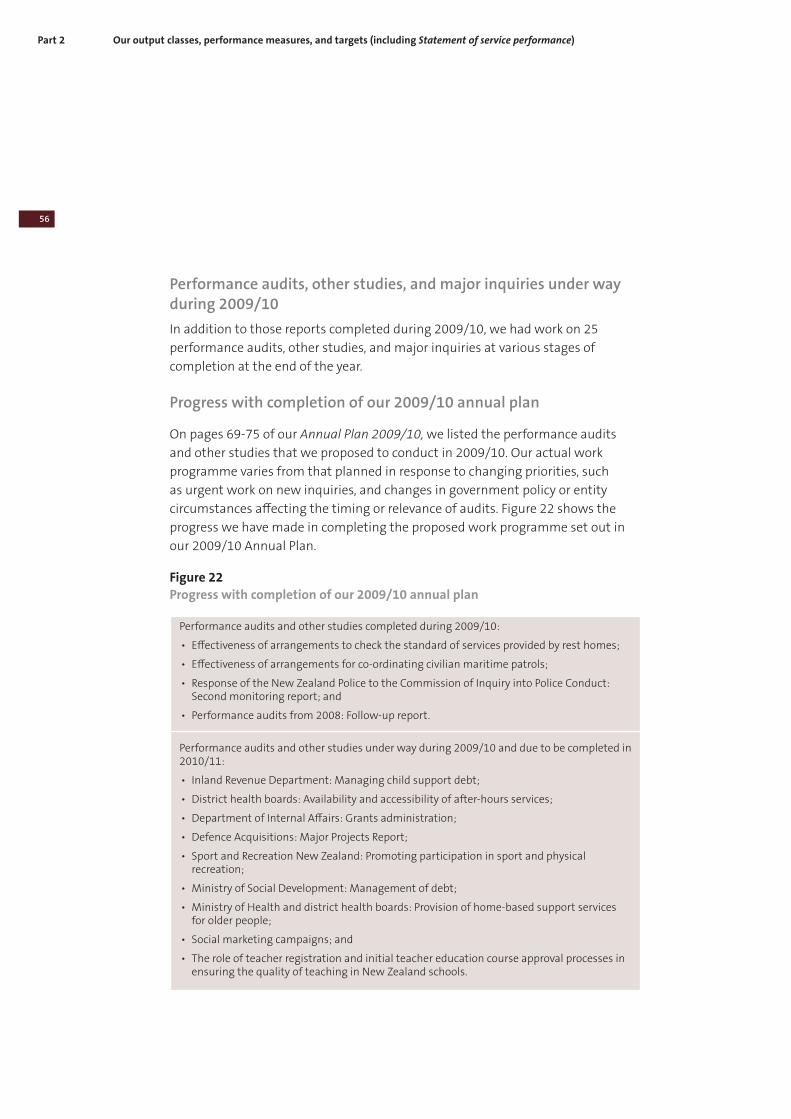
Part 2 Our output classes, performance measures, and targets (including Statement of service performance)
56
Performance audits, other studies, and major inquiries under way during 2009/10
In addition to those reports completed during 2009/10, we had work on 25
performance audits, other studies, and major inquiries at various stages of
completion at the end of the year.
Progress with completion of our 2009/10 annual plan
On pages 69-75 of our Annual Plan 2009/10, we listed the performance audits
and other studies that we proposed to conduct in 2009/10. Our actual work
programme varies from that planned in response to changing priorities, such
as urgent work on new inquiries, and changes in government policy or entity
circumstances affecting the timing or relevance of audits. Figure 22 shows the
progress we have made in completing the proposed work programme set out in
our 2009/10 Annual Plan.
Figure 22
Progress with completion of our 2009/10 annual plan
Performance audits and other studies completed during 2009/10:
• Effectiveness of arrangements to check the standard of services provided by rest homes;
• Effectiveness of arrangements for co-ordinating civilian maritime patrols;
• Response of the New Zealand Police to the Commission of Inquiry into Police Conduct: Second monitoring report; and
• Performance audits from 2008: Follow-up report.
Performance audits and other studies under way during 2009/10 and due to be completed in 2010/11:
• Inland Revenue Department: Managing child support debt;
• District health boards: Availability and accessibility of after-hours services;
• Department of Internal Affairs: Grants administration;
• Defence Acquisitions: Major Projects Report;
• Sport and Recreation New Zealand: Promoting participation in sport and physical recreation;
• Ministry of Social Development: Management of debt;
• Ministry of Health and district health boards: Provision of home-based support services for older people;
• Social marketing campaigns; and
• The role of teacher registration and initial teacher education course approval processes in ensuring the quality of teaching in New Zealand schools.
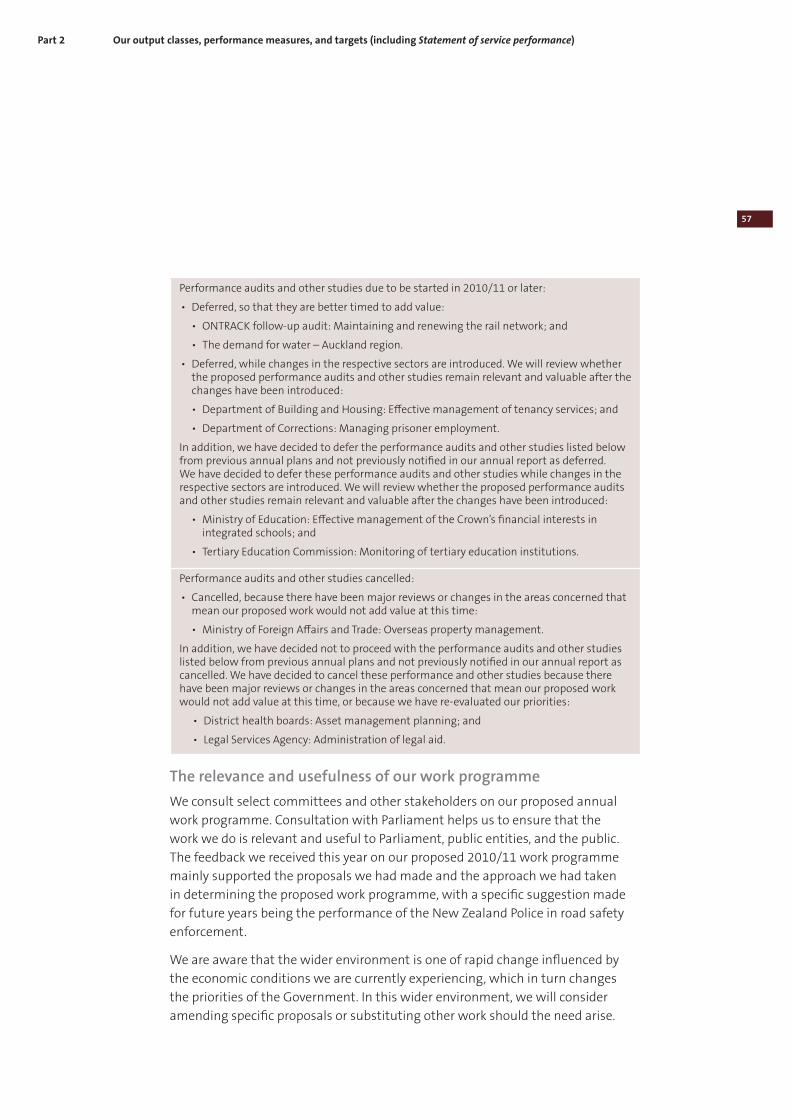
Part 2 Our output classes, performance measures, and targets (including Statement of service performance)
57
Performance audits and other studies due to be started in 2010/11 or later:
• Deferred, so that they are better timed to add value:
• ONTRACK follow-up audit: Maintaining and renewing the rail network; and
• The demand for water – Auckland region.
• Deferred, while changes in the respective sectors are introduced. We will review whether the proposed performance audits and other studies remain relevant and valuable after the changes have been introduced:
• Department of Building and Housing: Effective management of tenancy services; and
• Department of Corrections: Managing prisoner employment.
In addition, we have decided to defer the performance audits and other studies listed below from previous annual plans and not previously notified in our annual report as deferred. We have decided to defer these performance audits and other studies while changes in the respective sectors are introduced. We will review whether the proposed performance audits and other studies remain relevant and valuable after the changes have been introduced:
• Ministry of Education: Effective management of the Crown’s financial interests in integrated schools; and
• Tertiary Education Commission: Monitoring of tertiary education institutions.
Performance audits and other studies cancelled:
• Cancelled, because there have been major reviews or changes in the areas concerned that mean our proposed work would not add value at this time:
• Ministry of Foreign Affairs and Trade: Overseas property management.
In addition, we have decided not to proceed with the performance audits and other studies listed below from previous annual plans and not previously notified in our annual report as cancelled. We have decided to cancel these performance and other studies because there have been major reviews or changes in the areas concerned that mean our proposed work would not add value at this time, or because we have re-evaluated our priorities:
• District health boards: Asset management planning; and
• Legal Services Agency: Administration of legal aid.
The relevance and usefulness of our work programme
We consult select committees and other stakeholders on our proposed annual
work programme. Consultation with Parliament helps us to ensure that the
work we do is relevant and useful to Parliament, public entities, and the public.
The feedback we received this year on our proposed 2010/11 work programme
mainly supported the proposals we had made and the approach we had taken
in determining the proposed work programme, with a specific suggestion made
for future years being the performance of the New Zealand Police in road safety
enforcement.
We are aware that the wider environment is one of rapid change influenced by
the economic conditions we are currently experiencing, which in turn changes
the priorities of the Government. In this wider environment, we will consider
amending specific proposals or substituting other work should the need arise.
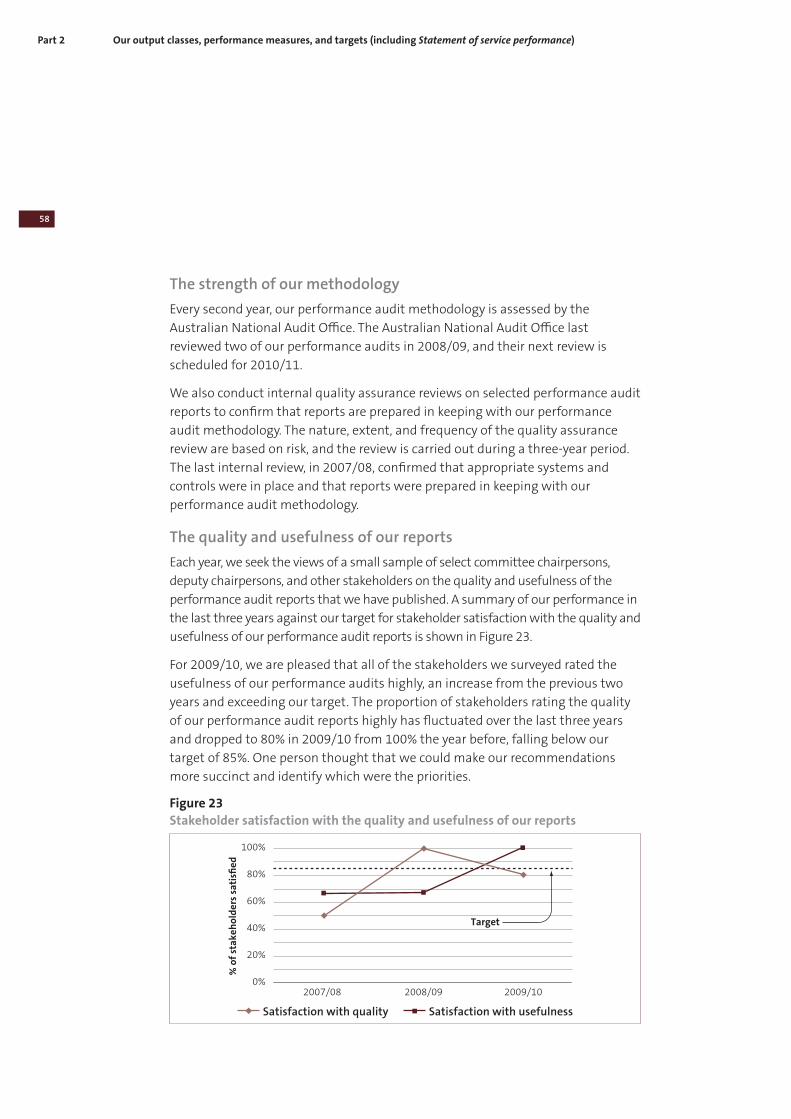
Part 2 Our output classes, performance measures, and targets (including Statement of service performance)
58
The strength of our methodology
Every second year, our performance audit methodology is assessed by the
Australian National Audit Office. The Australian National Audit Office last
reviewed two of our performance audits in 2008/09, and their next review is
scheduled for 2010/11.
We also conduct internal quality assurance reviews on selected performance audit
reports to confirm that reports are prepared in keeping with our performance
audit methodology. The nature, extent, and frequency of the quality assurance
review are based on risk, and the review is carried out during a three-year period.
The last internal review, in 2007/08, confirmed that appropriate systems and
controls were in place and that reports were prepared in keeping with our
performance audit methodology.
The quality and usefulness of our reports
Each year, we seek the views of a small sample of select committee chairpersons,
deputy chairpersons, and other stakeholders on the quality and usefulness of the
performance audit reports that we have published. A summary of our performance in
the last three years against our target for stakeholder satisfaction with the quality and
usefulness of our performance audit reports is shown in Figure 23.
For 2009/10, we are pleased that all of the stakeholders we surveyed rated the
usefulness of our performance audits highly, an increase from the previous two
years and exceeding our target. The proportion of stakeholders rating the quality
of our performance audit reports highly has fluctuated over the last three years
and dropped to 80% in 2009/10 from 100% the year before, falling below our
target of 85%. One person thought that we could make our recommendations
more succinct and identify which were the priorities.
Figure 23
Stakeholder satisfaction with the quality and usefulness of our reports
0%
20%
40%
60%
80%
100%
Satisfaction with quality
2007/08 2008/09 2009/10
% o
f st
ak
eh
old
ers
sa
tisfi
ed
Satisfaction with usefulness
Target
Part 2 Our output classes, performance measures, and targets (including Statement of service performance)
59
Each year, we also have two of our performance audit reports independently
reviewed to assess the quality of the reports in terms of: the presentation of
administrative and management context; report structure, presentation, and
format (including use of graphics and statistics); and the reasonableness of the
methodology used and the resulting conclusions and recommendations. For
2009/10, strengths of our reports identified by the reviewers included:
• a logical, clear, and concise structure and writing style;
• an executive summary covering the main messages; and
• clear and informative conclusions supported by the evidence.
There were some common themes identified by the reviewers for how we could
improve the quality and usefulness of our reports and comments from some of
our stakeholders that were surveyed. We will take action on the feedback from our
stakeholders and the suggestions of our independent reviewers. Both pointed to
the scope for our reports to be more analytical and sharper in their findings – for
example, through:
• presenting more data in graphs and tables and other graphics where relevant;
and
• including entity financial reporting information, resource statistics, and
performance indicators to provide more information on the context the entity
is operating in.
We are committed to adding value through insightful assessment of the
effectiveness and efficiency of the activities we report on and to continuously
strengthening the depth and relevance of our performance audits and other
studies. As we continue to sharpen our approach, this will be reflected in the
methods we use, the size of our reports, how we resource them, and how many
we produce.
Part 2 Our output classes, performance measures, and targets (including Statement of service performance)
60
InquiriesInquiries allow the Auditor-General to investigate in detail particular issues of
concern with the activities of public entities. In many cases, inquiries will result
in assurance to the organisation or the public that the organisation has managed
a situation appropriately. In some cases, a public report on an inquiry will enable
accountability for failures within an organisation and draw attention to the need
for improvements.
Inquiries can be large or small, and cover a wide range of issues. We can carry out
inquiries on our own initiative or when correspondence from the public draws
attention to potential issues. Each year, we usually receive:
• 200 to 300 external requests for inquiries; and
• 50 to 100 enquiries under the Local Authorities (Members’ Interests) Act.
The Auditor-General has discretion about which matters to inquire into. Our
resources are also limited. We therefore choose carefully which requests for
inquiries we follow up with in-depth investigation and reporting. We do not see
the Auditor-General’s office as an avenue for resolving individual complaints
or concerns about how a public entity has handled a particular matter. As the
auditor of these entities, our focus is on financial and organisational matters.
We examine requests and carry out preliminary work to identify whether the
issues raised suggest financial impropriety, problems with the organisation’s
overall governance and management, or other systemic or significant concerns
that may be important for the organisation or the sector, or may be of general
public interest.
We classify inquiries into three categories – routine, sensitive, and major –
depending on how serious the issues raised are. A routine inquiry involves
straightforward issues, and can often be carried out either by a review of
documents or through correspondence and discussion with the public entity. It
will not usually result in a published report. We always advise the correspondent
of our conclusions and the reasons for them, and in some instances we advise the
public entity of the matter.
Sensitive and major inquiries involve more complex issues and may attract a
broader level of public interest and attention. In these inquiries, we will often
review the public entity’s files and may also formally interview people. We may
report the results of these inquiries publicly, as well as advising the correspondent
of the results of our work.
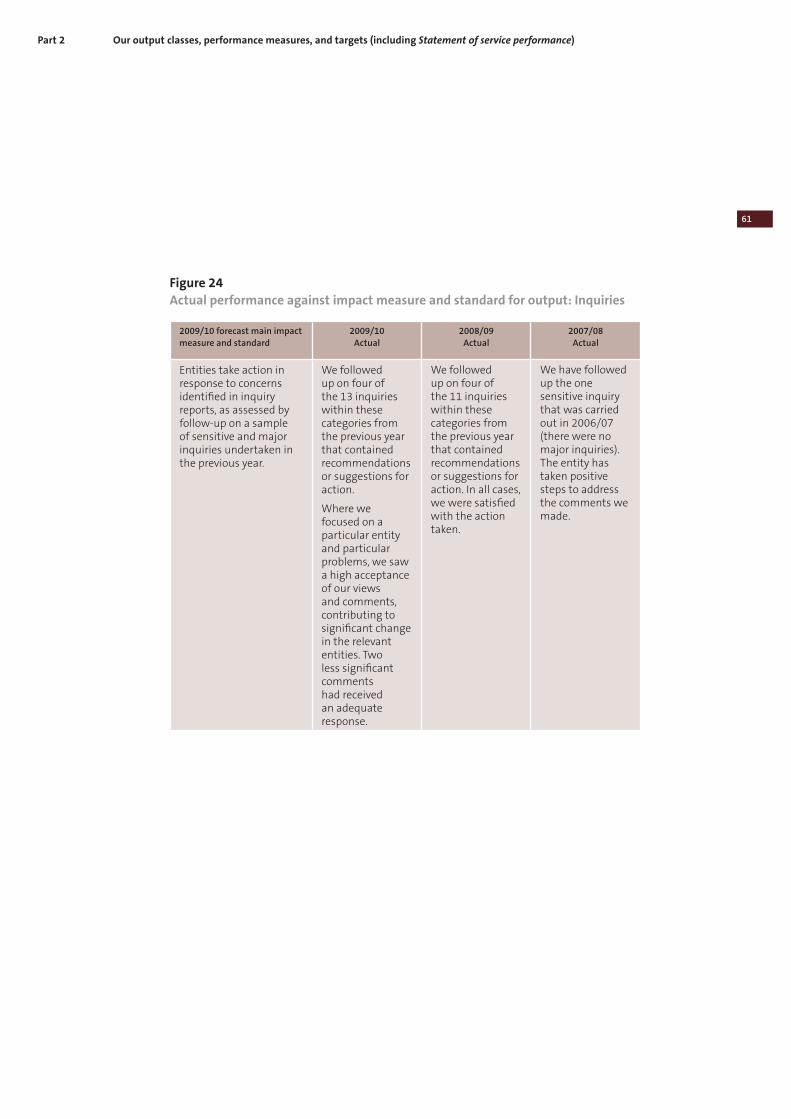
Part 2 Our output classes, performance measures, and targets (including Statement of service performance)
61
Figure 24
Actual performance against impact measure and standard for output: Inquiries
2009/10 forecast main impact measure and standard
2009/10 Actual
2008/09 Actual
2007/08 Actual
Entities take action in response to concerns identified in inquiry reports, as assessed by follow-up on a sample of sensitive and major inquiries undertaken in the previous year.
We followed up on four of the 13 inquiries within these categories from the previous year that contained recommendations or suggestions for action.
Where we focused on a particular entity and particular problems, we saw a high acceptance of our views and comments, contributing to significant change in the relevant entities. Two less significant comments had received an adequate response.
We followed up on four of the 11 inquiries within these categories from the previous year that contained recommendations or suggestions for action. In all cases, we were satisfied with the action taken.
We have followed up the one sensitive inquiry that was carried out in 2006/07 (there were no major inquiries). The entity has taken positive steps to address the comments we made.
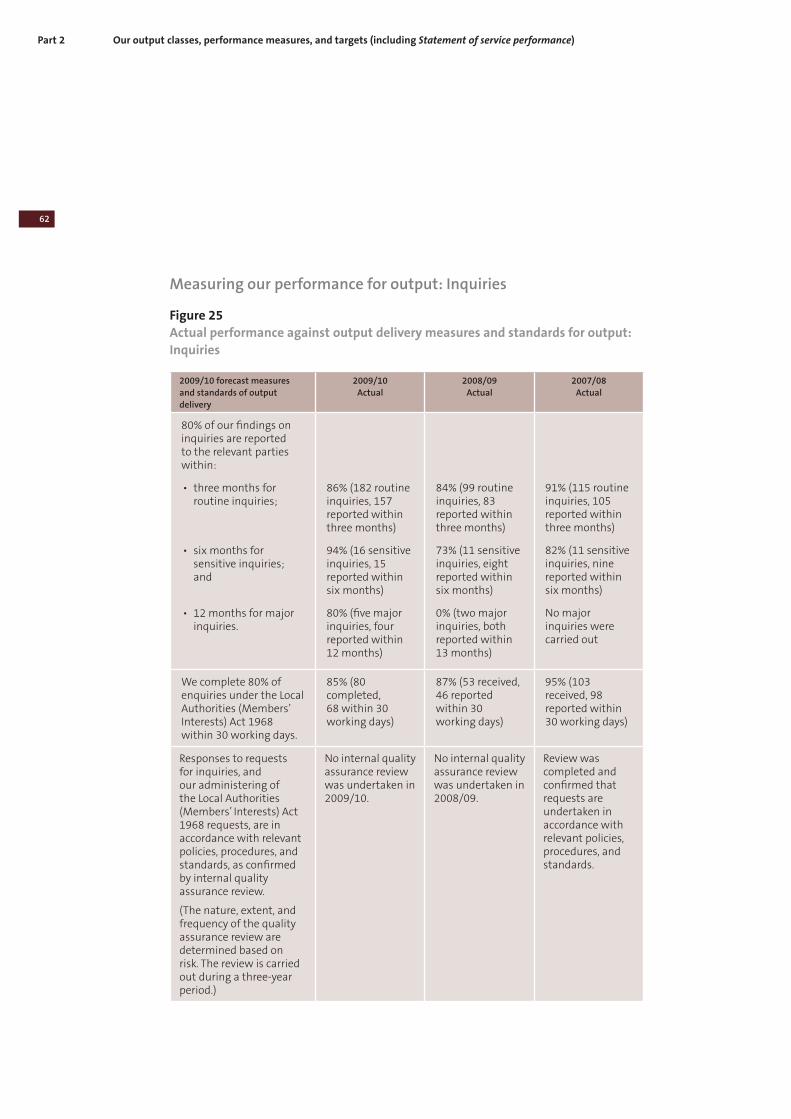
Part 2 Our output classes, performance measures, and targets (including Statement of service performance)
62
Measuring our performance for output: Inquiries
Figure 25
Actual performance against output delivery measures and standards for output:
Inquiries
2009/10 forecast measures and standards of output delivery
2009/10 Actual
2008/09 Actual
2007/08 Actual
80% of our findings on inquiries are reported to the relevant parties within:
• three months for routine inquiries;
• six months for sensitive inquiries; and
• 12 months for major inquiries.
86% (182 routine inquiries, 157 reported within three months)
94% (16 sensitive inquiries, 15 reported within six months)
80% (five major inquiries, four reported within 12 months)
84% (99 routine inquiries, 83 reported within three months)
73% (11 sensitive inquiries, eight reported within six months)
0% (two major inquiries, both reported within 13 months)
91% (115 routine inquiries, 105 reported within three months)
82% (11 sensitive inquiries, nine reported within six months)
No major inquiries were carried out
We complete 80% of enquiries under the Local Authorities (Members’ Interests) Act 1968 within 30 working days.
85% (80 completed, 68 within 30 working days)
87% (53 received, 46 reported within 30 working days)
95% (103 received, 98 reported within 30 working days)
Responses to requests for inquiries, and our administering of the Local Authorities (Members’ Interests) Act 1968 requests, are in accordance with relevant policies, procedures, and standards, as confirmed by internal quality assurance review.
(The nature, extent, and frequency of the quality assurance review are determined based on risk. The review is carried out during a three-year period.)
No internal quality assurance review was undertaken in 2009/10.
No internal quality assurance review was undertaken in 2008/09.
Review was completed and confirmed that requests are undertaken in accordance with relevant policies, procedures, and standards.
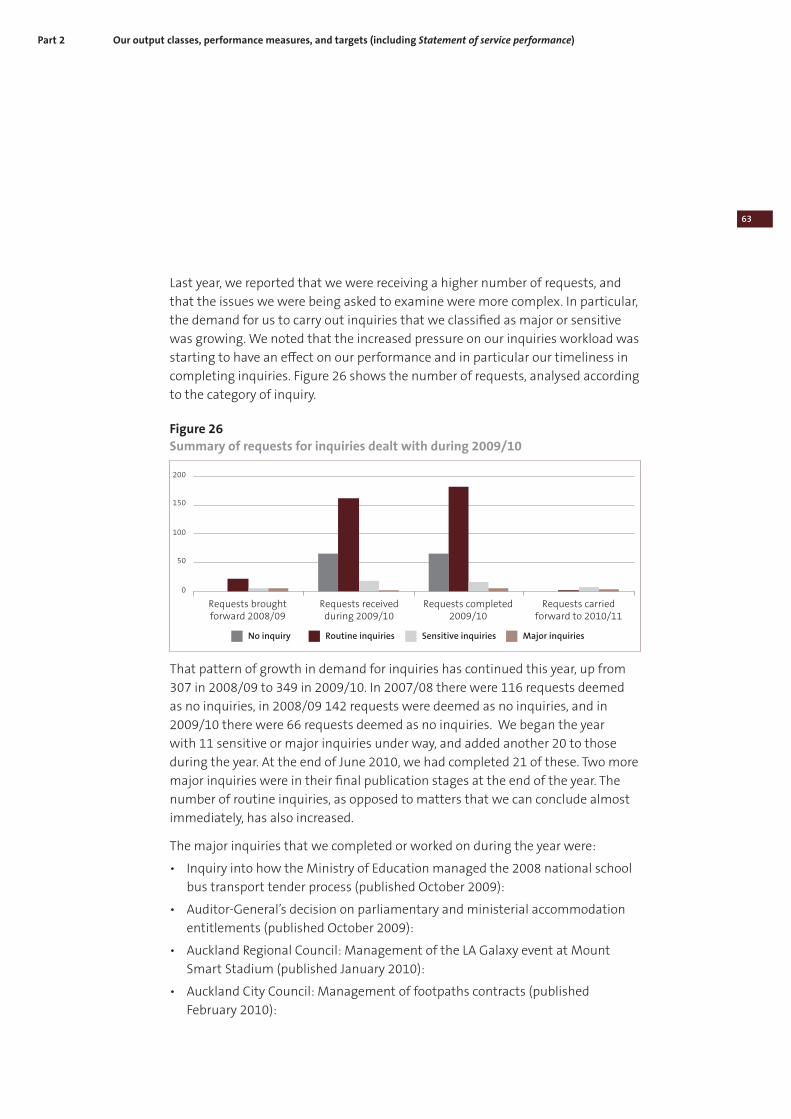
Part 2 Our output classes, performance measures, and targets (including Statement of service performance)
63
Last year, we reported that we were receiving a higher number of requests, and
that the issues we were being asked to examine were more complex. In particular,
the demand for us to carry out inquiries that we classified as major or sensitive
was growing. We noted that the increased pressure on our inquiries workload was
starting to have an effect on our performance and in particular our timeliness in
completing inquiries. Figure 26 shows the number of requests, analysed according
to the category of inquiry.
Figure 26
Summary of requests for inquiries dealt with during 2009/10
No inquiry
0
50
100
150
200
Requests brought Requests received Requests completed Requests carried
forward 2008/09 during 2009/10 2009/10 forward to 2010/11
Sensitive inquiries Major inquiriesRoutine inquiries
That pattern of growth in demand for inquiries has continued this year, up from
307 in 2008/09 to 349 in 2009/10. In 2007/08 there were 116 requests deemed
as no inquiries, in 2008/09 142 requests were deemed as no inquiries, and in
2009/10 there were 66 requests deemed as no inquiries. We began the year
with 11 sensitive or major inquiries under way, and added another 20 to those
during the year. At the end of June 2010, we had completed 21 of these. Two more
major inquiries were in their final publication stages at the end of the year. The
number of routine inquiries, as opposed to matters that we can conclude almost
immediately, has also increased.
The major inquiries that we completed or worked on during the year were:
• Inquiry into how the Ministry of Education managed the 2008 national school
bus transport tender process (published October 2009):
• Auditor-General’s decision on parliamentary and ministerial accommodation
entitlements (published October 2009):
• Auckland Regional Council: Management of the LA Galaxy event at Mount
Smart Stadium (published January 2010):
• Auckland City Council: Management of footpaths contracts (published
February 2010):
Part 2 Our output classes, performance measures, and targets (including Statement of service performance)
64
• Auditor-General’s inquiry into certain types of expenditure in Vote Ministerial
Services – Part 1 (published March 2010):
• Inquiry into New Zealand Defence Force payments to officers seconded to the
United Nations (published July 2010):
• Inquiry into the Plumbers, Gasfitters, and Drainlayers Board (published August
2010); and
• Inquiry into Vote Ministerial Services expenditure – Part 2 (departmental
systems) (publication pending).
As we discuss below, we also completed and published a major investigation
under the Local Authorities (Members’ Interests) Act 1968 into the participation
of Environment Canterbury councillors in council decisions when they had a
pecuniary interest in those decisions.
Given that major inquiries, particularly those in the political sphere, require the
involvement of senior staff, there have been flow-on effects on other parts of
our work. However, it is pleasing that we have managed to maintain the flow of
routine inquiry work.
Throughout the year, we have also been working on changes to the way in which
we resource and manage our inquiries work. The key goals are to:
• streamline straightforward processes where we can;
• be clearer and more consistent on which issues warrant inquiry by us; and
• improve our timeliness in providing responses and reports.
In the coming year, we will be updating the information we make publicly
available about this part of our work, to explain more fully the types of issues that
we can usefully inquire into, and what people can expect from the Office.
Enquiries under the Local Authorities (Members’ Interests) Act 1968
We also administer the Local Authorities (Members’ Interests) Act 1968 (the Act),
which governs the financial interests of members of local authorities. The number
of enquiries that we dealt with during the year, and our timeliness in responding,
are set out in Figure 26 above.
The main feature of the year in this work was our investigation into the
participation of councillors in decisions taken by Environment Canterbury on
changes to the charging regime for water consents, when they had a pecuniary
interest in those decisions. This investigation attracted significant public interest,
at a time when Environment Canterbury’s work and future role were politically
Part 2 Our output classes, performance measures, and targets (including Statement of service performance)
65
controversial. We published a report on our investigation in December 2009.3
In it, we explained our conclusion that the four affected councillors had all
breached the Act by participating, but that it would not be appropriate to
prosecute them for that breach. We noted that this was the type of situation
where we would have considered approving their participation, if they had
realised in advance that they could not participate and had applied to us.
For the further council decisions that followed on the charging regime, the
councillors applied for approval to participate. We approved their participation,
except for one major decision where we concluded that one councillor’s interest
was too substantial for her participation to be appropriate.
We are aware that this set of events created some confusion in the sector and
some concern about the potential scope of section 6 of the Act. Many councillors
and council staff have approached us for advice or approvals on a range of
situations in recent months. As a result, we have recently published a substantial
discussion of our work under this Act, and the Environment Canterbury analysis,
to provide the sector with further guidance.4
In that recent publication, we also reiterated our concern that the Act is out of
date and increasingly impractical to administer. We have previously suggested
that the contracting rule in section 3 of the Act achieved little, but added
compliance cost and risk to the sector. We had suggested that this rule should
be repealed, but that the participation rule in section 6 had merit. However,
developments over the last two years now suggest that this rule is also becoming
difficult to operate in practice. The Environment Canterbury decision, and
the uncertainty that has followed, illustrate its problems. We have therefore
suggested that the Act needs to be reviewed as a whole, from first principles, to
assess whether it is still relevant or appropriate.
The Auditor-General and the President of Local Government New Zealand have
recently written a joint letter to the Minister of Local Government, voicing their
concerns about the Act.
We realise that any legislative reform would take some time. We are therefore
continuing to administer the Act in a practical way, and to provide advice and
guidance to those affected by it. Our experience is that the number of requests
for advice or approvals under the Act increases at the time of the local authority
elections, as candidates and new members seek to clarify their situations.
3 Investigation into conflicts of interest of four councillors at Environment Canterbury, available on our website
www.oag.govt.nz.
4 Controller and Auditor-General, Local government: Results of the 2008/09 audits, Part 9, June 2010.
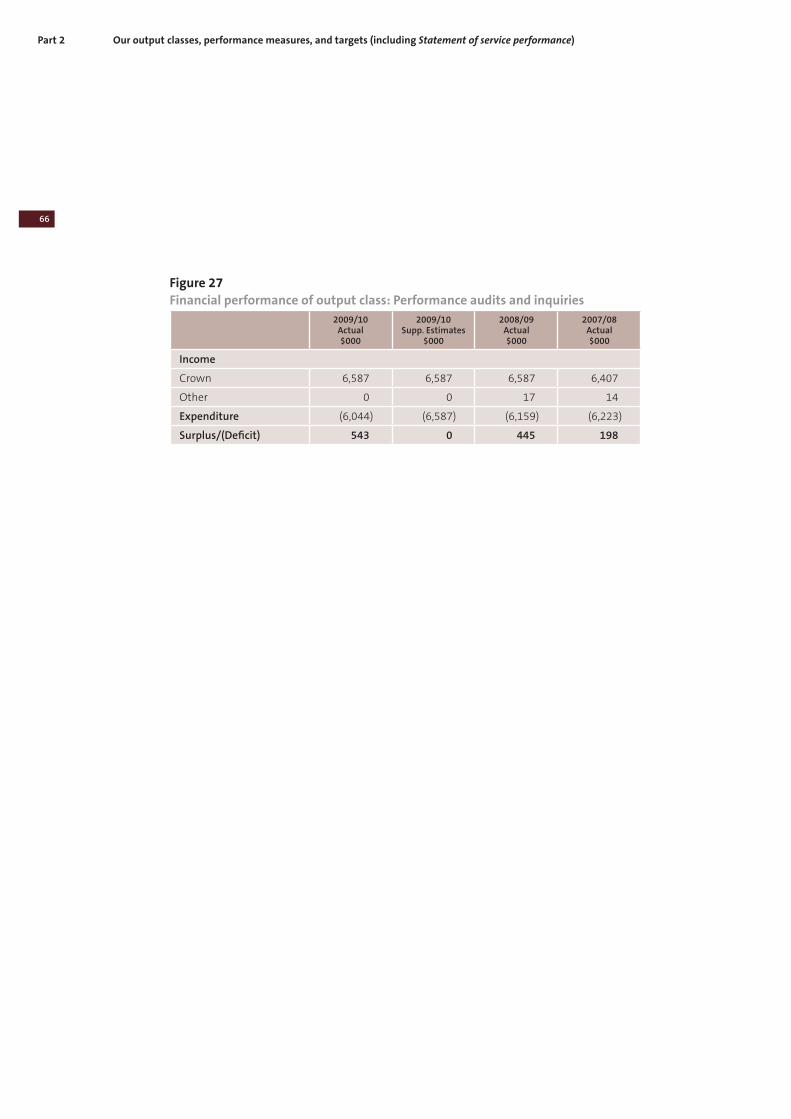
Part 2 Our output classes, performance measures, and targets (including Statement of service performance)
66
Figure 27
Financial performance of output class: Performance audits and inquiries
2009/10 Actual $000
2009/10 Supp. Estimates
$000
2008/09 Actual $000
2007/08 Actual $000
Income
Crown 6,587 6,587 6,587 6,407
Other 0 0 17 14
Expenditure (6,044) (6,587) (6,159) (6,223)
Surplus/(Deficit) 543 0 445 198
67
Part 3 Organisational health and capability
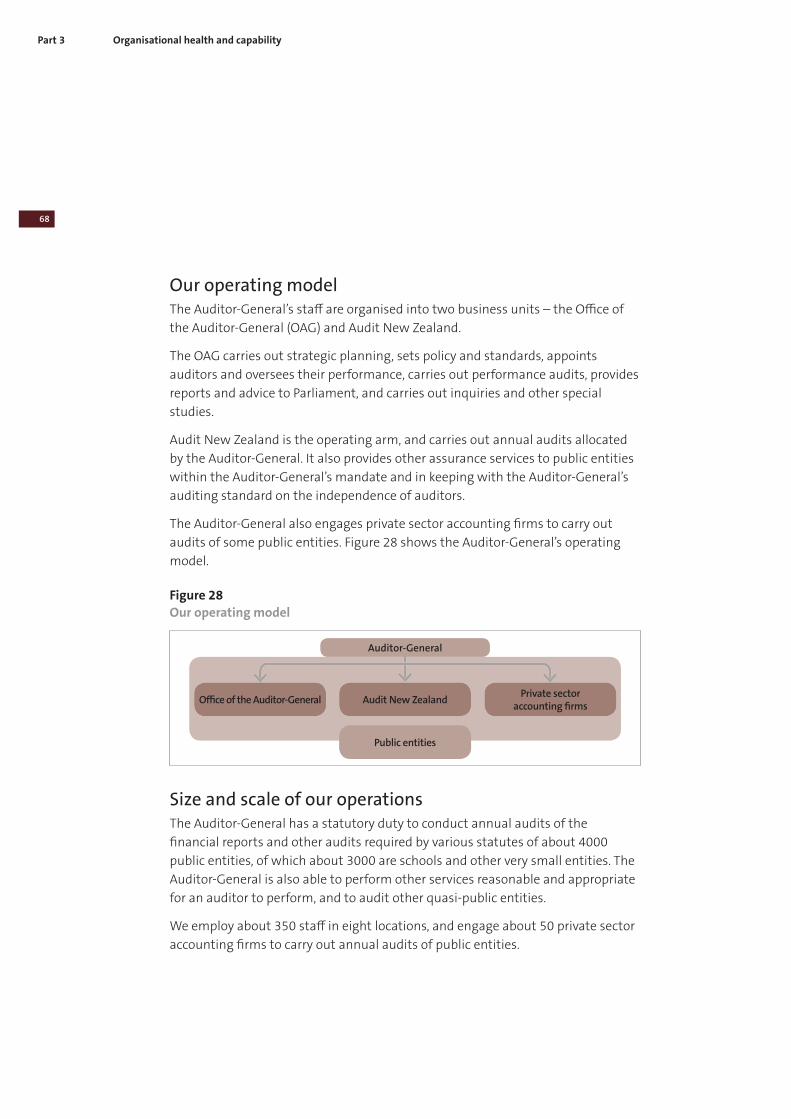
Part 3 Organisational health and capability
68
Our operating modelThe Auditor-General’s staff are organised into two business units – the Office of
the Auditor-General (OAG) and Audit New Zealand.
The OAG carries out strategic planning, sets policy and standards, appoints
auditors and oversees their performance, carries out performance audits, provides
reports and advice to Parliament, and carries out inquiries and other special
studies.
Audit New Zealand is the operating arm, and carries out annual audits allocated
by the Auditor-General. It also provides other assurance services to public entities
within the Auditor-General’s mandate and in keeping with the Auditor-General’s
auditing standard on the independence of auditors.
The Auditor-General also engages private sector accounting firms to carry out
audits of some public entities. Figure 28 shows the Auditor-General’s operating
model.
Figure 28
Our operating model
Auditor-General
Audit New ZealandOffice of the Auditor-GeneralPrivate sector
accounting firms
Public entities
Size and scale of our operationsThe Auditor-General has a statutory duty to conduct annual audits of the
financial reports and other audits required by various statutes of about 4000
public entities, of which about 3000 are schools and other very small entities. The
Auditor-General is also able to perform other services reasonable and appropriate
for an auditor to perform, and to audit other quasi-public entities.
We employ about 350 staff in eight locations, and engage about 50 private sector
accounting firms to carry out annual audits of public entities.
Part 3
69
Organisational health and capability
PeopleFor the 2009/10 year, our overall staff turnover has been around 10%, – half
historical levels. We attribute this drop to two factors: the worldwide recession
and improved leadership development programmes. The recession has
undoubtedly led to lower worldwide demand for accounting staff, which has
reduced the number of our newly qualified auditors leaving to travel overseas. In
Wellington in particular, the restraints on the public sector have also reduced the
demand for our people. Our ongoing leadership development programme has also
contributed to a reduction in attrition, because more senior staff have chosen to
stay.
We use a resource planning model to forecast audit staff requirements in future
years. This model has shown us that, even though attrition has lessened, we need
to maintain a certain level of recruitment for graduates. However, we were able
to reduce the recruitment of qualified employees. It also shows that we need to
continue to supplement our internal staff with secondees from private sector
accounting firms to help us through our peak workload periods.
Our recruitment initiatives and processes were again successful in 2009/10.
Twenty-five graduates joined the Office during the year, including 19 who had
worked with us as interns in the previous year.
In the past, we have recruited a small number of qualified auditors from the
United Kingdom and South Africa, but our lower attrition levels and the success of
our leadership development programme has meant that this was not needed this
year. Two of the five senior appointments made in 2009/10 were from within the
Office, and the other three resulted from our overseas recruitment programme in
2008/09.
Figure 29 provides a summary of staff numbers, their functional distribution, and
staff turnover for the year.
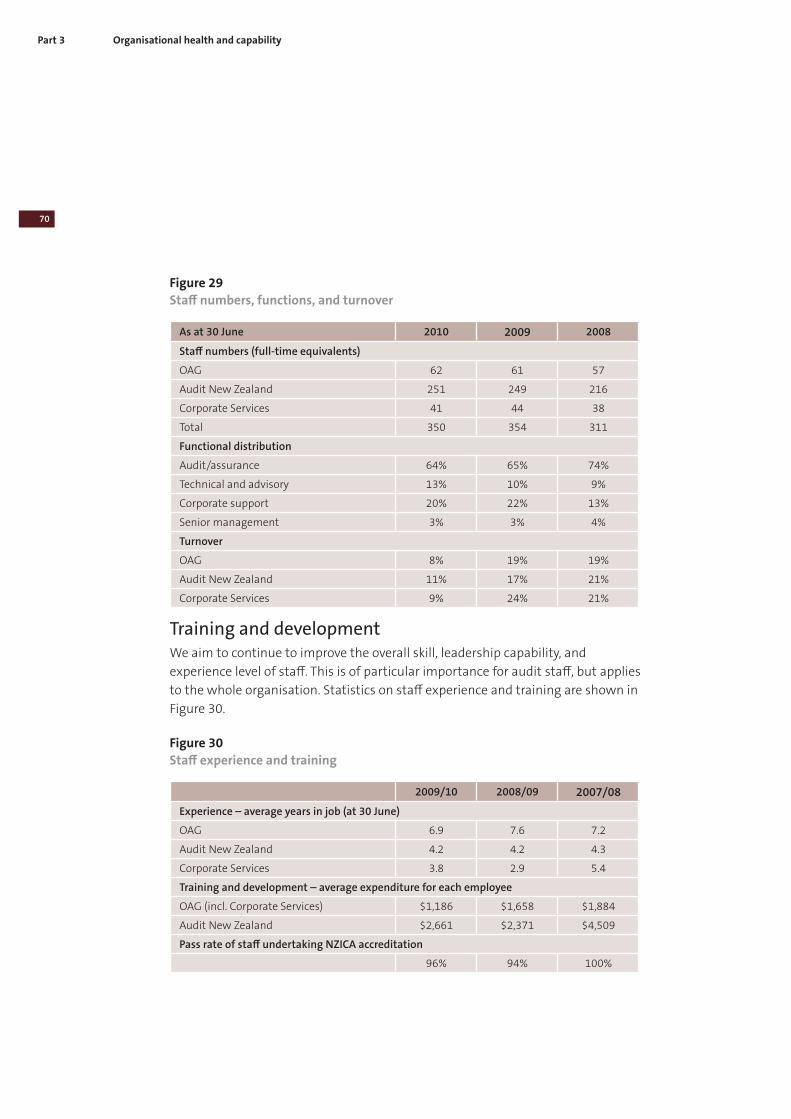
Part 3 Organisational health and capability
70
Figure 29
Staff numbers, functions, and turnover
As at 30 June 2010 2009 2008
Staff numbers (full-time equivalents)
OAG 62 61 57
Audit New Zealand 251 249 216
Corporate Services 41 44 38
Total 350 354 311
Functional distribution
Audit/assurance 64% 65% 74%
Technical and advisory 13% 10% 9%
Corporate support 20% 22% 13%
Senior management 3% 3% 4%
Turnover
OAG 8% 19% 19%
Audit New Zealand 11% 17% 21%
Corporate Services 9% 24% 21%
Training and developmentWe aim to continue to improve the overall skill, leadership capability, and
experience level of staff. This is of particular importance for audit staff, but applies
to the whole organisation. Statistics on staff experience and training are shown in
Figure 30.
Figure 30
Staff experience and training
2009/10 2008/09 2007/08
Experience – average years in job (at 30 June)
OAG 6.9 7.6 7.2
Audit New Zealand 4.2 4.2 4.3
Corporate Services 3.8 2.9 5.4
Training and development – average expenditure for each employee
OAG (incl. Corporate Services) $1,186 $1,658 $1,884
Audit New Zealand $2,661 $2,371 $4,509
Pass rate of staff undertaking NZICA accreditation
96% 94% 100%
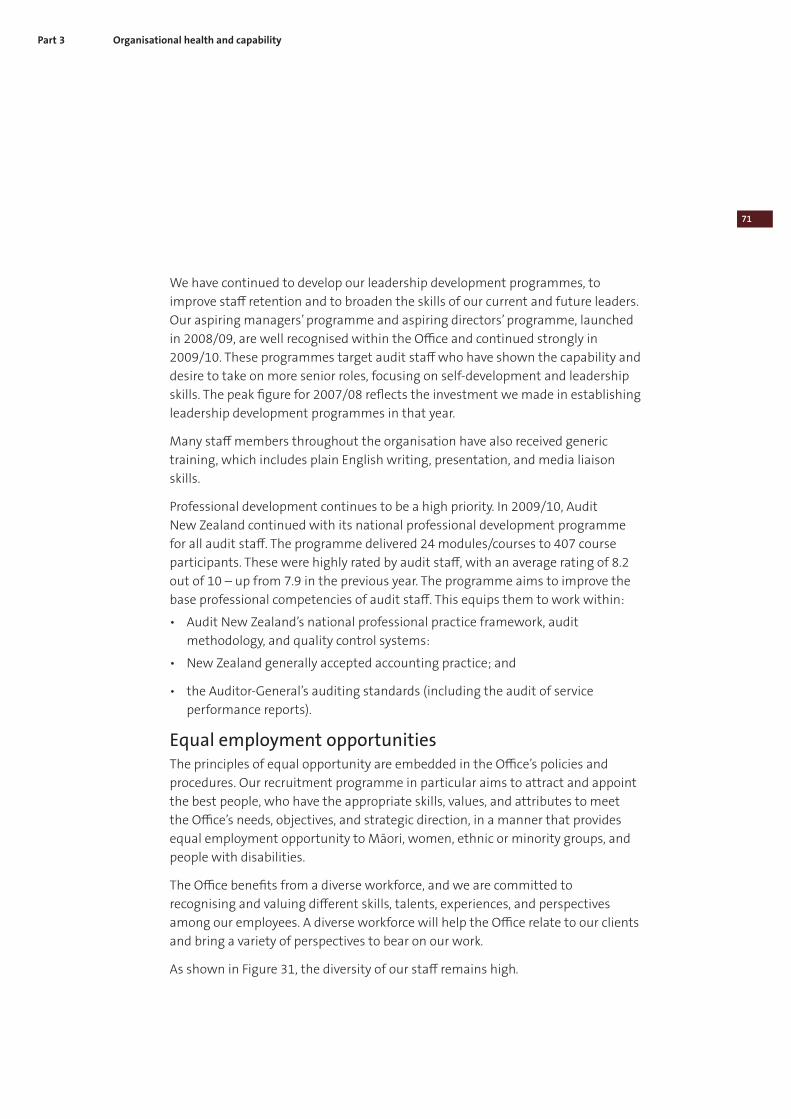
Part 3
71
Organisational health and capability
We have continued to develop our leadership development programmes, to
improve staff retention and to broaden the skills of our current and future leaders.
Our aspiring managers’ programme and aspiring directors’ programme, launched
in 2008/09, are well recognised within the Office and continued strongly in
2009/10. These programmes target audit staff who have shown the capability and
desire to take on more senior roles, focusing on self-development and leadership
skills. The peak figure for 2007/08 reflects the investment we made in establishing
leadership development programmes in that year.
Many staff members throughout the organisation have also received generic
training, which includes plain English writing, presentation, and media liaison
skills.
Professional development continues to be a high priority. In 2009/10, Audit
New Zealand continued with its national professional development programme
for all audit staff. The programme delivered 24 modules/courses to 407 course
participants. These were highly rated by audit staff, with an average rating of 8.2
out of 10 – up from 7.9 in the previous year. The programme aims to improve the
base professional competencies of audit staff. This equips them to work within:
• Audit New Zealand’s national professional practice framework, audit
methodology, and quality control systems:
• New Zealand generally accepted accounting practice; and
• the Auditor-General’s auditing standards (including the audit of service
performance reports).
Equal employment opportunities The principles of equal opportunity are embedded in the Office’s policies and
procedures. Our recruitment programme in particular aims to attract and appoint
the best people, who have the appropriate skills, values, and attributes to meet
the Office’s needs, objectives, and strategic direction, in a manner that provides
equal employment opportunity to Māori, women, ethnic or minority groups, and
people with disabilities.
The Office benefits from a diverse workforce, and we are committed to
recognising and valuing different skills, talents, experiences, and perspectives
among our employees. A diverse workforce will help the Office relate to our clients
and bring a variety of perspectives to bear on our work.
As shown in Figure 31, the diversity of our staff remains high.
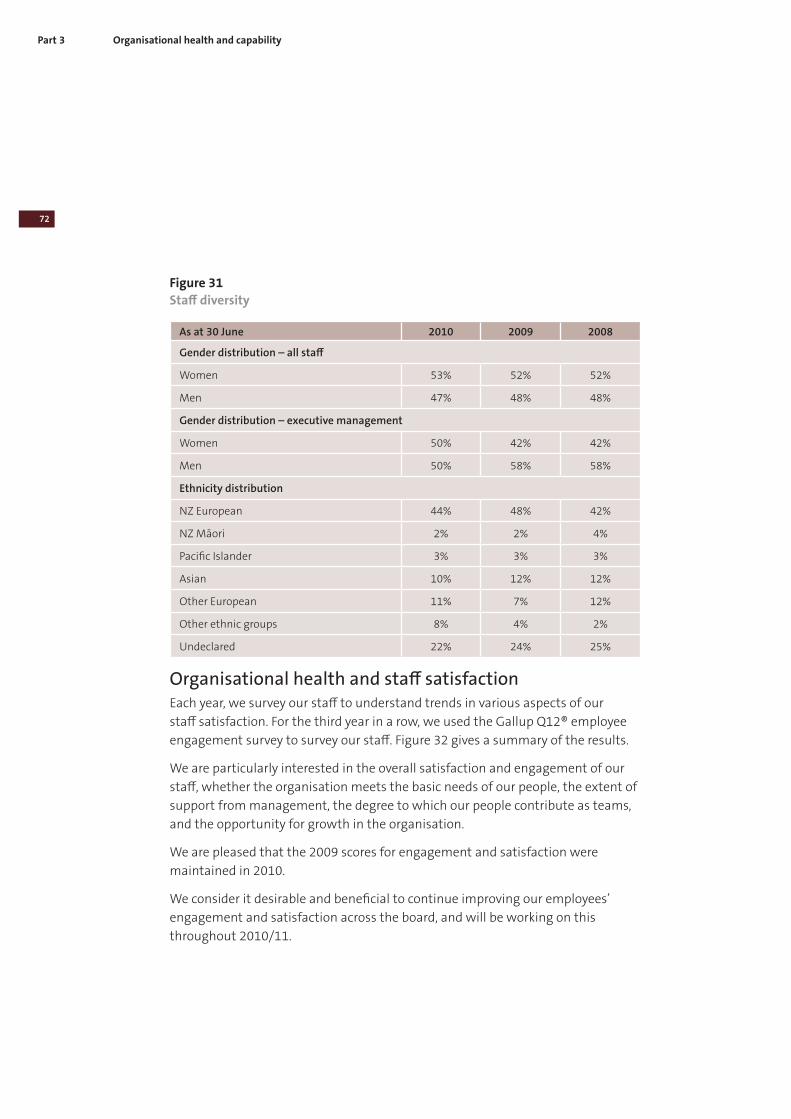
Part 3 Organisational health and capability
72
Figure 31
Staff diversity
As at 30 June 2010 2009 2008
Gender distribution – all staff
Women 53% 52% 52%
Men 47% 48% 48%
Gender distribution – executive management
Women 50% 42% 42%
Men 50% 58% 58%
Ethnicity distribution
NZ European 44% 48% 42%
NZ Māori 2% 2% 4%
Pacific Islander 3% 3% 3%
Asian 10% 12% 12%
Other European 11% 7% 12%
Other ethnic groups 8% 4% 2%
Undeclared 22% 24% 25%
Organisational health and staff satisfactionEach year, we survey our staff to understand trends in various aspects of our
staff satisfaction. For the third year in a row, we used the Gallup Q12® employee
engagement survey to survey our staff. Figure 32 gives a summary of the results.
We are particularly interested in the overall satisfaction and engagement of our
staff, whether the organisation meets the basic needs of our people, the extent of
support from management, the degree to which our people contribute as teams,
and the opportunity for growth in the organisation.
We are pleased that the 2009 scores for engagement and satisfaction were
maintained in 2010.
We consider it desirable and beneficial to continue improving our employees’
engagement and satisfaction across the board, and will be working on this
throughout 2010/11.
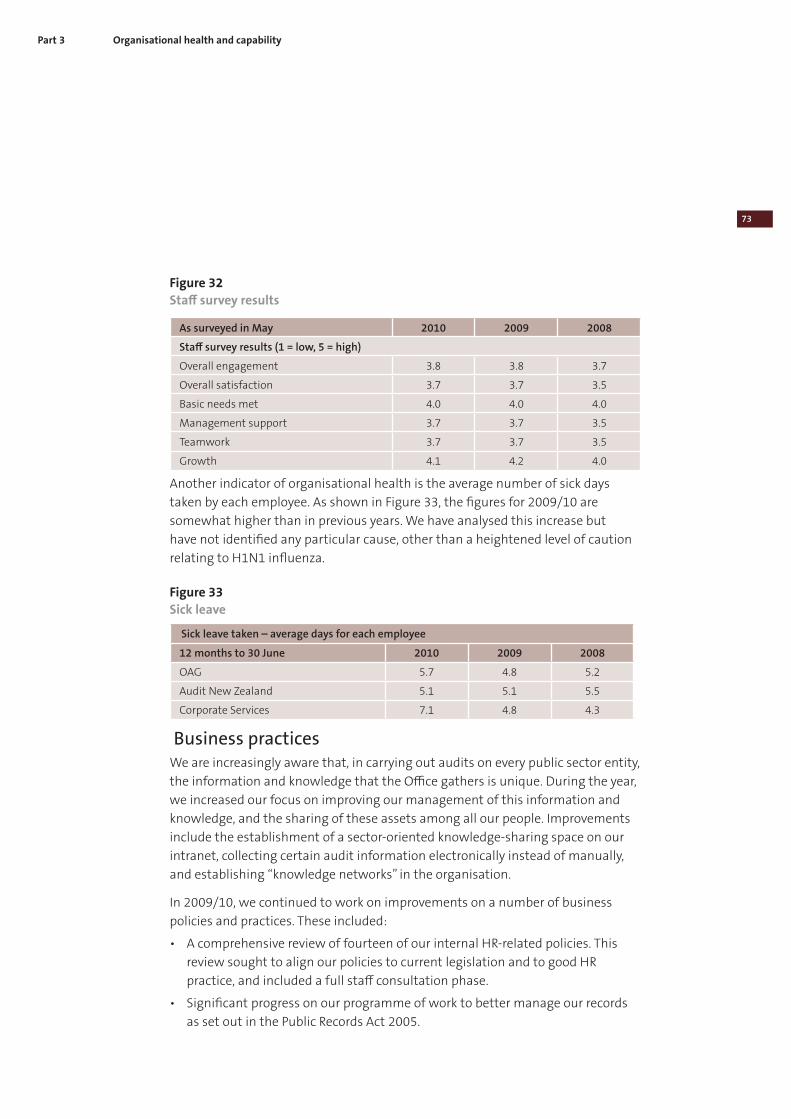
Part 3
73
Organisational health and capability
Figure 32
Staff survey results
As surveyed in May 2010 2009 2008
Staff survey results (1 = low, 5 = high)
Overall engagement 3.8 3.8 3.7
Overall satisfaction 3.7 3.7 3.5
Basic needs met 4.0 4.0 4.0
Management support 3.7 3.7 3.5
Teamwork 3.7 3.7 3.5
Growth 4.1 4.2 4.0
Another indicator of organisational health is the average number of sick days
taken by each employee. As shown in Figure 33, the figures for 2009/10 are
somewhat higher than in previous years. We have analysed this increase but
have not identified any particular cause, other than a heightened level of caution
relating to H1N1 influenza.
Figure 33
Sick leave
Sick leave taken – average days for each employee
12 months to 30 June 2010 2009 2008
OAG 5.7 4.8 5.2
Audit New Zealand 5.1 5.1 5.5
Corporate Services 7.1 4.8 4.3
Business practicesWe are increasingly aware that, in carrying out audits on every public sector entity,
the information and knowledge that the Office gathers is unique. During the year,
we increased our focus on improving our management of this information and
knowledge, and the sharing of these assets among all our people. Improvements
include the establishment of a sector-oriented knowledge-sharing space on our
intranet, collecting certain audit information electronically instead of manually,
and establishing “knowledge networks” in the organisation.
In 2009/10, we continued to work on improvements on a number of business
policies and practices. These included:
• A comprehensive review of fourteen of our internal HR-related policies. This
review sought to align our policies to current legislation and to good HR
practice, and included a full staff consultation phase.
• Significant progress on our programme of work to better manage our records
as set out in the Public Records Act 2005.
Part 3 Organisational health and capability
74
• Changes to our independence processes and systems that improve the
effectiveness and relevance of independence checking for staff.
FacilitiesIn July 2009, we relocated the staff of the OAG and our shared corporate services
staff (about half of our Wellington staff) to a single floor in another building.
For the last few years, our 220 Wellington-based staff have been located on
seven floors and in two buildings, significantly restricting the extent to which
collaboration and sharing of ideas can naturally occur. Moving OAG and corporate
services staff has reduced our Wellington accommodation to three floors
in two buildings. This co-location has, as anticipated, improved our internal
communications and collaboration.
We have previously identified the advantages of co-locating OAG and Audit New
Zealand Wellington staff. We delayed our search for suitable premises in 2009/10,
as we believed that the Wellington property market would continue to soften
during the year. We expect to continue this work in 2010/11.
The Office’s other facilities, including Audit New Zealand’s other offices, continued
to meet the needs of the organisation in 2009/10.
Information systemsThe Office, especially Audit New Zealand, is highly dependent on information
technology to complete its work. Audit staff working in the field need to have
remote access and communications tools to ensure an effective, efficient, and
customer-focused service. The OAG needs systems to manage the approximately
4000 audits we are responsible for.
Throughout the year, we continued to invest in maintaining and improving the
infrastructure supporting our auditors. Our normal rolling programme of laptop
computer replacement was continued, and this year we implemented an annual
maintenance programme for those laptops not yet due for replacement. We have
continued to improve the network and computing infrastructure in our regional
offices, and have increased the capability and security of our remote access
solutions. These programmes have led to a significant improvement in laptop and
network reliability for our audit staff during 2009/10.
On 1 July 2009, the Office’s new core financial system and integrated time and
cost management system became operational. The new system replaced several
separate systems that were no longer able to meet the information, management,
and security needs of the Office. The replacement system contains increased
functionality, including process workflow management and significantly improved
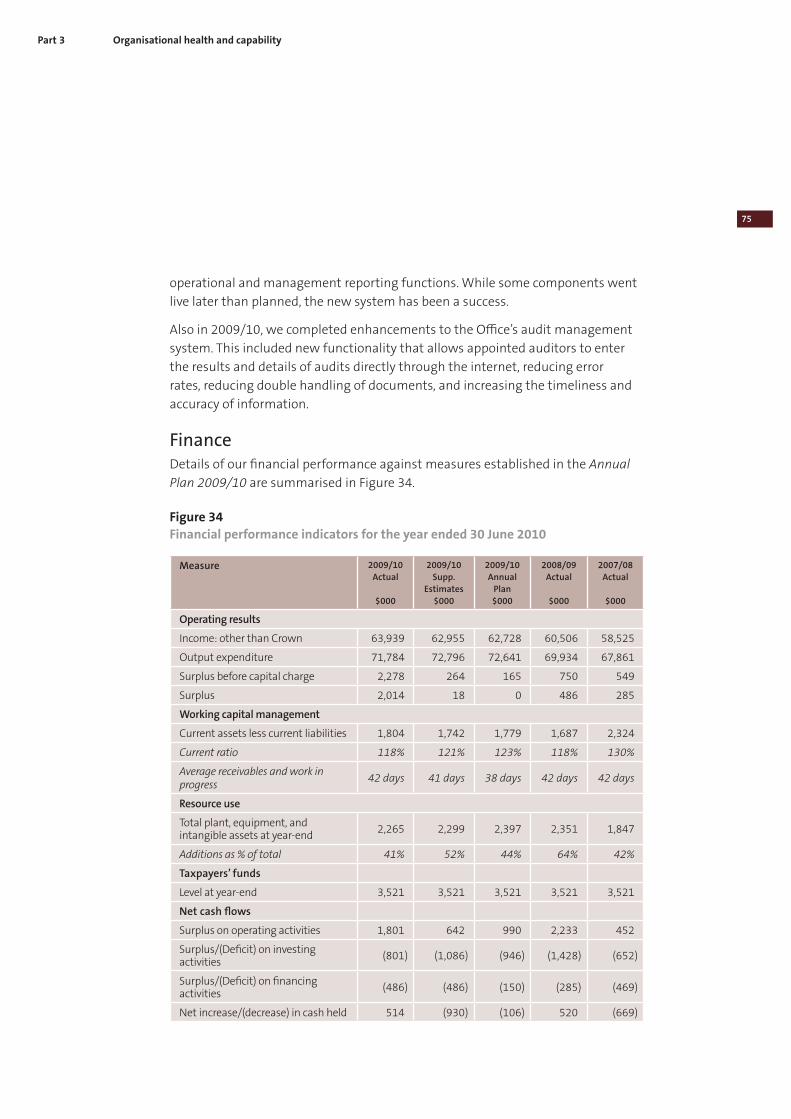
Part 3
75
Organisational health and capability
operational and management reporting functions. While some components went
live later than planned, the new system has been a success.
Also in 2009/10, we completed enhancements to the Office’s audit management
system. This included new functionality that allows appointed auditors to enter
the results and details of audits directly through the internet, reducing error
rates, reducing double handling of documents, and increasing the timeliness and
accuracy of information.
Finance Details of our financial performance against measures established in the Annual
Plan 2009/10 are summarised in Figure 34.
Figure 34
Financial performance indicators for the year ended 30 June 2010
Measure 2009/10 Actual
$000
2009/10 Supp.
Estimates $000
2009/10 Annual
Plan $000
2008/09 Actual
$000
2007/08 Actual
$000
Operating results
Income: other than Crown 63,939 62,955 62,728 60,506 58,525
Output expenditure 71,784 72,796 72,641 69,934 67,861
Surplus before capital charge 2,278 264 165 750 549
Surplus 2,014 18 0 486 285
Working capital management
Current assets less current liabilities 1,804 1,742 1,779 1,687 2,324
Current ratio 118% 121% 123% 118% 130%
Average receivables and work in progress
42 days 41 days 38 days 42 days 42 days
Resource use
Total plant, equipment, and intangible assets at year-end
2,265 2,299 2,397 2,351 1,847
Additions as % of total 41% 52% 44% 64% 42%
Taxpayers’ funds
Level at year-end 3,521 3,521 3,521 3,521 3,521
Net cash flows
Surplus on operating activities 1,801 642 990 2,233 452
Surplus/(Deficit) on investing activities
(801) (1,086) (946) (1,428) (652)
Surplus/(Deficit) on financing activities
(486) (486) (150) (285) (469)
Net increase/(decrease) in cash held 514 (930) (106) 520 (669)


77
Part 4 Risk Management
Part 4
78
Risk Management
Risk management framework
Our risk management framework is the set of elements of our management
system that we use to identify and manage risk. The framework is aligned to our
business outcomes and the strategies designed to achieve these outcomes.
Identifying and managing risk is a key part of our planning. Our strategic planning
defines plans and allocates resources to achieve certain objectives. An integral
part of the planning is to identify anything that might threaten the achievement
of those objectives.
We categorise the risks that we are exposed to as strategic or operational risks. All
risks are managed within the same framework, because experience shows that
inadequately managed operational risks can escalate to become strategic risks.
Strategic risksWe have identified our main strategic risks as being the loss of our independence,
audit failure, loss of capability, and loss of reputation:
• Loss of independence – The risk that we lose independence, in fact or
appearance, whether by failure on the part of the Auditor-General or appointed
auditors to act independently or otherwise, As independence underpins the
value of the Auditor-General’s work, loss of independence would undermine
trust in our organisation.
• Audit failure – The risk that we issue an incorrect audit opinion with material
impact, or a report that is significantly wrong in nature or process.
• Loss of capability – The risk that we are unable to retain, recruit, or access
people with the technical and other skills our audit work requires.
• Loss of reputation – The risk that we lose reputation or credibility, which would
affect our relationships with stakeholders.
These risks will always be present, but the way we do our work can greatly reduce
them.
Strategic risk mitigation actionsThe key mitigation actions are:
• the Auditor-General’s independence standards – the Auditor-General sets a
high standard for independence for both employees and appointed auditors
from chartered accounting firms;
• monitoring the independence of the two statutory officers, employees, and
appointed auditors – the system includes regular declarations of interest and,
where necessary, implementation of measures to avoid conflicts of interest;
Part 4
79
Risk Management
• adhering to professional auditing standards;
• quality assurance procedures, including complying with NZICA’s quality control
standards;
• peer review and substantiation procedures – these include annual independent
evaluation of our audit allocation and tendering processes, independent
external review of two performance audits each year, stakeholder feedback
interviews, and client surveys;
• an independent Audit and Risk Committee, comprising three external
members and the Deputy Controller and Auditor-General; and
• ongoing training and development of our staff – including talent and
capability management programmes, leadership development initiatives, and
professional development programmes.
Operational risksWe identify specific risks during our annual planning by carrying out a review
of the environment in which we operate. We consider economic, legal, social,
environmental, and technological developments, and changes in the accounting
and auditing professions that might affect us. We look too at the effect such
matters might have on our stakeholders and the public entities that we audit.
Demand created by changes within the public sector and the accounting and
auditing profession, together with the historic difficulty in finding and retaining
suitably qualified and experienced staff, has meant that our audit work has had to
focus more heavily on the financial statements of public entities. This has been at
the expense of public interest audit work based on fuller consideration of the risks
and challenges that entities face in their strategic, governance, and operational
contexts.
We have been working to rebalance our audit effort to consider this fuller
perspective in the audit of each public entity, to the extent judged appropriate by
the entity’s appointed auditor. These changes have been reflected in the revised
Auditor-General’s Auditing Standard on auditing service performance reports
(AG-4) issued in July 2009, followed by our grading of service performance
information and associated systems and controls within financial review reporting
to select committees. This should result in a stronger emphasis on non-financial
reporting and accountability. It may, over time, affect how our audits are costed,
resourced, carried out, and reported.
In Part 3 of this report, we describe the efforts we are making to maintain and
build our organisational health and capability to equip us to deal with the
increased demands of our environment.
Part 4
80
Risk Management
Refining our risk management frameworkOur risk management framework comprises processes for managing risk, to
ensure that all significant risks are identified, that mitigation measures are put
in place where appropriate, and that responsibility for implementing those
measures is clearly allocated.
There are two key steps in our risk management framework:
• an annual refreshing of our risks and controls, encompassing strategic,
environmental, and business plan changes; and
• a six-monthly review of the identified risks and controls, with subsequent
reporting to our leadership teams and our Audit and Risk Committee.
We continue to keep the framework under review, and to enhance it as
appropriate.
Part 4
81
Risk Management
Report of the Audit and Risk Committeefor the year to 30 June 2010
Members:
John Hagen MBA, MCom, FCA , Investigating accountant – Chairman
Stephen Revill BA, LLB
Phillippa Smith BA, LLB, MPP, Deputy Controller and Auditor-General
Neil Walter MA, CNZM, Director
The Audit and Risk Committee is an independent committee established by and
reporting directly to the Auditor-General. The Committee was established in 2003, as
the Audit Committee. The reference to risk was included in the name of the Committee
in December 2005, to better describe the Committee’s role.
The purpose of the Committee is to oversee:
• risk management and internal control;
• audit functions (internal and external) for the Office;
• financial and other external reporting;
• the governance framework and processes;
• compliance with legislation, policies and procedures.
The Committee has no management functions.
During the past year the Committee:
• met on three occasions to fulfil its duties and responsibilities;
• received briefings from the Auditor-General and other senior managers on key
business activities of the Office, as a basis for ensuring risks facing the Office are
being appropriately addressed;
• oversaw the Office’s continuing review of its risk management framework and the
procedures underpinning the framework;
• discussed with the external auditors their findings from their audit work;
• monitored the implementation of recommendations made by the external auditor;
• received and considered reports from the internal auditors (KPMG), and monitored
implementation of recommendations made by the internal auditors;
• reviewed the annual plan and annual financial statements of the Office prior to their
approval by the Auditor-General, having particular regard to the accounting policies
adopted, major judgmental areas, and compliance with legislation and relevant
standards;
The Committee has reported to the Auditor-General on the above and other matters
it has seen fit to do so. There are no outstanding or unresolved concerns which the
Committee has brought to the attention of the Auditor-General.
John Hagen
Chairman
for the Audit and Risk Committee
28 July 2010
Part 4
82
Risk Management
Part 5 Financial statements 2009/10
83
Contents
Audit report 84
Statement of responsibility 86
Statement of comprehensive income 87
Statement of changes in taxpayers’ funds (equity) 88
Statement of financial position 89
Statement of cash flows 90
Statement of commitments 91
Statement of contingent liabilities and contingent assets 92
Statement of output expenses, other expenses, and capital expenditure
against appropriations 93
Statement of unappropriated expenditure 94
Statement of trust money 94
Notes to the financial statements 95
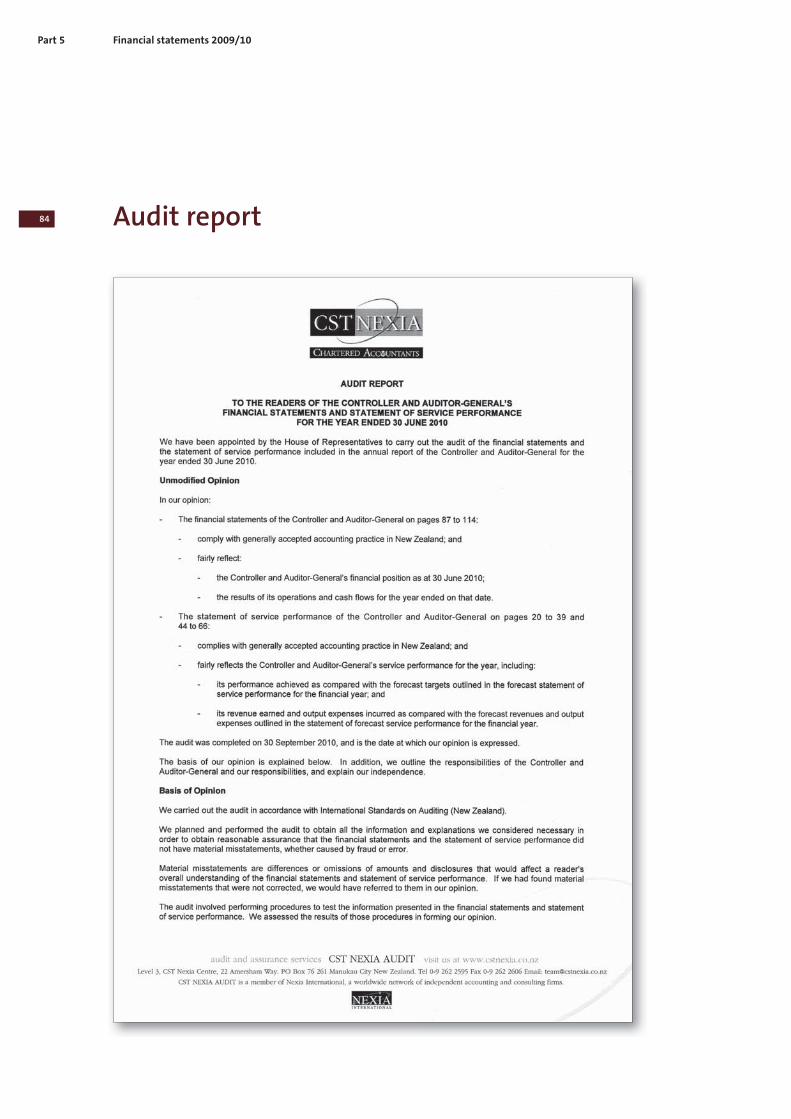
84
Part 5 Financial statements 2009/10
Audit report
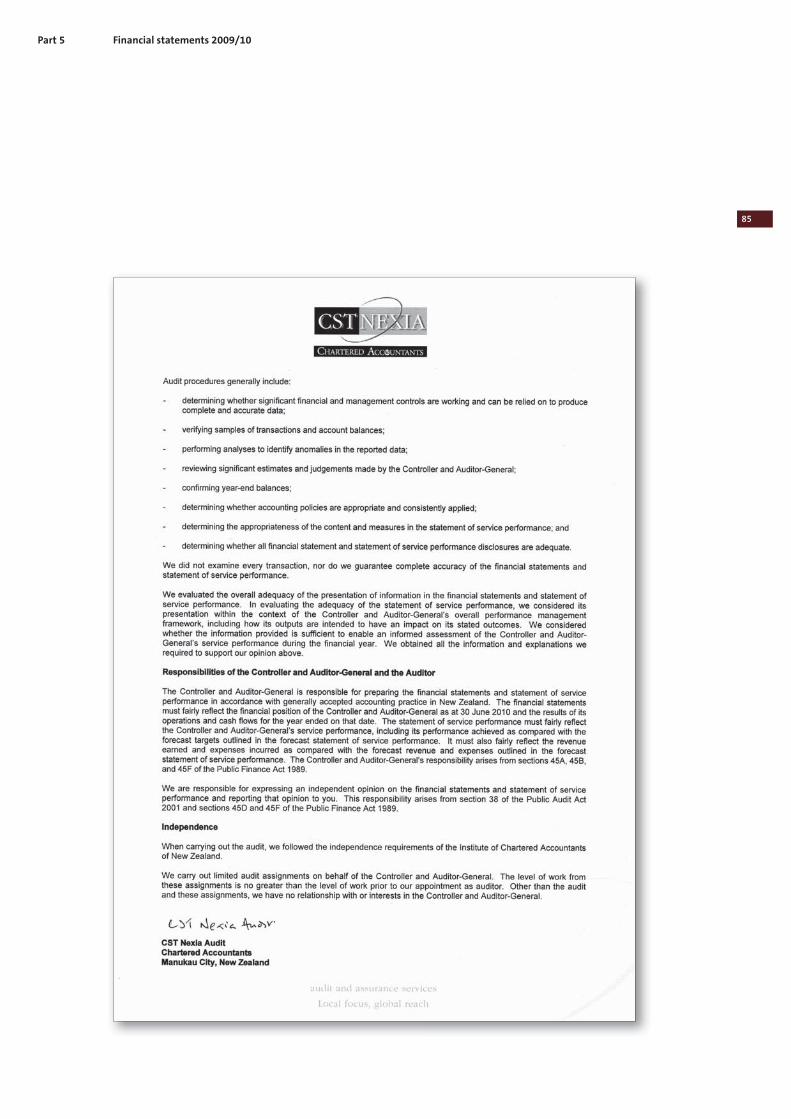
85
Financial statements 2009/10Part 5
86
Part 5 Financial statements 2009/10
Statement of responsibility
In terms of the Public Finance Act 1989 and the Public Audit Act 2001, the
Controller and Auditor-General is responsible for the accuracy and judgements
used in the preparation of the financial statements, and for establishing and
maintaining systems of internal control designed to provide ongoing assurance of
the integrity and reliability of financial reporting.
Appropriate systems of internal control have been employed to ensure that:
• all transactions are executed in accordance with authority;
• all transactions are correctly processed and accounted for in the financial
records; and
• the assets of the Office are properly safeguarded.
• In my opinion, the information set out in the statement of service performance,
the financial statements, and attached notes to those statements (on pages
20-39, 44-66, and 87-114) fairly reflects our service performance, financial
activities, and cash flows for the year ended 30 June 2010, and our financial
position as at that date.
Signed:
Lyn Provost
Controller and Auditor-General
30 September 2010
Countersigned:
Maria Viviers
Financial Controller
30 September 2010
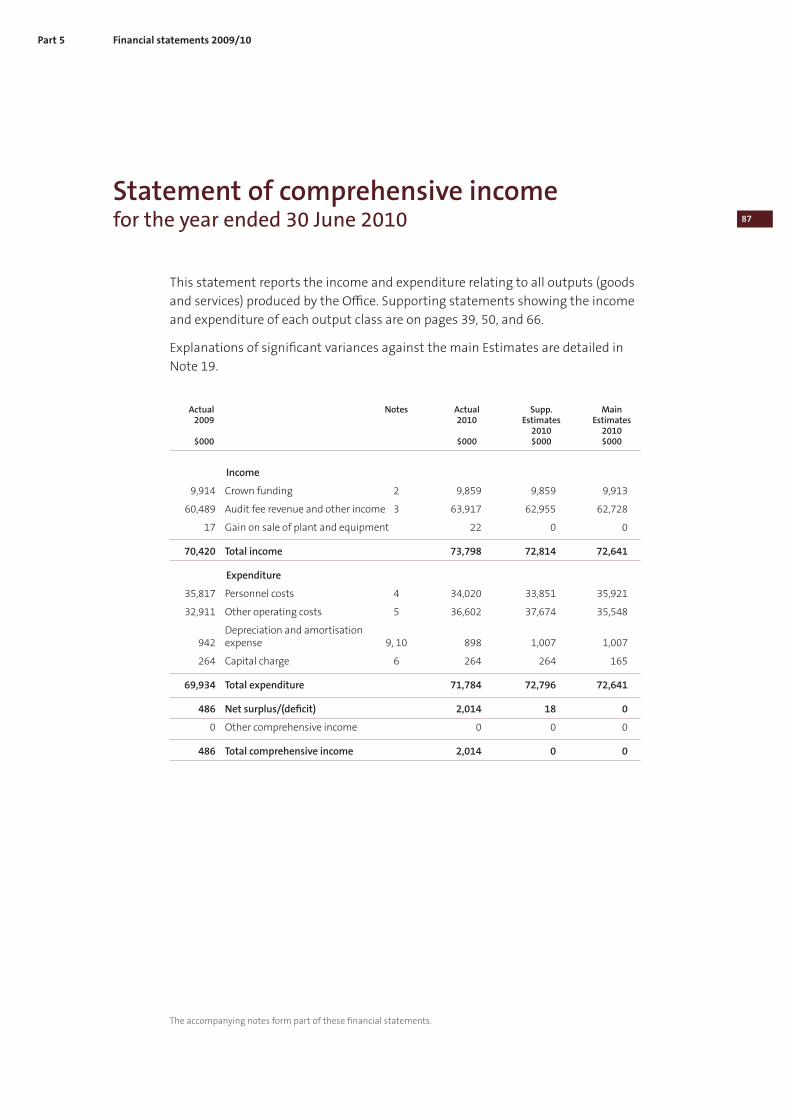
87
Financial statements 2009/10Part 5
Statement of comprehensive income for the year ended 30 June 2010
This statement reports the income and expenditure relating to all outputs (goods
and services) produced by the Office. Supporting statements showing the income
and expenditure of each output class are on pages 39, 50, and 66.
Explanations of significant variances against the main Estimates are detailed in
Note 19.
Actual Notes Actual Supp. Main 2009 2010 Estimates Estimates 2010 2010 $000 $000 $000 $000
Income
9,914 Crown funding 2 9,859 9,859 9,913
60,489 Audit fee revenue and other income 3 63,917 62,955 62,728
17 Gain on sale of plant and equipment 22 0 0
70,420 Total income 73,798 72,814 72,641
Expenditure
35,817 Personnel costs 4 34,020 33,851 35,921
32,911 Other operating costs 5 36,602 37,674 35,548
Depreciation and amortisation 942 expense 9, 10 898 1,007 1,007
264 Capital charge 6 264 264 165
69,934 Total expenditure 71,784 72,796 72,641
486 Net surplus/(deficit) 2,014 18 0
0 Other comprehensive income 0 0 0
486 Total comprehensive income 2,014 0 0
The accompanying notes form part of these financial statements.
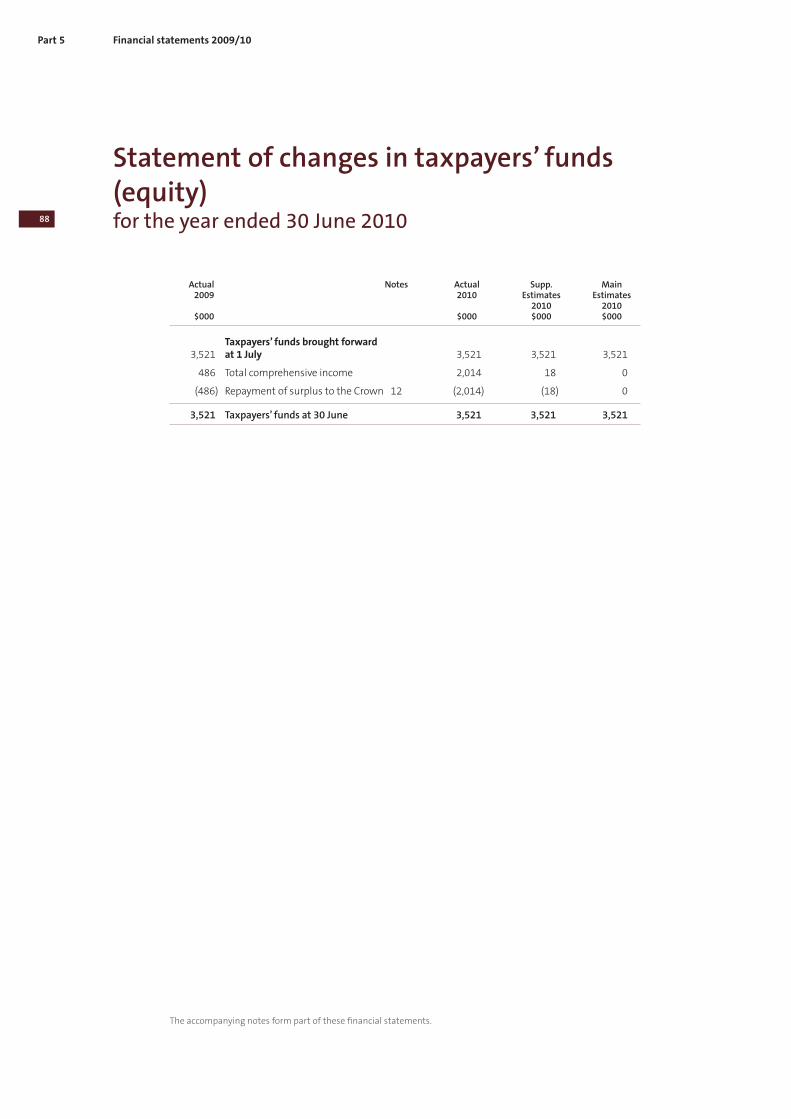
88
Part 5 Financial statements 2009/10
Statement of changes in taxpayers’ funds (equity)for the year ended 30 June 2010
Actual Notes Actual Supp. Main 2009 2010 Estimates Estimates 2010 2010 $000 $000 $000 $000
Taxpayers’ funds brought forward 3,521 at 1 July 3,521 3,521 3,521
486 Total comprehensive income 2,014 18 0
(486) Repayment of surplus to the Crown 12 (2,014) (18) 0
3,521 Taxpayers’ funds at 30 June 3,521 3,521 3,521
The accompanying notes form part of these financial statements.
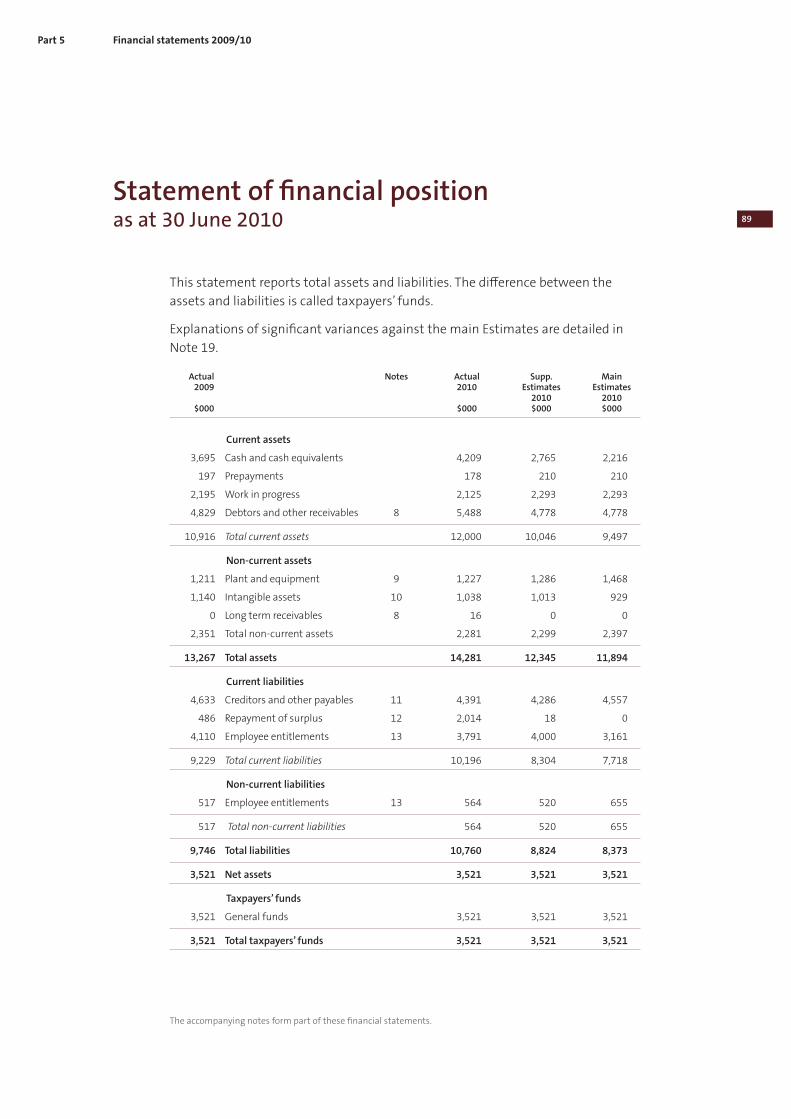
89
Financial statements 2009/10Part 5
Statement of financial positionas at 30 June 2010
This statement reports total assets and liabilities. The difference between the
assets and liabilities is called taxpayers’ funds.
Explanations of significant variances against the main Estimates are detailed in
Note 19.
Actual Notes Actual Supp. Main 2009 2010 Estimates Estimates 2010 2010 $000 $000 $000 $000
Current assets
3,695 Cash and cash equivalents 4,209 2,765 2,216
197 Prepayments 178 210 210
2,195 Work in progress 2,125 2,293 2,293
4,829 Debtors and other receivables 8 5,488 4,778 4,778
10,916 Total current assets 12,000 10,046 9,497
Non-current assets
1,211 Plant and equipment 9 1,227 1,286 1,468
1,140 Intangible assets 10 1,038 1,013 929
0 Long term receivables 8 16 0 0
2,351 Total non-current assets 2,281 2,299 2,397
13,267 Total assets 14,281 12,345 11,894
Current liabilities
4,633 Creditors and other payables 11 4,391 4,286 4,557
486 Repayment of surplus 12 2,014 18 0
4,110 Employee entitlements 13 3,791 4,000 3,161
9,229 Total current liabilities 10,196 8,304 7,718
Non-current liabilities
517 Employee entitlements 13 564 520 655
517 Total non-current liabilities 564 520 655
9,746 Total liabilities 10,760 8,824 8,373
3,521 Net assets 3,521 3,521 3,521
Taxpayers’ funds
3,521 General funds 3,521 3,521 3,521
3,521 Total taxpayers’ funds 3,521 3,521 3,521
The accompanying notes form part of these financial statements.
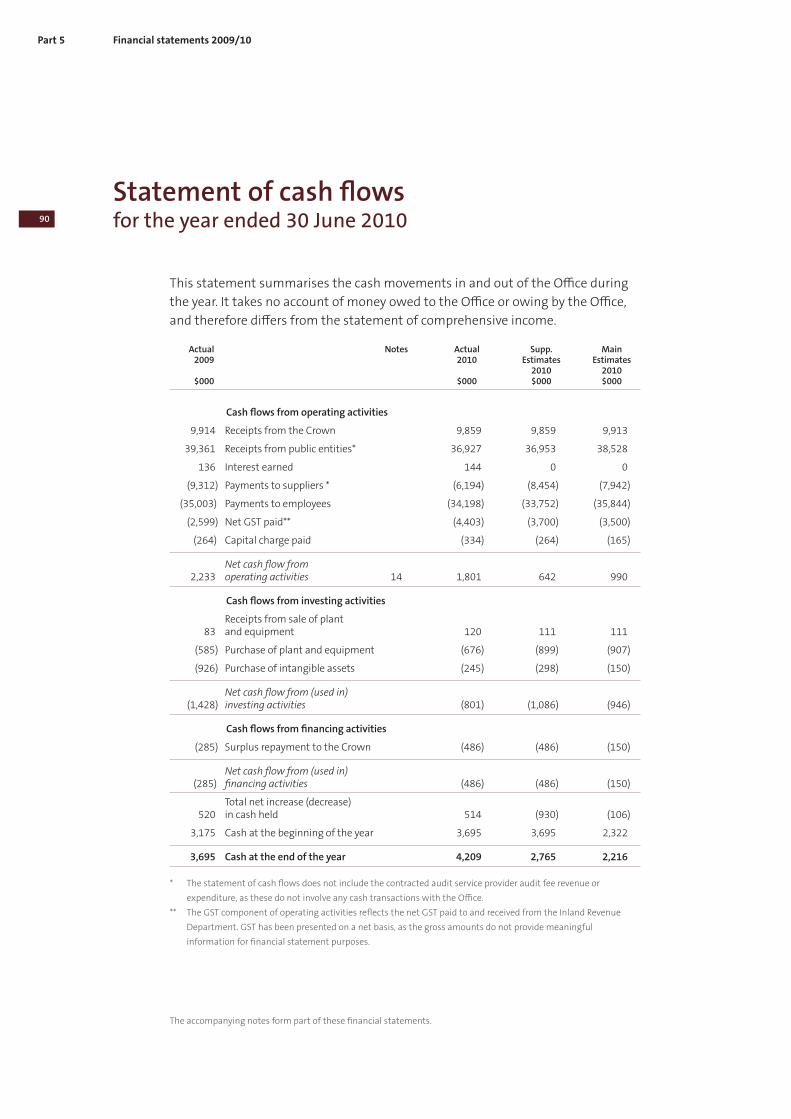
90
Part 5 Financial statements 2009/10
Statement of cash flowsfor the year ended 30 June 2010
This statement summarises the cash movements in and out of the Office during
the year. It takes no account of money owed to the Office or owing by the Office,
and therefore differs from the statement of comprehensive income.
Actual Notes Actual Supp. Main 2009 2010 Estimates Estimates 2010 2010 $000 $000 $000 $000
Cash flows from operating activities
9,914 Receipts from the Crown 9,859 9,859 9,913
39,361 Receipts from public entities* 36,927 36,953 38,528
136 Interest earned 144 0 0
(9,312) Payments to suppliers * (6,194) (8,454) (7,942)
(35,003) Payments to employees (34,198) (33,752) (35,844)
(2,599) Net GST paid** (4,403) (3,700) (3,500)
(264) Capital charge paid (334) (264) (165)
Net cash flow from 2,233 operating activities 14 1,801 642 990
Cash flows from investing activities
Receipts from sale of plant 83 and equipment 120 111 111
(585) Purchase of plant and equipment (676) (899) (907)
(926) Purchase of intangible assets (245) (298) (150)
Net cash flow from (used in) (1,428) investing activities (801) (1,086) (946)
Cash flows from financing activities
(285) Surplus repayment to the Crown (486) (486) (150)
Net cash flow from (used in) (285) financing activities (486) (486) (150)
Total net increase (decrease) 520 in cash held 514 (930) (106)
3,175 Cash at the beginning of the year 3,695 3,695 2,322
3,695 Cash at the end of the year 4,209 2,765 2,216
* The statement of cash flows does not include the contracted audit service provider audit fee revenue or
expenditure, as these do not involve any cash transactions with the Office.
** The GST component of operating activities reflects the net GST paid to and received from the Inland Revenue
Department. GST has been presented on a net basis, as the gross amounts do not provide meaningful
information for financial statement purposes.
The accompanying notes form part of these financial statements.
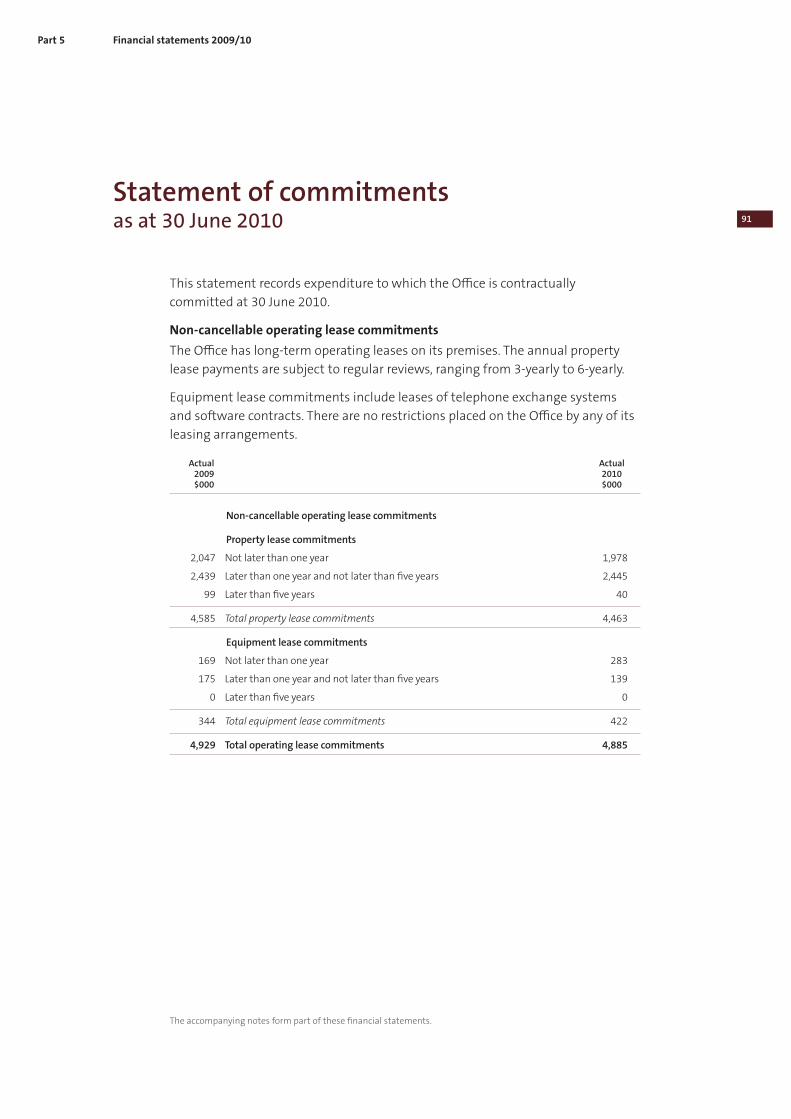
91
Financial statements 2009/10Part 5
Statement of commitmentsas at 30 June 2010
This statement records expenditure to which the Office is contractually
committed at 30 June 2010.
Non-cancellable operating lease commitments
The Office has long-term operating leases on its premises. The annual property
lease payments are subject to regular reviews, ranging from 3-yearly to 6-yearly.
Equipment lease commitments include leases of telephone exchange systems
and software contracts. There are no restrictions placed on the Office by any of its
leasing arrangements.
Actual Actual 2009 2010 $000 $000
Non-cancellable operating lease commitments
Property lease commitments
2,047 Not later than one year 1,978
2,439 Later than one year and not later than five years 2,445
99 Later than five years 40
4,585 Total property lease commitments 4,463
Equipment lease commitments
169 Not later than one year 283
175 Later than one year and not later than five years 139
0 Later than five years 0
344 Total equipment lease commitments 422
4,929 Total operating lease commitments 4,885
The accompanying notes form part of these financial statements.
92
Part 5 Financial statements 2009/10
Statement of contingent liabilities and contingent assetsas at 30 June 2010
This statement discloses situations that existed at 30 June 2010, the ultimate
outcome of which is uncertain and will be confirmed only on the occurrence of
one or more future events after the date of approval of the financial statements.
Contingent liabilities
The Office did not have any contingent liabilities as at 30 June 2010 (nil as at 30
June 2009).
Contingent assets
There were no contingent assets as at 30 June 2010 (nil as at 30 June 2009).
The accompanying notes form part of these financial statements.
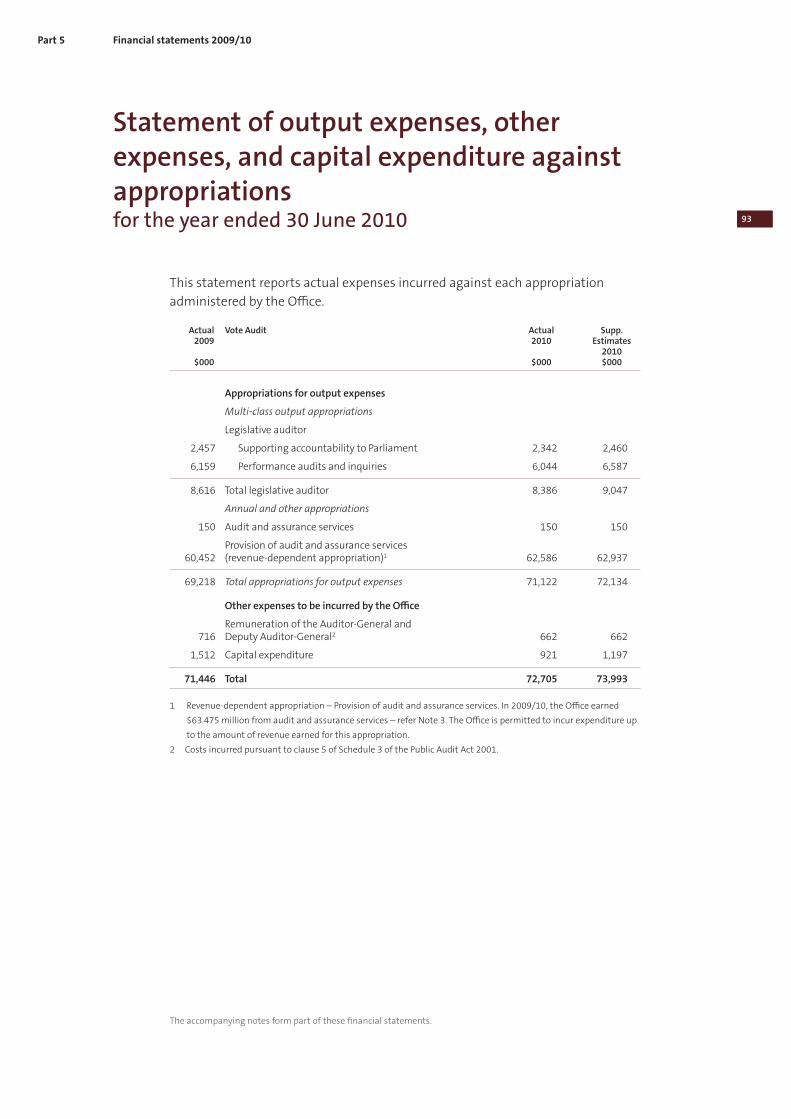
93
Financial statements 2009/10Part 5
Statement of output expenses, other expenses, and capital expenditure against appropriationsfor the year ended 30 June 2010
This statement reports actual expenses incurred against each appropriation
administered by the Office.
Actual Vote Audit Actual Supp. 2009 2010 Estimates 2010 $000 $000 $000
Appropriations for output expenses
Multi-class output appropriations
Legislative auditor
2,457 Supporting accountability to Parliament 2,342 2,460
6,159 Performance audits and inquiries 6,044 6,587
8,616 Total legislative auditor 8,386 9,047
Annual and other appropriations
150 Audit and assurance services 150 150
Provision of audit and assurance services 60,452 (revenue-dependent appropriation)1 62,586 62,937
69,218 Total appropriations for output expenses 71,122 72,134
Other expenses to be incurred by the Office
Remuneration of the Auditor-General and 716 Deputy Auditor-General2 662 662
1,512 Capital expenditure 921 1,197
71,446 Total 72,705 73,993
1 Revenue-dependent appropriation – Provision of audit and assurance services. In 2009/10, the Office earned
$63.475 million from audit and assurance services – refer Note 3. The Office is permitted to incur expenditure up
to the amount of revenue earned for this appropriation.
2 Costs incurred pursuant to clause 5 of Schedule 3 of the Public Audit Act 2001.
The accompanying notes form part of these financial statements.
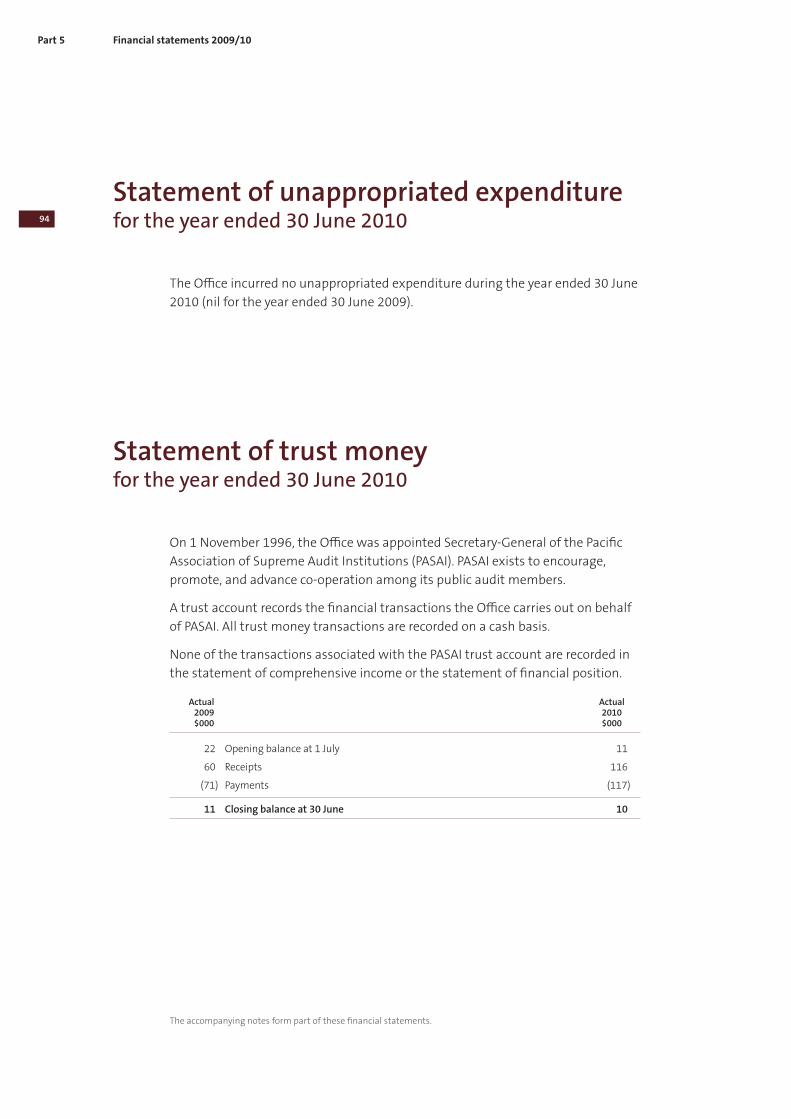
94
Part 5 Financial statements 2009/10
Statement of unappropriated expenditurefor the year ended 30 June 2010
The Office incurred no unappropriated expenditure during the year ended 30 June
2010 (nil for the year ended 30 June 2009).
The accompanying notes form part of these financial statements.
Statement of trust moneyfor the year ended 30 June 2010
On 1 November 1996, the Office was appointed Secretary-General of the Pacific
Association of Supreme Audit Institutions (PASAI). PASAI exists to encourage,
promote, and advance co-operation among its public audit members.
A trust account records the financial transactions the Office carries out on behalf
of PASAI. All trust money transactions are recorded on a cash basis.
None of the transactions associated with the PASAI trust account are recorded in
the statement of comprehensive income or the statement of financial position.
Actual Actual 2009 2010 $000 $000
22 Opening balance at 1 July 11
60 Receipts 116
(71) Payments (117)
11 Closing balance at 30 June 10
95
Financial statements 2009/10Part 5
Notes to the financial statementsfor the year ended 30 June 2010
Note 1: Statement of accounting policies
Reporting entity
The Controller and Auditor-General is a corporation sole established by section
10(1) of the Public Audit Act 2001, and is an Office of Parliament for the purposes
of the Public Finance Act 1989, and is domiciled in New Zealand.
The Controller and Auditor-General’s activities include work carried out by
the Office of the Auditor-General (OAG) and Audit New Zealand (referred to
collectively as “the Office”), and contracted audit service providers. The Office
has designated itself as a public benefit entity for the purposes of New Zealand
equivalents to International Financial Reporting Standards (NZ IFRS).
In addition, the Office has reported on trust money that it administers.
The financial statements of the Office are for the year ended 30 June 2010. The
financial statements were authorised for issue by the Controller and Auditor-
General on 30 September 2010.
Basis of preparation
The financial statements of the Controller and Auditor-General have been
prepared in accordance with sections 45A, 45B, and 45F of the Public Finance Act
1989.
These financial statements have been prepared in accordance with New Zealand
generally accepted accounting practice (NZ GAAP). They comply with NZ IFRS and
other applicable Financial Reporting Standards, as appropriate for a public benefit
entity.
The accounting policies set out below have been applied consistently to all periods
presented in these financial statements.
The financial statements have been prepared on a historical cost basis. The
financial statements are presented in New Zealand dollars, and all values are
rounded to the nearest thousand dollars ($000). The functional currency of the
Office is New Zealand dollars.
There have been no changes in accounting policies during the financial year.
The Office has adopted the following revisions to accounting standards during the
financial year, which have had only a presentational or disclosure effect:
• NZ IAS 1 Presentation of Financial Statements (revised 2007) replaces NZ IAS 1
Presentation of Financial Statements (issued 2004). The revised standard
96
Part 5 Financial statements 2009/10
requires information in financial statements to be aggregated on the basis
of shared characteristics and introduces a statement of comprehensive
income. The statement of comprehensive income will enable readers to
analyse changes in equity resulting from non-owner changes separately from
transactions with owners. The Office has decided to prepare a singe statement
of comprehensive income for the year ended 30 June 2010 under the revised
standard. Financial statement information for the year ended 30 June 2009 has
been restated accordingly
• NZ IAS 24 Related Party Disclosures (revised 2009) replaces NZ IAS 24
Related Party Disclosures (issued 2004) and is effective for reporting periods
commencing on or after 1 January 2011. The revised standard simplifies the
definition of a related party, clarifying its intended meaning and eliminating
inconsistencies from the definition. The Office has elected to early adopt the
revised standard and its effect has been fewer related parties and, hence, fewer
related parties transactions disclosed.
Standards, amendments and interpretations issued that are not yet effective and
have not been early adopted
Standards, amendments and interpretations issued but not yet effective that have
not been early adopted, and which are relevant to the Office include:
• NZ IFRS 9 Financial Instruments will eventually replace NZ IAS 39 Financial
Instruments: Recognition and Measurement. NZ IAS 39 is being replaced
through the following 3 main phases: Phase 1 Classification and Measurement,
Phase 2 Impairment Methodology, and Phase 3 Hedge Accounting. Phase 1 on
the classification and measurement of financial assets has been completed
and has been published in the new financial instrument standard NZ IFRS 9.
NZ IFRS 9 uses a single approach to determine whether a financial asset is
measured at amortised cost or fair value, replacing the many different rules
in NZ IAS 39. The approach in NZ IFRS 9 is based on how an entity manages
its financial instruments (its business model) and the contractual cash flow
characteristics of the financial assets. The new standard also requires a single
impairment method to be used, replacing the many different impairment
methods in NZ IAS 39. The new standard is required to be adopted for the year
ended 30 June 2014. The Office has not yet assessed the effect of the new
standard and expects it will not be early adopted.
Notes to the financial statements
97
Financial statements 2009/10Part 5
Accounting policies
Income
Income is measured at the fair value of the consideration received. Income is
derived mainly from the Crown for outputs provided to Parliament, from fees
for the audit of public entities’ financial statements, and from fees for other
assurance work carried out by Audit New Zealand at the request of public entities.
Crown funding
Revenue earned from the supply of outputs to the Crown is recognised as revenue
when earned.
Fee revenue generated by the Office for audits and other assurance work
Fee revenue is recognised when earned, by reference to the stage of completion of
audit and other assurance work, if the outcome can be estimated reliably. Revenue
accrues as the audit activity progress by reference to the value of work performed,
and as direct expenses that can be recovered are incurred. If the outcome of an
audit cannot be estimated reliably, revenue is recognised only to the extent of
the direct costs incurred in respect of the work performed. If there are significant
uncertainties regarding recovery, or if recovery is contingent on events outside our
control, no revenue is recognised.
Fee revenue generated by contracted audit service providers for audits
Fee revenue generated by contracted audit service providers for audits of public
entities is also recognised as the work progresses, based on advice from the
contracted audit service providers. Contracted audit service providers invoice and
collect audit fees directly from public entities.
Interest
Interest revenue is recognised using the effective interest method.
Expenditure
Expenses of audit service providers
Fees for audits of public entities carried out by contracted audit service providers
are recognised as the work progresses, based on advice from the contracted audit
service providers. Contracted audit service providers invoice and collect audit fees
directly from public entities.
Leases
An operating lease is a lease that does not transfer substantially all the risks and
rewards incidental to ownership of an asset. Lease payments under an operating
Notes to the financial statements
98
Part 5 Financial statements 2009/10
lease are recognised as an expense on a straight-line basis over the lease term. All
leases entered into by the Office are operating leases.
Foreign currency transactions
Foreign currency transactions (including those for which forward foreign
exchange contracts are held) are translated into the functional currency using
the exchange rates prevailing at the dates of the transactions. Foreign exchange
gains and losses resulting from the settlement of such transactions and from
the translation at year end exchange rates of monetary assets and liabilities
denominated in foreign currencies are recognised in the surplus or deficit.
Capital Charge
The capital charge is recognised as an expense in the period to which the charge
relates.
Financial instruments
Financial assets and financial liabilities are initially measured at fair value plus
transaction costs, unless they are carried at fair value through profit or loss, in
which case the transaction costs are recognised in the surplus or deficit.
Cash and cash equivalents
Cash includes cash on hand and funds on deposit with banks and is measured at
its face value.
Work in progress
Work in progress is stated at estimated realisable value, after providing for non-
recoverable amounts. Work in progress represents unbilled revenue.
Debtors and other receivables
Debtors and other receivables are initially measured at fair value and, where
appropriate, subsequently measured at amortised cost using the effective interest
rate, less impairment changes.
Impairment of a receivable is established when there is objective evidence that the
Office will not be able to collect amounts due according to the original terms of the
receivable. Significant financial difficulties of the debtor, probability that the debtor
will enter into bankruptcy, and default in payments are considered indicators that
the debt is impaired. The amount of the impairment is the difference between
the asset’s carrying amount and the present value of estimated future cash flows,
discounted using the original effective interest rate. The carrying amount of the
asset is reduced through the use of an allowance account, and the amount of the
loss is recognised in the surplus or deficit. Overdue receivables that are renegotiated
are reclassified as current (that is, not past due).
Notes to the financial statements
99
Financial statements 2009/10Part 5
Plant and equipment
Plant and equipment consists of furniture and fittings, office equipment, IT
hardware, and motor vehicles. Plant and equipment is shown at cost, less
accumulated depreciation and impairment losses.
Additions
Individual assets, or group of assets, are capitalised if their cost is greater than
$1,000.
The cost of an item of plant and equipment is recognised as an asset if, and only
if, it is probable that future economic benefits or service potential associated with
the item will flow to the Office and the cost of the item can be measured reliably.
In most instances, an item of plant and equipment is recognised at its cost. Where
an asset is acquired at no cost, or for a nominal cost, it is recognised at fair value
as at the date of acquisition.
Disposals
Gains and losses on disposals are determined by comparing the proceeds with the
carrying amount of the asset. Gains and losses on disposals are included in the
surplus or deficit.
Subsequent costs
Costs incurred subsequent to initial acquisition are capitalised only when it is
probable that future economic benefits or service potential associated with the
item will flow to the Office and the cost of the item can be measured reliably.
Depreciation
Depreciation is provided on a straight-line basis on all plant and equipment, at
rates that will write off the cost less estimated residual values of the plant and
equipment over their useful lives. The useful lives and associated depreciation
rates of major classes of assets have been estimated as follows:
Furniture and fittings 4 years (25%)
Office equipment 2.5 - 5 years (20% - 40%)
IT hardware 2.5 - 5 years (20% - 40%)
Motor vehicles 3-4 years (25% - 33%).
The residual value and useful life of an asset is reviewed, and adjusted if
applicable, at each balance date.
Notes to the financial statements
100
Part 5 Financial statements 2009/10
Intangible assets
Software acquisition and development
Acquired computer software licenses are capitalised on the basis of the costs
incurred to acquire and bring to use the specific software. Costs associated with
maintaining computer software are recognised as an expense when incurred.
Costs that are directly associated with the development of software for internal
use by the Office are recognised as an intangible asset. Direct costs include the
software development and employee costs.
Staff training costs are recognised as an expense when incurred.
Amortisation
The carrying value of an intangible asset with a finite life is amortised on a
straight-line basis over its useful life. Amortisation begins when the asset is
available for use and ceases at the date that the asset is derecognised. The
amortisation charge for each period is recognised in the surplus or deficit.
The useful life and associated amortisation rate of computer software is
estimated at between 2.5 and 5 years (20% - 40%).
Impairment of non-financial assets
Plant and equipment and intangible assets that have a finite useful life are
reviewed for impairment whenever events or changes in circumstances indicate
that the carrying amount may not be recoverable through either continued use
or disposal. An impairment loss is recognised for the amount by which the asset’s
carrying amount exceeds its recoverable amount. The recoverable amount is the
higher of an asset’s fair value less costs to sell and value in use.
An intangible asset that is not yet available for use at balance date is tested for
impairment annually.
Value in use is depreciated replacement cost for an asset where the future
economic benefits or service potential of the asset are not primarily dependent
on the asset’s ability to generate net cash inflows and where the entity would, if
deprived of the asset, replace its remaining future economic benefits or service
potential.
If an asset’s carrying amount exceeds its recoverable amount, the asset is
impaired and the carrying amount is written down to the recoverable amount.
The impairment loss is recognised in the surplus or deficit. Any reversal of an
impairment loss is also recognised in the surplus or deficit.
Notes to the financial statements
101
Financial statements 2009/10Part 5
Creditors and other payables
Creditors and other payables are initially measured at fair value and, where
appropriate, subsequently measured at amortised cost using the effective interest
method.
Income in advance
Income in advance is recognised where amounts billed are in excess of the
amounts recognised as revenue.
Employee entitlements
Short-term employee entitlements
Employee entitlements that the Office expects to be settled within 12 months of
balance date are measured at nominal values based on accrued entitlements at
current rates of pay.
These include salaries and wages accrued up to balance date, annual leave and
time off in lieu earned but not yet taken at balance date, retiring and long service
leave entitlements expected to be settled within 12 months, and sick leave.
The Office recognises a liability for sick leave to the extent that future absences
are expected to be greater than the sick leave entitlements earned in the future.
The amount is calculated based on the unused sick leave entitlements that can
be carried forward at balance date, to the extent that the Office anticipates those
unused entitlements will be used by staff to cover those future absences.
The Office recognises a liability and an expense for bonuses where it is
contractually obliged to pay them, or where there is a past practice that has
created a constructive obligation.
Long-term employee entitlements
Entitlements that are payable beyond 12 months, such as long service leave and
retiring leave have been calculated on an actuarial basis. The calculations are
based on:
• likely future entitlements based on years of service, years to entitlement,
the likelihood that staff will reach the point of entitlement and contractual
entitlements information; and
• the present value of the estimated future cash flows.
Notes to the financial statements
102
Part 5 Financial statements 2009/10
Superannuation schemes
Obligations for contributions to the Auditor-General’s Retirement Savings Plan,
Kiwisaver, and the Government Superannuation Fund are accounted for as defined
contribution plans, and are recognised as an expense in the surplus or deficit as
incurred.
Taxpayers’ funds
Taxpayers’ funds is the Crown’s investment in the Office, and is measured as the
difference between total assets and total liabilities.
Commitments
Expenses yet to be incurred on non-cancellable contracts that have been entered
into on or before balance date are disclosed as commitments to the extent that
there are equally unperformed obligations.
Cancellable commitments that have penalty or exit costs explicit in the
agreement on exercising that option to cancel are included in the Statement of
commitments at the value of that penalty or exit cost.
Goods and Services Tax
All items in the financial statements, including appropriation statements, are stated
exclusive of Goods and Services Tax (GST), except for receivables and payables in the
Statement of financial position, which are stated on a GST-inclusive basis.
Where GST is not recoverable as input tax, it is recognised as part of the related
asset or expense. The net amount of GST recoverable from, or payable to, the
Inland Revenue Department (IRD) is included as part of receivables or payables in
the Statement of financial position. The net GST paid to or received from the IRD,
including the GST relating to investing and financing activities, is classified as an
operating cash flow in the Statement of cash flows.
Commitments and contingencies are disclosed exclusive of GST.
Income tax
The Office is exempt from paying income tax in terms of section 43 of the Public
Audit Act 2001. Accordingly, no charge for income tax has been provided for.
Main Estimates and Supplementary Estimates
The Main Estimates figures are those included in the Office’s annual plan for
the year ended 30 June 2010. In addition, the financial statements also present
updated figures from the Supplementary Estimates. The main estimates and
supplementary estimates figures have been prepared in accordance with NZ GAAP,
using accounting policies that are consistent with those adopted in preparing
these financial statements.
Notes to the financial statements
103
Financial statements 2009/10Part 5
Output cost allocation
The Office has determined the cost of outputs using allocations as outlined below.
Direct costs are those costs directly attributable to a single output.
Direct costs that can readily be identified with a single output are assigned
directly to the relevant output class. For example, the cost of audits carried out by
contracted audit service providers is charged directly to output class: Provision of
audit and assurance services.
Indirect costs are those costs that cannot be identified in an economically feasible
manner with a specific output. These costs include: payroll costs; variable costs
such as travel; and operating overheads such as property costs, depreciation, and
capital charges.
Indirect costs are allocated according to the time charged to a particular activity.
There have been no changes in cost allocation policies since the date of the last
audited financial statements.
Judgements and estimations
The preparation of these financial statements requires judgements, estimations,
and assumptions that affect the application of policies and reported amounts
of assets and liabilities, income and expenses. The estimates and associated
assumptions are based on historical experience and various other factors that are
believed to be reasonable under the circumstances. Actual results may differ from
these estimates.
Assessing the value of audit fee revenue and associated work in progress or
income in advance for engagements open at balance date is the most significant
area where such judgements, estimations, and assumptions are made. This
involves estimating the stage of completion of each engagement based on the
value of work completed at balance date and the expected work to complete
the engagement. A different assessment of the outcome on an engagement
may result in a different value being determined for revenue and also a different
carrying value being determined for work in progress.
At 30 June 2010, there were a number of audits under way relating to
disestablishment of entities associated with dissolving Auckland councils and
council-controlled organisations. Due to the one-off nature of these engagements,
it was not possible to reliably estimate the outcome of these engagements.
Revenue for these engagements is therefore recognised at the level of direct costs
incurred, resulting in associated income in advance of $0.735 million.
Notes to the financial statements
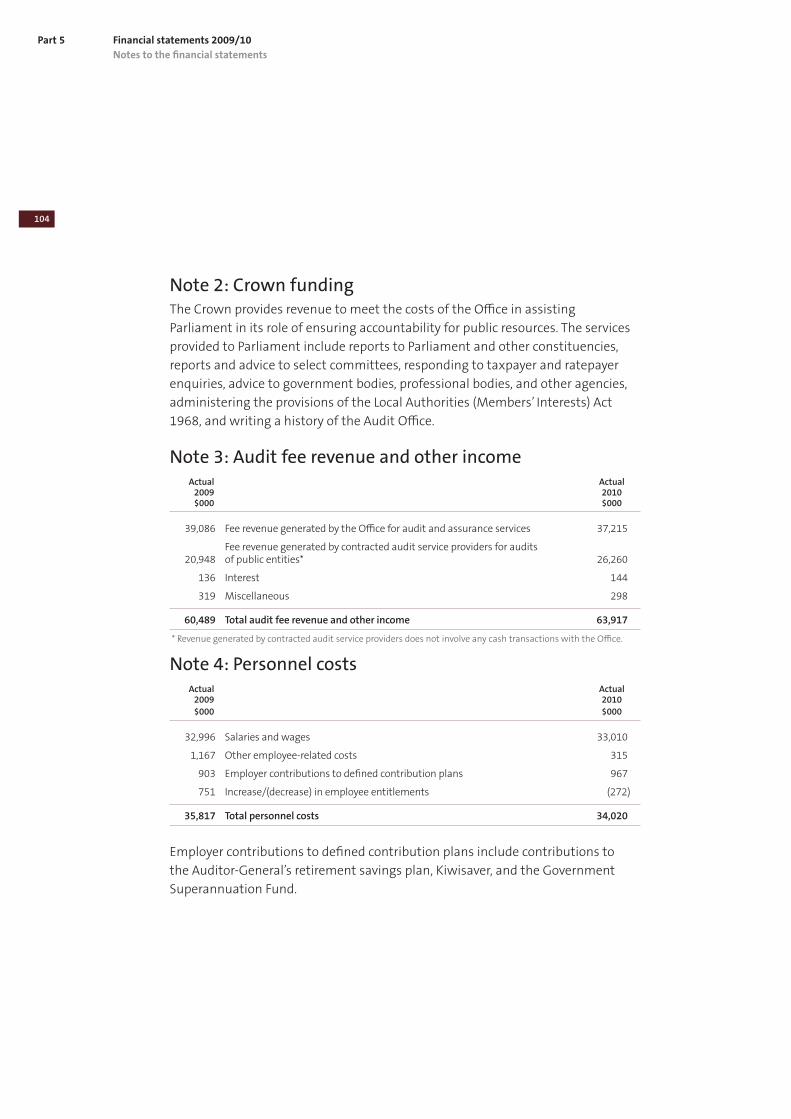
104
Part 5 Financial statements 2009/10
Note 2: Crown fundingThe Crown provides revenue to meet the costs of the Office in assisting
Parliament in its role of ensuring accountability for public resources. The services
provided to Parliament include reports to Parliament and other constituencies,
reports and advice to select committees, responding to taxpayer and ratepayer
enquiries, advice to government bodies, professional bodies, and other agencies,
administering the provisions of the Local Authorities (Members’ Interests) Act
1968, and writing a history of the Audit Office.
Note 3: Audit fee revenue and other income Actual Actual 2009 2010 $000 $000
39,086 Fee revenue generated by the Office for audit and assurance services 37,215
Fee revenue generated by contracted audit service providers for audits 20,948 of public entities* 26,260
136 Interest 144
319 Miscellaneous 298
60,489 Total audit fee revenue and other income 63,917
* Revenue generated by contracted audit service providers does not involve any cash transactions with the Office.
Note 4: Personnel costs Actual Actual 2009 2010 $000 $000
32,996 Salaries and wages 33,010
1,167 Other employee-related costs 315
903 Employer contributions to defined contribution plans 967
751 Increase/(decrease) in employee entitlements (272)
35,817 Total personnel costs 34,020
Employer contributions to defined contribution plans include contributions to
the Auditor-General’s retirement savings plan, Kiwisaver, and the Government
Superannuation Fund.
Notes to the financial statements
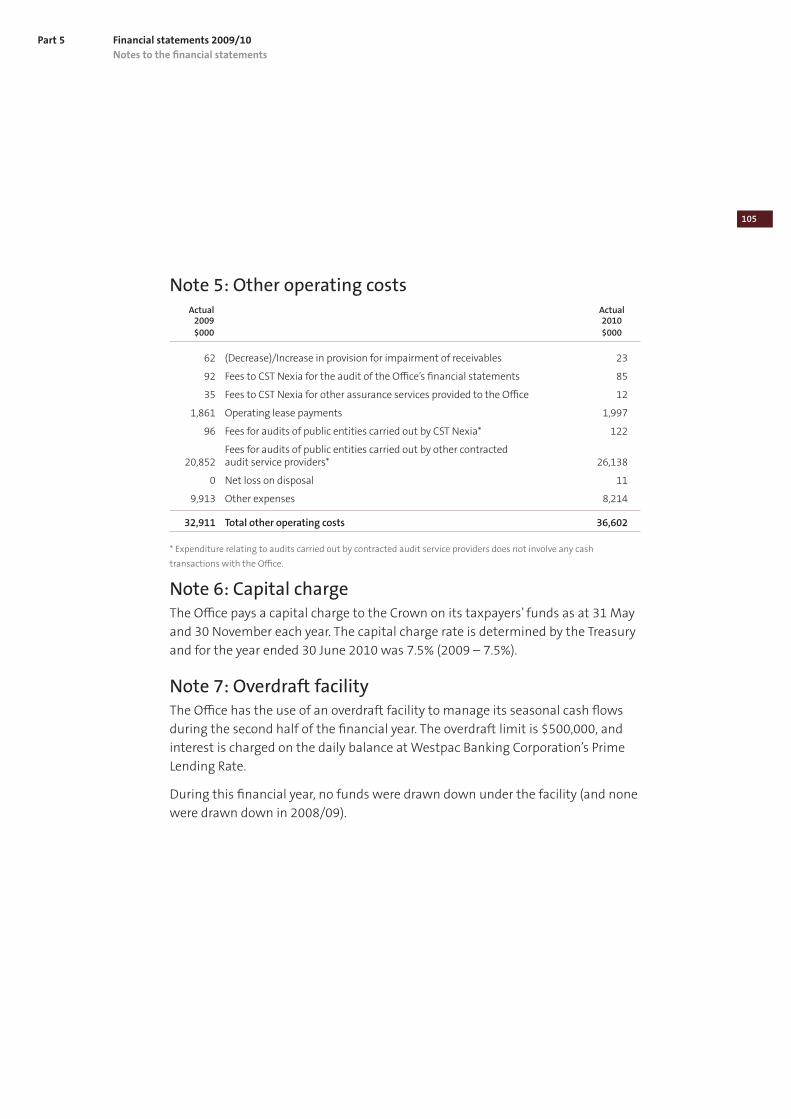
105
Financial statements 2009/10Part 5
Note 5: Other operating costs Actual Actual 2009 2010 $000 $000
62 (Decrease)/Increase in provision for impairment of receivables 23
92 Fees to CST Nexia for the audit of the Office’s financial statements 85
35 Fees to CST Nexia for other assurance services provided to the Office 12
1,861 Operating lease payments 1,997
96 Fees for audits of public entities carried out by CST Nexia* 122
Fees for audits of public entities carried out by other contracted 20,852 audit service providers* 26,138
0 Net loss on disposal 11
9,913 Other expenses 8,214
32,911 Total other operating costs 36,602
* Expenditure relating to audits carried out by contracted audit service providers does not involve any cash
transactions with the Office.
Note 6: Capital chargeThe Office pays a capital charge to the Crown on its taxpayers’ funds as at 31 May
and 30 November each year. The capital charge rate is determined by the Treasury
and for the year ended 30 June 2010 was 7.5% (2009 – 7.5%).
Note 7: Overdraft facilityThe Office has the use of an overdraft facility to manage its seasonal cash flows
during the second half of the financial year. The overdraft limit is $500,000, and
interest is charged on the daily balance at Westpac Banking Corporation’s Prime
Lending Rate.
During this financial year, no funds were drawn down under the facility (and none
were drawn down in 2008/09).
Notes to the financial statements
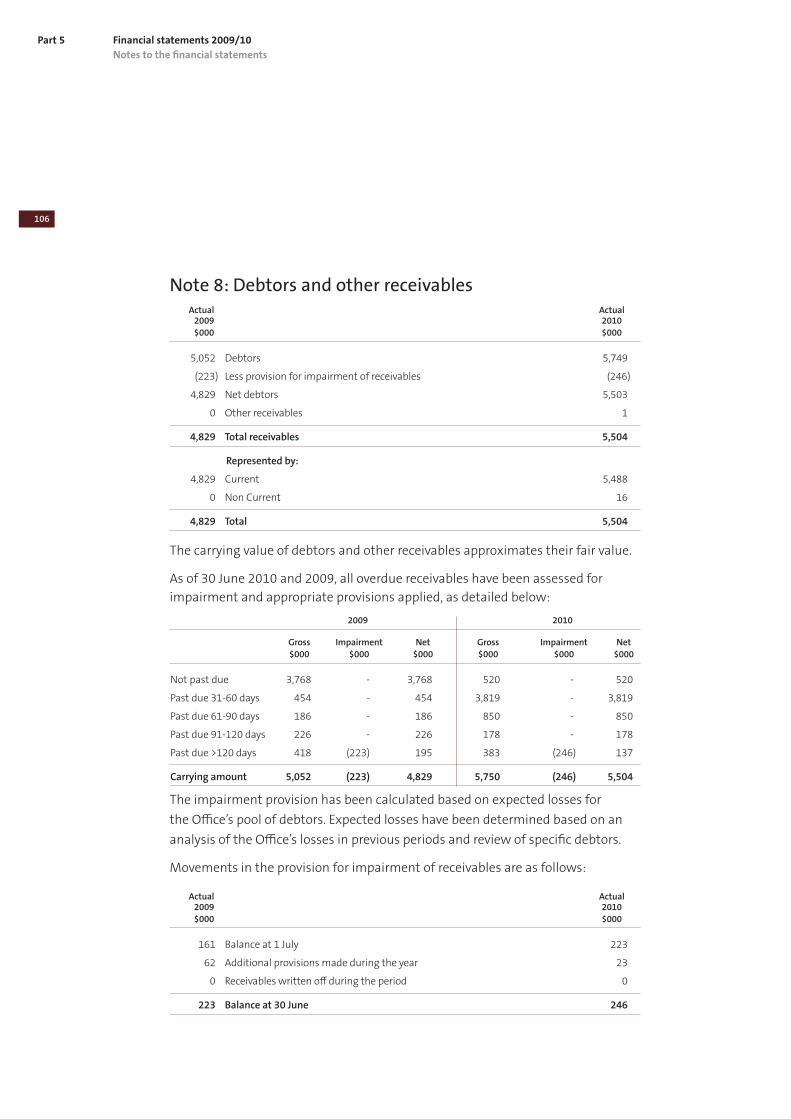
106
Part 5 Financial statements 2009/10
Note 8: Debtors and other receivables Actual Actual 2009 2010 $000 $000
5,052 Debtors 5,749
(223) Less provision for impairment of receivables (246)
4,829 Net debtors 5,503
0 Other receivables 1
4,829 Total receivables 5,504
Represented by:
4,829 Current 5,488
0 Non Current 16
4,829 Total 5,504
The carrying value of debtors and other receivables approximates their fair value.
As of 30 June 2010 and 2009, all overdue receivables have been assessed for
impairment and appropriate provisions applied, as detailed below:
2009 2010
Gross Impairment Net Gross Impairment Net $000 $000 $000 $000 $000 $000
Not past due 3,768 - 3,768 520 - 520
Past due 31-60 days 454 - 454 3,819 - 3,819
Past due 61-90 days 186 - 186 850 - 850
Past due 91-120 days 226 - 226 178 - 178
Past due >120 days 418 (223) 195 383 (246) 137
Carrying amount 5,052 (223) 4,829 5,750 (246) 5,504
The impairment provision has been calculated based on expected losses for
the Office’s pool of debtors. Expected losses have been determined based on an
analysis of the Office’s losses in previous periods and review of specific debtors.
Movements in the provision for impairment of receivables are as follows:
Actual Actual 2009 2010 $000 $000
161 Balance at 1 July 223
62 Additional provisions made during the year 23
0 Receivables written off during the period 0
223 Balance at 30 June 246
Notes to the financial statements
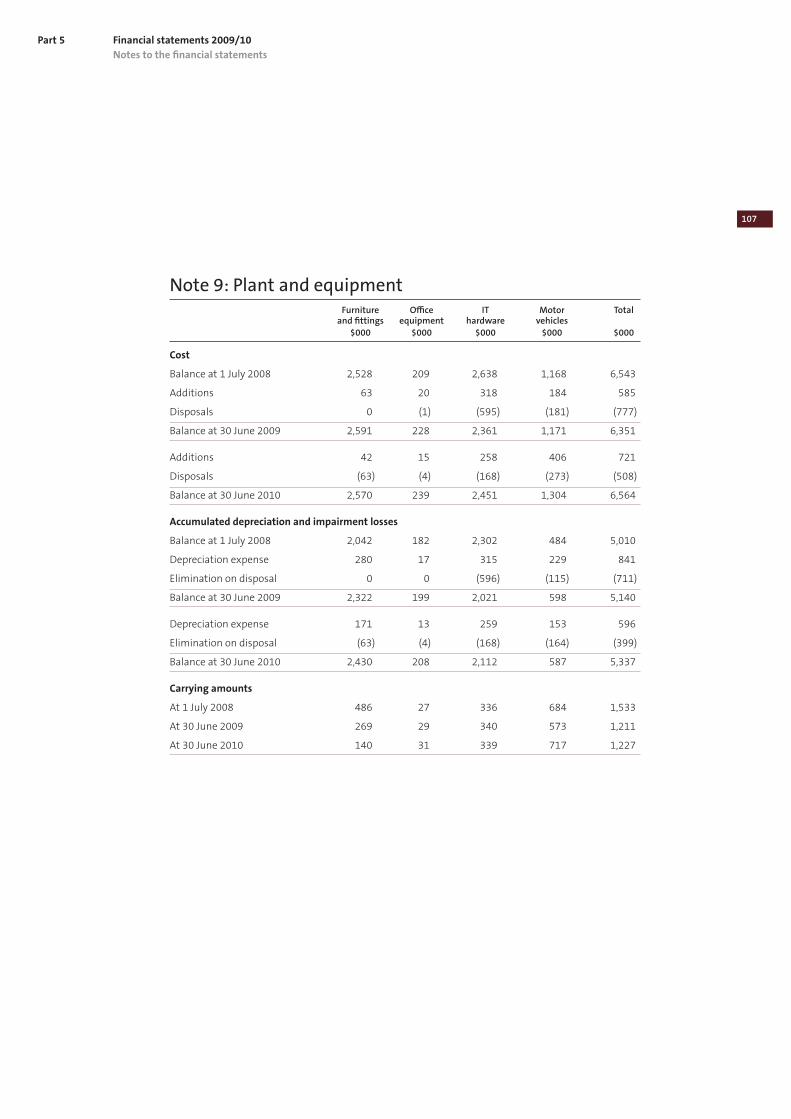
107
Financial statements 2009/10Part 5
Note 9: Plant and equipment Furniture Office IT Motor Total and fittings equipment hardware vehicles $000 $000 $000 $000 $000
Cost
Balance at 1 July 2008 2,528 209 2,638 1,168 6,543
Additions 63 20 318 184 585
Disposals 0 (1) (595) (181) (777)
Balance at 30 June 2009 2,591 228 2,361 1,171 6,351
Additions 42 15 258 406 721
Disposals (63) (4) (168) (273) (508)
Balance at 30 June 2010 2,570 239 2,451 1,304 6,564
Accumulated depreciation and impairment losses
Balance at 1 July 2008 2,042 182 2,302 484 5,010
Depreciation expense 280 17 315 229 841
Elimination on disposal 0 0 (596) (115) (711)
Balance at 30 June 2009 2,322 199 2,021 598 5,140
Depreciation expense 171 13 259 153 596
Elimination on disposal (63) (4) (168) (164) (399)
Balance at 30 June 2010 2,430 208 2,112 587 5,337
Carrying amounts
At 1 July 2008 486 27 336 684 1,533
At 30 June 2009 269 29 340 573 1,211
At 30 June 2010 140 31 339 717 1,227
Notes to the financial statements
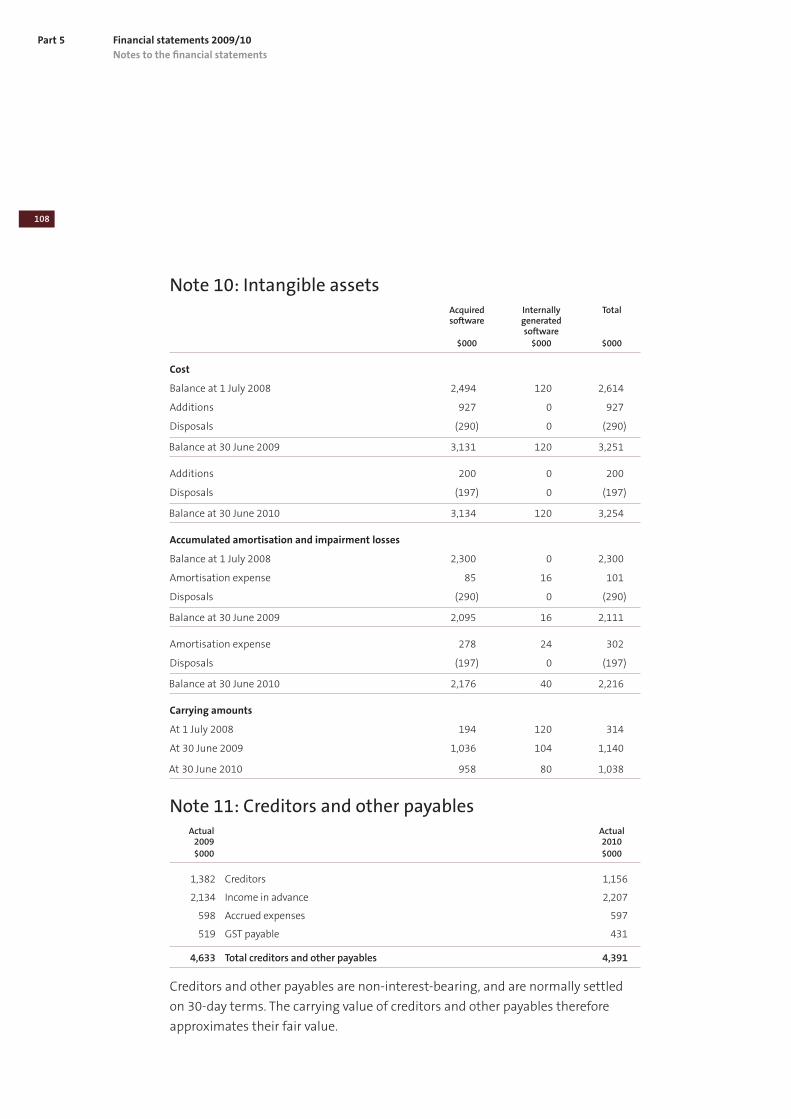
108
Part 5 Financial statements 2009/10
Note 10: Intangible assets Acquired Internally Total software generated software $000 $000 $000
Cost
Balance at 1 July 2008 2,494 120 2,614
Additions 927 0 927
Disposals (290) 0 (290)
Balance at 30 June 2009 3,131 120 3,251
Additions 200 0 200
Disposals (197) 0 (197)
Balance at 30 June 2010 3,134 120 3,254
Accumulated amortisation and impairment losses
Balance at 1 July 2008 2,300 0 2,300
Amortisation expense 85 16 101
Disposals (290) 0 (290)
Balance at 30 June 2009 2,095 16 2,111
Amortisation expense 278 24 302
Disposals (197) 0 (197)
Balance at 30 June 2010 2,176 40 2,216
Carrying amounts
At 1 July 2008 194 120 314
At 30 June 2009 1,036 104 1,140
At 30 June 2010 958 80 1,038
Note 11: Creditors and other payables Actual Actual 2009 2010 $000 $000
1,382 Creditors 1,156
2,134 Income in advance 2,207
598 Accrued expenses 597
519 GST payable 431
4,633 Total creditors and other payables 4,391
Creditors and other payables are non-interest-bearing, and are normally settled
on 30-day terms. The carrying value of creditors and other payables therefore
approximates their fair value.
Notes to the financial statements
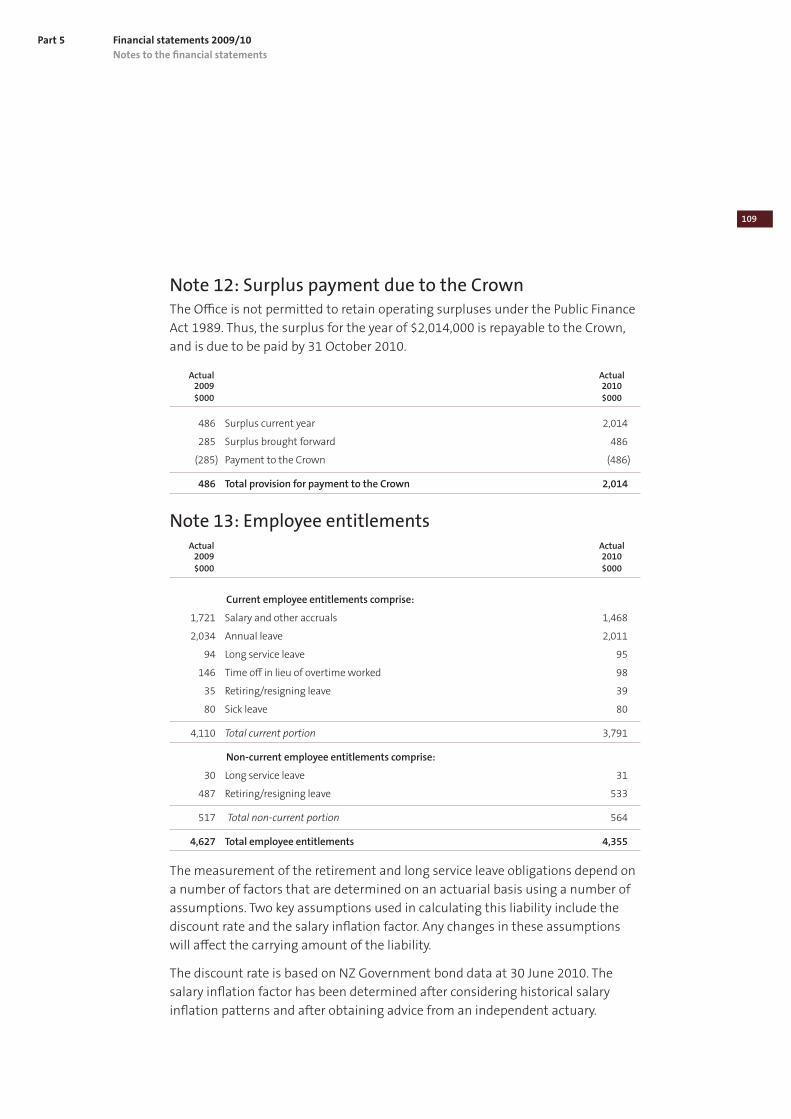
109
Financial statements 2009/10Part 5
Note 12: Surplus payment due to the CrownThe Office is not permitted to retain operating surpluses under the Public Finance
Act 1989. Thus, the surplus for the year of $2,014,000 is repayable to the Crown,
and is due to be paid by 31 October 2010.
Actual Actual 2009 2010 $000 $000
486 Surplus current year 2,014
285 Surplus brought forward 486
(285) Payment to the Crown (486)
486 Total provision for payment to the Crown 2,014
Note 13: Employee entitlements Actual Actual 2009 2010 $000 $000
Current employee entitlements comprise:
1,721 Salary and other accruals 1,468
2,034 Annual leave 2,011
94 Long service leave 95
146 Time off in lieu of overtime worked 98
35 Retiring/resigning leave 39
80 Sick leave 80
4,110 Total current portion 3,791
Non-current employee entitlements comprise:
30 Long service leave 31
487 Retiring/resigning leave 533
517 Total non-current portion 564
4,627 Total employee entitlements 4,355
The measurement of the retirement and long service leave obligations depend on
a number of factors that are determined on an actuarial basis using a number of
assumptions. Two key assumptions used in calculating this liability include the
discount rate and the salary inflation factor. Any changes in these assumptions
will affect the carrying amount of the liability.
The discount rate is based on NZ Government bond data at 30 June 2010. The
salary inflation factor has been determined after considering historical salary
inflation patterns and after obtaining advice from an independent actuary.
Notes to the financial statements
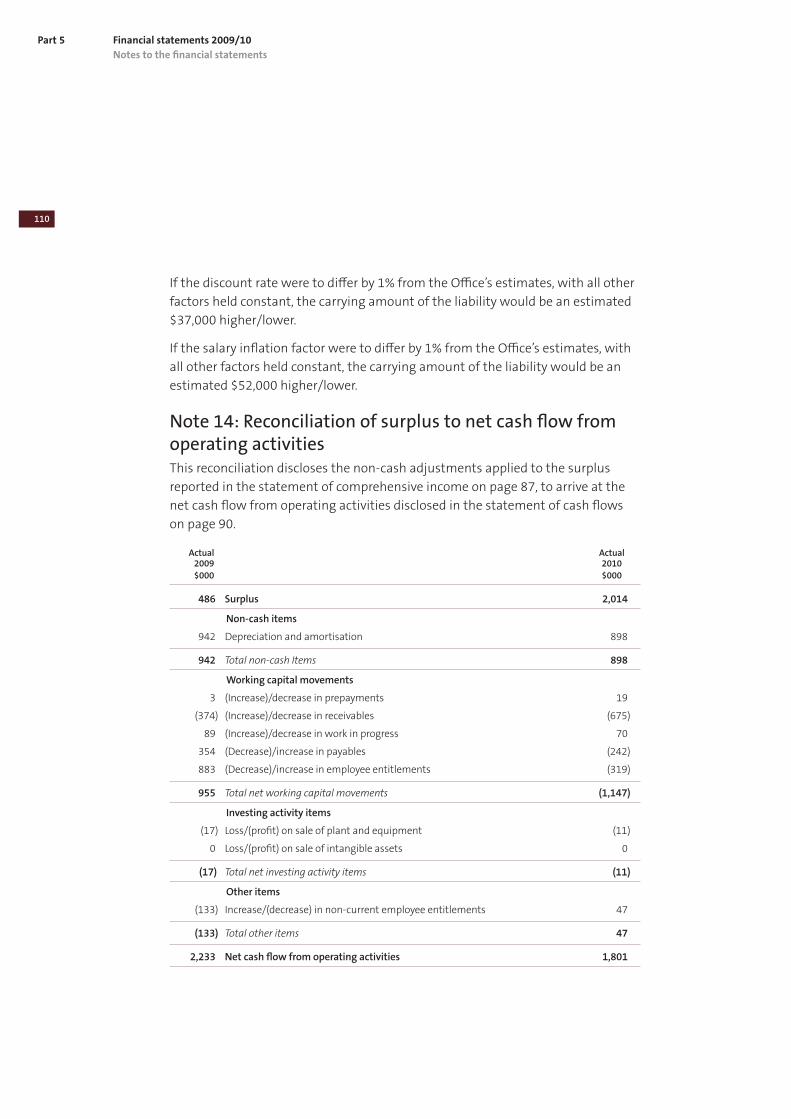
110
Part 5 Financial statements 2009/10
If the discount rate were to differ by 1% from the Office’s estimates, with all other
factors held constant, the carrying amount of the liability would be an estimated
$37,000 higher/lower.
If the salary inflation factor were to differ by 1% from the Office’s estimates, with
all other factors held constant, the carrying amount of the liability would be an
estimated $52,000 higher/lower.
Note 14: Reconciliation of surplus to net cash flow from operating activitiesThis reconciliation discloses the non-cash adjustments applied to the surplus
reported in the statement of comprehensive income on page 87, to arrive at the
net cash flow from operating activities disclosed in the statement of cash flows
on page 90.
Actual Actual 2009 2010 $000 $000
486 Surplus 2,014
Non-cash items
942 Depreciation and amortisation 898
942 Total non-cash Items 898
Working capital movements
3 (Increase)/decrease in prepayments 19
(374) (Increase)/decrease in receivables (675)
89 (Increase)/decrease in work in progress 70
354 (Decrease)/increase in payables (242)
883 (Decrease)/increase in employee entitlements (319)
955 Total net working capital movements (1,147)
Investing activity items
(17) Loss/(profit) on sale of plant and equipment (11)
0 Loss/(profit) on sale of intangible assets 0
(17) Total net investing activity items (11)
Other items
(133) Increase/(decrease) in non-current employee entitlements 47
(133) Total other items 47
2,233 Net cash flow from operating activities 1,801
Notes to the financial statements
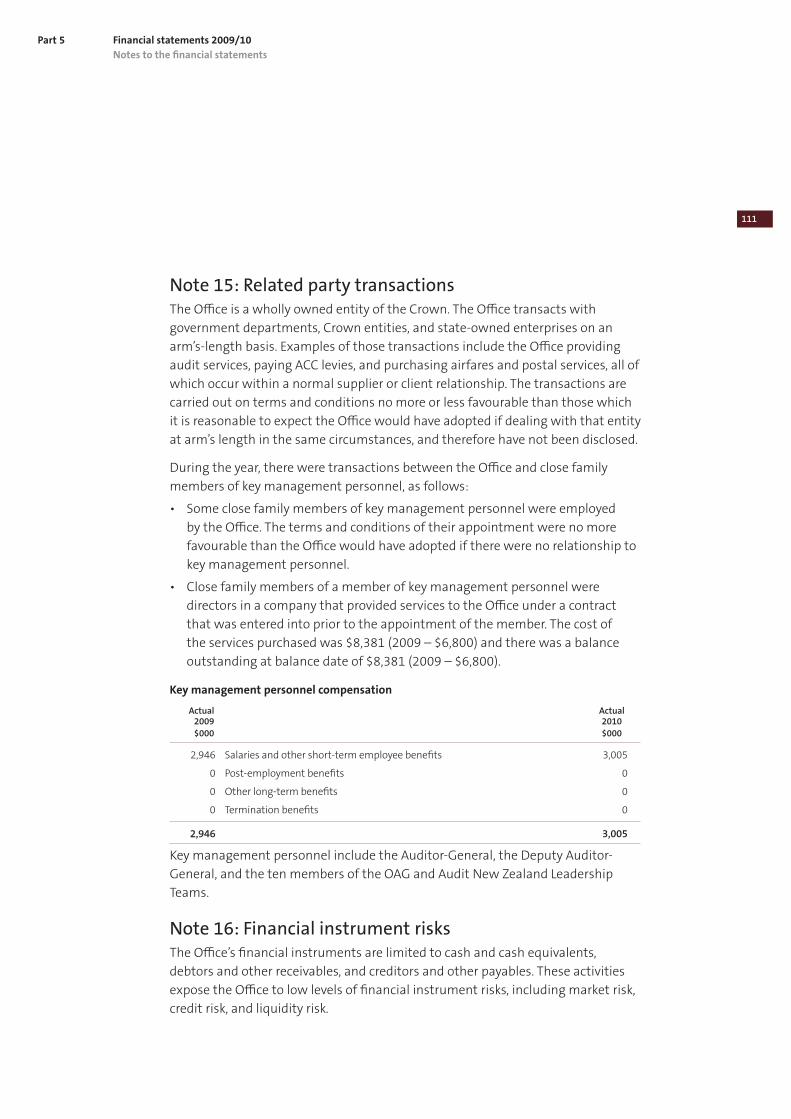
111
Financial statements 2009/10Part 5
Note 15: Related party transactionsThe Office is a wholly owned entity of the Crown. The Office transacts with
government departments, Crown entities, and state-owned enterprises on an
arm’s-length basis. Examples of those transactions include the Office providing
audit services, paying ACC levies, and purchasing airfares and postal services, all of
which occur within a normal supplier or client relationship. The transactions are
carried out on terms and conditions no more or less favourable than those which
it is reasonable to expect the Office would have adopted if dealing with that entity
at arm’s length in the same circumstances, and therefore have not been disclosed.
During the year, there were transactions between the Office and close family
members of key management personnel, as follows:
• Some close family members of key management personnel were employed
by the Office. The terms and conditions of their appointment were no more
favourable than the Office would have adopted if there were no relationship to
key management personnel.
• Close family members of a member of key management personnel were
directors in a company that provided services to the Office under a contract
that was entered into prior to the appointment of the member. The cost of
the services purchased was $8,381 (2009 – $6,800) and there was a balance
outstanding at balance date of $8,381 (2009 – $6,800).
Key management personnel compensation
Actual Actual 2009 2010 $000 $000
2,946 Salaries and other short-term employee benefits 3,005
0 Post-employment benefits 0
0 Other long-term benefits 0
0 Termination benefits 0
2,946 3,005
Key management personnel include the Auditor-General, the Deputy Auditor-
General, and the ten members of the OAG and Audit New Zealand Leadership
Teams.
Note 16: Financial instrument risksThe Office’s financial instruments are limited to cash and cash equivalents,
debtors and other receivables, and creditors and other payables. These activities
expose the Office to low levels of financial instrument risks, including market risk,
credit risk, and liquidity risk.
Notes to the financial statements
112
Part 5 Financial statements 2009/10
Market risk
Currency risk
Currency risk is the risk that the fair value or future cash flows of a financial
instrument will fluctuate because of changes in foreign exchange rates.
The Office incurs a small portion of operating expenditure in foreign currency, and
risk is minimised through prompt settlement. Recognised liabilities, which are
payable in a foreign currency were nil at balance date.
Interest rate risk
Interest rate risk is the risk that the fair value of a financial instrument will
fluctuate, or the cash flows from a financial instrument will fluctuate, due to
changes in market interest rates.
The Office has no interest-bearing financial instruments and, accordingly, has no
exposure to interest rate risk.
Credit risk
Credit risk is the risk that a third party will default on its obligation to the Office,
causing the Office to incur a loss.
In the normal course of the Office’s business, credit risk arises from debtors and
deposits with banks.
The Office is permitted to deposit funds only with Westpac, a registered bank with
high credit ratings. For its other financial instruments, the Office does not have
significant concentrations of credit risk.
The Office’s maximum credit exposure for each class of financial instrument is
represented by the total carrying amount of cash and cash equivalents, and net
debtors and other receivables (see Note 8).
There is no collateral held as security against these financial instruments,
including those instruments that are overdue or impaired.
Liquidity risk
Liquidity risk is the risk that the Office will encounter difficulty raising liquid funds
to meet commitments as they fall due.
In meeting its liquidity requirements, the Office closely monitors its forecast cash
requirements with expected debtor receipts and cash drawdowns from the New
Zealand Debt Management Office. The Office maintains a target level of available
cash to meet liquidity requirements.
The Office’s financial liabilities are outlined in Note 11: Creditors and other
payables. These are all due to be settled within two months.
Notes to the financial statements
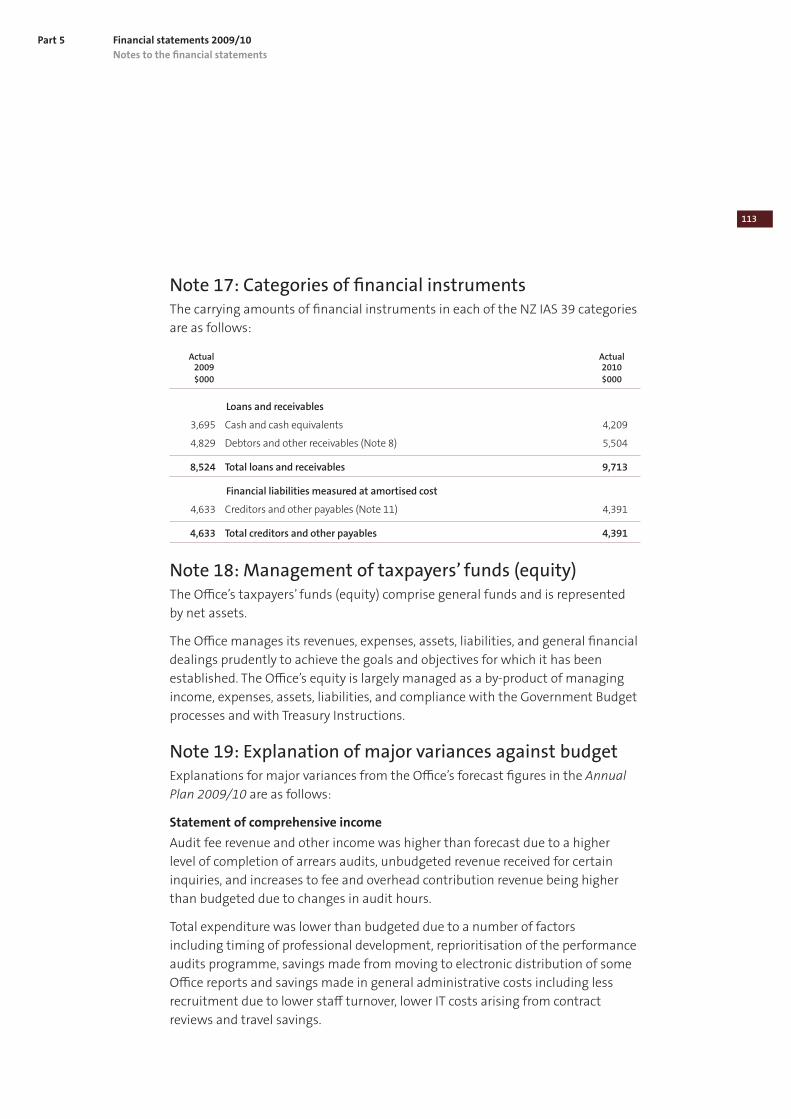
113
Financial statements 2009/10Part 5
Note 17: Categories of financial instrumentsThe carrying amounts of financial instruments in each of the NZ IAS 39 categories
are as follows:
Actual Actual 2009 2010 $000 $000
Loans and receivables
3,695 Cash and cash equivalents 4,209
4,829 Debtors and other receivables (Note 8) 5,504
8,524 Total loans and receivables 9,713
Financial liabilities measured at amortised cost
4,633 Creditors and other payables (Note 11) 4,391
4,633 Total creditors and other payables 4,391
Note 18: Management of taxpayers’ funds (equity)The Office’s taxpayers’ funds (equity) comprise general funds and is represented
by net assets.
The Office manages its revenues, expenses, assets, liabilities, and general financial
dealings prudently to achieve the goals and objectives for which it has been
established. The Office’s equity is largely managed as a by-product of managing
income, expenses, assets, liabilities, and compliance with the Government Budget
processes and with Treasury Instructions.
Note 19: Explanation of major variances against budgetExplanations for major variances from the Office’s forecast figures in the Annual
Plan 2009/10 are as follows:
Statement of comprehensive income
Audit fee revenue and other income was higher than forecast due to a higher
level of completion of arrears audits, unbudgeted revenue received for certain
inquiries, and increases to fee and overhead contribution revenue being higher
than budgeted due to changes in audit hours.
Total expenditure was lower than budgeted due to a number of factors
including timing of professional development, reprioritisation of the performance
audits programme, savings made from moving to electronic distribution of some
Office reports and savings made in general administrative costs including less
recruitment due to lower staff turnover, lower IT costs arising from contract
reviews and travel savings.
Notes to the financial statements
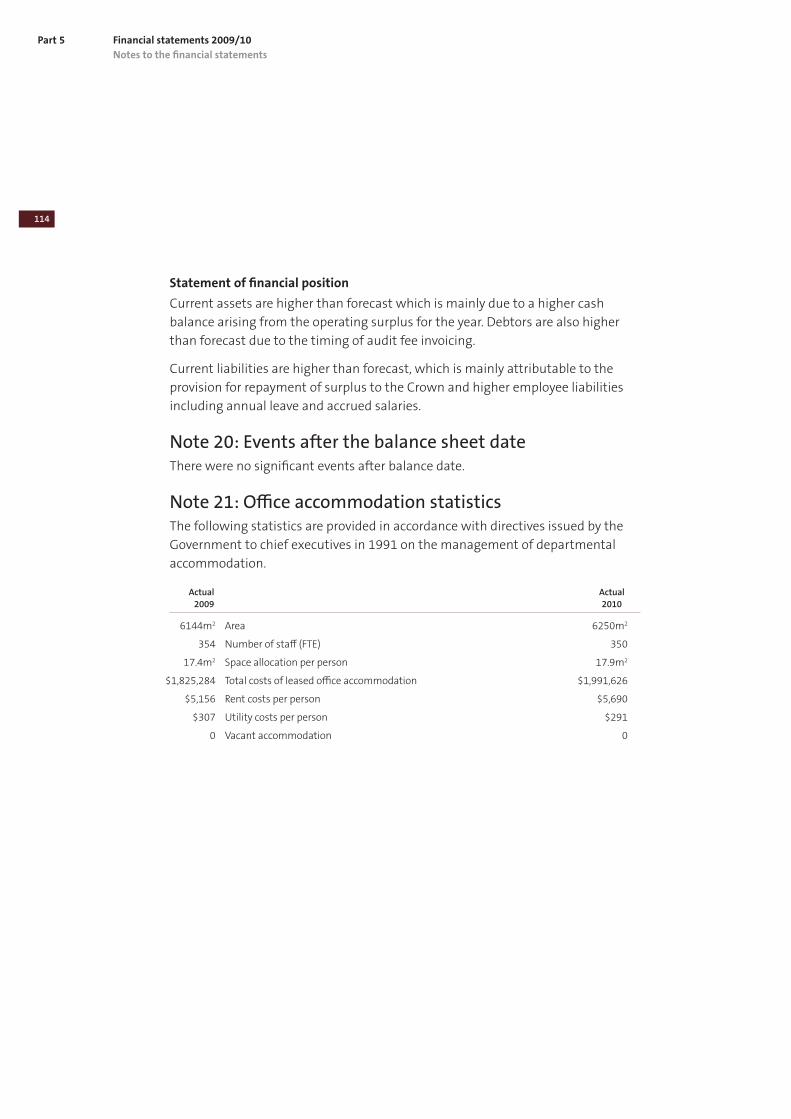
114
Part 5 Financial statements 2009/10
Statement of financial position
Current assets are higher than forecast which is mainly due to a higher cash
balance arising from the operating surplus for the year. Debtors are also higher
than forecast due to the timing of audit fee invoicing.
Current liabilities are higher than forecast, which is mainly attributable to the
provision for repayment of surplus to the Crown and higher employee liabilities
including annual leave and accrued salaries.
Note 20: Events after the balance sheet dateThere were no significant events after balance date.
Note 21: Office accommodation statisticsThe following statistics are provided in accordance with directives issued by the
Government to chief executives in 1991 on the management of departmental
accommodation.
Actual Actual 2009 2010
6144m2 Area 6250m2
354 Number of staff (FTE) 350
17.4m2 Space allocation per person 17.9m2
$1,825,284 Total costs of leased office accommodation $1,991,626
$5,156 Rent costs per person $5,690
$307 Utility costs per person $291
0 Vacant accommodation 0
Notes to the financial statements
115
Appendix 1Summary of reports on performance audits and other studies published in 2009/10
Performance auditsEffectiveness of arrangements to check the standard of services provided by rest
homes
We carried out a performance audit to assess the effectiveness and efficiency of
arrangements for checking the quality and safety of rest home services. Older
people who live in rest homes are some of the most vulnerable in our society,
so it is important to have effective arrangements to ensure that their care is
appropriate. Rest homes must be certified and audited to ensure that the care
they provide meets the Health and Disability Services Standards (the Standards).
The Ministry of Health (the Ministry) is responsible for auditing and certifying
rest homes and contracts out this work to eight designated auditing agencies
(DAAs). We found that the auditing of rest homes by DAAs has been inconsistent
and sometimes of poor quality. We also found that the Ministry’s monitoring of
the DAAs was weak. Rest homes are also monitored by district health boards.
Monitoring of rest homes by district health boards has not been well co-ordinated
with the work of the Ministry. The Ministry has put in place a programme of
work to address the issues found in our audit. However, it is too early to judge
whether the changes being made will make auditing, certifying, and monitoring
of rest homes more effective and efficient. We will follow up on progress with
implementing our recommendations during 2011.
Effectiveness of arrangements for co-ordinating civilian maritime patrols
New Zealand has interests in the extensive oceans over which we have rights
and responsibilities (the maritime domain). Maritime patrols are used to protect
these interests, by detecting and deterring illegal activities, and by gathering
information about activities that are occurring in the maritime domain. We
examined how effectively the National Maritime Co-ordination Centre (NMCC)
and other government agencies co-ordinate maritime patrols to support New
Zealand’s maritime interests. We found that, overall, NMCC had an appropriate
framework to support the effective co-ordination of maritime patrols. Some
improvements were needed so that the NMCC could enhance its whole-of-
government co-ordination role and make the most effective use of improved
patrol resources. These improvements included better strategic guidance for the
NMCC, clarifying the mandate for separate patrol co-ordination arrangements,
better understanding of the timing of agencies’ patrol needs, and more robust
data collection to show where gaps exist and where effort is effective. At the
time of the audit, the NMCC was already working to address some of these
issues. Because the NMCC is a whole-of-government arrangement, these matters
required consideration not just from the NMCC but from all organisations
involved or interested in maritime patrols.
116
Summary of reports on performance audits and other studies published in 2009/10Appendix 1
Response of the New Zealand Police to the Commission of Inquiry into Police
Conduct: Second monitoring report
In 2007, the Commission of Inquiry into Police Conduct (the Commission) released
its report into Police conduct. We were invited to monitor the Police’s response to
the Commission’s recommendations and published our first monitoring report in
2009. Our second monitoring report assesses whether the Police have effectively
implemented the projects and initiatives set out in their work programme. We
found that, while the Police had done a lot of work already to respond to the
Commission’s recommendations, the implementation of the Police’s response
is at a critical point. Without more concerted effort now, there is a risk that
progress will stall. We found that the Police need to build on the high degree of
commitment at senior levels to change, value and learn from the views of people
external to the Police, and monitor the effect of change to the service being
provided to the public. We also found that instances of behaviour inconsistent
with the Police Code of Conduct are still occurring.
Performance audits from 2008: Follow-up report
Our vision is to provide audit and assurance work that improves the performance
of, and the public’s trust in, the public sector. We aim to do this through giving
independent assurance to Parliament, public entities, and the public about
whether public entities are carrying out their activities effectively, efficiently, and
appropriately. We evaluate the effect of our performance audits by following up
on how the entities have responded to, and implemented, our recommendations.
This report sets out the actions public entities have taken in response to the
recommendations made in performance audit reports that we published
during 2008. Overall, we are satisfied with the responses to the findings of the
performance audit reports we completed during 2008.
Ministry of Education: Managing support for students with high special educational
needs
We carried out a performance audit to assess how well the Ministry of Education
(the Ministry) manages four initiatives set up to support school-age students
with high special educational needs. There are up to 20,500 students receiving
support through these four initiatives. Overall, the Ministry’s management of the
four initiatives was reasonable, and the basic systems and resources were in place
to enable the Ministry to deliver its support. We found that the Ministry needs to
improve how it identifies and monitors students with high special educational
needs. Our report encourages the Ministry to improve its information and
provide consistent support. We also recommended that the Ministry improve its
information and resources about the four initiatives and better collate data about
the effectiveness of the initiatives.
117
Summary of reports on performance audits and other studies published in 2009/10Appendix 1
Ministry of Justice: Supporting the management of court workloads
We carried out a performance audit to assess the effectiveness and efficiency of
the Ministry of Justice (the Ministry) in its work to help District Courts and the
High Court deal with their increasing workloads. Court workloads have increased
significantly in recent years, and forecasts show that the number of cases brought
before the courts will continue to grow. We found that, while the Ministry does
not control the court system and has only limited ability to manage individual
cases, it provides valuable advice and support to facilitate the efficient and
expeditious management of cases. We found that the Ministry is well positioned
to develop and provide support for increasing court workloads. The Ministry
works closely and well with the rest of the justice sector and is responding well to
challenges. It is important that the Ministry continues to do so, while recognising
that it alone cannot resolve the issue of court workloads or the efficiency of the
courts.
Defence acquisitions: Pilot major projects report
We have identified a need for the defence agencies to report more comprehensive
and useful information about the progress of major defence acquisition projects
to provide assurance to Parliament and other stakeholders that these projects
are managed well, and deliver the expected capabilities. In partnership with the
Ministry of Defence, New Zealand Defence Force, and the Treasury, and liaising
closely with the Foreign Affairs, Defence and Trade Select Committee (the
Committee), we have identified what information stakeholders expect to see
reported about these projects. This has led to the development of the major
projects report, which will outline this key information for eight of the most
significant current major defence acquisitions projects. We (the OAG and the two
defence agencies) developed a pilot report on one of these projects and presented
it to the Committee in late 2009. We will complete the first full major projects
report covering all eight projects later in 2010. The defence agencies intend to
then update this report annually and include information about new major
projects as they are introduced.
Local authorities: Planning to meet the forecast demand for drinking water
Access to good quality water for drinking, bathing, and clothes washing is
essential to our health and well-being. It is important for local authorities to
ensure that they have considered and planned for future demand for water
supply so they will have adequate infrastructure and/or arrangements to meet
community needs. We carried out a performance audit looking at eight local
authorities to help us form a view about how well prepared the country is to meet
the likely future demand for drinking water. All eight local authorities were able
118
Summary of reports on performance audits and other studies published in 2009/10Appendix 1
to ensure the security of their drinking water supply at the time of our audit. Only
three of the eight – Nelson City Council, Tasman District Council, and Tauranga
District Council – were managing their drinking water supplies effectively to meet
future demand for drinking water. The other five – Christchurch City Council,
Opotiki District Council, Kapiti Coast District Council, South Taranaki District
Council, and Central Otago District Council – had further work to do to improve
the accuracy of their forecasts and implement their strategies to meet future
demand. In some cases, this was a significant amount of work. However, they
know what they need to do and are making progress to implement improvements.
Provided those improvements continue, within the next 10 years these local
authorities should be better placed to meet the forecast demand for drinking
water.
Ministry of Social Development: Changes to the case management of sickness and
invalids’ beneficiaries
In 2008/09, the Ministry of Social Development (the Ministry) spent about $1.9
billion on sickness and invalids benefits, providing income support to people who
were unable to work because of ill health or a disability. In 2007, the Ministry
introduced a number of changes to improve how it determined eligibility for
sickness and invalids’ benefits, and to actively manage cases through regular
and effective contact with people receiving those benefits. We carried out a
performance audit to assess how well the changes were operating and whether
they were starting to have the intended effect. We found that the proposed
changes were beginning to take effect, but they were not being delivered
consistently. We recommended that the Ministry improve how it is monitoring the
effect of the changes, so it will be able to assess how well the various initiatives
are working and whether they are achieving the intended outcomes.
New Zealand Defence Force: Progress with the Defence Sustainability Initiative
We carried out a performance audit on the progress made by the New Zealand
Defence Force (NZDF) in implementing the Defence Sustainability Initiative. We
published two reports as a result of this audit – a classified report to NZDF and
central agencies outlining our views on the implementation of the Initiative
against specific technical measures, and a public report. We found that NZDF
had developed clear areas of focus for planning and measuring its progress in
implementing the initiative. NZDF had implemented significant improvements
in the delivery of corporate services and also made good progress in completing
projects designed to improve corporate capability and equipment shortages. We
also found that some of the Defence Sustainability Initiative’s objectives were not
able to be achieved because rates of deployment were higher than anticipated.
119
Summary of reports on performance audits and other studies published in 2009/10Appendix 1
Although we made some suggestions for further action to NZDF, we did not
consider it necessary to make any formal recommendations in our report.
The Civil Aviation Authority’s progress with improving certification and surveillance
The Civil Aviation Authority (the CAA) is the regulatory agency that safeguards
civil aviation in New Zealand. The CAA controls which operators enter the civil
aviation system (certification) and monitors operators’ ongoing adherence to
safety standards (surveillance). Since 1997, we have carried out four audits of
the CAA’s certification and surveillance functions for civil aviation operators. Our
most recent audit found that, of the 10 recommendations we made in 2005,
only one had been fully addressed, eight had been only partly addressed, and one
recommendation had not been addressed. We considered that the CAA has failed
to understand and effectively address the underlying causes of the weaknesses in
its certification and surveillance work. We made a number of recommendations
that are designed to improve the governance and accountability of the CAA’s
certification and surveillance functions, focus its regulatory actions, and improve
its management practices. We also recommended that the Ministry of Transport,
as the agency responsible for monitoring the CAA, take a more active role in
ensuring that progress is made in addressing the recommendations in our most
recent report.
Inquiries Inquiry into certain types of expenditure in Vote Ministerial Services – Part 1
On 2 March 2010, the Auditor-General, released terms of reference for an inquiry
into certain types of expenditure in Vote Ministerial Services that provide or have
the potential to provide private benefit to a Minister. The inquiry was initiated
by the Auditor-General after separate requests from the Prime Minister, Mr Phil
Heatley MP, and the Department of Internal Affairs.
The purpose of the inquiry was to:
• audit the expenditure incurred by Mr Heatley’s ministerial office from when
he became a Minister in November 2008 until he resigned from his ministerial
portfolios for Housing and Fisheries on 25 February 2010;
• review the rules, policies, and procedures to see whether they are appropriate
and effective, and identify any improvements that can be made; and
• consider any other matters that the Auditor-General considers relate to, or arise
from, the above.
120
Summary of reports on performance audits and other studies published in 2009/10Appendix 1
This report addressed the first part of our inquiry’s terms of reference. It
summarised the general principles that apply to public expenditure where there
could be private benefit and our overall findings and conclusions, followed by a
detailed report about our audit of Mr Heatley’s ministerial office expenditure.
Mr Heatley’s overall ministerial office expenditure was reasonable compared to
expenditure incurred by other ministerial offices for the period we looked at. We
found that a total of $1,402 of Mr Heatley’s expenditure – $608 in Vote Ministerial
Services and $794 in Vote Parliamentary Service – was outside the rules. In all
cases, Mr Heatley thought that the expenditure was within the rules, but he
did not understand the rules correctly. In the case of the expenditure in Vote
Parliamentary Service, the Parliamentary Service was also administering a rule
incorrectly for members of Parliament, and Mr Heatley is not the only member
who will have been affected.
We will be reporting separately on the remaining terms of reference.
Auckland City Council: Management of footpaths contracts
In May 2009 we were asked to carry out an inquiry into the Council’s management
of its footpaths contracts. We agreed to do so because of the nature of the
concerns being raised and because of the scale of the Council’s footpaths work.
Our inquiry aimed to understand the wider context of the Council’s footpaths
work, and to address several specific concerns. Our staff looked in depth at the
Council’s management of footpaths contracts during the past eight years to see
how the Council has developed its approach to footpaths work and whether there
were any fundamental flaws in the systems and processes for current or historical
contracts.
We concluded that the Council’s processes and procedures for managing
footpaths work – while still evolving – are reasonable and have been applied
adequately. We were satisfied that the Council has protected the interests of
ratepayers throughout its management of footpaths contracts.
We found no fundamental flaws or gaps in the Council’s contract management
processes, no apparent evidence of corruption at any level, and no waste. However,
in keeping with most large and complex asset management systems, we did find
some areas where the Council can tidy up its administrative processes and have
made a number of comments and suggestions and four recommendations for
improvement.
121
Summary of reports on performance audits and other studies published in 2009/10Appendix 1
Auckland Regional Council: Management of the LA Galaxy event at Mount Smart
Stadium
In December 2008, Auckland Regional Council (the Council) hosted an exhibition
football match between LA Galaxy (a team that included international football
star David Beckham) and an Oceania “All Stars” team at Mount Smart Stadium.
The event resulted in a loss to the Council of $1.88 million, essentially because
far fewer people purchased tickets to the match than the Council expected.
The chairman of the Council asked the Auditor-General to review the Council’s
handling of the event.
We reviewed how the Council handled the event. We concluded that, despite the
efforts of the council officers involved, the loss occurred because the LA Galaxy/
Oceania “All Stars” match was in essence the wrong event, at the wrong time, for
the wrong price.
Our inquiry focused particularly on the governance of the Mount Smart facility
and its position in the Council’s structure and operations, and on the Council’s
then lack of systems for monitoring and overseeing such events.
The Mount Smart operation was something of an orphan in the Council structure
– it did not fit well with the Council’s other functions and operations, and the
Council had not, at the time, considered or agreed on suitable governance and
business models for it. Although there was a general view within the Council that
Mount Smart Stadium needed to operate commercially, the decision to promote
the LA Galaxy event was made without a formal business strategy or a clear policy
about the level of commercial risk that the Council was willing to assume.
We were satisfied that the Council had correctly identified the problems with its
governance and management of Mount Smart Stadium, and that it was taking
appropriate steps to address those problems.
Investigation into conflicts of interest of four councillors at Environment Canterbury
In July 2009, we received a complaint that three councillors at Environment
Canterbury (the Council) had breached section 6(1) of the Local Authorities
(Members’ Interests) Act 1968 (the Act), by discussing and voting on a proposal
to recover the costs of managing water resources in Canterbury (the proposal).
In October 2009, the complainant told us that a fourth councillor might have
breached the Act.
Section 6(1) of the Act prohibits members of a local authority from discussing or
voting on a matter if they have a financial (or “pecuniary”) interest in it. Section
6(4) enables the Auditor-General to give a declaration that this prohibition will not
122
Summary of reports on performance audits and other studies published in 2009/10Appendix 1
apply if its application impedes the business of the local authority or is against the
interests of electors.
The Auditor-General is also responsible for taking enforcement action when
the requirements of the Act are breached. A breach of section 6(1) is a criminal
offence and the Auditor-General is the sole prosecuting authority. Therefore, we
investigated the complaints made to us about the potential breaches of the Act.
This report sets out our findings and conclusions.
We concluded that the four councillors have breached section 6(1) by participating
in a decision when they had a financial interest in it. However, we decided that a
prosecution would be unlikely to result in a conviction and that it would not be
appropriate in these circumstances to seek to have the councillors prosecuted. We
consulted the Crown Law Office before finalising our view. That Office agreed that
the Act had been breached and that a prosecution was not warranted.
We subsequently worked with the Council and the individual councillors to help
them deal more appropriately with conflicts of interest in later decisions on water
management issues, and granted declarations in appropriate cases to enable
councillors to participate.
How the Thames-Coromandel District Council managed leasing arrangements for
Council land in Whitianga
The Auditor-General inquired into aspects of how the Thames-Coromandel
District Council (the Council) has managed leasing arrangements for a block of
land in Moewai Road, Whitianga. The block of land is commonly referred to as
the Sherriff Block, and the Council has owned it since 2000. Our inquiry included
considering the nature of the Council’s leasing arrangements with Mr Dirk Sieling
before he was elected to the Council in 2007 and the handling of his interest in
the Sherriff Block after he became a Councillor.
We found that the Council was not effective in its management of the Sherriff
Block because it did not formally document a lease agreement or have
arrangements in place to manage its interests in the land. In our view, a formal
lease agreement would have provided clarity about the terms and conditions of
the lease of the Sherriff Block, including the requirement to pay rates.
We also concluded that the Council’s administration systems did not adequately
support the management of conflicts of interest in this matter. We understand
that the Council has now addressed the way that it administers matters where
there are conflicts of interest. For example, the staff member responsible for
sending out papers for Council or Committee meetings takes steps to ensure that
123
Summary of reports on performance audits and other studies published in 2009/10Appendix 1
Councillors do not receive information about matters in which they have declared
a conflict of interest.
In our view, Councillor Sieling handled his interest in the land in a reasonable
manner.
Auditor-General’s decision on parliamentary and ministerial accommodation
entitlements
In September 2009, the Auditor-General received some requests to inquire
into the way parliamentary and ministerial accommodation entitlements are
administered and how they have been applied in relation to Hon Bill English.
In relation to reimbursement of accommodation costs by the Parliamentary
Service and Mr English’s “primary place of residence”, we concluded that Mr
English had correctly completed the declarations he was required to as an MP,
and provided other information on his accommodation arrangements, in order
to claim Wellington accommodation costs. Mr English’s various declarations and
claims relating to his “primary place of residence” and accommodation costs
were considered and approved as appropriate by the Parliamentary Service or
successive Speakers. The fact that Mr English was being reimbursed for the
cost of renting a house owned by his family trust was not exceptional, and the
administrative system now includes protections such as a market evaluation of
rent.
In relation to the provision of a ministerial residence, we concluded that
Ministerial Services had not considered the status of a home owned by a family
trust until Mr English asked if Ministerial Services could take over the lease of the
property he was already renting from a family trust. Ministerial Services asked Mr
English to sign a declaration that he did not have a pecuniary interest in the family
trust. He did so, and attached a copy of the advice he had received about what
amounted to a beneficial interest in a trust for the purposes of Standing Orders.
Having received that declaration, Ministerial Services got a market evaluation of
the rent, took over the existing rental agreement, and provided the house as a
ministerial residence. In our view, the advice that Mr English relied on to make his
declaration was not applicable to this situation and was based on too narrow a
test for the Ministerial Services’ situation. We considered that Mr English did have
an indirect financial interest in the trust.
At Mr English’s request, the rental agreement between Ministerial Services and
the trust ended, and Mr English reimbursed the rent and other costs that had
been paid.
124
Summary of reports on performance audits and other studies published in 2009/10Appendix 1
The Prime Minister then announced that a new policy was to be implemented
under which Ministerial Services would no longer provide accommodation
directly for Ministers. Instead, Ministerial Services will simply provide a fixed level
of financial assistance to Ministers, who will make their own accommodation
arrangements. This approach will mean that the question of whether a Minister
has a personal financial interest in a property will no longer be relevant, and
may help to smooth the interface between the parliamentary and ministerial
accommodation entitlements systems.
How the Ministry of Education managed the 2008 national school bus transport
tender process
In February 2009, we announced the terms of reference for our inquiry into how
the Ministry of Education managed the 2008 national school bus transport tender
process. Our inquiry examined:
• how the Ministry prepared its overall procurement strategy and Request for
Proposal (RFP) for the 2008 bus tender process;
• the extent to which the RFP reflected the Ministry’s earlier consultation with
stakeholders, where appropriate, and the clarity with which any important
changes to the RFP were communicated to stakeholders;
• the extent to which the RFP rules were applied correctly and consistently by
Ministry staff, contractors, and the Tender Evaluation Committee; and
• the extent to which the Ministry responded promptly and effectively when
concerns were expressed about aspects of the 2008 bus tender process.
Overall, the Ministry’s procurement approach was sound. No process is perfect,
and we found a number of areas for improvement that we expect the Ministry to
address in any subsequent bus tender processes. The errors and inconsistencies
we found did not, in our view, undermine the overall outcome of the 2008 bus
tender process. However, the Ministry must strengthen the quality assurance
arrangements it has in place in subsequent bus tender processes.
Other studiesLocal government: Examples of better practice in setting local authorities’
performance measures
This report discusses examples of better practice that we saw in performance
measures within local authorities’ 2009-19 long-term council community plans.
The intention of the report is to promote discussion about improvement rather
than be a technical guide on performance measures for various activities.
125
Summary of reports on performance audits and other studies published in 2009/10Appendix 1
The Auditor-General has a significant interest in improving public management.
Improving local authorities’ performance information – especially in relation to
assessing performance and making decisions – is one way of improving such
management. The Auditor-General’s overview provides a useful perspective on the
report and also comments on the relevance of the report to proposed changes to
the Local Government Act 2002.
District Health Boards: Improving external service performance information
reporting
Checklist for district health boards: Improving your statement of intent
Our paper was provided to district health boards (DHBs) to identify, and help them
to consider, issues with the current state of non-financial performance reporting.
We hope that the paper will help improve the quality of DHB statements of intent
and, consequently, the annual reporting of actual performance. The checklist
augments Part 7 of our report to Parliament, Central government: Results of the
2008/09 audits, in which we discuss DHBs’ non-financial performance reporting in
the context of their planning and accountability framework.
Our observations are drawn from our 2008/09 audits of DHBs, in which we
reviewed the DHBs’ 2009/12 statements of intent. We concluded that the quality
of DHB service performance information was at the lower end of the scale, and
the checklist sets out where, in our view, further effort from the DHB sector could
result in significant improvement to the statement of intent (SOI) and annual
report. To demonstrate their effectiveness and efficiency to external stakeholders
(for example, Parliament and the public), DHBs need to ensure that they report on
the range of services they are accountable for and on how well they are providing
those services. This includes putting more effort into reporting on the quality of
those services. DHBs also need to clearly and separately report on the effect they
hope to achieve (that is, the impacts and outcomes resulting from their services).
Improved performance reporting in their SOIs and annual reports will help ensure
that DHBs are held accountable to Parliament and the public.


127
Appendix 2Entities audited under section 19 of the Public Audit Act 2001
Section 37(2)(c) of the Public Audit Act requires us to include in the annual
report a list of entities audited by the Auditor-General under an arrangement in
accordance with section 19 of the Act.
At 30 June 2010, arrangements had been entered into for audits of the following
entities:
• Antarctic Institute: Andrill Joint Venture
• AUT/Millennium Ownership Trust
• Gisborne Laundry Services
• Greytown District Trust Lands Trust
• Literacy Aotearoa
• Māori Education Trust
• New Zealand Sports Foundation Charitable Trust
• Tokelau International Trust Fund
• Unipol Recreation Limited.

129
Appendix 3Public entities not audited by the Auditor-General
Under section 5 of the Public Audit Act 2001, the Auditor-General is the auditor
of every public entity, which includes any entity controlled by one or more public
entities.
Section 5 uses both legal and financial reporting definitions of control. Section
5(2) says that an entity is controlled by one or more other entities if:
(a) the entity is a subsidiary of any of those other entities; or
(b) the other entity or entities together control the entity within the meaning
of any relevant approved financial reporting standard; or
(c) the other entity or entities can together control directly or indirectly the
composition of the board of the entity within the meaning of sections 7
and 8 of the Companies Act (which, for the purposes of this paragraph, are
to be read with all necessary modifications).
Applying paragraph (b) requires us to consider the substance of the relationship
between two entities to determine whether one controls another (within the
meaning of any relevant approved financial reporting standard).
In a number of instances, entities have disagreed with our conclusion that they
are public entities because they are controlled by one or more public entities. The
following entities are not currently audited by the Auditor-General because they
do not accept that they are public entities.
Canterbury Development Corporation Trust
Christchurch City Council was involved in setting up the Canterbury Development
Corporation Trust (the Trust). The purpose of the Trust is generally to improve the
well-being of people residing in the Canterbury region.
Canterbury Development Corporation
Canterbury Development Corporation Trust (the Trust) holds all the shares in
the Canterbury Development Corporation (the Corporation). The Corporation is
therefore a subsidiary of the Trust.
South Auckland Health Foundation
Counties Manukau Health Limited (which became Counties Manukau District
Health Board) was involved in setting up the South Auckland Health Foundation
(the Foundation). The purpose of the Foundation is mainly to support the
provision of healthcare in the Counties Manukau area.

130
Appendix 1 Public entities not audited by the Auditor-General
Te Wharekura O Rakaumangamanga Foundation Charitable Trust Board
Te Wharekura O Rakaumangamanga (a public school) set up Te Wharekura O
Rakaumangamanga Foundation Charitable Trust Board (the Foundation). The
purpose of the Foundation is mainly to promote education for the benefit of the
school and its community.
Wellington Girls’ Charitable Foundation
Wellington Girls’ College (a public school) was involved in setting up Wellington
Girls’ Charitable Foundation (the Foundation). The purpose of the Foundation
is mainly to assist and foster the educational and professional development of
students and staff of Wellington Girls’ College.
In addition, there are a number of other entities that we have initially assessed as
being public entities. However, we are yet to reach a conclusion on these entities.
We are working through a process with these other entities to reach a conclusion
on whether we consider them to be public entities.
131
Appendix 4Approach and method used for our stakeholder feedback interviews and client surveys
Stakeholder feedback interviews
We use our stakeholder feedback interviews to assess how Parliament and other
key stakeholders perceive the quality, relevance, and usefulness of our reports and
advice.
Using an independent consultant, we seek feedback from a sample of
stakeholders made up of 50% of select committees, a selection of central agencies,
and other representative groups. For our 2010 feedback interviews, our consultant
interviewed seven representatives of select committees and two representatives
of our other stakeholders.
Our questions covered the stakeholders’ satisfaction with the effect and
effectiveness of our work, as well as their satisfaction with the quality, relevance,
and usefulness of specific reports and types of advice.
Stakeholders were asked to respond to a series of qualitative open questions
and to rate us in a number of areas on a scale from 1 to 5, with 1 being strongly
disagree or very dissatisfied and 5 being strongly agree or very satisfied.
Client surveys
The Auditor-General uses an independent firm to conduct an annual client
satisfaction survey of public entities audited by the Auditor-General. The firm
surveys a random sample of public entities to measure the level of satisfaction
and identify areas where we need to improve our audit services.
Representatives of a sample of public entities are invited to participate in a
telephone interview to provide comment and to rate the following factors on a
scale from 1 to 10, with 1 being very low and 10 being very high:
• audit service providers’ understanding of public entities and the risks they face;
• audit service providers’ core audit ability;
• audit service providers’ staff knowledge;
• the way audit service providers’ staff work with entities, including governing
bodies and audit committees where relevant;
• the value that audit service providers add and the usefulness of the advice
given; and
• the overall degree of satisfaction with the service received from audit service
providers.

133
Appendix 5Senior management
Controller and Auditor-General Kevin Brady
(until 22 July 2009)
Lyn Provost
(from 5 October 2009)
Deputy Controller and Auditor-General Phillippa Smith
OAG Leadership Team
Assistant Auditor-General, Accounting and Auditing Policy Greg Schollum
Assistant Auditor-General, Corporate Services Peter Grant
Assistant Auditor-General, Legal Nicola White
Assistant Auditor-General, Local Government Bruce Robertson
Assistant Auditor-General, Parliamentary Group Wendy Venter
Assistant Auditor-General, Performance Audit Group Mike Scott
Assistant Auditor-General, Research and Development Ann Webster
Audit New Zealand Executive Leadership Team
Executive Director, Audit New Zealand Stephen Walker
General Manager, Operations Bethia Gibson
General Manager, Professional Practices Chong Lim

135
Appendix 6Directory of offices
Office of the Auditor-General
Level 2
State Services Commission Building
100 Molesworth Street
PO Box 3928
Wellington 6140
Telephone: (04) 917 1500
Fax: (04) 917 1549
Website: www.oag.govt.nz
Audit New Zealand
National Office
Level 8
St Paul’s Square
45 Pipitea Street
PO Box 99
Wellington 6140
Telephone: (04) 496 3099
or 0508 283 486 (0508 AUDIT NZ)
Fax: (04) 496 3095
Website: www.auditnz.govt.nz
Auckland
Level 10
Great Walls Finance Building
155 Queen Street
PO Box 1165
Auckland 1140
Telephone: 0508 283 486 (0508 AUDIT NZ)
Fax: (09) 366 0215
Hamilton
17 Clifton Road
PO Box 256
Hamilton 3240
Telephone: 0508 283 486 (0508 AUDIT NZ)
Fax: (07) 838 0508
Tauranga
745 Cameron Road
PO Box 621
Tauranga 3140
Telephone: 0508 283 486 (0508 AUDIT NZ)
Fax: (07) 577 9321
Palmerston North
49 Victoria Avenue
PO Box 149
Palmerston North 4440
Telephone: 0508 283 486 (0508 AUDIT NZ)
Fax: (06) 356 7794
Wellington
Level 8
St Paul’s Square
45 Pipitea Street
PO Box 99
Wellington 6140
Telephone: (04) 496 3099
or 0508 283 486 (0508 AUDIT NZ)
Fax: (04) 496 3195
Christchurch
Level 2
Charles Luney House
250 Oxford Terrace
PO Box 2
Christchurch 8140
Telephone: 0508 283 486 (0508 AUDIT NZ)
Fax: (03) 377 0167
Dunedin
Level 1
399 Moray Place
PO Box 232
Dunedin 9054
Telephone: 0508 283 486 (0508 AUDIT NZ)
Fax: (03) 479 0447

Publications by the Auditor-General
Other publications issued by the Auditor-General recently have been:
• Effectiveness of the Get Checked diabetes programme
• Spending on supplies and services by district health boards: Learning from examples
• New Zealand Transport Agency: Information and planning for maintaining and renewing
the state highway network
• District health boards: Availability and accessibility of after-hours services
• Matters arising from the 2009-19 long-term council community plans
• Inquiry into the Plumbers, Gasfitters, and Drainlayers Board
• Inland Revenue Department: Managing child support debt
• Inquiry into New Zealand Defence Force payments to officers seconded to the United
Nations
• The Civil Aviation Authority’s progress with improving certification and surveillance
• Annual Plan 2010/11
• Response of the New Zealand Police to the Commission of Inquiry into Police Conduct:
Second monitoring report
• Local government: Examples of better practice in setting local authorities’ performance
measures
• Local government: Results of the 2008/09 audits
• Statement of Intent 2010–13
• Performance audits from 2008: Follow-up report
• Effectiveness of arrangements for co-ordinating civilian maritime patrols
• Auditor-General’s inquiry into certain types of expenditure in Vote Ministerial Services –
Part 1
• Local authorities: Planning to meet the forecast demand for drinking water
WebsiteAll these reports are available in HTML and PDF format on our website – www.oag.govt.nz.
Most of them can also be obtained in hard copy on request – [email protected].
Mailing list for notification of new reportsWe offer a facility for people to be notified by email when new reports and public statements
are added to our website. The link to this service is in the Publications section of the website.
Sustainable publishingThe Office of the Auditor-General has a policy of sustainable publishing practices. This
report is printed on environmentally responsible paper stocks manufactured under the
environmental management system standard AS/NZS ISO 14001:2004 using Elemental
Chlorine Free (ECF) pulp sourced from sustainable well-managed forests. Processes for
manufacture include use of vegetable-based inks and water-based sealants, with disposal
and/or recycling of waste materials according to best business practices.

Office of the Auditor-General PO Box 3928, Wellington 6140
Telephone: (04) 917 1500 Facsimile: (04) 917 1549
Email: [email protected] Website: www.oag.govt.nz