Embed Size (px)
Citation preview


ANNUAL REPORT
On Water Quality Monitoring through Water Quality L ab Level-II,
Nashik for the 2010-2011
I N D E X
Chapter Particulars Page No.
I Executive Summary 1-4
II Introduction 5-10
III Methodology 11-15
IV Result & Observation 16-29
V Conclusion 30
VI Other Activities 31
VII Annexure 32-56

CHAPTER-1
EXECUTIVE SUMMERY
Annual Report On Water Quality Monitoring through Water Quality L ab Level-II, Nashik for the Year
2010-2011 1.1 Preamble:
The water quality monitoring in the area of surface water is performed in order to determine the
quality of water. Various parameters are analyzed in the laboratory and 6 parameters are tested at
field level. All these tasks are recorded are utilized for preparing the Annual Report by performing
some specific exercise. These data are considered in order to specify the quality of water at each
location. This also helps to determine the pollution level or concentration in each source of water
at each station.
1.2 Water Quality Monitoring - Objectives
Observations of analysis of physical & chemical parameters as per “Uniform Protocol for Water
Quality Monitoring Order 2005” for each location followed by Operation and Maintenance of
Water Quality Laboratory Level-II, Nashik as per Standard Guidelines and mandates including
collection, transportation and analysis of samples, data entry in SWDES Software and preparation
of the said Annual Report as per specific guidelines issued by Superintending Engineer, Data
Collection, Planning & Hydrology Circle, Nashik.
1.3 Water Quality Monitoring - Scope
The Annual Report is prepared for the year 2010-2011. The Table below shows the number of
sample analyzed during the reported period. In order to study water quality status station wise, all
locations covered under this lab during the year 2010-2011.
1

TABLE SHOWING SAMPLES ANALYSED DURING THE REPORTING PERIOD
Sr. No.
Year Trend Sample ( First Round)
Trend Sample
(Balance Round)
Dam Sample ( First Round)
Dam Sample ( Balance Round)
Total
1 2010-11 09 218 08 184 419
Total Samples analyzed during reporting period 419
Seasonal averages of all analyzed parameters are calculated for study of seasonal water quality
trend at each location.
1.4 Methodology:
Analysis of Physical and Chemical parameters is done in the laboratory on the basis of Standard
Analytical Procedure, Instrument Operating Instructions, HIS Manuals, CPCB Guidelines and
APHA, 21st Ed., 2005.
Data analyzed further validated with prescribed method as per Water Quality Manuals to verify
various Ratios manually and then it is entered in SWDES Software for Water Quality Data Entry.
Further the data is sent to State Data Center for further dissemination to user end.
Further more to get an idea of about data generated for the period it is decided and instructed to
analyzed the generated data for the said period in the form of Annual report with the help of
various tools in SWDES Software to find out critical parameters and critical locations in the
jurisdiction of this Lab.
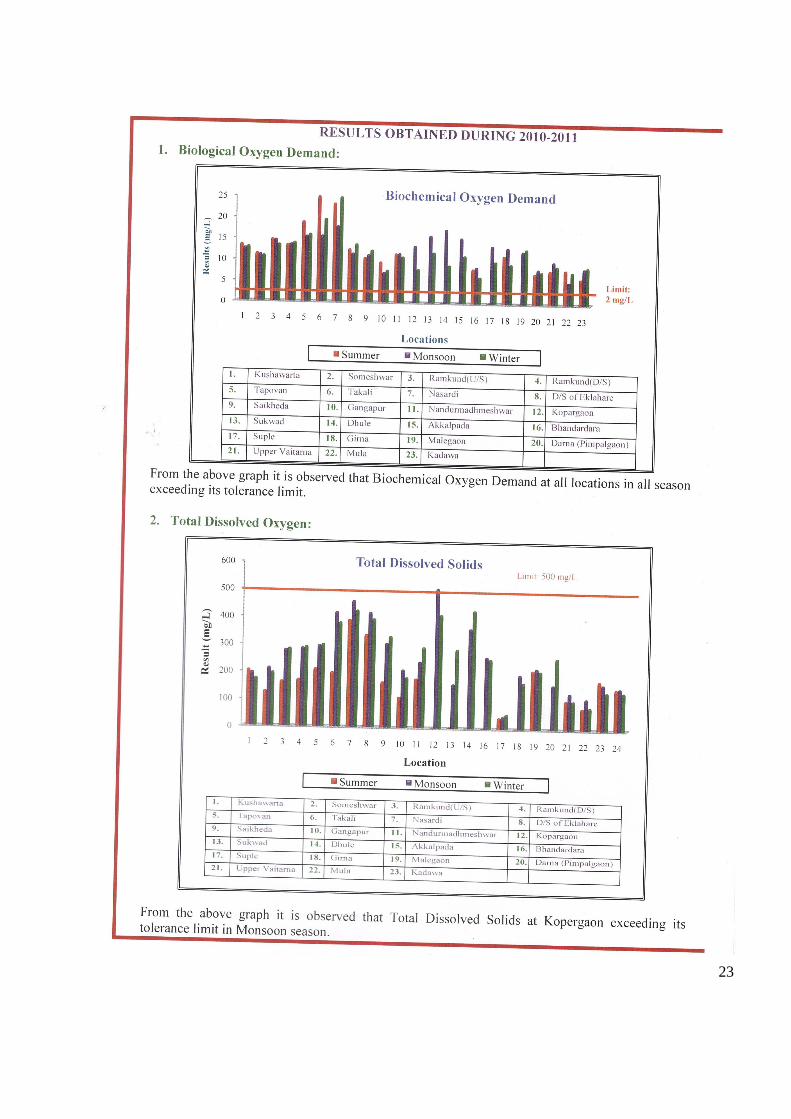
1.5 Result and Observation:
After observing all this data the physiochemical parameters like Biological Oxygen
Demand exceeds its tolerance limit in all season at all location. Total Dissolved Solids exceeds its
limit at Kopergaon in monsoon season. At Takali & Nasardi in monsoon season turbidity exceeds
its prescribed limit. At Kushawarta, Takali, Nasardi, D/s of Eklahare, Saikheda,
Nadurmahameshwar Dissolved Oxygen observed less than its desirable limit. Total Alkalinity at
Takali in winter season & at Nasardi in summer &n winter season exceeds its prescribed limit. At
Saikheda in summer season Boron exceeding its prescribed limit.
Bacteriological parameters i.e. Total coliforms & Faecal coliforms exceeds its prescribed limit at
all location in all season
2

1.6 Conclusion
After the observing all the results it can be concluded that, the value of Biological Oxygen
Demand is very high, even exceeding beyond desired limit is due to the presence of organic
matter, which reduces oxygen content in the water. Water having excess Biological Oxygen
Demand is not fit for human activities or consumption. The domestic waste may add great quantity
of organic & some inorganic materials that contribute turbidity. Under certain conditions, natural
water may contain appreciable ammonia of carbonate & hydroxide alkalinity.
Analysis results from all the locations have shown increase in value of Total Coliforms &
Feacal Coliforms because the discharge of sewage drainage waste into the water source even
increase in domestic discharge bacteria’s of various types increased.
With reference to Wilcox technique, it is observed that 3 locations such as Kushawarta,
Nasardi & Nandurmahadhmeshwar belongs to class C2 & S1. This indicates that the water flowing
along these locations is mostly suitable for irrigation purpose. For drinking purpose, it should be
treated before use.
1.7 Recommendations/Remedial Measures: � Domestic effluents may be treated and disinfected before discharging.
� Effluents from the non-point sources may be identified. These are required to be collected
and treated.
� Use of water of such polluted locations may be useful for salt tolerance crop and is
recommended based on special study.
� Use of direct source of water is to be avoided.
� Bathing at such location should be restricted.
� Tree plantation may be done on banks of rivers to minimize soil erosion and to improve the
area aesthetically.
� The artificial recharge of ground water through integrated watershed management
programme and rainwater harvesting will help to improve the ground water quality in the
area where the problem exists.
3

1.8 Suggestions:
� Awareness in community through local bodies, NGO’s, Educational institutes.
� Water literacy shall be increased.
� All disciplines can come together for water awareness campaigning.
� Annual Report shall be published regularly.
� Lean flow in river shall be maintained.
� Measures for sustainable use of water resources are necessary
� Measures for water conservation, recycling and optimal conjunctive use of surface and
ground water for specific uses are necessary.
� Farmers in the catchment area should be educated against use of extensive amount of
pesticides and chemical fertilizers. They should be encouraged to use organic manures.
� To create Environmental consciousness through education and mass awareness
programmes may be planned
� Besides the regular ground water quality monitoring, special studies should be
undertaken on micro-level basis where ground water quality has undergone deterioration
to ascertain the reasons, extent and remedial measures thereafter.
� The lack of facilities and awareness for proper disposal of waste and wastewater is mainly
causing the ground water quality deterioration in the state. Hence, it is suggested that
people in the rural and urban parts of the State should be made aware about the pollution of
the ground water and its impacts. Strict regulations must be observed to stop pollution of
ground water.
4

CHAPTER-2
INTRODUCTION
2.1 General:
The water quality monitoring is being carried out under Hydrology Project. Hydrology Project
SW, Maharashtra takes care of Surface Water Quality monitoring through 163 locations spread
over the division through the year. In accordance with decision taken in 1st meeting of Water
Quality Review Committee of state of Maharashtra, “The Uniform Protocol” for water monitoring
finalized by the Water Quality Assessment Authority formulated by the Ministry of Water
Resources is made available to Hydrology Project Surface Water, Maharashtra. In order to
determine the quality of water various parameters are analyzed in the laboratory and 6 parameters
are tested at field level. All these tasks are recorded are utilized for preparing the Annual Report by
performing some specific exercise. These data are considered in order to specify the quality of
water at each location. This also helps to determine the pollution level or concentration in each
source of water at each station.
2.2 Water Quality Monitoring - Objectives
Observations of analysis of physical & chemical parameters as per “Uniform Protocol for Water
Quality Monitoring Order 2005” for each location followed by Operation and Maintenance of
Water Quality Laboratory Level-II, Nashik as per Standard Guidelines and mandates including
collection, transportation and analysis of samples, data entry in SWDES Software and preparation
of the said Annual Report as per specific guidelines issued by CPCB, Delhi.
5

2.3 Water Quality Monitoring - Scope
The Table below shows the number of sample analyzed during the reported period. In order to
study water quality status station wise, all locations covered under this lab during the year 2010-
2011.
Seasonal averages of all analyzed parameters are calculated for study of seasonal water quality
trend at each location.
2.4 Other activities
Apart from monitoring of water quality network for Water Quality lab level II at Nashik, the
infrastructure facility is made available to the users from various Government, Non Government,
Private sector as well as individuals.
The facility is availed by many users with testing of sample towards drinking purpose, construction
purpose, swimming tanks, irrigation purpose & study purpose.
During the year 2010-2011 many clients approached to the laboratory. The valuable clients availed
the facility of the laboratory are as below;
1. Nashik Municipal Corporation
2. National Thermal Power Station
3. Various International School in Nashik City
4. Medical Institute like Ayurved College
5. KTHM College for study purpose.
6. Client from MIDC, Satpur.
REVENUE GENERATED DURING THE REPORTED PIRIOD
Sr. No. No. of clients approached Amount Received
1. 104 2,44,804/-
6

2.5 Extended Scope of Laboratory Under Hydrology Project(SW) Maharashtra Water Quality Monitoring is being carried out with
prescribe W.Q. Network with 6 Level-II & 38 Level-I Labs followed by 163 sampling locations
spread all over the State.
During the meeting of WQRC held in Mumbai Water Quality Lab Level-II, Nashik has
recommended as a referral lab for the State of Maharashtra. Hence Government of Maharashtra
has approved the proposal of up gradation of this lab to Level-II+ with provision of sophisticated
instruments like AAS, GC and Laminar Flow unit with raised layout as per prescribe norms of
towards recommended by MoEF & NABL accreditation as per Uniform Protocol.
AQC Exercise organized by CPCB – This lab participated in AQC Exercise organized by CPCB
during the reported period and will also participate in forthcoming exercise sustainable
development in Quality Assurance & Quality Control.
Training and Visits: Infrastructure facility is made available to the college student for in plant
training and their research purposes. Many visitors from various sectors visited the lab and
appreciated the efforts taken by this lab.
The infrastructure facility is also made available to all institutional organization for visit and study
purposes and the generated data of water quality is also made available to the users who are a
member of Hydrology Data User Group (HDUG) of Hydrology Project, Nashik.
7

ANNUAL REPORT FOR THE PERIOD OF 2010-2011
Water Quality Laboratory Level II at Nashik Salient Feature :-
1. General Structure of Laboratory:
1) Sampling Locations as per Water Quality Network covered in this Lab:-23
2) Monthly sample collection: - 23 samples.
3) Frequency of sampling: - Trend: – Monthly
Dam samples:– Fortnightly
4) Govt. staff related to Laboratory: -
1. Mr. M. K. Pokale, Superintending Engineer
2. Mr. V. D. Nemade, Executive Engineer
3. Mr. V. K. Kapoore, Asst Supt. Engineer
4. Mr. S.K. Kshirsagar (Govt. Analyst)
5) Lab operating Agency: - Ashwamedh Engineers & Consultants
C.S.L.,Nashik
a) Indoor Work – 1. Mr. H. P. Bhavsar (Branch Manager, Nashik Branch)
2. Mrs. C.A. Ekhande (Chief Analyst)
3. Mrs. N. Kapdnis (Microbiologist)
4. Mrs. N. Y. Mandlik (Jr. Analyst)
5. Mrs. N. S. Patil (Jr. Analyst)
6. Mr. R. N. Patil (Lab. Assistant)
b) Outdoor Work – 1. Mr. S.A. Shelar (Chemist & Outdoor work Coordinator)
2. Mr. K. N. Gujar (Chemist)
3. Mr. B. G. Jadhav (Chemist)
4. Mr. R. P. Bhalerao (Khalashi)
5. Mr. M. A. Albad (Khalashi)
6. Mr. P. D. Dhongde (Khalashi)
8

2. Scope of Work: Operation and Maintenance of Water Quality Laboratory Level-II,
Nashik
2.1 Outdoor Work: Surface water sampling and transporting the sample from
selected Water Quality network sampling points as per
schedule of sampling during the said period.
The Surface Water sampling includes:
a) Field determination as per standard guideline.
b) Field parameters to be tested on site & entry to be taken on ID form.
c) Sample to be transported to laboratory within prescribed time limit.
2.2 Indoor Work:
• Day to Day Operation and Maintenance of Water Quality Laboratory Level II.
• The work includes analysis of water samples as per the test procedures.
• Operating the instruments as per specified instruction manual.
• Entry of data in SWDES Software.
• Participating in Analytical Quality Control Exercise (AQC) round.
• Documents as per ISO 9001:2008 mandates.
i) Within Laboratory AQC ii) Intra Laboratory AQC iii) AQC by CPCB
• The Laboratory staff employed;
1) Chief Chemist: 1 No. 2) Sr. Research Officers: 2 Nos. 3) Research Assistant: 1 No. 4) Lab. Assistant: 1 No.
• The Indoor work also includes keeping data record.
• Log book of Lab equipment
• Preparation of monthly sampling Schedule.
• Keeping sampling record, instruments operation, Laboratory Management,
demonstration
• Training to Departmental staff as and when required.
Information gives to visitors & Customer Satisfaction. Work is carried out as per flow chart.
9
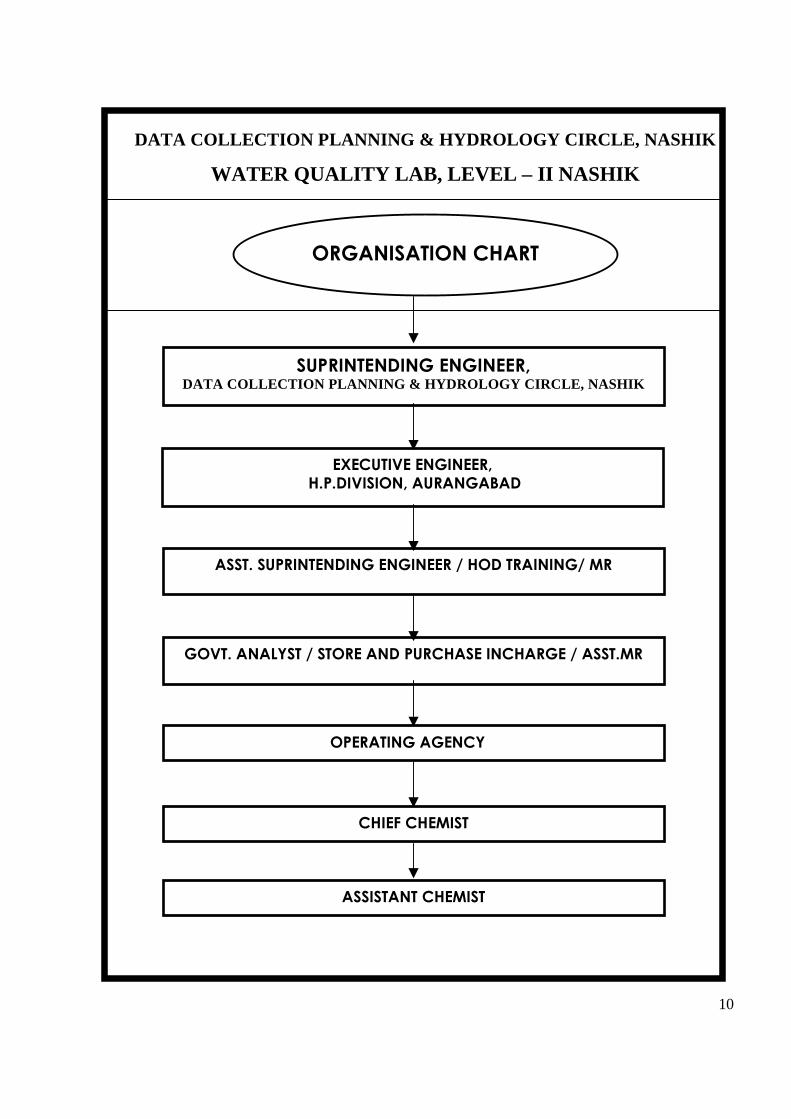
ORGANISATION CHART
DATA COLLECTION PLANNING & HYDROLOGY CIRCLE, NASHIK
WATER QUALITY LAB, LEVEL – II NASHIK
10
SUPRINTENDING ENGINEER, DATA COLLECTION PLANNING & HYDROLOGY CIRCLE, NASHIK
EXECUTIVE ENGINEER,
H.P.DIVISION, AURANGABAD
ASST. SUPRINTENDING ENGINEER / HOD TRAINING/ MR
GOVT. ANALYST / STORE AND PURCHASE INCHARGE / ASST.MR
OPERATING AGENCY
CHIEF CHEMIST
ASSISTANT CHEMIST

CHAPTER-3
METHODOLOGY
3.0 General:
This laboratory covers Surface Water component which covers Rivers and Reservoir Locations in
Godavari basin up to Kopergaon & Dhule district.
3.1 Rivers
Water is life and rivers are lifelines. Fortunately almost the entire country is criss-crossed by
rivers. Geographical area of the state is divided in five river basins viz. Godavari, Tapi, Panzara &
west flowing rivers in Konkan region.
3.2 Water Quality Monitoring - Objectives
Observations of analysis of physical & chemical parameters as per “Uniform Protocol for Water
Quality Monitoring Order 2005” for each location followed by Operation and Maintenance of
Water Quality Laboratory Level-II, Nashik as per Standard Guidelines and mandates including
collection, transportation and analysis of samples, data entry in SWDES Software and preparation
of the said Annual Report as per specific guidelines issued by Superintending Engineer, Data
Collection Planning & Hydrology Circle, Nashik.
3.3 Methodology:
Analysis of Physical and Chemical parameters is done in the laboratory on the basis of Standard
Analytical Procedures, Instrument Operating Instructions, HIS Manuals, CPCB Guidelines and
APHA, 21st Ed., 2005.
Data analyzed further validated with prescribed method as per Water Quality Manuals to verify
various Ratios manually and then it is entered in SWDES Software for Water Quality Data Entry.
Further the data is sent to State Data Center for further dissemination to user end.
Furthermore to get an idea of about data generated for the period it is decided and instructed to
analyzed the generated data for the said period in the form of Annual report with the help of
various tools in SWDES Software to find out critical parameters and critical locations in the
jurisdiction of this Lab.
11

The Table below shows the number of sample analyzed during the reported period. In order
to study water quality status station wise, all locations covered under this lab during the year 2010-
2011 are considered.
TABLE SHOWING SAMPLES ANALYSED DURING THE REPORTING PERIOD
Sr.No. Year
Trend Sample ( First
Round)
Trend Sample
(Balance Round)
Dam Sample ( First
Round)
Dam Sample
( Balance Round)
Total
1 2010-11 09 218 08 184 419
Total Samples analyzed during reporting period 419
3.4 Flow Chart
The work of analysis of sample is being monitored on the basis of flow chart generated in the lab
as per standard guidelines and analysis of sample is performs as per guidelines of world bank with
HIS manuals and APHA ,21 st Ed, 2005 as a standard procedures for analysis of samples.
As well refers BIS standards IS:10500 and other relevant BIS standards for analysis of various
samples received from users for various purposed like Drinking, Irrigation, Ice preparation,
Bathing ( Swimming Tank),Construction, study and various R & D Activities.
12

FLOW CHART OF ANALYSIS OF HP WATER SAMPLE
Sample Collection from Sampling Source with the help of Depth Sampler
Treatment: D.O. Fixing, Preservation of MPN Sample, Colour, Odour Temp, pH, EC, tested on field, and fill up ID form.
At Laboratory: Inward the Sample, Giving the Sr. No. to the sample noted In to sample entry register
ID form entry taken into SWEDS Software
Tests are carried out in lab as per Protocols. These tests are: Microbiological test, Chlorophyll-a, Temp, pH, D.O., B.O.D, Ammonia, Nitrate, Nitrite, TDS,
TSS, C.O.D., Turbidity, Alkalinity, Carbonate & Bicarbonate, Chloride, Fluoride, Boron, Iron, Sodium, Potassium, Total Hardness, Phosphorous,
Calcium etc.
Observations & calculations of all Analyzed Parameters are entered in the Data Sheet
The results of parameters are checked & validated
After Validation Check, all the data is entered in to Data Record and Validation Register
This data is finally entered in to SWEDS Software
Data sent to Executive Engineer, HDP Division, Nashik for further action
13

Methodology For the analysis of Water Quality samples the following parameters were analyzed during the Period 2010 – 2011
Table showing list of parameters and the methodology used for the analysis.
Sr. No Parameters Methodology
1. Colour APHA, 21st Ed., 2005, 2120-B, 2-2
2. Odour IS 3025 (Part 5): 1983, Reaffirmed 2006
3. Temperature APH APHA, 21st Ed., 2005, 2550-B, 2-61
4. pH APHA, 21st Ed., 2005, 4500-H+- B, 4-90
5. Electric Conductivity APHA, 21st Ed., 2005, 2510- B, 2-47
6. Dissolved Oxygen IS 3025 (Part 38): 1989, Reaffirmed 2003
7. Turbidity APHA, 21st Ed., 2005, 2130-B, 2-9
8. Total Solids IS 3025 (Part 15): 1984, Reaffirmed 2003, Amds.1
9. Dissolved Solids IS 3025 (Part 16): 1984, Reaffirmed 2006, Ed.2.1 (1999-12)
10. Suspended Solids IS 3025 (Part 17): 1984, Reaffirmed 2006, Amds.1
11. NH3-N APHA, 21st Ed., 2005, 4500-NH3 F, 4-110
12. NO2- APHA, 21st Ed., 2005, 4500-NO2-B, 4-118
13. NO3- APHA,21st Ed., 2005, 4500-NO3, B -4 -120
14. Total Phosphorous APHA, 21st Ed., 2005, 4500 P, E, 4-153
15. Biochemical Oxygen Demand IS 3025 (Part 44): 1993, Reaffirmed 2003, Amds.1
16. Chemical Oxygen Demand APHA, 21st Ed., 2005, 5220-B, 5-15
17. Potassium K+ IS 3025 (Part 45): 1993, Reaffirmed 2003, Amds.1
18. Sodium Na+ IS 3025 (Part 45):1993, Reaffirmed 2003, Amds.1
19. Calcium Ca++ APHA, 21st Ed., 2005, 3500-B, 3-65
20. Magnesium Mg++ APHA, 21st Ed., 2005, 3500-Mg, B, 3-84
21. Iron (as Fe) APHA, 21st Ed., 2005, 3111-B, 3-17
22. Carbonate CO3 APHA, 21st Ed., 2005, 2320-B, 2-27, 5 -1 & 4500-CO2-D, 4-34
23. Bi-Carbonate HCO3 APHA, 21st Ed., 2005, 2320-B, 2-27, 5 -3 & 4500-CO2-D, 4-34
24. Chloride Cl APHA, 21st Ed., 2005, 4500-Cl, B, 4-70
25. Fluoride F APHA, 21st Ed., 2005, 4500-F-, D, 4-85
26. Boron B APHA, 21st Ed., 2005, 4500-B-C, 4-23
27. Total Coliforms APHA, 21st Ed., 2005, 9221-B, 9-49
28. Faecal Coliforms APHA, 21st Ed., 2005, 9221-E, 9-56
29. Alkalinity IS 3025 (Part 23): 1986, Reaffirmed 2003, Amds.1
14
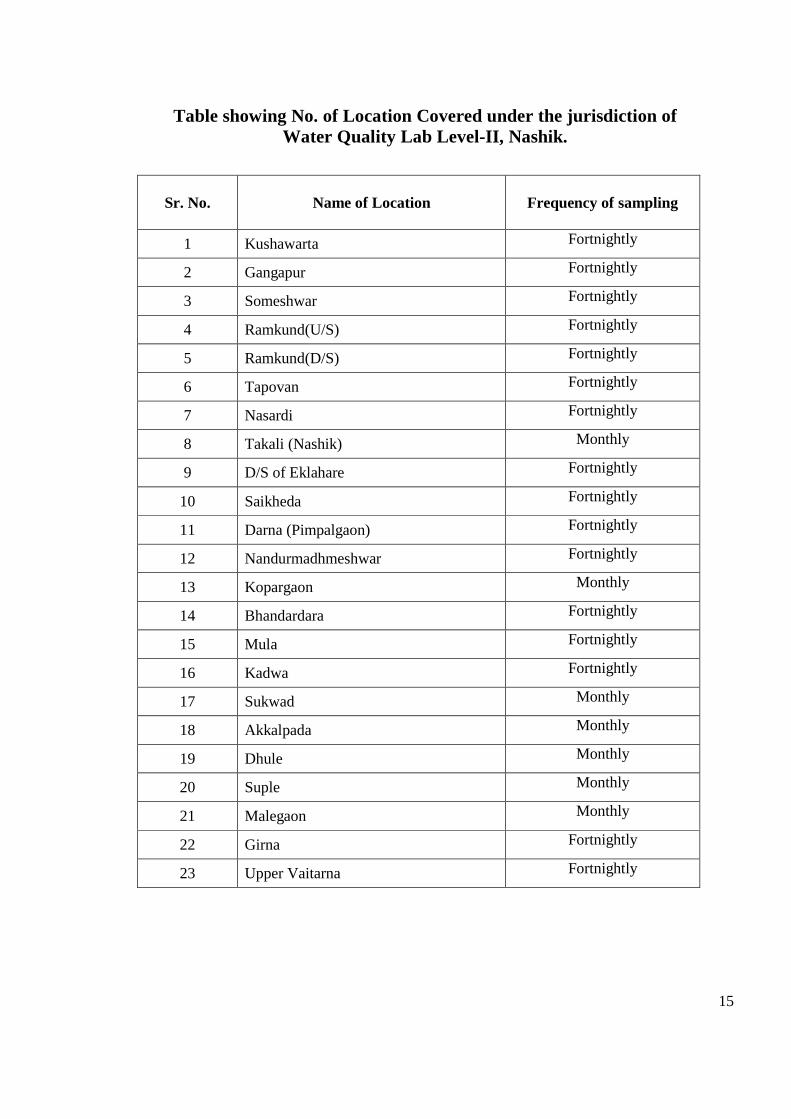
Table showing No. of Location Covered under the jurisdiction of Water Quality Lab Level-II, Nashik.
15
Sr. No. Name of Location
Frequency of sampling
1 Kushawarta Fortnightly
2 Gangapur Fortnightly
3 Someshwar Fortnightly
4 Ramkund(U/S) Fortnightly
5 Ramkund(D/S) Fortnightly
6 Tapovan Fortnightly
7 Nasardi Fortnightly
8 Takali (Nashik) Monthly
9 D/S of Eklahare Fortnightly
10 Saikheda Fortnightly
11 Darna (Pimpalgaon) Fortnightly
12 Nandurmadhmeshwar Fortnightly
13 Kopargaon Monthly
14 Bhandardara Fortnightly
15 Mula Fortnightly
16 Kadwa Fortnightly
17 Sukwad Monthly
18 Akkalpada Monthly
19 Dhule Monthly
20 Suple Monthly
21 Malegaon Monthly
22 Girna Fortnightly
23 Upper Vaitarna Fortnightly

CHAPTER - 4
RESULTS AND OBSERVATIONS
4.1 RESULTS AND CONCLUSIONS
The water quality monitoring in the area of surface water is performed in order to determine the
quality of water. Various parameters are analyzed in the laboratory and 6 parameters are tested at
field level. All these tasks are recorded are utilized for preparing the Annual Report by performing
some specific exercise. These data are considered in order to specify the quality of water at each
location. This also helps to determine the pollution level or concentration in each source of water
at each station.
4.2 Water Quality status- Stations wise Exercise
In order to study water quality status station wise, all locations covered under this lab during the
year 2010-2011. Seasonal averages of all analyzed parameters are calculated for study of seasonal
water quality trend at each location.
4.3 Objectives:
Observations of all physical & chemical parameters analyzed for each location individually &
interpretation of data to identify seasonal trend. Also critical parameters are identified at every
location, including finding out causes behind it at every location and every parameter.
4.4 Critical parameters Identified:
After observing all this data it is clear that most of the physical parameter are within tolerance
limit except at few locations, like Takali, Nasardi & Kopergaon etc.
Most of the chemical parameters are also within tolerance limits, except following parameters.
i) Dissolved Oxygen ii) Biological Oxygen Demand
Bacteriological parameters like Total Coliform and Faecal Colifroms are also exceeding the limits.
16

Classification of location on the basis of Wilcox technique towards use of water for irrigation purpose
Sr. No.
Name of Location Classification As per Wilcox Technique
Remarks
1 Kushawarta C2 & S1 B
2 Gangapur C2 & S1 B
3 Someshwar C2 & S1 B
4 Ramkund(U/S) C2 & S1 B
5 Ramkund(D/S) C2 & S1 B
6 Tapovan C2 & S1 B
7 Nasardi C2 & S1 B
8 Takali (Nashik) C2 & S1 B
9 D/S of Eklahare C2 & S1 B
10 Saikheda C2 & S1 B
11 Darna (Pimpalgaon) C1 & S1 A
12 Nandurmadhmeshwar C2 & S1 B
13 Kopargaon C2 & S1 B
14 Bhandardara C1 & S1 A
15 Mula C2 & S1 B
16 Kadwa C2 & S1 B
17 Sukwad C2 & S1 B
18 Akkalpada C2 & S1 B
19 Dhule C2 & S1 B
20 Suple C1 & S1 A
21 Malegaon C2 & S1 B
22 Girna C2 & S1 B
23 Upper Vaitarna C1 & S1 A
Note: A: Water is Good for Irrigation Purpose.
B: Water is Suitable for Irrigation Purpose.
C: Water is suitable for Salt Tolerant Plant.
D: Inadequate data and no flow in the river
17

18

CPCB Water Quality Criteria
Classification as per Wilcox Technique
Sr. No. Parameter Class Range Remark
C1 <250 Good For Most Soils & Crops C2 250-750 Some Leaching For Sensitive Crop C3 750-2250 Tolerant Crops & Leaching 1. Electrical Conductivity
C4 >2250 Only For Permeable Soils And
Tolerant Crops S1 0-10 Excellent S2 10-18 Good S3 18-26 Fair
2. SAR (Sodium Absorption Ratio)
S4 >26 Poor
19
Designated best use Quality Class
Primary Water Quality Criteria
Drinking water source without conventional treatment but with chlorination
A � Total coliform organisms (MPN/100 ml) shall be 50 or less � pH between 6.5 and 8.5 � Dissolved Oxygen 6 mg/l or more, and � Biochemical Oxygen Demand 2 mg/l or less
Outdoor bathing (organized)
B � Total coliform organisms(MPN/100 ml) shall be 500 or less � pH between 6.5 and 8.5 � Dissolved Oxygen 5 mg/l or more, and � Biochemical Oxygen Demand 3 mg/l or less
Drinking water source with conventional treatment
C � Total coliform organisms(MPN/100 ml) shall be 5000 or less � pH between 6 and 9 � Dissolved Oxygen 4 mg/l or more, and � Biochemical Oxygen Demand 3 mg/l or less
Propagation of wildlife and fisheries
D � pH between 6.5 and 8.5 � Dissolved Oxygen 4 mg/l or more, and � Free ammonia (as N) 1.2 mg/l or less
Irrigation, industrial cooling, and controlled disposal
E � pH between 6.0 and 8.5 � Electrical conductivity less than 2250 micro
mhos/cm, � Sodium Aborption Ratio less than 26, � and Boron less than 2 mg/l.
Below E � Not Meeting A, B, C, D & E Criteria

ICAR Standard for Irrigation Water
Sr. No. Parameter limit Unit
1. pH 6.5-8.5 -
2. Electrical Conductivity 2250 Micromhos/cm
3. Total Dissolved Oxygen 2100 mg/Lit
4. Chloride 600 mg/Lit
5. Sulphate 1000 mg/Lit
6. Boron 2 mg/Lit
7. % Sodium 60 %
8. SAR (Sodium Absorbance Ratio) 26 -
20

21

22
23

24

25

26

27

28

29

CHAPTER – 5
CONCLUSION
Observing Results of all the locations & the parameters tested during reported period, it can be
concluded that the value of chemical parameters exceeding the desired limits. This is due to the
presence of organic matter, which also reduces Oxygen content in the water. Water having excess
Biological Oxygen Demand is not fit for direct consumption.
Biological parameter i.e. Total Coliform & Feacal Coliform at every location exceeds the
prescribed limit as per IS 10500 of Drinking Water Standard. This is mainly due to discharge of
sewage; drainage in to water sources through Non-Point Sources needs to be identified.
As per classification on the basis of Wilcox Technique water at 4 locations out of 23 locations is
suitable for irrigation purpose & at 19 locations water is good for irrigation purpose.
Overall trend of water quality in reported period for covered location is indicating suitably of water
for irrigation purpose.
Finally, it can be concluded that water from all these locations is not suitable for drinking purpose
without treatment. It requires treatment before use. Secondly this water can be used for irrigation
purpose followed by traditional irrigation method.
30

CHAPTER - 6
OTHER ACTIVITIES
6.1 REVENUE GENERATION TO GOVERNMENT OF MAHARASHTRA
Apart from monitoring of water quality network for Water Quality lab level II at Nashik, the
infrastructure facility is made available to the users from various Government, Non Government,
Private sector as well as individuals.
The facility is availed by many users with testing of sample towards drinking purpose, construction
purpose, swimming tanks, irrigation purpose & study purpose.
During the year 2010-2011 many clients approached to the laboratory. The valuable clients availed
the facility of the laboratory are as below;
1. Nashik Municipal Corporation
2. National Thermal Power Station
3. Various International School in Nashik City
4. Medical Institute like Ayurved College
5. KTHM College for study purpose.
6. Client from Satpur MIDC
6.2 REVENUE GENERATED DURING THE REPORTED PIRIOD
Sr. No. No. of clients approached Amount Received
1. 49 3,83,152/-
31

Annexure - I
32

Annexure – II
33

34

35

Annexure – III
36

Annexure – IV
37

38

39

40

41

42

43

44

Annexure – V
45

46

47
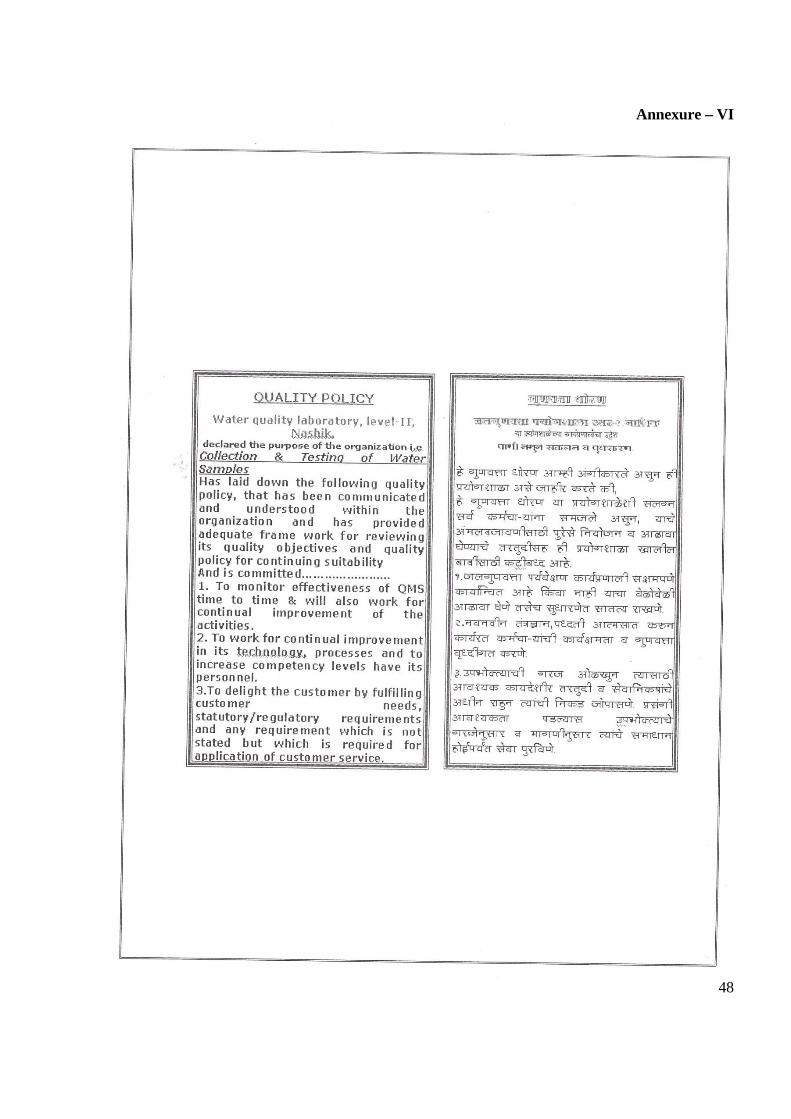
Annexure – VI
48

Annexure – VII
49

50
51
52

53

54

55

56