Embed Size (px)
Citation preview

ANNUAL REPORT
2010
DIRECTORS’ REPORTANNUAL REPORT 2010
Table of Contents
ANNUAL GENERAL MEETING
2010 Annual General Meeting of ThinkSmart Limited will be
held at Level 36, 250 St George’s Tce, Perth, Western Australia
on Monday 16th May at 3.30 pm.
A FOCUSED, GLOBAL BUSINESS 2
AN INNOVATIVE GROWTH COMPANY 4
GROWTH OPPORTUNITIES FOR THE FUTURE 6
EXECUTIVE CHAIRMAN & CEO REPORT 10
TRADING RESULTS UPDATE 12
CORPORATE & SOCIAL RESPONSIBILITY 15
DELIVERING VALUE THROUGH..... 16
FINANCIAL REPORT 17

1
ANNUAL REPORT 2011ANNUAL REPORT 2011
ThinkSmart Limited is a leading international financial services company in the provision of finance to small businesses and consumers shopping in electrical retailing stores.
ThinkSmart’s products fill the gap between a credit card and a bank loan, enabling its customers to get on-the-spot approval for the technology they need via a tax and cash flow friendly operating lease.
It’s a niche in which ThinkSmart has a leading international footprint.

2
DIRECTORS’ REPORT
ThinkSmart has long term distribution agreements with some of the world’s leading electrical retailers and banking institutions across Europe and Australasia.
ThinkSmart’s funding agreements are contracted to dates between 2011 and 2014
A Focused, Global BusinessDirectors’ Meetings
The following table sets out the number of directors’
meetings held during the financial year. During the financial
year 7 Board meetings were held.
Audit Nomination andandRisk Remuneration
Board Committee CommitteeDirector Meetings Meetings Meeting
A B A B A B
Peter Mansell 7 7 2 2 1 1
David Griffiths 6 7 2 2 1 1
Ned Montarello 7 7 2* - 1 1
Steven Penglis 7 7 1* - 1 1
A – Number of meetings attended
B – Number of meetings held during the time the director heldoffice during the year
* – Attendance by invitation from the Committee
Corporate Governance Statement
This statement outlines the main corporate governance
practices in place throughout the financial year, which comply
with the ASX Corporate Governance Council
recommendations, unless otherwise stated.
BOARD OF DIRECTORS
Role of the Board
The Board’s primary role is the protection and enhancement
of long-term shareholder value.
Matters which are specifically reserved for the Board or its
Committees under the Board Charter include:
� appointment of a chair;
� appointment and removal of the CEO;
� appointment of directors to fill a vacancy or as additional
directors;
� establishment of Board Committees, their membership
and delegated authorities;
� approval of dividends;
� development and review of corporate governance
principles and policies;
� approval of operational budgets, major capital
expenditure, acquisitions and divestitures in excess of
authority levels delegated to management;
� calling of meetings of shareholders; and
� any other specific matters nominated by the Board from
time to time.
It is also responsible for approving and monitoring financial
and other reporting. Detail of the Board’s charter is located in
the Company’s website (www.thinksmartworld.com).
The Board, together with the Nomination and Remuneration
Committee, determines the size and composition of the
Board, subject to the terms of the constitution.
The Board has delegated responsibility for operations and
administration of the Company to the Chief Executive Officer
and executive management. Responsibilities are delineated
by formal authority delegations.
ANNUAL REPORT 2010
3
ANNUAL REPORT 2011
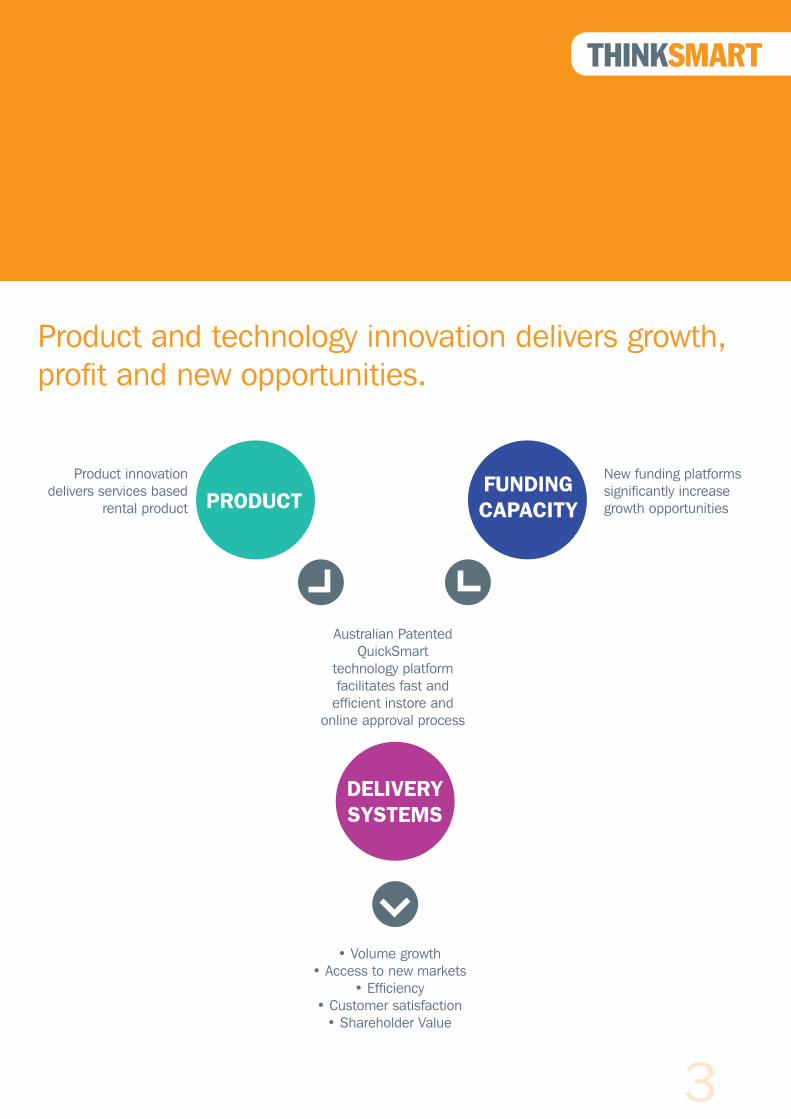
Product and technology innovation delivers growth, profit and new opportunities.
PRODUCTFUNDINGCAPACITY
DELIVERYSYSTEMS
Product innovationdelivers services based
rental product
New funding platformssignificantly increasegrowth opportunities
Australian Patented QuickSmart
technology platformfacilitates fast and
efficient instore andonline approval process
• Volume growth• Access to new markets
• Efficiency• Customer satisfaction
• Shareholder Value
ANNUAL REPORT 2011
4
DIRECTORS’ REPORT
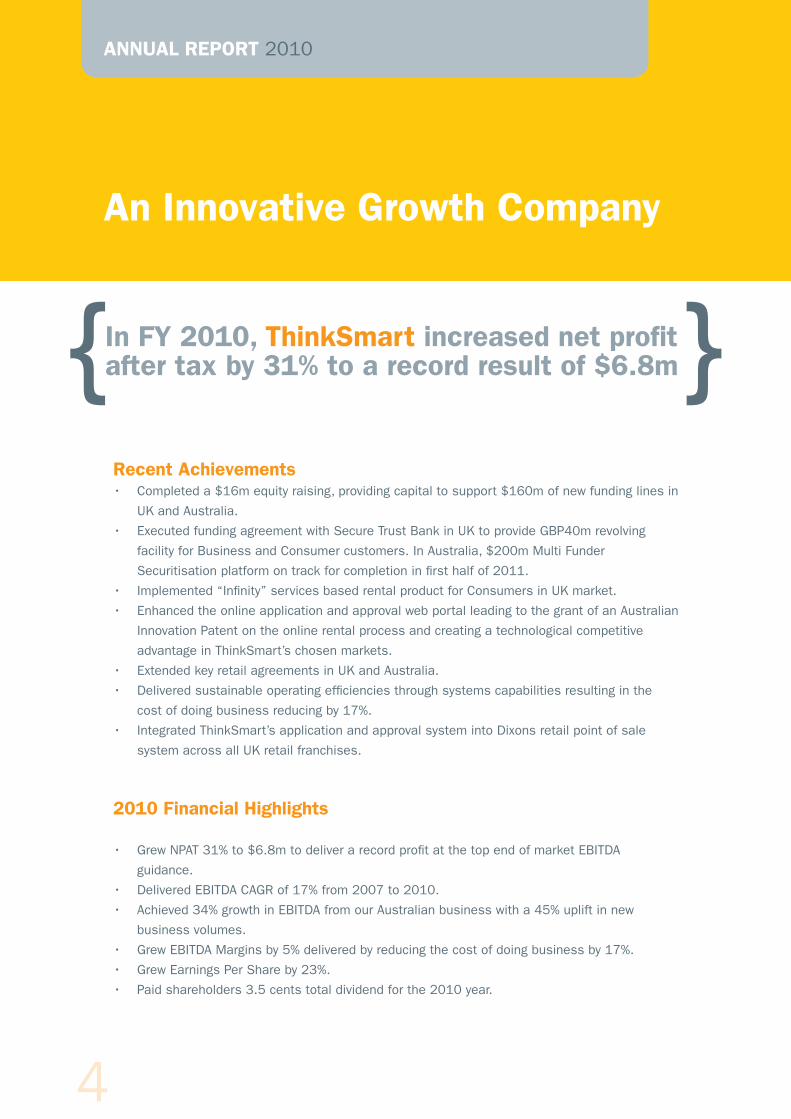
An Innovative Growth Company
In FY 2010, ThinkSmart increased net profit after tax by 31% to a record result of $6.8m} }Recent Achievements• Completed a $16m equity raising, providing capital to support $160m of new funding lines in
UK and Australia.
• Executed funding agreement with Secure Trust Bank in UK to provide GBP40m revolving
facility for Business and Consumer customers. In Australia, $200m Multi Funder
Securitisation platform on track for completion in first half of 2011.
• Implemented “Infinity” services based rental product for Consumers in UK market.
• Enhanced the online application and approval web portal leading to the grant of an Australian
Innovation Patent on the online rental process and creating a technological competitive
advantage in ThinkSmart’s chosen markets.
• Extended key retail agreements in UK and Australia.
• Delivered sustainable operating efficiencies through systems capabilities resulting in the
cost of doing business reducing by 17%.
• Integrated ThinkSmart’s application and approval system into Dixons retail point of sale
system across all UK retail franchises.
2010 Financial Highlights
• Grew NPAT 31% to $6.8m to deliver a record profit at the top end of market EBITDA
guidance.
• Delivered EBITDA CAGR of 17% from 2007 to 2010.
• Achieved 34% growth in EBITDA from our Australian business with a 45% uplift in new
business volumes.
• Grew EBITDA Margins by 5% delivered by reducing the cost of doing business by 17%.
• Grew Earnings Per Share by 23%.
• Paid shareholders 3.5 cents total dividend for the 2010 year.
ANNUAL REPORT 2010

5
ANNUAL REPORT 2011
$40,000
40.0%
8000
$30,000
30.0%
6000
$20,000
20.0%
4000
$10,000
10.0%
2000
$0
0.0%
$0
$45,000
45.0%
9000
$35,000
35.0%
7000
$25,000
25.0%
5000
$15,000
15.0%
3000
$5,000
5.0%
1000
2007
2007
2007
NPAT
Revenue
2008
2008
20082009
2009
20092010
2010
2010
Revenue +14%
$42.1m
Cost of Doing Business -17%
The Cost of Doing Business is the difference between the gross margin and EBITDA margin.
CAGR
(2007 - 2010)
NPAT +31%
$6.8m
-40.0% -20.0% 0.0% 20.0% 40.0% 60.0% 80.0% 100.0% 120.0%
Cost of Doing Business
FY2010 FY2009 % change
NPAT $6.8m $5.2m +31%
Total Revenue $42.1m $36.8m +14%
Earnings Per Share 6.5¢ 5.3¢ +23%
EBITDA $13.3m $11.9m +12%
EBITDA Margin (pre Corp Dev costs) 42% 40% +5%
Cost of Doing Business 22% 27% -17%
Final Dividend - partly franked 3.5cps 3.5cps no change
ANNUAL REPORT 2011
6
DIRECTORS’ REPORT
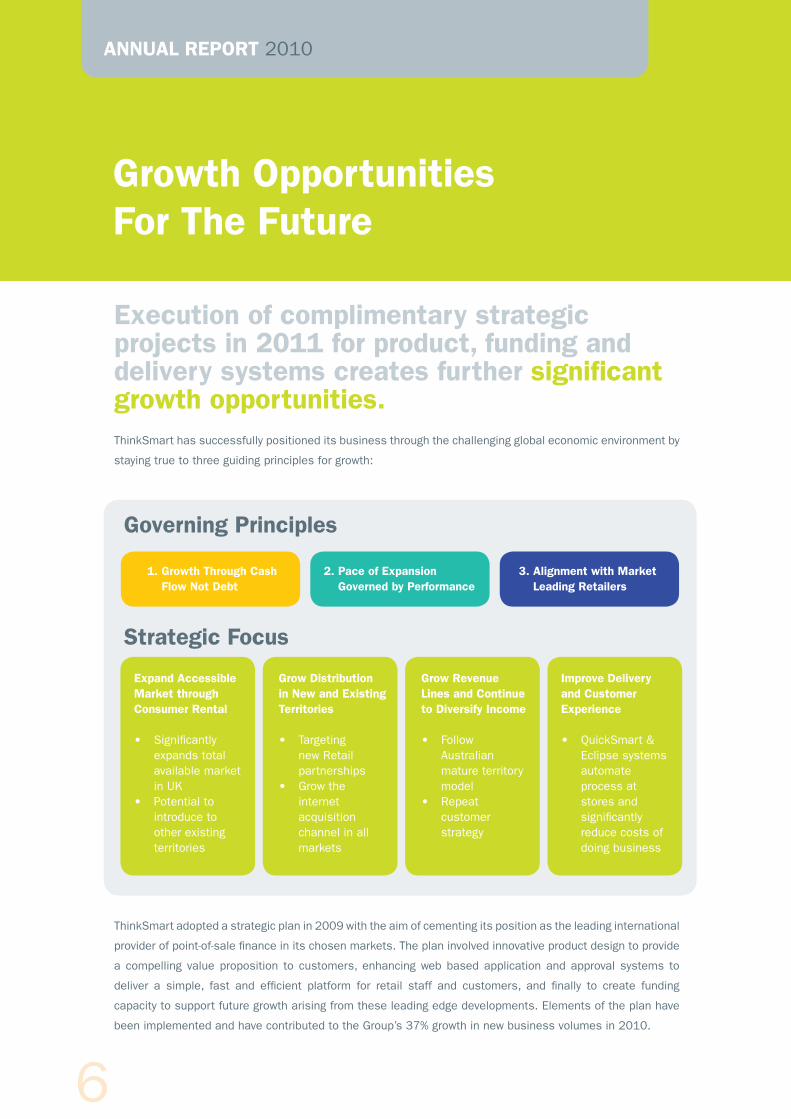
Growth Opportunities For The Future
ThinkSmart has successfully positioned its business through the challenging global economic environment by
staying true to three guiding principles for growth:
ThinkSmart adopted a strategic plan in 2009 with the aim of cementing its position as the leading international
provider of point-of-sale finance in its chosen markets. The plan involved innovative product design to provide
a compelling value proposition to customers, enhancing web based application and approval systems to
deliver a simple, fast and efficient platform for retail staff and customers, and finally to create funding
capacity to support future growth arising from these leading edge developments. Elements of the plan have
been implemented and have contributed to the Group’s 37% growth in new business volumes in 2010.
Execution of complimentary strategic projects in 2011 for product, funding and delivery systems creates further significant growth opportunities.
Governing Principles
1. Growth Through Cash Flow Not Debt
Expand Accessible Market through Consumer Rental
• Significantly expands total available market in UK
• Potential to introduce to other existing territories
Grow Distribution in New and Existing Territories
• Targeting new Retail partnerships
• Grow the internet acquisition channel in all markets
Grow Revenue Lines and Continue to Diversify Income
• Follow Australian mature territory model
• Repeat customer strategy
Improve Delivery and Customer Experience
• QuickSmart & Eclipse systems automate process at stores and significantly reduce costs of doing business
2. Pace of Expansion Governed by Performance
3. Alignment with Market Leading Retailers
Strategic Focus
ANNUAL REPORT 2010

7
ANNUAL REPORT 2011
Expand Accessible Market through Consumer Rental
ThinkSmart launched consumer rental in to the UK market in November 2010 with the Infinity product. This
services based product is a compelling value proposition for customers. A similar move into Consumer in
Australia over 5 years ago has seen consumer volumes increase at a compound annual growth rate of around
50% and this segment of the market now accounts for 70%+ of new business volumes in Australia.
Consumer rentals in the UK represent a material growth opportunity for 2011 and beyond, evidenced by the
relative size of the currently available Business segment across Dixons and the Consumer segment which is
4 times larger.
Outside of the UK, ThinkSmart is exploring the appetite from existing and potential retail partners to expand
ThinkSmart’s operations to include Consumer.
Grow Distribution in New and Existing Territories
ThinkSmart currently originates 32% of new business volumes in Australia online where the customer applies
through ThinkSmart’s website and once approval is notified the customer can execute the rental agreement
and collect the rental equipment instore. In addition to expanding distribution through traditional channels,
ThinkSmart is looking to increase its customer acquisition through Internet sales.
Recent technology developments in the UK market have seen ThinkSmart’s systems integrated with its retail
partner Dixons point of sale systems. When a customer is approved for rental finance at home they can print
out an approval confirmation that carries a unique barcode. This document can be scanned by any Dixons
point of sale terminal to authenticate the approved application and allow the customer to select equipment
up to the pre-approved limit. Equipment details are automatically captured by Dixons point of sale process
and added to the rental contract prior to execution by the customer.
The next phase of this evolution will deliver electronic signature technology to the application and approval
process creating the opportunity for ThinkSmart to offer rental finance to customers choosing to purchase
technology products through the Internet without visiting a traditional retail store. This innovative and leading
edge development will allow ThinkSmart to expand the distribution reach with existing retail partners in
addition to creating new relationship opportunities with participants in the online retail space. ThinkSmart’s
opportunity to expand distribution into new territories using online capability will reduce the establishment
costs and operating risks of expanding the Group’s international footprint.
ANNUAL REPORT 2011

8
DIRECTORS’ REPORT
Grow Revenue Lines and Continue to Diversify Income
ThinkSmart’s existing territories create opportunities to diversify the revenue base and grow total income. The
RentSmart business in Australia was established in 1996 and generates income from brokerage (Commercial
and Consumer rental finance), insurance, inertia and warranty services. In contrast, Italy operations were
established in 2007 and generate income from Commercial rental finance only. As each territory matures
the opportunity to grow revenue lines increases as demonstrated by the UK business which has recently
introduced the Consumer product.
Growth Opportunities For The Future (continued)
Improve Delivery and Customer Experience
ThinkSmart has transitioned from a telephone based applications and approval process to a web portal that
allows the customer to apply for rental finance from instore or from the comfort of their home or office. This
innovative approach has seen the time to complete the end to end process reduced to a few minutes thereby
delivering a significantly improved experience for customers and retailers alike. In addition, ThinkSmart has
achieved operating efficiencies that has led to a 17% reduction in the cost of doing business in 2010.
The QuickSmart system has been developed inhouse and has recently been awarded an Australian Innovation
Patent. Further developments including e-signature technology will further improve efficiency and the overall
experience for customers and retailers. The process establishes ThinkSmart as a global leader in this niche
and strengthens its competitive advantage in the markets it chooses to operate in.
13%
41%35%
5%19%
49% 51% 100%37%
20%
11%
19%
Commercial Consumer Insurance Warranty Inertia
Maturity Of Business Model
Australia(est 1996)
United Kingdom(est 2003)
Spain(est 2005)
Italy(est 2007)
ANNUAL REPORT 2010
9
ANNUAL REPORT 2011
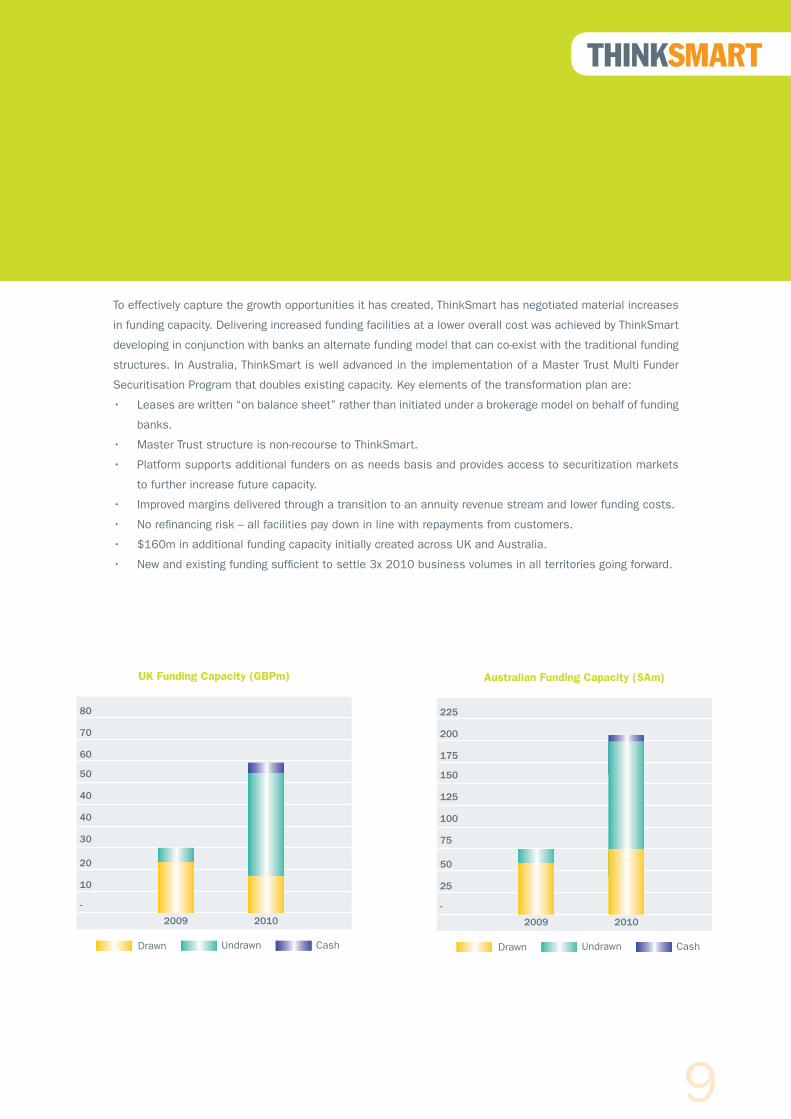
To effectively capture the growth opportunities it has created, ThinkSmart has negotiated material increases
in funding capacity. Delivering increased funding facilities at a lower overall cost was achieved by ThinkSmart
developing in conjunction with banks an alternate funding model that can co-exist with the traditional funding
structures. In Australia, ThinkSmart is well advanced in the implementation of a Master Trust Multi Funder
Securitisation Program that doubles existing capacity. Key elements of the transformation plan are:
• Leases are written “on balance sheet” rather than initiated under a brokerage model on behalf of funding
banks.
• Master Trust structure is non-recourse to ThinkSmart.
• Platform supports additional funders on as needs basis and provides access to securitization markets
to further increase future capacity.
• Improved margins delivered through a transition to an annuity revenue stream and lower funding costs.
• No refinancing risk – all facilities pay down in line with repayments from customers.
• $160m in additional funding capacity initially created across UK and Australia.
• New and existing funding sufficient to settle 3x 2010 business volumes in all territories going forward.
70
50
40
20
-
80
60
40
30
10
2009 2010
UK Funding Capacity (GBPm)
CashUndrawnDrawn
200
150
100
50
-
225
175
125
75
25
2009 2010
Australian Funding Capacity ($Am)
CashUndrawnDrawn
ANNUAL REPORT 2011
10
DIRECTORS’ REPORT
Executive Chairman & CEO Report
Dear Shareholders
I am pleased to be able to report that, for the Financial Year ended 31st December 2010, ThinkSmart delivered
a record full-year Net Profit after Tax of $6.8 million, up 31% on the previous year and delivering to the top end
of the full year EBITDA target. This result was achieved through increased revenue of 14% and a 17% reduction
in the cost of doing business.
Not only have we continued to prove our model’s resilience through the challenges of the global economic
downturn evidenced by 4 consecutive years of record profit growth since listing on the ASX in 2007, but we
have also reinforced with investors that ThinkSmart continues to be a growth company with a 37% uplift in new
business volumes in the year.
A Growth Company
To support the growth momentum ThinkSmart has successfully accessed increased global funding capacity to
support significant levels of future growth. In recent months ThinkSmart has captured $160 million in additional
funding capacity across Australia and UK which together with pre-existing capacity is sufficient to settle 3 times
2010 business volumes. The new funding arrangements provide flexibility and the structure supports additional
funders when growth in demand requires increased capacity, and overall lower funding costs will grow margins
over time.
Access to global funding lines requires a level of capital support and given the magnitude of additional funding
this lead to ThinkSmart raising $16m of additional equity in October 2010. It is expected that any future capital
requirements to support organic growth will be satisfied by internally generated capital.
Systems
The Australian deployment of our new “QuickSmart” online application portal in 2009 has been followed by
deployment to the UK in October 2010. The recently patented QuickSmart system makes the application
experience easier and faster for store sales people; delivering notable efficiency gains for our call centre teams;
and reduced our overall cost of doing business by 17%. The instore experience for the sales person and the
customer is vastly improved leading to increased penetration rates on computer sales. QuickSmart also creates
the opportunity to expand our distribution channels significantly through the growth of our Internet business.
Through a set of improvements to our online process and marketing, we have grown the Internet channel in
Australia to account for up to 32% of all volume in a month, up from 27% a year earlier.
Product
The introduction of services to the rental product in Australia has contributed to increases in volumes of 45% in
2010, far in excess of the computer sales growth of our retail partners. Following the success of the Australian
product initiatives, a more comprehensive services based consumer rental product was introduced to the
UK market in November 2010 though our long term retail partner Dixons. Together with the integration of
ANNUAL REPORT 2010

11
ANNUAL REPORT 2011
ThinkSmart’s systems into Dixons point of sale system, the Company is optimistic that the new Infinity consumer
product will drive growth and increased profitability in our UK operations in 2011 and beyond.
Markets
Retailing in Europe continues to be challenging however there are opportunities to grow the UK operations
leveraging the Infinity consumer product delivered through more efficient online systems and stable funding
capacity at an appropriate pricing structure. In Australia, the retailing outlook is stable however ThinkSmart sees
opportunities to leverage online capability together with lower delivery costs and increased funding capacity to
further grow future new business volumes.
ThinkSmart will continue to work towards leveraging and adapting its existing business model to capitalise on
opportunities in new territories. Further development of expansion opportunities will occur in 2011 with a view to
target new markets in 2012.
Growth Opportunities
ThinkSmart has successfully delivered the key elements of a successful growth strategy being:
• distribution through leading international retailers across global markets;
• capital to support growth expectations;
• product innovation recognised by retail partners as contributing value to their businesses;
• funding capacity to adequately support growth expectations;
• delivery systems that are leading edge and provide competitive advantage.
These elements have global application and support ThinkSmart’s growth ambitions in selected markets. In
2011 and beyond we seek to successfully leverage these strategic elements and profitably grow the international
businesses thereby delivering enhanced shareholder value.
Final Dividend
Finally, on 29 April 2011 we paid a final dividend of 3.5 cents per share partly franked, representing the full
dividend entitlement for the year. We thank all our staff for their continued hard work and enthusiasm and look
forward to continuing to grow together in 2011 and beyond.
Sincerely
NED MONTARELLO
Executive Chairman & CEO
ANNUAL REPORT 2011
12
DIRECTORS’ REPORT
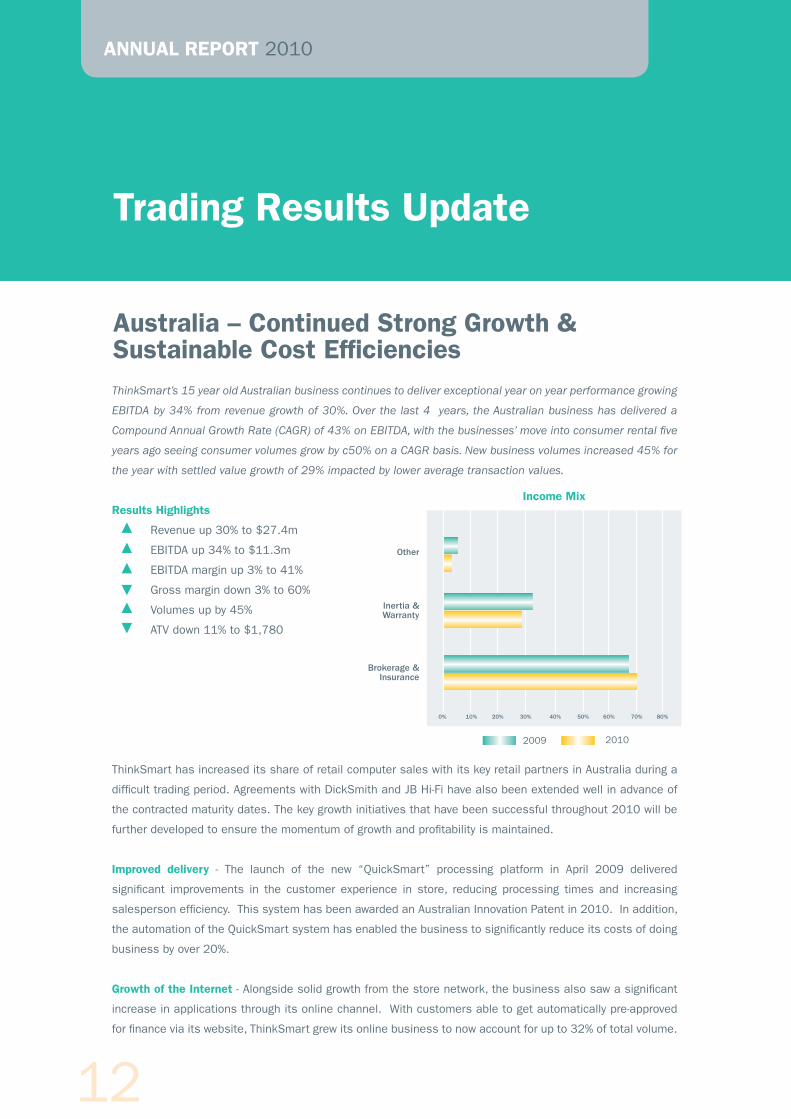
ThinkSmart’s 15 year old Australian business continues to deliver exceptional year on year performance growing
EBITDA by 34% from revenue growth of 30%. Over the last 4 years, the Australian business has delivered a
Compound Annual Growth Rate (CAGR) of 43% on EBITDA, with the businesses’ move into consumer rental five
years ago seeing consumer volumes grow by c50% on a CAGR basis. New business volumes increased 45% for
the year with settled value growth of 29% impacted by lower average transaction values.
Results Highlights
Revenue up 30% to $27.4m
EBITDA up 34% to $11.3m
EBITDA margin up 3% to 41%
Gross margin down 3% to 60%
Volumes up by 45%
ATV down 11% to $1,780
ThinkSmart has increased its share of retail computer sales with its key retail partners in Australia during a
difficult trading period. Agreements with DickSmith and JB Hi-Fi have also been extended well in advance of
the contracted maturity dates. The key growth initiatives that have been successful throughout 2010 will be
further developed to ensure the momentum of growth and profitability is maintained.
Improved delivery - The launch of the new “QuickSmart” processing platform in April 2009 delivered
significant improvements in the customer experience in store, reducing processing times and increasing
salesperson efficiency. This system has been awarded an Australian Innovation Patent in 2010. In addition,
the automation of the QuickSmart system has enabled the business to significantly reduce its costs of doing
business by over 20%.
Growth of the Internet - Alongside solid growth from the store network, the business also saw a significant
increase in applications through its online channel. With customers able to get automatically pre-approved
for finance via its website, ThinkSmart grew its online business to now account for up to 32% of total volume.
Australia – Continued Strong Growth & Sustainable Cost Efficiencies
Trading Results Update
Income Mix
0% 10% 20% 30% 40% 50% 60% 70% 80%
Other
Inertia & Warranty
Brokerage & Insurance
20102009
ANNUAL REPORT 2010

13
ANNUAL REPORT 2011
The growth of the online channel has helped reduce customer acquisition costs, and attracts a higher average
spend. However, this is partially offset by a 20 percentage point lower conversion rate. This experience in
online initiated business is transportable to other existing and future territories.
Product improvements – With the goal of improving customer acquisition and retention, in January 2010,
ThinkSmart rolled out a major new enhancement to its core rental product in Australia to include a suite of
added value service offerings that the customer benefits from over the life of their contract. This provides
more than $500 worth of added value on an average $2,000 deal. Based on the successful launch of the
UK Infinity consumer product, ThinkSmart is looking to further refine the Australian product offering to provide
broader appeal to customers and grow market share further.
The business is strongly positioned for 2011 and beyond with strong and committed retail relationships,
significant growth in funding capacity to support growth ambitions, and consistent and increasing revenue
from inertia and warranty.
United Kingdom - Stable EBITDA with Consumer creating growth opportunities
The focus of 2010 was to maintain the existing B2B product and at the same time develop an exciting and
compelling proposition for the Consumer customer. The Infinity product for Consumers was introduced in early
November and has been positively accepted by Dixons, our retail partner in the UK. The product is expected to
make a positive EBITDA contribution in 2011.
Results Highlights
Revenue unchanged at £7.3m
EBITDA down 5% to £3.5m
EBITDA margin down 9% to 47%
Gross margin down 4% to 79%
Volumes (B2B) down by 12%
ATV up 12% to £881
Income Mix
0% 10% 20% 30% 40% 50% 60% 70% 80%
Other
Inertia
Brokerage & Insurance
20102009
ANNUAL REPORT 2011

14
DIRECTORS’ REPORT
Against a backdrop of a challenging retail trading environment the business has maintained its position and
at the same time created opportunities in the Consumer segment that is expected to deliver significant future
value.
ThinkSmart has secured a strong funding proposition in the UK through the execution of a new GBP40m
revolving facility with Secure Trust Bank which initially runs to 2014. Negotiations with other potential funders
in this market continue as ThinkSmart seeks to move towards a multi funder platform in its key territories.
The Infinity product is available in all Curry’s outlets providing greater market share opportunity. ThinkSmart’s
QuickSmart application and approval system is integrated into Curry’s retail point of sales system thereby
delivering the most advanced and efficient in store process offered by ThinkSmart. This market leading
process provides a competitive advantage and achieves a high level of scaleability as volumes begin to grow
as retail markets improve.
In 2011, ThinkSmart plans to adopt e-signature technology to further enhance the experience for customers
and retail staff whilst further reducing ThinkSmart’s cost of delivery and broadening the appeal of the product
to online purchasers of technology. Encouragingly, the UK businesses second half 2010 application volumes
and EBITDA (over the first half) returned to growth providing a level of expectation for growth in 2011.
Mainland Europe – Stable performance during difficult trading
Spain - ThinkSmart’s Spanish business maintained positive EBITDA in FY 2010, growing its contribution off
a low base. New business volumes grew by over 60% for the year. Inertia revenues from business written in
2006 and 2007 continue to underpin profit performance
ThinkSmart continues to pursue opportunities to develop Spain into a multi-channel territory.
Italy - In Italy, ThinkSmart currently is reviewing its market strategy to incorporate an online approach.
France - France currently remains a challenging market for ThinkSmart, and its success is dependent upon
aligning with the right retail partners in the territory and our ability to secure a supportive funding partner.
There are no immediate plans to commence trading in this territory.
Trading Results Update (continued)
ANNUAL REPORT 2010
15
ANNUAL REPORT 2011
People
ThinkSmart recognises the value of its staff in delivering on its corporate goals. Accordingly, ThinkSmart is
committed to providing the right training, tools, leadership and professional support, required to enable its
employees to develop into highly productive, knowledgeable, and loyal individuals. ThinkSmart also seeks to
create a values based culture, providing the guiding principles within which our employees can develop and
excel.
These goals are primarily fostered through our “PeopleSmart” programme in Australia and the “Investor in
People” accreditation of our UK business. The PeopleSmart programme aims to build a great place to work
and cultivate the values of “people, performance, and culture”. PeopleSmart is made up of a committee of
employees from various departments to organize activities that align employees to the ThinkSmart values.
PeopleSmart also acts as a forum for the discussion of workplace issues, in order to improve the work
environment for ThinkSmart’s employees.
Community
At a corporate level, and through its PeopleSmart initiative, ThinkSmart looks to give back to the community
both financially and by donating time. At a corporate level ThinkSmart is a contributor to the St John of God
Cancer Centre for the treatment of cancer patients, as well as the provision of hospitality to their families.
ThinkSmart has donated a number of computers and other equipment to a Queensland primary school which
had lost all its technology equipment in the 2010 floods.
At a team level, ThinkSmart supports employee driven charitable initiatives both by making the time available
and in most cases, matching employee donations. Employees in the business have given generously and
participated actively in a range of community based initiatives including: the Premiers Disaster Relief Appeal
for the recent Queensland floods; blood and financial donations to the Red Cross; Make a Wish Foundation;
and Movember (Prostate Cancer Foundation and Beyond Blue).
Responsible Lending
ThinkSmart has been a practitioner of responsible lending practices for a number of years. Primarily these
practices are reflected within its lending criteria; however ThinkSmart is also a member of an approved
external dispute resolution scheme and regularly reviews the competence of its lending staff and its end to
end processes as it strives to achieve best practice. ThinkSmart regularly undertakes research and elicits
customer feedback to ensure that its product offering is aligned to community needs and that its customer
service is the best it can be.
Corporate & Social Responsibility
ANNUAL REPORT 2011
16
DIRECTORS’ REPORT
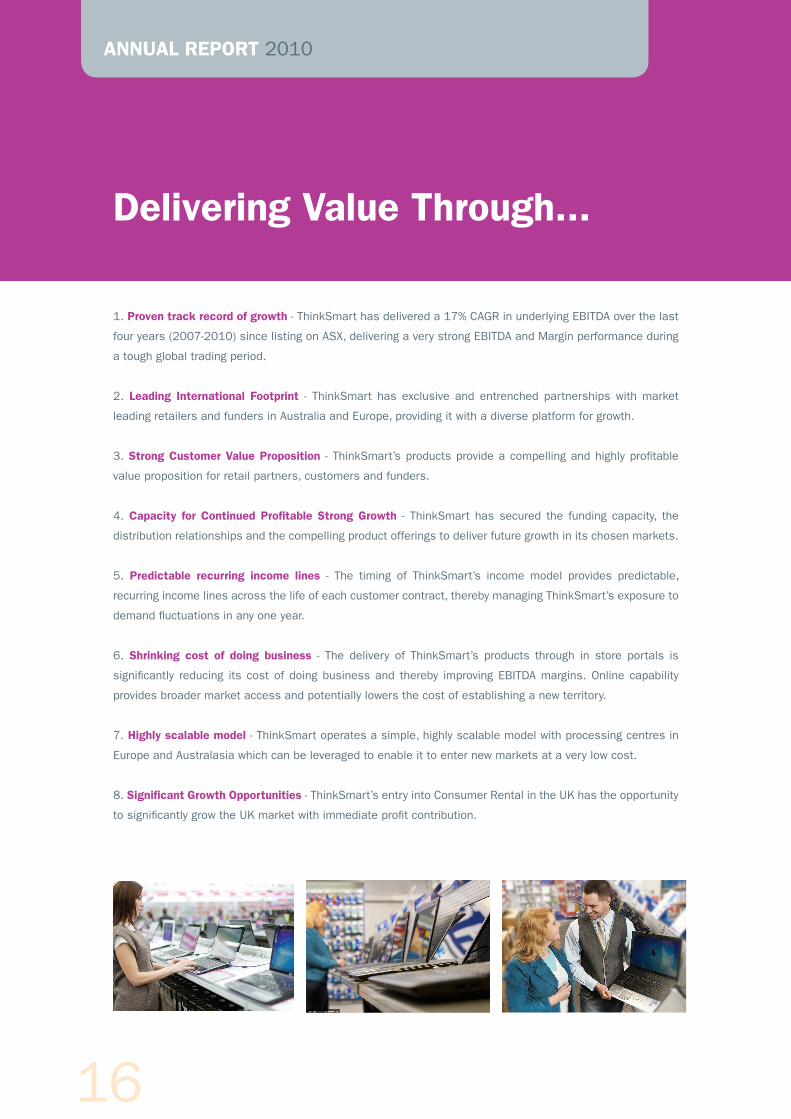
Delivering Value Through...
1. Proven track record of growth - ThinkSmart has delivered a 17% CAGR in underlying EBITDA over the last
four years (2007-2010) since listing on ASX, delivering a very strong EBITDA and Margin performance during
a tough global trading period.
2. Leading International Footprint - ThinkSmart has exclusive and entrenched partnerships with market
leading retailers and funders in Australia and Europe, providing it with a diverse platform for growth.
3. Strong Customer Value Proposition - ThinkSmart’s products provide a compelling and highly profitable
value proposition for retail partners, customers and funders.
4. Capacity for Continued Profitable Strong Growth - ThinkSmart has secured the funding capacity, the
distribution relationships and the compelling product offerings to deliver future growth in its chosen markets.
5. Predictable recurring income lines - The timing of ThinkSmart’s income model provides predictable,
recurring income lines across the life of each customer contract, thereby managing ThinkSmart’s exposure to
demand fluctuations in any one year.
6. Shrinking cost of doing business - The delivery of ThinkSmart’s products through in store portals is
significantly reducing its cost of doing business and thereby improving EBITDA margins. Online capability
provides broader market access and potentially lowers the cost of establishing a new territory.
7. Highly scalable model - ThinkSmart operates a simple, highly scalable model with processing centres in
Europe and Australasia which can be leveraged to enable it to enter new markets at a very low cost.
8. Significant Growth Opportunities - ThinkSmart’s entry into Consumer Rental in the UK has the opportunity
to significantly grow the UK market with immediate profit contribution.
ANNUAL REPORT 2010
17
ANNUAL REPORT 2011
FINANCIAL REPORT FINANCIAL YEAR ENDED 31 DECEMBER 2010
Corporate Information 18
Directors’ Report 19
Auditor’s Independence Declaration 42
Directors’ Declaration 43
Statement of Comprehensive Income 44
Statement of Financial Position 45
Statements of Changes in Equity 46
Statement of Cash Flow 47
Notes to the Financial Statements 48
Independent Audit Report 95
Shareholder Information 97
18
CORPORATE INFORMATION
ABN 24 092 319 698
DIRECTORSN R Montarello (Chairman and Chief Executive Officer)
D Griffiths (Deputy Chairman)
S Penglis
F de Vicente
COMPANY SECRETARYN Barker
REGISTERED OFFICELevel 1, The West Centre
1260 Hay Street
West Perth, WA 6005
Australia
PRINCIPAL PLACE OF BUSINESSLevel 1, The West Centre
1260 Hay Street
West Perth, WA 6005
Australia
Phone: +61 8 9463 7500
SHARE REGISTER Computershare Investor Services Pty Limited
Level 2, 45 St Georges Terrace
Perth, WA 6000
Australia
Phone: 1300 850 505
ThinkSmart Limited shares are listed on the Australian
Securities Exchange (ASX code: TSM)
SOLICITORSFreehills
250 St Georges Terrace
Perth, WA 6000
Australia
BANKERSANZ
West Perth
Australia
AUDITORSKPMG
Australia
19
ANNUAL REPORT 2011
DIRECTORS’ REPORT
The Directors of ThinkSmart Limited (the “Company”) submit
herewith the annual financial report of the Company and the
Group for the financial year ended 31 December 2010 and
the auditor’s report thereon. In order to comply with the
provisions of the Corporations Act 2001, the directors report
as follows:
DIRECTORSThe names and details of the Company’s directors in office
during the financial year and until the date of this report
are as follows. Directors were in office for this entire period
unless otherwise stated.
Names, qualifications, experience and special
responsibilities
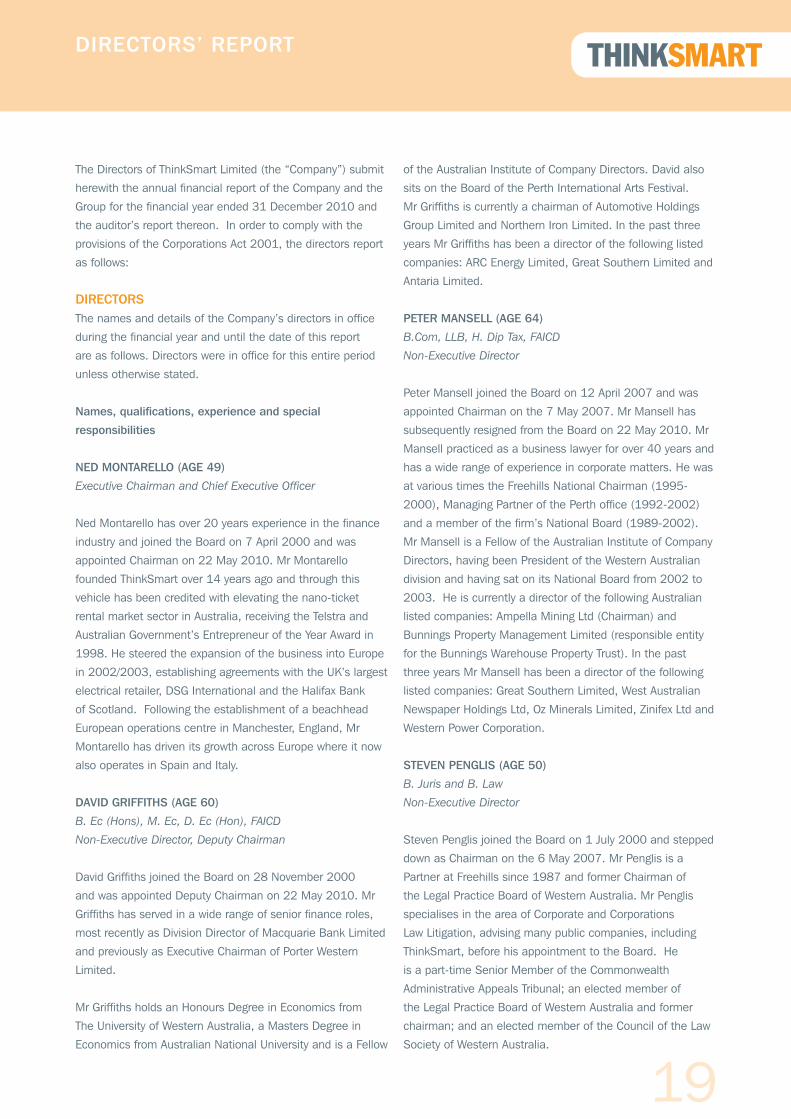
NED MONTARELLO (AGE 49)
Executive Chairman and Chief Executive Officer
Ned Montarello has over 20 years experience in the finance
industry and joined the Board on 7 April 2000 and was
appointed Chairman on 22 May 2010. Mr Montarello
founded ThinkSmart over 14 years ago and through this
vehicle has been credited with elevating the nano-ticket
rental market sector in Australia, receiving the Telstra and
Australian Government’s Entrepreneur of the Year Award in
1998. He steered the expansion of the business into Europe
in 2002/2003, establishing agreements with the UK’s largest
electrical retailer, DSG International and the Halifax Bank
of Scotland. Following the establishment of a beachhead
European operations centre in Manchester, England, Mr
Montarello has driven its growth across Europe where it now
also operates in Spain and Italy.
DAVID GRIFFITHS (AGE 60)
B. Ec (Hons), M. Ec, D. Ec (Hon), FAICD
Non-Executive Director, Deputy Chairman
David Griffiths joined the Board on 28 November 2000
and was appointed Deputy Chairman on 22 May 2010. Mr
Griffiths has served in a wide range of senior finance roles,
most recently as Division Director of Macquarie Bank Limited
and previously as Executive Chairman of Porter Western
Limited.
Mr Griffiths holds an Honours Degree in Economics from
The University of Western Australia, a Masters Degree in
Economics from Australian National University and is a Fellow
of the Australian Institute of Company Directors. David also
sits on the Board of the Perth International Arts Festival.
Mr Griffiths is currently a chairman of Automotive Holdings
Group Limited and Northern Iron Limited. In the past three
years Mr Griffiths has been a director of the following listed
companies: ARC Energy Limited, Great Southern Limited and
Antaria Limited.
PETER MANSELL (AGE 64)
B.Com, LLB, H. Dip Tax, FAICD
Non-Executive Director
Peter Mansell joined the Board on 12 April 2007 and was
appointed Chairman on the 7 May 2007. Mr Mansell has
subsequently resigned from the Board on 22 May 2010. Mr
Mansell practiced as a business lawyer for over 40 years and
has a wide range of experience in corporate matters. He was
at various times the Freehills National Chairman (1995-
2000), Managing Partner of the Perth office (1992-2002)
and a member of the firm’s National Board (1989-2002).
Mr Mansell is a Fellow of the Australian Institute of Company
Directors, having been President of the Western Australian
division and having sat on its National Board from 2002 to
2003. He is currently a director of the following Australian
listed companies: Ampella Mining Ltd (Chairman) and
Bunnings Property Management Limited (responsible entity
for the Bunnings Warehouse Property Trust). In the past
three years Mr Mansell has been a director of the following
listed companies: Great Southern Limited, West Australian
Newspaper Holdings Ltd, Oz Minerals Limited, Zinifex Ltd and
Western Power Corporation.
STEVEN PENGLIS (AGE 50)
B. Juris and B. Law
Non-Executive Director
Steven Penglis joined the Board on 1 July 2000 and stepped
down as Chairman on the 6 May 2007. Mr Penglis is a
Partner at Freehills since 1987 and former Chairman of
the Legal Practice Board of Western Australia. Mr Penglis
specialises in the area of Corporate and Corporations
Law Litigation, advising many public companies, including
ThinkSmart, before his appointment to the Board. He
is a part-time Senior Member of the Commonwealth
Administrative Appeals Tribunal; an elected member of
the Legal Practice Board of Western Australia and former
chairman; and an elected member of the Council of the Law
Society of Western Australia.
20
DIRECTORS’ REPORT
FERNANDO DE VICENTE (AGE 43)
B. Econ, MBA Bus
Non-Executive Director
Fernando de Vicente is a citizen of Spain whom has
joined the Board on 7 April 2010. Mr de Vicente has a
Degree in Economics (International Development) from the
University Complutense in Madrid, and an Executive MBA
from IESE Business School in Madrid. Mr de Vicente spent
nine years at DSG International, one of Europe’s largest
electrical retailers, where he most recently held the role of
International Managing Director, with responsibility for DSG’s
Central & Southern European operations, a A$3 billion
business with 350 stores across six countries.
Mr de Vicente started his career with DSG as Finance
Director for PC City Spain, and became the MD for Spain
in 2003. In 2006 he was promoted to Regional Managing
Director for South-East Europe based in Greece, before
assuming the role of International Managing Director in
2008. In March 2010, Mr de Vicente left DSG to become
the Executive Chairman of BodyBell Group, one of Spain’s
largest speciality retailers.
COMPANY SECRETARYNEIL BARKER
B.Bus, FCPA
Neil Barker is a Certified Practicing Accountant (Fellow)
with over 27 years experience in banking and finance. Prior
to joining ThinkSmart, Mr Barker was the Group Financial
Controller of Alinta Limited, an Australian public listed
company. Prior to joining Alinta, he was employed with the
NAB Group in senior finance roles based in the UK and
Australia.
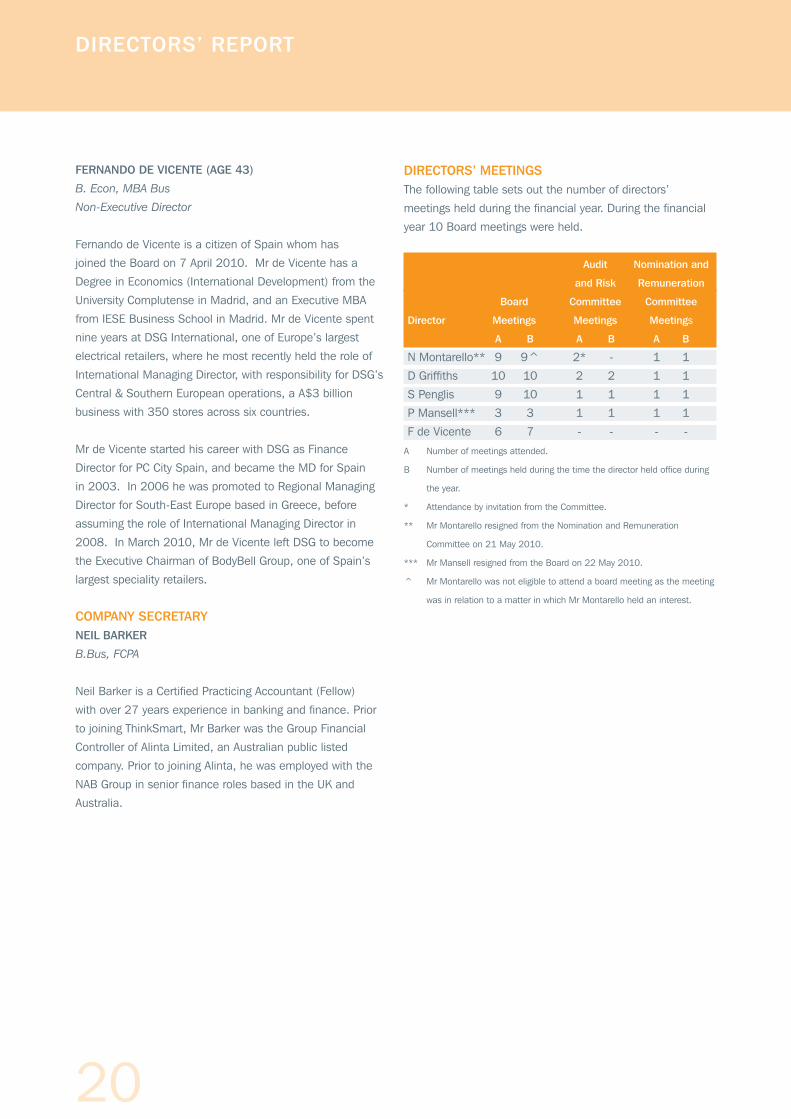
DIRECTORS’ MEETINGSThe following table sets out the number of directors’
meetings held during the financial year. During the financial
year 10 Board meetings were held.
Audit Nomination and
and Risk Remuneration
Board Committee Committee
Director Meetings Meetings Meetings
A B A B A B
N Montarello** 9 9^ 2* - 1 1
D Griffiths 10 10 2 2 1 1
S Penglis 9 10 1 1 1 1
P Mansell*** 3 3 1 1 1 1
F de Vicente 6 7 - - - -
A Number of meetings attended.
B Number of meetings held during the time the director held office during
the year.
* Attendance by invitation from the Committee.
** Mr Montarello resigned from the Nomination and Remuneration
Committee on 21 May 2010.
*** Mr Mansell resigned from the Board on 22 May 2010.
^ Mr Montarello was not eligible to attend a board meeting as the meeting
was in relation to a matter in which Mr Montarello held an interest.
21
ANNUAL REPORT 2011
CORPORATE GOVERNANCE STATEMENTThis statement outlines the main corporate governance
practices in place throughout the financial year, which comply
with the ASX Corporate Governance Council recommendations,
unless otherwise stated.
BOARD OF DIRECTORS
Role of the Board
The Board’s primary role is the protection and enhancement
of long-term shareholder value.
To fulfil this role, the Board has adopted a charter
which establishes the relationship between the Board
and management and describes their functions and
responsibilities. The Board’s responsibilities, as set out in the
Board Charter, include:
n working with management to establish ThinkSmart’s
strategic direction;
n monitoring management and financial performance;
n monitoring compliance and risk management;
n reviewing procedures in place for appointment of senior
management and monitoring of its performance and for
succession planning; and
n ensuring effective disclosure policies and procedures.
Matters which are specifically reserved for the Board or its
Committees under the Board Charter include:
n appointment of a chair;
n appointment and removal of the CEO;
n appointment of directors to fill a vacancy or as
additional directors;
n establishment of Board Committees, their membership
and delegated authorities;
n approval of dividends;
n development and review of corporate governance
principles and policies;
n approval of operational budgets, major capital
expenditure, acquisitions and divestitures in excess of
authority levels delegated to management;
n calling of meetings of shareholders; and
n any other specific matters nominated by the Board from
time to time.
It is also responsible for approving and monitoring financial
and other reporting. Detail of the Board’s charter is located
in the Company’s website (www.thinksmartworld.com).
The Board, together with the Nomination and Remuneration
Committee, determines the size and composition of the
Board, subject to the terms of the constitution.
The Board has delegated responsibility for operations and
administration of the Company to the Chief Executive Officer
and executive management. Responsibilities are delineated
by formal authority delegations.
Board process
To assist in the execution of its responsibilities, the Board
has established a Nomination and Remuneration Committee,
as well as an Audit and Risk Committee. These Committees
have written mandates and operating procedures, which are
reviewed on a regular basis. The Board has also established
framework for management of the Group including a system
of internal control, a business risk management process and
the establishment of appropriate ethical standards.
Independent professional advice and access to company
information
Following consultation with the chairperson, directors may
seek independent professional advice at the Company’s
expense. Generally, this advice will be available to all
directors.
Composition of the Board
The names of the directors of the Company in the office at
the date of this report are set out in the Directors’ report on
page 19 and 20 of this report. The composition of the Board
is determined using the following principles:
n The Board does not believe that it should establish a
limit on tenure. While tenure limits can help to ensure
that there are fresh ideas and viewpoints available to
the Board, they hold the disadvantage of losing the
contribution of directors who have been able to develop,
over a period of time, increasing insight in the Company
and its operation and, therefore, an increasing
contribution to the Board as a whole.
n It is intended that the Board should comprise a majority
of independent Non-Executive Directors and comprise
directors with a broad range of skills, expertise and
experience from a diverse range of backgrounds.
n The Board regularly reviews the independence of each
director in light of the interests disclosed to the Board.
22
DIRECTORS’ REPORT
On 22 May 2010, Mr Mansell retired from his role
as Chairman of the Board after leading the Company
through a successful transition to being a publicly listed
company, and Mr Montarello was subsequently appointed
Executive Chairman. The Board acknowledges the ASX
Recommendation that the Chairman be an Independent
Director, however, the Board views the appointment of Mr
Montarello as an advantage given his history of leadership
in the Company and finance industry, and his clear incentive
to maximize the interests of the Company. Mr Montarello
founded the Company over 14 years ago, and has been
involved in expanding the business through Australia and
overseas. His experience and insights continue to be
invaluable to the Group.
The Board is conscious of the ASX Corporate Governance
Recommendation stipulates that the roles of Chair and
Chief Executive Officer should not be exercised by the same
individual. Given the breadth of the Group’s operations and
the Executive Chairman’s extensive business experience, the
Board considers it appropriate that the Executive Chairman
be considered the most senior executive overseeing and
supervising the Group as well as managing the Group’s small
executive team in regard to this.
NOMINATION AND REMUNERATION COMMITTEE
The objective of the Nomination and Remuneration
Committee is to help the Board ensure that ThinkSmart has a
Board of an effective composition, size and the commitment
to adequately discharge its responsibilities and duties, and
to determine and review the compensation arrangements for
the Directors and senior management team.
The Nomination and Remuneration Committee reviews and
makes recommendations to the Board on remuneration
packages and policies applicable to the executives and
directors of the Company as well as the Group. On an annual
basis:
n Directors will provide written feedback in relation to
the Board and its Committees against an agreed set of
criteria and each Committee will do the same regarding
its own performance;
n Feedback will be collected by the chair of the Board,
or an external facilitator, and discussed by the Board,
with consideration being given as to whether any steps
should be taken to improve performance of the Board
or its Committees;
n The CEO will also provide feedback from senior
management in connection with any issues that may
be relevant in the context of the Board performance
review; and
n Where appropriate to facilitate the review process,
assistance may be obtained from third party advisers.
The current members of the Committee are S Penglis (Chair),
D Griffiths, and F De Vicente.
The Committee will meet as often as the Committee
members deem necessary in order to fulfil their role.
However, it is intended that the Committee will normally
meet at least annually.
The Committee consists of a minimum of 3 members,
majority being Non-Executive Directors, and an independent
director as chair. The Nomination and Remuneration
Committee has a documented charter, approved by
the Board, which is available on the website (www.
thinksmartworld.com).
REMUNERATION REPORT - AUDITED
The remuneration report for 2010, as presented below,
has been prepared for consideration by shareholders. The
remuneration report is set out under the following main
headings:
A: Principles of compensation
B: Directors’ and executive officers’ remuneration
C: Service agreements
D: Share-based compensation (options)
E: Share-based compensation (shares)
F: Bonus remuneration
A. PRINCIPLES OF COMPENSATION - AUDITED
Remuneration is referred to as compensation throughout
this report. Key management personnel have authority and
responsibility for planning, directing and controlling the
activities of the Company and the Group, including directors
of the Company and other executives. Key management
personnel comprise the directors of the Company and
executives for the Company and the Group including the five
most highly remunerated executives.

23
ANNUAL REPORT 2011
Compensation levels for key management personnel and
secretaries of the Company, and key management personnel
of the Group are competitively set with a view to:
n Maintain alignment with shareholders’ interests; and
n Ensure remuneration remains competitive to retain
and attract talented people who are key to delivering
sustained profitable growth of the Company.
The Nomination and Remuneration Committee obtains
independent advice on the appropriateness of compensation
packages of both the Company and the Group given trends
in comparative companies both locally and internationally
and the objectives of the Company’s compensation strategy.
The compensation structures explained below are
designed to attract suitably qualified candidates, reward
the achievement of strategic objectives, and achieve the
broader outcome of creation of value for shareholders. The
compensation structures take into account:
n the capability and experience of the key management
personnel;
n the key management personnel’s ability to control the
relevant segment/s’ performance; and
n the Group’s performance.
Compensation packages include a mix of fixed and variable
compensation and short-term and long-term performance-
based incentives.
Linking Executive Remuneration to Group Performance
The Directors of ThinkSmart Limited understand that linking
executive remuneration to Group performance is a driver of
performance. Since the Company raised equity and listed in
2007, it has delivered consistent growth in EBITDA (before
listing costs) and basic EPS.
The graph below demonstrates the Group’s consistent growth
in cash net profit after taxation measured on a like for like
basis since the Company listed on the ASX in 2007. The
Cash NPAT calculations for each year exclude from NPAT, on
a net of tax basis, amortisation costs, depreciation costs,
and unrealised foreign exchange costs. In addition, non
recurring items net of any applicable taxation are excluded
being redundancy costs in 2009, US operating costs in
2008 and IPO costs in 2007.
In considering the Group’s performance and benefits for
shareholder wealth, the Executive Chairman and Nomination
and Remuneration Committee have regard to the following
indices of the current financial year and the previous four
financial years.
2010 2009 2008 2007
Profit attributable toowners of the company $6,773,013 $5,171,776 $3,210,752 $738,066
Basic EPS 6.52 cents 5.35 cents 3.34 cents 0.80 cents
Dividends paid $1,937,788 $2,900,682 $1,933,788 -
Dividend paid per share 2 cents 3 cents 2 cents -
Share price at year end $0.73 $0.90 $0.17 $1.92
Change in share price ($0.17) $0.71 ($1.73) ($0.23)^
Return on capital employed 36% 34% 22% 6%
^Initial listing price of $2.15 is used as opening share price.
Profit is considered as one of the financial performance
target setting of the short term incentive. Profit amounts
for 2007 to 2010 have been calculated in accordance with
Australia Accounting Standards (AASBs).
The overall level of key management personnel
compensation takes into account the performance of the
Group over a number of years. Over the past four years, the
group’s profit from ordinary activities after income tax has
grown at an average rate per annum of over 109%. During
the same period, average key management personnel
compensation has grown by approximately 5.7% per annum.
10000
9000
8000
7000
6000
5000
4000
3000
2000
1000
2007 2008 2009 2010
Cash NPAT $’000s
Cash NPAT Non recurring items
24
DIRECTORS’ REPORT
The Directors of ThinkSmart Limited consider that a variety
of factors, including the broad economic environment,
market sentiment and financial performance, contribute to
the Company’s share price. In addition, there are no closely
comparable companies that would provide a meaningful
relative share price measure. As a result, the Executive
remuneration is linked to the Group’s financial performance.
Non-Executive Directors
Fees and payments to non-executive directors reflect the
demands which are made on and the responsibilities of the
Non-Executive Directors. Non-executive directors’ fees and
payments are reviewed annually by the Board. Non-Executive
Directors do not receive Share Options.
Non-Executive Director’s fees
The Non-Executive Directors shall be paid by way of fees for
services the maximum aggregate sum as may be approved
from time to time by ThinkSmart in general meeting. The
fees include Director’s fee as well as Board Committee
membership fee. The current maximum aggregate annual
sum approved by shareholders at a previous general
meeting is $600,000 (2009: $600,000). Any change to
that aggregate annual sum needs to be approved by the
shareholders. The constitution also makes provision for
ThinkSmart to pay all reasonable expenses of directors in
attending meetings and carrying out their duties.
Executive pay
The Company’s remuneration is market competitive and
aims to attract, retain and motivate high calibre employees
who contribute to the sustained growth of the ThinkSmart
business with a mix of the following four components:
n base pay and benefits;
n short-term performance incentives (STIs);
n long-term incentives through participation in the
ThinkSmart Long Term Incentive Plan; and
n other remuneration such as superannuation.
The purpose of STIs is to make a significant contribution to
the total reward package subject to meeting various targets
linked to the Company’s business objectives. An incentivised
reward structure is necessary to ensure a competitive
package in Australian and global marketplace for executives.
Incentives are designed to focus and motivate employees
to achieve outcomes beyond the expectation of normal
professional competence.
Remuneration is reviewed annually. In reviewing each
Executives’ salary, consideration is given to external
competitiveness, position responsibilities and individual
skills and experience. The STI component of Executive
remuneration is based on annual performance targets
and delivered in the form of cash. In 2010, the Company
has also introduced a new Long Term Incentive Plan
which recognises performance and behaviour that delivers
sustainable long term shareholder value and seeks to align
the interests of management with those of the shareholders.
Base pay
Executives are offered a competitive salary that comprises
the components of base pay and benefits that reflects the
applied professional competence of each Executive according
to his/her knowledge, experience and accountabilities. Base
pay for Executives is reviewed annually by Executive Director
to ensure the executive’s pay is competitive with the market.
An executive’s pay is also reviewed on promotion. Base pay
for Executive Chairman in reviewed annually by Nomination
and Remuneration Committee.
Short-term performance incentive
Short-term performance incentives (STIs) vary according to
individual contracts, however, for Executives they are broadly
based as follows:
n a component of the STI is linked to the individual
performance of the executive (this is based on a
number of factors, including performance against
budgets, achievement of key performance indicators
(KPIs) and other personal objectives).
n a component of the STI is linked to the financial
performance of the business or measured against
budgets determined at the beginning of each financial
year.
Using various profit performance targets and personal
performance objectives assessed against KPIs which are
aligned with achievement of the Board’s strategic objectives,
the Company ensures variable reward is only paid when
value has been created for shareholders. For middle and
lower level management, total STIs are linked to individual
performance measures and also to the financial performance
of the business. The STI bonus is delivered in the form of
cash.
25
ANNUAL REPORT 2011
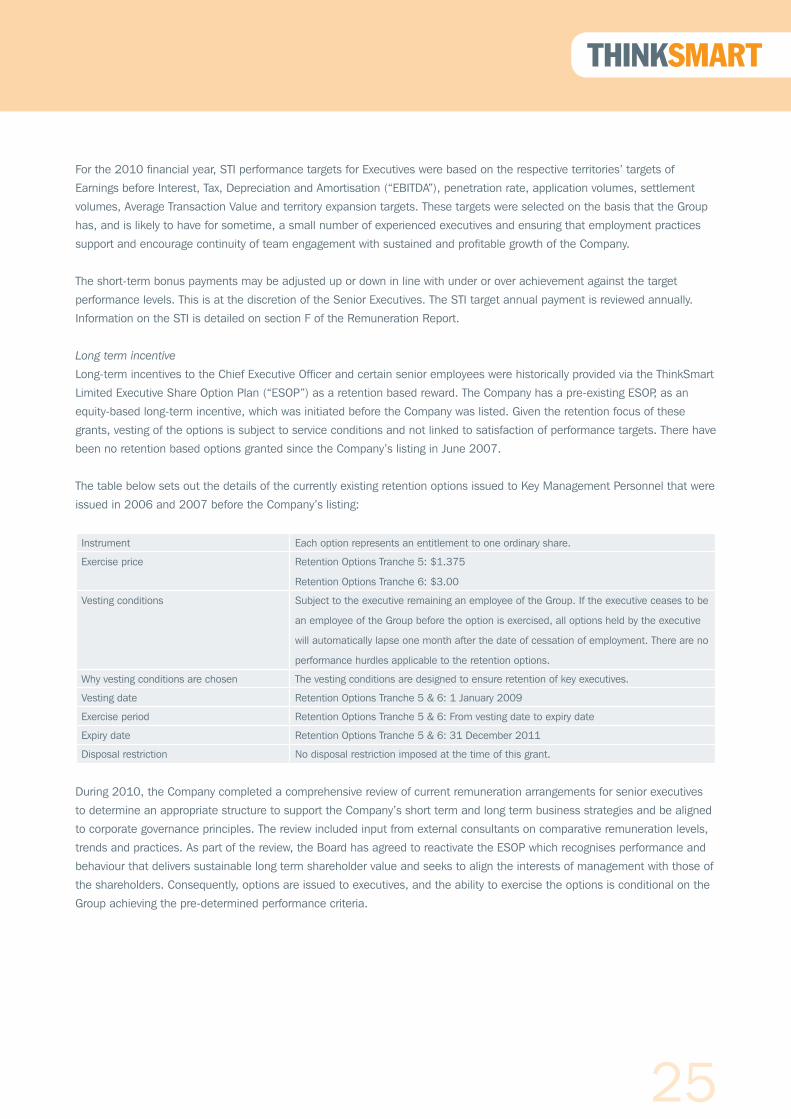
For the 2010 financial year, STI performance targets for Executives were based on the respective territories’ targets of
Earnings before Interest, Tax, Depreciation and Amortisation (“EBITDA”), penetration rate, application volumes, settlement
volumes, Average Transaction Value and territory expansion targets. These targets were selected on the basis that the Group
has, and is likely to have for sometime, a small number of experienced executives and ensuring that employment practices
support and encourage continuity of team engagement with sustained and profitable growth of the Company.
The short-term bonus payments may be adjusted up or down in line with under or over achievement against the target
performance levels. This is at the discretion of the Senior Executives. The STI target annual payment is reviewed annually.
Information on the STI is detailed on section F of the Remuneration Report.
Long term incentive
Long-term incentives to the Chief Executive Officer and certain senior employees were historically provided via the ThinkSmart
Limited Executive Share Option Plan (“ESOP”) as a retention based reward. The Company has a pre-existing ESOP, as an
equity-based long-term incentive, which was initiated before the Company was listed. Given the retention focus of these
grants, vesting of the options is subject to service conditions and not linked to satisfaction of performance targets. There have
been no retention based options granted since the Company’s listing in June 2007.
The table below sets out the details of the currently existing retention options issued to Key Management Personnel that were
issued in 2006 and 2007 before the Company’s listing:
Instrument Each option represents an entitlement to one ordinary share.
Exercise price Retention Options Tranche 5: $1.375
Retention Options Tranche 6: $3.00
Vesting conditions Subject to the executive remaining an employee of the Group. If the executive ceases to be
an employee of the Group before the option is exercised, all options held by the executive
will automatically lapse one month after the date of cessation of employment. There are no
performance hurdles applicable to the retention options.
Why vesting conditions are chosen The vesting conditions are designed to ensure retention of key executives.
Vesting date Retention Options Tranche 5 & 6: 1 January 2009
Exercise period Retention Options Tranche 5 & 6: From vesting date to expiry date
Expiry date Retention Options Tranche 5 & 6: 31 December 2011
Disposal restriction No disposal restriction imposed at the time of this grant.
During 2010, the Company completed a comprehensive review of current remuneration arrangements for senior executives
to determine an appropriate structure to support the Company’s short term and long term business strategies and be aligned
to corporate governance principles. The review included input from external consultants on comparative remuneration levels,
trends and practices. As part of the review, the Board has agreed to reactivate the ESOP which recognises performance and
behaviour that delivers sustainable long term shareholder value and seeks to align the interests of management with those of
the shareholders. Consequently, options are issued to executives, and the ability to exercise the options is conditional on the
Group achieving the pre-determined performance criteria.
26
DIRECTORS’ REPORT
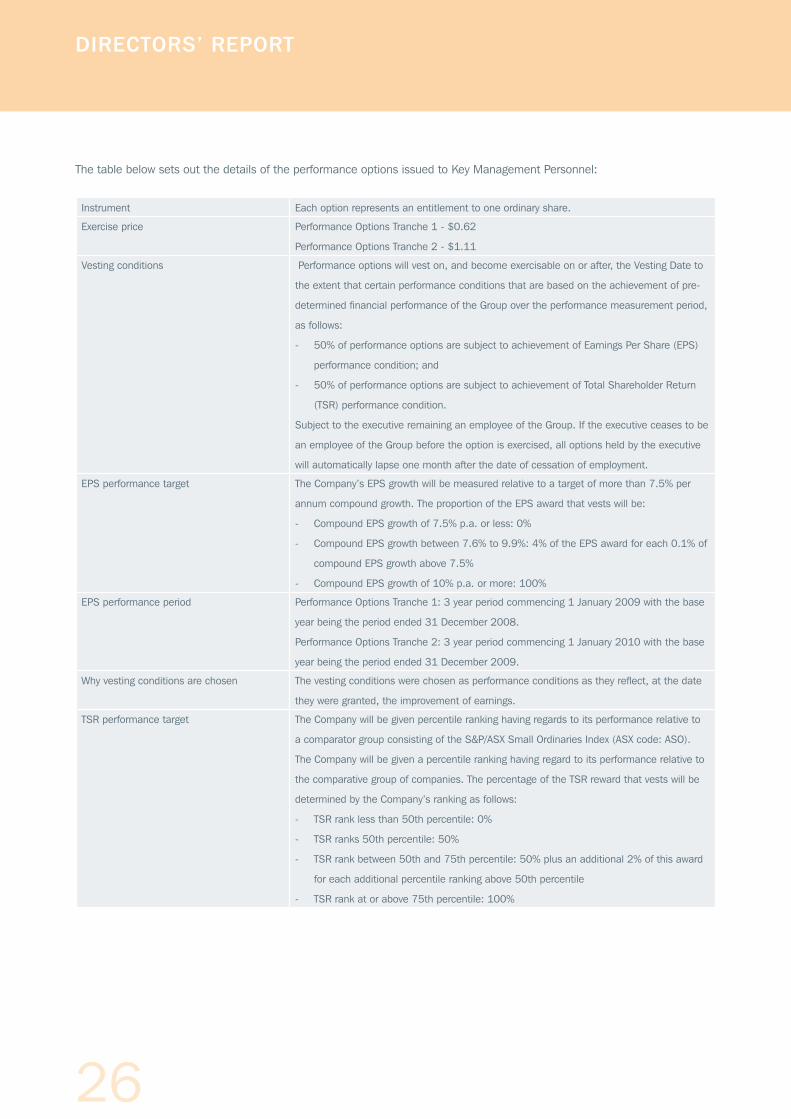
The table below sets out the details of the performance options issued to Key Management Personnel:
Instrument Each option represents an entitlement to one ordinary share.
Exercise price Performance Options Tranche 1 - $0.62
Performance Options Tranche 2 - $1.11
Vesting conditions Performance options will vest on, and become exercisable on or after, the Vesting Date to
the extent that certain performance conditions that are based on the achievement of pre-
determined financial performance of the Group over the performance measurement period,
as follows:
- 50% of performance options are subject to achievement of Earnings Per Share (EPS)
performance condition; and
- 50% of performance options are subject to achievement of Total Shareholder Return
(TSR) performance condition.
Subject to the executive remaining an employee of the Group. If the executive ceases to be
an employee of the Group before the option is exercised, all options held by the executive
will automatically lapse one month after the date of cessation of employment.
EPS performance target The Company’s EPS growth will be measured relative to a target of more than 7.5% per
annum compound growth. The proportion of the EPS award that vests will be:
- Compound EPS growth of 7.5% p.a. or less: 0%
- Compound EPS growth between 7.6% to 9.9%: 4% of the EPS award for each 0.1% of
compound EPS growth above 7.5%
- Compound EPS growth of 10% p.a. or more: 100%
EPS performance period Performance Options Tranche 1: 3 year period commencing 1 January 2009 with the base
year being the period ended 31 December 2008.
Performance Options Tranche 2: 3 year period commencing 1 January 2010 with the base
year being the period ended 31 December 2009.
Why vesting conditions are chosen The vesting conditions were chosen as performance conditions as they reflect, at the date
they were granted, the improvement of earnings.
TSR performance target The Company will be given percentile ranking having regards to its performance relative to
a comparator group consisting of the S&P/ASX Small Ordinaries Index (ASX code: ASO).
The Company will be given a percentile ranking having regard to its performance relative to
the comparative group of companies. The percentage of the TSR reward that vests will be
determined by the Company’s ranking as follows:
- TSR rank less than 50th percentile: 0%
- TSR ranks 50th percentile: 50%
- TSR rank between 50th and 75th percentile: 50% plus an additional 2% of this award
for each additional percentile ranking above 50th percentile
- TSR rank at or above 75th percentile: 100%
27
ANNUAL REPORT 2011
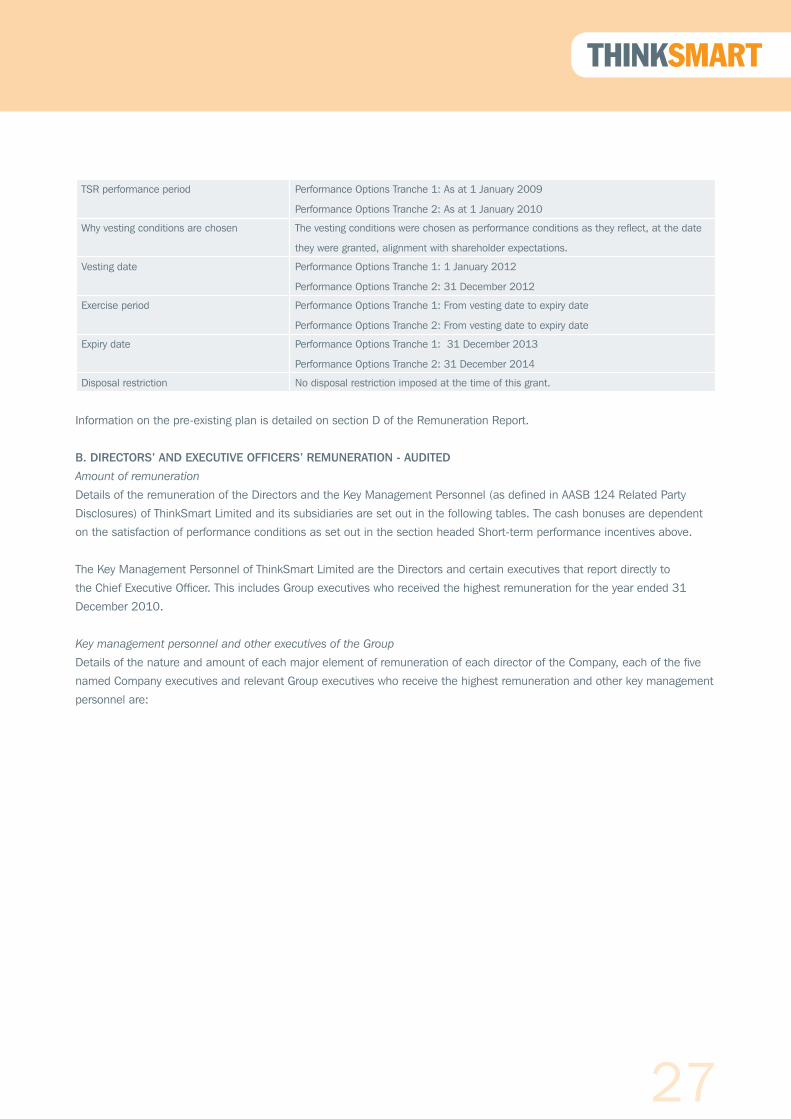
TSR performance period Performance Options Tranche 1: As at 1 January 2009
Performance Options Tranche 2: As at 1 January 2010
Why vesting conditions are chosen The vesting conditions were chosen as performance conditions as they reflect, at the date
they were granted, alignment with shareholder expectations.
Vesting date Performance Options Tranche 1: 1 January 2012
Performance Options Tranche 2: 31 December 2012
Exercise period Performance Options Tranche 1: From vesting date to expiry date
Performance Options Tranche 2: From vesting date to expiry date
Expiry date Performance Options Tranche 1: 31 December 2013
Performance Options Tranche 2: 31 December 2014
Disposal restriction No disposal restriction imposed at the time of this grant.
Information on the pre-existing plan is detailed on section D of the Remuneration Report.
B. DIRECTORS’ AND EXECUTIVE OFFICERS’ REMUNERATION - AUDITED
Amount of remuneration
Details of the remuneration of the Directors and the Key Management Personnel (as defined in AASB 124 Related Party
Disclosures) of ThinkSmart Limited and its subsidiaries are set out in the following tables. The cash bonuses are dependent
on the satisfaction of performance conditions as set out in the section headed Short-term performance incentives above.
The Key Management Personnel of ThinkSmart Limited are the Directors and certain executives that report directly to
the Chief Executive Officer. This includes Group executives who received the highest remuneration for the year ended 31
December 2010.
Key management personnel and other executives of the Group
Details of the nature and amount of each major element of remuneration of each director of the Company, each of the five
named Company executives and relevant Group executives who receive the highest remuneration and other key management
personnel are:

28
Short TermPost
employmentShare-based
payments Proportion of remu-neration perfor-mance related
Value of options as pro-
portion of remu-
nerationSalary
and fee
STI cash
bonus
Non-monetary benefits Total
Superan-nuation benefits
Termi-nation ben-efits
Options and
rights Shares Total
$ $ $ $ $ $ $ $ % %
DIRECTORS
Non-Executive Directors
P Mansell* 2010 24,751 - - 24,751 2,228 - - - 26,979 - -
2009 64,599 - - 64,599 5,814 - - - 70,413 - -
S Penglis 2010 62,145 - - 62,145 5,593 - - - 67,738 - -
2009 55,000 - - 55,000 4,950 - - - 59,950 - -
D Griffiths 2010 67,500 - - 67,500 6,075 - - - 73,575 - -
2009 58,750 - - 58,750 5,288 - - - 64,038 - -
F de Vicente* 2010 49,050 - - 49,050 - - - - 49,050 - -
2009 - - - - - - - - - - -
Executive Director
N Montarello 2010 649,527 48,000 - 697,527 31,651 - 87,531 - 816,709 17% 11%
2009 594,444 - - 594,444 40,318 - 14,174 - 648,936 2% 2%
EXECUTIVES
A Baum* 2010 141,666 - - 141,666 10,000 - 10,903 24,889 187,458 6% 6%
2009 - - - - - - - - - - -
N Barker 2010 322,996 26,000 - 348,996 31,410 - 35,671 - 416,077 15% 9%
2009 321,330 10,000 - 331,330 29,820 - 8,847 - 369,996 5% 2%
M Radotic** 2010 103,859 17,816 15,317 136,992 9,076 - 5,949 - 152,017 16% 4%
2009 233,922 34,692 20,653 289,267 21,410 - 2,591 - 313,267 12% 1%
S McDonagh* 2010 165,046 22,425 - 187,471 16,872 - - - 204,343 11% -
2009 259,231 6,500 - 265,731 23,916 - 2,591 - 292,237 3% 1%
G Varma 2010 268,623 15,089 - 283,712 25,534 - 13,872 - 323,118 4% 4%
2009 251,487 50,000 - 301,487 27,134 - 5,825 - 334,445 2% 2%
G Parry 2010 228,807 21,010 9,946 259,763 11,440 - 18,685 - 289,889 14% 6%
2009 248,790 19,824 11,686 280,300 12,439 - 2,591 - 295,330 8% 1%
Total 2010 2,083,970 150,340 25,263 2,259,573 149,879 - 172,612 24,889 2,606,953 12% 7%
Total 2009 2,087,552 121,016 32,339 2,240,907 171,088 - 36,617 - 2,448,612 6% 1%
* During the year, the Key Management Personnel has either resigned or been appointed. Please refer to the following page for details.
** Remuneration up to 30 June 2010, as Mr Radotic was reposted to a new role, where he is no longer classified as a KMP.
DIRECTORS’ REPORT

29
ANNUAL REPORT 2011
The following are Key Management Personnel of the Group:
Executive Director
n N Montarello (Chairman, Managing Director and Chief Executive Officer, ThinkSmart Limited)
Non-Executive Director
n P Mansell (Chairman, ThinkSmart Limited) – resigned 22 May 2010
n D Griffiths (Deputy Chairman, ThinkSmart Limited) – appointed Deputy Chairman 22 May 2010
n S Penglis (Non-Executive Director, ThinkSmart Limited)
n F de Vicente (Non-Executive Director, ThinkSmart Limited) – appointed to Board on the 7 April 2010
Executives
n A Baum (Group Chief Operating Officer, ThinkSmart Limited) – appointed 1 September 2010
n N Barker (Group Chief Financial Officer, ThinkSmart Limited)
n S McDonagh (Executive General Manager, RentSmart Unit Trust) – resigned 23 July 2010
n M Radotic (General Manager Sales & Marketing Continental Europe, RentSmart Limited) – ceased being a KMP after
reposting as General Manager Customer Care, RentSmart Unit Trust, on the 1 July 2010
n G Varma (Group Chief Information Officer, ThinkSmart Limited)
n G Parry (Managing Director - UK, RentSmart Limited)
C. SERVICE AGREEMENTS - AUDITED
Service agreements can provide for the provision of short-term performance incentives, eligibility for the ThinkSmart ESOP,
other benefits including the use of a Company motor vehicle, tax advisory fees, payment of benefits forgone at a previous
employer, relocation, living, tax equalisation, travel and accommodation expenses whilst an executive is required to live away
from their normal place of residence.
Only remuneration and other terms of employment for the Managing Director are formalised in a service agreement. The
Managing Director’s employment agreement has been extended to a fixed term of 3 years to 28 August 2012. All other
employment agreements are unlimited in term but capable of termination with one to three months’ notice by either the
Company or the executive. The Company can make a payment in lieu of notice.
In the event of retrenchment, the executives listed in the table on page 28 are entitled to the payment provided for in the
service agreement, where applicable. The employment of the executives may be terminated by the Company without notice by
payment in lieu of notice.
The service agreements also contain confidentiality and restraint of trade clauses.
D. SHARE BASED COMPENSATION (OPTIONS) - AUDITED
All options refer to options over ordinary shares of ThinkSmart Limited, which are exercisable on a one-for-one basis under
the Employee Share Options Plan (“ESOP”).
Options and rights over equity instruments granted as compensation – audited
Details on options over ordinary shares in the Company that were granted as compensation to each key management person
during the reporting period and details on options that vested during the reporting period are as follows:

30
DIRECTORS’ REPORT
No of options granted during
2010
Grant date Fair value per option at grant
date ($)
Exercise price per option
($)
Expiry date No of options vested during
2010
DIRECTORS
N Montarello 1,000,000 05/05/2010 0.2746 1.11 31/12/2014 -
EXECUTIVES
A Baum 333,333 01/09/2010 0.2287 1.11 31/12/2014 -
N Barker 333,333 05/05/2010 0.2746 1.11 31/12/2014 -
M Radotic 100,000 05/05/2010 0.2746 1.11 31/12/2014 -
G Varma 100,000 05/05/2010 0.2746 1.11 31/12/2014 -
G Parry 200,000 05/05/2010 0.2746 1.11 31/12/2014 -
No options are granted since the end of the financial year. The options are provided at no cost to the recipients.
Modification of terms of equity-settled share-based payment transactions - audited
No terms of equity-settled share-based payment transactions (including options and rights granted as compensation to a key
management person) have been altered or modified by the issuing entity during the reporting period or the prior period.
Exercise of options granted as compensation - audited
During the reporting period, the following shares were issued as a result of the exercise of options in the 2010 financial year.
No of shares Amount paid $/share
EXECUTIVES
N Barker 280,000 0.625

31
ANNUAL REPORT 2011
Analysis of options and rights over equity instruments granted as compensation - audited
Details of vesting profiles of the options granted as remuneration to each director of the Company and each of the five
named Company executives and relevant Group executives and other key management personnel are detailed below.
Options granted
Number of shares Grant Date % vested in year % forfeited in year (a)
Financial year in which grant vest
DIRECTORS
N Montarello 1,400,000 28/08/2006 -% -% 2009
1,000,000 30/06/2009 -% -% 2012
1,000,000 05/05/2010 -% -% 2012
EXECUTIVES
A Baum 333,333 01/09/2010 -% -% 2013
N Barker *280,000 05/01/2006 33% -% 2010
160,000 17/04/2007 -% -% 2009
120,000 17/04/2007 -% -% 2009
500,000 30/06/2009 -% -% 2012
333,333 05/05/2010 -% -% 2013
S McDonagh 300,000 30/06/2009 -% 100% 2012
M Radotic 160,000 17/04/2007 -% -% 2009
120,000 17/04/2007 -% -% 2009
300,000 30/06/2009 -% -% 2012
100,000 05/05/2010 -% -% 2013
G Varma *280,000 05/01/2006 33% -% 2010
150,000 30/06/2009 -% -% 2012
100,000 05/05/2010 -% -% 2013
G Parry 160,000 17/04/2007 -% -% 2009
120,000 17/04/2007 -% -% 2009
300,000 30/06/2009 -% -% 2012
200,000 05/05/2010 -% -% 2013
(a) The % forfeited in the year represents the reduction from the maximum number of options available to vest due to the
highest level performance criteria not being achieved.
* Option series vest equally over 3 years on 1 January 2008, 2009 and 2010.

32
DIRECTORS’ REPORT
Analysis of movement of options - audited
The movement during the reporting period, by value of options over ordinary shares in the Company held by each Company
director and each of the five named Company executives and relevant Group executives and other key management
personnel is detailed below.
Granted in year $ (a) Exercised in year $ (b) Lapsed in year $ (c)
DIRECTORS
N Montarello 274,600 - -
EXECUTIVES
A Baum 76,233 - -
N Barker 91,533 56,200 -
S McDonagh - - 87,000
M Radotic 27,460 - -
G Varma 27,460 - 19,600
G Parry 54,920 - -
Total 552,206 56,200 106,600
(a) The value of options granted in the year is the fair value of the options calculated at grant date using a binominal
option-pricing model. The total value of the options granted is included in the table above. This amount is allocated to
remuneration over the vesting period.
(b) The value of options exercised during the year is calculated as the market price of shares of the Company on the
Australian Securities Exchange as at close of trading on the date the options were exercised after deducting the price
paid to exercise the option.
(c) The value of the options that lapsed during the year represents the benefit forgone and is calculated at the date the
option lapsed using a binominal option-pricing model with no adjustments for whether the performance criteria had been
achieved.
E. SHARE BASED COMPENSATION (SHARES) - AUDITED
All shares refer to shares over ordinary shares of ThinkSmart Limited.
Shares granted as compensation – audited
Details on shares of the Company that were granted as compensation to each key management person during the reporting
period and details on shares vested during the reporting period are as follows:
No of shares
granted during
2010
Grant Date Fair value at grant
date ($)
Vesting period No of shares vested
during 2010
EXECUTIVES
A Baum 350,000 01/09/2010 0.64 3 years -
No shares are granted since the end of the financial year. The shares are provided at no cost to the recipient.
These shares were issued to A Baum upon him joining ThinkSmart Ltd and are held in escrow. The shares are ordinary shares
in the Company and will vest upon completion of a 3-year service period. During this period, Mr Baum is entitled to any
dividends declared by the Company and normal voting rights are attached. In the event that Mr Baum’s employment with the
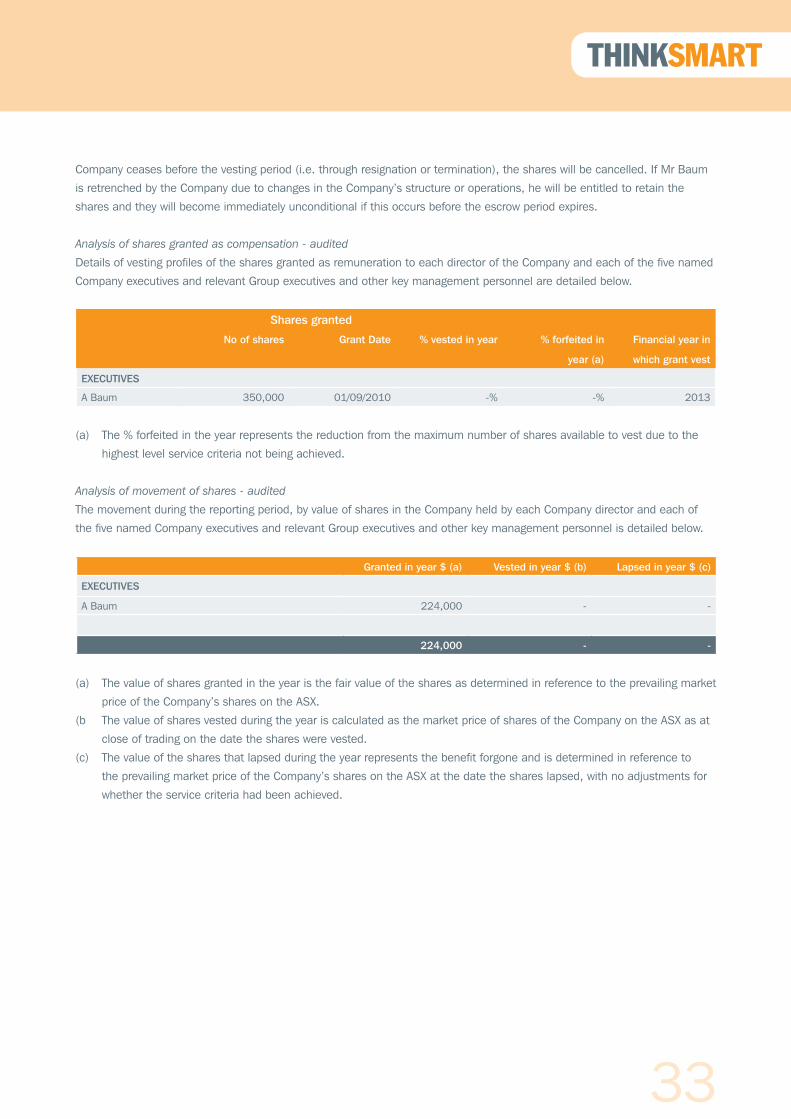
33
ANNUAL REPORT 2011
Company ceases before the vesting period (i.e. through resignation or termination), the shares will be cancelled. If Mr Baum
is retrenched by the Company due to changes in the Company’s structure or operations, he will be entitled to retain the
shares and they will become immediately unconditional if this occurs before the escrow period expires.
Analysis of shares granted as compensation - audited
Details of vesting profiles of the shares granted as remuneration to each director of the Company and each of the five named
Company executives and relevant Group executives and other key management personnel are detailed below.
Shares granted
No of shares Grant Date % vested in year % forfeited in
year (a)
Financial year in
which grant vest
EXECUTIVES
A Baum 350,000 01/09/2010 -% -% 2013
(a) The % forfeited in the year represents the reduction from the maximum number of shares available to vest due to the
highest level service criteria not being achieved.
Analysis of movement of shares - audited
The movement during the reporting period, by value of shares in the Company held by each Company director and each of
the five named Company executives and relevant Group executives and other key management personnel is detailed below.
Granted in year $ (a) Vested in year $ (b) Lapsed in year $ (c)
EXECUTIVES
A Baum 224,000 - -
Total 224,000 - -
(a) The value of shares granted in the year is the fair value of the shares as determined in reference to the prevailing market
price of the Company’s shares on the ASX.
(b The value of shares vested during the year is calculated as the market price of shares of the Company on the ASX as at
close of trading on the date the shares were vested.
(c) The value of the shares that lapsed during the year represents the benefit forgone and is determined in reference to
the prevailing market price of the Company’s shares on the ASX at the date the shares lapsed, with no adjustments for
whether the service criteria had been achieved.
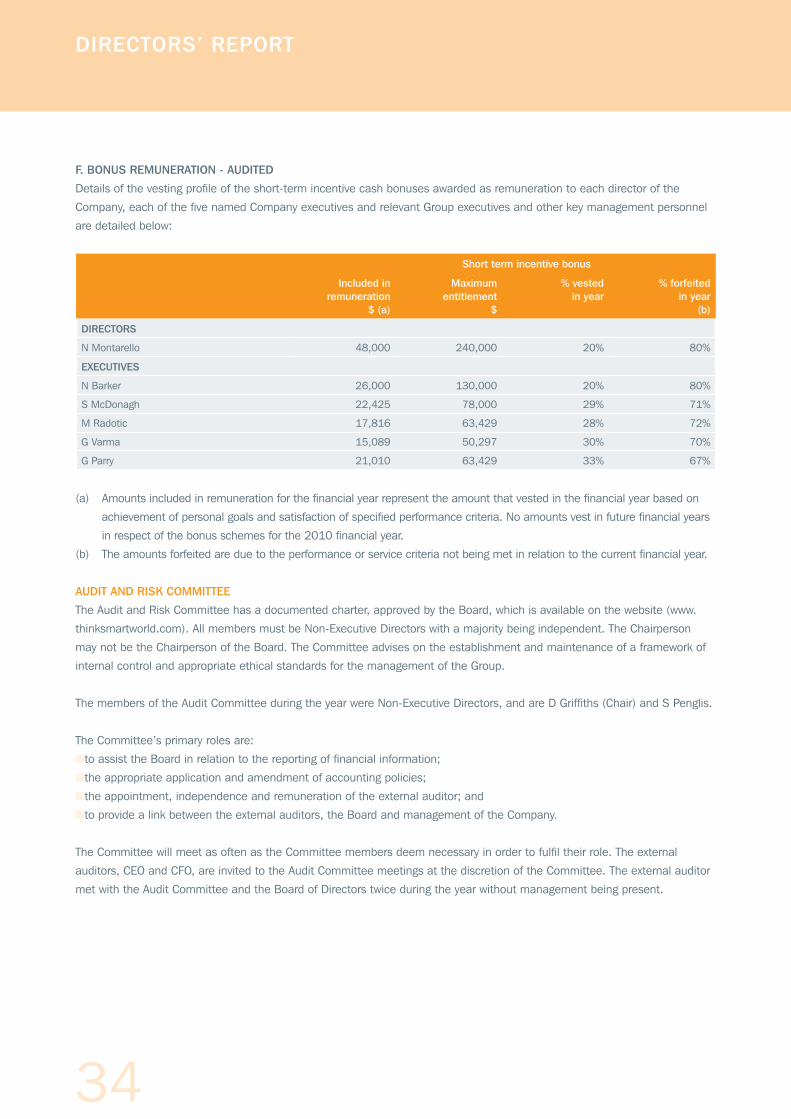
34
DIRECTORS’ REPORT
F. BONUS REMUNERATION - AUDITED
Details of the vesting profile of the short-term incentive cash bonuses awarded as remuneration to each director of the
Company, each of the five named Company executives and relevant Group executives and other key management personnel
are detailed below:
Short term incentive bonus
Included in remuneration
$ (a)
Maximum entitlement
$
% vested in year
% forfeited in year
(b)
DIRECTORS
N Montarello 48,000 240,000 20% 80%
EXECUTIVES
N Barker 26,000 130,000 20% 80%
S McDonagh 22,425 78,000 29% 71%
M Radotic 17,816 63,429 28% 72%
G Varma 15,089 50,297 30% 70%
G Parry 21,010 63,429 33% 67%
(a) Amounts included in remuneration for the financial year represent the amount that vested in the financial year based on
achievement of personal goals and satisfaction of specified performance criteria. No amounts vest in future financial years
in respect of the bonus schemes for the 2010 financial year.
(b) The amounts forfeited are due to the performance or service criteria not being met in relation to the current financial year.
AUDIT AND RISK COMMITTEE
The Audit and Risk Committee has a documented charter, approved by the Board, which is available on the website (www.
thinksmartworld.com). All members must be Non-Executive Directors with a majority being independent. The Chairperson
may not be the Chairperson of the Board. The Committee advises on the establishment and maintenance of a framework of
internal control and appropriate ethical standards for the management of the Group.
The members of the Audit Committee during the year were Non-Executive Directors, and are D Griffiths (Chair) and S Penglis.
The Committee’s primary roles are:
n to assist the Board in relation to the reporting of financial information;
n the appropriate application and amendment of accounting policies;
n the appointment, independence and remuneration of the external auditor; and
n to provide a link between the external auditors, the Board and management of the Company.
The Committee will meet as often as the Committee members deem necessary in order to fulfil their role. The external
auditors, CEO and CFO, are invited to the Audit Committee meetings at the discretion of the Committee. The external auditor
met with the Audit Committee and the Board of Directors twice during the year without management being present.
35
ANNUAL REPORT 2011
Risk management
The Committee’s specific function with respect to risk management is to review and report to the Board that:
n the Company’s ongoing risk management program effectively identifies all areas of potential risk;
n adequate policies and procedures have been designed and implemented to manage identified risks;
n a regular program of audits is undertaken to test the adequacy of and compliance with prescribed policies; and
n proper remedial action is undertaken to redress areas of weakness.
The risk management policy can be found on the Company’s website (www.thinksmartworld.com).
Internal audit
The Committee has the responsibility of:
n reviewing the internal audit objectives and resourcing (including determining whether the internal audit function is to be
provided by an internal or external party provider);
n ensuring an appropriate program of internal audit activity is conducted each financial year;
n reviewing and monitoring the progress of an internal audit and work program (without the presence of management);
n overseeing the coordination of the internal and external audit; and
n evaluating and critiquing management’s responsiveness to internal audit finding and recommendations.
Financial reporting
The Chief Executive Officer and the Chief Financial Officer have declared in writing to the Board that the Company’s financial
reports are founded on a sound system of risk management and internal compliance and control which implements the
policies adopted by the Board, and is operating efficiently and effectively in all material aspects.
Environmental regulation
The Group’s operations are not subject to any significant environmental regulation under both Commonwealth and State
legislation in relation to its activities.
Assessment of effectiveness of risk management
The Audit and Risk Committee is responsible for approving the internal audit plan to be conducted each financial year and
for the scope of the work to be performed. An independent review to assess and evaluate the quality of the internal audit
function is undertaken once every two years.
ETHICAL STANDARDS
All directors, managers and employees are expected to act with the utmost integrity and objectivity, striving at all times to
enhance the reputation and performance of the Group. Every employee has a nominated supervisor to whom they may refer
any issues arising from their employment.
Conflict of interest
Directors must keep the Board advised, on an ongoing basis, of any interest that could potentially conflict with those of the
Company. The Board has developed procedures to assist directors to disclose potential conflicts of interest.
36
DIRECTORS’ REPORT
Where the Board believes that a significant conflict exists for a director on a Board matter, the director concerned does not
receive the relevant Board papers and is not present at the meeting whilst the item is considered. Details of director related
entity transactions with the Company and the Group are set out in note 31 to the financial statements.
Code of conduct
ThinkSmart has developed a Code of Conduct which states ThinkSmart’s and its employees’ commitment to the conduct of
its business with employees, customers, funders, retailers and other external parties.
The Code is directed at maintaining high ethical standards and integrity. Employees are expected to adhere to ThinkSmart’s
policies, perform their duties diligently, properly use company resources, protect confidential information and avoid conflicts
of interest.
The Code sets out the reporting lines where there is a potential breach of the Code, ThinkSmart’s commitment to the Code
and the consequences of breaching the Code. The Code is acknowledged by all employees.
Trading in general Company securities by directors and employees
ThinkSmart’s Guidelines for Dealing in Securities explain and reinforce the Corporations Act 2001 requirements relating to
insider trading. The Guidelines are summarised below.
The Guidelines apply to all directors and employees of the ThinkSmart group, and their associates (“Relevant Persons”).
The Guidelines expressly prohibit Relevant Persons buying or selling ThinkSmart securities where the Relevant Person or
ThinkSmart is in possession of price sensitive or ‘inside’ information.
The Guidelines establish a ‘window period’, where, generally, Relevant Persons may buy or sell ThinkSmart’s securities on ASX
in the period from 31 days from the day following:
n the announcement of half-yearly results;
n the announcement of annual results; or
n the holding of the annual general meeting,
provided they are not in possession of inside information. Outside the window period, Relevant Persons must receive
clearance for any proposed dealing in ThinkSmart’s securities on ASX as follows:
n a director must receive approval from the Chair of the Board;
n the Chair must receive approval from the Board or the most senior director;
n executives and senior management must receive approval from the CEO; and
n all other Relevant persons must receive approval from the Company Secretary.
The Guidelines also prohibit short term dealing (buying and selling within 3 months) in ThinkSmart securities by Relevant
Persons.

37
ANNUAL REPORT 2011
DISCLOSURE POLICY
ThinkSmart understands its obligations under the ASX Listing Rules and Corporations Act 2001 to keep the market fully
informed of information which may have a material effect on the price or value of ThinkSmart’s securities. ThinkSmart has
adopted a Disclosure Policy which sets out its policy to strictly comply with the continuous disclosure requirements.
ThinkSmart’s Disclosure Policy is summarised below.
n The Company Secretary has the primary responsibility for all communication with the ASX in relation to Listing Rule
matters including lodging announcements with ASX. The Company Secretary is also responsible for ensuring senior
management is aware of the Disclosure Policy and that the Disclosure Policy is updated.
n If management becomes aware of any information at any time that should be considered for release to the market, it
must be reported immediately to the CEO, or the Group CFO / Company Secretary.
n Operating and divisional heads and group functional heads must ensure they have appropriate procedures in place within
their areas of responsibility to ensure that all relevant information is reported to them so it can be dealt with in accordance
with the Disclosure Policy.
COMMUNICATION WITH SHAREHOLDERS
The Board provides shareholders with information using a comprehensive Continuous Disclosure Policy which includes
identifying matters that may have a material effect on the price of the Company’s securities, notifying them to the ASX,
posting them on the Company’s website, and issuing media releases.
In summary, the Continuous Disclosure Policy operates as follows:
n Information is communicated to shareholders through ASX announcements, the annual report, annual general meeting
and half year and full year results announcements.
n Shareholders are able to access information, including media releases, key policies and the terms of reference of the
Board Committees through ThinkSmart’s website. All relevant ASX announcements will be posted on ThinkSmart’s
website as soon as they have been released to ASX.
n ThinkSmart encourages participation of shareholders at its annual general meeting. The external auditor will attend the
annual general meeting and be available to answer shareholder questions about the conduct of the audit and the preparation
and content of the auditor’s report.
PRINCIPAL ACTIVITIESThe Group’s principal activity in the course of the financial year was to arrange finance for the renting of equipment in
Australia and Europe.
There have been no significant changes in the nature of these activities during the year.
OPERATING AND FINANCIAL REVIEWThe after tax net profit of the consolidated entity, being ThinkSmart Limited and its controlled entities (the “Group” or
“consolidated entity”), for the year was $6,773,013 (2009: $5,171,776).
The period has seen the Group improve EBITDA by 12%, from $11.9m to $13.3m, or 21% if the impact of the strengthening
Australian dollar on translation of offshore earnings is ignored. EBITDA in the second half of 2010 was 34% higher than the
first half as a result of increased volumes and improved margins in Australia and the launch of the new Infinity consumer
product in the UK. The investments in core technology in the last 2 years continue to deliver operational efficiencies across
the Group with the cost of doing business reducing by 17% in the year. The Australian operations has increased its
EBITDA contribution by 34% from 45% higher settled volumes and a 12% increase in operating costs, whilst increasing
revenue by 30%.
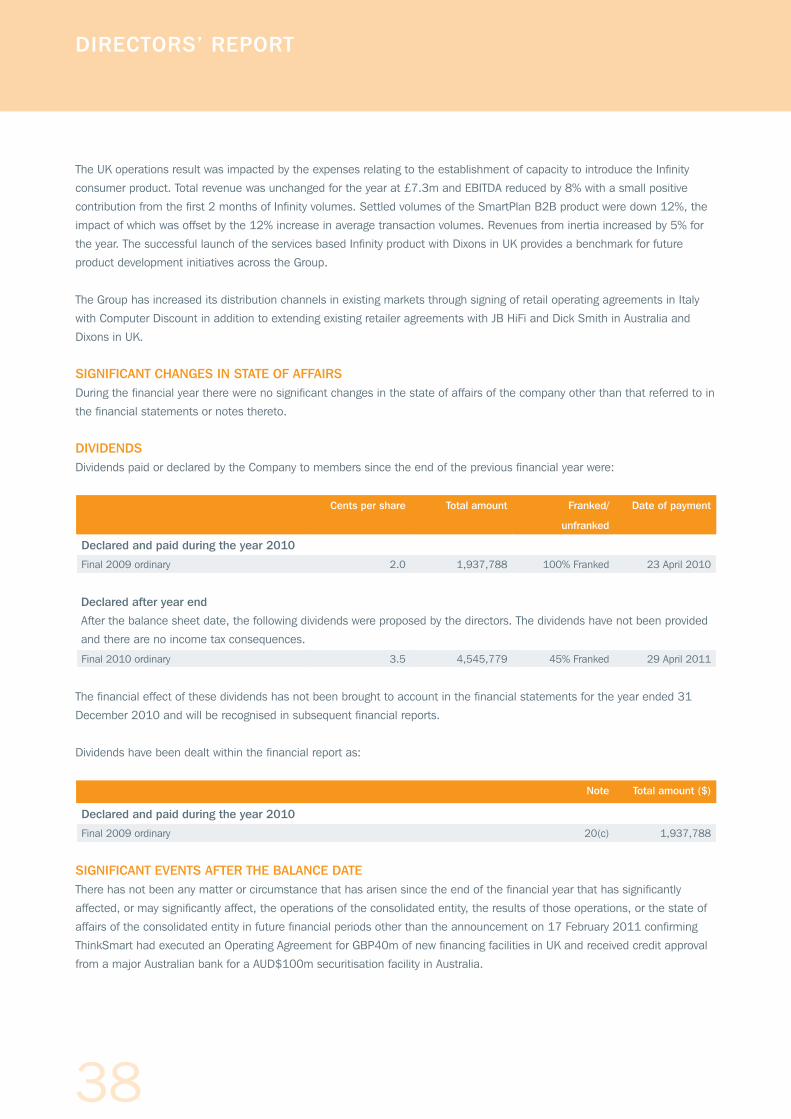
38
DIRECTORS’ REPORT
The UK operations result was impacted by the expenses relating to the establishment of capacity to introduce the Infinity
consumer product. Total revenue was unchanged for the year at £7.3m and EBITDA reduced by 8% with a small positive
contribution from the first 2 months of Infinity volumes. Settled volumes of the SmartPlan B2B product were down 12%, the
impact of which was offset by the 12% increase in average transaction volumes. Revenues from inertia increased by 5% for
the year. The successful launch of the services based Infinity product with Dixons in UK provides a benchmark for future
product development initiatives across the Group.
The Group has increased its distribution channels in existing markets through signing of retail operating agreements in Italy
with Computer Discount in addition to extending existing retailer agreements with JB HiFi and Dick Smith in Australia and
Dixons in UK.
SIGNIFICANT CHANGES IN STATE OF AFFAIRS During the financial year there were no significant changes in the state of affairs of the company other than that referred to in
the financial statements or notes thereto.
DIVIDENDSDividends paid or declared by the Company to members since the end of the previous financial year were:
Cents per share Total amount Franked/
unfranked
Date of payment
Declared and paid during the year 2010
Final 2009 ordinary 2.0 1,937,788 100% Franked 23 April 2010
Declared after year end
After the balance sheet date, the following dividends were proposed by the directors. The dividends have not been provided
and there are no income tax consequences.
Final 2010 ordinary 3.5 4,545,779 45% Franked 29 April 2011
The financial effect of these dividends has not been brought to account in the financial statements for the year ended 31
December 2010 and will be recognised in subsequent financial reports.
Dividends have been dealt within the financial report as:
Note Total amount ($)
Declared and paid during the year 2010
Final 2009 ordinary 20(c) 1,937,788
SIGNIFICANT EVENTS AFTER THE BALANCE DATEThere has not been any matter or circumstance that has arisen since the end of the financial year that has significantly
affected, or may significantly affect, the operations of the consolidated entity, the results of those operations, or the state of
affairs of the consolidated entity in future financial periods other than the announcement on 17 February 2011 confirming
ThinkSmart had executed an Operating Agreement for GBP40m of new financing facilities in UK and received credit approval
from a major Australian bank for a AUD$100m securitisation facility in Australia.
Lead Auditor’s Independence Declaration under Section 307C of the Corporations Act 2001no contraventions of the auditor independence require-ments as set out in the Corporations Act 2001 in relation to the audit; andno contraventions of any applicable code of professional conduct in relation to the audit.
KPMG
Denise McComish Partner
Perth
18 February 2011
To: the directors of ThinkSmart LimitedI declare that, to the best of my knowledge and belief, in re-lation to the audit for the financial year ended 31 December 2010 there have been:

39
ANNUAL REPORT 2011
LIKELY DEVELOPMENTS AND EXPECTED RESULTSThe Group will continue to execute its strategic plan to grow revenue by increasing business volumes through existing retail
partnerships in UK, Spain, Italy, Australia and New Zealand. In mainland Europe the Group will continue to execute a multi-
channel retailer model akin to the Australian business which should deliver market share gains in selected territories. There
will be an increased focus on direct origination of new business through online retail distribution.
Further information about likely developments in the operations of the Group and the expected results of those operations in
future financial years has not been included in this report because disclosure of the information would be likely to result in
unreasonable prejudice to the Group.
DIRECTORS’ INTERESTSThe relevant interests of each director in the shares and options over such instruments issued by the companies within the
Group and other related bodies corporate, as notified by the directors to the Australian Securities Exchange in accordance
with s205G(1) of the Corporations Act 2001, at the date of this report is as follows:
ThinkSmart Limited
Number of ordinary shares Number of options granted over
ordinary shares
N Montarello 22,020,297 2,000,000
S Penglis 1,272,600 -
D Griffiths 2,160,000 -
F de Vicente - -
SHARE OPTIONSOptions granted to directors and officers of the Company
During or since the end of the financial year, the Company granted options for no consideration over unissued ordinary shares
in the Company to the following directors and to the following of the five most highly remunerated officers of the Company as
part of their remuneration:
No of options granted Exercise price Expiry date
DIRECTORS
N Montarello 1,000,000 $1.11 31/12/2014
EXECUTIVES
N Barker 333,333 $1.11 31/12/2014
A Baum 333,333 $1.11 31/12/2014
G Varma 100,000 $1.11 31/12/2014
G Parry 200,000 $1.11 31/12/2014
All options were granted during the financial year. No options have been granted since the end of the financial year.
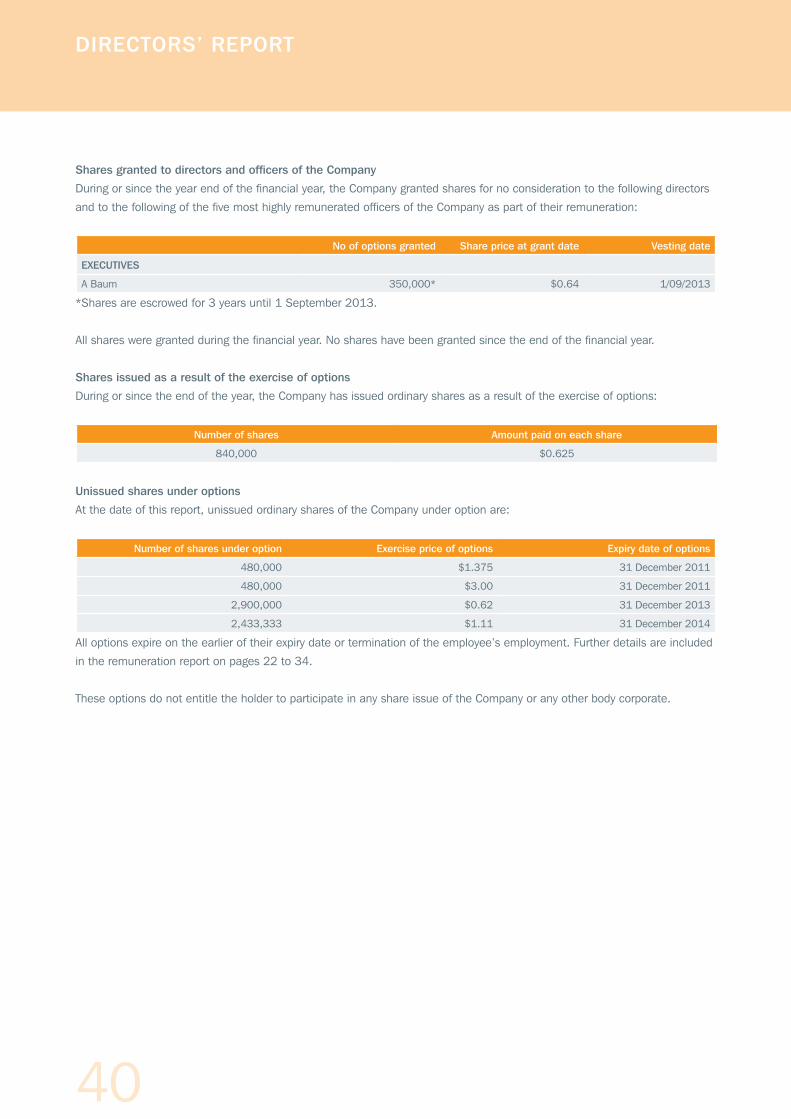
40
DIRECTORS’ REPORT
Shares granted to directors and officers of the Company
During or since the year end of the financial year, the Company granted shares for no consideration to the following directors
and to the following of the five most highly remunerated officers of the Company as part of their remuneration:
No of options granted Share price at grant date Vesting date
EXECUTIVES
A Baum 350,000* $0.64 1/09/2013
*Shares are escrowed for 3 years until 1 September 2013.
All shares were granted during the financial year. No shares have been granted since the end of the financial year.
Shares issued as a result of the exercise of options
During or since the end of the year, the Company has issued ordinary shares as a result of the exercise of options:
Number of shares Amount paid on each share
840,000 $0.625
Unissued shares under options
At the date of this report, unissued ordinary shares of the Company under option are:
Number of shares under option Exercise price of options Expiry date of options
480,000 $1.375 31 December 2011
480,000 $3.00 31 December 2011
2,900,000 $0.62 31 December 2013
2,433,333 $1.11 31 December 2014
All options expire on the earlier of their expiry date or termination of the employee’s employment. Further details are included
in the remuneration report on pages 22 to 34.
These options do not entitle the holder to participate in any share issue of the Company or any other body corporate.

41
ANNUAL REPORT 2011
INDEMNIFICATION AND INSURANCE OF DIRECTORS AND OFFICERSIn accordance to the Company’s constitution, the Company must indemnify its directors and officers on a full indemnity basis
and to the full extent permitted by law against all liabilities incurred by the directors and officers in their capacity as an officer
of the Company or of a related body corporate.
During the financial year, the company paid a premium in respect of a contract insuring the directors of the company (as
named above), the company secretary and all executive officers of the company and of any related body corporate against a
liability incurred as such a director, secretary or executive officer to the extent permitted by the Corporations Act 2001. The
contract of insurance prohibits disclosure of the nature of the liability and the amount of the premium.
The company has not otherwise, during or since the financial year, indemnified or agreed to indemnify an officer or auditor of
the company or of any related body corporate against a liability incurred by such an officer or director.
NON-AUDIT SERVICESDuring the year KPMG, the Company auditor, has performed certain other services in addition to their statutory duties.
The Board has considered the non-audit services provided during the year by the auditor and in accordance with written
advice provided by resolution of the Audit Committee, is satisfied that the provision of those non-audit services during the
year by the auditors is compatible with, and did not compromise, the auditor independence requirements of the Corporations
Act 2001 for the following reasons:
n All non-audit services are subject to the corporate governance procedures adopted by the Company and have been
reviewed by the Audit Committee to ensure they do not impact the integrity and objectivity of the auditor; and
n The non-audit services provided do not undermine the general principles relating to auditor independence as set out in
APES 110 Code of Ethics for Professional Accountants, as they did not involve reviewing or auditing the auditor’s own
work, acting in a management or decision making capacity for the Company, acting as an advocate for the Company or
jointly sharing risks and rewards.
Details of the amounts paid to the auditor of the Group, KPMG, and its related practices for audit and non-audit services
provided during the year are set out in note 25.
AUDITOR’S INDEPENDENCE DECLARATIONThe auditor’s independence declaration which forms part of this report, is included in page 42 of the financial report.
Signed in accordance with a resolution of the directors made pursuant to s.298 (2) of the Corporations Act 2001.
On behalf of the Directors
N Montarello
Director
Perth, 18 February 2011

42
AUDITOR’S INDEPENDENCE DECLARATION
Lead Auditor’s Independence Declaration under Section 307C of the Corporations Act 2001
To: the directors of ThinkSmart Limited
I declare that, to the best of my knowledge and belief, in relation to the audit for the financial year ended 31 December 2010
there have been:
(i) no contraventions of the auditor independence requirements as set out in the Corporations Act 2001 in relation to
the audit; and
(ii) no contraventions of any applicable code of professional conduct in relation to the audit.
KPMG
Denise McComish
Partner
Perth
18 February 2011

43
ANNUAL REPORT 2011
DIRECTORS’ DECLARATION
1. In the opinion of the Directors of ThinkSmart Limited (the “Company”):
a) The consolidated financial statements and notes and the remuneration disclosures that are designated as audited
in the Remuneration report of the Directors’ report, set out on pages 19 to 96, are in accordance with the
Corporations Act 2001, including:
I. Giving a true and fair view of the Group’s financial position as at 31 December 2010 and of their
performance, for the financial year ended on that date; and
II. Complying with Australian Accounting Standards (including the Australian Accounting Interpretations) and the
Corporations Regulations 2001;
b) The financial report also complies with International Financial Reporting Standards as disclosed in note 2; and
c) There are reasonable grounds to believe that the Company will be able to pay its debts as and when they become
due and payable.
2. The directors have been given the declarations required by Section 295A of the Corporations Act 2001 from the Chief
Executive Officer and Chief Financial Officer for the financial year ended 31 December 2010.
Signed in accordance with a resolution of the directors:
N Montarello
Director
Perth, 18 February 2011
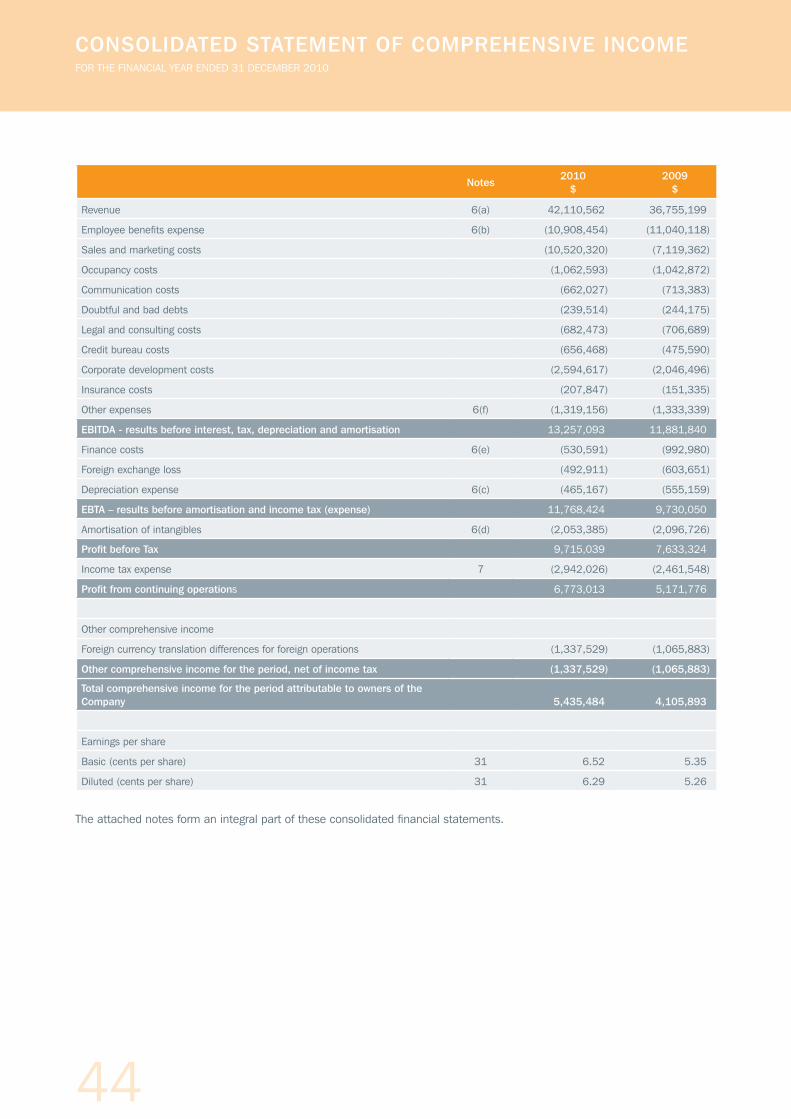
44
CONSOLIDATED STATEMENT OF COMPREHENSIVE INCOMEFOR THE FINANCIAL YEAR ENDED 31 DECEMBER 2010
Notes2010
$2009
$
Revenue 6(a) 42,110,562 36,755,199
Employee benefits expense 6(b) (10,908,454) (11,040,118)
Sales and marketing costs (10,520,320) (7,119,362)
Occupancy costs (1,062,593) (1,042,872)
Communication costs (662,027) (713,383)
Doubtful and bad debts (239,514) (244,175)
Legal and consulting costs (682,473) (706,689)
Credit bureau costs (656,468) (475,590)
Corporate development costs (2,594,617) (2,046,496)
Insurance costs (207,847) (151,335)
Other expenses 6(f) (1,319,156) (1,333,339)
EBITDA - results before interest, tax, depreciation and amortisation 13,257,093 11,881,840
Finance costs 6(e) (530,591) (992,980)
Foreign exchange loss (492,911) (603,651)
Depreciation expense 6(c) (465,167) (555,159)
EBTA – results before amortisation and income tax (expense) 11,768,424 9,730,050
Amortisation of intangibles 6(d) (2,053,385) (2,096,726)
Profit before Tax 9,715,039 7,633,324
Income tax expense 7 (2,942,026) (2,461,548)
Profit from continuing operations 6,773,013 5,171,776
Other comprehensive income
Foreign currency translation differences for foreign operations (1,337,529) (1,065,883)
Other comprehensive income for the period, net of income tax (1,337,529) (1,065,883)
Total comprehensive income for the period attributable to owners of the Company 5,435,484 4,105,893
Earnings per share
Basic (cents per share) 31 6.52 5.35
Diluted (cents per share) 31 6.29 5.26
The attached notes form an integral part of these consolidated financial statements.
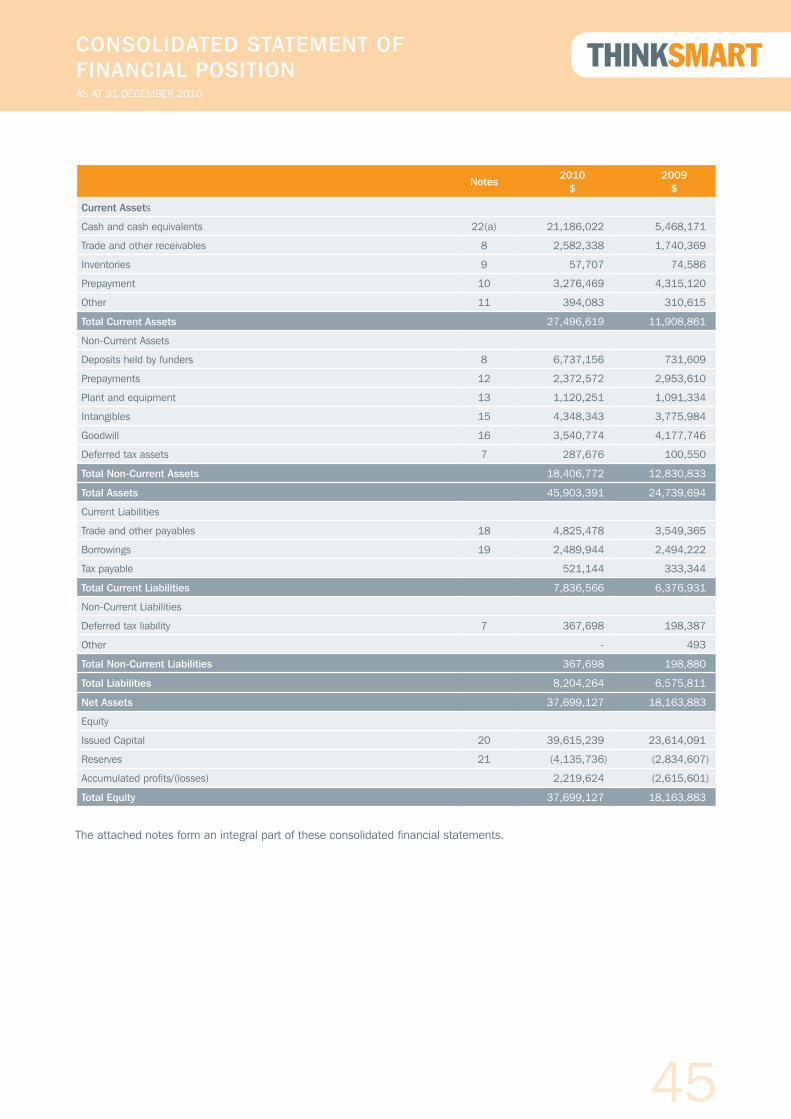
45
ANNUAL REPORT 2011
CONSOLIDATED STATEMENT OF FINANCIAL POSITIONAS AT 31 DECEMBER 2010
Notes2010
$2009
$
Current Assets
Cash and cash equivalents 22(a) 21,186,022 5,468,171
Trade and other receivables 8 2,582,338 1,740,369
Inventories 9 57,707 74,586
Prepayment 10 3,276,469 4,315,120
Other 11 394,083 310,615
Total Current Assets 27,496,619 11,908,861
Non-Current Assets
Deposits held by funders 8 6,737,156 731,609
Prepayments 12 2,372,572 2,953,610
Plant and equipment 13 1,120,251 1,091,334
Intangibles 15 4,348,343 3,775,984
Goodwill 16 3,540,774 4,177,746
Deferred tax assets 7 287,676 100,550
Total Non-Current Assets 18,406,772 12,830,833
Total Assets 45,903,391 24,739,694
Current Liabilities
Trade and other payables 18 4,825,478 3,549,365
Borrowings 19 2,489,944 2,494,222
Tax payable 521,144 333,344
Total Current Liabilities 7,836,566 6,376,931
Non-Current Liabilities
Deferred tax liability 7 367,698 198,387
Other - 493
Total Non-Current Liabilities 367,698 198,880
Total Liabilities 8,204,264 6,575,811
Net Assets 37,699,127 18,163,883
Equity
Issued Capital 20 39,615,239 23,614,091
Reserves 21 (4,135,736) (2,834,607)
Accumulated profits/(losses) 2,219,624 (2,615,601)
Total Equity 37,699,127 18,163,883
The attached notes form an integral part of these consolidated financial statements.
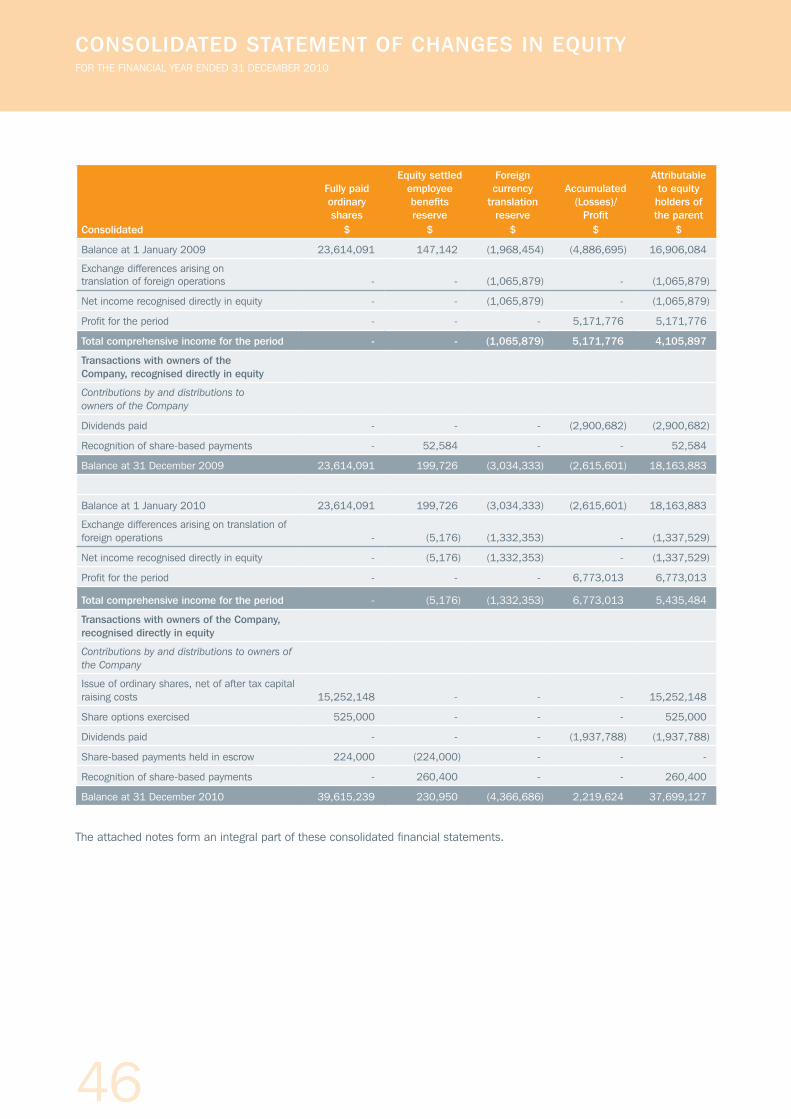
46
CONSOLIDATED STATEMENT OF CHANGES IN EQUITYFOR THE FINANCIAL YEAR ENDED 31 DECEMBER 2010
Consolidated
Fully paid ordinary shares
$
Equity settled employee benefits reserve
$
Foreign currency
translation reserve
$
Accumulated (Losses)/
Profit$
Attributable to equity holders of the parent
$
Balance at 1 January 2009 23,614,091 147,142 (1,968,454) (4,886,695) 16,906,084
Exchange differences arising on translation of foreign operations - - (1,065,879) - (1,065,879)
Net income recognised directly in equity - - (1,065,879) - (1,065,879)
Profit for the period - - - 5,171,776 5,171,776
Total comprehensive income for the period - - (1,065,879) 5,171,776 4,105,897
Transactions with owners of the Company, recognised directly in equity
Contributions by and distributions to owners of the Company
Dividends paid - - - (2,900,682) (2,900,682)
Recognition of share-based payments - 52,584 - - 52,584
Balance at 31 December 2009 23,614,091 199,726 (3,034,333) (2,615,601) 18,163,883
Balance at 1 January 2010 23,614,091 199,726 (3,034,333) (2,615,601) 18,163,883
Exchange differences arising on translation of foreign operations - (5,176) (1,332,353) - (1,337,529)
Net income recognised directly in equity - (5,176) (1,332,353) - (1,337,529)
Profit for the period - - - 6,773,013 6,773,013
Total comprehensive income for the period - (5,176) (1,332,353) 6,773,013 5,435,484
Transactions with owners of the Company, recognised directly in equity
Contributions by and distributions to owners of the Company
Issue of ordinary shares, net of after tax capital raising costs 15,252,148 - - - 15,252,148
Share options exercised 525,000 - - - 525,000
Dividends paid - - - (1,937,788) (1,937,788)
Share-based payments held in escrow 224,000 (224,000) - - -
Recognition of share-based payments - 260,400 - - 260,400
Balance at 31 December 2010 39,615,239 230,950 (4,366,686) 2,219,624 37,699,127
The attached notes form an integral part of these consolidated financial statements.
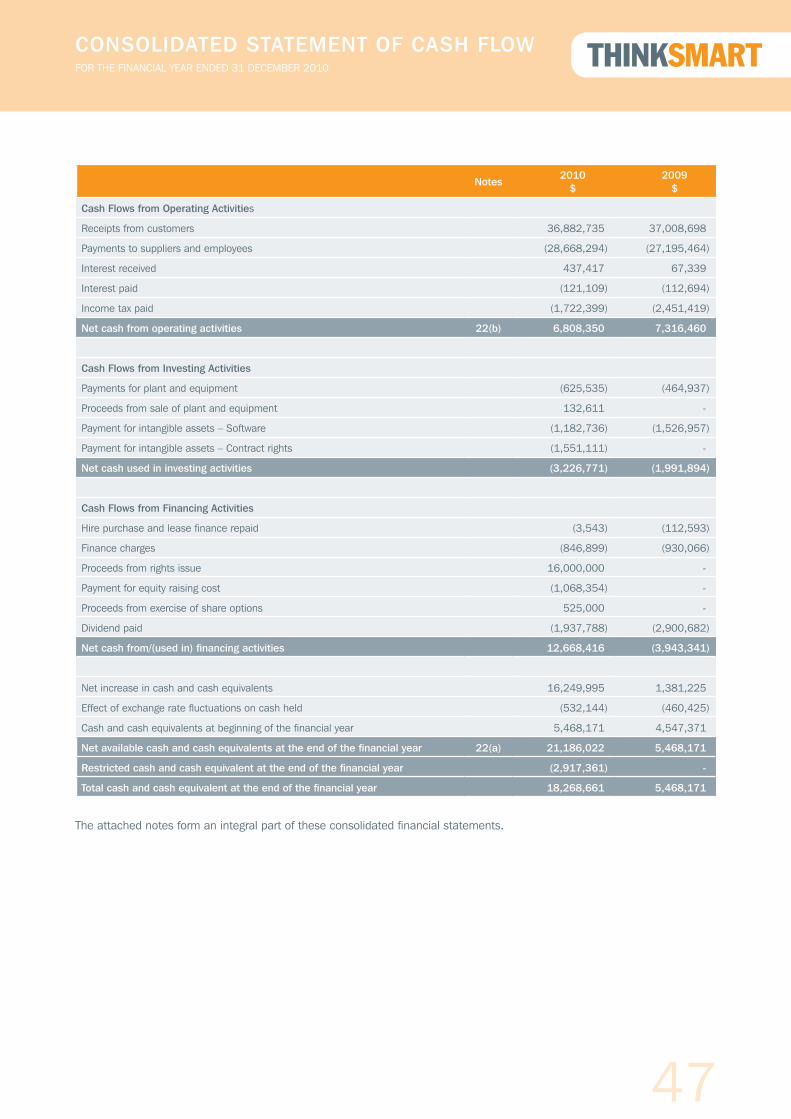
47
ANNUAL REPORT 2011
CONSOLIDATED STATEMENT OF CASH FLOWFOR THE FINANCIAL YEAR ENDED 31 DECEMBER 2010
Notes2010
$2009
$
Cash Flows from Operating Activities
Receipts from customers 36,882,735 37,008,698
Payments to suppliers and employees (28,668,294) (27,195,464)
Interest received 437,417 67,339
Interest paid (121,109) (112,694)
Income tax paid (1,722,399) (2,451,419)
Net cash from operating activities 22(b) 6,808,350 7,316,460
Cash Flows from Investing Activities
Payments for plant and equipment (625,535) (464,937)
Proceeds from sale of plant and equipment 132,611 -
Payment for intangible assets – Software (1,182,736) (1,526,957)
Payment for intangible assets – Contract rights (1,551,111) -
Net cash used in investing activities (3,226,771) (1,991,894)
Cash Flows from Financing Activities
Hire purchase and lease finance repaid (3,543) (112,593)
Finance charges (846,899) (930,066)
Proceeds from rights issue 16,000,000 -
Payment for equity raising cost (1,068,354) -
Proceeds from exercise of share options 525,000 -
Dividend paid (1,937,788) (2,900,682)
Net cash from/(used in) financing activities 12,668,416 (3,943,341)
Net increase in cash and cash equivalents 16,249,995 1,381,225
Effect of exchange rate fluctuations on cash held (532,144) (460,425)
Cash and cash equivalents at beginning of the financial year 5,468,171 4,547,371
Net available cash and cash equivalents at the end of the financial year 22(a) 21,186,022 5,468,171
Restricted cash and cash equivalent at the end of the financial year (2,917,361) -
Total cash and cash equivalent at the end of the financial year 18,268,661 5,468,171
The attached notes form an integral part of these consolidated financial statements.
48
NOTES TO THE FINANCIAL STATEMENTS
1. GENERAL INFORMATIONThinkSmart Limited (the “Company”) is a publicly listed company, incorporated and domiciled in Australia. The consolidated
financial statements of the Company as at and for the year ended 31 December 2010 comprise of the Company and its
subsidiaries (the “Group”). The Group’s principal activity is to arrange finance for renting of equipment in Australia, New Zealand
and Europe.
2. BASIS OF PREPARATIONA) STATEMENT OF COMPLIANCE
The consolidated financial statements are general purpose financial statements which have been prepared in accordance
with the Australian Accounting Standards (AASBs) adopted by the Australian Accounting Standards Board (AASB) and the
Corporations Act 2001. The consolidated financial statements comply with International Financial Reporting Standards (IFRSs)
and interpretations adopted by the International Accounting Standards Board (IASB).
The consolidated financial statements were authorised for issue by the Board of Directors on 18 February 2011.
B) BASIS OF MEASUREMENT
The financial report has been prepared on the basis of historical cost, except for the revaluation of certain non-current assets
and financial instruments. Cost is based on the fair values of the consideration given in exchange for assets. All amounts are
presented in Australian Dollars unless otherwise noted.
C) FUNCTIONAL AND PRESENTATION CURRENCY
These consolidated financial statements are presented in Australian dollars, which is the Company’s functional currency.
D) CHANGES IN ACCOUNTING POLICIES
Information regarding changes to the accounting policies of the Group are found as follows:
- Business combination – note 3(b)
- Consolidation – note 3(b)
E) REMOVAL OF PARENT ENTITY FINANCIAL STATEMENTS
The Group has applied amendments to the Corporations Act (2001) that remove the requirement for the Group to lodge parent
entity financial statements. Parent entity financials statements have been replaced by the specific parent entity disclosures in
note 32.
F) ACCOUNTING POLICIES AVAILABLE FOR EARLY ADOPTION NOT YET ADOPTED
A number of new standards and interpretations are effective for annual periods beginning after 1 July 2010 and have not been
applied in preparing this financial report. None of these are expected to have material effect on the financial report of the
Group, except for IFRS 9 Financial Instruments, which becomes mandatory for the Group’s 2014 financial report and could
change the classification and measurement of financial assets. The extent of the impact has not been determined.
49
ANNUAL REPORT 2011
3. SIGNIFICANT ACCOUNTING POLICIESThe accounting policies set out below have been applied consistently to all periods presented in these consolidated financial
statements, and have been applied consistently by Group entities, except as explained in note 2(d), which address changes
in accounting policies.
Certain comparative amounts have been reclassified to conform with the current year’s presentation (see note 6(g)).
A) BASIS OF CONSOLIDATION
The consolidated financial statements incorporate the financial statements of the company and entities controlled by the
company (its subsidiaries). Control is achieved when the company has the power to govern the financial and operating policies
of an entity so as to obtain the benefits from its activities. The results of subsidiaries acquired or disposed of during the year
are included in the consolidated income statement from the effective date of acquisition or up to the effective date of disposal,
as appropriate. The accounting policies of subsidiaries have been changed when necessary to align them with the policies
adopted by the Group.
Where necessary, adjustments are made to the financial statements of subsidiaries to bring their accounting policies in line
with those by other members of the Group. All intra-group balances, transactions, income and expenses are eliminated in full
on consolidation.
B) BUSINESS COMBINATIONS
Change in accounting policy
The Group has adopted revised AASB 3 Business Combinations (2009) and amended AASB 127 Consolidated and Separate
Financial Statements (2009) for business combinations occurring in the financial year starting 1 January 2010. All business
combinations occurring on or after 1 January 2010 are accounted for by applying the acquisition method. The change in
accounting policy is applied prospectively and has had no material impact on earnings per share, or any other disclosures in
this financial report.
For every business combination, the Group identifies the acquirer, which is the combining entity that obtains control of the other
combining entities or businesses. Control is the power to govern the financial and operating policies of an entity so as to obtain
benefits from its activities. In assessing control, the Group takes into consideration potential voting rights that currently are
exercisable. The acquisition date is the date on which control is transferred to the acquirer. Judgement is applied in determining
the acquisition date and determining whether control is transferred from one party to another.
Measuring goodwill
The Group measures goodwill as the fair value of consideration transferred including the recognised amount of any non-
controlling interest in the acquiree, less the net recognised amount (generally fair value) of the identifiable assets acquired and
liabilities assumed, all measured as of the acquisition date.
Consideration transferred includes the fair values of the asset transferred, liabilities incurred by the Group to the previous
owners of the acquiree, and equity interests issued by the Group. Consideration transferred also includes the fair value of
any contingent consideration and share-based payment awards of the acquiree that are replaced mandatorily in the business
combination (see below).
Share-based payment awards
When share-based payment awards exchanges (replacement awards) for awards held by acquiree’s employees (acquiree’s
awards) relate to past services, then a part of the market-based measure of the awards replaced is included in the consideration

50
NOTES TO THE FINANCIAL STATEMENTS
transferred. If they require future services, then the difference between the amount included in consideration transferred and
the market-based measure of the replacement awards is treated as post-combination compensation cost.
Contingent liabilities
A contingent liability of the acquiree is assumed in a business combination only if such a liability represents a present obligation
and arises from a past event, and its fair value can be measured reliably.
Non-controlling interest
The group measures any non-controlling interest at its proportionate interest in the identifiable net assets of the acquiree.
Transaction costs
Transaction costs that the Group incurs in connection with a business combination, such as finder’s fees, legal fees, due
diligence fees, and other professional and consulting fees, are expensed as incurred.
C) CASH AND CASH EQUIVALENTS
Cash comprises cash on hand and demand deposits. Cash equivalents are short-term, highly liquid investments that are readily
converted to known amounts of cash and which are subject to an insignificant risk of change in value.
Bank overdrafts are shown within borrowings in current liabilities in the balance sheet.
D) PLANT AND EQUIPMENT
Recognition and measurement
Items of property, plant and equipment are measured at cost less accumulated depreciation and accumulated impairment
losses. Cost includes expenditure that is directly attributable to the acquisition of the asset. Purchased software that is integral
to the functionality of the related equipment is capitalised as part of that equipment.
When parts of an item of property, plant and equipment have different useful lives they are accounted for as separate items
(major components) of property, plant and equipment.
The gain or loss on disposal of an item of property, plant and equipment is determined by comparing the proceeds from disposal
with the carrying amount of the property, plant and equipment, and is recognised net within other income/other expenses in
profit or loss.
Depreciation
Depreciation is based on the cost of an asset less its residual value. Significant component of individual assets are assessed
and if a component has a useful life that is different from the remainder of the asset, that component is depreciated separately.
Depreciation recognised in profit or loss on a straight-line basis over the estimated useful lives of each component of an item
of property, plant and equipment. Leased assets are depreciated over the shorter of the lease term and their useful lives unless
it is reasonably certain that the Group will obtain ownership by the end of the lease term.

51
ANNUAL REPORT 2011
The following estimated useful lives are used in the calculation of depreciation:
- Office furniture, fittings, equipment and computers 2.5 to 5 years
- Leasehold improvements the lease term
- Self-funded rental assets 2.5 to 5 years
- Motor vehicles 5 years
- Leased computer equipment and software 2.5 to 5 years
Depreciation methods, useful lives and residual values are reviewed at each reporting date.
E) LEASED ASSETS
Leases are classified at their inception as either operating or finance leases based on the economic substance of the agreement
so as to reflect the risks and benefits incidental to ownership.
Operating leases
The minimum lease payments of operating leases, where the lessor effectively retains substantially all of the risks and benefits
of ownership of the leased item, are recognised as an expense on a straight line basis.
Finance leases
Leases which effectively transfer substantially all of the risks and benefits incidental to ownership of the leased item to the
consolidated entity are capitalised at the present value of the minimum lease payments and disclosed as plant and equipment
under lease. A lease liability of equal value is also recognised.
Capitalised lease assets are depreciated over the shorter of the estimated useful life of the assets and the lease term.
Minimum lease payments are allocated between interest expense and reduction of the lease liability with the interest expense
calculated using the interest rate implicit in the lease and charged directly to the profit and loss.
F) TRADE AND OTHER ACCOUNTS PAYABLES
Trade payables are recognised when the consolidated entity becomes obliged to make future payments resulting from the
purchase of goods and services.
G) INVESTMENTS
Investments in controlled entities are recorded at the lower of cost and recoverable amount.
H) FINANCIAL ASSETS
Investments are recognised and derecognised on trade date where purchase or sale of an investment is under contract whose
terms require delivery of the investment within the timeframe established by the market concerned, and are initially measured
at fair value net of transaction costs. Subsequent to initial recognition, investments in subsidiaries are measured at cost in the
company financial statements. Subsequent to initial recognition, investments in associates are accounted for under the equity
method in the consolidated financial statements and the cost method in the company. Other financial assets are classified
into the following specified categories: financial assets at ‘fair value through profit and loss’, ‘held-to-maturity’ investments,
‘available-for-sale’ financial assets and ‘loans and receivables’. The classification depends on the nature and purpose of the
financial assets and is determined at the time of initial recognition.
Effective interest method
The effective interest method is a method of calculating the amortised cost of a financial asset and allocating interest income
over the relevant period. The effective interest rate is the rate that exactly discounts estimated future cash receipts through the
expected life of the financial asset or, where appropriate, a shorter period.
52
Loans and receivables
Trade receivables, loans, and other receivables are recorded at amortised cost less impairment.
Insurance prepayment
In respect to the UK operations, when an equipment insurance policy is issued by Allianz to RentSmart Limited’s customers,
RentSmart Limited pays the customer’s insurance premium to Allianz. RentSmart Limited subsequently collects the insurance
premium from the customer on a monthly basis over the life of the rental agreement. Where a policy is cancelled, the unexpired
premiums are refunded to RentSmart Limited.
I) IMPAIRMENT OF ASSETS
Financial assets
A financial asset is assessed at each reporting date to determine whether there is any objective evidence that it is impaired. A
financial asset is considered to be impaired if objective evidence indicates that one or more events have had a negative effect
on the estimated future cash flows of that asset.
An impairment loss in respect of a financial asset measured at amortised cost is calculated as the difference between its
carrying amount, and the present value of the estimated future cash flows discounted at the original effective interest rate. An
impairment loss in respect of an available-for sale financial asset is calculated by reference to its fair value.
Individually significant financial assets are tested for impairment on an individual basis. The remaining financial assets are
assessed collectively in groups that share similar credit risk characteristics.
All impairment losses are recognised in profit and loss. Any cumulative loss in respect of an available-for-sale financial asset
recognised previously in equity is transferred to profit and loss.
An impairment loss is reversed if the reversal can be related objectively to an event occurring after the impairment loss was
recognised. For financial assets measured at amortised cost and available-for-sale financial assets that are debt securities,
the reversal is recognised in profit and loss. For available-for-sale financial assets that are equity securities, the reversal is
recognised directly in other comprehensive income.
Non-financial assets
The carrying amounts of the Group’s non-financial assets, other than inventories and deferred tax assets, are reviewed at
each reporting date to determine whether there is any indication of impairment. If any such indication exists then the asset’s
recoverable amount is estimated. For goodwill and intangible assets that have indefinite lives or that are not yet available for
use, the recoverable amount is estimated at each reporting date.
The recoverable amount of an asset or cash-generating unit is the greater of its value in use and its fair value less costs to sell.
In assessing value in use, the estimated future cash flows are discounted to their present value using a pre-tax discount rate
that reflects current market assessments of the time value of money and the risks specific to the asset. For the purpose of
impairment testing, assets are grouped together into the smallest group of assets that generates cash inflows from continuing
use that are largely independent of the cash inflows of other assets or groups of assets (the “cash-generating unit”). The
goodwill acquired in a business combination, for the purpose of impairment testing, is allocated to cash-generating units that
are expected to benefit from the synergies of the combination.
An impairment loss is recognised if the carrying amount of an asset or its cash-generating unit exceeds its recoverable amount.
Impairment losses are recognised in profit or loss. Impairment losses recognised in respect of cash-generating units are
allocated first to reduce the carrying amount of the other assets in the unit (groups of units) on a pro rata basis.
NOTES TO THE FINANCIAL STATEMENTS

53
ANNUAL REPORT 2011
An impairment loss in respect of goodwill is not reversed. In respect of other assets, impairment losses recognised in the prior
periods are assessed at each reporting date for any indications that the loss has decreased or no longer exists. An impairment
loss is reversed if there has been a change in the estimates used to determine the recoverable amount. An impairment loss
is reversed only to the extent that the asset’s carrying amount does not exceed the carrying amount that would have been
determined, net of depreciation or amortisation, if no impairment loss had been recognised.
J) INTANGIBLE ASSETS
Intellectual property
Intellectual property is recorded at the cost of acquisition over the fair value of the identifiable net assets acquired, and is
amortised on a straight line basis over 20 years.
Inertia assets and distribution network assets
Intangible assets acquired in a business combination are identified and recognised separately from goodwill where they satisfy
the definition of an intangible asset and their fair values can be measured reliably. Intangible assets recognised are “inertia”
and “distribution networks” acquired on the acquisition of RentSmart Limited on 1 December 2006.
Inertia Assets
At the conclusion of the initial rental period, the Group is entitled to acquire the equipment from the funders at a nominal value.
Inertia represents the expected income streams from the unguaranteed residual interest in equipment on unexpired rental
contracts in existence at 1 December 2006. The maximum term of unexpired interest at 1 December 2006 is four years and
the intangible asset is amortised over the expected income profile of this revenue stream.
Distribution Network Assets
Distribution networks represent the value attributable to the retailer network from which rental contracts are originated. The
intangible asset is amortised on a straight line basis until the expected expiry of the contract, which is 4.5 years.
Contract Rights
The contractual rights obtained by the Group under financing agreements entered into with its funding partners and retail
partners constitute intangible assets with finite useful lives. These contract rights are recognised initially at cost and
amortised over their expected useful lives. In relation to funder contact rights, the expected useful life is the earlier of
the initial contract term or expected period until facility limit is reached. At each reporting date a review for indicators of
impairment is conducted.
Software development
Software development relates to the development of the Group’s proprietary SmartCheck credit application processing software
system. Software development costs are capitalised only up to the point when the software has been tested and is ready for
use in the manner intended by management.
Software development expenditure is capitalised only if the development costs can be measured reliably, the product process
is technically and commercially feasible, future economic benefits are probable, and the Group intends to and has sufficient
resources to complete development and to use or sell the asset. The expenditure capitalised includes the cost of direct labour
and overhead costs that are directly attributable to preparing the asset for its intended use.
The intangible asset is amortised on a straight line basis over its estimated useful life, which is 4 years. Capitalised software
development expenditure is measured at cost less accumulated amortisation and accumulated impairment losses.
54
K) GOODWILL
Goodwill acquired in a business combination is initially measured at its cost, being the excess of the cost of the business
combination over the acquirer’s interest in the net fair value of the identifiable assets, liabilities and contingent liabilities
recognised. Goodwill is subsequently measured at its cost less any impairment losses.
For the purpose of impairment testing, goodwill is allocated to each of the Group’s cash generating units (CGUs) or groups
of CGUs, expected to benefit from the synergies of the business combination. CGUs (or groups of CGUs) to which goodwill
has been allocated are tested for impairment annually, or more frequently if events or changes in circumstances indicate that
goodwill might be impaired.
If the recoverable amount of the CGU (or group of CGUs) is less than the carrying amount of the CGU (or group of CGUs), the
impairment loss is allocated first to reduce the carrying amount of any goodwill allocated to the CGU (or group of CGUs) and
then to the other assets of the CGU (or group of CGUs) pro-rata on the basis of the carrying amount of each asset in the CGU
(or CGUs). The impairment loss recognised for goodwill is recognised immediately in the profit or loss and is not reversed in the
subsequent period.
On disposal of an operation within a CGU, the attributable goodwill is included in the determination of the profit or loss of
disposal on the operation.
L) GOVERNMENT GRANTS
Government grants are assistance by the Government in the form of transfer of resources to the company in return for past
or future compliance with certain conditions to the operating activities of the company. Government grants are not recognised
until there is reasonable assurance that the company will or has complied with the conditions attaching to them and the grants
will be received. Government grants are recognised as income over the periods necessary to match them with the related costs
which they are intended to compensate. Government grants that are receivable as compensation for expenses or losses already
incurred are recognised as income of the period in which it becomes receivable.
M) EMPLOYEE BENEFITS
A liability is recognised for benefits accruing to employees in respect of wages and salaries and annual leave when it is probable
that settlement will be required and they are capable of being measured reliably.
The group’s net obligation in respect of long service leave is the amount of future benefit that employees earned in return for
their service in the current and prior periods plus related on-costs; that benefit is discounted to determine its present value, and
the fair value of any related assets is deducted.
Liabilities recognised in respect of employee benefits, which are expected to be settled within 12 months, are measured at their
nominal values, using the remuneration rate expected to apply at the time of settlement.
Liabilities recognised in respect of employee benefits, which are not expected to be settled within 12 months, are measured at
their present value of the estimated future cash flows to be made by the group.
Share–based payments
The grant date fair value of share-based payment awards granted to employees is recognised as an employee expense, with
a corresponding increase in equity, over the period that the employees unconditionally become entitled to the awards. The
amount recognised as an expense is adjusted to reflect the number of awards for which the related service and non-market
NOTES TO THE FINANCIAL STATEMENTS

55
ANNUAL REPORT 2011
vesting conditions are expected to be met, such that the amount ultimately recognised as an expense is based on the number
of awards that do not meet the related service and non-market performance conditions at the vesting date. For share-based
payment awards with non-vesting conditions, the grant date fair value of the share-based payment is measured to reflect such
conditions and there is no true-up for differences between expected and actual outcomes.
N) INVENTORIES
Inventories are valued at the lower of cost and net realisable value. Net realisable value represents the estimated selling price
less all estimated costs of completion and costs necessary to make use for sale.
O) REVENUE RECOGNITION
Revenue is measured at the fair value of the consideration received or receivable and is recognised to the extent that it is
probable that the economic benefits will flow to the entity and the revenue can be reliably measured. The following specific
recognition criteria must also be met before revenue is recognised:
Commission income
Commission receivable from funders is recognised at the time finance approval is given to the customer, adjusted for an
allowance for loans not expected to proceed to a contract by the funder.
Unguaranteed residual interest in equipment (inertia income)
At the conclusion of the initial rental period the consolidated entity is entitled to acquire the equipment from the funders at a
nominal value. All risks and rewards of ownership pass to the Group at that point and it has the option to either immediately
dispose of the equipment or continue to rent the asset to third parties.
• Ongoing rental income
Where the asset acquired from the funder is rented to third parties the income from that rental is brought to account when
the control of the right to receive this income is attained and can be reliably measured, usually on a monthly basis.
No ongoing rental income is brought to account in respect of the unexpired rental contracts.
• Income earned from sale of equipment
Where the asset acquired is sold the net sale proceeds are brought to account at the time of the sale.
Insurance income
Commission income includes commissions received on insurance policies issued by third party insurers to cover theft and
damage of rental equipment. In UK, a proportion of the insurance income is recognised at inception on the basis of stage of
completion of the service, with the remaining income recognised over the life of the policy. The revenue recognition policy for
the Australian insurance income is consistent with the treatment of commission income from funders.
P) FINANCIAL INSTRUMENTS
Non-derivative financial assets
The group initially recognises loans and receivables and deposits on the date that they are originated. All other financial assets
(including assets designated at fair value through profit or loss) are initially on the trade date at which the Group becomes a
party to the contractual provisions of the instrument.
The group derecognises a financial asset when the contractual rights to the cash flows from the asset expire, or it transfers the
right to receive the contractual cash flows on the financial asset in a transaction in which substantially all the risks and rewards
of ownership of the financial asset are transferred. Any interest in transferred financial assets that is created or retained by the
group is recognised as a separate asset or liability.

56
Financial assets and liabilities are offset and the net amount presented in the statement of financial position when, and only
when, the group has a legal right to offset the amounts and intends either to settle on a net basis or to realise the asset and
settle the liability simultaneously.
Loans and receivables
Loans and receivables are financial assets with fixed or determinable payments that are not quoted in an active market. Such
assets are recognised initially at fair value plus any directly attributable transaction costs. Subsequent to initial recognition loans
and receivables are measured at amortised cost using the effective interest method, less any impairment losses.
Non-derivative financial liabilities
The Group initially recognises debt securities issued and subordinated liabilities on the date that they are originated. The Group
derecognises a financial liability when its contractual obligations are discharged or cancelled or expire. Financial assets and
liabilities are offset and the net amount presented in the statement of financial position when, and only when, the Group has
a legal right to offset the amounts and intends either to settle on a net basis or to realise the asset and settle the liability
simultaneously.
Financial liabilities are recognised initially at fair value plus any directly attributable transaction costs. Subsequent to initial
recognition, these financial liabilities are measured at amortised cost using the effective interest rate method.
Share capital
Ordinary shares are classified as equity. Incremental costs directly attributable to issue of ordinary shares and share options are
recognised as a deduction from equity, net of any tax effects.
Q) INCOME TAX
Current tax
Current tax is calculated by reference to the amount of income taxes payable or recoverable in respect of the taxable profit or
tax loss for the period. It is calculated using tax rates and tax laws that have been enacted or substantively enacted by reporting
date. Current tax for current and prior periods is recognised as a liability (or asset) to the extent that it is unpaid (or refundable).
Deferred tax
Deferred tax is accounted for using the comprehensive balance sheet liability method in respect of temporary differences arising
from differences between the carrying amount of assets and liabilities in the financial statements and the corresponding tax
base of those items.
In principle, deferred tax liabilities are recognised for all taxable temporary differences. Deferred tax assets are recognised to
the extent that it is probable that sufficient taxable amounts will be available against which deductible temporary differences or
unused tax losses and tax offsets can be utilised. However, deferred tax assets and liabilities are not recognised if the temporary
differences giving rise to them arise from the initial recognition of assets and liabilities (other than as a result of a business
combination) which affects neither taxable income nor accounting profit. Furthermore, a deferred tax liability is not recognised
in relation to taxable temporary differences arising from goodwill.
Deferred tax liabilities are recognised for taxable temporary differences arising on investments in subsidiaries and joint ventures
except where the Consolidated Entity is able to control the reversal of the temporary differences and it is probable that the
temporary differences will not reverse in the foreseeable future.
NOTES TO THE FINANCIAL STATEMENTS

57
ANNUAL REPORT 2011
Deferred tax assets arising from deductible temporary differences associated with these investments and interests are only
recognised to the extent that it is probable that there will be sufficient taxable profits against which to utilise the benefits of the
temporary differences and they are expected to reverse in the foreseeable future.
Deferred tax assets and liabilities are measured at the tax rates that are expected to apply to the period(s) when the asset and
liability giving rise to them are realised or settled, based on tax rates (and tax laws) that have been enacted or substantively
enacted by reporting date. The measurement of deferred tax liabilities and assets reflects the tax consequences that would
follow from the manner in which the Consolidated Entity expects, at the reporting date, to recover or settle the carrying amount
of its assets and liabilities.
Deferred tax assets and liabilities are offset when they relate to income taxes levied by the same taxation authority and the
Company/Consolidated Entity intends to settle its current tax assets and liabilities on a net basis.
Current and deferred tax for the period
Current and deferred tax is recognised as an expense or income in the income statement, except when it relates to items
credited or debited directly to equity, in which case the deferred tax is also recognised directly in equity, or where it arises from
the initial accounting for a business combination, in which case it is taken into account in the determination of goodwill or
excess purchase consideration.
Tax consolidation
The Company and its wholly owned Australian resident entities formed a tax-consolidated group during 2009. As a consequence,
all members of the tax-consolidated group are taxed as a single entity from 1 January 2009. The head entity within the tax-
consolidated group is ThinkSmart Ltd.
R) GOODS AND SERVICES TAX
Revenues, expenses and assets are recognised net of the amount of goods and services tax (GST) except:
i) where the amount of GST incurred is not recoverable from the taxation authority, it is recognised as part of the cost of
acquisition of an asset or as part of an item of expense; and
ii) receivables and payables which are recognised inclusive of GST.
The net amount of GST recoverable from, or payable to, the taxation authority is included as part of receivables or payables.
Cash flows are included in the statement of cash flows on a gross basis. The GST component of cash flows arising from investing
and financing activities which is recoverable from, or payable to, the taxation authority is classified as operating cash flows.
S) FOREIGN CURRENCY TRANSACTIONS
Functional and presentation currency
Items included in the financial statements of each of the Group’s entities are measured using the currency of the primary
economic environment in which the Entity operates (“the functional currency”).
The Consolidated financial statements are presented in Australian dollars, which is ThinkSmart Limited’s functional and
presentation currency.
Foreign currency transactions
Transactions in foreign currencies are translated to the respective functional currencies of Group entities at exchange rates
at the dates of the transactions. Monetary assets and liabilities denominated in foreign currencies at the reporting date are
retranslated to the functional currency at the exchange rate at that date. The foreign currency gain or loss on monetary items is
58
the difference between amortised cost in the functional currency at the beginning of the period, adjusted for effective interest
and payments during the period, and the amortised cost in foreign currency translated at the exchange rate at the end of the
year.
Non-monetary assets and liabilities denominated in foreign currencies that are measured at fair value are retranslated to the
functional currency at the exchange rate at the date that the fair value was determined. Non-monetary items in a foreign
currency that are measured in terms of historical cost are translated using the exchange rate at the date of the transaction.
Foreign currency differences arising on retranslation are presented in profit or loss on a net basis, except for differences arising
on the retranslation of a financial liability designated as a hedge of the net investment in a foreign operation that is effective,
which are recognised in other comprehensive income.
Foreign operations
The assets and liabilities of foreign operations, including goodwill and fair value adjustments arising on acquisition, are translated
to the functional currency at exchange rates at the reporting date. The income and expenses of foreign operations, excluding
foreign operations in hyperinflationary economies, are translated to Australian dollars at exchange rates at the dates of the
transactions.
The income and expenses of foreign operations in hyperinflationary economies are translated to the functional currency at the
reporting date. Prior to translating the financial statements of foreign operations in hyperinflationary economies, their financial
statements for the current period are restated to account for changes in the general purchasing power of the local currency.
The restatement is based on relevant price indices at the reporting date.
Foreign currency differences are recognised in other comprehensive income, and presented in the foreign currency translation
reserve in equity. However, if the operation is a non-wholly-owned subsidiary, then the relevant proportionate share of the
translation difference is allocated to the non-controlling interests. When a foreign operation is disposed of such that control,
significant influence or joint control is lost, the cumulative amount in the translation reserve related to that foreign operation
is reclassified to the profit or loss as part of the gain or loss on disposal. When the Group disposes of only part of its interest
in a subsidiary that includes a foreign operation while retaining control, the relevant proportion of the cumulative amount is
reattributed to non-controlling interests. When the Group disposes of only part of its investment in an associate or joint venture
that includes a foreign operation while retaining significant influence or joint control, the relevant proportion of the cumulative
amount is classified to profit or loss.
T) EARNINGS PER SHARE
Basic earnings per share
Basic earnings per share is calculated by dividing the profit attributable to equity holders of the Company, excluding any costs
of servicing equity other than ordinary shares, by the weighted average number of ordinary shares outstanding during the year,
adjusted for bonus elements in ordinary shares issued during the year.
Diluted earnings per share
Diluted earnings per share adjusts the figures used in the determination of basic earnings per share to take into account the
after income tax effect of interest and other financing costs associated with dilutive potential ordinary shares and the weighted
average number of shares assumed to have been issued for no consideration in relation to dilutive potential ordinary shares.
U) CORPORATE DEVELOPMENT COSTS
Corporate developments costs are expensed as incurred in investing in new markets and primarily comprise of salary costs,
travel, consultancy and trademark protection.
NOTES TO THE FINANCIAL STATEMENTS

59
ANNUAL REPORT 2011
V) PROVISIONS
A provision is recognised if, as a result of a past event, the Group has a present legal or constructive obligation that can be
estimated reliably, and it is probable that an outflow of economic benefits will be required to settle the obligations. Provisions
are determined by discounting the expected future cash flows at a pre-tax rate that reflects current market assessments of
the time value of money and the risks specific to the liability.
W) LEASE PAYMENTS
Payments made under operating leases are recognised in profit or loss on a straight line basis over the term of the lease.
Lease incentives received are recognised as an integral part of the total lease expense, over the term of the lease.
Minimum lease payments made under finance leases are apportioned between the finance expense and the reduction of the
outstanding liability. The finance expense is allocated to each period during the lease term so as to produce a constant period
rate of interest on the remaining balance of the liability.
Contingent lease payments are accounted for by revising the minimum lease payments over the remaining term of the lease
when the contingency no longer exists and the lease adjustments are known.
X) FINANCE INCOME AND EXPENSES
Finance income comprises interest income on funds invested (included available-for-sale financial assets), dividend income,
gains on disposal of available-for-sale financial assets and changes in fair value of financial assets at fair value through profit
or loss. Interest income is recognised as it accrues in profit or loss, using the effective interest method. Dividend income
is recognised in profit or loss on the date the Group’s right to receive payment is established, which in the case of quoted
securities is the ex-dividend date.
Finance expenses comprise interest expense on borrowings, unwinding of the discount on provisions, dividends on preference
shares classified as liabilities, changes in the fair value of financial assets at fair value through profit or loss, impairment
losses recognised on financial assets, and losses on hedging instruments that are recognised in profit or loss. All borrowings
costs are recognised in profit or loss using the effective interest method.
Foreign currency gains and losses are reported on a net basis.
Y) SEGMENT REPORTING
An operating segment is a component of the Group that engages in business activities from which it may earn revenues and
incur expenses, including revenues and expenses that relate to transactions with any of the Group’s other components. All
operating segments’ operating results are regularly reviewed by the Group’s CEO to make decisions about resources to be
allocated to the segment and assess its performance, and for which discrete financial information is available.

60
Segment results, assets and liabilities include items attributable to a segment as well as those that can be allocated on
a reasonable basis. Unallocated items compromise mainly loans and borrowings and related expenses, and head office
expenses, and income tax assets and liabilities.
Segment capital expenditure is the total cost incurred during the period to acquire property, plant and equipment, and
intangible assets other than goodwill.
Z) DETERMINATION OF FAIR VALUE
A number of the Group’s accounting policies and disclosures require the determination of fair value, for both financial and
non-financial assets and liabilities. Fair values have been determined for measurement and/or disclosure purposes based
on the following methods. When applicable, further information about the assumptions made in determining fair values is
disclosed in the notes specific to that asset and liability.
Intangible assets
The fair value of intangible assets as a result of business combination is based on the discounted cash flows expected to be
derived from the use and eventual sale of the assets (refer to note 3(j)).
Trade and other receivables
The fair value of trade and other receivables is estimated as the present value of future cash flows, discounted at the market
rate of interest at the reporting date.
Non-derivative financial liabilities
Fair value, which is determined for disclosure purposes, is calculated based on the present value of future principal and
interest cash flows, discounted at the market rate of interest at the reporting date. For finance leases, the market rate of
interest is determined by reference to similar lease agreements.
Share-based payment transactions
The fair value of employee stock options is measured using a binomial model. Measurement inputs include share price on
measurement date, exercise price of the instrument, expected volatility (based on weighted average historic volatility adjusted
for changes expected due to publicly available information), weighted average expected life of the instruments (based on
historical experience and general option holder behaviour), expected dividends, and the risk-free interest rate (based on
government bonds). Service and non-market performance conditions attached to the transactions are not taken into account
in determining fair value.
The fair value of employee shares provided as compensation is measured using the closing share price on the date the
shares are granted.
Contingent consideration
The fair value of contingent consideration is calculated using the income approach based on the expected payment amounts
and their associated probabilities (i.e. probability-weighted). Since the contingent consideration is long-term in nature, it is
discounted to present value.
NOTES TO THE FINANCIAL STATEMENTS

61
ANNUAL REPORT 2011
4. CRITICAL ACCOUNTING JUDGEMENTS AND KEY SOURCES OF ESTIMATION UNCERTAINTYIn the application of the Group’s accounting policies, which are described in note 3, management is required to make judgments,
estimates and assumptions about carrying values of assets and liabilities that are not readily apparent from other sources.
The estimates and associated assumptions are based on historical experience and various other factors that are believed to
be reasonable under the circumstance, the results of which form the basis of making the judgments. Actual results may differ
from these estimates.
The estimates and underlying assumptions are reviewed on an ongoing basis. Revisions to accounting estimates are recognised
in the period in which the estimate is revised if the revision affects only that period, or in the period of the revision and future
periods if the revision affects both current and future periods.
Except as described below, in preparing this consolidated financial report, the significant judgements made by management in
applying the consolidated entity’s accounting policies and the key sources of estimation uncertainty were the same as those
that applied to the consolidated financial report as at and for the year ended 31 December 2009.
a) Key sources of estimation uncertainty and critical judgements in applying the entity’s accounting policies
The preparation of financial statements requires management to make judgements, estimates and assumptions that affect
the application of accounting policies and the reported amounts of assets, liabilities, income and expenses. Actual results
may differ from these estimates. Estimates and underlying assumptions are reviewed on an ongoing basis. Revisions to
accounting estimates are recognised in the period in which the estimate is revised and in any future periods affected.
In particular, information about significant areas of estimation uncertainty and critical judgements in applying accounting
policies that have the most significant affect on the amount recognised in the financial statements are described in the
following notes:
n Note 16 – measurement of the recoverable amounts of cash-generating units containing goodwill
n Note 15 – recoverable amount of intangible assets
n Note 7 – utilisation of tax losses
n Note 20 – measurement of share based payments
n Note 26 and 27 – contingent assets and liabilities
n Note 18 – Provision for employee entitlements

62
5. FINANCIAL RISK MANAGEMENTOverview
The Group has exposure to the following risks from the use of financial instruments:n Credit riskn Liquidity riskn Market risk
n Operational risk
This note presents information about the Group’s exposure to each of the above risks, the objectives, policies and processes
for measuring and managing risks, and the management of capital. Further quantitative disclosures are included throughout
this financial report.
The Board of Directors has overall responsibility for the establishment and oversight of the risk management framework. The
Board has established the Audit and Risk Management Committee, which is responsible for developing and monitoring risk
management policies. The Committee reports to the Board of Directors on its activities.
Risk management policies are established to identify and analyse the risks faced by the Group, to set appropriate limits
and controls, and to monitor risks and adherence to limits. Risk management policies and systems are reviewed regularly
to reflect the changes in market conditions and the Group’s activities. The Group, through its training and management
standards and procedures, aims to develop a disciplined and constructive control environment in which all employees
understand their roles and obligations.
The Audit and Risk Committee oversees how management monitors compliance with the Group’s risk management policies
and procedures and reviews the adequacy of the risk management framework in relation to the risks faced by the Group. The
Audit and Risk Committee is assisted in its oversight role by Internal Audit. Internal Audit undertakes both regular and ad hoc
reviews of risk management controls and procedures, the results of which are reported to the Audit and Risk Committee.
Credit Risk
Credit risk refers to the risk that a counterparty or customer will default on its contractual obligations resulting in financial loss
to the Group and arises principally from the Group’s assessment of recoverability from debtors. The Group has adopted a
policy of only dealing with credit worthy counterparties as a means of mitigating the risk of financial loss from defaults.
The Group has minimal concentrations of credit risk in relation to trade receivables. In most cases, credit risk arising from
customer rental contracts are not borne by the Group but by the funding institutions. The day to day management of credit
risk is undertaken by ensuring counterparties fall within specific risk criteria prepared by our financiers and the Board.
The Group’s credit risk exposure to funder deposits are more concentrated, however the counterparties are regulated banking
institutions and the credit risk exposure is assessed as low. The Group closely monitors the credit risk associated with each
funder deposit counterparty.
The Group assesses the impairment of receivables on an individual basis.
The carrying amount of financial assets recorded in the financial statements, net of any allowances for losses, represents the
Group’s maximum exposure to credit risk.
Guarantees
Group policy is to provide financial guarantees only to wholly-owned subsidiaries. Details of outstanding guarantees are
provided in note 32.
NOTES TO THE FINANCIAL STATEMENTS

63
ANNUAL REPORT 2011
Liquidity risk
Liquidity risk is the risk that the Group will not be able to meet its financial obligations as they fall due. The Group’s approach
to managing liquidity is to ensure, as far as possible, that it will always have sufficient liquidity to meet its liabilities when
due, under both normal and stressed conditions, without incurring unacceptable losses or risking damage to the Group’s
reputation.
The consolidated entity manages liquidity risk by maintaining adequate reserve facilities by continuously reviewing its facilities
and cash flows.
The Group ensures that it has sufficient cash on demand to meet expected operational expenses. In addition, the Group
maintains the following lines of credit:n Secured bank overdraft facility of $250,000. Interest is payable at ANZ’s reference rate.n Secured bill acceptance facility of $5,000,000, in which $2,500,000 is presently drawn down. Interest is payable at
prevailing bank rate.n Other operational facilities are set out in note 22 (c).
Market risk
Market risk is the risk that changes in market prices, such as foreign exchange rates, interest rates and equity prices will
affect the Group’s income or the value of its holdings of financial instruments. The objective of market risk management is to
manage and control market risk exposures within acceptable parameters, while optimising return.
Currency risk
The Group is exposed to currency risk on sales, purchases and borrowings that are denominated in a currency other than the
respective functional currencies of the Group entities, primarily the Australian dollar (AUD), but also the Euro (EUR), Sterling
(GBP) and US dollars (USD). The currencies in which these transactions primarily are denominated are AUD, EUR, GBP and USD.
Interest on borrowings is denominated in currencies that match the cash flows generated by the underlying operations of the
Group, primarily AUD, but also GBP and EUR. This provides an economic hedge and no derivatives are entered into.
Liabilities incurred in each respective geographical territory are paid for by the cash flows of the functional currency of that
territory. Exposures for singular transactions greater than $50,000 are considered for hedging by management, with forward
exchange contracts to mitigate exchange rate risk and are considered separately as they arise. The consolidated entity has no
forward exchange contracts as at reporting date (2009: nil).
Intercompany borrowings are denominated in the currency of the lender. Transaction recharges between the companies
provides an economic hedge and timing of payments are within the control of the Group to ensure economic viability, as a
result no derivatives are entered into.
In respect of other monetary assets and liabilities denominated in foreign currencies, the management ensures that the
Group’s net exposure is kept to an acceptable level by buying or selling foreign currencies at spot rates when necessary to
address the short term imbalances.
Interest rate risk
The Group has no significant non-current borrowings. The terms and conditions of current interest-bearing borrowings are set
out above. Exposure to interest rate risk on any future borrowings will be assessed by the Board and where appropriate, the
exposure to movement in interest rates may be hedged by entering into interest rate swaps, when considered appropriate by
the management and the Board.
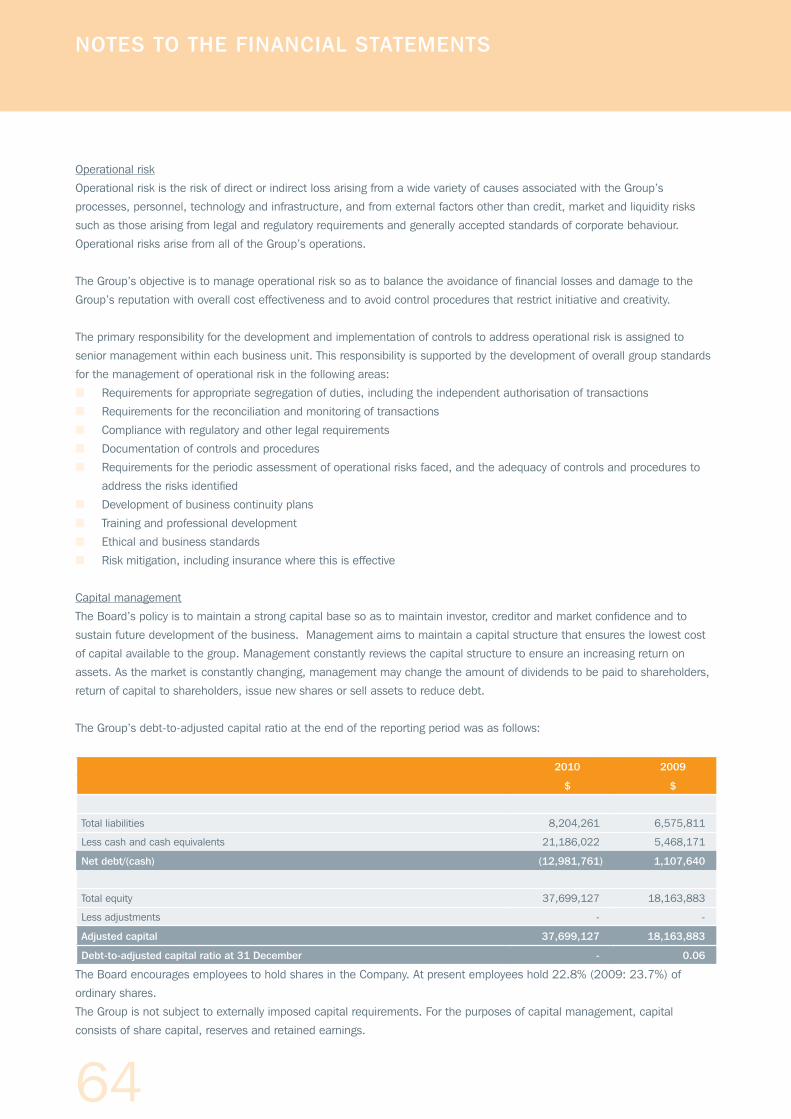
64
Operational risk
Operational risk is the risk of direct or indirect loss arising from a wide variety of causes associated with the Group’s
processes, personnel, technology and infrastructure, and from external factors other than credit, market and liquidity risks
such as those arising from legal and regulatory requirements and generally accepted standards of corporate behaviour.
Operational risks arise from all of the Group’s operations.
The Group’s objective is to manage operational risk so as to balance the avoidance of financial losses and damage to the
Group’s reputation with overall cost effectiveness and to avoid control procedures that restrict initiative and creativity.
The primary responsibility for the development and implementation of controls to address operational risk is assigned to
senior management within each business unit. This responsibility is supported by the development of overall group standards
for the management of operational risk in the following areas:
n Requirements for appropriate segregation of duties, including the independent authorisation of transactions
n Requirements for the reconciliation and monitoring of transactions
n Compliance with regulatory and other legal requirements
n Documentation of controls and procedures
n Requirements for the periodic assessment of operational risks faced, and the adequacy of controls and procedures to
address the risks identified
n Development of business continuity plans
n Training and professional development
n Ethical and business standards
n Risk mitigation, including insurance where this is effective
Capital management
The Board’s policy is to maintain a strong capital base so as to maintain investor, creditor and market confidence and to
sustain future development of the business. Management aims to maintain a capital structure that ensures the lowest cost
of capital available to the group. Management constantly reviews the capital structure to ensure an increasing return on
assets. As the market is constantly changing, management may change the amount of dividends to be paid to shareholders,
return of capital to shareholders, issue new shares or sell assets to reduce debt.
The Group’s debt-to-adjusted capital ratio at the end of the reporting period was as follows:
2010 2009
$ $
Total liabilities 8,204,261 6,575,811
Less cash and cash equivalents 21,186,022 5,468,171
Net debt/(cash) (12,981,761) 1,107,640
Total equity 37,699,127 18,163,883
Less adjustments - -
Adjusted capital 37,699,127 18,163,883
Debt-to-adjusted capital ratio at 31 December - 0.06
The Board encourages employees to hold shares in the Company. At present employees hold 22.8% (2009: 23.7%) of
ordinary shares.
The Group is not subject to externally imposed capital requirements. For the purposes of capital management, capital
consists of share capital, reserves and retained earnings.
NOTES TO THE FINANCIAL STATEMENTS

65
ANNUAL REPORT 2011
6. PROFITNotes 2010
$2009
$
Profit is arrived at after crediting/(charging) the following items:
a) Revenue
Commission income from funders 25,501,346 19,972,868
Revenue received on sale of equipment 4,675,138 4,959,036
Rental income 6,076,363 5,692,057
Insurance and warranty brokerage income 5,050,340 5,120,436
Other revenue 807,375 1,010,802
42,110,562 36,755,199
b) Employee benefits expense
Payments to employees 9,321,359 9,923,028
Employee superannuation cost 739,670 547,730
Share options cost 260,400 15,727
Provision for employee entitlements 587,025 553,633
10,908,454 11,040,118
c) Depreciation expense
Depreciation of plant and equipment 365,650 320,891
Depreciation of leasehold improvements 63,827 104,626
Depreciation of self funded rentals - 3,344
Depreciation of web sites - 565
Depreciation of lease equipment & software 35,690 125,733
465,167 555,159
d) Amortisation expense
Amortisation of software 660,681 586,788
Amortisation of contract rights 635,406 205,423
Amortisation of distribution network 100,988 124,427
Amortisation of inertia contracts 624,219 1,147,994
Amortisation of intellectual property 32,091 32,094
2,053,385 2,096,726

66
6. PROFIT (CONT.)2010
$2009
$
e) Finance (costs)/benefits
Interest revenue – other entities 437,417 67,339
– related parties - -
Total finance benefits 437,417 67,339
Interest expense – other entities (121,109) (130,253)
– related parties - -
Total interest costs (121,109) (130,253)
Finance charges (846,899) (930,066)
Total finance benefit/(cost) (530,591) (992,980)
f) Other Expenses
Gain/(Loss) on sale of property and equipment 73,866 -
Other expenses (1,393,022) (1,333,339)
(1,319,156) (1,333,339)
Other expenses comprise of other administrative expenses including postage, travel and training.
g) Reclassification of items of income and expense
To facilitate accurate comparison to 2010, certain items of income and expense have been reclassified as follows:
Prior year accounts2009
$Reclassification
$
Current year comparative 2009
$
Revenue 36,756,819 (1,620) 36,755,199
Employee benefits expense (10,522,389) (517,729) (11,040,118)
Sales and marketing costs (6,880,869) (238,493) (7,119,362)
Occupancy costs (1,043,357) 485 (1,042,872)
Communication costs (590,522) (122,861) (713,383)
Doubtful and bad debts (244,175) - (244,175)
Legal and consulting costs (686,886) (19,803) (706,689)
Credit bureau costs (475,184) (406) (475,590)
Corporate development costs (2,046,496) - (2,046,496)
Insurance costs (150,355) (980) (151,335)
Other expenses (2,234,746) 901,407 (1,333,339)
EBITDA - results before interest, tax, depreciation and amortisation 11,881,840 - 11,881,840
NOTES TO THE FINANCIAL STATEMENTS
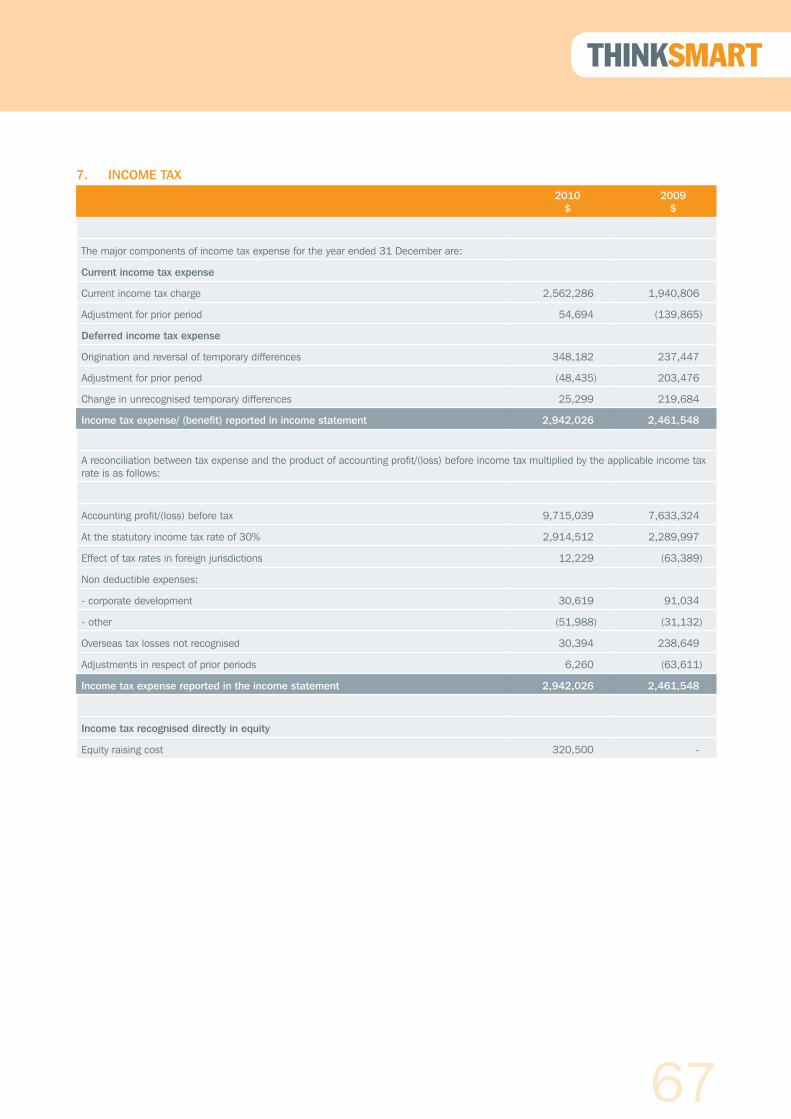
67
ANNUAL REPORT 2011
7. INCOME TAX2010
$2009
$
The major components of income tax expense for the year ended 31 December are:
Current income tax expense
Current income tax charge 2,562,286 1,940,806
Adjustment for prior period 54,694 (139,865)
Deferred income tax expense
Origination and reversal of temporary differences 348,182 237,447
Adjustment for prior period (48,435) 203,476
Change in unrecognised temporary differences 25,299 219,684
Income tax expense/ (benefit) reported in income statement 2,942,026 2,461,548
A reconciliation between tax expense and the product of accounting profit/(loss) before income tax multiplied by the applicable income tax rate is as follows:
Accounting profit/(loss) before tax 9,715,039 7,633,324
At the statutory income tax rate of 30% 2,914,512 2,289,997
Effect of tax rates in foreign jurisdictions 12,229 (63,389)
Non deductible expenses:
- corporate development 30,619 91,034
- other (51,988) (31,132)
Overseas tax losses not recognised 30,394 238,649
Adjustments in respect of prior periods 6,260 (63,611)
Income tax expense reported in the income statement 2,942,026 2,461,548
Income tax recognised directly in equity
Equity raising cost 320,500 -
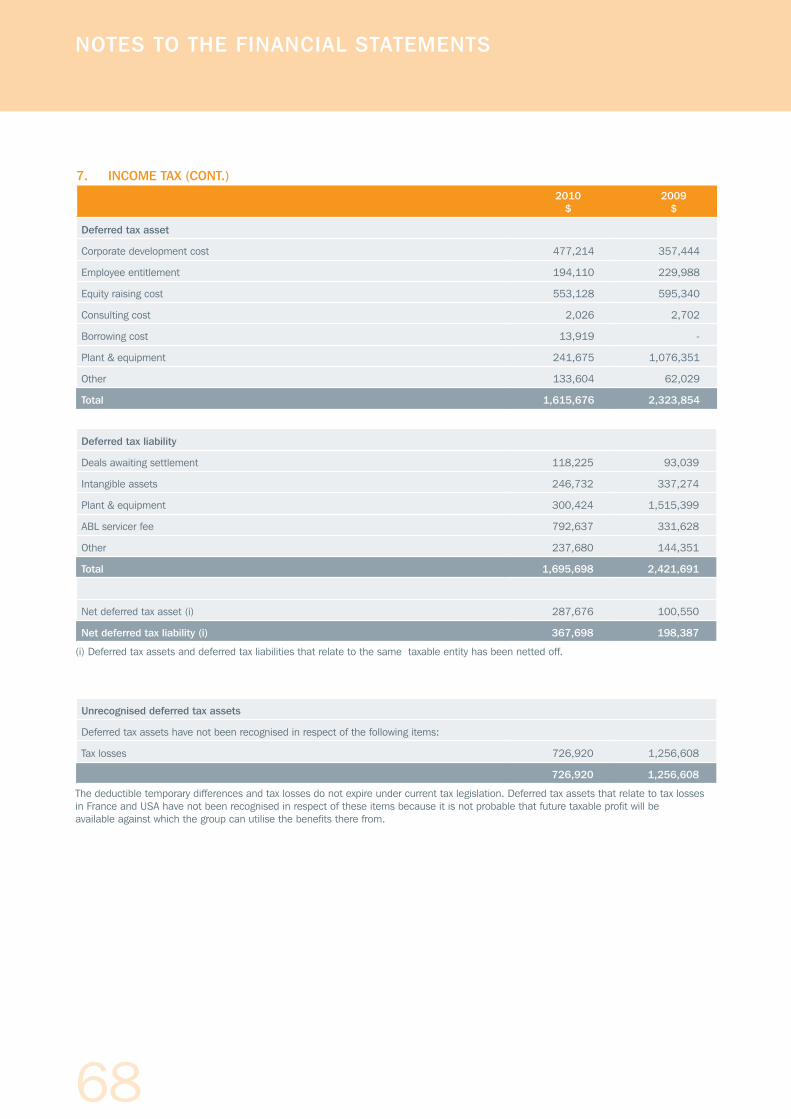
68
7. INCOME TAX (CONT.)2010
$2009
$
Deferred tax asset
Corporate development cost 477,214 357,444
Employee entitlement 194,110 229,988
Equity raising cost 553,128 595,340
Consulting cost 2,026 2,702
Borrowing cost 13,919 -
Plant & equipment 241,675 1,076,351
Other 133,604 62,029
Total 1,615,676 2,323,854
Deferred tax liability
Deals awaiting settlement 118,225 93,039
Intangible assets 246,732 337,274
Plant & equipment 300,424 1,515,399
ABL servicer fee 792,637 331,628
Other 237,680 144,351
Total 1,695,698 2,421,691
Net deferred tax asset (i) 287,676 100,550
Net deferred tax liability (i) 367,698 198,387
(i) Deferred tax assets and deferred tax liabilities that relate to the same taxable entity has been netted off.
Unrecognised deferred tax assets
Deferred tax assets have not been recognised in respect of the following items:
Tax losses 726,920 1,256,608
726,920 1,256,608
The deductible temporary differences and tax losses do not expire under current tax legislation. Deferred tax assets that relate to tax losses in France and USA have not been recognised in respect of these items because it is not probable that future taxable profit will be available against which the group can utilise the benefits there from.
NOTES TO THE FINANCIAL STATEMENTS
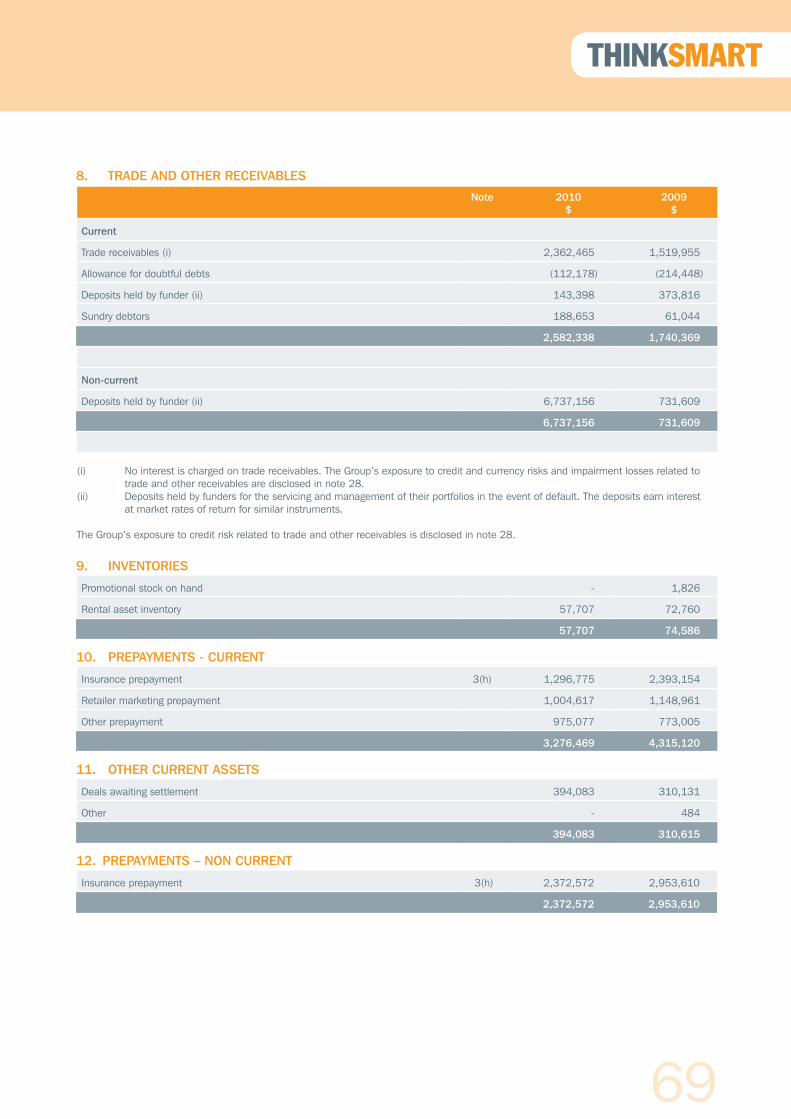
69
ANNUAL REPORT 2011
8. TRADE AND OTHER RECEIVABLES
Note 2010$
2009$
Current
Trade receivables (i) 2,362,465 1,519,955
Allowance for doubtful debts (112,178) (214,448)
Deposits held by funder (ii) 143,398 373,816
Sundry debtors 188,653 61,044
2,582,338 1,740,369
Non-current
Deposits held by funder (ii) 6,737,156 731,609
6,737,156 731,609
(i) No interest is charged on trade receivables. The Group’s exposure to credit and currency risks and impairment losses related to trade and other receivables are disclosed in note 28.
(ii) Deposits held by funders for the servicing and management of their portfolios in the event of default. The deposits earn interest at market rates of return for similar instruments.
The Group’s exposure to credit risk related to trade and other receivables is disclosed in note 28.
9. INVENTORIES
Promotional stock on hand - 1,826
Rental asset inventory 57,707 72,760
57,707 74,586
10. PREPAYMENTS - CURRENT
Insurance prepayment 3(h) 1,296,775 2,393,154
Retailer marketing prepayment 1,004,617 1,148,961
Other prepayment 975,077 773,005
3,276,469 4,315,120
11. OTHER CURRENT ASSETS
Deals awaiting settlement 394,083 310,131
Other - 484
394,083 310,615
12. PREPAYMENTS – NON CURRENT
Insurance prepayment 3(h) 2,372,572 2,953,610
2,372,572 2,953,610

70
13. PLANT & EQUIPMENT
Plant & Equipment
$
Leasehold improvements
$
Self funded rentals
$Web Sites
$
Lease equipment &
software$
Total $
Gross Carrying Amount
Cost or deemed cost
Balance at 1 Jan 2009 1,895,802 338,799 149,958 76,450 2,272,620 4,733,629
Net foreign currency translation differences (154,602) (62,110) - - (22,594) (239,306)
Additions 382,680 - - - 82,257 464,937
Disposals - - - - - -
Balance at 31 Dec 2009 2,123,880 276,689 149,958 76,450 2,332,283 4,959,260
Net foreign currency translation differences (179,554) (41,467) - - (9,012) (230,033)
Additions 384,004 - - - 241,531 625,535
Disposals (665,179) (4,718) (149,958) (76,450) (1,636,053) (2,532,358)
Balance at 31 Dec 2010 1,663,151 230,504 - - 928,749 2,822,404
Accumulated Depreciation
Balance at 1 Jan 2009 (1,153,126) (140,884) (140,011) (75,157) (1,963,495) (3,472,674)
Net foreign currency translation differences 98,799 38,513 - - 22,594 159,906
Disposals - - - - - -
Depreciation expense (320,891) (104,626) (3,344) (565) (125,733) (555,159)
Balance at 31 Dec 2009 (1,375,218) (206,997) (143,355) (75,722) (2,066,634) (3,867,926)
Effect of movement in exchange rate 111,068 37,247 - - 9,010 157,325
Disposals 566,746 3,073 143,355 75,722 1,684,719 2,473,615
Depreciation expense (365,650) (63,827) - - (35,690) (465,167)
Balance at 31 Dec 2010 (1,063,054) (230,504) - - (408,595) (1,702,153)
Net Book Value
At 31 Dec 2009 748,662 69,692 6,603 728 265,649 1,091,334
At 31 Dec 2010 600,097 - - - 520,154 1,120,251
NOTES TO THE FINANCIAL STATEMENTS
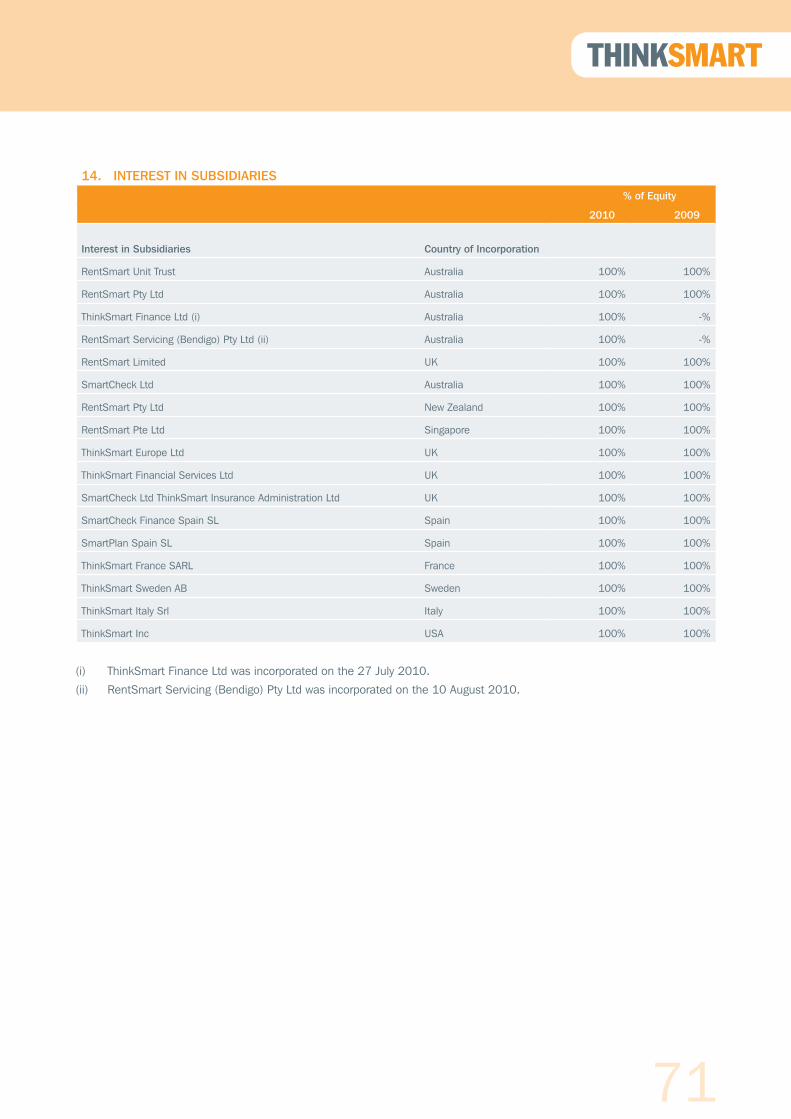
71
ANNUAL REPORT 2011
14. INTEREST IN SUBSIDIARIES% of Equity
2010 2009
Interest in Subsidiaries Country of Incorporation
RentSmart Unit Trust Australia 100% 100%
RentSmart Pty Ltd Australia 100% 100%
ThinkSmart Finance Ltd (i) Australia 100% -%
RentSmart Servicing (Bendigo) Pty Ltd (ii) Australia 100% -%
RentSmart Limited UK 100% 100%
SmartCheck Ltd Australia 100% 100%
RentSmart Pty Ltd New Zealand 100% 100%
RentSmart Pte Ltd Singapore 100% 100%
ThinkSmart Europe Ltd UK 100% 100%
ThinkSmart Financial Services Ltd UK 100% 100%
SmartCheck Ltd ThinkSmart Insurance Administration Ltd UK 100% 100%
SmartCheck Finance Spain SL Spain 100% 100%
SmartPlan Spain SL Spain 100% 100%
ThinkSmart France SARL France 100% 100%
ThinkSmart Sweden AB Sweden 100% 100%
ThinkSmart Italy Srl Italy 100% 100%
ThinkSmart Inc USA 100% 100%
(i) ThinkSmart Finance Ltd was incorporated on the 27 July 2010.
(ii) RentSmart Servicing (Bendigo) Pty Ltd was incorporated on the 10 August 2010.
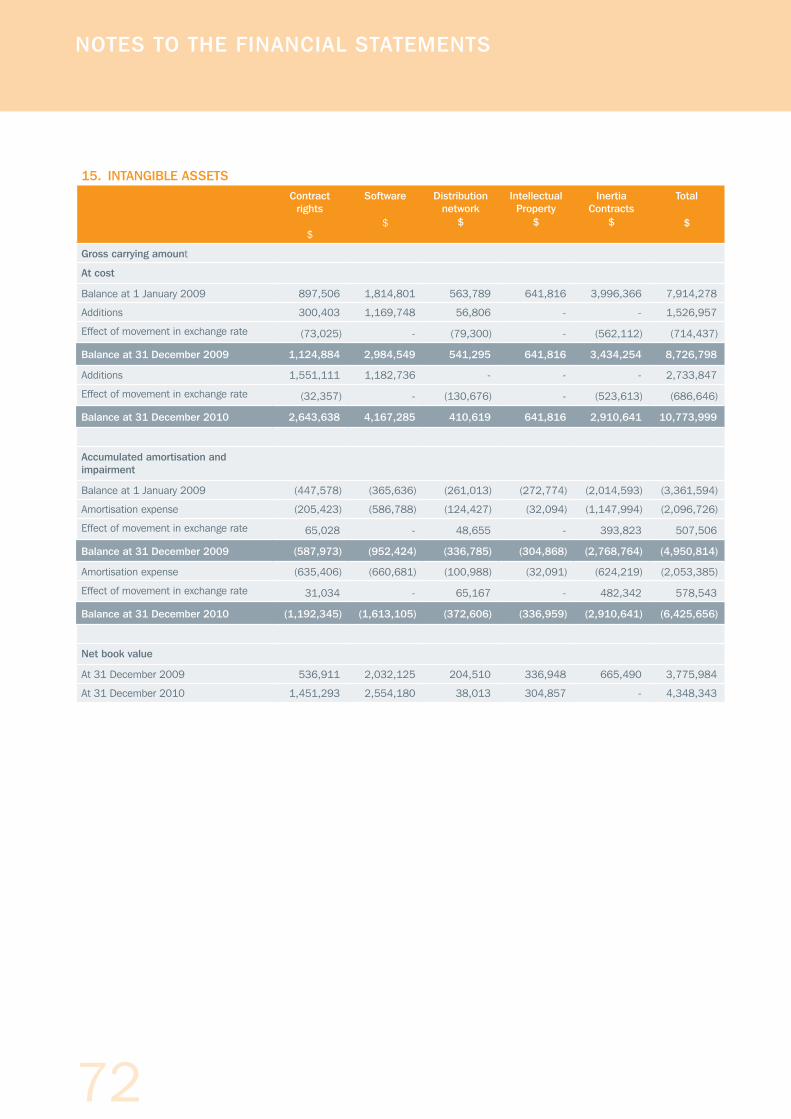
72
15. INTANGIBLE ASSETSContract
rights
$
Software
$
Distribution network
$
Intellectual Property
$
Inertia Contracts
$
Total
$
Gross carrying amount
At cost
Balance at 1 January 2009 897,506 1,814,801 563,789 641,816 3,996,366 7,914,278
Additions 300,403 1,169,748 56,806 - - 1,526,957
Effect of movement in exchange rate (73,025) - (79,300) - (562,112) (714,437)
Balance at 31 December 2009 1,124,884 2,984,549 541,295 641,816 3,434,254 8,726,798
Additions 1,551,111 1,182,736 - - - 2,733,847
Effect of movement in exchange rate (32,357) - (130,676) - (523,613) (686,646)
Balance at 31 December 2010 2,643,638 4,167,285 410,619 641,816 2,910,641 10,773,999
Accumulated amortisation and impairment
Balance at 1 January 2009 (447,578) (365,636) (261,013) (272,774) (2,014,593) (3,361,594)
Amortisation expense (205,423) (586,788) (124,427) (32,094) (1,147,994) (2,096,726)
Effect of movement in exchange rate 65,028 - 48,655 - 393,823 507,506
Balance at 31 December 2009 (587,973) (952,424) (336,785) (304,868) (2,768,764) (4,950,814)
Amortisation expense (635,406) (660,681) (100,988) (32,091) (624,219) (2,053,385)
Effect of movement in exchange rate 31,034 - 65,167 - 482,342 578,543
Balance at 31 December 2010 (1,192,345) (1,613,105) (372,606) (336,959) (2,910,641) (6,425,656)
Net book value
At 31 December 2009 536,911 2,032,125 204,510 336,948 665,490 3,775,984
At 31 December 2010 1,451,293 2,554,180 38,013 304,857 - 4,348,343
NOTES TO THE FINANCIAL STATEMENTS
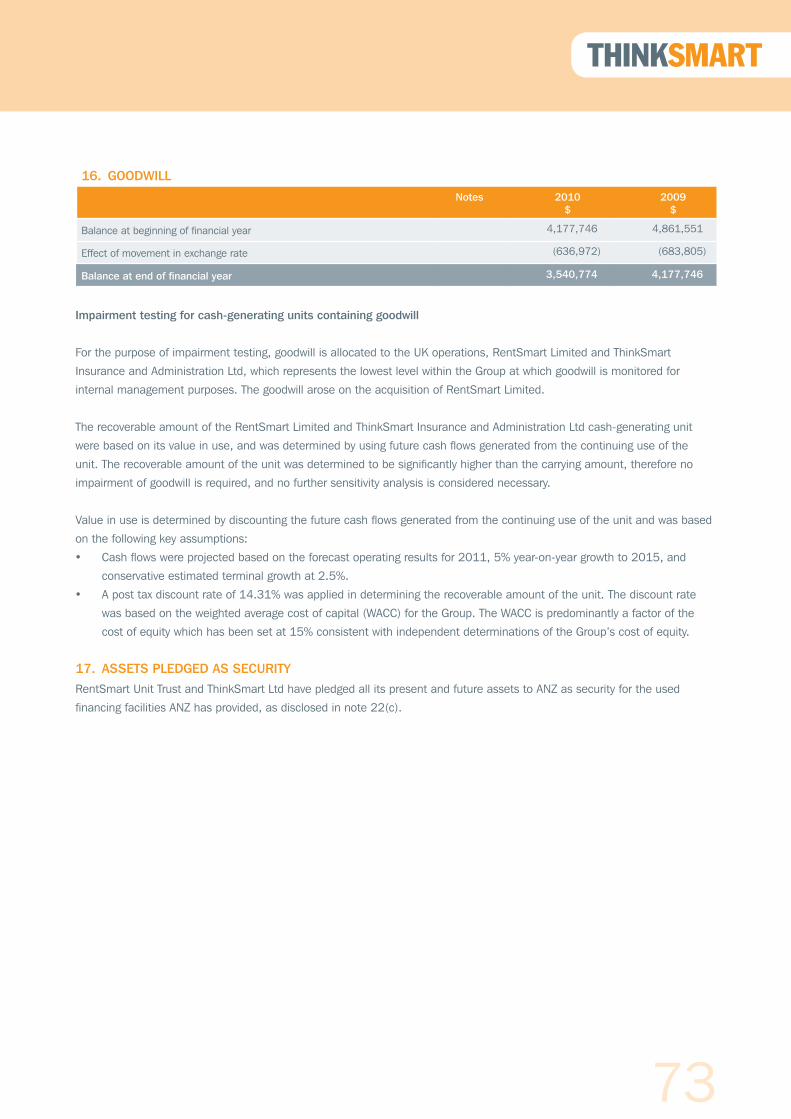
73
ANNUAL REPORT 2011
16. GOODWILL
Notes 2010$
2009$
Balance at beginning of financial year 4,177,746 4,861,551
Effect of movement in exchange rate (636,972) (683,805)
Balance at end of financial year 3,540,774 4,177,746
Impairment testing for cash-generating units containing goodwill
For the purpose of impairment testing, goodwill is allocated to the UK operations, RentSmart Limited and ThinkSmart
Insurance and Administration Ltd, which represents the lowest level within the Group at which goodwill is monitored for
internal management purposes. The goodwill arose on the acquisition of RentSmart Limited.
The recoverable amount of the RentSmart Limited and ThinkSmart Insurance and Administration Ltd cash-generating unit
were based on its value in use, and was determined by using future cash flows generated from the continuing use of the
unit. The recoverable amount of the unit was determined to be significantly higher than the carrying amount, therefore no
impairment of goodwill is required, and no further sensitivity analysis is considered necessary.
Value in use is determined by discounting the future cash flows generated from the continuing use of the unit and was based
on the following key assumptions:
• Cash flows were projected based on the forecast operating results for 2011, 5% year-on-year growth to 2015, and
conservative estimated terminal growth at 2.5%.
• A post tax discount rate of 14.31% was applied in determining the recoverable amount of the unit. The discount rate
was based on the weighted average cost of capital (WACC) for the Group. The WACC is predominantly a factor of the
cost of equity which has been set at 15% consistent with independent determinations of the Group’s cost of equity.
17. ASSETS PLEDGED AS SECURITYRentSmart Unit Trust and ThinkSmart Ltd have pledged all its present and future assets to ANZ as security for the used
financing facilities ANZ has provided, as disclosed in note 22(c).
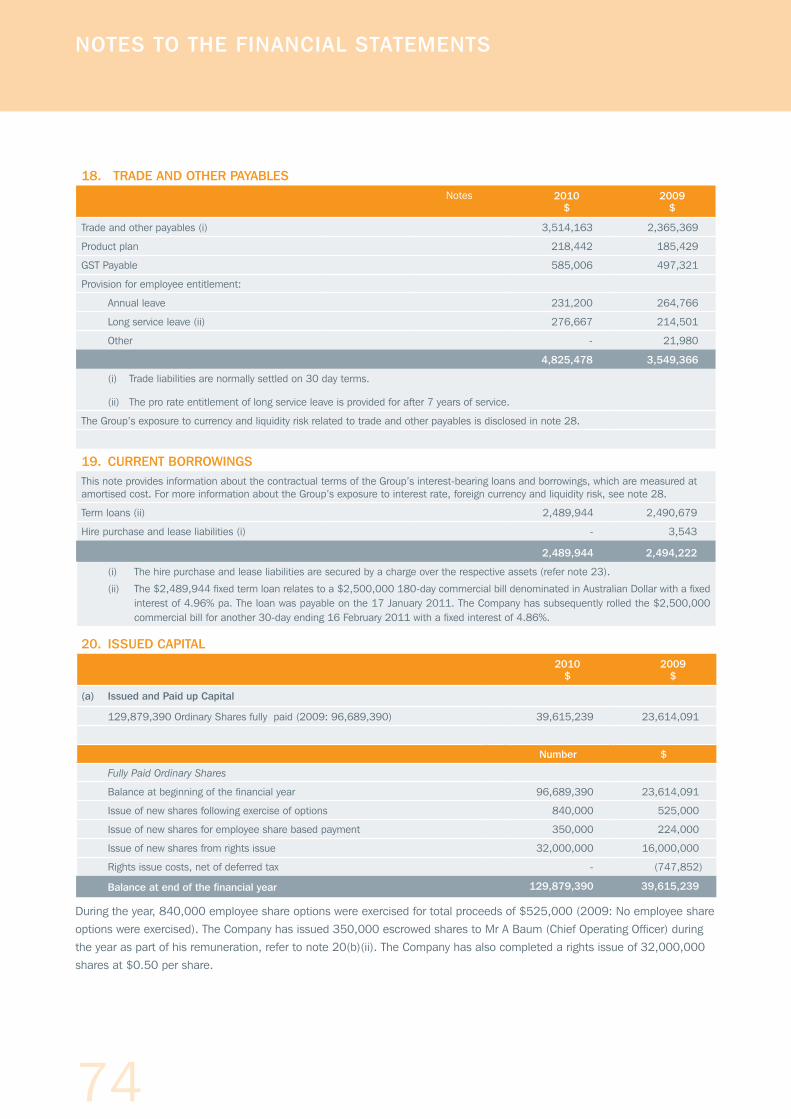
74
18. TRADE AND OTHER PAYABLESNotes 2010
$2009
$
Trade and other payables (i) 3,514,163 2,365,369
Product plan 218,442 185,429
GST Payable 585,006 497,321
Provision for employee entitlement:
Annual leave 231,200 264,766
Long service leave (ii) 276,667 214,501
Other - 21,980
4,825,478 3,549,366
(i) Trade liabilities are normally settled on 30 day terms.
(ii) The pro rate entitlement of long service leave is provided for after 7 years of service.
The Group’s exposure to currency and liquidity risk related to trade and other payables is disclosed in note 28.
19. CURRENT BORROWINGSThis note provides information about the contractual terms of the Group’s interest-bearing loans and borrowings, which are measured at amortised cost. For more information about the Group’s exposure to interest rate, foreign currency and liquidity risk, see note 28.
Term loans (ii) 2,489,944 2,490,679
Hire purchase and lease liabilities (i) - 3,543
2,489,944 2,494,222
(i) The hire purchase and lease liabilities are secured by a charge over the respective assets (refer note 23).
(ii) The $2,489,944 fixed term loan relates to a $2,500,000 180-day commercial bill denominated in Australian Dollar with a fixed interest of 4.96% pa. The loan was payable on the 17 January 2011. The Company has subsequently rolled the $2,500,000 commercial bill for another 30-day ending 16 February 2011 with a fixed interest of 4.86%.
20. ISSUED CAPITAL2010
$2009
$
(a) Issued and Paid up Capital
129,879,390 Ordinary Shares fully paid (2009: 96,689,390) 39,615,239 23,614,091
Number $
Fully Paid Ordinary Shares
Balance at beginning of the financial year 96,689,390 23,614,091
Issue of new shares following exercise of options 840,000 525,000
Issue of new shares for employee share based payment 350,000 224,000
Issue of new shares from rights issue 32,000,000 16,000,000
Rights issue costs, net of deferred tax - (747,852)
Balance at end of the financial year 129,879,390 39,615,239
During the year, 840,000 employee share options were exercised for total proceeds of $525,000 (2009: No employee share options were exercised). The Company has issued 350,000 escrowed shares to Mr A Baum (Chief Operating Officer) during the year as part of his remuneration, refer to note 20(b)(ii). The Company has also completed a rights issue of 32,000,000 shares at $0.50 per share.
NOTES TO THE FINANCIAL STATEMENTS

75
ANNUAL REPORT 2011
20. ISSUED CAPITAL (CONT.)
Ordinary Shares entitle the holder to participate in dividends and the proceeds on winding up the Company in proportion to
the number of and amount paid on the Shares held.
On a show of hands, every holder of Ordinary Shares present in the meeting in person or by proxy, is entitled to one vote, and
upon a poll each Share is entitled to one vote.
The Company does not have authorised capital or par value in respect to its issued shares.
(b)(i) Share Options – Employee Options
The Company has an ownership-based compensation scheme for executives and senior employees. Each employee share
option converts to one ordinary share of ThinkSmart Limited on exercise and payment of the exercise price. The options carry
neither rights or dividends nor voting rights. Options may be exercised at any time within the specified exercise period to the
date of their expiry.
Options issued in previous periods:• 640,000 options over ordinary shares were issued 17 April 2007 and exercisable at $1.375, vesting and exercisable on 1
January 2009 exercisable until 31 December 2011.• 720,000 options over ordinary shares were issued 17 April 2007 and exercisable at $3.00, vesting and exercisable on 1
January 2009 exercisable until 31 December 2011.• 3,350,000 options over ordinary shares were issued 30 June 2009 and exercisable at $0.62, with an exercise period between
1 January 2012 to 31 December 2013. Vesting of the options is subject to achievement of the following performance conditions:
- 50% of options are subject to achievement of Earnings per Share (“EPS”) performance conditions; and- 50% of options are subject to achievement of Total Shareholder Return (“TSR”) performance condition.
Options issued in the current period:• 2,200,000 and 333,333 options over ordinary shares were issued 5 May 2010 and 1 September 2010 respectively. The
options are exercisable at $1.11, with an exercise period between 1 January 2013 to 31 December 2014. Vesting of the options is subject to achievement of the following performance conditions:
- 50% of options are subject to achievement of Earnings per Share (“EPS”) performance conditions; and- 50% of options are subject to achievement of Total Shareholder Return (“TSR”) performance condition.
The value of these options will be expensed over the vesting period in accordance with AASB 2.
Below are options that were issued in 2010 and 2009:
Options series issued in 2010 Number Grant date Exercise periodExercise price
$Fair value at grant date
Employee options 2,200,000 05/05/20101 January 2013 to 31 December 2014 $1.11 $0.2746
Employee options 333,333 01/09/20101 January 2013 to 31 December 2014 $1.11 $0.2287
Options series issued in 2009 Number Grant date Exercise periodExercise price
$Fair value at grant date
Employee options 3,350,000 30/06/20091 January 2012 to 31 December 2013 $0.62 $0.0683
The weighted average fair value of the share options granted in 2010 is $0.27 (2009: $0.0683). Options were priced using
a binomial option pricing model. Expected volatility is based on that observed for comparable listed companies over the time
period appropriate to the option grant in question.
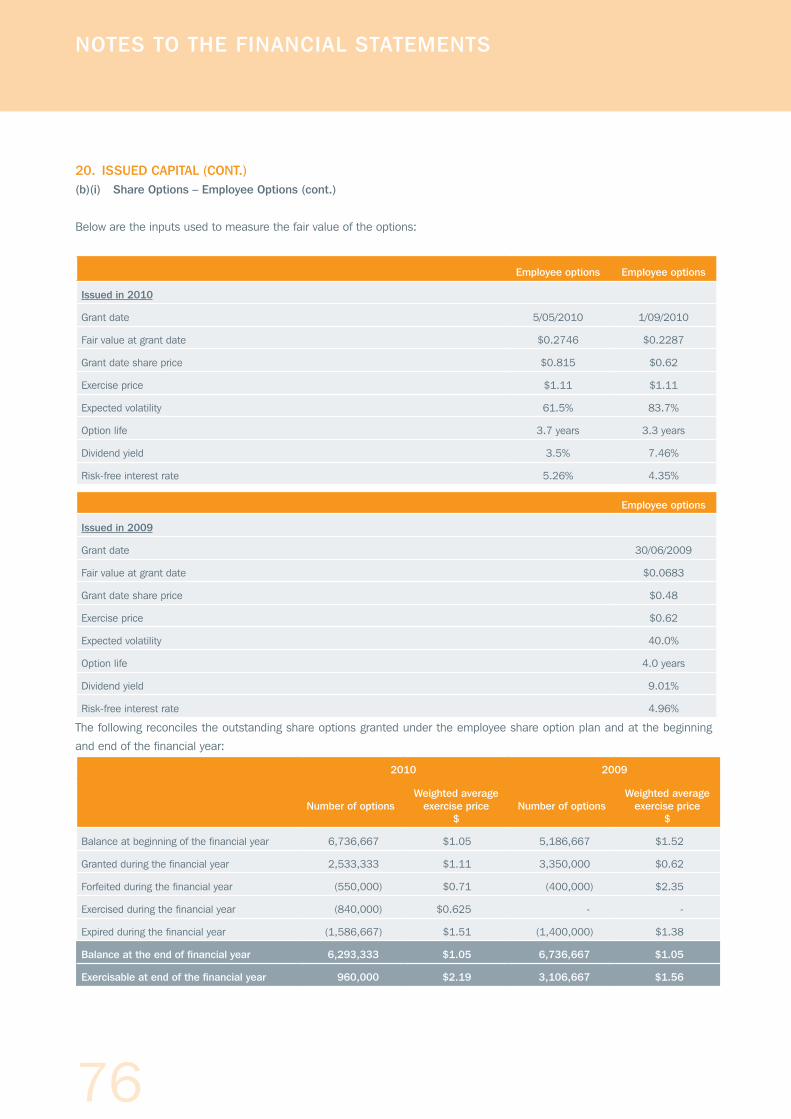
76
20. ISSUED CAPITAL (CONT.)(b)(i) Share Options – Employee Options (cont.)
Below are the inputs used to measure the fair value of the options:
Employee options Employee options
Issued in 2010
Grant date 5/05/2010 1/09/2010
Fair value at grant date $0.2746 $0.2287
Grant date share price $0.815 $0.62
Exercise price $1.11 $1.11
Expected volatility 61.5% 83.7%
Option life 3.7 years 3.3 years
Dividend yield 3.5% 7.46%
Risk-free interest rate 5.26% 4.35%
Employee options
Issued in 2009
Grant date 30/06/2009
Fair value at grant date $0.0683
Grant date share price $0.48
Exercise price $0.62
Expected volatility 40.0%
Option life 4.0 years
Dividend yield 9.01%
Risk-free interest rate 4.96%
The following reconciles the outstanding share options granted under the employee share option plan and at the beginning
and end of the financial year:
2010 2009
Number of optionsWeighted average
exercise price$
Number of optionsWeighted average
exercise price$
Balance at beginning of the financial year 6,736,667 $1.05 5,186,667 $1.52
Granted during the financial year 2,533,333 $1.11 3,350,000 $0.62
Forfeited during the financial year (550,000) $0.71 (400,000) $2.35
Exercised during the financial year (840,000) $0.625 - -
Expired during the financial year (1,586,667) $1.51 (1,400,000) $1.38
Balance at the end of financial year 6,293,333 $1.05 6,736,667 $1.05
Exercisable at end of the financial year 960,000 $2.19 3,106,667 $1.56
NOTES TO THE FINANCIAL STATEMENTS

77
ANNUAL REPORT 2011
20. ISSUED CAPITAL (CONT.)(b)(i) Share Options – Employee Options (cont.)
The options outstanding at 31 December 2010 have an exercise price in the range of $0.62 to $3.00 (2009: $0.625 to
$3.00) and a weighted average contractual life of 3.08 years (2009: 2.56 years).
The weighted average share price at the date of exercise for share options exercised during the year ended 31 December
2010 was $0.80 (2009: Nil, no options were exercised).
The following is the total expense recognised for the period arising from share-based payment transactions.
2010$
2009$
Share options granted in 2006 – equity settled 20,740 23,656
Share options granted in 2009 – equity settled 51,960 28,928
Share options granted in 2010 – equity settled 162,811 -
Shares as remuneration granted in 2010 – equity settled 24,889 -
Total expense recognised as employee costs 260,400 52,584
(b)(ii) Share Compensation – Employee Shares
Details on shares of the Company that were granted as compensation to each key management person during the reporting
period and details on shares vested during the reporting period are as follows:
No of shares granted during
2010
Grant date Fair value at grant date ($)
Vesting period
No of shares vested during
2010
Executives
A Baum 350,000 01/09/2010 0.64 3 years -
No shares are granted since the end of the financial year. The shares are provided at no cost to the recipients.
These shares were issued to A Baum upon him joining ThinkSmart Ltd and are held in escrow. The shares are ordinary shares
in the Company and will vest upon completion of a 3-year service period. During this period, Mr Baum is entitled to any
dividends declared by the Company and normal voting rights are attached. In the event that Mr Baum’s employment with the
Company ceases before the vesting period (i.e. through resignation or termination), the shares will be cancelled. If Mr Baum
is retrenched by the Company due to changes in the Company’s structure or operations, he will be entitled to retain the
shares and they will become immediately unconditional if this occurs before the escrow period expires.
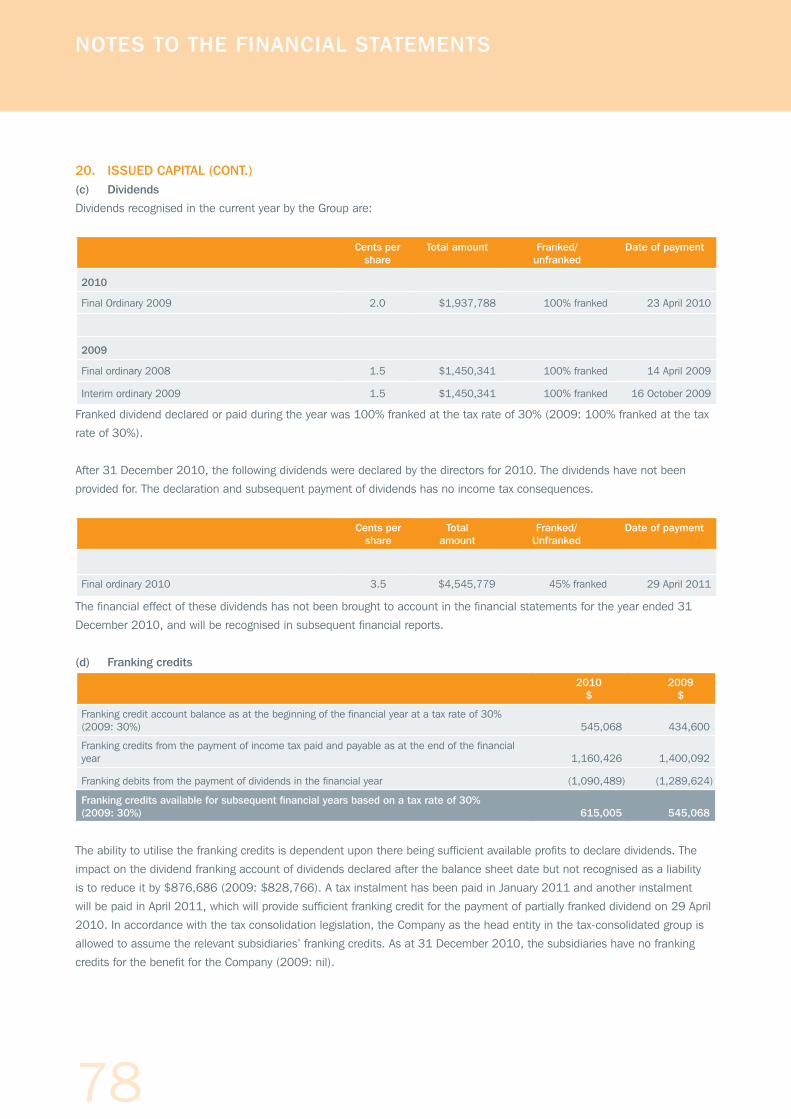
78
20. ISSUED CAPITAL (CONT.)(c) Dividends
Dividends recognised in the current year by the Group are:
Cents per share
Total amount Franked/ unfranked
Date of payment
2010
Final Ordinary 2009 2.0 $1,937,788 100% franked 23 April 2010
2009
Final ordinary 2008 1.5 $1,450,341 100% franked 14 April 2009
Interim ordinary 2009 1.5 $1,450,341 100% franked 16 October 2009
Franked dividend declared or paid during the year was 100% franked at the tax rate of 30% (2009: 100% franked at the tax
rate of 30%).
After 31 December 2010, the following dividends were declared by the directors for 2010. The dividends have not been
provided for. The declaration and subsequent payment of dividends has no income tax consequences.
Cents per share
Totalamount
Franked/Unfranked
Date of payment
Final ordinary 2010 3.5 $4,545,779 45% franked 29 April 2011
The financial effect of these dividends has not been brought to account in the financial statements for the year ended 31
December 2010, and will be recognised in subsequent financial reports.
(d) Franking credits
2010$
2009$
Franking credit account balance as at the beginning of the financial year at a tax rate of 30% (2009: 30%) 545,068 434,600
Franking credits from the payment of income tax paid and payable as at the end of the financial year 1,160,426 1,400,092
Franking debits from the payment of dividends in the financial year (1,090,489) (1,289,624)
Franking credits available for subsequent financial years based on a tax rate of 30% (2009: 30%) 615,005 545,068
The ability to utilise the franking credits is dependent upon there being sufficient available profits to declare dividends. The
impact on the dividend franking account of dividends declared after the balance sheet date but not recognised as a liability
is to reduce it by $876,686 (2009: $828,766). A tax instalment has been paid in January 2011 and another instalment
will be paid in April 2011, which will provide sufficient franking credit for the payment of partially franked dividend on 29 April
2010. In accordance with the tax consolidation legislation, the Company as the head entity in the tax-consolidated group is
allowed to assume the relevant subsidiaries’ franking credits. As at 31 December 2010, the subsidiaries have no franking
credits for the benefit for the Company (2009: nil).
NOTES TO THE FINANCIAL STATEMENTS
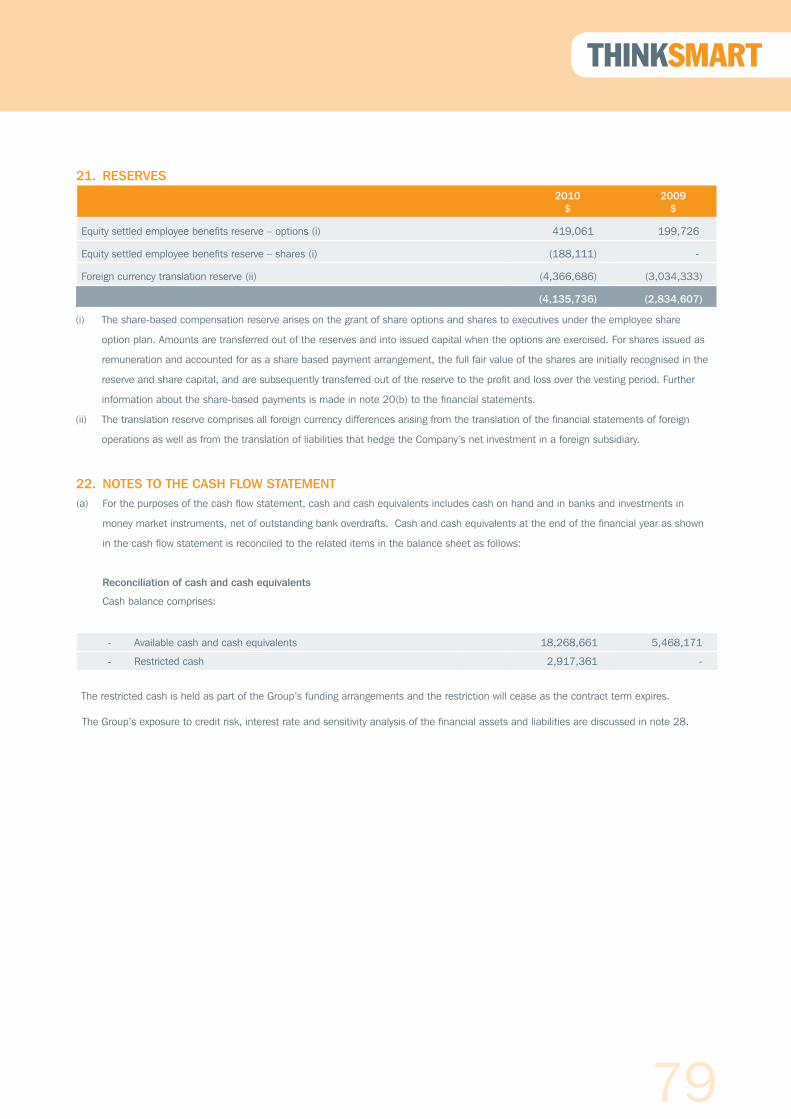
79
ANNUAL REPORT 2011
21. RESERVES2010
$2009
$
Equity settled employee benefits reserve – options (i) 419,061 199,726
Equity settled employee benefits reserve – shares (i) (188,111) -
Foreign currency translation reserve (ii) (4,366,686) (3,034,333)
(4,135,736) (2,834,607)
(i) The share-based compensation reserve arises on the grant of share options and shares to executives under the employee share
option plan. Amounts are transferred out of the reserves and into issued capital when the options are exercised. For shares issued as
remuneration and accounted for as a share based payment arrangement, the full fair value of the shares are initially recognised in the
reserve and share capital, and are subsequently transferred out of the reserve to the profit and loss over the vesting period. Further
information about the share-based payments is made in note 20(b) to the financial statements.
(ii) The translation reserve comprises all foreign currency differences arising from the translation of the financial statements of foreign
operations as well as from the translation of liabilities that hedge the Company’s net investment in a foreign subsidiary.
22. NOTES TO THE CASH FLOW STATEMENT(a) For the purposes of the cash flow statement, cash and cash equivalents includes cash on hand and in banks and investments in
money market instruments, net of outstanding bank overdrafts. Cash and cash equivalents at the end of the financial year as shown
in the cash flow statement is reconciled to the related items in the balance sheet as follows:
Reconciliation of cash and cash equivalents
Cash balance comprises:
- Available cash and cash equivalents 18,268,661 5,468,171
- Restricted cash 2,917,361 -
The restricted cash is held as part of the Group’s funding arrangements and the restriction will cease as the contract term expires.
The Group’s exposure to credit risk, interest rate and sensitivity analysis of the financial assets and liabilities are discussed in note 28.
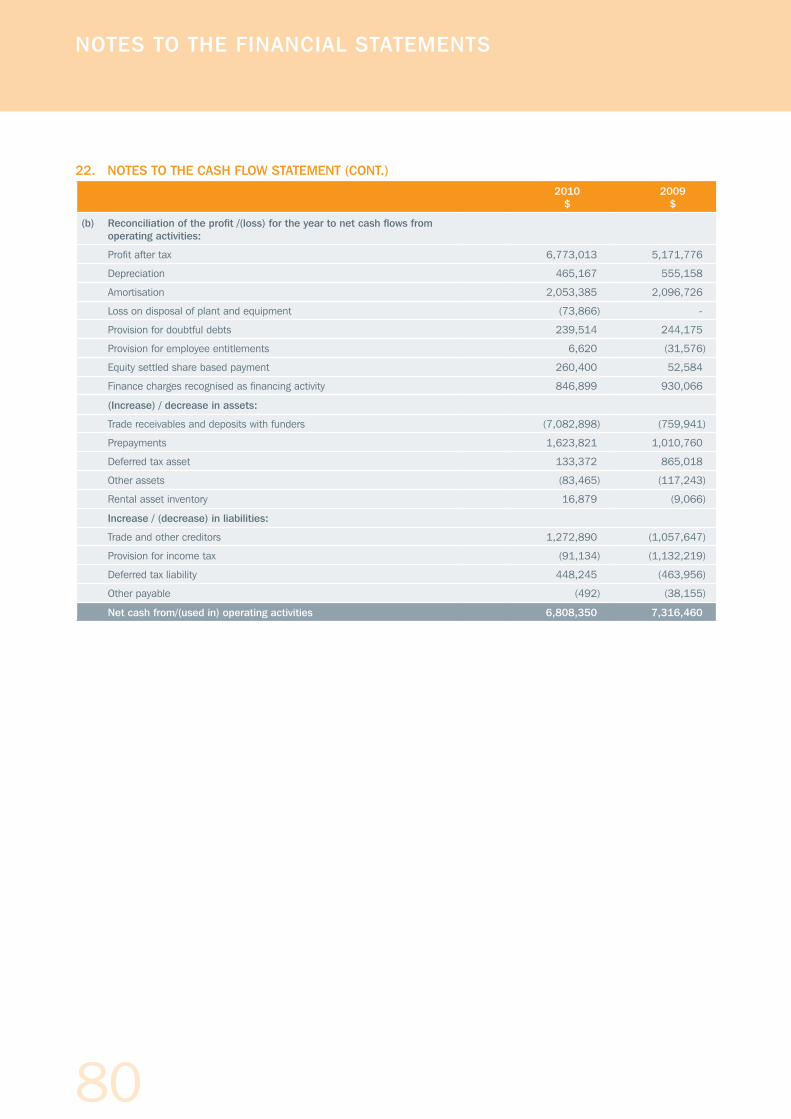
80
22. NOTES TO THE CASH FLOW STATEMENT (CONT.)2010
$2009
$
(b) Reconciliation of the profit /(loss) for the year to net cash flows from operating activities:
Profit after tax 6,773,013 5,171,776
Depreciation 465,167 555,158
Amortisation 2,053,385 2,096,726
Loss on disposal of plant and equipment (73,866) -
Provision for doubtful debts 239,514 244,175
Provision for employee entitlements 6,620 (31,576)
Equity settled share based payment 260,400 52,584
Finance charges recognised as financing activity 846,899 930,066
(Increase) / decrease in assets:
Trade receivables and deposits with funders (7,082,898) (759,941)
Prepayments 1,623,821 1,010,760
Deferred tax asset 133,372 865,018
Other assets (83,465) (117,243)
Rental asset inventory 16,879 (9,066)
Increase / (decrease) in liabilities:
Trade and other creditors 1,272,890 (1,057,647)
Provision for income tax (91,134) (1,132,219)
Deferred tax liability 448,245 (463,956)
Other payable (492) (38,155)
Net cash from/(used in) operating activities 6,808,350 7,316,460
NOTES TO THE FINANCIAL STATEMENTS
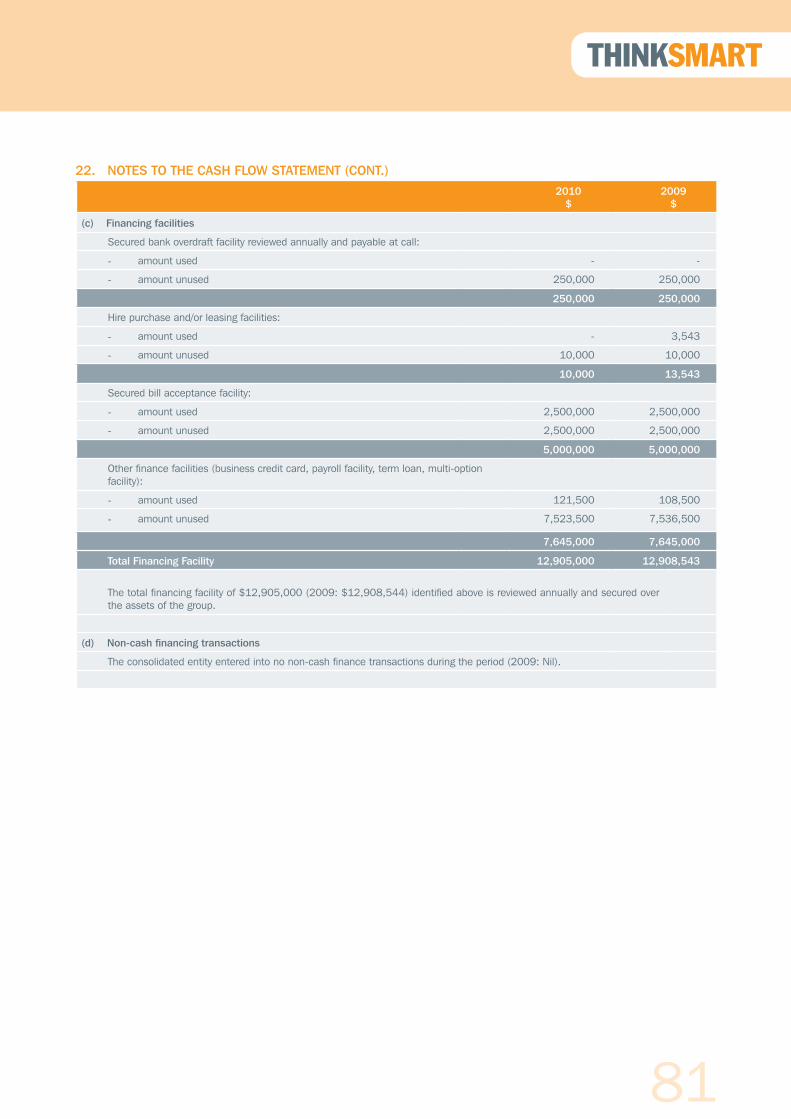
81
ANNUAL REPORT 2011
22. NOTES TO THE CASH FLOW STATEMENT (CONT.)2010
$2009
$
(c) Financing facilities
Secured bank overdraft facility reviewed annually and payable at call:
- amount used - -
- amount unused 250,000 250,000
250,000 250,000
Hire purchase and/or leasing facilities:
- amount used - 3,543
- amount unused 10,000 10,000
10,000 13,543
Secured bill acceptance facility:
- amount used 2,500,000 2,500,000
- amount unused 2,500,000 2,500,000
5,000,000 5,000,000
Other finance facilities (business credit card, payroll facility, term loan, multi-option facility):
- amount used 121,500 108,500
- amount unused 7,523,500 7,536,500
7,645,000 7,645,000
Total Financing Facility 12,905,000 12,908,543
The total financing facility of $12,905,000 (2009: $12,908,544) identified above is reviewed annually and secured over the assets of the group.
(d) Non-cash financing transactions
The consolidated entity entered into no non-cash finance transactions during the period (2009: Nil).
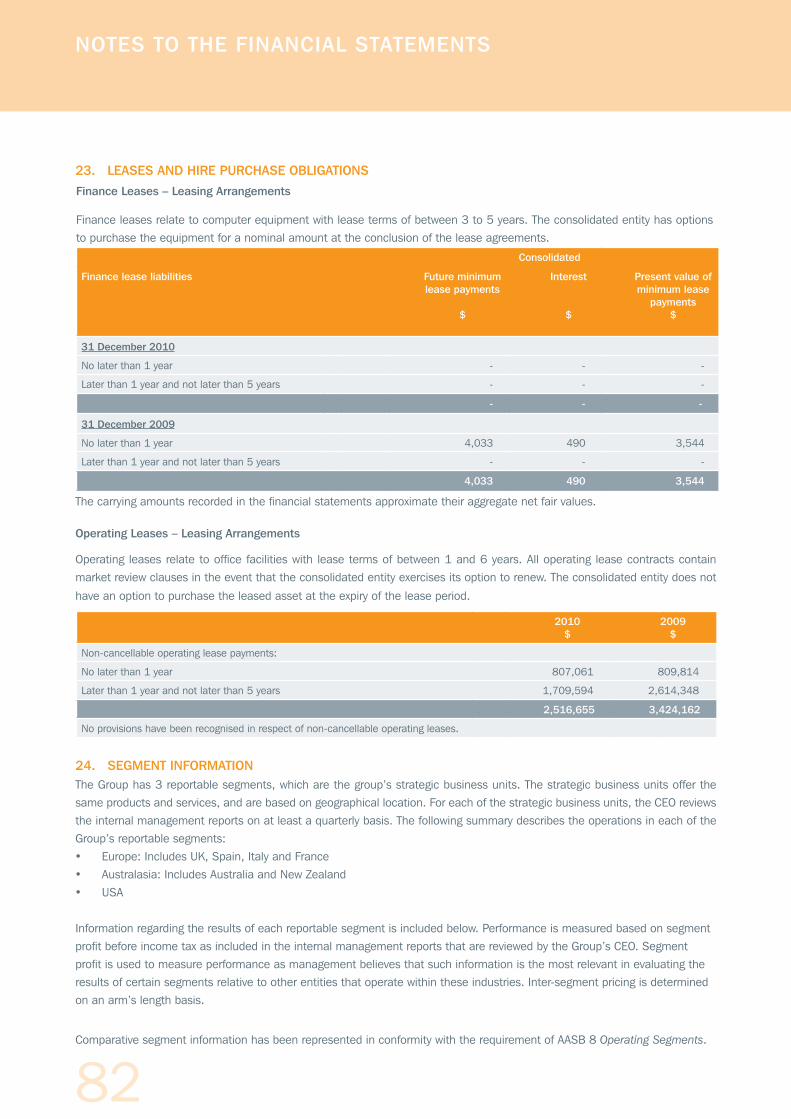
82
23. LEASES AND HIRE PURCHASE OBLIGATIONS
Finance Leases – Leasing Arrangements
Finance leases relate to computer equipment with lease terms of between 3 to 5 years. The consolidated entity has options to purchase the equipment for a nominal amount at the conclusion of the lease agreements.
Consolidated
Finance lease liabilities Future minimum lease payments
$
Interest
$
Present value of minimum lease
payments$
31 December 2010
No later than 1 year - - -
Later than 1 year and not later than 5 years - - -
- - -
31 December 2009
No later than 1 year 4,033 490 3,544
Later than 1 year and not later than 5 years - - -
4,033 490 3,544
The carrying amounts recorded in the financial statements approximate their aggregate net fair values.
Operating Leases – Leasing Arrangements
Operating leases relate to office facilities with lease terms of between 1 and 6 years. All operating lease contracts contain market review clauses in the event that the consolidated entity exercises its option to renew. The consolidated entity does not
have an option to purchase the leased asset at the expiry of the lease period.
2010$
2009$
Non-cancellable operating lease payments:
No later than 1 year 807,061 809,814
Later than 1 year and not later than 5 years 1,709,594 2,614,348
2,516,655 3,424,162
No provisions have been recognised in respect of non-cancellable operating leases.
24. SEGMENT INFORMATIONThe Group has 3 reportable segments, which are the group’s strategic business units. The strategic business units offer the same products and services, and are based on geographical location. For each of the strategic business units, the CEO reviews the internal management reports on at least a quarterly basis. The following summary describes the operations in each of the Group’s reportable segments:• Europe: Includes UK, Spain, Italy and France• Australasia: Includes Australia and New Zealand• USA
Information regarding the results of each reportable segment is included below. Performance is measured based on segment profit before income tax as included in the internal management reports that are reviewed by the Group’s CEO. Segment profit is used to measure performance as management believes that such information is the most relevant in evaluating the results of certain segments relative to other entities that operate within these industries. Inter-segment pricing is determined on an arm’s length basis.
Comparative segment information has been represented in conformity with the requirement of AASB 8 Operating Segments.
NOTES TO THE FINANCIAL STATEMENTS

83
ANNUAL REPORT 2011
24. SEGMENT INFORMATION (CONT.)Europe Australasia USA Total
Operating Segments Information about reportable segments for the year ended 31 December
2010$
2009$
2010$
2009$
2010$
2009$
2010$
2009$
External revenues 14,459,016 15,244,638 27,648,749 21,509,066 2,797 1,495 42,110,562 36,755,199
Intersegment revenue - - 1,474,304 2,061,806 - - 1,474,304 2,061,806
Interest income 9,628 2,374 2,484,275 950,438 - - 2,493,902 952,812
Interest expense (1,011,740) (915,329) (1,174,838) (100,397) - - (2,186,578) (1,015,726)
Depreciation and amortisation (1,166,759) (1,690,667) (1,351,793) (961,219) - - (2,518,552) (2,651,886)
Reportable segment profit before income tax 2,294,722 3,984,700 11,775,145 8,065,567 (16,983) (27,210) 14,052,883 12,023,058
Other material non-cash items:Impairment on plant and equipment and intangible assets - - - - - - - -
Reportable segment assets 17,707,606 15,591,339 27,902,009 8,817,925 1,894 6,456 45,611,508 24,415,720
Reportable segment liabilities 1,788,765 2,223,576 6,473,983 4,402,771 2,105 430 8,264,853 6,626,777
Capital expenditure 444,331 414,377 2,915,050 1,577,518 - - 3,359,381 1,991,895
Reconciliation of reportable segment revenues
Total revenue for reportable segments 43,584,866 38,817,005
Elimination of inter-segment revenue (1,474,304) (2,061,806)
Consolidated revenue 42,110,562 36,755,199
Reconciliation of reportable segment profit or loss
Total profit or loss for reportable segments 14,052,883 12,023,058
Elimination of inter-segment profits (1,482,828) (2,284,082)
Unallocated expenses (2,855,016) (2,105,652)
Consolidated profit before tax 9,715,039 7,633,324
Reconciliation of reportable segment assets
Total assets for reportable segments 45,611,508 24,415,720
Other unallocated amounts 291,883 323,974
Consolidated total assets 45,903,391 24,739,694
Reconciliation of reportable segment liabilities
Total liabilities for reportable segments 8,264,853 6,626,777
Other unallocated amounts (60,589) (50,966)
Consolidated total liabilities 8,204,264 6,575,811
There has been no change to the basis of segmentation or the measurement basis for the segment profit or loss since 31 December 2009.
Major customer
Revenues from the Group’s funding partners represent $25,501,346 (2009: $19,972,868) of the Group’s total revenue.
84
25. REMUNERATION OF AUDITORS2010 2009
$ $
Audit services:
Auditors of the Company:
Audit and review of financial reports (Australia) 224,807 181,330
Audit and review of financial reports (Overseas) 68,337 86,902
293,144 268,232
Services other than statutory audit:
Other assurance services
Tax and other services 22,133 33,896
22,133 33,896
The Group’s auditors are KPMG in 2010 and 2009.
26. COMMITMENTS AND CONTINGENT LIABILITIES Under the terms of the UK former funding agreement the group is potentially liable to refund part of its brokerage income in
the event that the funders bad debts exceed certain pre-agreed levels. As at 31 December 2010, the maximum amount of
brokerage income that the group may potentially have to refund in the future is $492,027 (2009:$485,516).
Under the terms of the UK current funding agreement with Secure Trust Bank, the group is obliged to purchase delinquent
leases from the funder at the funded amount. At 31 December 2010, the total funded amount of all leases funded by the
funder is $11,845,103 (2009: nil) against which the group has provided $683,372 (2009: nil) being its estimate of the
funded amount of these leases that are likely to become delinquent in the future.
Included in cash and cash equivalents, $2,917,361 (2009: nil) which are held as part of the Group’s funding arrangements
and are restricted.
Under the terms of its Australian funding agreement the group has deposits held by the funder as credit support for the
portfolio of leases funded by the funder. These deposits represent amounts held in excess of expected future losses, however
the group has a potential risk that, should losses exceed expected levels and alternate remedies are not made, a portion
of these deposits may be forfeit. As at 31 December 2010, the maximum amount of funder deposits that the group may
potentially forfeit in the future is $3,122,945 (2009: nil). Further funder deposits are held by the funder against the risk
of default by the group under the servicing provisions of its Australian funding agreement. Should the group default against
these obligations, the entire deposit would be forfeit. As at 31 December 2010 the deposit held against servicing default was
$2,643,398 (2009: $1,105,425).
Under the terms of its Australian funding agreement the group has issued a bank guarantee, held by a third party, in favour
of its Australian funder as an additional layer of credit support for the portfolio of leases funded by the funder. In the unlikely
event that losses exceed expected levels and alternate remedies are not made, including accessing funder deposits, and the
funder calls on the bank guarantee, the group would have a liability to the amount called upon. As at 31 December 2010,
the maximum exposure the group had under the bank guarantee was $7 million (2009: $7 million).
Under the terms of a new Retailer Agreement entered into in 2010, the Group committed to pay a deferred establishment fee
of $1,350,000. This establishment fee, when paid will be recognised as a contract rights intangible asset and amortised over
its expected useful life.
NOTES TO THE FINANCIAL STATEMENTS
85
ANNUAL REPORT 2011
27. CONTINGENT INERTIA ASSETS Under the Group’s accounting policy (note 3(o)), inertia revenue is not recognised until the conclusion of the initial rental period.
At this point, the Group is entitled to acquire the equipment from the funders at a nominal value, and the equipment can be
disposed of, or continue to be rented to third parties.
The Group does not have control over these future revenue streams and accordingly the revenue is not brought to account until
it is received.
A conservative estimate of its realisable value has been made by estimating expected sales proceeds through the least profitable
sales channel and public auction. The after-tax cash flows, calculated from rental contracts in existence at 31 December 2010,
are discounted using appropriate risk factors. The estimated value of future cash flows is $9,572,203 (2009: $10,635,969),
representing the discounted after tax value of assets as determined by reference to auction sales history.
At 1 December 2006, the Group acquired RentSmart Limited. Inertia income of $4,803,652 was recognised as an intangible
asset as part of the business combination. At 31 December 2010, this asset is fully amortised with nil carrying amount.
28. FINANCIAL INSTRUMENTS28 (a) Interest rate risk
Profile
At the reporting date, the interest rate profile of the Group’s interest-bearing financial instrument were:
Carrying amount
Note2010
$2009
$
Fixed rate instruments
Hire purchase and finance lease liability - 3,543
Financial liability - 3,543
Variable rate instruments
Cash and cash equivalent 21,186,022 5,468,171
Deposits held by funder (current) 143,398 373,816
Deposits held by funder (non-current) 6,737,156 731,609
Term loan (2,489,944) (2,490,679)
Net financial asset 25,576,632 4,082,917
86
28. FINANCIAL INSTRUMENTS (CONT.)28 (a) Interest rate risk (Cont.)
Sensitivity analysis
Variable rate instruments
The movements in profit are due to higher/lower interest costs from variable rate debt and cash balances. The Group does not
have derivative instruments, therefore a change in interest rates at the reporting date would not affect equity.
A change in 1% in interest rates would have increased or decreased the Group’s profit by $255,766 (2009: $40,829).
28 (b) Fair value of financial instruments
The carrying amounts of financial assets and financial liabilities recorded in the financial statements approximate their
aggregate net fair values.
28 (c) Credit risk management
Exposure to credit risk
The maximum credit risk exposure of the Group is the sum of the carrying amount of the Group’s financial assets and the
contingent liabilities in note 26. The carrying amount of the Group’s financial assets that is exposed to credit risk at reporting
date is:
Note2010
$2009
$
Cash and cash equivalent 22(a) 21,186,022 5,468,171
Trade receivables (current) 8 2,362,465 1,519,955
Deposits held by funder (current) 8 143,398 373,816
Deposits held by funder (non-current) 8 6,737,156 731,609
Sundry debtors 8 188,653 61,044
Deals awaiting settlement 11 394,083 310,131
Prepayments (current) 10 1,296,775 2,393,154
Prepayments (non-current) 12 2,372,572 2,953,610
34,681,124 13,811,490
The carrying amount of the Group’s financial assets that is exposed to credit risk at reporting date by geographic region is:
Australasia 22,110,658 4,419,067
Europe 12,568,574 9,386,297
USA 1,892 6,126
34,681,124 13,811,490
NOTES TO THE FINANCIAL STATEMENTS
87
ANNUAL REPORT 2011
28. FINANCIAL INSTRUMENTS (CONT.)28 (c) Credit risk management (cont.)
The carrying amount of the Group’s financial assets that is exposed to credit risk at reporting date by types of counterparty is:
2010$
2009$
Banks 21,186,022 5,468,171
Funders 8,202,305 1,448,720
Retail partners 790,063 529,695
Insurance partners 3,669,346 5,346,765
Others 833,388 1,018,139
34,681,124 13,811,490
In 2010, 66% (2009: 73%) of the total prepayment relates to RentSmart Limited’s upfront insurance premiums payment to
Allianz on behalf of the rental customer. The premiums are recovered from the customer on a monthly basis. In the event the
customer defaults, the policy is cancelled and Allianz refunds the unexpired premium.
Impairment losses
The ageing of the Group’s trade receivables at the reporting date was:
Gross2010
$
Impairment2010
$
Gross2009
$
Impairment2009
$
Not past due 2,088,171 53,993 1,040,151 23,246
Past due 0-30 days 104,134 5,468 98,626 32,494
Past due 31-120 days 88,350 25,172 93,604 26,927
Past due 120-365 days 79,042 27,545 209,286 125,820
More than 1 year 2,769 - 78,288 5,961
2,362,465 112,178 1,519,955 214,448
The movement in the allowance for impairment in respect of trade receivables during the year was as follows:
2010$
2009$
Balance at 1 January 214,448 258,615
Impairment loss recognised 239,513 244,175
Bad debt written off (308,555) (264,222)
Effect of exchange rate (33,228) (24,120)
Balance at 31 December 112,178 214,448
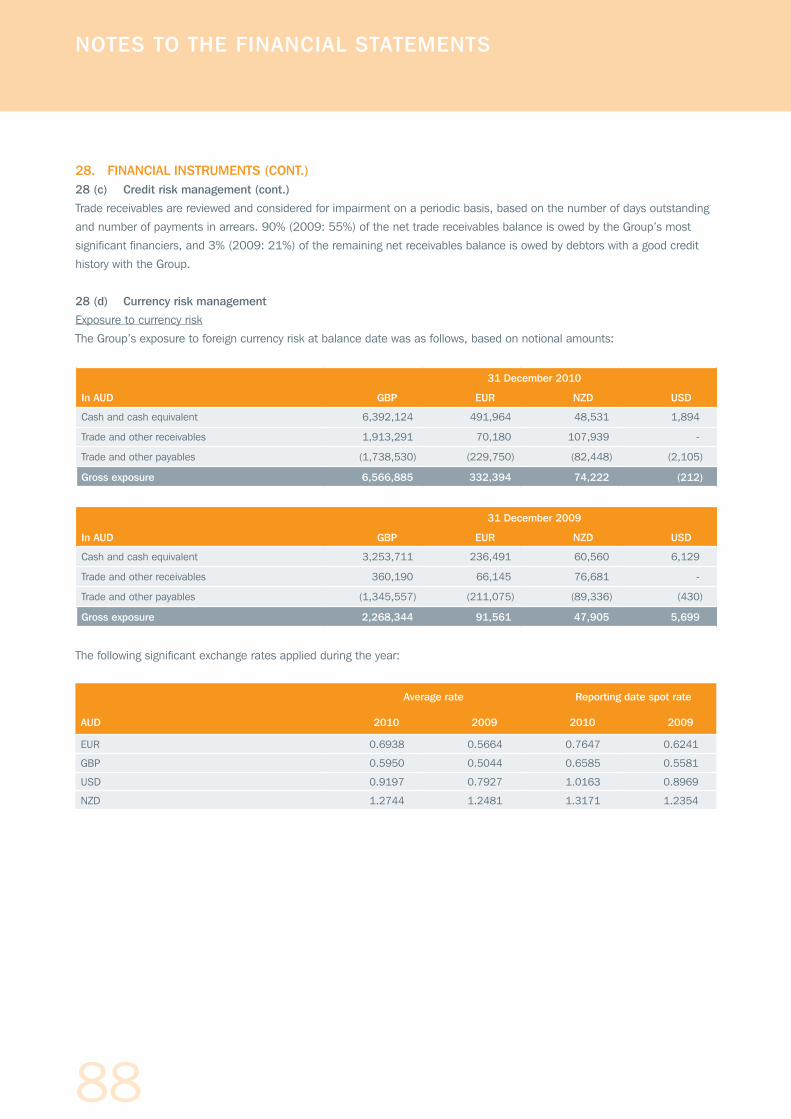
88
28. FINANCIAL INSTRUMENTS (CONT.)28 (c) Credit risk management (cont.)
Trade receivables are reviewed and considered for impairment on a periodic basis, based on the number of days outstanding
and number of payments in arrears. 90% (2009: 55%) of the net trade receivables balance is owed by the Group’s most
significant financiers, and 3% (2009: 21%) of the remaining net receivables balance is owed by debtors with a good credit
history with the Group.
28 (d) Currency risk management
Exposure to currency risk
The Group’s exposure to foreign currency risk at balance date was as follows, based on notional amounts:
31 December 2010
In AUD GBP EUR NZD USD
Cash and cash equivalent 6,392,124 491,964 48,531 1,894
Trade and other receivables 1,913,291 70,180 107,939 -
Trade and other payables (1,738,530) (229,750) (82,448) (2,105)
Gross exposure 6,566,885 332,394 74,222 (212)
31 December 2009
In AUD GBP EUR NZD USD
Cash and cash equivalent 3,253,711 236,491 60,560 6,129
Trade and other receivables 360,190 66,145 76,681 -
Trade and other payables (1,345,557) (211,075) (89,336) (430)
Gross exposure 2,268,344 91,561 47,905 5,699
The following significant exchange rates applied during the year:
Average rate Reporting date spot rate
AUD 2010 2009 2010 2009
EUR 0.6938 0.5664 0.7647 0.6241
GBP 0.5950 0.5044 0.6585 0.5581
USD 0.9197 0.7927 1.0163 0.8969
NZD 1.2744 1.2481 1.3171 1.2354
NOTES TO THE FINANCIAL STATEMENTS

89
ANNUAL REPORT 2011
28. FINANCIAL INSTRUMENTS (CONT.)28 (d) Currency risk management (cont.)
Sensitivity analysis
A 10% strengthening of the Australian dollar against the following currencies at 31 December would have increased/
(decreased) equity and profit and loss by the amounts shown below. This analysis assumes that all other variables, in
particular interest rates, remain constant. The analysis is performed on the same basis for 2009:
Equity$
Profit or loss$
31 December 2010
EUR 76,472 20,665
GBP (1,447,168) (82,553)
USD 19 1,544
NZD (24,525) (3,684)
31 December 2009
EUR 70,836 69,065
GBP (1,215,251) (133,817)
USD 548 2,473
A 10% weakening of the Australian dollar against the above currencies at 31 December would have had equal but opposite
effect on the above currencies to the amounts shown above, on the basis that all other variables remain constant.
28 (e) Liquidity risk management
The following are the contractual maturities of financial liabilities, including estimated interest payments and excluding the
impact of netting agreements:
Consolidated
Carrying Amount
$
Contractual cash flow
$
Less than 1 year
$
1-2 years
$
2-5 years
$
31 December 2010
Trade and other payables 4,317,615 (4,317,615) (4,317,615) - -
Term loans 2,489,944 (2,500,000) (2,500,000) - -
6,807,559 (6,807,559) (6,807,559) - -
31 December 2009
Trade and other payables 3,048,126 (3,048,126) (3,048,126) - -
Term loans 2,490,679 (2,500,000) (2,500,000) - -
Hire purchase and lease liabilities 3,543 (3,543) (3,543) - -
Product plan (non-current) 492 (492) - (492) -
5,542,840 (5,542,840) (5,542,348) (492) -
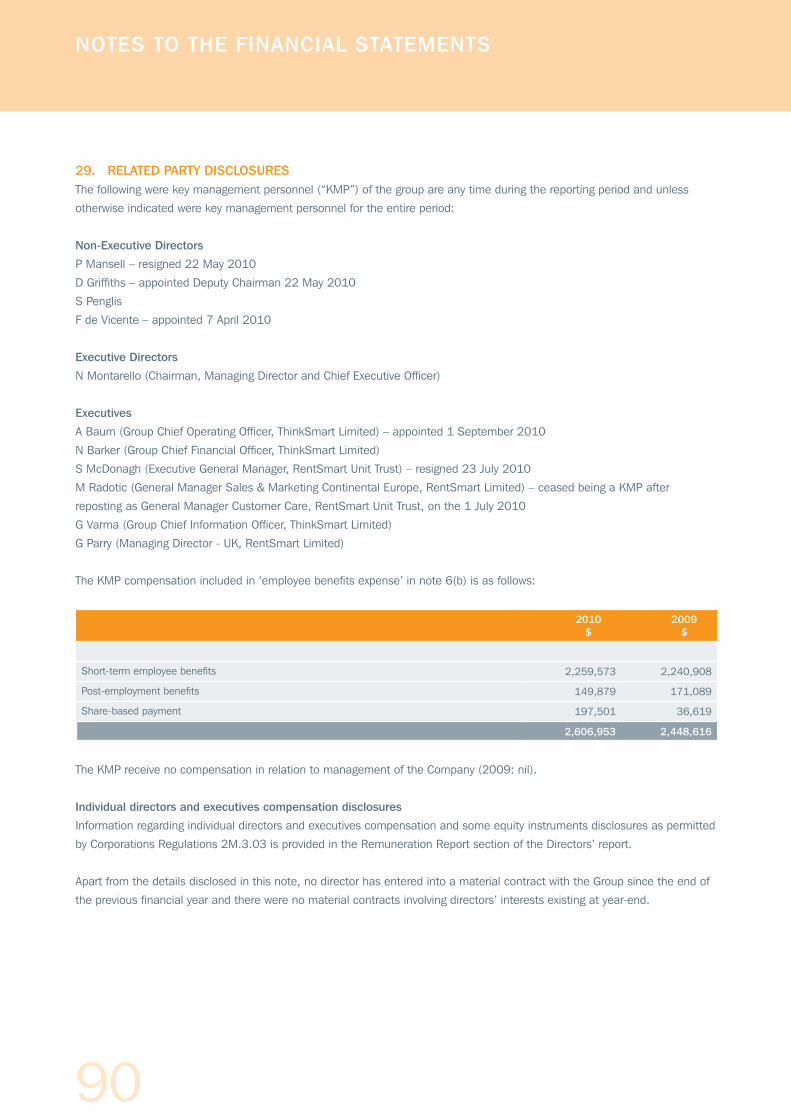
90
29. RELATED PARTY DISCLOSURESThe following were key management personnel (“KMP”) of the group are any time during the reporting period and unless
otherwise indicated were key management personnel for the entire period:
Non-Executive Directors
P Mansell – resigned 22 May 2010
D Griffiths – appointed Deputy Chairman 22 May 2010
S Penglis
F de Vicente – appointed 7 April 2010
Executive Directors
N Montarello (Chairman, Managing Director and Chief Executive Officer)
Executives
A Baum (Group Chief Operating Officer, ThinkSmart Limited) – appointed 1 September 2010
N Barker (Group Chief Financial Officer, ThinkSmart Limited)
S McDonagh (Executive General Manager, RentSmart Unit Trust) – resigned 23 July 2010
M Radotic (General Manager Sales & Marketing Continental Europe, RentSmart Limited) – ceased being a KMP after
reposting as General Manager Customer Care, RentSmart Unit Trust, on the 1 July 2010
G Varma (Group Chief Information Officer, ThinkSmart Limited)
G Parry (Managing Director - UK, RentSmart Limited)
The KMP compensation included in ‘employee benefits expense’ in note 6(b) is as follows:
2010$
2009$
Short-term employee benefits 2,259,573 2,240,908
Post-employment benefits 149,879 171,089
Share-based payment 197,501 36,619
2,606,953 2,448,616
The KMP receive no compensation in relation to management of the Company (2009: nil).
Individual directors and executives compensation disclosures
Information regarding individual directors and executives compensation and some equity instruments disclosures as permitted
by Corporations Regulations 2M.3.03 is provided in the Remuneration Report section of the Directors’ report.
Apart from the details disclosed in this note, no director has entered into a material contract with the Group since the end of
the previous financial year and there were no material contracts involving directors’ interests existing at year-end.
NOTES TO THE FINANCIAL STATEMENTS
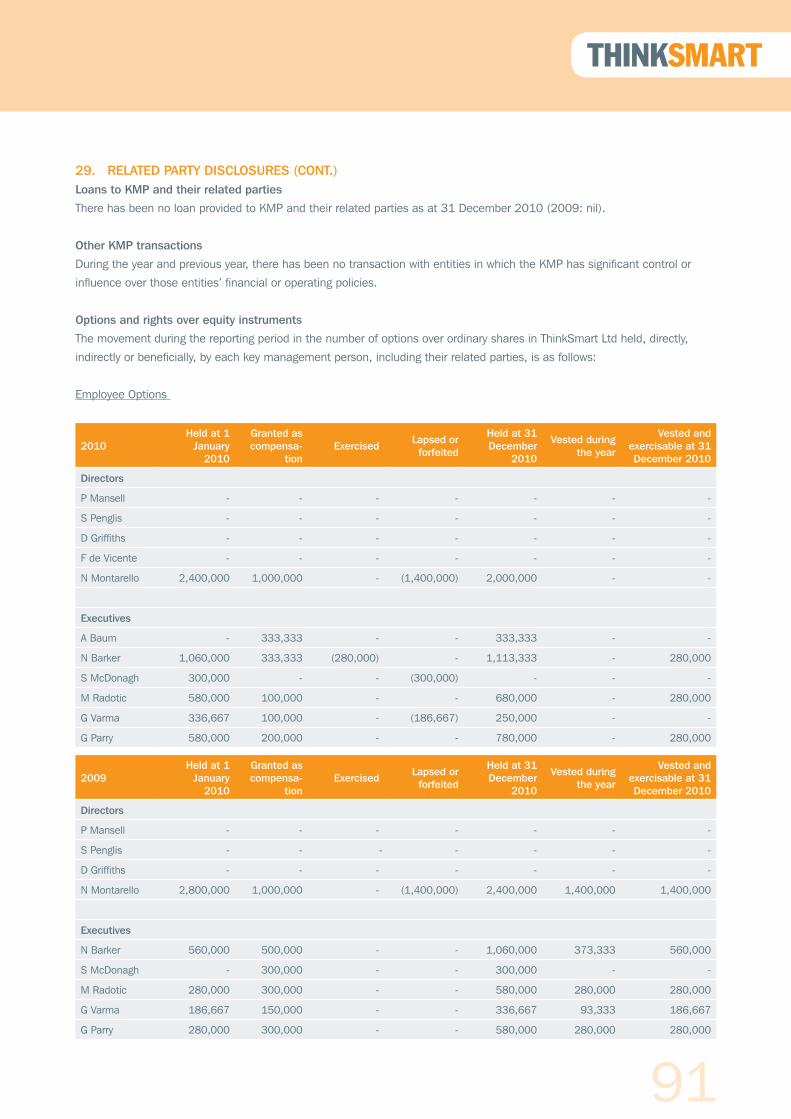
91
ANNUAL REPORT 2011
29. RELATED PARTY DISCLOSURES (CONT.)Loans to KMP and their related parties
There has been no loan provided to KMP and their related parties as at 31 December 2010 (2009: nil).
Other KMP transactions
During the year and previous year, there has been no transaction with entities in which the KMP has significant control or
influence over those entities’ financial or operating policies.
Options and rights over equity instruments
The movement during the reporting period in the number of options over ordinary shares in ThinkSmart Ltd held, directly,
indirectly or beneficially, by each key management person, including their related parties, is as follows:
Employee Options
2010Held at 1
January 2010
Granted as compensa-
tionExercised Lapsed or
forfeited
Held at 31 December
2010
Vested during the year
Vested and exercisable at 31 December 2010
Directors
P Mansell - - - - - - -
S Penglis - - - - - - -
D Griffiths - - - - - - -
F de Vicente - - - - - - -
N Montarello 2,400,000 1,000,000 - (1,400,000) 2,000,000 - -
Executives
A Baum - 333,333 - - 333,333 - -
N Barker 1,060,000 333,333 (280,000) - 1,113,333 - 280,000
S McDonagh 300,000 - - (300,000) - - -
M Radotic 580,000 100,000 - - 680,000 - 280,000
G Varma 336,667 100,000 - (186,667) 250,000 - -
G Parry 580,000 200,000 - - 780,000 - 280,000
2009Held at 1
January 2010
Granted as compensa-
tionExercised Lapsed or
forfeited
Held at 31 December
2010
Vested during the year
Vested and exercisable at 31 December 2010
Directors
P Mansell - - - - - - -
S Penglis - - - - - - -
D Griffiths - - - - - - -
N Montarello 2,800,000 1,000,000 - (1,400,000) 2,400,000 1,400,000 1,400,000
Executives
N Barker 560,000 500,000 - - 1,060,000 373,333 560,000
S McDonagh - 300,000 - - 300,000 - -
M Radotic 280,000 300,000 - - 580,000 280,000 280,000
G Varma 186,667 150,000 - - 336,667 93,333 186,667
G Parry 280,000 300,000 - - 580,000 280,000 280,000
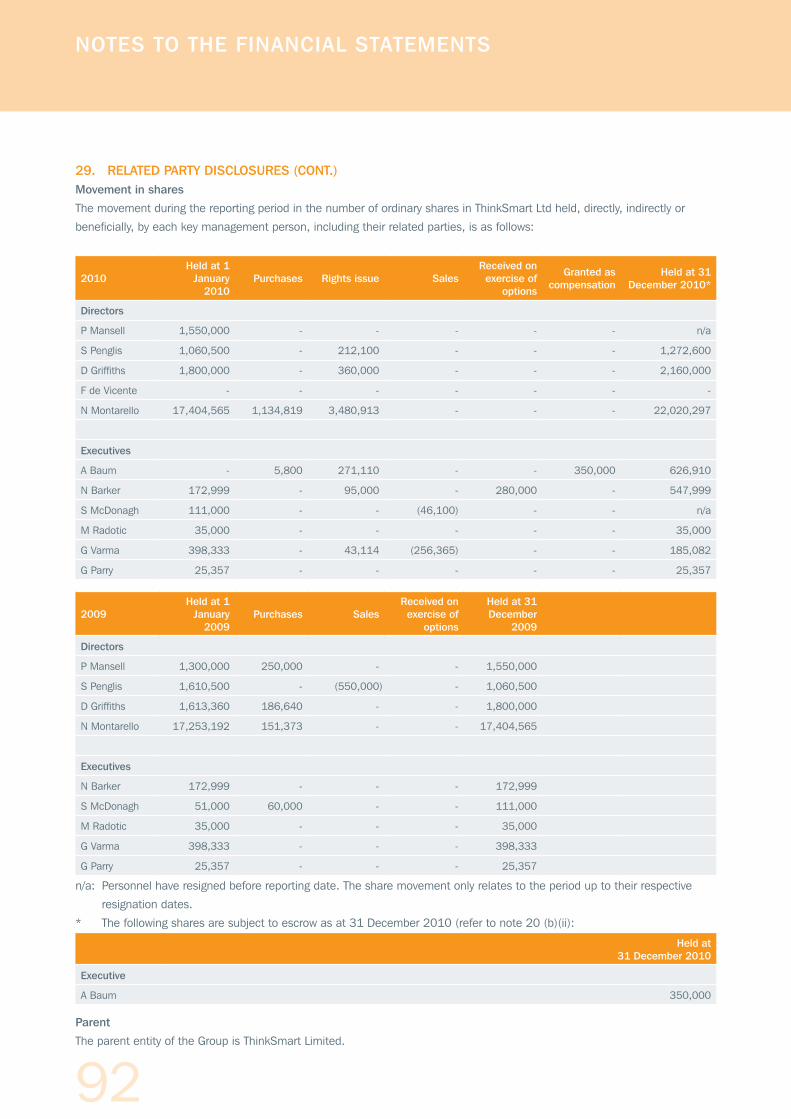
92
29. RELATED PARTY DISCLOSURES (CONT.)Movement in shares
The movement during the reporting period in the number of ordinary shares in ThinkSmart Ltd held, directly, indirectly or
beneficially, by each key management person, including their related parties, is as follows:
2010Held at 1
January 2010
Purchases Rights issue SalesReceived on exercise of
options
Granted as compensation
Held at 31 December 2010*
Directors
P Mansell 1,550,000 - - - - - n/a
S Penglis 1,060,500 - 212,100 - - - 1,272,600
D Griffiths 1,800,000 - 360,000 - - - 2,160,000
F de Vicente - - - - - - -
N Montarello 17,404,565 1,134,819 3,480,913 - - - 22,020,297
Executives
A Baum - 5,800 271,110 - - 350,000 626,910
N Barker 172,999 - 95,000 - 280,000 - 547,999
S McDonagh 111,000 - - (46,100) - - n/a
M Radotic 35,000 - - - - - 35,000
G Varma 398,333 - 43,114 (256,365) - - 185,082
G Parry 25,357 - - - - - 25,357
2009Held at 1
January 2009
Purchases SalesReceived on exercise of
options
Held at 31 December
2009
Directors
P Mansell 1,300,000 250,000 - - 1,550,000
S Penglis 1,610,500 - (550,000) - 1,060,500
D Griffiths 1,613,360 186,640 - - 1,800,000
N Montarello 17,253,192 151,373 - - 17,404,565
Executives
N Barker 172,999 - - - 172,999
S McDonagh 51,000 60,000 - - 111,000
M Radotic 35,000 - - - 35,000
G Varma 398,333 - - - 398,333
G Parry 25,357 - - - 25,357
n/a: Personnel have resigned before reporting date. The share movement only relates to the period up to their respective
resignation dates.
* The following shares are subject to escrow as at 31 December 2010 (refer to note 20 (b)(ii):
Held at 31 December 2010
Executive
A Baum 350,000
Parent
The parent entity of the Group is ThinkSmart Limited.
NOTES TO THE FINANCIAL STATEMENTS
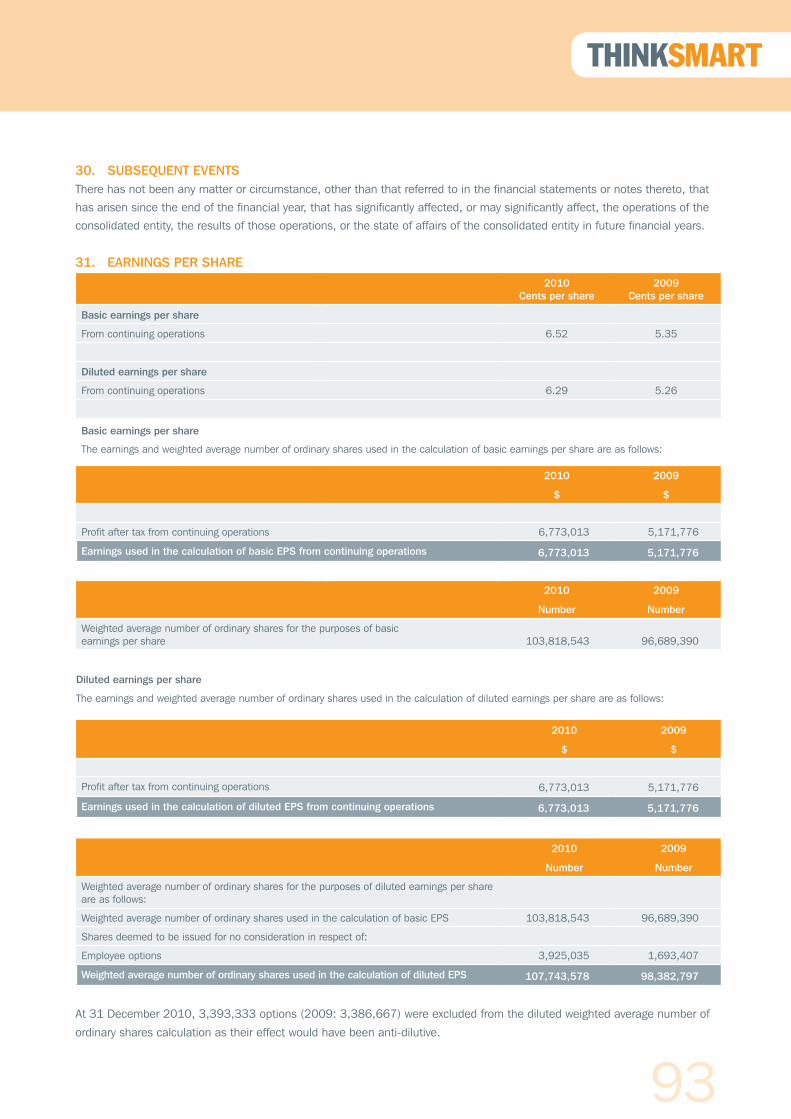
93
ANNUAL REPORT 2011
30. SUBSEQUENT EVENTSThere has not been any matter or circumstance, other than that referred to in the financial statements or notes thereto, that
has arisen since the end of the financial year, that has significantly affected, or may significantly affect, the operations of the
consolidated entity, the results of those operations, or the state of affairs of the consolidated entity in future financial years.
31. EARNINGS PER SHARE2010
Cents per share2009
Cents per share
Basic earnings per share
From continuing operations 6.52 5.35
Diluted earnings per share
From continuing operations 6.29 5.26
Basic earnings per share
The earnings and weighted average number of ordinary shares used in the calculation of basic earnings per share are as follows:
2010 2009
$ $
Profit after tax from continuing operations 6,773,013 5,171,776
Earnings used in the calculation of basic EPS from continuing operations 6,773,013 5,171,776
2010 2009
Number Number
Weighted average number of ordinary shares for the purposes of basic earnings per share 103,818,543 96,689,390
Diluted earnings per share
The earnings and weighted average number of ordinary shares used in the calculation of diluted earnings per share are as follows:
2010 2009
$ $
Profit after tax from continuing operations 6,773,013 5,171,776
Earnings used in the calculation of diluted EPS from continuing operations 6,773,013 5,171,776
2010 2009
Number Number
Weighted average number of ordinary shares for the purposes of diluted earnings per share are as follows:
Weighted average number of ordinary shares used in the calculation of basic EPS 103,818,543 96,689,390
Shares deemed to be issued for no consideration in respect of:
Employee options 3,925,035 1,693,407
Weighted average number of ordinary shares used in the calculation of diluted EPS 107,743,578 98,382,797
At 31 December 2010, 3,393,333 options (2009: 3,386,667) were excluded from the diluted weighted average number of
ordinary shares calculation as their effect would have been anti-dilutive.
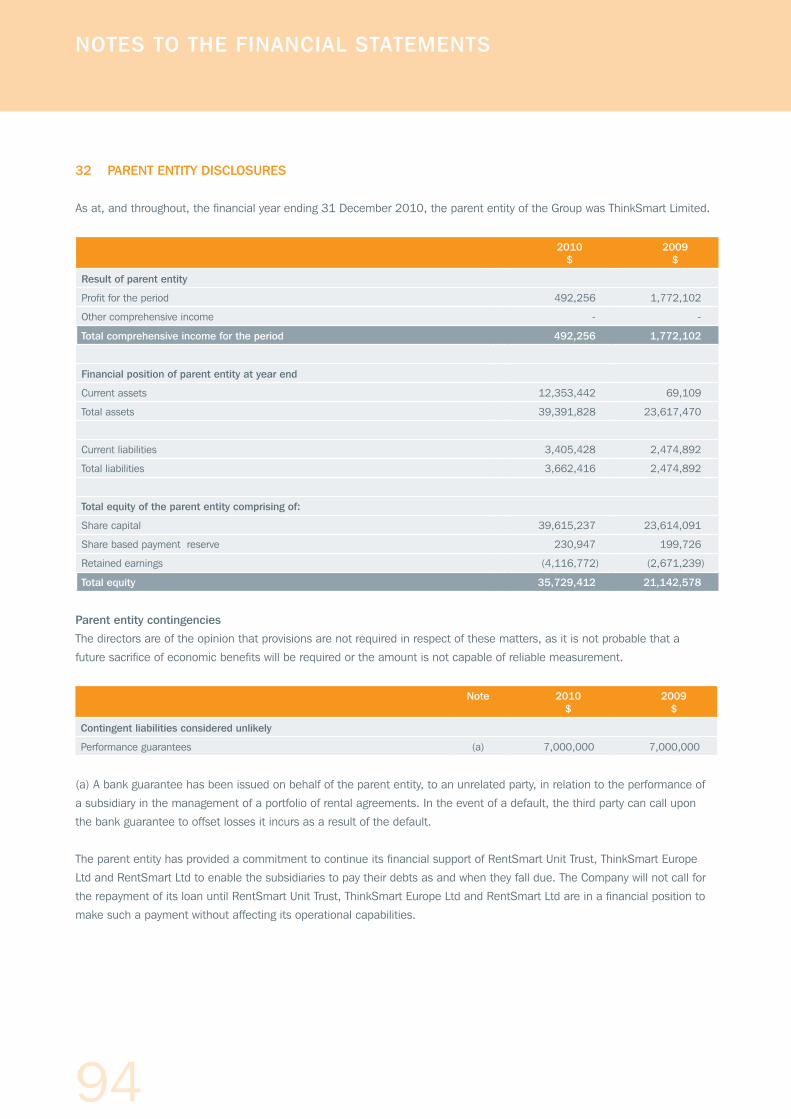
94
32 PARENT ENTITY DISCLOSURES
As at, and throughout, the financial year ending 31 December 2010, the parent entity of the Group was ThinkSmart Limited.
2010$
2009$
Result of parent entity
Profit for the period 492,256 1,772,102
Other comprehensive income - -
Total comprehensive income for the period 492,256 1,772,102
Financial position of parent entity at year end
Current assets 12,353,442 69,109
Total assets 39,391,828 23,617,470
Current liabilities 3,405,428 2,474,892
Total liabilities 3,662,416 2,474,892
Total equity of the parent entity comprising of:
Share capital 39,615,237 23,614,091
Share based payment reserve 230,947 199,726
Retained earnings (4,116,772) (2,671,239)
Total equity 35,729,412 21,142,578
Parent entity contingencies
The directors are of the opinion that provisions are not required in respect of these matters, as it is not probable that a
future sacrifice of economic benefits will be required or the amount is not capable of reliable measurement.
Note 2010$
2009$
Contingent liabilities considered unlikely
Performance guarantees (a) 7,000,000 7,000,000
(a) A bank guarantee has been issued on behalf of the parent entity, to an unrelated party, in relation to the performance of
a subsidiary in the management of a portfolio of rental agreements. In the event of a default, the third party can call upon
the bank guarantee to offset losses it incurs as a result of the default.
The parent entity has provided a commitment to continue its financial support of RentSmart Unit Trust, ThinkSmart Europe
Ltd and RentSmart Ltd to enable the subsidiaries to pay their debts as and when they fall due. The Company will not call for
the repayment of its loan until RentSmart Unit Trust, ThinkSmart Europe Ltd and RentSmart Ltd are in a financial position to
make such a payment without affecting its operational capabilities.
NOTES TO THE FINANCIAL STATEMENTS

95
ANNUAL REPORT 2011
Independent auditor’s report to the members of ThinkSmart Limited
We have audited the accompanying financial report of ThinkSmart Limited (the company), which comprises the consolidated
statement of financial position as at 31 December 2010, and consolidated statement of comprehensive income, consolidated
statement of changes in equity and consolidated statement of cash flows for the year ended on that date, notes 1 to 32
comprising a summary of significant accounting policies and other explanatory information and the directors’ declaration of the
Group comprising the company and the entities it controlled at the year’s end or from time to time during the financial year.
Directors’ responsibility for the financial report
The directors of the company are responsible for the preparation of the financial report that gives a true and fair view in
accordance with Australian Accounting Standards and the Corporations Act 2001 and for such internal control as the directors
determine is necessary to enable the preparation of the financial report that is free from material misstatement whether due to
fraud or error. In note 2, the directors also state, in accordance with Australian Accounting Standard AASB 101 Presentation
of Financial Statements, that the financial statements of the Group comply with International Financial Reporting Standards.
Auditor’s responsibility
Our responsibility is to express an opinion on the financial report based on our audit. We conducted our audit in accordance
with Australian Auditing Standards. These Auditing Standards require that we comply with relevant ethical requirements relating
to audit engagements and plan and perform the audit to obtain reasonable assurance whether the financial report is free from
material misstatement.
An audit involves performing procedures to obtain audit evidence about the amounts and disclosures in the financial report.
The procedures selected depend on the auditor’s judgement, including the assessment of the risks of material misstatement
of the financial report, whether due to fraud or error. In making those risk assessments, the auditor considers internal control
relevant to the entity’s preparation of the financial report that gives a true and fair view in order to design audit procedures
that are appropriate in the circumstances, but not for the purpose of expressing an opinion on the effectiveness of the entity’s
internal control. An audit also includes evaluating the appropriateness of accounting policies used and the reasonableness of
accounting estimates made by the directors, as well as evaluating the overall presentation of the financial report.
We performed the procedures to assess whether in all material respects the financial report presents fairly, in accordance with
the Corporations Act 2001 and Australian Accounting Standards, a true and fair view which is consistent with our understanding
of the Group’s financial position and of its performance.
We believe that the audit evidence we have obtained is sufficient and appropriate to provide a basis for our audit opinion.
Independence
In conducting our audit, we have complied with the independence requirements of the Corporations Act 2001.
INDEPENDENT AUDIT REPORT
96
Auditor’s opinion
In our opinion:
(a) the financial report of the Group is in accordance with the Corporations Act 2001, including:
(i) giving a true and fair view of the Group’s financial position as at 31 December 2010 and of its performance for the
year ended on that date; and
(ii) complying with Australian Accounting Standards and the Corporations Regulations 2001.
(b) the financial report also complies with International Financial Reporting Standards as disclosed in note 2.
Report on the remuneration report
We have audited the Remuneration Report included in the directors’ report for the year ended 31 December 2010. The
directors of the company are responsible for the preparation and presentation of the remuneration report in accordance with
Section 300A of the Corporations Act 2001. Our responsibility is to express an opinion on the remuneration report, based on
our audit conducted in accordance with auditing standards.
Auditor’s opinion
In our opinion, the remuneration report of ThinkSmart Limited for the year ended 31 December 2010, complies with Section
300A of the Corporations Act 2001.
KPMG
Denise McComish
Partner
Perth
18 February 2011
INDEPENDENT AUDIT REPORT
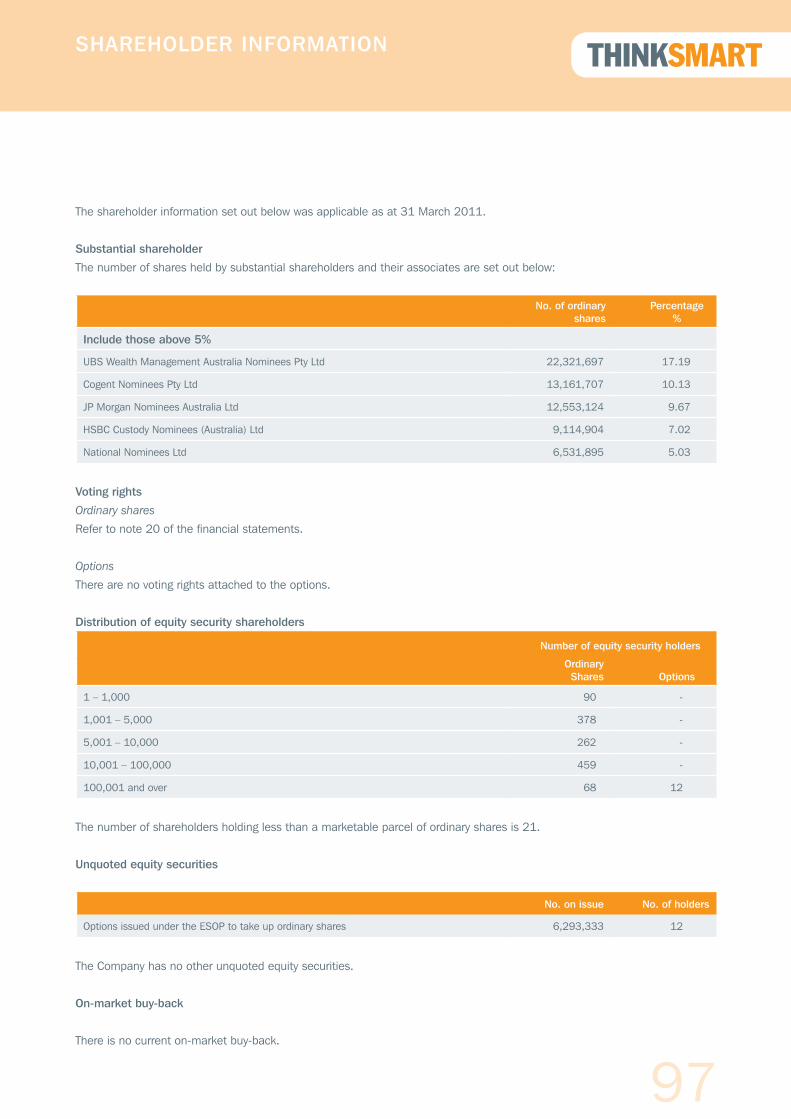
97
ANNUAL REPORT 2011
The shareholder information set out below was applicable as at 31 March 2011.
Substantial shareholder
The number of shares held by substantial shareholders and their associates are set out below:
No. of ordinary shares
Percentage %
Include those above 5%
UBS Wealth Management Australia Nominees Pty Ltd 22,321,697 17.19
Cogent Nominees Pty Ltd 13,161,707 10.13
JP Morgan Nominees Australia Ltd 12,553,124 9.67
HSBC Custody Nominees (Australia) Ltd 9,114,904 7.02
National Nominees Ltd 6,531,895 5.03
Voting rights
Ordinary shares
Refer to note 20 of the financial statements.
Options
There are no voting rights attached to the options.
Distribution of equity security shareholders
Number of equity security holders
Ordinary Shares Options
1 – 1,000 90 -
1,001 – 5,000 378 -
5,001 – 10,000 262 -
10,001 – 100,000 459 -
100,001 and over 68 12
The number of shareholders holding less than a marketable parcel of ordinary shares is 21.
Unquoted equity securities
No. on issue No. of holders
Options issued under the ESOP to take up ordinary shares 6,293,333 12
The Company has no other unquoted equity securities.
On-market buy-back
There is no current on-market buy-back.
SHAREHOLDER INFORMATION

98
Twenty largest shareholders
Name No. of ordinary shares held
Percentage of capital held
(%)
UBS Wealth Management Australia Nominees Pty Ltd 22,321,697 17.19
Cogent Nominees Pty Ltd 13,161,707 10.13
JP Morgan Nominees Australia Ltd 12,553,124 9.67
HSBC Custody Nominees (Australia) Ltd 9,114,904 7.02
National Nominees Ltd 6,531,895 5.03
JAWP Pty Ltd 5,189,473 4.00
Wroxby Pty Ltd 4,802,001 3.70
JP Morgan Nominees Australia Limited <Cash Income Account> 4,692,184 3.61
Kemast Investments Pty Ltd 3,960,000 3.05
Citicorp Nominees Pty Limited 3,925,046 3.02
Phoenix Properties International Pty Ltd 3,600,000 2.77
Aileendonan Investments Pty Ltd 2,500,000 1.92
Darju Pty Ltd 1,756,032 1.35
Osborne Properties Pty Ltd 1,274,000 0.98
Manfam Pty Ltd 1,150,000 0.89
Wulura Investments Pty Ltd 1,119,248 0.86
Wulura Investments Pty Ltd <PJT GAMMELL Super Fund Account> 1,017,850 0.78
Mrs Kelyna Margaret Penglis 916,800 0.71
Bradgale Nominees Pty Ltd 800,000 0.62
Equity Trustees Limited 790,000 0.61
SHAREHOLDER INFORMATION