Embed Size (px)
Citation preview

ANNUAL REPORT
YEAR ENDED MARCH 31, 2010
2010
AN
NU
AL
RE
PO
RT
20
10

Aiming to become a globally competitive financialservices group with the highest trust
We are a group of highly qualified professionals
that can provide truly valuable financial services to our customers.
Each of us thinks and acts with pride as experts in each business area
in order to LEAD the competition in creating and delivering
customer VALUE in a continually changing business environment.
This material contains certain forward-looking statements. Such forward-looking statements are not guarantees of future performance and involve risks and uncertainties, and actual results may materially differ from those contained in the forward-looking statements as a result of various factors. Important factors that might cause such a material difference include, but are not limited to, those economic conditions referred to in this material as assumptions. In addition, the following items are among the factors that could cause actual results to differ materially from the forward-looking statements in this material: business conditions in the banking industry, the regulatory environment, new legislation, competition with other financial services companies, changing technology and evolving banking industry standards and similar matters.

SMFG 2010 1
Spirit of InnovationWe LEAD the market by
providing innovative,globally competitive servicesthat meet customer needs.
Solution & Execution
We LEAD the business by using allthe knowledge and experiences ofour group to solve the issues of our customers, whether individuals or corporates, identified through a
deep understanding of their needs and financial situations.
SpeedWe LEAD the pace by
providing our customerswith desirable services in atimely manner with speed
and determination.
These activities are supported by our three core strengths:
We create new VALUE by forming teams of
specialists in various fields and providing optimal services to
our customers through two-way communication.
As a result, we will be selected as a truly trusted partner.
Sumitomo Mitsui Financial Group, Inc. September 2010
Public Relations Department 1-2, Yurakucho 1-chome, Chiyoda-ku, Tokyo 100-0006, Japan TEL: +81-3-5512-3411
Sumitomo Mitsui Banking Corporation Public Relations Department 1-2, Yurakucho 1-chome, Chiyoda-ku, Tokyo 100-0006, Japan TEL: +81-3-3501-1111
Notice of Address Change
The head offices of Sumitomo Mitsui Financial Group, Inc. and Sumitomo Mitsui Banking Corporation will move to the following addresses on October 18, 2010.
<New Addresses>
Sumitomo Mitsui Financial Group, Inc.Public Relations Department 1-2, Marunouchi 1-chome, Chiyoda-ku,
Tokyo 100-0005, Japan TEL: +81-3-3282-8111
Sumitomo Mitsui Banking CorporationPublic Relations Department 1-2, Marunouchi 1-chome, Chiyoda-ku,
Tokyo 100-0005, Japan TEL: +81-3-3282-1111
CONTENTS
•Message from the Management .............................. 2
•Business Overview .................................................. 10
Consumer Banking ................................................................. 10
Corporate Banking.................................................................. 12
Services for High Networth Individuals,
Business Owners and Employees ....................................... 14
Investment Banking ................................................................ 15
International Banking .............................................................. 16
Treasury Markets .................................................................... 17
•Group Companies ................................................... 18
•Financial Highlights ................................................. 21
•Financial Review ...................................................... 25
•Risk Management .................................................... 34
•Corporate Social Responsibility (CSR) .................... 50
•Initiatives for Enhancing Customer Satisfaction (CS) and Quality ........................................................... 51
•Corporate Governance ............................................ 52
•Internal Audit System .............................................. 53
•Compliance ............................................................. 54
•Environmental Preservation Initiatives ..................... 56
•Social Contribution Activities ................................... 60
•Human Resources ................................................... 64
•Financial Section and Corporate Data .................... 69
Financial Section..................................................................... 69
Corporate Data ....................................................................... 205
SMFG 20102
Message from the Management
We would like to thank you for your continued support and patronage. In this annual report, we review the
initiatives implemented in fiscal 2009, ended March 31, 2010, and explain our management policies for fiscal
2010.
Principal Initiatives in Fiscal 2009Having designated fiscal 2009 as the year for “establishing the
next foundation for future growth, while continuing to strengthen
business consistent with our philosophy of ‘Follow the Basics,’”
we have been implementing initiatives to control expenses, credit
costs and risk-adjusted assets in the core operation of our group
companies. Additionally, to achieve growth over the medium and
long term, we continued to focus on two strategic initiatives: “real-
izing a solid financial base as a global player” and “strengthening
targeted growth business areas.”
Specifically, at SMBC we reinforced our efforts to reduce
expenses during fiscal 2009, and kept the overhead ratio to
below 50%. We also took measures to reduce credit costs mainly
through measures tailored to the business circumstances of our
corporate borrowers. SMFG took steps to strengthen its capital
base during fiscal 2009, principally through a common equity
offering totaling ¥861.0 billion completed in July 2009, followed
by another offering totaling ¥973.0 billion completed in February
2010. Consequently, our consolidated Tier I ratio at the end of
March 2010 was 11.15%, an increase of 2.93% compared with
the end of March 2009. In addition, in October 2009 we laid the
foundation for the next stage of strong growth by consolidating
Nikko Cordial Securities into the Group as a wholly-owned subsid-
iary of SMBC.
As a result of these initiatives, consolidated ordinary profit
for fiscal 2009 was ¥558.7 billion, a year-on-year increase of
¥513.4 billion, while consolidated net income also increased, by
¥645.0 billion year on year, to ¥271.5 billion. In view of the public
nature of our business, while enhancing the Group’s capital to
maintain a sound financial position, we have set a fundamental
policy of increasing dividends stably and continuously through
sustainable growth in enterprise value and achieving a dividend
payout ratio of over 20% on a consolidated net income basis. As
SMFG recorded consolidated net income in fiscal 2009 versus
consolidated net loss of the previous fiscal year and the amount
was higher than the forecast announced in November 2009, we
have decided to increase the annual dividend for common shares
by ¥10 to ¥100 per share.
Regarding our medium-term management plan, or “LEAD
THE VALUE” plan that ended in March 2010, the macroeco-
nomic reality has diverged substantially from the plan’s original
assumptions, particularly since fiscal 2008, amid increasingly
uncertain business environment in domestic and overseas mar-
kets. Accordingly, we were unable to attain the originally targeted
level of earnings for fiscal 2009. We, however, have been making
steady progress in realizing the strategic initiatives – strengthen-
ing targeted growth business areas, and fortifying platforms to
support sustainable growth.
Management Policies in Fiscal 2010The business environment surrounding financial institutions is
changing greatly amid the global discussion about financial regu-
latory and supervisory reform to prevent another financial crisis.
Under these circumstances, we have designated our manage-
ment policies for fiscal 2010 as 1) “forward looking” - transforming
our business model to grow steadily under a new regulatory and
competitive environment and 2) emphasizing return on risks and
costs, in order to improve asset quality and thoroughly control
expenses and credit costs, so as to secure a resilient capital
base and reinforce our business portfolio to achieve sustainable
growth.
(1) Securing a resilient capital baseDuring fiscal 2009 we took steps to establish a resilient capital
base through the issuance of new shares, among other measures.
Moving forward, our focus will shift to steps such as reducing
stock price fluctuation risks associated with our stockholdings,
and building up retained earnings by reinforcing a business port-
folio to achieve sustainable growth. Through these measures, we
aim to maintain over around 10% of consolidated Tier I ratio.
Meanwhile, as a result of the common equity offerings exe-
cuted during fiscal 2009, the number of SMFG’s ordinary shares
issued reached approximately 1.4 billion shares, or more than
90% of the authorized ordinary shares of 1.5 billion stipulated
in SMFG’s Articles of Incorporation. We believe that securing
strategic flexibility, which will enable us to further strengthen
our targeted growth business areas, is essential to enhancing
SMFG’s medium- to long-term enterprise value. For this reason,
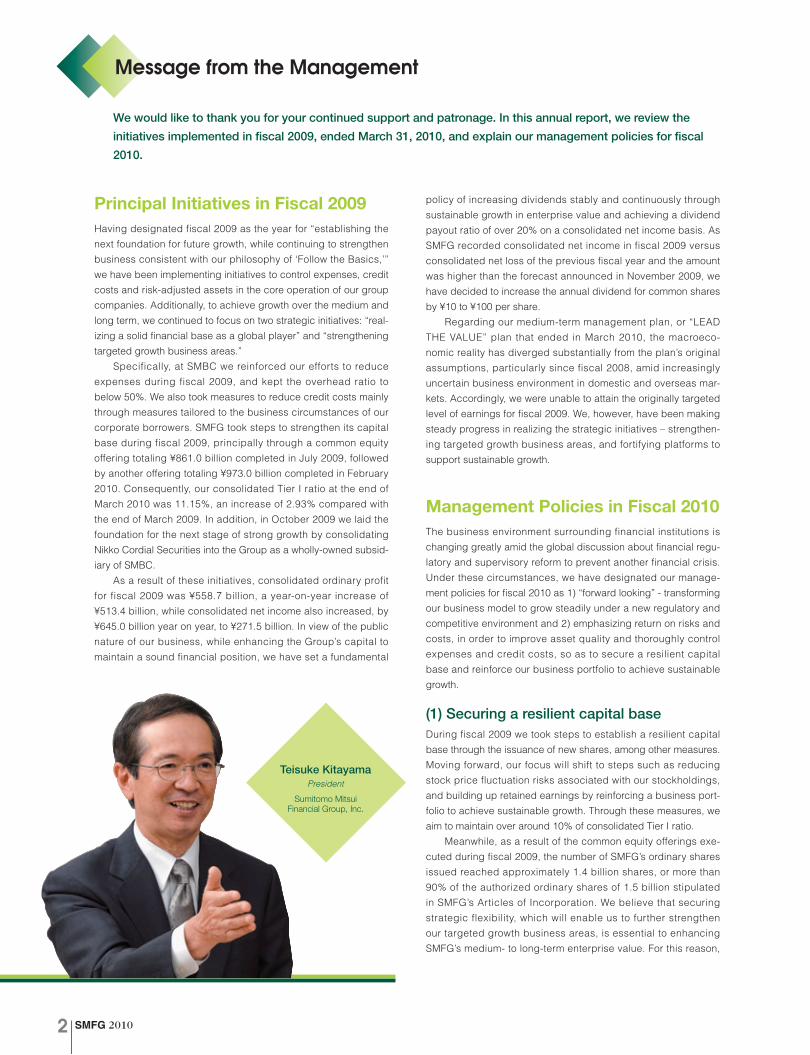
Teisuke KitayamaPresident
Sumitomo Mitsui Financial Group, Inc.

SMFG 2010 3
at the ordinary general shareholders meeting held in June 2010,
we proposed and received approval to increase the number of
authorized ordinary shares to 3.0 billion.
(2) Reinforcing our business portfolio to achieve sustainable growth
We will focus on targeted growth business areas to pursue profit-
ability, as well as review current businesses to fortify the bottom-
line profit. At the same time, we will further enhance customer
responsiveness by leveraging advisory functions and increase
productivity by improving business processes.
● Fortify bottom-line profit by reviewing current businesses
Facilitating financing to customers in an appropriate and proac-
tive manner is one of our management priorities.
SMBC has always worked hard on delivering optimal products
and services to customers based on a thorough understanding of
their needs and issues. Further, pursuant to the “Act concerning
Temporary Measures to Facilitate Financing for SMEs, etc.,” which
took effect in December 2009, we are enhancing our capability to
meet their needs, including establishing consulting desks for
SMEs and retail customers to address their financing concerns.
In addition to meeting customers’ financing needs, we will
continue to control and reduce credit costs and expenses and
rebalance our asset portfolio for more growth and profitability
in order to improve the risk-return profile and fortify bottom-line
profit.
The economic situation in Europe remains uncertain, but our
credit exposure in Portugal, Italy, Ireland, Greece, and Spain as
of March 31, 2010 totaled approximately ¥300 billion and was
mainly to large corporations and project-finance related. In the
case of Greece, where the economic situation is a particularly
serious cause for concern, the amount of exposure is not so large
and is mostly secured by collateral. We therefore believe that the
associated risks from this source are limited.
● Pursue profitability by focusing on targeted growth business areas
Nikko Cordial Securities
Nikko Cordial Securities in March 2010 drew up a three-year
medium-term management plan, up to the end of fiscal 2012,
with a prospect of “becoming a No. 1 general securities company
in Japan, which is excellent both in quality and in quantity and
globally competitive.” Maintaining a low-cost operation using
IT, Nikko Cordial Securities aims for sustainable expansion of
its businesses centered on the retail business, and creation of
new businesses centered on the wholesale business. It has
also adopted an active stance on employment of personnel and
enhancement of personnel development programs, while increas-
ing system investment and improving the organizational structure
of the head office in response to the full-line business operation.
Overseas operations, centered on Asia
Regarding SMFG’s operations in the Asia-Pacific region, in May
2010 we established the Financial Products Marketing Dept.,
which has taken charge of certain functions hitherto performed
by the representative offices of individual departments of SMBC’s
Investment Banking Unit. This is part of our efforts to offer fast
and appropriate solutions to customers whose financial needs
are becoming more diversified and sophisticated. Regarding
our operations in China, in April 2009 we established Sumitomo
Mitsui Banking Corporation (China) Limited to facilitate even more
closely tailored individual solutions for customers who operate
globally. With effect from April 2010, the responsibility for planning
and management of business with Japanese corporate custom-
ers was transferred from the Planning Dept., International Banking
Unit, to the Planning Dept., Corporate Banking Unit & Middle
Market Banking Unit. This change allows us to offer seamless
services both inside and outside Japan. In addition, in June 2010,
we received permission to establish a subsidiary in Malaysia, and
preparation is currently underway for its establishment in the first
half of 2011. As well as expanding our network of business base
in this way, we have also formed alliances with leading banks
in Asia to enable us to offer even higher value-added services.
These banks include Kookmin Bank in Korea, First Commercial
Bank in Taiwan, Eximbank in Vietnam, The Bank of East Asia in
Hong Kong, Bank Central Asia in Indonesia, and Kotak Mahindra
Bank in India.
In European and American markets, we will continue to bol-
ster our competitive-edge products, including project finance.
Through a business alliance with a South African subsidiary of the
major British financial institution Barclays PLC, we are strengthen-
ing our ability to provide services to Japanese companies operat-
ing in South Africa.
Masayuki OkuPresident
Sumitomo MitsuiBanking Corporation

SMFG 20104
We also take into account the discussions being held on the
introduction of liquidity standards, and are taking steps to ensure
more stable funding and investment in foreign currencies.
Payment & settlement services, and Consumer finance
In the credit card business, we have established a two-company
system within the Group, centered on Sumitomo Mitsui Card and
Cedyna. Our aim is to become “the number one credit card busi-
ness entity in Japan,” and we will continue to pursue economies
of scale while leveraging the strengths of each company to maxi-
mize top-line synergy.
Cedyna is now implementing initiatives for investment in
new businesses and system development to increase enterprise
value and speed up cost restructuring. To accelerate such initia-
tives, and to further clarify the positioning of Cedyna as one of
the Group’s core business entities in the credit card business
and enhance Cedyna’s capital base, the intermediate holding
company SMFG Card & Credit acquired new shares issued by
Cedyna through a third-party allotment in May 2010.
In the consumer finance business, our goal is to create an
even better foundation for meeting the sound financing needs of
individual consumers, capitalizing on strategic alliances of Group
companies to capture market share and thereby become more
efficient. As part of this strategy, ORIX Credit Corporation became
a consolidated subsidiary of SMBC in July 2009. In March 2010
we reviewed the consumer finance business model, which we
call “cascade strategy,” jointly operated by SMBC, Promise and
At-Loan, and the three companies reached a basic agreement on
the absorption-type merger between Promise and At-Loan with
Promise as the surviving company. Through these moves, we aim
to further raise our profile in Japan’s evolving consumer finance
market and target an even broader array of customer needs.
● Further enhance customer responsiveness by leveraging advisory functions
Solution providing for corporations, investment banking and trust businesses
We remain strongly committed to delivering to our corporate
clients high-quality solutions that precisely target a broad range
of management issues. Specifically, SMBC has three special-
ized departments, Corporate Advisory Division, Private Advisory
Department and Global Advisory Department, that operate cross-
sectionally across business segments — consumer, corporate
and overseas. This structure facilitates the pooling among these
departments of “V-KIP” — value, knowledge, information and
profits. As a result, we can deliver more tailored support to corpo-
rate clients and upgrade our ability to provide solutions. Sumitomo
Mitsui Finance and Leasing is engaged in aircraft operating lease
business, one of the strategic joint businesses in leasing with
Sumitomo Corporation, as well as a variety of other leasing ser-
vices that offer financial and sales solutions for both users and
suppliers. In addition, Japan Research Institute offers a lineup of
high value-added services by continuously strengthening services
that range from consulting for managerial innovation and IT utiliza-
tion to the planning and creation of strategic IT systems.
Financial consulting for individuals
Our aim is to harness the total capabilities of the Group to estab-
lish SMBC as the leading bank in the field of full-line personal
financial services for individuals. To this end, we are working to
realize even higher levels of customer convenience, principally
Basel Committee “Consultative proposal
to strengthen the resilience of the banking sector”
Reorganization in global financial
industry / Rebuilding
business model
Maintain over around 10% of consolidated
Tier I ratio
Target around 10% of
consolidatedROE in the
medium term
New financial regime Our strategy
Securing a resilient capital base
Reinforcing business portfolio to achieve sustainable growth
Benchmark targets
Management policy under the new financial regime

SMFG 2010 5
by reinforcing our online financial services. We also continue to
strive to realize “total consulting services” which offers customers
a wide range of one-stop financial services to meet diversifying
financial needs of individual customers. For example, in August
2009, all branches of SMBC started selling level-premium insur-
ances, and after making Nikko Cordial Securities SMBC’s wholly-
owned subsidiary in October 2009, through cooperation with
Nikko Cordial Securities, we have commenced a range of new
services including the sale of jointly developed investment trusts,
joint seminars and financial instruments intermediary service for
individuals. In May 2010 we also began handling single-premium
type variable permanent life insurances jointly developed with
Nikko Cordial Securities.
In June 2010 SMBC, Nikko Cordial Securities, and Barclays
PLC reached an agreement to commence joint operation in
private banking in Japan. Individual customers of SMBC will
be introduced to “SMBC Barclays Wealth Division,” which has
been set up within Nikko Cordial Securities. The Division will offer
investment solutions making use of unique strengths and the
know-how of Barclays Wealth, which is a leading global wealth
manager and a division of Barclays.
We are pursuing still closer collaboration between SMFG’s
banking and securities businesses in the field of financial services
for individuals, in order to offer a wider lineup of products and
services. For this purpose, in addition to the start of the finan-
cial instruments intermediary service for individuals by SMBC
and Nikko Cordial Securities, by the end of January 2011 Nikko
Cordial Securities will take over the services for individuals cur-
rently being offered by SMBC Friend Securities in collaboration
with SMBC. Meanwhile, with the goal of increasing the number
of customers using the services of SMBC Friend Securities, we
are expanding the company’s product lineup and diversifying
its information dissemination channels by holding investment
seminars, among other measures.
● Further increase productivity by improving business processes
We aim to maintain SMBC’s non-consolidated overhead ratio at
below 50%. We will do this by prioritizing expenses based on
size, timing, and effectiveness and adopt a stronger focus on our
targeted growth business areas in the allocation of the expenses
budget, while taking measures to raise operational efficiency.
These measures will be implemented in tandem with our
constant efforts to thoroughly comply with laws and regulations
both within and outside Japan and create a strong compliance
system. Specifically, SMBC aims to ensure consumer protection
by enhancing its framework for explaining financial products and
services to its customers. SMBC is also taking measures to miti-
gate potential conflicts of interest and avoid all transactions with
anti-social forces, and is pressing forward with the reinforcement
of its system for the prevention of money laundering.
With regard to customer satisfaction and the enhancement of
service quality, we intend to create a stronger system for ensur-
ing that customers’ requests are reflected in our management
decisions.
Concerning SMFG’s listing on the New York Stock Exchange,
we aim to build a framework that will greatly accelerate our drive
to develop our business as a global player. Expanding and diver-
sifying our investor base by securing access to the world’s largest
securities market is a key piece of the framework and, to this
end, we are pursuing further financial transparency and greater
convenience for investors. We are currently making final-stage
preparations for listing on the NYSE within fiscal 2010.
Fiscal 2010 Outlook and Policies Going Forward
Outlook for fiscal 2010
We expect consolidated ordinary profit of ¥690 billion, a year-
on-year increase of ¥131.3 billion and consolidated net income
of ¥340 billion, a ¥68.5 billion increase from the previous fiscal
year. This is based mainly on an increase in profit at SMBC and a
steady recovery in earnings of certain subsidiaries and affiliates.
We are planning an annual dividend of ¥100 per share of common
stock, the same level as the previous fiscal year, and half of the
amount (¥50 per share) will be paid as an interim dividend.
Dedicated to medium- to long-term growth in enterprise value
The business environment of financial institutions is changing
radically as regulators discuss the global reform of financial
regulations in order to prevent another financial crisis, but our
basic policy remains unchanged, namely, to become a “globally
competitive financial services group with the highest trust” by
maximizing our strengths of “Spirit of Innovation,” “Speed” and
“Solution & Execution.” While securing a resilient capital base,
we look forward, anticipate future changes and steadily transform
our business model. Through such means, we aim for sustainable
growth in enterprise value in order to meet the expectations of our
stakeholders. We ask for your support and understanding as we
endeavor to achieve these goals.
September 2010
Teisuke KitayamaPresidentSumitomo Mitsui Financial Group, Inc.
Masayuki OkuPresidentSumitomo Mitsui Banking Corporation
SMFG 20106
Key Achievements in Fiscal 2009
Supplementary Information
Management Policy in Fiscal 2010
Reinforcing business portfolio to achieve sustainable growth
Overseas business especially in Asia
Solution providing for corporations / Investment banking, trust business
Financial consulting for individuals
Payment & settlement services, consumer finance
Securing a resilient capital base
Target around 10% of consolidated ROE in the medium term
Management policy in fiscal 2010
Maintain over around 10% of consolidated Tier I ratio
“Forward looking”~Transforming our business model to grow steadily under a new regulatory and competitive environment Emphasizing return on risks and costs, in order to improve asset quality and thoroughly control expenses and credit costs
✔
✔
Pursue profitability by focusing on targeted growth business areas
Further enhance customer responsiveness by leveraging advisory functions
[SMFG’s targeted growth business areas]
Fortify bottom-line profit by reviewing current business
Further increase productivity by improving business processes
Improving risk-return profile by rebalancing our assets while meeting
customers’ financing needs / Controlling credit costs and expenses
Steadily accumulating earnings based on our management plan
Minimizing risks to our capital posed by volatility in our equity holdings
Initiatives toward NYSE listing
●
●
●
●
Retail / Wholesale securities business
Management policy for fiscal 2009 “Establishing the next foundation for future growth, while continuing to strengthen businesses consistent with our philosophy of ‘Follow the Basics’”
Managing expenses & credit costs
Steady income growth
Realizing a solid capital base as a global player
Initiatives to fortify targeted growth business areas
Made Nikko Cordial Securities a wholly-owned subsidiary and started its business as a new securities and investment banking company
Made ORIX Credit a consolidated subsidiary
Signed MOU on mutual business cooperation with Bank Central Asia (Indonesia)
Subscribed new shares of The Bank of East Asia (Hong Kong)
Raised common equity (¥1.8 trillion in total)
Repurchased hybrid securities (¥293 billion in total)
Conversion of preferred shares held by Goldman Sachs into common equity
●
●
●
Overhead ratio
YOY change +1.1%
Controlled below 50%
47.1%
SMBC non-consolidated
Total credit cost
YOY change + ¥295.4 billion
Substantiallyreduced
¥(254.7) billion
SMBC non-consolidated Tier I ratioCompared with
Mar. 09 +2.93%
Achievedtargeted level
11.15%
SMFG consolidated
Net incomeYOY change
+ JPY 645.0 bnCompared with Nov. 09 forecast + ¥51.6 billion
Increased ¥271.6 billion[Consolidated ROE:7.5%]
SMFG consolidated
Dividend for common share
YOY change + ¥10 / share
Increased ¥100 / share

SMFG 2010 7
Overseas Business
(Reference) Business Expansions in Asia
Strategic partners*1 Overseas channel network*2 Channel networkEstablished after fiscal 2009
*1 Bold print indicates the strategic partners in which SMBC has an investment in equity (includes equity investments currently planned)*2 Network of SMBC and principal overseas subsidiaries
China
Korea
Taiwan
Hong Kong
Philippines
Vietnam
Malaysia
Indonesia
India
Bank of ChinaIndustrial and Commercial Bank of ChinaAgricultural Bank of China
Kookmin Bank
First Commercial Bank
Bank of East Asia
Metrobank
Vietnam Eximbank
RHB Bank
Bank Central Asia
Standard Charterered BankKotak Mahindra Bank
Established SMBC (China) (April 2009)Functions such as planning and managing SMBC (China)’s business development for Japanese companies were shifted from the Planning Dept., International Banking Unit to the Planning Dept., Corporate Banking Unit & Middle Market Banking Unit (April 2010)
Received approval to establish a subsidiary bank in Malaysia (June 2010)
Established Financial Products Marketing Dept. (May 2010)
●
●
●
●
In the medium to long term, we aim to increase the proportion of Banking profit from International Banking Unit to overall Marketing units, which was 20% in fiscal 2009, by allocating more capital and resources into overseas business, especially in Asia where high growth is expected.
Trends of Banking profit in International Banking Unit*1
CMS*7 as voted by Corporates JPY CMS*7 as voted by Financial Institutions
Products with a competitive edge
Cash management providers’ ranking(in Asia Pacific)*6
4th
Large Corporates
5th
4th
Medium Corporates
3rd
Small Corporates
1st
*1 Sum of SMBC and its overseas subsidiaries (exchanged to USD at respective term-end FX rate). Managerial accounting basis*2 Source: Project finance mandated arranger (Project Finance International) *3 Source: Infrastructure Journal*4 Source: Syndicated loan bookrunner ranking (Thomson Reuters) *5 Source: “Basis Point” (Reuter LPC)*6 Source: “ASIAMONEY”: “The Cash Management Poll 2009” (Aug. 09) *7 “CMS” stands for “Cash Management Service”
2004Fiscal 200920082007
20%
7%
20062005
■ International Banking Unit (Left axis) ■ Proportion to Marketing units (Right axis)
(USD bn)
Project finance
1st among Japanese banks for the four consecutive years
Global ranking (Year 2009)*2 Awarded Global Arranger of the Year*3
6th
Loan syndication
Global ranking (Year 2009)*4 Ranked at 1st among foreign banks in China*5
0.0
0.5
1.5
1.0
0%
10%
20%
30%

SMFG 20108
Strategy for Securities Business (Nikko Cordial Securities)
SMFG’s Group Structure*1
Consolidated total assets ¥123 trillion
11.15%
40%60%
100%
100%
100%
100%
100%
22%
66%
69%
51%
34%
100%
¥104 trillion
¥70 trillion
¥57 trillion
approx. 26 mn
approx. 128,000
Consolidated Tier I ratio
Total assets
Deposits
Loans
Number of customer deposit accounts (individual customers)
Number of corporate borrowers
Sumitomo Mitsui Finance and Leasing
Japan Research Institute
Nikko Cordial Securities
SMBC Friend Securities
SMFG Card & Credit
Sumitomo Mitsui Card
Sumitomo Corporation
(Consumer finance)
(Credit card)
(Securities)
(System engineering and management consulting, etc.)
(Leasing)
NTT DOCOMO
SANYO SHINPAN*3
Cedyna
Promise *3
ORIX Credit
Sumitomo Mitsui Financial Group
Sumitomo Mitsui Banking Corporation
*1 As of Mar. 31, 2010. Stake (%) is as of August 31, 2010. *2 Total voting shares held by SMFG group. *3 Promise and Sanyo Shinpan planned to merge in Oct. 2010.
*2
SUMITOMO MITSUI Banking Corporation
Medium-term management planExpansion of customer base
Nikko Cordial Securities has made a good start in both its retail and wholesale businesses as our securities body. Going forward, we will pursue an integrated business model spanning banking and securities services businesses by accelerating cooperation between SMBC and Nikko Cordial Securities.
Customer assets
Number of successful deals in referral service <Number of deals in wholesale business referred by SMBC in fiscal 2009>
3Q, fiscal 2009 4Q, fiscal 2009
Aim to become No.1 general securities company in Japan which is
excellent both in quality and in quantity and globally competitive
Net operating revenue
Targeted ordinary profit in fiscal 2012 JPY 100 bn
Retail business[200]
Wholesale business[100]
2008/3
2,461
2009/3
2,481
2010/3
23.525.9
28.1
2,511
■ Stock ■ Bonds ■ Investment trusts ■ Other
■ After becoming a wholly-owned subsidiary
2004Fiscal 2005 2006 2007 2008 2009 2012
0
10
20
30
40
0
100
200
300
Investment banking business23%
Number of accounts (1,000)
Investment management77%
Investment management83%
Investment banking business17%
Over 200 deals Over 400 deals
(JPY bn)
(Unit: ¥ trillion)
After becoming a wholly-owned subsidiary
SMFG 2010 9
3/06 3/07 3/08 3/103/09 3/06 3/07 3/08 3/103/09 3/06 3/07 3/08 3/103/09
3/06 3/07 3/08 3/103/09 3/06 3/07 3/08 3/103/09 3/06 3/07 3/08 3/103/09
2005Fiscal 2006 2007 20092008 3/06 3/07 3/08 3/103/09 3/06 3/07 3/08 3/103/09
0
1
2
3
4
5
6
2.9
3.3
1.7
2.62.2
2.0
2.6
2.8
3.03.4
0
200
400
600
1,000
800
* Owner-occupied homes
Cumulative sales of pension-type insuranceBalance of investment trusts
Customer Assets(Investment Trusts and Pension-Type Insurance)
Unit: ¥ trillion Unsecured card loansOf which, portion under tie-up with Promise
Consumer Finance
Unit: ¥ billionSecuritized balanceBalance outstanding
Housing Loans*
Unit: ¥ trillion
Number of Internet Transactions
Unit: Millions
SMBC Direct Customer Contracts
Unit: Million customers
PC Bank Web21 (Number of Contracts)
Unit: Thousands of contract
Business Select LoansLoans guaranteed by credit guarantee corporations
Loan Syndications
Amount originated (¥ trillion)
Number of originations
Global e-Trade Service (Number of Contracts)
Unit: Thousands of contracts
Loans guaranteed by credit guarantee corporations and Business Select Loans
Unit: ¥ billion
0
60
180
120
179
108
151
166
129
0
2
4
6
10
8
10.1
6.6
8.4
9.3
7.4
0
30
60
90
120
150154
105
149141
125
0
5
10
20
15
0
2
4
6
10
8 7.6
6.7
9.38.6
7.0
531
702780 754
685
17.116.5
11.7
15.013.7
0
1,000
500
2,000
2,500
3,500
3,000
1,500
0
3
6
9
12 2.02.1
0.81.6
1.9
10.511.0
10.0 9.9 10.0
330
490
440
390
60
280
520
310
210
140
0
100
200
400
300
500
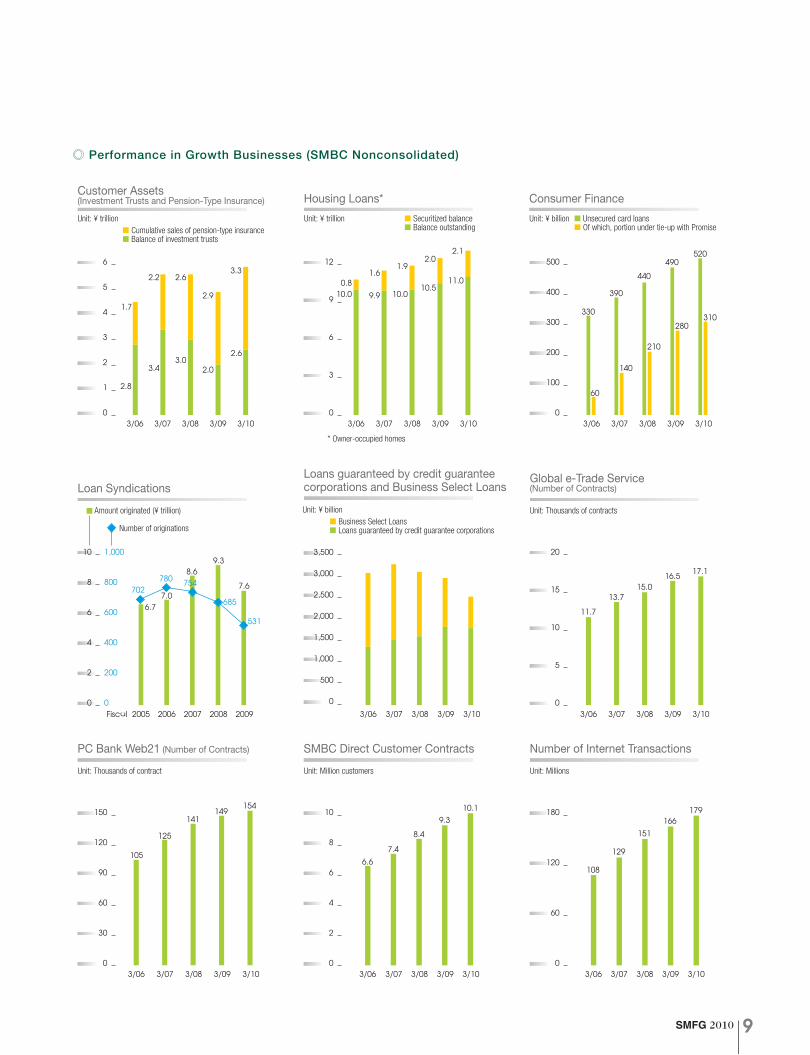
Performance in Growth Businesses (SMBC Nonconsolidated)

SMFG 201010
■ Consumer Banking
The Group companies of SMFG are collaborating to enhance the financial services they provide to consumers. Some of the key indicators of SMBC’s performance in fiscal 2009, reflecting the high esteem customers have for our services, include an outstanding balance of investment trusts under management of ¥2,620.7 billion (March 31, 2010); sales of foreign bonds and yen-denominated bonds of ¥212.7 billion; pension-type insurance sales of ¥381.8 billion; sales of single premium full life insurance of ¥60.9 billion; and mortgage loans outstanding of ¥14,497.5 billion (March 31, 2010).
Financial Consulting BusinessIn fiscal 2009, SMBC continued to broaden its product lineup of invest-ment trusts, annuity insurance for individuals, life insurance policies and other financial products. In investment trusts, SMBC expanded our lineup of investment targets to include funds such as those investing in bonds issued by emerging countries, while allow-ing customers to select from a number of currencies including the
Australian dollar and the Brazilian Real for hedging purposes, and funds primarily focused on the World Bank Green Bonds. Since October 2009 we have launched funds with customer access only via the Internet or mobile phones, and as of July 1, 2010 the number of such funds had reached thirty. In these ways, we are responding to a wide range of customer needs. In the field of life insurance policies, in August 2009 we expanded our over-the-counter sales of life insurance products at all our branches in Japan. By offering 20 dif-ferent insurance policies (as of March 31, 2010), including whole-life, term and medical, we can now meet a still broader range of customer needs. We have also further expanded our insurance policy lineup, including offering annuity insurance for individuals in which the annuity amount is set at a higher-than-normal level for an initial specified period. In our financial products intermediation business, we diversified our product lineup by offering yen-denominated bonds for the first time, as well as subscription of SMBC’s subordinated bonds (yen-denominated) and sale of foreign bonds. It is important to support customers after they have bought our products. As part of this commitment, we take many measures to keep customers up-to-date with devel-opments — for example, holding seminars about fund performance, issuing monthly and special market reports, and sending customers statements detailing assets via direct mailing.
Loan BusinessTo enable us to respond to the wide-ranging needs of our custom-ers, we have developed new products, and enhanced services. In February 2010, following our introduction in December 2008 of an unsecured educational loan, we began offering loans for car purchases (guaranteed by Promise Co., Ltd.) and a general-purpose unsecured loan. Customers can apply for these loans to the Consumer Finance Promotion Office, every day (except January 1) up to nine in the eve-ning using the automated loan contract machines installed within SMBC branches, the Internet, or other channels. In most cases, applicants receive a response on the same day. Such advantages mean these new loan products offer much greater convenience than conventional loans. As a result of these initiatives, more than 3,000 customers per year have applied for our unsecured educational loans, the first of this type of product to be offered. The “Act concerning Temporary Measures to Facilitate Financing for Small and Medium-Sized Enterprises, etc.” was enforced on December 4, 2009, with facilitating financing to housing loan borrowers as one of the objectives. In line with this objective, SMBC has set up the Consumer Facilitating Financing Dept. within the Planning Dept. of the Consumer Banking Unit. We have also appointed specialist staff for providing consult-ing and other forms of assistance tailored to the individual circumstances of customers experiencing difficulties repaying their housing loans, at all bank branches as well as within the nine special Loan Support Offices located nationwide. We will continue working to provide closely tailored sup-port services for such customers, and are working to improve the speed and precision of these services.
Settlement and Consumer Finance BusinessThe iD* credit service, which is based on a strategic alliance between SMFG and NTT DoCoMo, Inc., continues to grow. As of March 31, 2010, subscribers to this service and the terminals for accessing the service located on the premises of affiliated merchants totaled approximately 14.2 million and 440,000, respectively.
*iD is a trademark of NTT DoCoMo, Inc.
The consumer finance business collab-oratively launched in April 2005 by SMBC, Promise Co., Ltd. and At-Loan Co., Ltd., continues to grow also. There were 716 auto-mated contract machines and the balance of loans made by SMBC and At-Loan together totaled approximately ¥423.5 billion, as of March 31, 2010.
Business Overview
SMFG 2010 11
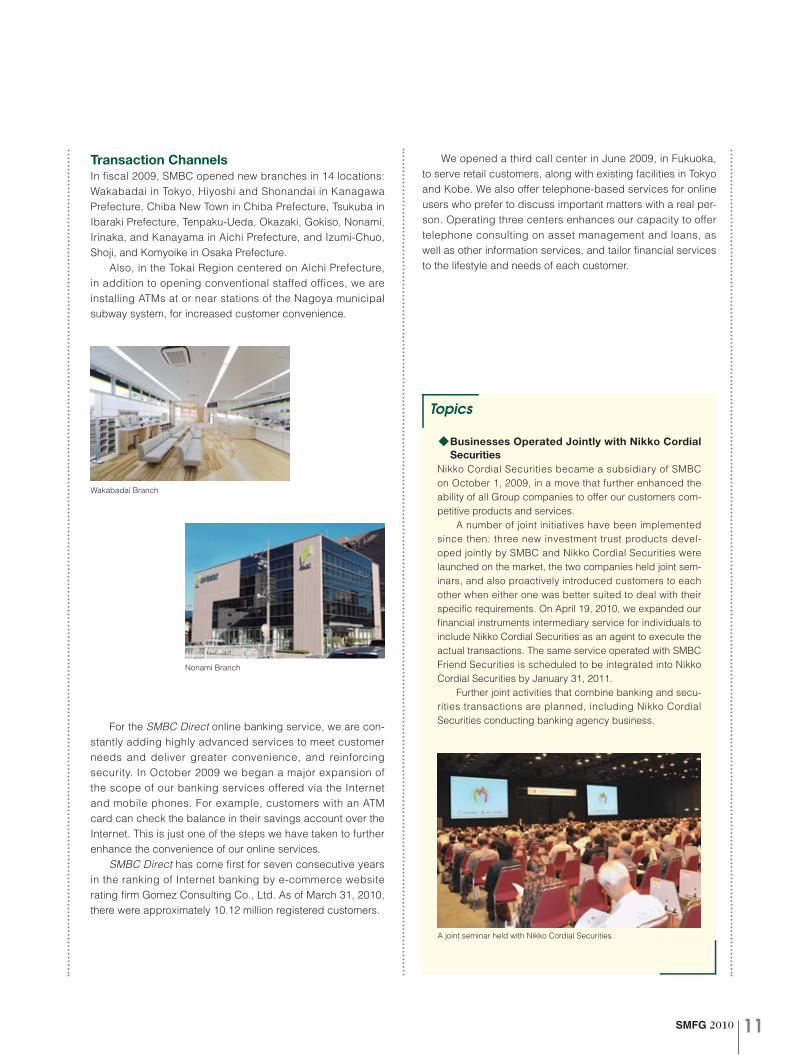
Transaction ChannelsIn fiscal 2009, SMBC opened new branches in 14 locations: Wakabadai in Tokyo, Hiyoshi and Shonandai in Kanagawa Prefecture, Chiba New Town in Chiba Prefecture, Tsukuba in Ibaraki Prefecture, Tenpaku-Ueda, Okazaki, Gokiso, Nonami, Irinaka, and Kanayama in Aichi Prefecture, and Izumi-Chuo, Shoji, and Komyoike in Osaka Prefecture. Also, in the Tokai Region centered on Aichi Prefecture, in addition to opening conventional staffed offices, we are installing ATMs at or near stations of the Nagoya municipal subway system, for increased customer convenience.
For the SMBC Direct online banking service, we are con-stantly adding highly advanced services to meet customer needs and deliver greater convenience, and reinforcing security. In October 2009 we began a major expansion of the scope of our banking services offered via the Internet and mobile phones. For example, customers with an ATM card can check the balance in their savings account over the Internet. This is just one of the steps we have taken to further enhance the convenience of our online services. SMBC Direct has come first for seven consecutive years in the ranking of Internet banking by e-commerce website rating firm Gomez Consulting Co., Ltd. As of March 31, 2010, there were approximately 10.12 million registered customers.
We opened a third call center in June 2009, in Fukuoka, to serve retail customers, along with existing facilities in Tokyo and Kobe. We also offer telephone-based services for online users who prefer to discuss important matters with a real per-son. Operating three centers enhances our capacity to offer telephone consulting on asset management and loans, as well as other information services, and tailor financial services to the lifestyle and needs of each customer.
Topics
l Businesses Operated Jointly with Nikko Cordial Securities
Nikko Cordial Securities became a subsidiary of SMBC on October 1, 2009, in a move that further enhanced the ability of all Group companies to offer our customers com-petitive products and services. A number of joint initiatives have been implemented since then: three new investment trust products devel-oped jointly by SMBC and Nikko Cordial Securities were launched on the market, the two companies held joint sem-inars, and also proactively introduced customers to each other when either one was better suited to deal with their specific requirements. On April 19, 2010, we expanded our financial instruments intermediary service for individuals to include Nikko Cordial Securities as an agent to execute the actual transactions. The same service operated with SMBC Friend Securities is scheduled to be integrated into Nikko Cordial Securities by January 31, 2011. Further joint activities that combine banking and secu-rities transactions are planned, including Nikko Cordial Securities conducting banking agency business.
Wakabadai Branch
Nonami Branch
A joint seminar held with Nikko Cordial Securities
SMFG 201012
■ Corporate Banking
Improving Products and Services for Midsized Companies and SMEs
•Initiatives to provide easier access to financingSMBC believes that the smooth and efficient supply of funds to its clients is its main social responsibility as a financial insti-tution. With companies facing growing challenges caused by the global financial crisis, we are making every effort to facili-tate financing to our corporate clients — midsized companies and SMEs — proactively and more tailored to their needs. To this end, in December 2009, SMBC established the Middle Market Facilitating Financing Department within the Planning Department of the Corporate Banking Unit. We will continue to implement initiatives to identify the ever-changing needs and issues of our corporate clients and offer more tailored products and services in order to support their business growth.
•Products and services to meet financing needsAmid the economic uncertainty, a broad range of financing needs is emerging. In order to meet these needs, we are con-stantly expanding our lineup of loans for our corporate clients. In 2008, SMBC introduced the Certified Company Support Loan for companies who have received SMBC designated national/local management-related certification or award; the Web Report Loan for companies using the Japanese national tax authorities’ e-Tax service; and the Asset Value Truck and Bus Loan which uses commercial vehicles as collateral (loan features were upgraded in 2009).
•Environmentally responsible products and servicesIn October 2008, SMBC launched the SMBC Environmental Assessment Loan/Private Placement Bonds. To be eligible, an applicant company must undergo an environmental evalua-tion using Japan Research Institute’s assessment standards. Loan terms depend on the evaluation results, which are disclosed to the applicant company to help improve its envi-ronmental protection measures. As of March 31, 2010, about 30 companies had raised approximately ¥100 billion in loans and bonds. SMBC announces these transactions to the public through SMBC press releases, newspaper advertisements and other forms of mass media, receiving high marks from our clients. In January 2010, this loan/bond product won the 2009 Nikkei Superior Products and Services Award for Superiority from Nikkei Inc., indicating the high regard in which it is held by Japanese society as a whole. Another initiative was the “Fight Global Warming Campaign” held from May through July 2009 in connection with SMBC-ECO Loan for companies with environmental management certifications. During the campaign period, SMBC used part of the earnings from the SMBC-ECO Loan to purchase and write off carbon credits equivalent to five tons of CO2 emissions per borrower, enabling the borrowers to play a part in combating global warming.
In April 2010, we added companies reporting their energy consumption to the Tokyo Metropolitan Government under its initiatives on reducing global warming to the scope of companies eligible for the SMBC-ECO Loan. In this way, we are supporting those midsized companies and SMEs that are taking a proactive approach to environmental issues. In addition, SMBC extends loans under two programs operated by the Ministry of the Environment in which the government pays the interest. One program is for supporting initiatives aimed at reaching the goals of the Kyoto Protocol, in which investments in facilities that reduce greenhouse gas emissions are partly subsidized. The other program is to support the acceleration of countermeasures against global warming. The Japanese government has set a high target of 25% reduction in the emission of greenhouse gases, and we believe this financing mechanism will provide invaluable sup-port for the environmental initiatives of Japanese industries.
•Information servicesSMBC has been strengthening its internal systems for busi-ness-matching, resulting in a dramatic increase in the number of business meetings we have arranged between possible partners. In particular, in our “all-in-one matching” program, which simultaneously matches a large number of corporate clients with the purchasing departments of large corporations, we have enhanced our corporate client information database, and are able to supply information on the purchasing needs of major corporations to more corporate clients. We will continue enhancing our ability to provide a wide spectrum of information to our clients.
Reinforcing Services for Globalizing CorporationsAn increasing number of our corporate clients are setting up businesses overseas, and they face a growing need to address issues such as differences in business practices; cultures; legal, accounting, and taxation systems, and inter-pretation of such systems; as well as funding. At SMBC, the Global Advisory Department was estab-lished to specifically help devise solutions for cross-border issues of globally operating clients. The department works to provide seamless support for the operations of companies both inside and outside Japan by straddling the three units of SMBC that do business with corporate clients – the Middle Market Banking Unit, the Corporate Banking Unit, and the International Banking Unit. Based in Tokyo, the department has staff members at SMBC offices overseas, chiefly in Asia. With about 200 professionals in the fields of foreign trade and global business operations, the department maximizes synergies by integrating issue-solving skills with expertise in collecting and analyzing information, and by making effective use of relationships with clients and business partners world-wide. Thanks to this infrastructure, we can devise customized solutions from a global perspective to serve both companies in Japan and their overseas subsidiaries.

SMFG 2010 13
We hold overseas business-related seminars with themes of particular interest to our clients, and distribute the latest information on overseas markets, enabling companies con-sidering the launch of an overseas business to gain insight into local conditions, regulations, industry trends, and other relevant matters. Our services are also useful for companies with established overseas operations who can count on us for valuable assistance in areas such as growth strategy and reorganization.
Intensifying Initiatives in the Chinese MarketChina is a major driver of global economic growth and many Japanese companies have already set up operations there, targeting the market that continues to grow. Japanese cor-porations’ entry into and business development in China is projected to accelerate in the coming years. To be able to more effectively meet the needs of such clients whose business straddles the Japanese and Chinese markets, at the beginning of fiscal 2010 SMBC appointed a director to be responsible for overseeing its Chinese subsid-iary Sumitomo Mitsui Banking Corporation (China) Limited. It also transferred responsibility for the planning, promotion, and management of transactions between the SMBC subsidiary in China and Japanese corporations from the International Banking Unit to a domestic banking unit. The aim of this move was to integrate SMBC services for clients’ head offices in Japan and their local subsidiaries in China, facilitating the smooth transaction of business and enabling us to deliver more closely tailored services.
Intensifying Initiatives in the Public and Financial SectorsWe are working to create solutions for issues of regional governments, public corporations and financial institutions. Moreover, to upgrade services for regional clients, we under-take joint initiatives with regional governments and financial institutions. In October 2009 SMBC was selected as the primary financial institution for the Tokyo Metropolitan Government’s Eco Finance Project. In partnership with Sumitomo Mitsui Finance & Leasing and other financial institutions, SMBC has created a number of financial products and programs, such as mortgage loans, leasing plans, and so on, that are designed to help improve the environment. These products proved popular, and over 300 applications for the mortgage loan had been received by the end of fiscal 2009.
l Business Alliance in the Environment Business in China
In November 2009, SMBC together with the Japan Research Institute signed a basic agreement with the Tianjin Eco-City Administrative Committee on initiatives to attract Japanese business corporations to the Tianjin Eco-city project. The Tianjin Eco-City project is the first large-scale project in China to build an ecologically friendly city to have been approved at the national government level. The new city will feature various measures to harmonize human activities with the natural environment, measures for conserving natural resources, and an efficient system of resource recycling. The environment business is expected to show signifi-cant further development in China along with the growth of the country’s overall market, and SMBC intends to play an important role in introducing Japanese companies to projects where they can make a major contribution. SMBC is strongly committed to delivering enhanced services for Japanese corporate clients in the process of setting up businesses in China or planning to do so.
Topics
In July 2008 SMBC signed a Cooperative Agreement for the Promotion of Industry with the Miyagi Prefectural Government and The 77 Bank, Ltd. In the third venture under this agreement, the three partners initiated a project to help companies in Miyagi Prefecture become more environmen-tally responsible as well as cut costs. Subsidies are provided by the prefectural government to help companies purchase equip-ment that contribute to energy conservation and cost-cutting. We are taking a variety of steps to make this project a success, such as holding seminars. We will continue to step up initiatives that contribute to regional economic growth while delivering high value-added services to clients throughout Japan.
Tokyo MetropolitanGovernment Primary financial institution: SMBC
(Project management, Overall coordination, Trust accounts)
Deposits
SMBC The TokyoTomin Bank
Seibu ShinkinBank
Sumitomo MitsuiFinance & Leasing
Individuals and business owners
Marketing of financial products with environmental benefits
Profits from fund management
The signing ceremony for the agreement on the Tianjin Eco-City project.
Seminar on energy conservation and cost-cutting
Tokyo Metropolitan Government Eco Finance Project

SMFG 201014
Private BankingCustomers can rely on PAD for all-inclusive financial advice concerning financial assets. We share and understand customers’ financial goals, including risk profiles, through a series of discussions with each customer. After agreeing on the goals, we create proposals for asset allocation and management.
Workplace BankingThe management environment for SMBC’s corporate cus-tomers is undergoing dramatic changes that are giving rise to various issues in the field of HR strategy. PAD employs the wide range of financial products and services offered by SMBC to prepare solutions to these issues, and supports corporate customers to create employee financial benefit programs and defined-contribution pension plans. Further, employees can obtain SMBC products and services for achieving financial and other goals in their lives through their employers in addition to SMBC marketing channels.
■ Services for High Networth Individuals, Business Owners and Employees
Private Advisory DepartmentThe Private Advisory Department (PAD) of SMBC specializes in products and services that meet the diverse requirements of business owners and high networth individuals. Activities of this department span three areas. The first is carefully tailored support services for business and asset succes-sion. We combine the extensive know-how of our own staff, accumulated over many years of experience, with the input of alliance partners such as leading tax accountancy firms. The second area is private banking services, which include comprehensive financial services for managing customers’ financial assets. These services, too, are offered in collabora-tion with alliance partners. The third area is workplace bank-ing services to support the HR strategies of corporate clients. This service category includes providing assistance in the design of employee savings and other employee financial benefit programs, and defined-contribution pension plans. By working with other SMBC Group companies and alli-ance partners, PAD uses its “One Bank” approach to provide seamlessly a broad range of products and services. This allows the department to cover many types of needs involving both individual and corporate clients.
Support for Business and Asset SuccessionPAD specialists prepare tailored proposals for customers with concerns about business and asset succession. We hold a variety of seminars to supply timely information and advise business owners on a wide range of matters. Our consulting services cover issues of all types involving both individuals and companies.
Sumitomo Mitsui Banking Corporation
SMFG companies
Support from specializedunits of SMBC
Alliance partners (leading tax accountancy firms and other professionals)
Sumitomo Mitsui Financial Group
Private Advisory Department
Businessgrowthneeds
Business succession
needs
Assetsuccession
needs
Assetmanagement
needs
Assistance foremployee benefit
programs
Corporate Business Office Branches
CustomersHigh networth individuals Business owners Heads of wealthy families
Businessstrategy
Assetmanagement
Tax paymentarrangements
Assetsuccession
Successionplan
Stock pricesimulations
Capital policy
M&A/MBO
Organizationalrestructuring
OURSOLUTION
1. SharingUnderstanding customers’
financial goals, and analyzing current portfolios
2. Consulting
4. Review 3. Action

SMFG 2010 15
■ Investment Banking
Accomplishments in Fiscal 2009SMBC was awarded the best arranger of syndicated loans in the Japanese market by Euroweek Asia magazine. It was also awarded “Global Arranger of the Year” by Infrastructure Journal in project finance for infrastructure development for its seawater desalination project finance deal in the Australian state of Victoria, and other projects. In addition, in settlement services, SMBC is steadily increasing its profile, ranking first for two consecutive years among Japanese banks in the Asia-Pacific region, in a cash management services survey conducted by Asiamoney magazine.
Collaboration with Nikko Cordial SecuritiesSince October 2009, Nikko Cordial Securities, Inc. (NCS) has been operating as a full-line securities company by adding wholesale capabilities to its retail securities business. SMBC has been referring its customers to NCS since the latter half of fiscal 2009, and as a result, NCS closed more than 100 deals introduced by SMBC in underwriting and M&A. Benefiting from the collaboration between SMBC and NCS, in the league tables published by Thomson Reuters, SMFG was third in the ranking of bookrunners in the “Japanese Corporate Bonds” category with a market share of 20.0% in the second half of fiscal 2009, and fourth with a market share of 8.8% in the “Global Equity & Equity-Related – Underwriting Value in Japan” category. SMFG will continue to strengthen further collaboration between SMBC and NCS so as to meet the diverse needs of our customers, including fund raising through capital markets, cross-border M&A, and debt securi-tization, more fully.
Japanese Corporate Bonds*1
Oct. 2009 – Mar. 2010
Rank Bookrunner Proceeds (¥ mil)
Market share
Number of deals
1 Mitsubishi UFJ Financial Group 913,567.1 21.4% 51
2 Mizuho Financial Group 877,981.5 20.5% 50
3 Sumitomo Mitsui Financial Group 855,233.5 20.0% 29
4 Nomura Holdings, Inc. 819,153.9 19.1% 54
5 Daiwa Securities Group Inc. 760,928.5 17.8% 57
6 Barclays Capital 14,600.0 0.3% 2
7 Shinkin Central Bank 10,000.0 0.2% 1
8 Citi 8,750.0 0.2% 1
9 Goldman Sachs & Co. 6,000.0 0.1% 1
10 Bank of America Merrill Lynch 5,000.0 0.1% 2
Global Equity & Equity-Related – Underwriting Value in Japan*1
Oct. 2009 – Mar. 2010
Rank Underwriter Proceeds (US$m)
Market share
Number of deals
1 Nomura Holdings, Inc. 19,816.7 34.8% 63
2 Mitsubishi UFJ Financial Group 5,856.2 10.3% 53
3 Daiwa Securities Group Inc. 5,375.9 9.4% 47
4 Sumitomo Mitsui Financial Group 5,004.8 8.8% 43
5 Mizuho Financial Group 4,745.7 8.3% 58
6 Goldman Sachs & Co. 4,091.0 7.2% 10
7 Morgan Stanley 3,465.3 6.1% 6
8 Citi 2,117.8 3.7% 4
9 JP Morgan 1,792.0 3.1% 9
10 Bank of America Merrill Lynch 1,761.6 3.1% 9
*1 Source: Thomson Reuters
Topics
l Reinforcing our operations in AsiaIn May 2010 SMBC established the Financial Products Marketing Department in Singapore, by integrating certain functions performed by various departments of Investment Banking Unit at its Singapore branch. This will enable us to meet the increasingly diversifying and sophisticated needs of our customers in Asia more flexibly. This department will provide a diversity of investment banking products such as debt securitization and derivatives, and will enable us to offer prompt and appropriate financial solutions to our customers more swiftly.
lProject FinanceSMBC is highly respected globally for its ability in project finance. It became the first financial institution from the Asia-Pacific region to be awarded “Global Arranger of the Year” for 2009 by Infrastructure Journal. In addition, SMBC placed among the top five global arrangers in the league table published by Project Finance International magazine.
Global Initial Mandated Lead Arrangers*2
Jan. – Dec. 2009
Rank Mandated Arranger Volume(US$m)
1 State Bank of India 19,944.9
2 Calyon 7,359.6
3 BNP Paribas S.A. 5,836.1
4 Société Générale 4,283.7
5 Sumitomo Mitsui Financial Group, Inc. 4,025.1
*2 Source: Project Finance International

SMFG 201016
■ International Banking
SMFG offers value-added services to clients (corporations,
financial institutions, governmental organizations and public
entities) operating globally by creating tailor-made solu-
tions that meet various local needs, mainly through SMBC’s
International Banking Unit.
SMBC has three regional headquarters — Europe, the
Americas and the Asia-Pacific region — and subsidiaries in
the emerging markets of China, Russia and Brazil. With this
network, we have the speed and flexibility to respond to dif-
fering needs in each region. We endeavor to become a global
commercial bank, capable of delivering our strengths in vari-
ous business opportunities in this vast international market.
Expansion of Overseas NetworkWe are working to expand our overseas branch network to
enhance services for Japanese companies and increase our
presence in the emerging markets.
Considerable progress is being made in developing the
infrastructure in Africa, and in March 2010 SMBC enhanced
the functions of its Johannesburg Representative Office in
a move to better serve the needs of our customers, mainly
Japanese corporations that are planning to set up businesses
in Africa or expand their existing operations there. In May
2010, SMBC signed an agreement on a business alliance
with Absa Bank Limited, one of the largest private-sector
banks in South Africa and a subsidiary of Barclays PLC of
the United Kingdom. This builds on the capital and business
alliance entered into with Barclays PLC in 2008. We hope
to leverage Absa’s wide marketing base in South Africa to
further enhance our services.
Capital and Business Alliances with Prominent Asian Financial InstitutionsOur alliance strategy in Asia is tailored to the characteristics
of each country and region. We aim to strengthen our solution
providing capability in the region, such as by expanding our
Asian currency denominated services.
In July 2009, SMBC established an alliance with PT Bank
Central Asia Tbk, the largest privately owned commercial
bank in Indonesia. Forming this partnership positions us
to better provide our customers with solutions that include
stable local-currency financing, cash management services,
and other corporate finance activities. In the same month,
SMBC signed a technical service agreement, including risk
management, with its capital and business alliance partner
Vietnam Export Import Commercial Joint Stock Bank. Then,
in December 2009, through private placement, SMBC
acquired shares of The Bank of East Asia, Ltd., a major
private-sector bank in Hong Kong. The bank was already
one of our business partners, and this investment has further
strengthened our collaborative ties.
We will continue to forge ties with leading financial institu-
tions, while organically growing our marketing network in
Asia — a multifaceted approach to expanding our business
operations in Asia.
Core IT System UpgradesStarting in fiscal 2009, SMBC has been revamping its Asian
accounting systems and customer information and manage-
ment administration systems as part of a worldwide opera-
tions system upgrade to support corporate clients operating
globally.
Strengthening of Risk ManagementAs part of a broader strategy for reinforcing our credit cost
control framework, SMBC has enhanced its credit monitoring
system, and has set up dedicated credit management units
in Europe and the United States.
SMBC has also reinforced coordination between the
Credit Management Department of the International Banking
Unit, which was established in fiscal 2009, and the credit
portfolio management (CPM) functions of regional head-
quarters to create an even more effective hedging system to
minimize the impact of economic fluctuations.
Strengthening of Compliance SystemThe global regulatory environment is changing rapidly, and
we are focusing our efforts on creating a compliance system
capable of swiftly responding to BIS guidelines and the regu-
latory authorities of countries across the globe.
SMBC has taken various steps to computerize adminis-
trative processes at its overseas offices and introduce more
advanced management systems in order to create an anti-
money laundering system in line with international standards.
Moving forward, we will continue to tighten controls on the
operational side still further.
Fostering Professionals Needed to Realize Overseas Business GrowthWe are strengthening our training and educational programs
in order to meet seamlessly and accurately customers’
increasingly diverse and advanced needs. We station promis-
ing young employees at our overseas offices or dispatch them
to specialist overseas financial institutions outside the Group.
In this way, we are developing employees with invaluable
expertise in international business. In Asia, where our opera-
tions are growing noticeably, SMBC’s Asia Pacific Training
Department is constantly enhancing seminars and e-learning
programs for our national staff in order to strengthen their abil-
ity to deliver the best solutions to our customers.

SMFG 2010 17
Topics
l Issuance of A$-denominated bonds for individual investors
We have been diversifying our longer-term procurement channels to adapt more effectively to new regulations and cope with an increasingly competitive market. In March 2010, SMBC issued corporate bonds denominated in Australian dollars for individual investors.
lSound Market OperationsSMBC executes sound market operations in response to changes in market conditions based on a conservative risk management policy. In addition, we are constantly taking steps to use even more advanced methods for our ALM activities.
Topics
lEnvironmental Business Opportunities OverseasWe are reinforcing our initiatives in the global environ-mental business. In Asia, SMBC is one of the advisors in the Tianjin Eco-City project in northern China. In March 2010, SMBC signed a financing agreement on a renew-able energy development project and other matters with the International Finance Corporation and Environmental Cooperation-Asia (ECO-Asia), a regional program of the United States Agency for International Development. On April 20, 2010, SMBC signed a memorandum of under-standing on the promotion of environmental business in Malaysia with the Federation of Malaysian Manufacturers (FMM) and the NGO Green Purchasing Network Association Malaysia (GPNM). In the Americas, SMBC signed a memorandum on a business alliance in emis-sions trading with the Banco de la Republica Oriental del Uruguay (a major financial institution administered by the government of Uruguay). This is the latest move in our continued expansion of our network of business alliances in South America, which began with Banco do Brasil, a leading Brazilian commercial bank, in August 2006.
trends in financial markets.
We are constantly improving the functions of i-Deal, a
system that allows clients to conclude foreign exchange con-
tracts over the Internet. Moving forward, the Treasury Unit will
continue working to fulfill all our customers’ market transaction
needs by offering full support services of the highest quality
in the industry.
ALM and Trading OperationsThrough its ALM and trading operations, and while controlling
market and liquidity risks, the Treasury Unit seeks to maximize
earnings by targeting opportunities created by trends in many
financial markets.
We will continue to conduct trading operations that take
advantage of changes in market conditions in order to gener-
ate a consistent stream of earnings.
■ Treasury Markets
SMFG, through the Treasury Unit of SMBC, aims to offer
increasingly higher value-added services to meet the ever
more sophisticated and diverse needs of its customers for
transactions in the money, foreign exchange, bond and
derivatives markets. To maintain and further strengthen profit-
ability, and while managing risk appropriately, the Treasury
Unit focuses on three goals: (a) expanding transaction volume
from its customers; (b) strengthening its asset-liability man-
agement (ALM) system and trading skills; and (c) bringing
sharper focus to portfolio management.
More Solutions and Services for Customers’ Market TransactionsSMBC is dedicated to supplying solutions that precisely
match the market transaction needs of its customers. To this
end, the Treasury Unit works with branches to create hedging
and other proposals for corporate clients that reflect shifting
SMFG President Kitayama with representatives of FMM and GPNM at the signing ceremony

SMFG 201018
Sumitomo Mitsui Banking Corporation (SMBC) was established in April 2001 through the merger of two leading banks: The Sakura Bank, Limited, and The Sumitomo Bank, Limited. Sumitomo Mitsui Financial Group, Inc., was established in December 2002 through a stock transfer as a bank holding company, and SMBC became a wholly owned subsidiary of SMFG. In March 2003, SMBC merged with the Wakashio Bank, Ltd. SMBC’s competitive advantages include a strong customer base, the quick implementation of strategies, and an extensive lineup of financial products and services that leverage the expertise of strategic Group com-panies in specialized areas. SMBC, as a core member of SMFG, works together with other members of the Group to offer customers highly sophisticated, comprehensive financial services.
Company Name: Sumitomo Mitsui Banking CorporationBusiness Profile: BankingEstablishment: June 6, 1996Head Office: 1-2, Yurakucho 1-chome, Chiyoda-ku,
Tokyo, Japan(As of October 18, 2010: 1-2, Marunouchi 1-chome, Chiyodaku, Tokyo Japan)
President: Masayuki OkuNumber of Employees: 22,460Number of branches and other business locations: In Japan: 1,549* Branches: 494 (Including 38 specialized deposit account branches) Subbranches: 164 Agency: 1 Offices handling non-banking business: 23 Automated service centers: 867 Overseas: 34 Branches: 15 Subbranches: 6 Representative offices: 13
* The number of domestic branches excludes ATMs located at the business sites of companies and at retail convenience stores.
www.smbc.co.jp/english/
Group Companies (as of March 31, 2010)
SUMITOMO MITSUI Banking CorporationSUMITOMO MITSUI Banking Corporation
SMFG CARD & CREDIT, INC.
Financial Information (Consolidated basis, years ended March 31)
Billions of yen2010 2009 2008 2007
For the Year:Ordinary income ..... ¥2,579.9 ¥2,989.6 ¥3,411.0 ¥2,925.6 Ordinary profit ........ 557.7 59.2 734.9 716.6Net income (loss) .... 332.4 (317.3) 351.8 401.7
At Year-End:Net assets ............... ¥6,894.5 ¥4,518.6 ¥5,080.7 ¥5,412.4Total assets ............ 120,041.3 115,849.3 108,637.7 98,570.6
Credit Ratings (as of June 30, 2010)
Long-term Short-termMoody’s Aa2 P–1Standard & Poor’s A+ A–1Fitch Ratings A F1R&I A+ a–1JCR AA– J–1+
Maximization of
top-line synergies
Pursuit of economies of scale
SMFG SUMITOMO MITSUI Financial group
SMFG CARD & CREDIT, INC.
Company Name: SMFG Card & Credit, Inc.Business Profile: Management of subsidiaries
and affiliatesEstablishment: October 1, 2008Head Office: 1-2, Yurakucho 1-chome,
Chiyoda-ku, Tokyo, Japan(As of October 18, 2010: 1-2, Marunouchi 1-chome, Chiyodaku, Tokyo Japan)
President & CEO: Kazuya Jono Number of Employees: 36
SMFG Card & Credit, Inc. (“FGCC”), was established in October 2008 as an intermedi-ate holding company of SMFG to hold shares of Sumitomo Mitsui Card Co., Ltd., and Cedyna Financial Corporation. FGCC is the core com-pany responsible for implementing SMFG’s credit card strategy and establishing uniform business policies. FGCC will also create a framework for promoting a solid partnership between Sumitomo Mitsui Card and Cedyna Financial Corporation, seek to realize economies of scale for the Group as a whole, and maximize top-line synergy by leveraging each party’s strengths.* Cedyna Financial Corporation was formed in April 2009
through the merger of three companies: Central Finance Co., Ltd., OMC Card, Inc., and QUOQ Inc., and has become one of the largest consumer finance companies in Japan.
The companies of the Sumitomo Mitsui Financial Group (SMFG) offer a diverse range of financial services, centered on banking operations, and including credit card services, leasing, information services, and securities.
Company Name: Sumitomo Mitsui Financial Group, Inc.Business Description: Management of banking subsidiaries (under the stipulations of Japan’s Banking Law) and of non-bank subsidiaries, as well as performance of ancillary functionsEstablishment: December 2, 2002Head Office: 1-2, Yurakucho 1-chome, Chiyoda-ku, Tokyo, Japan
(As of October 18, 2010: 1-2, Marunouchi 1-chome, Chiyodaku, Tokyo Japan)
Chairman of the Board: Masayuki Oku (Concurrent President at Sumitomo Mitsui Banking Corporation)President: Teisuke Kitayama (Concurrent Chairman of the Board of Directors at Sumitomo Mitsui Banking Corporation)Capital: ¥2,337.8 billion (as of March 31, 2010)Stock Exchange Listings:Tokyo Stock Exchange (First Section)Osaka Securities Exchange (First Section)Nagoya Stock Exchange (First Section)
www.smfg.co.jp/english/
• To provide optimum added value to our customers and together with them achieve growth
• To create sustainable shareholder value through business growth
• To provide a challenging and professionally reward-ing work environment for our dedicated employees
Our Mission

SMFG 2010 19
Sumitomo Mitsui Finance and Leasing Co., Ltd. (SMFL) was created from the merger of SMBC Leasing Company, Limited, and Sumisho Lease Co., Ltd., in October 2007. SMFL aims to become the top leasing com-pany in Japan in terms of both quantity and quality by leveraging (a) the financial solu-tions offered by other subsidiaries of SMFG, and (b) business relationships along the value chains in a wide range of industries held by the Sumitomo Corporation Group, one of Japan’s leading trading houses. SMFL is one of the leading companies in the leasing industry, known for its capabili-ties for offering high-value-added products and services, because of its strong market-ing position based on its access to chan-
nels to users of leased equipment and to suppliers of equipment, as well as having business in the aircraft operating lease field. SMFL is working to contribute to soci-ety as a leading leasing company by antici-pating future needs and offering top quality leasing services.
As the pioneer in the issuance of the VISA Card in Japan and a leader in the domestic credit card industry, Sumitomo Mitsui Card Company, Limited, enjoys the strong support of its many customers and plays a major role as one of the strategic businesses of SMFG. Leveraging its strong brand image and its excel-lent capabilities across a wide range of card-related services, the company provides settlement and financing services focused around providing credit services that meet customer needs. Through its credit card busi-ness operations, the company aims to actively contribute to the realization of comfortable and
affluent consumer lifestyles and make further dramatic advances as a leading brand in its industry sector.
Company Name: Sumitomo Mitsui Card Company, Limited
Business Profile: Credit card servicesEstablishment: December 26, 1967Head Office: Tokyo Head Office: 1-2-20, Kaigan,
Minato-ku, Tokyo Osaka Head Office: 4-5-15, Imab ashi,
Chuo-ku, OsakaPresident & CEO: Koichi TsukiharaNumber of Employees: 2,247
Company Name: Sumitomo Mitsui Finance and Leasing Co., Ltd.
Business Profile: LeasingEstablishment: February 4, 1963Head Office: Tokyo Head Office: 3-9-4, Nishi-Shimbashi, Minato-ku, Tokyo Osaka Head Office: 3-10-19, Minami-Semba, Chuo-ku, OsakaPresident & CEO: Koji IshidaNumber of Employees: 1,538
www.smbc-card.com(Japanese only)
www.smfl.co.jp/english/
Financial Information (Years ended March 31)
Billions of yen2010 2009 2008 2007
For the Year:Revenue from credit
card operations ......... ¥6,209.0 ¥5,858.7 ¥5,375.2 ¥4,753.8Operating revenue...... 183.6 180.2 168.4 157.6Operating profit........... 24.3 22.3 16.9 14.1
At Year-End:Number of cardholders
(in thousands) ........... 20,504 18,655 16,406 14,951
Credit Ratings (as of June 30, 2010)
Long-term Short-termJCR A+ J–1+
Credit Ratings (as of June 30, 2010)
Long-term Short-termR&I A+ a–1JCR AA– J–1+
Financial Information (Years ended March 31)
Billions of yen2010 2009 2008 2007*
For the Year: Revenue from leasing operations ¥733.6 ¥895.8 ¥1,054.1
¥599.4516.8
Operating revenue .... 894.7 947.6 708.4630.0379.9
Operating profit ......... 43.9 36.4 36.231.524.7
* The upper row of figures for 2007 are for SMBC Leasing and the lower row of figures are for Sumisho Lease.
www.cedyna.co.jp/english/
Cedyna Financial Corporation was formed in April 2009 through the merger of OMC Card, Inc., Central Finance Co., Ltd. and QUOQ Inc., bringing together the customer bases, marketing capabilities and propri-etary know-how of these credit card com-panies. It aims, in alliance with fellow SMFG Group member Sumitomo Mitsui Card, to become “the number one credit card busi-ness entity in Japan.” As one of Japan’s largest consumer finance companies offer-ing a fusion of the credit card, consumer credit and solutions businesses, Cedyna provides products and services of great value to its customers.
Company Name: Cedyna Financial CorporationBusiness Profile: Credit-card services, consumer creditEstablishment: September 11, 1950Head Office: Head Office: 3-23-20 Marunouchi, Naka-ku,
Nagoya Tokyo Head Office: 2-16-4 Konan, Minato-ku,
TokyoPresident & CEO: Hajime YamashitaNumber of Employees: 3,223
Credit Ratings (as of June 30, 2010)
Long-term Short-termStandard & Poor’s A– A–2JCR A J–1
Financial Information (Years ended March 31)
Billions of yen2010 2009
OMC* CF* QQ*For the Year:
Revenue from credit card operations .........
Operating revenue...... ¥223.9 ¥137.7 ¥80.6 ¥44.8Operating profit........... (40.8) 6.9 (1.4) (5.2)
At Year-End:Number of cardholders
(in thousands) ........... 24,933
* OMC: OMC Card, Inc.CF: Central Finance Co., Ltd.QQ: QUOQ Inc.

SMFG 201020
Providing a full range of securities ser-vices, focused mainly on retail customers, SMBC Friend Securities Co., Ltd. has one of the strongest financial positions among Japanese securities companies and boasts highly efficient operations with a nationwide network. SMBC Friend Securities offers services closely tailored to the needs of its customers and the communities it serves. It became a wholly owned subsidiary of SMFG through a share transfer in September 2006, and is developing business operations jointly with other SMFG Group companies. SMBC Friend Securities will continue to
move steadily forward toward its goal of becoming “a leading Japanese securities company in the retail market,” offering high-quality products and services matching the needs of its customers and building strong bonds of trust with them.
Company Name: SMBC Friend Securities Co., Ltd.Business Profile: Securities servicesEstablishment: March 2, 1948Head Office: 7-12, Kabuto-cho, Nihonbashi,
Chuo-ku, TokyoPresident & CEO: Osamu EndoNumber of Employees: 2,197
www.smbc-friend.co.jp(Japanese only)
Financial Information (Years ended March 31)
Billions of yen2010 2009 2008 2007
For the Year:Operating revenue ... ¥67.4 ¥43.2 ¥60.5 ¥58.7Operating profit....... 22.8 2.3 19.0 21.2
The Japan Research Institute, Limited (JRI), con-ducts “knowledge engineering” activities which effectively combine three functions: information systems integration, consulting, and think-tank services. All activities are guided by the funda-mental philosophy of “creating new value for the client.” JRI offers unique added value in many fields by leveraging IT expertise to plan and assemble strategic data systems and provide out-sourcing services. Additionally, its activities span consulting for corporate management strategies and governmental administrative reform, research and analysis on both domestic and foreign eco-nomic issues, and policy recommendation, as well as formulation of, and support for, start-up incubation in new markets and industries.
In December 2008, JRI concluded a capital and business alliance with NTT Data Co., Ltd. and JRI Solutions, Limited, an SMFG Group company offering IT solutions to custom-ers across a wide range of industries. And, in
January 2009, JRI Solutions began operations anew under the name “JSOL.” Looking ahead, JRI Group, while maintaining close relation-ships with other SMFG Group companies, will draw on the diverse range of resources and know-how of the NTT Data Group, as well as the know-how it has accumulated, to further grow and develop as a total IT service provider.
www.jri.co.jp/english/
Company Name: The Japan Research Institute, Limited
Business Profile: Systems engineering, data processing, management consulting, think-tank services
Establishment: November 1, 2002Head Office: Tokyo Head Office: 16, Ichibancho,
Chiyoda-ku, Tokyo Osaka Head Office: 2-2-4, Tosabori,
Nishi-ku, OsakaPresident & CEO: Yasuyuki KimotoNumber of Employees: 2,061
Financial Information (Years ended March 31)
Billions of yen2010 2009 2008 2007*
For the Year:Operating revenue .... ¥81.7 ¥88.0 ¥88.1 ¥84.6Operating profit ......... 0.9 1.0 3.8 3.0
* JSOL (formerly JRI Solutions) was spun off as a separate company in July 2006.
Since its establishment in July 1918, Nikko Cordial Securities Inc. — then known as Kawashimaya Shoten — has grown with its customers for over 90 years. It started a new chapter in Nikko Cordial’s history in October 2009 as a member of SMFG Group. One of the largest full-service secu-rities and investment banking firms in Japan and a provider of high-quality products and services, Nikko Cordial Securities is work-ing with SMBC to create a new business model integrating banking and securities activities. It aims to become the number one securities company in Japan by deliv-ering still more value.
Company Name: Nikko Cordial Securities Inc.Business Profile: Securities servicesEstablishment: June 15, 2009
Nikko Cordial De-merger Preparatory Company Ltd. was established to succeed all of the operations (excluding selected assets and liabilities) of former Nikko Cordial Securities Inc. and certain businesses of former Nikko Citigroup Ltd. through a corporate spin-off from Nikko Citi Holdings, Inc. On October 1, 2009, it started operating under the trade name “Nikko Cordial Securities Inc.”
Head Office: 3-1, Marunouchi 3-chome, Chiyoda-ku, Tokyo
President & CEO: Eiji WatanabeNumber of Employees: 6,533
Credit Ratings (as of June 30, 2010)
Long-term Short-termMoody’s Aa2 P–1Standard & Poor’s A A–1R&I A+ a–1JCR AA–
Financial Information (Years ended March 31)
2010 2009
1HFormer Nikko
Cordial Securities
Nikko Cordial SecuritiesFrom June 2009
(started operating under this trade name in October)
Former Nikko Cordial
SecuritiesFor the Year:
Operating revenue ......... ¥85.6 ¥104.9 ¥164.1Operating profit ............. 20.9 23.5 19.6
* Expenses related to preparatory costs prior to the start of operations were posted during the period from June to September.
www.nikko.co.jp/SEC/e-home.html

SMFG 2010 21
l Consolidated
Millions of yenYear ended March 31 2010 2009 2008 2007 2006For the Year:
Total income ................................................................. ¥ 3,184,688 ¥ 3,556,536 ¥ 4,739,040 ¥ 3,947,786 ¥ 3,803,089Total expenses ............................................................. 2,626,590 3,527,040 3,810,084 3,140,996 2,759,726Net income (loss) ......................................................... 271,559 (373,456) 461,536 441,351 686,841
At Year-End:Total net assets ............................................................ ¥ 7,000,805 ¥ 4,611,764 ¥ 5,224,076 ¥ 5,331,279 ¥ 4,454,399Total assets .................................................................. 123,159,513 119,637,224 111,955,918 100,858,309 107,010,575Risk-monitored loans ................................................... 1,529,484 1,586,317 1,092,661 1,067,386 1,243,160Reserve for possible loan losses ................................. 1,068,329 1,077,852 894,702 889,093 1,035,468Net unrealized gains (losses) on other securities ........ 586,414 (33,176) 745,420 1,825,168 1,373,337Number of employees .................................................. 57,888 48,079 46,429 41,428 40,681
Selected Ratios:Capital ratio .................................................................. 15.02% 11.47% 10.56% 11.31% 12.39%Return on Equity .......................................................... 7.63% —% 13.23% 13.07% 33.15%Price Earnings Ratio .................................................... 12.44x —x 11.06x 18.74x 13.72x
Per Share (Yen):Net assets .................................................................... ¥3,391.75 ¥2,790.27 ¥424,546.01 ¥469,228.59 ¥400,168.89Net income (loss) ......................................................... 248.40 (497.39) 59,298.24 57,085.83 94,733.62Net income — diluted ................................................... 244.18 — 56,657.41 51,494.17 75,642.93
Notes: 1. “Net unrealized gains (losses) on other securities” represent the difference between the market prices and acquisition costs (or amortized costs) of “other securities.” In principle, the values of stocks are calculated using the average market prices during the final month. For details, please refer to page 26.
2. “Number of employees” has been reported on the basis of full-time workers. “Number of employees” includes locally hired overseas staff members but excludes contract employees and temporary staff.
3. From the fiscal year ended March 31, 2007, in calculating total net assets and total assets, SMFG has applied “Accounting Standard for Presentation of Net Assets in the Balance Sheet” (Accounting Standards Board of Japan (“ASBJ”) Statement No. 5) and “Guidance on Accounting Standard for Presentation of Net Assets in the Balance Sheet” (ASBJ Guidance No. 8).
4. The ASBJ has revised “Guidance on Accounting Standard for Earnings per Share” (ASBJ Guidance No. 4). From the fiscal year ended March 31, 2007, SMFG has applied the revised Guidance and calculated net assets per share by including net deferred gains (losses) on hedges.
5. From the fiscal year ended March 31, 2007 (fiscal 2006), the consolidated capital ratio has been calculated according to the formula specified in the Financial Services Agency (“FSA”) Notification No. 20 issued in fiscal 2006, which is based on Article 52-25 of the Banking Act of Japan. The consolidated capital ratio of SMFG is calculated under Basel II. Please note that in fiscal 2005, the capital ratio was calculated according to the formula specified in the Ministry of Finance Notification No. 62 issued in fiscal 1998, which was based on Article 52-25 of the Banking Act of Japan.
6. “Net income — diluted” per share for the fiscal year ended March 31, 2009 is not reported due to a net loss. 7. SMFG implemented a 100-for-1 stock split of common stock on January 4, 2009. If the stock split had been implemented in the prior years, per share
information would be as follows:
YenYear ended March 31 2008 2007 2006Net assets ............................................................................................................................. ¥4,245.46 ¥4,692.29 ¥4,001.69Net income ........................................................................................................................... 592.98 570.86 947.34Net income — diluted ........................................................................................................... 566.57 514.94 756.43
Financial Highlights
Sumitomo Mitsui Financial Group

SMFG 201022
l Nonconsolidated
Millions of yenYear ended March 31 2010 2009 2008 2007 2006For the Year:
Operating income ......................................................... ¥ 133,379 ¥ 134,772 ¥ 111,637 ¥ 376,479 ¥ 55,482Dividends on investments in subsidiaries and affiliates ... 118,818 117,051 89,693 366,680 46,432
Operating expenses ..................................................... 16,641 8,790 6,246 3,641 3,196Net income ................................................................... 66,176 103,468 82,975 363,535 73,408
At Year-End:Total net assets (A) ...................................................... ¥4,805,574 ¥2,977,547 ¥2,968,749 ¥2,997,898 ¥3,935,426Total assets (B) ............................................................ 6,152,774 4,057,313 4,021,217 3,959,444 4,166,332Total net assets to total assets (A) / (B) ...................... 78.10% 73.39% 73.83% 75.72% 94.46%Capital stock ................................................................. 2,337,895 1,420,877 1,420,877 1,420,877 1,420,877
Number of shares issued Preferred stock .................................................... 70,001 103,401 120,101 120,101 950,101Common stock .................................................... 1,414,055,625 789,080,477 7,733,653 7,733,653 7,424,172
Number of employees .................................................. 183 167 136 131 124Selected Ratios:
Return on Equity .......................................................... 1.59% 3.52% 2.67% 13.71% 2.38%Price Earnings Ratio .................................................... 57.41x 28.79x 71.82x 23.10x 190.16xDividend payout ratio ................................................... 213.41% 75.96% 131.37% 15.31% 46.64%
Per Share (Yen):Net assets .................................................................... ¥3,256.32 ¥3,389.38 ¥339,454.71 ¥342,382.75 ¥330,206.27Dividends:
Common stock ......................................................... 100 90 12,000 7,000 3,000Preferred stock (Type 1) .......................................... / / / — 10,500Preferred stock (Type 2) .......................................... / / / — 28,500Preferred stock (Type 3) .......................................... / / / — 13,700Preferred stock (1st series Type 4) .......................... 67,500 135,000 135,000 135,000 135,000Preferred stock (2nd series Type 4) ........................ 67,500 135,000 135,000 135,000 135,000Preferred stock (3rd series Type 4) ......................... 67,500 135,000 135,000 135,000 135,000Preferred stock (4th series Type 4) ......................... 67,500 135,000 135,000 135,000 135,000Preferred stock (5th series Type 4) ......................... / / 135,000 135,000 135,000Preferred stock (6th series Type 4) ......................... / / 135,000 135,000 135,000Preferred stock (7th series Type 4) ......................... / / 135,000 135,000 135,000Preferred stock (8th series Type 4) ......................... / / 135,000 135,000 135,000Preferred stock (9th series Type 4) ......................... 67,500 135,000 135,000 135,000 135,000Preferred stock (10th series Type 4) ....................... 67,500 135,000 135,000 135,000 135,000Preferred stock (11th series Type 4) ....................... 67,500 135,000 135,000 135,000 135,000Preferred stock (12th series Type 4) ....................... 67,500 135,000 135,000 135,000 135,000Preferred stock (1st series Type 6) .......................... 88,500 88,500 88,500 88,500 88,500
Net income .................................................................. 53.82 118.43 9,134.13 46,326.41 6,836.35Net income — diluted ................................................... — — 9,133.76 41,973.46 6,737.46
Notes: 1. All SMFG employees are on secondment assignment from SMBC, etc. 2. From the fiscal year ended March 31, 2007, in calculating total net assets and total assets, SMFG has applied “Accounting Standard for Presentation
of Net Assets in the Balance Sheet” (ASBJ Statement No. 5) and “Guidance on Accounting Standard for Presentation of Net Assets in the Balance Sheet” (ASBJ Guidance No. 8).
3. The ASBJ has revised “Guidance on Accounting Standard for Earnings per Share” (ASBJ Guidance No. 4). From the fiscal year ended March 31, 2007, SMFG has applied the revised Guidance and calculated net assets per share by including net deferred gains (losses) on hedges.
4. SMFG implemented a 100-for-1 stock split of common stock on January 4, 2009. If the stock split had been implemented in the prior years, per share information would be as follows:
YenYear ended March 31 2008 2007 2006Net assets ............................................................................................................................. ¥3,394.55 ¥3,423.83 ¥3,302.06Dividends:
Common stock ................................................................................................................. 120 70 30Net income ........................................................................................................................... 91.34 463.26 68.36Net income — diluted ........................................................................................................... 91.34 419.73 67.37

SMFG 2010 23
l Consolidated
Millions of yenYear ended March 31 2010 2009 2008 2007 2006For the Year:
Total income ................................................................. ¥ 2,597,675 ¥ 2,991,839 ¥ 3,417,611 ¥ 2,971,693 ¥ 2,789,433Total expenses ............................................................. 2,039,296 2,941,009 2,691,606 2,220,971 1,903,374Net income (loss) ......................................................... 332,497 (317,306) 351,820 401,795 563,584
At Year-End:Total net assets ............................................................ ¥ 6,894,564 ¥ 4,518,647 ¥ 5,080,747 ¥ 5,412,458 ¥ 3,598,294Total assets .................................................................. 120,041,369 115,849,385 108,637,791 98,570,638 104,418,597Risk-monitored loans ................................................... 1,498,271 1,561,824 1,073,471 1,047,566 1,219,383Reserve for possible loan losses ................................. 1,007,160 1,011,845 848,031 860,799 1,006,223Net unrealized gains (losses) on other securities ........ 523,444 (59,758) 754,456 1,852,971 1,337,192Number of employees .................................................. 47,837 37,345 36,085 31,718 32,918
Selected Ratios:Capital ratio .................................................................. 16.68% 13.54% 12.19% 12.95% 10.77%Return on Equity .......................................................... 8.64% —% 9.56% 12.95% 30.15%
Per Share (Yen):Net assets .................................................................... ¥49,036.12 ¥41,492.54 ¥60,442.81 ¥67,823.69 ¥41,444.83Net income (loss) ......................................................... 4,240.20 (5,740.34) 6,132.91 7,072.09 9,864.54Net income — diluted ................................................... 4,236.01 — 6,132.75 7,012.46 9,827.19
Notes: 1. “Net unrealized gains (losses) on other securities” represent the difference between the market prices and acquisition costs (or amortized costs) of “other securities.” In principle, the values of stocks are calculated using the average market prices during the final month.
2. “Number of employees” has been reported on the basis of full-time workers. “Number of employees” includes locally hired overseas staff members but excludes contract employees and temporary staff.
3. From the fiscal year ended March 31, 2007, in calculating total net assets and total assets, SMBC has applied “Accounting Standard for Presentation of Net Assets in the Balance Sheet” (ASBJ Statement No. 5) and “Guidance on Accounting Standard for Presentation of Net Assets in the Balance Sheet” (ASBJ Guidance No. 8).
4. The ASBJ has revised “Guidance on Accounting Standard for Earnings per Share” (ASBJ Guidance No. 4). From the fiscal year ended March 31, 2007, SMBC has applied the revised Guidance and calculated net assets per share by including net deferred gains (losses) on hedges.
5. From the fiscal year ended March 31, 2007 (fiscal 2006), the consolidated capital ratio has been calculated according to the formula specified in the FSA Notification No. 19 issued in fiscal 2006, which is based on Article 14-2 of the Banking Act of Japan. The consolidated capital ratio of SMBC is calculated under Basel II. Please note that in fiscal 2005, the capital ratio was calculated according to the formula specified in the Ministry of Finance Notification No. 55 issued in fiscal 1993, which was based on Article 14-2 of the Banking Act of Japan.
6. “Net income — diluted” per share for the fiscal year ended March 31, 2009 is not reported due to a net loss.
Sumitomo Mitsui Banking Corporation

SMFG 201024
Millions of yenYear ended March 31 2010 2009 2008 2007 2006For the Year:
Total income ................................................................. ¥ 2,087,777 ¥ 2,548,073 ¥ 2,944,677 ¥ 2,492,577 ¥ 2,322,699Total expenses ............................................................. 1,633,026 2,520,286 2,437,222 1,905,648 1,576,026Net income (loss) ......................................................... 317,995 (301,116) 205,742 315,740 519,520(Appendix)
Gross banking profit (A) ........................................... 1,455,275 1,524,856 1,484,783 1,344,490 1,552,033Banking profit ........................................................... 778,589 747,647 819,691 782,330 810,593 Banking profit (before provision for general reserve for possible loan losses) ........................... 769,522 823,377 819,691 740,601 965,573 Expenses (excluding nonrecurring losses) (B) ........ 685,752 701,479 665,091 603,888 586,459
At Year-End:Total net assets ............................................................ ¥ 5,397,949 ¥ 2,546,493 ¥ 3,493,249 ¥ 3,992,884 ¥ 3,634,776Total assets .................................................................. 103,536,394 107,478,218 100,033,020 91,537,228 97,443,428Deposits ....................................................................... 77,630,639 76,905,708 69,382,834 68,809,338 68,222,167Loans and bills discounted ........................................... 56,619,058 60,241,266 56,957,813 53,756,440 51,857,559Securities ..................................................................... 28,536,200 28,000,515 22,758,241 20,060,873 25,202,541Risk-monitored loans ................................................... 1,068,017 1,137,058 770,587 721,064 914,173 Problem assets based on the Financial Reconstruction Law .................................... 1,100,685 1,194,170 803,939 738,667 960,095Reserve for possible loan losses ................................. 758,178 791,885 620,004 677,573 816,437 Net unrealized gains (losses) on other securities ........ 521,377 (42,701) 755,749 1,832,891 1,316,206Trust assets and liabilities ............................................ 1,403,236 1,262,993 1,175,711 1,174,396 1,305,915
Loans and bills discounted ...................................... 221,970 222,030 223,740 5,350 7,870Securities ................................................................. 457,585 392,812 273,504 267,110 238,205
Capital stock ................................................................. 1,770,996 664,986 664,986 664,986 664,986Number of shares issued (in thousands)
Preferred stock .................................................... 70 70 70 70 900Common stock .................................................... 106,248 56,355 56,355 56,355 55,212
Number of employees .................................................. 22,460 21,816 17,886 16,407 16,050Selected Ratios:
Capital ratio .................................................................. 18.28% 13.85% 12.67% 13.45% 11.35%Return on Equity .......................................................... 8.28% —% 5.64% 10.13% 26.57%Dividend payout ratio ................................................... 48.06% —% 41.99% 13.89% 63.02%Overhead ratio (B) / (A) ................................................ 47.1% 46.0% 44.8% 44.9% 37.8%
Per Share (Yen):Net assets .................................................................... ¥48,799.31 ¥41,404.62 ¥58,204.22 ¥67,124.90 ¥42,105.57Dividends:
Common stock ......................................................... 1,620 1,638 1,487 763 5,714Preferred stock (Type 1) .......................................... / / / / 10,500Preferred stock (Type 2) .......................................... / / / / 28,500Preferred stock (Type 3) .......................................... / / / / 13,700Preferred stock (1st series Type 6) .......................... 88,500 88,500 88,500 88,500 88,500
Net income (loss) ......................................................... 4,051.75 (5,453.06) 3,540.84 5,533.69 9,066.46Net income — diluted ................................................... — — — 5,487.21 9,050.63
Notes: 1. Please refer to page 161 for the definitions of risk-monitored loans and problem assets based on the Financial Reconstruction Law. 2. “Net unrealized gains (losses) on other securities” represent the difference between the market prices and acquisition costs (or amortized costs) of
“other securities.” The values of stocks are calculated using the average market prices during the final month. For details, please refer to page 31. 3. “Number of employees” has been reported on the basis of full-time workers. “Number of employees” includes locally hired overseas staff members
but excludes contract employees, temporary staff, and executive officers who are not also Board members. 4. From the fiscal year ended March 31, 2007, in calculating total net assets and total assets, SMBC has applied “Accounting Standard for Presentation
of Net Assets in the Balance Sheet” (ASBJ Statement No. 5) and “Guidance on Accounting Standard for Presentation of Net Assets in the Balance Sheet” (ASBJ Guidance No. 8).
5. The ASBJ has revised “Guidance on Accounting Standard for Earnings per Share” (ASBJ Guidance No. 4). From the fiscal year ended March 31, 2007, SMBC has applied the revised Guidance and calculated net assets per share by including net deferred gains (losses) on hedges.
6. From the fiscal year ended March 31, 2007 (fiscal 2006), the nonconsolidated capital ratio has been calculated according to the formula specified in the FSA Notification No. 19 issued in fiscal 2006, which is based on Article 14-2 of the Banking Act of Japan. The nonconsolidated capital ratio of SMBC is calculated under Basel II. Please note that in fiscal 2005, the capital ratio was calculated according to the formula specified in the Ministry of Finance Notification No. 55 issued in fiscal 1993, which was based on Article 14-2 of the Banking Act of Japan.
7. “Net income — diluted” per share for the fiscal years ended March 31, 2008 and after is not reported because no potentially dilutive shares have been issued.
l Nonconsolidated

SMFG 2010 25
Financial Review
Operating results for fiscal 2009 include the results of 307 consolidated subsidiaries and 58 subsidiaries and affiliates accounted for by the equity method.
Gross profit increased ¥70.7 billion year on year, to ¥2,236.6 billion. The principal reasons for this increase were 1) an increase in net interest income in SMBC’s international operations as a result of a decline in U.S. interest rates and an improvement in net interest margins, and 2) an increase
in net fees and commissions resulting from the acquisition of Nikko Cordial Securities. After adjusting for general and administrative expenses, credit cost, net losses on stocks, equity in losses of affiliates, and other items, ordinary profit increased ¥513.4 billion year on year, to ¥558.7 billion. The main factors were decreases in both credit cost and losses on devaluation of stocks resulting from the recovery in stock prices.
March 31 2010 (A) 2009 (B)Increase (decrease)
(A) – (B)Consolidated subsidiaries .............................................................................................. 307 288 19Subsidiaries and affiliates accounted for by the equity method ..................................... 58 79 (21)
Number of Consolidated Subsidiaries, and Subsidiaries and Affiliates Accounted for by the Equity Method
1. Operating Results
The following is a summary of SMFG’s consolidated financial results for the fiscal year ended March 31, 2010.
Sumitomo Mitsui Financial Group (Consolidated)
Sumitomo Mitsui Financial Group, Inc. and Subsidiaries
Millions of yen
Year ended March 31 2010 (A) 2009 (B)Increase (decrease)
(A) – (B)Consolidated gross profit ............................................................................................... ¥2,236,634 ¥2,165,880 ¥ 70,754
Net interest income .................................................................................................... 1,380,912 1,338,453 42,459Trust fees ................................................................................................................... 1,778 2,122 (344)Net fees and commissions......................................................................................... 608,616 557,178 51,438Net trading income..................................................................................................... 194,087 211,738 (17,651)Net other operating income ....................................................................................... 51,238 56,386 (5,148)
General and administrative expenses ........................................................................... (1,161,302) (1,063,419) (97,883)Credit cost (A) ................................................................................................................ (473,937) (769,484) 295,547
Write-off of loans ........................................................................................................ (176,672) (302,353) 125,681Provision for specific reserve for possible loan losses .............................................. (184,257) (297,400) 113,143Provision for general reserve for possible loan losses .............................................. (17,944) (104,145) 86,201Others ........................................................................................................................ (95,063) (65,585) (29,478)
Net gains (losses) on stocks .......................................................................................... (10,078) (183,677) 173,599Equity in earnings (losses) of affiliates .......................................................................... (21,542) (94,876) 73,334Net other income (expenses) ........................................................................................ (11,003) (9,111) (1,892)Ordinary profit ................................................................................................................ 558,769 45,311 513,458Extraordinary gains (losses) .......................................................................................... (671) (15,815) 15,144
Losses on impairment of fixed assets ........................................................................ (12,856) (7,363) (5,493)Gains on recoveries of written-off claims (B) ............................................................. 968 1,708 (740)
Income before income taxes and minority interests ...................................................... 558,097 29,495 528,602Income taxes:
Current ...................................................................................................................... (104,110) (72,238) (31,872)Deferred ..................................................................................................................... (74,759) (262,405) 187,646
Minority interests in net income .................................................................................... (107,668) (68,308) (39,360)Net income (loss) ........................................................................................................... ¥ 271,559 ¥ (373,456) ¥645,015Total credit cost (A) + (B) ............................................................................................... ¥ (472,968) ¥ (767,775) ¥294,807[Reference]Consolidated banking profit (Billions of yen) ................................................................. ¥ 832.3 ¥ 728.7 ¥ 103.6
Notes: 1. Consolidated gross profit = (Interest income – Interest expenses) + Trust fees + (Fees and commissions – Fees and commissions payments) + (Trading income – Trading losses) + (Other operating income – Other operating expenses)
2. Consolidated banking profit = SMBC’s nonconsolidated banking profit (before provision for general reserve for possible loan losses) + SMFG’s ordinary profit + Other subsidiaries’ ordinary profit (excluding nonrecurring factors) + Equity method affiliates’ ordinary profit ✕ Ownership ratio – Internal transactions (dividends, etc.)
Income Summary

SMFG 201026
After adjusting ordinary profit for extraordinary gains and losses, income taxes, and other items, net income was ¥271.5 billion, a year-on-year increase of ¥645.0 billion from the previous fiscal year’s net loss.
Deposits (excluding negotiable certificates of deposit) at the end of the fiscal year under review rose ¥3,079.0 billion in comparison with March 31, 2009, to ¥78,648.5 billion, and negotiable certificates of deposit decreased ¥465.6
billion, to ¥6,995.6 billion. Meanwhile, loans and bills discounted decreased ¥2,434.2
billion year on year, to ¥62,701.0 billion, and the balance of securities decreased ¥74.1 billion, to ¥28,623.9 billion.
Net assets amounted to ¥7,000.8 billion, and, of this total, stockholders’ equity was ¥4,644.6 billion, due to issuance of new shares and an increase in retained earnings from record-ing of net income.
Millions of yen
March 31 2010 (A) 2009 (B)Increase (decrease)
(A) – (B)Assets ............................................................................................................................ ¥123,159,513 ¥119,637,224 ¥3,522,289
Securities ................................................................................................................... 28,623,968 28,698,164 (74,196)Loans and bills discounted ........................................................................................ 62,701,033 65,135,319 (2,434,286)
Liabilities ........................................................................................................................ 116,158,708 115,025,460 1,133,248Deposits ..................................................................................................................... 78,648,595 75,569,497 3,079,098Negotiable certificates of deposit ............................................................................... 6,995,619 7,461,284 (465,665)
Net assets ...................................................................................................................... 7,000,805 4,611,764 2,389,041
Assets, Liabilities and Net Assets
Net unrealized gains on securities as of March 31, 2010 amounted to ¥645.0 billion, an increase of ¥651.7 billion from the previous fiscal year-end, reflecting an increase in the value of equities and other factors. Of this total, net
unrealized gains on other securities including “other money held in trust” — which are directly debited to net assets — totaled ¥586.4 billion, an increase of ¥619.9 billion from the losses of the previous term.
2. Unrealized Gains (Losses) on Securities
Millions of yen2010 2009
March 31Net unrealized
gains (losses) (A) (A) – (B)Unrealized
gainsUnrealized
lossesNet unrealized
gains (losses) (B)Unrealized
gainsUnrealized
lossesHeld-to-maturity securities .................. ¥ 58,610 ¥ 31,869 ¥ 59,344 ¥ 734 ¥26,741 ¥ 28,155 ¥ 1,414Other securities .................................. 586,414 619,590 799,355 212,941 (33,176) 356,834 390,011
Stocks ............................................. 410,984 403,922 543,745 132,761 7,062 287,380 280,317Bonds.............................................. 123,658 126,484 131,821 8,163 (2,826) 21,534 24,360Others ............................................. 51,771 89,183 123,788 72,017 (37,412) 47,920 85,332
Other money held in trust ................... 62 324 157 95 (262) — 262Total .................................................... 645,087 651,784 858,858 213,770 (6,697) 384,990 391,688
Stocks ............................................. 410,984 403,922 543,745 132,761 7,062 287,380 280,317Bonds.............................................. 182,369 157,950 191,162 8,793 24,419 49,690 25,270Others ............................................. 51,733 89,913 123,950 72,216 (38,180) 47,920 86,100
Notes: 1. The figures above include unrealized gains (losses) on negotiable certificates of deposit in “Cash and due from banks” and “Deposits with banks” and beneficiary claims on loan trusts in “Monetary claims bought,” etc.
2. Unrealized gains (losses) on stocks (including foreign stocks) are mainly calculated using the average market price during the final month of the respective reporting period. The rest of the securities are valuated at the market price as of the balance sheet date.
3. “Other securities” and “Other money held in trust” are valuated and recorded on the consolidated balance sheet at market prices. The figures in the table above indicate the differences between the acquisition costs (or amortized costs) and the balance sheet amounts. Among net unrealized gains (losses) on other securities as of March 31, 2010, ¥105 million that is recognized in the fiscal year's earnings by apply-ing fair value hedge accounting is not included in net assets.
4. Floating-rate Japanese government bonds which SMFG held as “Other securities” are carried on the consolidated balance sheet at their reasonably estimated amounts in accordance with the “Practical Solution on Measurement of Fair Value for Financial Assets” (ASBJ Practical Issues Task Force No. 25).
5. “Accounting Standard for Financial Instruments” (ASBJ Statement No. 10, partially revised on March 10, 2008) and “Implementation Guidance on Disclosures about Fair Value of Financial Instruments” (ASBJ Guidance No. 19, issued on March 10, 2008) became effective from the fiscal year ending on and after March 31, 2010. SMFG has applied them from the fiscal year ended March 31, 2010. As a result of this accounting change, compared with the former accounting method, “Monetary claims bought” increased by ¥8,710 million, “Securities” increased by ¥41,914 million, “Net unrealized gains (losses) on other securities” increased by ¥39,315 million, “Deferred tax assets” related to net unrealized gains (losses) on other securities decreased by ¥27,056 million, and “Reserve for possible loan losses” decreased by ¥34,999 million.
Unrealized Gains (Losses) on Securities
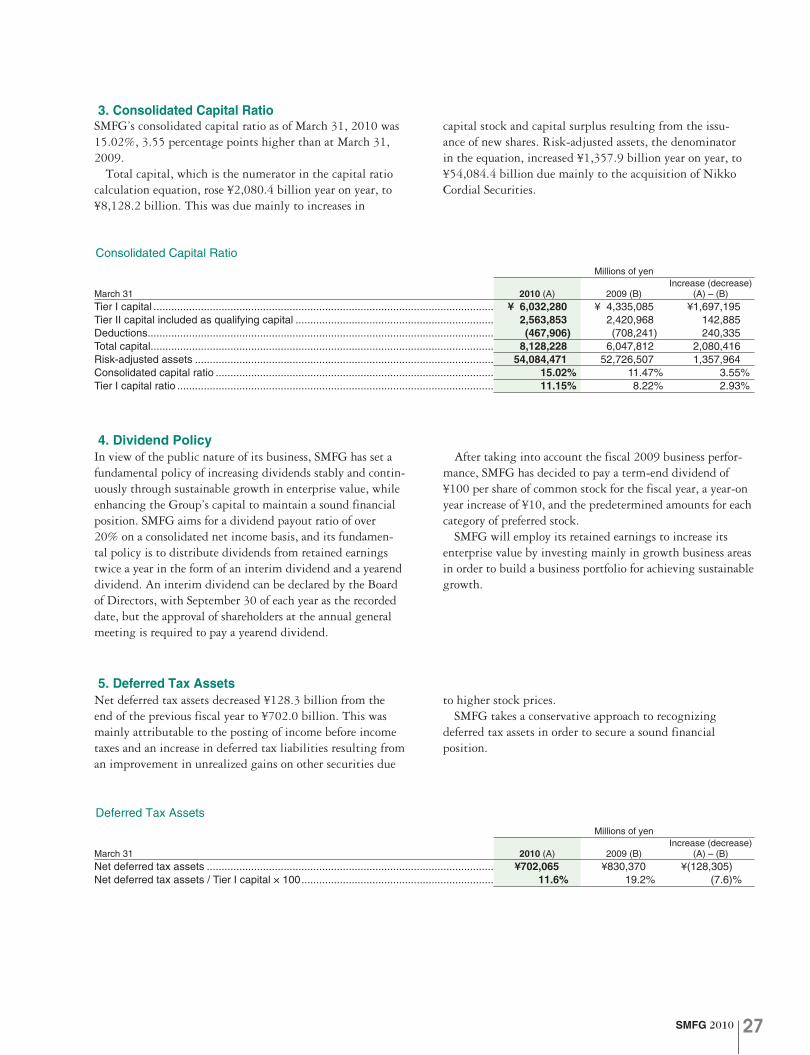
SMFG 2010 27
Millions of yen
March 31 2010 (A) 2009 (B)Increase (decrease)
(A) – (B)Tier I capital ................................................................................................................... ¥ 6,032,280 ¥ 4,335,085 ¥1,697,195Tier II capital included as qualifying capital ................................................................... 2,563,853 2,420,968 142,885Deductions ..................................................................................................................... (467,906) (708,241) 240,335Total capital .................................................................................................................... 8,128,228 6,047,812 2,080,416Risk-adjusted assets ..................................................................................................... 54,084,471 52,726,507 1,357,964Consolidated capital ratio .............................................................................................. 15.02% 11.47% 3.55%Tier I capital ratio ........................................................................................................... 11.15% 8.22% 2.93%
Consolidated Capital Ratio
SMFG’s consolidated capital ratio as of March 31, 2010 was 15.02%, 3.55 percentage points higher than at March 31, 2009.
Total capital, which is the numerator in the capital ratio calculation equation, rose ¥2,080.4 billion year on year, to ¥8,128.2 billion. This was due mainly to increases in
capital stock and capital surplus resulting from the issu-ance of new shares. Risk-adjusted assets, the denominator in the equation, increased ¥1,357.9 billion year on year, to ¥54,084.4 billion due mainly to the acquisition of Nikko Cordial Securities.
In view of the public nature of its business, SMFG has set a fundamental policy of increasing dividends stably and contin-uously through sustainable growth in enterprise value, while enhancing the Group’s capital to maintain a sound financial position. SMFG aims for a dividend payout ratio of over 20% on a consolidated net income basis, and its fundamen-tal policy is to distribute dividends from retained earnings twice a year in the form of an interim dividend and a yearend dividend. An interim dividend can be declared by the Board of Directors, with September 30 of each year as the recorded date, but the approval of shareholders at the annual general meeting is required to pay a yearend dividend.
After taking into account the fiscal 2009 business perfor-mance, SMFG has decided to pay a term-end dividend of ¥100 per share of common stock for the fiscal year, a year-on year increase of ¥10, and the predetermined amounts for each category of preferred stock.
SMFG will employ its retained earnings to increase its enterprise value by investing mainly in growth business areas in order to build a business portfolio for achieving sustainable growth.
4. Dividend Policy
5. Deferred Tax Assets
3. Consolidated Capital Ratio
Millions of yen
March 31 2010 (A) 2009 (B)Increase (decrease)
(A) – (B)Net deferred tax assets ................................................................................................. ¥702,065 ¥830,370 ¥(128,305)Net deferred tax assets / Tier I capital × 100 ................................................................. 11.6% 19.2% (7.6)%
Deferred Tax Assets
Net deferred tax assets decreased ¥128.3 billion from the end of the previous fiscal year to ¥702.0 billion. This was mainly attributable to the posting of income before income taxes and an increase in deferred tax liabilities resulting from an improvement in unrealized gains on other securities due
to higher stock prices. SMFG takes a conservative approach to recognizing
deferred tax assets in order to secure a sound financial position.

SMFG 201028
Gross banking profit in fiscal 2009 decreased ¥69.5 bil-lion from the previous fiscal year, to ¥1,455.2 billion, and expenses (excluding nonrecurring losses) declined ¥15.7 billion, to ¥685.7 billion. As a result, banking profit (before provision for general reserve for possible loan losses) decreased ¥53.8 billion, to ¥769.5 billion.
Ordinary profit — banking profit (before provision for general reserve for possible loan losses) adjusted for non-recurring items such as total credit cost and net gains on stocks — increased ¥426.6 billion, to ¥462.7 billion.
After adjustment of ordinary profit for extraordinary losses and income taxes, SMBC posted net income of ¥317.9 bil-lion, a year-on-year increase of ¥619.1 billion.
Gross Banking ProfitGross banking profit decreased ¥69.5 billion year on year, to ¥1,455.2 billion. This was due mainly to a decrease in foreign exchange-related gains resulting from the economic slowdown. This factor more than offset the higher net trad-ing income.
ExpensesExpenses (excluding nonrecurring losses) decreased ¥15.7 bil-lion to ¥685.7 billion, due mainly to more restrained opera-tions in light of the severe overall business environment.
Banking ProfitBanking profit (before provision for general reserve for pos-sible loan losses) decreased ¥53.8 billion from the previous fiscal year, to ¥769.5 billion.
2. Income Analysis1. Operating Results
Millions of yen
Year ended March 31 2010 (A) 2009 (B)Increase (decrease)
(A) – (B)Gross banking profit ...................................................................................................... ¥1,455,275 ¥1,524,856 ¥(69,581)
[Gross domestic banking profit] ................................................................................. [1,117,224] [1,147,202] [(29,978)][Gross international banking profit] ............................................................................ [338,050] [377,654] [(39,604)]Net interest income .................................................................................................... 1,046,382 1,018,389 27,993Trust fees ................................................................................................................... 1,736 2,074 (338)Net fees and commissions......................................................................................... 286,714 293,824 (7,110)Net trading income..................................................................................................... 115,356 175,038 (59,682)Net other operating income ....................................................................................... 5,085 35,530 (30,445)[Gross banking profit (excluding gains (losses) on bonds)] ....................................... [1,418,005] [1,498,728] [(80,723)]
Expenses (excluding nonrecurring losses) .................................................................... (685,752) (701,479) 15,727Personnel expenses .................................................................................................. (245,728) (236,966) (8,762)Nonpersonnel expenses ............................................................................................ (403,265) (426,231) 22,966Taxes ......................................................................................................................... (36,759) (38,282) 1,523
Banking profit (before provision for general reserve for possible loan losses) ... 769,522 823,377 (53,855)[Banking profit (before provision for general reserve for possible loan losses and gains (losses) on bonds)] ................................................ [732,252] [797,248] [(64,996)]
Provision for general reserve for possible loan losses .................................................. 9,067 (75,730) 84,797Banking profit ................................................................................................................. 778,589 747,647 30,942
Banking Profit
Billions of yen
Year ended March 31, 2010Consumer
Banking UnitMiddle MarketBanking Unit
Corporate Banking Unit
InternationalBanking Unit
TreasuryUnit Others Total
Banking profit (before provision for general reserve for possible loan losses) ................. ¥103.0 ¥254.2 ¥164.0 ¥114.6 ¥256.5 ¥(122.8) ¥769.5Year-on-year increase (decrease) .............................. (4.6) (39.7) 19.5 30.6 29.9 (89.6) (53.9)
Notes: 1. Year-on-year comparisons are those used for internal reporting and exclude changes due to interest rate and foreign exchange rate fluctuations. 2. “Others” consist of (1) financing costs on preferred securities and subordinated debt, (2) profit earned on investing the Bank’s own capital, and
(3) adjustment of inter-unit transactions, etc.
Banking Profit by Business Unit<Reference>
The following is a summary of SMBC’s nonconsolidated financial results for the fiscal year ended March 31, 2010.
Sumitomo Mitsui Banking Corporation (Nonconsolidated)
Sumitomo Mitsui Banking Corporation

SMFG 2010 29
Millions of yen
Year ended March 31 2010 (A) 2009 (B)Increase (decrease)
(A) – (B)Banking profit (before provision for general reserve for possible loan losses) .............. ¥ 769,522 ¥ 823,377 ¥ (53,855)Provision for general reserve for possible loan losses (A) ............................................ 9,067 (75,730) 84,797Banking profit ................................................................................................................. 778,589 747,647 30,942Nonrecurring gains (losses) ........................................................................................... (315,839) (711,591) 395,752
Credit cost (B) ............................................................................................................ (263,805) (474,358) 210,553Net gains (losses) on stocks ...................................................................................... 3,857 (220,429) 224,286
Gains on sale of stocks .......................................................................................... 56,719 7,066 49,653Losses on sale of stocks ........................................................................................ (886) (4,348) 3,462Losses on devaluation of stocks ............................................................................ (51,975) (223,147) 171,172
Others ........................................................................................................................ (55,892) (16,803) (39,089)Ordinary profit ................................................................................................................ 462,749 36,055 426,694Extraordinary gains (losses) .......................................................................................... (7,999) (8,269) 270
Gains (losses) on disposal of fixed assets ................................................................. 2,448 (2,139) 4,587Losses on impairment of fixed assets ........................................................................ (10,525) (6,138) (4,387)Gains on recoveries of written-off claims (C) ............................................................. 77 8 69
Income taxes:Current ....................................................................................................................... (44,997) (23,748) (21,249)Deferred ..................................................................................................................... (91,757) (305,154) 213,397
Net income (loss) ........................................................................................................... ¥ 317,995 ¥(301,116) ¥619,111
Total credit cost (A) + (B) + (C) ...................................................................................... ¥(254,660) ¥(550,079) ¥295,419Provision for general reserve for possible loan losses .............................................. 9,067 (75,730) 84,797Write-off of loans ........................................................................................................ (102,663) (231,412) 128,749Provision for specific reserve for possible loan losses .............................................. (92,114) (182,346) 90,232Losses on sales of delinquent loans .......................................................................... (69,259) (60,182) (9,077)Provision for loan loss reserve for specific overseas countries ................................. 232 (417) 649Gains on recoveries of written-off claims ................................................................... 77 8 69
Ordinary Profit and Net Income (Loss)
Nonrecurring Losses (Credit Cost, etc.)Nonrecurring losses amounted to ¥315.8 billion, an improve-ment of ¥395.7 billion from the previous fiscal year. The main factor was a decrease of ¥210.5 billion in credit cost, to ¥263.8 billion, due to the effects of the government’s economic stimu-lus package and SMBC’s business improvement and other measures tailored to each customer’s individual circumstances. In addition, SMBC recorded net gain on stocks of ¥3.8 billion versus net losses on stocks of ¥220.4 billion in the previous fis-cal year, an improvement of ¥224.2 billion, owing to gains on sale of stocks and a decrease in losses on devaluation of stocks due to the market’s recovery.
Total credit cost — the sum of credit cost recorded under “Nonrecurring losses,” provision for general reserve for possible loan losses, and gains on recoveries of written-off claims — amounted to ¥254.6 billion, a year-on-year decrease of ¥295.4 billion.
Ordinary ProfitAs a result of the foregoing, ordinary profit totaled ¥462.7 bil-lion, ¥426.6 billion higher than in the previous fiscal year.
Extraordinary Gains (Losses)Extraordinary losses amounted to ¥7.9 billion, a decrease of ¥0.2 billion from the previous year.
Net IncomeCurrent income taxes amounted to ¥44.9 billion, and deferred income taxes were ¥91.7 billion. As a result, net income increased ¥619.1 billion to ¥317.9 billion year on year.

SMFG 201030
AssetsIn spite of efforts to ensure a smooth supply of funds to our customers, SMBC’s assets as of March 31, 2010 decreased ¥3,941.8 billion from the previous fiscal year-end, to a total of ¥103,536.3 billion. This was due mainly to a ¥3,622.2 billion year on year decrease in loans and bills discounted, due to the weak borrowing demand in Japan and SMBC’s conservative stance on asset operations overseas.
LiabilitiesLiabilities as of March 31, 2010 amounted to ¥98,138.4 billion, a decrease of ¥6,793.2 billion from the previous fis-cal year-end. This is mainly due to a decrease of ¥4,153.7 billion in payables under securities lending transactions con-ducted as part of overall funding activities, and the amount declined in line with the decrease in assets.
Net AssetsNet assets at fiscal year-end amounted to ¥5,397.9 billion. Of this total, stockholders’ equity amounted to ¥4,949.0 billion, consisting of ¥1,770.9 billion in capital stock, ¥2,473.5 bil-lion in capital surplus (including ¥702.5 billion in other capi-tal surplus), and ¥704.4 billion in retained earnings.
Valuation and translation adjustments were ¥448.9 billion, comprising ¥379.3 billion in net unrealized gains on other securities, ¥48.0 billion in net deferred gains on hedges, and ¥21.5 billion in land revaluation excess.
3. Assets, Liabilities and Net Assets
Millions of yen
March 31 2010 (A) 2009 (B)Increase (decrease)
(A) – (B)Assets ............................................................................................................................ ¥103,536,394 ¥107,478,218 ¥(3,941,824)
Securities ................................................................................................................... 28,536,200 28,000,515 535,685Loans and bills discounted ........................................................................................ 56,619,058 60,241,266 (3,622,208)
Liabilities ........................................................................................................................ 98,138,445 104,931,725 (6,793,280)Deposits ..................................................................................................................... 70,457,266 69,499,997 957,269Negotiable certificates of deposit ............................................................................... 7,173,373 7,405,710 (232,337)
Net assets ...................................................................................................................... 5,397,949 2,546,493 2,851,456
Assets, Liabilities and Net Assets

SMFG 2010 31
Net unrealized gains on securities as of March 31, 2010 amounted to ¥565.8 billion versus net unrealized losses of ¥18.6 billion in the previous fiscal year-end, an increase of ¥584.5 billion, due mainly to improvements in stocks and
bonds. Net unrealized gains on other securities, including “other money held in trust,” which is directly debited to net assets, increased by ¥564.4 billion from the previous year’s losses, to ¥521.4 billion.
4. Unrealized Gains (Losses) on Securities
Millions of yen2010 2009
March 31Net unrealized
gains (losses) (A) (A) – (B)Unrealized
gainsUnrealized
lossesNet unrealized
gains (losses) (B)Unrealized
gainsUnrealized
lossesHeld-to-maturity securities .................. ¥ 57,903 ¥ 30,052 ¥ 58,530 ¥ 626 ¥27,851 ¥ 28,155 ¥ 304Stocks of subsidiaries and affiliates .... (13,471) (9,935) — 13,471 (3,536) — 3,536Other securities .................................. 521,377 564,078 738,870 217,493 (42,701) 337,535 380,237
Stocks ............................................. 371,459 388,004 518,132 146,672 (16,545) 273,058 289,604Bonds.............................................. 116,145 117,386 123,064 6,918 (1,241) 16,910 18,152Others ............................................. 33,772 58,686 97,674 63,901 (24,914) 47,566 72,480
Other money held in trust ................... 62 324 157 95 (262) — 262Total .................................................... 565,872 584,521 797,558 231,686 (18,649) 365,691 384,341
Stocks ............................................. 365,979 386,061 518,132 152,153 (20,082) 273,058 293,140Bonds.............................................. 174,049 147,440 181,594 7,545 26,609 45,066 18,456Others ............................................. 25,843 51,019 97,831 71,987 (25,176) 47,566 72,743
Notes: 1. The figures above include unrealized gains (losses) on negotiable certificates of deposit in “Cash and due from banks” and “Deposits with banks” and beneficiary claims on loan trusts in “Monetary claims bought,” etc.
2. Unrealized gains (losses) on stocks (excluding stocks of subsidiaries and affiliates) (including foreign stocks) are calculated using the average market price during the final month of the respective reporting period. The rest of the securities are valuated at the market price as of the balance sheet date.
3. “Other securities” and “Other money held in trust” are valuated and recorded on the balance sheet at market prices. The figures in the table above indicate the differences between the acquisition costs (or amortized costs) and the balance sheet amounts. Among net unrealized gains (losses) on other securities as of March 31, 2010, ¥105 million that is recognized in the fiscal year's earnings by apply-ing fair value hedge accounting is not included in net assets.
4. Floating-rate Japanese government bonds which SMBC held as “Other securities” are carried on the balance sheet at their reasonably estimated amounts in accordance with the “Practical Solution on Measurement of Fair Value of Financial Assets” (ASBJ Practical Issues Task Force No. 25).
5. “Accounting Standard for Financial Instruments” (ASBJ Statement No. 10, partially revised on March 10, 2008) became effective from the fiscal year ending on and after March 31, 2010. SMBC has applied them from the fiscal year ended March 31, 2010. As a result of this accounting change, compared with the former accounting method, “Monetary claims bought” increased by ¥8,710 million, Bonds in “Securities” increased by ¥46,708 million, Stocks in “Securities” increased by ¥1,217 million, “Net unrealized gains (losses) on other securities” increased by ¥39,714 million, Other securities in “Securities” decreased by ¥604 million, “Deferred tax assets” related to Net unrealized gains (losses) on other securities decreased by ¥27,178 million, and “Reserve for possible loan losses” decreased by ¥29,909 million.
Unrealized Gains (Losses) on Securities

SMFG 201032
Sub-prime Related Products
Products Other Than Sub-prime Related (Excludes GSE etc.)
Government Sponsored Enterprises etc.
As of March 31, 2010, the Group held ¥0.1 billion in sub-prime related securitized products and ¥16.5 billion other than sub-prime related products after write-offs and provisions. Those figures exclude Government Sponsored
Enterprises (“GSE”) etc. The amount of loss on securitized products for the fiscal year ended March 31, 2010 was ¥0.2 billion for sub-prime related products and no amount of loss for other than sub-prime related products.
1. Securitized Products
The figures contained in this section have been compiled on a managerial accounting basis.
Exposure of Securitized Products (Sumitomo Mitsui Financial Group (Consolidated))
(Billions of yen)
(Billions of yen)
March 31, 2010 March 31, 2009 Ratings ofunderlyingassets, etc.
Balances (after provisionsand write-offs)
Net unrealized gains/losses
(after write-offs)
Balances(after provisionsand write-offs)
Net unrealizedgains/losses
(after write-offs)Overseas OverseasChange from
Mar. 31, 2009Change fromMar. 31, 2009
Change fromMar. 31, 2009
Cards ¥ — ¥ (4.1) ¥ — ¥ (4.1) ¥ — ¥0.4 ¥ 4.1 ¥ 4.1 ¥(0.4)CLO 2.9 (2.2) 2.9 (2.2) 0.5 1.6 5.1 5.1 (1.1)Senior 2.8 (2.2) 2.8 (2.2) (0.2) 0.9 5.0 5.0 (1.1) AAA~AAEquity 0.1 (0.0) 0.1 (0.0) 0.7 0.7 0.1 0.1 — No ratings
CMBS 13.6 (7.2) — — 0.0 0.2 20.8 — (0.2) AAA~BBBInvestments to securitized products 16.5 (13.5) 2.9 (6.3) 0.5 2.2 30.0 9.2 (1.7)Warehousing Loans, etc. — (6.6) — (6.6) — — 6.6 6.6 —
Total ¥16.5 ¥(20.1) ¥2.9 ¥(12.9) ¥0.5 ¥2.2 ¥36.6 ¥15.8 ¥(1.7)Notes: 1. “Senior” means the upper tranche under senior-subordinate structure. 2. Warehousing loans are loans made based on collateral consisting of securitized investment products held by a special-purpose company estab-
lished for the purpose of securitization. 3. Credit ratings are in principle indicated by the lower of Standard & Poor’s (“S&P”) ratings and Moody’s Investors Service (“Moody’s”) ratings. Notation
of credit ratings follows the notation system of S&P. 4. There is no amount of RMBS (excludes GSE etc.) and ABCP. 5. Excludes GSE and SMBC’s exposure to subordinated beneficiaries owned through the securitization of SMBC’s loan receivables (see below).
(Billions of yen)
<Reference 1>
March 31, 2010 March 31, 2009 Ratings ofunderlyingassets, etc.
Balances (after provisionsand write-offs)
Net unrealized gains/losses
(after write-offs)
Balances(after provisionsand write-offs)
Net unrealizedgains/losses
(after write-offs)Overseas OverseasChange from
Mar. 31, 2009Change fromMar. 31, 2009
Change fromMar. 31, 2009
Investments to securitized products ¥0.1 ¥(0.2) ¥0.1 ¥(0.2) ¥0.0 ¥0.0 ¥0.3 ¥0.3 ¥ — Speculative ratings
Total ¥0.1 ¥(0.2) ¥0.1 ¥(0.2) ¥0.0 ¥0.0 ¥0.3 ¥0.3 ¥ —
March 31, 2010 March 31, 2009
Ratings, etc.Balances Net unrealized
gains/losses Balances Net unrealizedgains/lossesOverseas OverseasChange from
Mar. 31, 2009Change fromMar. 31, 2009
Change fromMar. 31, 2009
GSE etc. ¥35.9 ¥(239.3) ¥35.9 ¥(239.3) ¥0.2 ¥(2.9) ¥275.2 ¥275.2 ¥3.1 AAANotes: 1. GSE etc. includes GNMA, FNMA and FHLMC. Besides RMBS, SMFG held bonds issued by GSEs (FNMA, FHLMC and Federal Home Loan Banks) of
¥142.1 billion. 2. Credit ratings are in principle indicated by the lower of S&P ratings and Moody’s ratings. Notation of credit ratings follows the notation system of S&P. 3. The amount of gains on sales related to GSE etc. in the fiscal year ended March 31, 2010 was ¥3.1 billion.
<Reference 2>
(Billions of yen)
March 31, 2010 March 31, 2009
Balances Reserve for
possible loanlosses
BalancesReserve for
possible loanlosses
Overseas OverseasChange fromMar. 31, 2009
Sub-primerelated
Sub-primerelated
Receivables of residential mortgage loans ¥248.8 ¥(2.0) ¥ — ¥ — ¥ — ¥250.8 ¥ — ¥ — ¥ —Receivables of loans to corporations 7.8 0.7 — — 3.0 7.1 — — 1.5
Total ¥256.6 ¥(1.3) ¥ — ¥ — ¥3.0 ¥257.9 ¥ — ¥ — ¥1.5Notes: 1. No subsidiary other than SMBC has those subordinated beneficiaries mentioned above. 2. Reserves do not include general reserve for possible loan losses for normal borrowers.
Subordinated Beneficiaries in Securitization of SMBC’s Loans

SMFG 2010 33
2. Transactions with Monoline Insurance CompaniesCredit Derivatives (Credit Default Swap [“CDS”]) Transactions with Monoline Insurance Companies
Loans and Investments Guaranteed by Monoline Insurance Companies, etc.
(Billions of yen)
(Billions of yen)
March 31, 2010 March 31, 2009
ExposureReserve for
possible loanlosses
ExposureReserve for
possible loanlosses
Change fromMar. 31, 2009
Loans and investments guaranteed orinsured by monoline insurance companies ¥9.5 ¥(2.8) ¥0.0 ¥12.3 ¥0.0
Reference: In addition, we had ¥0.7 billion in commitment contracts (fully-drawn) to insurance companies with monoline insurance as group members.
March 31, 2010 March 31, 2009 March 31, 2010 March 31, 2009
Netexposure
Reserve forpossible loan
losses
Netexposure
Reserve forpossible loan
losses
Amount ofreference
assets
Amount ofreference
assetsChange fromMar. 31, 2009
Change fromMar. 31, 2009
Exposure to CDS transactions with monoline insurance companies ¥48.5 ¥(83.5) ¥13.6 ¥132.0 ¥5.0 ¥503.1 ¥(33.6) ¥536.7
(Billions of yen)
(Billions of yen)
Types of reference assets
March 31, 2010 March 31, 2009 Support for programs
Notional amount ofreference
assets
Reserve forpossible
loan losses
Notional amount ofreference
assets
Reserve forpossible
loan losses
Liquiditysupport
CreditsupportOverseas OverseasChange from
Mar. 31, 2009Change fromMar. 31, 2009
Claims on corporations ¥467.8 ¥(192.1) ¥105.1 ¥(107.2) ¥ — ¥659.9 ¥212.3 ¥ — Yes YesClaims on financial institutions 17.7 (2.0) 17.7 (2.0) — 19.7 19.7 — Yes YesRetail loan claims 15.8 (12.6) 15.8 (12.6) — 28.4 28.4 — Yes YesOther claims — (0.6) — (0.6) — 0.6 0.6 — Yes Yes
Total ¥501.3 ¥(207.3) ¥138.6 ¥(122.4) ¥ — ¥708.6 ¥261.0 ¥ —Note: Reserves do not include general reserve for possible loan losses for normal borrowers.
Reference: In addition, we provide liquidity and credit supports for ABCP programs which are sponsored by other banks.Total notional amount of reference assets of such programs is approximately ¥52 billion.
3. Leveraged Loans
4. Asset Backed Commercial Paper (ABCP) Programs as Sponsor
5. OthersWe have no securities issued by structured investment vehicles.
March 31, 2010 March 31, 2009
Loans Undrawncommitments
Reserve forpossible loan
lossesLoans Undrawn
commitments
Reserve forpossible loan
lossesChange fromMar. 31, 2009
Change fromMar. 31, 2009
Europe ¥261.1 ¥ (44.9) ¥ 28.8 ¥ (5.4) ¥ 6.2 ¥306.0 ¥ 34.2 ¥ 2.8Japan 176.2 (3.7) 11.8 (17.4) 12.7 179.9 29.2 13.4United States 113.2 (65.8) 73.5 3.5 12.2 179.0 70.0 4.1Asia (excluding Japan) 59.6 (19.2) 9.4 5.5 2.3 78.8 3.9 2.3
Total ¥610.1 ¥(133.6) ¥123.5 ¥(13.8) ¥33.4 ¥743.7 ¥137.3 ¥22.6Notes: 1. Above figures include the amount to be sold of approximately ¥10 billion.
In the fiscal year ended March 31, 2010, we sold leveraged loans of approximately ¥51 billion, and loss on the sale amounted to approximately ¥12 billion.
2. Above figures do not include leveraged loans which are included in underlying assets of “1. Securitized Products.” 3. Reserves do not include general reserve for possible loan losses for normal borrowers.

SMFG 201034
Risk Management
Basic ApproachAs risks in the financial services increase in diversity and com-
plexity, risk management—identifying, measuring, and controlling
risk—has never been more important in the management of a
financial holding company.
SMFG has encapsulated the basic principles to be employed
in risk management in the manual entitled Regulations on Risk
Management. In the manual, we have specified the basic poli-
cies for risk management: 1) Set forth SMFG’s Groupwide basic
policies for risk management after specifying the categories of
risk to which these policies apply; 2) Provide all necessary guid-
ance to Group companies to enable them to follow the basic
risk management policies set forth by SMFG and set up their
own appropriate risk management systems; and 3) Monitor the
implementation of risk management by all Group companies to
ensure that their practices meet the relevant standards.
(1) Types of Risk to Be ManagedAt SMFG, we classify risk into the following categories:
(1) credit risk, (2) market risk, (3) liquidity risk and (4) operational
risk (including processing risk and system risk). In addition, we
provide individually tailored guidance to help Group companies
identify categories of risk that need to be addressed. Risk cat-
egories are constantly reviewed, and new categories may be
added in response to changes in the operating environment.
The Corporate Risk Management Department works with the
Corporate Planning Department to comprehensively and sys-
tematically manage all these categories of risk across the entire
Group.
(2) Fundamental Principles and Basic Policies for Risk Management
SMFG’s Groupwide basic policies for risk management stipulate
the fundamental principles for risk management that must be
followed, and spell out risk management procedures from various
perspectives. These include managing risk on a consolidated
accounting basis, managing risk using quantification methods,
ensuring consistency with business strategies, setting up a sys-
tem of checks and balances, contingency planning for emergen-
cies and serious situations, and verifying preparedness to handle
all conceivable risk situations. In addition, there are specific
operational policies for implementing appropriate management
of risk by all Group companies.
Under SMFG’s Groupwide basic policies for risk manage-
ment, all Group companies periodically carry out reviews of the
basic management policies for each risk category, or whenever
deemed necessary, thus ensuring that the policies followed at
any time are the most appropriate. The management of SMFG
constantly monitors the conduct of risk management at Group
companies, providing guidance when necessary.
Risk Management SystemTop management plays an active role in determining SMFG’s
Groupwide basic policies for risk management. The system
works as follows: The basic policies for risk management are
determined by the Management Committee before being autho-
rized by the Board. The Management Committee, the designated
board members, and the relevant risk management departments
perform risk management according to the basic policies.
■SMFG’s Risk Management System
SMFG
SMBC
SMFGCard & Credit
SMBCFriend
Securities
SumitomoMitsui Card
CedynaFinancial
Sumitomo MitsuiFinance & Leasing
JapanResearchInstitute
Management Committee
Corporate RiskManagementDept.
Designated Board Members
Board of Directors
Corporate Auditors
External Audit
Internal Audit Unit
Board of Directors
Guidance for drafting of basic policies
Monitoring
Report
Corporate Planning Dept./Corporate Risk
Management Dept.Corporate Planning Dept./
Corporate Risk Management Dept.
Other Risks
Corporate Auditors
External Audit
Audit Dept.
Corporate-wideRisk Management
Bank-wideRisk Management
Credit & InvestmentPlanning Dept.
Operations Planning Dept.
IT Planning Dept.
Other Departments
Management Committee
Credit Risk Management Committee
Market Risk Management Committee
Designated Board Members Board Member in Charge of Risk Management Unit
General Affairs Dept.
IT Planning Dept.
Settle-ment Risk
System Risk
Operational Risk
Processing Risk
Liquidity Risk
Credit Risk
Corporate Risk ManagementDept.
Risk Manage-ment Unit
Market Risk
Credit Risk
Market Risk
Liquidity Risk
Processing Risk
System Risk
Operational Risk

SMFG 2010 35
■ Risk Management Framework
Liquidity Risk
Other Risks
Framework Risk Category
(Settlement Risk and Others)
ALM/Funding Gap
Managementby Risk Type
Credit Risk
Banking Risk/Trading Risk
Strategic Equity Investment Risk
Other Market-Related RisksRisk
Capital-Based Management
MarketRisk
Processing Risk
System Risk
Operational Risk
Liquidity risk is the risk that there may be difficulties in raising funds needed for settlements, as a result of the mismatching of uses of funds and sources of funds or unexpected outflows of funds, which may make it necessary to raise funds at higher rates than normal levels.
—
Credit risk is the possibility of a loss arising from a credit event, such as deterioration in the financial condition of a borrower, that causes an asset (including off-balance sheet transactions) to lose value or become worthless.
Market risk is the possibility that fluctuations in interest rates, foreign exchange rates, stock prices, or other market prices will change the market value of financial products, leading to a loss.
Processing risk is the possibility of losses arising from negligent processing by employees, accidents, or unauthorized activities.
System risk is the possibility of a loss arising from the failure, malfunction, or unauthorized use of computer systems.
Operational risk is the possibility of losses arising from inadequate or failed internal processes, people, and systems or from external events.
Risk management systems are in place at the individual
Group companies in accordance with SMFG’s Groupwide basic
policies for risk management. For example, at SMBC, specific
departments have been appointed to oversee the handling of
the four risk categories listed above, in addition to risks asso-
ciated with settlement. Each risk category is managed taking
into account the particular characteristics of that category. In
addition, the Risk Management Unit has been established—
independent of the business units—and the risk management
framework has been strengthened by consolidating the functions
for managing major risks—credit, market, liquidity and opera-
tional—into the Risk Management Unit and enhancing our across-
the-board risk monitoring ability. A board member is assigned to
oversee the Risk Management Unit comprising the Corporate
Risk Management Department and Credit & Investment Planning
Department. The Corporate Risk Management Department—the
unit’s planning department—comprehensively and systematically
manages all categories of risk in cooperation with the Corporate
Planning Department. Moreover, the Internal Audit Unit—
independent of all business units—conducts periodic audits to
ensure that the management system is functioning properly.
Furthermore, under our system top management plays an
active role in the approval of basic policies for risk management.
The decision-making process for addressing credit, market, and
liquidity risk at the operating level is strengthened by the Credit
Risk Management Committee and the Market Risk Management
Committee, which are subcommittees of the Management
Committee. The Management Committee is also attended by the
relevant department heads.
Risk Capital-Based Management(1) FrameworkIn order to maintain a balance between risk and return as well
as ensure the soundness of the Group from an overall perspec-
tive, we employ the risk capital-based management method.
We measure “risk capital” based on value at risk (VaR), etc.
as a uniform basic measure of credit, market, and operational
risk, taking account of the special characteristics of each type
of risk and the business activities of each Group company. We
then allocate capital appropriately and effectively to each unit
to keep total exposure to various risks within the scope of our
resources, i.e., capital. In this framework, risk capital includes
credit concentration risk and interest rate risk in the banking book
which are taken into account under the Second Pillar of Basel II.
In addition, we conduct risk capital-based management activities
on a consolidated basis, including each Group company.
Liquidity risk is managed within the context of cash-flow
plans and funding gap. Other risk categories are managed with
procedures closely attuned to the nature of the risk, as described
in the following paragraphs.
(2) Risk Capital LimitIn the case of credit and market risk, we set maximum risk capital
limits, which indicate the maximum risk that may be taken during
the period, taking account the level of stress stipulated in busi-
ness plans. In addition, for operational risk, we also allocate risk
capital, and, for the Group as a whole, we set total risk capital
allocations within SMFG’s capital. In the case of credit and market

SMFG 201036
risk, risk capital limits are sub-divided into guidelines or ceil-
ings for each business including VaR and loss limits. Therefore,
by strictly observing the VaR and loss limits, and other factors,
SMFG maintains the soundness of the Group as a whole.
Implementation of Basel IIThe Basel Capital Accord, an international agreement for ensur-
ing the soundness of banks through adherence to BIS capital
adequacy regulations, was revised in response to the diversifica-
tion of the banking business and the increasing sophistication of
risk management technology. The revised BIS regulations, known
as Basel II, became effective from March 31, 2007 in Japan.
Basel II requires banks to implement internal controls to serve
as the basis for capital calculation, and to strengthen their risk
management framework. It also requires disclosure of information
to encourage market discipline in risk management.
We have been implementing initiatives to strengthen our risk
management framework, taking into account Basel II and other
considerations. We introduced the advanced internal ratings-
based (IRB) approach for credit risk on March 31, 2009, and the
Advanced Measurement Approach (AMA) for operational risk on
March 31, 2008.
Details of the initiatives are provided below, and detailed
information on the capital ratio is provided in the discussion on
Capital Ratio Information appearing in the Financial Section and
Corporate Data.
Credit Risk1. Basic Approach to Credit Risk Management(1) Definition of Credit RiskCredit risk is the possibility of a loss arising from a credit event,
such as deterioration in the financial condition of a borrower, that
causes an asset (including off-balance sheet transactions) to
lose value or become worthless.
Overseas credits also include an element of country risk,
which is closely related to credit risk. This is the risk of loss
caused by changes in foreign exchange, or political or economic
situations.
(2) Fundamental Principles for Credit Risk ManagementAll Group companies follow the fundamental principles
established by SMFG to assess and manage credit risk on a
Groupwide basis and further raise the level of accuracy and
comprehensiveness of Groupwide credit risk management.
Each Group company must comprehensively manage credit risk
according to the nature of its business, and assess and manage
credit risk of individual loans and credit portfolios quantitatively
and using consistent standards.
Credit risk is the most significant risk to which SMFG is
exposed. Without effective credit risk management, the impact of
the corresponding losses on operations can be overwhelming.
The purpose of credit risk management is to keep credit risk
exposure to a permissible level relative to capital, to maintain
the soundness of Groupwide assets, and to ensure returns com-
mensurate with risk. This leads to a loan portfolio that achieves
high returns on capital and assets.
(3) Credit PolicySMBC’s credit policy comprises clearly stated universal and
basic operating concepts, policies, and standards for credit
operations, in accordance with the business mission and rules
of conduct.
SMBC is promoting the understanding of and strict adher-
ence to its credit policy among all its managers and employees.
By conducting risk-sensitive credit management, SMBC aims
to enhance shareholder value and play a key part in society by
providing high-value-added financial services.
2. Credit Risk Management SystemAt SMBC, the Credit & Investment Planning Department within
the Risk Management Unit is responsible for the comprehensive
management of credit risk. This department drafts and admin-
isters credit policies, the internal rating system, credit authority
guidelines, and credit application guidelines, and manages non-
performing loans (NPLs) and other aspects of credit portfolio
management. The department also cooperates with the
Corporate Risk Management Department in quantifying credit
risk (risk capital and risk-weighted assets) and controls the
bank’s entire credit risk. Further, the Credit Portfolio Management
Department within the Credit & Investment Planning Department
has been strengthening its active portfolio management function
whereby loan securitization and other market transactions are
used to stabilize the portfolio’s credit risk for a more sophisticated
portfolio.
The Corporate Research Department within the Corporate
Services Unit performs research on industries as well as
investigates the business situations of borrower enterprises to
detect early signs of problems or growth potential. The Credit
Administration Department is responsible for handling NPLs of
borrowers classified as potentially bankrupt or lower, and draws
up plans for their workouts, including write-offs, and corporate
rehabilitation. The department closely liaises with the Group
company SMBC Servicer Co., Ltd., which engages in related
services, and works to efficiently reduce the amount of NPLs by
such means as the sell-off of claims.
The credit departments within each business unit conduct
credit risk management along with branches, for loans handled
by their units and manage their units’ portfolios. The credit limits
they use are based on the baseline amounts established for each
grading category, with particular attention paid to evaluating and
managing customers or loans perceived to have particularly high
credit risk.

SMFG 2010 37
Risk Management Unit
Investment Banking Unit
Business Units
Management Committee
Board of Directors
External Audit (Auditing Firm)
Corporate Auditors
CreditDept.
Domestic Structured Finance
Structured Finance Credit Dept.
International Banking Unit
Overseas Corporations
Structured Finance
Credit Dept., Americas Div.Credit Dept., Europe Div.
Asia Credit Dept.Credit Management Dept.
Corporate Banking Unit
Large Domestic Corporations
Credit Dept.
Middle Market Banking Unit
Small and Medium-Sized Enterprises
Credit Dept.I & II
Consumer Banking Unit
Credit for Individuals
Credit Dept.
Internal Audit Unit
Corporate Services Unit
•Audits self-assessments, grading (obligors and facilities), and effectiveness of write-offs and reserves
Credit Review Dept.
•Audits credit risk management
Internal Audit Dept.•Aggregates risk for comprehensive management•Plans and proposes risk quantification methods
Corporate Risk Management Dept.
•Industry trend research•Credit assessment of major industry players
Corporate Research Dept.
•Manages problem assets (plans, implements corporate rehabilitation program, sells off the revitalized company)
Credit Administration Dept.
•Aggregates credit risk for unified management
•Plans and proposes basic credit policies
•Drafts, administers, and examines internal rating system
Credit & Investment Planning Dept.
•Undertakes active portfolio managementCredit Portfolio Management Dept.
The Internal Audit Unit, operating independently of the busi-
ness units, audits asset quality, accuracy of gradings and self-
assessment, and state of credit risk management, and reports
the results directly to the Board of Directors and the Management
Committee.
SMBC has established the Credit Risk Committee, as a con-
sultative body, to round out its oversight system for undertaking
flexible and efficient control of credit risk, and ensuring the overall
soundness of the bank’s loan operations.
■ SMBC’s Credit Risk Management System
3. Credit Risk Management Methods(1) Credit Risk Assessment and QuantificationAt SMBC, to effectively manage the risk involved in individual
loans as well as the credit portfolio as a whole, we first acknowl-
edge that every loan entails credit risks, assess the credit risk
posed by each borrower and loan using an internal rating system,
and quantify that risk for control purposes.
(a) Internal Rating System
There is an internal rating system for each asset control category
set according to portfolio characteristics. For example, credits
to commercial and industrial (C&I) companies, individuals for
business purposes (domestic only), sovereigns, public-sector
entities, and financial institutions are assigned an “obligor grade,”
which indicates the borrower’s creditworthiness, and/or “facility
grade,” which indicates the collectibility of assets taking into
account transaction conditions such as guarantee/collateral,
and tenor. An obligor grade is determined by first assigning a
financial grade using a financial strength grading model and data
obtained from the obligor’s financial statements. The financial
grade is then adjusted taking into account the actual state of the
obligor’s balance sheet and qualitative factors to derive the obli-
gor grade. In the event that the borrower is domiciled overseas,
internal ratings for credit are made after taking into consideration
country rank, which represents an assessment of the credit qual-
ity of each country, based on its political and economic situation,
as well as its current account balance and external debt. Self-
assessment is the obligor grading process for assigning lower
grades, and the borrower categories used in self-assessment are
consistent with the obligor grade categories.
Obligor grades and facility grades are reviewed once a year,
and, whenever necessary, such as when there are changes in the
credit situation.
There are also grading systems for small and medium-sized
enterprises (SME) loans, loans to individuals, and project finance
and other structured finance tailored according to the risk

SMFG 201038
characteristics of these types of assets.
The Credit & Investment Planning Department centrally man-
ages the internal rating systems, and properly designs, operates,
supervises, and validates the grading models. It validates the
grading models (including statistical validation) of main assets
following the procedures manual once a year, to ensure their
effectiveness and suitability.
(b) Quantification of Credit Risk
Credit risk quantification refers to the process of estimating the
degree of credit risk of a portfolio or individual loan taking into
account not just the obligor’s probability of default (PD), but also
the concentration of risk in a specific customer or industry and
the loss impact of fluctuations in the value of collateral, such as
real estate and securities.
Specifically, first, the PD by grade, loss given default (LGD),
credit quality correlation among obligors, and other parameter
values are estimated using historical data of obligors and facili-
ties stored in a database to calculate the credit risk. Then, based
on these parameters, we run a simulation of simultaneous default
using the Monte Carlo method to calculate our maximum loss
exposure to the estimated amount of the maximum losses that
may be incurred. Based on these quantitative results, we allocate
risk capital.
Risk quantification is also executed for purposes such as
to determine the portfolio’s risk concentration, or to simulate
economic movements (stress tests), and the results are used for
making optimal decisions across the whole range of business
operations, including formulating business plans and provid-
ing a standard against which individual credit applications are
assessed.
(2) Framework for Managing Individual Loans(a) Credit Assessment
At SMBC, credit assessment of corporate loans involves a variety
of financial analyses, including cash flow, to predict an enter-
prise’s capability of loan repayment and its growth prospects.
These quantitative measures, when combined with qualitative
analyses of industrial trends, the enterprise’s R&D capabilities,
the competitiveness of its products or services, and its manage-
ment caliber, result in a comprehensive credit assessment. The
loan application is analyzed in terms of the intended utilization
of the funds and the repayment schedule. Thus, SMBC is able to
arrive at an accurate and fair credit decision based on an objec-
tive examination of all relevant factors.
Increasing the understandability to customers of loan condi-
tions and approval standards for specific borrowing purposes
and loan categories is a part of SMBC’s ongoing review of lend-
ing practices, which includes the revision of loan contract forms
with the chief aim of clarifying lending conditions utilizing financial
covenants.
SMBC is also making steady progress in rationalizing its
credit assessment process. To respond pro-
actively and promptly to customers’ funding
needs—particularly those of SMEs—we employ
a standardized credit risk assessment process
for SMEs that uses a credit-scoring model.
With this process, we are building a regime for
efficiently marketing our Business Select Loan
and other SME loans.
In the field of housing loans for individuals,
we employ a credit assessment model based
on credit data amassed and analyzed by SMBC
over many years. This model enables our loan
officers to efficiently make rational decisions on
housing loan applications, and to reply to the
customers without delay. It also facilitates the
effective management of credit risk, as well as
the flexible setting of interest rates.
We also provide loans to individuals who
rent out properties such as apartments. The
loan applications are subjected to a precise
credit risk assessment process utilizing a risk
assessment model that factors in the projected
revenue from the rental business. The process
J1
J2
J3
J4
J5
J6
J7
J8
J9
J10
G1
G2
G3
G4
G5
G6
G7
G8
G9
G10
Domestic (C&I), etc.
Overseas (C&I), etc.
Obligor Grade
(Domestic)
Normal Assets
Substandard Loans
Doubtful Assets
Bankrupt andQuasi-BankruptAssets
Financial Reconstruction Law Based Disclosure Category
Very high certainty of debt repayment
High certainty of debt repayment
Satisfactory certainty of debt repayment
Debt repayment is likely but this could change in cases of significant changes in economic trends or business environment
No problem with debt repayment over the short term, but not satisfactory over the mid to long term and the situation could change in cases of significant changes in economic trends or business environment
Currently no problem with debt repayment, but there are unstable business and financial factors that could lead to debt repayment problems
Close monitoring is required due to problems in meeting loan terms and conditions, sluggish/unstable business, or financial problems
(Of which Substandard Borrowers)
Currently not bankrupt, but experiencing business difficulties, making insufficient progress in restructuring, and highly likely to go bankrupt
Though not yet legally or formally bankrupt, has serious business difficulties and rehabilitation is unlikely; thus, effectively bankrupt
Legally or formally bankrupt
NormalBorrowers
Substandard Borrowers
Potentially Bankrupt Borrowers
Borrowers Requiring Caution
Effectively Bankrupt Borrowers
Bankrupt Borrowers
DefinitionBorrowerCategory
J7R G7R
■SMBC’s Obligor Grading System

SMFG 2010 39
Obligor Information Processing Flow of Obligor Grading/Grading Outlook/Credit Policies/Action Plans/Facility Grading Assignment
Not Flagged
Self-Assessment Logic
NormalBorrowers
BorrowersRequiringCaution
PotentiallyBankrupt
Borrowers
EffectivelyBankrupt
Borrowers
BankruptBorrowers
Grading Outlook Assessment
PerformanceTrends
QualitativeRisk
Factors
•Positive•Flat•Negative
Action Plan Formulation
Facility Grading Assignment
Determination ofCredit Policies
Policy for HandlingEach Individual
Company
Credit Policy Segment
Flagged
Registrationof FinancialStatements/Creation andRevision ofCorporate
Card
Nonconsoli-dated
Financial Grade
ConsolidatedFinancial
Grade
Effective Financial
Grade
FlaggingAccording to
Self-Assessment
CriteriaQuantitativeAssessment
FinancialAssessment
Credit Status
QualitativeAssessment
RestructuringFeasibility
FinalObligorGrade
BasicApproach
SpecificAction Plan
+
■SMBC’s Credit Monitoring System
is also used to provide advice to such customers on how to
revise their business plans.
(b) Credit Monitoring System
At SMBC, in addition to analyzing loans at the application stage,
the Credit Monitoring System is utilized to reassess obligor
grades and review self-assessment and credit policies so that
problems can be detected at an early stage, and quick and
effective action can be taken. The system includes periodic
monitoring carried out each time an obligor enterprise discloses
financial results, as well as continuous monitoring performed
each time credit conditions change, as indicated in the diagram
below.
(3) Framework for Credit Portfolio ManagementIn addition to managing individual loans, SMBC applies the
following basic policies to the management of the entire credit
portfolio to maintain and improve its soundness and profitability
over the mid to long term.
(a) Risk-Taking within the Scope of Capital
To keep credit risk exposure to a permissible level relative to
capital, SMBC sets credit risk capital limits for internal control
purposes. Under these limits, separate guidelines are issued for
each business unit and marketing unit, such as for real estate
finance, fund investment, and investment in securitization prod-
ucts. Regular monitoring is conducted to make sure that these
guidelines are being followed, thus ensuring appropriate overall
management of credit risk.
(b) Controlling Concentration Risk
Because the concentration of credit risk in an industry or corpo-
rate group has the potential to substantially impair capital, SMBC
implements measures to prevent the excessive concentration of
loans in an industry and to control large exposure to individual
companies or corporate groups by setting guidelines for maxi-
mum loan amounts.
To manage country risk, SMBC also has credit limit guidelines
based on each country’s creditworthiness.
(c) Researching Borrowers More Rigorously and Balancing Risk
and Returns
Against a backdrop of drastic change in the business environ-
ment, SMBC rigorously researches borrower companies’ actual
conditions. It runs credit operations on the basic principle
of earning returns that are commensurate with the credit risk
involved, and makes every effort to reduce credit and capital
costs as well as general and administrative expenses.
(d) Prevention and Reduction of Non-Performing Loans
On NPLs and potential NPLs, SMBC carries out regular loan
reviews to clarify handling policies and action plans, enabling it
to swiftly implement measures to prevent deterioration of borrow-
ers’ business situations, support business recoveries, collect on
loans, and enhance loan security.
(e) Toward Active Portfolio Management
SMBC makes active use of credit derivatives, loan asset sales,
and other instruments to proactively and flexibly manage its port-
folio to stabilize credit risk.

SMFG 201040
(4) Self-Assessment, Asset Write-Offs and Provisions, and Disclosure of Problem Assets
(a) Self-Assessment
SMBC conducts rigorous self-assessment of asset quality
using criteria based on the Financial Inspection Manual of the
Financial Services Agency and the Practical Guideline published
by the Japanese Institute of Certified Public Accountants. Self-
assessment is the latter stage of the obligor grading process for
determining the borrower’s ability to fulfill debt obligations, and
the obligor grade criteria are consistent with the categories used
in self-assessment.
At the same time, self-assessment is a preparatory task for
ensuring SMBC’s asset quality and calculating the appropri-
ate level of write-offs and provisions. Each asset is assessed
individually for its security and collectibility. Depending on the
borrower’s current situation, the borrower is assigned to one of
five categories: Normal Borrowers, Borrowers Requiring Caution,
Potentially Bankrupt Borrowers, Effectively Bankrupt Borrowers,
and Bankrupt Borrowers. Based on the borrower’s category,
claims on the borrower are classified into Classification I, II, III,
and IV assets according to their default and impairment risk lev-
els, taking into account such factors as collateral and guarantees.
As part of our efforts to bolster risk management throughout the
Group, our consolidated subsidiaries carry out self-assessment
in substantially the same manner.
Borrower Categories, Defined
Normal Borrowers Borrowers with good earnings performances and no significant financial problems
Borrowers Requiring Caution Borrowers identified for close monitoring
Potentially Bankrupt Borrowers Borrowers perceived to have a high risk of falling into bankruptcy
Effectively Bankrupt Borrowers Borrowers that may not have legally or formally declared bankruptcy but are essentially bankrupt
Bankrupt Borrowers Borrowers that have been legally or formally declared bankrupt
Asset Classifications, Defined
Classification I Assets not classified under Classifications II, III, or IV
Classification II Assets perceived to have an above-average risk of uncollectibility
Classification III Assets for which final collection or asset value is very doubtful and which pose a high risk of incurring a loss
Classification IV Assets assessed as uncollectible or worthless
(b) Asset Write-Offs and Provisions
In cases where claims have been determined to be uncollectible,
or deemed to be uncollectible, write-offs signify the recognition
of losses on the account books with respect to such claims.
Write-offs can be made either in the form of loss recognition by
offsetting uncollectible amounts against corresponding balance
sheet items, referred to as a direct write-off, or else by recog-
nition of a loan loss provision on a contra-asset account in the
amount deemed uncollectible, referred to as an indirect write-off.
Recognition of indirect write-offs is generally known as provision
for the reserve for possible loan losses.
SMBC’s write-off and provision criteria for each self-
assessment borrower category are shown in the table below.
As part of our overall measures to strengthen risk management
throughout the Group, all consolidated subsidiaries use substan-
tially the same standards as SMBC for write-offs and provisions.
Self-Assessment Borrower Categories Standards for Write-Offs and Provisions
Normal Borrowers The expected loss amount for the next 12 months is calculated for each grade based on the grade’s historical bankruptcy rate, and the total amount is recorded as “provision for the general reserve for possible loan losses.”
Borrowers Requiring Caution These assets are divided into groups according to the level of default risk. Amounts are recorded as provisions for the general reserve in proportion to the expected losses based on the historical bankruptcy rate of each group. The groups are “claims on Substandard Borrowers” and “claims on other Borrowers Requiring Caution.” The latter group is further subdivided according to the borrower’s financial position, credit situation, and other factors. Further, when cash flows can be estimated reasonably accurately, the discounted cash flow (DCF) method is applied mainly to large claims for calculating the provision amount.
Potentially Bankrupt Borrowers A provision for the specific reserve for possible loan losses is made for the portion of Classification III assets (calculated for each borrower) not secured by collateral, guarantee, or other means. Further, when cash flows can be estimated reasonably accurately, the DCF method is applied mainly to large claims for calculating the provision amount.
Effectively Bankrupt/ Bankrupt Borrowers
Classification III asset and Classification IV asset amounts for each borrower are calculated, and the full amount of Classification IV assets (deemed to be uncollectible or of no value) is written off in principle and provision for the specific reserve is made for the full amount of Classification III assets.
Notes
General reserve Provisions made in accordance with general inherent default risk of loans, unrelated to specific individual loans or other claims
Specific reserve Provisions made for claims that have been found uncollectible in part or in total (individually evaluated claims)
Discounted Cash Flow Method
SMBC uses the discounted cash flow (DCF) method to cal-culate the provision amounts for large claims on Substandard Borrowers and Potentially Bankrupt Borrowers when the cash flow from repayment of principal and interest received can be estimated reasonably accurately. SMBC then makes provisions equivalent to the excess of the book value of the claims over the said cash inflow discounted by the initial contractual interest rate or the effective interest rate at the time of origination. One of the major advantages of the DCF method over conventional methods of calculating the provision amount is that it enables effective evaluation of each individual borrower. However, as the provision amount depends on the future cash flow estimated on the basis of the borrower’s business reconstruction plan and the DCF formula input values, such as the discount rate and the probability of the borrower going into bankruptcy, SMBC makes every effort to utilize up-to-date and correct data to realize the most accurate estimates possible.

SMFG 2010 41
(c) Disclosure of Problem Assets
Problem assets are loans and other claims of which recovery of
either principal or interest appears doubtful, and are disclosed
in accordance with the Banking Law (in which they are referred
to as “risk-monitored loans”) and the Financial Reconstruction
Law (where they are referred to as “problem assets”). Problem
assets are classified based on the borrower categories assigned
during self-assessment. For detailed information on results of
self-assessments, asset write-offs and provisions, and disclosure
of problem assets at March 31, 2010, please refer to page 162.
4. Market Credit Risk ManagementFinancial products, such as investments in funds, securitized
products, and credit derivatives, that bear indirect risk arising
from underlying assets such as bonds and loan obligations, are
considered to be exposed to both credit risk from the underlying
assets as well as “market risk” and “liquidity risk” that arise from
their trading as financial products. This is referred to as market
credit risk.
For these types of products, we manage credit risk using the
methods of analysis and assessment in detail of characteristics
of underlying assets, but, for the sake of complete risk manage-
ment, we also apply the methods for management of market and
liquidity risks.
In addition, we have established guidelines based on the
characteristics of these types of risk and appropriately manage
the risk of losses.
Market and Liquidity Risks1. Basic Approach to Market and Liquidity Risk
Management(1) Definitions of Market and Liquidity RisksMarket risk is the possibility that fluctuations in interest rates,
foreign exchange rates, stock prices, or other market prices will
change the market value of financial products, leading to a loss.
Liquidity risk is the risk that there may be difficulties in raising
funds needed for settlements, as a result of the mismatching
of uses of funds and sources of funds or unexpected outflows
of funds, which may make it necessary to raise funds at higher
rates than normal levels.
(2) Fundamental Principles for Market and Liquidity Risk Management
SMFG is working to further enhance the effectiveness of its quan-
titative management of market and liquidity risks across the entire
Group by setting allowable risk limits; ensuring the transparency
of the risk management process; clearly separating front-office,
middle-office and back-office operations; and establishing a
control system of mutual checks and balances.
2. Market and Liquidity Risk Management SystemOn the basis of SMFG’s Groupwide basic policies for risk
management, SMBC’s Board of Directors authorizes important
matters relating to the management of market and liquidity risks,
such as basic policies and risk limits, which are decided by the
Management Committee. Additionally, at SMBC, the Corporate
Risk Management Department, which is the planning department
of the Risk Management Unit, an independent of the business
units that directly handle market transactions, manages mar-
ket and liquidity risks in an integrated manner. The Corporate
Risk Management Department not only monitors the current
risk situations, but also reports regularly to the Management
Committee and the Board of Directors. Furthermore, SMBC’s
ALM Committee meets on a monthly basis to examine reports on
the state of observance of SMBC’s limits on market and liquidity
risks, and to review and discuss the SMBC’s ALM operation.
To prevent unforeseen processing errors as well as fraudulent
transactions, it is important to establish a system of checks on
the business units (front office). At SMBC, both the processing
Management CommitteeMarket Risk Management Committee
ALM Committee
Board Member in Charge ofRisk Management Unit
Policy Reporting
Back Office(Back offices of Japan and overseas branches)
Other market-relatedoperations
Front Office
Market operations (Treasury Unit)
Market operations (International Banking Unit)
(Group companies)
Front/Middle/Back Offices
Market operations
Managing Depts.
Middle Office (Corporate Risk Management Dept.)
LiquidityRisk
Manage-ment
MarketRisk
Manage-ment
Board of Directors
Inspection and verificationof transactions
Final approval and Management of Model, new products and risk limits
CorporateAuditors
ExternalAudit
(auditing firm)
InternalAudit Dept.
■ SMBC’s Market Risk and Liquidity Risk Management System

SMFG 201042
departments (back office) and the administrative departments
(middle office) conduct the checks. In addition, the Internal Audit
Unit of SMBC periodically performs comprehensive internal
audits to verify that the risk management framework is functioning
properly.
3. Market and Liquidity Risk Management Methods(1) Market Risk ManagementSMBC manages market risk by setting maximum limits for VaR
and maximum loss. These limits are set within the “market risk
capital limit” which is determined taking into account the bank’s
shareholders’ equity and other principal indicators of the bank’s
financial position and management resources.
Market risk can be divided into various factors: foreign
exchange rates, interest rates, equity prices and option risks.
SMBC manages each of these risk categories by employing the
VaR method as well as supplemental indicators suitable for man-
aging the risk of each risk factor, such as the BPV.
Please note that, in the case of interest rate fluctuation risk,
the methods for recognizing the dates for maturity of demand
deposits (current accounts and ordinary deposit accounts that
can be withdrawn at any time) and the method for estimating
the time of cancellation prior to maturity of time deposits and
consumer loans differ substantially. At SMBC, the maturity of
demand deposits that are expected to be left with the bank for
a prolonged period is regarded to be five years (2.5 years on
average). The cancellation prior to maturity of time deposits and
consumer loans is estimated based on historical data.
(a) VaR Results
The results of VaR calculations for fiscal 2009 are shown in the
table below. SMBC’s internal VaR model makes use of historical
data to prepare scenarios for market fluctuations and, by con-
ducting simulations of gains and losses, the model estimates
the maximum losses that may occur (this is known as the his-
torical simulation method). This internal SMBC model is evaluated
periodically by an independent auditing firm to assess its
appropriateness and accuracy.
(b) Back-Testing Results
The relationship between the VaR calculated with the model and
the actual profit and loss data is back-tested daily. The back-
testing results for SMBC’s trading accounts for fiscal 2009
are shown at the top of the next page. A data point below the
diagonal line indicates a loss in excess of the predicted VaR for
that day; however, as in fiscal 2008, there were no such excess
losses during fiscal 2009. This demonstrates that the SMBC VaR
model, with a one-sided confidence interval of 99.0%, is suf-
ficiently reliable.
Glossary1. VaR (Value at risk) The largest predicted loss that is possible given a fixed confidence interval. For example, VaR indicates, for a hold-ing period of one day and a confidence interval of 99.0%, the maximum loss that may occur as a result of market fluc-tuations in one day with a probability of 1%.
2. BPV (Basis point value) The amount of change in assessed value as a result of a one basis point (0.01%) movement in interest rates.
3. Trading A market operation for generating profit by taking advan-tage of short-term fluctuations in market values and differ-ences in value among markets.
4. Banking A market operation for generating profit through manage-ment of interest rates, terms, and other aspects of assets (loans, bonds, etc.) and liabilities (deposits, etc.).
June 2009
Sept. 2009
Dec. 2009
Mar. 2010
Trading Book Banking Book
Maximum
Minimum
Average
Trading Book Banking Book Trading Book
SMFG (consolidated) SMBC (consolidated) SMBC (nonconsolidated)
Banking Book
(Billions of yen)
Note: VaR for a one-day holding period with a one-sided confidence interval of 99.0% [computed daily using the historical simulation method (based on four years of historical observations)]. Principal consolidated subsidiaries are included and specific risks for the trading book are excluded.
2.7
2.0
1.7
1.5
42.2
43.7
33.3
33.8
2.8
1.2
1.6
44.0
31.8
37.7
2.7
2.0
1.7
1.5
40.3
42.1
32.0
32.8
2.8
1.2
1.6
42.4
30.9
36.2
36.7
38.6
28.4
28.9
2.5
0.8
1.3
39.0
27.1
32.5
2.3
1.6
1.4
1.2
■VaR Results
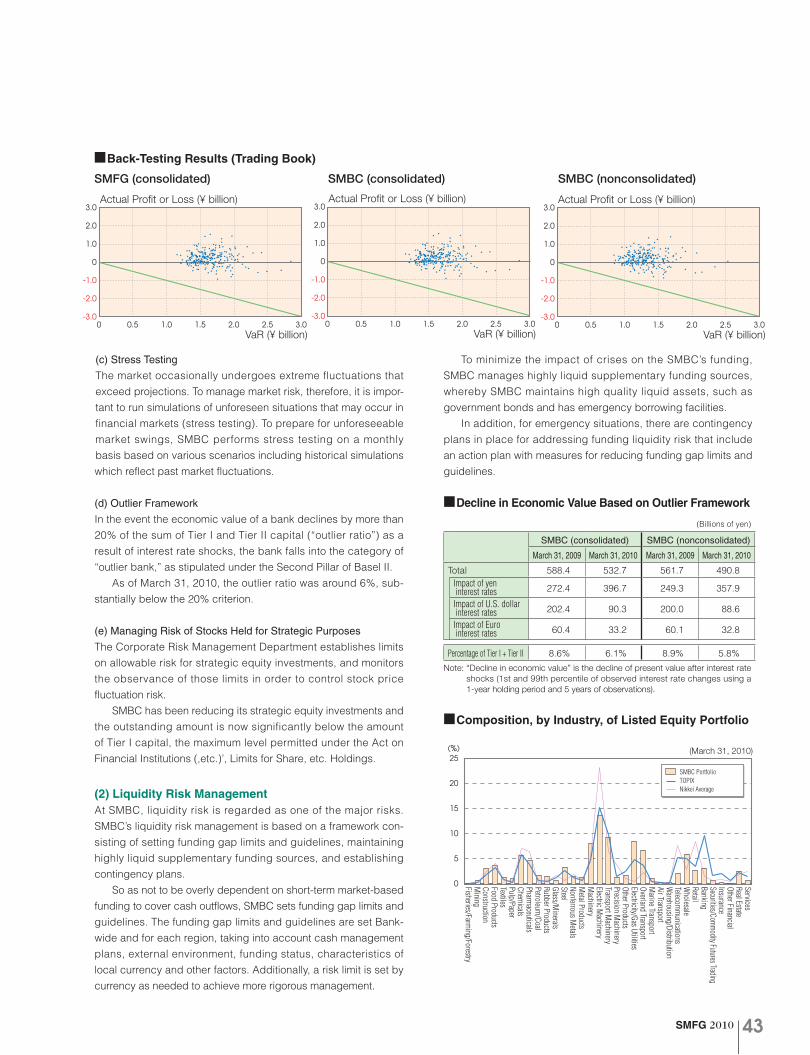
SMFG 2010 43
(c) Stress Testing
The market occasionally undergoes extreme fluctuations that
exceed projections. To manage market risk, therefore, it is impor-
tant to run simulations of unforeseen situations that may occur in
financial markets (stress testing). To prepare for unforeseeable
market swings, SMBC performs stress testing on a monthly
basis based on various scenarios including historical simulations
which reflect past market fluctuations.
(d) Outlier Framework
In the event the economic value of a bank declines by more than
20% of the sum of Tier I and Tier II capital (“outlier ratio”) as a
result of interest rate shocks, the bank falls into the category of
“outlier bank,” as stipulated under the Second Pillar of Basel II.
As of March 31, 2010, the outlier ratio was around 6%, sub-
stantially below the 20% criterion.
(e) Managing Risk of Stocks Held for Strategic Purposes
The Corporate Risk Management Department establishes limits
on allowable risk for strategic equity investments, and monitors
the observance of those limits in order to control stock price
fluctuation risk.
SMBC has been reducing its strategic equity investments and
the outstanding amount is now significantly below the amount
of Tier I capital, the maximum level permitted under the Act on
Financial Institutions (,etc.)’, Limits for Share, etc. Holdings.
(2) Liquidity Risk ManagementAt SMBC, liquidity risk is regarded as one of the major risks.
SMBC’s liquidity risk management is based on a framework con-
sisting of setting funding gap limits and guidelines, maintaining
highly liquid supplementary funding sources, and establishing
contingency plans.
So as not to be overly dependent on short-term market-based
funding to cover cash outflows, SMBC sets funding gap limits and
guidelines. The funding gap limits and guidelines are set Bank-
wide and for each region, taking into account cash management
plans, external environment, funding status, characteristics of
local currency and other factors. Additionally, a risk limit is set by
currency as needed to achieve more rigorous management.
To minimize the impact of crises on the SMBC’s funding,
SMBC manages highly liquid supplementary funding sources,
whereby SMBC maintains high quality liquid assets, such as
government bonds and has emergency borrowing facilities.
In addition, for emergency situations, there are contingency
plans in place for addressing funding liquidity risk that include
an action plan with measures for reducing funding gap limits and
guidelines.
■ Decline in Economic Value Based on Outlier Framework
(Billions of yen)
SMBC (consolidated) SMBC (nonconsolidated)
March 31, 2009 March 31, 2010 March 31, 2009 March 31, 2010
Total 588.4 532.7 561.7 490.8Impact of yen interest rates 272.4 396.7 249.3 357.9
Impact of U.S. dollar interest rates 202.4 90.3 200.0 88.6
Impact of Euro interest rates 60.4 33.2 60.1 32.8
Percentage of Tier I + Tier II 8.6% 6.1% 8.9% 5.8%
Note: “Decline in economic value” is the decline of present value after interest rate shocks (1st and 99th percentile of observed interest rate changes using a 1-year holding period and 5 years of observations).
■ Composition, by Industry, of Listed Equity Portfolio
SMBC PortfolioTOPIXNikkei Average
25(%)
0
5
10
15
20
(March 31, 2010)
Fisheries/Farming/Forestry
Mining
ConstructionFood ProductsTextilesPulp/Paper
Pharmaceuticals
Petroleum/Coal
Rubber ProductsGlass/M
ineralsSteelNonferrous M
etalsM
etal ProductsM
achineryElectric M
achineryTransport M
achineryPrecision M
achineryOther ProductsElectricity/Gas UtilitiesOverland TransportM
arine TransportAir TransportW
arehousing/DistributionTelecom
munications
Wholesale
RetailBankingSecurities/Commodity Futures TradingInsuranceOther FinancialReal EstateServices
Chemicals
3.0
2.0
3.02.01.0 2.51.50.5-3.0
-2.0
-1.0
0
0
1.0
Actual Profit or Loss (¥ billion)
VaR (¥ billion)
3.0
2.0
3.02.01.0 2.51.50.5-3.0
-2.0
-1.0
0
0
1.0
Actual Profit or Loss (¥ billion)
VaR (¥ billion)
3.0
2.0
3.02.01.0 2.51.50.5-3.0
-2.0
-1.0
0
0
1.0
Actual Profit or Loss (¥ billion)
VaR (¥ billion)
■Back-Testing Results (Trading Book)
SMFG (consolidated) SMBC (consolidated) SMBC (nonconsolidated)

SMFG 201044
Operational Risk1. Basic Approach to Operational Risk Management(1) Definition of Operational RiskOperational risk is the risk of loss resulting from inadequate or
failed internal processes, people and systems or from external
events. Specifically, Basel II—which, in addition to processing
risk and system risk, also covers legal risk, personnel risk, and
physical asset risk—defines the following seven types of events
that may lead to the risk of loss: (1) internal fraud, (2) external
fraud, (3) employment practices and workplace safety, (4) clients,
products and business practices, (5) damage to physical assets,
(6) business disruption and system failures, and (7) execution,
delivery, and process management.
(2) Fundamental Principles for Operational Risk Management SMFG and SMBC have drawn up the Regulations on Operational
Risk Management to define the basic rules to be observed in
the conduct of operational risk management across the entire
Group. Under these regulations, SMFG and SMBC have been
working to enhance the operational risk management framework
across the whole Group by establishing an effective system for
identification, assessment, controlling, and monitoring of material
operational risk and a system for executing contingency and
business continuity plans. In view of the inclusion of operational
risk in the framework of the capital adequacy requirements of
Basel II, SMFG has been working on a continuing basis to cre-
ate a more sophisticated quantification model and to enhance
operational risk management throughout the Group.
2. Operational Risk Management SystemSMFG has designed and implemented an operational risk
management framework for Groupwide basic policies for risk
management.
At SMBC, the Management Committee makes decisions
on important matters such as basic policies for operational
risk management, and these decisions are authorized by the
SMBC Board of Directors. In addition, SMBC has established its
Operational Risk Management Department, within the Corporate
Risk Management Department as an integrated operational risk
management department. This department works together with
other departments responsible for controlling processing risk and
system risk.
The operational risk management framework is described in
more detail in the later part of this section, but it can be outlined
as follows: operational risk is managed by (1) collecting and
analyzing internal loss data, and (2) comprehensively identifying
risk scenarios in each business process through a regular risk
control assessment to estimate the loss severity and frequency.
Operational risk impact is assessed for each risk scenario. When
high-severity scenarios are identified, each branch/department
establishes a risk mitigation plan and the Operational Risk
Management Department monitors the progress. Furthermore,
operational risk is quantified using the internal loss data and
scenarios, and the results of quantification are used to manage
and reduce operational risk.
The generation of internal loss data, scenarios identified
through risk control assessments, and status of risk mitigation
activities are regularly reported to the director in charge of the
Auditing of managementand measurement system
Integrated Operational RiskSupervisory Dept.
Measurement of operational risk
Corporate Risk Management Dept.Operational Risk Management Dept.
Board of Directors
Management Committee
Corporate Auditors
External Audit(Auditing Firm)
Internal Audit Dept.
InvestmentBankingTreasury
CorporateBanking
Middle MarketBanking
ConsumerBanking
InternationalBanking
Head Office departments
Decision and authorization of important matters related to operational risk management
Reporting on operational risk information, discussion on measures for risk mitigation
Operational Risk Committee
Direction Reporting
Direction Reporting
Reporting
Feedback of measurement results related to operational risk and direction for risk mitigation
Audit
Reporting Internal loss data
Reflection of internal loss data, external loss data and BEICFs in scenarios
Generation of scenarios and development of risk mitigation actions through risk control assessments
Board Member in Charge of Risk Management Unit
■SMBC’s Operational Risk Management System

SMFG 2010 45
Operational Risk Management Department. In addition, there
is the Operational Risk Committee, comprising all relevant units
of the bank, where operational risk information is reported and
risk mitigation plans are discussed. In this way, we realize a
highly effective operational risk management framework. The
operational risk situation is also reported to the Management
Committee and the Board of Directors on a regular basis, for
review of the basic policies on operational risk management.
Moreover, the bank’s independent Internal Audit Department
conducts periodic audits to ensure that the operational risk man-
agement system is functioning properly.
3. Operational Risk Management MethodologyAs previously defined, operational risk covers a wide range of
events, including the risk of losses due to errors in operation,
system failures, and natural disasters. Also, operational risk
events can occur virtually anywhere and everywhere. Thus, it is
essential to check whether material operational risks have been
overlooked, monitor the overall status of risks, and manage/
control them. To this end, it is necessary to be able to quantify
risks using a measurement methodology that can be applied
to all types of operational risk, and to comprehensively and
comparatively capture the status of and changes in potential
operational risks of business processes. Also, from the viewpoint
of internal control, the measurement methodology used to create
a risk mitigation plan must be such that the implementation of the
plan quantitatively reduces operational risk.
SMFG and SMBC have received an approval from Japan’s
Financial Services Agency for the application of the Advanced
Measurement Approach (AMA), which is the most sophisticated
measurement method out of the three cited methods under Basel
II for measurement of operational risk. SMFG and SMBC have
adopted the AMA for operational risk management and for cal-
culating operational risk-weighted assets. It has been used for
calculating the capital adequacy ratio since March 31, 2008.
When using the AMA, regulations require that the internal
measurement system (hereinafter, the “quantification model”)
must use four data elements (hereinafter, the “four elements”):
namely, internal loss data, external loss data, Business
Environment and Internal Control Factors (BEICFs), and sce-
narios analysis through risk control assessments. In addition,
the operational risk equivalent amount (hereinafter, “required
capital”) calculated under the AMA must cover the maximum loss
comparable to a one-year holding period and a 99.9 percentile
confidence interval.
The basic framework of the AMA quantification model of
SMFG and SMBC is outlined in the diagram below. Among the
four elements, collected internal loss data and the results of
scenarios analysis through risk control assessment are input
directly into the quantification model described later in this
section to calculate required capital and risk-weighted assets
(= required capital divided by 8%). In addition, external loss data
and BEICFs are used in verifying the assessment of scenarios,
along with internal loss data, to increase objectivity, accuracy,
and completeness.
The specific content and method of collection and use of the
four elements are described below. At present, 21 Group compa-
nies have adopted the AMA, including SMFG and SMBC, and all
Group companies collect and make use of the four elements.
■ Basic Framework of Operational Risk Measurement of SMFG and SMBC
(6) Risk Mitigation Initiatives
(1) Internal Loss Data
(2) External Loss Data
(3) BEICFs
Verifi-cation
Datainput
(4) Scenario Analysis through Risk Control Assessments
(5) Measurement Using the Quantification Model

SMFG 201046
(1) Internal Loss DataInternal loss data are defined as “the information on events in
which SMFG and SMBC incur losses resulting from the realization
of operational risk.” At SMFG and SMBC, internal loss data are
collected for all cases where the gross loss amount is at least
one yen (the threshold amount), and seven years of internal loss
data are directly used in the quantification of required capital for
operational risk.
(2) External Loss DataExternal loss data are defined as “the information on events in
which other banks, etc., incur losses resulting from the realization
of operational risk.” SMFG and other Group companies collect
external loss data where such losses may occur within the Group.
Please note that SMFG and SMBC have compiled external loss
data for more than 7,000 cases over the past nine years, which
are indirectly used in quantifying required capital for operational
risk.
(3) Business Environment and Internal Control Factors (BEICFs)
BEICFs are defined as “indicators of operational risk profiles of
SMFG and SMBC that reflect underlying business risk factors and
an assessment of the effectiveness of the internal control factors.”
The Group periodically collects data relating to changes in laws
and regulations, changes in internal rules and processes, and
launch of new business and products pertinent to the Group’s
business operations.
(4) Scenario Analysis through Risk Control AssessmentsRisk control assessment is defined as “risk management method-
ology to (a) identify material operational risks, and describe them
in terms of risk scenarios, (b) assess the risks and the effective-
ness of controls, and (c) estimate the frequency and severity of
risk scenarios.” SMFG and SMBC apply this methodology to their
principal business activities.
The purpose of risk control assessment is to identify material
and potential operational risks pertinent to business processes,
to measure them, and to develop and carry out a risk mitiga-
tion plan to manage the risks. Another purpose of risk control
assessment is to estimate the frequency of low-frequency and
high-severity events for each scenario (which may be difficult to
estimate using internal loss data alone).
During the process of periodic risk control assessment,
operational risks inherent in various business processes are
recognized as “scenarios.” The risk and control conditions
for each scenario are assessed, and the frequency of occur-
rence and amount of losses are estimated based on them. The
assessment process comprises three steps: (i) initial assess-
ment, (ii) Operational Risk Management Department review, and
(iii) final assessment. Through the process, the frequency of
“low-frequency and high-severity” events for each scenario are
estimated in terms of four loss amounts (¥100 million, ¥1 billion,
¥5 billion, and ¥10 billion). Please note that SMFG and SMBC
have identified more than 10,000 risk scenarios for the Group on
a consolidated basis.
As an effective mechanism for mitigating operational risks,
the maximum loss occurring once in 100 years (hereinafter,
(i) Initial Assessment (iii) Final Assessment(ii) Operational Risk Management Department Review
Calculation of required
capital
Implementation of risk mitigation
measures
Review of scenario assessment
Verification of magnitude rating
Check magnitude rating empirically against each risk scenario
Develop risk mitigation plans
Develop risk mitigation plans by scenario, focusing on those with higher magnitude rating
Assess the magnitude of scenarios
Calculate the maximum loss once in 100 years and assess the magnitude and classify into five categories
Estimate the frequency of the “low-frequency and high-severity” loss cases
Estimate the frequency of the “low-frequency and high-severity” loss cases that are difficult to estimate using internal loss data alone
Estimate the frequency of losses
for scenarios
Estimate the frequency of losses by scenario, taking account of past internal loss data
Estimate the severity of losses
for scenarios
Estimate the severity of losses by scenario, taking account of the amount of transactions used in various operations
Deriving scenarios
Identify risk patterns inherent in business processes and develop a comprehensive set of scenarios
Conduct assessment of risks and controls by scenario
Assessment of scenarios
■Flowchart for Risk Control Assessment (Example)

SMFG 2010 47
“scenario exposure”) is calculated for each scenario derived
through the risk control assessment, and then a magnitude rating
is provided by classifying them into five categories according to
the severity of loss. Risk mitigation plans are developed by the
relevant business units for those scenarios with high-severity risk
identified through magnitude rating.
The principal features of this risk control assessment method
are (1) “objectivity,” which is realized by estimating the frequency
of losses based on historical internal loss experience and by esti-
mating the severity of losses based on the transaction amounts
pertinent to the scenarios, and (2) an appropriate level of “sen-
sitivity,” because changes in the business environment and the
implementation of risk mitigation measures can be reflected in
the frequency and severity of losses by changing the assessment
of risk and control as well as transactions amounts.
(5) Measurement Using the Quantification ModelSMFG, SMBC, and other Group companies using the AMA
measure the maximum operational loss with a 99.9 percentile
confidence interval and a holding period of one year (hereinafter
referred to as 99.9% VaR) by using the four elements. In addition,
99.9% VaR is measured on an SMFG consolidated basis, SMBC
consolidated basis, and SMBC nonconsolidated basis. The
operational risk is measured for each of seven event types
defined under Basel II, and then, by calculating the simple sum
for all event types, 99.9% VaR is measured for each company
applying the AMA. Meanwhile, the Basic Indicator Approach
(BIA) is applied to estimate maximum operational risk losses for
Group companies other than those applying the AMA. Then, the
required capital and risk-weighted assets for SMFG and SMBC
Group are measured by aggregating these figures.
The outline of the quantification model for SMBC is as follows.
First, we generate a loss frequency distribution (number of loss
incidents over a one-year period) based on the number of histori-
cal internal losses. Then, we generate a loss severity distribution
(amount of loss per loss incident) based on internal losses and
frequency of “low-frequency and high-severity” events obtained
through the risk control assessment.
By using the loss frequency and loss severity distribu-
tions, the aggregated loss severity distribution is generated by
conducting Monte Carlo simulations and by generating various
combinations of loss occurrence and loss amount which are
simulated by changing these two factors. 99.0% VaR is calcu-
lated from the resulting aggregated loss severity distribution.
Finally, we multiply 99.0% VaR by a conversion factor
mentioned later in the section of “Capital Ratio Information” to
compute 99.9% VaR.
This quantification model takes into account not only empiri-
cal internal loss data but also potential risk (scenarios) identified
in the risk control assessment. An important feature of this model
is that it enables us to measure and reflect the “low-frequency
and high severity” events of operational risk. Moreover, by intro-
ducing a conversion factor, it is unnecessary to directly estimate
99.9% VaR, which tends to have a lower accuracy, and stable
estimation results can be obtained by estimating 99.0% VaR
which can be estimated with higher accuracy.
■Measurement Using the Quantification Model
Distribution of Loss Frequency
Sampling of the number of losses from the distribution (e.g., 5 incidents)
0.20
0.15
0.10
0.05
00 5 10 15 20 25 30
Number of incidents/year
Aggregated Loss Distribution
0.4
0.3
0.2
0.1
0
Aggregated annual loss amount
Distribution of Loss Severity0.30
0.25
0.20
0.15
0.10
0.05
00 2 4 6 8 10
Loss per incident
99.0% 99.9%
x conversion factor
Calculate aggregated annual loss amount (e.g., 450)
Repeat (e.g., 1 million times)
Total
Sampling of the amounts of losses corresponding to the above number of losses from the distribution of losses (e.g., 50, 100, 80, 150, 70)
Frequency x Severity
Probability of occurrence (frequency)
Probability of occurrence (frequency)
Probability of occurrence (frequency)

SMFG 201048
Please note that the accuracy of quantification model outputs
described above is secured through the regular ex ante and ex
post facto verification processes.
The breakdown of risk-weighted assets by event type for the
Group on a consolidated basis, computed with the previously
described quantification method, is as follows.
■ Breakdown of Consolidated Risk-Weighted Assets by Event Type
(March 31, 2010)
Event Type Percentage
(1) Internal fraud 10%
(2) External fraud 7%
(3) Employment practices and workplace safety 1%
(4) Clients, products, and business practices 20%
(5) Damage to physical assets 16%
(6) Business disruption and system failures 4%
(7) Execution, delivery, and process management 42%
Note: Only risk-weighted assets calculated under the AMA.
(6) Risk Mitigation InitiativesTo mitigate risk using the quantitative results of the AMA, SMFG
and SMBC implement risk mitigation measures to high-severity risk
scenarios identified in the previously mentioned magnitude rating.
In addition to the above, the operational risk-weighted assets
calculated using the quantification methods are allocated to the
business units of SMBC and other Group companies, as part of
initiatives to mitigate risk for the Group as a whole.
Specifically, (1) at the beginning of each fiscal year, the
operational risk-weighted assets calculated using the internal
loss data and the scenario exposure determined from the risk
control assessment are allocated to each business unit and
Group company, (2) during the fiscal year, each business unit
and Group company work to prevent the realization of opera-
tional risk and improve scenario control by implementing risk
mitigation measures, (3) during the first and second halves of the
fiscal year, the measurements of risk-weighted assets of each
business unit and Group company and an analysis of factors
causing the change from the previous half-year period (including
the frequency and severity of scenario) are fed back to the busi-
ness units and Group companies for revising their plans, and,
(4) finally, at the end of the fiscal year, by comparing the planned
versus actual results, we endeavor to enhance the awareness
of operational risk, improve the effectiveness of operational risk
management, and mitigate operational risk within the Group as a
whole.
Management Process/Roles of Organizational Units
Objectives
Magnitude rating assignment of risk scenarios
Mitigation of high-impact operational risk within the Group as a whole
Autonomous risk management by business units and Group companies as a whole
Planning
Preparation of plans for risk mitigation for high-impact risk scenarios based on risk control assessments
Decision to implement plans made by the Operational Risk Committee
Calculation of planned targets of each business unit and Group company under the AMA
Decision to implement related operating plans of each department and Group company made by the Management Committee and other decision-making and related bodies
Implementation
Implementation by the department responsible for the risk scenario
Implementation of risk mitigation measures
Implementation by the responsible department within each business unit and Group company
Prevention of internal loss occurrence, and improvements in risk and control of risk scenarios
Assessment and Review
Decision to implement plans, etc., made by the Operational Risk Committee
Reassessment of scenarios by taking account of the implementation of risk mitigation measures. Review of scenarios targeted for risk mitigation, followed by the further development and implementation of risk mitigation activities
Feedback of results from the unit in overall charge of operational risk, plus an assessment by the Management Committee and others of planned versus actual results at the end of the period
Results of measurements and analysis of changes from the previous half-year period (including the frequency and severity of scenario) are fed back to each business unit and Group companyPlans for operational
risk assets
■SMFG’s Operational Risk Mitigation Activities on a Semi-Annual Basis

SMFG 2010 49
4. Processing RiskProcessing risk is the possibility of losses arising from negligent
processing by employees, accidents, or unauthorized activities.
SMFG recognizes that all operations entail processing risk.
We are, therefore, working to raise the level of sophistication of
our management of processing risk across the whole Group by
ensuring that each branch conducts its own regular investiga-
tions of processing risk; minimizing losses in the event of pro-
cessing errors or negligence by drafting exhaustive contingency
plans; and carrying out thorough quantification of the risk under
management.
In the administrative regulations of SMBC, in line with SMFG’s
Groupwide basic policies for risk management, the basic
administrative regulations are defined as “comprehending the
risks and costs of administration and transaction processing, and
managing them accordingly,” and “seeking to raise the quality
of administration to deliver high-quality service to customers.”
Adding new policies or making major revisions to existing ones
for processing risk management requires the approval of both
the Management Committee and the Board of Directors.
In the administrative regulations, SMBC has also defined
specific rules for processing risk management. The rules
allocate processing risk management tasks among six types
of departments: operations planning departments, compliance
departments, operations departments, transaction execution
departments (primarily front-office departments, branches, and
branch service offices), internal audit departments, and the cus-
tomer support departments. In addition, there is a specialized
group within the Operations Planning Department to strengthen
administrative procedures throughout the Group.
5. System RiskSystem risk is the possibility of a loss arising from the failure,
malfunction, or unauthorized use of computer systems.
SMFG recognizes that reliable computer systems are essen-
tial for the effective implementation of management strategy
in view of the IT revolution. We strive to minimize system risk
by drafting regulations and specific management standards,
including a security policy. We also have contingency plans with
the goal of minimizing losses in the event of a system failure.
The development of such a system risk management system
ensures that the Group as a whole is undertaking adequate risk
management.
At SMBC, safety measures are strengthened according to risk
assessment based on the Financial Services Agency’s Financial
Inspection Manual, and the Security Guidelines published by the
Center for Financial Industry Information Systems (FISC).
Computer-related trouble at financial institutions now has
greater potential to impact society, with system risk diversifying
owing to the IT revolution, the resulting expansion of networks
and the rise in the number of personal computer users. To pre-
vent any computer system breakdowns, we have taken numer-
ous measures, including constant maintenance of our computer
system to ensure steady and uninterrupted operation, duplication
of various systems and infrastructures, and the establishment of
a disaster-prevention system consisting of computer centers in
eastern and western Japan. And to maintain the confidentiality
of customer information and prevent information leaks, sensi-
tive information is encrypted, unauthorized external access is
blocked, and all known countermeasures to secure data are
implemented. There are also contingency plans and training
sessions held as necessary to ensure full preparedness in the
event of an emergency. To maintain security, countermeasures
are revised as new technologies and usage patterns emerge.
Settlement RiskSettlement risk is the possibility of a loss arising from a trans-
action that cannot be settled as planned. Because this risk
comprises elements of several types of risk, including credit,
liquidity, processing, and system risk, it requires interdisciplinary
management.
At SMBC, the Operations Planning Department is respon-
sible for coordinating the management of settlement risk with the
Credit & Investment Planning Department, which oversees credit
risk, and the Corporate Risk Management Department, which
oversees liquidity risk.

SMFG 201050
Contributing tothe Sustainable Development of SocietySMFG’s goal is to earn the highest trust of society by meeting the public’s expectations and fulfilling its social responsibilities. Earning the highest level of trust requires the balanced provision of value to our four constituencies: customers, shareholders and the market, the environment and society, and employees. Through this process, we aim to contribute to the sustainable development of society as a whole, and to fulfill our corporate social responsibility.
Basic CSR PoliciesAs a basis for implementing its CSR activities, SMFG has formulated a definition of CSR and a set of business ethics that articulate its basic principles for the Group.
SMFG’s Definition of CSR
In the conduct of its business activities, SMFG fulfills its social responsibilities
by contributing to the sustainable development of society as a whole through
offering higher added value to (i) customers, (ii) shareholders and the market,
(iii) the environment and society, and (iv) employees.
Common SMFG CSR Philosophy: Business Ethics
I. Satisfactory Customer Services
We intend to be a financial services group that has the complete trust and
support of our customers. For this purpose, we will always provide services
that meet the true needs of our customers to assure their satisfaction and
earn confidence in the Group.
II. Sound Management
We intend to be a financial services group that maintains fair, transparent,
and sound management based on the principle of self-responsibility. For
this purpose, along with earning the firm confidence of our shareholders,
our customers, and the general public, we take a long-term view of our
business and operate it efficiently, and actively disclose accurate business
information about the Group. Through these activities, we work to maintain
continued growth based on a sound financial position.
III. Contributing to Social Development
We intend to be a financial services group that contributes to the healthy
development of society. For this purpose, we recognize the importance of
our mission to serve as a crucial part of the public infrastructure and also
our social responsibilities. With such recognition, we undertake business
operations that contribute to the steady development of Japan and the rest
of the world, and endeavor, as a good corporate citizen, to make a positive
contribution to society.
IV. Free and Active Business Environment
We intend to be a financial services group for which all officers and
employees work with pride and commitment. For this purpose, we respect
people and develop employees with extensive professional knowledge and
capabilities, thereby creating a free and active business environment.
V. Compliance
We intend to be a financial services group that always keeps in mind the
importance of compliance. For this purpose, we reflect our awareness
of Business Ethics in our business activities at all times. In addition, we
respond promptly to directives from auditors and inspectors. Through
these actions, we observe all laws and regulations, and uphold moral
standards in our business practices.
Key Points of CSR ActivitiesThe key points of our CSR activities are as follows. First of all, we have created a solid management framework, including corporate governance, internal auditing, compliance, and risk management systems. Second, we offer higher added value to our four major stakeholder groups in the following ways. • We endeavor to develop and prosper with our customers
by offering top-quality, high-value-added products and services.
• We maintain sound management through disclosing appro-priate information, designing and operating robust internal control systems, and managing to increase shareholder value.
• We implement initiatives on a continuing and active basis to contribute to society and preserve the natural environment.
• We work to foster a free and active business environment that emphasizes respect for individuals and allows employ-ees to realize their full potential.
Finally, we ultimately contribute to the sustainable develop-ment of society through all these activities.
Implementing CSR Activities andBusiness Growth Strategies in TandemSMFG and the Group companies position CSR activities as the basis for the effective implementation of business growth strate-gies and conduct these activities in tandem with their strategies to attain management objectives. The proper conduct of CSR activities is clearly an integral part of “management itself,” and commitment to serious implementation of CSR initiatives is the shortest path to reaching management objectives.
Corporate Social Responsibility (CSR)
Contributing to the Sustainable Development of Society
Customers Shareholdersand the Market
The Environmentand Society Employees
Group CSR Initiatives
Solid management structure(corporate governance, internal controls, compliance, risk
management, information disclosure, etc.)
High value-addedproducts and
services
SoundManagement
Social andcommunity
activities andenvironmental
activities
Corporateculture that respects
the individual
■ The SMFG CSR Concept

SMFG 2010 51
At SMBC, we created the Quality Management Department in April 2006, with the aim of drawing fully on VOC to make improvements in the bank’s business and management. The Quality Management Department is primarily responsible for analyzing the VOC data. Reports of this department are then dis-cussed by the CS and Quality Improvement Committee, whose members include the chairman and directors who are members of the bank’s Management Committee, and these reports are used proactively to enhance the satisfaction of our customers and the quality of our services. In parallel with these activities, we are undertaking a wide range of initiatives for improving customer satisfaction and quality. These include conducting questionnaire surveys to obtain the opinions of a broader range of customers by interviewing them at our branches and offices and via mail. Also, to provide services that will meet with greater customer satisfaction, we are conducting related training and educational programs.
VOC DatabaseWe have also created a VOC database, a record of the opinions that our customers have expressed, principally at our branches, and are working to make this database widely available within the bank. In addition, the data is analyzed and used by the Quality Management Department to provide guidance to our branches and to make improvement proposals to the Head Office
departments so they can establish bankwide CS enhancement measures. The Head Office departments also analyze the VOC data themselves and employ the results to make improvements in products and services.
CS and Quality Improvement CommitteeCS and Quality Improvement Committee, which is chaired by the president of SMBC, meets periodically to hear reports on the specific opinions that customers have expressed and to review the fluctuations in the number of opinions expressed from month to month. The committee also receives reports on the results of analyses of VOC and proposals for improvements, and members of management represented on the committee listen to these reports and consider appropriate courses of action. In addition, to instill the awareness of making our activities more customer centric, we prepare documents containing points based on specific examples and distribute these throughout the bank. We also arrange for study meetings and implement other measures, and the content of these activities is reported to members of management for their consideration. Moreover, to enhance customer satisfaction and the quality of our products and services from a broader point of view, we invite specialists familiar with these and related areas to provide their advice.
Initiatives for Enhancing Customer Satisfaction (CS) and Quality
Working closely with Group companies, SMFG is taking initiatives to enhance customer satisfaction and the quality of Group services and products. SMFG calls meetings of its Group Customer Satisfaction Committee periodically to review reports based on analyses of the Voice of the Customers (VOC) and discuss measures to increase customer satisfaction.
Branchesand
other offices
Opinions
Inputs
Guidance and measures
Guidance and measures
Reports
Analysis
Analysis/management
Response
Suggestionsfor improvementVOC Database
Directives
Reports
Directives
Customers
Relateddepartments
QualityManagement
Dept.
ManagementCommittee
CS andQuality
ImprovementCommittee,
etc.
■ Activities to Obtain and Act on Voice of the Customers

SMFG 201052
Our Stance on Corporate GovernanceSMFG and its Group companies follow the SMFG management
philosophy as a universal guide for Group management and
position this philosophy as the anchor for corporate action. To
implement the ideas contained in our Group philosophy, we
believe one of the issues with highest priority is strengthening
and improving our corporate governance system.
The SMFG Corporate Governance SystemSMFG employs the “corporate auditor” governance model in
which statutory auditors oversee the execution of business by
the directors. At SMFG, we have six corporate auditors, three of
whom are outside auditors. The auditors monitor the execution of
business operations of SMFG and its subsidiaries by attending
meetings of the Board of Directors and listen to reports on opera-
tions from the directors and others. They also examine docu-
ments relating to important decisions and receive reports from
the internal audit departments, representatives of subsidiaries of
SMFG, and the CPAs.
The chairman of SMFG serves as the chairman of the Board
of Directors of SMFG. This separates the role of the president,
whose responsibility is the overall supervision of business
activities of SMFG and other Group companies, from the role of
supervising management. To enhance the effectiveness of the
Board, we have appointed outside directors and formed four
governance committees: namely, the Auditing Committee, the
Risk Management Committee, the Compensation Committee,
and the Nominating Committee. Outside directors have been
appointed to all four of these committees to provide for corpo-
rate governance from an objective perspective. As the need
for objectivity is particularly acute in the case of the Auditing
Committee and the Compensation Committee, outside directors
serve as the chairmen of these committees. To ensure that the
execution of the Group’s business operations is in conformity
both with legal regulations and generally accepted practices, the
outside directors have been selected from among the ranks of
specialists (including CPAs, lawyers, and consultants).
SMFG has created the Management Committee to serve as
the top decision-making body, and it is under the direct super-
vision of the Board of Directors and chaired by the president
of SMFG. This committee is composed of directors chosen by
the president. Its role is to consider important matters related to
the execution of business and to make decisions for or against
the execution of matters in accord with the basic policies of the
Board of Directors. SMFG also has a Group Strategy Committee
that serves as a forum for the top managers of SMFG and all
other Group companies to exchange opinions and information
on their respective business plans. To enable SMFG to monitor
the execution of day-to-day business operations at SMBC, 10
SMFG directors (including three outside directors) of the total of
11 SMFG directors (including three outside directors) also serve
as directors of SMBC. To monitor the conduct of operations at
three major Group companies, namely, SMFG Card & Credit,
Inc., Sumitomo Mitsui Finance and Leasing Co., Ltd., and The
Japan Research Institute, Limited, the SMFG director in charge
of each of these subsidiaries serves as a director (and can be an
outside director) of these companies.
Furthermore, to maintain the soundness of management,
SMFG has established internal control systems to ensure the
proper conduct of company operations following the Japanese
Company Law. Designing and implementing an internal control
system, to strengthen management systems, is regarded as a
major issue, and initiatives are under way to enhance such inter-
nal control systems.
The SMBC Corporate Governance System SMBC employs the corporate auditor governance model. Of the
six statutory auditors appointed, three are from outside the bank.
To ensure sound and transparent management, SMBC separates
the two functions of management decision-making at the opera-
tional level and the overall supervision of the conduct of duties by
the management of the bank. For this purpose, the bank employs
a system under which executive officers are responsible for
operational duties, while the supervisory functions are performed
principally by the Board.
The chairman of the bank serves as the chairman of the
Board of Directors, and, to clearly separate his functions from
those of the president of the bank, who is responsible for the
overall supervision of the bank’s activities, the chairman does
not simultaneously serve as an executive officer and is primar-
ily responsible for supervising management’s execution of their
duties. As at SMFG and to ensure a robust supervisory func-
tion, outside directors are appointed to the Board of Directors.
At SMBC, three outside directors currently serve on the Board,
which has a total membership of sixteen.
Executive officers are appointed by the Board to manage
the operation of SMBC’s businesses. As of June 30, 2010, SMBC
has 72 executive officers, including the president, and 12 serve
concurrently as directors. The Management Committee of SMBC
is the highest decision-making body at the operational level and
is under the direct supervision of the Board of Directors. The
president chairs this committee and selects its members from
the executive officers. The committee members consider impor-
tant management issues based on policies set by the Board of
Directors, and the president has the authority to make the final
decision after considering the committee’s recommendations.
The president designates certain members of the
Management Committee to be Authorized Management
Committee members in charge of particular Head Office depart-
ments or units. All of these designated individuals are in charge
of implementing the directives of the Management Committee
within the businesses they oversee.
Corporate Governance

SMFG 2010 53
Corporate Auditors/Board of Corporate Auditors
Shareholders’ Meeting
Management Committee
Board of Directors
Business units subject to auditing
Nominating Committee
Compensation Committee
Risk Management Committee
AuditingCommittee
SMFG
Group Strategy Committee
Office of Corporate Auditors
Corporate Auditors/Board of Corporate Auditors
Office of Corporate Auditors
Shareholders’ Meeting
Board of Directors
Head Office/Business Units
All Departments
SMBC
Internal Audits
Audit Department
Auditing
Internal Audits
Internal Audit UnitInternal Audit DepartmentCredit Review Department
Internal Auditing CommitteeBusiness units subject to auditing
Management Committee Internal Auditing Committee
Monitoring
An Outline of the Group’s Internal Audit System In addition to the SMFG Auditing Committee, which functions
as a governance committee reporting to the Board of Directors,
we have established the Internal Auditing Committee, which is a
part of the Management Committee, to give a higher profile to the
internal auditing functions and facilitate effective conduct of inter-
nal audits. The Internal Auditing Committee meets every quarter,
and its members discuss important matters related to internal
auditing based on reports prepared by the departments respon-
sible for internal audits. There is also the Audit Department, which
is an internal auditing unit that is independent of the operational
departments of the Group.
The Audit Department conducts internal audits of the opera-
tions of all the Group’s units and departments to contribute to
optimal management and ensure the proper conduct of the
Group’s operations and the soundness of its assets. These audits
also have the function of verifying that the Group’s internal control
systems, including compliance and risk management, are oper-
ating appropriately and effectively. The Audit Department is also
responsible for the overall supervision of the internal audit sys-
tems of Group companies. It monitors the appropriateness and
effectiveness of the internal audit systems at Group companies
by verifying past data related to internal auditing and monitoring
activities, which include inspections and other activities based on
actual samples, and, when deemed necessary, by conducting
audits. Based on these activities, the Audit Department provides
recommendations and guidance to the business units and
departments as well as Group companies.
At SMBC, we have formed auditing departments that are
independent of bank units involved in marketing and other busi-
ness activities. Within the Internal Audit Unit of SMBC, we have
formed two departments: the Internal Audit Department and the
Credit Review Department. As at SMFG, SMBC has an Internal
Auditing Committee which is a part of its Management Committee
and responsible for examining and conducting deliberations on
reports on important matters submitted by the Internal Audit Unit.
The Internal Audit Unit is responsible for auditing compliance
and risk management at SMBC - its head office departments,
domestic and overseas branches - and SMBC group companies.
Auditing of operations of head office departments is conducted
by assessing the appropriateness of all internal control systems
of each department. In addition, audits of head office depart-
ments focus on material issues that arise in the management of
specific operations and categories of risk. These auditing activi-
ties emphasize the verification of “Targeted Audit Items” across
the whole of the bank’s organization.
Moreover, audits of branches and offices are not limited just
to checking for control and other deficiencies but also include
pointing out compliance and risk management problems and
making recommendations for corrective action. In other Group
companies, internal audit departments have been formed suited
to the respective nature of each company’s lines of business.
Initiatives to Enhance the Sophistication and Efficiency of Internal AuditingThe Audit Department has adopted methods following the stan-
dards of the Institute of Internal Auditors (IIA)*, an international
organization. The Audit Department conducts risk-based audits
and works to apply best practices to Group companies.
To fulfill effectively its role as the department in overall charge
of internal auditing, the Audit Department is constantly endeavor-
ing to advance the professional skills of personnel engaged in
internal auditing. Activities include collecting the latest informa-
tion on internal auditing from inside and outside Japan and dis-
seminating it to all Group companies. Also, the Audit Department
organizes training courses, led by outside experts, for the staff of
Group companies and encourages them to obtain international
qualifications to enhance their professional knowledge and skills in
internal auditing. To improve further the effectiveness of auditing,
we also take active measures on a Groupwide basis to assess the
quality of our internal auditing in the light of IIA standards.
* The Institute of Internal Auditors (IIA) was founded in 1941 in the United States as an organization dedicated to helping raise the level of specialization and professionalism of internal auditing staff. In addition to conducting theoretical and practical research on internal auditing, the IIA administers examinations for Certified Internal Auditor (CIA), which is the internationally recognized qualification in this field.
Internal Audit System

SMFG 201054
Basic Compliance PoliciesAs a financial services group offering a multiplicity of products
and services, SMFG is intensifying its efforts to maintain high
standards of compliance to carry out its mission as an impor-
tant part of the nation’s public infrastructure and fulfill its social
responsibilities. Through these efforts, SMFG is becoming a truly
outstanding global corporate group.
At SMFG, we have positioned compliance as one of the
principal supports of our Business Ethics (please refer to page
50), which serve as the basic principles for fulfilling our corporate
social responsibility (CSR). Accordingly, we regard strengthening
our compliance systems as one of our top management priorities.
Group Management from a Compliance PerspectiveAs a financial holding company, SMFG seeks to maintain and
enhance systems for providing appropriate direction, guidance,
and monitoring for the compliance and related systems of Group
companies to ensure the sound and proper conduct of business
activities throughout the entire Group.
Specific activities include holding regular meetings that
are attended by representatives of Group companies, as well
as meetings with individual companies, with the objective of
overseeing the state of autonomously implemented compliance
functions at those companies. The priority areas for strengthen-
ing oversight in fiscal 2010 include (a) guidance and oversight
of Group companies to deal with a changing regulatory envi-
ronment, and (b) creation of an internal management structure
appropriate for a comprehensive financial services group. These
measures will enable us to strengthen compliance management
at the individual Group company level.
Hotline for Reporting Improper Accounting and Auditing ActivitiesSMFG has established the SMFG Accounting and Auditing
Hotline to provide a channel for individuals within and outside
the Group to report improper activities. This hotline enables
us to quickly identify and take action against fraud and other
misconduct involving accounting and auditing at SMFG and its
consolidated subsidiaries.
Reports can be submitted by post or e-mail as follows.
PostSMFG Accounting and Auditing HotlineIwata Godo Attorneys and Counsellors at Law10th floor, Marunouchi Building2-4-1 Marunouchi, Chiyoda-ku, Tokyo 100-6310
* The hotline accepts alerts of improper activities concerning account-ing and auditing at SMFG and its consolidated subsidiaries.
* Anonymous reports are accepted, but, if possible, please provide personal information such as your name and contact number.
* Please provide as much detail as you can regarding the activities. An investigation may not be possible if the description is too vague.
* Personal information will not be disclosed to a third party without your consent, or unless required by law.
Compliance Systems at SMFG
Sumitomo Mitsui Financial Group, Inc.
Board of DirectorsManagement Committee
Compliance CommitteeGroup Business Management
Dept.
Audit Dept.
General Affairs Dept.
Corporate Auditors
Departments and OfficesGeneral Manager responsible for compliance
Compliance Officers to assist General Managers
Group CompaniesSMBC, SMFG Card & Credit*, Sumitomo Mitsui Finance and Leasing, JRI, and SMBC Friend Securities
Audit
Directions
Report
Management Report
Report
Report
Compliance SystemOversight and
GuidelinesAudit/MonitoringGroup Company
Audit/MonitoringGroup Company
* SMFG Card & Credit, Inc. is an intermediary holding company for Sumitomo Mitsui Card and Cedyna.
Compliance

SMFG 2010 55
Compliance at SMBC
■Compliance System Overview
AuditDirections
Report
Discuss
Directions
Report
Board of Directors, Management Committee Corporate Auditors
Internal Audit Dept.
Report and Discuss
Audit
Compliance Committee
Head Office Departments
Compliance UnitGeneral Affairs Dept.
(overall control), Legal Dept.
General Managers General Managers
Area Compliance Officers
Compliance Officers Compliance Officers
Directions, Monitoring and
Legal Support
Front-Line Offices (Corporate Business Offices, Branches)
Strengthening Compliance Systems Compliance with laws, regulations, and other social standards
is a basic requirement for corporations in general. Especially for
banks, compliance is a particularly important issue because of
their public mission and social responsibilities as key players in
the financial system and socioeconomic infrastructure.
SMBC, in line with the basic policy of SMFG, requires all its
management and staff to assign the highest value to maintaining
people’s trust, abiding by relevant laws and regulations, uphold-
ing high ethical standards, and acting fairly and sincerely. SMBC,
therefore, positions maintenance of high standards of compli-
ance as one of its most important management priorities, and
is committed to always abiding by the Banking Law, Financial
Instruments and Exchange Act and other legislation and taking
preventive measures against financial activities of anti-social
forces.
Management of the Compliance System SMBC adopts a basic, two-tiered structure to ensure compliance.
First, each department and office is held individually responsible
for making before the fact decisions that ensure its conduct com-
plies with laws and regulations. Second, an independent, Internal
Audit Unit conducts rigorous audits of department and branch
compliance.
To maintain this two-tiered structure and ensure it is operat-
ing effectively, the Compliance Unit, which includes the General
Affairs Department and the Legal Department, plans and imple-
ments systems and system improvements to secure compliance,
acting under directions from management. The Compliance
Unit also provides guidance and conducts monitoring activities
regarding the activities of all departments and branches, and
assists departments and branches make compliance decisions.
The framework of SMBC’s compliance system is shown in
the diagram at the bottom of this page. To ensure that this frame-
work functions effectively, SMBC also engages in the activities
described in the following paragraphs.
Issuance of a Compliance ManualTo assist management and staff in choosing proper courses of
action, SMBC has prepared its Compliance Manual containing 60
principles for action that provide objectives and guidance. This
manual has been approved by the Board of Directors, and all
management and staff have been fully apprised of its contents.
Preparation of Compliance ProgramsWith the objectives of ensuring that compliance systems function
effectively and making necessary improvements in compliance
systems within SMBC and its consolidated subsidiaries, the
Board of Directors prepares a specific plan for compliance-
related activities each fiscal year, including review of and
necessary revisions to regulations and training. In fiscal 2010,
measures focusing on better adapting our compliance posture
to social change are being implemented, including a review of
our marketing practices for derivative and other products which
entail risk, creating more effective mechanisms for resolving
complaints and conflict in anticipation of establishment of a new
Japanese financial-sector ADR (Alternative Dispute Resolution)
mechanism, further measures to facilitate financing to SMEs and
mortgage borrowers, and taking further preventive measures
against financial activities of anti-social forces.
Appointment of Compliance OfficersIn addition to the compliance officers appointed within the bank’s
departments and branches, we have appointed Area Compliance
Officers, who are independent from frontline departments,
within certain of our business units including the Middle Market
Banking Unit and the Consumer Banking Unit. These officers are
responsible for directing and overseeing compliance regarding
transactions carried out by the staff of our branches and other
frontline offices.
Formation of the Compliance CommitteeTo ensure that compliance issues related to various operations
within the bank are reviewed and discussed comprehensively,
we have formed the Compliance Committee, which has members
drawn from across the organization. This committee is chaired
by the director responsible for compliance issues and includes
the heads of relevant departments. To enhance the fairness and
objectivity of the committee’s deliberations, outside members
also participate in the Compliance Committee meetings.

SMFG 201056
Environmental Preservation Initiatives
The Group recognizes environmental preservation to be one of its most important management issues. Based
on our Group Environmental Policy, we are implementing initiatives to preserve and achieve harmony with the
natural environment in our corporate activities. SMFG is a signatory to the “Statement by Financial Institutions on
the Environment and Sustainable Development” of the United Nations Environment Programme (UNEP).
The Group Environmental PolicyBasic ConceptsRecognizing the importance of realizing a sustainable society, SMFG is making continuous efforts to harmonize environmental preserva-tion and corporate activities, in order to support the economy and contribute to the general well-being of society as a whole.
Specific Environmental Policies• We provide environment-friendly financial products, information, and solutions that help our customers in their efforts to preserve the
eco-system. • We devise ways to reduce levels of environmental risk posed by our own activities and those of society at large. • We are determined to fulfill our social responsibilities through the conservation of resources, energy saving, and the reduction of
waste. • We enforce a policy of strict adherence to environment-related laws and regulations. • We practice a high level of disclosure of information relating to the Group’s environmental activities, and make ceaseless efforts to
improve our contribution to environmental preservation, incorporating the views of our staff and concerned persons from outside the Group.
• We place a high priority on thoroughly educating our staff in our environmental principles, and in ensuring that they conform to these principles in the performance of their work.
• We actively and effectively conduct environmentally aware management, and make continuous efforts to improve our system for tack-ling environmental issues, including by setting targets for each business term and reviewing them when deemed advisable.
• These policies are published on the Group’s website, and are also available in printed form upon request.
Three Pillars of Group’s Activities Environmental Action Plan and the PDCA CycleThe three pillars of our environmental action plan are to
“reduce environmental impact,” “manage environmental
risk,” and “promote environmental businesses.” We set
environmental objectives for various activities and follow
the PDCA (plan, do, check, and act) cycle in these envi-
ronmental activities. SMFG and principal Group companies
have obtained ISO 14001 certification, the international
standard for environmental management systems (EMS).
EMS Enhancement System
PLAN
DO
CHECK
ACT
The Group Environmental Policy
Implementation of environmental initiatives
Reduce environmental impact
Manage environmental risk
Promote environmental businesses
SMFGOfficer in charge of environment: Officer in charge of Corporate Planning Dept.Officer responsible for environment management: GM of Group CSR Dept., Corporate Planning Dept.ISO 14001 Secretariat: Group CSR Dept., Corporate Planning Dept.
Corporate Planning Dept. Operational Section
SMFG Card & Credit
General Affairs Dept.Corporate Planning Dept.Corporate Planning Dept.Communications Dept.
SMBC Japan Research InstituteSMBC Friend SecuritiesSumitomo Mitsui
Finance and LeasingSumitomo Mitsui CardNikko Cordial Securities

SMFG 2010 57
Reducing Environmental Impact
• Realizing Carbon Neutrality
SMFG sets objectives each year for reduction in its use of electric
power and other sources of energy and is actively engaged in
reaching these energy conservation goals.
SMBC has made its Head Office “carbon neutral” through
the procurement of “green” sources of energy and purchases of
carbon credits.* Sumitomo Mitsui Finance and Leasing’s Tokyo
Head Office is also carbon neutral.* Carbon credits are also referred to as “Kyoto credits,” “emission allow-
ances,” and “Certified Emission Reductions (CER).” In this annual report, we use “carbon credits” to refer to these and the other concepts recog-nized under the Kyoto Protocol.
• Response to Amended Act on the Rational Use of Energy
In April 2010, the amendments to the Act on the Rational Use
of Energy came into effect, and as a result, the standard unit
for evaluation of energy management was changed from the
individual factory or office building to the entire company.
Companies using 1,500kl or more of energy (crude oil equivalent)
per annum are now required to establish an energy consumption
management system and draw up medium- to long-term plans for
improving energy efficiency, with the aim of reducing the volume
of energy consumed by at least 1% per year. In response, the
Group is taking measures to reduce energy consumption at all
workplaces, and is also developing a consultancy business to
meet the needs of customers attempting to conserve energy and
reduce CO2 emissions.
• Greening Bank Operations
SMBC has been steadily applying green IT to its branch terminals
and ATMs. The new CUTE terminal for handling over-the-counter
transactions, which was jointly developed with NEC Corporation
and Oki Electric Industry Co., Ltd., uses highly functional image
processing to electronically store documents, mainly copies of
driver’s license and other forms of IDs, for a reduction in paper
usage of 3 million A4 sheets per year. SMBC donated part of the
cost savings resulting from the introduction of this system to the
Tokyo Metropolitan Government’s Green Tokyo Fund, specifically
for the “Creating Umi-no-Mori (Sea Forest)” project, one of the
fund’s four greening projects.
In April 2010, SMBC began storing ATM transaction data,
which had hitherto been printed out on paper (the “ATM Journal”),
in the CUTE operations processing server. This is expected to
save 28 million A4 sheets annually.
Managing Environmental Risk
• Dealing with Soil Contamination and Asbestos Risk
To deal with the risk that land pledged as collateral by borrowers
may be contaminated, SMBC requires contamination risk assess-
ment for land meeting certain criteria. When the risk is judged to
be high, the assessed value of the potential risk is deducted from
the value of the collateral.
In addition, similar measures are taken regarding asbestos
risk — risk assessments are conducted for asset collateral meet-
ing certain criteria, and the assessed value of the potential risk is
deducted from the value of the collateral. SMBC also encourages
its customers to have structures surveyed more comprehensively
for asbestos pollution. Regarding its own premises, SMBC sur-
veys and properly removes asbestos from structures.
• Adoption of the “Equator Principles”
SMBC has adopted the Equator Principles, a set of principles for
determining, assessing and managing social and environmental
risk in project financing. Its Environment Analysis Department
assesses the social and environmental risk of large-scale projects
in accordance with the Equator Principles.
■ Flow Chart of SMBC’s Social and Environmental Risk Assessment
Promoting Environmental BusinessesThe Group pursues environmental business as an effective way
of contributing to society and the international community.
SMBC, in particular, formed the cross-organizational Eco-
Biz Promotion Council in fiscal 2005 to discuss periodically the
development of sophisticated and efficient products and services
that contribute to environmental maintenance and improvement.
Topics
l SMBC Environmental Assessment Loan/Private Placement Bond SMBC wins 2009 Nikkei Veritas Superiority Award
SMBC received the Nikkei Veritas Award for Superiority at the 2009 Nikkei Superior Products and Services Awards for its SMBC Environmental Assessment Loan/Private Placement Bond, a financial product developed in collaboration with the Japan Research Institute. In this product, the environmental friendliness of the business operations of a corporate customer seeking to raise funds is assessed using JRI’s own assess-ment standards. The terms and conditions of the loan or bond are then set in accordance with the results of the assessment. SMBC has received high praise for this product, which aims to support companies that are helping to pre-serve the global environment.
l New Bank Branch Terminal — CUTE Receives Special Award in Green IT AWARD 2009
The new CUTE terminal used in our branches, jointly devel-oped by SMBC with NEC Corporation and Oki Electric Industry Co., Ltd., received a special award at the Green IT AWARD 2009, held by the Green IT Promotion Council. The award was given for CUTE’s significant contribution to reducing the envi-ronmental impact of bank operations by realizing paperless processing using IT, as well as for being a good example of how companies in different industries can collaborate to help preserve the environment. This is the first time the award has been received by a bank.
Cus
tom
ers
Lend
ing
Bran
ches
Envir
onme
nt An
alysis
Dep
artme
nt
Credit Departments
Social and EnvironmentalRisk Assessment
Environmental Monitoring
Environmental Review
Screening
Covenants ComplianceEnvironmental Monitoring
Project Information
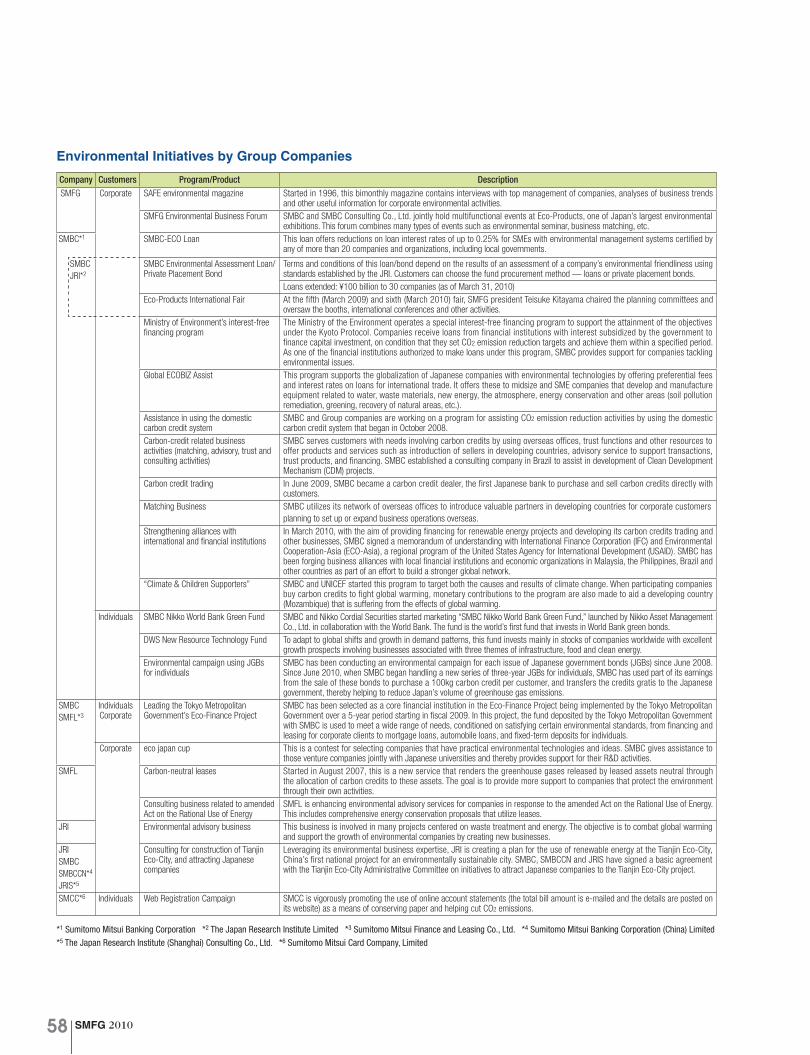
SMFG 201058
Environmental Initiatives by Group Companies
Company Customers Program/Product DescriptionSMFG Corporate SAFE environmental magazine Started in 1996, this bimonthly magazine contains interviews with top management of companies, analyses of business trends
and other useful information for corporate environmental activities.SMFG Environmental Business Forum SMBC and SMBC Consulting Co., Ltd. jointly hold multifunctional events at Eco-Products, one of Japan’s largest environmental
exhibitions. This forum combines many types of events such as environmental seminar, business matching, etc.SMBC*1 SMBC-ECO Loan This loan offers reductions on loan interest rates of up to 0.25% for SMEs with environmental management systems certified by
any of more than 20 companies and organizations, including local governments.
SMBCJRI*2
SMBC Environmental Assessment Loan/Private Placement Bond
Terms and conditions of this loan/bond depend on the results of an assessment of a company’s environmental friendliness using standards established by the JRI. Customers can choose the fund procurement method — loans or private placement bonds.Loans extended: ¥100 billion to 30 companies (as of March 31, 2010)
Eco-Products International Fair At the fifth (March 2009) and sixth (March 2010) fair, SMFG president Teisuke Kitayama chaired the planning committees and oversaw the booths, international conferences and other activities.
Ministry of Environment’s interest-free financing program
The Ministry of the Environment operates a special interest-free financing program to support the attainment of the objectives under the Kyoto Protocol. Companies receive loans from financial institutions with interest subsidized by the government to finance capital investment, on condition that they set CO2 emission reduction targets and achieve them within a specified period. As one of the financial institutions authorized to make loans under this program, SMBC provides support for companies tackling environmental issues.
Global ECOBIZ Assist This program supports the globalization of Japanese companies with environmental technologies by offering preferential fees and interest rates on loans for international trade. It offers these to midsize and SME companies that develop and manufacture equipment related to water, waste materials, new energy, the atmosphere, energy conservation and other areas (soil pollution remediation, greening, recovery of natural areas, etc.).
Assistance in using the domestic carbon credit system
SMBC and Group companies are working on a program for assisting CO2 emission reduction activities by using the domestic carbon credit system that began in October 2008.
Carbon-credit related business activities (matching, advisory, trust and consulting activities)
SMBC serves customers with needs involving carbon credits by using overseas offices, trust functions and other resources to offer products and services such as introduction of sellers in developing countries, advisory service to support transactions, trust products, and financing. SMBC established a consulting company in Brazil to assist in development of Clean Development Mechanism (CDM) projects.
Carbon credit trading In June 2009, SMBC became a carbon credit dealer, the first Japanese bank to purchase and sell carbon credits directly with customers.
Matching Business SMBC utilizes its network of overseas offices to introduce valuable partners in developing countries for corporate customers planning to set up or expand business operations overseas.
Strengthening alliances with international and financial institutions
In March 2010, with the aim of providing financing for renewable energy projects and developing its carbon credits trading and other businesses, SMBC signed a memorandum of understanding with International Finance Corporation (IFC) and Environmental Cooperation-Asia (ECO-Asia), a regional program of the United States Agency for International Development (USAID). SMBC has been forging business alliances with local financial institutions and economic organizations in Malaysia, the Philippines, Brazil and other countries as part of an effort to build a stronger global network.
“Climate & Children Supporters” SMBC and UNICEF started this program to target both the causes and results of climate change. When participating companies buy carbon credits to fight global warming, monetary contributions to the program are also made to aid a developing country (Mozambique) that is suffering from the effects of global warming.
Individuals SMBC Nikko World Bank Green Fund SMBC and Nikko Cordial Securities started marketing “SMBC Nikko World Bank Green Fund,” launched by Nikko Asset Management Co., Ltd. in collaboration with the World Bank. The fund is the world’s first fund that invests in World Bank green bonds.
DWS New Resource Technology Fund To adapt to global shifts and growth in demand patterns, this fund invests mainly in stocks of companies worldwide with excellent growth prospects involving businesses associated with three themes of infrastructure, food and clean energy.
Environmental campaign using JGBs for individuals
SMBC has been conducting an environmental campaign for each issue of Japanese government bonds (JGBs) since June 2008. Since June 2010, when SMBC began handling a new series of three-year JGBs for individuals, SMBC has used part of its earnings from the sale of these bonds to purchase a 100kg carbon credit per customer, and transfers the credits gratis to the Japanese government, thereby helping to reduce Japan’s volume of greenhouse gas emissions.
SMBCSMFL*3
IndividualsCorporate
Leading the Tokyo Metropolitan Government’s Eco-Finance Project
SMBC has been selected as a core financial institution in the Eco-Finance Project being implemented by the Tokyo Metropolitan Government over a 5-year period starting in fiscal 2009. In this project, the fund deposited by the Tokyo Metropolitan Government with SMBC is used to meet a wide range of needs, conditioned on satisfying certain environmental standards, from financing and leasing for corporate clients to mortgage loans, automobile loans, and fixed-term deposits for individuals.
Corporate eco japan cup This is a contest for selecting companies that have practical environmental technologies and ideas. SMBC gives assistance to those venture companies jointly with Japanese universities and thereby provides support for their R&D activities.
SMFL Carbon-neutral leases Started in August 2007, this is a new service that renders the greenhouse gases released by leased assets neutral through the allocation of carbon credits to these assets. The goal is to provide more support to companies that protect the environment through their own activities.
Consulting business related to amended Act on the Rational Use of Energy
SMFL is enhancing environmental advisory services for companies in response to the amended Act on the Rational Use of Energy. This includes comprehensive energy conservation proposals that utilize leases.
JRI Environmental advisory business This business is involved in many projects centered on waste treatment and energy. The objective is to combat global warming and support the growth of environmental companies by creating new businesses.
JRISMBCSMBCCN*4
JRIS*5
Consulting for construction of Tianjin Eco-City, and attracting Japanese companies
Leveraging its environmental business expertise, JRI is creating a plan for the use of renewable energy at the Tianjin Eco-City, China’s first national project for an environmentally sustainable city. SMBC, SMBCCN and JRIS have signed a basic agreement with the Tianjin Eco-City Administrative Committee on initiatives to attract Japanese companies to the Tianjin Eco-City project.
SMCC*6 Individuals Web Registration Campaign SMCC is vigorously promoting the use of online account statements (the total bill amount is e-mailed and the details are posted on its website) as a means of conserving paper and helping cut CO2 emissions.
*1 Sumitomo Mitsui Banking Corporation *2 The Japan Research Institute Limited *3 Sumitomo Mitsui Finance and Leasing Co., Ltd. *4 Sumitomo Mitsui Banking Corporation (China) Limited *5 The Japan Research Institute (Shanghai) Consulting Co., Ltd. *6 Sumitomo Mitsui Card Company, Limited

SMFG 2010 59
SMFG Environmental Business Forum at Eco-Products 2009
The Eco-Products exhibition, held each December, is one of Japan’s largest environ-mental exhibitions. Following on from last year’s event, SMFG once again held the SMFG Environmental Business Forum, comprising different types of environmental business events. Targeting many different types of stakeholder, such as those seeking to newly enter the environmental business field, those looking to expand their marketing channels, and those examining their options regarding information gathering, SMFG conducted business matching, set up booths with catalogs, and held lectures, semi-nars, and other programs. By these means, SMFG provided forums for representatives of companies in the environmental field to meet and exchange information, thereby giving rise to new business opportunities. Over the three-day duration of the exhibition, we held 17 seminars on various topics, as well as panel discussions. About 500 cases of business matching were arranged, and 41 companies had booths showcasing their products and services. In all, the SMFG Environmental Business Forum hosted a large number of business negotiations on new environmental technologies, products, and services.
Eco-Products International Fair 2010
This international fair is held every year to promote the growth of environmental businesses in the Asia-Pacific region and increase their global competitiveness by making their supply chains more eco-friendly. SMBC was a member of the Preparatory Committee in 2009 and 2010. The sixth Eco-Products International Fair, held in March 2010 in Jakarta, Indonesia, was the largest ever with 164 Asian companies and organizations participating, and more than 90,000 visitors during the 4-day event. At the international conference held parallel to the fair, lectures were given and panel discussions by world leaders and specialists on environmental issues from many countries were held. SMBC and JRI participated in a session on “Eco Business and Climate Change,” and representatives of the two companies made presentations on the outlook for and initiatives on carbon credits business in Asia.
Advisory services for the Tianjin Eco-City Project
The Tianjin Eco-City project is a large-scale eco-friendly urban development project being undertaken in China at the national government level, in line with the country’s policy on the environment and energy. The development of the Eco-City is guided by 22 quantitative key performance indicators which are set at high levels, such as a renewable energy utilization rate of 20% or higher and a green building* rate of 100%, in order to harmonize human activities with the natural environment, conserve natural resources, and efficiently recycle resources. The Japan Research Institute (JRI) has drawn up the plan for achieving the renewable energy utilization rate of 20% or higher, including the technologies and their implementation methodology. SMBC, meanwhile, has signed a business alliance agreement with Tianjin Eco-City Administrative Committee, together with Sumitomo Mitsui Banking Corporation (China) Limited, JRI, and the Japan Research Institute (Shanghai) Consulting Co., Ltd., to attract Japanese companies to the Tianjin Eco-City project. Moving forward, SMBC will further reinforce the services to Japanese companies setting up operations in the area by enhancing the collaboration with both Tianjin City and the Tianjin Eco-City project. JRI will actively promote initiatives for launching environment-/energy-related projects not only in the Tianjin Eco-City, but in many other parts of China, too.
SMBC Begins Handling World Bank Green Fund
On February 1, 2010, SMBC and Nikko Cordial Securities commenced handling of the SMBC Nikko World Bank Green Fund, an investment trust launched by Nikko Asset Management Co., Ltd. This fund is the world’s first fund developed in cooperation with the World Bank that invests in World Bank green bonds. The World Bank green bonds support World Bank-funded projects in developing countries to mitigate global warming. A portion of the profits from this green fund will be donated to UNICEF and the Japanese Red Cross.
Panel discussion at the international conference
Total asset value: ¥16,784 million (as of May 31, 2010) President Teisuke Kitayama of SMFG
explains the carbon credits business to Muhaimin Iskandar, Minister of Manpower and Transmigration of Indonesia.
Artist’s rendition of Tianjin Eco-City when completed
Hundreds of companies found prospec-tive business partners at the matching booth.
SMFG Booth
* “Green building” here refers to minimizing the building’s impact on the environment, and to use “people-friendly” methods of construction and urban planning.

SMFG 201060
Activities Contributing to Social Welfare
• Sign-Language CoursesTo enhance the ability of our employees to communicate with
and offer high-level services to hearing-impaired customers,
SMBC holds sign-language courses and seminars for inter-
ested employees. In fiscal 2009, we held one-day introductory
courses that were also attended by employees of Sumitomo
Mitsui Card, the Japan Research Institute, and SMBC Friend
Securities. Also in fiscal 2009, SMBC held training sessions for
employees to improve their communication skills, which included
using basic sign language, and learn about consideration for
the needs of both hearing-impaired customers and others.
These courses were
also attended by
employees of other
Group companies
and the Nikko Cordial
Securities Group.
• Volunteer Activities, and Blood Donation DrivesIn fiscal 2009, SMBC held courses on the environment, focus-
ing on the issue of biodiversity, which were attended by SMBC
employees and family members. SMBC also provided employees
with information on various volunteer activities and encouraged
them to participate. Blood donation drives were also held at
SMBC and Sumitomo Mitsui Card.
• Collection and Donation of Voided Postcards, Unused Prepaid Telephone Cards, and Used Postage Stamps
SMFG collects voided postcards from Group employees,
exchanges them for new postage stamps, and donates the
stamps to volunteer organizations to help them cover their post-
age costs. In addition, SMBC collects unused prepaid telephone
cards, Sumitomo Mitsui Finance and Leasing collects PET bottle
caps, SMBC Friend Securities collects PET bottle caps and used
postage stamps, and Sumitomo Mitsui Card collects used post-
age stamps and used prepaid cards from employees, donating
them to volunteer organizations.
• Installation of Charity Vending Machines; Sale of Products Made by Social Welfare Organizations
SMBC has installed vending machines at its head office under a
program in which contributions are made to welfare organizations
with every purchase of a soft drink from these machines. SMBC
also holds regular events where employees can buy products
made by NPOs employing persons with disabilities and NPOs
engaged in international cooperation initiatives.
• Donations to Organizations Assisting Senior CitizensSMBC Friend Securities has been donating part of the income
from a fund that invests in companies contributing to the bet-
terment of the aging population to organizations that assist and
provide nursing care for the elderly.
Fundamental approach to social contribution activities SMFG and its Group companies, in consideration of the public service nature of the financial services industry, recognize the
importance of using business operations to contribute to the development of society. In addition to this contribution to society
through day-to-day business operations, we must also act as a responsible corporate citizen by engaging in activities that help lay
the foundations for a better society in the future. In the spirit of corporate citizenship, SMFG and its Group companies will fulfill their
social obligations through a broad range of activities.
Policy on social contribution activities SMFG and its Group companies understand their role as responsible corporate citizens, and undertake activities that contribute
to the realization of a prosperous and sustainable society. We maintain an extensive social contribution program by planning and
executing social contribution activities at the corporate level, as well as encouraging employees to volunteer for worthwhile activities.
The central elements of our social contribution activitiesSMFG and its Group companies position the following four sectors as the core fields for social contributions: 1) social welfare;
2) local and international communities; 3) the environment; and 4) culture, the arts and education.
Social Contribution Activities
Topics
l SMBC Receives Commendation from Tokyo Metropolitan Governor for Contributions to Metropolitan Social Welfare Initiative
In January 2010 SMBC received a commendation from the Governor of Tokyo for contributions to an initiative to make Tokyo into a city with a high level of social welfare services. This was in recognition of SMBC’s various measures to promote the use of universal design and provide universal service throughout Japan.

SMFG 2010 61
Contribution Activities for Local and Overseas Communities
•Volunteer FundSMBC has a system in which employees who volunteer have
¥100 deducted from their salaries each month to fund donations
to organizations that perform volunteer work. As of July 2010,
more than 12,000 employees were participating in this program.
The following are some of the 27 activities funded by the
SMBC Volunteer Fund in fiscal 2009.
Overseas• Funding construction of an orphanage in Cambodia• School library opened in Laos• Operation of a clinic for refugees repatriated to Pakistan• Support for regional activities in Nepal to enable children to
attend school• Livelihood support for the most disadvantaged section of the
population in Myanmar, including the elderly and persons
with disabilities• Clean water project for schools in Southern Sudan• Measures to raise income levels in Bangladesh, including
microfinancing initiatives, and other support efforts• School meals program for elementary schools in Burkina
Faso• In Indonesia, scholarships for middle school and high school
students, a health program targeting infants, and others
Japan• For terminally ill young children, SMBC funds trips for them
and their families, to make their wish come true.• Offering opportunities for school students with hearing impair-
ments to meet and interact with members of a drama troupe• Funding for raising and training puppies to become assis-
tance dogs, including feeding, veterinary medical care and
obedience classes
In addition to the above, the SMBC Volunteer Fund also
donated money to help the victims of such overseas natural
disasters as the September 2009 Sumatra earthquake, the
Philippine Typhoon Ketsana, the 2009 Samoa earthquake,
and the 2010 Haiti earthquake, as well as natural disasters in
Japan including the catastrophic heavy rains in the Chugoku
and Northern Kyushu regions in July 2009, and Typhoon No. 9 in
August.
At Group member SAKURA KCS Corp., as of June 2010,
approximately 900 employees (around 80% of the company’s
total staff) have enrolled in their volunteer fund since fiscal
2009, and have contributed to reforestation projects in Hyogo
Prefecture, educational activities for the prevention of cancer,
and projects to help children in developing countries.
•Opening of Accounts for Donations to Disaster VictimsWhen major natural disasters occur, SMBC opens special
accounts to collect donations for relief efforts without the usual
fund transfer charges. SMBC also solicits donations for such
causes from its own employees and those of other Group
companies including Nikko Cordial Securities. In fiscal 2009,
accounts were established for relief efforts for the victims of the
July torrential rains in the Chugoku and Northern Kyushu regions
and Typhoon No. 9 in August, both in Japan, as well as Typhoon
Ketsana in the Philippines, the 2009 Samoa earthquake, the
2009 Sumatra earthquake, the 2010 Chile earthquake, and the
2010 Haiti earthquake. Following the Haiti earthquake in January,
Sumitomo Mitsui Card collected donations made by customers
using its credit cards.
•Activities of YUI, SMBC’s Volunteer OrganizationSMBC also provides active support for YUI, an in-house volunteer
organization that provides opportunities for SMBC employees to
plan and carry out volunteer activities. YUI activities conducted
on a regular basis include social events at schools for the
hearing-impaired, holding charity bazaars for items collected
from employees, and visits to facilities for the elderly. In addition
to the continued activities mentioned above, volunteers in Tokyo
and Osaka conducted
tree-planting activities
on the slopes of Mount
Fuji to mark the 10th
anniversary of the
establishment of YUI.
• Contributing to Local Communities
SMBC has been promoting and carrying out activities planned
by its branches and other offices in Japan to contribute to local
communities, including branch tours, cleaning up the local envi-
ronment, such as parks and other areas in the vicinity of SMBC
branches, participation in local festivals and events, exhibitions
of children’s art from around the world and concerts in the lob-
bies of SMBC branches.
Nikko Cordial Securities also takes part in these activities at
all its branches nationwide. The company has organized tours
of its branches, including hands-on work experience, as well as
local cleanup activities.
Nikko Cordial Securities employees clean up a sidewalk near a branch.

SMFG 201062
• Local Community Contribution by Overseas OfficesSMBC overseas offices conducted the following activities in fiscal
2009.• Sumitomo Mitsui Banking Corporation (China) Limited
established a scholarship program for students of Suzhou
University, Shanghai International Studies University, and
other universities.• SMBC’s Hong Kong Branch gave donations in support of an
orchestra composed of young Asian musicians.• SMBC’s Seoul Branch gave donations in support of a
Japanese-language drama festival aimed at promoting
understanding of Japanese culture.• SMBC’s Bangkok Branch arranged lectures at a business
school by an SMBC senior economist, and gave donations to
support facilities assisting children suffering from poverty in
outlying districts of Bangkok.• SMBC’s Hanoi Branch gave donations to a Japanese ophthal-
mologist who provides free treatment.• Employees of Sumitomo Mitsui Banking Corporation Europe
conducted volunteer activities in their time off. Also, the
money saved from switching to e-cards from traditional greet-
ing cards was donated to charity organizations.• The European office of the Japan Research Institute made a
donation in support of a Japanese-language speech contest.• Volunteer employees of SMBC and the Japan Research
Institute based in the
United States partici-
pate in school beauti-
fication programs. The
employees also give
donations, which are
matched by SMBC
Global Foundation.
•Support for UNICEFSMBC is a member corporation of the steering committee of
UNICEF Coin Aid and cooperates in the organization’s fund-
raising activities. To this end, SMBC places coin collection boxes
in its branches and offices in Japan and calls for donations from
the general public. The coins collected are sorted by currency
before being delivered to UNICEF.
SMBC also cooperates with UNICEF by implementing the
UNICEF Donation Account program. This program enables cus-
tomers to donate their interest earnings after tax to UNICEF and
SMBC provides a matching donation.
Sumitomo Mitsui Card and VJA group companies collect
donations to UNICEF, UNESCO, the World Wide Fund for Nature
Japan, and the World Food Program from holders of their cards
through the World Present point service. Sumitomo Mitsui Card
also makes its own donations to UNICEF, matching those of the
cardholders.
In addition, Sumitomo Mitsui Card also issues cards that
automatically make donations to specific charities, such as the
UNICEF VISA Card and the Red Feather VISA Card (offered in
cooperation with the Central Community Chest of Japan), and
also makes its own donations to the working funds of all these
organizations from its card business revenues.
• Participation in “TABLE FOR TWO”At SMBC’s head office, we operate a system through the non-
profit organization TABLE FOR TWO International of providing
donations to fund school meals in developing countries. The
price of a nutritiously balanced, low-calorie lunch plate offered
at the head-office employee cafeteria includes a ¥20 donation,
the price of one school meal. Vending machines have also been
installed selling health drinks whose price includes a donation to
TABLE FOR TWO International.
• Social Contribution Activities of In-House FoundationsBased in the United States,
SMBC Global Foundation
has distributed scholarships
to more than 5,000 university
students in Asian countries
since its establishment in
1994.
In the United States, it
supports study trips to Japan
organized by a high school in the Harlem area New York City.
Established in 1990, the SMBC Foundation for International
Cooperation aims to assist in developing the human resources
necessary to achieve sustainable growth in developing econo-
mies as well as promote international exchange activities. Since
its inception, the foundation has provided financial support for
7-8 students from Asian countries each year, to enable them to
attend universities in Japan. The foundation also offers subsi-
dies to research institutes and researchers undertaking projects
related to developing countries.
Environmental Activities
• Participation in Environmental Preservation InitiativesSMFG holds an “SMFG Clean-up Day” in which Group employ-
ees volunteer to pick up litter on beaches. In 2009, some 130
employees participated in this activity at two sites in Kanagawa
and Hyogo prefectures.
SMBC Friend Securities held its own beach cleanup events
in Chiba and Hyogo prefectures. About 130 employees took part.
In addition, employees of Sumitomo Mitsui Finance and Leasing
and Japan Research Institute regularly participate in cleanup
activities near their offices.
SMBC employees volunteered in the Sea Forest (tree-
planting) project organized by the Tokyo Metropolitan
Government, and also made donations to the project.

SMFG 2010 63
• SMBC Environmental Program NPO C.C.C Furano Field
SMBC also provides support
to an environmental project
implemented by screenwriter
Soh Kuramoto in Furano,
Hokkaido. SMBC is providing
support for reafforestation of
a golf course belonging to a
country club that was shut
down in Furano. C.C.C Furano Field holds educational courses
on environment, in particular exploring nature fully using the five
senses. Employees and their families are invited to tour the proj-
ect site to learn about and experience nature at first hand.
• Biodiversity Courses HeldIn fiscal 2009, SMBC held courses in Tokyo, Osaka and Nagoya
that enabled employees and family members to learn about bio-
diversity and become more closely involved in the tree-planting
movement by personally making “acorn cubes” (cubes of
earth and compost planted with an oak seedling). To teach the
courses, staff were invited from the Gobaimidori division of Annex
Co., Ltd., which was the recipi-
ent of the SMBC Prize in the
ecological contest eco japan
cup 2007 (an open competition
for environmental business
ventures), of which SMBC was
one of the sponsors.
• Support for EARTH PHOTO CONTESTSumitomo Mitsui Finance and Leasing supports a photography
contest aimed at communicating the importance of solving envi-
ronmental problems and spurring people to action. The company
presents the Sumitomo Mitsui Finance and Leasing Prize for
outstanding photographic entries.
Contributing to Cultural, Artistic, and Education Activities
•Charity Concert Held
SMBC has been arranging a charity concert, “A Toy Box of
Favorite Works,” every year since fiscal 2006, to support children
worldwide who have suffered from wars and natural disasters.
SMBC’s employee music societies, choir, chamber ensemble
and wind ensemble, perform a range of pieces from classical
favorites to Japanese songs, including anime songs, that appeal
to everyone from children to adults. Donations are collected from
the audience at the concert, and artwork submitted by children
around the world is displayed in the concert hall lobby. In addition,
a charity bazaar is held featuring items for sale that have been
handcrafted by SMBC employees.
•Children’s Illustration ContestSMBC held its first illustration contest for elementary school
children in Japan in fiscal 2007. In fiscal 2009, the contest saw
a large number of entries from children featuring unique ideas on
the theme of “Our Greener Future.” Winners were presented with
original bank passbooks featuring
their own entries. In addition, the
winning works were displayed
at SMBC branches throughout
Japan for the enjoyment of our
customers.
•Support for Cultural and Artistic VenturesIn support of the classical performing arts of Japan, Sumitomo
Mitsui Card donated a drop curtain to the National Theatre for the
National Engei Hall. The company also helps foster the next gen-
eration of Kabuki artists through sponsorship of performances by
children.
SMBC Friend Securities provides support for cultural and
artistic activities through sponsorship of art exhibitions such as
the works of Gyoshu Hayami (a painter of the traditional Nihonga
style) at the Yamatane Museum of Art.
•Financial and Economic EducationSMBC welcomes school field trips to bank branches and other
locations. Other financial and economic education activities
include a publication called What Does Bank Do?, a financial
education game on the SMBC website, support for Kidzania (job-
experience theme park for children), internship programs, and
many other programs. Sumitomo Mitsui Card, Japan Research
Institute and Nikko Cordial Securities also provide instructors for
classes at universities. Nikko Cordial Securities also organizes
tours and classes for students and members of the general
public to foster a deeper understanding of the work of securities
companies and the securities investment business.
•Student Internship ProgramThe Japan Research Institute welcomes student interns every
year to learn about career opportunities. The interns deepen
their understanding of the work performed by JRI by studying
at offices where next-generation business ventures are being
created in the fields of the environment and energy. SMBC Friend
Securities also offers internships every year. In fiscal 2009, 22
interns studied financial products and the securities business.

SMFG 201064
SMFG and the Group companies strive to create a workplace
for their human resources where each and every employee can
take pride in and be highly motivated about his or her work. In
the following pages, we would like to introduce some of initiatives
in the human resources area taken by SMBC, as well as by other
Group companies including Sumitomo Mitsui Card, Sumitomo
Mitsui Finance and Leasing, the Japan Research Institute, SMBC
Friend Securities, and Nikko Cordial Securities.
Five Goals of SMBC’s Human Resource Management
1. Maintain and strengthen sound business management to
enable SMBC to compete in global markets
2. Develop staff with specialized professional skills who can
provide customers with higher-value-added products and
services
3. Motivate employees even more strongly by respecting
their individuality based on understanding of the inherent
value of diversity and encouraging them to seek personal
fulfillment
4. Foster a corporate culture that encourages a forward-
looking and creative attitude and places value on mutual
collaboration
5. Be mindful of the social responsibilities of the Group,
and nurture a corporate culture that will contribute to the
healthy development of society
Training Staff with Specialized Professional SkillsTo provide a higher level of motivation for growth and develop-
ment among younger personnel, SMBC provides basic practical
training programs in consumer banking, corporate banking, and
operations under separate programs known as the Retail Banking
College, Corporate Banking College, and Banking Operations
College. Employees acquire the necessary business knowledge
and skills through a combina-
tion of on-the-job training and
classroom courses. SMBC
is currently reinforcing its
training system by assigning
mentors to new recruits at
the workplace and placing
regional and head-office men-
tors at the Training Institute.
Following the amendment of the Money Lending Business
Law, Sumitomo Mitsui Card has been putting increased effort into
the development of staff with professional expertise in the credit
business. Measures taken include active support for employees
to become registered money lending officers, and regularly hold-
ing in-house workshops on products and other topics.
Sumitomo Mitsui Finance and Leasing (SMFL) has estab-
lished “SMFL Standards,” which sets forth a human resources
development plan and methods for realizing its human resources
goal for each year. This is targeted principally at sogoshoku
(management-track) staff up to their fifth year in the company.
SMFL has created “Young Employees’ Growth Plan & Guide,”
based on the SMFL Standards and has also opened an in-house
business school that will be used to supplement on-the-job train-
ing from the current fiscal year onward.
The credo of Japan Research Institute (JRI) on human
resources is that its staff is the source of added value in its
solutions and proposals. In line with this, JRI has set up the
Staff Development Department within the Computer System
Division, and the Human Resources Incubation Center within the
Comprehensive Research Division for well-planned development
of human resources.
To improve young employees’ knowledge and raise their
skills so as to enable the company to cope effectively with the
diversification and increasing sophistication of the securities busi-
ness, SMBC Friend Securities has started a course of classes for
acquisition of in-house skill accreditation. It has also introduced
a tutor system to raise the effectiveness of on-the-job training for
new employees.
As a full-line securities company which needs to nurture a
wide variety of financial professionals, Nikko Cordial Securities
is working to provide enhanced training to impart the necessary
knowledge and skills in each specialist area. It has designated
the first three years after entering the company as the crucial
training period for young staff members, and is putting its full
corporate resources into cre-
ating an effective employee
development program.
In these ways, all Group
companies are taking mea-
sures to reinforce their human
resources development systems.
Creating a Corporate Culture that Derives Strength from Diversity
•Human Resources DiversityThe Group is implementing initiatives to create diversity (e.g.
gender, nationality) in the workplace. At SMBC, 40% of the new
university graduates hired for fiscal 2010 for sogoshoku and con-
sumer services positions were women, and the number of women
holding managerial positions has been increasing. In fiscal 2008,
the Diversity and Inclusion Department was established within
the Human Resources Department and other initiatives were
launched for creating a corporate culture that derives strength
from diversity.
•Revision of Personnel SystemTo enable motivated employees to take on the challenge of
performing more difficult work in a higher-level post, SMBC has
introduced a new workplace hierarchy system in which job rank-
ings are more finely subdivided. This should make it easier for
talented individuals to be quickly promoted to mid-management
levels. We are also aiming to create a more seamless organiza-
tional system in which an employee’s performance is evaluated
not simply in terms of a single year’s achievements on the job,
Human Resources
Corporate Banking College
Staff training at Nikko Cordial Securities

SMFG 2010 65
but also from the perspective of contribution to the company as
a whole.
•Creation of New Job TitlesSMBC has launched a new title, “Senior,” for ippanshoku (general
work) employees on the Business Career Path working in front-
office positions at the Middle Market Banking Unit. Sumitomo
Mitsui Card has likewise instituted a new ippanshoku employee
position using the term “Leader.” In this way, we are expanding
the playing field for ippanshoku staff so that they can be pro-
moted to managerial positions.
•Developing Staff Needed for Global OperationsAs a result of the growth of SMBC’s operations on the global
stage, proficiency in foreign languages is becoming increasingly
vital. To answer this need, SMBC is expanding its programs for
employees to study at language schools, and is assigning more
young employees to overseas offices.
SMBC is strongly committed to training national staff at its
overseas operations. The training facility established in Singapore
by the Asia Pacific Training Department covers a broad range
of subjects for employees in this region. Sessions are focused
primarily on business training and the development of capabilities
and skills. Furthermore, SMBC is taking steps to develop human
resources on a global scale by providing education in the his-
tory of the bank and its management philosophy to newly-hired
national staff during their training courses.
•Employing Persons with DisabilitiesSMBC has established a special company called SMBC Green
Service Co., Ltd. that provides employment opportunities for
people with physical disabilities. In December 2008, the company
opened the Kobe Branch, and in February 2009 the Unagidani
Office in Osaka for the purpose of creating jobs not only for
physically but also for mentally impaired persons. In addition, to
upgrade their skills, SMBC encourages its employees to partici-
pate actively in skill competitions for the disabled. Over the years,
a number of its employees have participated in the National Skill
Competition for the Disabled (known as the “Abilympics”), three
of whom were winners in the fiscal 2008 and 2009 competition.
As of March 2010, disabled people accounted for 1.90% of our
employees, above the legally mandatory level of 1.8%.
•Providing Support for a Good Work-Life BalanceThe Group has an employee support program that provides a
range of assistance for achieving a proper balance between work
and home. In fiscal 2008, Sumitomo Mitsui Card, SMFL, SMBC
Friend Securities, and JRI all drew up their own Work-Life Balance
Guidebook, based on actual experiences at SMBC. All Group
companies, including Nikko Cordial Securities, already operate
systems for parental leave, leave for taking care of sick children,
shorter working hours, restricted overtime work, and exemption
from late-night work. All these systems provide employee benefits
exceeding those mandated by law. In addition, SMBC, Sumitomo
Mitsui Card, and JRI provide child-care subsidies, while SMBC,
Sumitomo Mitsui Card, and SMFL operate a system for the rehir-
ing of former employees. These systems all help realize a good
work-life balance for the Group’s employees.
There are also annual Children’s Visitation Day and Family
Visitation Day to give employees’ family members a better under-
standing of employees’ work at SMBC, Sumitomo Mitsui Card,
SMFL, JRI, and SMBC Friend Securities. JRI also holds “Mama &
Papa Lunches” as forums for information exchange between
employees who are raising children while working. SMBC has
instituted a “Go Home Early to the Family Day,” while SMFL is
pursuing a campaign to encourage employees to reduce the
amount of overtime work. Nikko Cordial Securities has introduced
an online support system for employees returning to work after
parental leave. SMBC, Sumitomo Mitsui Card, and JRI have all
received the Kurumin certification from the Japanese Ministry
of Health, Labour and Welfare in recognition of their activities in
support of child rearing.
All Group companies are
doing their utmost to create
systems that ensure a good
work-life balance, as well as
workplaces where employees
can fully demonstrate their
abilities. We plan to pursue
such measures still further in
the future.
Heightening Awareness of Individual RightsAt SMBC, we have included in our principles of action the con-
cepts that “we will respect the individual human dignity of our
customers and employees” and “we will not permit discrimina-
tion of any kind.” We are implementing the following initiatives
to heighten the awareness of all employees regarding individual
rights.
• Conducting training meetings for manager-level staff (once a
year), and personnel newly appointed to management positions
and staff who have recently joined the bank
• Holding study meetings to discuss individual rights issues, with
manager-level personnel leading these sessions (twice a year)
• Soliciting slogans promoting individual rights from management
and staff (once a year)
l SMBC Named as One of the Best 25 Companies in Japan in the “Great Place to Work” RankingsIn March 2010, SMBC was selected for the third year running as one of the best companies in Japan as a place to work in the survey conducted by Great Place to Work® Institute Japan.* Great Place to Work® Institute, Inc., a U.S. company, is a survey organization that supplies data for the annual list of the “100 Best Places to Work” published by Fortune magazine. The survey has two major components: a survey of the internal systems and corporate culture of respondent companies, and a questionnaire survey of the employ-ees of these companies. The survey of employees receives a weighting of two-thirds in determining the final results.
Children’s Visitation Program

SMFG 201066
Staff ProfileSMBC �
March 31 2008 2009 2010
Number of employees* 20,273 23,543 25,122
Male 13,457 13,669 13,793
Percentage of total 66.38% 58.06% 54.90%
Female 6,816 9,874 11,329
Percentage of total 33.62% 41.94% 45.10%
Average age 38 yrs 7 mths 36 yrs 9 mths 36 yrs 2 mths
Male 40 yrs 10 mths 40 yrs 5 mths 40 yrs 2 mths
Female 34 yrs 2 mths 31 yrs 8 mths 31 yrs 3 mths
Average years of service 15 yrs 11 mths 13 yrs 10 mths 13 yrs 3 mths
Male 17 yrs 5 mths 16 yrs 11 mths 16 yrs 8 mths
Female 12 yrs 11 mths 9 yrs 6 mths 9 yrs 0 mths
Ratio of employees withdisabilities (% of total)** 2.05% 1.95% 1.90%
* The number of full-time employees, including employees seconded to other companies and organizations. The following have all been excluded from this total: executive officers, employees on short-term contracts, part-time employ-ees, employees of temporary employment agencies, and national staff at over-seas branches.
** As of March 1 of the respective years
April 1 2008 2009 2010
Number of new hires 1,254 962 569
Number of newly employed female graduates*** 518 388 204
Ratio of newly employed females to total new employees 41.3% 40.3% 35.9%
*** Includes sogoshoku staff and consumer service staff. Business Career Path employees are excluded.
Fiscal 2007 2008 2009
Number of women in managerial positions**** 354 456 584
Number of employees taking leave for child-rearing 163 222 331
Men taking such leave 22 27 29
Number of career hires 500 136 11
**** As of the end of the fiscal year
Sumitomo Mitsui Card �
March 31 2008 2009 2010
Number of employees* 1,989 2,156 2,247
Male 1,075 1,112 1,133
Percentage of total 54.05% 51.58% 50.42%
Female 914 1,044 1,114
Percentage of total 45.95% 48.42% 49.58%
Average age 36 yrs 4 mths 36 yrs 2 mths 36 yrs 4 mths
Male 39 yrs 8 mths 39 yrs 8 mths 39 yrs 10 mths
Female 32 yrs 2 mths 32 yrs 6 mths 32 yrs 10 mths
Average years of service 10 yrs 3 mths 10 yrs 3 mths 10 yrs 7 mths
Male 10 yrs 9 mths 11 yrs 2 mths 11 yrs 6 mths
Female 9 yrs 6 mths 9 yrs 4 mths 9 yrs 7 mths
* The number of full-time employees, including employees seconded to other companies and organizations. The following have all been excluded from this total: executive officers, employees on short-term contracts, part-time employ-ees, employees of temporary employment agencies, and national staff at over-seas branches.
April 1 2008 2009 2010
Number of new hires 114 98 84
Number of newly employed female graduates** 79 66 46
Ratio of newly employed females to total new employees 69.3% 67.3% 54.8%
** Includes contract employees
Sumitomo Mitsui Finance and Leasing �
March 31 2008 2009 2010
Number of employees* 1,575 1,640 1,666
Male 1,022 1,023 1,035
Percentage of total 64.89% 62.38% 62.12%
Female 553 617 631
Percentage of total 35.11% 37.62% 37.88%
Average age 37 yrs 2 mths 37 yrs 1 mths 37 yrs 3 mths
Male 40 yrs 2 mths 40 yrs 2 mths 40 yrs 3 mths
Female 31 yrs 9 mths 32 yrs 0 mths 32 yrs 4 mths
Average years of service 12 yrs 1 mths 12 yrs 1 mths 12 yrs 5 mths
Male 14 yrs 6 mths 14 yrs 10 mths 15 yrs 2 mths
Female 7 yrs 8 mths 7 yrs 6 mths 8 yrs 0 mths
* The number of full-time employees, including employees seconded to other companies and organizations. The following have all been excluded from this total: employees seconded from other companies and organizations, executive officers, employees on short-term contracts, part-time employees, employees of temporary employment agencies, and full-time employees of affiliates (including overseas subsidiaries).
April 1 2008 2009 2010
Number of new hires 48 40 28
Number of newly employed female graduates 5 2 1
Ratio of newly employed females to total new employees 10.4% 5.0% 3.6%
Japan Research Institute �
March 31 2008 2009 2010
Number of employees* 2,060 2,215 2,322
Male 1,618 1,732 1,792
Percentage of total 78.54% 78.19% 77.17%
Female 442 483 530
Percentage of total 21.46% 21.81% 22.83%
Average age 39 yrs 1 mths 38 yrs 11 mths 39 yrs 0 mths
Male 40 yrs 0 mths 39 yrs 8 mths 39 yrs 11 mths
Female 36 yrs 0 mths 35 yrs 11 mths 35 yrs 9 mths
Average years of service 9 yrs 8 mths 9 yrs 7 mths 9 yrs 11 mths
Male 10 yrs 0 mths 9 yrs 11 mths 10 yrs 3 mths
Female 8 yrs 8 mths 8 yrs 7 mths 8 yrs 8 mths
* The number of full-time employees, including employees seconded to other companies and organizations. The following have all been excluded from this total: executive officers, employees on short-term contracts, part-time employ-ees, employees of temporary employment agencies, and national staff at over-seas branches.
April 1 2008 2009 2010
Number of new hires 139 147 50
Number of newly employed female graduates** 39 46 14
Ratio of newly employed females to total new employees 28.1% 31.3% 28.0%
** Includes only sogoshoku staff. Ippanshoku staff are excluded.

SMFG 2010 67
SMBC Friend Securities �
March 31 2008 2009 2010
Number of employees* 1,911 2,011 2,072
Male 1,354 1,434 1,462
Percentage of total 70.85% 71.31% 70.56%
Female 557 577 610
Percentage of total 29.15% 28.69% 29.44%
Average age 36 yrs 9 mths 36 yrs 9 mths 36 yrs 11 mths
Male 39 yrs 3 mths 39 yrs 1 mths 39 yrs 4 mths
Female 30 yrs 9 mths 31 yrs 1 mths 31 yrs 4 mths
Average years of service 13 yrs 3 mths 13 yrs 2 mths 13 yrs 3 mths
Male 15 yrs 4 mths 15 yrs 1 mths 15 yrs 4 mths
Female 8 yrs 1 mths 8 yrs 3 mths 8 yrs 5 mths
* The number of full-time employees, including employees seconded to other companies and organizations. The following have all been excluded from this total: employees on short-term contracts, part-time employees, employees of temporary employment agencies, and national staff at overseas branches.
April 1 2008 2009 2010
Number of new hires 280 232 148
Number of newly employed female graduates** 132 117 68
Ratio of newly employed females to total new employees 47.1% 50.4% 45.9%
** Both non-area specified and area specified staff
Nikko Cordial Securities �
March* 2008 2009 2010
Number of employees** 7,137 6,004 6,584
Male 4,184 3,578 4,057
Percentage of total 58.62% 59.59% 61.62%
Female 2,953 2,426 2,527
Percentage of total 41.38% 40.41% 38.38%
Average age 37 yrs 8 mths 37 yrs 2 mths 38 yrs 1 mths
Male 38 yrs 11 mths 38 yrs 11 mths 39 yrs 6 mths
Female 36 yrs 0 mths 34 yrs 7 mths 35 yrs 9 mths
Average years of service 11 yrs 7 mths 12 yrs 0 mths 12 yrs 1 mths
Male 12 yrs 6 mths 13 yrs 0 mths 12 yrs 9 mths
Female 10 yrs 4 mths 10 yrs 7 mths 11 yrs 1 mths
* As of March 1 of the respective years** The number of full-time employees, including employees seconded to other
companies and organizations. The following have all been excluded from this total: executive officers, employees on short-term contracts, part-time employ-ees, employees of temporary employment agencies, and national staff at over-seas branches.
April 1 2008 2009 2010
Number of new hires*** 408 182 159
Number of newly employed female graduates 136 53 54
Ratio of newly employed females to total new employees 33.3% 29.1% 34.0%
*** Professional staff (Classes I-II) and FA
• The combined employment ratio for persons with disabilities for the above six companies was 1.88% as of March 2010.
Principal Work-Life Balance Systems (Employee Support Programs)
SMBC Sumitomo Mitsui CardSumitomo Mitsui Finance
and LeasingSMBC Friend Securities Japan Research Institute Nikko Cordial Securities
Parental leave18 months or maximum of 2 years in case of inability to place in daycare center
18 months or maximum of 2 years in case of inability to place in daycare center
1 year or maximum of 18 months in case of inability to place in daycare center
18 months or maximum of 2 years in case of inability to place in daycare center
18 months or maximum of 2 years in case of inability to place in daycare center
Up to 3 years old
Leave for taking care of sick
children
Up to March 31 in the 6th grade of elementary school (10 days per annum for one child; 20 days for two or more children)
Up to March 31 in the 6th grade of elementary school (5 days per annum for one child; 10 days for two or more children)
No restrictions on children’s age or number of days leave
Up to March 31 in the 3rd grade of elementary school (5 days per annum for one child; 10 days for two or more children)
Up to March 31 in the 6th grade of elementary school (5 days per annum for one child; 10 days for two or more children)
Up to entry into elementary school
Shorter working hours
Employees can choose shorter working hours for each day or fewer days worked per week, both applicable up to March 31 in the 6th grade of child’s elementary school.
Employees can choose shorter working hours for each day or fewer days worked per week, both applicable up to March 31 in the 3rd grade of the child’s elementary school.
Employees can reduce daily working hours to a minimum of 5 hours 30 minutes up to March 31 in the 6th grade of the child’s elementary school.
Employees can reduce daily working hours to between 6 hours and 6 hours 50 minutes up to March 31 in the 3rd grade of the child’s elementary school.
Employees can choose to work 6 hours per day (9:30 to 16:30) up to March 31 in the 3rd grade of the child’s elemen-tary school (this system can be combined with flextime).
Up to child’s entry into junior high school, employees can reduce working hours in incre-ments of 30 minutes for a maximum reduction of 2 hours 30 minutes per day.
Restrictions on overtime
Up to March 31 in the 6th grade of elementary school
Up to March 31 in the 3rd grade of elementary school
Up to entry into elementary school
Up to March 31 in the 3rd grade of elementary school
Up to entry into elementary school
Up to entry into junior high school
Exemption from late-night work
Up to March 31 in the 6th grade of elementary school
Up to March 31 in the 3rd grade of elementary school
Up to entry into elementary school
Up to March 31 in the 3rd grade of elementary school
For employees who are preg-nant or have given birth within 1 year
Up to entry into junior high school
Other principal systems
• Work relocations• Child-care subsidies• Leave to care for sick family
members• Shorter working hours to care
for sick family members• System for rehiring former
employees
• Work relocations• Child-care subsidies• Leave to care for sick family
members• System for rehiring former
employees
• Work relocations• System for rehiring former
employees
• Leave to care for sick family members
• Shorter working hours to care for sick family members
• Child-care subsidies• Leave to care for sick family
members• Shorter working hours to care
for sick family members
• Use of designated day-care center at discounted rates
• Leave to care for sick family members
• Special days off to care for sick family members
• Staggered working hours (shift system)

SMFG 201068

SMFG 2010 69
Financial Data Corporate Data
SMFGConsolidated Balance Sheets ..................................... 70
Consolidated Statements of Operations ...................... 72
Consolidated Statements of Changes in Net Assets ............................................... 73
Consolidated Statements of Cash Flows ..................... 75
Notes to Consolidated Financial Statements ............... 77
Independent Auditors’ Report ...................................... 132
SMBCSupplemental Information ............................................ 133
SMFGIncome Analysis (Consolidated) .................................. 138
Assets and Liabilities (Consolidated) ........................... 141
Capital (Nonconsolidated) ........................................... 144
SMBCIncome Analysis (Consolidated) .................................. 147
Assets and Liabilities (Consolidated) ........................... 150
Income Analysis (Nonconsolidated) ............................ 152
Deposits (Nonconsolidated) ........................................ 156
Loans (Nonconsolidated) ............................................. 158
Securities (Nonconsolidated) ....................................... 163
Ratios (Nonconsolidated) ............................................ 165
Capital (Nonconsolidated) ........................................... 167
Others (Nonconsolidated) ............................................ 168
Trust Assets and Liabilities (Nonconsolidated) ............ 170
Capital Ratio Information
SMFGCapital Ratio Information (Consolidated) ..................... 171
SMBCCapital Ratio Information ............................................. 203
Sumitomo Mitsui Financial Group, Inc.
Board of Directors, Corporate Auditors, and Executive Officers .......................................... 205
SMFG Organization ................................................ 205
Sumitomo Mitsui Banking Corporation
Board of Directors, Corporate Auditors, and Executive Officers .......................................... 206
SMBC Organization ................................................ 208
Principal Subsidiaries and Affiliates
Principal Domestic Subsidiaries .............................. 210
Principal Overseas Subsidiaries ............................. 211
Principal Affiliates .................................................... 212
International Directory ................................................. 213
Financial Section and Corporate Data
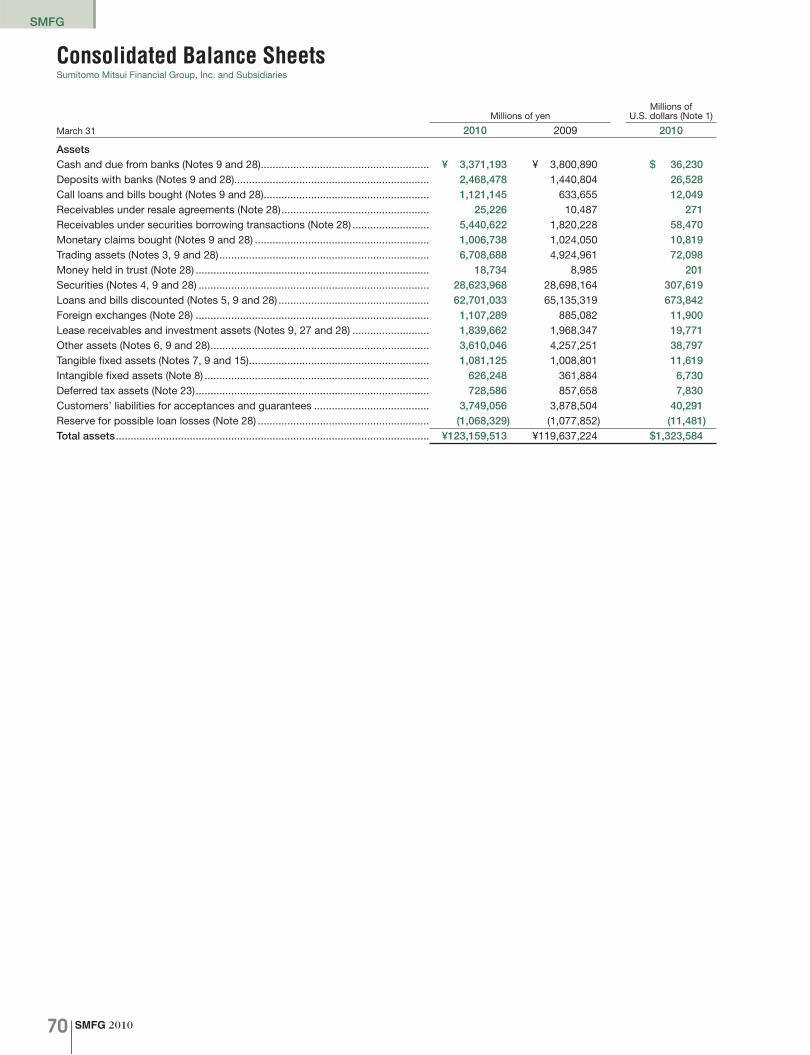
SMFG 201070
SMFG
Consolidated Balance SheetsSumitomo Mitsui Financial Group, Inc. and Subsidiaries
Millions of yenMillions of
U.S. dollars (Note 1)
March 31 2010 2009 2010
AssetsCash and due from banks (Notes 9 and 28) ......................................................... ¥ 3,371,193 ¥ 3,800,890 $ 36,230Deposits with banks (Notes 9 and 28).................................................................. 2,468,478 1,440,804 26,528Call loans and bills bought (Notes 9 and 28) ........................................................ 1,121,145 633,655 12,049Receivables under resale agreements (Note 28) .................................................. 25,226 10,487 271Receivables under securities borrowing transactions (Note 28) .......................... 5,440,622 1,820,228 58,470Monetary claims bought (Notes 9 and 28) ........................................................... 1,006,738 1,024,050 10,819Trading assets (Notes 3, 9 and 28) ....................................................................... 6,708,688 4,924,961 72,098Money held in trust (Note 28) ............................................................................... 18,734 8,985 201Securities (Notes 4, 9 and 28) .............................................................................. 28,623,968 28,698,164 307,619Loans and bills discounted (Notes 5, 9 and 28) ................................................... 62,701,033 65,135,319 673,842Foreign exchanges (Note 28) ............................................................................... 1,107,289 885,082 11,900Lease receivables and investment assets (Notes 9, 27 and 28) .......................... 1,839,662 1,968,347 19,771Other assets (Notes 6, 9 and 28) .......................................................................... 3,610,046 4,257,251 38,797Tangible fixed assets (Notes 7, 9 and 15) ............................................................. 1,081,125 1,008,801 11,619Intangible fixed assets (Note 8) ............................................................................ 626,248 361,884 6,730Deferred tax assets (Note 23) ............................................................................... 728,586 857,658 7,830Customers’ liabilities for acceptances and guarantees ....................................... 3,749,056 3,878,504 40,291Reserve for possible loan losses (Note 28) .......................................................... (1,068,329) (1,077,852) (11,481)Total assets .......................................................................................................... ¥123,159,513 ¥119,637,224 $1,323,584

SMFG 2010 71
SMFGConsolidated Balance Sheets
Millions of yenMillions of
U.S. dollars (Note 1)
March 31 2010 2009 2010
Liabilities and net assetsLiabilitiesDeposits (Notes 9, 10 and 28) .............................................................................. ¥ 85,644,215 ¥ 83,030,782 $ 920,411Call money and bills sold (Notes 9 and 28) .......................................................... 2,119,557 2,499,113 22,779Payables under repurchase agreements (Notes 9 and 28) .................................. 1,120,860 778,993 12,046Payables under securities lending transactions (Notes 9 and 28) ....................... 4,315,774 7,589,283 46,381Commercial paper (Note 28) ................................................................................ 310,787 — 3,340Trading liabilities (Notes 9, 11 and 28).................................................................. 5,066,727 3,597,658 54,452Borrowed money (Notes 9, 12 and 28)................................................................. 5,470,578 4,644,699 58,792Foreign exchanges (Note 28) ............................................................................... 192,299 281,145 2,066Short-term bonds (Notes 13 and 28).................................................................... 1,212,178 1,019,342 13,027Bonds (Notes 13 and 28) ...................................................................................... 3,422,672 3,683,483 36,783Due to trust account (Note 28) ............................................................................. 159,554 60,918 1,715Other liabilities (Notes 9, 14, 27 and 28) .............................................................. 3,193,146 3,803,046 34,316Reserve for employee bonuses ............................................................................ 43,443 27,659 467Reserve for executive bonuses ............................................................................ 2,333 513 25Reserve for employee retirement benefits (Note 26) ............................................ 41,691 35,643 448Reserve for executive retirement benefits ............................................................ 8,216 7,965 88Reserve for reimbursement of deposits ............................................................... 11,734 11,767 126Reserve under the special laws ........................................................................... 393 432 4Deferred tax liabilities (Note 23) ........................................................................... 26,520 27,287 285Deferred tax liabilities for land revaluation (Note 15) ............................................ 46,966 47,217 505Acceptances and guarantees (Note 9) ................................................................. 3,749,056 3,878,504 40,291Total liabilities ...................................................................................................... 116,158,708 115,025,460 1,248,347
Net assets (Note 24)Capital stock (Note 16) ........................................................................................ 2,337,895 1,420,877 25,125Capital surplus ..................................................................................................... 978,897 57,245 10,520Retained earnings ................................................................................................ 1,451,945 1,245,085 15,604Treasury stock ..................................................................................................... (124,061) (124,024) (1,333)Total stockholders’ equity ................................................................................... 4,644,677 2,599,183 49,916Net unrealized gains (losses) on other securities (Notes 23 and 28) .................... 412,708 (14,649) 4,435Net deferred losses on hedges (Notes 23 and 30) ............................................... (39,367) (20,835) (423)Land revaluation excess (Note 15) ....................................................................... 34,955 35,159 375Foreign currency translation adjustments ............................................................ (101,650) (129,068) (1,092)Total valuation and translation adjustments ...................................................... 306,646 (129,394) 3,295Stock acquisition rights (Note 31) ........................................................................ 81 66 1Minority interests ................................................................................................. 2,049,400 2,141,908 22,025Total net assets .................................................................................................... 7,000,805 4,611,764 75,237Total liabilities and net assets ............................................................................. ¥123,159,513 ¥119,637,224 $1,323,584
See accompanying notes to consolidated financial statements.
(Continued)

SMFG 201072
SMFG
Consolidated Statements of OperationsSumitomo Mitsui Financial Group, Inc. and Subsidiaries
Millions of yenMillions of
U.S. dollars (Note 1)
Year ended March 31 2010 2009 2010
IncomeInterest income ..................................................................................................... ¥1,695,805 ¥2,087,348 $18,225
Interest on loans and discounts ....................................................................... 1,287,955 1,564,768 13,842Interest and dividends on securities ................................................................. 241,216 299,616 2,592Interest on receivables under resale agreements ............................................. 902 1,750 10Interest on receivables under securities borrowing transactions ..................... 5,413 4,506 58Interest on deposits with banks ....................................................................... 14,757 42,738 159Interest on lease transactions ........................................................................... 74,542 77,772 801Other interest income ....................................................................................... 71,018 96,195 763
Trust fees .............................................................................................................. 1,778 2,122 19Fees and commissions (Note 17) ......................................................................... 729,364 672,752 7,838Trading income (Note 18) ..................................................................................... 194,087 211,738 2,086Other operating income (Note 19) ........................................................................ 453,012 529,599 4,869Other income (Note 21) ........................................................................................ 110,638 52,973 1,189Total income ........................................................................................................ 3,184,688 3,556,536 34,226
ExpensesInterest expenses ................................................................................................. 314,893 748,894 3,384
Interest on deposits .......................................................................................... 180,021 374,359 1,935Interest on borrowings and rediscounts ........................................................... 44,174 85,274 475Interest on payables under repurchase agreements ........................................ 1,390 7,298 15Interest on payables under securities lending transactions ............................. 6,165 59,962 66Interest on bonds and short-term bonds ......................................................... 73,652 89,256 791Other interest expenses ................................................................................... 9,489 132,743 102
Fees and commissions payments (Note 17) ........................................................ 120,748 115,574 1,298Other operating expenses (Note 20) .................................................................... 401,773 473,212 4,318General and administrative expenses .................................................................. 1,161,302 1,063,419 12,480Provision for reserve for possible loan losses ...................................................... 201,620 402,807 2,167Other expenses (Note 22) ..................................................................................... 426,252 723,131 4,581Total expenses ..................................................................................................... 2,626,590 3,527,040 28,228Income before income taxes and minority interests ......................................... 558,097 29,495 5,998Income taxes (Note 23):
Current .............................................................................................................. 104,110 72,238 1,119Deferred ............................................................................................................ 74,759 262,405 804
Minority interests in net income ........................................................................... 107,668 68,308 1,157Net income (loss) ................................................................................................. ¥ 271,559 ¥ (373,456) $ 2,918
See accompanying notes to consolidated financial statements.

SMFG 2010 73
SMFG
Millions of yenMillions of
U.S. dollars (Note 1)
Year ended March 31 2010 2009 2010
Stockholders’ equityCapital stock
Balance at the end of the previous fiscal year.................................................. ¥1,420,877 ¥1,420,877 $15,270Changes in the fiscal year:
Issuance of new shares ................................................................................ 917,018 — 9,855Net changes in the fiscal year....................................................................... 917,018 — 9,855
Balance at the end of the fiscal year ................................................................ ¥2,337,895 ¥1,420,877 $25,125Capital surplus
Balance at the end of the previous fiscal year.................................................. 57,245 57,826 615Changes in the fiscal year:
Issuance of new shares ................................................................................ 928,094 — 9,974Disposal of treasury stock ............................................................................ (108) (580) (1)Decrease due to decrease in affiliates .......................................................... (6,333) — (68)Net changes in the fiscal year....................................................................... 921,652 (580) 9,905
Balance at the end of the fiscal year ................................................................ ¥ 978,897 ¥ 57,245 $10,520Retained earnings
Balance at the end of the previous fiscal year.................................................. 1,245,085 1,740,610 13,381 Decrease in retained earnings at the beginning of the fiscal year due to accounting change of overseas subsidiaries ................................................. — (3,132) —Changes in the fiscal year:
Cash dividends ............................................................................................ (71,174) (118,833) (765)Net income (loss) .......................................................................................... 271,559 (373,456) 2,918Increase due to increase in subsidiaries ....................................................... 8 19 0Increase due to decrease in subsidiaries ..................................................... 3 8 0Decrease due to increase in subsidiaries ..................................................... (11) (14) (0)Decrease due to decrease in subsidiaries .................................................... (1) (1) (0)Increase due to decrease in affiliates ........................................................... 6,333 — 68Reversal of land revaluation excess ............................................................. 141 (114) 2Net changes in the fiscal year....................................................................... 206,859 (492,392) 2,223
Balance at the end of the fiscal year ................................................................ ¥1,451,945 ¥1,245,085 $15,604Treasury stock
Balance at the end of the previous fiscal year.................................................. (124,024) (123,989) (1,333)Changes in the fiscal year:
Purchase of treasury stock ........................................................................... (189) (943) (2)Disposal of treasury stock ............................................................................ 152 907 2Net changes in the fiscal year....................................................................... (36) (35) (0)
Balance at the end of the fiscal year ................................................................ ¥ (124,061) ¥ (124,024) $ (1,333)Total stockholders’ equity
Balance at the end of the previous fiscal year.................................................. 2,599,183 3,095,324 27,933Decrease in retained earnings at the beginning of the fiscal year due to accounting change of overseas subsidiaries ................................................. — (3,132) —Changes in the fiscal year:
Issuance of new shares ................................................................................ 1,845,113 — 19,829Cash dividends ............................................................................................. (71,174) (118,833) (765)Net income (loss) .......................................................................................... 271,559 (373,456) 2,918Purchase of treasury stock ........................................................................... (189) (943) (2)Disposal of treasury stock ............................................................................ 43 326 1Increase due to increase in subsidiaries ....................................................... 8 19 0Increase due to decrease in subsidiaries ..................................................... 3 8 0Decrease due to increase in subsidiaries ..................................................... (11) (14) (0)Decrease due to decrease in subsidiaries .................................................... (1) (1) (0)Increase due to decrease in affiliates ........................................................... 6,333 — 68Decrease due to decrease in affiliates .......................................................... (6,333) — (68)Reversal of land revaluation excess ............................................................. 141 (114) 2Net changes in the fiscal year....................................................................... 2,045,493 (493,008) 21,983
Balance at the end of the fiscal year ................................................................ ¥4,644,677 ¥2,599,183 $49,916
Consolidated Statements of Changes in Net AssetsSumitomo Mitsui Financial Group, Inc. and Subsidiaries
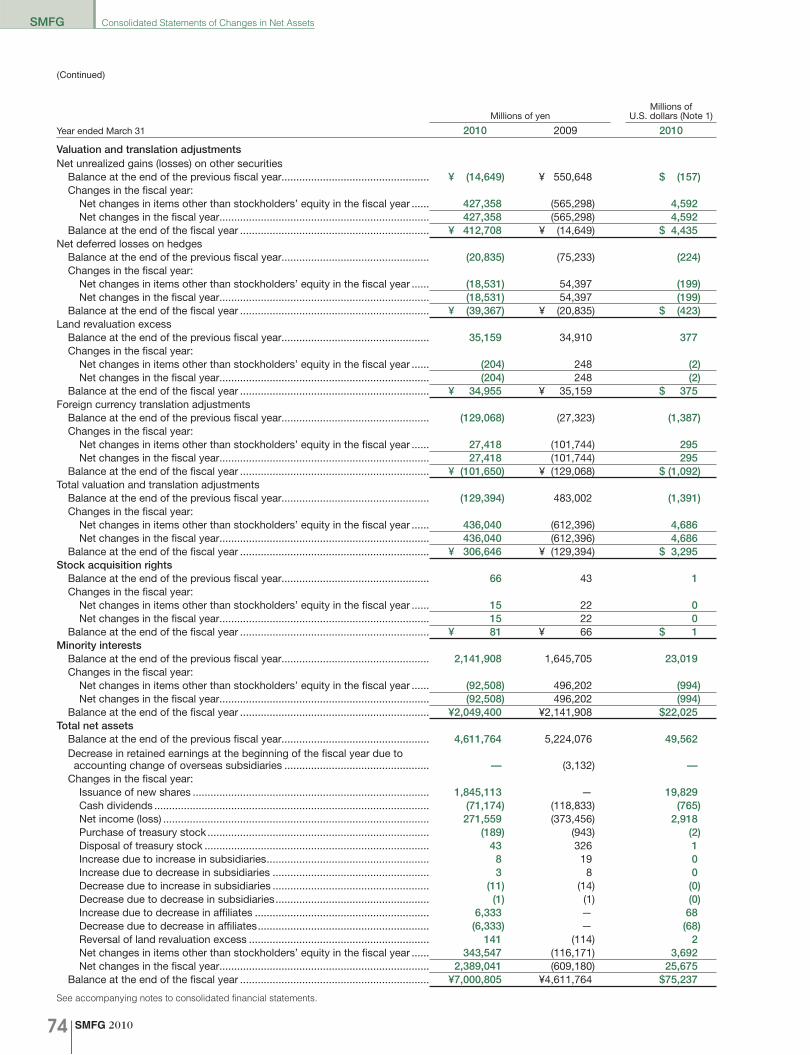
SMFG 201074
SMFG Consolidated Statements of Changes in Net Assets
Millions of yenMillions of
U.S. dollars (Note 1)
Year ended March 31 2010 2009 2010
Valuation and translation adjustmentsNet unrealized gains (losses) on other securities
Balance at the end of the previous fiscal year.................................................. ¥ (14,649) ¥ 550,648 $ (157)Changes in the fiscal year:
Net changes in items other than stockholders’ equity in the fiscal year ...... 427,358 (565,298) 4,592Net changes in the fiscal year....................................................................... 427,358 (565,298) 4,592
Balance at the end of the fiscal year ................................................................ ¥ 412,708 ¥ (14,649) $ 4,435Net deferred losses on hedges
Balance at the end of the previous fiscal year.................................................. (20,835) (75,233) (224)Changes in the fiscal year:
Net changes in items other than stockholders’ equity in the fiscal year ...... (18,531) 54,397 (199)Net changes in the fiscal year....................................................................... (18,531) 54,397 (199)
Balance at the end of the fiscal year ................................................................ ¥ (39,367) ¥ (20,835) $ (423)Land revaluation excess
Balance at the end of the previous fiscal year.................................................. 35,159 34,910 377Changes in the fiscal year:
Net changes in items other than stockholders’ equity in the fiscal year ...... (204) 248 (2)Net changes in the fiscal year....................................................................... (204) 248 (2)
Balance at the end of the fiscal year ................................................................ ¥ 34,955 ¥ 35,159 $ 375Foreign currency translation adjustments
Balance at the end of the previous fiscal year.................................................. (129,068) (27,323) (1,387)Changes in the fiscal year:
Net changes in items other than stockholders’ equity in the fiscal year ...... 27,418 (101,744) 295Net changes in the fiscal year....................................................................... 27,418 (101,744) 295
Balance at the end of the fiscal year ................................................................ ¥ (101,650) ¥ (129,068) $ (1,092)Total valuation and translation adjustments
Balance at the end of the previous fiscal year.................................................. (129,394) 483,002 (1,391)Changes in the fiscal year:
Net changes in items other than stockholders’ equity in the fiscal year ...... 436,040 (612,396) 4,686Net changes in the fiscal year....................................................................... 436,040 (612,396) 4,686
Balance at the end of the fiscal year ................................................................ ¥ 306,646 ¥ (129,394) $ 3,295Stock acquisition rights
Balance at the end of the previous fiscal year.................................................. 66 43 1Changes in the fiscal year:
Net changes in items other than stockholders’ equity in the fiscal year ...... 15 22 0Net changes in the fiscal year....................................................................... 15 22 0
Balance at the end of the fiscal year ................................................................ ¥ 81 ¥ 66 $ 1Minority interests
Balance at the end of the previous fiscal year.................................................. 2,141,908 1,645,705 23,019Changes in the fiscal year:
Net changes in items other than stockholders’ equity in the fiscal year ...... (92,508) 496,202 (994)Net changes in the fiscal year....................................................................... (92,508) 496,202 (994)
Balance at the end of the fiscal year ................................................................ ¥2,049,400 ¥2,141,908 $22,025Total net assets
Balance at the end of the previous fiscal year.................................................. 4,611,764 5,224,076 49,562Decrease in retained earnings at the beginning of the fiscal year due to accounting change of overseas subsidiaries ................................................. — (3,132) —Changes in the fiscal year:
Issuance of new shares ................................................................................ 1,845,113 — 19,829Cash dividends ............................................................................................. (71,174) (118,833) (765)Net income (loss) .......................................................................................... 271,559 (373,456) 2,918Purchase of treasury stock ........................................................................... (189) (943) (2)Disposal of treasury stock ............................................................................ 43 326 1Increase due to increase in subsidiaries ....................................................... 8 19 0Increase due to decrease in subsidiaries ..................................................... 3 8 0Decrease due to increase in subsidiaries ..................................................... (11) (14) (0)Decrease due to decrease in subsidiaries .................................................... (1) (1) (0)Increase due to decrease in affiliates ........................................................... 6,333 — 68Decrease due to decrease in affiliates .......................................................... (6,333) — (68)Reversal of land revaluation excess ............................................................. 141 (114) 2Net changes in items other than stockholders’ equity in the fiscal year ...... 343,547 (116,171) 3,692Net changes in the fiscal year....................................................................... 2,389,041 (609,180) 25,675
Balance at the end of the fiscal year ................................................................ ¥7,000,805 ¥4,611,764 $75,237
See accompanying notes to consolidated financial statements.
(Continued)

SMFG 2010 75
SMFG
Consolidated Statements of Cash FlowsSumitomo Mitsui Financial Group, Inc. and Subsidiaries
Millions of yenMillions of
U.S. dollars (Note 1)
Year ended March 31 2010 2009 2010
Cash flows from operating activities:Income before income taxes and minority interests ........................................ ¥ 558,097 ¥ 29,495 $ 5,998Depreciation ..................................................................................................... 136,860 123,025 1,471Losses on impairment of fixed assets .............................................................. 12,856 7,363 138Amortization of goodwill ................................................................................... 18,634 8,388 200Equity in losses of affiliates .............................................................................. 21,542 94,876 231Net change in reserve for possible loan losses ................................................ (1,419) 191,190 (15)Net change in reserve for employee bonuses .................................................. 7,543 102 81Net change in reserve for executive bonuses .................................................. 813 (630) 9Net change in reserve for employee retirement benefits .................................. 903 2,273 10Net change in reserve for executive retirement benefits .................................. 204 58 2Net change in reserve for reimbursement of deposits ..................................... (43) 1,350 (0)Interest income ................................................................................................. (1,695,805) (2,087,348) (18,225)Interest expenses ............................................................................................. 314,893 748,894 3,384Net (gains) losses on securities ........................................................................ (19,837) 155,831 (213)Net losses from money held in trust ................................................................. 245 134 3Net exchange losses ........................................................................................ 83,038 184,195 892Net (gains) losses from disposal of fixed assets .............................................. (11,176) 10,847 (120)Net change in trading assets ............................................................................ (983,770) (912,601) (10,572)Net change in trading liabilities ........................................................................ 1,195,098 1,028,101 12,844Net change in loans and bills discounted ........................................................ 3,591,071 (3,439,852) 38,593Net change in deposits ..................................................................................... 1,918,359 3,031,427 20,616Net change in negotiable certificates of deposit .............................................. (462,243) 4,384,033 (4,968)Net change in borrowed money (excluding subordinated borrowings) ............ 541,021 475,829 5,814Net change in deposits with banks .................................................................. (770,291) 764,080 (8,278) Net change in call loans and bills bought and others ...................................... (474,477) 409,341 (5,099)Net change in receivables under securities borrowing transactions ................ (3,226,847) 119,941 (34,679) Net change in call money and bills sold and others ......................................... (473,642) (1,186,720) (5,090)Net change in commercial paper ..................................................................... 310,787 — 3,340Net change in payables under securities lending transactions ........................ (3,409,463) 1,857,241 (36,641)Net change in foreign exchanges (assets) ........................................................ (220,622) 2,261 (2,371)Net change in foreign exchanges (liabilities) .................................................... (89,277) (19,280) (959)Net change in lease receivables and investment assets .................................. 202,531 46,904 2,177Net change in short-term bonds (liabilities) ...................................................... 168,836 244,242 1,814Issuance and redemption of bonds (excluding subordinated bonds) .............. (211,844) (283,810) (2,277)Net change in due to trust account .................................................................. 98,635 (19,878) 1,060Interest received ............................................................................................... 1,760,370 2,132,561 18,919Interest paid ...................................................................................................... (341,821) (765,686) (3,674)Other, net .......................................................................................................... (321,815) 137,137 (3,459)Subtotal ............................................................................................................ (1,772,056) 7,475,320 (19,044)Income taxes paid ............................................................................................ (108,864) (107,266) (1,170)
Net cash provided by (used in) operating activities .......................................... (1,880,921) 7,368,053 (20,214)

SMFG 201076
SMFG Consolidated Statements of Cash Flows
Millions of yenMillions of
U.S. dollars (Note 1)
Year ended March 31 2010 2009 2010
Cash flows from investing activities:Purchases of securities .................................................................................... ¥(46,300,009) ¥(53,213,459) $(497,582)Proceeds from sale of securities ...................................................................... 32,626,376 34,674,690 350,633Proceeds from maturity of securities ................................................................ 14,263,916 12,176,246 153,293Purchases of money held in trust ..................................................................... (9,748) (2,135) (105)Proceeds from sale of money held in trust ....................................................... 27 0 0Purchases of tangible fixed assets ................................................................... (156,154) (175,632) (1,678)Proceeds from sale of tangible fixed assets ..................................................... 37,114 12,081 399Purchases of intangible fixed assets ................................................................ (82,287) (74,489) (884)Proceeds from sale of intangible fixed assets .................................................. 111 58 1Purchases of stocks of subsidiaries ................................................................. — (21,925) —Proceeds from sale of stocks of subsidiaries ................................................... — 363 —Purchases of treasury stocks of subsidiaries ................................................... — (20,000) —Proceeds from purchase of stocks of subsidiaries resulting in change in scope of consolidation ................................................................................... — 355 —Purchases of stocks of subsidiaries resulting in change in scope of consolidation .................................................................................................. (537,007) (8,675) (5,771)Proceeds from sale of stocks of subsidiaries resulting in change in scope of consolidation ................................................................................... — 13,264 —
Net cash used in investing activities .................................................................. (157,661) (6,639,254) (1,694)Cash flows from financing activities:
Proceeds from issuance of subordinated borrowings ...................................... 8,000 5,000 86Repayment of subordinated borrowings .......................................................... (78,000) (92,500) (838)Proceeds from issuance of subordinated bonds and bonds with stock acquisition rights .................................................................................... 611,172 380,600 6,568Repayment of subordinated bonds and bonds with stock acquisition rights ............................................................................................. (639,981) (316,874) (6,878)Proceeds from issuance of stocks ................................................................... 1,824,896 — 19,612Dividends paid .................................................................................................. (71,063) (118,758) (764)Proceeds from contributions paid by minority stockholders ............................ 388,000 1,046,529 4,170Repayment to minority stockholders ................................................................ (492,987) (460,564) (5,298)Dividends paid to minority stockholders .......................................................... (98,791) (90,162) (1,062)Purchases of treasury stock ............................................................................. (189) (943) (2)Proceeds from disposal of treasury stock ........................................................ 43 326 1
Net cash provided by financing activities .......................................................... 1,451,099 352,652 15,595Effect of exchange rate changes on cash and due from banks........................ (302) (17,315) (3)Net change in cash and due from banks ........................................................... (587,786) 1,064,136 (6,316)Cash and due from banks at the beginning of the year .................................... 3,800,890 2,736,752 40,847Change in cash and due from banks due to merger of consolidated subsidiary ................................................................... 158,089 — 1,699Change in cash and due from banks due to newly consolidated subsidiaries ...................................................................... — 0 —Cash and due from banks at the end of the year .............................................. ¥ 3,371,193 ¥ 3,800,890 $ 36,230
See accompanying notes to consolidated financial statements.
(Continued)

SMFG 2010 77
SMFG
1. Basis of PresentationSumitomo Mitsui Financial Group, Inc. (“SMFG”) was established on December 2, 2002 as a holding company for the SMFG group through a statutory share transfer (kabushiki iten) of all of the out-standing equity securities of Sumitomo Mitsui Banking Corporation (“SMBC”) in exchange for SMFG’s newly issued securities. SMFG is a joint stock corporation with limited liability (Kabushiki Kaisha) incorporated under the Company Act of Japan. Upon formation of SMFG and completion of the statutory share transfer, SMBC became a direct wholly owned subsidiary of SMFG. SMFG has prepared the accompanying consolidated financial statements in accordance with the provisions set forth in the Japanese Financial Instruments and Exchange Act and its related accounting regulations, and in conformity with accounting principles gener-ally accepted in Japan (“Japanese GAAP”), which are different in certain respects as to application and disclosure requirements from International Financial Reporting Standards. The accounts of overseas subsidiaries and affiliated companies were based on accounting records maintained in conformity with generally accepted accounting principles (“GAAP”) prevailing in the respective countries of their domicile. Effective as from the fiscal year starting April 1, 2008, their accounting principles are in principle integrated with those of SMFG’s accounting policies for purposes of consolidation unless they apply different accounting principles and standards as required under U.S. GAAP or International Financial Reporting Standards in which case a certain limited number of items are adjusted based on their materiality. This change did not result in significant differences or impact on the consolidated financial state-ments of SMFG. The accompanying consolidated financial statements have been restructured and translated into English from the consolidated financial statements of SMFG prepared in accordance with Japanese GAAP. Some supplementary information included in the statutory Japanese language consolidated financial statements, but not necessarily required for fair presentation, is not presented in the accompanying consolidated financial statements. Amounts less than 1 million yen have been omitted. As a result, the totals in Japanese yen shown in the financial statements do not necessarily agree with the sum of the individual amounts. The translation of the Japanese yen amounts into U.S. dollars is included solely for the convenience of readers outside Japan, using the prevail-ing exchange rate at March 31, 2010, which was ¥93.05 to US$1. These translations should not be construed as representations that the Japanese yen amounts have been, could have been, or could in the future be, converted into U.S. dollars at that rate.
2. Significant Accounting Policies(1) Consolidation and equity method
(a) Scope of consolidationJapanese accounting standards on consolidated financial statements require a company to consolidate any subsidiary when the company substantially controls the operations of the enterprise, even if it is not a majority owned subsidiary. Control is defined as the power to govern the decision-making body of an enterprise.(i) Consolidated subsidiariesThe number of consolidated subsidiaries is as follows:March 31 2010 2009Consolidated subsidiaries .............. 307 288
Principal companies: Sumitomo Mitsui Banking Corporation THE MINATO BANK, LTD. Kansai Urban Banking Corporation Sumitomo Mitsui Banking Corporation Europe Limited Sumitomo Mitsui Banking Corporation (China) Limited Manufacturers Bank Sumitomo Mitsui Finance and Leasing Company, Limited Sumitomo Mitsui Card Company, Limited SMBC Finance Service Co., Ltd. SMBC Friend Securities Co., Ltd. Nikko Cordial Securities Inc. The Japan Research Institute, Limited SMBC Capital Markets, Inc.
Changes in the consolidated subsidiaries in the fiscal year ended March 31, 2010 are as follows: 62 companies including Nikko Cordial Securities Inc. were newly consolidated due mainly to acquisition of shares. 35 companies including QUOQ Inc. were excluded from the scope of consolidation because they were no longer subsidiaries due to merger and other reasons. Furthermore, 8 companies including Apricot Navigation Co., Ltd. were excluded from the scope of consolidation and became unconsolidated subsidiaries that are not accounted for by the equity method because they became operators of silent partnerships for lease transactions.(ii) Unconsolidated subsidiariesPrincipal company: SBCS Co., Ltd.
214 subsidiaries including SMLC MAHOGANY CO., LTD. are operators of silent partnerships for lease transac-tions and their assets and profits/losses do not belong to them substantially. Therefore, they have been excluded from the scope of consolidation pursuant to Article 5, Paragraph 1, Item 2 of the Consolidated Financial Statements Regulations. Other unconsolidated subsidiaries are also excluded from the scope of consolidation because their total amounts in terms of total assets, ordinary income, net income and retained earnings are immaterial, and as such, they do not hinder a rational judgment of SMFG’s financial position and results of operations when excluded from the scope of consolidation.
(b) Application of the equity methodJapanese accounting standards also require that any unconsolidated subsidiaries and affiliates which SMFG is able to exercise material influence over their financial and operating policies be accounted for by the equity method.(i) Unconsolidated subsidiaries accounted for by the equity
methodThe number of unconsolidated subsidiaries accounted for by the equity method is as follows:March 31 2010 2009Unconsolidated subsidiaries .......... 4 4
Principal company: SBCS Co., Ltd.
Notes to Consolidated Financial StatementsSumitomo Mitsui Financial Group, Inc. and SubsidiariesYears ended March 31, 2010 and 2009

SMFG 201078
SMFG Notes to Consolidated Financial Statements
(ii) Affiliates accounted for by the equity methodThe number of affiliates accounted for by the equity method is as follows:March 31 2010 2009Affiliates....................................... 54 75
Principal companies: Sumitomo Mitsui Auto Service Company, Limited Promise Co., Ltd. Cedyna Financial Corporation Daiwa SMBC Capital Co., Ltd. Daiwa SB Investments Ltd. Sumitomo Mitsui Asset Management Company, Limited
Changes in the affiliates accounted for by the equity method in the fiscal year ended March 31, 2010 are as follows: 16 companies including P.T. Nikko Securities Indonesia newly became affiliated companies accounted for by the equity method due mainly to acquisition of shares. 2 companies including AJCC CORPORATION were excluded from the scope of affiliated companies accounted for by the equity method because they became consolidated subsidiaries due to an increase in shareholding ratio. 35 companies including Daiwa Securities SMBC Co. Ltd. were also excluded due to a sale of stocks and other reasons.(iii) Unconsolidated subsidiaries that are not accounted for
by the equity method214 subsidiaries including SMLC MAHOGANY CO., LTD. are operators of silent partnerships for lease transac-tions and their assets and profits/losses do not belong to them substantially. Therefore, they have not been accounted for by the equity method pursuant to Article 10, Paragraph 1, Item 2 of the Consolidated Financial Statements Regulations.(iv) Affiliates that are not accounted for by the equity
methodPrincipal company: Daiwa SB Investments (USA) Ltd.
Affiliates that are not accounted for by the equity method are excluded from the scope of equity method because the attributable portions to SMFG from their total amounts in terms of net income and retained earnings are immaterial, and as such, they do not hinder a rational judgment of SMFG’s financial position and results of operations when excluded from the scope of equity method.
(c) The balance sheet dates of consolidated subsidiaries(i) The balance sheet dates of the consolidated subsidiaries
are as follows:March 31 2010 2009May 31 ......................................... — 1June 30 ........................................ 4 6July 31 ......................................... 2 2September 30 ............................... 5 5October 31 ................................... 2 2November 30 ............................... 5 4December 31 ................................ 120 125January 31 .................................... 18 15February 28 .................................. 8 7March 31 ...................................... 143 121
(ii) The financial statements of subsidiaries with balance sheets dated May 31, June 30, July 31, September 30, November 30 and January 31 are consolidated after the accounts are provisionally closed as of March 31 for the purpose of consolidation. For subsidiaries with balance sheets dated October 31, financial statements are consolidated based on the provisional financial statements closed as of January 31 or March 31. Other subsidiaries are consolidated on the basis of their respective balance sheet dates. Overseas consolidated subsidiaries with balance sheets dated December 31 were established in March 2010. Their financial statements are consolidated after the accounts are provisionally closed as of March 31. Appropriate adjustments are made for material transac-tions during the periods between their respective balance sheet dates and consolidated balance sheet dates.
(d) Special purpose entities(i) Outline of special purpose entities and transactionsSMBC provides loans, credit lines and liquidity lines to 12 special purpose entities (“SPEs”) for their funding needs and issuing of commercial paper. The SPEs are engaged in purchases of monetary claims such as receivables from SMBC customers and incorporated under the laws of the Cayman Islands or as intermediate corporations with limited liabilities. SMBC has no voting rights in the SPEs and sends no directors or employees. Accordingly, SMFG does not consolidate these SPEs. The combined assets and liabilities of the 12 SPEs as of their most recent closing dates of 2010 were ¥2,261,647 million ($24,306 million) and ¥2,261,476 million ($24,304 million), respectively. The respective amounts of 2009 were ¥3,140,527 million and ¥3,140,894 million.(ii) The amount of principal transactions with the SPEs as of and for the fiscal years ended March 31, 2010 and 2009 were as follows:
Millions of yenMillions ofU.S. dollars
March 31 2010 2009 2010Loans and bills discounted .................. ¥1,630,152 ¥1,851,401 $17,519Credit lines ................... 670,385 824,149 7,205Liquidity lines .............. 279,947 394,533 3,009
Millions of yenMillions ofU.S. dollars
Year ended March 31 2010 2009 2010Interest on loans and discounts .................... ¥17,520 ¥26,092 $188Fees and commissions ... 2,288 2,133 25
(2) Trading assets/liabilities and trading income/lossesTransactions for trading purposes (seeking gains arising from short-term changes in interest rates, currency exchange rates, or market prices of securities and other market related indices or from variation among markets) are included in “Trading assets” or “Trading liabilities” on the consolidated balance sheet on a trade date basis. Income and losses on trading-purpose transactions are recognized on a trade date basis and recorded as “Trading income” and “Trading losses.” Securities and monetary claims purchased for trading

SMFG 2010 79
SMFGNotes to Consolidated Financial Statements
purposes are stated at the fiscal year-end fair value, and financial derivatives such as swaps, futures and options are stated at amounts that would be settled if the transactions were terminated on the consolidated balance sheet date. “Trading income” and “Trading losses” include interest received or paid during the fiscal year. The year-on-year valuation differences of securities and monetary claims are also recorded in the above-mentioned accounts. As for the derivatives, assuming that the settlement will be made in cash, the year-on-year valuation differences are also recorded in the above-mentioned accounts.
(3) Securities(a) Other than securities classified for trading purposes, debt
securities that consolidated subsidiaries have the positive intent and ability to hold to maturity are classified as held-to-maturity securities and are carried at amortized cost (straight-line method) using the moving-average method. Investments in unconsolidated subsidiaries and affiliates that are not accounted for by the equity method are carried at cost using the moving-average method. Securities other than trading purpose securities, held-to-maturity securities and investments in unconsolidated subsidiaries and affiliates are classified as “other securities” (available-for-sale securities). Stocks (including foreign stocks) in other securities that have market prices are car-ried at their average market prices during the final month of the fiscal year, and bonds and others that have market prices are carried at their fiscal year-end market prices (cost of securities sold is calculated using primarily the moving-average method). Other securities, for which it is extremely difficult to determine fair value, are carried at cost using the moving-average method. Net unrealized gains (losses) on other securities, net of income taxes, are included in “Net assets,” after deducting the amount that is reflected in the fiscal year’s earnings by applying fair value hedge accounting.
(b) Securities included in money held in trust are carried using the same method used for securities mentioned above.
(4) Derivative transactionsDerivative transactions, other than those classified as trading derivatives, are carried at fair value, with revaluation gain or loss included in the income or loss, unless they are designated as effective hedging instruments.
(5) Depreciation(a) Tangible fixed assets
Buildings owned by SMFG and SMBC are depreciated using the straight-line method over the estimated useful lives of the respective assets. Assets other than buildings are depreciated using the declining-balance method. The estimated useful lives of major items are as follows: Buildings: 7 to 50 years Others: 2 to 20 years Other consolidated subsidiaries depreciate their tangible fixed assets primarily using the straight-line method over the estimated useful lives of the respective assets.
(b) Intangible fixed assetsIntangible fixed assets are depreciated using the straight-line method. Capitalized software for internal use owned
by SMFG and its consolidated domestic subsidiaries is depreciated over its estimated useful life (basically 5 years).
(c) Lease assetsLease assets with respect to non-transfer ownership finance leases, which are recorded in “Tangible fixed assets,” are depreciated using the straight-line method, assuming that lease term is its expected lifetime and salvage value is 0.
(6) Reserve for possible loan lossesThe reserve for possible loan losses of major consolidated subsidiaries is provided for as described below in accordance with the internal standards for write-offs and provisions. For claims on borrowers that have entered into bankruptcy, special liquidation proceedings or similar legal proceedings (“bankrupt borrowers”) or borrowers that are not legally or formally insolvent but are regarded as substantially in the same situation (“effectively bankrupt borrowers”), a reserve is provided for based on the amount of claims, after the write-off stated below, net of the expected amount of recoveries from collateral and guarantees. For claims on borrowers that are not currently bankrupt but are perceived to have a high risk of falling into bankruptcy (“potentially bankrupt borrowers”), a reserve is provided for in the amount deemed necessary based on an overall solvency assessment of the claims, net of the expected amount of recoveries from collateral and guarantees. The discounted cash flows (“DCF”) method is used for claims on borrowers whose cash flows from collection of principal and interest can be rationally estimated, and SMBC applies it to claims on large potentially bankrupt borrowers and claims on large borrowers requiring close monitoring that have been classified as “Past due loans (3 months or more)” or “Restructured loans,” whose total loans from SMBC exceed a certain amount. SMBC establishes a reserve for possible loan losses using the DCF method for such claims in the amount of the difference between the present value of the future collection from principal and interest (calculated using the rationally estimated cash flows discounted at the initial contractual interest rate) and the book value. For other claims, a reserve is provided for based on the historical loan-loss ratio. For claims originated in specific overseas countries, an addi-tional reserve is provided for in the amount deemed necessary based on the assessment of political and economic conditions. Branches and credit supervision departments assess all claims in accordance with the internal rules for self-assessment of assets, and the Credit Review Department, independent from these operating sections, reviews their assessment. The reserves are provided for based on the results of these assessments. The reserve for possible loan losses of other consolidated subsidiaries for general claims is provided for in the amount deemed necessary based on the historical loan-loss ratios, and for doubtful claims in the amount deemed uncollectible based on assessment of each claim. For collateralized or guaranteed claims on bankrupt borrow-ers and effectively bankrupt borrowers, the amount exceeding the estimated value of collateral and guarantees is deemed to be uncollectible and written off against the total outstanding

SMFG 201080
SMFG Notes to Consolidated Financial Statements
amount of the claims. The amount of write-off was ¥843,781 million ($9,068 million) and ¥717,010 million at March 31, 2010 and 2009, respectively.
(7) Reserve for employee bonusesThe reserve for employee bonuses is provided for payment of bonuses to employees, in the amount of estimated bonuses, which are attributable to the respective fiscal year.
(8) Reserve for executive bonusesThe reserve for executive bonuses is provided for payment of bonuses to executives, in the amount of estimated bonuses, which are attributable to the respective fiscal year.
(9) Reserve for employee retirement benefitsThe reserve for employee retirement benefits is provided for payment of retirement benefits to employees, in the amount deemed accrued at the fiscal year-end, based on the projected retirement benefit obligation and the fair value of plan assets at the fiscal year-end. Unrecognized prior service cost is amortized using the straight-line method, primarily over 9 years, over the employ-ees’ estimated average remaining service period from the fiscal year of its incurrence. Unrecognized net actuarial gain or loss is amortized using the straight-line method, primarily over 9 years, over the employees’ average remaining service period, commencing from the next fiscal year of incurrence. “Partial Amendments to Accounting Standard for Retirement Benefits (Part3)” (Accounting Standard Board of Japan (“ASBJ”) Statement No. 19, issued on July 31, 2008) became effective from the fiscal year beginning on and after April 1, 2009. Accordingly, SMFG has applied them from the fiscal year ended March 31, 2010. This accounting method has no impact on the consolidated financial statements for the fiscal year ended March 31, 2010.
(10) Reserve for executive retirement benefitsThe reserve for executive retirement benefits is provided for payment of retirement benefits to directors, corporate auditors and other executive officers, in the amount deemed accrued at the fiscal year-end based on the internal regulations.
(11) Reserve for reimbursement of depositsThe reserve for reimbursement of deposits which were derecognized as liabilities under certain conditions is provided for the possible losses on the future claims of withdrawal based on the historical reimbursements.
(12) Reserve under the special lawsThe reserve under the special laws is a reserve for eventual future operating losses from financial instruments transactions pursuant to Article 46-5 of the Financial Instruments and Exchange Act.
(13) Translation of foreign currency assets and liabilitiesAssets and liabilities of SMFG and SMBC denominated in foreign currencies and accounts of SMBC overseas branches are translated into Japanese yen mainly at the exchange rates prevailing at the consolidated balance sheet date, with the exception of stocks of subsidiaries and affiliates translated at rates prevailing at the time of acquisition. Other consolidated subsidiaries’ assets and liabilities denominated in foreign currencies are translated into Japanese yen at the exchange rates prevailing at their respective balance sheet dates.
(14) Lease transactions(a) Recognition of income on finance leases
Interest income is allocated to each period.(b) Recognition of income on operating leases
Primarily, lease-related income is recognized on a straight-line basis over the term of the lease, based on the contractual amount of lease fees per month.
(c) Recognition of income and expenses on installment salesPrimarily, installment-sales-related income and installment-sales-related expenses are recognized on a due-date accrual basis over the period of the installment sales.
(15) Hedge accounting(a) Hedging against interest rate changes
As for the hedge accounting method applied to hedging transactions for interest rate risk arising from financial assets and liabilities, SMBC applies deferred hedge accounting. SMBC applies deferred hedge accounting stipulated in “Treatment for Accounting and Auditing of Application of Accounting Standard for Financial Instruments in Banking Industry” (Japanese Institute of Certified Public Accountants (“JICPA”) Industry Audit Committee Report No. 24) to portfolio hedges on groups of large-volume, small-value monetary claims and debts. As for the portfolio hedges to offset market fluctuation, SMBC assesses the effectiveness of such hedges by clas-sifying the hedged items (such as deposits and loans) and the hedging instruments (such as interest rate swaps) by their maturity. As for the portfolio hedges to fix cash flows, SMBC assesses the effectiveness of such hedges by verifying the correlation between the hedged items and the hedging instruments. As for the individual hedges, SMBC assesses the effectiveness of such individual hedges. As a result of the application of JICPA Industry Audit Committee Report No. 24, SMBC discontinued the application of hedge accounting or applied fair value hedge accounting to a portion of the hedging instruments using “macro hedge,” which had been applied in order to manage interest rate risk arising from large-volume transactions in loans, deposits and other interest-earning assets and interest-bearing liabilities as a whole using derivatives pursuant to “Temporary Treatment for Accounting and Auditing of Application of Accounting Standard for Financial Instruments in Banking Industry” (JICPA Industry Audit Committee Report No. 15). The deferred hedge losses and gains related to such a portion of hedging instruments are charged to “Interest income” or “Interest expenses” over a 12-year period (maximum) according to their maturity from the fiscal year ended March 31, 2004. Gross amounts of deferred hedge losses on “macro hedge” (before deducting tax effect) at March 31, 2010 and 2009 were ¥2,470 million ($27 million) and ¥6,921 million, respectively. Gross amounts of deferred hedge gains on “macro hedge” (before deducting tax effect) at March 31, 2010 and 2009 were ¥2,416 million ($26 million) and ¥5,688 million, respectively.

SMFG 2010 81
SMFGNotes to Consolidated Financial Statements
(b) Hedging against currency fluctuationsSMBC applies deferred hedge accounting stipulated in “Treatment of Accounting and Auditing Concerning Accounting for Foreign Currency Transactions in Banking Industry” (JICPA Industry Audit Committee Report No. 25) to currency swap and foreign exchange swap trans-actions executed for the purpose of lending or borrowing funds in different currencies. Pursuant to JICPA Industry Audit Committee Report No. 25, SMBC assesses the effectiveness of currency swap and foreign exchange swap transactions executed for the purpose of offsetting the risk of changes in currency exchange rates by verifying that there are foreign-currency monetary claims and debts corresponding to the foreign-currency positions. In order to hedge risk arising from volatility of exchange rates for stocks of subsidiaries and affiliates and other securities (excluding bonds) denominated in foreign currencies, SMBC applies deferred hedge accounting or fair value hedge accounting, on the conditions that the hedged securities are designated in advance and that suf-ficient on-balance (actual) or off-balance (forward) liability exposure exists to cover the cost of the hedged securities denominated in the same foreign currencies.
(c) Hedging against share price fluctuationsSMBC applies fair value hedge accounting to individual hedges offsetting the price fluctuation of the shares that are classified under other securities, and that are held for the purpose of strategic investment, and accordingly evaluates the effectiveness of such individual hedges.
(d) Transactions between consolidated subsidiariesAs for derivative transactions between consolidated sub-sidiaries or internal transactions between trading accounts and other accounts (or among internal sections), SMBC manages the interest rate swaps and currency swaps that are designated as hedging instruments in accordance with the non-arbitrary and strict criteria for external transac-tions stipulated in JICPA Industry Audit Committee Report No. 24 and No. 25. Therefore, SMBC accounts for the gains or losses that arise from interest rate swaps and currency swaps in its earnings or defers them, rather than eliminating them. Certain other consolidated subsidiaries apply the deferred hedge accounting or fair value hedge account-ing or the special treatment for interest rate swaps. A consolidated domestic subsidiary (a leasing company) partly applies the accounting method that is permitted by “Temporary Treatment for Accounting and Auditing of Application of Accounting Standard for Financial Instruments in Leasing Industry” (JICPA Industry Audit Committee Report No. 19).
(16) Consumption taxesNational and local consumption taxes of SMFG and its consolidated domestic subsidiaries are accounted for using the tax-excluded method.
(17) Valuation of consolidated subsidiaries’ assets and liabilitiesAssets and liabilities of consolidated subsidiaries including the portion attributable to the minority stockholders are valued for consolidation at fair value when SMFG acquires control.
(18) Amortization of goodwillGoodwill on SMBC Friend Securities Co., Ltd., Sumitomo Mitsui Finance and Leasing Company, Limited, Nikko Cordial Securities Inc. and Kansai Urban Banking Corporation is amortized using the straight-line method over 20 years. Goodwill on other companies was charged or credited to income directly when incurred or benefited.
(19) Statements of cash flowsFor the purposes of presenting the consolidated statements of cash flows, cash and cash equivalents represent cash and due from banks.
(20) Application of new accounting standards(a) Accounting standard for financial instruments
“Accounting Standard for Financial Instruments” (ASBJ Statement No. 10, partially revised on March 10, 2008) and “Implementation Guidance on Disclosures about Fair Value of Financial Instruments” (ASBJ Guidance No. 19, issued on March 10, 2008) became effective from the fiscal year ending on and after March 31, 2010. SMFG has applied them from the fiscal year ended March 31, 2010. Accordingly, this accounting change has the fol-lowing impact on the consolidated financial statements as compared with the previous accounting method:
Millionsof yen
Millions ofU.S. dollars
Monetary claims bought ............. ¥ 8,710 $ 94Securities .................................... 41,914 450Net unrealized gains (losses) on other securities ..................... 39,315 423Deferred tax assets ...................... (27,056) (291)Reserve for possible loan losses ... (34,999) (376)
As a result, income before income taxes and minority interests increased by ¥19,251 million ($207 million) as compared with the former method.
(b) Practical Solution on Unification of Accounting Policies Applied to Foreign Subsidiaries for Consolidated Financial Statements “Practical Solution on Unification of Accounting Policies Applied to Foreign Subsidiaries for Consolidated Financial Statements” (ASBJ Practical Issues Task Force No. 18, issued on May 17, 2006) became effective from the fiscal year beginning on and after April 1, 2008. Accordingly, SMFG has applied it from the fiscal year ended March 31, 2009. This accounting method has decreased retained earnings at April 1, 2008 by ¥3,132 million, but has no material impact on the profit or loss for the fiscal year ended March 31, 2009.
(c) Accounting Standard for Lease TransactionsNon-transfer ownership finance leases had been accounted for using the same method as for operating leases. However, “Accounting Standard for Lease Transactions” (ASBJ Statement No. 13, issued on March 30, 2007) and “Implementation Guidance on Accounting Standard for Lease Transactions” (ASBJ Guidance No. 16, issued on March 30, 2007) became effective from the fiscal year begin-ning on and after April 1, 2008. Accordingly, SMFG has applied them from the fiscal year ended March 31, 2009. The treatment of non-transfer ownership finance lease transactions which commenced before April 1, 2008 was as follows:

SMFG 201082
SMFG Notes to Consolidated Financial Statements
(i) Lessee sideFuture minimum lease payments, excluding the interest portion, at March 31, 2008 are considered as acquisition cost and recorded as lease assets in either “Tangible fixed assets” or “Intangible fixed assets,” assuming they had been acquired at the beginning of the fiscal year.(ii) Lessor sideAppropriate book value, net of accumulated depreciation, of lease assets at March 31, 2008 was recorded as the beginning balance of “Lease receivables and investment assets.” Accordingly, this accounting change has the following impact on the consolidated financial statements as of and for the fiscal year ended March 31, 2009 as compared with the previous accounting method:
Millionsof yen
Lease receivables and investment assets ........ ¥1,968,347Tangible fixed assets:
Lease assets .............................................. 7,206Intangible fixed assets:
Lease assets .............................................. 480Loans and bills discounted ........................... (138,788)Lease assets .................................................. (1,205,021)Other assets ................................................. (662,005)Other liabilities ........................................... (32,205)
Interest income:Interest on lease transactions .................... ¥ 77,772Interest on loans and discounts ................ (7,659)
Interest expenses:Other interest expenses ............................ (639)
Other operating income:Lease-related income ................................ (503,389)Installment-related income ...................... (242,763)Other ....................................................... (810)
Other operating expenses:Lease-related expenses .............................. (472,005)Installment-related expenses .................... (206,456)
General and administrative expenses ............ (178)
As a result, income before income taxes and minority interests for the fiscal year ended March 31, 2009 increased by ¥2,423 million.
(21) Changes in presentation(a) Lease assets related to operating leases on lessor side (March
31, 2009: ¥180,273 million) had been included in “Lease assets.” From the fiscal year ended March 31, 2009, they are included in the following items because they have been immaterial:
Millionsof yen
March 31 2009Tangible fixed assets:
Buildings ................................................. ¥52,681Land ........................................................ 68,131Other tangible fixed assets ....................... 59,460
Intangible fixed assets:Software ................................................... 0
(b) “Losses (gains) on sale of subsidiaries’ shares and gains on change in equity of subsidiary” which had been reported in “Net cash provided by operating activities” in the fiscal year ended March 31, 2008, were ¥(5,622) million in the fiscal year ended March 31, 2009. They are included in “Other” from the fiscal year ended March 31, 2009 because they have been immaterial.
(22) Issuance of new sharesOn June 22, 2009, SMFG issued 219,700 thousand new shares of common stock at ¥3,766 per share (issue price) for final allocation by underwriters at ¥3,928 per share (offer price). Furthermore, in connection with the over-allotment of 15,300 thousand shares of common stock offered for sale at ¥3,928 per share (sales price) in the public offering, SMFG issued 8,931 thousand new shares of common stock at ¥3,766 per share (issue price) through third-party allocation to the underwriter who conducted the over-allotment on July 27, 2009. The purchase agreement for the offering prescribes that the total amount of issue price be treated as the total amount of subscription price and no underwriting commission be paid. Accordingly, other expenses do not include the amount equivalent to the underwriting commission for the offering in the amount of ¥37,038 million. Out of the issue price per share, ¥1,883 is accounted for as capital stock and ¥1,883 as capital surplus. On January 27, 2010, SMFG issued 340,000 thousand new shares of common stock at ¥2,702.81 per share (issue price) for final allocation by underwriters at ¥2,804 per share (offer price). Furthermore, in connection with the over-allotment of 20,000 thousand shares of common stock offered for sale at ¥2,804 per share (sales price) in the public offering, SMFG issued 20,000 thousand new shares of common stock at ¥2,702.81 per share (issue price) through third-party alloca-tion to the underwriter who conducted the over-allotment on February 10, 2010. The purchase agreement for the offering prescribes that the total amount of issue price be treated as the total amount of subscription price and no underwriting com-mission be paid. Accordingly, other expenses do not include the amount equivalent to the underwriting commission for the offering in the amount of ¥36,428 million. Out of the issue price per share, ¥1,351.405 is accounted for as capital stock and ¥1,351.405 as capital surplus. Equity of ¥11,075 million attributable to SMFG, which a consolidated subsidiary and an equity method affiliated company of SMFG recorded as earnings under the purchase agreement for the offering, was accounted for as “Capital surplus.”
(23) Change in method of valuation of certain securitiesFloating-rate Japanese government bonds which SMFG Group held as “Other securities — AFS securities” had been carried on the consolidated balance sheet at market values. From the fiscal year ended March 31, 2009, such bonds have been carried at their reasonably estimated amounts in accordance with the “Practical Solution on Measurement of Fair Value for Financial Assets” (ASBJ Practical Issues Task Force No. 25, issued on October 28, 2008). As a result of this accounting change, compared with the former accounting method at March 31, 2009, “Securities,” “Net unrealized gains on other
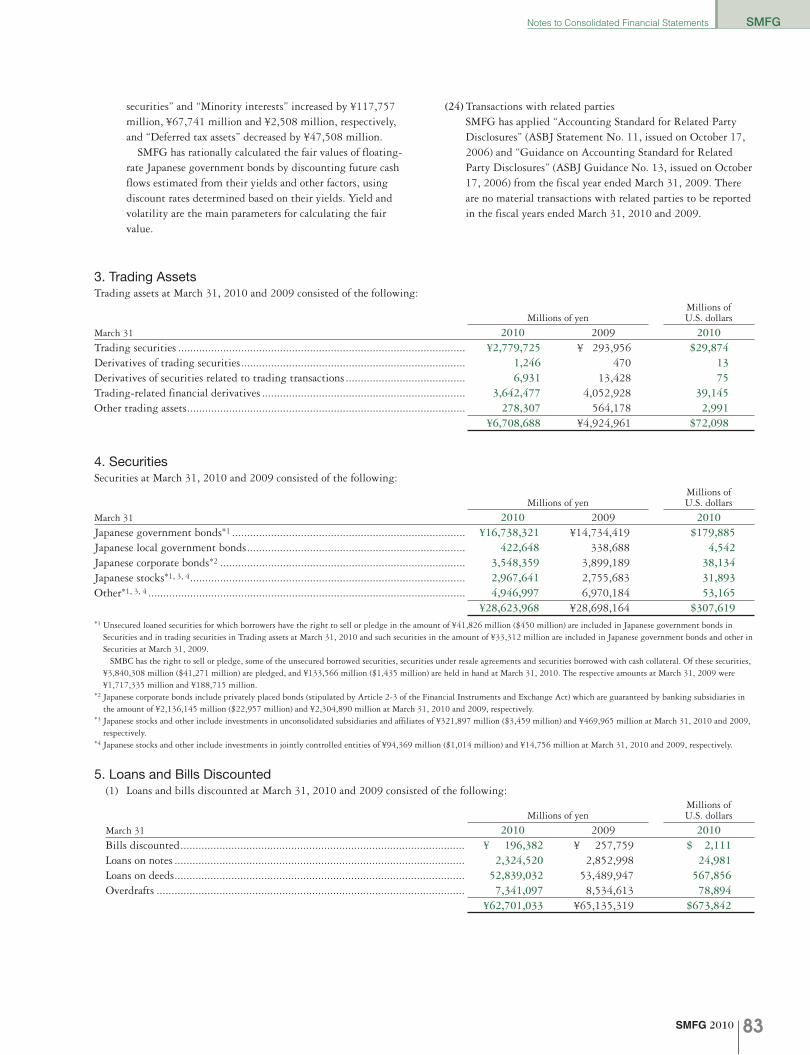
SMFG 2010 83
SMFGNotes to Consolidated Financial Statements
securities” and “Minority interests” increased by ¥117,757 million, ¥67,741 million and ¥2,508 million, respectively, and “Deferred tax assets” decreased by ¥47,508 million. SMFG has rationally calculated the fair values of floating-rate Japanese government bonds by discounting future cash flows estimated from their yields and other factors, using discount rates determined based on their yields. Yield and volatility are the main parameters for calculating the fair value.
(24) Transactions with related partiesSMFG has applied “Accounting Standard for Related Party Disclosures” (ASBJ Statement No. 11, issued on October 17, 2006) and “Guidance on Accounting Standard for Related Party Disclosures” (ASBJ Guidance No. 13, issued on October 17, 2006) from the fiscal year ended March 31, 2009. There are no material transactions with related parties to be reported in the fiscal years ended March 31, 2010 and 2009.
3. Trading AssetsTrading assets at March 31, 2010 and 2009 consisted of the following:
Millions of yenMillions of U.S. dollars
March 31 2010 2009 2010Trading securities ................................................................................................ ¥2,779,725 ¥ 293,956 $29,874Derivatives of trading securities ........................................................................... 1,246 470 13Derivatives of securities related to trading transactions ........................................ 6,931 13,428 75Trading-related financial derivatives .................................................................... 3,642,477 4,052,928 39,145Other trading assets ............................................................................................. 278,307 564,178 2,991
¥6,708,688 ¥4,924,961 $72,098
4. SecuritiesSecurities at March 31, 2010 and 2009 consisted of the following:
Millions of yenMillions of U.S. dollars
March 31 2010 2009 2010Japanese government bonds*1 .............................................................................. ¥16,738,321 ¥14,734,419 $179,885Japanese local government bonds ......................................................................... 422,648 338,688 4,542Japanese corporate bonds*2 .................................................................................. 3,548,359 3,899,189 38,134Japanese stocks*1, 3, 4 ............................................................................................ 2,967,641 2,755,683 31,893Other*1, 3, 4 .......................................................................................................... 4,946,997 6,970,184 53,165
¥28,623,968 ¥28,698,164 $307,619*1 Unsecured loaned securities for which borrowers have the right to sell or pledge in the amount of ¥41,826 million ($450 million) are included in Japanese government bonds in
Securities and in trading securities in Trading assets at March 31, 2010 and such securities in the amount of ¥33,312 million are included in Japanese government bonds and other in Securities at March 31, 2009. SMBC has the right to sell or pledge, some of the unsecured borrowed securities, securities under resale agreements and securities borrowed with cash collateral. Of these securities, ¥3,840,308 million ($41,271 million) are pledged, and ¥133,566 million ($1,435 million) are held in hand at March 31, 2010. The respective amounts at March 31, 2009 were ¥1,717,335 million and ¥188,715 million.
*2 Japanese corporate bonds include privately placed bonds (stipulated by Article 2-3 of the Financial Instruments and Exchange Act) which are guaranteed by banking subsidiaries in the amount of ¥2,136,145 million ($22,957 million) and ¥2,304,890 million at March 31, 2010 and 2009, respectively.
*3 Japanese stocks and other include investments in unconsolidated subsidiaries and affiliates of ¥321,897 million ($3,459 million) and ¥469,965 million at March 31, 2010 and 2009, respectively.
*4 Japanese stocks and other include investments in jointly controlled entities of ¥94,369 million ($1,014 million) and ¥14,756 million at March 31, 2010 and 2009, respectively.
5. Loans and Bills Discounted(1) Loans and bills discounted at March 31, 2010 and 2009 consisted of the following:
Millions of yenMillions of U.S. dollars
March 31 2010 2009 2010Bills discounted ............................................................................................... ¥ 196,382 ¥ 257,759 $ 2,111Loans on notes ................................................................................................. 2,324,520 2,852,998 24,981Loans on deeds ................................................................................................. 52,839,032 53,489,947 567,856Overdrafts ....................................................................................................... 7,341,097 8,534,613 78,894
¥62,701,033 ¥65,135,319 $673,842

SMFG 201084
SMFG Notes to Consolidated Financial Statements
(2) Loans and bills discounted included the following “Risk-monitored loans” stipulated in the Banking Act:
Millions of yenMillions of U.S. dollars
March 31 2010 2009 2010Risk-monitored loans:
Bankrupt loans*1.......................................................................................... ¥ 165,131 ¥ 292,088 $ 1,775Non-accrual loans*2 ..................................................................................... 1,075,782 1,019,352 11,561Past due loans (3 months or more)*3............................................................. 38,315 36,162 412Restructured loans*4 .................................................................................... 250,256 238,713 2,689
¥1,529,484 ¥1,586,317 $16,437*1 “Bankrupt loans” are loans, after write-off, to legally bankrupt borrowers as defined in Articles 96-1-3 and 96-1-4 of the Enforcement Ordinance No. 97 of the Japanese Corporate
Tax Law (issued in 1965) and on which accrued interest income is not recognized as there is substantial doubt about the ultimate collectability of either principal or interest because they are past due for a considerable period of time or for other reasons.
*2 “Non-accrual loans” are loans on which accrued interest income is not recognized, excluding “Bankrupt loans” and loans on which interest payments are deferred in order to support the borrowers’ recovery from financial difficulties.
*3 “Past due loans (3 months or more)” are loans on which the principal or interest is past due for 3 months or more, excluding “Bankrupt loans” and “Non-accrual loans.”*4 “Restructured loans” are loans on which terms and conditions have been amended in favor of the borrowers (e.g., reduction of the original interest rate, deferral of interest
payments, extension of principal repayments or debt forgiveness) in order to support the borrowers’ recovery from financial difficulties, excluding “Bankrupt loans,” “Non-accrual loans” and “Past due loans (3 months or more).”
(3) Bills discounted are accounted for as financial transactions in accordance with JICPA Industry Audit Committee Report No. 24. SMFG’s banking subsidiaries have rights to sell or pledge bank acceptance bought, commercial bills discounted, documentary bills and foreign exchanges bought without restrictions. The total face value at March 31, 2010 and 2009 was ¥617,381 million ($6,635 million) and ¥686,407 million, respectively.
(4) Commitment line contracts on overdrafts and loans are agreements to lend to customers, up to a prescribed amount, as long as there is no violation of any condition established in the contracts. The amounts of unused commitments at March 31, 2010 and 2009 were ¥41,957,592 million ($450,914 million) and ¥39,983,526 million, respectively, and the amounts of unused commitments whose origi-nal contract terms are within 1 year or unconditionally cancelable at any time at March 31, 2010 and 2009 were ¥36,373,235 million ($390,900 million) and ¥34,012,566 million, respectively. Since many of these commitments are expected to expire without being drawn upon, the total amount of unused commitments does not necessarily represent actual future cash flow requirements. Many of these commitments include clauses under which SMBC and other consolidated subsidiaries can reject an application from customers or reduce the contract amounts in the event that economic conditions change, SMBC and other consolidated subsidiaries need to secure claims, or other events occur. In addition, SMBC and other consolidated subsidiaries may request the customers to pledge collateral such as premises and securities at the time of the contracts, and take necessary measures such as monitoring customers’ financial positions, revising contracts when such need arises and securing claims after the contracts are made.
6. Other AssetsOther assets at March 31, 2010 and 2009 consisted of the following:
Millions of yenMillions of U.S. dollars
March 31 2010 2009 2010Prepaid expenses .................................................................................................. ¥ 30,643 ¥ 35,305 $ 329Accrued income ................................................................................................... 239,422 265,015 2,573Deferred assets ..................................................................................................... 488,712 868,188 5,252Financial derivatives* .......................................................................................... 1,079,708 1,406,092 11,604Other .................................................................................................................. 1,771,559 1,682,648 19,039
¥3,610,046 ¥4,257,251 $38,797* Referred to in Note 30

SMFG 2010 85
SMFGNotes to Consolidated Financial Statements
7. Tangible Fixed AssetsTangible fixed assets at March 31, 2010 and 2009 consisted of the following:
Millions of yenMillions of U.S. dollars
March 31 2010 2009 2010Buildings ............................................................................................................ ¥ 314,461 ¥ 296,219 $ 3,380Land* .................................................................................................................. 544,075 531,726 5,847Lease assets .......................................................................................................... 8,159 7,206 88Construction in progress ...................................................................................... 8,206 3,527 88Other tangible fixed assets ................................................................................... 206,222 170,121 2,216Total .................................................................................................................... ¥1,081,125 ¥1,008,801 $11,619Accumulated depreciation ................................................................................... ¥ 671,298 ¥ 616,324 $ 7,214* Includes land revaluation excess referred to in Note 15.
8. Intangible Fixed AssetsIntangible fixed assets at March 31, 2010 and 2009 consisted of the following:
Millions of yenMillions of U.S. dollars
March 31 2010 2009 2010Software .............................................................................................................. ¥215,563 ¥163,522 $2,317Goodwill ............................................................................................................. 363,507 186,793 3,906Lease assets .......................................................................................................... 367 480 4Other intangible fixed assets ................................................................................ 46,809 11,087 503
¥626,248 ¥361,884 $6,730
9. Assets Pledged as CollateralAssets pledged as collateral at March 31, 2010 and 2009 consisted of the following:
Millions of yenMillions of U.S. dollars
March 31 2010 2009 2010Assets pledged as collateral:
Cash and due from banks and Deposits with banks .......................................... ¥ 703 ¥ 339,948 $ 8Call loans and bills bought .............................................................................. 367,035 259,186 3,944Monetary claims bought .................................................................................. 1,870 2,020 20Trading assets .................................................................................................. 2,337,389 610,146 25,120Securities ......................................................................................................... 4,649,170 8,049,756 49,964Loans and bills discounted ............................................................................... 1,631,290 3,062,015 17,531Lease receivables and investment assets ............................................................ 15,478 41,993 166Tangible fixed assets ........................................................................................ 16,165 11,153 174Other assets (installment account receivable, etc.) ............................................ 3,087 2,165 33
Liabilities corresponding to assets pledged as collateral:Deposits .......................................................................................................... 24,992 27,060 269Call money and bills sold ................................................................................. 642,100 1,266,265 6,901Payables under repurchase agreements ............................................................. 1,120,860 778,993 12,046Payables under securities lending transactions .................................................. 3,664,591 6,332,775 39,383Trading liabilities ............................................................................................ 365,974 594,121 3,933Borrowed money .............................................................................................. 1,468,005 1,970,209 15,777Other liabilities ............................................................................................... 14,611 4,587 157Acceptances and guarantees ............................................................................. 123,733 134,530 1,330

SMFG 201086
SMFG Notes to Consolidated Financial Statements
In addition to the assets presented above, the following assets were pledged as collateral for cash settlements, variation margins of futures market transactions and certain other purposes at March 31, 2010 and 2009:
Millions of yenMillions of U.S. dollars
March 31 2010 2009 2010Cash and due from banks and Deposits with banks .............................................. ¥ 25,804 ¥ 19,380 $ 277Trading assets ...................................................................................................... 111,283 52,843 1,196Securities ............................................................................................................. 14,233,542 11,172,095 152,967Loans and bills discounted ................................................................................... 1,171,863 284,157 12,594
At March 31, 2010, other assets included surety deposits of ¥102,085 million ($1,097 million), variation margins of futures market transac-tions of ¥8,457 million ($91 million) and other variation margins of ¥83,768 million ($900 million). At March 31, 2009, other assets included surety deposits of ¥85,892 million and variation margins of futures market transactions of ¥6,252 million.
10. DepositsDeposits at March 31, 2010 and 2009 consisted of the following:
Millions of yenMillions of U.S. dollars
March 31 2010 2009 2010Current deposits .................................................................................................. ¥ 6,871,401 ¥ 6,588,074 $ 73,846Ordinary deposits ................................................................................................ 35,153,531 34,078,361 377,792Savings deposits ................................................................................................... 750,961 815,336 8,071Deposits at notice ................................................................................................ 5,363,534 5,162,137 57,642Time deposits ...................................................................................................... 26,888,129 25,039,089 288,964Negotiable certificates of deposit ......................................................................... 6,995,619 7,461,284 75,181Other deposits ..................................................................................................... 3,621,037 3,886,497 38,915
¥85,644,215 ¥83,030,782 $920,411
11. Trading LiabilitiesTrading liabilities at March 31, 2010 and 2009 consisted of the following:
Millions of yenMillions of U.S. dollars
March 31 2010 2009 2010Trading securities sold for short sales ................................................................... ¥1,582,808 ¥ 7,473 $17,010Derivatives of trading securities ........................................................................... 2,367 407 26Derivatives of securities related to trading transactions ........................................ 6,961 13,997 75Trading-related financial derivatives .................................................................... 3,474,589 3,575,780 37,341 ¥5,066,727 ¥3,597,658 $54,452
12. Borrowed MoneyBorrowed money at March 31, 2010 and 2009 consisted of the following:
Millions of yenMillions of U.S. dollars
Averageinterest rate*1
March 31 2010 2009 2010 2010 DueBorrowed money*2 ...................................................... ¥5,470,578 ¥4,644,699 $58,792 0.65% Jan. 2010 — Perpetual
*1 Average interest rate represents the weighted average interest rate based on the balances and rates at respective year-end of SMBC and other consolidated subsidiaries.*2 Includes subordinated borrowings of ¥378,729 million ($4,070 million) and ¥436,000 million at March 31, 2010 and 2009, respectively.
The repayment schedule over the next 5 years on borrowed money at March 31, 2010 was as follows:Millions of yen Millions of U.S. dollars
March 31 2010 2010Within 1 year ..................................................................................................................... ¥4,156,807 $44,673After 1 year through 2 years ............................................................................................... 325,880 3,502After 2 years through 3 years .............................................................................................. 262,602 2,822After 3 years through 4 years .............................................................................................. 140,698 1,512After 4 years through 5 years .............................................................................................. 263,870 2,836
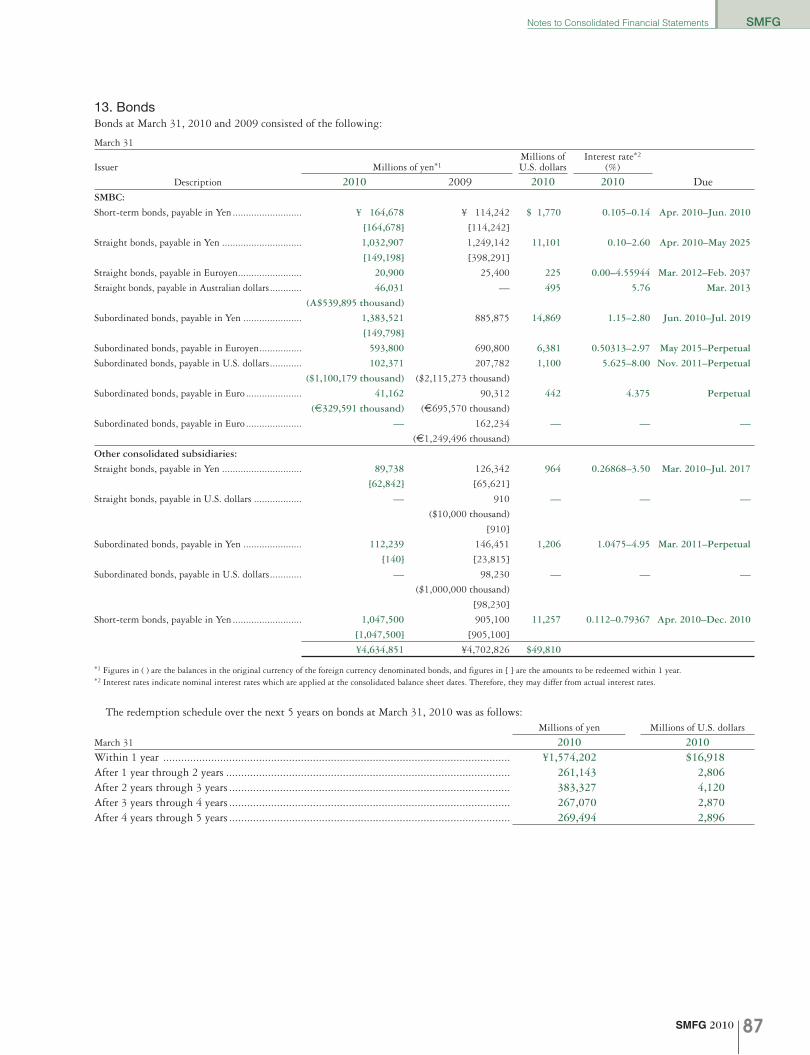
SMFG 2010 87
SMFGNotes to Consolidated Financial Statements
13. BondsBonds at March 31, 2010 and 2009 consisted of the following:
March 31
Issuer Millions of yen*1Millions of U.S. dollars
Interest rate*2
(%)
Description 2010 2009 2010 2010 DueSMBC:
Short-term bonds, payable in Yen .......................... ¥ 164,678 ¥ 114,242 $ 1,770 0.105–0.14 Apr. 2010–Jun. 2010
[164,678] [114,242]
Straight bonds, payable in Yen .............................. 1,032,907 1,249,142 11,101 0.10–2.60 Apr. 2010–May 2025
[149,198] [398,291]
Straight bonds, payable in Euroyen ........................ 20,900 25,400 225 0.00–4.55944 Mar. 2012–Feb. 2037
Straight bonds, payable in Australian dollars ............ 46,031 — 495 5.76 Mar. 2013
(A$539,895 thousand)
Subordinated bonds, payable in Yen ...................... 1,383,521 885,875 14,869 1.15–2.80 Jun. 2010–Jul. 2019
[149,798]
Subordinated bonds, payable in Euroyen ................ 593,800 690,800 6,381 0.50313–2.97 May 2015–Perpetual
Subordinated bonds, payable in U.S. dollars ............ 102,371 207,782 1,100 5.625–8.00 Nov. 2011–Perpetual
($1,100,179 thousand) ($2,115,273 thousand)
Subordinated bonds, payable in Euro ..................... 41,162 90,312 442 4.375 Perpetual
(€329,591 thousand) (€695,570 thousand)
Subordinated bonds, payable in Euro ..................... — 162,234 — — —
(€1,249,496 thousand)
Other consolidated subsidiaries:
Straight bonds, payable in Yen .............................. 89,738 126,342 964 0.26868–3.50 Mar. 2010–Jul. 2017
[62,842] [65,621]
Straight bonds, payable in U.S. dollars .................. — 910 — — —
($10,000 thousand)
[910]
Subordinated bonds, payable in Yen ...................... 112,239 146,451 1,206 1.0475–4.95 Mar. 2011–Perpetual
[140] [23,815]
Subordinated bonds, payable in U.S. dollars ............ — 98,230 — — —
($1,000,000 thousand)
[98,230]
Short-term bonds, payable in Yen .......................... 1,047,500 905,100 11,257 0.112–0.79367 Apr. 2010–Dec. 2010
[1,047,500] [905,100]
¥4,634,851 ¥4,702,826 $49,810
*1 Figures in ( ) are the balances in the original currency of the foreign currency denominated bonds, and figures in [ ] are the amounts to be redeemed within 1 year.*2 Interest rates indicate nominal interest rates which are applied at the consolidated balance sheet dates. Therefore, they may differ from actual interest rates.
The redemption schedule over the next 5 years on bonds at March 31, 2010 was as follows:Millions of yen Millions of U.S. dollars
March 31 2010 2010Within 1 year .................................................................................................................... ¥1,574,202 $16,918After 1 year through 2 years ............................................................................................... 261,143 2,806After 2 years through 3 years .............................................................................................. 383,327 4,120After 3 years through 4 years .............................................................................................. 267,070 2,870After 4 years through 5 years .............................................................................................. 269,494 2,896

SMFG 201088
SMFG Notes to Consolidated Financial Statements
14. Other LiabilitiesOther liabilities at March 31, 2010 and 2009 consisted of the following:
Millions of yenMillions of U.S. dollars
March 31 2010 2009 2010Accrued expenses ................................................................................................. ¥ 144,338 ¥ 268,050 $ 1,551Unearned income ................................................................................................. 174,931 177,998 1,880Income taxes payable ........................................................................................... 56,708 45,105 610Financial derivatives*1 ......................................................................................... 818,105 1,317,303 8,792Lease liabilities*2 ................................................................................................. 58,742 23,594 631Other .................................................................................................................. 1,940,320 1,970,993 20,852
¥3,193,146 ¥3,803,046 $34,316*1 Referred to in Note 30*2 Average interest rate on lease liabilities for the year ended March 31, 2010 was 3.52%. Non-transfer ownership finance lease with the lease term commenced before April 1, 2008 is
excluded from calculations of average interest rate.
The repayment schedule over the next 5 years on lease liabilities at March 31, 2010 was as follows:Millions of yen Millions of U.S. dollars
March 31 2010 2010Within 1 year ..................................................................................................................... ¥18,371 $197After 1 year through 2 years ............................................................................................... 14,033 151After 2 years through 3 years .............................................................................................. 10,175 109After 3 years through 4 years .............................................................................................. 6,327 68After 4 years through 5 years .............................................................................................. 3,510 38
15. Land Revaluation ExcessSMBC and another consolidated subsidiary revaluated their own land for business activities in accordance with the “Law Concerning Land Revaluation” (the “Law”) effective March 31, 1998 and the law concerning amendment of the Law effective March 31, 2001. The income taxes corresponding to the net unrealized gains are reported in “Liabilities” as “Deferred tax liabilities for land revaluation,” and the net unrealized gains, net of deferred taxes, are reported as “Land revaluation excess” in “Net assets.” A certain affiliate revaluated its own land for business activities in accordance with the Law. The net unrealized gains, net of deferred taxes, are reported as “Land revaluation excess” in “Net assets.”
Date of the revaluation SMBC: March 31, 1998 and March 31, 2002 Another consolidated subsidiary and an affiliate: March 31, 1999 and March 31, 2002
Method of revaluation (stipulated in Article 3-3 of the Law) SMBC: Fair values were determined by applying appropriate adjust-
ments for land shape and timing of appraisal to the values stipulated in Articles 2-3, 2-4 or 2-5 of the Enforcement Ordinance of the Law Concerning Land Revaluation (the Enforcement Ordinance No. 119) effective March 31, 1998.
Another consolidated subsidiary and an affiliate: Fair values were determined based on the values stipulated in
Articles 2-3 and 2-5 of the Enforcement Ordinance No. 119.
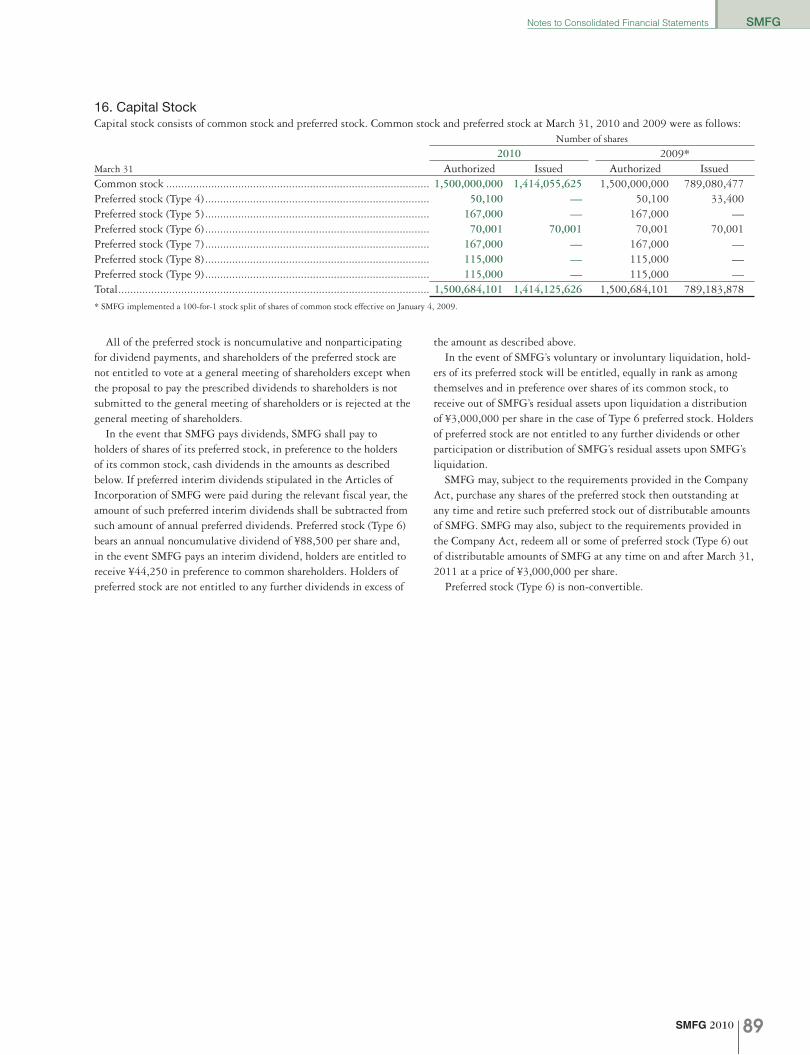
SMFG 2010 89
SMFGNotes to Consolidated Financial Statements
16. Capital StockCapital stock consists of common stock and preferred stock. Common stock and preferred stock at March 31, 2010 and 2009 were as follows:
Number of shares
2010 2009*March 31 Authorized Issued Authorized IssuedCommon stock ........................................................................................ 1,500,000,000 1,414,055,625 1,500,000,000 789,080,477Preferred stock (Type 4) ........................................................................... 50,100 — 50,100 33,400Preferred stock (Type 5) ........................................................................... 167,000 — 167,000 —Preferred stock (Type 6) ........................................................................... 70,001 70,001 70,001 70,001Preferred stock (Type 7) ........................................................................... 167,000 — 167,000 —Preferred stock (Type 8) ........................................................................... 115,000 — 115,000 —Preferred stock (Type 9) ........................................................................... 115,000 — 115,000 —Total ........................................................................................................ 1,500,684,101 1,414,125,626 1,500,684,101 789,183,878
* SMFG implemented a 100-for-1 stock split of shares of common stock effective on January 4, 2009.
All of the preferred stock is noncumulative and nonparticipating for dividend payments, and shareholders of the preferred stock are not entitled to vote at a general meeting of shareholders except when the proposal to pay the prescribed dividends to shareholders is not submitted to the general meeting of shareholders or is rejected at the general meeting of shareholders. In the event that SMFG pays dividends, SMFG shall pay to holders of shares of its preferred stock, in preference to the holders of its common stock, cash dividends in the amounts as described below. If preferred interim dividends stipulated in the Articles of Incorporation of SMFG were paid during the relevant fiscal year, the amount of such preferred interim dividends shall be subtracted from such amount of annual preferred dividends. Preferred stock (Type 6) bears an annual noncumulative dividend of ¥88,500 per share and, in the event SMFG pays an interim dividend, holders are entitled to receive ¥44,250 in preference to common shareholders. Holders of preferred stock are not entitled to any further dividends in excess of
the amount as described above. In the event of SMFG’s voluntary or involuntary liquidation, hold-ers of its preferred stock will be entitled, equally in rank as among themselves and in preference over shares of its common stock, to receive out of SMFG’s residual assets upon liquidation a distribution of ¥3,000,000 per share in the case of Type 6 preferred stock. Holders of preferred stock are not entitled to any further dividends or other participation or distribution of SMFG’s residual assets upon SMFG’s liquidation. SMFG may, subject to the requirements provided in the Company Act, purchase any shares of the preferred stock then outstanding at any time and retire such preferred stock out of distributable amounts of SMFG. SMFG may also, subject to the requirements provided in the Company Act, redeem all or some of preferred stock (Type 6) out of distributable amounts of SMFG at any time on and after March 31, 2011 at a price of ¥3,000,000 per share. Preferred stock (Type 6) is non-convertible.

SMFG 201090
SMFG Notes to Consolidated Financial Statements
17. Fees and CommissionsFees and commissions for the fiscal years ended March 31, 2010 and 2009 consisted of the following:
Millions of yenMillions of U.S. dollars
Year ended March 31 2010 2009 2010Fees and commissions:
Deposits and loans ........................................................................................... ¥ 70,592 ¥ 77,840 $ 759Remittances and transfers ................................................................................ 125,792 131,455 1,352Securities-related business ................................................................................ 54,363 33,872 584Agency ............................................................................................................ 14,763 14,673 159Safe deposits .................................................................................................... 6,684 6,914 72Guarantees ....................................................................................................... 49,365 50,852 530Credit card business ......................................................................................... 143,770 141,117 1,545Investment trusts ............................................................................................. 96,243 37,370 1,034Other ............................................................................................................... 167,789 178,654 1,803
¥729,364 ¥672,752 $7,838
Fees and commissions payments:Remittances and transfers ................................................................................ ¥ 31,050 ¥ 30,211 $ 334Other ............................................................................................................... 89,697 85,362 964
¥120,748 ¥115,574 $1,298
18. Trading IncomeTrading income for the fiscal years ended March 31, 2010 and 2009 consisted of the following:
Millions of yenMillions of U.S. dollars
Year ended March 31 2010 2009 2010Gains on trading securities .................................................................................. ¥ 63,424 ¥ 23,876 $ 682Gains on securities related to trading transactions ................................................ 2,254 1,221 24Gains on trading-related financial derivatives ...................................................... 127,833 179,255 1,374Other .................................................................................................................. 576 7,386 6
¥194,087 ¥211,738 $2,086
19. Other Operating IncomeOther operating income for the fiscal years ended March 31, 2010 and 2009 consisted of the following:
Millions of yenMillions of U.S. dollars
Year ended March 31 2010 2009 2010Gains on sale of bonds ......................................................................................... ¥ 90,942 ¥149,037 $ 978Gains on redemption of bonds ............................................................................. 10 57 0Lease-related income ............................................................................................ 243,237 252,966 2,614Gains on financial derivatives .............................................................................. — 7,142 —Other .................................................................................................................. 118,823 120,396 1,277
¥453,012 ¥529,599 $4,869
20. Other Operating ExpensesOther operating expenses for the fiscal years ended March 31, 2010 and 2009 consisted of the following:
Millions of yenMillions of U.S. dollars
Year ended March 31 2010 2009 2010Losses on sale of bonds ......................................................................................... ¥ 30,122 ¥ 68,882 $ 324Losses on redemption of bonds ............................................................................. 17,401 45,852 187Losses on devaluation of bonds ............................................................................. 331 7,049 3Bond issuance costs .............................................................................................. 1,197 606 13Lease-related expenses .......................................................................................... 201,932 194,349 2,170Losses on foreign exchange transactions ............................................................... 1,591 14,984 17Losses on financial derivatives .............................................................................. 17,011 — 183Other .................................................................................................................. 132,186 141,487 1,421
¥401,773 ¥473,212 $4,318

SMFG 2010 91
SMFGNotes to Consolidated Financial Statements
21. Other IncomeOther income for the fiscal years ended March 31, 2010 and 2009 consisted of the following:
Millions of yenMillions of U.S. dollars
Year ended March 31 2010 2009 2010Gains on sale of stocks and other securities .......................................................... ¥ 57,231 ¥15,242 $ 615Gains on money held in trust ............................................................................... 130 98 1Gains on disposal of fixed assets ........................................................................... 17,179 1,297 185Recoveries of written-off claims ........................................................................... 968 1,708 10Other .................................................................................................................. 35,128 34,627 378
¥110,638 ¥52,973 $1,189
22. Other ExpensesOther expenses for the fiscal years ended March 31, 2010 and 2009 consisted of the following:
Millions of yenMillions of U.S. dollars
Year ended March 31 2010 2009 2010Write-off of loans................................................................................................. ¥176,672 ¥302,353 $1,899Losses on sale of stocks and other securities .......................................................... 34,814 7,802 374Losses on devaluation of stocks and other securities .............................................. 32,495 191,117 349Losses on money held in trust .............................................................................. 375 232 4Losses on sale of delinquent loans ......................................................................... 76,439 62,549 821Equity in losses of affiliates .................................................................................. 21,542 94,876 232Losses on disposal of fixed assets .......................................................................... 6,003 12,144 65Losses on impairment of fixed assets* .................................................................. 12,856 7,363 138Other .................................................................................................................. 65,052 44,692 699
¥426,252 ¥723,131 $4,581
*Losses on impairment of fixed assets consisted of the following:
Year ended March 31
Purpose of use Millions of yenMillions of U.S. dollars
Area 2010 Type 2010 2009 2010Tokyo metropolitan area ........................................ Branch (1 branch) Land and buildings, etc. ¥ 13 ¥ 57 $ 0
Corporate assets (6 items) 8,295 4,700 89Idle assets (31 items) 1,511 664 16Other (4 items) 335 444 4
Kinki area ............................................................. Branch (1 branch) Land and buildings, etc. 164 389 2Corporate assets (2 items) 35 — 0Idle assets (38 items) 1,436 607 15Other (2 items) 256 318 3
Other .................................................................... Corporate assets (3 items) Land and buildings, etc. 21 — 0Idle assets (10 items) 281 179 3Other (2 items) 503 — 5
At SMBC, a branch, which continuously manages and determines its income and expenses, is the smallest unit of asset group for recognition and measurement of impairment loss of fixed assets. Assets such as corporate headquarters facilities, training facilities, data and system centers, and health and recreational facilities which do not produce cash flows that can be attributed to individual assets are treated as corporate assets. As for idle assets, impairment loss is measured individually. At other consolidated subsidiaries, a branch or other group is the smallest asset grouping unit as well. SMBC and other subsidiaries reduced the carrying amounts of long-lived assets of which investments are not expected to be fully recovered to their recoverable amounts, and recognized the losses as “losses on impairment of fixed assets,” which is included in “Other expenses.” SMBC reduced the carrying amounts of corporate assets and idle assets, and other consolidated subsidiaries reduced the carrying amounts of long-lived assets of their branches, corporate assets and idle assets. The recoverable amount is calculated using net realizable value which is basically determined by subtracting the expected disposal cost from the appraisal value based on the Real Estate Appraisal Standard.

SMFG 201092
SMFG Notes to Consolidated Financial Statements
23. Deferred Tax Assets and Liabilities(1) Significant components of deferred tax assets and liabilities at March 31, 2010 and 2009 were as follows:
Millions of yenMillions of U.S. dollars
March 31 2010 2009 2010Deferred tax assets:
Net operating loss carryforwards ............................................................ ¥ 485,533 ¥ 718,553 $ 5,218Write-off of securities ............................................................................ 282,386 354,168 3,035Reserve for possible loan losses ............................................................... 438,537 307,586 4,713Write-off of loans ................................................................................... 140,597 141,102 1,511Net unrealized gains (losses) on other securities ..................................... 20,707 72,185 223Reserve for employee retirement benefits ............................................... 74,489 64,968 800Net deferred losses on hedges ................................................................. 27,290 14,125 293Depreciation .......................................................................................... 12,392 9,058 133Other ..................................................................................................... 245,743 132,911 2,641Subtotal ................................................................................................. 1,727,678 1,814,660 18,567Valuation allowance ............................................................................... (739,555) (851,725) (7,948)Total deferred tax assets ......................................................................... 988,123 962,935 10,619
Deferred tax liabilities:Net unrealized gains (losses) on other securities ..................................... (169,312) (26,133) (1,820)Leveraged lease ...................................................................................... (28,392) (29,167) (305)Gains on securities contributed to employee retirement benefits trust .... (42,261) (42,263) (454)Securities returned from employee retirement benefits trust ................... (13,956) (14,711) (150)Undistributed earnings of overseas subsidiaries ...................................... (3,388) (2,206) (36)Other ..................................................................................................... (28,746) (18,082) (309)Total deferred tax liabilities ................................................................... (286,057) (132,564) (3,074)
Net deferred tax assets ............................................................................... ¥ 702,065 ¥ 830,370 $ 7,545
(2) SMFG and its domestic consolidated subsidiaries are subject to Japanese national and local income taxes, which, in the aggregate, would result in an effective statutory tax rate of approximately 40.69% for the years ended March 31, 2010 and 2009. A reconciliation of the effective income tax rate reflected in the accompanying consolidated statements of operations to the statutory tax rate for the years ended March 31, 2010 and 2009 was as follows:
2010 2009Statutory tax rate ............................................................................................................................... 40.69% 40.69%
Valuation allowance ....................................................................................................................... (10.81) 1,033.93Equity in losses of affiliates ............................................................................................................ 1.91 130.88Undistributed earnings of overseas subsidiaries .............................................................................. — (34.92)Dividends exempted for income tax purposes ................................................................................. — (6.24)Other ............................................................................................................................................. 0.26 (29.80)
Effective income tax rate .................................................................................................................... 32.05% 1,134.54%
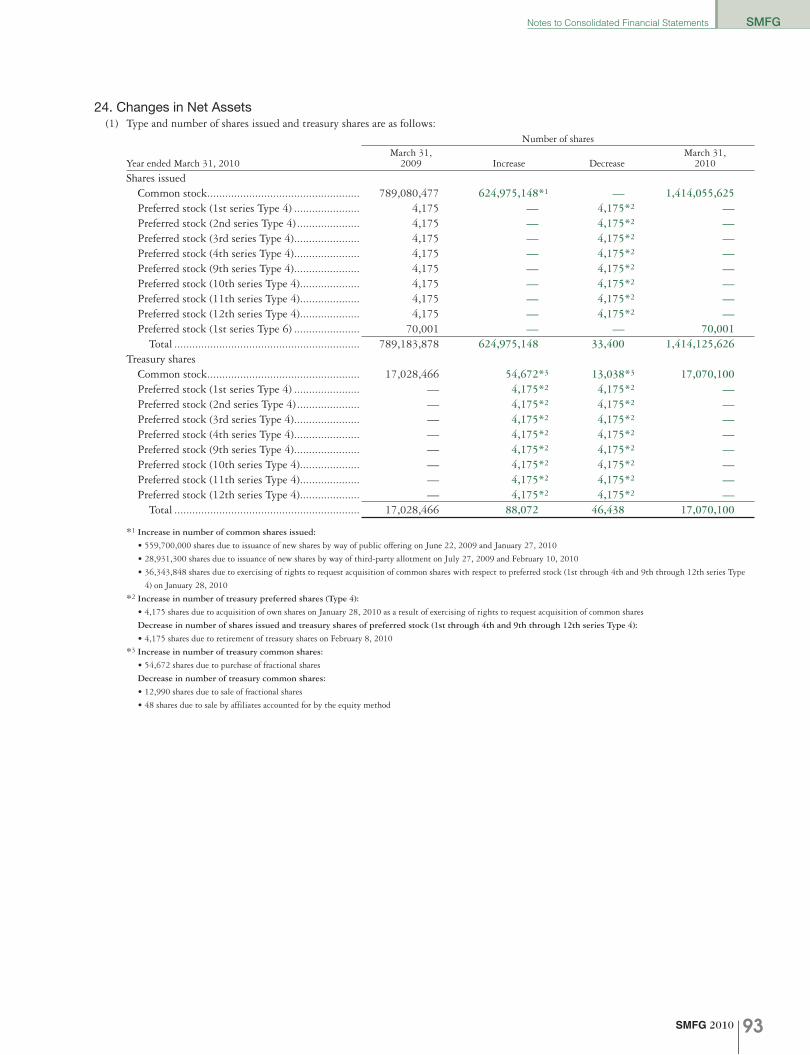
SMFG 2010 93
SMFGNotes to Consolidated Financial Statements
24. Changes in Net Assets(1) Type and number of shares issued and treasury shares are as follows:
Number of shares
Year ended March 31, 2010March 31,
2009 Increase DecreaseMarch 31,
2010
Shares issuedCommon stock ................................................... 789,080,477 624,975,148*1 — 1,414,055,625Preferred stock (1st series Type 4) ...................... 4,175 — 4,175*2 —Preferred stock (2nd series Type 4) ..................... 4,175 — 4,175*2 —Preferred stock (3rd series Type 4) ...................... 4,175 — 4,175*2 —Preferred stock (4th series Type 4) ...................... 4,175 — 4,175*2 —Preferred stock (9th series Type 4) ...................... 4,175 — 4,175*2 —Preferred stock (10th series Type 4) .................... 4,175 — 4,175*2 —Preferred stock (11th series Type 4) .................... 4,175 — 4,175*2 —Preferred stock (12th series Type 4) .................... 4,175 — 4,175*2 —Preferred stock (1st series Type 6) ...................... 70,001 — — 70,001
Total .............................................................. 789,183,878 624,975,148 33,400 1,414,125,626Treasury shares
Common stock ................................................... 17,028,466 54,672*3 13,038*3 17,070,100Preferred stock (1st series Type 4) ...................... — 4,175*2 4,175*2 —Preferred stock (2nd series Type 4) ..................... — 4,175*2 4,175*2 —Preferred stock (3rd series Type 4) ...................... — 4,175*2 4,175*2 —Preferred stock (4th series Type 4) ...................... — 4,175*2 4,175*2 —Preferred stock (9th series Type 4) ...................... — 4,175*2 4,175*2 —Preferred stock (10th series Type 4) .................... — 4,175*2 4,175*2 —Preferred stock (11th series Type 4) .................... — 4,175*2 4,175*2 —Preferred stock (12th series Type 4) .................... — 4,175*2 4,175*2 —
Total .............................................................. 17,028,466 88,072 46,438 17,070,100
*1 Increase in number of common shares issued:
• 559,700,000 shares due to issuance of new shares by way of public offering on June 22, 2009 and January 27, 2010
• 28,931,300 shares due to issuance of new shares by way of third-party allotment on July 27, 2009 and February 10, 2010
• 36,343,848 shares due to exercising of rights to request acquisition of common shares with respect to preferred stock (1st through 4th and 9th through 12th series Type
4) on January 28, 2010
*2 Increase in number of treasury preferred shares (Type 4):
• 4,175 shares due to acquisition of own shares on January 28, 2010 as a result of exercising of rights to request acquisition of common shares
Decrease in number of shares issued and treasury shares of preferred stock (1st through 4th and 9th through 12th series Type 4):
• 4,175 shares due to retirement of treasury shares on February 8, 2010
*3 Increase in number of treasury common shares:
• 54,672 shares due to purchase of fractional shares
Decrease in number of treasury common shares:
• 12,990 shares due to sale of fractional shares
• 48 shares due to sale by affiliates accounted for by the equity method
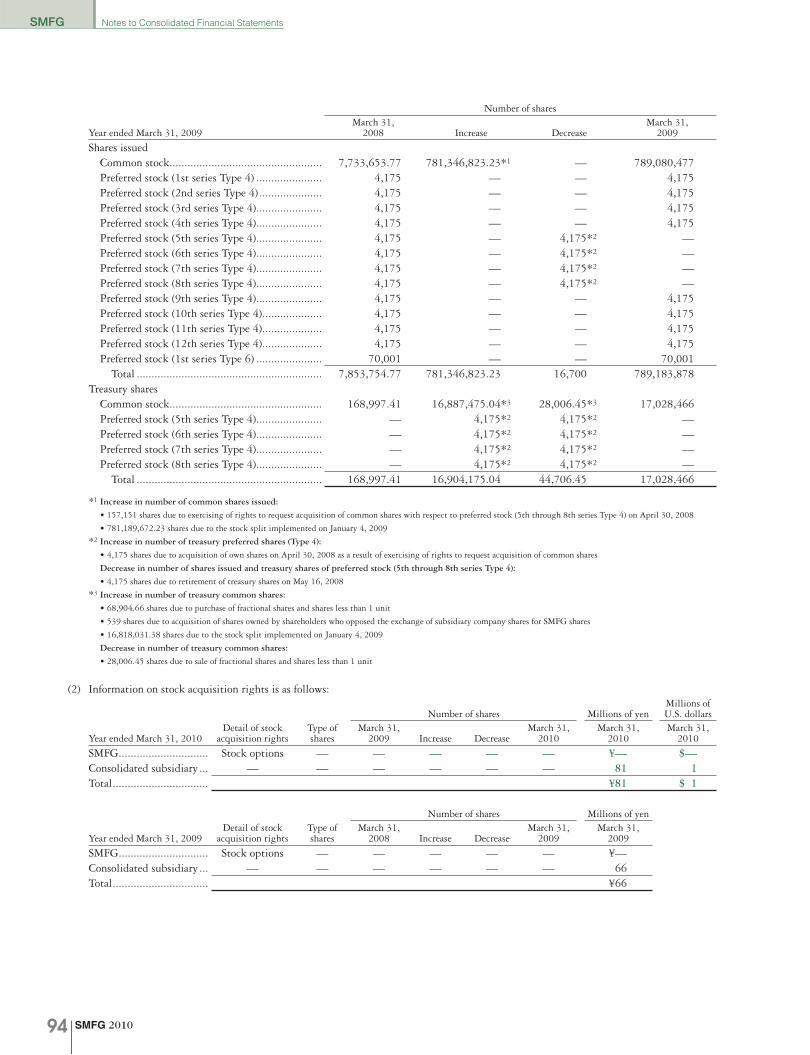
SMFG 201094
SMFG Notes to Consolidated Financial Statements
Number of shares
Year ended March 31, 2009March 31,
2008 Increase DecreaseMarch 31,
2009
Shares issuedCommon stock ................................................... 7,733,653.77 781,346,823.23*1 — 789,080,477Preferred stock (1st series Type 4) ...................... 4,175 — — 4,175Preferred stock (2nd series Type 4) ..................... 4,175 — — 4,175Preferred stock (3rd series Type 4) ...................... 4,175 — — 4,175Preferred stock (4th series Type 4) ...................... 4,175 — — 4,175Preferred stock (5th series Type 4) ...................... 4,175 — 4,175*2 —Preferred stock (6th series Type 4) ...................... 4,175 — 4,175*2 —Preferred stock (7th series Type 4) ...................... 4,175 — 4,175*2 —Preferred stock (8th series Type 4) ...................... 4,175 — 4,175*2 —Preferred stock (9th series Type 4) ...................... 4,175 — — 4,175Preferred stock (10th series Type 4) .................... 4,175 — — 4,175Preferred stock (11th series Type 4) .................... 4,175 — — 4,175Preferred stock (12th series Type 4) .................... 4,175 — — 4,175Preferred stock (1st series Type 6) ...................... 70,001 — — 70,001
Total .............................................................. 7,853,754.77 781,346,823.23 16,700 789,183,878Treasury shares
Common stock ................................................... 168,997.41 16,887,475.04*3 28,006.45*3 17,028,466Preferred stock (5th series Type 4) ...................... — 4,175*2 4,175*2 —Preferred stock (6th series Type 4) ...................... — 4,175*2 4,175*2 —Preferred stock (7th series Type 4) ...................... — 4,175*2 4,175*2 —Preferred stock (8th series Type 4) ...................... — 4,175*2 4,175*2 —
Total .............................................................. 168,997.41 16,904,175.04 44,706.45 17,028,466
*1 Increase in number of common shares issued:
• 157,151 shares due to exercising of rights to request acquisition of common shares with respect to preferred stock (5th through 8th series Type 4) on April 30, 2008
• 781,189,672.23 shares due to the stock split implemented on January 4, 2009
*2 Increase in number of treasury preferred shares (Type 4):
• 4,175 shares due to acquisition of own shares on April 30, 2008 as a result of exercising of rights to request acquisition of common shares
Decrease in number of shares issued and treasury shares of preferred stock (5th through 8th series Type 4):
• 4,175 shares due to retirement of treasury shares on May 16, 2008
*3 Increase in number of treasury common shares:
• 68,904.66 shares due to purchase of fractional shares and shares less than 1 unit
• 539 shares due to acquisition of shares owned by shareholders who opposed the exchange of subsidiary company shares for SMFG shares
• 16,818,031.38 shares due to the stock split implemented on January 4, 2009
Decrease in number of treasury common shares:
• 28,006.45 shares due to sale of fractional shares and shares less than 1 unit
(2) Information on stock acquisition rights is as follows:
Number of shares Millions of yenMillions of U.S. dollars
Year ended March 31, 2010Detail of stock
acquisition rightsType ofshares
March 31,2009 Increase Decrease
March 31,2010
March 31,2010
March 31,2010
SMFG .............................. Stock options — — — — — ¥— $—Consolidated subsidiary ... — — — — — — 81 1Total ................................ ¥81 $ 1
Number of shares Millions of yen
Year ended March 31, 2009Detail of stock
acquisition rightsType ofshares
March 31,2008 Increase Decrease
March 31,2009
March 31,2009
SMFG .............................. Stock options — — — — — ¥—Consolidated subsidiary ... — — — — — — 66Total ................................ ¥66

SMFG 2010 95
SMFGNotes to Consolidated Financial Statements
(3) Information on dividends is as follows:(a) Dividends paid in the fiscal year ended March 31, 2009
Millions of yen, except per share amount
Type of sharesAggregate amount
of dividendsCash dividends
per share Record date Effective date
Common stock ...................................................... ¥53,655 ¥ 7,000 March 31, 2008 June 27, 2008Preferred stock (1st series Type 4) .......................... 281 67,500 March 31, 2008 June 27, 2008Preferred stock (2nd series Type 4) ......................... 281 67,500 March 31, 2008 June 27, 2008Preferred stock (3rd series Type 4) ......................... 281 67,500 March 31, 2008 June 27, 2008Preferred stock (4th series Type 4) ......................... 281 67,500 March 31, 2008 June 27, 2008Preferred stock (5th series Type 4) ......................... 281 67,500 March 31, 2008 June 27, 2008Preferred stock (6th series Type 4) ......................... 281 67,500 March 31, 2008 June 27, 2008Preferred stock (7th series Type 4) ......................... 281 67,500 March 31, 2008 June 27, 2008Preferred stock (8th series Type 4) ......................... 281 67,500 March 31, 2008 June 27, 2008Preferred stock (9th series Type 4) ......................... 281 67,500 March 31, 2008 June 27, 2008Preferred stock (10th series Type 4) ....................... 281 67,500 March 31, 2008 June 27, 2008Preferred stock (11th series Type 4) ....................... 281 67,500 March 31, 2008 June 27, 2008Preferred stock (12th series Type 4) ....................... 281 67,500 March 31, 2008 June 27, 2008Preferred stock (1st series Type 6) .......................... 3,097 44,250 March 31, 2008 June 27, 2008
Date of resolution: Ordinary general meeting of shareholders held on June 27, 2008
Millions of yen, except per share amount
Type of sharesAggregate amount
of dividendsCash dividends
per share Record date Effective date
Common stock ...................................................... ¥54,753 ¥ 7,000 September 30, 2008 December 5, 2008Preferred stock (1st series Type 4) .......................... 281 67,500 September 30, 2008 December 5, 2008Preferred stock (2nd series Type 4) ......................... 281 67,500 September 30, 2008 December 5, 2008Preferred stock (3rd series Type 4) ......................... 281 67,500 September 30, 2008 December 5, 2008Preferred stock (4th series Type 4) ......................... 281 67,500 September 30, 2008 December 5, 2008Preferred stock (9th series Type 4) ......................... 281 67,500 September 30, 2008 December 5, 2008Preferred stock (10th series Type 4) ....................... 281 67,500 September 30, 2008 December 5, 2008Preferred stock (11th series Type 4) ....................... 281 67,500 September 30, 2008 December 5, 2008Preferred stock (12th series Type 4) ....................... 281 67,500 September 30, 2008 December 5, 2008Preferred stock (1st series Type 6) .......................... 3,097 44,250 September 30, 2008 December 5, 2008
Date of resolution: Meeting of the Board of Directors held on November 14, 2008
(b) Dividends paid in the fiscal year ended March 31, 2010Millions of yen, except per share amount
Type of sharesAggregate amount
of dividendsCash dividends
per share Record date Effective date
Common stock ...................................................... ¥15,707 ¥ 20 March 31, 2009 June 26, 2009Preferred stock (1st series Type 4) .......................... 281 67,500 March 31, 2009 June 26, 2009Preferred stock (2nd series Type 4) ......................... 281 67,500 March 31, 2009 June 26, 2009Preferred stock (3rd series Type 4) ......................... 281 67,500 March 31, 2009 June 26, 2009Preferred stock (4th series Type 4) ......................... 281 67,500 March 31, 2009 June 26, 2009Preferred stock (9th series Type 4) ......................... 281 67,500 March 31, 2009 June 26, 2009Preferred stock (10th series Type 4) ....................... 281 67,500 March 31, 2009 June 26, 2009Preferred stock (11th series Type 4) ....................... 281 67,500 March 31, 2009 June 26, 2009Preferred stock (12th series Type 4) ....................... 281 67,500 March 31, 2009 June 26, 2009Preferred stock (1st series Type 6) .......................... 3,097 44,250 March 31, 2009 June 26, 2009
Date of resolution: Ordinary general meeting of shareholders held on June 26, 2009

SMFG 201096
SMFG Notes to Consolidated Financial Statements
Millions of yen, except per share amount
Type of sharesAggregate amount
of dividendsCash dividends
per share Record date Effective date
Common stock ...................................................... ¥45,629 ¥ 45 September 30, 2009 December 4, 2009Preferred stock (1st series Type 4) .......................... 281 67,500 September 30, 2009 December 4, 2009Preferred stock (2nd series Type 4) ......................... 281 67,500 September 30, 2009 December 4, 2009Preferred stock (3rd series Type 4) ......................... 281 67,500 September 30, 2009 December 4, 2009Preferred stock (4th series Type 4) ......................... 281 67,500 September 30, 2009 December 4, 2009Preferred stock (9th series Type 4) ......................... 281 67,500 September 30, 2009 December 4, 2009Preferred stock (10th series Type 4) ....................... 281 67,500 September 30, 2009 December 4, 2009Preferred stock (11th series Type 4) ....................... 281 67,500 September 30, 2009 December 4, 2009Preferred stock (12th series Type 4) ....................... 281 67,500 September 30, 2009 December 4, 2009Preferred stock (1st series Type 6) .......................... 3,097 44,250 September 30, 2009 December 4, 2009
Date of resolution: Meeting of the Board of Directors held on November 13, 2009
(c) Dividends to be paid in the fiscal year ending March 31, 2011Millions of yen, except per share amount
Type of sharesAggregate amount
of dividendsSource
of dividendsCash dividends
per share Record date Effective date
Common stock ...................................................... ¥77,567 Retained earnings ¥ 55 March 31, 2010 June 29, 2010Preferred stock (1st series Type 6) .......................... 3,097 Retained earnings 44,250 March 31, 2010 June 29, 2010
Date of resolution: Ordinary general meeting of shareholders held on June 29, 2010
25. Cash FlowsFiscal year ended March 31, 2010
(1) Reconciliation of the opening balance and the net cash payment for acquisition with respect to acquisition of 18 companies including Nikko Cordial Securities Inc. is as follows:
Millions of yen Millions of U.S. dollars
Assets ................................................................................................................................... ¥ 1,953,475 $ 20,994Trading assets ................................................................................................................... 786,535 8,453
Liabilities ............................................................................................................................. ¥(1,552,271) $(16,682)Call money and bills sold .................................................................................................. (321,000) (3,450)Borrowed money ............................................................................................................... (295,020) (3,171)
Minority interests ................................................................................................................. (711) (8)Goodwill .............................................................................................................................. 167,607 1,801Acquisition costs for the 18 companies’ stocks ...................................................................... 568,099 6,105The 18 companies’ cash and due from banks ......................................................................... (58,246) (626)Net cash payment for acquisition of the 18 companies .......................................................... ¥ (509,853) $ (5,479)
(2) The major assets and liabilities which were acquired due to a merger between Kansai Urban Banking Corporation and The Biwako Bank, Limited are as follows:
Millions of yen Millions of U.S. dollars
Assets ................................................................................................................................... ¥1,113,801 $11,970Loans and bills discounted ................................................................................................ 795,445 8,549Securities .......................................................................................................................... 89,968 967
Liabilities ............................................................................................................................. ¥1,078,769 $11,593Deposits ........................................................................................................................... 1,033,256 11,104
(3) QUOQ Inc. and 1 other company were excluded from the scope of consolidation due to a merger with OMC Card, Inc. Their major assets and liabilities are as follows:
Millions of yen Millions of U.S. dollars
Assets ................................................................................................................................... ¥730,001 $7,845Other assets ...................................................................................................................... 401,031 4,310Customers’ liabilities for acceptances and guarantees ......................................................... 258,620 2,779
Liabilities ............................................................................................................................. ¥714,850 $7,682Borrowed money ............................................................................................................... 343,002 3,686Acceptances and guarantees .............................................................................................. 258,620 2,779
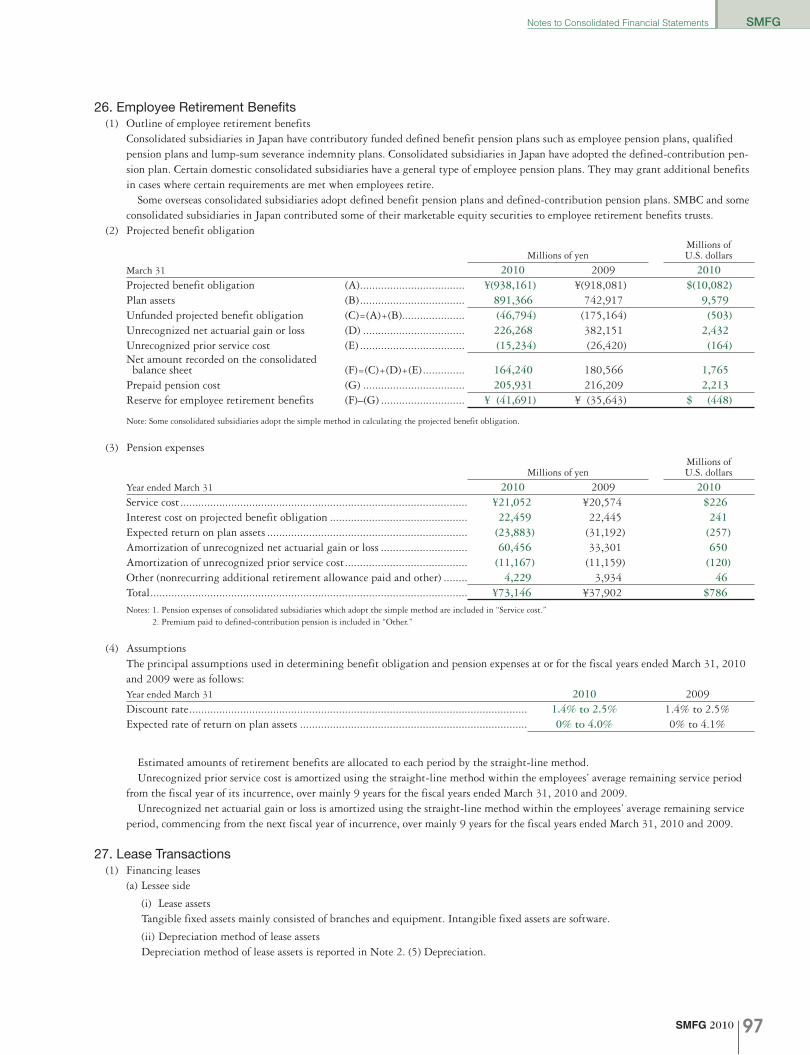
SMFG 2010 97
SMFGNotes to Consolidated Financial Statements
26. Employee Retirement Benefits(1) Outline of employee retirement benefits
Consolidated subsidiaries in Japan have contributory funded defined benefit pension plans such as employee pension plans, qualified pension plans and lump-sum severance indemnity plans. Consolidated subsidiaries in Japan have adopted the defined-contribution pen-sion plan. Certain domestic consolidated subsidiaries have a general type of employee pension plans. They may grant additional benefits in cases where certain requirements are met when employees retire. Some overseas consolidated subsidiaries adopt defined benefit pension plans and defined-contribution pension plans. SMBC and some consolidated subsidiaries in Japan contributed some of their marketable equity securities to employee retirement benefits trusts.
(2) Projected benefit obligation
Millions of yenMillions of U.S. dollars
March 31 2010 2009 2010Projected benefit obligation (A) ................................... ¥(938,161) ¥(918,081) $(10,082)Plan assets (B) ................................... 891,366 742,917 9,579Unfunded projected benefit obligation (C)=(A)+(B)..................... (46,794) (175,164) (503)Unrecognized net actuarial gain or loss (D) .................................. 226,268 382,151 2,432Unrecognized prior service cost (E) ................................... (15,234) (26,420) (164)Net amount recorded on the consolidated balance sheet (F)=(C)+(D)+(E) .............. 164,240 180,566 1,765Prepaid pension cost (G) .................................. 205,931 216,209 2,213Reserve for employee retirement benefits (F)–(G) ............................ ¥ (41,691) ¥ (35,643) $ (448)
Note: Some consolidated subsidiaries adopt the simple method in calculating the projected benefit obligation.
(3) Pension expenses
Millions of yenMillions of U.S. dollars
Year ended March 31 2010 2009 2010Service cost ................................................................................................ ¥21,052 ¥20,574 $226Interest cost on projected benefit obligation .............................................. 22,459 22,445 241Expected return on plan assets ................................................................... (23,883) (31,192) (257)Amortization of unrecognized net actuarial gain or loss ............................. 60,456 33,301 650Amortization of unrecognized prior service cost ......................................... (11,167) (11,159) (120)Other (nonrecurring additional retirement allowance paid and other) ........ 4,229 3,934 46Total .......................................................................................................... ¥73,146 ¥37,902 $786Notes: 1. Pension expenses of consolidated subsidiaries which adopt the simple method are included in “Service cost.”
2. Premium paid to defined-contribution pension is included in “Other.”
(4) AssumptionsThe principal assumptions used in determining benefit obligation and pension expenses at or for the fiscal years ended March 31, 2010 and 2009 were as follows:Year ended March 31 2010 2009Discount rate ................................................................................................................. 1.4% to 2.5% 1.4% to 2.5%Expected rate of return on plan assets ............................................................................ 0% to 4.0% 0% to 4.1%
Estimated amounts of retirement benefits are allocated to each period by the straight-line method. Unrecognized prior service cost is amortized using the straight-line method within the employees’ average remaining service period from the fiscal year of its incurrence, over mainly 9 years for the fiscal years ended March 31, 2010 and 2009. Unrecognized net actuarial gain or loss is amortized using the straight-line method within the employees’ average remaining service period, commencing from the next fiscal year of incurrence, over mainly 9 years for the fiscal years ended March 31, 2010 and 2009.
27. Lease Transactions(1) Financing leases
(a) Lessee side
(i) Lease assetsTangible fixed assets mainly consisted of branches and equipment. Intangible fixed assets are software.
(ii) Depreciation method of lease assetsDepreciation method of lease assets is reported in Note 2. (5) Depreciation.
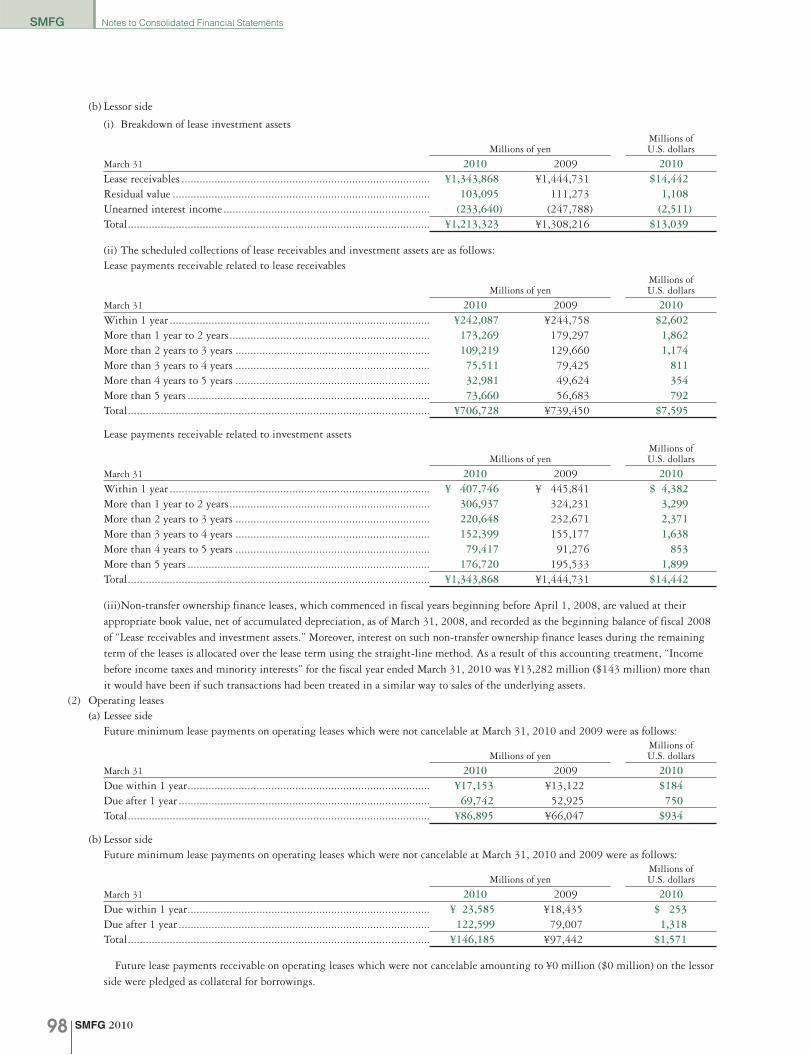
SMFG 201098
SMFG Notes to Consolidated Financial Statements
(b) Lessor side
(i) Breakdown of lease investment assets
Millions of yenMillions of U.S. dollars
March 31 2010 2009 2010Lease receivables ................................................................................... ¥1,343,868 ¥1,444,731 $14,442Residual value ...................................................................................... 103,095 111,273 1,108Unearned interest income ..................................................................... (233,640) (247,788) (2,511)Total ..................................................................................................... ¥1,213,323 ¥1,308,216 $13,039
(ii) The scheduled collections of lease receivables and investment assets are as follows:Lease payments receivable related to lease receivables
Millions of yenMillions of U.S. dollars
March 31 2010 2009 2010Within 1 year ....................................................................................... ¥242,087 ¥244,758 $2,602More than 1 year to 2 years ................................................................... 173,269 179,297 1,862More than 2 years to 3 years ................................................................. 109,219 129,660 1,174More than 3 years to 4 years ................................................................. 75,511 79,425 811More than 4 years to 5 years ................................................................. 32,981 49,624 354More than 5 years ................................................................................. 73,660 56,683 792Total ..................................................................................................... ¥706,728 ¥739,450 $7,595
Lease payments receivable related to investment assets
Millions of yenMillions of U.S. dollars
March 31 2010 2009 2010Within 1 year ....................................................................................... ¥ 407,746 ¥ 445,841 $ 4,382More than 1 year to 2 years ................................................................... 306,937 324,231 3,299More than 2 years to 3 years ................................................................. 220,648 232,671 2,371More than 3 years to 4 years ................................................................. 152,399 155,177 1,638More than 4 years to 5 years ................................................................. 79,417 91,276 853More than 5 years ................................................................................. 176,720 195,533 1,899Total ..................................................................................................... ¥1,343,868 ¥1,444,731 $14,442
(iii) Non-transfer ownership finance leases, which commenced in fiscal years beginning before April 1, 2008, are valued at their appropriate book value, net of accumulated depreciation, as of March 31, 2008, and recorded as the beginning balance of fiscal 2008 of “Lease receivables and investment assets.” Moreover, interest on such non-transfer ownership finance leases during the remaining term of the leases is allocated over the lease term using the straight-line method. As a result of this accounting treatment, “Income before income taxes and minority interests” for the fiscal year ended March 31, 2010 was ¥13,282 million ($143 million) more than it would have been if such transactions had been treated in a similar way to sales of the underlying assets.
(2) Operating leases(a) Lessee side
Future minimum lease payments on operating leases which were not cancelable at March 31, 2010 and 2009 were as follows:
Millions of yenMillions of U.S. dollars
March 31 2010 2009 2010Due within 1 year ................................................................................. ¥17,153 ¥13,122 $184Due after 1 year .................................................................................... 69,742 52,925 750Total ..................................................................................................... ¥86,895 ¥66,047 $934
(b) Lessor sideFuture minimum lease payments on operating leases which were not cancelable at March 31, 2010 and 2009 were as follows:
Millions of yenMillions of U.S. dollars
March 31 2010 2009 2010Due within 1 year ................................................................................. ¥ 23,585 ¥18,435 $ 253Due after 1 year .................................................................................... 122,599 79,007 1,318Total ..................................................................................................... ¥146,185 ¥97,442 $1,571
Future lease payments receivable on operating leases which were not cancelable amounting to ¥0 million ($0 million) on the lessor side were pledged as collateral for borrowings.

SMFG 2010 99
SMFGNotes to Consolidated Financial Statements
28. Financial Instruments(1) Status of financial instruments
(a) Policies on financial instrumentsSMFG conducts banking and other financial services such as leasing, securities, credit card, asset management and venture capital. Its banking business includes deposit taking, lending, securities trading and investment, remit-tance, foreign exchange, custody of funds and other assets related to financial futures transactions, bond subscription agent, trust business, over-the-counter sales of securities investment trusts and insurance products, and securities intermediation. These services entail holding of financial assets such as loans and bills discounted, bonds, and stocks. Meanwhile, SMFG raises funds through deposit taking, borrowing, bond offering, etc. Furthermore, it undertakes derivative transactions to meet customers’ hedging needs, to control market risk associated with deposit taking and lending (“ALM purposes”), and to make profit on short-term fluctuations in interest rates, foreign exchange rates, etc. (“trading purposes”).
(b) Details of financial instruments and associated risks
i) Financial assetsThe main financial assets held by SMFG include loans to foreign and domestic companies and domestic individuals, and securities such as bonds (government and corporate bonds) and stocks (foreign and domestic stocks), etc. Bonds such as government bonds are held for both trading and ALM purposes, and certain bonds are held as held-to-maturity securities. Stocks are held mainly for strategic purposes. These assets expose SMFG to credit risk, market risk and liquidity risk. Credit risk is the risk of loss arising from nonperfor-mance of obligations by the borrower or issuer due to factors such as deterioration in the borrower’s/issuer’s financial conditions. Market risk is the risk stemming from fluctuations in interest rates, exchange rates, or share prices. Liquidity risk is the risk arising from difficulty executing transactions in desired quantities at appropriate prices due to low market liquidity. These risks are properly monitored and managed based on “(c) Risk management framework for financial instru-ments” below.
ii) Financial liabilitiesFinancial liabilities of SMFG include borrowed money and bonds, etc. in addition to deposits. Deposits mainly comprise deposits of domestic and foreign companies and domestic individuals. Borrowed money and bonds include subordinated borrowings and subordinated bonds. Also, financial liabilities, like financial assets, expose SMFG to not only market risk but also funding liquidity risk: the risk of SMFG not being able to raise funds due to market turmoil, deterioration in its creditworthiness or other factors. These risks are properly monitored and managed based on “(c) Risk management framework for financial instruments” below.
iii) Derivative transactionsDerivatives handled by SMFG include foreign exchange futures; futures, forwards, swaps and options related to interest rates, currencies, equities, bonds and commodi-ties; and credit and weather derivatives. Major risks associated with derivatives include market risk, liquidity risk, and credit risk arising from nonperformance of contractual obligations due to deterioration in the counterparty’s financial conditions. These risks are properly monitored and managed based on “(c) Risk management framework for financial instruments” below. Hedge accounting is applied to derivative transac-tions executed for ALM purposes, as necessary. Hedging instruments, hedged items, hedging policy and the method to assess the effectiveness of hedging are described in “2. Significant Accounting Policies, (15) Hedge accounting.”
(c) Risk management framework for financial instrumentsThe fundamental matters on risk management for SMFG are set forth in “Risk Management Regulations.” SMFG’s Management Committee establishes the basic risk management policy, based on the Regulations, which is then approved by the Board of Directors. SMFG has a risk management system based on the basic policy. The Corporate Risk Management Department, which, together with the Corporate Planning Department, controls risk management across SMFG by monitoring the development and implementation of SMFG’s risk management system, and gives appropriate guidance as needed. Under this framework, SMFG comprehensively and systematically manages risks.
i) Management of credit riskSMFG conducts integrated management of credit risk according to its operational characteristics, and the credit risk inherent in its entire portfolio as well as the risk in individual credits are managed quantitatively and continuously.i. Credit risk management systemAt SMBC, basic policies on credit risk management and other significant matters require the resolution of the Management Committee and the approval of the Board of Directors. The Credit & Investment Planning Department of the Risk Management Unit is responsible for the comprehensive management of credit risk. This depart-ment establishes, revises or abolishes credit policies, the internal rating system, credit authority regulations, credit application regulations, and manages non-performing loans and other aspects of credit portfolio management. The department also controls SMBC’s total credit risk by quantifying credit risk (i.e. calculat-ing risk capital and risk-weighted assets) in cooperation with the Corporate Risk Management Department. The department also monitors risk situations and regularly reports to the Management Committee and the Board of Directors.
SMFG 2010100
SMFG Notes to Consolidated Financial Statements
Moreover, the Credit Portfolio Management Department within the Credit & Investment Planning Department works to stabilize SMBC’s overall credit portfolio through market transactions such as loan securitization. In the Corporate Services Unit, the Corporate Research Department analyzes industries as well as investigates the borrower’s business situ-ation to detect early signs of problems. The Credit Administration Department is responsible for formu-lating and implementing measures to reduce SMBC’s exposures mainly to borrowers classified as potentially bankrupt or lower. The Credit Departments of Consumer Banking Unit, Middle Market Banking Unit and other business units play a central role in credit screening and managing their units’ credit portfolios. Each business unit estab-lishes its credit limits based on the baseline amounts for each borrower grading category. Borrowers or loans perceived to have high credit risk undergo intensive evaluation and administration by the unit’s Credit Department. Moreover, the Credit Risk Committee, a consultative body straddling the business units, rounds out SMBC’s oversight system for undertaking flexible and efficient control of credit risk and ensuring the overall soundness of the bank’s loan operations. In addition to these, the Internal Audit Unit, operating independently from the business units, audits asset quality, grading accuracy, self-assessment, and appropriateness of credit risk management system, and reports the results directly to the Board of Directors and the Management Committee.ii. Method of credit risk managementSMBC properly manages the credit risk inherent in individual loans and the entire portfolio by assessing and quantifying the credit risk of each borrower/loan using the internal rating system. In addition to management of individual loans through credit screen-ing and monitoring, it manages the credit portfolio as described below in order to secure and improve the credit portfolio’s soundness and medium-term profitability.— Appropriate risk-taking within the scope of capital To limit credit risks to a permissible level relative to capital, “credit risk capital limit” has been established for internal control purposes. Under this limit, a general guideline and designated guidelines for real estate finance, investment in funds and securitization products, etc. are set for each business unit. Regular monitoring is conducted to ensure that these guidelines are being followed.— Controlling concentration riskConcentration of risk in specific borrowers/industries/countries could severely reduce a bank’s capital should it materialize. SMBC therefore implements measures to prevent concentration of credit risk in specific industries, and control large exposures to individual borrowers by setting guidelines for maximum loan amounts and conducting thorough loan reviews. To
manage country risk, SMBC also has credit limit guidelines based on each country’s creditworthiness.— Greater understanding of actual corporate condi-tions and balancing returns and risksSMBC runs credit operations on the basic principle of thoroughly understanding actual corporate conditions and gaining profit commensurate with the level of credit risk entailed, and makes every effort to improve profit at after-cost (credit cost, capital cost and overhead) level.— Reduction and prevention of non-performing loansOn non-performing loans and potential non-performing loans, SMBC carries out loan reviews to clarify credit policies and action plans, enabling it to swiftly imple-ment measures to prevent deterioration of borrowers’ business situations, support business recoveries, collect on loans, and enhance loan security.— Approaches to active portfolio managementSMBC is committed to agile portfolio management, such as using credit derivatives and selling loan claims, to stabilize its credit portfolio. In regards to financial instruments such as invest-ments in certain funds, securitized products and credit derivatives that indirectly retain risks related to assets such as corporate bonds and loan claims (underlying assets), such instruments entail market and liquidity risks in addition to credit risk, since such instruments are traded on the market. Credit risk management for these instruments involving detailed analysis and evalu-ation of characteristics of underlying assets is performed while market risk is comprehensively managed within the framework for managing market and liquidity risks. Moreover, guidelines have been established based on the characteristics of each type of risk. In regards to credit risk of derivative transactions, the potential exposure based on the market price is regularly calculated and properly managed. When the counterparty is a financial institution with whom SMBC frequently conducts derivative transactions, measures such as a close-out netting provision, which provide that offsetting credit exposures between the 2 parties will be combined into a single net payment from 1 party to the other in case of bankruptcy or other default event, are implemented to reduce credit risk.
ii) Management of market and liquidity risksSMFG manages market and liquidity risks by setting allowable risk limits; ensuring the transparency of the risk management process; and clearly separating front-office, middle-office, and back-office operations for a highly efficient system of mutual checks and balances.i. Market and liquidity risk management systemsAt SMBC, important matters such as basic policies for managing market and liquidity risks and risk manage-ment framework are determined by the Management Committee and then approved by the Board of Directors. The aforementioned Corporate Risk Management Department, which is independent from the business
SMFG 2010 101
SMFGNotes to Consolidated Financial Statements
units that directly handle business transactions, manages market and liquidity risks in an integrated manner. The department also monitors market and liquidity risk situations and regularly reports to the Management Committee and the Board of Directors. Furthermore, SMBC’s cross-departmental “ALM Committee” reports on the state of observance of market risk capital and liquidity risk capital limits, and deliberates on administration of ALM policies. SMBC also has a system whereby front-office departments, middle-office departments and back-office departments check each other’s work in order to prevent clerical errors, unauthorized transactions, etc. In addition, SMBC’s Internal Audit Unit, which is independent from other departments, periodically performs comprehensive internal audits to verify that the risk management framework is properly function-ing and reports the audit results to the Management Committee, the Board of Directors and other concerned committees and departments.ii. Market and liquidity risk management methodology— Market risk managementSMBC manages market risk by setting maximum loss and VaR (value at risk: maximum potential loss for a given probability) within the market risk capital limit that is set taking into account stockholders’ equity and other factors and in accordance with the market transaction policies. SMBC uses the historical simulation method (a method for estimating the maximum loss by running simulations of changes in profit and loss on market fluctuation scenarios based on historical data) to measure VaR. Regarding risks associated with foreign exchange rates, interest rates, equity risk, option prices and
other market risk factors, SMBC manages such risks by setting a maximum limit on the indicator suited for each market risk factor such as BPV (basis point value: denotes the change in value of a financial instrument resulting from a 0.01 percentage-point change in the yield).— Liquidity risk managementAt SMBC, funding liquidity risk is managed based on a framework consisting of setting funding gap limits and guidelines, maintaining a system of highly liquid supplementary funding sources, and establishing con-tingency plans. SMBC tries to avoid excessive reliance on short-term funds by managing funding gap limits and guidelines and has established a contingency plan covering emergency action plans such as reducing fund-ing gap limits and guidelines. In addition, to ensure smooth fulfillment of transactions in face of market turmoil, SMBC holds assets such as U.S. treasuries that can be sold immediately and emergency committed lines as supplemental liquidity. Moreover, to manage the liquidity risk of marketable instruments, derivative transactions, etc., SMBC has trading limits for each business office classified by currency, instrument, transaction period, etc. As for financial futures, etc., risks are managed by restricting positions within a certain percentage of open interest in the entire market.
(d) Supplementary explanations about matters concerning fair value of financial instrumentsFair values of financial instruments are based on their market prices and, in cases where market prices are not available, reasonably calculated prices. Such prices have been calculated using certain assumptions, and may differ if calculated based on different assumptions.

SMFG 2010102
SMFG Notes to Consolidated Financial Statements
(2) Fair value of financial instruments(a) Consolidated balance sheet amounts, fair values and net unrealized gains (losses) of financial instruments as of March 31, 2010 are as
follows. The amounts shown in the following table do not include financial instruments whose fair values are extremely difficult to determine, such as unlisted stocks classified as “other securities,” and stocks of subsidiaries and affiliates.
Millions of yen
2010
March 31Consolidated balance
sheet amount Fair valueNet unrealized gains
(losses)
1) Cash and due from banks and Deposits with banks*1 ....................... ¥ 5,838,781 ¥ 5,839,844 ¥ 1,0632) Call loans and bills bought*1 ........................................................... 1,119,705 1,121,304 1,5983) Receivables under resale agreements ................................................ 25,226 25,226 —4) Receivables under securities borrowing transactions ........................ 5,440,622 5,440,622 —5) Monetary claims bought*1 ............................................................... 997,290 1,010,523 13,2336) Trading assets
Securities classified as trading purposes ........................................ 3,058,033 3,058,033 —7) Money held in trust ......................................................................... 18,734 18,734 —8) Securities
Bond classified as held-to-maturity .............................................. 3,272,012 3,330,623 58,610Other securities ........................................................................... 24,383,712 24,383,712 —
9) Loans and bills discounted ............................................................... 62,701,033Reserve for possible loan losses*1 ................................................. (801,234)
61,899,799 62,891,684 991,88510) Foreign exchanges*1 ........................................................................ 1,101,719 1,105,607 3,88811) Lease receivables and investment assets*1 ......................................... 1,824,961 1,933,129 108,168
Total assets ...................................................................................... ¥108,980,596 ¥110,159,045 ¥1,178,4491) Deposits .......................................................................................... ¥ 78,648,595 ¥ 78,674,772 ¥ 26,1762) Negotiable certificates of deposit ..................................................... 6,995,619 6,995,575 (43)3) Call money and bills sold ................................................................. 2,119,557 2,119,557 (0)4) Payables under repurchase agreements ............................................. 1,120,860 1,120,860 —5) Payables under securities lending transactions ................................. 4,315,774 4,315,774 —6) Commercial paper ........................................................................... 310,787 310,787 —7) Trading liabilities
Trading securities sold for short sales ........................................... 1,582,808 1,582,808 —8) Borrowed money ............................................................................. 5,470,578 5,489,347 18,7689) Foreign exchanges ........................................................................... 192,299 192,299 —
10) Short-term bonds ............................................................................. 1,212,178 1,212,178 —11) Bonds .............................................................................................. 3,422,672 3,514,970 92,29812) Due to trust account ........................................................................ 159,554 159,554 —
Total liabilities ................................................................................ ¥105,551,287 ¥105,688,486 ¥ 137,199Derivative transactions*2
Hedge accounting not applied ..................................................... ¥ 245,128 ¥ 245,128 ¥ —Hedge accounting applied ........................................................... 183,211 183,211 —
Total ................................................................................................ ¥ 428,339 ¥ 428,339 ¥ —

SMFG 2010 103
SMFGNotes to Consolidated Financial Statements
Millions of U.S. dollars
2010
March 31Consolidated balance
sheet amount Fair valueNet unrealized gains
(losses)
1) Cash and due from banks and Deposits with banks*1 ....................... $ 62,749 $ 62,760 $ 112) Call loans and bills bought*1 ........................................................... 12,033 12,051 183) Receivables under resale agreements ................................................ 271 271 —4) Receivables under securities borrowing transactions ........................ 58,470 58,470 —5) Monetary claims bought*1 ............................................................... 10,718 10,860 1426) Trading assets
Securities classified as trading purposes ........................................ 32,864 32,864 —7) Money held in trust ......................................................................... 201 201 —8) Securities
Bond classified as held-to-maturity .............................................. 35,164 35,794 630Other securities ........................................................................... 262,050 262,050 —
9) Loans and bills discounted ............................................................... 673,842Reserve for possible loan losses*1 ................................................. (8,610)
665,232 675,891 10,65910) Foreign exchanges*1 ........................................................................ 11,840 11,882 4211) Lease receivables and investment assets*1 ......................................... 19,613 20,775 1,162
Total assets ...................................................................................... $1,171,205 $1,183,869 $12,6641) Deposits .......................................................................................... $ 845,229 $ 845,511 $ 2822) Negotiable certificates of deposit ..................................................... 75,181 75,181 (0)3) Call money and bills sold ................................................................. 22,779 22,779 (0)4) Payables under repurchase agreements ............................................. 12,046 12,046 —5) Payables under securities lending transactions ................................. 46,381 46,381 —6) Commercial paper ........................................................................... 3,340 3,340 —7) Trading liabilities
Trading securities sold for short sales ........................................... 17,010 17,010 —8) Borrowed money ............................................................................. 58,792 58,994 2029) Foreign exchanges ........................................................................... 2,067 2,067 —
10) Short-term bonds ............................................................................. 13,027 13,027 —11) Bonds .............................................................................................. 36,783 37,775 99212) Due to trust account ........................................................................ 1,715 1,715 —
Total liabilities ................................................................................ $1,134,350 $1,135,825 $ 1,475Derivative transactions*2
Hedge accounting not applied ..................................................... $ 2,634 $ 2,634 $ —Hedge accounting applied ........................................................... 1,969 1,969 —
Total ................................................................................................ $ 4,603 $ 4,603 $ —*1 Loans and bills discounted do not include general reserve for possible loan losses and specific reserve for possible loan losses. The reserves for possible losses on “Cash and
due from banks,” “Call loans and bills bought,” “Monetary claims bought,” “Foreign exchanges,” and “Lease receivables and investment assets” are deducted directly from “Consolidated balance sheet amount” since they are immaterial.
*2 The amounts collectively represent the derivative transactions which are recorded on “Trading assets,” “Trading liabilities,” “Other assets” and “Other liabilities.” Debts and credits arising from derivative transactions are presented on a net basis.
(b) Fair value calculation methodology for financial instrumentsAssets1) Cash and due from banks, 2) Call loans and bills bought, 3) Receivables under resale agreements, 4) Receivables under securities borrowing transactions, 9) Loans and bills discounted, 10) Foreign exchanges, and 11) Lease receivables and investment assets:Of these transactions, the book values of dues from banks without maturity and overdrafts with no specified repay-ment dates are regarded to approximate their fair values; thus, their fair values are their book values. For short-term transactions with remaining life as of the end of the fiscal year not exceeding 6 months, their fair
values are, in principle, their book value as book values are regarded to approximate fair values. The fair value of those with a remaining life of more than 6 months is, in principle, the present value of future cash flows (calculated by discounting estimated future cash flows, taking into account factors such as the borrower’s internal rating and pledged collateral, using a rate comprising of a risk-free interest rate and an overhead ratio). Certain consolidated subsidiaries of SMFG calculate the present value by discounting the estimated future cash flows computed based on the contractual interest rate, using a rate comprising a risk-free rate and a credit risk premium. Regarding claims on bankrupt borrowers, effectively

SMFG 2010104
SMFG Notes to Consolidated Financial Statements
bankrupt borrowers and potentially bankrupt borrowers, expected losses on such claims are calculated based on either the present value of expected future cash flows or the expected recoverable amount from collateral or guarantees. Since the claims’ balance sheet amounts at the closing date minus the current expected amount of loan losses approximate their fair values, such amounts are regarded as their fair values.5) Monetary claims bought:The fair values of monetary claims bought with market prices, such as beneficial interests in commodities invest-ment trusts, are based on their market prices as of the end of the fiscal year. The fair values of subordinated trust beneficiary interests related to securitized housing loans are based on the assessed value of underlying assets minus the assessed value of senior beneficial interests, etc. The fair values of other transactions are, in principle, based on prices calculated using methods similar to the methods applied to 9) Loans and bills discounted.6) Trading assets:The fair values of bonds and other securities held for trad-ing purposes are, in principle, based on their market price at the final date of the fiscal year.7) Money held in trust:The fair values of money held in trust are, in principle, based on the market prices of securities held in trust calculated using methods similar to the methods applied to 8) Securities.8) Securities:In principle, the fair values of stocks (including foreign stocks) are based on the average market price during 1 month before the end of the fiscal year. The fair values of bonds and securities with market prices other than stocks are prices calculated based on their market prices on the final date of the fiscal year. In light of the “Practical Solution on Measurement of Fair Value for Financial Assets” (ASBJ Practical Issue Task Force No. 25), the fair values of floating-rate Japanese government bonds are based on the present value of future cash flows (the government bond yield is used to discount and estimate future cash flows). Bond yield and yield volatility are the main price parameters. The fair values of those without market prices, such as private-placement bonds, are based on the present value of future cash flows calculated by discounting estimated future cash flows tak-ing into account the borrower’s internal rating and pledged collateral by a rate comprising a risk-free interest rate and an overhead ratio. However, the fair values of bonds issued by bankrupt borrowers, effectively bankrupt borrowers and potentially bankrupt borrowers are based on the bond’s face value after the deduction of the expected amount of a loss on the bond computed by using the same method applied to the estimation of a loan loss. Meanwhile, the fair values of publicly offered investment trusts are calculated based on the published net asset value (NAV) per share, while those of private placement investment trusts are calculated based on the NAV published by securities firms and other financial institutions.
Liabilities1) Deposits, 2) Negotiable certificates of deposit and 12) Due to trust account:The fair values of demand deposits and deposits without maturity are based on their book values as at the end of the fiscal year. The fair values of short-term transactions with remaining life as of the end of the fiscal year not exceeding 6 months are also based on their book values, as their book values are regarded to approximate their market values. The fair values of transactions with a remaining life of more than 6 months are, in principle, based on the present value of future cash flows calculated using the rate applied to the same type of deposits that are newly accepted until the end of the remaining life.3) Call money and bills sold, 4) Payables under repurchase agreements, 5) Payables under securities lending transac-tions, 6) Commercial paper, 8) Borrowed money, 10) Short-term bonds and 11) Bonds:The fair values of short-term transactions with remaining life as of the end of the fiscal year not exceeding 6 months are based on their book values, as their book values are regarded to approximate their fair values. For transactions with a remaining life of more than 6 months, their fair values are, in principle, based on the present value of future cash flows calculated using the refinancing rate applied to the same type of instruments for the remaining life. The fair values of bonds are based on the present value of future cash flows calculated using the rate derived from the data on the yields of benchmark bonds and publicly-offered subordinated bonds published by securities firms.7) Trading liabilities:The fair values of bonds sold for short sales and other securities for trading purposes are, in principle, based on their market prices on the final date of the fiscal year.9) Foreign exchanges:The fair values of foreign currency-denominated deposits without maturity received from other banks are based on their book values as at the end of the fiscal year. The fair values of foreign exchange related short-term borrowings are based on their book values, as their book values are regarded to approximate their fair values.Derivatives transactionsThe fair values of exchange-traded derivatives are based on their closing prices. With regard to OTC transactions, the fair values of interest rate, currency, stock, bond and credit derivatives are based on their settlement prices as at the end of the fiscal year calculated based on the present value of the expected future cash flows or using valuation tech-niques such as the option pricing model. The fair values of commodity derivatives transactions are based on their settlement prices as at the end of the fiscal year, calculated based on the derivative instrument’s components, includ-ing price and contract term.

SMFG 2010 105
SMFGNotes to Consolidated Financial Statements
(3) Consolidated balance sheet amounts of financial instruments whose fair values are extremely difficult to determine are as follows:
Millions of yen Millions of U.S. dollars
March 31 2010 2010Monetary claims bought:
Monetary claims bought without market prices*1 ........................................................ ¥ 7,889 $ 85Securities:
Unlisted stocks, etc.*2, 4 .............................................................................................. 291,922 3,137Investments in partnership, etc.*3, 4 ............................................................................. 354,422 3,809
Total ................................................................................................................................ ¥654,234 $7,031*1 Beneficiary claims that (a) behave more like equity than debt, (b) do not have market prices, and (c) for which it is difficult to rationally estimate fair values. They include com-
modity investments and beneficiary claims on loan trusts.*2 Not included in the scope of fair value disclosure since there are no market prices and it is extremely difficult to determine their fair values.*3 Capital contributions with no market prices. The above-stated amount includes the book value amount of investments in the partnership of which the SMFG records net changes
in their balance sheets and statements of income.*4 Unlisted stocks and investments in partnership totaling ¥26,770 million ($288 million) was written-off in the fiscal year ended March 31, 2010.
(4) Redemption schedule of monetary claims bought and securities with maturitiesMillions of yen
2010
March 31 Within 1 yearAfter 1 year
through 5 yearsAfter 5 years
through 10 years After 10 years
Deposits with banks ..................................................... ¥ 4,728,741 ¥ 2,685 ¥ — ¥ —Call loans and bills bought ........................................... 1,120,590 555 — —Receivables under resale agreements ............................. 25,226 — — —Receivables under securities borrowing transactions ..... 5,440,622 — — —Monetary claims bought*1 ............................................ 649,799 93,698 62,313 189,786Securities*1 .................................................................. 9,638,321 11,344,537 3,138,161 717,074
Bonds classified as held-to-maturity .......................... 69,571 2,713,680 483,955 —Japanese government bonds .................................. 65,000 2,410,000 390,000 —Japanese local government bonds .......................... 1,595 113,592 38,972 —Japanese corporate bonds ....................................... 2,976 188,087 50,283 —Other .................................................................... — 2,000 4,700 —
Other securities with maturity .................................. 9,568,749 8,630,856 2,654,206 717,074Japanese government bonds .................................. 8,226,690 3,456,218 1,712,053 364,500Japanese local government bonds .......................... 25,723 216,764 20,276 46Japanese corporate bonds ....................................... 675,629 2,130,381 363,670 60,592Other .................................................................... 640,706 2,827,491 558,206 291,934
Loans and bills discounted*1, 2 ...................................... 13,552,411 22,297,810 7,923,621 10,884,978Foreign exchanges*1 ..................................................... 1,101,482 2,520 — —Lease receivables and investment assets*1 ...................... 565,311 1,000,911 114,874 40,375Total ............................................................................. ¥36,822,506 ¥34,742,718 ¥11,238,970 ¥11,832,214

SMFG 2010106
SMFG Notes to Consolidated Financial Statements
Millions of U.S. dollars
2010
March 31 Within 1 yearAfter 1 year
through 5 yearsAfter 5 years
through 10 years After 10 years
Deposits with banks ..................................................... $ 50,819 $ 29 $ — $ —Call loans and bills bought ........................................... 12,043 6 — —Receivables under resale agreements ............................. 271 — — —Receivables under securities borrowing transactions ..... 58,470 — — —Monetary claims bought*1 ............................................ 6,983 1,007 670 2,040Securities*1 .................................................................. 103,582 121,919 33,725 7,706
Bonds classified as held-to-maturity .......................... 748 29,164 5,201 —Japanese government bonds .................................. 699 25,900 4,191 —Japanese local government bonds .......................... 17 1,221 419 —Japanese corporate bonds ....................................... 32 2,021 540 —Other .................................................................... — 22 51 —
Other securities with maturity .................................. 102,834 92,755 28,525 7,706Japanese government bonds .................................. 88,411 37,144 18,399 3,917Japanese local government bonds .......................... 276 2,329 219 1Japanese corporate bonds ....................................... 7,261 22,895 3,908 651Other .................................................................... 6,886 30,387 5,999 3,137
Loans and bills discounted*1, 2 ...................................... 145,647 239,632 85,154 116,980Foreign exchanges*1 ..................................................... 11,838 27 — —Lease receivables and investment assets*1 ...................... 6,075 10,757 1,235 434Total ............................................................................. $395,728 $373,377 $120,784 $127,160
*1 The amounts shown in the table above do not include amounts for claims on bankrupt borrowers, effectively bankrupt borrowers and potentially bankrupt borrowers and other claims for which redemption is unlikely. The amounts for such claims are as follows:
Millions of yen Millions of U.S. dollars
March 31 2010 2010
Monetary claims bought .................................................................................................................................... ¥ 3,196 $ 34
Securities ........................................................................................................................................................... 16,989 183
Loans and bills discounted ................................................................................................................................. 1,213,627 13,043
Foreign exchanges ............................................................................................................................................. 3,286 35
Lease receivables and investment assets .............................................................................................................. 10,048 108
*2 Does not include loans without tenure totaling ¥6,829,836 million ($73,400 million).
(5) Redemption schedule of bonds, borrowed money and other interest-bearing debtsMillions of yen
2010
March 31 Within 1 yearAfter 1 year
through 5 yearsAfter 5 years
through 10 years After 10 years
Deposits* .................................................................... ¥73,936,151 ¥4,093,970 ¥ 365,131 ¥251,172Negotiable certificates of deposit .................................. 6,959,781 35,838 — —Call money and bills sold .............................................. 2,119,557 — — —Payables under repurchase agreements .......................... 1,120,860 — — —Payables under securities lending transactions .............. 4,315,774 — — —Commercial paper ........................................................ 310,787 — — —Borrowed money .......................................................... 4,156,807 993,051 172,326 148,392Foreign exchanges ........................................................ 192,299 — — —Short-term bonds .......................................................... 1,212,200 — — —Bonds ........................................................................... 362,002 1,181,035 1,471,394 408,790Due to trust account ..................................................... 159,554 — — —Total ............................................................................. ¥94,845,775 ¥6,303,896 ¥2,008,852 ¥808,356

SMFG 2010 107
SMFGNotes to Consolidated Financial Statements
Millions of U.S. dollars
2010
March 31 Within 1 yearAfter 1 year
through 5 yearsAfter 5 years
through 10 years After 10 years
Deposits* ..................................................................... $ 794,585 $43,998 $ 3,924 $2,699Negotiable certificates of deposit .................................. 74,796 385 — —Call money and bills sold .............................................. 22,779 — — —Payables under repurchase agreements .......................... 12,046 — — —Payables under securities lending transactions .............. 46,381 — — —Commercial paper ........................................................ 3,340 — — —Borrowed money .......................................................... 44,673 10,672 1,852 1,595Foreign exchanges ........................................................ 2,067 — — —Short-term bonds .......................................................... 13,027 — — —Bonds ........................................................................... 3,890 12,692 15,813 4,393Due to trust account ..................................................... 1,715 — — —Total ............................................................................. $1,019,299 $67,747 $21,589 $8,687* Demand deposits are included in “Within 1 year.” Deposits include current deposits.
29. Fair Value Information(1) Securities
The amounts shown in the following tables include trading securities and short-term bonds classified as “Trading assets,” negotiable certificates of deposit bought classified as “Deposits with banks,” and beneficiary claims on loan trusts classified as “Monetary claims bought,” in addition to “Securities” stated in the consolidated balance sheets.
Fiscal year ended March 31, 2010(a) Securities classified as trading purposes
Millions of yen Millions of U.S. dollars
March 31 2010 2010Valuation gains included in the earnings for the fiscal year ....................................... ¥(2,583) $(28)
(b) Bonds classified as held-to-maturityMillions of yen
2010
March 31Consolidated balance
sheet amount Fair valueNet unrealized gains (losses)
Bonds with unrealized gains:Japanese government bonds ................................................................ ¥2,551,114 ¥2,600,336 ¥49,221Japanese local government bonds ........................................................ 151,580 154,660 3,079Japanese corporate bonds .................................................................... 239,417 246,457 7,039Other .................................................................................................. 2,195 2,199 4
Subtotal .......................................................................................... ¥2,944,308 ¥3,003,653 ¥59,344Bonds with unrealized losses:
Japanese government bonds ................................................................ ¥ 320,098 ¥ 319,472 ¥ (626)Japanese local government bonds ........................................................ 2,700 2,697 (2)Japanese corporate bonds .................................................................... 411 410 (1)Other .................................................................................................. 15,121 15,017 (104)
Subtotal .......................................................................................... ¥ 338,331 ¥ 337,596 ¥ (734)Total ................................................................................................... ¥3,282,639 ¥3,341,250 ¥58,610

SMFG 2010108
SMFG Notes to Consolidated Financial Statements
Millions of U.S. dollars
2010
March 31Consolidated balance
sheet amount Fair valueNet unrealized gains (losses)
Bonds with unrealized gains:Japanese government bonds ................................................................ $27,417 $27,946 $529Japanese local government bonds ........................................................ 1,629 1,662 33Japanese corporate bonds .................................................................... 2,573 2,649 76Other .................................................................................................. 23 23 0
Subtotal .......................................................................................... $31,642 $32,280 $638Bonds with unrealized losses:
Japanese government bonds ................................................................ $ 3,440 $ 3,433 $ (7)Japanese local government bonds ........................................................ 29 29 (0)Japanese corporate bonds .................................................................... 4 4 (0)Other .................................................................................................. 163 162 (1)
Subtotal .......................................................................................... $ 3,636 $ 3,628 $ (8)Total ................................................................................................... $35,278 $35,908 $630
(c) Other securitiesMillions of yen
2010
March 31Consolidated balance
sheet amount Acquisition costNet unrealized gains (losses)
Other securities with unrealized gains:Stocks ................................................................................................. ¥ 1,604,127 ¥ 1,060,381 ¥ 543,745Bonds ................................................................................................. 13,863,729 13,731,907 131,821
Japanese government bonds ............................................................ 10,769,980 10,707,770 62,209Japanese local government bonds .................................................... 196,170 194,047 2,123Japanese corporate bonds ................................................................. 2,897,578 2,830,090 67,488
Other .................................................................................................. 2,494,792 2,371,004 123,788Subtotal .......................................................................................... ¥17,962,649 ¥17,163,293 ¥ 799,355
Other securities with unrealized losses:Stocks ................................................................................................. ¥ 786,294 ¥ 919,055 ¥(132,761)Bonds ................................................................................................. 3,580,276 3,588,439 (8,163)
Japanese government bonds ............................................................ 3,097,128 3,099,871 (2,743)Japanese local government bonds .................................................... 72,197 72,313 (116)Japanese corporate bonds ................................................................. 410,951 416,253 (5,302)
Other .................................................................................................. 2,542,531 2,614,548 (72,017)Subtotal .......................................................................................... ¥ 6,909,102 ¥ 7,122,043 ¥(212,941)
Total ................................................................................................... ¥24,871,752 ¥24,285,337 ¥ 586,414
Millions of U.S. dollars
2010
March 31Consolidated balance
sheet amount Acquisition costNet unrealized gains (losses)
Other securities with unrealized gains:Stocks ................................................................................................. $ 17,240 $ 11,396 $ 5,844Bonds ................................................................................................. 148,992 147,575 1,417
Japanese government bonds ............................................................ 115,744 115,075 669Japanese local government bonds .................................................... 2,108 2,085 23Japanese corporate bonds ................................................................. 31,140 30,415 725
Other .................................................................................................. 26,811 25,481 1,330Subtotal .......................................................................................... $193,043 $184,452 $ 8,591
Other securities with unrealized losses:Stocks ................................................................................................. $ 8,450 $ 9,877 $(1,427)Bonds ................................................................................................. 38,477 38,565 (88)
Japanese government bonds ............................................................ 33,285 33,314 (29)Japanese local government bonds .................................................... 776 777 (1)Japanese corporate bonds ................................................................. 4,416 4,474 (58)
Other .................................................................................................. 27,324 28,098 (774)Subtotal .......................................................................................... $ 74,251 $ 76,540 $(2,289)
Total ................................................................................................... $267,294 $260,992 $ 6,302Notes: 1. Net unrealized gains (losses) on other securities shown above include gains of ¥105 million ($1 million) that are recognized in the fiscal year’s earnings by applying
fair value hedge accounting.

SMFG 2010 109
SMFGNotes to Consolidated Financial Statements
2. Consolidated balance sheet amounts of other securities whose fair values are extremely difficult to determine are as follows:Millions of yen Millions of U.S. dollars
March 31 2010 2010
Stocks ............................................................................................................................................ ¥285,123 $3,064
Other ............................................................................................................................................ 369,111 3,967
Total .............................................................................................................................................. ¥654,234 $7,031
These amounts are not included in “(c) Other securities” since there are no market prices and it is extremely difficult to determine their fair values.
(d) Held-to-maturity bonds sold during the year ended March 31, 2010There are no corresponding transactions.
(e) Other securities sold during the year ended March 31, 2010Millions of yen
2010Year ended March 31 Sales amount Gains on sales Losses on salesStocks ..................................................................................................... ¥ 107,588 ¥ 50,898 ¥ (3,556)Bonds ..................................................................................................... 20,061,150 35,397 (6,154)
Japanese government bonds ................................................................ 19,422,804 32,937 (5,915)Japanese local government bonds ........................................................ 196,472 634 (103)Japanese corporate bonds .................................................................... 441,872 1,825 (136)
Other ..................................................................................................... 12,193,240 61,872 (24,367)Total ....................................................................................................... ¥32,361,979 ¥148,167 ¥(34,079)
Millions of U.S. dollars
2010Year ended March 31 Sales amount Gains on sales Losses on salesStocks ..................................................................................................... $ 1,156 $ 547 $ (38)Bonds ..................................................................................................... 215,595 380 (66)
Japanese government bonds ................................................................ 208,735 354 (64)Japanese local government bonds ........................................................ 2,111 7 (1)Japanese corporate bonds .................................................................... 4,749 19 (1)
Other ..................................................................................................... 131,040 665 (262)Total ....................................................................................................... $347,791 $1,592 $(366)
(f) Change of classification of securitiesThere are no corresponding transactions.
(g) Write-down of securitiesSecurities (excluding stocks of subsidiaries and affiliates) with fair value are considered as impaired if the fair value declines materi-ally below the acquisition cost and such decline is not considered as recoverable. In such a case, the fair value is recognized as the consolidated balance sheet amount and the amount of write-down is accounted for as valuation loss for the fiscal year. Valuation loss for the fiscal year was ¥19,519 million ($210 million). The rule for determining “material decline” is as follows and is based on the classification of issuers under self-assessment of assets.
Bankrupt/Effectively bankrupt/Potentially bankrupt issuers: Fair value is lower than acquisition cost.Issuers requiring caution: Fair value is 30% or more lower than acquisition cost.Normal issuers: Fair value is 50% or more lower than acquisition cost.Bankrupt issuers: Issuers that are legally bankrupt or formally declared bankrupt.Effectively bankrupt issuers: Issuers that are not legally bankrupt but regarded as substantially bankrupt.Potentially bankrupt issuers: Issuers that are not bankrupt now, but are perceived to have a high risk of falling into bankruptcy.Issuers requiring caution: Issuers that are identified for close monitoring.Normal issuers: Issuers other than the above 4 categories of issuers.
Fiscal year ended March 31, 2009(a) Securities classified as trading purposes
Millions of yen
March 31 2009Consolidated balance sheet amount ............................................................................................................................. ¥858,134Valuation gains included in the earnings for the fiscal year ......................................................................................... 502

SMFG 2010110
SMFG Notes to Consolidated Financial Statements
(b) Bonds classified as held-to-maturity with fair valueMillions of yen
2009
March 31
Consolidatedbalance sheet
amount Fair valueNet unrealizedgains (losses)
Unrealizedgains
Unrealizedlosses
Japanese government bonds ............................................... ¥1,574,004 ¥1,596,291 ¥22,286 ¥22,582 ¥ 295Japanese local government bonds ....................................... 96,312 97,265 953 962 9Japanese corporate bonds ................................................... 392,209 396,215 4,006 4,611 605Other ................................................................................ 9,181 8,676 (504) — 504Total .................................................................................. ¥2,071,708 ¥2,098,449 ¥26,741 ¥28,155 ¥1,414
Note: Fair value is calculated using market prices at the fiscal year-end.
(c) Other securities with fair valueMillions of yen
2009
March 31Acquisition
cost
Consolidatedbalance sheet
amountNet unrealizedgains (losses)
Unrealizedgains
Unrealizedlosses
Stocks ................................................................................ ¥ 1,978,015 ¥ 1,985,078 ¥ 7,062 ¥287,380 ¥280,317Bonds ................................................................................ 14,010,902 14,008,076 (2,826) 21,534 24,360
Japanese government bonds ........................................... 13,158,932 13,160,414 1,482 20,029 18,547Japanese local government bonds ................................... 242,419 242,376 (43) 499 542Japanese corporate bonds ............................................... 609,550 605,286 (4,264) 1,005 5,270
Other ................................................................................ 6,048,145 6,010,732 (37,412) 47,920 85,332Total .................................................................................. ¥22,037,063 ¥22,003,887 ¥(33,176) ¥356,834 ¥390,011
Notes: 1. Consolidated balance sheet amount is calculated as follows: Stocks (including foreign stocks): Average market prices during 1 month before the fiscal year-end Bonds and other: Market prices at the fiscal year-end or fair value based on the DCF method on certain Japanese government bonds 2. Other securities with fair value are considered as impaired if the fair value declines materially below the acquisition cost and such decline is not considered as recover-
able. In such a case, the fair value is recognized as the consolidated balance sheet amount and the amount of write-down is accounted for as valuation loss for the fiscal year. Valuation loss for the fiscal year ended March 31, 2009 was ¥156,721 million. The rule for determining “material decline” is as follows and is based on the classification of issuers under self-assessment of assets.
Bankrupt/Effectively bankrupt/Potentially bankrupt issuers: Fair value is lower than acquisition cost. Issuers requiring caution: Fair value is 30% or more lower than acquisition cost. Normal issuers: Fair value is 50% or more lower than acquisition cost. Bankrupt issuers: Issuers that are legally bankrupt or formally declared bankrupt. Effectively bankrupt issuers: Issuers that are not legally bankrupt but regarded as substantially bankrupt. Potentially bankrupt issuers: Issuers that are not bankrupt now, but are perceived to have a high risk of falling into bankruptcy. Issuers requiring caution: Issuers that are identified for close monitoring. Normal issuers: Issuers other than the above 4 categories of issuers.
(d) Held-to-maturity bonds sold during the year ended March 31, 2009There are no corresponding transactions.
(e) Other securities sold during the year ended March 31, 2009Millions of yen
Year ended March 31 2009Sales amount .............................................................................................................................................................. ¥34,610,449Gains on sales ............................................................................................................................................................. 158,285Losses on sales ............................................................................................................................................................. 75,997
(f) Securities with no available market valueMillions of yen
Consolidated balance sheet
amount
March 31 2009Bonds classified as held-to-maturity:
Beneficiary claims on accounts receivable, etc. ....................................................................................................... ¥ 9,996Other securities:
Unlisted stocks (excluding OTC stocks) .................................................................................................................. 332,450Unlisted bonds ....................................................................................................................................................... 2,901,693Unlisted foreign securities ...................................................................................................................................... 800,543Other ...................................................................................................................................................................... 564,348

SMFG 2010 111
SMFGNotes to Consolidated Financial Statements
(g) Change of classification of securitiesThere are no corresponding transactions.
(h) Redemption schedule of other securities with maturities and held-to-maturity bondsMillions of yen
2009
March 31 Within 1 yearAfter 1 year
through 5 yearsAfter 5 years
through 10 years After 10 years
Bonds ........................................................................................ ¥3,416,761 ¥11,895,495 ¥1,987,483 ¥1,659,495Japanese government bonds ................................................... 2,802,254 9,376,045 1,133,529 1,422,588Japanese local government bonds ........................................... 32,001 232,744 73,889 52Japanese corporate bonds ....................................................... 582,504 2,286,704 780,064 236,853
Other ........................................................................................ 1,077,576 4,272,647 788,691 609,101Total .......................................................................................... ¥4,494,337 ¥16,168,143 ¥2,776,174 ¥2,268,597
(2) Money held in trust(a) Money held in trust classified as trading purposes
Millions of yenMillions of U.S. dollars
March 31 2010 2009 2010Consolidated balance sheet amount ............................................................ ¥1,483 ¥1,416 $16Valuation gains (losses) included in the earnings for the fiscal year ............. 13 (3) 0
(b) Money held in trust classified as held-to-maturityThere are no corresponding transactions.
(c) Other money held in trust
Millions of yenMillions of U.S. dollars
March 31 2010 2009 2010Acquisition cost ......................................................................................... ¥17,188 ¥7,830 $184Consolidated balance sheet amount ............................................................ 17,250 7,568 185Net unrealized gains (losses) ...................................................................... 62 (262) 1
Unrealized gains .................................................................................... 157 — 2Unrealized losses .................................................................................... (95) (262) (1)
Note: Consolidated balance sheet amount is calculated using market prices at the fiscal year-end.
(3) Net unrealized gains (losses) on other securities and other money held in trust
Millions of yenMillions of U.S. dollars
March 31 2010 2009 2010Net unrealized gains (losses) ...................................................................... ¥586,154 ¥(34,044) $6,299
Other securities ..................................................................................... 586,091 (33,781) 6,299Other money held in trust ..................................................................... 62 (262) 0
(–) Deferred tax liabilities .......................................................................... 168,758 14,428 1,813Net unrealized gains (losses) on other securities (before following adjustment) .................................................................. 417,396 (48,472) 4,486(–) Minority interests ................................................................................. 7,991 (5,400) 86(+) SMFG’s interest in net unrealized gains (losses) on valuation of other
securities held by affiliates accounted for by the equity method .......... 3,304 28,422 35Net unrealized gains (losses) on other securities ......................................... ¥412,708 ¥(14,649) $4,435Notes: 1. Net unrealized gains (losses) on other securities as of March 31, 2010 included gains of ¥105 million ($1 million) that are recognized in the fiscal year’s earnings by
applying fair value hedge accounting. 2. Net unrealized gains (losses) included foreign currency translation adjustments on non-marketable securities denominated in foreign currencies.
30. Derivative TransactionsFiscal year ended March 31, 2010
(1) Derivative transactions to which the hedge accounting method is not appliedThe following tables set forth the contract amount or the amount equivalent to the principal, fair value, valuation gains (losses) and cal-culation method of the relevant commodities by category with respect to derivative transactions to which the hedge accounting method is not applied at the end of the fiscal year. Contract amount does not indicate the market risk relating to derivative transactions.

SMFG 2010112
SMFG Notes to Consolidated Financial Statements
(a) Interest rate derivativesMillions of yen
2010Contract amount
Fair valueValuation
gains (losses)March 31 Total Over 1 yearListedInterest rate futures:
Sold .................................................................................................... ¥ 27,455,094 ¥ 1,429,658 ¥ (26,886) ¥ (26,886)Bought ............................................................................................... 32,231,909 1,234,295 30,344 30,344
Over-the-counterForward rate agreements:
Sold .................................................................................................... — — — —Bought ............................................................................................... 25,246,604 907,098 (340) (340)
Interest rate swaps: ................................................................................. 364,973,058 264,226,831 125,966 125,966Receivable fixed rate/payable floating rate .......................................... 168,753,817 124,132,310 4,254,072 4,254,072Receivable floating rate/payable fixed rate .......................................... 170,326,998 122,682,985 (4,118,551) (4,118,551)Receivable floating rate/payable floating rate ...................................... 25,798,196 17,317,488 (6,016) (6,016)
Interest rate swaptions:Sold .................................................................................................... 2,691,761 1,954,642 (59,016) (59,016)Bought ............................................................................................... 2,467,679 2,051,889 64,750 64,750
Caps:Sold .................................................................................................... 24,121,287 7,413,055 (13,228) (13,228)Bought ............................................................................................... 11,007,401 3,766,465 7,726 7,726
Floors:Sold ................................................................................................... 1,761,137 659,758 (18,523) (18,523)Bought ............................................................................................... 10,689,965 2,103,435 11,058 11,058
Other:Sold .................................................................................................... 732,102 342,078 (23,327) (23,327)Bought ............................................................................................... 2,526,134 1,235,256 81,184 81,184
Total ....................................................................................................... / / ¥ 179,707 ¥ 179,707
Millions of U.S. dollars
2010Contract amount
Fair valueValuation
gains (losses)March 31 Total Over 1 yearListedInterest rate futures:
Sold .................................................................................................... $ 295,057 $ 15,364 $ (289) $ (289)Bought ............................................................................................... 346,393 13,265 326 326
Over-the-counterForward rate agreements:
Sold .................................................................................................... — — — —Bought ............................................................................................... 271,323 9,749 (4) (4)
Interest rate swaps: ................................................................................. 3,922,333 2,839,622 1,354 1,354Receivable fixed rate/payable floating rate .......................................... 1,813,582 1,334,039 45,718 45,718Receivable floating rate/payable fixed rate .......................................... 1,830,489 1,318,463 (44,262) (44,262)Receivable floating rate/payable floating rate ...................................... 277,251 186,109 (65) (65)
Interest rate swaptions:Sold .................................................................................................... 28,928 21,006 (634) (634)Bought ............................................................................................... 26,520 22,051 696 696
Caps:Sold .................................................................................................... 259,229 79,667 (142) (142)Bought ............................................................................................... 118,296 40,478 83 83
Floors:Sold ................................................................................................... 18,927 7,090 (199) (199)Bought ............................................................................................... 114,884 22,605 119 119
Other:Sold .................................................................................................... 7,868 3,676 (251) (251)Bought ............................................................................................... 27,148 13,275 872 872
Total ....................................................................................................... / / $ 1,931 $ 1,931
Notes: 1. The above transactions are valued at fair value and the valuation gains (losses) are accounted for in the consolidated statements of operations. 2. Fair value of transactions listed on exchange is calculated using the closing prices on the Tokyo Financial Exchange and others.
Fair value of OTC transactions is calculated using discounted present value and option pricing models.

SMFG 2010 113
SMFGNotes to Consolidated Financial Statements
(b) Currency derivativesMillions of yen
2010Contract amount
Fair valueValuation
gains (losses)March 31 Total Over 1 yearOver-the-counterCurrency swaps ....................................................................................... ¥22,944,557 ¥15,000,880 ¥(197,861) ¥ (37,404)Currency swaptions:
Sold .................................................................................................... 812,380 787,350 (14,820) (14,820)Bought ............................................................................................... 962,113 861,923 30,552 30,552
Forward foreign exchange ....................................................................... 34,515,123 3,923,138 116,047 116,047Currency options:
Sold .................................................................................................... 3,855,995 2,479,933 (313,707) (313,707)Bought ............................................................................................... 3,850,518 2,378,255 388,407 388,407
Other:Sold .................................................................................................... 51 — 1 1Bought ............................................................................................... 42 — 0 0
Total ...................................................................................................... / / ¥ 8,620 ¥169,077
Millions of U.S. dollars
2010Contract amount
Fair valueValuation
gains (losses)March 31 Total Over 1 yearOver-the-counterCurrency swaps ....................................................................................... $246,583 $161,213 $(2,126) $ (402)Currency swaptions:
Sold .................................................................................................... 8,731 8,462 (159) (159)Bought ............................................................................................... 10,340 9,263 328 328
Forward foreign exchange ....................................................................... 370,931 42,162 1,247 1,247Currency options:
Sold .................................................................................................... 41,440 26,652 (3,371) (3,371)Bought ............................................................................................... 41,381 25,559 4,174 4,174
Other:Sold .................................................................................................... 1 — 0 0Bought ............................................................................................... 0 — 0 0
Total ...................................................................................................... / / $ 93 $1,817
Notes: 1. The above transactions are valued at fair value and the valuation gains (losses) are accounted for in the consolidated statements of operations. 2. Fair value is calculated using discounted present value and option pricing models.
(c) Equity derivativesMillions of yen
2010Contract amount
Fair valueValuation
gains (losses)March 31 Total Over 1 yearListedEquity price index futures:
Sold .................................................................................................... ¥ 57,478 ¥ — ¥ (1,416) ¥ (1,416)Bought ............................................................................................... 35,779 — 955 955
Equity price index options:Sold .................................................................................................... 1,825 — (1) (1)Bought ............................................................................................... 225 — 1 1
Over-the-counterEquity options:
Sold .................................................................................................... 226,398 152,641 (45,488) (45,488)Bought ............................................................................................... 233,424 225,474 45,680 45,680
Other:Sold .................................................................................................... 114 — (0) (0)Bought ............................................................................................... 294 — 16 16
Total ....................................................................................................... / / ¥ (253) ¥ (253)

SMFG 2010114
SMFG Notes to Consolidated Financial Statements
Millions of U.S. dollars
2010Contract amount
Fair valueValuation
gains (losses)March 31 Total Over 1 yearListedEquity price index futures:
Sold .................................................................................................... $ 618 $ — $ (15) $ (15)Bought ............................................................................................... 385 — 10 10
Equity price index options:Sold .................................................................................................... 20 — (0) (0)Bought ............................................................................................... 2 — 0 0
Over-the-counterEquity options:
Sold .................................................................................................... 2,433 1,640 (489) (489)Bought ............................................................................................... 2,509 2,423 491 491
Other:Sold .................................................................................................... 1 — (0) (0)Bought ............................................................................................... 3 — 0 0
Total ....................................................................................................... / / $ (3) $ (3)
Notes: 1. The above transactions are valued at fair value and the valuation gains (losses) are accounted for in the consolidated statements of operations. 2. Fair value of transactions listed on exchange is calculated using the closing prices on the Tokyo Stock Exchange and others.
Fair value of OTC transactions is calculated using option pricing models.
(d) Bond derivativesMillions of yen
2010Contract amount
Fair valueValuation
gains (losses)March 31 Total Over 1 yearListedBond futures:
Sold .................................................................................................... ¥1,320,583 ¥ — ¥5,799 ¥5,799Bought ............................................................................................... 1,232,748 — (6,710) (6,710)
Bond futures options:Sold .................................................................................................... 8,652 — 5 5Bought ............................................................................................... 209,652 — 256 256
Over-the-counterForward bond agreements:
Sold .................................................................................................... — — — —Bought ............................................................................................... 42,092 39,082 919 919
Bond options:Sold .................................................................................................... 270,000 — (247) (247)Bought ............................................................................................... 270,000 — 262 262
Total ....................................................................................................... / / ¥ 285 ¥ 285
Millions of U.S. dollars
2010Contract amount
Fair valueValuation
gains (losses)March 31 Total Over 1 yearListedBond futures:
Sold .................................................................................................... $14,192 $ — $62 $62Bought ............................................................................................... 13,248 — (72) (72)
Bond futures options:Sold .................................................................................................... 93 — 0 0Bought ............................................................................................... 2,253 — 3 3
Over-the-counterForward bond agreements:
Sold .................................................................................................... — — — —Bought ............................................................................................... 452 420 10 10
Bond options:Sold .................................................................................................... 2,902 — (3) (3)Bought ............................................................................................... 2,902 — 3 3
Total ....................................................................................................... / / $ 3 $ 3
Notes: 1. The above transactions are valued at fair value and the valuation gains (losses) are accounted for in the consolidated statements of operations. 2. Fair value of transactions listed on exchange is calculated using the closing prices on the Tokyo Stock Exchange and others.
Fair value of OTC transactions is calculated using discounted present value and option pricing models.

SMFG 2010 115
SMFGNotes to Consolidated Financial Statements
(e) Commodity derivativesMillions of yen
2010Contract amount
Fair valueValuation
gains (losses)March 31 Total Over 1 yearListedCommodity futures:
Sold .................................................................................................... ¥ 11,998 ¥ — ¥ (160) ¥ (160)Bought ............................................................................................... 12,235 — 154 154
Over-the-counterCommodity swaps:
Receivable fixed price/payable floating price....................................... 213,634 199,442 (48,721) (48,721)Receivable floating price/payable fixed price....................................... 172,127 159,140 101,006 101,006Receivable floating price/payable floating price .................................. 7 7 0 0
Commodity options:Sold .................................................................................................... 22,674 16,019 (198) (198)Bought ............................................................................................... 25,623 16,355 1,821 1,821
Total ....................................................................................................... / / ¥ 53,902 ¥ 53,902
Millions of U.S. dollars
2010Contract amount
Fair valueValuation
gains (losses)March 31 Total Over 1 yearListedCommodity futures:
Sold .................................................................................................... $ 129 $ — $ (2) $ (2)Bought ............................................................................................... 131 — 2 2
Over-the-counterCommodity swaps:
Receivable fixed price/payable floating price....................................... 2,296 2,143 (524) (524)Receivable floating price/payable fixed price....................................... 1,850 1,710 1,086 1,086Receivable floating price/payable floating price .................................. 0 0 0 0
Commodity options:Sold .................................................................................................... 244 172 (2) (2)Bought ............................................................................................... 275 176 19 19
Total ....................................................................................................... / / $ 579 $ 579
Notes: 1. The above transactions are valued at fair value and the valuation gains (losses) are accounted for in the consolidated statements of operations. 2. Fair value of transactions listed on exchange is calculated using the closing prices on the New York Mercantile Exchange and others.
Fair value of OTC transactions is calculated based on factors such as price of the relevant commodity and contract term. 3. Commodity derivatives are transactions on fuel and metal.
(f) Credit derivative transactionsMillions of yen
2010Contract amount
Fair valueValuation
gains (losses)March 31 Total Over 1 yearOver-the-counterCredit default options:
Sold .................................................................................................... ¥1,174,089 ¥1,079,228 ¥(73,555) ¥(73,555)Bought ............................................................................................... 1,362,339 1,078,463 76,421 76,421
Total ....................................................................................................... / / ¥ 2,865 ¥ 2,865
Millions of U.S. dollars
2010Contract amount
Fair valueValuation
gains (losses)March 31 Total Over 1 yearOver-the-counterCredit default options:
Sold .................................................................................................... $12,618 $11,598 $(790) $(790)Bought ............................................................................................... 14,641 11,590 821 821
Total ....................................................................................................... / / $ 31 $ 31
Notes: 1. The above transactions are valued at fair value and the valuation gains (losses) are accounted for in the consolidated statements of operations. 2. Fair value is calculated using discounted present value and option pricing models. 3. “Sold” represents transactions in which the credit risk is accepted; “Bought” represents transactions in which the credit risk is transferred.

SMFG 2010116
SMFG Notes to Consolidated Financial Statements
(2) Derivative transactions to which the hedge accounting method is appliedThe following tables set forth the contract amount or the amount equivalent to the principal, fair value and calculation method of the relevant commodities by category with respect to derivative transactions to which the hedge accounting method is applied at the end of the fiscal year. Contract amount does not indicate the market risk relating to derivative transactions.(a) Interest rate derivatives
Millions of yen
March 31 2010
Hedge accounting method Principal items hedged
Contract amount
Type of derivative Total Over 1 year Fair value
Deferral hedge method Interest rate futures: Interest-earning/bearing financial assets/liabilities such as loans and bills discounted, other securi-ties (bonds), deposits and negotiable certificates of deposits
Sold ................................................................. ¥ 687,343 ¥ 372,196 ¥ (126)Bought ............................................................ 15,799,182 — 1,862
Interest rate swaps: .............................................. 33,670,699 27,749,612 23,415Receivable fixed rate/payable floating rate ....... 22,949,812 18,482,089 321,049Receivable floating rate/payable fixed rate ....... 10,661,052 9,237,689 (298,913)Receivable floating rate/payable floating rate ... 59,833 29,833 1,278
Interest rate swaptions:Sold ................................................................. 470,930 460,558 (605)Bought ............................................................ 751 — (1)
Caps:Sold ................................................................. — — —Bought ............................................................ 600 — 0
Floors:Sold ................................................................. 171 — (0)Bought ............................................................ 7,850 7,850 0
Recognition of gain or loss on the hedging instrument
Interest rate swaps: .............................................. Loans and bills discounted; other securities (bonds)
72,655 69,368 (4,662)Receivable floating rate/payable fixed rate ....... 72,655 69,368 (4,662)
Special treatment for interest rate swaps
Interest rate swaps: .............................................. Loans and bills discounted; borrowed money;Bonds
9,135,218 9,105,823
(Note 3)Receivable fixed rate/payable floating rate ....... 25,500 14,500Receivable floating rate/payable fixed rate ....... 9,077,718 9,063,623Receivable floating rate/payable floating rate ... 32,000 27,700
Total .................................................................... / / ¥ 19,880
Millions of U.S. dollars
March 31 2010
Hedge accounting method Principal items hedged
Contract amount
Type of derivative Total Over 1 year Fair value
Deferral hedge method Interest rate futures: Interest-earning/bearing financial assets/liabilities such as loans and bills discounted, other securi-ties (bonds), deposits and negotiable certificates of deposits
Sold ................................................................. $ 7,387 $ 4,000 $ (1)Bought ............................................................ 169,792 — 20
Interest rate swaps: .............................................. 361,856 298,223 252Receivable fixed rate/payable floating rate ....... 246,640 198,625 3,450Receivable floating rate/payable fixed rate ....... 114,573 99,277 (3,212)Receivable floating rate/payable floating rate ... 643 321 14
Interest rate swaptions:Sold ................................................................. 5,061 4,950 (7)Bought ............................................................ 8 — (0)
Caps:Sold ................................................................. — — —Bought ............................................................ 6 — 0
Floors:Sold ................................................................. 2 — (0)Bought ............................................................ 84 84 0
Recognition of gain or loss on the hedging instrument
Interest rate swaps: .............................................. Loans and bills discounted; other securities (bonds)
781 745 (50)Receivable floating rate/payable fixed rate ....... 781 745 (50)
Special treatment for interest rate swaps
Interest rate swaps: .............................................. Loans and bills discounted; borrowed money;Bonds
98,175 97,859
(Note 3)Receivable fixed rate/payable floating rate ....... 274 156Receivable floating rate/payable fixed rate ....... 97,557 97,406Receivable floating rate/payable floating rate ... 344 297
Total .................................................................... / / $ 214
Notes: 1. SMFG applies deferred hedge accounting stipulated in “Treatment for Accounting and Auditing of Application of Accounting Standard for Financial Instruments in Banking Industry” (JICPA Industry Audit Committee Report No. 24).

SMFG 2010 117
SMFGNotes to Consolidated Financial Statements
2. Fair value of transactions listed on exchange is calculated using the closing prices on the Tokyo Financial Exchange and others. Fair value of OTC transactions is calculated using discounted present value and option pricing models.
3. Interest rate swap amounts measured by the special treatment for interest rate swaps are treated with the borrowed money or other transaction that is subject to the hedge. Therefore such fair value is included in the fair value of the relevant transaction subject to the hedge in “28. Financial Instruments.”
(b) Currency derivativesMillions of yen
March 31 2010
Hedge accounting method Principal items hedged
Contract amount
Type of derivative Total Over 1 year Fair value
Deferral hedge method Currency swaps. ................................................... Foreign currency denomi-nated loans and bills discounted; other securities (bonds); deposits; foreign currency exchange, etc.
¥2,058,317 ¥1,849,783 ¥163,796
Forward foreign exchange .................................... 10,152 — 111
Recognition of gain or loss on the hedging instrument
Currency swaps. ................................................... Deposits 19,785 — (301)
Allocation method Currency swaps. ................................................... Deposits; borrowed money 7,866 6,635(Note 3)
Forward foreign exchange .................................... 124,361 —
Total .................................................................... / / ¥163,607
Millions of U.S. dollars
March 31 2010
Hedge accounting method Principal items hedged
Contract amount
Type of derivative Total Over 1 year Fair value
Deferral hedge method Currency swaps. ................................................... Foreign currency denomi-nated loans and bills discounted; other securities (bonds); deposits; foreign currency exchange, etc.
$22,121 $19,879 $1,760
Forward foreign exchange .................................... 109 — 1
Recognition of gain or loss on the hedging instrument
Currency swaps. ................................................... Deposits 213 — (3)
Allocation method Currency swaps. ................................................... Deposits; borrowed money 85 71(Note 3)
Forward foreign exchange .................................... 1,336 —
Total .................................................................... / / $1,758
Notes: 1. SMFG applies deferred hedge accounting stipulated in “Treatment for Accounting and Auditing Concerning Accounting for Foreign Currency Transactions in Banking Industry” (JICPA Industry Audit Committee Report No. 25).
2. Fair value is calculated using discounted present value. 3. Foreign forward exchange amounts treated by the allocation method are treated with the deposit or other transaction that is subject to the hedge. Therefore such fair
value is included in the fair value of the relevant transaction subject to the hedge in “28. Financial Instruments.”
(c) Equity derivativesMillions of yen
March 31 2010
Hedge accounting method Principal items hedged
Contract amount
Type of derivative Total Over 1 year Fair value
Recognition of gain or loss on the hedging instrument
Equity price index swaps: Other securities (equity)Receivable equity index/payable floating rate ... ¥ — ¥ — ¥ —
Receivable floating rate/payable equity index ... 9,534 9,534 (276)
Total .................................................................... / / ¥(276)
Millions of U.S. dollars
March 31 2010
Hedge accounting method Principal items hedged
Contract amount
Type of derivative Total Over 1 year Fair value
Recognition of gain or loss on the hedging instrument
Equity price index swaps: Other securities (equity)Receivable equity index/payable floating rate ... $ — $ — $—
Receivable floating rate/payable equity index ... 102 102 (3)
Total .................................................................... / / $ (3)
Note: Fair value is calculated using discounted present value.

SMFG 2010118
SMFG Notes to Consolidated Financial Statements
Fiscal year ended March 31, 2009(1) Interest rate derivatives
Millions of yen
2009Contract amount
Fair valueValuation
gains (losses)March 31 Total Over 1 yearListedInterest rate futures:
Sold .................................................................................................... ¥ 17,636,094 ¥ 1,254,229 ¥ (41,578) ¥ (41,578)Bought ............................................................................................... 19,571,966 1,557,621 51,493 51,493
Over-the-counterForward rate agreements:
Sold .................................................................................................... — — — —Bought ............................................................................................... 15,742,690 97,966 114 114
Interest rate swaps: ................................................................................. 395,948,961 283,809,494 207,729 207,729Receivable fixed rate/payable floating rate .......................................... 186,295,438 135,517,151 4,508,393 4,508,393Receivable floating rate/payable fixed rate .......................................... 186,981,391 132,487,292 (4,300,450) (4,300,450)Receivable floating rate/payable floating rate ...................................... 22,579,384 15,712,303 4,399 4,399
Interest rate swaptions:Sold .................................................................................................... 2,690,323 1,789,900 (65,983) (65,983)Bought ............................................................................................... 2,802,501 2,143,328 65,627 65,627
Caps:Sold .................................................................................................... 27,834,072 12,451,630 (5,342) (5,342)Bought ............................................................................................... 13,867,378 6,122,525 3,263 3,263
Floors:Sold ................................................................................................... 3,351,169 1,816,123 (21,272) (21,272)Bought ............................................................................................... 5,116,400 2,810,008 8,036 8,036
Other:Sold .................................................................................................... 1,177,521 575,022 (32,707) (32,707)Bought ............................................................................................... 3,454,028 2,000,040 100,656 100,656
Total ....................................................................................................... / / ¥ 270,036 ¥ 270,036
Notes: 1. The above transactions are valued at fair value and the valuation gains (losses) are accounted for in the consolidated statements of operations.Derivative transactions to which the deferred hedge accounting method is applied are not included in the amounts above.
2. Fair value of transactions listed on exchange is calculated using the closing prices on the Tokyo Financial Exchange and others.Fair value of OTC transactions is calculated using discounted present value and option pricing models.
(2) Currency derivativesMillions of yen
2009Contract amount
Fair valueValuation
gains (losses)March 31 Total Over 1 yearOver-the-counterCurrency swaps ....................................................................................... ¥22,343,204 ¥14,918,715 ¥(138,309) ¥(107,046)Currency swaptions:
Sold .................................................................................................... 863,862 863,862 (13,907) (13,907)Bought ............................................................................................... 964,627 955,373 30,040 30,040
Forward foreign exchange ....................................................................... 44,250,845 4,431,723 108,517 108,517Currency options:
Sold .................................................................................................... 4,448,659 2,475,706 (269,220) (269,220)Bought ............................................................................................... 4,356,557 2,411,169 303,847 303,847
Total ...................................................................................................... / / ¥ 20,967 ¥ 52,231
Notes: 1. The above transactions are valued at fair value and the valuation gains (losses) are accounted for in the consolidated statements of operations. The amounts above do not include the following:
(a) Derivative transactions to which the deferred hedge accounting method is applied; (b) Those that are allotted to financial assets/liabilities denominated in foreign currencies and whose fair values are already reflected in the consolidated balance
sheets; and (c) Those that are allotted to financial assets/liabilities denominated in foreign currencies, and the financial assets/liabilities are eliminated in the process of
consolidation. 2. Fair value is calculated using discounted present value and option pricing models.

SMFG 2010 119
SMFGNotes to Consolidated Financial Statements
(3) Equity derivativesMillions of yen
2009Contract amount
Fair valueValuation
gains (losses)March 31 Total Over 1 yearListedEquity price index futures:
Sold .................................................................................................... ¥ 14,239 ¥ — ¥ (632) ¥ (632)Bought ............................................................................................... 14,533 — 636 636
Equity price index options:Sold .................................................................................................... 2,218 — (17) (17)Bought ............................................................................................... 144 — 3 3
Over-the-counterEquity options:
Sold .................................................................................................... 219,238 145,209 (63,785) (63,785)Bought ............................................................................................... 219,238 145,209 63,785 63,785
Total ....................................................................................................... / / ¥ (9) ¥ (9)
Notes: 1. The above transactions are valued at fair value and the valuation gains (losses) are accounted for in the consolidated statements of operations.Derivative transactions to which the deferred hedge accounting method is applied are not included in the amounts above.
2. Fair value of transactions listed on exchange is calculated using the closing prices on the Tokyo Stock Exchange and others.Fair value of OTC transactions is calculated using option pricing models.
(4) Bond derivativesMillions of yen
2009Contract amount
Fair valueValuation
gains (losses)March 31 Total Over 1 yearListedBond futures:
Sold .................................................................................................... ¥976,285 ¥ — ¥(9,158) ¥(9,158)Bought ............................................................................................... 964,958 — 8,638 8,638
Bond futures options:Sold .................................................................................................... 15,000 — 1 1Bought ............................................................................................... — — — —
Over-the-counterForward bond agreements:
Sold .................................................................................................... — — — —Bought ............................................................................................... 44,076 44,059 561 561
Bond options:Sold .................................................................................................... 450,000 — — —Bought ............................................................................................... 450,000 — 1 1
Total ....................................................................................................... / / ¥ 44 ¥ 44
Notes: 1. The above transactions are valued at fair value and the valuation gains (losses) are accounted for in the consolidated statements of operations. Derivative transactions to which the deferred hedge accounting method is applied are not included in the amounts above.
2. Fair value of transactions listed on exchange is calculated using the closing prices on the Tokyo Stock Exchange and others.Fair value of OTC transactions is calculated using discounted present value and option pricing models.

SMFG 2010120
SMFG Notes to Consolidated Financial Statements
(5) Commodity derivativesMillions of yen
2009Contract amount
Fair valueValuation
gains (losses)March 31 Total Over 1 yearListedCommodity futures:
Sold .................................................................................................... ¥ — ¥ — ¥ — ¥ —Bought ............................................................................................... 156 — 25 25
Over-the-counterCommodity swaps:
Receivable fixed price/payable floating price....................................... 295,434 246,531 37,408 37,408Receivable floating price/payable fixed price....................................... 243,608 194,760 27,707 27,707
Commodity options:Sold .................................................................................................... 14,335 11,786 (779) (779)Bought ............................................................................................... 39,276 33,637 2,015 2,015
Total ....................................................................................................... / / ¥66,376 ¥66,376
Notes: 1. The above transactions are valued at fair value and the valuation gains (losses) are accounted for in the consolidated statements of operations. Derivative transactions to which the deferred hedge accounting method is applied are not included in the amounts above.
2. Fair value of transactions listed on exchange is calculated using the closing prices on the New York Mercantile Exchange and others.Fair value of OTC transactions is calculated based on factors such as price of the relevant commodity and contract term.
3. Commodity derivatives are transactions on fuel and metal.
(6) Credit derivative transactionsMillions of yen
2009Contract amount
Fair valueValuation
gains (losses)March 31 Total Over 1 yearOver-the-counterCredit default options:
Sold .................................................................................................... ¥1,179,621 ¥1,167,801 ¥(209,630) ¥(209,630)Bought ............................................................................................... 1,325,430 1,308,288 229,275 229,275
Total ....................................................................................................... / / ¥ 19,644 ¥ 19,644
Notes: 1. The above transactions are valued at fair value and the valuation gains (losses) are accounted for in the consolidated statements of operations. Derivative transactions to which the deferred hedge accounting method is applied are not included in the amounts above.
2. Fair value is calculated using discounted present value and option pricing models. 3. “Sold” represents transactions in which the credit risk is accepted; “Bought” represents transactions in which the credit risk is transferred.
31. Stock Options1. Share-based compensation expenses which were accounted for as general and administrative expenses in the fiscal years ended March 31,
2010 and 2009 are as follows:
Millions of yenMillions of U.S. dollars
Year ended March 31 2010 2009 2010Share-based compensation expenses ................................................................. ¥15 ¥22 ¥0
2. Outline of stock options and changes is as follows:(1) SMFG
(a) Outline of stock options Date of resolution June 27, 2002 Title and number of grantees ............................................................... Directors and employees of SMFG and SMBC: 677Number of stock options* ................................................................... Common shares: 162,000Grant date ........................................................................................... August 30, 2002 Condition for vesting ........................................................................... N.A. Requisite service period ....................................................................... N.A. Exercise period .................................................................................... June 28, 2004 to June 27, 2012 * “Number of stock options” is reported in consideration of the 100-for-1 stock split implemented on January 4, 2009.

SMFG 2010 121
SMFGNotes to Consolidated Financial Statements
(b) Stock options granted and changesNumber of stock optionsDate of resolution June 27, 2002Before vested
Previous fiscal year-end .................................................................... —Granted ........................................................................................... —Forfeited .......................................................................................... —Vested.............................................................................................. —Outstanding .................................................................................... —
After vested ........................................................................................Previous fiscal year-end* .................................................................. 108,100Vested.............................................................................................. —Exercised ......................................................................................... — Forfeited .......................................................................................... —Exercisable ....................................................................................... 108,100
* Number of stock as of the previous fiscal year-end is reported in consideration of the 100-for-1 stock split implemented on January 4, 2009.
Price information (Yen)Date of resolution June 27, 2002Exercise price ....................................................................................... ¥6,649Average exercise price .......................................................................... — Fair value at the grant date .................................................................. —
(2) Kansai Urban Banking Corporation (a) Outline of stock options Date of resolution June 28, 2001 June 27, 2002 June 27, 2003 June 29, 2004 June 29, 2005 June 29, 2006
Title and number of grantees ........................................... Directors andemployees
45
Directors and employees
44
Directors and employees
65
Directors and employees
174
Directors and employees
183
Directors9
Number of stock options ................................................. Common shares 238,000
Common shares234,000
Common shares306,000
Common shares399,000
Common shares464,000
Common shares162,000
Grant date ....................................................................... July 31, 2001 July 31, 2002 July 31, 2003 July 30, 2004 July 29, 2005 July 31, 2006
Condition for vesting ....................................................... N.A. N.A. N.A. N.A. N.A. N.A.
Requisite service period ................................................... N.A. N.A. N.A. N.A. N.A. N.A.
Exercise period ................................................................ June 29, 2003to June 28,
2011
June 28, 2004 to June 27,
2012
June 28, 2005 to June 27,
2013
June 30, 2006to June 29,
2014
June 30, 2007 to June 29,
2015
June 30, 2008to June 29,
2016
Date of resolution June 29, 2006 June 28, 2007 June 28, 2007 June 27, 2008 June 26, 2009Title and number of grantees .......................................... Officers not
doubling asdirectors 14
Employees 46
Directors 10
Officers not doubling as directors 14
Employees 48
Directors 9Officers not doubling as directors 16
Employees 45
Directors 11Officers not doubling as directors 14
Employees 57
Number of stock options ................................................. Common shares115,000
Common shares174,000
Common shares112,000
Common shares289,000
Common shares350,000
Grant date ....................................................................... July 31, 2006 July 31, 2007 July 31, 2007 July 31, 2008 July 31, 2009
Condition for vesting ....................................................... N.A. N.A. N.A. N.A. N.A.
Requisite service period ................................................... N.A. N.A. N.A. N.A. N.A.
Exercise period ................................................................ June 30, 2008to June 29,
2016
June 29, 2009to June 28,
2017
June 29, 2009to June 28,
2017
June 28, 2010 to June 27,
2018
June 27, 2011 to June 26,
2019

SMFG 2010122
SMFG Notes to Consolidated Financial Statements
(b) Stock options granted and changesNumber of stock optionsDate of resolution June 28, 2001 June 27, 2002 June 27, 2003 June 29, 2004 June 29, 2005 June 29, 2006Before vested
Previous fiscal year-end ................................................ — — — — — —Granted ....................................................................... — — — — — —Forfeited ...................................................................... — — — — — —Vested.......................................................................... — — — — — —Outstanding ................................................................ — — — — — —
After vested Previous fiscal year-end ................................................ 112,000 158,000 228,000 329,000 451,000 162,000Vested.......................................................................... — — — — — —Exercised ..................................................................... 8,000 20,000 6,000 — — —Forfeited ...................................................................... — — — 4,000 — —Exercisable ................................................................... 104,000 138,000 222,000 325,000 451,000 162,000
Date of resolution June 29, 2006 June 28, 2007 June 28, 2007 June 27, 2008 June 26, 2009Before vested
Previous fiscal year-end ................................................ — 174,000 112,000 289,000 —Granted ....................................................................... — — — — 350,000Forfeited ...................................................................... — — — — —Vested.......................................................................... — 174,000 112,000 — —Outstanding ................................................................ — — — 289,000 350,000
After vested Previous fiscal year-end ................................................ 115,000 — — — —Vested.......................................................................... — 174,000 112,000 — —Exercised ..................................................................... — — — — —Forfeited ...................................................................... — — — — —Exercisable ................................................................... 115,000 174,000 112,000 — —
Price information (Yen) Date of resolution June 28, 2001 June 27, 2002 June 27, 2003 June 29, 2004 June 29, 2005 June 29, 2006Exercise price ................................................................... ¥155 ¥131 ¥179 ¥202 ¥313 ¥490Average exercise price ...................................................... 200 163 200 — — —Fair value at the grant date .............................................. — — — — — 138
Date of resolution June 29, 2006 June 28, 2007 June 28, 2007 June 27, 2008 June 26, 2009Exercise price ................................................................... ¥490 ¥461 ¥461 ¥302 ¥193Average exercise price ...................................................... — — — — —Fair value at the grant date .............................................. 138 96 96 37 51
(c) Valuation technique used for valuating fair value of stock options Stock options granted in the fiscal year ended March 31, 2010 were valued using the Black-Scholes option pricing model and the principal parameters were as follows:
Date of resolution June 26, 2009Expected volatility *1 ........................................................................ 49.10% Average expected life *2 ..................................................................... 5 years Expected dividends *3 ........................................................................ ¥3 per share Risk-free interest rate *4 .................................................................... 0.70% *1 Calculated based on the actual stock prices during the 5 years from June 2004 to June 2009*2 The average expected life could not be estimated rationally due to an insufficient amount of data. Therefore, it was estimated assuming that the options were exercised at the
midpoint of the exercise period. *3 The actual dividends on common stock for the fiscal year ended March 31, 2009*4 Japanese government bond yield corresponding to the average expected life
(d) Method of estimating number of stock options vested Only the actual number of forfeited stock options is reflected because it is difficult to rationally estimate the actual number of stock options that will be forfeited in the future.

SMFG 2010 123
SMFGNotes to Consolidated Financial Statements
32. Segment Information(1) Business segment information
Millions of yen
2010
Year ended March 31 Banking business Leasing business Other business Total Elimination Consolidated
I. Ordinary income
(1) External customers ...................... ¥ 2,281,797 ¥ 322,691 ¥ 561,976 ¥ 3,166,465 ¥ — ¥ 3,166,465
(2) Intersegment .............................. 46,765 5,484 242,343 294,593 (294,593) —
Total ................................................ 2,328,562 328,176 804,319 3,461,058 (294,593) 3,166,465
Ordinary expenses ................................ 1,880,076 284,948 683,373 2,848,397 (240,700) 2,607,696
Ordinary profit ..................................... ¥ 448,486 ¥ 43,228 ¥ 120,946 ¥ 612,661 ¥ (53,892) ¥ 558,769II. Assets, depreciation, losses on impairment
of fixed assets and capital expenditure
Assets .............................................. ¥111,831,177 ¥2,735,416 ¥13,570,744 ¥128,137,338 ¥(4,977,824) ¥123,159,513
Depreciation .................................... 78,608 28,501 29,746 136,856 4 136,860
Losses on impairment of fixed assets ... 11,396 988 470 12,856 — 12,856
Capital expenditure .......................... 108,434 88,583 41,424 238,441 0 238,441
Millions of yen
2009
Year ended March 31 Banking business Leasing business Other business Total Elimination Consolidated
I. Ordinary income
(1) External customers ...................... ¥ 2,773,183 ¥ 332,465 ¥ 447,194 ¥ 3,552,843 ¥ — ¥ 3,552,843
(2) Intersegment .............................. 65,756 5,511 306,084 377,352 (377,352) —
Total ................................................ 2,838,940 337,976 753,279 3,930,196 (377,352) 3,552,843
Ordinary expenses ................................ 2,800,453 306,585 681,077 3,788,116 (280,583) 3,507,532
Ordinary profit ..................................... ¥ 38,486 ¥ 31,391 ¥ 72,201 ¥ 142,080 ¥ (96,769) ¥ 45,311II. Assets, depreciation, losses on impairment
of fixed assets and capital expenditure
Assets .............................................. ¥114,704,051 ¥2,918,254 ¥8,222,027 ¥125,844,333 ¥(6,207,109) ¥119,637,224
Depreciation .................................... 70,803 25,491 26,722 123,017 7 123,025
Losses on impairment of fixed assets ... 6,541 — 821 7,363 — 7,363
Capital expenditure .......................... 124,546 102,240 23,326 250,113 7 250,121
Millions of U.S. dollars
2010
Year ended March 31 Banking business Leasing business Other business Total Elimination Consolidated
I. Ordinary income
(1) External customers ...................... $ 24,522 $ 3,468 $ 6,040 $ 34,030 $ — $ 34,030
(2) Intersegment .............................. 503 59 2,604 3,166 (3,166) —
Total ................................................ 25,025 3,527 8,644 37,196 (3,166) 34,030
Ordinary expenses ................................ 20,205 3,063 7,344 30,612 (2,587) 28,025
Ordinary profit ..................................... $ 4,820 $ 464 $ 1,300 $ 6,584 $ (579) $ 6,005II. Assets, depreciation, losses on impairment
of fixed assets and capital expenditure
Assets .............................................. $1,201,840 $29,397 $145,843 $1,377,080 $(53,496) $1,323,584
Depreciation .................................... 845 306 320 1,471 0 1,471
Losses on impairment of fixed assets ... 122 11 5 138 — 138
Capital expenditure .......................... 1,165 952 445 2,562 0 2,562
Notes: 1. The business segmentation is classified based on SMFG’s internal management purpose. Ordinary income and ordinary profit are presented as counterparts of sales and operating profit of companies in other industries.
2. “Other business” includes securities, credit card, investment banking, loans, venture capital, system development and information processing. 3. Assets in Elimination include unallocated corporate assets of ¥6,214,065 million ($66,782 million) and ¥4,117,977 million at March 31, 2010 and 2009, respec-
tively, which mainly consist of investments in subsidiaries and affiliates. 4. Ordinary income represents total income excluding gains on disposal of fixed assets, recoveries of written-off claims and other extraordinary gains. Ordinary expenses
represent total expenses excluding losses on disposal of fixed assets, losses on impairment of fixed assets and other extraordinary expenses. 5. As mentioned in Note 2. (20) (a), “Accounting Standard for Financial Instruments” (ASBJ Statement No. 10, partially revised on March 10, 2008) and
“Implementation Guidance on Disclosures about Fair Value of Financial Instruments” (ASBJ Guidance No. 19, issued on March 10, 2008) became effective from the fiscal year ending on and after March 31, 2010, and SMFG has applied them from the fiscal year ended March 31, 2010. As a result of the accounting change, Ordinary expenses of “Banking business” for the year ended March 31, 2010 decreased by ¥19,251 million ($207 million) and Ordinary profit of “Banking business” increased by ¥19,251 million ($207 million) as compared with the former method. Assets of “Banking business” increased by ¥59,270 million ($637 million) and Assets of “Other business” decreased by ¥703 million ($8 million).

SMFG 2010124
SMFG Notes to Consolidated Financial Statements
6. As mentioned in Note 2. (20) (c), non-transfer ownership finance leases were formerly accounted for using the same method as for operating leases. “Accounting Standard for Lease Transactions” (ASBJ Statement No. 13, issued on March 30, 2007) and “Implementation Guidance on Accounting Standard for Lease Transactions” (ASBJ Guidance No. 16, issued on March 30, 2007) became effective from the fiscal year beginning on and after April 1, 2008, and SMFG has applied them from the fiscal year ended March 31, 2009. As a result of the accounting change, Ordinary income of “Leasing business” for the year ended March 31, 2009 decreased by ¥691,719 million as compared with the former method. Ordinary expenses of “Banking business” and “Other business” increased by ¥22 million and ¥1 million, respectively, and Ordinary expenses of “Leasing business” decreased by ¥694,173 million. In terms of Ordinary profit, “Banking business” decreased by ¥22 million and “Other business” decreased by ¥1 million, while “Leasing business” increased by ¥2,453 million. Assets of “Banking business” and “Other business” increased by ¥7,447 million and ¥27,348 million, respectively, while Assets of “Leasing business” decreased by ¥36,473 million.
(2) Geographic segment informationMillions of yen
2010
Year ended March 31 Japan The AmericasEurope and Middle East
Asia and Oceania Total Elimination Consolidated
I. Ordinary income
(1) External customers ......... ¥ 2,707,111 ¥ 205,016 ¥ 126,121 ¥ 128,216 ¥ 3,166,465 ¥ — ¥ 3,166,465
(2) Intersegment ................. 21,793 106,215 2,641 3,856 134,507 (134,507) —
Total ................................... 2,728,905 311,232 128,763 132,072 3,300,973 (134,507) 3,166,465
Ordinary expenses ................... 2,344,349 171,438 115,093 69,893 2,700,774 (93,077) 2,607,696
Ordinary profit ........................ ¥ 384,555 ¥ 139,794 ¥ 13,669 ¥ 62,178 ¥ 600,198 ¥ (41,429) ¥ 558,769
II. Assets ...................................... ¥107,412,125 ¥8,255,658 ¥4,931,900 ¥5,638,760 ¥126,238,444 ¥(3,078,930) ¥123,159,513
Millions of yen
2009
Year ended March 31 Japan The AmericasEurope and Middle East
Asia and Oceania Total Elimination Consolidated
I. Ordinary income
(1) External customers ......... ¥ 2,886,164 ¥ 230,755 ¥ 245,279 ¥ 190,644 ¥ 3,552,843 ¥ — ¥ 3,552,843
(2) Intersegment ................. 125,334 95,462 6,959 22,639 250,396 (250,396) —
Total ................................... 3,011,499 326,218 252,238 213,284 3,803,239 (250,396) 3,552,843
Ordinary expenses ................... 3,026,816 282,617 255,544 172,847 3,737,825 (230,293) 3,507,532
Ordinary profit (loss) ............... ¥ (15,317) ¥ 43,600 ¥ (3,305) ¥ 40,436 ¥ 65,414 ¥ (20,102) ¥ 45,311
II. Assets ...................................... ¥102,162,307 ¥10,054,434 ¥5,537,019 ¥5,157,482 ¥122,911,244 ¥(3,274,020) ¥119,637,224
Millions of U.S. dollars
2010
Year ended March 31 Japan The AmericasEurope and Middle East
Asia and Oceania Total Elimination Consolidated
I. Ordinary income
(1) External customers ......... $ 29,093 $ 2,203 $ 1,356 $ 1,378 $ 34,030 $ — $ 34,030
(2) Intersegment ................. 234 1,142 28 41 1,445 (1,445) —
Total ................................... 29,327 3,345 1,384 1,419 35,475 (1,445) 34,030
Ordinary expenses ................... 25,194 1,843 1,237 751 29,025 (1,000) 28,025
Ordinary profit ........................ $ 4,133 $ 1,502 $ 147 $ 668 $ 6,450 $ (445) $ 6,005
II. Assets ...................................... $1,154,348 $88,723 $53,003 $60,599 $1,356,673 $(33,089) $1,323,584
Notes: 1. The geographic segmentation is classified based on the degrees of the following factors: geographic proximity, similarity of economic activities and relationship of business activities among regions. Ordinary income and ordinary profit are presented as counterparts of sales and operating profit of companies in other industries.
2. The Americas includes the United States, Brazil, Canada and others; Europe and Middle East includes the United Kingdom, Germany, France and others; Asia and Oceania includes China, Singapore, Australia and others except Japan.
3. Assets in Elimination include unallocated corporate assets of ¥6,214,065 million ($66,782 million) and ¥4,117,977 million at March 31, 2010 and 2009, respec-tively, which mainly consist of investments in subsidiaries and affiliates.
4. Ordinary income represents total income excluding gains on disposal of fixed assets, recoveries of written-off claims and other extraordinary gains. Ordinary expenses represent total expenses excluding losses on disposal of fixed assets, losses on impairment of fixed assets and other extraordinary expenses.
5. As mentioned in Note 2. (20) (a), “Accounting Standard for Financial Instruments” (ASBJ Statement No. 10, partially revised on March 10, 2008) and “Implementation Guidance on Disclosures about Fair Value of Financial Instruments” (ASBJ Guidance No. 19, issued on March 10, 2008) became effective from the fiscal year ending on and after March 31, 2010, and SMFG has applied them from the fiscal year ended March 31, 2010. As a result of the accounting change, Ordinary expenses of “Japan” for the year ended March 31, 2010 decreased by ¥19,251 million ($207 million) and Ordinary profit of “Japan” increased by ¥19,251 million ($207 million) as compared with the former method. Assets of “Japan,” “Europe and Middle East” and “Asia and Oceania” increased by ¥58,612 million ($630 million), ¥341 million ($4 million) and ¥181 million ($2 million), respectively. Assets of “The Americas” decreased by ¥567 million ($6 million).
6. As mentioned in Note 2. (20) (c), non-transfer ownership finance leases were formerly accounted for using the same method as for operating leases. “Accounting Standard for Lease Transactions” (ASBJ Statement No. 13, issued on March 30, 2007) and “Implementation Guidance on Accounting Standard for Lease Transactions” (ASBJ Guidance No. 16, issued on March 30, 2007) became effective from the fiscal year beginning on and after April 1, 2008, and SMFG has applied them from the fiscal year ended March 31, 2009. As a result of the accounting change, Ordinary income of “Japan” and Ordinary expenses of “Japan” for the year ended March 31, 2009 decreased by ¥676,849 million and ¥679,279 million as compared with the former method; Ordinary profit of “Japan” increased by ¥2,430 million. Assets of “Japan” decreased by ¥29,782 million.
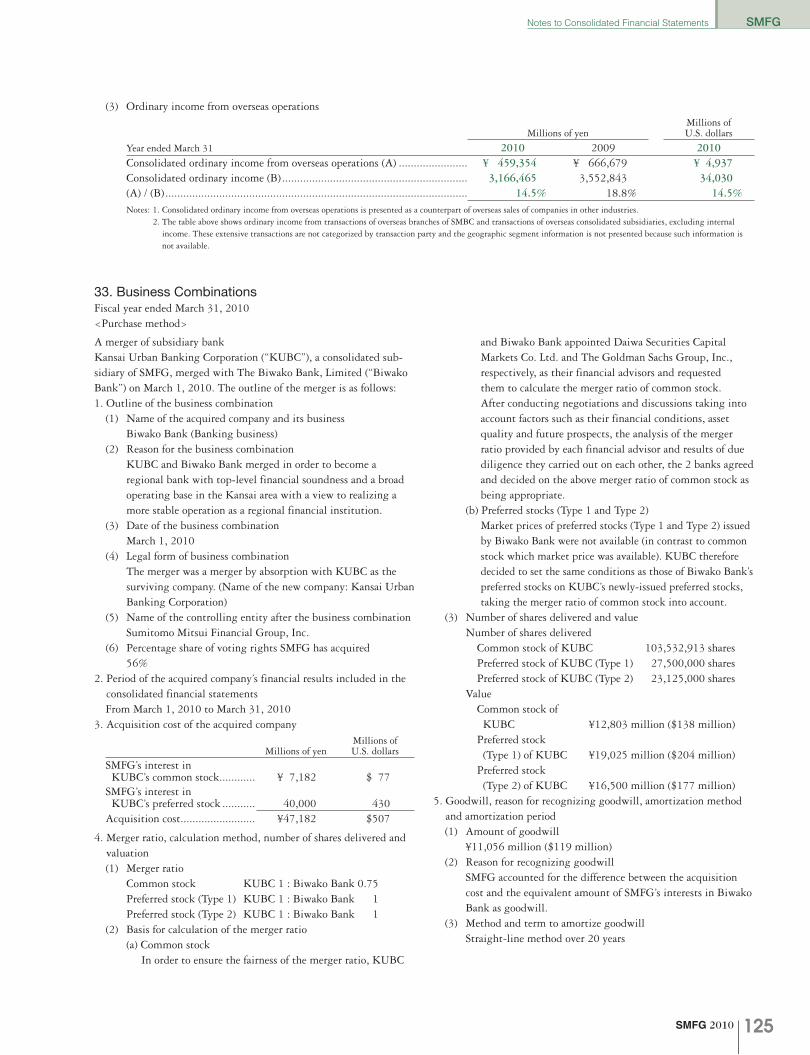
SMFG 2010 125
SMFGNotes to Consolidated Financial Statements
(3) Ordinary income from overseas operations
Millions of yenMillions of U.S. dollars
Year ended March 31 2010 2009 2010Consolidated ordinary income from overseas operations (A) ....................... ¥ 459,354 ¥ 666,679 ¥ 4,937Consolidated ordinary income (B) .............................................................. 3,166,465 3,552,843 34,030(A) / (B) ..................................................................................................... 14.5% 18.8% 14.5%Notes: 1. Consolidated ordinary income from overseas operations is presented as a counterpart of overseas sales of companies in other industries. 2. The table above shows ordinary income from transactions of overseas branches of SMBC and transactions of overseas consolidated subsidiaries, excluding internal
income. These extensive transactions are not categorized by transaction party and the geographic segment information is not presented because such information is not available.
33. Business CombinationsFiscal year ended March 31, 2010<Purchase method>
A merger of subsidiary bankKansai Urban Banking Corporation (“KUBC”), a consolidated sub-sidiary of SMFG, merged with The Biwako Bank, Limited (“Biwako Bank”) on March 1, 2010. The outline of the merger is as follows:1. Outline of the business combination
(1) Name of the acquired company and its businessBiwako Bank (Banking business)
(2) Reason for the business combinationKUBC and Biwako Bank merged in order to become a regional bank with top-level financial soundness and a broad operating base in the Kansai area with a view to realizing a more stable operation as a regional financial institution.
(3) Date of the business combinationMarch 1, 2010
(4) Legal form of business combinationThe merger was a merger by absorption with KUBC as the surviving company. (Name of the new company: Kansai Urban Banking Corporation)
(5) Name of the controlling entity after the business combinationSumitomo Mitsui Financial Group, Inc.
(6) Percentage share of voting rights SMFG has acquired56%
2. Period of the acquired company’s financial results included in the consolidated financial statements
From March 1, 2010 to March 31, 20103. Acquisition cost of the acquired company
Millions of yenMillions of U.S. dollars
SMFG’s interest in KUBC’s common stock ............ ¥ 7,182 $ 77SMFG’s interest in KUBC’s preferred stock ........... 40,000 430Acquisition cost ......................... ¥47,182 $507
4. Merger ratio, calculation method, number of shares delivered and valuation(1) Merger ratio
Common stock KUBC 1 : Biwako Bank 0.75Preferred stock (Type 1) KUBC 1 : Biwako Bank 1Preferred stock (Type 2) KUBC 1 : Biwako Bank 1
(2) Basis for calculation of the merger ratio(a) Common stock
In order to ensure the fairness of the merger ratio, KUBC
and Biwako Bank appointed Daiwa Securities Capital Markets Co. Ltd. and The Goldman Sachs Group, Inc., respectively, as their financial advisors and requested them to calculate the merger ratio of common stock. After conducting negotiations and discussions taking into account factors such as their financial conditions, asset quality and future prospects, the analysis of the merger ratio provided by each financial advisor and results of due diligence they carried out on each other, the 2 banks agreed and decided on the above merger ratio of common stock as being appropriate.
(b) Preferred stocks (Type 1 and Type 2)Market prices of preferred stocks (Type 1 and Type 2) issued by Biwako Bank were not available (in contrast to common stock which market price was available). KUBC therefore decided to set the same conditions as those of Biwako Bank’s preferred stocks on KUBC’s newly-issued preferred stocks, taking the merger ratio of common stock into account.
(3) Number of shares delivered and valueNumber of shares delivered Common stock of KUBC 103,532,913 shares Preferred stock of KUBC (Type 1) 27,500,000 shares Preferred stock of KUBC (Type 2) 23,125,000 sharesValue Common stock of KUBC ¥12,803 million ($138 million) Preferred stock (Type 1) of KUBC ¥19,025 million ($204 million) Preferred stock (Type 2) of KUBC ¥16,500 million ($177 million)
5. Goodwill, reason for recognizing goodwill, amortization method and amortization period(1) Amount of goodwill
¥11,056 million ($119 million)(2) Reason for recognizing goodwill
SMFG accounted for the difference between the acquisition cost and the equivalent amount of SMFG’s interests in Biwako Bank as goodwill.
(3) Method and term to amortize goodwillStraight-line method over 20 years

SMFG 2010126
SMFG Notes to Consolidated Financial Statements
6. Amounts of assets and liabilities acquired on the day of the busi-ness combination(1) Assets
Millions of yenMillions of U.S. dollars
Total assets ................................ ¥1,113,801 $11,970Loans and bills discounted ......... 795,445 8,549Securities ................................... 89,968 967
(2) Liabilities
Millions of yenMillions of U.S. dollars
Total liabilities .......................... ¥1,078,769 $11,593Deposits .................................... 1,033,256 11,104
7. Approximate amounts of impact on the consolidated statement of operations for the fiscal year ended March 31, 2010, assuming that the business combinations had been completed on the commence-ment date of the fiscal year(1) The difference between the ordinary income and other income
data estimated, assuming that the business combinations had been completed on the commencement date of the fiscal year and the actual ordinary income and other income data that are recorded in the consolidated statement of income is as follows:
Millions of yenMillions of U.S. dollars
Ordinary income ....................... ¥25,832 $278Ordinary profit .......................... 705 8Net income ............................... 183 2
Note: Ordinary income is presented as counterparts of sales of companies in other industries.
(2) Calculation method of the approximate amounts and material assumptionsThe approximate amounts were calculated retroactively to the commencement date of the fiscal year based on the amounts stated in Biwako Bank’s statement of income for the period from April 1, 2009 to February 28, 2010, including the amount of amortization of goodwill for the same period and are different from results of operation if the business combination had been completed on the commencement date of the fiscal year. The information mentioned above has not been audited by KPMG AZSA & Co.
<Business combination of subsidiaries>A merger of credit card companiesA consolidated subsidiary, QUOQ Inc. (“QUOQ”) and equity method affiliates, Central Finance Co., Ltd. (“CF”) and OMC Card, Inc. (“OMC Card”) merged on April 1, 2009. The new company was named Cedyna Financial Corporation and became an equity method affiliate of SMFG. The outline of the merger is as follows:1. Outline of the business combination
(1) Company profilesSurviving company: OMC Card (Credit card business)Merged company: CF (Shopping credit business and general credit business)Merged company: QUOQ (Shopping credit business and general credit business)
(2) Reasons for the business combinationThe credit card market is growing steadily, propelled by the
expansion into new areas of settlement, such as for small purchases, the growing popularity of reward point programs, and other developments. Further substantial growth of the industry is anticipated with the greater use of credit cards to pay for public services charges and in other fields. At the same time, the business environment surrounding the industry is changing dramatically — development of new technologies and new services, such as electronic money; investment in systems that can respond to customers’ needs for more in-depth, sophisticated and diverse services; enactment of laws on money lending business; etc. — and the industry is at a major turning point. In the shopping credit business, the Installment Sales Act is being revised amid the trend to strengthen consumer protection. Under these circumstances, the companies need to restructure their operations in order to establish new business models. On April 1, 2009, CF, OMC Card and QUOQ merged to create one of the largest consumer finance companies in Japan with a high level of specialization and flexibility in its core businesses of credit cards and shopping credit by combining the customer bases, marketing capabilities, know-how and other resources of the 3 companies.
(3) Date of business combinationApril 1, 2009
(4) Legal form of the business combinationThe merger was a merger by absorption with OMC Card as the surviving company. (Name of the new company: Cedyna Financial Corporation)
2. Outline of accounting method SMFG applies the accounting procedures stipulated by Articles 39,
42 and 48 of the “Accounting Standard for Business Divestitures” (ASBJ Statement No. 7).
3. Name of the business segment, in which the subsidiary was included, in the segment information Other business
4. Approximate amounts of the subsidiary’s earnings included in the consolidated statement of operations for the fiscal year ended March 31, 2010
SMFG did not record profit or loss of QUOQ and its subsidiaries because they were excluded from the scope of consolidation at the beginning of the fiscal year.
5. Status after the business combination QUOQ and its subsidiaries are excluded from the scope of consoli-
dation, and Cedyna Financial Corporation has become an affiliated company accounted for by the equity method.
Fiscal year ended March 31, 2009There is no material information to be reported.

SMFG 2010 127
SMFGNotes to Consolidated Financial Statements
34. Per Share DataYen U.S. dollars
March 31 2010 2009 2010Net assets per share ............................................................................................. ¥3,391.75 ¥2,790.27 $36.45
Yen U.S. dollars
Year ended March 31 2010 2009 2010Net income (loss) per share .................................................................................. ¥248.40 ¥(497.39) $2.67Net income per share (diluted) ............................................................................ 244.18 — 2.62Notes: 1. Net income (loss) per share and Net income per share (diluted) are calculated based on the following. Net income per share (diluted) for the fiscal year ended March 31, 2009
is not reported due to a net loss.
Millions of yen, except number of shares Millions of U.S. dollars
Year ended March 31 2010 2009 2010
Net income (loss) per share:
Net income (loss) ................................................................................................................. ¥271,559 ¥(373,456) $2,919
Amount not attributable to common stockholders ............................................................... 8,449 10,704 91
Dividends on preferred stock........................................................................................... 8,449 10,704 91
Net income (loss) attributable to common stock .................................................................. ¥263,109 ¥(384,160) $2,828
Average number of common stock during the year (in thousands) ........................................ 1,059,227 772,348 /
Net income per share (diluted):
Adjustment for net income .................................................................................................. ¥ 1,931 ¥ — $ 21
Dividends on preferred stock........................................................................................... 2,254 — 24
Stock acquisition rights issued by subsidiaries and affiliates ............................................ (322) — (3)
Increase in number of common stock (in thousands) ............................................................ 26,191 — /
Preferred stock ................................................................................................................ 26,191 — /
Outline of dilutive securities which were not included in the calculation of “Net income per share (diluted)” for the fiscal year ended March 31, 2010 because they do not have dilutive effect:
Stock acquisition rights: 1 type (Number of stock acquisition rights: 1,081 units)
2. Net assets per share is calculated based on the following:
Millions of yen, except number of shares Millions of U.S. dollars
March 31 2010 2009 2010
Net assets ................................................................................................................................. ¥7,000,805 ¥4,611,764 $75,237
Amounts excluded from Net assets ........................................................................................... 2,262,582 2,457,530 24,316
Preferred stock ..................................................................................................................... 210,003 310,203 2,257
Dividends on preferred stock ............................................................................................... 3,097 5,352 33
Stock acquisition rights ....................................................................................................... 81 66 1
Minority interests ................................................................................................................ 2,049,400 2,141,908 22,025
Net assets attributable to common stock at the fiscal year-end .................................................. ¥4,738,223 ¥2,154,233 $50,921
Number of common stock at the fiscal year-end used for the calculation of Net assets per share (in thousands) .......................................................................................... 1,396,985 772,052 /

SMFG 2010128
SMFG Notes to Consolidated Financial Statements
35. Parent Company(1) Nonconsolidated Balance Sheets
Sumitomo Mitsui Financial Group, Inc.
Millions of yenMillions of
U.S. dollars (Note 1)
March 31 2010 2009 2010AssetsCurrent assets ........................................................................................... ¥ 111,033 ¥ 23,730 $ 1,193
Cash and due from banks ..................................................................... 86,283 1,281 927Prepaid expenses .................................................................................. 26 22 0Deferred tax assets................................................................................ — 39 —Accrued income .................................................................................... 223 19 2Accrued income tax refunds ................................................................. 24,065 21,844 259Other current assets .............................................................................. 435 522 5
Fixed assets .............................................................................................. 6,041,740 4,033,583 64,930Tangible fixed assets ............................................................................. 1 2 0
Buildings ............................................................................................ 0 0 0Equipment.......................................................................................... 1 2 0
Intangible fixed assets ........................................................................... 8 11 0Software ............................................................................................. 8 11 0
Investments and other assets ............................................................... 6,041,729 4,033,568 64,930Investments in subsidiaries and affiliates .......................................... 6,041,729 4,028,093 64,930Deferred tax assets ............................................................................ — 5,475 —
Total assets ............................................................................................... ¥6,152,774 ¥4,057,313 $66,123
Liabilities and net assetsLiabilitiesCurrent liabilities ........................................................................................ ¥ 954,073 ¥1,079,566 $10,253
Short-term borrowings .......................................................................... 948,030 1,078,030 10,188Accounts payable .................................................................................. 1,541 298 17Accrued expenses ................................................................................. 3,299 120 35Income taxes payable ........................................................................... 3 372 0Business office taxes payable ............................................................... 5 5 0Reserve for employees bonuses ........................................................... 101 102 1Reserve for executive bonuses ............................................................. 71 — 1Other current liabilities ........................................................................... 1,020 637 11
Fixed liabilities ........................................................................................... 393,126 199 4,225Bonds .................................................................................................... 392,900 — 4,223Reserve for executive retirement benefits ............................................. 226 199 2
Total liabilities ........................................................................................... 1,347,199 1,079,766 14,478
Net assetsStockholders’ equity
Capital stock .......................................................................................... 2,337,895 1,420,877 25,125Capital surplus ....................................................................................... 1,833,073 916,163 19,700
Capital reserve ................................................................................... 1,559,374 642,355 16,759Other capital surplus.......................................................................... 273,699 273,808 2,941
Retained earnings .................................................................................. 678,042 683,907 7,287Other retained earnings
Voluntary reserve ........................................................................... 30,420 30,420 327Retained earnings brought forward ............................................... 647,622 653,487 6,960
Treasury stock ....................................................................................... (43,437) (43,400) (467)Total stockholders’ equity ........................................................................ 4,805,574 2,977,547 51,645Total net assets ......................................................................................... 4,805,574 2,977,547 51,645Total liabilities and net assets .................................................................. ¥6,152,774 ¥4,057,313 $66,123

SMFG 2010 129
SMFGNotes to Consolidated Financial Statements
(2) Nonconsolidated Statements of IncomeSumitomo Mitsui Financial Group, Inc.
Millions of yenMillions of
U.S. dollars (Note 1)
Year ended March 31 2010 2009 2010Operating income ..................................................................................... ¥133,379 ¥134,772 $1,434
Dividends on investments in subsidiaries and affiliates ........................ 118,818 117,051 1,277Fees and commissions received from subsidiaries ............................... 14,560 17,721 157
Operating expenses ................................................................................. 16,641 8,790 179General and administrative expenses ................................................... 8,353 8,790 90Interest on bonds................................................................................... 8,287 — 89
Operating profit ........................................................................................ 116,737 125,982 1,255
Nonoperating income ............................................................................... 369 151 4Interest income on deposits .................................................................. 347 110 4Fees and commissions .......................................................................... 2 14 0Other nonoperating income ................................................................... 19 27 0
Nonoperating expenses ........................................................................... 22,572 23,824 243Interest on borrowings ........................................................................... 9,115 11,910 98Fees and commissions payments ......................................................... 4,104 11,912 44Amortization of stock issuance cost ..................................................... 9,324 — 100Amortization of bond issuance cost ...................................................... 28 — 1Other nonoperating expenses ............................................................... 0 0 0
Ordinary profit ........................................................................................... 94,534 102,309 1,016
Extraordinary loss ..................................................................................... 22,688 — 244Losses on sales of stocks of affiliate ..................................................... 22,688 — 244
Income before income taxes ................................................................... 71,846 102,309 772Income taxes:
Current ................................................................................................... 154 2,393 2Deferred ................................................................................................. 5,514 (3,552) 59
Net income ................................................................................................ ¥ 66,176 ¥103,468 $ 711
Yen U.S. dollars (Note 1)
2010 2009 2010Per share data:
Net income ............................................................................................ ¥53.82 ¥118.43 $0.58Net income — diluted ............................................................................ — — —
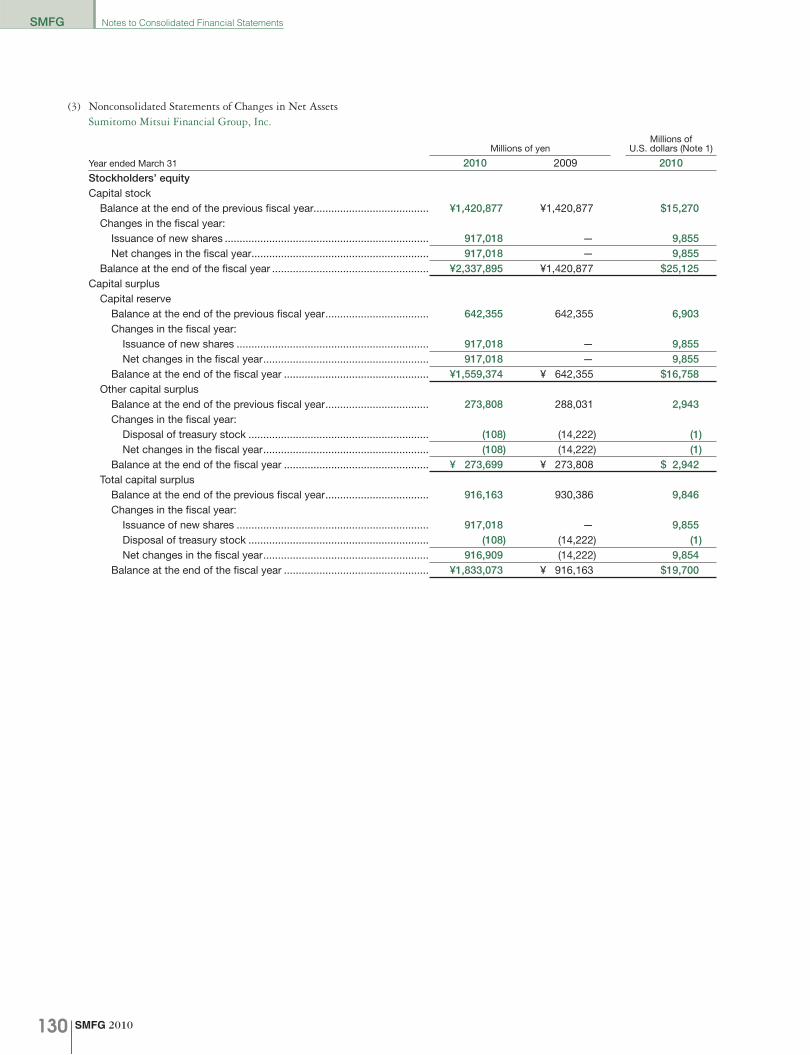
SMFG 2010130
SMFG Notes to Consolidated Financial Statements
(3) Nonconsolidated Statements of Changes in Net AssetsSumitomo Mitsui Financial Group, Inc.
Millions of yenMillions of
U.S. dollars (Note 1)
Year ended March 31 2010 2009 2010Stockholders’ equityCapital stock
Balance at the end of the previous fiscal year....................................... ¥1,420,877 ¥1,420,877 $15,270Changes in the fiscal year:
Issuance of new shares ..................................................................... 917,018 — 9,855Net changes in the fiscal year............................................................ 917,018 — 9,855
Balance at the end of the fiscal year ..................................................... ¥2,337,895 ¥1,420,877 $25,125Capital surplus
Capital reserveBalance at the end of the previous fiscal year ................................... 642,355 642,355 6,903Changes in the fiscal year:
Issuance of new shares ................................................................. 917,018 — 9,855Net changes in the fiscal year ........................................................ 917,018 — 9,855
Balance at the end of the fiscal year ................................................. ¥1,559,374 ¥ 642,355 $16,758Other capital surplus
Balance at the end of the previous fiscal year ................................... 273,808 288,031 2,943Changes in the fiscal year:
Disposal of treasury stock ............................................................. (108) (14,222) (1)Net changes in the fiscal year ........................................................ (108) (14,222) (1)
Balance at the end of the fiscal year ................................................. ¥ 273,699 ¥ 273,808 $ 2,942Total capital surplus
Balance at the end of the previous fiscal year ................................... 916,163 930,386 9,846Changes in the fiscal year:
Issuance of new shares ................................................................. 917,018 — 9,855Disposal of treasury stock ............................................................. (108) (14,222) (1)Net changes in the fiscal year ........................................................ 916,909 (14,222) 9,854
Balance at the end of the fiscal year ................................................. ¥1,833,073 ¥ 916,163 $19,700

SMFG 2010 131
SMFGNotes to Consolidated Financial Statements
Millions of yenMillions of
U.S. dollars (Note 1)
Year ended March 31 2010 2009 2010Stockholders’ equityRetained earnings
Other retained earningsVoluntary reserve
Balance at the end of the previous fiscal year ............................... ¥ 30,420 ¥ 30,420 $ 327Changes in the fiscal year:
Net changes in the fiscal year .................................................... — — —Balance at the end of the fiscal year.............................................. ¥ 30,420 ¥ 30,420 $ 327
Retained earnings brought forwardBalance at the end of the previous fiscal year ............................... 653,487 670,259 7,023Changes in the fiscal year:
Cash dividends .......................................................................... (72,041) (120,240) (774)Net income ................................................................................. 66,176 103,468 711Net changes in the fiscal year .................................................... (5,865) (16,772) (63)
Balance at the end of the fiscal year.............................................. ¥ 647,622 ¥ 653,487 $ 6,960Total retained earnings
Balance at the end of the previous fiscal year ................................... 683,907 700,679 7,350Changes in the fiscal year:
Cash dividends .............................................................................. (72,041) (120,240) (774)Net income ..................................................................................... 66,176 103,468 711Net changes in the fiscal year ........................................................ (5,865) (16,772) (63)
Balance at the end of the fiscal year ................................................. ¥ 678,042 ¥ 683,907 $ 7,287Treasury stock
Balance at the end of the previous fiscal year....................................... (43,400) (83,194) (467)Changes in the fiscal year:
Purchase of treasury stock ................................................................ (189) (943) (2)Disposal of treasury stock ................................................................. 152 40,736 2Net changes in the fiscal year............................................................ (37) 39,793 (0)
Balance at the end of the fiscal year ..................................................... ¥ (43,437) ¥ (43,400) $ (467)Total stockholders’ equity
Balance at the end of the previous fiscal year....................................... 2,977,547 2,968,749 31,999Changes in the fiscal year:
Issuance of new shares ..................................................................... 1,834,037 — 19,710Cash dividends .................................................................................. (72,041) (120,240) (774)Net income ........................................................................................ 66,176 103,468 711Purchase of treasury stock ................................................................ (189) (943) (2)Disposal of treasury stock ................................................................. 43 26,513 1Net changes in the fiscal year............................................................ 1,828,026 8,798 19,646
Balance at the end of the fiscal year ..................................................... ¥4,805,574 ¥2,977,547 $51,645Total net assets
Balance at the end of the previous fiscal year....................................... 2,977,547 2,968,749 31,999Changes in the fiscal year:
Issuance of new shares ..................................................................... 1,834,037 — 19,710Cash dividends .................................................................................. (72,041) (120,240) (774)Net income ........................................................................................ 66,176 103,468 711Purchase of treasury stock ................................................................ (189) (943) (2)Disposal of treasury stock ................................................................. 43 26,513 1Net changes in the fiscal year............................................................ 1,828,026 8,798 19,646
Balance at the end of the fiscal year ..................................................... ¥4,805,574 ¥2,977,547 $51,645
(Continued)
SMFG 2010132
SMFG Independent Auditors’ Report
To the Board of Directors ofSumitomo Mitsui Financial Group, Inc.:
We have audited the accompanying consolidated balance sheets of Sumitomo Mitsui Financial Group, Inc. (“SMFG”) and subsidiaries as of March 31, 2010 and 2009, and the related consolidated statements of operations, changes in net assets and cash flows for the years then ended, expressed in Japanese yen. These consolidated financial statements are the responsibility of SMFG’s management. Our responsibility is to independently express an opinion on these consolidated financial statements based on our audits.
We conducted our audits in accordance with auditing standards generally accepted in Japan. Those standards require that we plan and perform the audit to obtain reasonable assurance about whether the financial statements are free of material misstatement. An audit includes examining, on a test basis, evidence supporting the amounts and disclosures in the financial statements. An audit also includes assessing the accounting principles used and significant estimates made by management, as well as evaluating the overall financial statement presentation. We believe that our audits provide a reasonable basis for our opinion.
In our opinion, the consolidated financial statements referred to above present fairly, in all material respects, the consolidated financial position of SMFG and subsidiaries as of March 31, 2010 and 2009, and the consolidated results of their operations and their cash flows for the years then ended, in conformity with accounting principles generally accepted in Japan.
The consolidated financial statements as of and for the year ended March 31, 2010 have been translated into United States dollars solely for convenience of the readers. We have recomputed the translation, and, in our opinion, the consolidated financial statements expressed in Japanese yen have been translated into United States dollars on the basis set forth in Note 1 to the consolidated financial statements.
Tokyo, Japan
June 29, 2010
Independent Auditors’ Report
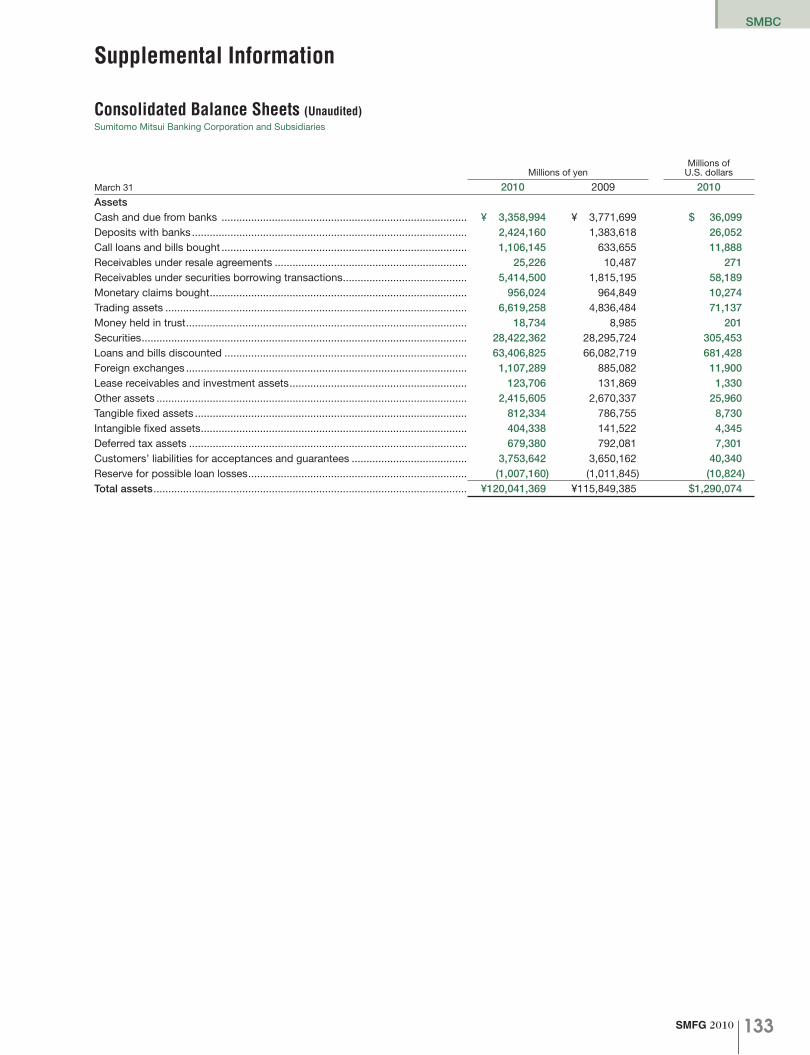
SMFG 2010 133
SMBC
Consolidated Balance Sheets (Unaudited)Sumitomo Mitsui Banking Corporation and Subsidiaries
Millions of yenMillions of
U.S. dollars
March 31 2010 2009 2010AssetsCash and due from banks ................................................................................... ¥ 3,358,994 ¥ 3,771,699 $ 36,099Deposits with banks ............................................................................................. 2,424,160 1,383,618 26,052Call loans and bills bought ................................................................................... 1,106,145 633,655 11,888Receivables under resale agreements ................................................................. 25,226 10,487 271Receivables under securities borrowing transactions .......................................... 5,414,500 1,815,195 58,189Monetary claims bought ....................................................................................... 956,024 964,849 10,274Trading assets ...................................................................................................... 6,619,258 4,836,484 71,137Money held in trust ............................................................................................... 18,734 8,985 201Securities .............................................................................................................. 28,422,362 28,295,724 305,453Loans and bills discounted .................................................................................. 63,406,825 66,082,719 681,428Foreign exchanges ............................................................................................... 1,107,289 885,082 11,900Lease receivables and investment assets ............................................................ 123,706 131,869 1,330Other assets ......................................................................................................... 2,415,605 2,670,337 25,960Tangible fixed assets ............................................................................................ 812,334 786,755 8,730Intangible fixed assets .......................................................................................... 404,338 141,522 4,345Deferred tax assets .............................................................................................. 679,380 792,081 7,301Customers’ liabilities for acceptances and guarantees ....................................... 3,753,642 3,650,162 40,340Reserve for possible loan losses .......................................................................... (1,007,160) (1,011,845) (10,824)Total assets .......................................................................................................... ¥120,041,369 ¥115,849,385 $1,290,074
Supplemental Information

SMFG 2010134
SMBC Supplemental Information
Millions of yenMillions of
U.S. dollars
March 31 2010 2009 2010Liabilities and net assetsLiabilitiesDeposits ............................................................................................................... ¥ 85,792,098 ¥ 83,124,568 $ 922,000Call money and bills sold ..................................................................................... 2,119,557 2,499,113 22,779Payables under repurchase agreements .............................................................. 1,120,860 778,993 12,046Payables under securities lending transactions ................................................... 4,313,334 7,577,109 46,355Commercial paper ................................................................................................ 310,787 — 3,340Trading liabilities ................................................................................................... 5,042,720 3,606,319 54,194Borrowed money .................................................................................................. 4,030,914 2,908,479 43,320Foreign exchanges ............................................................................................... 192,299 281,145 2,067Short-term bonds ................................................................................................. 381,678 114,242 4,102Bonds ................................................................................................................... 3,339,672 3,565,376 35,891Due to trust account ............................................................................................ 159,554 60,918 1,715Other liabilities ...................................................................................................... 2,441,434 3,037,797 26,238Reserve for employee bonuses ............................................................................ 35,415 19,963 380Reserve for executive bonuses ............................................................................ 1,808 167 19Reserve for employee retirement benefits............................................................ 19,259 13,506 207Reserve for executive retirement benefits ............................................................ 6,863 6,613 74Reserve for reimbursement of deposits ............................................................... 11,734 11,767 126Reserve under the special laws ............................................................................ 34 0 0Deferred tax liabilities ........................................................................................... 26,167 27,275 281Deferred tax liabilities for land revaluation ........................................................... 46,966 47,217 505Acceptances and guarantees ............................................................................... 3,753,642 3,650,162 40,340Total liabilities ...................................................................................................... 113,146,805 111,330,737 1,215,979
Net assetsCapital stock ........................................................................................................ 1,770,996 664,986 19,033Capital surplus ..................................................................................................... 2,709,682 1,603,672 29,120Retained earnings ................................................................................................ 668,074 448,750 7,180Total stockholders’ equity ................................................................................... 5,148,753 2,717,409 55,333Net unrealized gains (losses) on other securities ................................................. 377,456 (60,148) 4,056Net deferred losses on hedges ............................................................................ (38,516) (20,306) (414)Land revaluation excess ....................................................................................... 34,897 35,099 375Foreign currency translation adjustments ............................................................ (99,481) (120,606) (1,069)Total valuation and translation adjustments ...................................................... 274,356 (165,961) 2,948Stock acquisition rights ........................................................................................ 81 66 1Minority interests .................................................................................................. 1,471,373 1,967,133 15,813Total net assets .................................................................................................... 6,894,564 4,518,647 74,095Total liabilities and net assets ............................................................................. ¥120,041,369 ¥115,849,385 $1,290,074
Notes: 1. Amounts less than 1 million yen have been omitted. 2. For the convenience of readers, the accompanying U.S. dollar financial statements have been translated from Japanese yen, as a matter of
arithmetical computation only, at the rate of ¥93.05 to US$1, the exchange rate prevailing at March 31, 2010.
(Continued)
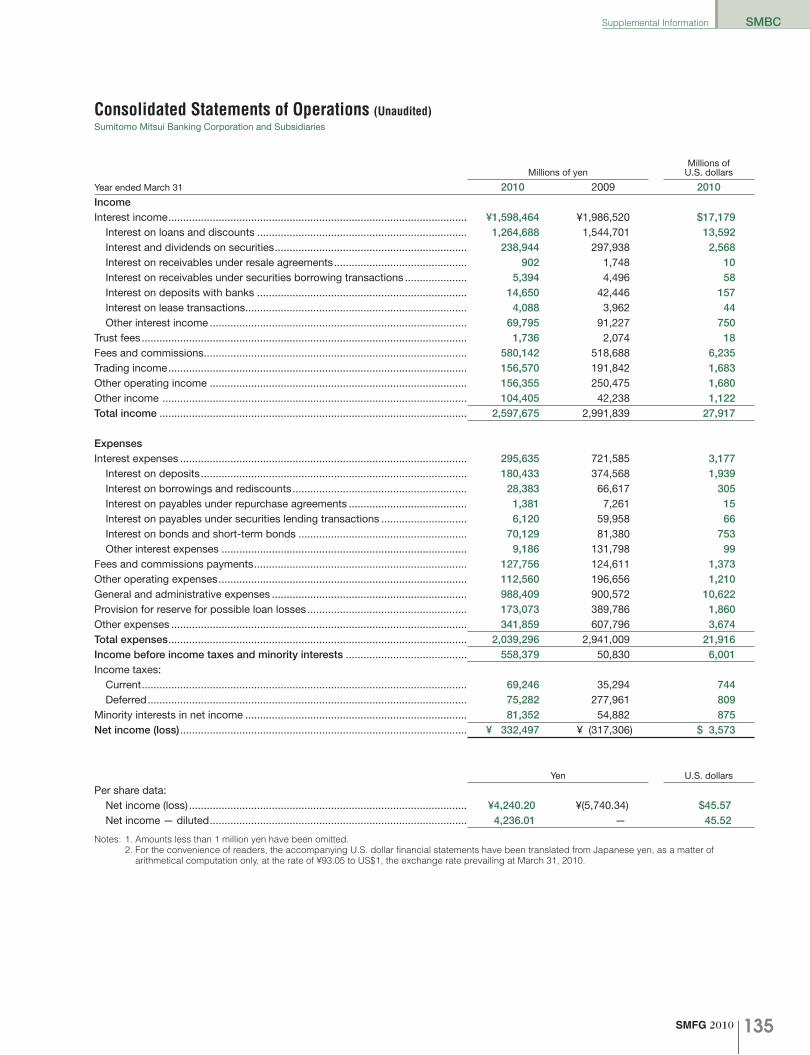
SMFG 2010 135
SMBCSupplemental Information
Consolidated Statements of Operations (Unaudited)Sumitomo Mitsui Banking Corporation and Subsidiaries
Millions of yenMillions of
U.S. dollars
Year ended March 31 2010 2009 2010IncomeInterest income ..................................................................................................... ¥1,598,464 ¥1,986,520 $17,179
Interest on loans and discounts ....................................................................... 1,264,688 1,544,701 13,592Interest and dividends on securities ................................................................. 238,944 297,938 2,568Interest on receivables under resale agreements ............................................. 902 1,748 10Interest on receivables under securities borrowing transactions ..................... 5,394 4,496 58Interest on deposits with banks ....................................................................... 14,650 42,446 157Interest on lease transactions ........................................................................... 4,088 3,962 44Other interest income ....................................................................................... 69,795 91,227 750
Trust fees .............................................................................................................. 1,736 2,074 18Fees and commissions ......................................................................................... 580,142 518,688 6,235Trading income ..................................................................................................... 156,570 191,842 1,683Other operating income ....................................................................................... 156,355 250,475 1,680Other income ....................................................................................................... 104,405 42,238 1,122Total income ........................................................................................................ 2,597,675 2,991,839 27,917
ExpensesInterest expenses ................................................................................................. 295,635 721,585 3,177
Interest on deposits .......................................................................................... 180,433 374,568 1,939Interest on borrowings and rediscounts ........................................................... 28,383 66,617 305Interest on payables under repurchase agreements ........................................ 1,381 7,261 15Interest on payables under securities lending transactions ............................. 6,120 59,958 66Interest on bonds and short-term bonds ......................................................... 70,129 81,380 753Other interest expenses ................................................................................... 9,186 131,798 99
Fees and commissions payments ........................................................................ 127,756 124,611 1,373Other operating expenses .................................................................................... 112,560 196,656 1,210General and administrative expenses .................................................................. 988,409 900,572 10,622Provision for reserve for possible loan losses ...................................................... 173,073 389,786 1,860Other expenses .................................................................................................... 341,859 607,796 3,674Total expenses ..................................................................................................... 2,039,296 2,941,009 21,916Income before income taxes and minority interests ......................................... 558,379 50,830 6,001Income taxes:
Current .............................................................................................................. 69,246 35,294 744Deferred ............................................................................................................ 75,282 277,961 809
Minority interests in net income ........................................................................... 81,352 54,882 875Net income (loss) ................................................................................................. ¥ 332,497 ¥ (317,306) $ 3,573
Yen U.S. dollars
Per share data:Net income (loss) .............................................................................................. ¥4,240.20 ¥(5,740.34) $45.57Net income — diluted ....................................................................................... 4,236.01 — 45.52
Notes: 1. Amounts less than 1 million yen have been omitted. 2. For the convenience of readers, the accompanying U.S. dollar financial statements have been translated from Japanese yen, as a matter of
arithmetical computation only, at the rate of ¥93.05 to US$1, the exchange rate prevailing at March 31, 2010.

SMFG 2010136
SMBC Supplemental Information
Nonconsolidated Balance Sheets (Unaudited)Sumitomo Mitsui Banking Corporation
Millions of yenMillions of
U.S. dollarsMarch 31 2010 2009 2010AssetsCash and due from banks .................................................................................... ¥ 2,863,985 ¥ 2,597,429 $ 30,779Deposits with banks ............................................................................................. 2,408,004 2,697,579 25,879Call loans and bills bought ................................................................................... 514,179 255,095 5,526Receivables under resale agreements ................................................................. 45,594 48,113 490Receivables under securities borrowing transactions .......................................... 1,703,828 1,815,195 18,311Monetary claims bought ....................................................................................... 435,027 396,183 4,675Trading assets ...................................................................................................... 3,670,091 3,885,704 39,442Money held in trust ............................................................................................... 10,724 8,985 115Securities .............................................................................................................. 28,536,200 28,000,515 306,676Loans and bills discounted .................................................................................. 56,619,058 60,241,266 608,480Foreign exchanges ............................................................................................... 743,446 748,149 7,990Other assets ......................................................................................................... 1,823,647 2,259,982 19,598Tangible fixed assets ............................................................................................ 705,036 696,680 7,577Intangible fixed assets .......................................................................................... 133,323 126,070 1,433Deferred tax assets .............................................................................................. 456,556 668,343 4,906Customers’ liabilities for acceptances and guarantees ....................................... 3,625,868 3,826,694 38,967Reserve for possible loan losses .......................................................................... (758,178) (791,885) (8,148)Reserve for possible losses on investments ........................................................ — (1,888) —Total assets .......................................................................................................... ¥103,536,394 ¥107,478,218 $1,112,696
Liabilities and net assetsLiabilitiesDeposits ............................................................................................................... ¥ 77,630,639 ¥ 76,905,708 $ 834,290Call money and bills sold ..................................................................................... 1,554,374 2,479,743 16,705Payables under repurchase agreements .............................................................. 492,311 773,534 5,291Payables under securities lending transactions ................................................... 3,407,301 7,561,013 36,618Commercial paper ................................................................................................ 310,787 — 3,340Trading liabilities ................................................................................................... 2,909,131 2,705,478 31,264Borrowed money .................................................................................................. 2,747,767 4,663,553 29,530Foreign exchanges ............................................................................................... 214,526 282,360 2,305Short-term bonds ................................................................................................. 164,678 114,242 1,770Bonds ................................................................................................................... 3,245,992 3,319,693 34,884Due to trust account ............................................................................................. 159,554 60,918 1,715Other liabilities ...................................................................................................... 1,600,879 2,163,237 17,204Reserve for employee bonuses ............................................................................ 10,207 10,720 110Reserve for executive bonuses ............................................................................ 426 — 5Reserve for executive retirement benefits ............................................................ 5,147 4,992 55Reserve for point service program ....................................................................... 1,862 2,359 20Reserve for reimbursement of deposits ............................................................... 10,634 10,873 114Reserve under the special laws ............................................................................ — 0 —Deferred tax liabilities for land revaluation ........................................................... 46,352 46,599 498Acceptances and guarantees ............................................................................... 3,625,868 3,826,694 38,967Total liabilities ...................................................................................................... 98,138,445 104,931,725 1,054,685
Net assetsCapital stock ........................................................................................................ 1,770,996 664,986 19,033Capital surplus ..................................................................................................... 2,473,558 1,367,548 26,583Retained earnings ................................................................................................ 704,485 499,666 7,571Total stockholders’ equity ................................................................................... 4,949,040 2,532,201 53,187Net unrealized gains (losses) on other securities ................................................. 379,353 (52,741) 4,077Net deferred gains (losses) on hedges ................................................................. 48,020 45,359 516Land revaluation excess ....................................................................................... 21,535 21,673 231Total valuation and translation adjustments ...................................................... 448,909 14,291 4,824Total net assets .................................................................................................... 5,397,949 2,546,493 58,011Total liabilities and net assets ............................................................................. ¥103,536,394 ¥107,478,218 $1,112,696Notes: 1. Amounts less than 1 million yen have been omitted. 2. For the convenience of readers, the accompanying U.S. dollar financial statements have been translated from Japanese yen, as a matter of
arithmetical computation only, at the rate of ¥93.05 to US$1, the exchange rate prevailing at March 31, 2010.
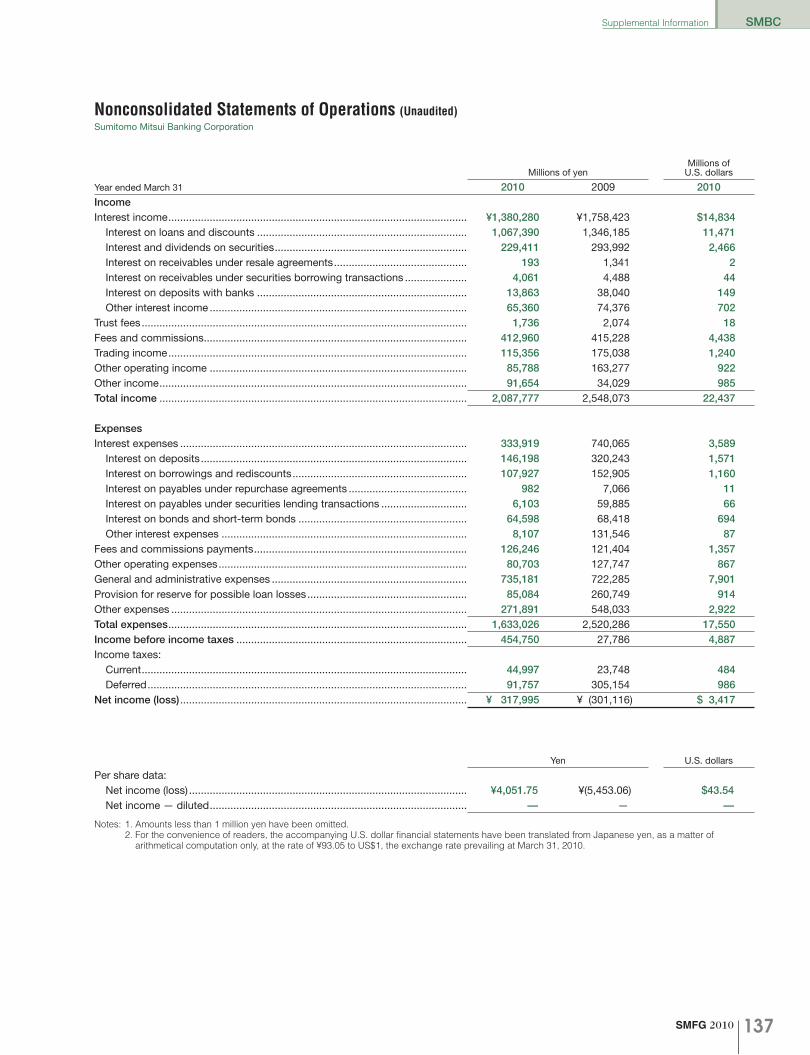
SMFG 2010 137
SMBCSupplemental Information
Nonconsolidated Statements of Operations (Unaudited)Sumitomo Mitsui Banking Corporation
Millions of yenMillions of
U.S. dollars
Year ended March 31 2010 2009 2010IncomeInterest income ..................................................................................................... ¥1,380,280 ¥1,758,423 $14,834
Interest on loans and discounts ....................................................................... 1,067,390 1,346,185 11,471Interest and dividends on securities ................................................................. 229,411 293,992 2,466Interest on receivables under resale agreements ............................................. 193 1,341 2Interest on receivables under securities borrowing transactions ..................... 4,061 4,488 44Interest on deposits with banks ....................................................................... 13,863 38,040 149Other interest income ....................................................................................... 65,360 74,376 702
Trust fees .............................................................................................................. 1,736 2,074 18Fees and commissions ......................................................................................... 412,960 415,228 4,438Trading income ..................................................................................................... 115,356 175,038 1,240Other operating income ....................................................................................... 85,788 163,277 922Other income ........................................................................................................ 91,654 34,029 985Total income ........................................................................................................ 2,087,777 2,548,073 22,437
ExpensesInterest expenses ................................................................................................. 333,919 740,065 3,589
Interest on deposits .......................................................................................... 146,198 320,243 1,571Interest on borrowings and rediscounts ........................................................... 107,927 152,905 1,160Interest on payables under repurchase agreements ........................................ 982 7,066 11Interest on payables under securities lending transactions ............................. 6,103 59,885 66Interest on bonds and short-term bonds ......................................................... 64,598 68,418 694Other interest expenses ................................................................................... 8,107 131,546 87
Fees and commissions payments ........................................................................ 126,246 121,404 1,357Other operating expenses .................................................................................... 80,703 127,747 867General and administrative expenses .................................................................. 735,181 722,285 7,901Provision for reserve for possible loan losses ...................................................... 85,084 260,749 914Other expenses .................................................................................................... 271,891 548,033 2,922Total expenses ..................................................................................................... 1,633,026 2,520,286 17,550Income before income taxes .............................................................................. 454,750 27,786 4,887Income taxes:
Current .............................................................................................................. 44,997 23,748 484Deferred ............................................................................................................ 91,757 305,154 986
Net income (loss) ................................................................................................. ¥ 317,995 ¥ (301,116) $ 3,417
Yen U.S. dollars
Per share data:Net income (loss) .............................................................................................. ¥4,051.75 ¥(5,453.06) $43.54Net income — diluted ....................................................................................... — — —
Notes: 1. Amounts less than 1 million yen have been omitted. 2. For the convenience of readers, the accompanying U.S. dollar financial statements have been translated from Japanese yen, as a matter of
arithmetical computation only, at the rate of ¥93.05 to US$1, the exchange rate prevailing at March 31, 2010.

SMFG 2010138
SMFG
Income Analysis (Consolidated)Sumitomo Mitsui Financial Group, Inc. and Subsidiaries
Millions of yen2010 2009
Year ended March 31Domesticoperations
Overseasoperations Elimination Total
Domestic operations
Overseas operations Elimination Total
Interest income ..................................................... ¥1,392,919 ¥405,558 ¥(102,672) ¥1,695,805 ¥1,561,085 ¥618,228 ¥(91,965) ¥2,087,348Interest expenses .................................................. 297,268 118,923 (101,319) 314,872 495,194 341,615 (87,945) 748,863
Net interest income ................................................... 1,095,650 286,634 (1,352) 1,380,933 1,065,890 276,613 (4,019) 1,338,484Trust fees ................................................................... 1,778 — — 1,778 2,122 — — 2,122
Fees and commissions ......................................... 651,331 80,655 (2,622) 729,364 592,845 80,926 (1,019) 672,752Fees and commissions payments ........................ 111,320 10,923 (1,495) 120,748 105,882 10,590 (899) 115,574
Net fees and commissions ........................................ 540,011 69,731 (1,126) 608,616 486,962 70,335 (119) 557,178Trading income...................................................... 186,117 28,902 (20,932) 194,087 194,201 29,779 (12,241) 211,738Trading losses ....................................................... 8,313 12,619 (20,932) — 3,449 8,791 (12,241) —
Net trading income .................................................... 177,804 16,283 — 194,087 190,751 20,987 — 211,738Other operating income ........................................ 401,898 51,325 (210) 453,012 503,422 26,403 (226) 529,599Other operating expenses..................................... 355,904 45,967 (98) 401,773 438,969 34,574 (331) 473,212
Net other operating income (expenses) .................... 45,993 5,358 (112) 51,238 64,453 (8,171) 105 56,386
Notes: 1. Domestic operations comprise the operations of SMFG, its domestic consolidated banking subsidiaries (excluding overseas branches) and other domestic consolidated subsidiaries. Overseas operations comprise the operations of the overseas branches of domestic consolidated banking subsidiaries and overseas consolidated subsidiaries.
2. Income and expenses resulting from money held in trust are included in “Other income” and “Other expenses.” Therefore, “Interest expenses” are shown after deduction of expenses (2010, ¥20 million; 2009, ¥30 million) related to the management of money held in trust.
3. Intersegment transactions are reported in the “Elimination” column.
Operating Income, Classified by Domestic and Overseas Operations
Millions of yen2010 2009
Year ended March 31 Average balance Interest Earnings yield Average balance Interest Earnings yieldInterest-earning assets .............................................. ¥86,229,707 ¥1,392,919 1.62% ¥80,327,278 ¥1,561,085 1.94%
Loans and bills discounted ................................... 55,382,826 1,058,896 1.91 53,272,205 1,145,251 2.15Securities .............................................................. 24,828,351 218,390 0.88 21,707,712 270,374 1.25Call loans and bills bought .................................... 343,760 2,499 0.73 392,838 5,403 1.38Receivables under resale agreements .................. 13,958 15 0.11 17,008 89 0.53
Receivables under securities borrowing transactions ....................................... 2,293,522 5,413 0.24 687,341 4,506 0.66Deposits with banks .............................................. 319,399 1,819 0.57 848,609 11,257 1.33Lease receivables and investment assets ............ 1,763,180 66,477 3.77 1,837,506 70,747 3.85
Interest-bearing liabilities .......................................... ¥91,491,665 ¥ 297,268 0.32% ¥87,827,514 ¥ 495,194 0.56%Deposits ............................................................... 68,495,143 106,542 0.16 66,460,734 196,916 0.30Negotiable certificates of deposit ......................... 6,939,707 17,939 0.26 4,072,822 24,331 0.60Call money and bills sold ...................................... 1,857,443 2,855 0.15 2,727,860 12,527 0.46Payables under repurchase agreements .............. 612,826 677 0.11 436,712 2,066 0.47 Payables under securities lending transactions ... 2,859,188 6,165 0.22 4,182,183 59,962 1.43Commercial paper................................................. — — — — — —Borrowed money ................................................... 5,842,252 117,900 2.02 5,463,776 125,225 2.29Short-term bonds .................................................. 1,084,084 2,902 0.27 765,144 6,678 0.87Bonds .................................................................... 3,591,097 69,577 1.94 3,481,382 65,248 1.87
Notes: 1. Domestic operations comprise the operations of SMFG, its domestic consolidated banking subsidiaries (excluding overseas branches) and other domestic consolidated subsidiaries.
2. In principle, average balances are calculated by using daily balances. However, some domestic consolidated subsidiaries use weekly, monthly or semiannual balances instead.
3. “Interest-earning assets” are shown after deduction of the average balance of noninterest-earning deposits (2010, ¥965,438 million; 2009, ¥824,712 million).
4. Income and expenses resulting from money held in trust are included in “Other income” and “Other expenses.” Therefore, “Interest-earning assets” are shown after deduction of the average balance of money held in trust (2010, ¥12,392 million; 2009, ¥8,583 million). “Interest-bearing liabilities” are shown after deduction of amounts equivalent to the average balance of money held in trust (2010, ¥12,392 million; 2009, ¥8,583 million) and corresponding interest (2010, ¥20 million; 2009, ¥30 million).
Average Balance, Interest and Earnings Yield of Interest-Earning Assets and Interest-Bearing LiabilitiesDomestic Operations

SMFG 2010 139
SMFGIncome Analysis (Consolidated)
Millions of yen2010 2009
Year ended March 31 Average balance Interest Earnings yield Average balance Interest Earnings yieldInterest-earning assets .............................................. ¥16,461,908 ¥405,558 2.46% ¥16,094,115 ¥618,228 3.84%
Loans and bills discounted ................................... 11,059,619 314,641 2.84 11,650,846 486,109 4.17Securities .............................................................. 1,656,478 31,115 1.88 1,350,840 35,424 2.62Call loans and bills bought .................................... 812,878 5,158 0.63 384,028 9,283 2.42Receivables under resale agreements .................. 13,963 887 6.36 103,425 1,661 1.61
Receivables under securities borrowing transactions ....................................... — — — — — —Deposits with banks .............................................. 2,154,320 14,078 0.65 1,936,988 35,982 1.86Lease receivables and investment assets ............ 195,486 8,065 4.13 160,047 7,025 4.39
Interest-bearing liabilities .......................................... ¥11,816,818 ¥118,923 1.01% ¥ 9,633,089 ¥341,615 3.55%Deposits ................................................................ 7,472,668 40,606 0.54 6,968,130 134,070 1.92Negotiable certificates of deposit ......................... 1,811,253 16,102 0.89 710,309 23,579 3.32Call money and bills sold ...................................... 1,205,537 3,416 0.28 580,174 9,996 1.72Payables under repurchase agreements .............. 364,451 713 0.20 546,903 5,232 0.96 Payables under securities lending transactions ... — — — — — —Commercial paper................................................. 82,513 194 0.24 — — —Borrowed money ................................................... 440,869 11,669 2.65 452,531 20,929 4.62Short-term bonds .................................................. — — — — — —Bonds .................................................................... 158,169 9,459 5.98 265,035 17,328 6.54
Notes: 1. Overseas operations comprise the operations of the overseas branches of domestic consolidated banking subsidiaries and overseas consolidated subsidiaries.
2. In principle, average balances are calculated by using daily balances. However, some overseas consolidated subsidiaries use weekly, monthly, quarterly or semiannual balances instead.
3. “Interest-earning assets” are shown after deduction of the average balance of noninterest-earning deposits (2010, ¥156,583 million; 2009, ¥89,200 million).
Overseas Operations
Millions of yen2010 2009
Year ended March 31 Average balance Interest Earnings yield Average balance Interest Earnings yieldInterest-earning assets .............................................. ¥100,773,612 ¥1,695,805 1.68% ¥94,925,190 ¥2,087,348 2.20%
Loans and bills discounted ................................... 64,723,468 1,280,297 1.98 63,459,263 1,550,081 2.44Securities .............................................................. 26,505,349 241,216 0.91 23,342,579 299,616 1.28Call loans and bills bought .................................... 1,156,638 7,657 0.66 776,867 14,686 1.89Receivables under resale agreements .................. 27,922 902 3.23 120,433 1,750 1.45
Receivables under securities borrowing transactions ....................................... 2,293,522 5,413 0.24 687,341 4,506 0.66Deposits with banks .............................................. 2,259,797 14,757 0.65 2,470,670 42,738 1.73Lease receivables and investment assets ............ 1,958,655 74,542 3.81 1,997,553 77,772 3.89
Interest-bearing liabilities .......................................... ¥101,186,263 ¥ 314,872 0.31% ¥95,678,084 ¥ 748,863 0.78%Deposits ................................................................ 75,750,461 145,979 0.19 73,111,647 326,447 0.45Negotiable certificates of deposit ......................... 8,750,961 34,042 0.39 4,783,132 47,911 1.00Call money and bills sold ...................................... 3,062,980 6,271 0.20 3,308,035 22,524 0.68Payables under repurchase agreements .............. 977,278 1,390 0.14 983,616 7,298 0.74Payables under securities lending transactions ... 2,859,188 6,165 0.22 4,182,183 59,962 1.43Commercial paper................................................. 82,513 194 0.24 — — —Borrowed money ................................................... 4,580,881 37,708 0.82 4,452,520 62,750 1.41Short-term bonds .................................................. 1,084,084 2,902 0.27 765,144 6,678 0.87Bonds .................................................................... 3,552,249 70,749 1.99 3,746,418 82,577 2.20
Notes: 1. The figures above comprise totals for domestic and overseas operations after intersegment eliminations. 2. In principle, average balances are calculated by using daily balances. However, some consolidated subsidiaries use weekly, monthly, quarterly or
semiannual balances instead. 3. “Interest-earning assets” are shown after deduction of the average balance of noninterest-earning deposits (2010, ¥1,123,299 million; 2009,
¥913,415 million). 4. Income and expenses resulting from money held in trust are included in “Other income” and “Other expenses.” Therefore, “Interest-earning assets”
are shown after deduction of the average balance of money held in trust (2010, ¥12,392 million; 2009, ¥8,583 million). “Interest-bearing liabilities” are shown after deduction of amounts equivalent to the average balance of money held in trust (2010, ¥12,392 million; 2009, ¥8,583 million) and corresponding interest (2010, ¥20 million; 2009, ¥30 million).
Total of Domestic and Overseas Operations

SMFG 2010140
SMFG Income Analysis (Consolidated)
Millions of yen2010 2009
Year ended March 31Domestic operations
Overseas operations Elimination Total
Domestic operations
Overseas operations Elimination Total
Trading income .......................................................... ¥186,117 ¥28,902 ¥(20,932) ¥194,087 ¥194,201 ¥29,779 ¥(12,241) ¥211,738Gains on trading securities ................................... 63,212 211 — 63,424 23,210 666 — 23,876
Gains on securities related to trading transactions ............................................ 2,254 — — 2,254 1,174 46 — 1,221Gains on trading-related financial derivatives ....... 120,075 28,691 (20,932) 127,833 162,430 29,066 (12,241) 179,255Others ................................................................... 576 — — 576 7,386 — — 7,386
Trading losses............................................................ ¥ 8,313 ¥12,619 ¥(20,932) ¥ — ¥ 3,449 ¥ 8,791 ¥(12,241) ¥ —Losses on trading securities ................................. — — — — — — — —
Losses on securities related to trading transactions ............................................ — — — — — — — —Losses on trading-related financial derivatives ..... 8,313 12,619 (20,932) — 3,449 8,791 (12,241) —Others ................................................................... — — — — — — — —
Notes: 1. Domestic operations comprise the operations of SMFG, its domestic consolidated banking subsidiaries (excluding overseas branches) and other domestic consolidated subsidiaries. Overseas operations comprise the operations of the overseas branches of domestic consolidated banking subsidiaries and overseas consolidated subsidiaries.
2. Intersegment transactions are reported in the “Elimination” column.
Trading Income
Millions of yen2010 2009
Year ended March 31Domestic operations
Overseas operations Elimination Total
Domestic operations
Overseas operations Elimination Total
Fees and commissions .............................................. ¥651,331 ¥80,655 ¥(2,622) ¥729,364 ¥592,845 ¥80,926 ¥(1,019) ¥672,752Deposits and loans ............................................... 20,660 49,988 (55) 70,592 21,805 56,034 — 77,840Remittances and transfers .................................... 118,012 7,782 (2) 125,792 123,080 8,535 (161) 131,455Securities-related business ................................... 54,380 0 (16) 54,363 33,872 0 — 33,872Agency .................................................................. 14,763 — — 14,763 14,673 — — 14,673Safe deposits ........................................................ 6,681 2 — 6,684 6,911 3 — 6,914Guarantees ............................................................ 40,468 9,138 (242) 49,365 43,792 7,360 (300) 50,852Credit card business ............................................. 143,770 — — 143,770 141,117 — — 141,117
Fees and commissions payments ............................. ¥111,320 ¥10,923 ¥(1,495) ¥120,748 ¥105,882 ¥10,590 ¥ (899) ¥115,574Remittances and transfers .................................... 26,285 4,920 (155) 31,050 26,796 3,576 (161) 30,211
Notes: 1. Domestic operations comprise the operations of SMFG, its domestic consolidated banking subsidiaries (excluding overseas branches) and other domestic consolidated subsidiaries. Overseas operations comprise the operations of the overseas branches of domestic consolidated banking subsidiaries and overseas consolidated subsidiaries.
2. Intersegment transactions are reported in the “Elimination” column.
Fees and Commissions

SMFG 2010 141
SMFG
Assets and Liabilities (Consolidated)Sumitomo Mitsui Financial Group, Inc. and Subsidiaries
Millions of yen Millions of yenMarch 31 2010 March 31 2009Domestic operations: Domestic operations:
Manufacturing...................................... ¥ 6,694,906 12.39% Manufacturing...................................... ¥ 6,992,808 12.75%Agriculture, forestry, fisheries and mining ........................... 153,473 0.28
Agriculture, forestry, fisheries and mining ........................... 149,678 0.27
Construction ........................................ 1,095,482 2.03 Construction ........................................ 1,274,948 2.32 Transportation, communications and public enterprises ....................... 3,271,221 6.05
Transportation, communications and public enterprises ....................... 3,387,724 6.17
Wholesale and retail ............................ 4,497,698 8.33 Wholesale and retail ............................ 5,051,330 9.21Finance and insurance ........................ 4,299,050 7.96 Finance and insurance ........................ 4,306,969 7.85Real estate, goods rental and leasing ... 8,210,117 15.20 Real estate ........................................... 7,627,384 13.90Services ............................................... 4,077,881 7.55 Services ............................................... 5,605,333 10.22Municipalities ....................................... 1,117,092 2.07 Municipalities ....................................... 1,058,239 1.93Others .................................................. 20,606,900 38.14 Others .................................................. 19,409,786 35.38Subtotal ............................................... ¥54,023,825 100.00% Subtotal ............................................... ¥54,864,204 100.00%
Overseas operations: Overseas operations:Public sector ........................................ ¥ 43,100 0.50% Public sector ........................................ ¥ 35,350 0.34%Financial institutions ............................ 543,997 6.27 Financial institutions ............................ 501,739 4.88Commerce and industry ...................... 7,223,161 83.24 Commerce and industry ...................... 8,602,419 83.75Others .................................................. 866,948 9.99 Others .................................................. 1,131,605 11.03Subtotal ............................................... ¥ 8,677,208 100.00% Subtotal ............................................... ¥10,271,115 100.00%
Total ......................................................... ¥62,701,033 — Total ......................................................... ¥65,135,319 —
Notes: 1. Domestic operations comprise the operations of SMFG, its domestic consolidated banking subsidiaries (excluding overseas branches) and other domestic consolidated subsidiaries. Overseas operations comprise the operations of the overseas branches of domestic consolidated banking subsidiaries and overseas consolidated subsidiaries.
2. Japan offshore banking accounts are included in overseas operations’ accounts. 3. In accordance with the revision of the Japan Standard Industrial Classification (in November 2007), from the fiscal year beginning on April 1, 2009,
the sector classification has been partly changed. “Goods rental and leasing” is included in others in fiscal 2008.
Balance of Loan Portfolio, Classified by Industry
Millions of yenMarch 31 2010 2009Domestic operations:
Liquid deposits ............................................................................................ ¥42,901,390 ¥41,462,895Fixed-term deposits .................................................................................... 25,125,350 23,463,313Others .......................................................................................................... 3,613,206 3,882,490Subtotal ....................................................................................................... 71,639,946 68,808,699Negotiable certificates of deposit ................................................................ 5,166,704 6,032,611Total ............................................................................................................. ¥76,806,651 ¥74,841,310
Overseas operations:Liquid deposits ............................................................................................ ¥ 5,238,038 ¥ 5,181,014Fixed-term deposits .................................................................................... 1,762,779 1,575,776Others .......................................................................................................... 7,831 4,007Subtotal ....................................................................................................... 7,008,648 6,760,798Negotiable certificates of deposit ................................................................ 1,828,914 1,428,673Total ............................................................................................................. ¥ 8,837,563 ¥ 8,189,471
Grand total ...................................................................................................... ¥85,644,215 ¥83,030,782
Notes: 1. Domestic operations comprise the operations of SMFG, its domestic consolidated banking subsidiaries (excluding overseas branches) and other domestic consolidated subsidiaries. Overseas operations comprise the operations of the overseas branches of domestic consolidated banking subsidiaries and overseas consolidated subsidiaries.
2. Liquid deposits = Current deposits + Ordinary deposits + Savings deposits + Deposits at notice 3. Fixed-term deposits = Time deposits + Installment savings
Deposits and Negotiable Certificates of DepositYear-End Balance
Year-End Balance

SMFG 2010142
SMFG Assets and Liabilities (Consolidated)
Millions of yenMarch 31 2010 2009General reserve ............................................................................................... ¥ 702,606 ¥ 691,539Specific reserve ............................................................................................... 365,087 385,050Loan loss reserve for specific overseas countries .......................................... 636 1,261Reserve for possible loan losses ..................................................................... ¥1,068,329 ¥1,077,852Amount of direct reduction .............................................................................. ¥ 843,781 ¥ 717,010
Reserve for Possible Loan Losses
Millions of yenMarch 31 2010 2009Bankrupt loans ................................................................................................ ¥ 165,131 ¥ 292,088Non-accrual loans ........................................................................................... 1,075,782 1,019,352Past due loans (3 months or more) ................................................................. 38,315 36,162Restructured loans .......................................................................................... 250,256 238,713Total ................................................................................................................. ¥1,529,484 ¥1,586,317Amount of direct reduction .............................................................................. ¥ 727,633 ¥ 607,936
Notes: Definition of risk-monitored loan categories 1. Bankrupt loans: Credits for which accrued interest is not accounted in revenue; credits extended to borrowers that are undergoing bankruptcy,
corporate reorganization and rehabilitation proceedings or debtors receiving orders of disposition by suspension of business at bill clearinghouses 2. Non-accrual loans: Credits for which accrued interest is not accounted in revenue; credits, excluding loans to bankrupt borrowers and loans with
grace for interest payment to assist in corporate reorganization or to support business 3. Past due loans (3 months or more): Loans with payment of principal or interest in arrears for more than 3 months, calculated from the day following
the contractual due date, excluding borrowers in categories 1. and 2. 4. Restructured loans: Loans to borrowers in severe financial condition given certain favorable terms and conditions to assist in corporate rehabilitation
or to support business, excluding borrowers in categories 1. through 3.
Risk-Monitored Loans
Millions of yenMarch 31 2010 2009Bankrupt and quasi-bankrupt assets .............................................................. ¥ 392,424 ¥ 505,666Doubtful assets ............................................................................................... 881,239 865,603Substandard loans .......................................................................................... 298,179 281,917Total of problem assets ................................................................................... 1,571,842 1,653,186Normal assets ................................................................................................. 68,431,335 70,894,602Total ................................................................................................................. ¥70,003,177 ¥72,547,788Amount of direct reduction .............................................................................. ¥ 843,781 ¥ 717,010
Notes: Definition of problem asset categories 1. Bankrupt and quasi-bankrupt assets: Credits to borrowers undergoing bankruptcy, corporate reorganization, and rehabilitation proceedings, as well
as claims of a similar nature 2. Doubtful assets: Credits for which final collection of principal and interest in line with original agreements is highly improbable due to deterioration of
financial position and business performance, but not insolvency of the borrower 3. Substandard loans: Past due loans (3 months or more) and restructured loans, excluding 1. and 2. 4. Normal assets: Credits to borrowers with good business performance and in financial standing without identified problems and not classified into the
3 categories above
Problem Assets Based on the Financial Reconstruction Law

SMFG 2010 143
SMFGAssets and Liabilities (Consolidated)
Millions of yen2010 2009
March 31Domestic operations
Overseas operations Elimination Total
Domestic operations
Overseas operations Elimination Total
Trading assets ........................................................... ¥6,156,853 ¥587,881 ¥(36,046) ¥6,708,688 ¥3,934,682 ¥1,011,003 ¥(20,723) ¥4,924,961Trading securities .................................................. 2,747,496 32,229 — 2,779,725 287,025 6,931 — 293,956Derivatives of trading securities ............................ 1,246 — — 1,246 470 — — 470 Securities related to trading transactions ............. — — — — — — — —
Derivatives of securities related to trading transactions ............................................ 6,931 — — 6,931 13,428 — — 13,428Trading-related financial derivatives ..................... 3,123,235 555,288 (36,046) 3,642,477 3,069,579 1,004,072 (20,723) 4,052,928Other trading assets.............................................. 277,943 363 — 278,307 564,178 — — 564,178
Trading liabilities ........................................................ ¥4,470,010 ¥632,763 ¥(36,046) ¥5,066,727 ¥2,684,086 ¥ 934,296 ¥(20,723) ¥3,597,658Trading securities sold for short sales .................. 1,582,808 — — 1,582,808 7,131 341 — 7,473Derivatives of trading securities ............................ 2,367 — — 2,367 407 — — 407
Securities related to trading transactions sold for short sales .............................................. — — — — — — — —
Derivatives of securities related to trading transactions ............................................ 6,961 — — 6,961 13,997 — — 13,997Trading-related financial derivatives ..................... 2,877,873 632,763 (36,046) 3,474,589 2,662,549 933,954 (20,723) 3,575,780Other trading liabilities .......................................... — — — — — — — —
Notes: 1. Domestic operations comprise the operations of SMFG, its domestic consolidated banking subsidiaries (excluding overseas branches) and other domestic consolidated subsidiaries. Overseas operations comprise the operations of the overseas branches of domestic consolidated banking subsidiaries and overseas consolidated subsidiaries.
2. Intersegment transactions are reported in the “Elimination” column.
Trading Assets and Liabilities
Millions of yenMarch 31 2010 2009Domestic operations:
Japanese government bonds ...................................................................... ¥16,738,321 ¥14,734,419Japanese local government bonds ............................................................. 422,648 338,688Japanese corporate bonds ......................................................................... 3,548,359 3,899,189Japanese stocks .......................................................................................... 2,924,446 2,536,410Others .......................................................................................................... 3,492,404 5,136,736Subtotal ....................................................................................................... ¥27,126,180 ¥26,645,444
Overseas operations:Japanese government bonds ...................................................................... ¥ — ¥ —Japanese local government bonds ............................................................. — —Japanese corporate bonds ......................................................................... — —Japanese stocks .......................................................................................... — —Others .......................................................................................................... 1,454,593 1,833,447Subtotal ....................................................................................................... ¥ 1,454,593 ¥ 1,833,447
Unallocated corporate assets:Japanese government bonds ...................................................................... ¥ — ¥ —Japanese local government bonds ............................................................. — —Japanese corporate bonds ......................................................................... — —Japanese stocks .......................................................................................... 43,194 219,272Others .......................................................................................................... — —Subtotal ....................................................................................................... ¥ 43,194 ¥ 219,272
Total ................................................................................................................. ¥28,623,968 ¥28,698,164
Notes: 1. Domestic operations comprise the operations of SMFG, its domestic consolidated banking subsidiaries (excluding overseas branches) and other domestic consolidated subsidiaries. Overseas operations comprise the operations of the overseas branches of domestic consolidated banking subsidiaries and overseas consolidated subsidiaries.
2. “Others” include foreign bonds and foreign stocks.
SecuritiesYear-End Balance

SMFG 2010144
SMFG
Capital (Nonconsolidated)Sumitomo Mitsui Financial Group, Inc.
Millions of yenNumber of shares issued Capital stock Capital reserve
Changes Balances Changes Balances Changes BalancesApril 1, 2005 — March 31, 2006*1 ........... 922,593.28 8,253,573.77 ¥ — ¥1,352,651 ¥ — ¥1,352,764January 31, 2006*2 .................................. 80,000 8,333,573.77 45,220 1,397,871 45,220 1,397,984February 28, 2006*3 ................................. 40,700 8,374,273.77 23,005 1,420,877 23,005 1,420,989May 17, 2006*4 ........................................ (68,000) 8,306,273.77 — 1,420,877 — 1,420,989August 11, 2006*5 .................................... — 8,306,273.77 — 1,420,877 (1,000,000) 420,989September 1, 2006*6 ............................... 249,015 8,555,288.77 — 1,420,877 221,365 642,355September 6, 2006*7 ............................... (67,000) 8,488,288.77 — 1,420,877 — 642,355September 29, 2006*8 ............................. (439,534) 8,048,754.77 — 1,420,877 — 642,355October 11, 2006*9 .................................. (195,000) 7,853,754.77 — 1,420,877 — 642,355April 30, 2008*10 ...................................... 157,151 8,010,905.77 — 1,420,877 — 642,355May 16, 2008*11 ....................................... (16,700) 7,994,205.77 — 1,420,877 — 642,355January 4, 2009*12 ................................... 781,189,672.23 789,183,878 — 1,420,877 — 642,355June 22, 2009*13 ...................................... 219,700,000 1,008,883,878 413,695 1,834,572 413,695 1,056,050July 27, 2009*14 ....................................... 8,931,300 1,017,815,178 16,817 1,851,389 16,817 1,072,868January 27, 2010*15 ................................. 340,000,000 1,357,815,178 459,477 2,310,867 459,477 1,532,345January 28, 2010*16 ................................. 36,343,848 1,394,159,026 — 2,310,867 — 1,532,345February 8, 2010*17 ................................. (33,400) 1,394,125,626 — 2,310,867 — 1,532,345February 10, 2010*18 ............................... 20,000,000 1,414,125,626 27,028 2,337,895 27,028 1,559,374
Remarks:*1 Conversion of 107,087 shares of preferred stock (13th series Type 4) to 1,029,680.28 shares of common stock*2 Public offering: Common stock: 80,000 shares
Issue price: ¥1,130 thousand Capitalization: ¥565 thousand*3 Allotment to third parties: Common stock: 40,700 shares
Issue price: ¥1,130 thousand Capitalization: ¥565 thousand*4 Repurchase and cancellation of 35,000 shares of preferred stock (Type 1) and 33,000 shares of preferred stock (Type 2)*5 Capital reserve was transferred to other capital surplus pursuant to Article 448-1 of the Company Act.*6 Increase in the number of common stock as a result of share exchange for making SMBC Friend Securities Co., Ltd. our wholly-owned subsidiary (share
exchange ratio: 1-to-0.0008)*7 Repurchase and cancellation of 67,000 shares of preferred stock (Type 2)*8 Repurchase and cancellation of 500,000 shares of preferred stock (Type 3) and increase in shares of common stock of 60,466*9 Repurchase and cancellation of 195,000 shares of preferred stock (Type 3)*10 Increase in shares of common stock of 157,151 as a result of exercise of rights to purchase all the shares of preferred stock (5th to 8th series Type 4)*11 Decrease in shares of preferred stock (Type 4) of 16,700 as a result of cancellation of all the shares of preferred stock (5th to 8th series Type 4)*12 Increase in shares of common stock of 781,189,672.23 as a result of 100-for-1 stock split*13 Public offering: Common stock: 219,700,000 shares
Issue price: ¥3,766 Capitalization: ¥1,883*14 Allotment to third parties: Common stock: 8,931,300 shares
Issue price: ¥3,766 Capitalization: ¥1,883*15 Public offering: Common stock: 340,000,000 shares
Issue price: ¥2,702.81 Capitalization: ¥1,351.405*16 Increase in shares of common stock of 36,343,848 as a result of exercise of rights to purchase all the shares of preferred stock (1st to 4th and 9th to 12th
series Type 4)*17 Decrease in shares of preferred stock (Type 4) of 33,400 as a result of cancellation of all the shares of preferred stock (1st to 4th and 9th to 12th series
Type 4)*18 Allotment to third parties: Common stock: 20,000,000 shares
Issue price: ¥2,702.81 Capitalization: ¥1,351.405
Change in Number of Shares Issued and Capital Stock
March 31, 2010 Number of shares issuedCommon stock ............................................................................................................................................................... 1,414,055,625Preferred stock (1st series Type 6) ................................................................................................................................. 70,001Total ................................................................................................................................................................................ 1,414,125,626
Number of Shares Issued
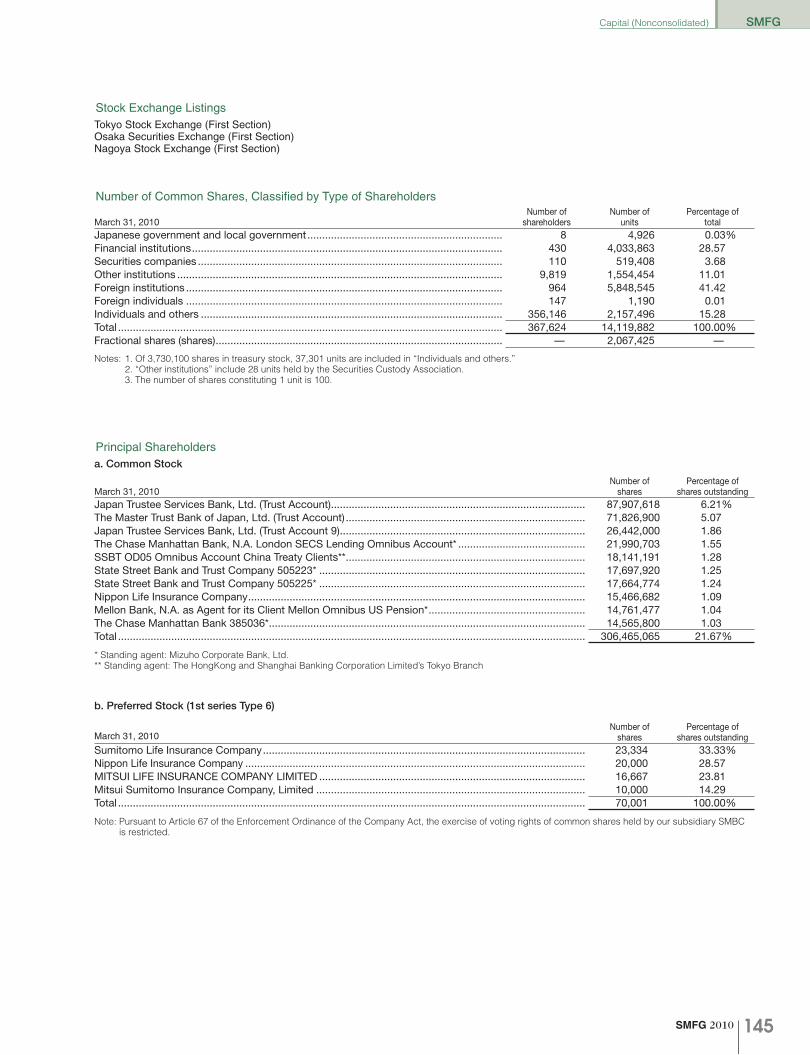
SMFG 2010 145
SMFGCapital (Nonconsolidated)
March 31, 2010Number of
sharesPercentage of
shares outstandingJapan Trustee Services Bank, Ltd. (Trust Account) ...................................................................................... 87,907,618 6.21%The Master Trust Bank of Japan, Ltd. (Trust Account) ................................................................................. 71,826,900 5.07Japan Trustee Services Bank, Ltd. (Trust Account 9) ................................................................................... 26,442,000 1.86The Chase Manhattan Bank, N.A. London SECS Lending Omnibus Account* ........................................... 21,990,703 1.55SSBT OD05 Omnibus Account China Treaty Clients** ................................................................................. 18,141,191 1.28State Street Bank and Trust Company 505223* .......................................................................................... 17,697,920 1.25State Street Bank and Trust Company 505225* .......................................................................................... 17,664,774 1.24Nippon Life Insurance Company .................................................................................................................. 15,466,682 1.09Mellon Bank, N.A. as Agent for its Client Mellon Omnibus US Pension* ..................................................... 14,761,477 1.04The Chase Manhattan Bank 385036* ........................................................................................................... 14,565,800 1.03Total .............................................................................................................................................................. 306,465,065 21.67%
* Standing agent: Mizuho Corporate Bank, Ltd.** Standing agent: The HongKong and Shanghai Banking Corporation Limited’s Tokyo Branch
Principal Shareholdersa. Common Stock
March 31, 2010Number of
shareholders Number of
unitsPercentage of
totalJapanese government and local government .................................................................. 8 4,926 0.03%Financial institutions ......................................................................................................... 430 4,033,863 28.57Securities companies ....................................................................................................... 110 519,408 3.68Other institutions .............................................................................................................. 9,819 1,554,454 11.01Foreign institutions ........................................................................................................... 964 5,848,545 41.42Foreign individuals ........................................................................................................... 147 1,190 0.01Individuals and others ...................................................................................................... 356,146 2,157,496 15.28Total .................................................................................................................................. 367,624 14,119,882 100.00%Fractional shares (shares) ................................................................................................. — 2,067,425 —
Notes: 1. Of 3,730,100 shares in treasury stock, 37,301 units are included in “Individuals and others.” 2. “Other institutions” include 28 units held by the Securities Custody Association. 3. The number of shares constituting 1 unit is 100.
Number of Common Shares, Classified by Type of Shareholders
Tokyo Stock Exchange (First Section)Osaka Securities Exchange (First Section)Nagoya Stock Exchange (First Section)
Stock Exchange Listings
March 31, 2010Number of
sharesPercentage of
shares outstandingSumitomo Life Insurance Company ............................................................................................................. 23,334 33.33%Nippon Life Insurance Company ................................................................................................................... 20,000 28.57MITSUI LIFE INSURANCE COMPANY LIMITED .......................................................................................... 16,667 23.81Mitsui Sumitomo Insurance Company, Limited ........................................................................................... 10,000 14.29Total .............................................................................................................................................................. 70,001 100.00%
Note: Pursuant to Article 67 of the Enforcement Ordinance of the Company Act, the exercise of voting rights of common shares held by our subsidiary SMBC is restricted.
b. Preferred Stock (1st series Type 6)

SMFG 2010146
SMFG Capital (Nonconsolidated)
YenYear ended March 31 2010 2009 2008 2007 2006High ....................................................................................... ¥4,520 ¥9,640 ¥1,210,000 ¥1,390,000 ¥1,370,000Low ........................................................................................ 2,591 2,585 633,000 1,010,000 659,000
Notes: 1. Stock prices of common shares as quoted on the Tokyo Stock Exchange (First Section). 2. SMFG implemented 100-for-1 stock split on January 4, 2009. Stock prices for the year ended March 31, 2009 are reported assuming that the stock
split had been effective from April 1, 2008. 3. Preferred stocks (1st series Type 6) are not listed on exchanges.
Common Stock Price RangeStock Price Performance
YenOctober 2009 November 2009 December 2009 January 2010 February 2010 March 2010
High .............................................................. ¥3,500 ¥3,290 ¥3,080 ¥3,160 ¥2,982 ¥3,150Low ............................................................... 2,960 2,610 2,630 2,591 2,767 2,848
Notes: 1. Stock prices of common shares as quoted on the Tokyo Stock Exchange (First Section). 2. Preferred stocks (1st series Type 6) are not listed on exchanges.
Six-Month Performance
March 31 2010Number of shares granted............................................................................................................ 108,100 sharesType of stock ................................................................................................................................ Common stockIssue price .................................................................................................................................... ¥6,649 per shareAmount capitalized when shares are issued ................................................................................ ¥3,325 per shareExercise period of stock options .................................................................................................. From June 28, 2004 to June 27, 2012
Note: Former SMBC issued and granted stock options to certain directors and employees pursuant to the resolution of the ordinary general meeting of share-holders held on June 27, 2002. SMFG succeeded the obligations related to the stock options at the time of its establishment pursuant to the resolution of the preferred shareholders’ meeting held on September 26, 2002 and the extraordinary shareholders’ meeting held on September 27, 2002.
Stock Options

SMFG 2010 147
SMBC
Income Analysis (Consolidated)Sumitomo Mitsui Banking Corporation and Subsidiaries
Millions of yen2010 2009
Year ended March 31Domestic operations
Overseasoperations Elimination Total
Domestic operations
Overseasoperations Elimination Total
Interest income ..................................................... ¥1,302,315 ¥389,577 ¥(93,427) ¥1,598,464 ¥1,466,092 ¥610,270 ¥(89,841) ¥1,986,520Interest expenses .................................................. 272,565 116,457 (93,407) 295,615 469,307 335,909 (83,661) 721,554
Net interest income ................................................... 1,029,750 273,119 (19) 1,302,849 996,784 274,360 (6,179) 1,264,966Trust fees ................................................................... 1,736 — — 1,736 2,074 — — 2,074
Fees and commissions ......................................... 502,032 80,658 (2,549) 580,142 438,721 80,929 (962) 518,688Fees and commissions payments ........................ 118,326 10,923 (1,493) 127,756 114,918 10,590 (897) 124,611
Net fees and commissions ........................................ 383,705 69,735 (1,055) 452,385 323,803 70,338 (65) 394,077Trading income...................................................... 148,600 28,902 (20,932) 156,570 174,304 29,779 (12,241) 191,842Trading losses ....................................................... 8,313 12,619 (20,932) — 3,449 8,791 (12,241) —
Net trading income .................................................... 140,287 16,283 — 156,570 170,854 20,987 — 191,842Other operating income ........................................ 140,284 16,083 (12) 156,355 230,448 20,051 (24) 250,475Other operating expenses..................................... 103,485 9,074 — 112,560 170,926 25,730 — 196,656
Net other operating income (expenses) .................... 36,799 7,008 (12) 43,795 59,521 (5,678) (24) 53,818
Notes: 1. Domestic operations comprise the operations of SMBC (excluding overseas branches) and its domestic consolidated subsidiaries. Overseas opera-tions comprise the operations of SMBC’s overseas branches and its overseas consolidated subsidiaries.
2. Income and expenses resulting from money held in trust are included in “Other income” and “Other expenses.” Therefore, “Interest expenses” are shown after deduction of expenses (2010, ¥20 million; 2009, ¥30 million) related to the management of money held in trust.
3. Intersegment transactions are reported in the “Elimination” column.
Operating Income, Classified by Domestic and Overseas Operations
Millions of yen
2010 2009
Year ended March 31 Average balance Interest Earnings yield Average balance Interest Earnings yield
Interest-earning assets ................................... ¥85,101,802 ¥1,302,315 1.53% ¥79,343,082 ¥1,466,092 1.85%Loans and bills discounted ......................... 56,291,108 1,036,964 1.84 54,408,361 1,124,991 2.07Securities .................................................... 24,649,455 216,124 0.88 21,519,840 268,696 1.25Call loans and bills bought ......................... 337,927 2,495 0.74 375,755 5,287 1.41Receivables under resale agreements ........ 13,958 15 0.11 16,674 87 0.52 Receivables under securities borrowing transactions ............................. 2,277,769 5,394 0.24 684,275 4,496 0.66Deposits with banks ................................... 268,117 1,704 0.64 801,981 10,986 1.37
Interest-bearing liabilities ............................... ¥89,290,815 ¥ 272,565 0.31% ¥85,639,021 ¥ 469,307 0.55%Deposits...................................................... 68,567,643 106,566 0.16 66,523,917 196,972 0.30Negotiable certificates of deposit ............... 7,227,930 18,280 0.25 4,094,711 24,451 0.60Call money and bills sold ............................ 1,855,873 2,853 0.15 2,736,245 12,571 0.46Payables under repurchase agreements .... 607,324 668 0.11 430,988 2,028 0.47 Payables under securities lending transactions ................................. 2,829,428 6,120 0.22 4,179,957 59,958 1.43Commercial paper ...................................... — — — — — —Borrowed money ........................................ 4,462,011 104,896 2.35 4,036,960 107,661 2.67Short-term bonds ....................................... 238,247 468 0.20 67,214 478 0.71Bonds ......................................................... 3,292,435 60,201 1.83 3,332,131 63,573 1.91
Notes: 1. Domestic operations comprise the operations of SMBC (excluding overseas branches) and its domestic consolidated subsidiaries. 2. In principle, average balances are calculated by using daily balances. However, some domestic consolidated subsidiaries use weekly, monthly or
semiannual balances instead. 3. “Interest-earning assets” are shown after deduction of the average balance of noninterest-earning deposits (2010, ¥946,938 million; 2009, ¥818,050
million). 4. Income and expenses resulting from money held in trust are included in “Other income” and “Other expenses.” Therefore, “Interest-earning assets”
are shown after deduction of the average balance of money held in trust (2010, ¥12,392 million; 2009, ¥8,583 million). “Interest-bearing liabilities” are shown after deduction of amounts equivalent to the average balance of money held in trust (2010, ¥12,392 million; 2009, ¥8,583 million) and corresponding interest (2010, ¥20 million; 2009, ¥30 million).
Average Balance, Interest and Earnings Yield of Interest-Earning Assets and Interest-Bearing LiabilitiesDomestic Operations

SMFG 2010148
SMBC Income Analysis (Consolidated)
Millions of yen
2010 2009
Year ended March 31 Average balance Interest Earnings yield Average balance Interest Earnings yield
Interest-earning assets ................................... ¥16,085,915 ¥389,577 2.42% ¥15,945,396 ¥610,270 3.83%Loans and bills discounted ......................... 10,971,078 312,374 2.85 11,584,510 484,291 4.18Securities .................................................... 1,459,443 22,821 1.56 1,350,798 35,424 2.62Call loans and bills bought ......................... 812,878 5,158 0.63 384,028 9,283 2.42Receivables under resale agreements ........ 13,963 887 6.36 103,425 1,661 1.61 Receivables under securities borrowing transactions ............................. — — — — — —Deposits with banks ................................... 2,152,553 14,066 0.65 1,930,859 35,964 1.86
Interest-bearing liabilities ............................... ¥11,763,523 ¥116,457 0.99% ¥ 9,534,917 ¥335,909 3.52%Deposits ..................................................... 7,472,669 40,606 0.54 6,968,130 134,070 1.92Negotiable certificates of deposit ............... 1,811,253 16,102 0.89 710,309 23,579 3.32Call money and bills sold ............................ 1,205,537 3,416 0.28 580,174 9,996 1.72Payables under repurchase agreements .... 364,451 713 0.20 546,903 5,232 0.96 Payables under securities lending transactions ................................. — — — — — —Commercial paper ...................................... 82,513 194 0.24 — — —Borrowed money ........................................ 387,573 9,308 2.40 354,359 15,544 4.39Short-term bonds ....................................... — — — — — —Bonds ......................................................... 158,169 9,459 5.98 265,035 17,328 6.54
Notes: 1. Overseas operations comprise the operations of SMBC’s overseas branches and its overseas consolidated subsidiaries. 2. In principle, average balances are calculated by using daily balances. However, some overseas consolidated subsidiaries use weekly, monthly,
quarterly or semiannual balances instead. 3. “Interest-earning assets” are shown after deduction of the average balance of noninterest-earning deposits (2010, ¥156,324 million; 2009, ¥88,670
million).
Overseas Operations
Millions of yen
2010 2009
Year ended March 31 Average balance Interest Earnings yield Average balance Interest Earnings yield
Interest-earning assets ................................... ¥99,271,616 ¥1,598,464 1.61% ¥93,549,650 ¥1,986,520 2.12%Loans and bills discounted ......................... 65,563,988 1,257,034 1.92 64,569,148 1,530,130 2.37Securities .................................................... 26,108,898 238,944 0.92 22,870,639 297,938 1.30Call loans and bills bought ......................... 1,150,805 7,653 0.67 759,784 14,570 1.92Receivables under resale agreements ........ 27,922 902 3.23 120,099 1,748 1.46 Receivables under securities borrowing transactions ............................. 2,277,769 5,394 0.24 684,275 4,496 0.66Deposits with banks ................................... 2,208,380 14,650 0.66 2,419,248 42,446 1.75
Interest-bearing liabilities ............................... ¥99,138,171 ¥ 295,615 0.30% ¥93,434,902 ¥ 721,554 0.77%Deposits...................................................... 75,827,957 146,051 0.19 73,178,249 326,538 0.45Negotiable certificates of deposit ............... 9,039,183 34,382 0.38 4,805,020 48,030 1.00Call money and bills sold ............................ 3,061,410 6,270 0.20 3,316,420 22,567 0.68Payables under repurchase agreements .... 971,775 1,381 0.14 977,892 7,261 0.74 Payables under securities lending transactions ................................. 2,829,428 6,120 0.22 4,179,957 59,958 1.43Commercial paper ...................................... 82,513 194 0.24 — — —Borrowed money ........................................ 3,151,386 21,919 0.70 2,967,596 44,050 1.48Short-term bonds ....................................... 238,247 468 0.20 67,214 478 0.71Bonds ......................................................... 3,450,605 69,660 2.02 3,597,166 80,902 2.25
Notes: 1. The figures above comprise totals for domestic and overseas operations after intersegment eliminations. 2. In principle, average balances are calculated by using daily balances. However, some consolidated subsidiaries use weekly, monthly, quarterly or
semiannual balances instead. 3. “Interest-earning assets” are shown after deduction of the average balance of noninterest-earning deposits (2010, ¥1,103,197 million; 2009,
¥906,513 million). 4. Income and expenses resulting from money held in trust are included in “Other income” and “Other expenses.” Therefore, “Interest-earning assets”
are shown after deduction of the average balance of money held in trust (2010, ¥12,392 million; 2009, ¥8,583 million). “Interest-bearing liabilities” are shown after deduction of amounts equivalent to the average balance of money held in trust (2010, ¥12,392 million; 2009, ¥8,583 million) and corresponding interest (2010, ¥20 million; 2009, ¥30 million).
Total of Domestic and Overseas Operations
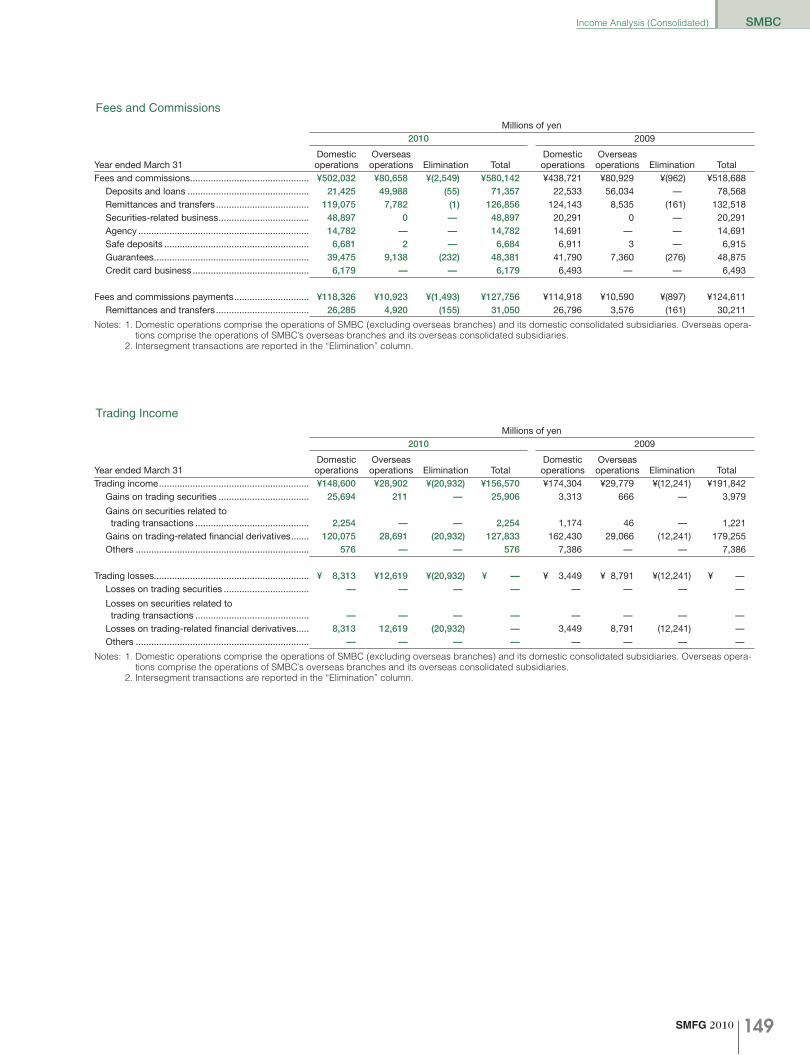
SMFG 2010 149
SMBCIncome Analysis (Consolidated)
Millions of yen2010 2009
Year ended March 31Domestic operations
Overseas operations Elimination Total
Domestic operations
Overseas operations Elimination Total
Trading income .......................................................... ¥148,600 ¥28,902 ¥(20,932) ¥156,570 ¥174,304 ¥29,779 ¥(12,241) ¥191,842Gains on trading securities ................................... 25,694 211 — 25,906 3,313 666 — 3,979
Gains on securities related to trading transactions ............................................ 2,254 — — 2,254 1,174 46 — 1,221Gains on trading-related financial derivatives ....... 120,075 28,691 (20,932) 127,833 162,430 29,066 (12,241) 179,255Others ................................................................... 576 — — 576 7,386 — — 7,386
Trading losses............................................................ ¥ 8,313 ¥12,619 ¥(20,932) ¥ — ¥ 3,449 ¥ 8,791 ¥(12,241) ¥ —Losses on trading securities ................................. — — — — — — — —
Losses on securities related to trading transactions ............................................ — — — — — — — —Losses on trading-related financial derivatives ..... 8,313 12,619 (20,932) — 3,449 8,791 (12,241) —Others ................................................................... — — — — — — — —
Notes: 1. Domestic operations comprise the operations of SMBC (excluding overseas branches) and its domestic consolidated subsidiaries. Overseas opera-tions comprise the operations of SMBC’s overseas branches and its overseas consolidated subsidiaries.
2. Intersegment transactions are reported in the “Elimination” column.
Trading Income
Millions of yen2010 2009
Year ended March 31Domestic operations
Overseas operations Elimination Total
Domestic operations
Overseas operations Elimination Total
Fees and commissions .............................................. ¥502,032 ¥80,658 ¥(2,549) ¥580,142 ¥438,721 ¥80,929 ¥(962) ¥518,688Deposits and loans ............................................... 21,425 49,988 (55) 71,357 22,533 56,034 — 78,568Remittances and transfers .................................... 119,075 7,782 (1) 126,856 124,143 8,535 (161) 132,518Securities-related business ................................... 48,897 0 — 48,897 20,291 0 — 20,291Agency .................................................................. 14,782 — — 14,782 14,691 — — 14,691Safe deposits ........................................................ 6,681 2 — 6,684 6,911 3 — 6,915Guarantees ............................................................ 39,475 9,138 (232) 48,381 41,790 7,360 (276) 48,875Credit card business ............................................. 6,179 — — 6,179 6,493 — — 6,493
Fees and commissions payments ............................. ¥118,326 ¥10,923 ¥(1,493) ¥127,756 ¥114,918 ¥10,590 ¥(897) ¥124,611Remittances and transfers .................................... 26,285 4,920 (155) 31,050 26,796 3,576 (161) 30,211
Notes: 1. Domestic operations comprise the operations of SMBC (excluding overseas branches) and its domestic consolidated subsidiaries. Overseas opera-tions comprise the operations of SMBC’s overseas branches and its overseas consolidated subsidiaries.
2. Intersegment transactions are reported in the “Elimination” column.
Fees and Commissions

SMFG 2010150
SMBC
Assets and Liabilities (Consolidated)Sumitomo Mitsui Banking Corporation and Subsidiaries
Balance of Loan Portfolio, Classified by Industry
Millions of yen
March 31 2010 2009
Domestic operations:Liquid deposits ............................................................................................ ¥42,959,169 ¥41,544,906Fixed-term deposits .................................................................................... 25,125,800 23,465,803Others .......................................................................................................... 3,617,857 3,884,852Subtotal ....................................................................................................... 71,702,827 68,895,562Negotiable certificates of deposit ................................................................ 5,246,004 6,035,411Total ............................................................................................................. ¥76,948,832 ¥74,930,974
Overseas operations:Liquid deposits ............................................................................................ ¥ 5,243,318 ¥ 5,185,137Fixed-term deposits .................................................................................... 1,763,200 1,575,776Others .......................................................................................................... 7,831 4,007Subtotal ....................................................................................................... 7,014,351 6,764,920Negotiable certificates of deposit ................................................................ 1,828,914 1,428,673Total ............................................................................................................. ¥ 8,843,265 ¥ 8,193,594
Grand total ...................................................................................................... ¥85,792,098 ¥83,124,568Notes: 1. Domestic operations comprise the operations of SMBC (excluding overseas branches) and its domestic consolidated subsidiaries. Overseas opera-
tions comprise the operations of SMBC’s overseas branches and its overseas consolidated subsidiaries. 2. Liquid deposits = Current deposits + Ordinary deposits + Savings deposits + Deposits at notice 3. Fixed-term deposits = Time deposits + Installment savings
Deposits and Negotiable Certificates of DepositYear-End Balance
Year-End BalanceMillions of yen Millions of yen
March 31 2010 March 31 2009Domestic operations: Domestic operations:
Manufacturing...................................... ¥ 6,689,718 12.20% Manufacturing...................................... ¥ 6,986,393 12.50%Agriculture, forestry, fisheries and mining ........................... 153,199 0.28
Agriculture, forestry, fisheries and mining ........................... 149,268 0.28
Construction ........................................ 1,094,835 2.00 Construction ........................................ 1,274,261 2.28 Transportation, communications and public enterprises ....................... 3,261,007 5.95
Transportation, communications and public enterprises ....................... 3,380,038 6.05
Wholesale and retail ............................ 4,475,464 8.17 Wholesale and retail ............................ 5,030,129 9.00Finance and insurance ........................ 5,271,565 9.62 Finance and insurance ........................ 5,496,504 9.84Real estate, goods rental and leasing ... 8,179,721 14.92 Real estate ........................................... 7,598,081 13.60Services ............................................... 4,192,580 7.65 Services ............................................... 5,762,527 10.31Municipalities ....................................... 1,117,092 2.04 Municipalities ....................................... 1,058,239 1.89Others .................................................. 20,374,612 37.17 Others .................................................. 19,133,674 34.25Subtotal ............................................... ¥54,809,798 100.00% Subtotal ............................................... ¥55,869,119 100.00%
Overseas operations: Overseas operations:Public sector ........................................ ¥ 43,100 0.50% Public sector ........................................ ¥ 35,350 0.35%Financial institutions ............................ 543,997 6.33 Financial institutions ............................ 501,739 4.91Commerce and industry ...................... 7,142,983 83.09 Commerce and industry ...................... 8,544,905 83.66Others .................................................. 866,945 10.08 Others .................................................. 1,131,604 11.08Subtotal ............................................... ¥ 8,597,027 100.00% Subtotal ............................................... ¥10,213,599 100.00%
Total ......................................................... ¥63,406,825 — Total ......................................................... ¥66,082,719 —Notes: 1. Domestic operations comprise the operations of SMBC (excluding overseas branches) and its domestic consolidated subsidiaries. Overseas opera-
tions comprise the operations of SMBC’s overseas branches and its overseas consolidated subsidiaries. 2. Japan offshore banking accounts are included in overseas operations’ accounts. 3. In accordance with the revision of the Japan Standard Industrial Classification (in November 2007), from the fiscal year beginning on April 1, 2009,
the sector classification has been partly changed. “Goods rental and leasing” is included in others in fiscal 2008.

SMFG 2010 151
SMBCAssets and Liabilities (Consolidated)
Millions of yenMarch 31 2010 2009Domestic operations:
Japanese government bonds ...................................................................... ¥16,738,321 ¥14,734,414Japanese local government bonds ............................................................. 422,648 338,688Japanese corporate bonds ......................................................................... 3,531,793 3,878,294Japanese stocks .......................................................................................... 2,843,148 2,407,718Others .......................................................................................................... 3,431,856 5,103,160Subtotal ....................................................................................................... ¥26,967,768 ¥26,462,276
Overseas operations:Japanese government bonds ...................................................................... ¥ — ¥ —Japanese local government bonds ............................................................. — —Japanese corporate bonds ......................................................................... — —Japanese stocks .......................................................................................... — —Others .......................................................................................................... 1,454,593 1,833,447Subtotal ....................................................................................................... ¥ 1,454,593 ¥ 1,833,447
Total ................................................................................................................. ¥28,422,362 ¥28,295,724Notes: 1. Domestic operations comprise the operations of SMBC (excluding overseas branches) and its domestic consolidated subsidiaries. Overseas opera-
tions comprise the operations of SMBC’s overseas branches and its overseas consolidated subsidiaries. 2. “Others” include foreign bonds and foreign stocks.
Securities
Millions of yenMarch 31 2010 2009Bankrupt loans ................................................................................................ ¥ 162,969 ¥ 290,237Non-accrual loans ........................................................................................... 1,047,913 997,888Past due loans (3 months or more) ................................................................. 38,249 36,119Restructured loans .......................................................................................... 249,139 237,579Total ................................................................................................................. ¥1,498,271 ¥1,561,824Amount of direct reduction .............................................................................. ¥ 710,815 ¥ 590,174Notes: Definition of risk-monitored loan categories 1. Bankrupt loans: Credits for which accrued interest is not accounted in revenue; credits extended to borrowers that are undergoing bankruptcy,
corporate reorganization and rehabilitation proceedings or debtors receiving orders of disposition by suspension of business at bill clearinghouses 2. Non-accrual loans: Credits for which accrued interest is not accounted in revenue; credits, excluding loans to bankrupt borrowers and loans with
grace for interest payment to assist in corporate reorganization or to support business 3. Past due loans (3 months or more): Loans with payment of principal or interest in arrears for more than 3 months, calculated from the day following
the contractual due date, excluding borrowers in categories 1. and 2. 4. Restructured loans: Loans to borrowers in severe financial condition given certain favorable terms and conditions to assist in corporate rehabilitation
or to support business, excluding borrowers in categories 1. through 3.
Risk-Monitored Loans
Year-End Balance
Millions of yen2010 2009
March 31Domestic operations
Overseas operations Elimination Total
Domestic operations
Overseas operations Elimination Total
Trading assets ........................................................... ¥6,067,423 ¥587,881 ¥(36,046) ¥6,619,258 ¥3,846,205 ¥1,011,003 ¥(20,723) ¥4,836,484Trading securities .................................................. 2,656,782 32,229 — 2,689,011 185,122 6,931 — 192,053Derivatives of trading securities ............................ 1,244 — — 1,244 455 — — 455 Securities related to trading transactions ............. — — — — — — — —
Derivatives of securities related to trading transactions ............................................ 6,931 — — 6,931 13,428 — — 13,428Trading-related financial derivatives ..................... 3,124,521 555,288 (36,046) 3,643,763 3,083,019 1,004,072 (20,723) 4,066,368Other trading assets.............................................. 277,943 363 — 278,307 564,178 — — 564,178
Trading liabilities ........................................................ ¥4,446,003 ¥632,763 ¥(36,046) ¥5,042,720 ¥2,692,747 ¥ 934,296 ¥(20,723) ¥3,606,319Trading securities sold for short sales .................. 1,557,587 — — 1,557,587 2,370 341 — 2,711Derivatives of trading securities ............................ 2,296 — — 2,296 389 — — 389
Securities related to trading transactions sold for short sales .............................................. — — — — — — — —
Derivatives of securities related to trading transactions ............................................ 6,961 — — 6,961 13,997 — — 13,997Trading-related financial derivatives ..................... 2,879,158 632,763 (36,046) 3,475,875 2,675,989 933,954 (20,723) 3,589,220Other trading liabilities .......................................... — — — — — — — —
Notes: 1. Domestic operations comprise the operations of SMBC (excluding overseas branches) and its domestic consolidated subsidiaries. Overseas opera-tions comprise the operations of SMBC’s overseas branches and its overseas consolidated subsidiaries.
2. Intersegment transactions are reported in the “Elimination” column.
Trading Assets and Liabilities

SMFG 2010152
SMBC
Income Analysis (Nonconsolidated)Sumitomo Mitsui Banking Corporation
Millions of yen2010 2009
Year ended March 31Domesticoperations
Internationaloperations Total
Domesticoperations
Internationaloperations Total
Interest income ........................................... ¥1,063,182 ¥323,681 ¥1,380,280 ¥1,184,053 ¥583,654 ¥1,758,423[6,583] [9,284]
Interest expenses ....................................... 153,247 187,233 333,898 253,773 495,545 740,034[6,583] [9,284]
Net interest income ........................................ 909,934 136,448 1,046,382 930,279 88,109 1,018,389Trust fees ........................................................ 1,736 — 1,736 2,074 — 2,074
Fees and commissions ............................... 321,837 91,123 412,960 322,455 92,772 415,228Fees and commissions payments .............. 108,603 17,643 126,246 102,214 19,190 121,404
Net fees and commissions ............................. 213,233 73,480 286,714 220,241 73,582 293,824Trading income ........................................... 2,424 112,932 115,356 10,763 164,275 175,038Trading losses ............................................. — — — — — —
Net trading income ......................................... 2,424 112,932 115,356 10,763 164,275 175,038Other operating income .............................. 30,585 55,202 85,788 46,440 116,837 163,277Other operating expenses .......................... 40,690 40,012 80,703 62,596 65,150 127,747
Net other operating income (expenses) ......... (10,104) 15,190 5,085 (16,156) 51,686 35,530Gross banking profit ....................................... ¥1,117,224 ¥338,050 ¥1,455,275 ¥1,147,202 ¥377,654 ¥1,524,856Gross banking profit rate (%) ......................... 1.50% 1.98% 1.60% 1.65% 1.96% 1.76%Notes: 1. Domestic operations include yen-denominated transactions by domestic branches, while international operations include foreign-currency-
denominated transactions by domestic branches and operations by overseas branches. Yen-denominated nonresident transactions and Japan offshore banking accounts are included in international operations.
2. “Interest expenses” are shown after deduction of amounts equivalent to interest expenses on money held in trust (2010, ¥20 million; 2009, ¥30 million).
3. Figures in brackets [ ] indicate interest payments between domestic and international operations. As net interest figures are shown for interest rate swaps and similar instruments, some figures for domestic and international operations do not add up to their sums.
4. Gross banking profit rate = Gross banking profit / Average balance of interest-earning assets ✕ 100
Gross Banking Profit, Classified by Domestic and International Operations
Millions of yen2010 2009
Year ended March 31 Average balance Interest Earnings yield Average balance Interest Earnings yieldInterest-earning assets ................................... ¥74,033,481 ¥1,063,182 1.43% ¥69,174,259 ¥1,184,053 1.71%
[563,457] [6,583] [2,101,755] [9,284]Loans and bills discounted ......................... 49,843,442 866,832 1.73 48,534,275 962,176 1.98Securities .................................................... 21,750,902 174,752 0.80 17,380,685 190,320 1.09Call loans .................................................... 59,440 382 0.64 102,047 851 0.83Receivables under resale agreements ........ 95 0 0.13 1,806 8 0.49 Receivables under securities borrowing transactions ............................. 1,397,584 4,059 0.29 682,464 4,488 0.65Bills bought ................................................. 36,110 1,266 3.50 54,955 1,074 1.95Deposits with banks ................................... 105,873 929 0.87 45,750 422 0.92
Interest-bearing liabilities ............................... ¥74,843,531 ¥ 153,247 0.20% ¥70,686,399 ¥ 253,773 0.35%Deposits...................................................... 59,829,387 77,419 0.12 57,747,050 123,812 0.21Negotiable certificates of deposit ............... 7,376,192 18,792 0.25 4,062,350 24,063 0.59Call money .................................................. 1,533,682 1,662 0.10 2,661,112 10,653 0.40Payables under repurchase agreements .... 390,348 465 0.11 434,189 2,043 0.47 Payables under securities lending transactions ................................. 1,039,464 1,472 0.14 1,877,785 8,422 0.44Borrowed money ........................................ 2,095,517 11,532 0.55 1,716,288 17,185 1.00Short-term bonds ....................................... 165,447 303 0.18 67,214 478 0.71Bonds ......................................................... 2,265,856 35,766 1.57 2,020,588 27,771 1.37
Notes: 1. “Interest-earning assets” are shown after deduction of the average balance of noninterest-earning deposits (2010, ¥875,040 million; 2009, ¥756,651 million). “Interest-bearing liabilities” are shown after deduction of amounts equivalent to the average balance of money held in trust (2010, ¥10,191 million; 2009, ¥8,583 million) and corresponding interest (2010, ¥20 million; 2009, ¥30 million).
2. Figures in brackets [ ] indicate the average balances of interdepartmental lending and borrowing activities between domestic and international operations and related interest expenses. As net interest figures are shown for interest rate swaps and similar instruments, some figures for domestic and international operations do not add up to their sums.
Average Balance, Interest and Earnings Yield of Interest-Earning Assets and Interest-Bearing LiabilitiesDomestic Operations

SMFG 2010 153
SMBCIncome Analysis (Nonconsolidated)
Millions of yen2010 2009
Year ended March 31 Average balance Interest Earnings yield Average balance Interest Earnings yieldInterest-earning assets ................................... ¥90,505,247 ¥1,380,280 1.52% ¥86,320,727 ¥1,758,423 2.03%
Loans and bills discounted ......................... 59,084,981 1,062,893 1.79 58,730,789 1,337,305 2.27Securities .................................................... 26,081,394 229,411 0.87 22,459,998 293,992 1.30Call loans .................................................... 360,432 3,231 0.89 381,273 7,805 2.04Receivables under resale agreements ........ 45,678 193 0.42 118,440 1,341 1.13Receivables under securities borrowing transactions ............................. 1,397,842 4,061 0.29 682,464 4,488 0.65Bills bought ................................................. 36,110 1,266 3.50 54,955 1,074 1.95Deposits with banks ................................... 2,326,324 13,863 0.59 2,416,428 38,040 1.57
Interest-bearing liabilities ............................... ¥91,005,657 ¥ 333,898 0.36 ¥87,821,511 ¥ 740,034 0.84%Deposits...................................................... 68,439,416 111,844 0.16 66,639,826 273,495 0.41Negotiable certificates of deposit ............... 9,122,327 34,354 0.37 4,756,043 46,748 0.98Call money .................................................. 2,143,773 3,903 0.18 3,316,021 22,573 0.68Payables under repurchase agreements .... 736,627 982 0.13 979,963 7,066 0.72Payables under securities lending transactions ................................. 2,619,166 6,103 0.23 4,159,197 59,885 1.43Borrowed money ........................................ 4,049,972 103,829 2.56 4,252,644 130,331 3.06Short-term bonds ....................................... 165,447 303 0.18 67,214 478 0.71Bonds ......................................................... 3,312,293 64,294 1.94 3,336,931 67,939 2.03
Notes: 1. “Interest-earning assets” are shown after deduction of the average balance of noninterest-earning deposits (2010, ¥1,013,420 million; 2009, ¥849,475 million). “Interest-bearing liabilities” are shown after deduction of amounts equivalent to the average balance of money held in trust (2010, ¥10,191 million; 2009, ¥8,583 million) and corresponding interest (2010, ¥20 million; 2009, ¥30 million).
2. Figures in the table above indicate the net average balances of amounts adjusted for interdepartmental lending and borrowing activities between domestic and international operations and related interest expenses.
Total of Domestic and International Operations
Millions of yen2010 2009
Year ended March 31 Average balance Interest Earnings yield Average balance Interest Earnings yieldInterest-earning assets ................................... ¥17,035,222 ¥323,681 1.90% ¥19,248,223 ¥583,654 3.03%
Loans and bills discounted ......................... 9,241,539 196,060 2.12 10,196,514 375,128 3.67Securities .................................................... 4,330,491 54,658 1.26 5,079,312 103,672 2.04Call loans .................................................... 300,991 2,849 0.94 279,225 6,953 2.49Receivables under resale agreements ........ 45,582 193 0.42 116,634 1,332 1.14Receivables under securities borrowing transactions ............................. 257 2 0.85 — — —Bills bought ................................................. — — — — — —Deposits with banks ................................... 2,220,451 12,933 0.58 2,370,678 37,617 1.58
Interest-bearing liabilities ............................... ¥16,725,582 ¥187,233 1.11% ¥19,236,867 ¥495,545 2.57%[563,457] [6,583] [2,101,755] [9,284]
Deposits...................................................... 8,610,028 34,424 0.39 8,892,776 149,683 1.68Negotiable certificates of deposit ............... 1,746,135 15,562 0.89 693,692 22,685 3.27Call money .................................................. 610,090 2,241 0.36 654,909 11,920 1.82Payables under repurchase agreements .... 346,279 517 0.14 545,774 5,022 0.92Payables under securities lending transactions ................................. 1,579,701 4,631 0.29 2,281,411 51,463 2.25Borrowed money ........................................ 1,954,454 92,296 4.72 2,536,355 113,145 4.46Bonds ......................................................... 1,046,437 28,527 2.72 1,316,342 40,168 3.05
Notes: 1. “Interest-earning assets” are shown after deduction of the average balance of noninterest-earning deposits (2010, ¥138,379 million; 2009, ¥92,824 million).
2. Figures in brackets [ ] indicate the average balances of interdepartmental lending and borrowing activities between domestic and international operations and related interest expenses. As net interest figures are shown for interest rate swaps and similar instruments, some figures for domestic and international operations do not add up to their sums.
3. The average balance of foreign-currency-denominated transactions by domestic branches in international operations is calculated by the monthly current method, under which the TT middle rate at the end of the previous month is applied to nonexchange transactions of the month concerned.
International Operations

SMFG 2010154
SMBC Income Analysis (Nonconsolidated)
Millions of yen2010 2009
Year ended March 31
Volume-relatedincrease
(decrease)
Rate-relatedincrease
(decrease)
Netincrease
(decrease)
Volume-relatedincrease
(decrease)
Rate-relatedincrease
(decrease)
Netincrease
(decrease)Interest income ............................................... ¥69,782 ¥(190,653) ¥(120,871) ¥61,677 ¥(50,476) ¥11,200
Loans and bills discounted ......................... 22,767 (118,112) (95,344) 36,842 (19,368) 17,473Securities .................................................... 35,111 (50,678) (15,567) 24,720 (26,693) (1,972)Call loans .................................................... (303) (166) (469) (1,608) 90 (1,517)Receivables under resale agreements ........ (4) (3) (8) (115) (13) (128)Receivables under securities borrowing transactions ............................. 2,077 (2,506) (429) (1,915) (551) (2,467)Bills bought ................................................. (368) 560 191 652 (178) 474Deposits with banks ................................... 528 (20) 507 272 115 388
Interest expenses ........................................... ¥ 8,512 ¥(109,038) ¥(100,526) ¥12,243 ¥(16,696) ¥ (4,453)Deposits...................................................... 2,694 (49,086) (46,392) 937 (3,681) (2,743)Negotiable certificates of deposit ............... 8,442 (13,713) (5,271) 9,020 260 9,281Call money .................................................. (3,303) (5,687) (8,991) 2,251 (1,788) 463Payables under repurchase agreements .... (187) (1,390) (1,578) 1,524 (112) 1,412Payables under securities lending transactions ................................. (2,744) (4,205) (6,949) 3,506 (956) 2,550Borrowed money ........................................ 2,087 (7,739) (5,652) (1,875) (676) (2,552)Short-term bonds ....................................... 180 (355) (175) 478 — 478Bonds ......................................................... 3,596 4,399 7,995 (1,020) 3,494 2,473
Breakdown of Interest Income and Interest ExpensesDomestic Operations
Millions of yen2010 2009
Year ended March 31
Volume-relatedincrease
(decrease)
Rate-relatedincrease
(decrease)
Netincrease
(decrease)
Volume-related increase
(decrease)
Rate-relatedincrease
(decrease)
Netincrease
(decrease)Interest income ............................................... ¥(61,205) ¥(198,767) ¥(259,972) ¥88,656 ¥(207,277) ¥(118,621)
Loans and bills discounted ......................... (32,439) (146,629) (179,068) 96,517 (102,964) (6,447)Securities .................................................... (13,658) (35,355) (49,013) 31,654 (57,976) (26,322)Call loans .................................................... 206 (4,310) (4,104) (3,473) (6,607) (10,080)Receivables under resale agreements ........ (560) (578) (1,139) (1,579) (713) (2,292) Receivables under securities borrowing transactions ............................. 2 — 2 — — —Deposits with banks ................................... (2,246) (22,437) (24,683) (23,542) (31,751) (55,294)
Interest expenses ........................................... ¥(57,830) ¥(250,481) ¥(308,311) ¥76,854 ¥(227,391) ¥(150,537)Deposits...................................................... (4,613) (110,644) (115,258) 3,740 (154,348) (150,607)Negotiable certificates of deposit ............... 9,379 (16,502) (7,122) 2,796 (12,797) (10,000)Call money .................................................. (764) (8,914) (9,678) 5,802 (7,628) (1,826)Payables under repurchase agreements .... (1,368) (3,136) (4,504) 3,302 (3,838) (536)Payables under securities lending transactions ................................. (12,231) (34,600) (46,831) 30,157 (18,317) 11,839Borrowed money ........................................ (25,958) 5,109 (20,849) 42,043 (12,147) 29,895Bonds ......................................................... (7,658) (3,982) (11,641) (5,153) (5,843) (10,997)
International Operations
Millions of yen2010 2009
Year ended March 31
Volume-related increase
(decrease)
Rate-relatedincrease
(decrease)
Netincrease
(decrease)
Volume-related increase
(decrease)
Rate-relatedincrease
(decrease)
Netincrease
(decrease)Interest income ............................................... ¥63,817 ¥(441,960) ¥(378,142) ¥134,713 ¥(242,567) ¥(107,853)
Loans and bills discounted ......................... 6,371 (280,784) (274,412) 102,052 (91,025) 11,026Securities .................................................... 31,853 (96,434) (64,580) 49,850 (78,146) (28,295)Call loans .................................................... (405) (4,168) (4,573) (7,154) (4,443) (11,598)Receivables under resale agreements ........ (568) (579) (1,148) (1,796) (624) (2,421) Receivables under securities borrowing transactions ............................. 2,078 (2,505) (427) (1,915) (551) (2,467)Bills bought ................................................. (368) 560 191 652 (178) 474Deposits with banks ................................... (1,368) (22,808) (24,176) (22,770) (32,135) (54,905)
Interest expenses ........................................... ¥11,683 ¥(417,819) ¥(406,136) ¥ 54,601 ¥(210,025) ¥(155,423)Deposits...................................................... 2,940 (164,591) (161,651) 2,706 (156,058) (153,351)Negotiable certificates of deposit ............... 16,443 (28,837) (12,393) 15,816 (16,536) (719)Call money .................................................. (6,077) (12,592) (18,669) 5,999 (7,362) (1,363)Payables under repurchase agreements .... (1,420) (4,662) (6,083) 4,924 (4,047) 876 Payables under securities lending transactions ................................. (16,479) (37,302) (53,781) 30,506 (16,117) 14,389Borrowed money ........................................ (5,982) (20,519) (26,501) 23,057 4,285 27,343Short-term bonds ....................................... 180 (355) (175) 478 — 478Bonds ......................................................... (498) (3,146) (3,645) (5,033) (3,489) (8,523)
Note: Volume/rate variance is prorated according to changes in volume and rate.
Total of Domestic and International Operations

SMFG 2010 155
SMBCIncome Analysis (Nonconsolidated)
Millions of yen2010 2009
Year ended March 31Domestic operations
Internationaloperations Total
Domestic operations
Internationaloperations Total
Trading income ............................................... ¥2,424 ¥112,932 ¥115,356 ¥10,763 ¥164,275 ¥175,038Gains on trading securities ......................... 1,309 — 1,309 3,313 — 3,313 Gains on securities related to trading transactions .................................. — 2,254 2,254 — 1,221 1,221 Gains on trading-related financial derivatives .................................. — 110,677 110,677 — 163,054 163,054Others ......................................................... 1,114 0 1,115 7,449 — 7,449
Trading losses ................................................ ¥ — ¥ — ¥ — ¥ — ¥ — ¥ —Losses on trading securities ....................... — — — — — —Losses on securities related to trading transactions .................................. — — — — — —Losses on trading-related financial derivatives .................................. — — — — — —Others ......................................................... — — — — — —
Note: Figures represent net gains after offsetting income against expenses.
Trading Income
Millions of yen2010 2009
Year ended March 31Domestic operations
Internationaloperations Total
Domestic operations
Internationaloperations Total
Fees and commissions ................................... ¥321,837 ¥91,123 ¥412,960 ¥322,455 ¥92,772 ¥415,228Deposits and loans ..................................... 11,114 36,137 47,252 10,866 40,973 51,840Remittances and transfers ......................... 92,857 24,162 117,019 96,014 27,122 123,136Securities-related business ........................ 13,280 1,125 14,405 17,256 2,818 20,075Agency ........................................................ 11,611 — 11,611 11,777 — 11,777Safe deposits .............................................. 6,249 — 6,249 6,472 — 6,472Guarantees ................................................. 20,934 14,434 35,368 21,005 9,679 30,684
Fees and commissions payments .................. ¥108,603 ¥17,643 ¥126,246 ¥102,214 ¥19,190 ¥121,404Remittances and transfers ......................... 20,479 8,000 28,479 20,385 7,770 28,155
Fees and Commissions
Millions of yen2010 2009
Year ended March 31Domestic operations
Internationaloperations Total
Domestic operations
Internationaloperations Total
Net other operating income (expenses) ......... ¥(10,104) ¥15,190 ¥ 5,085 ¥(16,156) ¥51,686 ¥35,530Gains (losses) on bonds ............................. 9,070 28,199 37,270 (32,420) 58,548 26,128Gains (losses) on derivatives ...................... (15,682) (629) (16,310) 12,680 898 13,578Losses on foreign exchange transactions ... — (9,635) (9,635) — (2,472) (2,472)
Net Other Operating Income (Expenses)
Millions of yenYear ended March 31 2010 2009Salaries and related expenses ........................................................................ ¥206,536 ¥205,624Retirement benefit cost ................................................................................... 14,146 6,084Welfare expenses ............................................................................................ 31,479 31,835Depreciation .................................................................................................... 68,855 60,889Rent and lease expenses ................................................................................ 50,809 50,647Building and maintenance expenses .............................................................. 5,377 8,373Supplies expenses .......................................................................................... 5,856 6,812Water, lighting, and heating expenses............................................................. 5,084 5,441Traveling expenses .......................................................................................... 2,658 3,765Communication expenses ............................................................................... 7,420 7,455Publicity and advertising expenses ................................................................. 7,307 11,349Taxes, other than income taxes....................................................................... 36,759 38,282Deposit insurance ............................................................................................ 48,892 48,763Others .............................................................................................................. 194,569 216,154Total ................................................................................................................. ¥685,752 ¥701,479Note: Because expenses in the table above exclude nonrecurring losses, they are reconciled with the figures reported on page 28.
General and Administrative Expenses

SMFG 2010156
SMBC
Millions of yenMarch 31 2010 2009Domestic operations:
Liquid deposits ............................................................................................ ¥40,457,064 59.5% ¥39,432,942 59.2%Fixed-term deposits .................................................................................... 20,973,648 30.9 19,984,641 30.0Others .......................................................................................................... 1,119,778 1.6 1,136,752 1.7Subtotal ....................................................................................................... 62,550,491 92.0 60,554,335 90.9Negotiable certificates of deposit ................................................................ 5,431,866 8.0 6,047,604 9.1Total ............................................................................................................. ¥67,982,357 100.0% ¥66,601,940 100.0%
International operations:Liquid deposits ............................................................................................ ¥ 4,171,693 43.3% ¥ 4,900,826 47.6%Fixed-term deposits .................................................................................... 1,355,428 14.0 1,342,381 13.0Others .......................................................................................................... 2,379,653 24.7 2,702,454 26.2Subtotal ....................................................................................................... 7,906,775 82.0 8,945,662 86.8Negotiable certificates of deposit ................................................................ 1,741,507 18.0 1,358,105 13.2Total ............................................................................................................. ¥ 9,648,282 100.0% ¥10,303,767 100.0%
Grand total ...................................................................................................... ¥77,630,639 — ¥76,905,708 —Notes: 1. Liquid deposits = Current deposits + Ordinary deposits + Savings deposits + Deposits at notice 2. Fixed-term deposits = Time deposits + Installment savings
Deposits and Negotiable Certificates of Deposit
Deposits (Nonconsolidated)Sumitomo Mitsui Banking Corporation
Millions of yenYear ended March 31 2010 2009Domestic operations:
Liquid deposits ............................................................................................ ¥38,899,878 ¥38,108,576Fixed-term deposits .................................................................................... 20,484,955 19,165,009Others .......................................................................................................... 444,553 473,464Subtotal ....................................................................................................... 59,829,387 57,747,050Negotiable certificates of deposit ................................................................ 7,376,192 4,062,350Total ............................................................................................................. ¥67,205,580 ¥61,809,401
International operations:Liquid deposits ............................................................................................ ¥ 4,417,417 ¥ 4,623,996Fixed-term deposits .................................................................................... 1,366,600 1,104,938Others .......................................................................................................... 2,826,011 3,163,841Subtotal ....................................................................................................... 8,610,028 8,892,776Negotiable certificates of deposit ................................................................ 1,746,135 693,692Total ............................................................................................................. ¥10,356,164 ¥ 9,586,469
Grand total ...................................................................................................... ¥77,561,744 ¥71,395,870Notes: 1. Liquid deposits = Current deposits + Ordinary deposits + Savings deposits + Deposits at notice 2. Fixed-term deposits = Time deposits + Installment savings 3. The average balance of foreign-currency-denominated transactions by domestic branches in international operations is calculated by the monthly
current method.
Millions of yenMarch 31 2010 2009Individual ......................................................................................................... ¥35,637,984 52.8% ¥34,889,209 52.7%Corporate ........................................................................................................ 31,921,076 47.2 31,335,180 47.3Total ................................................................................................................. ¥67,559,060 100.0% ¥66,224,389 100.0%Notes: 1. Figures are before adjustment on interoffice accounts in transit. 2. Negotiable certificates of deposit are excluded. 3. Accounts at overseas branches and Japan offshore banking accounts are excluded.
Balance of Deposits, Classified by Type of Depositor
Year-End Balance
Average Balance

SMFG 2010 157
SMBCDeposits (Nonconsolidated)
Millions of yenMarch 31 2010 2009Less than three months ................................................................................... ¥ 8,154,589 ¥ 7,494,172
Fixed interest rates ...................................................................................... 6,896,813 6,278,535Floating interest rates .................................................................................. 32,997 700Others .......................................................................................................... 1,224,778 1,214,936
Three — six months ........................................................................................ 4,330,949 4,045,532Fixed interest rates ...................................................................................... 4,185,966 3,963,667Floating interest rates .................................................................................. 52,536 4,500Others .......................................................................................................... 92,446 77,365
Six months — one year ................................................................................... 5,947,747 5,583,297Fixed interest rates ...................................................................................... 5,880,649 5,533,874Floating interest rates .................................................................................. 42,996 21,510Others .......................................................................................................... 24,102 27,911
One — two years ............................................................................................. 1,515,226 1,660,255Fixed interest rates ...................................................................................... 1,458,697 1,640,874Floating interest rates .................................................................................. 54,160 18,885Others .......................................................................................................... 2,369 495
Two — three years ........................................................................................... 1,202,825 1,251,850Fixed interest rates ...................................................................................... 1,136,927 1,229,574Floating interest rates .................................................................................. 58,720 18,990Others .......................................................................................................... 7,177 3,285
Three years or more ........................................................................................ 1,177,692 1,291,870Fixed interest rates ...................................................................................... 487,367 781,847Floating interest rates .................................................................................. 684,927 491,636Others .......................................................................................................... 5,397 18,386
Total ................................................................................................................. ¥22,329,032 ¥21,326,977Fixed interest rates ...................................................................................... 20,046,421 19,428,374Floating interest rates .................................................................................. 926,337 556,222Others .......................................................................................................... 1,356,272 1,342,381
Note: The figures above do not include installment savings.
Balance of Time Deposits, Classified by Maturity
Millions of yenMarch 31 2010 2009Individual ......................................................................................................... ¥2,620,727 ¥2,040,366Corporate ........................................................................................................ 310,685 201,138Total ................................................................................................................. ¥2,931,412 ¥2,241,504Note: Balance of investment trusts is recognized on a contract basis and measured according to each fund’s net asset balance at the fiscal year-end.
Balance of Investment Trusts, Classified by Type of Customer

SMFG 2010158
SMBC
Millions of yenMarch 31 2010 2009Domestic operations:
Loans on notes ............................................................................................ ¥ 1,472,451 ¥ 1,932,245Loans on deeds ........................................................................................... 38,069,787 37,914,257Overdrafts .................................................................................................... 8,202,796 9,780,746Bills discounted ........................................................................................... 152,782 216,066Subtotal ....................................................................................................... ¥47,897,818 ¥49,843,316
International operations:Loans on notes ............................................................................................ ¥ 416,026 ¥ 454,926Loans on deeds ........................................................................................... 8,223,003 9,853,939Overdrafts .................................................................................................... 82,210 88,613Bills discounted ........................................................................................... — 470Subtotal ....................................................................................................... ¥ 8,721,240 ¥10,397,950
Total ................................................................................................................. ¥56,619,058 ¥60,241,266
Balance of Loans and Bills Discounted
Millions of yenYear ended March 31 2010 2009Domestic operations:
Loans on notes ............................................................................................ ¥ 1,720,223 ¥ 1,978,289Loans on deeds ........................................................................................... 38,993,305 36,221,243Overdrafts .................................................................................................... 8,969,237 10,094,088Bills discounted ........................................................................................... 160,676 240,653Subtotal ....................................................................................................... ¥49,843,442 ¥48,534,275
International operations:Loans on notes ............................................................................................ ¥ 444,610 ¥ 502,065Loans on deeds ........................................................................................... 8,704,843 9,559,202Overdrafts .................................................................................................... 91,980 132,123Bills discounted ........................................................................................... 104 3,124Subtotal ....................................................................................................... ¥ 9,241,539 ¥10,196,514
Total ................................................................................................................. ¥59,084,981 ¥58,730,789Note: The average balance of foreign-currency-denominated transactions by domestic branches in international operations is calculated by the monthly
current method.
Millions of yenMarch 31 2010 2009Securities ......................................................................................................... ¥ 562,243 ¥ 496,562Commercial claims .......................................................................................... 996,719 974,977Commercial goods .......................................................................................... — —Real estate ....................................................................................................... 6,895,988 6,700,496Others .............................................................................................................. 603,538 527,776Subtotal ........................................................................................................... 9,058,490 8,699,811Guaranteed ...................................................................................................... 21,075,681 21,371,798Unsecured ....................................................................................................... 26,484,887 30,169,656Total ................................................................................................................. ¥56,619,058 ¥60,241,266
Balance of Loans and Bills Discounted, Classified by Collateral
Millions of yenMarch 31 2010 2009Funds for capital investment ........................................................................... ¥21,487,115 38.0% ¥21,398,268 35.5%Funds for working capital ................................................................................ 35,131,942 62.0 38,842,997 64.5Total ................................................................................................................. ¥56,619,058 100.0% ¥60,241,266 100.0%
Balance of Loans and Bills Discounted, Classified by Purpose
Loans (Nonconsolidated)Sumitomo Mitsui Banking Corporation
Year-End Balance
Average Balance

SMFG 2010 159
SMBCLoans (Nonconsolidated)
Millions of yenMarch 31 2010 2009One year or less .............................................................................................. ¥ 8,933,280 ¥ 9,736,533One — three years .......................................................................................... 9,765,902 9,926,623
Floating interest rates .................................................................................. 7,597,080 7,543,515Fixed interest rates ...................................................................................... 2,168,821 2,383,107
Three — five years ........................................................................................... 7,973,882 8,815,570Floating interest rates .................................................................................. 6,035,859 6,797,016Fixed interest rates ...................................................................................... 1,938,023 2,018,554
Five — seven years ......................................................................................... 2,479,598 3,470,099Floating interest rates .................................................................................. 2,035,407 2,629,283Fixed interest rates ...................................................................................... 444,190 840,816
More than seven years .................................................................................... 19,181,387 18,423,079Floating interest rates .................................................................................. 18,171,664 17,261,520Fixed interest rates ...................................................................................... 1,009,722 1,161,559
No designated term ......................................................................................... 8,285,006 9,869,360Floating interest rates .................................................................................. 8,285,006 9,869,360Fixed interest rates ...................................................................................... — —
Total ................................................................................................................. ¥56,619,058 ¥60,241,266Note: Loans with a maturity of one year or less are not classified by floating or fixed interest rates.
Balance of Loans and Bills Discounted, Classified by Maturity
Balance of Loan Portfolio, Classified by Industry
Millions of yen Millions of yenMarch 31 2010 March 31 2009Domestic operations: Domestic operations:
Manufacturing...................................... ¥ 6,308,200 12.7% Manufacturing...................................... ¥ 6,632,207 12.9%Agriculture, forestry, fisheries and mining ........................... 146,765 0.3
Agriculture, forestry, fisheries and mining ........................... 143,591 0.3
Construction ........................................ 897,987 1.8 Construction ........................................ 1,088,910 2.1Transportation, communications and public enterprises ....................... 3,067,711 6.2
Transportation, communications and public enterprises ....................... 3,208,281 6.3
Wholesale and retail ............................ 4,061,267 8.2 Wholesale and retail ............................ 4,632,637 9.0Finance and insurance ........................ 5,907,426 11.9 Finance and insurance ........................ 5,967,376 11.7Real estate, goods rental and leasing ... 6,809,580 13.8 Real estate ........................................... 6,222,052 12.1Services ............................................... 3,769,330 7.6 Services ............................................... 5,260,544 10.3Municipalities ....................................... 984,186 2.0 Municipalities ....................................... 970,577 1.9Others .................................................. 17,573,287 35.5 Others .................................................. 17,115,639 33.4Subtotal ............................................... ¥49,525,741 100.0% Subtotal ............................................... ¥51,241,816 100.0%
Overseas operations: Overseas operations:Public sector ........................................ ¥ 21,320 0.3% Public sector ........................................ ¥ 25,567 0.3%Financial institutions ............................ 484,892 6.8 Financial institutions ............................ 524,236 5.8Commerce and industry ...................... 6,026,280 85.0 Commerce and industry ...................... 7,708,512 85.7Others .................................................. 560,823 7.9 Others .................................................. 741,134 8.2Subtotal ............................................... ¥ 7,093,316 100.0% Subtotal ............................................... ¥ 8,999,450 100.0%
Total ......................................................... ¥56,619,058 — Total ......................................................... ¥60,241,266 —Notes: 1. Domestic operations comprise the operations of SMBC (excluding overseas branches). Overseas operations comprise the operations of SMBC’s
overseas branches. 2. Japan offshore banking accounts are included in overseas operations’ accounts. 3. In accordance with the revision of the Japan Standard Industrial Classification (in November 2007), from the fiscal year beginning on April 1, 2009,
the sector classification has been partly changed. “Goods rental and leasing” is included in others in fiscal 2008.
Millions of yenMarch 31 2010 2009Total domestic loans (A) .................................................................................. ¥49,525,741 ¥51,241,816Loans to individuals, and small and medium-sized enterprises (B) ................ 34,457,098 35,667,854(B) / (A) ............................................................................................................. 69.6% 69.6%Notes: 1. The figures above exclude the outstanding balance of loans at overseas branches and of Japan offshore banking accounts. 2. Small and medium-sized enterprises are individuals or companies with capital stock of ¥300 million or less, or an operating staff of 300 or fewer
employees. (Exceptions to these capital stock and staff restrictions include wholesalers: ¥100 million, 100 employees; retailers: ¥50 million, 50 employees; and service industry companies: ¥50 million, 100 employees.)
Loans to Individuals/Small and Medium-Sized Enterprises

SMFG 2010160
SMBC Loans (Nonconsolidated)
Millions of yenYear ended March 31 2010 2009Write-off of loans ............................................................................................. ¥102,663 ¥231,412Note: Write-off of loans include amount of direct reduction.
Write-Off of Loans
Millions of yenMarch 31 2010 2009Ukraine ............................................................................................................ ¥ 160 ¥3,456Iceland ............................................................................................................. 1,112 1,160Pakistan ........................................................................................................... 61 64Argentina ......................................................................................................... 4 4Total ................................................................................................................. ¥1,339 ¥4,686Ratio of the total amounts to total assets ....................................................... 0.00% 0.00%Number of countries ........................................................................................ 4 4
Specific Overseas Loans
Millions of yenMarch 31 2010 2009Consumer loans .............................................................................................. ¥15,400,531 ¥15,002,856
Housing loans .............................................................................................. 14,497,508 14,077,130Residential purpose ................................................................................. 11,010,697 10,509,845
Others .......................................................................................................... 903,023 925,726Note: Housing loans include general-purpose loans used for housing purposes as well as housing loans and apartment house acquisition loans.
Consumer Loans Outstanding
Millions of yen
Balance at beginningof the fiscal year
Increase duringthe fiscal year
Decrease during the fiscal year Balance at endof the fiscal yearYear ended March 31, 2010 Objectives Others
General reserve for possible loan losses.................. ¥504,379 ¥497,582 ¥ — ¥506,310*1, 2 ¥495,650[2,270]
Specific reserve for possible loan losses ................. 284,799 267,351 109,562 180,245*1, 2 262,343[18]
For nonresident loans ........................................... 71,028 35,393 35,048 40,988*1, 2 30,385[10]
Loan loss reserve for specific overseas countries ... 417 184 — 417*1 184Total .......................................................................... ¥789,596 ¥765,118 ¥109,562 ¥686,973 ¥758,178
[2,288]Amount of direct reduction ....................................... ¥477,529 ¥478,042
[1,954]
*1 Transfer from reserves by reversal or origination method*2 “Others” under “Decrease during the fiscal year” include the amount transferred to Sumitomo Mitsui Banking Corporation (China) Limited in connection
with a business transfer. The transferred amount comprises ¥1,931 million for the general reserve for possible loan losses and ¥5,008 million for the specific reserve for possible loan losses for nonresident loans.
Note: Figures in brackets [ ] indicate foreign exchange translation adjustments.
Millions of yen
Balance at beginningof the fiscal year
Increase duringthe fiscal year
Decrease during the fiscal year Balance at endof the fiscal yearYear ended March 31, 2009 Objectives Others
General reserve for possible loan losses.................. ¥428,663 ¥506,649 ¥ — ¥428,663* ¥506,649[2,256]
Specific reserve for possible loan losses ................. 188,975 284,818 86,503 102,471* 284,818[109]
For nonresident loans ........................................... 28,307 71,309 15,005 13,301* 71,039[86]
Loan loss reserve for specific overseas countries ... 0 417 — 0* 417Total .......................................................................... ¥617,639 ¥791,885 ¥86,503 ¥531,135 ¥791,885
[2,365]Amount of direct reduction ....................................... ¥332,924 ¥479,484
[886]
*Transfer from reserves by reversal or origination methodNote: Figures in brackets [ ] indicate foreign exchange translation adjustments.
Breakdown of Reserve for Possible Loan Losses

SMFG 2010 161
SMBCLoans (Nonconsolidated)
Millions of yenMarch 31 2010 2009Bankrupt loans ................................................................................................ ¥ 112,973 ¥ 196,062Non-accrual loans ........................................................................................... 776,364 744,692Past due loans (3 months or more) ................................................................. 22,889 32,549Restructured loans .......................................................................................... 155,790 163,753Total ................................................................................................................. ¥1,068,017 ¥1,137,058Amount of direct reduction .............................................................................. ¥ 411,715 ¥ 419,511Notes: Definition of risk-monitored loan categories 1. Bankrupt loans: Credits for which accrued interest is not accounted in revenue; credits extended to borrowers that are undergoing bankruptcy,
corporate reorganization and rehabilitation proceedings or debtors receiving orders of disposition by suspension of business at bill clearinghouses 2. Non-accrual loans: Credits for which accrued interest is not accounted in revenue; credits, excluding loans to bankrupt borrowers and loans with
grace for interest payment to assist in corporate reorganization or to support business 3. Past due loans (3 months or more): Loans with payment of principal or interest in arrears for more than 3 months, calculated from the day following
the contractual due date, excluding borrowers in categories 1. and 2. 4. Restructured loans: Loans to borrowers in severe financial condition given certain favorable terms and conditions to assist in corporate rehabilitation
or to support business, excluding borrowers in categories 1. through 3.
Risk-Monitored Loans
Millions of yenMarch 31 2010 2009Bankrupt and quasi-bankrupt assets .............................................................. ¥ 224,335 ¥ 319,627Doubtful assets ............................................................................................... 697,670 678,240Substandard loans .......................................................................................... 178,679 196,303Total of problem assets ................................................................................... 1,100,685 1,194,170Normal assets ................................................................................................. 62,116,059 66,028,576Total ................................................................................................................. ¥63,216,745 ¥67,222,747Amount of direct reduction .............................................................................. ¥ 478,042 ¥ 479,484Notes: Definition of problem asset categories These assets are disclosed based on the provisions of Article 7 of the Financial Reconstruction Law (Law No. 132 of 1998) and classified into the 4
categories based on financial position and business performance of obligors in accordance with Article 6 of the Law. Assets in question include private placement bonds, loans and bills discounted, foreign exchanges, accrued interest, and advance payment in “other assets,” customers’ liabilities for acceptances and guarantees, and securities lent under the loan for consumption or leasing agreements. Privately-placed bonds guaranteed by SMBC have been recorded with fair value since March 31, 2010, in accordance with the revision of “Accounting Standard for Financial Instruments.”
1. Bankrupt and quasi-bankrupt assets: Credits to borrowers undergoing bankruptcy, corporate reorganization, and rehabilitation proceedings, as well as claims of a similar nature
2. Doubtful assets: Credits for which final collection of principal and interest in line with original agreements is highly improbable due to deterioration of financial position and business performance, but not insolvency of the borrower
3. Substandard loans: Past due loans (3 months or more) and restructured loans, excluding 1. and 2. 4. Normal assets: Credits to borrowers with good business performance and in financial standing without identified problems and not classified into the
3 categories above
Problem Assets Based on the Financial Reconstruction Law
Problem Assets Based on the Financial Reconstruction Law, and Risk-Monitored Loans
Category of borrowers underself-assessment
Problem assets based on the FinancialReconstruction Law Risk-monitored loans
Other assets
Bankrupt loans
Non-accrual loans
Past due loans (3 months or more)
Restructured loans
Bankrupt Borrowers
Total loans Total loansOther assets
Bankrupt andquasi-bankrupt assets
Substandard loans
(Normal assets)
Doubtful assets
Normal Borrowers
Effectively Bankrupt Borrowers
Potentially Bankrupt Borrowers
Borrowers Requiring Caution
A B C
C

SMFG 2010162
SMBC Loans (Nonconsolidated)
Notes: 1. Includes amount of direct reduction totaling ¥478.0 billion. 2. Includes reserves for assets that are not subject to disclosure under the Financial Reconstruction Law. (Bankrupt/Effectively Bankrupt Borrowers:
¥6.0 billion; Potentially Bankrupt Borrowers: ¥11.6 billion) 3. Reserve ratios for claims on Bankrupt/Effectively Bankrupt Borrowers, Potentially Bankrupt Borrowers, Substandard Borrowers, and Borrowers
Requiring Caution: The proportion of each category’s total unsecured claims covered by reserve for possible loan losses. 4. Reserve ratios for claims on Normal Borrowers and Borrowers Requiring Caution (excluding claims to Substandard Borrowers): The proportion of
each category’s total claims covered by reserve for possible loan losses. The reserve ratio for unsecured claims on Borrowers Requiring Caution (excluding claims to Substandard Borrowers) is shown in brackets.
5. Includes amount of specific reserve for Borrowers Requiring Caution totaling ¥16.3 billion. 6. Ratio of problem assets to total assets subject to the Financial Reconstruction Law 7. Reserve ratio = (Specific reserve + General reserve for substandard loans) / (Bankrupt and quasi-bankrupt assets + Doubtful assets + Substandard
loans – Portion secured by collateral or guarantees, etc.)
Category ofborrowers underself-assessment
March 31, 2010
Problem assets based onthe Financial Reconstruction Law
Reserve for possibleloan losses
Bankrupt Borrowers
Effectively BankruptBorrowers
PotentiallyBankruptBorrowers
BorrowersRequiringCaution
Normal Borrowers
Classification under self-assessment
Classification I Classification II Classification IIIReserve ratio
NPL ratio (A) / (4)1.74%
(Note 6)
Loan loss reserve for specific overseas countries
Total reserve for possible loan losses
(B) Specific reserve + General reservefor substandard loans
General reserve for substandard loans ¥53.2 ¥75.9
¥24.4(Note 2)
53.50%(Note 3)
Reserve ratio(B) / (D)74.22%
(Note 7)
100%(Note 3)
78.58%(Note 3)
7.30%[14.37%](Note 4)
16.81%(Note 3)
0.24%(Note 4)
¥221.6(Note 2)
(Note 5)¥512.0
¥0.1
¥299.2
¥758.1
¥224.3
¥697.7
¥178.7
¥62,116.0
(4)
(A) = (1) + (2) + (3)
¥63,216.7
¥1,100.7
¥206.0
¥415.7
¥18.3
¥282.0
Portion secured by collateral or guarantees, etc. (C) = (5) + (6) + (7) ¥697.6
Coverage ratio { (B) + (C) } / (A)
Unsecured portion(D) = (A) – (C) ¥403.1
90.56%
Classification IV
(Billions of yen)
Specificreserve
Generalreserve
Bankrupt andquasi-bankrupt assets (1)
Claims to normalborrowers
Portion of claims secured bycollateral or guarantees, etc. (5) Fully reserved
Necessaryamount
reserved
Directwrite-offs(Note 1)
Portion of claims secured bycollateral or guarantees, etc. (6)
Portion of substandard loanssecured by collateral or
guarantees, etc. (7)
Claims to borrowers requiringcaution, excluding claims to
substandard borrowers
Doubtful assets (2)
Substandard loans (3)
(Claims to substandard borrowers)
Normal assets
Total
Classification under Self-Assessment, Disclosure of Problem Assets, and Write-Offs/Reserves
Off-Balancing Problem Assets
Billions of yen
March 31, 2008➀
Fiscal 2008 March 31, 2009➁
Fiscal 2009 March 31, 2010➂New occurrences Off-balanced New occurrences Off-balanced
Bankrupt and quasi-bankrupt assets ... ¥117.8 ¥265.7 ¥ (63.9) ¥319.6 ¥ 86.1 ¥(181.4) ¥224.3Doubtful assets .................................... 402.0 659.0 (382.7) 678.3 529.3 (509.9) 697.7Total ...................................................... ¥519.8 ¥924.7 ¥(446.6) ¥997.9 ¥615.4 ¥(691.3) ¥922.0
Increase/Decrease
➁ – ➀
Increase/Decrease
➂ – ➁Bankrupt and quasi-bankrupt assets ... ¥201.8 ¥(95.3)Doubtful assets .................................... 276.3 19.4Total ...................................................... ¥478.1 ¥(75.9)Notes: 1. The off-balancing (also known as “final disposal”) of problem assets refers to the removal of such assets from the bank’s balance sheet by way of
sale, direct write-off or other means. 2. The figures shown in the above table under “new occurrences” and “off-balanced” are simple additions of the figures for the first and second halves
of the 2 periods reviewed. Amounts of ¥201.2 billion for fiscal 2008 and ¥179.6 billion in fiscal 2009, recognized as “new occurrences” in the first halves of the terms, were included in the amounts off-balanced in the respective second halves.

SMFG 2010 163
SMBC
Securities (Nonconsolidated)Sumitomo Mitsui Banking Corporation
Millions of yenMarch 31 2010 2009Domestic operations:
Japanese government bonds ...................................................................... ¥16,085,664 ¥14,156,993Japanese local government bonds ............................................................. 221,206 230,074Japanese corporate bonds ......................................................................... 3,102,608 3,461,950Japanese stocks .......................................................................................... 3,661,722 2,674,474Others .......................................................................................................... 316,286 299,183
Foreign bonds .......................................................................................... / /Foreign stocks ......................................................................................... / /
Subtotal ....................................................................................................... ¥23,387,488 ¥20,822,677International operations:
Japanese government bonds ...................................................................... ¥ — ¥ —Japanese local government bonds ............................................................. — —Japanese corporate bonds ......................................................................... — —Japanese stocks .......................................................................................... — —Others .......................................................................................................... 5,148,712 7,177,837
Foreign bonds .......................................................................................... 3,680,136 5,909,304Foreign stocks ......................................................................................... 1,468,576 1,268,533
Subtotal ....................................................................................................... ¥ 5,148,712 ¥ 7,177,837Total ................................................................................................................. ¥28,536,200 ¥28,000,515
Balance of Securities
Millions of yenYear ended March 31 2010 2009Domestic operations:
Japanese government bonds ...................................................................... ¥14,930,938 ¥10,443,471Japanese local government bonds ............................................................. 189,976 291,620Japanese corporate bonds ......................................................................... 3,282,013 3,417,624Japanese stocks .......................................................................................... 2,995,811 2,787,330Others .......................................................................................................... 352,162 440,638
Foreign bonds .......................................................................................... / /Foreign stocks ......................................................................................... / /
Subtotal ....................................................................................................... ¥21,750,902 ¥17,380,685International operations:
Japanese government bonds ...................................................................... ¥ — ¥ —Japanese local government bonds ............................................................. — —Japanese corporate bonds ......................................................................... — —Japanese stocks .......................................................................................... — —Others .......................................................................................................... 4,330,491 5,079,312
Foreign bonds .......................................................................................... 2,952,764 3,781,077Foreign stocks ......................................................................................... 1,377,727 1,298,234
Subtotal ....................................................................................................... ¥ 4,330,491 ¥ 5,079,312Total ................................................................................................................. ¥26,081,394 ¥22,459,998Note: The average balance of foreign-currency-denominated transactions by domestic branches in international operations is calculated by the monthly
current method.
Average Balance
Year-End Balance

SMFG 2010164
SMBC Securities (Nonconsolidated)
Millions of yenMarch 31 2010 2009One year or less
Japanese government bonds ...................................................................... ¥ 8,305,240 ¥ 2,766,864Japanese local government bonds ............................................................. 5,051 6,583Japanese corporate bonds ......................................................................... 244,651 459,270Others .......................................................................................................... 487,627 769,913
Foreign bonds .......................................................................................... 461,065 747,013Foreign stocks ......................................................................................... — 32
One — three yearsJapanese government bonds ...................................................................... 2,332,761 5,382,532Japanese local government bonds ............................................................. 23,156 34,858Japanese corporate bonds ......................................................................... 909,752 827,275Others .......................................................................................................... 1,869,529 2,929,003
Foreign bonds .......................................................................................... 1,821,487 2,874,357Foreign stocks ......................................................................................... — —
Three — five yearsJapanese government bonds ...................................................................... 3,194,614 3,633,747Japanese local government bonds ............................................................. 145,341 120,299Japanese corporate bonds ......................................................................... 1,188,567 1,180,058Others .......................................................................................................... 835,749 1,277,275
Foreign bonds .......................................................................................... 799,999 1,249,202Foreign stocks ......................................................................................... — —
Five — seven yearsJapanese government bonds ...................................................................... 223,828 361,833Japanese local government bonds ............................................................. 46,320 67,956Japanese corporate bonds ......................................................................... 408,874 374,270Others .......................................................................................................... 266,636 345,942
Foreign bonds .......................................................................................... 245,407 313,155Foreign stocks ......................................................................................... — —
Seven — 10 yearsJapanese government bonds ...................................................................... 1,675,402 639,034Japanese local government bonds ............................................................. 1,285 323Japanese corporate bonds ......................................................................... 266,342 384,222Others .......................................................................................................... 298,386 442,824
Foreign bonds .......................................................................................... 298,386 418,981Foreign stocks ......................................................................................... — —
More than 10 yearsJapanese government bonds ...................................................................... 353,817 1,372,980Japanese local government bonds ............................................................. 48 52Japanese corporate bonds ......................................................................... 84,420 236,853Others .......................................................................................................... 167,416 443,260
Foreign bonds .......................................................................................... 53,790 306,593Foreign stocks ......................................................................................... 113,625 136,666
No designated termJapanese government bonds ...................................................................... — —Japanese local government bonds ............................................................. — —Japanese corporate bonds ......................................................................... — —Japanese stocks .......................................................................................... 3,661,722 2,674,474Others .......................................................................................................... 1,539,653 1,268,801
Foreign bonds .......................................................................................... — —Foreign stocks ......................................................................................... 1,354,951 1,131,834
TotalJapanese government bonds ...................................................................... ¥16,085,664 ¥14,156,993Japanese local government bonds ............................................................. 221,206 230,074Japanese corporate bonds ......................................................................... 3,102,608 3,461,950Japanese stocks .......................................................................................... 3,661,722 2,674,474Others .......................................................................................................... 5,464,999 7,477,021
Foreign bonds .......................................................................................... 3,680,136 5,909,304Foreign stocks ......................................................................................... 1,468,576 1,268,533
Balance of Securities Held, Classified by Maturity

SMFG 2010 165
SMBC
Millions of yenMarch 31 2010 2009Domestic operations:
Loans and bills discounted (A) .................................................................... ¥47,897,818 ¥49,843,316Deposits (B) ................................................................................................. 67,982,357 66,601,940Loan-deposit ratio (%)
(A) / (B) ..................................................................................................... 70.45% 74.83%Ratio by average balance for the fiscal year ............................................ 74.16 78.52
International operations:Loans and bills discounted (A) .................................................................... ¥ 8,721,240 ¥10,397,950Deposits (B) ................................................................................................. 9,648,282 10,303,767Loan-deposit ratio (%)
(A) / (B) ..................................................................................................... 90.39% 100.91%Ratio by average balance for the fiscal year ............................................ 89.23 106.36
Total:Loans and bills discounted (A) .................................................................... ¥56,619,058 ¥60,241,266Deposits (B) ................................................................................................. 77,630,639 76,905,708Loan-deposit ratio (%)
(A) / (B) ..................................................................................................... 72.93% 78.33%Ratio by average balance for the fiscal year ............................................ 76.17 82.26
Note: Deposits include negotiable certificates of deposit.
Loan-Deposit Ratio
Ratios (Nonconsolidated)Sumitomo Mitsui Banking Corporation
PercentageYear ended March 31 2010 2009Domestic operations:
Interest-earning assets (A) ........................................................................... 1.43% 1.71%Interest-bearing liabilities (B) ....................................................................... 1.02 1.23(A) – (B) ........................................................................................................ 0.41 0.48
International operations:Interest-earning assets (A) ........................................................................... 1.90% 3.03%Interest-bearing liabilities (B) ....................................................................... 1.54 2.99(A) – (B) ........................................................................................................ 0.36 0.04
Total:Interest-earning assets (A) ........................................................................... 1.52% 2.03%Interest-bearing liabilities (B) ....................................................................... 1.11 1.63(A) – (B) ........................................................................................................ 0.41 0.40
Yield/Interest Rate
PercentageYear ended March 31 2010 2009Ordinary profit to total assets .......................................................................... 0.44% 0.03%Ordinary profit to stockholders’ equity ............................................................ 12.13 1.06Net income to total assets .............................................................................. 0.30 —Net income to stockholders’ equity ................................................................ 8.28 —Notes: 1. Ordinary profit (net income) to total assets = Ordinary profit (net income) / Average balance of total assets excluding customers’ liabilities for
acceptances and guarantees ✕ 100 2. Ordinary profit (net income) to stockholders’ equity = (Ordinary profit (net income) – Preferred dividends) / {(Stockholders’ equity at the beginning
of the fiscal year – Number of shares of preferred stock outstanding at the beginning of the fiscal year ✕ Issue price) + (Net assets at the end of the fiscal year – Number of shares of preferred stock outstanding at the end of the fiscal year ✕ Issue price)} divided by 2 ✕ 100
3. Net income to total assets and net income to stockholders’ equity for the year ended March 31, 2009 are not reported due to a net loss.
Income Ratio

SMFG 2010166
SMBC Ratios (Nonconsolidated)
Millions of yenMarch 31 2010 2009Domestic operations:
Securities (A) ................................................................................................ ¥23,387,488 ¥20,822,677Deposits (B) ................................................................................................. 67,982,357 66,601,940Securities-deposit ratio (%)
(A) / (B) ..................................................................................................... 34.40% 31.26%Ratio by average balance for the fiscal year ............................................ 32.36 28.11
International operations:Securities (A) ................................................................................................ ¥ 5,148,712 ¥ 7,177,837Deposits (B) ................................................................................................. 9,648,282 10,303,767Securities-deposit ratio (%)
(A) / (B) ..................................................................................................... 53.36% 69.66%Ratio by average balance for the fiscal year ............................................ 41.81 52.98
Total:Securities (A) ................................................................................................ ¥28,536,200 ¥28,000,515Deposits (B) ................................................................................................. 77,630,639 76,905,708Securities-deposit ratio (%)
(A) / (B) ..................................................................................................... 36.75% 36.40%Ratio by average balance for the fiscal year ............................................ 33.62 31.45
Note: Deposits include negotiable certificates of deposit.
Securities-Deposit Ratio

SMFG 2010 167
SMBC
Millions of yenNumber of shares issued Capital stock Capital reserve
Changes Balances Changes Balances Changes BalancesAugust 9, 2005*1 ....................................... — 56,112,948 ¥ — ¥ 664,986 ¥(344,900) ¥ 665,033May 17, 2006*2 ......................................... 214,194 56,327,142 — 664,986 — 665,033September 6, 2006*3 ................................ 173,770 56,500,912 — 664,986 — 665,033September 29, 2006*4 .............................. 601,757 57,102,669 — 664,986 — 665,033October 11, 2006*5 ................................... 153,181 57,255,850 — 664,986 — 665,033October 31, 2006*6 ................................... (830,000) 56,425,850 — 664,986 — 665,033September 10, 2009*7 .............................. 20,672,514 77,098,364 427,972 1,092,959 427,972 1,093,006September 29, 2009*8 .............................. 8,211,569 85,309,933 170,000 1,262,959 170,000 1,263,006November 26, 2009*9 ............................... 992,453 86,302,386 23,999 1,286,959 23,999 1,287,006February 16, 2010*10 ................................ 20,016,015 106,318,401 484,037 1,770,996 484,037 1,771,043
Remarks:*1 Capital reserve was transferred to other capital surplus pursuant to Article 289-2 of the Commercial Code and Article 18-2 of the Banking Act*2 Conversion of 35,000 shares of preferred stock (Type 1) and 33,000 shares of preferred stock (Type 2) to 214,194 shares of common stock*3 Conversion of 67,000 shares of preferred stock (Type 2) to 173,770 shares of common stock*4 Conversion of 500,000 shares of preferred stock (Type 3) to 601,757 shares of common stock*5 Conversion of 195,000 shares of preferred stock (Type 3) to 153,181 shares of common stock*6 Cancellation of 35,000 shares of preferred stock (Type 1), 100,000 shares of preferred stock (Type 2) and 695,000 shares of preferred stock (Type 3)*7 Allotment to third parties: Common stock: 20,672,514 shares
Issue price: ¥41,405 Capitalization: ¥20,702.5*8 Allotment to third parties: Common stock: 8,211,569 shares
Issue price: ¥41,405 Capitalization: ¥20,702.5*9 Allotment to third parties: Common stock: 992,453 shares
Issue price: ¥48,365 Capitalization: ¥24,182.5*10 Allotment to third parties: Common stock: 20,016,015 shares
Issue price: ¥48,365 Capitalization: ¥24,182.5
Changes in Number of Shares Issued and Capital Stock
Capital (Nonconsolidated)Sumitomo Mitsui Banking Corporation
March 31, 2010 Number of shares issuedCommon stock ................................................................................................................................................... 106,248,400Preferred stock (1st series Type 6) ..................................................................................................................... 70,001Total .................................................................................................................................................................... 106,318,401
Note: The shares above are not listed on any stock exchange.
Number of Shares Issued
March 31, 2010 Number of sharesPercentage of
shares outstandingSumitomo Mitsui Financial Group, Inc. .......................................................... 106,248,400 100.00%
Principal Shareholdersa. Common Stock
March 31, 2010 Number of sharesPercentage of
shares outstandingSumitomo Mitsui Financial Group, Inc. .......................................................... 70,001 100.00%
b. Preferred Stock (1st series Type 6)

SMFG 2010168
SMBC
March 31 2010 2009Automated service centers.............................................................................. 32,391 30,112
Number of Automated Service Centers
Millions of yenYear ended March 31 2010 2009Exchange for remittance:
Destined for various parts of the country:Number of accounts (thousands) ............................................................ 407,093 418,744Amount .................................................................................................... ¥ 653,586,914 ¥ 752,361,420
Received from various parts of the country:Number of accounts (thousands) ............................................................ 300,189 303,475Amount .................................................................................................... ¥ 804,727,712 ¥ 842,122,120
Collection:Destined for various parts of the country:
Number of accounts (thousands) ............................................................ 2,679 3,121Amount .................................................................................................... ¥ 6,396,030 ¥ 8,345,032
Received from various parts of the country:Number of accounts (thousands) ............................................................ 1,006 1,163Amount .................................................................................................... ¥ 2,722,318 ¥ 2,933,632
Total ................................................................................................................. ¥1,467,432,974 ¥1,605,762,205
Domestic Exchange Transactions
Others (Nonconsolidated)Sumitomo Mitsui Banking Corporation
March 31 2010 2009Number of employees ..................................................................................... 22,460 21,816Average age (years–months) ........................................................................... 33–10 35–6Average length of employment (years–months) .............................................. 10–6 12–5Average annual salary (thousands of yen) ....................................................... ¥7,336 ¥8,258Notes: 1. Temporary and part-time staff are excluded from the above calculations but includes overseas local staff. Executive officers who do not concurrently
serve as Directors are excluded from “Number of employees.” 2. “Average annual salary” includes bonus, overtime pay and other fringe benefits. 3. Overseas local staff are excluded from the above calculations other than “Number of employees.”
Employees
March 31 2010 2009Domestic network:
Main offices and branches .......................................................................... 494 482Subbranches ............................................................................................... 164 159Agency ......................................................................................................... 1 1
Overseas network:Branches ..................................................................................................... 15 20Subbranches ............................................................................................... 6 7Representative offices ................................................................................. 13 16
Total ................................................................................................................. 693 685Note: “Main offices and branches” includes the International Business Operations Dept. (2010, 2 branches; 2009, 2 branches), specialized deposit account
branches (2010, 38 branches; 2009, 38 branches) and ATM administration branches (2010, 17 branches; 2009, 17 branches).
Number of Offices

SMFG 2010 169
SMBCOthers (Nonconsolidated)
Millions of U.S. dollarsYear ended March 31 2010 2009Outward exchanges:
Foreign bills sold.......................................................................................... $1,463,062 $1,285,824Foreign bills bought ..................................................................................... 992,185 696,353
Incoming exchanges:Foreign bills payable .................................................................................... $ 699,127 $ 735,705Foreign bills receivable ................................................................................ 21,821 30,633
Total ................................................................................................................. $3,176,196 $2,748,515Note: The figures above include foreign exchange transactions by overseas branches.
Foreign Exchange Transactions
Millions of yenMarch 31 2010 2009Securities ......................................................................................................... ¥ 19,578 ¥ 7,291Commercial claims .......................................................................................... 22,672 17,762Commercial goods .......................................................................................... — 5,292Real estate ....................................................................................................... 52,716 53,769Others .............................................................................................................. 5,857 6,945Subtotal ........................................................................................................... ¥ 100,824 ¥ 91,061Guaranteed ...................................................................................................... 459,711 396,284Unsecured ....................................................................................................... 3,065,332 3,339,348Total ................................................................................................................. ¥3,625,868 ¥3,826,694
Breakdown of Collateral for Customers’ Liabilities for Acceptances and Guarantees

SMFG 2010170
SMBC
Trust Assets and Liabilities (Nonconsolidated)Sumitomo Mitsui Banking Corporation
Millions of yenMarch 31 2010 2009Assets:
Loans and bills discounted .......................................................................... ¥ 221,970 ¥ 222,030Loans on deeds ....................................................................................... 221,970 222,030
Securities ..................................................................................................... 457,585 392,812Japanese government bonds .................................................................. 293,082 222,231Corporate bonds...................................................................................... 16,067 39,629Japanese stocks ...................................................................................... 4,766 128Foreign securities..................................................................................... 143,419 130,522Other securities ........................................................................................ 250 300
Securities held in custody accounts ............................................................ 3,070 3,096Monetary claims .......................................................................................... 465,734 501,399
Monetary claims for housing loans .......................................................... 22,773 73,967Other monetary claims ............................................................................ 442,960 427,431
Tangible fixed assets ................................................................................... 19 45Equipment................................................................................................ 19 45
Intangible fixed assets ................................................................................. 8 33Other intangible fixed assets ................................................................... 8 33
Other claims ................................................................................................ 2,918 4,329Call loans ..................................................................................................... 52,302 54,687Due from banking account .......................................................................... 159,554 60,918Cash and due from banks ........................................................................... 40,072 22,179
Deposits with banks ................................................................................ 40,072 22,179Others .......................................................................................................... — 1,462
Others ...................................................................................................... — 1,462Total assets .................................................................................................. ¥1,403,236 ¥1,262,993
Liabilities:Designated money trusts............................................................................. ¥ 537,388 ¥ 359,986Specified money trusts ................................................................................ 163,750 161,817Money in trusts other than money trusts ..................................................... 220,008 220,287Security trusts.............................................................................................. 3,082 3,102Monetary claims trusts ................................................................................ 458,273 437,734Equipment trusts ......................................................................................... 51 10Composite trusts ......................................................................................... 20,681 78,569Other trusts .................................................................................................. — 1,485Total liabilities .............................................................................................. ¥1,403,236 ¥1,262,993
Notes: 1. Amounts less than 1 million yen have been omitted. 2. SMBC has no co-operative trusts under any other trust bank’s administration as of the year-end. 3. SMBC does not deal with any trusts with principal indemnification. 4. Excludes trusts whose monetary values are difficult to calculate.
Statements of Trust Assets and Liabilities

SMFG 2010 171
SMFG
Capital Ratio InformationSumitomo Mitsui Financial Group, Inc. and Subsidiaries
The consolidated capital ratio is calculated using the method stipulated in “Standards for Bank Holding Company to Examine the Adequacy of Its Capital Based on Assets, Etc. Held by It and Its Subsidiaries Pursuant to Article 52-25 of the Banking Law” (Notification 20 issued by the Japanese Financial Services Agency in 2006; hereinafter referred to as “the Notification”). In addition to the method stipulated in the Notification to calculate the consolidated capital ratio (referred to as “First Standard” in the Notification), SMFG has adopted the advanced internal ratings-based (IRB) approach for calculating credit risk-weighted asset amounts. Further, SMFG has implemented market risk controls, and, in calculating the amount corresponding to operational risk, the Advanced Measurement Approach (AMA). “Capital Ratio Information” was prepared based on the Notification, and the terms and details in the section may differ from the terms and details in other sections of this report.
■ Scope of Consolidation1. Consolidated Capital Ratio Calculation
• Number of consolidated subsidiaries: 307Please refer to “Principal Subsidiaries and Affiliates” on page 210 for their names and business outline.
• Scope of consolidated subsidiaries for calculation of the consolidated capital ratio is based on the scope of consolidated subsidiaries for preparing consolidated financial statements.
• There are no affiliates to which the proportionate consolidation method is applied.• There are no companies engaged exclusively in ancillary banking business or in developing new businesses as stipulated in Article 52-23
of the Banking Law.
2. Deduction from Capital• Number of nonconsolidated subsidiaries subject to deduction from capital: 218
Principal subsidiaries: SMLC MAHOGANY CO., LTD. (Office rental, etc.) SBCS Co., Ltd. (Venture capital and consulting)
• Number of financial affiliates subject to deduction from capital: 83Please refer to “Principal Subsidiaries and Affiliates” on page 210 for their names and business outline.
3. Restrictions on Movement of Funds and Capital within Holding Company GroupThere are no special restrictions on movement of funds and capital among SMFG and its group companies.
4. Companies Subject to Deduction from Capital, with Capital below Basel II Required Amount and Total Shortfall AmountNot applicable.

SMFG 2010172
SMFG Capital Ratio Information
■ Capital Structure Information (Consolidated Capital Ratio (First Standard))Regarding the calculation of the capital ratio, certain procedures were performed by KPMG AZSA & Co. pursuant to “Treatment of Inspection of the Capital Ratio Calculation Framework Based on Agreed-Upon Procedures” (JICPA Industry Committee Report No. 30). The certain procedures performed by the external auditor are not part of the audit of consolidated financial statements. The certain procedures performed on our internal control framework for calculating the capital ratio are based on procedures agreed upon by SMFG and the external auditor and are not a validation of appropriateness of the capital ratio itself or opinion on the internal controls related to the capital ratio calculation.
Millions of yenMarch 31 2010 2009Tier I capital: Capital stock .................................................................................................... ¥ 2,337,895 ¥ 1,420,877
Capital surplus ................................................................................................. 978,897 57,245Retained earnings ............................................................................................ 1,451,945 1,245,085Treasury stock .................................................................................................. (124,061) (124,024)Cash dividends to be paid ............................................................................... (80,665) (21,059)Unrealized losses on other securities ............................................................... — (14,649)Foreign currency translation adjustments ........................................................ (101,650) (129,068)Stock acquisition rights .................................................................................... 81 66Minority interests .............................................................................................. 2,042,251 2,147,100Goodwill and others ......................................................................................... (398,709) (186,792)Gain on sale on securitization transactions...................................................... (37,453) (42,102)Amount equivalent to 50% of expected losses in excess of provision ............ (36,249) (17,590)Total Tier I capital (A) ........................................................................................ 6,032,280 4,335,085
Tier II capital: Unrealized gains on other securities after 55% discount................................. 254,032 —Land revaluation excess after 55% discount ................................................... 37,033 37,211General reserve for possible loan losses.......................................................... 69,371 80,374Subordinated debt ........................................................................................... 2,203,415 2,303,382Total Tier II capital ............................................................................................ 2,563,853 2,420,968Tier II capital included as qualifying capital (B) ................................................ 2,563,853 2,420,968
Deductions*: (C) ..................................................................................................................... 467,906 708,241Total qualifying capital: (D) = (A) + (B) – (C) ............................................................................................ ¥ 8,128,228 ¥ 6,047,812Risk-weighted assets: On-balance sheet items ................................................................................... ¥42,684,693 ¥41,703,547
Off-balance sheet items ................................................................................... 7,833,411 7,693,647Market risk items .............................................................................................. 448,397 265,723Operational risk ................................................................................................ 3,117,968 3,063,589Total risk-weighted assets (E) ........................................................................... ¥54,084,471 ¥52,726,507
Tier I risk-weighted capital ratio: (A) / (E) ✕ 100 .................................................................................................... 11.15% 8.22%Total risk-weighted capital ratio: (D) / (E) ✕ 100 ................................................................................................... 15.02% 11.47%Required capital: (E) ✕ 8% ........................................................................................................... ¥ 4,326,757 ¥ 4,218,120
* “Deductions” refers to deductions stipulated in Article 8-1 of the Notification and includes willful holding of securities issued by other financial institutions and securities stipulated in Clause 2.

SMFG 2010 173
SMFGCapital Ratio Information
■ Capital RequirementsBillions of yen
March 31 2010 2009Capital requirements for credit risk:
Internal ratings-based approach ............................................................................................................ ¥5,194.2 ¥4,909.4Corporate exposures: ........................................................................................................................ 3,381.4 3,200.6
Corporate exposures (excluding specialized lending) .................................................................... 2,950.7 2,782.6Sovereign exposures ...................................................................................................................... 37.4 28.4Bank exposures .............................................................................................................................. 139.7 161.6Specialized lending ......................................................................................................................... 253.6 228.1
Retail exposures: ................................................................................................................................ 905.4 833.1Residential mortgage exposures .................................................................................................... 434.6 345.6Qualifying revolving retail exposures .............................................................................................. 110.9 95.0Other retail exposures ..................................................................................................................... 359.9 392.5
Equity exposures: ............................................................................................................................... 336.6 287.7Grandfathered equity exposures .................................................................................................... 191.6 160.8PD/LGD approach .......................................................................................................................... 81.4 55.5Market-based approach ................................................................................................................. 63.6 71.4
Simple risk weight method.......................................................................................................... 46.6 71.1Internal models method .............................................................................................................. 17.0 0.3
Credit risk-weighted assets under Article 145 of the Notification ...................................................... 183.6 180.5Securitization exposures .................................................................................................................... 107.7 125.7Other exposures ................................................................................................................................. 279.5 281.7
Standardized approach .......................................................................................................................... 570.0 656.5Total capital requirements for credit risk ................................................................................................ 5,764.2 5,565.9
Capital requirements for market risk:Standardized measurement method ...................................................................................................... 21.1 4.2
Interest rate risk .................................................................................................................................. 15.3 3.1Equity position risk ............................................................................................................................. 1.9 0.4Foreign exchange risk......................................................................................................................... 2.6 0.7Commodities risk ................................................................................................................................ 0.1 —Options ............................................................................................................................................... 1.2 —
Internal models method .......................................................................................................................... 14.7 17.0Total capital requirements for market risk .............................................................................................. 35.9 21.3
Capital requirements for operational risk:Advanced measurement approach ........................................................................................................ 232.2 223.5Basic indicator approach ........................................................................................................................ 17.2 21.6Total capital requirements for operational risk........................................................................................ 249.4 245.1
Total amount of capital requirements ....................................................................................................... ¥6,049.5 ¥5,832.3
Notes: 1. Capital requirements for credit risk are capital equivalents to “credit risk-weighted assets ✕ 8%” under the standardized approach and “credit risk-weighted assets ✕ 8% + expected loss amount” under the IRB approach. Regarding exposures to be deducted from capital, the deduction amount is added to the amount of required capital.
2. Portfolio classification is after CRM. 3. “Securitization exposures” includes such exposures based on the standardized approach. 4. “Other exposures” includes estimated lease residual values, purchased receivables (including exposures to qualified corporate enterprises and others), long settlement
transactions and other assets.
■ Internal Ratings-Based (IRB) Approach1. Scope SMFG and the following consolidated subsidiaries have adopted the advanced IRB approach for exposures as of March 31, 2009. (1) Domestic Operations Sumitomo Mitsui Banking Corporation, Sumitomo Mitsui Card Company, Limited and SMBC Guarantee Co., Ltd.
(2) Overseas Operations Sumitomo Mitsui Banking Corporation Europe Limited, Sumitomo Mitsui Banking Corporation (China) Limited, Sumitomo Mitsui
Banking Corporation of Canada, Banco Sumitomo Mitsui Brasileiro S.A., ZAO Sumitomo Mitsui Rus Bank, PT Bank Sumitomo Mitsui Indonesia, SMBC Leasing and Finance, Inc., SMBC Capital Markets, Inc., SMBC Capital Markets Limited, SMBC Derivative Products Limited and SMBC Capital Markets (Asia) Limited
THE MINATO BANK, LTD. and SMBC Finance Service Co., Ltd. have adopted the foundation IRB approach. Among consolidated subsidiaries that have adopted the standardized approach for exposures as of March 31, 2010, Sumitomo Mitsui
Finance and Leasing Co., Ltd. is scheduled to adopt the foundation IRB approach from March 31, 2012, and Kansai Urban Banking Corporation from March 31, 2013. Both companies reviewed their schedules for adoption of the approach which was originally planned.
Note: Directly controlled SPCs and limited partnerships for investment of consolidated subsidiaries using the advanced IRB approach have also adopted the advanced IRB approach. Further, the advanced IRB approach is applied to equity exposures on a group basis, including equity exposures of consolidated subsidiaries applying the standardized approach.

SMFG 2010174
SMFG Capital Ratio Information
2. Exposures by Asset Class(1) Corporate Exposures
A. Corporate, Sovereign and Bank Exposures(A) Rating Procedures
• “Corporate, sovereign and bank exposures” includes credits to domestic and overseas commercial/industrial (C&I) companies, individuals for business purposes (domestic only), sovereigns, public sector entities, and financial institutions. Business loans such as apartment construction loans, and small and medium-sized enterprises (SME) loans with standardized screening process (hereinafter referred to as “standardized SME loans”) are, in principle, included in “retail exposures.” However, credits of more than ¥100 million are treated as corporate exposures in accordance with the Notification.
• An obligor is assigned an obligor grade by first assigning a financial grade using a financial strength grading model and data obtained from the obligor’s financial statements. The financial grade is then adjusted taking into account the actual state of the obligor’s balance sheet and qualitative factors to derive the obligor grade (for details, please refer to “Credit Risk Assessment and Quantification” on page 37). Different rating series are used for domestic and overseas obligors — J1 ~ J10 for domestic obligors and G1 ~ G10 for overseas obligors — as shown below due to differences in actual default rate levels and portfolios’ grade distribution. Different Probability of Default (PD) values are applied also.
• In addition to the above basic rating procedure which builds on the financial grade assigned at the beginning, in some cases, the obligor grade is assigned based on the parent company’s credit quality or credit ratings published by external rating agencies. The Japanese government, local authorities and other public sector entities with special basis for existence and unconventional financial statements are assigned obligor grades based on their attributes (for example, “local municipal corporations”), as the data on these obligors are not suitable for conventional grading models. Further, credits to individuals for business purposes, business loans and standardized SME loans are assigned obligor grades using grading models developed specifically for these exposures.
• PDs used for calculating credit risk-weighted assets are estimated based on the default experience for each grade and taking into account the possibility of estimation errors. In addition to internal data, external data are used to estimate and validate PDs. The definition of default is the definition stipulated in the Notification (an event that would lead to an exposure being classified as “substandard loans,” “doubtful assets” or “bankrupt and quasi-bankrupt assets” occurring to the obligor).
• Loss given defaults (LGDs) used in the calculation of credit risk-weighted assets are estimated based on historical loss experience of credits in default, taking into account the possibility of estimation errors.
Obligor GradeDomestic Corporate
Overseas Corporate Definition Borrower Category
J1 G1 Very high certainty of debt repayment Normal BorrowersJ2 G2 High certainty of debt repaymentJ3 G3 Satisfactory certainty of debt repaymentJ4 G4 Debt repayment is likely but this could change in cases of
significant changes in economic trends or business environmentJ5 G5 No problem with debt repayment over the short term, but not
satisfactory over the mid to long term and the situation could change in cases of significant changes in economic trends or business environment
J6 G6 Currently no problem with debt repayment, but there are unstable business and financial factors that could lead to debt repayment problems
J7 G7 Close monitoring is required due to problems in meeting loan terms and conditions, sluggish/unstable business, or financial problems
Borrowers Requiring Caution
J7R G7R Of which Substandard Borrowers Substandard BorrowersJ8 G8 Currently not bankrupt, but experiencing business difficulties,
making insufficient progress in restructuring, and highly likely to go bankrupt
Potentially Bankrupt Borrowers
J9 G9 Though not yet legally or formally bankrupt, has serious business difficulties and rehabilitation is unlikely; thus, effectively bankrupt
Effectively Bankrupt Borrowers
J10 G10 Legally or formally bankrupt Bankrupt Borrowers

SMFG 2010 175
SMFGCapital Ratio Information
(B) Portfolioa. Domestic Corporate, Sovereign and Bank Exposures
Billions of yenExposure amount Weighted
averageCCF
Weightedaverage
PD
Weightedaverage
LGD
WeightedaverageELdefault
Weightedaverage
risk weightMarch 31, 2010 TotalOn-balance sheet assets
Off-balance sheet assets
Undrawnamount
J1-J3 ...................................¥18,017.3 ¥12,663.0 ¥5,354.3 ¥4,012.5 75.00% 0.07% 35.32% —% 16.75%J4-J6 ................................... 15,045.7 11,722.7 3,322.9 1,064.0 75.00 1.63 31.40 — 58.82J7 (excluding J7R) ............... 2,400.6 2,146.4 254.2 16.4 75.00 16.54 30.14 — 134.64Japanese government and local municipal corporations .... 22,671.2 22,406.6 264.6 0.8 75.00 0.00 35.09 — 0.09Others .................................. 5,547.9 5,030.6 517.3 133.0 75.00 1.34 38.01 — 56.63Default (J7R, J8-J10) ........... 1,429.6 1,379.2 50.3 1.7 100.00 100.00 53.74 52.98 9.54Total .....................................¥65,112.3 ¥55,348.6 ¥9,763.7 ¥5,228.4 — — — — —
Billions of yenExposure amount Weighted
averageCCF
Weightedaverage
PD
Weightedaverage
LGD
WeightedaverageELdefault
Weightedaverage
risk weightMarch 31, 2009 TotalOn-balance sheet assets
Off-balance sheet assets
Undrawnamount
J1-J3 ...................................¥22,896.4 ¥16,440.3 ¥ 6,456.0 ¥4,124.9 75.00% 0.09% 34.11% —% 18.11%J4-J6 ................................... 11,785.4 9,153.6 2,631.8 510.4 75.00 1.32 29.16 — 50.90J7 (excluding J7R) ............... 2,241.2 1,938.0 303.3 78.4 75.00 11.86 30.38 — 126.04Japanese government and local municipal corporations .... 20,025.1 19,936.9 88.2 10.6 75.00 0.00 35.04 — 0.18Others .................................. 5,348.4 4,767.9 580.5 136.7 75.00 1.50 38.41 — 63.05Default (J7R, J8-J10) ........... 1,315.4 1,243.6 71.9 6.2 100.00 100.00 54.85 53.20 20.64Total .....................................¥63,611.9 ¥53,480.3 ¥10,131.7 ¥4,867.3 — — — — —Note: “Others” includes exposures guaranteed by credit guarantee corporations, exposures to public sector entities and voluntary organizations, and exposures to obligors
not assigned obligor grades because they have yet to close their books (for example, newly established companies), as well as business loans and standardized SME loans of more than ¥100 million.
b. Overseas Corporate, Sovereign and Bank Exposures
Billions of yenExposure amount Weighted
averageCCF
Weightedaverage
PD
Weightedaverage
LGD
WeightedaverageELdefault
Weightedaverage
risk weightMarch 31, 2010 TotalOn-balance sheet assets
Off-balance sheet assets
Undrawnamount
G1-G3 .................................. ¥17,929.1 ¥11,601.0 ¥6,328.1 ¥2,928.6 75.00% 0.18% 29.84% —% 17.54%G4-G6 .................................. 946.2 768.1 178.1 168.0 75.00 2.32 29.39 — 73.64G7 (excluding G7R) ............. 459.1 280.3 178.8 102.6 75.00 24.59 29.26 — 158.78Others .................................. 152.5 105.5 47.0 4.4 75.00 1.55 40.66 — 86.53Default (G7R, G8-G10) ........ 212.0 199.0 13.0 7.2 100.00 100.00 71.52 64.33 89.89Total ..................................... ¥19,698.8 ¥12,953.9 ¥6,744.9 ¥3,210.9 — — — — —
Billions of yenExposure amount Weighted
averageCCF
Weightedaverage
PD
Weightedaverage
LGD
WeightedaverageELdefault
Weightedaverage
risk weightMarch 31, 2009 TotalOn-balance sheet assets
Off-balance sheet assets
Undrawnamount
G1-G3 .................................. ¥22,863.0 ¥14,594.6 ¥8,268.4 ¥3,062.3 75.00% 0.14% 30.24% —% 17.28%G4-G6 .................................. 975.9 768.3 207.6 145.6 75.00 1.76 34.30 — 81.87G7 (excluding G7R) ............. 459.2 316.9 142.3 63.1 75.00 19.85 32.42 — 170.42Others .................................. 107.0 63.2 43.8 20.3 75.00 1.09 40.16 — 86.42Default (G7R, G8-G10) ........ 270.7 260.8 9.9 1.5 100.00 100.00 73.74 66.19 94.41Total ..................................... ¥24,675.9 ¥16,003.9 ¥8,672.0 ¥3,292.7 — — — — —

SMFG 2010176
SMFG Capital Ratio Information
B. Specialized Lending (SL)(A) Rating Procedures
• “Specialized lending” is sub-classified into “project finance,” “object finance,” “commodity finance,” “income-producing real estate” (IPRE) and “high-volatility commercial real estate” (HVCRE) in accordance with the Notification. Project finance is financing of a single project, such as a power plant or transportation infrastructure, and cash flows generated by the project are the primary source of repayment. Object finance includes aircraft finance and ship finance, and IPRE and HVCRE include real estate finance (a primary example is non-recourse real estate finance). There were no commodity finance exposures as of March 31, 2010.
• Each SL product is classified as either a facility assigned a PD grade and LGD grade or a facility assigned a grade based primarily on the expected loss ratio, both using grading models and qualitative assessment. The former has the same grading structure as that of corporate, and the latter has ten grade levels as with obligor grades but the definition of each grade differs from that of the obligor grade which is focused on PD. For the credit risk-weighted asset amount for the SL category, the former facility is calculated in a manner similar to corporate exposures, while the latter facility is calculated by mapping the expected loss-based facility grades to the below five categories (hereinafter the “slotting criteria”) of the Notification because it does not satisfy the requirements for PD application specified in the Notification.
(B) Portfolioa. Slotting Criteria Applicable Portion
(a) Project Finance and Object Finance
Billions of yen
Risk weight
2010 2009March 31 Project finance Object finance Project finance Object financeStrong:
Residual term less than 2.5 years .................... 50% ¥ 125.6 ¥ 0.6 ¥ 107.2 ¥ 8.3Residual term 2.5 years or more ...................... 70% 746.9 41.0 771.1 163.1
Good:Residual term less than 2.5 years .................... 70% 23.3 — 22.5 —Residual term 2.5 years or more ...................... 90% 169.9 4.1 187.2 —
Satisfactory .......................................................... 115% 42.1 — 23.8 —Weak ..................................................................... 250% 61.5 — 68.0 —Default .................................................................. — 18.0 — 3.6 —Total ...................................................................... ¥1,187.0 ¥45.7 ¥1,183.3 ¥171.4
Note: A portion of object finance has been calculated using the PD/LGD approach.
(b) HVCRE
Risk weight
Billions of yenMarch 31 2010 2009Strong:
Residual term less than 2.5 years .................... 70% ¥ — ¥ —Residual term 2.5 years or more ...................... 95% — —
Good:Residual term less than 2.5 years .................... 95% 32.5 46.6Residual term 2.5 years or more ...................... 120% 10.8 79.9
Satisfactory .......................................................... 140% 152.9 162.0Weak ..................................................................... 250% 11.1 22.1Default .................................................................. — 6.5 3.1Total ...................................................................... ¥213.6 ¥313.6
b. PD/LGD Approach Applicable Portion, Other Than Slotting Criteria Applicable Portion
(a) Object Finance
Billions of yenExposure amount Weighted
averageCCF
Weightedaverage
PD
Weightedaverage
LGD
WeightedaverageELdefault
Weightedaverage
risk weightMarch 31, 2010 TotalOn-balance sheet assets
Off-balance sheet assets
Undrawnamount
G1-G3 .................................. ¥103.0 ¥ 97.7 ¥ 5.3 ¥ 1.8 75.00% 0.51% 20.86% —% 41.74%G4-G6 .................................. 43.8 34.4 9.5 10.2 75.00 2.43 12.95 — 36.56G7 (excluding G7R) ............. 10.7 10.7 0.1 0.1 75.00 19.75 29.84 — 170.29Others .................................. — — — — — — — — —Default (G7R, G8-G10) ........ 5.5 5.5 0.0 — — 100.00 65.16 57.96 89.94Total ..................................... ¥163.1 ¥148.2 ¥14.9 ¥12.1 — — — — —

SMFG 2010 177
SMFGCapital Ratio Information
Billions of yenExposure amount Weighted
averageCCF
Weightedaverage
PD
Weightedaverage
LGD
WeightedaverageELdefault
Weightedaverage
risk weightMarch 31, 2009 TotalOn-balance sheet assets
Off-balance sheet assets
Undrawnamount
G1-G3 .................................. ¥ 49.4 ¥42.2 ¥ 7.2 ¥ 9.5 75.00% 0.78% 19.17% —% 44.23%G4-G6 .................................. 30.5 22.5 8.1 10.0 75.00 1.20 20.39 — 51.90G7 (excluding G7R) ............. 9.2 9.2 0.1 0.1 75.00 20.08 37.66 — 209.69Others .................................. 10.8 10.7 0.0 0.0 75.00 4.94 19.72 — 67.76Default (G7R, G8-G10) ........ 3.1 3.0 0.1 — — 100.00 71.45 63.89 94.41Total ..................................... ¥103.0 ¥87.6 ¥15.4 ¥19.7 — — — — —
(b) IPREBillions of yen
Exposure amount Weightedaverage
CCF
Weightedaverage
PD
Weightedaverage
LGD
WeightedaverageELdefault
Weightedaverage
risk weightMarch 31, 2010 TotalOn-balance sheet assets
Off-balance sheet assets
Undrawnamount
J1-J3 ................................... ¥ 447.4 ¥ 433.2 ¥ 14.2 ¥ — —% 0.05% 34.47% —% 12.15%J4-J6 ................................... 1,024.4 879.1 145.3 4.2 75.00 2.26 33.31 — 83.85J7 (excluding J7R) ............... 45.5 42.0 3.5 — — 14.11 34.14 — 167.65Others .................................. 67.3 65.5 1.8 2.5 75.00 8.74 35.23 — 72.00Default (J7R, J8-J10) ........... 9.6 9.6 — — — 100.00 50.48 49.60 10.92Total ..................................... ¥1,594.2 ¥1,429.4 ¥164.8 ¥6.7 — — — — —
Billions of yenExposure amount Weighted
averageCCF
Weightedaverage
PD
Weightedaverage
LGD
WeightedaverageELdefault
Weightedaverage
risk weightMarch 31, 2009 TotalOn-balance sheet assets
Off-balance sheet assets
Undrawnamount
J1-J3 ................................... ¥ 925.9 ¥ 820.5 ¥105.4 ¥— —% 0.10% 36.48% —% 19.72%J4-J6 ................................... 523.6 480.1 43.5 4.2 75.00 1.55 32.00 — 72.26J7 (excluding J7R) ............... 59.6 59.5 0.2 — — 13.43 35.10 — 158.37Others .................................. 68.3 66.3 2.0 2.7 75.00 4.23 37.84 — 116.66Default (J7R, J8-J10) ........... — — — — — — — — —Total ..................................... ¥1,577.4 ¥1,426.3 ¥151.1 ¥6.9 — — — — —
(2) Retail ExposuresA. Residential Mortgage Exposures
(A) Rating Procedures• “Residential mortgage exposures” includes mortgage loans to individuals and some real estate loans in which the property consists
of both residential and commercial facilities such as a store or rental apartment units, but excludes apartment construction loans.• Mortgage loans are rated as follows.
Mortgage loans are allocated to a portfolio segment with similar risk characteristics in terms of (a) default risk determined using loan contract information, results of an exclusive grading model and a borrower category under self-assessment executed in accordance with the financial inspection manual of the Japanese FSA, and (b) recovery risk at the time of default determined using Loan To Value (LTV) calculated based on the assessment value of collateral real estate. PDs and LGDs are estimated based on the default experience for each segment and taking into account the possibility of estimation errors. Further, the portfolio is subdivided based on the lapse of years from the contract date, and the effectiveness of segmentation in terms of default risk and recovery risk is validated periodically. Internal data are used to estimate and validate PDs and LGDs. The definition of default is the definition stipulated in the Notification.
(B) Portfolio
March 31, 2010
Billions of yen
Weightedaverage
PD
Weightedaverage
LGD
Weightedaverage ELdefault
Weightedaverage
risk weight
Exposure amount
Total On-balancesheet assets
Off-balance sheet assets
Mortgage loansPD segment:
Not delinquentUse model ......................... ¥10,633.8 ¥10,565.2 ¥68.6 0.37% 44.59% —% 27.60%Others ............................... 769.8 769.8 — 0.83 60.25 — 73.02
Delinquent ............................. 106.3 99.9 6.4 31.53 48.55 — 276.96Default .......................................... 163.2 162.7 0.5 100.00 45.69 43.23 30.69Total .............................................. ¥11,673.1 ¥11,597.6 ¥75.6 — — — —

SMFG 2010178
SMFG Capital Ratio Information
March 31, 2009
Billions of yen
Weightedaverage
PD
Weightedaverage
LGD
Weightedaverage ELdefault
Weightedaverage
risk weight
Exposure amount
Total On-balancesheet assets
Off-balance sheet assets
Mortgage loansPD segment:
Not delinquentUse model ......................... ¥ 9,551.6 ¥ 9,471.1 ¥80.5 0.38% 38.94% —% 24.30%Others ............................... 840.5 840.5 — 0.83 56.72 — 68.49
Delinquent ............................. 63.0 56.8 6.1 35.47 42.47 — 242.06Default .......................................... 121.1 120.5 0.6 100.00 48.48 45.46 37.79Total .............................................. ¥10,576.1 ¥10,488.9 ¥87.2 — — — —
Notes: 1. “Others” includes loans guaranteed by employers. 2. “Delinquent” loans are past due loans and loans to obligors categorized as “Borrowers Requiring Caution” that do not satisfy the definition of default stipulated
in the Notification.
B. Qualifying Revolving Retail Exposures (QRRE)(A) Rating Procedures
• “Qualifying revolving retail exposures” includes card loans and credit card balances.• Card loans and credit card balances are rated as follows.
Card loans and credit card balances are allocated to a portfolio segment with similar risk characteristics determined based, for card loans, on the credit quality of the loan guarantee company, credit limit, settlement account balance and payment history, and, for credit card balances, on repayment history and frequency of use. PDs and LGDs used to calculate credit risk-weighted asset amounts are estimated based on the default experience for each segment and taking into account the possibility of estimation errors. Further, the effectiveness of segmentation in terms of default risk and recovery risk is validated periodically. Internal data are used to estimate and validate PDs and LGDs. The definition of default is the definition stipulated in the Notification.
(B) Portfolio
March 31, 2010
Billions of yen
Weightedaverage
CCF
Weightedaverage
PD
Weightedaverage
LGD
Weightedaverage ELdefault
Weightedaverage
risk weight
Exposure amount
Undrawn amountTotal
On-balancesheet assets
Off-balance sheet assets Balance Increase
Card loansPD segment:
Not delinquent ........ ¥ 568.2 ¥ 509.0 ¥ 59.2 ¥ — ¥ 180.4 32.84% 2.12% 85.76% —% 54.67%Delinquent ............... 12.8 12.4 0.4 — 3.3 12.05 22.22 76.31 — 206.05
Credit card balancesPD segment:
Not delinquent ........ 1,010.7 669.3 341.5 — 4,127.7 8.27 1.42 77.93 — 29.52Delinquent ............... 7.8 6.6 1.2 — — — 85.68 80.67 — 89.76
Default ............................ 30.6 26.9 3.8 — — — 100.00 86.86 80.65 77.68Total ................................ ¥1,630.3 ¥1,224.1 ¥406.1 ¥ — ¥4,311.5 — — — — —
March 31, 2009
Billions of yen
Weightedaverage
CCF
Weightedaverage
PD
Weightedaverage
LGD
Weightedaverage ELdefault
Weightedaverage
risk weight
Exposure amount
Undrawn amountTotal
On-balancesheet assets
Off-balance sheet assets Balance Increase
Card loansPD segment:
Not delinquent ........ ¥ 542.1 ¥ 477.7 ¥ 64.4 ¥— ¥ 167.8 38.37% 1.86% 85.89% —% 49.01%Delinquent ............... 12.8 12.4 0.4 — 3.5 11.56 22.19 76.35 — 206.51
Credit card balancesPD segment:
Not delinquent ........ 979.3 648.7 330.7 — 4,008.1 8.25 1.15 79.86 — 26.88Delinquent ............... 7.9 6.7 1.2 — — — 80.05 82.99 — 121.48
Default ............................ 24.0 21.0 3.1 — — — 100.00 89.29 82.40 86.10Total ................................ ¥1,566.1 ¥1,166.3 ¥399.7 ¥— ¥4,179.4 — — — — —
Notes: 1. The on-balance sheet exposure amount is estimated by estimating the amount of increase in each transaction balance and not by multiplying the undrawn amount by the CCF.
2. “Weighted average CCF” is the “On-balance sheet exposure amount ÷ Undrawn amount” and provided for reference only. It is not used for estimating on-balance sheet exposure amounts.
3. Past due loans of less than three months are recorded in “Delinquent.”

SMFG 2010 179
SMFGCapital Ratio Information
C. Other Retail Exposures(A) Rating Procedures
• “Other retail exposures” includes business loans such as apartment construction loans, standardized SME loans, and consumer loans such as My Car Loan.
• Business loans, standardized SME loans and consumer loans are rated as follows.a. Business loans and standardized SME loans are allocated to a portfolio segment with similar risk characteristics in terms of
(a) default risk determined using loan contract information, results of exclusive grading model and borrower category under self-assessment executed in accordance with the financial inspection manual of the Japanese FSA, and (b) recovery risk determined based on, for standardized SME loans, obligor attributes and, for business loans, LTV. PDs and LGDs are estimated based on the default experience for each segment and taking into account the possibility of estimation errors.
b. Rating procedures for consumer loans depends on whether the loan is collateralized. Collateralized consumer loans are allocated to a portfolio segment using the same standards as for mortgage loans of “A. Residential Mortgage Exposures.” Uncollateralized consumer loans are allocated to a portfolio segment based on account history. PDs and LGDs are estimated based on the default experience for each segment and taking into account the possibility of estimation errors.
Further, the effectiveness of segmentation in terms of default risk and recovery risk is validated periodically. Internal data are used to estimate and validate PDs and LGDs. The definition of default is the definition stipulated in the Notification.
(B) PortfolioBillions of yen
Weightedaverage
PD
Weightedaverage
LGD
Weightedaverage ELdefault
Weightedaverage
risk weight
Exposure amount
March 31, 2010 TotalOn-balance sheet assets
Off-balance sheet assets
Business loansPD segment:
Not delinquentUse model ......................... ¥1,101.4 ¥1,088.4 ¥ 13.0 0.92% 53.50% —% 48.62%Others ............................... 360.3 359.2 1.1 0.61 57.28 — 26.55
Delinquent ............................. 456.4 453.2 3.2 33.13 63.32 — 88.08Consumer loans
PD segment:Not delinquent
Use model ......................... 497.7 246.4 251.3 1.16 67.20 — 69.20Others ............................... 193.4 191.6 1.8 1.76 62.66 — 77.85
Delinquent ............................. 51.2 51.0 0.2 22.36 54.27 — 124.64Default .......................................... 140.9 140.8 0.2 100.00 66.53 62.29 53.05Total .............................................. ¥2,801.3 ¥2,530.5 ¥270.8 — — — —
Billions of yen
Weightedaverage
PD
Weightedaverage
LGD
Weightedaverage ELdefault
Weightedaverage
risk weight
Exposure amount
March 31, 2009 TotalOn-balance sheet assets
Off-balance sheet assets
Business loansPD segment:
Not delinquentUse model ......................... ¥1,339.0 ¥1,322.3 ¥ 16.7 1.01% 59.94% —% 56.15%Others ............................... 381.3 380.6 0.8 0.67 61.95 — 28.28
Delinquent ............................. 551.8 548.5 3.3 25.13 67.72 — 98.83Consumer loans
PD segment:Not delinquent
Use model ......................... 342.3 260.4 81.9 1.33 52.18 — 55.55Others ............................... 214.9 213.0 1.9 1.80 62.13 — 77.49
Delinquent ............................. 47.8 47.7 0.2 24.60 46.49 — 111.02Default .......................................... 153.4 151.8 1.6 100.00 72.99 67.26 71.59Total .............................................. ¥3,030.6 ¥2,924.2 ¥106.4 — — — —
Notes: 1. “Business loans” includes apartment construction loans and standardized SME loans. 2. “Others” includes loans guaranteed by employers. 3. “Delinquent” loans are past due loans and loans to obligors categorized as “Borrowers Requiring Caution” that do not satisfy the definition of default stipulated
in the Notification.

SMFG 2010180
SMFG Capital Ratio Information
(3) Equity Exposures and Credit Risk-Weighted Assets under Article 145 of the NotificationA. Equity Exposures
(A) Rating ProceduresWhen acquiring equities subject to the PD/LGD approach, issuers are assigned obligor grades using the same rules as those of general credits to C&I companies, sovereigns and financial institutions. The obligors are monitored (for details, please refer to page 39) and their grades are revised if necessary (credit risk-weighted asset amount is set to 1.5 times when they are not monitored individually). In the case there is no credit transaction with the issuer or it is difficult to obtain financial information, internal grades are assigned using ratings of external rating agencies if it is a qualifying investment. In the case it is difficult to obtain financial information and it is not a qualifying investment, the simple risk weight method under the market-based approach is applied.
(B) Portfolioa. Equity Exposure Amounts
Billions of yenMarch 31 2010 2009Market-based approach ............................................................................................................ ¥ 234.2 ¥ 221.0
Simple risk weight method .................................................................................................... 149.5 219.7Listed equities (300%) ....................................................................................................... 48.0 40.6Unlisted equities (400%) .................................................................................................... 101.5 179.1
Internal models method ......................................................................................................... 84.7 1.3PD/LGD approach ..................................................................................................................... 724.6 533.3Grandfathered equity exposures ............................................................................................... 2,259.6 1,895.6Total ........................................................................................................................................... ¥3,218.4 ¥2,650.0
Notes: 1. The above exposures are “equity exposures” stipulated in the Notification and differ from “stocks” described in the consolidated financial statements. 2. “Grandfathered equity exposures” amount was calculated in accordance with Supplementary Provision 13 of the Notification.
b. PD/LGD Approach
March 31
Billions of yen2010 2009
Exposure amount
Weighted average
PD
Weightedaverage
risk weightExposure amount
Weightedaverage
PD
Weightedaverage
risk weightJ1-J3 ....................................................... ¥514.7 0.05% 110.62% ¥472.4 0.07% 114.28%J4-J6 ....................................................... 79.1 1.51 250.79 16.1 0.66 209.86J7 (excluding J7R) ................................... 1.6 12.54 444.29 6.3 10.14 442.73Others ...................................................... 128.7 0.40 121.35 38.4 0.17 106.93Default (J7R, J8-J10) ............................... 0.5 100.00 — 0.0 100.00 —Total ......................................................... ¥724.6 — — ¥533.3 — —
Notes: 1. The above exposures are “equity exposures” stipulated in the Notification to which the PD/LGD approach is applied and differ from “stocks” described in the consolidated financial statements.
2. “Others” includes exposures to overseas corporate entities.
B. Credit Risk-Weighted Assets under Article 145 of the Notification(A) Outline of method for calculating credit risk assets
Exposures under Article 145 of the Notification include credits to funds. In the case of such exposures, in principle, each underlying asset of the fund is assigned an obligor grade to calculate the asset’s credit risk-weighted asset amount and the amounts are totaled to derive the credit risk-weighted asset amount of the fund. When equity exposures account for more than half of the underlying assets of the fund, or it is difficult to directly calculate the credit risk-weighted asset amount of individual underlying assets, the credit risk-weighted asset amount of the fund is calculated using the simple majority adjustment method, in which credit risk-weighted assets are calculated using a risk weight of 400% (when the risk-weighted average of individual assets underlying the portfolio is less than 400%) or a risk weight of 1250% (in other cases).
(B) PortfolioBillions of yen
March 31 2010 2009Exposures under Article 145 of the Notification ........................................................................ ¥667.8 ¥743.6

SMFG 2010 181
SMFGCapital Ratio Information
(4) Analysis of Actual LossesA. Year-on-Year Comparison of Actual Losses
SMFG recorded total credit costs (the total of the general provisions, non-performing loan write-offs, and gains on collection of written-off claims) of ¥473.0 billion on a consolidated basis for fiscal 2009, a year-on-year decrease of ¥294.8 billion. SMBC recorded ¥254.7 billion in total credit costs on a nonconsolidated basis in fiscal 2009, a year-on-year decrease of ¥295.4 billion. In terms of exposure category, the credit cost for corporate exposures decreased ¥194.8 billion year-on-year, to ¥216.6 billion. The credit cost for bank exposures decreased ¥19.1 billion year-on-year, to ¥3.5 billion. These results are due primarily to the impact of the government’s economic stimulus measures; SMBC’s measures to improve the business and financial situation of borrowers that are tailored to each borrower’s circumstances; and a reduction in credit cost related to non-Japanese corporates due to improved overseas market conditions.
Total Credit Costs Billions of yen
Fiscal 2009 (A) Fiscal 2008 (B) Fiscal 2007 Increase
(decrease) (A) – (B)
SMFG (consolidated) total ..................................................... ¥473.0 ¥767.8 ¥248.6 ¥(294.8)SMBC (consolidated) total .................................................... 419.4 724.4 221.6 (305.0)SMBC (nonconsolidated) total .............................................. 254.7 550.1 147.8 (295.4)
Corporate exposures ......................................................... 216.6 411.4 143.2 (194.8)Sovereign exposures ......................................................... 3.9 (0.4) 0.4 4.3Bank exposures ................................................................. 3.5 22.7 0.0 (19.1)Residential mortgage exposures ....................................... 0.7 0.5 0.1 0.1QRRE ................................................................................. 0.1 0.0 0.0 0.0Other retail exposures ....................................................... 61.6 68.1 59.8 (6.5)
Notes: 1. The above amounts do not include gains/losses on equity exposures, exposures on capital market-driven transactions (such as bonds) and exposures under Article 145 of the Notification that were recognized as gains/losses on bonds and stocks in the statements of operations.
2. Exposure category amounts do not include general provisions for Normal Borrowers. 3. Bracketed fiscal year amounts indicate gains generated by the reversal of provisions, etc. 4. Credit costs for residential mortgage exposures and QRRE guaranteed by consolidated subsidiaries are not included in the total credit costs of SMBC
(nonconsolidated).
B. Comparison of Estimated and Actual LossesBillions of yen
Fiscal 2009 Fiscal 2008 Fiscal 2007Estimated loss amounts
Actual loss
amounts
Estimated loss amountsActual loss
amounts
Estimated loss amountsActual loss
amounts
After deductionof reserves
After deductionof reserves
After deductionof reserves
SMFG (consolidated) total ................ ¥ — ¥ — ¥473.0 ¥ — ¥ — ¥767.8 ¥ — ¥ — ¥248.6SMBC (consolidated) total ................ — — 419.4 — — 724.4 — — 221.6SMBC (nonconsolidated) total .......... 1,197.2 354.0 254.7 954.2 323.9 550.1 887.7 311.4 147.8
Corporate exposures ................... 984.0 210.0 216.6 806.7 278.6 411.4 778.6 252.6 143.2Sovereign exposures ................... 5.8 4.3 3.9 9.0 7.5 (0.4) 11.2 9.6 0.4Bank exposures .......................... 52.1 34.4 3.5 6.1 5.9 22.7 5.1 4.9 0.0Residential mortgage exposures ... 4.0 3.4 0.7 4.0 3.6 0.5 4.6 4.1 0.1QRRE ......................................... 0.1 0.1 0.1 0.1 0.1 0.0 0.1 0.1 0.0Other retail exposures .................. 151.2 107.5 61.6 128.3 65.9 68.1 88.2 53.1 59.8
Notes: 1. Amounts on consumer loans guaranteed by consolidated subsidiaries or affiliates as well as on equity exposures and other exposures under Article 145 of the Notification are excluded.
2. “Estimated loss amounts” are the EL at the beginning of the term. 3. “After deduction of reserves” represents the estimated loss amounts after deduction of reserves for possible losses on substandard loans or below.
■ Standardized Approach1. Scope
The following consolidated subsidiaries have adopted the standardized approach for exposures as of March 31, 2010 (i.e. consolidated subsidiaries not listed in the “Internal Ratings-Based (IRB) Approach: 1. Scope” on page 173).
(1) Consolidated subsidiaries planning to adopt phased rollout of the foundation IRB approachSumitomo Mitsui Finance and Leasing Co., Ltd. and Kansai Urban Banking Corporation
(2) Other consolidated subsidiariesThese are consolidated subsidiaries judged not to be significant in terms of credit risk management based on the type of business, scale, and other factors. These subsidiaries will adopt the standardized approach on a permanent basis.

SMFG 2010182
SMFG Capital Ratio Information
2. Credit Risk-Weighted Asset Calculation MethodologyA 100% risk weight is applied to claims on corporates in accordance with Article 45 of the Notification, and risk weights corresponding to country risk scores published by the Organization for Economic Co-operation and Development (OECD) are applied to claims on sovereigns and financial institutions.
3. Exposure Balance by Risk Weight Segment
March 31
Billions of yen2010 2009
Of which assigned country risk score
Of which assigned country risk score
0% ............................................................................................ ¥ 6,454.8 ¥ 89.9 ¥ 1,681.0 ¥143.010% .......................................................................................... 277.8 — 579.8 —20% .......................................................................................... 801.0 343.4 686.5 290.035% .......................................................................................... 1,126.2 — 1,410.7 —50% .......................................................................................... 210.7 1.2 188.6 1.175% .......................................................................................... 1,352.8 — 1,670.4 —100% ........................................................................................ 5,567.0 0.1 6,247.0 0.1150% ........................................................................................ 41.1 — 43.5 —Capital deduction ..................................................................... 0.0 — — —Others ....................................................................................... 0.0 — — —Total .......................................................................................... ¥15,831.4 ¥434.5 ¥12,507.4 ¥434.1
Notes: 1. The above amounts are exposures after CRM (but before deduction of direct write-offs). Please note that for off-balance sheet assets the amount of exposure has been included.
2. Securitization exposures have not been included.
■ Credit Risk Mitigation Techniques1. Risk Management Policy and Procedures
In calculating credit risk-weighted asset amounts, SMFG takes into account credit risk mitigation (CRM) techniques. Specifically, amounts are adjusted for eligible financial or real estate collateral, guarantees, and credit derivatives or by netting loans against the obligors’ deposits with SMFG financial institutions. The methods and scope of these adjustments and methods of management are as follows.
(1) Scope and ManagementA. Collateral (Eligible Financial or Real Estate Collateral)
SMBC designates deposits and securities as eligible financial collateral, and land and buildings as eligible real estate collateral. Real estate collateral is evaluated by taking into account its fair value, appraisal value, and current condition, as well as our lien position. Real estate collateral must maintain sufficient collateral value in the event security rights must be exercised due to delinquency. However, during the period from acquiring the rights to exercising the rights, the property may deteriorate or suffer damage from earthquakes or other natural disasters, or there may be changes in the lien position due to, for example, attachment or establishment of liens by a third party. Therefore, the regular monitoring of collateral is implemented according to the type of property and the type of security interest.
B. Guarantees and Credit DerivativesGuarantors are sovereigns, municipal corporations, credit guarantee corporations and other public entities, financial institutions, and C&I companies. Counterparties to credit derivative transactions are mostly domestic and overseas banks and securities companies. Credit risk-weighted asset amounts are calculated taking into account credit risk mitigation of guarantees and credit derivatives acquired from entities with sufficient ability to provide protection such as sovereigns, municipal corporations and other public sector entities of comparable credit quality, and financial institutions and C&I companies with sufficient credit ratings.
C. Netting of Loans against DepositsSMBC verifies the legal effectiveness of netting arrangements for loans and deposits for each transaction. Specifically, lending transactions subject to the netting of loans against deposits are stipulated in the “Agreement on Bank Transactions,” and fixed-term deposits that have fixed maturity dates and cannot be transferred to third-party entities are subject to netting. Regarding deposits with us submitted as collateral, their effect as credit risk mitigation is taken into account under the eligible financial collateral framework described in A. above. Further, maturity dates and balances (including the post-netting situation) are monitored for subject loans and deposits in accordance with the Notification. When there is a maturity/currency mismatch, netting is executed after making adjustments as stipulated in the Notification, and the credit risk-weighted asset amount is calculated after netting.

SMFG 2010 183
SMFGCapital Ratio Information
(2) Concentration of Credit Risk and Market Risk Accompanying Application of Credit Risk Mitigation TechniquesAt SMBC, there is a framework in place for controlling concentration of risk in obligors with large exposures which includes credit limit guidelines, risk concentration monitoring, and reporting to the Credit Risk Committee (please refer to page 36). Further, exposures to these obligors are monitored on a group basis, taking into account risk concentration in their parent companies in cases of guaranteed exposures. When marketable financial products (for example, credit derivatives) are used as credit risk mitigants, market risk generated by these products is controlled by setting upper limits.
2. Exposure Balance after CRMBillions of yen
2010 2009
March 31Eligible financial
collateralOther eligible IRB collateral
Eligible financialcollateral
Other eligible IRB collateral
Advanced IRB approach .......................................................... ¥ — ¥ — ¥ — ¥ —Foundation IRB approach ........................................................ 85.7 59.3 0.0 84.5
Corporate exposures ............................................................ 85.7 59.3 0.0 84.5Sovereign exposures ............................................................ — — — —Bank exposures .................................................................... — — — —
Standardized approach ............................................................ 1,833.1 — 184.9 —Total .......................................................................................... ¥1,918.7 ¥59.3 ¥184.9 ¥84.5
Billions of yen2010 2009
March 31 Guarantee Credit derivative Guarantee Credit derivativeIRB approach ........................................................................... ¥7,143.3 ¥258.5 ¥7,846.1 ¥281.0
Corporate exposures ............................................................ 6,345.8 258.5 7,157.5 281.0Sovereign exposures ............................................................ 412.2 — 249.4 —Bank exposures .................................................................... 182.6 — 215.5 —Residential mortgage exposures .......................................... 202.5 — 223.6 —QRRE .................................................................................... — — — —Other retail exposures .......................................................... 0.1 — 0.1 —
Standardized approach ............................................................ 62.0 — 290.6 —Total .......................................................................................... ¥7,205.3 ¥258.5 ¥8,136.7 ¥281.0
■ Derivative Transactions and Long Settlement Transactions1. Risk Management Policy and Procedures
(1) Policy on Collateral Security and Impact of Deterioration of Our Credit QualityCollateralized derivative is a CRM technique in which collateral is delivered or received regularly in accordance with replacement cost. The Group conducts collateralized derivative transactions as necessary, thereby reducing credit risk. In the event our credit quality deteriorates, however, the counterparty may demand additional collateral, but its impact is deemed to be insignificant.
(2) NettingNetting is another CRM technique, and “close-out netting” is the main type of netting. In close-out netting, when a default event, such as bankruptcy, occurs to the counterparty, all claims against, and obligations to, the counterparty, regardless of maturity and currency, are netted out to create a single claim or obligation. Close-out netting is applied to foreign exchange and swap transactions covered under a master agreement with a net-out clause or other means of securing legal effectiveness, and the effect of CRM is taken into account only for such claims and obligations.
2. Credit Equivalent Amounts(1) Derivative Transactions and Long Settlement Transactions
A. Calculation MethodCurrent exposure method

SMFG 2010184
SMFG Capital Ratio Information
B. Credit Equivalent AmountsBillions of yen
March 31 2010 2009Gross replacement cost ................................................................................................................ ¥4,999.8 ¥5,963.9Gross add-on amount ................................................................................................................... 3,380.6 3,638.4Gross credit equivalent amount .................................................................................................... 8,380.4 9,602.3
Foreign exchange related transactions ..................................................................................... 3,211.0 3,912.9Interest rate related transactions ............................................................................................... 4,777.2 5,290.4Gold related transactions .......................................................................................................... — —Equities related transactions ..................................................................................................... 69.6 1.7Precious metals (excluding gold) related transactions .............................................................. — —Other commodity related transactions ...................................................................................... 167.7 206.7Credit default swaps .................................................................................................................. 154.9 190.7
Reduction in credit equivalent amount due to netting .................................................................. 4,574.6 5,087.1Net credit equivalent amount ........................................................................................................ 3,805.8 4,515.2Collateral amount .......................................................................................................................... 20.2 —
Qualifying financial collateral ..................................................................................................... 20.2 —Qualifying other collateral .......................................................................................................... — —
Net credit equivalent amount (after taking into account CRM effect of collateral) ..................................................................... ¥3,785.6 ¥4,515.2
(2) Notional Principal Amounts of Credit DerivativesCredit Default Swaps
Billions of yen2010 2009
Notional principal amount Notional principal amount
March 31 TotalOf which for CRM Total
Of which for CRM
Protection purchased ......................................................... ¥ 841.6 ¥258.5 ¥ 846.8 ¥281.0Protection provided ............................................................ 1,147.2 — 1,107.5 —
Note: “Notional principal amount” is defined as the total of “amounts subject to calculation of credit equivalents” and “amounts employed for CRM.”
■ Securitization Exposures1. Risk Management Policy and Procedures
Definition of securitization exposure has been clarified in order to properly identify, measure, evaluate and report risks, and a risk management department, independent of business units, has been established to centrally manage risks from recognizing securitization exposures to measuring, evaluating and reporting credit risk-weighted assets. The Group takes one of the following positions in securitization transactions.• Originator (a direct or indirect originator of underlying assets or a sponsor of an ABCP conduit or a similar program that acquires
exposures from third-party entities)• Investor• Others (for example, provider of swap for preventing a mismatch between the dividend on trust beneficiary rights and cash flows
generated by underlying assets on which the rights are issued)
2. Credit Risk-Weighted Asset Calculation Methodology There are three methods of calculating the credit risk-weighted asset amount of securitization exposures subject to the IRB approach: the ratings-based approach, the supervisory formula, and the internal assessment approach. The methods are used as follows.• First, securitization exposures are examined and the ratings-based approach is applied to qualifying exposures.• The remaining exposures are examined and the supervisory formula is applied to qualifying exposures.• The remaining exposures are deducted from capital. The credit risk-weighted asset amount for securitization exposures subject to the standardized approach is calculated mostly using ratings published by qualifying rating agencies or based on weighted average risk weights of underlying assets as stipulated in the Notification.
3. Accounting Policy on Securitization TransactionsAccounting treatment of securitization of financial assets is as follows. Extinguishment of financial assets is recognized when the contractual rights over the financial assets are exercised, forfeited or control over the rights is transferred to a third-party, and the difference between the book value of the financial assets and the amount received/paid is recorded as the term’s gain/loss. When the control over the contractual rights is not deemed to have been transferred, the securitization transaction is treated as a financial transaction such as a mortgage loan. When a portion of financial assets satisfies the extinguishment condition, the extinguishment of the said portion is recognized and the difference between the book value of the extinguished portion and the amount received/paid is recorded as the term’s gain/loss. The book

SMFG 2010 185
SMFGCapital Ratio Information
value of the extinguished portion is calculated by allocating the book value of the financial assets based on the proportion of the financial assets’ fair value that the extinguished portion represents. Further, the remaining portion whose fair value is available is measured at fair value, and the related valuation differences are reported as a component of “net assets.” The impairments are measured and recorded as necessary.
4. Qualifying External Ratings AgenciesWhen computing credit risk-weighted asset amounts for securitization exposures using the rating-based approach under the IRB approach or standardized approach, the risk weights are determined by mapping the ratings of qualifying rating agencies to the risk weights stipulated in the Notification. The qualifying rating agencies are Rating and Investment Information, Inc. (R&I), Japan Credit Rating Agency, Ltd. (JCR), Moody’s Investors Service, Inc. (Moody’s), Standard & Poor’s Ratings Services (S&P), and Fitch Ratings Ltd. (Fitch). When more than one rating is available for an exposure, the second smallest risk weight is used, in accordance with the Notification.
5. Portfolio(1) Securitization Transactions as Originator
A. As Originator (excluding as Sponsor)(A) Underlying Assets
Billions of yenMarch 31, 2010 Fiscal 2009
Underlying asset amount
TotalAsset
transfer typeSynthetic
typeSecuritized
amount Defaultamount
Loss amount
Gains/losses on sales
Claims on corporates ................ ¥ 96.6 ¥ 96.6 ¥ 0.1 ¥ — ¥ 7.6 ¥ 2.6 ¥ —Mortgage loans ......................... 1,609.6 1,609.6 — 43.0 1.9 0.4 2.5Retail loans (excluding mortgage loans) ..... 68.4 0.2 68.2 — 14.1 17.8 —Other claims .............................. 244.0 54.4 189.7 — 0.1 0.4 —Total ........................................... ¥2,018.7 ¥1,760.8 ¥258.0 ¥43.0 ¥23.7 ¥21.2 ¥2.5
Billions of yenMarch 31, 2009 Fiscal 2008
Underlying asset amount
TotalAsset
transfer typeSynthetic
typeSecuritized
amount Defaultamount
Loss amount
Gains/losses on sales
Claims on corporates ................ ¥ 151.7 ¥ 151.7 ¥ — ¥348.9 ¥10.7 ¥ 1.4 ¥—Mortgage loans ......................... 1,712.1 1,712.1 — 91.4 1.0 0.3 5.6Retail loans (excluding mortgage loans) ..... 201.7 80.1 121.7 2.4 19.6 14.5 —Other claims .............................. 284.5 87.2 197.3 113.1 0.1 1.1 0.0Total ........................................... ¥2,350.0 ¥2,031.0 ¥318.9 ¥555.8 ¥31.5 ¥17.2 ¥5.6
Notes: 1. The above amounts include the amount of underlying assets securitized during the term without entailing securitization exposure. 2. “Default amount” is the total of underlying assets which are past due three months or more and defaulted underlying assets. 3. “Other claims” includes claims on Private Finance Initiative (PFI) businesses and lease fees. 4. Following Articles 230 and 248 of the Notification, there were no amounts that represent exposure to products subject to early call provisions to investors.
(B) Securitization Exposuresa. Underlying Assets by Asset Type
Billions of yen2010 2009
March 31Term-endbalance
To be deducted
from capital
Increasein capital equivalent
Term-endbalance
To be deducted
from capital
Increasein capital equivalent
Claims on corporates .............................. ¥ 48.9 ¥ 3.6 ¥ — ¥ 52.0 ¥ 1.9 ¥ —Mortgage loans ....................................... 191.2 36.6 37.5 178.4 35.1 42.1Retail loans (excluding mortgage loans) ... 21.3 7.1 — 45.4 13.9 —Other claims ............................................ 140.0 7.7 — 147.6 9.3 —Total ......................................................... ¥401.4 ¥55.0 ¥37.5 ¥423.4 ¥60.3 ¥42.1

SMFG 2010186
SMFG Capital Ratio Information
b. Risk Weights
Billions of yen2010 2009
March 31Term-end balance
Required capital
Term-end balance
Required capital
20% or less .................................................................. ¥175.0 ¥ 1.1 ¥194.8 ¥ 1.4100% or less ................................................................ 13.2 0.5 20.0 0.6650% or less ................................................................ — — 2.0 0.7Less than 1250% ......................................................... — — — —Capital deduction ......................................................... 213.3 55.0 206.7 60.3Total .............................................................................. ¥401.4 ¥56.6 ¥423.4 ¥63.0
(C) Amount of credit risk-weighted assets calculated using Supplementary Provision 15 of the NotificationBillions of yen
March 31 2010 2009Amount of credit risk-weighted assets calculated using Supplementary Provision 15 of the Notification ... ¥ — ¥ —
B. As Sponsor(A) Underlying Assets
Billions of yenMarch 31, 2010 Fiscal 2009
Underlying asset amount
TotalAsset
transfer typeSynthetic
typeSecuritized
amount Defaultamount
Lossamount
Claims on corporates .............................. ¥510.4 ¥510.4 ¥ — ¥3,957.1 ¥ 91.4 ¥ 90.8Mortgage loans ....................................... — — — — 1.9 1.9Retail loans (excluding mortgage loans) .... 159.7 159.7 — 807.5 8.4 9.2Other claims ............................................ 84.1 84.1 — 49.9 8.3 8.1Total ......................................................... ¥754.2 ¥754.2 ¥ — ¥4,814.4 ¥110.0 ¥110.0
Billions of yenMarch 31, 2009 Fiscal 2008
Underlying asset amount
TotalAsset
transfer typeSynthetic
typeSecuritized
amount Defaultamount
Lossamount
Claims on corporates .............................. ¥ 796.9 ¥ 796.9 ¥ — ¥6,093.3 ¥124.0 ¥121.8Mortgage loans ....................................... — — — — 0.9 0.9Retail loans (excluding mortgage loans) .... 142.4 142.4 — 619.1 5.4 6.9Other claims ............................................ 116.7 116.7 — 163.3 3.1 3.0Total ......................................................... ¥1,056.0 ¥1,056.0 ¥ — ¥6,875.7 ¥133.5 ¥132.6
Notes: 1. The above amounts include the amount of underlying assets securitized during the term without entailing securitization exposure. 2. “Default amount” is the total of underlying assets which are past due three months or more and defaulted underlying assets. 3. “Default amount” and “Loss amount” when acting as a sponsor of securitization of customer claims are estimated using the following methods and
alternative data, as in some cases it can be difficult to obtain relevant data in a timely manner because the underlying assets have been recovered by the customer.
(1) “Default amount” estimation method • For securitization transactions subject to the ratings-based approach, the amount is estimated based on information on underlying assets obtainable from
customers, etc. • For securitization transactions subject to the supervisory formula, the amount is estimated based on obtainable information on, or default rate of, each
obligor. Further, when it is difficult to estimate the amount using either method, it is conservatively estimated by assuming that the underlying asset is a default asset.
(2) “Loss amount” estimation method • For securitization transactions subject to the ratings-based approach, the amount is the same amount as the default amount estimated conservatively in (1)
above. • For securitization transactions subject to the supervisory formula, when expected loss ratios of defaulted underlying assets can be determined, the amount
is estimated using the ratios. When it is difficult to determine the ratios, the amount is the same amount as the default amount estimated in (1) above. 4. “Other claims” includes lease fees. 5. Following Articles 230 and 248 of the Notification, there were no amounts that represent exposure to products subject to early call provisions to investors.

SMFG 2010 187
SMFGCapital Ratio Information
(B) Securitization Exposuresa. Underlying Assets by Asset Type
Billions of yen2010 2009
March 31Term-endbalance
To be deducted
from capital
Increasein capital
equivalentTerm-endbalance
To be deducted
from capital
Increasein capital
equivalentClaims on corporates .............................. ¥388.8 ¥0.4 ¥ — ¥648.4 ¥1.2 ¥ —Mortgage loans ....................................... — — — — — —Retail loans (excluding mortgage loans) .... 149.4 — — 122.4 — —Other claims ............................................ 80.9 — — 111.7 — —Total ......................................................... ¥619.1 ¥0.4 ¥ — ¥882.5 ¥1.2 ¥ —
Note: “Other claims” includes lease fees.
b. Risk Weights
Billions of yen2010 2009
March 31Term-end balance
Required capital
Term-end balance
Required capital
20% or less .................................................................. ¥547.5 ¥3.9 ¥826.0 ¥6.0100% or less ................................................................ 70.3 2.3 55.3 1.6650% or less ................................................................ 0.9 0.1 — —Less than 1250% ......................................................... — — — —Capital deduction ......................................................... 0.4 0.4 1.2 1.2Total .............................................................................. ¥619.1 ¥6.7 ¥882.5 ¥8.8
(C) Amount of credit risk-weighted assets calculated using Supplementary Provision 15 of the NotificationBillions of yen
March 31 2010 2009Amount of credit risk-weighted assets calculated using Supplementary Provision 15 of the Notification ... ¥ — ¥ —
(2) Securitization Transactions in which the Group is the InvestorSecuritization Exposures(A) Underlying Assets by Asset Type
Billions of yen2010 2009
March 31Term-endbalance
To be deducted
from capital
Increasein capital
equivalentTerm-endbalance
To be deducted
from capital
Increasein capital
equivalentClaims on corporates .............................. ¥257.0 ¥41.0 ¥ — ¥261.7 ¥50.1 ¥ —Mortgage loans ....................................... — — — — — —Retail loans (excluding mortgage loans) .... 0.3 — — 5.4 — —Other claims ............................................ 15.3 0.6 — 15.3 1.0 —Total ......................................................... ¥272.6 ¥41.6 ¥ — ¥282.4 ¥51.1 ¥ —
Note: “Other claims” includes securitization products.
(B) Risk WeightsBillions of yen
2010 2009
March 31Term-end balance
Required capital
Term-end balance
Required capital
20% or less .................................................................. ¥144.4 ¥ 0.2 ¥146.7 ¥ 0.4100% or less ................................................................ 29.8 1.6 26.7 1.7650% or less ................................................................ 5.8 1.0 6.7 0.8Less than 1250% ......................................................... — — — —Capital deduction ......................................................... 92.6 41.6 102.3 51.1Total .............................................................................. ¥272.6 ¥44.4 ¥282.4 ¥54.0
(C) Amount of credit risk-weighted assets calculated using Supplementary Provision 15 of the NotificationBillions of yen
March 31 2010 2009Amount of credit risk-weighted assets calculated using Supplementary Provision 15 of the Notification ... ¥2.1 ¥ —
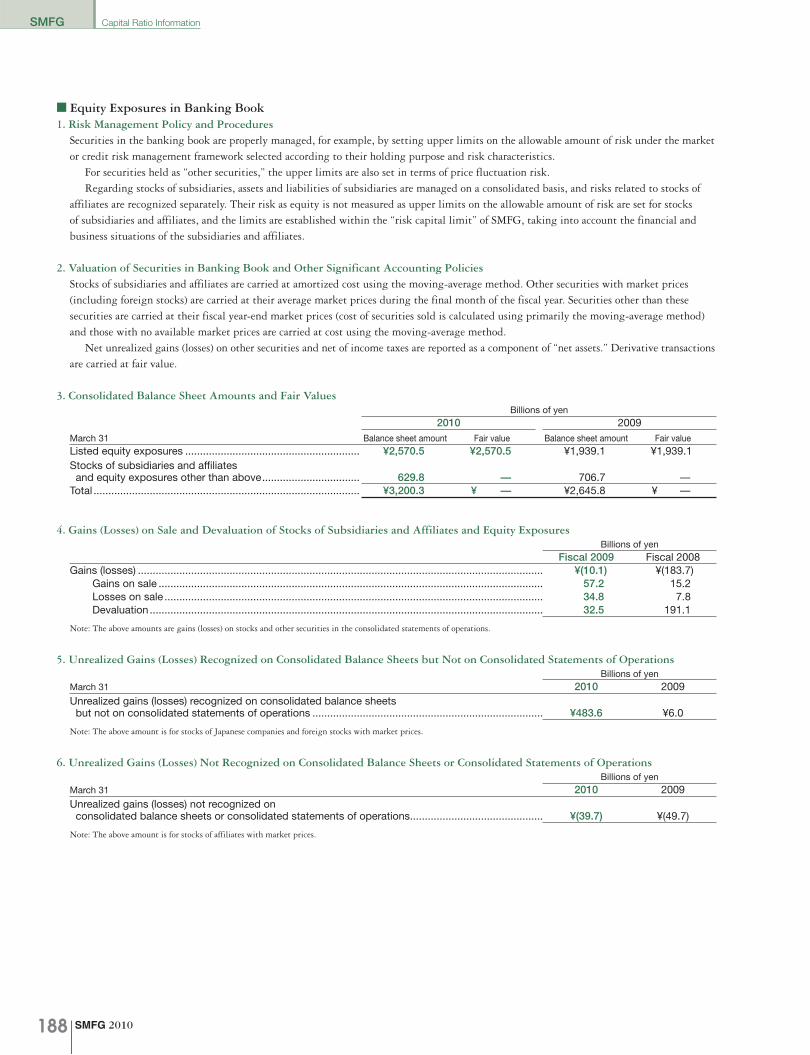
SMFG 2010188
SMFG Capital Ratio Information
■ Equity Exposures in Banking Book1. Risk Management Policy and Procedures
Securities in the banking book are properly managed, for example, by setting upper limits on the allowable amount of risk under the market or credit risk management framework selected according to their holding purpose and risk characteristics. For securities held as “other securities,” the upper limits are also set in terms of price fluctuation risk. Regarding stocks of subsidiaries, assets and liabilities of subsidiaries are managed on a consolidated basis, and risks related to stocks of affiliates are recognized separately. Their risk as equity is not measured as upper limits on the allowable amount of risk are set for stocks of subsidiaries and affiliates, and the limits are established within the “risk capital limit” of SMFG, taking into account the financial and business situations of the subsidiaries and affiliates.
2. Valuation of Securities in Banking Book and Other Significant Accounting PoliciesStocks of subsidiaries and affiliates are carried at amortized cost using the moving-average method. Other securities with market prices (including foreign stocks) are carried at their average market prices during the final month of the fiscal year. Securities other than these securities are carried at their fiscal year-end market prices (cost of securities sold is calculated using primarily the moving-average method) and those with no available market prices are carried at cost using the moving-average method. Net unrealized gains (losses) on other securities and net of income taxes are reported as a component of “net assets.” Derivative transactions are carried at fair value.
3. Consolidated Balance Sheet Amounts and Fair Values Billions of yen
2010 2009March 31 Balance sheet amount Fair value Balance sheet amount Fair valueListed equity exposures ........................................................... ¥2,570.5 ¥2,570.5 ¥1,939.1 ¥1,939.1Stocks of subsidiaries and affiliates and equity exposures other than above ................................. 629.8 — 706.7 —Total .......................................................................................... ¥3,200.3 ¥ — ¥2,645.8 ¥ —
4. Gains (Losses) on Sale and Devaluation of Stocks of Subsidiaries and Affiliates and Equity ExposuresBillions of yen
Fiscal 2009 Fiscal 2008Gains (losses) ......................................................................................................................................... ¥(10.1) ¥(183.7)
Gains on sale .................................................................................................................................. 57.2 15.2Losses on sale ................................................................................................................................ 34.8 7.8Devaluation ..................................................................................................................................... 32.5 191.1
Note: The above amounts are gains (losses) on stocks and other securities in the consolidated statements of operations.
5. Unrealized Gains (Losses) Recognized on Consolidated Balance Sheets but Not on Consolidated Statements of OperationsBillions of yen
March 31 2010 2009Unrealized gains (losses) recognized on consolidated balance sheets but not on consolidated statements of operations .............................................................................. ¥483.6 ¥6.0
Note: The above amount is for stocks of Japanese companies and foreign stocks with market prices.
6. Unrealized Gains (Losses) Not Recognized on Consolidated Balance Sheets or Consolidated Statements of OperationsBillions of yen
March 31 2010 2009Unrealized gains (losses) not recognized on consolidated balance sheets or consolidated statements of operations ............................................. ¥(39.7) ¥(49.7)
Note: The above amount is for stocks of affiliates with market prices.

SMFG 2010 189
SMFGCapital Ratio Information
■ Exposure Balance by Type of Assets, Geographic Region, Industry and Residual Term1. Exposure Balance by Type of Assets, Geographic Region and Industry
Billions of yenMarch 31, 2010 Loans, etc. Bonds Derivatives Others TotalDomestic operations (excluding offshore banking accounts)
Manufacturing............................................................................ ¥ 9,958.8 ¥ 207.8 ¥ 557.1 ¥2,165.3 ¥ 12,889.1Agriculture, forestry, fishery and mining .................................... 246.4 0.0 12.7 32.4 291.6Construction .............................................................................. 1,463.0 32.5 10.2 169.6 1,675.2Transport, information, communications and utilities ................ 4,633.5 135.3 194.7 764.4 5,727.9Wholesale and retail .................................................................. 5,939.6 80.3 577.1 607.5 7,204.5Financial and insurance ............................................................. 14,876.2 521.1 1,252.2 288.9 16,938.4Real estate, goods rental and leasing ....................................... 8,764.6 368.8 63.0 427.4 9,623.8Services ..................................................................................... 4,998.4 124.2 75.8 446.8 5,645.2Local municipal corporations .................................................... 2,087.8 572.1 4.6 6.8 2,671.3Other industries ......................................................................... 22,358.2 19,254.3 35.6 3,994.5 45,642.6Subtotal ..................................................................................... ¥75,326.7 ¥21,296.4 ¥2,782.9 ¥8,903.7 ¥108,309.6
Overseas operations and offshore banking accountsSovereigns ................................................................................. ¥ 2,446.5 ¥ 386.7 ¥ 5.6 ¥ — ¥ 2,838.8Financial institutions .................................................................. 2,691.9 408.8 656.4 22.4 3,779.4C&I companies .......................................................................... 9,106.8 205.5 327.4 — 9,639.7Others ........................................................................................ 1,725.3 229.5 6.8 523.6 2,485.2Subtotal ..................................................................................... ¥15,970.5 ¥ 1,230.5 ¥ 996.1 ¥ 546.0 ¥ 18,743.1
Total ............................................................................................... ¥91,297.2 ¥22,526.9 ¥3,779.1 ¥9,449.6 ¥127,052.7
Billions of yenMarch 31, 2009 Loans, etc. Bonds Derivatives Others TotalDomestic operations (excluding offshore banking accounts)
Manufacturing............................................................................ ¥10,224.7 ¥ 134.5 ¥ 605.5 ¥1,872.6 ¥ 12,837.3Agriculture, forestry, fishery and mining .................................... 241.6 0.1 15.7 29.4 286.8Construction .............................................................................. 1,668.8 47.4 12.3 153.5 1,882.0Transport, information, communications and utilities ................ 4,714.2 102.0 191.3 697.6 5,705.1Wholesale and retail .................................................................. 6,576.8 83.1 627.3 568.7 7,855.8Financial and insurance ............................................................. 11,915.5 981.7 1,427.4 315.3 14,639.9Real estate ................................................................................. 8,173.3 363.0 54.9 170.8 8,762.0Services ..................................................................................... 6,540.2 123.7 89.4 612.0 7,365.3Local municipal corporations .................................................... 1,772.1 468.1 5.8 77.6 2,323.6Other industries ......................................................................... 20,607.4 18,948.3 30.6 4,756.3 44,342.6Subtotal ..................................................................................... ¥72,434.6 ¥21,251.7 ¥3,060.2 ¥9,253.8 ¥106,000.4
Overseas operations and offshore banking accountsSovereigns ................................................................................. ¥ 1,544.9 ¥ 895.1 ¥ 5.0 ¥ — ¥ 2,444.9Financial institutions .................................................................. 2,766.4 265.7 940.1 49.4 4,021.5C&I companies .......................................................................... 10,294.4 213.0 498.3 — 11,005.7Others ........................................................................................ 1,997.4 246.1 11.5 346.0 2,600.9Subtotal ..................................................................................... ¥16,603.0 ¥ 1,619.8 ¥1,454.8 ¥ 395.4 ¥ 20,073.1
Total ............................................................................................... ¥89,037.6 ¥22,871.6 ¥4,515.0 ¥9,649.2 ¥126,073.4
Notes: 1. The above amounts are exposures after CRM. 2. The above amounts do not include securitization exposures and credit risk-weighted assets under Article 145 of the Notification. 3. “Loans, etc.” includes loans, commitments and off-balance sheet assets except derivatives, and “Others” includes equity exposures and standardized approach applied funds. 4. “Domestic operations” comprises the operations of SMFG, its domestic consolidated banking subsidiaries (excluding overseas branches) and other domestic consolidated
subsidiaries. “Overseas operations” comprises the operations of the overseas branches of domestic consolidated banking subsidiaries and overseas consolidated subsidiaries. 5. In accordance with the revision of the Japan Standard Industrial Classification (in November 2007), from March 31, 2010, the industrial classification has been partly
changed.

SMFG 2010190
SMFG Capital Ratio Information
2. Exposure Balance by Type of Assets and Residual TermBillions of yen
March 31, 2010 Loans, etc. Bonds Derivatives Others TotalTo 1 year ........................................................................................ ¥30,571.7 ¥ 8,940.2 ¥ 477.9 ¥ 329.7 ¥ 40,319.4More than 1 year to 3 years........................................................... 16,227.0 4,768.3 1,059.2 873.5 22,928.1More than 3 years to 5 years ......................................................... 9,914.1 5,114.9 1,117.7 963.9 17,110.5More than 5 years to 7 years ......................................................... 3,896.4 696.2 359.0 243.3 5,194.9More than 7 years .......................................................................... 23,616.6 3,007.3 765.3 217.6 27,606.7No fixed maturity ........................................................................... 7,071.4 — — 6,821.6 13,893.0Total ............................................................................................... ¥91,297.2 ¥22,526.9 ¥3,779.1 ¥9,449.6 ¥127,052.7
Billions of yenMarch 31, 2009 Loans, etc. Bonds Derivatives Others TotalTo 1 year ........................................................................................ ¥28,106.8 ¥ 4,055.7 ¥ 600.8 ¥ 399.4 ¥ 33,162.7More than 1 year to 3 years........................................................... 15,529.8 8,851.1 1,413.2 938.8 26,732.9More than 3 years to 5 years ......................................................... 11,562.0 5,875.1 1,106.2 1,106.5 19,649.7More than 5 years to 7 years ......................................................... 5,031.3 960.1 579.0 277.3 6,847.7More than 7 years .......................................................................... 22,396.3 3,129.6 815.9 180.6 26,522.3No fixed maturity ........................................................................... 6,411.5 — — 6,746.7 13,158.2Total ............................................................................................... ¥89,037.6 ¥22,871.6 ¥4,515.0 ¥9,649.2 ¥126,073.4
Notes: 1. The above amounts are exposures after CRM. 2. The above amounts do not include securitization exposures and credit risk-weighted assets under Article 145 of the Notification. 3. “Loans, etc.” includes loans, commitments and off-balance sheet assets except derivatives, and “Others” includes equity exposures and standardized approach applied funds. 4. “No fixed maturity” includes exposures not classified by residual term.
3. Term-End Balance of Exposures Past Due 3 Months or More or Defaulted and Their Breakdown(1) By Geographic Region
Billions of yenMarch 31 2010 2009Domestic operations (excluding offshore banking accounts) ........................................................ ¥2,285.0 ¥2,174.3Overseas operations and offshore banking accounts ..................................................................... 220.5 297.3
Asia .............................................................................................................................................. 19.1 23.4North America.............................................................................................................................. 101.5 218.3Other regions ............................................................................................................................... 99.9 55.6
Total ................................................................................................................................................. ¥2,505.5 ¥2,471.6
Notes: 1. The above amounts are credits subject to self-assessment, including mainly off-balance sheet credits to obligors categorized as “Substandard Borrowers” or lower under self-assessment.
2. The above amounts include partial direct write-offs (direct reductions). 3. “Domestic operations” comprises the operations of SMFG, its domestic consolidated banking subsidiaries (excluding overseas branches) and other domestic
consolidated subsidiaries. “Overseas operations” comprises the operations of the overseas branches of domestic consolidated banking subsidiaries and overseas consolidated subsidiaries, and the term-end balances are calculated based on the obligor’s domicile country.

SMFG 2010 191
SMFGCapital Ratio Information
(2) By IndustryBillions of yen
March 31 2010Domestic operations (excluding offshore banking accounts)
Manufacturing.............................................................................................................................. ¥ 252.8Agriculture, forestry, fishery and mining ...................................................................................... 7.6Construction ................................................................................................................................ 147.0Transport, information, communications and utilities .................................................................. 124.3Wholesale and retail .................................................................................................................... 278.9Financial and insurance ............................................................................................................... 33.0Real estate, goods rental and leasing ......................................................................................... 771.5Services ....................................................................................................................................... 349.8Other industries ........................................................................................................................... 320.1Subtotal ....................................................................................................................................... ¥2,285.0
Overseas operations and offshore banking accountsFinancial institutions .................................................................................................................... ¥ 49.8C&I companies ............................................................................................................................ 170.7Subtotal ....................................................................................................................................... ¥ 220.5
Total ................................................................................................................................................. ¥2,505.5
Billions of yenMarch 31 2009Domestic operations (excluding offshore banking accounts)
Manufacturing.............................................................................................................................. ¥ 206.5Agriculture, forestry, fishery and mining ...................................................................................... 5.3Construction ................................................................................................................................ 166.7Transport, information, communications and utilities .................................................................. 130.6Wholesale and retail .................................................................................................................... 269.7Financial and insurance ............................................................................................................... 60.5Real estate ................................................................................................................................... 720.3Services ....................................................................................................................................... 342.7Other industries ........................................................................................................................... 272.0Subtotal ....................................................................................................................................... ¥2,174.3
Overseas operations and offshore banking accountsFinancial institutions .................................................................................................................... ¥ 62.3C&I companies ............................................................................................................................ 235.1Subtotal ....................................................................................................................................... ¥ 297.3
Total ................................................................................................................................................. ¥2,471.6
Notes: 1. The above amounts are credits subject to self-assessment, including mainly off-balance sheet credits to obligors categorized as “Substandard Borrowers” or lower under self-assessment.
2. The above amounts include partial direct write-offs (direct reductions). 3. “Domestic operations” comprises the operations of SMFG, its domestic consolidated banking subsidiaries (excluding overseas branches) and other domestic
consolidated subsidiaries. “Overseas operations” comprises the operations of the overseas branches of domestic consolidated banking subsidiaries and overseas consolidated subsidiaries.
4. In accordance with the revision of the Japan Standard Industrial Classification (in November 2007), from March 31, 2010, the industrial classification has been partly changed.
4. Term-End Balances of General Reserve for Possible Loan Losses, Specific Reserve for Possible Loan Losses and Loan Loss Reserve for Specific Overseas Countries(1) By Geographic Region
Billions of yen
March 31 2010 (A) 2009 (B) 2008Increase (decrease)
(A) – (B)General reserve for possible loan losses......................................... ¥ 702.6 ¥ 691.5 ¥ 593.7 ¥ 11.1Loan loss reserve for specific overseas countries .......................... 0.6 1.3 0.0 (0.7)Specific reserve for possible loan losses ........................................ 1,208.9 1,102.1 819.6 106.8
Domestic operations (excluding offshore banking accounts) ..... 1,126.3 970.4 738.5 155.9Overseas operations and offshore banking accounts ................. 82.6 131.7 81.1 (49.1)
Asia .......................................................................................... 20.0 19.3 10.1 0.7North America .......................................................................... 25.1 75.8 68.1 (50.7)Other regions ........................................................................... 37.5 36.5 2.9 1.0
Total ................................................................................................. ¥1,912.1 ¥1,794.9 ¥1,413.3 ¥117.2
Notes: 1. “Specific reserve for possible loan losses” includes partial direct write-offs (direct reductions). 2. “Domestic operations” comprises the operations of SMFG, its domestic consolidated banking subsidiaries (excluding overseas branches) and other domestic
consolidated subsidiaries. “Overseas operations” comprises the operations of the overseas branches of domestic consolidated banking subsidiaries and overseas consolidated subsidiaries, and the term-end balances are calculated based on the obligor’s domicile country.

SMFG 2010192
SMFG Capital Ratio Information
(2) By IndustryBillions of yen
March 31 2010 2009 Increase (decrease)General reserve for possible loan losses............................................................ ¥ 702.6 ¥ 691.5 ¥ 11.1Loan loss reserve for specific overseas countries ............................................. 0.6 1.3 (0.7)Specific reserve for possible loan losses ........................................................... 1,208.9 1,102.1 106.8
Domestic operations (excluding offshore banking accounts) ........................ 1,126.3 970.4 155.9Manufacturing ............................................................................................. 143.5 128.1 15.4Agriculture, forestry, fishery and mining ..................................................... 3.3 1.2 2.1Construction ............................................................................................... 86.0 91.2 (5.2)Transport, information, communications and utilities ................................. 74.7 45.9 28.8Wholesale and retail.................................................................................... 169.3 173.3 (4.0)Financial and insurance .............................................................................. 14.8 21.1 (6.3)Real estate, goods rental and leasing ........................................................ 336.7 225.4 111.3Services ...................................................................................................... 161.0 145.8 15.1Other industries .......................................................................................... 137.0 138.4 (1.4)
Overseas operations and offshore banking accounts .................................... 82.6 131.7 (49.1)Financial institutions ................................................................................... 36.7 32.0 4.7C&I companies ........................................................................................... 45.9 99.7 (53.8)
Total .................................................................................................................... ¥1,912.1 ¥1,794.9 ¥117.2
Notes: 1. “Specific reserve for possible loan losses” includes partial direct write-offs (direct reductions). 2. “Domestic operations” comprises the operations of SMFG, its domestic consolidated banking subsidiaries (excluding overseas branches) and other domestic
consolidated subsidiaries. “Overseas operations” comprises the operations of the overseas branches of domestic consolidated banking subsidiaries and overseas consolidated subsidiaries.
3. In accordance with the revision of the Japan Standard Industrial Classification (in November 2007), from March 31, 2010, the industrial classification has been partly changed. Accordingly, the amendments have been retroactively applied to the data of the previous term (ended March 31, 2009), so as to allow comparison.
Billions of yenMarch 31 2009 2008 Increase (decrease)General reserve for possible loan losses............................................................ ¥ 691.5 ¥ 593.7 ¥ 97.8Loan loss reserve for specific overseas countries ............................................. 1.3 0.0 1.3Specific reserve for possible loan losses ........................................................... 1,102.1 819.6 282.5
Domestic operations (excluding offshore banking accounts) ........................ 970.4 738.5 231.9Manufacturing ............................................................................................. 128.1 76.3 51.8Agriculture, forestry, fishery and mining ..................................................... 1.2 1.3 (0.1)Construction ............................................................................................... 91.2 71.3 19.9Transport, information, communications and utilities ................................. 45.9 49.2 (3.3)Wholesale and retail.................................................................................... 173.3 142.7 30.6Financial and insurance .............................................................................. 21.1 19.2 1.9Real estate .................................................................................................. 224.1 110.9 113.2Services ...................................................................................................... 147.1 135.2 11.9Other industries .......................................................................................... 138.4 132.4 6.0
Overseas operations and offshore banking accounts .................................... 131.7 81.1 50.6Financial institutions ................................................................................... 32.0 0.9 31.1C&I companies ........................................................................................... 99.7 80.2 19.5
Total .................................................................................................................... ¥1,794.9 ¥1,413.3 ¥381.6
Notes: 1. “Specific reserve for possible loan losses” includes partial direct write-offs (direct reductions). 2. “Domestic operations” comprises the operations of SMFG, its domestic consolidated banking subsidiaries (excluding overseas branches) and other domestic
consolidated subsidiaries. “Overseas operations” comprises the operations of the overseas branches of domestic consolidated banking subsidiaries and overseas consolidated subsidiaries.

SMFG 2010 193
SMFGCapital Ratio Information
5. Loan Write-Offs by IndustryBillions of yenFiscal 2009
Domestic operations (excluding offshore banking accounts)Manufacturing..................................................................................................................................... ¥ 19.2Agriculture, forestry, fishery and mining ............................................................................................. 0.3Construction ....................................................................................................................................... 4.8Transport, information, communications and utilities ......................................................................... 6.7Wholesale and retail ........................................................................................................................... 32.2Financial and insurance ...................................................................................................................... (4.8)Real estate, goods rental and leasing ................................................................................................ 54.0Services .............................................................................................................................................. 16.5Other industries .................................................................................................................................. 50.2Subtotal .............................................................................................................................................. ¥179.1
Overseas operations and offshore banking accountsFinancial institutions ........................................................................................................................... ¥ (3.2)C&I companies ................................................................................................................................... 0.8Subtotal .............................................................................................................................................. ¥ (2.4)
Total ........................................................................................................................................................ ¥176.7
Billions of yenFiscal 2008
Domestic operations (excluding offshore banking accounts)Manufacturing..................................................................................................................................... ¥ 46.1Agriculture, forestry, fishery and mining ............................................................................................. 0.7Construction ....................................................................................................................................... 32.4Transport, information, communications and utilities ......................................................................... 11.3Wholesale and retail ........................................................................................................................... 54.7Financial and insurance ...................................................................................................................... 9.6Real estate .......................................................................................................................................... 52.9Services .............................................................................................................................................. 28.2Other industries .................................................................................................................................. 44.6Subtotal .............................................................................................................................................. ¥280.5
Overseas operations and offshore banking accountsFinancial institutions ........................................................................................................................... ¥ 5.6C&I companies ................................................................................................................................... 16.3Subtotal .............................................................................................................................................. ¥ 21.9
Total ........................................................................................................................................................ ¥302.4
Notes: 1. “Domestic operations” comprises the operations of SMFG, its domestic consolidated banking subsidiaries (excluding overseas branches) and other domestic consolidated subsidiaries. “Overseas operations” comprises the operations of the overseas branches of domestic consolidated banking subsidiaries and overseas consolidated subsidiaries.
2. In accordance with the revision of the Japan Standard Industrial Classification (in November 2007), from fiscal 2009, the industrial classification has been partly changed.

SMFG 2010194
SMFG Capital Ratio Information
■ Market Risk1. Scope
The following approaches are used to calculate market risk equivalent amounts.(1) Internal Models Method
General market risk of SMBC, Sumitomo Mitsui Banking Corporation Europe Limited, Sumitomo Mitsui Banking Corporation (China) Limited, SMBC Capital Markets, Inc., SMBC Capital Markets Limited, SMBC Derivative Products Limited, and SMBC Capital Markets (Asia) Limited
(2) Standardized Measurement Method• Specific risk• General market risk of consolidated subsidiaries other than SMBC, Sumitomo Mitsui Banking Corporation Europe Limited,
Sumitomo Mitsui Banking Corporation (China) Limited, SMBC Capital Markets, Inc., SMBC Capital Markets Limited, SMBC Derivative Products Limited, and SMBC Capital Markets (Asia) Limited
• A portion of general market risk of SMBC
2. Valuation Method Corresponding to Transaction CharacteristicsAll assets and liabilities held in the trading book — therefore, subject to calculation of the market risk equivalent amount — are transactions with high market liquidity. Securities and monetary claims are carried at the fiscal year-end market price, and derivatives such as swaps, futures and options are stated at amounts that would be settled if the transactions were terminated at the consolidated balance sheet date.
3. VaR Results (Trading Book)Billions of yen
Fiscal 2009 Fiscal 2008Fiscal year-end ....................................................................................................................................... ¥1.5 ¥2.0Maximum ................................................................................................................................................ 2.8 2.8Minimum ................................................................................................................................................. 1.2 1.4Average .................................................................................................................................................. 1.6 2.0
Notes: 1. The VaR results for a one-day holding period with a one-sided confidence interval of 99.0%, computed daily using the historical simulation method based on four years of historical observations.
2. Specific risks for the trading book are excluded. 3. Principal consolidated subsidiaries are included.
■ Interest Rate Risk in Banking BookInterest rate risk in the banking book fluctuates significantly depending on the method of recognizing maturity of demand deposits (such as current accounts and ordinary deposits from which funds can be withdrawn on demand) and the method of predicting early withdrawal from fixed-term deposits and prepayment of consumer loans. Key assumptions made by SMBC in measuring interest rate risk in the banking book are as follows.
1. Method of Recognizing Maturity of Demand DepositsThe total amount of demand deposits expected to remain with the bank for the long term (with 50% of the lowest balance during the past 5 years as the upper limit) is recognized as a core deposit amount and interest rate risk is measured for each maturity with 5 years as the maximum term (the average is 2.5 years).
2. Method of Estimating Early Withdrawal from Fixed-term Deposits and Prepayment of Consumer LoansThe rate of early withdrawal from fixed-term deposits and the rate of prepayment of consumer loans are estimated and the rates are used to calculate cash flows used for measuring interest rate risk.
3. VaR Results (Banking Book)Billions of yen
Fiscal 2009 Fiscal 2008Fiscal year-end ....................................................................................................................................... ¥33.8 ¥41.4Maximum ................................................................................................................................................ 44.0 43.9Minimum ................................................................................................................................................. 31.8 26.9Average .................................................................................................................................................. 37.7 34.2
Notes: 1. The VaR results for a one-day holding period with a one-sided confidence interval of 99.0%, computed daily using the historical simulation method based on four years of historical observations.
2. Principal consolidated subsidiaries are included.

SMFG 2010 195
SMFGCapital Ratio Information
■ Operational Risk1. Operational Risk Equivalent Amount Calculation Methodology
SMFG adopted the Advanced Measurement Approach (AMA) for exposures as of March 31, 2008. As of March 31, 2010, the following consolidated subsidiaries have also adopted the AMA, and the remaining consolidated subsidiaries have adopted the Basic Indicator Approach (BIA). Sumitomo Mitsui Banking Corporation, Sumitomo Mitsui Card Company, Limited, The Japan Research Institute, Limited, SMBC
Friend Securities Co., Ltd., Sumitomo Mitsui Finance and Leasing Co., Ltd., Kansai Urban Banking Corporation, The Japan Net Bank, Limited, SMBC Guarantee Co., Ltd., SMBC Finance Service Co., Ltd., THE MINATO BANK, LTD., SMBC Center Service Co., Ltd., SMBC Delivery Service Co., Ltd., SMBC Green Service Co., Ltd., SMBC International Business Co., Ltd., SMBC International Operations Co., Ltd., SMBC Loan Business Service Co., Ltd., SMBC Market Service Co., Ltd., SMBC Loan Administration and Operations Service Co., Ltd., Sumitomo Mitsui Banking Corporation Europe Limited and Sumitomo Mitsui Banking Corporation (China) Limited.
Sumitomo Mitsui Banking Corporation (China) Limited, established in April 2009, has adopted the AMA since its foundation. Among companies which have adopted the BIA, Nikko Cordial Securities Inc. is making preparations to adopt the AMA for exposures as of September 30, 2011.
2. Outline of the AMAAn outline of the AMA for operational risk management is described in the section on Risk Management. In this section, we would like to present an explanation of the preparation of data that is input into the quantification model and the verification of scenario assessment using internal loss data, external loss data, and Business Environment and Internal Control Factors (BEICFs). We will also give an outline of the methodology for measuring the operational risk equivalent amount (“required capital”) using the quantification model.
(1) Scenario Analysis through Risk Control AssessmentsA. Preparation of Data Input into the Quantification Model
In order to estimate the frequency of occurrence of “low-frequency and high-severity” events, which is the purpose of risk control assessment, we estimate the loss frequency in terms of four loss amounts (¥100 million, ¥1 billion, ¥5 billion, and ¥10 billion) for each scenario, then input the total amount by loss event type for each entity, namely, SMFG (consolidated), SMBC (consolidated), and SMBC (nonconsolidated), into the quantification model. At SMFG and SMBC, by using a different assessment method according to loss event type and organizational classification, we obtain a proper grasp of operational risk profile of the Group. The following section provides typical calculation examples for scenarios of SMBC domestic business offices.
Internal Loss Data
External Loss DataB. Verification
A. Data input
Risk Mitigation Initiatives
(1) Scenario Analysis through Risk Control Assessments
(2) Measurement Using the Quantification Model
BEICFs

SMFG 2010196
SMFG Capital Ratio Information
(A) Deriving and Scoring Scenariosa. Deriving Scenarios
In order to grasp all potential risks of a business/product, we first identify “business processes & /products” stipulated in the “Common Procedures of Operations.” Then, we derive all possible scenarios for the generation of a loss event of prescribed magnitude by breaking down the operation process of each “business processes & /products” into “processing types.” We evaluate each individual scenario on an operation process basis.
b. Scenario Assessment
In order to assess scenarios, it is necessary to quantify loss frequency and amount for each scenario. At SMBC, in order to quantify loss frequency for each scenario, we execute risk control assessments on each scenario. In risk assessment, in order to measure the easiness of loss occurrence in each operation process before taking into account the risk management (control) situation, we set standards for various assessment items — transaction volume, volatility of transaction volume, time limits and so on — and the operation process is scored on how well the standards are met.
(Example)Product
Operation process(a) Explanation to customer
(b) Request for preparation of application form
(c) Presentation of conditions to customer, conclusion of contract
(d) Conclusion of the deal with Treasury Marketing
Department
(e) Entry of contract implementation form
(f) Exchange of forward contract
Explanation
Receipt and check
Agreements and contracts
Internal transfer
System entries
Issuance, notification and reporting
(a) Explanation
(b) Attribute confirmation
(c) Receipt and check
(d) Issuance, notification and reporting
(e) Internal transfer
(f) Application, decision and authorization
(g) Agreements and contracts
(h) Preparation of vouchers, etc. and making entries
(i) System entries
(j) Management during contract period
(k) Safekeeping, depositing and withdrawal
Business
Classification of Business, Products and Processing Type (Example)
Exchange forward contract
Processing type
Conclusion of exchange forward contract
1
0
2
1
0
0
0
Risk Scoring (Examples)Perspective
Easiness of making an error
(a) Transaction volume
(b) Volatility of transaction volumes
(c) Time limits
(d) Complexity of process
(e) Complexity of products
(f) Deal with outside party
(g) Booking of business products
Largeness of annual processing volume
Degree of concentration of processing on specific dates
Shortness of deadlines and degree of urgency
Degree of processing complexity, processing volume per task
Product complexity
Easiness of an error leadingto a clerical accident
Risk Items What to Assess Score
Easiness of error in transferring actual items/funds to customer/other bank leading to loss accidentEasiness of error in handling of, or in notifying actions to be taken on, products with market risk leading to loss event

SMFG 2010 197
SMFGCapital Ratio Information
(B) Quantifying Loss Frequency of Each Scenarioa. Generation of “Average Frequency Table” for Domestic Business Offices
To quantify loss frequency for domestic branches, we assume future loss frequency is similar to historical loss frequency. And we generate an average frequency table, which is used to estimate future loss frequency. The average frequency table comprises rows of total risk score and columns of total control score and the number of loss occurrences in a one-year period for each combination of scores is given. As risk and control assessment items are expected to have different loss occurrence contribution ratios, we analyze their loss occurrence contribution ratios for each assessment item by executing a regression analysis and weight each assessment item.
b. Quantifying Loss Frequency of Each Scenario
Total risk assessment score and total control assessment score are calculated for each scenario taking into account the weight of each assessment item described above. Then, the loss frequency of each scenario (the number of times the loss event described in the scenario occurs during a one-year period) is estimated using the average frequency table.
(C) Quantifying Loss Amount for Each ScenarioIn order to quantify the loss amount for each scenario, we generate loss distribution for each “business process & product” by using the historical transaction data of SMBC. Specifically, we assume that the historical transaction volume follows a log-normal distribution (distribution in which the logarithm of a variable follows the normal distribution) for each “business process & product” and generate the loss-severity distribution.
Control assessment is executed from the perspective of preventive control and detection & recovery control. We set standards for various items — establishment of manuals and procedures, processing authority and pre-process check, post-process check, and so on — and the operation process is scored on how well the standards are met.
1
0
1
0
0
Control Assessment (Examples)
Design of procedures
Authority and verification
System situation
(a) Establishment of manuals and procedures
(b) Details of manuals and procedures
(c) Processing authority and pre-process check
(d) Post-process check
(e) System processing
Whether rules/ procedures/etc. have been documented or updated
Assess processing authority, pre-process check
Degree of system processing
Perspective Risk Items What to Assess Score
Whether there are rules for accurate processing execution without omissions and whether they are effective (excluding those included in below three risk items)
Assess post-process check and accident detection measures (assess only preventive measures)
2.0 2.4 2.8 3.2 3.6 4.0
5.5
4.5 5.5
3.5 4.5
2.5 3.5 2.40
1.5 2.5
0.5 1.5
0.5
Average Frequency Table (Example)
Total ScoreControl
Risk
(Times/Year)

SMFG 2010198
SMFG Capital Ratio Information
(D) Estimating the Frequency of Occurrence of the “Low-Frequency and High-Severity” EventsIn order to estimate the probability of occurrence in terms of four loss amounts (¥100 million, ¥1 billion, ¥5 billion, and ¥10 billion) for each scenario, we use a log-normal distribution function for each scenario. Because we assume the log-normal distribution to each “business process & product,” in case one loss event occurs in a one-year period, potential loss can be regarded as likewise arising from log-normal distribution. Therefore, in this case, we estimate the probability of occurrence of four loss amounts by substituting each loss amount for the loss amount of log-normal distribution. In case that one loss event occurs in a one-year period, the method described above is followed. However, in case that several numbers of loss events occur in a one-year period, it is conceivable that the events occurred independently of each other. Therefore, the probability of occurrence of several loss events can be calculated by the probability of one loss event raised to the power of its loss frequency. As we quantify the loss frequency for each scenario using the average frequency table for loss events over a one-year period, we are able to estimate the probability of four loss amounts by the probability arising from the above log-normal distribution function, raised to the power of loss frequency derived from the frequency table. After estimating the loss frequency in terms of the four loss amounts for each scenario, we sum results for each loss event type and input them into the quantification model for SMFG (consolidated), SMBC (consolidated), and SMBC (nonconsolidated).
B. Verification of Scenarios Using Three Data Elements At SMFG and SMBC, the verifications of the assessments of scenarios using internal loss data, external loss data, and BEICFs (hereinafter, “3 data elements”) are implemented periodically. Specifically, SMFG and SMBC use these data and information and use them to determine, periodically, whether there are any scenarios that have been omitted and whether the assessments of the scenarios are appropriate to ensure the completeness and appropriateness of the scenarios.
(A) Reassessment of Scenarios Using Internal Loss DataBoth SMFG and SMBC, in principle, compile internal loss data on all gross loss amounts of at least one yen. From the data, internal loss data which fulfill the established criteria are drawn, and the content of the related loss events is considered; then, a judgment is made regarding whether or not to review the scenario in question. Specifically, we pose a number of issues to consider, such as whether the scenario exists at SMBC, and, if so, whether the deviation between the actual loss and the assessed value of the scenario is within the tolerance range. In considering these issues, we follow a set pattern of logical reasoning in making a decision on whether the scenario should be revised. When we decide it is necessary to revise the scenario, we make a reassessment based on the internal loss data. In this process, we consider redeveloping and reassessing the scenario and other related matters to ensure that the internal loss data is properly reflected in the scenario.
(B) Reassessment of Scenarios Using External Loss DataAt SMFG and SMBC, we have a database containing more than 7,000 cases of external losses that have been taken from the mass media, including newspapers, and purchased from data vendors. A framework has been created to enable the sharing of this database across the Group. From this database, we draw external loss data which fulfill the established criteria, and the content of the related loss events is considered; then, a judgment is made regarding whether or not to revise the scenario in question. Specifically, we pose a number of issues to consider, such as whether the scenarios in question exist at SMBC, and, if so, whether the deviation between the actual loss and the assessed value of the scenario is within the tolerance range. In considering these issues, we follow a set pattern of logical reasoning in making a decision on whether the scenario should be reviewed. When we decide it is necessary for the scenario to be reviewed, we make a reassessment based on the external loss data. In this process, we consider deriving and reassessing the scenario and other related matters to ensure that the external loss data is properly reflected in the scenario.

SMFG 2010 199
SMFGCapital Ratio Information
(C) Reassessment of Scenarios Using BEICFsAt SMFG and SMBC, we compile data related to changes in laws and regulations, changes in internal rules, policies and procedures, and new business, products and process, all of which are business environment and internal control factors (BEICFs). We use this information to consider periodically whether our scenarios should be reconsidered, and, even for events other than those listed previously, when major changes occur in the business environment, our systems provide, as necessary, for the consideration of whether scenarios should be revised. When we decide it is necessary for the scenario to be reviewed, we make a reassessment based on the information related to changes and other factors in BEICFs. In this process, we consider redeveloping and reassessing the scenario and other related matters to ensure that the changes in BEICFs are properly reflected in our scenarios.
(2) Measurement Using the Quantification ModelWhen calculating operational risk using the quantification model, firstly, we input seven-year historical internal loss data (realized risks) and the data on the frequency of “low-frequency and high-severity” events (potential risks) in terms of four loss amounts, which have been estimated through risk control assessments, and generate a loss distribution. Secondly, we use this distribution to estimate the maximum loss amount with a 99.0 percentile confidence interval (hereinafter referred to as 99.0% VaR). Thirdly, we multiply this maximum loss by a number, which we call “the risk capital conversion factor,” to estimate 99.9% VaR. Finally, we calculate required capital by using a multiplier that has been determined based on the number of times in which actual losses have exceeded predicted losses through the use of back testing. In estimation of the aggregated loss distribution, we need to estimate the loss severity and frequency distribution. In addition, we confirm whether the quantification model is functioning appropriately and conservatively in measuring operational risk by implementing various types of sensitivity analysis and verification tests. The following chart puts the main points of this quantification method in order and explains how the results of measurement are verified.
0.4
0.3
0.2
0.1
0
99.0 99.9
A. Measurement Using the Quantification Model
(D) Calculation of Required Capital
Aggregated Loss DistributionFrequency Severity
B. Verification of the Quantification Model
(A) Verification of Quantification Accuracy(B) Implementation of Regular Verification Process (Pre-testing, Back testing)
(B) Estimation of Loss Frequency Distribution
Reiteration
Probability of occurrence(frequency)
Amount of annual loss
Times the risk capitalconversion factor
Total
Sampling of the numberof losses fromthe distribution
Calculation ofannual loss amount
Sampling of the amount oflosses of the cases drawnfrom the distribution
(A) Estimation of Loss Severity Distribution
(C)

SMFG 2010200
SMFG Capital Ratio Information
A. Measurement Using the Quantification Model(A) Estimation of Loss Severity Distribution
a. Smoothed Bootstrap Method
We employ the “smoothed bootstrap” method for generating the loss distribution. The smoothed bootstrap method is one of the methods that connect the distribution, of the realized risk and the potential risk event, smoothly. Under this method, no assumptions are made about the shape of the distribution as a whole, but assumptions are made on the individual distribution related to realized individual losses. Therefore, this method takes advantage of the widely known parametric method (method assuming a distribution) as well as the non-parametric one (method not assuming a distribution). Under the non-parametric method, if we use historical internal loss data to generate the loss severity distribution, we are not able to create the samples outside the actual observation points, and also it is particularly difficult to create a distribution with a fat tail. However, through the use of the method that can combine such data (on actual observations) with data on potential risks, it becomes possible to create large losses that occur rarely (with a potential impact) and that have not actually been found in historical internal loss data. In generating the distribution, while “high-frequency low-severity” events are based on sufficient historical internal loss data volume, for “low-frequency high-severity” events in the tail of the distribution, the historical internal data volume is insufficient. This approach makes it possible to reflect the severity (frequency of occurrence) of potential risk that has been assessed in the risk control assessments. In this way, using this model, realized risks and potential risks can be combined with congruity. In estimating the loss distribution under this method, the Kernell function (partially assumed function) is applied to the loss data by the pile-up of functions. In particular, the log-normal distribution is applied as the Kernell function.
b. Supplementing Results of Risk Control Assessments with Extreme Value Theory
In order to capture potential risks, a statistical method known as Extreme Value Theory is used in addition to the results of risk control assessments. Extreme Value Theory is the statistical assessment method by which risks that may occur in the future accompanying larger losses than the actually observed ones in the internal loss data can be quantified, and fulfills the role of supplementing the risk control assessments.
5,000,000
10,000,000
8,000,000
15,000,000
7,000,000
Gaining a grasp of realized risk Capturing potential risks
Collection of internal loss data Statistical estimates from internal loss data(Extreme Value Theory)
Estimates from risk control assessments
Body part of the “high-frequency low-severity”loss severity distribution
Tail part of the “low-frequency high-severity”loss severity distribution
Combination of the loss severity distributions
Smoothed bootstrap method
Loss occurrence for the last 7 years (or period actually collected)
Estimates of potential risk that may emerge
(Example)
(Example)
Period
Amount of loss Frequency of occurrence 2003 / 1H
2004 / 1H
2005 / 1H
2005 / 1H
2005 / 2H
¥100 million or more
¥1 billion or more
¥5 billion or more
¥10 billion or more
Once in 5 years
Once in 10 years
Once in 50 years
Once in 100 years
Amount of loss
Smoothed bootstrap method
Body part
Amount of losses
Tail part
Frequency of occurrence
¥100million
¥1billion
¥5billion
¥10billion

SMFG 2010 201
SMFGCapital Ratio Information
(B) Estimation of Loss Frequency DistributionThe Poisson distribution (probability distribution often used in estimating the number of occurrences of rare events) is used for generating the loss frequency distribution. To estimate the Poisson distribution, it is necessary to estimate the average number of annual losses, but in this model, we do not simply take the annual average of all cases of losses for the entire period (several fiscal years) but instead, estimate the annual average number of loss cases for each fiscal year individually. Through this approach, we are able to take account of the deviations in the historical incidence of losses for different periods and are able to estimate loss cases that may occur in the future more appropriately.
(C) Risk Capital Conversion Factor γWe calculate 99.0% VaR from the estimated aggregated loss distribution, and then multiply the risk capital conversion factor γ (gamma) in order to compute 99.9% VaR. By introducing γ it is unnecessary to estimate 99.9% VaR directly which can be estimated with lower accuracy, and it provides with stable estimation results by estimating 99.0% VaR which can be estimated with higher accuracy. The factor γ means the ratio between 99.9% VaR and 99.0% VaR. In other words, it is the risk profile of the loss distribution and an indicator for the characteristics of the tail part of the distribution. The risk profile of the loss distribution is different for each loss event type, by which the calculation is performed. In addition, we have verified statistically that it could differ among SMFG (consolidated), SMBC (consolidated), and SMBC (nonconsolidated). To reflect their characteristics, we set a different value of γ for each entity. There is a tendency for γ to become smaller, etc., when there is a distribution of large expected losses or when the tail of the distribution is highly dense. When setting γ initially, we conduct an analysis, taking into account the possibility of changes in the risk profiles of many types of loss distributions, and set values that maintain the stability and the conservativeness of capital. In addition, we assess changes in the risk profiles of the most recent loss distributions, including the present one, and, when changes are above a certain level, we conduct a review of the γ values. This makes it possible to keep values of γ appropriate to changes in the risk profile of the loss distribution and calculate stable values of required capital.
(D) Calculation of Required CapitalWe calculate required capital by multiplying the 99.9% VaR calculated in the previous section by the multiplier for each loss event type that has been determined based on the number of breaches in back testing. As will be mentioned later, back testing is conducted periodically, and, when realized risk is found to be greater than the risks estimated with the quantification model (back testing excess), we take necessary steps, such as multiplying by the multiplier determined through prior analysis, to maintain the conservativeness of required capital estimates. We then add the required capital amounts calculated for each loss event type to compute the required capital for SMFG (consolidated), SMBC (consolidated), and SMBC (nonconsolidated). Please note that in calculating required capital, we do not subtract expected losses.
B. Verification of the Quantification ModelWe conduct a range of sensitivity and verification tests to ensure that the measurement results of the quantification model are appropriate (quantification accuracy) and to confirm that our model is capable of measuring the amounts corresponding to the maximum losses from operational risk that may be incurred for a one year holding period, with a one-sided 99.9 percentile confidence interval. In the following paragraphs, we would like to explain the methods for assessing the quantification accuracy of our measurements and the framework we have in place for regular verifications.
(A) Verification of Quantification AccuracyWe have confirmed the reliability of the quantification model through a verification process from various perspectives. Specifically, we obtain a quantitative grasp of the possibilities for variation in measurement results that may arise from preconditions or assumptions made at the time the models were designed. In particular, we assess the possibilities for underestimating required capital and the possible magnitude of such underestimates. Then, in our periodic verification framework, which is described below, we make analyses of how to compensate for such underestimates. We apply our understanding of the possibilities for underestimation to the multiplier derived from back testing, and, if the accuracy of the quantification model deteriorates, we introduce a framework for making adjustments in the multiplier to avoid underestimating the amount of required capital.

SMFG 2010202
SMFG Capital Ratio Information
(B) Implementation of Regular Verification ProcessTo confirm the appropriateness of the quantification model on a continuing basis, we conduct a regular verification process. Specifically, there are two types of verifications. One is back testing, which enables us to make a comprehensive judgment on the appropriateness of measurement results, and the other is pre-testing, in which we verify the accuracy of the quantification model prior to conducting actual measurements. In the following paragraphs, we present an explanation of these two test types.
a. Back Testing
In conducting back tests, we compare the estimates made by the quantification model with the maximum loss arising from business activities to verify on an ex post facto basis whether the measurement results obtained from the model are conservative enough and appropriate. When actual losses become greater than the losses estimated by the model (actual losses exceed the estimate when back tests are conducted), we apply the multiplier factor in accordance with the number of excesses in order to ensure conservativeness of quantification results. Back testing is a well-known method for verifying comprehensively the appropriateness of VaR (statistical) models. We employ the test to obtain the maximum loss amount with the given confidence interval which the tests work effectively. By comparing the test results with the losses that actually occur, we increase the effectiveness of back testing.
b. Pre-testing
Pre-testing is conducted periodically, prior to use of the model for actual measurements, to verify whether the possibility of underestimation is increasing (model risk is rising), since it is possible that the multiplier used in back testing may lead to underestimation. As a result of pre-test verifications, we are able to confirm, on a continuing basis, whether the multiplier used in back testing is conservative enough or model risk is emerging.
3. Usage of Insurance to Mitigate RiskSMFG had not taken measures to mitigate operational risk through insurance coverage for exposures as of March 31, 2010.
4. Required Capital by Operational Risk Measurement MethodBillions of yen
March 31 2010 2009Advanced Measurement Approach ........................................................................................................ ¥232.2 ¥223.5Basic Indicator Approach ....................................................................................................................... 17.2 21.6Total ........................................................................................................................................................ ¥249.4 ¥245.1

SMFG 2010 203
SMBC
Capital Ratio InformationSumitomo Mitsui Banking Corporation and Subsidiaries
■ Capital Structure Information (Consolidated Capital Ratio (International Standard))Millions of yen
March 31 2010 2009Tier I capital: Capital stock .................................................................................................... ¥ 1,770,996 ¥ 664,986
Capital surplus ................................................................................................. 2,709,682 1,603,672Retained earnings ............................................................................................ 668,074 448,750Cash dividends to be paid ............................................................................... (62,702) (19,947)Unrealized losses on other securities ............................................................... — (60,148)Foreign currency translation adjustments ........................................................ (99,481) (120,606)Stock acquisition rights .................................................................................... 81 66Minority interests .............................................................................................. 1,470,612 1,972,044Goodwill and others ......................................................................................... (220,978) (0)Gain on sale on securitization transactions...................................................... (37,453) (42,102)Amount equivalent to 50% of expected losses in excess of provision ............ (21,336) (3,207)Total Tier I capital (A) ........................................................................................ 6,177,492 4,443,507
Tier II capital: Unrealized gains on other securities after 55% discount................................. 224,106 —Land revaluation excess after 55% discount ................................................... 37,033 37,211General reserve for possible loan losses.......................................................... 49,937 58,610Subordinated debt ........................................................................................... 2,203,415 2,303,618Total Tier II capital ............................................................................................ 2,514,493 2,399,439Tier II capital included as qualifying capital (B) ................................................ 2,514,493 2,399,439
Deductions: (C) ..................................................................................................................... 339,212 284,199Total qualifying capital: (D) = (A) + (B) – (C) ............................................................................................ ¥ 8,352,773 ¥ 6,558,747Risk-weighted assets: On-balance sheet items ................................................................................... ¥39,030,287 ¥37,853,376
Off-balance sheet items ................................................................................... 7,583,421 7,364,078Market risk items .............................................................................................. 426,799 248,081Operational risk ................................................................................................ 3,032,531 2,882,871 Amount obtained by multiplying by 12.5 the excess of the amount obtained by multiplying the old required capital by the rate prescribed by the Notification over the new required capital ........................................... — 83,273Total risk-weighted assets (E) ........................................................................... ¥50,073,039 ¥48,431,681
Tier I risk-weighted capital ratio: (A) / (E) ✕ 100 .................................................................................................... 12.33% 9.17%Total risk-weighted capital ratio: (D) / (E) ✕ 100 ................................................................................................... 16.68% 13.54%Required capital: (E) ✕ 8% ........................................................................................................... ¥ 4,005,843 ¥ 3,874,534
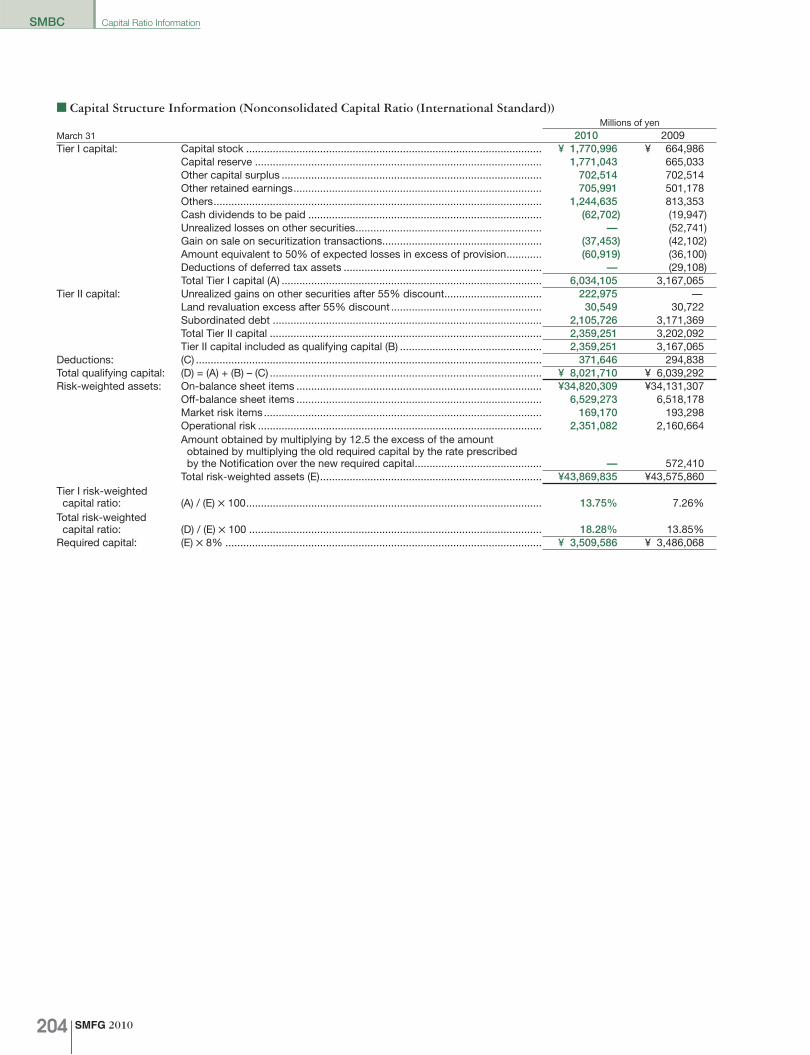
SMFG 2010204
SMBC Capital Ratio Information
■ Capital Structure Information (Nonconsolidated Capital Ratio (International Standard))Millions of yen
March 31 2010 2009Tier I capital: Capital stock .................................................................................................... ¥ 1,770,996 ¥ 664,986
Capital reserve ................................................................................................. 1,771,043 665,033Other capital surplus ........................................................................................ 702,514 702,514Other retained earnings .................................................................................... 705,991 501,178Others ............................................................................................................... 1,244,635 813,353Cash dividends to be paid ............................................................................... (62,702) (19,947)Unrealized losses on other securities ............................................................... — (52,741)Gain on sale on securitization transactions...................................................... (37,453) (42,102)Amount equivalent to 50% of expected losses in excess of provision ............ (60,919) (36,100)Deductions of deferred tax assets ................................................................... — (29,108)Total Tier I capital (A) ........................................................................................ 6,034,105 3,167,065
Tier II capital: Unrealized gains on other securities after 55% discount................................. 222,975 —Land revaluation excess after 55% discount ................................................... 30,549 30,722Subordinated debt ........................................................................................... 2,105,726 3,171,369Total Tier II capital ............................................................................................ 2,359,251 3,202,092Tier II capital included as qualifying capital (B) ................................................ 2,359,251 3,167,065
Deductions: (C) ..................................................................................................................... 371,646 294,838Total qualifying capital: (D) = (A) + (B) – (C) ............................................................................................ ¥ 8,021,710 ¥ 6,039,292Risk-weighted assets: On-balance sheet items ................................................................................... ¥34,820,309 ¥34,131,307
Off-balance sheet items ................................................................................... 6,529,273 6,518,178Market risk items .............................................................................................. 169,170 193,298Operational risk ................................................................................................ 2,351,082 2,160,664 Amount obtained by multiplying by 12.5 the excess of the amount obtained by multiplying the old required capital by the rate prescribed by the Notification over the new required capital ........................................... — 572,410Total risk-weighted assets (E) ........................................................................... ¥43,869,835 ¥43,575,860
Tier I risk-weighted capital ratio: (A) / (E) ✕ 100 .................................................................................................... 13.75% 7.26%Total risk-weighted capital ratio: (D) / (E) ✕ 100 ................................................................................................... 18.28% 13.85%Required capital: (E) ✕ 8% ........................................................................................................... ¥ 3,509,586 ¥ 3,486,068

SMFG 2010 205
Sumitomo Mitsui Financial Group, Inc. *Authorized Management Committee Members
■ Board of Directors, Corporate Auditors, and Executive Officers (as of June 30, 2010)
Corporate Data
BOARD OF DIRECTORS
Masayuki OkuChairman of the Board and Representative Director
Teisuke KitayamaPresident and Representative Director
Wataru Ohara*Deputy President and Representative DirectorAudit Dept.
Hideo Shimada*DirectorIT Planning Dept.Director of The Japan Research Institute, Limited
Takeshi Kunibe*DirectorSubsidiaries & Affiliates Dept., Corporate Planning Dept., Financial Accounting Dept., Strategic Financial Planning Dept.
Satoru Nakanishi*DirectorConsumer Business Planning Dept.
Junsuke Fujii*DirectorGeneral Affairs Dept., Human Resources Dept.
Koichi Miyata*DirectorPublic Relations Dept., Corporate Planning Dept.,Financial Accounting Dept., Strategic Financial Planning Dept., Corporate Risk Management Dept.
Shigeru IwamotoDirector (outside)
Yoshinori YokoyamaDirector (outside)
Kuniaki NomuraDirector (outside)
CORPORATE AUDITORS
Hiroki NishioCorporate Auditor
Yoji YamaguchiCorporate Auditor
Hideo SawayamaCorporate Auditor
Hiroshi ArakiCorporate Auditor (outside)
Ikuo UnoCorporate Auditor (outside)
Satoshi ItoCorporate Auditor (outside)
EXECUTIVE OFFICERS
Tetsuya Kubo*Senior Managing DirectorInvestment Banking Planning Dept.
Kazuya Jono*Senior Managing DirectorCard Business Dept.President of SMFG Card & Credit, Inc.
■ SMFG Organization (as of June 30, 2010)
Shareholders’ Meeting
Board of Directors
Risk Management Committee
Auditing Committee
Compensation Committee
Nominating Committee
Public Relations Dept.
Corporate Planning Dept.Investor Relations Dept.Group CSR Dept.
Audit Dept.Group Business Management Dept.
Financial Accounting Dept.
Strategic Financial Planning Dept.
Investment Banking Planning Dept.
Consumer Business Planning Dept.
Card Business Dept.
Subsidiaries & Affiliates Dept.
IT Planning Dept.
General Affairs Dept.
Human Resources Dept.
Corporate Risk Management Dept.Office of Corporate Auditors
Corporate Auditors/Board of Corporate
Auditors
Group Strategy Committee
Management Committee

SMFG 2010206
Sumitomo Mitsui Banking Corporation *1 Executive Officers *2 Authorized Management Committee Members
■ Board of Directors, Corporate Auditors, and Executive Officers (as of June 30, 2010)
BOARD OF DIRECTORS
Chairman of the Board
Teisuke KitayamaPresident
Masayuki Oku*1
Deputy Presidents
Yoshinori Kawamura*1 *2
Head of Corporate Banking UnitGlobal Advisory Dept.
Hideo Shimada*1 *2
IT Planning Dept., IT Business Strategy Planning Dept., Operations Planning Dept., Operations Support Dept., Director of The Japan Research Institute, Limited
Keiichi Ando*1
Located at Osaka (in charge of West Japan),Deputy Head of Middle Market Banking Unit (Credit Dept. II)
Senior Managing Directors
Takeshi Kunibe*1 *2
Public Relations Dept., Corporate Planning Dept., Financial Accounting Dept., Strategic Financial Planning Dept., Subsidiaries & Affiliates Dept.
Tetsuya Kubo*1 *2
Head of Investment Banking Unit
Satoru Nakanishi*1 *2
Head of Consumer Banking Unit
Junsuke Fujii*1 *2
Human Resources Dept., Human Resources Development Dept., Quality Management Dept., General Affairs Dept., Legal Dept., Administrative Services Dept.
Koichi Miyata*1 *2
Risk Management Unit (Corporate Risk Management Dept., Credit & Investment Planning Dept.)Human Resources Dept., Human Resources Development Dept.
Kazuya Jono*1
Head of Private Advisory Dept.President of SMFG Card & Credit, Inc.
Yoshihiko Shimizu*1 *2
Head of Middle Market Banking UnitCorporate Advisory Division, Global Advisory Dept.
Hiroshi Minoura*1 *2
Head of International Banking Unit
Directors (outside)
Shigeru Iwamoto
Yoshinori Yokoyama
Kuniaki Nomura
CORPORATE AUDITORS
Hiroki YazeCorporate Auditor
Yasuyuki HayaseCorporate Auditor
Hiroshi ArakiCorporate Auditor (outside)
Ikuo UnoCorporate Auditor (outside)
Satoshi ItoCorporate Auditor (outside)
Hiroki NishioCorporate Auditor
EXECUTIVE OFFICERS
Senior Managing Director
Jun MizoguchiHead of Europe DivisionPresident of Sumitomo Mitsui Banking Corporation Europe Limited
Managing Directors
Koichi Minami*2
Corporate Research Dept., Credit Administration Dept.Deputy Head of Corporate Banking Unit (Credit Dept.) and Investment Banking Unit (Structured Finance Credit Dept., Trust Services Dept.)
Koichi Danno*2
Internal Audit Dept., Credit Review Dept.
Mitsunori WatanabeHead of Corporate Advisory Division
Yujiro ItoGeneral Affairs Dept., Legal Dept., Administrative Services Dept.
Shuichi KageyamaOsaka Corporate Banking Division (Osaka Corporate Banking Depts. I, II, and III)
Seiichiro Takahashi*2
Head of Treasury Unit
Hidetoshi FurukawaNagoya Corporate Banking Division (Nagoya Corporate Banking Dept.)Head of Nagoya Middle Market Banking Division
Ikuhiko MorikawaDeputy Head of Consumer Banking Unit
Nobuaki KurumataniPublic Relations Dept., Corporate Planning Dept.
Katsunori OkuboDeputy Head of International Banking Unit, Middle Market Banking Unit, Corporate Banking UnitGlobal Advisory Dept.Chairman of Sumitomo Mitsui Banking Corporation (China) Limited
Ryosuke HaradaDeputy Head of Middle Market Banking Unit (Credit Dept. I)
Hiroyuki Iwami(Managing Director without portfolio)
Yuichiro UedaTokyo Corporate Banking Division (Tokyo Corporate Banking Depts. III, IV, and VI)

SMFG 2010 207
Shusuke KuroseDeputy Head of Middle Market Banking Unit (in charge of East Japan)
Masaki TachibanaHead of Americas Division
Toru NagamotoDeputy Head of Middle Market Banking Unit (in charge of East Japan)
Kohei HirotaDeputy Head of Middle Market Banking Unit (in charge of West Japan)
Yoshimi MiuraTokyo Corporate Banking Division (Tokyo Corporate Banking Depts. I, II, and V)
Masahiro FuchizakiIT Planning Dept., IT Business Strategy Planning Dept., Operations Planning Dept., Operations Support Dept.
Directors
Toshimi TagataGeneral Manager, Real Estate Finance Dept.
William M. GinnGeneral Manager, Corporate Banking Dept.-II, Americas Division and Specialized Finance Dept., Americas DivisionChairman of SMBC Leasing and Finance, Inc.
Ichiro OnishiDeputy Head of Consumer Banking Unit
Kazunori OkuyamaVice Chairman and President of Sumitomo Mitsui Banking Corporation (China) Limited
Atsuhiko InoueDeputy Head of Corporate Advisory Division
Shogo SekimotoGeneral Manager, Tokyo Corporate Banking Dept. I
Toshiyuki TeramotoGeneral Manager, Credit Dept. I, Middle Market Banking Unit
Manabu NaritaGeneral Manager, Planning Dept., Corporate Banking Unit & Middle Market Banking Unit
Chan Chi Keung, ChrisGeneral Manager, Corporate Banking Dept., Greater China
Shinichi HayashidaDeputy Head of International Banking Unit
Shunso MatsudaHead of Tokyo Toshin Middle Market Banking Division and Saitama Ikebukuro Middle Market Banking Division
Tadashi MatsuhashiHead of Tokyo Higashi Middle Market Banking Division
Etsutaka InoueHead of Osaka Minami Middle Market Banking Division
Katsuhiko KanabeGeneral Manager, IT Planning Dept.
Hisaya KuroyanagiHead of Shibuya Middle Market Banking Division and Yokohama Middle Market Banking Division
Yasushi SakaiGeneral Manager, Financial Accounting Dept.
Hiroshi MishimaGeneral Manager, Planning Dept., Treasury Unit
Jun OtaGeneral Manager, Planning Dept., Investment Banking Unit
Yasuyuki KawasakiGeneral Manager, Planning Dept., International Banking Unit
Fumiaki KuraharaGeneral Manager, Structured Finance Dept.
Makoto TakashimaGeneral Manager, Corporate Planning Dept.
Ryoji YukinoGeneral Manager, Planning Dept., Consumer Banking Unit
Kunio YokoyamaHead of Shinjuku Middle Market Banking Division
Shigeru SadakariGeneral Manager, Internal Audit Dept.
Hiroaki HattoriHead of Kobe Middle Market Banking Division
Kiyoshi MiuraHead of Osaka Kita Middle Market Banking Division
Masaki AshibeGeneral Manager, Credit Dept. II, Middle Market Banking Unit
Seiichi UenoGeneral Manager, Credit Dept., Corporate Banking Unit
Kozo OginoGeneral Manager, Tokyo Corporate Banking Dept. IV
Hiromitsu KawagoeDeputy Head of Corporate Advisory Division
Masahiro NakagawaGeneral Manager, Real Estate Corporate Business Office
Hiroichi FukudaGeneral Manager, Electronic Commerce Banking Dept.
Hitoshi IshiiGeneral Manager, Marunouchi Corporate Business Office
Koji KimuraGeneral Manager, Corporate Risk Management Dept.
Atsushi KurodaGeneral Manager, Tokyo Corporate Banking Dept. V
Seiji SatoGeneral Manager, Tokyo Corporate Banking Dept. III
Masayuki ShimuraHead of Asia Pacific Division
Katsunori TanizakiGeneral Manager, International Treasury Dept.
Tomohiro NishikawaHead of Kyoto Hokuriku Middle Market Banking Unit and General Manager, Kyoto Corporate Business Office-I
Takafumi YamahiroGeneral Manager, Operations Planning Dept.

SMFG 2010208
Public Relations Dept.Corporate Planning Dept.
Financial Accounting Dept.
Financial Research Dept.CSR Dept.
IT Planning Dept.IT Business Strategy Planning Dept.
Quality Management Dept.Customer Relations Dept.
Human Resources Dept.
Human Resources Development Dept.
Training InstituteCounseling Dept.Diversity and Inclusion Dept.
General Affairs Dept.
Financial Products Compliance Dept.Antimonopoly Law Monitoring Dept.
Financial Crime Prevention Dept.International Compliance Dept.
Legal Dept.
Internal Audit Dept.Credit Review Dept.
Subsidiaries & Affiliates Dept.Strategic Financial Planning Dept.
Corporate Staff Unit
Compliance Unit
Corporate Risk Management Dept.Operational Risk Management Dept.Risk Management Systems Dept.
Credit & Investment Planning Dept.Credit Portfolio Management Dept.
Risk Management Unit
Administrative Services Dept.Secretariat
Operations Planning Dept.Operations Support Dept.Corporate Research Dept.Credit Administration Dept.
Corporate Services Unit
Internal Audit Unit
Credit Business Dept.
Shareholders’Meeting
Board ofDirectors
Management Committee
Corporate Auditors/Board of Corporate AuditorsCorporate Auditors/Board of Corporate Auditors
Office of Corporate Auditors
Equity Portfolio Management Dept.
Consumer Banking Unit
Middle Market Banking Unit
Corporate Banking Unit
International Banking Unit
Treasury Unit
Investment Banking Unit
■ SMBC Organization (as of June 30, 2010)

SMFG 2010 209
Planning Dept., Consumer Banking Unit
Marketing Dept.Consumer Compliance Dept.
Next W•ing Project Dept.Consumer Facilitating Financing Dept.
Personal Product Development Dept.Financial Consulting Dept.
Consumer Loan Dept.
Planning Dept., Corporate Banking Unit & Middle Market Banking Unit
Credit Monitoring Dept.
Small Enterprises Credit Portfolio Administration Dept.
Credit Monitoring Dept.
Middle Market Facilitating Financing Dept.
Corporate Advisory Division
Mass Retail Dept.
Block Consumer Business Office
Middle Market Banking Division
Branch
Corporate Banking Dept.
Global Client Business Dept.Global Corporate Investment Dept.Global Trade Finance Dept.
Global Institutional Banking Dept.
Consumer Loan Promotion OfficeApartment House Loan Promotion Office
Branches/Representative Offices in North East Asia
Corporate Business Office
Financial Development OfficeReal Estate Corporate Business OfficePublic Institutions Business OfficeBusiness Support Office
Business Promotion Office
Departments of Americas Division
Loan Support OfficePrivate Banking Dept.Direct Banking Dept.Consumer Finance Promotion Office
Departments of Europe Division
Tokyo Corporate Banking Division Osaka Corporate Banking DivisionNagoya Corporate Banking Division
Americas DivisionEurope Division
Branches/Representative Offices in Asia Pacific Division
Universal Banking Dept.
Asia Pacific Division
Credit Dept., Consumer Banking Unit
Public & Financial Institutions Banking Dept.Business Promotion & Solution Dept.
Small and Medium Enterprises Marketing Dept.
Credit Dept. I, Middle Market Banking Unit
Credit Dept. II, Middle Market Banking Unit
Credit Dept., Corporate Banking Unit
Planning Dept., International Banking UnitIT & Business Administration Planning Dept.Asia Pacific Training Dept.
Planning Dept., Asia Pacific Division Asia Credit Dept., International Banking Unit
Environment Analysis Dept.
Planning Dept., Americas DivisionCredit Dept., Americas DivisionRisk Management Dept., Americas Division
Planning Dept., Europe DivisionCredit Dept., Europe DivisionRisk Management Dept., Europe Division
Compliance Dept., Americas Division
Credit Management Dept., International Banking Unit
Planning Dept., Treasury UnitTreasury Dept.International Treasury Dept.Trading Dept.Treasury Marketing Dept.
Planning Dept., Investment Banking Unit
Syndication Dept.
Securities Business Planning Dept.Strategic Products Dept.
Environmental Products Dept.Shipping Finance Dept.
Securities Direct Sales Dept.
Structured Finance Dept.
Stock Execution Dept.Trust Business Operations Dept.
Trust Services Dept.
Real Estate Finance Dept.M&A Advisory Services Dept.Merchant Banking Dept.
Financial Products Marketing Dept.
Financial Products Dept.
Structured Finance Credit Dept.
Branch Service OfficeHead/Main Service OfficePublic Institutions Operations Office
Electronic Commerce Banking Dept.
Asset Finance Dept.Global Securities Business Dept.
Global Transaction Banking Dept.
Settlement Finance Unit
Private Advisory Dept. Private Advisory Business Dept.Corporate Employees Business Dept.
Defined Contribution Dept.
Global Advisory Dept.

SMFG 2010210
Principal Subsidiaries and Affiliates (as of March 31, 2010)
■ Principal Domestic Subsidiaries
Company Name Issued Capital(Millions of Yen)
Percentage ofSMFG’s Voting
Rights (%)
Percentage ofSMBC’s Voting
Rights (%)Established Main Business
Sumitomo Mitsui Banking Corporation 1,770,996 100 — Jun. 6, 1996 Commercial banking
Sumitomo Mitsui Card Company, Limited 34,000 0 (65.99) — Dec. 26, 1967 Credit card services
Sumitomo Mitsui Finance and Leasing Company, Limited 15,000 60 — Feb. 4, 1963 Leasing
The Japan Research Institute, Limited 10,000 100 — Nov. 1, 2002 System engineering, data processing, management consulting, and economic research
SMBC Friend Securities Co., Ltd. 27,270 100 — Mar. 2, 1948 Securities
SMFG Card & Credit, Inc. 100 100 — Oct. 1, 2008 Business management
Nikko Cordial Securities Inc. 10,000 0 (100) 100 Jun. 15, 2009 Securities
SAKURA CARD CO., LTD. 7,438 0 (95.74) 85.14 (10.59) Feb. 23, 1983 Credit card services
ORIX CREDIT CORPORATION 22,170 0 (50.99) 50.99 Jun. 21, 1979 Consumer loans
SMM Auto Finance, Inc. 7,700 0 (56) 41 Sep. 17, 1993 Automotive financing
The Japan Net Bank, Limited 37,250 0 (59.70) 59.70 Sep. 19, 2000 Commercial banking
SMBC Loan Business Planning Co., Ltd. 100,010 0 (100) 100 Apr. 1, 2004 Management support services
SMBC Loan Adviser Co., Ltd. 10 0 (100) 0 (100) Apr. 1, 1998 Consulting and agency services for consumer loans
SMBC Guarantee Co., Ltd. 187,720 0 (100) 0 (100) Jul. 14, 1976 Credit guarantee
SMBC Finance Business Planning Co., Ltd. 10 0 (100) 100 Apr. 1, 2004 Management support services
SMBC Finance Service Co., Ltd. 71,705 0 (100) 0 (100) Dec. 5, 1972 Loans, collecting agent and factoring
SMBC Business Support Co., Ltd. 10 0 (100) 0 (100) Jul. 1, 2004 Clerical work outsourcer
Financial Link Co., Ltd. 160 0 (100) 0 (100) Sep. 29, 2000 Data processing service and e-trading consulting
SMBC Consulting Co., Ltd. 1,100 0 (100) 50 (25) May 1, 1981 Management consulting and seminar organizer
SMBC Support & Solution Co., Ltd. 10 0 (100) 100 Apr. 1, 1996 Help desk and system support
SMBC Servicer Co., Ltd. 1,000 0 (100) 100 Mar. 11, 1999 Servicer
SAKURA KCS Corporation 2,054 0 (50.21) 27.53 (5.00) Mar. 29, 1969 System engineering and data processing
THE MINATO BANK, LTD. 27,484 0 (46.44) 45.10 (1.33) Sep. 6, 1949 Commercial banking
Kansai Urban Banking Corporation 47,039 0 (60.24) 49.43 (0.35) Jul. 1, 1922 Commercial banking
SMBC Staff Service Co., Ltd. 90 0 (100) 100 Jul. 15, 1982 Temporary manpower service
SMBC Learning Support Co., Ltd. 10 0 (100) 100 May 27, 1998 Seminar organizer
SMBC PERSONNEL SUPPORT CO., LTD. 10 0 (100) 100 Apr. 15, 2002 Banking clerical work
SMBC Center Service Co., Ltd. 100 0 (100) 100 Oct. 16, 1995 Banking clerical work
SMBC Delivery Service Co., Ltd. 30 0 (100) 100 Jan. 31, 1996 Banking clerical work
SMBC Green Service Co., Ltd. 30 0 (100) 100 Mar. 15, 1990 Banking clerical work
SMBC International Business Co., Ltd. 20 0 (100) 100 Sep. 28, 1983 Banking clerical work
SMBC International Operations Co., Ltd. 40 0 (100) 100 Dec. 21, 1994 Banking clerical work
SMBC Loan Business Service Co., Ltd. 70 0 (100) 100 Sep. 24, 1976 Banking clerical work
SMBC Principal Finance Co., Ltd. 100 0 (100) 100 Mar. 8, 2010 Investments for corporate revitalization and other related investments
SMBC Market Service Co., Ltd. 10 0 (100) 100 Feb. 3, 2003 Banking clerical work
SMBC Loan Administration and Operations Service Co., Ltd. 10 0 (100) 100 Feb. 3, 2003 Banking clerical work
SMBC Property Research Service Co., Ltd. 30 0 (100) 100 Feb. 1, 1984 Banking clerical work
Japan Pension Navigator Co., Ltd. 1,600 0 (69.71) 69.71 Sep. 21, 2000 Defined contribution plan administrator
SMBC Electronic Monetary Claims Recording Co., Ltd. 500 0 (100) 100 Apr. 16, 2009 Electronic monetary claims recording
SMBC Barclays Wealth Service Co., Ltd.*1 30 0 (100) 100 Mar. 1, 2010 Provision and translation of business tools and research information
Note: Figures in parentheses ( ) in the voting rights columns indicate voting rights held indirectly via subsidiaries and affiliates.*1 SMFG and SMBC’s voting rights in SMBC Barclays Wealth Service Co., Ltd. has been at 50.1% since July 1, 2010.
All companies shown hereunder are consolidated subsidiaries or affiliates of Sumitomo Mitsui Financial Group, Inc.Those printed in green ink are consolidated subsidiaries or affiliates of Sumitomo Mitsui Banking Corporation.

SMFG 2010 211
■ Principal Overseas Subsidiaries
Company Name Country Issued CapitalPercentage ofSMFG’s Voting
Rights (%)
Percentage ofSMBC’s Voting
Rights (%)Established Main Business
Sumitomo Mitsui Banking Corporation Europe Limited U.K. US$1,600 million 0 (100) 100 Mar. 5, 2003 Commercial banking
Sumitomo Mitsui Banking Corporation (China) Limited China CNY7.0 billion 0 (100) 100 Apr. 27, 2009 Commercial banking
Manufacturers Bank U.S.A. US$80.786 million 0 (100) 100 Jun. 26, 1962 Commercial banking
Sumitomo Mitsui Banking Corporation of Canada Canada C$169 million 0 (100) 100 Apr. 1, 2001 Commercial banking
Banco Sumitomo Mitsui Brasileiro S.A. Brazil R$409.357 million 0 (100) 100 Oct. 6, 1958 Commercial banking
ZAO Sumitomo Mitsui Rus Bank Russia RUB1.6 billion 0 (100) 99 May. 8, 2009 Commercial banking
PT Bank Sumitomo Mitsui Indonesia Indonesia Rp1,502.4 billion 0 (99) 99 Aug. 22, 1989 Commercial banking
SMBC Leasing and Finance, Inc. U.S.A. US$1,620 0 (100) 89.69 (7.69) Nov. 9, 1990 Leasing, investments
SMBC Capital Markets, Inc. U.S.A. US$100 0 (100) 90 (10) Dec. 4, 1986 Derivatives and investments
SMBC Securities, Inc. U.S.A. US$100 0 (100) 90 (10) Aug. 8, 1990 Securities, investments
SMBC Financial Services, Inc. U.S.A. US$3 million 0 (100) 100 Aug. 8, 1990 Investments, investment advisor
SMBC Cayman LC Limited*2 Cayman Islands US$500 0 (100) 100 Feb. 7, 2003 Credit guarantee, bond investment
Sumitomo Finance (Asia) Limited Cayman Islands US$35 million 0 (100) 100 Sep. 26, 1973 Investments
SBTC, Inc. U.S.A. US$50 million 0 (100) 100 Jan. 26, 1998 Investments
SB Treasury Company L.L.C. U.S.A. US$470 million 0 (100) 0 (100) Jan. 26, 1998 Loans
SB Equity Securities (Cayman), Limited Cayman Islands ¥25,000 million 0 (100) 100 Dec. 15, 1998 Finance
SFVI Limited British Virgin Islands US$300 0 (100) 100 Jul. 30, 1997 Investments
Sakura Finance (Cayman) Limited Cayman Islands US$100,000 0 (100) 100 Feb. 11, 1991 Finance
Sakura Preferred Capital (Cayman) Limited Cayman Islands ¥10 million 0 (100) 100 Nov. 12, 1998 Finance
SMBC International Finance N.V. Netherlands Antilles US$200,000 0 (100) 100 Jun. 25, 1990 Finance
SMBC Leasing Investment LLC U.S.A. US$236.494 million 0 (100) 0 (100) Apr. 7, 2003 Investments in leasing
SMBC Capital Partners LLC U.S.A. US$10,000 0 (100) 100 Dec. 18, 2003 Holding and trading securities
SMBC MVI SPC Cayman Islands US$195 million 0 (100) 100 Sep. 9, 2004 Loans, buying/selling of monetary claims
SMBC DIP Limited Cayman Islands US$8 million 0 (100) 100 Mar. 16, 2005 Loans, buying/selling of monetary claims
SMBC Capital Markets Limited U.K. US$797 million 0 (100) 100 Mar. 13, 1990 Derivatives and investments
SMBC Derivative Products Limited U.K. US$300 million 0 (100) 0 (100) Apr. 18, 1995 Derivatives and investments
SMBC Capital India Private Limited India Rs400 million 0 (100) 99.99 (0.00) Apr. 3, 2008 Advisory services
Sumitomo Mitsui Finance Dublin Limited Ireland US$18 million 0 (100) 100 Sep. 19, 1989 Finance
Sakura Finance Asia Limited Hong Kong US$65.5 million 0 (100) 100 Oct. 17, 1977 Investments
Sumitomo Mitsui Finance Australia Limited Australia A$156.5 million 0 (100) 100 Jun. 29, 1984 Investments
SMFG Preferred Capital USD 1 Limited Cayman Islands US$649.491 million 100 — Nov. 28, 2006 Finance
*2 SMBC Cayman LC Limited, like other subsidiaries of SMBC, is a separate corporate entity with its own separate creditors and the claims of such creditors are prior to the claims of SMBC, as the direct or indirect holder of the equity in such subsidiary.

SMFG 2010212
■ Principal Affiliates
Company Name Country Issued CapitalPercentage ofSMFG’s Voting
Rights (%)
Percentage ofSMBC’s Voting
Rights (%)Established Main Business
SMFG Preferred Capital GBP 1 Limited Cayman Islands £73.676 million 100 — Nov. 28, 2006 Finance
SMFG Preferred Capital USD 2 Limited Cayman Islands US$1,800 million 100 — Oct. 25, 2007 Finance
SMFG Preferred Capital GBP 2 Limited Cayman Islands £250 million 100 — Oct. 25, 2007 Finance
SMFG Preferred Capital JPY 1 Limited Cayman Islands ¥135,000 million 100 — Jan. 11, 2008 Finance
SMFG Preferred Capital USD 3 Limited Cayman Islands US$1,350 million 100 — Jul. 8, 2008 Finance
SMFG Preferred Capital JPY 2 Limited Cayman Islands ¥698,900 million 100 — Nov. 3, 2008 Finance
SMFG Preferred Capital JPY 3 Limited Cayman Islands ¥392,900 million 100 — Aug. 12, 2009 Finance
SMBC Preferred Capital USD 1 Limited Cayman Islands US$663.141 million 0 (100) 100 Nov. 28, 2006 Finance
SMBC Preferred Capital GBP 1 Limited Cayman Islands £78.576 million 0 (100) 100 Nov. 28, 2006 Finance
SMBC Preferred Capital USD 2 Limited Cayman Islands US$1,811 million 0 (100) 100 Oct. 25, 2007 Finance
SMBC Preferred Capital GBP 2 Limited Cayman Islands £251.5 million 0 (100) 100 Oct. 25, 2007 Finance
SMBC Preferred Capital JPY 1 Limited Cayman Islands ¥137,000 million 0 (100) 100 Jan. 11, 2008 Finance
SMBC Preferred Capital USD 3 Limited Cayman Islands US$1,358 million 0 (100) 100 Jul. 8, 2008 Finance
SMBC Preferred Capital JPY 2 Limited Cayman Islands ¥706,500 million 0 (100) 100 Nov. 19, 2008 Finance
Company Name Issued Capital(Millions of Yen)
Percentage ofSMFG’s Voting
Rights (%)
Percentage ofSMBC’s Voting
Rights (%)Established Main Business
Daiwa SMBC Capital Co., Ltd.*1 18,767 0 (40) 40 Oct. 20, 1983 Venture capital
Daiwa Securities SMBC Principal Investments Co., Ltd. 500 0 (40) 40 Feb. 1, 2010 Investments, fund management
Daiwa SB Investments Ltd. 2,000 43.96 — Apr. 1, 1999 Investment advisory and investment trust management
Sumitomo Mitsui Asset Management Company, Limited 2,000 0 (27.5) 27.5 Dec. 1, 2002 Investment advisory and investment trust
management
JSOL CORPORATION 5,000 0 (50) — Jul. 3, 2006 System engineering and data processing
Sakura Information Systems Co., Ltd. 600 0 (49) 49 Nov. 29, 1972 System engineering and data processing
Vietnam Export Import Commercial Joint Stock Bank
VND12,526.947billion 0 (15.06) 15.06 May 24, 1989 Commercial banking
Promise Co., Ltd. 80,737 0 (22.02) 22.02 Mar. 20, 1962 Consumer loans
At-Loan Co., Ltd. 10,912 0 (100) 49.99 (50.00) Jun. 8, 2000 Consumer loans
SANYO SHINPAN FINANCE CO., LTD. 16,268 0 (100) 0 (100) Nov. 22, 1946 Consumer loans
POCKET CARD CO., LTD. 11,268 0 (47.01) 4.99 (42.01) May 25, 1982 Credit card services
Cedyna Financial Corporation*2 57,843 0 (48.58) — Sep. 11, 1950 Credit card and installment services
Sumitomo Mitsui Auto Service Company, Limited 6,950 39.99 — Feb. 21, 1981 Leasing
*1 Daiwa SMBC Capital Co., Ltd. is no longer an affiliate of Sumitomo Mitsui Financial Group or Sumitomo Mitsui Banking Corporation as of July 1, 2010, due to dissolution of the venture capital joint venture with Daiwa Securities Group Inc.
*2 Cedyna Financial Corporation became a consolidated subsidiary, on May 31, 2010.

SMFG 2010 213
Asia and Oceania
SMBC Branches and Representative Offices Hong Kong Branch7th & 8th Floor, One InternationalFinance Centre, 1 Harbour ViewStreet, Central, Hong KongSpecial Administrative Region,The People’s Republic of ChinaTel: 852 (2206) 2000Fax: 852 (2206) 2888
Shanghai Branch11F, Shanghai World FinancialCenter, 100 Century Avenue,Pudong New Area, Shanghai200120, The People’s Republic ofChinaTel: 86 (21) 3860-9000Fax: 86 (21) 3860-9999
Dalian Representative OfficeSenmao Building 9F, 147Zhongshan Lu, Dalian 116011,The People’s Republic of ChinaTel: 86 (411) 8370-7873Fax: 86 (411) 8370-7761
Chongqing Representative Office27F, Metropolitan Tower, 68Zourong Road, Yuzhong District,Chongqing 400010, The People’sRepublic of ChinaTel: 86 (23) 6280-3394Fax: 86 (23) 6280-3748
Shenyang Representative OfficeRoom No. 606, Gloria Plaza HotelShenyang, No. 32 Yingbin Street,Shenhe District, Shenyang110013, The People’s Republic ofChinaTel: 86 (24) 2252-8310Fax: 86 (24) 2252-8769(*) Shenyang Representative Office is closed
on August 13, 2010.
Taipei Branch3F, Walsin Lihwa Xinyi Building,No. 1 Songzhi Road, Xinyi District,Taipei 110, TaiwanTel: 886-2-2720-8100Fax: 886-2-2720-8287
Seoul BranchYoung Poong Bldg. 7F, 33,Seorin-dong, Jongno-gu,Seoul, 110-752, KoreaTel: 82-2-732-1801Fax: 82-2-399-6330
Singapore Branch3 Temasek Avenue #06-01,Centennial Tower, Singapore039190, The Republic ofSingaporeTel: 65-6882-0001Fax: 65-6887-0330
Labuan BranchLevel 12 (B&C), Main OfficeTower, Financial Park Labuan,Jalan Merdeka, 87000 Labuan,Federal Territory, MalaysiaTel: 60 (87) 410955Fax: 60 (87) 410959
Labuan Branch Kuala Lumpur Marketing OfficeLetter Box No. 25, 29th Floor,UBN Tower, 10, Jalan P. Ramlee,50250 Kuala Lumpur, MalaysiaTel: 60 (3) 2026-8392Fax: 60 (3) 2026-8395
Kuala Lumpur Representative OfficeLetter Box No. 25, 29th Floor,UBN Tower, 10, Jalan P. Ramlee,50250 Kuala Lumpur, MalaysiaTel: 60 (3) 2026-8392Fax: 60 (3) 2026-8395
Ho Chi Minh City Branch9th Floor, The Landmark,5B Ton Duc Thang Street,District 1, Ho Chi Minh City,VietnamTel: 84 (8) 3520-2525Fax: 84 (8) 3822-7762
Hanoi Branch1105, 11th Floor, Pacific PlaceBuilding, 83B Ly Thuong KietStreet, Hanoi, VietnamTel: 84 (4) 3946-1100Fax: 84 (4) 3946-1133
Yangon Representative OfficeRoom Number 717/718, 7th Floor,Traders Hotel, 223 Sule PagodaRoad, Pabedan Township,Yangon, MyanmarTel: 95 (1) 242828 ext.7717Fax: 95 (1) 381227
Bangkok Branch8th-10th Floor, Q.House LumpiniBuilding, 1 South Sathorn Road,Tungmahamek, Sathorn, Bangkok10120, ThailandTel: 66 (2) 353-8000Fax: 66 (2) 353-8282
Manila Representative Office20th Floor, Rufino Pacific Tower,6784 Ayala Avenue, Makati City,Metro Manila, The PhilippinesTel: 63 (2) 841-0098/9Fax: 63 (2) 811-0877
Sydney BranchLevel 35, The Chifley Tower,2 Chifley Square, Sydney, NSW2000, AustraliaTel: 61 (2) 9376-1800Fax: 61 (2) 9376-1863
International Directory (as of June 30, 2010)
SMFG 2010214
SMBC Principal Subsidiaries/AffiliatesSMFG Network Sumitomo Mitsui Banking Corporation (China) LimitedHead Office (Shanghai)11F, Shanghai World FinancialCenter, 100 Century Avenue,Pudong New Area, Shanghai200120, The People’s Republic ofChinaTel: 86 (21) 3860-9000Fax: 86 (21) 3860-9999
Sumitomo Mitsui Banking Corporation (China) LimitedShanghai Puxi Sub-Branch1, 12, 13,12F, Maxdo Center, 8 Xingyi Road, Changning District, Shanghai, The People’s Republic of ChinaTel: 86 (21) 2219-8000Fax: 86 (21) 2219-8199(*) opened on July 5, 2010
Sumitomo Mitsui Banking Corporation (China) LimitedBeijing BranchUnit1601,16F, North Tower,Beijing Kerry Centre, No.1, GuangHua Road, Chao Yang District,Beijing 100020, The People’sRepublic of ChinaTel: 86 (10) 5920-4500Fax: 86 (10) 5915-1080
Sumitomo Mitsui Banking Corporation (China) LimitedTianjin Branch12F, The Exchange Tower 2, 189Nanjing Road, Heping District,Tianjin 300051, The People’sRepublic of ChinaTel: 86 (22) 2330-6677Fax: 86 (22) 2319-2111
Sumitomo Mitsui Banking Corporation (China) LimitedTianjin Binhai Sub-Branch8F, E2B, Binhai Financial Street,No. 20, Guangchang East Road,TEDA, Tianjin 300457, ThePeople’s Republic of ChinaTel: 86 (22) 6622-6677Fax: 86 (22) 6628-1333
Sumitomo Mitsui Banking Corporation (China) LimitedGuangzhou Branch12F, International Finance Place,No.8 Huaxia Road, Tianhe District,Guangzhou 510623, The People’sRepublic of ChinaTel: 86 (20) 3819-1888Fax: 86 (20) 3810-2028
Sumitomo Mitsui Banking Corporation (China) LimitedSuzhou Branch23F, Metropolitan Towers, No. 199Shi Shan Road, Suzhou NewDistrict, Suzhou, Jiangsu 215011,The People’s Republic of ChinaTel: 86 (512) 6825-8205Fax: 86 (512) 6825-6121
Sumitomo Mitsui Banking Corporation (China) LimitedSuzhou Industrial Park Sub-Branch 16F, International Building, No. 2,Suhua Road, Suzhou IndustrialPark, Jiangsu Province 215021,The People’s Republic of ChinaTel: 86 (512) 6288-5018Fax: 86 (512) 6288-5028
Sumitomo Mitsui Banking Corporation (China) LimitedHangzhou Branch23F, Golden Plaza, No.118, QingChun Road, Xia Cheng District,Hangzhou, Zhejiang 310003,The People’s Republic of ChinaTel: 86 (571) 2889-1111Fax: 86 (571) 2889-6699
Sumitomo Mitsui Banking Corporation (China) LimitedShenyang Branch1501, E Building, Shenyang Fortune Plaza, 59 Beizhan Road, Shenhe District, Shenyang, 110013The People’s Republic of ChinaTel: 86 (24) 3128-7000Fax: 86 (24) 3128-7005
PT Bank Sumitomo Mitsui IndonesiaSummitmas II, 10th Floor, JI.Jendral Sudirman Kav. 61-62,Jakarta 12190, IndonesiaTel: 62 (21) 522-7011Fax: 62 (21) 522-7022
Sumitomo Mitsui Finance Australia LimitedLevel 35, The Chifley Tower,2 Chifley Square, Sydney, NSW2000, AustraliaTel: 61 (2) 9376-1800Fax: 61 (2) 9376-1863
SMBC Capital Markets LimitedHong Kong Branch7th Floor, One International Finance Centre, 1 Harbour ViewStreet, Central, Hong KongSpecial Administrative Region,The People’s Republic of ChinaTel: 852-2532-8500Fax: 852-2532-8505
SMBC Metro Investment Corporation20th Floor, Rufino Pacific Tower,6784 Ayala Avenue, Makati City,Metro Manila, The PhilippinesTel: 63-2-8110845Fax: 63-2-8110876
Vietnam Export ImportCommercial Joint Stock Bank7 Le Thi Hong Gam Street,Nguyen Thai Binh Ward, District1, Ho Chi Minh City, VietnamTel: 84 (8) 3821-0055Fax: 84 (8) 3829-6063
SBCS Co., Ltd.10th Floor, Q. House LumpiniBuilding, No.1 South Sathorn Road,Tungmahamek, Sathorn,Bangkok 10120 ThailandTel: 66 (2) 677-7270~5Fax: 66 (2) 677-7279

SMFG 2010 215
BSL Leasing Co., Ltd.19th Floor, Sathorn City Tower,175 South Sathorn Road, Thungmahamek, Sathorn,Bangkok, 10120 ThailandTel: 66 (2) 670-4700Fax: 66 (2) 679-6160
SMBC Capital India Private LimitedB-14/A, Qutab Institutional Area,Katwaria Sarai, New Delhi-1100016, IndiaTel: 91 (11) 4607-8366Fax: 91 (11) 4607-8355
The Japan Research Institute (Shanghai) Solution Co., Ltd.Unit 141, 18F, HSBC Tower, 1000 Lujiazui Ring Road,Pudong New Area,Shanghai, 200120 The People’sRepublic of ChinaTel: 86 (21) 6841-2788Fax: 86 (21) 6841-1287(*) relocated on July 19, 2010
The Japan Research Institute(Shanghai) Consulting Co., Ltd.Unit 41, 18F, HSBC Tower, 1000 Lujiazui Ring Road,Pudong New Area,Shanghai, 200120 The People’sRepublic of ChinaTel: 86 (21) 6841-1288Fax: 86 (21) 6841-1287(*) relocated on July 19, 2010
The Japan Research Institute (Shanghai) Consulting Co., Ltd.Beijing BranchUnit 906, 9F, North Tower, Beijing Kerry Centre, No.1, Guanghua Road, Chaoyang District, Beijing 100020, The People’s Republic of ChinaTel: 86 (10) 8529-8141Fax: 86 (10) 8529-7343
Sumitomo Mitsui Finance and Leasing (Singapore) Pte. Ltd.152 Beach Road,Gateway East #21-5,Singapore 189721Tel: 65-6224-2955Fax: 65-6225-3570
Sumitomo Mitsui Finance and Leasing (Hong Kong) Ltd.Room 2703, Tower I,Admiralty Centre, 18 HarcourtRoad, Hong Kong SpecialAdministrative Region,The People’s Republic of ChinaTel: 852-2523-4155Fax: 852-2845-9246
SMFL Leasing (Thailand) Co., Ltd.30th Floor, Q. HouseLumpini Building,1 South Sathorn Road,Tungmahamek, Sathorn,Bangkok 10120 ThailandTel: 66 (2) 677-7400Fax: 66 (2) 677-7413
Sumitomo Mitsui Finance and Leasing (China) Co., Ltd.Room 2502-2503, Goldlion Tower,138 Ti Yu Dong Road,Guangzhou, 510620The People’s Republic of ChinaTel: 86 (20) 8755-0021Fax: 86 (20) 8755-0422
Sumitomo Mitsui Finance and Leasing (China) Co., Ltd. Shanghai BranchUnit 2301-2303,Lippo Plaza, 222 Middle Huaihai Road, Luwan District, Shanghai, 200021 The People’s Republic of ChinaTel: 86(21)5396-5522Fax: 86(21)5396-5552
SMFL Leasing (Malaysia) Sdn. Bhd.Letter Box No. 58, 11th Floor,UBN Tower, 10 Jalan P. Ramlee,50250 Kuala Lumpur, MalaysiaTel: 60 (3) 2026-2619Fax: 60 (3) 2026-2627
PT. SMFL Leasing IndonesiaSummitmas II, 12th Floor, Jl.Jend.Sudirman Kav. 61-62 Jakarta Selatan 12190, IndonesiaTel: 62 (21) 520-2083Fax: 62 (21) 520-2088
Sumitomo Mitsui Auto Leasing & Service (Thailand) Co., Ltd.161, Nuntawan Building, 10th Floor,Rajdamri Road,Khwaeng Lumpinee,Khet Pathumwan,Bangkok Metropolis, ThailandTel: 66-2252-9511Fax: 66-2255-3130
PROMISE (HONG KONG) CO., LTD.14th Floor, Luk Kwok Centre,72 Gloucester Road,Wanchai, Hong Kong Special Administrative Region, The People’s Republic of ChinaTel: 852 (3199) 1000Fax: 852 (2528) 5472
PROMISE (THAILAND) CO., LTD.15th Floor, Capital Tower, All Seasons Place, 87/1 Wireless Road, Lumpini, Phatumwan, Bangkok 10330 ThailandTel: 66 (2) 655-8574Fax: 66 (2) 655-8170
PROMISE (SHENZHEN) CO., LTD.Room 911-912, Ying Long Development Center, Shennan Road 6025, Fu Tian District, Shenzhen 518040, The People’s Republic of ChinaTel: 86 (755) 2396-6200Fax: 86 (755) 2396-6379

SMFG 2010216
The Americas
SMBC Branches and Representative Offices New York Branch277 Park Avenue, New York,NY 10172, U.S.A.Tel: 1 (212) 224-4000Fax: 1 (212) 593-9522
Cayman BranchP.O. Box 694, Edward Street,George Town, Grand Cayman,Cayman Islands
Los Angeles Branch601 South Figueroa Street,Suite 1800, Los Angeles,CA 90017, U.S.A.Tel: 1 (213) 452-7800Fax: 1 (213) 623-6832
San Francisco Branch555 California Street, Suite 3350,San Francisco, CA 94104, U.S.A.Tel: 1 (415) 616-3000Fax: 1 (415) 397-1475
Houston Representative OfficeTwo Allen Center, 1200 SmithStreet, Suite 1140 Houston, Texas77002, U.S.A.Tel: 1 (713) 277-3500Fax: 1 (713) 277-3555
Mexico City Representative OfficeTorre Altiva Boulevard ManuelAvila Camacho 138 Piso 2, Loc. BLomas de Chapultepec, 11000Mexico, D.F.Tel: 52 (55) 2623-0200Fax: 52 (55) 2623-1375
SMBC Principal Subsidiaries/AffiliatesSMFG Network Manufacturers Bank515 South Figueroa Street,Los Angeles, CA 90071, U.S.A.Tel: 1 (213) 489-6200Fax: 1 (213) 489-6254
Sumitomo Mitsui Banking Corporation of CanadaErnst & Young Tower, Suite 1400,P.O. Box 172, Toronto DominionCentre, Toronto, Ontario M5K1H6, CanadaTel: 1 (416) 368-4766Fax: 1 (416) 367-3565
Banco Sumitomo Mitsui Brasileiro S.A.Avenida Paulista, 37-11 e 12andar, Sao Paulo-SP-CEP 01311-902, BrazilTel: 55 (11) 3178-8000Fax: 55 (11) 3289-1668
SMBC Capital Markets, Inc.277 Park Avenue, New York,NY 10172, U.S.A.Tel: 1 (212) 224-5100Fax: 1 (212) 224-5181
SMBC Leasing and Finance, Inc.277 Park Avenue, New York,NY 10172, U.S.A.Tel: 1 (212) 224-5200Fax: 1 (212) 224-5222
SMBC Securities, Inc.277 Park Avenue, New York,NY 10172, U.S.A.Tel: 1 (212) 224-5300Fax: 1 (212) 224-5333
JRI America, Inc.277 Park Avenue, New York,NY 10172, U.S.A.Tel: 1 (212) 224-4200Fax: 1 (212) 224-4611
Europe, Middle-East and Africa
SMBC Branches and Representative Offices Düsseldorf BranchPrinzenallee 7,40549 Düsseldorf,Federal Republic of GermanyTel: 49 (211) 36190Fax: 49 (211) 3619236
Brussels BranchAvenue des Arts, 58, Bte. 18,1000 Brussels, BelgiumTel: 32 (2) 551-5000Fax: 32 (2) 513-4100
Dubai BranchBuilding One, 5th Floor, GatePrecinct, Dubai InternationalFinancial Centre, PO Box 506559Dubai, United Arab EmiratesTel: 971 (4) 428-8000Fax: 971 (4) 428-8001
Madrid Representative OfficeVillanueva, 12-1. B, 28001 Madrid,SpainTel: 34 (91) 576-6196Fax: 34 (91) 577-7525
SMBC Amsterdam Representative OfficeStrawinskylaan 1733 Toren D-12,1077XX Amsterdam, TheNetherlandsTel: 31 (20) 718-3888Fax: 31 (20) 718-3889
Prague Representative OfficeInternational Business Centre,Pobrezni 3,186 00 Prague 8,Czech RepublicTel: 420-224-832-911Fax: 420-224-832-933

SMFG 2010 217
Bahrain Representative OfficeNo. 406 & 407 (Entrance 3, 4thFloor) Manama Centre,Government Road, Manama,State of BahrainTel: 973-17223211Fax: 973-17224424
Tehran Representative Office4th Floor, 80 Nezami GangaviStreet, Vali-e-Asr Avenue, Tehran14348, Islamic Republic of IranTel: 98 (21) 8879-4586/4569Fax: 98 (21) 8820-6523
Doha QFC OfficeOffice 1901, 19th Floor, QatarFinancial Centre Tower,Diplomatic Area-West bay, Doha,Qatar, P.O. Box 23769Tel: 974-4496-7572Fax: 974-4496-7576
Cairo Representative OfficeFlat No. 6 of the 14th Fl., 3 IbnKasir Street, Cornish El Nile, Giza,Arab Republic of EgyptTel: 20 (2) 3761-7657Fax: 20 (2) 3761-7658
Johannesburg Representative OfficeBuilding Four, First Floor,Commerce Square,39 Rivonia Road, Sandhurst,Sandton 2196, South AfricaTel: 27 (11) 502-1780Fax: 27 (11) 502-1790
SMBC Principal Subsidiaries/AffiliatesSMFG Network Sumitomo Mitsui Banking Corporation Europe Limited Head Office99 Queen Victoria Street, LondonEC4V 4EH, U.K.Tel: 44 (20) 7786-1000Fax: 44 (20) 7236-0049
Sumitomo Mitsui Banking Corporation Europe Limited Paris Branch20, Rue de la Ville l’Evêque,75008 Paris, FranceTel: 33 (1) 44 (71) 40-00Fax: 33 (1) 44 (71) 40-50
Sumitomo Mitsui Banking Corporation Europe Limited Milan BranchVia della Spiga 30/ Via Senato 25,20121 Milan, ItalyTel: 39 (02) 7636-1700Fax: 39 (02) 7636-1701
Sumitomo Mitsui Banking Corporation Europe Limited Moscow Representative OfficePresnenskaya naberezhnaya, house 10, block C, Moscow, 123317 Russian FederationTel: 7 (495) 287-8265Fax: 7 (495) 287-8266
SMBC Capital Markets Limited99 Queen Victoria Street, LondonEC4V 4EH, U.K.Tel: 44 (20) 7786-1400Fax: 44 (20) 7786-1490
SMBC Derivative Products Limited99 Queen Victoria Street, LondonEC4V 4EH, U.K.Tel: 44 (20) 7786-1400Fax: 44 (20) 7786-1490
ZAO Sumitomo Mitsui Rus BankPresnenskaya naberezhnaya, house 10, block C, Moscow 123317, Russian FederationTel: 7 (495) 287-8200Fax: 7 (495) 287-8201
Sumitomo Mitsui Finance Dublin LimitedLa Touche House, I.F.S.C.,Custom House Docks, Dublin 1,IrelandTel: 353 (1) 670-0066Fax: 353 (1) 670-0353
JRI Europe, Limited99 Queen Victoria Street, LondonEC4V 4EH, U.K.Tel: 44 (20) 7406-2700Fax: 44 (20) 7406-2799
SMFL Aircraft Capital Corporation B.V.World Trade Center Amsterdam, Strawinskylaan 907,1077 XX Amsterdam, The NetherlandsTel: 31-20-575-2570Fax: 31-20-575-2571

SMFG 2010218
**SMBCE:Sumitomo Mitsui Banking Corporation Europe Limited
ZAO Sumitomo Mitsui Rus Bank
SMBCE**Moscow Representative Office
GLOBAL NETWORK
Sumitomo MitsuiBanking Corporation
Europe Limited
SMBCE** Paris BranchSMBCE** Milan Branch
Brussels Branch
SMBC Amsterdam Representative Office
Düsseldorf Branch
Madrid Representative Office
Prague Representative Office
Tehran Representative Office
SMBC Capital IndiaPrivate Limited
Dubai BranchBahrain Representative Office
Doha QFC Office
Cairo Representative Office
Dubai BranchJohannesburg Representative Office
Sumitomo Mitsui Finance Dublin Limited
Sydney BranchSumitomo Mitsui Finance Australia Limited
SMBC Capital Markets Limited
Asia and Oceania
■ Sumitomo Mitsui Banking Corporation (China) Limited Head Office (Shanghai)
■ Sumitomo Mitsui Banking Corporation (China) Limited Tianjin Branch
■ Sumitomo Mitsui Banking Corporation (China) Limited Guangzhou Branch
■ Sumitomo Mitsui Banking Corporation (China) Limited Suzhou Branch
■ Sumitomo Mitsui Banking Corporation (China) Limited Hangzhou Branch
■ Sumitomo Mitsui Banking Corporation (China) Limited Beijing Branch
■ Sumitomo Mitsui Banking Corporation (China) Limited Shenyang Branch
■ Sumitomo Mitsui Banking Corporation (China) Limited Tianjin Binhai Sub-Branch
■ Sumitomo Mitsui Banking Corporation (China) Limited Suzhou Industrial Park Sub-Branch
■ Shanghai Branch■ Dalian Representative Office■ Chongqing Representative Office■ Shenyang Representative Office■ Hong Kong Branch
SMBC Capital Markets Limited Hong Kong Branch■ Taipei Branch■ Seoul Branch■ Singapore Branch■ Labuan Branch■ Labuan Branch Kuala Lumpur Marketing Office
Kuala Lumpur Representative Office
■ Ho Chi Minh City Branch■ Hanoi Branch■ Vietnam Export Import Commercial Joint Stock Bank■ Yangon Representative Office■ Bangkok Branch
SBCS Co., Limited■ Manila Representative Office
SMBC Metro Investment Corporation■ Sydney Branch
Sumitomo Mitsui Finance Australia Limited■ PT Bank Sumitomo Mitsui Indonesia■ SMBC Capital India Private Limited

SMFG 2010 219
Tianjin Binhai Sub-Branch Houston Representative Office
SMBC Leasing and Finance, Inc.SMBC Securities, Inc.
Europe, Middle East and AfricaThe Americas
Overseas service network (as of June 30, 2010) Branches*: 15 Sub-Branches*: 6 Representative Offices: 13 Total: 34Also showing principal overseas subsidiaries* Number of each status is based on the definition in Japan.
Mexico City Representative Office
Seoul Branch
Hong Kong Branch
GuangzhouBranch Taipei Branch
Head Office (Shanghai)*2
Shanghai BranchHangzhou
Branch
Suzhou Branch
SMBC Capital Markets LimitedHong Kong Branch
Tianjin Branch
Beijing Branch
Shenyang Branch
PT Bank Sumitomo Mitsui Indonesia
Kuala Lumpur Representative Office
Singapore Branch
Labuan Branch Kuala Lumpur Marketing Office
Labuan Branch
Bangkok BranchSBCS Co., Limited
Ho Chi Minh City BranchVietnam Export ImportCommercial Joint Stock Bank
Yangon Representative Office
Chongqing Representative Office
Dalian Representative
Office
Shenyang Representative Office*1
Hanoi Branch
Manila Representative OfficeSMBC Metro Investment Corp.
Suzhou Industrial Park Sub-Branch
New York Branch
Los Angeles Branch
San Francisco Branch
Manufacturers Bank
Sumitomo Mitsui Banking Corporation of Canada
Cayman Branch
Banco Sumitomo Mitsui Brasileiro S.A.
SMBC Capital Markets, Inc.
Indicates branch or sub-branch of Sumitomo Mitsui Banking Corporation (China) Limited
*1 Shenyang Representative Office is closed on August 13, 2010.*2 Shanghai Puxi Sub-Branch opened on July 5, 2010.
■ New York BranchSMBC Capital Markets, Inc.SMBC Leasing and Finance, Inc.SMBC Securities, Inc.
■ Los Angeles Branch*■ San Francisco Branch*■ Houston Representative Office*■ Mexico City Representative Office*■ Cayman Branch■ Manufacturers Bank■ Sumitomo Mitsui Banking Corporation of
Canada■ Banco Sumitomo Mitsui Brasileiro S.A.
■ Sumitomo Mitsui Banking Corporation Europe LimitedSMBC Capital Markets Limited
■ Sumitomo Mitsui Banking Corporation Europe Limited Paris Branch
■ Sumitomo Mitsui Banking Corporation Europe Limited Milan Branch
■ Düsseldorf Branch■ Brussels Branch■ SMBC Amsterdam Representative Office■ Madrid Representative Office■ Prague Representative Office
■ Sumitomo Mitsui Banking Corporation Europe Limited Moscow Representative Office
■ ZAO Sumitomo Mitsui Rus Bank■ Sumitomo Mitsui Finance Dublin Limited■ Dubai Branch■ Doha QFC Office■ Bahrain Representative Office■ Tehran Representative Office■ Cairo Representative Office■ Dubai Branch Johannesburg Representative
Office*

Printed in Japan
AN
NU
AL
RE
PO
RT
20
10
www.smfg.co.jp/english