Embed Size (px)
Citation preview

MAYOR OF LONDON Transport for London
Annual Report and Statement of Accounts 2009/10
Transport for London – Annual Report and Statement of Accounts 2009/102
Contents
3
Contents
Message from the Mayor 4
Commissioner’s foreword 6
The year at a glance 8
Operational performance tables 10
Efficient and effective business operations 12
Supporting economic development and population growth 16
Enhancing the quality of life for all Londoners 34
Improving the safety and security of all Londoners 44
Improving transport opportunities for all Londoners 52
Reducing transport’s contribution to climate change and improving its resilience 58
Supporting delivery of the 2012 Games and securing a lasting legacy 66
Improving efficiency, equality and partnerships 70
Progress against the Mayor’s Transport Strategy 76
Statement of Accounts 82
Chief Officers 164
Members of TfL 166
Membership of TfL panels and committees 168
Directors of Crossrail Ltd 170
Remuneration 172

Transport for London – Annual Report and Statement of Accounts 2009/104
Message from the Mayor
This Annual Report sets out the areas in which Londoners started to see tangible benefits of sustained investment in their transport system.
The truly marvellous, shining, air-conditioned East London line was completed and opened on time and to budget. Linking Hackney and Croydon, it will create jobs, generate wealth and give whole communities a better chance to enjoy London’s prosperity. It is the first major stage in what will become the Capital’s orbital railway.
The Docklands Light Railway engineered a 50 per cent increase in capacity on its busiest line by introducing a three-car service – again on time and to budget.
The Tube upgrade – a project of vital importance to the UK economy – forged ahead.
Better still, we finally heard the death-rattle of the monstrously expensive and inefficient London Underground Public Private Partnership (PPP). The final PPP contractor, Tube Lines, is now a subsidiary of Transport for London (TfL). Not only will
this save hundreds of millions of pounds, it will also mean that we can reduce the impact of weekend closures on passengers and businesses. The Tube will be upgraded in a way that suits Londoners, not lawyers.
The construction of Crossrail, a project that is now a potent symbol of the country’s confidence in economic recovery, continues apace.
Despite the pressures on public finances, now is not the time to curtail the scope or slow the pace of investment in London’s transport system. The Tube upgrade, Crossrail and the bus network are of such critical strategic importance to the UK’s economy that ill considered cuts would prove catastrophic. It would stifle growth in the UK’s most productive area and condemn millions of commuters to overcrowding and an increasingly unreliable service.
To safeguard this investment, I have had to make tough decisions. I increased fares to ensure that London’s own contribution to this programme can be maintained.
The Commissioner and I also drove forward our root and branch efficiency programme. This will deliver more than £5bn of savings, blazing a trail for the Government’s own approach to cost savings, now just getting under way.
But, recognising the vital importance of major capital investment should not blind us to the very many positive things we can do for relatively small sums of money.
After many years of people talking about it, I got the Train Operating Companies to agree

5Message from the Mayor
to use Oyster, enabling rail passengers in London to get the benefits and convenience of TfL’s Oyster card.
The cycling revolution is happening. The Barclays Cycle Hire Scheme launches this summer and the first two Cycle Superhighways are in delivery.
We’ve had great success in making the transport system even safer. Bus-related crime is at a six-year low and Tube crime has fallen by 26 per cent in recent years.
These fantastic results are due to more uniformed officers, highly visible staff at stations and more CCTV and Help points.
This year I launched my new Transport Strategy setting out my long-term vision for London’s transport to ensure we continue to deliver critical upgrades ahead of the 2012 Games and beyond. I’m looking forward to working with the Government to ensure that crucial investment in the Capital’s transport system is protected so that vision can be realised.
My thanks go the management, staff and Board of TfL for their tremendous achievements and to Londoners for their continued support for improved transport.
Boris Johnson Mayor of London

Transport for London – Annual Report and Statement of Accounts 2009/106
Commissioner’s foreword
London is the economic powerhouseof the UK. Our job at Transport forLondon (TfL) is to help keep it that wayby providing the day-to-day transportservices required to support investmentin the Capital, future growth and improveLondoners’ quality of life.
Our high levels of operational performance, as measured by customer satisfaction and other performance metrics, has continued. I believe that this is the longest period of sustained good operational performance by TfL or any of its predecessors since before the second world war.
We are also making good progress in delivering the Mayor’s immediate priorities, and his longer-term vision for transport. Significant achievements in the year include new and refurbished stations, improved Tube, Docklands Light Railway and Overground trains and, of course, the new East London line. In the process, and as the credit rating agencies among others have acknowledged, we have again demonstrated a very strong track record of delivering on time and to budget.
The economic climate is the toughest in living memory. Therefore, it is right that we have taken decisive and tough action to provide clear value for tax and fare payers. Our focus on this will be continuous and relentless.
We are ahead of the game in delivering one of the largest efficiency programmes anywhere in the UK public sector, with more than £5bn being saved. Work on multiple schemes, for which no funding is available, has been stopped; senior salaries have been frozen for two consecutive years; and the Chief Officers and I have waived our performance awards. In addition, back-office costs are being reduced by twenty five per cent, overall staff numbers are being reduced by eight per cent, spending on consultants and temporary workers has been cut, we have moved significant numbers of staff to cheaper offices, and we have radically reduced marketing and communications expenditure.
The period has also seen us introduce greater scrutiny and transparency of what we do and how we do it. A new independent group – the Investment Programme Advisory Group under the chairmanship of David James – has been established to advise the TfL Board and publicly report on our delivery. Not only is TfL now more efficient, it is also a more open organisation.
My thanks go to the Chief Officers, the management and staff, including those of our contractors, and all of our other partners for their hard work during the year.
Peter Hendy Commissioner Transport for London

7Commissioner’s foreword
Transport for London – Annual Report and Statement of Accounts 2009/108
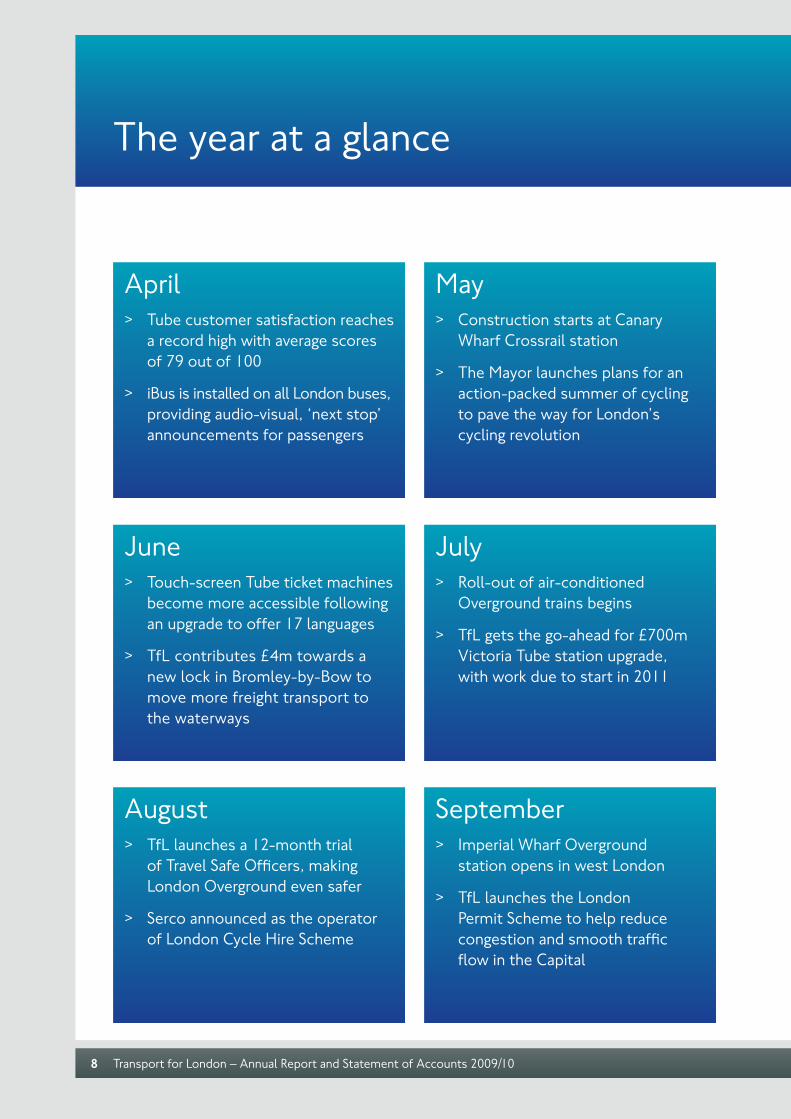
The year at a glance
July > Roll-out of air-conditioned
Overground trains begins
> TfL gets the go-ahead for £700m Victoria Tube station upgrade, with work due to start in 2011
September > Imperial Wharf Overground
station opens in west London
> TfL launches the London Permit Scheme to help reduce congestion and smooth traffic flow in the Capital
May > Construction starts at Canary
Wharf Crossrail station
> The Mayor launches plans for an action-packed summer of cycling to pave the way for London’s cycling revolution
August > TfL launches a 12-month trial
of Travel Safe Officers, making London Overground even safer
> Serco announced as the operator of London Cycle Hire Scheme
April > Tube customer satisfaction reaches
a record high with average scores of 79 out of 100
> iBus is installed on all London buses, providing audio-visual, ‘next stop’ announcements for passengers
June > Touch-screen Tube ticket machines
become more accessible following an upgrade to offer 17 languages
> TfL contributes £4m towards a new lock in Bromley-by-Bow to move more freight transport to the waterways

9The year at a glance 9
January > Additional cycle funding announced
for 13 Outer London boroughs
> Oyster pay as you go now accepted on all National Rail services in Greater London
March > Bus-related crime across the
Capital drops by 10.5 per cent, reaching a six-year low
> A £6m transformation of Woolwich town centre is completed
November > Oyster pay as you go now valid on
Thames Clippers’ services
> New Tube station ticket hall cuts queues at King’s Cross St. Pancras
February > The first three-carriage trains go
into service on the Docklands Light Railway
> Smarter Travel Sutton scheme delivers a 75 per cent increase in cycling
October > The first air-conditioned Tube
train arrives in London, a step towards replacement of the entire Metropolitan line fleet
> New South Quay Docklands Light Railway station opens
December > Wrightbus chosen to design and
build the New Bus for London
> Legible London pedestrian information system expanded to cover more of the West End, Richmond and Twickenham, plus South Bank and Bankside
Transport for London – Annual Report and Statement of Accounts 2009/1010
Operational performance tables
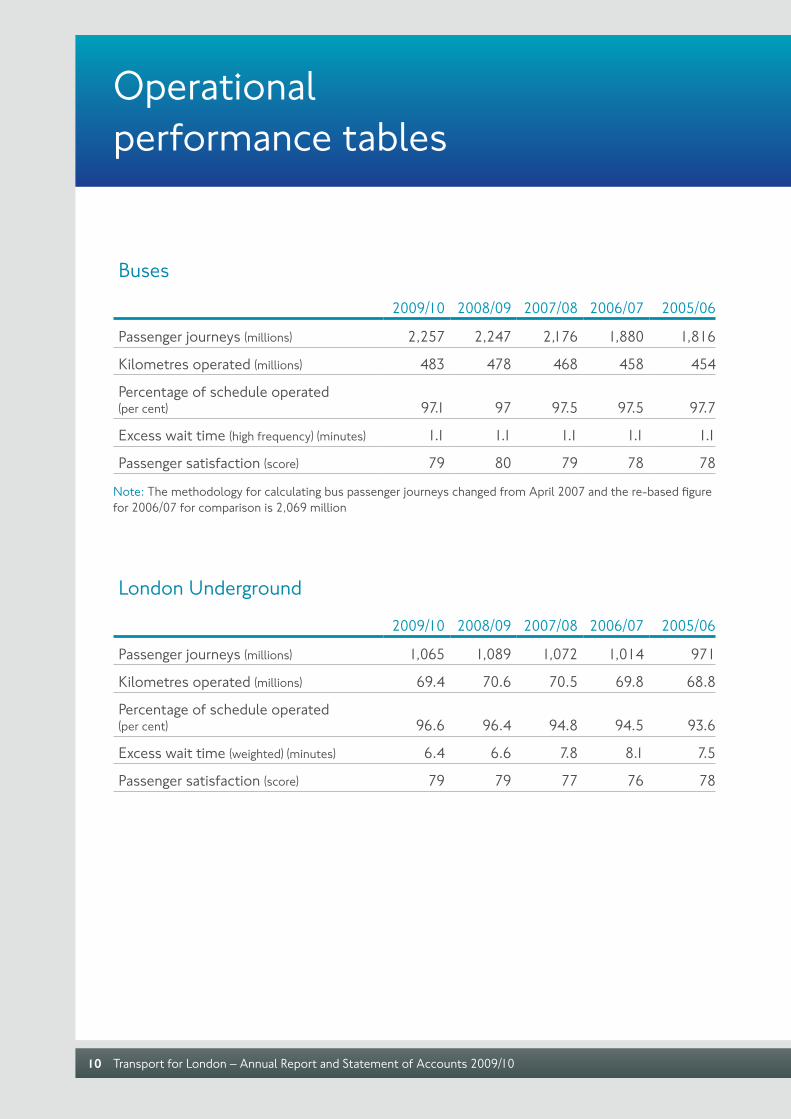
Buses
2009/10 2008/09 2007/08 2006/07 2005/06
Passenger journeys (millions) 2,257 2,247 2,176 1,880 1,816
Kilometres operated (millions) 483 478 468 458 454
Percentage of schedule operated (per cent) 97.1 97 97.5 97.5 97.7
Excess wait time (high frequency) (minutes) 1.1 1.1 1.1 1.1 1.1
Passenger satisfaction (score) 79 80 79 78 78
Note: The methodology for calculating bus passenger journeys changed from April 2007 and the re-based figure for 2006/07 for comparison is 2,069 million
London Underground
2009/10 2008/09 2007/08 2006/07 2005/06
Passenger journeys (millions) 1,065 1,089 1,072 1,014 971
Kilometres operated (millions) 69.4 70.6 70.5 69.8 68.8
Percentage of schedule operated (per cent) 96.6 96.4 94.8 94.5 93.6
Excess wait time (weighted) (minutes) 6.4 6.6 7.8 8.1 7.5
Passenger satisfaction (score) 79 79 77 76 78

11Operational performance tables 11
2009/10 2008/09 2007/08 2006/07 2005/06
Passenger journeys (millions) 69 66 67 61 54
Kilometres operated (millions) 4.6 3.9 4.4 4.4 3.6
On-time performance (per cent) 94.8 94.6 97.3 97.8 97.3
Passenger satisfaction (score) 91.9 92 97.3 96.8 95.4
Note: Significant infrastructure and construction work was carried out on the Docklands Light Railway to prepare for three-car services which has impacted on 2009/10 passenger satisfaction.
Docklands Light Railway
2009/10 2008/09 2007/08
Kilometres operated (millions) 3.4 3.4 n/a
On-time performance (per cent) 93.2 92.2 91.4
Passenger satisfaction (score) 78.5 73 n/a
Note: London Overground services started operation in November 2007. Previously, services were operated by Silverlink Metro. Journey data are not reported at present as passenger numbers are derived from revenue allocations based on passenger surveys and can only be considered as estimations. TfL is currently introducing a new fleet of trains on to the London Overground network. These trains have a weighing system which should allow passenger data to be provided in future years.
London Overground
London Tramlink
2009/10 2008/09 2007/08 2006/07 2005/06
Passenger journeys (millions) 26.5 27.0 26.3 24.8 20.8
Kilometres operated (millions) 2.6 2.7 2.6 2.5 2.4
Planned kilometres delivered (per cent) 98.6 98.4 99 99.3 97.4
Passenger satisfaction (score) 86.3 86 85 84 n/a

Transport for London – Annual Report and Statement of Accounts 2009/1012

13
Efficient and effectivebusiness operations
Efficient and effective business operations
Reducing costsThe scope and ambition of TfL’s savingsprogramme has nearly doubled since lastyear’s budget, with £438m gross savingsbudgeted in 2010/11.
Over the next three years £1.7bn of savings are assumed as part of a wider cost reduction programme totalling more than £5bn over the Business Plan period. This represents an ambitious and comprehensive change programme encompassing all areas of the organisation.
The Business Plan, on which last year’s budget was based, included £2.4bn of efficiencies (arising from ‘back-office’ and support expenditure) resulting from TfL’s Operating Cost Review. On coming to office, and faced with significant financial pressures, the Mayor challenged TfL’s management and staff to deliver further cost savings in order to reduce the need to cut investment or frontline services.
A continuous savings exercise was undertaken as part of TfL’s planning process. All budget holders were asked to identify options to meet a 2.5 per cent savings target – through further efficiencies, opportunities to generate additional secondary revenue and by identifying or cutting out the lowest priority areas of expenditure.
This year, TfL continued to identify further efficiencies, examine opportunities to generate additional secondary revenue and highlight the lowest priority areas of expenditure. This resulted in a comprehensive programme comprising around 250 individual initiatives, ranging from small-scale local savings projects to high-value organisational change programmes. During the past financial year, gross savings of £306m have been achieved.
In a difficult economic climate, TfL has continued to work hardduring 2009/10 to deliver its investment commitments withinavailable funding levels, while protecting frontline services.

Transport for London – Annual Report and Statement of Accounts 2009/1014
London Underground
A number of savings programme activities have begun and are delivering benefits:
> The integration of Metronet has led to over 1,000 fewer roles in central services
> A rationalisation of project requirements has reduced sub-surface line upgrade costs
> Value engineering and procurement strategy reviews have saved capital project costs
> Reduced maintenance costs have been delivered as a result of a number of contract consolidations
> Improved procurement processes have achieved project cost savings on the sub-surface railway power upgrade programme
Surface Transport
An independent review of the bus network has been carried out to explore the potential for further savings in the planning and contracting of services.
The study concluded that bus provision efficiency in London compares favourably to other cities, and the most significant savings can only be achieved through reducing the quality or frequency of services. However, there are others which are being pursued, for example, working with operators to investigate ways of reducing the costs of vehicle financing.
This year, East Thames Buses was sold to London General Transport Services Limited, part of the Go Ahead Group. The transfer will save TfL £4.5m over the next three years, through the sale of the asset and reduced operating costs.
Considerable savings have also been achieved in the costs of Congestion Charging and Traffic Enforcement through reductions in staffing and contractual efficiencies. Over the Business Plan period, £240m savings will be achieved.
15Efficient and effective business operations
London Rail
Savings of £2.9m for 2009/10 have been achieved through reducing back-office support and overheads.
Corporate
The number of directorates in the TfL corporate centre has been cut from five to three. The number of Chief Officers was also reduced with corresponding cost savings, and Planning was downsized following the cancellation of work on unfunded projects.
A review of ticketing costs has resulted in the termination of an expensive Private Finance Initiative (PFI) contract that provided a range of ticketing services for London Underground and London Buses. A new contract will offer greater value for money, with increased service levels and greater flexibility for future improvements.
Savings have also been achieved by moving some staff to alternative office accommodation, leveraging relevant lease expiry/break clauses for higher cost buildings and implementing plans to move out of the more expensive properties. TfL vacated four locations during the year.
A review of marketing and customer research has led to savings of more than £23m per annum in marketing expenditure across TfL, of which £16.5m has been re-allocated to fund the Mayor’s election commitment to provide extra policing resource.
Phase 1 of a project to streamline customer contact centres was completed during the year, saving £20m. Further integration and technology improvements will be made over the next three years.
Finance activities are also being consolidated and rationalised, particularly the areas of management reporting, business planning and financial transactions. The HR function has also been reviewed.

Transport for London – Annual Report and Statement of Accounts 2009/1016
TfL is investing billions to ensure London is prepared for the estimated population and workforce growth – 800,000 and 400,000 people respectively by 2021.
Supporting economic development and population growth
Supporting economic development and population growth 17
Tube upgradesWith London’s population expected to grow by 1.3 million over the next 20years, the expansion of the Underground network is vital. The delivery of the biggest investment programme in generations continued during the year and when complete, will provide around 30 per cent extra capacity onthe Tube.
Improvements are also being made to existing services. Piccadilly line passengers are experiencing improved journeys after a new timetable was introduced. The line is used by more than 650,000 people a day and provides an important link through the heart of the Capital’s tourist and entertainment districts and beyond to Heathrow Airport. The timetable changes, introduced progressively with the last phase in May, have included increasing services on some of the busiest parts of the line at certain times. Trains are now more reliable and passenger waiting times have dropped by an average 25 per cent. Additionally, overall journey times have been cut and the modified service can recover from delays more quickly.
Tube passengers in West London now have more frequent and reliable services after major changes to enhance the Circle line service were introduced during December. The line now runs as an end-to-end service – from Edgware Road, around the circle through High Street Kensington, Victoria and Liverpool Street, then on to Hammersmith. A small proportion of passengers now need to change trains at Edgware Road, but the new service pattern has almost doubled the frequency of trains between Paddington and Hammersmith. It has also allowed the entire service to recover more quickly following any incidents and enabled capacity to be increased on some other parts of the District, Metropolitan and Hammersmith & City lines.
Tube Lines, the PPP contractor, was unable to finish the Jubilee line upgrade by the end of December 2009, the contractual completion date (see page 21). The project, which is the first of the major line upgrades designed to deliver significant extra capacity, is likely to be completed at least 10 months late, while extensive weekend closures continue to disrupt services. Tube Lines has required almost three times as many weekend closures as were originally planned.

Transport for London – Annual Report and Statement of Accounts 2009/1018
When complete, the Jubilee line upgrade will allow trains to run every two minutes at peak times, and provide a third more capacity. This is in addition to the 17 per cent capacity increase created in 2006 with the introduction of a seven-car service. It will also reduce waiting times, provide faster trains, and journey times will be around 22 per cent quicker. Overall, at least an extra 10,000 passenger trips an hour will be able to take place during peak periods.
In stark contrast to Tube Lines’ failure to deliver, good progress has been made on the upgrade of lines transferred to TfL control following the collapse of Metronet. The Victoria line is being upgraded with a new signalling system, a control centre and a fleet of 47 new trains. The first train entered passenger service in July and following successful running at off-peak times, is now operating at peak times as well, with further new trains now in service and the roll-out of the whole fleet continuing. The new signalling and control systems have all been installed and continue to prove themselves alongside the existing signalling, which will remain in place until all the old trains have been phased out.
The first of the new air-conditioned, walk-through ‘S-stock’ trains for the sub-surface (Circle, District, Hammersmith & City and Metropolitan) lines was delivered in October and is being tested prior to introduction on the Metropolitan line later this year. This will begin the process of replacing the current sub-surface train fleets, some of which have been in service for nearly 50 years.
In July, London Underground issued an invitation to tender for the re-signalling of these lines. This is the biggest piece of work in the entire Tube upgrade programme and will replace a variety of systems that have been in place for more than 50 years, with some equipment up to 100 years old. The new signalling system will be more efficient, delivering significant extra capacity and enabling quicker and more frequent journeys.
30% increase in London’s rail-based capacity due to Crossrail and Tube upgrades
Supporting economic development and population growth 19
Following the Metronet collapse in 2007, London Underground decided to re-tender as the original contract, placed by Metronet, did not provide the most effective technical solution or the best value for money.
By the end of December, tenders for this project had been received and London Underground began the process of evaluating them. One of the targets set to potential suppliers was to reduce, as far as possible, the need for weekend and other closures. Although some level of closures will always be required to complete the work safely and on time, the aim is to learn from the experience of other metros, such as Paris and Madrid, and deliver the upgrade with less disruption than has been necessary on some other Tube lines.
The Tube upgrades and Crossrail – the 118km rail link between Maidenhead and Heathrow in the west and Shenfield and Abbey Wood in the east – constitute the backbone of the investment programme and are dependent on each other to realise their full benefits. From 2017, when Crossrail services begin, they will add more than 30 per cent to London’s rail-based transport capacity.
As well as progress with the major line upgrades, the process of ongoing renewal of the Tube’s core assets continued – with the replacement of 27km of track, the refurbishment or replacement of 26 escalators and lifts, plus the completion of 23 station refurbishments and modernisations.
Station upgradesImprovements continued at key Tube stations across the network. A total of £1bn is being invested at Tottenham Court Road to upgrade the Underground station, build the new Crossrail station and create a piazza outside Centrepoint.
The main construction is expected to be finished in 2016 when passengers will benefit from a ticket hall almost six times the size of the current one, plus new entrances and more access points to platforms, which will reduce congestion. There will also be additional escalators and five new lifts providing step-free access.
In July, plans to upgrade Victoria Tube station received Government approval, and in March the redevelopment contract was awarded. Victoria is one of the Capital’s busiest stations, with more than 80 million passengers using it each year. During the morning rush hour it suffers from severe overcrowding and it is often necessary to stop passengers entering for periods to avoid platform overcrowding.
The station will benefit from investment of around £700m, and when the upgrade is complete, capacity will increase by around 50 per cent. It will have a larger ticket hall, seven
80 million passengers use Victoria Tube station each year
Transport for London – Annual Report and Statement of Accounts 2009/1020
new lifts and nine extra escalators. Also, step-free access from street level to all platforms will make it easier to change services. Construction is due to start during 2010 and will take around seven years to finish.
In November, a new state-of-the-art ticket hall opened at King’s Cross St. Pancras Underground station, doubling capacity, cutting congestion and improving accessibility. Passengers now benefit from 10 new escalators, six lifts, plus more ticket machines. Additionally, around 300 metres of tunnels link the ticket hall with the Northern, Piccadilly and Victoria lines, providing new entrances to the deep-level platforms. There is also step-free access to five of the six lines that serve the station opening up significant new journey opportunities. Step-free access to the Northern line will be available from mid-2010.
King’s Cross St. Pancras is a national and international gateway for millions of Londoners and visitors every year. It is a key 2012 Games station and by the time the event arrives in the Capital, more than 100,000 people will be passing through it at peak times every day. The 2,000 square metre northern ticket hall, which was funded by the Department for Transport (DfT) as part of TfL’s Investment Programme, is the station’s third ticket hall and an early indication of the transport improvements being delivered in preparation for the Games.
In January, TfL issued an invitation to tender for the £300m redevelopment of Bond Street Tube station. The contract is likely to be awarded by summer 2010 with construction due to begin at the end of the year.
The station has more than 155,000 daily passengers and when Crossrail arrives in 2017, this figure is expected to reach 225,000. When complete, the station will provide a seamless interchange between Tube and Crossrail services, improved journey times and reduced congestion. Other benefits include a new ticket hall on Marylebone Lane, which will increase capacity and provide step-free access to platforms, plus more escalators to the Jubilee line.
The redevelopment will transform the Bond Street area and act as a catalyst for further investment to secure the West End as a premier shopping and entertainment destination and employment centre.
Utility diversions and enabling works around Crossrail’s Bond Street Hanover Square station began in December in preparation for the start of construction, and will continue throughout 2010.
Improvements are also continuing at Blackfriars Tube station, which is closed until late 2011 while the main railway station is rebuilt. Although the upgrades are primarily designed to improve the Thameslink network, passengers on the Underground will also enjoy a completely transformed station when it re-opens. It will provide quicker and easier interchange between National Rail and Tube services, offering new escalators from the platforms to a larger Underground ticket hall area, plus step-free access. Additionally, there will be an improved public address system, better lighting and enhanced station security.

Supporting economic development and population growth 21
Crossrail on track Europe’s largest construction project, Crossrail, gathered pace in 2009/10. Theline will revolutionise transport in the South East and bring 1.5 million people within a 60-minute commute of the City.
Crossrail will provide improved access to jobs, health, education and welfare services. It will increase the Capital’s rail capacity by 10 per cent and help reinforce London’s position as a world-leading business and financial centre.
In September, Crossrail secured one of the largest loans ever awarded for a transport project when the European Investment Bank agreed to provide it with a £1bn loan facility. This recognises the importance of the new rail link to London’s economy and that of the UK as a whole.
Construction work began on the first Crossrail station – Canary Wharf – in May. Located in North Dock, it will be one of the biggest stations on the Crossrail network and will include 9,290 square metres of retail space and a roof-top park.
Demolition work was completed at Tottenham Court Road to enable a major redevelopment of the station. Crossrail construction will begin here during 2010 and, in May, a 40-metre crane was brought in to assist with utility diversions in the Charing Cross Road area ahead of this work starting.
In April, the Mayor announced the setting up of a tunnelling academy to be delivered by Crossrail for the industry as a whole. Due to
open in early summer 2011, it will provide first-class engineering training in the key skills needed to work in tunnel excavation and underground construction. Tunnelling for Crossrail will begin in late 2011.
PPP contractsIn March, the PPP Arbiter published FinalDirections on Tube Lines’ costs for the second period of the PPP contract.
The Arbiter determined that the economic and efficient price for maintaining the upgrade of the Jubilee, Northern and Piccadilly lines over seven-and-a-half years from mid-2010 to 2017 should be £4.46bn.
The final costs remained much less than the original £6.8bn sought by Tube Lines – and its shareholders, Amey (Ferrovial) and Bechtel – and around £1.3bn less than their final demand. The Arbiter’s views also endorsed TfL’s original cost evalution but highlighted a shortfall against TfL’s £4bn budget.
Rather than demanding that Tube Lines raise the finance required to complete the upgrades (as was always envisaged under the PPP contracts) the Arbiter suggested TfL should raise additional funds itself, or amend its requirements.
The Mayor and TfL argued that this situation demonstrates that the PPP contract is not delivering for Londoners and taxpayers, and that all PPP finance should be raised by Tube Lines and its shareholders. TfL confirmed that it would continue to explore all options including legal remedies.1
1 The reporting period for the 2009/10 Annual Report ended on 31 March 2010. Following this, in May 2010, TfL announced that it had reached agreement with Bechtel and Amey (Ferrovial) to buy their shares in Tube Lines. When the deal is complete, Tube Lines will become a wholly owned subsidiary of TfL. This will bring the complex PPP structure to an end.

Transport for London – Annual Report and Statement of Accounts 2009/1022
The Arbiter confirmed that Tube Lines could have completed the Jubilee line upgrade on time and budget and should also have finished around half the Northern line by summer 2010. The Arbiter also made it clear that delays, and any increased costs, were Tube Lines responsibility, as shown when a £327m claim against London Underground was rejected in its entirety by an independent QC earlier in the year.
By contrast, in June, the National Audit Office issued a report on the former Metronet companies’ conduct which showed that, following the period of Administration and subsequent transfer to TfL, performance improved on the Bakerloo, Central, Victoria, Waterloo & City, Circle, District, Hammersmith & City and Metropolitan lines. The upgrade programmes now under London Underground’s direct control are progressing well.
Docklands Light Railway upgrades During 2009/10, further improvements were made to the Docklands Light Railway to upgrade services from two to three carriages to provide a 50 per cent capacity increase. Major construction work included extending platforms, strengthening viaducts and improving junctions.
The £325m project has been supported by a proactive marketing, stakeholder and press campaign which has seen Docklands Light Railway’s reputation remain intact with passengers and key stakeholder groups during the works.
Supporting economic development and population growth 23
In December, Bank Docklands Light Railway station closed for a month so engineering upgrades could take place on the Bank to Lewisham branch line – the network’s busiest route.
This two-and-a-half-year investment programme project was completed in January and has seen three-car services gradually introduced. The first, full three-car service will operate for the London Marathon in April, and a full passenger service will run on the Bank – Lewisham route before summer 2010.
Fifty-five new carriages, costing £100m, have been purchased to supplement the existing fleet and enable the three-car trains to run. Their improved interior layout provides more room and easier exit and entrance. Forty-eight are already operating and the final seven are in production.
The suspension of services also allowed for the remodelling of the junction which splits the Bank and Tower Gateway lines, enabling a more efficient and frequent train service to both destinations. The Olympic Delivery Authority (ODA) contributed £6.4m for the work.
New track works also took place during the year. A complex ‘flyunder’ was completed to allow quicker commuter journeys from Bank to Canary Wharf and Lewisham. By linking Westferry and Canary Wharf stations it means trains can avoid stopping at West India Quay station. And, a new flyover was completed at Canning Town station, which enables more trains to use it. Benefits include an improved service for residents along the Beckton line and for the ExCeL exhibition centre.
During October, an extraordinary feat of engineering on the Docklands Light Railway effectively ‘moved’ South Quay station without any disruption to passengers. On the evening of Friday 26 October, the station closed and a state-of-the-art £30m replacement opened the following Monday just 125-metres away, after weekend testing.
The old station was situated on a curve, so platforms could not be lengthened to cater for three-car services. However, the new station was built further down the line on a straight section of track. The contractor, Taylor Woodrow, ensured it was constructed without the line or station ever being closed.
The new station includes a full-length canopy to provide weather protection for waiting passengers and two ground-level concourses. Both have Oyster facilities, ticket machines and cycle stands. The eastern concourse houses two fully-enclosed staircases to each platform. The western concourse covers a larger area and provides the bulk of the station facilities including a passenger lift, two energy-efficient escalators and fully-enclosed staircases to each platform.
The ‘move’ was funded by TfL and the London Borough of Tower Hamlets. The borough secured £7m in Section 106 contributions from developers involved in the nearby Millennium Quarter. Section 106 of the Town and Country Planning Act 1990 enables funding for works of public benefit to be obtained from developers by the local authority.

Transport for London – Annual Report and Statement of Accounts 2009/1024
Expanding the Overground In July, the roll-out began of 54 new London Overground trains.
The three-carriage trains can carry almost 500 people – an eight per cent increase compared to their predecessors – and feature a range of passenger benefits (see page 42). They are also designed to be 10 times more reliable than the previous models. By 2011, a fourth carriage will be added to services, increasing capacity by a third.
The first 24 Overground trains are running on the existing Stratford to Richmond, Clapham Junction to Willesden Junction and Watford to Euston lines. A further 20 will run on the
Dalston Junction to West Croydon route when it opens in May.
During 2009/10, the new £7.8m Imperial Wharf station opened, providing west Londoners with a direct connection to the Overground and rail networks for the first time.
Passengers are now benefiting from high-frequency rail connections to Shepherd’s Bush, for shopping destination Westfield, and the major transport interchanges of Clapham Junction and Willesden Junction. The station features Oyster ticketing, a staffed ticket office, step-free access, CCTV, plus the latest security and information features.

Supporting economic development and population growth 25
Funding for the station was split as follows: £4.8m from St George, the developer; £1m from TfL; £1.35m from the London Borough of Hammersmith & Fulham and £650,000 from the Royal Borough of Kensington & Chelsea.
The project highlights the effective partnerships between national, regional and local organisations which enabled the station to be delivered ahead of schedule. It demonstrates how public and private sector cooperation can successfully provide significant new public transport infrastructure for the benefit of local residents and businesses.
Imperial Wharf is served by London Overground’s new air-conditioned trains and, from 2011, will welcome four longer trains an hour. Southern trains also call at the station.
In September, London Overground took over the management of 10 stations between New Cross and West Croydon to prepare for the completion of the new London Overground East London line. The stations are New Cross Gate, Brockley, Honor Oak Park, Forest Hill, Sydenham, Crystal Palace, Penge, West Anerley, Norwood Junction and West Croydon.
TfL is investing £1.4bn to modernise the Overground and incorporate the East London line. When it opens in spring 2010, it will form part of a revitalised and expanded London Overground network connecting Hackney in northeast London and Croydon in the south with frequent, metro-style services. The line will be a major contribution to the regeneration of some the Capital’s poorest boroughs, employing 300 people. In addition, half of its train drivers live in the boroughs of Lewisham, Southwark or Tower Hamlets.
In 2011, the line will join with London Overground’s Richmond to Stratford branch, when a spur will be completed between
Dalston Junction to link with Canonbury and Highbury & Islington. In 2012, the second phase of the project will be completed between Clapham Junction and Surrey Quays to form an orbital railway. It will serve 22 London boroughs and give hundreds of thousands of people quick and convenient access to the Capital’s wider integrated transport network.
Other passenger benefits will include new, air-conditioned trains, driver-monitored CCTV, wider doors and gangways plus wheelchair spaces. Four new step-free stations (Dalston Junction, Haggerston, Hoxton and Shoreditch High Street) will have improved safety features, new touch-screen ticket machines and state-of-the-art CCTV.
In February, London Overground’s Gospel Oak to Stratford line closed for major track and signal upgrades, platform lengthening and station refurbishments. The works are part of a massive £326m programme which will allow more frequent services and longer trains and is expected to provide additional capacity for the 2012 Games and beyond.
Demand on this section of the line is expected to rise by a quarter over the next seven years. TfL and the ODA are providing three quarters of the funding for the project, with the remainder coming from Network Rail and the DfT. The upgrade will be complete in 2011, well ahead of the Games.
In early April, two new 250-metre London Overground platforms opened at Stratford Regional station to reduce congestion, provide more capacity and increase accessibility. They form an ‘island platform’ which allows trains to pass on either side. Additionally, there are new Help points, clearer signs, information screens and CCTV cameras. Access to the rest of the station is

Transport for London – Annual Report and Statement of Accounts 2009/1026
via two subways connected to the platforms by lifts and stairs.
In early 2010, a programme of major station improvements began. All London Overground stations will undergo significant refurbishments to enhance entrances, ticket halls, platforms, passenger information and safety features, including more CCTV coverage and Help points. This work is due to be completed by late 2011.
Enhancing bus servicesTfL continues to improve routes and access to bus services. Around 6.4 million people travel on the Capital’s buses every day, and more than 90 per cent of Londoners live within 400 metresof a bus stop.
The bus network changes continuously, responding to people’s travel needs. Research and liaison with stakeholders continued during the year and 72 formal consultations were carried out on proposed service alterations.
Improvements included new services for housing areas, support for regeneration and better links with the rail network. There were also changes to various services as part of town centre and street improvement projects.
These included schemes in South Kensington, Woolwich and Brixton, plus new bus lanes in Holborn and Piccadilly Circus. A 10 per cent reduction in bus flows along Oxford Street was introduced in 2009/10, and articulated buses were replaced on routes 38, 507 and 521. All other routes are expected to be converted by the end of 2011 – a Mayoral commitment.
In February, two East London Transit routes started running, serving Ilford, Barking and Dagenham Dock. The new services are expected to carry around six million passengers a year and provide better connections between local communities, jobs and other transport modes.
Sixteen new vehicles manufactured exclusively for the service use dedicated bus lanes which have been introduced to busier parts of the route. The buses feature the latest environmentally friendly engines, more leg room and iBus. Street improvements have also been delivered as part of the scheme, including road re-surfacing, better street lighting, upgraded bus stops and shelters and improved public spaces.
The buses for the new service are among more than 1,000 that are replacing older vehicles in TfL’s 8,500-strong bus fleet.
A borough-led project to reduce overall journey time and improve reliability for bus passengers along route 38 (from Hackney to Victoria bus station) was completed on time and to budget. The project, which received support from TfL, involved creating a more pleasant and safe environment for all road users, including pedestrians and cyclists, while providing a robust service for local communities and businesses. It received the ‘Improvement to Bus Services’ award at the London Transport Awards in March.
90% of Londoners live within 400 metres of a bus stop

Supporting economic development and population growth 27
Improving tramsTfL is investing £28m in a major programme of upgrades and maintenance on London’s Tramlink network.
During the summer, work was carried out to replace track, points and drainage at East Croydon tramstop, which has suffered due to heavy traffic crossing. Passengers are now experiencing smoother, faster journeys and reduced noise levels. It has also enabled a temporary speed restriction to be lifted. Across the tram network, the number of these restrictions has been reduced from 38 in 2007 (before TfL’s acquisition) to just two.
Expanding Oyster More than seven million Oyster cards areregularly used in London and last year accounted for more than three billion passenger journeys. More than 80 per cent of all Tube and bus payments in the Capital are now made with Oyster.
In November, Oyster pay as you go was rolled out to river services. From 2 January 2010, the ticketing system was extended to cover all commuter rail routes within Greater London, particularly benefiting people living in the south and northeast of the Capital, where previously Oyster had not been widely available. Passengers can now travel seamlessly across the network switching between Tube and rail services.
A total of £40m was invested to install or upgrade equipment at every train station in the Capital to deliver Oyster on National Rail. The extension has opened up a range of new journey opportunities as rail passengers travelling into and across London from other parts of the country now need just one ticket.
National Rail Oyster fares are zonally based, but are different from fares on TfL services. A combined TfL/National Rail fare is now charged for Oyster journeys that incorporates both TfL and National Rail services. TfL is working with the Association of Train Operating Companies with a view to simplifying this fares structure.
The expansion of Oyster pay as you go on National Rail has doubled the number of stations where it is accepted and has led to a significant increase in the amount of people who benefit. Additionally, since January, a new Oyster rail map has been showing the reach of Oyster around the Capital at all stations across London.
To ensure people not travelling through Zone 1 pay the best value fare, new pink Oyster route validators were installed at key London Overground and Tube stations in September. This has resulted in many passengers paying cheaper fares by touching in mid-way through their journeys, depending on the route they take.
The validators can identify those who have avoided travelling through Zone 1 for journeys where there are several route options, and ensure the appropriate fare is charged. Passengers are still required to touch in and out at either end of their journey.
The new technology has been installed at Gospel Oak, Gunnersbury, Highbury & Islington, Kensington Olympia, Rayners Lane, Stratford, West Brompton, Willesden Junction and Blackhorse Road, where passengers usually change trains or services.

Transport for London – Annual Report and Statement of Accounts 2009/1028
Better interchangeWork continued across the transport network to improve access and interchange between services.
In November, TfL published its Interchange Best Practice Guidelines, which seek to improve the quality of planning, design and operation of public transport interchanges. The new northern ticket hall at King’s Cross St. Pancras, which opened in November, exemplifies the principles outlined in the document and has enhanced passengers’ experiences when changing between trains and other modes of transport.
Also in November, a new footbridge opened at Limehouse Docklands Light Railway station making it easier to transfer between National Rail services. Around 3,000 passengers transfer from c2c westbound to Docklands Light Railway eastbound platforms during the morning peak as part of their journey to the Canary Wharf area. Previously, they had to go to street level to move between platforms. The £1.9m footbridge was funded with £1.65m from TfL and £250,000 from the DfT’s Access for All Small Scheme.
The bridge features a full-length canopy, lighting and CCTV coverage linked to the Docklands Light Railway control centre; ticket barriers for access to the c2c platform; Oyster card validators for use when entering the Docklands Light Railway platform; and a step-free route to the westbound c2c platform from street level via a lift.
Smoothing traffic flow A number of activities took place during 2009/10 to improve the road network, make journeys more reliable and improve conditions for all road users.
Major focus was placed on reviewing and developing traffic control technology, minimising disruption from planned roadworks and unplanned events, plus ensuring effective maintenance and improving TfL’s road network and traffic signals.
London Streets reviewed 1,003 traffic signal timings at sites across the Capital to ensure their safe and efficient operation. This included several major intersections, such as Trafalgar Square, Hyde Park Corner, Vauxhall Cross and Hanger Lane Gyratory. Across the sites, delays were reduced by 5.9 per cent.
During the year, Split Cycle Offset Optimisation Technique (SCOOT) infrastructure was installed at 335 sites in London. The technology dynamically changes signal timings to best suit traffic conditions using road sensors. SCOOT is already operating at around 2,000 signals, constantly re-phasing the lights to reduce stops and delays. Over the next five years, a further 665 traffic signals and, therefore, 50 per cent of London’s 6,000 signals will have the system
900 days of disruption were saved by coordinating utility works at a single site during 2009/10

Supporting economic development and population growth 29
installed. In addition, 199 signal sites were modernised to include latest technology to improve their resilience.
Work also took place to develop and obtain approval for a new pilot scheme to implement Pedestrian Countdown at traffic signals. The system will help signalised junctions operate more efficiently, by providing pedestrians with clear information about how long they have to cross the road.
Managing roadworksIn November, TfL and 18 London boroughs received permission from the DfT to introduce a common permit scheme to ensure that any organisation wanting to dig up the Capital’s roads causes minimum disruption.
On 11 January, the London Permit Scheme was introduced on TfL’s road network and to date, almost 12,000 permits have been issued. In addition, TfL has been able to reject around 1,800 permit applications which would have caused unnecessary disruption. In the same period, more than 240 days of disruption have been saved through companies working together.
In April, the Mayor introduced a ‘Code of Conduct for Roadworks’ aiming to smooth traffic flow and better manage roadworks.
The code’s signatories – the five main utility companies that carry out works on London’s roads – agreed to 10 key principles to help reduce delays and disruption associated with their roadworks.
The code saw an increase in works undertaken outside peak hours and greater use of covers over excavated roads, which allowed the road to be used at peak times.
Also, more than 900 days of disruption were saved by more than one utility company working on a single site at the same time.
In February, a sixth utility company signed up to the code which was strengthened to include new targets. It now covers almost 95 per cent of the works carried out on TfL’s roads.
Both the code and the London Permit Scheme have had a positive impact on managing the road network, but further plans include the possible introduction of a ‘lane rental’ scheme to charge works promoters for occupation of space on TfL’s busiest roads.
The scheme could allow companies to avoid charges in certain circumstances, for example if works were carried out at times that were less traffic-sensitive or they employed practices which enabled the carriageway to return to traffic use at peak times.
TfL has worked with the DfT to help develop a scheme and plans to consult stakeholders in summer 2010, with a view to introducing new regulations in October 2011.
1,800permit applications have been rejected by TfL preventing unnecessary disruption from roadworks
Transport for London – Annual Report and Statement of Accounts 2009/1030
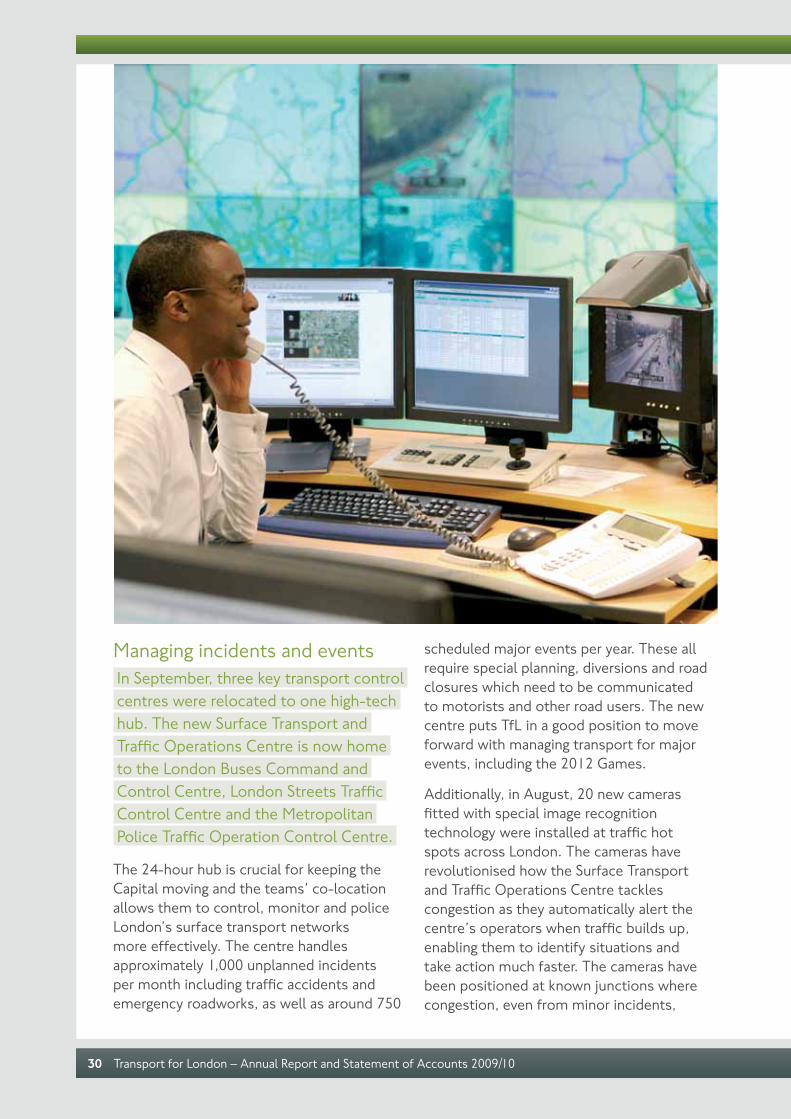
Managing incidents and eventsIn September, three key transport control centres were relocated to one high-tech hub. The new Surface Transport and Traffic Operations Centre is now hometo the London Buses Command and Control Centre, London Streets Traffic Control Centre and the Metropolitan Police Traffic Operation Control Centre.
The 24-hour hub is crucial for keeping the Capital moving and the teams’ co-location allows them to control, monitor and police London’s surface transport networks more effectively. The centre handles approximately 1,000 unplanned incidents per month including traffic accidents and emergency roadworks, as well as around 750
scheduled major events per year. These all require special planning, diversions and road closures which need to be communicated to motorists and other road users. The new centre puts TfL in a good position to move forward with managing transport for major events, including the 2012 Games.
Additionally, in August, 20 new cameras fitted with special image recognition technology were installed at traffic hot spots across London. The cameras have revolutionised how the Surface Transport and Traffic Operations Centre tackles congestion as they automatically alert the centre’s operators when traffic builds up, enabling them to identify situations and take action much faster. The cameras have been positioned at known junctions where congestion, even from minor incidents,
Supporting economic development and population growth 31
can build up on surrounding roads and significantly impact traffic, causing delays for all road users.
The new technology has been developed by TfL in partnership with Ipsotek Ltd. TfL is now looking at ways to expand its use to further improve conditions for the benefit of all the Capital’s road users.
Improving London’s roadsMajor maintenance on the Gallows Corner flyover in east London was completed in July.
The essential safety works have significantly extended the life of the flyover, which was built as a temporary structure in the 1970s. They also minimise the need for any further large scale maintenance for at least a decade, contributing to smoother traffic flow and reduced congestion.
Work on the A406 Hanger Lane in west London continued with the construction of foundations for two new bridges, as the original Victorian structures were not built for modern vehicles. Once work is complete, new road layouts will help improve traffic flow. The construction and assembly of the new bridges and the demolition of the old ones is expected to be finished in early 2011.
As part of the project, new cycle lanes and footways have been installed. More are still to be completed, and two new signalised pedestrian crossings will make the area more attractive and safer. The full scheme is currently scheduled to be completed by summer 2011.
Work began in August on a new westbound contraflow bus lane to run between Shaftesbury Avenue and Piccadilly Circus. It will particularly benefit bus passengers
using route 38 – a key service between Clapton and Victoria. Westminster Council carried out the works through its Living City programme in partnership with TfL. The total cost was £2.3m, with £1.3m being provided by the council and £1m from TfL.
February saw the start of a £70m, three-year refurbishment programme in the northbound Blackwall Tunnel. Improvements include new fire and incident detection systems, better access for emergency services, new CCTV cameras, a communication system, and better lighting and ventilation. Works are being carried out at night to minimise disruption.
In December, the A40 Acton Bridges scheme in Ealing was completed with the opening of the Perryn Road footbridge. The works, which began in October 2005, saw two old road bridges, which crossed four National Rail lines, completely removed and replaced while the A40 remained open. Wider footpaths and new segregated cycle lanes were created across the bridges to further improve access around the area.
In December, substantial highway and urban realm improvements were delivered to introduce the East London Transit, ahead of schedule and on budget. The project contributes to quicker journey times for bus passengers, as well as smoother traffic flows for all road users.
1,000unplanned traffic incidents per month are managed by the Surface Transport and Traffic Operations Centre
Transport for London – Annual Report and Statement of Accounts 2009/1032
Congestion ChargingIn November, the Mayor announced that he would make the Congestion Charge easier and fairer for the Capital’s motorists.
His proposals include a new automated payment system, provisionally called CC Auto Pay, which will make it simpler to pay the charge and, for those who opt in, bring an end to fines.
The automated system will mean that motorists who register for an account can pay by debit or credit card, or by direct debit, and avoid the possibility of ever receiving a penalty charge. For these customers, the daily charge will rise to just £9, as opposed to £10 for those who continue to pay through existing channels.
The Mayor has also announced that the £1 fleet discount will be removed, which will mean fleet operators pay the same per vehicle as customers using CC Auto Pay. The system will be introduced in January 2011, subject to consultation. In addition, a consultation process will start on the proposal to remove the Western Extension in December 2010.
FreightTfL continued to work closely with the freight industry during the year.
The Freight Operator Recognition Scheme went from strength to strength. The free voluntary initiative for freight users and operators aims to improve road freight transport standards by providing its members with a range of incentives. It now has 1,239 registered depots representing 52,144 freight vehicles or 15.8 per cent of the commercially registered vehicles in London and the South East.
Phase 1 of a new online facility was launched in May, providing a one-stop shop for information about delivering freight into London. Development of Phase 2, interactive mapping and a Freight Journey Planner, is under way.
Delivery Service Plans have been introduced to increase operational efficiency of commercial premises. By adopting this approach at its own Palestra office, TfL has reduced the number of deliveries by 20 per cent and shifted some to off-peak periods, cutting carbon dioxide (CO2) and saving money through reduced transport and ordering costs.
Construction Logistic Plans are also being used to manage construction site deliveries more effectively and reduce journeys.
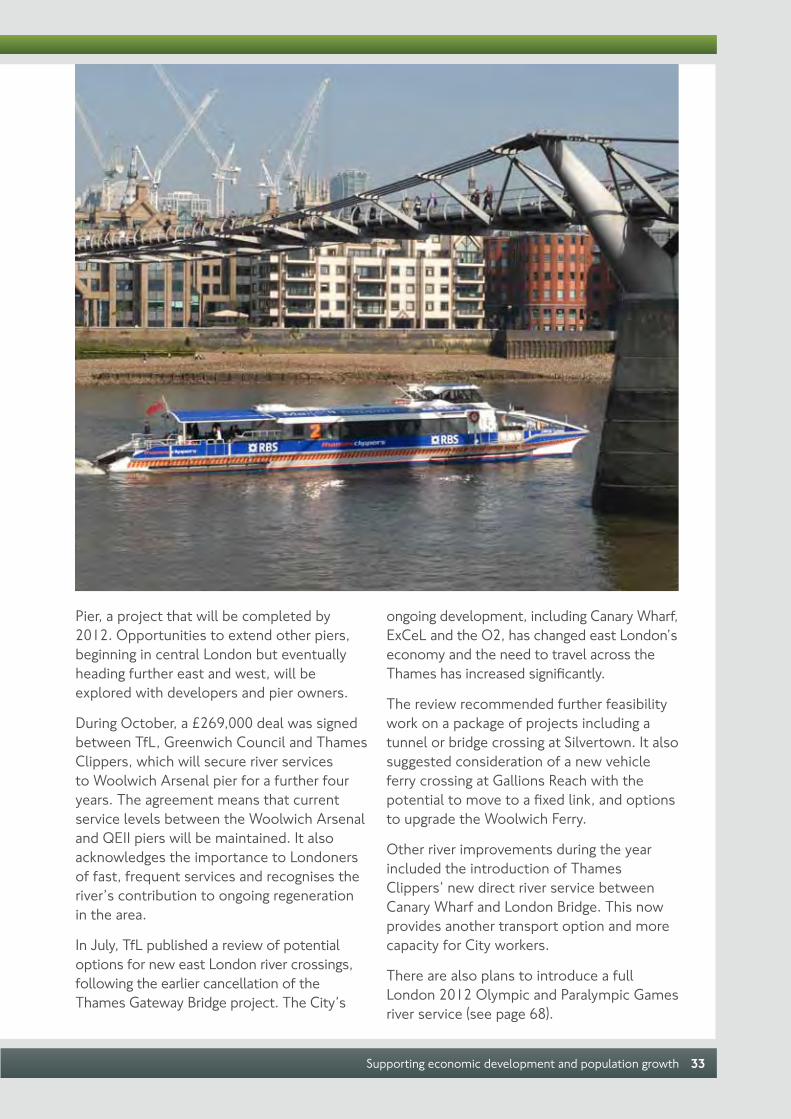
Boosting river servicesPlans to integrate river services into the Capital’s transport network gatheredpace in 2009/10.
More than 30 organisations, including London’s pier owners, boat operators and borough councils, signed up to the Mayor’s river concordat, committing them to work together to reduce barriers to the growth of river services.
Part of the concordat focuses on providing river commuters with the ease and convenience of Oyster, and Thames Clippers introduced Oyster pay as you go in November. Additionally, improved signage and information at piers and railway stations is making the public more aware of river services as an alternative to the Tube or train and explains the difference between fast ferries and leisurely cruises.
TfL and the ODA are providing £1.5m and £250,000 respectively to extend Tower
Supporting economic development and population growth 33
Pier, a project that will be completed by 2012. Opportunities to extend other piers, beginning in central London but eventually heading further east and west, will be explored with developers and pier owners.
During October, a £269,000 deal was signed between TfL, Greenwich Council and Thames Clippers, which will secure river services to Woolwich Arsenal pier for a further four years. The agreement means that current service levels between the Woolwich Arsenal and QEII piers will be maintained. It also acknowledges the importance to Londoners of fast, frequent services and recognises the river’s contribution to ongoing regeneration in the area.
In July, TfL published a review of potential options for new east London river crossings, following the earlier cancellation of the Thames Gateway Bridge project. The City’s
ongoing development, including Canary Wharf, ExCeL and the O2, has changed east London’s economy and the need to travel across the Thames has increased significantly.
The review recommended further feasibility work on a package of projects including a tunnel or bridge crossing at Silvertown. It also suggested consideration of a new vehicle ferry crossing at Gallions Reach with the potential to move to a fixed link, and options to upgrade the Woolwich Ferry.
Other river improvements during the year included the introduction of Thames Clippers’ new direct river service between Canary Wharf and London Bridge. This now provides another transport option and more capacity for City workers.
There are also plans to introduce a full London 2012 Olympic and Paralympic Games river service (see page 68).

Transport for London – Annual Report and Statement of Accounts 2009/1034
TfL is investing millions to ensure London is prepared for estimated population and workforce growth – 800,000 and 400,000 people respectively by 2021.
Enhancing the quality of life for all Londoners
Enhancing the quality of life for all Londoners 35
London’s public transport system plays a fundamental part in improving the quality of life for all.
The cycling revolution A host of initiatives took place during 2009/10 to progress the Mayor’spledge to create a cycling revolutionin the Capital.
Around 500,000 daily bicycle journeys are now made in London, up nine per cent in the year since the Mayor was elected. Additionally, record funding has been invested in a number of major projects to encourage further take-up.
A new scheme to provide the Capital with 6,000 hire bikes will go live in July 2010. The bikes will be available 24 hours a day, all year, from up to 400 central London docking stations, positioned roughly every 300 metres. The stations will have local route information and cycle times to key destinations.
The affordable hire system aims to make short trips in central London faster and simpler. It is expected to generate around 40,000 daily cycle journeys in the area and remove many of the barriers to cycling, such as access to a bicycle, secure cycle parking, fear of theft, maintenance and storage.
Serco will operate the scheme on behalf of TfL. An access fee, starting from as little as £1
for 24 hours, rising to £45 for annual access, will be charged. The first 30 minutes of every trip are free, then charges range from £1 for a journey of between 30 minutes and one hour, up to £50 for 24 hours.
In June, the Mayor also announced plans for 12 Cycle Superhighways, which will provide safer, faster and more direct cycle routes into the city from Outer London. Two pilot routes will open in summer 2010 – from Barking to Tower Gateway and Merton to the City.
The routes will be clearly marked and easy to follow with bespoke signs and road markings. There will also be information about journey times and links to other cycle routes. The bold markings will increase awareness among other road users, and make it clear that the route is used by lots of cyclists.
More than half of the trips in the Capital that could be made by bicycle take place in Outer London (2.4 million journeys a day), with most being made by car.
A key mayoral priority is to increase cycling in these Outer London boroughs and in January, 13 were selected to become ‘Biking Boroughs’. Each one was awarded £25,000 to fund a local study examining how cycling could be developed in their areas.
Transport for London – Annual Report and Statement of Accounts 2009/1036
Enhancing the quality of life for all Londoners 37
The boroughs are Barking & Dagenham, Bexley, Brent, Bromley, Croydon, Ealing, Haringey, Havering, Hillingdon, Hounslow, Kingston, Merton and Redbridge.
More parking facilities for cyclists were rolled out during the year. At Euston station 138 additional cycle parking spaces were installed and TfL funded new ‘two-tier’ bike racks at Liverpool Street station, which increased parking from 116 to 233 spaces. By 2012, TfL aims to have provided 66,000 new cycle parking spaces across the city.
A host of events took place during the Mayor’s and TfL’s Summer of Cycling campaign, designed to encourage more people to take to two wheels.
As part of the initiative, workplaces were encouraged to take part in the London Cycle Challenge. The web-based competition encouraged individuals and the Capital’s workplaces to cycle more during the month of June and compete to see who could cover the most miles. More than 5,400 people from over 250 businesses got involved, double the participation levels in 2008.
This year the Cycle Challenge was also introduced to schools, with some 300 pupils from 19 schools taking part. Combined, participants managed to clock up 948,689 miles – equivalent to cycling around the world 38 times.
A new eight-week initiative to encourage more people to cycle to work was launched by the Mayor and TfL in August. Called Cycle Fridays, it was primarily for the novice commuter cyclist, and involved led rides by experienced riders, departing from six locations across the city and travelling into central London every Friday. Those taking part were greeted by marshals and received a basic bike check and TfL cycle maps before taking to the road.
The final leg of the Tour of Britain, on 19 September, brought 96 of the world’s elite cyclists to London. It was the sixth time the Capital had been involved in the Tour, which is the largest, free-to-attend sporting event in the country. The race will finish in the city again in 2010 and 2011.
The Mayor of London’s Skyride, on 20 September, proved popular with around 65,000 cyclists enjoying traffic-free access to central London roads. Also, a Skyride was held in Hounslow in August, which attracted 11,000 cyclists. There are plans to hold more mass events in Outer London during 2010.
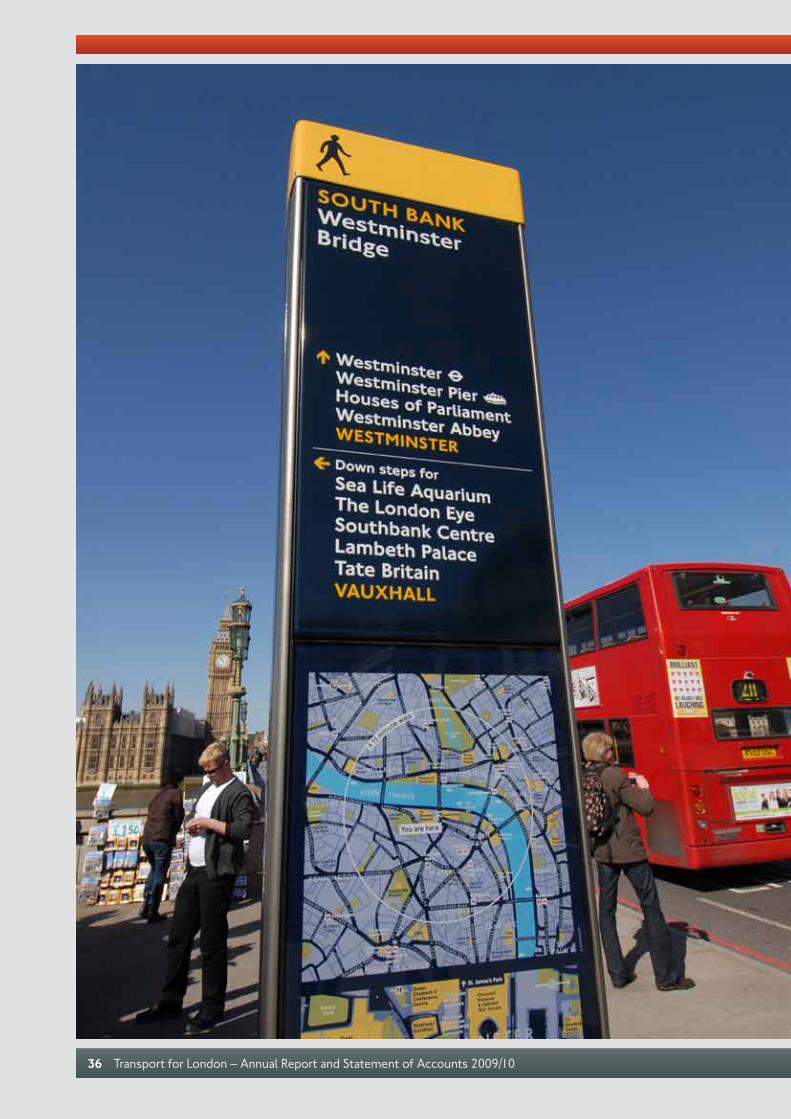
Plans for pedestriansTfL’s Legible London pedestrian information system was extended to new areas of the Capital during 2009/10. First launched in 2007 in Bond Street, Legible London’s maps and signs make iteasier for people to navigate on foot andencourage them to walk more.
The new areas are: Bloomsbury, Covent Garden and Holborn; Southbank and Bankside; plus Richmond and Twickenham town centres. Legible London maps have been integrated into customer information at Tube stations and bus stops in these areas.
65,000 cyclists enjoyed traffic- free roads at the Mayor of London’s Skyride
Transport for London – Annual Report and Statement of Accounts 2009/1038
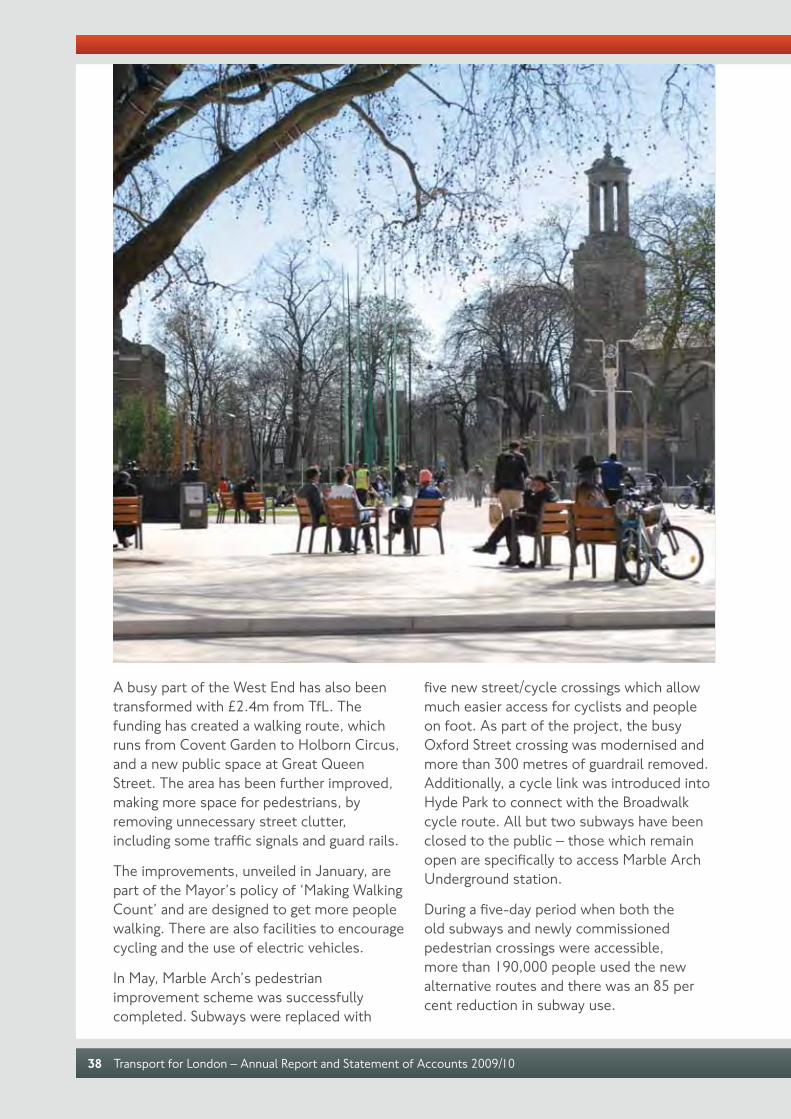
A busy part of the West End has also been transformed with £2.4m from TfL. The funding has created a walking route, which runs from Covent Garden to Holborn Circus, and a new public space at Great Queen Street. The area has been further improved, making more space for pedestrians, by removing unnecessary street clutter, including some traffic signals and guard rails.
The improvements, unveiled in January, are part of the Mayor’s policy of ‘Making Walking Count’ and are designed to get more people walking. There are also facilities to encourage cycling and the use of electric vehicles.
In May, Marble Arch’s pedestrian improvement scheme was successfully completed. Subways were replaced with
five new street/cycle crossings which allow much easier access for cyclists and people on foot. As part of the project, the busy Oxford Street crossing was modernised and more than 300 metres of guardrail removed. Additionally, a cycle link was introduced into Hyde Park to connect with the Broadwalk cycle route. All but two subways have been closed to the public – those which remain open are specifically to access Marble Arch Underground station.
During a five-day period when both the old subways and newly commissioned pedestrian crossings were accessible, more than 190,000 people used the new alternative routes and there was an 85 per cent reduction in subway use.
Enhancing the quality of life for all Londoners 39
In March, a £6m facelift of Woolwich town centre was completed, making it safer for pedestrians, cyclists and road users. The work was carried out in partnership with Greenwich Council and benefits include wider pavements and more space to reduce crowding at bus stops.
In November, south London’s Brixton Hill Gyratory was removed and the road returned to two-way traffic. The removal was part of TfL’s Brixton town centre improvement work, which has already seen pavements widened, new signalised pedestrian crossings and improvements to bus lanes. Also, as part of the project to redevelop Brixton town centre, a new public square opened in February, specifically designed for the community to use for cultural activities and events. This attraction will contribute to the regeneration of the area and improve quality of life for local people.
In July, work began on a £7.6m improvement scheme for Gants Hill town centre. The works, around the Gants Hill roundabout, have been developed in consultation with Redbridge Council and will introduce trees and grassed areas to revitalise the site. New pedestrian crossings, a pedestrian walkway/cycleway, wide footways, plus seating and cycle parking will also be installed. TfL will contribute £5.4m towards the scheme, which complements Redbridge Council’s plans to improve central Gants Hill through new housing and business opportunities. The work is due to be completed in summer 2010.
In June, almost 800 responses were received to a consultation on proposals to improve the Henlys Corner junction in north London. A total of 85 per cent of people agreed or strongly agreed with the need to improve the junction. The plans will provide controlled crossings for pedestrians and cyclists, while smoothing traffic flow, through better traffic management. TfL has carried out site investigations, published an Official Journal of the European Union (OJEU) notice and is finalising the design. Providing consents are obtained, construction will start in early 2011.
In July, a new foot and cycle bridge opened at Bedfont Road in Hounslow. Built alongside the existing road bridge, the £950,000 structure provides safe and easy access for pedestrians and cyclists travelling between Bedfont and Feltham, to the west of the borough. The existing bridge had no paths for pedestrians and cyclists shared the narrow road with other traffic.
A six-week consultation, including a public exhibition, took place during October and November on proposed changes to the Tottenham Hale Gyratory in north London. Plans include converting the system to two-way traffic, improving facilities and access for pedestrians and cyclists, reducing the volume of traffic on Broad Lane, constructing a larger bus station and introducing more convenient bus stops. This project is essential to underpin proposed local urban regeneration. Additionally, a new public square would be created at Tottenham Hale station.
Transport for London – Annual Report and Statement of Accounts 2009/1040
Enhancing the quality of life for all Londoners 41
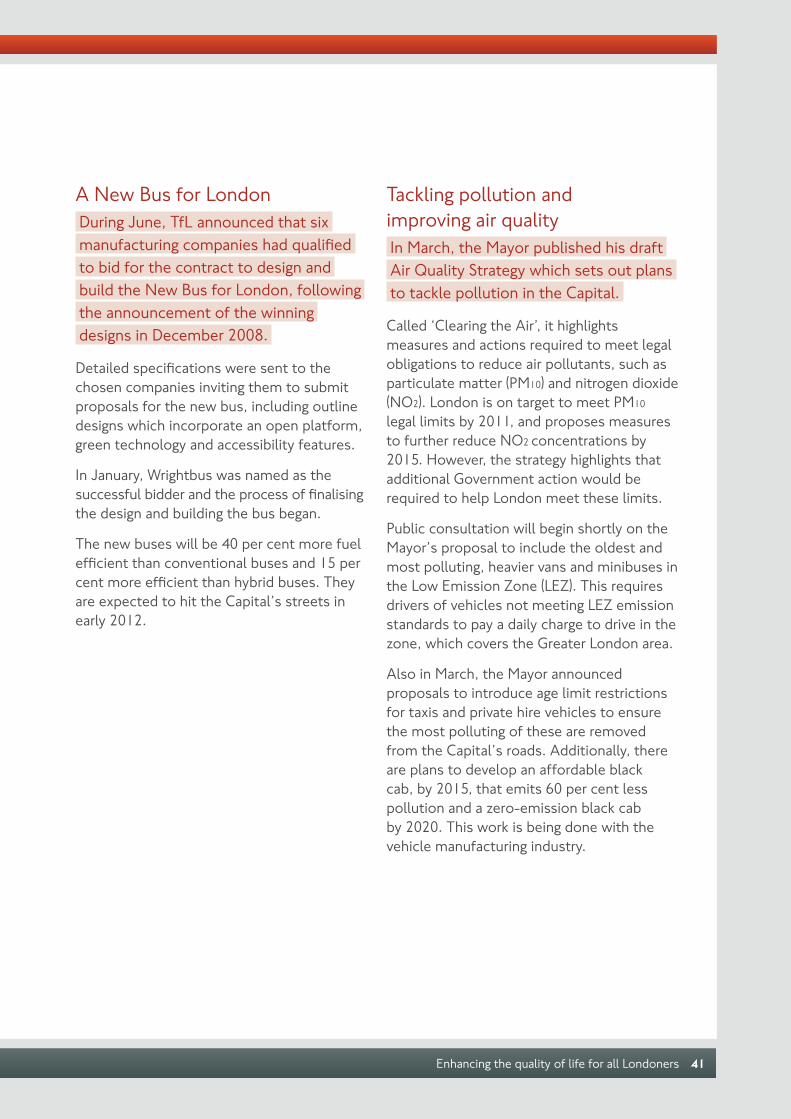
A New Bus for London During June, TfL announced that six manufacturing companies had qualified to bid for the contract to design and build the New Bus for London, followingthe announcement of the winning designs in December 2008.
Detailed specifications were sent to the chosen companies inviting them to submit proposals for the new bus, including outline designs which incorporate an open platform, green technology and accessibility features.
In January, Wrightbus was named as the successful bidder and the process of finalising the design and building the bus began.
The new buses will be 40 per cent more fuel efficient than conventional buses and 15 per cent more efficient than hybrid buses. They are expected to hit the Capital’s streets in early 2012.
Tackling pollution and improving air qualityIn March, the Mayor published his draft Air Quality Strategy which sets out plans to tackle pollution in the Capital.
Called ‘Clearing the Air’, it highlights measures and actions required to meet legal obligations to reduce air pollutants, such as particulate matter (PM10) and nitrogen dioxide (NO2). London is on target to meet PM10 legal limits by 2011, and proposes measures to further reduce NO2 concentrations by 2015. However, the strategy highlights that additional Government action would be required to help London meet these limits.
Public consultation will begin shortly on the Mayor’s proposal to include the oldest and most polluting, heavier vans and minibuses in the Low Emission Zone (LEZ). This requires drivers of vehicles not meeting LEZ emission standards to pay a daily charge to drive in the zone, which covers the Greater London area.
Also in March, the Mayor announced proposals to introduce age limit restrictions for taxis and private hire vehicles to ensure the most polluting of these are removed from the Capital’s roads. Additionally, there are plans to develop an affordable black cab, by 2015, that emits 60 per cent less pollution and a zero-emission black cab by 2020. This work is being done with the vehicle manufacturing industry.
Transport for London – Annual Report and Statement of Accounts 2009/1042
Improved trainsIn October, the first of a fleet of 191 new, air-conditioned ‘S-stock’ Tube trains for the Circle, District, Hammersmith & City and Metropolitan lines arrived in the Capital. It is due to enter service on the Metropolitan line in summer 2010.
The new trains are one of a number of measures that will improve passengers’ travelling experience in warmer weather.
New air-conditioned Overground trains also began running on the London Overground network. The trains feature state-of-the-art information displays and announcements, on board CCTV and improved security due to better layout and clearer sightlines through the carriages.
Similar to those on the Tube, they have more flip-down seats which provide extra standing room for hop-on, hop-off journeys. They also have more capacity than the previous models (see page 24).
As part of the Victoria line Tube upgrade, the first of 47 new trains was introduced into passenger service during July. They have nearly 20 per cent more capacity and feature in-carriage CCTV, improved wheelchair access, better ventilation, plus enhanced visual and audio customer information systems.
RecyclingDiscussions were initiated this year with the boroughs to locate recycling bins outside bus stations.
The majority of London’s free newspapers that are distributed on or around the network are taken away by passengers or are left on vehicles. Bus operators recycle waste left on board but the amount generated at bus stations is not enough to justify installing recycling bins for public use.
47 new Tube trains will be introduced on the Victoria line

Enhancing the quality of life for all Londoners 43

Transport for London – Annual Report and Statement of Accounts 2009/1044
Across the Capital’s transport networks, crime levels are down while the public’s perceptions and confidence continue to improve.
Improving the safety and security of all Londoners
Improving the safety and security of all Londoners 45
Tackling crimeDuring 2009/10, bus-related crime fellby more than eight per cent – a six-yearlow. The total number of incidents was 24,976 compared with 27,170 the previous year.
Crime levels also fell on the Underground and Docklands Light Railway – from 15,109 in 2008/09 to 14,536 in 2009/10. There are now 12,000 CCTV cameras across the Tube network with the figure due to rise to 14,000 in the coming years. There are also 1,500 Help points.
The 32 dedicated Transport Hub Teams, launched in 2008/09, continue to provide a highly visible presence in specific problem areas and work closely with local Safer Transport Teams.
In July, a joint 12-month trial between TfL and Croydon Council gave travel passes to 14 Neighbourhood Enforcement Officers in the area, plus four additional council staff, so they can use buses while on patrol. The initiative will help TfL and Croydon Council work together to deploy resources in the best possible way to deter crime and antisocial behaviour.
In August, a 12-month trial saw 20 new Travel Safe Officers deployed on London Overground services. The officers will, in time, have the power to issue penalty notices for disorder offences such as graffiti, criminal damage or littering. They will also be able to take the names and addresses of people behaving unacceptably on the network and forward them to the police.
The officers will liaise closely with the British Transport Police’s (BTP’s) Neighbourhood Policing Teams, which already work on the Overground and provide an extra deterrent to unacceptable behaviour. Other safety improvements have included staff at stations during operating hours, enhanced lighting and repairs to CCTV equipment. New trains also have clear sightlines right through the carriage and on board CCTV monitored by the driver has been designed to increase passengers’ sense of safety. Further security upgrades will see more Help points and cameras at all stations by 2011.
In November, TfL and the Metropolitan Police Safer Transport Command carried out targeted patrols across the Capital as part of a four-week operation called Safebus. The initiative aimed to provide reassurance to passengers during the Halloween and bonfire night period, when bus-related crime traditionally increases by 20 per cent.
Transport for London – Annual Report and Statement of Accounts 2009/1046
Road safetyIn December, an 18-month trial began in Camden Town, north London, to reduce road casualties and smooth traffic flow.
The speed limit was lowered from 30mph to 20mph on the red route section of Camden High Street and new traffic light timings were introduced to help enforce it. Three sets of existing traffic lights are now phased so that vehicles observing the speed restrictions should be able to pass through all green traffic lights on the road. If drivers exceed 20mph, they will be caught in the red light phase, which will slow down traffic.
The trial is the first of its kind on the TfL road network. It is being introduced because Camden High Street has almost double the number of collisions of other borough A-roads, with 11 people seriously injured in the past three years. TfL will monitor the trial to assess the impact of the 20mph limit. The results will help determine whether it should be enforced permanently.
In January, average speed cameras started to be installed on a dangerous stretch of the A13 in east London for a trial expected to halve deaths and serious injuries when it goes live in summer 2010.
The 12km stretch between Canning Town and the Goresbrook Interchange is the first major urban road in the UK to use average speed cameras to enforce the speed limit. A total of 84 cameras, based at 37 locations, will be used.
The collision rate on this part of the road is around a fifth higher than is typical of major roads in London. Nearly 500 collisions, including three fatal and 34 serious accidents, were recorded on the stretch between 2006 and 2008. Half of those were caused by speeding.
Motorcycle awarenessIn September, a TfL road safety campaign urged drivers to ‘give motorcyclists a second thought’.
The initiative aimed to cut the number of motorcyclists killed or injured on London’s roads and its TV ads warned of a dangerous optical effect, caused by the way the brain assesses approaching objects. Psychologists believe this could put motorcyclists at risk, particularly when drivers turn right, as it leads them to underestimate the time that small vehicles take to reach them.
Tests using footage of vans, cars and motorcycles approaching at identical speeds showed that the participants regularly estimated that motorcycles would take longer to reach them than larger vehicles.
Last year there were 4,890 incidents in Greater London where motorcycles and/or scooters were in collision with other road users. Of these, 848 resulted in a death or serious injury.
In February, a new team of 12 full-time police officers was created to reduce motorcycle casualties in the Capital. The London Motorcycle Policy Unit, set up in partnership with the Metropolitan Police, runs one-day, practical training sessions, under the banner ‘BikeSafe-London’. The courses are helping to make motorcyclists safer and better riders by improving their knowledge, skills and experience. The team also carries out on-street enforcement to ensure that the motorbikes on London’s streets are roadworthy and legal.
To coincide with clocks going forward in March, scooter riders were also urged to sign up for the ScooterSafe initiative. The scheme’s one-day courses provide the opportunity to develop riding and awareness

Improving the safety and security of all Londoners 47
skills with the aim of reducing deaths and serious injuries.
Cycle safetyThe number of cyclists killed or seriously injured on London’s roads has fallen by 24 per cent compared to the mid to late- 90s, despite a 117 per cent increase in cycle journeys on major roads during thattime. Since 2008, cyclist fatalities and serious injuries have been reduced by three per cent (445 to 433 in 2009).
In November, the Mayor released his draft Cycle Safety Action Plan and invited London boroughs and cycling groups to comment on it. The document highlighted a number of proposals to improve cyclists’ safety including boosting training, working with freight operators, championing safety trials and creating a Cycle Safety Working Group
of key road user and cycling organisations. It was sent to approximately 100,000 cyclists across the city to obtain their views, and the final plan was published in March 2010.
A new report from TfL revealed that, between 2001 and 2006, the most common type of cyclist fatality in London involved a large vehicle changing lanes to the left or turning left. The Mayor is calling on freight companies operating in the Capital to fit side-guards on their vehicles, or other devices such as safety mirrors, to ensure that cyclists remain in clear view of drivers. Currently, operators are exempt from fitting them, but research has shown they might have helped prevent the deaths of 15 out of 23 cyclists during those years. The Mayor has also asked the Government to revoke the exemption and change the law so that all heavy goods vehicles weighing more than 3.5 tonnes, regardless of age, should have additional

Transport for London – Annual Report and Statement of Accounts 2009/1048
Don’t let yourfriendship die on the road
Look out for your mates
DR.12.indd 1 27/2/09 14:49:01

Improving the safety and security of all Londoners 49
Don’t let yourfriendship die on the road
Look out for your mates
DR.12.indd 1 27/2/09 14:49:01
safety mirrors fitted. TfL has approached the DfT to discuss a trial of safety mirrors at traffic lights along the planned Cycle Superhighways, to improve visibility of cyclists for drivers of large vehicles.
In July, TfL’s website (tfl.gov.uk) premiered a five-minute film aimed at helping cyclists and lorry drivers navigate London’s busy roads, and each other, safely. It showed both cyclist and driver viewpoints and outlined a series of golden rules to ensure both stay safe on the roads. The film was sent to more than 140,000 London cyclists and lorry drivers. A full-length version was also circulated to haulage companies and road safety officers, in addition to being available online.
Although the number of adults receiving cycle training in the Capital has nearly doubled in the past two years, new TfL research showed that only one in 10 Londoners and just three in 10 of the city’s cyclists have had cycle training. TfL is working hard to promote the free and low-cost training provided by many borough councils. Sessions are individually tailored and enable the cyclist to deal with a wide range of traffic conditions.
In addition, TfL is investing in training related to the Cycle Hire Scheme and Cycle Superhighways to supplement the programme and support new cyclists.
Teen road safetyIn June, TfL teamed up with social networking site Bebo for an initiative aimed at reducing teen road deaths and injuries.
The site’s popular online drama ‘Sofia’s Diary’ ran a storyline in which the star re-evaluated her attitude to road safety when it directly affected someone close to her. The plot added momentum to TfL’s most recent teen road safety campaign, ‘Think! Look out for your mates’.
In October, a campaign was launched to advise teenagers to take care on or near roads as the seasons change and evenings draw in. Research has revealed that, between 2006 and 2008, a quarter of all collisions involving teens took place from October to December. They typically occur on weekdays at peak times when young people are travelling to and from school.
As part of the campaign, limited edition reflective wristbands with the slogan ‘Think! Don’t let your friendship die on the road’ were given out at concerts and youth centres. They encouraged teens to stay visible and subtly reminded them about the importance of road safety.
140,000cyclists and lorry drivers received TfL’s freight safety film

Transport for London – Annual Report and Statement of Accounts 2009/1050
Raising awarenessIn April, new TfL research revealed thateagerness to impress friends could be a significant factor in collisions involving young drivers. Those aged 17 to 25 account for eight per cent of London‘sdrivers, but are involved in 18 per centof collisions.
The report revealed the extent to which young drivers, particularly males, are affected by peer pressure. Thirty-one per cent of respondents said they had been urged to speed by friends, with one in three males and one in five females risking losing their licence by speeding to impress others. This was despite a third of respondents claiming they would not be able to maintain their lifestyle, including their job, if they lost their driving licence. The findings were released to support a joint campaign by TfL and the London Safety Camera Partnership, which warns young people about the consequences of illegal driving.
In 2009/10, the DfT launched a TV, poster and online campaign after new research showed that one in 10 young male drivers admitted driving after taking illegal drugs. It also showed that one in five drivers killed in road accidents may have had an impairing drug in their system. TfL worked on a regional campaign which highlighted the fact that police can tell if someone is driving under the influence of drugs, as illegal substances have an involuntary effect on the eyes.
The campaign warned that the consequences of being convicted of drug-driving are the same as for drink-driving – a minimum 12 months driving ban, a criminal record and a fine of up to £5,000.
Safer cabs TfL continued to alert people to the dangers of travelling in illegal cabsand launched a new wave of the Safer Travel at Night campaign to coincide with the Christmas party season.
The initiative, which warns against using unbooked minicabs, featured a powerful TV and cinema advert reminding passengers that getting into any minicab without booking can pose a serious risk of sexual assault.
The joint campaign between TfL, the Metropolitan Police and the City of London Police, was launched six years ago. Since then the number of women willing to take illegal cabs has dropped by almost 80 per cent, while the number of cab-related sexual offences has almost halved. However, a small but significant number of younger women continue to use illegal cabs despite the dangers they present.
Safety was also boosted throughout the campaign with increased night-time operations by the Metropolitan Police’s Cab Enforcement Unit, part of the TfL-funded Safer Transport Command. In addition, Safer Transport Teams carried out a number of
5,500 arrests have been made by the Metropolitan Police Cab Enforcement Unit since 2003
Improving the safety and security of all Londoners 51
local operations. Since 2003, the unit has made around 5,500 arrests for touting and cab-related offences.
The campaign also promoted TfL’s Cabwise service. It provides people who text ‘CAB’ to 60835 with the numbers of two local, licensed private hire companies and one taxi (black cab) firm.
TfL continued to work with the boroughs to provide late-night marshalled taxi ranks. These are now set up in Liverpool Street and Haymarket in central London, and
Bromley, Beckenham, Kingston and Romford in Outer London.
In September, TfL announced plans to tighten guidelines for licensing taxi and private hire drivers in the Capital. In future, licences will not be granted to applicants who have been convicted of serious or violent offences, unless there are exceptional mitigating circumstances.
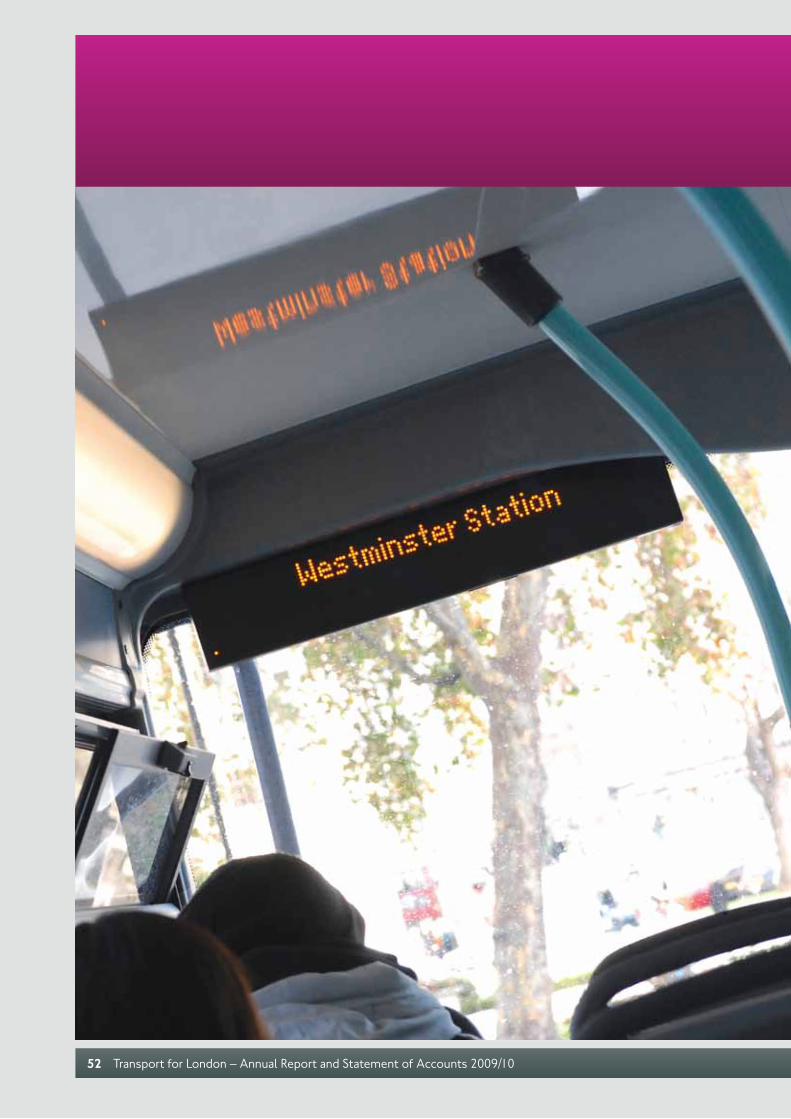
Transport for London – Annual Report and Statement of Accounts 2009/1052

TfL’s aim is to address the physical, financial, or communication barriers, whether real or perceived, that prevent people from using public transport in the Capital.
Improving transport opportunities for all Londoners
Improving transport opportunities for all Londoners 53
Visitor Oyster TfL has re-enforced its commitment tohelp people visiting the Capital by forming a number of new partnerships to sell Visitor Oyster cards.
This includes a partnership with easyJet, the UK’s largest airline, which in July became the first company to sell the cards on London-bound flights. More than 40,000 have been sold generating revenue of £800,000.
TfL has also worked with Air Southwest to sell Oyster cards on board flights into London. In addition, a marketing campaign by Docklands Light Railway encouraged passengers to pre-buy Oyster cards to reduce their queuing time at stations.
In June, a deal was signed with Train Operating Company First to sell Visitor Oyster cards on board Wrexham & Shropshire services into London Marylebone.
Visitor Oyster cards work in the same way as other Oyster cards and offer passengers quick and easy access to TfL services the moment they arrive in the Capital. They have pre-loaded credit limits, dependent on the organisation retailing the card.
In October, TfL launched an online visitor shop in partnership with Visit Britain, which has received 600,000 hits and produced revenue of more than £500,000.
A number of other strategic partners currently sell Visitor Oyster cards including Visit London, National Express coach services, Gatwick Express, Stansted Express, Oxford Tube coach services, Eurostar and Superbreak. They are also available at a number of overseas travel agents.
Oyster for young peopleYoung people who have their Oyster photocards (known as Zip) withdrawn due to bad behaviour can now get them back through voluntary community work.
The initiative, called Earn your travel back, began in September. It invites youngsters to contact v (the National Young Volunteers Service), which will arrange for them to take part in a day’s work for either BTCV (formerly the British Trust for Conservation Volunteers) or the London Wildlife Trust.
Building on the Zip scheme introduced in 2008, it aims to deal with young people who lose their concession because of consistent bad behaviour, such as bullying,

Transport for London – Annual Report and Statement of Accounts 2009/1054
using threatening language or defacing Oyster cards. Those who have their cards taken away due to criminal behaviour are not eligible.
Also this year, an online facility was introduced to enable young people to change the photo on their Oyster card for a £10 fee.
Accessible networks In November, TfL published its revised Disability and Deaf Equality Scheme document, which sets out plans to continue improving travel choices for disabled and deaf people who live, visit or work in London.
Around 18 per cent of Londoners are disabled or deaf and the scheme’s action plan indicates how TfL will promote disability
equality and ensure that its activities meet the needs of disabled and deaf people over the next three years.
The scheme builds on improvements already made. New links and extensions now provide Londoners with more opportunities to travel to jobs and leisure facilities across the Capital. All Tube station refurbishments include measures to improve the journey experience of disabled, hearing and visually impaired people. Wide-aisle gates, tactile strips and colour-contrasting handrails all enable more confident, independent travel.
TfL plans to take forward these principles with the new Crossrail stations. Twenty-eight of its 37 stations will be step-free, including all interchanges. Trains will have wide doors with dedicated spaces for wheelchairs, plus enhanced audio-visual information.
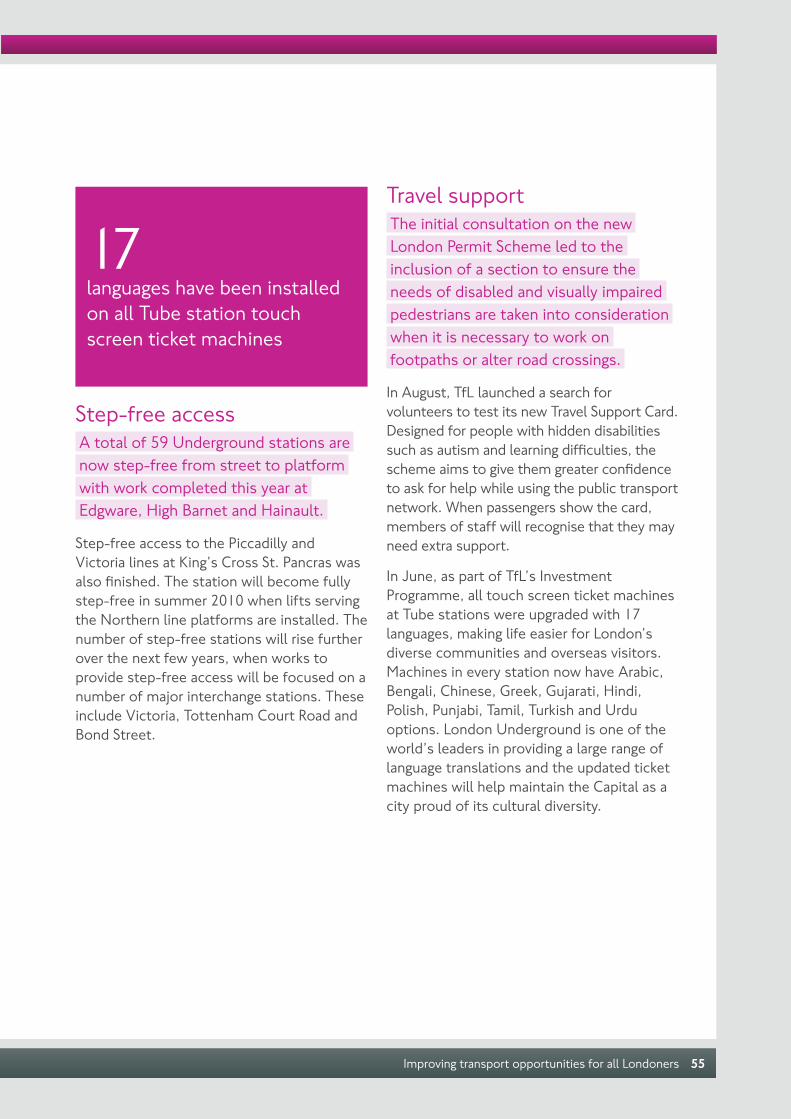
Improving transport opportunities for all Londoners 55
Step-free accessA total of 59 Underground stations arenow step-free from street to platform with work completed this year at Edgware, High Barnet and Hainault.
Step-free access to the Piccadilly and Victoria lines at King’s Cross St. Pancras was also finished. The station will become fully step-free in summer 2010 when lifts serving the Northern line platforms are installed. The number of step-free stations will rise further over the next few years, when works to provide step-free access will be focused on a number of major interchange stations. These include Victoria, Tottenham Court Road and Bond Street.
Travel supportThe initial consultation on the new London Permit Scheme led to the inclusion of a section to ensure the needs of disabled and visually impaired pedestrians are taken into consideration when it is necessary to work on footpaths or alter road crossings.
In August, TfL launched a search for volunteers to test its new Travel Support Card. Designed for people with hidden disabilities such as autism and learning difficulties, the scheme aims to give them greater confidence to ask for help while using the public transport network. When passengers show the card, members of staff will recognise that they may need extra support.
In June, as part of TfL’s Investment Programme, all touch screen ticket machines at Tube stations were upgraded with 17 languages, making life easier for London’s diverse communities and overseas visitors. Machines in every station now have Arabic, Bengali, Chinese, Greek, Gujarati, Hindi, Polish, Punjabi, Tamil, Turkish and Urdu options. London Underground is one of the world’s leaders in providing a large range of language translations and the updated ticket machines will help maintain the Capital as a city proud of its cultural diversity.
17 languages have been installed on all Tube station touch screen ticket machines
Transport for London – Annual Report and Statement of Accounts 2009/1056

Improving transport opportunities for all Londoners 57
Enhanced passenger information The roll-out of the iBus information system was completed in April. Now all 8,500 London buses carry thestate-of-the-art technology which informs passengers of their next stop and final destination.
It is designed to help people travel confidently, especially when visiting unfamiliar parts of the city, and is of particular benefit to hearing or visually impaired people.
In the next two years real-time passenger information will be transformed with bus arrival times at all 19,000 bus stops available to people by internet and mobile phone. In addition, new Countdown signs will provide arrival time predictions at 2,500 key stops. The mobile and web information should be available in early 2011, with the roll-out of new Countdown signs following later in the year.
In February, TfL added an online bus information tool to its website (tfl.gov.uk), providing passengers with detailed information about bus services across the Capital. People can search for information using a postcode, street name, route number or place of interest. The facility will then display the nearest bus stops, details of routes that call at a particular stop, plus the current timetables.
In July, TfL formed an innovative partnership with Coca-Cola Great Britain to display up-to-the-minute Tube travel information on its famous Piccadilly Circus sign, which is located in the heart of the Capital’s shopping and theatre district. The partnership is
initially for 12 months and, if successful, will be extended. The move complements TfL’s extensive range of online Travel Tools available at tfl.gov.uk. These include a travel information status board, plus free text and email alerts which Londoners and visitors can use to work out the quickest way to get from A to B while on the move.
Two travel information centres opened in the Capital during 2009/10. In September, a larger, accessible travel centre opened at Euston mainline station, and in March, another opened in King’s Cross St. Pancras station with a team of 15 staff. The new additions bring the number of centres to six, all providing a one-stop shop for advice about transport services. This includes information about fares and tickets, visitor attractions, theatres and sightseeing tours. Last year, the centres helped more than two million customers.
Door-to-door servicesDial-a-Ride, the door-to-door service for Londoners unable to access mainstream public transport services, continued to build on improvements.
A total of 1,254,746 trips were completed – an increase of 76,424 (6.5 per cent) from the previous year and for every 100 bookings 92 trips were successfully scheduled. Demand for the service increased by 5.7 per cent compared to the previous year.
In October, a new telephone system was introduced to better manage calls to the booking centre. The system will be further enhanced to enable self-service booking facilities for customers, which is expected to go live in July 2010.

Transport for London – Annual Report 2009/1058
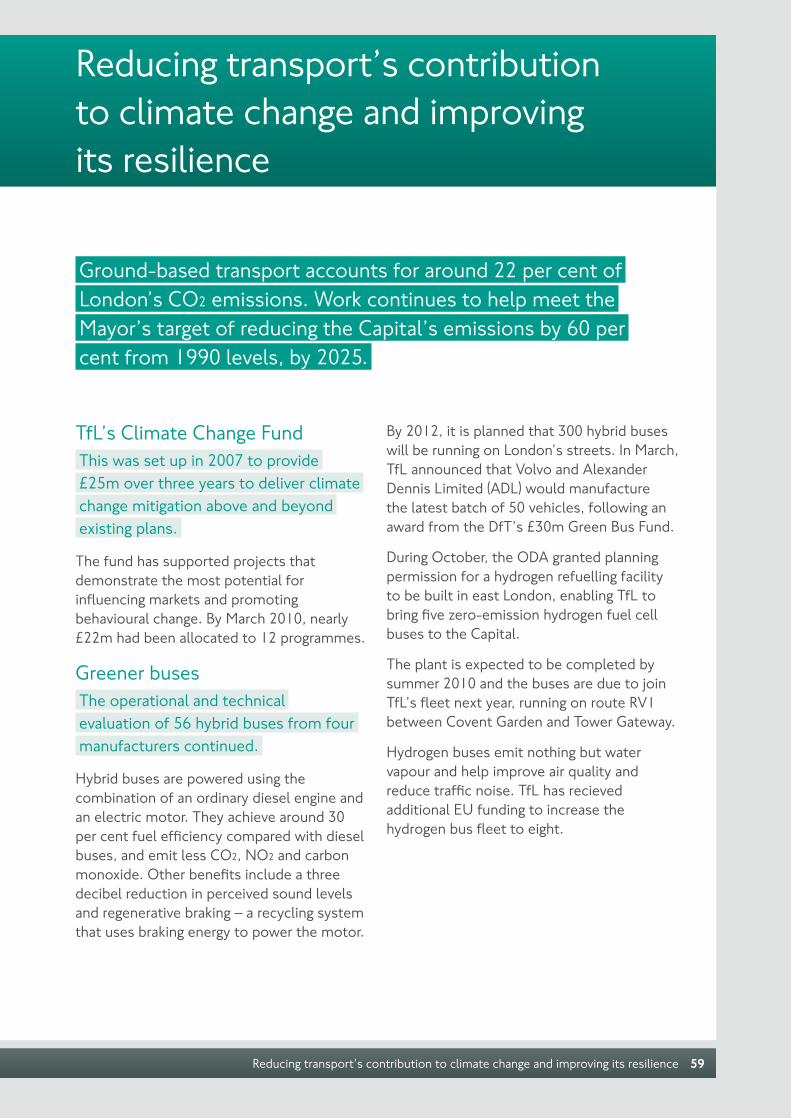
Reducing transport’s contribution to climate change and improving its resilience
Reducing transport’s contribution to climate change and improving its resilience 59
Ground-based transport accounts for around 22 per cent of London’s CO2 emissions. Work continues to help meet the Mayor’s target of reducing the Capital’s emissions by 60 per cent from 1990 levels, by 2025.
TfL’s Climate Change FundThis was set up in 2007 to provide £25m over three years to deliver climatechange mitigation above and beyondexisting plans.
The fund has supported projects that demonstrate the most potential for influencing markets and promoting behavioural change. By March 2010, nearly £22m had been allocated to 12 programmes.
Greener busesThe operational and technical evaluation of 56 hybrid buses from four manufacturers continued.
Hybrid buses are powered using the combination of an ordinary diesel engine and an electric motor. They achieve around 30 per cent fuel efficiency compared with diesel buses, and emit less CO2, NO2 and carbon monoxide. Other benefits include a three decibel reduction in perceived sound levels and regenerative braking – a recycling system that uses braking energy to power the motor.
By 2012, it is planned that 300 hybrid buses will be running on London’s streets. In March, TfL announced that Volvo and Alexander Dennis Limited (ADL) would manufacture the latest batch of 50 vehicles, following an award from the DfT’s £30m Green Bus Fund.
During October, the ODA granted planning permission for a hydrogen refuelling facility to be built in east London, enabling TfL to bring five zero-emission hydrogen fuel cell buses to the Capital.
The plant is expected to be completed by summer 2010 and the buses are due to join TfL’s fleet next year, running on route RV1 between Covent Garden and Tower Gateway.
Hydrogen buses emit nothing but water vapour and help improve air quality and reduce traffic noise. TfL has recieved additional EU funding to increase the hydrogen bus fleet to eight.
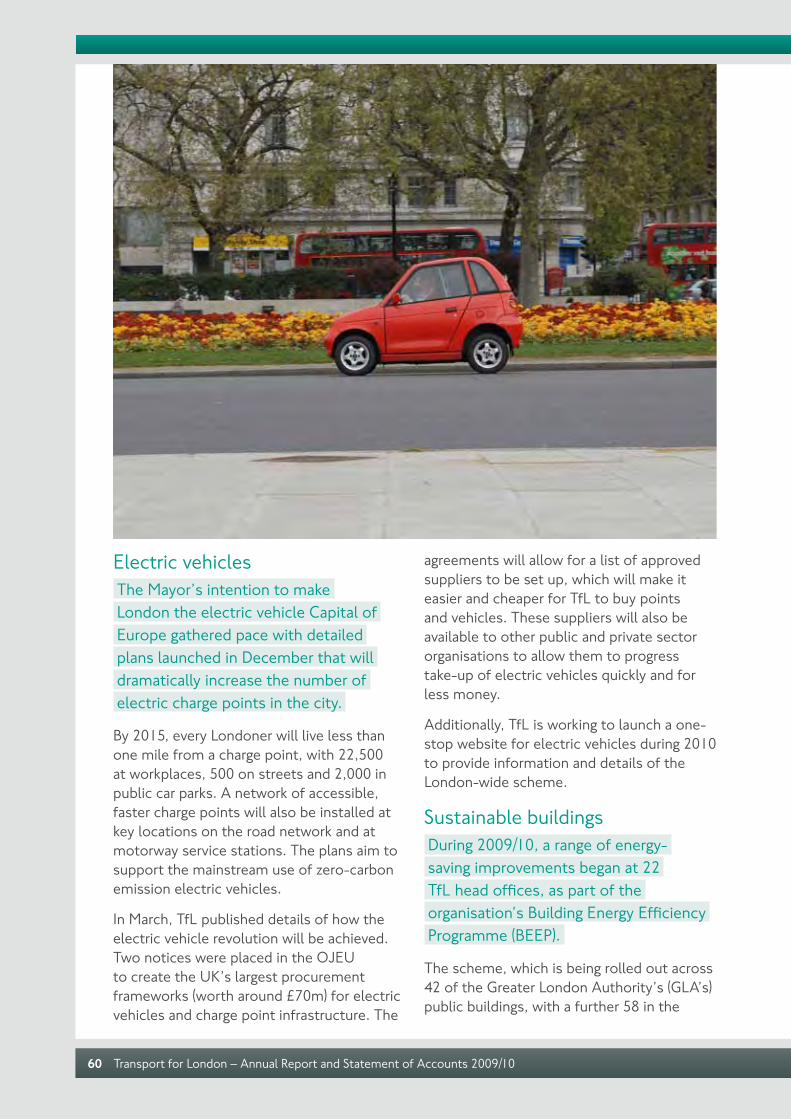
Transport for London – Annual Report and Statement of Accounts 2009/1060
Electric vehiclesThe Mayor’s intention to make London the electric vehicle Capital of Europe gathered pace with detailed plans launched in December that will dramatically increase the number of electric charge points in the city.
By 2015, every Londoner will live less than one mile from a charge point, with 22,500 at workplaces, 500 on streets and 2,000 in public car parks. A network of accessible, faster charge points will also be installed at key locations on the road network and at motorway service stations. The plans aim to support the mainstream use of zero-carbon emission electric vehicles.
In March, TfL published details of how the electric vehicle revolution will be achieved. Two notices were placed in the OJEU to create the UK’s largest procurement frameworks (worth around £70m) for electric vehicles and charge point infrastructure. The
agreements will allow for a list of approved suppliers to be set up, which will make it easier and cheaper for TfL to buy points and vehicles. These suppliers will also be available to other public and private sector organisations to allow them to progress take-up of electric vehicles quickly and for less money.
Additionally, TfL is working to launch a one-stop website for electric vehicles during 2010 to provide information and details of the London-wide scheme.
Sustainable buildingsDuring 2009/10, a range of energy-saving improvements began at 22 TfL head offices, as part of the organisation’s Building Energy Efficiency Programme (BEEP).
The scheme, which is being rolled out across 42 of the Greater London Authority’s (GLA’s) public buildings, with a further 58 in the
Reducing transport’s contribution to climate change and improving its resilience 61
pipeline, includes installing solar panels, improving draught proofing and ensuring that electricity voltage is delivered at the most efficient level.
As part of the innovative programme, energy companies guarantee a set level of energy (and therefore financial) savings, which allow organisations to fund investment in improvements. The risk of introducing efficiency measures is greatly reduced by having the companies guarantee the savings.
The work at TfL has been pivotal in the creation of a national BEEP framework, which provides a commercial model for public bodies to finance energy efficiency improvements to their buildings. It is anticipated that if successfully rolled out to public buildings, it could be modified to function within the private sector.
When the programme is complete, more than 70 energy efficiency projects will save £555,000 and stop 2,500 tonnes of CO2 being released each year.
In summer, 1,800 TfL staff moved into new premises at 14 Pier Walk, the first new building to be completed at the major development at Greenwich peninsula next to the O2 arena. The building has received an ‘excellent’ rating for its energy efficiency and water and waste management by the internationally recognised BREEAM standard, the leading and most widely used environmental assessment method for buildings.
A ‘living roof’ has been installed at Pier Walk to help boost local ecology, improve insulation and limit the flood impact from rainfall. Inside, kitchen work surfaces are made from recycled glass that originally started life as windows on 1967 Victoria line Tube carriages.
The move is a key part of TfL’s property strategy to improve the overall quality and productivity of its workspace, while still achieving significant efficiencies.
In February, a £2.4m combined heat and power plant, which includes the UK’s biggest hydrogen fuel cell inside a building, began providing energy for Palestra, TfL’s office in Southwark. Financed by the £25m TfL Climate Change Fund, the system generates energy locally, and aims to cut carbon emissions by up to 30 per cent and save £90,000 off bills. At times of peak energy use, the building generates a quarter of its own power, rising to 100 per cent off-peak. The waste heat from power generation is pumped into a unit on the roof which supplements six electric chillers and keeps the building cool.
To communicate the benefits of hydrogen and the fuel cell, a permanent exhibition display was created at Palestra which is powered by the energy generated on site.
Also in February, TfL signed-up to the 10:10 commitment. This pledge aims to cut carbon emissions from head office buildings by 10 per cent between 1 April 2010 and 31 March 2011. An estimated £400,000 will be saved from head office energy bills during the period, which will be reinvested in more energy-saving projects.
2,500 tonnes of CO2 will be saved each year by more than 70 energy efficiency projects
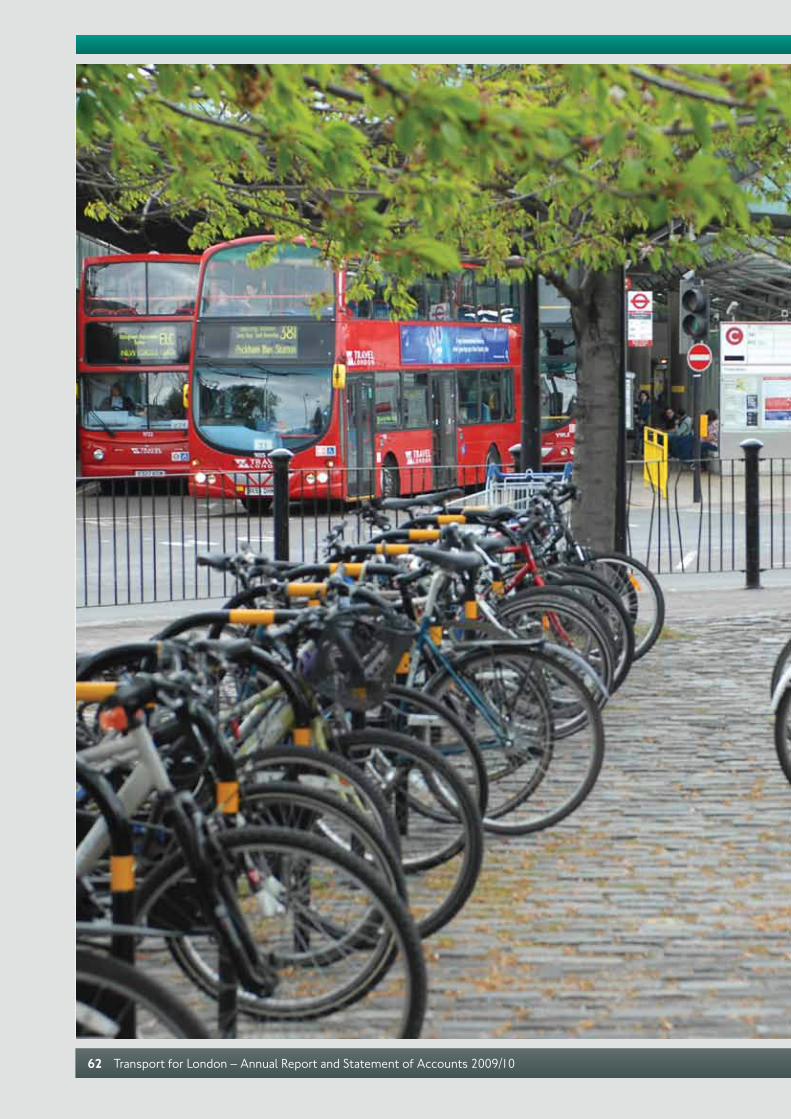
Transport for London – Annual Report and Statement of Accounts 2009/1062
Reducing transport’s contribution to climate change and improving its resilience 63
TfL is a founding member of the Better Buildings Partnership – a collaboration of London’s leading commercial property owners and organisations, which is supported by the Mayor. It aims to develop solutions to improve the sustainability of London’s existing commercial buildings and produce CO2 savings to achieve the Mayor’s target of a 60 per cent reduction by 2025, from 1990 levels. TfL is also part of Green 500, which sets out to enlist some of London’s largest organisations, and mentor them through their carbon reduction commitments.
In June, TfL won three awards at the first Green 500 and Better Buildings Partnership awards: the gold portfolio award for carbon efficiency at its head office buildings; gold standard under the Green 500 scheme; and a special commendation for the Palestra project.
Also this year, TfL was awarded for its energy saving credentials as a client at the CIBSE Low Carbon Performance Awards. Its head office buildings also received the Carbon Trust Standard in March, which recognises commitment to carbon reduction.
Energy saving lightsIn August, the Mayor announced investment of £2.4m from the TfL Climate Change Fund for thousands of new energy saving lights in traffic signals.
The lights cut CO2 emissions and last about 10 times longer than standard bulbs. A total of 3,500 traffic signals at around 300 junctions will be fitted with them, saving 600 tonnes of CO2 a year and around £200,000 in energy costs. These benefits are estimates, and a technical evaluation currently under way will verify the savings. TfL is now seeking organisations to supply and fit the lights.
All London Buses’ roadside ticket machines, plus 3,500 solar powered bus stops and 640 shelters, have LED lighting.
Smarter travel In March, the third and final Annual Report on the Smarter Travel Sutton scheme was published. It revealed the scheme has helped achieve a 75 per cent increase in cycling in the borough since its launch three years ago.
TfL worked in partnership with the London Borough of Sutton to deliver the scheme, which sets out to encourage residents to travel by public transport, on foot or by bike. Other highlights included a six per cent drop in the proportion of residents’ journeys made by car, plus an increase in bus travel.
In addition, all 68 Sutton schools had a travel plan in place by March 2008, two years ahead of Government targets.
The two-and-a-half-year Smarter Travel Richmond upon Thames programme began in April. Activity included the introduction of 700 on-street cycle stands, 105 car club bays, the launch of two travel plan networks for businesses, and a roadshow event attended by around 30,000 residents.
Work began with local schools to deliver coordinated school travel planning and
700 on-street cycle stands installed as part of Smarter Travel Richmond

Transport for London – Annual Report and Statement of Accounts 2009/1064
safer routes engineering schemes. The number of adults in Richmond aware of Car Clubs increased from 12 to 61 per cent and membership more than doubled to 2,700 following a targeted advertising campaign. Other results have also suggested an increase in levels of walking and cycling.
Across London, the Workplace Travel Plan programme continued to engage key businesses to reduce car use and encourage active modes for commuter and business travel. Results show that at 93 sites with approved plans, an average 9.2 per cent fall in single-occupancy vehicle use was achieved.
The programme also supports businesses by encouraging healthier, more active travel, as well as TfL’s cycling objectives through the delivery of employee cycle benefits. More than 90 per cent of London schools are now signed up to a travel plan, and car use has dropped by an average of 6.2 per cent since introducing School Travel Plans in 2004.
Reducing carbon emissions on the TubeIn January, London Underground became one of the first public transport operators to achieve the Carbon Trust Standard, in recognition of its work and ongoing commitment to improve carbon efficiency.
The standard was awarded based on actions and achievements between 2006 and 2009, as well as plans to cut carbon emissions in the future. The amount of CO2 released per passenger kilometre reduced from 81g in 2006/07 to 75g in 2008/09.
London Underground’s staff-led Energy Station Challenge is estimated to have reduced CO2 emissions by 5,500 tonnes in the last three years, saving around £700,000.
The use of regenerative braking on new trains on the Victoria and sub-surface lines (Circle, District, Hammersmith & City and Metropolitan) will save an estimated 17,000 tonnes of CO2 every year with a financial saving of approximately £2m.
Additionally, energy efficient lighting including LED technology has been installed at several stations across the Underground network and the new Northern line service control centre boasts London’s largest living roof, the first on a railway building.
Low-carbon stationsWork continued at stations across the network to save energy and reduce emissions. At South Croydon station, electricity use has been cut thanks to 42 photovoltaic solar panels that are now powering new CCTV cameras and lighting.
The technology is totally National Grid-free, resulting in 136 per cent of carbon emissions being off-set. Other improvements at the station include a 400 metre path for pedestrians and cyclists, new parking for bicycles and motorcycles, plus larger parking bays for disabled drivers. The station forecourt has also been refurbished.
TfL worked with Southern Railway, London Rail, Croydon Borough Council, Network Rail and Seltrans on the £435,000 project.
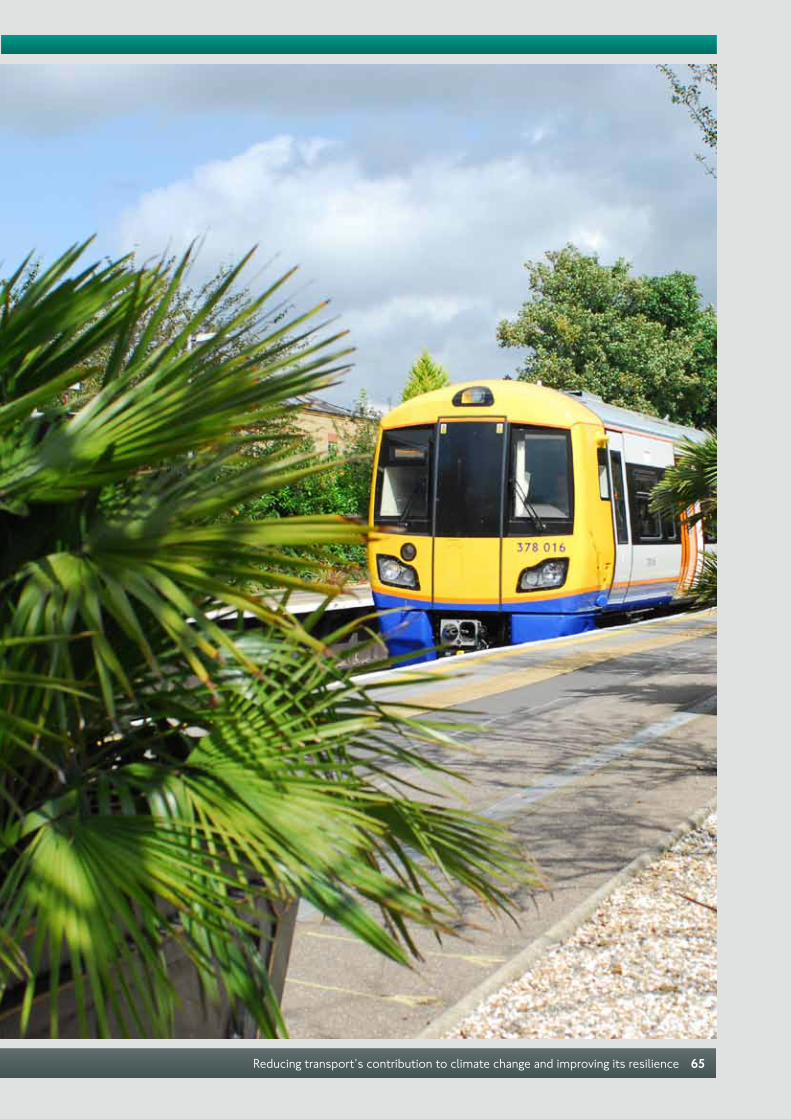
Reducing transport’s contribution to climate change and improving its resilience 65
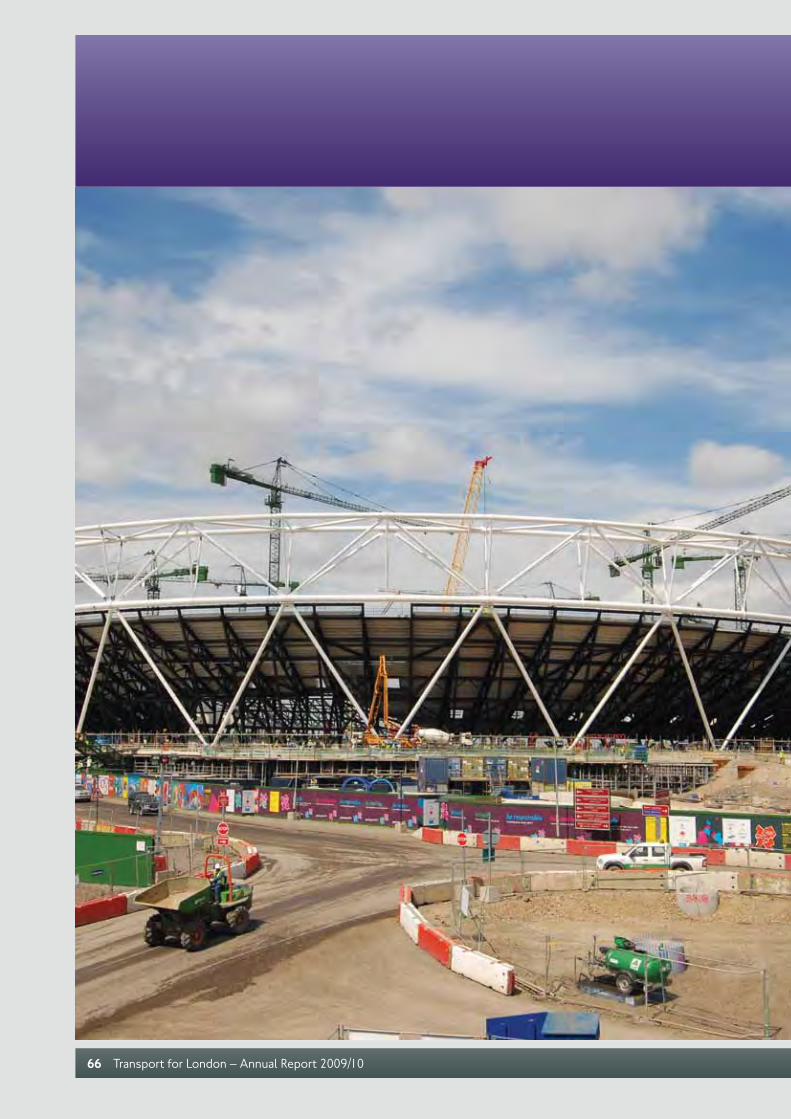
Transport for London – Annual Report 2009/1066
More than 800,000 spectators could attend the Games every day. TfL aims to ensure that each one can walk, cycle, travel by public transport or use park-and-ride services.
Supporting delivery of the 2012 Games and securing a lasting legacy
Supporting delivery of the 2012 Games and securing a lasting legacy 67
More than 800,000 spectators could attend the Games every day. TfL aims to ensure that each one can walk, cycle, travel by public transport or use park-and-ride services.
The sustainable Games The London 2012 Olympic and Paralympic Games will be the most sustainable ever.
TfL is working with London 2012 and other partners to ensure best use is made of existing infrastructure and that the transport network is being maximised for spectators and the Games’ workforce.
Extending the Docklands Light RailwayThe Docklands Light Railway will playa crucial role during the 2012 Games,providing fully accessible transport forthe Olympic Park and other key venues.
During April, an £18.2m funding package from the ODA was confirmed that will enable infrastructure improvements to continue on the Beckton route. This branch serves the Olympic venue ExCeL, and currently operates a two-car service. The finance will enable a third carriage to be introduced to keep pace with growing passenger numbers and demand for the 2012 Games. The route is expected to transport around 70,000 passengers a day during the event.
Also benefiting local residents before and after the Games is the expanded three-car service on the Docklands Light Railway’s busiest route (Bank to Lewisham), which began in January. It will be fully rolled out across the network during 2010, and is being part-funded by the ODA.
Work continues on the 6km Docklands Light Railway extension to Stratford International. It follows the Jubilee line route and is made up of former North London line stations at Canning Town, West Ham and Stratford. The extension also has four new stations: Star Lane, Abbey Road, Stratford High Street and Stratford International.
When it opens in autumn 2010, it will provide a major boost to the area. Benefits will include improved transport capacity and a reliable, frequent service from Stratford International to Woolwich and Beckton, well in advance of the 2012 Games.

Transport for London – Annual Report and Statement of Accounts 2009/1068
Olympic Route NetworkTfL has been working with the ODA to develop a network of roads – called the Olympic Route Network (ORN) – which will ensure members of the Olympic Family (Games officials and athletes) can travel to key venues and destinations quickly and easily.
The programme to develop the ORN has made significant progress this year. Following full public consultation on the proposed network by the DfT, a Designation Order was made in July that defines roads forming the ORN and gives the ODA a number of powers. These include putting in place traffic regulations, designating additional roads (subject to consultation), and approving planned roadworks on the ORN.
Preliminary designs for the ORN are now almost complete and an upgrade of traffic signals and permanent road improvements are already providing early benefits for Londoners.
In addition, TfL is working with boroughs, highway authorities and utility companies to develop a strategy to minimise disruption caused by street and roadworks during the Games.
Olympic walking and cyclingDuring 2009/10, progress was made on developing a network of routes designed to enable and encourage Games’ spectators to travel on foot or by bike.
The Olympic Walking and Cycle Route programme was granted £9.81m to complete eight routes. Their creation involves 121 different schemes and by March, 12 had been completed and preliminary work had begun on all but 15. The network will
be completed during 2011 so people can benefit well ahead of the Games.
Olympic river serviceLondon River Services, the ODA and boat operators have been working together to develop plans to run servicesfrom central London based on existing patterns of operation.
The main focus is on destination piers that are within easy walking distance of the Olympic venues at Maritime Greenwich and Greenwich Peninsula. The London Eye, Westminster and London Bridge are key piers for passengers joining river services for Olympic venues. Standard 15-minute frequencies will run with extra capacity to respond to spectator demand.
Urban realm improvementsIn March, the Mayor announced £11.5mfunding for projects in six London boroughs to help transform the look and feel of the Capital in time for the 2012 Games.
In Westminster, £7m will restore Piccadilly, St James’s and Pall Mall to their former status as great London boulevards with two-way traffic. Another £1.5m will fund
£11.5min funding was announced for urban realm improvements in six London boroughs

Supporting delivery of the 2012 Games and securing a lasting legacy 69
a revamp for Jubilee Gardens in Lambeth and £1.3m will be used to improve Kingsland High Street in Hackney. Projects in Camden, Enfield and Merton also had funding approved.
All the projects were chosen as they support the Mayor’s Great Outdoors programme, which aims to improve public spaces, and will be of direct benefit to the 2012 Games. Walking and cycle routes to Olympic sites will be upgraded, pedestrian crossings and access to stations will be improved and footways will be decluttered.
The waterways In June, a new canal lock, the Prescott Channel, opened in Bromley-by-Bow. TfL contributed £4m to the structure,which was built specifically with the construction work for the 2012 Games in mind.
Freight operators are able to bypass London’s roads and use the network of waterways instead. The lock can accommodate barges
weighing up to 350 tonnes, the equivalent of taking 17 lorries off the roads, helping to smooth traffic flow. After the Games, facilities such as this will remain for the long-term benefit of London’s freight industry.
Upgrading key stationsAs well as the ongoing programme of lineupgrades on the Tube (particularly on theJubilee line, which will serve a number ofkey Games venues and have a third morecapacity once work is completed thisyear), several key stations are beingupgraded in advance of the Games.
Stratford Regional station is being completely transformed, with new platforms, subways, walkways, lifts and ticket halls. Work is well advanced at Green Park and Southfields stations to deliver full step-free access in 2011 and 2010 respectively.
Transport for London – Annual Report and Statement of Accounts 2009/1070
As well as transforming London’s transport networks, TfL isensuring its business operations run efficiently and effectively and deliver maximum value for fare and taxpayers.
Improving efficiency, equality and partnerships
Improving efficiency, equality and partnerships 71
As well as transforming London’s transport networks, TfL isensuring its business operations run efficiently and effectively and deliver maximum value for fare and taxpayers.
Delivering for LondonIn March, the TfL Board approved a £9.2bn budget for 2010/11 which will deliver radical improvements to passenger services.
Part of TfL’s Investment Programme, the budget includes operating cost and capital investment and will fund projects due for completion in later years. It is underpinned by a drive to provide better value for fare and taxpayers through at least £5.2bn in efficiency savings to be delivered over the term of TfL’s Business Plan, which runs to 2018.
In the same month, the Mayor confirmed the appointment of six world-class experts to a new independent advisory group tasked with overseeing TfL’s Investment Programme. The members have a wide range of experience in disciplines including engineering, finance and project management, plus technical and commercial expertise. They will provide impartial advice, scrutinise the delivery of the programme and will look at maintenance, renewal, upgrades and major projects.
The team’s skills and experience will enable it to fully advise on, and examine, all aspects of the programme, including the ex-Metronet works. However, the group will have no remit over Crossrail which is subject to separate governance and assurance arrangements.2
FaresThe Mayor’s 2010 fares package was designed to ensure the continued delivery of frontline services andsafeguard vital improvements needed to sustain the Capital’s transport network.
Free and concessionary fares for London’s older and young people, and those on low incomes, have been protected. Forty per cent of bus passengers can therefore continue to travel free or at a concessionary rate. Additionally, the Freedom Pass remains valid for travel 24 hours a day on all TfL services.
Bus fares rose by 12.7 per cent and Tube fares by 3.9 per cent. However, this is comparable to 2005 and 2006 increases, when bus and Tube fares went up by 12.7 per cent and four per cent, and 12.9 per cent
2 The reporting period for the 2009/10 Annual Report ended on 31 March 2010. Following this, TfL announced that it had reached agreement with Bechtel and Amey (Ferrovial) to buy their shares in Tube Lines, which will result in it becoming a wholly owned subsidiary of TfL when the deal is finalised. The independent advisory group’s remit will be expanded to cover all Tube activities.
Transport for London – Annual Report and Statement of Accounts 2009/1072
and 3.9 per cent respectively. For the majority of journeys, Oyster continues to provide the best value single journey and daily prices across the TfL network.
Working with the boroughsIn April, the Mayor and the boroughs published the London City Charter, which commits them to working togetherto ensure public services continue to improve and are delivered as efficiently as possible.
The work with London Councils and boroughs to reform the Local Implementation Plan process has made it easier for boroughs to produce their transport plans.
During 2010/11, London’s boroughs will receive £155m to deliver local transport improvements and initiatives.
These include enhancing town centres and public spaces, making roads safer, increasing cycling facilities, improving sustainable transport options, supporting electric vehicles and car clubs, and smoothing traffic flow.
Eight boroughs along the route of the two pilot Cycle Superhighways have been allocated an additional £1.49m. The money will provide cycle training, parking and maintenance to address the anticipated increase in demand from residents living near the new infrastructure.
A simpler, more flexible system now allows boroughs to move funding between projects if, during the course of the year, they find more or less investment is needed for individual schemes.
During 2009/10, a CCTV camera sharing project delivered seven additional CCTV partnership schemes between TfL and the London boroughs. These allow TfL and the
boroughs to share each others cameras, and have resulted in an increase in the number of cameras available to both of around 200, for a minimal cost. A major benefit of the scheme is the reduction of on-street furniture and lower costs for new cameras.
Commitment to diversityBlack, Asian and minority ethnic employees make up 32 per cent of TfL’sworkforce and 25 per cent of employeesare women.
TfL endeavours to attract people who are under-represented in the organisation to apply for available jobs. It also requires subcontractors to demonstrate how they address equality and inclusion issues through delivery of TfL projects.
TfL is committed to equality and inclusion in all its operations. In January, London Underground gave its support to a new campaign by leading disfigurement charity Changing Faces. A total of 430 poster advertising spaces on the Tube were donated to the campaign during one week in January. The posters featured thought-provoking photographs of children with different types of facial disfigurement and challenged people not to judge on appearance. The campaign set out to break down stereotypes and assumptions that the public may have of young people with a physical difference.
During 2009/10, Surface Transport worked with disability organisations to develop a work placement project which employed two disabled people. These projects will be further developed in 2010/11. In addition, a class session on equality and inclusion issues was created and piloted by TfL’s senior managers. It is now ready to be rolled out across the organisation next year.
Improving efficiency, equality and partnerships 73
Efficient buildings Over the next 25 years, TfL plans to save up to £100m through its new office accommodation strategy.
As part of this it is consolidating its back-office operations at three principle locations – Palestra in Southwark, Greenwich Peninsula and The Shard at London Bridge. This strategy will significantly reduce operating costs and provide a greener working environment.
In November, three key transport control operations were relocated to one building saving rental costs.
Responsible procurementTfL is working to embed responsible procurement throughout its operations.
During 2009/10, it was independently evaluated at Level 5 – the highest level – of the flexible framework for sustainable procurement. Developed by the UK Government Sustainable Procurement Taskforce, the framework enables organisations to benchmark themselves against best practice implementation of sustainable procurement. The achievement reinforces TfL’s successful implementation of the GLA Group Responsible Procurement Policy.
Also this year, TfL has developed an approach that ensures its supply chain develops its workforce while offering employment and training opportunities to local communities. The contract for the London Cycle Hire Scheme was the first to be awarded with these conditions attached, and it will mean the creation of almost 180 new jobs including 29 new apprentices. TfL contracts worth almost £3.5bn now include these conditions, and will provide around 3,500 apprenticeship and training opportunities through the supply chain over the next four to five years. The model developed within TfL is now being rolled out across the broader GLA family.
Victoria Coach Station In May, Victoria Coach Station became the first organisation in the transport sector to achieve the Government’s Customer Service Excellence standard.
It was assessed against a wide range of criteria including customer satisfaction, complaint resolution and the professionalism of staff. The coach station received particular commendation for its complaint handling, which the assessor said indicated ‘a dedication to getting things right for the customer’.
The standard replaces the former charter mark scheme, which the coach station had held since 1994. It is awarded for three years and annual follow-up checks will ensure standards are being maintained and improvements put in place where possible.
£100m savings will be made by TfL through its new office accommodation strategy
Transport for London – Annual Report and Statement of Accounts 2009/1074
Newspaper contract In March, TfL announced that, subject to contract, London Underground and London Bus Services Ltd would award Associated Newspapers Ltd with the concession to distribute a free morning title at around 250 Tube stations and 14London bus stations.
This allows the contract holder, owner of the Metro, to distribute free papers on weekday mornings. The concession lasts for seven-and-a-half years and Metro’s owner has held the current contract, which expired on April 2 2010, since 1999. The title has become part of daily life in the Capital.
Revenue from the deal will go towards improving London’s public transport system, including the upgrade of the Tube. It will also fund carbon-cutting projects and aims to further encourage newspaper recycling with more bins at key stations. In addition, the deal will feature measures to cut the number of copies left behind at the end of every day.
London Transport Museum The Museum had a productive and busy year and welcomed more than 282,000 visitors.
Two exhibitions were held during 2009/10: Street Smart offered families a hands-on way to learn about road safety, and Suburbia, supported by American Express, explored how public transport helped create the Capital’s suburbs and how they have featured in its cultural landscape.
As a subsidiary company of TfL, and an educational and heritage charity, London Transport Museum works closely with TfL while enjoying the financial benefits of charitable status. More than 50 organisations contribute to the Museum’s work annually, through a thriving Corporate Members’ Scheme. This year the scheme has benefited from 10 per cent growth due to the launch of ‘Thought Leadership’ events, supported by Eversheds. The programme offers an opportunity for members, the Government and leading academics to discuss cross-sector industry issues. These include climate change, funding, technology and the promotion of engineering as a career choice.
The Museum attained accreditation under Visit England’s Visitor Attraction Quality Assurance Scheme for the second consecutive year. It is also accredited by the Council for Museums, Libraries and Archives (MLA) under the national standards scheme and its collections are designated as being of national importance. Through the MLA, the Museum is funded by the Renaissance programme to deliver projects that support education and community development.
282,000 people visited London Transport Museum during the year

Improving efficiency, equality and partnerships 75
During the year, innovative programmes continued to reach new and wider audiences both on-site and through outreach initiatives, with school group visits reaching capacity.
A partnership with TfL and the London Apprenticeship Company supported a number of young people considering careers in the transport industry. The scheme, called ‘Route into Work’, delivered practical
activities to help build the employability skills of young people not in education.
Additionally, the Museum worked with BTP this year to deliver training for their new volunteer Transport Youth Engagement Officers.

Transport for London – Annual Report and Statement of Accounts 2009/1076
Over the next two decades, London’s population is expected to grow by around 1.25 million and its workforceby 750,000.
It is TfL’s responsibility to ensure the Capital’s public transport network is fit to cope with these increases.
Paving the way, the new Mayor’s Transport Strategy (MTS), published in May 2010, covers the next 20 years to 2031.
Its goals and outcomes have been shaped with help from the people of London, through a three-month public consultation that began in October 2009. And it reflects ideas outlined both in the Mayor’s ‘Way to Go!’ document published in November 2008 and his Statement of Intent (May 2009), published for consultation with the London Assembly and the GLA Group.
Alongside a new London Plan and Economic Development Strategy, the revised MTS builds on what has already been achieved during the 10 years since the original strategy was established, and sets out a vision for London’s long-term growth and development.
The new MTS identifies six goals:
> Support economic development and population growth
> Enhance the quality of life for all Londoners
> Improve safety and security of all Londoners
> Improve transport opportunities for all Londoners
> Reduce transport’s contribution to climate change and improve its resilience
> Support delivery of the London 2012 Olympic and Paralympic Games and its legacy
These goals will guide TfL as it develops a transport system geared for the next decade and beyond. That work is already under way in many respects – Crossrail, Tube upgrades, London Overground’s expansion, walking and cycling initiatives, plus schemes to smooth traffic flow and make transport safer and more accessible to everyone.
In this Annual Report, TfL is obliged to report on achievements delivered in support of the 2001 MTS – the legal strategy in place during the reporting period, April 2009 to March 2010. The following pages highlight key elements of the progress made during that time.
Progress against the Mayor’s Transport Strategy
Progress against the Mayor’s Transport Strategy 77Progress against the Mayor’s Transport Strategy 7777
Priority A Reducing traffic congestion:
> TfL and 18 London boroughs introduced a permit scheme, aimed at reducing disruption from roadworks. It requires companies to apply for permission before digging up the Capital’s busiest main roads. It also gives permit authorities greater ability to control the timing and management of works being carried out on their roads plus more opportunities to coordinate works, thereby minimising disruption
> TfL and six utility companies operating in London have signed up to the Mayor’s Code of Conduct for Roadworks. The code seeks to encourage best practice and innovative working methods by works promoters and improve collaboration between them to reduce unnecessary disruption from roadworks
> A high-tech, 24-hour control hub opened in September, combining three centres overseeing London’s bus, street and Metropolitan Police traffic operations. It handles about 1,000 unplanned incidents a month as well as 750 scheduled major annual events
> Twenty special image-recognition cameras were installed at traffic hot spots, enabling control centre operators to respond rapidly when situations occur
Priority BOvercoming the backlog of investment on the Underground so as to safely increase capacity, reduce overcrowding and increase reliability and frequency of services:
> The biggest investment in the Tube for decades, which will increase capacity by almost a third, gathered pace. In July, the re-signalling programme for the Circle, District, Hammersmith & City and Metropolitan lines was put out to tender. In December, the Circle line was extended to Hammersmith as part of a new service pattern. Progress was also made on the Jubilee line, although the contractor has been unable to complete on time
> The first of the Victoria line’s new trains entered service in July along with a new signalling system. And the first of 191 new air-conditioned trains for the Circle, District, Metropolitan and Hammersmith & City lines arrived for testing in October, and is due to enter service in summer 2010
> Timetable improvements on the Piccadilly line have made journeys faster and cut waiting times by a quarter
> Station improvements continued. A new ticket hall opened at King’s Cross St. Pancras, and plans to upgrade Victoria Tube station were approved. A tender was issued for the £300m redevelopment of Bond Street station and work continued on Blackfriars Tube station
Transport for London – Annual Report and Statement of Accounts 2009/1078
Priority CMaking radical improvements to bus services across London, including increasing the bus system’s capacity, improving reliability and increasing frequency of services:
> All 8,500 London buses now have iBus state-of-the-art on board information technology which tells passengers their location, next stop and final destination
> Excess waiting time on high-frequency bus services was maintained at 1.1 minutes, matching the best-ever recorded levels. This is the principal measure of bus service reliability
> Contracts were awarded to develop Countdown signs, providing bus arrival information at 2,500 bus stops, and TfL’s website now provides more service details
> Work has begun on a new and innovative London bus which will be 40 per cent more fuel efficient than conventional buses. It is expected to enter service in 2011
> A high-frequency bus service, called East London Transit, began operating between Ilford, Barking and Dagenham Dock. It is expected to carry about six million passengers a year
Priority DBetter integration of the National Railsystem with London’s other transport systems to facilitate commuting, reduce overcrowding, increase safety and move towards a London-wide, high frequency ‘turn up and go’ metro service:
> The Oyster ticketing system was extended to cover all commuter rail routes within Greater London. More than seven million Oyster cards are now regularly used, accounting for more than three billion journeys last year
> West Londoners gained direct access to the London Overground and rail networks with the opening of the £7.8m Imperial Wharf station, which links the major Clapham Junction and Willesden Junction interchanges
> The roll-out of 54 new air-conditioned, three-carriage Overground trains began in July. With flip-down seats to provide extra standing room for hop-on, hop-off journeys, they can carry almost 500 passengers each – eight per cent more than the old stock

Progress against the Mayor’s Transport Strategy 79
Priority EIncreasing the overall capacity of London’s transport system by promoting major new cross-London rail links including improving access to international transport facilities; improved orbital rail links in Inner London; and new Thames river crossings in east London: > Work began on the first Crossrail station,
Canary Wharf. One of the biggest on the Crossrail network, it will enable the growth of the Docklands area, supporting economic growth and regeneration
> Tottenham Court Road station’s redevelopment continued in preparation for Crossrail
> TfL published a review of options for new east London river crossings, following cancellation of the Thames Gateway Bridge project
> London Overground took control of 10 stations between Surrey Quays and West Croydon as it prepared for the re-opening of the East London line in spring 2010
Priority FImproving journey time reliability for car users, which will particularly benefitOuter London where car use dominates,while reducing car dependency by increasing travel choice:
> TfL reviewed 1,003 traffic signal timings across the Capital to ensure their safe and efficient operation and to reduce stop-start delays, including at major intersections like Trafalgar Square, Hyde Park Corner and Hanger Lane Gyratory
> Infrastructure that enables traffic signal timings to adapt automatically in real- time to best suit current traffic conditions has been added to an additional 335 sites to help reduce delays and congestion
> Consultation on proposed changes to the Tottenham Hale Gyratory showed strong public support for plans, which include converting to two-way traffic, improving facilities for pedestrians and cyclists, and creating a public square at Tottenham Hale station
Transport for London – Annual Report and Statement of Accounts 2009/1080
Priority GSupporting local transport initiatives to include: improved access to towncentres and regeneration areas; walking and cycling schemes; safer routes to school; road safety improvements; better maintenance of roads and bridges; and improved coordination of streetworks:
> TfL’s collaboration with the London Borough of Sutton on the Smarter Travel Sutton scheme, which encourages residents to walk, cycle or use public transport, has seen a six per cent cut in car journeys over three years. Cycling has increased by 75 per cent
> Twelve Outer London boroughs were selected as ‘Biking Boroughs’ and awarded funds to look at ways of developing cycling in their areas
> A £6m facelift of Woolwich town centre was completed, improving safety for pedestrians, cyclists and road users. Among other local regeneration projects, several pedestrian improvement schemes were carried out in the West End
Priority HMaking the distribution of goods and services in London more reliable, sustainable and efficient, while minimising negative environmental impacts:
> Proposals were announced to include the oldest and most polluting heavier vans and minibuses in the LEZ. Restrictions were also proposed on the most polluting taxis and private hire vehicles
> The Freight Operator Recognition Scheme, which helps measure operators’ efficiency, was reinforced with the London Freight Plan, providing guidance on reducing fuel use, emissions and CO2 levels
Progress against the Mayor’s Transport Strategy 81
Priority IImproving the accessibility of London’s transport system so that everyone, regardless of disability, can enjoy the benefits of living in, working in and visiting the Capital, thus improving social inclusion:
> A total of 59 Underground stations are now step-free and work is progressing to increase this number
> A Travel Support Card, making it easier for people with hidden disabilities such as autism to ask for help from staff, was introduced
> All touch-screen ticket machines at Tube stations have now been upgraded to operate in 17 languages, making travel easier for London’s diverse communities as well as visitors
> Building on improvements made in recent years, TfL revised its Disability and Deaf Equality Scheme, which sets out plans for improving travel for disabled and deaf people in London
Priority JBringing forward new integration initiatives to: provide integrated, simpleand affordable public transport areas; improve key interchanges; enhance safety and security across all means of travel; ensure that taxis and privatehire vehicles are improved and fully incorporated into London’s transport system; and provide much better information and waiting environments: > Oyster pay as you go was extended to
allow seamless travel across Tube, bus, rail and river services
> Twenty new Travel Safe Officers began patrolling London Overground services to deter antisocial behaviour, as part of a 12-month trial
> TfL announced plans to tighten guidelines for licensing taxi and private hire drivers in London and the Safer Travel at Night campaign continued to build awareness of the dangers of illegal cabs
> Wider availability of Visitor Oyster cards is expected to make travel on London’s public transport network easier and more attractive. During the year, easyJet and First Train Operating Company began selling the cards, which have pre-loaded credit limits. Other partners already include Eurostar, National Express coach services, Gatwick Express and Stansted Express

Statement of Accounts
Transport for London – Annual Report and Statement of Accounts 2009/1082

Statement of Accounts 83
Explanatory Foreword and Financial Review 84
Statement of Responsibilities for the Accounts 94
Annual Governance Statement 95
Independent Audit Report to Transport for London 102
Group Income and Expenditure Account 106
Corporation Income and Expenditure Account 107
Statement of Movement on the General Fund Balance 108
Reconciliation of the Deficit on the Corporation’s Single Entity Income and Expenditure Account to the Deficit/(Surplus) on the Group Accounts 109
Statements of Total Recognised Gains and Losses 110
Group and Corporation Balance Sheets 111
Cash Flow Statements 112
Statement of Accounting Policies 116
Notes to the Accounts 122
Explanatory Foreword andFinancial Review
Transport for London – Annual Report and Statement of Accounts 2009/1084
This drove a significant increase in capital expenditure. With an uncertain economic background, passenger demand declined. To offset the risk to TfL’s revenue, the Mayor increased fares above inflation, and TfL significantly increased its savings programme resulting in a £5 billion efficiencies over the life of the business plan.
HighlightsTowards the end of 2009/10, passengerdemand across the TfL network startedto show signs of recovery from thedecline in passenger numbers seen earlyin 2009/10. Year on year, passenger journeys on the Underground fell by 2.2 per cent to 1.07 billion, the first fall in numbers since 2005/06. Service demand on the bus network rose very slightly to 2.26 billion passenger journeys for the year, and the Docklands Light Railway carried 69 million passengers in the year.
The fall in passenger numbers was offset by an above inflation fares package designed to enable TfL to maintain its Investment Programme. This resulted in a 4.1 per cent increase in revenue to £3,594m. Operational spend excluding exceptional items decreased by 0.7 per cent to £5,274m.
The level of capital works being undertaken during 2009/10 remained high, and included a much increased contribution from the Crossrail project. Capital expenditure during the year was up 11.2 per cent to £3,139m.
RevenueTfL’s main source of revenue remainsfares on the London Undergroundand bus network, including revenuein respect of free travel for older anddisabled people. This represents80.9 per cent of all revenue generated in 2009/10. The lower levels of passenger demand across the network, offset by fare increases, resulted in a 1.3 per cent increase in fares revenue on the Underground to £1,635m, and a 6.1 per cent increase in fares revenue on the bus network to £1,145m.
2009/10 was a year of challenges for TfL. Major projects wereprogressed to improve and extend service. These included the integration of Metronet; Tube upgrades; extensions on London Overground and the Docklands Light Railway; and preliminary works on the Crossrail project.
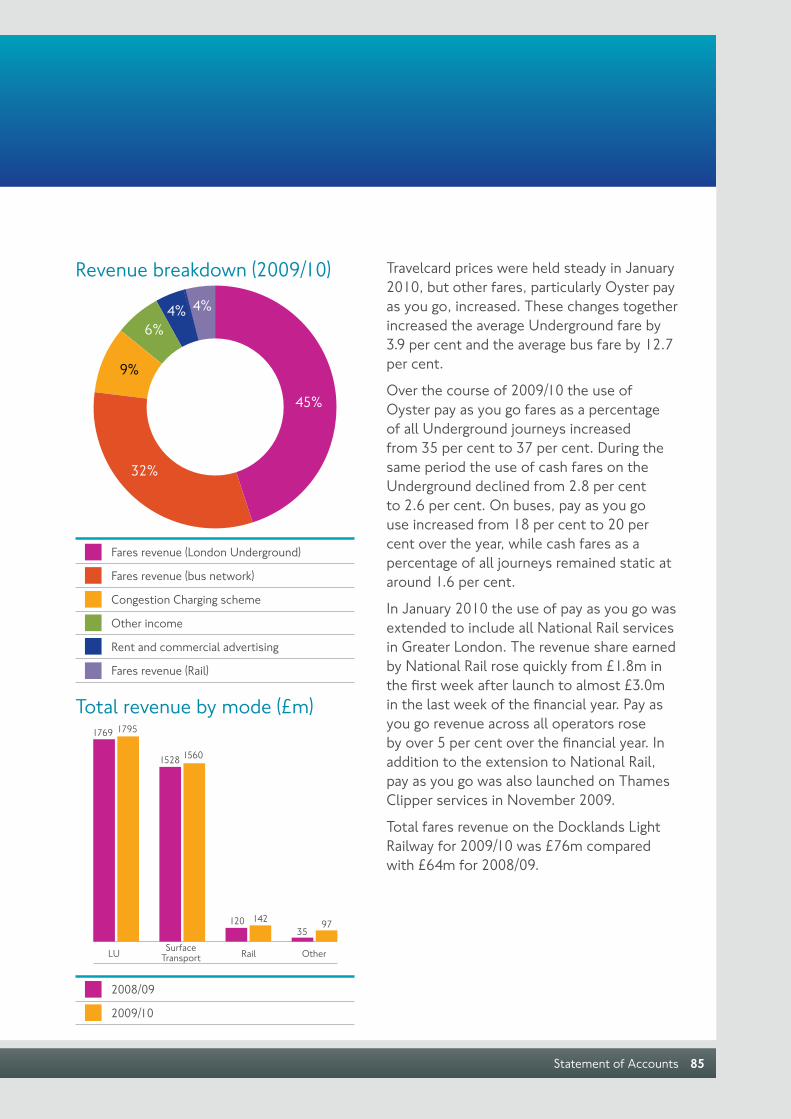
Statement of Accounts 85
Revenue breakdown (2009/10)
Total revenue by mode (£m)
Travelcard prices were held steady in January 2010, but other fares, particularly Oyster pay as you go, increased. These changes together increased the average Underground fare by 3.9 per cent and the average bus fare by 12.7 per cent.
Over the course of 2009/10 the use of Oyster pay as you go fares as a percentage of all Underground journeys increased from 35 per cent to 37 per cent. During the same period the use of cash fares on the Underground declined from 2.8 per cent to 2.6 per cent. On buses, pay as you go use increased from 18 per cent to 20 per cent over the year, while cash fares as a percentage of all journeys remained static at around 1.6 per cent.
In January 2010 the use of pay as you go was extended to include all National Rail services in Greater London. The revenue share earned by National Rail rose quickly from £1.8m in the first week after launch to almost £3.0m in the last week of the financial year. Pay as you go revenue across all operators rose by over 5 per cent over the financial year. In addition to the extension to National Rail, pay as you go was also launched on Thames Clipper services in November 2009.
Total fares revenue on the Docklands Light Railway for 2009/10 was £76m compared with £64m for 2008/09.
Fares revenue (London Underground)
Fares revenue (bus network)
Congestion Charging scheme
Other income
Rent and commercial advertising
Fares revenue (Rail)
45%
32%
4%4%6%
9%
2008/09
2009/10
LU
1769 1795
1528 1560
120 14235
97
Rail OtherSurfaceTransport

Transport for London – Annual Report and Statement of Accounts 2009/1086
Operational expenditure Operating expenditure on theUnderground increased by 3.5 per centto £2,301m. This increase arose from the combined effects of pay awards and inflationary pressures, mainly in property costs and utility charges. Bus network costs increased overall by approximately £29m to £1,837m. There was an increase of £52m due to contract price adjustments applied to all bus contracts. These price adjustments are based on a weighted uplift using Retail Price Index (RPI), earnings index and diesel prices. This was offset by other operating cost savings and a reduction in funding for the East Thames Buses operations which were sold in September 2009.
There was a decrease in expenditure on Congestion Charging mainly due to a reduction in staff costs and lower contract costs from the new operator.
Expenditure on Rail increased as a result of the inclusion of London Tramlink for the full year and increased costs at Docklands Light Railway reflecting the full year costs of operating the Woolwich Arsenal extension.
TfL continued to support borough schemes that improve the quality, safety, accessibility and sustainability of the local travelling environment. The overall funding package for 2009/10 included £153m provided directly to the boroughs through the LIP programme, and additional expenditure of £12m renewing traffic signals on borough roads. Other financial assistance included payments related to Taxicard.
Expenditure breakdown (2009/10)
Expenditure by mode (£m)
Running costs
Staff costs
PPP maintenance, leasing and PFI charges
Financial assistance
53%
30%
3%14%
2008/09
2009/10
LU
2223 2301
2586 2607
243 268123
Rail OtherSurfaceTransport
236

Statement of Accounts 87
Interest and finance charges Interest payable increased by £69mdue to increased borrowings and higheraverage finance lease creditors. Interest receivable decreased by £91m reflecting significantly lower interest rates and lower average cash balances.
Balance sheetNet assets decreased by £2,174mbetween 31 March 2009 and 31 March2010, largely due to an increase in the pension deficit of £1,002m and the use of grant to fund the Investment Programme. Fixed assets increased significantly, reflecting the continuing high levels of capital expenditure particularly in respect of the Crossrail project. As explained further below, £319m of fixed assets were provided under the PPP contract with Tube Lines. This resulted in an increase in finance lease creditors over one year, although this was offset by the termination of the Prestige PFI contract.
Capital expenditureCapital expenditure rose to £3,139m. Nearly 48 per cent of TfL’s capital expenditure during 2009/10 related to capital works being undertaken onLU’s infrastructure.
Capital expenditure by mode (£m)
On the Underground, good progress has continued on the upgrades of the Victoria and sub-surface (Metropolitan, District and Circle & Hammersmith) lines. The first new Victoria line train entered passenger service in July, initially at off-peak times, and by the end of the year five of the new trains were operating throughout the traffic day. New signalling and control systems have been installed and continue to prove themselves alongside the existing signalling, which will remain in place until all the old trains have been phased out.
The first of the new air-conditioned, walkthrough ‘S-stock’ trains for the sub-surface lines was delivered to London in October and is being tested prior to introduction at the north end of the Metropolitan line later this year.
2008/09
2009/10
LU
16071495
224 201905
1360
86 83
OtherSurfaceTransport
Rail/Crossrail
905
Transport for London – Annual Report and Statement of Accounts 2009/1088
As well as progress with the major line upgrades, the process of ongoing renewal of the Underground’s core assets continued with the replacement during the year of 27 kilometres of track, refurbishment or replacement of 26 escalators and lifts, and the completion of 23 station refurbishments and modernisations.
In November 2009 the new Northern ticket hall opened at King’s Cross St. Pancras station, doubling capacity, cutting congestion and improving accessibility with step-free access provided to five of the six lines that serve the station. Step-free access to the Northern line will be available later this year.
Preparatory work is well underway for the upgrade of Victoria station following Government approval of the project in July 2009. Major redevelopment is also in progress at Tottenham Court Road in order to upgrade the Underground station and to provide an interchange with Crossrail.
In Surface Transport, £201m was spent on capital works, including: the Cycle Hire Scheme; other cycling and walking initiatives; completion of the iBus radio and information system; renewal works programme on the Transport for London Road Network (TLRN); safety improvements to bridges and tunnels; and traffic signal modernisation.
Capital expenditure of £1,360m was incurred by Rail, of which £569m relates to London Rail and £791m to the Crossrail project. The London Rail expenditure includes DLR projects such as the Stratford International extension, capacity enhancement works to upgrade the railway to enable three car operation, and the acquisition of new rolling stock. Other projects included completing the extension to the East London Line, which opened in May 2010, and London Overground improvements for the North London Line. For the Crossrail project, £319m was spent on preparatory works and £472m on the acquisition of properties required for the project.
FinancingTfL raised further funds during the yearfrom a variety of sources to support itsInvestment Programme. Set out below is a table summarising movements in long-term borrowing in the year. In addition to the sources of financing in the table below, other sources of financing include the PPP and PFIs (see also Notes 19 and 21 to the accounts).

Statement of Accounts 89
The borrowing limit for the Corporation set by the Mayor for 2009/10 was £4.197bn.
Cash and short-term investments Total cash and short-term investments (364 days or less) held by the Corporation at 31 March 2010 amounted to £1,509m. The average yield from TfL’s cash investments for 2009/10 was 0.66 per cent. The yield is significantly reduced this year as a result of generally lower interest rates and a change in investment strategy. Most of the cash is represented by reserves and borrowing earmarked to fund TfL’s future Investment Programme including the Crossrail project.
PensionsAs at 31 March 2010, the majority ofTfL’s employees are members of thePublic Sector Section of the TfL PensionFund, following the transfer of the twoformer Metronet Sections into the PublicSector Section on 30 March 2010.
Over the past year, the fair value of the assets of these Sections has increased by over £1,150m. This is more than offset by an increase in the actuarial value of future liabilities of £2,116m, and as a consequence the deficit of pension scheme assets over future liabilities for the TfL Pension Fund has increased by £966m.
In addition, at 31 March 2010 the Group had future liabilities under unfunded pension arrangements of £52m, an increase of £11m from 2009.
The latest full actuarial valuation of the TfL Pension Fund was carried out as at 31 March 2009. The 2009 valuation showed a deficit on the three Sections for funding purposes of £1,331m, and as a result of this the employers agreed a revised Schedule of Contributions with the Pension Fund.
£m NotesOpening borrowing at 1 April 2009 3,018
European Investment Bank loans
• East London line 66
The fifth and final instalment of a total facility of £450m to be drawn down over five years. The loan has an interest rate of 4.293 per cent fixed for the full loan amount. Repayment is in 15 equal instalments from March 2017
• Docklands Light Railway 200
The loan has an interest rate of 4.856 per cent fixed for the full loan amount. Repayment is in 12 equal instalments from March 2021
• Crossrail 150
The first instalment of a total facility of £1bn drawn over six years. The loan has an average fixed interest rate of 4.9 per cent. Repayment of the loan is between 2021 and 2058
Public Works Loan Board 684
Forty separate loans with a weighted average interest rate of 4.19 per cent and final maturity ranging between 2018 and 2059
Closing borrowing at 31 March 2010 4,118

Transport for London – Annual Report and Statement of Accounts 2009/1090
Prospects and outlookIn October 2009, TfL published itsupdated Business Plan for the years to 2017/18. This adjusted the previous year’s plan for the significant impacts of the recession and integration of Metronet, whilst maintaining delivery of key projects to meet the transport needs of the London 2012 Olympic and Paralympic Games.
The Crossrail project, a £16bn investment in a new rail route across London, has started construction of enabling works. Crossrail will deliver a 10 per cent increase in rail-based network capacity in London, and is expected to contribute around £40bn to the wider UK economy.
Financing of the Business Plan is from:
> Fares income
> Congestion Charge income
> Government grant and TfL borrowing
> Secondary income such as advertising
> Third party funding for specific projects
> Sales of property and other assets
PassengersThe investment in the Business Plan isdesigned to support London’s projectedgrowth - population growth of up to 1.25million and employment growth of up to0.75 million by 2031. This means there will be around three million extra trips a day in the Capital by 2031.
The Tube upgrades will provide more than a 30 per cent increase in capacity by 2022, catering for anticipated demand growth and addressing current overcrowding.
Fares policyThe Business Plan assumes that fares willrise at two per cent above the RPI in each year of the Plan period. Fares decisions are taken annually by the Mayor. To help offset financial pressures caused by factors including the collapse of Metronet and a recession-linked fall in Tube ridership, the fares package for 2010 was set so that, overall, bus fares will rise by 12.7 per cent and Tube fares by 3.9 per cent.

Statement of Accounts 91
Revenue pressuresThe economic climate has deterioratedsignificantly since the 2008 Business Planwas produced. TfL’s Business Plan published in 2009, reflected the deterioration in economic conditions that had occurred since the previous Plan and the estimated impact on fares income, and made various adjustments to compensate. The economic situation continues to be monitored closely. If income is lower than anticipated, further adjustments to expenditure will be made, to ensure that financial balance is maintained.
Cost pressuresTfL’s operations and ongoing InvestmentProgramme are subject to a range ofpotential cost pressures. These include:
Economy Unexpected inflation on operating and capital costs, together with impacts on passenger demand levels.
Asset renewal Unforeseen costs of bringing transport assets such as roads and the Underground into a state of good repair.
Legislative complianceAdditional national and EU legal requirements.
Energy pricesIncrease in oil and/or electricity prices.
Terrorism Terrorism-related and increased security costs.
Treasury risk managementThe Board approves prudent treasurypolicies that comply both with theprinciples of the CIPFA Prudential Codeand investment guidance issued by theSecretary of State under Section 15 (1) (a)of the Local Government Act 2003. Senior management directly controls day-to-day treasury operations. The Finance and Policy Committee (a sub-committee of the TfL Board) is the primary forum for discussing the annual treasury investment strategy and policy matters and for submitting proposals to the Board.
Treasury operates on a centralised, non-speculative risk basis. Its purpose is to identify and mitigate residual treasury-related financial risks inherent to the Group’s business operations.
TfL has considered the implications of its overall asset and liability management, with analysis continuing on its overall exposure to inflation and interest rates as they affect its commercial markets (passenger levels, fare revenues and costs) and in its financial activities (financial costs and investment returns on cash balances).
The results of this analysis did not lead to significant changes in the recommended treasury management strategy (medium/long-term fixed-rate debt and short-term cash investments with institutions having high credit ratings), but have focused on the opportunities to increase yield without risking underlying security.
Transport for London – Annual Report and Statement of Accounts 2009/1092
The primary treasury-related financial risks faced by the Group are counterparty credit, liquidity and interest rate movements. These are the focus of treasury policies, as set out below:
Counterparty credit The Group’s exposure to credit-related losses i.e. non-performance by counterparties on financial instruments, is mitigated by setting a minimum required credit rating and applying financial limits based on credit ratings. For 2009/10, TfL followed a conservative investment strategy, investing only with UK Government (via the Debt Management Office) and the four main UK clearing banks. The amounts that can be invested with the DMO were not limited, while amounts invested with the UK clearing banks were based on the bank’s credit rating and any Government support. The minimum limit is A+ / A1 with a financial limit of £40m, and the maximum is AAA / Aaa with a limit of £200m. Credit ratings are obtained from the three main ratings agencies and are kept under constant review.
Funding and liquidityTo ensure continuity of affordable funding, debt maturities are spread over a range of dates which broadly equate to the lives of assets purchased with the proceeds of debt. The maturity profile of debt outstanding at 31 March 2010 is set out in Note 21 to the accounts. Due to the size and long-term nature of future commitments, significant cash balances are held to mitigate the risk of any future restriction of access to funds.
Interest ratesTfL has approved parameters of a minimum of 50 per cent fixed-rate on existing and forecast debt. The proportion of fixed-rate debt borrowings at the year end was 100 per cent. Cash investments at the year end reflected rates for maturities ranging from overnight to 45 days, with a weighted average maturity of 27 days.
Statement of Accounts 93
Accounting statementsTransport for London is a statutorycorporation established by section 154 of the Greater London Authority Act 1999 (GLA Act 1999). It is afunctional body of the Greater LondonAuthority (GLA) and reports to the Mayorof London. The legal structure is complex in comparison to that of most local authorities and comprises:
> The Corporation, which is made up of London Streets, the Public Carriage Office and the corporate centre which, for legal and accounting purposes, constitutes TfL
> The TfL Group, which is made up of the Corporation and its subsidiaries as set out in Note 12
Under the GLA Act 1999, the Corporation is treated as a Local Authority for accounting purposes and the Statement of Accounts, which includes the individual financial statements of the Corporation, has been prepared in accordance with the Code of Practice on Local Authority Accounting in the United Kingdom 2009: A Statement of Recommended Practice (SORP).
TfL’s subsidiaries are subject to the accounting requirements of the Companies Act 2006 and separate statutory accounts are prepared for each subsidiary and for the Transport Trading Limited Group (TTL Group). The financial statements for the TfL Group, which consolidate the accounts of the Corporation and its subsidiaries on the basis set out in the statement of accounting policies (paragraph d), are also presented alongside the financial statements of the Corporation.
The Statement of Accounts comprises:
> The Corporation income and expenditure account, statement of movement on general fund balance, statement of total recognised gains and losses, balance sheet, cash flow statement
> The statement of accounting policies
> Statement of responsibilities for the accounts
> Notes to the Corporation financial statements
The Group Accounts comprise:
> The Group income and expenditure account, statement of total recognised gains and losses, balance sheet and cash flow statement
> Reconciliation of the single entity income and expenditure account surplus or deficit to the group income and expenditure account surplus or deficit
Within the Statement of Accounts references to the ‘Corporation’ relate to the transactions, assets and liabilities of TfL. References to the ‘Group’ relate to the accounts of TfL and its subsidiaries.
Statement of Responsibilities for the Accounts
Transport for London – Annual Report and Statement of Accounts 2009/1094
The Corporation is required to:
> Make arrangements for the proper administration of its financial affairs and to secure that one of its officers (its Chief Finance Officer) has responsibility for the administration of those affairs
> Manage its affairs to secure economic, efficient and effective use of resources and safeguard its assets
The Chief Finance Officer is responsible for the preparation of the Statement of Accounts for the Corporation and the Group which, in the terms of the SORP, is required to give a true and fair view of the financial position of the Corporation and Group at the accounting date and the income and expenditure for the year ended 31 March.
In preparing this Statement of Accounts I certify that I have:
> Selected suitable accounting policies and then applied them consistently
> Made judgements and estimates that were reasonable and prudent
> Complied with the SORP
> Kept proper accounting records which were up to date
> Taken reasonable steps for the prevention and detection of fraud and other irregularities
Stephen Critchley Chief Finance Officer
23 June 2010
Statement of Accounts 95
Scope of responsibility Transport for London (TfL) is responsible for ensuring that its business is conducted in accordance with the law and proper standards, and that public money is safeguarded and properly accounted for, and used economically, efficiently and effectively. TfL also has a duty under the Local Government Act 1999 to make arrangements to secure continuous improvement in the way in which its functions are exercised, having regard to a combination of economy, efficiency and effectiveness.
In discharging this overall responsibility, TfL is responsible for putting in place proper arrangements for the governance of its affairs and facilitating the effective exercise of its functions, which includes arrangements for the management of risk.
TfL has approved and adopted a revised Code of Governance, which is consistent with the principles of the revised CIPFA/ SOLACE Framework Delivering Good Governance in Local Government.
A copy of the TfL Code of Governance is on our website at www.tfl.gov.uk or can be obtained from the Corporate Governance Adviser, Windsor House, 42-50 Victoria Street, London, SW1H 0TL. This statement explains how TfL has complied with the Code and also meets the requirements of regulation 4(2) of the Accounts and Audit Regulations 2003 as amended by the Accounts and Audit (Amendment) (England) Regulations 2006 in relation to the publication of a statement on internal control.
The purpose of the governance framework The governance framework comprises the systems and processes, and culture and values, by which TfL is directed and controlled and the activities through which it accounts to, engages with and leads the community. It enables TfL to monitor the achievement of its strategic objectives and the delivery of appropriate, cost-effective services.
The system of internal control is a significant part of that framework and is designed to manage risk and provide reasonable although not absolute assurance of effectiveness. The system of internal control is based on an ongoing process designed to identify and prioritise the risks to the achievement of TfL’s policies, aims and objectives, to evaluate the likelihood of those risks being realised and the impact should they be realised, and to manage them efficiently, effectively and economically.
The governance framework has been in place at TfL since the year ended 31 March 2001. It remained in place up to the date of approval of the 2009/10 Statement of Accounts.
Annual Governance Statement

Transport for London – Annual Report and Statement of Accounts 2009/1096
The governance framework The Mayor, who serves as its Chair, appoints the TfL Board members. The Board determines and agrees TfL’s strategic direction and oversees the performance of the executive team.
The Board has five committees:
> Finance and Policy
> Audit
> Remuneration
> Safety, Health and Environment Assurance
> Special Purpose Committee
There are four panels, made up of Board members, which provide strategic advice to the Board on the development and execution of policy:
> Corporate
> Rail and Underground
> Surface Transport
> Environment and Planning
The Audit Committee has been delegated the responsibility for overseeing corporate governance in TfL. It has received reports on the implementation of the Code of Governance, the Annual Governance Statement contained in these accounts and the results of the compliance review. It receives regular reports from the General Counsel and the Director of Internal Audit and is responsible for the annual assurance process.
The Commissioner of TfL, advised by his Chief Officers, is responsible and accountable for the delivery of the day to day operations of TfL. The General Counsel has the overall responsibility for the operation of the Code and for ensuring that it is integral to the routine functioning of TfL. In addition, the Director of Internal Audit annually comments on the adequacy and effectiveness of the Code and the extent of TfL’s compliance with it.
TfL is working to ensure that good governance is fully incorporated into the culture of the organisation and is applied consistently and transparently.
TfL identifies and communicates its vision of its purpose and intended outcomes for citizens and service users by:
> The Mayor developing and publishing a Transport Strategy reflecting national and local priorities
> The Budget and Business Plan reflecting the Transport Strategy and allocating resources accordingly
> Reviewing on a regular basis the implications of the Transport Strategy for its governance arrangements
> Ensuring that those making decisions are provided with information that is fit for purpose – relevant, timely and gives clear explanations of technical issues and their implications
> Conducting its business on an open basis, subject only to the requirements of appropriate levels of individual and commercial confidentiality and security
Statement of Accounts 97
TfL measures the quality of servicesfor users, ensures they are delivered inaccordance with TfL’s objectives andensures that they represent the best useof resources by:
> Having in place sound systems for providing management information for performance measurement purposes
> Ensuring performance information is collected at appropriate intervals across all activities
> Having comprehensive and understandable performance plans in place
> Monitoring and reporting performance against agreed targets
> Maximising its resources and allocating them according to priorities
> Having in place effective arrangements to identify and deal with failure in service delivery
> Developing and maintaining an effective scrutiny function for its Investment Programme that encourages constructive challenge and enhances TfL’s performance overall
TfL defines and documents the roles andresponsibilities of the Board, Committees,Panels and officers with clear delegationarrangements and protocols by:
> Having a documented scheme of delegation that reserves appropriate responsibilities to the Board and provides officers with the authority to conduct routine business
> Having the roles and responsibilities of Board members and senior officers clearly documented
TfL has developed and communicatesthe requirements of the Code ofConduct, defining the standards ofbehaviour for members and staff by:
> Ensuring it is an organisation that has a climate of openness, support and respect
> Ensuring that standards of conduct and personal behaviour expected of members and staff, between members and staff and between TfL, its partners and the community are defined and communicated through codes of conduct and protocols
> Putting in place arrangements to ensure that members and officers of TfL are not influenced by prejudice, bias or conflicts of interest
> Ensuring that an effective process, which includes an effective Remuneration Committee, is in place to set the terms and conditions for remuneration of the Commissioner and Chief Officers
> Developing and maintaining shared values including leadership values for both the organisation and staff reflecting public expectations and communicating these to members, staff, the community and partners
> Putting in place arrangements to ensure that systems and processes are designed in conformity with appropriate ethical standards, and monitors their continuing effectiveness in practice
> Setting targets for performance in the delivery of services to ensure equality for all
> Using its shared values to act as a guide for decision making and as a basis
Transport for London – Annual Report and Statement of Accounts 2009/1098
for developing positive and trusting relationships within TfL
TfL reviews and updates standingorders, standing financial instructions,its scheme of delegation and supportingprocedures that clearly define how decisions are taken and the processes and controls required to manage risks by:
> Having a clear hierarchy of governance documentation whose components are regularly reviewed
> Maintaining robust systems for identifying and evaluating all significant risks
> Maintaining an effective risk management system
> Ensuring that risk management is embedded into its culture, with members and officers at all levels recognising that risk management is part of their jobs
TfL ensures that the core functions ofthe Audit Committee are delivered by:
> Having an effective, independent Audit Committee
> Having the Audit Committee develop and maintain an effective standard of conduct overview
> Having an internal audit department which complies with relevant professional standards
> Having an internal audit plan that is driven by an annual evidenced assessment of the key business risks facing TfL
> Substantially completing the internal audit plan. Divergence from the plan is due to changes in business requirements
TfL ensures compliance with relevantlaws, internal policies and procedures,and that expenditure is lawful by:
> Ensuring that all activities are legally correct, fully documented, appropriately authorised and carried on in a planned manner
> Making a senior officer responsible for ensuring that appropriate advice is given in all financial matters, for keeping proper financial records and accounts and for maintaining an effective system of internal financial control
> Maintaining proper records to ensure that the annual accounts show a true and fair view and that expenditure has been properly authorised and allocated in an appropriate manner
> Ensuring that a senior officer is responsible for all activities being legally correct, fully documented and appropriately authorised
> Developing and maintaining open and effective mechanisms for documenting evidence for decisions and recording the criteria, rationale and considerations on which decisions are based
> Putting in place arrangements to safeguard against conflicts of interest
> Ensuring that professional advice on matters that have legal or financial implications is available and recorded well in advance of decision making and used appropriately

Statement of Accounts 99
> Actively recognising the limits of lawful activity placed on it but also striving to utilise powers to the full benefit of the public
> Observing all legal requirements placed upon it and integrating the key principles of good public law – rationality, legality and natural justice – into its procedures and decision-making processes
TfL has made arrangements forwhistle-blowing and for receiving andinvestigating complaints from the public by:
> Ensuring that effective, transparent and accessible arrangements are in place for making, receiving and dealing with complaints
> Ensuring that arrangements are in place for whistle-blowing to which staff and all those contracting with TfL have access
TfL identifies the development needs ofmembers and officers in relation to theirstrategic roles, supported by appropriatetraining by:
> Ensuring that its Board members and officers are provided with the necessary training to perform their roles
> Ensuring that its staff are competent to perform their roles
> Ensuring that the Chief Finance Officer has the skills, resources and support necessary to perform effectively in his role and that this role is properly understood throughout TfL
> Assessing the skills required by members and officers and committing to develop
those skills to enable roles to be carried out effectively and
> Developing skills on a continuing basis to improve performance, including the ability to scrutinise and challenge and to recognise when outside expert advice is needed
TfL establishes clear channels ofcommunication with all sections of thecommunity and other stakeholders,ensuring accountability and encouragingopen consultation by:
> Having in place proper arrangements designed to encourage individuals and groups from all sections of the community to engage with, contribute to and participate in the work of TfL
> Making clear to staff and the public what it is accountable for and to whom
> Publishing, publicising and making generally available an annual report as soon as practicable after the end of the financial year
> The annual report presenting an objective and understandable account of its activities and achievements and its financial position and performance
> Cooperating with appropriate organisations to ensure there is independent scrutiny of its financial and operational reporting processes
> Having a clear policy on the types of issues it will consult on or engage with the public and service users about, including a feedback mechanism for those consultees to demonstrate what has changed as a result
Transport for London – Annual Report and Statement of Accounts 2009/10100
TfL incorporates good governancearrangements in respect of partnershipsand other group working by:
> Fostering effective delivery relationships and partnerships with other public sector agencies, the private and voluntary sectors
> Establishing appropriate arrangements to engage with all sections of the public effectively
> Establishing appropriate arrangements to engage with interest groups such as financial institutions, businesses and voluntary groups to ensure they are able to interact with TfL on matters of mutual interest
The Chief Finance Officer (CFO) plays an active part in TfL strategic decision making. The CFO is appointed and removed by the Board: reviews all papers relating to financial management for the Chief Officers, Committees or Board in advance attends all Board and Strategic Executive Group meetings and has unrestricted access to the Commissioner.
Review of effectiveness TfL has responsibility for conducting, at least annually, a review of the effectiveness of its governance framework including the system of internal control. The review of effectiveness is informed by the work of the senior officers within TfL who have responsibility for the development and maintenance of the governance environment, the Director of Internal Audit’s annual report, and also by comments made by the external auditors and other review agencies and inspectorates.
TfL’s General Counsel has the responsibility for overseeing the implementation and monitoring the operation of the Code and reporting annually to the Audit Committee on compliance with the Code and any changes that may be necessary to maintain it and ensure its effectiveness in practice.
In addition, the Director of Internal Audit annually comments on the adequacy and effectiveness of the Code and the extent of TfL’s compliance with it.
We have been advised on the implications of the result of the review of the effectiveness of the governance framework by the Audit Committee, and a plan to ensure continuous improvement of the system is in place.
Significant governance issues Balancing the need to manage within the Government settlement and deliver the Mayor’s priorities is the most significant issue facing TfL and one that will continue to present a challenge to its management. Effective governance arrangements and senior officer oversight will be maintained to ensure appropriate and timely responses to such issues that arise.
Other issues to be addressed during the year relate to maintaining continued effective project delivery. Particular focus will need to be maintained on the delivery of the Investment Programme and Crossrail, which is being delivered by Crossrail Limited, a wholly-owned subsidiary of TfL. Dealing with the consequences of TfL’s proposed acquisition of shares in Tube Lines (Holdings) Limited will also be a priority. One recent development that will provide a significant improvement in our oversight and delivery

Statement of Accounts 101
capability is the creation of the Investment Programme Advisory Group (IPAG). This group will provide independent and impartial advice to the Board on all aspects of the delivery of the TfL Investment Programme, including maintenance, renewal, upgrades and major projects.
We propose over the coming year to continue to improve and develop our governance arrangements. We are confident that the current governance processes and planned developments will enable us to meet the challenges identified above.
Signed
Chair of TfL Board
Commissioner

Independent Audit Report to Transport for London
Transport for London – Annual Report and Statement of Accounts 2009/10102
Opinion on the financial statementsWe have audited the financial statements of Transport for London (‘the Corporation’) and the Transport for London Group (‘the Group’) for the year ended 31 March 2010 which comprise the Explanatory Foreword and Financial Review, the Corporation and Group Income and Expenditure Accounts, the Statement of Movement on the General Fund Balance, the Reconciliation of the Deficit/(Surplus) on the Corporation’s Single Entry Income and Expenditure Account to the Surplus on the Group Accounts, the Statement of Total Recognised Gains and Losses, the Balance Sheets, the Cash Flow Statements and the related notes. These financial statements have been prepared under the accounting policies set out therein.
This report is made solely to Transport for London, as a body, in accordance with Part II of the Audit Commission Act 1998. Our audit work has been undertaken so that we might state to Transport for London as a body, those matters we are required to state to it in an auditor’s report and for no other purpose. To the fullest extent permitted by law, we do not accept or assume responsibility to anyone other than Transport for London, as a body, for our audit work, for this report, or for the opinions we have formed.
Respective Responsibilities of the Chief Finance Officer and the AuditorThe Chief Finance Officer’s responsibilities for preparing the financial statements in accordance with applicable laws and regulations and the Statement of Recommended Practice on Local Authority Accounting in the United Kingdom 2009 are set out in the Statement of Responsibilities.
Our responsibility is to audit the financial statements in accordance with relevant legal and regulatory requirements and the International Standards on Auditing (UK and Ireland).
We report to you our opinion as to whether the financial statements give a true and fair view of the financial position of the Corporation and the Group in accordance with applicable laws and regulations and the Statement of Recommended Practice on Local Authority Accounting in the United Kingdom 2009.

Statement of Accounts 103
We review whether the Annual Governance Statement reflects compliance with ‘Delivering Good Governance in Local Government: A Framework’ published by CIPFA/SOLACE in June 2007. We report if it does not comply with proper practices specified by CIPFA/SOLACE or if the Statement is misleading or inconsistent with other information we are aware of from our audit of the financial statements. We are not required to consider, nor have we considered, whether the Statement covers all risks and controls. Neither are we required to form an opinion on the effectiveness of the Corporation’s corporate governance procedures or its risk and control procedures.
We read other information published with the financial statements, and consider whether it is consistent with the audited financial statements. This other information comprises the Annual Report. We consider the implications for our report if we become aware of any apparent misstatements or material inconsistencies with the financial statements. Our responsibilities do not extend to any other information.
Basis of audit opinionWe conducted our audit in accordance with the Audit Commission Act 1998, the Code of Audit Practice issued by the Audit Commission and International Standards on Auditing (UK and Ireland) issued by the Auditing Practices Board.
An audit includes examination, on a test basis, of evidence relevant to the amounts and disclosures in the financial statements. It also includes an assessment of the significant estimates and judgements made by the Chief Finance Officer in the preparation of the financial statements, and of whether the accounting policies are appropriate to the Corporation and the Group’s circumstances, consistently applied and adequately disclosed.
We planned and performed our audit so as to obtain all the information and explanations which we considered necessary in order to provide us with sufficient evidence to give reasonable assurance that the financial statements are free from material misstatement, whether caused by fraud or other irregularity or error. In forming our opinion, we evaluated the overall adequacy of the presentation of information in the financial statements.
Transport for London – Annual Report and Statement of Accounts 2009/10104
OpinionIn our opinion the financial statements of the Corporation and the Group give a true and fair view, in accordance with applicable laws and regulations and the Statement of Recommended Practice on Local Authority Accounting in the United Kingdom 2009, of the financial position of the Corporation and the Group as at 31 March 2010 and their income and expenditure for the year then ended.
CertificateWe certify that we have completed the audit of the accounts in accordance with the requirements of the Audit Commission Act 1998 and the Code of Audit Practice issued by the Audit Commission.
June Awty, Senior Statutory Auditor For and on behalf of KPMG LLP, Statutory Auditor Chartered Accountants, London
6 August 2010

Statement of Accounts 105
Conclusion on arrangements for securing economy, efficiency and effectiveness
The Corporation’s ResponsibilitiesThe Corporation is responsible for putting in place proper arrangements to secure economy, efficiency and effectiveness in its use of resources, to ensure proper stewardship and governance, and to regularly review the adequacy and effectiveness of these arrangements.
Auditor’s ResponsibilitiesWe are required by the Audit Commission Act 1998 to be satisfied that proper arrangements have been made by the Corporation for securing economy, efficiency and effectiveness in its use of resources. The Code of Audit Practice issued by the Audit Commission requires us to report to you our conclusion in relation to proper arrangements, having regard to relevant criteria specified by the Audit Commission for other local government bodies. We report if significant matters have come to our attention which prevent us from concluding that the Corporation has made such proper arrangements. We are not required to consider, nor have we considered, whether all aspects of the Corporation’s arrangements for securing economy, efficiency and effectiveness in its use of resources are operating effectively.
ConclusionWe have undertaken our audit in accordance with the Code of Audit Practice and we are satisfied that, in all significant respects, the Corporation made proper arrangements to secure economy, efficiency and effectiveness in its use of resources for the year ended 31 March 2010.
June Awty, Senior Statutory Auditor For and on behalf of KPMG LLP, Statutory Auditor Chartered Accountants, London
6 August 2010

Group Income and Expenditure Account
Transport for London – Annual Report and Statement of Accounts 2009/10106
Note
Group2009/10
£m
Group2008/09
restated* £m
Highways, roads and transport servicesExpenditure 3 5,273.7 5,312.5
Depreciation of fixed assets 11c 801.4 707.5
Exceptional items 6 - (1,503.2)
Revenue 1, 2 (3,594.3) (3,451.5)
Amortisation of deferred capital grants 11c (398.6) (379.2)
Net cost of services 2,082.2 686.1
Loss on disposal of assets 8 14.5 85.8
Finance income 9 (13.9) (104.6)
Finance costs 9 390.7 322.1
Pensions interest cost and expected return on pensions assets 22a 98.7 41.7
Net operating expenditure 2,572.2 1,031.1
Revenue transport grant for operations 7 (1,081.8) (1,231.4)
Other revenue grant (273.8) (63.4)
Precept (12.0) (12.0)
Deficit/(Surplus) for the year 1,204.6 (275.7)
* See Statement of Accounting Policies (Note u) Accounting for PFI transactions and similar contracts.
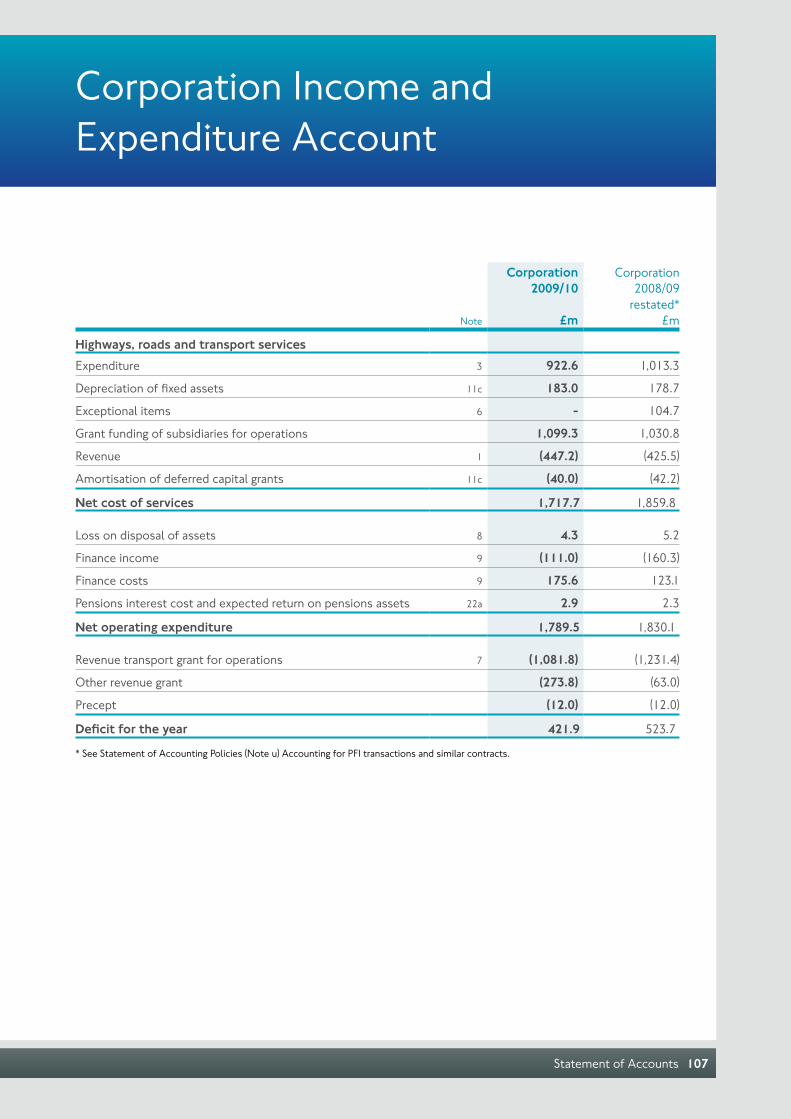
Statement of Accounts 107
Note
Corporation2009/10
£m
Corporation2008/09
restated*£m
Highways, roads and transport servicesExpenditure 3 922.6 1,013.3
Depreciation of fixed assets 11c 183.0 178.7
Exceptional items 6 - 104.7
Grant funding of subsidiaries for operations 1,099.3 1,030.8
Revenue 1 (447.2) (425.5)
Amortisation of deferred capital grants 11c (40.0) (42.2)
Net cost of services 1,717.7 1,859.8
Loss on disposal of assets 8 4.3 5.2
Finance income 9 (111.0) (160.3)
Finance costs 9 175.6 123.1
Pensions interest cost and expected return on pensions assets 22a 2.9 2.3
Net operating expenditure 1,789.5 1,830.1
Revenue transport grant for operations 7 (1,081.8) (1,231.4)
Other revenue grant (273.8) (63.0)
Precept (12.0) (12.0)
Deficit for the year 421.9 523.7
* See Statement of Accounting Policies (Note u) Accounting for PFI transactions and similar contracts.
Corporation Income and Expenditure Account
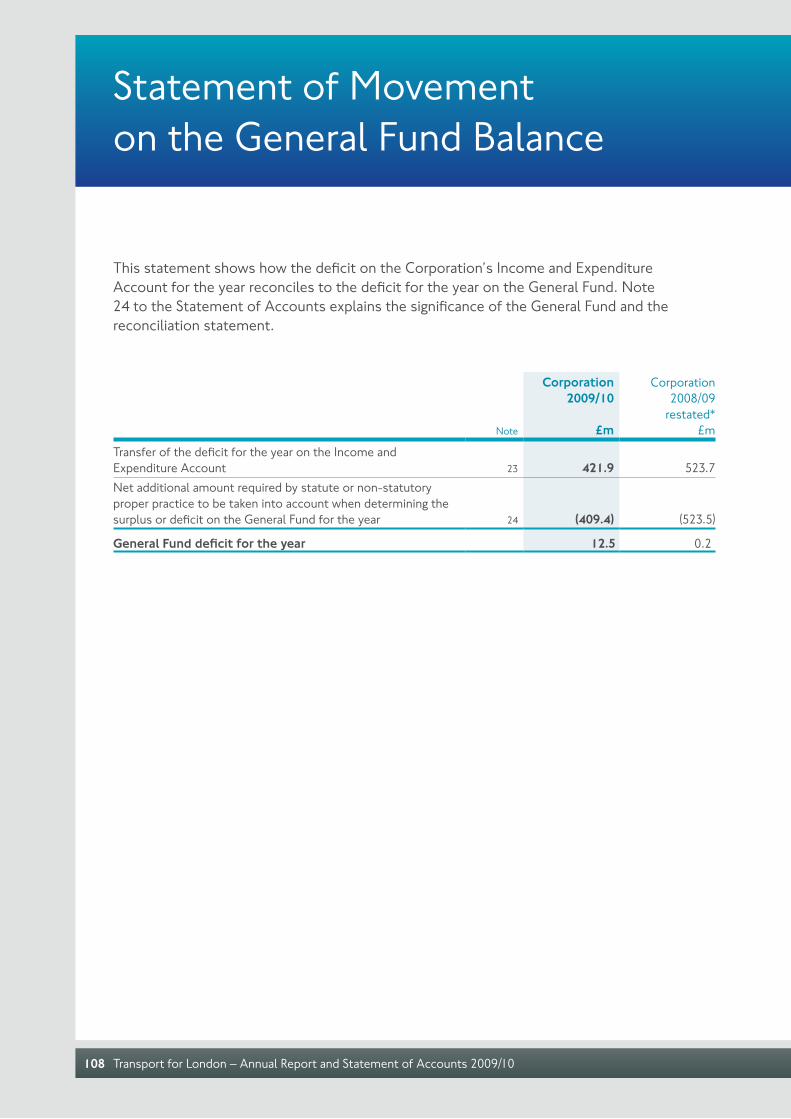
Statement of Movement on the General Fund Balance
Transport for London – Annual Report and Statement of Accounts 2009/10108
This statement shows how the deficit on the Corporation’s Income and Expenditure Account for the year reconciles to the deficit for the year on the General Fund. Note 24 to the Statement of Accounts explains the significance of the General Fund and the reconciliation statement.
Note
Corporation 2009/10
£m
Corporation2008/09
restated*£m
Transfer of the deficit for the year on the Income and Expenditure Account 23 421.9 523.7Net additional amount required by statute or non-statutory proper practice to be taken into account when determining the surplus or deficit on the General Fund for the year 24 (409.4) (523.5)
General Fund deficit for the year 12.5 0.2
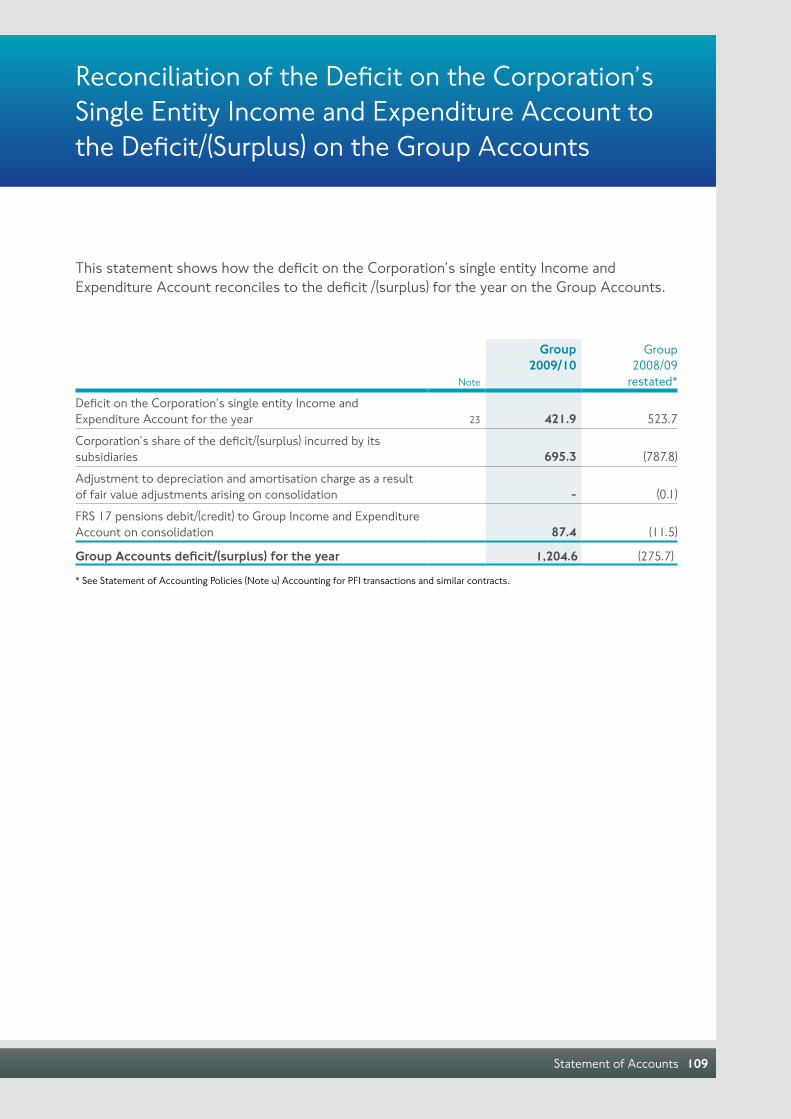
Statement of Accounts 109
Reconciliation of the Deficit on the Corporation’s Single Entity Income and Expenditure Account to the Deficit/(Surplus) on the Group Accounts
This statement shows how the deficit on the Corporation’s single entity Income and Expenditure Account reconciles to the deficit /(surplus) for the year on the Group Accounts.
Note
Group 2009/10
Group2008/09
restated*
Deficit on the Corporation’s single entity Income and Expenditure Account for the year 23 421.9 523.7
Corporation’s share of the deficit/(surplus) incurred by its subsidiaries 695.3 (787.8)
Adjustment to depreciation and amortisation charge as a result of fair value adjustments arising on consolidation - (0.1)
FRS 17 pensions debit/(credit) to Group Income and Expenditure Account on consolidation 87.4 (11.5)
Group Accounts deficit/(surplus) for the year 1,204.6 (275.7)
* See Statement of Accounting Policies (Note u) Accounting for PFI transactions and similar contracts.
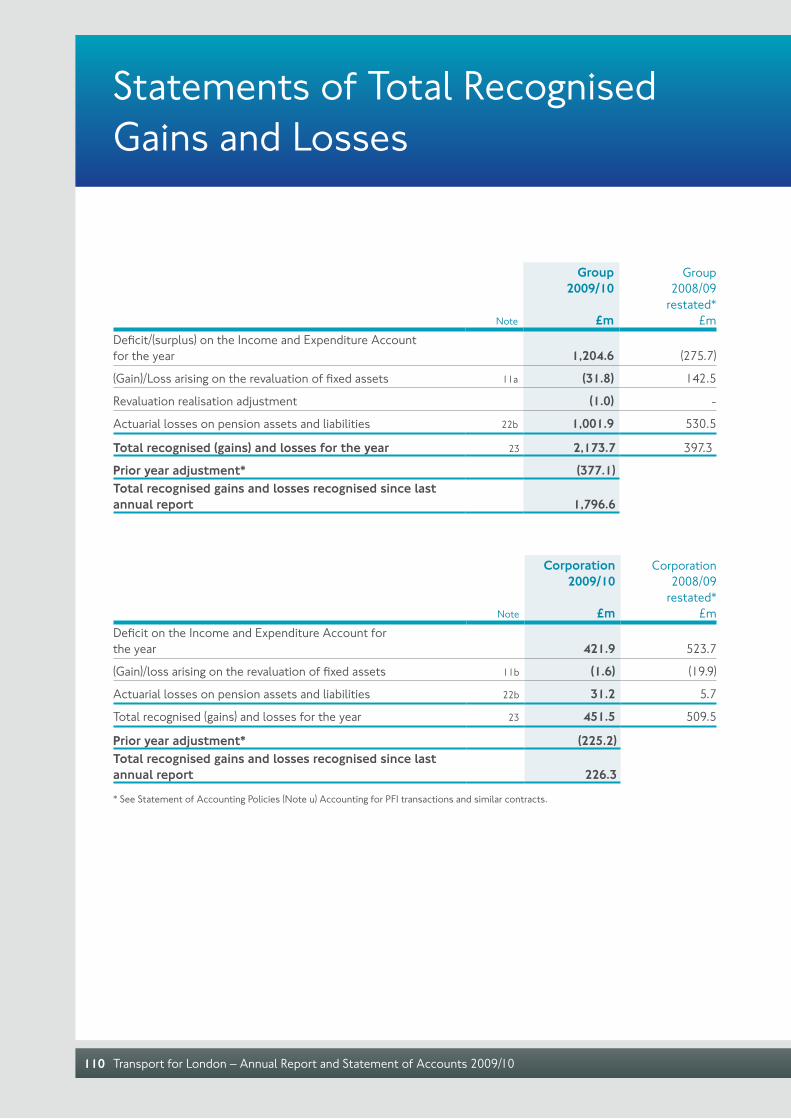
Statements of Total Recognised Gains and Losses
Transport for London – Annual Report and Statement of Accounts 2009/10110
Note
Group 2009/10
£m
Group2008/09
restated*£m
Deficit/(surplus) on the Income and Expenditure Account for the year 1,204.6 (275.7)
(Gain)/Loss arising on the revaluation of fixed assets 11a (31.8) 142.5
Revaluation realisation adjustment (1.0) -
Actuarial losses on pension assets and liabilities 22b 1,001.9 530.5
Total recognised (gains) and losses for the year 23 2,173.7 397.3
Prior year adjustment* (377.1)Total recognised gains and losses recognised since last annual report 1,796.6
Note
Corporation 2009/10
£m
Corporation2008/09
restated*£m
Deficit on the Income and Expenditure Account for the year 421.9 523.7
(Gain)/loss arising on the revaluation of fixed assets 11b (1.6) (19.9)
Actuarial losses on pension assets and liabilities 22b 31.2 5.7
Total recognised (gains) and losses for the year 23 451.5 509.5
Prior year adjustment* (225.2)Total recognised gains and losses recognised since last annual report 226.3
* See Statement of Accounting Policies (Note u) Accounting for PFI transactions and similar contracts.

Statement of Accounts 111
Note
Group2010
£m
Group2009
restated*£m
Corporation 2010
£m
Corporation2009
restated*£m
Tangible fixed assetsInfrastructure and other property 15,848.5 14,526.2 2,433.4 2,457.6Rolling stock 1,747.4 1,572.2 - -Plant and equipment 1,215.0 1,053.6 211.7 143.1Non-operational assets 2,818.2 2,304.0 640.1 265.7Total tangible fixed assets 11a,b 21,629.1 19,456.0 3,285.2 2,866.4Investment in subsidiaries 12 - - 22.5 22.5Long-term debtors 14 - - 3,083.5 2,184.9Total long term assets 21,629.1 19,456.0 6,391.2 5,073.8Current assetsStocks 13 18.3 20.2 2.3 2.7Debtors 14 698.6 488.4 368.7 206.9Short-term investments 15 1,472.5 1,967.8 1,427.8 1,925.8Cash at bank and in hand 16 36.9 34.1 7.0 11.2Total current assets 2,226.3 2,510.5 1,805.8 2,146.6Current liabilitiesCreditors: amounts falling due within one year 17a (2,067.1) (2,079.2) (410.6) (477.0)Net current assets 159.2 431.3 1,395.2 1,669.6Total assets less current liabilities 21,788.3 19,887.3 7,786.4 6,743.4Creditors: amounts falling due after one year 17b (2,581.2) (2,519.5) (212.7) (219.4)Provisions for liabilities and charges 18 (617.2) (193.8) (475.2) (77.8)Borrowings due after more than one year 19 (4,117.8) (3,017.6) (4,117.8) (3,017.6)Net assets excluding grants 14,472.1 14,156.4 2,980.7 3,428.6Deferred grants 20 (9,710.5) (8,216.2) (698.0) (724.0)Net assets excluding pension and other post-retirement liabilities 4,761.6 5,940.2 2,282.7 2,704.6Pension and other post-retirement liabilities 22a (2,142.6) (1,147.5) (46.9) (17.3)Total net assets 2,619.0 4,792.7 2,235.8 2,687.3Capital and reservesGeneral fund 153.8 166.3 153.8 166.3Earmarked reserves 878.0 1,141.7 878.0 1,141.7Other reserves 1,587.2 3,484.7 1,204.0 1,379.3Total capital employed 23 2,619.0 4,792.7 2,235.8 2,687.3
Group and Corporation Balance Sheets as at 31 March
These accounts were approved by the Board on 23 June 2010
Boris Johnson Chair of TfL
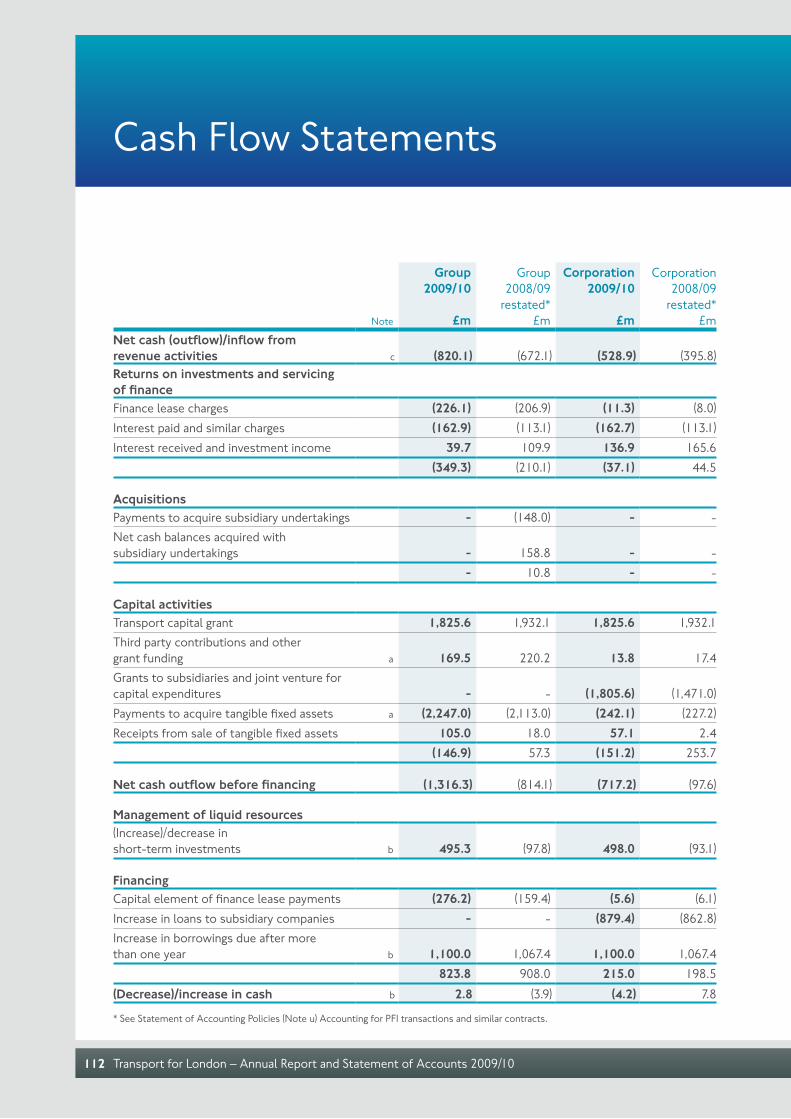
Cash Flow Statements
Transport for London – Annual Report and Statement of Accounts 2009/10112
Note
Group2009/10
£m
Group 2008/09
restated*£m
Corporation 2009/10
£m
Corporation 2008/09
restated*£m
Net cash (outflow)/inflow from revenue activities c (820.1) (672.1) (528.9) (395.8)Returns on investments and servicing of finance Finance lease charges (226.1) (206.9) (11.3) (8.0)Interest paid and similar charges (162.9) (113.1) (162.7) (113.1)Interest received and investment income 39.7 109.9 136.9 165.6
(349.3) (210.1) (37.1) 44.5
AcquisitionsPayments to acquire subsidiary undertakings - (148.0) - -Net cash balances acquired with subsidiary undertakings - 158.8 - -
- 10.8 - -
Capital activitiesTransport capital grant 1,825.6 1,932.1 1,825.6 1,932.1Third party contributions and other grant funding a 169.5 220.2 13.8 17.4Grants to subsidiaries and joint venture for capital expenditures - - (1,805.6) (1,471.0)Payments to acquire tangible fixed assets a (2,247.0) (2,113.0) (242.1) (227.2)Receipts from sale of tangible fixed assets 105.0 18.0 57.1 2.4
(146.9) 57.3 (151.2) 253.7
Net cash outflow before financing (1,316.3) (814.1) (717.2) (97.6)
Management of liquid resources(Increase)/decrease in short-term investments b 495.3 (97.8) 498.0 (93.1)
FinancingCapital element of finance lease payments (276.2) (159.4) (5.6) (6.1)Increase in loans to subsidiary companies - - (879.4) (862.8)Increase in borrowings due after more than one year b 1,100.0 1,067.4 1,100.0 1,067.4
823.8 908.0 215.0 198.5(Decrease)/increase in cash b 2.8 (3.9) (4.2) 7.8
* See Statement of Accounting Policies (Note u) Accounting for PFI transactions and si milar contracts.

Statement of Accounts 113
a) Cash Flow Statements: reconciliation with the accounts
Note
Group2009/10
£m
Group 2008/09
restated*£m
Corporation2009/10
£m
Corporation2008/09
restated*£m
Capital expenditure Additions to fixed assets 11a, b (3,139.3) (2,822.4) (661.6) (202.9)
(Increase)/decrease in debtors (0.5) (25.7) 23.6 (25.0)Increase/(decrease) in creditors due within one year 114.9 15.8 (24.5) 3.8
Increase in creditors due after more than one year 0.5 0.2 0.5 0.2
Additions under finance lease arrangements 357.8 722.4 - -
Increase/(decrease) in provisions and other items 419.6 (3.3) 419.9 (3.3)
Capital expenditure per cash flow statement (2,247.0) (2,113.0) (242.1) (227.2)
Contributions from third parties for capital expenditureThird party contributions and other grant funding 20 164.6 236.5 14.0 17.4
(Increase)/decrease in debtors 4.9 (16.3) (0.2) -Contributions from third parties per cash flow statement 169.5 220.2 13.8 17.4
*See Statement of Accounting Policies (Note u) Accounting for PFI transactions and similar contracts.
Notes to the Cash Flow Statements
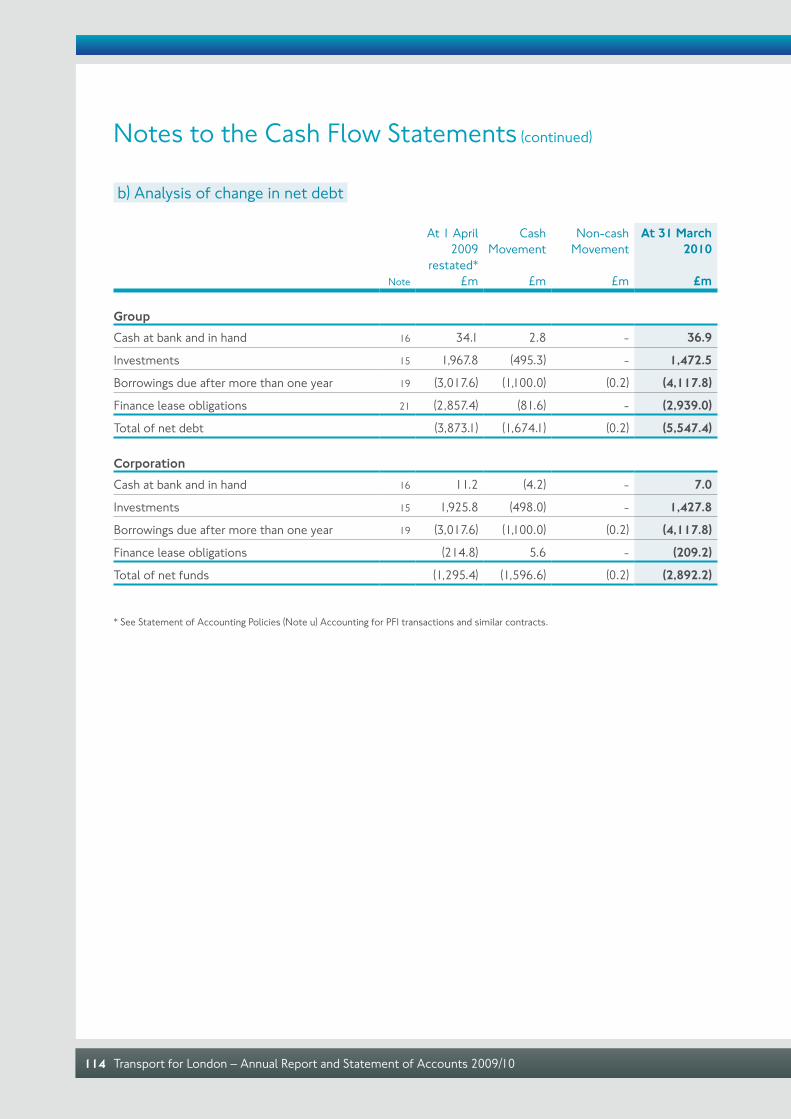
Transport for London – Annual Report and Statement of Accounts 2009/10114
b) Analysis of change in net debt
Note
At 1 April 2009
restated*£m
CashMovement
£m
Non-cashMovement
£m
At 31 March 2010
£m
GroupCash at bank and in hand 16 34.1 2.8 - 36.9
Investments 15 1,967.8 (495.3) - 1,472.5
Borrowings due after more than one year 19 (3,017.6) (1,100.0) (0.2) (4,117.8)
Finance lease obligations 21 (2,857.4) (81.6) - (2,939.0)
Total of net debt (3,873.1) (1,674.1) (0.2) (5,547.4)
CorporationCash at bank and in hand 16 11.2 (4.2) - 7.0
Investments 15 1,925.8 (498.0) - 1,427.8
Borrowings due after more than one year 19 (3,017.6) (1,100.0) (0.2) (4,117.8)
Finance lease obligations (214.8) 5.6 - (209.2)
Total of net funds (1,295.4) (1,596.6) (0.2) (2,892.2)
* See Statement of Accounting Policies (Note u) Accounting for PFI transactions and similar contracts.
Notes to the Cash Flow Statements (continued)
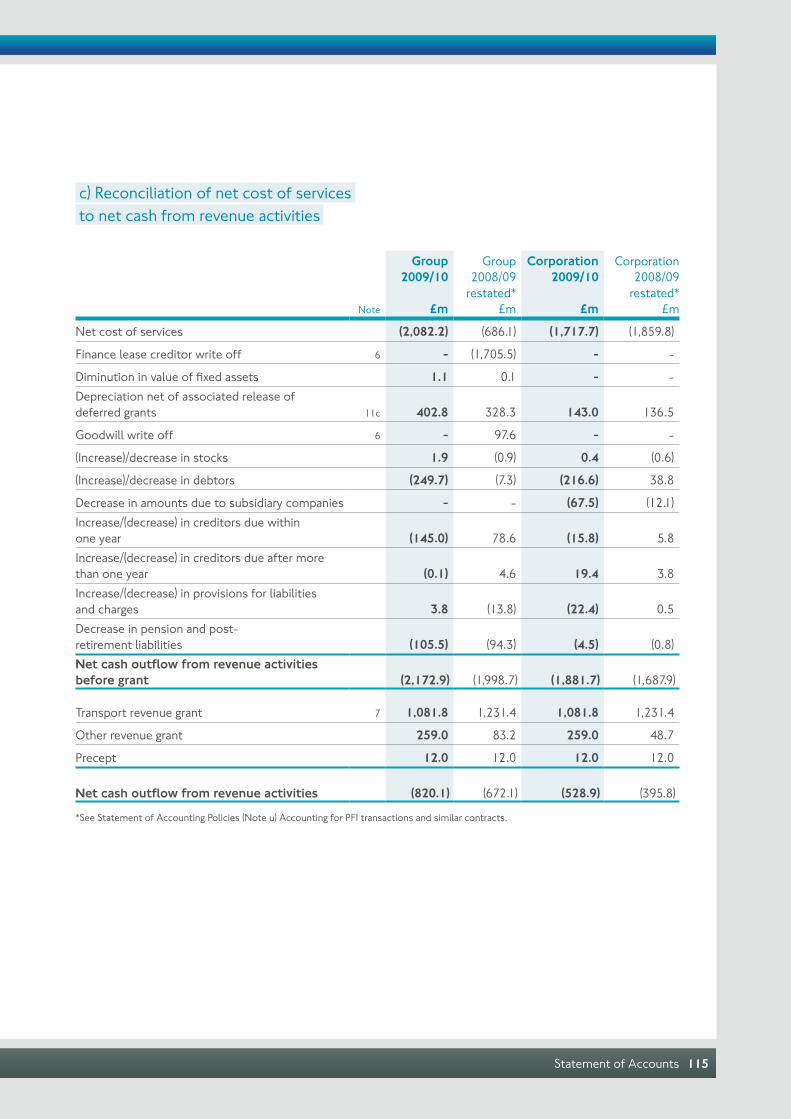
Statement of Accounts 115
c) Reconciliation of net cost of services to net cash from revenue activities
Note
Group 2009/10
£m
Group 2008/09
restated*£m
Corporation 2009/10
£m
Corporation 2008/09
restated* £m
Net cost of services (2,082.2) (686.1) (1,717.7) (1,859.8)
Finance lease creditor write off 6 - (1,705.5) - -
Diminution in value of fixed assets 1.1 0.1 - -Depreciation net of associated release of deferred grants 11c 402.8 328.3 143.0 136.5
Goodwill write off 6 - 97.6 - -
(Increase)/decrease in stocks 1.9 (0.9) 0.4 (0.6)
(Increase)/decrease in debtors (249.7) (7.3) (216.6) 38.8
Decrease in amounts due to subsidiary companies - - (67.5) (12.1)Increase/(decrease) in creditors due within one year (145.0) 78.6 (15.8) 5.8Increase/(decrease) in creditors due after more than one year (0.1) 4.6 19.4 3.8Increase/(decrease) in provisions for liabilities and charges 3.8 (13.8) (22.4) 0.5Decrease in pension and post- retirement liabilities (105.5) (94.3) (4.5) (0.8)Net cash outflow from revenue activities before grant (2,172.9) (1,998.7) (1,881.7) (1,687.9)
Transport revenue grant 7 1,081.8 1,231.4 1,081.8 1,231.4
Other revenue grant 259.0 83.2 259.0 48.7
Precept 12.0 12.0 12.0 12.0
Net cash outflow from revenue activities (820.1) (672.1) (528.9) (395.8)
*See Statement of Accounting Policies (Note u) Accounting for PFI transactions and similar contracts.
Statement of Accounting Policies
Transport for London – Annual Report and Statement of Accounts 2009/10116
a) Code of practiceThe accounts have been prepared in accordance with the Code of Practice on Local Authority Accounting in the United Kingdom 2009 (‘the SORP’), developed by the Chartered Institute of Public Finance and Accountancy (CIPFA) and the Local Authority (Scotland) Accounts Advisory Committee (LASAAC) Joint Committee and approved by the Accounting Standards Board.
b) Changes in accounting policiesThe 2009 SORP introduced major changes to the accounts for local authorities and similar bodies when accounting for PFI transactions and similar contracts for accounting periods commencing on or after 1 April 2009 as well as impacting the comparative period starting on or after 1 April 2008. The new accounting policy is fully dealt with below in note u). The cumulative impact of the restatements relating to prior years has been recognised in the accounts as a prior year adjustment and comparative figures for 2008/09 have been restated. The effect of implementing the new accounting policy was to decrease the deficit for the year on the Group Income and Expenditure Account by £44m (2008/09 decrease the surplus by £1m) (Corporation increase the deficit by £10m, 2008/09 increase the deficit by £10m) and to increase Group total net assets at 31 March 2010 by £421m (31 March 2009 £377m) (Corporation increase net assets by £215m, 2009 £225m).
c) Basis of accountingThe accounts are made up to 31 March. The Corporation is a single service authority and all expenditure is attributable to the provision of highways, roads and transport services.
The accounts have been prepared on the historical cost basis, except for the revaluation of certain properties and financial instruments. The principal accounting policies adopted are set out below.
d) Basis of preparation of group accountsThe SORP requires local authorities with, in aggregate, material interests in subsidiary and associated companies and joint ventures, to prepare group accounts consistent with UK GAAP.
The Group accounts presented with the Corporation's accounts consolidate the individual accounts of Transport for London and its subsidiary undertakings.
A subsidiary undertaking is an entity over which the Group exercises control. TfL exercises control over all of its subsidiaries through holding 100 per cent of the voting interests either directly or through intermediate holding companies.
Merger accounting principles are applied where transfers into the Group of subsidiary undertakings, including statutory transfers, have the characteristics of group reconstructions in accordance with Financial Reporting Standard 6 – Acquisitions and Mergers. With merger accounting, the carrying values of the assets and liabilities of the parties to the combination are not required to be adjusted to fair value on consolidation, although appropriate adjustments are made to achieve uniformity of accounting policies where necessary.
In other cases, the acquisition method of accounting is adopted. Under this method, the identifiable assets and liabilities of an acquired entity are recorded at their fair values at the date of acquisition. The results of subsidiary undertakings acquired or disposed of are included in the Group income and expenditure account from the date of acquisition until the date of disposal.
e) Segmental reportingThe Group’s primary reporting segments comprise business segments and there are no geographical segments. Business segments are based on the internal management structure of the organisation. They reflect components of the Group with distinguishable revenues, costs and assets and are subject to risks different to those of other reportable segments.
f) Revenue recognition and expenditureSales revenue on trading activities comprises the value of sales of services or goods in the normal course of business, exclusive of Value Added Tax. The main source of revenue is ticket sales deriving from the provision of public transport in the London area and income from related services. Turnover also includes amounts receivable from the London Borough Councils and County authorities in respect of free and reduced fare travel for the elderly and disabled. Revenue is recognised on an earned basis and revenue

Statement of Accounts 117
received in advance is spread over the period to which it relates. Revenue earned by franchisees, or contractors, providing transport services on behalf of the Group is not taken into account, except in the limited circumstances where the Group shares the risk of revenue volatility with the franchisee.
g) Grants and other fundingThe main source of grant is Transport Grant, which is non-specific in that it is applied both to maintaining services and to fund capital expenditure.
In the accounts of the Corporation, Transport Grant is divided into three elements:
> The element used to finance revenue expenditure in the Corporation, including grants to subsidiaries to finance their own revenue expenditure
> The element used to finance capital expenditure in the Corporation, which is accounted for as described below
> The element used to finance capital expenditure in the subsidiaries, which is not accounted for in the Corporation’s income and expenditure account, but is shown in the Corporation’s cash flow statement under Capital activities
In the accounts of the Corporation and the Group, grants applied for revenue purposes are accounted for in the year in which they arise, in common with other income, and are credited to the income and expenditure account.
Grants and other contributions for capital expenditure are accounted for on an accruals basis and recognised in the accounts when the conditions for their receipt have been complied with and there is reasonable assurance that the grant or contribution will be received.
Where expenditure on fixed assets is financed either wholly or partly by grants or other contributions, the amount of the grant is credited initially to the deferred capital grants account. Amounts are released over the useful life of the asset to match the depreciation on the asset to which it relates.
h) Tangible fixed assetsAll expenditure (excluding routine repairs and maintenance) on the acquisition of capital assets, or expenditure which significantly adds to the value, capacity in use, or useful economic life of existing assets, is capitalised as a fixed asset on an accruals basis. Fixed assets are classified as operational assets (those presently used for the delivery of public services or for support tasks) and non-operational assets (surplus property awaiting sale and assets under construction).
Operational assetsInfrastructure consists of roads, tunnels, viaducts, bridges, stations, track, signalling and bus stations and stands. Infrastructure, rolling stock and equipment are carried at their fair value when transferred to the Group, together with the cost of subsequent additions. The fair values have been calculated on the basis of depreciated replacement cost.
London Underground assets are carried at the estimated cost of modern equivalent assets as at 31 March 1998, together with the cost of subsequent additions, written down to reflect their remaining estimated useful lives. Bored tunnels, excavations for stations, and embankments entering service in London Underground prior to 1 April 1992 are carried at nil value as there are no records of their historical cost and it is impractical to provide a reliable valuation.
Other property consists of business properties, used by the Group for its own purposes, which are not limited in their future use by operational constraints or requirements and which are not integral to the infrastructure (e.g. offices). These properties were valued at open market value at 31 March 2010 (on an existing use basis) by the Director of TfL Group Property and Facilities and by suitably qualified TfL staff. The revaluation is taken to the fixed asset revaluation reserve.
Non-operational assetsThese assets consist of investment properties commercially let and capable of being separated from operational property (eg offices, shops, residential property and disused operational property awaiting disposal), property awaiting disposal and assets
Transport for London – Annual Report and Statement of Accounts 2009/10118
under construction. The investment properties and properties awaiting disposal are valued like other property but with additional consideration of alternative uses. Assets under construction are carried at historical cost and are not depreciated until they come into use.
Depreciation Assets are depreciated on a straight-line basis over their estimated useful lives, which are reviewed regularly, and which for the major categories fall in the following ranges:
Tunnels and embankments up to 100 yearsBridges and viaducts up to 100 yearsTrack up to 50 yearsRoad pavement up to 15 yearsRoad foundations up to 50 yearsSignalling 15-40 yearsStations up to 50 yearsOther property 20-50 yearsRolling stock 30-50 yearsLifts and escalators 25-40 yearsPlant and equipment 3-40 yearsComputer equipment 3 years
Leasehold properties are amortised over the shorter of the lease term and 40 years. Property awaiting disposal is not depreciated.
London Underground Public Private Partnership (PPP) London Underground has three Public Private Partnership (PPP) contracts. Under these contracts, existing London Underground assets are allocated to the PPP contractors for a 30 year period from when the contracts were established, during which the PPP contractors maintain, enhance and replace these assets. London Underground pays service charges to the PPP contractor. Since the acquisition of the assets of the Metronet Infracos in May 2008, two of these PPP contracts are now intra-group.
London Underground retains substantial risks and rewards of ownership of the assets allocated to the PPP contractors during the contract term. These assets continue to be recorded as fixed assets in the Group accounts. Similarly, new assets acquired or constructed by the PPP contractors for London Underground are recorded as fixed asset additions in the Group accounts and a corresponding liability is recorded as a finance lease creditor within creditors in the Group accounts. An imputed finance charge
on this liability is included in interest payable in the Group income and expenditure account.
Service charges paid by London Underground to the PPP contractors are allocated to the income and expenditure account to reflect management’s estimate of the value of operating services received, with the balance applied to amortise the finance lease creditor over the term of the contract. Performance adjustments to the service charges are also recorded within expenditure charged to revenue.
Assets in course of constructionThese assets are carried at cost and are not depreciated until they are available for customer service. They include expenditure on new and extended railway lines and major expansions to stations.
i) Goodwill Where the cost of a business combination exceeds the fair values attributable to the net assets acquired, the resulting goodwill is capitalised and tested for impairment whenever indicators exist that the carrying value may not be recoverable. Goodwill is amortised over 20 years. Goodwill is allocated to income-generating units for the purposes of impairment testing.
j) Intangible assets other than goodwillThe Group does not capitalise internally generated intangible assets, including research and development costs. Purchased software is also not capitalised, unless it is not separable from an item of related hardware.
k) StocksStocks consist primarily of fuel, uniforms, and materials required for the operation and maintenance of infrastructure. Stocks are included in the balance sheet at cost less provision for obsolescence. Equipment and materials held for use in a capital programme are accounted for as stock until they are issued to the project, at which stage they become part of assets under construction.
l) Financial assetsFinancial assets are classified into two types:
> Loans and receivables – assets that have fixed or determinable payments but are not quoted in an active market
Statement of Accounting Policies (continued)
Statement of Accounts 119
> Available-for-sale assets – assets that have a quoted market price and/or do not have fixed or determinable payments
Loans and receivablesLoans and receivables are initially measured at fair value and carried at their amortised cost. Annual credits to the income and expenditure account for interest receivable are based on the carrying amount of the asset multiplied by the effective rate of interest for the instrument. All loans and receivables are shown in the balance sheet at the outstanding principal receivable plus the difference between interest credited to the income and expenditure account and interest received.
Where loans and receivables are impaired, arising from a past event, they are written down and a charge made to the income and expenditure account. Provision is made for bad and doubtful debts, and uncollectible debts are written off to net cost of services.
Any losses/gains that arise on the derecognition of the asset are debited/credited to the income and expenditure account. Derecognition arises when the asset is sold or otherwise disposed of.
Available-for-sale assetsAvailable-for-sale assets are initially measured and carried at fair value. Where fair value cannot be measured reliably, the instrument is carried at cost (less any impairment losses). Where the asset has fixed or determinable payments, annual credits to the income and expenditure account for interest receivable are based on the amortised cost of the asset multiplied by the effective rate of interest for the instrument. Where there are no fixed or determinable payments, income (eg dividends) is credited to the income and expenditure account when it becomes receivable.
Assets recorded in the balance sheet at fair value are based on the following principles:
> Instruments with quoted market prices – the market price
> Other instruments with fixed and determinable payments – the total value of the discounted cash flows
> Equity shares with no quoted market prices – independent appraisal of company valuations
Increases/decreases in fair value are recognised in the statement of total recognised gains and losses (STRGL) and transferred to the Available-for-sale Reserve. The exception is where impairment losses have been incurred or the asset has been derecognised – these are debited/credited to the income and expenditure account together with earlier losses less the gains for the asset previously accumulated in the Available-for-sale Reserve.
m) Financial liabilitiesFinancial liabilities are initially measured at fair value and carried at their amortised cost. Annual charges to the income and expenditure account for interest payable are based on the carrying amount of the liability, multiplied by the effective rate of interest for the instrument.
Instruments entered into before 1 April 2006There are a number of financial guarantees, referred to in Note 29, that are not required to be accounted for as financial instruments. They are reflected in the Statement of Accounts to the extent that provisions are required or a contingent liability note is needed under the policies set out in paragraph o).
Guarantees entered into after 1 April 2006 are initially measured at fair value and carried at the higher of amortised cost or any amount required to be recognised under provisions and contingencies.
n) BorrowingsLong term borrowings are carried in the Corporation and Group balance sheets net of discounts and issue costs. These discounts and issue costs are amortised to revenue over the duration of the debt. In the income and expenditure accounts, this charge is made through interest payable.
o) Provisions and contingencies Provisions are recognised in respect of liabilities which exist at the balance sheet date where the amount or date of payment is uncertain. They are charged to net cost of services in the year that they are recognised.
The Group has a number of uncertainties surrounding projects, including claims in the course of negotiations, which may affect the financial outcome. Where it is possible but not probable that a liability exists at the balance sheet date, or where the liability cannot be reliably estimated, no provision is made

Transport for London – Annual Report and Statement of Accounts 2009/10120
and a contingent liability is disclosed in the accounts. Contingent liabilities are monitored to ensure that, where a possible obligation has become probable or a transfer of economic benefits has become probable, a provision is made. The Statement of Accounts includes provisions based on management's best estimate of the outcome of these uncertainties (see Note 18).
p) ReservesThe capital accounting regime requires the maintenance of two special reserve accounts in the balance sheet:
> The Revaluation Reserve, which represents the net gain arising on the periodic revaluation of fixed assets
> The Capital Adjustment Account, which reflects the difference between the cost of fixed assets consumed and the capital financing set aside to pay for them
The depreciation charge to the income and expenditure account in the Corporation on the current value of fixed assets is met by an appropriation from the Capital Adjustment Account. Revaluation gains are depreciated, with an amount equal to the difference between current value depreciation charged on assets and the depreciation that would have been chargeable based on their historical cost being transferred each year from the Revaluation Reserve to the Capital Adjustment Account. These two reserve account balances do not form part of the resources available to the Group and Corporation.
Transport for London sets aside specific amounts as earmarked reserves for future policy purposes or to cover contingencies. Reserves are created by appropriating amounts from the General Fund. When expenditure to be financed from earmarked reserves is incurred, it is charged to the income and expenditure account in that year and included in Net Cost of Services. A corresponding amount is then appropriated back into the General Fund from earmarked reserves so that there is no net impact on the General Fund surplus or deficit for the year.
The accounting requirements for financial instruments are similar to those for fixed assets, in that financial assets are required to be carried at fair value (unless they have fixed or determinable payments but are not quoted in an active market) and the outcome of proper accounting practices for the Income and
Expenditure Account is different from that on the General Fund surplus or deficit for the year.
Two reserves are required to be maintained:
> The Available-for-Sale Financial Instruments Reserve – records unrealised revaluation gains arising from holding available-for-sale investments, plus any unrealised losses that have not arisen from impairment of the assets
> The Financial Instruments Adjustment Account – provides a balancing mechanism between the different rates at which gains and losses (such as premiums on the early repayment of debt) are recognised under the SORP and are required by statute to be met from the General Fund.
These reserves are matched by borrowings and investments within the Balance Sheet and do not represent resources available to the Corporation.
q) InsuranceThe Group maintains certain insurance policies for damage to and loss of owned/third party property and for its potential liabilities to employees and third parties. In addition, the Group selectively self-insures its exposures under the above policies and to other risks. Provision is made for the estimated value of the Group’s liability in respect of self-insured losses.
r) Pensions The Group’s employees are members of a number of defined benefit schemes. In accordance with FRS 17, the regular service cost of pension provision relating to the period, together with the cost of any benefits relating to past service, is charged to the Group income and expenditure account. A charge equal to the increase in the present value of the schemes’ liabilities (because the benefits are closer to settlement) and a credit equivalent to the Group's long-term expected return on assets (based on the market value of the schemes’ assets at the start of the period), is included in the income and expenditure account.
The difference between the market value of the assets of the schemes and the present value of accrued pension liabilities is shown as an asset or liability, net of deferred tax. Any difference between the expected return on assets and that actually achieved is recognised in the statement of total recognised gains and losses along with differences which arise from experience or assumption changes.
Statement of Accounting Policies (continued)
Statement of Accounts 121
For certain defined benefit schemes, the Corporation and/or the Group is unable to identify its share of the underlying assets and liabilities of the scheme on a consistent and reasonable basis. Under FRS 17, these schemes are accounted for as defined contribution schemes.
s) Taxation Current tax assets and liabilities are measured at the amount expected to be recovered from or paid to the tax authorities, based on tax rates and laws that are enacted or substantively enacted at the balance sheet date.
Provision is made within the Group accounts for deferred taxation arising from timing differences between profits or losses as computed for taxation purposes and profits or losses as stated in the Accounts to the extent it is payable or recoverable in the foreseeable future.
t) LeasesAssets held under finance leases are included in tangible fixed assets and are depreciated on a straight-line basis over their estimated useful lives. Rentals payable are apportioned between the finance charge and a reduction of the outstanding obligation for future amounts payable the finance charge being allocated to accounting periods over the lease term so as to produce a constant rate of charge on the remaining balance of the obligation.
The Group has also entered into operating leases in respect of properties, rolling stock and motor vehicles. Rentals payable under operating leases have been accounted for in the period to which they relate.
Note u) below deals with PFI agreements.
u) Private Finance Initiative (PFI) transactions and similar contracts
The 2009 SORP introduced new requirements for accounting for infrastructure PFI schemes where the local authority or similar body controls the use of the infrastructure and the residual interest in the infrastructure at the end of the arrangement. These arrangements are now to be treated as service concession arrangements, following the same requirements as under IFRIC 12 (an interpretation under IFRS).
TfL therefore recognises PFI assets as items of property, plant and equipment together with a liability to pay for them. The fair values of services received under the contract are recorded as operating expenses.
The annual unitary payment is separated into the following component parts, using appropriate estimation techniques where necessary:
a) The service charge element
b) Repayment of the liability
c) The interest element (using the interest rate implicit in the contract)
Services received The fair value of services received in the year is recorded under the relevant expenditure headings within ‘operating expenses’.
PFI AssetThe PFI assets are recognised as property, plant and equipment, when they come into use. The assets are measured initially at fair value in accordance with the principles of FRS15.
Where the operator enhances property already recognised in the Balance Sheet, the fair value of the enhancement in the carrying value of the property is recognised as an asset.
PFI liabilityA PFI liability is recognised at the same time as the PFI assets are recognised. It is measured initially at the same amount as the fair value of the PFI assets and is subsequently measured as a finance lease liability in accordance with SSAP 21.
An annual finance cost is calculated by applying the implicit interest rate in the lease to the opening lease liability for the period, and is charged to ‘Finance Costs’ within the Income and Expenditure Account.
The element of the annual unitary payment that is allocated as a finance lease rental is applied to meet the annual finance cost and to repay the lease liability over the contract term.
Life cycle replacementComponents of the asset replaced by the operator during the contract (‘lifecycle replacement’) are capitalised where they meet the Group’s criteria for capital expenditure. They are capitalised at the time they are provided by the operator and are measured initially at their fair value.
Off balance sheet PFI arrangements which are accounted for as operating leases are dealt with as detailed in note t) above.
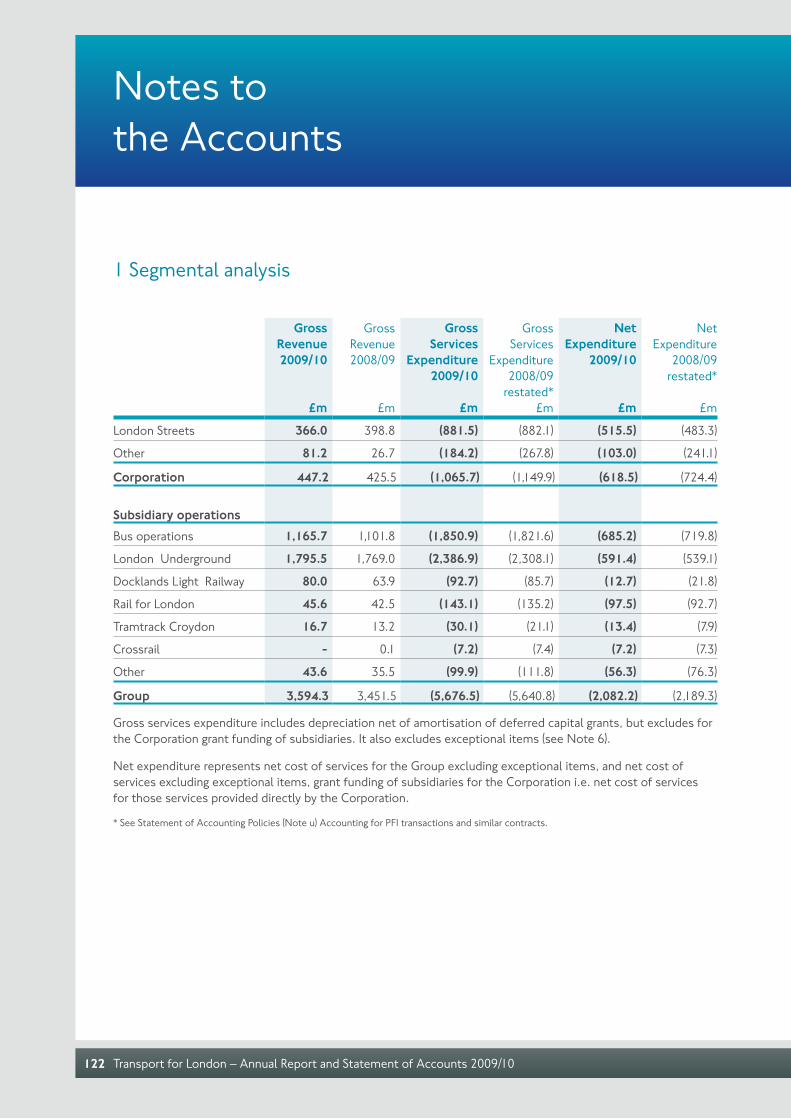
Notes to the Accounts
Transport for London – Annual Report and Statement of Accounts 2009/10122
1 Segmental analysis
GrossRevenue2009/10
£m
GrossRevenue2008/09
£m
Gross Services
Expenditure2009/10
£m
GrossServices
Expenditure 2008/09
restated*£m
NetExpenditure
2009/10
£m
Net Expenditure
2008/09restated*
£m
London Streets 366.0 398.8 (881.5) (882.1) (515.5) (483.3)
Other 81.2 26.7 (184.2) (267.8) (103.0) (241.1)
Corporation 447.2 425.5 (1,065.7) (1,149.9) (618.5) (724.4)
Subsidiary operationsBus operations 1,165.7 1,101.8 (1,850.9) (1,821.6) (685.2) (719.8)
London Underground 1,795.5 1,769.0 (2,386.9) (2,308.1) (591.4) (539.1)
Docklands Light Railway 80.0 63.9 (92.7) (85.7) (12.7) (21.8)
Rail for London 45.6 42.5 (143.1) (135.2) (97.5) (92.7)
Tramtrack Croydon 16.7 13.2 (30.1) (21.1) (13.4) (7.9)
Crossrail - 0.1 (7.2) (7.4) (7.2) (7.3)
Other 43.6 35.5 (99.9) (111.8) (56.3) (76.3)
Group 3,594.3 3,451.5 (5,676.5) (5,640.8) (2,082.2) (2,189.3)
Gross services expenditure includes depreciation net of amortisation of deferred capital grants, but excludes for the Corporation grant funding of subsidiaries. It also excludes exceptional items (see Note 6).
Net expenditure represents net cost of services for the Group excluding exceptional items, and net cost of services excluding exceptional items, grant funding of subsidiaries for the Corporation i.e. net cost of services for those services provided directly by the Corporation.
* See Statement of Accounting Policies (Note u) Accounting for PFI transactions and similar contracts.
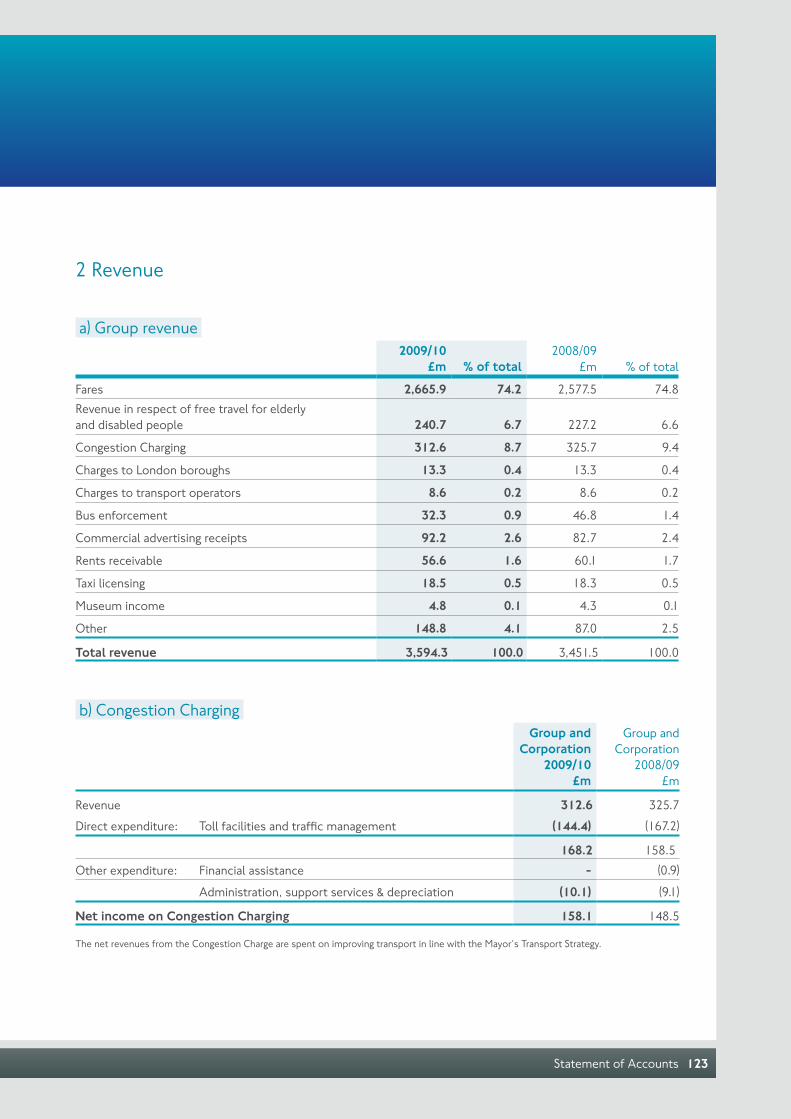
Statement of Accounts 123
2 Revenue
a) Group revenue2009/10
£m % of total2008/09
£m % of total
Fares 2,665.9 74.2 2,577.5 74.8Revenue in respect of free travel for elderly and disabled people 240.7 6.7 227.2 6.6
Congestion Charging 312.6 8.7 325.7 9.4
Charges to London boroughs 13.3 0.4 13.3 0.4
Charges to transport operators 8.6 0.2 8.6 0.2
Bus enforcement 32.3 0.9 46.8 1.4
Commercial advertising receipts 92.2 2.6 82.7 2.4
Rents receivable 56.6 1.6 60.1 1.7
Taxi licensing 18.5 0.5 18.3 0.5
Museum income 4.8 0.1 4.3 0.1
Other 148.8 4.1 87.0 2.5
Total revenue 3,594.3 100.0 3,451.5 100.0
b) Congestion ChargingGroup and
Corporation2009/10
£m
Group and Corporation
2008/09 £m
Revenue 312.6 325.7Direct expenditure: Toll facilities and traffic management (144.4) (167.2)
168.2 158.5Other expenditure: Financial assistance - (0.9)
Administration, support services & depreciation (10.1) (9.1)
Net income on Congestion Charging 158.1 148.5
The net revenues from the Congestion Charge are spent on improving transport in line with the Mayor’s Transport Strategy.

Transport for London – Annual Report and Statement of Accounts 2009/10124
3 Expenditure (before exceptional items)
Note
Group 2009/10
£m
Group2008/09
restated*£m
Corporation2009/10
£m
Corporation2008/09
restated*£m
Staff costs:Wages and salaries 1,075.9 1,053.1 158.5 152.6Social security costs 87.8 88.0 13.3 13.3Pension costs 22a 140.8 167.6 39.8 36.5
1,304.5 1,308.7 211.6 202.4Operating leases 73.8 65.8 4.6 4.2PFI charges 163.7 173.7 3.7 3.7Financial assistance 4 181.7 190.3 181.7 190.3Supplies and services 6,689.3 6,396.4 1,182.6 815.6
8,413.0 8,134.9 1,584.2 1,216.2Capital expenditure 11a, b (3,139.3) (2,822.4) (661.6) (202.9)
Expenditure charged to revenue 5,273.7 5,312.5 922.6 1,013.3
Group2009/10Number
Group2008/09Number
Corporation2009/10Number
Corporation2008/09Number
Average number of employees:Permanent employees (including those on fixed term contracts) 25,126 25,675 3,508 3,420Agency staff 2,290 3,004 385 713
Average number of employees 27,416 28,679 3,893 4,133
Group 2009/10
£m
Group 2008/09
£m
Corporation2009/10
£m
Corporation2008/09
£m
The cost of services include the following amounts:Auditors’ remuneration for statutory audit services 1.6 1.7 0.4 0.6Auditors’ remuneration for non-statutory audit services - 0.3 - 0.1Auditors’ remuneration for non-audit services 0.4 0.1 0.2 -
2.0 2.1 0.6 0.7
Operating leasesThe Group leases certain properties on short-term and long-term leases. The rents payable on these leases were £54.2m (2008/09 £58.4m). The rents payable under these leases are subject to renegotiation at various intervals specified in the leases. The Group pays all insurance, maintenance and repairs of these properties.Total other operating lease rentals for the Group included in the income and expenditure account were £19.6m (2008/09 £7.4m). Payments under these lease agreements, which include the cost of routine maintenance and repairs, are charged to revenue over the period of the leases from the time the assets become operational.* See Statement of Accounting Policies (Note u) Accounting for PFI transactions and similar contracts.
Notes to the Accounts (continued)

Statement of Accounts 125
4 Financial assistanceTfL may give financial assistance to any body or person in respect of expenditure incurred or to be incurred by that body or person in doing anything which, in the opinion of TfL, is conducive to the provision of safe, integrated, efficient and economic transport facilities or services to, from or within Greater London.
Financial assistance given under section 159 of the Greater London Authority Act 1999 is outlined below:
Note
Corporation 2009/10
£m
Corporation2008/09
£m
Financial assistance to subsidiaries Transport Trading Limited 189.6 125.4London Underground Limited 1,886.4 1,546.7London Bus Services Limited 705.0 762.2London Buses Limited 0.3 1.4Docklands Light Railway Limited 208.3 213.6Rail for London Limited 492.0 459.0Victoria Coach Station Limited - 0.6Tramtrack Croydon Limited 4.3 9.2London Transport Museum Limited 5.6 6.4Crossrail Limited 283.7 91.9
3,775.2 3,216.4
Financial assistance to London boroughs and other third partiesLondon Investment Programme 153.1 170.4Taxicard 12.5 11.9Three Mills Lock - 1.2Olympics Velopark - 2.5Safety schemes 5.2 -Cycle network 4.7 -Other schemes 6.2 4.3
3 181.7 190.3
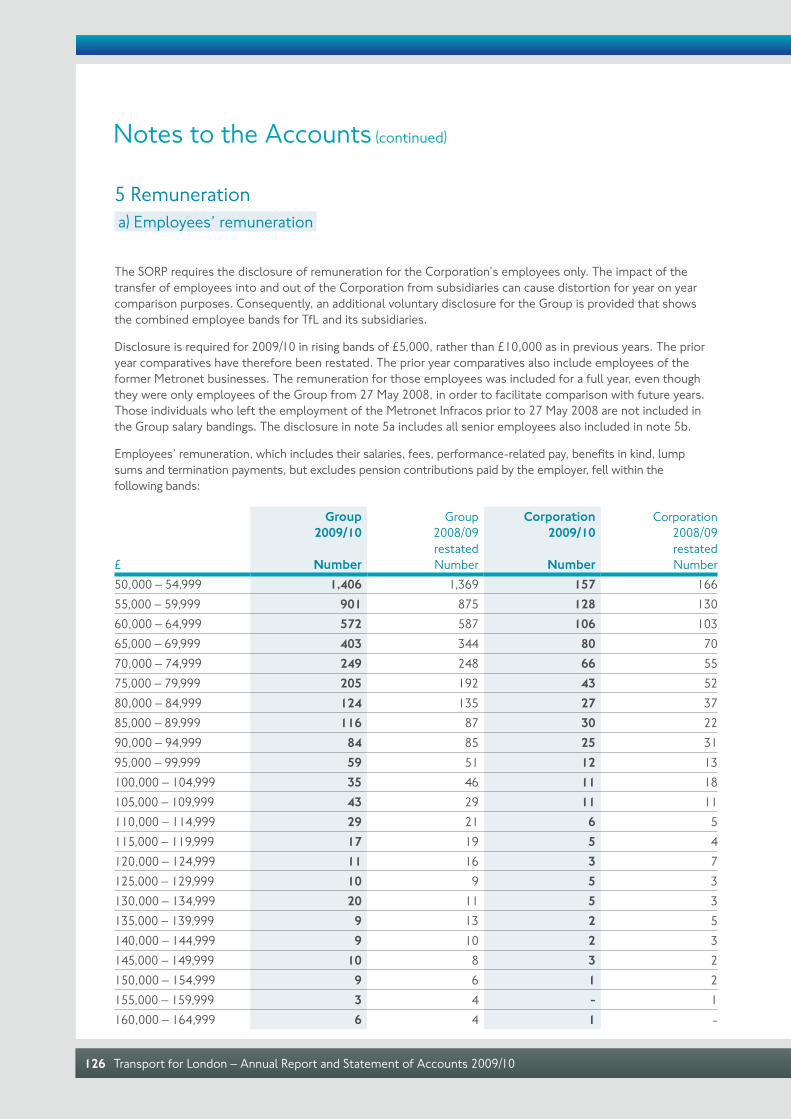
Transport for London – Annual Report and Statement of Accounts 2009/10126
5 Remunerationa) Employees’ remuneration
The SORP requires the disclosure of remuneration for the Corporation’s employees only. The impact of the transfer of employees into and out of the Corporation from subsidiaries can cause distortion for year on year comparison purposes. Consequently, an additional voluntary disclosure for the Group is provided that shows the combined employee bands for TfL and its subsidiaries.
Disclosure is required for 2009/10 in rising bands of £5,000, rather than £10,000 as in previous years. The prior year comparatives have therefore been restated. The prior year comparatives also include employees of the former Metronet businesses. The remuneration for those employees was included for a full year, even though they were only employees of the Group from 27 May 2008, in order to facilitate comparison with future years. Those individuals who left the employment of the Metronet Infracos prior to 27 May 2008 are not included in the Group salary bandings. The disclosure in note 5a includes all senior employees also included in note 5b.
Employees’ remuneration, which includes their salaries, fees, performance-related pay, benefits in kind, lump sums and termination payments, but excludes pension contributions paid by the employer, fell within the following bands:
£
Group 2009/10
Number
Group 2008/09restatedNumber
Corporation2009/10
Number
Corporation 2008/09restatedNumber
50,000 – 54,999 1,406 1,369 157 16655,000 – 59,999 901 875 128 13060,000 – 64,999 572 587 106 10365,000 – 69,999 403 344 80 7070,000 – 74,999 249 248 66 5575,000 – 79,999 205 192 43 5280,000 – 84,999 124 135 27 3785,000 – 89,999 116 87 30 2290,000 – 94,999 84 85 25 3195,000 – 99,999 59 51 12 13100,000 – 104,999 35 46 11 18105,000 – 109,999 43 29 11 11110,000 – 114,999 29 21 6 5115,000 – 119,999 17 19 5 4120,000 – 124,999 11 16 3 7125,000 – 129,999 10 9 5 3130,000 – 134,999 20 11 5 3135,000 – 139,999 9 13 2 5140,000 – 144,999 9 10 2 3145,000 – 149,999 10 8 3 2150,000 – 154,999 9 6 1 2155,000 – 159,999 3 4 - 1160,000 – 164,999 6 4 1 -
Notes to the Accounts (continued)

Statement of Accounts 127
£
Group 2009/10
Number
Group 2008/09 restatedNumber
Corporation2009/10
Number
Corporation 2008/09 restatedNumber
165,000 – 169,999 2 5 1 1170,000 – 174,999 7 2 3 2175,000 – 179,999 4 7 2 6180,000 – 184,999 4 1 1 1185,000 – 189,999 1 - - -190,000 – 194,999 - 2 - -195,000 – 199,999 1 1 - -200,000 – 204,999 - 1 - 1205,000 – 209,999 5 - 2 -210,000 – 214,999 1 3 1 1215,000 – 219,999 1 - - -225,000 – 229,999 2 1 1 -230,000 – 234,999 3 - - -235,000 – 239,999 - 1 - -240,000 – 244,999 - 1 - 1255,000 – 259,999 1 1 - 1260,000 – 264,999 - 1 - -265,000 – 269,999 2 - 1 -270,000 – 274,999 - 2 - 1280,000 – 284,999 1 - 1 -285,000 – 289,999 - 1 - 1310,000 – 314,999 1 - 1 -320,000 – 324,999 1 - - -355,000 – 359,999 - 1 - 1390,000 – 394,999 1 1 1 -410,000 – 414,999 - 1 - 1475,000 – 479,999 - 1 - 1515,000 – 519,999 1 - 1 -550,000 – 554,999 1 - - -575,000 – 579,999 - 1 - -Total 4,370 4,204 745 762
b) Remuneration for senior employeesThe Accounts and Audit (Amendment No. 2) (England) Regulations 2009 introduce a new legal requirement for disclosure of individual remuneration details for senior employees. Senior employees are those with a base salary of £150,000 or more, calculated on a full time equivalent basis for those working part-time.
Disclosure is made for each financial year under various categories, and set out on the following pages.
Employer’s pension contributions include the contribution in respect of future benefit accrual. Separately, member contributions are payable by employees at the rate of five per cent of pensionable salary.

Transport for London – Annual Report and Statement of Accounts 2009/10128
Notes to the Accounts (continued)
Notesa Salary sacrificed for pension of £17,132 (2008/09 £16,612)b Performance-related pay of £12,000 (2008/09 nil) sacrificed to pension fundc Entered service 22 March 2010d Part-time, three days per weeke Performance-related pay paid in 2008/09 includes a one-off performance award agreed in June 2007f Appointed as Interim Managing Director, London Underground 1 May 2009. The table only includes amounts
relating to Interim Managing Director role as previous salary was below £150,000
Notes
Salary (including fees and
allowances2009/10
£
Performance-related pay for 2008/09 paid in year
2009/10£
Compensation for loss of
employment2009/10
£
Benefits in kind
2009/10£
Total remuneration
excluding pension
contributions2009/10
£
Employer's contribution
to pension2009/10
£
Salary (including fees and
allowances)2008/09
£
Performance-related pay
for 2007/08 paid in year
2008/09£
Current employees excluding CrossrailPeter Hendy, Commissioner a 330,198 61,466 - 1,887 393,551 - 330,140 146,440
Steve Allen, Managing Director, Finance 253,436 56,592 - 573 310,601 45,551 238,334 48,080
David Brown, Managing Director, Surface Transport b 271,353 43,415 - 1,887 316,655 60,900 270,900 58,513
Ian Brown, Managing Director, London Rail 205,719 48,664 - 1,542 255,925 44,892 205,376 55,510
Mike Brown, Managing Director, London Underground c 60,556 - - 79 60,635 - - -
Howard Carter, General Counsel 217,081 49,588 - 1,887 268,556 45,914 216,720 55,438
Michèle Dix, Managing Director, Planning d 145,740 32,660 - 1,887 180,287 37,319 145,740 33,352
Vernon Everitt, Managing Director, Group Marketing and Communications e 228,235 53,797 - 1,887 283,919 26,791 227,854 127,610
Richard Parry, Interim Managing Director, London Underground f 184,709 - - - 184,709 36,450 - -
Sarah Atkins, Director of Reviews and Legal, London Underground g 155,615 27,000 - 1,542 184,157 41,885 155,355 8,000
Ian Campbell, Chief Information Officer h 18,973 - - 271 19,244 4,925 - -
Howard Collins, Chief Operating Officer, London Underground 194,186 24,000 - 1,542 219,728 41,787 140,733 19,019
Stephen Critchley, Chief Finance Officer 159,488 20,000 - - 179,488 41,770 158,411 20,434
Frank Douglas, Group Human Resources Director i 24,795 - - - 24,795 2,056 - -
Robert Doyle, Head of Track and Signals, London Underground 172,739 9,389 - 1,542 183,670 27,722 172,623 17,047
Gerald Duffy, Director of Employee Relations, London Underground 150,913 22,000 - 573 173,486 41,308 150,626 24,539
Garrett Emmerson, Chief Operating Officer Streets, Surface Transport j 160,403 12,090 - 573 173,066 41,770 96,566 -
David Hendry, Finance Director, Surface Transport 151,139 20,000 - 1,542 172,681 41,272 150,641 -
Philip Hufton, Chief Maintenance Officer, London Underground 232,891 35,000 - - 267,891 27,722 205,883 31,200
Ben Plowden, Director of Better Routes and Places, Surface Transport 174,522 35,100 - - 209,622 44,658 183,042 34,816
Peter Regan, Corporate Finance Director 154,469 71,153 - 573 226,195 40,273 154,258 47,600
Geoff Virrels, Commercial Adviser, London Underground k 130,886 - - 1,542 132,428 98,740 181,149 43,920
David Waboso, Director of Line Upgrades, London Underground 177,888 27,500 - 1,542 206,930 44,112 177,529 34,000
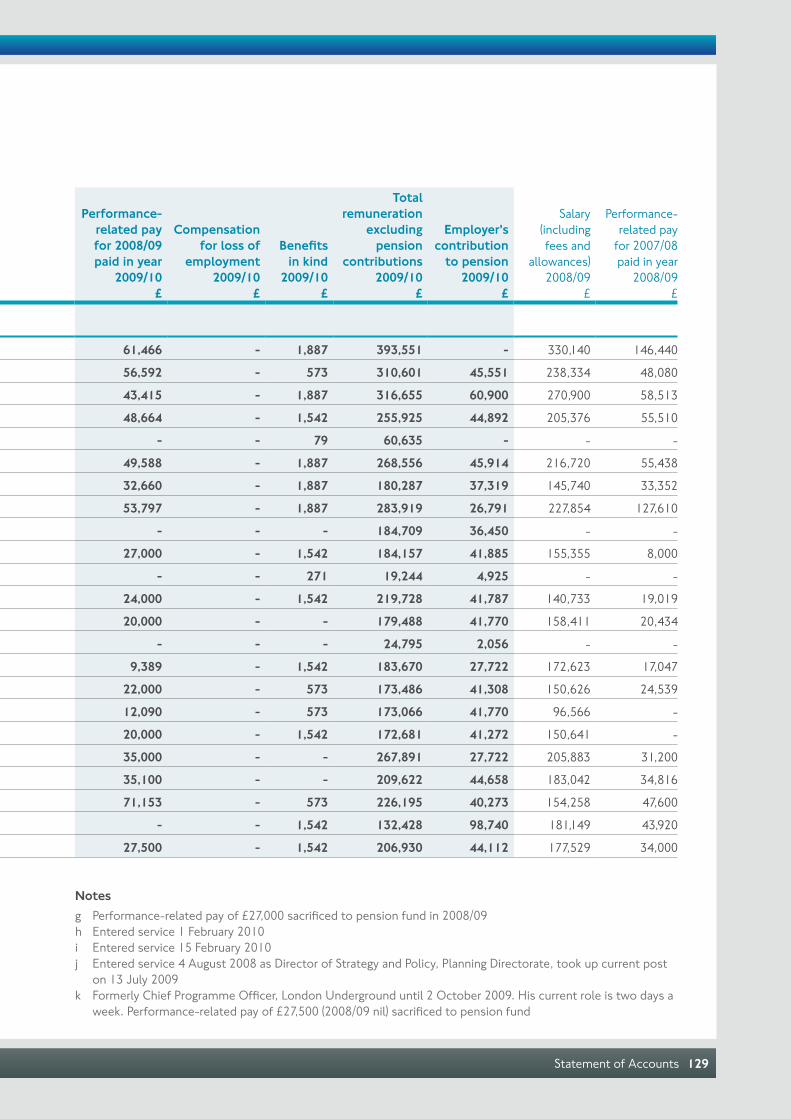
Statement of Accounts 129
Notesg Performance-related pay of £27,000 sacrificed to pension fund in 2008/09h Entered service 1 February 2010i Entered service 15 February 2010j Entered service 4 August 2008 as Director of Strategy and Policy, Planning Directorate, took up current post
on 13 July 2009k Formerly Chief Programme Officer, London Underground until 2 October 2009. His current role is two days a
week. Performance-related pay of £27,500 (2008/09 nil) sacrificed to pension fund
Notes
Salary (including fees and
allowances2009/10
£
Performance-related pay for 2008/09 paid in year
2009/10£
Compensation for loss of
employment2009/10
£
Benefits in kind
2009/10£
Total remuneration
excluding pension
contributions2009/10
£
Employer's contribution
to pension2009/10
£
Salary (including fees and
allowances)2008/09
£
Performance-related pay
for 2007/08 paid in year
2008/09£
Current employees excluding CrossrailPeter Hendy, Commissioner a 330,198 61,466 - 1,887 393,551 - 330,140 146,440
Steve Allen, Managing Director, Finance 253,436 56,592 - 573 310,601 45,551 238,334 48,080
David Brown, Managing Director, Surface Transport b 271,353 43,415 - 1,887 316,655 60,900 270,900 58,513
Ian Brown, Managing Director, London Rail 205,719 48,664 - 1,542 255,925 44,892 205,376 55,510
Mike Brown, Managing Director, London Underground c 60,556 - - 79 60,635 - - -
Howard Carter, General Counsel 217,081 49,588 - 1,887 268,556 45,914 216,720 55,438
Michèle Dix, Managing Director, Planning d 145,740 32,660 - 1,887 180,287 37,319 145,740 33,352
Vernon Everitt, Managing Director, Group Marketing and Communications e 228,235 53,797 - 1,887 283,919 26,791 227,854 127,610
Richard Parry, Interim Managing Director, London Underground f 184,709 - - - 184,709 36,450 - -
Sarah Atkins, Director of Reviews and Legal, London Underground g 155,615 27,000 - 1,542 184,157 41,885 155,355 8,000
Ian Campbell, Chief Information Officer h 18,973 - - 271 19,244 4,925 - -
Howard Collins, Chief Operating Officer, London Underground 194,186 24,000 - 1,542 219,728 41,787 140,733 19,019
Stephen Critchley, Chief Finance Officer 159,488 20,000 - - 179,488 41,770 158,411 20,434
Frank Douglas, Group Human Resources Director i 24,795 - - - 24,795 2,056 - -
Robert Doyle, Head of Track and Signals, London Underground 172,739 9,389 - 1,542 183,670 27,722 172,623 17,047
Gerald Duffy, Director of Employee Relations, London Underground 150,913 22,000 - 573 173,486 41,308 150,626 24,539
Garrett Emmerson, Chief Operating Officer Streets, Surface Transport j 160,403 12,090 - 573 173,066 41,770 96,566 -
David Hendry, Finance Director, Surface Transport 151,139 20,000 - 1,542 172,681 41,272 150,641 -
Philip Hufton, Chief Maintenance Officer, London Underground 232,891 35,000 - - 267,891 27,722 205,883 31,200
Ben Plowden, Director of Better Routes and Places, Surface Transport 174,522 35,100 - - 209,622 44,658 183,042 34,816
Peter Regan, Corporate Finance Director 154,469 71,153 - 573 226,195 40,273 154,258 47,600
Geoff Virrels, Commercial Adviser, London Underground k 130,886 - - 1,542 132,428 98,740 181,149 43,920
David Waboso, Director of Line Upgrades, London Underground 177,888 27,500 - 1,542 206,930 44,112 177,529 34,000
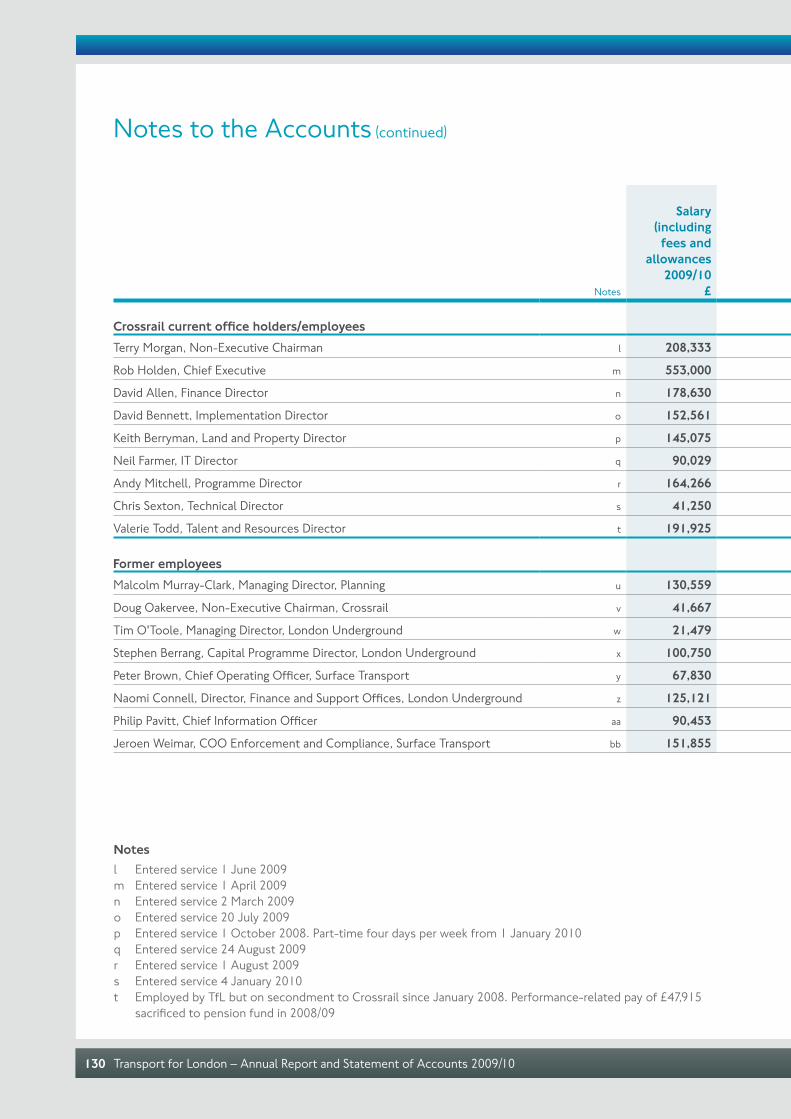
Transport for London – Annual Report and Statement of Accounts 2009/10130
Notes to the Accounts (continued)
Notes
Salary (including fees and
allowances2009/10
£
Performance-related pay for 2008/09 paid in year
2009/10£
Compensation for loss of
employment2009/10
£
Benefits in kind
2009/10£
Total remuneration
excluding pension
contributions2009/10
£
Employer's contribution
to pension2009/10
£
Salary (including fees and
allowances)2008/09
£
Performance-related pay
for 2007/08 paid in year
2008/09£
Crossrail current office holders/employees Terry Morgan, Non-Executive Chairman l 208,333 - - 1,265 209,598 - - -
Rob Holden, Chief Executive m 553,000 - - 1,495 554,495 35,004 - -
David Allen, Finance Director n 178,630 - - 1,495 180,125 30,685 14,322 -
David Bennett, Implementation Director o 152,561 - - 641 153,202 22,823 - -
Keith Berryman, Land and Property Director p 145,075 6,750 - - 151,825 26,482 90,000 -
Neil Farmer, IT Director q 90,029 - - 920 90,949 18,903 - -
Andy Mitchell, Programme Director r 164,266 - - 624 164,890 20,193 - -
Chris Sexton, Technical Director s 41,250 - - - 41,250 7,572 - -
Valerie Todd, Talent and Resources Director t 191,925 41,078 - 1,887 234,890 45,516 190,129 -
Former employees Malcolm Murray-Clark, Managing Director, Planning u 130,559 32,660 41,478 502 205,199 408,952 145,740 33,352
Doug Oakervee, Non-Executive Chairman, Crossrail v 41,667 - - - 41,667 - 337,444 54,000
Tim O'Toole, Managing Director, London Underground w 21,479 70,000 - - 91,479 5,521 320,567 150,000
Stephen Berrang, Capital Programme Director, London Underground x 100,750 8,000 - 13,506 122,256 18,510 199,302 9,983
Peter Brown, Chief Operating Officer, Surface Transport y 67,830 16,000 - 139 83,969 13,882 178,630 -
Naomi Connell, Director, Finance and Support Offices, London Underground z 125,121 27,000 - 1,139 153,260 28,025 155,355 39,000
Philip Pavitt, Chief Information Officer aa 90,453 57,500 - 612 148,565 - 212,755 29,440
Jeroen Weimar, COO Enforcement and Compliance, Surface Transport bb 151,855 19,000 - 1,616 172,471 41,272 155,565 20,000
Notesl Entered service 1 June 2009m Entered service 1 April 2009n Entered service 2 March 2009o Entered service 20 July 2009p Entered service 1 October 2008. Part-time four days per week from 1 January 2010q Entered service 24 August 2009r Entered service 1 August 2009s Entered service 4 January 2010t Employed by TfL but on secondment to Crossrail since January 2008. Performance-related pay of £47,915
sacrificed to pension fund in 2008/09
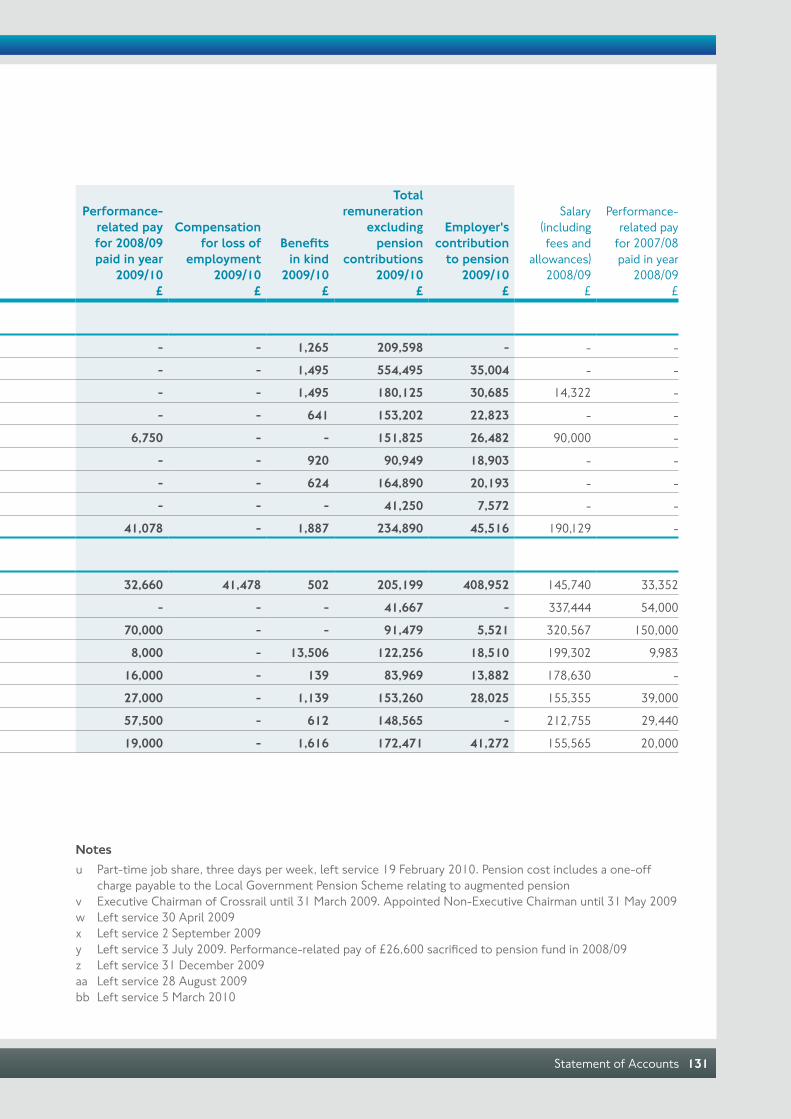
Statement of Accounts 131
Notes
Salary (including fees and
allowances2009/10
£
Performance-related pay for 2008/09 paid in year
2009/10£
Compensation for loss of
employment2009/10
£
Benefits in kind
2009/10£
Total remuneration
excluding pension
contributions2009/10
£
Employer's contribution
to pension2009/10
£
Salary (including fees and
allowances)2008/09
£
Performance-related pay
for 2007/08 paid in year
2008/09£
Crossrail current office holders/employees Terry Morgan, Non-Executive Chairman l 208,333 - - 1,265 209,598 - - -
Rob Holden, Chief Executive m 553,000 - - 1,495 554,495 35,004 - -
David Allen, Finance Director n 178,630 - - 1,495 180,125 30,685 14,322 -
David Bennett, Implementation Director o 152,561 - - 641 153,202 22,823 - -
Keith Berryman, Land and Property Director p 145,075 6,750 - - 151,825 26,482 90,000 -
Neil Farmer, IT Director q 90,029 - - 920 90,949 18,903 - -
Andy Mitchell, Programme Director r 164,266 - - 624 164,890 20,193 - -
Chris Sexton, Technical Director s 41,250 - - - 41,250 7,572 - -
Valerie Todd, Talent and Resources Director t 191,925 41,078 - 1,887 234,890 45,516 190,129 -
Former employees Malcolm Murray-Clark, Managing Director, Planning u 130,559 32,660 41,478 502 205,199 408,952 145,740 33,352
Doug Oakervee, Non-Executive Chairman, Crossrail v 41,667 - - - 41,667 - 337,444 54,000
Tim O'Toole, Managing Director, London Underground w 21,479 70,000 - - 91,479 5,521 320,567 150,000
Stephen Berrang, Capital Programme Director, London Underground x 100,750 8,000 - 13,506 122,256 18,510 199,302 9,983
Peter Brown, Chief Operating Officer, Surface Transport y 67,830 16,000 - 139 83,969 13,882 178,630 -
Naomi Connell, Director, Finance and Support Offices, London Underground z 125,121 27,000 - 1,139 153,260 28,025 155,355 39,000
Philip Pavitt, Chief Information Officer aa 90,453 57,500 - 612 148,565 - 212,755 29,440
Jeroen Weimar, COO Enforcement and Compliance, Surface Transport bb 151,855 19,000 - 1,616 172,471 41,272 155,565 20,000
Notesu Part-time job share, three days per week, left service 19 February 2010. Pension cost includes a one-off
charge payable to the Local Government Pension Scheme relating to augmented pensionv Executive Chairman of Crossrail until 31 March 2009. Appointed Non-Executive Chairman until 31 May 2009w Left service 30 April 2009x Left service 2 September 2009y Left service 3 July 2009. Performance-related pay of £26,600 sacrificed to pension fund in 2008/09z Left service 31 December 2009aa Left service 28 August 2009bb Left service 5 March 2010

Transport for London – Annual Report and Statement of Accounts 2009/10132
6 Exceptional items
Group2009/10
£m
Group2008/09
£m
Corporation 2009/10
Corporation2008/09
£m
Release from finance lease creditor - (1,705.5) - -
Write off of goodwill - 97.6 - -Provision against loan receivable from the Metronet Infracos - 104.7 - 104.7
Total exceptional items included in expenditure - (1,503.2) - 104.7
7 Transport grantAllocation of transport grant receivable:
Note
Group 2009/10
£m
Group2008/09
£m
Corporation2009/10
£m
Corporation2008/09
£mGrant from Department for Transport applied to fund revenue expenditure 1,081.8 1,231.4 1,081.8 1,231.4Grant from Department for Transport taken to deferred grants 20 1,805.6 1,802.1 - 331.2Grant from Department for Transport used to fund capital expenditure in subsidiaries - - 1,805.6 1,470.9
Total transport grant receivable 2,887.4 3,033.5 2,887.4 3,033.5
8 Loss on disposal or retirement of assets
Note
Group2009/10
£m
Group2008/09
£m
Corporation2009/10
£m
Corporation2008/09
£m
Net proceeds (104.8) (17.4) (57.1) (2.2)
Capital grant released 20 (77.3) (307.4) - -
(182.1) (324.8) (57.1) (2.2)
Less net book value 11a, b 196.6 410.6 61.4 7.4
Loss on disposal of assets 14.5 85.8 4.3 5.2
Notes to the Accounts (continued)

Statement of Accounts 133
9 Net finance charges
The finance income recognised in the Income and Expenditure Account is made up as follows:
Group
2009/10£m
Group2008/09
£m
Corporation2009/10
£m
Corporation2008/09
£m
Interest income on bank deposits (13.9) (104.6) (13.2) (100.5)
Interest income on loans to subsidiaries - - (97.8) (59.8)
Interest receivable and investment income (13.9) (104.6) (111.0) (160.3)
The finance costs recognised in the Income and Expenditure Account are made up as follows:
Group2009/10
£m
Group2008/09
restated*£m
Corporation2009/10
£m
Corporation2008/09
restated*£m
Interest on finance lease creditors 226.1 206.9 11.3 8.0Interest expense on financial liabilities measured at amortised cost 164.3 115.2 164.3 115.1
Other 0.3 - - -
Interest payable and similar charges 390.7 322.1 175.6 123.1
* See Statement of Accounting Policies (Note u) Accounting for PFI transactions and similar contracts.

Transport for London – Annual Report and Statement of Accounts 2009/10134
10 Taxation
The Corporation is exempt from corporation tax but the subsidiaries are assessable individually to taxation in accordance with the Income and Corporation Taxes Act 1988. No liability for corporation tax arises in respect of the current year.
Group 2009/10
Group2008/09
restated*
(Deficit)/Surplus for the year before tax (1,204.6) 275.7
Corporation tax at 28% (2008/09 28%) (337.3) 77.2Capital allowances for the year less than depreciation (26.6) 41.0
Adjustment for capital gains - 23.5
Non-taxable exceptional items - (450.3)
Other timing differences 50.5 (50.0)
Overseas earnings (0.8) (1.3)
Permanent difference in TfL Corporation 118.1 145.6
Loss for the year carried forward 196.1 214.3
Current tax charge for the year - -
At 31 March 2010 the Group had a net deferred tax asset of £545.1m (2009 £616.8m) comprised of tax losses carried forward, accelerated capital allowances and short-term timing differences. No deferred tax asset is accounted for, as it is not believed that such an asset would be recoverable in the foreseeable future. The full potential liability for deferred taxation in respect of potential capital gains on revalued fixed assets has not been quantified as no tax liability is expected to arise due to the availability of rollover relief.
*See Statement of Accounting Policies (Note u) Accounting for PFI transactions and similar contracts.
Notes to the Accounts (continued)
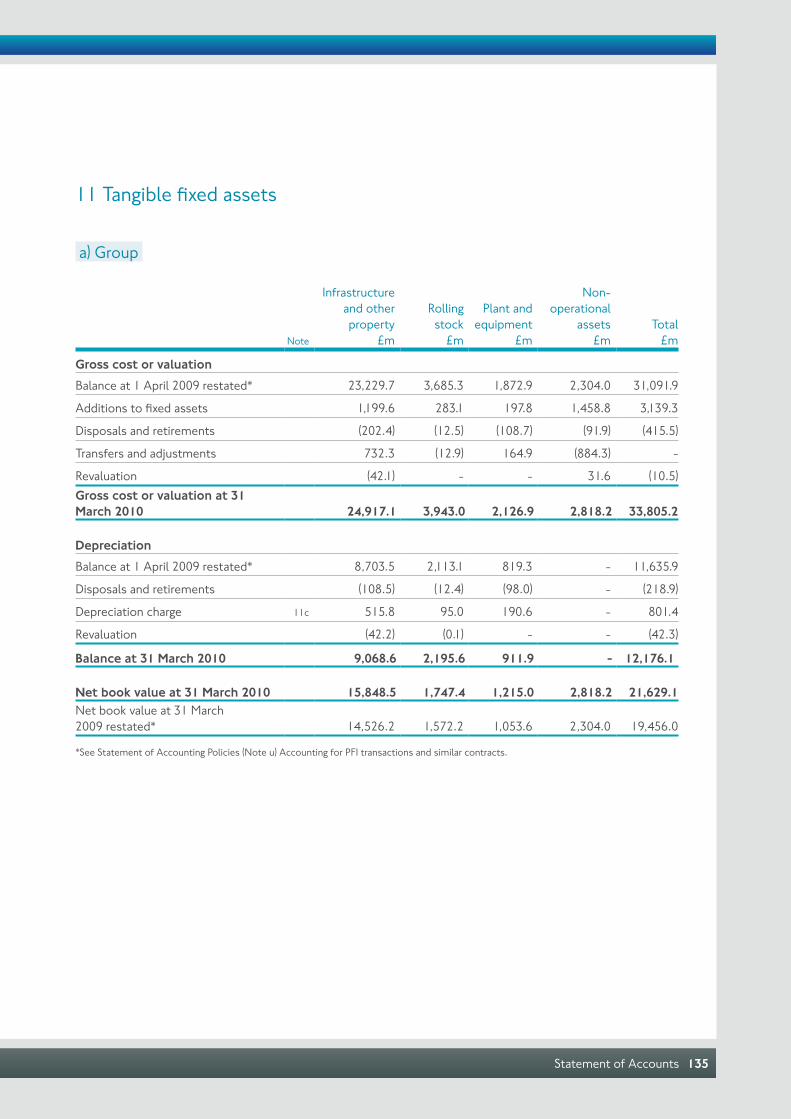
Statement of Accounts 135
11 Tangible fixed assets
a) Group
Note
Infrastructure and otherproperty
£m
Rollingstock
£m
Plant andequipment
£m
Non-operational
assets£m
Total£m
Gross cost or valuationBalance at 1 April 2009 restated* 23,229.7 3,685.3 1,872.9 2,304.0 31,091.9
Additions to fixed assets 1,199.6 283.1 197.8 1,458.8 3,139.3
Disposals and retirements (202.4) (12.5) (108.7) (91.9) (415.5)
Transfers and adjustments 732.3 (12.9) 164.9 (884.3) -
Revaluation (42.1) - - 31.6 (10.5)Gross cost or valuation at 31 March 2010 24,917.1 3,943.0 2,126.9 2,818.2 33,805.2
DepreciationBalance at 1 April 2009 restated* 8,703.5 2,113.1 819.3 - 11,635.9
Disposals and retirements (108.5) (12.4) (98.0) - (218.9)
Depreciation charge 11c 515.8 95.0 190.6 - 801.4
Revaluation (42.2) (0.1) - - (42.3)
Balance at 31 March 2010 9,068.6 2,195.6 911.9 - 12,176.1
Net book value at 31 March 2010 15,848.5 1,747.4 1,215.0 2,818.2 21,629.1Net book value at 31 March 2009 restated* 14,526.2 1,572.2 1,053.6 2,304.0 19,456.0
*See Statement of Accounting Policies (Note u) Accounting for PFI transactions and similar contracts.

Transport for London – Annual Report and Statement of Accounts 2009/10136
PPP assets and PFI and other leased assetsThe net book value above includes the following amounts in respect of PFI and other leased assets and assets allocated to PPP contractors:
Infrastructure and otherproperty
£m
Rollingstock
£m
Plant andequipment
£m
Non-operational
assets£m
Total
£m
Gross costPPP assets 7,717.8 974.3 239.4 48.4 8,979.9
PFI and other leased assets 653.4 96.2 734.7 - 1,484.3
8,371.2 1,070.5 974.1 48.4 10,464.2
DepreciationPPP assets 2,345.5 536.7 165.1 - 3,047.3
PFI and other leased assets 119.5 25.5 121.0 - 266.0
2,465.0 562.2 286.1 - 3,313.3
Net book value at 31 March 2010 5,906.2 508.3 688.0 48.4 7,150.9Net book value at 31 March 2009 restated* 5,734.2 498.2 840.5 35.8 7,108.7
* See Statement of Accounting Policies (Note u) Accounting for PFI transactions and similar contracts.
Notes to the Accounts (continued)
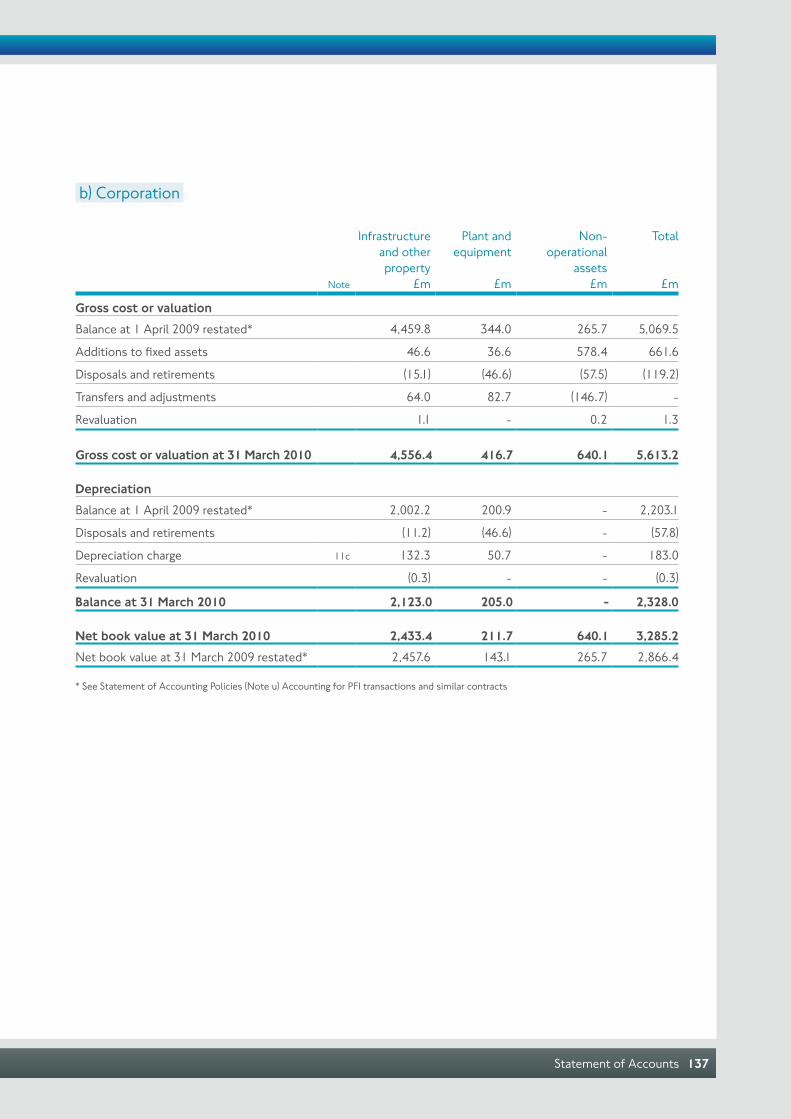
Statement of Accounts 137
b) Corporation
Note
Infrastructure and other property
£m
Plant andequipment
£m
Non-operational
assets£m
Total
£m
Gross cost or valuationBalance at 1 April 2009 restated* 4,459.8 344.0 265.7 5,069.5
Additions to fixed assets 46.6 36.6 578.4 661.6
Disposals and retirements (15.1) (46.6) (57.5) (119.2)
Transfers and adjustments 64.0 82.7 (146.7) -
Revaluation 1.1 - 0.2 1.3
Gross cost or valuation at 31 March 2010 4,556.4 416.7 640.1 5,613.2
DepreciationBalance at 1 April 2009 restated* 2,002.2 200.9 - 2,203.1
Disposals and retirements (11.2) (46.6) - (57.8)
Depreciation charge 11c 132.3 50.7 - 183.0
Revaluation (0.3) - - (0.3)
Balance at 31 March 2010 2,123.0 205.0 - 2,328.0
Net book value at 31 March 2010 2,433.4 211.7 640.1 3,285.2Net book value at 31 March 2009 restated* 2,457.6 143.1 265.7 2,866.4
* See Statement of Accounting Policies (Note u) Accounting for PFI transactions and similar contracts
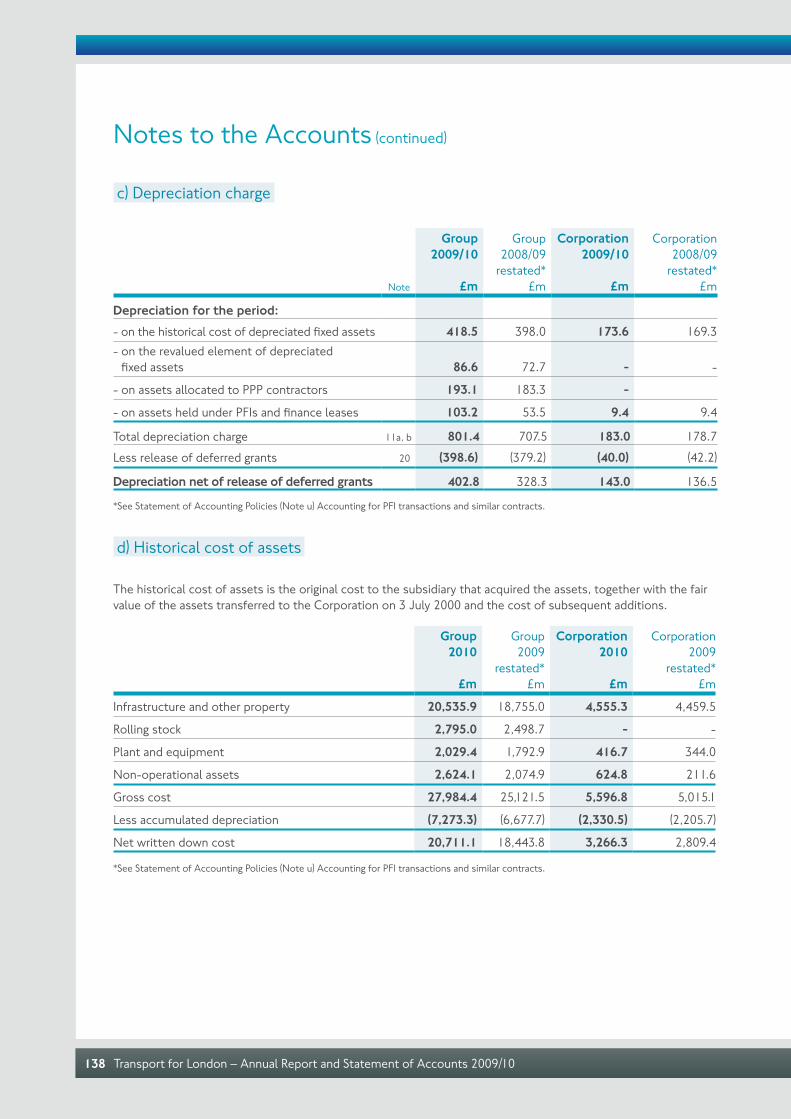
Transport for London – Annual Report and Statement of Accounts 2009/10138
c) Depreciation charge
Note
Group2009/10
£m
Group2008/09
restated*£m
Corporation 2009/10
£m
Corporation2008/09
restated*£m
Depreciation for the period:- on the historical cost of depreciated fixed assets 418.5 398.0 173.6 169.3- on the revalued element of depreciated
fixed assets 86.6 72.7 - -
- on assets allocated to PPP contractors 193.1 183.3 -
- on assets held under PFIs and finance leases 103.2 53.5 9.4 9.4
Total depreciation charge 11a, b 801.4 707.5 183.0 178.7Less release of deferred grants 20 (398.6) (379.2) (40.0) (42.2)
Depreciation net of release of deferred grants 402.8 328.3 143.0 136.5
*See Statement of Accounting Policies (Note u) Accounting for PFI transactions and similar contracts.
d) Historical cost of assets
The historical cost of assets is the original cost to the subsidiary that acquired the assets, together with the fair value of the assets transferred to the Corporation on 3 July 2000 and the cost of subsequent additions.
Group2010
£m
Group2009
restated*£m
Corporation2010
£m
Corporation2009
restated*£m
Infrastructure and other property 20,535.9 18,755.0 4,555.3 4,459.5
Rolling stock 2,795.0 2,498.7 - -
Plant and equipment 2,029.4 1,792.9 416.7 344.0
Non-operational assets 2,624.1 2,074.9 624.8 211.6
Gross cost 27,984.4 25,121.5 5,596.8 5,015.1
Less accumulated depreciation (7,273.3) (6,677.7) (2,330.5) (2,205.7)
Net written down cost 20,711.1 18,443.8 3,266.3 2,809.4
*See Statement of Accounting Policies (Note u) Accounting for PFI transactions and similar contracts.
Notes to the Accounts (continued)

Statement of Accounts 139
e) Group assets
Group 2010
Number
Group 2009
Number
Railway carriages 4,243 4,204
Track route length (kilometres) 458 458
Railway stations 289 289
Bridges and viaducts 2,062 2,061
Roads (kilometres) 582 582
Car ferries 3 3
Buses 391 552
Bus garages, stations and stands 361 357
Bus shelters 9,741 9,643
Offices 161 172
Piers 9 9
f) Capital expenditure analysed by source of finance
Note
Corporation2010
£m
Corporation2009
£m
Analysis by source of finance:
Transport capital grants - 183.1
Prudential borrowing used to fund fixed assets 277.6 -
Third party contributions 20 14.0 17.4
Capital receipts 57.1 2.4
Working capital 312.9 -
11b 661.6 202.9
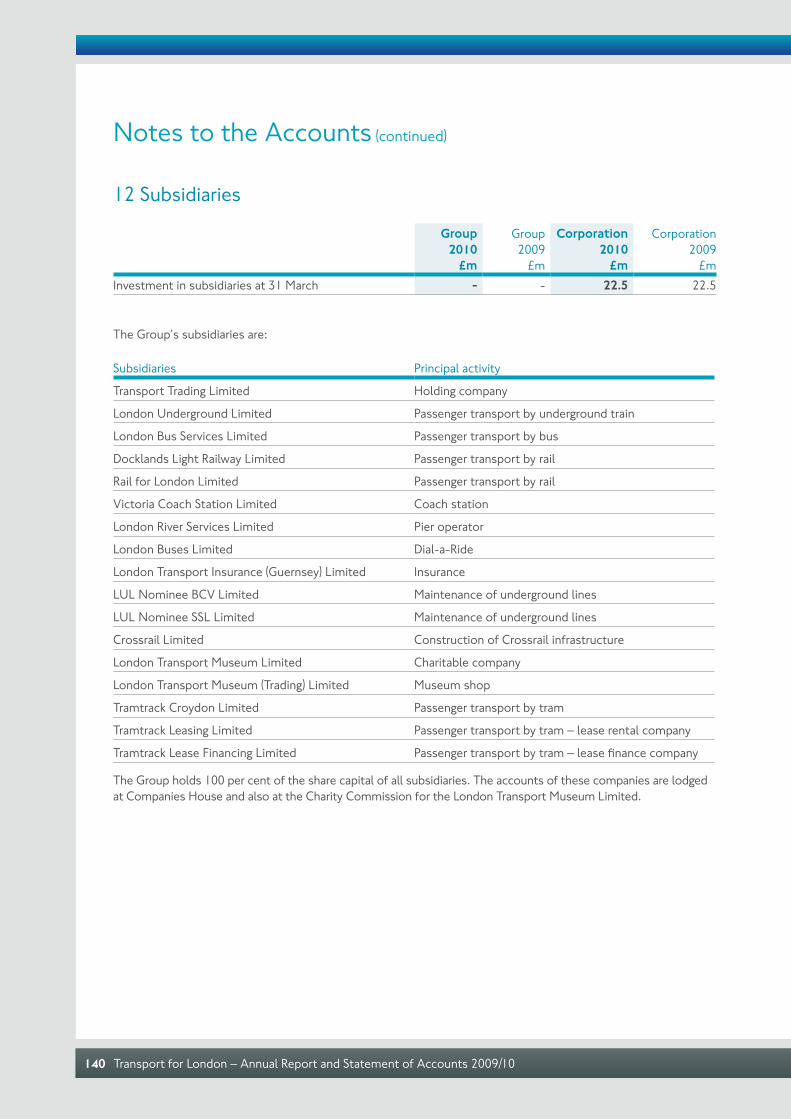
Transport for London – Annual Report and Statement of Accounts 2009/10140
12 Subsidiaries
Group2010
£m
Group2009
£m
Corporation 2010
£m
Corporation2009
£mInvestment in subsidiaries at 31 March - - 22.5 22.5
The Group’s subsidiaries are:
Subsidiaries Principal activity
Transport Trading Limited Holding company
London Underground Limited Passenger transport by underground train
London Bus Services Limited Passenger transport by bus
Docklands Light Railway Limited Passenger transport by rail
Rail for London Limited Passenger transport by rail
Victoria Coach Station Limited Coach station
London River Services Limited Pier operator
London Buses Limited Dial-a-Ride
London Transport Insurance (Guernsey) Limited Insurance
LUL Nominee BCV Limited Maintenance of underground lines
LUL Nominee SSL Limited Maintenance of underground lines
Crossrail Limited Construction of Crossrail infrastructure
London Transport Museum Limited Charitable company
London Transport Museum (Trading) Limited Museum shop
Tramtrack Croydon Limited Passenger transport by tram
Tramtrack Leasing Limited Passenger transport by tram – lease rental company
Tramtrack Lease Financing Limited Passenger transport by tram – lease finance company
The Group holds 100 per cent of the share capital of all subsidiaries. The accounts of these companies are lodged at Companies House and also at the Charity Commission for the London Transport Museum Limited.
Notes to the Accounts (continued)
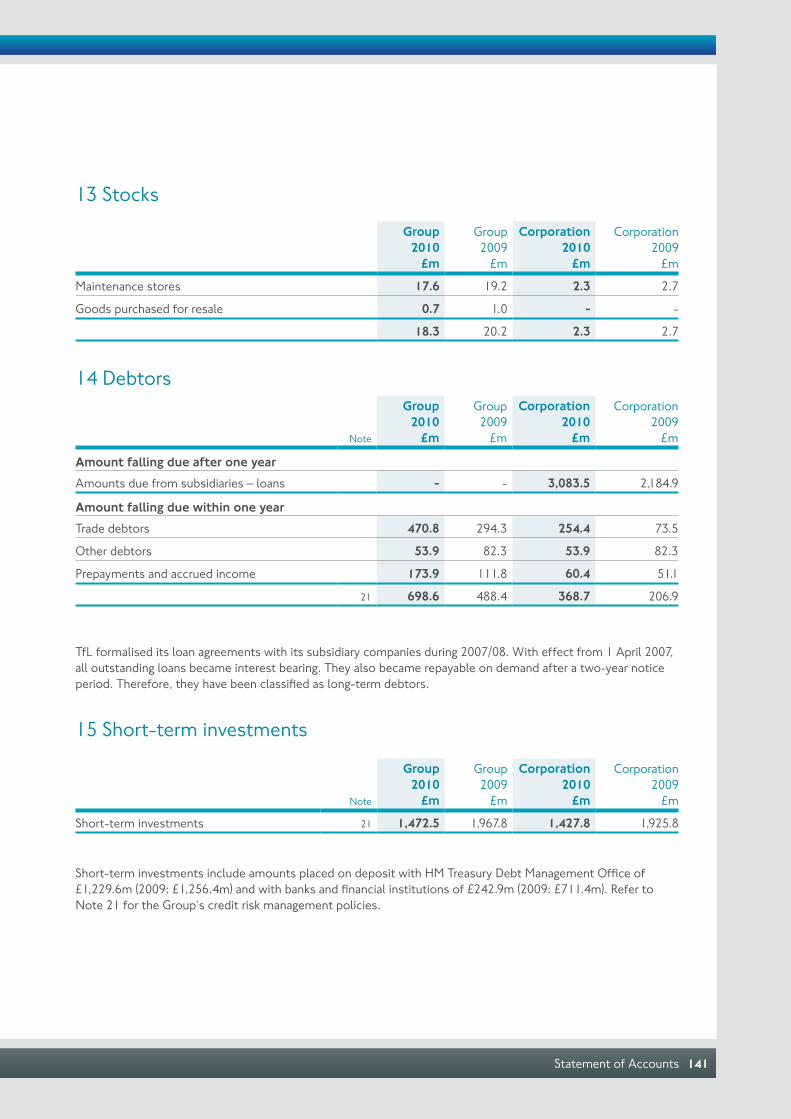
Statement of Accounts 141
13 Stocks
Group2010
£m
Group2009
£m
Corporation2010
£m
Corporation2009
£m
Maintenance stores 17.6 19.2 2.3 2.7
Goods purchased for resale 0.7 1.0 - -
18.3 20.2 2.3 2.7
14 Debtors
Note
Group2010
£m
Group2009
£m
Corporation2010
£m
Corporation2009
£m
Amount falling due after one yearAmounts due from subsidiaries – loans - - 3,083.5 2,184.9
Amount falling due within one yearTrade debtors 470.8 294.3 254.4 73.5
Other debtors 53.9 82.3 53.9 82.3
Prepayments and accrued income 173.9 111.8 60.4 51.1
21 698.6 488.4 368.7 206.9
TfL formalised its loan agreements with its subsidiary companies during 2007/08. With effect from 1 April 2007, all outstanding loans became interest bearing. They also became repayable on demand after a two-year notice period. Therefore, they have been classified as long-term debtors.
15 Short-term investments
Note
Group2010
£m
Group2009
£m
Corporation2010
£m
Corporation2009
£m
Short-term investments 21 1,472.5 1,967.8 1,427.8 1,925.8
Short-term investments include amounts placed on deposit with HM Treasury Debt Management Office of £1,229.6m (2009: £1,256.4m) and with banks and financial institutions of £242.9m (2009: £711.4m). Refer to Note 21 for the Group’s credit risk management policies.

Transport for London – Annual Report and Statement of Accounts 2009/10142
16 Cash at bank and in hand
Note
Group2010
£m
Group2009
£m
Corporation2010
£m
Corporation2009
£m
Cash at bank 12.2 13.4 6.8 11.0
Cash in hand and in transit 24.7 20.7 0.2 0.2
21 36.9 34.1 7.0 11.2
17 Creditors
Note
Group2010
£m
Group2009
restated*£m
Corporation2010
£m
Corporation2009
restated*£m
a) Amounts falling due within one yearTrade creditors 853.1 996.0 239.4 256.2
Capital works 594.0 479.0 56.2 80.7
Amounts due to subsidiary companies - - 98.3 126.7Finance lease obligations repayable within one year 21 389.0 368.7 6.8 5.7
Salaries and wages 43.0 44.1 9.9 7.7Receipts in advance for Travelcards, bus passes and Oyster cards 188.0 191.4 - -
2,067.1 2,079.2 410.6 477.0
b) Amounts falling due after more than one yearRetentions on capital contracts 1.3 0.8 1.3 0.8
Accruals and deferred income 29.9 30.0 9.0 9.5
Finance lease obligations 21 2,550.0 2,488.7 202.4 209.1
2,581.2 2,519.5 212.7 219.4
* See Statement of Accounting Policies (Note u) Accounting for PFI transactions and similar contracts.
Notes to the Accounts (continued)

Statement of Accounts 143
18 Provisions for liabilities and charges
Note
At 1 April 2009
£m
Payments in year
£m
Increase/(decrease) in
provision£m
At 31 March2010
£m
GroupClaims for compensation 112.8 (9.9) (7.4) 95.5
Capital investment activities 5.3 (0.1) 419.9 425.1
Unfunded pension liabilities 22f 40.6 (4.2) 15.5 51.9
Other 35.1 (16.0) 25.6 44.7
193.8 (30.2) 453.6 617.2
CorporationClaims for compensation 43.3 (4.9) (24.2) 14.2
Capital investment activities 5.1 - 420.0 425.1
Unfunded pension liabilities 24.1 (3.0) 7.5 28.6
Other 5.3 (7.9) 9.9 7.3
77.8 (15.8) 413.2 475.2
* See Statement of Accounting Policies (Note u) Accounting for PFI transactions and similar contracts.
Claims for compensation include provisions in respect of disputes in the ordinary course of business relating to projects and contracts for which the outcome is uncertain. While a claim is ongoing TfL is unable to disclose the quantum or timing of any possible settlement as this could prejudice its commercial position.
Capital investment activities includes compulsory purchases, claims in respect of structural damage or diminution in value of properties affected by transport schemes, and other related third party claims.
Details of unfunded pension liabilities are given in Note 22f.

Transport for London – Annual Report and Statement of Accounts 2009/10144
19 Borrowings The carrying value of debt is as follows:
Note
Group2010
£m
Group2009
£m
Corporation2010
£m
Corporation2009
£m
Borrowings 21 4,117.8 3,017.6 4,117.8 3,017.6
The increase in borrowings reflects the drawdowns on the EIB facilities for the East London line, Crossrail and Docklands Light Railway of £416m and net proceeds from Public Works Loan Board borrowings of £684m.
20 Deferred grants
Note
Group 2010
£m
Group 2009
£m
Corporation2010
£m
Corporation2009
£m
Balance at 1 April 8,216.2 6,864.2 724.0 417.6
Transport grant 7 1,805.6 1,802.1 - 331.2
Third party contributions and other grant funding 11f 164.6 236.5 14.0 17.4
Release of deferred grant:
- to meet the depreciation charge 11c (398.6) (379.2) (40.0) (42.2)
- on disposal of tangible fixed assets 8 (77.3) (307.4) - -
Balance at 31 March 9,710.5 8,216.2 698.0 724.0
Notes to the Accounts (continued)

Statement of Accounts 145
21 Nature and extent of risks arising from financial instrumentsFair value of assets and liabilities carried at amortised cost
Financial liabilities and financial assets represented by loans and receivables are carried in the balance sheet at amortised cost.
The fair values of all financial liabilities compared to carrying amounts are as follows:
Note
Group2010
Carrying amount
£m
Group2010
Fair value
£m
Group2009
Carrying amount
restated*£m
Group2009
Fair valuerestated*
£m
Trade and other payables 1,709.3 1,709.3 1,741.3 1,741.3
Finance lease obligations 17 2,939.0 2,939.0 2,857.4 2,857.4
Borrowings 19 4,117.8 4,079.0 3,017.6 3,118.3
Financial liabilities 8,766.1 8,727.3 7,616.3 7,717.0
*See Statement of Accounting Policies (Note u) Accounting for PFI transactions and similar contracts. At 31 March 2010, the average mid-market value of the group’s quoted debt was £553.5m (2009 £566.8m). All other financial liabilities have fair values equal to their book value. Loans bear a market rate of interest at the time the borrowings were made.
The fair values of all financial assets compared to carrying amounts are as follows:
Note
Group2010
Carryingamount
£m
Group2010
Fair value
£m
Group2009
Carrying amount
£m
Group2009
Fair value
£m
Trade and other receivables 14 698.6 698.6 488.4 488.4
Cash and cash equivalents:
Deposits less than 3 months 15 1,472.5 1,472.5 1,967.8 1,967.8
Cash at bank and in hand 16 36.9 36.9 34.1 34.1
Financial assets 2,208.0 2,208.0 2,490.3 2,490.3
All financial assets have fair values equal to their book value.
GovernanceTfL has taken account of the CIPFA recommendations contained in the Code of Practice and Cross-Sectoral Guidance Notes (Fully Revised Second Edition) (the Treasury Management Code) issued in 2009 for Treasury Management in the Public Services, the Local Government Act 2003, the Capital Finance and Accounts Regulations 2003 and the fully revised second edition of CIPFA’s Prudential Code for Capital Finance in Local Authorities (the Prudential Code) issued in 2009, in managing the financial risks faced by the Group.
TfL specifically considers the short and long-term funding requirements of its operations, its capital investment programmes and liquidity required to discharge its financial obligations when they fall due. It also considers
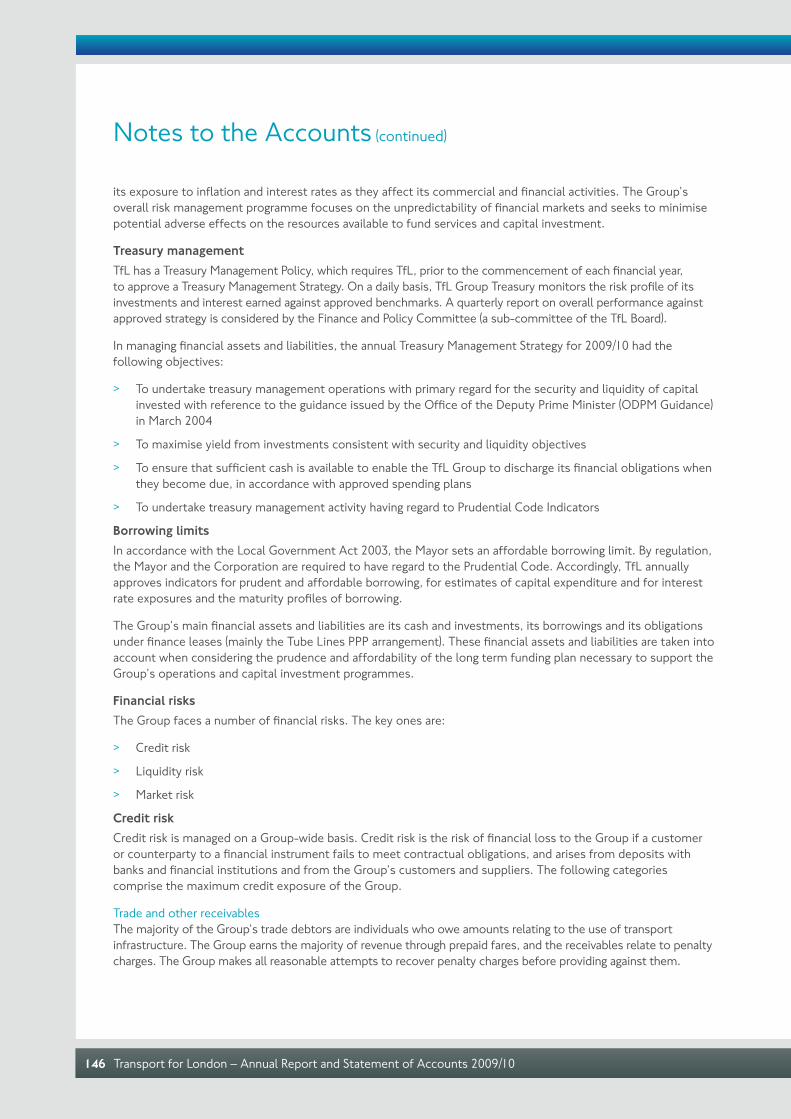
Transport for London – Annual Report and Statement of Accounts 2009/10146
its exposure to inflation and interest rates as they affect its commercial and financial activities. The Group’s overall risk management programme focuses on the unpredictability of financial markets and seeks to minimise potential adverse effects on the resources available to fund services and capital investment.
Treasury managementTfL has a Treasury Management Policy, which requires TfL, prior to the commencement of each financial year, to approve a Treasury Management Strategy. On a daily basis, TfL Group Treasury monitors the risk profile of its investments and interest earned against approved benchmarks. A quarterly report on overall performance against approved strategy is considered by the Finance and Policy Committee (a sub-committee of the TfL Board).
In managing financial assets and liabilities, the annual Treasury Management Strategy for 2009/10 had the following objectives:
> To undertake treasury management operations with primary regard for the security and liquidity of capital invested with reference to the guidance issued by the Office of the Deputy Prime Minister (ODPM Guidance) in March 2004
> To maximise yield from investments consistent with security and liquidity objectives
> To ensure that sufficient cash is available to enable the TfL Group to discharge its financial obligations when they become due, in accordance with approved spending plans
> To undertake treasury management activity having regard to Prudential Code Indicators
Borrowing limitsIn accordance with the Local Government Act 2003, the Mayor sets an affordable borrowing limit. By regulation, the Mayor and the Corporation are required to have regard to the Prudential Code. Accordingly, TfL annually approves indicators for prudent and affordable borrowing, for estimates of capital expenditure and for interest rate exposures and the maturity profiles of borrowing.
The Group’s main financial assets and liabilities are its cash and investments, its borrowings and its obligations under finance leases (mainly the Tube Lines PPP arrangement). These financial assets and liabilities are taken into account when considering the prudence and affordability of the long term funding plan necessary to support the Group’s operations and capital investment programmes.
Financial risksThe Group faces a number of financial risks. The key ones are:
> Credit risk
> Liquidity risk
> Market risk
Credit riskCredit risk is managed on a Group-wide basis. Credit risk is the risk of financial loss to the Group if a customer or counterparty to a financial instrument fails to meet contractual obligations, and arises from deposits with banks and financial institutions and from the Group’s customers and suppliers. The following categories comprise the maximum credit exposure of the Group.
Trade and other receivablesThe majority of the Group’s trade debtors are individuals who owe amounts relating to the use of transport infrastructure. The Group earns the majority of revenue through prepaid fares, and the receivables relate to penalty charges. The Group makes all reasonable attempts to recover penalty charges before providing against them.
Notes to the Accounts (continued)

Statement of Accounts 147
Other receivables include amounts due under contractual arrangements with suppliers, and include prepayments for work to be performed. These counterparties are assessed individually for their creditworthiness at the time of entering into contract and termination provisions are included to mitigate the Group’s risk.
InvestmentsAll cash balances are invested in accordance with the Treasury Management Code and with regard to the ODPM Guidance, which requires a prudent approach to the investment of surplus funds with priority given to security and liquidity. TfL maintains the investment policy of short-term, high-security specified investments, which must satisfy the conditions set out below:
> The investment is denominated in Sterling and any payments or repayments in respect of the investment are payable in Sterling only
> The investment is not a long-term investment (i.e. has a maturity of less than one year)
> The investment does not involve the acquisition of share or loan capital in any body corporate
> The investment is either:
- made with the UK Government or
- made with a body or in an investment scheme which has been awarded a high (investment grade) credit rating by a credit rating agency
Non-UK Government investments are made only with banks and financial institutions if placed on TfL’s Approved Investment List. In determining whether to place an institution on the Approved Investment List, for 2009/10 the Investment Group made up of senior TfL staff considered the financial position and jurisdiction of the institution, the market pricing of credit default swaps for the institution, any implicit or explicit Government support for the institution and any other relevant factors that could influence the institution’s general creditworthiness.
Deposit limits per institution on the Approved Investment List, and the maximum term of deposits, are linked to a minimum credit rating of the institution (in the range of A+ to AAA) from at least two credit rating agencies (at the time of making the deposit).
In addition, there is a country exposure limit of £200m, so that at any one time the aggregate of all investments in entities in a single country or jurisdiction does not exceed this limit. This applies for all countries except the UK. Following the global credit crisis, new investments were placed only with HM Government’s Debt Management Office and the four main UK clearing banks.
GuaranteesThe Corporation provides guarantees to third parties under Section 160 of the Greater London Authority Act 1999, which are deemed necessary for the fulfilment of its policies. The Group’s policy is to recognise guarantees at fair value initially and amortise this over the life of the guarantee. Where indications are that a payment is likely to occur under a guarantee, this is accounted for as a provision, in accordance with the SORP. Further detail is given in Note 29.
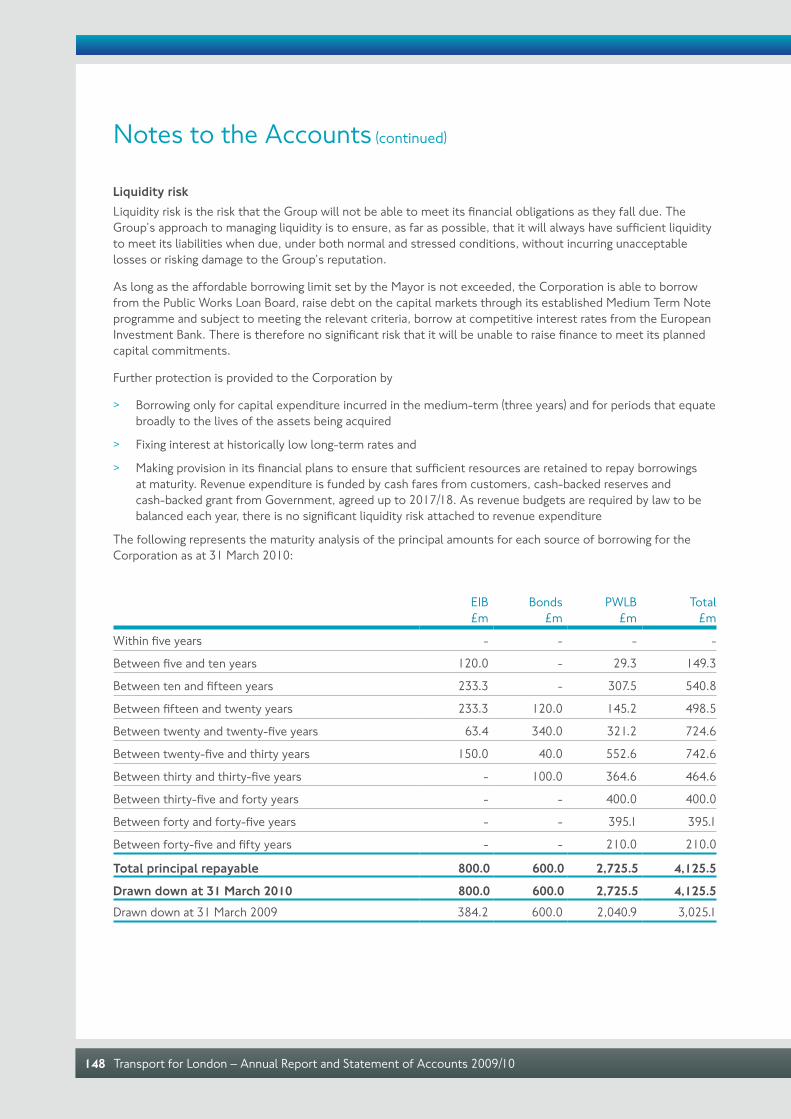
Transport for London – Annual Report and Statement of Accounts 2009/10148
Liquidity riskLiquidity risk is the risk that the Group will not be able to meet its financial obligations as they fall due. The Group’s approach to managing liquidity is to ensure, as far as possible, that it will always have sufficient liquidity to meet its liabilities when due, under both normal and stressed conditions, without incurring unacceptable losses or risking damage to the Group’s reputation.
As long as the affordable borrowing limit set by the Mayor is not exceeded, the Corporation is able to borrow from the Public Works Loan Board, raise debt on the capital markets through its established Medium Term Note programme and subject to meeting the relevant criteria, borrow at competitive interest rates from the European Investment Bank. There is therefore no significant risk that it will be unable to raise finance to meet its planned capital commitments.
Further protection is provided to the Corporation by
> Borrowing only for capital expenditure incurred in the medium-term (three years) and for periods that equate broadly to the lives of the assets being acquired
> Fixing interest at historically low long-term rates and
> Making provision in its financial plans to ensure that sufficient resources are retained to repay borrowings at maturity. Revenue expenditure is funded by cash fares from customers, cash-backed reserves and cash-backed grant from Government, agreed up to 2017/18. As revenue budgets are required by law to be balanced each year, there is no significant liquidity risk attached to revenue expenditure
The following represents the maturity analysis of the principal amounts for each source of borrowing for the Corporation as at 31 March 2010:
EIB£m
Bonds£m
PWLB£m
Total£m
Within five years - - - -
Between five and ten years 120.0 - 29.3 149.3
Between ten and fifteen years 233.3 - 307.5 540.8
Between fifteen and twenty years 233.3 120.0 145.2 498.5
Between twenty and twenty-five years 63.4 340.0 321.2 724.6
Between twenty-five and thirty years 150.0 40.0 552.6 742.6
Between thirty and thirty-five years - 100.0 364.6 464.6
Between thirty-five and forty years - - 400.0 400.0
Between forty and forty-five years - - 395.1 395.1
Between forty-five and fifty years - - 210.0 210.0
Total principal repayable 800.0 600.0 2,725.5 4,125.5
Drawn down at 31 March 2010 800.0 600.0 2,725.5 4,125.5Drawn down at 31 March 2009 384.2 600.0 2,040.9 3,025.1
Notes to the Accounts (continued)

Statement of Accounts 149
The maturity analysis of PFI and other finance lease creditors for the group is as follows:
Group2010
£m
Group 2009
restated*£m
Within one year 389.0 368.7
Between one and five years 1,750.6 1,673.0
Between five and ten years 336.7 320.5
Over ten years 462.7 495.2
Total finance lease creditor payable 2,939.0 2,857.4
* See Statement of Accounting Policies (Note u) Accounting for PFI transactions and similar contracts.
Market riskMarket risk is the risk that changes in market prices, such as foreign exchange rates, interest rates and equity prices will affect the Group’s income or the value of its holdings of financial instruments.
Interest rate riskThe Corporation has to date borrowed at fixed rates of interest. While this protects the Group from adverse increases in interest rates, in a low interest rate environment these rates could potentially be higher than equivalent floating rates.
Because interest rates are currently fixed at historically low levels, the Corporation is not exposed to upward interest rate movements on its current borrowings.
TfL Group Treasury invested surplus cash in short term instruments, typically with terms ranging from overnight to 45 days. As described in this Note (see Credit risk), the Corporation has adopted a very cautious investment strategy for new investments.
Foreign exchange riskThe Group has no financial assets or liabilities denominated in foreign currencies and thus has no translation exposure to gains or losses arising from movements in exchange rates. For 2009/10, the policy on managing transactional foreign exchange risk related to contractual obligations with overseas providers was to pass the exchange risk to the vendor.
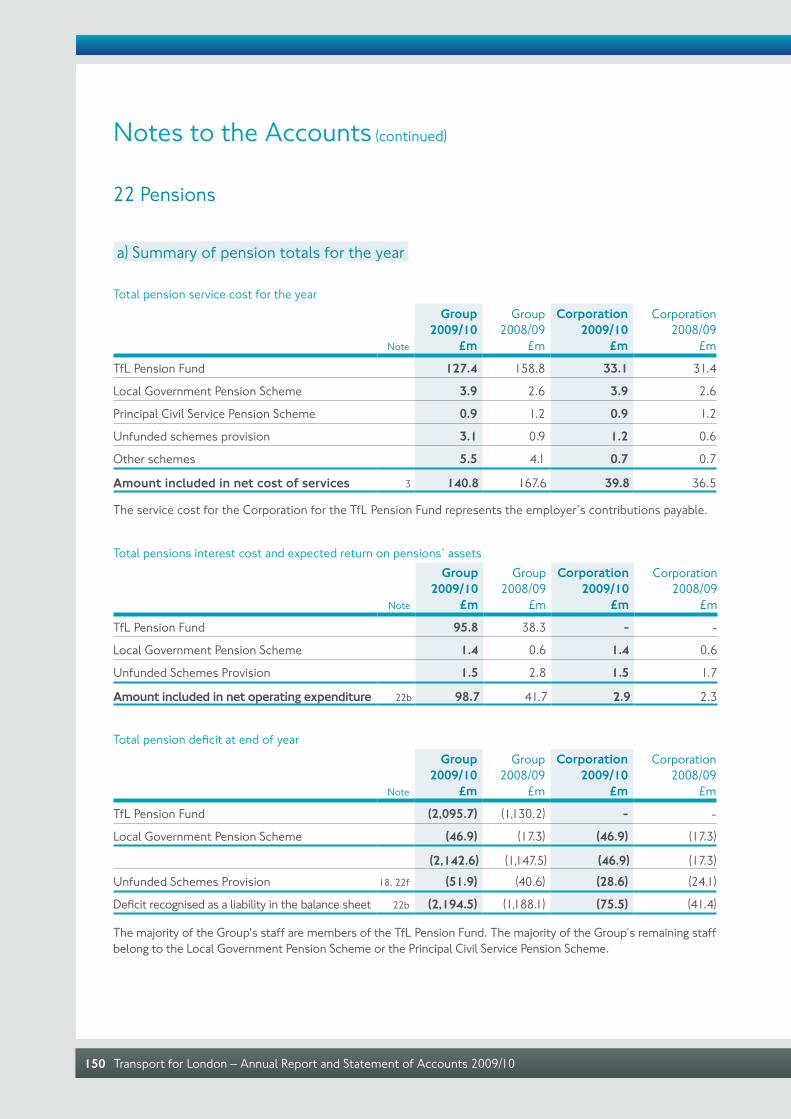
Transport for London – Annual Report and Statement of Accounts 2009/10150
22 Pensions
a) Summary of pension totals for the year
Total pension service cost for the year
Note
Group2009/10
£m
Group2008/09
£m
Corporation2009/10
£m
Corporation2008/09
£m
TfL Pension Fund 127.4 158.8 33.1 31.4
Local Government Pension Scheme 3.9 2.6 3.9 2.6
Principal Civil Service Pension Scheme 0.9 1.2 0.9 1.2
Unfunded schemes provision 3.1 0.9 1.2 0.6
Other schemes 5.5 4.1 0.7 0.7
Amount included in net cost of services 3 140.8 167.6 39.8 36.5
The service cost for the Corporation for the TfL Pension Fund represents the employer’s contributions payable.
Total pensions interest cost and expected return on pensions’ assets
Note
Group2009/10
£m
Group2008/09
£m
Corporation2009/10
£m
Corporation2008/09
£m
TfL Pension Fund 95.8 38.3 - -
Local Government Pension Scheme 1.4 0.6 1.4 0.6
Unfunded Schemes Provision 1.5 2.8 1.5 1.7
Amount included in net operating expenditure 22b 98.7 41.7 2.9 2.3
Total pension deficit at end of year
Note
Group2009/10
£m
Group2008/09
£m
Corporation2009/10
£m
Corporation2008/09
£m
TfL Pension Fund (2,095.7) (1,130.2) - -
Local Government Pension Scheme (46.9) (17.3) (46.9) (17.3)
(2,142.6) (1,147.5) (46.9) (17.3)Unfunded Schemes Provision 18, 22f (51.9) (40.6) (28.6) (24.1)
Deficit recognised as a liability in the balance sheet 22b (2,194.5) (1,188.1) (75.5) (41.4)
The majority of the Group's staff are members of the TfL Pension Fund. The majority of the Group’s remaining staff belong to the Local Government Pension Scheme or the Principal Civil Service Pension Scheme.
Notes to the Accounts (continued)
Statement of Accounts 151
b) TfL Pension SchemesThis section deals with those pension funds to which the Group contributions are accounted for under FRS 17 as defined benefit schemes.
TfL Pension FundThe TfL Pension Fund, to which the Group contributes, is a final salary scheme established under trust. The Fund’s Trustee is the TfL Trustee Company Limited, a wholly owned subsidiary of TfL. Under the rules of the Fund, its 18 Trustee Directors are nominated in equal numbers by TfL and on behalf of the Fund's membership.
Every three years, the TfL Pension Fund’s actuary makes valuations and recommends the level of contributions to be made by the participating employers to ensure the long-term solvency of the Fund. The latest valuation of the Fund was carried out as at 31 March 2009 by the Actuary, a partner of consulting actuaries, Tower Watson (formerly Watson Wyatt), using the projected unit method.
A revised Schedule of Contributions was agreed between the Trustee and the employers following the formal funding valuation of the TfL Pension Fund.
For the Public Sector Section, employers’ contributions for the period 1 September 2007 to 31 March 2010 were 31.0 per cent, and contributions from 1 April 2010 until 31 March 2020 will continue to be 31.0 per cent with additional lump sum payments due in 2018, 2019 and 2020. The recovery plan states that the expectation is that the funding shortfall will be eliminated by 31 March 2020.
The Corporation and the Group both account for pension costs in accordance with FRS 17. The underlying assets and liabilities of the Public Sector Section cover a number of Group entities and cannot be readily split between each undertaking on a consistent and reliable basis. Thus, in accordance with the standard, the Corporation treats contributions to the Public Sector Section as if they were contributions to a defined contribution plan. The pension cost recognised in the Corporation's accounts for the Public Sector Section is the amount of contributions payable to the scheme during the year. The BCV and SSL Sections transferred to the Public Sector Section on 30 March 2010. As these sections only cover individuals employed by London Underground, they were accounted for as defined benefit schemes in the accounts of London Underground and in the Group accounts.
A valuation of the TfL Pension Fund has been prepared for accounting purposes on an FRS 17 basis as at 31 March 2010. The assumptions used by the actuary are the best estimates chosen from a range of possible actuarial assumptions, whilst the present value of the scheme’s liabilities is derived from cash flow projections. Due to the timescale covered, neither the assumptions nor the cash flow projections may necessarily be borne out in practice.
The liabilities for the TfL Pension Fund have been calculated using the mortality assumptions adopted for the latest funding valuation as at 31 March 2009. Standard mortality tables were used, adjusted to reflect the recent mortality experience of the Fund's pensioners at that date. An allowance was made for future mortality improvements in line with the medium cohort projections.
Local Government Pension SchemeThe Local Government Pension Scheme is a funded multi-employer defined benefit scheme. The Corporation is able to identify its share of the assets and liabilities of the scheme and this scheme has therefore been accounted for as a defined benefit scheme under FRS 17. Employer’s contributions were payable at the rate of 15.8 per cent (2008/09 15.8 per cent) of pensionable pay. The Corporation's share of the underlying assets and liabilities resulted in a deficit of £46.9m (2008/09 £17.3m). A full actuarial valuation was carried out at 31 March 2007 with the next one due as at 31 March 2010. The annual report and accounts for the whole scheme can be found on the London Pensions Fund Authority website (www.lpfa.org.uk).
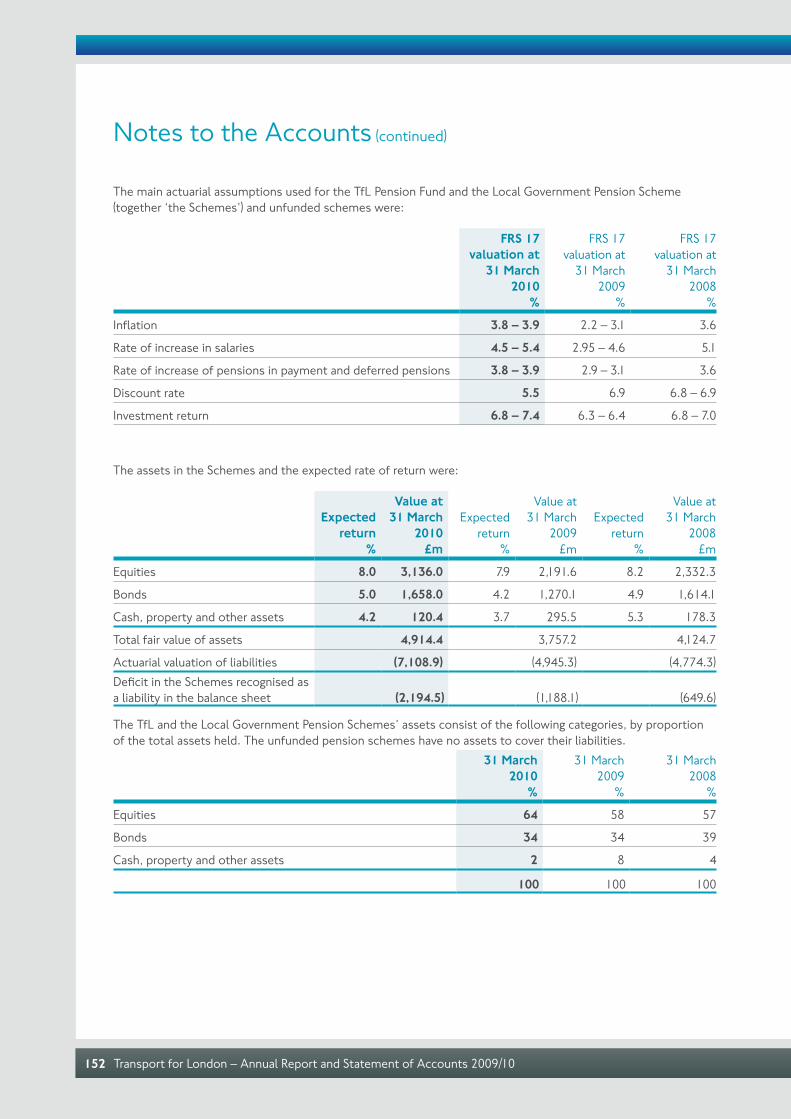
Transport for London – Annual Report and Statement of Accounts 2009/10152
The main actuarial assumptions used for the TfL Pension Fund and the Local Government Pension Scheme (together ‘the Schemes’) and unfunded schemes were:
FRS 17valuation at
31 March 2010
%
FRS 17valuation at
31 March 2009
%
FRS 17 valuation at
31 March 2008
%
Inflation 3.8 – 3.9 2.2 – 3.1 3.6
Rate of increase in salaries 4.5 – 5.4 2.95 – 4.6 5.1
Rate of increase of pensions in payment and deferred pensions 3.8 – 3.9 2.9 – 3.1 3.6
Discount rate 5.5 6.9 6.8 – 6.9
Investment return 6.8 – 7.4 6.3 – 6.4 6.8 – 7.0
The assets in the Schemes and the expected rate of return were:
Expectedreturn
%
Value at31 March
2010£m
Expectedreturn
%
Value at31 March
2009£m
Expectedreturn
%
Value at31 March
2008£m
Equities 8.0 3,136.0 7.9 2,191.6 8.2 2,332.3
Bonds 5.0 1,658.0 4.2 1,270.1 4.9 1,614.1
Cash, property and other assets 4.2 120.4 3.7 295.5 5.3 178.3
Total fair value of assets 4,914.4 3,757.2 4,124.7
Actuarial valuation of liabilities (7,108.9) (4,945.3) (4,774.3)Deficit in the Schemes recognised as a liability in the balance sheet (2,194.5) (1,188.1) (649.6)
The TfL and the Local Government Pension Schemes’ assets consist of the following categories, by proportion of the total assets held. The unfunded pension schemes have no assets to cover their liabilities.
31 March 2010
%
31 March 2009
%
31 March 2008
%
Equities 64 58 57
Bonds 34 34 39
Cash, property and other assets 2 8 4
100 100 100
Notes to the Accounts (continued)

Statement of Accounts 153
Income and Expenditure Account
Group2009/10
£m
Group 2008/09
£m
Corporation 2009/10
£m
Corporation 2008/09
£m
Analysis of amounts charged to net cost of servicesCurrent service cost 131.4 158.3 2.1 1.7
Past service cost 0.4 3.7 0.4 1.2
Curtailment and settlements 2.6 0.2 2.6 0.2
Total charged to net costs of services 134.4 162.2 5.1 3.1
Analysis of pensions interest cost and expected return on assetsInterest on Schemes’ liabilities 339.8 348.7 5.2 5.6
Expected return on Schemes’ assets (241.1) (307.0) (2.3) (3.3)
Total charged to net operating expenditure 98.7 41.7 2.9 2.3
Total amount included in operating expenditure in Income and Expenditure Account 233.1 203.9 8.0 5.4
Contribution to pension reserve (103.0) 10.0 1.6 (1.5)
Amount to be met from government grant 130.1 213.9 9.6 3.9
Group2009/10
£m
Group 2008/09
£m
Corporation2009/10
£m
Corporation 2008/09
£m
Analysis of amounts recognised in the Statement of Total Recognised Gains and Losses (STRGL)
Actuarial loss recognised in STRGL during the year 1,001.9 530.5 31.2 5.7
Cumulative loss recognised in STRGL at end of the year 1,803.7 801.8 48.1 16.9
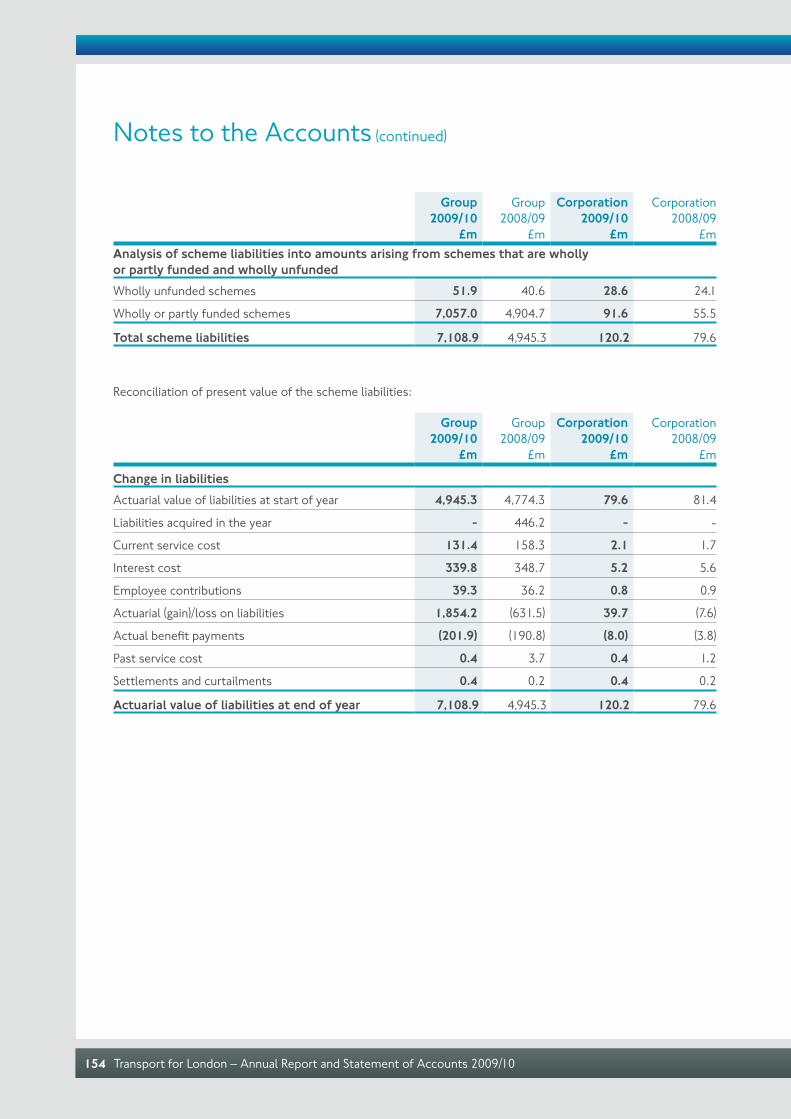
Transport for London – Annual Report and Statement of Accounts 2009/10154
Group2009/10
£m
Group 2008/09
£m
Corporation2009/10
£m
Corporation 2008/09
£mAnalysis of scheme liabilities into amounts arising from schemes that are wholly or partly funded and wholly unfundedWholly unfunded schemes 51.9 40.6 28.6 24.1
Wholly or partly funded schemes 7,057.0 4,904.7 91.6 55.5
Total scheme liabilities 7,108.9 4,945.3 120.2 79.6
Reconciliation of present value of the scheme liabilities:
Group2009/10
£m
Group 2008/09
£m
Corporation2009/10
£m
Corporation 2008/09
£m
Change in liabilitiesActuarial value of liabilities at start of year 4,945.3 4,774.3 79.6 81.4
Liabilities acquired in the year - 446.2 - -
Current service cost 131.4 158.3 2.1 1.7
Interest cost 339.8 348.7 5.2 5.6
Employee contributions 39.3 36.2 0.8 0.9
Actuarial (gain)/loss on liabilities 1,854.2 (631.5) 39.7 (7.6)
Actual benefit payments (201.9) (190.8) (8.0) (3.8)
Past service cost 0.4 3.7 0.4 1.2
Settlements and curtailments 0.4 0.2 0.4 0.2
Actuarial value of liabilities at end of year 7,108.9 4,945.3 120.2 79.6
Notes to the Accounts (continued)
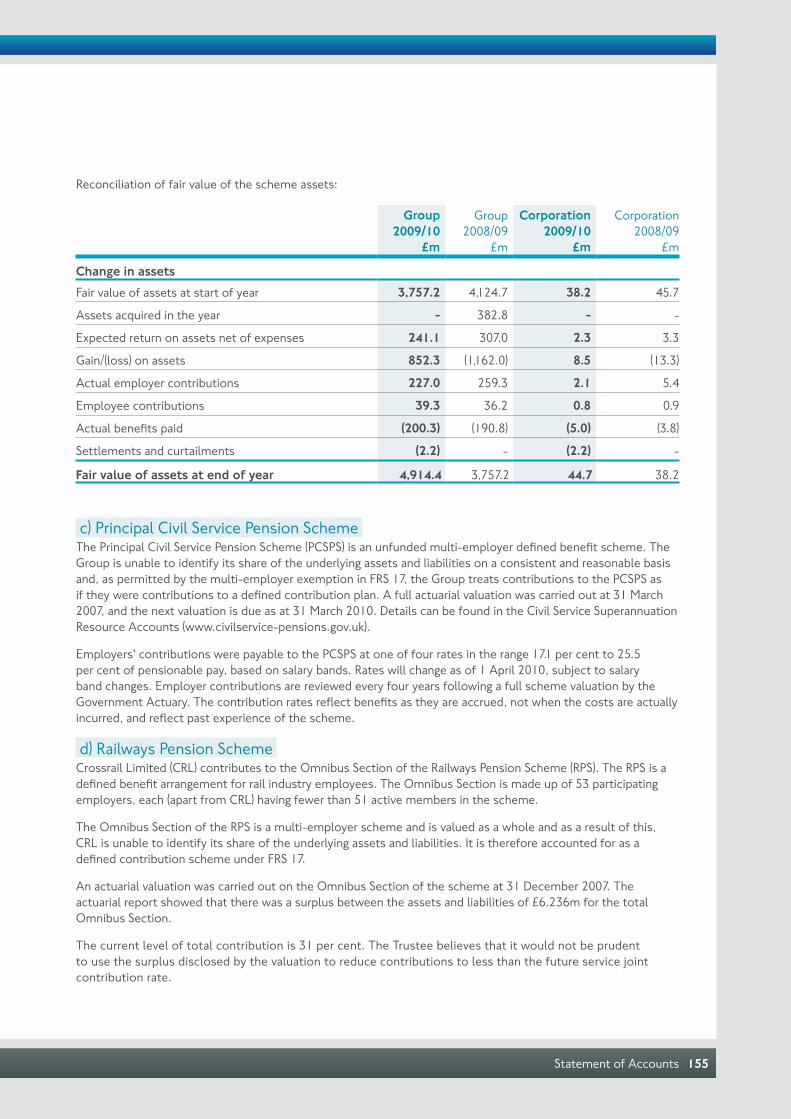
Statement of Accounts 155
Reconciliation of fair value of the scheme assets:
Group2009/10
£m
Group 2008/09
£m
Corporation2009/10
£m
Corporation 2008/09
£m
Change in assetsFair value of assets at start of year 3,757.2 4,124.7 38.2 45.7
Assets acquired in the year - 382.8 - -
Expected return on assets net of expenses 241.1 307.0 2.3 3.3
Gain/(loss) on assets 852.3 (1,162.0) 8.5 (13.3)
Actual employer contributions 227.0 259.3 2.1 5.4
Employee contributions 39.3 36.2 0.8 0.9
Actual benefits paid (200.3) (190.8) (5.0) (3.8)
Settlements and curtailments (2.2) - (2.2) -
Fair value of assets at end of year 4,914.4 3,757.2 44.7 38.2
c) Principal Civil Service Pension SchemeThe Principal Civil Service Pension Scheme (PCSPS) is an unfunded multi-employer defined benefit scheme. The Group is unable to identify its share of the underlying assets and liabilities on a consistent and reasonable basis and, as permitted by the multi-employer exemption in FRS 17, the Group treats contributions to the PCSPS as if they were contributions to a defined contribution plan. A full actuarial valuation was carried out at 31 March 2007, and the next valuation is due as at 31 March 2010. Details can be found in the Civil Service Superannuation Resource Accounts (www.civilservice-pensions.gov.uk).
Employers' contributions were payable to the PCSPS at one of four rates in the range 17.1 per cent to 25.5 per cent of pensionable pay, based on salary bands. Rates will change as of 1 April 2010, subject to salary band changes. Employer contributions are reviewed every four years following a full scheme valuation by the Government Actuary. The contribution rates reflect benefits as they are accrued, not when the costs are actually incurred, and reflect past experience of the scheme.
d) Railways Pension SchemeCrossrail Limited (CRL) contributes to the Omnibus Section of the Railways Pension Scheme (RPS). The RPS is a defined benefit arrangement for rail industry employees. The Omnibus Section is made up of 53 participating employers, each (apart from CRL) having fewer than 51 active members in the scheme.
The Omnibus Section of the RPS is a multi-employer scheme and is valued as a whole and as a result of this, CRL is unable to identify its share of the underlying assets and liabilities. It is therefore accounted for as a defined contribution scheme under FRS 17.
An actuarial valuation was carried out on the Omnibus Section of the scheme at 31 December 2007. The actuarial report showed that there was a surplus between the assets and liabilities of £6.236m for the total Omnibus Section.
The current level of total contribution is 31 per cent. The Trustee believes that it would not be prudent to use the surplus disclosed by the valuation to reduce contributions to less than the future service joint contribution rate.
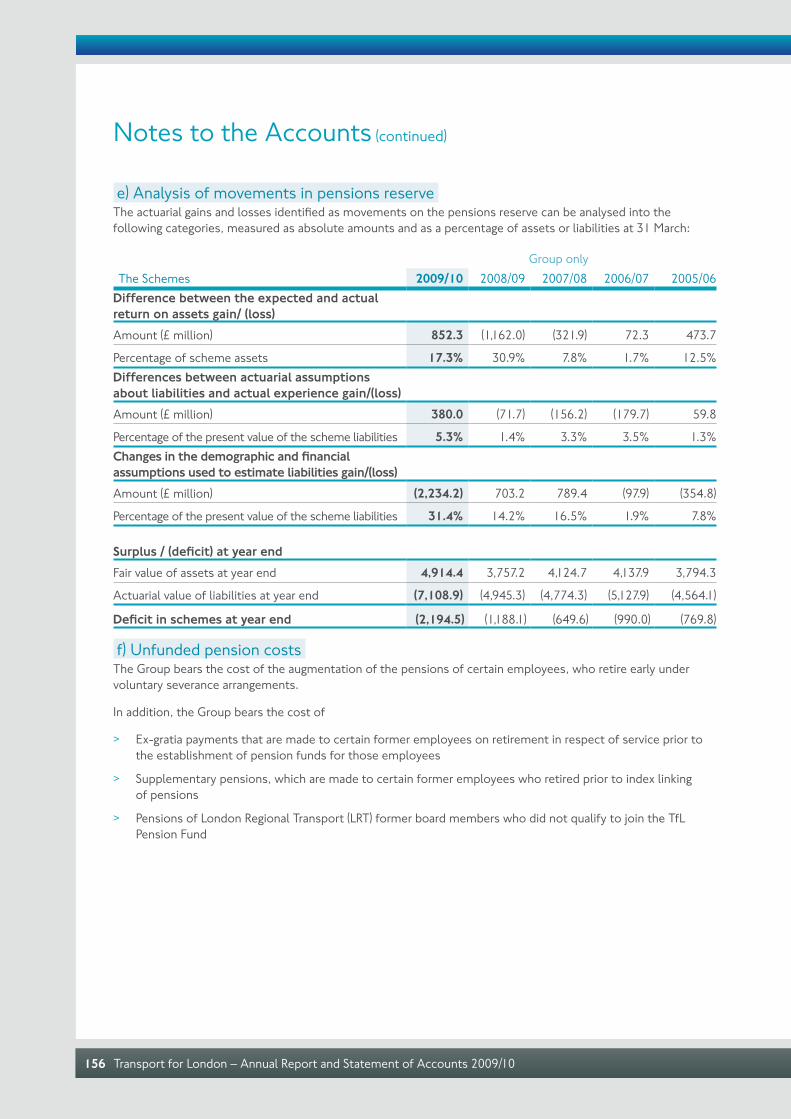
Transport for London – Annual Report and Statement of Accounts 2009/10156
e) Analysis of movements in pensions reserveThe actuarial gains and losses identified as movements on the pensions reserve can be analysed into the following categories, measured as absolute amounts and as a percentage of assets or liabilities at 31 March:
Group onlyThe Schemes 2009/10 2008/09 2007/08 2006/07 2005/06
Difference between the expected and actual return on assets gain/ (loss)Amount (£ million) 852.3 (1,162.0) (321.9) 72.3 473.7
Percentage of scheme assets 17.3% 30.9% 7.8% 1.7% 12.5%Differences between actuarial assumptions about liabilities and actual experience gain/(loss)Amount (£ million) 380.0 (71.7) (156.2) (179.7) 59.8
Percentage of the present value of the scheme liabilities 5.3% 1.4% 3.3% 3.5% 1.3%Changes in the demographic and financial assumptions used to estimate liabilities gain/(loss)Amount (£ million) (2,234.2) 703.2 789.4 (97.9) (354.8)
Percentage of the present value of the scheme liabilities 31.4% 14.2% 16.5% 1.9% 7.8%
Surplus / (deficit) at year endFair value of assets at year end 4,914.4 3,757.2 4,124.7 4,137.9 3,794.3
Actuarial value of liabilities at year end (7,108.9) (4,945.3) (4,774.3) (5,127.9) (4,564.1)
Deficit in schemes at year end (2,194.5) (1,188.1) (649.6) (990.0) (769.8)
f) Unfunded pension costsThe Group bears the cost of the augmentation of the pensions of certain employees, who retire early under voluntary severance arrangements.
In addition, the Group bears the cost of
> Ex-gratia payments that are made to certain former employees on retirement in respect of service prior to the establishment of pension funds for those employees
> Supplementary pensions, which are made to certain former employees who retired prior to index linking of pensions
> Pensions of London Regional Transport (LRT) former board members who did not qualify to join the TfL Pension Fund
Notes to the Accounts (continued)

Statement of Accounts 157
Punter Southall, consulting actuaries, were instructed to report on the financial position of the unfunded pension liabilities as at 31 March 2010 for the purpose of FRS17 only. The report does not constitute a formal actuarial valuation of the unfunded pension liabilities. The valuation as at 31 March 2010 was £51.9m (2009 £40.6m) and is fully provided for in these accounts.
23 Movements in reservesThis statement shows the movements on the Group and Corporation’s reserves. It distinguishes between movements resulting from the gains and losses for the year and movements resulting from transfers between reserves, most of which the Corporation is required to make in accordance with statute or non-statutory proper practice.
Group
Balance at 1 April 2009
restated*£m
Gains/(losses) for
the year£m
TransfersBetweenreserves
£m
Balance at31 March
2010£m
General fund* 166.3 (421.9) 409.4 153.8
Earmarked reserves 1,141.7 - (263.7) 878.0
Capital adjustment account* 1,369.0 - (107.5) 1,261.5
Fixed asset revaluation reserve 1,654.5 32.8 (126.4) 1,560.9
Group profit and loss reserve* 944.4 (782.7) 191.2 352.9
Capital reserves in subsidiaries 5.8 - - 5.8
Group pensions reserve (1,037.7) (1,001.9) (103.0) (2,142.6)
Merger reserve 466.1 - - 466.1
Other reserves 82.6 - - 82.6
4,792.7 (2,173.7) - 2,619.0
Corporation
Balance at I April 2009
restated*£m
Gains/(losses) for
the year£m
TransfersBetweenreserves
£m
Balance at31 March
2010£m
General fund* 166.3 (421.9) 409.4 153.8
Earmarked reserves 1,141.7 - (263.7) 878.0
Capital adjustment account* 1,369.0 - (107.5) 1,261.5
Fixed asset revaluation reserve 54.5 1.6 (39.8) 16.3
Pensions reserve in Corporation (17.3) (31.2) 1.6 (46.9)
Other Corporation reserves (26.9) - - (26.9)
2,687.3 (451.5) - 2,235.8
* See Statement of Accounting Policies (Note U) Accounting for PFI transactions and similiar contracts
Earmarked reserves have been established to finance future capital projects, consistent with TfL’s approved Business Plan, and also to cover contingencies. In addition, reserves have been set aside to finance certain capital projects, which were not included in the approved Business Plan but have been committed to by the Board, where it is considered appropriate to fund such projects from reserves.

Transport for London – Annual Report and Statement of Accounts 2009/10158
The pensions reserve represents pension and other post retirement liabilities as shown on the Balance Sheet excluding those reflected on the Balance Sheets of the subsidiary companies. The merger reserve of £466.1m arose as a result of the transfer of the net assets of LRT, including the share capital of London Underground Limited, to TfL in 2003. It represents the share capital of LU and was taken as a credit to reserves as no consideration was given by TfL in respect of the transfer.
The capital reserves in subsidiaries are distributable reserves in respect of net profits and losses transferred to provide for future capital investment. Other reserves relate to the transfer of the net assets of LRT and LU to the TfL group in 2003.
The General Fund at 31 March 2009 was restated for the prior year adjustment arising from the change in accounting policy as set out in accounting policy note b).
24 Reconciliation of the surplus for the year on the Income and Expenditure Account to the surplus for the year on the General Fund
The surplus for the year on the General Fund was £409.4m higher than (2008/09 £523.5m higher) the Income and Expenditure Account result for the Corporation. This is explained as follows:
The Income and Expenditure Account discloses the income received and expenditure incurred in operating the Corporation’s services for the year and is equivalent to the profit and loss account of a business. Income and expenditure and the resulting surplus or deficit for the year is measured in accordance with the SORP which is essentially the same as UK GAAP.
There are, however, certain items which the Corporation is required to charge or credit to its General Fund when determining the balance on that Fund which are laid down in statute and non-statutory ‘proper practices’ rather than being UK GAAP based. An example of this is that depreciation of fixed assets is charged to the Income and Expenditure Account in accordance with UK GAAP but then excluded from the General Fund in accordance with statute.
The surplus or deficit on the Income and Expenditure Account is the best measure of the Corporation and Group’s operating financial performance for the year. However, the surplus or deficit on the General Fund is also important since it indicates whether the Corporation added to or drew on its General Fund balances during the year. This in turn affects the amount of General Fund balance that the Corporation can take into account when determining its spending plans for the following year.
The table below gives a detailed breakdown of the differences between the income and expenditure included in the Corporation’s Income and Expenditure Account in accordance with the SORP, and the amounts that statute and non-statutory proper practice required the Corporation to charge and credit to the General Fund Balance.
Notes to the Accounts (continued)
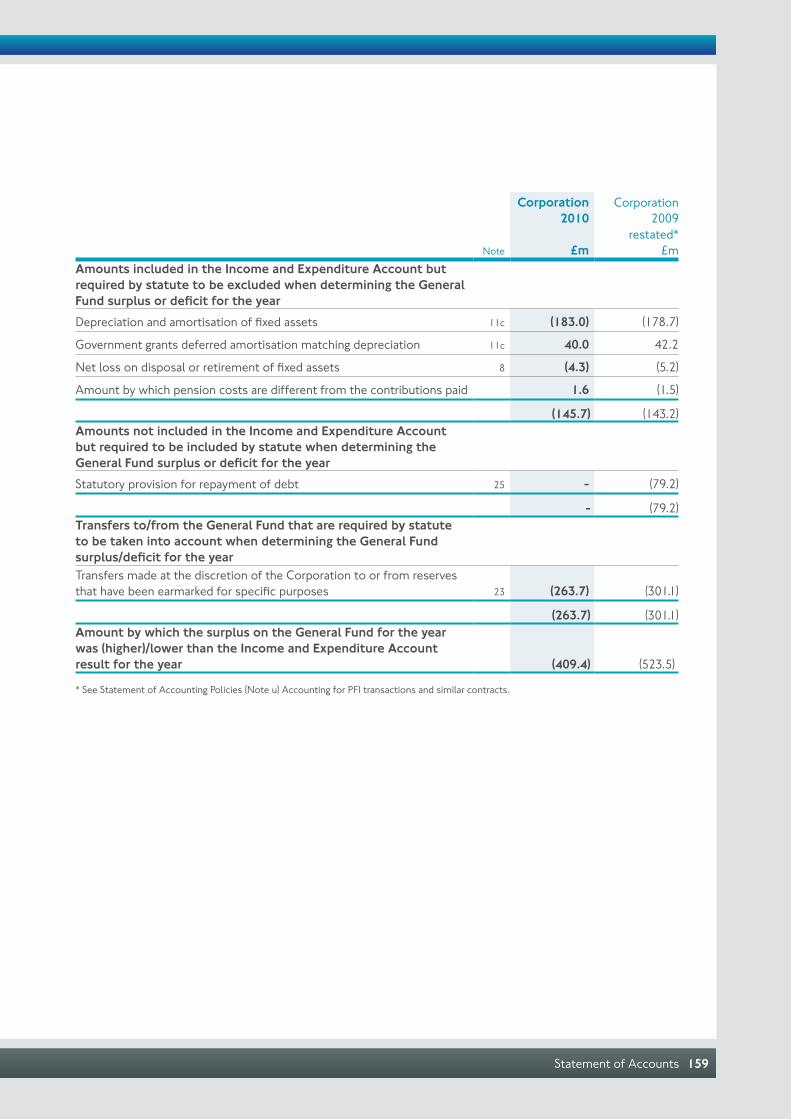
Statement of Accounts 159
Note
Corporation2010
£m
Corporation2009
restated*£m
Amounts included in the Income and Expenditure Account but required by statute to be excluded when determining the General Fund surplus or deficit for the yearDepreciation and amortisation of fixed assets 11c (183.0) (178.7)
Government grants deferred amortisation matching depreciation 11c 40.0 42.2
Net loss on disposal or retirement of fixed assets 8 (4.3) (5.2)
Amount by which pension costs are different from the contributions paid 1.6 (1.5)
(145.7) (143.2)Amounts not included in the Income and Expenditure Account but required to be included by statute when determining the General Fund surplus or deficit for the yearStatutory provision for repayment of debt 25 - (79.2)
- (79.2)Transfers to/from the General Fund that are required by statute to be taken into account when determining the General Fund surplus/deficit for the year Transfers made at the discretion of the Corporation to or from reserves that have been earmarked for specific purposes 23 (263.7) (301.1)
(263.7) (301.1)Amount by which the surplus on the General Fund for the year was (higher)/lower than the Income and Expenditure Account result for the year (409.4) (523.5)
* See Statement of Accounting Policies (Note u) Accounting for PFI transactions and similar contracts.
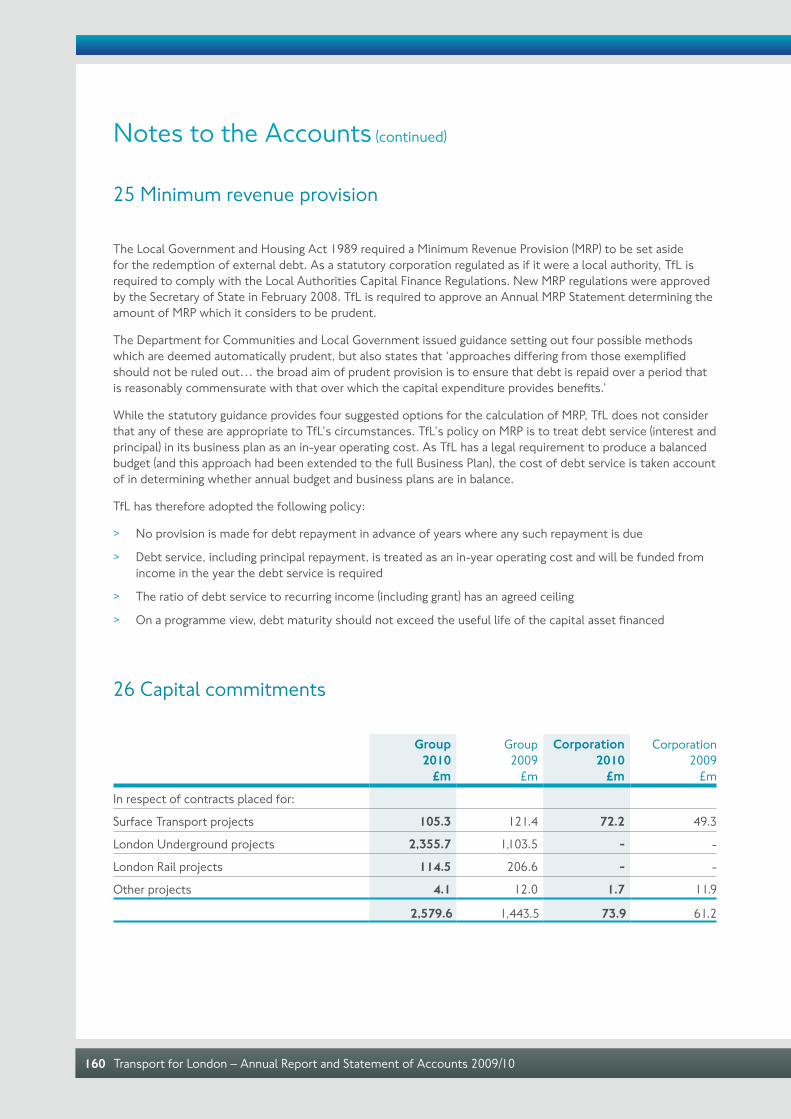
Transport for London – Annual Report and Statement of Accounts 2009/10160
25 Minimum revenue provision
The Local Government and Housing Act 1989 required a Minimum Revenue Provision (MRP) to be set aside for the redemption of external debt. As a statutory corporation regulated as if it were a local authority, TfL is required to comply with the Local Authorities Capital Finance Regulations. New MRP regulations were approved by the Secretary of State in February 2008. TfL is required to approve an Annual MRP Statement determining the amount of MRP which it considers to be prudent.
The Department for Communities and Local Government issued guidance setting out four possible methods which are deemed automatically prudent, but also states that ‘approaches differing from those exemplified should not be ruled out… the broad aim of prudent provision is to ensure that debt is repaid over a period that is reasonably commensurate with that over which the capital expenditure provides benefits.’
While the statutory guidance provides four suggested options for the calculation of MRP, TfL does not consider that any of these are appropriate to TfL’s circumstances. TfL’s policy on MRP is to treat debt service (interest and principal) in its business plan as an in-year operating cost. As TfL has a legal requirement to produce a balanced budget (and this approach had been extended to the full Business Plan), the cost of debt service is taken account of in determining whether annual budget and business plans are in balance.
TfL has therefore adopted the following policy:
> No provision is made for debt repayment in advance of years where any such repayment is due
> Debt service, including principal repayment, is treated as an in-year operating cost and will be funded from income in the year the debt service is required
> The ratio of debt service to recurring income (including grant) has an agreed ceiling
> On a programme view, debt maturity should not exceed the useful life of the capital asset financed
26 Capital commitments
Group2010
£m
Group2009
£m
Corporation2010
£m
Corporation2009
£m
In respect of contracts placed for:
Surface Transport projects 105.3 121.4 72.2 49.3
London Underground projects 2,355.7 1,103.5 - -
London Rail projects 114.5 206.6 - -
Other projects 4.1 12.0 1.7 11.9
2,579.6 1,443.5 73.9 61.2
Notes to the Accounts (continued)

Statement of Accounts 161
27 Financial commitments
a) Operating leasesAs at 31 March, the Group and the Corporation were committed to making the following payments during the next year in respect of operating leases:
Group2010
£m
Group2009
restated*£m
Corporation2010
£m
Corporation2009
restated*£m
Property leases which expire:
Within one year 4.6 1.7 - -
Between one and five years 11.3 16.4 0.2 -
Thereafter 38.8 32.6 6.6 -
54.7 50.7 6.8 -Other leases which expire:
Within one year 4.2 0.6 - 0.1
Between one and five years 9.4 9.0 0.2 0.3
Thereafter 18.3 4.6 - -
31.9 14.2 0.2 0.4
* A number of PFI agreements previously accounted for as operating leases are now accounted for as finance leases, following the change of accounting policy described in accounting policy note b). Prior year comparatives have been restated accordingly.
b) PPPLondon Underground has entered into three PPP contracts for the maintenance, enhancement and replacement of its operational assets, although following the failure of the two Metronet Infracos, two contracts are now intra-group. The contracts are for 30 years and are re-negotiable every 7.5 years. The amount payable to the PPP contractors is dependent upon their performance. The capital element of the contracts over the 30 year period is estimated to be between £15bn and £20bn.
c) ContingenciesThere are a number of uncertainties surrounding projects, including claims in the course of negotiations, which may affect the financial outcome. Where claims are possible but not probable, or unquantifiable, such claims are treated as contingent liabilities. Contingent liabilities are not recognised in the Statement of Accounts, but are monitored to ensure that, where a possible obligation has become probable or a transfer of economic benefits has become probable, a provision is made. The financial statements include provisions based on management's best estimate of the outcome of these uncertainties (see Note 18).
While any disputes are ongoing TfL does not disclose the quantum or timing of any possible settlement as this could prejudice its commercial position.

Transport for London – Annual Report and Statement of Accounts 2009/10162
28 Related partiesTransport for London is required by the Accounting Code of Practice (ACOP) and FRS 8 Related Party Disclosures to disclose all material related party transactions.
A related party is one which has direct or indirect control over the organisation, or influence over the financial and operational policies of the organisation. It follows that those persons who have control or influence over the organisation or policies of the Corporation may be involved in related party transactions where they also have control or influence over the organisation which has dealings with the Corporation. A related party transaction can also arise between parties subject to influence or control from the same external source. The related parties to the Corporation are:
> Its Board Members, Chief Officers and Commissioner > Central Government > Greater London Authority (GLA) and other functional bodies > Partnerships and associated companies > The TfL Pension Fund
Disclosure of these transactions allows readers to assess the extent to which the Corporation might have been constrained in its ability to operate independently or might have secured the ability to limit another party’s ability to bargain freely with it.
Most of the transactions between these parties are reported elsewhere in the Statement of Accounts. The Accounts of the TfL Pension Fund are prepared separately and are subject to a separate audit opinion.
Board Members, Chief Officers and the Commissioner are required to complete a declaration regarding any related party transactions.
Central Government is responsible for providing the statutory framework within which the Corporation operates and provides the majority of its funding in the form of Transport Grant. Transport Grant is paid by the Department for Transport to the Greater London Authority, which in turn pays the grant to the Corporation. Details of Transport Grant are disclosed in the Corporation and Group Income and Expenditure Accounts and Cash Flow Statements and are therefore not included in this note.
During 2009/10 there were no other material related party transactions except as disclosed below.
Total income during the year
£m
Total expenditure during the year
£m
Outstanding balance at 31
March 2010£m
Greater London Authority (GLA) 1.8 2.8 1.1
Metropolitan Police Authority (MPA) 0.3 94.2 (7.7)
London Development Agency (LDA) 3.0 0.2 (0.3)
29 Guarantees Section 160 of the Greater London Authority Act 1999 sets out the conditions under which TfL may give certain guarantees, indemnities or similar arrangements.
TfL and its subsidiaries have entered into a joint and several guarantee in favour of HSBC Bank plc as security for any bank indebtedness outstanding from time to time. TfL gave the guarantee under section 160(1) of the Greater London Authority Act 1999.
Notes to the Accounts (continued)

Statement of Accounts 163
TfL has given guarantees in respect of some of its subsidiary companies’ contracts. The amount that could be payable by TfL under the guarantees (as described below) varies depending on a number of factors, including, inter alia, responsibility for termination of the underlying contract, when termination occurs during the life of the contract, breakage cost and other contractual costs which are not known before the event. For information only, the approximate maximum amounts of debt that were envisaged to be drawn by the counterparty at the signing of the agreements are disclosed. For the avoidance of doubt, these amounts may not represent the amounts that could be payable by TfL under the guarantees but are shown here to give an indication of the relative size of each contract.
Approximate maximum amount of debt available for drawdown under the relevant debt facilities as part of the:
£m
Agreement with Tube Lines 1,803
Agreement with CityLink 502
Agreement with Canary Wharf Properties (Crossrail) Limited 500
Agreement with QW Rail Leasing Ltd 290
Agreement with WARE 218
Agreement with TranSys 197
Agreement with PADCo and EDF Energy Powerlink Ltd 168
Agreement with CARE 164
Agreement with Pittville Leasing Limited 51
Agreement with APSLL 4
While the guarantee in relation to the PPP Contract of Tube Lines noted above is the most significant guarantee issued on behalf of LU, it should also be noted that TfL guarantees LU termination obligations under a further two contracts relating to the Northern Line Train Service Contracts and the Jubilee Line Agreement. Unlike the agreements listed above, the contracts are not based on an initial amount of debt and so cannot be quantified in a similar manner.
No arrangements were entered into with another person under which that person gives a guarantee which TfL has power to give under section 160 (4) and no indemnities associated with the guarantees were given by virtue of section 160 (5) of the Greater London Authority Act 1999.
30 Events after the balance sheet dateOn 7 May 2010 an agreement was finalised that paved the way for Tube Lines to become a wholly owned subsidiary of Transport Trading Limited, which is itself a wholly owned subsidiary of Transport for London. The acquisition was completed on 27 June 2010, and changes the nature of the relationship between the Group and Tube Lines. The impact of this will be determined and agreed over the coming months.
The acquisition will be reflected in the Group’s accounts for the year ending 31 March 2011.

Transport for London – Annual Report and Statement of Accounts 2009/10164

165Chief Officers
Chief Officers(as at 31 March 2010)
Peter Hendy CBECommissioner
David BrownManaging Director Surface Transport
Howard CarterGeneral Counsel
Mike BrownManaging Director London Underground
Vernon EverittManaging Director Group Marketing and Communications
Steve AllenManaging Director Finance
Ian BrownManaging Director London Rail
Michèle DixManaging Director Planning
Chief Officer changes Richard Parry was appointed Interim Managing Director London Underground from 1 May 2009 to 21 March 2010. Mike Brown was appointed Managing Director London Underground on 22. March 2010.Malcolm Murray-Clark retired with effect from 30 June 2009.

Transport for London – Annual Report and Statement of Accounts 2009/10166
Members of TfL(as at 31 March 2010)
Boris JohnsonChairman
Peter Anderson
Charles Belcher
Judith Hunt OBE
Baroness Tanni Grey-Thompson
Daniel MoylanDeputy Chairman
Claudia Arney
Christopher Garnett
Eva Lindholm
Sir Mike Hodgkinson
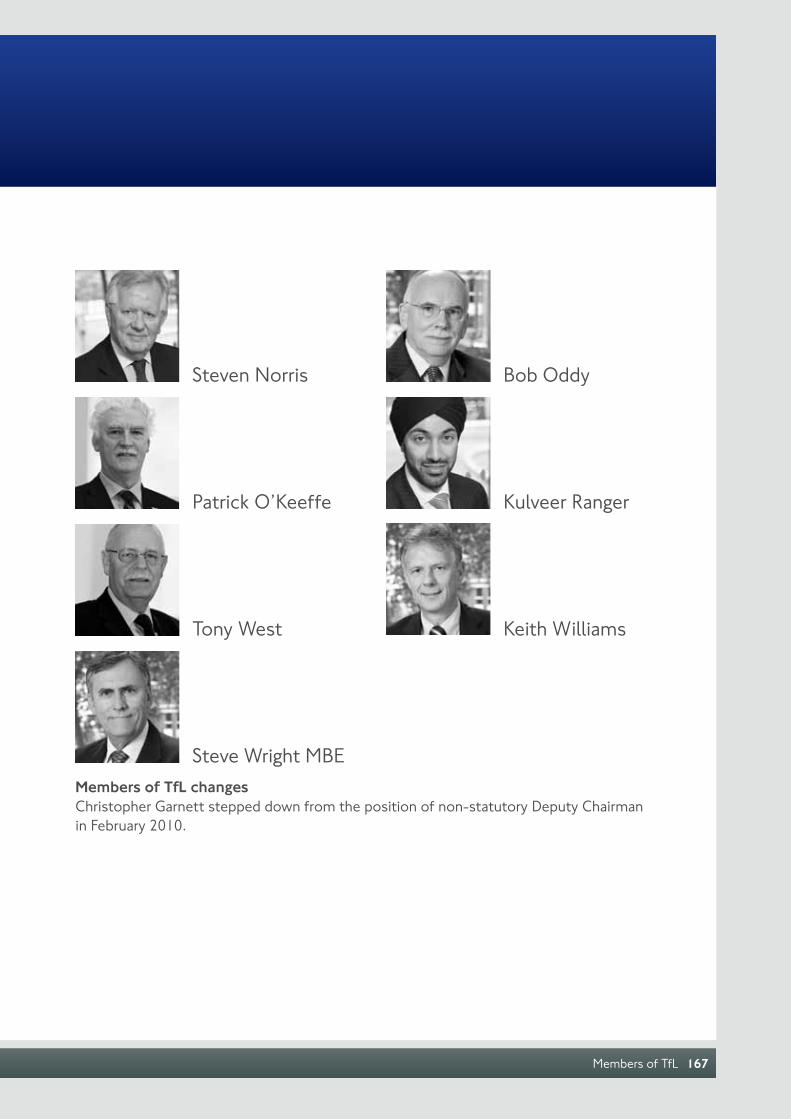
167Members of TfL
Steven Norris
Patrick O’Keeffe
Tony West
Steve Wright MBE
Bob Oddy
Kulveer Ranger
Keith Williams
Members of TfL changes Christopher Garnett stepped down from the position of non-statutory Deputy Chairman in February 2010.

Transport for London – Annual Report and Statement of Accounts 2009/10168
Members of TfL
Boris Johnson – ChairmanDaniel Moylan – Deputy ChairmanPeter AndersonClaudia ArneyCharles BelcherChristopher GarnettBaroness Tanni Grey-ThompsonSir Mike HodgkinsonJudith HuntEva LindholmSteven NorrisBob OddyPatrick O’KeeffeKulveer RangerTony WestKeith WilliamsSteve Wright
Committees of TfL
Audit CommitteeJudith Hunt – ChairKeith Williams – Vice ChairCharles BelcherDaniel MoylanPatrick O’KeeffeSteve Wright
Finance and Policy CommitteePeter Anderson – ChairDaniel Moylan – Vice ChairClaudia ArneyChristopher GarnettSir Mike HodgkinsonJudith HuntEva LindholmSteven NorrisKulveer RangerTony West
Membership of TfL panels and committees (as at 31 March 2010)
Members of TfL changes Christopher Garnett stepped down from the position of non-statutory Deputy Chairman in February 2010.

169Membership of TfL panels and committees
Remuneration CommitteeDaniel Moylan – ChairChristopher GarnettSir Mike HodgkinsonJudith HuntBoris Johnson
Safety, Health and Environment Assurance CommitteeTony West – ChairChristopher Garnett – Vice ChairCharles BelcherBaroness Tanni Grey-ThompsonDaniel MoylanBob Oddy
Special Purpose CommitteeDaniel Moylan – ChairChristopher GarnettKeith Williams
Panels
Corporate PanelBaroness Tanni Grey-Thompson – Chair Patrick O’Keeffe – Vice ChairPeter AndersonJudith HuntDaniel Moylan Tony West
Environment and Planning PanelSir Mike Hodgkinson – Chair Eva Lindholm – Vice ChairDaniel MoylanSteven NorrisPatrick O’Keeffe
Rail and Underground PanelChristopher Garnett – ChairSteve Wright – Vice Chair Peter AndersonCharles BelcherSir Mike HodgkinsonDaniel MoylanTony West
Surface Transport PanelSteven Norris – ChairCharles Belcher – Vice ChairBaroness Tanni Grey-ThompsonDaniel MoylanBob OddyPatrick O’KeeffeKeith WilliamsSteve Wright

Transport for London – Annual Report and Statement of Accounts 2009/10170
Directors of Crossrail Ltd(as at 31 March 2010)
Terry Morgan CBEChairman
Michael Cassidy CBE
Sir Joe Dwyer
Rob Holden CBE
Heather Rabbatts CBE
David Allen
Patrick Crawford
Sir Mike Hodgkinson
Robert Jennings CBE
Andy Mitchell
171
Chief Officer changesRob Holden CBE became Chief Executive of Crossrail on 1 April 2009.Robert Jennings CBE became a director on 30 April 2009.Andy Mitchell became a director on 1 September 2009.Terry Morgan CBE became Chairman on 1 June 2009.Dr Graham Plant ceased to be a director on 14 August 2009.Doug Oakervee ceased to be a director on 31 May 2009.
Directors of Crossrail Ltd
Remuneration
Transport for London – Annual Report and Statement of Accounts 2009/10172
This report outlines TfL’s policy regarding the remuneration of its Members and the Commissioner and Chief Officers, who are responsible for directing the affairs of the organisation.
Policy for MembersMembers are appointed by the Mayor and are non-executive. Remuneration payable for 2009/10 for each Member (with the exception of the two Deputy Chairmen) related directly to the number of panels and committees on which each member served. Remuneration also took into account those members who served as Chair of the committees and panels, up to a capped maximum.
Remuneration levels are set for each Mayoral term, but are reviewed periodically to reflect the responsibilities and accountabilities of the role. With effect from 1 August 2004, the basic fee was £18,000 per annum. Members who acted as Chair, or as a member of a committee or panel, received additional fees of £4,000 per annum (as a Chair) and £2,000 per annum (as a Member) for each appointment. The maximum payment in aggregate was £24,000 per annum, except for the position of Deputy Chairman. The annual fee was payable at the rate of £60,000 per annum in total for Daniel Moylan, the statutory Deputy Chairman, and £40,000 per annum for Christopher Garnett, the non-statutory Deputy Chairman. Most Members also received free travel for themselves and a nominee valid on TfL transport modes.
The remuneration for each Member for the year ending 31 March 2010 is shown in the table opposite.
Policy for Chief OfficersRemuneration CommitteeThe Remuneration Committee currently consists of five Members of TfL. The terms of reference of the Remuneration Committee include reviewing the remuneration of the Commissioner and Chief Officers.
Remuneration policyChief Officers are employed by TfL or its subsidiary companies. The policy of TfL is to provide remuneration packages for Chief Officers which attract, retain and motivate individuals of the high calibre required to manage such a large, complex organisation.
Remuneration packages reflect their responsibilities, experience and performance and the market from which TfL recruits. The Remuneration Committee has established a reward structure commensurate with this policy, which includes a base salary and a performance award scheme against the achievement of a range of financial and operational service performance targets.
TfL engaged Towers Watson, one of the leading remuneration consultancies, to review the remuneration of Chief Officers against a peer group of transport, infrastructure and engineering companies with which TfL competes for senior staff.
This concluded that TfL executives are paid at the lower end of the remuneration paid in comparator organisations; the total compensation paid to TfL’s Chief Officers is
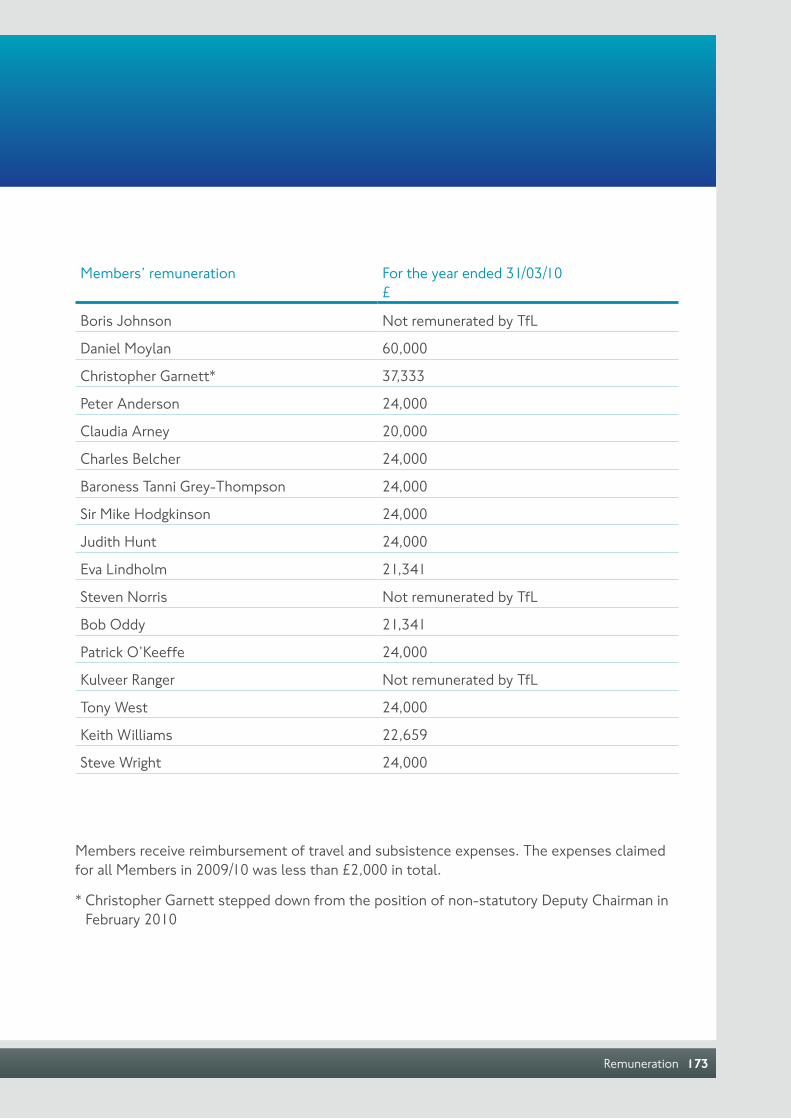
Remuneration 173
Members’ remuneration For the year ended 31/03/10 £
Boris Johnson Not remunerated by TfL
Daniel Moylan 60,000
Christopher Garnett* 37,333
Peter Anderson 24,000
Claudia Arney 20,000
Charles Belcher 24,000
Baroness Tanni Grey-Thompson 24,000
Sir Mike Hodgkinson 24,000
Judith Hunt 24,000
Eva Lindholm 21,341
Steven Norris Not remunerated by TfL
Bob Oddy 21,341
Patrick O’Keeffe 24,000
Kulveer Ranger Not remunerated by TfL
Tony West 24,000
Keith Williams 22,659
Steve Wright 24,000
Members receive reimbursement of travel and subsistence expenses. The expenses claimed for all Members in 2009/10 was less than £2,000 in total.
* Christopher Garnett stepped down from the position of non-statutory Deputy Chairman in February 2010
Remuneration
Transport for London – Annual Report and Statement of Accounts 2009/10174
generally in the lower quartile of the market and significantly below the lower quartile for the Commissioner and the Managing Director of Finance.
Remuneration of senior staff In recognition of the difficult economic climate and financial constraints on TfL, in 2009/10 the base pay of the Commissioner, Chief Officers, Directors and senior managers was frozen and a reduction applied to the overall performance award budget in respect of delivery in 2008/09. The Commissioner’s salary was £348,444. The Commissioner was also entitled to a performance award for 2008/09 of £136,590 but elected to receive only £61,466 of this.
In recognition of the continuing difficult economic climate, the base pay of the Commissioner, Chief Officers and Directors will again be frozen for 2010/11.
The Commissioner and Chief Officers have also decided to waive in their entirety the performance awards made to them in respect of delivery in 2009/10. For the Commissioner, the award waived was £132,409. The combined sum in performance awards waived by the Commissioner and Chief Officers amounted to around £500,000.
The total number of TfL staff receiving total remuneration of over £50,000 is on page 126 and the remuneration of senior employees with a base salary of over £150,000 is on page 128.
As a result of the pay freeze and reductions in performance awards, the underlying number of TfL staff earning total remuneration of
more than £100,000 has fallen 8.5 per cent from 212 to 194. There has been an increase in the number of staff at Crossrail earning total remuneration of more than £100,000 (from 8 to 23) due to the recruitment of senior staff to take the project into its delivery phase. There was also an increase in the number of severance payments (from 11 to 34) made to those who would have earned total remuneration of less than £100,000 excluding the severance payment.
Other benefitsSenior officers are eligible to receive the following:
> Private medical insurance
> Annual health check-ups
> Subscriptions to professional organisations
> Pension

Remuneration
Remuneration 175
> Where appropriate, recompense for loss of benefits from previous employers and/or to comply with TfL’s policies
> As with all TfL employees, the Commissioner and Chief Officers are provided with a free travel pass for themselves and a nominee valid on TfL transport modes. Chief Officers who joined after 1 April 1996 are eligible to receive reimbursement of 75 per cent of the cost of an annual season ticket on National Rail. Chief Officers employed by predecessor organisations prior to April 1996 receive National Rail facilities in line with the policy of the predecessor organisation
Pension arrangementsChief Officers are eligible for the following pension benefits:
> Membership of the TfL Pension Fund, a ‘defined benefit’ scheme which provides for a pension payable from age 65, based on 1/60th of pensionable salary for each year of service
> Pensionable salary is capped for joiners from 1 June 1989. For 2009/10, the cap was £123,600
> Up to 25 per cent of the value of the pension can be taken as a cash sum (under current legislation)
> Lump sum death benefit of four times salary on death in service
> Dependant’s pension and children’s pensions are paid on death in service and after retirement
> Member contributions payable at the rate of five per cent of pensionable salary
> Pension payable in the event of retirement due to ill-health
> An employer contribution of up to 10 per cent of salary to the TfL Supplementary Pension Scheme, a ‘defined contribution’ scheme which provides additional benefits for those earning above the cap
The Commissioner is entitled to a pension based on TfL service equal to what would be due under the TfL Pension Fund if the cap did not apply.
Crossrail remuneration committeeCrossrail is a wholly owned subsidiary of TfL with its own governance arrangements. These include a board comprising executive and independent non-executive directors as well as two non-executive directors appointed by TfL and DfT. The Crossrail Remuneration Committee operates to its own Remuneration Framework, in respect of Crossrail Limited.
Transport for London – Annual Report and Statement of Accounts 2009/10176
An electronic version of TfL’s Annual Report and Accounts 2009/10 is available at tfl.gov.uk/annualreport. It is also available in audio, Braille and a range of other languages.
To order the format you require, please tick the relevant box in the list opposite, include your name and address and return to:
Transport for London, Windsor House, 42-50 Victoria Street, London SW1H 0TL
Alternatively, call 020 7126 4500 or email [email protected]
Alternative formats

177Alternative formats
o Audio (English)
o Arabic
o Bengali
o Chinese
o French
o Greek
o Gujarati
o Braille
o Hindi
o Punjabi
o Spanish
o Turkish
o Urdu
o Vietnamese
Name
Address

Produced by Group Publishing August 2010