Embed Size (px)
Citation preview
Annual Report 2011-2012
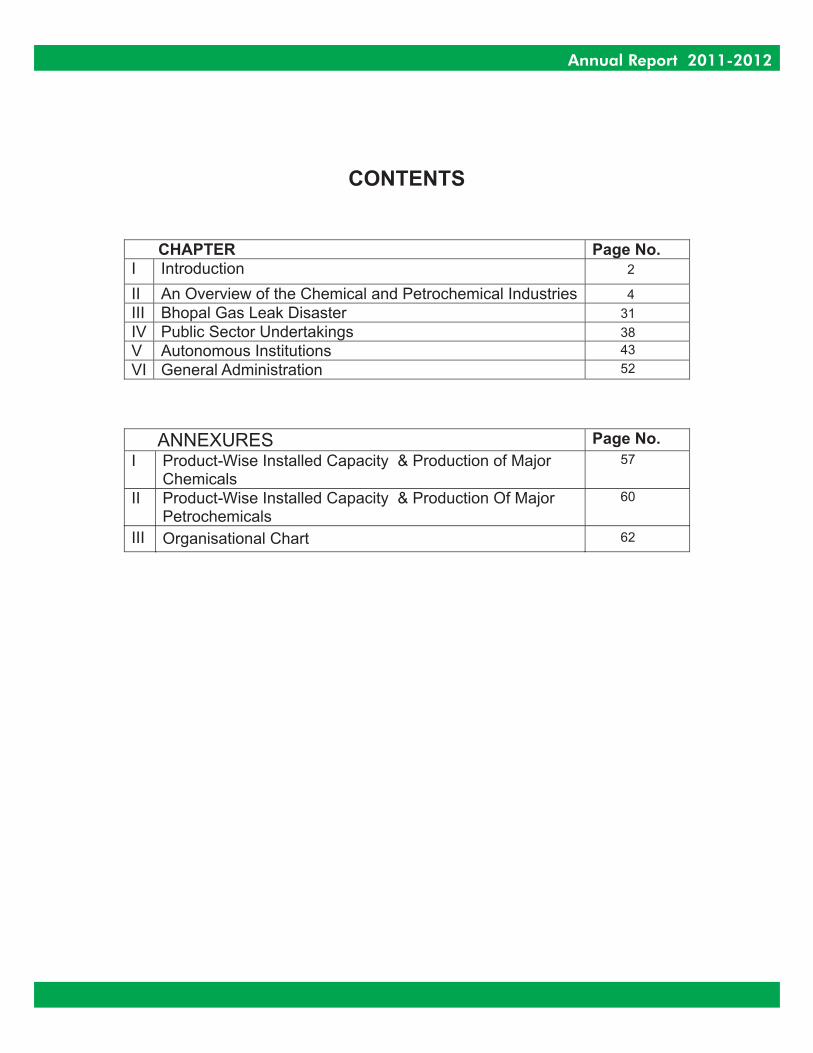
CONTENTS
CHAPTER Page No.
I Introduction
II An Overview of the Chemical and Petrochemical IndustriesIII Bhopal Gas Leak DisasterIV Public Sector UndertakingsV Autonomous InstitutionsVI General Administration
ANNEXURES Page No.
I Product-Wise Installed Capacity & Production of MajorChemicals
II Product-Wise Installed Capacity & Production Of MajorPetrochemicals
III Organisational Chart
2
4
31
38
43
52
57
60
62

1.0 Introduction
1.1
1.2
1.3
Department of Chemicals and Petrochemicals (DCPC) aims:
i. To formulate and implement policy and programmes for achieving growth
and development of the chemical and petrochemical sectors in the country; and
ii. To foster the spirit of public-private partnership for overall development of
above-mentioned sectors of industry.
The Department has the mandate to deal with the following broad subject
matters:
i. Insecticides excluding the administration of The Insecticides Act, 1968 (46
of 1968);
ii. Molasses;
iii. Alcohol – Industrial and Potable from the molasses route;
iv. Dyestuffs and Dye Intermediates;
v. All organic and inorganic chemicals, not specifically allotted to any other
Ministry or Department;
vi. Planning, Development and control of, and assistance to, all industries
being dealt with by the Department;
vii. Bhopal Gas Leak Disaster-Special Laws relating thereto;
viii. Petrochemicals;
ix. Industries relating to production of non-Cellulose Synthetic Fibers (Nylons,
Polyesters,Acrylic etc);
x. Synthetic Rubber; and
xi. Plastics including fabrications of plastic and moulded goods.
The Department has two functional divisions viz. Chemicals, and
Petrochemicals. There are two PSUs in the chemical sector namely Hindustan
Organic Chemicals Ltd. (HOCL) and Hindustan Insecticide Ltd. (HIL) and one
PSU in the Petrochemical sector viz. Brahmaputra Cracker and Polymer Ltd
(BCPL). The autonomous institutes under this Department are Central Institute
INTRODUCTION
Chapter- I
Annual Report 2011-2012
2

of Plastic Engineering and Technology (CIPET) and Institute of Pesticides
Formulation and Technology (IPFT), which are sanctioned financial grants by
this Department.
Shri M.K.Alagiri and Shri Srikant Kumar Jena are the Minister of Chemicals
and Fertilizers and Minister of State for Chemicals and Fertilizers, respectively.
Shri K. Jose Cyriac has been Secretary of the Department since 29.06.2011.
1.4
Annual Report 2011-2012
3

AN OVERVIEW OF THE CHEMICALAND PETROCHEMICAL INDUSTRY
An Overview of the Chemical Industry
2.1
2.2
Chemical Sector- Production Trends
2.3
2.4
The chemical industry, which includes basic chemicals and its products,
petrochemicals, fertilizers, paints & varnishes, gases, soaps, perfumes &
toiletries and pharmaceuticals is one of the most diversified of all industrial
sectors covering thousands of commercial products. It plays an important role in
the overall development of the Indian economy. It contributes about 3% in the
GDP of the country.
The chemical and petrochemical sector in India presently constitutes 14%
of the domestic industrial activity. The growth of petrochemicals and chemicals is
projected at 12.6% and 8% respectively in 11th Five Year Plan. According to the
United Nations Industrial Development Organisation (UNIDO), in terms of value
added at constant 2000 prices, the Indian chemical Industry was the 6th largest
in the world and 3rd largest in Asia in the year 2008. As per the latest available
information from industry associations, the size of the Indian Chemical Industry
in the year 2010 was US $ 108.4 Billion.
Chemical Industry is one of the oldest industries in India, which contributes
significantly towards industrial and economic growth of the nation. The Indian
Chemical Industry is the 6th largest in the world and 3rd largest in Asia. It
provides valuable chemicals for various end products such as textiles, paper,
paints and varnishes, leather etc., which are required in almost all walks of life.
The Indian Chemical Industry forms the backbone of the industrial and
agricultural development of India and provides building blocks for downstream
industries.
The Indian Chemical Industry comprises both small and large-scale units.
The fiscal concessions granted to the small-scale sector in mid-eighties led to
establishment of a large number of units in the Small Scale Industries (SSI)
sector. Currently, the Indian Chemical industry is in the midst of a phase of major
restructuring and consolidation. With the shift in emphasis on product
innovation, brand building and environmental friendliness, this industry is
increasingly moving towards greater customer orientation. Even though India
enjoys an abundant supply of basic raw materials, it will have to build upon
technical services and marketing capabilities to face global competition and
increase its share of exports.
Chapter- II
Annual Report 2011-2012
4

2.5
2.6
2.7
2.8
2.9
As the Indian economy was a protected economy till the early nineties, very
limited large-scale R&D was undertaken by the Chemical industry to create
intellectual property. The product patent regime came into force w.e.f. January
2005. Accordingly, the units have to be more innovative with state of the art R&D
Establishments. This will help in development of newer molecules. With a
number of scientific institutions, the country's strength lies in its large pool of
highly trained scientific manpower.
India also produces a large number of fine and specialty chemicals, which
have very specific uses and find wide usage as food additives, pigments,
polymer additives, anti-oxidants in the rubber industry, etc.
In the Chemical Sector, 100 percent FDI is permissible. Manufacture of
most chemical products inter-alia covering organic/ inorganic, dyestuffs and
pesticides is delicensed. The entrepreneurs need to submit only IEM with the
Department of Industrial Policy and Promotion, provided no locational angle is
applicable. Only the following items are covered in the compulsory licensing list
because of their hazardous nature:
- Hydrocyanic acid & its derivatives
- Phosgene & its derivatives
- Isocynates & di-isocynates of hydrocarbons.
The Dyestuff sector is one of the important segments of the chemical
industry in India, having forward and backward linkages with a variety of sectors
like textiles, leather, paper, plastics, printing inks and foodstuffs. The textile
industry accounts for the largest consumption of dyestuffs at nearly 70 percent.
From being importers and distributors in the 1950s, it has now emerged as a very
strong industry and a major foreign exchange earner. India has emerged as a
global supplier of dyestuffs and dye intermediates, particularly for reactive, acid,
vat and direct dyes. India accounts for approximately 7 percent of the world
production.
Apart from chemical fertilizers, pesticides played an important role in the
"Green Revolution" during the 1960s and 1970s. Indian exports of
agrochemicals have shown an impressive growth over the last five years. The
key export destination markets are USA, U.K., France, Netherlands, Belgium,
Spain, South Africa, Bangladesh, Malaysia and Singapore. India is one of the
most dynamic generic pesticide manufacturers in the world with more than 60
technical grade pesticides being manufactured indigenously by 125 producers
consisting of large and medium scale enterprises (including about 10
multinational companies) and more than 500 pesticide formulators spread over
the country.
Annual Report 2011-2012
5
2.10
2.11
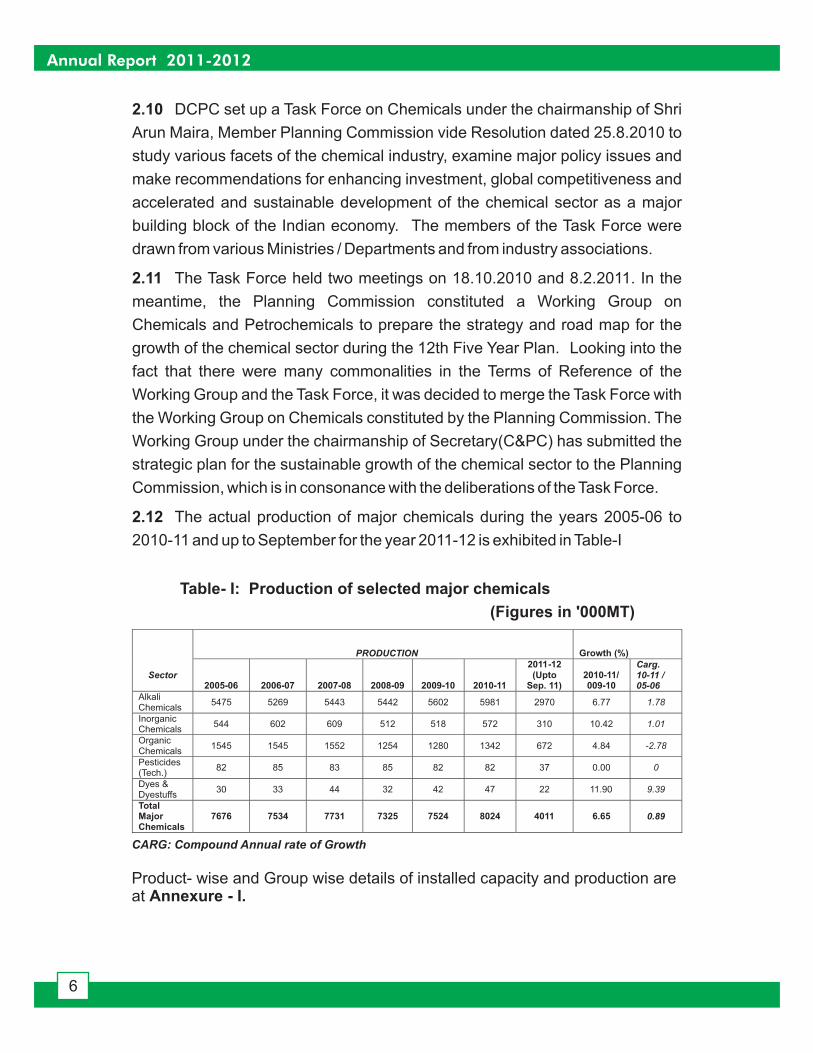
2.12
DCPC set up a Task Force on Chemicals under the chairmanship of Shri
Arun Maira, Member Planning Commission vide Resolution dated 25.8.2010 to
study various facets of the chemical industry, examine major policy issues and
make recommendations for enhancing investment, global competitiveness and
accelerated and sustainable development of the chemical sector as a major
building block of the Indian economy. The members of the Task Force were
drawn from various Ministries / Departments and from industry associations.
The Task Force held two meetings on 18.10.2010 and 8.2.2011. In the
meantime, the Planning Commission constituted a Working Group on
Chemicals and Petrochemicals to prepare the strategy and road map for the
growth of the chemical sector during the 12th Five Year Plan. Looking into the
fact that there were many commonalities in the Terms of Reference of the
Working Group and the Task Force, it was decided to merge the Task Force with
the Working Group on Chemicals constituted by the Planning Commission. The
Working Group under the chairmanship of Secretary(C&PC) has submitted the
strategic plan for the sustainable growth of the chemical sector to the Planning
Commission, which is in consonance with the deliberations of the Task Force.
The actual production of major chemicals during the years 2005-06 to
2010-11 and up to September for the year 2011-12 is exhibited in Table-I
Sector
PRODUCTION Growth (%)
2005-06 2006-07 2007-08 2008-09 2009-10 2010-11
2011-12(Upto
Sep. 11)2010-11/009-10
Carg.10-11 /05-06
AlkaliChemicals
5475 5269 5443 5442 5602 5981 2970 6.77 1.78
InorganicChemicals
544 602 609 512 518 572 310 10.42 1.01
OrganicChemicals
1545 1545 1552 1254 1280 1342 672 4.84 -2.78
Pesticides(Tech.)
82 85 83 85 82 82 37 0.00 0
Dyes &Dyestuffs
30 33 44 32 42 47 22 11.90 9.39
TotalMajorChemicals
7676 7534 7731 7325 7524 8024 4011 6.65 0.89
CARG: Compound Annual rate of Growth
Product- wise and Group wise details of installed capacity and production areat Annexure - I.
Annual Report 2011-2012
6
Table- I: Production of selected major chemicals
(Figures in '000MT)
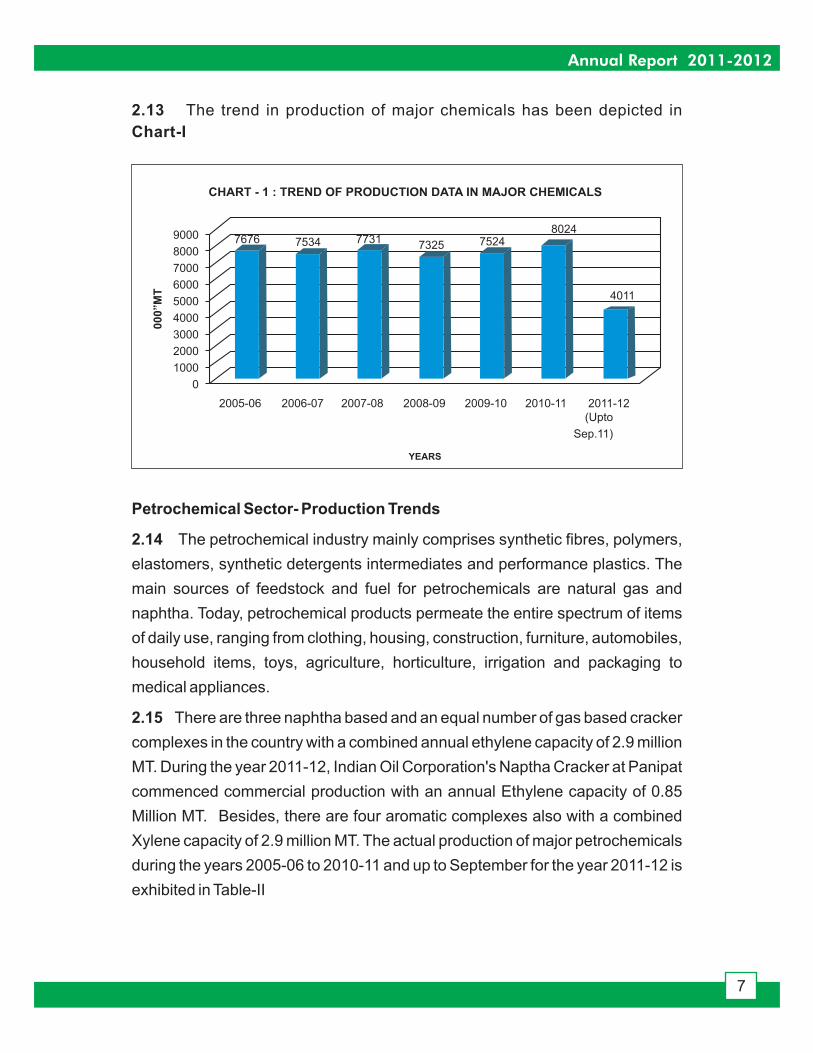
2.13
Chart-I
The trend in production of major chemicals has been depicted in
(Upto
Sep.11)
9000
8000
7000
6000
5000
4000
3000
2000
1000
0
2005-06 2006-07 2007-08 2008-09 2009-10 2010-11 2011-12
YEARS
00
0”M
T
CHART - 1 : TREND OF PRODUCTION DATA IN MAJOR CHEMICALS
7676 7534 77317325 7524
8024
4011
Petrochemical Sector- Production Trends
2.14
2.15
The petrochemical industry mainly comprises synthetic fibres, polymers,
elastomers, synthetic detergents intermediates and performance plastics. The
main sources of feedstock and fuel for petrochemicals are natural gas and
naphtha. Today, petrochemical products permeate the entire spectrum of items
of daily use, ranging from clothing, housing, construction, furniture, automobiles,
household items, toys, agriculture, horticulture, irrigation and packaging to
medical appliances.
There are three naphtha based and an equal number of gas based cracker
complexes in the country with a combined annual ethylene capacity of 2.9 million
MT. During the year 2011-12, Indian Oil Corporation's Naptha Cracker at Panipat
commenced commercial production with an annual Ethylene capacity of 0.85
Million MT. Besides, there are four aromatic complexes also with a combined
Xylene capacity of 2.9 million MT. The actual production of major petrochemicals
during the years 2005-06 to 2010-11 and up to September for the year 2011-12 is
exhibited in Table-II
Annual Report 2011-2012
7
Sub-group
PRODUCTION Growth (%)
2005-06 2006-07 2007-08 2008-09 2009-10 2010-112011-12(Upto
Sep. 11)
2010-11/2009-10
Carg/ 10-11/ 05-06
SyntheticFibers
1906 2250 2524 2343 2601 2791 1323 7.30 7.93
Polymers 4768 5183 5304 5060 4791 5292 2780 10.46 2.11
Elastomers(S.Rubber)
110 101 106 96 106 95 44 -10.38 -2.89
Synth.DetergentIntermediates
556 556 585 552 618 638 303 3.24 2.79
Performance Plastics 127 133 157 141 172 191 84 11.05 8.50
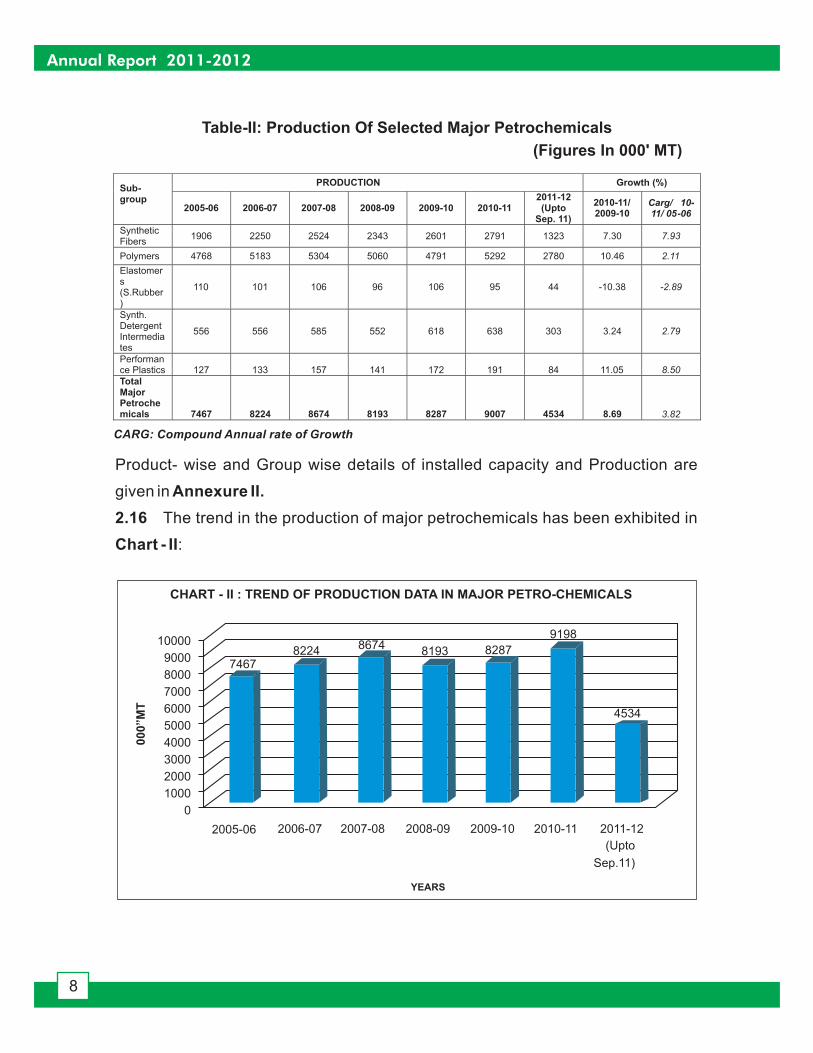
TotalMajorPetrochemicals 7467 8224 8674 8193 8287 9007 4534 8.69 3.82
Table-II: Production Of Selected Major Petrochemicals
(Figures In 000' MT)
Product- wise and Group wise details of installed capacity and Production are
given in Annexure II.
2.16
Chart - II
The trend in the production of major petrochemicals has been exhibited in
:
7467
10000
9000
8000
7000
6000
5000
4000
3000
2000
1000
0
2005-06 2006-07 2007-08 2008-09 2009-10 2010-11 2011-12
(Upto
Sep.11)
8224 86748193 8287
9198
4534
YEARS
CHART - II : TREND OF PRODUCTION DATA IN MAJOR PETRO-CHEMICALS
00
0”M
T
Annual Report 2011-2012
8
CARG: Compound Annual rate of Growth
2.17
Index of Industrial Production
2.18
From Table II it may be seen that the production of polymers account for
more than 60% of the total production of major petrochemicals. Till 2010- 11, the
production of petrochemicals grew at the rate of 3.82% annually over 2005-06.
This industry could not escape the impact of global meltdown and during the year
2010-1, the annual growth decelerated to 3.82% since 2005-06. Trends in
production of petrochemicals are expected to improve by the end of 2011-12.
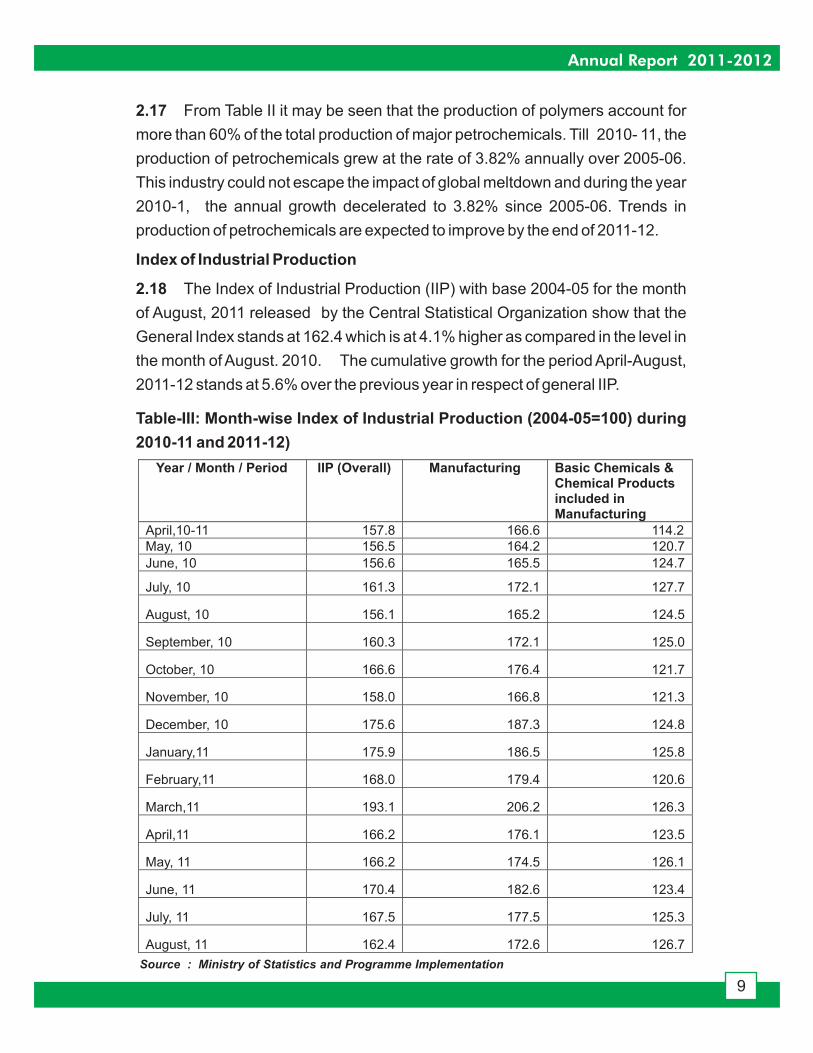
The Index of Industrial Production (IIP) with base 2004-05 for the month
of August, 2011 released by the Central Statistical Organization show that the
General Index stands at 162.4 which is at 4.1% higher as compared in the level in
the month of August. 2010. The cumulative growth for the period April-August,
2011-12 stands at 5.6% over the previous year in respect of general IIP.
Year / Month / Period IIP (Overall) Manufacturing Basic Chemicals &Chemical Productsincluded inManufacturing
April,10-11 157.8 166.6 114.2May, 10 156.5 164.2 120.7
June, 10 156.6 165.5 124.7
July, 10 161.3 172.1 127.7
August, 10 156.1 165.2 124.5
September, 10 160.3 172.1 125.0
October, 10 166.6 176.4 121.7
November, 10 158.0 166.8 121.3
December, 10 175.6 187.3 124.8
January,11 175.9 186.5 125.8
February,11 168.0 179.4 120.6
March,11 193.1 206.2 126.3
April,11 166.2 176.1 123.5
May, 11 166.2 174.5 126.1
June, 11 170.4 182.6 123.4
July, 11 167.5 177.5 125.3
August, 11 162.4 172.6 126.7
Table-III: Month-wise Index of Industrial Production (2004-05=100) during
2010-11 and 2011-12)
Source : Ministry of Statistics and Programme Implementation
Annual Report 2011-2012
9
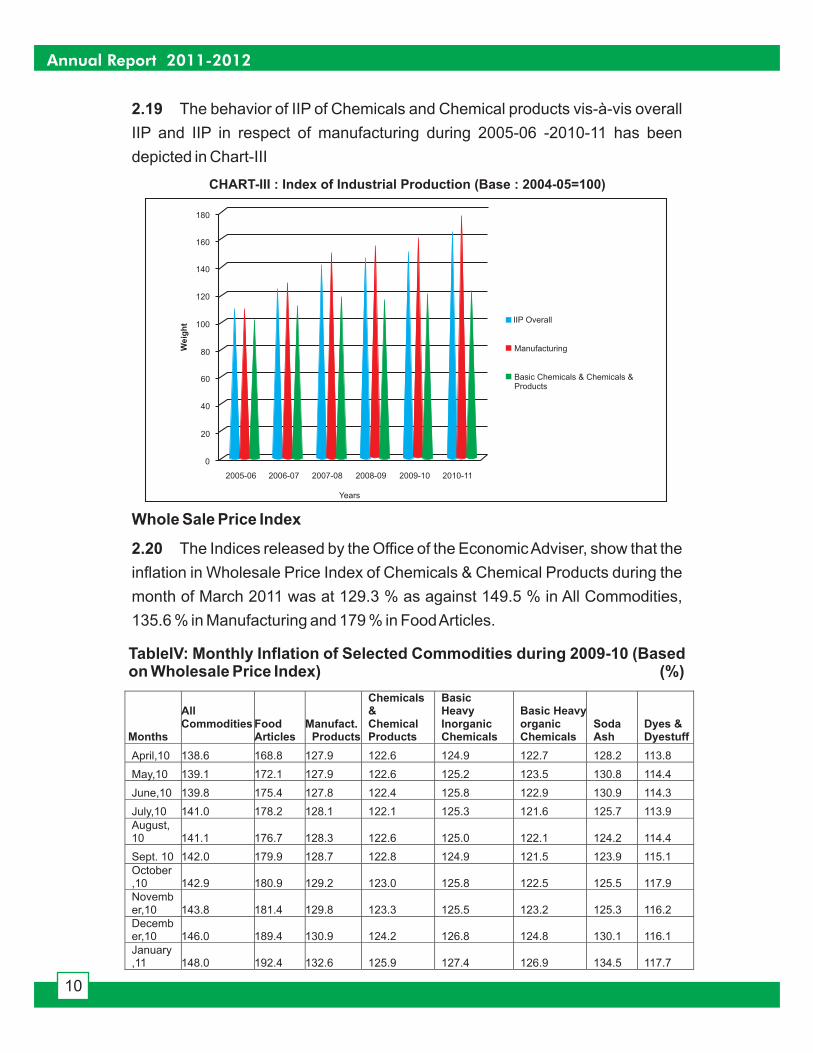
2.19 The behavior of IIP of Chemicals and Chemical products vis-à-vis overall
IIP and IIP in respect of manufacturing during 2005-06 -2010-11 has been
depicted in Chart-III
Whole Sale Price Index
2.20 The Indices released by the Office of the EconomicAdviser, show that the
inflation in Wholesale Price Index of Chemicals & Chemical Products during the
month of March 2011 was at 129.3 % as against 149.5 % in All Commodities,
135.6 % in Manufacturing and 179 % in FoodArticles.
CHART-III : Index of Industrial Production (Base : 2004-05=100)
0
20
40
60
80
100
120
140
160
180
2005-06 2006-07 2007-08 2008-09 2009-10 2010-11
IIP Overall
Manufacturing
Basic Chemicals & Chemicals &Products
Weig
ht
Years
TableIV: Monthly Inflation of Selected Commodities during 2009-10 (Basedon Wholesale Price Index) (%)
Months
AllCommodities Food
ArticlesManufact.
Products
Chemicals&ChemicalProducts
BasicHeavyInorganicChemicals
Basic HeavyorganicChemicals
SodaAsh
Dyes &Dyestuff
April,10 138.6 168.8 127.9 122.6 124.9 122.7 128.2 113.8
May,10 139.1 172.1 127.9 122.6 125.2 123.5 130.8 114.4
June,10 139.8 175.4 127.8 122.4 125.8 122.9 130.9 114.3
July,10 141.0 178.2 128.1 122.1 125.3 121.6 125.7 113.9August,10 141.1 176.7 128.3 122.6 125.0 122.1 124.2 114.4
Sept. 10 142.0 179.9 128.7 122.8 124.9 121.5 123.9 115.1October,10 142.9 180.9 129.2 123.0 125.8 122.5 125.5 117.9November,10 143.8 181.4 129.8 123.3 125.5 123.2 125.3 116.2December,10 146.0 189.4 130.9 124.2 126.8 124.8 130.1 116.1January,11 148.0 192.4 132.6 125.9 127.4 126.9 134.5 117.7
Annual Report 2011-2012
10

Months
AllCommodities Food
ArticlesManufact.
Products
Chemicals&ChemicalProducts
BasicHeavyInorganicChemicals
Basic HeavyorganicChemicals
SodaAsh
Dyes &Dyestuff
February,11 148.1 181.3 134.0 127.7 128.3 129.3 136.4 117.2March,11 149.5 179.0 135.6 129.3 130.2 131.7 138.4 119.0
April,11 152.1 186.8 136.6 131.0 132.8 133.9 142.5 118.5
May,11 152.4 186.3 137.4 131.8 135.2 135.5 145.5 119.1
June,11 153.1 188.8 137.9 132.2 137.2 135.0 144.9 119.7
July,11 154.2 192.8 138.0 132.7 138.6 134.9 149.2 120.7August,11 154.9 193.7 138.8 133.0 138.2 136.1 148.0 120.4
Sept. 11 155.8 196.5 138.6 133.5 137.0 134.9 149.1 120.1
Source: Office of the Economic Adviser, Min. of Commerce & Industry
2.21 Table-V and Chart IV below show the WPI of chemicals & chemical
products vis-a-vis all commodities and manufactured products during the years
2005-06 to 2011-12.-
Particulars 2005-06 2006-07 2007-08 2008-09 2009-10 2010-11
All Commodities 104.47 111.35 116.63 126.02 130.81 143.32Food Articles 105.38 115.52 123.57 134.8 155.39 179.63ManufacturingProducts 102.42 108.22 113.39 120.38 123.05 130.07Chemicals &Chemical Products 103.79 108.94 112.83 118.07 117.76 124.04
Chart IV : Wholesale Price Index of chemicals & Chemical
Products vis-a-vis Other Commodities
300
200
100
02005
-06
2006
-07
2007
-08
2008
-09
2009
-10
2010
-11
104.47
105.38
102.42
103.79
111.35
115.52
108.22
108.94
116.63
123.57
113.39
112.83
126.02
134.8
120.38
118.07
130.81
155.39
123.05
117.76
143.32
179.63
130.07
124.04
All Commodities
Food Articles
Manufacturing Products
Chemicals & Chemical Products
Annual Report 2011-2012
11
Table V: WPI of Chemicals & Chemical Products
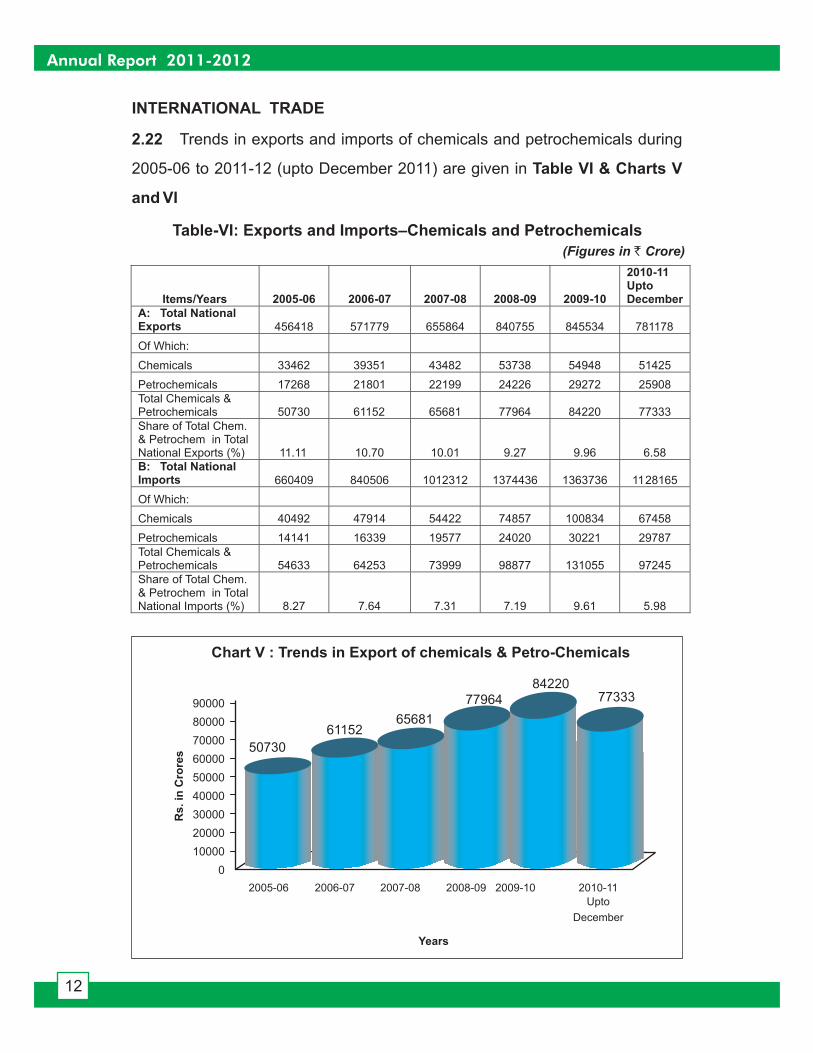
2.22
Table VI & Charts V
and VI
Trends in exports and imports of chemicals and petrochemicals during
2005-06 to 2011-12 (upto December 2011) are given in
Items/Years 2005-06 2006-07 2007-08 2008-09 2009-10
2010-11UptoDecember
A: Total NationalExports 456418 571779 655864 840755 845534 781178
Of Which:
Chemicals 33462 39351 43482 53738 54948 51425
Petrochemicals 17268 21801 22199 24226 29272 25908Total Chemicals &Petrochemicals 50730 61152 65681 77964 84220 77333Share of Total Chem.& Petrochem in TotalNational Exports (%) 11.11 10.70 10.01 9.27 9.96 6.58B: Total NationalImports 660409 840506 1012312 1374436 1363736 1128165
Of Which:
Chemicals 40492 47914 54422 74857 100834 67458
Petrochemicals 14141 16339 19577 24020 30221 29787Total Chemicals &Petrochemicals 54633 64253 73999 98877 131055 97245Share of Total Chem.& Petrochem in TotalNational Imports (%) 8.27 7.64 7.31 7.19 9.61 5.98
Chart V : Trends in Export of chemicals & Petro-Chemicals
90000
80000
70000
60000
50000
40000
30000
20000
10000
0
2005-06 2006-07 2007-08 2008-09 2009-10 2010-11
Upto
December
Years
Rs
. in
Cro
res 50730
6115265681
7796484220
77333
Annual Report 2011-2012
12
(Figures in Crore)`
Table-VI: Exports and Imports–Chemicals and Petrochemicals
INTERNATIONAL TRADE

2.23
Plan Schemes
2.24
The share of Imports of the Chemicals & Petrochemicals in the total
National Imports slightly increased from 8.27% to 9.61% during the period 2005-
06 to 2009-10 whereas the share of Exports declined from 11.11% to 9.9%
corresponding period. (Table-VI).
Keeping in view the promotional, facilitatory and regulatory role of the
Department in the development of chemical and petrochemical sectors, the
public sector investment proposed through plan schemes is quite limited. A
major plan scheme being implemented, besides the releases made to PSUs and
autonomous institutions, is the Assam Gas Cracker Project, for which a Capital
Subsidy of Rs. 4690 crore on fixed cost basis shall be provided by Department of
Chemicals and Petrochemicals. When completed in Decemer 2013, the project
is expected to generate substantial employment, both direct as well as indirect
and will attract substantial investments in setting up of downstream plastic
processing industries. The Plan Schemes of the Department also support the
Public Sector Undertakings and Autonomous Bodies attached to the
Department.
Annual Report 2011-2012
13
140000
120000
100000
80000
60000
40000
20000
0
2005-06 2006-07 2007-08 2008-09 2009-10 2010-11
Upto
December
Years
Rs
. in
Cro
res
5463364253
73999
98877
131055
97245
Chart V : Trends in Import of chemicals & Petro-Chemicals
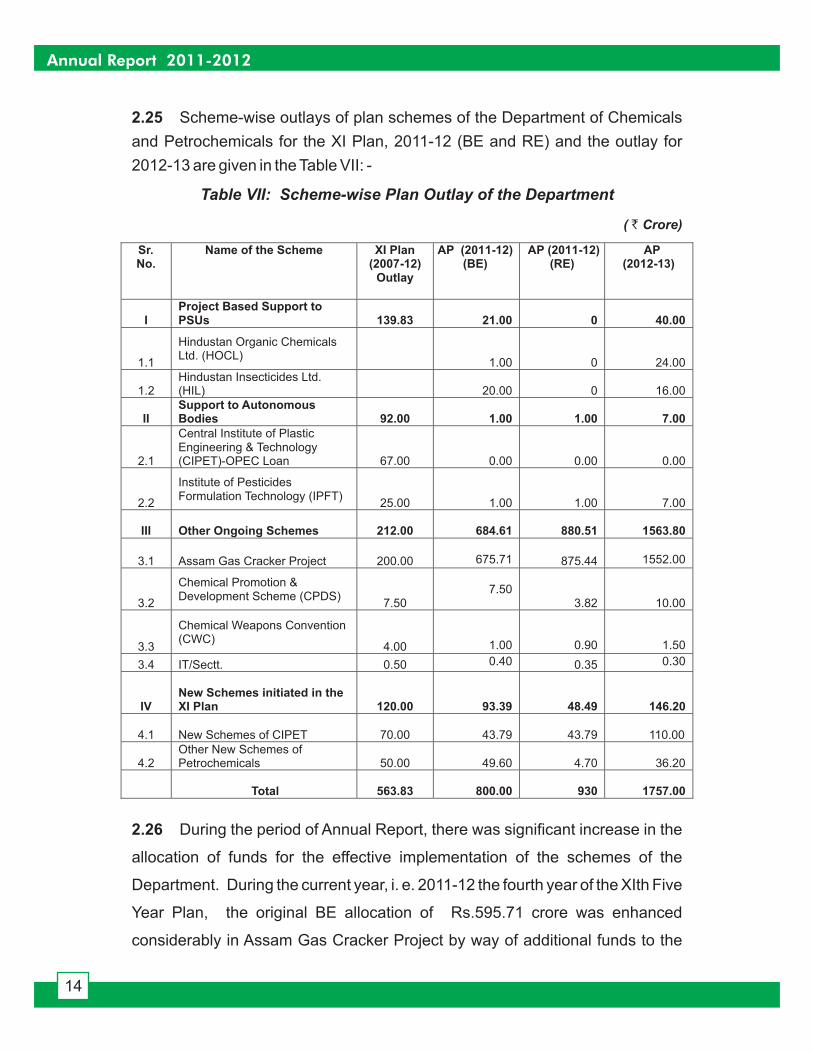
2.25 Scheme-wise outlays of plan schemes of the Department of Chemicals
and Petrochemicals for the XI Plan, 2011-12 (BE and RE) and the outlay for
2012-13 are given in the Table VII: -
Table VII: Scheme-wise Plan Outlay of the Department
( Crore)`
Sr.No.
Name of the Scheme XI Plan(2007-12)
Outlay
AP (2011-12)(BE)
AP (2011-12)(RE)
AP(2012-13)
IProject Based Support toPSUs 139.83 21.00 0 40.00
1.1
Hindustan Organic ChemicalsLtd. (HOCL)
1.00 0 24.00
1.2Hindustan Insecticides Ltd.(HIL) 20.00 0 16.00
IISupport to AutonomousBodies 92.00 1.00 1.00 7.00
2.1
Central Institute of PlasticEngineering & Technology(CIPET)-OPEC Loan 67.00 0.00 0.00 0.00
2.2
Institute of PesticidesFormulation Technology (IPFT)
25.00 1.00 1.00 7.00
III Other Ongoing Schemes 212.00 684.61 880.51 1563.80
3.1 Assam Gas Cracker Project 200.00 675.71 875.44 1552.00
3.2
Chemical Promotion &Development Scheme (CPDS)
7.507.50
3.82 10.00
3.3
Chemical Weapons Convention(CWC)
4.00 1.00 0.90 1.50
3.4 IT/Sectt. 0.50 0.40 0.35 0.30
IVNew Schemes initiated in theXI Plan 120.00 93.39 48.49 146.20
4.1 New Schemes of CIPET 70.00 43.79 43.79 110.00
4.2Other New Schemes ofPetrochemicals 50.00 49.60 4.70 36.20
Total 563.83 800.00 930 1757.00
2.26 During the period of Annual Report, there was significant increase in the
allocation of funds for the effective implementation of the schemes of the
Department. During the current year, i. e. 2011-12 the fourth year of the XIth Five
Year Plan, the original BE allocation of Rs.595.71 crore was enhanced
considerably in Assam Gas Cracker Project by way of additional funds to the
Annual Report 2011-2012
14

tune of Rs. 199.73 crore (Plan) through Supplementary Grant. On the Non-Plan
side, Supplementary Grants of Rs.410.73 crore was received for payment of
exgratia to the victims of Bhopal Gas. The following tables present Plan and
Non-Plan Revised Estimates of Budget during 2011-12 andActuals 2010-11.
S.No. Name of the Schemes Actuals 2010-11 RE 2011-12
1 Secretariat 0.51 0.35
2New Schemes ofPetrochemicals 4.71 4.70
3 Assam Gas Cracker Project 796.73 775.44
4 CPDS 2.30 3.82
5 CWC 0.92 0.90
6 IPFT 0.58 1.00
7 CIPET-OPEC 74.02 43.79
8 HIL 0.00 0.00
9 HOCL 0.00 0.00
10 NER 0.00 100.00
Total 879.77 930.00
S.No. Name of the Schemes Actuals 2010-11 RE 2011-12 BE 2012-13
1 Secretariat 11.81 11.85 13.28
2 CIPET 0.53 0.53 0.00
3Assam Gas CrackerProject 0.00 0.01 0.01
4Bhopal Gas LeakDisaster 332.81 415.62 27.70
5 CWC 0.05 0.00 0.01
6 IPFT 2.60 3.29 3.50
7 PCL 1.10 1.10 1.10
8 HIL 0.00 0.01 0.01
9 HOCL 0.00 0.01 0.01
Total 348.90 432.42 45.62
Annual Report 2011-2012
15
Table VIII: Actuals 2010-11 & RE 2011-12 (Plan)(` in Crore)
Table IX: Actuals 2010-11, RE 2011-12 & BE 2012-13 (Non-Plan)
(` in Crore)

2.27
2.28
Petroleum, Chemical Petrochemical Investment Regions (PCPIRs)
Policy
The Policy
Approval Of PCPIRs & Current Status
During the year, special attention was paid to the liquidation of Utilisation
Certificates (UCs). An amount of Rs. 193 lakh involved in pending UCs as on
1.4.2011, the amount of covered by pending UCs has been brought down to Rs.
46 lakh as on 30.9.2011.
Regarding Audit by C&AG, no PAC para is pending. In case of C&AG
(Commercial) paras, 4 paras are pending for which efforts are being made to
liquidate at the earliest.
2.29
i) The PCPIR Policy is a window to ensure the adoption of a holistic approach
to promote the petroleum, chemicals and petrochemical sectors in an
integrated and environment friendly manner on a large scale. Such
integrated PCPIRs would reap the benefits of co-siting, networking and
greater efficiency through use of common infrastructure and support
services.
ii) The PCPIR is a specifically delineated investment region having an area of
about 250 sq kms (with minimum 40% of the designated area earmarked for
processing activities). This region will be a combination of production
projects, public utilities, logistics, environmental protection, residential
areas and administrative services.
iii) The Cabinet Committee on Economic Affairs (CCEA), in its meeting held on
8th March 2007 approved the Policy Resolution for setting up of PCPIRs.
As per the PCPIR Policy, Government of India is to ensure availability of
external physical infrastructure linkages to the PCPIR including Rail, Road
(National Highways), Ports, Airports and Telecom in a time bound manner.
This infrastructure will be created/upgraded through Public Private
Partnerships to the extent possible and the Central Government will provide
necessary viability gap funding (VGF) through existing schemes.
iv) PCPIR Proposals of the Governments of Andhra Pradesh (AP), Gujarat and
West Bengal were approved by the CCEA in February 2009, while the
proposal of Govt of Orissa was approved in December 2010. These PCPIRs
Annual Report 2011-2012
16
are expected to create infrastructure worth Rs. 57385.7 crore. The industrial
investment in these regions is expected to be to the tune of Rs. 7, 63,914
crore while employment generation for about 36 lakh persons is expected
over a period of a time.
v) Memorandum of Agreement have been signed between the Government of
India represented by Department of Chemicals and Petrochemicals and the
Governments of AP, Gujarat and West Bengal. Notification of these three
PCPIRs has been completed and Development Boards have been set up.
The State Governments are in the process of finalising the Master Plans and
obtaining Environmental Clearances. Investments amounting to Rs. 99412
crore have been made in these three PCPIRs since their approval.
Memorandum of Agreement with Govt of Orissa was signed in November,
2011.
vi) A committee headed by Secretary (C&PC) has been constituted to monitor
the progress of implementation of the approved PCPIRs. The significant
achievements in the PCPIRs approved at Haldia, Kakinada and Dahej are as
follows:
a)
Notification of the PCPIR is over.
Socio Economic Survey carried out in Nayachar Island by Jadavpur
University. Report has been subitted and rehabilitation strategy
finalized.
Detailed Project Report submitted by Tata Consulting Engineers in
March'11
Rapid EIAreport preparation is in progress.
IOCL's refinery upgraded to 7.5 MMTPA.
Constitution of the West Bengal PCPIR Management Board and
notification.
Launch of website www.wbpcpir.com
Signing of Power Purchase Agreement with the Power Tenant with a
committed investment of Rs. 12870 crore
b)
MoU has been signed between the State Government and the Anchor
Tenant viz. OPAL, which has incurred a total expenditure of Rs.4900 crore
till May, 2011.
West Bengal PCPIR
Gujarat PCPIR
�
�
�
�
�
�
�
�
�
Annual Report 2011-2012
17

�
�
�
�
�
�
�
�
�
�
�
�
�
�
�
�
�
The PCPIR has been notified under the Special Investment Region (SIR)
Act. 92.94 sq. kms. have been acquired. 44.77 sq.kms is under
acquisition
Completion of a detailed study of 18 villages involving rehabilitation.
Terms of Reference of EIA study have been approved by M/o E&F for
approval.
Rs. 77,119 crore of investment has been attracted in the PCPIR.
151 MoUs signed for investment of Rs. 70,506 crore during Vibrant
Gujarat 2011.
Petronet LNG is setting up a 1200 mega watt power plant
Regional Development Authority constituted by Government of Gujarat
on 18.09.2010 under the Special Investment Region Act, 2009 of Govt of
Gujarat.
Detailed Development Plan has been published.
MoU signed by State Govt with Gujarat Maritime Board for development
of marine shipbuilding park in Dahej with investment of Rs. 1000 crore.
Adani Petronet Port has completed construction of Phase II with port
capacity 8 MMTPA
Govt of Gujarat is upgrading the 4 lane State Highway from Bharuch to
Dahej to 6 lane
Work of 2 RUBs in progress with investment of Rs. 5.8 crore
Work of ROB at Bharuch Jambusar Road and 4 laning of ROB on main
railway line at Chavaj is under progress.
Bharuch –Dahej rail line conversion to broad gauge likely to be completed
by Oct'11.
c)
Notification of the PCPIR is completed.
Feasibility Study for the rail line linking APSEZ to Gangavaram Port has
been awarded to RITES Limited.
Acquisition of additional 4.14 sq.km of the processing land and filing of
requisition for acquisition of additional 35.19 sq.kms.
Andhra Pradesh PCPIR
Annual Report 2011-2012
18

�
�
�
�
vii) PCPIR proposal from Govt of Tamil Nadu was recommended to the CCEA
by the High Powered Committee chaired by Cabinet Secretary in April'11
subject to resolution of certain issues with Ministry of Road Transport and
Highways (MoRTH). MoRTH conveyed its final view in the matter only in
January, 2011. The proposal will now be placed before the Cabinet
Committee on EconomicAffairs.
xi) The Department of Chemicals and Petrochemicals has actively showcased
and promoted the PCPIRs in collaboration with the State Governments and
industry associations through various investor meets, exhibitions and
national and international road shows.
I) The Government approved the National Policy on Petrochemicals on
12.4.2007. The National Policy on Petrochemicals aims to:
a) Increase investments in the sector (both upstream and downstream) and
capture a slice of the resurgent Asian demand in polymers and downstream
processing through additions in capacity and production by ensuring
availability of raw materials at internationally competitive prices, creating
quality infrastructure and other facilitation to ensure value addition and
increase exports.
b) Increase the domestic demand and per capita consumption of plastics and
synthetic fibres from the present level of 4 Kgs and 1.6 Kgs, increase the
competitiveness, polymer absorption capacity and value addition in the
domestic downstream plastic processing industry through modernization,
research and development measures and freeing it from structural
constraints
2.30 NATIONAL POLICY ON PETROCHEMICALS
M/s LEA Associates, South Asia Pvt. Ltd has been appointed as
Consultants for the Master Plan.
Constitution of a Special Development Authority to function as
Management Board
Engaging of EPTRI as consultant for EIA studies. Approval of TOR by
M/o E&F is awaited.
Actual investment of Rs. 9423.82 crore
Annual Report 2011-2012
19
c) Facilitate investment in the emerging areas of petrochemicals
d) Achieve environmentally sustainable growth in the petrochemical sector
through innovative methods of plastic waste management, recycling and
development of bio-, photodegradable polymers and plastics.
e) Promote Research and Development in Petrochemicals and promote
Human Resource Development
ii) In pursuance of National Policy on Petrochemicals the Department of
Chemicals & Petrochemicals is implementing the following 3 schemes,
formulated in the year 2010-11, in the 11 Five Year Plan viz:
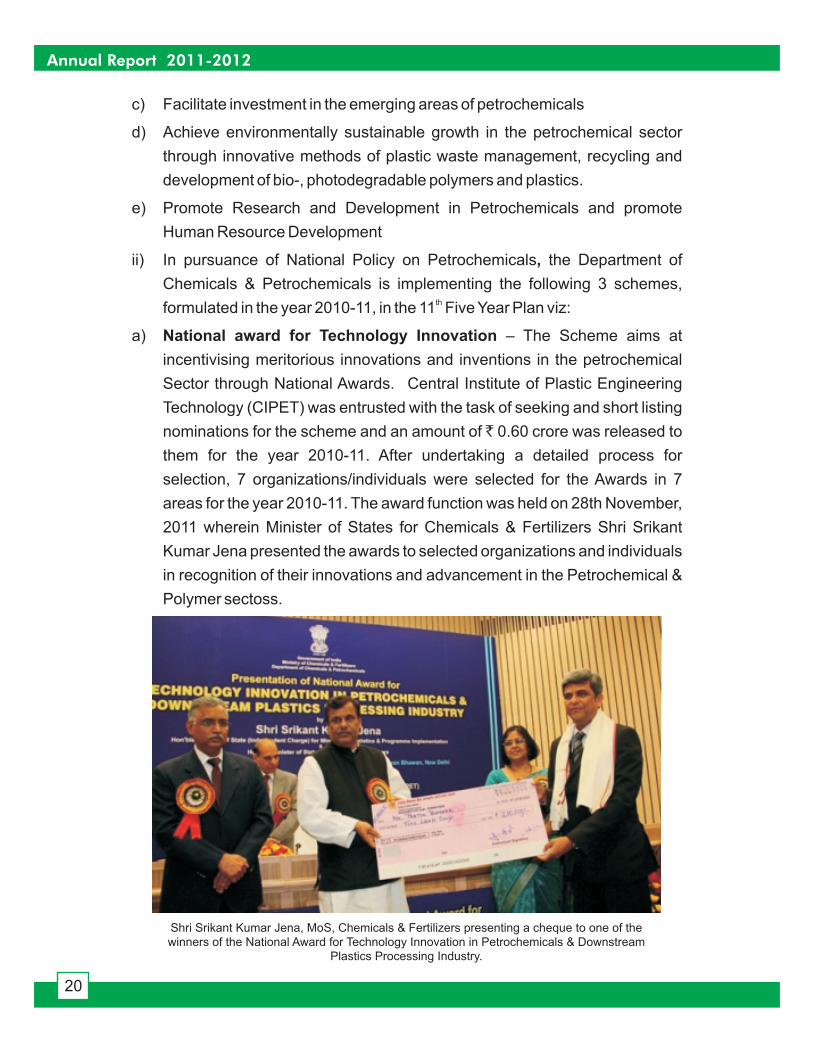
a) – The Scheme aims at
incentivising meritorious innovations and inventions in the petrochemical
Sector through National Awards. Central Institute of Plastic Engineering
Technology (CIPET) was entrusted with the task of seeking and short listing
nominations for the scheme and an amount of 0.60 crore was released to
them for the year 2010-11. After undertaking a detailed process for
selection, 7 organizations/individuals were selected for the Awards in 7
areas for the year 2010-11. The award function was held on 28th November,
2011 wherein Minister of States for Chemicals & Fertilizers Shri Srikant
Kumar Jena presented the awards to selected organizations and individuals
in recognition of their innovations and advancement in the Petrochemical &
Polymer sectoss.
,
National award for Technology Innovation
th
`
Shri Srikant Kumar Jena, MoS, Chemicals & Fertilizers presenting a cheque to one of thewinners of the National Award for Technology Innovation in Petrochemicals & Downstream
Plastics Processing Industry.
Annual Report 2011-2012
20
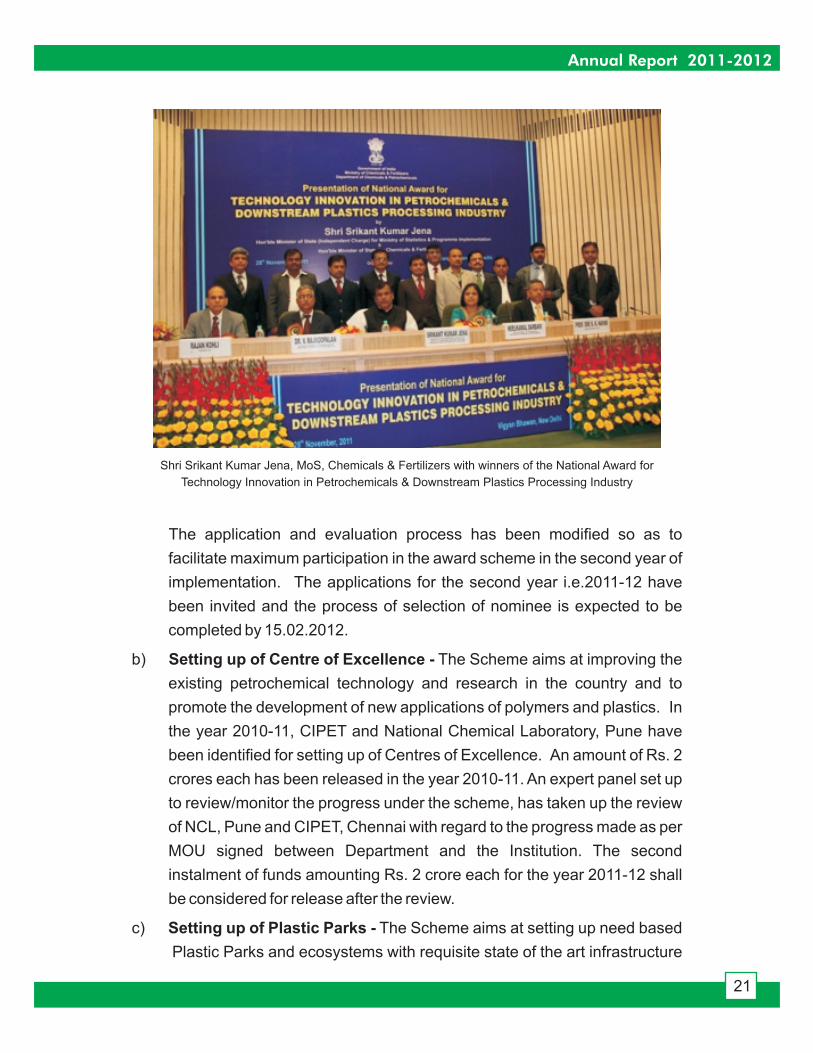
Shri Srikant Kumar Jena, MoS, Chemicals & Fertilizers with winners of the National Award for
Technology Innovation in Petrochemicals & Downstream Plastics Processing Industry
The application and evaluation process has been modified so as to
facilitate maximum participation in the award scheme in the second year of
implementation. The applications for the second year i.e.2011-12 have
been invited and the process of selection of nominee is expected to be
completed by 15.02.2012.
b) The Scheme aims at improving the
existing petrochemical technology and research in the country and to
promote the development of new applications of polymers and plastics. In
the year 2010-11, CIPET and National Chemical Laboratory, Pune have
been identified for setting up of Centres of Excellence. An amount of Rs. 2
crores each has been released in the year 2010-11. An expert panel set up
to review/monitor the progress under the scheme, has taken up the review
of NCL, Pune and CIPET, Chennai with regard to the progress made as per
MOU signed between Department and the Institution. The second
instalment of funds amounting Rs. 2 crore each for the year 2011-12 shall
be considered for release after the review.
c) The Scheme aims at setting up need based
Plastic Parks and ecosystems with requisite state of the art infrastructure
Setting up of Centre of Excellence -
Setting up of Plastic Parks -
Annual Report 2011-2012
21
and enabling common facilities to assist the sector to move up the value
chain and contribute to the economy more effectively. The scheme was
deliberated upon twice by the Standing Finance Committee headed by
Secretary (C&PC) in the year 2010-11 before approval and finalization of
scheme guidelines. The Expression of Interest for appointment of
Programme Manager was firmed up after detailed deliberations. The
Programme Manager for implementation of the scheme viz. Ms. Grant
Thornton India has been appointed. All State Governments were
requested to send their preliminary proposals. Several State Governments
have shown their interest in setting up Plastic Parks. The operational
guidelines for the implementation are being firmed up. In principle
approval of setting up of 2 plastic parks and release of initial grants in this
regard is envisaged during the current year.
i) The Assam Gas Cracker Project was initiated in pursuance of the
Memorandum of Settlement signed between Central Government and All
Assam Students Union (AASU) and All Assam Gana Parishad (AAGP) on
15th August 1985. Cabinet Committee on Economic Affairs (CCEA), in its
meeting held on 18th April, 2006, approved the setting up of the Assam
Gas Cracker Project at a project cost of Rs. 5460.61 Crores (fixed cost). A
joint venture company namely M/s. Brahmaputra Cracker & Polymer
Limited (BCPL), incorporated on 8th January 2007 is implementing the
project.
ii) The project has witnessed time and cost overruns owing to various reasons
such as time escalation, sub optimal size of the plant, increase in
infrastructural requirements & utilities and off sites resulting from
engineering and operational requirements, increase in construction cost,
frequent bandhs, labour unrest, inadequate availability of skilled
manpower at the site, prolonged monsoon etc.,.
iii) Accordingly, the Cabinet Committee on Economic Affairs has approved
Revised cost estimates (RCE) of Rs. 8920 crore (on "as built basis") for
setting up of theAssam Gas Cracker Project by BCPL. The funding pattern
envisaged for the project comprises of Capital Subsidy of Rs. 4690.00
crore, Debt amounting to Rs. 2961.00 crore and Equity of Rs. 1269.00
crore. The revised capital subsidy will be sought by the Department of
2.31 Assam Gas Cracker Project
Annual Report 2011-2012
22

Chemicals and Petrochemicals from the Ministry of Finance / Planning
Commission in 2011-12 and 2012-13 by way of additional budgetary
support. The Revised project schedule envisages mechanical completion
by July, 2013 and commissioning by December, 2013.
iv) The overall physical progress, as on 15th December, 2011 is 59.1% as
against the revised scheduled target of 58.2%. The cumulative
expenditure incurred during the year 2011-12, as on 15th December, 2011
is Rs.3512.41 crore including the expenditure of Rs 1336.53 crore in the
year 2011-12. Further, as on 15th December, 2011, the total financial
commitment to the tune of Rs. 7800.00 crore has been made.
v) The civil and structural works, mechanical and piping works for all the
process units viz. Cracker, polyethylene & polypropylene units and gas
processing, Gas sweetening & gas de-hydration units are under progress.
The delivery of Tertiary compressor for Ethylene Cracker Unit and
readiness of utility systems (Raw Water Treatment Plant, De-
Mineralisation Plant, Cooling Tower-1&2, Nitrogen 2, Flare) and Captive
Power Plant are falling in critical paths of the project schedule. These
activities are kept in focus and are being closely followed. All the Critical
Material Requisition (MRs) and Critical Tenders have been ordered /
awarded. Out of total 672 Material Requisitions (MRs), 667 MRs have
been ordered and balance MRs are targeted to be ordered progressively
by December, 2011. Out of a total of 108 tenders, 92. have been awarded
and the remaining tenders are targeted to be awarded progressively as per
project schedule.
vi). The Department of Chemicals and Petrochemicals has released the entire
budget outlay of Rs.675.71 crore to BCPL towards Capital Subsidy for the
year 2011-12. The civil works are in an advanced stage and most of the
payments will have to be made in the next few months. Most supply
contracts involve 90% or so payment against despatch of delivery, which
have started in full swing. Based on the actual progress, BCPL, as per their
revised funding plan for the current year and the revised cost estimates and
commissioning schedule, has projected increased requirement of capital
subsidy from the Government in the current year. Accordingly, additional
funds amounting Rs.1137.33 crore, over and above Rs.675.71 crore
Annual Report 2011-2012
23

allocated in Budget Estimates was sought in the second batch of
supplementary Demand for Grants 2011-12 to support project activities/
progress. An amount of Rs.199.73 crore (approved capital subsidy of
Rs.2138 crore minus capital subsidy provided till date i.e.
Rs.1938.27crore) has been approved in the second batch of
supplementary demand for grants and the same has been released to
BCPL.
vii) Based on the recommendation of Public Enterprises Selection Board
(PESB) and approval of Appointment Committee of Cabinet (ACC) for
appointment, Shri P.N.Prasad Chief Operating Officer, BCPL has been
appointed as Managing Director, BCPL. Further, in accordance with the
Guidelines on Corporate Governance, the proposal for appointment of 02
independent Non-Official Directors was forwarded to Department of
Personnel & Training (DoPT) for approval of Competent Authority. After
getting approval of DoPT, Shri P.C.Sharma, former Chief Secretary, Govt of
Assam has been appointed as Independent Director. The selection and
recruitment process for experienced personnel at all levels in BCPL has
also been expedited. Presently, 149 executives / engineers have been
recruited in BCPL, of which approx. 70% are from the North East. BCPL
has again been directed to expeditiously complete the phase-wise
recruitment of sanctioned posts.
viii) The Assam Gas Cracker Project is expected to lead to substantial
employment generation, as a result of investments in downstream plastic
processing industries and allied activities. The project is considered to be
of crucial significance for the state ofAssam and the North-Eastern region.
CWC is a universal non-discriminatory, multilateral, Disarmament Treaty,
which bans the development, production, acquisitions, transfer, use and
stockpile of all chemical weapons. India is a party to this Treaty. It has 188
Member States as its members as on 30.09.2011. India has a well-developed
chemical industry relevant to the Convention. The Department is also an
administrative Department for the CWCAct 2000, which is in force in the country.
In terms of the allocation of work in relation to this CWC activity, the Department
of C&PC is responsible for chemical industry matters and more specifically
CHEMICAL WEAPONS CONVENTION (CWC)
2.32
Annual Report 2011-2012
24
preparation of declarations, facilitation of inspections by OPCW teams and also
for creating awareness in the industry about its obligations under the
Convention.
Declarations and verification are the two important aspects for
implementation of the convention. Each State Party is required to make annual
declarations of the production, import and export of scheduled chemicals and
their production facilities. Declarations in respect of a large number of plant sites
producing other Organic Chemical Industries (also called OCPF) are also
required to be made. India has been making declarations within the prescribed
time frame.
Inspections are routinely conducted by the OPCW to ensure that the
activities in scheduled chemicals are in accordance with the provisions of the
Convention. India has so far received one hundred seven (107) inspections (as
on 25.10.2011). The same include 13 successfully hosted inspections received
so far by India during 2011. DCPC deputes escort officers to the industrial units
for facilitating advance preparation for hosting inspections as also for its actual
undertaking. The Department has also set up Help Desks in PPP mode in
association with the Indian Chemical Council (ICC) at various places with a
concentration of chemical industry of relevance to CWC for facilitating
compliance by the chemical industry in its obligations under CWC. These help
desks have the following coverage:
2.33
2.34
Location States covered
Hyderabad Andhra Pradesh, Orrisa and ChattisgarhKolkata Bihar, Jharkhand, West Bengal and Northe
Eastern RegionsDelhi Uttar Pradesh, Himachal Pradesh, Haryana,
Punjab, Chandigarh, Uttarakhand & J&KMumbai Maharashtra, Goa, Rajasthan, Madhya Pradesh
etc.Chennai Tamilnadu, Karnataka and KeralaVadodara Gujarat
2.35 The Help Desks have been set up for undertaking the following activities:-
i. Disseminate information on CWC to all stakeholders giving a clear over-
view including details of obligations of the chemical industry under the CWC
Act.
ii. Identification of units, which are potential declarants through industry
surveys and facilitate them in filing declarations.
Annual Report 2011-2012
25
iii. Assist the units in filling declarations proforma as stipulated under the CWC
Act.
iv. Prepare training material for circulation in consultation with the Deptt. of
C&PC.
v. Conduct awareness workshops in the vicinity. 15 Awareness Programmes
have been conducted during the period.
vi. Give due publicity to the Chemical Weapons Convention.
vii. Send a monthly report to the Department on the activities conducted by
them.
viii. Assist the Department in verification of the correctness of the declarations
filed by scheduled units through visits to plants and scrutiny of declaration
materials.
ix. Any other work assigned to it relating to the CWCAct.
In the past, Annual Declarations of Anticipated Activities (ADAA) and
Annual Declarations of Past Activities (ADPA) were submitted by the facilities
manually. In view of the growing number of declarations and in order to improve
the quality of declarations, Department of Chemicals & Petrochemicals, in
association with NIC took an initiative to devise a system by which the declarants
would file declarations on-line. The software prepared by NIC was launched on
30.9.2011 to facilitate declarants to submit their declarations on-line.
To promote the growth of the chemical sector, IndiaChem - Gujarat 2011,
the second in the series of India Chem Gujarat - an International exhibition &
conference covering Specialty, Fine Chemicals, Agrochemicals and Colorants
was inaugurated by Shri Narendra Modi, Hon'ble Chief Minister of Gujarat at
Mahatma Mandir on 13th of October 2011 at Mahatma Mandir, Gandhinagar,
Gujarat. The event was jointly organized by the Department of Chemicals &
Petrochemicals, Govt. of India, Govt. of Gujarat, iNDEXTb and Federation of
Indian Chambers of Commerce and Industry (FICCI). Chemexcil organized an
International Reverse Buyer-Seller meet during the exhibition.
2.36
INDIACHEM GUJARAT 2011
2.37
Annual Report 2011-2012
26
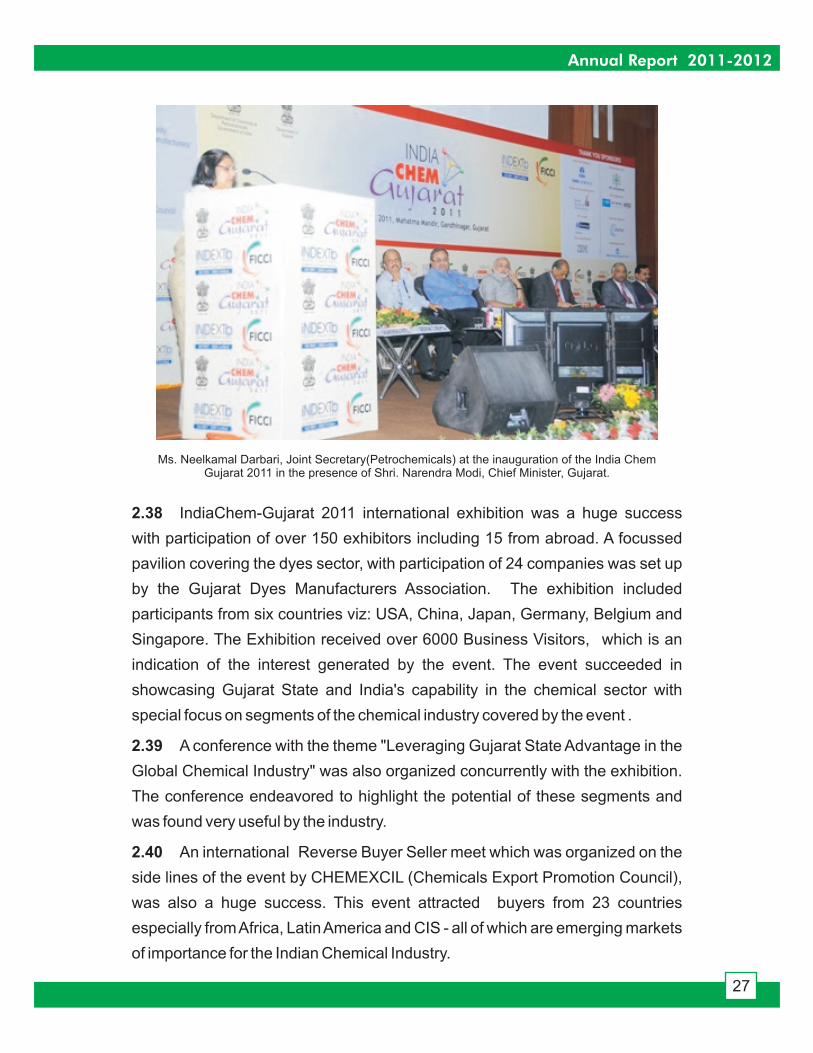
Ms. Neelkamal Darbari, Joint Secretary(Petrochemicals) at the inauguration of the India ChemGujarat 2011 in the presence of Shri. Narendra Modi, Chief Minister, Gujarat.
2.38
2.39
2.40
IndiaChem-Gujarat 2011 international exhibition was a huge success
with participation of over 150 exhibitors including 15 from abroad. A focussed
pavilion covering the dyes sector, with participation of 24 companies was set up
by the Gujarat Dyes Manufacturers Association. The exhibition included
participants from six countries viz: USA, China, Japan, Germany, Belgium and
Singapore. The Exhibition received over 6000 Business Visitors, which is an
indication of the interest generated by the event. The event succeeded in
showcasing Gujarat State and India's capability in the chemical sector with
special focus on segments of the chemical industry covered by the event .
A conference with the theme "Leveraging Gujarat State Advantage in the
Global Chemical Industry" was also organized concurrently with the exhibition.
The conference endeavored to highlight the potential of these segments and
was found very useful by the industry.
An international Reverse Buyer Seller meet which was organized on the
side lines of the event by CHEMEXCIL (Chemicals Export Promotion Council),
was also a huge success. This event attracted buyers from 23 countries
especially fromAfrica, LatinAmerica and CIS - all of which are emerging markets
of importance for the Indian Chemical Industry.
Annual Report 2011-2012
27
Rotterdam Convention on Prior Informed Consent for trade in hazardous
Chemicals.
2.41
2.42
MAJOR PROVISIONS
2.43
2.44
2.45
2.46
Rotterdam Convention on Prior Informed Consent Procedures (PIC) is a
legally binding instrument, which was adopted on 10th September 1998 by a
Conference of Plenipotentiaries in Rotterdam. This Convention has entered into
force on 24th February 2004. India acceded to the Convention on 24.5.2006.
The objectives of this Convention are to promote shared responsibility
and cooperative efforts among Parties in the international trade of certain
hazardous chemicals in order to protect human health and the environment from
potential harm. It also seeks to contribute to the environmentally sound use of
these hazardous chemicals, by facilitating information exchange about their
characteristics, providing for a national decision making process on their import
and export and by disseminating these decisions to the Parties.
The Convention covers pesticides and industrial chemicals that have
been banned or severely restricted for health or environmental reasons by
Parties and which have been notified by Parties for inclusion in the PIC
procedure.
There are 40 chemicals listed inAnnex III of the Convention and subject to
the PIC procedure, including 25 pesticides, 4 severely hazardous pesticide
formulations and 11 industrial chemicals. Parties are required to communicate
their import policy for these chemicals to PIC Secretariat.
Each Party is required to designate a NationalAuthority for performing the
administrative functions required under the Convention. Department of
Chemicals and Petrochemicals is the Designated National Authority (DNA) for
industrial chemicals and Department of Agriculture and Co-operation is the DNA
for pesticides.
The exporting Party has to provide the export notification to the importing
Party in respect of banned or severely restricted chemicals in the importing
country. The export notifications received from other Parties for industrial
chemicals are being examined by Department of Chemicals and
Petrochemicals, being the DNA for chemicals, and acknowledgement/reply is
sent to the DNAof the exporting country.
Annual Report 2011-2012
28
Stockholm Convention on Persistent Organic Pollutants (POPs)
2.47
2.48
2.49
Registration EvaluationAuthorisation of Chemicals (REACH)
2.50
The Stockholm Convention is a global treaty to protect human health and
environment from persistent organic pollutants (POPs). POPs are chemicals
that remain intact in the environment for long periods, become widely distributed
geographically, accumulate in the fatty tissue of living organisms and are toxic to
human beings and wildlife. POPs travel globally and can cause damage
wherever they travel. The Convention lays down that in its implementation,
Governments will take measures to eliminate or reduce the release of POPs into
the environment. This Convention entered into force on 17th May 2004. India
ratified this Convention on 13.1.2006.
The Stockholm Convention seeks the elimination or restriction of
production and use of all intentionally produced POPs (industrial chemicals and
pesticides). The Convention also seeks the continuing minimization and
wherever feasible, ultimate elimination of the releases of unintentionally
produced POPs such as dioxins and furans. At present, twenty one chemicals
are covered under the Stockholm Convention, of which the use of DDT is
restricted in India. Use of DDT has been banned for agricultural purposes; it is
produced in a restricted manner for use in vector control only. India has
obtained exemption for use of DDT for vector control. Further, the chemical
Dieldrin, which is also listed under the Stockholm Convention, is used in a
restricted manner for locust control.
Stockpiles and wastes containing POPs must be managed and disposed
of in a safe, efficient and environmentally sound manner, taking into account
international rules, standards and guidelines. Each country is required to
develop a plan for implementing its obligations under the Convention. A Global
Environment Facility (GEF) has been set up as an interim financial mechanism,
to assist the developing countries in implementation of the Convention.
European Union has enacted a legislation entitled REACH under which
the industry has been made responsible for the safety of products. The new
legislation envisages:
Annual Report 2011-2012
29
Registration:
Evalution:
Authorisation:
2.51
2.52
to provide information on the safe use of chemicals manufactured
or imported in quantities more than 1 tonne per annum.
the information provided by industry will be assessed for
completeness and
Substances of highest concern will require additional
assessment of use and may be approved if the controls are adequate or
alternatives are unviable. Alternatively, they may be restricted if the measure
required to manage the risks are deemed inappropriate.
REACH legislation enacted by EU came into force w.e.f. 1.6.2007. The
process of pre-registration of chemicals with European Chemical Agency
(ECHA) closed on 1.12.2008. As of 1st December 2008, 650 companies from
India have pre-registered 7500 substances through CHEMEXCIL. There are
many other companies, which have pre-registered their products directly with
ECHA.
With the closure of pre-registration phase, the deadline for registration
with ECHAis as under:
Substances placed in market in quantities over 1000 MT orsubstances of very high concern
1-12-2010
Substances placed in market in quantities of 100-1000 MT 1-6-2013
Substances placed in market in quantities up to 100 MT 1-6-2018
2.53 AHelp Desk on REACH has been established in CHEMEXCIL for helping
the chemical exporters to the EU. The Help Desk guides exporters about the
procedures to be followed for meeting the requirements of REACH. It also
facilitates the registration of chemicals exported. CHEMEXCIL has taken steps
for forming local consortia in respect of substances due to be registered by
December'10 with an aim to share and thereby reduce the costs involved. So far
56 such consortia in respect of 150 substances have been formed.
Annual Report 2011-2012
30

Chapter- III
3.1
3.2
3.3
Adjudication of Compensation Claims
3.4
An industrial disaster of unprecedented scale occurred In the night of
2nd/3rd December, 1984 when Methyl Iso-cyanate (MIC), a lethal gas stored in
two tanks of Union Carbide India Limited (UCIL)'s pesticide unit at Bhopal,
leaked into the atmosphere causing thousands of deaths and injuring a large
number of people. The State Government of Madhya Pradesh as well as the
Central Government undertook immediate relief and rehabilitation measures, for
the victims of the gas leak disaster and their families. Various relief measures
are still continuing.
A large number of civil and criminal cases were filed against UCIL and its
management in various Courts by individuals and groups. To ensure proper
legal representation of the victims and settlement of their claims, the
Government of India enacted the Bhopal Gas Leak Disaster (Processing of
Claims) Act, 1985 and a Scheme there under. The Office of the Welfare
Commissioner, Bhopal Gas Victims was set up for adjudication of all the claims
and disbursement of compensation to the victims under the provisions of this
Act.
The Hon'ble Supreme Court vide its orders and settlement dated 14th &
15th February, 1989 had finally settled the litigation on the compensation
amount payable to Bhopal Gas Victims. Under the settlement, the Union Carbide
Corporation was directed to pay a compensation of US $ 470 million, which was
deposited by the Company with the Registrar of the Supreme Court of India, in
February 1989.
Under the provisions of the Bhopal Gas Leak Disaster (Processing of
Claims) Act, 1985, the Office of the Welfare Commissioner, Bhopal Gas Victims,
Bhopal was set up in 1985 for speedy disbursal of the compensation amount to
the survivors and families of the victims of the gas leak disaster. The actual
disbursement of the compensation started from November 1992 after the order
of the Supreme Court dated 16th October 1992 laid down the modalities for the
payment of compensation. By 30.09.2011 approximately Rs. 1548.55 crores
had been awarded to 5, 74,376 claimants. The position of original compensation
claims as on 31.12.2011 is as follows:
BHOPAL GAS LEAK DISASTER
Annual Report 2011-2012
31

S. No. Category Number ofcases awarded
Total Amount Awarded(Original) in Rs. crore
1. Death 5295 54.642. Permanent
disability4902* 25.18
3. Temporarydisability
35,455** 137.66
4. Utmost severe cases 42 0.41
5. Minor injuries 5,27,894*** 1,328.54
6. Loss of property/PSU 555 2.01
7. loss of livestock 233 0.11
TOTAL 5,74,376 1548.55
*, **, *** 10,047 cases claimed under Death category were, after adjudication, considered under the
categories of Permanent disability (1,703 cases), Temporary disability (1,783 cases) and the rest as Minor
injury (6,561 cases). Thus the total number of cases under various categories are: Permanent disability -
4,902 (3,199 + 1,703), Temporary disability: 35,455 (33,672 + 1,783) and Minor injuries - 5, 27,894 (5,
21,333 + 6,561).
3.5
3.6
The Supreme Court vide its order dated 19th July,2004 had directed the
Welfare Commissioner to disburse the balance amount of approximately
Rs.1500 crores, which was lying unspent with the Reserve Bank of India, on pro-
rata basis to the claimants(in the ratio of 1:1 of original compensation). The
distribution of pro-rata compensation commenced from 15th November, 2004,
as per the directions of the Supreme Court. Till 31.12.2011, a sum of Rs.
1510.40 crore has been disbursed to 5, 62,766 claimants on pro-rata basis. The
work of distribution of pro-rata compensation is continuing. The Welfare
Commissioner has sought the directions of the Supreme Court on the issue of
closure of cases of absentee claimants for pro-rata compensation. The Supreme
Court is yet to issue any orders/directions in this regard.
The Government, on the recommendations of the GoM, has decided to
pay ex-gratia to the following categories of gas victims:-
Annual Report 2011-2012
32
Category Ex-gratiaDeath 10 lakh (less amount already received)Permanent disability 5 lakh (less amount already received)Injury of utmost severity 5 lakh (less amount already received)
Cancer cases 2 lakh (less amount already received)Total Renal Failure Cases 2 lakh (less amount already received)Temporary disability 1 lakh (less amount already received)
An amount of Rs. 740.28 crore has been approved by the Government for
disbursement of ex-gratia amongst the above categories of victims and the
same has been released to the Welfare Commissioner for disbursement of ex-
gratia to the victims falling in above categories. The Office of the Welfare
Commissioner has commenced disbursal of ex-gratia to the Gas victims on
19.12.2010. Upto 31.12.2011, 41,364 cases have been decided and a sum of
Rs. 619.22 crore has been disbursed.
As part of the initial relief and rehabilitation measures, the Central
Government provided financial assistance to the extent of Rs. 102 crore over a
period of 4 years starting from 1985 onwards, for carrying out the rehabilitation
related work. Subsequently, the Central Government also approved an Action
Plan with an outlay of Rs.163.10 crore for medical, economic, social and
environmental rehabilitation of the gas victims, the outlay for which was later
revised upwards to Rs. 258 crore. It was decided that the outlay was to be
shared between the Central Government and the State Government of Madhya
Pradesh in the ratio of 75:25, and accordingly the Central Government released
Rs.193.50 crores as its 75% share. For subsequent maintenance and other
recurring expenditure involved in respect of all the schemes covered under the
Action Plan, the State Government of Madhya Pradesh was advised to make
appropriate provisions in itsAnnual Plan.
The State Government of Madhya Pradesh had submitted to GoM, inApril
2008, a new Memorandum on Plan of Action with an outlay of 982.75 crore for
various rehabilitation measures to be taken for Bhopal Gas Victims. The
Government, on the recommendations of the GoM, has approved sanction of
Rs. 272.75 crore as Additional Central Assistance (ACA), on 75:25 basis to the
Action plan for the Rehabilitation Measures of Bhopal Gas Victims
3.7
3.8
Annual Report 2011-2012
33
`
`
`
`
`
`
State Government, in the first instance, for the various rehabilitation measures to
be taken by the State Government of Madhya Pradesh.
Under the directions of the Supreme Court, a Specialty Hospital named
Bhopal Memorial Hospital and Research Centre (BMHRC) has been
constructed at Bhopal with super specialty facilities, by the former Union Carbide
Corporation. As per the directions of the Supreme Court, a Trust named the
'Bhopal Memorial Hospital Trust' was set up under the Chairmanship of retired
Chief Justice of India Shri A.M. Ahmadi in August 1998, to oversee the
construction and management of the Specialty Hospital. The Hospital started
functioning in July 2000.
The hospital has 330 beds with facilities in 12 disciplines viz., Cardio
Thoracic Surgery, Nephrology, Urology, Neurology, Neuro Surgery,
Opthalmology, Pulmonary Medicine, and Psychiatry etc. 8 Mini Units of the
Hospital have been set up in various gas- affected wards in Bhopal, for the gas
victims. Free medical treatment to in-door gas patients and free medicines to gas
victims visiting the mini units and the main BMHRC (OPD Center) are being
provided since the commissioning of the Hospital and its mini units. The Hospital
also bears the expenditure incurred on surgical facilities provided to gas victims
and even provides expensive treatment to cardiac patients and patients with
other serious ailments.
The Central Government had, in June, 2010, on the recommendations of
the GoM, decided to take over BMHRC through the Department of Atomic
Energy and Department of Bio-technology. The Supreme Court endorsed the
decision on 19.07.10. The administration of BMHRC is now being overseen by
Tata Memorial Centre. The Committee of Secretaries in September, 2011, has
approved a proposal moved by Department of Atomic Energy that BMHRC be
appropriately taken over and administered by Department of Health Research
and the same has been approved by the Cabinet in its meeting held on
04.01.2012.
The High Court of M.P. while hearing a Public Interest Litigation
2802/2004 filed on environmental remediation of the UCIL plant site, had
constituted a Task Force in 2005 under the Chairmanship of the Secretary,
Department of Chemicals and Petrochemicals for co-coordinating the overall
Specialty Hospital at Bhopal
3.9
3.10
3.11
Environmental Remediation of the UCIL plant site
3.12
Annual Report 2011-2012
34

environmental remediation of the plant site at Bhopal. The Government of M.P.
in consultation with the M.P. Pollution Control Board prepared a three-phase
road map for removal/disposal of the toxic wastes lying in and around the plant
site at Bhopal, which was approved by the High Court. The Task Force has been
co-coordinating the tasks under the road-map, which include removal/disposal
of stored toxic wastes lying at the plant site, complete remediation of the
contaminated soil, ground-water of the area in and around the plant site and
dismantling and de-commissioning of the plant. The High Court of M.P. through
the Task Force has been monitoring the environmental remediation work.
Out of the 390 MT of stored toxic wastes lying at UCIL plant, 40 MT of lime
sludge has been disposed off in the Treatment, Storage, Disposal Facility
(TSDF) at Pithampur in June, 2008. The directions of the High Court that the
remaining 350 MT of toxic wastes be incinerated in the BEIL incinerator at
Ankleshwar, Gujarat was contested by the Govt. of Gujarat in the Supreme
Court. The Supreme Court, after a series of hearings, disposed off the SLP vide
order dated 28th January, 2010 and endorsed the decision of the Task Force that
the new incinerator at Pithampur, MP will be operationalized at the earliest after
which the wastes can be incinerated in that incinerator. Accordingly after the
necessary permissions were accorded by State Government of MP, the trial run
of the incinerator at Pithampur started in May, 2010. After the trial run with non-
UCIL waste is completed successfully and the incinerator is stabilized, trial run
with UCILwaste was to be taken up.
As per the decision of the Government, on the basis of recommendations
of the GoM, an Oversight Committee has been constituted under the
Chairmanship of Minister of State (I/c) Ministry of Environment and Forests, Co-
chairmanship of Minister in charge of BGTR&R Department, Govt. of MP to
provide oversight and support to remediation actions to be taken by Govt. of M.P.
The Government has also decided to bear the cost of remediation, presently
estimated as Rs.310 crore, pending restitution claim from the polluter. The
matter with regard to fixing of the liability on the polluter is pending in the High
Court of M.P.
The present Group of Ministers (GoM) was reconstituted on 26th May,
2010 to examine all the issues relating to Bhopal remediation measures and to
3.13
3.14
Group of Ministers on Bhopal Gas Leak Disaster
3.15
Annual Report 2011-2012
35

make appropriate recommendations regarding relief and rehabilitation of Bhopal
Gas Victims and their families. The GoM met continuously for four days from
18.6.2010 to 21.6.2010 and considered all issues concerning the tragedy
including compensation, extradition of Warren Anderson, legal matters, Bhopal
Memorial Hospital and Research Centre, health related issues, environment
related issues and the new Plan of Action submitted by the Govt. of MP. The
recommendations of the GoM were considered by the Cabinet and certain
decisions taken with strict time lines for implementation. In keeping with the
decisions of Cabinet, a sum of Rs. 272.75 crore has been provided on 75:25
sharing basis to State Government of M.P. for various rehabilitation measures
for the victims; Rs. 740.28 crore have been provided for disbursement of ex-
gratia to specified categories of victims; CBI has filed the revision application and
appeal in the sessions court against order dated 7.6.2010 of CJM, Bhopal. CBI
has filed Curative Petition against order dated 13.9.1996 of Supreme Court;
which has been dismissed by the Court in May,2011; Ministry of External Affairs
is pursuing the matter of extradition of Warren Anderson in consultation with the
CBI and the Ministry of Law, a fresh request for extradition of Warren Anderson
has been sent to the concerned authorities of the US Government by Ministry of
ExternalAffairs inApril,2011; Supreme Court has endorsed taking over of BMHT
by the Central Government; ICMR has set up its 31st research centre at Bhopal;
the Department of Chemicals & Petrochemicals has filed a Curative Petition in
the Supreme Court on 03.12.2010 against its judgements of 1989 and 1991
settling the compensation amount at US $ 470 million and asking for its
enhancement; a transfer petition has also been filed for transferring the W.P. No.
2802/2004 from Madhya Pradesh High Court to Supreme Court.
The GoM has also recommended that the issue relating to incineration of
350 MT of toxic waste in the TSDF at Pithampur will be examined further by the
Oversight Committee based on the final recommendations of the Peer Review
Committee about the process/technology to be used and the site for its disposal.
The Peer Review Committee was constituted to review the Reports of NEERI,
NGRI and IICT for environmental remediation of plant site and surrounding
areas. The final report of the Peer Review Committee has been submitted to the
Oversight Committee by the Ministry of Science and Technology. The issue of
disposal of 350 MT of toxic waste was considered by the Oversight Committee in
its meetings held on 24th March, 2011 and 25th May, 2011 in view of
3.16
Annual Report 2011-2012
36
Government of Madhya Pradesh expressing their inability to incinerate the said
waste at Pithampur. The Oversight Committee considered the option of
disposal of the toxic waste by the Defence Research and Development
Organization (DRDO) in their incinerator facility at Nagpur, Maharashtra. A PIL
filed by private parties against entry and disposal of this toxic waste at Nagpur,
was disposed off on 21st July, 2011 by Bombay High Court directing
Government of Maharashtra and Maharashtra Pollution Control Board (MPCB)
to approach High Court of Madhya Pradesh at Jabalpur as the case was pending
with that Court. The High Court of Madhya Pradesh vide orders dated 28.07.11
and 11.08.11 had suspended the transfer of waste to Nagpur and directed the
MPCB to analyse the samples and inspect the DRDO facility at Nagpur to ensure
incineration at DRDO facility will not cause any hazards to nearby people.
MPCB expressed its inability to analyse the likelihood of hazard from disposal of
toxic waste and submitted to Court on 09.12.11 that statutory permission to
DRDO could not be granted because of non-compliance with statutory
provisions by DRDO.
The Court on 19.12.11 has directed the Central Government to get the
test of incineration of waste material and analysis of the fumes and residue
carried out in the selected laboratory and to submit the report. Ministry of
Environment and Forests is submitting regular status reports in the High court of
Madhya Pradesh as per its directions for disposal of toxic waste.
3.17
Annual Report 2011-2012
37

HINDUSTAN ORGANIC CHEMICALS LIMITED
4.1
4.2
4.3
4.4
4.5
Hindustan Organic Chemicals Limited (HOCL) was incorporated on 12th
December 1960; for setting up manufacturing capacities for chemicals/
intermediates which are required for production of Dyes, Dye-intermediates,
Rubber chemicals, Pesticides, Drugs and pharmaceuticals, laminates, etc. It
was expected that indigenous manufacture of these chemicals and
intermediates would give impetus to downstream industry resulting in setting up
of chemical units and achieving self-sufficiency for the country in this area. The
objective behind setting up of HOCL has been achieved as over the years, more
than 500 units based on HOCL's products have been set up all over the country
which have not only helped in achieving self sufficiency but have also entered
the international market by exporting chemicals, dyes and drugs for over the last
many years.
The products manufactured by HOCL include phenol, acetone,
formaldehyde, nitrobenzene, aniline, nitro toluene, sulphuric acid/ oleum,
acetanilide and Hydrogen Peroxide. The raw materials used by HOCL are
Benzene, Toluene, LPG, Methanol, naphtha and Sulphur, most of which come
from Petroleum Refineries.
HOCL has two units at Rasayani (Maharashtra) and Kochi (Kerala). It also
has a subsidiary company, M/s Hindustan Fluorocarbons Limited located at
Rudraram (Andhra Pradesh) for manufacture of poly-tetra-fluoro-ethylene
(PTFE), a high- technology engineering plastic.
The Kochi Unit has been achieving more than 100% capacity utilization
due to the measures taken for continuous supply of raw materials through
pipeline network established between BPCL-KR and HOC Plant, which has
helped the company to streamline the production without any interruption. It has
also helped the Company to reduce overheads and expenditure for sampling
and totally eliminate the handling losses that occurred when the raw material
was received by tanker lorries, thus improving the efficiency of operation and
safety.
The following are details of the physical and financial performance of the
Company for the last five years:
Chapter- IV
PUBLIC SECTOR UNDERTAKINGS
Annual Report 2011-2012
38

Year Production(MT)
Turnover(Rs. Crore)
Net Profit/ Loss(Rs`. Crore)
2006-07 207110 591.25 (+) 17.042007-08 242013 666.59 (+) 13.612008-09 245192 620.90 (-) 25.272009-10 221249 520.71 (-) 83.072010-11 238684 738.03 (+)25.71
4.6 New Proposals and Projects
M/S HINDUSTAN FLUOROCARBONS LIMITED
4.7
4.8
i) To improve the operational efficiency of the Rasayani plant, the
changeover of feed stock from Naptha to CNG for Hydrogen plant and
furnace oil to CNG in the Boiler for steam production is completed. This
has helped the company to reduce the cost of production for hydrogen
gas which is an important raw material for the production of Aniline and
Nitro toluene through cheaper process steam.
ii) Gainful utilization of surplus land available in Rasayani and Panvel by
associating with reputed PSUs like RCF and JNPT is under
consideration.
iii) Refurbishment of C.N.A, plant alongwith expansion of N2O4 facility from
300 TPA to 500 TPA with the financial assistance of Rs. 27 crore from
ISRO is under implementation.
M/s Hindustan Fluorocarbons Ltd. (HFL) is a subsidiary company of
Hindustan Organic Chemicals Limited. HFL was incorporated on 14.7.1983. The
Regd. office of the company is located at No.1402, Babukhan Estate, Bashir
Bagh, Hyderabad. The company is engaged in the manufacture of Poly Tetra-
Fluoro Ethylene (PTFE) and Chloro-Di-Fluoro Methane (CFM-22). PTFE is
extensively used in chemical, mechanical, electrical and electronic industries
and has strategic applications in the defence and aeronautical sectors. The
factory is located at Rudraram, Dist. Medak,Andhra Pradesh.
The company is under BIFR. The Rehabilitation package under the
operating agency M/s. IDBI is approved by BIFR on 03/12/2007.
Implementation of the same is already undertaken by HOCL management. The
rehabilitation proposal largely consists of Thermal Oxidation of CFM-23
produced during process of production of CFM-22 which is entitled for Clean
Development Mechanism (CDM) benefits. The company has obtained the host
country approval from the Ministry of Environment and Forest (MOEF) and the
Annual Report 2011-2012
39
project is registered by United Nations Framework Conventions On Climate
Change (UNFCCC) Board on 14th of Nov. 2008. With the implementation of
CDM, the company is expected to have positive net worth by 2013-14. The
expected revenue out of CDM project is around Rs. 20 Crore. The company has
sold 2, 10,000 Certified Emission Reductions (CERs), earning a revenue of Rs.
17 crore in the year 2011-12. The Company expects to earn about Rs. 10-15
crore per annum from the sale of CERs regularly.
Hindustan Insecticides Limited (HIL) was incorporated in 1954 and set up
its factory in Delhi for manufacturing DDT to meet the demand of National
Malaria Eradication Programme (NMEP) presently known as National Vector
Borne Disease Control Programme (NVBDCP) launched by Govt. of India. This
plant went into production in April 1955. In 1957, the company set up their
second factory at Udyogamandal, near Cochin for the manufacture of DDT. The
company set up a plant at Rasayani, Maharashtra in 1977 for the manufacture of
Malathion, an insecticide used in public health. Another DDT plant was set up at
Rasayani in 1983. DDT is even today the most effective tool to fight dreaded
diseases like Malaria, Dengue, Kala Azar, and Japanese Encephalitis etc. The
company has contributed a lot in keeping these diseases under check in India.
Today, HIL is the largest producer of DDT in the world and the only other
producer is in China.
With a view to make quality pesticides available to farmers as part of the
Green Revolution, HIL has put up manufacturing facilities for various agro
pesticides at Udyogamandal, Kerala and Rasayani, Maharashtra. The
company manufactures technicals such as Endosulfan, Dicofol, Malathion
Butachlor, DDVP, Monocrotophos, Mancozeb etc. and around 27 agro
formulations at its plants at Udyogamandal (Kerala), Rasayani (Maharashtra)
and Bhatinda (Punjab). The company has a well-equipped Central R&D
Complex at Udyog Vihar, Gurgaon, Haryana along with an experimental farm.
In an effort to achieve international standard for its products and systems,
all the Units of the company took an initiative and successfully received ISO
9001:2000 certificate. Rasayani Unit has also been accredited with ISO: 14000
and ISO 18001:2007.
HINDUSTAN INSECTICIDES LIMITED
4.9
4.10
4.11
Annual Report 2011-2012
40
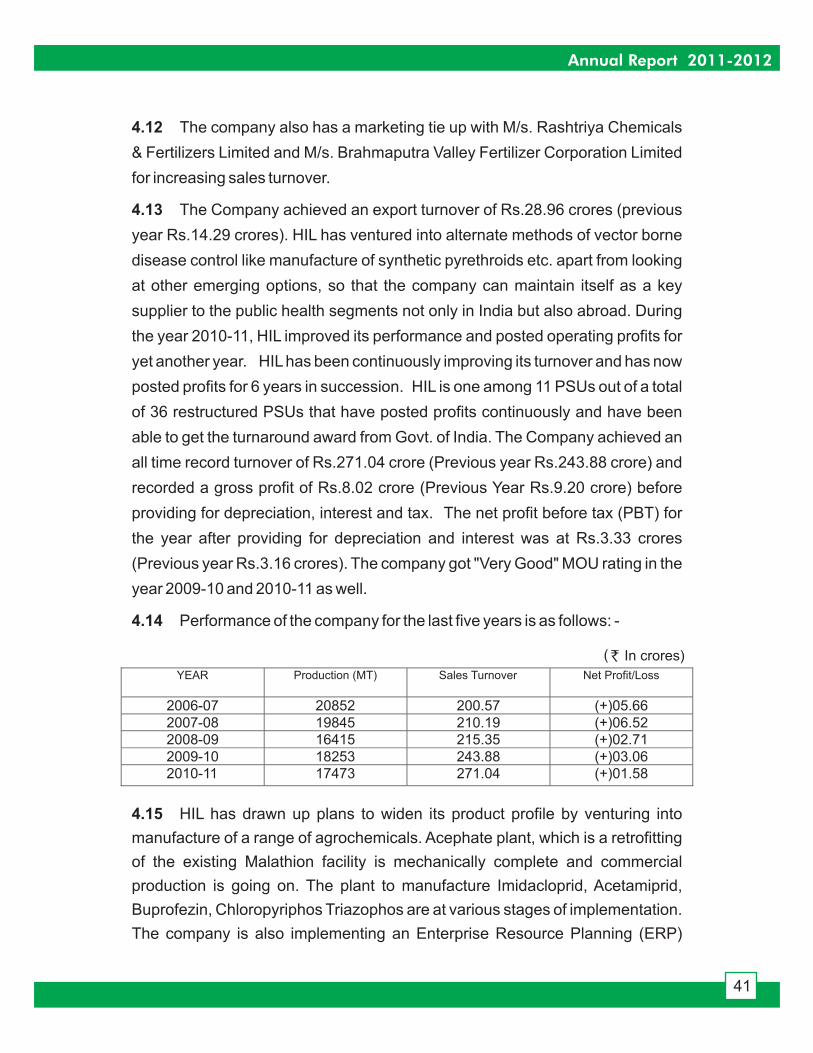
4.12
4.13
4.14
The company also has a marketing tie up with M/s. Rashtriya Chemicals
& Fertilizers Limited and M/s. Brahmaputra Valley Fertilizer Corporation Limited
for increasing sales turnover.
The Company achieved an export turnover of Rs.28.96 crores (previous
year Rs.14.29 crores). HIL has ventured into alternate methods of vector borne
disease control like manufacture of synthetic pyrethroids etc. apart from looking
at other emerging options, so that the company can maintain itself as a key
supplier to the public health segments not only in India but also abroad. During
the year 2010-11, HIL improved its performance and posted operating profits for
yet another year. HILhas been continuously improving its turnover and has now
posted profits for 6 years in succession. HIL is one among 11 PSUs out of a total
of 36 restructured PSUs that have posted profits continuously and have been
able to get the turnaround award from Govt. of India. The Company achieved an
all time record turnover of Rs.271.04 crore (Previous year Rs.243.88 crore) and
recorded a gross profit of Rs.8.02 crore (Previous Year Rs.9.20 crore) before
providing for depreciation, interest and tax. The net profit before tax (PBT) for
the year after providing for depreciation and interest was at Rs.3.33 crores
(Previous year Rs.3.16 crores). The company got "Very Good" MOU rating in the
year 2009-10 and 2010-11 as well.
Performance of the company for the last five years is as follows: -
( In crores)
YEAR Production (MT) Sales Turnover Net Profit/Loss
2006-07 20852 200.57 (+)05.662007-08 19845 210.19 (+)06.522008-09 16415 215.35 (+)02.712009-10 18253 243.88 (+)03.062010-11 17473 271.04 (+)01.58
4.15 HIL has drawn up plans to widen its product profile by venturing into
manufacture of a range of agrochemicals. Acephate plant, which is a retrofitting
of the existing Malathion facility is mechanically complete and commercial
production is going on. The plant to manufacture Imidacloprid, Acetamiprid,
Buprofezin, Chloropyriphos Triazophos are at various stages of implementation.
The company is also implementing an Enterprise Resource Planning (ERP)
Annual Report 2011-2012
41
`

package to further streamline the Production, Marketing and Financial System
etc.
BCPL was incorporated on 8th January 2007. It is implementing the
Assam Gas Project, the details of which are outlined in Section 2.31 of this
Report.
BRAHMAPUTRACRACKER & POLYMER LIMITED (BCPL)
4.16
Annual Report 2011-2012
42

Chapter- V
Central Institute of Plastics Engineering and Technology (CIPET)
5.1
5.2
5.3
5.4
CIPET is an ISO 9001:2008 QMS, NABL, ISO/IEC 17020 accredited
premier Institution devoted toAcademic, Technology Support & Research (ATR)
activities for the growth of Plastics & allied industries in the country. CIPET
operates at 22 locations spread across the country. CIPET has 15 centres at
Ahmedabad,Amritsar,Aurangabad, Bhopal, Bhubaneswar, Chennai, Guwahati,
Hyderabad, Hajipur, Haldia, Jaipur, Imphal, Lucknow, Mysore and Panipat. All
the CIPET centres have state of art infrastructural facilities in the areas of
Design, CAD/CAM/CAE, Tooling & Mould Manufacturing, Plastics processing,
Testing and Quality control to cater to the needs of plastics & allied industries in
the country.
To provide qualified Human Resource to the industry, CIPET offers a
blend of specialized academic Programs in the field of Plastics Engineering &
Technology, be it Doctoral, Post Graduate, Undergraduate, Post Diploma or
Diploma. Every year, CIPET trains students through long-term and short-term
Programs with hands-on experience with the most sophisticated facilities in
Design, CAD/CAM, Tool Room, Plastics Processing and Plastics Testing &
Quality Control. With a strong Alumni base of 50,000 professionals across the
world "CIPET" is indeed a recognized qualifying brand for supervisory and
managerial human resource for the plastics industries.
CIPET renders Technology Support Services in Design, Tooling, Plastics
Processing, and Testing & Quality Assurance both in India and abroad. The
biodegradable testing facility of CIPET, the first of its kind in the country works
jointly with European Bioplastics & International Biodegradable products
Institute.
Envisioned to be a Global R&D Hub, CIPET has established two
exclusive R & D wings at Chennai and Bhubaneswar. The Advanced Research
School for Technology & Product Simulation - ARSTPS at Chennai focuses on
Innovative Product Design for Automobile, Aerospace, Medical and Packaging
Industries, product and Tool Design Conceptualization, E- Manufacturing of
Prototypes, Rapid Prototyping for Lead Time Reduction, Reverse Engineering
for Metal Substitution withAesthetic and ErgonomicalApproach. The Laboratory
AUTONOMOUS INSTITUTIONS
Annual Report 2011-2012
43
for Advanced Research in Polymeric Materials (LARPM) at Bhubaneswar
concentrates on Bio polymers, E Waste Recycling, Polymer Composites &
Nanocomposites, Characterization of Blends, Alloys, and Fuel Cells. The Main
Objectives of the R & D wings are to jointly collaborate R&D projects with the
industry and with Indian and Foreign Universities to develop working Prototypes,
to find Solutions to Engineering Problems and to conduct Micro-analysis on
behavior of Materials, Structures and Mechanical Systems.
CIPET has signed Memorandum of Agreement with several leading
International Universities for faculty & student exchange Programs, bilateral R &
D initiatives and collaborative research projects. CIPET has established very
good interaction with Regional & National Plastics Associations in India & it is a
founder member of Plast India Foundation. Through the funding support from
the administrative Ministry, OPEC, UNIDO and World Bank, CIPET is constantly
updating its civil and technical infrastructure facilities & capabilities aimed at
continual process improvement, enhancing the knowledge & competency level
of employees and providing dedicated services to valued customers.
CIPET is conducting 10 different long-term training programs viz.
Diploma, Post Diploma, Post Graduate Diploma, Undergraduate, Post Graduate
and Ph.D. programs with varying levels of qualification for entry. As against
8853 students enrolled for the long term courses in 2009-10, 9523 students
have been admitted during 2011-12 - 8% more than the previous year.
Apart from the regular courses, the Institute also offers highly specialized
and customized Short - Term Programs in the field of Plastics Engineering &
Technology to update and improve the skill competency of technical manpower
in the plastics and allied industries. In the year 2010 - 11, 19553 participants
attended various Short term courses. CIPET is committed to impart Short term
courses for 21600 participants by the end of 2011-12, a 10% increase from the
previous year.
i) Tailor made Short Term Courses were offered to foreign nationals. 10
students from CIATEQ Advanced Technology Centre, Mexico and 9
students from Srilanka Export Development Council, Sri Lanka have
5.5
Academic programmes
Long term programmes
5.6
Short-term programmes
5.7
Annual Report 2011-2012
44
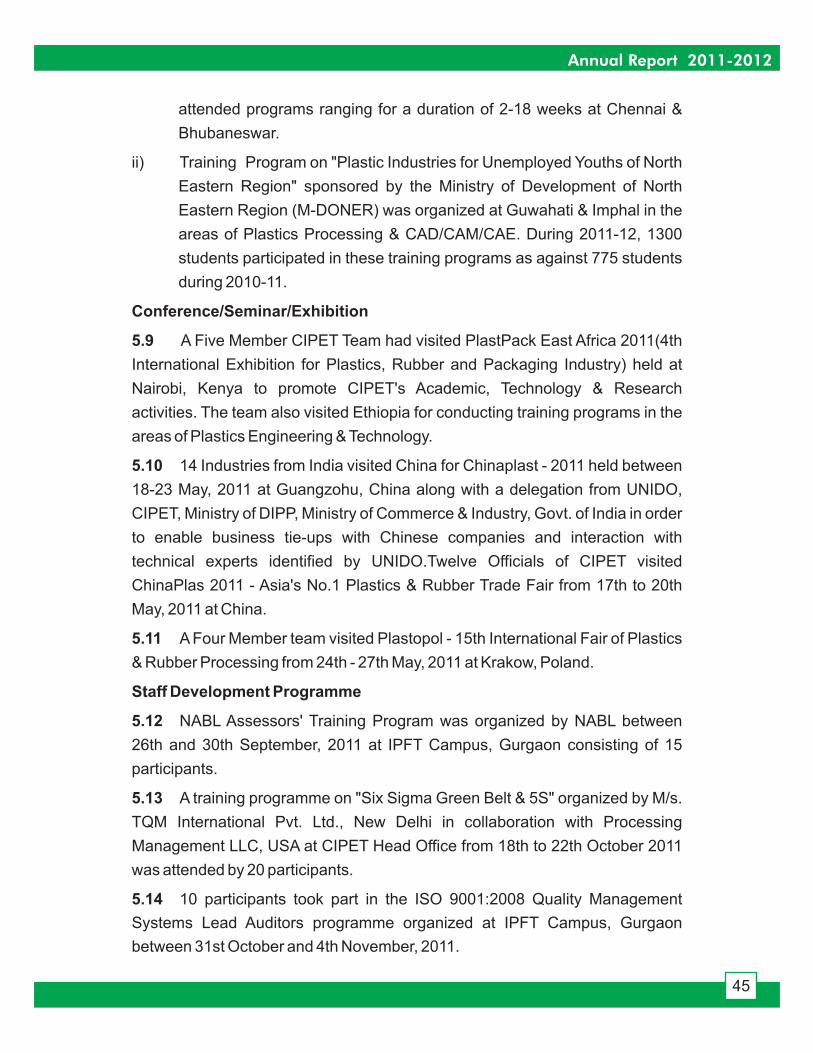
attended programs ranging for a duration of 2-18 weeks at Chennai &
Bhubaneswar.
ii) Training Program on "Plastic Industries for Unemployed Youths of North
Eastern Region" sponsored by the Ministry of Development of North
Eastern Region (M-DONER) was organized at Guwahati & Imphal in the
areas of Plastics Processing & CAD/CAM/CAE. During 2011-12, 1300
students participated in these training programs as against 775 students
during 2010-11.
A Five Member CIPET Team had visited PlastPack East Africa 2011(4th
International Exhibition for Plastics, Rubber and Packaging Industry) held at
Nairobi, Kenya to promote CIPET's Academic, Technology & Research
activities. The team also visited Ethiopia for conducting training programs in the
areas of Plastics Engineering & Technology.
14 Industries from India visited China for Chinaplast - 2011 held between
18-23 May, 2011 at Guangzohu, China along with a delegation from UNIDO,
CIPET, Ministry of DIPP, Ministry of Commerce & Industry, Govt. of India in order
to enable business tie-ups with Chinese companies and interaction with
technical experts identified by UNIDO.Twelve Officials of CIPET visited
ChinaPlas 2011 - Asia's No.1 Plastics & Rubber Trade Fair from 17th to 20th
May, 2011 at China.
A Four Member team visited Plastopol - 15th International Fair of Plastics
& Rubber Processing from 24th - 27th May, 2011 at Krakow, Poland.
NABL Assessors' Training Program was organized by NABL between
26th and 30th September, 2011 at IPFT Campus, Gurgaon consisting of 15
participants.
A training programme on "Six Sigma Green Belt & 5S" organized by M/s.
TQM International Pvt. Ltd., New Delhi in collaboration with Processing
Management LLC, USA at CIPET Head Office from 18th to 22th October 2011
was attended by 20 participants.
10 participants took part in the ISO 9001:2008 Quality Management
Systems Lead Auditors programme organized at IPFT Campus, Gurgaon
between 31st October and 4th November, 2011.
Conference/Seminar/Exhibition
5.9
5.10
5.11
Staff Development Programme
5.12
5.13
5.14
Annual Report 2011-2012
45

Technology Support/Services
5.15
Research and DevelopmentActivities
5.16
CIPET has been entrusted with prestigious assignments to provide
Technology support services. During the reporting period, the major Technology
Support Services undertaken are: -
i) CIPET has been awarded the Contract for Testing & Evaluation of
Contraceptive Devices - condoms, copper-T and tubal rings from
13.09.2011 to 12.09.2013 by the Ministry of Health & Family welfare,
Government of India.
ii) CIPET's expertise as third party InspectionAgency for plastics products is
recognized by various Central & State Governments organizations for
plastics & allied products. During 2011-12, CIPET undertook 1180
assignments from reputed industries across the country on behalf of
various State Government and its undertakings.
iii) M/s Ordnance Factory, Dum Dum has placed an order with CIPET for
Design & Development of Hot Runner Moulds for 20 Round Magazine
Assembly.
iv) CIPET has been accredited as a Type-A Inspection Body for 23 products
under scope of accreditation for its pre-delivery Inspection, which would
enhance the opportunity for generating internal resources.
During the reporting period, the following R&D activities have been
carried out through the R&D wings (LARPM &ARSTPS) of CIPET:
i) 11 sponsored R & D projects from various funding agencies like DST, DIT,
CSIR, OIDB, DCPC & Dept. of Bio-technology, etc. have been carried
out.
ii) 05 students have registered for Ph.D Program in the field of Polymer
Science & Engineering; 02 faculties have submitted Ph.D. Thesis.
iii) 25 Research papers have either been published in various International
Journals of high impact or presented in international conferences.
iv) 34 M.Tech. Theses work had been carried out.
v) Department of Chemicals & Petrochemicals, Govt of India had identified
CIPET for Setting up of 'Centre of Excellence for Green Transportation
Network (CoE-GREET)" to be implemented within a period of three
years.
Annual Report 2011-2012
46
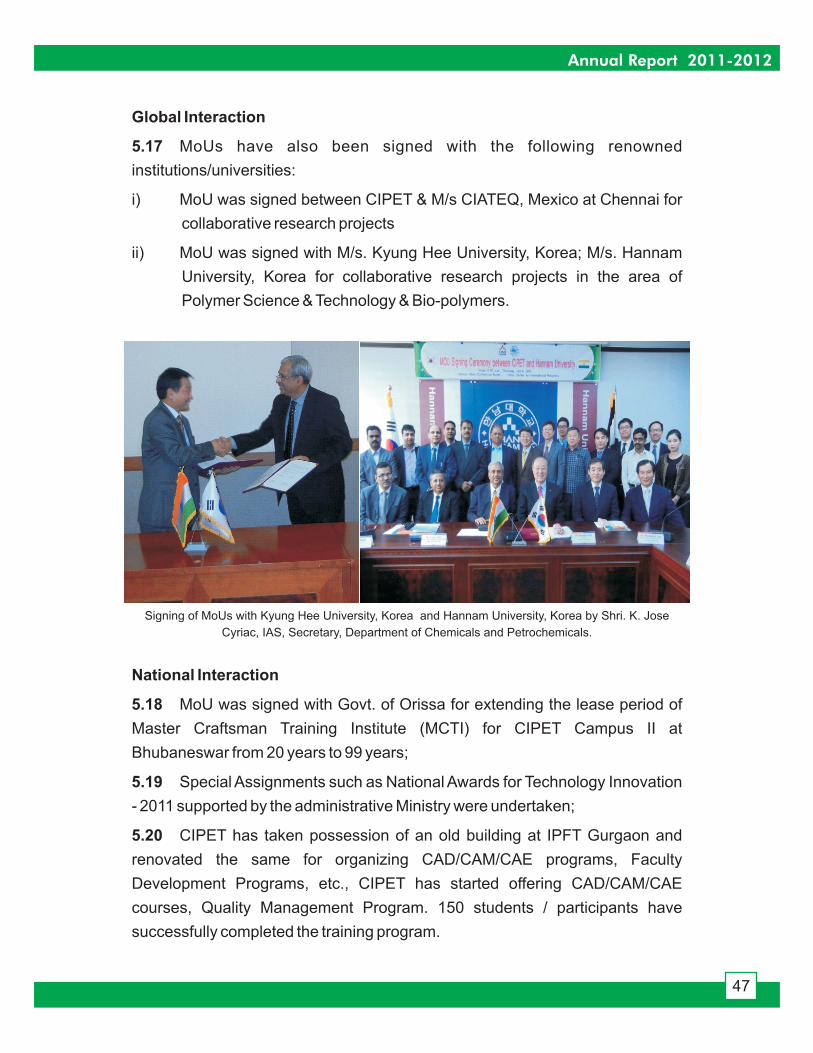
Global Interaction
5.17 MoUs have also been signed with the following renowned
institutions/universities:
i) MoU was signed between CIPET & M/s CIATEQ, Mexico at Chennai for
collaborative research projects
ii) MoU was signed with M/s. Kyung Hee University, Korea; M/s. Hannam
University, Korea for collaborative research projects in the area of
Polymer Science & Technology & Bio-polymers.
Signing of MoUs with Kyung Hee University, Korea and Hannam University, Korea by Shri. K. Jose
Cyriac, IAS, Secretary, Department of Chemicals and Petrochemicals.
National Interaction
5.18
5.19
5.20
MoU was signed with Govt. of Orissa for extending the lease period of
Master Craftsman Training Institute (MCTI) for CIPET Campus II at
Bhubaneswar from 20 years to 99 years;
Special Assignments such as National Awards for Technology Innovation
- 2011 supported by the administrative Ministry were undertaken;
CIPET has taken possession of an old building at IPFT Gurgaon and
renovated the same for organizing CAD/CAM/CAE programs, Faculty
Development Programs, etc., CIPET has started offering CAD/CAM/CAE
courses, Quality Management Program. 150 students / participants have
successfully completed the training program.
Annual Report 2011-2012
47
Inauguration of the National Workshop by Hon'ble Minister (Chemicals & Fertilizers), Shri. M.K.Alagiri
Annual Report 2011-2012
48
UNIDO Mission
5.21
5.22
Plastics Waste Management
5.23
Important Events
5.24
Awareness Program on Intellectual Properties (IPR) was conducted at
Delhi,Ahmedabad, Chennai & Bhubaneswar.
Steering Committee Meeting of UNIDO-ICAMT was held on 25th August
2011 at Head Quarters Bangalore under the leadership of DIPP, Ministry of
Commerce & Industry.Action plan for next six months has been evolved.
Shri S. Sugumar, Chief Manager (Technical), CIPET Head Office
participated in the Delegate Program at Japan during November 2011. The main
objective of the visit was to study Plastics Waste Management at Japan and
adopt the same technology in India.
National Workshop on "Plastics Waste Management" was inaugurated
by Shri M KAlagiri - Hon'ble Union Minister of Chemicals & Fertilizers at Madurai
on 22 January, 2011.
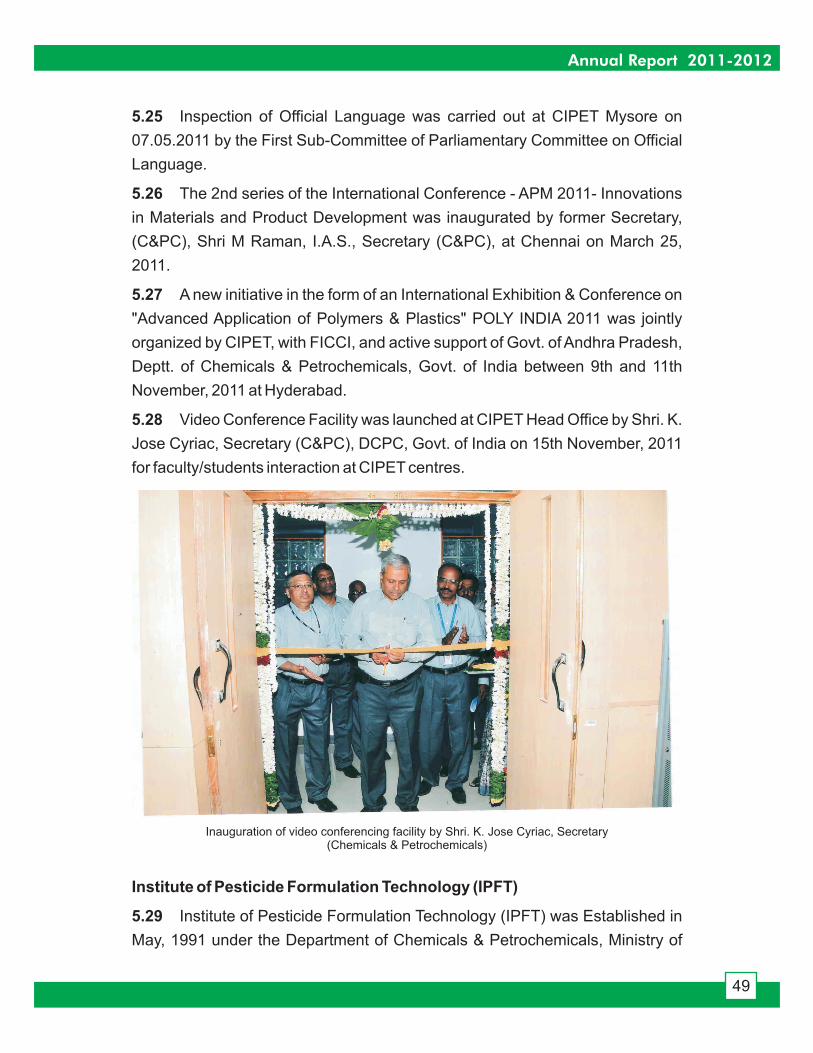
5.25
5.26
5.27
5.28
Inspection of Official Language was carried out at CIPET Mysore on
07.05.2011 by the First Sub-Committee of Parliamentary Committee on Official
Language.
The 2nd series of the International Conference - APM 2011- Innovations
in Materials and Product Development was inaugurated by former Secretary,
(C&PC), Shri M Raman, I.A.S., Secretary (C&PC), at Chennai on March 25,
2011.
A new initiative in the form of an International Exhibition & Conference on
"Advanced Application of Polymers & Plastics" POLY INDIA 2011 was jointly
organized by CIPET, with FICCI, and active support of Govt. of Andhra Pradesh,
Deptt. of Chemicals & Petrochemicals, Govt. of India between 9th and 11th
November, 2011 at Hyderabad.
Video Conference Facility was launched at CIPET Head Office by Shri. K.
Jose Cyriac, Secretary (C&PC), DCPC, Govt. of India on 15th November, 2011
for faculty/students interaction at CIPET centres.
Inauguration of video conferencing facility by Shri. K. Jose Cyriac, Secretary(Chemicals & Petrochemicals)
Institute of Pesticide Formulation Technology (IPFT)
5.29 Institute of Pesticide Formulation Technology (IPFT) was Established in
May, 1991 under the Department of Chemicals & Petrochemicals, Ministry of
Annual Report 2011-2012
49

Chemicals & Fertilizers as an autonomous institution. IPFT has established a
healthy rapport with the pesticides industries and has been able to successfully
transfer technology for safer, efficient and environment friendly formulations.
IPFT consists of three major Divisions and a Pilot plant. The Institute carries out
both in-house and external projects. The Institute also functions as a Technical
Coordinator Unit (TCU) on User and Environment friendly pesticide formulation
technology and quality control of RENPAP, one of the largest networks of
UNDP/UNIDO comprising of 15 countries ofAsia.
The main objectives of IPFT as given in the Memorandum of Association
of the Society are:
i) Development and production of state-of-the-art user and environment
friendly pesticide formulation technology.
ii) Promotion of efficient application technologies suiting the existing
requirements of the newer formulations.
iii) Information dissemination of safe manufacturing practices, quality
assurances, raw material specification and sources.
iv) Analytical and consultancy services.
v) Fostering the improvement in the qualification and usefulness of
pesticide scientists working in the agrochemical area.
vi) Continuing education through specialized training for pesticide
personnel.
IPFT has been participating in Organization for the Prohibition of
Chemical Weapons (OPCW) Profiency tests and seeking the status of a
"Designated Lab" by the. Recently, the lab participated in 29th OPCW
Proficiency Test held in April, 2011 and performed well (Grade 'A') and got the
status of a Designated Lab by the OPCW. This is an International Recognition
and IPFT has entered into the elite club of one of the few "OPCW Designated
Labs" world over.
M/s Entosav, Istanbul, Turkey has given the following Two Sponsored
Projects to IPFT: (i) Development of Lambda Cyhalothrin 25% Capsule
Suspension (CS) Formulation (ii) Development of Deltamethrin 12.5% +
Objectives of the Institute
5.30
Achievements during the year 2011 -12
5.31
5.32
Annual Report 2011-2012
50
Piperonoyl Butoxide 12.5% Water Dispersible Tablets (WT) Formulation at a
total cost of US$ 24,000 ( Rs. 11.0 lakhs).
DRDO Sponsored Projects: Defence Research & Development
Establishment (DRDE), DRDO, Ministry of Defence, Gwalior has sanctioned a
Task Project at a cost of Rs. 9.63 lakhs to IPFT for "Studies on safer and Eco-
friendly Mosquito Repellent formulations for Armed Forces". Another Task
Project entitled "Development of Synthetic Pyrethroid Formulations for Long
term Impregnation" at a cost of Rs. 8.50 lakhs has been sanctioned to IPFT by
the Defence Research Laboratory Tezpur (DRLT),Assam.
A day long Interactive Seminar with Agrochemical Industries was held on
April 09, 2011 with the help and cooperation of PMFI at Mumbai which was
attended by seventy representatives from various industries. As a result of this
interactive seminar, IPFT has received an overwhelming response and a
number of industry sponsored projects are coming IPFT's way.
IPFT has entered into MOUs with Directorate of maize research (DMR),
IARI, New Delhi and National Centre for Integrated pest Management (NCIPM),
IARI, New Delhi for undertaking collaborative projects.
IPFT continues to be a Laboratory accredited by National Accreditation
Board for Testing & Calibration Laboratories (NABL) as per ISO - 17025 (2005)
for the analysis of Pesticides and CWC related chemicals. The Desktop Audit of
the Lab was held in October, 2011.
IPFT has been successful in getting BIS Recognition/Certification in
June, 2011. This will result in increased revenue generation as IPFT has
qualified to receive samples for testing from BIS.
Research Assistants and Junior & Senior Research Fellows have been
recruited at IPFT to strengthen and support research activities in the mandated
work domain. In addition, 04 posts in various disciplines have been filled and
action has been initiated to fill up remaining vacancies.
Procurement of Equipment: Various sophisticated equipment /
instrument, inter-alia, including Automatic weather station, Water Distillation
Unit, Orbital Shaking Incubator, Nano Micro size Analyser and Super Speed
centrifuge & Refrigerated centrifuge have been procured by IPFT for automation
of various research activities.
5.33
5.34
5.35
5.36
5.37
5.38
5.39
Annual Report 2011-2012
51
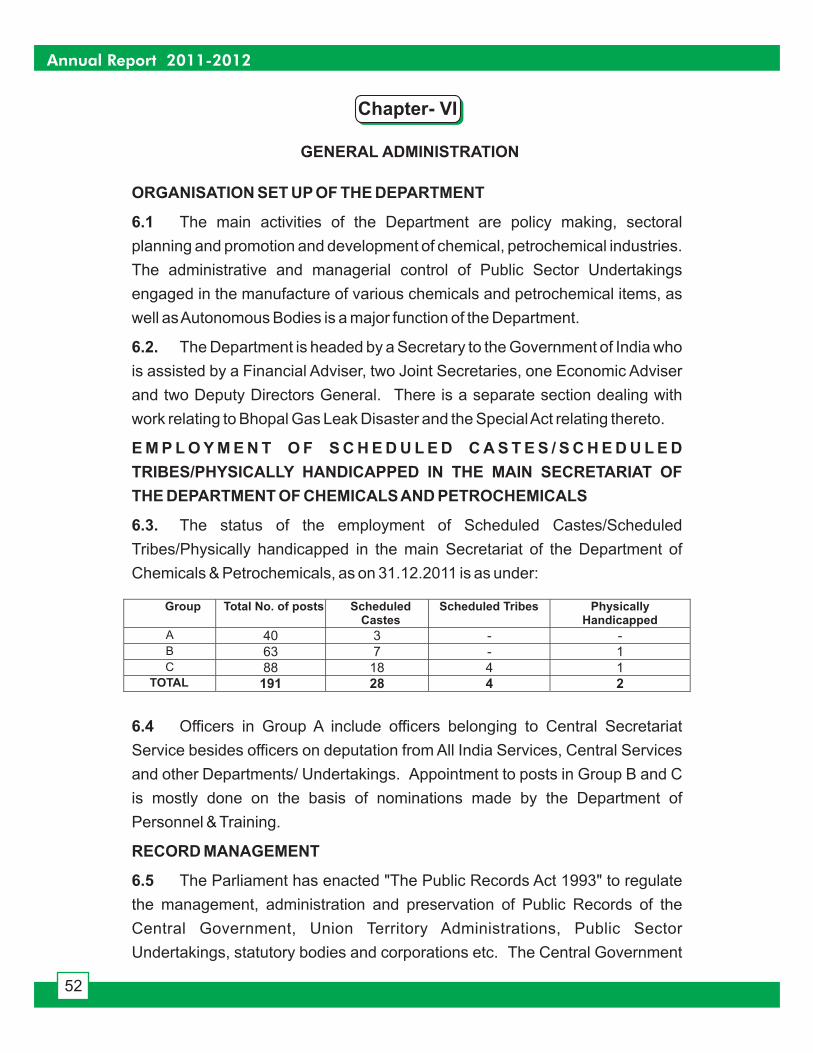
Chapter- VI
ORGANISATION SET UP OF THE DEPARTMENT
6.1
6.2.
E M P L O Y M E N T O F S C H E D U L E D C A S T E S / S C H E D U L E D
TRIBES/PHYSICALLY HANDICAPPED IN THE MAIN SECRETARIAT OF
THE DEPARTMENT OF CHEMICALSAND PETROCHEMICALS
6.3.
The main activities of the Department are policy making, sectoral
planning and promotion and development of chemical, petrochemical industries.
The administrative and managerial control of Public Sector Undertakings
engaged in the manufacture of various chemicals and petrochemical items, as
well asAutonomous Bodies is a major function of the Department.
The Department is headed by a Secretary to the Government of India who
is assisted by a Financial Adviser, two Joint Secretaries, one Economic Adviser
and two Deputy Directors General. There is a separate section dealing with
work relating to Bhopal Gas Leak Disaster and the SpecialAct relating thereto.
The status of the employment of Scheduled Castes/Scheduled
Tribes/Physically handicapped in the main Secretariat of the Department of
Chemicals & Petrochemicals, as on 31.12.2011 is as under:
GENERAL ADMINISTRATION
Group Total No. of posts ScheduledCastes
Scheduled Tribes PhysicallyHandicapped
A 40 3 - -B 63 7 - 1C 88 18 4 1
TOTAL 191 28 4 2
6.4
RECORD MANAGEMENT
6.5
Officers in Group A include officers belonging to Central Secretariat
Service besides officers on deputation from All India Services, Central Services
and other Departments/ Undertakings. Appointment to posts in Group B and C
is mostly done on the basis of nominations made by the Department of
Personnel & Training.
The Parliament has enacted "The Public Records Act 1993" to regulate
the management, administration and preservation of Public Records of the
Central Government, Union Territory Administrations, Public Sector
Undertakings, statutory bodies and corporations etc. The Central Government
Annual Report 2011-2012
52
has also made rules to carry out the provisions of the Act. In terms of the
provisions and terms contained in Section 5(1) of theAct, the Under Secretary in-
charge of General Administration has been nominated as the Records Officer in
the Department. A modernized Record Room has been set up in the
Department under the Plan Scheme run by Department of AR&PG. Requisite
reports and returns are being sent to NationalArchives of India (NAI) regularly.
In order to ensure compliance of the statutory provisions and Presidential
Orders on the Official Language Policy of the Government, there is a Hindi
Section in the Department and also in its Attached and Subordinate Offices.
Assistant Director (OL) and Joint Director (OL) supervise the work of the Hindi
Section under the overall guidance of a Joint Secretary.
All documents like Annual Report, Performance Budget, Demand for
Grants, Parliament Questions and Assurances, Material for Standing
committee, C& AG Reports, Cabinet Notes, Updation of Departmental website,
the documents falling under Section 3 (3) of the Official Language Act, 1963
were issued in bilingual form. All letters received in Hindi were replied to in Hindi
as per Rule 5 of the Official Language Rules, 1976. Efforts were made to
progressively increase the use of Hindi in day-to-day official work as set out in the
Annual Programme formulated by the Department of Official Language.
Hindi fortnight was organized in the Department from 15th to 30th
September 2011. During this period, five competitions in Hindi Typing, Hindi
Shorthand, Hindi Essay, Noting and Drafting and Translation were held. A
competition on Hindi Essay exclusively for Group 'D' employees was also held.
Separate prizes were earmarked for non-Hindi speaking officers and staff.
Meritorious participants were given cash prizes.
The Department has an Official Language Implementation Committee
under the Chairpersonship of Joint Secretary and its' meetings were held
regularly. The progress made in the use of Hindi was reviewed and suggestions
for further improvement were adopted for compliance.
Quarterly progress Reports for each quarter during the year were
compiled on the basis of inputs received from different Sections of the
Department and sent to the Department of Official language for inclusion in the
data base. Reports received from Attached and Subordinate Offices were
USE OF HINDI IN OFFICIAL WORK
6.6
6.7
6.8
6.9
6.10
Annual Report 2011-2012
53
reviewed and deficiencies found therein were suggested for rectification. Follow
up action on the observations of the Department of Official Language on the
Annual Assessment Report was initiated in the Department and necessary
instructions were issued.
In order to impart working knowledge of Hindi, officers and employees not
possessing such knowledge, are sent for in-service training as per the
programme formulated by the Hindi Teaching Scheme, Department of Official
Language. Staff members are also sent for Hindi stenography and typing
training under the same scheme. On successful completion of such training,
they are given advance annual increments and cash awards depending on their
performance ratings.
There is an annual cash award scheme under which officers/employees
doing their official work in Hindi are required to maintain their daily work sheet for
the entire year and submit it for evaluation by the screening committee
constituted in the Department.
The Department has a Chief Vigilance Officer (CVO) of the rank of Joint
Secretary to look into complaints against the employees of the Department as
well as Board Level Officers of the Public Sector Undertakings and
Organizations under its administrative control. A Director/Deputy Secretary and
an Under Secretary along with a Vigilance Section assist the CVO.
A number of complaints were received during the year 2011-12. These
complaints were investigated and appropriate action was taken thereon.
Vigilance Awareness Week" was organized during the period 31st
October to 5th November, 2011. All the PSUs and Autonomous Bodies under
the administrative control of the Department of Chemicals and Petrochemicals
were also advised to organize 'Vigilance Awareness Week' as per guidelines of
CVC. Apledge was administered to the staff and officers of the Department.
A Grievance Cell was established in the Office of Minister Chemicals and
Fertilizers, Department of Chemicals and Petrochemicals in the month of July
2004. This Cell is monitoring grievances related to all chemicals and
petrochemicals viz. theirAvailability, Quality, Pricing, Policy Matters etc.
6.11
6.12
ACTIVITIESANDACHIEVEMENTS OF THE VIGILANCE SET UP
6.13
6.14
6.15
GRIEVANCE CELL
6.16
Annual Report 2011-2012
54

6.17
GENDER EQUALITY
6.18
RIGHTS OF PERSONS WITH DISABILITIES
6.19
6.20
6.21
Publicity about the setting up of this Grievance Cell was given through the
National daily newspapers of Hindi and English. The online Grievance
Redressal Mechanism, Public Grievance Redressal and Monitoring System
(PGRAMS) has been brought into operation w.e.f 1st August 2005. For giving
wide publicity to the Grievance Cell, information has been uploaded on the
website of Department of Chemicals & Petrochemicals and also on the websites
of the Institutions / Organizations falling under the purview of Department of
Chemicals & Petrochemicals. A link has been provided on the home page of
Department of Chemicals and Petrochemicals to access PGRAMS with the
websites of the Institutions/Organizations under Department of Chemicals &
Petrochemicals. The Grievance Cell plays a vital role in the redressal of
grievances of the common citizen.
In compliance with the Supreme Court judgment laying down certain
guidelines to be followed for prevention of sexual harassment of female
employees at work places, the Department has constituted a Complaint
Committee. The Committee is functional since June 2002
Department of Chemicals & Petrochemicals follows the guidelines issued
by Government of India from time to time regarding rights of the persons with
disabilities.
Department of Chemicals & Petrochemicals is the cadre controlling
authority in respect of 12 technical posts in Group 'A', 5 posts of Staff Car Drivers,
2 posts of Sr. Gestetnor Operator and 1 post of Dispatch Rider in Group 'C' and
48 Group 'D' posts. The Department has identified two posts for physically
handicapped persons [one for Hearing Handicapped (HH) and one for
Orthopaedically Handicapped (OH)] in Group 'D' posts. Point No.1 in the
reservation roster has been earmarked for an orthopaedically handicapped
person. The next point will arise only at the time of filling up of 34th vacancy. An
orthopaedically handicapped person has filled up the post identified for OH. The
identified post for hearing handicapped will be filled up on availability of vacancy.
It is ensured that persons with disabilities have easy access to the
physical environment and other facilities and services. The Information and
Facilitation Centre of the Department has been set up specifically on the ground
Annual Report 2011-2012
55
floor in Shastri Bhawan enabling easy and obstacle free accessibility for such
persons. Senior officers of this Department are always available to listen to the
problems, if any, of persons with disabilities.
The Right to Information Act-2005 was published in the Gazette of India
on 21st June 2005 with the mandate to promote transparency and accountability
in the working of every public authority. As per the provisions of the Act, all
relevant information relating to the Department have been made available on the
Web site and is being updated regularly in a manner which is easily accessible
and comprehensible to the public. Seven (7) Central Public Information Officers
(CPIO) have been nominated in the Department to provide information to the
public and information seekers. In addition, four (4) senior officers of the rank of
Joint Secretary and above have been designated as Appellate Authority for the
particular subjects they are concerned with.
RIGHT TO INFORMATION
6.22
Annual Report 2011-2012
56
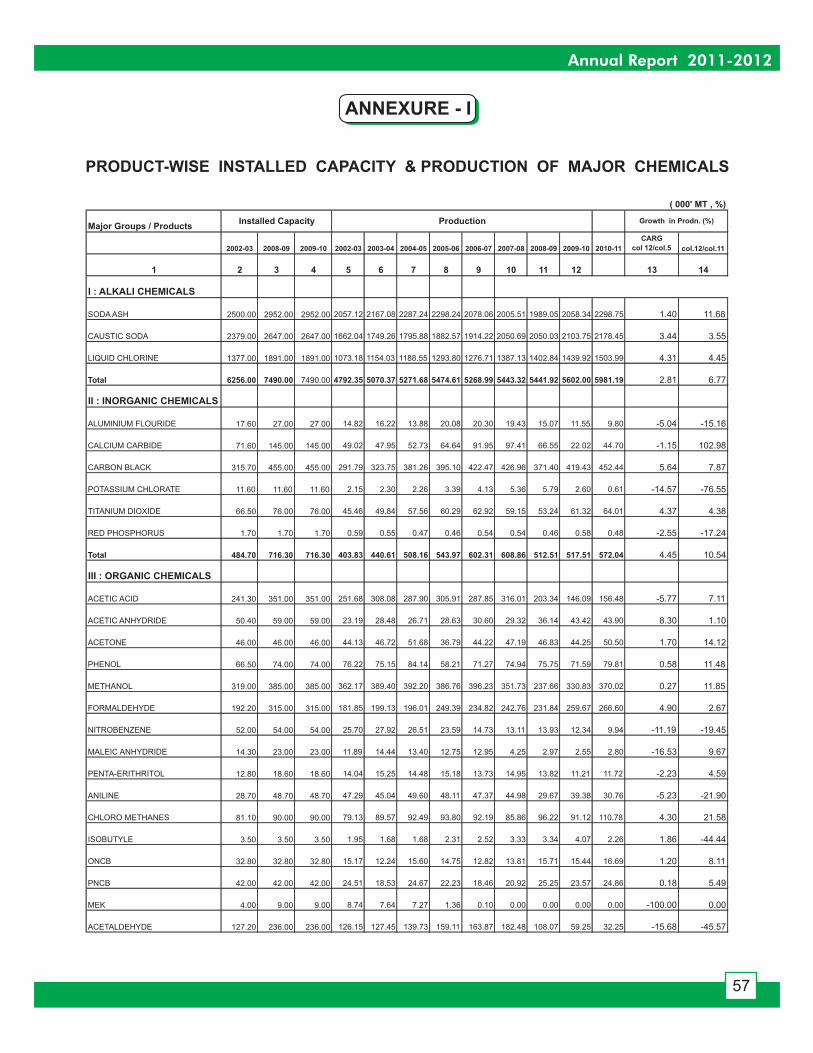
ANNEXURE - I
Major Groups / Products
2002-03 2008-09 2009-10 2002-03 2003-04 2004-05 2005-06 2006-07 2007-08 2008-09 2009-10 2010-11
CARG
col 12/col.5 col.12/col.11
1 2 3 4 5 6 7 8 9 10 11 12 13 14
I : ALKALI CHEMICALS
SODA ASH 2500.00 2952.00 2952.00 2057.12 2167.08 2287.24 2298.24 2078.06 2005.51 1989.05 2058.34 2298.75 1.40 11.68
CAUSTIC SODA 2379.00 2647.00 2647.00 1662.04 1749.26 1795.88 1882.57 1914.22 2050.69 2050.03 2103.75 2178.45 3.44 3.55
LIQUID CHLORINE 1377.00 1891.00 1891.00 1073.18 1154.03 1188.55 1293.80 1276.71 1387.13 1402.84 1439.92 1503.99 4.31 4.45
Total 6256.00 7490.00 7490.00 4792.35 5070.37 5271.68 5474.61 5268.99 5443.32 5441.92 5602.00 5981.19 2.81 6.77
II : INORGANIC CHEMICALS
ALUMINIUM FLOURIDE 17.60 27.00 27.00 14.82 16.22 13.88 20.08 20.30 19.43 15.07 11.55 9.80 -5.04 -15.16
CALCIUM CARBIDE 71.60 145.00 145.00 49.02 47.95 52.73 64.64 91.95 97.41 66.55 22.02 44.70 -1.15 102.98
CARBON BLACK 315.70 455.00 455.00 291.79 323.75 381.26 395.10 422.47 426.96 371.40 419.43 452.44 5.64 7.87
POTASSIUM CHLORATE 11.60 11.60 11.60 2.15 2.30 2.26 3.39 4.13 5.36 5.79 2.60 0.61 -14.57 -76.55
TITANIUM DIOXIDE 66.50 76.00 76.00 45.46 49.84 57.56 60.29 62.92 59.15 53.24 61.32 64.01 4.37 4.38
RED PHOSPHORUS 1.70 1.70 1.70 0.59 0.55 0.47 0.46 0.54 0.54 0.46 0.58 0.48 -2.55 -17.24
Total 484.70 716.30 716.30 403.83 440.61 508.16 543.97 602.31 608.86 512.51 517.51 572.04 4.45 10.54
III : ORGANIC CHEMICALS
ACETIC ACID 241.30 351.00 351.00 251.68 308.08 287.90 305.91 287.85 316.01 203.34 146.09 156.48 -5.77 7.11
ACETIC ANHYDRIDE 50.40 59.00 59.00 23.19 28.48 26.71 28.63 30.60 29.32 36.14 43.42 43.90 8.30 1.10
ACETONE 46.00 46.00 46.00 44.13 46.72 51.68 36.79 44.22 47.19 46.83 44.25 50.50 1.70 14.12
PHENOL 66.50 74.00 74.00 76.22 75.15 84.14 58.21 71.27 74.94 75.75 71.59 79.81 0.58 11.48
METHANOL 319.00 385.00 385.00 362.17 389.40 392.20 386.76 396.23 351.73 237.66 330.83 370.02 0.27 11.85
FORMALDEHYDE 192.20 315.00 315.00 181.85 199.13 196.01 249.39 234.82 242.76 231.84 259.67 266.60 4.90 2.67
NITROBENZENE 52.00 54.00 54.00 25.70 27.92 26.51 23.59 14.73 13.11 13.93 12.34 9.94 -11.19 -19.45
MALEIC ANHYDRIDE 14.30 23.00 23.00 11.89 14.44 13.40 12.75 12.95 4.25 2.97 2.55 2.80 -16.53 9.67
PENTA-ERITHRITOL 12.80 18.60 18.60 14.04 15.25 14.48 15.18 13.73 14.95 13.82 11.21 11.72 -2.23 4.59
ANILINE 28.70 48.70 48.70 47.29 45.04 49.60 48.11 47.37 44.98 29.67 39.38 30.76 -5.23 -21.90
CHLORO METHANES 81.10 90.00 90.00 79.13 89.57 92.49 93.80 92.19 85.86 96.22 91.12 110.78 4.30 21.58
ISOBUTYLE 3.50 3.50 3.50 1.95 1.68 1.68 2.31 2.52 3.33 3.34 4.07 2.26 1.86 -44.44
ONCB 32.80 32.80 32.80 15.17 12.24 15.60 14.75 12.82 13.81 15.71 15.44 16.69 1.20 8.11
PNCB 42.00 42.00 42.00 24.51 18.53 24.67 22.23 18.46 20.92 25.25 23.57 24.86 0.18 5.49
MEK 4.00 9.00 9.00 8.74 7.64 7.27 1.36 0.10 0.00 0.00 0.00 0.00 -100.00 0.00
ACETALDEHYDE 127.20 236.00 236.00 126.15 127.45 139.73 159.11 163.87 182.48 108.07 59.25 32.25 -15.68 -45.57
Installed Capacity Production Growth in Prodn. (%)
( 000' MT , %)
PRODUCT-WISE INSTALLED CAPACITY & PRODUCTION OF MAJOR CHEMICALS
Annual Report 2011-2012
57
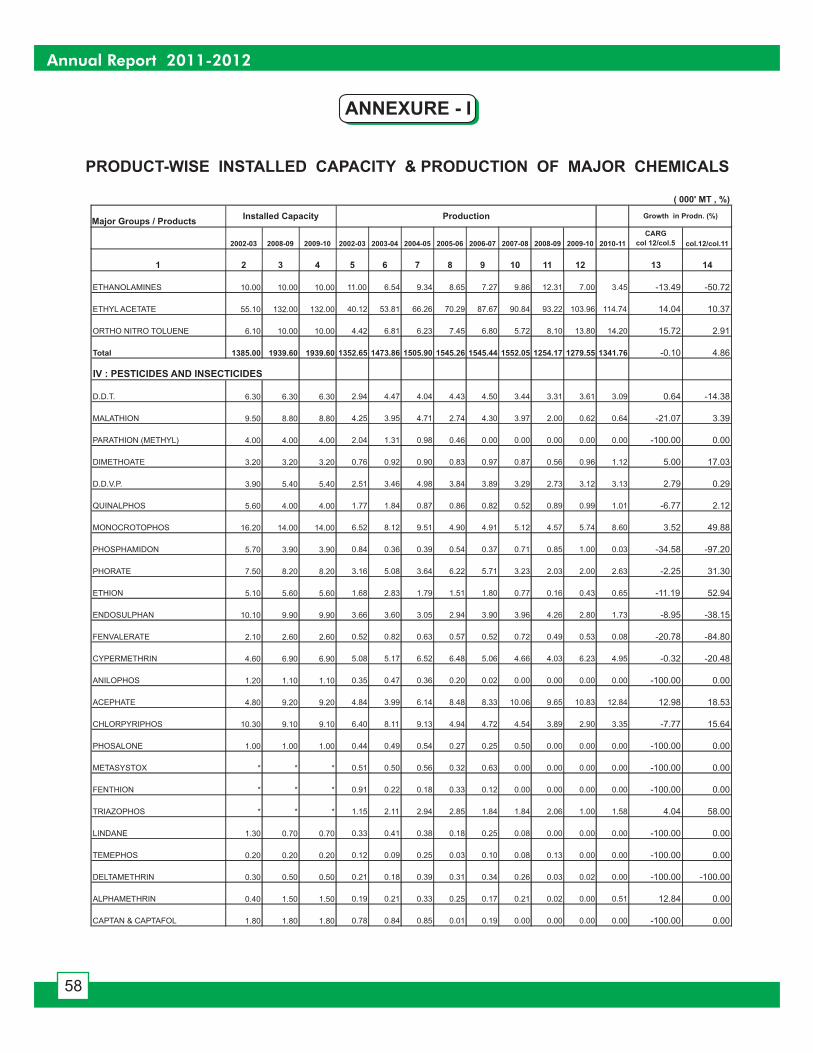
ETHANOLAMINES 10.00 10.00 10.00 11.00 6.54 9.34 8.65 7.27 9.86 12.31 7.00 3.45 -13.49 -50.72
ETHYL ACETATE 55.10 132.00 132.00 40.12 53.81 66.26 70.29 87.67 90.84 93.22 103.96 114.74 14.04 10.37
ORTHO NITRO TOLUENE 6.10 10.00 10.00 4.42 6.81 6.23 7.45 6.80 5.72 8.10 13.80 14.20 15.72 2.91
Total 1385.00 1939.60 1939.60 1352.65 1473.86 1505.90 1545.26 1545.44 1552.05 1254.17 1279.55 1341.76 -0.10 4.86
IV : PESTICIDES AND INSECTICIDES
D.D.T. 6.30 6.30 6.30 2.94 4.47 4.04 4.43 4.50 3.44 3.31 3.61 3.09 0.64 -14.38
MALATHION 9.50 8.80 8.80 4.25 3.95 4.71 2.74 4.30 3.97 2.00 0.62 0.64 -21.07 3.39
PARATHION (METHYL) 4.00 4.00 4.00 2.04 1.31 0.98 0.46 0.00 0.00 0.00 0.00 0.00 -100.00 0.00
DIMETHOATE 3.20 3.20 3.20 0.76 0.92 0.90 0.83 0.97 0.87 0.56 0.96 1.12 5.00 17.03
D.D.V.P. 3.90 5.40 5.40 2.51 3.46 4.98 3.84 3.89 3.29 2.73 3.12 3.13 2.79 0.29
QUINALPHOS 5.60 4.00 4.00 1.77 1.84 0.87 0.86 0.82 0.52 0.89 0.99 1.01 -6.77 2.12
MONOCROTOPHOS 16.20 14.00 14.00 6.52 8.12 9.51 4.90 4.91 5.12 4.57 5.74 8.60 3.52 49.88
PHOSPHAMIDON 5.70 3.90 3.90 0.84 0.36 0.39 0.54 0.37 0.71 0.85 1.00 0.03 -34.58 -97.20
PHORATE 7.50 8.20 8.20 3.16 5.08 3.64 6.22 5.71 3.23 2.03 2.00 2.63 -2.25 31.30
ETHION 5.10 5.60 5.60 1.68 2.83 1.79 1.51 1.80 0.77 0.16 0.43 0.65 -11.19 52.94
ENDOSULPHAN 10.10 9.90 9.90 3.66 3.60 3.05 2.94 3.90 3.96 4.26 2.80 1.73 -8.95 -38.15
FENVALERATE 2.10 2.60 2.60 0.52 0.82 0.63 0.57 0.52 0.72 0.49 0.53 0.08 -20.78 -84.80
CYPERMETHRIN 4.60 6.90 6.90 5.08 5.17 6.52 6.48 5.06 4.66 4.03 6.23 4.95 -0.32 -20.48
ANILOPHOS 1.20 1.10 1.10 0.35 0.47 0.36 0.20 0.02 0.00 0.00 0.00 0.00 -100.00 0.00
ACEPHATE 4.80 9.20 9.20 4.84 3.99 6.14 8.48 8.33 10.06 9.65 10.83 12.84 12.98 18.53
CHLORPYRIPHOS 10.30 9.10 9.10 6.40 8.11 9.13 4.94 4.72 4.54 3.89 2.90 3.35 -7.77 15.64
PHOSALONE 1.00 1.00 1.00 0.44 0.49 0.54 0.27 0.25 0.50 0.00 0.00 0.00 -100.00 0.00
METASYSTOX * * * 0.51 0.50 0.56 0.32 0.63 0.00 0.00 0.00 0.00 -100.00 0.00
FENTHION * * * 0.91 0.22 0.18 0.33 0.12 0.00 0.00 0.00 0.00 -100.00 0.00
TRIAZOPHOS * * * 1.15 2.11 2.94 2.85 1.84 1.84 2.06 1.00 1.58 4.04 58.00
LINDANE 1.30 0.70 0.70 0.33 0.41 0.38 0.18 0.25 0.08 0.00 0.00 0.00 -100.00 0.00
TEMEPHOS 0.20 0.20 0.20 0.12 0.09 0.25 0.03 0.10 0.08 0.13 0.00 0.00 -100.00 0.00
DELTAMETHRIN 0.30 0.50 0.50 0.21 0.18 0.39 0.31 0.34 0.26 0.03 0.02 0.00 -100.00 -100.00
ALPHAMETHRIN 0.40 1.50 1.50 0.19 0.21 0.33 0.25 0.17 0.21 0.02 0.00 0.51 12.84 0.00
CAPTAN & CAPTAFOL 1.80 1.80 1.80 0.78 0.84 0.85 0.01 0.19 0.00 0.00 0.00 0.00 -100.00 0.00
PRODUCT-WISE INSTALLED CAPACITY & PRODUCTION OF MAJOR CHEMICALS
ANNEXURE - I
Major Groups / Products
2002-03 2008-09 2009-10 2002-03 2003-04 2004-05 2005-06 2006-07 2007-08 2008-09 2009-10 2010-11
CARG
col 12/col.5 col.12/col.11
1 2 3 4 5 6 7 8 9 10 11 12 13 14
Installed Capacity Production Growth in Prodn. (%)
( 000' MT , %)
Annual Report 2011-2012
58
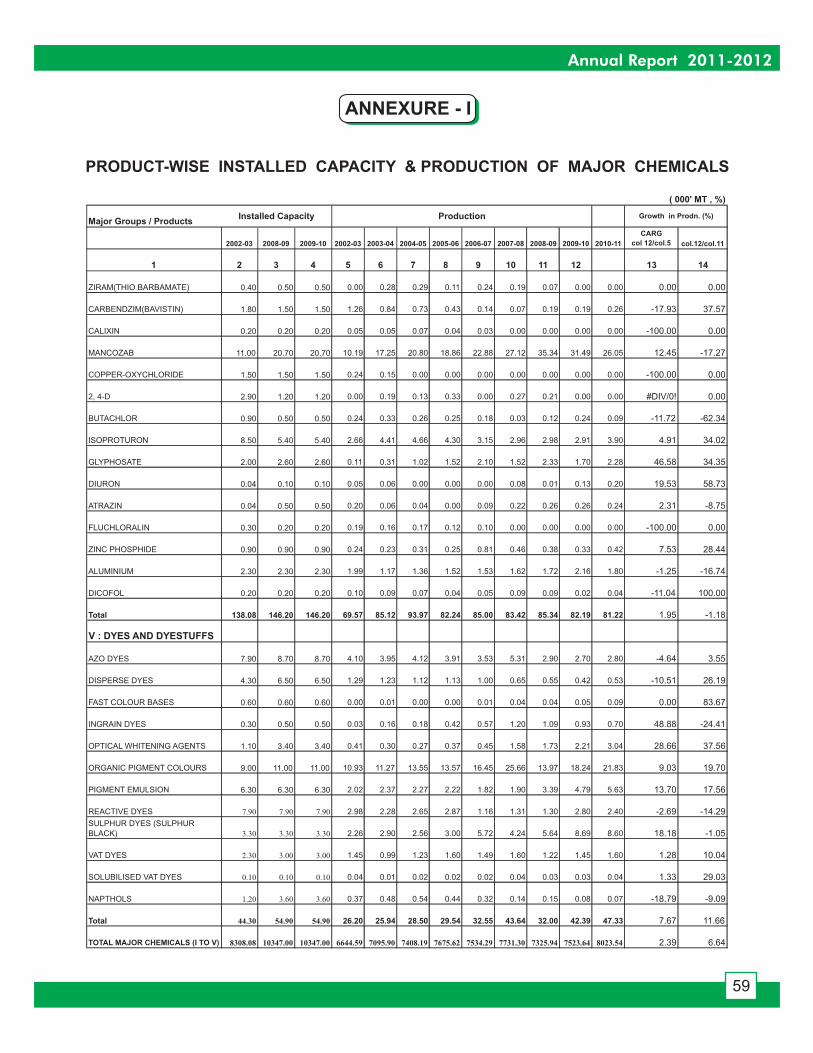
ANNEXURE - I
ZIRAM(THIO BARBAMATE) 0.40 0.50 0.50 0.00 0.28 0.29 0.11 0.24 0.19 0.07 0.00 0.00 0.00 0.00
CARBENDZIM(BAVISTIN) 1.80 1.50 1.50 1.26 0.84 0.73 0.43 0.14 0.07 0.19 0.19 0.26 -17.93 37.57
CALIXIN 0.20 0.20 0.20 0.05 0.05 0.07 0.04 0.03 0.00 0.00 0.00 0.00 -100.00 0.00
MANCOZAB 11.00 20.70 20.70 10.19 17.25 20.80 18.86 22.88 27.12 35.34 31.49 26.05 12.45 -17.27
COPPER-OXYCHLORIDE 1.50 1.50 1.50 0.24 0.15 0.00 0.00 0.00 0.00 0.00 0.00 0.00 -100.00 0.00
2, 4-D 2.90 1.20 1.20 0.00 0.19 0.13 0.33 0.00 0.27 0.21 0.00 0.00 #DIV/0! 0.00
BUTACHLOR 0.90 0.50 0.50 0.24 0.33 0.26 0.25 0.18 0.03 0.12 0.24 0.09 -11.72 -62.34
ISOPROTURON 8.50 5.40 5.40 2.66 4.41 4.66 4.30 3.15 2.96 2.98 2.91 3.90 4.91 34.02
GLYPHOSATE 2.00 2.60 2.60 0.11 0.31 1.02 1.52 2.10 1.52 2.33 1.70 2.28 46.58 34.35
DIURON 0.04 0.10 0.10 0.05 0.06 0.00 0.00 0.00 0.08 0.01 0.13 0.20 19.53 58.73
ATRAZIN 0.04 0.50 0.50 0.20 0.06 0.04 0.00 0.09 0.22 0.26 0.26 0.24 2.31 -8.75
FLUCHLORALIN 0.30 0.20 0.20 0.19 0.16 0.17 0.12 0.10 0.00 0.00 0.00 0.00 -100.00 0.00
ZINC PHOSPHIDE 0.90 0.90 0.90 0.24 0.23 0.31 0.25 0.81 0.46 0.38 0.33 0.42 7.53 28.44
ALUMINIUM 2.30 2.30 2.30 1.99 1.17 1.36 1.52 1.53 1.62 1.72 2.16 1.80 -1.25 -16.74
DICOFOL 0.20 0.20 0.20 0.10 0.09 0.07 0.04 0.05 0.09 0.09 0.02 0.04 -11.04 100.00
Total 138.08 146.20 146.20 69.57 85.12 93.97 82.24 85.00 83.42 85.34 82.19 81.22 1.95 -1.18
V : DYES AND DYESTUFFS
AZO DYES 7.90 8.70 8.70 4.10 3.95 4.12 3.91 3.53 5.31 2.90 2.70 2.80 -4.64 3.55
DISPERSE DYES 4.30 6.50 6.50 1.29 1.23 1.12 1.13 1.00 0.65 0.55 0.42 0.53 -10.51 26.19
FAST COLOUR BASES 0.60 0.60 0.60 0.00 0.01 0.00 0.00 0.01 0.04 0.04 0.05 0.09 0.00 83.67
INGRAIN DYES 0.30 0.50 0.50 0.03 0.16 0.18 0.42 0.57 1.20 1.09 0.93 0.70 48.88 -24.41
OPTICAL WHITENING AGENTS 1.10 3.40 3.40 0.41 0.30 0.27 0.37 0.45 1.58 1.73 2.21 3.04 28.66 37.56
ORGANIC PIGMENT COLOURS 9.00 11.00 11.00 10.93 11.27 13.55 13.57 16.45 25.66 13.97 18.24 21.83 9.03 19.70
PIGMENT EMULSION 6.30 6.30 6.30 2.02 2.37 2.27 2.22 1.82 1.90 3.39 4.79 5.63 13.70 17.56
REACTIVE DYES 7.90 7.90 7.90 2.98 2.28 2.65 2.87 1.16 1.31 1.30 2.80 2.40 -2.69 -14.29
SULPHUR DYES (SULPHUR
BLACK) 3.30 3.30 3.30 2.26 2.90 2.56 3.00 5.72 4.24 5.64 8.69 8.60 18.18 -1.05
VAT DYES 2.30 3.00 3.00 1.45 0.99 1.23 1.60 1.49 1.60 1.22 1.45 1.60 1.28 10.04
SOLUBILISED VAT DYES 0.10 0.10 0.10 0.04 0.01 0.02 0.02 0.02 0.04 0.03 0.03 0.04 1.33 29.03
NAPTHOLS 1.20 3.60 3.60 0.37 0.48 0.54 0.44 0.32 0.14 0.15 0.08 0.07 -18.79 -9.09
Total 44.30 54.90 54.90 26.20 25.94 28.50 29.54 32.55 43.64 32.00 42.39 47.33 7.67 11.66
TOTAL MAJOR CHEMICALS (I TO V) 8308.08 10347.00 10347.00 6644.59 7095.90 7408.19 7675.62 7534.29 7731.30 7325.94 7523.64 8023.54 2.39 6.64
Major Groups / Products
2002-03 2008-09 2009-10 2002-03 2003-04 2004-05 2005-06 2006-07 2007-08 2008-09 2009-10 2010-11
CARG
col 12/col.5 col.12/col.11
1 2 3 4 5 6 7 8 9 10 11 12 13 14
Installed Capacity Production Growth in Prodn. (%)
( 000' MT , %)
PRODUCT-WISE INSTALLED CAPACITY & PRODUCTION OF MAJOR CHEMICALS
Annual Report 2011-2012
59
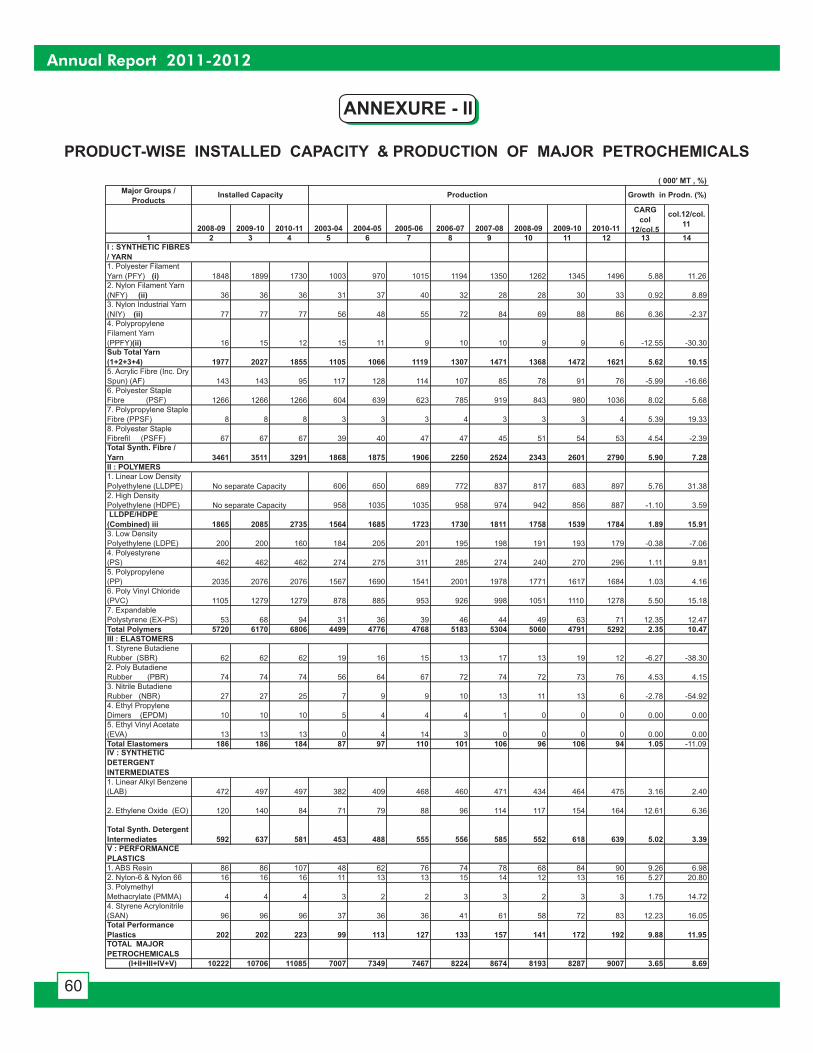
Major Groups /
Products
2008-09 2009-10 2010-11 2003-04 2004-05 2005-06 2006-07 2007-08 2008-09 2009-10 2010-11
CARG
col
12/col.5
col.12/col.
11
1 2 3 4 5 6 7 8 9 10 11 12 13 14
I : SYNTHETIC FIBRES
/ YARN
1. Polyester Filament
Yarn (PFY) (i) 1848 1899 1730 1003 970 1015 1194 1350 1262 1345 1496 5.88 11.262. Nylon Filament Yarn
(NFY) (ii) 36 36 36 31 37 40 32 28 28 30 33 0.92 8.893. Nylon Industrial Yarn
(NIY) (ii) 77 77 77 56 48 55 72 84 69 88 86 6.36 -2.374. Polypropylene
Filament Yarn
(PPFY)(ii) 16 15 12 15 11 9 10 10 9 9 6 -12.55 -30.30Sub Total Yarn
(1+2+3+4) 1977 2027 1855 1105 1066 1119 1307 1471 1368 1472 1621 5.62 10.15
5. Acrylic Fibre (Inc. Dry
Spun) (AF) 143 143 95 117 128 114 107 85 78 91 76 -5.99 -16.666. Polyester Staple
Fibre (PSF) 1266 1266 1266 604 639 623 785 919 843 980 1036 8.02 5.687. Polypropylene Staple
Fibre (PPSF) 8 8 8 3 3 3 4 3 3 3 4 5.39 19.338. Polyester Staple
Fibrefil (PSFF) 67 67 67 39 40 47 47 45 51 54 53 4.54 -2.39Total Synth. Fibre /
Yarn 3461 3511 3291 1868 1875 1906 2250 2524 2343 2601 2790 5.90 7.28
II : POLYMERS
1. Linear Low Density
Polyethylene (LLDPE) 606 650 689 772 837 817 683 897 5.76 31.382. High Density
Polyethylene (HDPE) 958 1035 1035 958 974 942 856 887 -1.10 3.59LLDPE/HDPE
(Combined) iii 1865 2085 2735 1564 1685 1723 1730 1811 1758 1539 1784 1.89 15.91
3. Low Density
Polyethylene (LDPE) 200 200 160 184 205 201 195 198 191 193 179 -0.38 -7.064. Polyestyrene
(PS) 462 462 462 274 275 311 285 274 240 270 296 1.11 9.815. Polypropylene
(PP) 2035 2076 2076 1567 1690 1541 2001 1978 1771 1617 1684 1.03 4.166. Poly Vinyl Chloride
(PVC) 1105 1279 1279 878 885 953 926 998 1051 1110 1278 5.50 15.187. Expandable
Polystyrene (EX-PS) 53 68 94 31 36 39 46 44 49 63 71 12.35 12.47Total Polymers 5720 6170 6806 4499 4776 4768 5183 5304 5060 4791 5292 2.35 10.47
III : ELASTOMERS
1. Styrene Butadiene
Rubber (SBR) 62 62 62 19 16 15 13 17 13 19 12 -6.27 -38.302. Poly Butadiene
Rubber (PBR) 74 74 74 56 64 67 72 74 72 73 76 4.53 4.153. Nitrile Butadiene
Rubber (NBR) 27 27 25 7 9 9 10 13 11 13 6 -2.78 -54.924. Ethyl Propylene
Dimers (EPDM) 10 10 10 5 4 4 4 1 0 0 0 0.00 0.005. Ethyl Vinyl Acetate
(EVA) 13 13 13 0 4 14 3 0 0 0 0 0.00 0.00Total Elastomers 186 186 184 87 97 110 101 106 96 106 94 1.05 -11.09IV : SYNTHETIC
DETERGENT
INTERMEDIATES
1. Linear Alkyl Benzene
(LAB) 472 497 497 382 409 468 460 471 434 464 475 3.16 2.40
2. Ethylene Oxide (EO) 120 140 84 71 79 88 96 114 117 154 164 12.61 6.36
Total Synth. Detergent
Intermediates 592 637 581 453 488 555 556 585 552 618 639 5.02 3.39
V : PERFORMANCE
PLASTICS
1. ABS Resin 86 86 107 48 62 76 74 78 68 84 90 9.26 6.982. Nylon-6 & Nylon 66 16 16 16 11 13 13 15 14 12 13 16 5.27 20.803. Polymethyl
Methacrylate (PMMA) 4 4 4 3 2 2 3 3 2 3 3 1.75 14.724. Styrene Acrylonitrile
(SAN) 96 96 96 37 36 36 41 61 58 72 83 12.23 16.05Total Performance
Plastics 202 202 223 99 113 127 133 157 141 172 192 9.88 11.95
TOTAL MAJOR
PETROCHEMICALS
(I+II+III+IV+V) 10222 10706 11085 7007 7349 7467 8224 8674 8193 8287 9007 3.65 8.69
No separate Capacity
( 000' MT , %)
Installed Capacity Production Growth in Prodn. (%)
No separate Capacity
ANNEXURE - II
Annual Report 2011-2012
60
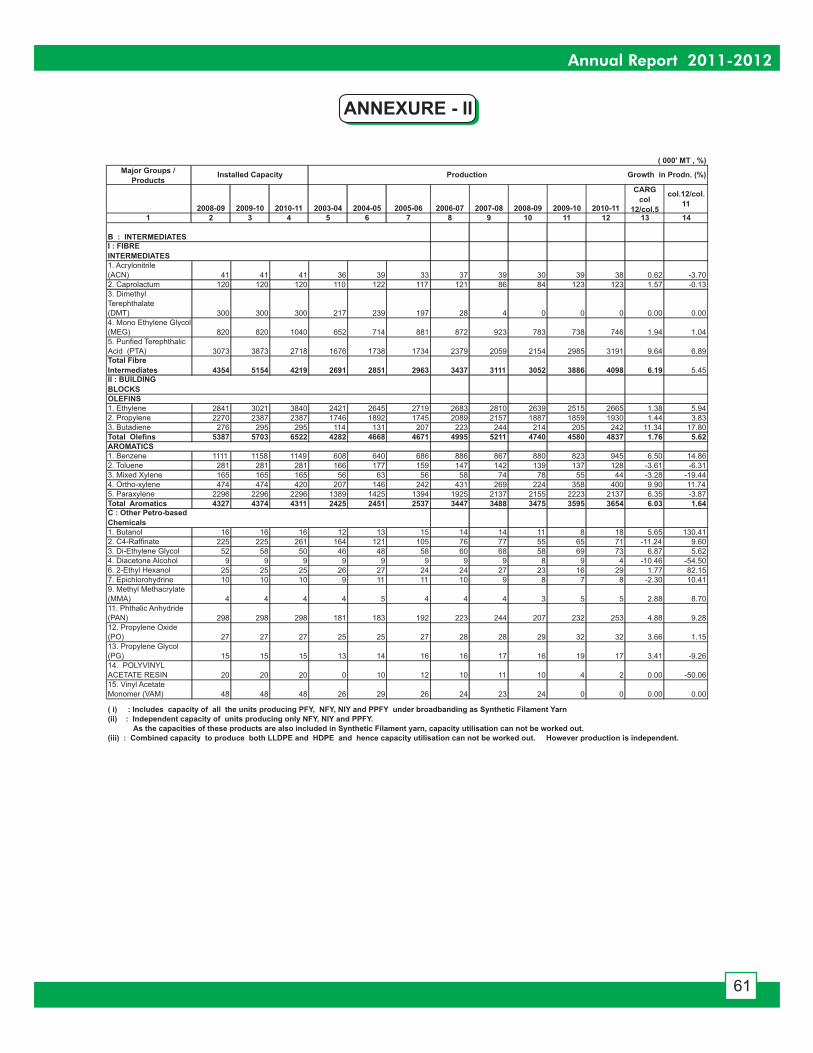
ANNEXURE - II
Major Groups /
Products
2008-09 2009-10 2010-11 2003-04 2004-05 2005-06 2006-07 2007-08 2008-09 2009-10 2010-11
CARG
col
12/col.5
col.12/col.
11
1 2 3 4 5 6 7 8 9 10 11 12 13 14
( 000' MT , %)
Installed Capacity Production Growth in Prodn. (%)
B : INTERMEDIATES
I : FIBRE
INTERMEDIATES
1. Acrylonitrile
(ACN) 41 41 41 36 39 33 37 39 30 39 38 0.62 -3.702. Caprolactum 120 120 120 110 122 117 121 86 84 123 123 1.57 -0.133. Dimethyl
Terephthalate
(DMT) 300 300 300 217 239 197 28 4 0 0 0 0.00 0.004. Mono Ethylene Glycol
(MEG) 820 820 1040 652 714 881 872 923 783 738 746 1.94 1.045. Purified Terephthalic
Acid (PTA) 3073 3873 2718 1676 1738 1734 2379 2059 2154 2985 3191 9.64 6.89Total Fibre
Intermediates 4354 5154 4219 2691 2851 2963 3437 3111 3052 3886 4098 6.19 5.45II : BUILDING
BLOCKS
OLEFINS
1. Ethylene 2841 3021 3840 2421 2645 2719 2683 2810 2639 2515 2665 1.38 5.942. Propylene 2270 2387 2387 1746 1892 1745 2089 2157 1887 1859 1930 1.44 3.833. Butadiene 276 295 295 114 131 207 223 244 214 205 242 11.34 17.80Total Olefins 5387 5703 6522 4282 4668 4671 4995 5211 4740 4580 4837 1.76 5.62
AROMATICS
1. Benzene 1111 1158 1149 608 640 686 886 867 880 823 945 6.50 14.862. Toluene 281 281 281 166 177 159 147 142 139 137 128 -3.61 -6.313. Mixed Xylene 165 165 165 56 63 56 58 74 78 55 44 -3.28 -19.444. Ortho-xylene 474 474 420 207 146 242 431 269 224 358 400 9.90 11.745. Paraxylene 2296 2296 2296 1389 1425 1394 1925 2137 2155 2223 2137 6.35 -3.87Total Aromatics 4327 4374 4311 2425 2451 2537 3447 3488 3475 3595 3654 6.03 1.64
C : Other Petro-based
Chemicals
1. Butanol 16 16 16 12 13 15 14 14 11 8 18 5.65 130.412. C4-Raffinate 225 225 261 164 121 105 76 77 55 65 71 -11.24 9.603. Di-Ethylene Glycol 52 58 50 46 48 58 60 68 58 69 73 6.87 5.624. Diacetone Alcohol 9 9 9 9 9 9 9 9 8 9 4 -10.46 -54.506. 2-Ethyl Hexanol 25 25 25 26 27 24 24 27 23 16 29 1.77 82.157. Epichlorohydrine 10 10 10 9 11 11 10 9 8 7 8 -2.30 10.419. Methyl Methacrylate
(MMA) 4 4 4 4 5 4 4 4 3 5 5 2.88 8.7011. Phthalic Anhydride
(PAN) 298 298 298 181 183 192 223 244 207 232 253 4.88 9.2812. Propylene Oxide
(PO) 27 27 27 25 25 27 28 28 29 32 32 3.66 1.1513. Propylene Glycol
(PG) 15 15 15 13 14 16 16 17 16 19 17 3.41 -9.2614. POLYVINYL
ACETATE RESIN 20 20 20 0 10 12 10 11 10 4 2 0.00 -50.0615. Vinyl Acetate
Monomer (VAM) 48 48 48 26 29 26 24 23 24 0 0 0.00 0.00
( i) : Includes capacity of all the units producing PFY, NFY, NIY and PPFY under broadbanding as Synthetic Filament Yarn
(ii) : Independent capacity of units producing only NFY, NIY and PPFY.
As the capacities of these products are also included in Synthetic Filament yarn, capacity utilisation can not be worked out.
(iii) : Combined capacity to produce both LLDPE and HDPE and hence capacity utilisation can not be worked out. However production is independent.
Annual Report 2011-2012
61
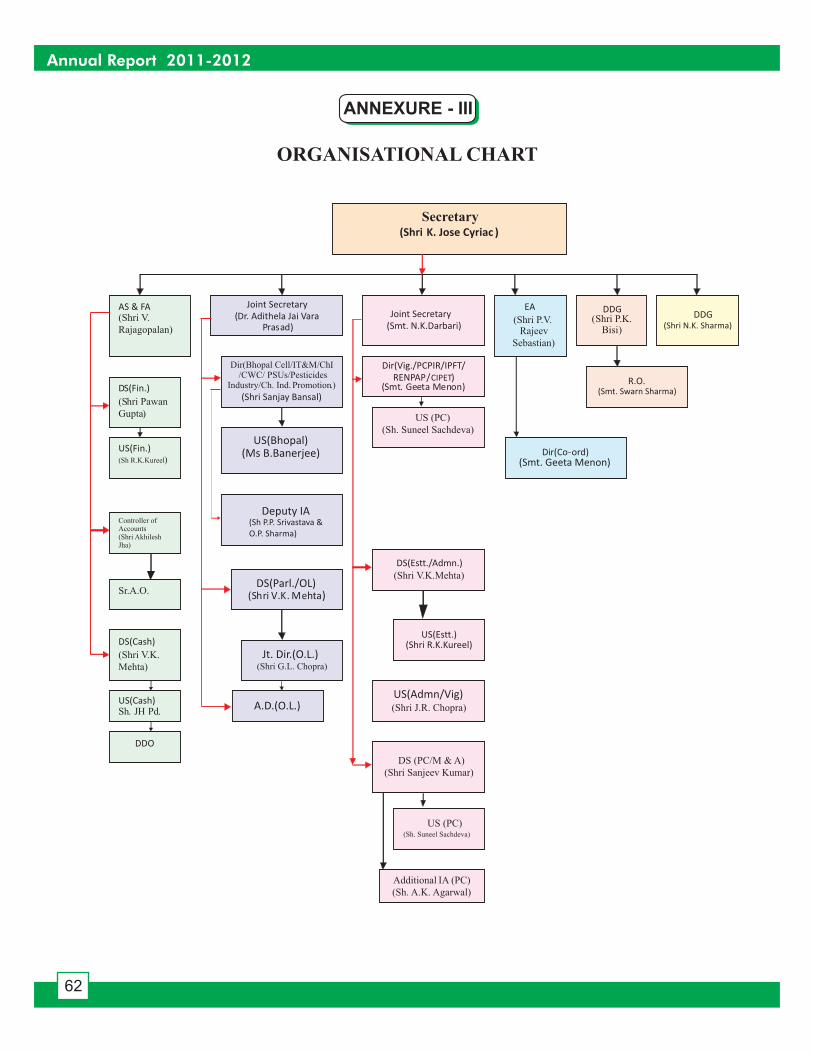
ANNEXURE - III
Deputy IA[Sh P.P. Srivastava &
O.P. Sharma]
Secretary(Shri K. Jose Cyriac )
Joint Secretary
(Dr. Adithela Jai Vara Joint Secretary
(Smt. N.K.Darbari)
EA
(Shri P.V.Rajeev
Sebastian)
DDG(Shri P.K.
Bisi)
AS & FA(Shri V.
Rajagopalan)
DS(Fin.)
(Shri Pawan
Gupta)
US(Fin.)(Sh R.K.Kureel)
DS(Cash)
(Shri V.K.
Mehta)
US(Cash)
Dir(Bhopal Cell/IT&M/ChI/CWC/ PSUs/Pesticides
Industry/Ch. Ind. Promotion.)
(Shri Sanjay Bansal)
US(Bhopal)(Ms B.Banerjee)
DS(Parl./OL)
Jt. Dir.(O.L.)(Shri G.L. Chopra)
A.D.(O.L.)
DS(Estt./Admn.)
(Shri V.K.Mehta)
US(Estt.)(Shri R.K.Kureel)
US(Admn/Vig)(Shri J.R. Chopra)
Dir(Co-ord)(Smt. Geeta Menon)
R.O.(Smt. Swarn Sharma)
DDO
DS (PC/M & A)
(Shri Sanjeev Kumar)
US (PC)
(Sh. Suneel Sachdeva)
Additional IA (PC)
(Sh. A.K. Agarwal)
Sr.A.O.
US (PC)(Sh. Suneel Sachdeva)
Controller ofAccounts(Shri AkhileshJha)
Dir(Vig./PCPIR/IPFT/
RENPAP/CIPET)
DDG(Shri N.K. Sharma)
ORGANISATIONAL CHART
Annual Report 2011-2012
62
Deputy IA(Sh P.P. Srivastava &
O.P. Sharma)