Embed Size (px)
Citation preview

Annual Report 2011
Repositioning for profitable growth

CSM at a glance 4Message from CEO Gerard Hoetmer 6Financial highlights 8Key Figures 10
Report of the Board of Management 11Our vision and strategy 12
Financial Commentary 2011,
Dividend Proposal, Prospects for 2012 15
CSM Bakery Supplies 20
Purac 26
Our people 32
Innovation 36
Procurement 44
Corporate Governance 46
Risk Management 50
Key risk areas 51
Report of the Supervisory Board 62
Committees of the Supervisory Board 63
Remuneration Policy 66
Sustainability report 69
Financial Statements 91
Contents Financial Statements 2011 93Consolidated Income Statement 93
Consolidated Statement of Comprehensive Income 93
Consolidated Statement of Financial Position 94
Consolidated Statement of Changes in Equity 95
Consolidated Statement of Cash Flows 96
Other Information 141Statutory Arrangement for Appropriation of Profit 142
Auditor’s Report to the General Meeting of
Shareholders of CSM nv 143
Brief Resumés of the Members of the
Supervisory Board 144
Brief Resumés of the Members of the Board of
Management 146
Group Structure 147
Five years in figures 148
Information on the CSM Share 150
Important Dates 151
Trend in the Share Price 151
Contents
3

4 | CSM Annual Report 2011
CSM at a glanceB
AK
ERy
Supp
lIES Bakery products
BA
KER
y Su
pplI
ES Bakery ingredientsWe continue to strengthen our leading position in the manufacturing and sale of premium finished and semi-finished pastry products, such as fully decorated cakes, donuts, muffins, European style viennoiserie and American cookies. Our innovation strengths, combined with deep market insights are our engine for growth that gives us our competitive edge in the market. Our activities have been focused on North America and Europe, where we are a leading supplier, and we are increasing our presence in fast-growing emerging markets, , such as in Asia and the Middle East.
CSM is market leader in ingredients such as bread improvers, bread and pastry mixes, bakery margarines and emulsifiers, fruit and (non) dairy-based pastry creams, fillings, icings and glazes. We focus on areas where we can offer added value, meaning that we do not offer basic bakery product ingredients such as flour and sugar. CSM has a strong reputation in ingredient technology, which is the backbone of our strategy to drive growth.Within this segment, our customer base comprises traditional artisan bakeries, industrial bakers and supermarkets that offer in-store finishing of bakery products.
CSM has leadership positions in two large business-to-business markets. Bakery Supplies is a leading global supplier of bakery products and ingredients. purac is a fermentation powerhouse with a leading position in the field of food preservation, biobased chemicals and bio-plastics components produced from lactic acid, lactic acid derivatives and other fermentation-based materials.
Our mission is to make our customers successful by creating unique experiences through the best products, technologies and services.
CSM operates worldwide and generates annual sales of € 3.1 billion and has a workforce of around 9,800 employees in 28 countries. CSM is listed on NYSE Euronext

CSM at a glance | 5
puR
AC
puR
ACWe offer natural preservation solutions for safe,
healthy and delicious food. Our focus is on products that enhance food safety and prolong shelf life so our customers can reduce waste and minimize quality deterioration. Natural preservation solutions are the perfect response to our market’s preference for natural, healthy and clean label products. All our ingredients are produced from renewable agricultural products used in a broad range of processed foods and beverages.
Preservation
More sustainable solutions are replacing traditional mineral oil-based chemicals. We are one most experienced companies in the production of ingredients and chemicals through the fermentation of carbohydrates. Our technology is based on renewable resources, and we have developed a number of successful products based on lactic acid, for the polymers and chemical industry.
Biobased chemicals and bioplastics
Bakery SuppliesCSM Bakery Supplies offers a full line of the finest ingredients and bakery products available, and all the benefits of our extensive global expertise and technology. Our bakery product portfolio ranges from bakery margarines, bread improvers, mixes and fruit fillings, to frozen dough, and part and fully baked products. Our customers include artisan and industrial bakeries, supermarkets, takeaway establishments, coffee chains and caterers.
puracPurac is a leading player in the field of food preservation, biobased chemicals and bio-plastics components produced from lactic acid, lactic acid derivatives and other fermentation-based products. Purac delivers innovative solutions and business concepts which are based on pure, natural ingredients and processes. Purac is active in preservation, mineral fortification and biobased chemicals for the food, health care, chemical and polymer industries.

6 | CSM Annual Report 2011
Repositioning for profitable growth
Message fromCEO Gerard Hoetmer
2011 was a very challenging year for us. We faced substantial raw material cost inflation in a difficult consumer environment impacting our volumes in an intensified competitive landscape. This put our 2011 results under severe pressure and led to a disappointing EBITA level.

CSM Annual Report 2011 | 7
During this year, we have seen an accelerating structural shift from the European traditional artisan bakery channel towards in-store- bakery and out-of-home channels. We had to recognize that our European Bakery Supplies business, based on its portfolio and positioning in 2011, would no longer have the cash flow generating capacity that justified the carrying value of its assets. This has unfortunately led to a non-cash impairment charge of € 249 million. This does not reflect the strengthening of the strategic position of our European Bakery Supplies activities as addressed in our business review.
We are committed to turning the challenges we face into opportunities by strengthening our competitiveness, lowering our cost base, improving our agility and making clear choices how we allocate our resources. As a consequence we have initiated a restructuring program and have done a business review, which we believe will result in a more focused business for the future.
Our business review has resulted in a distinct series of conclusions and actions for each division clustered into four key points:• Reassessment of the cost base• Simplifying the Bakery Supplies Organization• Reshaping the Bakery Supplies portfolio (predominantly in
Europe)• Aggressively growing Purac while reducing its financial
dependency on Bakery Supplies
We are rapidly implementing our restructuring program, announced and initiated in October 2011. This has led to a FTE reduction of 400 so far, progressing in line with our guidance of a total reduction of 500 FTE for the full cost reduction plan.
We have concluded that approx. 30% of our business in Bakery Supplies Europe is not matching our criteria. This means that these businesses should either enhance their performance
or strategic action will follow. So far we have earmarked, as part of this 30% of BSEU, at least € 100 million of sales to be divested, which we plan to pursue in 2012.
In Bakery Supplies North America we are strategically well positioned. Our portfolio has been strengthened significantly through Best Brands in 2010. Operational improvement is key for improving our profitability, for which we have the actions in place.
Purac is performing in line with its strategic intent, and should now grow faster and leverage its fermentation capability to be self-sustaining in growth and investments. Next to growing our baseline and enhancing agility, we will accelerate this path to self-sustainability by actively pursuing alliances and partnerships.
In light of exploiting the opportunities from our business review and reflecting on the 2011 results, we will propose a dividend of € 0.70 per common share.
It is clear that the trading environment in 2012 will remain very challenging. With our actions I am confident that CSM is better positioned to face these challenges head on to improve our long term profitability.
Gerard Hoetmer, CEO
I would like to express my gratitude to all our stakeholders for their confidence in CSM. Our suppliers and customers have also faced the same tough market conditions as we and this experience has highlighted, more than ever, the value of working in partnership. It has also been a tough year for our shareholders and we endeavor to keep them updated on the progress of our strategy and the implementation of our business review in 2012. Last but not least, I would like to thank our employees. Saying goodbye to valued employees is one of the toughest decisions a CEO has to make and they are never taken lightly. I would like to thank each and every employee who contributed to CSM in 2011.
8 | CSM Annual Report 2011
34% Bakery Supplies Europepurac
Bakery Supplies Europe
Bakery Supplies North America
2011
2010
2009
2008
2007
purac
Bakery Supplies Europe
Bakery Supplies North America
94.0
2011
2010
2009
2008
2007
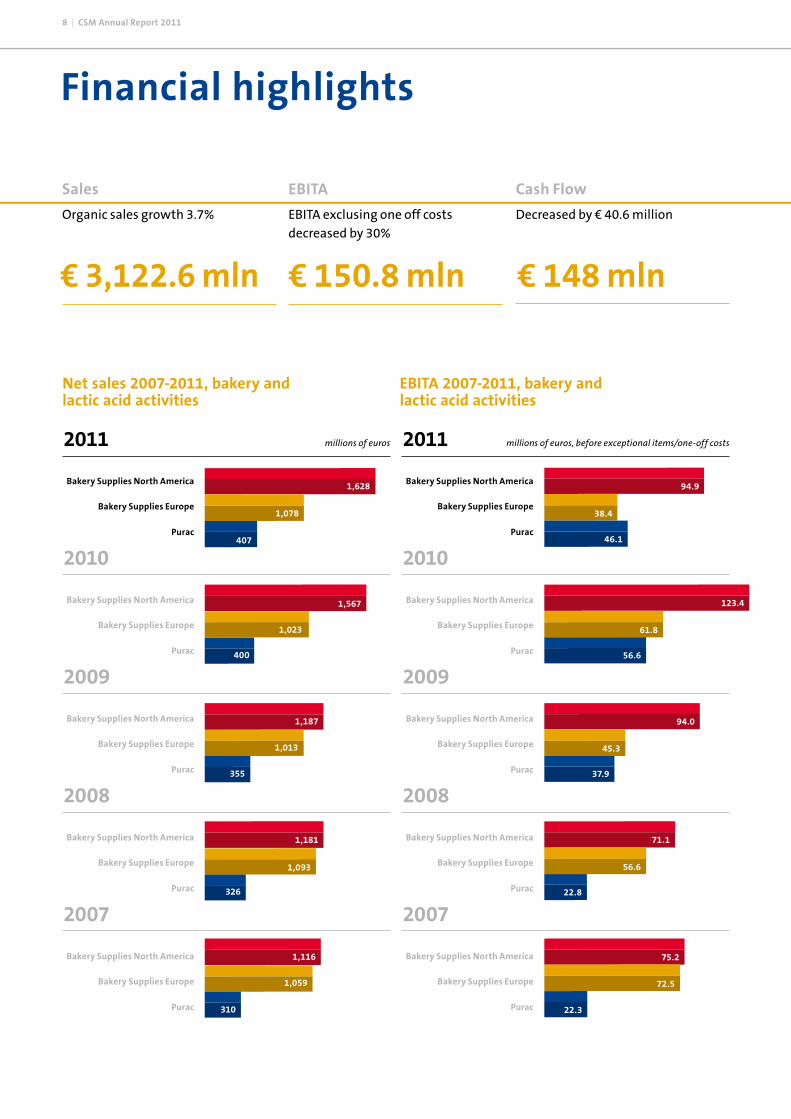
Net sales 2007-2011, bakery and lactic acid activities
EBITA 2007-2011, bakery and lactic acid activities
millions of euros millions of euros, before exceptional items/one-off costs
Financial highlights
Sales
Organic sales growth 3.7%decreased by 1.7%
€ 150.8 mln
EBITA
EBITA exclusing one off costs decreased by 30%
Cash Flow
Decreased by € 40.6 million
€ 148 mln€ 3,122.6 mln
1,628
1,078
407
400
1,567
1,023
355
1,187
1,013
326
1,093
1,181
310
1,116
1,059
purac
Bakery Supplies Europe
Bakery Supplies North America
purac
Bakery Supplies Europe
Bakery Supplies North America
purac
Bakery Supplies Europe
Bakery Supplies North America
purac
Bakery Supplies Europe
Bakery Supplies North America
56.6
123.4
61.8
37.9
94.0
45.3
22.8
71.1
56.6
22.3
75.2
72.5
purac
Bakery Supplies Europe
Bakery Supplies North America
purac
Bakery Supplies Europe
Bakery Supplies North America
purac
Bakery Supplies Europe
Bakery Supplies North America
purac
Bakery Supplies Europe
Bakery Supplies North America
94.9
38.4
46.1

Financial highlights | 9
Number of Employees 2011 by region
Net sales 2011 by region
Net sales by division Number of employees by division
52% Bakery Supplies North America
13% Purac
34% Bakery Supplies Europe
10% Purac 1% Corporate
46% Bakery Supplies North America
43% Bakery Supplies Europe
2011 2011
Net sales by region and Number of Employees by region
Healthy balance sheet ratios
€ -2.64
Earnings per share ROCE
Excluding one-off costs
6.80%2.8x EBITDA
Healthy
balance sheet ratios
4.9%The Netherlands
910
34.1%Rest of Europe
3,888
3.8%Other Countries
385North America
57.2%
4,707

10 | CSM Annual Report 2011
Key Figures 2011 2010
Income Statement
Net sales 3,112.6 2,990.1
EBITA excluding one-off costs 150.8 215.2
EBITA 130.2 193.8
Operating result -149.5 158.1
EBITDA excluding one-off costs 222.8 286.8
Result after taxes -174.3 99.3
Balance Sheet
Non-current assets 1,558.9 1,791.1
Current assets excluding cash and cash equivalents 740.4 717.5
Non-interest-bearing current liabilities 478.5 483.1
Net debt position 1 615.6 631.0
Provisions 256.9 277.3
Equity 948.3 1,117.2
Key data per common share
Number of issued common shares 67,658,699 65,998,134
Number of common shares with dividend rights 67,580,372 65,873,803
Weighted average number of outstanding common shares* 67,557,754 67,515,917
Price as at 31 December 12.08 26.19
Highest price in calendar year 26.88 26.27
Lowest price in calendar year 9.25 18.55
Market capitalization as at 31 December 816 1,725
Earnings in euros 2 * -2.64 1.41
Diluted earnings in euros 2 * -2.64 1.40
Cash flow from operating activities per common share, in euros 2 * 2.13 2.73
Other key data
Cash flow from operating activities 148.0 188.6
Depreciation/amortization fixed assets 102.7 107.3
Capital expenditure on (in)tangible fixed assets 91.7 83.2
Number of employees at closing date 9,843 9,664
Number of issued cumulative preference shares 2,983,794 2,983,794
Equity per share in euros 3 13.44 16.22
Ratios
EBITA margin % 4 4.2 6.5
Result after taxes / net sales % -5.6 3.3
ROCE % 5 5.9 9.1
Net debt position/EBITDA 6 2.8 2.1
Interest cover 7 7.6 9.7
Balance sheet total : equity 1:0.4 1:0.4
Net debt position : equity 1:1.5 1:1.8
Current assets : current liabilities 1:0.6 1:0.6
* previous year is restated for stock dividend1 Net debt position comprises interest-bearing debts less cash and cash equivalents.2 Per common share in euros after deduction of dividend on cumulative preference shares.3 Equity per share is equity divided by the number of shares with dividend rights.4 EBITA margin % is EBITA divided by net sales x 100.5 ROCE % is EBITA for the year divided by the average capital employed x 100. The goodwill
included in capital employed relates to management goodwill, being the goodwill capitalized and the goodwill charged directly to equity since 1978, the year when CSM started its diversification process.
6 EBITDA is "Earnings Before Interest, Taxes, Depreciation, Amortization and Impairment of intangible fixed assets", here including acquisition and divestment results for the full year 2011 and excluding one-off costs.
7 Interest cover is EBITDA as defined in Note 6 divided by net interest income and charges.

Report of the Board of Management

12 | CSM Annual Report 2011
CSM is a leading global organization with a strong local presence that is underpinned by its people through the shared values of passion, partnership and performance. We have leadership positions in two large business-to-business markets. Bakery Supplies is a leading global supplier of bakery products and ingredients. purac is a fermentation powerhouse with a leading position in the field of food preservation, biobased chemicals and bio-plastics components produced from lactic acid, lactic acid derivatives and other fermentation-based materials.
As a preferred partner, we are supporting the development of some of the world’s leading brands. We have achieved this through the vision and strategy, which is the framework for our day-to-day business decisions.
Our visionWe aspire to improve the quality and sustainability of life. We support this vision by contributing to a society where people can make a conscious choice for safe, healthy, nutritious and delicious food. We are passionate about providing the very best products, technologies and services to our customers to helping them to succeed.
Our missionWe aim to make our customers successful by creating unique experiences through the best products, technologies and services. We combine products and services to provide effective solutions based on our intimate knowledge of customer requirements. This means going beyond understanding our customers’ needs, by also understanding the consumer’ needs. These insights impact everything we do, from product development to collaborating as strategic partner.
Our strategyOur strategy is focused on further building our leadership position for both Bakery Supplies and Purac to ensure sustainable and profitable growth, while delivering returns which are above the market average. This means that we aim for number one or two positions in the markets where we wish to compete, which is consistent with the outcome of our recent business review.Our ambition is to deliver the best products to serve the needs of the market and to be the preferred partner for our customers, and make them successful in their markets. The following strategic initiatives enable us to achieve this and deliver sustainable and profitable growth:
Delighting consumers with health & wellness, with indulgent and with anywhere, anytime consumer products: We see an increasing demand for health and wellness options as consumers across the world pursue healthier lifestyles and make healthier food choices. In 2011, CSM has developed a unique range of Better4U and Good4U products. Using state of the art technologies, we have brought products to the market that are reduced in fat, saturated fat, sugar, salt or calories. Some of our innovations provide more fruit, nuts, vitamins, minerals, fiber, or whole grains. In addition we have developed the means to offer cleaner labels.
We also see an increasing trend for more sophisticated tastes; as many consumers begin to experiment with new products and new flavors.
At the same time, consumers are looking for the highest quality products in places other than the traditional outlets and channels, resulting in a demand for access to ‘anytime, any place’ bakery products.
In this trend of evolving sales channels in the bakery supplies market, we have seen the shift from the traditional artisan channel towards retail channels accelerating in 2011. To be successful in the in-store-bakery and out- of-home channels, operating in partnership is key, as these channels require strong innovation skills.
Building partnerships through the best customer service: Customers in all of our markets are looking to suppliers to form a new kind of relationship. Partnerships are increasingly important, including support in key capabilities like product development, logistics solutions and promotional activities, which require multi-functional business solutions.
These partnerships are being activated in tailored Key Account Management programs. In 2011 we were able to achieve volume growth with our key accounts in a declining market.
Expanding into new markets across the globe: High-growth emerging economies like China, Brazil, the Near East and Asia-Pacific represent exciting opportunities for both Bakery Supplies and Purac.Our preferred route to new geographies is to embark on existing customer relationships or through joint ventures that enables us to start up rapidly with limited investments.
Our vision and strategy

Report of the Board of Management | 13
In 2011 we have opened a new facility in China, which has significantly increased CSM's reach to the market in Greater China. Furthermore, we achieved a leading position in North Africa through a joint venture with the Tunisian based company GIAS s.a. In order to reap the benefits and to be able to progress fast, we have invested in key people in the new regions.
Driving value through global sustainability leadership: Our businesses are facing sustainability requirements across the value chain, from consumers to regulators to our own business partners. This trend greatly benefits Purac, with its natural preservatives and bio-plastics, while Bakery Supplies is positioning itself as a supplier to customers looking to work with partners that have a sustainable approach to the environment. For more information, read our sustainability report on page 69.
Our competitive strengthIn our highly competitive environment, we have unique competitive strengths supporting the successful execution of our strategy:
Scale of operationsBoth our Bakery Supplies and Purac activities are leaders in their respective markets. We have, in contrast to many of our competitors the scale to substantially invest in capabilities that strengthen our competitive edge, and further drive growth and profitability. These include:• Innovation and product development centers around the
world staffed by the best practitioners in their field;• Marketing, market data and customer intimacy, which
provide insights into not only our customers, but also their customers, which are often the end consumer. This is part of our service offering to our customers and simultaneously drives our innovation efforts to make sure they deliver on market needs;
• Technology and supply chain expertise. Our production plants do benefit from our insights into the latest technologies and improvement programs;
• A global procurement department, staffed with experts on specific raw materials who understand the market dynamics. Our capability of attracting and investing in the right people for the right job.
Global presencePurac is a worldwide operating organization, present on all continents. Bakery Supplies is predominantly active in the
North American and European markets but is expanding into other continents. This global presence offers the following benefits:• The opportunity to serve international customers worldwide
with advice, service and safe and consistent products.• The ability to generate insights into new developments from
around the world and apply these in other geographic areas.• Exciting careers for our employees with opportunities to work in many different markets and experience different cultures.
Financial strengthBeing one of the few public companies active in our markets we have significant opportunities to attract additional financing when attractive opportunities arise. This gives us the opportunity to:• Support the growth of our business with the acquisition of
and alliances with companies in our markets that enhance our market position, increase sales, consolidate the market and reduce costs. This is particularly the case in the bakery markets.
• Support future organic growth through capital expenditures especially focusing on Purac.
Business ReviewIn 2011 CSM faced a weak economic environment, driven by both short term and long term trends, which created extremely tough trading conditions. Volatile and upsurge in raw materials costs, weakened consumer demand in an increasingly competitive landscape, while consumer behavior underwent structural changes. This has brought changes to the marketplace which we needed to address. To this end, we have completed a business review and initiated a company-wide restructuring program to strengthen CSM's positioning in this changing market reality.
In our business review we assessed our businesses on several criteria, including market position and potential in terms of market leadership, capability to add value, profit contribution in conjunction with required capital, and growth potential.
The business review has led to a distinct set of conclusions and action points, which we will execute with highest priority;
Reassessment of the cost baseAlready set in motion is our Relevance Cost reduction plan, as announced in October 2011, which we will further execute during 2012 to save at least € 30 million in 2012 and leading for the full program to a saving of € 50 million in 2013. As

14 | CSM Annual Report 2011
of the announcement of the plan we have implemented a number of actions such as; de-layering and restructuring of Bakery Products NA resulting in a reduction of the number of FTE’s of 330, reorganizations at a number of European Bakery Supplies organizations and further efficiency measures at Purac and at our headquarters. This has in total led to a reduction of approx. 400 FTE’s in line with the realization of our guidance of a reduction of 500 FTE’s for the full cost reduction plan.
Simplifying the Bakery Supplies OrganizationEurope offers, through a rather complex business model, a wide portfolio of products in many countries with different market dynamics. Improving our performance requires a leaner and more agile business model, for which we have taken the necessary measures such as: implementation of a central category organization, simplifying the Eastern European organization and shifting resources to the growing segments.In North America the emphasis is on Bakery Products NA where we will continue with streamlining the organization following the merger of Brill and Best Brands.
Reshaping the Bakery Supplies portfolioIn our Bakery Supplies businesses we have identified the areas on which both Bakery Supplies Europe and Bakery Supplies North America focus to drive profitable growth. These include focus on the frozen segment, leveraging key
account management, enhancing our value added positioning and addressing the underlying consumer trends, which are embedded in our strategy.We will reshape the European portfolio and focus on the growing segments. In addition, we will exploit opportunities to strengthen or achieve market leadership in these growing segments through alliances and acquisitions. Given our traditional stronghold in artisan, our European businesses are experiencing the impact of the shift in market channels to the fullest extent. Next to operational measures, we will make changes to the portfolio to improve long term profitability.
The criteria used for the business review have driven the decision making in our portfolio focus. We have concluded that approx. 30% of our business in Bakery Supplies Europe is no longer matching our criteria. This means that these businesses should either enhance their performance or strategic action will follow. As a first consequence, as a part of this 30% of BSEU at least € 100 million of sales has already been identified to be divested, which we plan to pursue in 2012. The results of the business review in North America have reinforced our existing strategy and confirmed that we are strategically well positioned. We strengthened our portfolio significantly through Best Brands in 2010 and now have leading positions in all our strategic segments. The business review has confirmed our strategic focus to continue to grow in a limited number of emerging markets.
Aggressively growing purac while reducing its financial dependency on Bakery Supplies
Purac has many strategic opportunities to leverage its fermen-tation capability in both horizontal and vertical extension of the business. Our aim is for Purac to realize its potential and to accelerate growth to become self-sustaining in financing its growth and investments and to be less dependent on the cash flow of Bakery Supplies. To achieve this, Purac must grow to a size that organic growth alone cannot deliver. We will pursue alliances and partnerships to further exploit our capabilities in the field of fermentation, downstream processing and bio-mass applications.
performance goalsWithin the framework of our strategy, we have set ambitious goals to realize above average returns and to meet our leading financial KPI’s, including Organic Sales growth, ROCE, EBITA margin and net debt / EBITDA.
To monitor and manage the execution of our strategy we also have introduced underlying company-specific KPI’s, such as sales of new products, working capital days on hand and service levels.

Report of the Board of Management | 15
ResultsNet salesNet sales were 4.1% higher in 2011 compared to 2010, up to € 3,112.6 million (2010: € 2,990.1 million). Acquisitions contrib-uted € 94.0 million (3.1%). Exchange rate differences, especially the US dollar, negatively impacted net sales by € 81.5 million (-2.7%). Adjusted for the acquisition and currency effects, organic growth was € 110.0 million (3.7%).
Breakdown of organic growth:
Bakery Supplies North America 3.3%
Bakery Supplies Europe 4.4%
Purac 3.7%
The organic growth development for Bakery Supplies North America was driven by increased selling prices (10.4%) to compensate for higher raw materials costs, largely offset by lower volumes sold (7.1%) as a result of the recessionary envi-ronment. Europe showed a comparable picture, with increased selling prices contributing 7.0%, while the decline in volumes sold was 2.6%.
Also at Purac, organic growth was driven by increased selling prices (4.6%) to compensate for higher input costs, being offset by a negative volume effect of 0.9% due to increased competi-tion and a weaker economic climate.
EBITA EBITA excluding one-off acquisition and integration costs decreased by € 64.4 million, or 29.9%, to € 150.8 million (2010: € 215.2 million). EBITA including the one-off costs (related to the restructuring program, the integration of the acquisition of Best Brands and the impairment of some tangible fixed assets) amounted to € 130.2 million. The net acquisition effect amounted to € 9.7 million. EBITA has been negatively impacted by € 4.4 million due to the translation of income in foreign currencies to the euro.
Breakdown of (the change in) EBITA (excluding one-off costs)
2011 2010
BSNA 94.9 123.4 -23.1%
BSEU 38.4 61.8 -37.9%
Purac 46.1 56.6 -18.6%
Corporate -28.6 -26.6 -7.5%
Financial Commentary 2011, Dividend proposal, prospects for 2012
millions of euros
Development of the results per division is explained in the divisional sections.
The impact of the increased raw material costs in 2011 versus 2010 amounted to € 255 million, increased selling prices of € 231 million compensated these additional costs to a large extent.
One-Off costsThe costs that were identified to be incidental and outside the normal course of business were:• Costs relating to the Best Brands integration for an amount
of € 6.4 million (2010 € 21.4 million.);• Costs recorded in relation to the restructuring program
Relevance for an amount of € 11.1 million;• Impairment of the pilot lactide plant at Purac Spain for an
amount of € 3.1 million, as a result of the start-up of the new lactide plant in Thailand;
• Goodwill impairment BSEU for an amount of € 249 million.
Impairment of BSEu GoodwillThe profitability of our European bakery activities decreased considerably in 2011. Margins were impacted by higher raw material costs and volumes sold declined, especially in our ingredients business for the artisan and industrial channels. All parties in the bakery industry had to deal with strongly increased raw material costs, which have been translated into higher prices in all bakery channels, which subsequently led to higher selling prices for the end-consumer. Combined with the difficult economic environment and the reduced spending power of consumers, we have seen the structural shift from the traditional artisan bakery channel towards the cheaper and more convenient supermarket channel accelerating in 2011.
The carrying amount of European bakery supplies activities were valued at € 695 million, of which the largest part (€ 517 million) is goodwill. This goodwill mainly relates to the bakery activities acquired in 2000. The goodwill paid for these activities was largely based on the highly profitable ingredi-ents position in the artisan and industry channels. The bakery activities delivered substantial cash flows over the past years. However, due to the structural changes in the marketplace, including the shift from artisan to in-store-bakeries and out-of-home channels, the cash generating capacity of the European Bakery Supplies activities has diminished to such an extent that an impairment of the book value is required.
Multiple scenario analyses have been performed which resulted in a non-cash impairment charge of € 249 million on the BSEU

16 | CSM Annual Report 2011
goodwill. In accordance with IFRS, when making these analyses we have taken into consideration only the current asset base and activities and did not reflect the actions resulting from our business review.
Financial Income and ChargesNet financial charges increased by € 2.1 million to € 29.7 million. The higher expenses are mainly due to lower positive fair value effects of derivatives and the full year effect of the private placement of US$ 300 million, concluded in the 4th quarter of 2010. This followed the Best Brands acquisition and included a shift into more long term and higher interest funding. In 2010 interest charges were negatively influenced by one-off refinancing costs. Based on constant currencies, for 2012 we expect our interest expenses to be in line with 2011.
TaxesNet tax showed a positive effect of € 5.0 million compared to an expense of € 31.2 million in 2010. The tax effect has been significantly impacted by the goodwill impairment charge. Excluding the goodwill impairment effect, net tax as percentage on income before tax is 31.0% (in 2010: 23.9%). For 2012, the tax burden is expected to be in the range of 25% to 30%.
Net resultResult after taxes is showing a loss of € 174.3 million, signifi-cantly impacted by the net effect of € 222.4 million of the impairment charge of BSEU goodwill. Excluding the impairment charge, the net result would have ended at a profit of € 48.1 million, a decrease of € 51.2 million compared to the net result of 2010. The EBITA decline in 2011 has been partly compen-sated by lower taxes and lower amortization expenses.
Balance SheetCapital employed including goodwill (on historical costs) increased by € 72.3 million to € 2,239.9 million. The main move-ments were:
millions of euros Net capital expenditure on (in)tangible fixed assets 91.7
Depreciation / amortization of (in)tangible fixed assets -102.7
Impairment fixed assets -3.1
Acquisition 11.8
Investment financial fixed assets 8.8
Tax positions 21.5
Provisions 10.4
Working capital increase 3.7
Exchange rate differences 29.2
The acquisition effect relates to the acquisition of Classic Cakes Ltd. in the UK in January 2011. The major capital expenditures in Bakery Supplies, besides regular replacement of fixed assets, consisted of investments in manufacturing efficiency and capacity increase both in frozen and ingredients. The largest capital expenditure at Purac was the final part for the new PLA factory in Thailand. Furthermore, important investments in IT have been made for an improved global IT structure and func-tionality and further standardization of IT systems within our Bakery Supplies organization.
We expect, at constant currencies, depreciation and amortization expenses of fixed assets in 2012 to be comparable to 2011.
Working capital increased by € 3.7 million to € 254.9 million. The acquisition and currency effects contributed respectively € 0.8 million and € 3.3 million. The net effect of increased working capital is € 0.4 million.
Equity before profit appropriation decreased by € 168.9 million to € 948.3 million. The main movements were:
• The subtraction of the negative result after taxes of € 174.3 million, including the impairment charge of intangible fixed assets of € 249 million;
• A decrease of € 23.2 million in connection with the dividend for financial year 2010;
• Positive exchange rate differences of € 22.5 million due to the translation of equity denominated in currencies other than the euro;
• Positive movement of € 5.3 million in the hedge reserve.
At the end of 2011 the ratio between balance sheet total and equity was 1:0.4 (2010: 1:0.4).
Cash FlowCash flow from operating activities decreased by € 40.6 million compared to 2010 amounting to € 148 million. This is the balance of mainly a lower result after taxes, and a negative impact of the movement in working capital and provisions of € 1.7 million, offset by lower taxes and interest paid of € 17.5 million.
The cash flow needed for investment activities was € 102.9 million in 2011. Next to the acquisition of Classic Cakes Ltd and the invest-ment in the Tunisian joint venture, capital expenditure contrib-uted the most with € 95.2 million to this usage of cash flow.
Cash flow from financing activities amounting to € 49.4 million negative include the dividend payments of € 23.2 million as well

Report of the Board of Management | 17
as repayments and proceeds of loans amounting to € 26.2 million.
FinancingAt the end of 2011 the net debt position was 2.8x EBITDA (2010 2.1x) and the interest cover for 2011 was 7.6x (2010 9.7x). We continue to stay well within the limits of our financing covenants.
The net debt position amounted to € 615.6 million at the end of 2011, a decrease of € 15.4 million compared to the end of 2010. This is the net balance of the following major movements:• A positive cash flow from operating activities before working
capital and provisions of € 206.2 million;• A net investment in (in)tangible fixed assets of € 83.1 million;• Dividend payments of € 23.2 million;• The acquisition of Classic Cakes Ltd and the investment in the
Tunisian joint venture of total € 19.8 million;• Tax paid on profit of € 19.6 million;• Interest payments of € 29.4 million;• An increase of € 9.2 million due to working capital and
provisions.On 31 December 2011 the interest-bearing non-current liabilities amounted to € 726.9 million (31 December 2010: € 745.7 million). The average effective interest rate of the non-current liabilities outstanding on 31 December 2011 was 3.5% and the average remaining term 4.0 years (31 December 2010: average interest rate 3.7 % and average term 4.5 years).
Reservation and Dividend policyThe reservation policy is aimed at creating and retaining sufficient financial scope to realize the growth objectives while maintaining healthy balance sheet ratios. CSM intends to add or charge the profit or loss to the company reserves after payment of the statutory dividend on financing preference shares and after deduction of the proposed dividend on common shares. Issues such as financing requirements, acquisitions, divestments, reorganizations or other strategic considerations can lead to adjustments in the reserves and the reservation policy.The amount of dividend on common shares and the type of dividend that the company will pay to its shareholders depend on the financial results of the company, the business climate and other relevant factors. In principle, CSM aims at an even and, if possible, upward trend in the dividend.
Dividend proposalUpon adoption of the financial statements holders of financing preference shares will receive the statutory dividend. The dividend proposal on common shares will be presented to the
General Shareholders Meeting to be held on 7 May, 2012. In light of exploiting the opportunities from our business review and reflecting on the 2011 results, the dividend proposed on common shares amounts to € 0.70 per share. Shareholders will be able to choose between a cash and stock dividend charged to the reserves. The dividend in common shares is exempt from Dutch dividend taxes.
Outlook 2012Consumer confidence is still very fragile in many of our main markets and could continue to have an impact on demand. In addition, volatility of raw material pricing is likely to remain. Although there has been some easing for a number of soft commodities, it is too early to say whether this trend will persist.
Within the challenging economic environment in many of the countries where we operate, we have initiated actions to re-position CSM for profitable growth in the years to come. As a consequence our business portfolio will go through significant reshaping over the course of the year.
Our restructuring program, initiated in October 2011, will deliver net savings of € 30 million in 2012, rising to € 50 million in 2013. However, this will be partly offset by some cost inflation and increased production expenses as the new lactide factory in Thailand has commenced production but will not yet be fully utilized in 2012.
We will be emphasizing capital control; working capital will continue to be managed tightly although it will as usual show a seasonal pattern with most of the cash flow being generated in the latter half of the year. Investments in fixed assets and acqui-sitions will be aligned with our cash flow generation.
Given the economic uncertainties, volumes not expected to pick up on the short term, and our efforts on implementing the stra-tegic and operational re-alignment, 2012 will be a transitional year for CSM. As the rise in raw materials costs and the decline in consumer demand accelerated in the course of 2011, it is evident that the first half of 2012 will face a tough comparison with the first half of 2011.

18 | CSM Annual Report 2011A
lter
nat
ive
Sub
stra
tes
Frid
ges
oft
– A
sm
art
solu
tio
nA
del
icio
us
do
nu
t w
ith
less
fat
prem
ium
pas
try
Incr
ease
d re
ach
to m
arke
t in
Gre
ater
Ch
ina
Bu
ild
ing
a co
mp
lete
pre
serv
atio
n p
ort
foli
oW
in in
th
e m
arke
t th
rou
gh
par
tner
ship
s
In-store bakeries are rapidly gaining market share. In Anglo-Saxon countries, supermarkets already account for the lion’s share of sales, while in other Western countries, supermarkets are rapidly making inroads into the bakery market. CSM is servicing the in store bakery channel with best-in-class products and value added services by building strategic partnerships.
The in-store bakery growth trend accelerated further in 2011, particularly in Europe, driven by changing consumer behavior. This was partly due to the recessionary environment, but also triggered by the continually improving quality and extensive choice that in-store-bakeries are offering today. CSM is well positioned to benefit from this trend.
Success in in store bakeries calls for innovative products, built on consumer insights, strong technical support, and solutions that minimize operational handling and maximize customer's experience of freshly baked goods. CSM has the capabilities to deliver in all these areas.
Teaming up with key customers as their preferred supplier is one of our strategic growth themes. CSM has a Key Account Management approach in place to deliver on the broad set of competences required to be successful. How we work with ASDA, one of the largest retailers in the United Kingdom, is a good example;
With ASDA the year started with a joint planning & strategy day during which ASDA's Category strategy for the year was mapped out and CSM identified where its core competencies had synergy to drive the in store bakery category into strong growth.
By using extensive category data, shopper insights and experience, the CSM team developed a three-pronged strategy. This included a wholesale strategy that encouraged trade up to large package sizes, driving sales volume for CSM and adding value to the category. This was so successful that it now accounts for 15% of ASDA’s in-store cake sales with CSM’s iced ring donuts and cookies at the forefront of this burgeoning market.
In recognition of this work, CSM was awarded 'Best Category Support' at the ASDA Bakery awards for its success in the in-store category. This focus and partnership approach to planning has ensured a service level improvement to over 99%, which led to CSM also winning ASDA’s award for 'Best Supplier in Bakery'.
Win in the market through partnerships

Report of the Board of Management | 19

20 | CSM Annual Report 2011
CSM Bakery Supplies
CSM Bakery Supplies produces and distributes an extensive range of premium quality bakery products and ingredients for artisan and industrial bakeries, and for in-store and out-of-home markets, mainly in Europe and North America, with a growing presence in emerging markets. We supply customers with finished or semi-finished products as well as ingredients.
The Bakery Supplies market Bakery products are a core product in many Western markets with a household penetration of nearly 100%. Grain-based breads and pastries are an important part of consumers’ daily diets in large parts of the world, while in non-Western markets, bakery products are becoming increasingly popular. The market has developed into a wide range of products, from traditional breads to the finest pastries, offering unprecedented levels of choice for today’s consumer at anytime of the day.
Innovation is the key growth driver in the bakery market. Innovations include product development addressing the trends in the marketplace, while innovations in technology and application improve the baking process.
Technology and packaging have extended the shelf life of many bakery products. In addition, technology and innovation have increased the quality of (semi) finished bakery products that can compete with freshly baked goods. This has opened up many opportunities to diversify sales channels. The artisan baker remains the most important channel in Europe, although in-store-bakeries in supermarkets and out-of-home channels are increasing their sales in the bakery market worldwide.
The Bakery Supplies market in which CSM operates can be divided into
• Ingredients;• (semi) Finished products.
CSM’s position in Bakery SuppliesCSM has a leading position in the bakery market. Our position is based on the high quality of our products and the value-adding services, for which we are renowned.
• IngredientsCSM is market leader in ingredients such as bread improvers, bread and pastry mixes, bakery margarines and emulsifiers, fruit and (non) dairy-based pastry creams, fillings, icings and glazes. We focus on areas where we can offer added value, meaning that we do not offer basic bakery product ingredients such as flour and sugar. CSM has a strong reputation in ingredient technology, which is the backbone of our strategy to drive growth.

Report of the Board of Management | 21
bakery industry to drive further growth. Coupled with improved production technology, innovation is key to addressing these market trends.
New indulgence: Driven by the trend towards healthier food, consumers have become more conscious when allowing themselves to consume indulgent products, and demanding that these should be of the highest premium quality. Many consumers have become more experimental with new products, new flavors and new moments to enjoy our products. This is allowing us to exchange products from one part of the world into other markets.
Expanding into new markets: The growth of bakery markets in developed countries, where there is limited population growth, is relatively low and aligned to overall GDP. Growth rates are considerably higher in emerging markets where populations are steadily expanding. In addition, in these regions bread and pastry are becoming increasingly important in people's daily consumption patterns.
Customer support & services: Our Bakery Supplies customers are increasingly looking for suppliers who can support them in various ways, including product development, logistics solutions and marketing activities. We identify an increasing demand for what we call customer intimacy-based solutions that we are able to provide.
In addition to these long term trends, we have seen the impact that current trading environment is having on the market, with both the consumer and our customer seeking to economize. Our customer suppport & services are working on providing our customers with the right insights to respond to these needs, and tailor our offering accordingly, for example the reformula-tion of products or different packaging.
Within this segment, our customer base comprises traditional artisan bakeries, industrial bakers and supermarkets that offer in-store finishing of bakery products.
• Finished and Semi-Finished productsWe continue to strengthen our leading position in the manu-facturing and sale of premium finished and semi-finished pastry products, such as fully decorated cakes, donuts, muffins, European style viennoiserie and American cookies. Our innova-tion strengths, combined with deep market insights are our engine for growth that gives us our competitive edge in the market. Our activities within this segment have been focused on North America and Europe, where we are a leading supplier. Although limited, we have an increasing presence in fast-growing emerging markets, such as in Asia and the Middle East.
Main market trendsWe recognize a number of key market trends, for which CSM Bakery Supplies is very well positioned to capitalize on to drive future growth:
New types of outlets: In Europe, the artisan bakery is still the traditional outlet for daily bread and pastries, but the landscape is rapidly changing. In most Western countries, supermarkets are increasingly making inroads into the bakery markets and are already accounting for an important share in sales. More consumers are demanding bakery products wherever they might be; shopping or on the go. They no longer expect these products to only be available throughout traditional outlets and channels, which is resulting in other types of outlets gradually selling more bakery products. The largest sales growth is through out-of-home channels such as coffee houses, convenience stores at train stations and petrol stations, and restaurants, which can offer bakery products anywhere and anytime.
Improved production technology: Sales growth in new types of outlets has been partly driven by modern technology that allows freezing of partly or fully baked products. Consumer demand has also responded to the increased quality and perceived freshness of bakery products that modern bake-off equipment can deliver.
Demand for healthier products: Healthier food is becoming a major factor in how consumers make their choices. The trend in calorie reduction and consumers’ increasing awareness of healthy ingredients, espe-cially with regard to fats and fibers, are an opportunity for the
2,500
2,000
1,500
1,000
500
0
Net sales CSM Bakery Supplies
2007 2008 2009 2010 2011
millions of euros

22 | CSM Annual Report 2011
CSM's Bakery Supplies strategyCSM's strategy is geared towards further building our leader-ship position in our markets and ensuring sustainable and profitable growth with returns above market average, driven by our strategic initiatives
The starting point of our strategy is our passion for delivering the best products and being a true partner to our customers. Our global reach and capabilities give us a unique competitive edge that supports its successful execution.
passion for our products:We continuously develop new and innovative products that meet the needs of our customer and end-consumers. Our global capabilities in the field of marketing and innovation are the key to converting global trends and developments into our product portfolio. On the other hand, we also have a strong local and regional presence and an in-depth understanding of the local markets, to which we tailor our offering.
partnership: We aim to partner with our customers to achieve mutual growth and prosperity. This means not only supplying the right product to each customer, but also providing a range of customer support services. We provide the technical expertise they need in order to improve the quality of their products and the efficiency of their operations.
We also invest in market data and product development, which enables us to work with customers to define new ways of attracting consumers and increasing sales. Our partnership approach nurtures long lasting relationships and often makes CSM a ‘preferred supplier’.
Developments and Results in 2011The markets in which Bakery Supplies achieves the majority of its sales, the US market and the Western and Southern European markets, were seriously impacted by the economic downturn. Consumer confidence was affected by the turbu-lence in worldwide markets, which in turn negatively impacted their behavior and spending. As of Q2 we have been confronted with consumers willing to spend less on their purchases. At the same time, we had begun to implement significant price increases to compensate for surges in raw material costs. The rise in raw material prices that began in 2010 reached its peak around the mid of 2011. Since then, we have seen some pressure easing, although both volatility and price levels have remained high overall. While we have significantly increased our selling prices, on balance this was not sufficient to fully
compensate for the increased raw material costs. As announced in October 2011, we initiated a restructuring program to reduce our cost base and thereby restore profitability. In addition we conducted a business review to realign our focus and be able to deliver on our financial commitments.
Market SituationRecessionary economic situation in North America and EuropeAs said before, the economic downturn in the United States and Europe and the ongoing financial crisis have weakened demand. The fall in consumer confidence had led to even lower consumer spending. Although we provide daily consumer needs, this recessionary environment has inevitably impacted demand. Following the consumers' behavior, many of our customers have been trading down to cheaper alternatives within our ingredient and pastry assortment, leading to shifts in product mix. In addition, we have seen consumers shifting towards low priced sales channels, where we are less strongly positioned. Moreover, both our customers and consumers were mindful about limiting waste to reduce costs. This all resulted in a decline in volumes sold.
Raw Material price VolatilitySince 2007 raw material markets have seen continuous volatility with a sharp upward underlying trend. This movement is driven by a number of developments: rising demand from developing countries driven by increased consumer food spending, increased demand for vegetable oils and fats from the bio-fuel industry, fluctuations in harvests around the world and increasing invest-ments from financial markets in soft commodities. Responding efficiently to changes in raw material prices has been critical to our company, and the investments made in previous years towards professionalizing our global procurement team has miti-gated the effects of these rises for us and our customers.
2,000
1,600
1,200
800
400
0
Net sales CSM Bakery Supplies North America
2007 2008 2009 2010 2011
millions of US dollars

Report of the Board of Management | 23
We took our responsibilities as market leader by achieving substantial price increases. In addition, we reformulated our product offering where appropriate to safeguard profitability and offer choice to our customers. Despite these important joint efforts of our procurement team, our sales departments and our R&D organization, we could not fully compensate for the effects of the increases in raw material prices in 2011.
Increased shift in importance of the supermarket as primary bakery channelSupermarkets are continuously increasing their share of total consumer spending in bakery at the expense of artisan chan-nels. The challenging economic environment has accelerated this trend. The artisan baker channel is traditionally a strong-hold for CSM; we have a significant market share particularly in Western and Southern European countries. Although we have strengthened our position in the in-store-bakery channels in supermarkets, particularly in Europe, this could not fully miti-gate the impact of declining volumes in the artisan market.
RestructuringBoth Bakery Supplies divisions have embarked on our company-wide restructuring program, which was initiated as a response to the difficult trading environment and the increase in raw material costs in October 2011. This program targets improved effective-ness and efficiency of our operations. All activities and related expenses and investments are being scrutinized and assessed in relation to their value adding capacity. Measures resulting from this restructuring program range from closures of production sites and sales offices to cuts in discretionary expenses. In total, the restructuring program should deliver a cost reduction of € 30 million in 2012, with the vast majority of these cost savings to be delivered by our Bakery Supplies divisions.
Results 2011: Bakery Supplies North America
Sales increased by US$ 186.5 million (9.0%) to US$ 2,263.8 million, mainly driven by our price increases (10.4%). The full year consolidation of Best Brands, acquired 19 March 2010, contributed US$ 114.7 million (5.3%) to our sales value. The increase in sales was for a large part offset by a drop in volumes sold of 7.1%. This volume decline is predominantly the result of lower consumer spending as a reaction to the tough economic environment.
Our margins were negatively impacted as our selling prices did not yet fully compensate for the increase in raw material costs. In addition, lower volumes sold also had an effect on the absorption of fixed costs. In the second half of 2011 we finalized the closures of two factories, of which one was a former Best
CASE
CSM
BA
KER
y Su
pplI
ES
The Invisible GOODNESS™ range of pastry products.Governments, consumers and companies are increa-
singly looking for products which can help us achieve
healthier lifestyles. The Invisible Goodness™ pastry
range is a perfect fit. These innovations help our
customers addressing consumer trends by offering
an attractive choice for consumers as compared
to market benchmarks with a higher calorie and
fat content:• Energy intake reductions are substantial and
meaningful in a weight management context.• The products offer significantly reduced satu-
rated fatty acids contents; mainstream medical, heart-health and government authorities advise that saturated fat is a dietary risk factor for cardiovascular disease.
• The taste and eating experience is excellent.
All products are based on the Invisible Goodness™
bakery fat technology developed by CSM. Both the
bakery fats and the frozen pastry range provide the
opportunity to our customers to produce a wide
variety of bakery products which are better-for-you
from a health & wellness perspective, yet offer the
taste and eating experience consumers expect.

24 | CSM Annual Report 2011
Brands facility, to deliver on anticipated synergies following the integration of Best Brands and as part of our company-wide cost reduction program to improve profitability. The overall restructuring measures in BSNA led to a reduction of headcount of 330 in total. As a consequence, EBITA before one-off costs came down to US$ 132 million (2010: US$ 163.3 million), or as a percentage of sales to 5.8%. (2010: 7.9%).
Capital employed has been impacted by the increased raw material costs on inventory and indirectly on receivables due to increased selling prices. A major effort has been undertaken by our people to reduce working capital and to limit the invest-ments in fixed assets resulting in a reduction of US$ 38.4 million to a total of US$ 1,313.7 million. Our average working capital cash conversion cycle remained fairly stable and ended at 30.2 days, from 29.8 days in 2010, indicating continued cash disci-pline within our organization, despite the upward pressure due to higher raw material costs and increased selling prices. Capital expenditures amounted to US$ 29.2 million, US$ 4.0 million less than depreciation. No major capital expenditures took place in 2011. Mainly as a result of the lower EBITA, ROCE before one-off costs ended at 9.7% compared to 12.7% in 2010
Results 2011: Bakery Supplies EuropeThe circumstances outlined above also applied to our European business, but in addition, especially the growing uncertainty in the Euro zone and its consequences for consumers accelerated the decline in volumes sold throughout 2011. For the total year
sales value increased by € 55.2 million, positively impacted by higher selling prices of 7.0 % on average, but this was mostly offset by lower volumes sold of 2.6%. This decline in volumes sold was mainly caused by lower sales in the artisan and indus-trial channels. In the in-store-bakery and out-of-home channels we saw a small increase. Our margins were further compressed by higher raw material costs that were not fully compensated by higher selling prices and product reformulations.
We have responded to these lower margins by reducing costs wherever possible, although this could not prevent that EBITA before one-off costs ended at € 38.4 million, a substantial decrease from € 61.8 million in 2010. EBITA as percentage of sales decreased to 3.6% from 6.0% in 2010. Further cost reduc-tions will be an important driver to improve our operating performance.
In 2011, we made a correction on the carrying value of our assets. The European bakery activities were valued at € 695 million, of which the largest part (€ 517 million) is goodwill. This goodwill mainly relates to the acquisition of the bakery activi-ties acquired in 2000 from Unilever. The goodwill paid for these activities was largely based on the very profitable ingredients position in the artisan and industrial channels. The Bakery Supplies activities delivered substantial cash flows over the past years. However, due to the structural changes in the market-place, including the shift from artisan to in-store-bakeries and out-of-home channels, the cash generating capacity of the European Bakery Supplies activities has diminished to an extent that an impairment on the book value is required. This has led to an impairment charge of € 249 million. We were able to decrease working capital at year end to € 58.1 million (2010: € 59.3 million). The positive impact of lower inventory volumes and strict cash control more than compen-sated the effect of higher raw materials and selling prices. Our average cash conversion cycle ended at 31.1 days, from 24.7 days in 2010 reflecting the sharp increase during the year as a result of raw material and selling prices. Net capital expenditure on fixed assets amounted to € 18.9 million, which was below the depreciation level of € 22.4 million. No major large capital expenditures have been made with the exception of invest-ments in IT. Our ROCE before one-off costs decreased mainly as a result of lower EBITA to 4.6% in 2011.
1,250
1,000
750
500
250
0
Net sales CSM Bakery Supplies Europe
2007 2008 2009 2010 2011
millions of euros

Report of the Board of Management | 25
CASE
CSM
BA
KER
y Su
pplI
ES
Our joint venture in TunisPart of CSM's strategy is to expand into emerging economies
with high growth rates. North Africa is such a region. CSM has
established its presence through a joint venture with the Tunisian
based company GIAS s.a., which gave CSM a leading position in
Bakery Ingredients and Margarines in North Africa.
The North African region, Tunisia in particular, has appealing
market dynamics. Domestic growth of up to 6% percent in recent
years, improving living standards driving consumption, and new
western style consumer habits being embraced. A new political era
has also begun, which will also involve liberalization of trade and
greater economic transparency.
Being successful in North Africa depends on a number of critical
factors. By far most important is the understanding of the local
culture and a good relationship network. A well established
distribution network is also key to reaching the market. This is why
CSM preferred to enter this market with a strong local partner to
be able to leverage the market potential with combined strengths.
Achieving the position we jointly have with Gias today, would
have taken a long time to build organically. The local strength from
Gias combined with CSM's global expertise has given us the head
start to pursue aggressive growth now a new era, following the
revolution, has begun. Dan Frolec, as Vice President of CSM CISNEA
responsible for this region comments: "We are proud to have
CSM-GIAS as part of the CSM family and I look forward to building
together our presence in North and West-Africa. This joint venture
co-operation and integration of resources from both companies
can also serve as a best practice example to increase CSM's
footprint in emerging markets."
Since the CSM Gias venture has started off in January, we have
started to exploit and embed synergies, such as procurement
optimization through connecting to CSM's supplier network and
market intelligence. The product portfolio has been boosted by
CSM's innovative solutions and relationships with international
accounts have been tightened. Ghassen Slama, Chief Executive
Officer of CSM Gias comments: "It obviously has been a volatile
year in the region, which wasn't easy to operate in. It bodes well for
the future how we have managed to work together to get the joint
business started to the level we are today."
In the meanwhile, all operations are fully integrated and processes
are synchronized with CSM standards. Now the social situation
has settled down in the region, CSM Gias can agressively pursue
its growth opportunities in the market; 2012 has started off with
double digit volume growth.
26 | CSM Annual Report 2011
purac
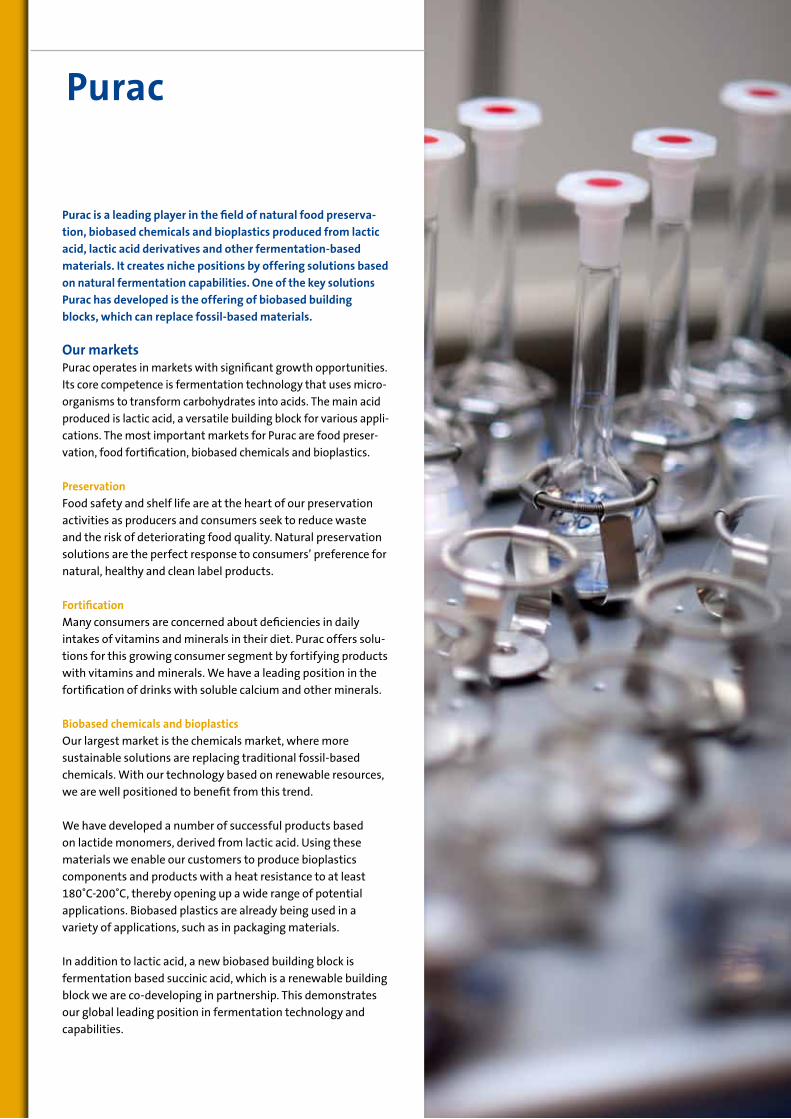
purac is a leading player in the field of natural food preserva-tion, biobased chemicals and bioplastics produced from lactic acid, lactic acid derivatives and other fermentation-based materials. It creates niche positions by offering solutions based on natural fermentation capabilities. One of the key solutions purac has developed is the offering of biobased building blocks, which can replace fossil-based materials.
Our marketsPurac operates in markets with significant growth opportunities. Its core competence is fermentation technology that uses micro-organisms to transform carbohydrates into acids. The main acid produced is lactic acid, a versatile building block for various appli-cations. The most important markets for Purac are food preser-vation, food fortification, biobased chemicals and bioplastics.
preservationFood safety and shelf life are at the heart of our preservation activities as producers and consumers seek to reduce waste and the risk of deteriorating food quality. Natural preservation solutions are the perfect response to consumers’ preference for natural, healthy and clean label products.
FortificationMany consumers are concerned about deficiencies in daily intakes of vitamins and minerals in their diet. Purac offers solu-tions for this growing consumer segment by fortifying products with vitamins and minerals. We have a leading position in the fortification of drinks with soluble calcium and other minerals.
Biobased chemicals and bioplasticsOur largest market is the chemicals market, where more sustainable solutions are replacing traditional fossil-based chemicals. With our technology based on renewable resources, we are well positioned to benefit from this trend.
We have developed a number of successful products based on lactide monomers, derived from lactic acid. Using these materials we enable our customers to produce bioplastics components and products with a heat resistance to at least 180˚C-200˚C, thereby opening up a wide range of potential applications. Biobased plastics are already being used in a variety of applications, such as in packaging materials.
In addition to lactic acid, a new biobased building block is fermentation based succinic acid, which is a renewable building block we are co-developing in partnership. This demonstrates our global leading position in fermentation technology and capabilities.

Report of the Board of Management | 27
Main market trendsWe recognize a number of key market trends, for which Purac is well positioned to capitalize upon to drive future growth:
SustainabilitySustainability is one of the key opportunities in the chemicals and polymers markets. There is a huge trend in the global industries towards biobased chemicals made from renewable resources aimed at reducing CO2 emissions and decreasing the dependency on fossil raw materials. Purac is well positioned to contribute with a series of so-called biobased building blocks in which lactic acid, lactides and succinic acid can become impor-tant platform molecules for the production of more complex chemicals.
Safe, healthy and natural foodIn the food industry, food safety and the extension of shelf life are key. Furthermore, healthy and balanced nutritional profiles have become important value drivers. Simultaneously, we see a clear trend to reducing the number of ingredients on product labels and moving towards "clean labels”. Lactic acid, lactic acid derivatives and ferments provide a broad range of solutions to these trends.
purac’s positionPurac plays a leading role in providing healthy, natural and biobased products within its markets. Its continued invest-ments in research and development and close cooperation with customers have given it a strong and preferential market position.
While focused on developing new and innovative products, Purac has not lost sight of its competitive cost position. It has further strengthened this advantage with a far-reaching effi-ciency program that concentrated the production of lactic acid into three large-scale factories on three continents at locations where its main raw materials are abundantly available. Highly specialized products like lactic acid-based derivatives are manu-factured close to its research & development facilities.
purac's strategyCSM's strategy is geared towards achieving or maintaining leadership in our markets and ensuring sustainable and profit-able growth with returns above market average.
For Purac, our long-term strategy is to drive growth by continued investment in the creation of new products and related production capacity. Purac aims to increase its invest-ment in fermentation technology and application development
in the coming years. In 2010 we began building a new factory in Thailand to produce lactides for the bioplastics industry. This € 45 million investment was completed in 2011. The plant increases our lactides capacity and enables us to meet growing demand in 2012 and beyond.
Innovation is at the heart of Purac's strategy. Being market leader, most market growth has been initiated by innovative products and applications developed by Purac. Due to the nature of the products and applications that Purac develops, innovations are likely to take a number of years before starting to deliver significant sales.
Intimate cooperation with our main customers is vital to increasing the success rate of our innovations and the speed with which these are absorbed by the market. Application research is often done in close cooperation with customers. We also team up with universities and other institutions around the world.
As a result of the large opportunities to grow our business in Food and Chemicals & Pharma, but especially in lactides as a feedstock for bioplastics, we have invested substantially in our organization. In 2011 we continued to strengthen our organi-zation by recruiting highly skilled and educated personnel to support the realization of the opportunities ahead.
Major developments and results 2011The development of Purac’s activities was mixed. The chemical and pharma market continued to perform strongly, but the food market was under pressure due to lower consumer spending and competition from lower cost in use alternatives as substi-tutes for its preservation products. Purac is making progress in its bioplastics activities, although this has not yet translated
400
320
240
160
80
0
Net sales purac
2007 2008 2009 2010 2011
millions of euros

28 | CSM Annual Report 2011
into sizeable commercial contracts. Its global presence exposes Purac to faster growing economies, which provided a degree of relief from the recessionary environment in the United States and Europe.
Raw material price volatilitySince 2007 raw material markets have seen continuous volatility with a sharp upward underlying trend. This move-ment is driven by a number of developments, which include: new demand from developing countries driven by increased consumer spending in food; increased demand from the bio-fuel industry; fluctuations in harvests around the world and; increased interest from financial markets in raw materials as an investment category. Responding efficiently to these move-ments in raw material prices is critical for our business; the investments made over the past years in our global procure-ment team have certainly mitigated the effects for CSM.
Recessionary economic situation in North America and EuropeIn addition to the difficult economic conditions in the United States and many European countries, the slowdown has been aggravated by the financial crisis. This has had a negative impact on consumer confidence in these countries.Purac's worldwide presence enabled us to benefit from the growth in the Asian and South American markets.
progress bioplastics strategyIn 2011 we continued our strategic path in bioplastics, although we recognize that it takes time to commercialize our proposi-tion given the scale of technological advancement offered and the time required by potential customers to develop application capabilities. The construction of our new lactide factory in Thailand has been successfully completed and has started delivering to customers as of early 2012. Based upon current forecasts the capacity utilization of this factory will grow throughout 2012, but not at the levels that will deliver an appropriate level of return in the very short-term. We continue to see strong signs that the market is developing, for example demonstrated by the announced commitment of several leading global brands towards green packaging. In 2011 we continued to expand our organization to support the growth of bioplastics, a process that commenced in 2010. We are convinced that we have the organization, the capabilities and the products in place to achieve commercial successes in 2012
and beyond, but progress and timing of customer investment are not fully under our control. We also continue to commit substantial resources to the next generation of plastics from lactides, which will no longer use food stock as a raw material but will be produced from bio-mass, such as waste material.(case alternative substrates)
Results 2011Sales of Purac increased from € 400.4 million to € 407.2 million, a combination of higher sales within Chemicals & Pharma segments and lower sales in food. In our Chemicals & Pharma segments we benefited from the continuously increasing demand for more natural products replacing mineral oil based products. The strong presence of this segment in Asia and Latin America further contributed to the good performance.
In our food segment we were confronted with lower volumes as well as pressure on average pricing as a result of competition from lower cost in use chemical derived preservation products in the United States. These products were legally not allowed in the US market until recently. We have responded to this by expanding our preservation product portfolio to be able to meet the needs of all segments of the market; targeting both the low cost in use segment with a newly launched product line as well as the premium fully natural clean label segment (link to case).
Our margins came under pressure from increasing raw mate-rial costs, which could not be fully compensated by price and mix changes in the short-term. Purac's results were further impacted by increased expenses of approx. € 2.4 million to expand the organization to develop and market bioplastics. As a result EBITA before one-off costs decreased by € 10.5 million to € 46.1 million (2010: € 56.6 million), and as a percentage of sales to 11.3% (2010: 14.1%).
Capital employed at year end increased to € 342.2 million from € 332.9 million. Capital expenditures exceed by € 12.8 million our annual depreciation charge of € 25.5 million. From the total capital expenditures of € 38.3 million, of which € 18.6 million was related to the new Thai lactide facility. Working capital increased by € 5.0 million to € 79.0 million, mainly as a result of higher raw material costs. Our average cash conversion cycle ended at 83.7 days, from 70.9 days in 2010, which is mainly the result of higher inventories and lower payables during the year. ROCE before one-off costs decreased from 18.8% in 2010 to 13.3 % in 2011.

Report of the Board of Management | 29
CASE
pu
RA
C
purac wins award for puraQPurac has won the Food Ingredients Europe Excellence
Award 2011 for its natural flavoring solution for sodium
reduction: PuraQ Arome NA4, in the category 'Savory/
Meat Innovation of the Year'. The prestigious award
follows two nominations from Purac's food solutions
this year, an impressive recognition of our dedication
to natural food preservation and flavoring. As health
authorities continue to highlight the dangers of excess
sodium on public health, this award highlights for food
processors that reducing salt is not only achievable,
but can actually positively improve their end-products.
PuraQ Arome NA4 is a multifunctional solution that
allows food producers to reduce sodium by up to 40%
without compromising on original quality, offering salty
taste, improved texture and water activity control. Food
producers can even boost flavors while cutting back
on salt levels, thanks to the savory and salty taste of
PuraQ Arome NA4. With this product, we contribute to
a healthier society.

30 | CSM Annual Report 2011Fr
idg
eso
ft –
A s
mar
t so
luti
on
A d
elic
iou
s d
on
ut
wit
h le
ss f
atpr
emiu
m p
astr
yIn
crea
sed
reac
h to
mar
ket
in G
reat
er C
hin
aB
uil
din
g a
com
ple
te p
rese
rvat
ion
po
rtfo
lio
Win
in t
he
mar
ket
thro
ug
h p
artn
ersh
ips
Today's world is increasingly conscious of the need to protect our environment and address the scarcity of fossil fuels. purac provides building blocks for poly lactic acid (plA); plastics from renewable resources, which are fully compostable at the end of their useful life. This proposition becomes even more compelling when the raw materials to produce these building blocks (lactides) are not longer derived from crops that could also be used for food, as food scarcity is another threat to our sustainability. purac operates at the forefront of developing alternative substrates.
Society is ever more aware that the production of fuels, chemicals and materials from fossil fuels is not sustainable. Meanwhile, industry has started to develop products based on renewable raw materials, or so called bio-based products. However, these renewable raw materials are also not endlessly available, since the amount of land for farming is limited and is also required for the production of food products for a rapidly growing world population. This means that more sustainable solutions are needed.
One option to escape the conflict between the restricted land availability for biomass production and the biomass needs for food, fuels, chemicals and other materials, is to make better use of existing biomass that is not used as a raw materials in the production of food products. Examples of this are agricultural byproducts such as corn stove and paper waste.
Purac started a research program several years ago on the use of so-called alternative substrates for the production of lactic acid and lactides, rather than the traditionally used starch substrates derived from sugar and tapioca. A driver for this research is that the demand for lactic acid will grow largely as a result of the rising demand for poly lactic acid. However, the use of alternative substrates for the production of chemicals such as lactic acid is quite a challenge, since biomass needs to be fragmented into fractions before it can be used for further processing. Such processes also need to be sustainable and highly efficient to be viable. Collaboration between industry and the public domain is accelerating progress in jointly addressing these challenges. Purac is partnering with universities, institutes and private industry as a research member in the public-private partnership BE-Basic. Apart from the knowledge network within BE-Basic, Purac is involved in bioprocess pilot facilities needed to test and scale-up these new processes.
Purac’s development program for alternative substrates is on schedule and a full scale demonstration plant is scheduled to become operational in 2015. Once the choice of the most suitable alternative substrate has been determined, further considerations with regard to technology and location for the investment will be finalized.
Alternative Substrates for even more sustainable Chemicals
Alt
ern
ativ
e Su
bst
rate
s

Report of the Board of Management | 31

32 | CSM Annual Report 2011
The success of CSM is created by our people, at all levels. Throughout the year, we continued to invest significant time and resources to develop tools, processes and forward-looking initiatives to create a compelling and competitive corporate environment. Offering career development opportunities and an appealing place to work not only attracts the best talent, but retains and develops people to give them a solid base to perform.In order to address the current challenges in the marketplace, CSM announced the necessity to adapt the organization to a more agile operating model. This requires a thought through human resources program. The core of every change process is the capability to change behavior and to embed a new mindset. In 2011, critical competencies and leadership behaviors have been identified to equip our people and the organization for the future.
Our ValuesOur deeply embedded corporate values, Passion, Partnership and Performance, are the cornerstone of our strategy and guide us each day to deliver the best products, technologies and services to our customers. Our values inspire our people and knit us together, uniting us into one culture across divisions and countries.
The CSM leadership BehaviorsThe identification of the critical competencies required to execute our business strategy was successfully developed in 2011. Through numerous company-wide and cross-functional workshops and an arduous, thoughtful selection process, we selected 11 leadership behaviors. Our corporate core values of Passion, Partnership and Performance are distinct from our leadership behaviors. We see our Core Values as an ‘entrance ticket’ and ‘condition to progress’ within the organization. The CSM leadership behaviors describe the behavior we expect from our leaders in order to deliver on our strategy. Each of the leadership behaviors holds up a bar of excellence against which we will assess our talent and structure their development plans.
Our people Strategy:The aim of our People strategy is to drive transformation and create the conditions for the company's development, through nurturing a company culture and helping individuals and teams to grow. The HR function needs to ensure that CSM has the tools, structure and culture needed to deliver on our aspirations as a company. Our People strategy builds from our business strategy and rests upon four key pillars, which reflect where we will invest in capability and infrastructure to support the success of our company and people: Business Agility, Performance Culture, Leadership to Deliver, and Rewarding Performance.
Talent Management and a High performance CultureTo support the assessment and development of our talent and ensure that our external recruiting is held to the highest standard, 2011 also saw CSM institutionalizing a host of best-in-class talent management processes. Career planning and progression, succession planning, talent review and performance management are all executed with one cohesive, global process that secures for objectivity, transparency, growth and mobility. Each of these processes is underpinned by the CSM Leadership Behaviors. Talent Management is a core element in our People Strategy which is designed to facilitate the execution of our business strategy. A suite of supporting tools were piloted in 2011 and will be fully implemented globally by year end 2012.
learning & DevelopmentLearning & Development is core to our Talent Management objectives. A new curriculum has been developed and rolled out globally for closing development gaps against our identified leadership behaviors along with a global training program on the competencies themselves. Over one hundred leaders around the globe were trained in an interactive, collaborative web cast. CSM continues to support the progression of its top talent through a variety of development opportunities including formal and on the job training, exciting projects, international experience and exposure. In addition, we have focused Leadership Development Programs aimed at developing the next generation of CSM leaders.
Our two Leadership Development Programs (“LDP”) target high potentials at key junctures in their progression within the company. The first brings together high potential managers whom we expect to grow into a senior management role within the next 5 to 7 years. This program is a regional, cross-divisional curriculum executed in four distinct modules throughout the year. The focus is on improving personal and managerial skills as well as stakeholder management, operating more effectively in an international environment, gaining in-depth knowledge about the company, and creating a peer set from which participants can seek advice and a sense of community.
The second LDP targets high-potential senior managers who we expect to be the successors of our executive leadership team in 5 to 7 years. The focus of this program is to improve strategic insights, change management and managerial skills, enhance influencing abilities, learn how to apply the advantage of cultural differences within the company, and share best practices.
For graduates, CSM has both MBA and trainee programs in place globally. These two-year programs provide multinational, cross-functional and multicultural experience, including six month
Our people

Report of the Board of Management | 33
international assignments and structured training modules to develop leadership and management skills. Our two year program encourages graduates to take responsibility early and get engaged in our day-to-day business. It also focuses on the internationalization of trainees, incorporating flexibility across the business and encouraging cultural awareness.
leveraging our global scaleOur operating framework seeks to combine the strength of our global scale and capabilities with local operations. Getting that balance right is essential for delivering on our strategy. This year, we assessed the effectiveness of our operating model with the aim of further improving our agility and efficiency. This has led to a restructuring program which also inevitably involves outflow of employees, which we highly regret.
As a global company with operations in 28 countries, we understand the importance of providing our people with the broadest possible experiences. Our company structure requires a diverse management team that is well connected and takes an international approach to growing the business. To this end, we provide our employees with opportunities to work on large scale and complex projects, sometimes abroad, to further deploy and challenge their unique skills and capabilities where we need them most.
Our workforceIn 2011, the average workforce increased from 9,456 to 9,900 (FTE). Bakery Supplies North America employs the largest number, with a total of 4,589 employees, followed by Bakery Supplies Europe with 4,231 and Purac with 1,022 people worldwide.
We have expanded our activities in new regions and invested in staffing our strategic initatives. This increase is partly being offset by redundancies related to the restructuring program initiated in October 2011 and the closure of two plants in the US following the integration of Best Brands. See page 88 for statistics on population, diversity, years of employment, absenteism and training.
SafetyWe are committed to high environmental, safety and health (ESH) standards. To meet this commitment, we maintain management systems that are designed to ensure continued compliance, while supporting improvement. CSM encourages the implementation of environmental and health and safety management systems, such as ISO 14001 or a comparable norm for operating companies used to minimize environmental impact. Purac has implemented the OSHAS 18001 health and
safety management system at its plants, in Bakery Supplies Europe implementation is progressing. We conduct regular audits to monitor compliance and performance of ESH standards at our businesses worldwide as part of the CSM requirements program. CSM has a simple credo: "healthy and safe from home to work and healthy and safe back home again". We also work with our business partners towards sustainable and responsible ESH practices among suppliers, contractors, and customers. We strive for open communication and dialogue in the workplace and with our stakeholders so we can respond to any concerns and suggestions.
It is with deep regret that we need to report that we were confronted with a fatality at one of our sites in North America. CSM thoroughly investigated the accident. Although the site was fully compliant with our training program and personnel was properly trained and certified, we decided to retrain all operations personnel at the location. Furthermore, best practices were shared across several other sites to prevent a similar occurrence at another location. To emphasize the importance of safety across the organization, safety performance, best practices, and breakthrough initiatives are shared periodically at the plant management level.
CSM in SocietyCSM provides through Bakery Supplies North America (BSNA) partnership support to the March of Dimes, Feeding America, Red Cross, and the Salvation Army. The March of Dimes strongly promotes folic acid as a main contributor to a healthy pregnancy, and BSNA includes folic acid in a portion of its products. Feeding America is a food bank organization, and as BSNA is in the food industry, this directly compliments the mission of collecting food for the needy. BSNA employees believe in giving back to the community, for example, we regularly hold blood drives for the Red Cross and donate to the Salvation Army for National Donut Day.
Another example of our societal involvement is Purac's contribution to aid initiatives following the floods in Thailand in October 2011. Next to donating money, funds which were raised by Purac Thailand and its employees, the company also supported by deploying Purac staff volunteers in helping the army distributing food, water and other goods to flood affected area's.
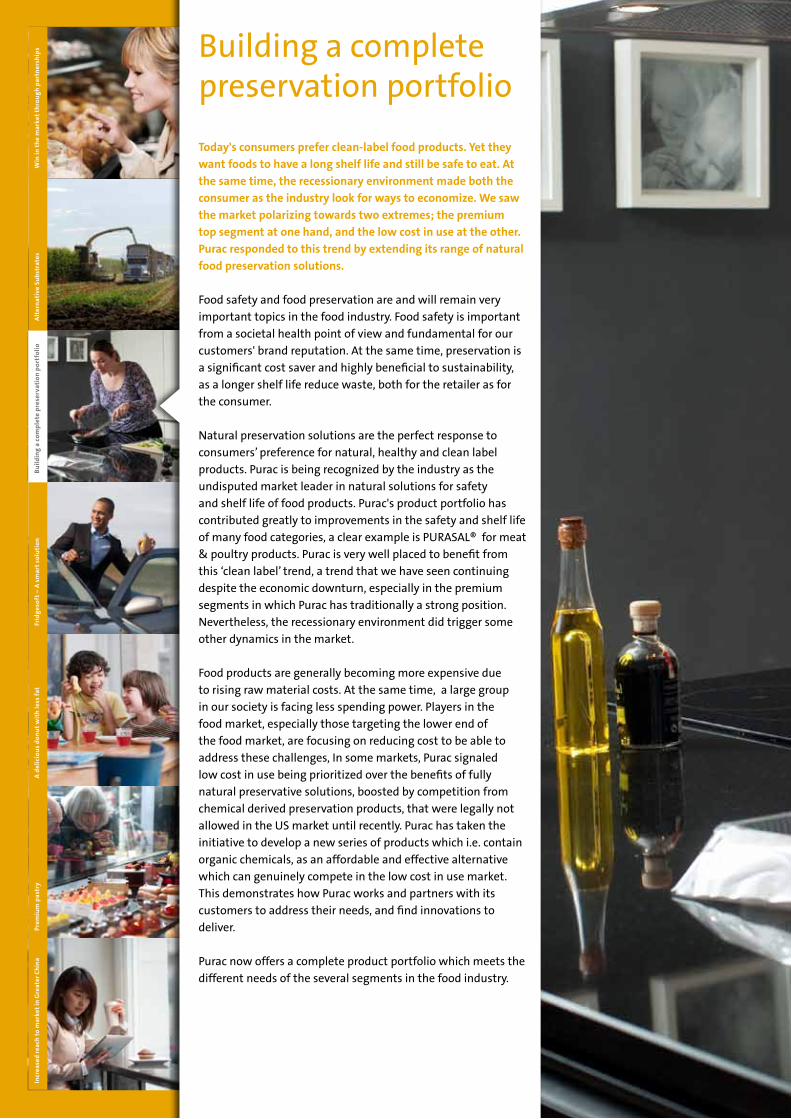
34 | CSM Annual Report 2011A
lter
nat
ive
Sub
stra
tes
Frid
ges
oft
– A
sm
art
solu
tio
nA
del
icio
us
do
nu
t w
ith
less
fat
prem
ium
pas
try
Incr
ease
d re
ach
to m
arke
t in
Gre
ater
Ch
ina
Win
in t
he
mar
ket
thro
ug
h p
artn
ersh
ips
Today's consumers prefer clean-label food products. yet they want foods to have a long shelf life and still be safe to eat. At the same time, the recessionary environment made both the consumer as the industry look for ways to economize. We saw the market polarizing towards two extremes; the premium top segment at one hand, and the low cost in use at the other. purac responded to this trend by extending its range of natural food preservation solutions.
Food safety and food preservation are and will remain very important topics in the food industry. Food safety is important from a societal health point of view and fundamental for our customers' brand reputation. At the same time, preservation is a significant cost saver and highly beneficial to sustainability, as a longer shelf life reduce waste, both for the retailer as for the consumer. Natural preservation solutions are the perfect response to consumers’ preference for natural, healthy and clean label products. Purac is being recognized by the industry as the undisputed market leader in natural solutions for safety and shelf life of food products. Purac's product portfolio has contributed greatly to improvements in the safety and shelf life of many food categories, a clear example is PURASAL® for meat & poultry products. Purac is very well placed to benefit from this ‘clean label’ trend, a trend that we have seen continuing despite the economic downturn, especially in the premium segments in which Purac has traditionally a strong position. Nevertheless, the recessionary environment did trigger some other dynamics in the market.
Food products are generally becoming more expensive due to rising raw material costs. At the same time, a large group in our society is facing less spending power. Players in the food market, especially those targeting the lower end of the food market, are focusing on reducing cost to be able to address these challenges, In some markets, Purac signaled low cost in use being prioritized over the benefits of fully natural preservative solutions, boosted by competition from chemical derived preservation products, that were legally not allowed in the US market until recently. Purac has taken the initiative to develop a new series of products which i.e. contain organic chemicals, as an affordable and effective alternative which can genuinely compete in the low cost in use market. This demonstrates how Purac works and partners with its customers to address their needs, and find innovations to deliver.
Purac now offers a complete product portfolio which meets the different needs of the several segments in the food industry.
Building a complete preservation portfolio
Bu
ild
ing
a co
mp
lete
pre
serv
atio
n p
ort
foli
o

Report of the Board of Management | 35
36 | CSM Annual Report 2011
Innovation
Innovation is at the heart of CSM. It is a key differentiator in our strategic positioning and fundamental to maintaining and strengthening our leading position. The changing environment in which CSM operates today has further demonstrated its importance. Innovation is crucial for deepening our relationships with customer and helping them to succeed in the marketplace. Our unique position allows us to be an innovator leader; our size and global scale give us the financial strength and reach to be the industry leader in R&D in our fields of interest worldwide, far ahead of competition. Our commitment to innovation is deeply embedded in our strategy and culture. We have the resources in place to secure our position, today and in the future to remain the innovator in our industries.
Innovation at Bakery SuppliesInnovation is not just about great ideas and state-of-the-art technology. It also involves identifying market trends and opportunities and customer intimacy. That is why innovation at CSM is fuelled as follows:1. Product Development Centers that are close to our markets
and secure a swift response to customer demands 2. Innovation Centers focused on long-term technology
development.The cooperation between these two channels drives our unique “from global to local” positioning in the market. It enables us to convert global trends and developments into initiatives that work in local markets while at the same time, leveraging local bakery technology across the globe.
Our production Development Centers have a strong local and regional presence and an in depth understanding of their markets. They are supported by the expertise of our global network and operate closely alongside the business, acting as a sparring partner for our customers.Our product application specialists work together with our customers in developing their strategies, supported by our market insights. The Production Development Centers play an important role in addressing and mitigating the higher raw material costs for our customers by redesigning products. For instance, for some customers it is key to maintain pricing levels for some categories, which we can accommodate by applying alternative ingredient technologies or adapting composition or weight. Servicing our customers by addressing their specific needs and challenges truly nurtures the partnerships we have with them.
Innovation Centers are primarily focused on anticipating global trends and merging this with our consumer insights and input from the Product Development Centers. Our researchers at the
Innovation Centers are focused on turning scientific insights into commercially appealing and viable technologies. These innovation centers target step-change solutions. Solutions that meet consumer and customer needs better than available alternatives. They help us devise an innovation strategy that is in line with the CSM overall strategy, by developing original solutions through a portfolio of projects. These help to meet the challenges that arise from changing consumer and customer demands, market developments, new technologies, and emerging legislation and regulations. The centers collaborate extensively, exchanging ideas, product and processing technologies, knowledge of raw materials and best practices.
Our innovation network represents our global reach, comprising of six Innovation Centers and 20 Product Development centers. Our Product Development network and our Innovation Centers are organized by product category and by field of expertise (Bakery Ingredients, Sweet Ingredients, Bakery Fats, Emulsifiers and Bakery Products) similarly in both Europe and the United States.
Focus areasWe have multi-disciplined category teams in place, consisting of people from marketing, product development centers, innovation centers and supply chain, to secure all interfaces. These category teams develop our product group strategies.
The product group strategies drive our innovation program to address global market trends in health & wellness, indulgence, convenience and changing customer needs and consumer behavior. In addition, we anticipate the impact of greater environmental awareness, sustainability and globalization. The Innovation program has three main focus areas: i) Health and Wellness; ii) convenience, and iii) indulgence/experience.
Health & WellnessHealth and Wellness is generally acknowledged as the leading theme in the food industry. A primary focus point is to offer smart alternatives and a delicious choice of calorie reduced alternatives in the sweet bakery aisle. This is especially relevant considering that overweight and obesity and the lack of certain essential nutrients are serious health threats and a daily reality for many consumers. As our products play a pivotal role in achieving a balanced diet, we will increasingly be offering alternative product choices.
Other aspects of our Health and Wellness innovation strategy include; a multifaceted approach aimed at expanding health benefits (fiber, fortification); addressing the nutrient profiles and caloric density of indulgence products; and removing
Report of the Board of Management | 37
CASE
CSM
BA
KER
y Su
pplI
ES
unraveling the "Fat-DNA"
We have launched a program aimed at removing transfats
from our European product portfolio, of which the final steps
are almost complete. This will make CSM the first supplier of
bakery products that has completely banned transfat in its
portfolio in Europe, which is a significant accomplishment.
We are taking these learnings to the United States, while
realizing that the focus is more on reducing saturated fats in
this market.
The increasing demand for bakery products made with only
non trans-fatty acids has created all kinds of challenges.
Our customers and their consumers have high standards
where it comes to the mouth feel, bite, look and flavor they
want from baked goods, like croissants. To be able to make
high performing transfat-free products that have the same
baking performance characteristics as the ones they are
replacing, we had to go back to the drawing board. Like
human DNA, each combination of components can interact
to create a new product. But DNA is only part of the story.
How you grew up and where you are from also determine
who you are. Similarly, processing and environmental factors
can determine how components interact and turn out.
To create a transfat-free croissant, we first had to identify
what is present in the fats we use before calculating
what each component of that fat contributes and how
they impact factors like texture and mouth feel. Our
Innovation Centers performed the analytical work, while
our sophisticated pilot processing plant for bakery fats is
currently testing out these theories. We have also worked
closely with our oils suppliers and we are modifying our
processing conditions to get the best performance out of
our product formulations. This analytical understanding
is helping us move away from transfats and to produce
products that perform in a way that our customers and
consumers desire.

38 | CSM Annual Report 2011
CASE STuDy BAKKERy SupplIES
Genius™ brings convenience in France
undesirable components and component levels from bakery products. Next to all the health benefits we aim to deliver, there is always one final ingredient for success: that these innovations be achieved without compromizing on taste.
The innovation strategy for Health and Wellness underpins the important role bakery products have in our diet. Bakery products are being consumed as part of people's daily diet, but also for special treats or snacks. Examples are:
• Indulgence products & treats; • Good4u products;
ConvenienceOne of the trends determining the changing landscape in which CSM operates, is the (structural) shift towards in-store bakeries and out-of-home. Customers in these sales channels do not normally deploy full-scale bakery equipment nor a specifically skilled bakery workforce. Particularly these customers look for solutions that minimize the operational handling and maximize consumers' experience of freshly baked goods. For artisan bakers, the focus is on convenient solutions that enable them to focus on activities, where they can add the best value. The innovation strategy for convenience comprises "easy to prepare" and "de-skilling" solutions that allow our customers to optimize their operations, offering robust convenience formats that can deliver a pristine bakery experience without requiring in-depth bakery skills.On the consumer side, our convenience innovations are focusing on product formats that allow a freshly prepared bakery product experience at any moment and any place during the day.
Indulgence/ ExperienceA growing number of consumers are becoming more adventurous with new products and new flavors from different parts of the world. At the same time, there is an important drive towards authenticity and heritage. We see growing awareness about indulgent products today; these should have the highest premium quality, and often presented in smaller portions.
The innovation strategy for indulgence/experience is combining these trends. By sharing knowledge, expertise and consumer insights from around the world, we are able to tweak product winners to the requirements of other markets or formats.
Developments 2011In 2011, a number of successful innovations were launched, such as:• The SunFry ring donut; a delicious treat with at least 40%
less fat than standard donuts and significantly less calories. (see case)
• Fridgesoft; an enzyme-based technology that extends shelf life, prevents staling, and maintains the resilience of bread products. (see case)
• A range of 'health' breads being low on carbs and high on proteins (see case)
• A mix for macarons that enables bakers without sufficient expertise or lacking time to deliver a premium and consistent quality (see case)
• A variety of 'mini bite" concepts; petite sized indulgent prod-ucts presented in an appealing and innovative way targeted a out-of-home outlets
• Exchanging European expertise to the US and vice versa: • Range of tortilla mix innovations for the European market,
including multigrain-, dietary fibers- and bread-style tortillas • Range of European pastry for the US market
Innovation at puracPurac has a centrally managed Innovation and Competence Center and four regional application laboratories. The knowledge generated by the Innovation and Competence Center is used to develop new products and applications that meet the needs of its specific markets: natural food preservation, bioplastics and biobased chemicals.
To share this knowledge with our customers on an even larger scale, we have created four regional application laboratories in Gorinchem (the Netherlands), São Paulo, Chicago and Singapore, which work closely with the Innovation Center. These laboratories form a global technical network with the ability to roll out new product and application technologies locally and regionally. Being closer to our customers increases the effectiveness of our overall innovation chain and enables us to launch more new products and applications faster and more successfully.
Focus areasPurac responds to global food trends by exploring innovations based on natural food preservation solutions. Its focus areas are food safety and the extension of shelf life. The challenge is to develop solutions that reduce the number of ingredients on product labels and achieving “clean labels”. New product development is also focused on lowering costs per kilo of food product for our customers. Many of Purac's solutions are formulations based on lactic acid and its derivatives, although other solutions have also been developed and launched successfully at the same time.

Report of the Board of Management | 39
CASE puRAC FOOD SAFETy
Sustainability is a key theme in Purac’s portfolio. As a leading player in biobased chemicals made from renewable resources, such as beet sugar, cane sugar, corn and tapioca, Purac also aims to contribute to the global industry’s search for solutions that reduce CO2 emissions and decrease dependency on fossil fuels.
Purac is well positioned to contribute to a new generation of biobased building blocks in which lactic acid and lactides can become important platform chemicals. Purac operates at the forefront of the development of products, technology and applications for biobased Poly Lactic Acid (PLA). Alongside lactic acid related products, Purac is also developing biobased succinic acid in partnership. Succinic acid is a platform molecule which can be used as a building block for the production of many chemicals and even more applications.
Developments 2011Consumers are increasingly seeking clean-label food products, yet want foods to have a long shelf life and still be safe to eat. In 2011, Purac launched a number of new products, five of which are in direct response to this clean-label trend. These products improve the shelf life and/or safety of food products and comply with the needs of the food industry for more clean labeling. We see a high demand for products fitting this description, especially in the United States. In mid 2011 PuraQ Safe RS39, a new preservation solution for refrigerated foods, was launched. This product aims to control pathogenic bacteria like Listeria which can cause severe illnesses. The need for such preservation solution is growing with the increasing number of fresh food products on the market.
Another important trend in the food industry is salt reduction. In 2010 and 2011 Purac has launched new products that enable food manufacturers to meet with this need. One of these new products, PuraQ Arome NA4, was awarded the Food Ingredients Europe Excellence Award 2011 in the category 'Savory/Meat Innovation of the Year'.
In addition to new products, Purac also launched a tool for beverage formulators. This innovative online tool has been developed to assist R&D teams in formulating stable calcium fortified beverages saving valuable development and testing time. This tool enables the highly innovative beverage industry to apply speed-to-market of new products.
In 2011, Purac made further progress with the development of products, technology and applications for biobased Poly Lactic Acid (PLA). Together with Sulzer Chemtech the first industrial
CASE
INN
OV
ATIO
N
low-carb, high proteins, great taste!Many diet-gurus around the world do promote
low-carb diets. Consumer research indicates that
many consumers are trying to adhere to some sort
of lower carb diet. Bread is typically associated with
a very high amount of carbohydrates, but is often
seen as an essential part of people's daily diet. This
low-carb awareness has triggered a demand for
low-carb bread.
CSM has anticipated this demand by launching
a bread range around low carbs, starting off in
Germany. These breads have two times more
protein than regular breads. At the same time they
have a reduced carbohydrate share by up to 80 %. So
almost half of the energy comes straight form the
protein. Protein contributes to the maintenance of
muscle mass and bones.
The novelty is not about the bread being low-
carb, neither that it contains protein. Breads with
these characteristics were on the market already.
The exciting part of this innovation is the great
taste, its nutritional value and the excellent dough
characteristics. This bread is a great alternative for
those people who want to adhere to a low-carb diet
and still want to enjoy a good slice of bread.

40 | CSM Annual Report 2011
PLA plant running with the innovative Lactides technology was put into service at Synbra in the Netherlands. The plant has a capacity of 5,000 tons PLA and has a cost-efficient polymerization technology based on Purac’s unique high purity L-Lactide and D-Lactide. The construction of the plant was completed in early 2011, followed by a commissioning and testing period. In the meantime various grades of high quality PLA are being produced a.o. for Synbra’s Biofoam® product line which aims to replace fossil based Poly Styrene. The Biofoam products are applied as insulation material in buildings and light weighted packaging materials, such as cold store and freeze boxes.
In early 2010 work began on the construction of Purac’s new lactide plant in Thailand, at its existing site in Rayong. The construction of this new plant was completed on time and within budget in 2011. The plant produces lactide monomers for bioplastics. The investment has been driven by CSM’s commitment to lead the market development for lactic acid based bioplastics (PLA). This market is highly attractive as PLA contributes, with commercially viable products, to a significantly lower carbon dioxide footprint than the traditional fossil plastics.
The investment for this new 75,000 tons Lactide plant was approx. € 45 million. It has started production early 2012 to meet Purac’s current level of demand and to accelerate market development. The products are aimed at a broad segment of today’s plastics market and enable Purac’s partners to produce bioplastic products with high heat resistance of up to 180-200°C/270-300 °F. It is designed to produce both L-Lactides and D-Lactides, made out of lactic acid sourced from the existing Purac plants. In 2011 Purac further embarked on its customer development for PLA and entered new relationships and pilots to further develop application capabilities.

Report of the Board of Management | 41
CASE
INN
OV
ATIO
N
Our mix for macarons; convenience meets high premium
French macarons are thin, flavorful almond based meringue
cookies that are sandwiched together with a filling. They
have a smooth, crisp shell and a moist, slightly chewy
interior, and come in endless colors and flavors. Macarons
are perceived as light, which perfectly suits the mindful
trendy consumer.
Macarons are a French staple and if you happen to be in Paris,
you’ll have no trouble finding them at most bakeries. Outside
France, the cookies are growing in popularity, but are not
yet that easy to find. Bakeries do recognize the potential of
this appealing premium product, but the complexity of the
product witheld many bakers to include it in their product
range, despite the attractiveness of its premium proposition.
Why is making macarons so difficult? It requires an
experienced pastry chef to succeed.
Numerous variables affect the product: the source of water,
almond powder, egg whites, sugar, etc. Measurement is
key and mixing time needs to be done very precise. This all
makes it difficult to offer consistent quality and requires a
lot of time and attention. As a consequence, many bakers
willing to build on this trend rely on frozen macarons, that
don’t allow any personalization.
CSM has developed a mix for macarons that enables bakers
without sufficient expertise or lacking time to deliver a
premium and consistent quality. CSM had the courage to
test and launch the product in the lion's den; it has been
launched in France first. The success in this market has
proven the strength of the product; customer feedback
was very positive and confirmed the high convenience of
the making and the premium quality of the tasting. It is
the perfect solution for the entrepreneurial artisan baker,
offering high convenience & personalization without
compromizing on quality, look and taste.
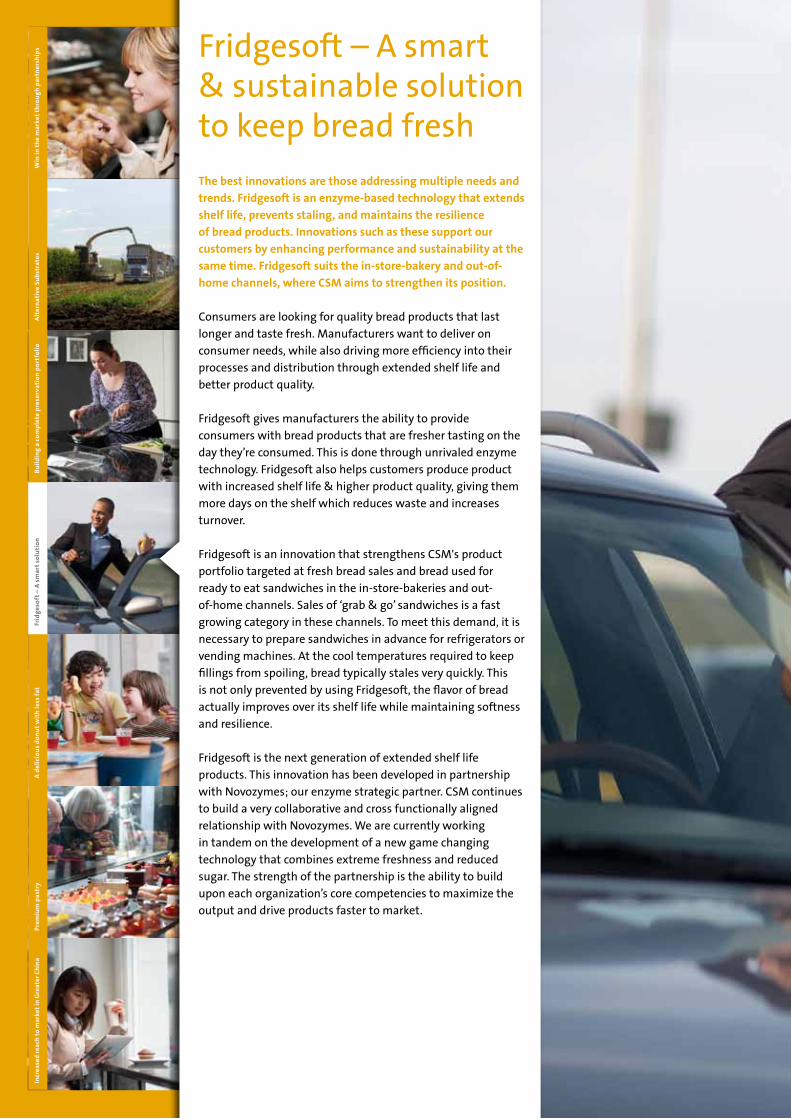
42 | CSM Annual Report 2011A
lter
nat
ive
Sub
stra
tes
A d
elic
iou
s d
on
ut
wit
h le
ss f
atpr
emiu
m p
astr
yIn
crea
sed
reac
h to
mar
ket
in G
reat
er C
hin
aW
in in
th
e m
arke
t th
rou
gh
par
tner
ship
s
The best innovations are those addressing multiple needs and trends. Fridgesoft is an enzyme-based technology that extends shelf life, prevents staling, and maintains the resilience of bread products. Innovations such as these support our customers by enhancing performance and sustainability at the same time. Fridgesoft suits the in-store-bakery and out-of-home channels, where CSM aims to strengthen its position.
Consumers are looking for quality bread products that last longer and taste fresh. Manufacturers want to deliver on consumer needs, while also driving more efficiency into their processes and distribution through extended shelf life and better product quality.
Fridgesoft gives manufacturers the ability to provide consumers with bread products that are fresher tasting on the day they’re consumed. This is done through unrivaled enzyme technology. Fridgesoft also helps customers produce product with increased shelf life & higher product quality, giving them more days on the shelf which reduces waste and increases turnover. Fridgesoft is an innovation that strengthens CSM's product portfolio targeted at fresh bread sales and bread used for ready to eat sandwiches in the in-store-bakeries and out-of-home channels. Sales of ‘grab & go’ sandwiches is a fast growing category in these channels. To meet this demand, it is necessary to prepare sandwiches in advance for refrigerators or vending machines. At the cool temperatures required to keep fillings from spoiling, bread typically stales very quickly. This is not only prevented by using Fridgesoft, the flavor of bread actually improves over its shelf life while maintaining softness and resilience.
Fridgesoft is the next generation of extended shelf life products. This innovation has been developed in partnership with Novozymes; our enzyme strategic partner. CSM continues to build a very collaborative and cross functionally aligned relationship with Novozymes. We are currently working in tandem on the development of a new game changing technology that combines extreme freshness and reduced sugar. The strength of the partnership is the ability to build upon each organization’s core competencies to maximize the output and drive products faster to market.
Fridgesoft – A smart & sustainable solution to keep bread fresh
Bu
ild
ing
a co
mp
lete
pre
serv
atio
n p
ort
foli
oFr
idg
eso
ft –
A s
mar
t so
luti
on

Report of the Board of Management | 43

44 | CSM Annual Report 2011
Managing the volatility of raw material prices and optimizing sourcing costs provide CSM with a significant competitive advantage. procurement activities are coordinated globally to capitalize on combined volumes and joint expertise across divisions, enabling us to control our procurement process and to mitigate risks.
In 2011 we experienced another year price volatility in most of the raw materials we use. We expect this situation to remain for the foreseeable future, so it is vital that we continue developing and investing in our risk management capabilities. Our global procurement approach gives us the scale, market insights, and the required level of expertise to deliver on this.
Organization and structureProcurement at CSM is run as a global function, and is geared towards supporting the specific business strategies of our Bakery Supplies North America, Bakery Supplies Europe and Purac divisions. Value creation is delivered by contributing to sales growth initiatives in the divisions, as well as cost reductions of raw materials and services, which includes a strong focus on risk-management.
Our procurement staff is organized into dedicated regional teams for execution under a common group-wide procurement framework. This centrally led structure has demonstrated its efficacy by further driving economies of scale, increasing transparency, lowering risks, and deepening our market insights.
A deep-seated understanding of the supply markets is a prerequisite to minimize price-risks, and to create a level playing field in our interactions with suppliers. Through our centralized procurement approach we have developed in-depth expertise of our key materials, which are all underpinned with detailed sourcing strategies.
Experts working under a global mandate are responsible for our key commodities such as cocoa, sugar, wheat, vegetable oils, chemicals, and corn. This network of global commodity experts focuses on risk management, and on providing market intelligence to our key customers. It is particularly important in today's volatile environment, that the effects of raw material costs are well communicated to our sales teams in the regions, and integrated in the pricing strategies of our final products, which has our utmost attention.
Managing riskOur global approach to procurement with regional execution improves our market insights, which in turn helps us mitigate risks by securing raw material supplies that meet our needs more effectively. With better market intelligence and risk-management skills and tools, we align our material positions to the requirements of our customers and manage price developments and product availability throughout the year.
We have also rationalized our supplier base in different material categories. We have done this for a number of ingredients, which has encouraged greater flexibility from our major suppliers when dealing with shortages in raw materials, resulting in lower risks.
Supporting innovationWe not only partner with our customers in our R&D and product innovations, but we also involve our suppliers in the innovation process. We leverage our procurement expertise in support of our innovations in each division, via close collaboration with a select group of suppliers, thereby increasing the success rate of our development projects. The right sourcing strategy in combination with the skills required to build and develop the key supplier relationships is often critical to the success of new product development. In 2011, we initiated five strategic suppliers for a much closer collaboration on innovation.
procurement

Report of the Board of Management | 45
Developments in 2011In 2011, most of our key commodities experienced significant price increases, and several materials doubled in price compared with 2010. Despite actively using all the tools at our disposal, we could not prevent significant higher raw material costs. Nevertheless, our expertise driven approach and strong interfaces with both our internal and external stakeholders have proven their value, and significantly mitigated the impact of these costs and delayed their impact.
Driving down our cost level has been our primary focus in building the global procurement function over the years. Having the structure and systems in place to optimize our procurement costs, we have intensified our efforts in supporting the business in growing sales.
A major initiative we launched in the year was to conduct a benchmarking of our procurement capabilities in Europe and North America against external best practice to identify development areas and opportunities to further leverage the skills we have built. In Europe this resulted in a transformation program, which will be completed by early 2013, while a similar program is also under development in North America. The main output of this transformation will be a much closer alignment between procurement and other business functions within CSM, entering strategic partnerships with suppliers, and enhancing our risk-management skills even further.
In 2011 we have put sustainable sourcing high on our agenda, and have developed a roadmap and implementation plan towards sustainable sourcing objectives. During the year we switched to using 100% RSPO certified palm oil for our bakery products in Europe, and we have started initiatives to source sustainable cocoa and sugar. Read more about sustainable sourcing in our Sustainability section and how this has been implemented for palm oil.

46 | CSM Annual Report 2011
Corporate Governance
GeneralCSM recognizes the importance of good corporate governance and the principles contained within the Dutch corporate governance code (the “Code”), namely, that a company is a long-term partnership between various parties related to the company. Corporate management bears overall responsibility for balancing the interests of these parties, mostly with the aim of ensuring continuity of the company. At the same time, CSM aims to create long-term value for its shareholders. CSM is committed to embedding the Code principles within the company, thereby abiding by the core concepts of good business practices, integrity, openness, and transparent and well-supervised management. The full text of the Code can be viewed at: www.commissiecorporategovernance.nl.
Compliance with the CodeWith the exception of the deviations outlined in the paragraphs below, CSM endorses and adheres to the principles and best practices of the Code.
Important changes in the corporate governance structure are presented to the General Shareholders Meeting for discussion. Our corporate governance policy, including the relevant regulations and reports, can be viewed on the CSM website.
Deviations from the CodeCSM departs from the provisions of the Code with regard to; (a) the severance arrangements in the event of non-voluntary resignation by members of the Board of Management and; (b) the possible financing of income tax on vested shares under the share plan by selling part of the vested shares.
Regarding its composition, the Supervisory Board always tries to strike the right balance between expertise and experience. A certain degree of age and gender variation may be instrumental in achieving the desired balance in the composition of the Board, but diversity on the basis of age and gender is not a goal as such. In this respect, the profile of CSM’s Supervisory
Board deviates from best practice provision III.3.1 of the Code, as it does not pursue specific diversity related objectives. The required expertise and experience, as well as the availability of the right candidates, is decisive when proposing candidates for (re)appointment.
There are two other aspects in which CSM departs from the Code. The members of the Supervisory Board and the Board of Management are appointed by the General Shareholders Meeting on the basis of nominations by the Supervisory Board. The CSM Articles of Association state that the General Shareholders Meeting can overrule any such nomination by an absolute majority of the votes cast, provided the said majority represents at least 1/3 of the issued capital. In contrast with the Code, no second meeting will be convened if there is no quorum, as a second meeting is not required by law.
The General Shareholders Meeting may decide to suspend or dismiss a member of the Board of Management or the Supervisory Board by an absolute majority of the votes cast, provided the said majority represents at least 1/3 of the issued capital. This quorum requirement does not apply if the proposal for suspension or dismissal is submitted by the Supervisory Board. In contrast with the Code, no second meeting will be convened if there is no quorum, as a second meeting is not required by law.
Corporate Governance StatementThe information and statement pursuant to the Decree of December 23, 2004 to determine additional regulations regarding the content of the Annual Report, as amended in March and December 2009, have been published on CSM’s website www.csmglobal.com (Section Investor Relations under the heading Corporate Governance).
StructureCSM nv is an international holding company as described by Section 153, subsection 3 paragraph b, of Book 2 of the Dutch

Report of the Board of Management | 47
Civil Code. The “large company” regime therefore does not apply to CSM nv. Corporate governance relates to the management and supervision of the company, accountability, and the influence of stakeholders on decision-making. The Board of Management is responsible for developing objectives and strategy, determining the risk profile and implementing strategic and operational policies. The independent Supervisory Board oversees and advises the Board of Management. From among its members, the Supervisory Board has appointed an Audit Committee, a Nomination Committee and a Remuneration Committee.
The Board of Management fulfils its duties by promoting the interests of CSM and its businesses. These interests are understood as the interests of all stakeholders, including customers, shareholders, employees, suppliers, and financial partners. CSM is aware of its corporate and social responsibilities and is deeply committed to protecting the interests of the community. CSM works on the principle that corporate management should consistently develop and implement corporate policies taking into account the long-term and continuity perspective. CSM endorses the importance of clear accountability for its policies and the results thereof.
Common shares in CSM are listed on NYSE Euronext Stock Exchange in Amsterdam. The financing preference shares are not listed. No restrictions apply for the transfer of shares. If a shareholder or group of shareholders acquires 30% or more of the share capital, the said shareholder or group of shareholders is required by law to make an offer for the entire outstanding capital.
Shareholders have voting rights in proportion to the number of shares held.
The Annual General Shareholders Meeting will be held within six months of the close of the financial year. At this meeting,
the Annual Report and Financial Statements drawn up by the Board of Management will be presented for adoption, amongst other things. If requests are received from shareholders who individually or collectively represent a least one percent (1%) of the issued capital or at least € 50 million of market capitalization, to place items on the General Shareholders Meeting agenda, these will be honored provided they are submitted to CSM at least 45 days prior to the date of the meeting, unless such items are deemed incompatible with important company interests.
Extraordinary General Shareholders Meetings will be held as often as the Board of Management and Supervisory Board so desire. An Extraordinary General Shareholders Meeting must also be held if one or more shareholders who collectively represent at least 1/10 of the issued capital submit a written request to this effect to the Board of Management or the Supervisory Board enclosing a detailed list of agenda items. If neither the Board of Management nor the Supervisory Board – which have equal powers in this matter – responds in such a way that this extraordinary General Shareholders Meeting can be convened within six weeks of the request, the applicants are at liberty to convene the meeting themselves and appoint a Chairman.
With the exception of cases in which a larger majority is required by law or the Articles of Association, decisions at the General Shareholders Meeting will be taken by an absolute majority of the votes cast. Decisions to amend the Articles of Association and/or dissolve the company may only be taken at a General Shareholders Meeting in which at least two-thirds of the issued capital is represented and by a majority of at least three-quarters of the votes cast, unless the proposal has been submitted by all incumbent members of the Board of Management with the collective approval of all incumbent members of the Supervisory Board, in which case the decision may be taken by an absolute majority of votes, regardless of the represented capital.

48 | CSM Annual Report 2011A
lter
nat
ive
Sub
stra
tes
prem
ium
pas
try
Incr
ease
d re
ach
to m
arke
t in
Gre
ater
Ch
ina
Win
in t
he
mar
ket
thro
ug
h p
artn
ersh
ips
Consumers across the world are pursuing healthier lifestyles and looking for healthier options in the food they eat. Delighting consumers with products that address these trends is one of CSM's strategic growth drivers. Our innovation program galvanizes our innovation centers and marketing teams around the world to work together and convert consumer insights into an attractive portfolio, developing the technology to make it happen.
Health and Wellness is generally acknowledged as a leading theme of the global food industry. CSM is committed to bring innovations to the market that help consumers achieve healthier diets and make weight maintenance easier in a meaningful and tasty way. These include products that provide significant reductions in saturated fat and calories compared to market benchmarks, yet still offer a great taste and eating experience. One appealing example is the recently launched SunFry ring donut; a delicious treat with at least 40% less fat than standard donuts and significantly less calories. But most crucially for success: without compromizing on taste!
The project started off by identifying what experience consumers are looking for when eating a donut. In today's society, improved health & wellness benefits are generally encouraged and appreciated, but most important is that a donut is still seen as a treat, that means that it ultimately should be an indulgent experience.
Our innovation and marketing teams collaborated closely together to design the characteristics of this 'next generation donut', setting an ambitious goal for (saturated) fat and calorie reduction. To make this happen we combined a new technology we had been refining over several years with 'better for you' sunflower oils to create a unique SunFry Baking Technology that delivers a tasty donut, with less fat and fewer calories.
Consumer feedback confirms that we have succeeded in delivering on the health & wellness benefits without losing the indulgent experience: ‘This donuts taste every bit as soft and delicious as the donuts I know and love, but are less greasy on my fingers and in my mouth so I can enjoy the pure taste of it!’
In line with what we aspired, SunFry ring donuts are being perceived as that delicious treat which does not compromise on taste, appealing to both heavy, and light donut shoppers!
A delicious donut with less fat
Bu
ild
ing
a co
mp
lete
pre
serv
atio
n p
ort
foli
oFr
idg
eso
ft –
A s
mar
t so
luti
on
A
del
icio
us
do
nu
t w
ith
less
fat

Report of the Board of Management | 49

50 | CSM Annual Report 2011
Risk management
Risk management and internal controlCSM operates worldwide with operating companies in various markets and jurisdictions. Against this backdrop it is important to ensure the timely identification and effective management of all significant risks inherent to the execution of our strategy and realization of our objectives. The Board of Management is responsible for the design, implementation and operation of CSM’s risk management and internal control systems.
Our governance model identifies clear reporting and accountability structures in line with the corporate governance code (see pages 46-47).
Risk management approachOur approach to risk management is aligned with the Enterprise Risk Management framework of the Committee of Sponsoring Organizations of the Treadway Commission (COSO – ERM), which aims to achieve a reasonable level of assurance. This approach aims to embed risk awareness and risk management at all levels of CSM to ensure risk decisions are taken and evaluated consciously and properly. Our risk management approach covers Strategic/Market, Operational and Financial/Compliance risks and can be illustrated as follows:
Risk management workshops are held bi-annually to identify the critical risks for all Business Units. Action plans to mitigate the risks are and will be developed and the progress of risk mitigation actions will be followed periodically. Risks are being discussed on an ongoing basis during quarterly meetings between the Business Units and the Board of Management.
InsuranceInsurance is an integral part of our risk management approach as it is an instrument to manage the financial consequences of risks. The choice to obtain external insurance cover depends on the cost efficiency of the instrument. The coverage of insurances is monitored and benchmarked regularly.
Strategic / Market Operational Financial /
Compliance
Entity Wide Controls
Global Control Framework
Monitoring and Audit

Report of the Board of Management | 51
Key risk areas
The following table describes the main risks that have been identified, their impact and the mitigation measures taken to offset them.
Type of risk possible impact Mitigation
Strategic and market risks This area can also be affected by legal and regulatory changes made by governments, which could severely impact our business but cannot be influenced by us.
Impact of the economic environment Global economic conditions impact our bakery business as demand for our products fluctuates in line with GDP development. At the same time, demand for lactic acid products is impacted by the cyclical market conditions that affect some of our customers.
We cannot neutralize the overall effect of an economic downturn, but we can offset some of the impact by reducing costs and adjusting our product offering to meet changing demand. We have built a degree of flexibility into our production costs by hiring temporary staff. We are also able to adjust our product offering with relative ease because of our extensive Research & Development and procurement experience.
Inability to manage market and structural changes
Ongoing strategic reorganization and volatile market conditions inevitably put a strain on management’s ability to deal with all changes successfully. Failure to respond adequately or in a timely manner could severely damage CSM’s financial position and its future growth prospects. The availability of good management and systems is vital.
We continuously review the effectiveness of our organizational structure and the quality of our management. We aim to find the right people for the right position and to align our systems and structures to market developments.
Not meeting the needs of customers and end consumers
It is essential to continuously innovate and revitalize our product range in line with today’s market trends in order to maintain market leadership and avoid a narrowing margin on our products.
Bakery Supplies has established eight Innovation Centers across Europe and North America. At the same time, Purac has established a core Innovation & Competence center with four regional application labs.
Our innovation and competence organization focuses on the successful development of products that meet the needs of customers and end users Significant investments have also been made in monitoring market trends and consumer needs.
52 | CSM Annual Report 2011
Type of risk Possible impact Mitigation
PLA Bioplastic developments not meeting customer needs
Lactic acid is one of the sources for manufacturing bio-plastics and other technologies are or will be developed to target this promising market. The attractiveness of the bio-plastics market is driven by growing consumer demand for degradable plastics made from renewable sources. Demand may increase or decrease with its relative cost compared to conventional oil-based plastics.
Purac keeps a close eye on competing technologies and is maintaining its competitiveness by continuously refining its offering from a product specification and cost perspective.
Early 2010 we began the construction of a Purac lactide plant in Thailand to produce components for bio-plastics, increasing our investment in this technology. At the end of 2011 total spend amounted to € 45 million and the investment has become operational in Q1 2012.
Losing our competitive position We operate in a highly competitive market in which it is essential to keep cost and service levels at least on par with those of our competitors. Failing to achieve this could lead to market share erosion by competitors or customers substituting our products with alternatives.
Our Research & Development efforts are not only geared to product introductions but also to production improvements. Improving our cost competitiveness has long been a top priority. To this end, we have restructured our manufacturing footprint, enhanced production specialization and optimized logistics. Continuous IT investments are being made to support our business requirements and achieve cost efficiencies as well as to improve customer responsiveness and service levels.
Attractive Bakery Supplies acquisition targets not being available
Growth by acquisitions plays and important part in our Bakery Supplies strategy. The execution of our growth strategy is hampered if there are no candidates available to deliver the value required by our financial standards, which could potentially weaken our position if the competition is also pursuing acquisitions.
With an average market share of approximately 10% in our major markets in the US and Europe, we believe acquisition opportunities do exist. In recent years, we have changed our structure in such a way as to be able to easily integrate new acquisitions into our organization. This will result in stronger synergies through the elimination of costs and/or the realization of faster sales growth. It also enhances our ability to offer competitive market prices and meets our value creation requirements.

Report of the Board of Management | 53
Operational risks
Business continuity Serious disruption of our supply chain as a result of calamities such as fire, flood or earthquakes, or due to contamination, strikes or major system breakdowns, could have a major impact on our profitability. The closure and specialization of factories for efficiency reasons have increased this risk.
Our risk management approach aims to detect and prioritize the most serious risks areas, leading to a discontinuation of our supply chain. We are working to develop appropriate back-up measures and where possible, these measures are tested for effectiveness.
Based on best practices and experiences, we continuously review and improve manuals and guidelines at our operations to support employees in preventing and limiting risk calamities and mitigating their effects.
Raw material & energy price volatility and availability
As we have seen in 2011 and previous years, sudden increases or decreases in the price of raw materials can seriously impact the margins of our products sold. Scarceness of raw materials due to excessive demand or production interruption at suppliers can also impact our results because of sales declines and due to the additional costs incurred to satisfy our raw materials needs.
We continuously invest in the relationship with our customers, advising on changes in product assortment, technology and changes in consumer behavior. We believe a relationship based on transparency and trust, in which true value is added, supports our ability to (partly) pass on increased costs via price increases or redevelop products with lower cost ingredients in collaboration with our customers.
Our procurement department, globally organized with dedicated finance support has developed adequate measures to secure contract positions to minimize or delay exposure to cost fluctuations of raw materials that could negatively impact our margins. These measures include early warnings of possible impact to our organization and our customers. Furthermore, we have implemented a multiple-supplier sourcing policy for our most critical raw materials.
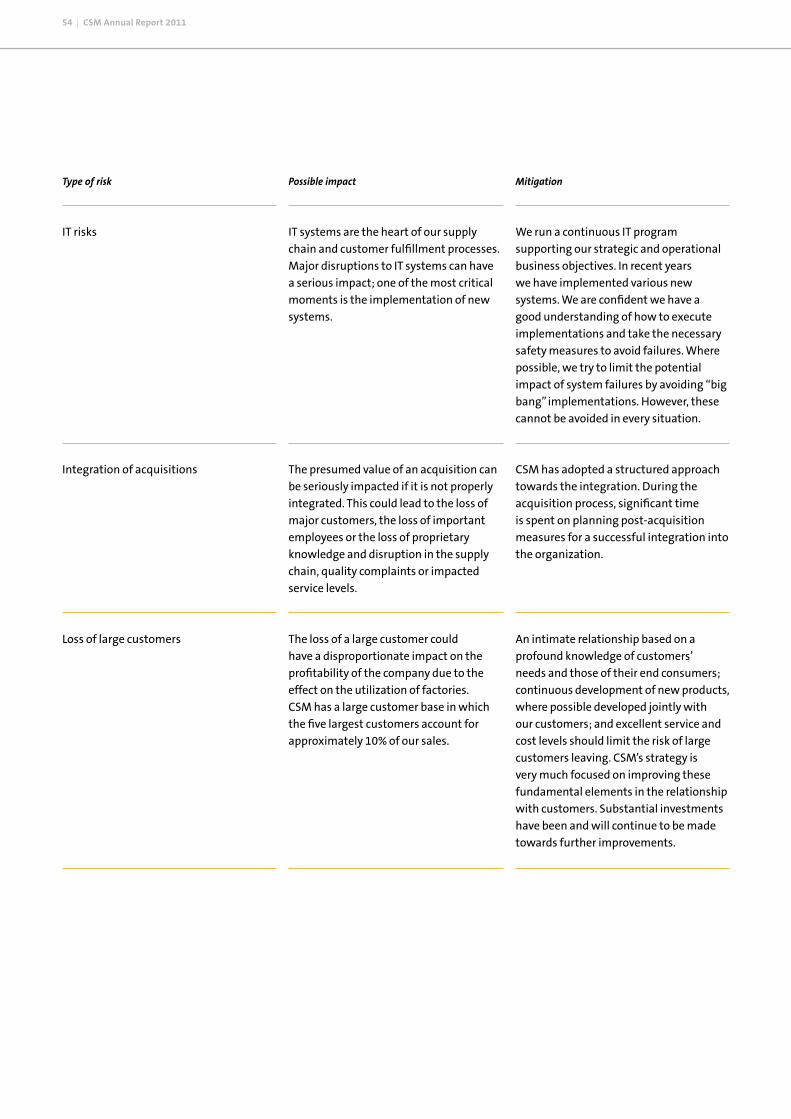
54 | CSM Annual Report 2011
Type of risk Possible impact Mitigation
IT risks IT systems are the heart of our supply chain and customer fulfillment processes. Major disruptions to IT systems can have a serious impact; one of the most critical moments is the implementation of new systems.
We run a continuous IT program supporting our strategic and operational business objectives. In recent years we have implemented various new systems. We are confident we have a good understanding of how to execute implementations and take the necessary safety measures to avoid failures. Where possible, we try to limit the potential impact of system failures by avoiding “big bang” implementations. However, these cannot be avoided in every situation.
Integration of acquisitions The presumed value of an acquisition can be seriously impacted if it is not properly integrated. This could lead to the loss of major customers, the loss of important employees or the loss of proprietary knowledge and disruption in the supply chain, quality complaints or impacted service levels.
CSM has adopted a structured approach towards the integration. During the acquisition process, significant time is spent on planning post-acquisition measures for a successful integration into the organization.
Loss of large customers The loss of a large customer could have a disproportionate impact on the profitability of the company due to the effect on the utilization of factories. CSM has a large customer base in which the five largest customers account for approximately 10% of our sales.
An intimate relationship based on a profound knowledge of customers’ needs and those of their end consumers; continuous development of new products, where possible developed jointly with our customers; and excellent service and cost levels should limit the risk of large customers leaving. CSM’s strategy is very much focused on improving these fundamental elements in the relationship with customers. Substantial investments have been and will continue to be made towards further improvements.

Report of the Board of Management | 55
Financial and compliance risks
Legal and regulatory compliance The company’s business is subject to regulations by international, national and local governmental agencies. Non-compliance with local laws, food safety regulations, human health, safety and many other regulations could pose a serious threat. CSM could be exposed to substantial claims from various parties or permits could be cancelled.
Our corporate Code of Conduct, policies and procedures are properly maintained and made available to all staff via the CSM intranet and are frequently communicated. Compliance is enforced by the local companies supported by the Group.
Volatility in the exchange rate of various currencies
As CSM operates in various non-euro countries we have to deal with volatility of exchange rates of a number of currencies versus the euro. This impact can be seen in the translation of the results and equity of foreign entities into euros and in the results of transactions when there is a difference between the currency of the production costs and the currency in which the sale of the product is being made.
CSM has a hedging policy in place to limit the impact of volatility of foreign exchange rates. Hedging the impact of the foreign currency translation risk is partly and indirectly effectuated through increasing CSM’s liabilities in foreign currencies. Of the total external debt of CSM approximately 70% is denominated in US dollars, which partly offsets the large equity translation exposure CSM has against the US dollar. The exposure to transaction risks is hedged by offsetting the long or short term currency position through a system of gradually selling and/or respectively buying this currency to mitigate the impact of sudden movements in currencies. A sensitivity analysis of interest rate changes can be found in Note 25 of the financial statements.

56 | CSM Annual Report 2011
Type of risk Possible impact Mitigation
Insufficient liquidity to finance operations
As CSM is financed through a mix of equity and interest-bearing loans, a sudden increase in its liquidity needs or a decrease in available credit might pose a threat to the continuity of the financing of the company.
In order to avoid unexpected increases in its liquidity needs, CSM has a planning & control system in place that manages the working capital needs of the company and gives an early warning in case of a sudden increase taking place. In the event of an increase in its liquidity needs CSM has sufficient committed loan facilities of approximately € 700 million at its disposal. At the end of 2011 CSM had used approx. € 460 million of these facilities. The facilities can be used up to a maximum allowable net debt to EBITDA ratio of 3.5x. At the end of 2011 this ratio was 2.8x.
Pension risks Pension risks mainly relate to the funding risk of our defined benefit plans. The most important effects are attributable to economic factors such as interest rates, equity risk, inflation risk and foreign exchange risk. Adverse stock market developments negatively affect the assets of CSM’s pension funds, while falling interest rates lead to lower discount rates and higher pension liabilities.
CSM gives considerable attention and assigns considerable resources towards ensuring disclosure, awareness and control of pension exposure and related financial risks. CSM’s pension landscape is diverse.
In Europe, CSM has a few defined benefit plans, covering a substantial number of its employees in the Netherlands, the UK, Germany and Belgium. Outside Europe the pension risk is considered not material, as CSM has mainly defined contribution plans in place or pension arrangements with local insurance companies.
The investment strategy of the pension funds and the associated tactical asset allocation are based on asset, region and currency diversification to offset funding risks. The funding position 2011 has deteriorated due to the decline of the interest rate although no substantial cash payments by CSM are required in the short term.

Report of the Board of Management | 57
Financial reporting Non-compliance with International Financial Reporting Standards (IFRS) can pose a serious threat. Not informing our shareholders and other stakeholders in conformity with IFRS could lead to a lack of trust, reputation damage, a declining share price, and potential legal claims.
Our financial reporting systems and processes are geared towards our business requirements and support business reviews. For group reporting we deploy a standard consolidation tool. Our corporate accounting policies and procedures are properly maintained and made available to all our staff via the CSM intranet and are communicated frequently to our finance community. A monthly review of finance reports is performed by corporate and business unit teams. Our global control framework should warrant adherence to IFRS.The finance community has been trained in 2011 in view of the latest IFRS developments and in the area of commodity
Tax CSM operates in many countries and has to manage compliance with a wide variety of tax laws.
We have an adequate quarterly reporting system in place, hold regular tax meetings, and visit our operating companies to monitor compliance. In addition, our global tax control framework should also warrant compliance. A transfer pricing policy and documentation are in place as well. Furthermore, we work with external tax experts who support our tax planning and returns and advise us in compliance matters.
Interest rate increases To a large extent, CSM is financed via interest-bearing loans, with variable interest rates, which at the end of 2011 amounted to approx. € 700 million in total.
fluctuations in the interest rate paid, CSM has agreed to long-term interest rates with its financial partners. A sensitivity analysis of interest rate changes can be found in Note 25 of the financial statements.

58 | CSM Annual Report 2011
Control measuresIn order to prevent risks from occurring and to mitigate the effect
of risks if they occur, CSM has a number of control measures in
place, the details of which are explained below.
Entity-wide controlsOur entity-wide controls are not limited to those outlined in this
section, although various examples of policies and procedures can
be found which are implemented by local operating companies.
legal and regulatory reviewLocal management is responsible for compliance. Divisional Legal
is consulted by local management on an ongoing basis. Every six
months, local and divisional management reports legal issues
exceeding € 100,000 to Corporate Legal and Corporate Finance.
Fraud prevention & Code of ConductCSM has a continuous focus on fraud prevention, which is
supported by the distribution of the “Good to know on fraud!”
booklet throughout the Group. The booklet is also available on our
intranet to all employees. This publication, comprising the Code
of Conduct, creates awareness and provides examples of how to
identify and respond to fraud. The Code of Conduct can be found
on our website.
Whistleblower procedureA Whistleblower Policy and reporting system are in place to enable
our employees to report potential integrity issues or violations
of our Code of Conduct. In 2011, 3 cases were reported. Each of
these cases has been followed up by CIAS (Corporate Internal
Audit Services) and where necessary, appropriate measures and
or actions have been taken by management. These whistleblower
cases, including follow up actions taken, are reported to the Audit
Committee.
letter of representationEvery six months, Managing Directors and Finance Directors of each
reporting entity and divisional Finance Directors provide a Letter of
Representation to the Board of Management. This letter represents
compliance with financial reporting and internal controls.
Financial Control Framework As CSM operates worldwide, it is committed to maintaining
high-quality, reliable financial reporting and a sound control
environment.
All reporting entities assess operational effectiveness of their
financial closing and reporting processes, at mid-year and end-
of-year, confirming compliance with the relevant guidelines and
IFRS. Together with the Letters of Representation, this ensures the
integrity of our financial reporting. During 2011 our main entities
performed an assessment of the operational effectiveness of
their key financial process controls. The assessments have been
audited by the internal and external auditors. The scope of our
Information Security policy is fully aligned with the ISO 27002
standard and also meets our financial reporting requirements. All
entities performed assessments with the guidance to prioritize
their improvements actions on nine key risk areas ranging from
information system continuity to disaster recovery, and from user
management to adequate design of roles and responsibilities in
our application systems. In 2011, we have further improved our
control framework by introducing a risk based scoping approach
enabling a more focused and dedicated set of controls for each
reporting entity.
Monitoring and Audits Business planning, budgeting & management reviewBased on the CSM strategy and plans, divisional targets are set
for the annual budget process. After determining the divisional
budgets, targets are rolled out to the business units, operating
companies and operational levels. Quarterly updated estimates are
made The divisions monitor business performance on a periodic
basis using a defined set of critical performance indicators and
periodic divisional reviews of actual results, and by visiting local
entities frequently.
Operational management meets at least once a month to discuss
the strategy and related risks, the actual performance versus
budget, and other significant matters. The Board of Management
has daily contact and meets once a month with the Executive
team. The Executive team consists of the division presidents
and the global functional leaders. The Board of Management
reviews the divisional businesses on a quarterly basis. Next to this,
members of the Board of Management regularly visit our main
local business operations.
Internal audit Internal audit supports the organization to accomplish its
objectives by bringing a systematic, disciplined approach to
evaluate and improve the effectiveness of internal control and
governance processes.

Report of the Board of Management | 59
of our risk management and internal control systems, and reviews
of business and the Audit Committee are an integral part of the
company’s risk management approach. It should be noted that the
above does not imply that these systems and procedures provide
certainty as to the realization of strategic, operational and financial
business objectives, nor can they prevent all misstatements,
inaccuracies, errors, frauds and non-compliances with laws and
regulations. On the basis thereof, the Board of Management
believes to the best of its knowledge that the internal risk
management and control systems provide a reasonable level
of security against inaccuracies of material importance in the
financial reporting.
These systems operated adequately in the year under review; and
there are no indications that the systems would not be adequate
in 2012.
All in all, the Board of Management is of the opinion that it has
fulfilled the best practice provision II.1.4 of the Dutch corporate
governance code with due observance of the recommendations of
the Corporate Governance Code Monitoring Commission.
Responsibility StatementTo the best of our knowledge the financial statements give a
true and fair view of the assets, liabilities, financial position and
profit of CSM and its consolidated companies. Further to the
best of our knowledge the annual report gives a true and fair
view of the position of CSM as at the balance sheet date, and of
the development during the financial year of CSM and its group
companies included in the financial statements, together with
a description of principal risks CSM faces. The members of the
Board of Management have signed the financial statements
pursuant to their statutory obligations under Article 2:101(2) of
the Netherlands Civil Code and Article 5:25c(2.c) of the Financial
Markets Supervision Act (“Wet op het financieel toezicht”).
Diemen, the Netherlands, 20 February 2012
Board of Management CSM nv
Gerard Hoetmer (CEO)
Koos Kramer (CFO)
The objective of CIAS (Corporate Internal Audit services) is
to provide a broad range of audit services designed to assist
the Board of Management in controlling the Group business
operations by providing independent, objective assurance and
consulting services designed to add value to the organization's
operations. CIAS evaluates risks and ensures that the controls in
place are adequate to mitigate those risks. Next to the “assurance
role”, an important role of CIAS is to provide value to the business
through tailor-made operational audits, identifying best practices
and indicating improvement opportunities to Management.
The focus of CIAS is evenly spread over the following areas:
• Compliance of the operating companies with the Financial Control Framework;
• Value-adding audits (focused on key business processes);• Special projects (due diligence, post mortems, fraud preven-
tion, review of business cases, quality assurance projects).
Internal audit at CSM is based on co-source: a small department
in combination with external parties, providing specialized
knowledge and flexibility. In 2011 45 audits were performed and
reported.
Audit results are reported to the Board of Management and the
Audit Committee.
External auditOur external financial audit engagement ensures that all main
entities are audited by the external auditor either for statutory
and/or group purposes. The focus of the external auditor’s work is
the financial reporting with the objective of providing a reasonable
basis for the audit opinion on the fairness of the presentation of
the financial position.
Management representationCSM’s risk management and internal control system are designed
to identify in a timely manner the risks inherent to our strategic,
operational and financial business objectives and to determine
appropriate risk responses as generally described above. Risk
management and actions taken in the year under review are
regularly reported to and discussed by the Supervisory Board and
Audit Committee.
Internal representations received from management, regular
management reviews, reviews of the design and implementation
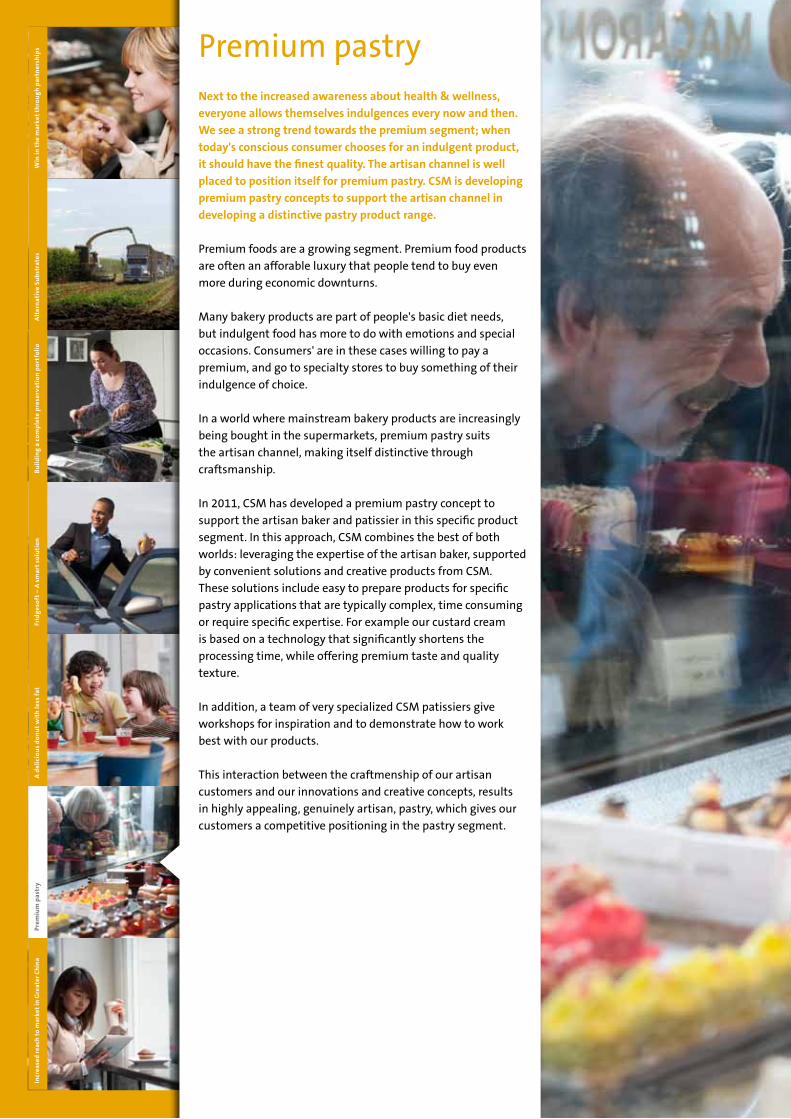
60 | CSM Annual Report 2011A
lter
nat
ive
Sub
stra
tes
Incr
ease
d re
ach
to m
arke
t in
Gre
ater
Ch
ina
Win
in t
he
mar
ket
thro
ug
h p
artn
ersh
ips
Next to the increased awareness about health & wellness, everyone allows themselves indulgences every now and then. We see a strong trend towards the premium segment; when today's conscious consumer chooses for an indulgent product, it should have the finest quality. The artisan channel is well placed to position itself for premium pastry. CSM is developing premium pastry concepts to support the artisan channel in developing a distinctive pastry product range.
Premium foods are a growing segment. Premium food products are often an afforable luxury that people tend to buy even more during economic downturns.
Many bakery products are part of people's basic diet needs, but indulgent food has more to do with emotions and special occasions. Consumers' are in these cases willing to pay a premium, and go to specialty stores to buy something of their indulgence of choice.
In a world where mainstream bakery products are increasingly being bought in the supermarkets, premium pastry suits the artisan channel, making itself distinctive through craftsmanship.
In 2011, CSM has developed a premium pastry concept to support the artisan baker and patissier in this specific product segment. In this approach, CSM combines the best of both worlds: leveraging the expertise of the artisan baker, supported by convenient solutions and creative products from CSM. These solutions include easy to prepare products for specific pastry applications that are typically complex, time consuming or require specific expertise. For example our custard cream is based on a technology that significantly shortens the processing time, while offering premium taste and quality texture.
In addition, a team of very specialized CSM patissiers give workshops for inspiration and to demonstrate how to work best with our products.
This interaction between the craftmenship of our artisan customers and our innovations and creative concepts, results in highly appealing, genuinely artisan, pastry, which gives our customers a competitive positioning in the pastry segment.
Premium pastryB
uil
din
g a
com
ple
te p
rese
rvat
ion
po
rtfo
lio
Frid
ges
oft
– A
sm
art
solu
tio
n
A d
elic
iou
s d
on
ut
wit
h le
ss f
atpr
emiu
m p
astr
y

Report of the Board of Management | 61

62 | CSM Annual Report 2011
Report of the Supervisory Board
General InformationFinancial Statements, 1 January 2011 - 31 December 2011The financial statements prepared by the Board of Management for the financial year 2011 have been audited and certified by Deloitte Accountants B.V. The auditors’ findings on the finan-cial statements have been discussed with the Supervisory Board. The Supervisory Board has accepted the financial state-ments and recommends that they be adopted by the General Shareholders’ Meeting. The Supervisory Directors have signed the financial statements pursuant to their statutory obligation under Article 2:101(2) of the Netherlands Civil Code.
Meetings of the Supervisory BoardDuring the report year the Supervisory Board held seven regular meetings with the Board of Management. The discussions at these meetings (and the pre-discussions at the respective committee meetings) covered frequently recurring topics, such as strategy updates, the CSM portfolio, developments in results, business developments in the divisions and operating companies, trends in the markets where CSM operates, key investments, group risks, internal risk management and control systems, the outcome of the Board of Management’s evalua-tion of the set-up and operation of these systems, corporate governance, corporate social responsibility, the organizational structure, management development, acquisitions and divest-ments, the financial statements and the annual report. In the past year, in addition to these regular meetings, three specific topic meetings were held to discuss in more detail innovation progress, raw material developments, procurement, strategic initiatives, IT projects and saving programs. Members of the Supervisory Board regularly meet with the business leaders and other members of the Executive.The Supervisory Board visited the production facilities of Bakery Supplies Europe in Gerlenhofen, Germany. Prior to its regular meetings with the Board of Management the Supervisory Board also meets in the absence of the Board of Management to discuss, amongst others, developments in the results, and the profile, composition and performance of the Board of Management. The Supervisory Board at regular
intervals also evaluates its own performance, the perfor-mance of its committees and that of its members. Focus points include expertise, independence, integrity, critical ability, and a balanced composition of the Supervisory Board.
Composition of the Supervisory BoardMr. P. Bouw resigned as member and chairman of the Supervisory Board following the General Shareholders Meeting in May 2011. Mr. Bouw had served 12 years on the Board. CSM is deeply grateful to Mr. Bouw for his contribution to CSM during his tenure. He has proven himself an efficient and respected chairman both of the Supervisory Board and the Shareholders meetings. Mr. Bouw, a bridge builder, has always been very keen on content and discus-sion items were looked at from different angles.
Mr. Bouw was succeeded as chairman by Mr. M.P.M. de Raad, vice-chairman of the Supervisory Board. Mr. R.H.P. Markham, member of the Supervisory Board, was appointed vice-chairman, as successor to Mr. De Raad.The Shareholders Meeting also approved the appointment of Mr. J. de Kreij as member of the Supervisory Board following the meeting. It was also announced that Mr. De Kreij would become a member of the Audit Committee. Mr. De Kreij is vice-chairman and CFO of Koninklijke Vopak N.V.
Regarding its composition the Supervisory Board always tries to strike the right balance between expertise and experience. A certain degree of age and gender variation may be instrumental in achieving the desired balance in the composition of the Board, but diversity on the basis of age and gender is not a goal as such. Required expertise and experience as well as the availability of the right candidates will be decisive when proposing candidates for (re)appointment.
In the judgement of the Supervisory Board all its members are independent as required by the Corporate Governance Code.
The Supervisory Board expresses it's appreciation to the Board of Management and all CSM employees for their passion and continued efforts.
Report of the Supervisory Board | 63
Committees of the Supervisory Board
Audit CommitteeThe members of the Audit Committee are Mr. R. Pieterse (Chairman), Mr. W. Spinner and Mr. J.P. de Kreij.In 2011 the Audit Committee met seven times in the presence of the CFO, the external auditor, the Director Financial Accounting, the Director Internal Control and the Director Internal Audit Services. The agenda at these meetings covered, amongst others, the annual and half-year figures, the interim manage-ment statements, accounting issues, the operation of the internal risk management and control systems and organization, tax matters (the financing plan), treasury, information tech-nology developments and organization and the reports of the internal and external auditors.
Nomination Committee Following the resignation of Mr. P. Bouw as member of the Supervisory Board at the annual shareholders meeting early May 2011, the nomination committee consists of Messrs. M.P.M de Raad (Chairman) and R. Markham (member). Until then Mr. P. Bouw had been Chairman and M.P.M. de Raad member. The nomination committee met 5 times in 2011. The nomination
committee discussed among other subjects the composition of and changes in the Supervisory Board. Together with the Board of Management attention was paid to the functioning of the CSM Executive and other senior managers and the impact of the Relevance restructuring program. Next to that it discussed the outcome of the annual talent management review.
Remuneration CommitteeFollowing the resignation of Mr. P. Bouw as member of the Supervisory Board at the annual shareholders meeting early May 2011, the remuneration committee consists of Messrs. R. Markham (chairman) and M.P.M de Raad (member). Until then Mr. M.P.M. de Raad had been chairman and Mr. P. Bouw member. The remuneration committee met 6 times in 2011 and discussed among other subjects the level of achievement of the 2010 Short Term Incentive Plan (STIP) targets for the members of the Board of Management, the progress of the STIP 2011 targets and the target setting for STIP 2012. They confirmed the vesting at par level of the Long Term Incentive Plan (LTIP) 2008. After the acquisition of Danisco by DuPont, it was decided to replace Danisco by Novozymes in the CSM peer group.

64 | CSM Annual Report 2011A
lter
nat
ive
Sub
stra
tes
Win
in t
he
mar
ket
thro
ug
h p
artn
ersh
ips
One of CSM's strategic growth themes is to expand into emerging economies with high growth rates. CSM strengthened its presence in greater China by building a production facility in Shanghai, China.
In May 2011, CSM opened a new facility in Shanghai for the production of dry bakery ingredients, such as mixes for bread, cake and muffins, to serve markets in China, Hong Kong, and Taiwan. Economic growth in these countries is driving domestic consumption and many western products, some with an Asian twist, are gaining popularity, such as western style bread products for breakfast and afternoon snacks.
As CSM’s global customers are expanding into China, we are extending our services to them to support their strategic ambitions.
Although CSM has been active in Greater China for many years, it only supplied products sourced from subsidiaries in Europe and North America. CSM China will continue to import products for the high-end market with premium items, as genuine Western products from abroad still appeal to more cosmopolitan areas in Asia who are able to afford it. At the same time, there is also a domestic market, which requires a different approach, both in terms of product range and pricing.
With this local production, CSM can tailor its local product portfolio to domestic requirements and respond faster to customers' needs. Like the Asian preference for a softer bite, but also to be able to operate competitively from a cost perspective.For example, CSM is tapping into the growing popularity of western style donuts, but unlike donuts in the United States, donuts in China are significantly less sweet and softer then their American counterparts. With the newly built facility, CSM has significantly increased its reach to the market in Greater China.
Increased reach to market in Greater China
Bu
ild
ing
a co
mp
lete
pre
serv
atio
n p
ort
foli
oFr
idg
eso
ft –
A s
mar
t so
luti
on
A
del
icio
us
do
nu
t w
ith
less
fat
prem
ium
pas
try
Incr
ease
d r
each
to
mar
ket
in G
reat
er C
hin
a

Report of the Board of Management | 65

66 | CSM Annual Report 2011
Remuneration policy
The STIP financial targets for 2011 were not met. Given the disap-pointing developments in 2011, the Board of Management has decided to also waive their STIP personal targets entitlements.
long-Term Incentive planThe long-term incentive for the Board of Management is based on the Long-Term Incentive Plan (LTIP) linked to relative total shareholder return (TSR).
Each year members of the Board of Management are entitled to an “at target” conditional grant of CSM shares. The CEO is enti-tled to a conditional share grant value of 60% of his base salary. The CFO is entitled to a conditional share grant value of 50% of his base salary. The performance criterion for the LTIP is Total Shareholder Return over a three-year performance period.
CSM's TSR is compared with a peer group of ten comparable companies. Based on independent analysis the performance of CSM relative to this peer group is assessed at the end of the three-year performance period. According to the remuneration policy applicable starting 2010 target performance has been set at position 5 in the peer group based on detailed analyses. If CSM delivers an outstanding performance (first or second in the peer group) over the period 2011-2014 the LTIP will amount to 175% of the “at target” grant, if the performance is below the treshold (below position 6 in the peergroup) the shares do not vest at all. The Remuneration Committee evaluates the performance of CSM in relation to the peer group, using data supplied by a leading bank in the Netherlands.Upon vesting the members of the Board of Management will receive a gross amount which is equal to the gross dividend which would have been paid on the shares in the period of conditional allocation.At the time of vesting the members of the Board of Management may sell as many shares as necessary to pay the related income tax. The vested shares will be blocked for two years.
The Supervisory Board periodically determines the peer group. Due to the fact that Danisco's stock listing ended in 2011 this company has been replaced by Novozymes. The peer group is currently consisting of Novozymes (DK), General Mills (US), Aryzta
The aim of the remuneration policy for the Board of Management is to create a total remuneration package and employment condi-tions linked to the strategy and which are competitive, with a strong emphasis on performance-related pay.
The total remuneration package for the Board of Management is benchmarked against companies in the Netherlands of compa-rable size and complexity as CSM. This benchmark is set at the median level of this group of comparable executives based on various sources of market data on the remuneration for execu-tives of companies in the Netherlands.
Base SalaryThe base salary is set at the median level of similar manage-ment positions and adjusted annually on 1 May on the basis of the consumer price index for family expenditure as published by Statistics Netherlands ("CBS"). The adjustment as at 1 May 2011 amounted to 1.2%.
Short-Term Incentive plan (STIp)Members of the Board of Management are entitled to a short-term “at target” incentive. The CEO is entitled to an "at target" bonus incentive of 60% of his base salary in case of realization of the short term targets. The CFO is entitled to an "at target" bonus incentive of 50% of his base salary in case of realization of the short term targets . Three financial targets, organic growth, cash flow from operating activities and EBITA, account for 75% of STIP, while 25% relates to personal targets. The extent to which these personal targets have been realized is determined by the Supervisory Board.
In case a target is exceeded members of the Board of Management are entitled to a higher STIP than the “at target” incentive for that particular target. For the CEO a maximum STIP of 90% of base salary may apply and for the CFO a maximum STIP of 75% of his base salary may apply. For both the CEO and the CFO the maximum bonus incentive can be achieved in case all targets, financial and personal, are substantially exceeded (defined as 115% or more of each target). In case a target is not realized a smaller STIP than the “at target” incentive will be paid out, with the understanding that no STIP will be awarded for substantially lower performance (defined as 85% or less of the target).

Report of the Supervisory Board | 67
(CH), Kerry Group (IR), Grupo Bimbo (SP), Nutreco (NL), Ralcorp (US), Flower Food (US), Greencore (US) and Wessanen (NL). In case of changes to companies within the peer group for whatever reason, the Supervisory Board may decide to make one or more adjustments to the composition of the group.
The at target and maximum number of conditionally granted shares for each member of the Board of Management and the movements in the number of conditionally granted shares are specified in note 30 to the financial statements.
In 2011, the shares conditionally granted in 2008 vested per May. As CSM ranked in 6th position in the peer group, 100% (2010: 50%) of the conditionally granted shares have vested in accord-ance with the at that time applicable LTIP-formula.
Commitment AwardThe members of the Board of Management are entitled to an annual Commitment award in the form of CSM shares with a value of 10% of their respective base salary. The shares are blocked until the end of their employment with CSM with the understanding that as many shares as necessary may be sold to pay the related income tax. In 2011, as in previous years, the Board members have not used this option.An overview of the Commitment Award shares can be found in note 30 to the financial statements.
pensionThe pension plan for the members of the Board of Management is a defined contribution plan, the contributions being paid by CSM. The plan is within the fiscal boundaries (Table 2, Witteveen franchise) using 65 as the retirement age. The members of the Board of Management are also insured for a disability pension and death-in-service.
Other benefits and entitlementsMembers of the Board of Management are provided with benefits in line with benefits applicable to other senior managers in CSM (e.g. company car, expense allowance).
CSM does not grant loans to members of the Board of Management. Hence, there are no outstanding loans.
Employment ContractMembers of the Board of Management are appointed for a period of four years and may be reappointed with the approval of the General Shareholders Meeting.
Messrs G.J. Hoetmer and N.J.M. Kramer have an employment contract for an indefinite period of time which expires at the retirement age or earlier if terminated by either party. The notice period for all members of the Board of Management is three months. CSM, being the employer, is required to give six months’ notice.
A severance pay arrangement has been agreed with the members of the Board of Management. This severance pay deviates from provision II.2.8 of the Dutch Corporate Governance Code. This deviation originates from the time of the appointment of Mr Hoetmer in 2005, enabling CSM to offer him a competi-tive package of employment conditions. The same severance pay arrangement was offered to the members of the Board of Management appointed shortly after Mr Hoetmer. The agreed severance pay can amount to a maximum of 1.5 times the sum of the annual base salary and the most recently determined short-term incentive. In addition, contributions to the base pension plan and the Commitment Award will be continued for a further two years.
New appointments to the Board of Management will be treated in accordance with the practice of good governance and regula-tions in force at the time of the appointment.
The members of the Board of Management may accept a maximum of two paid or unpaid positions on an outside super-visory board or any other such (advisory) position, provided they obtain the prior approval of the Supervisory Board.
Currently, only Mr. Hoetmer has an external unpaid appoint-ment with the Stichting "Spieren voor Spieren" (www.spieren-voorspieren.nl), a charity organization active for the benefit of children suffering from muscular diseases.

68 | CSM Annual Report 2011
Remuneration for the Supervisory BoardTotal remuneration for members and former members of the Supervisory Board in 2011 amounted to € 0.3 million (2010: € 0.3 million). The table below provides details on the various committees.
Diemen, the Netherlands, 20 February 2012On behalf of the Supervisory Board
M.P.M. de Raad
2011 2010
M.P.M. de Raad, Chairman (member Remuneration
Committee / Chairman Nomination Committee) 65 58
R.H.P. Markham, Vice-Chairman (Chairman Remuneration
Committee / member Nomination Committee) 51
R. Pieterse (Chairman Audit Committee) 56 56
W. Spinner (member Audit Committee) 51 52
J.P. de Kreij (member Audit Committee) 34
P. Bouw, resigned 23 68
L.A.A. van den Berghe, resigned 17
Total 280 251
2011 2010 2011 2010 20112010
thousands of euros
G.J. Hoetmer 600 594 351 587 951 1.181
N.J.M. Kramer 454 434 239 388 693 822
R.P. Plantenberg* 134 137 271
Total 1,054 1,162 590 1,112 1,644 2,274
2011 201020102011
thousands of euros
G.J. Hoetmer 223 231 1.174 1.412
N.J.M. Kramer 168 157 861 979
R.P. Plantenberg (until 1 May 2010) 88 359
Total 391 476 2,035 2,750
No loans or advance payments or any guarantees to that effect have been granted to the members of the Supervisory Board.
None of the members of the Supervisory Board has shares in the company or any option rights relating thereto (as at 20 February 2012).
Total Remuneration
Fixed salary Variable salary Total salary
TotalPension and other provisions
Remuneration for the Board of ManagementTotal annual remuneration for the CSM Board of Management amounted to € 2.0 million in 2011 (2010: € 2.8 million). The reduction on balance is due to changes in the composition of
the Board in 2010, a higher LTIP vesting and a non-payment of STIP over 2011 (waiver Board of Management as described earlier).
* Mr. Plantenberg resigned as board member as at 1 May 2010. His remuneration until the end of employment (September 2011) amounts to € 0.7 million and has been fully recorded in 2010.

Report of the Board of Management | 69
company or any option rights relating thereto (as at 20 February 2012).Diemen, the Netherlands, 20 February 2012
Sustainability Report

70 | CSM Annual Report 2011
200720082011 2010 2009
Number of employees
CSM overall 9,990 9,456 8,430 8,433 8,432
Bakery Suplies Europe 4,231 4,023 3,965 4,101 4,023
Bake Supplies North America 4,589 4,409 4,409 3,451 3,329
Purac 1,022 970 970 965 1,032
Holding 58 53 49 49 48
Employees per region/country
Netherlands 6.1% 5.2% 9.4% 7,4% 8.7%
Rest of Europe 41.8% 44.2% 46.0% 47.5% 45.7%
North America 47.9% 47.5% 40.9% 41.0% 41.9%
Rest of the world 4.2% 3.1% 3.7% 4.1% 3.7%
Female/male ratio female male female male female male female male female male
33.1% 66.9% 33.9% 66.1% 31.7% 68.3% 30.8% 69.2% 30.1% 69.9%
Average age female male female male female male female male female male
41.3 42.9 41.4 42.7 40.6 42.4 39.7 41.8 39.5 41.7
Average years of employment female male female male female male female male female male
5.3 6.7 7.7 9.7 7.7 9.9 7.7 9.8 7.6 10.0
Absenteism ratio (>one day) 3.27% 2.30% 2.70% 2.30% 2.70%
Average investment in training/
education. in euros
per employee (excluding corporate
management training program) € 395 € 441 € 486 € 326 € 458
Key Figures Sustainability
profit
Net sales 3,113 2,990 2,556 2,599 2,486
Net sales by division
Bakery Supplies Europe 1,078 1,023 1,013 1,181 1,059
Bakery Supplies North America 1,628 1,567 1,187 1,092 1,116
Purac 407 400 355 326 310
Net sales by region
Netherlands 152 149 100 154 134
Rest of Europe 1,061 1,006 1,018 1,066 1,042
North America 1,781 1,719 1,299 1,294 1,230
EBITA before one off costs 151 215 151 133 154
EBITA 130 194 151 113 65
Operating result -150 158 143 107 60
Result after taxes from
continuing operations 90 56 64
Result after taxes -174 99 87 90 203
Equity 948 1,117 998 942 958
Market capitalization
(as at 31 December) 816 1,725 1,192 711 1,428
people
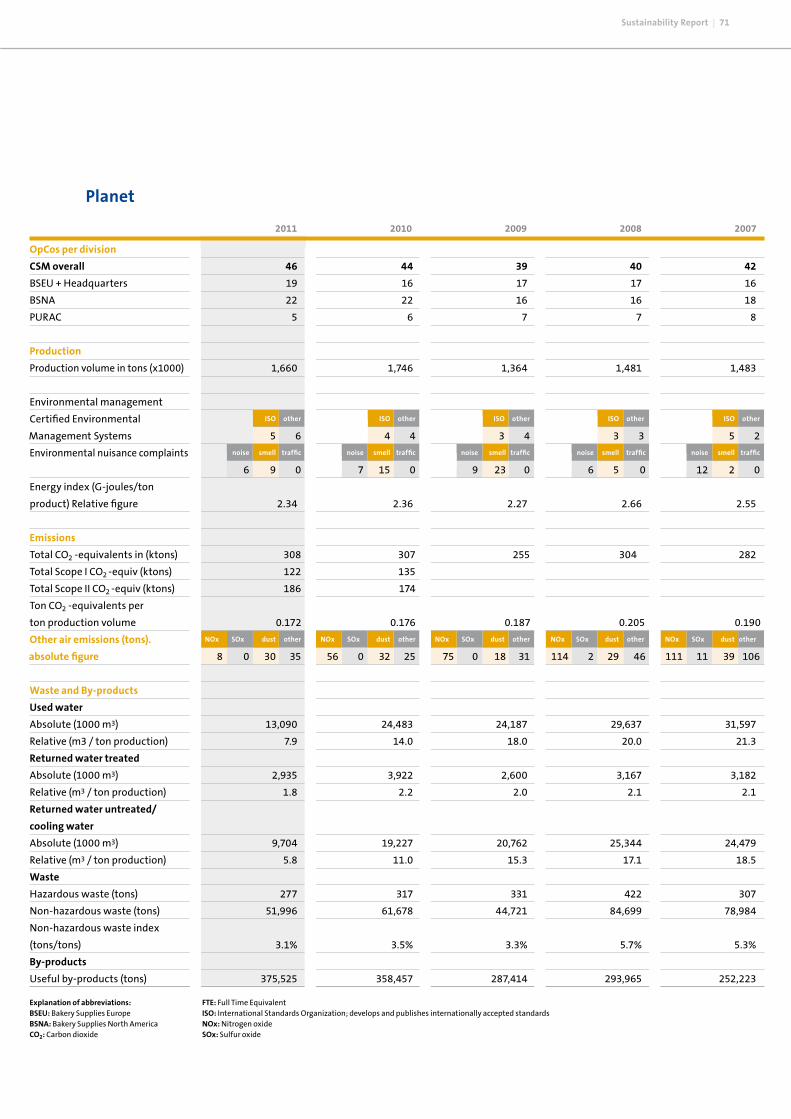
Sustainability Report | 71
planet
200720082011 2010 2009
OpCos per division
CSM overall 46 44 39 40 42
BSEU + Headquarters 19 16 17 17 16
BSNA 22 22 16 16 18
PURAC 5 6 7 7 8
production
Production volume in tons (x1000) 1,660 1,746 1,364 1,481 1,483
Environmental management
Certified Environmental ISO other ISO other ISO other ISO other ISO other
5 6 4 4 3 4 3 3 5 2
Environmental nuisance complaints noise smell traffic noise smell traffic noise smell traffic noise smell traffic noise smell traffic
6 9 0 7 15 0 9 23 0 6 5 0 12 2 0
Energy index (G-joules/ton
product) Relative figure 2.34 2.36 2.27 2.66 2.55
Emissions
Total CO2 -equivalents in (ktons) 308 307 255 304 282
Total Scope I CO2 -equiv (ktons) 122 135
Total Scope II CO2 -equiv (ktons) 186 174
Ton CO2 -equivalents per
ton production volume 0.172 0.176 0.187 0.205 0.190
Other air emissions (tons). NOx SOx dust other NOx SOx dust other NOx SOx dust other NOx SOx dust other NOx SOx dust other
8 0 30 35 56 0 32 25 75 0 18 31 114 2 29 46 111 11 39 106
Waste and By-products
used water
Absolute (1000 m3) 13,090 24,483 24,187 29,637 31,597
Relative (m3 / ton production) 7.9 14.0 18.0 20.0 21.3
Returned water treated
Absolute (1000 m3) 2,935 3,922 2,600 3,167 3,182
Relative (m3 / ton production) 1.8 2.2 2.0 2.1 2.1
Returned water untreated/
cooling water
Absolute (1000 m3) 9,704 19,227 20,762 25,344 24,479
Relative (m3 / ton production) 5.8 11.0 15.3 17.1 18.5
Waste
Hazardous waste (tons) 277 317 331 422 307
Non-hazardous waste (tons) 51,996 61,678 44,721 84,699 78,984
Non-hazardous waste index
(tons/tons) 3.1% 3.5% 3.3% 5.7% 5.3%
By-products
Useful by-products (tons) 375,525 358,457 287,414 293,965 252,223
absolute figure
Management Systems
Explanation of abbreviations:BSEu: Bakery Supplies EuropeBSNA: Bakery Supplies North AmericaCO2: Carbon dioxide
FTE: Full Time EquivalentISO: International Standards Organization; develops and publishes internationally accepted standards NOx: Nitrogen oxide SOx: Sulfur oxide

72 | CSM Annual Report 2011
Sustainability
Doing business in a sustainable way is embedded in our long term strategy. Sustainability is driven in CSM through leadership commitment and a strategic approach. It is based on under-standing the most relevant sustainability issues for our business and our stakeholders and balancing the elements of people, planet and profit. Our innovative and sustainable solutions for our Bakery Supplies and purac divisions have both consumer and societal needs in mind. For us, implementing sustainability means embedding it in our organization, setting and working towards our objectives, and engaging with partners over our entire value chain.
The CSM sustainability visionIt is our vision to provide for a healthier, more sustainable world with ample food. Through the smarter use of natural resources, our innovative solutions have both consumer and societal needs in mind. In our Bakery Supplies businesses, healthier options and new solutions make better use of resources and result in the more efficient use of consumer food products. Purac's biobased prod-ucts from renewable raw materials provide the building blocks of the future. Guided by this vision, Purac is developing processes which do not interfere with the main products in the food value chain.
Aligning our businesses to meet future needs in consideration of health, the best use of natural resources and an increasing popula-tion supports not only our long-term success, but also that of our partners and stakeholders. Our vision of a sustainable future is driven by our shared values of passion, partnership and perfor-mance and by balancing the elements of People, Planet and Profit in everything we do. We are delivering tomorrow’s products today.
Our approachSustainability is one of our strategic initiatives. For us sustain-ability means balancing the elements of People, Planet and Profit in all that we do.
people: Trust through EngagementWe believe that by engaging with stakeholders and under-standing their needs and expectations, we are better able to align our actions with them and anticipate future developments. Important stakeholders for us are: employees, customers, inves-tors, suppliers, community, NGOs, and society as a whole. Gaining trust with our stakeholders is based on transparent actions and communications.
planet: Responsibility and ReductionOur responsibility to the environment involves not only moni-toring and reporting environmental impact and resource use, but also setting and working towards reduction targets. That is why we are working towards our ambitious reduction targets in the areas of energy, water, waste (raw material loss) and packaging.
profit: Creating Shared Value We believe that by embedding sustainability in our business, we can create shared value together with our stakeholders. Creating shared value ensures that our goals are aligned with our stakeholders and our partnerships are intended to create value for all sides. Sustainability is aimed at securing our long-term profitability and license to operate. We also see cost reductions and efficiencies through our sustainability efforts and imple-ment sustainability to mitigate risk. In providing innovative and more sustainable products and services to our customers, we are securing our preferred position with customers, investors, and new employees
The most relevant sustainability issues for CSMIdentifying and managing the most relevant sustainability issues for CSM is a core element of our sustainability approach. CSM recently conducted an extensive issue evaluation in order to determine which sustainability issues have the most impact on our business and which are the most important for our stake-holders. This process was based on identifying all the relevant issues along our value chain, including external stakeholders, and then determining which are the most material for us. This process involved conducting internal workshops with our business and corporate divisions and carrying out an extensive review of our external stakeholders with the support of an external consultant.
The resulting materiality matrix compares the importance of each issue relative to its impact on CSM. Issues found in the upper right corner of the matrix are the most relevant. Understanding these key issues and addressing them through management systems ensures that CSM is prepared for future developments. This approach enables us to minimize risks early and identify new opportunities. Therefore, we ensure that these key issues are reflected as themes in our activities and strategic approach. We will continue to monitor and evaluate sustainability issues on an ongoing basis.

Sustainability Report | 73
CSM Sustainability Framework
people planet profit
Trust through Engagement
Responsibility & Reduction
Create Sustainable Value
VisionObjectives
Value Chain
Initiaves
Strategy Innovation Sourcing Operations Customer Consumer
Issue Identifi- cation, Stakeholder Engagement
Carbon Footprint Reduction
SustainableSourcing
Operational Excellence
Sustainable products & Solutions
Sustainability Communi-cations
Governance Code of Conduct, Values, Standards
Sustainable products •
Energy/Climate change •
Healthy food •
Renewable resources •Traceability •
Food waste •
packaging •Water •
Waste •
Deforestation/Biodiversity •
Corruption •
Sustainable agriculture •
Human rights/labour rights •
Global food crisis •
Occupational health & safety •
Impact on CSM
Stak
eho
lder
's c
on
cern
Sustainability frameworkOur holistic approach is illustrated through our sustainability framework, which acts as a strategic umbrella to define sustaina-bility through the elements of People, Planet and Profit and guide its implementation, from its basis in Governance to highlighting
key initiatives along our value chain. Our approach stresses the business case for sustainability and is fueled by the prospects to, one the one hand, create value through seizing opportunities, and on the other hand, mitigate risks.

74 | CSM Annual Report 2011
Integral to our businessIn our fields of business, we see a number of issues and concerns that impact the environment and society. We play our part in a way that is closely aligned to our strategy, our business model and our spheres of influence at the same time. Therefore, we are actively pursuing initiatives along our value chain in key areas:• Sustainable Sourcing• Carbon footprint reduction • Operational excellence• Sustainable Products and Solutions
Sustainable SourcingAs a sustainable company, we set and measure our performance goals not only for economic achievements, but also for environ-mental protection and social well-being. We expect our suppliers to uphold similar standards. As such, we aim to build and main-tain long-term and mutually beneficial relationships with our suppliers and move forward with our suppliers to create long-term sustainable value together. Together with our suppliers we must ensure that we:• Contribute to the sustainability of the earth’s resources and the
protection of the environment• Comply with the laws and regulations of the countries where
we operate and respect local norms and values• Are a responsible member of the communities in which we
operate• Respect the rights and safety of our employees as ethical
employers
Our Sustainable Sourcing Program will help us to uphold these
standards in our value chain. In order to provide clarity on our sustainability expectations for suppliers, we have developed our CSM Supplier Code (http://www.csmglobal.com/Csm/EN/Sustainability/ Our-Approach/CSM-Supplier-Code.aspx). This outlines in general terms our minimum expectations of suppliers in order to ensure that they operate in an ethical manner. It describes the underlying principles which apply to our relationship.
Further, we have begun to implement our Sustainable Sourcing Program by focusing on the most critical raw materials, starting with palm oil, sugar and cocoa. This involves engaging with suppliers of these agricultural raw materials in the form of a self-assessment and through recognized multi-stakeholder initiatives, such as the RSPO.
For example, as part of this Program, we have increased our commitment to Sedex by becoming an AB member. Sedex, the Supplier Ethical Data Exchange (http://www.sedexglobal.com/), is a not for profit membership organization for busi-
nesses committed to continuous improvement of the ethical and responsible practices in their supply chains. We are encouraging our suppliers to use this secure web-based platform for sharing information on four key pillars: health and safety, labor stand-ards, business integrity and the environment. This will support our efforts in assessing social and environmental aspects of our suppliers. Also, this approach helps to reduce duplication and increase cooperation and transparency along the supply chain.
Palm oil has been our first priority in working towards a sustain-able supply base. We started the road towards sustainable sourcing in 2005 by becoming member of the RSPO, Roundtable on Sustainable Palm Oil (http://www.rspo.org/). We have increased our commitment to sustainable palm oil in 2011. For more information about our progress, see ‘Sustainable Products and Solutions’.
Also, as sugar cane is an important raw material for us, we have made a commitment to join Bonsucro (http://www.bonsucro.com/). The Bonsucro Standard is the first ever metric based Standard which measures the impact of the sustainable produc-tion of sugar cane. This multi-stakeholder initiative has devel-oped a sustainability standard and certification system and aims to reduce the environmental and social impacts of sugarcane.

Sustainability Report | 75
CASE
Su
STA
INA
BIl
ITy
Reducing gas consumption through operational excellenceA good example of how we have successfully pursued
our operational excellence program is the improvement
we achieved in our Manchester facility by installing an
Energy Management System (EMS); a centralized control
system designed specifically for the control of industrial
heating.
The system uses self-learning predictive programming
coupled with high accuracy digital temperature sensing
and many energy saving features to ensure the existing
heating on the site is controlled in the most efficient way.
This system enabled us to achieve fuel savings
by utilising residual heat in the airflow, while its
control and optimization programming tools and
functionality drives further significant energy savings.
These optimization programs include for instance the
monitoring of the overnight temperature to calculate
how long the heating needs fire to bring the site up to
target temperature. This eliminates the waste of having
set clocks to bring the heating on for a preset time,
irrespective of the night being mild or severe.
After only nine months, we were able to reduce our
gas consumption by more than 40%. This means a
significant contribution to our sustainability objectives
on site level, while the cost savings in energy benefit our
bottom line as well. Thanks to the achieved cost savings,
the investment will be paid back within 12 months.
Further, the sustainability of cocoa and chocolate are part of our focus. CSM is a member of UTZ CERTIFIED, one of the largest sustainability programs for coffee, cocoa and tea in the world. This means that we are able to provide our customers with UTZ certified cocoa and chocolate upon request. UTZ provides a certi-fication and traceability program for socially and environmen-tally responsible cocoa production that meets the needs of both producers and markets.
Carbon footprint reduction We understand that investigating and reducing environmental impact means looking at all stages of a product or process’s life from cradle to grave. That is why we use Life Cycle Assessment (LCA) to assess environmental impacts, including the carbon foot-print of products and processes. This includes the impacts of raw material extraction, processing, manufacture, distribution, use, and disposal or recycling. We believe that by quantifying sustain-ability information, we can better understand our resource use and impacts and introduce sustainability parameters to support our decision making process.
In Bakery Supplies we are working on carbon footprint reduction in two ways. First, we are developing new processes which make smarter use of natural resources. For example, innovative baking processes enabling longer shelf life reduce impact in several ways. Less bread is wasted, both on our customer and consumer side, and distribution channels are optimized. Second, our operational excellence programs are creating improvements and efficiencies that promote sustainability, such as reducing energy usage, waste and water. In addition, we are lowering our carbon footprint by migrating to more sustainable packaging materials and developing smarter packaging solutions.
For Purac, driving carbon footprint reduction is deeply linked to the business strategy. Purac’s products help to reduce CO2 emis-sions by lowering society’s dependency on fossil fuels. Purac's innovation program includes the development of new generation biobased chemicals and the use of lactic acid and succinic acid as potentially important platform chemicals to replace fossil fuel based chemicals. In Purac, our focus is to deliver a reduction in

76 | CSM Annual Report 2011
Shaping our sustainable future is an ongoing process. In
2010 we defined sustainability objectives which are aligned
with our strategic framework. These play an important role
in reflecting our commitment and driving our sustainability
performance over the organization. These objectives are being
driven through working groups from the different divisions.
Health and Wellness Objective for 2014
• double the number of products with a calorie reduction of
15-50+%, including ingredients that enable our customers
to manufacture products with a similar calorie reduction.
In 2011 we have made a good start towards achieving this
ambition and many new products are finding their way to the
market already.
Sustainable palm Oil Objective for 2015
• switch to fully sustainable palm oil for all products in
regions where available
In 2011, we have strengthened our commitment to
sustainable palm oil by switching to sustainable palm oil in
all of our frozen bakery products in Europe and are one of the
first companies to sell bakery products with the "Mixed" RSPO
trademark.
Operational Excellence Objectives for 2016
• 20% Reduction in Energy Consumption and 20-30%
enhancement of Energy from Sustainable Sources
• 20% Reduction in Losses of Raw Material Resources
• 20% Reduction in Packaging weight and when changing
packaging, convert to recycled/sustainable (like PLA)
• 20% Reduction in Clean Water use (surface and
groundwater)
We have made good progress in identifying projects to lead
us toward these objectives and implemented improvements
already in 2011. Further, our energy efficiency improvement
for the period 2005-2020 is planned to be in accordance with
the Multi Year Agreements on Energy efficiency (European
policies). To improve the energy balance of our facilities, we
will strive to take measures according to the BATNEEC principle
(Best Available Techniques Not Entailing Excessive Cost).
Some Sustainability Objectives
CO2 emissions through both our Poly Lactic Acid (PLA) proposition and its gypsum free technology.
Purac is at the forefront in the development of products, technol-ogies and applications for biobased and biodegradable PLA. We have expanded our capacity through a new 75,000 ton lactides plant in Thailand. As lactide is a precursor for PLA based polymers, this product delivers a more favorable CO2 footprint compared to traditional oil-based polymers. For example, bio-plastics produced based on lactide plant from this plant alone translate to a CO2, reduction of more than 125,000 tons compared to plastics based on Low Density Poly Ethylene (LDPE). Purac also continues to advance its technology to produce lactic acid in a gypsum free process. Purac is preparing to invest in this new process to be able to produce on a substantial scale of 20,000 tons capacity. This would mean a reduction in CO2 emission of 12,000 tons and a reduction of waste.
Operational excellence Our ongoing operational excellence programs aim to make improvements that support our sustainability objectives. This is achieved through the use of better technology, operational effi-ciencies and greater awareness. These programs are embedded in our CSM strategy and are part of our overall ambitions. Our main focus areas are energy efficiency, water reduction, waste reduction and to make our packaging more sustainable. To meet our objectives in these areas, in 2011 we established working groups with members from each division. Over the last year, these groups placed a strong focus on developing a better under-standing of usage and impacts over the range of applications, sharing best practices, and developing long term project plans to meet the 2016 objectives. Also, a variety of improvement meas-ures were implemented, which are described below.
Energy reductions in our Bakery Division During 2010, a complete review of energy and water consump-tion and reduction efforts for all sites was completed. We have reduced the amount of consumed kilowatt hours throughout multiple facilities. An optimization of air compressors to reduce electrical energy use was carried out at several sites. Both our Bischheim and Manchester sites replaced sub-optimally used compressors with more efficient screw compressors which adapt to all loads, representing energy savings of 80 and 90Mwh, respectively. At our Atlanta plant, optimizing the condenser configuration to include an ammonia condenser increased effi-ciencies significantly, saving more than 600 Mwh.
The retrofit of existing light systems to energy efficient bulbs, reflectors, ballasts and replacing obsolete fixture is an example

Sustainability Report | 77
of an ongoing focus in North America. Motion sensors to regulate lighting are used to turn on only when activity is taking place in a certain area. Our Gerlenhofen site implemented a strict plan to eliminate air leakages, achieving 200 Mwh in savings. Other improvements include shifting from heating fuel to natural gas for our boilers, replacing traditional bulbs with LED bulbs (repre-senting an annual 800 Mwh saving). Our Crema site achieved significant energy reductions through the replacement of its steam generator (representing an annual 1200 Mwh saving).
Overall, these energy savings of almost 3000 Mwh are significant, representing approximately the annual electricity consump-tion of approximately 750 families of four people. Additionally, our sites are introducing tools to accurately track energy use (Sankey 0diagrams) and rollout activities to optimize energy use, such as through reduced losses, improved insulation, process changes, and weekend condition optimization. Also, improved management systems, such as the implementation of an Energy Management System (EMS) to control time and temperature automatically have significantly reduced gas use.
Water reductions in our Bakery DivisionIn North America, the amount of water usage has been reduced over the last year. For example, utilizing a vendor relationship, we identified the most effective sanitation chemical requiring a smaller volume of water to achieve the same outcome. Using a lower water volume requires less steam to heat the water, which also decreases the amount of natural gas used. This led to a reduction of over 14% in water usage in 2011. In our Crema site, we have successfully reduced the amount of water used over the last several years. This is a result of increased sensitivity towards water use and technical measures. Between 2007 and 2011, the water use was decreased by almost 50%. The improved maintenance of pipes and condensers, installation of automatic valves, pumps, and controllers, as well switching from water to air cooling made this possible. Also, our Bischheim site reduced water consumption by 33% over the last year through the careful planning of production activities and a compressor replacement.
Water and Energy reductions in PuracPurac started the construction of two anaerobic waste water treatment plants for lactic acid plants in Brazil and Thailand. Not only do these state of the art water treatment systems clean waste water in an efficient way, but they also generate a very interesting byproduct: biogas. Bacteria in these anaerobic waste water treatment systems convert the organic material in the waste water into methane gas. This gas is collected and sent to Purac’s steam boilers, replacing up to 10% of the natural gas required to run the plant. With this technology, Purac will
burn less fossil fuel and build on its already strong position as a sustainable producer of Lactic Acid and Derivatives. Both plants are expected to come on line in the summer of 2012.
Purac plants across the globe have historically been state of the art with respect to the efficient use and re-use of water and energy, implementing industry best practices with regard to evaporation and energy use. The reuse of vapors increases the efficiency of our evaporators and reduces our steam require-ments to a fraction of what is needed from a straight energy balance perspective. In addition, Purac designs its facilities to maximize heat recovery and minimize the total energy necessary to convert sugar or dextrose to lactic acid. Reclaiming the heat from various streams means also reclaiming the water containing this heat, which is recovered and reused at other locations in the facility, such as in fermentation. This means that Purac manages to achieve multiple uses from its water before it is disposed, reducing the amount of fresh water used by 60%.
Packaging improvementsFor us, packaging is a key focus area in our sustainability efforts. Packaging plays several roles for us. It provides protection and preserves product quality over the supply chain. It may serve a communication role, must be convenient at the usage level and enable responsible disposal. Our work on more sustainable packaging looks not only at packaging weight, but also pack-aging material and packaging design. Packaging design is also an important element in our considerations, as avoiding food waste typically has a greater environmental impact than the packaging itself.
Over the last years, we have reviewed our packaging solutions in terms of functional fit for purpose and identified optimization projects to reduce packaging weight and increase cost efficiency. In the last year we executed several projects involving increasing the recyclable content, optimizing packaging sizes and using more sustainable materials. We reduced the thickness of our margarine wrappers by 14% at our sites in Merksem, Crema and Delmenhorst. We have redesigned our pails to reduce their weight by 3%. For several sites, we reduced the thickness of bags for both manual and automated applications significantly by moving from LDPE to HDPE and making better use of our suppliers’ improved extrusion technology. At our Delmenhorst site, we switched from folding carton to corrugated wrap packaging, reducing packaging weight by more than 400 tons. Also we switched from plastic polystyrene-based trays to paper trays in our Wirral and Aartselaar sites. This resulted in a significant reduction of our carbon footprint by more than 600 tons CO2 equivalent.

78 | CSM Annual Report 2011
Size optimization for primary and secondary packaging saved another 80 tons of packaging material and in some cases we could transport more units per pallet and thus reduce the amount of trucks on the roads. Overall, these improvements, besides being cost effective, resulted in the reduction of plastic by more than 100 tons and paper by more than 500 tons. This combined with the other projects lowered our carbon footprint by more than one thousand tons CO2 equivalent. Further packaging projects are in the pipeline, targeting further weight reduction, increase recycled content and moving to more sustainable materials.
Waste reductionWe have continued our strategic focus on packaging and recy-cling. In North America, multiple sites were able to increase the amount of paper, cardboard, and plastic that was recycled instead of being sent to the local landfills. For example, one site in North America partnered with the local waste services to determine that cake mix bags are considered as recyclable materials. This project resulted in three thousand additional bags recycled per day as well as an additional cost savings from the reduction of bags being sent to the landfill.
Our European sites have been working with the principle of zero based waste for more than 2 years. In 2011, we have realized a significant reduction in raw material losses of 17% in Bakery Products and 8% in Ingredients. The reduction is a result of many local projects dealing with change over sequences, cleaning order, weight control and more focus on accurate measurements and daily control. Additionally, better analysis of our inventories has resulted in optimal production run-lengths which reduces the technical waste associated with changeovers between products.
Sustainable products and solutionsSustainable products are those which support our sustainability themes – these are our most important sustainability issues, including: healthy food, renewable resources, and energy and climate. Sustainable products linked with the ‘healthy food’ theme are included under our ‘health & wellness’ initiative. Other examples are our products to help to reduce salt intake. Our natural food preservation products are based on renewable resources. These products and our sustainable solutions support our customer’s efforts in reducing the impact over the value chain.
Poly Lactic Acid (PLA)We see that millions of tons of plastics are used every year. Trends in the oil industry and in climate developments have forced the plastics industry to find ways to reduce oil dependence and minimize the impact that plastics currently have on our environ-ment. As a result, the use of renewable resources in industrial
products, including plastics, has increased over the last few years due to an increase in oil prices combined with fast developments in fermentative industrial production technology and biotech-nology. This has created an influx of bio-plastic products into the market, which are either biobased, biodegradable or both and so provide a sustainable, environmentally friendly answer for the plastics industry. Our solutions for PLA bio-plastics have been created to allow producers to develop the polymers that have the best performance for their particular application. Based on discussions with our partners Purac has developed new prod-ucts and new fermentation and purification processes. A new PLA polymerization process has been developed with lactides as starting material. By making use of already existing economies of scale for lactic acid, these solutions greatly reduce technology hurdles and financial risks for our partners, while allowing value-added applications to be developed.
Alternative SubstratesAt Purac we are working on alternative substrates for even more sustainable chemicals. In order to continue to drive its global leadership, Purac is investing heavily in advancing technology for the next generation of lactic acid production. One of these developments is the use of so called alternative substrates, which do not interfere with the food supply chain, for the production of lactic acid. For more information, see the case on ‘Alternative Substrates for even more sustainable Chemicals’.
Health and WellnessObesity and lack of essential nutrients are serious health threats that are a daily reality for a large part of the world’s popula-tion, particularly in markets CSM serves. Both Bakery Supplies and Purac are well positioned to contribute to a more balanced and sustainable and safe food supply. Bakery products have a pivotal role in the diet and consumers are increasingly looking for 'Better4U' and 'Good4U' options.
In 2011, CSM has developed a unique range of Better4U and Good4U products, proven to match taste expectations (with no compromise) and offering meaningful Health & Wellness benefits. Using state of the art technologies, we have manufac-tured products which are reduced in fat, saturated fat, sugar, salt or calories. Some of our innovations provide more fruit, nuts, vitamins, minerals, fiber, or whole grains. And we have developed the means to offer cleaner labels. Notable product examples are our Invisible Goodness™ Bakery pastry range, or the new range of lower fat donuts launched recently. These are products which provide significant reductions in (saturated) fat and calories compared to market benchmarks, yet offer a great taste and eating experience.

Sustainability Report | 79
CASE
Su
STA
INA
BIl
ITy
Sustainable palm Oil
Palm oil has been our first priority in working towards
a sustainable supply base. We started the road towards
sustainable sourcing in 2005 by becoming member of the
RSPO, Roundtable on Sustainable Palm Oil. In the course of
the last years, CSM Europe has established an RSPO supply
chain and certified 11 factories. Since 2010, we offer our
customers the opportunity to select from the three RSPO
sourcing models for sustainable palm oil.
In 2011, we have strengthened our commitment by using
only sustainable palm oil for all of our frozen bakery products
in Europe. Since July 2011, CSM has become one of the first
holders of the new RSPO Trademark license. This means CSM
is one of the first companies now selling bakery products with
the "Mixed" RSPO trademark on its labels. CSM is actively
supporting its customers who wish to follow the RSPO vision
of sustainable palm oil. We plan to increase our commitment
by sourcing only sustainable palm oil, where market
conditions allow, by the end of 2015.
WWF has included CSM in its 2011 Sustainable Palm Oil
Scorecard, (http://wwf.panda.org/what_we_do/footprint/
agriculture/palm_oil/solutions/responsible_purchasing/
scorecard2011/scores/volume/manufacturers/) where we
received a score of 7 in the Consumer Goods Manufacturers
category. Criteria included in this assessment were RSPO
membership, future commitment, and volume range
purchased. This shows that we are on the right track
and encourages us to continue to make progress in our
commitment to sustainable palm oil.
Further, RSPO Secretary General Darrel Webber the use of
the trademark by CSM Europe, saying: “We applaud CSM
Europe in making this progressive and significant move
towards sustainable palm oil by being one of the early
adopters of the Trademark. This demonstrates industry
leadership, visionary thinking and a long term commitment
towards the company’s customers. Aimed at educating and
creating consumer awareness amongst end consumers, the
trademark was launched in June this year allowing RSPO
members to use the logo on-pack and in communication
about products that contain palm-derived ingredients
sourced in compliance with the RSPO standards. To date, the
trademark has received enquiries from 20 countries around
the world with license granted to key producer and consumer
markets including United Kingdom; Belgium; Malaysia;
France; Indonesia; Colombia; United States of America;
and Germany.”

80 | CSM Annual Report 2011
the benefits of enrichment through flour fortification is only € 0.10 per person per year (B vitamins and iron, 70 kg flour). CSM is proud to provide flour enrichment and play an important part in improving public health in many countries around the world.
How we manage itAt CSM, we are aware of the environmental impact of our business operations and require all of our operating companies to comply with national, local, regional, and all other applicable laws. We are committed to protecting the present and future needs of our stakeholders by conducting our business in a safe and sustainable manner. We work on the development of sustainable products and technologies and embed sustainability criteria in our manage-ment processes. By engaging with stakeholders and partners, we aim to increase sustainability over our value chain.
Sustainability organizationAs one of our four strategic focal areas, sustainability has the full attention of our organization and is embedded in our manage-ment structure. This starts with the strategic commitment and sponsorship of our Board of Management and Executive Team. Our Global Head of Sustainability, together with members of our business and corporate divisions form CSM’s Sustainability Steering Committee, which oversees our progress in driving CSM’s sustainability initiatives on a monthly basis. Our initiatives are managed through dedicated working groups focusing on specific areas of social and environmental performance. Further, all employees are made aware of CSM’s commitment and ambi-tions related to sustainability and corporate governance and encouraged to play their part.
Code of ConductCSM has a Code of Conduct to safeguard compliance with laws and regulations in the countries in which it operates. Moreover, it adheres to the OECD Guidelines for Multinational Enterprises, which is especially relevant to countries where proper and decent working conditions and respect for human rights may not be guaranteed by national legislation or the local enforcement regime. At CSM, we conduct our business with fairness, honesty, integrity and respect for the interests of stakeholders in a wide variety of social, political and economic settings. This relates to CSM employees individually and the organization as a whole.
Sustainability reportingCSM has a management process to collect its performance indicator reporting based on the key indicators which are most relevant to our business. These Key Performance Indicators (KPIs) measure the impact of our actions and are used to measure the effectiveness of our reduction efforts. Since 2004, we report
Further, an important aspect of our Health & Wellness initia-tive focuses on calorie reduction. The calorie reductions we can achieve in our innovations are meaningful, considering the fact that relatively small sustained changes in energy intake and/or expenditure in the order of 100 kcal, just 4% of our calorie intake, can make a difference. Scientific studies indicate that affecting our daily energy balance by just 100 kcal may prevent weight gain at a population level (Hill et al., 2003). Conversely, the consumption of an additional 20 to 50 kcal/day over a year could contribute to 1 kg of body weight gain (Dutch Nutrition Centre, 2007). This is why CSM has the objective to, over a period of three years starting in 2011, double the number of products with a calorie reduction of 15-50+%, including ingredients that enable our customers to manufacture products with a similar calorie reduction. CSM is well on its way to offer innovations to the market, targeted at helping consumers achieve healthier diets and making weight maintenance easier in a meaningful and tasty way.
Food PreservationFood safety and shelf life are at the heart of our preservation activities in Purac, as producers and consumers seek to reduce waste and the risk of deteriorating food quality. Natural preser vation solutions are the perfect response to consumers’ preference for natural, healthy and clean label products. Also in our product portfolio of Bakery Supplies we provide natural solutions to extend shelf life, based on enzyme technology, helping our customers and consumers to reduce waste.
Salt Reduction
Salt in our diet is a major contributor to hypertension and associated with coronary linked deaths. Studies suggest that at least one in four people suffers from hypertension and that this statistic will increase. We provide a natural flavoring solution for sodium reduction. For example, our PuraQ, which helps food manufacturers to retain a salty, savory taste, while lowering the sodium content.
Flour FortificationCSM provides flour enrichment to millers throughout North America as well as different parts of the world. Although regula-tions and practices vary widely, flour is often enriched with four B vitamins (thiamin, riboflavin, niacin and folic acid) and iron. Some countries also add vitamin A and zinc depending on the needs of the population. The implementation of vitamin enrichment has played a major role in making the occurrence of diseases such as beriberi and pellagra very uncommon in regions where flour is enriched. Further, neural tube defects, such as spinda bifida may be prevented through folic acid. A typical cost to provide

Sustainability Report | 81
CASE
Su
STA
INA
BIl
ITy
Sustainability themes over our value chain
Our sustainability initiatives are aligned with our most
relevant sustainability themes and can be found along
the different parts of our value chain. These range from
collaborating in multi-stakeholder organizations, such as
those focusing on the biobased economy and alternative
substrates, to sustainable sourcing, to making our own
operations more sustainable, to delivering more sustainable
products to our customers, and ultimately consumers.
Therefore, the link between identifying the most important
sustainability issues and focusing on these as key themes for
our sustainability approach is made. This means developing
objectives around these themes and driving action plans and
performance for them. Further, our sustainability initiatives
involve engagement with stakeholders from different parts
of our value chain. Therefore, collaborating with these
stakeholders in a transparent way on these initiatives is a
key priority for us.
Agricultural Raw Materials CSM Customers & Consumers
Global food crisis
Alternative substrates
Renewable resources
BE-Basic
Tracebility
Sustainable Sourcing
Energy, Water, packaging,
Waste
Operational Excellence
Sustainable products & Solutions,
Healthy Food, Food waste
Health & Wellness
according to the Global Reporting Initiative (GRI) and are included in GRI’s newly launched Sustainability Disclosure Database. In 2011, our quarterly reporting of KPI's validated the reliability and transparency of our data and supported our efforts in working towards objectives related to our most important performance indicators, such as energy and water. We provide a balanced pres-
entation of our sustainability performance related to all opera-tions under our control and under shared responsibility.
Our sustainability reporting systems are supported by a data collection system that allows us to track and manage issues and other projects as part of the standard management agenda.

82 | CSM Annual Report 2011
As part of our efforts towards total Quality Management and following on from our success at Bakery Supplies Europe (BSEU), we have formulated CSM requirements for supply chain and plan to implement and audit this in the whole of CSM, including the new regions.
These requirements define CSM’s framework for Quality, Good Manufacturing Practices (GMP), Food safety (HACCP), and Safety and Environment. Together with other policies on ethics and the use of genetically modified materials, among others, they repre-sent the standard to which CSM adheres to. Consequently, we have started to require an adherence to these from our external suppliers as well.
Employee SafetyWe are committed to high environmental, safety and health (ESH) standards. To meet this commitment, we maintain management systems that are designed to ensure continued compliance, while supporting improvement. CSM encourages the implementation of environmental and health and safety management systems, such as ISO 14001 or a comparable norm for operating companies used to minimize environmental impact. Purac has implemented the OSHAS 18001 health and safety management system at its plants, in Bakery Supplies Europe implementation is progressing. We conduct regular audits to monitor compliance and perfor-mance of ESH standards at our businesses worldwide as part of the CSM requirements program. CSM has a simple credo: "healthy and safe from home to work and healthy and safe back home again". We also work with our business partners towards sustain-able and responsible ESH practices among suppliers, contractors, and customers. We strive for open communication and dialogue in the workplace and with our stakeholders so we can respond to any concerns and suggestions.
Stakeholder engagementAs a responsible member of society, CSM maintains an open and honest dialogue with all stakeholders who are interested in the company and its business operations. Listening to others and learning from our stakeholders informs our decision-making, strengthens our relationships and helps us deliver our commit-ments and succeed as a business. We seek common ground with stakeholders to enable us to integrate sustainability across all business solutions.
InvestorsCSM manages an ongoing investor relations program to ensure that all potential investors and analysts have access to the latest information on company developments. CSM attaches great value to good relations with its shareholders and recognizes the importance of good corporate governance. It is committed to achieving the highest standards within its policies.
EmployeesOur CSM Works Councils across Europe and local employee representatives play an important role in supporting the busi-ness by participating in dialogues that have added value to both our people and our customers. We engage with employees on sustainability. We launched our Sustainable Value initiative to strengthen our momentum in driving Sustainability at CSM. This global initiative involved interviews and workshops with cross-functional representation over all divisions. We also conduct a variety of internal communications, such as a sustainability blog and webinars. Further, employees were encouraged to consider their own impacts using the WWF personal footprint calculator. These initiatives helped employees to better understand sustain-ability in general as well as how sustainability adds value to our company, our external stakeholders, our customers and society.
partnershipsTop Institute Food & Nutrition, TIFN, (http://www.tifn.nl/tifn/website.nsf/xpPFI.xspis) is a joint initiative of the Dutch govern-ment, the food industry, universities and research institutes. It is part of the “Food Valley” initiative to strengthen the innovative and competitive capabilities of the food industry. It conducts long-term strategic and fundamental research into the develop-ment of innovative, new healthy food. CSM participates in TIFN together with other industrial partners, including DSM, Unilever, Vion, Friesland Campina. Research is organized on a project basis and performed at various locations of the participating organizations.
ICOS Cleantech Fund I and II are venture funds that are investing in early technology start-ups based in the Netherlands, in partnership with Delft University of Technology. They focus on new technologies that promote sustainability and the environ-ment such as sustainable life cycle technologies. CSM actively participates in the fund’s Investment Board, together with fund

Sustainability Report | 83
managers ICOS Capital, Imtech and Royal BAM Group, to gain insight into the new ideas developing in the Dutch market and which help increase the success rate of the fund.
Fedima, the Federation of the European Union Manufacturers and Suppliers of Ingredients to the Bakery, Confectionery and Patisserie Industries, runs working groups on sustainability which are co-chaired by CSM. It is Fedima’s task to provide active guidance and support in sustainability matters to its member organizations and other companies. CSM played a leading role to develop a Carbon measuring and reporting tool consistent with the Green House Gas Protocol for its members to use. This year, a new working group is being launched to focus on waste and packaging. Other topics high on the agenda are verification and taxation systems.
Purac is a partner of BE-Basic. This public-private partner-ship is coordinated by the Delft University of Technology, The Netherlands. This organization supports the development of clean, robust and competitive biobased chemicals, materials and energy industries, including the responsible monitoring and control of healthy soil and water environments, based on the advanced genomics technologies and bioprocess engineering. BE-Basic unifies the capabilities of Dutch and international world-class universities, institutes and advanced industries of various sizes. We actively participate in two working groups of BE-Basic, first in the development of processes to produce fermentable sugars from ligno-cellulosic substrates for the production of organic acids. Second, we participate in a working group to address the social embedding of a biobased society.
Purac is participating in a study for TEEB (The Economics of Ecosystems Service and Biodiversity), a major international initia-tive to draw attention to the global economic benefits of biodi-versity and highlight the growing costs of biodiversity loss and ecosystem degradation. A first assessment on the dependence and impacts on ecosystem services including risks and oppor-tunities, bio-based programs and bio-plastics were assessed as feasible opportunity for the chemicals sector. With the project “TEEB for the Netherlands” the Netherlands government is analyzing, in cooperation with Purac, the economic value of biodi-versity and ecosystem services for the chemical sector by looking at various alternatives for the production of PLA (polylactic acid).
The comparison is about PLA production from traditional food grade substrates versus alternative substrates. Purac is used as an example in the economic top sector chemistry as defined by the Dutch Ministry of Economy, Agriculture and Innovation.
Bakery Supplies North America provides partnership support to the United States Compliance Corporation. This program develops site-specific hazard and risk assessments to avoid internal and external safety threats.
Bakery Supplies North America (BSNA) provides partnership support to the March of Dimes, Feeding America, Red Cross, and the Salvation Army. The March of Dimes strongly promotes folic acid as a main contributor to a healthy pregnancy, and BSNA includes folic acid in a portion of its products. Feeding America is a food bank organization, and as BSNA is in the food industry, this directly compliments the mission of collecting food for the needy. BSNA employees believe in giving back to the community, for example, we regularly hold blood drives for the Red Cross and donate to the Salvation Army for National Donut Day.
CSM has been an RSPO, Roundtable on Sustainable Palm Oil, member since 2005. The RSPO is a multi-stakeholder initia-tive dedicated to promoting sustainable production of palm oil worldwide. The RSPO has more than 700 members including palm growers, oil processors, traders, consumer goods manufac-turers, retailers, investors and social and environmental NGO's. The RSPO promotes the growth and use of sustainable palm oil through co-operation within the supply chain and open dialogue with its stakeholders. Its mission is to advance the production, procurement and use of sustainable oil palm products through the development, implementation and verification of credible global standards and the engagement of stakeholders along the supply chain.
In 2012, CSM has become a member of Bonsucro, a global multi-stakeholder non-profit initiative dedicated to reducing the environmental and social impacts of sugar cane production. It aims to achieve this with a Standard that measures these impacts accurately, and with the development of a system to certify that sustainable practices are being adhered to.

84 | CSM Annual Report 2011
Sustainability Statistics
Total production Volume (1000 Tons)
2000
1600
1200
800
400
0
2007 2008 2009 2010 2011
Trends in Environmental KpIs
production volume and Energy consumption
Energy Index (GJ/Ton product)
3.0
2.5
2.0
1.5
1.0
0.5
0.0
2007 2008 2009 2010 2011
From 2010 to 2011, our total production volume decreased by almost 5%, from 1,746 to 1,660 thousand tons. Our overall energy use for heating and electricity decreased almost 6%, from 4.1x10⁶ GJ to 3.9 x10⁶ GJ. As a result, a small decrease in our energy index from 2.36 to 2.34 was recorded. One-third of the energy use is related to electricity and the remainder to
heating, including natural gas, steam and fuel oil. We have made first improvements related to energy consumption and energy management at several sites. Decreasing our energy consump-tion will continue to be a central focus area of our sustainability efforts in order to meet our 2016 objective.
Greenhouse gas emissions
Total Greenhouse Gas Emissions (Tons CO2 equivalent)
350
300
250
200
150
100
50
0
2007 2008 2009 2010 2011
CSM reports CO2 emissions according to the Green House Gas Protocol’s definition of scope I and scope II. Our total greenhouse gas emissions in terms of CO2 equivalents in 2011 were 308,000 tons CO2equiv. Our scope I emissions amount to 122,000 tons CO2 equiv and consist of the production-related consumption of natural gas and fuel oil. Our scope II emissions amount to 186,000 tons CO2 equiv and are a result of purchased electricity (161,000 tons CO2 equiv) and purchased steam for one of our Purac facitili-ties (24,000 tons CO2 equiv). The overall CO2 equivalent remained at a similar level as in 2010 despite reductions in both natural gas and electricity use.

Sustainability Report | 85
Air emissions
Air Emissions (Tons)
120
100
80
60
40
20
0
2008 2009 2010 2007
NOx SOx Dust Other
2011
We achieved a reduction in NOx due to improvements related to more efficient boilers and increased measurement accuracy. Dust and other emissions remained approximately the same. Other
emissions consist of ethanol produced during Purac’s fermenta-tion process, carbon monoxide emissions and Volatile organic compounds in small amounts.
Environmental Nuisance Complaints
25
20
15
10
5
0
20102009 2008 2007
Noise Oder
2011
Environmental nuisance complaints
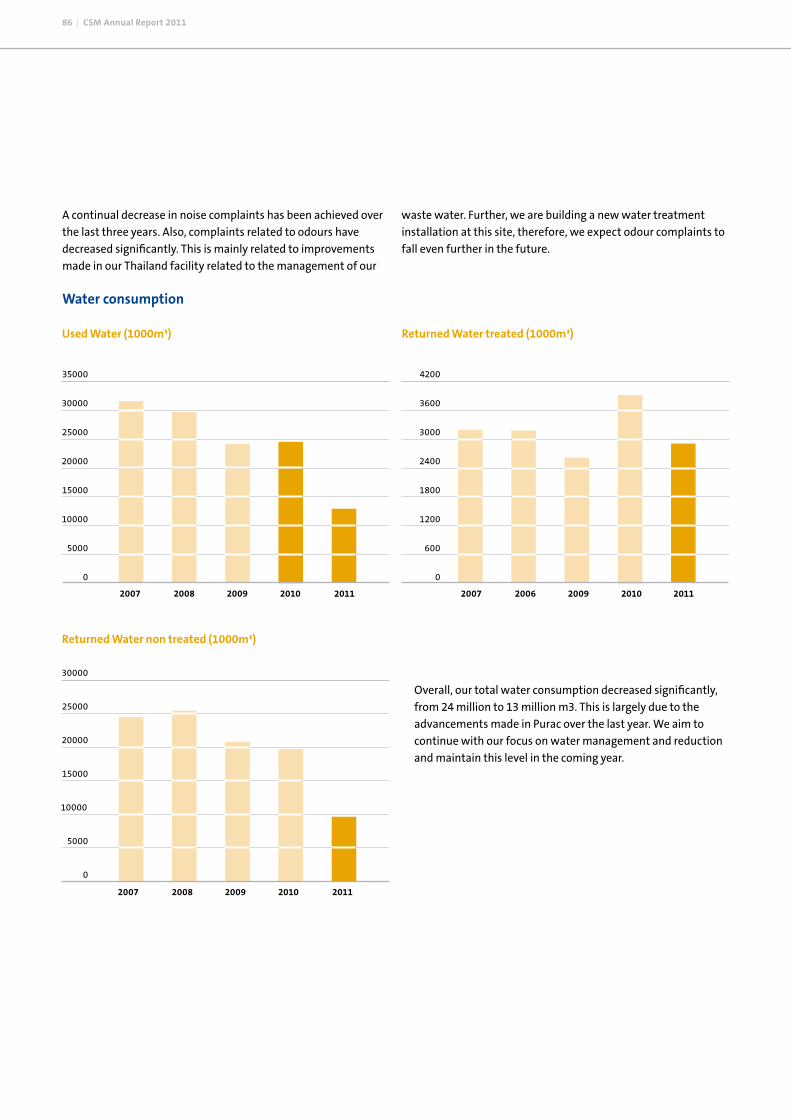
86 | CSM Annual Report 2011
A continual decrease in noise complaints has been achieved over the last three years. Also, complaints related to odours have decreased significantly. This is mainly related to improvements made in our Thailand facility related to the management of our
waste water. Further, we are building a new water treatment installation at this site, therefore, we expect odour complaints to fall even further in the future.
Water consumption
used Water (1000m³) Returned Water treated (1000m³)
35000
30000
25000
20000
15000
10000
5000
0
2007 2008 2009 2010
4200
3600
3000
2400
1800
1200
600
0
2011 2007 2006 2009 2010 2011
Returned Water non treated (1000m³)
30000
25000
20000
15000
10000
5000
0
2007 2008 2009 2010 2011
Overall, our total water consumption decreased significantly, from 24 million to 13 million m3. This is largely due to the advancements made in Purac over the last year. We aim to continue with our focus on water management and reduction and maintain this level in the coming year.

Sustainability Report | 87
useful by-products, hazardous and non-hazardous waste
500
400
300
200
100
0
Hazardous Waste (Tons)
2007 2008 2009 2010 2011
useful By-products (Tons)
360000
300000
240000
180000
120000
60000
0
2007 2008 2009 2010 2011
Non-Hazardous Waste (Tons)
100000
80000
60000
40000
20000
0
2007 2008 2009 2010 2011
We achieved a reduction in our hazardous and non-hazardous waste volumes. Efforts such as redirecting materials from the landfill to recycling processes have contributed to this reduction. Our zero-based waste approach and improved management systems related to production and inventory management will support our efforts to achieve further reductions.

88 | CSM Annual Report 2011
Trends in Social KpI's
Diversity
Female/Male Ratio
100%
80%
60%
40%
20%
0%
2009 2010
Female Male
2007 2008 2011
The male-female ration remained faily stable, with the male population representing approx. 66.7% of the total, while females are 33.3%, as shown in chart figure X.
The average age of CSM employees is 42.3 years, with 42.9 years as the average age for males and 41.3 years as the average age for females.
Age distribution per division
800
700
600
500
400
300
200
100
0
16-20 21-25 26-30 31-35 36-40 41-45 46-50 51-55 56-60 61-65 >65
Bakery Supplies Europe
Bakery Supplies North America
Purac
Corporate
years of employment
Female Male
Average years of employment 12
10
8
6
4
2
0
2007 2008 2009 2010 2011
The overall average years of employment is 6.2 years. This decline compared to 2010 can be explained by the inflow of Best Brands employees, of which no historical employment statistics are recorded. For males the average years of employment is 6.7 years, while for females it is 5.3 years.

Sustainability Report | 89
Absenteeism
Absenteeism (>1day)
4%
3%
2%
1%
0%
2009 2010 2007 2008 2011
At CSM, we focus on health and safety programs, safety trainings, and on the general wellbeing and welfare of our employees. We achieve this through ongoing communication and engagement. We continued our health programs, and campaigns, aimed at reducing accidents by increasing awareness, and where needed, implemented new procedures to maintain a healthy and safe working environment.
Training
500
400
300
200
100
0
Average investment in Training and Education in € per employee
2009 2010 2007 2008 2011
In 2011, we invested on average of € 395 per employee in training, which is equal to 14 hours, which is a reduction of 2 hours compared with 2010.

Financial Statements | 91
Financial Statements 2011
Consolidated Financial Statements 93Consolidated Income Statement 93
Consolidated Statement of Comprehensive Income 93
Consolidated Statement of Financial Position 94
Consolidated Statement of Changes in Equity 95
Consolidated Statement of Cash Flows 96
Notes to the Consolidated Financial Statements 971. Accounting Information 97
2. Accounting Principles 98
3. Consolidated Income Statement before
One-Off costs 103
4. Segment Information 104
5. Other Proceeds 106
6. Payroll and Social Insurance 107
7. Depreciation/Amortization
of (In)Tangible Fixed Assets 107
8. Financial Income and Charges 107
9. Taxes 108
10. Earnings per Common Share 109
11. Property, Plant & Equipment 110
12. Intangible Fixed Assets 111
13. Loans, Receivables and Other 113
14. Joint Ventures and Associates 113
15. Inventories 114
16. Receivables 115
17. Cash and Cash Equivalents 115
18. Equity 116
19. Provisions 119
20. Pensions 120
21. Deferred Tax 122
22. Non-Current Liabilities 124
23. Interest-Bearing Current Liabilities 125
24. Acquisitions 126
25. Financial Instruments 127
26. Off-Balance Sheet Financial
Rights and Commitments 133
27. Related Party Transactions 133
28. Events after Balance Sheet Date 133
29. Cash Flow Statement 133
30. Additional Information 134
Company Financial Statements 136Company Balance Sheet 136
Company Income Statement 136
Notes to the Company Financial Statements 13731. Financial Fixed Assets 137
32. Receivables 138
33. Tax assets 138
34. Cash and Cash Equivalents 138
35. Equity 138
36. Non-Current Liabilities 138
37. Interest-Bearing Current Liabilities 138
38. Non-Interest-Bearing Current Liabilities 139
39. Off-Balance Sheet Commitments 139
40. Personnel 139
92 | CSM Annual Report 2011
Contents

Financial Statements | 93
Consolidated Income Statement
millions of euros Note 2011 2010
Netsales 4. 3,112.6 2,990.1
Costsofrawmaterialsandconsumables -1,851.3 -1,703.1
Productioncosts -427.5 -421.8
Warehousinganddistributioncosts -245.5 -226.7
Gross profit 588.3 638.5
Sellingexpenses -248.6 -246.8
Research&developmentcosts -43.4 -44.9
Generalandadministrativeexpenses -196.8 -193.1
Impairmentofgoodwill 12. -249.0
Otherproceeds 5. 4.4
Operating result -149.5 158.1
Financialincome 8. 2.0 10.2
Financialcharges 8. -31.7 -37.8
Resultsfromjointventuresandassociates 14. -0.1
Result before taxes -179.3 130.5
Taxes 9. 5.0 -31.2
Result after taxes -174.3 99.3
Per common share in euros 10.
Earnings -2.64 1.41
Dilutedearnings -2.64 1.40
Consolidated Statement of Comprehensive Income
millions of euros Note 2011 2010
Result after taxes -174.3 99.3
Other comprehensive results:
Translationreserve 18. 24.2 53.1
Hedgereserve 18. 6.6 3.3
Taxesrelatingtoothercomprehensiveresults 18. -3.1 -1.1
Total comprehensive result after taxes -146.6 154.6

94 | CSM Annual Report 2011
Consolidated Statement of Financial Position
before profit appropriation, millions of euros Note As at 31-12-2011 As at 31-12-2010
Assets
Property, plant & equipment 11. 583.0 574.6
Intangible fixed assets 12. 912.4 1,146.8
Loans, receivables and other 13. 9.9 9.2
Joint ventures and associates 14. 9.1 1.3
Deferred tax assets 21. 44.5 59.2
Total non-current assets 1,558.9 1,791.1
Inventories 15. 337.9 335.4
Receivables 16. 376.5 366.0
Tax assets 26.0 16.1
Cash and cash equivalents 17. 116.0 118.7
Total current assets 856.4 836.2
Total assets 2,415.3 2,627.3
Equity and liabilities
Equity 18. 948.3 1,117.2
Provisions 19. 89.4 97.4
Deferred tax liabilities 21. 144.0 154.5
Non-current liabilities 22. 726.9 745.7
Total non-current liabilities 960.3 997.6
Interest-bearing current liabilities 23. 4.7 4.0
Trade payables 311.9 296.7
Other non-interest-bearing current liabilities 144.6 154.0
Provisions 19. 23.5 25.4
Tax liabilities 22.0 32.4
Total current liabilities 506.7 512.5
Total equity and liabilities 2,415.3 2,627.3

Financial Statements | 95
As at 1 January 2010 16.9 74.8 -49.6 955.7 997.8
Result after taxes 2010 99.3 99.3
Other comprehensive result after tax 2010 55.3 55.3
Transfers to/from Other reserves 21.3 -21.3
Total comprehensive result after tax 2010 76.6 78.0 154.6
Cash dividend -36.2 -36.2
Stock dividend 0.3 -0.3
Share-based remuneration transfers -0.6 0.6
Share-based remuneration charged to result 1.0 1.0
Total transactions with shareholders 0.3 -0.3 0.4 -35.6 -35.2
As at 31 December 2010 17.2 74.5 27.4 998.1 1.117.2
Result after taxes 2011 -174.3 -174.3
Other comprehensive result after tax 2011 27.7 27.7
Transfers to/from Other reserves -1.1 1.1
Total comprehensive result after tax 2011 26.6 -173.2 -146.6
Cash dividend -23.2 -23.2
Stock dividend 0.4 -0.4
Share-based remuneration transfers -1.0 1.0
Share-based remuneration charged to result 0.9 0.9
Total transactions with shareholders 0.4 -0.4 -0.1 -22.2 -22.3
As at 31 December 2011 17.6 74.1 53.9 802.7 948.3
For more information on equity see Note 18.
Consolidated Statement of Changes in Equity
before profit appropriation, millions of euros
Share capital
Share premium
reserve
Other reserves
Retained earnings
Total
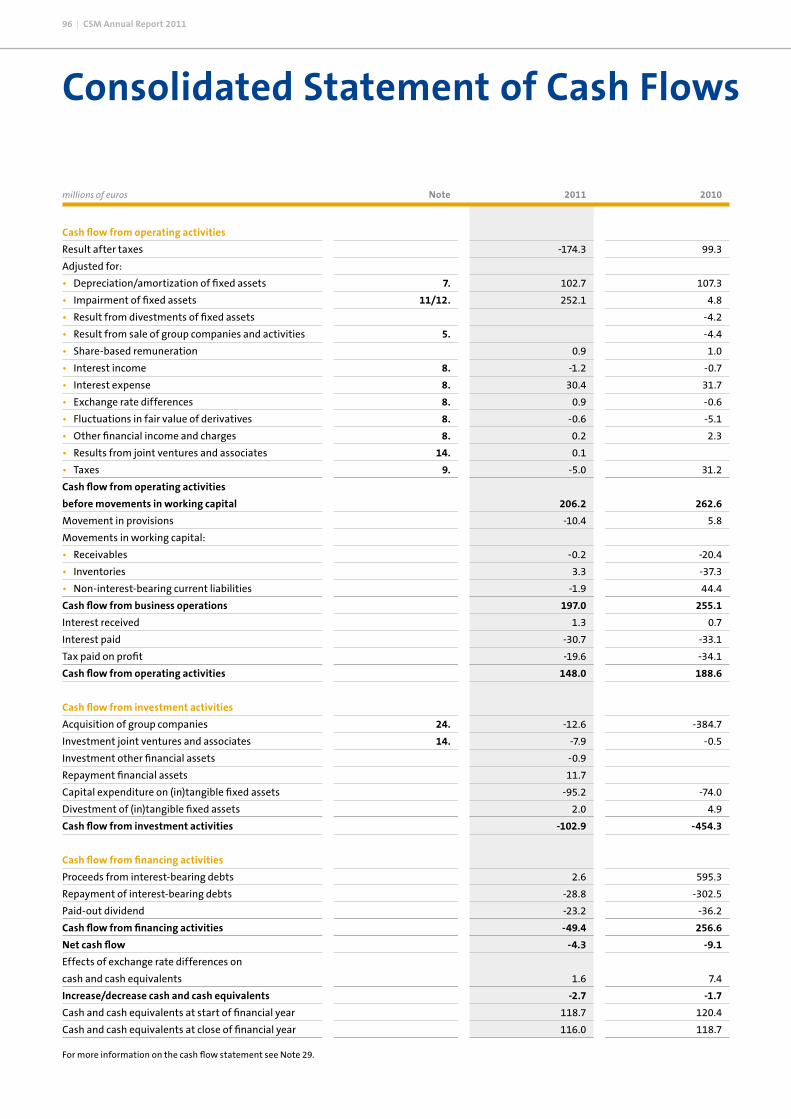
96 | CSM Annual Report 2011
Consolidated Statement of Cash Flows
millions of euros Note 2011 2010
Cash flow from operating activities
Result after taxes -174.3 99.3
Adjusted for:
• Depreciation/amortization of fixed assets 7. 102.7 107.3
• Impairment of fixed assets 11/12. 252.1 4.8
• Result from divestments of fixed assets -4.2
• Result from sale of group companies and activities 5. -4.4
• Share-based remuneration 0.9 1.0
• Interest income 8. -1.2 -0.7
• Interest expense 8. 30.4 31.7
• Exchange rate differences 8. 0.9 -0.6
• Fluctuations in fair value of derivatives 8. -0.6 -5.1
• Other financial income and charges 8. 0.2 2.3
• Results from joint ventures and associates 14. 0.1
• Taxes 9. -5.0 31.2
Cash flow from operating activities
before movements in working capital 206.2 262.6
Movement in provisions -10.4 5.8
Movements in working capital:
• Receivables -0.2 -20.4
• Inventories 3.3 -37.3
• Non-interest-bearing current liabilities -1.9 44.4
Cash flow from business operations 197.0 255.1
Interest received 1.3 0.7
Interest paid -30.7 -33.1
Tax paid on profit -19.6 -34.1
Cash flow from operating activities 148.0 188.6
Cash flow from investment activities
Acquisition of group companies 24. -12.6 -384.7
Investment joint ventures and associates 14. -7.9 -0.5
Investment other financial assets -0.9
Repayment financial assets 11.7
Capital expenditure on (in)tangible fixed assets -95.2 -74.0
Divestment of (in)tangible fixed assets 2.0 4.9
Cash flow from investment activities -102.9 -454.3
Cash flow from financing activities
Proceeds from interest-bearing debts 2.6 595.3
Repayment of interest-bearing debts -28.8 -302.5
Paid-out dividend -23.2 -36.2
Cash flow from financing activities -49.4 256.6
Net cash flow -4.3 -9.1
Effects of exchange rate differences on
cash and cash equivalents 1.6 7.4
Increase/decrease cash and cash equivalents -2.7 -1.7
Cash and cash equivalents at start of financial year 118.7 120.4
Cash and cash equivalents at close of financial year 116.0 118.7
For more information on the cash flow statement see Note 29.

Financial Statements | 97
Notes to the Consolidated Financial Statements
General CSM nv is an internationally operating company engaged in the development, production, sale and distribution of bakery supplies and food ingredients. It also develops, produces and sells a variety of lactic acid applications for the food, chemical and pharmaceutical industries. CSM operates in business-to-business markets mainly in Europe and North America, but also has operations in Asia, South America and Africa.
CSM is based in Amsterdam and listed on NYSE Euronext Amsterdam.
The consolidated financial statements drawn up by the Board of Management have been discussed by the Supervisory Board on 20 February 2012. They will be presented to the General Shareholders Meeting for adoption on 7 May 2012.
In compliance with Section 2:402 of the Dutch Civil Code the income statement of CSM nv is presented in a summarized form as it is incorporated in the consolidated financial state-ments.
Acquisitions The following acquisition influenced the 2011 consolidation:
Classic Cakes On 31 January 2011 CSM completed the acquisition of 100% of the ownership interest in UK-based Classic Cakes Ltd. The acquisition price was GBP 11.4 million. Classic Cakes has annual sales of GBP 10.3 million and a workforce of 90. For more information on acquisitions see Note 24.
Reported Amounts Unless stated otherwise all amounts in the financial state-ments are reported in millions of euros.
1. Accounting Information
US dollar 1.39 1.33 1.29 1.34
GB pound 0.87 0.86 0.84 0.86
Japanese yen 110.88 116.19 100.10 108.80
Brazilian real 2.32 2.33 2.41 2.22
Thai baht 42.29 41.88 40.75 40.10
Average exchange rate 2011
Average exchange rate 2010
Exchange rate 31 December 2011
Exchange rate 31 December 2010
Exchange rates of Main Currencies in Euros

98 | CSM Annual Report 2011
General The consolidated financial statements of CSM nv have been prepared in accordance with the International Financial Reporting Standards (IFRS) adopted by the European Union. With the exception of financial instruments, the financial statements in general are prepared on the basis of the historical cost principle.
In 2011, CSM applied all the new and amended standards and interpretations published by the International Accounting Standards Board (IASB) and the International Financial Reporting Interpretations Committee (IFRIC), if and insofar as these applied to CSM and were effective as at 1 January 2011. The main effective change applied by CSM at 1 January 2011 is: • IAS 31: Interests in joint ventures Anticipating future IFRS standards concerning joint venture accounting, CSM has changed its accounting principle from proportional consolidation to the IFRS allowed alternative equity method. This has no material impact on CSM's results or equity. None of the new and amended IFRS and IFRIC interpretations, which were not yet effective, have been applied by CSM. The main effective change after 1 January 2011 is:• IAS 19: Employee benefits revised CSM anticipates that IAS 19: Employee benefits revised will be adopted in the Group's consolidated financial statements for the year starting 1 January 2013 and that the application of this revised standard will have an impact on amounts reported in respect of the Group's financial liabilities, results and equity. If the revised standard would have been applied at 1 January 2012, without taken into consideration the corresponding tax effects, equity would have been decreased by approx. € 40 million and the pension provision would have been increased by the same amount. CSM also anticipates that the application of all other new and amended IFRS and IFRIC interpretations currently known for future periods will have no impact on the CSM financial statements.
Consolidation The consolidation includes the financial data of CSM nv and its group companies (together “CSM”). All inter-company receivables, debts and transactions have been eliminated. Group companies are companies in which CSM nv exercises control. The results of acquisitions and divestments are recog-nized from the moment that control is obtained or transferred.
Foreign Currency The consolidated financial statements are in euros. The euro is CSM nv’s functional and presentation currency. The functional currency is the currency of the primary environment where the group company operates and may therefore differ from one company to another. Transactions in other than the functional currency are translated at the exchange rates that apply on the transaction date. Any monetary assets and liabilities resulting from such transactions are translated at the exchange rates on the balance sheet date. Any exchange rate differences are recognized in the income statement or deferred in equity in case of hedge accounting. The assets and liabilities of consolidated foreign group compa-nies and the long-term foreign-currency loans, which have been taken out to finance these subsidiaries, are converted into euros on the balance sheet date, taking taxes into account. The subsequent currency translation differences are incor-porated in the translation reserve in equity. The results of the foreign group companies are translated into euros on the basis of average exchange rates. The difference between net profit on the basis of average exchange rates and net profit on the basis of the exchange rates as at the balance sheet date is incorporated in the translation reserve in equity. If a foreign operation is divested or scaled down the associated cumulative currency translation differences are recognized as result in the income statement. Property, Plant & Equipment Land, buildings, machinery, installations and other operating assets are valued at the acquisition price or the cost of produc-tion, subject to straight line depreciation calculated over the estimated economic life and the estimated residual value. The cost of production includes the cost of materials and direct labor and an attributable part of the indirect costs. Land is not depreciated. Grants are deducted from the acquisition price or the production costs of the assets to which the grant relates. Property, plant and equipment are tested for impairment if there are indications for this. Impairment is the amount by which the book value of the property, plant and equipment exceeds the recoverable amount. The recoverable amount of an asset is the higher of (a) value in use and (b) fair value less cost to sell. Intangible Fixed Assets Goodwill Goodwill represents the excess of the cost of an acquisition over the fair value of the identifiable assets and liabilities purchased at the date of acquisition. Goodwill is valued at
2. Accounting Principles

Financial Statements | 99
cost less impairment. Goodwill is tested for impairment annu-ally – or more often if there are indications for impairment. Impairment is the amount by which the book value of the good-will of a cash-flow-generating unit exceeds the recoverable amount, being the higher of (a) value in use and (b) fair value less cost to sell. The value in use is the present value of the cash flows which the unit is expected to generate. If impairment is incurred, the impairment is charged to the income statement.When an entity or activity is sold or closed down the goodwill allocated to the entity is included in the calculations for the result of the sale. Customer Base The customer base comprises the part of the paid acquisition sum which is allocated to the value of the acquired customer base. It is valued at fair value as at the acquisition date and amortized using a straight line method over the estimated economic life. Amortization charges arising from customer base are recognized in selling expenses. The value of the customer base is tested for impairment whenever there is an indication that the assets may be impaired. Brands and Licenses Brands and licenses comprise the part of the paid acquisition sum which is allocated to the value of the acquired trademarks and product licenses. Brands and licenses are valued against the fair value per acquisition date and are subject to straight line amortization calculated over the estimated economic life. Amortization charges arising from brands and licenses are recognized in selling expenses. The value of the brands and licenses is tested for impairment whenever there is an indica-tion that the assets may be impaired. Research & Development Costs Research & development costs comprise the part of the paid acquisition sum which is allocated to the value of the acquired research & development costs and valued at fair value at acquisition date. Own research costs are not capitalized, but charged to the income statement. Own development costs are capitalized if the appropriate criteria are met. Research & development costs are valued at cost and amortized using a straight line method over the estimated economic life. Amortization charges arising from research & development costs are recognized in research & development costs. The value of the development costs is tested for impairment whenever there is an indication that the assets may be impaired.
Non-Compete Agreements Non-compete agreements comprise the part of the paid acqui-sition sum which is allocated to the value of the acquired non-compete agreements. Non-compete agreements are valued against the fair value per acquisition date and are subject to straight line amortization over the estimated economic life. Amortization charges arising from non-compete agreements are recognized in selling expenses. The value of the non-compete agreements is tested for impairment whenever there is an indication that the assets may be impaired. Favorable Purchase Contracts Favorable purchase contracts comprise the part of the paid acquisition sum which is allocated to the value of the acquired favorable purchase contracts. Favorable purchase contracts are valued against the fair value per acquisition date and are subject to amortization in the income statement as cost of raw materials and consumables in line with the reporting of the underlying purchase contracts in the income statement. The value of the favorable purchase contracts is tested for impair-ment whenever there is an indication that the assets may be
impaired.
Other Intangible Fixed Assets Other intangible fixed assets consist primarily of capitalized or acquired third-party software and licenses. Other intangible fixed assets are valued at historical cost if capitalized or at fair value if acquired and amortized on a straight line basis over the estimated economic life. Software and licenses amortization charges are recognized in general and administrative expenses. Emission rights are not recognized in the balance sheet as cost is zero. The value of the other intan-gible fixed assets is tested for impairment whenever there is an indication that the assets may be impaired. Financial Fixed Assets Loans, Receivables and Other Loans and receivables with fixed or determinable payments (generally, with a duration of more than one year) are valued at amortized cost less provisions where necessary. Joint Ventures and Associates Joint ventures and associates are valued at equity value. Deferred Taxes Deferred taxes concern tax loss carry forward and liabilities and assets arising from temporary differences between the tax bases and their carrying amounts in the consolidated financial statements of (in)tangible fixed assets, inventories and

100 | CSM Annual Report 2011
provisions. Deferred taxes are determined using tax rates that have been enacted by the balance sheet date and are expected to apply when the related deferred income tax is realized or the deferred tax liability is settled. Deferred tax assets are recog-nized to the extent that is probable that future taxable profit will be available against which the temporary difference and tax loss carryforward can be utilized. Tax assets and liabilities are netted when there is a legal right and the intention to offset. Deferred tax assets and liabilities with the same term and relating to the same fiscal unities are offset against each other. Inventories Inventories of raw materials, consumables, technical materials and packaging are stated at the lower of cost (first in, first out) and net realizable value. Inventories of work in progress and finished products are stated at the lower of production cost and net realizable value. Total cost of production includes payroll costs and materials and an allocated part of the indirect production costs. A valuation adjustment is deducted for non-marketable inventories. Receivables Receivables are valued on the basis of the amortized cost using the effective interest rate method less provisions deemed necessary for non-collectibility. Cash and Cash Equivalents Cash and cash equivalents comprise cash in bank, cash in hand and current deposits with original maturities of three months. Bank overdrafts are presented as current interest-bearing liabilities. Equity CSM runs a share plan for the Board of Management and share based plans for Senior Management. The fair value of the right to shares on the date of allocation is recognized in the income statement as payroll costs over the vesting period. Liabilities concerning share based plans with payment in shares are included in equity and measured only initially. Liabilities concerning share based plans with payment in cash are included in provisions and remeasured every period. Provisions Pensions CSM runs pension plans in various countries for most of its employees. These schemes reflect the legal requirements, the customs and the situation in the country concerned. They are administered partly by the company and partly by external
parties, such as industrial pension funds and insurance companies. The pension commitments arising from defined benefit plans are calculated using the projected unit credit method. Actuarial gains and losses are recognized using the “corridor” method, whereby the actuarial results are only recognized in the income statement for the financial year if the total of the unrecognized actuarial results as at the start of the financial year exceeds the bandwidth of 10% of the greater of the pension plan commitments and the fair value of the plan assets (the “corridor”). The excess is spread to income over the employee’s expected average remaining working life, starting in the financial year following the balance sheet date of exceeding the bandwidth. Movements in commitments due to changes to defined benefit plans, as far as past service costs are concerned, are amortized on a straight-line basis over the vesting period. If and insofar as commitments have vested upon the introduction of or after a possible change to the defined benefit plan the relevant movements are charged immediately to the result. The result arising from the curtailment or settlement of a defined benefit pension plan is recognized as soon as the curtailment or settle-ment occurs. It consists of the movement in the present value of the defined benefit obligation and the fair value of the plan assets and any unrecognized actuarial results and past service costs. Curtailments may arise if there is a material decline in the number of employees in the pension plan or if the content of the plan changes in such a way that the claims will be substan-tially lower in the future years of service. The pension premiums for the defined contribution pension plans are charged to income when incurred. Other Long-Term Employee Benefit Commitments The other long-term employee benefit commitments relate mainly to anniversaries, years of service, termination pack-ages, and medical costs. The commitments arising from these benefits are accounted for similarly as the defined benefit pension plans. Other Provisions The other provisions relate mostly to reorganization, restruc-turing and other, which represent a legal or constructive obliga-tion as a result of a past event, the amount of which is uncer-tain but which can be estimated reliably and of which it is more likely than not that an outflow of resources is required to settle the obligation. The provisions are measured at the present value of the expected cost to settle the obligation.

Financial Statements | 101
Liabilities Interest-bearing liabilities are recognized initially at fair value and subsequently at amortized cost using the effective interest method. Upon sale or settlement of interest-bearing liabilities any profits or losses are directly recognized in the income state-ment.
Leases Lease agreements in which the lessor transfers substantially all risks and rewards of the ownership of an asset to the lessee are classified as financial leases. All assets and liabilities of a financial lease are capitalized at the lower of the fair value of the leased asset and the present value of the minimum lease payments. Lease agreements that do not meet the condi-tions for a financial lease are classified as operational leases. Payments made are charged to income on a straight-line basis over the period of the lease. Net Sales Net sales comprises the proceeds of goods delivered to third parties less discounts and value-added tax. Net sale of goods is recognized when CSM has transferred the actual risks and rewards of ownership of the goods to the buyer, when the amount of the proceeds can be reliably meas-ured, and when it is probable that the economic benefits of the sale will accrue to CSM. Costs of Raw Materials and Consumables Costs of raw materials and consumables relate to the cost of consumption of raw materials, consumables, and packaging materials. Production Costs
Production costs are the costs relating to production operations. Warehousing and Distribution Costs Warehousing and distribution costs relate to the costs of warehousing and transport, including transport insurance. Selling Expenses Selling expenses relate to the costs of marketing and sales. General and Administrative Expenses General and administrative expenses relate to the costs of administration, management, and IT. Taxes Tax on the result is calculated on the basis of the result before taxes, taking account of untaxed profit elements, non- and
partly-deductible costs and fiscal facilities. The prevailing nominal tax rates are applied. Non-recoverable withholding taxes on foreign dividends are taken into account. Financial Instruments and Hedge Activities Upon initial inclusion in the financial statements as at the start date of the contract derivative financial instruments are recog-nized at fair value. Subsequently, at each reporting date, they are measured at fair value. The recognition of any arising results depends on whether or not the derivative instrument can be qualified as a hedging instrument and the type of hedged item.If no hedge accounting is applied the fair value fluctuations of the derivative financial instruments are recognized in the income statement. CSM designates certain derivative financial instruments as: • hedge for possible fluctuations in cash flows which can be
attributed to a certain currency, interest rate or commodity price risk associated with a recognized asset or liability or a highly probable expected future transaction (cash flow hedge), or
• hedge for net investments in foreign operations (net invest-ment hedge).
Upon entering into a transaction the relationship between the hedging instrument and the hedged position, as well as the risk management criteria and the starting points for entering into various hedging transactions are documented. CSM also documents its estimate as to whether the derivative financial instrument offsets the movements in the fair values or cash flows of the hedged positions effectively. The documentation process starts at the time of entering into such a contract and is updated continuously. The fair value of derivative financial instruments which are used as hedging instruments and movements in the hedge reserve in equity are explained in the Financial Instruments note. Cash Flow Hedge The effective part of changes in the fair value of derivative financial instruments which are designated and classified as cash flow hedge is recognized in equity. Gains or losses from the non-effective part are directly recognized in the income
statement. If a hedging instrument expires, is sold or if the instrument can no longer be qualified as a hedging instrument, the cumu-lative gains and losses remain in equity until the expected

102 | CSM Annual Report 2011
future transaction is recognized in the income statement. If the expected future transaction is no longer probable the cumula-tive result is transferred immediately from equity to the income statement. Net Investment Hedge Hedges for net investments in foreign operations are handled in a similar way as cash flow hedges. Gains or losses from the hedging instrument which can be attributed to the effective part of the hedge are recognized in equity; any gains or losses which cannot be attributed to the effective part are directly recognized as financial income and charges in the income statement.Cumulative gains and losses in equity are recognized in the income statement as soon as the foreign operation is partly divested or sold.
Critical Accounting Estimates and Judgements CSM makes use of accounting estimates and judgements. Described below are the estimates and judgements as at the balance sheet date that carry a substantial risk of a material adjustment to the book value of assets and liabilities in the next financial year. Acquisitions CSM undertakes a process to identify all assets and liabilities acquired, including acquired intangible fixed assets. The judge-ments made in identifying all acquired assets, determining the estimated fair value assigned to each class of assets acquired and liabilities assumed, as well as asset lifes, can materially impact results of operations. Estimated fair values are based on information available near the acquisition date and on expectations and assumptions that have been assessed as reasonable by CSM. For more information see Note 24.
Goodwill Impairment Every year, CSM tests the goodwill based upon the higher of fair value less cost to sell and the value-in-use method. The value in use is calculated on the basis of estimates and judgements of the expected cash flows which are discounted on a WACC basis. For a description of the main estimates, valuation assumptions and a sensitivity analysis of the applied assumptions see Note 12. Property, Plant & Equipment Property, plant and equipment (PPE) are tested for sustained impairment if there is an indication of possible impairment. A key factor is the recoverable amount which is calculated on the basis of estimates and assumptions of anticipated discounted cash flows, on the one hand, and an estimate of the fair value less cost to sell, on the other. Pensions Actuarial calculations are used to determine provisions for Group personnel arrangements and net receivables or obli-gations from Group pension plans. These calculations use assumptions in respect of future developments in salary, mortality, staff turnover, return on investments et cetera. Changes to these estimates and assumptions can lead to actuarial gains and losses which are recognized in the income statement, provided a bandwidth of 10% of the greater of the obligation from the plan and the fair value of the plan assets is exceeded. The excess is spread to income over the participant’s expected average remaining working life. For more information on the applied assumptions see Note 20. Taxes
CSM is subject to various tax systems across the world. Estimates and judgements are used to determine the tax items in the financial statements. Interpretation differences in tax liabilities are also taken into account. For more information see Note 21.

Financial Statements | 103
3. Consolidated Income Statement before One-off costs
TotalOne-off costsBefore
one-off costsOne-off costs TotalBefore
one-off costs
2011 2010
Net sales 3,112.6 3,112.6 2,990.1 2,990.1
Costs of raw materials and consumables -1,851.3 -1,851.3 -1,700.2 -2.9 -1,703.1
Production costs -423.8 -3.7 -427.5 -415.5 -6.3 -421.8
Warehousing and distribution costs -245.5 -245.5 -226.7 -226.7
Gross profit 592.0 -3.7 588.3 647.7 -9.2 638.5
Selling expenses -247.1 -1.5 -248.6 -246.8 -246.8
Research & development costs -43.2 -0.2 -43.4 -44.9 -44.9
General and administrative expenses -181.6 -15.2 -196.8 -180.9 -12.2 -193.1
Impairment of goodwill -249.0 -249.0
Other proceeds 4.4 4.4
Operating result 120.1 -269.6 -149.5 179.5 -21.4 158.1
Financial income 2.0 2.0 10.2 10.2
Financial charges -31.7 -31.7 -37.8 -37.8
Results from joint ventures and associates -0.1 -0.1
Result before taxes 90.3 -269.6 -179.3 151.9 -21.4 130.5
Taxes -27.5 32.5 5.0 -39.5 8.3 -31.2
Result after taxes 62.8 -237.1 -174.3 112.4 -13.1 99.3
The consolidated income statement for financial years 2011 and 2010 before one-off costs (non-IFRS financial measures) can be presented as follows.
One-off costs items may occur up to and including the "Operating result" item. The one-off item "Taxes" relates to taxes on these one-off costs only. It does not include incidental tax gains and losses. One-off costs are considered whenever the operating perfor-mance is damaged by an incidental cause outside the normal course of business. In 2011, one-off costs were recorded for restructuring program Relevance (€ 11.1 million), Best Brands
integration costs (€ 6.4 million), impairment of tangible fixed assets (pilot plant Spain) at Purac (€ 3.1 million), and goodwill impairment for Bakery Supplies Europe (€ 249 million). In 2010, one-off costs were recorded and related mainly to the Best Brands acquisition and its integration costs. For more information on impairment of tangible fixed assets see Note 11. For more information on goodwill impairment see Note 12.

104 | CSM Annual Report 2011
For its strategic decision making process CSM distinguishes between the bakery operations (Bakery Supplies), lactic acid operations (Purac) and corporate activities segments. The bakery operations are subdivided into a European segment and a North American segment. The bakery operations comprise the development, production and sale of bakery ingredients and products. The lactic acid operations involve the development, production and sale of lactic acid and lactic acid derivatives which are used in food,
2008 2011 2010 2011 2010 2011 2010
P&L information
Net sales 1,077.8 1,022.6 1,627.6 1,567.1 407.2 400.4
EBITA including one-off costs 35.8 61.8 85.1 102.0 41.9 56.6
One-off costs 251.6 9.8 21.4 4.2
Operating result -216.9 58.9 63.0 73.2 37.3 52.7
Balance sheet information
Total assets 737.3 963.1 1,062.3 1,056.6 424.6 441.0
Total liabilities 310.4 343.2 287.5 282.0 79.1 83.0
Capital employed year-end 842.2 786.3 1,018.4 1,009.0 342.2 332.9
Average capital employed 832.4 837.6 982.2 971.5 345.4 300.6
Depreciation of property, plant & equipment 22.4 22.3 23.9 24.9 25.5 24.4
Amortization of intangible fixed assets 3.7 2.9 22.1 28.8 4.6 3.9
Other information
Capital expenditure on property, plant & equipment 18.9 14.5 21.0 17.0 38.3 37.9
Capital expenditure on intangible fixed assets 8.7 2.9 0.6 2.0 10.3
Impairment of tangible fixed assets 0.8 6.3 3.1 -2.3
Impairment of goodwill 249.0
Average number of employees 4,231 4,023 4,589 4,409 1,022 971
Alternative non-IFRS performance measures
EBITA margin % 3.3 6.0 5.2 6.5 10.3 14.1
ROCE % 4.3 7.4 8.7 10.5 12.1 18.8
Alternative non-IFRS performance measures
excluding one-off costs
EBITA 38.4 61.8 94.9 123.4 46.1 56.6
EBITA margin % 3.6 6.0 5.8 7.9 11.3 14.1
ROCE % 4.6 7.4 9.7 12.7 13.3 18.8
Bakery Supplies Europe Bakery Supplies North America
Purac
Segment Information by Business Area
4. Segment Information
pharmaceutical and technical products. Corporate activities concern activities which cannot directly be allocated to one of the other segments, such as corporate finance, HR and legal.
CSM generates almost all of its revenues from the sale of goods. As non-current assets are not easily available they are not disclosed in the segment overview. For more information on the impairment of tangible fixed assets see Note 11 and on the impairment of goodwill see Note 12.
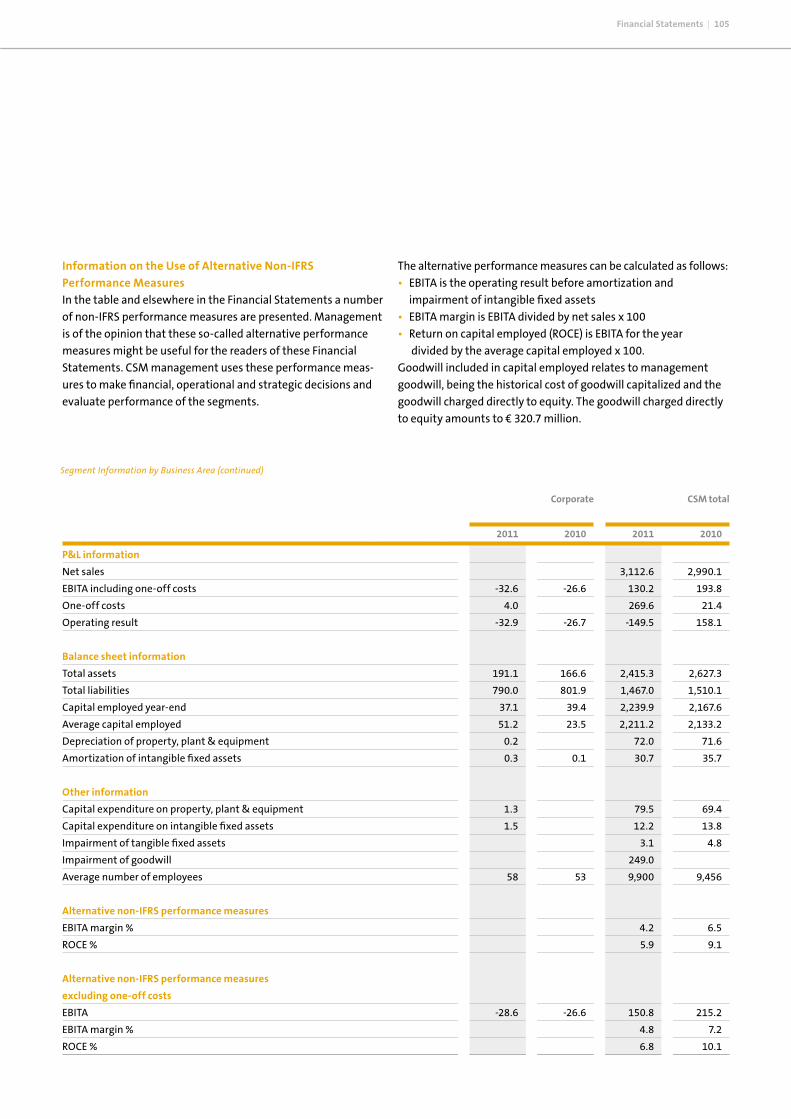
Financial Statements | 105
Segment Information by Business Area (continued)
Information on the Use of Alternative Non-IFRS Performance Measures In the table and elsewhere in the Financial Statements a number of non-IFRS performance measures are presented. Management is of the opinion that these so-called alternative performance measures might be useful for the readers of these Financial Statements. CSM management uses these performance meas-ures to make financial, operational and strategic decisions and evaluate performance of the segments.
2008 2010 2009 2011 2010 2011 2010
P&L information
Net sales 3,112.6 2,990.1
EBITA including one-off costs -32.6 -26.6 130.2 193.8
One-off costs 4.0 269.6 21.4
Operating result -32.9 -26.7 -149.5 158.1
Balance sheet information
Total assets 191.1 166.6 2,415.3 2,627.3
Total liabilities 790.0 801.9 1,467.0 1,510.1
Capital employed year-end 37.1 39.4 2,239.9 2,167.6
Average capital employed 51.2 23.5 2,211.2 2,133.2
Depreciation of property, plant & equipment 0.2 72.0 71.6
Amortization of intangible fixed assets 0.3 0.1 30.7 35.7
Other information
Capital expenditure on property, plant & equipment 1.3 79.5 69.4
Capital expenditure on intangible fixed assets 1.5 12.2 13.8
Impairment of tangible fixed assets 3.1 4.8
Impairment of goodwill 249.0
Average number of employees 58 53 9,900 9,456
Alternative non-IFRS performance measures
EBITA margin % 4.2 6.5
ROCE % 5.9 9.1
Alternative non-IFRS performance measures
excluding one-off costs
EBITA -28.6 -26.6 150.8 215.2
EBITA margin % 4.8 7.2
ROCE % 6.8 10.1
CorporateC
CSM total
The alternative performance measures can be calculated as follows:• EBITA is the operating result before amortization and
impairment of intangible fixed assets • EBITA margin is EBITA divided by net sales x 100 • Return on capital employed (ROCE) is EBITA for the year
divided by the average capital employed x 100. Goodwill included in capital employed relates to management goodwill, being the historical cost of goodwill capitalized and the goodwill charged directly to equity. The goodwill charged directly to equity amounts to € 320.7 million.

106 | CSM Annual Report 2011
Segment Information by Geographical Region
The above information is based on the geographical location of the assets.
Net sales by geographical region based on the geographical location of the customers is shown in the table below
2011 2010
The Netherlands 103.3 96.0
Rest of Europe 1,069.0 1,022.9
North America 1,739.3 1,688.3
Other countries 201.0 182.9
Total 3,112.6 2,990.1
2011 2010
Remeasurement of previously held interest PGLA-1 4.4
Total 4.4
2011 2010 2011 2010 2011 2010
Net sales 152.1 148.4 1,061.3 1,006.1 1,780.9 1,718.8
Average capital employed 171.6 168.3 825.2 795.5 1,041.3 1,019.4
Capital expenditure on fixed assets 21.7 15.6 20.2 14.8 23.8 26.8
Depreciation and amortization of fixed assets 12.3 11.4 26.8 26.3 52.8 58.5
Average number of employees 910 854 3,888 3,741 4,717 4,528
Rest of Europe North AmericaThe Netherlands
2011 2010 2011 2010
Net sales 118.3 116.8 3,112.6 2,990.1
Average capital employed 173.1 150.0 2,211.2 2,133.2
Capital expenditure on fixed assets 26.0 26.0 91.7 83.2
Depreciation and amortization of fixed assets 10.8 11.1 102.7 107.3
Average number of employees 385 333 9,900 9,456
Other countries
5. Other Proceeds
CSM total

6. Payroll and Social Insurance
7. Depreciation/Amortization of (In)Tangible Fixed Assets
8. Financial Income and Charges
Financial Statements | 107
2011 2010
Payroll 410.6 411.2
Pension premiums – defined benefit pension plans 14.7 13.9
Pension premiums – defined contribution pension plans 15.0 12.0
Other social insurance 58.6 55.4
Share-based remuneration 0.9 1.0
Total 499.8 493.5
2011 2010
Depreciation of property, plant & equipment 72.0 71.6
Amortization of intangible fixed assets 30.7 35.7
Total 102.7 107.3
2011 2010
Interest income -1.2 -0.7
Interest charges 30.4 31.7
Exchange rate differences 0.9 -1.8
Recycling of exchange rate differences
from translation reserve 1.2
Fluctuations in fair value of derivatives -0.6 -5.1
Other 0.2 2.3
Total 29.7 27.6
Net financial charges increased by € 2.1 million to € 29.7 million. The higher expenses compared to last year are mainly due to lower positive fair value effects of derivatives and to the full year impact of the financing of the US$ 300 million
private placement following the Best Brands acquisition which included a shift to longer term and higher interest funding (fixed rate). In 2010 interest charges had been negatively influ-enced by initial refinancing costs.

9. Taxes
108 | CSM Annual Report 2011
2011 2010
Result before taxes -179.3 130.5
Applicable tax charge at average statutory tax rate -41.5 40.6
Income not subject to tax -9.6 -9.4
Expenses not deductible for tax purposes 3.0 5.0
Additions/releases of the valuation allowance 16.3 -5.9
Additions/releases of tax provision -10.8 3.5
Adjustment in respect of prior years 2.0 -2.1
Effects of recycling -0.5
Effects of goodwill impairment 35.6
Tax charge (income) -5.0 31.2
2.8% 23.9%
Reconciliation of result before taxes and tax charge
The average statutory tax rate is the average of the statutory tax rates in the countries where CSM operates, weighted on the basis of the result from ordinary activities before taxes in each of these countries.The average tax rate on operations was 2.8% in 2011 (2010: 23.9%). The realization of deferred tax assets depends on the expected future profitability. As it is uncertain and based on manage-ment expectations the valuation allowance has been increased.
The adjustment in respect of the effects of goodwill impair-ment reflects the part of the goodwill impairment which is not deductable for tax purposes.The adjustment in respect of the releases of tax provisions mainly relates to the completion of a tax audit in the USA, for which a provision had been previously recorded.The adjustment in respect of prior years reflects the effects of changes to relevant regulations, facts or other factors compared to those used in establishing the current tax position or deferred tax balance in previous years.
Breakdown of the tax charge recognized in equity
2011 2010
Tax liability due to loan-related exchange rate differences 1.7 0.5
Tax liability due to hedge results of financial instruments 1.4 0.6
Tax charge (income) recognized in equity 3.1 1.1
2011 2010
Current tax -5.6 14.8
Deferred tax 0.6 16.4
Tax charge (income) -5.0 31.2

10. Earnings per Common Share
Financial Statements | 109
Earnings per common share are calculated by dividing the profit available for holders of common shares by the weighted average number of outstanding common shares in CSM nv.Diluted earnings per common share are calculated by dividing
the profit available for holders of common shares by the weighted average number of outstanding common shares in CSM nv adjusted for the effects of potential exercise of share rights by the Board of Management.
2011 2010
Result after taxes -174.3 99.3
Minus: dividend cumulative financing preference shares 4.3 4.3
Profit available for holders of common shares (A) -178.6 95.0
Weighted average number of outstanding
common shares (B) 67.6 67.5
Plus: common shares related to share rights 0.2 0.2
Weighted average number of outstanding
common shares after dilution (C) 67.8 67.7
Per common share in euros
Earnings (A/B) -2.64 1.41
Diluted earnings (A/C) -2.64 1.40

11. Property, Plant & Equipment
110 | CSM Annual Report 2011
1 January 2010
Acquisition prices 41.5 266.2 804.4 67.4 31.7 0.2 1,211.4
Cumulative depreciation -102.1 -556.3 -49.0 -4.1 -711.5
Book value 41.5 164.1 248.1 18.4 27.6 0.2 499.9
Movements
Capital expenditure 0.7 3.0 22.8 3.1 39.7 0.1 69.4
Divestments -0.1 -2.8 -0.2 2.3 -0.8
Exchange rate differences 2.5 10.3 14.6 1.2 2.0 30.6
Acquisition of group companies 0.6 4.9 43.4 3.0 51.9
Depreciation -10.0 -54.5 -7.3 0.2 -71.6
Impairment -4.0 -3.1 -7.1
Impairment reversal 2.3 2.3
Other 5.6 6.3 1.4 -13.3
Net movement in book value 3.8 9.7 29.0 -1.8 33.9 0.1 74.7
31 December 2010
Acquisition prices 45.3 293.1 887.4 69.8 65.4 0.3 1,361.3
Cumulative depreciation -119.3 -610.3 -53.2 -3.9 -786.7
Book value 45.3 173.8 277.1 16.6 61.5 0.3 574.6
Movements
Capital expenditure 1.1 4.1 26.4 7.4 40.5 79.5
Divestments -0.1 -0.4 -0.1 -1.1 -0.3 -2.0
Exchange rate differences 0.3 1.4 1.3 0.2 0.7 3.9
Acquisition of group companies 1.3 0.8 2.1
Depreciation -10.6 -53.9 -7.5 -72.0
Impairment -3.1 -3.1
Other -0.2 4.0 15.6 4.3 -23.7
Net movement in book value 1.2 0.1 -13.3 4.3 16.4 -0.3 8.4
31 December 2011
Acquisition prices 46.5 303.5 916.4 80.9 77.9 1,425.2
Cumulative depreciation -129.6 -652.6 -60.0 -842.2
Book value 46.5 173.9 263.8 20.9 77.9 583.0
Depreciation rates 2.5-4% 6.7-12.5% 20-50% 6.7-12.5%
TotalNot em-ployed in
operations
Underconstruc-
tion
Other fixed
assets
Machinery and
equipment
BuildingsLand
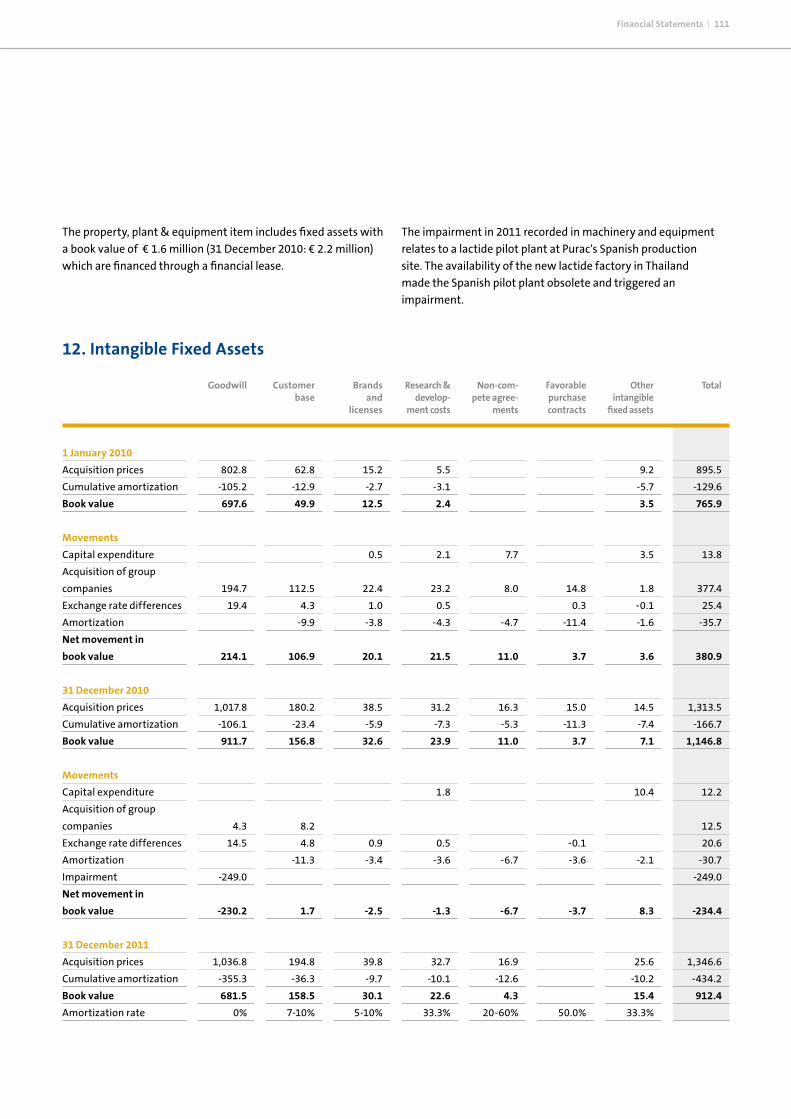
Financial Statements | 111
Goodwill Customer base
Brands and
licenses
Research &
develop- ment costs
Non-com- pete agree-
ments
12. Intangible Fixed Assets
The property, plant & equipment item includes fixed assets with a book value of € 1.6 million (31 December 2010: € 2.2 million) which are financed through a financial lease.
The impairment in 2011 recorded in machinery and equipment relates to a lactide pilot plant at Purac's Spanish production site. The availability of the new lactide factory in Thailand made the Spanish pilot plant obsolete and triggered an impairment.
Favorable purchase contracts
Other intangible
fixed assets
Total
1 January 2010
Acquisition prices 802.8 62.8 15.2 5.5 9.2 895.5
Cumulative amortization -105.2 -12.9 -2.7 -3.1 -5.7 -129.6
Book value 697.6 49.9 12.5 2.4 3.5 765.9
Movements
Capital expenditure 0.5 2.1 7.7 3.5 13.8
Acquisition of group
companies 194.7 112.5 22.4 23.2 8.0 14.8 1.8 377.4
Exchange rate differences 19.4 4.3 1.0 0.5 0.3 -0.1 25.4
Amortization -9.9 -3.8 -4.3 -4.7 -11.4 -1.6 -35.7
Net movement in
book value 214.1 106.9 20.1 21.5 11.0 3.7 3.6 380.9
31 December 2010
Acquisition prices 1,017.8 180.2 38.5 31.2 16.3 15.0 14.5 1,313.5
Cumulative amortization -106.1 -23.4 -5.9 -7.3 -5.3 -11.3 -7.4 -166.7
Book value 911.7 156.8 32.6 23.9 11.0 3.7 7.1 1,146.8
Movements
Capital expenditure 1.8 10.4 12.2
Acquisition of group
companies 4.3 8.2 12.5
Exchange rate differences 14.5 4.8 0.9 0.5 -0.1 20.6
Amortization -11.3 -3.4 -3.6 -6.7 -3.6 -2.1 -30.7
Impairment -249.0 -249.0
Net movement in
book value -230.2 1.7 -2.5 -1.3 -6.7 -3.7 8.3 -234.4
31 December 2011
Acquisition prices 1,036.8 194.8 39.8 32.7 16.9 25.6 1,346.6
Cumulative amortization -355.3 -36.3 -9.7 -10.1 -12.6 -10.2 -434.2
Book value 681.5 158.5 30.1 22.6 4.3 15.4 912.4
Amortization rate 0% 7-10% 5-10% 33.3% 20-60% 50.0% 33.3%

112 | CSM Annual Report 2011
Goodwill Impairment TestGoodwill is allocated to CSM's cash generating units (CGUs) identified as the operating segments. For CSM the operating segments Bakery Supplies North America, Bakery Supplies Europe and Purac are the levels to which goodwill of CSM should be allocated for the purposes of impairment testing.
The recoverable amount of each CGU is determined using a value-in-use method. The main assumptions used are derived from the financial and business plans of each division for 2012 which have been approved by the Board of Management. Cash flows in 2013 and beyond are based on an estimated net sales growth rate of 0-1%. From 2016 onwards a stable growth of 1.0% is taken into account for the operating
Breakdown of the book value of the goodwill by division
As at 31 December 2011 As at 31 December 2010
CSM Bakery Supplies Europe* 268 512
CSM Bakery Supplies North America 410 396
Purac 4 4
Total 682 912
Main reasons for this approach are:• It represents a non-arbitrary, reasonable and consistent basis
for the allocation of goodwill.• The allocation is also in line with the expected synergies at the
time of the acquisition with benefits for more than one entity and channel.
• The allocation represents the lowest level where goodwill is monitored by the Board of Management, while not being larger than the operating segments.
segments Bakery Supplies North America and Purac in combination with a relatively constant cost structure. For the operating segment Bakery Supplies Europe no growth is taken into account.
For each operating segment, the future cash flows are discounted on the basis of WACC before tax.
pre-tax post-taxpost-taxpre-tax
Breakdown of the WACC by division
Bakery Supplies North America 10.0% 7.0% 12.9% 8.0%
Bakery Supplies Europe 10.0% 7.6% 10.7% 7.8%
Purac 9.8% 7.6% 11.2% 8.1%
As at 31 December 2011 As at 31 December 2010
In addition, for the operating segments Bakery Supplies North America and Purac sensitivity analyses have been carried out in respect of the assumptions using:• a terminal value growth of 0% • a discount rate of +1%.
Given the assumptions above and the outcome of analyses the Board of Management has concluded that the value-in-use of the segments Bakery Supplies North America and Purac is not lower than the book value of the respective segments including goodwill.
Goodwill Impairment Bakery Supplies EuropeThe profitability of our European bakery activities decreased considerably in 2011. Margins were impacted by higher raw material costs and volumes sold declined, especially in our ingredients business in the artisan and industrial channels. All parties in the bakery industry had to deal with strongly increased raw material costs, which have been translated into higher prices in all bakery channels, leading to higher selling prices for the end-consumer. Combined with the difficult economic situation and the reduced spending power of consumers, we have seen an acceleration in the structural
* At the end of 2011 the CSM Bakery Supplies Europe goodwill was decreased with an impairment of € 249 million.

13. Loans, Receivables and Other
14. Joint Ventures and Associates
As at 1 January 2010 1.5 1.5
Investment 0.5 0.5
Income statement -0.7 -0.7
As at 31 December 2010 1.3 1.3
Investment 7.2 0.7 7.9
Income statement 0.1 -0.2 -0.1
As at 31 December 2011 7.3 1.8 9.1
Joint ventures Associates Total
Financial Statements | 113
shift from the traditional artisan bakery channel towards the cheaper and more convenient supermarket channel in 2011. The carrying amount of the European Bakery activities were valued at € 695 million, of which the largest part (€ 517 million) is goodwill. This goodwill mainly relates to the bakery supplies activities acquired in 2000. The goodwill paid for these activi-ties was largely based on the highly profitable ingredients position in the artisan and industrial channels. The Bakery Supplies activities delivered substantial cash flows over the past years. However, due to structural changes in the market-place, including the shift from artisan to in-store bakeries and
out-of-home channels, the cash generating capacity of these activities has diminished to such an extent that an impairment of the book value is required. Taking this new market reality into account, multiple scenario analyses in the range from strategic ambition to negative growth have been performed which resulted in, in accordance with IFRS rules, an impairment charge of € 249 million on the Bakery Supplies Europe goodwill.
This goodwill impairment loss has been considered as a one-off cost and is included in the operating result.
As at 1 January 2010 9.2 9.2
Acquisitions 0.4 0.4
Income statement -0.4 -0.4
As at 31 December 2010 9.2 9.2
Investment 0.9 0.9
Repayments -0.2 -0.2
As at 31 December 2011 9.9 9.9
Long-term receivables& others
Derivatives Total
The book value of the long-term receivables does not signifi-cantly deviate from the fair value. The long-term receivables mainly comprise a disbursed loan of € 6.3 million (interest rate
5.5%) to Stichting Pensioenfonds CSM Suiker and a disbursed loan of € 2.0 million (interest rate 0%) to partially finance the beet growers joining Cosun following the sale of CSM Sugar in 2007.

114 | CSM Annual Report 2011
Movements in inventories impairment provision
2011 2010
As at 1 January -9.5 -9.2
Additions/releases -4.2 -1.4
Use 2.9 1.4
Exchange rate differences -0.3 -0.3
As at 31 December -11.1 -9.5
Interest % heldIncomestatement
Liabilities Net SalesAssetsincluding goodwill
CSM-GIAS S.A. 8.3 1.0 7.4 0.1 50%
Total Joint ventures 8.3 1.0 7.4 0.1
France Fondants S.A. 0.6 0.3 1.5 40%
Dutch Technology Fund I BV 2.3 1.2 -0.1 33%
Icos Cleantech Fund II BV 0.6 0.2 -0.1 24%
Total Associates 3.5 1.7 1.5 -0.2
Total Joint ventures
and Associates 11.8 2.7 8.9 -0.1
15. Inventories
As at 31 December 2011 As at 31 December 2010
Raw materials, consumables,
technical materials and packaging 109.0 102.3
Work in progress 14.1 13.4
Finished product 225.9 229.2
Impairment provision -11.1 -9.5
Total 337.9 335.4
On 14 January 2011 CSM announced that it had entered into a joint venture agreement with the Tunisia based company GIAS s.a., which has a leading position in bakery ingredients and margarines in North Africa. This joint venture operates under the name of CSM-GIAS s.a. giving CSM access to a distribu-tion network of African countries and allowing it to sell its full bakery product portfolio in this market.
The transaction has no material effect on CSM's financials. During 2010 the PGLA-1 joint venture was consolidated proportionally until 16 July 2010, which was the ending date of this joint venture.The group's share of the results of its principal joint ventures and associates, all of which are unlisted, and its aggregated assets (including goodwill) and liabilities is as follows:

17. Cash and Cash Equivalents
In 2011 no short deposits are included in the cash and cash equivalents (31 December 2010: € 25.0 million).
Financial Statements | 115
Breakdown of expired credit terms Total < 30 days 30-60 days 60-90 days > 90 days
BSEU 23.6 14.0 3.6 1.8 4.2
BSNA 23.2 14.3 3.8 1.0 4.1
Purac 7.4 5.8 0.9 0.4 0.3
Total 54.2 34.1 8.3 3.2 8.6
Movements in trade receivables impairment provision
2011 2010
As at 1 January -10.9 -11.9
Additions/releases -2.5 -0.8
Use 1.0 3.1
Acquisition / divestment -0.9
Exchange rate differences -0.2 -0.4
As at 31 December -12.6 -10.9
The additions/releases of the trade receivables impairment provision are recognized as general and administrative expenses.
16. Receivables
As at 31 December 2011 As at 31 December 2010
Trade receivables 358.9 344.1
Impairment provision -12.6 -10.9
Other receivables 9.1 8.1
Derivatives 5.6 3.0
Prepayments and accrued income 15.5 21.7
Total 376.5 366.0
Remaining term of receivables is less than one year. The face value of the receivables (excluding derivatives) does not signifi-cantly deviate from the fair value.The credit risk associated with trade receivables is managed by the local finance managers. Periodically, each division reports the expired credit terms and the movements in the provisions for trade receivables to the Board of Management. The maximum credit risk in respect of trade receivables is € 358.9 million (2010: € 344.1 million).
Trade receivables are not interest-bearing and generally have an average term of credit of 30-90 days. The impairment provision is based on expired terms of credit and defined indi-vidually. The trade receivables item includes an amount of € 54.2 million in receivables with expired terms of credit which are expected to be received and are therefore not provided for.

18. Equity
116 | CSM Annual Report 2011
Finprefs Dividend First dividend review date Review interval
FPA series 5.77% 1 August 2012 five years
FPB series 6.07% 1 August 2012 five years
FPC series 6.40% 1 August 2017 five years
Share CapitalAs at 31 December 2011 the authorized share capital totaled € 50 million, consisting of 182 million common shares with a nominal value of € 0.25 each and 18 million cumulative financing preference shares with a nominal value of € 0.25
each, divided into three series of six million named FPA, FPB and FPC. The series of cumulative financing preference shares have the following dividend percentages and dividend review dates.
Movements in Number of Issued Shares
Common FPA FPB FPC
As at 1 January 2011 65,998,134 852,512 852,512 1,278,770
Stock dividend 1,660,565
As at 31 December 2011 67,658,699 852,512 852,512 1,278,770
Movements in Number of Shares with Dividend Rights
Common FPA FPB FPC
As at 1 January 2011 65,873,803 852,512 852,512 1,278,770
Share-based remuneration 46,004
Stock dividend 1,660,565
As at 31 December 2011 67,580,372 852,512 852,512 1,278,770
Holders of cumulative financing preference shares have priority over holders of common shares regarding dividend payments and liquidation proceeds.
The average dividend until first dividend review date on outstanding cumulative financing preference shares is 6.34% as at 31 December 2011.
Movements in Treasury Stock Common Shares
Number Nominal amount (in euros)
As at 1 January 2011 124,331 31,083
Share-based remuneration -46,004 -11,501
As at 31 December 2011 78,327 19,582
As at 31 December 2011, CSM has a Treasury Stock of 78,327 common shares at its disposal with a nominal value of € 0.25 each (representing 0.1% of total share capital issued) at an average acquisition price of € 26.87.Treasury Stock shares have no dividend rights.
Share movement: Stock dividendDuring the report year the company placed at the common shareholders' disposal a stock dividend totaling 1,660,565 shares (2010: 1,020,718).

Valuation Allocated Unvested Shares 2011: Board of ManagementThe fair value of the above mentioned performance-related shares allocated in 2011 was € 31.94 per share (2010: € 29.96). The fair value is estimated by using the Black & Scholes model and the assumptions set forth below.
Financial Statements | 117
2008 42,476 42,476
2009 109,732 109,732
2010 44,048 44,048
2011 40,551 40,551
Total 196,256 40,551 42,476 194,331
Total as at 31.12.2010
Allocated in 2011 Expired in 2011 Total as at 31.12.2011
Year of allocation
Movements in Number of Unvested Shares: Board of Management
Share-Based Remuneration Arrangements: Management Reward plans ("Phantom plan") are available for certain members of management. Participants in these plans are awarded a provi- sional cash payment. Depending on the Total Shareholders' Return (TSR) of CSM compared with the peer group and/or continued employment after a period of three to four years, the actual gross amount if any is determined and paid.A Share Buying Program is in place for managers who also partici-pate in the Phantom plan. On 1 October of the year following the calendar year in which participants have acquired shares, a gross cash payment worth 30% of the fair value on this date of the shares acquired is made to the participants.Certain members of management receive a package of CSM shares worth 9.5% of their fixed salary (Commitment Award). They may sell as many shares as are necessary to pay the income tax obligations. The acquired shares will be held until the end of their employment at CSM.
The total nominal value of € 415,141 (2010: € 255,180) arising from the stock dividend during the report year has been charged to the share premium reserve.
Share movement: Share-based remuneration During the report year the company transferred a total of 46,004 shares (2010: 25,003) pursuant to share-based remuneration arrangements.
Share-Based Remuneration Arrangements: Board of ManagementA share plan is in place for the Board of Management. Two current and one former member of the Board of Management have a total of 194,331 unvested share rights in the company as at 31 December 2011 (2010: 196,256). The nominal amount of the shares which are claimable under unvested share rights equals € 48,583 per that date.
2011 2010
Risk-free interest rate 2.59% 1.80%
Expected dividend gains 0 0
Expected volatility in share price 36% 37%
Term 3 years 3 years
Movements in Number of Blocked Commitment Award Shares: Total Management
Total 59,528 12,880 9,448 62,960
Total as at 31.12.2010
Allocated in 2011 Released in 2011 Total as at 31.12.2011

118 | CSM Annual Report 2011
As at 1 January 2010 -37.2 -15.9 2.4 1.1 -49.6
• Net investment hedge
Exchange rate differences foreign currency loan -5.8 -5.8
Tax effect 1.5 1.5
• Translation difference
Foreign group companies 58.9 58.9
Tax effect -1.7 -1.7
• Cash flow hedge
Fluctuations in fair value derivatives 3.4 3.4
Tax effect -1.0 -1.0
• Share-based remuneration charged to result 1.0 1.0
• Share-based remuneration transfers -0.6 -0.6
• Movement in capitalization of development costs 21.5 21.5
• Other transfers -0.2 -0.2
As at 31 December 2010 15.7 -13.5 23.9 1.3 27.4
• Net investment hedge
Exchange rate differences foreign currency loan 6.1 6.1
Tax effect -1.5 -1.5
• Translation difference
Foreign group companies 18.1 18.1
Tax effect -0.2 -0.2
• Cash flow hedge
Fluctuations in fair value derivatives 6.6 6.6
Tax effect -1.3 -1.3
• Share-based remuneration charged to result 0.9 0.9
• Share-based remuneration transfers -1.0 -1.0
• Movement in capitalization of development costs -1.3 -1.3
• Other transfers 0.1 0.1
As at 31 December 2011 38.2 -8.2 22.6 1.3 53.9
Movements in Legal Reserves
Hedge reserve
Develop -ment costs
Translation reserve
Share plan reserve
Total
Other Reserves
In specific circumstances legal reserves must be created in accordance with Part 9, Book 2 of the Netherlands Civil Code. The legal reserves comprise the translation reserve, hedge reserve and development costs reserve. In case a legal reserve has a negative value no payments can be made from the retained earnings up to the level of the negative value(s). The
positive legal reserves as at 31 December 2011 amount to € 60.8 million.
A reserve for non-transferable profits is not applicable as CSM has no restrictions to transfer profits from its operations in the different countries.

19. Provisions
Pensions and Early Retirement Schemes Pension and early retirement schemes relate to post employ-ment defined benefit arrangements. For more details see Note 20.
Long-Term Personnel Commitments Long-term personnel commitments relate mainly to anniver-sary commitments, past-service commitments, conditional incentive plans and health insurance.
Reorganization and RestructuringThis provision relates mainly to the restructuring program Relevance and the restructuring of factories of Bakery Supplies Europe and North America.
Other Provisions The other provisions relate mainly to loss-making contracts, legal disputes and other litigation risks.
Financial Statements | 119
As at 31 December 2011 As at 31 December 2010
Pensions and early retirement schemes 70.5 70.8
Long-term personnel commitments 10.9 12.8
Reorganization and restructuring 21.8 21.8
Other 9.7 17.4
Total 112.9 122.8
Movements in provisions
As at 1 January 2011 70.8 12.8 21.8 17.4 122.8
Addition charged to result 16.0 0.8 12.4 1.4 30.6
Release credited to result -1.3 -1.8 -4.0 -5.5 -12.6
Withdrawal for intended purpose -14.9 -0.9 -8.7 -3.9 -28.4
Exchange rate differences -0.1 0.3 0.3 0.5
As at 31 December 2011 70.5 10.9 21.8 9.7 112.9
Short-term part included
in provisions
As at 31 December 2011 21.8 1.7 23.5
TotalOtherPension and early retirement
schemes
Long-term person nel
commitments
Reorganization and
restructuring

20. Pensions
120 | CSM Annual Report 2011
CSM has several defined benefit pension plans in place mainly in Europe. Generally, the plans are based on average pay and are
either wholly or partly funded. All plans have been established in accordance with the legal requirements of the countries involved.
As at31.12.2008
As at31.12.2007
As at31.12.2009
As at31.12.2010
As at31.12.2011
Present value of pension commitments 581.7 610.1 567.4 526.1 526.8
Fair value of plan assets -498.3 -511.7 -463.5 -435.7 -529.4
Balance 83.4 98.4 103.9 90.4 -2.6
Unrecognized actuarial gains / losses current year -36.9 -48.1 -47.1 -33.4 53.5
Unrecognized past-service pension costs -1.5 -1.7 -1.9 -2.1 -2.2
Off-balance-sheet assets 25.5 22.2 16.8 19.8 31.6
Net liability 70.5 70.8 71.7 74.7 80.3
The unrecognized actuarial losses and gains are due to the level of the corridor, which is a bandwidth of 10% of the greater of the pension plan commitment and the fair value of the plan assets within which unrecognized actuarial results are recognized.
One pension scheme shows a total surplus of € 25.5 million as at 31 December 2011. As this is not immediately available to CSM the asset has not been recognized in the balance sheet.
Breakdown of the pension costs in respect of defined benefit pension plans in the income statement
2011 2010
Current service costs 13.8 11.3
Interest charges 27.6 28.4
Expected return on plan assets -28.0 -26.4
Actuarial gains/losses -1.3 -1.5
Past-service costs 0.2 0.1
Contribution by employees -0.9 -0.8
Movement in unrecognized asset 3.3 5.3
Subtotal 14.7 16.4
Gains/losses from significant curtailments -2.5
Total pension costs 14.7 13.9
The gains/losses from significant curtailments are the result of changes to a pension plan at CSM UK.
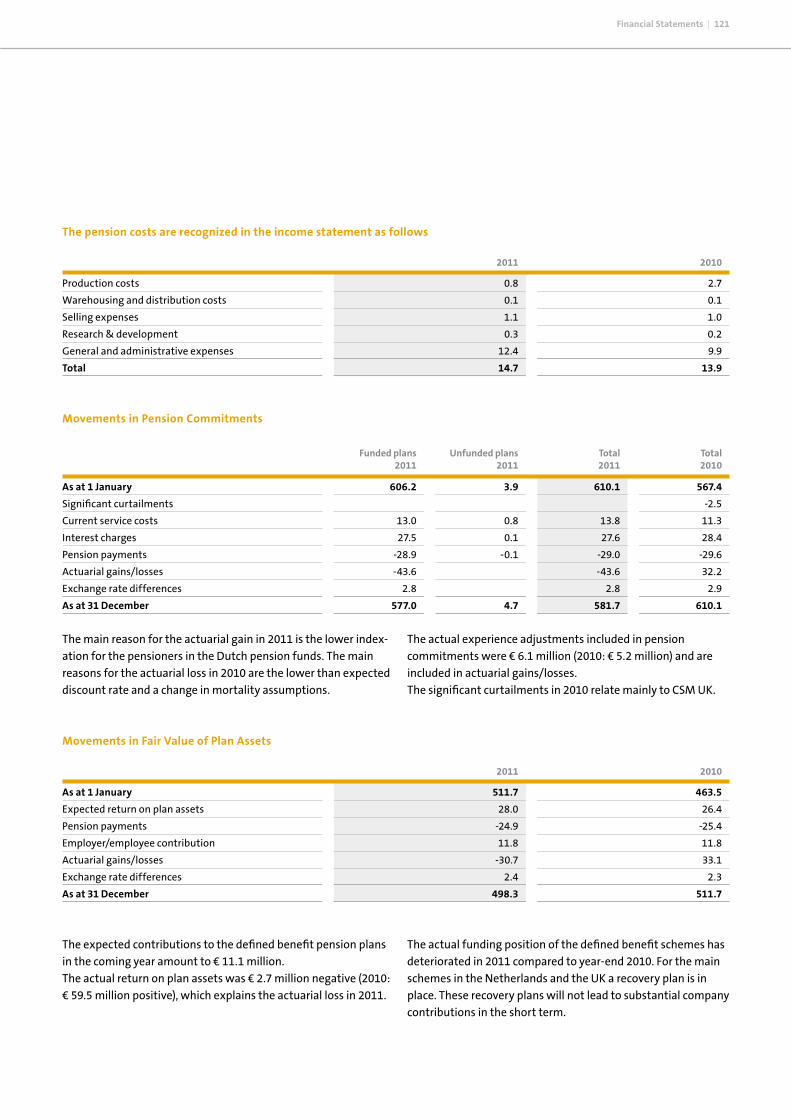
Total 2011
Total 2010
Unfunded plans 2011
Funded plans2011
Financial Statements | 121
The pension costs are recognized in the income statement as follows 2011 2010
Production costs 0.8 2.7
Warehousing and distribution costs 0.1 0.1
Selling expenses 1.1 1.0
Research & development 0.3 0.2
General and administrative expenses 12.4 9.9
Total 14.7 13.9
Movements in Pension Commitments
As at 1 January 606.2 3.9 610.1 567.4
Significant curtailments -2.5
Current service costs 13.0 0.8 13.8 11.3
Interest charges 27.5 0.1 27.6 28.4
Pension payments -28.9 -0.1 -29.0 -29.6
Actuarial gains/losses -43.6 -43.6 32.2
Exchange rate differences 2.8 2.8 2.9
As at 31 December 577.0 4.7 581.7 610.1
Movements in Fair Value of Plan Assets
2011 2010
As at 1 January 511.7 463.5
Expected return on plan assets 28.0 26.4
Pension payments -24.9 -25.4
Employer/employee contribution 11.8 11.8
Actuarial gains/losses -30.7 33.1
Exchange rate differences 2.4 2.3
As at 31 December 498.3 511.7
The main reason for the actuarial gain in 2011 is the lower index-ation for the pensioners in the Dutch pension funds. The main reasons for the actuarial loss in 2010 are the lower than expected discount rate and a change in mortality assumptions.
The actual experience adjustments included in pension commitments were € 6.1 million (2010: € 5.2 million) and are included in actuarial gains/losses. The significant curtailments in 2010 relate mainly to CSM UK.
The expected contributions to the defined benefit pension plans in the coming year amount to € 11.1 million. The actual return on plan assets was € 2.7 million negative (2010: € 59.5 million positive), which explains the actuarial loss in 2011.
The actual funding position of the defined benefit schemes has deteriorated in 2011 compared to year-end 2010. For the main schemes in the Netherlands and the UK a recovery plan is in place. These recovery plans will not lead to substantial company contributions in the short term.

21. Deferred Tax
122 | CSM Annual Report 2011
The Main Weighted Average Actuarial Assumptions
2011 2010
Discount rate 4.6% 4.6%
Expected return on plan assets 5.5% 5.5%
Future salary increases 2.7% 2.7%
Inflation 2.6% 2.8%
Asset Categories of Plan Assets
2011 2010
Equity securities 138.7 148.8
Debt securities 307.6 294.8
Real estate 25.6 28.1
Other 26.4 40.0
Total assets 498.3 511.7
Breakdown of Deferred Tax Assets and Liabilities
2011 2010
Deferred tax liabilities 154.5 60.0
Deferred tax assets -59.2 -53.0
As at start of financial year 95.3 7.0
Tax charge in income statement 0.6 16.4
Translation differences foreign group companies 3.2 -0.1
Acquisition/sale of group companies 2.2 70.7
Tax charge movements in equity -1.8 1.3
As at close of financial year 99.5 95.3
Deferred tax liabilities 144.0 154.5
Deferred tax assets -44.5 -59.2
As at close of financial year 99.5 95.3
The discount rate is based on the return of high-quality fixed income corporate bonds. For the eurozone discount rate this return is based on the "iBoxx Corporates AA 10+". To match the actual duration of the pension liabilities the rate needs an upward (or downward) adjustment, which is based on the difference between the European Central Bank (ECB) interest curve corre-sponding to the "iBoxx Corporates AA10+" duration and the ECB interest curve corresponding to the actual duration in the fund.
The expected return on plan assets is determined as a weighted
average rate of return based on the current and projected investment portfolio mix of each plan, taking into account the corresponding long-term yields for the separate asset categories.The investment strategy is based on the composition of the obligations of the pension schemes. Based on Asset Liability Management models analyses have been performed on a regular basis to define the investment portfolio. At year-end the asset allocation was as follows:

Financial Statements | 123
Deferred tax liabilities
Deferred tax assets
Deferred tax liabilities
Deferred tax assets
Breakdown of Deferred Tax Assets and Liabilities by Type
Property, plant & equipment -13.9 47.1 -13.6 39.9
Intangible fixed assets -6.5 107.6 -7.5 129.2
Current assets/liabilities -20.0 5.3 -12.2 3.9
Tax loss carry forward -16.8 -33.7
Provisions -6.0 3.3 -15.2 4.0
Other -0.7 0.1 -1.4 1.9
-63.9 163.4 -83.6 178.9
Netting 19.4 -19.4 24.4 -24.4
Total -44.5 144.0 -59.2 154.5
Breakdown of Deferred Taxes due to Tax Loss Carry Forward
2011 2010
Total tax loss carry forward 269.5 250.1
Tax loss carry forward not qualified as deferred tax asset -184.6 -106.1
Tax loss carry forward qualified as deferred tax asset 84.9 144.0
Average tax rate 19.8% 23.4%
Deferred tax asset 16.8 33.7
The short-term part of deferred tax assets, after write-down and netting with the short-term part of deferred tax liabilities, amounts to € 18.9 million (2010: € 20.7 million).Depending on the term of anticipated realization of deferred tax assets and liabilities, these are netted. This may be the case
for a legal entity or for a group of legal entities which are considered one fiscal unity. After netting deferred tax assets and liabilities are assessed and the possibilities of future realization analyzed. This may result in full or partial write-down of the relevant tax asset or liability.
The resulting tax assets mainly relate to France (€ 7.6 million), Germany (€ 5.3 million) and Belgium (€ 2.0 million).
As at 31 December 2010As at 31 December 2011

Fair value
as at 31.12.2010
Balance sheet value
as at 31.12.2010
Fair value
as at 31.12.2011
Balance sheet value
as at 31.12.2011
22. Non-Current Liabilities
124 | CSM Annual Report 2011
Breakdown of the Tax Charge Arising from Deferred Tax Assets and Liabilities in the Income Statement, by Type
2011 2010
Property, plant & equipment 3.4 5.4
Intangible fixed assets -25.0 -0.8
Current assets/liabilities -5.2 3.2
Tax loss carry forward 16.1 -1.2
Provisions 8.2 11.6
Exchange rate differences loans 2.6
Financial instruments -0.8
Other 1.3 -1.8
Total 0.6 16.4
The deferred tax charge related to the tax loss carry forward is mainly caused by additions to the valuation allowance on the related tax assets in view of the expected future realization
thereof. The deferred tax charge related to intangible fixed assets is mainly caused by the goodwill impairment.
As at 31.12.2010
As at 31.12.2011
As at 31.12.2010
As at 31.12.2010
As at 31.12.2011
As at 31.12.2011
Private placement 2010 232.0 224.3 3.93 3.93 6.3 7.3
Owed to credit institutions 476.8 467.4 2.92 3.54 2.5 3.5
Financial lease commitments 2.4 1.5 7.00 4.24 6.7 1.0
Derivatives 15.7 52.5 3.23 4.10 1.8 1.1
Total 726.9 745.7
Weighted average 3.48 3.71 4.0 4.5
The fair value of the main long-term loans is as follows
Private placement 2010 232.0 255.3 224.3 244.8
Owed to credit institutions 476.8 477.7 467.4 468.4
The weighted average of the term has been calculated on the basis of the remaining terms of the individual loans.
Repayments on the above amounts are due within five years for € 590.5 million and after five years for € 136.4 million.
Average term in yearsEffective interest %
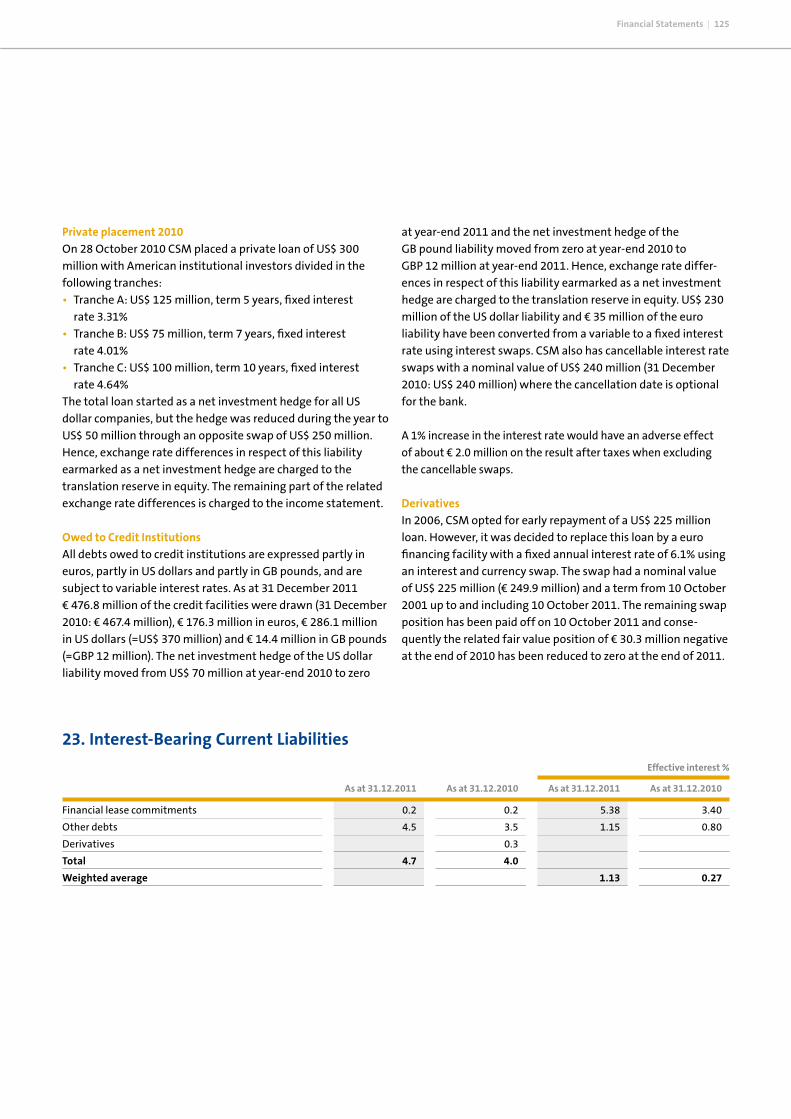
As at 31.12.2010As at 31.12.2011As at 31.12.2010As at 31.12.2011
Effective interest %
23. Interest-Bearing Current Liabilities
Financial Statements | 125
Financial lease commitments 0.2 0.2 5.38 3.40
Other debts 4.5 3.5 1.15 0.80
Derivatives 0.3
Total 4.7 4.0
Weighted average 1.13 0.27
Private placement 2010 On 28 October 2010 CSM placed a private loan of US$ 300 million with American institutional investors divided in the following tranches: • Tranche A: US$ 125 million, term 5 years, fixed interest
rate 3.31% • Tranche B: US$ 75 million, term 7 years, fixed interest
rate 4.01%• Tranche C: US$ 100 million, term 10 years, fixed interest
rate 4.64%The total loan started as a net investment hedge for all US dollar companies, but the hedge was reduced during the year to US$ 50 million through an opposite swap of US$ 250 million. Hence, exchange rate differences in respect of this liability earmarked as a net investment hedge are charged to the translation reserve in equity. The remaining part of the related exchange rate differences is charged to the income statement.
Owed to Credit Institutions All debts owed to credit institutions are expressed partly in euros, partly in US dollars and partly in GB pounds, and are subject to variable interest rates. As at 31 December 2011 € 476.8 million of the credit facilities were drawn (31 December 2010: € 467.4 million), € 176.3 million in euros, € 286.1 million in US dollars (=US$ 370 million) and € 14.4 million in GB pounds (=GBP 12 million). The net investment hedge of the US dollar liability moved from US$ 70 million at year-end 2010 to zero
at year-end 2011 and the net investment hedge of the GB pound liability moved from zero at year-end 2010 to GBP 12 million at year-end 2011. Hence, exchange rate differ-ences in respect of this liability earmarked as a net investment hedge are charged to the translation reserve in equity. US$ 230 million of the US dollar liability and € 35 million of the euro liability have been converted from a variable to a fixed interest rate using interest swaps. CSM also has cancellable interest rate swaps with a nominal value of US$ 240 million (31 December 2010: US$ 240 million) where the cancellation date is optional for the bank.
A 1% increase in the interest rate would have an adverse effect of about € 2.0 million on the result after taxes when excluding the cancellable swaps.
Derivatives In 2006, CSM opted for early repayment of a US$ 225 million loan. However, it was decided to replace this loan by a euro financing facility with a fixed annual interest rate of 6.1% using an interest and currency swap. The swap had a nominal value of US$ 225 million (€ 249.9 million) and a term from 10 October 2001 up to and including 10 October 2011. The remaining swap position has been paid off on 10 October 2011 and conse-quently the related fair value position of € 30.3 million negative at the end of 2010 has been reduced to zero at the end of 2011.

24. Acquisitions
126 | CSM Annual Report 2011
GBP GBP GBP euro
Fair value
as at 31-01-2011Fair value
as at 31-01-2011Fair value
adjustment
as at 31-01-2011
Local book value before acquisition
as at 31-01-2011
Breakdown of acquired assets and liabilities Classic Cakes
Property, plant & equipment 1.7 0.1 1.8 2.1
Intangible fixed assets (customer base) 7.1 7.1 8.2
Inventories 0.4 0.4 0.5
Receivables 1.4 1.4 1.6
Cash and cash equivalents 0.5 0.5 0.6
Trade payables and other
non-interest-bearing current liabilities -1.1 -1.1 -1.3
Deferred tax liabilities 0.1 -2.0 -1.9 -2.2
Current tax liabilities -0.5 -0.5 -0.6
Identifiable assets minus liabilities 2.5 5.2 7.7 8.9
Goodwill 3.7 3.7 4.3
Assets minus liabilities 2.5 8.9 11.4 13.2
Classic CakesOn 31 January 2011 CSM announced the acquisition of UK-based Classic Cakes Ltd. Classic Cakes produces a high quality range of premium sweet bakery products, servicing the foodservice and retail markets. The company and its facilities are based in Daventry. Classic Cakes has annual sales of € 11.4 million and employs some 90 people. This transaction strengthens CSM's leadership position in the market segments that it has targeted for growth, particularly the retail and foodservice channels. The transaction has no material impact on CSM's financials. The acquired business contributed revenues of GBP 10.2 million (€ 11.8 million) and EBITA excluding acquisition costs of GBP 0.6 million (€ 0.7 million) to the group for the period from
31 January 2011 to 31 December 2011. The acquisition costs related to the acquisition resulted in a negative amount of GBP 0.2 million (€ 0.3 million). These costs are included in general and administrative expenses in CSM's consolidated income for the year 2011.
The applied GB pound/euro exchange rate at the acquisition date is: 0.87
The following table summarizes the amounts of identified assets acquired and liabilities assumed at the acquisition date expressed in local book value, fair value adjustment and resulting fair value.
millions:
The goodwill generated as part of the transaction is attributable to the workforce of the acquired business and the significant synergies expected to arise after the acquisition of Classic Cakes. The goodwill is not expected to be deductible for tax purposes.
The fair value of the assets acquired includes trade receivables of GBP 1.4 million. The gross amount due under contracts is GBP 1.4 million, of which nothing is expected to be uncollect-ible. CSM did not acquire any other class of receivable as a result of the acquisition of Classic Cakes.

25. Financial Instruments
Financial Statements | 127
GBP euro
Fair value as at 31-01-2011
Payment in cash 11.4 13.2
Total consideration 11.4 13.2
Acquired cash and cash equivalents -0.5 -0.6
Net cash outflow 10.9 12.6
millions:
Breakdown of the acquisition price Classic Cakes
Fair value as at 31-01-2011
Pro forma adjustment full-year
effect Classic Cakes
CSM Pro forma CSM
These amounts have been calculated after applying the group's accounting policies and adjusting the results of the acquisition to reflect the additional depreciation and amortization that would have been charged assuming the fair value adjustments
to property, plant and equipment and intangible fixed assets and normal allocated interest on the investment had been applied from 1 January 2011 onwards, together with the resulting tax effects.
General CSM uses various financial instruments in order to secure an optimal financing structure, in accordance with a financial policy approved by the Board of Management.CSM also uses various financial instruments in order to reduce purchase price risks, in accordance with a purchase policy approved by the Board of Management.
Capital Risk Management CSM manages its capital to ensure that entities in the CSM Group will be able to continue as going concerns while maxi-mizing return to stakeholders through the optimization of the debt and equity balance. The Group's overall strategy remains unchanged from 2010.
The capital structure of CSM consists of net debt (interest-bearing debts as detailed in Notes 22 and 23 offset by cash and cash equivalents as detailed in Note 17) and equity of CSM. The CSM risk management committee reviews the capital structure of CSM on a semi-annual basis. As part of this review, the committee considers the cost of capital and the risks associ-ated with each class of capital. For CSM, the main conditions for the credit facility are as follows: the net debt position/EBITDA ratio may not exceed the factor 3.5 and the interest cover ratio may not be lower than 3.5. CSM internally sets these ratios at 3.0 for net debt position divided by EBITDA and 4.0 for the interest cover. The external conditions and internal targets were met in 2011 as well as in 2010.
Net sales 3,112.6 1.1 3,113.7
Operating result -149.5 0.1 -149.4
Result after taxes -174.3 0.1 -174.2
Earnings per share -2.64 0.00 -2.64
The table below shows the pro-forma result if CSM had the acquisition been made as at 1 January 2011

128 | CSM Annual Report 2011
The table below shows the ratios at year-end
2011 2010
Net debt position/EBITDA 2.8 2.1
Interest cover 7.6 9.7
Currency Risk Management Currency risk management distinguishes between translation risks and transaction risks.
Translation Risks The translation risk arises because CSM is active on the inter-national market, which means that it is exposed to risks arising from currency fluctuations, particularly in the US dollar, Brazilian real, Thai baht, and GB pound.
In principle, CSM applies the matching principle. This means that capital employed in foreign operations is financed using
the country’s currency in order to avoid wide fluctuations due to translation effects. For practical reasons a specific limit is defined for each currency. Due to the impact of the credit crisis on US dollar volatility and possible impact on the covenants, CSM increased its US dollar limit temporarily.
CSM does not hedge translation risks in respect of operating results. This means that currency fluctuations particularly in the US dollar can have a material effect on CSM’s income state-ment. Translation effects of the operating result are partially hedged by the interest paid on the US dollar loan.
Net risk position
millions of euros
Currency 2011 2010
• US dollar 542.5 353.9
• GB pound 73.5 73.7
• Brazilian real 33.1 34.1
• Thai baht 143.5 114.5
Breakdown of the net amount of unhedged translation risk for each currency as at 31 December 2011
Transaction RisksThe currency transaction risk arises in the course of ordinary business activities. CSM uses forward currency contracts and currency swaps in order to hedge the risk arising from purchase and sales transactions and/or commitments from current
purchase and sales contracts. Transactions that are highly prob-able to occur are fully hedged and included in cash flow hedge accounting. Other transactions reasonably probable to occur are partially hedged. For practical reasons a specific limit is defined for each currency.
Valued at fair value the forward currency contracts are recognized in the balance sheet as follows As at 31 December 2011 As at 31 December 2010
Receivables 1.0 0.2
Current liabilities -2.8 -0.3
Total -1.8 -0.1

Financial Statements | 129
Hedge accounting is being applied to these contracts; any unrealized fluctuations in the fair value are deferred in the hedge reserve of equity until the underlying hedged transac-tion is recognized in the result. All forward currency contracts expire within a year.
Sensitivity AnalysisThe results of Purac (transaction and translation effects) and CSM Bakery Supplies North America (translation effect) are relatively most exposed to the effect of fluctuations in the US dollar. A fall of US$ 0.01 in the exchange rate of the US dollar against the euro would have a net negative impact of approx. € 0.7 million on net profit.
Interest Risk Management Interest rate swaps and forward interest rate contracts are used to adjust the nature of the interest rate and currency of long-term financing to fit the desired risk profile. Periodically, the Board of Management makes an assessment as to whether the fixing of the long-term financing still meets the desired risk profile.As the interest rate has been fixed (3.5% on average) for all CSM long-term debt (approx. € 727 million) for a period of on average 4.0 years, the interest risk is limited.CSM entered into interest rate swaps for US$ 230 million and € 35 million to hedge the variable interest risk of part of the
US$ 370 million and € 176.3 million debt owed to credit institu-tions. The fair value of those swaps was € 13.6 million negative as at 31 December 2011 (31 December 2010: € 21.8 million negative) and is recognized in non-current liabilities. Except for the cancellable interest rate swaps hedge accounting is applied to these interest rate swaps. Further analysis is found in the section on hedge transactions.
Sensitivity Analysis If the interest rate would increase by 50 basis points the net result would increase by € 1.7 million and equity by € 1.6 million. This sensitivity analysis takes into account the change in the fair value of the interest rate swaps and the effect of the variable interest loans and receivables on cash flows.
Purchase Risk Management Commodity derivative contracts (swaps and collars) are used by CSM to reduce the risk profile on purchasing.
The commodity derivative contracts concern the main commodi-ties used by CSM, which are wheat, oils, corn, sugar and cocoa.CSM entered into commodity derivative contracts to hedge the variable price risk of the main used commodities. The fair value of these contracts was € 2.1 million as at 31 December 2011 (31 December 2010: € 2.8 million). Hedge accounting is applied for the major part of these commodity derivative contracts. Further analysis is found in the section on hedge transactions.
Valued at fair value the commodity derivative contracts are recognized in the balance sheet as follows As at 31 December 2011 As at 31 December 2010
Receivables 2.1 2.8
Total 2.1 2.8
All commodity derivative contracts expire within a year.
Sensitivity AnalysisIf the purchase price of the involved commodities would increase by 10% the net result would be impacted by € 1.0 million positive and the hedge reserve would increase by € 3.2 million.
Valuation of Financial Instruments CSM measures fair values using the following fair value hier-archy that reflects the significance of the inputs used in making the measurements:
• Level 1: Fair value measurements based on quoted prices (unadjusted) in active markets for identical assets or lia-bilities.
• Level 2: Fair value measurements based on inputs other than level 1 quoted prices that are observable for the asset or liability, either directly (i.e. as prices) or indirectly (i.e. derived from prices).
• Level 3: Fair value measurements based on valuation tech-niques that include inputs for the asset or liability that are based on observable market data (unobservable inputs).

130 | CSM Annual Report 2011
Breakdown valuation of financial instruments
31 December 2011 Level 1 Level 2 Level 3 Total
Derivatives
• Foreign exchange contracts -1.8 -1.8
• Commodity swaps/collars 2.1 2.1
• Interest rate swaps (cash flow hedges) -13.6 -13.6
• Exchange swaps 2.5 2.5
• Cancellable interest rate swap -2.1 -2.1
Total liability -12.9 -12.9
Total balance
sheet value
Fair
valueDerivatives
hedge accounting
Other debts
Loans and
recei v -ables
Derivatives
through
income statement31 December 2011
Breakdown fair values financial instruments
Financial fixed assets
• Loans 7.9 7.9 7.9
• Loans non-interest-bearing 2.0 2.0 2.0
Receivables
• Trade receivables 346.3 346.3 346.3
• Other receivables 9.1 9.1 9.1
• Accruals and deferred income 15.5 15.5 15.5
Cash
• Cash other 116.0 116.0 116.0
Interest-bearing liabilities
• Private placement 2010 -193.3 -193.3 -212.7
• Private placement 2010 (net investment hedge) -38.7 -38.7 -42.6
• Owed to credit institutions -462.4 -462.4 -463.3
• Owed to credit institutions (net investment hedge) -14.4 -14.4 -14.4
• Financial lease commitments -2.6 -2.6 -2.6
• Other debts -4.5 -4.5 -4.5
Non-interest-bearing liabilities
• Trade payables -311.9 -311.9 -311.9
• Other payables -144.6 -144.6 -144.6
Derivatives
• Foreign exchange contracts -1.8 -1.8 -1.8
• Commodity swaps/collars 2.1 2.1 2.1
• Interest rate swaps (cash flow hedges) -13.6 -13.6 -13.6
• Exchange swaps 2.5 2.5 2.5
• Cancellable interest rate swap -2.1 -2.1 -2.1
Total -10.8 -2.1 496.8 -1,172.4 -688.5 -712.7

Financial Statements | 131
Fair values are determined as follows• The fair value of financial fixed assets does not significantly
deviate from the book value.• The fair value of receivables equals the book value because of
their short-term character.• Cash and cash equivalents are measured at nominal value
which, given the short-term and risk-free character, corre-sponds to the fair value.
• Market quotations are used to determine the fair value of debt owed to private parties, credit institutions and other debts. As there are no market quotations for most of the loans the fair value of short- and long-term loans is deter-mined by discounting the future cash flows at the yield curve applicable as at 31 December.
• Financial lease commitments: the fair value is estimated at the present value of the future cash flows, discounted at the interest rate for similar contracts which is applicable as at the balance sheet date. This fair value equals the book value.
• Given the short-term character, the fair value of non-interest-bearing liabilities equals the book value.
• Currency and interest derivatives are measured on the basis of the present value of future cash flows over the remaining term of the contracts, using the bank interest rate (such as Euribor) as at the reporting date for the remaining term of the contracts. The present value in foreign currencies is converted using the exchange rate applicable as at the reporting date.
• Commodity derivatives are measured on the basis of the present value of future cash flows, using market quotations or own variable marketprice estimations of the involved commodity as at the reporting date.
Hedge Transactions
The amount of € 8.2 million negative in hedge reserve (see Note 18) relates to hedging of risks arising from future purchase and sales transactions and/or commitments from current purchase and sales contracts amounting to € 96.2 million. The amount of € 9.2 million negative relates to an interest payment hedge using an interest rate swap. This amount will be released between now and 2015, matching the release to the interest payments. Effectively, only the fixed hedged interest level will remain in the income statement. The remaining € 1.0 million positive, relating to foreign exchange and commodity contracts, will materialize within the current year.The amount of € 38.2 million in translation reserve (see Note 18) relates to currency fluctuations in respect of net investments in foreign operations less the currency fluctuations of the corre-sponding net investment hedges. In case of divestment of a net investment in a foreign operation, the corresponding net impact of the currency fluctuations is moved from the translation reserve to the income statement.
In the past year no cash flow hedges were terminated due to changes to the expected future transaction. No ineffective parts were recorded in respect of the net investment hedge and cash flow hedge.
Derivatives
Short < 1 year Long > 1 year
Derivatives receivables used as hedge instrument in
cash flow hedge relations:
Foreign exchange contracts 1.0 0.2
Commodity swaps/collars 2.1 2.8
Derivatives receivables used as hedge instrument
in net investment hedge relations:
Foreign exchange contracts 2.5
Derivatives liabilities used as hedge instrument
in cash flow hedge relations:
Foreign exchange contracts -2.8 -0.3
Interest rate swaps -1.3 -12.3 -21.9
Total derivatives in hedge relation 1.5 2.7 -12.3 -21.9
Derivatives liabilities not used in a hedge relation
with value change through income statement:
Currency swaps -0.3 -30.3
Cancellable currency interest swap -1.0 -1.1 -0.3
Total derivatives through income statement -1.0 -0.3 -1.1 -30.6
Total derivatives 0.5 2.4 -13.4 -52.5
31.12.201031.12.201131.12.201031.12.2011

132 | CSM Annual Report 2011
Total More than 5 years
Less than 1 year
Between 1 and 5 years
Effective interest %
As at 31 December 2011
Private placement 2010 3.93 96.7 135.3 232.0
Owed to credit institutions 2.92 476.8 476.8
Financial lease commitments 6.88 0.2 1.3 1.1 2.6
Derivatives 3.23 2.7 13.0 15.7
Other debts 1.15 4.5 4.5
Trade payables 311.9 311.9
Other non-interest-bearing current liabilities 144.6 144.6
Total 463.9 587.8 136.4 1,188.1
As at 31 December 2010
Private placement 2010 3.93 93.5 130.8 224.3
Owed to credit institutions 3.54 467.4 467.4
Financial lease commitments 4.14 1.7 1.7
Derivatives 4.08 33.7 19.1 52.8
Other debts 0.80 3.4 0.1 3.5
Trade payables 296.7 296.7
Other non-interest-bearing current liabilities 154.0 154.0
Total 487.8 581.8 130.8 1,200.4
Credit Risk ManagementCSM runs a credit risk in relation to financial instruments. This risk consists of the losses that would be incurred if the other party were to default on its contractual obligations. In respect of disbursed loans, other receivables and cash and cash equiva-lents the maximum credit risk equals the book value (see Notes
13, 16 and 17). In respect of derivatives it equals the fair value shown in the table above. Given the credit rating that it requires of its partners (at least single A) CSM has no reason to assume that they will not honor their contractual obligations. Based on today's insights, the actual credit risk is virtually nil.
Liquidity RiskLiquidity risk is the risk of CSM not being able to obtain sufficient liquidity to meet its obligations in time. Periodically, the Board of Management evaluates liquidity for the next 12 months. The committed credit facilities at CSM’s long-term disposal amounted to € 700 million as at 31 December 2011. As at 31 December 2011 € 476.8 million had been drawn.CSM also has a private loan of US$ 300 million with US institu-tional investors.
The main conditions for the credit facility and the private loan are:• The ratio of net debt position divided by EBITDA (“Earnings
Before Interest, Taxes, Depreciation, Amortization, Impair-ment of intangible fixed assets, and “One-off costs”) may not exceed the factor 3.5.
• A minimum interest cover of 3.5.
These conditions were met during 2011 and as at 31 December 2011, as was the case in 2010.To provide insight into the liquidity risk the table below shows the contractual terms of the financial obligations (converted at balance sheet date), including interest paid.The table below analyzes CSM’s financial obligations which will be settled on a net basis, according to relevant expiration dates, based on the remaining period from the balance sheet date to the contractual expiration date. The amounts shown are contractual non-discounted cash flows with an exception for derivatives, of which the cash flows are based on fair value.
26. Off-Balance Sheet Financial Rights and Commitments
Financial CommitmentsAs at 31 December 2011 the nominal value of future commit-ments from operational lease contracts for property, plant & equipment was € 120.5 million (2010: € 140.2 million), of which € 27.9 million expires within one year, € 39.4 million between 1 and 5 years, and € 53.2 million after 5 years. Short-Term CommitmentsThe purchase and sales commitments from current orders amounted to € 532.1 million as at 31 December 2011 (2010: € 380.6 million).
The capital expenditure commitments not yet incurred amounted to € 15.2 million for (in)tangibles as at 31 December 2011 (2010: € 11.6 million).
Contingent CommitmentsGuaranteesThird-party guarantees amounted to € 23.3 million as at 31 December 2011 (2010: € 26.6 million). No significant future losses are expected from these guarantees. Furthermore, CSM nv guarantees a dormant closed UK pension scheme to duly perform all the financial obligations. As at 31 December 2011 the scheme was not in deficit.
27. Related Party Transactions
Financial Statements | 133
On 23 December 2011 CSM signed a contract to buy assets for an amount of € 14.5 million from Stichting CSM Suiker Pensioenfonds, a pension fund in which CSM nv is the sole sponsor. The legal title of the assets passed after balance
sheet date on 2 January 2012. Together with this transaction a disbursed loan of € 6.3 million currently classified within loans and receivables was settled after balance sheet date.
28. Events after Balance Sheet Date
On 23 January 2012 CSM announced that it had acquired the business and other assets of UK-based The Cookie Man Limited. This acquisition complements CSM’s operations in the UK, both in terms of portfolio and customers. With manufacturing operations in Esher, Surrey, The Cookie Man is a sizeable business focusing
on cakes and cookies which are sold to the main retailers and out-of-home customers in the UK. At acquisition date the company employed some 340 people. The assets could be acquired at a nominal amount in view of the entity's bankruptcy proceedings.
29. Cash Flow Statement
The consolidated cash flow statement is drawn up using the indirect method. The items in the consolidated income statement and the consolidated statement of the financial position have been adjusted for changes that do not influence cash inflow and outflow in the report year. Working capital consists of inventories and receivables minus non-interest-bearing current liabilities, excluding payable dividend, interest and income tax. The cash
flow from the acquisition of group companies consists of acquisi-tion price payments for the acquired companies less cash and cash equivalents of those companies.
The interest-bearing debts consist of non-current and current liabilities.The effects of exchange rate differences on cash and cash equivalents are presented separately.

30. Additional Information
Remuneration Policy Board of Management For more information on the remuneration policy please refer to the report of the Supervisory Board. The number of conditionally granted shares per member of the Board of Management is as follows
Year of vestingMaximum number outstanding
as at 31.12.2011
‘At target’ number outstanding
as at 31.12.2011
Granted in
G.J. Hoetmer 2009 30,909 46,364 2012
2010 16,040 28,070 2013
2011 14,222 24,889 2014
N.J.M. Kramer 2009 21,123 31,684 2012
2010 9,130 15,978 2013
2011 8,950 15,662 2014
R.P. Plantenberg 2009 21,123 31,684 2012
Total as at 31-12-2011 121,497 194,331
134 | CSM Annual Report 2011
Maximum number out standing
as at 31.12.2011
Vested in2011
Maximum numbergranted in 2011
Expired in 2011
Maximum number out standing
as at 31.12.2010
The movements in the number of shares conditionally granted to members of the Board of Management are as follows
G.J. Hoetmer 92,394 24,889 3,954 14,006 99,323
N.J.M. Kramer 59,920 15,662 2,699 9,559 63,324
R.P. Plantenberg 43,942 2,699 9,559 31,684
Total 196,256 40,551 9,352 33,124 194,331
Number as at 31.12.
2011
Awarded in 2011 Realised in 2011Number as at 31.12.
2010
G.J. Hoetmer 13,831 4,016 17,847
N.J.M. Kramer 9,448 3,032 12,480
R.P. Plantenberg 9,448 9,448
Total 32,727 7,048 9,448 30,327
Breakdown of the number of Commitment Award shares, which are blocked until the end of employment of the member concerned

2011 2010 2011 2010 20112010
Total salaryVariable salaryFixed salary
2011 201020102011
TotalPension and other provisions
Breakdown remuneration Supervisory BoardTotal remuneration for members of the Supervisory Board in 2011 was € 0.3 million (2010: € 0.3 million), specified as follows:
Financial Statements | 135
Breakdown remuneration Board of Management thousands of euros
G.J. Hoetmer 600 594 351 587 951 1,181
N.J.M. Kramer 454 434 239 388 693 822
R.P. Plantenberg* 134 137 271
Total 1,054 1,162 590 1,112 1,644 2,274
G.J. Hoetmer 223 231 1,174 1,412
N.J.M. Kramer 168 157 861 979
R.P. Plantenberg* 88 359
Total 391 476 2,035 2,750
thousands of euros 2011 2010
M.P.M. de Raad, Chairman (member Remuneration
Committee/Chairman Nomination Committee) 65 58
R.H.P. Markham, Vice-Chairman (Chairman Remuneration
Committee/member Nomination Committee) 51
R. Pieterse (Chairman Audit Committee) 56 56
W. Spinner (member Audit Committee) 51 52
J.P. de Kreij (member Audit Committee) 34
P. Bouw, resigned 23 68
L.A.A. van den Berghe, resigned 17
Total 280 251
* Mr Plantenberg resigned as board member as at 1 May 2010. His remuneration until the end of employment (September 2011) amounts to € 0.7 million
and has been fully recorded in 2010.
No loans or advance payments or any guarantees to that effect have been made or issued to the members of the Supervisory Board.
None of the members of the Supervisory Board has shares in the company or any option rights relating thereto (as at 20 February 2012).
Audit ServicesTotal audit services for the financial year 2011 amount to € 2.2 million and can be specified as follows:
Total 2010Deloitte Other 2011
Total 2011Deloitte Accountants bv 2011
Audit services 392 1,212 1,604 1,638
Audit related services 56 56 118
Non audit services 573 573 51
Total audit services 448 1,785 2,233 1,807
thousands of euros

136 | CSM Annual Report 2011
Company Balance Sheet
before profit appropriation, millions of euros Note As at 31.12.2011 As at 31.12.2010
Assets
Intangible fixed assets 27.3 27.3
Financial fixed assets 31. 1,285.8 1,448.6
Total fixed assets 1,313.1 1,475.9
Receivables 32. 7.4 3.2
Tax assets 33. 0.9 6.6
Cash and cash equivalents 34. 14.0 38.9
Total current assets 22.3 48.7
Total assets 1,335.4 1,524.6
Equity and liabilities
Common share capital 17.6 17.2
Share premium reserve 74.1 74.5
Other reserves 53.9 27.4
Retained earnings 802.7 998.1
Equity 35. 948.3 1,117.2
Deferred tax liabilities 0.1
Non-current liabilities 36. 366.9 383.8
Total non-current liabilities 366.9 383.9
Interest-bearing current liabilities 37. 12.9 17.5
Non-interest-bearing current liabilities 38. 7.3 6.0
Total current liabilities 20.2 23.5
Total equity and liabilities 1,335.4 1,524.6
Company Income Statement
millions of euros 2011 2010
Result from group companies after taxes -217.0 84.1
Other income and charges after taxes 42.7 15.2
Result after taxes -174.3 99.3
Company Financial Statements

31. Financial Fixed Assets
Financial Statements | 137
Notes to the Company Financial Statements
GeneralThe separate financial statements of CSM nv are drawn up in accordance with the principles referred to in Part 9, Book 2 of the Dutch Civil Code. By using the option in Section 2:362 (8) of the Dutch Civil Code the same accounting principles (including the principles for recognizing financial instruments as equity or debt) may be applied in the separate financial statements and the consolidated financial statements. Participations in group
companies are valued on the basis of net asset value. Net asset value is determined by valuing assets, provisions and liabili-ties and calculating the result using the accounting principles applied in the consolidated financial statements (see Note 2).
A list has been filed at the Amsterdam Trade Register setting out the data on the group companies as required under Sections 2:379 and 2:414 of the Dutch Civil Code.
As at 31 December 2011 As at 31 December 2010
Participations in group companies 485.4 696.5
Loans to group companies 792.7 770.8
Joint ventures and associates 8.8 1.0
Owed to/by group companies -1.1 -19.7
Total 1,285.8 1,448.6
The balance of the participations in group companies and loans to group companies is positive in all participations of CSM nv. Amounts owed to or by group companies are long-term. For more information on joint ventures and associates see Note 14.
2011 2010
Movements in participations in group companies:
As at start of financial year 696.5 603.9
Paid-in capital 145.4 3.4
Capital repayment -95.2
Result of group companies -217.0 84.1
Dividend group companies -29.3 -7.6
Exchange rate differences 12.2 11.2
Other -27.2 1.5
As at close of financial year 485.4 696.5
Movements in loans to group companies:
As at start of financial year 770.8 635.7
Exchange rate differences 17.0 44.1
Disbursements 154.4 157.6
Repayments -149.5 -66.6
As at close of financial year 792.7 770.8

34. Cash and Cash Equivalents
32. Receivables
The receivables relate to commodity and foreign exchange derivatives.
33. Tax Assets
The tax assets relate mainly to income tax overpayments by the fiscal unity of € 0.5 million and € 0.4 million in inter-company dividend withholding tax to be settled with future dividend withholding tax payments to the tax authorities.
35. Equity
See Consolidated Statement of Changes in Equity and Note 18 to the consolidated financial statements.
36. Non-Current Liabilities
A As at December 2011 As at December 2010
Owed to credit institutions 351.2 331.3
Derivatives 15.7 52.5
Total 366.9 383.8
See Note 22 to the consolidated financial statements.
37. Interest-Bearing Current Liabilities
A As at December 2011 As at December 2010
Owed to credit institutions 12.9 17.1
Derivatives 0.4
Total 12.9 17.5
138 | CSM Annual Report 2011
The cash and cash equivalents were available and payable without notice in 2011.

39. Off-Balance Sheet Commitments
Contingent LiabilitiesUnder Section 2:403 of the Dutch Civil Code the company assumes liability for the debts incurred by Dutch group companies. The relevant declarations have been filed for perusal at the office of the relevant Trade Register.The company guarantees external loans of US$ 370 million and € 70 million drawn by group companies on the credit facility of the company.
Fiscal Unity CSM nv and a number of subsidiaries in the Netherlands are part of fiscal unities for corporate income and value added taxes. During the period the companies are part of a fiscal unity they are jointly and severally liable for the liabilities of the fiscal unity.
40. Personnel
On average, 2 personnel were employed by CSM nv in the Netherlands during 2011 (2010: 2.3 personnel).
38. Non-Interest-Bearing Current Liabilities
A As at December 2011 As at December 2010
Taxes and social insurance premiums 0.1
Other debts and accruals and deferred income 7.2 6.0
Total 7.3 6.0
Diemen, the Netherlands, 20 February 2012. Supervisory Board Board of Management M.P.M. de Raad, Chairman G.J. Hoetmer, Chairman R.H.P. Markham N.J.M. KramerJ.P. de Kreij R. Pieterse W. Spinner
Financial Statements | 139

Other Information
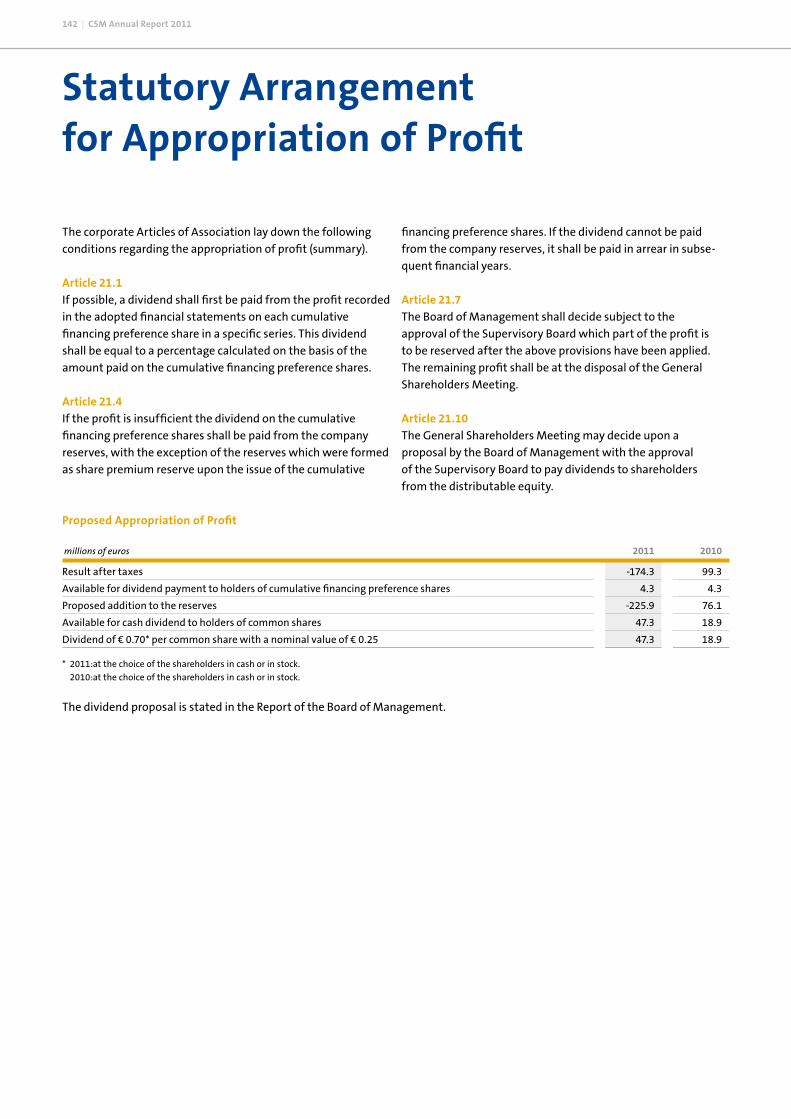
142 | CSM Annual Report 2011
Statutory Arrangement for Appropriation of Profit
* 2011:at the choice of the shareholders in cash or in stock.
2010:at the choice of the shareholders in cash or in stock.
Proposed Appropriation of Profit millions of euros 2011 2010
Result after taxes -174.3 99.3
Available for dividend payment to holders of cumulative financing preference shares 4.3 4.3
Proposed addition to the reserves -225.9 76.1
Available for cash dividend to holders of common shares 47.3 18.9
Dividend of € 0.70* per common share with a nominal value of € 0.25 47.3 18.9
The corporate Articles of Association lay down the following conditions regarding the appropriation of profit (summary).
Article 21.1 If possible, a dividend shall first be paid from the profit recorded in the adopted financial statements on each cumulative financing preference share in a specific series. This dividend shall be equal to a percentage calculated on the basis of the amount paid on the cumulative financing preference shares.
Article 21.4 If the profit is insufficient the dividend on the cumulative financing preference shares shall be paid from the company reserves, with the exception of the reserves which were formed as share premium reserve upon the issue of the cumulative
financing preference shares. If the dividend cannot be paid from the company reserves, it shall be paid in arrear in subse-quent financial years.
Article 21.7 The Board of Management shall decide subject to the approval of the Supervisory Board which part of the profit is to be reserved after the above provisions have been applied. The remaining profit shall be at the disposal of the General Shareholders Meeting.
Article 21.10 The General Shareholders Meeting may decide upon a proposal by the Board of Management with the approval of the Supervisory Board to pay dividends to shareholders from the distributable equity.
The dividend proposal is stated in the Report of the Board of Management.
Financial Statements | 143
Independent auditor's reportTo: the Shareholder of CSM N.V.
Report on the financial statementsWe have audited the accompanying financial statements 2011 of CSM N.V., Amsterdam. The financial statements include the consolidated financial statements and the company financial statements. The consolidated financial statements comprise the consolidated statement of financial position as at December 31, 2011, the consolidated statements of compre-hensive income, changes in equity and cash flows for the year then ended, and notes, comprising a summary of the signifi-cant accounting policies and other explanatory information presented on pages 93 up to and including 135 of this report. The company financial statements comprise the company balance sheet as at December 31, 2011 the company profit and loss account for the year then ended and the notes, comprising a summary of the accounting policies and other explanatory information presented on pages 136 up to and including 142 of this report.
Management's responsibilityManagement is responsible for the preparation and fair presentation of these financial statements in accordance with International Financial Reporting Standards as adopted by the European Union and with Part 9 of Book 2 of the Dutch Civil Code, and for the preparation of the report of the board of management in accordance with Part 9 of Book 2 of the Dutch Civil Code. Furthermore management is responsible for such internal control as it determines is necessary to enable the preparation of the financial statements that are free from material misstatement, whether due to fraud or error.
Auditor's responsibilityOur responsibility is to express an opinion on these financial statements based on our audit. We conducted our audit in accordance with Dutch law, including the Dutch Standards on Auditing. This requires that we comply with ethical require-ments and plan and perform the audit to obtain reasonable assurance about whether the financial statements are free from material misstatement.An audit involves performing procedures to obtain audit evidence about the amounts and disclosures in the financial statements. The procedures selected depend on the auditor's judgment, including the assessment of the risks of material misstatement of the financial statements, whether due to fraud or error.
In making those risk assessments, the auditor considers internal control relevant to the entity's preparation and fair presen-tation of the financial statements in order to design audit procedures that are appropriate in the circumstances, but not for the purpose of expressing an opinion on the effectiveness of the entity's internal control. An audit also includes evalu-ating the appropriateness of accounting policies used and the reasonableness of accounting estimates made by management, as well as evaluating the overall presentation of the financial statements.We believe that the audit evidence we have obtained is suffi-cient and appropriate to provide a basis for our audit opinion.
Opinion with respect to the consolidated financial statementsIn our opinion, the consolidated financial statements give a true and fair view of the financial position of CSM N.V. as at December 31, 2011 and of its result and its cashflows for the year then ended in accordance with International Financial Reporting Standards as adopted by the European Union and with Part 9 of Book 2 of the Dutch Civil Code.
Opinion with respect to the company financial statementsIn our opinion, the company financial statements give a true and fair view of the financial position of CSM N.V. as at December 31, 2011 and of its result for the year then ended in accordance with Part 9 of Book 2 of the Dutch Civil Code.
Report on other legal and regulatory requirementsPursuant to the legal requirement under Section 2:393 sub 5 at e and f of the Dutch Civil Code, we have no deficiencies to report as a result of our examination whether the report of the board of management, presented on pages 11 up to and including 68, to the extent we can assess, has been prepared in accordance with Part 9 of Book 2 of this Code, and whether the information as required under Section 2:392 sub 1 at b-h has been annexed. Further we report that the report of the board of management, to the extent we can assess, is consistent with the financial statements as required by Section 2:391 sub 4 of the Dutch Civil Code.
Rotterdam, February 20, 2012Deloitte Accountants B.V.
Already signed: G.M. Dekker

144 | CSM Annual Report 2011
M.P.M. de Raad (1945), ChairmanNationality DutchPrevious positions Member Board of Management Koninklijke Ahold N.V. Member Board of Management Metro AG Chairman Board SHV Makro N.V. Member Board SHV Holdings N.V.Supervisory directorships HAL Holding N.V. Metro AG Düsseldorf Vion Holding N.V. Vollenhoven Olie Groep B.V. TiasNimbas Business School, University of Tilburg Chairman Supervisory Board Jeroen Bosch HospitalFirst appointed in 2004Current term of office 2008 – 2012
R.H.P. Markham (1946)Nationality BritishPrevious positions Executive Director and Chief Finance Officer Unilever N.V.Supervisory directorships Non-Executive Director of Legal and General Plc (UK) Non-Executive Director of United Parcel Services Inc. (UK) Non-Executive Director of Astra Zeneca Plc (UK) Non-Executive Director of Standard Chartered Plc (UK)Additional positions Member of the Board of the Financial Reporting Council (UK) Chairman of the Board of Moorfield Eye Hospital NHS Foundation Trust (UK)First appointed in 2010Current term of office 2010 – 2014
J.P. de Kreij (1959)Nationality DutchPosition Vice Chairman Executive Board & Chief Financial Officer of Royal Vopak N.V.Supervisory directorships Member Supervisory Board Evides N.V.Additional positions Member Advisory Council of the Listed Companies of NSYE Euronext First appointed in 2011Current term of office 2011 – 2015
Brief Resumés of the Members of the Supervisory Board
per 31.12.2011

Financial Statements | 145
R. Pieterse (1942)Nationality DutchPrevious position Chairman Board of Management Wolters Kluwer N.V.Supervisory directorships Chairman Koninklijke Grolsch N.V. Chairman Mercurius Groep B.V. Non-executive director board SABMiller plcAdditional positions Board member of various FoundationsFirst appointed in 2004Current term of office 2008 – 2012
W. Spinner (1948)Nationality GermanPrevious position Member Board of Management Bayer AGSupervisory directorships Member Altana AG, Wesel (Germany) Chairman ROESER GmbH Bochum (Germany) Chairman CABB International GmbH, Sulzbach (Germany) Member The Zuellig Group International Hong KongFirst appointed in 2004Current term of office 2011 – 2015

146 | CSM Annual Report 2011
G.J. Hoetmer (1956), Chief Executive Officer Nationality DutchPrevious position Senior Vice President Supply Chain Unilever Foods, member of Unilever Foods Executive, Leader of Unilever’s global overheads and organization
restructuring.Additional position(s) Chairman Spieren voor Spieren FoundationFirst appointed in May 2005Current term of office 2009 – 2013
N.J.M. Kramer (1959), Chief Financial OfficerNationality DutchPrevious position (Interim) Director Finance Vroom & Dreesmann, CFO and member of the Executive Board Wessanen NVFirst appointed in April 2006Current term of office 2010 – 2014
Brief Resumés of the Members of the Board of Management
Company Secretary
J.W.E. van der Klaauw (1955)Nationality DutchEmployed since August 1986
per 31.12.2011

Financial Statements | 147
Group Structure
CSM nv
CSM Bakery Supplies Europe CSM Bakery Supplies North America Purac
Main Product Groups
Bakery ingredients and products Bakery ingredients and products Lactic acid and lactic acid derivatives
Operating Companies
CSM Austria BakeMark Ingredients Canada Purac America
CSM Benelux BakeMark USA Purac Argentina
CSM China Caravan Ingredients Purac Asia Pacific
CSM Deutschland CSM Bakery Products NA Purac biochem
CSM France CSM Bakery Supplies Latin America Purac bioquímica
CSM Hellas CSM Bakery Supplies Mexicana Purac China
CSM Ibérica Purac Deutschland
CSM International Purac France
CSM Italia Purac Hungary
CSM Japan Purac India
CSM Magyarország Purac Japan
CSM Nordic Purac Korea
CSM Polska Purac Mexico
CSM Romania Purac Polska
CSM Russia Purac Russia
CSM Tunisia Purac sínteses
CSM Turkey Purac Thailand
CSM UK
Kate’s Cakes
MARGO CSM Schweiz
As at 20 February 2012

148 | CSM Annual Report 2011
Five Years in Figures
millions of euros 2011 2010 2009 2008 2007
Continuing operations *
Net sales 3,113 2,990 2,556 2,599 2,486
EBITA excluding exceptional items/one-off costs 151 215 151 133 154
EBITA 130 194 151 113 65
Operating result -150 158 143 107 60
EBITDA excluding exceptional items/one-off costs 223 287 212 193 215
Result after taxes -174 99 87 90 56
Earnings per common share in euros 1 -2.64 1.41 1.25 1.32 0.82
Diluted earnings per common share in euros 1 -2.64 1.40 1.25 1.32 0.81
Cash flow from operating activities 148 189 277 99 143
Cash flow from operating activities per common share. in euros 1** 2.13 2.73 4.15 1.48 2.15
Depreciation/amortization fixed assets 103 107 69 66 66
Capital expenditure on fixed assets 92 83 47 64 116
EBITA margin % 2 4.2 6.5 5.9 4.4 2.6
Result after taxes/net sales % -5.6 3.3 3.4 3.5 2.3
ROCE % 3 5.9 9.1 8.2 6.2 3.6
Number of employees at closing date 9,843 9,664 8,430 8,433 8,726
Total operations
Income Statement
Result after taxes -174 99 87 90 203
Balance Sheet
Non-current assets 1,559 1,791 1,330 1,361 1,373
Current assets 740 718 554 662 638
Non-interest-bearing current liabilities 479 483 386 381 415
Net debt position 4 616 631 328 528 456
Provisions 257 277 171 172 182
Equity 948 1,117 998 942 958
Key data per common share
Number of issued common shares 67,658,699 65,998,134 64,977,416 62,031,279 66,331,279
Number of common shares with dividend rights 67,580,372 65,873,803 64,828,082 61,868,026 61,802,201
Weighted average number of outstanding common shares ** 67,557,754 67,515,917 65,837,383 64,795,388 65,280,284
Price as at 31 December 12.08 26.19 18.38 11.50 23.10
Highest price in calendar year 26.88 26.27 18.68 25.90 29.72
Lowest price in calendar year 9.25 18.55 7.97 9.43 22.35
Market capitalization as at 31 December 816 1,725 1,192 711 1,428
Earnings in euros ** -2.64 1.41 1.25 1.32 3.06
Diluted earnings in euros ** -2.64 1.40 1.25 1.32 3.05

Financial Statements | 149
* The previous years are not restated for discontinued operations later on.
**Only the preceding year is restated for stock dividend. 1 Per common share in euros after deduction of dividend on cumulative preference shares.2 EBITA margin % is EBITA divided by net sales x 100.
3 ROCE % is EBITA for the year divided by the average capital employed x 100. The goodwill included in capital employed relates to management goodwill, being the goodwill capital-ized and the goodwill charged directly to equity since 1978, the year when CSM started its diversification process.
4 Net debt position comprises interest-bearing debts less cash and cash equivalents.
5 Equity per share is equity divided by the number of shares with dividend rights.
6 EBITDA is "Earnings Before Interest, Taxes, Depreciation, Amortization and Impairment of intangible fixed assets", here including acquisition and divestment effects recalculated for the full year and excluding exceptional items/one-off costs.
7 Interest cover is EBITDA as defined in Note 6 divided by net interest income and charges.
millions of euros 2011 2010 2009 2008 2007
Other key data
Number of employees at closing date 9,843 9,664 8,430 8,433 8,726
Number of issued cumulative preference shares 2,983,794 2,983,794 2,983,794 2,983,794 2,983,794
Equity per share in euros 5 13.44 16.22 14.71 14.52 14.78
Ratios
Net debt position/EBITDA 6 2.8 2.1 1.6 2.8 2.1
Interest cover 7 7.6 9.7 8.0 7.1 8.5
Balance sheet total : equity 1:0.4 1:0.4 1:0.5 1:0.4 1:0.5
Net debt position : equity 1:1.5 1:1.8 1:3.0 1:1.8 1:2.1
Current assets : current liabilities 1:0.6 1:0.6 1:0.6 1:0.5 1:0.6

150 | CSM Annual Report 2011
Share CapitalCSM nv is listed on NYSE Euronext Amsterdam N.V.As at 31 December 2012 67,658,699 common shares of € 0.25 each and 2,983,794 financing preference of € 0.25 each had been issued, including 78,327 common shares with CSM nv.
Substantial Holding and Shares with Special Rights as meant in Part 5.3.3 WFT, Part 1Under the Listed Companies Disclosure Act of 2006, the
Other Information 2011 2010 2009 2008
Number of common shares with dividend rights x 1,000
as at 31 December 67,580 65,874 64,828 61,868
Market capitalization in millions of euros as at 31 December 816 1,725 1,192 711
Highest share price 26.88 26.27 18.68 25.90
Lowest share price 9.25 18.55 7.97 9.43
Share price as at 31 December 12.08 26.19 18.38 11.50
Average daily turnover of shares 414,275 320,656 288,791 372,167
Information on the CSM Share
following notifications of capital interest in CSM as at 31 December 2011 were reported:
• ASR Nederland N.V. 6.68%• ING Groep N.V. 10.59%• Lansdowne Partners Limited 10.15%
N.B.: As at 20 February 2012 CSM nv has a capital interest of 0.1%.

Movement in price of CSM shares from 2 January 2007 to 31 December 2011 (per share of € 0.25; 2 January 2007 = 100%)Midkap index (2 January 2007 = 100%)
Financial Statements | 151
Important Dates *
7 May 2012 General Shareholders Meeting9 May 2012 Ex date11 May 2012 Record Date30 May 2012 Dividend payable for 201124 April 2012 Publication of the interim management statement first quarter 20128 August 2012 Publication of half-year figures 201225 October 2012 Publication of the interim management statement third quarter 20126 May 2013 General Shareholders Meeting
* subject to change
100%
2010 2011200920082007
Trend in the Share Price
80%
60%
40%
20%
0%
120%

Colophon
Design/artwork Monter, AmsterdamPhotography Sander Foederer, Den HaagPrinting drukkerij Practicum, Soest