Embed Size (px)
DESCRIPTION
SINTEF Offshore Blowout Database
Citation preview
SINTEF REPORT TITLE
Blowout and Well Release Characteristics and Frequencies,
2011
SINTEF Technology and Society Safety Research
Address: NO-7465 Trondheim, NORWAY Location: S P Andersens veg 5 Telephone: +47 73 59 27 56 Fax: +47 73 59 28 96 Enterprise No.: NO 948 007 029 MVA
AUTHOR(S)
Per Holand, ExproSoft
CLIENT(S)
Multiclient
REPORT NO. CLASSIFICATION CLIENTS REF.
SINTEF F21297 Confidential Espen Fyhn Nilsen, Statoil
CLASS. THIS PAGE ISBN PROJECT NO. NO. OF PAGES/APPENDICES
Open 60S067 85/1
ELECTRONIC FILE CODE PROJECT MANAGER (NAME, SIGN.) CHECKED BY (NAME, SIGN.)
\\Bombay\es201016\BLOWOUT\Tekst 2011\Annual report 2011 SINTEF Offshore Blowout Database Final.docx
Per Holand Lars Bodsberg
FILE CODE DATE APPROVED BY (NAME, POSITION, SIGN.)
2011-12-29 Lars Bodsberg, Research Director
ABSTRACT
This report is based on the 2011 Version of the SINTEF Offshore Blowout Database. The report gives
an overview of offshore blowout and well release characteristics and frequencies.
Blowout data from the US Gulf of Mexico Outer Continental Shelf, the Norwegian waters, and the UK
waters from the period 1980-01-01 until 2009-12-31 have been focused on.
KEYWORDS ENGLISH NORWEGIAN
GROUP 1
Marine Technology
Marin Teknikk
GROUP 2
Offshore
Offshore
SELECTED BY AUTHOR
Risk
Risiko
Blowout
Utblåsning
Frequencies
Frekvenser

Blowout and Well Release Characteristics and Frequencies, 2011 version Page: 3
PREFACE
This report is based on the SINTEF Offshore Blowout Database, version 2011. The intention
of the report is to give an overview of blowout/well release characteristics and frequencies,
and not to analyse and evaluate the different blowout types. The format of the report is
similar to the report that was issued last year.
Three new tables concerning drilling rig type vs. water depth have been added. Table 2.8,
page 19 (concerning incident occurrences), and Table 6.7 and Table 6.8 on page 68 and 69
(concerning exposure data).
A new Phase of operation has been defined. The new phase is “other”. This phase was
defined because a couple of incidents have been observed were abandoned wells having
developed leaks after many years.
A new Installation type has been defined. The new installation type is “other”. This
installation type was defined because one incident occurred during well intervention with a
service vessel.
Appendix 1 to this report lists criteria used for the database fields in general.
Some key updates from 2010 version
Software
Some minor bug fixes have been carried out.
Exposure data
The exposure data has been updated also to include the 2009 exposure data.
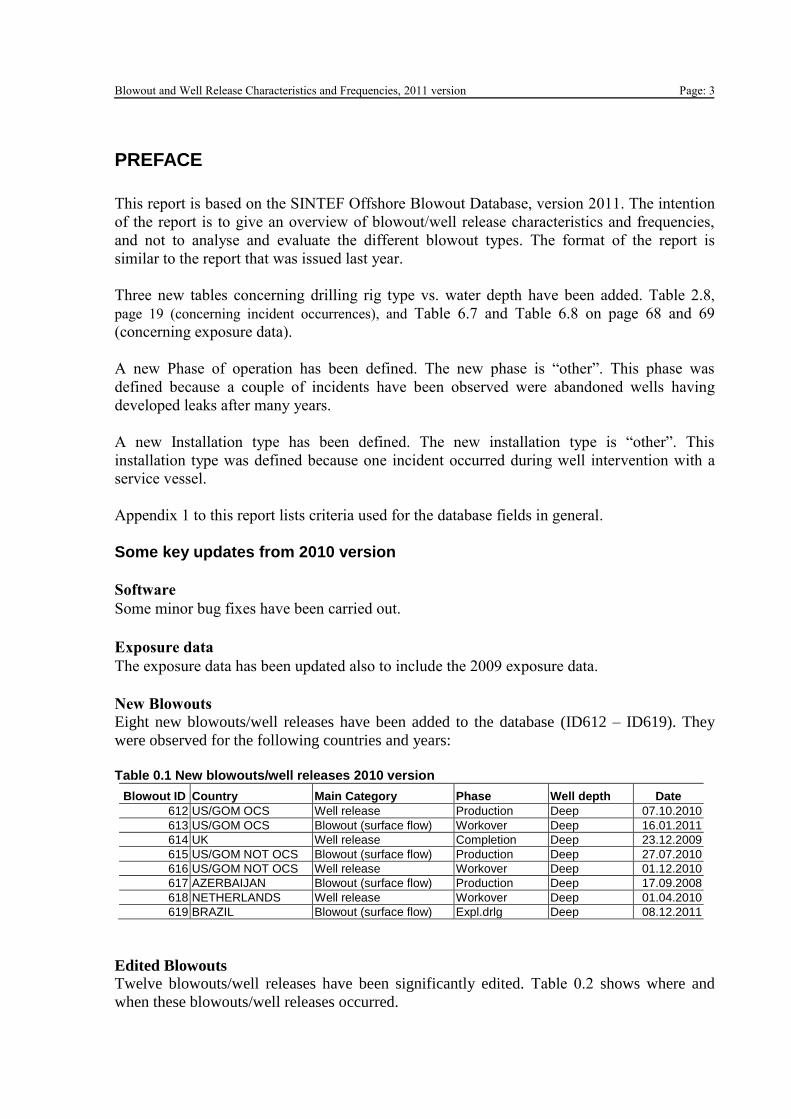
New Blowouts
Eight new blowouts/well releases have been added to the database (ID612 – ID619). They
were observed for the following countries and years:
Table 0.1 New blowouts/well releases 2010 version
Blowout ID Country Main Category Phase Well depth Date
612 US/GOM OCS Well release Production Deep 07.10.2010
613 US/GOM OCS Blowout (surface flow) Workover Deep 16.01.2011
614 UK Well release Completion Deep 23.12.2009
615 US/GOM NOT OCS Blowout (surface flow) Production Deep 27.07.2010
616 US/GOM NOT OCS Well release Workover Deep 01.12.2010
617 AZERBAIJAN Blowout (surface flow) Production Deep 17.09.2008
618 NETHERLANDS Well release Workover Deep 01.04.2010
619 BRAZIL Blowout (surface flow) Expl.drlg Deep 08.12.2011
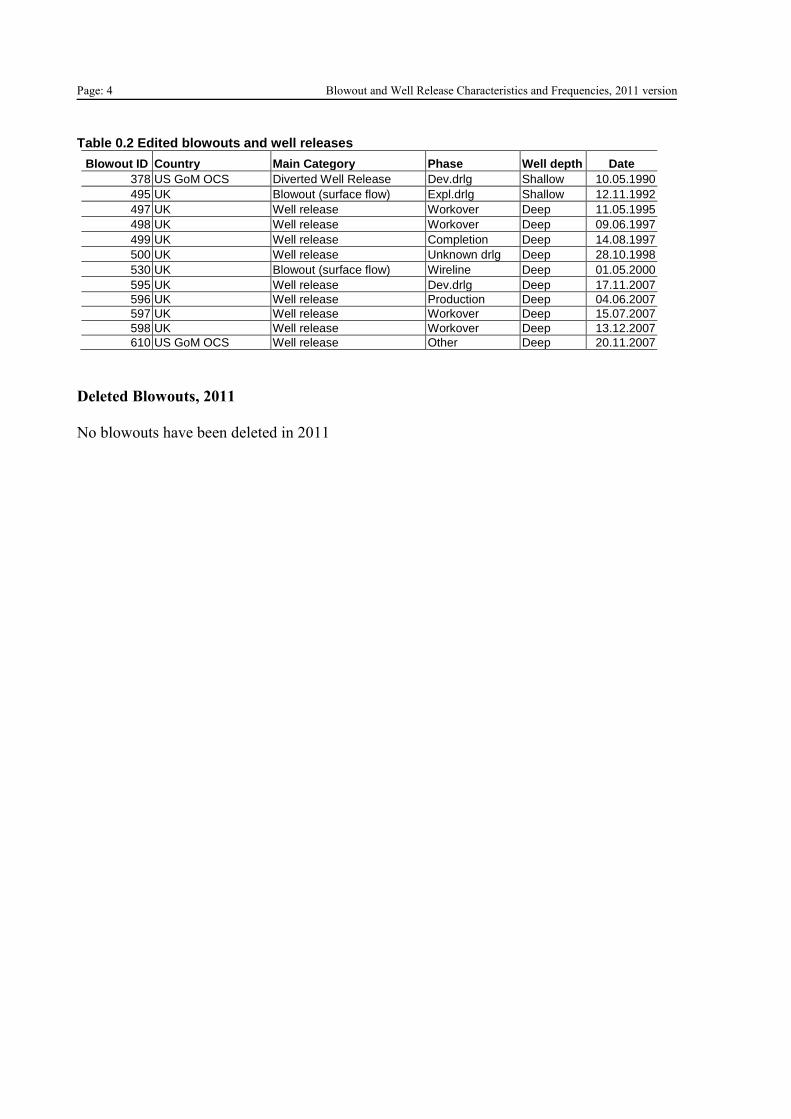
Edited Blowouts
Twelve blowouts/well releases have been significantly edited. Table 0.2 shows where and
when these blowouts/well releases occurred.
Page: 4 Blowout and Well Release Characteristics and Frequencies, 2011 version
Table 0.2 Edited blowouts and well releases
Blowout ID Country Main Category Phase Well depth Date
378 US GoM OCS Diverted Well Release Dev.drlg Shallow 10.05.1990
495 UK Blowout (surface flow) Expl.drlg Shallow 12.11.1992
497 UK Well release Workover Deep 11.05.1995
498 UK Well release Workover Deep 09.06.1997
499 UK Well release Completion Deep 14.08.1997
500 UK Well release Unknown drlg Deep 28.10.1998
530 UK Blowout (surface flow) Wireline Deep 01.05.2000
595 UK Well release Dev.drlg Deep 17.11.2007
596 UK Well release Production Deep 04.06.2007
597 UK Well release Workover Deep 15.07.2007
598 UK Well release Workover Deep 13.12.2007
610 US GoM OCS Well release Other Deep 20.11.2007
Deleted Blowouts, 2011
No blowouts have been deleted in 2011
Blowout and Well Release Characteristics and Frequencies, 2011 version Page: 5
LIST OF CONTENTS
PREFACE ..................................................................................................................................................... 3
1. ABOUT THE DATABASE ................................................................................................................................ 7
1.1 PARTICIPANTS ................................................................................................................................................... 7 1.2 DATABASE STRUCTURE ....................................................................................................................................... 7 1.3 IMPORTANT DEFINITIONS .................................................................................................................................... 9 1.4 CATEGORY AND SUB-CATEGORY ......................................................................................................................... 10 1.5 PHASE OF OPERATION ....................................................................................................................................... 11 1.6 NORTH SEA STANDARDS ................................................................................................................................... 11
2. OVERVIEW OF BLOWOUTS/WELL RELEASES INCLUDED IN THE DATABASE ................................................ 13
2.1 INTRODUCTION ............................................................................................................................................... 13 2.2 DATA QUALITY ................................................................................................................................................ 13 2.3 OVERVIEW OF COUNTRIES REPRESENTED IN THE DATABASE ..................................................................................... 14 2.4 DURING WHAT OPERATIONAL PHASES DO BLOWOUTS/WELL RELEASES OCCUR? ......................................................... 16 2.5 NO. OF BLOWOUTS/WELL RELEASES PER YEAR ...................................................................................................... 17 2.6 WATER DEPTH VS. BLOWOUTS/WELL RELEASES..................................................................................................... 18 2.7 INSTALLATION TYPE VS. WATER DEPTH FOR DRILLING INCIDENTS ............................................................................... 18
3. BLOWOUTS VS. WELL RELEASES ................................................................................................................ 21
4. OVERALL BLOWOUT/WELL RELEASE EXPERIENCE ...................................................................................... 23
4.1 BLOWOUT/WELL RELEASE VS. FLOW MEDIUM ..................................................................................................... 23 4.2 BLOWOUT/WELL RELEASE VS. FLOW-RATES ......................................................................................................... 24 4.3 SEVERITY ....................................................................................................................................................... 24 4.4 IGNITION OF BLOWOUTS/WELL RELEASES ............................................................................................................ 24 4.5 BLOWOUT/WELL RELEASE DURATION ................................................................................................................. 26 4.6 BLOWOUT/WELL RELEASE FLOW-PATHS AND RELEASE POINTS ................................................................................ 27 4.7 BLOWOUT/WELL RELEASE CAUSES ..................................................................................................................... 31 4.8 OPERATIONS AND ACTIVITIES WHEN BLOWOUT/WELL RELEASE OCCURS .................................................................... 35 4.9 EXPLORATION WILDCATS VS. EXPLORATION APPRAISAL BLOWOUTS/WELL RELEASES .................................................... 39 4.10 BLOWOUTS FROM AUSTRALIA, CANADA EAST COAST, THE NETHERLANDS, AND US/CALIFORNIA OCS .......................... 39
5. “NORMAL” DRILLING AND PRODUCTION EXPOSURE DATA ....................................................................... 41
5.1 DRILLING EXPOSURE DATA ................................................................................................................................ 41 5.1.1 US GoM OCS ....................................................................................................................................... 41 5.1.2 United Kingdom .................................................................................................................................. 43 5.1.3 Norway ............................................................................................................................................... 43 5.1.4 The Netherlands ................................................................................................................................. 46 5.1.5 Canadian East Coast ........................................................................................................................... 47 5.1.6 US Pacific OCS ..................................................................................................................................... 49 5.1.7 Australia ............................................................................................................................................. 50 5.1.8 Denmark ............................................................................................................................................. 52 5.1.9 Compiled Drilling Exposure Data ........................................................................................................ 52
5.2 PRODUCTION EXPOSURE DATA ........................................................................................................................... 54 5.2.1 US GoM OCS ....................................................................................................................................... 54 5.2.2 United Kingdom .................................................................................................................................. 55 5.2.3 Norway ............................................................................................................................................... 56 5.2.4 US Pacific OCS ..................................................................................................................................... 57 5.2.5 Compiled Production Exposure Data .................................................................................................. 58
6. VARIOUS EXPOSURE DATA ........................................................................................................................ 61
6.1 WELL DEPTH RELATED EXPOSURE DATA .............................................................................................................. 61 6.1.1 US GoM OCS Wells .............................................................................................................................. 61 6.1.2 Norwegian Wells ................................................................................................................................ 62
6.2 WATER DEPTH RELATED DRILLING EXPOSURE DATA ............................................................................................... 64
Page: 6 Blowout and Well Release Characteristics and Frequencies, 2011 version
6.3 DRILLING INSTALLATION TYPE VS. WELL TYPE AND WATER DEPTH ............................................................................. 68 6.4 SHUT-IN WELLHEAD PRESSURE RELATED EXPOSURE DATA ...................................................................................... 69
6.4.1 US GoM OCS Drilling Wells ................................................................................................................ 69 6.4.2 Norwegian Drilling Wells ................................................................................................................... 71 6.4.3 US GoM OCS Wells in Production ....................................................................................................... 72
6.5 PRODUCTION RATES AND GAS OIL RATIO DATA, US GOM OCS .............................................................................. 73 6.5.1 Production Rates ................................................................................................................................ 73 6.5.2 Gas Oil Ratio ...................................................................................................................................... 75
6.6 WORKOVER FREQUENCY EXPOSURE DATA ........................................................................................................... 76 6.7 WIRELINE FREQUENCY EXPOSURE DATA .............................................................................................................. 77 6.8 COILED TUBING AND SNUBBING EXPOSURE DATA ................................................................................................. 78
7. OVERALL BLOWOUT/WELL RELEASE FREQUENCIES ................................................................................... 81
REFERENCES .................................................................................................................................................. 85
APPENDIX 1 BLOWOUT DATABASE STRUCTURE AND CODING ........................................................................ I
A1. OVERALL DATABASE STRUCTURE .......................................................................................................................... II A2. DESCRIPTION OF DATABASE FIELDS AND ASSOCIATED CODES .................................................................................... IV FIELD 3 CATEGORY ......................................................................................................................................... IV FIELD 4 SUB CATEGORY ....................................................................................................................................V FIELD 5 COUNTRY .......................................................................................................................................... VI FIELD 10 INSTALLATION TYPE ............................................................................................................................. VI FIELD 12 WELL STATUS ..................................................................................................................................... VI FIELD 18 MTSIP (MAKS THEORETIC SHUTIN WH PRESSURE) ................................................................................. VI FIELD 24 ROCK TYPE ...................................................................................................................................... VIII FIELD 25 FORMATION AGE .............................................................................................................................. VIII FIELD 27 PHASE ............................................................................................................................................. VIII FIELD 28 OPERATION ....................................................................................................................................... IX FIELD 29 ACTIVITY ........................................................................................................................................... XI FIELD 30 EXTERNAL CAUSE ............................................................................................................................... XII FIELD 31 LOSS OF BARRIER 1 ............................................................................................................................ XII FIELD 32 LOSS OF BARRIER 2 ........................................................................................................................... XIV FIELD 34 NORTH SEA STANDARDS .................................................................................................................... XIV FIELD 35 FLOWPATH ....................................................................................................................................... XV FIELD 36 RELEASE POINT .................................................................................................................................. XV FIELD 37 FLOW MEDIUM ................................................................................................................................ XVI FIELD 41 IGNITION TYPE.................................................................................................................................. XVI FIELD 42 CONSEQUENCE CLASS ....................................................................................................................... XVII FIELD 44 POLLUTION ..................................................................................................................................... XVII FIELD 48 CONTROL METHOD .......................................................................................................................... XVII FIELD 50 DATA QUALITY ................................................................................................................................ XVII
Blowout and Well Release Characteristics and Frequencies, 2011 version Page: 7
1. About the Database
1.1 Participants
The SINTEF Offshore Blowout Database was initiated in 1984. There are two new
participants in 2011, URS Energy and Construction, Inc and Maersk Drilling. One
participant, Mide Technology Corporation, has left the project. By December 2 2011 the
following companies were sponsoring the database:
1. Statoil
2. BP Norge
3. Safetec Nordic A/S
4. Total E&P Norge AS
5. Scandpower AS
6. Shell Research Limited
7. DNV
8. Lilleaker Consulting a.s.
9. Eni Norge AS
10. ConocoPhillips Norge
11. BHP Billiton
12. Torus Insurance Marketing Limited
13. Husky Energy
14. AconaWellpro AS
15. Proactima
16. URS Energy and Construction, Inc
17. Maersk Drilling
1.2 Database Structure
The SINTEF Offshore Blowout Database includes blowout/well release descriptions, drilling
and production exposure data for certain areas in the world.
Blowout/ well release descriptions
The database contains 51 different fields describing each blowout/well release. The various
fields are grouped in six different groups. They are:
1. Category and location
2. Well description
3. Present operation
4. Blowout causes
5. Blowout Characteristics
6. Other
Page: 8 Blowout and Well Release Characteristics and Frequencies, 2011 version
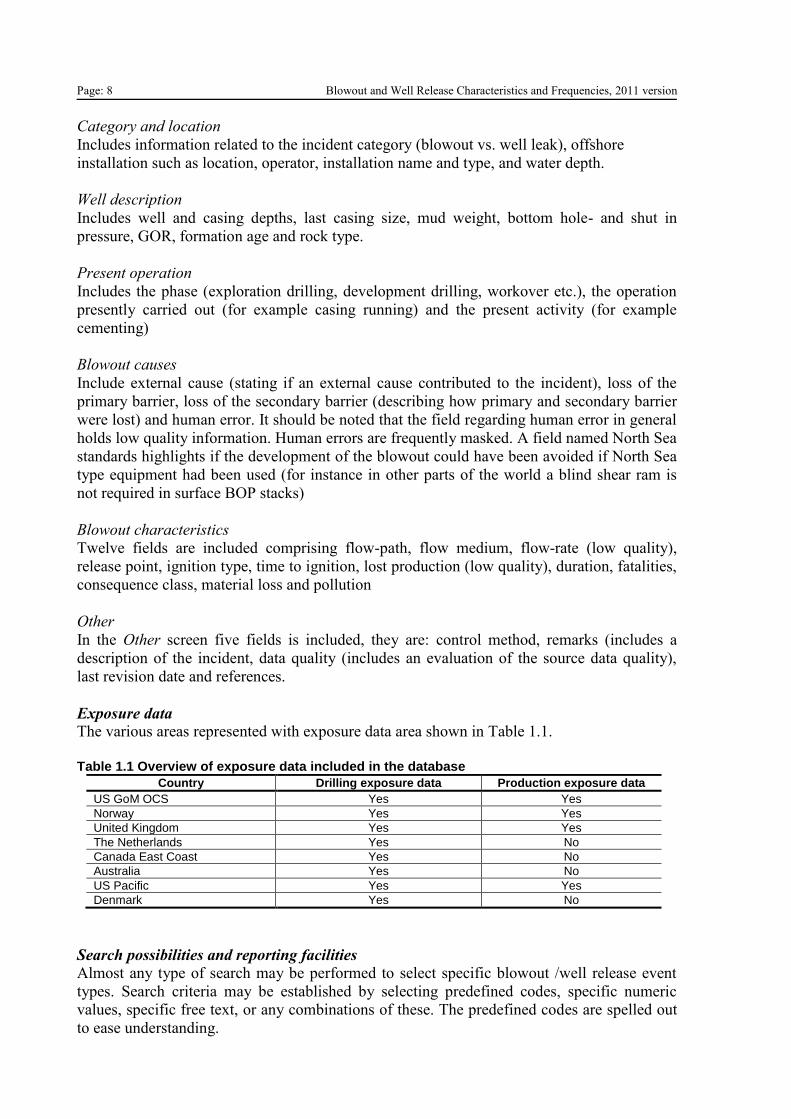
Category and location
Includes information related to the incident category (blowout vs. well leak), offshore
installation such as location, operator, installation name and type, and water depth.
Well description
Includes well and casing depths, last casing size, mud weight, bottom hole- and shut in
pressure, GOR, formation age and rock type.
Present operation
Includes the phase (exploration drilling, development drilling, workover etc.), the operation
presently carried out (for example casing running) and the present activity (for example
cementing)
Blowout causes
Include external cause (stating if an external cause contributed to the incident), loss of the
primary barrier, loss of the secondary barrier (describing how primary and secondary barrier
were lost) and human error. It should be noted that the field regarding human error in general
holds low quality information. Human errors are frequently masked. A field named North Sea
standards highlights if the development of the blowout could have been avoided if North Sea
type equipment had been used (for instance in other parts of the world a blind shear ram is
not required in surface BOP stacks)
Blowout characteristics
Twelve fields are included comprising flow-path, flow medium, flow-rate (low quality),
release point, ignition type, time to ignition, lost production (low quality), duration, fatalities,
consequence class, material loss and pollution
Other
In the Other screen five fields is included, they are: control method, remarks (includes a
description of the incident, data quality (includes an evaluation of the source data quality),
last revision date and references.
Exposure data
The various areas represented with exposure data area shown in Table 1.1.
Table 1.1 Overview of exposure data included in the database
Country Drilling exposure data Production exposure data
US GoM OCS Yes Yes
Norway Yes Yes
United Kingdom Yes Yes
The Netherlands Yes No
Canada East Coast Yes No
Australia Yes No
US Pacific Yes Yes
Denmark Yes No
Search possibilities and reporting facilities
Almost any type of search may be performed to select specific blowout /well release event
types. Search criteria may be established by selecting predefined codes, specific numeric
values, specific free text, or any combinations of these. The predefined codes are spelled out
to ease understanding.
Blowout and Well Release Characteristics and Frequencies, 2011 version Page: 9
The database program counts and presents the events satisfying the search criteria. The
selected data may be viewed, printed or copied to separate Excel files for further analyses.
The exposure data and the blowout data are not linked. Blowout frequencies can therefore not
directly be established.
1.3 Important Definitions
The following main definitions have been utilised when categorising the blowouts/well
releases in categories and sub-categories.
Blowout definition
NPD came up with a blowout definition in their proposal for the new regulations.
(“Aktivitetsforskriften, eksternt høringsutkast av 3.7.2000, høringsfrist 3.11.2000”).
Med utblåsing som nevnt i denne paragrafen første ledd, menes formasjonsfluid som
strømmer ut av brønnen eller mellom formasjonslagene etter at alle definerte tekniske
brønnbarrierer eller operasjon av disse har sviktet.
Translated to English the definition will be:
A blowout is an incident where formation fluid flows out of the well or between
formation layers after all the predefined technical well barriers or the activation of
the same have failed.
The definition has however not become a part of the Petroleum Safety Authority Norway
regulation, but remains the database blowout definition.
Well release definition: The reported incident is a well release if oil or gas flowed from the
well from some point were flow was not intended and the flow was stopped by use of the
barrier system that was available on the well at the time the incident started.
Shallow gas definition: Any gas zone penetrated before the BOP has been installed. Any
zone penetrated after the BOP is installed is not shallow gas (typical Norwegian definition of
shallow gas).
All shallow gas incidents in the database have at the extent possible been categorised
according to the typical Norwegian definition of shallow gas. This definition is not relevant
for all US GoM incidents because:
US GoM OCS reservoirs vary highly in depth. Some reservoirs were as shallow as
200 meters.
For some incidents they had sat a full BOP stack, but had no intention to use it
because it would likely cause a blowout outside the casing and a possible crater.
For some incidents they had drilled very deep without running an extra casing string
and the BOP.
And for some incident they had used a combination of a BOP and a diverter.
Page: 10 Blowout and Well Release Characteristics and Frequencies, 2011 version
Further, for many of the incidents the description of the incident in the sources is insufficient,
and some assumptions have to be made. A general comment is that it is not easy to categorise
all the incidents in shallow and deep incidents because of the above.
It should further be noted that it is in many cases difficult to determine if a shallow gas
incident shall be regarded as a blowout or not. In February 2007 a report was published,
named “Shallow Gas Project, Shallow gas events 1984 – 2006 in the Norwegian Sector”, by
AGR – Triangle. The report was prepared for the Petroleum Safety Authority Norway. This
report describes 44 shallow gas events. These 44 events have been reviewed, and some
blowouts were added to the database, and many incidents were disregarded. Typically
incidents that were reported with a strong seafloor flow, or the diverter was used, were
regarded as blowouts. Incidents only referring to gas bubbles were disregarded. This report is
enclosed the West Vanguard Blowout (Blowout ID 278) in the database.
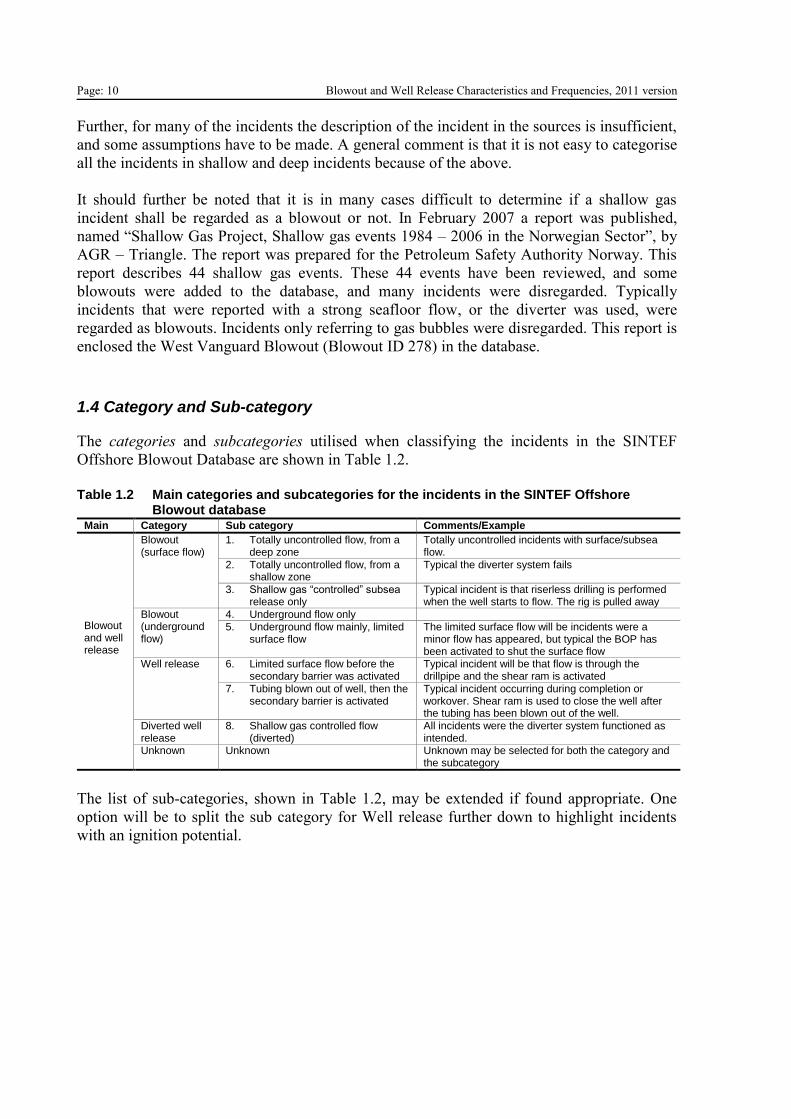
1.4 Category and Sub-category
The categories and subcategories utilised when classifying the incidents in the SINTEF
Offshore Blowout Database are shown in Table 1.2.
Table 1.2 Main categories and subcategories for the incidents in the SINTEF Offshore
Blowout database Main Category Sub category Comments/Example
Blowout and well release
Blowout (surface flow)
1. Totally uncontrolled flow, from a deep zone
Totally uncontrolled incidents with surface/subsea flow.
2. Totally uncontrolled flow, from a shallow zone
Typical the diverter system fails
3. Shallow gas “controlled” subsea release only
Typical incident is that riserless drilling is performed when the well starts to flow. The rig is pulled away
Blowout (underground flow)
4. Underground flow only 5. Underground flow mainly, limited
surface flow The limited surface flow will be incidents were a minor flow has appeared, but typical the BOP has been activated to shut the surface flow
Well release 6. Limited surface flow before the secondary barrier was activated
Typical incident will be that flow is through the drillpipe and the shear ram is activated
7. Tubing blown out of well, then the secondary barrier is activated
Typical incident occurring during completion or workover. Shear ram is used to close the well after the tubing has been blown out of the well.
Diverted well release
8. Shallow gas controlled flow (diverted)
All incidents were the diverter system functioned as intended.
Unknown Unknown Unknown may be selected for both the category and the subcategory
The list of sub-categories, shown in Table 1.2, may be extended if found appropriate. One
option will be to split the sub category for Well release further down to highlight incidents
with an ignition potential.
Blowout and Well Release Characteristics and Frequencies, 2011 version Page: 11
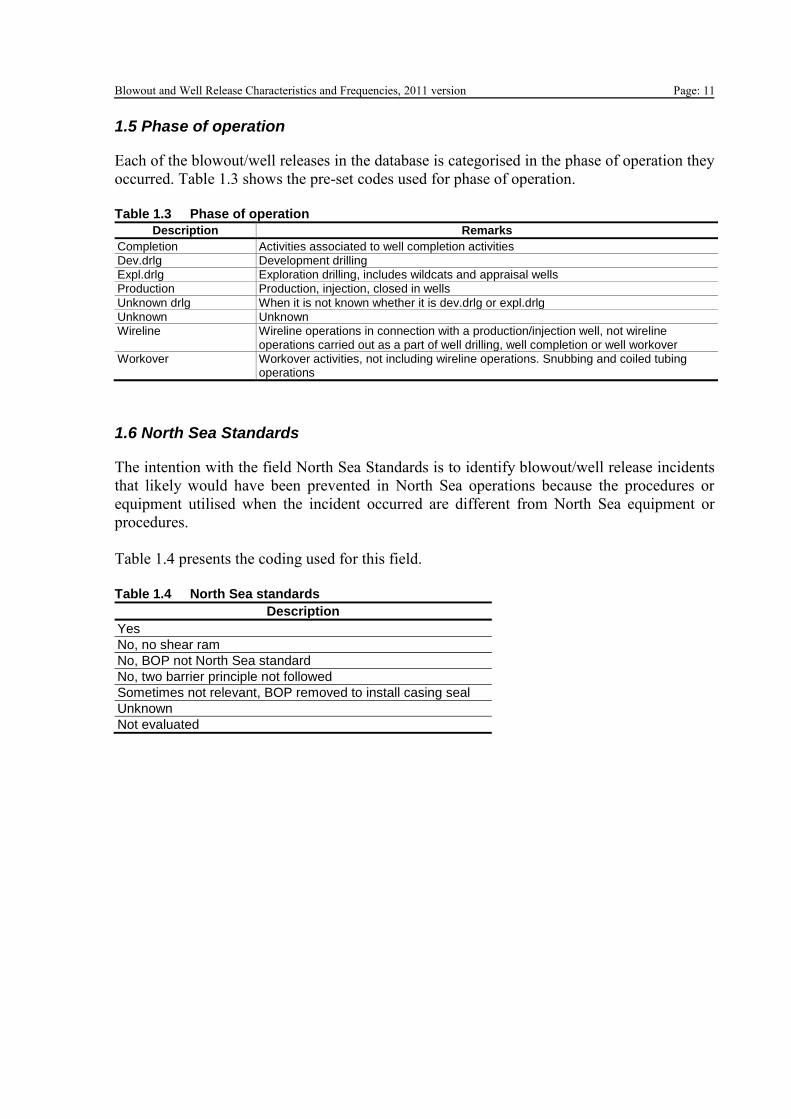
1.5 Phase of operation
Each of the blowout/well releases in the database is categorised in the phase of operation they
occurred. Table 1.3 shows the pre-set codes used for phase of operation.
Table 1.3 Phase of operation
Description Remarks
Completion Activities associated to well completion activities
Dev.drlg Development drilling
Expl.drlg Exploration drilling, includes wildcats and appraisal wells
Production Production, injection, closed in wells
Unknown drlg When it is not known whether it is dev.drlg or expl.drlg
Unknown Unknown
Wireline Wireline operations in connection with a production/injection well, not wireline operations carried out as a part of well drilling, well completion or well workover
Workover Workover activities, not including wireline operations. Snubbing and coiled tubing operations
1.6 North Sea Standards
The intention with the field North Sea Standards is to identify blowout/well release incidents
that likely would have been prevented in North Sea operations because the procedures or
equipment utilised when the incident occurred are different from North Sea equipment or
procedures.
Table 1.4 presents the coding used for this field.
Table 1.4 North Sea standards
Description
Yes
No, no shear ram
No, BOP not North Sea standard
No, two barrier principle not followed
Sometimes not relevant, BOP removed to install casing seal
Unknown
Not evaluated

Page: 12 Blowout and Well Release Characteristics and Frequencies, 2011 version
Blowout and Well Release Characteristics and Frequencies, 2011 version Page: 13
2. Overview of Blowouts/Well releases Included in the Database
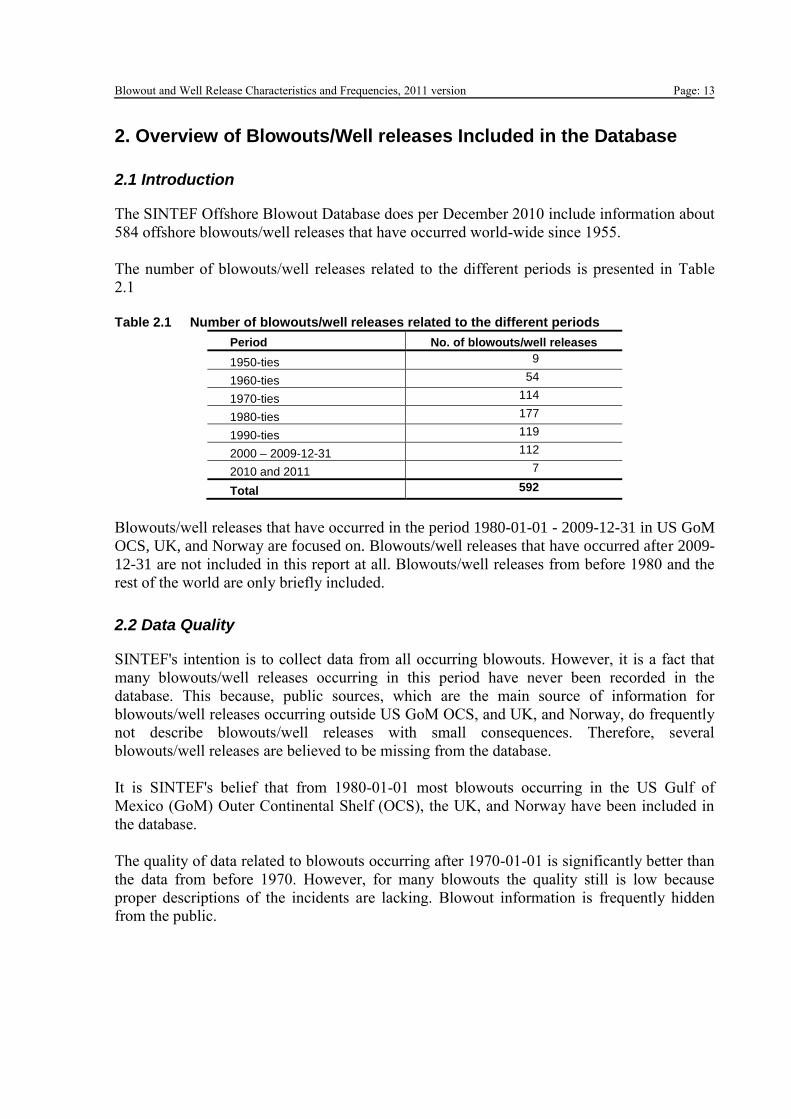
2.1 Introduction
The SINTEF Offshore Blowout Database does per December 2010 include information about
584 offshore blowouts/well releases that have occurred world-wide since 1955.
The number of blowouts/well releases related to the different periods is presented in Table
2.1
Table 2.1 Number of blowouts/well releases related to the different periods
Period No. of blowouts/well releases
1950-ties 9
1960-ties 54
1970-ties 114
1980-ties 177
1990-ties 119
2000 – 2009-12-31 112
2010 and 2011 7
Total 592
Blowouts/well releases that have occurred in the period 1980-01-01 - 2009-12-31 in US GoM
OCS, UK, and Norway are focused on. Blowouts/well releases that have occurred after 2009-
12-31 are not included in this report at all. Blowouts/well releases from before 1980 and the
rest of the world are only briefly included.
2.2 Data Quality
SINTEF's intention is to collect data from all occurring blowouts. However, it is a fact that
many blowouts/well releases occurring in this period have never been recorded in the
database. This because, public sources, which are the main source of information for
blowouts/well releases occurring outside US GoM OCS, and UK, and Norway, do frequently
not describe blowouts/well releases with small consequences. Therefore, several
blowouts/well releases are believed to be missing from the database.
It is SINTEF's belief that from 1980-01-01 most blowouts occurring in the US Gulf of
Mexico (GoM) Outer Continental Shelf (OCS), the UK, and Norway have been included in
the database.
The quality of data related to blowouts occurring after 1970-01-01 is significantly better than
the data from before 1970. However, for many blowouts the quality still is low because
proper descriptions of the incidents are lacking. Blowout information is frequently hidden
from the public.
Page: 14 Blowout and Well Release Characteristics and Frequencies, 2011 version
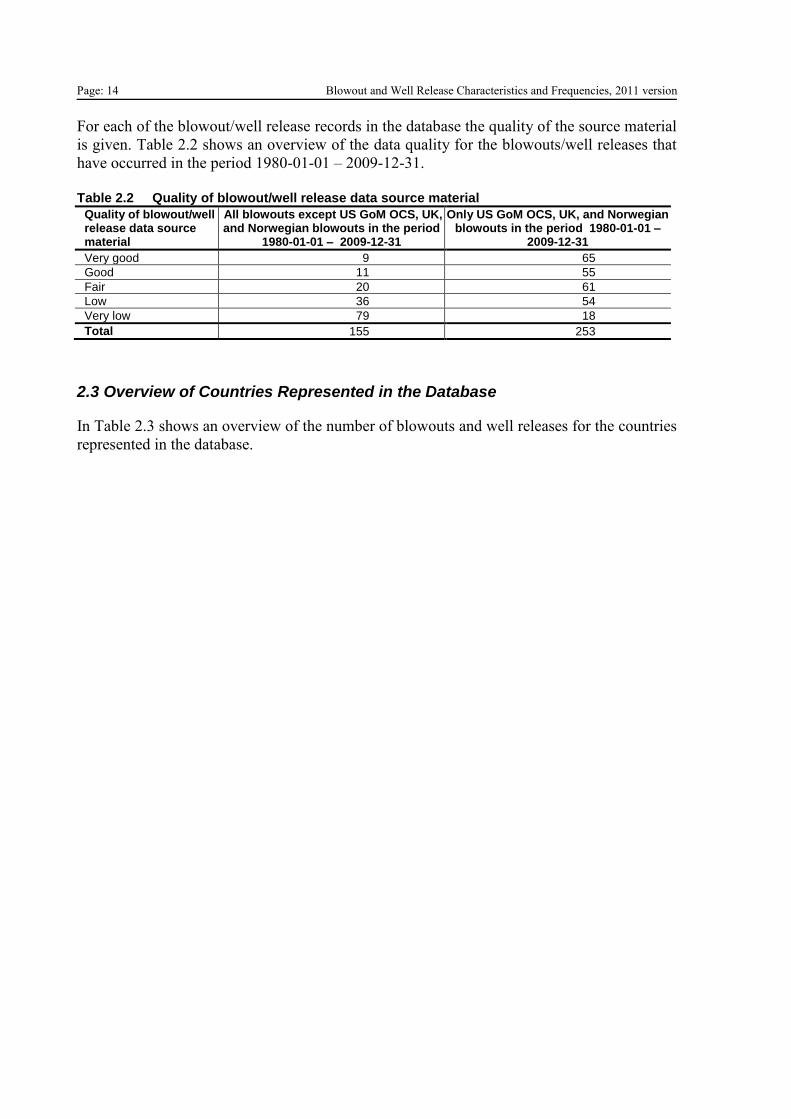
For each of the blowout/well release records in the database the quality of the source material
is given. Table 2.2 shows an overview of the data quality for the blowouts/well releases that
have occurred in the period 1980-01-01 – 2009-12-31.
Table 2.2 Quality of blowout/well release data source material
Quality of blowout/well release data source material
All blowouts except US GoM OCS, UK, and Norwegian blowouts in the period
1980-01-01 – 2009-12-31
Only US GoM OCS, UK, and Norwegian blowouts in the period 1980-01-01 –
2009-12-31
Very good 9 65
Good 11 55
Fair 20 61
Low 36 54
Very low 79 18
Total 155 253
2.3 Overview of Countries Represented in the Database
In Table 2.3 shows an overview of the number of blowouts and well releases for the countries
represented in the database.
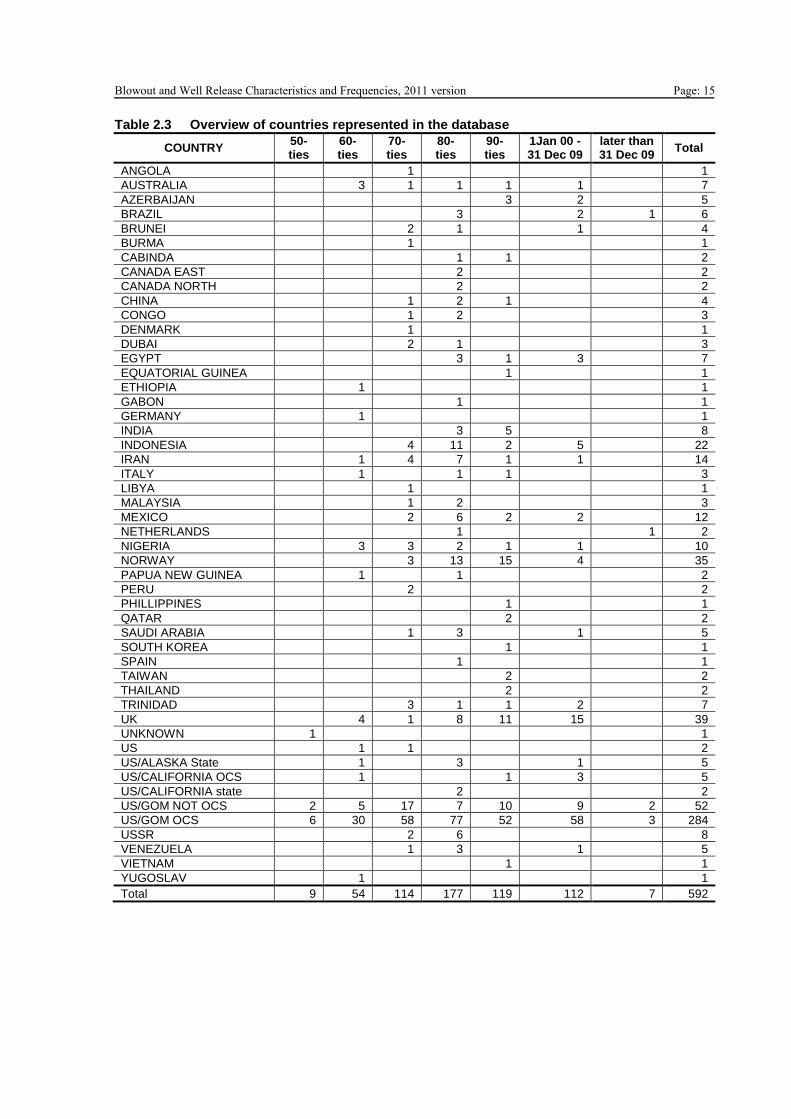
Blowout and Well Release Characteristics and Frequencies, 2011 version Page: 15 Table 2.3 Overview of countries represented in the database
COUNTRY 50-ties
60-ties
70-ties
80-ties
90-ties
1Jan 00 - 31 Dec 09
later than 31 Dec 09
Total
ANGOLA 1 1
AUSTRALIA 3 1 1 1 1 7
AZERBAIJAN 3 2 5
BRAZIL 3 2 1 6
BRUNEI 2 1 1 4
BURMA 1 1
CABINDA 1 1 2
CANADA EAST 2 2
CANADA NORTH 2 2
CHINA 1 2 1 4
CONGO 1 2 3
DENMARK 1 1
DUBAI 2 1 3
EGYPT 3 1 3 7
EQUATORIAL GUINEA 1 1
ETHIOPIA 1 1
GABON 1 1
GERMANY 1 1
INDIA 3 5 8
INDONESIA 4 11 2 5 22
IRAN 1 4 7 1 1 14
ITALY 1 1 1 3
LIBYA 1 1
MALAYSIA 1 2 3
MEXICO 2 6 2 2 12
NETHERLANDS 1 1 2
NIGERIA 3 3 2 1 1 10
NORWAY 3 13 15 4 35
PAPUA NEW GUINEA 1 1 2
PERU 2 2
PHILLIPPINES 1 1
QATAR 2 2
SAUDI ARABIA 1 3 1 5
SOUTH KOREA 1 1
SPAIN 1 1
TAIWAN 2 2
THAILAND 2 2
TRINIDAD 3 1 1 2 7
UK 4 1 8 11 15 39
UNKNOWN 1 1
US 1 1 2
US/ALASKA State 1 3 1 5
US/CALIFORNIA OCS 1 1 3 5
US/CALIFORNIA state 2 2
US/GOM NOT OCS 2 5 17 7 10 9 2 52
US/GOM OCS 6 30 58 77 52 58 3 284
USSR 2 6 8
VENEZUELA 1 3 1 5
VIETNAM 1 1
YUGOSLAV 1 1
Total 9 54 114 177 119 112 7 592
Page: 16 Blowout and Well Release Characteristics and Frequencies, 2011 version
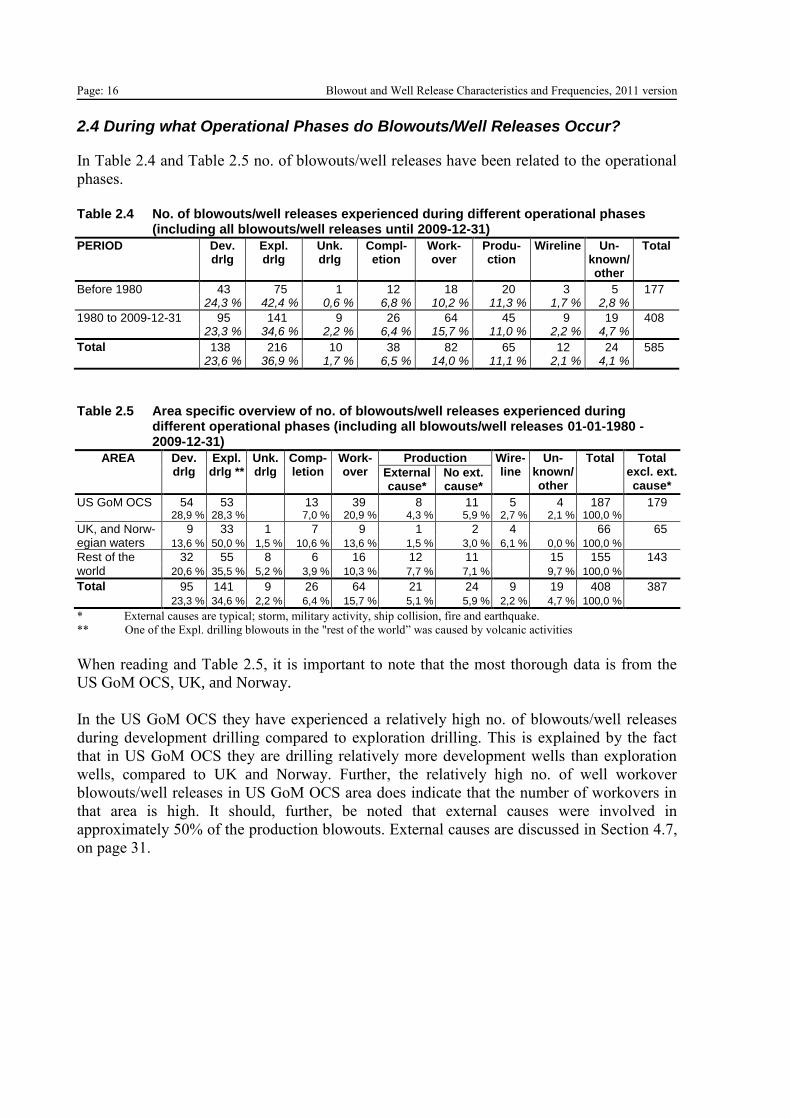
2.4 During what Operational Phases do Blowouts/Well Releases Occur?
In Table 2.4 and Table 2.5 no. of blowouts/well releases have been related to the operational
phases.
Table 2.4 No. of blowouts/well releases experienced during different operational phases
(including all blowouts/well releases until 2009-12-31)
PERIOD Dev. drlg
Expl. drlg
Unk. drlg
Compl-etion
Work-over
Produ-ction
Wireline Un-known/other
Total
Before 1980 43 75 1 12 18 20 3 5 177 24,3 % 42,4 % 0,6 % 6,8 % 10,2 % 11,3 % 1,7 % 2,8 %
1980 to 2009-12-31 95 141 9 26 64 45 9 19 408 23,3 % 34,6 % 2,2 % 6,4 % 15,7 % 11,0 % 2,2 % 4,7 %
Total 138 216 10 38 82 65 12 24 585 23,6 % 36,9 % 1,7 % 6,5 % 14,0 % 11,1 % 2,1 % 4,1 %
Table 2.5 Area specific overview of no. of blowouts/well releases experienced during
different operational phases (including all blowouts/well releases 01-01-1980 - 2009-12-31)
AREA Dev. drlg
Expl. drlg **
Unk. drlg
Comp-letion
Work-over
Production Wire-line
Un-known/other
Total Total excl. ext. cause*
External cause*
No ext. cause*
US GoM OCS 54 53 13 39 8 11 5 4 187 179 28,9 % 28,3 % 7,0 % 20,9 % 4,3 % 5,9 % 2,7 % 2,1 % 100,0 %
UK, and Norw-egian waters
9 33 1 7 9 1 2 4 66 65 13,6 % 50,0 % 1,5 % 10,6 % 13,6 % 1,5 % 3,0 % 6,1 % 0,0 % 100,0 %
Rest of the world
32 55 8 6 16 12 11 15 155 143 20,6 % 35,5 % 5,2 % 3,9 % 10,3 % 7,7 % 7,1 % 9,7 % 100,0 %
Total 95 141 9 26 64 21 24 9 19 408 387 23,3 % 34,6 % 2,2 % 6,4 % 15,7 % 5,1 % 5,9 % 2,2 % 4,7 % 100,0 %
* External causes are typical; storm, military activity, ship collision, fire and earthquake.
** One of the Expl. drilling blowouts in the "rest of the world” was caused by volcanic activities
When reading and Table 2.5, it is important to note that the most thorough data is from the
US GoM OCS, UK, and Norway.
In the US GoM OCS they have experienced a relatively high no. of blowouts/well releases
during development drilling compared to exploration drilling. This is explained by the fact
that in US GoM OCS they are drilling relatively more development wells than exploration
wells, compared to UK and Norway. Further, the relatively high no. of well workover
blowouts/well releases in US GoM OCS area does indicate that the number of workovers in
that area is high. It should, further, be noted that external causes were involved in
approximately 50% of the production blowouts. External causes are discussed in Section 4.7,
on page 31.
Blowout and Well Release Characteristics and Frequencies, 2011 version Page: 17
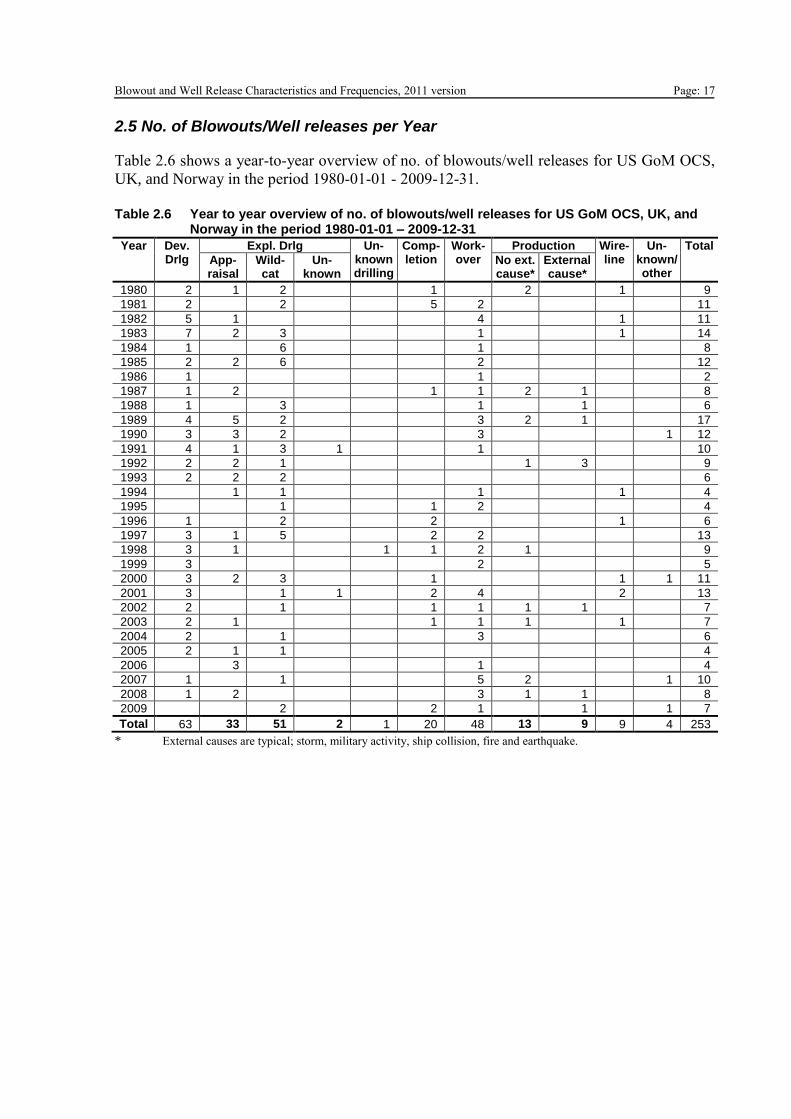
2.5 No. of Blowouts/Well releases per Year
Table 2.6 shows a year-to-year overview of no. of blowouts/well releases for US GoM OCS,
UK, and Norway in the period 1980-01-01 - 2009-12-31.
Table 2.6 Year to year overview of no. of blowouts/well releases for US GoM OCS, UK, and
Norway in the period 1980-01-01 – 2009-12-31
Year Dev. Drlg
Expl. Drlg Un-known drilling
Comp-letion
Work-over
Production Wire-line
Un-known/other
Total
App- raisal
Wild- cat
Un- known
No ext. cause*
External cause*
1980 2 1 2 1 2 1 9
1981 2 2 5 2 11
1982 5 1 4 1 11
1983 7 2 3 1 1 14
1984 1 6 1 8
1985 2 2 6 2 12
1986 1 1 2
1987 1 2 1 1 2 1 8
1988 1 3 1 1 6
1989 4 5 2 3 2 1 17
1990 3 3 2 3 1 12
1991 4 1 3 1 1 10
1992 2 2 1 1 3 9
1993 2 2 2 6
1994 1 1 1 1 4
1995 1 1 2 4
1996 1 2 2 1 6
1997 3 1 5 2 2 13
1998 3 1 1 1 2 1 9
1999 3 2 5
2000 3 2 3 1 1 1 11
2001 3 1 1 2 4 2 13
2002 2 1 1 1 1 1 7
2003 2 1 1 1 1 1 7
2004 2 1 3 6
2005 2 1 1 4
2006 3 1 4
2007 1 1 5 2 1 10
2008 1 2 3 1 1 8
2009 2 2 1 1 1 7
Total 63 33 51 2 1 20 48 13 9 9 4 253
* External causes are typical; storm, military activity, ship collision, fire and earthquake.
Page: 18 Blowout and Well Release Characteristics and Frequencies, 2011 version
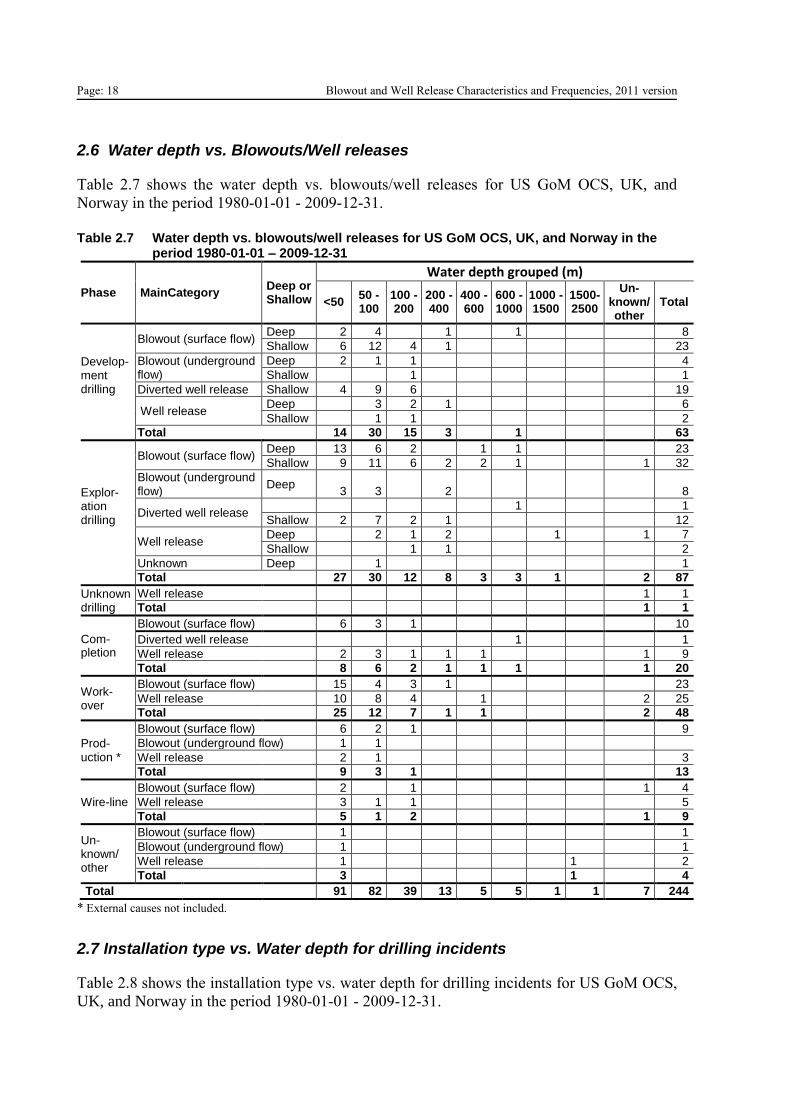
2.6 Water depth vs. Blowouts/Well releases
Table 2.7 shows the water depth vs. blowouts/well releases for US GoM OCS, UK, and
Norway in the period 1980-01-01 - 2009-12-31.
Table 2.7 Water depth vs. blowouts/well releases for US GoM OCS, UK, and Norway in the
period 1980-01-01 – 2009-12-31
Phase MainCategory Deep or Shallow
Water depth grouped (m)
<50 50 - 100
100 - 200
200 - 400
400 - 600
600 - 1000
1000 - 1500
1500-2500
Un-known/other
Total
Develop-ment drilling
Blowout (surface flow) Deep 2 4
1
1
8
Shallow 6 12 4 1
23
Blowout (underground flow)
Deep 2 1 1
4
Shallow
1
1
Diverted well release Shallow 4 9 6
19
Well release Deep
3 2 1
6
Shallow
1 1
2
Total
14 30 15 3
1
63
Explor-ation drilling
Blowout (surface flow) Deep 13 6 2
1 1
23
Shallow 9 11 6 2 2 1
1 32
Blowout (underground flow)
Deep 3 3
2
8
Diverted well release
1
1
Shallow 2 7 2 1
12
Well release Deep
2 1 2
1
1 7
Shallow
1 1
2
Unknown Deep
1
1
Total
27 30 12 8 3 3 1
2 87
Unknown drilling
Well release
1 1
Total
1 1
Com-pletion
Blowout (surface flow)
6 3 1
10
Diverted well release
1
1
Well release
2 3 1 1 1
1 9
Total
8 6 2 1 1 1
1 20
Work-over
Blowout (surface flow)
15 4 3 1
23
Well release
10 8 4
1
2 25
Total
25 12 7 1 1
2 48
Prod-uction *
Blowout (surface flow)
6 2 1
9
Blowout (underground flow) 1 1
Well release
2 1
3
Total
9 3 1
13
Wire-line
Blowout (surface flow)
2
1
1 4
Well release
3 1 1
5
Total
5 1 2
1 9
Un-known/ other
Blowout (surface flow)
1
1
Blowout (underground flow) 1
1
Well release 1
1 2
Total
3
1 4
Total 91 82 39 13 5 5 1 1 7 244
* External causes not included.
2.7 Installation type vs. Water depth for drilling incidents
Table 2.8 shows the installation type vs. water depth for drilling incidents for US GoM OCS,
UK, and Norway in the period 1980-01-01 - 2009-12-31.
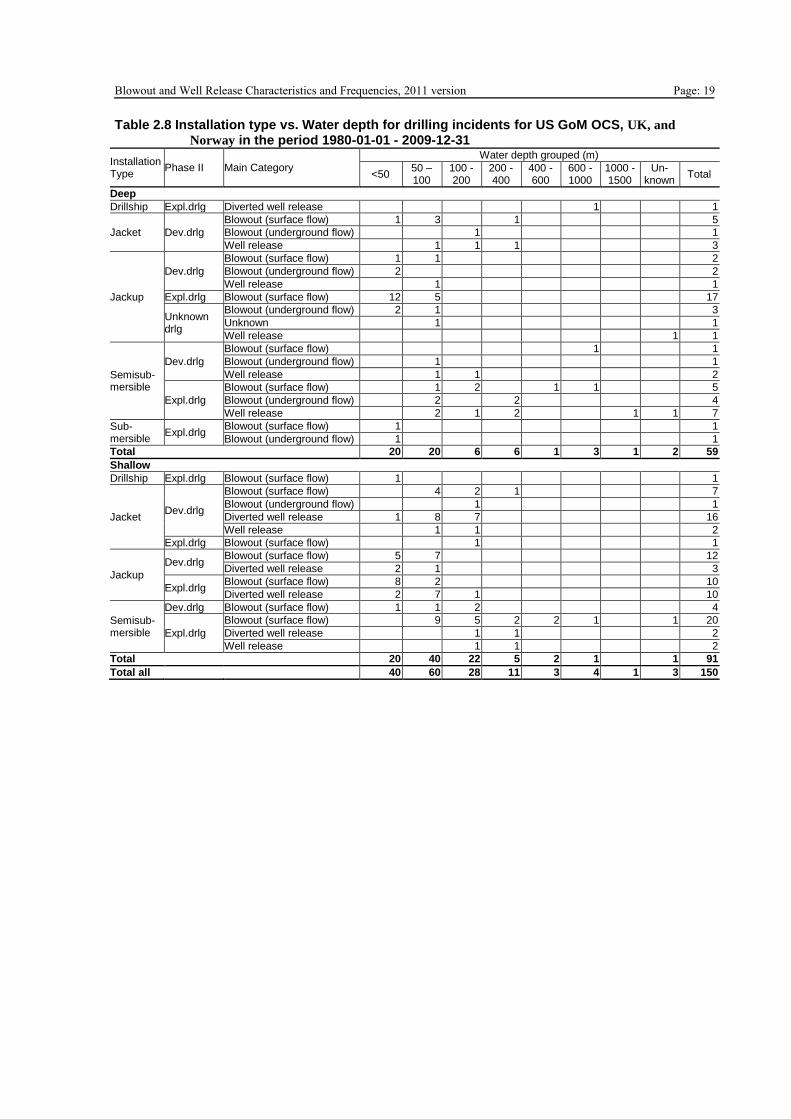
Blowout and Well Release Characteristics and Frequencies, 2011 version Page: 19 Table 2.8 Installation type vs. Water depth for drilling incidents for US GoM OCS, UK, and
Norway in the period 1980-01-01 - 2009-12-31
Installation Type
Phase II Main Category
Water depth grouped (m)
<50 50 – 100
100 - 200
200 - 400
400 - 600
600 - 1000
1000 - 1500
Un-known
Total
Deep
Drillship Expl.drlg Diverted well release
1
1
Jacket Dev.drlg
Blowout (surface flow) 1 3
1
5
Blowout (underground flow)
1
1
Well release
1 1 1
3
Jackup
Dev.drlg
Blowout (surface flow) 1 1
2
Blowout (underground flow) 2
2
Well release
1
1
Expl.drlg Blowout (surface flow) 12 5
17
Unknown drlg
Blowout (underground flow) 2 1
3
Unknown
1
1
Well release
1 1
Semisub-mersible
Dev.drlg
Blowout (surface flow)
1
1
Blowout (underground flow)
1
1
Well release
1 1
2
Expl.drlg
Blowout (surface flow)
1 2
1 1
5
Blowout (underground flow)
2
2
4
Well release
2 1 2
1 1 7
Sub-mersible
Expl.drlg Blowout (surface flow) 1
1
Blowout (underground flow) 1
1
Total 20 20 6 6 1 3 1 2 59
Shallow
Drillship Expl.drlg Blowout (surface flow) 1
1
Jacket Dev.drlg
Blowout (surface flow)
4 2 1
7
Blowout (underground flow)
1
1
Diverted well release 1 8 7
16
Well release
1 1
2
Expl.drlg Blowout (surface flow)
1
1
Jackup
Dev.drlg Blowout (surface flow) 5 7
12
Diverted well release 2 1
3
Expl.drlg Blowout (surface flow) 8 2
10
Diverted well release 2 7 1
10
Semisub-mersible
Dev.drlg Blowout (surface flow) 1 1 2
4
Expl.drlg
Blowout (surface flow)
9 5 2 2 1
1 20
Diverted well release
1 1
2
Well release
1 1
2
Total
20 40 22 5 2 1
1 91
Total all
40 60 28 11 3 4 1 3 150

Page: 20 Blowout and Well Release Characteristics and Frequencies, 2011 version
Blowout and Well Release Characteristics and Frequencies, 2011 version Page: 21
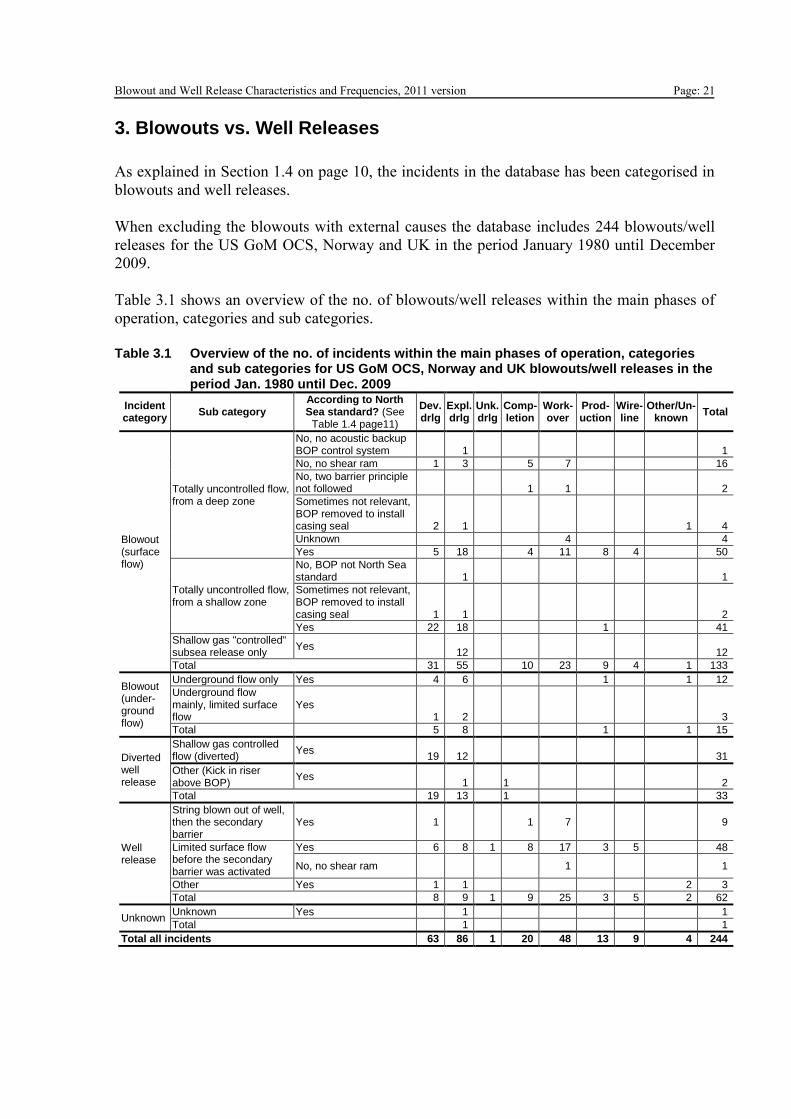
3. Blowouts vs. Well Releases
As explained in Section 1.4 on page 10, the incidents in the database has been categorised in
blowouts and well releases.
When excluding the blowouts with external causes the database includes 244 blowouts/well
releases for the US GoM OCS, Norway and UK in the period January 1980 until December
2009.
Table 3.1 shows an overview of the no. of blowouts/well releases within the main phases of
operation, categories and sub categories.
Table 3.1 Overview of the no. of incidents within the main phases of operation, categories
and sub categories for US GoM OCS, Norway and UK blowouts/well releases in the period Jan. 1980 until Dec. 2009
Incident category
Sub category According to North Sea standard? (See
Table 1.4 page11)
Dev. drlg
Expl. drlg
Unk. drlg
Comp-letion
Work-over
Prod-uction
Wire-line
Other/Un-known
Total
Blowout (surface flow)
Totally uncontrolled flow, from a deep zone
No, no acoustic backup BOP control system 1 1
No, no shear ram 1 3
5 7
16
No, two barrier principle not followed
1 1
2
Sometimes not relevant, BOP removed to install casing seal 2 1
1 4
Unknown
4
4
Yes 5 18
4 11 8 4
50
Totally uncontrolled flow, from a shallow zone
No, BOP not North Sea standard
1
1
Sometimes not relevant, BOP removed to install casing seal 1 1
2
Yes 22 18
1
41
Shallow gas "controlled" subsea release only
Yes
12
12
Total 31 55 10 23 9 4 1 133
Blowout (under-ground flow)
Underground flow only Yes 4 6 1 1 12
Underground flow mainly, limited surface flow
Yes 1 2
3
Total
5 8
1
1 15
Diverted well release
Shallow gas controlled flow (diverted)
Yes 19 12
31
Other (Kick in riser above BOP)
Yes
1
1
2
Total 19 13
1
33
Well release
String blown out of well, then the secondary barrier
Yes 1
1 7
9
Limited surface flow before the secondary barrier was activated
Yes 6 8 1 8 17 3 5
48
No, no shear ram
1
1
Other Yes 1 1
2 3
Total 8 9 1 9 25 3 5 2 62
Unknown Unknown Yes
1
1
Total
1
1
Total all incidents 63 86 1 20 48 13 9 4 244

Page: 22 Blowout and Well Release Characteristics and Frequencies, 2011 version
Blowout and Well Release Characteristics and Frequencies, 2011 version Page: 23
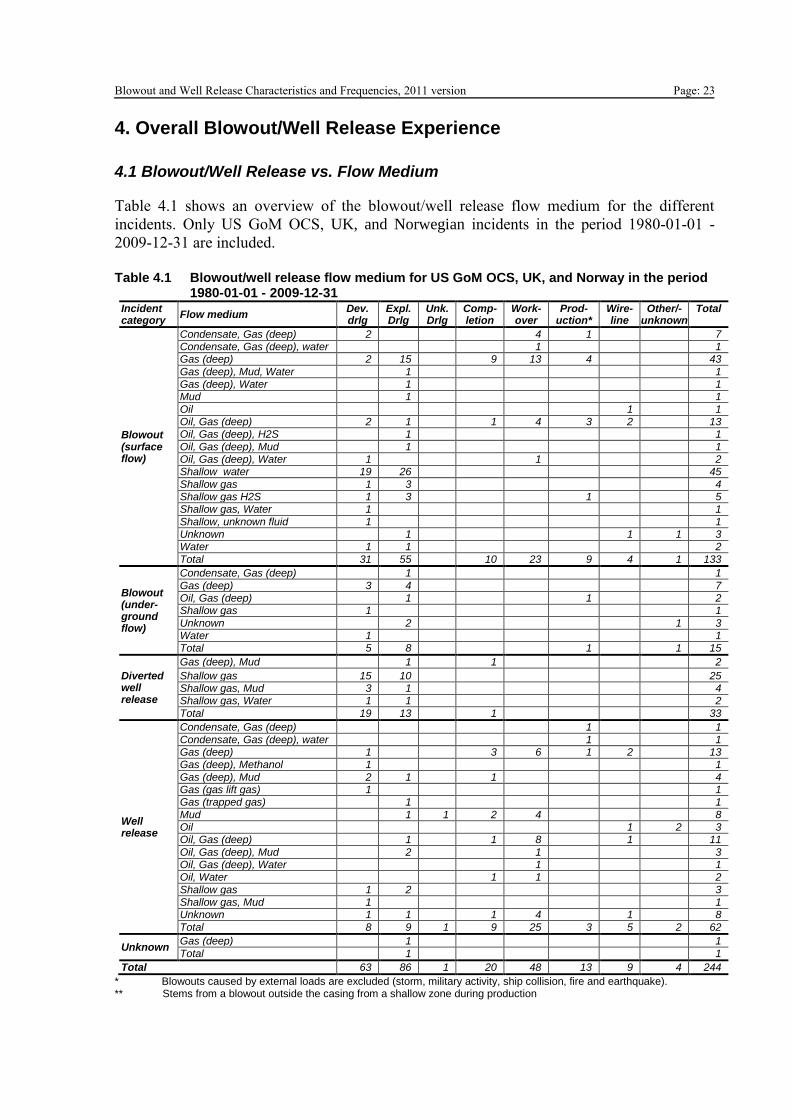
4. Overall Blowout/Well Release Experience
4.1 Blowout/Well Release vs. Flow Medium
Table 4.1 shows an overview of the blowout/well release flow medium for the different
incidents. Only US GoM OCS, UK, and Norwegian incidents in the period 1980-01-01 -
2009-12-31 are included.
Table 4.1 Blowout/well release flow medium for US GoM OCS, UK, and Norway in the period
1980-01-01 - 2009-12-31 Incident category
Flow medium Dev. drlg
Expl. Drlg
Unk. Drlg
Comp-letion
Work-over
Prod-uction*
Wire-line
Other/-unknown
Total
Blowout (surface flow)
Condensate, Gas (deep) 2
4 1
7 Condensate, Gas (deep), water
1
1
Gas (deep) 2 15
9 13 4
43
Gas (deep), Mud, Water
1
1 Gas (deep), Water
1
1
Mud
1
1
Oil
1
1 Oil, Gas (deep) 2 1
1 4 3 2
13
Oil, Gas (deep), H2S
1
1
Oil, Gas (deep), Mud
1
1 Oil, Gas (deep), Water 1
1
2
Shallow water 19 26
45
Shallow gas 1 3
4 Shallow gas H2S 1 3
1
5
Shallow gas, Water 1
1
Shallow, unknown fluid 1
1 Unknown
1
1 1 3
Water 1 1
2
Total 31 55
10 23 9 4 1 133
Blowout (under-ground flow)
Condensate, Gas (deep)
1
1
Gas (deep) 3 4
7 Oil, Gas (deep)
1
1
2
Shallow gas 1
1
Unknown
2
1 3 Water 1
1
Total 5 8
1
1 15
Diverted well release
Gas (deep), Mud
1
1
2
Shallow gas 15 10
25 Shallow gas, Mud 3 1
4
Shallow gas, Water 1 1
2
Total 19 13
1
33
Well release
Condensate, Gas (deep)
1
1
Condensate, Gas (deep), water
1
1 Gas (deep) 1
3 6 1 2
13
Gas (deep), Methanol 1
1
Gas (deep), Mud 2 1
1
4 Gas (gas lift gas) 1
1
Gas (trapped gas)
1
1
Mud
1 1 2 4
8 Oil
1 2 3
Oil, Gas (deep)
1
1 8
1
11
Oil, Gas (deep), Mud
2
1
3 Oil, Gas (deep), Water
1
1
Oil, Water
1 1
2
Shallow gas 1 2
3 Shallow gas, Mud 1
1
Unknown 1 1
1 4
1
8
Total 8 9 1 9 25 3 5 2 62
Unknown Gas (deep)
1
1
Total
1
1
Total 63 86 1 20 48 13 9 4 244
* Blowouts caused by external loads are excluded (storm, military activity, ship collision, fire and earthquake). ** Stems from a blowout outside the casing from a shallow zone during production
Page: 24 Blowout and Well Release Characteristics and Frequencies, 2011 version
4.2 Blowout/Well Release vs. Flow-rates
The blowout/well release flow-rates from the actual incidents described in the database are
poorly documented. For some blowouts flow-rate figures exist, but for most blowouts they do
not exist.
The database has, however, three fields that describe the flow-rates during well tests for the
actual well or close by wells. These fields are Gas volume, Oil volume and Water volume.
Flow-rates are important figures in risk and environment analyses. To establish a realistic
distribution of flow-rates to expect for specific fields, field specific productivity data should
be compared to blowout/well release experience with respect to remaining restrictions in the
wells during the blowout/well release situations. For several blowouts/well releases there are
significant flow restrictions that will reduce the flow.
4.3 Severity
The blowout/well release database contains a specific field describing blowout/well release
severity. The quality of the information in this field is relatively low. These data are therefore
not presented in this report. However, it should be noted that most of the blowouts/well
releases do cause relatively small damages.
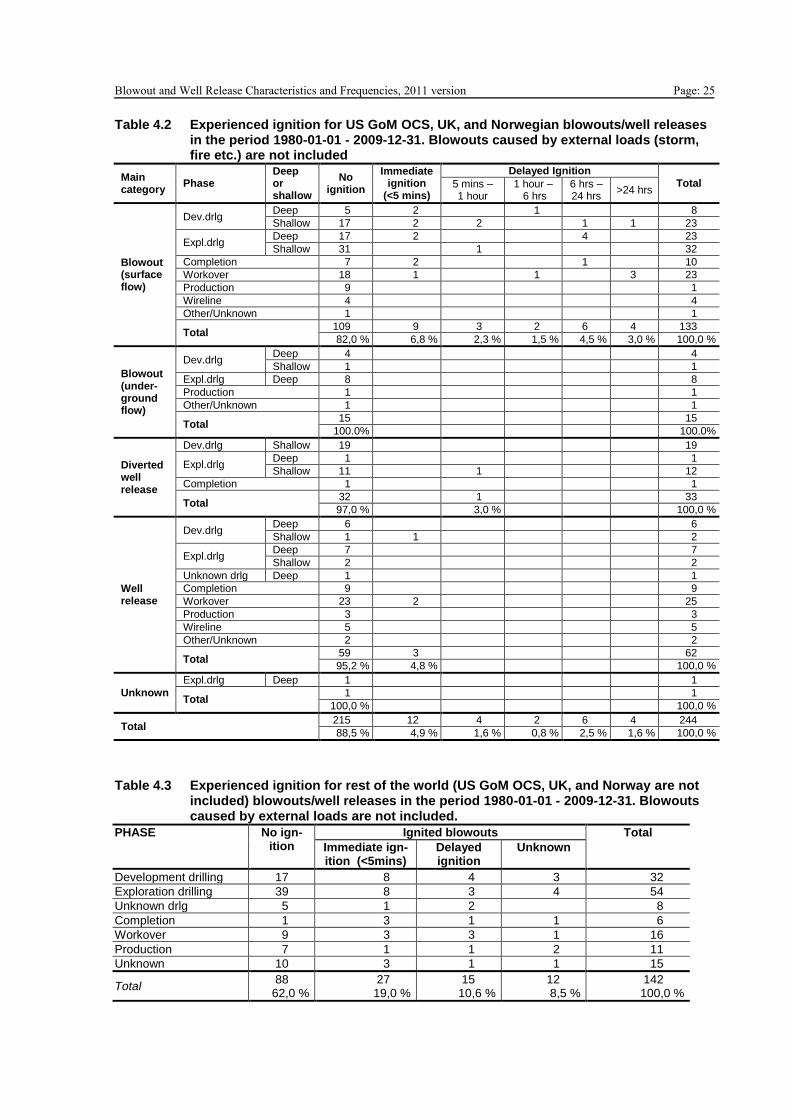
4.4 Ignition of Blowouts/Well Releases
In Table 4.2 and Table 4.3 experienced data related to ignition of blowouts/well releases are
presented. Only incidents from the period 1980-01-01 - 2009-12-31 have been included. It
has been chosen to separate US GoM OCS, UK, and Norwegian blowouts/well releases from
the rest of the world. Blowouts caused by external loads (storm, fire etc. are not included)
Please note that it should not be differed between ignition probability for an oil blowout/well
release and a gas blowout, because for oil blowouts the volume of gas blowing is very high
compared to the volume of oil blowing.
Blowout and Well Release Characteristics and Frequencies, 2011 version Page: 25 Table 4.2 Experienced ignition for US GoM OCS, UK, and Norwegian blowouts/well releases
in the period 1980-01-01 - 2009-12-31. Blowouts caused by external loads (storm, fire etc.) are not included
Main category
Phase Deep or shallow
No ignition
Immediate ignition
(<5 mins)
Delayed Ignition Total 5 mins –
1 hour 1 hour –
6 hrs 6 hrs – 24 hrs
>24 hrs
Blowout (surface flow)
Dev.drlg Deep 5 2
1
8
Shallow 17 2 2
1 1 23
Expl.drlg Deep 17 2
4
23
Shallow 31
1
32
Completion 7 2
1
10
Workover 18 1
1
3 23
Production 9
1
Wireline 4
4
Other/Unknown 1
1
Total 109 9 3 2 6 4 133
82,0 % 6,8 % 2,3 % 1,5 % 4,5 % 3,0 % 100,0 %
Blowout (under-ground flow)
Dev.drlg Deep 4
4
Shallow 1
1
Expl.drlg Deep 8
8
Production 1
1
Other/Unknown 1
1
Total 15
15
100.0%
100.0%
Diverted well release
Dev.drlg Shallow 19
19
Expl.drlg Deep 1
1
Shallow 11
1
12
Completion 1
1
Total 32
1
33
97,0 %
3,0 %
100,0 %
Well release
Dev.drlg Deep 6
6
Shallow 1 1
2
Expl.drlg Deep 7
7
Shallow 2
2
Unknown drlg Deep 1
1
Completion 9
9
Workover 23 2
25
Production 3
3
Wireline 5
5
Other/Unknown 2
2
Total 59 3
62
95,2 % 4,8 %
100,0 %
Unknown
Expl.drlg Deep 1
1
Total 1
1
100,0 %
100,0 %
Total 215 12 4 2 6 4 244
88,5 % 4,9 % 1,6 % 0,8 % 2,5 % 1,6 % 100,0 %
Table 4.3 Experienced ignition for rest of the world (US GoM OCS, UK, and Norway are not
included) blowouts/well releases in the period 1980-01-01 - 2009-12-31. Blowouts caused by external loads are not included.
PHASE No ign-ition
Ignited blowouts Total
Immediate ign-ition (<5mins)
Delayed ignition
Unknown
Development drilling 17 8 4 3 32
Exploration drilling 39 8 3 4 54
Unknown drlg 5 1 2 8
Completion 1 3 1 1 6
Workover 9 3 3 1 16
Production 7 1 1 2 11
Unknown 10 3 1 1 15
Total 88 27 15 12 142
62,0 % 19,0 % 10,6 % 8,5 % 100,0 %
Page: 26 Blowout and Well Release Characteristics and Frequencies, 2011 version
If comparing Table 4.2 and Table 4.3, far more ignited blowouts/well releases in the material
for the "rest of the world". The main reason is probably that from "rest of the world"
blowouts with small consequences are more seldom reported.
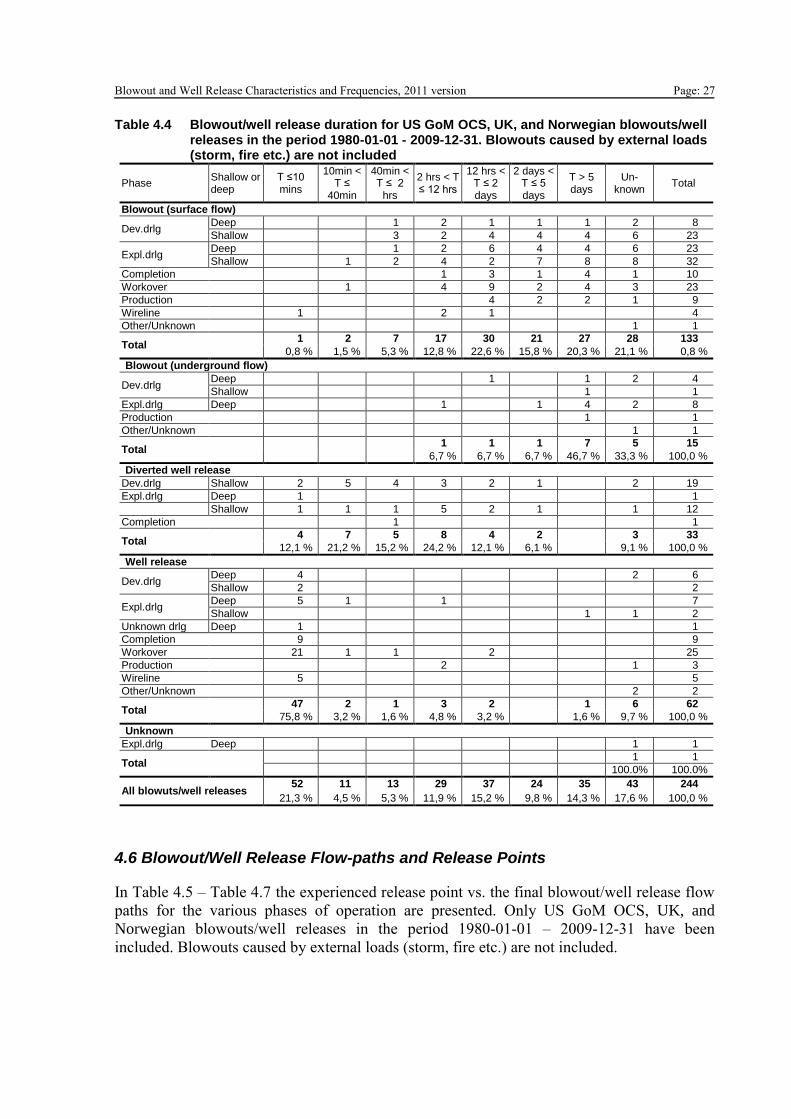
4.5 Blowout/Well Release Duration
In Table 4.4 the experienced blowout/well release duration is presented. Only US GoM OCS,
UK, and Norwegian blowouts/well releases in the period 1980-01-01 - 2009-12-31 have been
included. Blowouts caused by external loads (storm, fire etc.) are not included.
It should be noted that bridged or depleted are listed as primary cause for regaining well
control for 31 out of the 55 exploration drilling Blowout (surface flow), and 14 of the 31
development drilling Blowout (surface flow).
For the diverted well releases (both exploration and development drilling) bridged or
depleted are listed as primary cause for regaining well control for 15 out of the 32 well
releases.
Blowout and Well Release Characteristics and Frequencies, 2011 version Page: 27 Table 4.4 Blowout/well release duration for US GoM OCS, UK, and Norwegian blowouts/well
releases in the period 1980-01-01 - 2009-12-31. Blowouts caused by external loads (storm, fire etc.) are not included
Phase Shallow or deep
T ≤10 mins
10min < T ≤
40min
40min < T ≤ 2
hrs
2 hrs < T ≤ 12 hrs
12 hrs < T ≤ 2 days
2 days < T ≤ 5 days
T > 5 days
Un-known
Total
Blowout (surface flow)
Dev.drlg Deep 1 2 1 1 1 2 8
Shallow 3 2 4 4 4 6 23
Expl.drlg Deep 1 2 6 4 4 6 23
Shallow 1 2 4 2 7 8 8 32
Completion 1 3 1 4 1 10
Workover 1 4 9 2 4 3 23
Production 4 2 2 1 9
Wireline 1 2 1 4
Other/Unknown 1 1
Total 1 2 7 17 30 21 27 28 133
0,8 % 1,5 % 5,3 % 12,8 % 22,6 % 15,8 % 20,3 % 21,1 % 0,8 %
Blowout (underground flow)
Dev.drlg Deep 1 1 2 4
Shallow 1 1
Expl.drlg Deep 1 1 4 2 8
Production 1 1
Other/Unknown 1 1
Total 1 1 1 7 5 15
6,7 % 6,7 % 6,7 % 46,7 % 33,3 % 100,0 %
Diverted well release
Dev.drlg Shallow 2 5 4 3 2 1 2 19
Expl.drlg Deep 1 1
Shallow 1 1 1 5 2 1 1 12
Completion 1 1
Total 4 7 5 8 4 2 3 33
12,1 % 21,2 % 15,2 % 24,2 % 12,1 % 6,1 % 9,1 % 100,0 %
Well release
Dev.drlg Deep 4 2 6
Shallow 2 2
Expl.drlg Deep 5 1 1 7
Shallow 1 1 2
Unknown drlg Deep 1 1
Completion 9 9
Workover 21 1 1 2 25
Production 2 1 3
Wireline 5 5
Other/Unknown 2 2
Total 47 2 1 3 2 1 6 62
75,8 % 3,2 % 1,6 % 4,8 % 3,2 % 1,6 % 9,7 % 100,0 %
Unknown
Expl.drlg Deep 1 1
Total 1 1
100.0% 100.0%
All blowuts/well releases 52 11 13 29 37 24 35 43 244
21,3 % 4,5 % 5,3 % 11,9 % 15,2 % 9,8 % 14,3 % 17,6 % 100,0 %
4.6 Blowout/Well Release Flow-paths and Release Points
In Table 4.5 – Table 4.7 the experienced release point vs. the final blowout/well release flow
paths for the various phases of operation are presented. Only US GoM OCS, UK, and
Norwegian blowouts/well releases in the period 1980-01-01 – 2009-12-31 have been
included. Blowouts caused by external loads (storm, fire etc.) are not included.
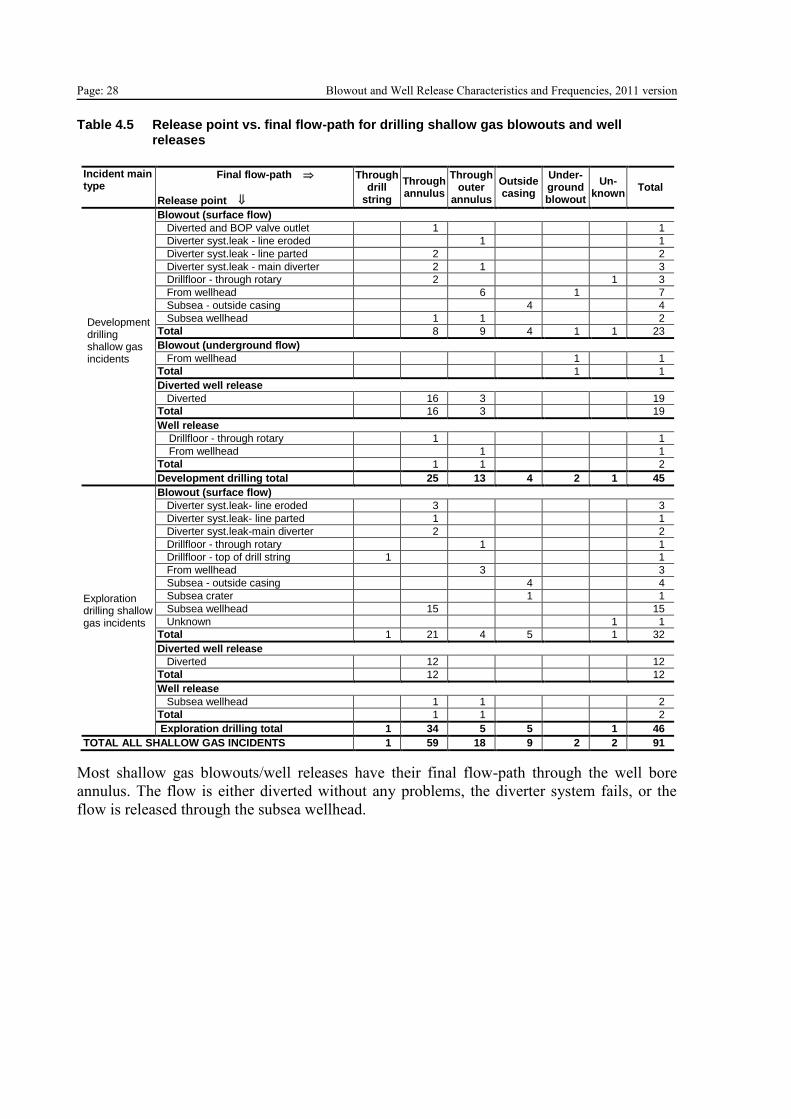
Page: 28 Blowout and Well Release Characteristics and Frequencies, 2011 version Table 4.5 Release point vs. final flow-path for drilling shallow gas blowouts and well
releases
Incident main type
Final flow-path
Release point
Through drill
string
Through annulus
Through outer
annulus
Outside casing
Under-ground blowout
Un-known
Total
Development drilling shallow gas incidents
Blowout (surface flow)
Diverted and BOP valve outlet
1
1
Diverter syst.leak - line eroded
1
1
Diverter syst.leak - line parted
2
2
Diverter syst.leak - main diverter
2 1
3
Drillfloor - through rotary
2
1 3
From wellhead
6
1
7
Subsea - outside casing
4
4
Subsea wellhead
1 1
2
Total
8 9 4 1 1 23
Blowout (underground flow) From wellhead
1
1
Total
1
1
Diverted well release Diverted
16 3
19
Total
16 3
19
Well release Drillfloor - through rotary
1
1
From wellhead
1
1
Total
1 1
2
Development drilling total
25 13 4 2 1 45
Exploration drilling shallow gas incidents
Blowout (surface flow) Diverter syst.leak- line eroded
3
3
Diverter syst.leak- line parted
1
1
Diverter syst.leak-main diverter
2
2
Drillfloor - through rotary
1
1
Drillfloor - top of drill string 1
1
From wellhead
3
3
Subsea - outside casing
4
4
Subsea crater
1
1
Subsea wellhead
15
15
Unknown
1 1
Total 1 21 4 5
1 32
Diverted well release Diverted
12
12
Total
12
12
Well release Subsea wellhead
1 1
2
Total
1 1
2
Exploration drilling total 1 34 5 5
1 46
TOTAL ALL SHALLOW GAS INCIDENTS 1 59 18 9 2 2 91
Most shallow gas blowouts/well releases have their final flow-path through the well bore
annulus. The flow is either diverted without any problems, the diverter system fails, or the
flow is released through the subsea wellhead.
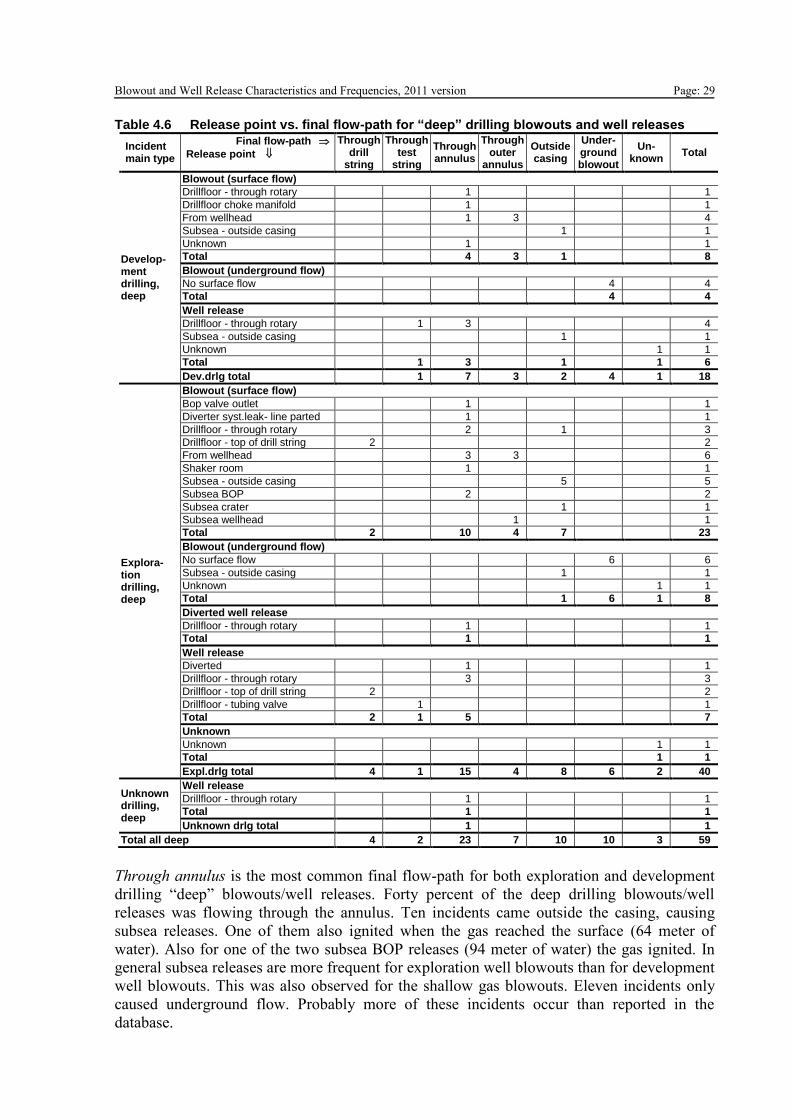
Blowout and Well Release Characteristics and Frequencies, 2011 version Page: 29 Table 4.6 Release point vs. final flow-path for “deep” drilling blowouts and well releases
Incident main type
Final flow-path
Release point
Through drill
string
Through test
string
Through annulus
Through outer
annulus
Outside casing
Under-ground blowout
Un-known
Total
Develop-ment drilling, deep
Blowout (surface flow)
Drillfloor - through rotary
1
1
Drillfloor choke manifold
1
1
From wellhead
1 3
4
Subsea - outside casing
1
1
Unknown
1
1
Total
4 3 1
8
Blowout (underground flow)
No surface flow
4
4
Total
4
4
Well release
Drillfloor - through rotary
1 3
4
Subsea - outside casing
1
1
Unknown
1 1
Total
1 3
1
1 6
Dev.drlg total 1 7 3 2 4 1 18
Explora-tion drilling, deep
Blowout (surface flow)
Bop valve outlet
1
1
Diverter syst.leak- line parted
1
1
Drillfloor - through rotary
2
1
3
Drillfloor - top of drill string 2
2
From wellhead
3 3
6
Shaker room
1
1
Subsea - outside casing
5
5
Subsea BOP
2
2
Subsea crater
1
1
Subsea wellhead
1
1
Total 2
10 4 7
23
Blowout (underground flow)
No surface flow
6 6
Subsea - outside casing
1
1
Unknown
1 1
Total
1 6 1 8
Diverted well release
Drillfloor - through rotary
1
1
Total
1
1
Well release
Diverted
1
1
Drillfloor - through rotary
3
3
Drillfloor - top of drill string 2
2
Drillfloor - tubing valve 1
1
Total 2 1 5
7
Unknown
Unknown
1 1
Total
1 1
Expl.drlg total 4 1 15 4 8 6 2 40
Unknown drilling, deep
Well release
Drillfloor - through rotary
1
1
Total
1
1
Unknown drlg total 1 1
Total all deep 4 2 23 7 10 10 3 59
Through annulus is the most common final flow-path for both exploration and development
drilling “deep” blowouts/well releases. Forty percent of the deep drilling blowouts/well
releases was flowing through the annulus. Ten incidents came outside the casing, causing
subsea releases. One of them also ignited when the gas reached the surface (64 meter of
water). Also for one of the two subsea BOP releases (94 meter of water) the gas ignited. In
general subsea releases are more frequent for exploration well blowouts than for development
well blowouts. This was also observed for the shallow gas blowouts. Eleven incidents only
caused underground flow. Probably more of these incidents occur than reported in the
database.
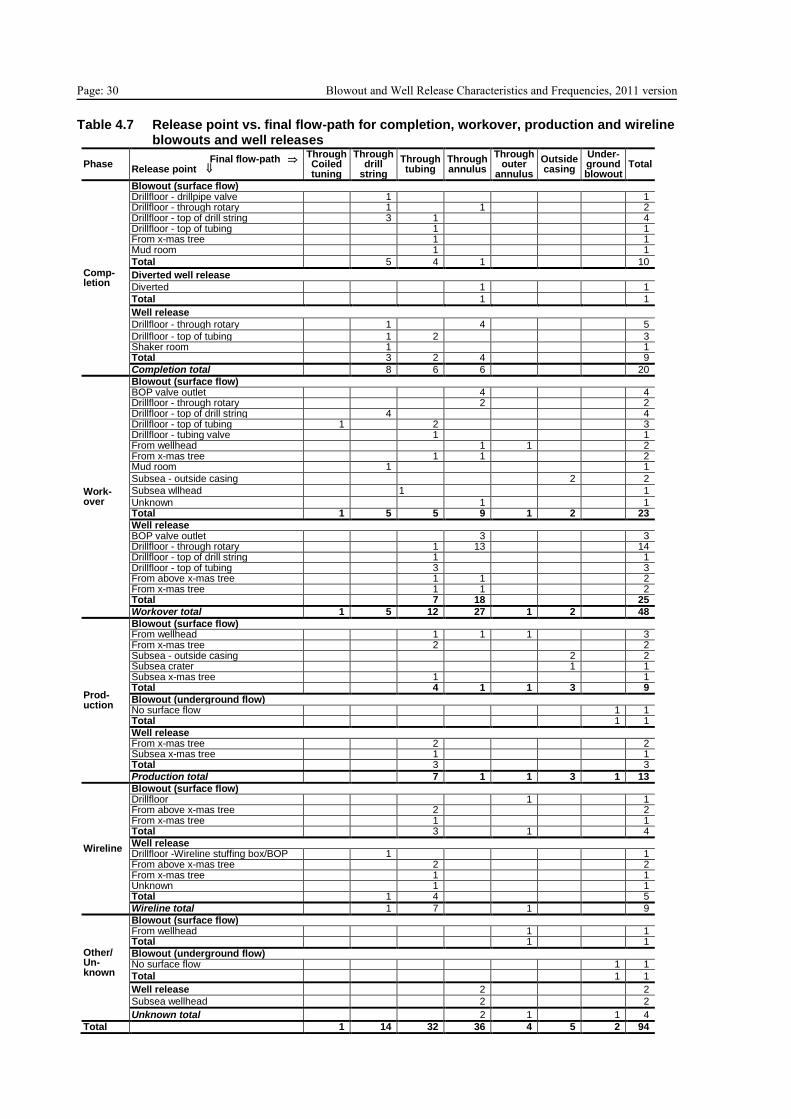
Page: 30 Blowout and Well Release Characteristics and Frequencies, 2011 version Table 4.7 Release point vs. final flow-path for completion, workover, production and wireline
blowouts and well releases
Phase Final flow-path
Release point
Through Coiled tuning
Through drill
string
Through tubing
Through annulus
Through outer
annulus
Outside casing
Under-ground blowout
Total
Comp-letion
Blowout (surface flow) Drillfloor - drillpipe valve
1
1
Drillfloor - through rotary
1
1
2 Drillfloor - top of drill string
3 1
4
Drillfloor - top of tubing
1
1 From x-mas tree
1
1
Mud room
1
1
Total
5 4 1
10
Diverted well release
Diverted
1
1
Total
1
1
Well release Drillfloor - through rotary
1
4
5
Drillfloor - top of tubing
1 2
3 Shaker room
1
1
Total
3 2 4
9
Completion total 8 6 6 20
Work- over
Blowout (surface flow) BOP valve outlet
4
4
Drillfloor - through rotary
2
2 Drillfloor - top of drill string
4
4
Drillfloor - top of tubing 1
2
3 Drillfloor - tubing valve
1
1
From wellhead
1 1
2 From x-mas tree
1 1
2
Mud room
1
1
Subsea - outside casing
2
2
Subsea wllhead
1
1
Unknown
1
1 Total 1 5 5 9 1 2
23
Well release BOP valve outlet
3
3
Drillfloor - through rotary
1 13
14 Drillfloor - top of drill string
1
1
Drillfloor - top of tubing
3
3 From above x-mas tree
1 1
2
From x-mas tree
1 1
2 Total
7 18
25
Workover total 1 5 12 27 1 2
48
Prod-uction
Blowout (surface flow) From wellhead
1 1 1
3
From x-mas tree
2
2 Subsea - outside casing
2
2
Subsea crater
1
1 Subsea x-mas tree
1
1
Total
4 1 1 3
9
Blowout (underground flow) No surface flow
1 1
Total
1 1
Well release From x-mas tree
2
2
Subsea x-mas tree
1
1 Total
3
3
Production total 7 1 1 3 1 13
Wireline
Blowout (surface flow) Drillfloor
1
1
From above x-mas tree
2
2 From x-mas tree
1
1
Total
3
1
4
Well release Drillfloor -Wireline stuffing box/BOP
1
1
From above x-mas tree
2
2 From x-mas tree
1
1
Unknown
1
1 Total
1 4
5
Wireline total 1 7 1 9
Other/ Un-known
Blowout (surface flow) From wellhead
1
1
Total
1
1
Blowout (underground flow) No surface flow
1 1
Total
1 1
Well release
2
2
Subsea wellhead
2
2
Unknown total 2 1 1 4
Total 1 14 32 36 4 5 2 94
Blowout and Well Release Characteristics and Frequencies, 2011 version Page: 31
Most blowouts during completion result in flow through the tubing or the drill string/work
string. It is important to note that for several of these blowouts the BOP stack did not include
a blind-shear ram (Table 3.1 on page 21). With a blind-shear ram these blowouts could have
been stopped at an earlier stage, and they would in many cases not have been categorised as a
blowout. It is not mandatory to use blind-shear rams in US OCS surface BOPs.
The normal flow-paths for workover blowouts/well releases are either through the drill
string/tubing or through the annulus. It is important to note that also for several of these
blowouts the BOP stack did not include a blind-shear ram (Table 3.1 on page 21). Further,
the drill string/tubing blowouts are mostly released from the top of the drill string/tubing
hanging in the rotary table slips. Annulus blowouts do mostly come through the rotary.
Wireline blowouts typically flow through the tubing and the release point is above the X-mas
tree.
Eight of the twelve production blowouts came to the air in the wellhead/X-mas tree area.
4.7 Blowout/Well Release Causes
Normally to experience a blowout, at least one primary and one secondary barrier have to
fail. For drilling, workover and completion blowouts the primary barriers are usually the
hydrostatic pressure from the mud column and the secondary barrier is the mechanical
barriers, either subsea or on the installation. For production wells the primary and secondary
barriers are mechanical barriers.
It should be noted that when drilling in shallow zones there is normally only one blowout
barrier. The installations do, however, have means for forcing the gas away from the
installation. In this report those means are treated as a secondary barrier.
The blowout database does contain fields for describing the blowout/well release causes, i.e.
why were the primary and secondary barrier lost?
Further, the database contains one field that describes whether the blowout/well release was
"caused" by an external load. Out of the 253 blowouts/well releases from US GoM OCS, UK,
and Norway in the period 1980-01-01 - 2009-12-31, nine were "caused" by an external load
(Table 2.6, page 17). It is, however, important to note that an external load normally only
ruins the topside barrier. To experience a blowout, the downhole barrier also has to fail. So an
external load will not be the single blowout cause. Typically the external load ruins the
wellhead/X-mas tree barriers of an active well, and the downhole barrier fails to activate or is
leaking.
Page: 32 Blowout and Well Release Characteristics and Frequencies, 2011 version
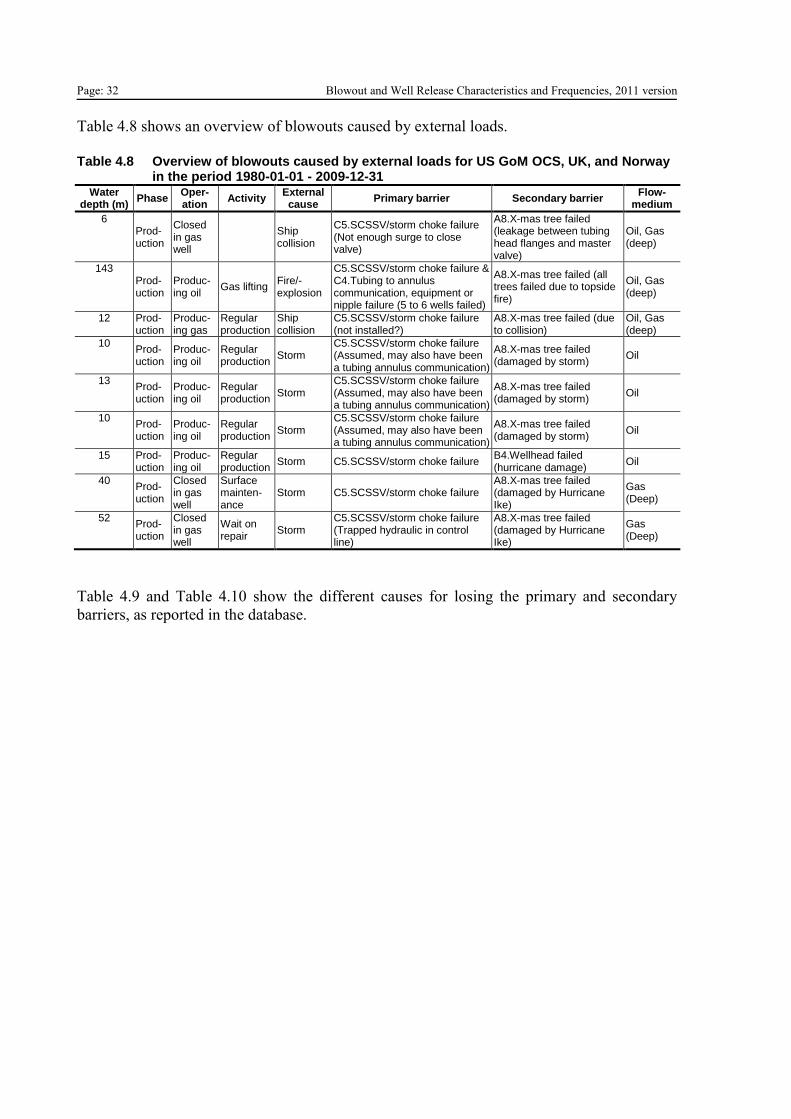
Table 4.8 shows an overview of blowouts caused by external loads.
Table 4.8 Overview of blowouts caused by external loads for US GoM OCS, UK, and Norway
in the period 1980-01-01 - 2009-12-31 Water
depth (m) Phase
Oper-ation
Activity External cause
Primary barrier Secondary barrier Flow-
medium
6 Prod-uction
Closed in gas well
Ship collision
C5.SCSSV/storm choke failure (Not enough surge to close valve)
A8.X-mas tree failed (leakage between tubing head flanges and master valve)
Oil, Gas (deep)
143 Prod-uction
Produc-ing oil
Gas lifting Fire/-explosion
C5.SCSSV/storm choke failure & C4.Tubing to annulus communication, equipment or nipple failure (5 to 6 wells failed)
A8.X-mas tree failed (all trees failed due to topside fire)
Oil, Gas (deep)
12 Prod-uction
Produc-ing gas
Regular production
Ship collision
C5.SCSSV/storm choke failure (not installed?)
A8.X-mas tree failed (due to collision)
Oil, Gas (deep)
10 Prod-uction
Produc-ing oil
Regular production
Storm C5.SCSSV/storm choke failure (Assumed, may also have been a tubing annulus communication)
A8.X-mas tree failed (damaged by storm)
Oil
13 Prod-uction
Produc-ing oil
Regular production
Storm C5.SCSSV/storm choke failure (Assumed, may also have been a tubing annulus communication)
A8.X-mas tree failed (damaged by storm)
Oil
10 Prod-uction
Produc-ing oil
Regular production
Storm C5.SCSSV/storm choke failure (Assumed, may also have been a tubing annulus communication)
A8.X-mas tree failed (damaged by storm)
Oil
15 Prod-uction
Produc-ing oil
Regular production
Storm C5.SCSSV/storm choke failure B4.Wellhead failed (hurricane damage)
Oil
40 Prod-uction
Closed in gas well
Surface mainten-ance
Storm C5.SCSSV/storm choke failure A8.X-mas tree failed (damaged by Hurricane Ike)
Gas (Deep)
52 Prod-uction
Closed in gas well
Wait on repair
Storm C5.SCSSV/storm choke failure (Trapped hydraulic in control line)
A8.X-mas tree failed (damaged by Hurricane Ike)
Gas (Deep)
Table 4.9 and Table 4.10 show the different causes for losing the primary and secondary
barriers, as reported in the database.
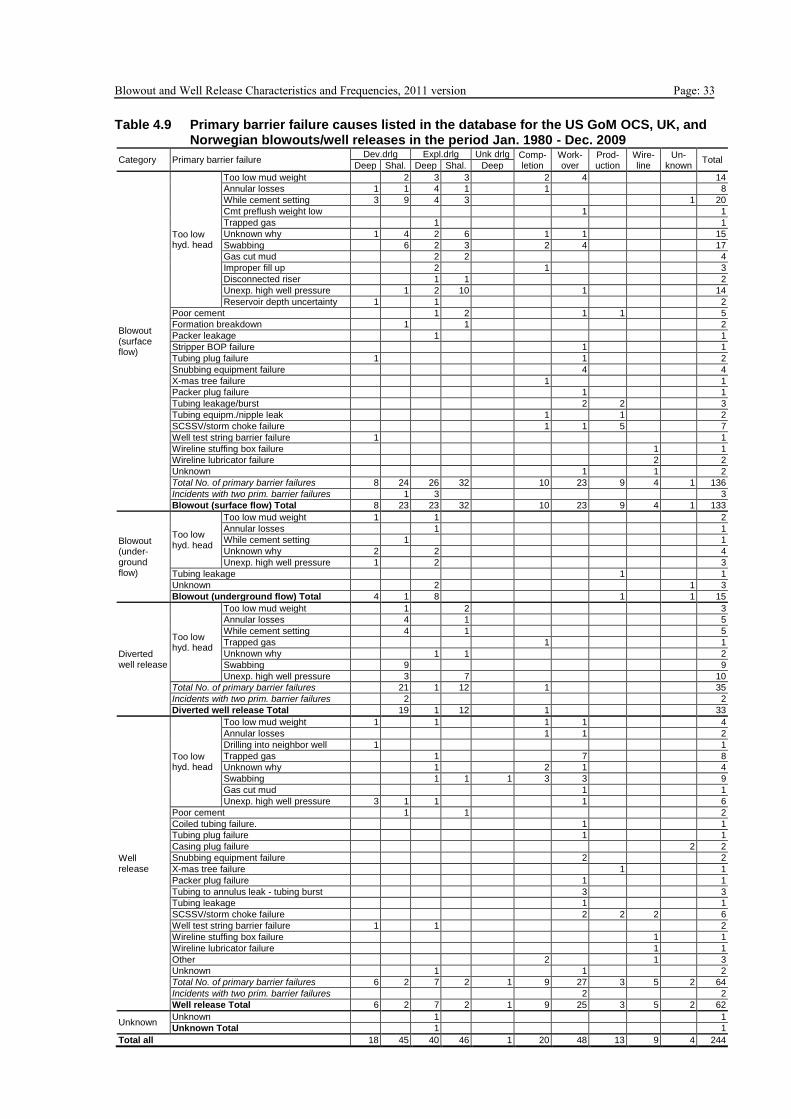
Blowout and Well Release Characteristics and Frequencies, 2011 version Page: 33 Table 4.9 Primary barrier failure causes listed in the database for the US GoM OCS, UK, and
Norwegian blowouts/well releases in the period Jan. 1980 - Dec. 2009
Category Primary barrier failure Dev.drlg Expl.drlg Unk drlg Comp-
letion Work-over
Prod-uction
Wire-line
Un-known
Total Deep Shal. Deep Shal. Deep
Blowout (surface flow)
Too low hyd. head
Too low mud weight
2 3 3
2 4
14
Annular losses 1 1 4 1
1
8
While cement setting 3 9 4 3
1 20
Cmt preflush weight low
1
1
Trapped gas
1
1
Unknown why 1 4 2 6
1 1
15
Swabbing
6 2 3
2 4
17
Gas cut mud
2 2
4
Improper fill up
2
1
3
Disconnected riser
1 1
2
Unexp. high well pressure
1 2 10
1
14
Reservoir depth uncertainty 1
1
2
Poor cement
1 2
1 1
5
Formation breakdown
1
1
2
Packer leakage
1
1
Stripper BOP failure
1
1
Tubing plug failure 1
1
2
Snubbing equipment failure
4
4
X-mas tree failure
1
1
Packer plug failure
1
1
Tubing leakage/burst
2 2
3
Tubing equipm./nipple leak
1
1
2
SCSSV/storm choke failure
1 1 5
7
Well test string barrier failure 1
1
Wireline stuffing box failure
1
1
Wireline lubricator failure
2
2
Unknown
1
1
2
Total No. of primary barrier failures 8 24 26 32 10 23 9 4 1 136
Incidents with two prim. barrier failures 1 3 3
Blowout (surface flow) Total 8 23 23 32 10 23 9 4 1 133
Blowout (under-ground flow)
Too low hyd. head
Too low mud weight 1
1
2
Annular losses
1
1
While cement setting
1
1
Unknown why 2
2
4
Unexp. high well pressure 1
2
3
Tubing leakage
1
1
Unknown
2
1 3
Blowout (underground flow) Total 4 1 8 1 1 15
Diverted well release
Too low hyd. head
Too low mud weight
1
2
3
Annular losses
4
1
5
While cement setting
4
1
5
Trapped gas
1
1
Unknown why
1 1
2
Swabbing
9
9
Unexp. high well pressure
3
7
10
Total No. of primary barrier failures 21 1 12 1 35
Incidents with two prim. barrier failures 2 2
Diverted well release Total 19 1 12 1 33
Well release
Too low hyd. head
Too low mud weight 1
1
1 1
4
Annular losses
1 1
2
Drilling into neighbor well 1
1
Trapped gas
1
7
8
Unknown why
1
2 1
4
Swabbing
1 1 1 3 3
9
Gas cut mud
1
1
Unexp. high well pressure 3 1 1
1
6
Poor cement
1
1
2
Coiled tubing failure.
1
1
Tubing plug failure
1
1
Casing plug failure
2 2
Snubbing equipment failure
2
2
X-mas tree failure
1
1
Packer plug failure
1
1
Tubing to annulus leak - tubing burst
3
3
Tubing leakage
1
1
SCSSV/storm choke failure
2 2 2
6
Well test string barrier failure 1
1
2
Wireline stuffing box failure
1
1
Wireline lubricator failure
1
1
Other
2
1
3
Unknown
1
1
2
Total No. of primary barrier failures 6 2 7 2 1 9 27 3 5 2 64
Incidents with two prim. barrier failures 2 2
Well release Total 6 2 7 2 1 9 25 3 5 2 62
Unknown Unknown
1
1
Unknown Total
1
1
Total all 18 45 40 46 1 20 48 13 9 4 244
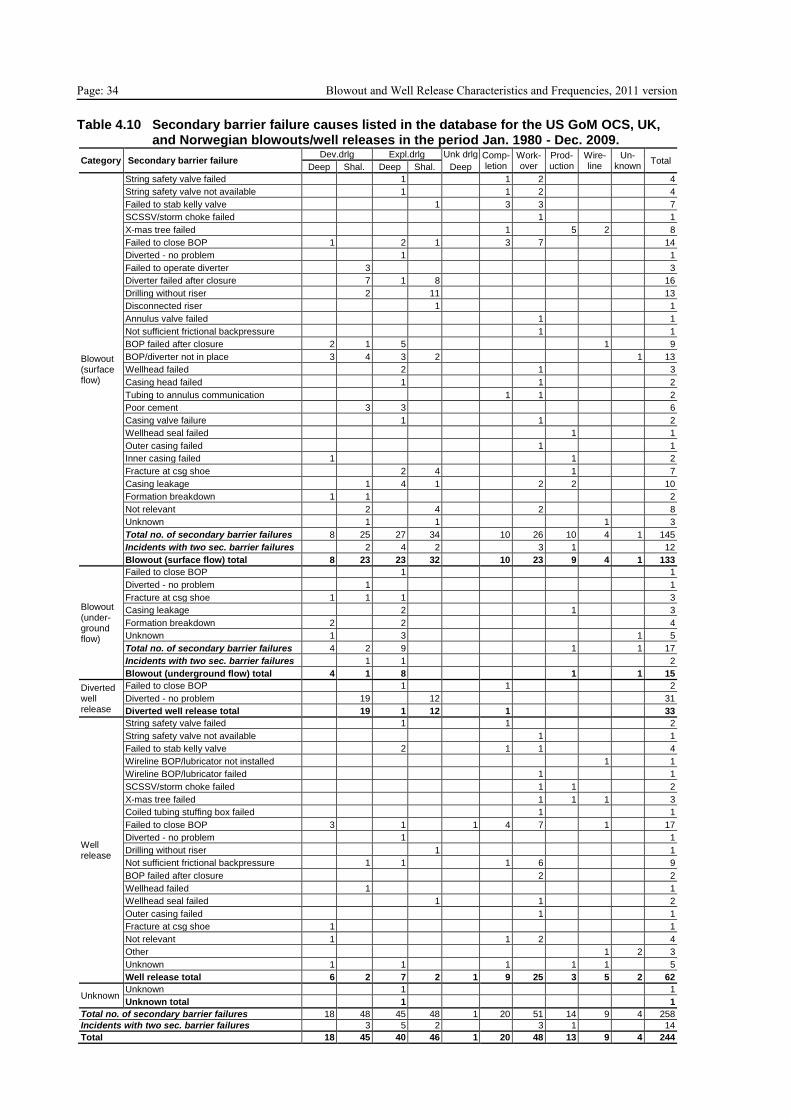
Page: 34 Blowout and Well Release Characteristics and Frequencies, 2011 version Table 4.10 Secondary barrier failure causes listed in the database for the US GoM OCS, UK,
and Norwegian blowouts/well releases in the period Jan. 1980 - Dec. 2009.
Category Secondary barrier failure Dev.drlg Expl.drlg Unk drlg Comp-
letion Work-over
Prod-uction
Wire-line
Un-known
Total Deep Shal. Deep Shal. Deep
Blowout (surface flow)
String safety valve failed
1
1 2
4
String safety valve not available
1
1 2
4
Failed to stab kelly valve
1
3 3
7
SCSSV/storm choke failed
1
1
X-mas tree failed
1
5 2
8
Failed to close BOP 1
2 1
3 7
14
Diverted - no problem
1
1
Failed to operate diverter
3
3
Diverter failed after closure
7 1 8
16
Drilling without riser
2
11
13
Disconnected riser
1
1
Annulus valve failed
1
1
Not sufficient frictional backpressure
1
1
BOP failed after closure 2 1 5
1
9
BOP/diverter not in place 3 4 3 2
1 13
Wellhead failed
2
1
3
Casing head failed
1
1
2
Tubing to annulus communication
1 1
2
Poor cement
3 3
6
Casing valve failure
1
1
2
Wellhead seal failed
1
1
Outer casing failed
1
1
Inner casing failed 1
1
2
Fracture at csg shoe
2 4
1
7
Casing leakage
1 4 1
2 2
10
Formation breakdown 1 1
2
Not relevant
2
4
2
8
Unknown
1
1
1
3
Total no. of secondary barrier failures 8 25 27 34 10 26 10 4 1 145
Incidents with two sec. barrier failures
2 4 2
3 1
12
Blowout (surface flow) total 8 23 23 32 10 23 9 4 1 133
Blowout (under-ground flow)
Failed to close BOP
1
1
Diverted - no problem
1
1
Fracture at csg shoe 1 1 1
3
Casing leakage
2
1
3
Formation breakdown 2
2
4
Unknown 1
3
1 5
Total no. of secondary barrier failures 4 2 9 1 1 17
Incidents with two sec. barrier failures
1 1
2
Blowout (underground flow) total 4 1 8 1 1 15
Diverted well release
Failed to close BOP
1
1
2
Diverted - no problem
19
12
31
Diverted well release total 19 1 12 1 33
Well release
String safety valve failed
1
1
2
String safety valve not available
1
1
Failed to stab kelly valve
2
1 1
4
Wireline BOP/lubricator not installed
1
1
Wireline BOP/lubricator failed
1
1
SCSSV/storm choke failed
1 1
2
X-mas tree failed
1 1 1
3
Coiled tubing stuffing box failed
1
1
Failed to close BOP 3
1
1 4 7 1
17
Diverted - no problem
1
1
Drilling without riser
1
1
Not sufficient frictional backpressure
1 1
1 6
9
BOP failed after closure
2
2
Wellhead failed
1
1
Wellhead seal failed
1
1
2
Outer casing failed
1
1
Fracture at csg shoe 1
1
Not relevant 1
1 2
4
Other
1 2 3
Unknown 1
1
1
1 1
5
Well release total 6 2 7 2 1 9 25 3 5 2 62
Unknown Unknown
1
1
Unknown total 1 1
Total no. of secondary barrier failures 18 48 45 48 1 20 51 14 9 4 258
Incidents with two sec. barrier failures
3 5 2
3 1
14
Total 18 45 40 46 1 20 48 13 9 4 244
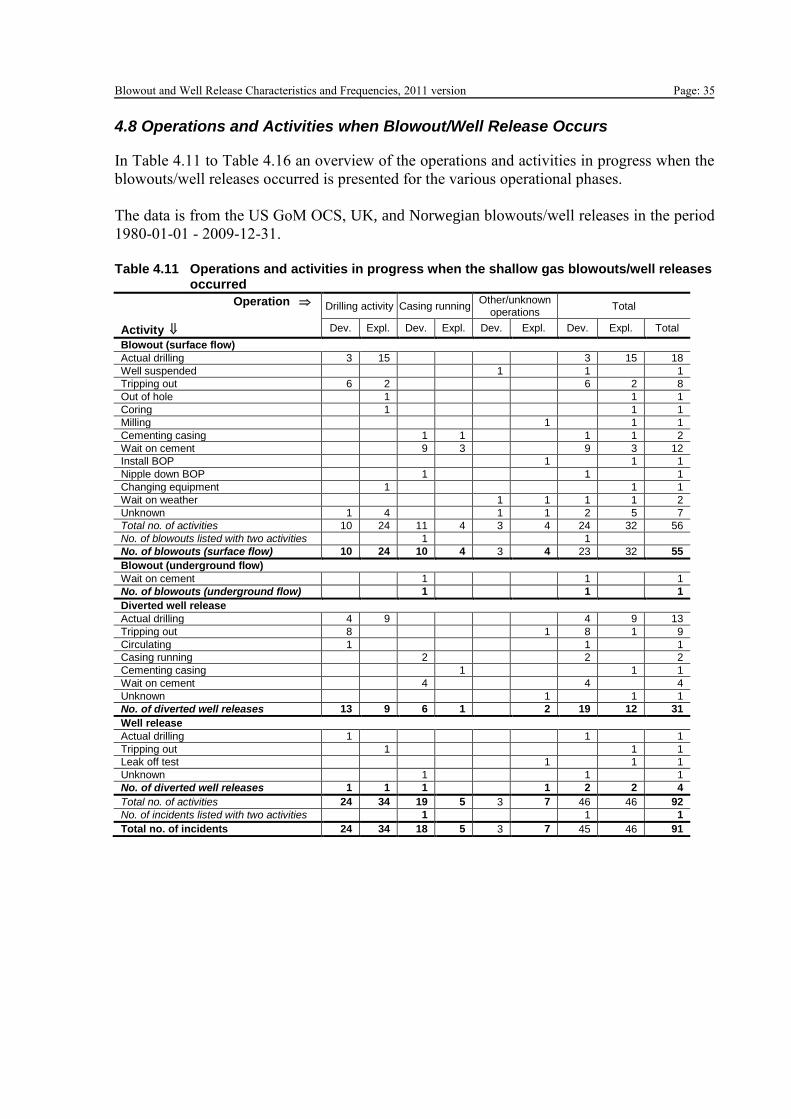
Blowout and Well Release Characteristics and Frequencies, 2011 version Page: 35
4.8 Operations and Activities when Blowout/Well Release Occurs
In Table 4.11 to Table 4.16 an overview of the operations and activities in progress when the
blowouts/well releases occurred is presented for the various operational phases.
The data is from the US GoM OCS, UK, and Norwegian blowouts/well releases in the period
1980-01-01 - 2009-12-31.
Table 4.11 Operations and activities in progress when the shallow gas blowouts/well releases
occurred
Operation
Activity
Drilling activity Casing running Other/unknown
operations Total
Dev. Expl. Dev. Expl. Dev. Expl. Dev. Expl. Total
Blowout (surface flow) Actual drilling 3 15
3 15 18
Well suspended
1 1 1
Tripping out 6 2
6 2 8
Out of hole
1
1 1
Coring
1
1 1
Milling
1 1 1
Cementing casing
1 1 1 1 2
Wait on cement
9 3 9 3 12
Install BOP
1 1 1
Nipple down BOP 1 1 1
Changing equipment
1
1 1
Wait on weather
1 1 1 1 2
Unknown 1 4
1 1 2 5 7
Total no. of activities 10 24 11 4 3 4 24 32 56
No. of blowouts listed with two activities
1
1 No. of blowouts (surface flow) 10 24 10 4 3 4 23 32 55
Blowout (underground flow)
Wait on cement 1 1 1
No. of blowouts (underground flow) 1 1 1
Diverted well release
Actual drilling 4 9 4 9 13
Tripping out 8 1 8 1 9
Circulating 1 1 1
Casing running 2 2 2
Cementing casing 1 1 1
Wait on cement 4 4 4
Unknown 1 1 1
No. of diverted well releases 13 9 6 1 2 19 12 31
Well release
Actual drilling 1 1 1
Tripping out 1 1 1
Leak off test 1 1 1
Unknown 1 1 1
No. of diverted well releases 1 1 1 1 2 2 4
Total no. of activities 24 34 19 5 3 7 46 46 92
No. of incidents listed with two activities
1
1 1
Total no. of incidents 24 34 18 5 3 7 45 46 91
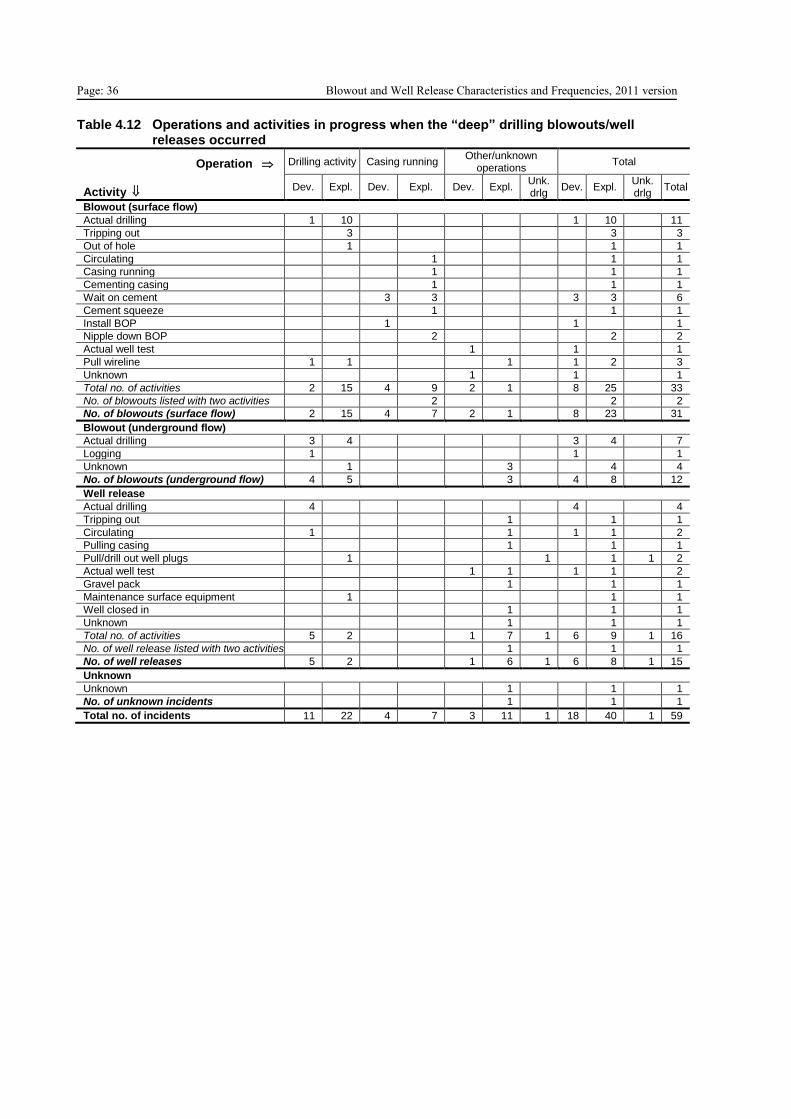
Page: 36 Blowout and Well Release Characteristics and Frequencies, 2011 version Table 4.12 Operations and activities in progress when the “deep” drilling blowouts/well
releases occurred
Operation
Activity
Drilling activity Casing running Other/unknown
operations Total
Dev. Expl. Dev. Expl. Dev. Expl. Unk. drlg
Dev. Expl. Unk. drlg
Total
Blowout (surface flow) Actual drilling 1 10 1 10 11
Tripping out 3 3 3
Out of hole 1 1 1
Circulating 1 1 1
Casing running 1 1 1
Cementing casing 1 1 1
Wait on cement 3 3 3 3 6
Cement squeeze 1 1 1
Install BOP 1 1 1
Nipple down BOP 2 2 2
Actual well test 1 1 1
Pull wireline 1 1 1 1 2 3
Unknown 1 1 1
Total no. of activities 2 15 4 9 2 1 8 25 33
No. of blowouts listed with two activities 2 2 2
No. of blowouts (surface flow) 2 15 4 7 2 1 8 23 31
Blowout (underground flow)
Actual drilling 3 4 3 4 7
Logging 1 1 1
Unknown 1 3 4 4
No. of blowouts (underground flow) 4 5 3 4 8 12
Well release
Actual drilling 4 4 4
Tripping out 1 1 1
Circulating 1 1 1 1 2
Pulling casing 1 1 1
Pull/drill out well plugs 1 1 1 1 2
Actual well test 1 1 1 1 2
Gravel pack 1 1 1
Maintenance surface equipment 1 1 1
Well closed in 1 1 1
Unknown 1 1 1
Total no. of activities 5 2 1 7 1 6 9 1 16
No. of well release listed with two activities 1 1 1
No. of well releases 5 2 1 6 1 6 8 1 15
Unknown
Unknown 1 1 1
No. of unknown incidents 1 1 1
Total no. of incidents 11 22 4 7 3 11 1 18 40 1 59
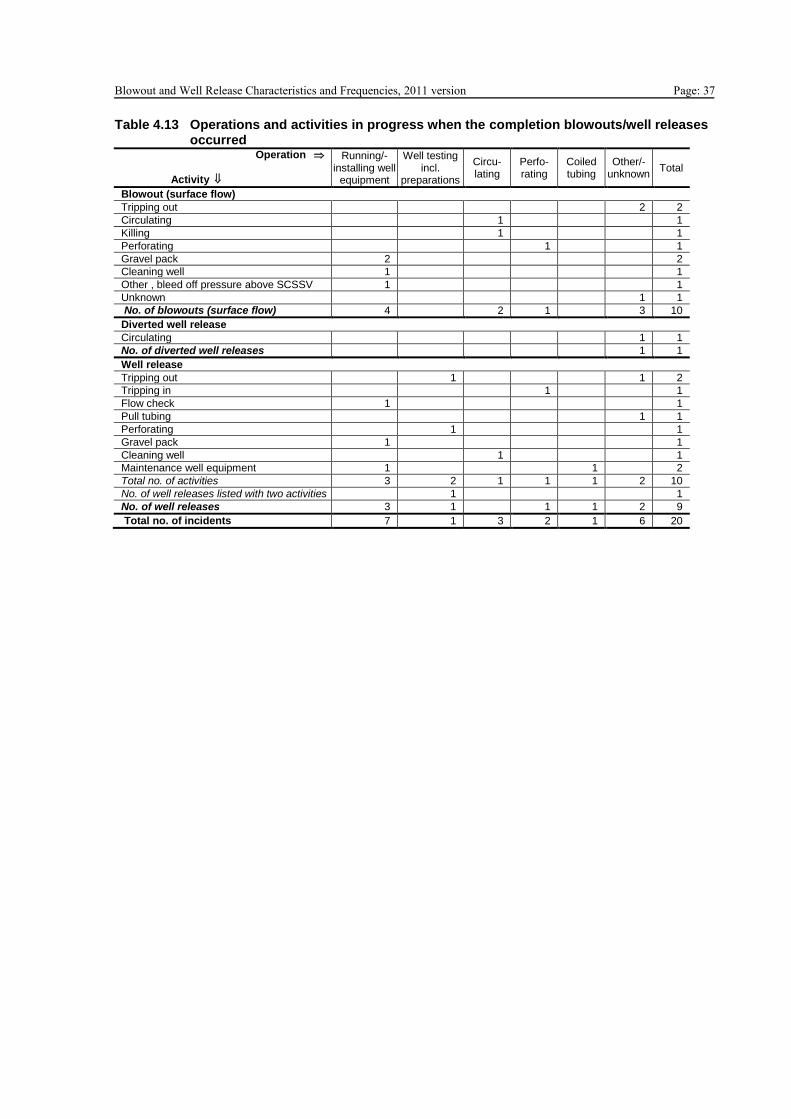
Blowout and Well Release Characteristics and Frequencies, 2011 version Page: 37 Table 4.13 Operations and activities in progress when the completion blowouts/well releases
occurred Operation
Activity
Running/-installing well
equipment
Well testing incl.
preparations
Circu-lating
Perfo-rating
Coiled tubing
Other/-unknown
Total
Blowout (surface flow) Tripping out
2 2
Circulating
1
1
Killing
1
1
Perforating
1
1
Gravel pack 2
2
Cleaning well 1
1
Other , bleed off pressure above SCSSV 1
1
Unknown
1 1
No. of blowouts (surface flow) 4 2 1 3 10
Diverted well release Circulating
1 1
No. of diverted well releases
1 1
Well release Tripping out
1
1 2
Tripping in
1
1
Flow check 1
1
Pull tubing
1 1
Perforating
1
1
Gravel pack 1
1
Cleaning well
1
1
Maintenance well equipment 1
1
2
Total no. of activities 3 2 1 1 1 2 10
No. of well releases listed with two activities
1
1
No. of well releases 3 1 1 1 2 9
Total no. of incidents 7 1 3 2 1 6 20
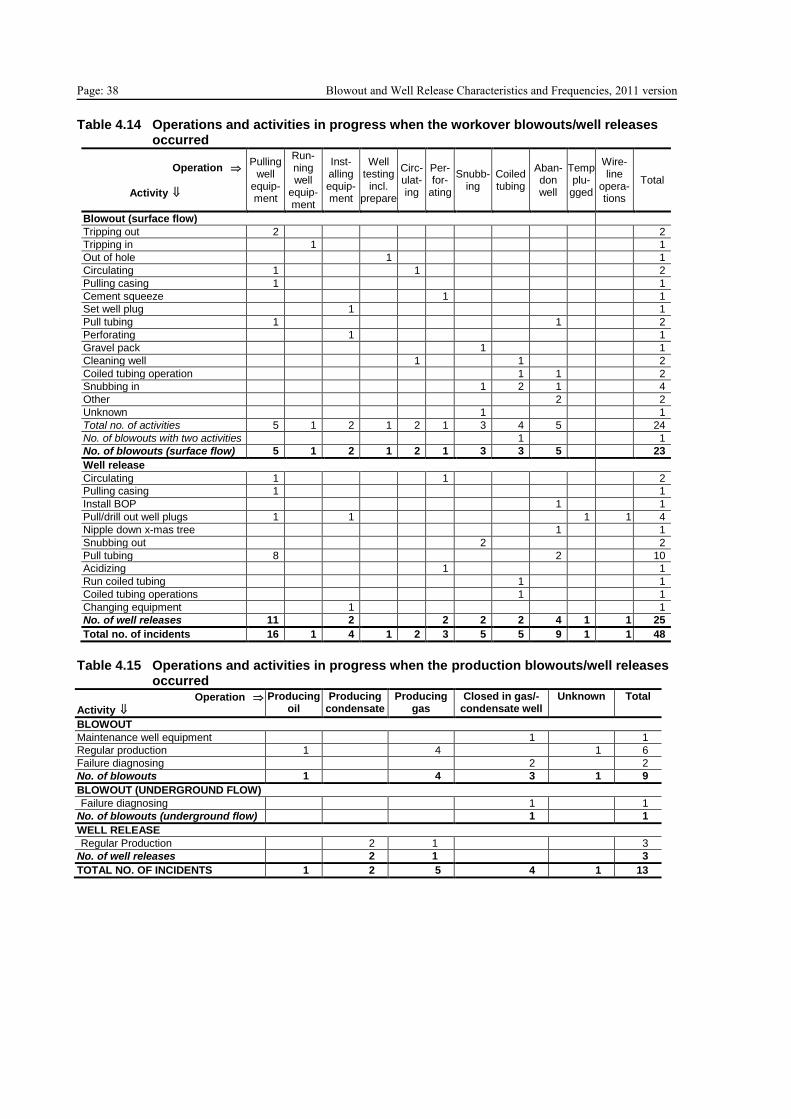
Page: 38 Blowout and Well Release Characteristics and Frequencies, 2011 version Table 4.14 Operations and activities in progress when the workover blowouts/well releases
occurred
Operation
Activity
Pulling well
equip-ment
Run-ning well
equip-ment
Inst-alling equip-ment
Well testing
incl. prepare
Circ-ulat-ing
Per-for-
ating
Snubb-ing
Coiled tubing
Aban-don well
Temp plu-
gged
Wire-line
opera-tions
Total
Blowout (surface flow)
Tripping out 2
2
Tripping in
1
1
Out of hole
1
1
Circulating 1
1
2
Pulling casing 1
1
Cement squeeze
1
1
Set well plug
1
1
Pull tubing 1
1
2
Perforating
1
1
Gravel pack
1
1
Cleaning well
1
1
2
Coiled tubing operation
1 1
2
Snubbing in
1 2 1
4
Other
2
2
Unknown
1
1
Total no. of activities 5 1 2 1 2 1 3 4 5
24
No. of blowouts with two activities
1
1
No. of blowouts (surface flow) 5 1 2 1 2 1 3 3 5
23
Well release
Circulating 1
1
2
Pulling casing 1
1
Install BOP
1
1
Pull/drill out well plugs 1
1
1 1 4
Nipple down x-mas tree
1
1
Snubbing out
2
2
Pull tubing 8
2
10
Acidizing
1
1
Run coiled tubing
1
1
Coiled tubing operations
1
1
Changing equipment
1
1
No. of well releases 11
2
2 2 2 4 1 1 25
Total no. of incidents 16 1 4 1 2 3 5 5 9 1 1 48
Table 4.15 Operations and activities in progress when the production blowouts/well releases
occurred Operation
Activity Producing
oil Producing
condensate Producing
gas Closed in gas/-
condensate well Unknown Total
BLOWOUT
Maintenance well equipment 1 1
Regular production 1 4 1 6
Failure diagnosing 2 2
No. of blowouts 1 4 3 1 9
BLOWOUT (UNDERGROUND FLOW)
Failure diagnosing 1 1
No. of blowouts (underground flow) 1 1
WELL RELEASE
Regular Production 2 1 3
No. of well releases 2 1 3
TOTAL NO. OF INCIDENTS 1 2 5 4 1 13
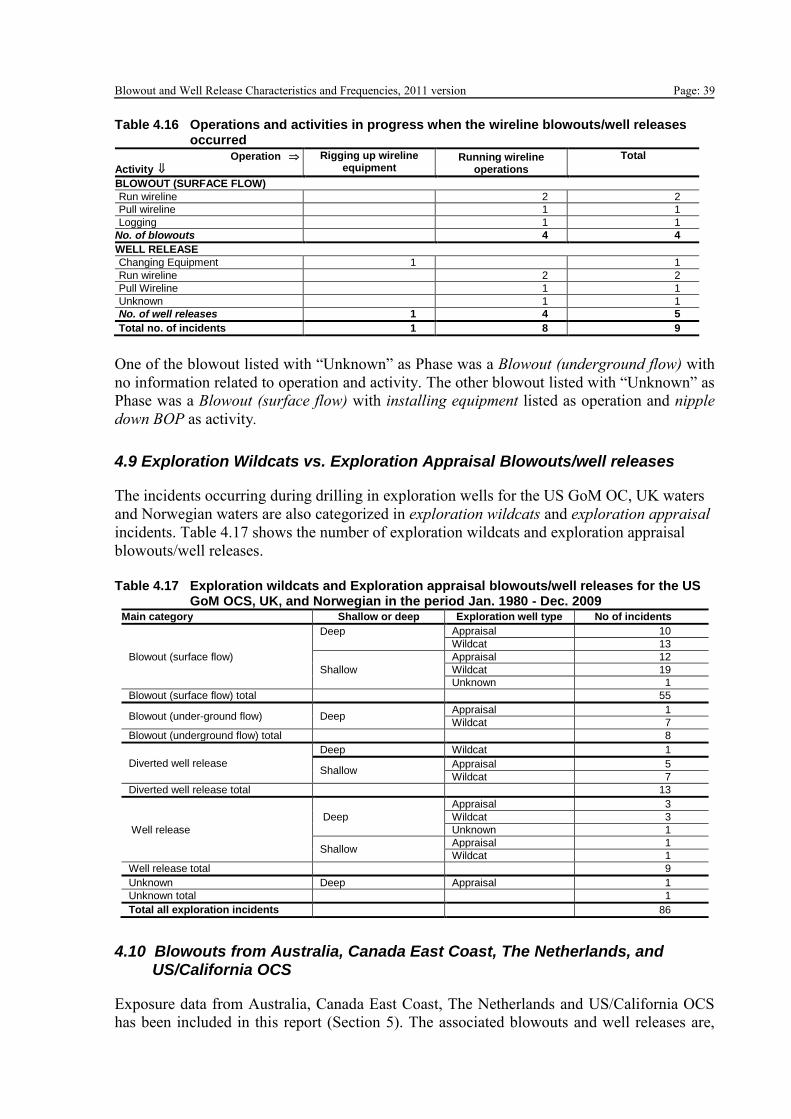
Blowout and Well Release Characteristics and Frequencies, 2011 version Page: 39 Table 4.16 Operations and activities in progress when the wireline blowouts/well releases
occurred Operation
Activity Rigging up wireline
equipment Running wireline
operations
Total
BLOWOUT (SURFACE FLOW)
Run wireline 2 2
Pull wireline 1 1
Logging 1 1
No. of blowouts 4 4
WELL RELEASE
Changing Equipment 1 1
Run wireline 2 2
Pull Wireline 1 1
Unknown 1 1
No. of well releases 1 4 5
Total no. of incidents 1 8 9
One of the blowout listed with “Unknown” as Phase was a Blowout (underground flow) with
no information related to operation and activity. The other blowout listed with “Unknown” as
Phase was a Blowout (surface flow) with installing equipment listed as operation and nipple
down BOP as activity.
4.9 Exploration Wildcats vs. Exploration Appraisal Blowouts/well releases
The incidents occurring during drilling in exploration wells for the US GoM OC, UK waters
and Norwegian waters are also categorized in exploration wildcats and exploration appraisal
incidents. Table 4.17 shows the number of exploration wildcats and exploration appraisal
blowouts/well releases.
Table 4.17 Exploration wildcats and Exploration appraisal blowouts/well releases for the US
GoM OCS, UK, and Norwegian in the period Jan. 1980 - Dec. 2009 Main category Shallow or deep Exploration well type No of incidents
Blowout (surface flow)
Deep
Appraisal 10
Wildcat 13
Shallow
Appraisal 12
Wildcat 19
Unknown 1
Blowout (surface flow) total 55
Blowout (under-ground flow) Deep Appraisal 1
Wildcat 7
Blowout (underground flow) total 8
Diverted well release
Deep Wildcat 1
Shallow Appraisal 5
Wildcat 7
Diverted well release total 13
Well release
Deep
Appraisal 3
Wildcat 3
Unknown 1
Shallow Appraisal 1
Wildcat 1
Well release total 9
Unknown Deep Appraisal 1
Unknown total 1
Total all exploration incidents 86
4.10 Blowouts from Australia, Canada East Coast, The Netherlands, and US/California OCS
Exposure data from Australia, Canada East Coast, The Netherlands and US/California OCS
has been included in this report (Section 5). The associated blowouts and well releases are,
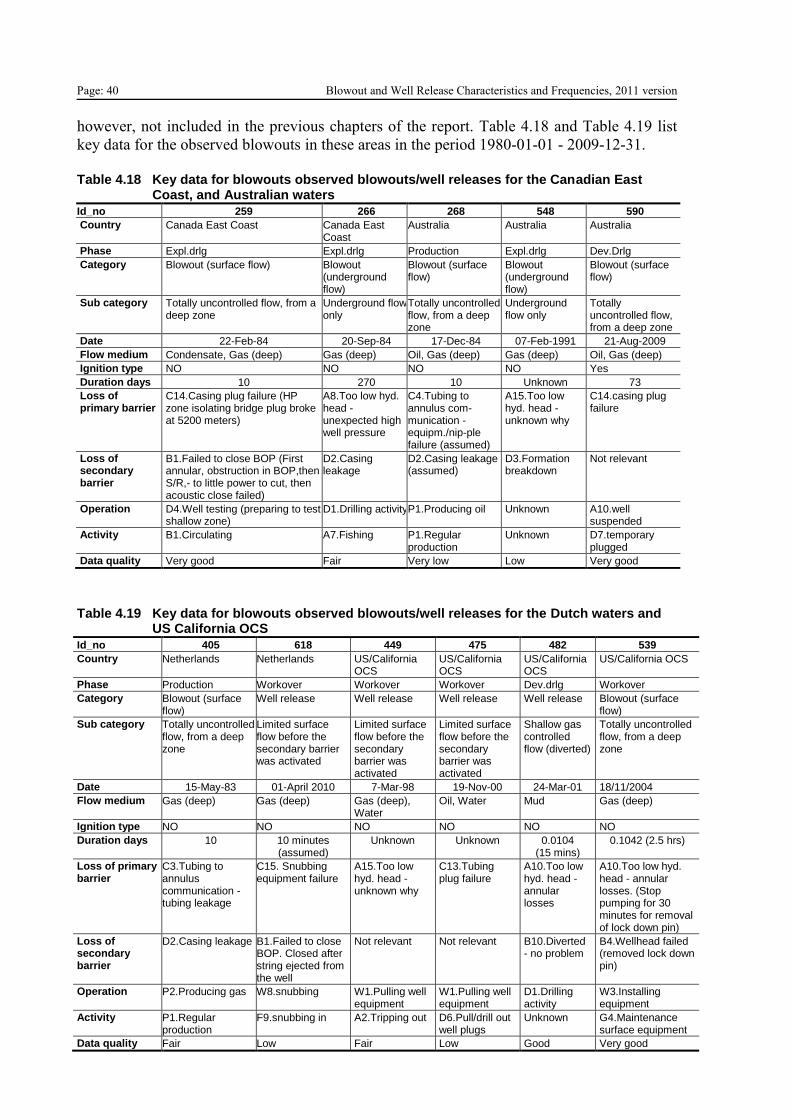
Page: 40 Blowout and Well Release Characteristics and Frequencies, 2011 version
however, not included in the previous chapters of the report. Table 4.18 and Table 4.19 list
key data for the observed blowouts in these areas in the period 1980-01-01 - 2009-12-31.
Table 4.18 Key data for blowouts observed blowouts/well releases for the Canadian East
Coast, and Australian waters Id_no 259 266 268 548 590
Country Canada East Coast Canada East Coast
Australia Australia Australia
Phase Expl.drlg Expl.drlg Production Expl.drlg Dev.Drlg
Category Blowout (surface flow) Blowout (underground flow)
Blowout (surface flow)
Blowout (underground flow)
Blowout (surface flow)
Sub category Totally uncontrolled flow, from a deep zone
Underground flow only
Totally uncontrolled flow, from a deep zone
Underground flow only
Totally uncontrolled flow, from a deep zone
Date 22-Feb-84 20-Sep-84 17-Dec-84 07-Feb-1991 21-Aug-2009
Flow medium Condensate, Gas (deep) Gas (deep) Oil, Gas (deep) Gas (deep) Oil, Gas (deep)
Ignition type NO NO NO NO Yes
Duration days 10 270 10 Unknown 73
Loss of primary barrier
C14.Casing plug failure (HP zone isolating bridge plug broke at 5200 meters)
A8.Too low hyd. head - unexpected high well pressure
C4.Tubing to annulus com-munication - equipm./nip-ple failure (assumed)
A15.Too low hyd. head - unknown why
C14.casing plug failure
Loss of secondary barrier
B1.Failed to close BOP (First annular, obstruction in BOP,then S/R,- to little power to cut, then acoustic close failed)
D2.Casing leakage
D2.Casing leakage (assumed)
D3.Formation breakdown
Not relevant
Operation D4.Well testing (preparing to test shallow zone)
D1.Drilling activity P1.Producing oil Unknown A10.well suspended
Activity B1.Circulating A7.Fishing P1.Regular production
Unknown D7.temporary plugged
Data quality Very good Fair Very low Low Very good
Table 4.19 Key data for blowouts observed blowouts/well releases for the Dutch waters and
US California OCS Id_no 405 618 449 475 482 539
Country Netherlands Netherlands US/California OCS
US/California OCS
US/California OCS
US/California OCS
Phase Production Workover Workover Workover Dev.drlg Workover
Category Blowout (surface flow)
Well release Well release Well release Well release Blowout (surface flow)
Sub category Totally uncontrolled flow, from a deep zone
Limited surface flow before the secondary barrier was activated
Limited surface flow before the secondary barrier was activated
Limited surface flow before the secondary barrier was activated
Shallow gas controlled flow (diverted)
Totally uncontrolled flow, from a deep zone
Date 15-May-83 01-April 2010 7-Mar-98 19-Nov-00 24-Mar-01 18/11/2004
Flow medium Gas (deep) Gas (deep) Gas (deep), Water
Oil, Water Mud Gas (deep)
Ignition type NO NO NO NO NO NO
Duration days 10 10 minutes (assumed)
Unknown Unknown 0.0104 (15 mins)
0.1042 (2.5 hrs)
Loss of primary barrier
C3.Tubing to annulus communication - tubing leakage
C15. Snubbing equipment failure
A15.Too low hyd. head - unknown why
C13.Tubing plug failure
A10.Too low hyd. head - annular losses
A10.Too low hyd. head - annular losses. (Stop pumping for 30 minutes for removal of lock down pin)
Loss of secondary barrier
D2.Casing leakage B1.Failed to close BOP. Closed after string ejected from the well
Not relevant Not relevant B10.Diverted - no problem
B4.Wellhead failed (removed lock down pin)
Operation P2.Producing gas W8.snubbing W1.Pulling well equipment
W1.Pulling well equipment
D1.Drilling activity
W3.Installing equipment
Activity P1.Regular production
F9.snubbing in A2.Tripping out D6.Pull/drill out well plugs
Unknown G4.Maintenance surface equipment
Data quality Fair Low Fair Low Good Very good
Blowout and Well Release Characteristics and Frequencies, 2011 version Page: 41
5. “Normal” Drilling and Production Exposure Data
The exposure date in this section of the report includes yearly well drilling and no. of wells in
production for some specific areas. The offshore drilling wells are from Norway, UK, US
GoM OCS, East Coast of Canada and the Netherlands. The production data stems from
Norway, UK, and US GoM OCS.
The format of the exposure data varies for the different areas.
5.1 Drilling Exposure Data
5.1.1 US GoM OCS
The drilling exposure data for the US GoM OCS stems from a computerised list of all wells
drilled (/1/). A version from November 2011 was used for this report. The file includes
information on borehole activities such as drilling activity, counts on the number of boreholes
completed, and number of shut-in's. Additional information includes the lease number, well
name, and spud date, the well class, surface area/block number, well depths, and statistics on
well status summary. Per November 2011 the data-file includes information from more than
51 700 wells drilled all time in the US GoM OCS.
The number of wells drilled in the US GoM OCS area is presented in Table 5.1.
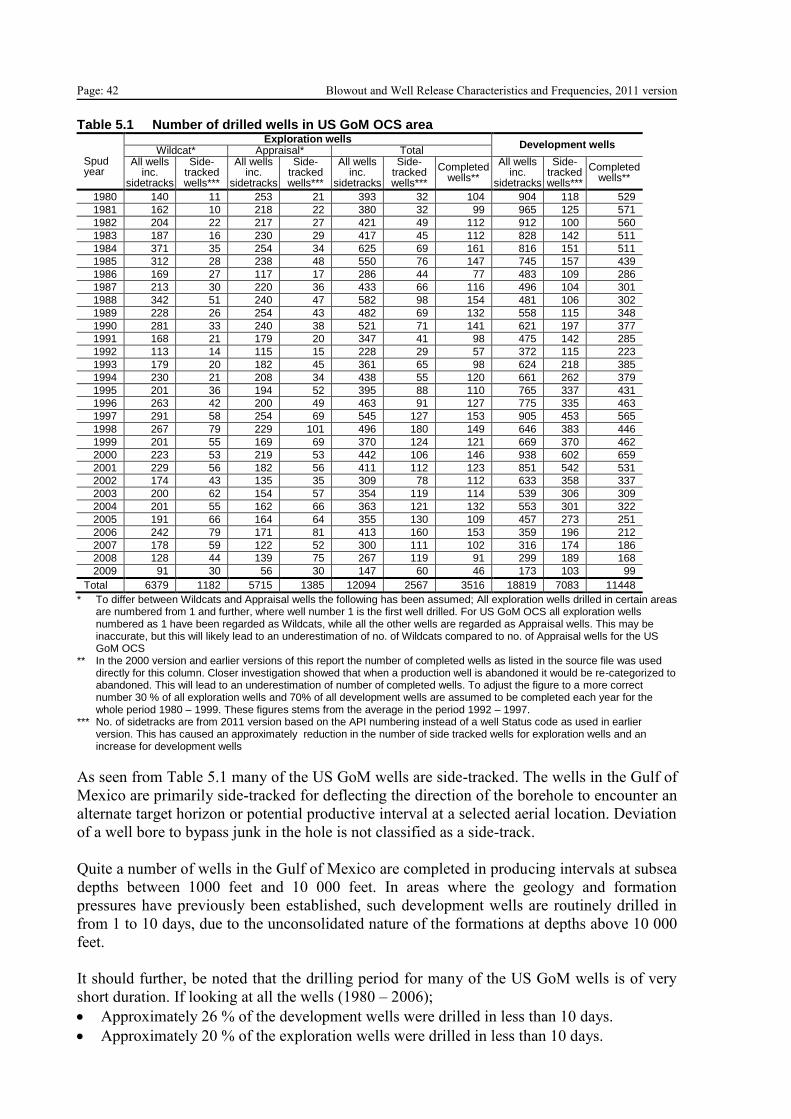
Page: 42 Blowout and Well Release Characteristics and Frequencies, 2011 version Table 5.1 Number of drilled wells in US GoM OCS area
Spud year
Exploration wells Development wells
Wildcat* Appraisal* Total All wells
inc. sidetracks
Side-tracked wells***
All wells inc.
sidetracks
Side-tracked wells***
All wells inc.
sidetracks
Side-tracked wells***
Completed wells**
All wells inc.
sidetracks
Side-tracked wells***
Completed wells**
1980 140 11 253 21 393 32 104 904 118 529
1981 162 10 218 22 380 32 99 965 125 571
1982 204 22 217 27 421 49 112 912 100 560
1983 187 16 230 29 417 45 112 828 142 511
1984 371 35 254 34 625 69 161 816 151 511
1985 312 28 238 48 550 76 147 745 157 439
1986 169 27 117 17 286 44 77 483 109 286
1987 213 30 220 36 433 66 116 496 104 301
1988 342 51 240 47 582 98 154 481 106 302
1989 228 26 254 43 482 69 132 558 115 348
1990 281 33 240 38 521 71 141 621 197 377
1991 168 21 179 20 347 41 98 475 142 285
1992 113 14 115 15 228 29 57 372 115 223
1993 179 20 182 45 361 65 98 624 218 385
1994 230 21 208 34 438 55 120 661 262 379
1995 201 36 194 52 395 88 110 765 337 431
1996 263 42 200 49 463 91 127 775 335 463
1997 291 58 254 69 545 127 153 905 453 565
1998 267 79 229 101 496 180 149 646 383 446
1999 201 55 169 69 370 124 121 669 370 462
2000 223 53 219 53 442 106 146 938 602 659
2001 229 56 182 56 411 112 123 851 542 531
2002 174 43 135 35 309 78 112 633 358 337
2003 200 62 154 57 354 119 114 539 306 309
2004 201 55 162 66 363 121 132 553 301 322
2005 191 66 164 64 355 130 109 457 273 251
2006 242 79 171 81 413 160 153 359 196 212
2007 178 59 122 52 300 111 102 316 174 186
2008 128 44 139 75 267 119 91 299 189 168
2009 91 30 56 30 147 60 46 173 103 99
Total 6379 1182 5715 1385 12094 2567 3516 18819 7083 11448
* To differ between Wildcats and Appraisal wells the following has been assumed; All exploration wells drilled in certain areas are numbered from 1 and further, where well number 1 is the first well drilled. For US GoM OCS all exploration wells numbered as 1 have been regarded as Wildcats, while all the other wells are regarded as Appraisal wells. This may be inaccurate, but this will likely lead to an underestimation of no. of Wildcats compared to no. of Appraisal wells for the US GoM OCS
** In the 2000 version and earlier versions of this report the number of completed wells as listed in the source file was used directly for this column. Closer investigation showed that when a production well is abandoned it would be re-categorized to abandoned. This will lead to an underestimation of number of completed wells. To adjust the figure to a more correct number 30 % of all exploration wells and 70% of all development wells are assumed to be completed each year for the whole period 1980 – 1999. These figures stems from the average in the period 1992 – 1997.
*** No. of sidetracks are from 2011 version based on the API numbering instead of a well Status code as used in earlier version. This has caused an approximately reduction in the number of side tracked wells for exploration wells and an increase for development wells
As seen from Table 5.1 many of the US GoM wells are side-tracked. The wells in the Gulf of
Mexico are primarily side-tracked for deflecting the direction of the borehole to encounter an
alternate target horizon or potential productive interval at a selected aerial location. Deviation
of a well bore to bypass junk in the hole is not classified as a side-track.
Quite a number of wells in the Gulf of Mexico are completed in producing intervals at subsea
depths between 1000 feet and 10 000 feet. In areas where the geology and formation
pressures have previously been established, such development wells are routinely drilled in
from 1 to 10 days, due to the unconsolidated nature of the formations at depths above 10 000
feet.
It should further, be noted that the drilling period for many of the US GoM wells is of very
short duration. If looking at all the wells (1980 – 2006);
Approximately 26 % of the development wells were drilled in less than 10 days.
Approximately 20 % of the exploration wells were drilled in less than 10 days.
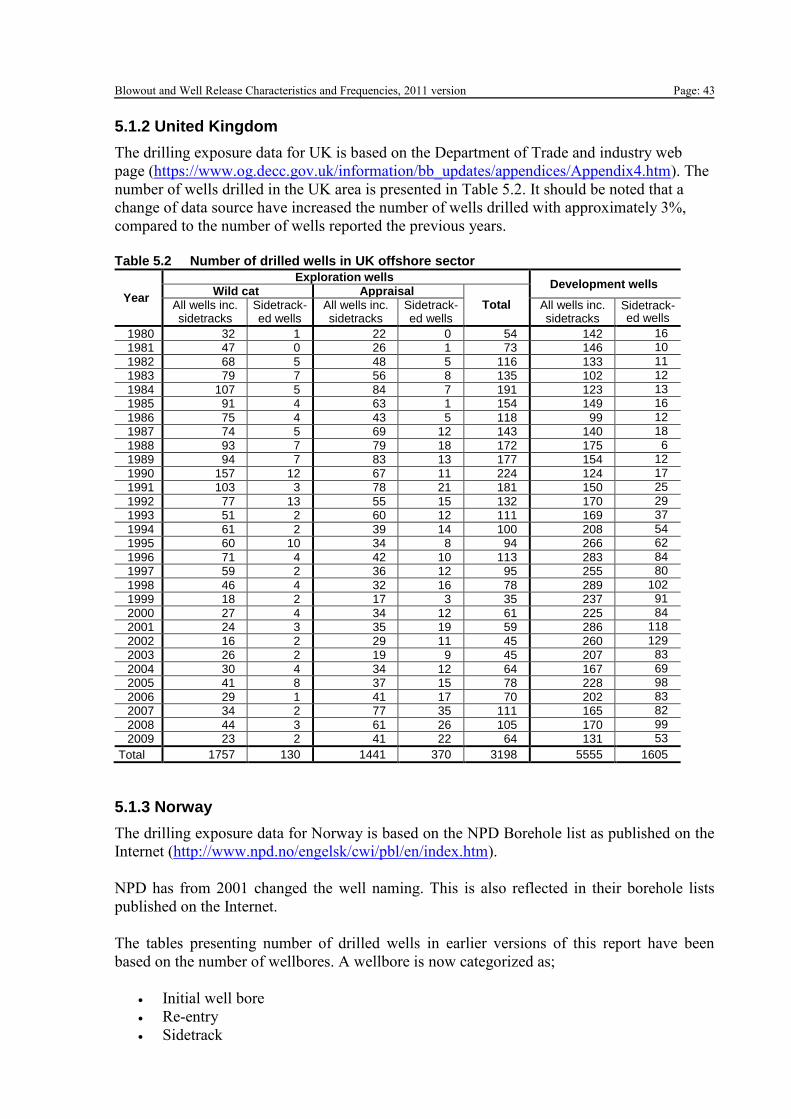
Blowout and Well Release Characteristics and Frequencies, 2011 version Page: 43
5.1.2 United Kingdom
The drilling exposure data for UK is based on the Department of Trade and industry web
page (https://www.og.decc.gov.uk/information/bb_updates/appendices/Appendix4.htm). The
number of wells drilled in the UK area is presented in Table 5.2. It should be noted that a
change of data source have increased the number of wells drilled with approximately 3%,
compared to the number of wells reported the previous years.
Table 5.2 Number of drilled wells in UK offshore sector
Year
Exploration wells Development wells
Wild cat Appraisal Total All wells inc.
sidetracks Sidetrack-ed wells
All wells inc. sidetracks
Sidetrack-ed wells
All wells inc. sidetracks
Sidetrack-ed wells
1980 32 1 22 0 54 142 16
1981 47 0 26 1 73 146 10
1982 68 5 48 5 116 133 11
1983 79 7 56 8 135 102 12
1984 107 5 84 7 191 123 13
1985 91 4 63 1 154 149 16
1986 75 4 43 5 118 99 12
1987 74 5 69 12 143 140 18
1988 93 7 79 18 172 175 6
1989 94 7 83 13 177 154 12
1990 157 12 67 11 224 124 17
1991 103 3 78 21 181 150 25
1992 77 13 55 15 132 170 29
1993 51 2 60 12 111 169 37
1994 61 2 39 14 100 208 54
1995 60 10 34 8 94 266 62
1996 71 4 42 10 113 283 84
1997 59 2 36 12 95 255 80
1998 46 4 32 16 78 289 102
1999 18 2 17 3 35 237 91
2000 27 4 34 12 61 225 84
2001 24 3 35 19 59 286 118
2002 16 2 29 11 45 260 129
2003 26 2 19 9 45 207 83
2004 30 4 34 12 64 167 69
2005 41 8 37 15 78 228 98
2006 29 1 41 17 70 202 83
2007 34 2 77 35 111 165 82
2008 44 3 61 26 105 170 99
2009 23 2 41 22 64 131 53
Total 1757 130 1441 370 3198 5555 1605
5.1.3 Norway
The drilling exposure data for Norway is based on the NPD Borehole list as published on the
Internet (http://www.npd.no/engelsk/cwi/pbl/en/index.htm).
NPD has from 2001 changed the well naming. This is also reflected in their borehole lists
published on the Internet.
The tables presenting number of drilled wells in earlier versions of this report have been
based on the number of wellbores. A wellbore is now categorized as;
Initial well bore
Re-entry
Sidetrack
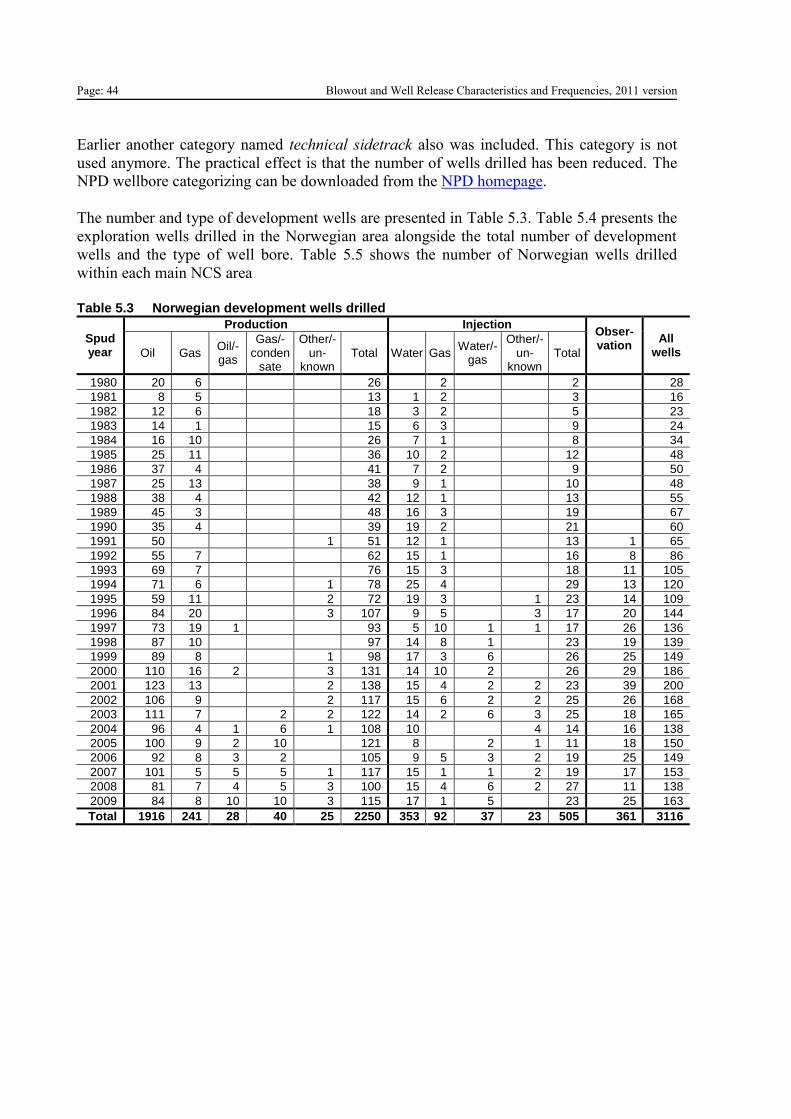
Page: 44 Blowout and Well Release Characteristics and Frequencies, 2011 version
Earlier another category named technical sidetrack also was included. This category is not
used anymore. The practical effect is that the number of wells drilled has been reduced. The
NPD wellbore categorizing can be downloaded from the NPD homepage.
The number and type of development wells are presented in Table 5.3. Table 5.4 presents the
exploration wells drilled in the Norwegian area alongside the total number of development
wells and the type of well bore. Table 5.5 shows the number of Norwegian wells drilled
within each main NCS area
Table 5.3 Norwegian development wells drilled
Spud year
Production Injection Obser-vation
All wells Oil Gas
Oil/-gas
Gas/-conden
sate
Other/-un-
known Total Water Gas
Water/-gas
Other/-un-
known Total
1980 20 6 26 2 2 28
1981 8 5 13 1 2 3 16
1982 12 6 18 3 2 5 23
1983 14 1 15 6 3 9 24
1984 16 10 26 7 1 8 34
1985 25 11 36 10 2 12 48
1986 37 4 41 7 2 9 50
1987 25 13 38 9 1 10 48
1988 38 4 42 12 1 13 55
1989 45 3 48 16 3 19 67
1990 35 4 39 19 2 21 60
1991 50 1 51 12 1 13 1 65
1992 55 7 62 15 1 16 8 86
1993 69 7 76 15 3 18 11 105
1994 71 6 1 78 25 4 29 13 120
1995 59 11 2 72 19 3 1 23 14 109
1996 84 20 3 107 9 5 3 17 20 144
1997 73 19 1 93 5 10 1 1 17 26 136
1998 87 10 97 14 8 1 23 19 139
1999 89 8 1 98 17 3 6 26 25 149
2000 110 16 2 3 131 14 10 2 26 29 186
2001 123 13 2 138 15 4 2 2 23 39 200
2002 106 9 2 117 15 6 2 2 25 26 168
2003 111 7 2 2 122 14 2 6 3 25 18 165
2004 96 4 1 6 1 108 10 4 14 16 138
2005 100 9 2 10 121 8 2 1 11 18 150
2006 92 8 3 2 105 9 5 3 2 19 25 149
2007 101 5 5 5 1 117 15 1 1 2 19 17 153
2008 81 7 4 5 3 100 15 4 6 2 27 11 138
2009 84 8 10 10 3 115 17 1 5 23 25 163
Total 1916 241 28 40 25 2250 353 92 37 23 505 361 3116
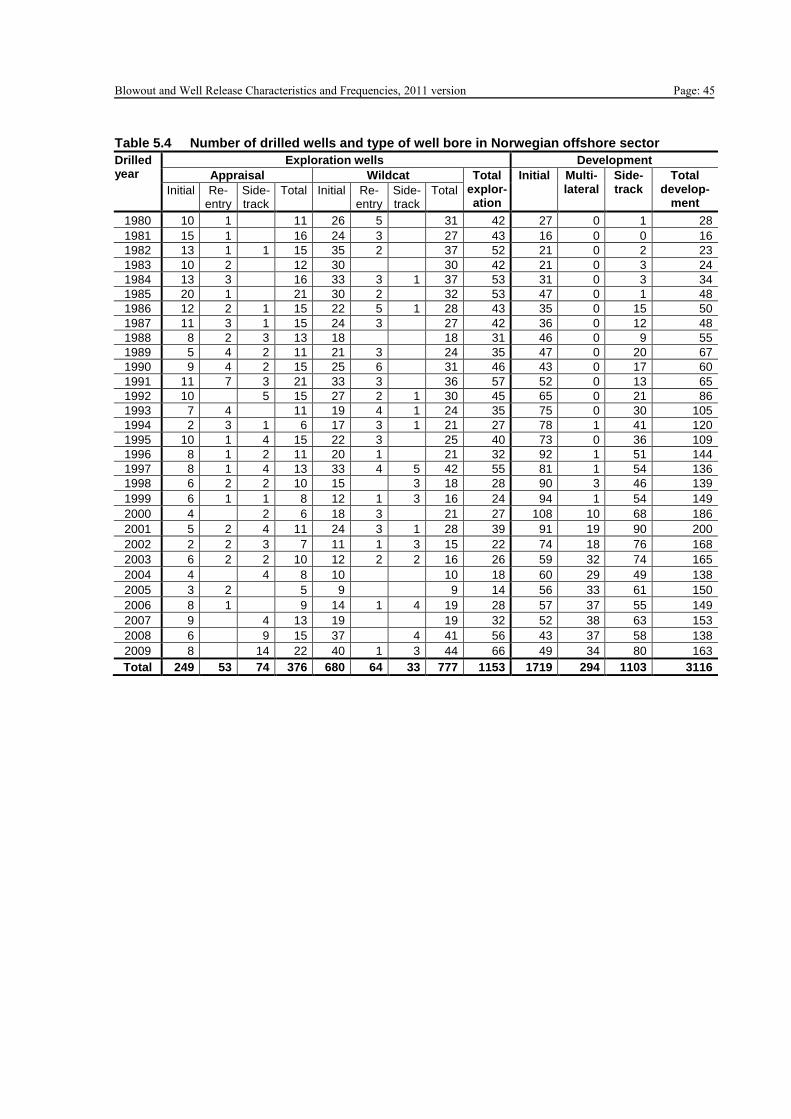
Blowout and Well Release Characteristics and Frequencies, 2011 version Page: 45
Table 5.4 Number of drilled wells and type of well bore in Norwegian offshore sector
Drilled year
Exploration wells Development
Appraisal Wildcat Total explor-ation
Initial Multi-lateral
Side-track
Total develop-
ment Initial Re-
entry Side-track
Total Initial Re-entry
Side-track
Total
1980 10 1 11 26 5 31 42 27 0 1 28
1981 15 1 16 24 3 27 43 16 0 0 16
1982 13 1 1 15 35 2 37 52 21 0 2 23
1983 10 2 12 30 30 42 21 0 3 24
1984 13 3 16 33 3 1 37 53 31 0 3 34
1985 20 1 21 30 2 32 53 47 0 1 48
1986 12 2 1 15 22 5 1 28 43 35 0 15 50
1987 11 3 1 15 24 3 27 42 36 0 12 48
1988 8 2 3 13 18 18 31 46 0 9 55
1989 5 4 2 11 21 3 24 35 47 0 20 67
1990 9 4 2 15 25 6 31 46 43 0 17 60
1991 11 7 3 21 33 3 36 57 52 0 13 65
1992 10 5 15 27 2 1 30 45 65 0 21 86
1993 7 4 11 19 4 1 24 35 75 0 30 105
1994 2 3 1 6 17 3 1 21 27 78 1 41 120
1995 10 1 4 15 22 3 25 40 73 0 36 109
1996 8 1 2 11 20 1 21 32 92 1 51 144
1997 8 1 4 13 33 4 5 42 55 81 1 54 136
1998 6 2 2 10 15 3 18 28 90 3 46 139
1999 6 1 1 8 12 1 3 16 24 94 1 54 149
2000 4 2 6 18 3 21 27 108 10 68 186
2001 5 2 4 11 24 3 1 28 39 91 19 90 200
2002 2 2 3 7 11 1 3 15 22 74 18 76 168
2003 6 2 2 10 12 2 2 16 26 59 32 74 165
2004 4 4 8 10 10 18 60 29 49 138
2005 3 2 5 9 9 14 56 33 61 150
2006 8 1 9 14 1 4 19 28 57 37 55 149
2007 9 4 13 19 19 32 52 38 63 153
2008 6 9 15 37 4 41 56 43 37 58 138
2009 8 14 22 40 1 3 44 66 49 34 80 163
Total 249 53 74 376 680 64 33 777 1153 1719 294 1103 3116
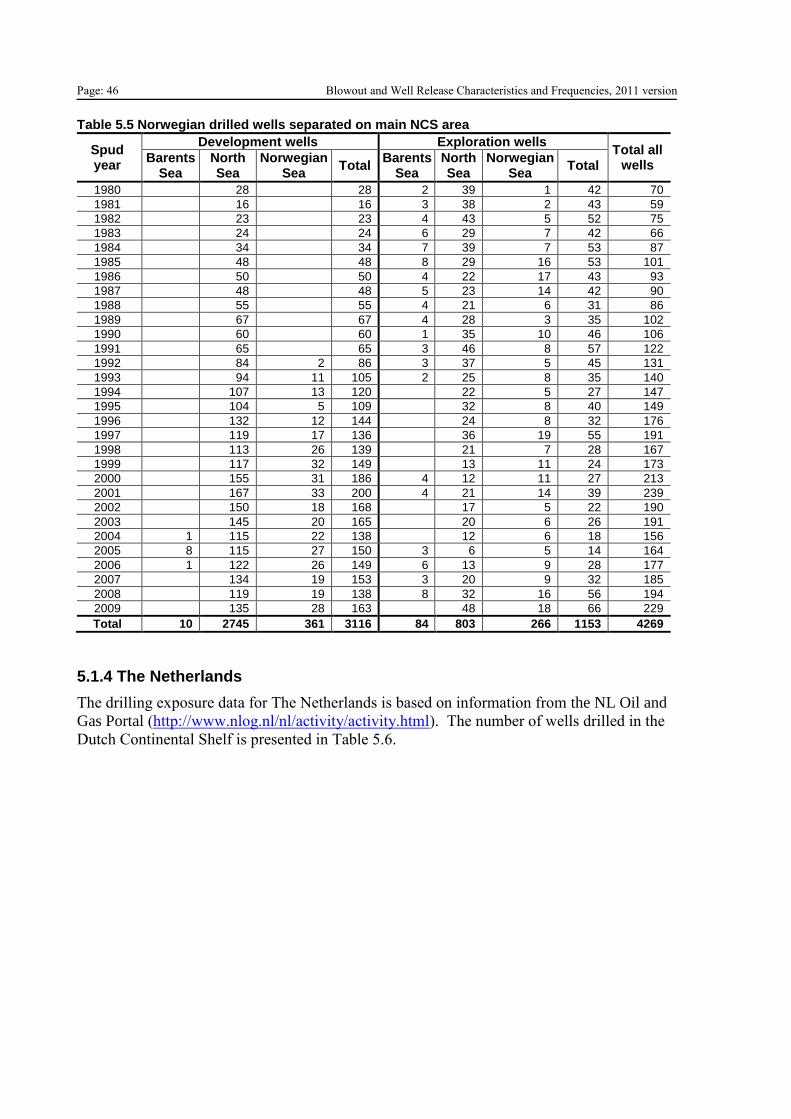
Page: 46 Blowout and Well Release Characteristics and Frequencies, 2011 version Table 5.5 Norwegian drilled wells separated on main NCS area
Spud year
Development wells Exploration wells Total all
wells Barents
Sea North Sea
Norwegian Sea
Total Barents
Sea North Sea
Norwegian Sea
Total
1980 28 28 2 39 1 42 70
1981 16 16 3 38 2 43 59
1982 23 23 4 43 5 52 75
1983 24 24 6 29 7 42 66
1984 34 34 7 39 7 53 87
1985 48 48 8 29 16 53 101
1986 50 50 4 22 17 43 93
1987 48 48 5 23 14 42 90
1988 55 55 4 21 6 31 86
1989 67 67 4 28 3 35 102
1990 60 60 1 35 10 46 106
1991 65 65 3 46 8 57 122
1992 84 2 86 3 37 5 45 131
1993 94 11 105 2 25 8 35 140
1994 107 13 120 22 5 27 147
1995 104 5 109 32 8 40 149
1996 132 12 144 24 8 32 176
1997 119 17 136 36 19 55 191
1998 113 26 139 21 7 28 167
1999 117 32 149 13 11 24 173
2000 155 31 186 4 12 11 27 213
2001 167 33 200 4 21 14 39 239
2002 150 18 168 17 5 22 190
2003 145 20 165 20 6 26 191
2004 1 115 22 138 12 6 18 156
2005 8 115 27 150 3 6 5 14 164
2006 1 122 26 149 6 13 9 28 177
2007 134 19 153 3 20 9 32 185
2008 119 19 138 8 32 16 56 194
2009 135 28 163 48 18 66 229
Total 10 2745 361 3116 84 803 266 1153 4269
5.1.4 The Netherlands
The drilling exposure data for The Netherlands is based on information from the NL Oil and
Gas Portal (http://www.nlog.nl/nl/activity/activity.html). The number of wells drilled in the
Dutch Continental Shelf is presented in Table 5.6.
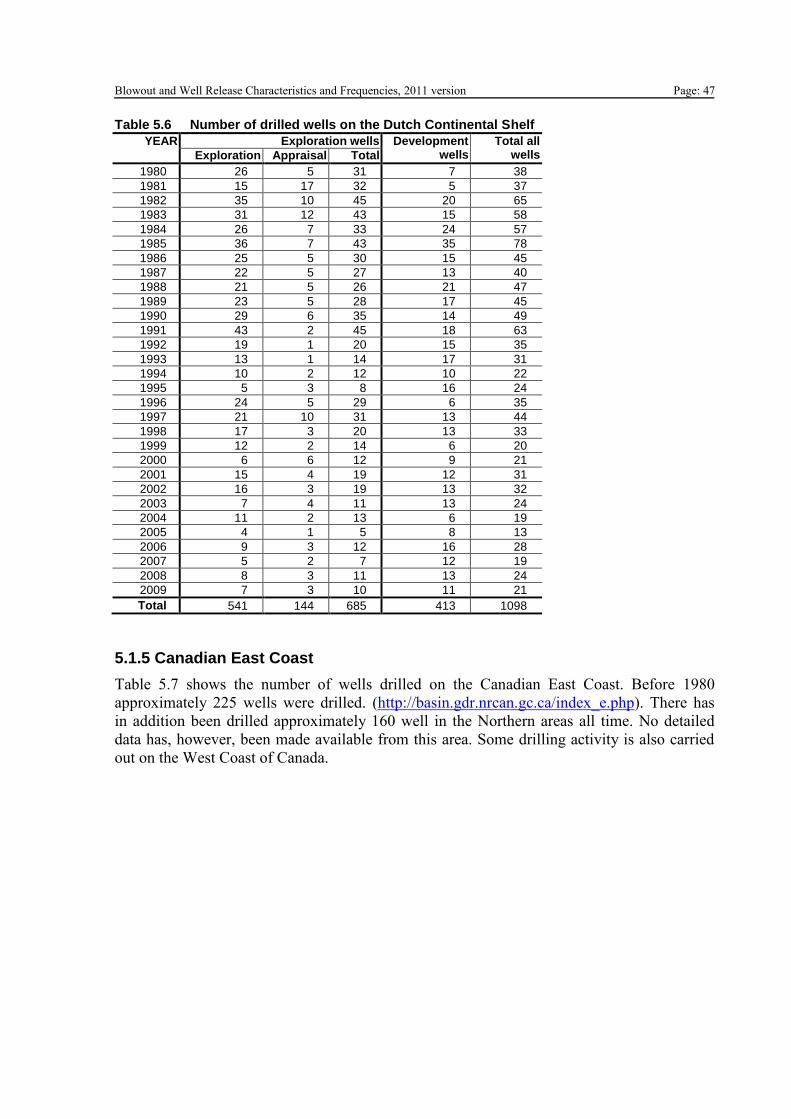
Blowout and Well Release Characteristics and Frequencies, 2011 version Page: 47 Table 5.6 Number of drilled wells on the Dutch Continental Shelf
YEAR Exploration wells Development wells
Total all wells Exploration Appraisal Total
1980 26 5 31 7 38
1981 15 17 32 5 37
1982 35 10 45 20 65
1983 31 12 43 15 58
1984 26 7 33 24 57
1985 36 7 43 35 78
1986 25 5 30 15 45
1987 22 5 27 13 40
1988 21 5 26 21 47
1989 23 5 28 17 45
1990 29 6 35 14 49
1991 43 2 45 18 63
1992 19 1 20 15 35
1993 13 1 14 17 31
1994 10 2 12 10 22
1995 5 3 8 16 24
1996 24 5 29 6 35
1997 21 10 31 13 44
1998 17 3 20 13 33
1999 12 2 14 6 20
2000 6 6 12 9 21
2001 15 4 19 12 31
2002 16 3 19 13 32
2003 7 4 11 13 24
2004 11 2 13 6 19
2005 4 1 5 8 13
2006 9 3 12 16 28
2007 5 2 7 12 19
2008 8 3 11 13 24
2009 7 3 10 11 21
Total 541 144 685 413 1098
5.1.5 Canadian East Coast
Table 5.7 shows the number of wells drilled on the Canadian East Coast. Before 1980
approximately 225 wells were drilled. (http://basin.gdr.nrcan.gc.ca/index_e.php). There has
in addition been drilled approximately 160 well in the Northern areas all time. No detailed
data has, however, been made available from this area. Some drilling activity is also carried
out on the West Coast of Canada.
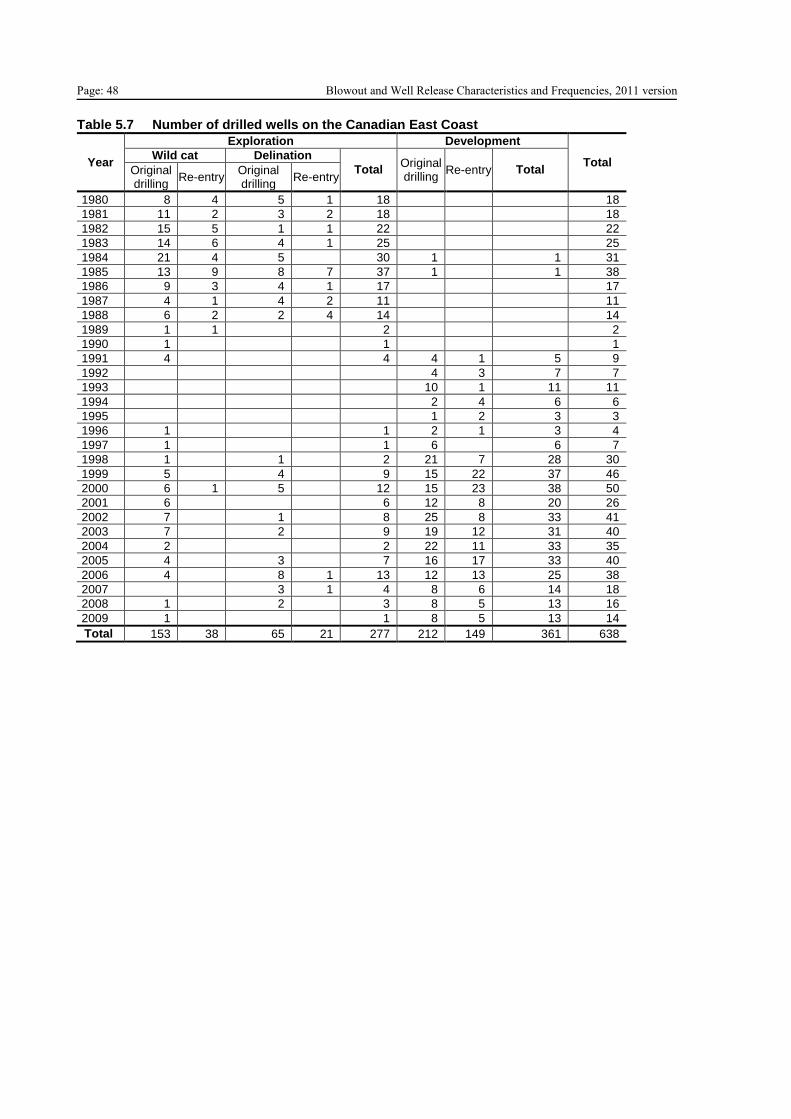
Page: 48 Blowout and Well Release Characteristics and Frequencies, 2011 version Table 5.7 Number of drilled wells on the Canadian East Coast
Year
Exploration Development
Total Wild cat Delination
Total Original drilling
Re-entry Total Original drilling
Re-entry Original drilling
Re-entry
1980 8 4 5 1 18 18
1981 11 2 3 2 18 18
1982 15 5 1 1 22 22
1983 14 6 4 1 25 25
1984 21 4 5 30 1 1 31
1985 13 9 8 7 37 1 1 38
1986 9 3 4 1 17 17
1987 4 1 4 2 11 11
1988 6 2 2 4 14 14
1989 1 1 2 2
1990 1 1 1
1991 4 4 4 1 5 9
1992 4 3 7 7
1993 10 1 11 11
1994 2 4 6 6
1995 1 2 3 3
1996 1 1 2 1 3 4
1997 1 1 6 6 7
1998 1 1 2 21 7 28 30
1999 5 4 9 15 22 37 46
2000 6 1 5 12 15 23 38 50
2001 6 6 12 8 20 26
2002 7 1 8 25 8 33 41
2003 7 2 9 19 12 31 40
2004 2 2 22 11 33 35
2005 4 3 7 16 17 33 40
2006 4 8 1 13 12 13 25 38
2007 3 1 4 8 6 14 18
2008 1 2 3 8 5 13 16
2009 1 1 8 5 13 14
Total 153 38 65 21 277 212 149 361 638
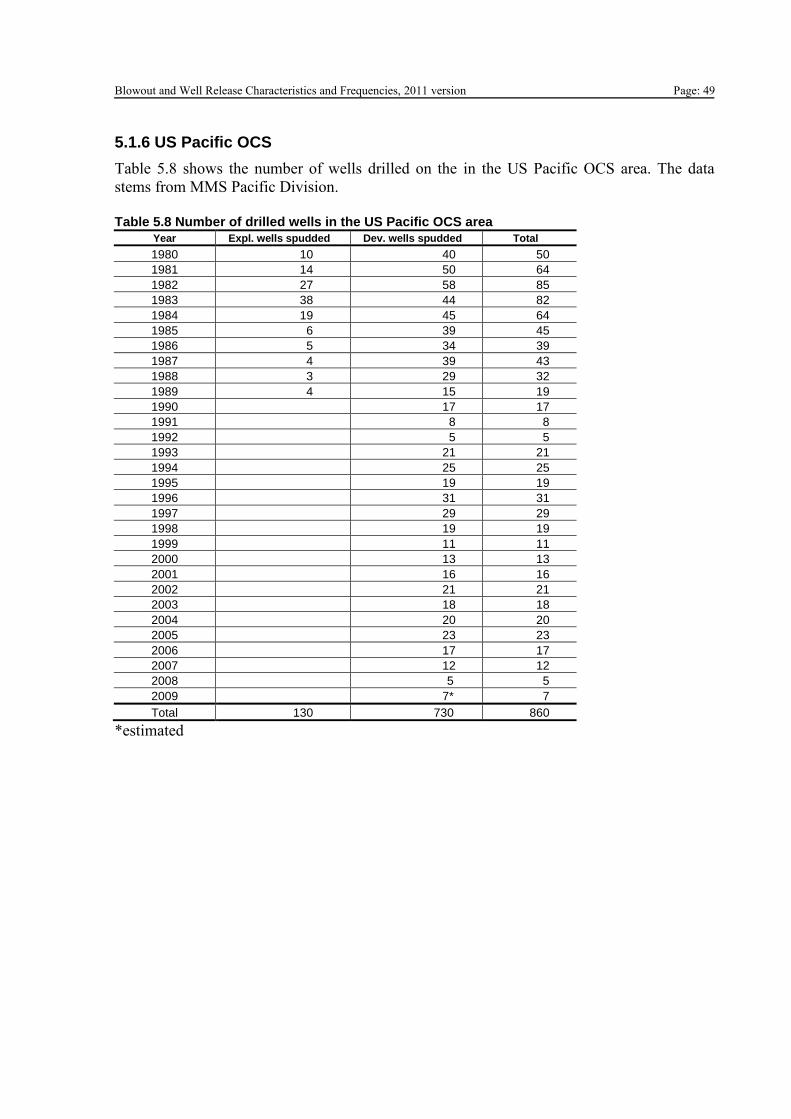
Blowout and Well Release Characteristics and Frequencies, 2011 version Page: 49
5.1.6 US Pacific OCS
Table 5.8 shows the number of wells drilled on the in the US Pacific OCS area. The data
stems from MMS Pacific Division.
Table 5.8 Number of drilled wells in the US Pacific OCS area
Year Expl. wells spudded Dev. wells spudded Total
1980 10 40 50
1981 14 50 64
1982 27 58 85
1983 38 44 82
1984 19 45 64
1985 6 39 45
1986 5 34 39
1987 4 39 43
1988 3 29 32
1989 4 15 19
1990 17 17
1991 8 8
1992 5 5
1993 21 21
1994 25 25
1995 19 19
1996 31 31
1997 29 29
1998 19 19
1999 11 11
2000 13 13
2001 16 16
2002 21 21
2003 18 18
2004 20 20
2005 23 23
2006 17 17
2007 12 12
2008 5 5
2009 7* 7
Total 130 730 860
*estimated
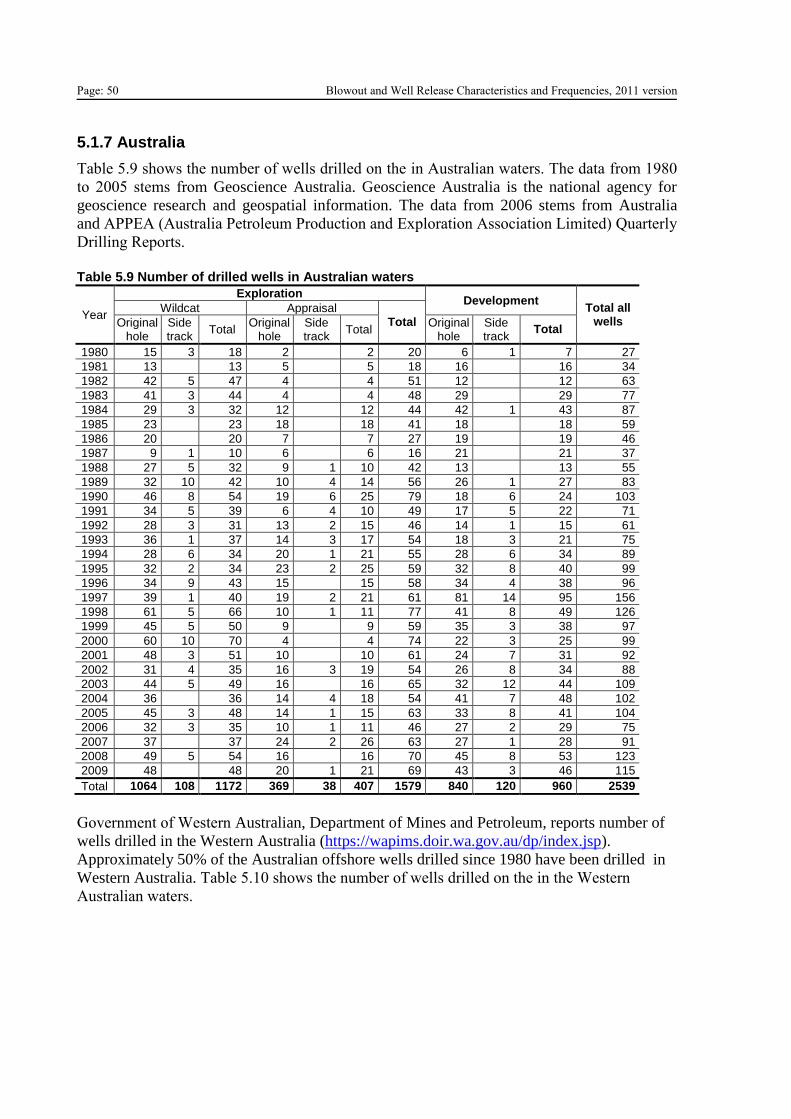
Page: 50 Blowout and Well Release Characteristics and Frequencies, 2011 version
5.1.7 Australia
Table 5.9 shows the number of wells drilled on the in Australian waters. The data from 1980
to 2005 stems from Geoscience Australia. Geoscience Australia is the national agency for
geoscience research and geospatial information. The data from 2006 stems from Australia
and APPEA (Australia Petroleum Production and Exploration Association Limited) Quarterly
Drilling Reports.
Table 5.9 Number of drilled wells in Australian waters
Year
Exploration Development
Total all wells
Wildcat Appraisal Total Original
hole Side track
Total Original
hole Side track
Total Original
hole Side track
Total
1980 15 3 18 2 2 20 6 1 7 27
1981 13 13 5 5 18 16 16 34
1982 42 5 47 4 4 51 12 12 63
1983 41 3 44 4 4 48 29 29 77
1984 29 3 32 12 12 44 42 1 43 87
1985 23 23 18 18 41 18 18 59
1986 20 20 7 7 27 19 19 46
1987 9 1 10 6 6 16 21 21 37
1988 27 5 32 9 1 10 42 13 13 55
1989 32 10 42 10 4 14 56 26 1 27 83
1990 46 8 54 19 6 25 79 18 6 24 103
1991 34 5 39 6 4 10 49 17 5 22 71
1992 28 3 31 13 2 15 46 14 1 15 61
1993 36 1 37 14 3 17 54 18 3 21 75
1994 28 6 34 20 1 21 55 28 6 34 89
1995 32 2 34 23 2 25 59 32 8 40 99
1996 34 9 43 15 15 58 34 4 38 96
1997 39 1 40 19 2 21 61 81 14 95 156
1998 61 5 66 10 1 11 77 41 8 49 126
1999 45 5 50 9 9 59 35 3 38 97
2000 60 10 70 4 4 74 22 3 25 99
2001 48 3 51 10 10 61 24 7 31 92
2002 31 4 35 16 3 19 54 26 8 34 88
2003 44 5 49 16 16 65 32 12 44 109
2004 36 36 14 4 18 54 41 7 48 102
2005 45 3 48 14 1 15 63 33 8 41 104
2006 32 3 35 10 1 11 46 27 2 29 75
2007 37 37 24 2 26 63 27 1 28 91
2008 49 5 54 16 16 70 45 8 53 123
2009 48 48 20 1 21 69 43 3 46 115
Total 1064 108 1172 369 38 407 1579 840 120 960 2539
Government of Western Australian, Department of Mines and Petroleum, reports number of
wells drilled in the Western Australia (https://wapims.doir.wa.gov.au/dp/index.jsp).
Approximately 50% of the Australian offshore wells drilled since 1980 have been drilled in
Western Australia. Table 5.10 shows the number of wells drilled on the in the Western
Australian waters.
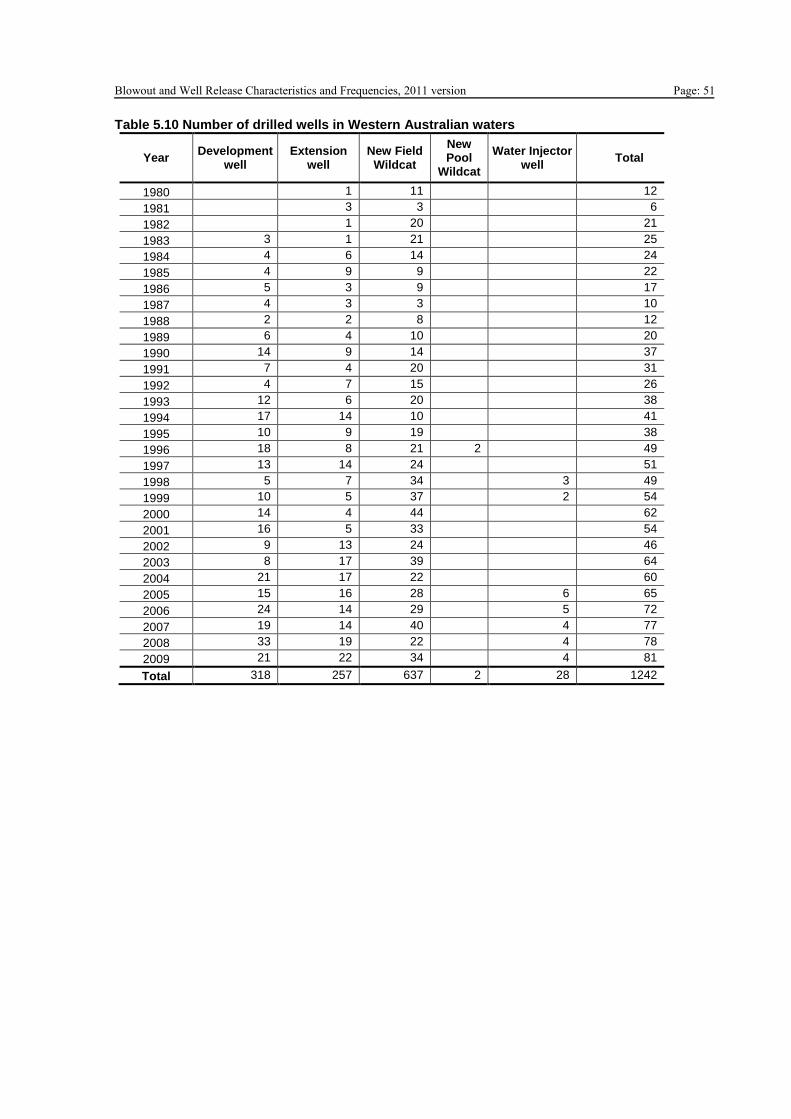
Blowout and Well Release Characteristics and Frequencies, 2011 version Page: 51 Table 5.10 Number of drilled wells in Western Australian waters
Year Development
well Extension
well New Field
Wildcat
New Pool
Wildcat
Water Injector well
Total
1980 1 11 12
1981 3 3 6
1982 1 20 21
1983 3 1 21 25
1984 4 6 14 24
1985 4 9 9 22
1986 5 3 9 17
1987 4 3 3 10
1988 2 2 8 12
1989 6 4 10 20
1990 14 9 14 37
1991 7 4 20 31
1992 4 7 15 26
1993 12 6 20 38
1994 17 14 10 41
1995 10 9 19 38
1996 18 8 21 2 49
1997 13 14 24 51
1998 5 7 34 3 49
1999 10 5 37 2 54
2000 14 4 44 62
2001 16 5 33 54
2002 9 13 24 46
2003 8 17 39 64
2004 21 17 22 60
2005 15 16 28 6 65
2006 24 14 29 5 72
2007 19 14 40 4 77
2008 33 19 22 4 78
2009 21 22 34 4 81
Total 318 257 637 2 28 1242
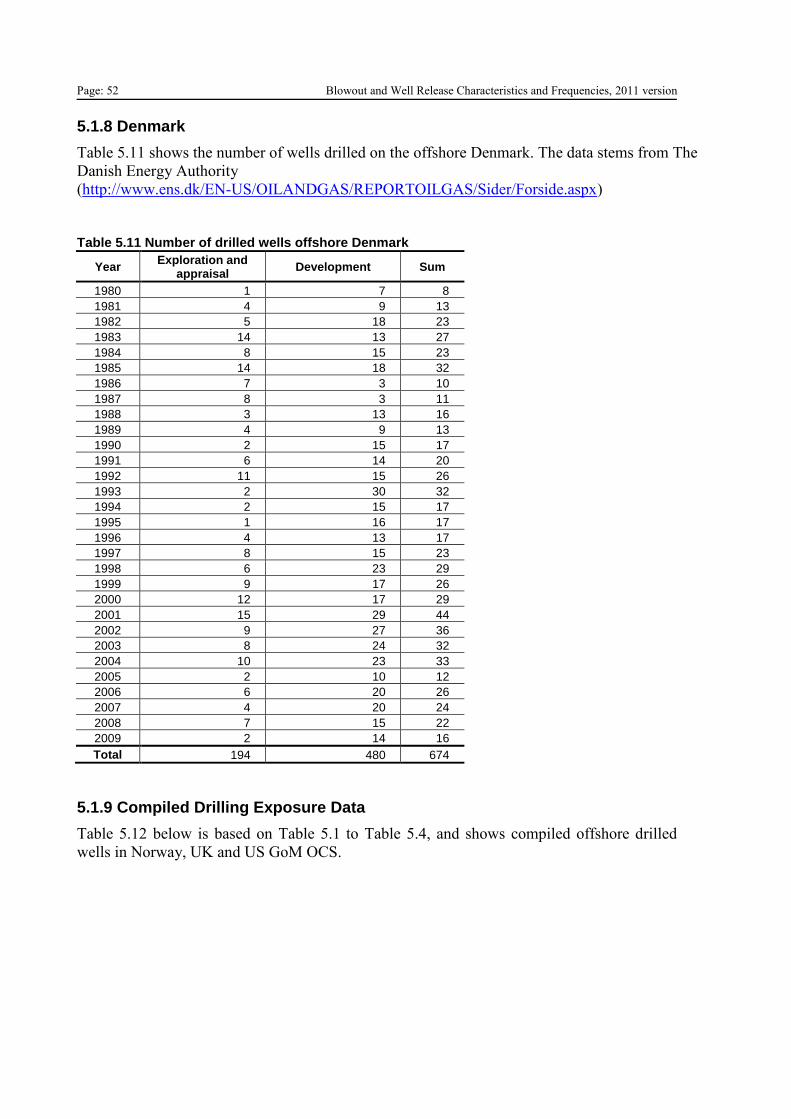
Page: 52 Blowout and Well Release Characteristics and Frequencies, 2011 version
5.1.8 Denmark
Table 5.11 shows the number of wells drilled on the offshore Denmark. The data stems from The
Danish Energy Authority
(http://www.ens.dk/EN-US/OILANDGAS/REPORTOILGAS/Sider/Forside.aspx)
Table 5.11 Number of drilled wells offshore Denmark
Year Exploration and
appraisal Development Sum
1980 1 7 8
1981 4 9 13
1982 5 18 23
1983 14 13 27
1984 8 15 23
1985 14 18 32
1986 7 3 10
1987 8 3 11
1988 3 13 16
1989 4 9 13
1990 2 15 17
1991 6 14 20
1992 11 15 26
1993 2 30 32
1994 2 15 17
1995 1 16 17
1996 4 13 17
1997 8 15 23
1998 6 23 29
1999 9 17 26
2000 12 17 29
2001 15 29 44
2002 9 27 36
2003 8 24 32
2004 10 23 33
2005 2 10 12
2006 6 20 26
2007 4 20 24
2008 7 15 22
2009 2 14 16
Total 194 480 674
5.1.9 Compiled Drilling Exposure Data
Table 5.12 below is based on Table 5.1 to Table 5.4, and shows compiled offshore drilled
wells in Norway, UK and US GoM OCS.
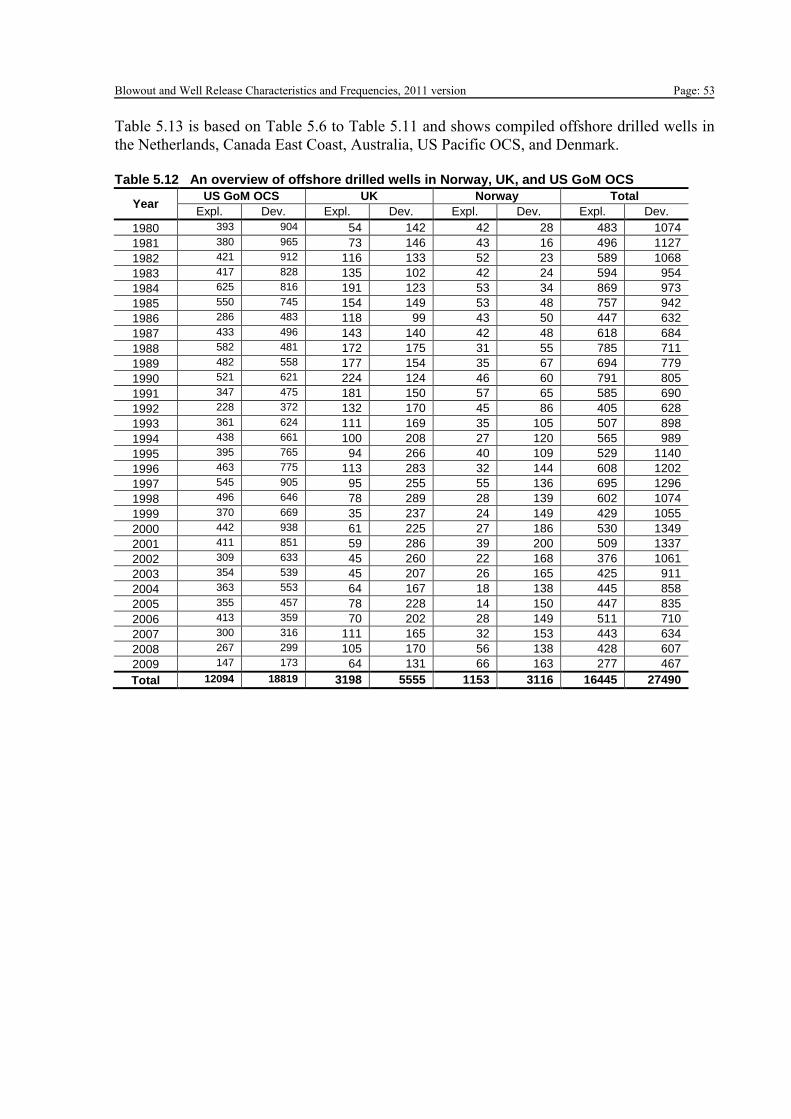
Blowout and Well Release Characteristics and Frequencies, 2011 version Page: 53
Table 5.13 is based on Table 5.6 to Table 5.11 and shows compiled offshore drilled wells in
the Netherlands, Canada East Coast, Australia, US Pacific OCS, and Denmark.
Table 5.12 An overview of offshore drilled wells in Norway, UK, and US GoM OCS
Year US GoM OCS UK Norway Total
Expl. Dev. Expl. Dev. Expl. Dev. Expl. Dev.
1980 393 904 54 142 42 28 483 1074
1981 380 965 73 146 43 16 496 1127
1982 421 912 116 133 52 23 589 1068
1983 417 828 135 102 42 24 594 954
1984 625 816 191 123 53 34 869 973
1985 550 745 154 149 53 48 757 942
1986 286 483 118 99 43 50 447 632
1987 433 496 143 140 42 48 618 684
1988 582 481 172 175 31 55 785 711
1989 482 558 177 154 35 67 694 779
1990 521 621 224 124 46 60 791 805
1991 347 475 181 150 57 65 585 690
1992 228 372 132 170 45 86 405 628
1993 361 624 111 169 35 105 507 898
1994 438 661 100 208 27 120 565 989
1995 395 765 94 266 40 109 529 1140
1996 463 775 113 283 32 144 608 1202
1997 545 905 95 255 55 136 695 1296
1998 496 646 78 289 28 139 602 1074
1999 370 669 35 237 24 149 429 1055
2000 442 938 61 225 27 186 530 1349
2001 411 851 59 286 39 200 509 1337
2002 309 633 45 260 22 168 376 1061
2003 354 539 45 207 26 165 425 911
2004 363 553 64 167 18 138 445 858
2005 355 457 78 228 14 150 447 835
2006 413 359 70 202 28 149 511 710
2007 300 316 111 165 32 153 443 634
2008 267 299 105 170 56 138 428 607
2009 147 173 64 131 66 163 277 467
Total 12094 18819 3198 5555 1153 3116 16445 27490
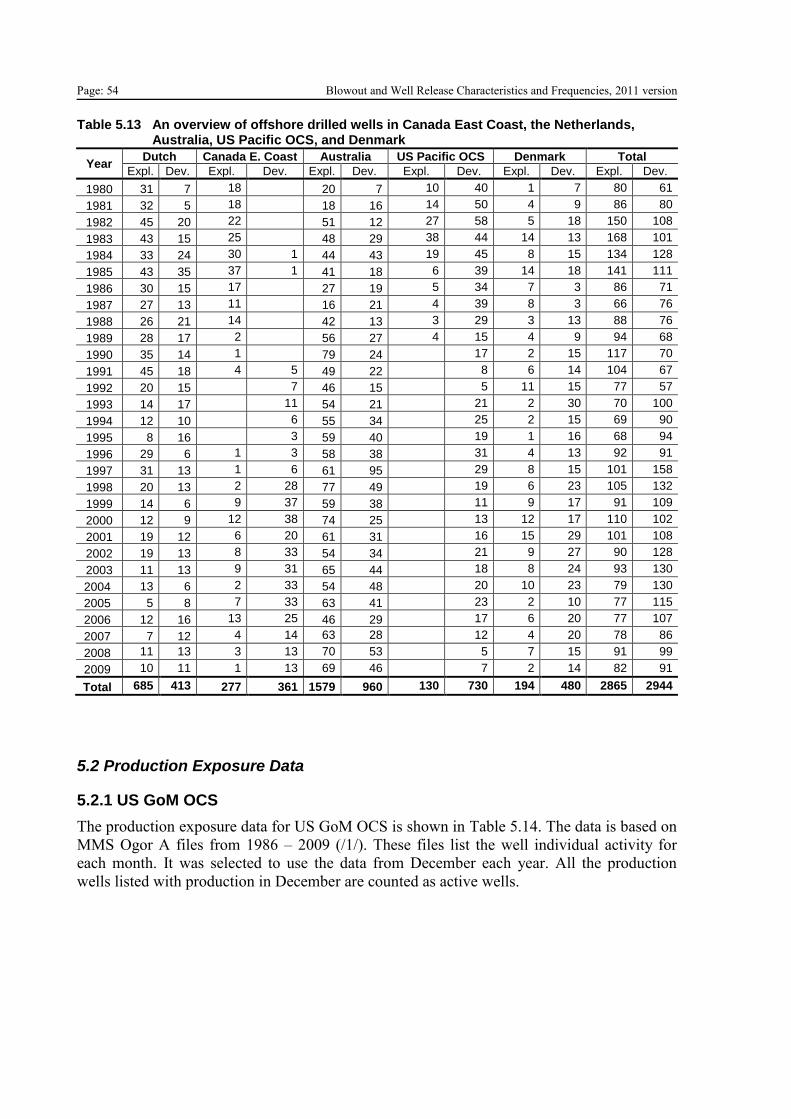
Page: 54 Blowout and Well Release Characteristics and Frequencies, 2011 version Table 5.13 An overview of offshore drilled wells in Canada East Coast, the Netherlands,
Australia, US Pacific OCS, and Denmark
Year Dutch Canada E. Coast Australia US Pacific OCS Denmark Total
Expl. Dev. Expl. Dev. Expl. Dev. Expl. Dev. Expl. Dev. Expl. Dev.
1980 31 7 18 20 7 10 40 1 7 80 61
1981 32 5 18 18 16 14 50 4 9 86 80
1982 45 20 22 51 12 27 58 5 18 150 108
1983 43 15 25 48 29 38 44 14 13 168 101
1984 33 24 30 1 44 43 19 45 8 15 134 128
1985 43 35 37 1 41 18 6 39 14 18 141 111
1986 30 15 17 27 19 5 34 7 3 86 71
1987 27 13 11 16 21 4 39 8 3 66 76
1988 26 21 14 42 13 3 29 3 13 88 76
1989 28 17 2 56 27 4 15 4 9 94 68
1990 35 14 1 79 24 17 2 15 117 70
1991 45 18 4 5 49 22 8 6 14 104 67
1992 20 15 7 46 15 5 11 15 77 57
1993 14 17 11 54 21 21 2 30 70 100
1994 12 10 6 55 34 25 2 15 69 90
1995 8 16 3 59 40 19 1 16 68 94
1996 29 6 1 3 58 38 31 4 13 92 91
1997 31 13 1 6 61 95 29 8 15 101 158
1998 20 13 2 28 77 49 19 6 23 105 132
1999 14 6 9 37 59 38 11 9 17 91 109
2000 12 9 12 38 74 25 13 12 17 110 102
2001 19 12 6 20 61 31 16 15 29 101 108
2002 19 13 8 33 54 34 21 9 27 90 128
2003 11 13 9 31 65 44 18 8 24 93 130
2004 13 6 2 33 54 48 20 10 23 79 130
2005 5 8 7 33 63 41 23 2 10 77 115
2006 12 16 13 25 46 29 17 6 20 77 107
2007 7 12 4 14 63 28 12 4 20 78 86
2008 11 13 3 13 70 53 5 7 15 91 99
2009 10 11 1 13 69 46 7 2 14 82 91
Total 685 413 277 361 1579 960 130 730 194 480 2865 2944
5.2 Production Exposure Data
5.2.1 US GoM OCS
The production exposure data for US GoM OCS is shown in Table 5.14. The data is based on
MMS Ogor A files from 1986 – 2009 (/1/). These files list the well individual activity for
each month. It was selected to use the data from December each year. All the production
wells listed with production in December are counted as active wells.
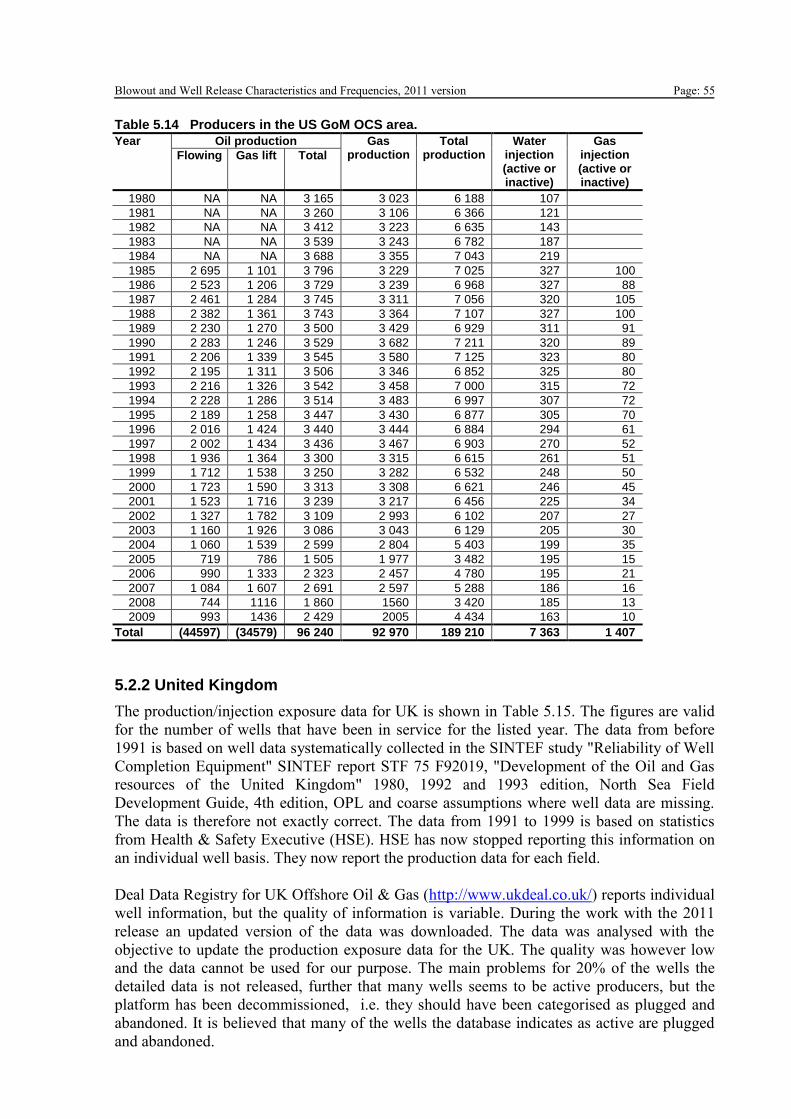
Blowout and Well Release Characteristics and Frequencies, 2011 version Page: 55 Table 5.14 Producers in the US GoM OCS area.
Year Oil production Gas production
Total production
Water injection (active or inactive)
Gas injection (active or inactive)
Flowing Gas lift Total
1980 NA NA 3 165 3 023 6 188 107
1981 NA NA 3 260 3 106 6 366 121
1982 NA NA 3 412 3 223 6 635 143
1983 NA NA 3 539 3 243 6 782 187
1984 NA NA 3 688 3 355 7 043 219
1985 2 695 1 101 3 796 3 229 7 025 327 100
1986 2 523 1 206 3 729 3 239 6 968 327 88
1987 2 461 1 284 3 745 3 311 7 056 320 105
1988 2 382 1 361 3 743 3 364 7 107 327 100
1989 2 230 1 270 3 500 3 429 6 929 311 91
1990 2 283 1 246 3 529 3 682 7 211 320 89
1991 2 206 1 339 3 545 3 580 7 125 323 80
1992 2 195 1 311 3 506 3 346 6 852 325 80
1993 2 216 1 326 3 542 3 458 7 000 315 72
1994 2 228 1 286 3 514 3 483 6 997 307 72
1995 2 189 1 258 3 447 3 430 6 877 305 70
1996 2 016 1 424 3 440 3 444 6 884 294 61
1997 2 002 1 434 3 436 3 467 6 903 270 52
1998 1 936 1 364 3 300 3 315 6 615 261 51
1999 1 712 1 538 3 250 3 282 6 532 248 50
2000 1 723 1 590 3 313 3 308 6 621 246 45
2001 1 523 1 716 3 239 3 217 6 456 225 34
2002 1 327 1 782 3 109 2 993 6 102 207 27
2003 1 160 1 926 3 086 3 043 6 129 205 30
2004 1 060 1 539 2 599 2 804 5 403 199 35
2005 719 786 1 505 1 977 3 482 195 15
2006 990 1 333 2 323 2 457 4 780 195 21
2007 1 084 1 607 2 691 2 597 5 288 186 16
2008 744 1116 1 860 1560 3 420 185 13
2009 993 1436 2 429 2005 4 434 163 10
Total (44597) (34579) 96 240 92 970 189 210 7 363 1 407
5.2.2 United Kingdom
The production/injection exposure data for UK is shown in Table 5.15. The figures are valid
for the number of wells that have been in service for the listed year. The data from before
1991 is based on well data systematically collected in the SINTEF study "Reliability of Well
Completion Equipment" SINTEF report STF 75 F92019, "Development of the Oil and Gas
resources of the United Kingdom" 1980, 1992 and 1993 edition, North Sea Field
Development Guide, 4th edition, OPL and coarse assumptions where well data are missing.
The data is therefore not exactly correct. The data from 1991 to 1999 is based on statistics
from Health & Safety Executive (HSE). HSE has now stopped reporting this information on
an individual well basis. They now report the production data for each field.
Deal Data Registry for UK Offshore Oil & Gas (http://www.ukdeal.co.uk/) reports individual
well information, but the quality of information is variable. During the work with the 2011
release an updated version of the data was downloaded. The data was analysed with the
objective to update the production exposure data for the UK. The quality was however low
and the data cannot be used for our purpose. The main problems for 20% of the wells the
detailed data is not released, further that many wells seems to be active producers, but the
platform has been decommissioned, i.e. they should have been categorised as plugged and
abandoned. It is believed that many of the wells the database indicates as active are plugged
and abandoned.
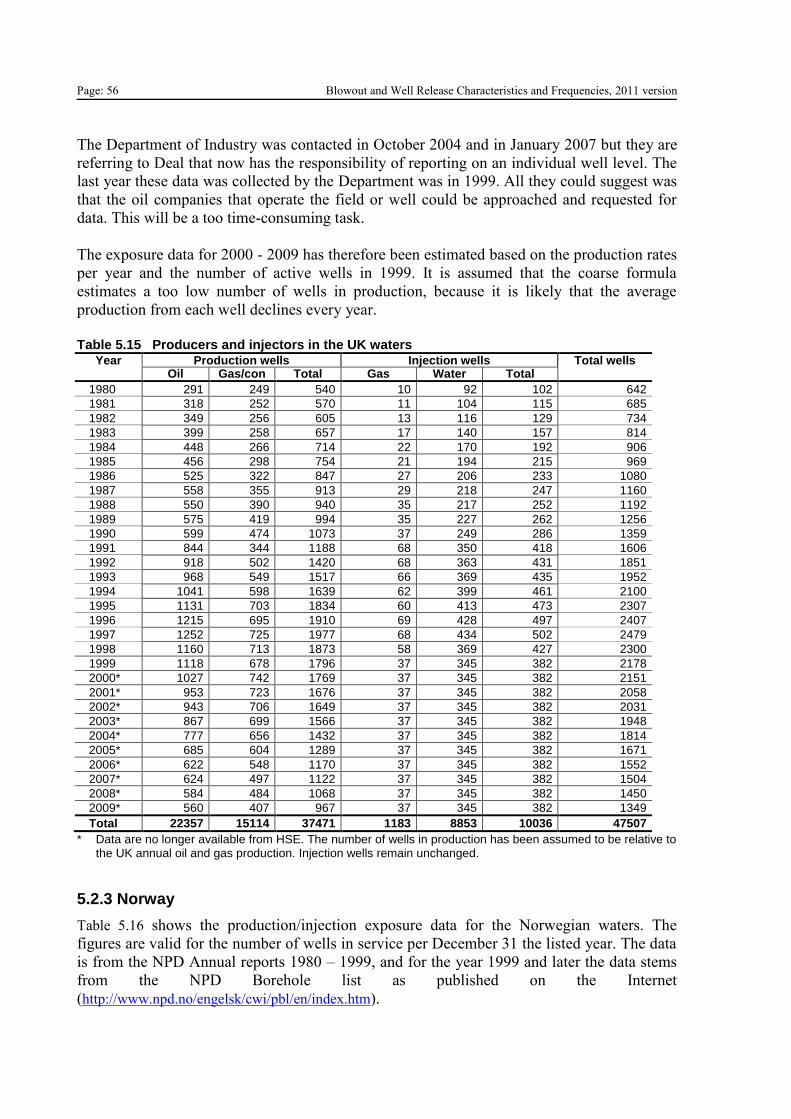
Page: 56 Blowout and Well Release Characteristics and Frequencies, 2011 version
The Department of Industry was contacted in October 2004 and in January 2007 but they are
referring to Deal that now has the responsibility of reporting on an individual well level. The
last year these data was collected by the Department was in 1999. All they could suggest was
that the oil companies that operate the field or well could be approached and requested for
data. This will be a too time-consuming task.
The exposure data for 2000 - 2009 has therefore been estimated based on the production rates
per year and the number of active wells in 1999. It is assumed that the coarse formula
estimates a too low number of wells in production, because it is likely that the average
production from each well declines every year.
Table 5.15 Producers and injectors in the UK waters
Year Production wells Injection wells Total wells Oil Gas/con Total Gas Water Total
1980 291 249 540 10 92 102 642
1981 318 252 570 11 104 115 685
1982 349 256 605 13 116 129 734
1983 399 258 657 17 140 157 814
1984 448 266 714 22 170 192 906
1985 456 298 754 21 194 215 969
1986 525 322 847 27 206 233 1080
1987 558 355 913 29 218 247 1160
1988 550 390 940 35 217 252 1192
1989 575 419 994 35 227 262 1256
1990 599 474 1073 37 249 286 1359
1991 844 344 1188 68 350 418 1606
1992 918 502 1420 68 363 431 1851
1993 968 549 1517 66 369 435 1952
1994 1041 598 1639 62 399 461 2100
1995 1131 703 1834 60 413 473 2307
1996 1215 695 1910 69 428 497 2407
1997 1252 725 1977 68 434 502 2479
1998 1160 713 1873 58 369 427 2300
1999 1118 678 1796 37 345 382 2178
2000* 1027 742 1769 37 345 382 2151
2001* 953 723 1676 37 345 382 2058
2002* 943 706 1649 37 345 382 2031
2003* 867 699 1566 37 345 382 1948
2004* 777 656 1432 37 345 382 1814
2005* 685 604 1289 37 345 382 1671
2006* 622 548 1170 37 345 382 1552
2007* 624 497 1122 37 345 382 1504
2008* 584 484 1068 37 345 382 1450
2009* 560 407 967 37 345 382 1349
Total 22357 15114 37471 1183 8853 10036 47507
* Data are no longer available from HSE. The number of wells in production has been assumed to be relative to the UK annual oil and gas production. Injection wells remain unchanged.
5.2.3 Norway
Table 5.16 shows the production/injection exposure data for the Norwegian waters. The
figures are valid for the number of wells in service per December 31 the listed year. The data
is from the NPD Annual reports 1980 – 1999, and for the year 1999 and later the data stems
from the NPD Borehole list as published on the Internet
(http://www.npd.no/engelsk/cwi/pbl/en/index.htm).
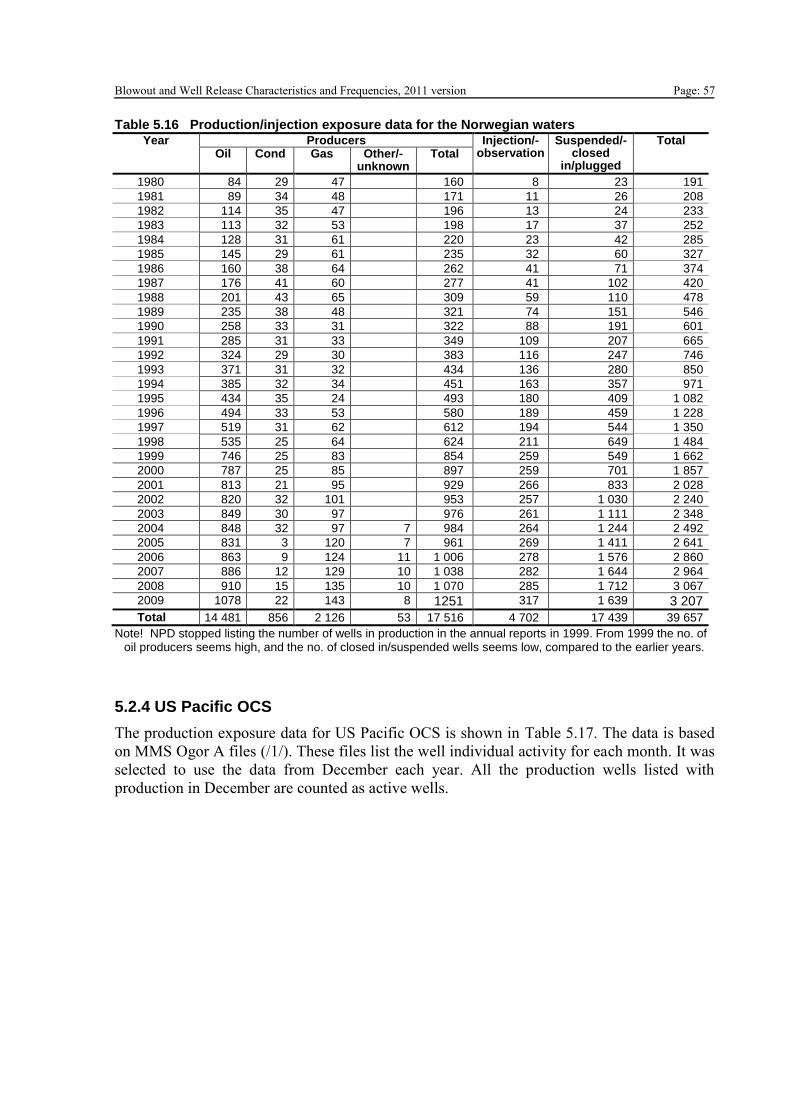
Blowout and Well Release Characteristics and Frequencies, 2011 version Page: 57 Table 5.16 Production/injection exposure data for the Norwegian waters
Year Producers Injection/-observation
Suspended/-closed
in/plugged
Total Oil Cond Gas Other/-
unknown Total
1980 84 29 47 160 8 23 191
1981 89 34 48 171 11 26 208
1982 114 35 47 196 13 24 233
1983 113 32 53 198 17 37 252
1984 128 31 61 220 23 42 285
1985 145 29 61 235 32 60 327
1986 160 38 64 262 41 71 374
1987 176 41 60 277 41 102 420
1988 201 43 65 309 59 110 478
1989 235 38 48 321 74 151 546
1990 258 33 31 322 88 191 601
1991 285 31 33 349 109 207 665
1992 324 29 30 383 116 247 746
1993 371 31 32 434 136 280 850
1994 385 32 34 451 163 357 971
1995 434 35 24 493 180 409 1 082
1996 494 33 53 580 189 459 1 228
1997 519 31 62 612 194 544 1 350
1998 535 25 64 624 211 649 1 484
1999 746 25 83 854 259 549 1 662
2000 787 25 85 897 259 701 1 857
2001 813 21 95 929 266 833 2 028
2002 820 32 101 953 257 1 030 2 240
2003 849 30 97 976 261 1 111 2 348
2004 848 32 97 7 984 264 1 244 2 492
2005 831 3 120 7 961 269 1 411 2 641
2006 863 9 124 11 1 006 278 1 576 2 860
2007 886 12 129 10 1 038 282 1 644 2 964
2008 910 15 135 10 1 070 285 1 712 3 067
2009 1078 22 143 8 1251 317 1 639 3 207
Total 14 481 856 2 126 53 17 516 4 702 17 439 39 657
Note! NPD stopped listing the number of wells in production in the annual reports in 1999. From 1999 the no. of oil producers seems high, and the no. of closed in/suspended wells seems low, compared to the earlier years.
5.2.4 US Pacific OCS
The production exposure data for US Pacific OCS is shown in Table 5.17. The data is based
on MMS Ogor A files (/1/). These files list the well individual activity for each month. It was
selected to use the data from December each year. All the production wells listed with
production in December are counted as active wells.
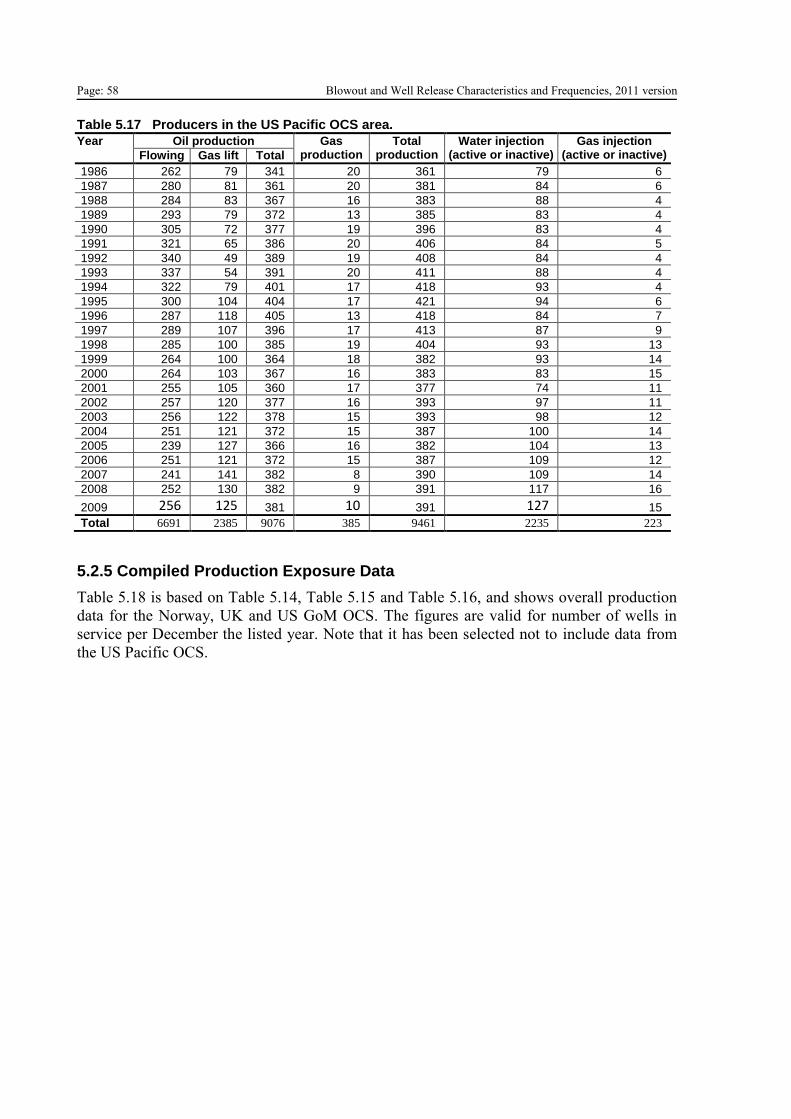
Page: 58 Blowout and Well Release Characteristics and Frequencies, 2011 version Table 5.17 Producers in the US Pacific OCS area.
Year Oil production Gas production
Total production
Water injection (active or inactive)
Gas injection (active or inactive) Flowing Gas lift Total
1986 262 79 341 20 361 79 6
1987 280 81 361 20 381 84 6
1988 284 83 367 16 383 88 4
1989 293 79 372 13 385 83 4
1990 305 72 377 19 396 83 4
1991 321 65 386 20 406 84 5
1992 340 49 389 19 408 84 4
1993 337 54 391 20 411 88 4
1994 322 79 401 17 418 93 4
1995 300 104 404 17 421 94 6
1996 287 118 405 13 418 84 7
1997 289 107 396 17 413 87 9
1998 285 100 385 19 404 93 13
1999 264 100 364 18 382 93 14
2000 264 103 367 16 383 83 15
2001 255 105 360 17 377 74 11
2002 257 120 377 16 393 97 11
2003 256 122 378 15 393 98 12
2004 251 121 372 15 387 100 14
2005 239 127 366 16 382 104 13
2006 251 121 372 15 387 109 12
2007 241 141 382 8 390 109 14
2008 252 130 382 9 391 117 16
2009 256 125 381 10 391 127 15
Total 6691 2385 9076 385 9461 2235 223
5.2.5 Compiled Production Exposure Data
Table 5.18 is based on Table 5.14, Table 5.15 and Table 5.16, and shows overall production
data for the Norway, UK and US GoM OCS. The figures are valid for number of wells in
service per December the listed year. Note that it has been selected not to include data from
the US Pacific OCS.
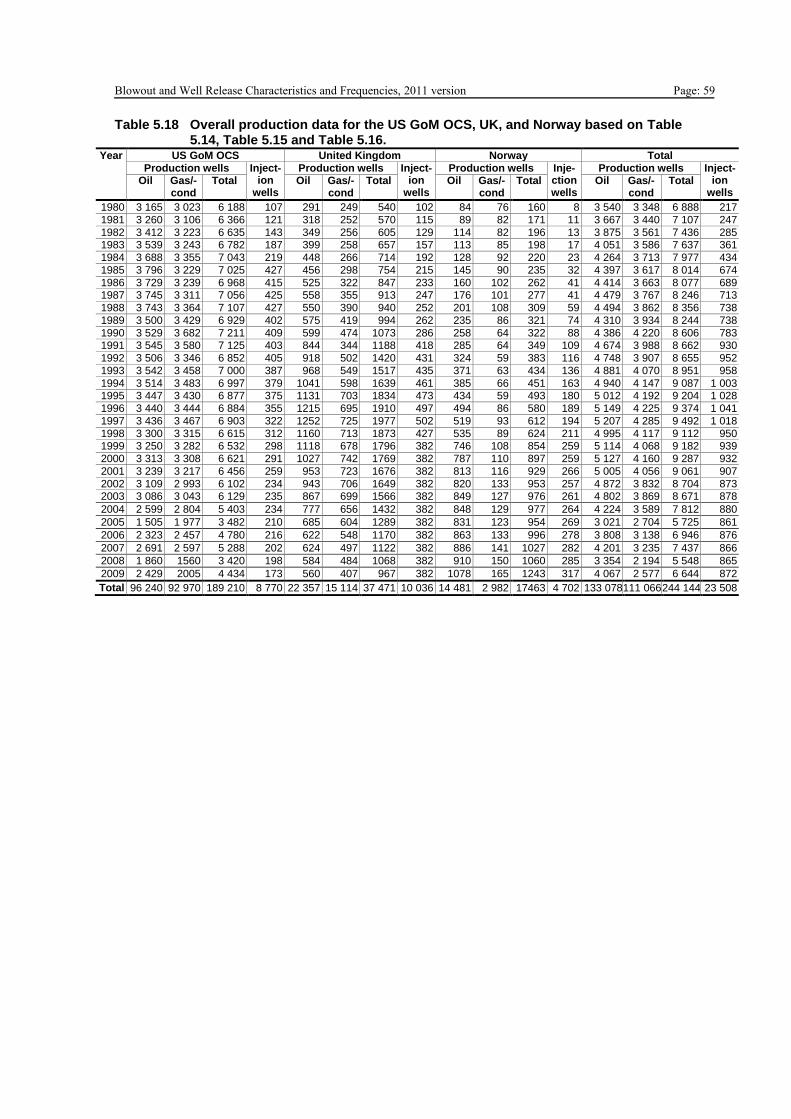
Blowout and Well Release Characteristics and Frequencies, 2011 version Page: 59 Table 5.18 Overall production data for the US GoM OCS, UK, and Norway based on Table
5.14, Table 5.15 and Table 5.16. Year US GoM OCS United Kingdom Norway Total
Production wells Inject-ion
wells
Production wells Inject-ion
wells
Production wells Inje-ction wells
Production wells Inject-ion
wells Oil Gas/-
cond Total Oil Gas/-
cond Total Oil Gas/-
cond Total Oil Gas/-
cond Total
1980 3 165 3 023 6 188 107 291 249 540 102 84 76 160 8 3 540 3 348 6 888 217
1981 3 260 3 106 6 366 121 318 252 570 115 89 82 171 11 3 667 3 440 7 107 247
1982 3 412 3 223 6 635 143 349 256 605 129 114 82 196 13 3 875 3 561 7 436 285 1983 3 539 3 243 6 782 187 399 258 657 157 113 85 198 17 4 051 3 586 7 637 361
1984 3 688 3 355 7 043 219 448 266 714 192 128 92 220 23 4 264 3 713 7 977 434
1985 3 796 3 229 7 025 427 456 298 754 215 145 90 235 32 4 397 3 617 8 014 674
1986 3 729 3 239 6 968 415 525 322 847 233 160 102 262 41 4 414 3 663 8 077 689 1987 3 745 3 311 7 056 425 558 355 913 247 176 101 277 41 4 479 3 767 8 246 713
1988 3 743 3 364 7 107 427 550 390 940 252 201 108 309 59 4 494 3 862 8 356 738
1989 3 500 3 429 6 929 402 575 419 994 262 235 86 321 74 4 310 3 934 8 244 738
1990 3 529 3 682 7 211 409 599 474 1073 286 258 64 322 88 4 386 4 220 8 606 783 1991 3 545 3 580 7 125 403 844 344 1188 418 285 64 349 109 4 674 3 988 8 662 930
1992 3 506 3 346 6 852 405 918 502 1420 431 324 59 383 116 4 748 3 907 8 655 952
1993 3 542 3 458 7 000 387 968 549 1517 435 371 63 434 136 4 881 4 070 8 951 958
1994 3 514 3 483 6 997 379 1041 598 1639 461 385 66 451 163 4 940 4 147 9 087 1 003 1995 3 447 3 430 6 877 375 1131 703 1834 473 434 59 493 180 5 012 4 192 9 204 1 028
1996 3 440 3 444 6 884 355 1215 695 1910 497 494 86 580 189 5 149 4 225 9 374 1 041
1997 3 436 3 467 6 903 322 1252 725 1977 502 519 93 612 194 5 207 4 285 9 492 1 018
1998 3 300 3 315 6 615 312 1160 713 1873 427 535 89 624 211 4 995 4 117 9 112 950 1999 3 250 3 282 6 532 298 1118 678 1796 382 746 108 854 259 5 114 4 068 9 182 939
2000 3 313 3 308 6 621 291 1027 742 1769 382 787 110 897 259 5 127 4 160 9 287 932
2001 3 239 3 217 6 456 259 953 723 1676 382 813 116 929 266 5 005 4 056 9 061 907
2002 3 109 2 993 6 102 234 943 706 1649 382 820 133 953 257 4 872 3 832 8 704 873 2003 3 086 3 043 6 129 235 867 699 1566 382 849 127 976 261 4 802 3 869 8 671 878
2004 2 599 2 804 5 403 234 777 656 1432 382 848 129 977 264 4 224 3 589 7 812 880
2005 1 505 1 977 3 482 210 685 604 1289 382 831 123 954 269 3 021 2 704 5 725 861
2006 2 323 2 457 4 780 216 622 548 1170 382 863 133 996 278 3 808 3 138 6 946 876
2007 2 691 2 597 5 288 202 624 497 1122 382 886 141 1027 282 4 201 3 235 7 437 866
2008 1 860 1560 3 420 198 584 484 1068 382 910 150 1060 285 3 354 2 194 5 548 865
2009 2 429 2005 4 434 173 560 407 967 382 1078 165 1243 317 4 067 2 577 6 644 872
Total 96 240 92 970 189 210 8 770 22 357 15 114 37 471 10 036 14 481 2 982 17463 4 702 133 078 111 066 244 144 23 508

Page: 60 Blowout and Well Release Characteristics and Frequencies, 2011 version
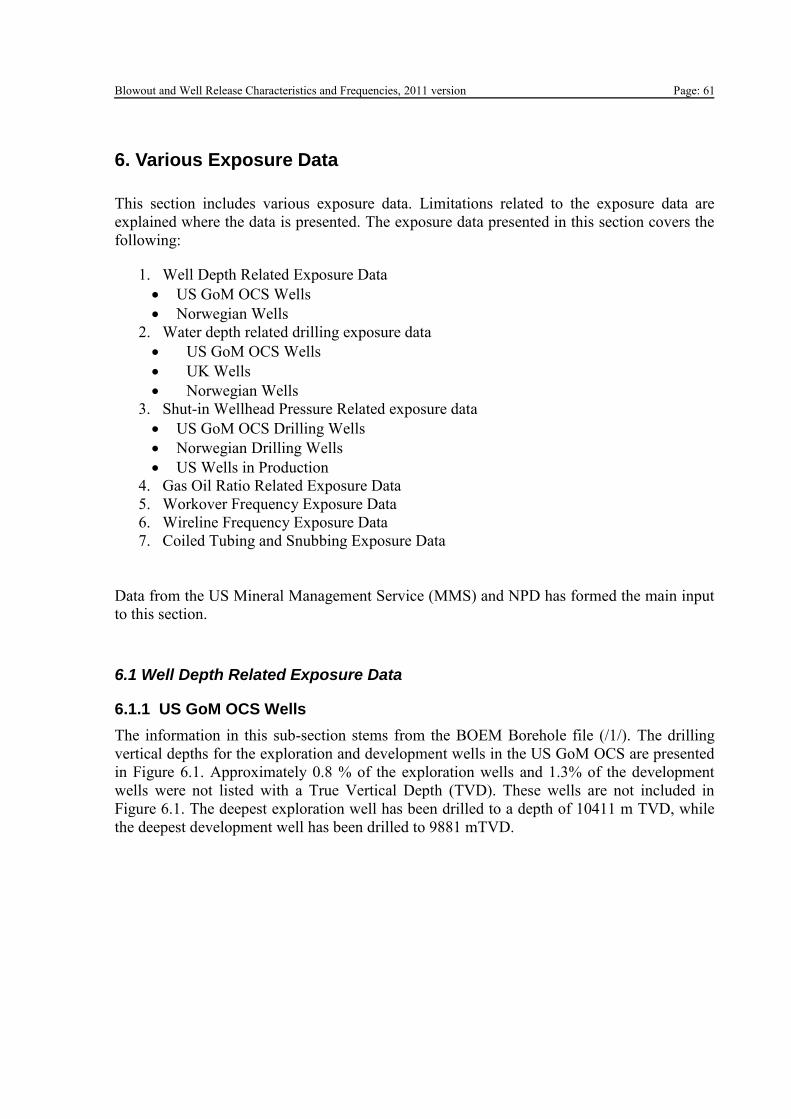
Blowout and Well Release Characteristics and Frequencies, 2011 version Page: 61
6. Various Exposure Data
This section includes various exposure data. Limitations related to the exposure data are
explained where the data is presented. The exposure data presented in this section covers the
following:
1. Well Depth Related Exposure Data
US GoM OCS Wells
Norwegian Wells
2. Water depth related drilling exposure data
US GoM OCS Wells
UK Wells
Norwegian Wells
3. Shut-in Wellhead Pressure Related exposure data
US GoM OCS Drilling Wells
Norwegian Drilling Wells
US Wells in Production
4. Gas Oil Ratio Related Exposure Data
5. Workover Frequency Exposure Data
6. Wireline Frequency Exposure Data
7. Coiled Tubing and Snubbing Exposure Data
Data from the US Mineral Management Service (MMS) and NPD has formed the main input
to this section.
6.1 Well Depth Related Exposure Data
6.1.1 US GoM OCS Wells
The information in this sub-section stems from the BOEM Borehole file (/1/). The drilling
vertical depths for the exploration and development wells in the US GoM OCS are presented
in Figure 6.1. Approximately 0.8 % of the exploration wells and 1.3% of the development
wells were not listed with a True Vertical Depth (TVD). These wells are not included in
Figure 6.1. The deepest exploration well has been drilled to a depth of 10411 m TVD, while
the deepest development well has been drilled to 9881 mTVD.
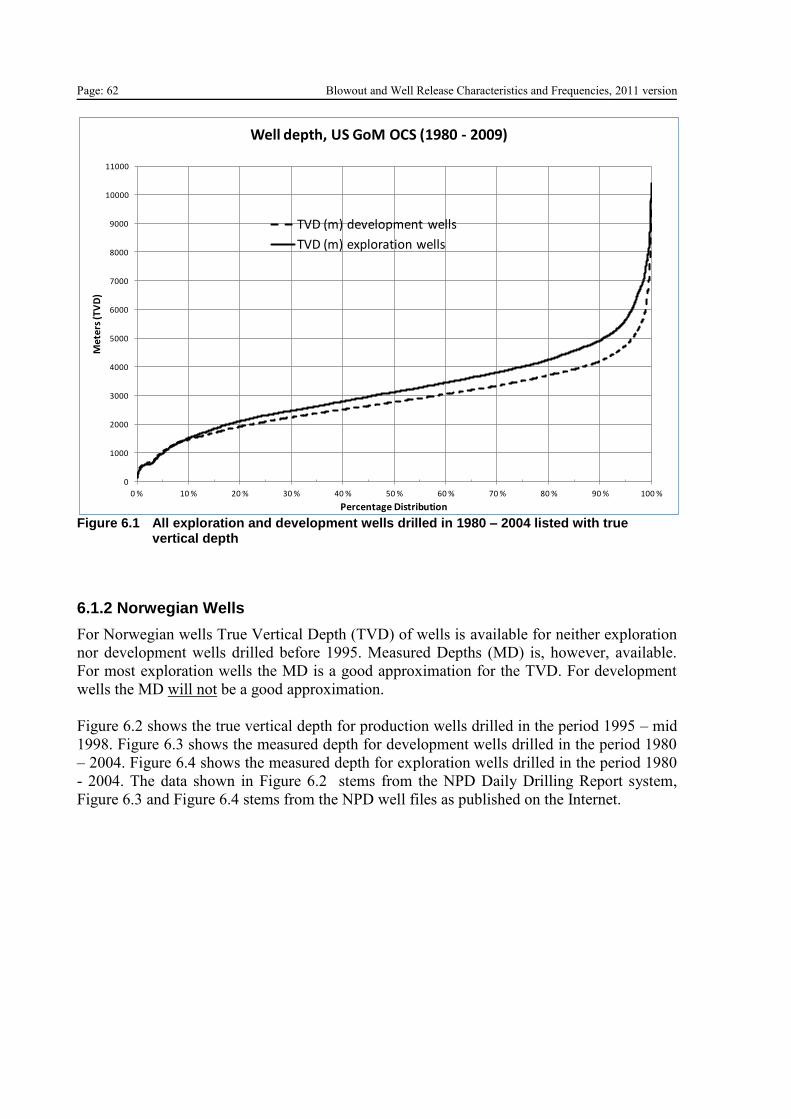
Page: 62 Blowout and Well Release Characteristics and Frequencies, 2011 version
Figure 6.1 All exploration and development wells drilled in 1980 – 2004 listed with true
vertical depth
6.1.2 Norwegian Wells
For Norwegian wells True Vertical Depth (TVD) of wells is available for neither exploration
nor development wells drilled before 1995. Measured Depths (MD) is, however, available.
For most exploration wells the MD is a good approximation for the TVD. For development
wells the MD will not be a good approximation.
Figure 6.2 shows the true vertical depth for production wells drilled in the period 1995 – mid
1998. Figure 6.3 shows the measured depth for development wells drilled in the period 1980
– 2004. Figure 6.4 shows the measured depth for exploration wells drilled in the period 1980
- 2004. The data shown in Figure 6.2 stems from the NPD Daily Drilling Report system,
Figure 6.3 and Figure 6.4 stems from the NPD well files as published on the Internet.
0
1000
2000
3000
4000
5000
6000
7000
8000
9000
10000
11000
0 % 10 % 20 % 30 % 40 % 50 % 60 % 70 % 80 % 90 % 100 %
Met
ers
(TV
D)
Percentage Distribution
Well depth, US GoM OCS (1980 - 2009)
TVD (m) development wells
TVD (m) exploration wells
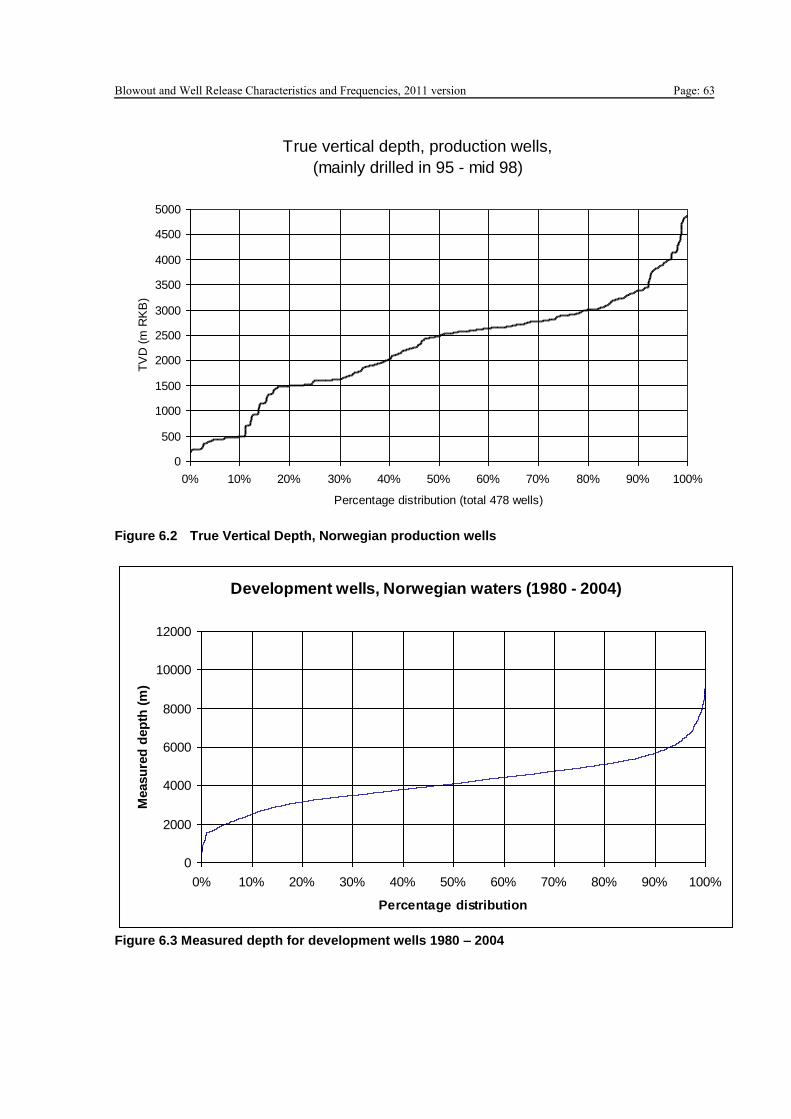
Blowout and Well Release Characteristics and Frequencies, 2011 version Page: 63
Figure 6.2 True Vertical Depth, Norwegian production wells
Figure 6.3 Measured depth for development wells 1980 – 2004
True vertical depth, production wells,
(mainly drilled in 95 - mid 98)
0
500
1000
1500
2000
2500
3000
3500
4000
4500
5000
0% 10% 20% 30% 40% 50% 60% 70% 80% 90% 100%
Percentage distribution (total 478 wells)
TV
D (
m R
KB
)
Development wells, Norwegian waters (1980 - 2004)
0
2000
4000
6000
8000
10000
12000
0% 10% 20% 30% 40% 50% 60% 70% 80% 90% 100%
Percentage distribution
Measu
red
dep
th (
m)
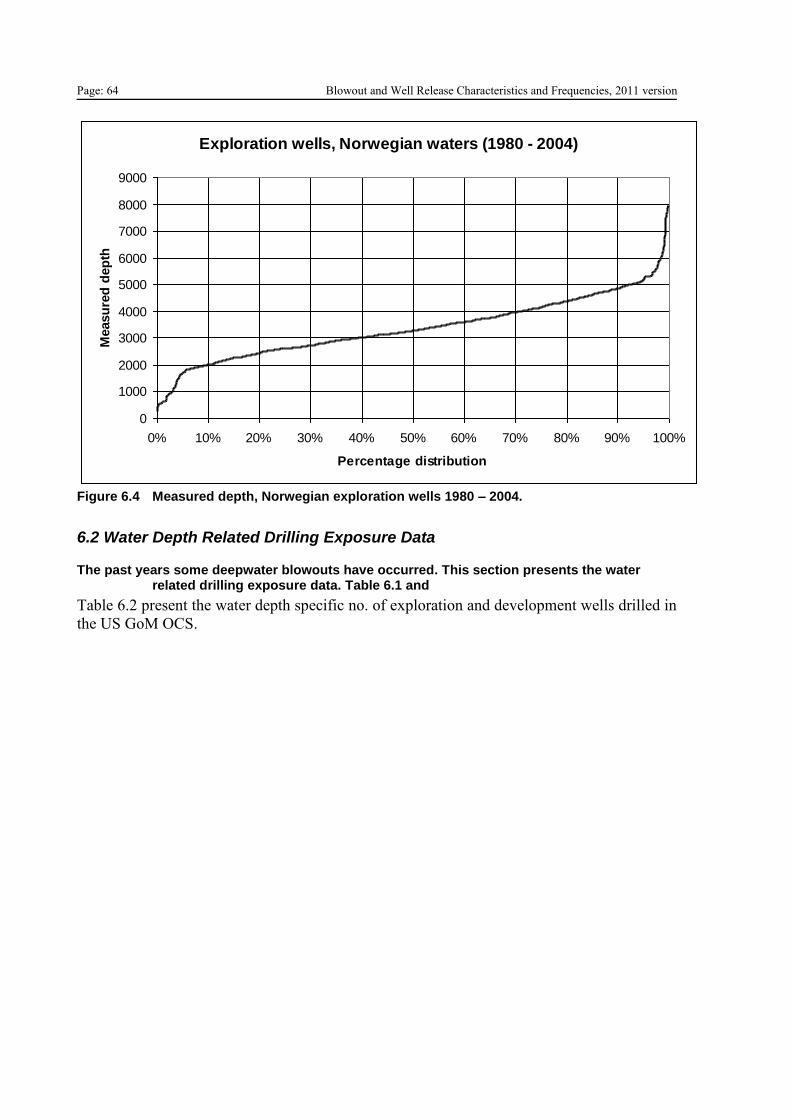
Page: 64 Blowout and Well Release Characteristics and Frequencies, 2011 version
Figure 6.4 Measured depth, Norwegian exploration wells 1980 – 2004.
6.2 Water Depth Related Drilling Exposure Data
The past years some deepwater blowouts have occurred. This section presents the water related drilling exposure data. Table 6.1 and
Table 6.2 present the water depth specific no. of exploration and development wells drilled in
the US GoM OCS.
Exploration wells, Norwegian waters (1980 - 2004)
0
1000
2000
3000
4000
5000
6000
7000
8000
9000
0% 10% 20% 30% 40% 50% 60% 70% 80% 90% 100%
Percentage distribution
Measu
red
dep
th
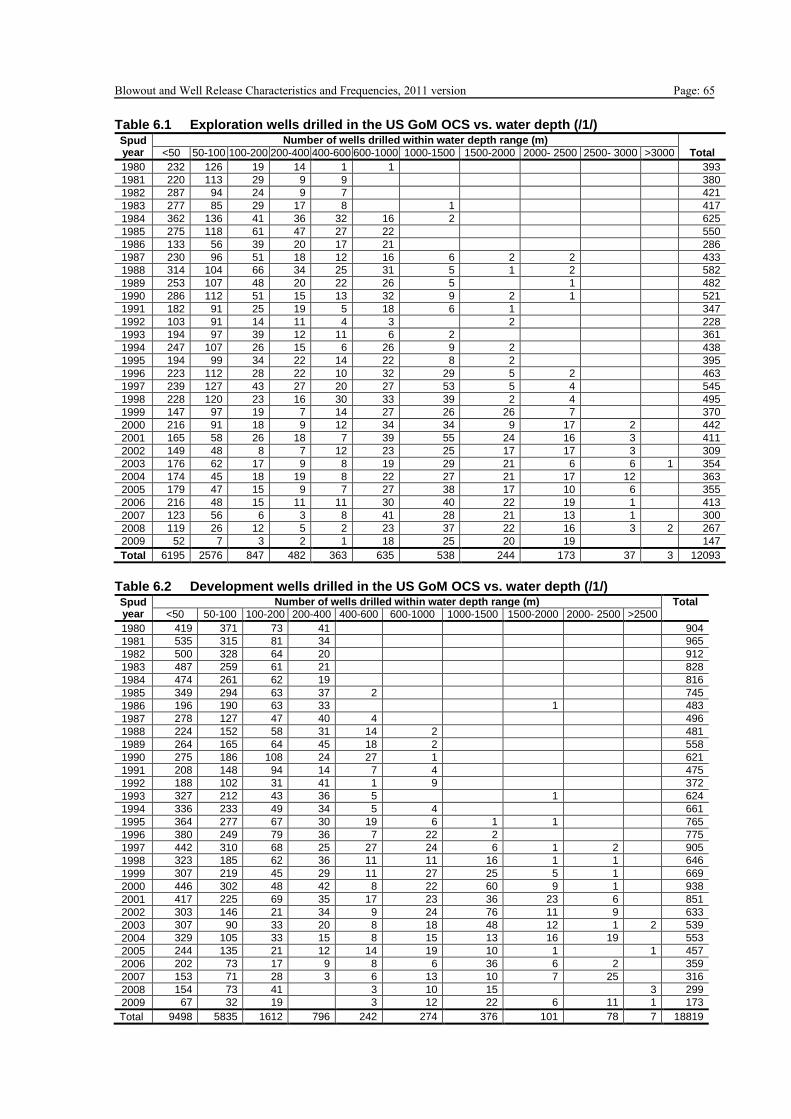
Blowout and Well Release Characteristics and Frequencies, 2011 version Page: 65 Table 6.1 Exploration wells drilled in the US GoM OCS vs. water depth (/1/) Spud year
Number of wells drilled within water depth range (m)
<50 50-100 100-200 200-400 400-600 600-1000 1000-1500 1500-2000 2000- 2500 2500- 3000 >3000 Total
1980 232 126 19 14 1 1 393
1981 220 113 29 9 9 380
1982 287 94 24 9 7 421
1983 277 85 29 17 8 1 417
1984 362 136 41 36 32 16 2 625
1985 275 118 61 47 27 22 550
1986 133 56 39 20 17 21 286
1987 230 96 51 18 12 16 6 2 2 433
1988 314 104 66 34 25 31 5 1 2 582
1989 253 107 48 20 22 26 5 1 482
1990 286 112 51 15 13 32 9 2 1 521
1991 182 91 25 19 5 18 6 1 347
1992 103 91 14 11 4 3 2 228
1993 194 97 39 12 11 6 2 361
1994 247 107 26 15 6 26 9 2 438
1995 194 99 34 22 14 22 8 2 395
1996 223 112 28 22 10 32 29 5 2 463
1997 239 127 43 27 20 27 53 5 4 545
1998 228 120 23 16 30 33 39 2 4 495
1999 147 97 19 7 14 27 26 26 7 370
2000 216 91 18 9 12 34 34 9 17 2 442
2001 165 58 26 18 7 39 55 24 16 3 411
2002 149 48 8 7 12 23 25 17 17 3 309
2003 176 62 17 9 8 19 29 21 6 6 1 354
2004 174 45 18 19 8 22 27 21 17 12 363
2005 179 47 15 9 7 27 38 17 10 6 355
2006 216 48 15 11 11 30 40 22 19 1 413
2007 123 56 6 3 8 41 28 21 13 1 300
2008 119 26 12 5 2 23 37 22 16 3 2 267
2009 52 7 3 2 1 18 25 20 19 147
Total 6195 2576 847 482 363 635 538 244 173 37 3 12093
Table 6.2 Development wells drilled in the US GoM OCS vs. water depth (/1/) Spud year
Number of wells drilled within water depth range (m) Total <50 50-100 100-200 200-400 400-600 600-1000 1000-1500 1500-2000 2000- 2500 >2500
1980 419 371 73 41 904
1981 535 315 81 34 965
1982 500 328 64 20 912
1983 487 259 61 21 828
1984 474 261 62 19 816
1985 349 294 63 37 2 745
1986 196 190 63 33 1 483
1987 278 127 47 40 4 496
1988 224 152 58 31 14 2 481
1989 264 165 64 45 18 2 558
1990 275 186 108 24 27 1 621
1991 208 148 94 14 7 4 475
1992 188 102 31 41 1 9 372
1993 327 212 43 36 5 1 624
1994 336 233 49 34 5 4 661
1995 364 277 67 30 19 6 1 1 765
1996 380 249 79 36 7 22 2 775
1997 442 310 68 25 27 24 6 1 2 905
1998 323 185 62 36 11 11 16 1 1 646
1999 307 219 45 29 11 27 25 5 1 669
2000 446 302 48 42 8 22 60 9 1 938
2001 417 225 69 35 17 23 36 23 6 851
2002 303 146 21 34 9 24 76 11 9 633
2003 307 90 33 20 8 18 48 12 1 2 539
2004 329 105 33 15 8 15 13 16 19 553
2005 244 135 21 12 14 19 10 1 1 457
2006 202 73 17 9 8 6 36 6 2 359
2007 153 71 28 3 6 13 10 7 25 316
2008 154 73 41 3 10 15 3 299
2009 67 32 19 3 12 22 6 11 1 173
Total 9498 5835 1612 796 242 274 376 101 78 7 18819
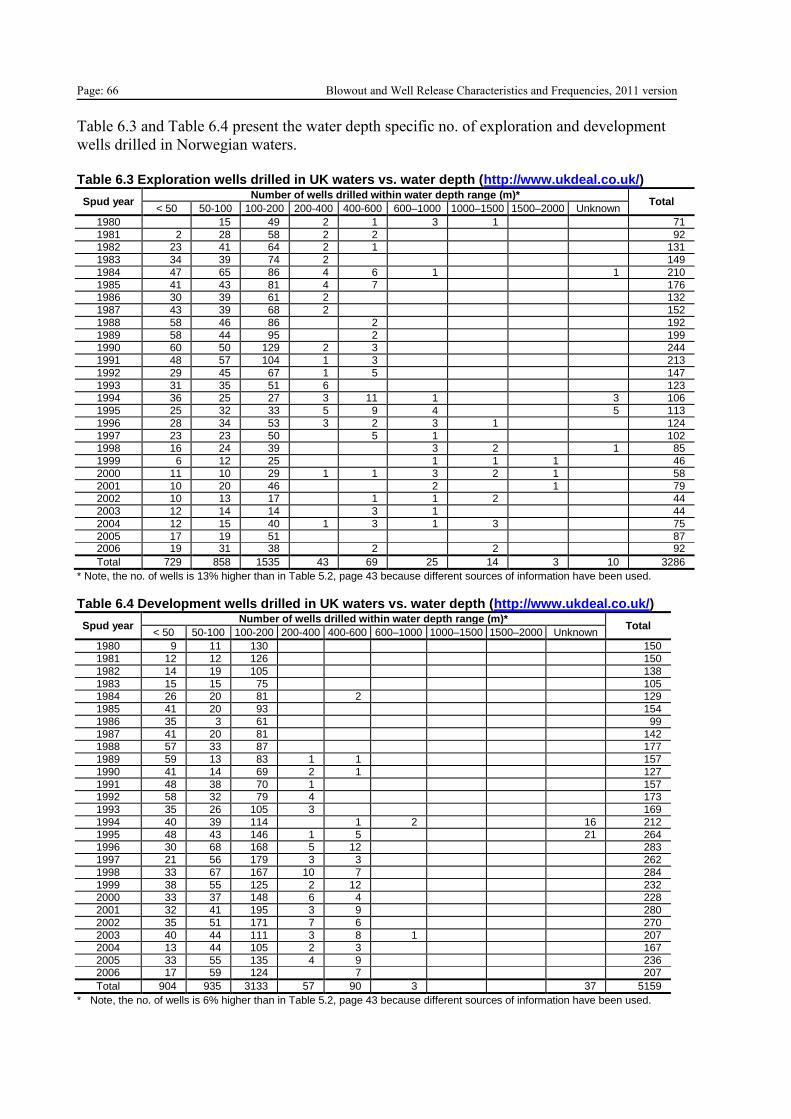
Page: 66 Blowout and Well Release Characteristics and Frequencies, 2011 version
Table 6.3 and Table 6.4 present the water depth specific no. of exploration and development
wells drilled in Norwegian waters.
Table 6.3 Exploration wells drilled in UK waters vs. water depth (http://www.ukdeal.co.uk/)
Spud year Number of wells drilled within water depth range (m)*
Total < 50 50-100 100-200 200-400 400-600 600–1000 1000–1500 1500–2000 Unknown
1980 15 49 2 1 3 1 71
1981 2 28 58 2 2 92 1982 23 41 64 2 1 131
1983 34 39 74 2 149
1984 47 65 86 4 6 1 1 210
1985 41 43 81 4 7 176 1986 30 39 61 2 132
1987 43 39 68 2 152
1988 58 46 86 2 192
1989 58 44 95 2 199 1990 60 50 129 2 3 244
1991 48 57 104 1 3 213
1992 29 45 67 1 5 147
1993 31 35 51 6 123 1994 36 25 27 3 11 1 3 106
1995 25 32 33 5 9 4 5 113
1996 28 34 53 3 2 3 1 124
1997 23 23 50 5 1 102 1998 16 24 39 3 2 1 85
1999 6 12 25 1 1 1 46
2000 11 10 29 1 1 3 2 1 58
2001 10 20 46 2 1 79 2002 10 13 17 1 1 2 44
2003 12 14 14 3 1 44
2004 12 15 40 1 3 1 3 75
2005 17 19 51 87 2006 19 31 38 2 2 92
Total 729 858 1535 43 69 25 14 3 10 3286
* Note, the no. of wells is 13% higher than in Table 5.2, page 43 because different sources of information have been used.
Table 6.4 Development wells drilled in UK waters vs. water depth (http://www.ukdeal.co.uk/)
Spud year Number of wells drilled within water depth range (m)*
Total < 50 50-100 100-200 200-400 400-600 600–1000 1000–1500 1500–2000 Unknown
1980 9 11 130 150
1981 12 12 126 150
1982 14 19 105 138
1983 15 15 75 105 1984 26 20 81 2 129
1985 41 20 93 154
1986 35 3 61 99
1987 41 20 81 142 1988 57 33 87 177
1989 59 13 83 1 1 157
1990 41 14 69 2 1 127
1991 48 38 70 1 157 1992 58 32 79 4 173
1993 35 26 105 3 169
1994 40 39 114 1 2 16 212
1995 48 43 146 1 5 21 264 1996 30 68 168 5 12 283
1997 21 56 179 3 3 262
1998 33 67 167 10 7 284
1999 38 55 125 2 12 232 2000 33 37 148 6 4 228
2001 32 41 195 3 9 280
2002 35 51 171 7 6 270
2003 40 44 111 3 8 1 207 2004 13 44 105 2 3 167
2005 33 55 135 4 9 236 2006 17 59 124 7 207
Total 904 935 3133 57 90 3 37 5159
* Note, the no. of wells is 6% higher than in Table 5.2, page 43 because different sources of information have been used.
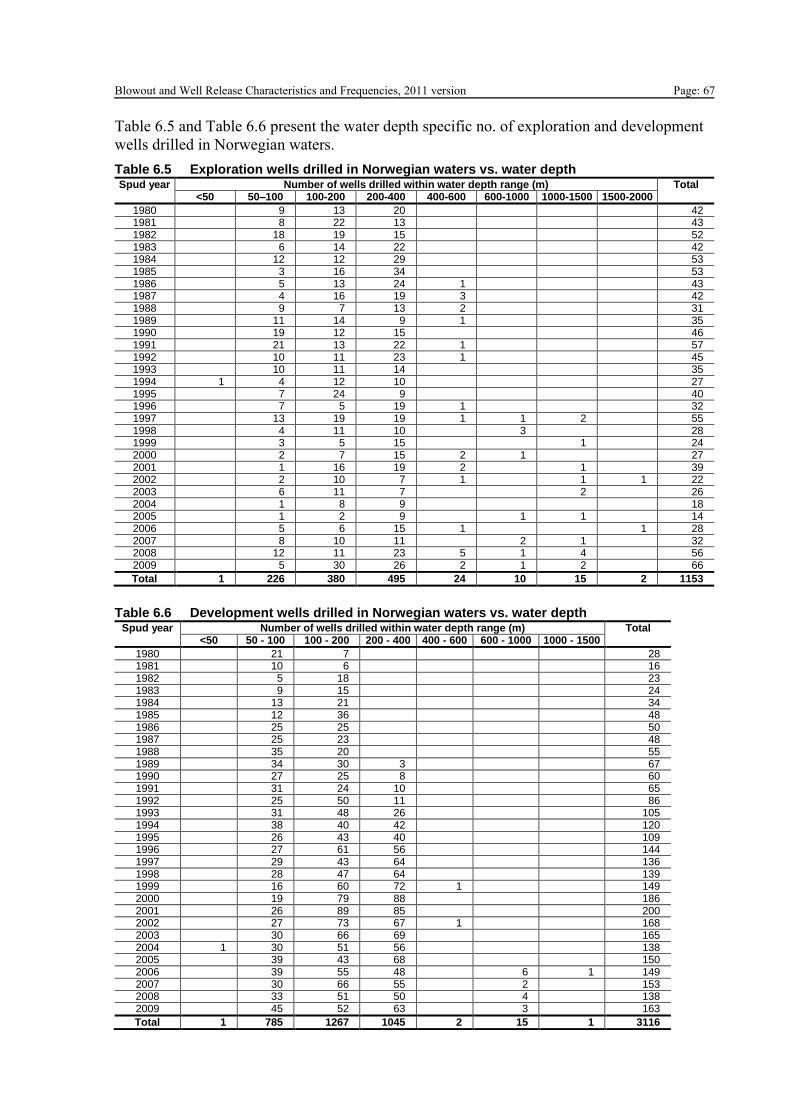
Blowout and Well Release Characteristics and Frequencies, 2011 version Page: 67
Table 6.5 and Table 6.6 present the water depth specific no. of exploration and development
wells drilled in Norwegian waters.
Table 6.5 Exploration wells drilled in Norwegian waters vs. water depth Spud year Number of wells drilled within water depth range (m) Total
<50 50–100 100-200 200-400 400-600 600-1000 1000-1500 1500-2000
1980 9 13 20 42 1981 8 22 13 43 1982 18 19 15 52 1983 6 14 22 42 1984 12 12 29 53 1985 3 16 34 53 1986 5 13 24 1 43 1987 4 16 19 3 42 1988 9 7 13 2 31 1989 11 14 9 1 35 1990 19 12 15 46 1991 21 13 22 1 57 1992 10 11 23 1 45 1993 10 11 14 35 1994 1 4 12 10 27 1995 7 24 9 40 1996 7 5 19 1 32 1997 13 19 19 1 1 2 55 1998 4 11 10 3 28 1999 3 5 15 1 24 2000 2 7 15 2 1 27 2001 1 16 19 2 1 39 2002 2 10 7 1 1 1 22 2003 6 11 7 2 26 2004 1 8 9 18 2005 1 2 9 1 1 14 2006 5 6 15 1 1 28 2007 8 10 11 2 1 32 2008 12 11 23 5 1 4 56 2009 5 30 26 2 1 2 66
Total 1 226 380 495 24 10 15 2 1153
Table 6.6 Development wells drilled in Norwegian waters vs. water depth
Spud year Number of wells drilled within water depth range (m) Total <50 50 - 100 100 - 200 200 - 400 400 - 600 600 - 1000 1000 - 1500
1980 21 7 28 1981 10 6 16 1982 5 18 23 1983 9 15 24 1984 13 21 34 1985 12 36 48 1986 25 25 50 1987 25 23 48 1988 35 20 55 1989 34 30 3 67 1990 27 25 8 60 1991 31 24 10 65 1992 25 50 11 86 1993 31 48 26 105 1994 38 40 42 120 1995 26 43 40 109 1996 27 61 56 144 1997 29 43 64 136 1998 28 47 64 139 1999 16 60 72 1 149 2000 19 79 88 186 2001 26 89 85 200 2002 27 73 67 1 168 2003 30 66 69 165 2004 1 30 51 56 138 2005 39 43 68 150 2006 39 55 48 6 1 149 2007 30 66 55 2 153 2008 33 51 50 4 138 2009 45 52 63 3 163
Total 1 785 1267 1045 2 15 1 3116
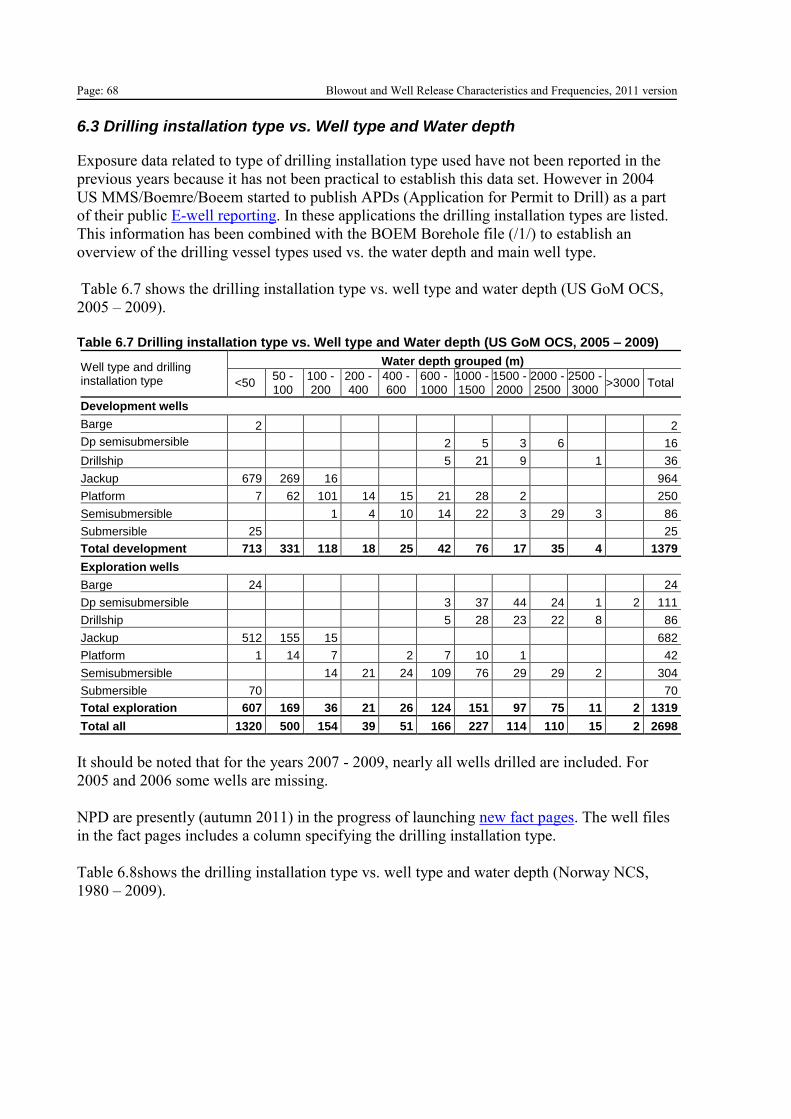
Page: 68 Blowout and Well Release Characteristics and Frequencies, 2011 version
6.3 Drilling installation type vs. Well type and Water depth
Exposure data related to type of drilling installation type used have not been reported in the
previous years because it has not been practical to establish this data set. However in 2004
US MMS/Boemre/Boeem started to publish APDs (Application for Permit to Drill) as a part
of their public E-well reporting. In these applications the drilling installation types are listed.
This information has been combined with the BOEM Borehole file (/1/) to establish an
overview of the drilling vessel types used vs. the water depth and main well type.
Table 6.7 shows the drilling installation type vs. well type and water depth (US GoM OCS,
2005 – 2009).
Table 6.7 Drilling installation type vs. Well type and Water depth (US GoM OCS, 2005 – 2009)
Well type and drilling installation type
Water depth grouped (m)
<50 50 - 100
100 - 200
200 - 400
400 - 600
600 - 1000
1000 - 1500
1500 -2000
2000 - 2500
2500 - 3000
>3000 Total
Development wells
Barge 2
2
Dp semisubmersible
2 5 3 6
16
Drillship
5 21 9
1
36
Jackup 679 269 16
964
Platform 7 62 101 14 15 21 28 2
250
Semisubmersible
1 4 10 14 22 3 29 3
86
Submersible 25
25
Total development 713 331 118 18 25 42 76 17 35 4
1379
Exploration wells
Barge 24
24
Dp semisubmersible
3 37 44 24 1 2 111
Drillship
5 28 23 22 8
86
Jackup 512 155 15
682
Platform 1 14 7
2 7 10 1
42
Semisubmersible
14 21 24 109 76 29 29 2
304
Submersible 70
70
Total exploration 607 169 36 21 26 124 151 97 75 11 2 1319
Total all 1320 500 154 39 51 166 227 114 110 15 2 2698
It should be noted that for the years 2007 - 2009, nearly all wells drilled are included. For
2005 and 2006 some wells are missing.
NPD are presently (autumn 2011) in the progress of launching new fact pages. The well files
in the fact pages includes a column specifying the drilling installation type.
Table 6.8shows the drilling installation type vs. well type and water depth (Norway NCS,
1980 – 2009).
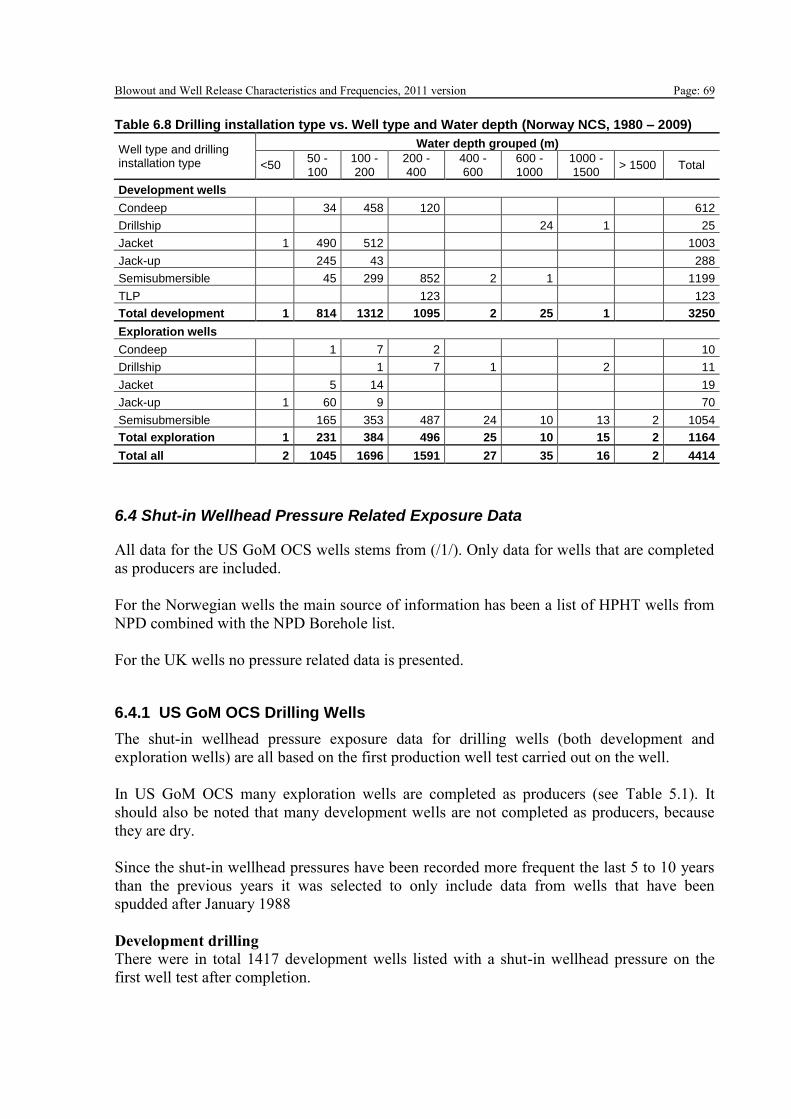
Blowout and Well Release Characteristics and Frequencies, 2011 version Page: 69 Table 6.8 Drilling installation type vs. Well type and Water depth (Norway NCS, 1980 – 2009)
Well type and drilling installation type
Water depth grouped (m)
<50 50 - 100
100 - 200
200 - 400
400 - 600
600 - 1000
1000 - 1500
> 1500 Total
Development wells
Condeep
34 458 120
612
Drillship
24 1
25
Jacket 1 490 512
1003
Jack-up
245 43
288
Semisubmersible
45 299 852 2 1
1199
TLP
123
123
Total development 1 814 1312 1095 2 25 1
3250
Exploration wells
Condeep
1 7 2
10
Drillship
1 7 1
2
11
Jacket
5 14
19
Jack-up 1 60 9
70
Semisubmersible
165 353 487 24 10 13 2 1054
Total exploration 1 231 384 496 25 10 15 2 1164
Total all 2 1045 1696 1591 27 35 16 2 4414
6.4 Shut-in Wellhead Pressure Related Exposure Data
All data for the US GoM OCS wells stems from (/1/). Only data for wells that are completed
as producers are included.
For the Norwegian wells the main source of information has been a list of HPHT wells from
NPD combined with the NPD Borehole list.
For the UK wells no pressure related data is presented.
6.4.1 US GoM OCS Drilling Wells
The shut-in wellhead pressure exposure data for drilling wells (both development and
exploration wells) are all based on the first production well test carried out on the well.
In US GoM OCS many exploration wells are completed as producers (see Table 5.1). It
should also be noted that many development wells are not completed as producers, because
they are dry.
Since the shut-in wellhead pressures have been recorded more frequent the last 5 to 10 years
than the previous years it was selected to only include data from wells that have been
spudded after January 1988
Development drilling
There were in total 1417 development wells listed with a shut-in wellhead pressure on the
first well test after completion.
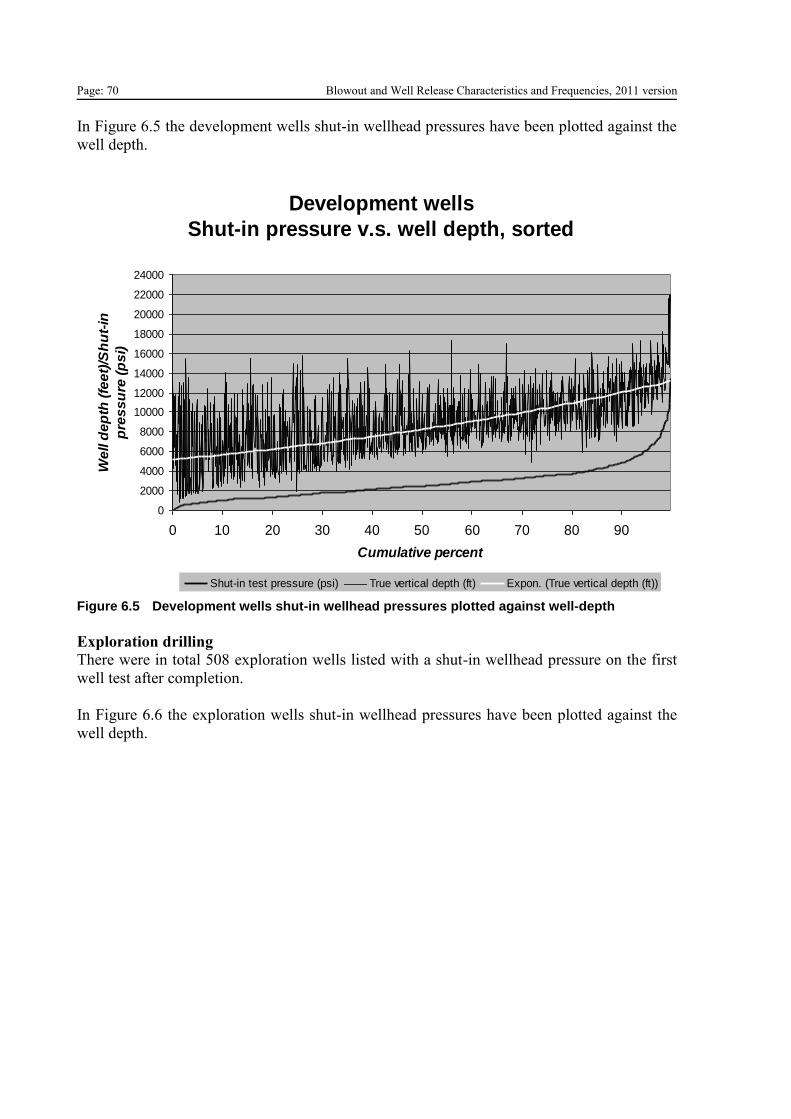
Page: 70 Blowout and Well Release Characteristics and Frequencies, 2011 version
In Figure 6.5 the development wells shut-in wellhead pressures have been plotted against the
well depth.
Figure 6.5 Development wells shut-in wellhead pressures plotted against well-depth
Exploration drilling
There were in total 508 exploration wells listed with a shut-in wellhead pressure on the first
well test after completion.
In Figure 6.6 the exploration wells shut-in wellhead pressures have been plotted against the
well depth.
Development wells
Shut-in pressure v.s. well depth, sorted
0
2000
4000
6000
8000
10000
12000
14000
16000
18000
20000
22000
24000
0 10 20 30 40 50 60 70 80 90
Cumulative percent
We
ll d
ep
th (
fee
t)/S
hu
t-in
pre
ss
ure
(p
si)
Shut-in test pressure (psi) True vertical depth (ft) Expon. (True vertical depth (ft))
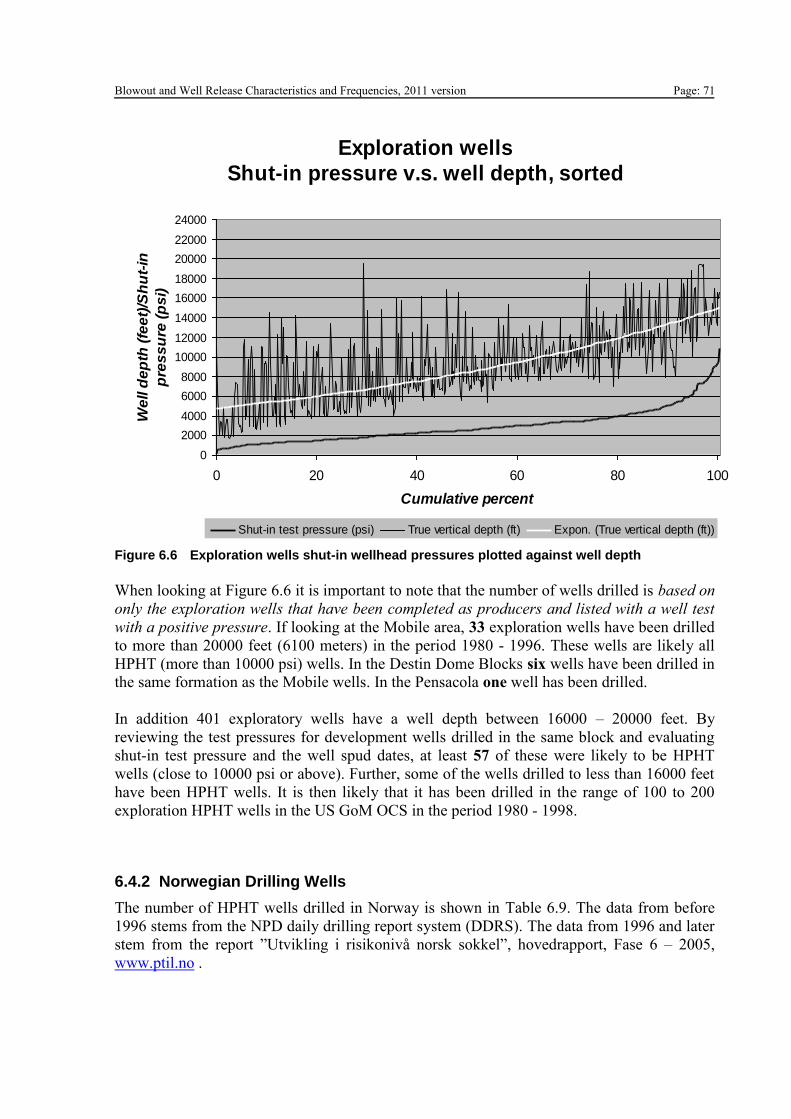
Blowout and Well Release Characteristics and Frequencies, 2011 version Page: 71
Figure 6.6 Exploration wells shut-in wellhead pressures plotted against well depth
When looking at Figure 6.6 it is important to note that the number of wells drilled is based on
only the exploration wells that have been completed as producers and listed with a well test
with a positive pressure. If looking at the Mobile area, 33 exploration wells have been drilled
to more than 20000 feet (6100 meters) in the period 1980 - 1996. These wells are likely all
HPHT (more than 10000 psi) wells. In the Destin Dome Blocks six wells have been drilled in
the same formation as the Mobile wells. In the Pensacola one well has been drilled.
In addition 401 exploratory wells have a well depth between 16000 – 20000 feet. By
reviewing the test pressures for development wells drilled in the same block and evaluating
shut-in test pressure and the well spud dates, at least 57 of these were likely to be HPHT
wells (close to 10000 psi or above). Further, some of the wells drilled to less than 16000 feet
have been HPHT wells. It is then likely that it has been drilled in the range of 100 to 200
exploration HPHT wells in the US GoM OCS in the period 1980 - 1998.
6.4.2 Norwegian Drilling Wells
The number of HPHT wells drilled in Norway is shown in Table 6.9. The data from before
1996 stems from the NPD daily drilling report system (DDRS). The data from 1996 and later
stem from the report ”Utvikling i risikonivå norsk sokkel”, hovedrapport, Fase 6 – 2005,
www.ptil.no .
Exploration wells
Shut-in pressure v.s. well depth, sorted
0
2000
4000
6000
8000
10000
12000
14000
16000
18000
20000
22000
24000
0 20 40 60 80 100
Cumulative percent
We
ll d
ep
th (
fee
t)/S
hu
t-in
pre
ss
ure
(p
si)
Shut-in test pressure (psi) True vertical depth (ft) Expon. (True vertical depth (ft))
Page: 72 Blowout and Well Release Characteristics and Frequencies, 2011 version Table 6.9 Number of HP/HT wells drilled in the Norwegian waters sorted on years
Year No. of HPHT wells (>690 bar and/or > 150
oC)
Exploration Production
1984 3
1985 2
1986 2
1987 0
1988 3
1989 3
1990 8
1991 7
1992 9
1993 5
1994 3
1995 2
1996 3 4
1997 5 1
1998 2 1
1999 4 2
2000 2
2001 3
2002 3 2
2003 2 1
2004 2 10
2005 3 20
Total 76 41
6.4.3 US GoM OCS Wells in Production
The pressure exposure data for production wells are based on all the well tests with a listed
shut-in wellhead pressure in the period 1980 – 1996 (/1/).
Totally 48264 tests were listed with a positive wellhead shut-in pressure. Many well tests
were not listed with well test pressures. The distribution of well tests in four different
pressure ranges is presented in Table 6.10.
Table 6.10 Pressure ranges in production wells in US GoM OCS wells
Pressure range No. of well tests
Relative distribution
below 6000 psi (414 bar) 46928 97,23 %
6000 – 8000 psi pressure 926 1,92 %
8000 – 10000 psi 336 0,70 %
more than 10000 psi (690 bar) 74 0,15 %
Total 48264 100,00 %
In Figure 6.7 the development wells shut-in wellhead pressures have been plotted against the
well depth.
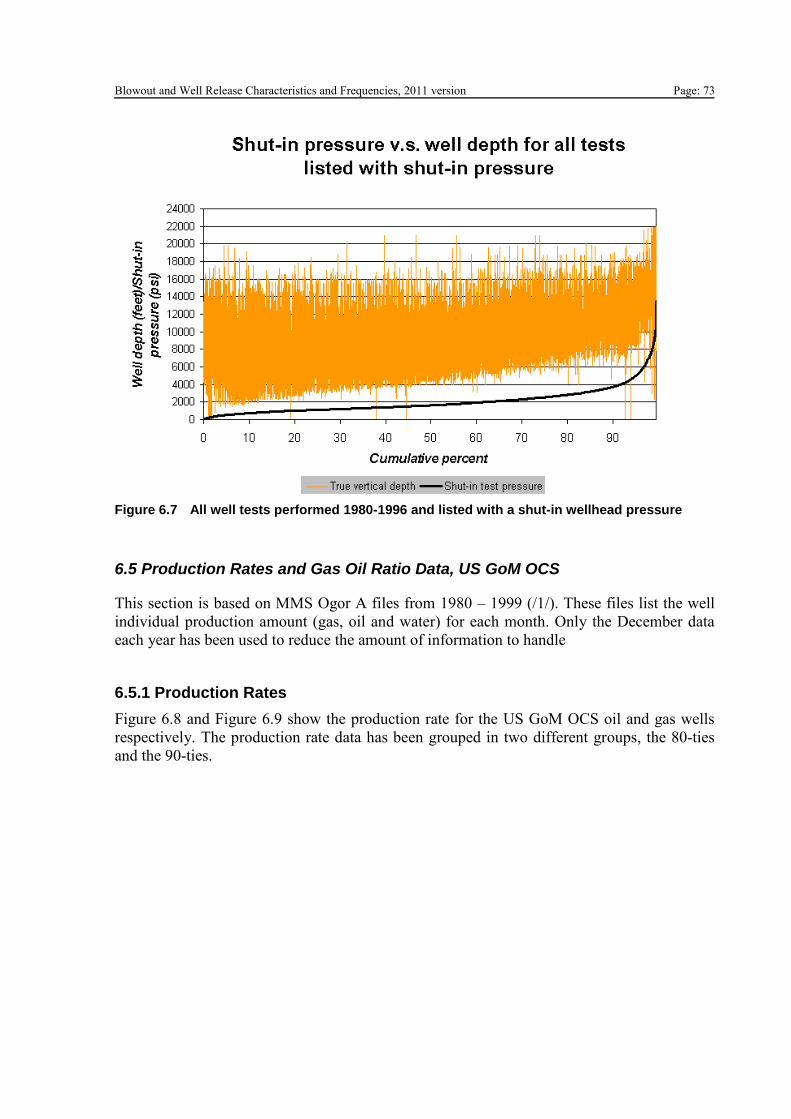
Blowout and Well Release Characteristics and Frequencies, 2011 version Page: 73
Figure 6.7 All well tests performed 1980-1996 and listed with a shut-in wellhead pressure
6.5 Production Rates and Gas Oil Ratio Data, US GoM OCS
This section is based on MMS Ogor A files from 1980 – 1999 (/1/). These files list the well
individual production amount (gas, oil and water) for each month. Only the December data
each year has been used to reduce the amount of information to handle
6.5.1 Production Rates
Figure 6.8 and Figure 6.9 show the production rate for the US GoM OCS oil and gas wells
respectively. The production rate data has been grouped in two different groups, the 80-ties
and the 90-ties.
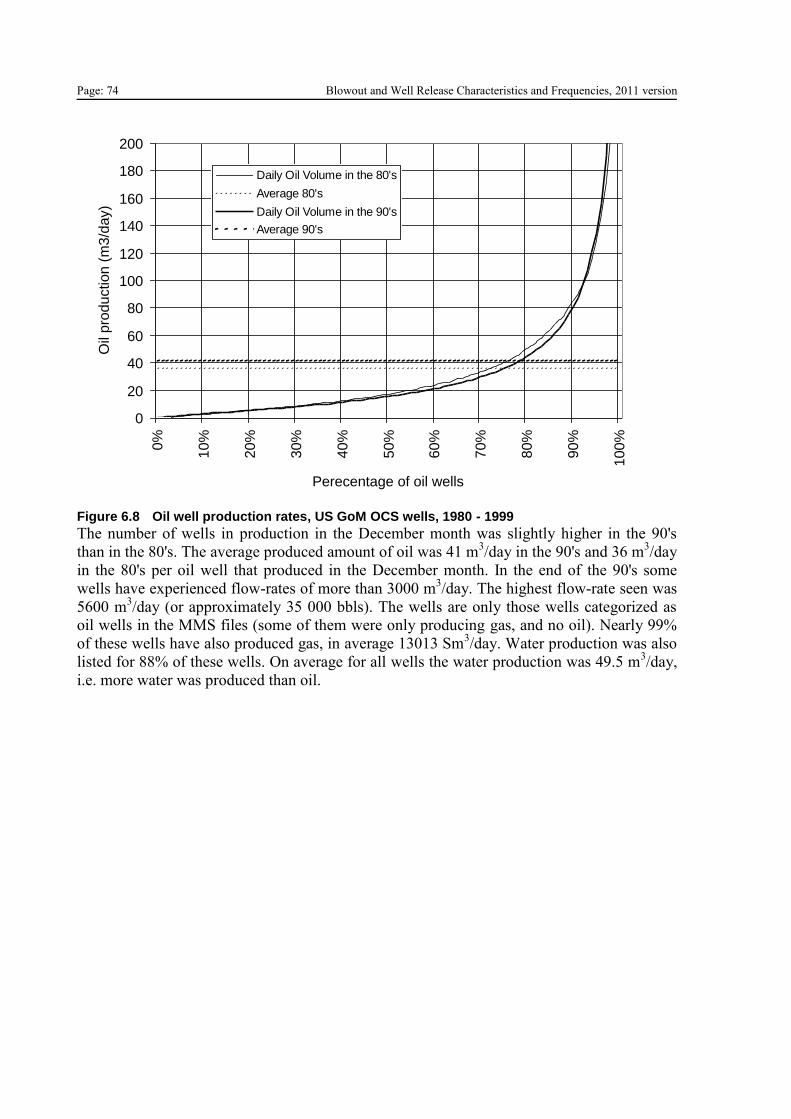
Page: 74 Blowout and Well Release Characteristics and Frequencies, 2011 version
Figure 6.8 Oil well production rates, US GoM OCS wells, 1980 - 1999
The number of wells in production in the December month was slightly higher in the 90's
than in the 80's. The average produced amount of oil was 41 m3/day in the 90's and 36 m
3/day
in the 80's per oil well that produced in the December month. In the end of the 90's some
wells have experienced flow-rates of more than 3000 m3/day. The highest flow-rate seen was
5600 m3/day (or approximately 35 000 bbls). The wells are only those wells categorized as
oil wells in the MMS files (some of them were only producing gas, and no oil). Nearly 99%
of these wells have also produced gas, in average 13013 Sm3/day. Water production was also
listed for 88% of these wells. On average for all wells the water production was 49.5 m3/day,
i.e. more water was produced than oil.
0
20
40
60
80
100
120
140
160
180
2000%
10%
20%
30%
40%
50%
60%
70%
80%
90%
100%
Perecentage of oil wells
Oil
pro
duction
(m
3/d
ay)
Daily Oil Volume in the 80's
Average 80's
Daily Oil Volume in the 90's
Average 90's
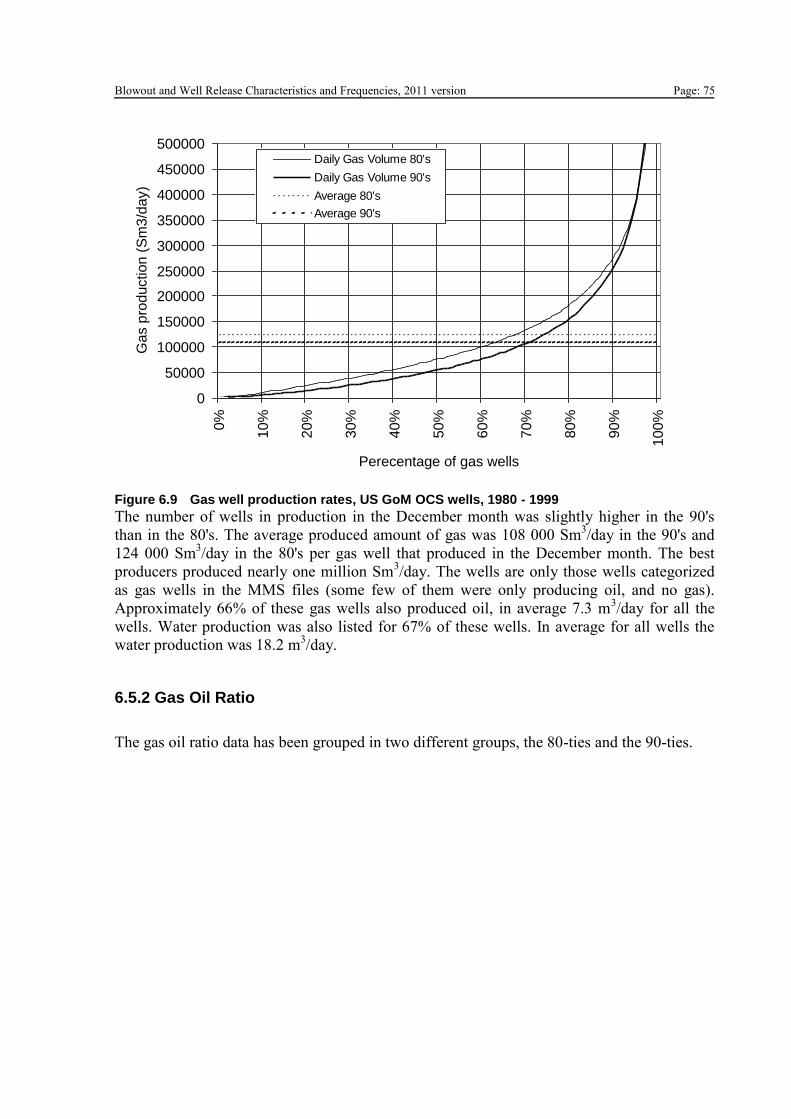
Blowout and Well Release Characteristics and Frequencies, 2011 version Page: 75
Figure 6.9 Gas well production rates, US GoM OCS wells, 1980 - 1999
The number of wells in production in the December month was slightly higher in the 90's
than in the 80's. The average produced amount of gas was 108 000 Sm3/day in the 90's and
124 000 Sm3/day in the 80's per gas well that produced in the December month. The best
producers produced nearly one million Sm3/day. The wells are only those wells categorized
as gas wells in the MMS files (some few of them were only producing oil, and no gas).
Approximately 66% of these gas wells also produced oil, in average 7.3 m3/day for all the
wells. Water production was also listed for 67% of these wells. In average for all wells the
water production was 18.2 m3/day.
6.5.2 Gas Oil Ratio
The gas oil ratio data has been grouped in two different groups, the 80-ties and the 90-ties.
0
50000
100000
150000
200000
250000
300000
350000
400000
450000
500000
0%
10%
20%
30%
40%
50%
60%
70%
80%
90%
100%
Perecentage of gas wells
Ga
s p
rod
uction
(S
m3
/da
y)
Daily Gas Volume 80's
Daily Gas Volume 90's
Average 80's
Average 90's
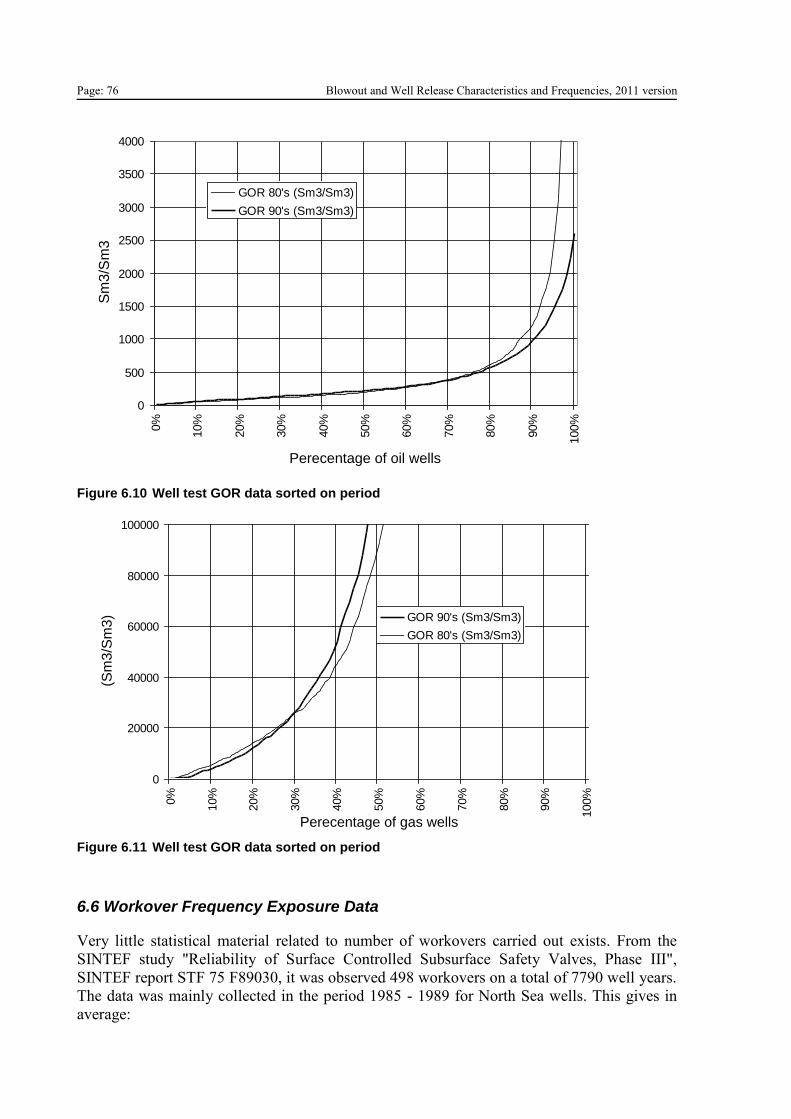
Page: 76 Blowout and Well Release Characteristics and Frequencies, 2011 version
Figure 6.10 Well test GOR data sorted on period
Figure 6.11 Well test GOR data sorted on period
6.6 Workover Frequency Exposure Data
Very little statistical material related to number of workovers carried out exists. From the
SINTEF study "Reliability of Surface Controlled Subsurface Safety Valves, Phase III",
SINTEF report STF 75 F89030, it was observed 498 workovers on a total of 7790 well years.
The data was mainly collected in the period 1985 - 1989 for North Sea wells. This gives in
average:
0
500
1000
1500
2000
2500
3000
3500
40000%
10%
20%
30%
40%
50%
60%
70%
80%
90%
100%
Perecentage of oil wells
Sm
3/S
m3
GOR 80's (Sm3/Sm3)
GOR 90's (Sm3/Sm3)
0
20000
40000
60000
80000
100000
0%
10%
20%
30%
40%
50%
60%
70%
80%
90%
100%
Perecentage of gas wells
(Sm
3/S
m3) GOR 90's (Sm3/Sm3)
GOR 80's (Sm3/Sm3)
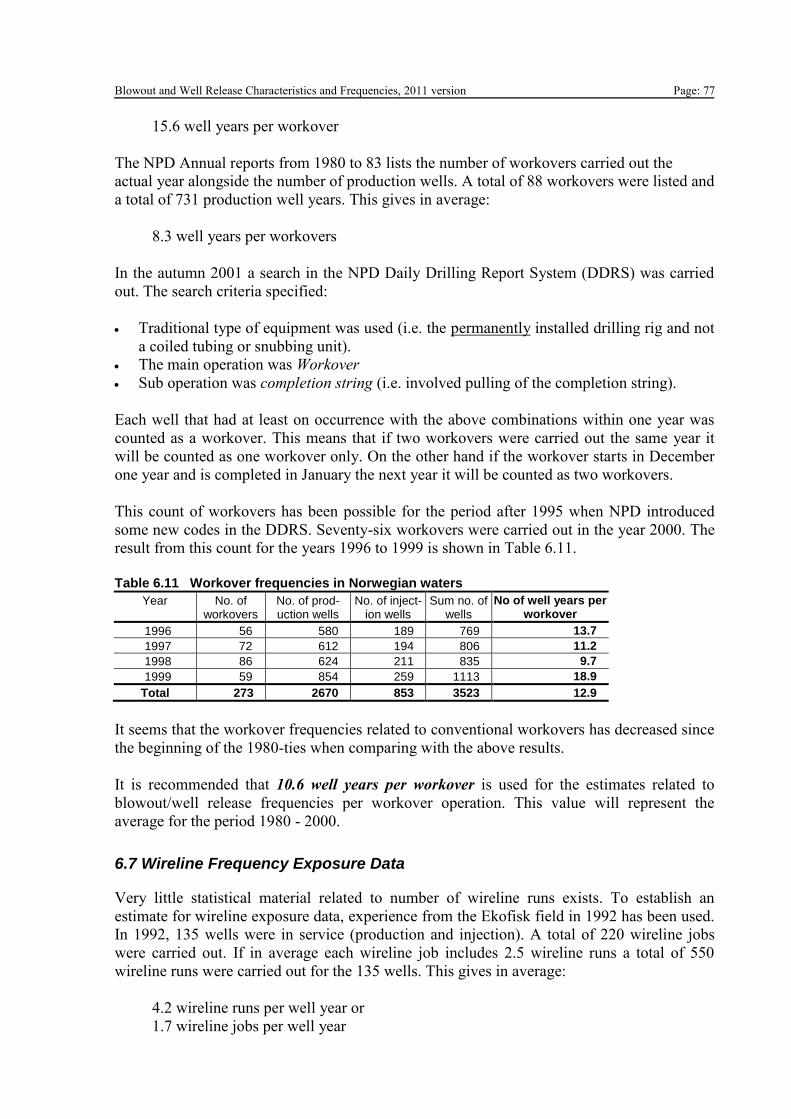
Blowout and Well Release Characteristics and Frequencies, 2011 version Page: 77
15.6 well years per workover
The NPD Annual reports from 1980 to 83 lists the number of workovers carried out the
actual year alongside the number of production wells. A total of 88 workovers were listed and
a total of 731 production well years. This gives in average:
8.3 well years per workovers
In the autumn 2001 a search in the NPD Daily Drilling Report System (DDRS) was carried
out. The search criteria specified:
Traditional type of equipment was used (i.e. the permanently installed drilling rig and not
a coiled tubing or snubbing unit).
The main operation was Workover
Sub operation was completion string (i.e. involved pulling of the completion string).
Each well that had at least on occurrence with the above combinations within one year was
counted as a workover. This means that if two workovers were carried out the same year it
will be counted as one workover only. On the other hand if the workover starts in December
one year and is completed in January the next year it will be counted as two workovers.
This count of workovers has been possible for the period after 1995 when NPD introduced
some new codes in the DDRS. Seventy-six workovers were carried out in the year 2000. The
result from this count for the years 1996 to 1999 is shown in Table 6.11.
Table 6.11 Workover frequencies in Norwegian waters
Year No. of workovers
No. of prod-uction wells
No. of inject-ion wells
Sum no. of wells
No of well years per workover
1996 56 580 189 769 13.7
1997 72 612 194 806 11.2
1998 86 624 211 835 9.7
1999 59 854 259 1113 18.9
Total 273 2670 853 3523 12.9
It seems that the workover frequencies related to conventional workovers has decreased since
the beginning of the 1980-ties when comparing with the above results.
It is recommended that 10.6 well years per workover is used for the estimates related to
blowout/well release frequencies per workover operation. This value will represent the
average for the period 1980 - 2000.
6.7 Wireline Frequency Exposure Data
Very little statistical material related to number of wireline runs exists. To establish an
estimate for wireline exposure data, experience from the Ekofisk field in 1992 has been used.
In 1992, 135 wells were in service (production and injection). A total of 220 wireline jobs
were carried out. If in average each wireline job includes 2.5 wireline runs a total of 550
wireline runs were carried out for the 135 wells. This gives in average:
4.2 wireline runs per well year or
1.7 wireline jobs per well year
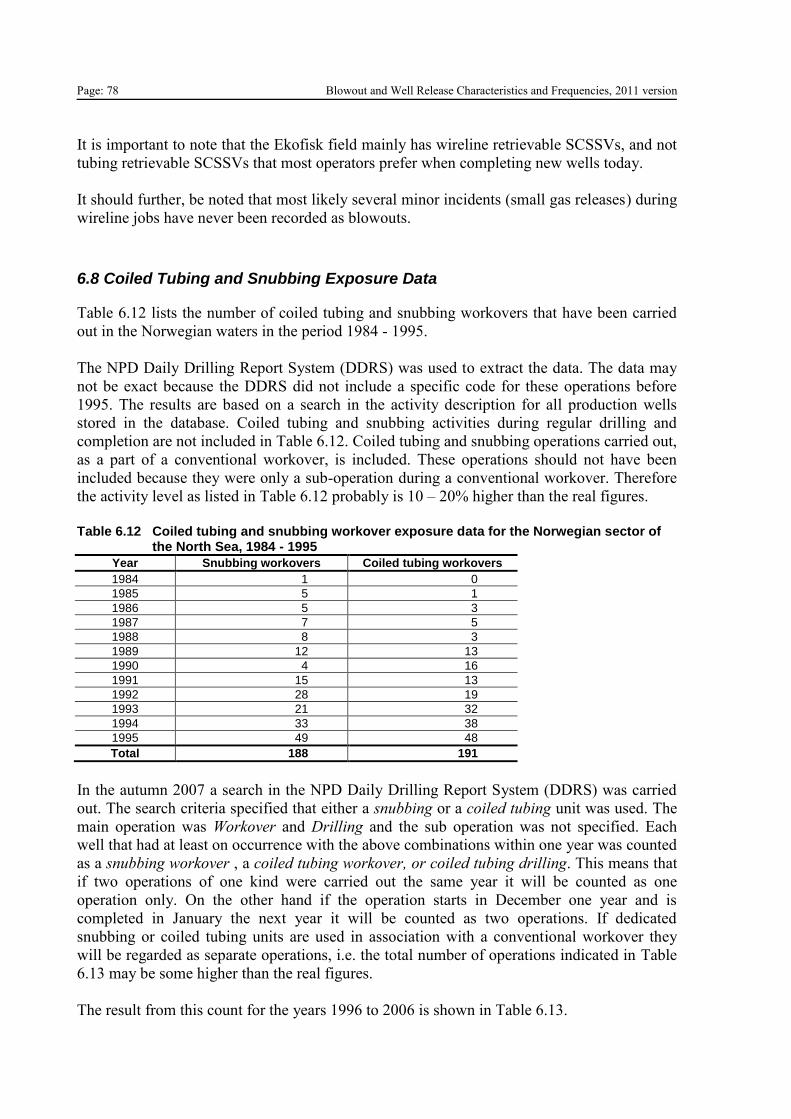
Page: 78 Blowout and Well Release Characteristics and Frequencies, 2011 version
It is important to note that the Ekofisk field mainly has wireline retrievable SCSSVs, and not
tubing retrievable SCSSVs that most operators prefer when completing new wells today.
It should further, be noted that most likely several minor incidents (small gas releases) during
wireline jobs have never been recorded as blowouts.
6.8 Coiled Tubing and Snubbing Exposure Data
Table 6.12 lists the number of coiled tubing and snubbing workovers that have been carried
out in the Norwegian waters in the period 1984 - 1995.
The NPD Daily Drilling Report System (DDRS) was used to extract the data. The data may
not be exact because the DDRS did not include a specific code for these operations before
1995. The results are based on a search in the activity description for all production wells
stored in the database. Coiled tubing and snubbing activities during regular drilling and
completion are not included in Table 6.12. Coiled tubing and snubbing operations carried out,
as a part of a conventional workover, is included. These operations should not have been
included because they were only a sub-operation during a conventional workover. Therefore
the activity level as listed in Table 6.12 probably is 10 – 20% higher than the real figures.
Table 6.12 Coiled tubing and snubbing workover exposure data for the Norwegian sector of
the North Sea, 1984 - 1995
Year Snubbing workovers Coiled tubing workovers
1984 1 0
1985 5 1
1986 5 3
1987 7 5
1988 8 3
1989 12 13
1990 4 16
1991 15 13
1992 28 19
1993 21 32
1994 33 38
1995 49 48
Total 188 191
In the autumn 2007 a search in the NPD Daily Drilling Report System (DDRS) was carried
out. The search criteria specified that either a snubbing or a coiled tubing unit was used. The
main operation was Workover and Drilling and the sub operation was not specified. Each
well that had at least on occurrence with the above combinations within one year was counted
as a snubbing workover , a coiled tubing workover, or coiled tubing drilling. This means that
if two operations of one kind were carried out the same year it will be counted as one
operation only. On the other hand if the operation starts in December one year and is
completed in January the next year it will be counted as two operations. If dedicated
snubbing or coiled tubing units are used in association with a conventional workover they
will be regarded as separate operations, i.e. the total number of operations indicated in Table
6.13 may be some higher than the real figures.
The result from this count for the years 1996 to 2006 is shown in Table 6.13.
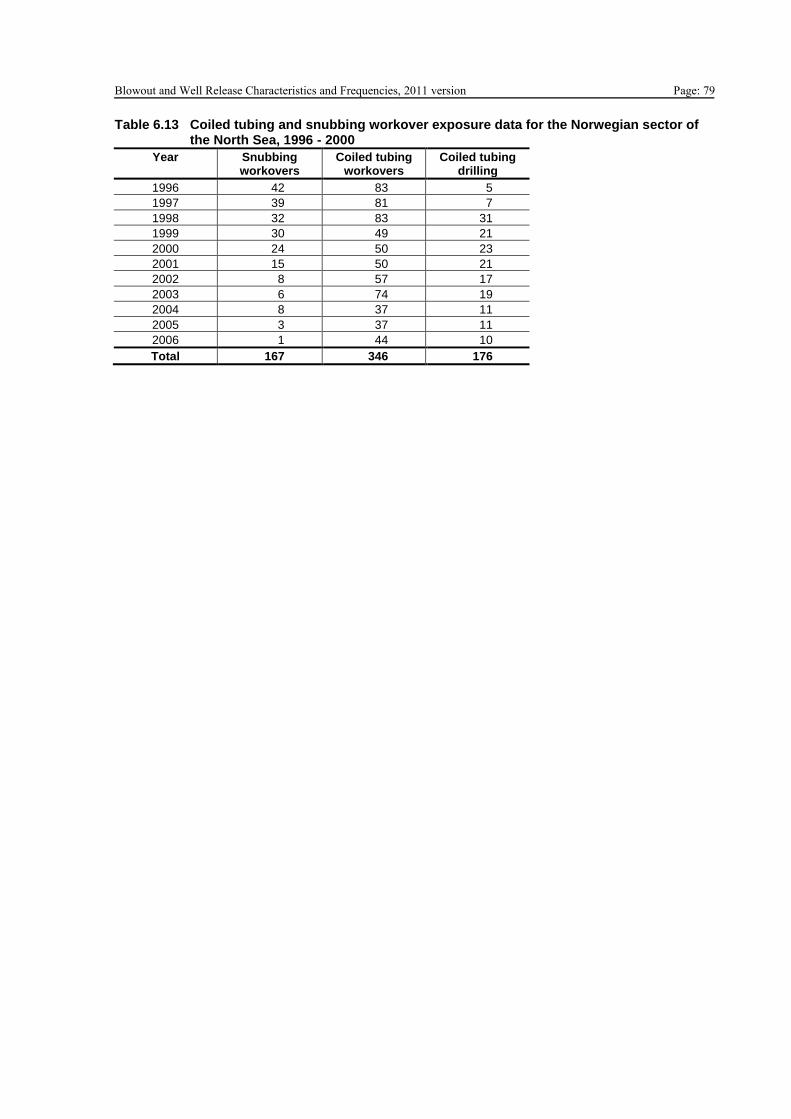
Blowout and Well Release Characteristics and Frequencies, 2011 version Page: 79 Table 6.13 Coiled tubing and snubbing workover exposure data for the Norwegian sector of
the North Sea, 1996 - 2000
Year Snubbing workovers
Coiled tubing workovers
Coiled tubing drilling
1996 42 83 5
1997 39 81 7
1998 32 83 31
1999 30 49 21
2000 24 50 23
2001 15 50 21
2002 8 57 17
2003 6 74 19
2004 8 37 11
2005 3 37 11
2006 1 44 10
Total 167 346 176

Page: 80 Blowout and Well Release Characteristics and Frequencies, 2011 version
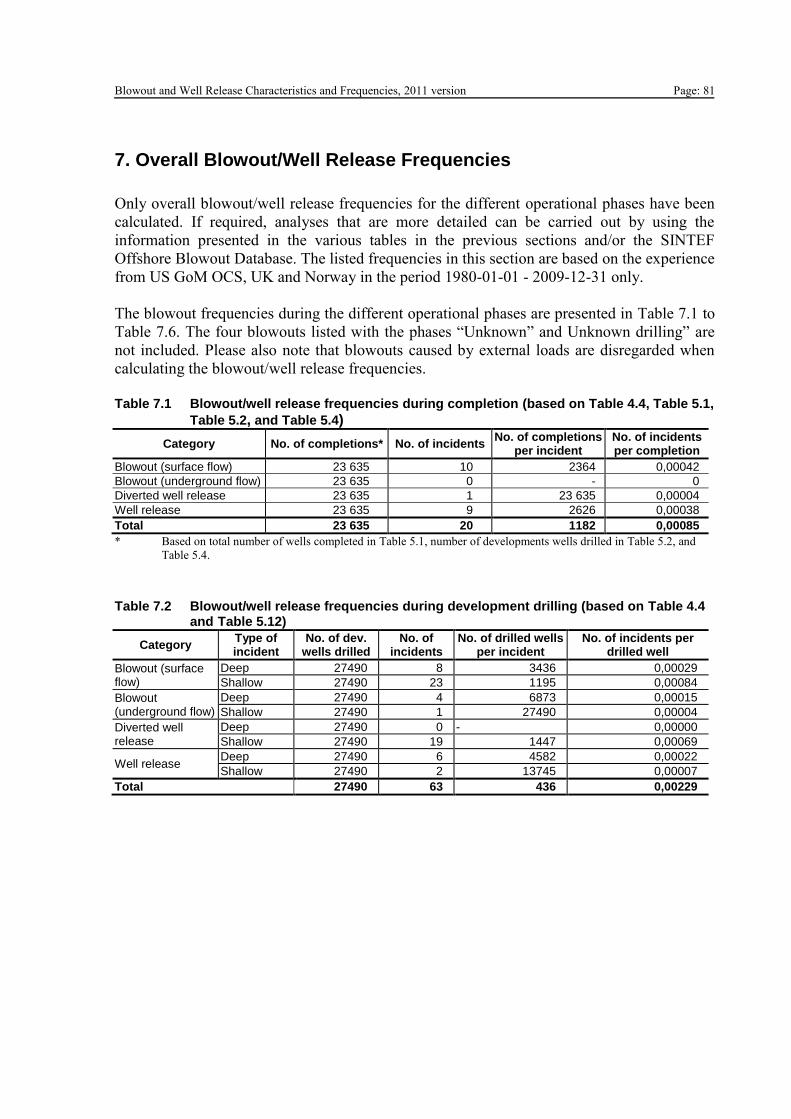
Blowout and Well Release Characteristics and Frequencies, 2011 version Page: 81
7. Overall Blowout/Well Release Frequencies
Only overall blowout/well release frequencies for the different operational phases have been
calculated. If required, analyses that are more detailed can be carried out by using the
information presented in the various tables in the previous sections and/or the SINTEF
Offshore Blowout Database. The listed frequencies in this section are based on the experience
from US GoM OCS, UK and Norway in the period 1980-01-01 - 2009-12-31 only.
The blowout frequencies during the different operational phases are presented in Table 7.1 to
Table 7.6. The four blowouts listed with the phases “Unknown” and Unknown drilling” are
not included. Please also note that blowouts caused by external loads are disregarded when
calculating the blowout/well release frequencies.
Table 7.1 Blowout/well release frequencies during completion (based on Table 4.4, Table 5.1,
Table 5.2, and Table 5.4)
Category No. of completions* No. of incidents No. of completions
per incident No. of incidents per completion
Blowout (surface flow) 23 635 10 2364 0,00042
Blowout (underground flow) 23 635 0 - 0
Diverted well release 23 635 1 23 635 0,00004
Well release 23 635 9 2626 0,00038
Total 23 635 20 1182 0,00085
* Based on total number of wells completed in Table 5.1, number of developments wells drilled in Table 5.2, and
Table 5.4.
Table 7.2 Blowout/well release frequencies during development drilling (based on Table 4.4
and Table 5.12)
Category Type of incident
No. of dev. wells drilled
No. of incidents
No. of drilled wells per incident
No. of incidents per drilled well
Blowout (surface flow)
Deep 27490 8 3436 0,00029
Shallow 27490 23 1195 0,00084
Blowout (underground flow)
Deep 27490 4 6873 0,00015
Shallow 27490 1 27490 0,00004
Diverted well release
Deep 27490 0 - 0,00000
Shallow 27490 19 1447 0,00069
Well release Deep 27490 6 4582 0,00022
Shallow 27490 2 13745 0,00007
Total 27490 63 436 0,00229
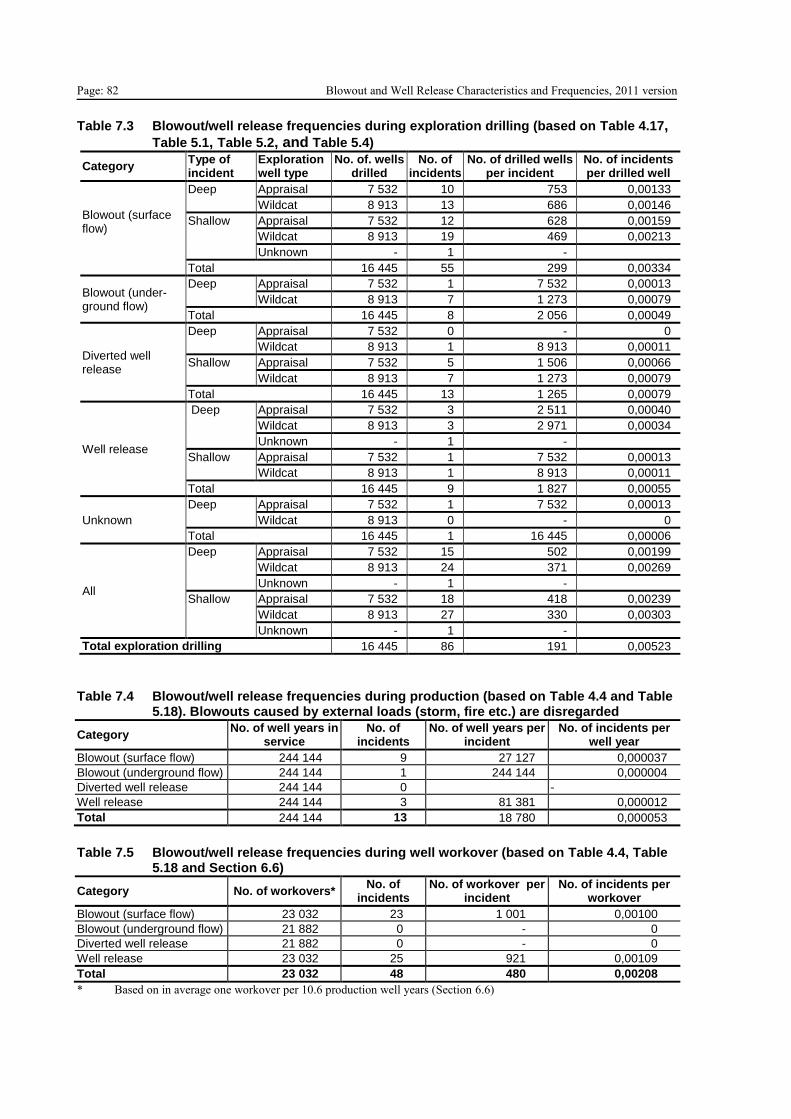
Page: 82 Blowout and Well Release Characteristics and Frequencies, 2011 version Table 7.3 Blowout/well release frequencies during exploration drilling (based on Table 4.17,
Table 5.1, Table 5.2, and Table 5.4)
Category Type of incident
Exploration well type
No. of. wells drilled
No. of incidents
No. of drilled wells per incident
No. of incidents per drilled well
Blowout (surface flow)
Deep Appraisal 7 532 10 753 0,00133
Wildcat 8 913 13 686 0,00146
Shallow Appraisal 7 532 12 628 0,00159
Wildcat 8 913 19 469 0,00213
Unknown - 1 -
Total 16 445 55 299 0,00334
Blowout (under-ground flow)
Deep Appraisal 7 532 1 7 532 0,00013
Wildcat 8 913 7 1 273 0,00079
Total 16 445 8 2 056 0,00049
Diverted well release
Deep Appraisal 7 532 0 - 0
Wildcat 8 913 1 8 913 0,00011
Shallow Appraisal 7 532 5 1 506 0,00066
Wildcat 8 913 7 1 273 0,00079
Total 16 445 13 1 265 0,00079
Well release
Deep Appraisal 7 532 3 2 511 0,00040
Wildcat 8 913 3 2 971 0,00034
Unknown - 1 -
Shallow Appraisal 7 532 1 7 532 0,00013
Wildcat 8 913 1 8 913 0,00011
Total 16 445 9 1 827 0,00055
Unknown
Deep Appraisal 7 532 1 7 532 0,00013
Wildcat 8 913 0 - 0
Total 16 445 1 16 445 0,00006
All
Deep Appraisal 7 532 15 502 0,00199
Wildcat 8 913 24 371 0,00269
Unknown - 1 -
Shallow Appraisal 7 532 18 418 0,00239
Wildcat 8 913 27 330 0,00303
Unknown - 1 -
Total exploration drilling 16 445 86 191 0,00523
Table 7.4 Blowout/well release frequencies during production (based on Table 4.4 and Table
5.18). Blowouts caused by external loads (storm, fire etc.) are disregarded
Category No. of well years in
service No. of
incidents No. of well years per
incident No. of incidents per
well year
Blowout (surface flow) 244 144 9 27 127 0,000037
Blowout (underground flow) 244 144 1 244 144 0,000004
Diverted well release 244 144 0 -
Well release 244 144 3 81 381 0,000012
Total 244 144 13 18 780 0,000053
Table 7.5 Blowout/well release frequencies during well workover (based on Table 4.4, Table
5.18 and Section 6.6)
Category No. of workovers* No. of
incidents No. of workover per
incident No. of incidents per
workover
Blowout (surface flow) 23 032 23 1 001 0,00100
Blowout (underground flow) 21 882 0 - 0
Diverted well release 21 882 0 - 0
Well release 23 032 25 921 0,00109
Total 23 032 48 480 0,00208
* Based on in average one workover per 10.6 production well years (Section 6.6)

Blowout and Well Release Characteristics and Frequencies, 2011 version Page: 83 Table 7.6 Blowout/well release frequencies during wireline (based on Table 4.4, Table 5.18
and Section 6.7)
Category No. of wireline
jobs* No. of
incidents No. of wireline jobs
per incident No. of incidents per
wireline job
Blowout (surface flow) 415 045 4 103 761 0,000010
Blowout (underground flow) 403 818 0 - 0
Diverted well release 403 818 0 - 0
Well release 415 045 5 83 009 0,000012
Total 415 045 9 46 116 0,000022
* Based on in average 1.7 wireline jobs per production well years (Section 6.7)

Page: 84 Blowout and Well Release Characteristics and Frequencies, 2011 version

Blowout and Well Release Characteristics and Frequencies, 2011 version Page: 85
REFERENCES
1 Files retrieved from/bought from BOEM in the US (former MMS (Mineral Management
Service) and Boemre):
http://www.gomr.mms.gov/homepg/pubinfo/freeasci/freedesc.html (used for
downloading files related to well drilling and well production data)
File: 5137 Historical Well Test by Area and Block ASCII (bought from MMS)
Ogor A, Well production files bought from MMS (1980 –1996)
Ogor A, Well production files downloaded from MMS (1996 –2009) US GoM region
Ogor A, Well production files downloaded from MMS (1986 –2009) US Pacific region

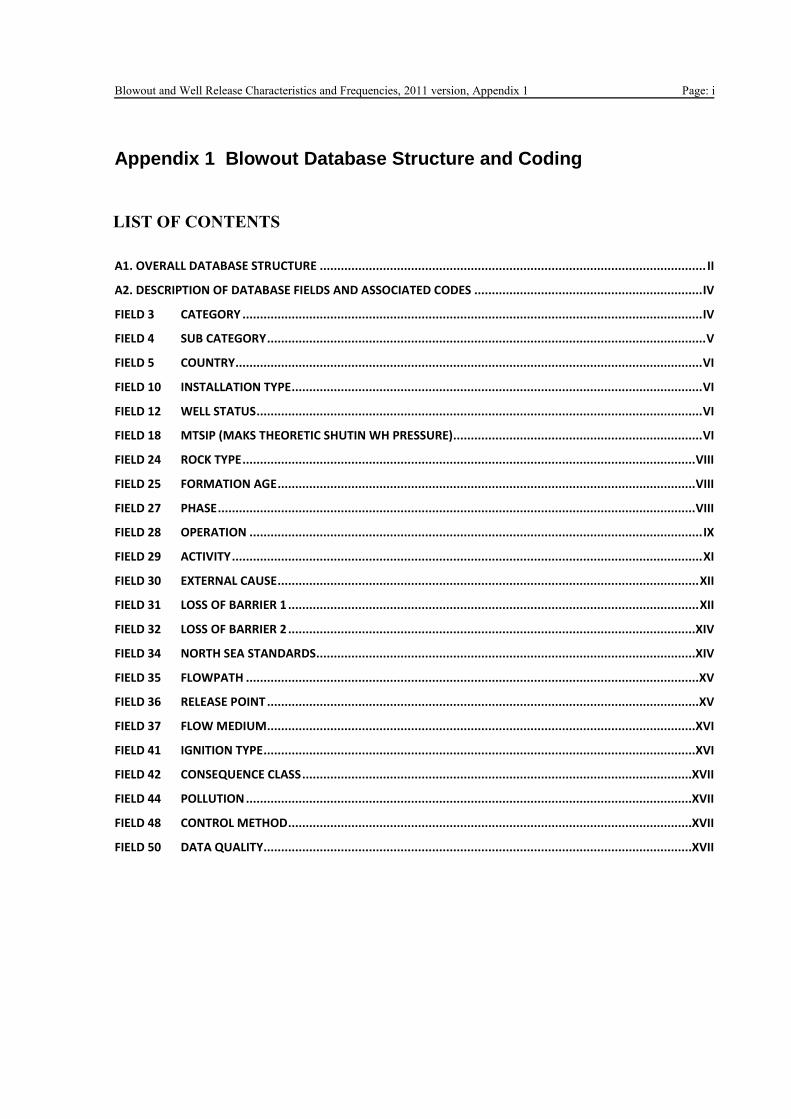
Blowout and Well Release Characteristics and Frequencies, 2011 version, Appendix 1 Page: i
Appendix 1 Blowout Database Structure and Coding
LIST OF CONTENTS
A1. OVERALL DATABASE STRUCTURE .............................................................................................................. II
A2. DESCRIPTION OF DATABASE FIELDS AND ASSOCIATED CODES ................................................................. IV
FIELD 3 CATEGORY ................................................................................................................................... IV
FIELD 4 SUB CATEGORY ............................................................................................................................. V
FIELD 5 COUNTRY ..................................................................................................................................... VI
FIELD 10 INSTALLATION TYPE ..................................................................................................................... VI
FIELD 12 WELL STATUS ............................................................................................................................... VI
FIELD 18 MTSIP (MAKS THEORETIC SHUTIN WH PRESSURE)....................................................................... VI
FIELD 24 ROCK TYPE ................................................................................................................................. VIII
FIELD 25 FORMATION AGE ....................................................................................................................... VIII
FIELD 27 PHASE ........................................................................................................................................ VIII
FIELD 28 OPERATION ................................................................................................................................. IX
FIELD 29 ACTIVITY ...................................................................................................................................... XI
FIELD 30 EXTERNAL CAUSE ........................................................................................................................ XII
FIELD 31 LOSS OF BARRIER 1 ..................................................................................................................... XII
FIELD 32 LOSS OF BARRIER 2 .................................................................................................................... XIV
FIELD 34 NORTH SEA STANDARDS............................................................................................................ XIV
FIELD 35 FLOWPATH ................................................................................................................................. XV
FIELD 36 RELEASE POINT ........................................................................................................................... XV
FIELD 37 FLOW MEDIUM.......................................................................................................................... XVI
FIELD 41 IGNITION TYPE ........................................................................................................................... XVI
FIELD 42 CONSEQUENCE CLASS ...............................................................................................................XVII
FIELD 44 POLLUTION ...............................................................................................................................XVII
FIELD 48 CONTROL METHOD ...................................................................................................................XVII
FIELD 50 DATA QUALITY..........................................................................................................................XVII
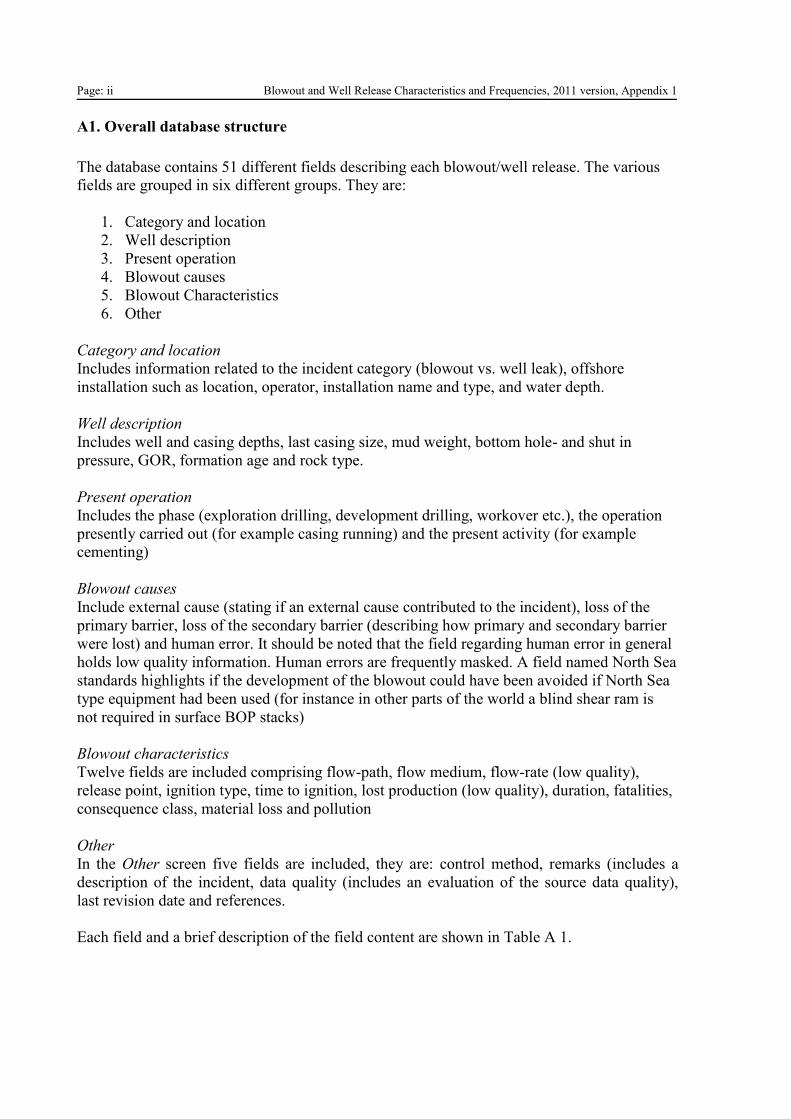
Page: ii Blowout and Well Release Characteristics and Frequencies, 2011 version, Appendix 1
A1. Overall database structure
The database contains 51 different fields describing each blowout/well release. The various
fields are grouped in six different groups. They are:
1. Category and location
2. Well description
3. Present operation
4. Blowout causes
5. Blowout Characteristics
6. Other
Category and location
Includes information related to the incident category (blowout vs. well leak), offshore
installation such as location, operator, installation name and type, and water depth.
Well description
Includes well and casing depths, last casing size, mud weight, bottom hole- and shut in
pressure, GOR, formation age and rock type.
Present operation
Includes the phase (exploration drilling, development drilling, workover etc.), the operation
presently carried out (for example casing running) and the present activity (for example
cementing)
Blowout causes
Include external cause (stating if an external cause contributed to the incident), loss of the
primary barrier, loss of the secondary barrier (describing how primary and secondary barrier
were lost) and human error. It should be noted that the field regarding human error in general
holds low quality information. Human errors are frequently masked. A field named North Sea
standards highlights if the development of the blowout could have been avoided if North Sea
type equipment had been used (for instance in other parts of the world a blind shear ram is
not required in surface BOP stacks)
Blowout characteristics
Twelve fields are included comprising flow-path, flow medium, flow-rate (low quality),
release point, ignition type, time to ignition, lost production (low quality), duration, fatalities,
consequence class, material loss and pollution
Other
In the Other screen five fields are included, they are: control method, remarks (includes a
description of the incident, data quality (includes an evaluation of the source data quality),
last revision date and references.
Each field and a brief description of the field content are shown in Table A 1.
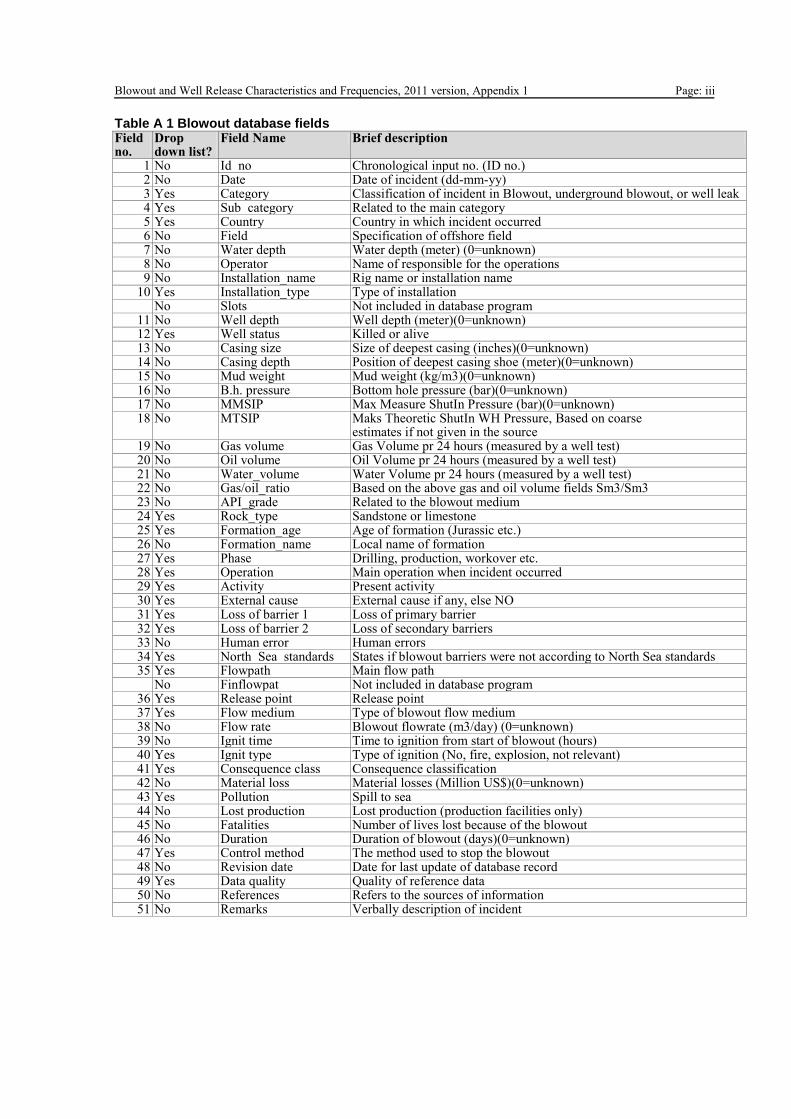
Blowout and Well Release Characteristics and Frequencies, 2011 version, Appendix 1 Page: iii
Table A 1 Blowout database fields Field no.
Drop down list?
Field Name Brief description
1 No Id_no Chronological input no. (ID no.) 2 No Date Date of incident (dd-mm-yy) 3 Yes Category Classification of incident in Blowout, underground blowout, or well leak 4 Yes Sub_category Related to the main category 5 Yes Country Country in which incident occurred 6 No Field Specification of offshore field 7 No Water depth Water depth (meter) (0=unknown) 8 No Operator Name of responsible for the operations 9 No Installation_name Rig name or installation name
10 Yes Installation_type Type of installation No Slots Not included in database program
11 No Well depth Well depth (meter)(0=unknown) 12 Yes Well status Killed or alive 13 No Casing size Size of deepest casing (inches)(0=unknown) 14 No Casing depth Position of deepest casing shoe (meter)(0=unknown) 15 No Mud weight Mud weight (kg/m3)(0=unknown) 16 No B.h. pressure Bottom hole pressure (bar)(0=unknown) 17 No MMSIP Max Measure ShutIn Pressure (bar)(0=unknown) 18 No MTSIP Maks Theoretic ShutIn WH Pressure, Based on coarse
estimates if not given in the source 19 No Gas volume Gas Volume pr 24 hours (measured by a well test) 20 No Oil volume Oil Volume pr 24 hours (measured by a well test) 21 No Water_volume Water Volume pr 24 hours (measured by a well test) 22 No Gas/oil_ratio Based on the above gas and oil volume fields Sm3/Sm3 23 No API_grade Related to the blowout medium 24 Yes Rock_type Sandstone or limestone 25 Yes Formation_age Age of formation (Jurassic etc.) 26 No Formation_name Local name of formation 27 Yes Phase Drilling, production, workover etc. 28 Yes Operation Main operation when incident occurred 29 Yes Activity Present activity 30 Yes External cause External cause if any, else NO 31 Yes Loss of barrier 1 Loss of primary barrier 32 Yes Loss of barrier 2 Loss of secondary barriers 33 No Human error Human errors 34 Yes North_Sea_standards States if blowout barriers were not according to North Sea standards 35 Yes Flowpath Main flow path
No Finflowpat Not included in database program 36 Yes Release point Release point 37 Yes Flow medium Type of blowout flow medium 38 No Flow rate Blowout flowrate (m3/day) (0=unknown) 39 No Ignit time Time to ignition from start of blowout (hours) 40 Yes Ignit type Type of ignition (No, fire, explosion, not relevant) 41 Yes Consequence class Consequence classification 42 No Material loss Material losses (Million US$)(0=unknown) 43 Yes Pollution Spill to sea 44 No Lost production Lost production (production facilities only) 45 No Fatalities Number of lives lost because of the blowout 46 No Duration Duration of blowout (days)(0=unknown) 47 Yes Control method The method used to stop the blowout 48 No Revision date Date for last update of database record 49 Yes Data quality Quality of reference data 50 No References Refers to the sources of information 51 No Remarks Verbally description of incident
Page: iv Blowout and Well Release Characteristics and Frequencies, 2011 version, Appendix 1
A2. Description of database fields and associated codes
Field 3 Category
For the field Category the Table A 2 shows the pre-defined fields.
Table A 2 Category fields
ID Description
1 Blowout (surface flow) 2 Blowout (underground flow) 3 Well release 4 Diverted well release 5 Unknown
20 Not evaluated
The following main definitions have been utilised when categorising the blowouts/well
releases in main categories and sub-categories.
Blowout definition
NPD came up with a blowout definition in their proposal for the new regulations.
(“Aktivitetsforskriften, eksternt høringsutkast av 3.7.2000, høringsfrist 3.11.2000”).
Med utblåsing som nevnt i denne paragrafen første ledd, menes formasjonsfluid som
strømmer ut av brønnen eller mellom formasjonslagene etter at alle definerte tekniske
brønnbarrierer eller operasjon av disse har sviktet.
Translated to English the definition will be:
A blowout is an incident where formation fluid flows out of the well or between
formation layers after all the predefined technical well barriers or the activation of
the same have failed.
The definition does however not seem to have become a part of the final new NPD
regulation, but remains the database blowout definition.
Well release definition: The reported incident is a well release if oil or gas flowed from the
well from some point were flow was not intended and the flow was stopped by use of the
barrier system that was available on the well at the time the incident started.
Shallow gas definition: Any gas zone penetrated before the BOP has been installed. Any
zone penetrated after the BOP is installed is not shallow gas (typical Norwegian definition of
shallow gas).
All shallow gas incidents in the database have at the extent possible been categorised
according to the typical Norwegian definition of shallow gas. This definition is not relevant
for all US GoM incidents because:
US GoM OCS reservoirs vary highly in depth. Some reservoirs were as shallow as
200 meters.
Blowout and Well Release Characteristics and Frequencies, 2011 version, Appendix 1 Page: v
For some incidents they had sat a full BOP stack, but had now intention to use it
because it would likely cause a blowout outside the casing and a possible crater.
For some incidents they had drilled very deep without running an extra casing string
and the BOP.
And for some incident they had used a combination of a BOP and a diverter.
Further, for many of the incidents the description of the incident in the sources is insufficient,
and some assumptions have to be made. A general comment is that it is not easy to categorise
all the incidents in shallow and deep incidents because of the above.
Field 4 Sub Category
For the field Sub category the Table A 3 shows the pre-defined fields.
Table A 3 Sub category
ID Description
1 Totally uncontrolled flow, from a deep zone
2 Totally uncontrolled flow, from a shallow zone
3 Shallow gas “controlled” subsea release only
4 Underground flow only
5 Underground flow mainly, limited surface flow
6 Limited surface flow before the secondary barrier was activated
7 String blown out of well, then the secondary barrier is activated
8 Shallow gas controlled flow (diverted)
9 Unknown
10 Other
20 Not evaluated
Table A 4 shows the link between the category and sub category.
Table A 4 Categories and subcategories for the incidents in the SINTEF Offshore Blowout
database Main Category Sub category Comments/Example
Blowout and well release
Blowout (surface flow)
1. Totally uncontrolled flow, from a deep zone
Totally uncontrolled incidents with surface/subsea flow.
2. Totally uncontrolled flow, from a shallow zone
Typical the diverter system fails
3. Shallow gas “controlled” subsea release only
Typical incident is that riserless drilling is performed when the well starts to flow. The rig is pulled away
Blowout (underground flow)
4. Underground flow only 5. Underground flow mainly, limited
surface flow The limited surface flow will be incidents were a minor flow has appeared, but typical the BOP has been activated to shut the surface flow
Well release 6. Limited surface flow before the secondary barrier was activated
Typical incident will be that flow is through the drillpipe and the shear ram is activated
7. Tubing blown out of well, then the secondary barrier is activated
Typical incident occurring during completion or workover. Shear ram is used to close the well after the tubing has been blown out of the well.
Diverted well release
8. Shallow gas controlled flow (diverted)
All incidents were the diverter system functioned as intended.
Unknown Unknown Unknown may be selected for both the category and the subcategory
The list of sub-categories shown in Table A 3 may be extended if found appropriate. One
option will be to split the sub category for Well leakage further down to highlight incidents
with an ignition potential.
Page: vi Blowout and Well Release Characteristics and Frequencies, 2011 version, Appendix 1
Field 5 Country
All countries that have experienced an offshore blowout are included in the dropdown list. It
should be noted that for US several options for Country exist, depending on the area.
Field 10 Installation Type
This is a pre-coded field. Table A 5 shows the existing installation types.
Table A 5 Installation types
Description Comments
BARGE
DRILLSHIP
JACKET Includes Condeep
JACKUP
SATELLITE One well structure
SEMISUBMERSIBLE
SUBMERSIBLE
SUBSEA PROD
TENSION LEG
Other
UNKNOWN
Field 12 Well Status
Table A 6 shows the Well status classification used.
Table A 6 Well status
ID Description Remarks
0 ALIVE Mainly production and wireline, may also in some cases apply for
workover
1 KILLED Drilling, workover, completion) applies when the wellhead normally
should only be exposed to hydrostatic pressure.
2 UNKNOWN
Field 18 MTSIP (Maks Theoretic Shutin WH Pressure)
This field was developed when working with a project focusing HP HT blowout risk. The
information included stems from various sources and estimates.
NOTE:
High shut-in wellhead pressure wells have been focused:
Blowouts/well leaks listed with 345 bar shut-in pressures are wells were the shut-in
pressure is unknown, but less than 345 bars
Blowouts/well leaks listed with 1 bar shut-in pressures are wells were the shut-in pressure
is Not relevant
Blowouts/well leaks listed with 0 bar shut-in pressures are wells were the shut-in pressure
is Unknown
The most used pressure definition for a HPHT well in Norway is that wells with a shut-in
well head pressure above 690 bar (10000 psi) are to be regarded as a HPHT wells. The
maximum Shut-in wellhead pressures are normally not listed in the sources of information
used for the blowout input data, so these pressures had to be deducted from other sources or
Blowout and Well Release Characteristics and Frequencies, 2011 version, Appendix 1 Page: vii
parameters for the given blowout/well leak. The following three main approaches were:
1. Review the blowout description in the database records and in the files to see if any
specific wellhead shut-in pressures were given.
2. Find the actual shut-in wellhead pressures in the US GoM OCS well test database (/1/), or
for close by wells at approximately the same depth. This was for US blowouts/well leaks
only.
3. Estimate the shut-in wellhead pressure based on information about the mud weight and
the true vertical depth, or the down hole well pressure, and assuming the well was filled
with methane gas
The shut-in well head pressures have been divided in the following four main groups
For the blowouts/well leaks that obviously did have a shut-in wellhead pressure below 345
bar (5000 psi) it has not been made any attempts to find the approximate maximum shut-in
wellhead pressure. The blowout was just categorised in that group.
For the other blowouts/well leaks more efforts were used. When reviewing the well tests data
file including shut-in wellhead pressures for approximately 48 000 well tests, some pressures
could directly be found, while for other an approximate pressure was found.
For the blowouts/well leaks were the down hole pressure were given in the source this was
used for estimating the shut-in wellhead pressure. For the blowouts/well leaks where a mud
weight was given the shut-in pressures were estimated based on the mud weight and the true
vertical well depth. Either the mud weight when the blowout occurred or the mud weight
after the well control was re-established were used. It was then estimated that the complete
well bore was filled with methane with a density of 0,71 kg/m3 at atmospheric pressure
The formula used was as follows (only metric units were used):
PSI = Pbottom - methane * g * DTVD * (Pbottom + PSI)/ (2 * PATM)
the solution for PSI will then be:
PSI = Pbottom (1- methane * g * DTVD/ 2 * PATM)/(1 + methane * g * DTVD/ 2 * PATM)
Where;
DTVD = True vertical depth
Pbottom = Bottom hole pressure = listed or = mud * g * DTVD
methane = density of methane at atmospheric pressure = 0,71 kg/m3
mud = density of mud
g = gravity force
PSI = Shut-in wellhead pressure
PATM = Atmospheric pressure
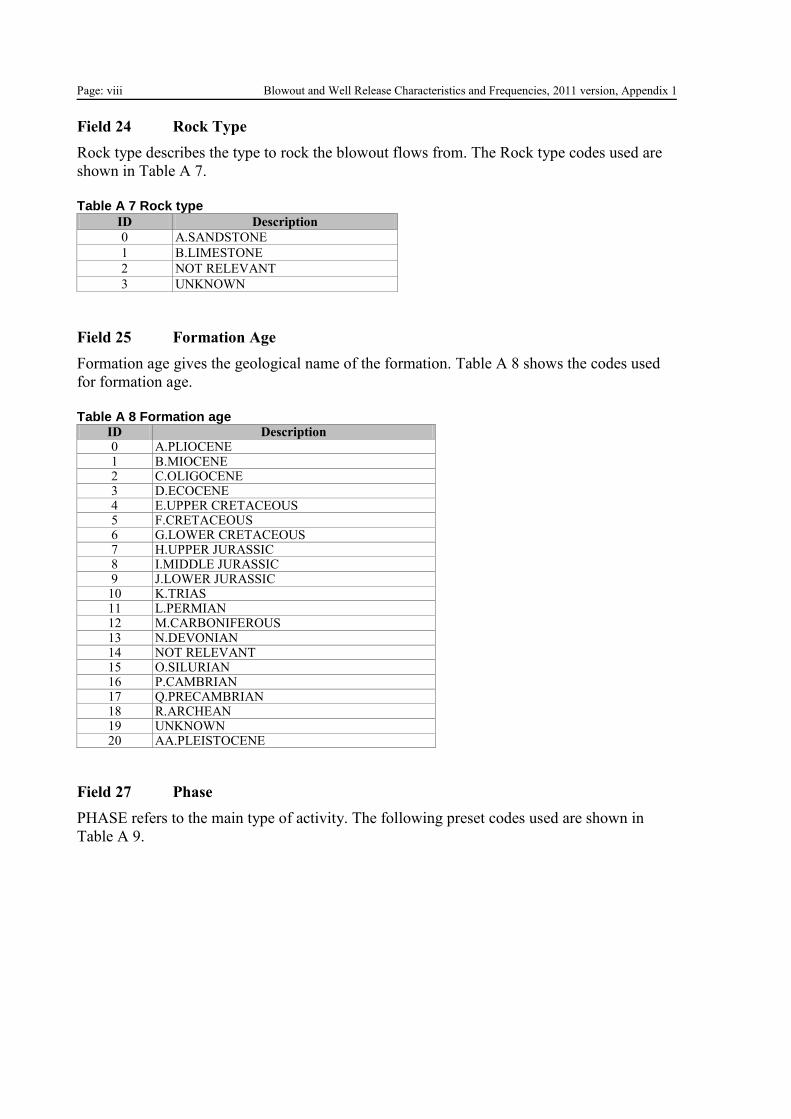
Page: viii Blowout and Well Release Characteristics and Frequencies, 2011 version, Appendix 1
Field 24 Rock Type
Rock type describes the type to rock the blowout flows from. The Rock type codes used are
shown in Table A 7.
Table A 7 Rock type
ID Description
0 A.SANDSTONE
1 B.LIMESTONE
2 NOT RELEVANT
3 UNKNOWN
Field 25 Formation Age
Formation age gives the geological name of the formation. Table A 8 shows the codes used
for formation age.
Table A 8 Formation age
ID Description 0 A.PLIOCENE 1 B.MIOCENE 2 C.OLIGOCENE 3 D.ECOCENE 4 E.UPPER CRETACEOUS 5 F.CRETACEOUS 6 G.LOWER CRETACEOUS 7 H.UPPER JURASSIC 8 I.MIDDLE JURASSIC 9 J.LOWER JURASSIC 10 K.TRIAS 11 L.PERMIAN 12 M.CARBONIFEROUS 13 N.DEVONIAN 14 NOT RELEVANT 15 O.SILURIAN 16 P.CAMBRIAN 17 Q.PRECAMBRIAN 18 R.ARCHEAN 19 UNKNOWN 20 AA.PLEISTOCENE
Field 27 Phase
PHASE refers to the main type of activity. The following preset codes used are shown in
Table A 9.
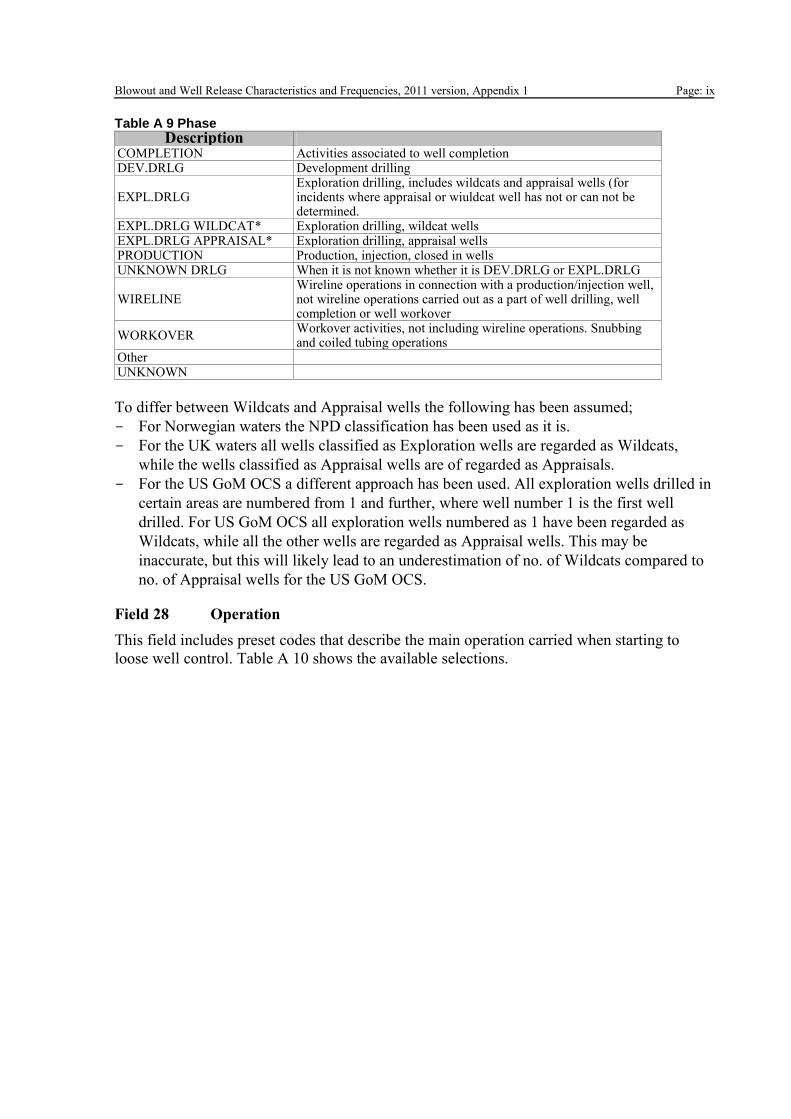
Blowout and Well Release Characteristics and Frequencies, 2011 version, Appendix 1 Page: ix
Table A 9 Phase
Description COMPLETION Activities associated to well completion DEV.DRLG Development drilling
EXPL.DRLG Exploration drilling, includes wildcats and appraisal wells (for incidents where appraisal or wiuldcat well has not or can not be determined.
EXPL.DRLG WILDCAT* Exploration drilling, wildcat wells EXPL.DRLG APPRAISAL* Exploration drilling, appraisal wells PRODUCTION Production, injection, closed in wells UNKNOWN DRLG When it is not known whether it is DEV.DRLG or EXPL.DRLG
WIRELINE Wireline operations in connection with a production/injection well, not wireline operations carried out as a part of well drilling, well completion or well workover
WORKOVER Workover activities, not including wireline operations. Snubbing and coiled tubing operations
Other UNKNOWN
To differ between Wildcats and Appraisal wells the following has been assumed;
- For Norwegian waters the NPD classification has been used as it is.
- For the UK waters all wells classified as Exploration wells are regarded as Wildcats,
while the wells classified as Appraisal wells are of regarded as Appraisals.
- For the US GoM OCS a different approach has been used. All exploration wells drilled in
certain areas are numbered from 1 and further, where well number 1 is the first well
drilled. For US GoM OCS all exploration wells numbered as 1 have been regarded as
Wildcats, while all the other wells are regarded as Appraisal wells. This may be
inaccurate, but this will likely lead to an underestimation of no. of Wildcats compared to
no. of Appraisal wells for the US GoM OCS.
Field 28 Operation
This field includes preset codes that describe the main operation carried when starting to
loose well control. Table A 10 shows the available selections.
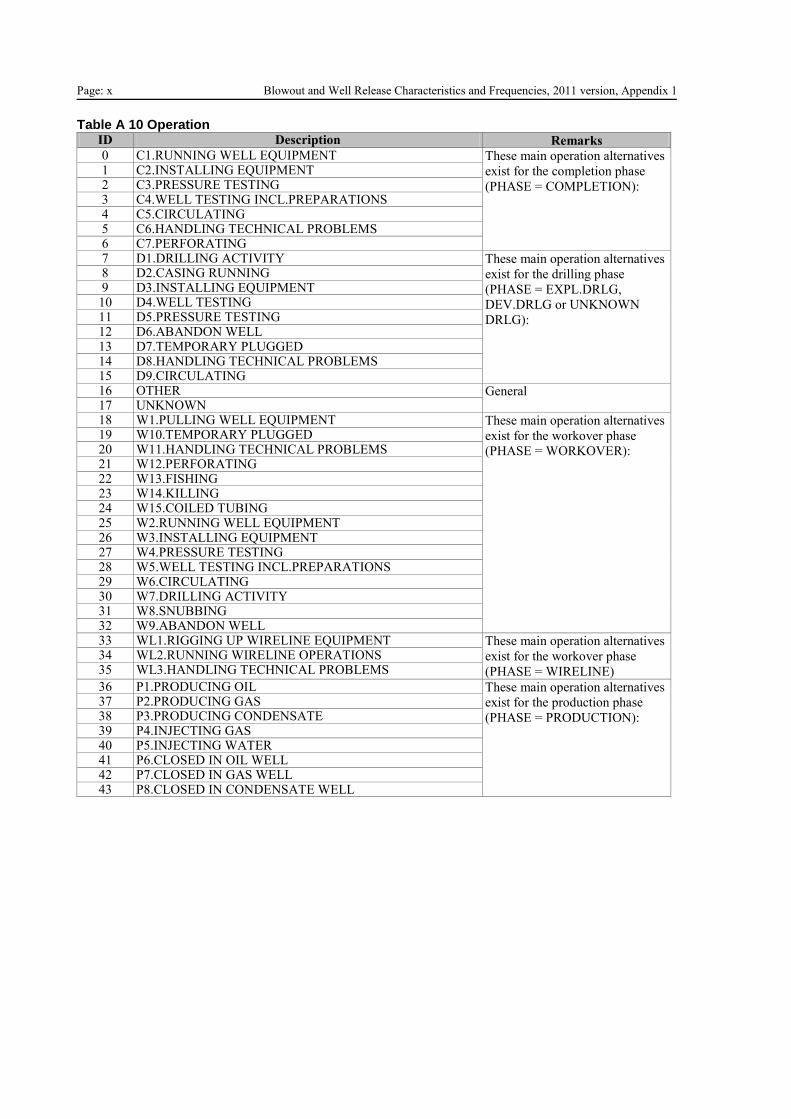
Page: x Blowout and Well Release Characteristics and Frequencies, 2011 version, Appendix 1 Table A 10 Operation
ID Description Remarks 0 C1.RUNNING WELL EQUIPMENT These main operation alternatives
exist for the completion phase
(PHASE = COMPLETION):
1 C2.INSTALLING EQUIPMENT 2 C3.PRESSURE TESTING 3 C4.WELL TESTING INCL.PREPARATIONS 4 C5.CIRCULATING 5 C6.HANDLING TECHNICAL PROBLEMS 6 C7.PERFORATING 7 D1.DRILLING ACTIVITY These main operation alternatives
exist for the drilling phase
(PHASE = EXPL.DRLG,
DEV.DRLG or UNKNOWN
DRLG):
8 D2.CASING RUNNING 9 D3.INSTALLING EQUIPMENT 10 D4.WELL TESTING 11 D5.PRESSURE TESTING 12 D6.ABANDON WELL 13 D7.TEMPORARY PLUGGED 14 D8.HANDLING TECHNICAL PROBLEMS 15 D9.CIRCULATING 16 OTHER General 17 UNKNOWN 18 W1.PULLING WELL EQUIPMENT These main operation alternatives
exist for the workover phase
(PHASE = WORKOVER):
19 W10.TEMPORARY PLUGGED 20 W11.HANDLING TECHNICAL PROBLEMS 21 W12.PERFORATING 22 W13.FISHING 23 W14.KILLING 24 W15.COILED TUBING 25 W2.RUNNING WELL EQUIPMENT 26 W3.INSTALLING EQUIPMENT 27 W4.PRESSURE TESTING 28 W5.WELL TESTING INCL.PREPARATIONS 29 W6.CIRCULATING 30 W7.DRILLING ACTIVITY 31 W8.SNUBBING 32 W9.ABANDON WELL 33 WL1.RIGGING UP WIRELINE EQUIPMENT These main operation alternatives
exist for the workover phase
(PHASE = WIRELINE)
34 WL2.RUNNING WIRELINE OPERATIONS 35 WL3.HANDLING TECHNICAL PROBLEMS
36 P1.PRODUCING OIL These main operation alternatives
exist for the production phase
(PHASE = PRODUCTION):
37 P2.PRODUCING GAS 38 P3.PRODUCING CONDENSATE 39 P4.INJECTING GAS 40 P5.INJECTING WATER 41 P6.CLOSED IN OIL WELL 42 P7.CLOSED IN GAS WELL 43 P8.CLOSED IN CONDENSATE WELL
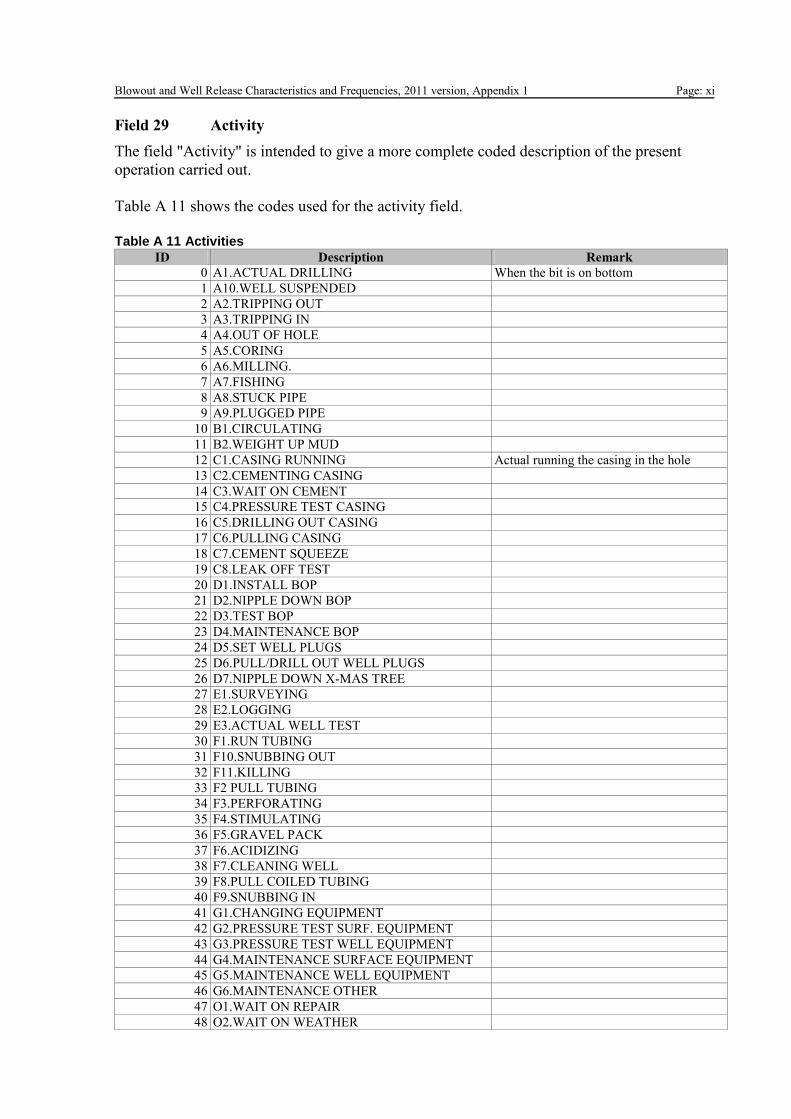
Blowout and Well Release Characteristics and Frequencies, 2011 version, Appendix 1 Page: xi
Field 29 Activity
The field "Activity" is intended to give a more complete coded description of the present
operation carried out.
Table A 11 shows the codes used for the activity field.
Table A 11 Activities
ID Description Remark
0 A1.ACTUAL DRILLING When the bit is on bottom
1 A10.WELL SUSPENDED
2 A2.TRIPPING OUT
3 A3.TRIPPING IN
4 A4.OUT OF HOLE
5 A5.CORING
6 A6.MILLING.
7 A7.FISHING
8 A8.STUCK PIPE
9 A9.PLUGGED PIPE
10 B1.CIRCULATING
11 B2.WEIGHT UP MUD
12 C1.CASING RUNNING Actual running the casing in the hole
13 C2.CEMENTING CASING
14 C3.WAIT ON CEMENT
15 C4.PRESSURE TEST CASING
16 C5.DRILLING OUT CASING
17 C6.PULLING CASING
18 C7.CEMENT SQUEEZE
19 C8.LEAK OFF TEST
20 D1.INSTALL BOP
21 D2.NIPPLE DOWN BOP
22 D3.TEST BOP
23 D4.MAINTENANCE BOP
24 D5.SET WELL PLUGS
25 D6.PULL/DRILL OUT WELL PLUGS
26 D7.NIPPLE DOWN X-MAS TREE
27 E1.SURVEYING
28 E2.LOGGING
29 E3.ACTUAL WELL TEST
30 F1.RUN TUBING
31 F10.SNUBBING OUT
32 F11.KILLING
33 F2 PULL TUBING
34 F3.PERFORATING
35 F4.STIMULATING
36 F5.GRAVEL PACK
37 F6.ACIDIZING
38 F7.CLEANING WELL
39 F8.PULL COILED TUBING
40 F9.SNUBBING IN
41 G1.CHANGING EQUIPMENT
42 G2.PRESSURE TEST SURF. EQUIPMENT
43 G3.PRESSURE TEST WELL EQUIPMENT
44 G4.MAINTENANCE SURFACE EQUIPMENT
45 G5.MAINTENANCE WELL EQUIPMENT
46 G6.MAINTENANCE OTHER
47 O1.WAIT ON REPAIR
48 O2.WAIT ON WEATHER
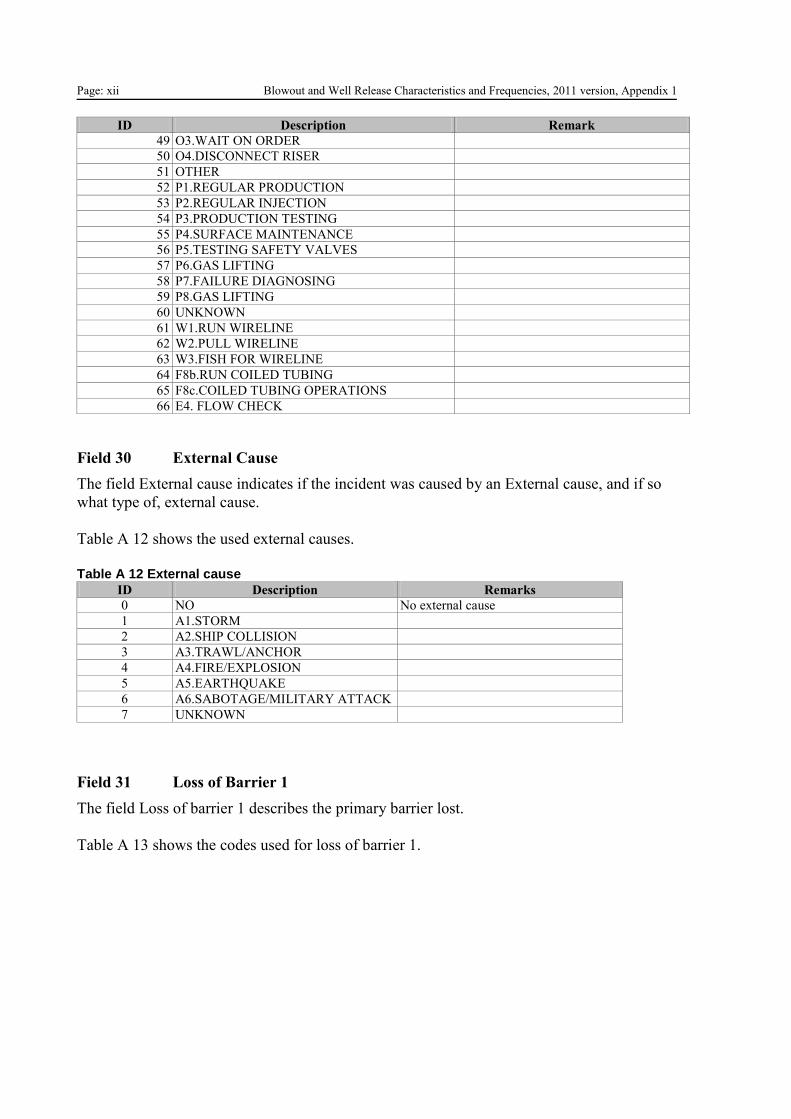
Page: xii Blowout and Well Release Characteristics and Frequencies, 2011 version, Appendix 1
ID Description Remark
49 O3.WAIT ON ORDER
50 O4.DISCONNECT RISER
51 OTHER
52 P1.REGULAR PRODUCTION
53 P2.REGULAR INJECTION
54 P3.PRODUCTION TESTING
55 P4.SURFACE MAINTENANCE
56 P5.TESTING SAFETY VALVES
57 P6.GAS LIFTING
58 P7.FAILURE DIAGNOSING
59 P8.GAS LIFTING
60 UNKNOWN
61 W1.RUN WIRELINE
62 W2.PULL WIRELINE
63 W3.FISH FOR WIRELINE
64 F8b.RUN COILED TUBING
65 F8c.COILED TUBING OPERATIONS
66 E4. FLOW CHECK
Field 30 External Cause
The field External cause indicates if the incident was caused by an External cause, and if so
what type of, external cause.
Table A 12 shows the used external causes.
Table A 12 External cause
ID Description Remarks
0 NO No external cause
1 A1.STORM
2 A2.SHIP COLLISION
3 A3.TRAWL/ANCHOR
4 A4.FIRE/EXPLOSION
5 A5.EARTHQUAKE
6 A6.SABOTAGE/MILITARY ATTACK
7 UNKNOWN
Field 31 Loss of Barrier 1
The field Loss of barrier 1 describes the primary barrier lost.
Table A 13 shows the codes used for loss of barrier 1.
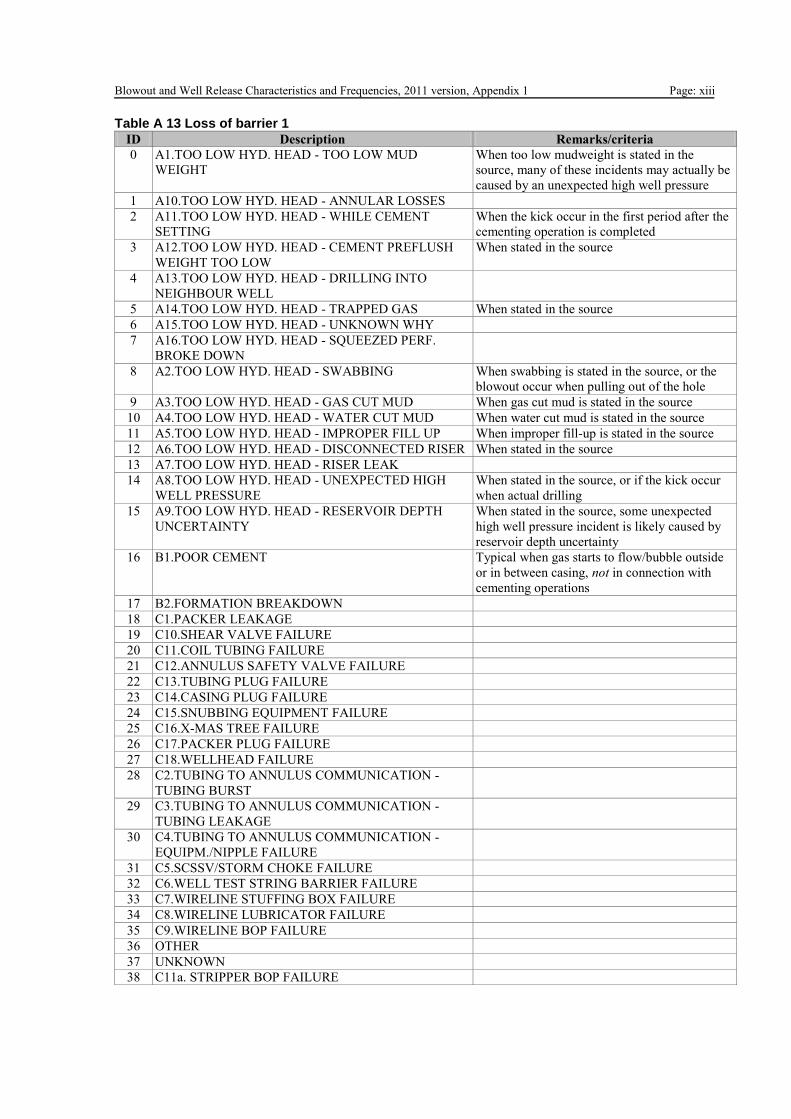
Blowout and Well Release Characteristics and Frequencies, 2011 version, Appendix 1 Page: xiii
Table A 13 Loss of barrier 1
ID Description Remarks/criteria
0 A1.TOO LOW HYD. HEAD - TOO LOW MUD
WEIGHT
When too low mudweight is stated in the
source, many of these incidents may actually be
caused by an unexpected high well pressure
1 A10.TOO LOW HYD. HEAD - ANNULAR LOSSES
2 A11.TOO LOW HYD. HEAD - WHILE CEMENT
SETTING
When the kick occur in the first period after the
cementing operation is completed
3 A12.TOO LOW HYD. HEAD - CEMENT PREFLUSH
WEIGHT TOO LOW
When stated in the source
4 A13.TOO LOW HYD. HEAD - DRILLING INTO
NEIGHBOUR WELL
5 A14.TOO LOW HYD. HEAD - TRAPPED GAS When stated in the source
6 A15.TOO LOW HYD. HEAD - UNKNOWN WHY
7 A16.TOO LOW HYD. HEAD - SQUEEZED PERF.
BROKE DOWN
8 A2.TOO LOW HYD. HEAD - SWABBING When swabbing is stated in the source, or the
blowout occur when pulling out of the hole
9 A3.TOO LOW HYD. HEAD - GAS CUT MUD When gas cut mud is stated in the source
10 A4.TOO LOW HYD. HEAD - WATER CUT MUD When water cut mud is stated in the source
11 A5.TOO LOW HYD. HEAD - IMPROPER FILL UP When improper fill-up is stated in the source
12 A6.TOO LOW HYD. HEAD - DISCONNECTED RISER When stated in the source
13 A7.TOO LOW HYD. HEAD - RISER LEAK
14 A8.TOO LOW HYD. HEAD - UNEXPECTED HIGH
WELL PRESSURE
When stated in the source, or if the kick occur
when actual drilling
15 A9.TOO LOW HYD. HEAD - RESERVOIR DEPTH
UNCERTAINTY
When stated in the source, some unexpected
high well pressure incident is likely caused by
reservoir depth uncertainty
16 B1.POOR CEMENT Typical when gas starts to flow/bubble outside
or in between casing, not in connection with
cementing operations
17 B2.FORMATION BREAKDOWN
18 C1.PACKER LEAKAGE
19 C10.SHEAR VALVE FAILURE
20 C11.COIL TUBING FAILURE
21 C12.ANNULUS SAFETY VALVE FAILURE
22 C13.TUBING PLUG FAILURE
23 C14.CASING PLUG FAILURE
24 C15.SNUBBING EQUIPMENT FAILURE
25 C16.X-MAS TREE FAILURE
26 C17.PACKER PLUG FAILURE
27 C18.WELLHEAD FAILURE
28 C2.TUBING TO ANNULUS COMMUNICATION -
TUBING BURST
29 C3.TUBING TO ANNULUS COMMUNICATION -
TUBING LEAKAGE
30 C4.TUBING TO ANNULUS COMMUNICATION -
EQUIPM./NIPPLE FAILURE
31 C5.SCSSV/STORM CHOKE FAILURE
32 C6.WELL TEST STRING BARRIER FAILURE
33 C7.WIRELINE STUFFING BOX FAILURE
34 C8.WIRELINE LUBRICATOR FAILURE
35 C9.WIRELINE BOP FAILURE
36 OTHER
37 UNKNOWN
38 C11a. STRIPPER BOP FAILURE
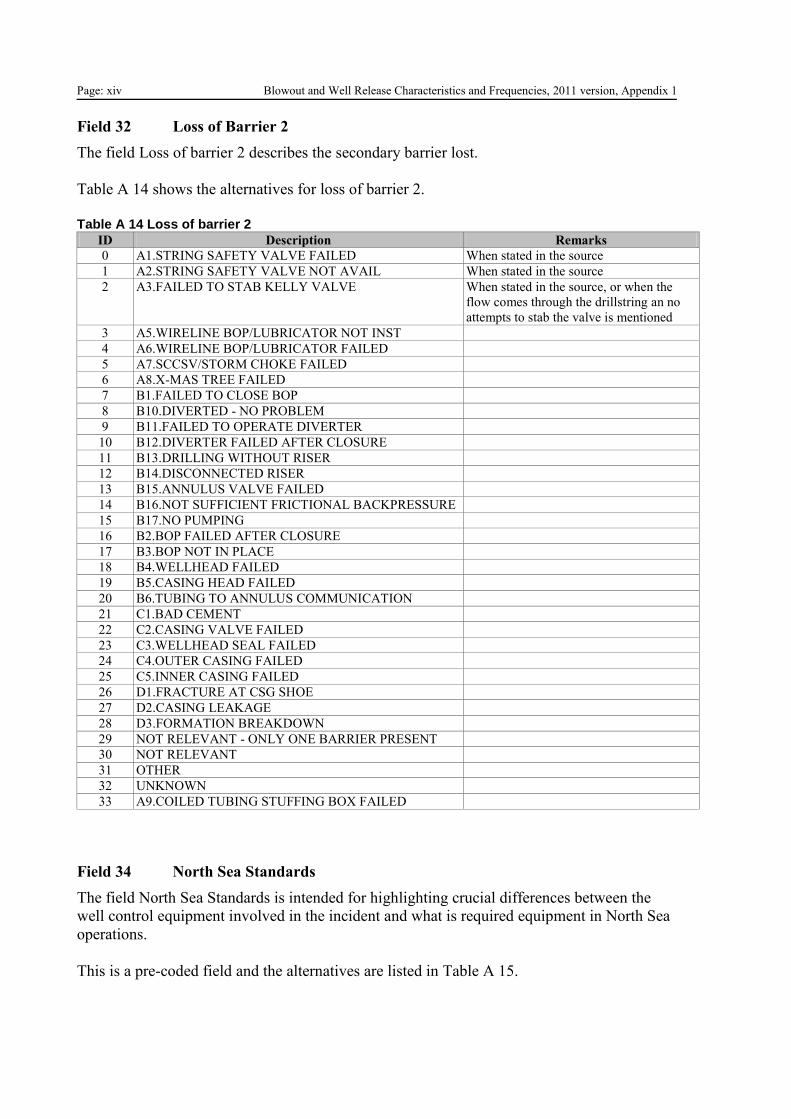
Page: xiv Blowout and Well Release Characteristics and Frequencies, 2011 version, Appendix 1
Field 32 Loss of Barrier 2
The field Loss of barrier 2 describes the secondary barrier lost.
Table A 14 shows the alternatives for loss of barrier 2.
Table A 14 Loss of barrier 2
ID Description Remarks
0 A1.STRING SAFETY VALVE FAILED When stated in the source
1 A2.STRING SAFETY VALVE NOT AVAIL When stated in the source
2 A3.FAILED TO STAB KELLY VALVE When stated in the source, or when the
flow comes through the drillstring an no
attempts to stab the valve is mentioned
3 A5.WIRELINE BOP/LUBRICATOR NOT INST
4 A6.WIRELINE BOP/LUBRICATOR FAILED
5 A7.SCCSV/STORM CHOKE FAILED
6 A8.X-MAS TREE FAILED
7 B1.FAILED TO CLOSE BOP
8 B10.DIVERTED - NO PROBLEM
9 B11.FAILED TO OPERATE DIVERTER
10 B12.DIVERTER FAILED AFTER CLOSURE
11 B13.DRILLING WITHOUT RISER
12 B14.DISCONNECTED RISER
13 B15.ANNULUS VALVE FAILED
14 B16.NOT SUFFICIENT FRICTIONAL BACKPRESSURE
15 B17.NO PUMPING
16 B2.BOP FAILED AFTER CLOSURE
17 B3.BOP NOT IN PLACE
18 B4.WELLHEAD FAILED
19 B5.CASING HEAD FAILED
20 B6.TUBING TO ANNULUS COMMUNICATION
21 C1.BAD CEMENT
22 C2.CASING VALVE FAILED
23 C3.WELLHEAD SEAL FAILED
24 C4.OUTER CASING FAILED
25 C5.INNER CASING FAILED
26 D1.FRACTURE AT CSG SHOE
27 D2.CASING LEAKAGE
28 D3.FORMATION BREAKDOWN
29 NOT RELEVANT - ONLY ONE BARRIER PRESENT
30 NOT RELEVANT
31 OTHER
32 UNKNOWN
33 A9.COILED TUBING STUFFING BOX FAILED
Field 34 North Sea Standards
The field North Sea Standards is intended for highlighting crucial differences between the
well control equipment involved in the incident and what is required equipment in North Sea
operations.
This is a pre-coded field and the alternatives are listed in Table A 15.
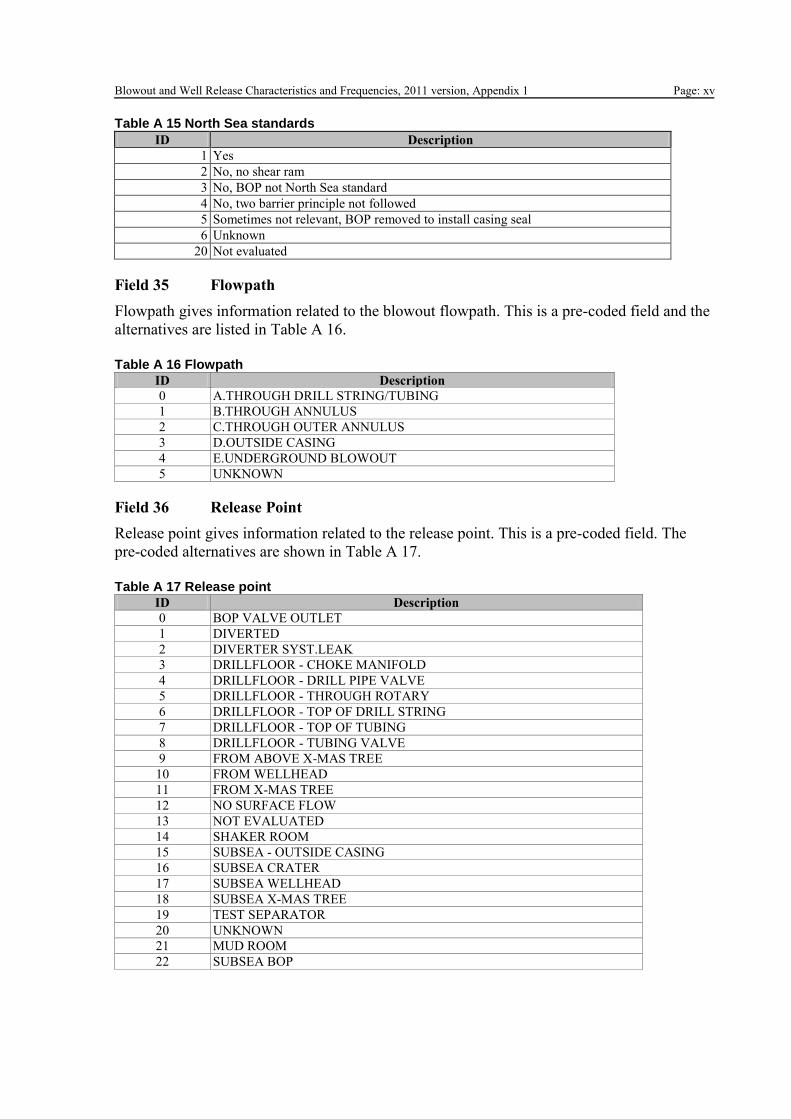
Blowout and Well Release Characteristics and Frequencies, 2011 version, Appendix 1 Page: xv
Table A 15 North Sea standards
ID Description
1 Yes
2 No, no shear ram
3 No, BOP not North Sea standard
4 No, two barrier principle not followed
5 Sometimes not relevant, BOP removed to install casing seal
6 Unknown
20 Not evaluated
Field 35 Flowpath
Flowpath gives information related to the blowout flowpath. This is a pre-coded field and the
alternatives are listed in Table A 16.
Table A 16 Flowpath
ID Description
0 A.THROUGH DRILL STRING/TUBING
1 B.THROUGH ANNULUS
2 C.THROUGH OUTER ANNULUS
3 D.OUTSIDE CASING
4 E.UNDERGROUND BLOWOUT
5 UNKNOWN
Field 36 Release Point
Release point gives information related to the release point. This is a pre-coded field. The
pre-coded alternatives are shown in Table A 17.
Table A 17 Release point
ID Description
0 BOP VALVE OUTLET
1 DIVERTED
2 DIVERTER SYST.LEAK
3 DRILLFLOOR - CHOKE MANIFOLD
4 DRILLFLOOR - DRILL PIPE VALVE
5 DRILLFLOOR - THROUGH ROTARY
6 DRILLFLOOR - TOP OF DRILL STRING
7 DRILLFLOOR - TOP OF TUBING
8 DRILLFLOOR - TUBING VALVE
9 FROM ABOVE X-MAS TREE
10 FROM WELLHEAD
11 FROM X-MAS TREE
12 NO SURFACE FLOW
13 NOT EVALUATED
14 SHAKER ROOM
15 SUBSEA - OUTSIDE CASING
16 SUBSEA CRATER
17 SUBSEA WELLHEAD
18 SUBSEA X-MAS TREE
19 TEST SEPARATOR
20 UNKNOWN
21 MUD ROOM 22 SUBSEA BOP
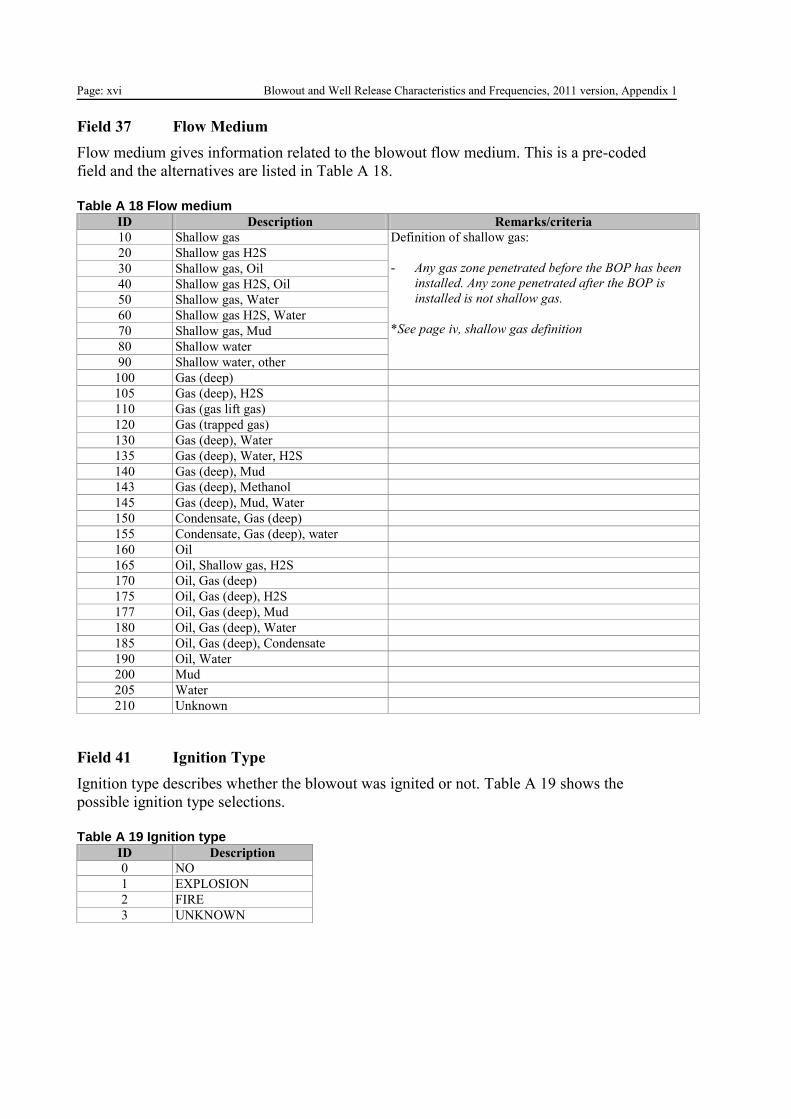
Page: xvi Blowout and Well Release Characteristics and Frequencies, 2011 version, Appendix 1
Field 37 Flow Medium
Flow medium gives information related to the blowout flow medium. This is a pre-coded
field and the alternatives are listed in Table A 18.
Table A 18 Flow medium
ID Description Remarks/criteria
10 Shallow gas Definition of shallow gas:
- Any gas zone penetrated before the BOP has been
installed. Any zone penetrated after the BOP is
installed is not shallow gas.
*See page iv, shallow gas definition
20 Shallow gas H2S
30 Shallow gas, Oil
40 Shallow gas H2S, Oil
50 Shallow gas, Water
60 Shallow gas H2S, Water
70 Shallow gas, Mud
80 Shallow water
90 Shallow water, other
100 Gas (deep)
105 Gas (deep), H2S
110 Gas (gas lift gas)
120 Gas (trapped gas)
130 Gas (deep), Water
135 Gas (deep), Water, H2S
140 Gas (deep), Mud
143 Gas (deep), Methanol
145 Gas (deep), Mud, Water
150 Condensate, Gas (deep)
155 Condensate, Gas (deep), water
160 Oil
165 Oil, Shallow gas, H2S
170 Oil, Gas (deep)
175 Oil, Gas (deep), H2S
177 Oil, Gas (deep), Mud
180 Oil, Gas (deep), Water
185 Oil, Gas (deep), Condensate
190 Oil, Water
200 Mud
205 Water
210 Unknown
Field 41 Ignition Type
Ignition type describes whether the blowout was ignited or not. Table A 19 shows the
possible ignition type selections.
Table A 19 Ignition type
ID Description
0 NO
1 EXPLOSION
2 FIRE
3 UNKNOWN
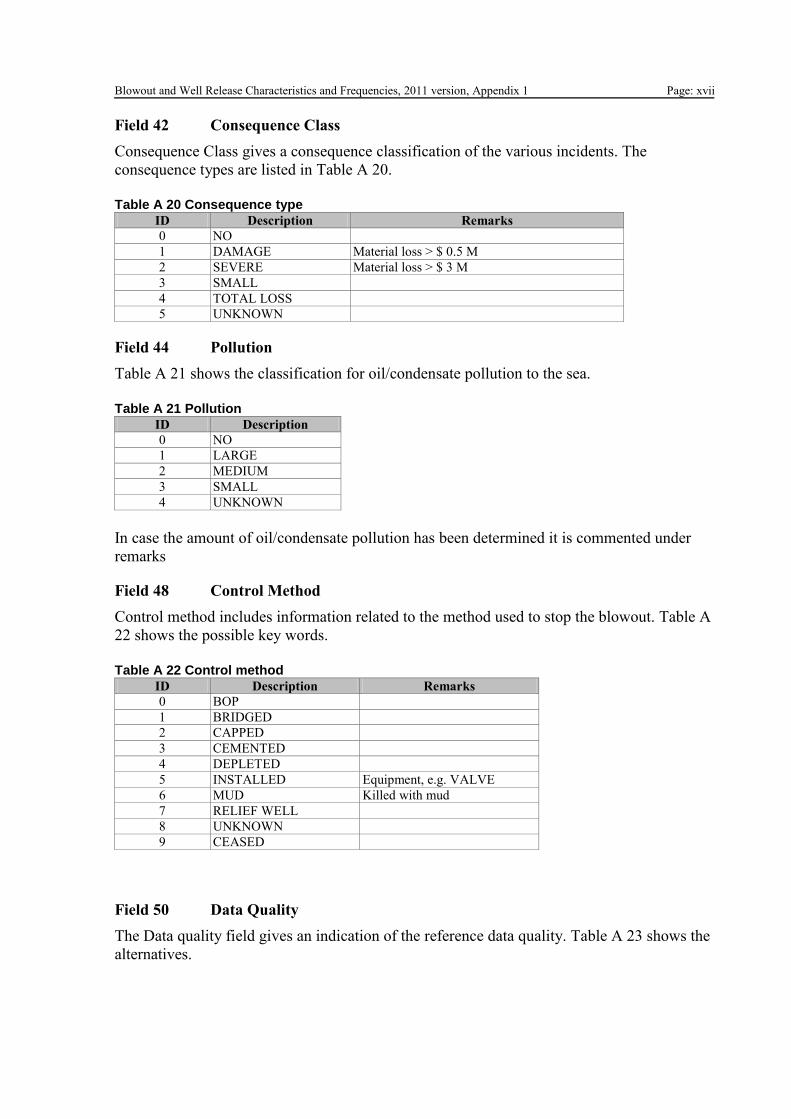
Blowout and Well Release Characteristics and Frequencies, 2011 version, Appendix 1 Page: xvii
Field 42 Consequence Class
Consequence Class gives a consequence classification of the various incidents. The
consequence types are listed in Table A 20.
Table A 20 Consequence type
ID Description Remarks
0 NO
1 DAMAGE Material loss > $ 0.5 M
2 SEVERE Material loss > $ 3 M
3 SMALL
4 TOTAL LOSS
5 UNKNOWN
Field 44 Pollution
Table A 21 shows the classification for oil/condensate pollution to the sea.
Table A 21 Pollution
ID Description
0 NO
1 LARGE
2 MEDIUM
3 SMALL
4 UNKNOWN
In case the amount of oil/condensate pollution has been determined it is commented under
remarks
Field 48 Control Method
Control method includes information related to the method used to stop the blowout. Table A
22 shows the possible key words.
Table A 22 Control method
ID Description Remarks
0 BOP
1 BRIDGED
2 CAPPED
3 CEMENTED
4 DEPLETED
5 INSTALLED Equipment, e.g. VALVE
6 MUD Killed with mud
7 RELIEF WELL
8 UNKNOWN
9 CEASED
Field 50 Data Quality
The Data quality field gives an indication of the reference data quality. Table A 23 shows the
alternatives.

Page: xviii Blowout and Well Release Characteristics and Frequencies, 2011 version, Appendix 1 Table A 23 Data Quality
ID Description Remarks/criteria
3 VERY GOOD is used if the data record is based on the authorities or the companies investigation
report
1 GOOD Is used if the incident is well documented through technical articles or other sources
0 FAIR If the source list an overall description of the incident
2 LOW If the quality of the source information is low, but some crucial facts are described
4 VERY LOW When the source material is very scarce