Embed Size (px)
Citation preview

ANNUAL REPORT 2011For the fiscal year ended March 31, 2011

Home Electronics
/Industry
Audio Visual
Car Electronics
CommunicationInformation
Operating Results
Net sales
Operating income
Net income
Financial Position
Total assets
Total net assets
Per Share Data
Net income
Basic
Diluted
Cash dividends
$ 744,607
33,129
12,482
$ 638,117
359,136
$ 0.17
—
0.11
(3.8)%
11.1
(44.3)
(5.4)%
(4.1)
(43.9)%
—
12.5
¥ 61,914
2,754
1,037
¥ 53,059
29,862
¥ 14.14
—
9.00
¥ 64,371
2,479
1,862
¥ 56,113
31,127
¥ 25.19
—
8.00
Millions of yenPercent change
2010/2011Thousands ofU.S. dollars
Yen U.S. dollars
2010 2011 2011
Note: The U.S. dollar amounts represent translations of Japanese yen, for convenience only, at the rate of ¥83.15 = U.S. $1.00.
Years ended March 31
(2,500)
2,500
5,000
Millions of yen
2007 2008 2009
2007 2008 20090
5
10
15
Yen
3,693
2,094 1,8621,037
(1,620)
2010 2011
2010
14.00 14.00
9.00
2011
8.009.00
Millions of yen
2007 2008 20090
2,000
4,000
6,000
2007 2008 2009
(30)
30
60
Yen
0
30,000
60,000
90,000
Millions of yen
2007 2008 2009
Millions of yen
0
25,000
50,000
75,000
2007 2008 2009 2010
Total assetsTotal net assets
5,1665,654
238
2010
2,479 2,754
2011
2010
47.48
27.32 25.19
14.14
2011(21.68)
2010
79,07487,659
72,742
2011
64,37161,914
65,575
34,564
66,737
32,386
58,168
29,079
2011
56,113
31,127
53,059
29,862
Net sales Operating income Net income (loss)
Total assets/Total net assets Basic net income (loss) per share Cash dividends per share
0
0
“Dreams, Inspiration, and Future” — It’s all in your hands! —
● SMK PhilosophySMK is committed to the advancement of mankind through development of the information society, by integrating its current technological strengths and creating advanced technology.
● Action Guidelines1. Contribute to society with pride and confidence.2. Be customer-oriented, with zeal and sincerity.3. Challenge courageously for higher goals without fear of failure.4. Trust and respect each other for a brighter working atmosphere.5. Keep an open mind, and view SMK from a global perspective.
Financial HighlightsTo Our Shareholders and InvestorsOverview of Consolidated Results by DivisionSMK’s New LineupTopicsGlobal NetworkFinancial Section Five-Year Summary Financial Review Consolidated Balance Sheets Consolidated Statements of Income Consolidated Statement of Comprehensive Income Consolidated Statements of Changes in Net Assets Consolidated Statements of Cash Flows Notes to Consolidated Financial Statements Report of Independent AuditorsShares and ShareholdersBoard of Directors and Corporate AuditorsCorporate Data
23579
1213131415171718192027282930
Financial Highlights
C o n t e n t s
1 2
Introduction
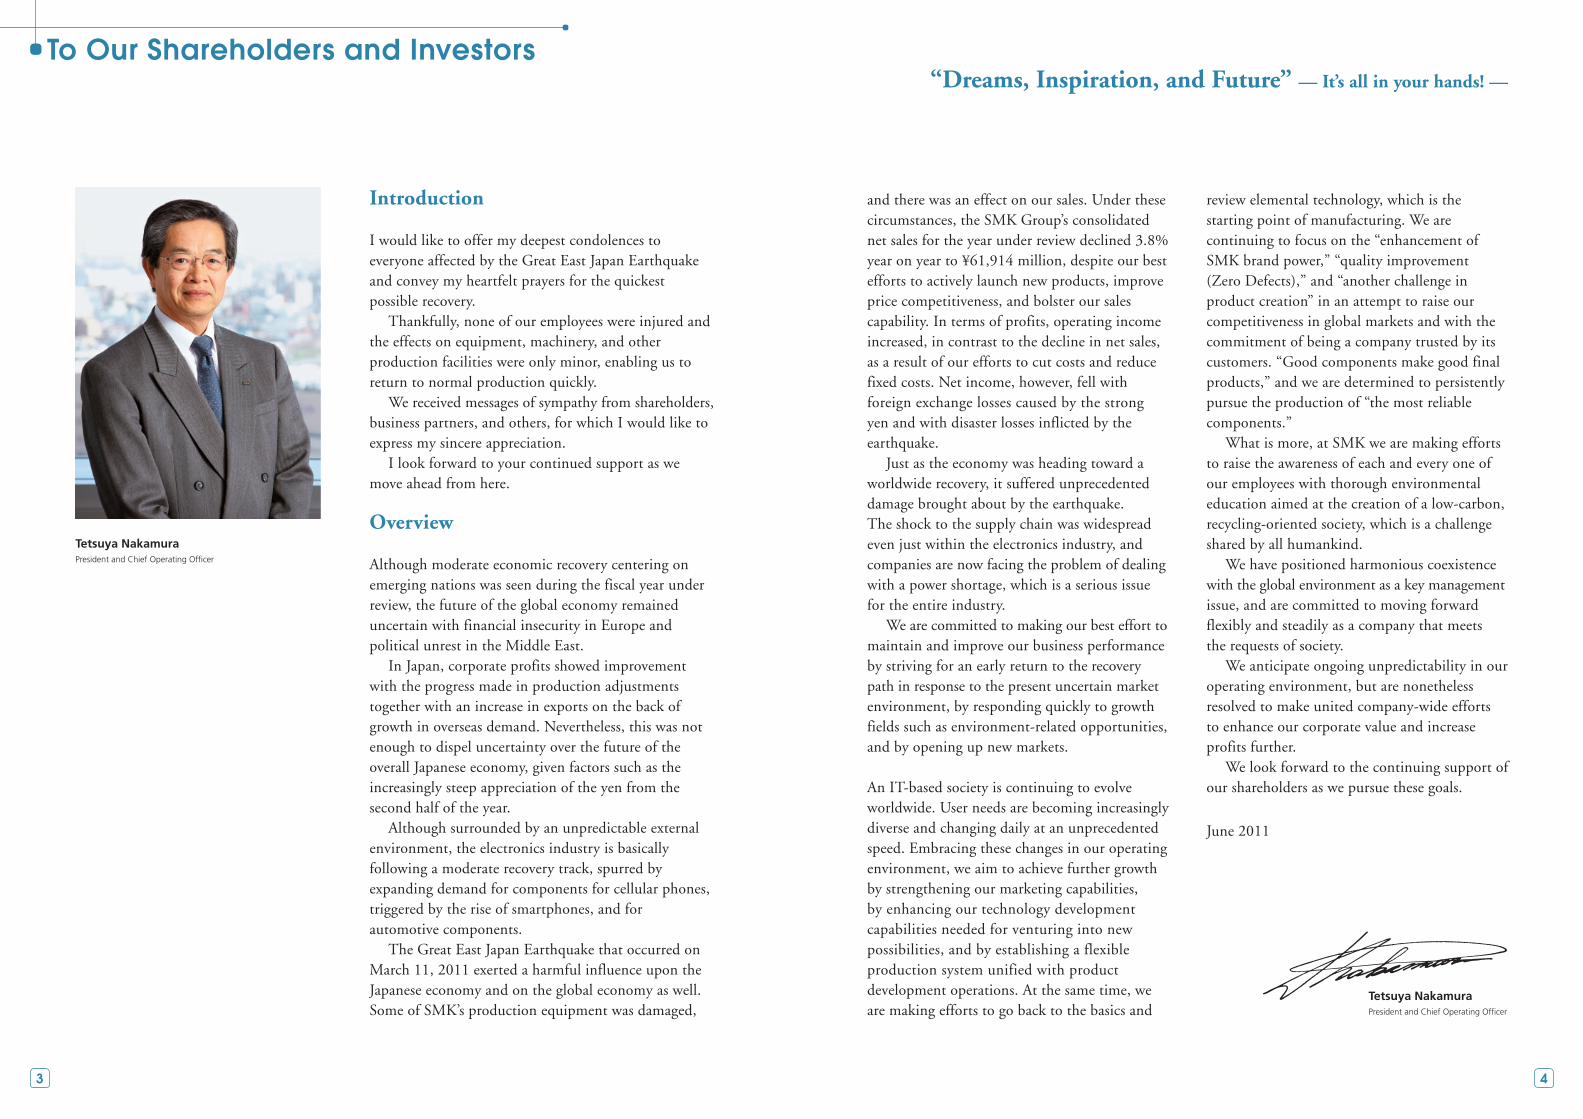
I would like to offer my deepest condolences to everyone affected by the Great East Japan Earthquake and convey my heartfelt prayers for the quickest possible recovery. Thankfully, none of our employees were injured and the effects on equipment, machinery, and other production facilities were only minor, enabling us to return to normal production quickly. We received messages of sympathy from shareholders, business partners, and others, for which I would like to express my sincere appreciation. I look forward to your continued support as we move ahead from here.
Overview
Although moderate economic recovery centering on emerging nations was seen during the fiscal year under review, the future of the global economy remained uncertain with financial insecurity in Europe and political unrest in the Middle East. In Japan, corporate profits showed improvement with the progress made in production adjustments together with an increase in exports on the back of growth in overseas demand. Nevertheless, this was not enough to dispel uncertainty over the future of the overall Japanese economy, given factors such as the increasingly steep appreciation of the yen from the second half of the year. Although surrounded by an unpredictable external environment, the electronics industry is basically following a moderate recovery track, spurred by expanding demand for components for cellular phones, triggered by the rise of smartphones, and for automotive components. The Great East Japan Earthquake that occurred on March 11, 2011 exerted a harmful influence upon the Japanese economy and on the global economy as well. Some of SMK’s production equipment was damaged,
Tetsuya NakamuraPresident and Chief Operating Officer
Tetsuya NakamuraPresident and Chief Operating Officer
and there was an effect on our sales. Under these circumstances, the SMK Group’s consolidated net sales for the year under review declined 3.8% year on year to ¥61,914 million, despite our best efforts to actively launch new products, improve price competitiveness, and bolster our sales capability. In terms of profits, operating income increased, in contrast to the decline in net sales, as a result of our efforts to cut costs and reduce fixed costs. Net income, however, fell with foreign exchange losses caused by the strong yen and with disaster losses inflicted by the earthquake. Just as the economy was heading toward a worldwide recovery, it suffered unprecedented damage brought about by the earthquake. The shock to the supply chain was widespread even just within the electronics industry, and companies are now facing the problem of dealing with a power shortage, which is a serious issue for the entire industry. We are committed to making our best effort to maintain and improve our business performance by striving for an early return to the recovery path in response to the present uncertain market environment, by responding quickly to growth fields such as environment-related opportunities, and by opening up new markets.
An IT-based society is continuing to evolve worldwide. User needs are becoming increasingly diverse and changing daily at an unprecedented speed. Embracing these changes in our operating environment, we aim to achieve further growth by strengthening our marketing capabilities, by enhancing our technology development capabilities needed for venturing into new possibilities, and by establishing a flexible production system unified with product development operations. At the same time, we are making efforts to go back to the basics and
review elemental technology, which is the starting point of manufacturing. We are continuing to focus on the “enhancement of SMK brand power,” “quality improvement (Zero Defects),” and “another challenge in product creation” in an attempt to raise our competitiveness in global markets and with the commitment of being a company trusted by its customers. “Good components make good final products,” and we are determined to persistently pursue the production of “the most reliable components.” What is more, at SMK we are making efforts to raise the awareness of each and every one of our employees with thorough environmental education aimed at the creation of a low-carbon, recycling-oriented society, which is a challenge shared by all humankind. We have positioned harmonious coexistence with the global environment as a key management issue, and are committed to moving forward flexibly and steadily as a company that meets the requests of society. We anticipate ongoing unpredictability in our operating environment, but are nonetheless resolved to make united company-wide efforts to enhance our corporate value and increase profits further. We look forward to the continuing support of our shareholders as we pursue these goals.
June 2011
To Our Shareholders and Investors“Dreams, Inspiration, and Future” — It’s all in your hands! —
3 4

AudioVisual
CarElectronics
Communication
InformationHome
Electronics/Industry
Main products
Main products
®
Main products
ConnectionSystemDivision
FunctionalComponentsDivision
Touch PanelDivision
In addition to net sales for the divisions presented above, net sales of ¥242 million were earned by “other” businesses in the term under review.Net sales for the Research & Development Center were included in net sales for “other” businesses.
48.6%
13.5%
37.5%
Overview of results by division
Connection SystemDivision
Other¥242 million
0.4%
¥23,242 million
Touch PanelDivision¥8,350
million
FunctionalComponents
Division¥30,080
million
Net sales
(April 1, 2010 to March 31, 2011)
Overview of Consolidated Results by Division
In the first half of the year, components for digital appliances and car electronics supported by the eco-point and subsidies systems as well as components for smartphones and PCs brought in above-target results. However, the market environment deteriorated in the second half of the year with factors such as rapid appreciation of the yen and credit uneasiness in Europe, resulting in poor performance with sluggish sales mainly in components for cellular phones and video game consoles.
At present, demand is surging for components for solar power systems, which are attracting attention as a new energy, and components for LED lighting are also expected to do well.
Going forward, the division aims to expand businesses in the environmental and medical sectors in addition to its mainstay information and communication and AV markets.
In the first half of the year, components for cellular phones and other communications equipment, particularly smartphones, as well as components for vehicle-mounted and other electric parts achieved solid sales results. Components for air conditioners and home appliances also helped expand sales for the division, thanks to the effects of the eco-point system. In the second half of the year, however, changes in market conditions resulted in poor performance overall, particularly components for game consoles and PCs. Going forward, the division aims to accelerate the development and market launches of new products, especially in the vehicle-mounted and eco-friendly sectors, which are anticipated to expand, and to also make efforts to grow its existing businesses further, particularly for remote controls, which is the core of the division’s sales.
Driven by solid demand for new cars in North America, China, and emerging nations, touch panels for car navigation systems sold well. Touch panels for the smartphone market performed below-target, in part due to clients’ changed market launch schedules for some models. Supported by demand in China, sales in the industrial machinery market were nearly on-target. From here on, the division will make efforts to expand its businesses further by speeding up the development of medium and large capacitive touch panels, for which demand is rising rapidly, and by launching products in such markets as in-car products, tablet devices, and POS.
The many different electronic components that SMK manufactures are widely used by electronics manufacturers in and outside Japan. The markets for these components can be broadly classified into five categories: the audio visual market, the car electronics market, the communication market, the information market, and the home electronics/industry market.
Three divisions, namely the Connection System (CS) Division, the Functional Components (FC) Division, and the Touch Panel (TP) Division, as well as the Research & Development Center are responsible for developing products that constantly meet market requirements in the five markets outlined above. The three divisions handle operations ranging from product planning and design to mass production, while the Research & Development Center is primarily in charge of designing and developing products in new and other fields.
In this section, we present an overview of each of our results the three divisions achieved in the fiscal year under review.
5 6

Connectors for LED lighting developed with consideration for safety and heat resistance
Projected capacitive touch panels
Mini 1-dome switch developed
Human body communication module developed
With the LED lighting market attracting rising attention, demand in the market is expected to expand. Taking note of this market, we recently enhanced our series of connectors for LED lighting. Products in this series are compliant with IEC standards and provisions of the Electrical Appliances and Material Safety Act. Consideration was also given to safety and heat resistance by ensuring creepage distance and spatial distance. The product repertoire consists of five models of connectors: three models for base and line lighting and two models for LED lamps. The three models for base and line lighting (LT-1, LT-2, and LT-3 series) connect LED mounting boards together or connect LED mounting boards to power boards. The two types for LED lamps (LT-4 and LT-5 series) are one-piece connectors that directly connect LED mounting boards to power boards. Products in these series enable harness-free assembly, contribute to reliability during long-term use, and help reduce production process times. From here on, we will meet the needs of this market, which is expected to continue growing, and will actively expand our sales promotion in this area.
We have been actively developing, taking orders for, and growing sales of multi-touch capable projected capacitive touch panels, for which market demand has been intensifying. During the previous fiscal year, we developed products with excellent operability and a focus on thinner and lighter models for mobile devices and supplied these to various Japanese cellular phone manufacturers. Furthermore, we developed ahead of the industry, and started taking orders for genuine capacitive touch panels for in-car navigation systems (operating temperature range: –30°C to +85°C; storage temperature range: –40°C to +95°C) in order to meet demand from the automotive market. From here on, we will move forward with development, focusing on increasing the size of capacitive touch panels and improving the feeling of operation. We aim to expand sales, with orders coming not only from within Japan but also from overseas markets.
The cellular phone and compact device markets have been demanding smaller and thinner electronic components in recent years. In response, we recently developed a mini 1-dome switch that enables devices to be made even smaller and thinner. This product, which expands our lineup of strong-selling 1-dome switches for smartphones, is 30% smaller than our conventional product in terms of area ratio. There is also demand for switches to be more reliable. For example, switches should not detach from the board if dropped during set assembly or during product use. To cope with this, we ensure stable contact reliability by continuing to use a contact spring model that is highly regarded in our 1-dome switches. Moreover, unlike conventional products, this product uses an actuator-attached sheet in place of a cover, which helps prevent displacement during insertion. We expect use of this product to expand to a wider variety of applications in the future, including in cellular phones, tablet PCs, and other portable equipment.
SMK developed a human body communication module, applying the electric field method. Human body communication is a technology that uses a human body as a channel for communication, developed focusing on a human body’s nature of leading a weak current. One of its advantages is its “security,” characterized by the fact that data never leaks out of the human body, while the other is an “energy-saving feature” such that it does not need to emit radio waves and saves energy consumption, which are both unlike the conventional radio wave communications. Generally speaking, there exist two methods for human body communication such as the electric field method and the electric current method, and SMK has adopted the former. In the electric field method, a transmitter induces a modulated electric field on the surface of a human body and a receiver detects the emerged electric field as information. A feature of the electric field method is that you communicate through the electric field induced on the surface of a human body and it is possible to communicate even if the electrodes on the transmitter or on the receiver do not directly contact the human body. For example, when used in access control, it is unnecessary for you to pick out the IC card. This should be a considerably convenient feature, unlike conventional contactless IC cards.
Connectors for LED lighting
Applications: LED lighting, LED lamps
Applications (in-car devices): Car navigation systems, central control systems
Mini 1-dome switch
Applications: Cellular phones and other mobile equipment
Human body communication module
Applications: Access control systems and more
SMK’s New Lineup
Projected capacitive touch panels (mobile devices/in-car devices)
Applications (mobile devices): Cellular phones
7 8

Topics
Photovoltaicsystem
Smart meter Eco monitor LED lighting Electrical appliance
Power conditioner
Junction box
Switchboard
SMK aims to contribute to green devices such as photovoltaic systems, LED lighting,
eco monitors, and smart meters, and develop electronic components that cater to a wide
range of needs.
We are actively developing products that can
meet the needs of customers. In the case of
photovoltaic systems, our “connectors for
photovoltaic modules” have excellent usability
and waterproof performance, considering that
cables can easily be made waterproof with our
unique waterproof structure. As to LED lighting,
our “connectors for LED lighting” are
compatible with the thermal operating
environment of LEDs. We have applied our track
record and technical capabilities acquired over
many years to eco monitors and smart meters,
working to develop new products such as touch
panels and communication modules.
The PV System Expo (Photovoltaic Power Generation System
Expo) was held at Tokyo Big Sight from March 2 to 4, 2011.
This is an international specialty tradeshow that brings
together exhibits including system equipment which makes up
photovoltaic power generation systems as
well as products and technology relating to
system design, construction, installation,
and maintenance.
SMK exhibited a number of products
related to the environmental market,
including connectors for photovoltaic
modules and connectors for LED lighting.
SMK’s activities in the green device market
SMK exhibits at the Photovoltaic Power Generation System Expo (PV System Expo)
Eco monitorResistive touch panels
Smart meterSpecified low power RF modules
Photovoltaic systemConnectors for photovoltaic modules
LED lightingConnectors for LED lighting
9 10

In February 2011, SMK Corporation’s US affiliate company SMK-Link acquired France-based
Movea’s Gyration business unit.
The Gyration business acquired by SMK has an established reputation for products such as the
motion control technology-operated Air Mouse
(US registered trademark). The acquisition enables
SMK-Link to develop, manufacture, and market
products using Movea’s SmartMotion™,
MotionTools and other licensed technologies,
thereby enhancing its product lineup. Moreover,
further expansion of sales can be expected from use
of the Gyration brand, which enjoys a high degree
of name recognition in the West.
ASIASMK High-Tech Taiwan Trading Co., Ltd.SMK Electronics (H.K.) Ltd.SMK Trading (H.K.) Ltd.SMK Dongguan Gaobu FactorySMK Electronics (Shenzhen) Co., Ltd.SMK Electronics (Shenzhen) Co., Ltd. Futian OfficeSMK Electronics (Shenzhen) Co., Ltd. Xi’an OfficeSMK Electronics Technology Development (Shenzhen) Co., Ltd.SMK Electronics Trading (Shanghai) Co., Ltd.SMK Electronics INT’L Trading (Shanghai) Co., Ltd.SMK Electronics INT’L Trading (Shanghai) Co., Ltd. Beijing OfficeSMK Electronics Singapore Pte. Ltd.SMK Electronics (Malaysia) Sdn. Bhd.SMK Electronics (Phils.) CorporationSMK Korea Co., Ltd.
EUROPESMK Europe N.V. SMK Europe N.V., U.K. BranchSMK Europe N.V., France BranchSMK Europe N.V., Munich OfficeSMK Europe N.V., Dortmund OfficeSMK (U.K.) Ltd.SMK Hungary Kft.
NORTH AMERICASMK Electronics Corporation U.S.A.SMK Electronics Corporation U.S.A., San Jose OfficeSMK Electronics Corporation U.S.A., East OfficeSMK Electronics Corporation U.S.A., Los Angeles OfficeSMK Electronics Corporation U.S.A., Seattle OfficeSMK Electronics Corporation U.S.A., Chicago OfficeSMK Electronics Corporation U.S.A., Detroit OfficeSMK-Link Electronics CorporationSMK Manufacturing, Inc.SMK Electronica S.A. de C.V.SMK Mexicana S.R.L. de C.V.SMK Mexicana S.R.L. de C.V., Mexico City Office
Sales OfficeWorksWorks & Office
Head Office (Tokyo)
USA/Mexico SMK Manufacturing, Inc. / SMK Electronica S.A. de C.V.
Founded in 1988, SMK Electronica works as a twin plant, in Tijuana in northwestern Mexico, together with SMK Manufacturing, founded in 1982 in San Diego in the southwestern United States. Located just 10 km apart, they are able to produce and deliver remote controls for all kinds of consumer electronics, taking advantage of the Mexican work force that seeks better job opportunities and the key location that represents the entrance to the United States. Tijuana and San Diego are two very important cities for the North American Free Trade Agreement and part of a dynamic economic zone in North America.
Marco Lopez, Plant Manager, SMK Electronica S.A.de C.V.
Topics
SMK has developed and released the PadDock 10™
speaker stand and docking station for the iPad. This unique
stand rotates and tilts and is uses custom designed oval
speakers for the best media experience. In addition to high
speed charging, an integrated Sync mode allows users to
add music and install applications from their computer.
The product was exhibited in the SMK-Link zone at the
International CES tradeshow held in Las Vegas from
January 6 to 9, 2011, where it attracted a great deal of
interest from visitors.
PadDock 10™ developed and released
US affiliate SMK-Link acquires France-based Movea’s Gyration business unit
Features
(1) Charges the iPad
(2) Synchs with iTunes
(3) Rotating stand (switch between portrait and landscape views)
(4) Tilts back and forth to find the most comfortable viewing angle
Global Network
Note: In August 2011, a new model for the iPad 2 was launched.
11 12

Five-Year SummaryCorporation and Consolidated Subsidiaries
SMK’s net sales for fiscal 2011, which ended March 31, 2011, decreased 3.8% year on year, to ¥61,914 million (US$744,607 thousand). Operating income rose 11.1% year on year, to ¥2,754 million (US$33,129 thousand) with net income of ¥1,037 million (US$12,482 thousand).
Net SalesNet sales recovered moderately with expanded demand for components
for cellular phones, triggered by the rise of smartphones, and for
automotive components, despite the global and Japanese economies not
reaching a condition that could dispel overall uncertainty over the future.
As a result, net sales were ¥61,914 million (US$744,607 thousand),
down 3.8% year on year.
Operating IncomeEfforts to strengthen profitability by introducing new products, reducing
costs, and cutting fixed costs in the face of a decline in operating income
attributable to lower net sales resulted in operating income rising 11.1%
year on year to ¥2,754 million (US$33,129 thousand).
Net IncomeNet income was ¥1,037 million (US$12,482 thousand) due in part to
the effects of foreign exchange losses resulting from the appreciation of
the yen and disaster losses caused by the Great East Japan Earthquake.
Total Net Assets/ROEAs of March 31, 2011, total net assets were ¥29,862 million
(US$359,136 thousand). ROE stood at 3.4%.
Total Assets/ROAAs of March 31, 2011, total assets were ¥53,059 million (US$638,117
thousand). ROA stood at 1.9%.
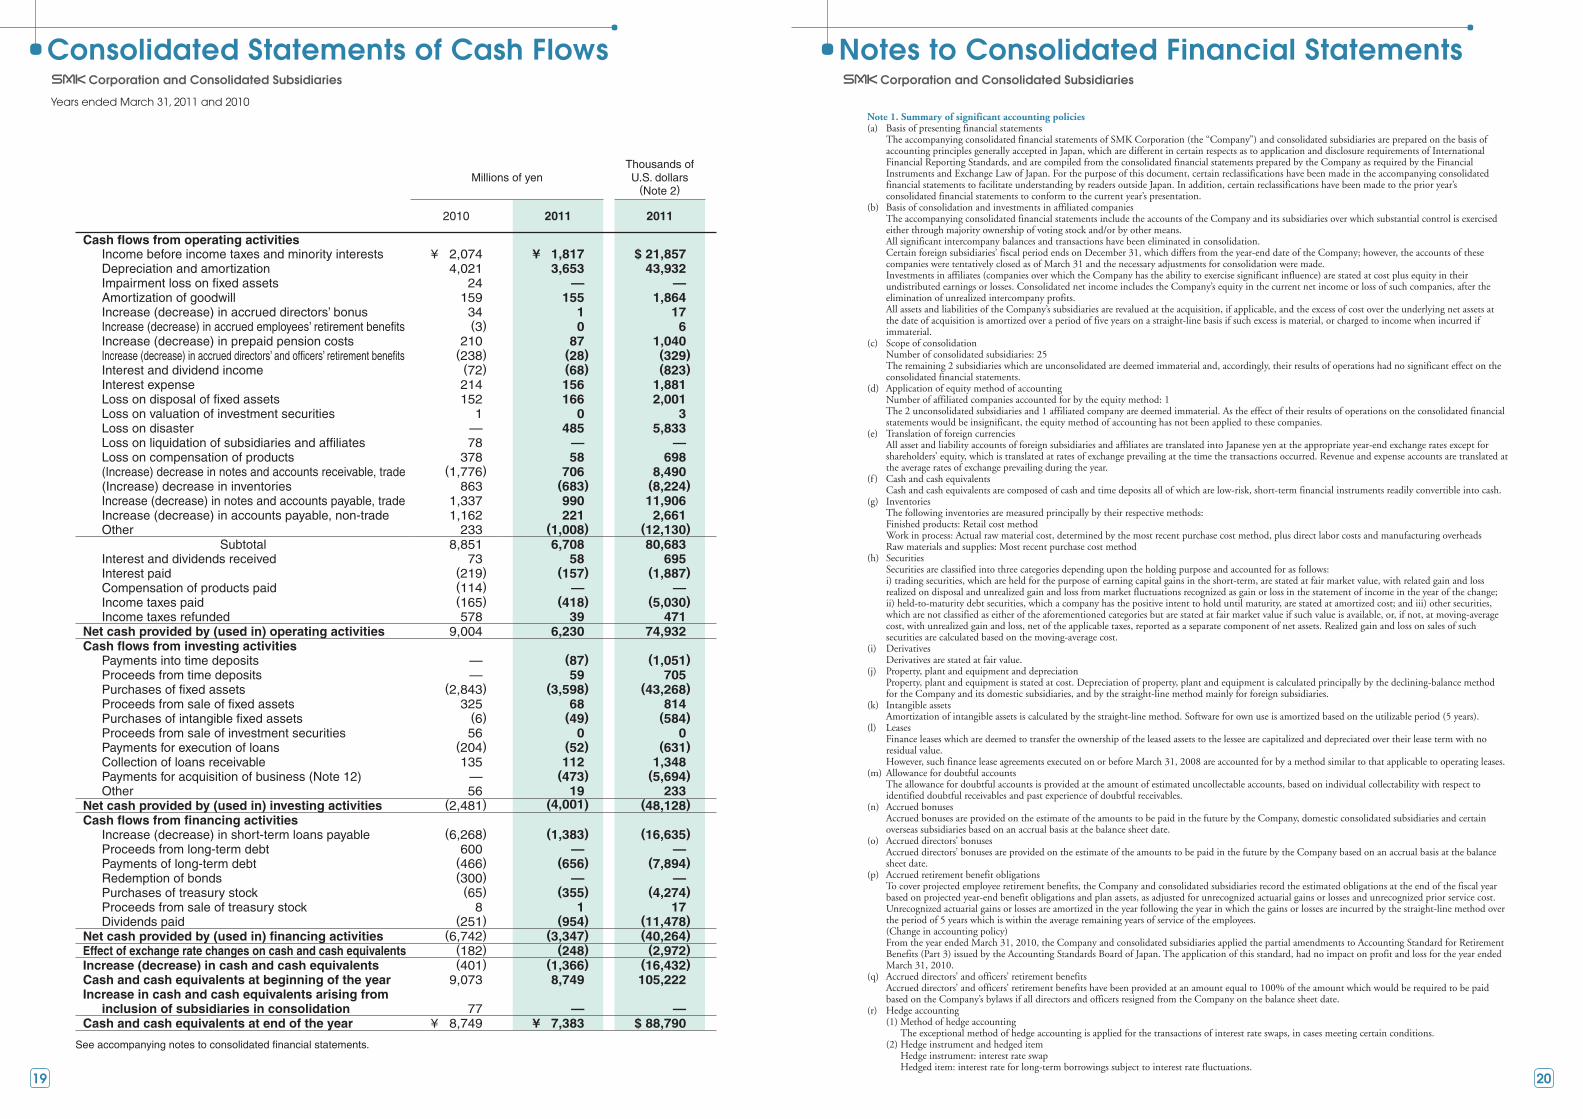
Cash FlowsNet cash flow from operating activities amounted to ¥6,230 million
(US$74,932 thousand), net cash used in investing activities totaled
¥4,001 million (US$48,128 thousand) and net cash used in financing
activities was valued at ¥3,347 million (US$40,264 thousand).
0
29,000
31,000
33,000
35,000
Millions of yen
2007 2008 2009 2010 2011(As of March 31)
Total net assets
34,564
32,386
29,079
31,127
29,862
0
(6)
6
12
2007 2008 2009 2010(Years ended March 31)
%
2011
Return on equity (ROE)
11.0
6.3 6.2
(5.3)
3.4
0
(3)
3
6
2007 2008 2009 2010(Years ended March 31)
%
2011
Return on assets (ROA)
5.8
3.2 3.3
(2.6)
1.9
Millions of yenThousands of U.S. dollars
Years ended and as of March 31 2007 2008 2009 2010 2011 2011
Operating Results
Net sales ¥ 79,074 ¥ 87,659 ¥ 72,742 ¥ 64,371 ¥ 61,914 $ 744,607
Operating income 5,166 5,654 238 2,479 2,754 33,129
Net income (loss) 3,693 2,094 (1,620) 1,862 1,037 12,482
Financial Position
Total assets ¥ 65,575 ¥ 66,737 ¥ 58,168 ¥ 56,113 ¥ 53,059 $ 638,117
Total net assets 34,564 32,386 29,079 31,127 29,862 359,136
Yen U.S. dollars
Per Share Data
Total net assets ¥ 445.33 ¥ 427.75 ¥ 392.15 ¥ 420.07 ¥ 408.12 $ 4.91
Net income (loss)
Basic 47.48 27.32 (21.68) 25.19 14.14 0.17
Diluted 47.41 27.30 — — — —
Cash dividends 14.00 14.00 9.00 8.00 9.00 0.11
Financial ReviewFinancial Section
Note: The U.S. dollar amounts represent translations of Japanese yen, for convenience only, at the rate of ¥83.15 = U.S. $1.00.
13 14

As of March 31, 2011 and 2010
Corporation and Consolidated Subsidiaries
Millions of yenThousands ofU.S. dollars
(Note 2)
Assets 2010 2011 2011
Current assets
Cash and cash equivalents (Note 17) ¥ 8,749 ¥ 7,383 $ 88,790
Time deposits (Note 17) 9 60 721
Notes and accounts receivable, trade (Note 17) 16,337 14,842 178,495
Allowance for doubtful accounts (61) (48) (580)
Inventories (Note 3) 5,241 5,672 68,220
Deferred tax assets (Note 8) 1,303 885 10,642
Other current assets 2,402 3,060 36,806
33,980 31,854 383,094
Investments and long-term loans
Investment securities (Notes 13 and 17) 2,863 2,493 29,984
Long-term loans receivable 247 103 1,236
Other investments (Note 14) 1,659 1,602 19,270
Allowance for doubtful accounts (232) (116) (1,393)
4,537 4,082 49,097
Property, plant and equipment (Notes 4, 7 and 18)
Land 4,432 4,424 53,206
Buildings 16,906 17,143 206,165
Machinery and vehicles 18,627 16,843 202,566
Tooling and office furniture 25,116 20,503 246,571
Construction in progress 10 29 346
65,091 58,942 708,854
Less-accumulated depreciation (48,158) (42,696) (513,480)
16,933 16,246 195,374
Other assets
Deferred tax assets (Note 8) 111 271 3,265
Intangible assets 552 606 7,287
663 877 10,552
Total assets ¥ 56,113 ¥ 53,059 $ 638,117
See accompanying notes to consolidated financial statements.
Millions of yenThousands ofU.S. dollars
(Note 2)
Liabilities and net assets 2010 2011 2011
Current liabilities
Short-term loans payable (Notes 4 and 17) ¥ 4,406 ¥ 3,207 $ 38,564
Notes and accounts payable, trade (Note 17) 3,402 3,290 39,565
Accrued income taxes 197 344 4,140
Accrued bonus 828 771 9,268
Accrued directors’ bonus 35 36 433
Accounts payable, non-trade (Note 17) 7,440 7,691 92,499
Other current liabilities 1,325 1,423 17,118
17,633 16,762 201,587
Long-term liabilities
Long-term debt (Notes 4 and 17) 6,560 5,720 68,791
Accrued employees’ retirement benefits (Note 14) 16 16 187
Accrued directors’ and officers’ retirement benefits 153 125 1,509
Other long-term liabilities (Note 8) 624 574 6,907
7,353 6,435 77,394
Net assets
Shareholders’ equity (Note 10)
Common stock
Authorized: 195,961,274 shares
Issued and outstanding: 79,000,000 shares 7,996 7,996 96,174
Capital surplus 12,353 12,353 148,561
Retained earnings 15,798 15,876 190,933
Treasury stock (Note 11) (2,953) (3,308) (39,790)
33,194 32,917 395,878
Accumulated other comprehensive income
Net unrealized gains (losses) on other securities 499 266 3,204
Foreign currency translation adjustments (2,687) (3,449) (41,483)
(2,188) (3,183) (38,279)
Subscription rights to shares (Note 20) 117 123 1,482
Minority interests 4 5 55
31,127 29,862 359,136
Total liabilities and net assets ¥ 56,113 ¥ 53,059 $ 638,117
Consolidated Balance Sheets
15 16

Millions of yenThousands ofU.S. dollars
(Note 2)
2010 2011 2011Net sales (Note 19) ¥ 64,371 ¥ 61,914 $ 744,607Cost of sales (Notes 3 and 5) 54,010 51,345 617,499Selling, general and administrative expenses (Notes 5 and 6) 7,882 7,815 93,979Operating income (Note 19) 2,479 2,754 33,129Other income
Interest and dividend income 72 68 823Rent income 960 927 11,152Gain on sales of fixed assets 91 39 463Other 365 167 2,013Total other income 1,488 1,201 14,451
Other expensesInterest expense 214 156 1,881Rent expense 306 301 3,617Foreign exchange loss, net 595 879 10,573Loss on disposal of fixed assets 152 166 2,001Loss on valuation of investment securities 1 0 3Impairment loss on fixed assets (Note 7) 24 — —Loss on disaster — 485 5,833Other 601 151 1,815Total other expenses 1,893 2,138 25,723
Income before income taxes and minority interests 2,074 1,817 21,857Income taxes (Note 8)
Current 561 434 5,211Deferred (349) 345 4,152
Income before minority interests 1,862 1,038 12,494Minority interests — 1 12Net income ¥ 1,862 ¥ 1,037 $ 12,482
Millions of yenThousands ofU.S. dollars
(Note 2)
2011 2011Income before minority interests ¥ 1,038 $ 12,494Other comprehensive income
Net unrealized gains (losses) on other securities (233) (2,798)Foreign currency translation adjustments (762) (9,169)Total other comprehensive income ¥ (995) $ (11,967)
Comprehensive income ¥ 43 $ 527Total comprehensive income attributable to:
Shareholders of the Company 42 515Minority interests 1 12
See accompanying notes to consolidated financial statements.
YenU.S. dollars
(Note 2)
Per share data Total net assets ¥ 420.07 ¥ 408.12 $ 4.91 Net income
Basic 25.19 14.14 0.17Diluted — — —
Cash dividends 8.00 9.00 0.11
See accompanying notes to consolidated financial statements.
See accompanying notes to consolidated financial statements.
Millions of yen
Shareholders’ equity Accumulated other comprehensive income
Number of shares of
common stockCommon
stockCapital
surplusRetained earnings
Treasury stock
Total shareholders’
equity
Net unrealized gains (losses)
on other securities
Foreign currency
translation adjustments
Total accumulated other
comprehensive income
Subscription rights to
sharesMinority interests
Total net assets
Balance at March 31, 2009 79,000,000 ¥ 7,996 ¥ 12,348 ¥ 13,961 ¥ (2,873) ¥ 31,432 ¥ (29) ¥ (2,393) ¥ (2,422) ¥ 56 ¥ 13 ¥ 29,079
Cash dividends paid (222) (222) — (222)
Change in scope of consolidation 197 197 — 197
Net income 1,862 1,862 — 1,862
Acquisition of treasury stock (66) (66) — (66)
Disposition of treasury stock 5 10 15 — 15
Change in treasury stock resulting from change in equity in affiliates accounted for by equity method (24) (24) — (24)
Net changes in items other than shareholders equity — 528 (294) 234 61 (9) 286
Total changes — — 5 1,837 (80) 1,762 528 (294) 234 61 (9) 2,048
Balance at March 31, 2010 79,000,000 7,996 12,353 15,798 (2,953) 33,194 499 (2,687) (2,188) 117 4 31,127
Cash dividends paid (959) (959) — (959)
Net income 1,037 1,037 — 1,037
Acquisition of treasury stock (356) (356) — (356)
Disposition of treasury stock (0) 1 1 — 1
Net changes in items other than shareholders equity — (233) (762) (995) 6 1 (988)
Total changes — — (0) 78 (355) (277) (233) (762) (995) 6 1 (1,265)
Balance at March 31, 2011 79,000,000 ¥ 7,996 ¥ 12,353 ¥ 15,876 ¥ (3,308) ¥ 32,917 ¥ 266 ¥ (3,449) ¥ (3,183) ¥ 123 ¥ 5 ¥ 29,862
Thousands of U.S. dollars (Note 2)
Shareholders’ equity Accumulated other comprehensive income
Common stock
Capital surplus
Retained earnings
Treasury stock
Total shareholders’
equity
Net unrealized gains (losses)
on other securities
Foreign currency
translation adjustments
Total accumulated other
comprehensive income
Subscription rights to
sharesMinority interests
Total net assets
Balance at March 31, 2010 $ 96,174 $ 148,565 $ 190,000 $ (35,519) $ 399,220 $ 6,002 $ (32,314) $ (26,312) $ 1,402 $ 43 $ 374,353
Cash dividends paid (11,549) (11,549) — (11,549)
Net income 12,482 12,482 — 12,482
Acquisition of treasury stock (4,292) (4,292) — (4,292)
Disposition of treasury stock (4) 21 17 — 17
Net changes in items other than shareholders equity — (2,798) (9,169) (11,967) 80 12 (11,875)
Total changes — (4) 933 (4,271) (3,342) (2,798) (9,169) (11,967) 80 12 (15,217)
Balance at March 31, 2011 $ 96,174 $ 148,561 $ 190,933 $ (39,790) $ 395,878 $ 3,204 $ (41,483) $ (38,279) $ 1,482 $ 55 $ 359,136
Years ended March 31, 2011 and 2010
Year ended March 31, 2011
Years ended March 31, 2011 and 2010
Corporation and Consolidated Subsidiaries
Corporation and Consolidated Subsidiaries
Corporation and Consolidated Subsidiaries
Consolidated Statements of Income
Consolidated Statement of Comprehensive Income
Consolidated Statements of Changes in Net Assets
17 18
Millions of yenThousands ofU.S. dollars
(Note 2)
2010 2011 2011
Cash flows from operating activitiesIncome before income taxes and minority interests ¥ 2,074 ¥ 1,817 $ 21,857Depreciation and amortization 4,021 3,653 43,932Impairment loss on fixed assets 24 — —Amortization of goodwill 159 155 1,864Increase (decrease) in accrued directors’ bonus 34 1 17Increase (decrease) in accrued employees’ retirement benefits (3) 0 6Increase (decrease) in prepaid pension costs 210 87 1,040Increase (decrease) in accrued directors’ and officers’ retirement benefits (238) (28) (329)Interest and dividend income (72) (68) (823)Interest expense 214 156 1,881Loss on disposal of fixed assets 152 166 2,001Loss on valuation of investment securities 1 0 3Loss on disaster — 485 5,833Loss on liquidation of subsidiaries and affiliates 78 — —Loss on compensation of products 378 58 698(Increase) decrease in notes and accounts receivable, trade (1,776) 706 8,490(Increase) decrease in inventories 863 (683) (8,224)Increase (decrease) in notes and accounts payable, trade 1,337 990 11,906Increase (decrease) in accounts payable, non-trade 1,162 221 2,661Other 233 (1,008) (12,130)
Subtotal 8,851 6,708 80,683Interest and dividends received 73 58 695Interest paid (219) (157) (1,887)Compensation of products paid (114) — —Income taxes paid (165) (418) (5,030)Income taxes refunded 578 39 471
Net cash provided by (used in) operating activities 9,004 6,230 74,932Cash flows from investing activities
Payments into time deposits — (87) (1,051)Proceeds from time deposits — 59 705Purchases of fixed assets (2,843) (3,598) (43,268)Proceeds from sale of fixed assets 325 68 814Purchases of intangible fixed assets (6) (49) (584)Proceeds from sale of investment securities 56 0 0Payments for execution of loans (204) (52) (631)Collection of loans receivable 135 112 1,348Payments for acquisition of business (Note 12) — (473) (5,694)Other 56 19 233
Net cash provided by (used in) investing activities (2,481) (4,001) (48,128)Cash flows from financing activities
Increase (decrease) in short-term loans payable (6,268) (1,383) (16,635)Proceeds from long-term debt 600 — —Payments of long-term debt (466) (656) (7,894)Redemption of bonds (300) — —Purchases of treasury stock (65) (355) (4,274)Proceeds from sale of treasury stock 8 1 17Dividends paid (251) (954) (11,478)
Net cash provided by (used in) financing activities (6,742) (3,347) (40,264)Effect of exchange rate changes on cash and cash equivalents (182) (248) (2,972)Increase (decrease) in cash and cash equivalents (401) (1,366) (16,432)Cash and cash equivalents at beginning of the year 9,073 8,749 105,222Increase in cash and cash equivalents arising from
inclusion of subsidiaries in consolidation 77 — —Cash and cash equivalents at end of the year ¥ 8,749 ¥ 7,383 $ 88,790
See accompanying notes to consolidated financial statements.
Note 1. Summary of significant accounting policies(a) Basis of presenting financial statements The accompanying consolidated financial statements of SMK Corporation (the “Company”) and consolidated subsidiaries are prepared on the basis of
accounting principles generally accepted in Japan, which are different in certain respects as to application and disclosure requirements of International Financial Reporting Standards, and are compiled from the consolidated financial statements prepared by the Company as required by the Financial Instruments and Exchange Law of Japan. For the purpose of this document, certain reclassifications have been made in the accompanying consolidated financial statements to facilitate understanding by readers outside Japan. In addition, certain reclassifications have been made to the prior year’s consolidated financial statements to conform to the current year’s presentation.
(b) Basis of consolidation and investments in affiliated companies The accompanying consolidated financial statements include the accounts of the Company and its subsidiaries over which substantial control is exercised
either through majority ownership of voting stock and/or by other means. All significant intercompany balances and transactions have been eliminated in consolidation. Certain foreign subsidiaries’ fiscal period ends on December 31, which differs from the year-end date of the Company; however, the accounts of these
companies were tentatively closed as of March 31 and the necessary adjustments for consolidation were made. Investments in affiliates (companies over which the Company has the ability to exercise significant influence) are stated at cost plus equity in their
undistributed earnings or losses. Consolidated net income includes the Company’s equity in the current net income or loss of such companies, after the elimination of unrealized intercompany profits.
All assets and liabilities of the Company’s subsidiaries are revalued at the acquisition, if applicable, and the excess of cost over the underlying net assets at the date of acquisition is amortized over a period of five years on a straight-line basis if such excess is material, or charged to income when incurred if immaterial.
(c) Scope of consolidation Number of consolidated subsidiaries: 25 The remaining 2 subsidiaries which are unconsolidated are deemed immaterial and, accordingly, their results of operations had no significant effect on the
consolidated financial statements.(d) Application of equity method of accounting Number of affiliated companies accounted for by the equity method: 1 The 2 unconsolidated subsidiaries and 1 affiliated company are deemed immaterial. As the effect of their results of operations on the consolidated financial
statements would be insignificant, the equity method of accounting has not been applied to these companies.(e) Translation of foreign currencies All asset and liability accounts of foreign subsidiaries and affiliates are translated into Japanese yen at the appropriate year-end exchange rates except for
shareholders’ equity, which is translated at rates of exchange prevailing at the time the transactions occurred. Revenue and expense accounts are translated at the average rates of exchange prevailing during the year.
(f ) Cash and cash equivalents Cash and cash equivalents are composed of cash and time deposits all of which are low-risk, short-term financial instruments readily convertible into cash.(g) Inventories The following inventories are measured principally by their respective methods: Finished products: Retail cost method Work in process: Actual raw material cost, determined by the most recent purchase cost method, plus direct labor costs and manufacturing overheads Raw materials and supplies: Most recent purchase cost method(h) Securities Securities are classified into three categories depending upon the holding purpose and accounted for as follows: i) trading securities, which are held for the purpose of earning capital gains in the short-term, are stated at fair market value, with related gain and loss
realized on disposal and unrealized gain and loss from market fluctuations recognized as gain or loss in the statement of income in the year of the change; ii) held-to-maturity debt securities, which a company has the positive intent to hold until maturity, are stated at amortized cost; and iii) other securities, which are not classified as either of the aforementioned categories but are stated at fair market value if such value is available, or, if not, at moving-average cost, with unrealized gain and loss, net of the applicable taxes, reported as a separate component of net assets. Realized gain and loss on sales of such securities are calculated based on the moving-average cost.
(i) Derivatives Derivatives are stated at fair value.(j) Property, plant and equipment and depreciation Property, plant and equipment is stated at cost. Depreciation of property, plant and equipment is calculated principally by the declining-balance method
for the Company and its domestic subsidiaries, and by the straight-line method mainly for foreign subsidiaries.(k) Intangible assets Amortization of intangible assets is calculated by the straight-line method. Software for own use is amortized based on the utilizable period (5 years).(l) Leases Finance leases which are deemed to transfer the ownership of the leased assets to the lessee are capitalized and depreciated over their lease term with no
residual value. However, such finance lease agreements executed on or before March 31, 2008 are accounted for by a method similar to that applicable to operating leases.(m) Allowance for doubtful accounts The allowance for doubtful accounts is provided at the amount of estimated uncollectable accounts, based on individual collectability with respect to
identified doubtful receivables and past experience of doubtful receivables.(n) Accrued bonuses Accrued bonuses are provided on the estimate of the amounts to be paid in the future by the Company, domestic consolidated subsidiaries and certain
overseas subsidiaries based on an accrual basis at the balance sheet date.(o) Accrued directors’ bonuses Accrued directors’ bonuses are provided on the estimate of the amounts to be paid in the future by the Company based on an accrual basis at the balance
sheet date.(p) Accrued retirement benefit obligations To cover projected employee retirement benefits, the Company and consolidated subsidiaries record the estimated obligations at the end of the fiscal year
based on projected year-end benefit obligations and plan assets, as adjusted for unrecognized actuarial gains or losses and unrecognized prior service cost. Unrecognized actuarial gains or losses are amortized in the year following the year in which the gains or losses are incurred by the straight-line method over
the period of 5 years which is within the average remaining years of service of the employees. (Change in accounting policy)
From the year ended March 31, 2010, the Company and consolidated subsidiaries applied the partial amendments to Accounting Standard for Retirement Benefits (Part 3) issued by the Accounting Standards Board of Japan. The application of this standard, had no impact on profit and loss for the year ended March 31, 2010.
(q) Accrued directors’ and officers’ retirement benefits Accrued directors’ and officers’ retirement benefits have been provided at an amount equal to 100% of the amount which would be required to be paid
based on the Company’s bylaws if all directors and officers resigned from the Company on the balance sheet date.(r) Hedge accounting (1) Method of hedge accounting
The exceptional method of hedge accounting is applied for the transactions of interest rate swaps, in cases meeting certain conditions. (2) Hedge instrument and hedged item
Hedge instrument: interest rate swapHedged item: interest rate for long-term borrowings subject to interest rate fluctuations.
Years ended March 31, 2011 and 2010
Corporation and Consolidated Subsidiaries
Consolidated Statements of Cash FlowsCorporation and Consolidated Subsidiaries
Notes to Consolidated Financial Statements
19 20

(3) Hedge policyThe Company uses interest rate swaps to avoid risks from interest rate fluctuations on borrowings, only when approved by the management.
(4) Assessment of hedge effectivenessAs the exceptional method is applied for interest rate swap, the assessment of hedge effectiveness is omitted.
(s) Income taxes Deferred income taxes are recognized based on the differences between financial reporting and the tax bases of the assets and liabilities and are calculated
using the enacted tax rates and laws which will be in effect when the differences are expected to reverse.(t) Per share information Basic net income per share is computed based on the net income available for distribution to shareholders of common stock and weighted-average number
of shares of common stock outstanding during the year. Diluted net income per share is computed based on the net income available for distribution to shareholders and weighted-average number of shares of common stock outstanding during each year after giving effect to the dilutive potential of shares of common stock to be issued upon the conversion of convertible bonds.
Net assets per share is computed based on the net assets available for distribution to shareholders of common stock and the number of shares of common stock outstanding at the balance sheet date. Cash dividends per share shown for each period in the consolidated statements of income represent the dividends applicable to the respective period.
(u) Change in method of accounting (1) Accounting Standard for Asset Retirement Obligations
From the year ended March 31, 2011 the Company adopted the Accounting Standard for Asset Retirement Obligations and the Guidance on Accounting Standard for Asset Retirement Obligations. The application of this standard had no impact on profit and loss for the year ended March 31, 2011.
(2) Accounting Standard for Business Combinations and related mattersFrom the year ended March 31, 2011 the Company adopted the Accounting Standard for Business Combinations, the Accounting Standard for Consolidated Financial Statements, the partial amendments to Accounting Standard for Research and Development Costs, the revised Accounting Standard for Business Divestitures, the revised Accounting Standard for Equity Method of Accounting for Investments and the revised Guidance on Accounting Standard for Business Combinations and Accounting Standard for Business Divestitures.
(3) Accounting Standard for Presentation of Comprehensive IncomeFrom the year ended March 31, 2011 the Company adopted the Accounting Standard for Presentation of Comprehensive Income. In accordance with the new standard, consolidated statements of comprehensive income for the year ended March 31, 2010 is not presented. The comparative information for the year March 31, 2010 is disclosed in Note 9.
Note 2. U.S. dollar amounts The U.S. dollar amounts are stated solely for the convenience of the reader at the rate of U.S.$1.00 = ¥83.15, the approximate rate of exchange at March
31, 2011. The translation should not be construed as a representation that the Japanese yen amounts actually represent, have been or could be converted into U.S. dollars at that or any other rate.
Note 3. Inventories Inventories as of March 31, 2010 and 2011, consisted of the following:
Millions of yen Thousands of U.S. dollars2010 2011 2011
Finished products ¥ 2,469 ¥ 2,572 $ 30,933Work in process 588 648 7,797Raw materials and supplies 2,184 2,452 29,490Total ¥ 5,241 ¥ 5,672 $ 68,220
The write-downs of inventories resulted from decreased profitability for the year ended March 31, 2010 and 2011 were as follows:Millions of yen Thousands of U.S. dollars
2010 2011 2011Cost of sales ¥ 459 ¥ 290 $ 3,487
Note 4. Short-term loans payable and long-term debt Short-term loans payable and long-term debt as of March 31, 2010 and 2011, consisted of the following:
Short-term loans payable Millions of yen Thousands of U.S. dollars2010 2011 2011
Loans, principally from banks with interestrates ranging from 0.66% to 0.75%:Secured ¥ 400 ¥ 255 $ 3,070Unsecured 3,350 2,112 25,395Total ¥ 3,750 ¥ 2,367 $ 28,465
Long-term debt Millions of yen Thousands of U.S. dollars2010 2011 2011
Loans, principally from banks with interestrates ranging from 0.84% to 2.30%:Secured ¥ 4,366 ¥ 4,110 $ 49,426Unsecured 2,850 2,450 29,465Less: portion due within one year (656) (840) (10,100)Total ¥ 6,560 ¥ 5,720 $ 68,791
The assets pledged as collateral for short-term and long-term debt as of March 31, 2010 and 2011 were summarized as follows:Millions of yen Thousands of U.S. dollars
2010 2011 2011Property, plant and equipment-book value ¥ 1,973 ¥ 1,896 $ 22,804
The aggregate annual maturities of long-term debt (including current portion) outstanding as of March 31, 2011 were summarized as follows:Year ending March 31, Millions of yen Thousands of U.S. dollars2012 ¥ 840 $ 10,1002013 3,903 46,9422014 1,692 20,3512015 125 1,498Total ¥ 6,560 $ 78,891
Note 5. Research and development costs Research and development costs included in cost of sales and selling, general and administrative expenses for the years ended March 31, 2010 and 2011
amounted to ¥2,770 million and ¥2,903 million ($34,908 thousand), respectively.
Note 6. Selling, general and administrative expenses Major elements of selling, general and administrative expenses for the years ended March 31, 2010 and 2011 were as follows:
Millions of yen Thousands of U.S. dollars2010 2011 2011
Salaries and wages of employees ¥ 3,454 ¥ 3,382 $ 40,678Provision for bonus 264 312 3,750Provision for directors’ and offi cers’ bonus 34 36 433Retirement benefit cost 271 243 2,923Provision for directors’ and offi cers’ retirement benefi t 41 35 424Provision for doubtful accounts — 9 112
Note 7. Impairment of fixed assets An impairment loss is recognized when the carrying amount of asset exceeds undiscounted future net cash flows which are expected to be generated by such
asset. The impairment loss is measured by the amount by which the carrying amount of the asset exceeds its recoverable amount, being the higher of discounted future net cash flows or net realizable value.
For the year ended March 31, 2010, the impairment loss was recognized for the following assets:Millions of yen
2010Machinery and vehicles
Tooling and office furniture TotalAsset group Location Use
SMK U.K. Ltd. U.K. Switch production facilities ¥ 17 ¥ 7 ¥ 24Total ¥ 17 ¥ 7 ¥ 24
For the year ended March 31, 2011, there was no major impairment loss recognized.
Note 8. Income taxes Income taxes applicable to the Company and its domestic subsidiaries comprised corporation, inhabitants’ and enterprise taxes which, in the aggregate,
resulted in statutory tax rate of approximately 40.5% for the years ended March 31, 2010 and 2011, respectively. Reconciliations between the statutory tax rate and the effective tax rates for the years ended March 31, 2010 and 2011 were as follows:
2010 2011Statutory tax rate 40.5% 40.5%Items such as entertainment expenses permanently not deductible for tax purposes 2.1 1.8Items such as dividend income permanently not deductible for tax purposes (14.7) (20.6)Tax credit for research and development cost (1.1) (3.8)Foreign tax credit (18.4) —Change in valuation allowance (4.9) 13.1Statutory tax rate differences in subsidiaries (18.5) (9.1)Elimination of dividend income 23.5 20.9Other 1.7 (0.0)Effective tax rates 10.2% 42.8%
The significant components of deferred tax assets and liabilities at March 31, 2010 and 2011 were as follows:Millions of yen Thousands of U.S. dollars
2010 2011 2011Deferred tax assets: Inventory write-down disallowed ¥ 137 ¥ 131 $ 1,580 Accrued bonuses disallowed 320 297 3,565 Intercompany profi t on inventory 70 65 781 Retirement benefi ts disallowed 263 301 3,622 Allowance for doubtful accounts 56 47 564 Impairment loss 252 176 2,122 Operating loss carryforwards for tax purposes 145 209 2,515 Carried forward foreign tax credit 425 250 3,000 Other 638 669 8,051 Valuation allowance (320) (557) (6,701) Deferred tax assets 1,986 1,588 19,099
Deferred tax liabilities: Deferred gain on land (108) (108) (1,303) Advanced depreciation on buildings (117) (108) (1,296) Reserve for special depreciation (30) (21) (255) Net unrealized gains on other securities (331) (199) (2,398) Other (155) (122) (1,462)Net deferred tax assets ¥ 1,245 ¥ 1,030 $ 12,385
Note 9. Comprehensive income and other comprehensive income The following table shows to whom comprehensive income is attributable:
Millions of yen2010
Shareholders of the Company ¥ 2,096Minority interests —Total comprehensive income ¥ 2,096
The following table presents components of other comprehensive income for the year ended March 31, 2010:Millions of yen
2010Net unrealized gains (losses) on other securities ¥ 528Foreign currency translation adjustments (294)Total other comprehensive income ¥ 234
Note 10. Shareholders’ equity The Corporation Law of Japan provides that an amount equal to 10% of the amount to be distributed as distributions of capital surplus (other than the
capital reserve) and retained earnings (other than the legal reserve) be transferred to the capital reserve and the legal reserve, respectively, until the sum of the capital reserve and the legal reserve equals 25% of the common stock account. Such distributions can be made at any time by resolution of the shareholder’s meeting, or by the Board of Directors if certain conditions are met, but neither the capital reserve nor the legal reserve is available for distributions.
Note 11. Treasury stock The number of common stock of the Company held by the Company, consolidated subsidiaries and affiliated companies subject to the equity method at
March 31, 2010 and 2011 totaled 5,185,336 shares and 6,142,417 shares, respectively.21 22

Note 12. Supplementary information on the consolidated statements of cash flows Assets acquired and liabilities assumed resulting from the acquisition of business and related payments for the year ended March 31, 2011 are as follows:
Millions of yen Thousands of U.S. dollars2011 2011
Current assets ¥ 270 $ 3,244Non current assets 273 3,285 Total assets 543 6,529Current liabilities (70) (835) Total liabilities (70) (835)Payments for acquisition of business ¥ 473 $ 5,694
Note 13. Securities Information regarding securities classified as other securities at March 31, 2010 and 2011 was summarized as follows:
Millions of yen Thousands of U.S. dollars2010 2011 2011
Fair value CostsUnrealizedgain (loss) Fair value Costs
Unrealizedgain (loss) Fair value Costs
Unrealizedgain (loss)
Securities whose fair value exceeds their costStocks ¥ 2,360 ¥ 1,469 ¥ 891 ¥ 1,950 ¥ 1,456 ¥ 494 $ 23,453 $ 17,522 $ 5,931Others 47 36 11 48 36 12 580 432 148
2,407 1,505 902 1,998 1,492 506 24,033 17,954 6,079Securities whose cost exceeds their fair valueStocks 248 320 (72) 268 332 (64) 3,228 3,993 (765)
248 320 (72) 268 332 (64) 3,228 3,993 (765)Total ¥ 2,655 ¥ 1,825 ¥ 830 ¥ 2,266 ¥ 1,824 ¥ 442 $ 27,261 $ 21,947 $ 5,314
Unlisted stocks of ¥36 million at March 31, 2010 and ¥36 million ($431 thousand) at March 31, 2011 are not included in the above table because there were no quoted market prices available and the fair value is extremely difficult to determine.
Information regarding sales of securities for the year ended March 31, 2010 was as follows:Millions of yen
2010Proceeds from sales of securities ¥ 53Gains of sales 16Losses on sales (0)
Note 14. Accrued employees’ retirement benefits (a) Outline of retirement benefit plans
The Company and certain of its domestic consolidated subsidiaries transferred the retirement benefit plans to the corporate pension fund plans under the Defined Benefits Enterprise Pension Law of Japan on April 1, 2004. On the same day the approval was obtained for the exemption from the substituted portion of the welfare pension fund plans from the Minister of Health, Labor and Welfare. At the same time, the Company and certain of its domestic consolidated subsidiaries revised the retirement benefit schemes and adopted the cash balance pension plans and the defined contribution pension plans for a part of future contribution.
(b) Retirement benefit obligation as of March 31, 2010 and 2011Millions of yen Thousands of U.S. dollars
2010 2011 2011Retirement benefit obligation ¥ 7,199 ¥ 7,330 $ 88,154Fair value of plan assets (6,289) (6,188) (74,415)Funded status 910 1,142 13,739Unrecognized actuarial gains (losses) (1,913) (2,059) (24,768)Net amount recognized in the consolidated balance sheets (1,003) (917) (11,029)Prepaid pension costs 1,019 933 11,216 Accrued employees’ retirement benefits ¥ 16 ¥ 16 $ 187
(c) Retirement benefit costMillions of yen Thousands of U.S. dollars
2010 2011 2011Service cost, net of plan participants’ contributions ¥ 322 ¥ 327 $ 3,927Interest cost 142 144 1,736Expected returns on plan assets (162) (194) (2,335)Amortization of unrecognized actuarial (gains) losses 471 377 4,539Contribution to defined contribution pension plan 53 63 757Net periodic cost ¥ 826 ¥ 717 $ 8,624
(d) Assumptions to calculate the actuarial present value of the benefit obligation and the expected return on plan assets2010 2011
Discount rate 2.0% 2.0%Expected return on plan assets 3.5% 3.5%Amortization period of unrecognized actuarial gains or losses 5 years 5 years
Note 15. Derivatives As a matter of policy, the Company does not speculate in derivative transactions. The Company does not anticipate nonperformance by any of the
counterparties to the derivative transactions, all of whom are leading domestic financial institutions with high bond ratings. In accordance with the Company’s policy, the accounting department controls derivative transactions and requires approval by the director responsible for
accounting and the representative directors of the Company. The director who has the responsibility to control the performance and the related risks connected with derivatives reports these to the Management Committee of the Company.
The Company uses interest rate swaps to avoid risks from interest rate fluctuations on borrowings. The exception method of hedge accounting is used to account for those transactions.
(Currency related) Millions of yen Thousands of U.S. dollars
Contractamount Fair value
Unrealizedgain (loss)
Contractamount Fair value
Unrealizedgain (loss)
Forward foreign exchange contracts: 2010 2011 2010 2011 2010 2011 2011 2011 2011Sell: US$ ¥ 1,780 ¥ 2,029 ¥ (46) ¥ (29) ¥ (46) ¥ (29) $24,398 $ (348) $ (348) EUR — — — — — — — — — Total ¥ 1,780 ¥ 2,029 ¥ (46) ¥ (29) ¥ (46) ¥ (29) $24,398 $ (348) $ (348)
(1) Calculation of fair valueThe fair value is calculated by the forward exchange rate.
(2) Derivative transactions to which hedge accounting was applied are excluded from the above table.
(Interest related) Millions of yen Thousands of U.S. dollarsContractamount
Due afterone year
Contractamount
Due afterone year
2010 2011 2010 2011 2011 2011Interest rate swaps ¥ 2,636 ¥ 2,468 ¥ 2,468 ¥ 1,969 $29,681 $23,680
Since exceptional treatment is applied to interest rate swaps transactions, they are accounted for as if they were an integral part of the hedged long-term debt, and their fair value is included in the fair value of long-term debt in Note 17.
Note 16. Leases Lease expenses and pro forma amounts of depreciation and interest expense for finance leases for the years ended March 31, 2010 and 2011 were as follows:
Millions of yen Thousands of U.S. dollars2010 2011 2011
Lease expenses ¥ 1 ¥ — $ — Reversal of allowance for impairment loss on leased assets — — — Depreciation 1 — — Interest expense 0 — — Impairment loss — — —
Depreciation is calculated based on the straight-line method, assuming that useful life is within the lease term with no residual value. Interest is calculated based on the discrepancy between total lease expenses and acquisition cost and is allocated to each term by the interest method.
Future minimum lease payments for non-cancellable operating leases subsequent to March 31, 2010 and 2011 were as follows:Millions of yen Thousands of U.S. dollars
2010 2011 2011 Due within one year ¥ 5 ¥ 4 $ 48 Due after one year 5 1 7 Total ¥ 10 ¥ 5 $ 55
Note 17. Financial instruments (Additional information)
From the year ended March 31, 2010, the Company and consolidated subsidiaries applied the Accounting Standard for Financial Instruments and the Guidance on Disclosures about Fair Value of Financial Instruments issued by the Accounting Standards Board of Japan.
(1) Policy for financial instrumentsThe Company and consolidated subsidiaries raise funds through bank borrowings.The Company and consolidated subsidiaries use derivatives for the purpose of reducing risk and do not enter into derivatives for speculative or trading purposes.
(2) Types of financial instruments and related riskTrade receivables—trade notes and accounts receivable—are exposed to credit risk in relation to customers. Regarding this risk, the credit management is executed periodically.Marketable securities and investment securities are exposed to market risk. The fair value of those securities is reported in a board meeting periodically.Substantially all trade payables—trade notes and accounts payable—have payment due dates within one year.Short-term borrowings are raised mainly in connection with business activities, and the repayment dates of long-term debt extend up to four years from the balance sheet date. Long-term debt with variable interest rates is exposed to interest rate fluctuation risk. However, to reduce such risk and fix interest expense for long-term debt bearing interest at variable rates, the Company and consolidated subsidiaries utilize interest rate swap transactions as a hedging instrument.Information regarding fair value of financial instruments at March 31, 2010 and 2011 was summarized as follows:
Millions of yen2010
Book value Fair value DifferenceCash and cash equivalents ¥ 8,749 ¥ 8,749 ¥ —Time deposits 9 9 —Notes and accounts receivable, trade 16,337 16,337 —Investment securities 2,654 2,654 —Short-term loans payable 3,750 3,750 —Notes and accounts payable, trade 3,402 3,402 —Accounts payable, non-trade 7,440 7,440 —Long-term debt 7,216 7,127 (89)Derivatives (46) (46) —
Millions of yen Thousands of U.S. dollars2011 2011
Book value Fair value Difference Book value Fair value DifferenceCash and cash equivalents ¥ 7,383 ¥ 7,383 ¥ — $ 88,790 $ 88,790 $ —Time deposits 60 60 — 721 721 —Notes and accounts receivable, trade 14,842 14,842 — 178,495 178,495 —Investment securities 2,267 2,267 — 27,262 27,262 —Short-term loans payable 2,367 2,367 — 28,465 28,465 —Notes and accounts payable, trade 3,290 3,290 — 39,565 39,565 —Accounts payable, non-trade 7,691 7,691 — 92,499 92,499 —Long-term debt 6,560 6,529 (31) 78,891 78,517 (374)Derivatives (29) (29) — (348) (348) —
Long-term debt includes current portion of long-term debt which is booked as short-term loans payable in balance sheets. 1. Methods to determine the estimated fair value of financial instruments and other matters related to securities and derivative transactions Cash and cash equivalents, time deposits, and notes and accounts receivable, trade Since these items are settled in a short period of time, their carrying value approximates fair value. Investment securities The fair value of stocks is based on quoted market prices. Short-term loans payable, notes and accounts payable, trade, and accounts payable, non-trade Since these items are settled in a short period of time, their carrying value approximates fair value. Long-term debt The fair value of long-term debt is based on the present value of the total of principal and interest discounted by the interest rate to be applied if
similar new loans were entered into. Derivatives Please refer to Note 15 Derivatives of the notes to the consolidated financial statements. 2. Financial instruments whose fair value is extremely difficult to determine
Millions of yenThousands of U.S. dollars
2010 2011 2011Unlisted securities ¥ 208 ¥ 226 $ 2,722Unlisted securities are not included in the investment securities because there were no quoted market prices available and the fair value is extremely difficult to determine.
23 24

3. The schedules for redemption of monetary assets and securities with maturitiesMillions of yen
2010Due within
one yearDue after one year through five years
Due after five years through ten years
Cash equivalents and time deposits ¥ 8,749 ¥ — ¥ —Notes and accounts receivable, trade 16,337 — —Investment securities (other) — 15 31Total ¥ 25,086 ¥ 15 ¥ 31
Millions of yen Thousands of U.S. dollars2011 2011
Due within one year
Due after one year through five years
Due after five years through ten years
Due within one year
Due after one year through five years
Due after five years through ten years
Cash equivalents and time deposits ¥ 7,435 ¥ — ¥ — $ 89,414 $ — $ —Notes and accounts receivable, trade 14,842 — — 178,496 — —Investment securities (other) — 15 33 — 181 400Total ¥ 22,277 ¥ 15 ¥ 33 $ 267,910 $ 181 $ 400
Note 18. Investment and rental property (Additional information) From the year ended March 31, 2010, the Company and consolidated subsidiaries applied the Accounting Standard for Disclosures about Fair Value of
Investment and Rental Property and the Guidance on Accounting Standard for Disclosures about Fair Value of Investment and Rental Property issued by the Accounting Standards Board of Japan.
The profit of investment and rental property for the years ended March 31, 2010 and 2011 amounted to ¥655 million and ¥627 million ($7,535 thousand), respectively.
Information on the fair value of investment and rental property at March 31, 2010 and 2011 was summarized as follows:Millions of yen Thousands of U.S. dollars
2010 2011 2011Book value
beginning of the yearBook value
end of the year Fair valueBook value
beginning of the yearBook value
end of the year Fair valueBook value
beginning of the yearBook value
end of the year Fair value¥ 4,150 ¥ 4,119 ¥ 8,833 ¥ 4,119 ¥ 4,055 ¥ 8,282 $ 49,541 $ 48,762 $ 99,601
1. The fair value represents the acquisition cost less accumulated depreciation.2. The fair value is mainly estimated by real estate agency.
Note 19. Segment information (Additional information) From the year ended March 31, 2011, the Company and consolidated subsidiaries applied the Accounting Standard for Disclosures about Segments of an
Enterprise and Related information and the Guidance on the Accounting Standard for Disclosures about Segments of an Enterprise and Related information issued by the Accounting Standards Board of Japan.
(Over view) The reporting segments of the Company and consolidated subsidiaries are designed as business segments whose segregated financial information can be
obtained and to which the management reviews to decide on the allocation of managerial and financial resources and to evaluate their financial performance. The Company and consolidated subsidiaries are primarily engaged in the three divisions as follows; CS (Connection System) Division: The division produces and sells connectors and jacks. FC (Functional Components) Division: The division produces and sells switches, units, remote controls and camera modules. TP (Touch Panel) Division: The division produces and sells touch panels.
The business segment information is prepared by taking almost the same methods as described in Note 1.
1. Business segment informationMillions of yen
2010Connection System
DivisionFunctional Components
DivisionTouch Panel
Division Other Total Adjustment ConsolidatedNet sales
Outside customers ¥ 27,712 ¥ 27,521 ¥ 8,952 ¥ 186 ¥ 64,371 ¥ — ¥ 64,371Intersegment sales — — — — — — —Total 27,712 27,521 8,952 186 64,371 — 64,371
Operating income 719 1,481 184 95 2,479 — 2,479 Identifiable assets 16,263 13,372 4,861 4,507 39,003 17,110 56,113 Others
Depreciation 2,618 1,010 267 7 3,902 — 3,902Increase in fixed assetsand intangible fixed assets 1,317 847 425 92 2,681 — 2,681
Millions of yen
2011Connection System
DivisionFunctional Components
DivisionTouch Panel
Division Other Total Adjustment ConsolidatedNet sales
Outside customers ¥ 23,242 ¥ 30,080 ¥ 8,350 ¥ 242 ¥ 61,914 ¥ — ¥ 61,914Intersegment sales — — — — — — —Total 23,242 30,080 8,350 242 61,914 — 61,914
Operating income (loss) 565 2,223 (143) 109 2,754 — 2,754 Identifiable assets 14,038 13,646 5,307 4,326 37,317 15,742 53,059 Others
Depreciation 2,223 1,017 295 8 3,543 — 3,543Increase in fixed assetsand intangible fixed assets 2,254 833 814 25 3,926 — 3,926
Thousands of U.S. dollars
2011Connection System
DivisionFunctional Components
DivisionTouch Panel
Division Other Total Adjustment ConsolidatedNet sales
Outside customers $ 279,519 $ 361,756 $ 100,421 $ 2,911 $ 744,607 $ — $ 744,607Intersegment sales — — — — — — —Total 279,519 361,756 100,421 2,911 744,607 — 744,607
Operating income (loss) 6,797 26,737 (1,718) 1,313 33,129 — 33,129 Identifiable assets 168,823 164,116 63,823 52,035 448,797 189,320 638,117 Others
Depreciation 26,731 12,227 3,555 94 42,607 — 42,607Increase in fixed assetsand intangible fixed assets 27,102 10,019 9,786 309 47,216 — 47,216
2. Geographical information(1) Net sales
Millions of yen2011 Japan Asia North America Europe Other ConsolidatedNet sales ¥ 18,010 ¥ 25,358 ¥ 16,197 ¥ 2,057 ¥ 292 ¥ 61,914
Thousands of U.S. dollars2011 Japan Asia North America Europe Other ConsolidatedNet sales $ 216,598 $ 304,967 $ 194,792 $ 24,743 $ 3,507 $ 744,607(2) Fixed assets
Millions of yen2011 Japan Asia North America Europe ConsolidatedFixed assets ¥ 11,230 ¥ 4,289 ¥ 331 ¥ 395 ¥ 16,245
Thousands of U.S. dollars2011 Japan Asia North America Europe ConsolidatedFixed assets $ 135,054 $ 51,587 $ 3,978 $ 4,755 $ 195,374
3. Information about major customers The Company and consolidated subsidiaries have no major customers which account for at or more than 10% of net sales. 4. Information about the amorization of goodwill and the balance of goodwill
Millions of yen Thousands of U.S. dollars2011 FC FCAmortization ¥ 155 $ 1,864Book value ¥ 446 $ 5,369
Note 20. Stock option plan At the board of directors meeting held on April 24, 2008, a stock option plan was approved. Under this plan, certain employees of the Company and a
director and employees of affiliated companies were granted options to purchase common stock of 1,102,000 shares in total at an exercise price of ¥509. Those eligible could exercise the options when the market price exceeded 130% of the exercise price for preceding day within the term of exercise, which was from June 1, 2010 to May 31, 2013.
Stock option activities during the years ended March 31, 2010 and 2011 were as follows:
2010 Number of Shares Outstanding at beginning of year 1,102,000 Non-eligible at end of year 1,102,000 The fair value of stocks when granted ¥115
2011 Number of Shares Outstanding at beginning of year 1,102,000 Non-eligible at end of year 1,072,000 The fair value of stocks when granted ¥115 ($1.38)
Note 21. Related party transactions Significant transactions with related parties for the years ended March 31, 2010 and 2011 were as follows:
Millions of yenTransactions Balances
2010 Guaranty money deposited Rent Other investments RentTerutaka Ikeda ¥ — ¥ 14 ¥ 15 ¥ —
Millions of yenTransactions Balances
2011 Guaranty money deposited Rent Other investments RentTerutaka Ikeda ¥ — ¥ 14 ¥ 15 ¥ —
Thousands of U.S. dollarsTransactions Balances
2011 Guaranty money deposited Rent Other investments RentTerutaka Ikeda $ — $ 167 $ 174 $ —
Note 22. Business combination On February 14, 2011, a consolidated subsidiary of the Company acquired Movea, Inc.’s Gyration business. The Gyration brand is well known,
particularly in Europe and the U.S., and the acquisition should contribute to the development of new markets for SMK-Link products. In addition, the Company anticipates that it will be able to further develop product lines by utilizing Movea, Inc.’s innovative technology. Consequently, the Company intends to expand business in the field of peripheral equipment in the U.S., Europe, Japan and other areas.
The results of operation for Gyration business for the period from February 15, 2011 to March 31, 2011 is included in the Company’s consolidated statement of income.
The amounts of assets acquired and liabilities assumed of this business at the date of the acquisition were as follows:Millions of yen Thousands of U.S. dollars
2011 2011Current assets ¥ 259 $ 3,112Non current assets 11 138
Total assets 270 3,250Current liabilities (67) (801)
Total liabilities (67) (801)
Acquisition cost and goodwill were recorded in the amounts of ¥454 million ($5,461 thousand) and ¥250 million ($3,013 thousand), respectively. The goodwill is being amortized over a period of 5 years by the straight-line method.
Note 23. Subsequent events The following appropriation of retained earnings of the Company, which has not been reflected in the accompanying consolidated financial statements for
the year ended March 31, 2011, was approved at a shareholder’s meeting held on June 23, 2011.Millions of yen Thousands of U.S. dollars
2011 2011Cash dividends (¥4.00 = $0.05 per share) ¥ 292 $ 3,512
25 26

(As of March 31, 2011)
Authorized shares: 195,961,274
Issued shares: 79,000,000
Number of shareholders: 11,331
Major shareholders (top ten)
Nippon Life Insurance CompanyMizuho Corporate Bank, Ltd.Dai Nippon Printing Co., Ltd.The Bank of Tokyo-Mitsubishi UFJ, Ltd.SMK Cooperating Company Share Holding AssociationMitsubishi UFJ Trust and Banking CorporationJapan Trustee Services Bank, Ltd. (Trust Account)Terutaka IkedaThe Showa Ikeda Memorial FoundationSMK Employees Share Holding Association
4,0013,6193,2003,1342,0341,9371,6431,5401,5001,484
5.484.954.384.292.782.652.252.10 2.052.03
Shares owned (1,000 shares) Percentage of shares (%)
1–999 shares
1,000–9,999 shares
10,000–99,999 shares
100,000–499,999 shares
500,000 shares–
2,158 (19.05%)
8,459 (74.65%)
642 (5.67%)
56 (0.49%)
16 (0.14%)
Share ownership by number
Financial institutions
Financial instruments dealers
Companies and other entities
Foreign investors
Individuals and others
Treasury stock
22,513,685 (28.50%)
1,960,665 (2.48%)
11,105,827 (14.06%)
3,334,550 (4.22%)
34,082,394 (43.14%)
6,002,879 (7.60%)
Share ownership by shareholder type (unit: share)
Note: SMK holds 6,002 thousand shares of treasury stock, but they are excluded from the above list. Figures for percentage of shares are calculated excluding treasury stock.
Report of Independent Auditors Shares and Shareholders
Please see our website for detailed IR information.
The IR Information section of SMK’s
website includes annual reports and
presentation materials. The website also
carries information about SMK’s products,
corporate data, CSR initiatives, and
commitment to the environment.
http://www.smk.co.jp/IR Information
Home page
27 28

Yoshio SakuraiDirector, Executive Vice President,
Chief Technology Officer
Hajime YamadaDirector, Executive Vice President,
Chief Financial Officer
Yuji TanahashiDirector
Tetsuya NakamuraPresident and
Chief Operating Officer
Yasumitsu IkedaDirector, Executive Deputy PresidentSales Division
Terutaka IkedaAuditor and
Chairman of Auditors Meeting
Kenji KobayashiAuditor
Kouichiro SugiharaAuditor
Naru NakashimaAuditor
Harutaka SekiAuditor
Yoshiyuki KakuExecutive Vice President
Connection System Division
Tsutomu IsodaVice President
Research and Development
Hiroshi MiyakawaVice PresidentSales Division
Shigechika YanagiVice President
Touch Panel Division
Takemi IshibashiVice President
Production Management
Kohei OhgakiVice President
Corporate Planning andGeneral Affairs
Hideo MatsumotoVice President
Sales Division, Europe
Mikio WakabayashiVice President
Functional Components Division
Paul EvansExecutive Vice PresidentSales Division, Americas
Akira UtazakiVice President
Deputy Division Director of Sales Division
(As of June 23, 2011)
CORPORATE EXECUTIVE OFFICERSDIRECTORS
AUDITORS
(As of March 31, 2011)
Name: SMK Corporation
Established: January 15, 1929
Primary business: Manufacture and sale of various parts for electro-communication device and electronic equipment
Capital: ¥7,996,828,021
Stock exchange listing: Tokyo Stock Exchange
Administrator of shareholders’ register: Mitsubishi UFJ Trust and Banking Corporation
Independent auditors: Ernst & Young ShinNihon LLC Tokyo, Japan
Employees (SMK-Group): 11,969
Head office: 5-5, Togoshi 6-chome, Shinagawa-ku, Tokyo 142-8511, Japan Tel 81-3-3785-1111 Fax 81-3-3785-1878
Subsidiaries & affiliates: Domestic: Subsidiaries 5 companies Affiliates 2 companiesOverseas: Subsidiaries 22 companies
Website: http://www.smk.co.jp/
Board of Directors and Corporate Auditors
Corporate Data
29 30

5-5, Togoshi 6-chome, Shinagawa-ku, Tokyo 142-8511, JAPANTelephone: 81-3-3785-1111 Fax: 81-3-3785-1878
Printed in Japan
http://www.smk.co.jp/