Embed Size (px)
Citation preview
We Can Handle It.
Annual Report 2011/2012
Demag Cranes AG Annual Report 2011/2012 1
Table of Contents
CEO Letter to the Shareholders 2Report of the Supervisory Board 4Products at a glance 7Management report 9Foreword 11Business and environment 11Business performance of the Demag Cranes Group and its segments in financial year 2011/2012
32
Business performance of the Group and its segments 37Demag Cranes Group financial review 39Demag Cranes AG financial review 44Development of non‐financial success factors 47Risk report 50Report on post‐balance sheet date events 57Forecast report 58Consolidated Financial Statements 61Statement of comprehensive income 64Statement of financial position 65Statement of changes in equity 67Statement of cash flow 68Notes to the Consolidated Financial Statements 69Notes to the Statement of comprehensive income 91Notes to the Statement of financial position 95Other disclosures 120Responsibility statement 150Auditors’ report 151Publisher’s note 153
Demag Cranes AG Annual Report 2011/2012 2
CEO Letter to the Shareholders
Dear Shareholders,
We look back on a year full of change: On 30 January 2012, Demag Cranes AG and Terex Germany GmbH & Co. KG, an indirect wholly‐owned subsidiary of Terex Corporation, Westport, USA, signed a domination and profit and loss transfer agreement that came into effect on entry in the commercial registry on 18 April 2012.
Since April 2012, an integration team has been tasked with integrating the Demag Cranes Group step by step into the Terex Group. We want customers, business partners and employees to benefit as soon as possible from the extra value we can generate with a larger structure, a wider product range and extended sales channels. The changes are now becoming visible as our Industrial Cranes, Services and Port Technology segments are incorporated in Terex Material Handling & Port Solutions.
Material Handling encompasses both the Industrial Cranes business and related Services activities. In this annual report, we present the Services figures separately one more time for ease of comparison with previous years. That aside, from the short financial year onwards, the new structure will also be reflected in our reporting to the capital market. The strong Demag brand continues in the Terex Group – a clear mark of commitment to the Industrial Cranes and related Services business. Terex Port Solutions takes in the port activities previously conducted by Demag Cranes under the Gottwald brand and additionally the Terex port equipment business. In our financial reporting, however, we continue to report solely on the port activities of Demag Cranes. As a result of the integration, Gottwald products are consequently sold from June 2012 under the Terex® | Gottwald brand. The new Port Solutions portfolio of both Terex and Demag Cranes now offers a significantly more comprehensive range of solutions in the industry for automated and non‐automated cargo handling.
We attained key milestones in both businesses during the past year:
In August 2012, Demag Cranes signed the agreements to launch a joint venture with Weihua, one of China’s largest crane builders. The joint venture, Demag Weihua (Liaoning) Material Handling Machinery Co. Ltd., will be responsible for the development and production of components and parts for cranes and hoists in the mid‐market segment. This marks a further milestone in our strategy of boosting emerging market revenue share on a lasting basis.
In August, Terex Port Solutions succeeded in securing major contracts from APM Terminals and Rotterdam World Gateway (RWG) for automated handling systems to equip new container terminals in Rotterdam, the Netherlands. The orders comprise supplying environment‐friendly battery driven Lift AGVs (automated guided vehicles) developed by ourselves, including automated battery exchange stations and our automated stacking cranes for operation of the container yard. This means Terex Port Solutions now has a hand in six automated container terminals – more than any other manufacturer in the world.
We are also happy with the past financial year in operating terms. All three segments put in a positive performance, even if the growth rates in both order intake and revenue were down relative to the previous year. We improved on the key performance indicators. Although our operating EBIT margin is significantly lower than anticipated at the beginning of the financial year, we met our May 2012 forecast in every respect. The associated economic uncertainty makes it difficult, however, to
Demag C
predict hpage 59.
Yours sin
Aloysius CEO
Cranes AG
how the bus.
ncerely,
Rauen
siness will pe
erform in the
Annual Repor
e coming ye
rt 2011/2012
ar. For detaiils on our ouutlook, pleas
3
se turn to
Demag Cranes AG Annual Report 2011/2012 4
Report of the Supervisory Board
During the course of financial year 2011/2012, the Supervisory Board of Demag Cranes AG fulfilled its obligations as required by law, the Articles of Association and the Rules of Procedure and advised the Management Board in its management of the Company.
For the purpose of monitoring the executive management, the Supervisory Board dealt regularly and in detail with the current position of the Company and the further development of the Demag Cranes Group. The Management Board provided the Supervisory Board with regular, prompt and comprehensive information in verbal or written form, in particular on the course of business and business development in the individual segments, the position of the Company and the Group, proposed business policies, corporate planning and strategy, the profitability of the Company, risk management and compliance. In the event of matters and decisions of fundamental importance to the Company, the Management Board involved the Supervisory Board in advance. If a transaction or action by the Management Board required the approval of the Supervisory Board, it was presented by the Management Board in the proper manner and decided upon by the Supervisory Board.
In my capacity as Chairman of the Supervisory Board, I regularly discussed issues related to the Company’s strategy, planning, business development, risk position, risk management and compliance with the Management Board, particularly the Chairman of the Management Board, also outside the Supervisory Board meetings. Thus, I always learned immediately of any events that could be of significance for evaluating the Group’s position and prospects.
In addition, the committee chairmen regularly briefed the Supervisory Board meetings on the work being carried out by the individual committees.
The Supervisory Board held six ordinary and four extraordinary meetings in financial year 2011/2012. The ordinary meetings of the Supervisory Board were held on 29 November 2011, 9 January 2012, 30 January 2012, 15 March 2012, 4 May 2012 and 29 August 2012, and the extraordinary meetings on 5 December 2011, 12 January 2012, 16 March 2012 and 5 July 2012. Due to the urgency of the matters in hand, the extraordinary Supervisory Board meetings were sometimes held by teleconference. On 20 June 2012 and 24 October 2012, the Supervisory Board also adopted resolutions in writing without meeting.
There were no conflicts of interest involving members of the Management or Supervisory Boards in financial year 2011/2012. Further information can be found in the Corporate Governance Report on page 2 et seqq.
Activities and meetings of the committees
The Supervisory Board has formed a total of four committees. In addition to the Mediation Committee, whose formation is required by Section 27 (3) of the German Co‐determination Act (MitbestG), there is the General Committee, the Audit Committee and the Nominations Committee. The committees primarily prepare topics and resolutions for meetings of the full Supervisory Board. In some cases, they also have decision‐making powers transferred to them, insofar as the law permits, by the Supervisory Board. With the exception of the Nominations Committee, the committees each have four members, of whom two are employee representatives and two are

Demag Cranes AG Annual Report 2011/2012 5
shareholder representatives. The Nominations Committee comprises all six shareholder representatives on the Supervisory Board.
Specifically, the General Committee prepares the personnel‐related decisions of the Supervisory Board, such as the terms of Management Board members’ employment contracts including their remuneration, the appointment and dismissal of Management Board members and the nomination of the Chairman of the Management Board. The General Committee held a total of six meetings in financial year 2011/2012, on 23 November 2011, 29 November 2011, 5 December 2011, 1 March 2012, 12 April 2012 and 3 May 2012.
The Audit Committee prepares the Supervisory Board’s decision on the adoption of the Financial Statements and the approval of the Consolidated Financial Statements. To this end, it is responsible for conducting the preliminary review of the Financial Statements, the Consolidated Financial Statements and the combined Management Report, checking the independence of the auditors and the services additionally provided by the auditors, engaging the auditors, specifying the points on which the audit should focus and agreeing the auditors’ fee. The Audit Committee also discusses the half‐yearly and quarterly financial reports with the Management Board prior to their publication and deals, in particular, with the oversight of the financial reporting process, the effectiveness of the internal control system and the internal audit system as well as compliance. In addition, the Audit Committee assists the Supervisory Board in monitoring the executive management. The Audit Committee met a total of six times in financial year 2011/2012, on 28 November 2011, 5 December 2011, 30 January 2012, 4 May 2012, 5 July 2012 and 28 August 2012. The Chairman of the Audit Committee has at no time been a member of the Company’s Management Board, is independent and, as a result of his education and professional experience, has appropriate accounting and auditing expertise.
The Nominations Committee met once in financial year 2011/2012, on 29 November 2011.
There was no reason in financial year 2011/2012 to convene a meeting of the Mediation Committee pursuant to Section 27 (3) of the German Co‐determination Act (MitbestG).
Audit of the Financial Statements and Consolidated Financial Statements
On 16 March 2012, the Annual General Meeting resolved to appoint PricewaterhouseCoopers AG, Wirtschaftsprüfungsgesellschaft, Düsseldorf, as auditors of the Financial Statements and Consolidated Financial Statements for financial year 2011/2012. The Supervisory Board engaged PricewaterhouseCoopers AG, Wirtschaftsprüfungsgesellschaft, Düsseldorf, as auditors for financial year 2011/2012, concluded the agreements regarding the auditors’ fee and followed the Audit Committee’s recommendations in specifying the points on which audit activities should focus.
The audit of the Financial Statements and Consolidated Financial Statements as at 30 September 2012 focused on the following: presentation and deferral of revenue, particularly when using the percentage‐of‐completion method; the impact on earnings of the over‐ or undervaluation of assets, an excess or shortfall of provisions and estimated amounts in the accounts (management override of controls); recoverability of assets (incl. goodwill), including note disclosures and clear documentation (plausibility of assumptions used to calculate recoverable amount, including replacement cost of capital); effects of the domination & profit and loss transfer agreement; the recognition of current income tax and deferred tax; opportunity and risk reporting in the Group Management Report and assessment of the risk early warning system.
Demag C
Pricewatunqualifprepared2012. Thmember2012 anexaminematerialinformatthe intethat theauditorsconducteEUR 128ConsolidBoard apexaminathe Finaadopted
Corpora
In financCompanCode of within tStatemeBoards iStock Co2012. Th
FinanciaSupervisemployecompani
Düsseldo The Supe Dr. MichChairma
Cranes AG
terhouseCoofied audit od by the Mahe financial rs of the Supd the Superved in detail i findings oftion. In doinrnal control ere were no also reported an inform8,000 in finandated Financpproved the ation. The Suncial Statemd.
te Governan
cial year 20y’s corporat15 May 20
the Demag ent on Corpossued an uporporations Ahis declaratio
l year 2011sory Board wees and theies for their w
orf, 30 Nove
ervisory Boa
hael W. Ernesn
opers AG, Wopinion on anagement Bstatement
pervisory Bovisory Boardn the presenf their auditg so, the audand risk mao circumstanted that, inmal review asncial year 20cial Statemefindings of t
upervisory Boments and Co
nce
011/2012, thte governan12, the ManCranes Groorate Goverpdated DeclaAct (AktG), won is publishe
1/2012 was would like toe employee work.
mber 2012
rd
stus
Wirtschaftsprthe FinanciaBoard for thdocuments ard in good d meeting of nce of the ats, answeredditors confiranagement snces that w addition tos at 31 Marc011/2012. Hants as well the auditors’oard followensolidated F
he Supervisoce. Pursuantnagement aup in the Crnance. On 3ration of Cowhich the Sued on the Int
a particulao express its representat
Annual Repor
rüfungsgeselal Statemenhe financial yand the autime. At thef 29 Novembuditors. At bd questions rmed that nosystem in rewould call ino performinh 2012 and aving thorouas the comb audit. It did
ed the Audit Financial Stat
ory Board agt to Clause nd SupervisoCorporate G30 Novembompliance in pervisory Boternet at ww
arly eventfu thanks andtives of all
rt 2011/2012
llschaft, Düsnts and Conyear from 1 ditors’ audite Audit Comber 2012, theboth meetinand were a
o material wlation to thento questiong the finanprovided audughly examinbined Mana not raise anCommittee’stements. The
gain devote3.10 of the ory Boards Governance er 2012, theaccordance oard adoptedww.demagcra
l year for t recognitionGroup mem
sseldorf, audnsolidated FOctober 20t reports wemittee meete documentsgs, the auditavailable to eaknesses he financial ren the auditocial statemedit‐related sened the Finagement Repny objectionss recommene Financial S
d consideraGerman Coreport on coReport in ce Managemwith Sectiond at its meetanes‐ag.com
the Demag to the Man
mber compa
dited and isFinancial Sta011 to 30 Seere submittting of 28 Ns were discutors reporteprovide any
had been ideeporting proors’ impartiaent audits, tervices amoncial Statemport, the Sus on completndation and aStatements w
ble attentioorporate Govorporate govconnection
ment and Sun 161 of theting on 29 N
m.
Cranes Gronagement Boanies and as
6
ssued an atements eptember ed to all ovember ussed and ed on the y further ntified in ocess and ality. The they had unting to
ments and pervisory tion of its approved were thus
on to the vernance vernance with the pervisory e German ovember
oup. The oard, the ssociated
Demag C
Produc
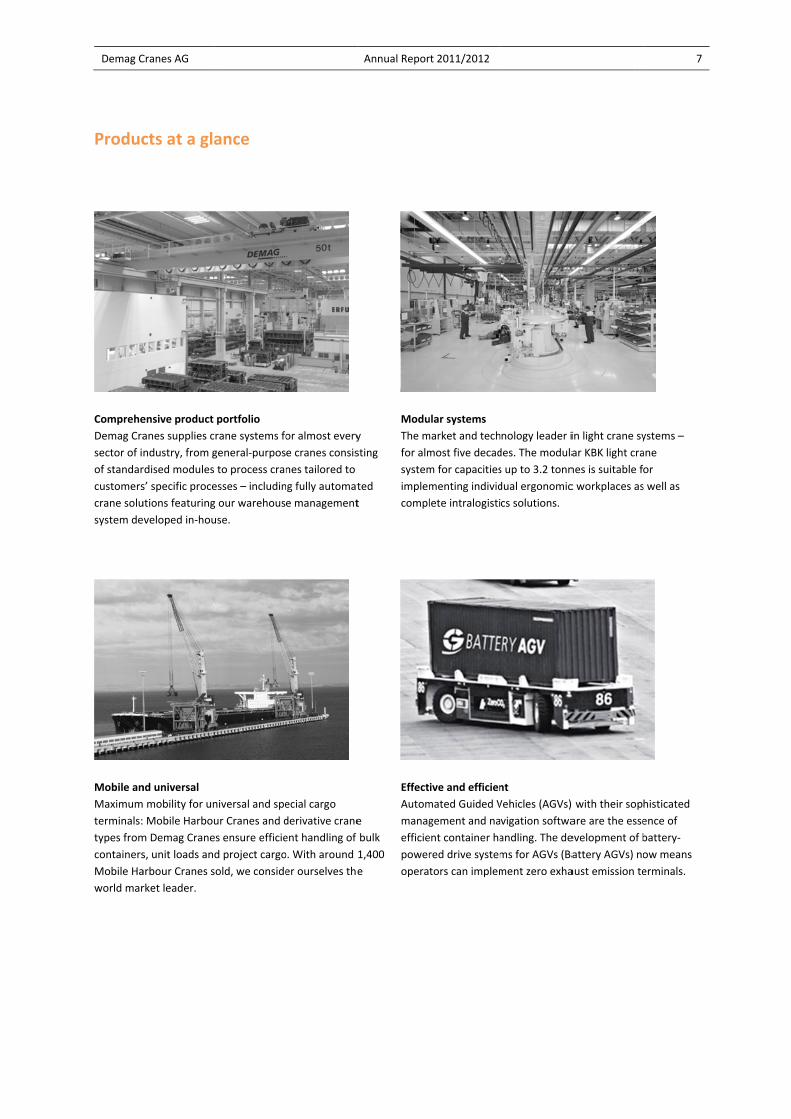
Comprehe
Demag Cra
sector of i
of standar
customers
crane solu
system de
Mobile an
Maximum
terminals:
types from
containers
Mobile Ha
world mar
Cranes AG
cts at a gla
ensive product
anes supplies c
ndustry, from g
rdised modules
s’ specific proce
utions featuring
eveloped in‐hou
nd universal
mobility for un
Mobile Harbou
m Demag Crane
s, unit loads and
arbour Cranes s
rket leader.
ance
portfolio
rane systems fo
general‐purpos
to process cran
esses – includin
g our warehous
use.
niversal and spe
ur Cranes and d
es ensure efficie
d project cargo
sold, we conside
or almost every
e cranes consis
nes tailored to
g fully automat
e management
ecial cargo
derivative crane
ent handling of
o. With around
er ourselves the
Annual Repor
y
sting
ted
t
Modu
The m
for alm
system
imple
compl
e
bulk
1,400
e
Effect
Autom
manag
efficie
power
opera
rt 2011/2012
ular systems
market and tech
most five decad
m for capacities
menting individ
lete intralogisti
ive and efficien
mated Guided V
gement and na
ent container ha
red drive system
tors can implem
nology leader i
des. The modula
s up to 3.2 tonn
dual ergonomic
cs solutions.
nt
Vehicles (AGVs)
vigation softwa
andling. The de
ms for AGVs (Ba
ment zero exha
in light crane sy
ar KBK light cra
nes is suitable f
c workplaces as
with their sop
are are the esse
evelopment of b
attery AGVs) no
aust emission te
7
ystems –
ane
or
s well as
histicated
ence of
battery‐
ow means
erminals.
Demag C
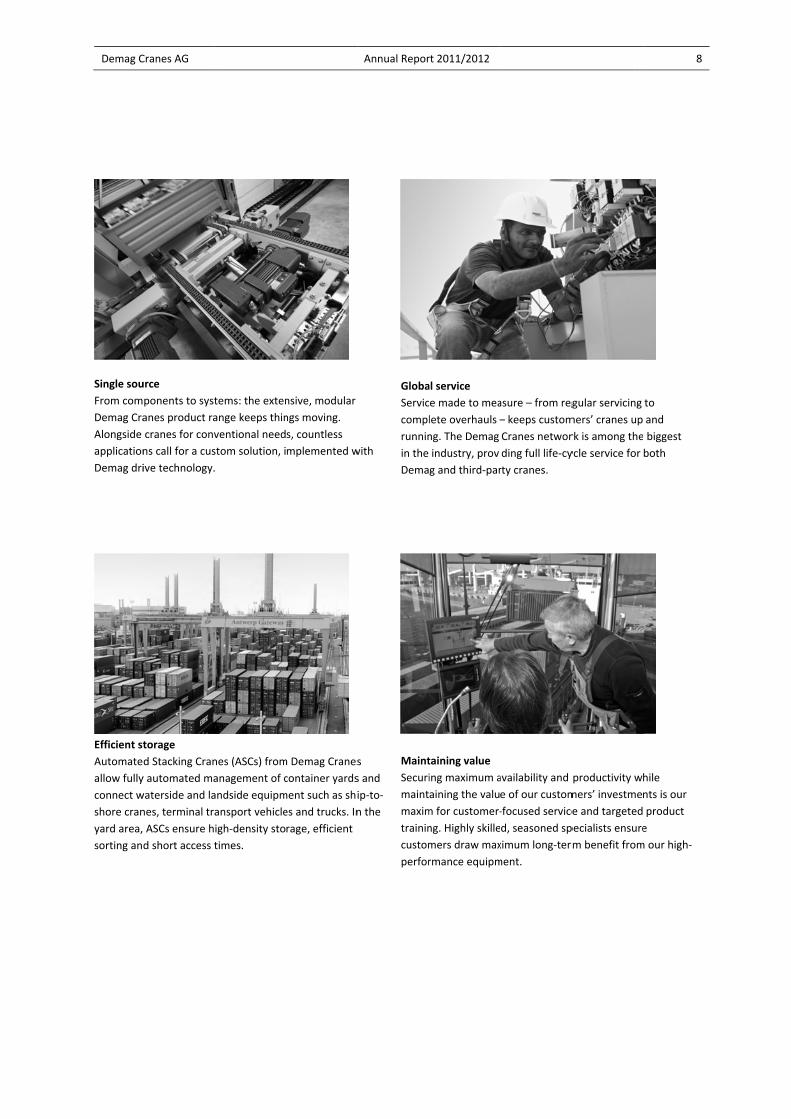
Single sou
From com
Demag Cra
Alongside
application
Demag dri
Efficient st
Automate
allow fully
connect w
shore cran
yard area,
sorting an
Cranes AG
urce
ponents to syst
anes product ra
cranes for conv
ns call for a cus
ive technology.
torage
d Stacking Cran
y automated ma
waterside and la
nes, terminal tr
ASCs ensure h
d short access t
tems: the exten
ange keeps thin
ventional need
stom solution, i
.
nes (ASCs) from
anagement of c
andside equipm
ansport vehicle
igh‐density sto
times.
nsive, modular
ngs moving.
s, countless
mplemented w
m Demag Cranes
container yards
ment such as shi
es and trucks. In
rage, efficient
Annual Repor
with
Globa
Servic
compl
runnin
in the
Dema
s
s and
ip‐to‐
n the
Maint
Securi
maint
maxim
trainin
custom
perfor
rt 2011/2012
al service
ce made to mea
lete overhauls –
ng. The Demag
industry, provi
g and third‐par
taining value
ing maximum a
aining the valu
m for customer‐
ng. Highly skille
mers draw max
rmance equipm
asure – from reg
– keeps custom
Cranes networ
ding full life‐cy
rty cranes.
availability and
e of our custom
‐focused service
d, seasoned sp
ximum long‐term
ment.
gular servicing
mers’ cranes up
rk is among the
ycle service for
productivity wh
mers’ investmen
e and targeted
pecialists ensure
m benefit from
8
to
and
biggest
both
hile
nts is our
product
e
m our high‐
Demag Cranes AG Annual Report 2011/2012 9
Combined Group Management Report and Management Report of Demag Cranes AG
for the financial year
from 1 October 2011 to 30 September 2012
Demag Cranes AG Annual Report 2011/2012 10
Table of contents
Foreword .......................................................................................................................... 11
Business and environment ................................................................................................ 11
Group structure and business activities ................................................................................................................ 11 Organisation and locations ................................................................................................................................... 14 Management structure ......................................................................................................................................... 15 Group management .............................................................................................................................................. 15 Statement on corporate governance under Section 289a of the German Commercial Code .............................. 16 Corporate governance report ............................................................................................................................... 16 Remuneration report ............................................................................................................................................ 16 Disclosures under Sections 289 (4) and 315 (4) of the German Commercial Code and explanatory report on these disclosures by the Management Board of Demag Cranes AG ..................................................................... 23 General economic environment ........................................................................................................................... 30 Effects of the economic environment on business performance ......................................................................... 31
Business performance of the Demag Cranes Group and its segments in financial year 2011/2012 ........................................................................................................................ 32
Takeover by Terex and integration into the Terex Group ..................................................................................... 32 Overall assessment of business performance and target attainment in the financial year ................................. 33 Demag Cranes AG shares ...................................................................................................................................... 34
Business performance of the Group and its segments ....................................................... 37
Demag Cranes Group financial review .............................................................................. 39
Demag Cranes Group earnings ............................................................................................................................. 39 Demag Cranes Group cash flows .......................................................................................................................... 41 Demag Cranes Group financial position ................................................................................................................ 42
Demag Cranes AG financial review.................................................................................... 44
Demag Cranes AG earnings ................................................................................................................................... 44 Demag Cranes AG cash flows and balance sheet .................................................................................................. 45
Development of non‐financial success factors .................................................................. 47
Employees ............................................................................................................................................................. 47 Procurement and purchasing ................................................................................................................................ 48 Research and development .................................................................................................................................. 48 Environment and occupational safety .................................................................................................................. 49
Risk report ........................................................................................................................ 50
Risk management system ..................................................................................................................................... 50 Opportunity management .................................................................................................................................... 51 Significant individual risks ..................................................................................................................................... 51 Assessment of the risk situation and change in the risk position since the previous year ................................... 54 Disclosures under Section 289 (5) and Section 315 (2) 5 of the German Commercial Code (main features of the internal control system and of the risk management system in relation to the financial reporting process) and explanatory report on these disclosures by the Management Board of Demag Cranes AG ................................ 55
Report on post‐balance sheet date events ........................................................................ 57
Forecast report ................................................................................................................. 58
Introduction .......................................................................................................................................................... 58 Business outlook for the Demag Cranes Group .................................................................................................... 59
Demag Cranes AG Annual Report 2011/2012 11
Foreword
The Consolidated Financial Statements of Demag Cranes AG on which this report is based were prepared in accordance with the International Financial Reporting Standards (IFRS) as adopted in the EU. Demag Cranes AG is the parent company of the Demag Cranes Group. It continues after the majority takeover by Terex to perform the usual functions of a management holding company as well as assuming responsibility for operational management. In this capacity, the Company manages and administers its Group member companies and associated companies. During the past financial year, in the course of its ordinary operating activities, Demag Cranes AG provided services in its shared services function relating to Financial Controlling, Finances and Accounting, Group Accounting, IT, Strategic Purchasing, Human Resources, Corporate Strategy, Corporate Communication & Marketing and Language Services. The position and future development of Demag Cranes AG depend mainly on the business success of the Demag Cranes Group. The Separate Company Financial Statements of Demag Cranes AG, on which this Combined Management Report is also based, were prepared in accordance with the provisions of the German Commercial Code (HGB) and the German Stock Corporations Act (AktG).
The Demag Cranes Group and Demag Cranes AG Combined Management Report are prepared in euros, the functional currency of Demag Cranes AG. All figures are rounded to the nearest million euros unless otherwise stated. All percentages relate to figures stated to the nearest euro. The amount shown for each individual item and total is the figure with the smallest rounding difference. Reported totals may therefore differ slightly from the sum of the individual reported amounts.
Business and environment
Group structure and business activities
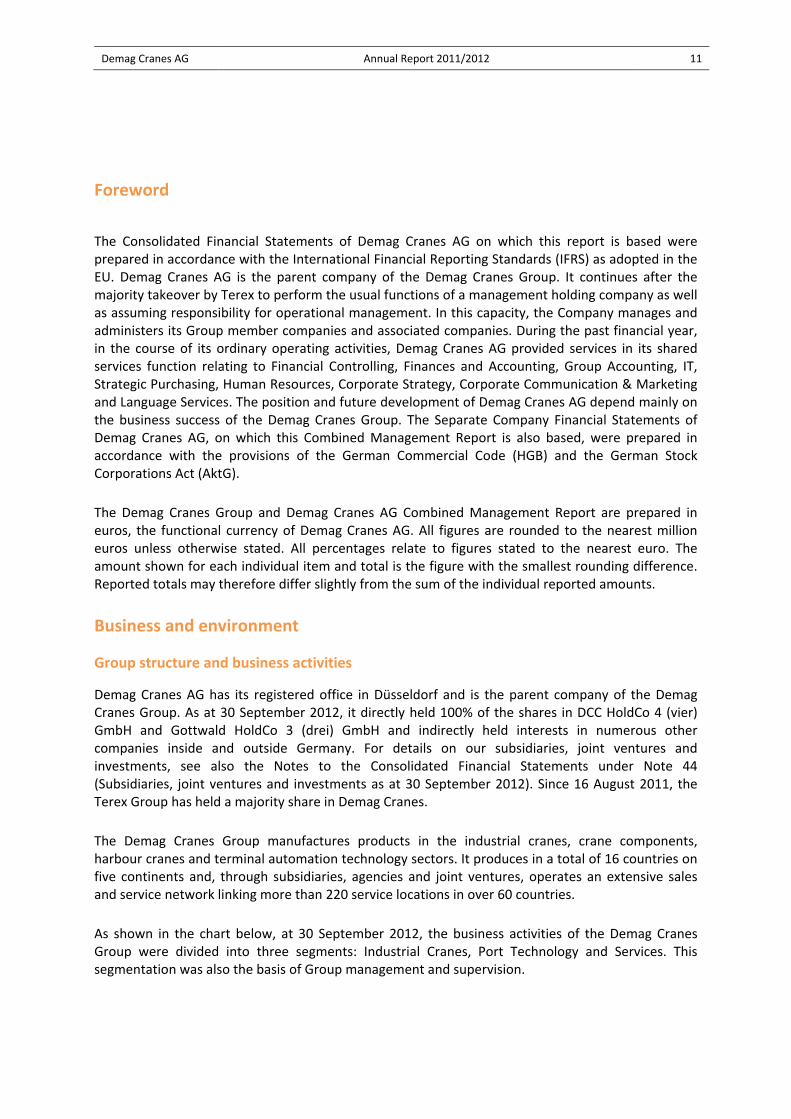
Demag Cranes AG has its registered office in Düsseldorf and is the parent company of the Demag Cranes Group. As at 30 September 2012, it directly held 100% of the shares in DCC HoldCo 4 (vier) GmbH and Gottwald HoldCo 3 (drei) GmbH and indirectly held interests in numerous other companies inside and outside Germany. For details on our subsidiaries, joint ventures and investments, see also the Notes to the Consolidated Financial Statements under Note 44 (Subsidiaries, joint ventures and investments as at 30 September 2012). Since 16 August 2011, the Terex Group has held a majority share in Demag Cranes.
The Demag Cranes Group manufactures products in the industrial cranes, crane components, harbour cranes and terminal automation technology sectors. It produces in a total of 16 countries on five continents and, through subsidiaries, agencies and joint ventures, operates an extensive sales and service network linking more than 220 service locations in over 60 countries.
As shown in the chart below, at 30 September 2012, the business activities of the Demag Cranes Group were divided into three segments: Industrial Cranes, Port Technology and Services. This segmentation was also the basis of Group management and supervision.

Demag Cranes AG Annual Report 2011/2012 12
Demag Cranes – built on three pillars until 30 September 2012
Demag Cranes forms the core of Material Handling & Port Solutions segment of the Terex Corporation. In the course of its integration into the Terex group, Demag Cranes no longer intends to report in future to the capital market on its three segments Industrial Cranes, Port Technology and Services. In line with the new organisation within Terex, the business activities of the Industrial Cranes and Services segments will be grouped under Material Handling while those of the Demag Port Technology segment, the Terex Port Equipment business as well as the Terex Reach Stacker business in Montceau les Mines will be part of Port solutions in the future. The Terex Port Equipment business and the Reach Stacker business in Montceau Les Mines will not be included in the Financial Statements of Demag Cranes. The former entities of Demag Cranes that have been sold to Terex are included in the Financial Statements until the date of sale. As a result, figures reported in the Financial Statements of Terex Corporation for the Material Handling & Port Solutions segment will thus not be comparable with those in the Consolidated Financial Statement of Demag Cranes.
TEREX Material Handling & Port Solutions
Port Solutions (Port Technology &
Terex Port Equipment, Terex reach stacker business)
Material Handling (Industrial Cranes &
Services)
Demag Cranes
Material Handling & Port Solutions
Material Handling (Industrial Cranes &
Services)
Port Solutions (Port Technology)
• Standard and Process Cranes • Crane construction kit • Rope and chain hoists
• Mobile Harbour Cranes • Automated Stacking Cranes • Automated Guided Vehicles
• Spare parts • Refurbishment • Field service
FY 2011/2012 key figures
Order intake: EUR 1,326.6 million Revenue: EUR 1,123.3 million Oper. EBIT: EUR 89.2 million
Industrial Cranes Port Technology Services
• Share of revenue: 46.6 % • Installed base: > 600,000
• Share of revenue: 23.6 %• Around 1,500 MHC sold
• Share of revenue: 29.8 %
Demag Cranes AG Annual Report 2011/2012 13
Industrial Cranes products and markets
Port Technology products and markets
• Standard Cranes • Process Cranes • Crane construction kit • Rope and chain hoists • Travel unit components • Switch and control systems • Geared motors & drives • Load handling attachments • Crane components
• General manufacturing • Engineering companies • Pulp & paper producers • Steelmaking companies • Shipbuilders • Energy utilities • Storage & logistics • Automotive industry • Waste sector • Mechanical engineering industry
• Excellent positioning in technologically advanced and high quality product segments
• Konecranes Plc. • Columbus McKinnon Corporation
• ABUS • Kito Corporation
Product portfolio End markets Market position
Competitors
• Mobile Harbour Cranes• Automated Guided Vehicles • Automated Stacking Cranes • Wide Span Gantries • Turnkey projects for ports & intermodal terminals
• Consulting and software tools for planning and optimising terminal operations
• Spare parts • Service
• Large port & terminal operators
• Small multifunctional ports • Intermodal handling within inland ports
• New terminal projects and ”Green Ports”
• #1 in Mobile Harbour Cranes based on market share and installed base of about 1,500 cranes sold
• Technological leader in automated port technology
• Konecranes Plc. • Kalmar • ZPMC Co. Ltd. • Liebherr International AG
Product portfolio End markets Market position
Competitors
Demag Cranes AG Annual Report 2011/2012 14
Services products and markets
Organisation and locations
In the Industrial Cranes segment, crane girders are produced and cranes are assembled at 21 plants in highly industrialised regions around the world. The components required for the production of industrial cranes are supplied by our own two component plants in Wetter an der Ruhr (Germany) and Uslar (Germany) as well as five plants that manufacture cranes and components located in São Paulo (Brazil), Chakan (India), Slaný (Czech Republic), Agrate (Italy) and Shanghai (China). Seven of the 21 crane plants are operated by MHE‐Demag (S) Pte Ltd., Singapore, a 50/50 joint venture between Demag Cranes & Components GmbH, Wetter, and Jebsen & Jessen (SEA) Pte Ltd., Singapore. In less industrialised regions, the Group works together with crane manufacturing partners and provides them with our own components and production‐related engineering services. This gives us broad geographical coverage and operational flexibility. Crane girders produced by local partners are then locally assembled with Demag components to create cranes in line with our quality requirements. This allows us to plan production capacities better and to use them more profitably. The product development activities of the Industrial Cranes segment targeting emerging markets are increasingly being relocated to these regions. In Pune (India) and Shanghai (China), for example, development centres have been established for industrial crane and port technology products. This creates in‐depth product expertise tailored to these specific markets. In August 2012, Demag Cranes signed the agreements to launch a joint venture with Weihua, one of China’s largest crane builders. The joint venture, Demag Weihua (Liaoning) Material Handling Machinery Co. Ltd., will be responsible for the development and production of components and parts for cranes and hoists in the mid‐market segment.
Production as well as the technical areas of the Port Technology segment are located at the Düsseldorf plant, with engineering and research as well as development activities also based in the development centre in Pune (India). Both our main market in Europe and our international customers are served centrally from Düsseldorf. Operations focus on the production of critical large components that determine product quality as well as on final assembly. We additionally draw on a worldwide network of suppliers and production partners. The cranes we produce are transported along the Rhine to the North Sea ports of Antwerp and Rotterdam and from there on to end
• Commissioning • Operator and safety training courses
• Crane inspections and safety checks
• Crane runway surveys • Maintenance agreements • Spare parts and accessories • Factory repairs • General overhauls • Crane upgrades and refurbishment
• 24/7 emergency service
• Customers of the industrial cranes segment and other crane operators worldwide
• Demag Cranes, crane components and drives
• Non‐Demag cranes and components
• Lifting equipment
• Market leader regarding installed base of more than 660,000 cranes and hoists
• Service network with more than 220 service centres
• In‐house service departments of customers
• Multitude of small service providers
• Other crane manufacturers • Industrial service providers
Product portfolio End markets Market position
Competitors
Demag Cranes AG Annual Report 2011/2012 15
customers. Worldwide sales and service in the Port Technology segment are carried out by centrally based key account managers for international customers, but also regionally by Demag Cranes AG’s regional subsidiaries, or by contractual partners.
In the Services segment, the Demag Cranes Group operates one of the largest crane and lifting equipment service networks on the market. The largest installed base in the world numbering over 660,000 Demag cranes and electric hoists is served by more than 220 service centres worldwide. Our service sales team actively approaches customers and our services are provided by our own, qualified staff.
The spare parts business is increasingly being conducted via our web‐based Demag Shop system. This gives customers direct access to Demag spare parts and components as well as to automated, cost‐effective business processes with a direct link to the central spare parts logistics system and production. Repair centres for general overhauls and repairs to crane components are available globally. A centrally organised competence centre provides development services for complex crane refurbishment projects.
Management structure
The Management Board, as the executive body, holds responsibility for the segments. It is supported by five executive vice presidents, who together with the Management Board form the Executive Committee. Ongoing Group management and reporting to the capital market and Supervisory Board are based on standard reporting.
The sales organisation, through which the sale of our products and services is managed Group‐wide, comprises local sales and service companies as well as a partner network.
The production network comprises our own strategically sited component factories in Germany, Brazil and China as well as local crane factories and partners, and ensures consistently top product quality at high levels of efficiency.
Group management
Demag Cranes AG’s key performance indicator system
Demag Cranes AG uses a performance indicator system based around a number of globally standardised and clearly structured key performance indicators (KPIs). The basis consists of IFRS figures adjusted as necessary in accordance with internal control needs. This includes adjusting for one‐off items.
The most important KPIs are as follows: cash generation (cash flow return on revenue), return on capital, return on sales, working capital as a percentage of revenue, order intake and order book as advanced indicators and functional indicators.
Among these key performance indicators, the profitability indicators play a special part as they essentially use operating net income, a central management indicator, as the target metric in the denominator. Indicators based on earnings before interest and tax (EBIT) and revenue are used as key measures of target attainment for all parts of the Group and also as the basis for calculating variable compensation.
Demag Cranes AG Annual Report 2011/2012 16
Statement on corporate governance under Section 289a of the German Commercial Code
The Statement on corporate governance is available for viewing online at www.demagcranes‐ag.com/statement_on_corporate_governance.
Corporate governance report
The Corporate governance report is available for viewing online at www.demagcranes‐ag.com/corporategovernance.
Remuneration report
With regard to commercial law disclosure requirements, the following Remuneration Report also forms an integral part of the Notes to the Consolidated Financial Statements and Group Management Report.
Compensation for the Management Board
Overall Management Board compensation normally comprises a fixed salary, a performance‐based bonus, pension benefits and fringe benefits. Management Board member Lawrence Lockwood additionally participates in the Terex Corporation Long Term Incentive Plan. Management Board members Rainer Beaujean and Thomas H. Hagen, who stepped down in 2011, additionally participate in the Demag Cranes AG Matching Stock Program (MSP).
The appropriate level of compensation to be received by members of the Management Board overall is determined by the full Supervisory Board at the proposal of the General Committee based on a performance review.
Aloysius Rauen’s contract as member of the Management Board, which has been renewed until 30 April 2017, was revised with effect from 1 October 2011 and supplemented with provisions relating to D&O insurance by Supervisory Board resolution of 4 January 2012.
By resolution of the Supervisory Board of 5 December 2011, Axel Joachim Arendt was appointed on an interim basis pursuant to Section 105 of the German Stock Corporations Act to fill a vacant post on the Management Board. Following the departure of Mr Beaujean, the Management Board would otherwise no longer have had at least two members as required by the Articles of Association. The employment contract signed with Mr Arendt with effect from 5 December 2011 ended, together with his office as member of the Management Board, on 15 May 2012.
Lawrence Lockwood was appointed to the Management Board of the Company on 16 May 2012. His Management Board contract signed with effect from 16 May 2012 ends on 31 December 2013. The components of his compensation and other benefits under his Management Board contract are paid, for the time being, by Terex Corporation and normally refunded to the latter by Demag Cranes AG against invoice.
Demag Cranes AG Annual Report 2011/2012 17
Non‐performance‐related compensation, old‐age and surviving dependants’ pensions, and fringe benefits
The non‐performance‐related component of compensation comprises basic compensation and fringe benefits.
For the CEO, Aloysius Rauen, this includes vested pension benefits from his 65th birthday. The amount of this pension is determined based on the length of Mr Rauen’s service at Demag Cranes AG and amounts to up to 40% of his final gross fixed salary. Until the end of their contract terms, Mr Hagen und Mr Beaujean additionally received contributions towards an external pension plan. For the duration of his Management Board contract, Mr Lockwood is entitled to participate in the Terex retirement plan (401(k) plan), under which Terex pays a company contribution of 100% of the first five percent of Mr Lockwood’s contributions up to a maximum of USD 12,500.
The Management Board contract with Mr Rauen also provides for a surviving dependants’ pension in the form of a life‐long widow’s pension. The widow’s pension amounts to 60% of the maximum retirement pension.
Finally, members of the Management Board receive fringe benefits in the form of non‐cash compensation, primarily comprising insurance premiums (e.g. contributions to health and long‐term care insurance, life and accident insurance), expenses (e.g. travel) and use of a company car. Certain additional fringe benefits apply specifically for Mr Lockwood including relocation and other costs arising through his relocation to Germany from the USA. These specific fringe benefits are met in part by Demag Cranes AG and in part by Terex Corporation.
There is also a directors’ and officers’ liability insurance (D&O) policy for members of the Management Board, which provides for a suitable deductible. For each claim, the members of the Management Board being claimed for personally meet 10% of the loss up to a maximum amount for all claims made within one year of 150% of the Management Board member’s fixed annual compensation (deductible).
Performance‐related compensation and long‐term incentive components
With the exception of Mr Arendt (who is now no longer a member), members of the Management Board received performance‐related compensation during the reporting period in the form of a bonus. The bonus consists of a target bonus and an additional bonus.
The maximum annual target bonus is EUR 800,000 for the CEO, Mr Rauen, and USD 136,000 for the CFO, Mr Lockwood. The maximum annual additional bonus is EUR 440,000 for Mr Rauen and USD 95,200 for Mr Lockwood.
The target bonus is linked to the attainment of targets defined by the Supervisory Board relating to operating EBIT (50% weighting) and operating net income after tax (50% weighting). If the targets are attained in full, 100% of the target bonus is paid out. If the targets fail to be met by 20% or less, the bonus paid out is reduced accordingly on a straight‐line basis, with a final figure of 25% of the target bonus being reached if 80% of the target is met. If one of the targets fails to be met by more than 20%, there is no entitlement to the bonus, in which event the Supervisory Board decides at its own discretion whether to grant a bonus and the amount of the bonus.
Demag Cranes AG Annual Report 2011/2012 18
The granting and size of the additional bonus depend on attainment of highly demanding targets set by the Supervisory Board for the key performance indicators of operating EBIT and operating net income after tax.
For Mr Rauen, two thirds of the target and additional bonuses for the first of three financial years is paid out after the first financial year. The remaining third is only paid out after the third financial year if and to the extent that the relevant targets for the second and third financial years are attained. For the target bonus, the amount of the remaining third to be paid out is calculated on the basis of the average target attainment for the second and third financial years. This two‐year average must be at least 80%, with the individual target attainment figures for the two years capped at a maximum of 100%. The average figure calculated in this way is multiplied by the as yet unpaid portion of the target bonus (one third) from the first financial year to determine the amount to be paid for the first financial year. Just as for the target bonus, only two thirds of the additional bonus is paid out after the first financial year. The remaining third is paid out after the third financial year if and to the extent that the special targets for the additional bonus for the second and third financial years are attained, based on the average attainment of targets for the additional bonus.
The target bonus for Mr Rauen amounted to EUR 525,000 for the reporting period; the additional bonus amounted to EUR 0. Under the staggered pay‐out arrangements as described above, two thirds of the target and additional bonuses for the first of three financial years will be paid out after the first financial year – i.e. after financial year 2011/2012. The remaining third will be paid out after the third financial year subject to the above conditions. Mr Rauen will therefore be paid a target bonus of EUR 350,000 and an additional bonus of EUR 0 for financial year 2011/2012.
Management Board member Lockwood will be paid a (pro rata temporis) target bonus of EUR 26,000 and a (pro rata temporis) additional bonus of EUR 0 for financial year 2011/2012. Irrespective of the above bonus arrangements, Mr Lockwood continues to participate (at the expense of Terex Corporation) in the Terex Long Term Incentive Plan. Under this plan, Terex Corporation has granted him long‐term and short‐term incentive benefits (shares and cash) for which, by resolution of the Board of Directors of Terex Corporation, he will continue to be taken into consideration. The grant conditions for the incentive benefits are to correspond with those of the Terex Long Term Incentive Plan, which are laid down annually by the Board of Directors of Terex Corporation.
Specific arrangements for members of the Management Board who have stepped down during the reporting period
Following consummation of the tender offer from Terex Industrial Holding AG and the resulting change of control, the two Management Board members Rainer Beaujean and Thomas H. Hagen exercised their special right of termination with effect from 30 November 2011.
In full settlement of Mr Beaujean’s and Mr Hagen’s entitlements to pro rata temporis target and additional bonuses under their Management Board contracts, a final payment of EUR 65,000 each was agreed in the context of their departure from the Management Board. This is equivalent to two thirds of their respective maximum pro rata temporis target bonus.
It was also agreed in the context of Mr Beaujean’s and Mr Hagen’s departure from the Management Board that they would continue to participate in the Company’s Matching Stock Program (MSP) and would not lose their MSP entitlements (the MSP entitles participants to subscribe for phantom shares if they have acquired Demag Cranes AG shares). The number of rights granted to Mr Beaujean
Demag Cranes AG Annual Report 2011/2012 19
and Mr Hagen and the fair value of those rights as at the grant date are stated below under “Matching Stock Program (MSP).”
The contributions towards an external pension plan for Mr Beaujean and Mr Hagen continued to be paid up to 30 November 2011, including on a pro rata temporis basis for financial year 2011/2012.
In the context of Mr Beaujean’s and Mr Hagen’s departure, a reduction was agreed to the widows’ and orphans’ pensions provided for in their Management Board contracts. This results in a widow’s pension of EUR 34,400 p.a. and an orphan’s pension of EUR 17,200 p.a. in relation to the two former Management Board members Mr Beaujean and Mr Hagen.
No specific arrangements were made for termination of Mr Arendt’s office as member of the Management Board.
Management Board compensation for financial year 2011/2012
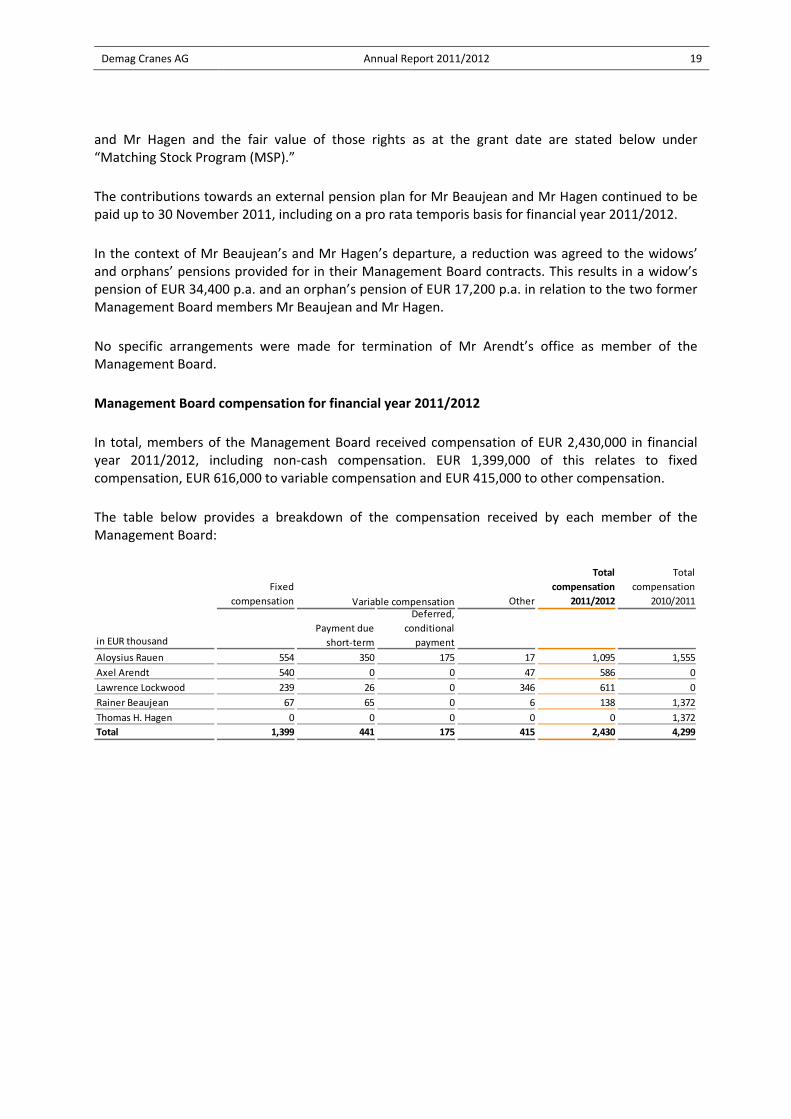
In total, members of the Management Board received compensation of EUR 2,430,000 in financial year 2011/2012, including non‐cash compensation. EUR 1,399,000 of this relates to fixed compensation, EUR 616,000 to variable compensation and EUR 415,000 to other compensation.
The table below provides a breakdown of the compensation received by each member of the Management Board:
Fixed
compensation Other
Total
compensation
2011/2012
Total
compensation
2010/2011
in EUR thousand
Aloysius Rauen 554 350 175 17 1,095 1,555
Axel Arendt 540 0 0 47 586 0
Lawrence Lockwood 239 26 0 346 611 0
Rainer Beaujean 67 65 0 6 138 1,372
Thomas H. Hagen 0 0 0 0 0 1,372
Total 1,399 441 175 415 2,430 4,299
Variable compensation
Payment due
short‐term
Deferred,
conditional
payment
Demag Cranes AG Annual Report 2011/2012 20
Pensions and surviving dependants’ pensions
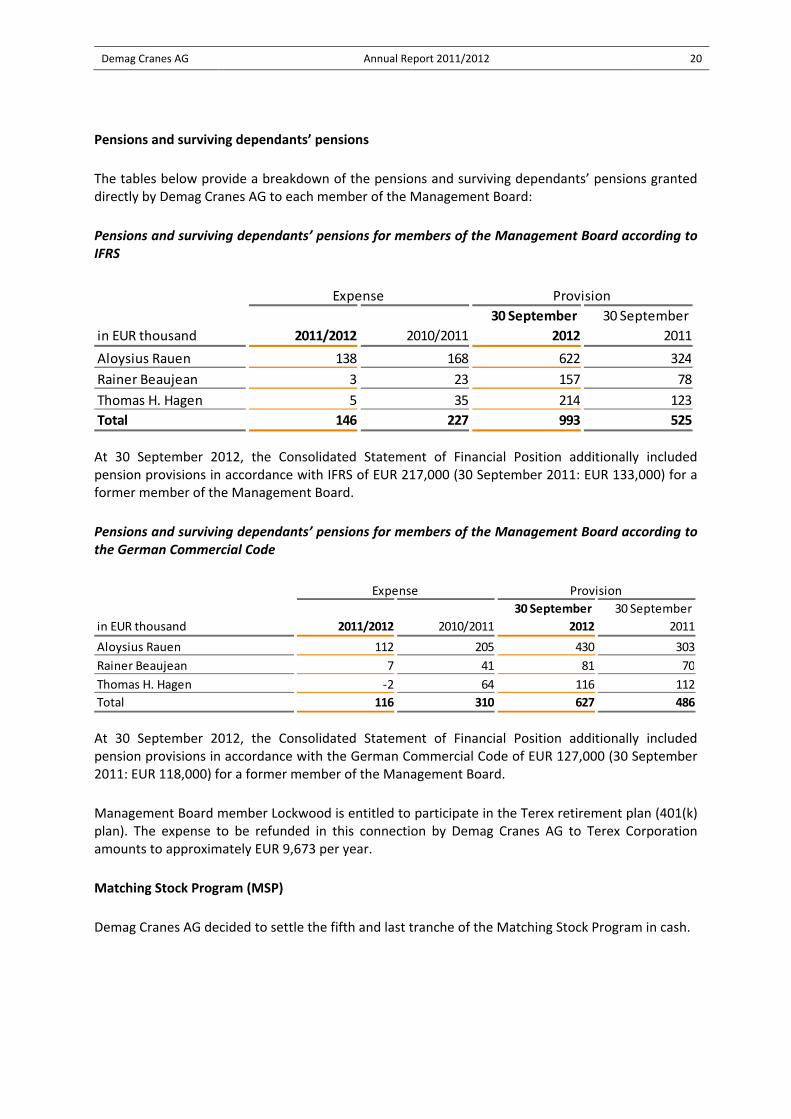
The tables below provide a breakdown of the pensions and surviving dependants’ pensions granted directly by Demag Cranes AG to each member of the Management Board:
Pensions and surviving dependants’ pensions for members of the Management Board according to IFRS
At 30 September 2012, the Consolidated Statement of Financial Position additionally included pension provisions in accordance with IFRS of EUR 217,000 (30 September 2011: EUR 133,000) for a former member of the Management Board.
Pensions and surviving dependants’ pensions for members of the Management Board according to the German Commercial Code
At 30 September 2012, the Consolidated Statement of Financial Position additionally included pension provisions in accordance with the German Commercial Code of EUR 127,000 (30 September 2011: EUR 118,000) for a former member of the Management Board.
Management Board member Lockwood is entitled to participate in the Terex retirement plan (401(k) plan). The expense to be refunded in this connection by Demag Cranes AG to Terex Corporation amounts to approximately EUR 9,673 per year.
Matching Stock Program (MSP)
Demag Cranes AG decided to settle the fifth and last tranche of the Matching Stock Program in cash.
in EUR thousand 2011/2012 2010/2011
30 September
2012
30 September
2011
Aloysius Rauen 138 168 622 324
Rainer Beaujean 3 23 157 78
Thomas H. Hagen 5 35 214 123
Total 146 227 993 525
Expense Provision
in EUR thousand 2011/2012 2010/2011
30 September
2012
30 September
2011
Aloysius Rauen 112 205 430 303
Rainer Beaujean 7 41 81 70
Thomas H. Hagen ‐2 64 116 112
Total 116 310 627 486
Expense Provision
Demag Cranes AG Annual Report 2011/2012 21
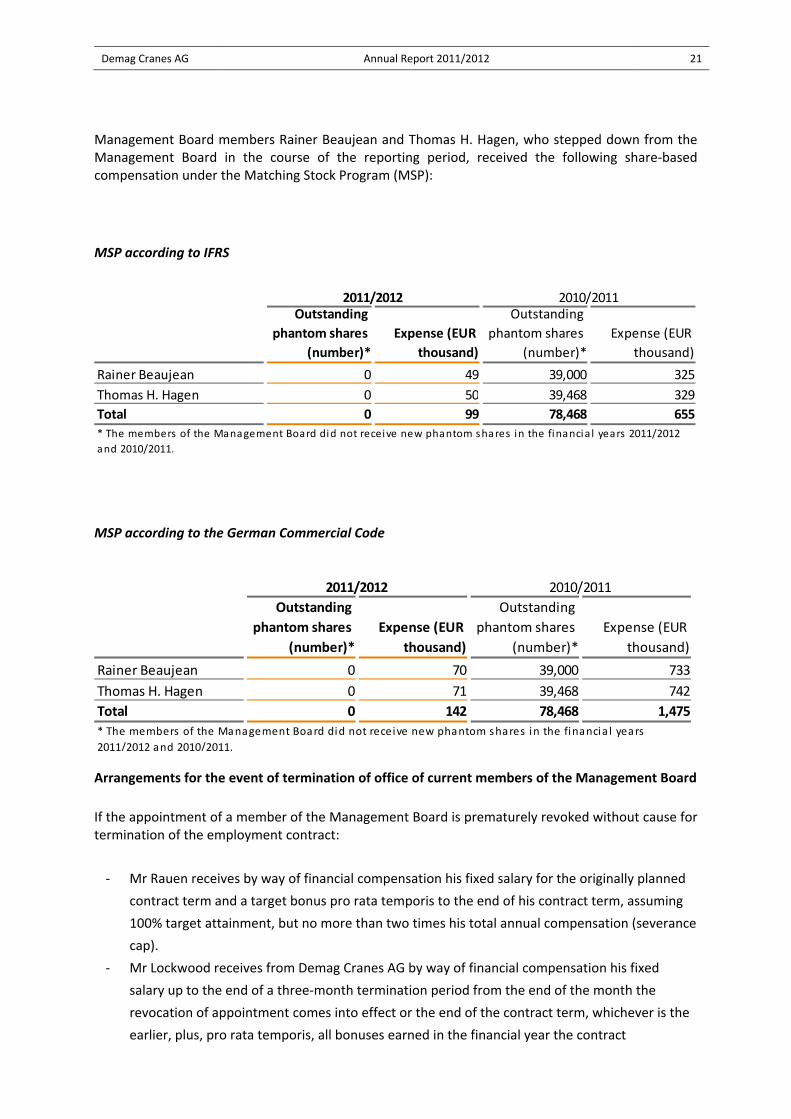
Management Board members Rainer Beaujean and Thomas H. Hagen, who stepped down from the Management Board in the course of the reporting period, received the following share‐based compensation under the Matching Stock Program (MSP):
MSP according to IFRS
MSP according to the German Commercial Code
Arrangements for the event of termination of office of current members of the Management Board
If the appointment of a member of the Management Board is prematurely revoked without cause for termination of the employment contract:
‐ Mr Rauen receives by way of financial compensation his fixed salary for the originally planned
contract term and a target bonus pro rata temporis to the end of his contract term, assuming
100% target attainment, but no more than two times his total annual compensation (severance
cap).
‐ Mr Lockwood receives from Demag Cranes AG by way of financial compensation his fixed
salary up to the end of a three‐month termination period from the end of the month the
revocation of appointment comes into effect or the end of the contract term, whichever is the
earlier, plus, pro rata temporis, all bonuses earned in the financial year the contract
Outstanding
phantom shares
(number)*
Expense (EUR
thousand)
Outstanding
phantom shares
(number)*
Expense (EUR
thousand)
Rainer Beaujean 0 49 39,000 325
Thomas H. Hagen 0 50 39,468 329
Total 0 99 78,468 655
2011/2012 2010/2011
* The members of the Management Board did not receive new phantom shares in the financia l years 2011/2012
and 2010/2011.
Outstanding
phantom shares
(number)*
Expense (EUR
thousand)
Outstanding
phantom shares
(number)*
Expense (EUR
thousand)
Rainer Beaujean 0 70 39,000 733
Thomas H. Hagen 0 71 39,468 742
Total 0 142 78,468 1,475
2011/2012 2010/2011
* The members of the Management Board did not receive new phantom shares in the financia l years
2011/2012 and 2010/2011.
Demag Cranes AG Annual Report 2011/2012 22
termination comes into effect. Moreover, he receives from Terex Corp. his fixed salary for two
years (this is reduced to one year of fixed salary following the 2nd anniversary of his
appointment to the Management Board), taking into account any payment of fixed salary by
Demag Cranes AG, and continued vesting of his Terex long‐term incentive awards and U.S.
health care continuation during the severance period.
If the Company has good cause to terminate an employment contract without notice within the meaning of Section 626 of the German Civil Code (BGB), claims for compensation are excluded and the Management Board member concerned does not receive any bonus payments, pro rata temporis or otherwise, for the then current financial year.
In the event of a change of control, Mr Rauen has the right to terminate his Management Board contract within six months at three months’ notice to the end of a month. A change of control is deemed to take place when either (i) a shareholder acquires control of the Company within the meaning of Section 29 of the German Securities Acquisition and Takeover Act (WpÜG) by holding at least 30% of the voting rights in the Company, including voting rights attributable to the shareholder under Section 30 WpÜG, or (ii) an intercompany agreement within the meaning of Section 291 of the German Stock Corporation Act (AktG) under which the Company is a dependent company is entered into and comes into force or (iii) the Company is merged with another legal entity pursuant to Section 2 of the German Transformation Act (UmwG), unless, based on the agreed exchange ratio, the value of the other legal entity is less than 50% of the value of the Company. If the special termination right is exercised, Mr Rauen receives by way of financial compensation the fixed salary up to the planned end of the contract term and a target bonus pro rata temporis up to the end of the contract term, assuming 100% target attainment, but no more than two times the total annual compensation (severance cap).
Supervisory Board compensation
Supervisory Board compensation is governed by the Articles of Association of Demag Cranes AG. Contrary to Clause 5.4.6 of the German Corporate Governance Code as amended on 15 May 2012, members of the Supervisory Board of Demag Cranes AG only receive basic annual compensation of EUR 25,000; the Chairman of the Supervisory Board receives 2.5 times and each vice chairman receives 1.5 times that amount. Members of committees – except for the Mediation Committee required under Section 27 (3) MitbestG and the Nominations Committee – additionally receive 0.1 times their basic compensation for each committee on which they sit.
Chairmen of committees additionally receive 0.25 times their basic compensation; this does not apply to the Chairman of the Supervisory Board, the Chairman of the Mediation Committee required under Section 27 (3) MitbestG or the Chairman of the Nominations Committee. In addition to their basic annual compensation, members of the Supervisory Board receive an attendance fee of EUR 1,500 for each Supervisory Board and committee meeting they attend, but no more than EUR 1,500 per calendar day. Reasonable out‐of‐pocket expenses are refunded on presentation of receipts.
Fixed compensation is stipulated for the Supervisory Board in view of the independence it must have to be able to carry out its monitoring function. The performance of this function should not be tied to any monetary incentives.
Demag Cranes AG Annual Report 2011/2012 23
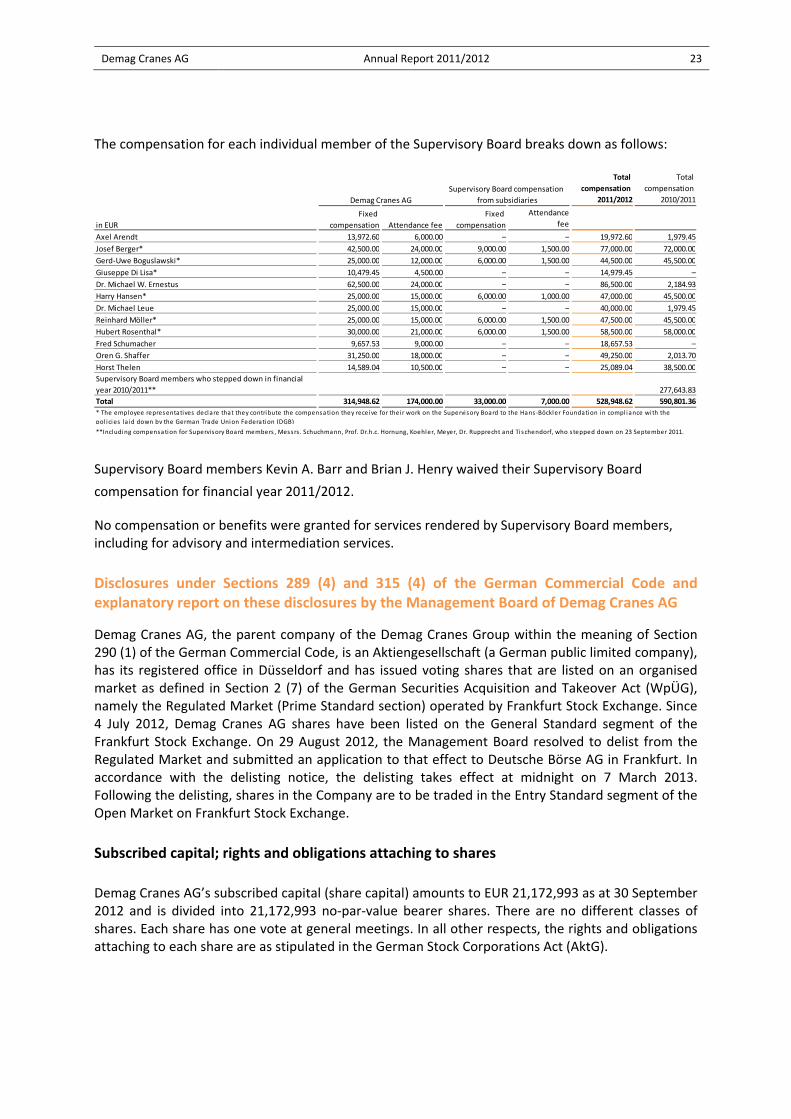
The compensation for each individual member of the Supervisory Board breaks down as follows:
Supervisory Board members Kevin A. Barr and Brian J. Henry waived their Supervisory Board
compensation for financial year 2011/2012.
No compensation or benefits were granted for services rendered by Supervisory Board members, including for advisory and intermediation services.
Disclosures under Sections 289 (4) and 315 (4) of the German Commercial Code and explanatory report on these disclosures by the Management Board of Demag Cranes AG
Demag Cranes AG, the parent company of the Demag Cranes Group within the meaning of Section 290 (1) of the German Commercial Code, is an Aktiengesellschaft (a German public limited company), has its registered office in Düsseldorf and has issued voting shares that are listed on an organised market as defined in Section 2 (7) of the German Securities Acquisition and Takeover Act (WpÜG), namely the Regulated Market (Prime Standard section) operated by Frankfurt Stock Exchange. Since 4 July 2012, Demag Cranes AG shares have been listed on the General Standard segment of the Frankfurt Stock Exchange. On 29 August 2012, the Management Board resolved to delist from the Regulated Market and submitted an application to that effect to Deutsche Börse AG in Frankfurt. In accordance with the delisting notice, the delisting takes effect at midnight on 7 March 2013. Following the delisting, shares in the Company are to be traded in the Entry Standard segment of the Open Market on Frankfurt Stock Exchange.
Subscribed capital; rights and obligations attaching to shares
Demag Cranes AG’s subscribed capital (share capital) amounts to EUR 21,172,993 as at 30 September 2012 and is divided into 21,172,993 no‐par‐value bearer shares. There are no different classes of shares. Each share has one vote at general meetings. In all other respects, the rights and obligations attaching to each share are as stipulated in the German Stock Corporations Act (AktG).
Total
compensation
2011/2012
Total
compensation
2010/2011
Attendance
fee
Axel Arendt 13,972.60 6,000.00 – – 19,972.60 1,979.45
Josef Berger* 42,500.00 24,000.00 9,000.00 1,500.00 77,000.00 72,000.00
Gerd‐Uwe Boguslawski* 25,000.00 12,000.00 6,000.00 1,500.00 44,500.00 45,500.00
Giuseppe Di Lisa* 10,479.45 4,500.00 – – 14,979.45 –
Dr. Michael W. Ernestus 62,500.00 24,000.00 – – 86,500.00 2,184.93
Harry Hansen* 25,000.00 15,000.00 6,000.00 1,000.00 47,000.00 45,500.00
Dr. Michael Leue 25,000.00 15,000.00 – – 40,000.00 1,979.45
Reinhard Möller* 25,000.00 15,000.00 6,000.00 1,500.00 47,500.00 45,500.00
Hubert Rosenthal* 30,000.00 21,000.00 6,000.00 1,500.00 58,500.00 58,000.00
Fred Schumacher 9,657.53 9,000.00 – – 18,657.53 –
Oren G. Shaffer 31,250.00 18,000.00 – – 49,250.00 2,013.70
Horst Thelen 14,589.04 10,500.00 – – 25,089.04 38,500.00
Supervisory Board members who stepped down in financial
year 2010/2011** 277,643.83
Total 314,948.62 174,000.00 33,000.00 7,000.00 528,948.62 590,801.36
Demag Cranes AG
Supervisory Board compensation
from subsidiaries
in EUR
Fixed
compensation Attendance fee
* The employee representatives declare that they contribute the compensation they receive for their work on the Supervi sory Board to the Hans ‐Böckler Foundation in compl iance with the
pol icies la id down by the German Trade Union Federation (DGB)
Fixed
compensation
**Including compensation for Supervisory Board members , Messrs . Schuchmann, Prof. Dr.h.c. Hornung, Koehler, Meyer, Dr. Rupprecht and Tischendorf, who stepped down on 23 September 2011.
Demag Cranes AG Annual Report 2011/2012 24
Restrictions on the transfer of securities and on voting rights
Shares in Demag Cranes AG are not subject to any restrictions on voting rights under the Articles of Association or by law at the balance sheet date. No restrictions on voting rights resulting from agreements between shareholders are known to the Management Board.
Holdings relating to more than 10% of voting rights
TIHAG Funding GmbH notified Demag Cranes AG in a voting rights notification that its share of voting rights in Demag Cranes AG passed above the 3, 5, 10, 15, 20, 25, 30, 50 and 75% threshold on 26 April 2012 and amounted to 82.92% (17,345,848 voting rights) on that day. The voting rights attributable to TIHAG Funding GmbH are held directly by Terex Industrial Holding AG. As well as to TIHAG Funding GmbH, the voting rights held by Terex Industrial Holding AG are also attributed to Terex Germany GmbH & Co. KG, Düsseldorf, Germany, Terex Verwaltungs GmbH, Düsseldorf, Germany, Terex European Holdings B.V., Amsterdam, Netherlands, Terex Netherlands B.V., Amsterdam, Netherlands and Terex Corporation, Westport, USA.
Elliott Asset Management LLC, Elliott Capital Advisors L.P., Braxton Associates, Inc., all of New York, USA, and Paul E. Singer, USA, notified Demag Cranes AG in a voting rights notification that their respective percentages of the voting rights in the Company passed above the 10% threshold on 15 August 2011 and amounted to 10.08% (2,133,794 voting rights) on that day. Cornwall (Luxembourg) S.à r.l. notified Demag Cranes AG in a voting rights notification that its share of voting rights in the Company passed above the 3, 5 and 10% threshold on 15 March 2012 and amounted to 12.70% (2,689,317 voting rights) on that day. Elliott International Capital Advisors Inc., New York, USA, Elliott International Limited, George Town, Cayman Islands and Hambledon Inc. George Town, Cayman Islands, notified Demag Cranes AG in a voting rights notification that their respective percentages of the voting rights in the Company passed above the 10% threshold on 15 March 2012 and amounted to 12.71% (2,691,317 voting rights) on that day. The voting rights are held through various investment companies, to each of which they are attributable, in some cases reciprocally.
No other direct or indirect holdings in the Company’s share capital that relate to more than 10% of voting rights are known to the Management Board.
Securities carrying special rights
None of the shares issued by Demag Cranes AG carries special rights with regard to control of the Company.
How rights are exercised on shares under an employee share scheme if not directly by employees
No information is available on the exercise of voting rights on shares under an employee share scheme where the rights are not directly exercised by employees.
Demag Cranes AG Annual Report 2011/2012 25
Appointment and replacement of members of the Management Board; amendments to the Articles of Association
The statutory governing and representative body of Demag Cranes AG is the Management Board. Under Article 6 (1) of the Articles of Association, the Management Board consists of at least two members. The size of the Management Board is otherwise decided by the Supervisory Board. The Supervisory Board may appoint deputy members of the Management Board. If the Supervisory Board does not nominate a Management Board member as CEO, the Management Board elects a spokesperson from among its number.
The Management Board of the Company consisted on 30 September 2012 of CEO Aloysius Rauen and Lawrence Lockwood.
Appointment and replacement of Management Board members are effected on the basis of Sections 84 and 85 of the German Stock Corporations Act (AktG) and Section 31 of the German Co‐determination Act (MitbestG). In accordance with Section 84, AktG, members of the Management Board are appointed by the Supervisory Board for terms not exceeding five years. Management Board members may also be reappointed or their terms extended in increments not exceeding five years. The contracts with current members of the Management Board expire as follows:
Aloysius Rauen: 30 April 2017
Lawrence Lockwood: 31 December 2013
Extension of terms and reappointment require a new resolution of the Supervisory Board, which can normally be adopted no earlier than one year before the end of the current term. The Supervisory Board may revoke the appointment of a member of the Management Board before the end of the member’s term of office for cause, for example, in the event of gross breach of duty or of a vote of no confidence at a general meeting. The Company is represented by two Management Board members or by one Management Board member acting jointly with an authorised signatory (Prokurist).
In accordance with Section 179, AktG, amendments to the Articles of Association normally require a resolution of the general meeting. In departure from this general rule, amendments that solely affect the wording of the Articles of Association may be adopted by the Supervisory Board. The Company’s Articles of Association provide that, unless otherwise stipulated by law, general meeting resolutions require a simple majority of votes cast and, if the law stipulates a majority of represented capital, a simple majority of the share capital represented at the time of the vote.
Powers of the Management Board to issue and buy back shares
Under Article 4 (5) of the Articles of Association, the Management Board is authorised, subject to Supervisory Board approval, to increase the Company’s share capital by issuing new no‐par‐value bearer shares, each representing a pro rata amount of one euro of the share capital, for cash or non‐cash consideration in one or more issues by up to a total of EUR 10,586,496 by or before 1 March 2016.
Demag Cranes AG Annual Report 2011/2012 26
The new shares may be taken up by one or more financial institutions determined by the Management Board or taken up by one or more enterprises within the meaning of the first sentence of Section 53 (1), of the first sentence of Section 53b (1) or of Section 53b (7) of the Banking Act (Kreditwesengesetz) subject to an undertaking that the shares will be offered to existing shareholders (indirect rights issue).
In certain circumstances and subject to Supervisory Board approval, the Management Board is authorised to exclude existing shareholders’ statutory right of pre‐emption.
a) When issuing shares for non‐cash consideration for the purpose of granting to third parties shares representing a pro rata amount of up to EUR 4,243,598 of the share capital in connection with business combinations or to acquire a business, part of a business or ownership interests in a business, including to increase the size of existing holdings of ownership interests or other assets;
b) To the extent needed to provide holders of warrants or convertible bonds issued by the Company or by Group companies under the management of the Company, for the purpose of preventing dilution, with rights to new shares in the amount they would be entitled to on exercise of the right of purchase or conversion or on discharge of the conversion obligation or obligation to sell;
c) To exclude any fractional amount arising in a rights issue;
d) When issuing shares for cash consideration provided that, in accordance with Section 203 (1) and (2) and the fourth sentence of Section 186 (3) of the German Stock Corporations Act (AktG), the issue price of the new shares is not significantly lower than the stock market price, at the time the final issue price is set by the Management Board, of existing listed shares of the same class and carrying the same rights and provided that the new shares for which the right of pre‐emption is excluded do not together comprise more than 10% of the share capital at the time this authorisation comes into effect or at the time the authorisation is exercised, whichever amount is the lesser. The 10% maximum is reduced by the pro rata amount of the share capital attributed to shares (i) issued or sold during the lifetime of this authorisation or in application, directly or mutatis mutandis, of the fourth sentence of Section 186 (3), AktG or (ii) required to be issued to serve warrant‐linked or convertible bonds in respect of which a right of purchase or a right of conversion or a conversion obligation exists and which have been issued during the lifetime of this authorisation to the exclusion of existing shareholders’ right of pre‐emption in application mutatis mutandis of the fourth sentence of Section 186 (3), AktG.
The Management Board is authorised, subject to Supervisory Board approval, to decide the remaining details of the increase in share capital and its conduct, including the nature of rights attached to shares and the conditions of share issue.
By resolution of the Company’s Annual General Meeting of 2 March 2010, the Management Board of Demag Cranes AG is further authorised, subject to Supervisory Board approval, to issue convertible and/or warrant‐linked bearer bonds (collectively ‘bonds’) with limited or unlimited maturities up to an aggregate face value of EUR 210,000,000 on one or more occasions by or before 1 March 2015 and to give the bondholders conversion rights and/or options (including with an attached conversion obligation) to no‐par‐value bearer shares in the Company making up a maximum EUR 4,200,000 portion of the share capital in accordance with the detailed terms and conditions of the convertible or warrant‐linked bond issue. The bonds are required to be issued solely for cash.
Demag Cranes AG Annual Report 2011/2012 27
The bonds may be denominated in euros or – up to the equivalent of the stipulated maximum amount – in a foreign currency that is legal tender, for example, the currency of an OECD country. The bonds may also be issued by a Group company managed by the Company; in such instances, the Management Board may, subject to Supervisory Board approval, guarantee the bonds on the Company’s behalf and give bondholders conversion rights and/or options (including with an attached conversion obligation) to no‐par‐value bearer shares in the Company. The issues must be divided into individual bonds.
In a warrant‐linked bond issue, one or more warrants are attached to each bond, granting the bondholder an option to subscribe for no‐par‐value bearer shares in the Company according to the terms and conditions of the option as laid down by the Management Board. The option lifetime must not exceed the maturity of the warrant‐linked bond issue.
In a convertible bond issue, bondholders are given the right to convert their bonds into no‐par‐value bearer shares in the Company in accordance with the detailed terms and conditions of the convertible bond as laid down by the Management Board. The conversion ratio is arrived at by dividing the face value of a bond, or the issue price if lower, by the stipulated conversion price for a no‐par‐value bearer share in the Company. The conversion ratio may be rounded up or down to the nearest integer; an additional cash payment may also be stipulated if applicable.
The convertible bond terms and conditions may further stipulate a conversion obligation at maturity (or earlier). The portion of the share capital made up by no‐par‐value Company shares issued on conversion of each bond must not exceed the face value of the bond.
The terms and conditions of the convertible or warrant‐linked bonds may give the Company a right to grant bond creditors new shares or treasury shares in the Company instead of all or part of any amount due. Subject to more detailed provisions laid down in the bond terms and conditions, the value of such shares is determined as the arithmetic mean, rounded up to the nearest full cent, of closing auction prices for the same class of Company shares in XETRA trading (or a functionally equivalent successor trading system) on Frankfurt Stock Exchange on the last three trading days before notice of conversion or exercise.
The terms and conditions of the convertible or warrant‐linked bonds may further provide on each occasion for treasury shares in the Company to be granted on conversion or exercise. They may also provide that instead of granting holders of convertible or warrant‐linked bonds shares in the Company, the Company may pay bondholders the equivalent value in cash. Subject to more detailed provisions laid down in the bond terms and conditions, the value of such shares is determined as the arithmetic mean, rounded up to the nearest full cent, of closing auction prices for the same class of Company shares in XETRA trading (or a functionally equivalent successor trading system) on Frankfurt Stock Exchange on the last three trading days before notice of conversion or exercise.
The stipulated conversion or exercise price on each occasion must be at least 80% of the arithmetic mean of the closing auction prices for the same class of Company shares in XETRA trading (or a functionally equivalent successor trading system) on Frankfurt Stock Exchange from the start of the subscription period to the third day (inclusive) before announcement of the final terms and conditions in accordance with the second sentence of Section 186 (2) of the German Stock Corporations Act (AktG).
Demag Cranes AG Annual Report 2011/2012 28
If, during the conversion or exercise period, the Company conducts a rights issue for existing shareholders or issues further convertible or warrant‐linked bonds or grants or guarantees conversion rights or options and does not give existing holders of conversion rights or options a corresponding subscription right of the scope they would be entitled to after exercising their conversion rights or options or meeting their conversion obligations, or increases the share capital out of retained earnings, the terms and conditions of the convertible and/or warrant‐linked bonds must ensure that there is no effect on the economic value of existing conversion rights and/or options by providing for a modification of the conversion rights and/or options to maintain that value unless such modification is already required by law. The same applies mutatis mutandis upon a decrease in share capital, other corporate measures, restructuring, change of control, extraordinary dividend or other similar measures that may dilute the share value.
Company shareholders normally have pre‐emptive rights; that is, convertible and/or warrant‐linked bonds must normally be offered to them. The bonds may also be bought by one or more banks provided they are then offered to shareholders. If bonds are issued by a Group company, the Company must ensure that subscription rights are granted to Company shareholders.
The Management Board may, subject to Supervisory Board approval, exclude shareholders’ pre‐emptive rights to bonds if, after due appraisal, it finds the issue price not to be significantly below the bonds’ theoretical market value as determined by generally accepted financial mathematical methods. The authorisation to exclude shareholders’ pre‐emptive rights is limited, however, to bonds with a conversion right or option (including with an attached conversion obligation) to shares making up no more than 10% of the share capital when the authorisation takes effect or, if smaller, of the share capital when the authorisation is exercised. The 10% maximum must be determined taking into account any amount of share capital relating to (i) shares issued during the lifetime of the authorisation under the fourth sentence of Section 186 (3), AktG to the exclusion of existing shareholders’ pre‐emptive rights and (ii) shares sold during the lifetime of the authorisation out of repurchased treasury stock other than on the stock market or by way of an offer to all shareholders with the fourth sentence of Section 186 (3), AktG applying mutatis mutandis; any fractional amounts resulting from the subscription ratio; and any amount needed so that it is possible to give holders of previously issued conversion rights or options a subscription right of the scope they would be entitled to as shareholders after exercising their conversion rights or options or meeting their conversion obligations.
The Management Board is authorised, subject to Supervisory Board approval and where applicable in agreement with the boards of bond‐issuing Group companies, to decide the remaining details of the bond issues and terms, including interest rates and how interest is applied, issue price, term to maturity and denomination, anti‐dilution provisions, conversion or option periods and conversion or exercise price.
In conjunction with granting the Management Board authorisation to issue bonds, conditional authority was given to increase the Company's share capital by up to EUR 4,200,000 by issuing up to 4,200,000 new no‐par‐value bearer shares each comprising one euro of share capital (‘Conditional Capital’). The conditional authority to issue shares is to be used for granting shares to holders of or creditors under convertible and/or warrant‐linked bonds issued with the above authorisation. Shares are to be issued under the conditional authority solely to the extent that conversion rights and/or options are exercised or conversion obligations under such bonds are fulfilled and the Conditional Capital is needed for the purpose according to the terms and conditions of the convertible and/or warrant‐linked bonds. The new shares are to be issued at the exercise or conversion price determined in accordance with the above authorisation. The new shares are entitled to dividends

Demag Cranes AG Annual Report 2011/2012 29
from the start of the financial year they are issued on exercise of conversion rights or options or on fulfilment of conversion obligations. The Management Board is authorised, subject to Supervisory Board approval, to decide the remaining details with regard to issuing shares under the conditional authority.
The Company made no use of its authorisation to issue convertible and/or warrant‐linked bonds in financial year 2011/2012; no shares were issued out of the Conditional Capital. Likewise, no shares were issued out of Authorised Capital.
There is no authorisation to buy back shares.
Significant agreements conditional upon a change of control following a takeover bid
The syndicated credit facility arranged by Demag Cranes AG granted each lender the right to call due its share of the facility (loans and guarantees given) subject to certain requirements if a party or a group of parties acting in concert acquires control of Demag Cranes AG (change of control). After the domination & profit and loss transfer agreement between Demag Cranes AG and Terex Germany GmbH & Co. KG, an indirect wholly‐owned subsidiary of Terex Corporation, Westport, USA, came into effect on 18 April 2012, the EUR 350 million revolving credit facility (including the ancillary facility for guarantees in the amount of EUR 150 million) was repaid in full and terminated on 21 May 2012. For further information on how the Demag Cranes Group is currently financed see “Demag Cranes Group financial position.”
In the event of a change of control in the Company, the CEO has the right to terminate his Management Board contract and give up his Management Board mandate within six months, giving three months’ notice to the end of a month. Circumstances in which a change of control is deemed to take place include when a shareholder acquires control of the Company within the meaning of Section 29 of the German Securities Acquisition and Takeover Act (WpÜG) by holding at least 30% of the voting rights in the Company, including voting rights attributable to the shareholder under Section 30 WpÜG.
Demag Cranes AG is not party to any other significant agreement that takes effect, alters or terminates upon a change of control of the Company following a takeover bid.
Agreements with members of the Management Board or employees for the event of a takeover bid
If he exercises his special termination right, the CEO receives by way of financial compensation his fixed salary up to the planned end of his contract term and a target bonus pro rata temporis up to the end of his contract term, assuming 100% target attainment, but no more than two times his total annual compensation. For further information on Management Board contracts, please see the Remuneration Report.
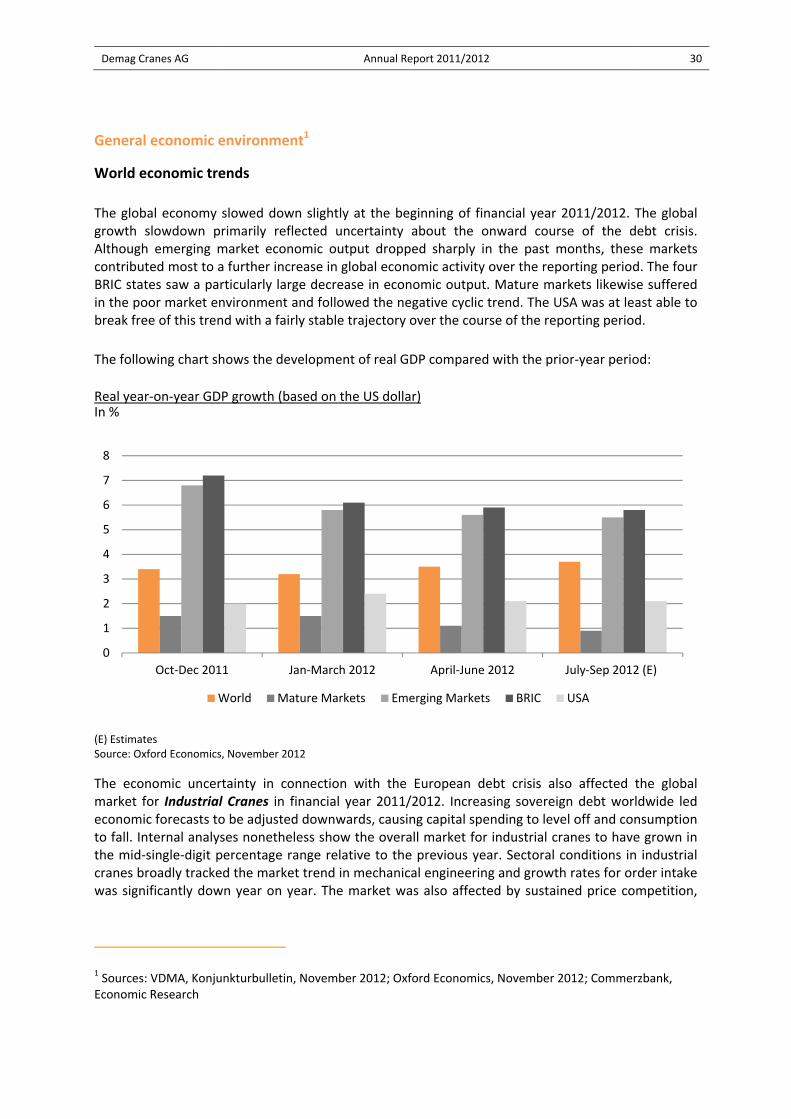
Demag Cranes AG Annual Report 2011/2012 30
General economic environment1
World economic trends
The global economy slowed down slightly at the beginning of financial year 2011/2012. The global growth slowdown primarily reflected uncertainty about the onward course of the debt crisis. Although emerging market economic output dropped sharply in the past months, these markets contributed most to a further increase in global economic activity over the reporting period. The four BRIC states saw a particularly large decrease in economic output. Mature markets likewise suffered in the poor market environment and followed the negative cyclic trend. The USA was at least able to break free of this trend with a fairly stable trajectory over the course of the reporting period.
The following chart shows the development of real GDP compared with the prior‐year period:
Real year‐on‐year GDP growth (based on the US dollar) In %
(E) Estimates Source: Oxford Economics, November 2012
The economic uncertainty in connection with the European debt crisis also affected the global market for Industrial Cranes in financial year 2011/2012. Increasing sovereign debt worldwide led economic forecasts to be adjusted downwards, causing capital spending to level off and consumption to fall. Internal analyses nonetheless show the overall market for industrial cranes to have grown in the mid‐single‐digit percentage range relative to the previous year. Sectoral conditions in industrial cranes broadly tracked the market trend in mechanical engineering and growth rates for order intake was significantly down year on year. The market was also affected by sustained price competition,
1 Sources: VDMA, Konjunkturbulletin, November 2012; Oxford Economics, November 2012; Commerzbank, Economic Research
0
1
2
3
4
5
6
7
8
Oct‐Dec 2011 Jan‐March 2012 April‐June 2012 July‐Sep 2012 (E)
World Mature Markets Emerging Markets BRIC USA

Demag Cranes AG Annual Report 2011/2012 31
mainly driven by surplus capacity, the large number of competitors and the financial crisis mentioned above.
The market in the Port Technology segment was characterised by a further increase in container handling at ports and rising volumes of marine cargo, although this growth trend weakened slightly towards the end of the financial year. Customers in the Port Technology segment stepped up investing activity in response to the rising trend in transhipment volumes. This fuelled general growth in demand for versatile cargo handling equipment such as Mobile Harbour Cranes. The terminal systems business, too, developed positively in the reporting period. In the past financial year, we secured contracts for automated handling systems from two terminal operators to equip new container terminals on Maasvlakte II in Rotterdam, the Netherlands. Our customers continue to show interest in cost‐saving or environmentally friendly solutions, but demand is subject to pronounced price competition.
Industry conditions likewise improved in the Services segment. The positive order situation and the resulting high level of machine capacity utilisation created customer demand for our services and spare parts.
Effects of the economic environment on business performance
All three of the Demag Cranes Group’s segments performed well during the past financial year, although the rates of increase in order intake and revenue were lower than in 2010/2011. This was due mainly to the ongoing sovereign debt crisis and the economic uncertainty associated with it.
In the Industrial Cranes segment, demand for our products continued to rise compared with financial year 2010/2011. The rate of growth in order intake slowed, however (year‐on‐year increase: 2011/2012: 5.5%; 2010/2011: 24.9%). The increased price competition emerging in the market also had an impact on our business in that revenue continued to improve, but the rate of increase was lower than in the previous year (year‐on‐year increase: 2011/2012: 7.0%; 2010/2011: 11.1%). From a regional perspective, the main growth drivers were Germany and emerging markets such as China.
In the Port Technology segment, our customers not only replaced old cranes, but also invested in expansion due to the higher level of capacity utilisation at port terminals as a result of rising freight volumes and transport rates. In addition, major project business resumed. The current situation on the financial markets has increased the overall complexity of concluding contracts for customers and suppliers. Revenue also continued to increase in the Port Technology segment, but here, too, growth slowed year on year (year‐on‐year increase: 2011/2012: 10.8%; 2010/2011: 25.8%).
The Services segment benefited from increased capacity utilisation by our customers and the greater use of crane systems associated with it. Order intake and revenue did not increase year on year due to the one‐time effect of the sale of two US companies to Terex.
Demag Cranes AG Annual Report 2011/2012 32
Business performance of the Demag Cranes Group and its segments in financial year 2011/2012
Takeover by Terex and integration into the Terex Group
Following the successful takeover of Demag Cranes by Terex Industrial Holding AG, a subsidiary of Terex Corporation, Westport, Connecticut, USA, a further milestone was reached in the past financial year: The domination & profit and loss transfer agreement signed in January 2012 between Demag Cranes AG and Terex Germany GmbH & Co. KG, an indirect wholly‐owned subsidiary of Terex Corporation, Westport, USA, was entered in the commercial registry on 18 April 2012 and has therefore entered in force. The agreement had already been approved at the Annual General Meeting of Demag Cranes AG on 16 March 2012. Under the agreement, Terex Germany GmbH & Co. KG offered to acquire the shares held by outside shareholders of Demag Cranes AG in return for cash compensation of EUR 45.52 per no‐par value share pursuant to Section 305 of the German Stock Corporations Act (AktG). The agreement also provides for an annual guaranteed dividend payment to outside shareholders of Demag Cranes AG for the term of the agreement in the gross amount of EUR 3.33 per no‐par value share (EUR 3.04 net per no‐par value share). The payment obligations of Terex Germany GmbH & Co. KG under the domination & profit and loss transfer agreement are secured by a letter of comfort issued by Terex Corporation.
After the domination & profit and loss transfer agreement came into effect in April 2012, an integration team was established in May 2012 with the aim of swiftly integrating Demag Cranes into the Terex Group so that the potential created by the business combination could be quickly realised. The business of the Demag Cranes Group is managed since the takeover as a fifth segment, Material Handling & Port Solutions (MH&PS). Material Handling encompasses the Industrial Cranes and the Services business, which continues under the successful and renowned Demag brand. The brand name is solely appended with the words “A Terex Brand”. Port Solutions comprises the Demag Cranes Port Technology business and the Terex Port Equipment as well Reach Stacker businesses. The Gottwald brand continues as Terex® | Gottwald. As a high‐performance global Group, Terex is well positioned to fulfil its mission of providing solutions to Machinery and Industrial Product customers that yield superior productivity and return on investment. That, in turn, contributes to achieving the Group’s purpose, which is to help improve the lives of people around the world. In this way, Demag Cranes, with its values and its objective of being number one in the markets its services, is an ideal strategic fit with Terex Corporation.
Overall responsibility for the MH&PS segment is held by Aloysius Rauen. Dr Lars Brzoska heads Material Handling and Klaus Peter Hoffmann is in charge of Port Solutions. Both Material Handling and Port Solutions are key in further advancing the diversification of the Terex portfolio as a whole. Material Handling is strongly oriented towards customers in the industrial products sector and is heavily service‐centric. Terex aims to expand this experience and expertise throughout the Group. By bringing together Terex Port Equipment with Gottwald, we now have a global port equipment division with a broad product range. This makes us one of the three globally leading companies in the industry.
Operationally, the objective is to manage the entire Group as “One Terex”. The goal in the integration of Demag Cranes is therefore first and foremost to identify opportunities for revenue and profit growth on the foundation of the shared customer base while exploring potential to cut operating costs by shared use of resources.
Demag Cranes AG Annual Report 2011/2012 33
Demag Cranes intends to bring its capital market reporting into line with this new structure and to report on the Material Handling & Port Solutions segment in future. This new segmentation is also to form the basis of Group management and supervision. The Terex Port Equipment business and the Reach Stacker business in Montceau Les Mines will not be included in the Financial Statements of Demag Cranes. The former entities of Demag Cranes that have been sold to Terex are included in the Financial Statements until the date of sale.
Overall assessment of business performance and target attainment in the financial year
Overall, financial year 2011/2012 was a successful one for us despite the uncertain environment.
At operating level, we continued to grow. Our Group order intake increased by 18.3% compared with financial year 2010/2011 to EUR 1,326.6 million, with all segments making a positive contribution. We also lifted revenue year on year: at EUR 1,123.3 million (forecast: around EUR 1.1 billion), Group revenue was 5.7% up on the prior‐year figure (financial year 2010/2011: EUR 1,062.3 million). The Group’s operating EBIT amounted to EUR 89.2 million, a year‐on‐year increase of 17.9%. The operating EBIT margin stood at 7.9%. In May 2012, we had updated our forecast, predicting that the EBIT margin would be up on the prior year (EBIT margin 2010/2011: 7.1%). We thus improved on the key performance indicators. Although our operating EBIT margin is significantly lower than anticipated at the beginning of the financial year, we met our May 2012 forecast in every respect.
The Industrial Cranes segment generated revenue of EUR 524.0 million (2010/2011: EUR 489.8 million) and operating EBIT of EUR 13.6 million (2010/2011: EUR 10.8 million). During the past financial year, we continued to expand our business activities and consolidate our market position in emerging markets in particular, as a result of which these regions contributed successfully to our revenue growth.
The Port Technology segment generated revenue of EUR 264.8 million (2010/2011: EUR 239.0 million) and operating EBIT of EUR 13.4 million (2010/2011: EUR 9.2 million). Encouragingly, the past financial year saw us receive orders from two terminal operators for automated handling systems to equip new container terminals at Maasvlakte II in Rotterdam.
The Services segment also performed well, generating revenue of EUR 334.5 million (2010/2011: EUR 333.5 million) and operating EBIT of EUR 67.6 million (2010/2011: EUR 66.2 million). Revenue and operating EBIT did not materially improve compared with the prior year primarily due to the sale of the two US companies Demag Cranes & Components US, Cleveland, USA and Crane America Services, Dayton, USA to Terex USA, LLC, a Delaware limited liability company, USA, effective 29 June 2012. Prior to the sale of the two US companies, for the first nine months of the 2011/2012 fiscal year, revenue was up approximately 11% and operating EBIT was up approximately 10%.
Group free cash flow before financing and restructuring payments amounted to EUR 115.6 million and net cash to EUR 26.8 million.
Demag Cranes AG Annual Report 2011/2012 34
Demag Cranes AG shares2
Demag Cranes AG shares have a very low level of trading liquidity in the past financial year due to its existing ownership structure. The shares opened financial year 2011/2012 at EUR 58.00 on 1 October 2011 and closed at EUR 49.57 on 30 September 2012.
On 16 March 2012, this year’s Annual General Meeting for financial year 2010/2011 took place in Düsseldorf. Represented at the AGM were 20,311,069 shares, or 95.93% of the share capital. The motions put by the Management and Supervisory Boards under agenda items 3 to 7 were approved by the requisite majority, while Terex Industrial Holding AG’s countermotion with regard to agenda item 2 on the appropriation of net income was likewise passed by the requisite majority. Terex Industrial Holding AG had put a countermotion to agenda item 2 proposing that, of the net income for financial year 2010/2011 of EUR 71,138,167.54, a total of EUR 846,919.72 be distributed to shareholders by paying a dividend of EUR 0.04 per share and EUR 70,291,247.82 be carried forward.
On 26 March 2012, Demag Cranes AG applied for the shares’ admission to trading on the Prime Standard segment of the Frankfurt Stock Exchange to be revoked. Following confirmation by Deutsche Börse, the revocation of admission to trading took effect at midnight on 3 July 2012. Since 4 July 2012, Demag Cranes AG shares have been listed on the General Standard segment of the Frankfurt Stock Exchange.
The domination & profit and loss transfer agreement signed between Demag Cranes AG and Terex Germany GmbH & Co. KG, an indirect wholly‐owned subsidiary of Terex Corporation, Westport, USA, in January 2012 and approved at the Annual General Meeting in March was entered in the commercial registry on 18 April 2012 and has therefore entered in force.
At the Extraordinary General Meeting on 29 August 2012, the motion to change the financial year to the calendar year and thus create a short financial year from 1 October 2012 to 31 December 2012 was passed by the requisite majority. From 1 January 2013, the Company’s financial year will be the calendar year.
Following the General Meeting, the Management Board decided to apply to have the shares’ admission to trading on the Regulated Market (General Standard segment) of Deutsche Börse revoked. An application in this regard was submitted to Deutsche Börse AG, Frankfurt am Main. Following its publication on the Frankfurt Stock Exchange’s website, the revocation will take effect at midnight on 7 March 2013. The Management Board also decided to apply for the shares to be admitted to the Entry Standard segment of the Frankfurt Stock Exchange’s Open Market. The aim is for them to be admitted on the date on which the revocation of admission to the Regulated Market takes effect. The Management Board believes the Entry Standard is the ideal segment for aligning the costs of the stock exchange listing with the current ownership structure. At the same time, the Entry Standard continues to ensure a high degree of transparency for shareholders.
2 Closing prices on the Frankfurt Stock Exchange; source: www.ariva.de

Demag Cranes AG Annual Report 2011/2012 35
Key share data Financial
year 2011/2012 2010/2011 2009/2010
Number of shares in millions 21.17 21.17 21.17
Year‐end closing price (Closing prices on 30 Sept 2012, 30 Sept 2011, 30 Sept 2010) EUR 49.57 58.34* 28.14*
Market capitalisation (on 30 Sept 2012, 30 Sept 2011, 30 Sept 2010)
in EUR million 1049.5 1235.2* 595.8*
Average daily trading volume shares 76,034 139,859* 141,740*
Share price: annual high EUR 60.30 59.10* 28.76*
Share price: annual low EUR 47.20 28.73* 21.33*
Earnings per share EUR 4.00 0.31 1.31
Operating earnings per share EUR 2.80 2.21 1.44
Dividend per share EUR 3.33 0.04 0.60
*As per XETRA
Identification Numbers and Codes
WKN (German securities identification number) DCAG01
ISIN DE000DCAG010
Reuters D9CGn.DE
Bloomberg D9C GR
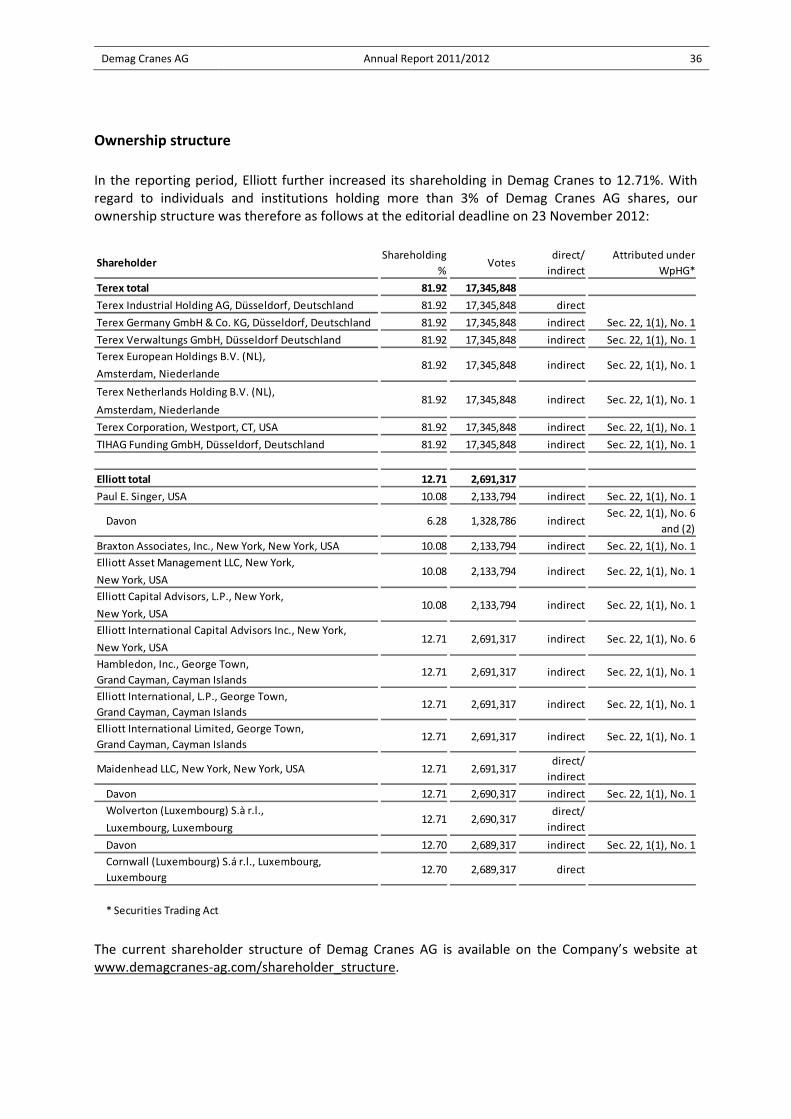
Demag Cranes AG Annual Report 2011/2012 36
Ownership structure
In the reporting period, Elliott further increased its shareholding in Demag Cranes to 12.71%. With regard to individuals and institutions holding more than 3% of Demag Cranes AG shares, our ownership structure was therefore as follows at the editorial deadline on 23 November 2012:
The current shareholder structure of Demag Cranes AG is available on the Company’s website at www.demagcranes‐ag.com/shareholder_structure.
ShareholderShareholding
%Votes
direct/
indirect
Attributed under
WpHG*
Terex total 81.92 17,345,848
Terex Industrial Holding AG, Düsseldorf, Deutschland 81.92 17,345,848 direct
Terex Germany GmbH & Co. KG, Düsseldorf, Deutschland 81.92 17,345,848 indirect Sec. 22, 1(1), No. 1
Terex Verwaltungs GmbH, Düsseldorf Deutschland 81.92 17,345,848 indirect Sec. 22, 1(1), No. 1
Terex European Holdings B.V. (NL),
Amsterdam, Niederlande
Terex Netherlands Holding B.V. (NL),
Amsterdam, Niederlande
Terex Corporation, Westport, CT, USA 81.92 17,345,848 indirect Sec. 22, 1(1), No. 1
TIHAG Funding GmbH, Düsseldorf, Deutschland 81.92 17,345,848 indirect Sec. 22, 1(1), No. 1
Elliott total 12.71 2,691,317
Paul E. Singer, USA 10.08 2,133,794 indirect Sec. 22, 1(1), No. 1
Davon 6.28 1,328,786 indirect Sec. 22, 1(1), No. 6
and (2)
Braxton Associates, Inc., New York, New York, USA 10.08 2,133,794 indirect Sec. 22, 1(1), No. 1
Elliott Asset Management LLC, New York,
New York, USA
Elliott Capital Advisors, L.P., New York,
New York, USA
Elliott International Capital Advisors Inc., New York,
New York, USA
Hambledon, Inc., George Town,
Grand Cayman, Cayman Islands12.71 2,691,317 indirect Sec. 22, 1(1), No. 1
Elliott International, L.P., George Town,
Grand Cayman, Cayman Islands12.71 2,691,317 indirect Sec. 22, 1(1), No. 1
Elliott International Limited, George Town,
Grand Cayman, Cayman Islands12.71 2,691,317 indirect Sec. 22, 1(1), No. 1
Maidenhead LLC, New York, New York, USA 12.71 2,691,317direct/
indirect
Davon 12.71 2,690,317 indirect Sec. 22, 1(1), No. 1
Wolverton (Luxembourg) S.à r.l.,
Luxembourg, Luxembourg
Davon 12.70 2,689,317 indirect Sec. 22, 1(1), No. 1
Cornwall (Luxembourg) S.á r.l., Luxembourg,
Luxembourg12.70 2,689,317 direct
* Securities Trading Act
Sec. 22, 1(1), No. 1
Sec. 22, 1(1), No. 1
Sec. 22, 1(1), No. 1
Sec. 22, 1(1), No. 1
Sec. 22, 1(1), No. 612.71 2,691,317 indirect
12.71 2,690,317direct/
indirect
10.08 2,133,794 indirect
10.08 2,133,794 indirect
81.92 17,345,848 indirect
81.92 17,345,848 indirect

Demag Cranes AG Annual Report 2011/2012 37
Business performance of the Group and its segments
Order intake/order book
The Demag Cranes Group generated order intake of EUR 1,326.6 million in financial year 2011/2012, an increase of 18.3% on financial year 2010/2011 (EUR 1,121.2 million). The segments contributed to this encouraging order growth as follows:
The Group order book stood at EUR 545.7 million as at 30 September 2012, an improvement of 50.9% on the prior‐year figure (EUR 361.7 million). The significant increase compared with 2010/2011 is due to two major project wins in the Port Technology segment.
In the Industrial Cranes segment, order intake increased by 5.5% to EUR 542.9 million in financial year 2011/2012. The Industrial Cranes segment order book stood at EUR 216.7 million as at 30 September 2012 (30 September 2011: EUR 201.5 million).
The Port Technology segment can also look back on strong order performance: compared with financial year 2010/2011, the value of orders received rose by 66.4% from EUR 267.3 million to EUR 444.7 million. This strong performance was due to the two major project wins already mentioned. The Port Technology segment order book amounted to EUR 285.9 million as at 30 September 2012 (30 September 2011: EUR 105.6 million).
Greater capacity utilisation and the associated increased use of crane systems by our customers also led to an improvement in the order situation of the Services segment. The fact that orders did not materially increase as compared with financial year 2010/2011 was primarily due to the previously mentioned sale of the two US companies.
The Services segment order book amounted to EUR 43.2 million as at 30 September 2012 (30 September 2011: EUR 54.6 million).
in EUR million 2011/2012 2010/2011 ∆ 2009/2010
Industrial Cranes 542.9 514.8 5.5% 412.2
Services 339.0 339.1 0.0% 301.5
Industrial Cranes and Services 881.9 853.9 3.3% 713.7
Port Technology 444.7 267.3 66.4% 197.0
Group order intake 1,326.6 1,121.2 18.3% 910.6
1 October to 30 September
in EUR million 2012 2011 ∆ 2010
Industrial Cranes 216.7 201.5 7.5% 180.0
Services 43.2 54.6 ‐21.0% 49.6
Industrial Cranes and Services 259.8 256.1 1.4% 229.6
Port Technology 285.9 105.6 170.8% 76.9
Group order book 545.7 361.7 50.9% 306.6
30 September

Demag Cranes AG Annual Report 2011/2012 38
Revenue
Group revenue was up 5.7% in the past financial year to EUR 1,123.3 million (financial year 2010/2011: EUR 1,062.3 million). All segments contributed to this increase.
The Industrial Cranes segment generated revenue of EUR 524.0 million, 7.0% more than in financial year 2010/2011 (EUR 489.8 million). On the product side, the main sales drivers were the flexible‐use crane construction kits and Standard Cranes.
The Port Technology segment lifted revenue by 10.8% to EUR 264.8 million. The sales growth is due, in particular, to the healthy level of prior‐year orders for Mobile Harbour Cranes, the revenue recognised for a portion of the Automated Guided Vehicles under the large order with Europe Container Terminals (ECT), Rotterdam from 2011 and higher services.
Revenue in the Services segment rose to EUR 334.5 million in financial year 2011/2012 and was therefore on a par with the previous year (financial year 2010/2011: EUR 333.5 million). Revenue did not materially increase as due to the previously mentioned sale of the two US companies.
Revenue is distributed among the regions as follows:
in EUR million 2011/2012 2010/2011 ∆ 2009/2010
Industrial Cranes 524.0 489.8 7.0% 440.8
Services 334.5 333.5 0.3% 300.6
Industrial Cranes and Services 858.5 823.3 4.3% 741.4
Port Technology 264.8 239.0 10.8% 189.9
Group revenue 1,123.3 1,062.3 5.7% 931.3
1 October to 30 September
in EUR million 2011/2012 2010/2011 ∆ 2011/2012 2010/2011 2009/2010 2008/2009
Germany 226.7 204.6 10.8% 20.2 19.3 20.5 22.2
Rest of Europe 319.3 292.4 9.2% 28.4 27.5 32.0 32.9
North America 128.5 123.2 4.3% 11.4 11.6 11.8 11.5
Mature markets 674.5 620.2 8.8% 60.0 58.4 64.3 66.6
BRIC countries 191.2 185.3 3.2% 17.0 17.4 15.4 12.7
Central and South America 30.3 36.6 ‐17.0% 2.7 3.4 2.5 2.3
Asia/Pacific 160.3 163.0 ‐1.7% 14.3 15.3 11.8 13.2
Other 67.0 57.2 17.1% 6.0 5.4 5.9 5.2
Emerging markets 448.8 442.0 1.5% 40.0 41.6 35.7 33.4
Group revenue 1,123.3 1,062.3 5.7% 100.0 100.0 100.0 100.0
1 October to 30 September
in % of revenue
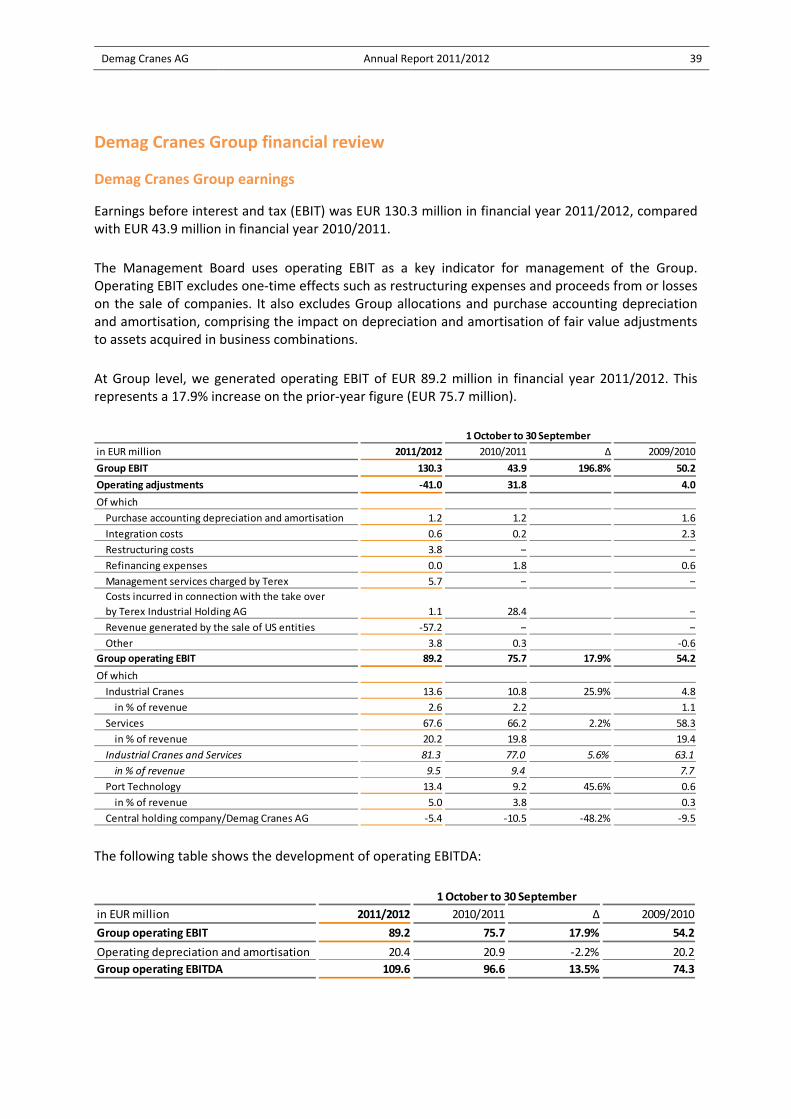
Demag Cranes AG Annual Report 2011/2012 39
Demag Cranes Group financial review
Demag Cranes Group earnings
Earnings before interest and tax (EBIT) was EUR 130.3 million in financial year 2011/2012, compared with EUR 43.9 million in financial year 2010/2011.
The Management Board uses operating EBIT as a key indicator for management of the Group. Operating EBIT excludes one‐time effects such as restructuring expenses and proceeds from or losses on the sale of companies. It also excludes Group allocations and purchase accounting depreciation and amortisation, comprising the impact on depreciation and amortisation of fair value adjustments to assets acquired in business combinations.
At Group level, we generated operating EBIT of EUR 89.2 million in financial year 2011/2012. This represents a 17.9% increase on the prior‐year figure (EUR 75.7 million).
The following table shows the development of operating EBITDA:
in EUR million 2011/2012 2010/2011 ∆ 2009/2010
Group EBIT 130.3 43.9 196.8% 50.2
Operating adjustments ‐41.0 31.8 4.0
Of which
Purchase accounting depreciation and amortisation 1.2 1.2 1.6
Integration costs 0.6 0.2 2.3
Restructuring costs 3.8 – –
Refinancing expenses 0.0 1.8 0.6
Management services charged by Terex 5.7 – –
Costs incurred in connection with the take over
by Terex Industrial Holding AG 1.1 28.4 –
Revenue generated by the sale of US entities ‐57.2 – –
Other 3.8 0.3 ‐0.6
Group operating EBIT 89.2 75.7 17.9% 54.2
Of which
Industrial Cranes 13.6 10.8 25.9% 4.8
in % of revenue 2.6 2.2 1.1
Services 67.6 66.2 2.2% 58.3
in % of revenue 20.2 19.8 19.4
Industrial Cranes and Services 81.3 77.0 5.6% 63.1
in % of revenue 9.5 9.4 7.7
Port Technology 13.4 9.2 45.6% 0.6
in % of revenue 5.0 3.8 0.3
Central holding company/Demag Cranes AG ‐5.4 ‐10.5 ‐48.2% ‐9.5
1 October to 30 September
in EUR million 2011/2012 2010/2011 ∆ 2009/2010
Group operating EBIT 89.2 75.7 17.9% 54.2
Operating depreciation and amortisation 20.4 20.9 ‐2.2% 20.2
Group operating EBITDA 109.6 96.6 13.5% 74.3
1 October to 30 September
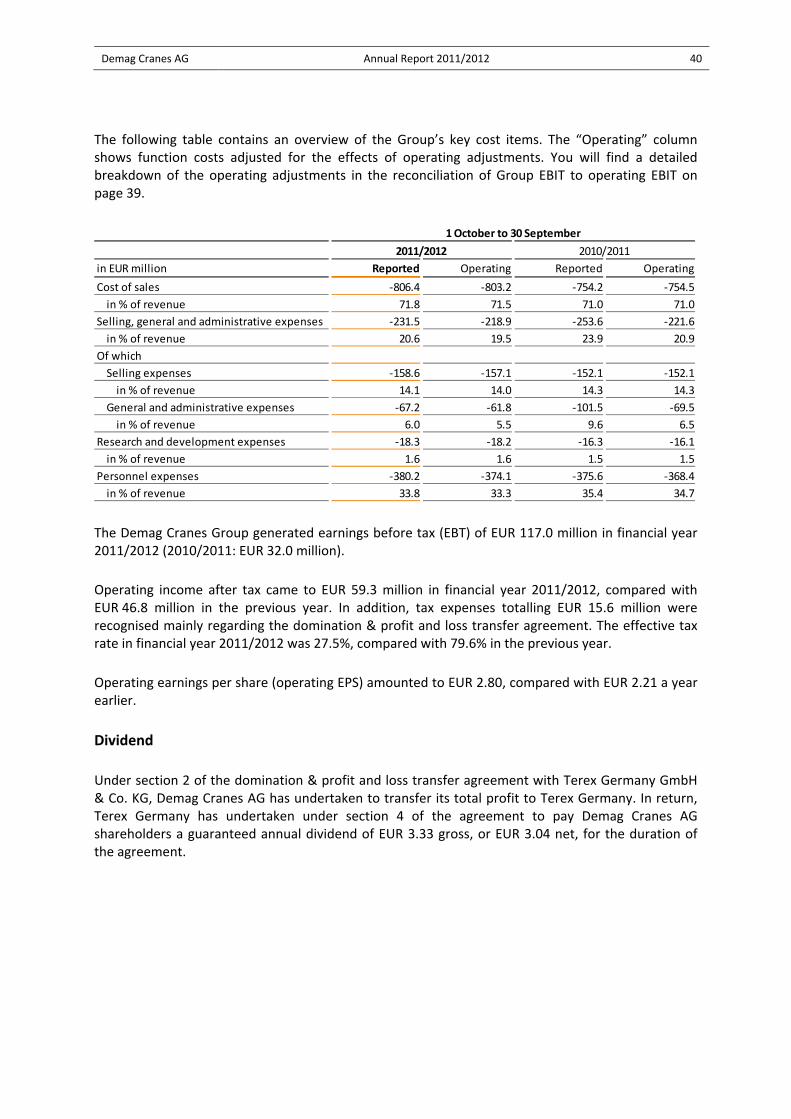
Demag Cranes AG Annual Report 2011/2012 40
The following table contains an overview of the Group’s key cost items. The “Operating” column shows function costs adjusted for the effects of operating adjustments. You will find a detailed breakdown of the operating adjustments in the reconciliation of Group EBIT to operating EBIT on page 39.
The Demag Cranes Group generated earnings before tax (EBT) of EUR 117.0 million in financial year 2011/2012 (2010/2011: EUR 32.0 million).
Operating income after tax came to EUR 59.3 million in financial year 2011/2012, compared with EUR 46.8 million in the previous year. In addition, tax expenses totalling EUR 15.6 million were recognised mainly regarding the domination & profit and loss transfer agreement. The effective tax rate in financial year 2011/2012 was 27.5%, compared with 79.6% in the previous year.
Operating earnings per share (operating EPS) amounted to EUR 2.80, compared with EUR 2.21 a year earlier.
Dividend
Under section 2 of the domination & profit and loss transfer agreement with Terex Germany GmbH & Co. KG, Demag Cranes AG has undertaken to transfer its total profit to Terex Germany. In return, Terex Germany has undertaken under section 4 of the agreement to pay Demag Cranes AG shareholders a guaranteed annual dividend of EUR 3.33 gross, or EUR 3.04 net, for the duration of the agreement.
in EUR million Reported Operating Reported Operating
Cost of sales ‐806.4 ‐803.2 ‐754.2 ‐754.5
in % of revenue 71.8 71.5 71.0 71.0
Selling, general and administrative expenses ‐231.5 ‐218.9 ‐253.6 ‐221.6
in % of revenue 20.6 19.5 23.9 20.9
Of which
Selling expenses ‐158.6 ‐157.1 ‐152.1 ‐152.1
in % of revenue 14.1 14.0 14.3 14.3
General and administrative expenses ‐67.2 ‐61.8 ‐101.5 ‐69.5
in % of revenue 6.0 5.5 9.6 6.5
Research and development expenses ‐18.3 ‐18.2 ‐16.3 ‐16.1
in % of revenue 1.6 1.6 1.5 1.5
Personnel expenses ‐380.2 ‐374.1 ‐375.6 ‐368.4
in % of revenue 33.8 33.3 35.4 34.7
1 October to 30 September
2011/2012 2010/2011

Demag Cranes AG Annual Report 2011/2012 41
Demag Cranes Group cash flows
Free cash flow before financing – cash flow from operating activities minus cash flow from investing activities – was EUR 115.1 million in the reporting period (2010/2011: minus EUR 13.2 million). The figure changed as follows year on year:
Cash flow from operating activities increased compared with financial year 2010/2011 by EUR 26.6 million to EUR 40.7 million in the reporting period. This mostly related to the decrease in net working capital, primarily in inventories. Cash flow from investing activities changed relative to financial year 2010/2011 from a negative cash flow of EUR 27.3 million to a positive cash flow of EUR 74.4 million. This mainly reflects the sale of the two US companies Demag Cranes & Components US, Cleveland, USA and Crane America Services, Dayton, USA to Terex USA, LLC, a Delaware limited liability company, USA, for a purchase price of EUR 102.4 million.
The following table shows a breakdown of capital expenditure on intangible assets, property, plant and equipment by segment:
Group financing
Further information is provided in the Notes to the Consolidated Financial Statements under Note 35 (Capital management).
in EUR million 2011/2012 2010/2011 ∆
Cash flow from operating activities 40.7 14.1 188,6%
Cash flow from investing activities 74.4 ‐27.3 n/a
Free cash flow before financing 115.1 ‐13.2 n/a
Restructuring payments 0.5 4.0 ‐87.8%
Free cash flow before financing and restructuring payments 115.6 ‐9.2 n/a
1 October to 30 September
in EUR million 2011/2012 2010/2011 ∆
Industrial Cranes 12.6 18.2 ‐31.1%
Services 2.2 1.9 14.9%
Industrial Cranes and Services 14.8 20.1 ‐26.7%
Port Technology 4.3 3.9 9.2%
Central holding company/Demag Cranes AG 3.2 2.6 23.0%
Capital expenditure 22.3 26.7 ‐16.5%
1 October to 30 September
in EUR million 30 Sept 2012 30 June 2012 31 March 2012 31 Dec 2011 30 Sept 2011
Non‐current loans and borrowings 0.8 0.8 135.9 135.9 126.0
Current loans and borrowings 8.8 60.3 8.7 3,6 3.8
Cash and cash equivalents ‐55.9 ‐52.6 ‐94.2 ‐102.9 ‐107.6
Other current financial assets ‐15.7 ‐13.0 ‐0.3 ‐0.3 ‐0.4
Net debt in connection with
available‐for‐sale assets 35.3 – – – –
Net debt ‐26.8 ‐4.5 50.0 36.2 21.8

Demag Cranes AG Annual Report 2011/2012 42
Net debt changed from EUR 21.8 million at 30 September 2011 to a net cash position of EUR 26.8 million at 30 September 2012. This was due, in particular, to the cash inflow from the sale of the US companies Demag Cranes & Components US, Cleveland, USA and Crane America Services, Dayton, USA to Terex USA, LLC, a Delaware limited liability company, USA at a purchase price of EUR 102.4 million.
After the domination & profit and loss transfer agreement between Demag Cranes AG and Terex Germany GmbH & Co. KG, an indirect wholly‐owned subsidiary of Terex Corporation, Westport, USA, came into effect on 18 April 2012, the EUR 350 million revolving credit facility (including the ancillary facility for guarantees in the amount of EUR 150 million) was repaid in full on 21 May 2012. Fine‐tuning the Group’s financing is the responsibility of Group treasury. The primary objective in this is to guarantee the Company’s continued ability to operate as a going concern and its earnings power. Rolling cash forecasts and central cash management ensure that the Group has adequate funding at all times, including in the form of borrowings and credit balances at Terex Germany GmbH & Co. KG.
In the context of its financing activities, Demag Cranes AG requires not only loans and borrowings, but also guarantee facilities allowing bid, down payment, performance and warranty bonds/guarantees to be issued on its behalf. Bank guarantees are drawn under bilateral guarantee facilities. The central aim of this financing portfolio is to secure suitable lines of credit for us to field the liquidity needed for industry‐specific seasonal fluctuations and the ongoing development of our business.
Our financing is supplemented with off‐balance sheet operating leases, including for IT hardware and for the vehicle fleet in the Services segment.
The Demag Cranes Group normally borrows centrally as part of the Terex cash pooling arrangement. Local borrowing is only taken out in individual instances if Group borrowing is unfavourable due to the legal environment. Demag Cranes AG must expressly approve such borrowing, however. A central cash pooling arrangement allows cash surpluses at Group member companies to be deployed cost‐effectively in the Group.
Financial risks are explained in the Risk report on page 51 and in the Notes to the Consolidated Financial Statements, under Note 28 (Loans and borrowings).
Demag Cranes Group financial position
The financial position of the Demag Cranes Group changed as follows in the reporting period:
Net working capital – inventories, advance payments made and trade receivables less trade payables and advance payments received – declined from EUR 251.9 million at 30 September 2011 to EUR 204.2 million at 30 September 2012. This was due, in particular, to the sale of the two US
in EUR million 30 Sept 2012 30 June 2012 31 March 2012 31 Dec 2011 30 Sept 2011
Inventories 188.0 214.8 229.4 228.9 225.8
Advance payments made 4.1 4.9 3.6 4.7 5.7
Trade receivables 147.9 168.7 184.8 182.7 194.2
Trade payables ‐48.9 ‐56.8 ‐65.5 ‐66.7 ‐93.0
Advance payments received ‐86.9 ‐78.4 ‐94.4 ‐95.4 ‐80.7
Net working capital 204.2 253.2 257.9 254.2 251.9
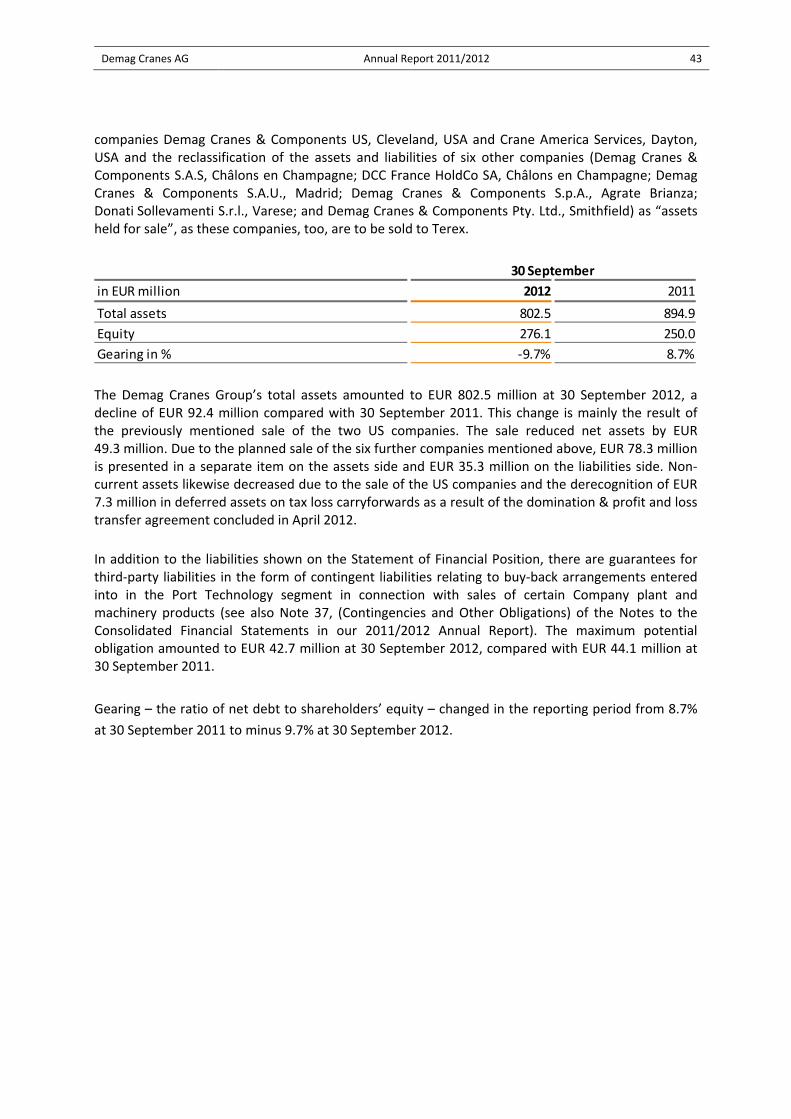
Demag Cranes AG Annual Report 2011/2012 43
companies Demag Cranes & Components US, Cleveland, USA and Crane America Services, Dayton, USA and the reclassification of the assets and liabilities of six other companies (Demag Cranes & Components S.A.S, Châlons en Champagne; DCC France HoldCo SA, Châlons en Champagne; Demag Cranes & Components S.A.U., Madrid; Demag Cranes & Components S.p.A., Agrate Brianza; Donati Sollevamenti S.r.l., Varese; and Demag Cranes & Components Pty. Ltd., Smithfield) as “assets held for sale”, as these companies, too, are to be sold to Terex.
The Demag Cranes Group’s total assets amounted to EUR 802.5 million at 30 September 2012, a decline of EUR 92.4 million compared with 30 September 2011. This change is mainly the result of the previously mentioned sale of the two US companies. The sale reduced net assets by EUR 49.3 million. Due to the planned sale of the six further companies mentioned above, EUR 78.3 million is presented in a separate item on the assets side and EUR 35.3 million on the liabilities side. Non‐current assets likewise decreased due to the sale of the US companies and the derecognition of EUR 7.3 million in deferred assets on tax loss carryforwards as a result of the domination & profit and loss transfer agreement concluded in April 2012.
In addition to the liabilities shown on the Statement of Financial Position, there are guarantees for third‐party liabilities in the form of contingent liabilities relating to buy‐back arrangements entered into in the Port Technology segment in connection with sales of certain Company plant and machinery products (see also Note 37, (Contingencies and Other Obligations) of the Notes to the Consolidated Financial Statements in our 2011/2012 Annual Report). The maximum potential obligation amounted to EUR 42.7 million at 30 September 2012, compared with EUR 44.1 million at 30 September 2011.
Gearing – the ratio of net debt to shareholders’ equity – changed in the reporting period from 8.7%
at 30 September 2011 to minus 9.7% at 30 September 2012.
in EUR million 2012 2011
Total assets 802.5 894.9
Equity 276.1 250.0
Gearing in % ‐9.7% 8.7%
30 September
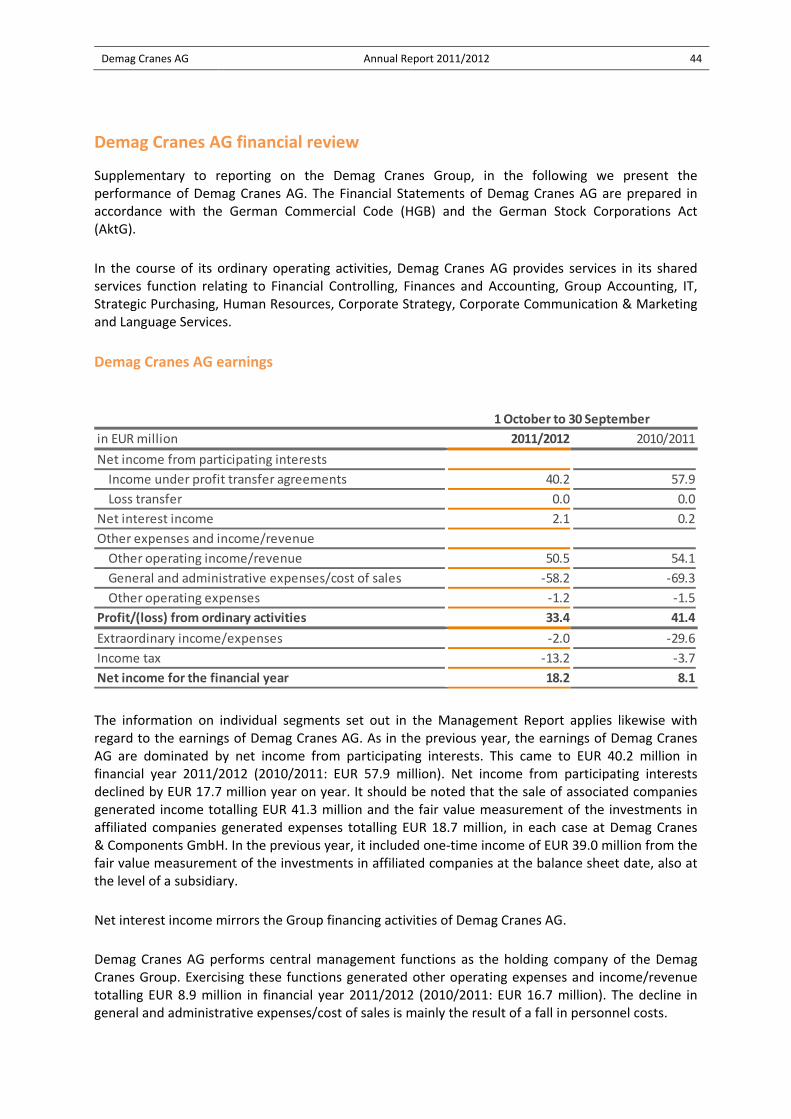
Demag Cranes AG Annual Report 2011/2012 44
Demag Cranes AG financial review
Supplementary to reporting on the Demag Cranes Group, in the following we present the performance of Demag Cranes AG. The Financial Statements of Demag Cranes AG are prepared in accordance with the German Commercial Code (HGB) and the German Stock Corporations Act (AktG).
In the course of its ordinary operating activities, Demag Cranes AG provides services in its shared services function relating to Financial Controlling, Finances and Accounting, Group Accounting, IT, Strategic Purchasing, Human Resources, Corporate Strategy, Corporate Communication & Marketing and Language Services.
Demag Cranes AG earnings
The information on individual segments set out in the Management Report applies likewise with regard to the earnings of Demag Cranes AG. As in the previous year, the earnings of Demag Cranes AG are dominated by net income from participating interests. This came to EUR 40.2 million in financial year 2011/2012 (2010/2011: EUR 57.9 million). Net income from participating interests declined by EUR 17.7 million year on year. It should be noted that the sale of associated companies generated income totalling EUR 41.3 million and the fair value measurement of the investments in affiliated companies generated expenses totalling EUR 18.7 million, in each case at Demag Cranes & Components GmbH. In the previous year, it included one‐time income of EUR 39.0 million from the fair value measurement of the investments in affiliated companies at the balance sheet date, also at the level of a subsidiary.
Net interest income mirrors the Group financing activities of Demag Cranes AG.
Demag Cranes AG performs central management functions as the holding company of the Demag Cranes Group. Exercising these functions generated other operating expenses and income/revenue totalling EUR 8.9 million in financial year 2011/2012 (2010/2011: EUR 16.7 million). The decline in general and administrative expenses/cost of sales is mainly the result of a fall in personnel costs.
in EUR million 2011/2012 2010/2011
Net income from participating interests
Income under profit transfer agreements 40.2 57.9
Loss transfer 0.0 0.0
Net interest income 2.1 0.2
Other expenses and income/revenue
Other operating income/revenue 50.5 54.1
General and administrative expenses/cost of sales ‐58.2 ‐69.3
Other operating expenses ‐1.2 ‐1.5
Profit/(loss) from ordinary activities 33.4 41.4
Extraordinary income/expenses ‐2.0 ‐29.6
Income tax ‐13.2 ‐3.7
Net income for the financial year 18.2 8.1
1 October to 30 September
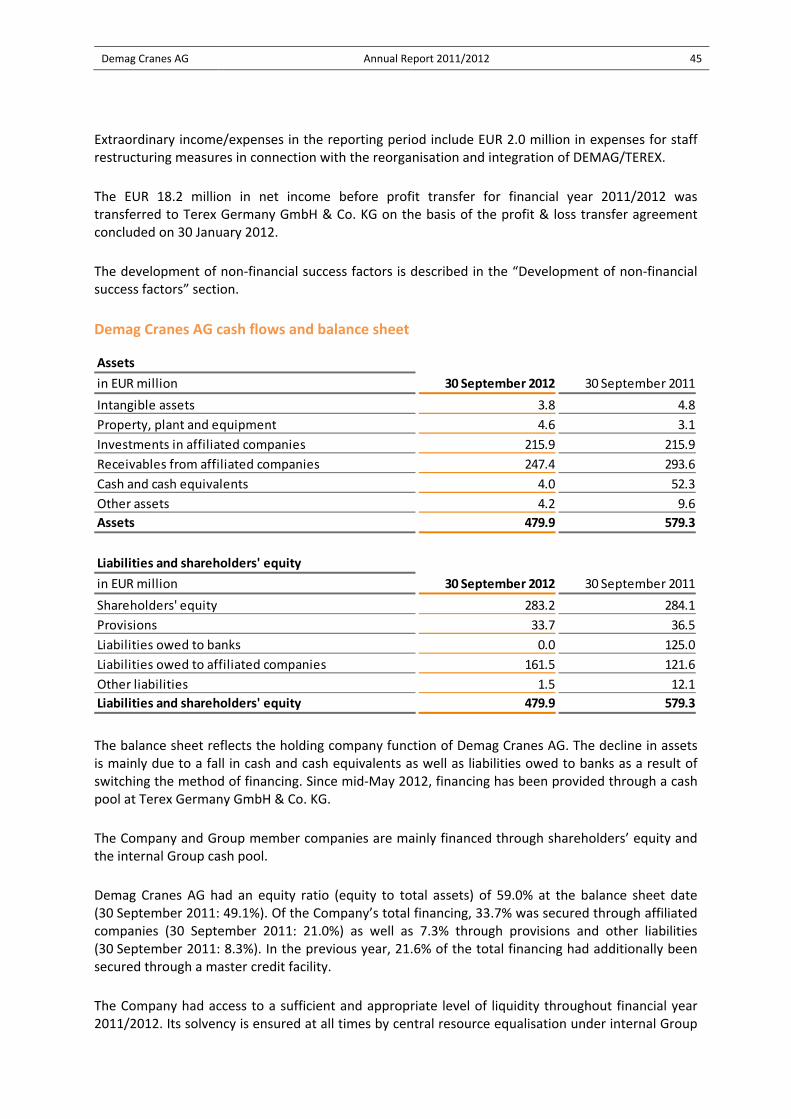
Demag Cranes AG Annual Report 2011/2012 45
Extraordinary income/expenses in the reporting period include EUR 2.0 million in expenses for staff restructuring measures in connection with the reorganisation and integration of DEMAG/TEREX.
The EUR 18.2 million in net income before profit transfer for financial year 2011/2012 was transferred to Terex Germany GmbH & Co. KG on the basis of the profit & loss transfer agreement concluded on 30 January 2012.
The development of non‐financial success factors is described in the “Development of non‐financial success factors” section.
Demag Cranes AG cash flows and balance sheet
The balance sheet reflects the holding company function of Demag Cranes AG. The decline in assets is mainly due to a fall in cash and cash equivalents as well as liabilities owed to banks as a result of switching the method of financing. Since mid‐May 2012, financing has been provided through a cash pool at Terex Germany GmbH & Co. KG.
The Company and Group member companies are mainly financed through shareholders’ equity and the internal Group cash pool.
Demag Cranes AG had an equity ratio (equity to total assets) of 59.0% at the balance sheet date (30 September 2011: 49.1%). Of the Company’s total financing, 33.7% was secured through affiliated companies (30 September 2011: 21.0%) as well as 7.3% through provisions and other liabilities (30 September 2011: 8.3%). In the previous year, 21.6% of the total financing had additionally been secured through a master credit facility.
The Company had access to a sufficient and appropriate level of liquidity throughout financial year 2011/2012. Its solvency is ensured at all times by central resource equalisation under internal Group
Assets
in EUR million 30 September 2012 30 September 2011
Intangible assets 3.8 4.8
Property, plant and equipment 4.6 3.1
Investments in affiliated companies 215.9 215.9
Receivables from affiliated companies 247.4 293.6
Cash and cash equivalents 4.0 52.3
Other assets 4.2 9.6
Assets 479.9 579.3
Liabilities and shareholders' equity
in EUR million 30 September 2012 30 September 2011
Shareholders' equity 283.2 284.1
Provisions 33.7 36.5
Liabilities owed to banks 0.0 125.0
Liabilities owed to affiliated companies 161.5 121.6
Other liabilities 1.5 12.1
Liabilities and shareholders' equity 479.9 579.3
Demag Cranes AG Annual Report 2011/2012 46
cash pooling, which comes under the Terex Corporation’s central cash and foreign exchange management system.
As the holding company for the Demag Cranes Group, Demag Cranes AG derives most of its income from its subsidiaries. The expectations for the Group’s business development outlined in the forecast report are likely to be reflected in the earnings of Demag Cranes AG.
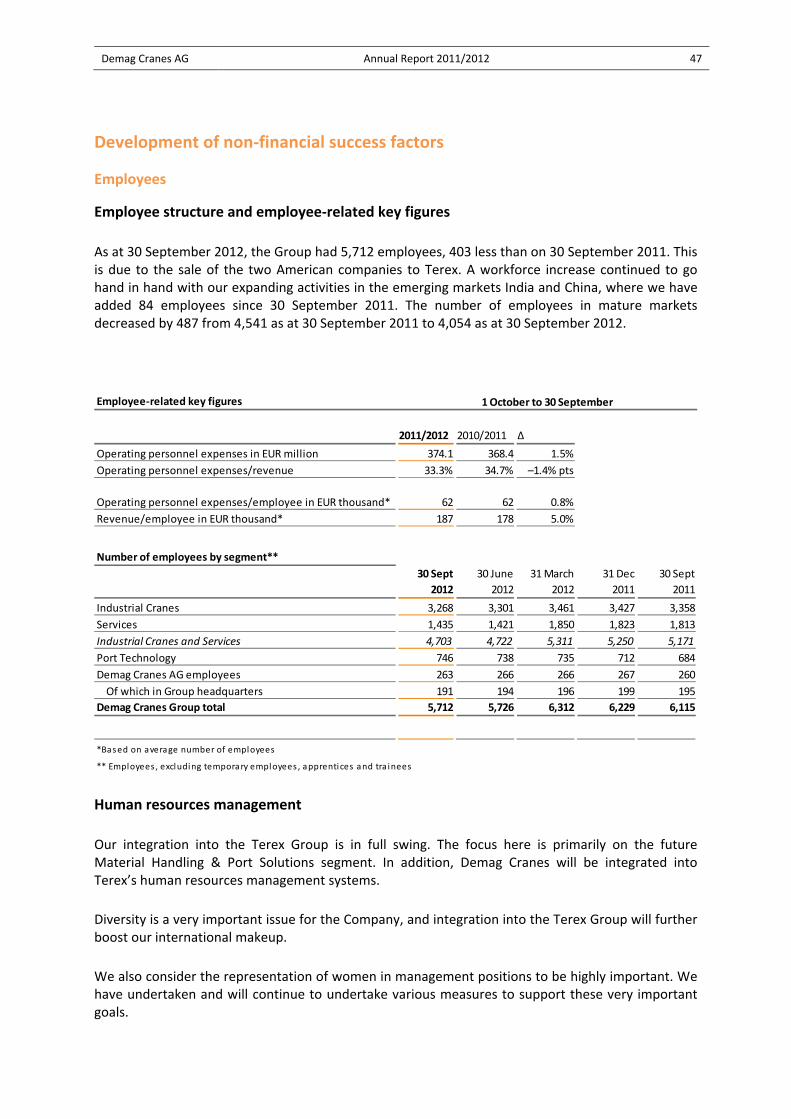
Demag Cranes AG Annual Report 2011/2012 47
Development of non‐financial success factors
Employees
Employee structure and employee‐related key figures
As at 30 September 2012, the Group had 5,712 employees, 403 less than on 30 September 2011. This is due to the sale of the two American companies to Terex. A workforce increase continued to go hand in hand with our expanding activities in the emerging markets India and China, where we have added 84 employees since 30 September 2011. The number of employees in mature markets decreased by 487 from 4,541 as at 30 September 2011 to 4,054 as at 30 September 2012.
Human resources management
Our integration into the Terex Group is in full swing. The focus here is primarily on the future Material Handling & Port Solutions segment. In addition, Demag Cranes will be integrated into Terex’s human resources management systems.
Diversity is a very important issue for the Company, and integration into the Terex Group will further boost our international makeup.
We also consider the representation of women in management positions to be highly important. We have undertaken and will continue to undertake various measures to support these very important goals.
Employee‐related key figures
2011/2012 2010/2011 ∆
Operating personnel expenses in EUR million 374.1 368.4 1.5%
Operating personnel expenses/revenue 33.3% 34.7% –1.4% pts
Operating personnel expenses/employee in EUR thousand* 62 62 0.8%
Revenue/employee in EUR thousand* 187 178 5.0%
1 October to 30 September
Number of employees by segment**
30 Sept
2012
30 June
2012
31 March
2012
31 Dec
2011
30 Sept
2011
Industrial Cranes 3,268 3,301 3,461 3,427 3,358
Services 1,435 1,421 1,850 1,823 1,813
Industrial Cranes and Services 4,703 4,722 5,311 5,250 5,171
Port Technology 746 738 735 712 684
Demag Cranes AG employees 263 266 266 267 260
Of which in Group headquarters 191 194 196 199 195
Demag Cranes Group total 5,712 5,726 6,312 6,229 6,115
*Based on average number of employees
** Employees, excluding temporary employees , apprentices and tra inees

Demag Cranes AG Annual Report 2011/2012 48
Procurement and purchasing
In the past financial year, delivery times for key components remained similar to those in financial year 2010/2011. A key focus for Demag Cranes AG’s Corporate Purchasing was therefore to ensure procurement of materials in a timely manner by coordinating capacity with suppliers as early as possible. Moreover, we continually reviewed the credit standing of our suppliers to identify unfavourable developments early on and, if necessary, to introduce necessary countermeasures quickly. We also continued to take necessary measures so that we do not become too dependent on any individual supplier.
In the period under review, we saw price increase requests from a number of our suppliers. The Demag Cranes Group’s internationally focused procurement strategies enabled us to offset these price increases in most cases. The Company’s global purchasing presence allows Corporate Purchasing to react flexibly to constantly changing market conditions and to systematically exploit local procurement advantages. In this regard, the focus is on the procurement markets in emerging economies, where we have our own purchasing offices in key locations.
In the financial year, expenses for supplies and services amounted to approximately EUR 539 million (2010/2011: approximately EUR 540 million), of which some EUR 404 million (2010/2011: around EUR 411 million) was spent on materials.
Research and development
In our research and development (R&D) activities, we aim to provide customers with the highest standards of innovative products and services. We do our utmost in the process to satisfy customer needs in terms of performance, value for money and reliability. We achieve this from our position as technology leaders by constantly seeking groundbreaking, future‐ready solutions and improving existing products.
R&D expenses, including capitalised development expenses, amounted to EUR 20.8 million in financial year 2011/2012, compared with EUR 21.8 million in the previous financial year. EUR 2.5 million (previous year: EUR 5.5 million) of this amount was capitalised. In line with development work carried out, development expenses were also capitalised in the Industrial Cranes and Services segments in the year under review (EUR 1.2 million). Total R&D expenses broken down by segment were as follows:
• EUR 4.6 million (22.4% of total R&D expenses) (previous year: EUR 6.6 million, 30.3%) was attributable to the Port Technology segment;
• EUR 16.2 million (77.6% of total R&D expenses) (previous year: EUR 15.2 million, 69.7%) was attributable to the Industrial Cranes and the Services segments;
R&D in the Industrial Cranes segment continued to focus on expanding the product range for fast‐growing markets, and notably China and India. This included adding further models to the Bas product range.
Demag Cranes AG Annual Report 2011/2012 49
Developments in the Port Technology segment focused on expanding the mobile harbour crane product range and reducing manufacturing costs, allowing us to compete more effectively in emerging economies. We also worked on producing more effective, eco‐friendly solutions with the development, implementation and launch of battery‐powered AGVs.
Environment and occupational safety
Opportunities to protect the environment abound in any company: separating waste, avoiding emissions, using resources sparingly – these are just a few examples of activities that are an integral part of our corporate policy. More and more companies are being required not only to implement quality and environmental management systems, but also prove that they have introduced systems to manage occupational health and safety issues. This requirement and the responsibility, goals and duties anchored in our corporate policy led to the successful introduction of an OHSAS 18001:2007 occupational health and safety management system as part of a matrix certification at the German production locations as well as the Czech production location at the end of 2011.
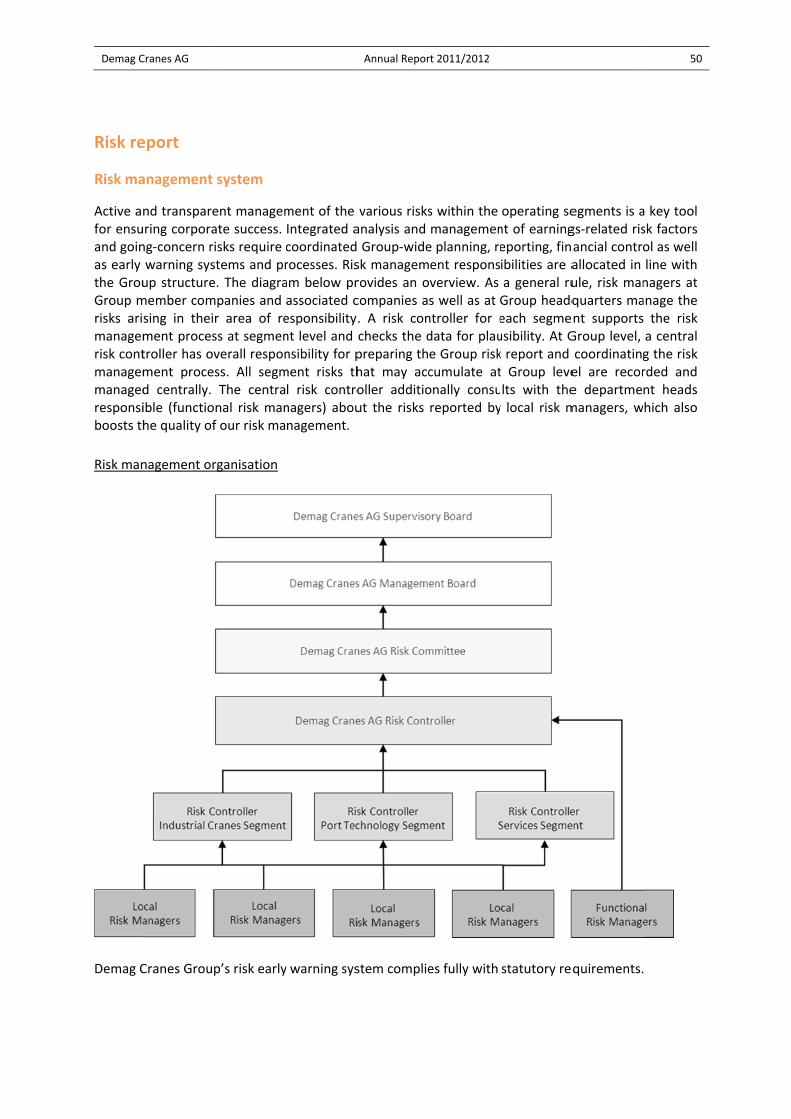
Demag C
Risk re
Risk ma
Active afor ensuand goinas early the GrouGroup mrisks arimanagemrisk contmanagemmanagedresponsiboosts th
Risk man
Demag C
Cranes AG
eport
anagement
nd transpareuring corporang‐concern riwarning sysup structuremember comsing in theiment procestroller has ovment proced centrally. ible (functiohe quality of
nagement or
Cranes Group
system
ent managemate success. isks require stems and pre. The diagrampanies and r area of ress at segmenverall responss. All segmThe centranal risk manf our risk ma
rganisation
p’s risk early
ment of the Integrated acoordinatedrocesses. Risam below prassociated cesponsibilitynt level and nsibility for pment risks thl risk contronagers) abounagement.
y warning sys
Annual Repor
various risksanalysis and Group‐widesk managemrovides an ocompanies a. A risk conchecks the dpreparing thhat may accoller additiout the risks
stem complie
rt 2011/2012
s within the managemene planning, reent responsverview. As s well as at ntroller for edata for plaue Group riskcumulate atonally consureported by
es fully with
operating sent of earningeporting, finibilities are aa general ruGroup headqeach segmeusibility. At Gk report and t Group levelts with they local risk m
statutory re
egments is ags‐related risancial controallocated in ule, risk manquarters mant supportsGroup level, coordinatingel are recore departmemanagers, w
quirements.
50
a key tool sk factors ol as well line with nagers at anage the the risk a central g the risk rded and nt heads hich also
Demag Cranes AG Annual Report 2011/2012 51
Opportunity management
Separation of risk management and opportunity management
As a rule, we address risk management and opportunity management separately. A separate risk reporting system documents risks and supports risk monitoring. Recording and communicating opportunities, on the other hand, is an integral part of the established management and control system between Group member companies and associated companies and the parent company, Demag Cranes AG. The management of individual companies is directly responsible for identifying, analysing and acting on operational opportunities.
Significant individual risks
Financial risks
The Demag Cranes Group is exposed to financial risk in its operating activities. Monitoring, controlling and limiting this risk at Group level (financial risk management) and fine‐tuning the Group’s finances are the responsibility of Group treasury. The primary objective in this is to guarantee the Company’s continued ability to operate as a going concern and its earnings power. Rolling cash forecasts and central cash management ensure that the Group has adequate funding at all times, including in the form of borrowings and credit balances at Terex Germany GmbH & Co. KG. Derivative financial instruments are used solely to hedge underlying transactions. Trading, settlement and back office functions are strictly separated.
The following financial risks are managed in the Demag Cranes Group:
Currency risks
Most Group business is transacted in euros, US dollars and pounds Sterling. The Group is mainly exposed to currency risk where payables and receivables exist or are likely to arise in a currency other than the local currency of the company recording them. As part of active risk management, foreign currency payables and receivables are normally hedged as they arise using financial instruments (foreign exchange contracts) (see also the Notes to the Consolidated Financial Statements under Note 34 (Additional disclosures on financial instruments)).
Liquidity risks
Liquidity risk can result in the Demag Cranes Group being unable to make available the funds needed to meet financial obligations entered into in its operating business or in connection with financial instruments. Safeguarding the liquidity of the Demag Cranes Group while allowing sufficient reserves for special eventualities is therefore an integral part of ongoing liquidity management. Resource equalisation within the Group through cash pooling and intercompany loans ensures that cash surpluses at individual Group member companies are efficiently used to meet funding needs in others. Sufficient cash‐pool credit facilities at Terex Germany GmbH & Co. KG ensured that neither funding nor liquidity shortfalls arose in financial year 2011/2012. Under the cash pooling agreement entered into by Demag Cranes AG, the Group had EUR 150.0 million undrawn on a credit facility at the balance sheet date (2010/2011: EUR 35.0 million). The cash‐pool credit facility at Terex Germany GmbH & Co. KG can be drawn against at any time and at short notice. Under bilateral loan
Demag Cranes AG Annual Report 2011/2012 52
agreements, the Group also had access to EUR 29.3 million in undrawn guarantee facilities at the balance sheet date (2010/2011: EUR 27.8 million).
Credit risks
Credit risk arises when customers or other contractual partners delay or default in meeting their obligations under a business transaction and financial losses are suffered as a result. The Demag Cranes Group counters specific credit risk by only doing business with parties of good credit standing, primarily based on the ratings of national and international trade credit rating agencies, and by rigorously observing risk limits laid down by trade credit insurers. Credit risk is also avoided by agreeing advance payments and the use of documentary letters of credit.
Compliance risks
Reporting on compliance risks covers risks such as legal risks, risks arising from fraudulent activity, corruption or breaches of antitrust law, and risks arising from breaches of other compliance regulations. The Demag Cranes Group has established a compliance management system that counters these risks through the Code of Conduct as well as various compliance corporate policies, audits and employee training initiatives. A regular Group‐wide compliance report describes the status of the compliance management system so that risks can be promptly identified and appropriate measures taken. Compliance risk is also addressed within the higher‐level risk management system. The Management Board and the Compliance Officers review the compliance management system of Demag Cranes AG regularly and adapt it to meet changing requirements.
As a result of the combination of Terex Corporation and Demag Cranes, the Demag Cranes compliance program is in the process of being integrated with the Terex Corporation compliance program in a coordinated fashion. The Company is expected to benefit from both its participation in the Terex Corporation compliance program and its access to greater compliance resources.
Operating risks
Sales risks
Given its worldwide operations, the Demag Cranes Group is exposed to fluctuations in prices and volumes on its sales markets. It counters this general risk by diversifying its product portfolio as well as the sectors and regional markets to which it sells. By continuously monitoring the markets, it updates its sales strategy is to take account, for example, of changing customer requirements or competitor behaviour.
Procurement risks
There are certain dependencies relating to suppliers of the Demag Cranes Group. These arise in part because there are only limited possibilities for changing suppliers of certain components and assemblies at short notice and in part because there is a technical/commercial dependency on suppliers of certain components, especially mould‐specific components. The Group has defined clear procurement strategies for such cases to safeguard supplies in the long term. Bought‐in parts account for a large proportion of production costs. As the steel industry, for example, is subject to strong cyclical movements, prices can be volatile. Through a wide range of specific measures, the Group constantly endeavours to secure prevailing market prices.
Demag Cranes AG Annual Report 2011/2012 53
Production process risks
Production processes can give rise to complex risks, the main ones being unanticipated technical difficulties, unforeseen developments at project locations, problems at partner companies or subcontractors and the resulting disruptions to logistics. These risks are minimised by issuing comprehensive corporate policies and procedural instructions on project and quality management, product and occupational safety as well as environmental protection. Risks are also mitigated through systematic employee training and development, continuous improvements to production processes and technologies as well as regular plant and system maintenance. The Group has adequate insurance cover for losses resulting from technical failure, fire, explosions and similar events.
Major project risks
Within the Group, potential major project risks, such as liability and earnings risks, are continuously monitored and mitigated through strict project management and control.
Cost overruns can occur, however, especially on major automated projects, but can be managed by limiting liability and concentrating on core products. Nevertheless, it must be ensured that the necessary resources are in place to carry out projects.
Product risks
In order to maintain its competitiveness, the Demag Cranes Group works continuously to develop new products and improve the existing product range. Despite using cutting‐edge project management, monitoring and control techniques, new product development entails considerable cost risk. This risk lies not only in the actual development phase, but also after market launch due to a possible need for technical improvements that can only be identified once products are in continuous operation under real‐use conditions. Risks arising from product liability cannot be ruled out entirely. They may affect the Demag Cranes Group in the form of financial losses and damage to its reputation. Insurance has been taken out to cover product liability claims.
Strategic risks
Economic risks
Most of the products and services provided by the Demag Cranes Group can be allocated to the global market for cargo handling equipment and material logistics. Demand for such goods partly depends on the general economic trend.
In the course of the financial year, economic growth slowed again as a result of the debt crisis in the euro zone.
The Industrial Cranes segment’s products are used in a diverse range of industries and serve a variety of customer groups. These include end customers who operate in cyclical sectors, i.e. in sectors particularly sensitive to changes in the economy as well as to global and regional trends. It remains difficult to make forecasts for the Industrial Cranes segment because it is heavily reliant on the economic cycle.
Demag Cranes AG Annual Report 2011/2012 54
The Port Technology segment is dependent on worldwide cargo volumes and growth in container handling. Furthermore, automation revenues in this segment are mainly determined by major project business, which by its nature is subject to certain fluctuations. Generally speaking, container handling is down slightly on the previous year in almost all regions bar Africa and North America.
Although all service units in the Services segment contributed to a positive business performance, as the economic situation remains strained worldwide it remains difficult to make forecasts for the Services segment.
Risks related to price competition
The Demag Cranes Group operates in markets characterised by intense competition and in some cases considerable price pressure resulting from the overcapacity caused by the financial and economic crisis. This price pressure is apparent in emerging economies and particularly so in mature markets. Here, technological benefits cannot always be given adequate consideration when making purchasing decisions owing to the sometimes very limited funds available for new investments. In order to develop and maintain a competitive edge in spite of this, the Demag Cranes Group invests in developing products for differentiated customer and market segments as well as in expanding its distribution and service network.
Competitive risks
Any company operating globally in the mechanical engineering sector faces risks arising from the activities of competitors. Observation of our competitors suggests that global competition will continue to rise in the Demag Cranes Group’s product segments. We counter these risks by constantly monitoring the market and developing product, pricing and marketing strategies on the basis of our observations.
Assessment of the risk situation and change in the risk position since the previous year
As in the previous year, no risks were identified in the course of early risk detection activities in the past financial year that raised doubts about the ability of the Group and Demag Cranes AG to continue as a going concern.
In the course of financial year 2011/2012, the risk position improved overall compared with the previous year. However, it is currently impossible to assess whether the trend in the global economy, the development of the debt crisis in several countries could cause the risk position of the Group and Demag Cranes AG to deteriorate.
Demag Cranes AG Annual Report 2011/2012 55
Disclosures under Section 289 (5) and Section 315 (2) 5 of the German Commercial Code (main features of the internal control system and of the risk management system in relation to the financial reporting process) and explanatory report on these disclosures by the Management Board of Demag Cranes AG
According to the explanatory memorandum to the German Accounting Law Modernisation Act (BilMoG), the internal control system encompasses the policies, processes and tasks that help ensure effective and efficient financial reporting, the quality of the financial reporting and compliance with applicable law. This also includes the internal audit system to the extent that it relates to financial reporting.
The risk management system in relation to the financial reporting process encompasses, as part of and hence in the same way as the internal control system, financial reporting control and monitoring processes in particular with regard to items on the statement of financial position associated with the management of risk.
Main features of the internal control system and of the risk management system in relation to the financial reporting process
The main features of the internal control and risk management system at Demag Cranes AG and in the Demag Cranes Group in relation to the (Group) financial reporting process may be described as follows:
• The Demag Cranes Group has a clear organisational, corporate, control and monitoring structure.
• Coordinated Group‐wide planning, reporting, financial control and early warning systems and processes ensure integrated analysis and management of earnings‐related risk factors and going‐concern risks.
• Functional responsibilities (e.g. accounting, financial control and internal audit) are clearly assigned for all parts of the financial reporting process.
• Accounting IT systems are secured against unauthorised access.
• Most finance systems in deployment are standard software.
• A suitable system of internal policies (including on Group‐wide risk management and accounting) is in place and subject to ongoing refinement in line with development needs.
• Departments involved in the financial reporting process meet quantitative and qualitative requirements.
• The completeness and accuracy of accounting data are regularly verified by sampling and plausibility checks performed both manually and by the software used. A risk controller for each segment supports the risk management process at segment level and checks the data for plausibility.

Demag Cranes AG Annual Report 2011/2012 56
• Key processes related to financial reporting are subject to regular analysis. The Group‐wide risk management system is continuously adapted in line with current developments and regularly tested for effectiveness.
• The dual control system is applied throughout all processes related to financial reporting.
• Processes related to financial reporting are subject to scrutiny by the internal audit function.
• The Supervisory Board supervises matters including key aspects of financial reporting, risk management and the audit mandate together with its main points of focus.
Explanatory notes on the main features of the internal control system and of the risk management system in relation to the financial reporting process
The internal control and risk management system in relation to the financial reporting process as set out above ensures that matters pertaining to the business are fully and accurately recognised, presented and measured in the accounts and so are included in external financial reporting.
The internal control and risk management system at Demag Cranes AG also ensures that financial reporting in the Demag Cranes Group is uniform and in compliance with legal and statutory requirements as well as internal corporate policies. The central tasks performed by Demag Cranes AG include consolidating the figures, checking differences between actual and budgeted amounts, assessing recognised goodwill for impairment and examining the accounts to determine whether these have been kept correctly, the Group‐wide accounting and financial control policies have been observed and the financial data thus meet regulatory requirements. This ongoing process is assured through the preparation of monthly accounts, in which the final amounts are checked by various units for plausibility, completeness and variance from the monthly budget. In addition to the accounting and financial control functions, this involves operations managers and, in some cases, internal audit as required by the annual audit plan.
The purpose of the uniform Group risk management system, which fully meets the statutory requirements, is to identify risks in good time, assess them and communicate them appropriately. Report users are thus provided with accurate, relevant and reliable information. All Group member companies submit their financial data to Demag Cranes AG for consolidation in accordance with the uniform Group reporting calendar.
The effectiveness of the internal control system in relation to the financial reporting process is regularly reviewed by internal audit, which has access to all data and audits individual areas and Group member companies in detail using sampling methods. In doing so, it examines whether the internal control system was implemented in this context, i.e. whether transactions were checked, and whether the dual control system was applied in all areas, for example.
Working in close cooperation, the compliance management and internal audit functions perform spot checks to monitor compliance with internal codes and the relevant laws relating to compliance. Points of focus here include anticorruption arrangements.
The uniform Group IT system incorporates authorisation procedures; if a subsidiary is audited by internal audit, these authorisation procedures and their implementation are also assessed.

Demag Cranes AG Annual Report 2011/2012 57
Automated controls and plausibility checks ensure the completeness and accuracy of data entries. In some cases, data are validated fully automatically and discrepancies highlighted.
Report on post‐balance sheet date events
The Management Board, after obtaining approval from the Supervisory Board, has decided to sell the companies Demag Cranes & Components S.A.S, Châlons en Champagne; DCC France HoldCo SA, Châlons en Champagne; Demag Cranes & Components S.A.U., Madrid; Demag Cranes & Components S.p.A., Agrate Brianza; Donati Sollevamenti S.r.l., Varese; and Demag Cranes & Components Pty. Ltd., Smithfield to the corresponding in‐country Terex entities: Terex Cranes SAS, France, Terex Equipment and Machinery S.L.U. Spain, Terex Italia S.r.l. Italy und Terex Australia Pte. Ltd. Australia.
Demag Cranes AG Annual Report 2011/2012 58
Forecast report
Introduction
The following statements on the future development and performance of the Demag Cranes Group and the key underlying assumptions concerning market and industry developments are based on assessments which Demag Cranes AG considers realistic on the basis of the information currently available to it. They nevertheless involve a high degree of uncertainty and an unavoidable risk that forecast developments may not actually occur, either in the general pattern or to the extent anticipated.
The global economy is taking longer than expected to recover. In its interim assessment in September, the Organisation for Economic Co‐operation and Development (OECD) said it expects the weak growth in G7 nations to continue as the year progresses. Even major emerging economies such as China continue to cool. The euro zone is in a slight recession, which as well as impacting on peripheral states is increasingly taking a toll on core countries. The environment for German foreign trade therefore also remains under strain.
With the further integration of Demag Cranes into the Terex Group, the two segments Industrial Cranes and Services are now combined into the Material Handling segment.
The Industrial Cranes segment is a late‐cycle business that, from past experience, responds with a time lag to cyclical changes in the overall economy. There is a risk of the ongoing uncertainty in connection with the European sovereign debt crisis leading to further cyclic slowdown. This may impact the Industrial Cranes segment in the shape of lower capital expenditure by our customers. In light of this, we estimate the growth opportunities to be moderate overall. However, we will also adapt our procurement, production, sales, service, marketing and organisation functions to these new market circumstances through comprehensive cost‐cutting programmes.
In our view, additional growth prospects arise from advancing industrialisation in emerging markets and the accompanying trend towards increased production efficiency. This favours demand for high‐quality crane components. We aim to develop further potential by expanding the product portfolio in the mid‐range product/price bracket, as provided for in our strategy for the BRIC states. Such potential is available on the one hand in emerging markets – even if establishing supply chains and new distribution channels in such regions has shown signs during the new financial year of posing more of a challenge than initially expected. On the other hand, we also see growth opportunities for these products in mature markets given the shift in customers’ investment behaviour as a result of the economic and financial crisis as well as the current economic uncertainties. We have already expanded our product portfolio accordingly and will continue in the same vein so that we can respond flexibly to changing customer needs. The joint venture with the Chinese Weihua Group must be regarded as a further pillar of growth and a strategically important step in intensifying our development of the Chinese market.
We likewise continue to expect growth in the Services segment in the years ahead. Our customers show an ongoing trend towards outsourcing and switching to professional maintenance services. Our customer base in emerging markets is also expanding. At the same time, the performance of the services business remains dependent on industrial capacity utilisation, which can be adversely affected by uncertainty in connection with the debt crisis. Risks arise here, for example, from the weak economic constitution of the countries of Southern Europe. In general, we see stronger growth in the Services segment in emerging markets, partly due to heightened safety requirements. Thanks
Demag Cranes AG Annual Report 2011/2012 59
to our existing installed base, however, mature markets offer ongoing growth potential. We have additionally identified further growth potential for the Services segment for which we have adjusted our strategic focus: By assuming more functional responsibility and offering a broader selection of services, we enable our customers to focus on their own core business. Through our services, we also make it possible for customers to gain maximum benefit from their crane systems in all processes.
Under the given conditions, market growth in the Port Technology segment for financial year 2013 is heavily dependent on our customers’ business performance and market opportunities. Despite the current climate of uncertainty, we see a positive trend in the growth projections from Drewry Shipping Consultants for container and bulk cargo transhipments because, from experience, any increase in transhipment rates drives corresponding demand for port and handling technology. Innovative products, however, continue to provide additional opportunities in port technology as elsewhere. The battery‐powered, zero‐emission Automated Guided Vehicle (AGV) remains a prime example of this, as it is now in deployment with terminal operators in Rotterdam. We also see the current growth in the terminal systems business as an opportunity to benefit from growth potential and to demonstrate our expertise for follow‐up projects. The amalgamation of the activities of Terex and Gottwald Port Technology in Terex Port Solutions – each of which was already a major supplier in the ports sector on its own – means we can serve port technology customers and meet their needs to the best possible extent from a single source.
Business outlook for the Demag Cranes Group
Having appropriately weighed up the opportunities and risks, we expect overall order intake, revenue volume and operating EBIT worldwide in the Material Handling segment, which includes the Industrial Cranes and Services segments, to increase only moderately in the next 12‐24 months, excluding the effects of changes in the composition of the group. The development of demand for industrial cranes must be viewed separately by market: We expect stagnation and potentially even a decline in demand in central Europe, mainly as a result of the crisis‐related uncertainty on the previously stable markets of Germany, Austria and Switzerland. We also expect a fall in demand in markets that have been affected by the crisis for some time, i.e., the Mediterranean countries of Spain, Italy and Greece. While we generally expect further growth in the Services segment, excluding the effects of changes in the composition of the group, the development of the service business remains dependent on the industry’s capacity utilisation, which may continue to be negatively impacted by the uncertainty surrounding the debt crisis.
We also anticipate moderate growth in order intake, revenue and operating EBIT in the Port Technology segment in the next 12‐24 months, of which our Mobile Harbour Cranes constitute the basic business. Marketing of the newly designed compact crane family could provide additional impetus. Furthermore, revenue recognised from the two major projects in the Netherlands could have a positive impact on segment revenue. We expect the price pressure and fierce competition to persist in the Port Technology segment as well.
For the next 12 months we see revenues for the Demag Cranes Group as a whole to be below those of the 2011/2012 financial year (EUR 1,123 million). This is mainly due to the sale of companies to Terex, as already mentioned in the report on post balance sheet date events, which represented about 13% of group sales and 7% of group operating EBIT in the 2011/2012 Financial Year. Operating EBIT margin for the next 12 months is expected to be stable compared with the Financial Year 2011/2012 (7.9%) provided that our revenue projection is attained. We expect to make a significant profit on the sale of the aforementioned companies. Capex for the Group will amount to approximately 2% to 3% of revenue.
Demag C
Howeveforecastnegativeextensiv
It is verydegree osegmentbelieve wrelies coincreasepositive portfoliooperatinenergy c
Düsseldo
Aloysius
Cranes AG
r, the devels will contine impact on ve cost‐cuttin
y difficult to of uncertaintts depends hwe can achieonsiderably e here boostdirection, tho of Terex Png EBIT will icosts and the
orf, 28 Nove
Rauen
opment of nue to rise,the cost basng programs
predict howty in the oveheavily on deve further gon the devts demand fohen we beliePort Solutionimprove in le pricing env
mber 2012
raw materia constitutesse. However,and increase
w the busineerall economemand for cgrowth if the velopment oor handling eve we are vns – to partine with theironment no
Lawrenc
Annual Repor
als prices ans a risk fact, we will ended efficiency
ess will devemy. Since thecapital goods conditions aof containerequipment. very well poticipate in te revenue gronetheless co
ce Lockwood
rt 2011/2012
nd energy cotor. The expdeavour to cy, so as to off
lop over thee trend in ths and capaciare favourabr and bulk If these indsitioned – ethis market rowth. The tonstitute risk
osts, which apected pricecounteract tfset any effe
e following yhe Industriality utilisationble. The Port cargo transhicators contspecially witgrowth. Wetrend in rawk factors.
according toe rises couldhese factorsects.
years due to Cranes andn in the induTechnology hipments, stinue to devth the entiree would expw material p
60
o current d have a s through
the high d Services ustry, we segment
since any elop in a e product pect that rices and

Demag Cranes AG Annual Report 2011/2012 61
Consolidated Financial Statements for the financial year
1 October 2011 to 30 September 2012
Demag Cranes AG Annual Report 2011/2012 62
Table of contents
Statement of comprehensive income ......................................................................................... 64
Statement of financial position .................................................................................................. 65
Statement of changes in equity .................................................................................................. 67
Statement of cash flow ............................................................................................................... 68
Notes to the Consolidated Financial Statements ......................................................................... 69
1. General information ...................................................................................................................................... 69 2. Basis of preparation ....................................................................................................................................... 69 3. New and revised standards and interpretations ........................................................................................... 70 4. Accounting policies ........................................................................................................................................ 74 5. Accounting estimates and judgements ......................................................................................................... 88 6. Consolidated Group ....................................................................................................................................... 90
Notes to the Statement of comprehensive income ..................................................................... 91
7. Revenue ......................................................................................................................................................... 91 8. Selling, general and administrative expenses ................................................................................................ 91 9. Research and development expenses ........................................................................................................... 92 10. Other operating income and other operating expenses ............................................................................. 92 11. Income from investments accounted for using the equity method ............................................................ 92 12. Interest and similar income and interest and similar expenses .................................................................. 93 13. Income tax ................................................................................................................................................... 93 14. Earnings per share ....................................................................................................................................... 94
Notes to the Statement of financial position .............................................................................. 95
15. Goodwill and other intangible assets .......................................................................................................... 95 16. Property, plant and equipment ................................................................................................................... 99 17. Investment property .................................................................................................................................. 102 18. Investments accounted for using the equity method ............................................................................... 103 19. Other investments ..................................................................................................................................... 103 20. Trade receivables and other financial assets ............................................................................................. 104 21. Other non‐financial assets ......................................................................................................................... 105 22. Inventories ................................................................................................................................................. 106 23. Cash and cash equivalents ......................................................................................................................... 106 24. Non‐current assets held for sale and associated liabilities ........................................................................ 107 25. Shareholders’ equity .................................................................................................................................. 107 26. Provisions for pensions and similar obligations......................................................................................... 111 27. Other provisions ........................................................................................................................................ 114 28. Loans and borrowings ................................................................................................................................ 116 29. Trade payables and other financial liabilities ............................................................................................ 117 30. Other non‐financial liabilities .................................................................................................................... 117 31. Deferred tax ............................................................................................................................................... 118
Other disclosures ...................................................................................................................... 120
32. Statement of cash flow .............................................................................................................................. 120 33. Segment reporting ..................................................................................................................................... 121 34. Additional disclosures on financial instrument ......................................................................................... 125 35. Capital management.................................................................................................................................. 133 36. Contractual commitments ......................................................................................................................... 134 37. Contingent liabilities and other obligations ............................................................................................... 135 38. Related parties ........................................................................................................................................... 136 39. Personnel expenses and number of employees ........................................................................................ 138 40. Corporate governance code ...................................................................................................................... 139
Demag Cranes AG Annual Report 2011/2012 63
41. Exemption under Section 264 (3) of the German Commercial Code ........................................................ 139 42. Auditors’ fees ............................................................................................................................................. 139 43. Events after the balance sheet date .......................................................................................................... 139 44. Subsidiaries, joint ventures and investments as at 30 September 2012 ................................................... 140 45. Mandates ................................................................................................................................................... 145
Responsibility statement ........................................................................................................... 150
Auditors’ report ........................................................................................................................ 151
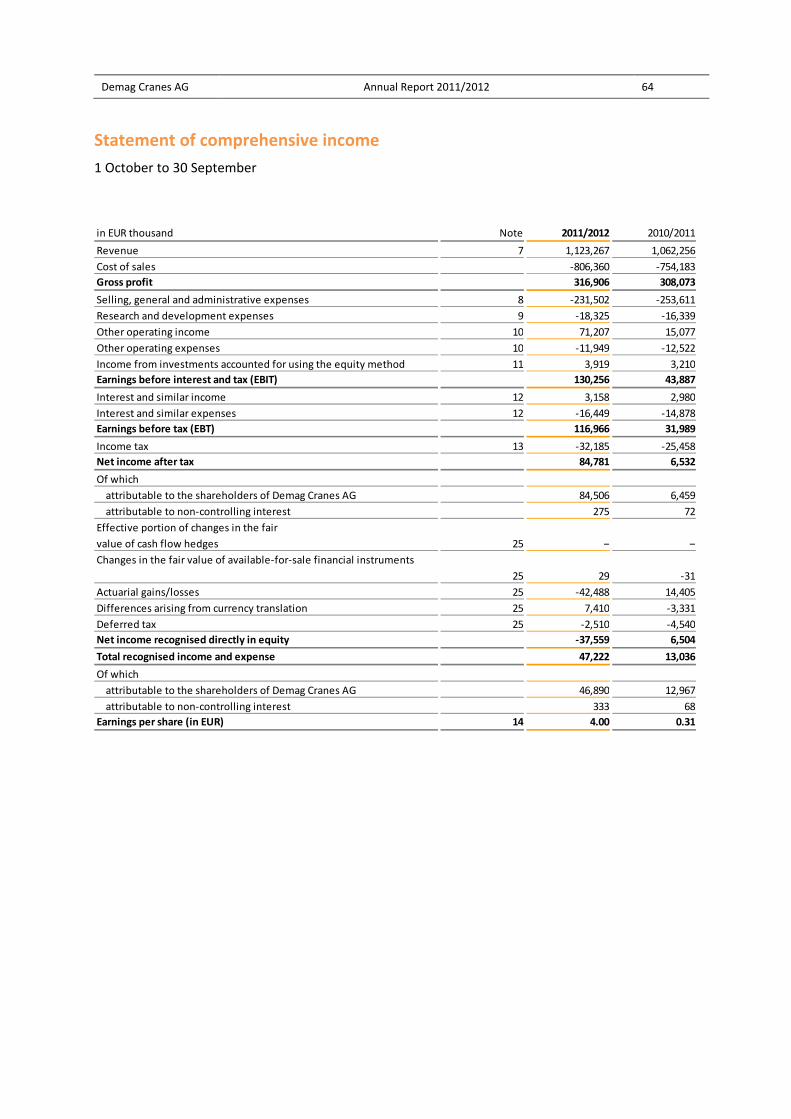
Demag Cranes AG Annual Report 2011/2012 64
Statement of comprehensive income
1 October to 30 September
in EUR thousand Note 2011/2012 2010/2011
Revenue 7 1,123,267 1,062,256
Cost of sales ‐806,360 ‐754,183
Gross profit 316,906 308,073
Selling, general and administrative expenses 8 ‐231,502 ‐253,611
Research and development expenses 9 ‐18,325 ‐16,339
Other operating income 10 71,207 15,077
Other operating expenses 10 ‐11,949 ‐12,522
Income from investments accounted for using the equity method 11 3,919 3,210
Earnings before interest and tax (EBIT) 130,256 43,887
Interest and similar income 12 3,158 2,980
Interest and similar expenses 12 ‐16,449 ‐14,878
Earnings before tax (EBT) 116,966 31,989
Income tax 13 ‐32,185 ‐25,458
Net income after tax 84,781 6,532
Of which
attributable to the shareholders of Demag Cranes AG 84,506 6,459
attributable to non‐controlling interest 275 72
Effective portion of changes in the fair
value of cash flow hedges
Changes in the fair value of available‐for‐sale financial instruments
29
Actuarial gains/losses 25 ‐42,488 14,405
Differences arising from currency translation 25 7,410 ‐3,331
Deferred tax 25 ‐2,510 ‐4,540
Net income recognised directly in equity ‐37,559 6,504
Total recognised income and expense 47,222 13,036
Of which
attributable to the shareholders of Demag Cranes AG 46,890 12,967
attributable to non‐controlling interest 333 68
Earnings per share (in EUR) 14 4.00 0.31
25 – –
25 ‐31
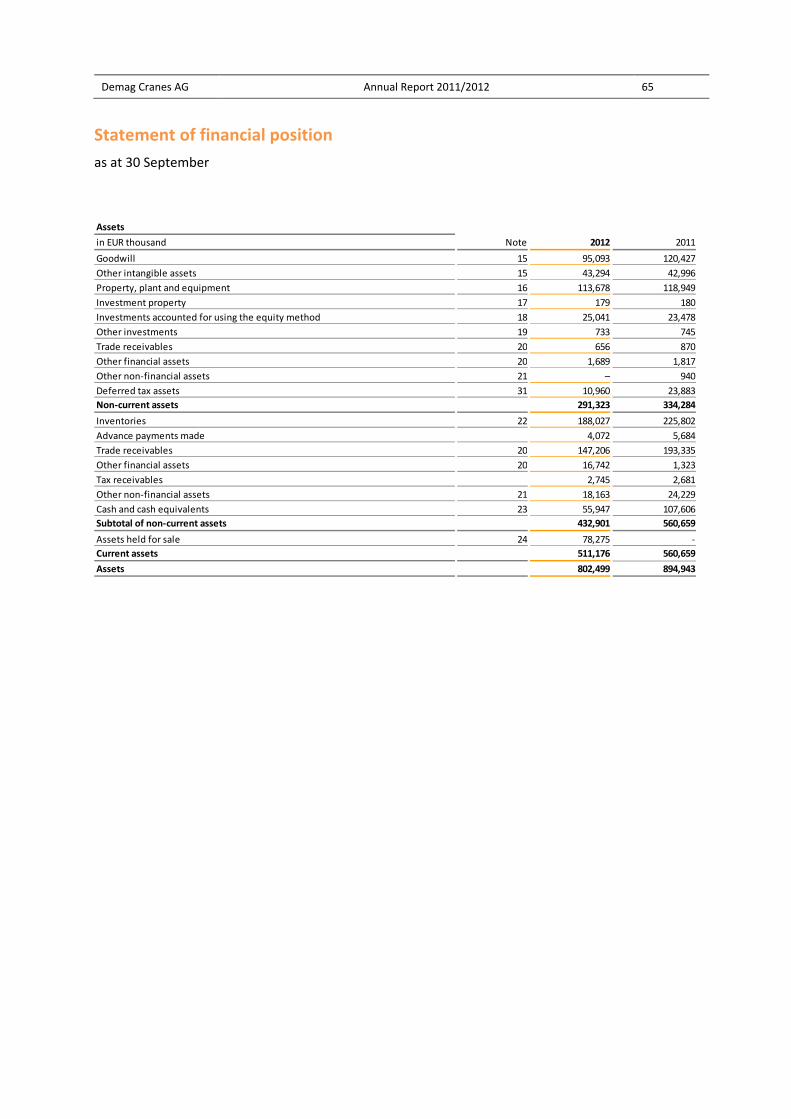
Demag Cranes AG Annual Report 2011/2012 65
Statement of financial position
as at 30 September
Assets
in EUR thousand Note 2012 2011
Goodwill 15 95,093 120,427
Other intangible assets 15 43,294 42,996
Property, plant and equipment 16 113,678 118,949
Investment property 17 179 180
Investments accounted for using the equity method 18 25,041 23,478
Other investments 19 733 745
Trade receivables 20 656 870
Other financial assets 20 1,689 1,817
Other non‐financial assets 21 – 940
Deferred tax assets 31 10,960 23,883
Non‐current assets 291,323 334,284
Inventories 22 188,027 225,802
Advance payments made 4,072 5,684
Trade receivables 20 147,206 193,335
Other financial assets 20 16,742 1,323
Tax receivables 2,745 2,681
Other non‐financial assets 21 18,163 24,229
Cash and cash equivalents 23 55,947 107,606
Subtotal of non‐current assets 432,901 560,659
Assets held for sale 24 78,275 ‐
Current assets 511,176 560,659
Assets 802,499 894,943
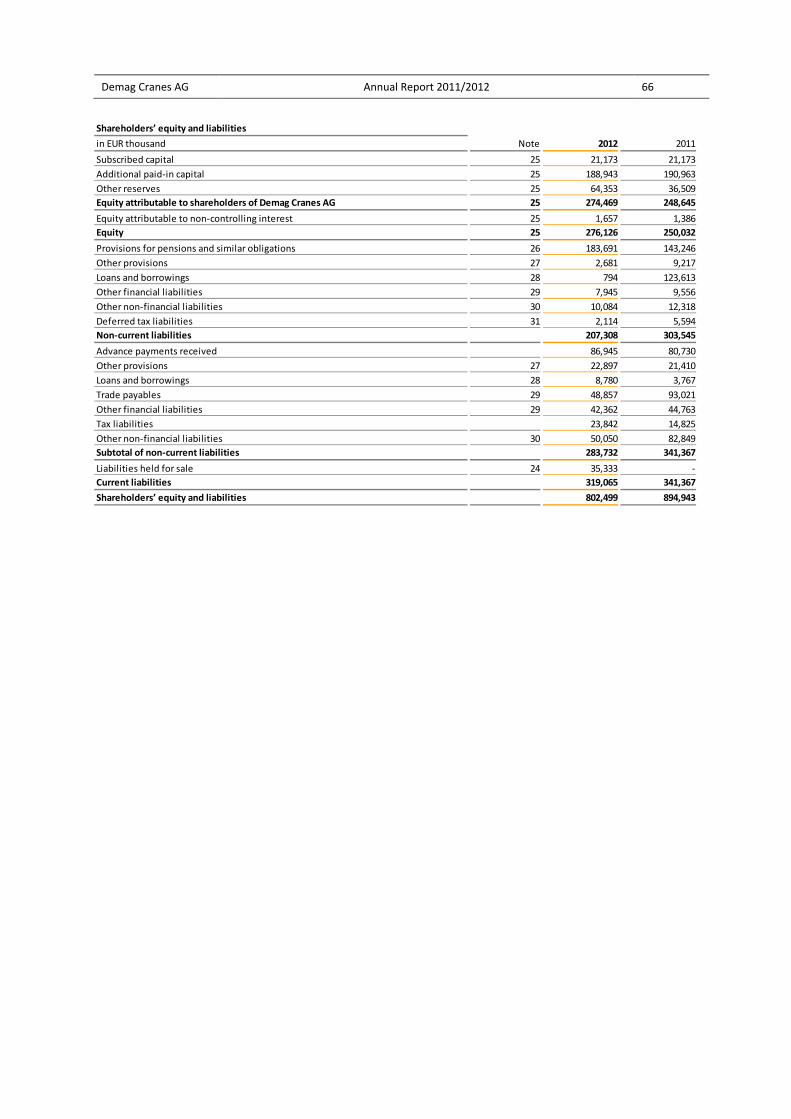
Demag Cranes AG Annual Report 2011/2012 66
Shareholders’ equity and liabilities
in EUR thousand Note 2012 2011
Subscribed capital 25 21,173 21,173
Additional paid‐in capital 25 188,943 190,963
Other reserves 25 64,353 36,509
Equity attributable to shareholders of Demag Cranes AG 25 274,469 248,645
Equity attributable to non‐controlling interest 25 1,657 1,386
Equity 25 276,126 250,032
Provisions for pensions and similar obligations 26 183,691 143,246
Other provisions 27 2,681 9,217
Loans and borrowings 28 794 123,613
Other financial liabilities 29 7,945 9,556
Other non‐financial liabilities 30 10,084 12,318
Deferred tax liabilities 31 2,114 5,594
Non‐current liabilities 207,308 303,545
Advance payments received 86,945 80,730
Other provisions 27 22,897 21,410
Loans and borrowings 28 8,780 3,767
Trade payables 29 48,857 93,021
Other financial liabilities 29 42,362 44,763
Tax liabilities 23,842 14,825
Other non‐financial liabilities 30 50,050 82,849
Subtotal of non‐current liabilities 283,732 341,367
Liabilities held for sale 24 35,333 ‐
Current liabilities 319,065 341,367
Shareholders’ equity and liabilities 802,499 894,943
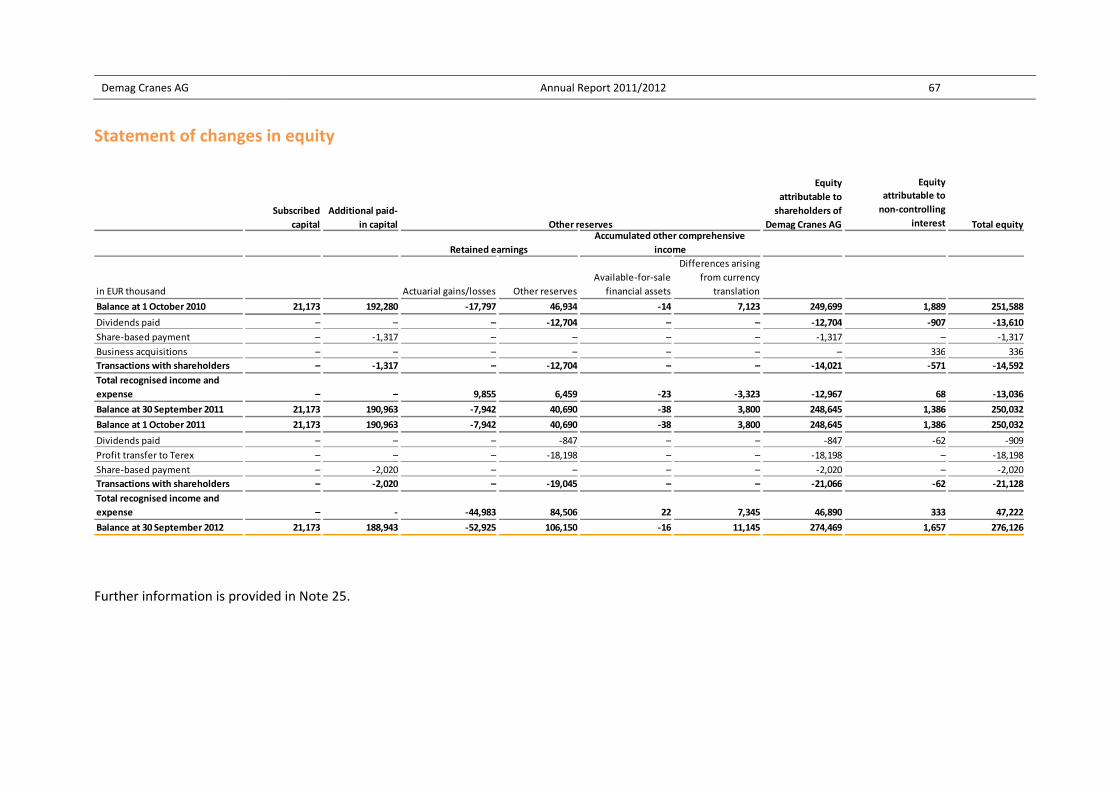
Demag Cranes AG Annual Report 2011/2012 67
Statement of changes in equity
Further information is provided in Note 25.
Equity
attributable to
non‐controlling
interest
in EUR thousand Actuarial gains/losses Other reserves
Available‐for‐sale
financial assets
Differences arising
from currency
translation
Balance at 1 October 2010 21,173 192,280 ‐17,797 46,934 ‐14 7,123 249,699 1,889 251,588
Dividends paid – – – ‐12,704 – – ‐12,704 ‐907 ‐13,610
Share‐based payment – ‐1,317 – – – – ‐1,317 – ‐1,317
Business acquisitions – – – – – – – 336 336
Transactions with shareholders – ‐1,317 – ‐12,704 – – ‐14,021 ‐571 ‐14,592
Total recognised income and
expense – – 9,855 6,459 ‐23 ‐3,323 ‐12,967 68 ‐13,036
Balance at 30 September 2011 21,173 190,963 ‐7,942 40,690 ‐38 3,800 248,645 1,386 250,032
Balance at 1 October 2011 21,173 190,963 ‐7,942 40,690 ‐38 3,800 248,645 1,386 250,032
Dividends paid – – – ‐847 – – ‐847 ‐62 ‐909
Profit transfer to Terex – – – ‐18,198 – – ‐18,198 – ‐18,198
Share‐based payment – ‐2,020 – – – – ‐2,020 – ‐2,020
Transactions with shareholders – ‐2,020 – ‐19,045 – – ‐21,066 ‐62 ‐21,128
Total recognised income and
expense – ‐ ‐44,983 84,506 22 7,345 46,890 333 47,222
Balance at 30 September 2012 21,173 188,943 ‐52,925 106,150 ‐16 11,145 274,469 1,657 276,126
Equity
attributable to
shareholders of
Demag Cranes AG Total equity
Retained earnings
Accumulated other comprehensive
income
Subscribed
capital
Additional paid‐
in capital Other reserves
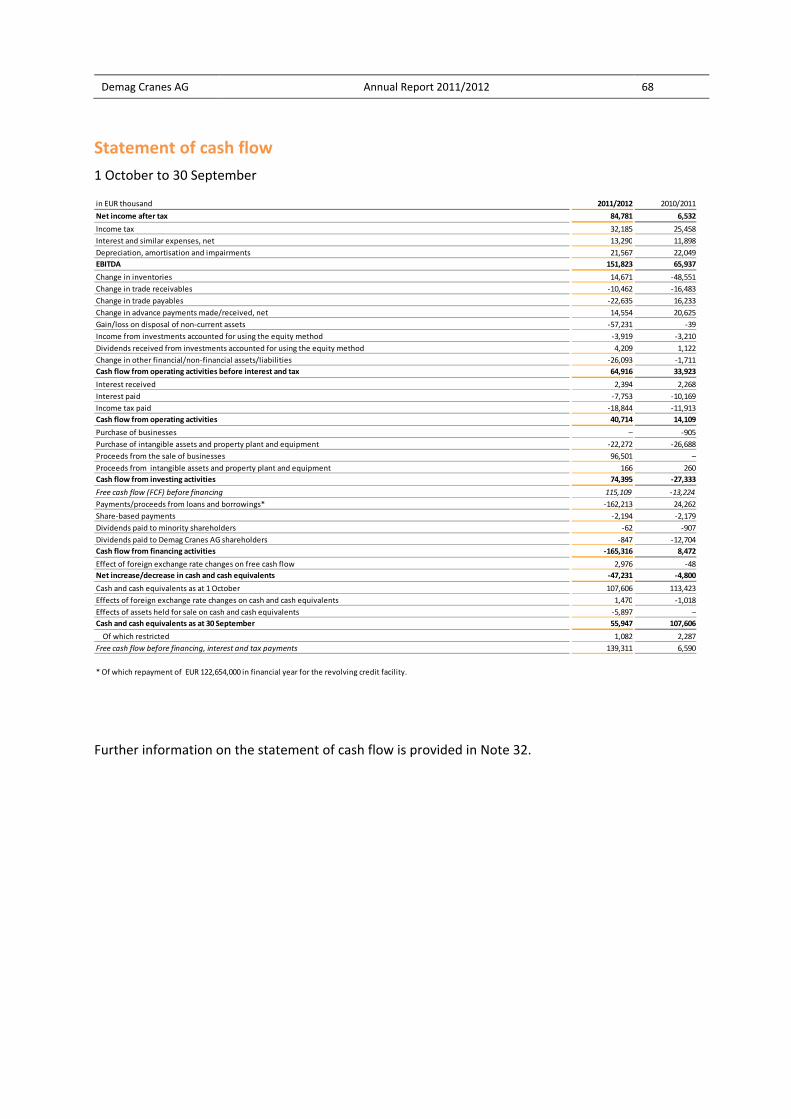
Demag Cranes AG Annual Report 2011/2012 68
Statement of cash flow
1 October to 30 September
Further information on the statement of cash flow is provided in Note 32.
in EUR thousand 2011/2012 2010/2011
Net income after tax 84,781 6,532
Income tax 32,185 25,458
Interest and similar expenses, net 13,290 11,898
Depreciation, amortisation and impairments 21,567 22,049
EBITDA 151,823 65,937
Change in inventories 14,671 ‐48,551
Change in trade receivables ‐10,462 ‐16,483
Change in trade payables ‐22,635 16,233
Change in advance payments made/received, net 14,554 20,625
Gain/loss on disposal of non‐current assets ‐57,231 ‐39
Income from investments accounted for using the equity method ‐3,919 ‐3,210
Dividends received from investments accounted for using the equity method 4,209 1,122
Change in other financial/non‐financial assets/liabilities ‐26,093 ‐1,711
Cash flow from operating activities before interest and tax 64,916 33,923
Interest received 2,394 2,268
Interest paid ‐7,753 ‐10,169
Income tax paid ‐18,844 ‐11,913
Cash flow from operating activities 40,714 14,109
Purchase of businesses – ‐905
Purchase of intangible assets and property plant and equipment ‐22,272 ‐26,688
Proceeds from the sale of businesses 96,501 –
Proceeds from intangible assets and property plant and equipment 166 260
Cash flow from investing activities 74,395 ‐27,333
Free cash flow (FCF) before financing 115,109 ‐13,224
Payments/proceeds from loans and borrowings* ‐162,213 24,262
Share‐based payments ‐2,194 ‐2,179
Dividends paid to minority shareholders ‐62 ‐907
Dividends paid to Demag Cranes AG shareholders ‐847 ‐12,704
Cash flow from financing activities ‐165,316 8,472
Effect of foreign exchange rate changes on free cash flow 2,976 ‐48
Net increase/decrease in cash and cash equivalents ‐47,231 ‐4,800
Cash and cash equivalents as at 1 October 107,606 113,423
Effects of foreign exchange rate changes on cash and cash equivalents 1,470 ‐1,018
Effects of assets held for sale on cash and cash equivalents ‐5,897 –
Cash and cash equivalents as at 30 September 55,947 107,606
Of which restricted 1,082 2,287
Free cash flow before financing, interest and tax payments 139,311 6,590
* Of which repayment of EUR 122,654,000 in financial year for the revolving credit facility.

Demag Cranes AG Annual Report 2011/2012 69
Notes to the Consolidated Financial Statements
1. General information
Demag Cranes AG is a Germany‐based listed company. Demag Cranes AG is registered under
registration number HRB 54517 in the commercial registry at Düsseldorf local court. The address of
its registered office is Forststrasse 16, 40597 Düsseldorf, Germany.
Demag Cranes comprises the segments Industrial Cranes, Port Technology and Services. The business
ranges from the development and design of technically advanced cranes and hoists to automated
transport and logistics systems for ports and terminals, the provision of services relating to these
products and the manufacture of high‐quality components.
The Management Board of Demag Cranes AG has prepared the Consolidated Financial Statements
and submitted them to the Supervisory Board on 28 November 2012. The Consolidated Financial
Statements are to be released for publication in their present form at the Supervisory Board Meeting
on 29 November 2012.
Demag Cranes AG has been a subsidiary of Terex Industrial Holding AG, Düsseldorf, since 16 August
2011 and is included in the Consolidated Financial Statements of Terex Corporation, Westport,
Connecticut, USA.
2. Basis of preparation
The Consolidated Financial Statements of Demag Cranes AG for the financial year 1 October 2011 to
30 September 2012 are prepared in accordance with the International Financial Reporting Standards
(IFRS) issued by the International Accounting Standards Board (IASB) and the Interpretations of the
International Financial Reporting Standards Interpretations Committee (IFRS IC) applicable at the
balance sheet date and as adopted by the European Union (EU). The supplementary requirements in
Section 315a (1) of the German Commercial Code are also met.
The Statement of comprehensive income combines the income statement and net income
recognised directly in equity. It is prepared using the cost of sales method. Assets and liabilities are
presented in the Statement of financial position using a current/non‐current classification. Certain
items in the Statement of comprehensive income and the Statement of financial position are
combined for the sake of clarity. These items are explained in the Notes.
The Consolidated Financial Statements are prepared on a historical cost basis with the exception that
derivative financial instruments and available‐for‐sale financial assets are measured at fair value
where this can be reliably determined.
Preparation of the Consolidated Financial Statements has required the use of estimates and
assumptions that affect the recognition and measurement of assets and liabilities, the amounts of
expense and income items, and disclosures relating to contingent assets and contingent liabilities.
Material judgements that the Management Board has made in applying IFRS are described along
with the main estimates whose review may result in material changes in the next financial year in
Note 5, Accounting estimates and judgements.
Demag Cranes AG Annual Report 2011/2012 70
The Consolidated Financial Statements are prepared in euros, the functional currency of Demag
Cranes AG. All figures are rounded to the nearest thousand euros unless otherwise stated. All
percentages relate to figures stated to the nearest euro. The amount shown for each individual item
and total is the figure with the smallest rounding difference. Reported totals may therefore differ
slightly from the sum of the individual reported amounts.
3. New and revised standards and interpretations
New standards and interpretations effective in financial year 2011/2012
The following new or revised standards were effective in the past financial year:
Amendments to IAS 24: Related party disclosures and IFRS 8: Operating segments
The definition of a related party has been revised to simplify the application of IAS 24. The
amendments also simplify disclosure requirements for entities that are at least significantly
influenced by the state. The revised IAS 24 also results in amendments to IFRS 8. The amendments
do not have a material impact on Demag Cranes.
Amendments to IFRIC 14: Prepayments of a minimum funding requirement
The Interpretation addresses accounting for prepayments of a minimum funding requirement on a
defined benefit plan. It allows such prepayments to be recognised as assets. The Interpretation is not
relevant to the Consolidated Financial Statements of Demag Cranes AG.
Annual improvements
As part of its annual improvements project, the IASB amended various standards in May 2010 with
the aim of streamlining the International Financial Reporting Standards and clarifying wording. Some
of the affected standards are effective from 1 October 2010 and others from 1 October 2011. The
amendments do not have a material impact on the Consolidated Financial Statements of Demag
Cranes AG.
IFRS 7: Disclosures – Transfers of financial assets
The amendments to IFRS 7 are concerned with the risk exposures relating to transfers of financial
assets and the effect of those risks on an entity’s financial position. The amendments aim to promote
transparency in the reporting of transfer transactions, particularly those that involve securitisation of
financial assets.
The amendments to IFRS 7 do not have a material impact on the Consolidated Financial Statements
of Demag Cranes AG.
Standards and interpretations effective in later financial years
A number of International Financial Reporting Standards issued by the IASB and endorsed by the EU
are effective for future periods and Demag Cranes has not elected early adoption.
Demag Cranes AG Annual Report 2011/2012 71
IAS 1: Presentation of financial statements – Presentation of items of other comprehensive
income
The amendments relate to the presentation of other comprehensive income in the Statement of
comprehensive income. Items of other comprehensive income must be grouped into items that will
be subsequently recycled (reclassified to profit or loss) and those that will not subsequently be
recycled (not reclassified to profit or loss).
Demag Cranes is currently assessing the effects of the amendments on the presentation of the
Statement of comprehensive income for the Demag Cranes Group. The amendments are not
expected to have a material impact on the Group’s financial position and financial performance.
The amendments are effective for annual periods beginning on or after 1 July 2012.
IAS 19: Employee benefits
The amendments mainly relate to the elimination of the corridor method for the recognition of
actuarial gains and losses, a restructuring of pension expense, a redefinition and thus a change in
accounting for top‐up amounts under partial retirement plans, and additional notes disclosures.
Elimination of the corridor method does not affect Demag Cranes, as actuarial gains and losses are
already recognised in other comprehensive income.
The remaining changes will affect Demag Cranes. The impacts on the Consolidated Financial
Statements are currently being assessed.
The amended IAS 19 is effective for annual periods beginning on or after 1 January 2013.
Demag Cranes does not expect that the changes in accounting requirements will have a significant
effect on the Group’s financial position and financial performance.
The IASB and the IFRS Interpretations Committee have issued the following standards, amendments
to standards, and interpretations whose application is not yet mandatory and is conditional upon
their endorsement by the European Union.
IFRS 9: Financial Instruments
In November 2009 the IASB issued IFRS 9 (Financial Instruments), containing rules for the
classification and measurement of financial assets. In October 2010 it issued new requirements for
the classification and measurement of financial liabilities, incorporating them into IFRS 9. This marks
the completion of the first part of a three‐part project to completely revise the accounting treatment
of financial instruments. The new standard defines two instead of four measurement categories for
financial assets, with classification to be based partly on the company’s business model and partly on
the characteristics of the contractual cash flows from the respective financial asset. An embedded
derivative in a structured product will no longer have to be assessed for possible separate accounting
treatment unless the host is a non‐financial contract. A hybrid contract that includes a financial host
must be classified and measured in its entirety. An amendment passed in December 2011 postponed
Demag Cranes AG Annual Report 2011/2012 72
the mandatory effective date of IFRS 9 to annual periods beginning on or after January 1, 2015. The
disclosure requirements under IFRS 7 concerning the first‐time application of IFRS 9 were amended
at the same time. IFRS 9 has not yet been endorsed by the European Union. The changes will not
have a material impact on the presentation of the Group’s financial position or results of operations.
IAS 12: Income Taxes
In December 2010, the IASB issued an amendment to IAS 12 (Income Taxes). This amendment
introduces a rebuttable presumption that the carrying amount of an asset will normally be recovered
through sale rather than use. The change is particularly relevant for the calculation of deferred taxes
in countries where the income tax rates on gains from divestments differ from those on regular
rental income, for example. In this connection, SIC‐21 (Income Taxes – Recovery of Revalued Non‐
Depreciable Assets) was integrated into IAS 12 (Income Taxes), except where it relates to real estate
held as investment property. The revised standard is to be applied retrospectively for annual periods
beginning on or after January 1, 2012. The amendment has not yet been endorsed by the European
Union. The new standard will not have a material impact on the presentation of the Group’s financial
position or results of operations.
Consolidation standards: IFRS 10, IFRS 11, IFRS 12, IFRS 13, IAS 27, IAS 28
In May 2011 the IASB published four new standards: IFRS 10 (Consolidated Financial Statements),
IFRS 11 (Joint Arrangements), IFRS 12 (Disclosure of Interests in Other Entities) and IFRS 13 (Fair
Value Measurement). It also published amendments to two existing standards, IAS 27 (Separate
Financial Statements) and IAS 28 (Investments in Associates and Joint Ventures). Application is
mandatory for annual periods beginning on or after January 1, 2013. These new standards and
amendments have not yet been endorsed by the European Union. The impact the changes will have
on the presentation of its financial position and results of operations is currently being evaluated.
IFRS 10 (Consolidated Financial Statements) lays down the criteria for the inclusion of a company’s
participating interests in its consolidated financial statements irrespective of the nature of the
interest. The criteria are based on a principle of control defined in the standard, which also contains
detailed instructions for applying this principle. IFRS 10 thus entirely replaces the corresponding
provisions of IAS 27 (Consolidated and Separate Financial Statements) and SIC‐12 (Consolidation –
Special Purpose Entities).
IFRS 11 (Joint Arrangements) prescribes the accounting for joint arrangements over which control is
shared with a third party. The accounting treatment is determined by the rights and obligations
resulting from the joint arrangement rather than by the legal form as in the past. Joint arrangements
are classified as either joint operations or joint ventures. Each party to a joint operation must in
future recognize its shares of the operation’s assets and liabilities in accordance with its rights and
obligations. Investments in joint ventures are to be accounted for using the equity method. IFRS 11
supersedes IAS 31 (Interests in Joint Ventures) and SIC‐13 (Jointly Controlled Entities – Non‐
Monetary Contributions by Venturers).
Demag Cranes AG Annual Report 2011/2012 73
The IASB has revised IAS 28 (Investments in Associates and Joint Ventures) to address the accounting
for investments in both associates and joint ventures using the equity method.
IFRS 12 (Disclosure of Interests in Other Entities) prescribes the information to be disclosed in the
notes to the financial statements about interests in subsidiaries, associates, joint arrangements and
non‐consolidated structured entities. The objective of these disclosures is to enable the users of an
entity’s financial statements to understand the nature of its interests in other entities, the risks
associated with them, and the effects of the interests on its financial position and results of
operations.
In light of the amendments made by IFRS 10 (Consolidated Financial Statements) and IFRS 12, the
IASB published a revised version of IAS 27 (Separate Financial Statements), which is now devoted
entirely to accounting for interests in subsidiaries, associates and joint ventures in IFRS separate
financial statements.
In IFRS 13 (Fair Value Measurement), the IASB provides a uniform definition of fair value and how it is
measured and specifies the related information to be provided in the notes. This standard prescribes
how – rather than when – an asset or liability is to be measured at fair value, the fair value being
defined as the price that would be received to sell an asset or paid to transfer a liability. IFRS 13 must
be applied prospectively when it is first applied.
IAS 32 Financial Instruments – Offsetting Financial Assets and Liabilities
In December 2011 the IASB issued “Offsetting Financial Assets and Financial Liabilities” (Amendments
to IAS 32) and “Disclosures – Offsetting Financial Assets and Financial Liabilities” (Amendments to
IFRS 7). The amendments to IAS 32 (Financial Instruments: Presentation) clarify what is meant by
“right of set‐off in all circumstances” and “simultaneous settlement.” The amendments to IFRS 7
(Financial Instruments: Disclosures) require gross and net offsetting amounts reflected in the
statement of financial position – along with other existing rights of set‐off that do not meet the
requirements for set‐off in the statement of financial position – to be presented in tabular form in
future. The amendments are required to be applied retrospectively for annual and interim periods
beginning on or after January 1, 2013 (IFRS 7 amendments) or January 1, 2014 (IAS 32 amendments).
They have not yet been endorsed by the European Union. The impact the changes will have on the
presentation of its financial position and results of operations is currently being evaluated.
Demag Cranes AG Annual Report 2011/2012 74
4. Accounting policies
The accounting policies set out in the following correspond to the methods applied in the previous
financial year.
Subsidiaries
Subsidiaries are companies that are controlled by Demag Cranes AG, meaning that Demag Cranes
AG, by virtue of holding a majority of their voting rights or through other means, has the power to
govern their financial and operating policies so as to obtain benefits from their activities. Subsidiaries
are included in the Consolidated Financial Statements from the date Demag Cranes AG obtains
control and cease to be included when control is lost. The results of subsidiaries acquired and
disposed of during the year are included in the Statement of comprehensive income from the date of
acquisition and up to the date of disposal.
The Consolidated Financial Statements are prepared on the basis of uniform accounting policies. All
intra‐Group transactions including the resulting balances, income and expenses are eliminated in full.
Non‐controlling interests are measured at the non‐controlling interests’ proportionate share of the
net assets of consolidated subsidiaries. Demag Cranes has not elected to apply the alternative
treatment of measuring non‐controlling interests at fair value. Non‐controlling interests are
identified separately from the equity attributable to shareholders of Demag Cranes AG. The same
item includes non‐controlling interests in total recognised income and expense for the period and in
each component of total recognised income and expense. This allocation of annual changes in net
assets is made even if it results in the non‐controlling interests having a deficit balance.
Investments in subsidiaries that are of minor overall significance to the presentation of the financial
position and financial performance of the Group are measured at cost less any impairments and
accounted for under other investments as investments in associates.
All subsidiaries of Demag Cranes AG are shown in the list of subsidiaries, joint ventures and
investments as at 30 September 2012, after the Notes to the Consolidated Financial Statements.
Interests in joint ventures
Demag Cranes AG includes one joint venture (MHE‐Demag (S) Pte. Ltd., Singapore) in its Consolidated
Financial Statements. A joint venture is a contractual arrangement whereby Demag Cranes AG and at
least one other third party directly or indirectly undertake an economic activity that is subject to joint
control.
The Group’s investment in the joint venture is accounted for in the Consolidated Financial
Statements using the equity method.
The interest in a joint venture accounted for using the equity method is initially recognised in the
Statement of financial position at cost. The carrying amount is subsequently increased or decreased
by changes in Demag Cranes’ share of the net assets of the joint venture after the date of acquisition
and by any impairment of its interest in the joint venture. Intra‐Group transactions are eliminated in
Demag Cranes AG Annual Report 2011/2012 75
proportion with Demag Cranes’ interests in it. If the Group’s share of losses from a joint venture
exceeds the carrying amount of its interest in the joint venture concerned, such losses are only taken
into account to the extent that Demag Cranes has incurred legal or constructive obligations to cover
them. The joint venture’s financial year is the calendar year. The figures included are based on
interim financial statements whose reporting date is set back by one month.
The share of profit or loss from income from investments accounted for using the equity method
reported in the Statement of comprehensive income is Demag Cranes’ share of profit or loss from
the joint venture.
The joint ventures are shown in the list of subsidiaries, joint ventures and investments as at 30
September 2012, after the Notes to the Consolidated Financial Statements.
Currency translation
The Consolidated Financial Statements are prepared in euros, the functional currency of Demag
Cranes AG. The financial statements of foreign entities included in the Consolidated Financial
Statements are prepared in local currency, which is the functional currency of the companies
concerned. Transactions in currencies other than the applicable functional currency are translated at
the average spot exchange rate prevailing at the date of the transaction. Monetary items (such as
payables and receivables) denominated in foreign currencies are translated into euros at the average
spot exchange rate prevailing on the balance sheet date. Non‐monetary items are translated at
historical exchange rates. Exchange differences arising on the translation of monetary balance sheet
items into functional currency are recognised under other operating income or under other
operating expenses, except gains and losses on foreign currency transactions relating to financing
activities, which are recognised in interest and similar income or in interest and similar expenses.
The financial statements of foreign subsidiaries included in the Consolidated Financial Statements
with functional currencies other than the euro are translated from local currency into the Group
presentation currency (euros). The assets and liabilities of foreign subsidiaries are translated using
the exchange rates prevailing at the balance sheet date. Equity items are translated at the historical
exchange rates prevailing at their recognition date. Income and expenses are translated at the
average exchange rates for the period. Exchange differences arising on the translation of foreign
entity financial statements are reported in equity as a net amount under other comprehensive
income. On disposal of a foreign entity, any accumulated net gains or losses are recognised in profit
or loss. The accumulated exchange differences reported in equity as at 30 September 2012 mainly
relate to the Group’s companies in the UK, the Czech Republic and China.
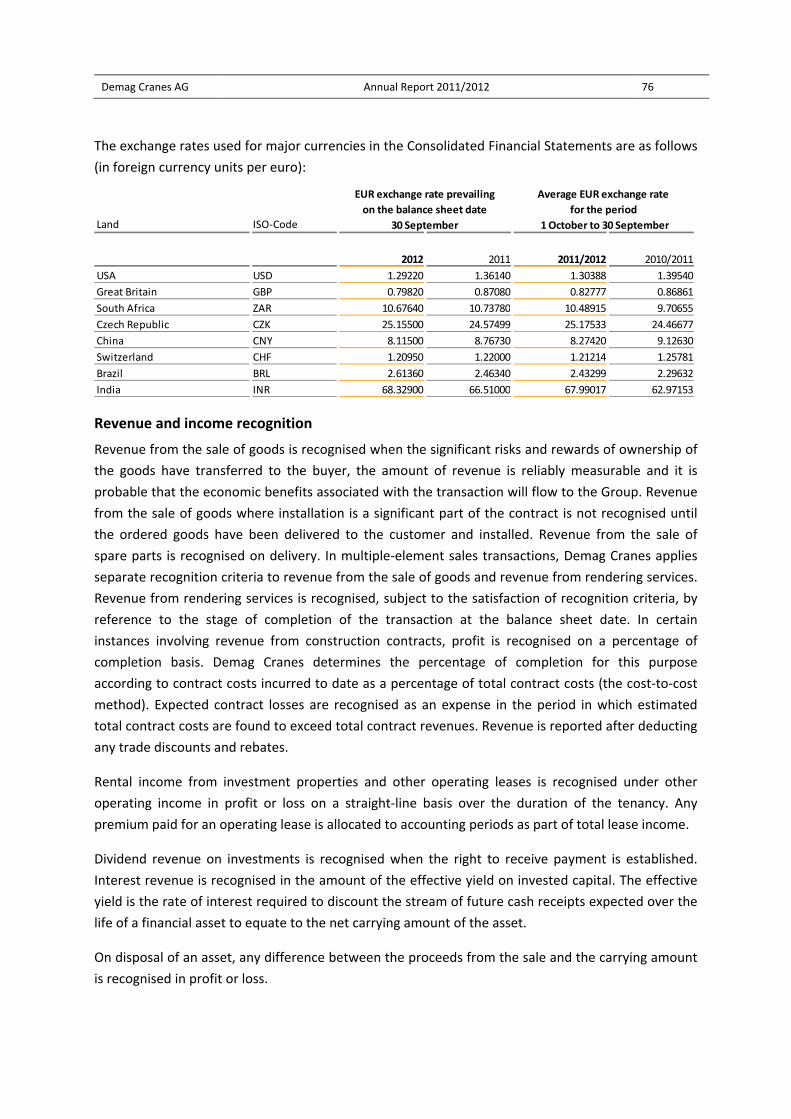
Demag Cranes AG Annual Report 2011/2012 76
The exchange rates used for major currencies in the Consolidated Financial Statements are as follows
(in foreign currency units per euro):
Revenue and income recognition
Revenue from the sale of goods is recognised when the significant risks and rewards of ownership of
the goods have transferred to the buyer, the amount of revenue is reliably measurable and it is
probable that the economic benefits associated with the transaction will flow to the Group. Revenue
from the sale of goods where installation is a significant part of the contract is not recognised until
the ordered goods have been delivered to the customer and installed. Revenue from the sale of
spare parts is recognised on delivery. In multiple‐element sales transactions, Demag Cranes applies
separate recognition criteria to revenue from the sale of goods and revenue from rendering services.
Revenue from rendering services is recognised, subject to the satisfaction of recognition criteria, by
reference to the stage of completion of the transaction at the balance sheet date. In certain
instances involving revenue from construction contracts, profit is recognised on a percentage of
completion basis. Demag Cranes determines the percentage of completion for this purpose
according to contract costs incurred to date as a percentage of total contract costs (the cost‐to‐cost
method). Expected contract losses are recognised as an expense in the period in which estimated
total contract costs are found to exceed total contract revenues. Revenue is reported after deducting
any trade discounts and rebates.
Rental income from investment properties and other operating leases is recognised under other
operating income in profit or loss on a straight‐line basis over the duration of the tenancy. Any
premium paid for an operating lease is allocated to accounting periods as part of total lease income.
Dividend revenue on investments is recognised when the right to receive payment is established.
Interest revenue is recognised in the amount of the effective yield on invested capital. The effective
yield is the rate of interest required to discount the stream of future cash receipts expected over the
life of a financial asset to equate to the net carrying amount of the asset.
On disposal of an asset, any difference between the proceeds from the sale and the carrying amount
is recognised in profit or loss.
Land ISO‐Code
USA USD 1.29220 1.36140 1.30388 1.39540
Great Britain GBP 0.79820 0.87080 0.82777 0.86861
South Africa ZAR 10.67640 10.73780 10.48915 9.70655
Czech Republic CZK 25.15500 24.57499 25.17533 24.46677
China CNY 8.11500 8.76730 8.27420 9.12630
Switzerland CHF 1.20950 1.22000 1.21214 1.25781
Brazil BRL 2.61360 2.46340 2.43299 2.29632
India INR 68.32900 66.51000 67.99017 62.97153
EUR exchange rate prevailing
on the balance sheet date
30 September
Average EUR exchange rate
for the period
1 October to 30 September
2012 2011 2011/2012 2010/2011

Demag Cranes AG Annual Report 2011/2012 77
Cost of sales
The cost of sales reported in the Statement of comprehensive income consists of all costs directly
attributable to the production process. These include direct material and direct labour, allocable
overheads such as depreciation, production‐related administrative overheads, impairments of
production‐related tangible and intangible assets, and inventory write‐downs.
Research and development expenses
Research expenses are recognised in the period in which they are incurred.
Expenditure is incurred for development activities when research findings or other knowledge are
applied to a plan or design for the production of new or substantially improved products or
processes. Demag Cranes recognises an intangible asset arising from development if the outcome is
technically and commercially feasible and it is considered probable that the product or process to be
developed will generate future economic benefits. The development expenditure recognised as an
intangible asset includes direct material, direct labour and allocated overheads. Other development
expenses are recognised as expense in cost of sales when incurred. Further information is provided in
Note 9.
Capitalised development expenses are presented in the Statement of financial position net of
accumulated amortisation and accumulated impairments. Development expenses recognised as
assets are amortised on a straight‐line basis over the estimated period in which products based on
the intangible asset will be marketed. Demag Cranes subjects internally generated intangible assets
to annual impairment testing during the development phase and at other times only when there are
indications of impairment. Further information on development costs capitalised in the financial year
is provided in Note 15.
Tax
Tax assets and liabilities for the current and prior periods are measured at the amount expected to
be recovered from or paid to the taxation authorities, using the tax rates that have been enacted by
the end of the reporting period. Deferred tax relating to items recognised directly in equity is likewise
recognised directly in equity.
Deferred tax is accounted for using the temporary difference approach. It is measured by applying
the applicable tax rate to temporary differences between the carrying amounts of assets and
liabilities in the Statement of financial position and the tax bases used in the computation of taxable
profit. The applicable tax rate is the rate prevailing at the balance sheet date or the rate that is
virtually certain to apply for the relevant Group member company when the temporary differences
reverse.
Deferred tax assets are only recognised for temporary differences to the extent that it is probable
that there will be sufficient taxable profits against which to utilise the benefits. Deferred tax assets
are also recognised for tax loss carryforwards to the extent that it is probable that future taxable
profit will be available against which the unused tax losses can be utilised. The carrying amount of
deferred tax assets is reviewed at each balance sheet date and adjusted to reflect any change in the
Demag Cranes AG Annual Report 2011/2012 78
probability that the benefits can be utilised. The carrying amount of each deferred tax asset is
reviewed at each balance sheet date and is reduced to the extent that it is no longer probable that
sufficient taxable profit will be available against which a loss arising on reversal of the temporary
difference can be utilised. Any unrecognised deferred tax assets are reassessed at each balance sheet
date and recognised to the extent that it has become probable that future taxable profit will be
available to allow the deferred tax asset to be recovered. Deferred tax liabilities are recognised for all
taxable temporary differences.
Deferred tax liabilities are not recognised for taxable temporary differences resulting from the initial
recognition of goodwill. Similarly, deferred tax liabilities are not recognised for temporary differences
resulting from the initial recognition of other assets or liabilities in transactions other than business
combinations where the initial recognition affects neither taxable profit nor net income. Demag
Cranes does not recognise deferred tax liabilities for taxable temporary differences associated with
investments in subsidiaries and associates or with interests in joint ventures if it is probable that the
temporary difference will not reverse in the foreseeable future, if the Company is able to control the
timing of the reversal, or if it is not probable that sufficient taxable profits will be available against
which a loss arising on reversal of the temporary difference can be utilised.
Demag Cranes offsets deferred tax assets and deferred tax liabilities to the extent that it has a legally
enforceable right to set off current tax assets against current tax liabilities relating to income taxes
levied by the same taxation authority.
Further information on deferred taxes is provided in Note 31.
Value‐added tax refundable by or payable to the taxation authority is accounted for by Demag
Cranes as part of other non‐financial assets and other non‐financial liabilities, respectively.
Goodwill and negative goodwill
Goodwill recognised on a business combination is the excess of the consideration transferred to
achieve control and the fair value of any previously held interests in the acquiree over the
remeasured net assets of the acquiree. Goodwill is subsequently measured at cost less any
accumulated impairment losses.
For the purpose of impairment testing, which is done at least annually, Demag Cranes allocates
goodwill to the cash‐generating units – the three segments – that are expected to reap synergies
from the business combination. On disposal of part of a cash‐generating unit to which goodwill has
been allocated, the attributable amount of goodwill is included in the determination of the profit or
loss on disposal. Goodwill recognised on acquisition of an equity‐accounted investment is included in
the carrying amount of the Group’s investment and is not assessed for impairment separately.
Further information on impairment testing in accordance with IAS 36 is provided in Note 15.
If the consideration transferred to achieve control and the fair value of any previously held interests
in the acquiree falls short of the net assets of the acquiree measured at the acquisition date, Demag
Cranes, after reassessing the amounts, recognises the excess immediately in profit or loss (gain from
a bargain purchase).
Demag Cranes AG Annual Report 2011/2012 79
Other intangible assets
Other intangible assets comprise patents, trademarks, software, service agreements, technology,
customer relations, supplier relations and capitalised development projects.
Separately acquired intangible assets are recognised at cost less accumulated amortisation and
accumulated impairment losses. Intangible assets acquired by Demag Cranes in a business
combination are initially recognised at fair value at the acquisition date. Expenditure on internally
generated intangible assets is capitalised if the criteria for recognition of an asset are satisfied.
Subsequent expenditure on intangible assets is added to the carrying amount of the intangible asset
if, and only if, it substantially increases the future economic benefits embodied in the asset and the
cost can be reliably estimated. Borrowing costs that are attributable to the purchase or production of
a qualifying asset form part of the cost of that asset. All other expenditure in connection with
intangible assets is recognised immediately in profit or loss.
Intangible assets with finite useful lives are amortised on a straight‐line basis over the period of any
contractual rights or the period over which they are expected to be used, whichever is the shorter.
Demag Cranes AG additionally reviews such assets at least annually for indications of impairment.
The useful lives of intangible assets are normally as follows:
Intangible assets with indefinite useful lives are not amortised. Instead, Demag Cranes tests such
assets at least annually for impairment. Trademarks are not amortised if they are established
trademarks and there is no determinable limit to their useful lives.
Estimated useful lives are reviewed at each financial year‐end and changed if necessary. Changes in
accounting estimates are applied prospectively in profit and loss in accordance with IAS 8.
Intangible assets are derecognised on disposal or when no future economic benefits are expected for
Demag Cranes. The gain or loss arising from the derecognition of an intangible asset is determined as
the difference between the net disposal proceeds, if any, and the carrying amount of the asset. It is
recognised in profit or loss in the period of disposal.
Changes in other intangible assets are presented in Note 15.
Property, plant and equipment
Property, plant and equipment consists of land, land rights and buildings, including buildings on
third‐party land, plant and machinery, prepayments and assets under construction, tools and
equipment, and other assets.
Useful life
Patents, licences and similar rights 5 years
Capitalised development projects 5 years
Trademarks Indefinite
Software 3 years
Service agreements 6 years
Demag Cranes AG Annual Report 2011/2012 80
Property, plant and equipment are carried at cost less any accumulated depreciation and any
accumulated impairment losses. Demolition, removal, restoration and recultivation expenses are
recognised as part of the cost of property, plant and equipment and an equal amount is recognised in
other provisions. Borrowing costs that are attributable to the purchase or production of a qualifying
asset form part of the cost of that asset. All other expenses, such as for maintenance or
modernisation, are recognised immediately in profit or loss.
Parts of an item of property, plant and equipment with a cost that is significant in relation to the
total cost of the item and a useful life significantly different to that of other parts are depreciated
separately.
Subsequent costs that increase future economic benefit and can be reliably estimated likewise form
part of the cost of property, plant and equipment.
Expenditure for major maintenance and repairs is added to the carrying amount of an item of
property, plant and equipment if fixed servicing or overhaul intervals can be reliably determined.
Depreciation is charged on a straight‐line basis over the useful life of an item of property, plant and
equipment. The revaluation method is not used. Demag Cranes normally estimates the useful lives as
follows:
Estimated useful lives and depreciation methods are reviewed at each financial year‐end and
changed as necessary. Changes in accounting estimates are applied in profit and loss.
Items of property, plant and equipment are derecognised on disposal (e.g. sale, scrapping or
demolition) or when no future economic benefits are expected for Demag Cranes. The gain or loss
arising from the derecognition of an item of property, plant and equipment is determined as the
difference between the net disposal proceeds, if any, and the carrying amount of the asset. It is
recognised in profit or loss in the period of disposal.
Investment property
The investment property item consists of one site and one building on it held to earn rental income
and for capital appreciation.
Investment property is measured at cost less any accumulated depreciation and any accumulated
impairment losses (cost model). Depreciation is charged as for property, plant and equipment. Rental
Useful life
Factory and office buildings 25 to 33 years
Other buildings 8 to 50 years
Plant and machinery 5 to 12 years
Tools and equipment 3 to 10 years
Vehicles 5 to 8 years
IT equipment and hardware 3 to 5 years

Demag Cranes AG Annual Report 2011/2012 81
income is recognised as other operating income in the Statement of comprehensive income and
depreciation as other expenses.
Investment property is derecognised on disposal or when the investment property is permanently
withdrawn from use and no future economic benefits are expected from its disposal.
Impairment of non‐current non‐financial assets
Demag Cranes assesses at least at each balance sheet date whether there is any indication that
goodwill, other intangible assets, property, plant and equipment and investment properties are
impaired. If any such indication exists, the asset is tested for impairment.
Goodwill, other intangible assets with indefinite useful lives and intangible assets not yet available
for use at the balance sheet date are also tested for impairment at each balance sheet date
irrespective of whether there is any indication that they are impaired. If the recoverable amount of
an asset or the cash‐generating unit to which it belongs is less than its carrying amount, the
difference is recognised in profit or loss as an impairment loss. A cash‐generating unit is a group of
assets that generates cash inflows that are largely independent of the cash inflows from other assets
or groups of assets. An impairment loss recognised for a cash‐generating unit is first allocated to
reduce the carrying amount of any goodwill allocated to the unit and then to the other non‐current
assets of the unit pro rata on the basis of the carrying amount of each asset in the unit. If there is an
indication that an impairment may no longer exist, Demag Cranes remeasures the recoverable
amount. If this exceeds the carrying amount of the asset or cash‐generating unit, the impairment loss
is reversed up to a maximum of cost less any accumulated depreciation or amortisation. Impairment
losses recognised for goodwill are not reversed.
Other non‐current assets are tested for impairment if there is any indication that the assets are
impaired or that an impairment loss recognised in prior periods may no longer exist. An impairment
loss recognised in prior periods is reversed if, and only if, there has been a change in the estimates
used to determine the asset’s recoverable amount since the last impairment loss was recognised.
The increased carrying amount attributable to a reversal of an impairment loss is limited to the
recoverable amount or the carrying amount that would have been determined, net of amortisation
or depreciation, had no impairment loss been recognised in prior years. A reversal of an impairment
loss is recognised in profit or loss.
Leasing
Leases that transfer to Demag Cranes (as lessee) substantially all the risks and rewards incidental to
ownership of an asset are classified as finance leases. At the commencement of the lease term,
finance leases are recognised as assets at amounts equal to the fair value of the leased property or, if
lower, the present value of the minimum lease payments. The future lease payments are recognised
in the Statement of financial position under loans and borrowings.
Lease payments are apportioned in accordance with the effective interest method between the
finance charge and the reduction of the outstanding liability so as to produce a constant periodic rate
Demag Cranes AG Annual Report 2011/2012 82
of interest on the remaining balance. The interest charge is recognised in interest and similar
expenses.
Lease payments under leases where the lessor retains substantially all the risks and rewards
incidental to ownership (operating leases) are recognised as an expense on a straight‐line basis over
the lease term unless another allocation to periods is more representative of the time pattern of
Demag Cranes’ benefit from the use of the leased asset. Contingent payments under an operating
lease are recognised as an expense in the period in which they are incurred. The benefit of incentives
to enter into an operating lease is recognised as a reduction of rental expense over the lease term,
on a straight‐line basis unless another systematic basis is more representative of the time pattern of
Demag Cranes’ benefit from the use of the leased asset.
Inventories
Inventories are measured at the lower of cost and net realisable value. Cost of purchase is measured
using the rolling average method and cost of conversion using the standard cost method. Cost of
conversion includes direct production costs, including direct material and direct labour, and allocated
production overheads including depreciation on factory buildings and equipment. Borrowing costs
that are directly attributable to a qualifying asset form part of the cost of that asset. Inventory write‐
downs include appropriate deductions for unusually long holding periods and obsolescence.
Construction contracts
Construction contracts that meet the applicable criteria are accounted for using the percentage‐of‐
completion method. Demag Cranes normally determines the percentage of completion for this
purpose according to contract costs incurred to date as a percentage of expected contract cost (cost‐
to‐cost method). Where the outcome of a construction contract cannot be measured reliably,
revenue is recognised only in the amount of contract costs incurred that it is probable will be
recoverable (zero‐profit method). The gross amount due from or to customers for contract work is
presented under trade receivables or trade payables as appropriate. The gross amount due is equal
to cost incurred plus recognised profits, less any recognised losses and progress billings up to a
maximum of work performed. Amounts paid by customers in excess of amounts due are reported in
liabilities as advance payments received. Any anticipated contract losses are recognised immediately
in full in profit or loss. Further information is provided in Note 20.
Financial instruments
A financial instrument is any contract that gives rise to a financial asset of one entity and a financial
liability or equity instrument of another entity. Demag Cranes initially recognises a financial
instrument when a company in the Demag Cranes Group becomes a party to the contractual
provisions governing the instrument. Financial instruments are recognised and derecognised on the
settlement date.
As in the previous year, there were no reclassifications of financial instruments during the financial
year.
Demag Cranes AG Annual Report 2011/2012 83
Primary financial instruments
Financial assets and financial liabilities are initially recognised at fair value plus directly attributable
transaction costs, except financial instruments at fair value through profit or loss, which are
recognised at fair value without transaction costs. The fair value of financial instruments traded on
organised markets is determined using the quoted price on the balance sheet date. If Demag Cranes
has financial instruments for which there is not an active market, their fair value is determined by
using a valuation technique. Subsequent measurement is carried out in accordance with the
classification of financial instruments into the categories that follow. Financial assets with the
exception of those classified as at fair value through profit or loss are tested at each balance sheet
date for impairment.
Held to maturity
This category consists of financial assets quoted in an active market with fixed or determinable
payments and fixed maturity that Demag Cranes has the intention and ability to hold to maturity.
Financial assets held to maturity are measured at amortised cost using the effective interest method,
less any impairment losses. Demag Cranes does not have any financial instruments held to maturity
at the balance sheet date.
Loans and receivables
Loans and receivables are non‐derivative financial assets with fixed or determinable payments that
are not quoted in an active market. This category mainly consists of trade receivables and cash and
cash equivalents. These are measured at amortised cost using the effective interest method less
accumulated impairment losses. Receivables that carry no interest or that bear an off‐market
interest rate are measured at the present value of future cash receipts.
At fair value through profit or loss
This category contains two subcategories: held for trading, and designated as at fair value through
profit or loss. These assets are measured at all times at fair value. Changes in their fair value are
recognised in profit or loss. The held for trading subcategory contains the fair value of currency and
interest rate derivatives (further information is provided in Notes 20, 29 and 34). Demag Cranes has
no financial instruments in the designated as at fair value through profit or loss category.
Available‐for‐sale financial assets
This category encompasses all financial assets which, based on objective criteria, are not classified in
any other category or which Demag Cranes has designated as available for sale. Available‐for‐sale
financial assets at Demag Cranes mainly comprise long‐term securities and investments in associates.
Long‐term securities are measured at fair value. Gains and losses arising from changes in their fair
value are recognised directly in equity under available‐for‐sale financial assets, except for
impairment losses and exchange differences arising on translation of monetary items denominated
in foreign currencies, which are recognised directly as income or expense in profit or loss. When the
assets are derecognised, the accumulated gain or loss previously recognised in equity is recognised in
Demag Cranes AG Annual Report 2011/2012 84
profit or loss. Associates are measured at cost less any accumulated impairment losses as they are of
minor overall significance. Further information on this category is provided in Notes 19 and 34.
Financial liabilities measured at amortised cost
Financial liabilities in this category are measured at amortised cost using the effective interest
method, recognising the interest expense in profit or loss in accordance with the effective interest
rate for the period. At Demag Cranes, the category comprises loans and borrowings (Notes 28 and
34), trade payables and a portion of other financial liabilities (Notes 29 and 34).
Derivative financial instruments
Hedging is used to manage interest and exchange rate risk. The hedging instruments used by Demag
Cranes mainly consist of foreign exchange contracts and interest rate swaps.
All derivative financial instruments are accounted for as financial assets or financial liabilities and
measured at fair value at the balance sheet date. Changes in the fair value of derivative financial
instruments are recognised as income or expense in profit or loss. Derivative financial instruments
are accounted for by the rules applicable to the at fair value through profit or loss category. Hedge
accounting was not applied in the financial year.
Impairment of financial assets
Financial assets classified as loans and receivables or available for sale are tested for impairment at
each balance sheet date. A financial asset is impaired if there are indications that Demag Cranes may
not recover part of its initial investment and the present value of the future cash flows or the fair
value of the financial asset is less than the instrument’s carrying amount. On an available‐for‐sale
equity instrument, a significant or prolonged decline in the fair value of the financial instrument
below its cost is to be considered objective evidence of impairment. Financial assets are tested for
impairment individually or on a portfolio basis. Demag Cranes recognises allowances as appropriate
for all identifiable credit risks. The remaining credit risk from financial instruments corresponds to
their carrying amounts. The impairment loss on a financial instrument measured at amortised cost is
the difference between the asset’s carrying amount and the present value of estimated future cash
flows from the asset discounted at the instrument’s original effective interest rate. An impairment
loss directly reduces the carrying amount of all affected financial instruments except for trade
receivables, where impairment losses are recognised through an allowance account. When a trade
receivable is considered uncollectible, it is written off against the allowance account. Subsequent
recoveries of amounts previously written off are accounted for by reversing the allowance account to
profit or loss.
If in a subsequent period the fair value of an available‐for‐sale financial asset other than an equity
instrument increases and the increase can be objectively related to an event occurring after the
impairment loss was recognised, the impairment loss is reversed through profit or loss and any
increase in excess of amortised cost is recognised directly in equity. Impairment losses recognised in
profit or loss for an investment in an equity instrument classified as available for sale are not

Demag Cranes AG Annual Report 2011/2012 85
reversed. Any increase in fair value after recognition of an impairment loss is recognised directly in
equity.
Derecognition of financial instruments
A financial asset is derecognised when the contractual rights to the cash flows from the asset expire
or it is transferred to another party with all the risks and rewards of ownership. If on formal transfer
of a financial asset Demag Cranes neither transfers nor retains substantially all the risks and rewards
of ownership and retains control of the transferred asset, it continues to recognise the financial asset
to the extent of its continuing involvement and recognises as a liability any obligations created in the
transfer. If Demag Cranes retains substantially all the risks and rewards of ownership of a transferred
financial asset, it continues to recognise the asset and recognises a secured loan for the
consideration received.
Demag Cranes derecognises a financial liability when, and only when, the underlying obligation is
discharged or cancelled or expires.
Financial instruments: Other investments
The other investments item consists of two sub‐items – associates and long‐term securities – and
comes under the available‐for‐sale financial assets category. Long‐term securities are measured at
fair value. This is determined by prices quoted in an active market. Gains and losses arising from
changes in fair value are recognised directly in equity, taking account of any deferred tax. On
disposal, the accumulated gain or loss previously recognised directly in equity is recognised in profit
or loss. The appropriate classification of securities is determined on purchase and reviewed at each
balance sheet date. There were no reclassifications in the financial year.
Investments in associates are measured at cost less accumulated impairment losses, as they are of
minor overall significance. There were no indications of impairment in the financial year.
Further information on the other investments item is provided in Note 19.
Financial instruments: Trade receivables
Trade receivables are classified in the loans and receivables category. They are initially recognised at
fair value plus directly attributable transaction costs and subsequently measured at amortised cost
using the effective interest method, less accumulated impairment losses.
Financial instruments: Other financial assets
Other financial assets other than derivative financial instruments are measured at amortised cost less
accumulated impairment losses. These assets are classified in the loans and receivables category. The
measurement of derivative financial instruments is explained in a separate section (Derivative
financial instruments).
Financial instruments: Cash and cash equivalents
Cash and cash equivalents include cash on hand and in banks, bank deposits on up to one‐day notice
and securities with a residual maturity of up to three months at the acquisition date. These holdings
Demag Cranes AG Annual Report 2011/2012 86
are classified in the loans and receivables category. Demag Cranes measures cash and cash
equivalents at amortised cost.
Non‐current assets held for sale and associated liabilities
To be classed as assets held for sale, assets must be available for immediate sale and their sale must
be highly probable. Assets held for sale can be individual non‐current assets or groups of assets held
for sale (disposal groups). Liabilities that are disposed of with assets held for sale in a single
transaction are part of a disposal group and are reported separately under current liabilities as
liabilities associated with assets held for sale.
Non‐current assets held for sale and disposal groups cease to be depreciated or amortised, and are
measured at their carrying amount or at fair value less costs to sell, whichever is lower.
Share‐based payment
Demag Cranes has an equity‐settled share‐based payment scheme (Matching Stock Program) for
executives and managerial employees. Settlement is in Demag Cranes AG shares. The amount of the
equity‐settled payment obligation is the fair value of the options at the grant date. This is
independently assessed using Monte Carlo simulation. Demag Cranes recognises share‐based
payments in personnel expenses on a straight‐line basis over the vesting period with a matching
increase in additional paid‐in capital. A provision is additionally recognised for payroll deductions pro
rata in accordance with changes in the fair value of the options.
Pension obligations
Pension obligations arise under defined contribution and defined benefit plans. Contributions to
defined contribution plans are recognised as an expense in profit or loss in the year employees have
rendered service entitling them to the contributions.
The present value of the obligation under defined benefit plans is measured separately for each plan
using the projected unit credit method, based on the estimated amount of benefit employees have
earned up to the balance sheet date. Demag Cranes obtains an actuarial valuation to measure the
amount of its obligation each year. Demag Cranes’ net obligation is determined by subtracting the
fair value of plan assets from the present value of the defined benefit obligation. The discount rate
used is the yield at the balance sheet date on senior corporate bonds with maturities approximating
to the duration of the benefit. Experience adjustments and changes in actuarial parameters over
time can result in differences between the actual and expected benefit obligation and the actual and
expected return on plan assets. The resulting actuarial gains and losses are recognised directly in
equity (in retained earnings) and presented separately in the Statement of comprehensive income. If
plan benefits are subsequently increased, the share of the present value of the increased benefits
that relates to employees’ past service (the past service cost) is recognised as expense on a straight‐
line basis over the vesting period. The past service cost for benefits that are vested immediately is
recognised immediately in profit or loss.
Demag Cranes AG Annual Report 2011/2012 87
Other provisions
Other provisions are recognised if at the balance sheet date Demag Cranes has a present obligation
(legal or constructive) as a result of a past event, it is probable that an outflow of resources
embodying economic benefits will be required to settle the obligation and a reliable estimate can be
made of the amount of the obligation. Where the time value of money is material, provisions are
recognised at the discounted present value of the expected amount of the obligation. The discount
rate used is a pre‐tax rate that reflects current market assessments of the time value of money and
the cash flow risk on the liability. If it is virtually certain that the amount of a provision will be
reimbursed by an identifiable third party, the expected reimbursement is recognised as a separate
asset. Provisions for the estimated cost of product warranties are recognised when products are sold.
Restructuring provisions are recognised when a detailed formal restructuring plan has been drawn
up and announced to the parties affected. Changes in estimates used in the measurement of
provisions are recognised in profit or loss. No provision is recognised for costs that need to be
incurred to operate in the future. Provisions for onerous contracts are recognised if and to the extent
it becomes apparent that the unavoidable costs of meeting the obligations under the contract
exceed the economic benefits expected to be received under it.
Financial instruments: Loans and borrowings
Interest‐bearing loans and borrowings are initially recognised at fair value less transaction costs
incurred on inception. Subsequent to initial recognition, interest‐bearing loans and borrowings are
measured at amortised cost, with the difference between the initial amount and the repayment
amount being recognised as interest expense over the loan term using the effective interest method.
Gains and losses arising from amortisation of such differences and derecognition of financial
liabilities are recognised immediately in profit or loss.
Financial guarantee contracts are initially measured at fair value plus any transaction costs directly
attributable to their issue. They are subsequently measured at the higher of the amount of any
provision recognised for giving the guarantee and the amount initially recognised less accumulated
amortisation.
Financial instruments: Trade payables
Trade payables are financial liabilities that Demag Cranes measures at amortised cost using the
effective interest method.
Contingent liabilities
A contingent liability is a possible obligation that arises from past events and whose existence will be
confirmed only by the occurrence or non‐occurrence of one or more uncertain future events, or a
present obligation where it is possible but not probable that an outflow of resources embodying
economic benefits will be required to settle the obligation or the amount of the obligation cannot be
measured with sufficient reliability.
Demag Cranes AG Annual Report 2011/2012 88
5. Accounting estimates and judgements
The preparation of financial statements in conformity with IFRS requires the use of estimates and
assumptions that affect the amount of assets and liabilities and disclosures on contingent assets and
liabilities at the balance sheet date and the amount of income and expenses during the reporting
period. Actual amounts may differ from these estimates. The estimates and assumptions are based
on experience and other factors considered relevant in measuring carrying amounts where these are
not readily apparent from other reliable sources. Demag Cranes reviews the estimates and
underlying assumptions on an ongoing basis. Revisions to accounting estimates are recognised in the
period in which an estimate is revised if the revision affects only that period, or in the period of the
revision and future periods if the revision affects both current and future periods.
In the preparation of the Consolidated Financial Statements, the Management Board of Demag
Cranes AG used estimates and assumptions relating to material items as follows:
Assessment of the need to recognise impairments and measurement of the amount of any
impairment loss
Demag Cranes assesses at each reporting date whether there is any indication that items of property,
plant and equipment, intangible assets or investment property are impaired. To test for impairment,
an asset’s or cash‐generating unit’s recoverable amount is compared with its carrying amount. The
recoverable amount is fair value less costs to sell or value in use, whichever is higher. Demag Cranes
normally measures the recoverable amount on the basis of fair value less costs to sell. In estimating
fair value less costs to sell, management makes assumptions regarding expected future cash flows
from each asset or cash‐generating unit, using appropriate discount rates. The recoverable amount
of trademarks in other intangible assets is determined using the relief from royalty method.
Impairment testing has confirmed the carrying amounts of goodwill and trademarks.
Estimated useful lives
Useful lives are based on estimates. The estimated useful lives of intangible assets, property, plant
and equipment and investment property are reviewed at each financial year‐end. As in the previous
year, the review has not identified any need to alter the estimated useful life of any asset.
Recognition and measurement of development expenses
Development expenses are capitalised if the recognition criteria are satisfied. Management makes
assumptions in this connection concerning the size of expected future cash flows, the applicable
discount rates and the period over which expected future benefits will be generated. Development
expenses are amortised over the expected useful life of the asset from the point at which it is able to
be used. EUR 2,695,000 in development expenses were capitalised in financial year 2011/2012
(2010/2011: EUR 5,509,000). Impairment testing of capitalised development expenses did not result
in recognition of any impairment losses in financial year 2011/2012. Further information on the
impairment of capitalised development expenses is provided in Note 15.
Demag Cranes AG Annual Report 2011/2012 89
Accounting for pensions and similar obligations
Demag Cranes uses actuarial valuations in the measurement of pensions and similar obligations.
These valuations are made on the basis, among other things, of expected returns on plan assets,
future salary increases, future pension increases, mortality and staff turnover. Due to their long‐term
focus, these estimates are subject to material uncertainty. The provision for pensions and similar
obligations amounted to EUR 183,691,000 at the balance sheet date (30 September 2011: EUR
143,246,000). Further information is provided in Note 26.
Accounting for restructuring provisions
The size of restructuring provisions is based on management’s best estimate. Changes in estimates
may become necessary as the restructuring plan takes on substance and is implemented. The
restructuring provision came to EUR 4,235,000 at 30 September 2012 (30 September 2011: EUR
2,478,000). Further information is provided in Note 27.
Other personnel‐related obligations and partial retirement obligations
Recognition and measurement of partial retirement obligations and other personnel‐related
obligations likewise involve estimates and assumptions regarding the expected timing and amount.
Factors affecting the size of the provision include biometric data used in calculations, workforce
turnover and take‐up of partial retirement arrangements. Other personnel‐related obligations
totalled EUR 37,237,000 at the balance sheet date (30 September 2011: EUR 65,895,000). Partial
retirement obligations came to EUR 8,364,000 (30 September 2011: EUR 10,253,000). Further
information is provided in Note 30.
Share‐based payment
In determining the fair value of equity instruments, Demag Cranes applies a suitable valuation
technique (Monte Carlo simulation) that reflects the conditions of its share‐based payment scheme.
The variables incorporated in the valuation model and the fair values of equity instruments are
presented in Note 25.
Deferred tax assets
Deferred tax assets are recognised for tax loss carryforwards to the extent that it is probable that
there will be taxable profits permitting their utilisation. Their measurement requires estimates as to
the timing and amount of taxable profits against which they can be utilised. At 30 September 2012,
the net carrying amount of deferred tax assets recognised for tax loss carryforwards amounted to
EUR 3,253,000 (30 September 2011: EUR 10,437,000). Further information is provided in Note 31.
All estimates and assumptions are based on the best available information and the objective of
achieving a fair presentation of the financial position, financial performance and cash flows of Demag
Cranes. Due to the uncertainty associated with estimates and assumptions, actual results may differ
from the reported amounts.
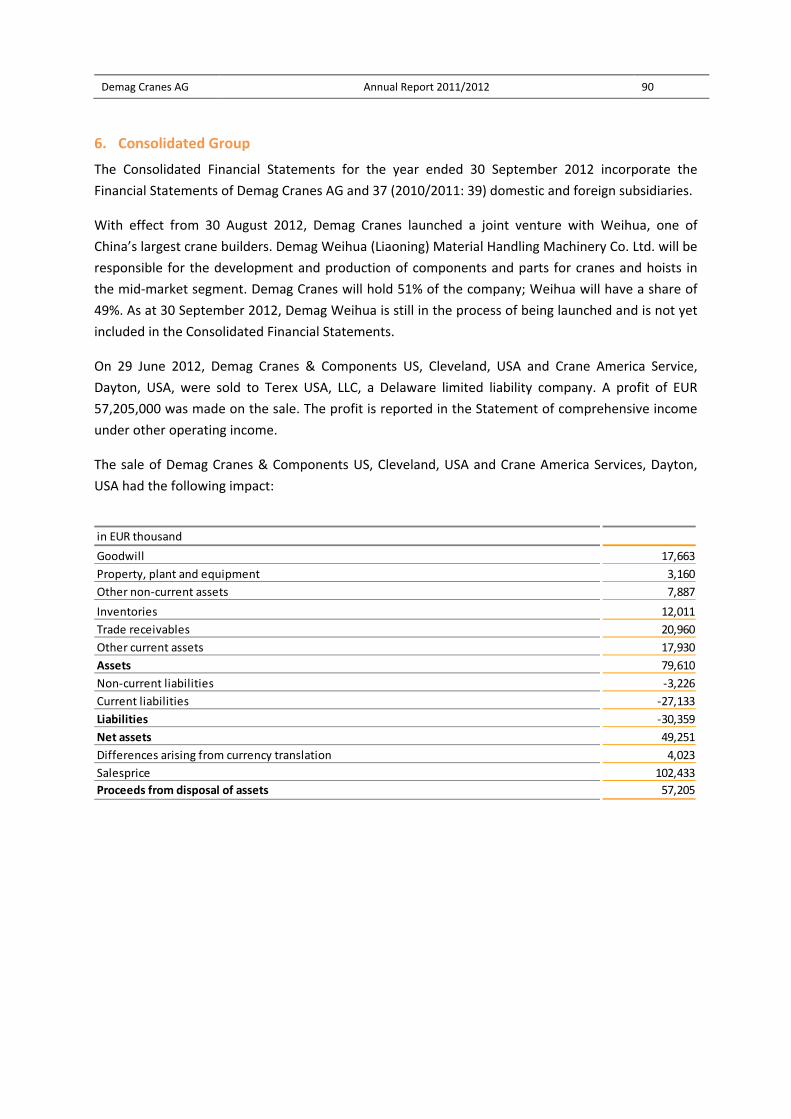
Demag Cranes AG Annual Report 2011/2012 90
6. Consolidated Group
The Consolidated Financial Statements for the year ended 30 September 2012 incorporate the
Financial Statements of Demag Cranes AG and 37 (2010/2011: 39) domestic and foreign subsidiaries.
With effect from 30 August 2012, Demag Cranes launched a joint venture with Weihua, one of
China’s largest crane builders. Demag Weihua (Liaoning) Material Handling Machinery Co. Ltd. will be
responsible for the development and production of components and parts for cranes and hoists in
the mid‐market segment. Demag Cranes will hold 51% of the company; Weihua will have a share of
49%. As at 30 September 2012, Demag Weihua is still in the process of being launched and is not yet
included in the Consolidated Financial Statements.
On 29 June 2012, Demag Cranes & Components US, Cleveland, USA and Crane America Service,
Dayton, USA, were sold to Terex USA, LLC, a Delaware limited liability company. A profit of EUR
57,205,000 was made on the sale. The profit is reported in the Statement of comprehensive income
under other operating income.
The sale of Demag Cranes & Components US, Cleveland, USA and Crane America Services, Dayton,
USA had the following impact:
in EUR thousand
Goodwill 17,663
Property, plant and equipment 3,160
Other non‐current assets 7,887
Inventories 12,011
Trade receivables 20,960
Other current assets 17,930
Assets 79,610
Non‐current liabilities ‐3,226
Current liabilities ‐27,133
Liabilities ‐30,359
Net assets 49,251
Differences arising from currency translation 4,023
Salesprice 102,433
Proceeds from disposal of assets 57,205
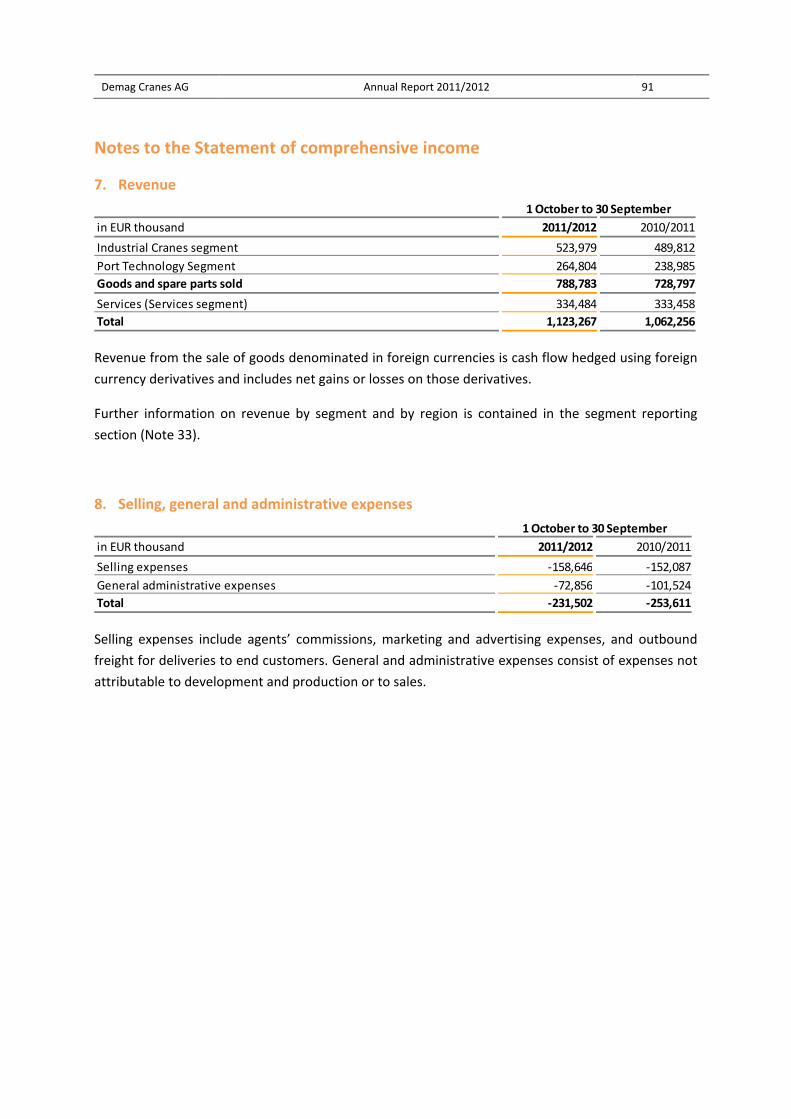
Demag Cranes AG Annual Report 2011/2012 91
Notes to the Statement of comprehensive income
7. Revenue
Revenue from the sale of goods denominated in foreign currencies is cash flow hedged using foreign
currency derivatives and includes net gains or losses on those derivatives.
Further information on revenue by segment and by region is contained in the segment reporting
section (Note 33).
8. Selling, general and administrative expenses
Selling expenses include agents’ commissions, marketing and advertising expenses, and outbound
freight for deliveries to end customers. General and administrative expenses consist of expenses not
attributable to development and production or to sales.
in EUR thousand 2011/2012 2010/2011
Industrial Cranes segment 523,979 489,812
Port Technology Segment 264,804 238,985
Goods and spare parts sold 788,783 728,797
Services (Services segment) 334,484 333,458
Total 1,123,267 1,062,256
1 October to 30 September
in EUR thousand 2011/2012 2010/2011
Selling expenses ‐158,646 ‐152,087
General administrative expenses ‐72,856 ‐101,524
Total ‐231,502 ‐253,611
1 October to 30 September
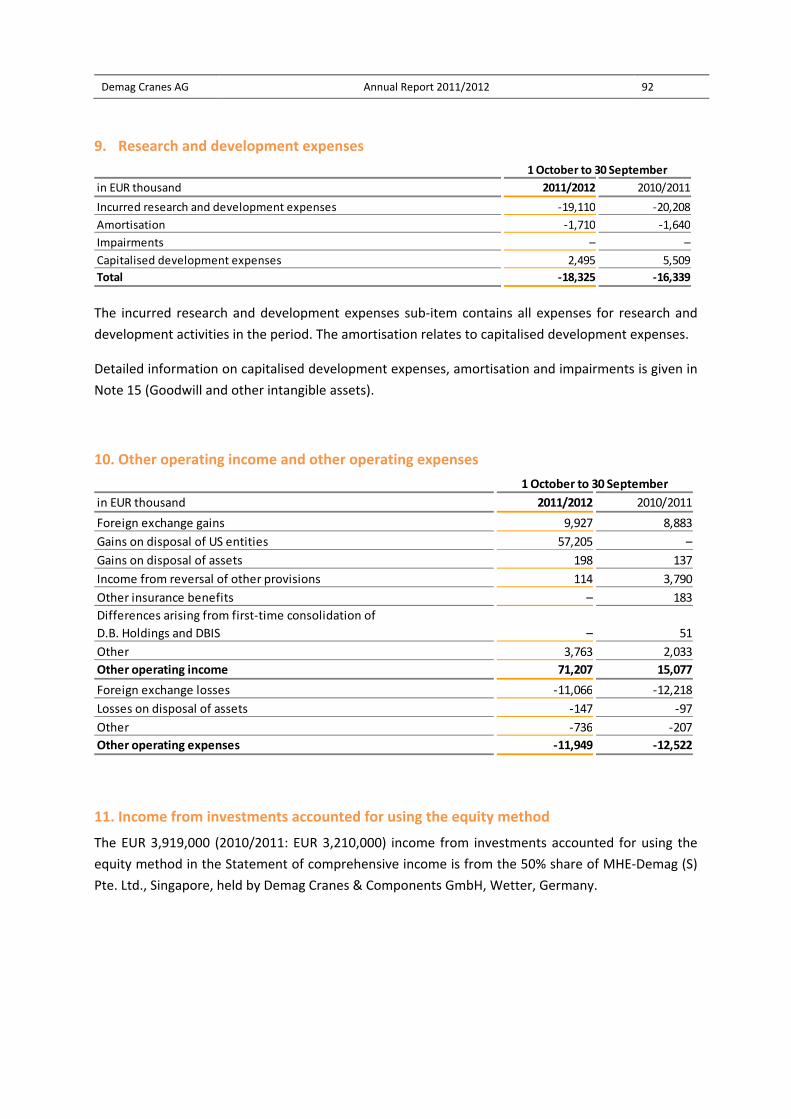
Demag Cranes AG Annual Report 2011/2012 92
9. Research and development expenses
The incurred research and development expenses sub‐item contains all expenses for research and
development activities in the period. The amortisation relates to capitalised development expenses.
Detailed information on capitalised development expenses, amortisation and impairments is given in
Note 15 (Goodwill and other intangible assets).
10. Other operating income and other operating expenses
11. Income from investments accounted for using the equity method
The EUR 3,919,000 (2010/2011: EUR 3,210,000) income from investments accounted for using the
equity method in the Statement of comprehensive income is from the 50% share of MHE‐Demag (S)
Pte. Ltd., Singapore, held by Demag Cranes & Components GmbH, Wetter, Germany.
in EUR thousand 2011/2012 2010/2011
Incurred research and development expenses ‐19,110 ‐20,208
Amortisation ‐1,710 ‐1,640
Impairments – –
Capitalised development expenses 2,495 5,509
Total ‐18,325 ‐16,339
1 October to 30 September
in EUR thousand 2011/2012 2010/2011
Foreign exchange gains 9,927 8,883
Gains on disposal of US entities 57,205 –
Gains on disposal of assets 198 137
Income from reversal of other provisions 114 3,790
Other insurance benefits – 183
Differences arising from first‐time consolidation of
D.B. Holdings and DBIS – 51
Other 3,763 2,033
Other operating income 71,207 15,077
Foreign exchange losses ‐11,066 ‐12,218
Losses on disposal of assets ‐147 ‐97
Other ‐736 ‐207
Other operating expenses ‐11,949 ‐12,522
1 October to 30 September
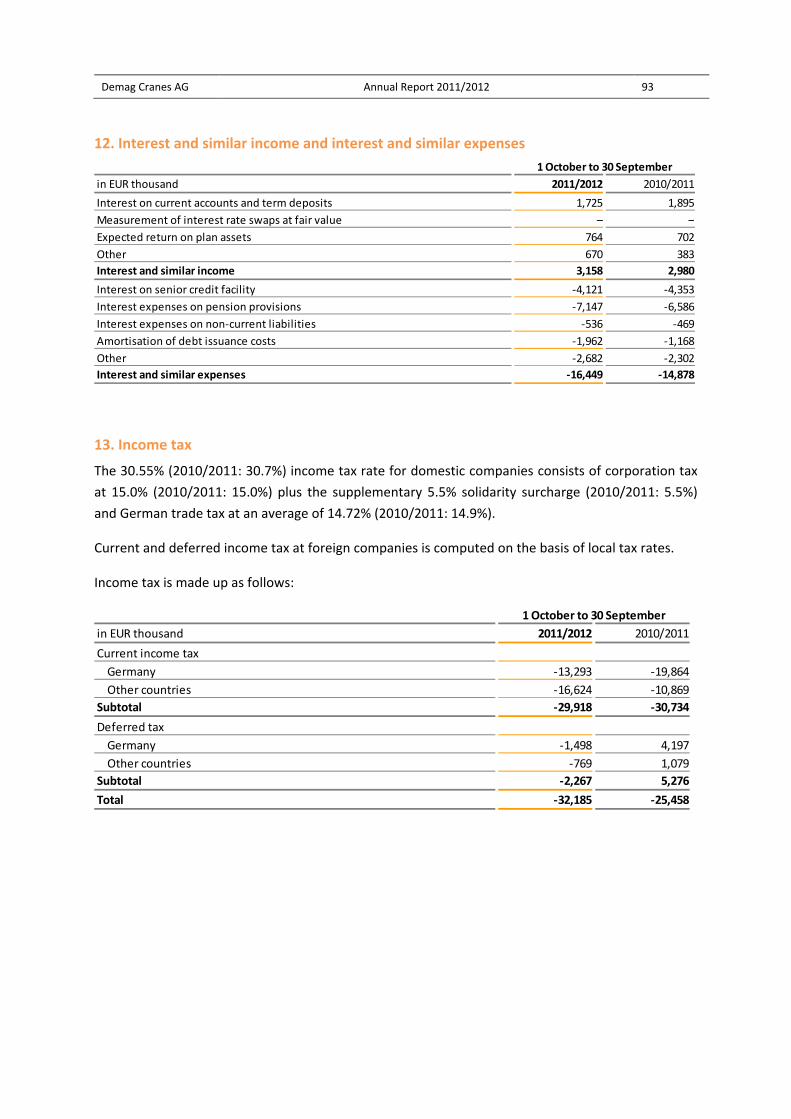
Demag Cranes AG Annual Report 2011/2012 93
12. Interest and similar income and interest and similar expenses
13. Income tax
The 30.55% (2010/2011: 30.7%) income tax rate for domestic companies consists of corporation tax
at 15.0% (2010/2011: 15.0%) plus the supplementary 5.5% solidarity surcharge (2010/2011: 5.5%)
and German trade tax at an average of 14.72% (2010/2011: 14.9%).
Current and deferred income tax at foreign companies is computed on the basis of local tax rates.
Income tax is made up as follows:
in EUR thousand 2011/2012 2010/2011
Interest on current accounts and term deposits 1,725 1,895
Measurement of interest rate swaps at fair value – –
Expected return on plan assets 764 702
Other 670 383
Interest and similar income 3,158 2,980
Interest on senior credit facility ‐4,121 ‐4,353
Interest expenses on pension provisions ‐7,147 ‐6,586
Interest expenses on non‐current liabilities ‐536 ‐469
Amortisation of debt issuance costs ‐1,962 ‐1,168
Other ‐2,682 ‐2,302
Interest and similar expenses ‐16,449 ‐14,878
1 October to 30 September
in EUR thousand 2011/2012 2010/2011
Current income tax
Germany ‐13,293 ‐19,864
Other countries ‐16,624 ‐10,869
Subtotal ‐29,918 ‐30,734
Deferred tax
Germany ‐1,498 4,197
Other countries ‐769 1,079
Subtotal ‐2,267 5,276
Total ‐32,185 ‐25,458
1 October to 30 September
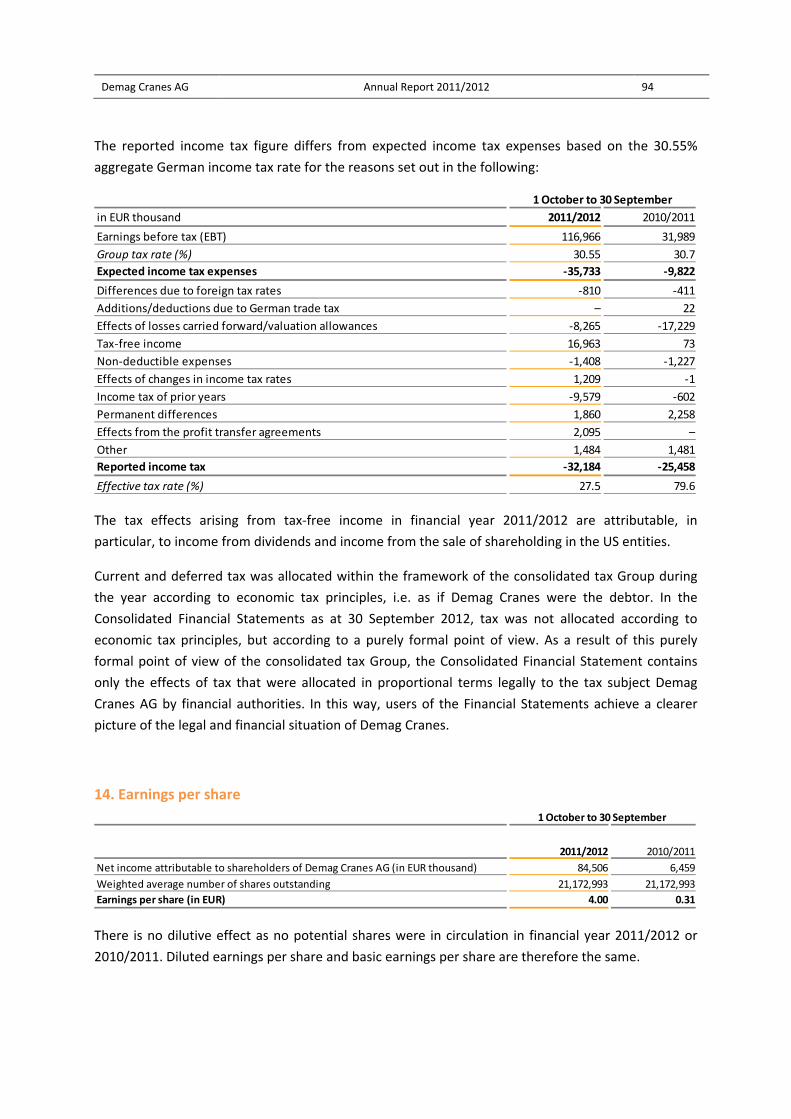
Demag Cranes AG Annual Report 2011/2012 94
The reported income tax figure differs from expected income tax expenses based on the 30.55%
aggregate German income tax rate for the reasons set out in the following:
The tax effects arising from tax‐free income in financial year 2011/2012 are attributable, in
particular, to income from dividends and income from the sale of shareholding in the US entities.
Current and deferred tax was allocated within the framework of the consolidated tax Group during
the year according to economic tax principles, i.e. as if Demag Cranes were the debtor. In the
Consolidated Financial Statements as at 30 September 2012, tax was not allocated according to
economic tax principles, but according to a purely formal point of view. As a result of this purely
formal point of view of the consolidated tax Group, the Consolidated Financial Statement contains
only the effects of tax that were allocated in proportional terms legally to the tax subject Demag
Cranes AG by financial authorities. In this way, users of the Financial Statements achieve a clearer
picture of the legal and financial situation of Demag Cranes.
14. Earnings per share
There is no dilutive effect as no potential shares were in circulation in financial year 2011/2012 or
2010/2011. Diluted earnings per share and basic earnings per share are therefore the same.
in EUR thousand 2011/2012 2010/2011
Earnings before tax (EBT) 116,966 31,989
Group tax rate (%) 30.55 30.7
Expected income tax expenses ‐35,733 ‐9,822
Differences due to foreign tax rates ‐810 ‐411
Additions/deductions due to German trade tax – 22
Effects of losses carried forward/valuation allowances ‐8,265 ‐17,229
Tax‐free income 16,963 73
Non‐deductible expenses ‐1,408 ‐1,227
Effects of changes in income tax rates 1,209 ‐1
Income tax of prior years ‐9,579 ‐602
Permanent differences 1,860 2,258
Effects from the profit transfer agreements 2,095 –
Other 1,484 1,481
Reported income tax ‐32,184 ‐25,458
Effective tax rate (%) 27.5 79.6
1 October to 30 September
Net income attributable to shareholders of Demag Cranes AG (in EUR thousand) 84,506 6,459
Weighted average number of shares outstanding 21,172,993 21,172,993
Earnings per share (in EUR) 4.00 0.31
1 October to 30 September
2011/2012 2010/2011
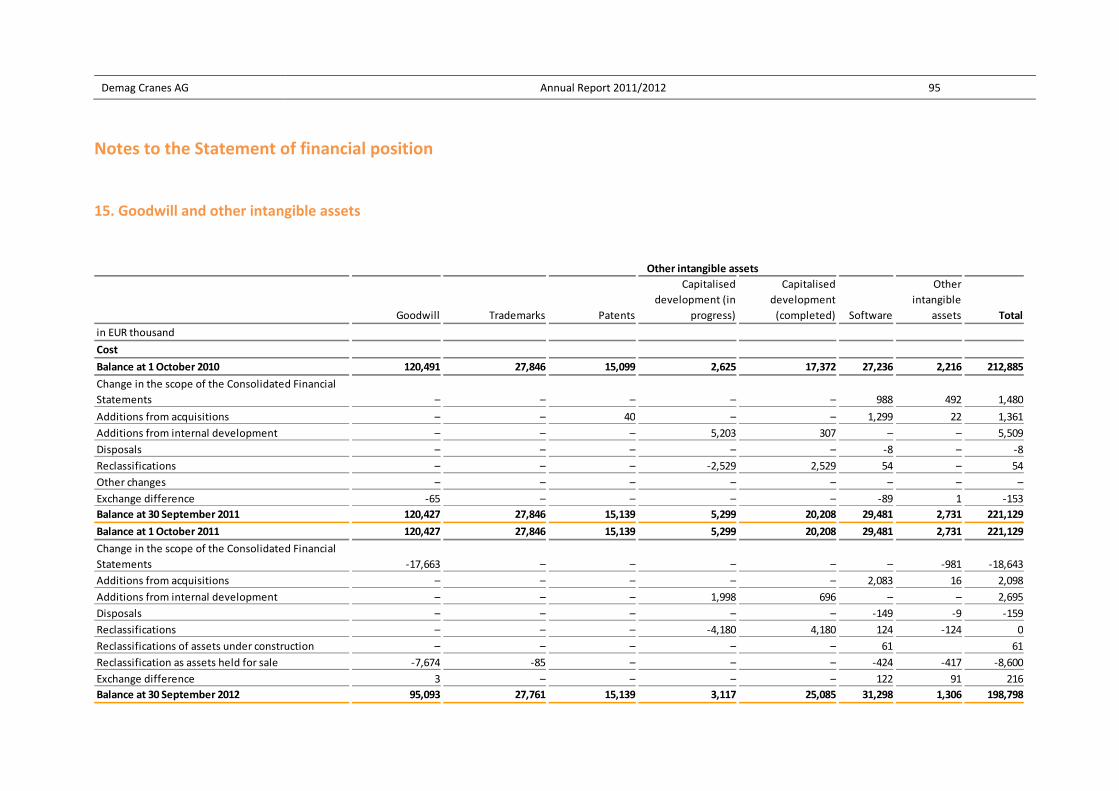
Demag Cranes AG Annual Report 2011/2012 95
Notes to the Statement of financial position
15. Goodwill and other intangible assets
Goodwill Trademarks Patents
Capitalised
development (in
progress)
Capitalised
development
(completed) Software
Other
intangible
assets Total
in EUR thousand
Cost
Balance at 1 October 2010 120,491 27,846 15,099 2,625 17,372 27,236 2,216 212,885
Change in the scope of the Consolidated Financial
Statements – – – – – 988 492 1,480
Additions from acquisitions – – 40 – – 1,299 22 1,361
Additions from internal development – – – 5,203 307 – – 5,509
Disposals – – – – – ‐8 – ‐8
Reclassifications – – – ‐2,529 2,529 54 – 54
Other changes – – – – – – – –
Exchange difference ‐65 – – – – ‐89 1 ‐153
Balance at 30 September 2011 120,427 27,846 15,139 5,299 20,208 29,481 2,731 221,129
Balance at 1 October 2011 120,427 27,846 15,139 5,299 20,208 29,481 2,731 221,129
Change in the scope of the Consolidated Financial
Statements ‐17,663 – – – – – ‐981 ‐18,643
Additions from acquisitions – – – – – 2,083 16 2,098
Additions from internal development – – – 1,998 696 – – 2,695
Disposals – – – – – ‐149 ‐9 ‐159
Reclassifications – – – ‐4,180 4,180 124 ‐124 0
Reclassifications of assets under construction – – – – – 61 61
Reclassification as assets held for sale ‐7,674 ‐85 – – – ‐424 ‐417 ‐8,600
Exchange difference 3 – – – – 122 91 216
Balance at 30 September 2012 95,093 27,761 15,139 3,117 25,085 31,298 1,306 198,798
Other intangible assets
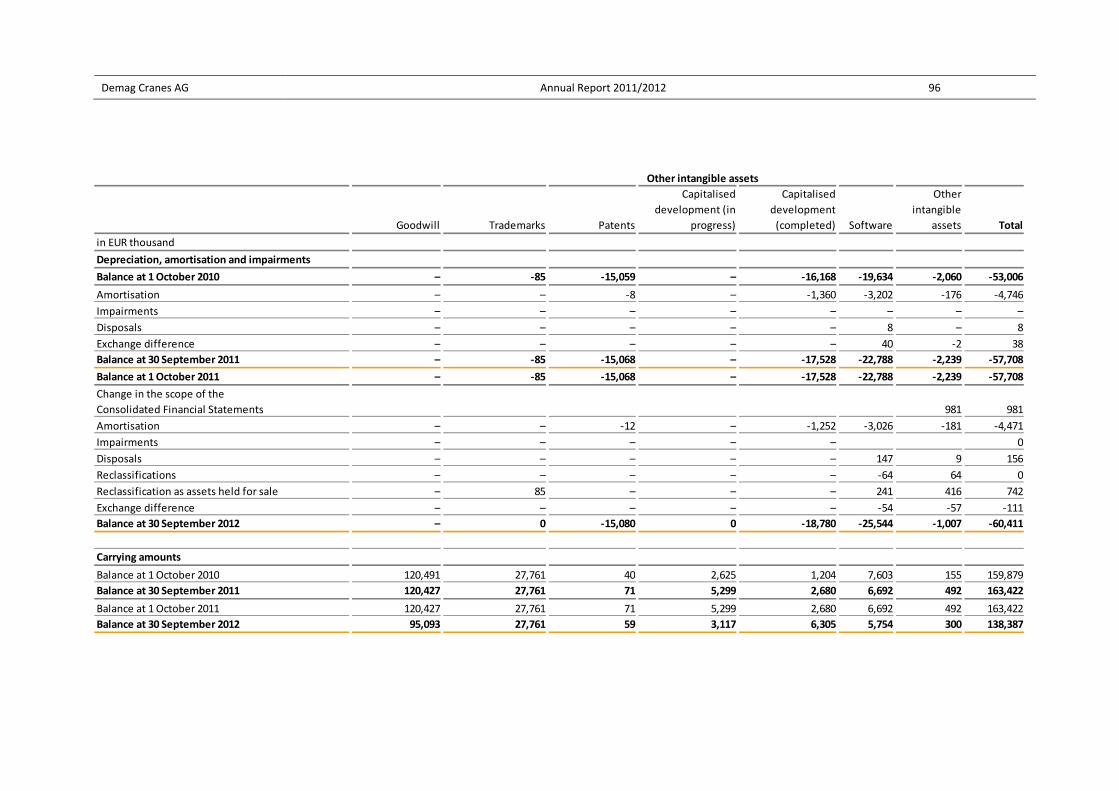
Demag Cranes AG Annual Report 2011/2012 96
Goodwill Trademarks Patents
Capitalised
development (in
progress)
Capitalised
development
(completed) Software
Other
intangible
assets Total
in EUR thousand
Depreciation, amortisation and impairments
Balance at 1 October 2010 – ‐85 ‐15,059 – ‐16,168 ‐19,634 ‐2,060 ‐53,006
Amortisation – – ‐8 – ‐1,360 ‐3,202 ‐176 ‐4,746
Impairments – – – – – – – –
Disposals – – – – – 8 – 8
Exchange difference – – – – – 40 ‐2 38
Balance at 30 September 2011 – ‐85 ‐15,068 – ‐17,528 ‐22,788 ‐2,239 ‐57,708
Balance at 1 October 2011 – ‐85 ‐15,068 – ‐17,528 ‐22,788 ‐2,239 ‐57,708
Change in the scope of the
Consolidated Financial Statements 981 981
Amortisation – – ‐12 – ‐1,252 ‐3,026 ‐181 ‐4,471
Impairments – – – – – 0
Disposals – – – – – 147 9 156
Reclassifications – – – – – ‐64 64 0
Reclassification as assets held for sale – 85 – – – 241 416 742
Exchange difference – – – – – ‐54 ‐57 ‐111
Balance at 30 September 2012 – 0 ‐15,080 0 ‐18,780 ‐25,544 ‐1,007 ‐60,411
Carrying amounts
Balance at 1 October 2010 120,491 27,761 40 2,625 1,204 7,603 155 159,879
Balance at 30 September 2011 120,427 27,761 71 5,299 2,680 6,692 492 163,422
Balance at 1 October 2011 120,427 27,761 71 5,299 2,680 6,692 492 163,422
Balance at 30 September 2012 95,093 27,761 59 3,117 6,305 5,754 300 138,387
Other intangible assets
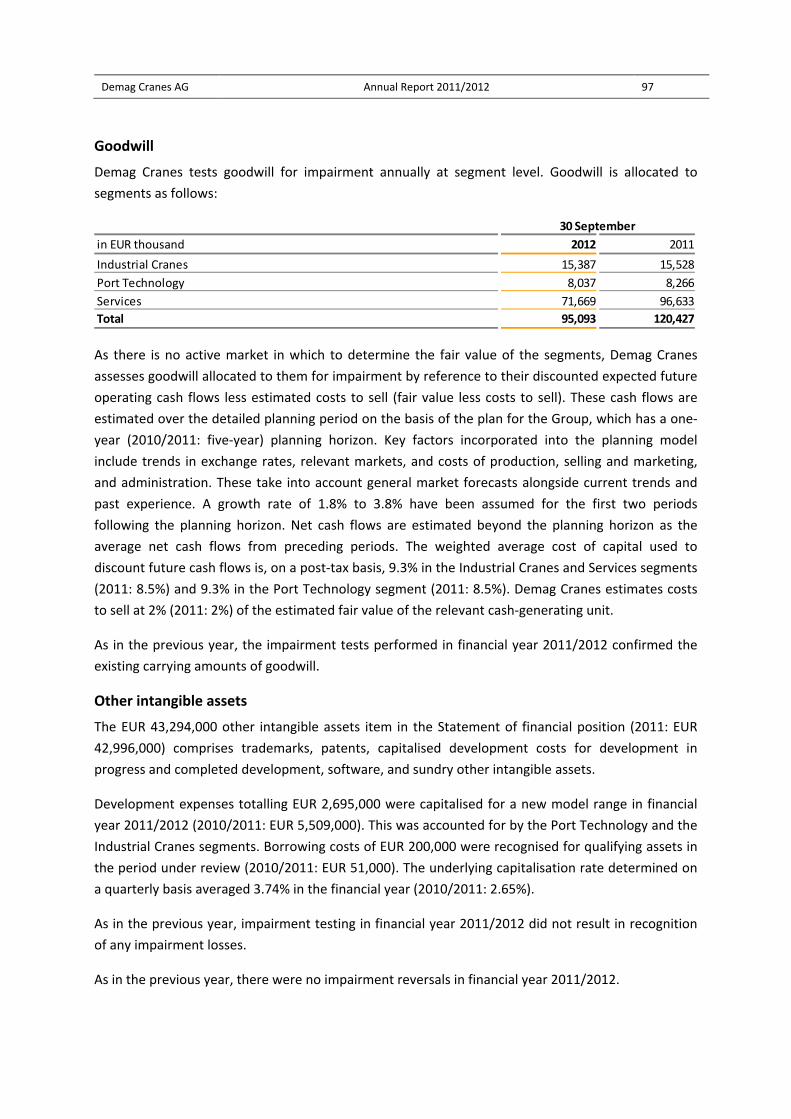
Demag Cranes AG Annual Report 2011/2012 97
Goodwill
Demag Cranes tests goodwill for impairment annually at segment level. Goodwill is allocated to
segments as follows:
As there is no active market in which to determine the fair value of the segments, Demag Cranes
assesses goodwill allocated to them for impairment by reference to their discounted expected future
operating cash flows less estimated costs to sell (fair value less costs to sell). These cash flows are
estimated over the detailed planning period on the basis of the plan for the Group, which has a one‐
year (2010/2011: five‐year) planning horizon. Key factors incorporated into the planning model
include trends in exchange rates, relevant markets, and costs of production, selling and marketing,
and administration. These take into account general market forecasts alongside current trends and
past experience. A growth rate of 1.8% to 3.8% have been assumed for the first two periods
following the planning horizon. Net cash flows are estimated beyond the planning horizon as the
average net cash flows from preceding periods. The weighted average cost of capital used to
discount future cash flows is, on a post‐tax basis, 9.3% in the Industrial Cranes and Services segments
(2011: 8.5%) and 9.3% in the Port Technology segment (2011: 8.5%). Demag Cranes estimates costs
to sell at 2% (2011: 2%) of the estimated fair value of the relevant cash‐generating unit.
As in the previous year, the impairment tests performed in financial year 2011/2012 confirmed the
existing carrying amounts of goodwill.
Other intangible assets
The EUR 43,294,000 other intangible assets item in the Statement of financial position (2011: EUR
42,996,000) comprises trademarks, patents, capitalised development costs for development in
progress and completed development, software, and sundry other intangible assets.
Development expenses totalling EUR 2,695,000 were capitalised for a new model range in financial
year 2011/2012 (2010/2011: EUR 5,509,000). This was accounted for by the Port Technology and the
Industrial Cranes segments. Borrowing costs of EUR 200,000 were recognised for qualifying assets in
the period under review (2010/2011: EUR 51,000). The underlying capitalisation rate determined on
a quarterly basis averaged 3.74% in the financial year (2010/2011: 2.65%).
As in the previous year, impairment testing in financial year 2011/2012 did not result in recognition
of any impairment losses.
As in the previous year, there were no impairment reversals in financial year 2011/2012.
in EUR thousand 2012 2011
Industrial Cranes 15,387 15,528
Port Technology 8,037 8,266
Services 71,669 96,633
Total 95,093 120,427
30 September
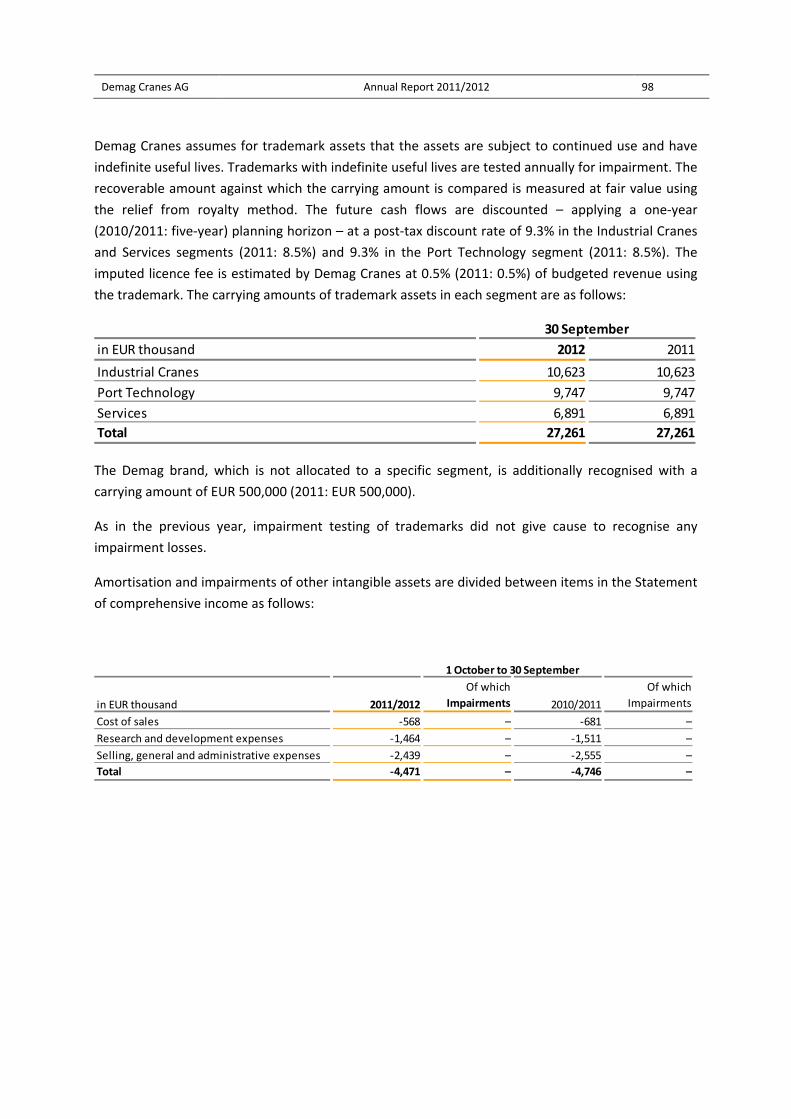
Demag Cranes AG Annual Report 2011/2012 98
Demag Cranes assumes for trademark assets that the assets are subject to continued use and have
indefinite useful lives. Trademarks with indefinite useful lives are tested annually for impairment. The
recoverable amount against which the carrying amount is compared is measured at fair value using
the relief from royalty method. The future cash flows are discounted – applying a one‐year
(2010/2011: five‐year) planning horizon – at a post‐tax discount rate of 9.3% in the Industrial Cranes
and Services segments (2011: 8.5%) and 9.3% in the Port Technology segment (2011: 8.5%). The
imputed licence fee is estimated by Demag Cranes at 0.5% (2011: 0.5%) of budgeted revenue using
the trademark. The carrying amounts of trademark assets in each segment are as follows:
The Demag brand, which is not allocated to a specific segment, is additionally recognised with a
carrying amount of EUR 500,000 (2011: EUR 500,000).
As in the previous year, impairment testing of trademarks did not give cause to recognise any
impairment losses.
Amortisation and impairments of other intangible assets are divided between items in the Statement
of comprehensive income as follows:
in EUR thousand 2012 2011
Industrial Cranes 10,623 10,623
Port Technology 9,747 9,747
Services 6,891 6,891
Total 27,261 27,261
30 September
Of which Of which
Impairments Impairments
Cost of sales ‐568 – ‐681 –
Research and development expenses ‐1,464 – ‐1,511 –
Selling, general and administrative expenses ‐2,439 – ‐2,555 –
Total ‐4,471 – ‐4,746 –
1 October to 30 September
in EUR thousand 2011/2012 2010/2011
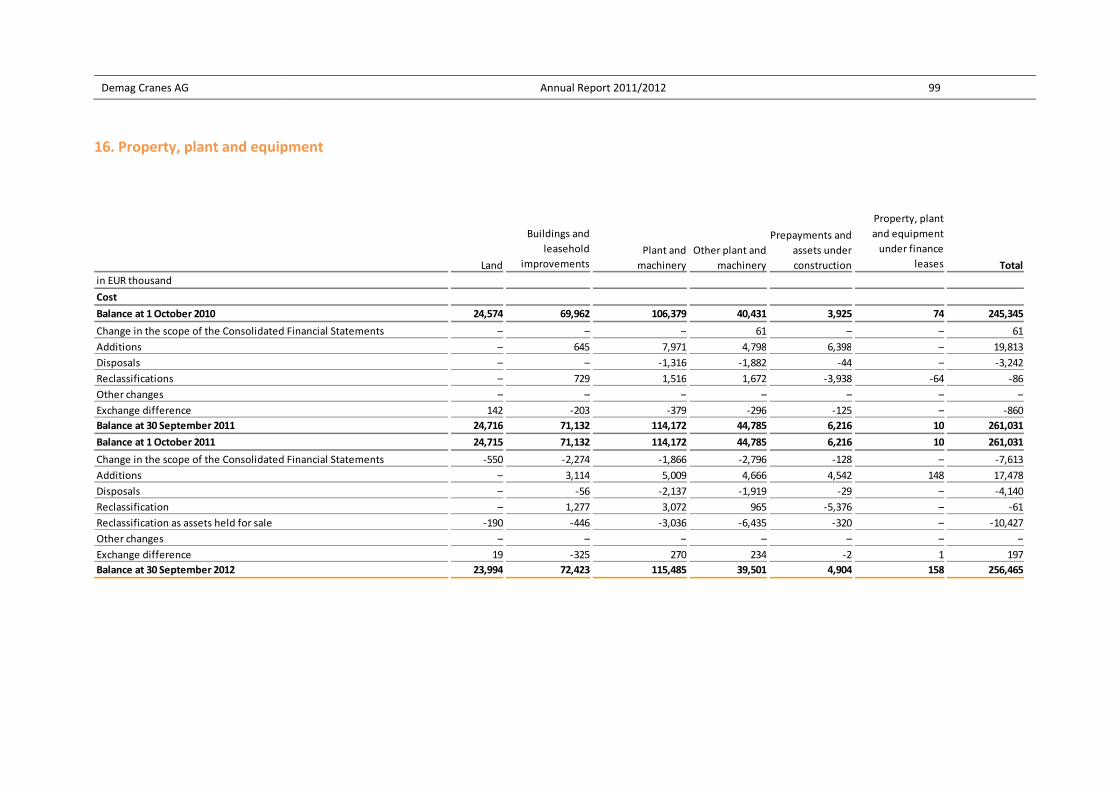
Demag Cranes AG Annual Report 2011/2012 99
16. Property, plant and equipment
Buildings and
leasehold
improvements
Property, plant
and equipment
under finance
leases
in EUR thousand
Cost
Balance at 1 October 2010 24,574 69,962 106,379 40,431 3,925 74 245,345
Change in the scope of the Consolidated Financial Statements – – – 61 – – 61
Additions – 645 7,971 4,798 6,398 – 19,813
Disposals – – ‐1,316 ‐1,882 ‐44 – ‐3,242
Reclassifications – 729 1,516 1,672 ‐3,938 ‐64 ‐86
Other changes – – – – – – –
Exchange difference 142 ‐203 ‐379 ‐296 ‐125 – ‐860
Balance at 30 September 2011 24,716 71,132 114,172 44,785 6,216 10 261,031
Balance at 1 October 2011 24,715 71,132 114,172 44,785 6,216 10 261,031
Change in the scope of the Consolidated Financial Statements ‐550 ‐2,274 ‐1,866 ‐2,796 ‐128 – ‐7,613
Additions – 3,114 5,009 4,666 4,542 148 17,478
Disposals – ‐56 ‐2,137 ‐1,919 ‐29 – ‐4,140
Reclassification – 1,277 3,072 965 ‐5,376 – ‐61
Reclassification as assets held for sale ‐190 ‐446 ‐3,036 ‐6,435 ‐320 – ‐10,427
Other changes – – – – – – –
Exchange difference 19 ‐325 270 234 ‐2 1 197
Balance at 30 September 2012 23,994 72,423 115,485 39,501 4,904 158 256,465
Land
Plant and
machinery
Other plant and
machinery
Prepayments and
assets under
construction Total
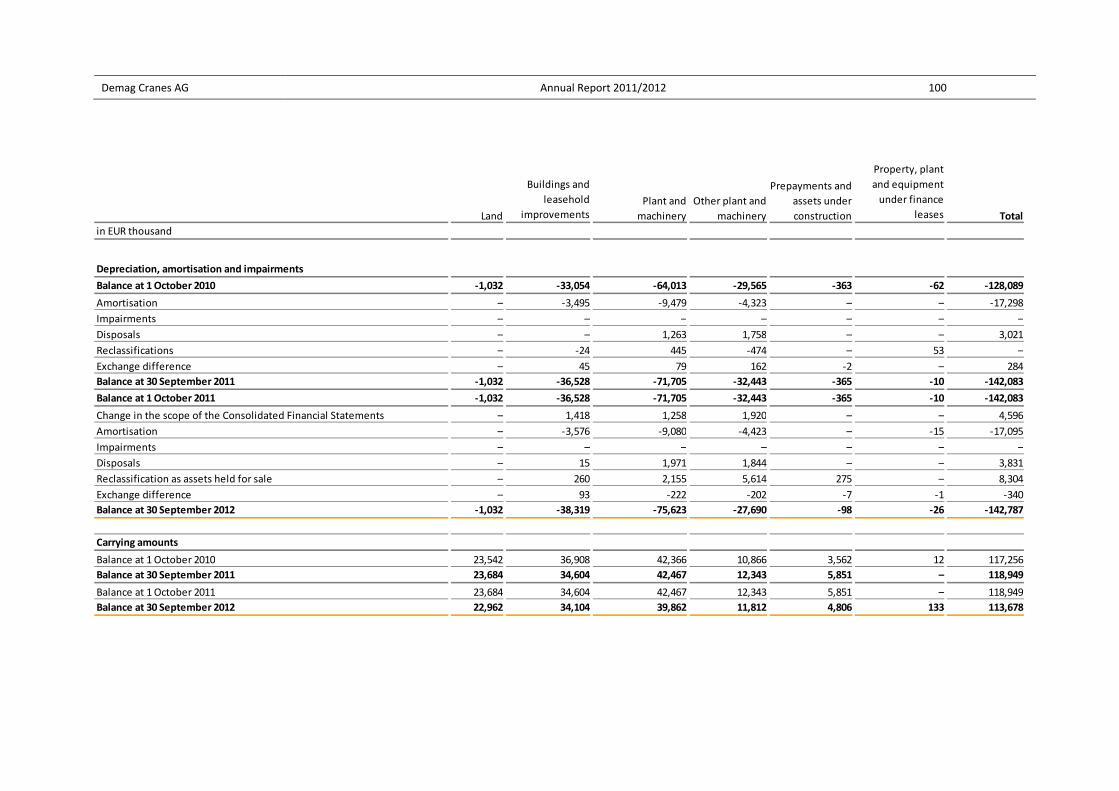
Demag Cranes AG Annual Report 2011/2012 100
Buildings and
leasehold
improvements
Property, plant
and equipment
under finance
leases
in EUR thousand
Depreciation, amortisation and impairments
Balance at 1 October 2010 ‐1,032 ‐33,054 ‐64,013 ‐29,565 ‐363 ‐62 ‐128,089
Amortisation – ‐3,495 ‐9,479 ‐4,323 – – ‐17,298
Impairments – – – – – – –
Disposals – – 1,263 1,758 – – 3,021
Reclassifications – ‐24 445 ‐474 – 53 –
Exchange difference – 45 79 162 ‐2 – 284
Balance at 30 September 2011 ‐1,032 ‐36,528 ‐71,705 ‐32,443 ‐365 ‐10 ‐142,083
Balance at 1 October 2011 ‐1,032 ‐36,528 ‐71,705 ‐32,443 ‐365 ‐10 ‐142,083
Change in the scope of the Consolidated Financial Statements – 1,418 1,258 1,920 – – 4,596
Amortisation – ‐3,576 ‐9,080 ‐4,423 – ‐15 ‐17,095
Impairments – – – – – – –
Disposals – 15 1,971 1,844 – – 3,831
Reclassification as assets held for sale – 260 2,155 5,614 275 – 8,304
Exchange difference – 93 ‐222 ‐202 ‐7 ‐1 ‐340
Balance at 30 September 2012 ‐1,032 ‐38,319 ‐75,623 ‐27,690 ‐98 ‐26 ‐142,787
Carrying amounts
Balance at 1 October 2010 23,542 36,908 42,366 10,866 3,562 12 117,256
Balance at 30 September 2011 23,684 34,604 42,467 12,343 5,851 – 118,949
Balance at 1 October 2011 23,684 34,604 42,467 12,343 5,851 – 118,949
Balance at 30 September 2012 22,962 34,104 39,862 11,812 4,806 133 113,678
Other plant and
machinery
Prepayments and
assets under
construction TotalLand
Plant and
machinery
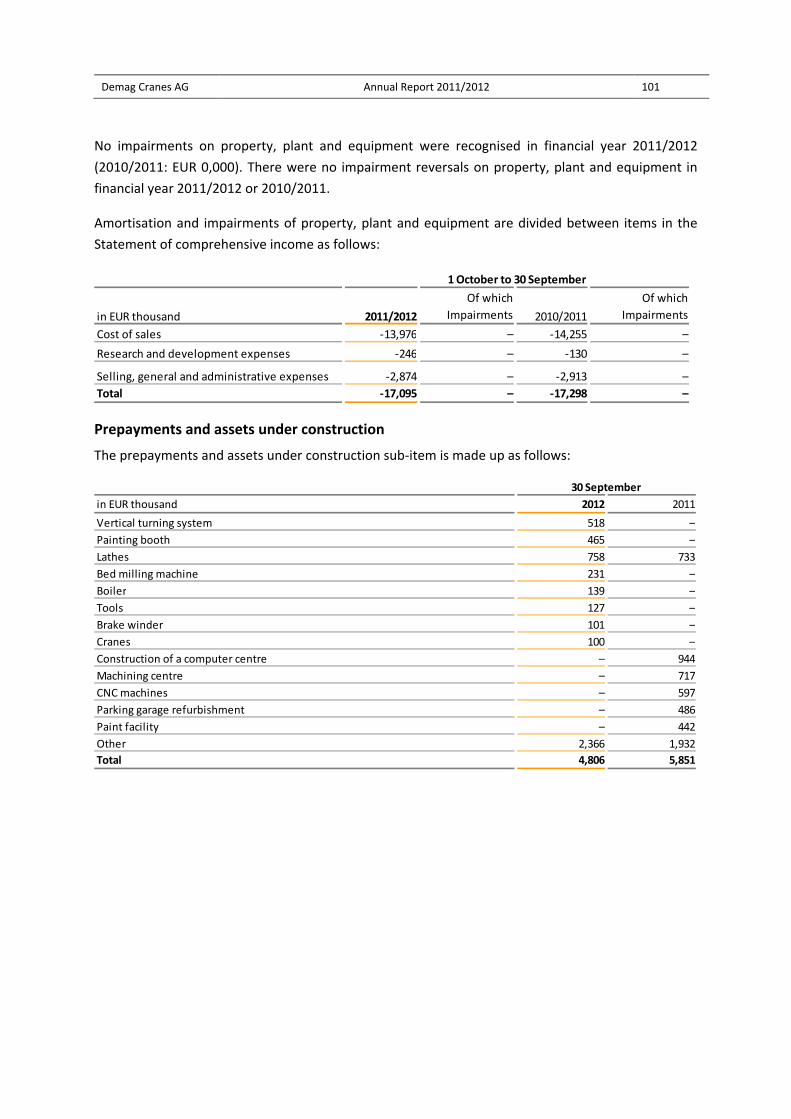
Demag Cranes AG Annual Report 2011/2012 101
No impairments on property, plant and equipment were recognised in financial year 2011/2012
(2010/2011: EUR 0,000). There were no impairment reversals on property, plant and equipment in
financial year 2011/2012 or 2010/2011.
Amortisation and impairments of property, plant and equipment are divided between items in the
Statement of comprehensive income as follows:
Prepayments and assets under construction
The prepayments and assets under construction sub‐item is made up as follows:
Of which Of which
Impairments Impairments
Cost of sales ‐13,976 – ‐14,255 –
Research and development expenses ‐246 – ‐130 –
Selling, general and administrative expenses ‐2,874 – ‐2,913 –
Total ‐17,095 – ‐17,298 –
1 October to 30 September
in EUR thousand 2011/2012 2010/2011
in EUR thousand 2012 2011
Vertical turning system 518 –
Painting booth 465 –
Lathes 758 733
Bed milling machine 231 –
Boiler 139 –
Tools 127 –
Brake winder 101 –
Cranes 100 –
Construction of a computer centre – 944
Machining centre – 717
CNC machines – 597
Parking garage refurbishment – 486
Paint facility – 442
Other 2,366 1,932
Total 4,806 5,851
30 September
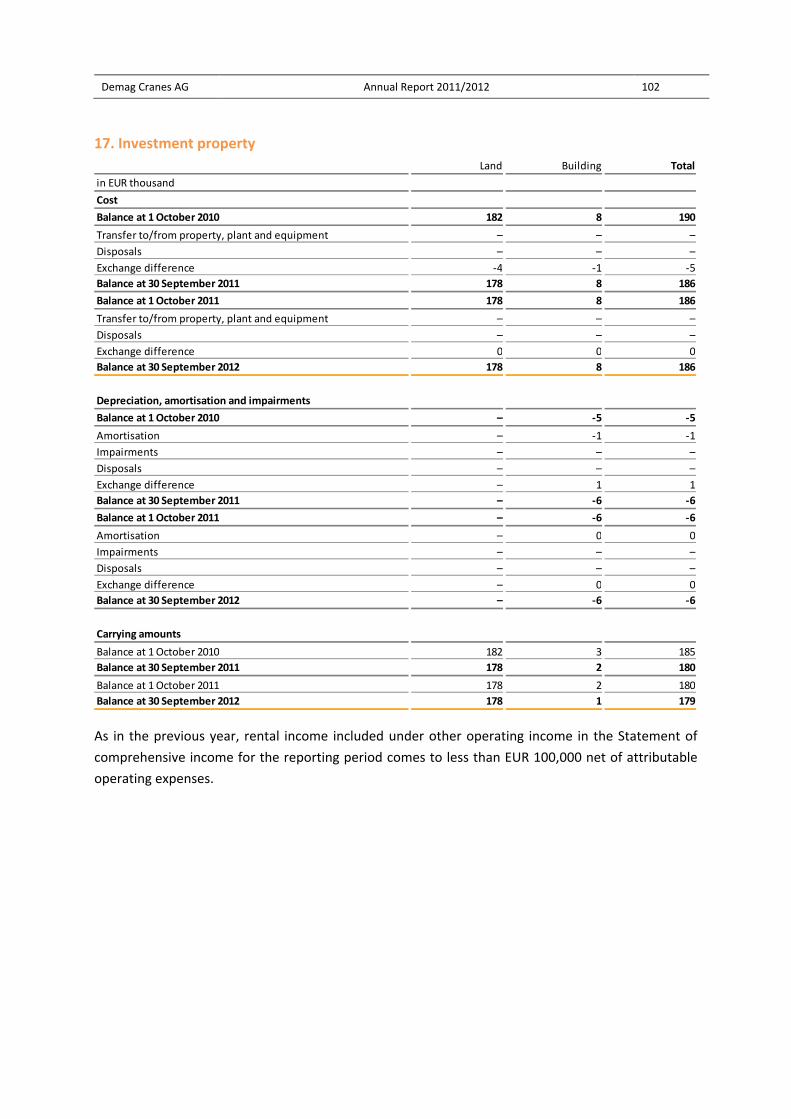
Demag Cranes AG Annual Report 2011/2012 102
17. Investment property
As in the previous year, rental income included under other operating income in the Statement of
comprehensive income for the reporting period comes to less than EUR 100,000 net of attributable
operating expenses.
Land Building Total
in EUR thousand
Cost
Balance at 1 October 2010 182 8 190
Transfer to/from property, plant and equipment – – –
Disposals – – –
Exchange difference ‐4 ‐1 ‐5
Balance at 30 September 2011 178 8 186
Balance at 1 October 2011 178 8 186
Transfer to/from property, plant and equipment – – –
Disposals – – –
Exchange difference 0 0 0
Balance at 30 September 2012 178 8 186
Depreciation, amortisation and impairments
Balance at 1 October 2010 – ‐5 ‐5
Amortisation – ‐1 ‐1
Impairments – – –
Disposals – – –
Exchange difference – 1 1
Balance at 30 September 2011 – ‐6 ‐6
Balance at 1 October 2011 – ‐6 ‐6
Amortisation – 0 0
Impairments – – –
Disposals – – –
Exchange difference – 0 0
Balance at 30 September 2012 – ‐6 ‐6
Carrying amounts
Balance at 1 October 2010 182 3 185
Balance at 30 September 2011 178 2 180
Balance at 1 October 2011 178 2 180
Balance at 30 September 2012 178 1 179
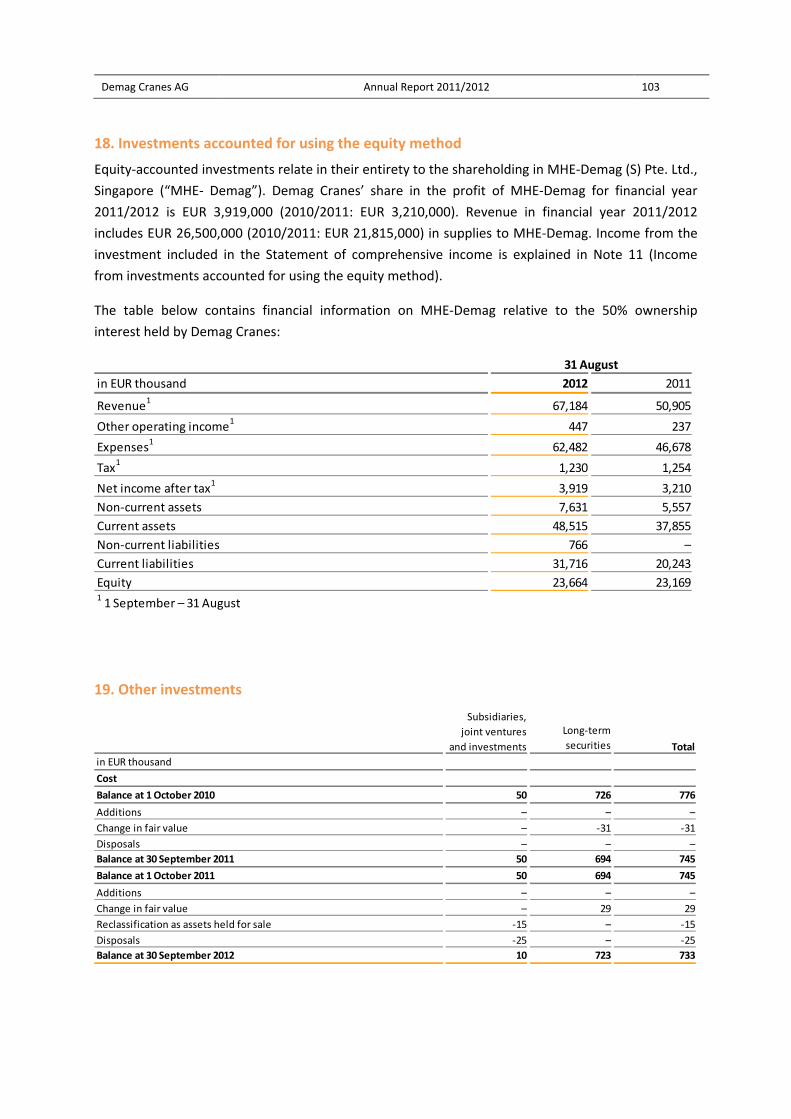
Demag Cranes AG Annual Report 2011/2012 103
18. Investments accounted for using the equity method
Equity‐accounted investments relate in their entirety to the shareholding in MHE‐Demag (S) Pte. Ltd.,
Singapore (“MHE‐ Demag”). Demag Cranes’ share in the profit of MHE‐Demag for financial year
2011/2012 is EUR 3,919,000 (2010/2011: EUR 3,210,000). Revenue in financial year 2011/2012
includes EUR 26,500,000 (2010/2011: EUR 21,815,000) in supplies to MHE‐Demag. Income from the
investment included in the Statement of comprehensive income is explained in Note 11 (Income
from investments accounted for using the equity method).
The table below contains financial information on MHE‐Demag relative to the 50% ownership
interest held by Demag Cranes:
19. Other investments
in EUR thousand 2012 2011
Revenue1
67,184 50,905
Other operating income1
447 237
Expenses1
62,482 46,678
Tax1
1,230 1,254
Net income after tax1
3,919 3,210
Non‐current assets 7,631 5,557
Current assets 48,515 37,855
Non‐current liabilities 766 –
Current liabilities 31,716 20,243
Equity 23,664 23,169
31 August
1 1 September – 31 August
Long‐term
securities
in EUR thousand
Cost
Balance at 1 October 2010 50 726 776
Additions – – –
Change in fair value – ‐31 ‐31
Disposals – – –
Balance at 30 September 2011 50 694 745
Balance at 1 October 2011 50 694 745
Additions – – –
Change in fair value – 29 29
Reclassification as assets held for sale ‐15 – ‐15
Disposals ‐25 – ‐25
Balance at 30 September 2012 10 723 733
Subsidiaries,
joint ventures
and investments Total

Demag Cranes AG Annual Report 2011/2012 104
20. Trade receivables and other financial assets
The current trade receivables are mostly receivables with country‐specific maturities on which no
interest is charged.
The non‐current trade receivables are for supplies to customers payable in one to five years. Interest
is charged on these at market rates.
As in the previous year, no receivables were forfaited during the financial year.
Derivative financial instruments mainly consist of derivatives with positive fair values of EUR 484,000
(2011: EUR 335,000) that are not used for hedging purposes.
Trade receivables past due at 30 September 2012 before impairment losses recognised on a
collective basis:
Impairment losses totalling EUR 6,599,000 (2011: EUR 9,903,000) were individually recognised on
trade receivables with a gross carrying amount of EUR 28,935,000 (2011: EUR 16,286,000).
There was no indication at the balance sheet date that debtors will not meet their payment
obligations with regard to trade receivables neither impaired nor past due.
in EUR thousand Current Non‐current Total Current Non‐current Total
Trade receivables 144,048 1,083 145,131 203,867 1,159 205,026
Trade receivables from
associates and joint ventures
Derivative financial instruments 484 – 484 335 – 335
Receivables from
employees
Contract work trade
receivables/payables
Other 15,757 1,689 17,446 401 1,817 2,218
Gross 170,529 2,772 173,301 205,245 2,976 208,221
Impairments ‐6,581 ‐427 ‐7,009 ‐10,587 ‐289 ‐10,876
Net 163,948 2,345 166,293 194,658 2,687 197,345
30 September 2012 30 September 2011
6,239 – 6,239 54 – 54
589–589
3,500 – – –
502
– 3,500
– 502
in EUR thousand 2012 2011
Gross carrying amount 154,870 205,080
Individual impairments ‐6,599 ‐9,903
Trade receivables 148,271 195,177
Of which at the balance sheet date neither impaired
nor past due 95,580 161,089
up to 30 days past due 15,389 16,488
31 to 60 days past due 4,738 4,302
61 to 90 days past due 3,379 2,186
91 to 180 days past due 3,049 2,204
181 to 360 days past due 3,205 1,820
over 360 days past due 594 704
30 September

Demag Cranes AG Annual Report 2011/2012 105
Impairment losses on trade receivables and other financial assets have changed as follows:
Impairment losses totalling EUR 6,599,000 (2011: EUR 9,904,000) were individually recognised on
trade receivables and other financial assets with a gross carrying amount of EUR 161,104,000 (2011:
EUR 208,221,000). Trade receivables for which individual assessment did not reveal any indication of
impairment were grouped into receivables with similar credit risk characteristics and collectively
assessed for impairment based on historical loss experience. This resulted in the recognition of
impairment losses on a collective basis totalling EUR 41,000 (2011: EUR 972,000). The impaired
receivables are owed by a large number of different customers. Receivables are monitored by the
individual Group companies.
Detailed information on financial instruments is provided in Note 34.
Construction contracts in progress at the balance sheet date:
Revenue from construction contracts came to EUR 3,500,000 in financial year 2011/2012
(2010/2011: EUR 421,000), comprising EUR 3,500,000 in the Industrial Cranes segment (2010/2011:
EUR 421,000). There were no retentions at the balance sheet date.
21. Other non‐financial assets
The carrying amounts of other non‐financial assets largely match their fair values.
Of which specific
allowances
Of which specific
allowances
Balance at 1 October ‐10,876 ‐9,904 ‐11,527 ‐9,345
Additions ‐4,003 ‐3,865 ‐4,173 ‐3,909
Reversals 3,944 3,778 3,270 1,824
Drawings 1,150 1,150 1,531 1,531
Exchange difference ‐228 ‐206 22 ‐6
Sale/reclassification 3,005 2,449 – –
Balance at 30 September ‐7,009 ‐6,599 ‐10,876 ‐9,904
2011/2012 2010/2011
in EUR thousand Total Total
in EUR thousand 2012 2011
Construction costs incurred 2,846 345
plus recognised profits 654 86
Progress billings – ‐431
Total 3,500 –
30 September
in EUR thousand Current Non‐current Total Current Non‐current Total
Other tax receivables 7,339 – 7,339 13,235 – 13,235
Prepayments 3,334 – 3,334 2,686 940 3,627
Deferred charges 4,111 – 4,111 4,835 – 4,835
Other 3,587 1,073 4,660 3,492 1,073 4,565
Gross 18,372 1,073 19,445 24,248 2,014 26,262
Impairments ‐209 ‐1,073 ‐1,282 ‐19 ‐1,073 ‐1,092
Net 18,163 0 18,163 24,229 940 25,170
30 September 2012 30 September 2011
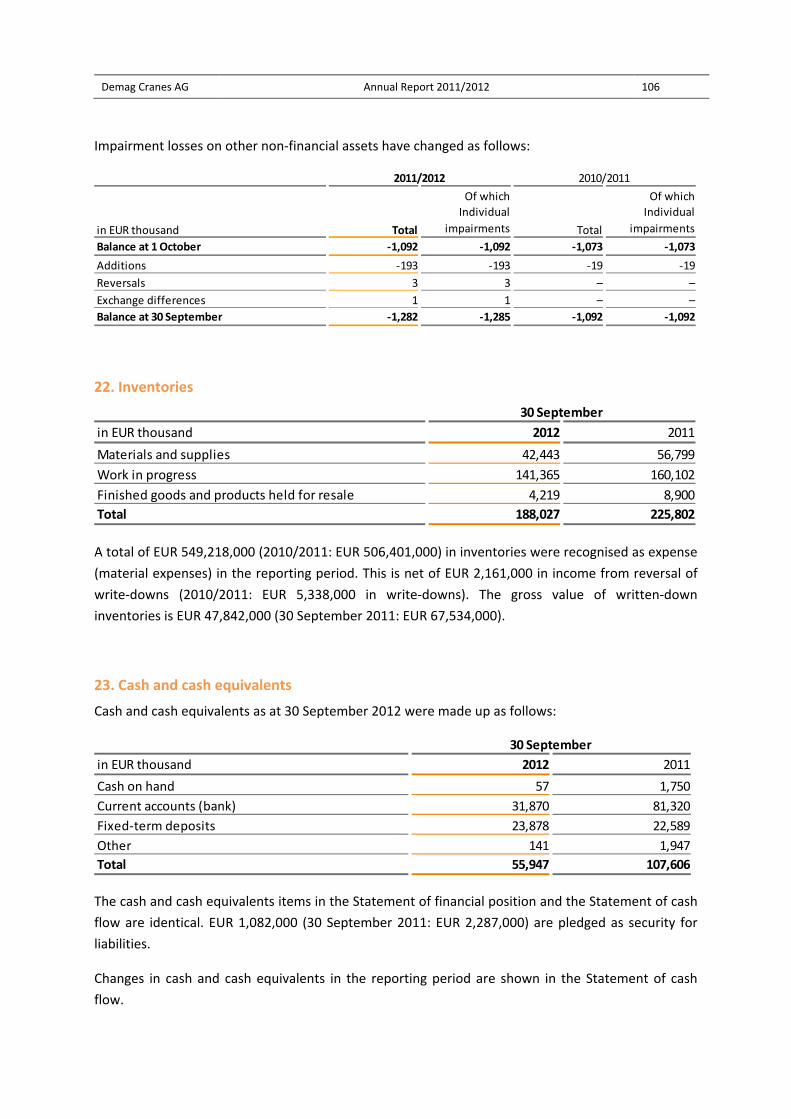
Demag Cranes AG Annual Report 2011/2012 106
Impairment losses on other non‐financial assets have changed as follows:
22. Inventories
A total of EUR 549,218,000 (2010/2011: EUR 506,401,000) in inventories were recognised as expense
(material expenses) in the reporting period. This is net of EUR 2,161,000 in income from reversal of
write‐downs (2010/2011: EUR 5,338,000 in write‐downs). The gross value of written‐down
inventories is EUR 47,842,000 (30 September 2011: EUR 67,534,000).
23. Cash and cash equivalents
Cash and cash equivalents as at 30 September 2012 were made up as follows:
The cash and cash equivalents items in the Statement of financial position and the Statement of cash
flow are identical. EUR 1,082,000 (30 September 2011: EUR 2,287,000) are pledged as security for
liabilities.
Changes in cash and cash equivalents in the reporting period are shown in the Statement of cash
flow.
Of which Of which
Individual
impairments
Individual
impairments
Balance at 1 October ‐1,092 ‐1,092 ‐1,073 ‐1,073
Additions ‐193 ‐193 ‐19 ‐19
Reversals 3 3 – –
Exchange differences 1 1 – –
Balance at 30 September ‐1,282 ‐1,285 ‐1,092 ‐1,092
2011/2012 2010/2011
in EUR thousand Total Total
in EUR thousand 2012 2011
Materials and supplies 42,443 56,799
Work in progress 141,365 160,102
Finished goods and products held for resale 4,219 8,900
Total 188,027 225,802
30 September
in EUR thousand 2012 2011
Cash on hand 57 1,750
Current accounts (bank) 31,870 81,320
Fixed‐term deposits 23,878 22,589
Other 141 1,947
Total 55,947 107,606
30 September
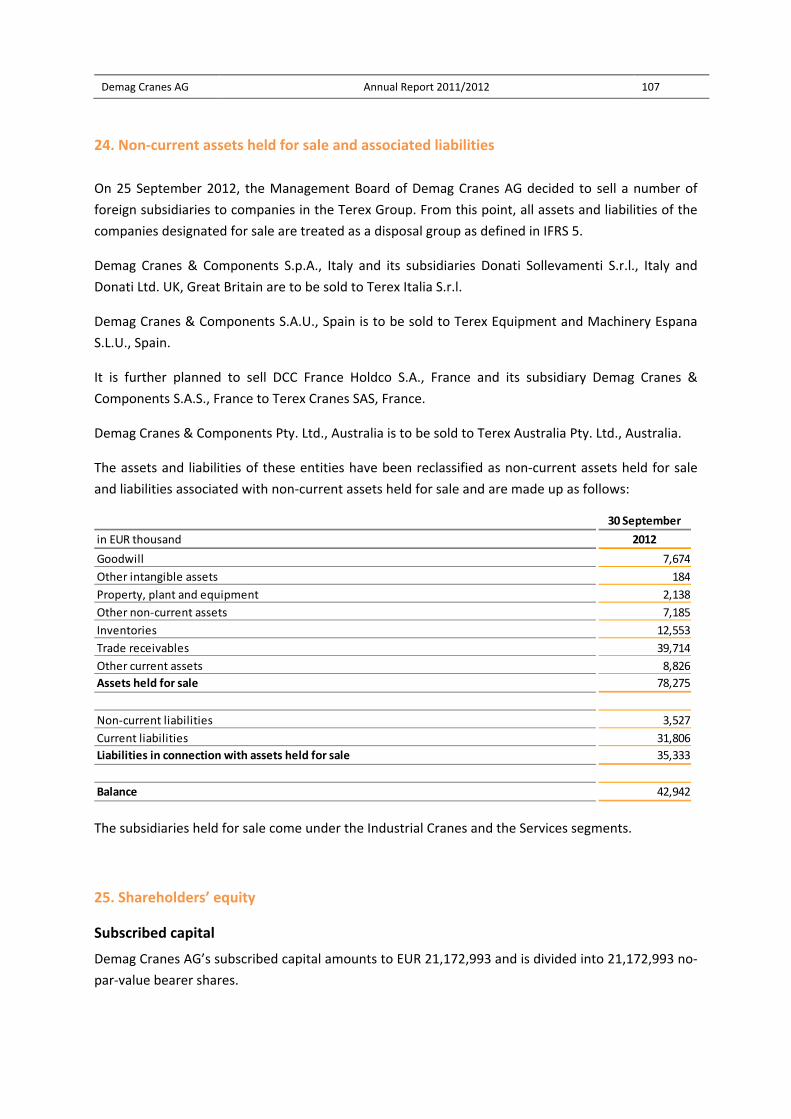
Demag Cranes AG Annual Report 2011/2012 107
24. Non‐current assets held for sale and associated liabilities
On 25 September 2012, the Management Board of Demag Cranes AG decided to sell a number of
foreign subsidiaries to companies in the Terex Group. From this point, all assets and liabilities of the
companies designated for sale are treated as a disposal group as defined in IFRS 5.
Demag Cranes & Components S.p.A., Italy and its subsidiaries Donati Sollevamenti S.r.l., Italy and
Donati Ltd. UK, Great Britain are to be sold to Terex Italia S.r.l.
Demag Cranes & Components S.A.U., Spain is to be sold to Terex Equipment and Machinery Espana
S.L.U., Spain.
It is further planned to sell DCC France Holdco S.A., France and its subsidiary Demag Cranes &
Components S.A.S., France to Terex Cranes SAS, France.
Demag Cranes & Components Pty. Ltd., Australia is to be sold to Terex Australia Pty. Ltd., Australia.
The assets and liabilities of these entities have been reclassified as non‐current assets held for sale
and liabilities associated with non‐current assets held for sale and are made up as follows:
The subsidiaries held for sale come under the Industrial Cranes and the Services segments.
25. Shareholders’ equity
Subscribed capital
Demag Cranes AG’s subscribed capital amounts to EUR 21,172,993 and is divided into 21,172,993 no‐
par‐value bearer shares.
30 September
in EUR thousand 2012
Goodwill 7,674
Other intangible assets 184
Property, plant and equipment 2,138
Other non‐current assets 7,185
Inventories 12,553
Trade receivables 39,714
Other current assets 8,826
Assets held for sale 78,275
Non‐current liabilities 3,527
Current liabilities 31,806
Liabilities in connection with assets held for sale 35,333
Balance 42,942

Demag Cranes AG Annual Report 2011/2012 108
Management Board authorisations
By resolution of the Annual General Meeting of 2 March 2011, the Management Board is authorised
subject to Supervisory Board approval to increase the Company’s share capital by up to EUR
10,586,000 by issuing new no‐par‐value bearer shares, each comprising one euro of share capital, for
cash or non‐cash consideration on one or more occasions by or before 1 March 2016 (authorized
capital). In circumstances listed in the authorising resolution, the Management Board is authorised to
exclude existing shareholders’ statutory right of pre‐emption.
By resolution of the Company’s Annual General Meeting of 2 March 2010, the Management Board of
Demag Cranes AG is further authorised, subject to Supervisory Board approval, to issue convertible
and/or warrant‐linked bearer bonds (collectively ‘bonds’) with limited or unlimited maturities up to
an aggregate face value of EUR 210,000,000 on one or more occasions by or before 1 March 2015
and to give the bondholders conversion rights and/or options (including with an attached conversion
obligation) to no‐par‐value bearer shares in the Company making up a maximum EUR 4,200,000
portion of the share capital in accordance with the detailed terms and conditions of the convertible
or warrant‐linked bond issue (conditional capital). The bonds are required to be issued solely for
cash.
No convertible bonds or warrant‐linked bonds had been issued as at the 30 September 2012 balance
sheet date.
Additional paid‐in capital
The change in additional paid‐in capital during the financial year relates to the share option scheme
(Matching Stock Program).
Share‐based payment (Matching Stock Program)
To promote the attainment of its business goals, Demag Cranes launched a Matching Stock Program
(MSP) in 2006. The MSP was a form of long‐term compensation with an incentive component and
entitled executives and managerial employees to subscribe for phantom shares. For each MSP share
acquired in the MSP, participants received five tranches – one tranche a year – of six phantom shares
each. The phantom shares were subject to a two‐year lock‐up period from allocation of each tranche
and exercised automatically thereafter at the base price on attainment of a specific performance
threshold.
The performance threshold for the first (2006) tranche was attained. The phantom shares were
allocated to participants and the two‐year lock‐up period has since expired.
The performance thresholds for the second (2007) and third (2008) tranches were not attained.
The performance threshold for the fourth (2009) tranche was attained on 23 June 2011. Participants
exercised 286,002 phantom shares that were initially blocked until 23 June 2013. Due to the takeover
by Terex Industrial Holding AG, these phantom shares were released ahead of time with effect from
22 June 2012.
Demag Cranes AG Annual Report 2011/2012 109
The performance threshold for the fifth (2010) tranche of the Matching Stock Program (base price
EUR 28.40; exercise price EUR 51.09) was attained on 23 June 2012.
The 43,420 remaining MSP shares from the fifth tranche entitled participants to exercise 260,520
phantom shares. As the gross MSP gain – the difference between the base price and the
performance threshold for all remaining phantom shares – exceeded the MSP cap of EUR 4,000, the
gross MSP gain was reduced to the MSP cap on a pro rata basis for all participants.
Demag Cranes AG made use of the opportunity provided by the takeover by Terex Industrial Holding
AG to settle the fifth and last tranche of the Matching Stock Program in cash. The net MSP gain (gross
MSP gain less payroll tax and social insurance contributions) was determined to be EUR 2,194,000
and was paid out to participants.
As at 30 September 2012, there were no phantom shares outstanding at Demag Cranes (30
September 2011: 264,198 phantom shares outstanding).
Demag Cranes recognised an expense and credited to additional paid‐in capital an amount of EUR
173,000 for the MSP in 2011/2012 (2010/2011: EUR 123,000). The liability for payment of payroll tax
and social insurance contributions for plan participants was EUR 0,000 (2010/2011: EUR 483,000) at
the balance sheet date.
Retained earnings
Retained earnings consist of net income for the financial year, accumulated profits carried forward
less dividends, together with differences between the expected and actual defined benefit obligation
and the actual and expected return on plan assets.
Other comprehensive income
Other comprehensive income comprises three items: cash flow hedges, available‐for‐sale financial
assets, and differences arising from currency translation.
The available‐for‐sale financial assets item contains the accumulated net gain or loss recognised in
equity on available‐for‐sale financial assets.
Exchange rate effects from translating the financial statements of foreign entities whose functional
currency is not the same as Demag Cranes AG’s reporting currency are reported in differences arising
from currency translation.
The components of accumulated other comprehensive income presented in the Statement of
changes in equity are stated after income tax. In the Statement of comprehensive income, changes in
the financial year are presented before tax along with the tax effect relating to net income
recognised directly in equity. The table below reconciles the before‐tax to the after‐tax amounts.
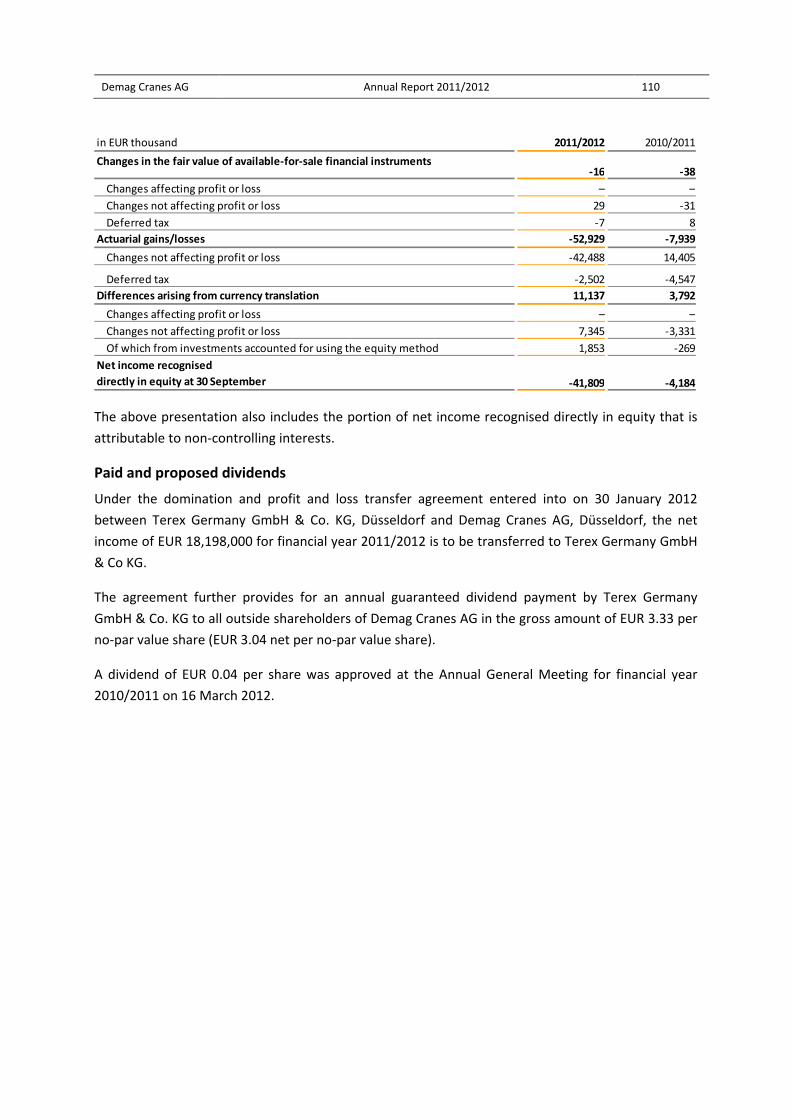
Demag Cranes AG Annual Report 2011/2012 110
The above presentation also includes the portion of net income recognised directly in equity that is
attributable to non‐controlling interests.
Paid and proposed dividends
Under the domination and profit and loss transfer agreement entered into on 30 January 2012
between Terex Germany GmbH & Co. KG, Düsseldorf and Demag Cranes AG, Düsseldorf, the net
income of EUR 18,198,000 for financial year 2011/2012 is to be transferred to Terex Germany GmbH
& Co KG.
The agreement further provides for an annual guaranteed dividend payment by Terex Germany
GmbH & Co. KG to all outside shareholders of Demag Cranes AG in the gross amount of EUR 3.33 per
no‐par value share (EUR 3.04 net per no‐par value share).
A dividend of EUR 0.04 per share was approved at the Annual General Meeting for financial year
2010/2011 on 16 March 2012.
in EUR thousand 2011/2012 2010/2011
Changes in the fair value of available‐for‐sale financial instruments
Changes affecting profit or loss – –
Changes not affecting profit or loss 29 ‐31
Deferred tax ‐7 8
Actuarial gains/losses ‐52,929 ‐7,939
Changes not affecting profit or loss ‐42,488 14,405
Deferred tax ‐2,502 ‐4,547
Differences arising from currency translation 11,137 3,792
Changes affecting profit or loss – –
Changes not affecting profit or loss 7,345 ‐3,331
Of which from investments accounted for using the equity method 1,853 ‐269
Net income recognised
directly in equity at 30 September ‐41,809 ‐4,184
‐16 ‐38

Demag Cranes AG Annual Report 2011/2012 111
26. Provisions for pensions and similar obligations
The provisions for pensions and similar obligations are made up as follows:
Defined benefit obligation
In Germany, Demag Cranes pays post‐employment benefits to almost all retired employees. Outside
Germany, post‐employment benefits have been granted to employees in Switzerland. The level of
post‐employment benefit depends on salary‐based entitlement and/or position in the Company and
length of service.
The defined benefit obligation changed as follows in financial year 2011/2012:
The actuarial gains and losses result from differences between the actual and expected benefit
obligation. The change in accumulated actuarial gains and losses mainly relates to a change in the
discount rate from 4.75% to 3.15%.
The table below reconciles the present value of the defined benefit obligation to the amount of the
obligation stated in the Statement of financial position:
in EUR thousand 2012 2011
Defined benefit obligation 174,551 134,634
Deferred compensation 9,137 8,608
Similar obligations 3 3
Total 183,691 143,246
30 September
in EUR thousand Germany Other countries Total Germany Other countries Total
Defined benefit obligation
as at 1 October
Current service cost 1,467 514 1,981 1,918 510 2,429
Interest cost 6,268 499 6,767 5,750 484 6,234
Exchange differences – 192 192 – 1,647 1,647
Contributions by plan
participants – 426 426 – 395 395
Actuarial gains/losses
Benefits paid ‐7,727 139 ‐7,587 ‐7,634 ‐557 ‐8,191
Other ‐964 – ‐964 484 ‐2,676 ‐2,192
Defined benefit obligation
as at 30 October
Of which
funded – 20,496 20,496 – 18,467 18,467
unfunded 171,805 2,745 174,551 131,326 3,309 134,635
2011/2012 2010/2011
131,326 21,776 153,102 146,038 21,137 167,175
‐15,230 836 ‐14,394
171,805 23,241 195,046 131,326 21,776 153,102
41,435 ‐305 41,129
in EUR thousand 2012 2011 2010 2009 2008
Defined benefit obligation 195,046 153,102 167,175 140,242 120,796
Fair value of plan assets ‐20,496 ‐18,467 ‐19,209 ‐16,600 ‐16,753
Amount not recognised as asset – – – – 55
Prepayments – – – – –
Provision for defined benefit obligation 174,551 134,634 147,966 123,642 104,097
30 September
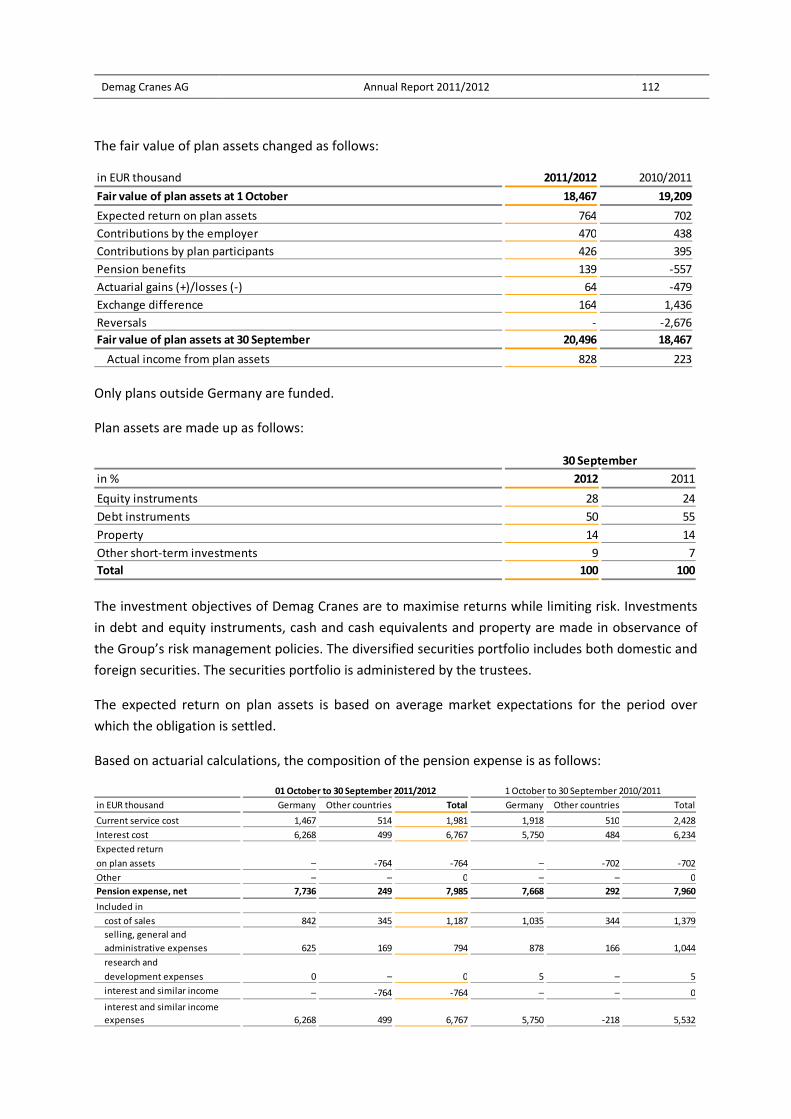
Demag Cranes AG Annual Report 2011/2012 112
The fair value of plan assets changed as follows:
Only plans outside Germany are funded.
Plan assets are made up as follows:
The investment objectives of Demag Cranes are to maximise returns while limiting risk. Investments
in debt and equity instruments, cash and cash equivalents and property are made in observance of
the Group’s risk management policies. The diversified securities portfolio includes both domestic and
foreign securities. The securities portfolio is administered by the trustees.
The expected return on plan assets is based on average market expectations for the period over
which the obligation is settled.
Based on actuarial calculations, the composition of the pension expense is as follows:
in EUR thousand 2011/2012 2010/2011
Fair value of plan assets at 1 October 18,467 19,209
Expected return on plan assets 764 702
Contributions by the employer 470 438
Contributions by plan participants 426 395
Pension benefits 139 ‐557
Actuarial gains (+)/losses (‐) 64 ‐479
Exchange difference 164 1,436
Reversals ‐ ‐2,676
Fair value of plan assets at 30 September 20,496 18,467
Actual income from plan assets 828 223
in % 2012 2011
Equity instruments 28 24
Debt instruments 50 55
Property 14 14
Other short‐term investments 9 7
Total 100 100
30 September
in EUR thousand Germany Other countries Total Germany Other countries Total
Current service cost 1,467 514 1,981 1,918 510 2,428
Interest cost 6,268 499 6,767 5,750 484 6,234
Expected return
on plan assets
Other – – 0 – – 0
Pension expense, net 7,736 249 7,985 7,668 292 7,960
Included in
cost of sales 842 345 1,187 1,035 344 1,379
selling, general and
administrative expenses 625 169 794 878 166 1,044
research and
development expenses
interest and similar income
interest and similar income
expenses
01 October to 30 September 2011/2012 1 October to 30 September 2010/2011
– ‐764 ‐764 ‐702– ‐702
0
– –
5– 0 5 –
0
‐218 5,532
– ‐764 ‐764
6,268 499 6,767 5,750
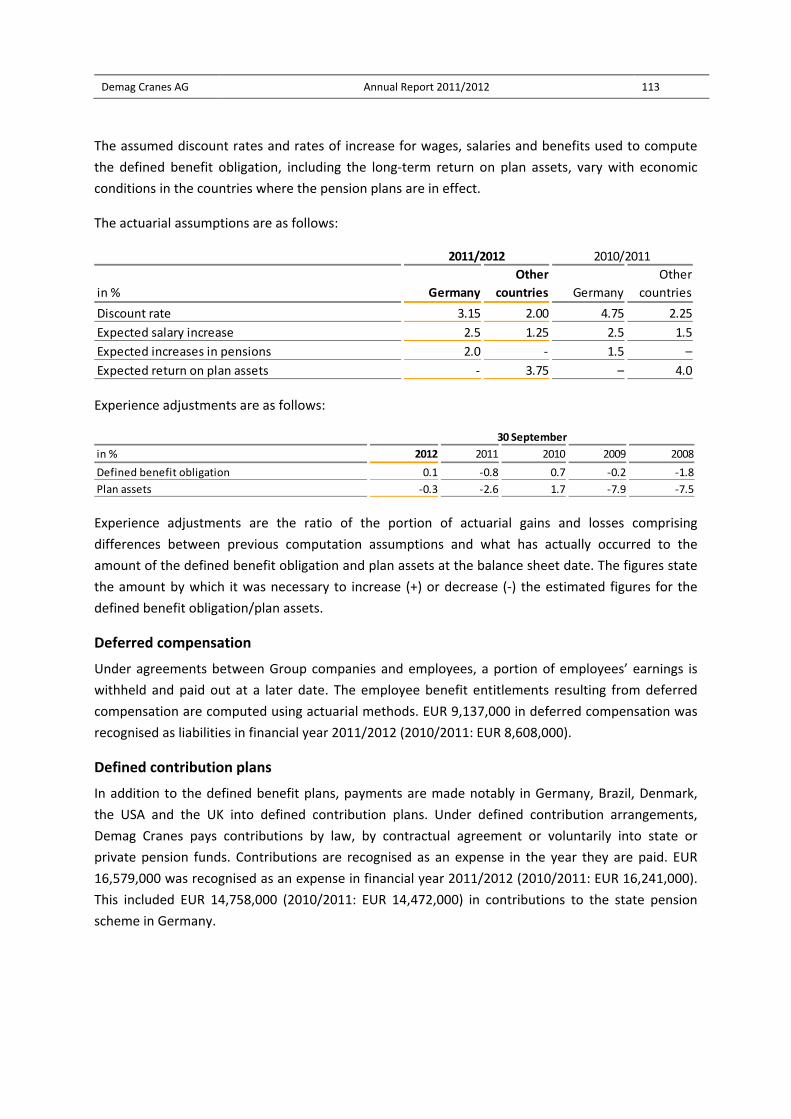
Demag Cranes AG Annual Report 2011/2012 113
The assumed discount rates and rates of increase for wages, salaries and benefits used to compute
the defined benefit obligation, including the long‐term return on plan assets, vary with economic
conditions in the countries where the pension plans are in effect.
The actuarial assumptions are as follows:
Experience adjustments are as follows:
Experience adjustments are the ratio of the portion of actuarial gains and losses comprising
differences between previous computation assumptions and what has actually occurred to the
amount of the defined benefit obligation and plan assets at the balance sheet date. The figures state
the amount by which it was necessary to increase (+) or decrease (‐) the estimated figures for the
defined benefit obligation/plan assets.
Deferred compensation
Under agreements between Group companies and employees, a portion of employees’ earnings is
withheld and paid out at a later date. The employee benefit entitlements resulting from deferred
compensation are computed using actuarial methods. EUR 9,137,000 in deferred compensation was
recognised as liabilities in financial year 2011/2012 (2010/2011: EUR 8,608,000).
Defined contribution plans
In addition to the defined benefit plans, payments are made notably in Germany, Brazil, Denmark,
the USA and the UK into defined contribution plans. Under defined contribution arrangements,
Demag Cranes pays contributions by law, by contractual agreement or voluntarily into state or
private pension funds. Contributions are recognised as an expense in the year they are paid. EUR
16,579,000 was recognised as an expense in financial year 2011/2012 (2010/2011: EUR 16,241,000).
This included EUR 14,758,000 (2010/2011: EUR 14,472,000) in contributions to the state pension
scheme in Germany.
in % Germany
Other
countries Germany
Other
countries
Discount rate 3.15 2.00 4.75 2.25
Expected salary increase 2.5 1.25 2.5 1.5
Expected increases in pensions 2.0 ‐ 1.5 –
Expected return on plan assets ‐ 3.75 – 4.0
2011/2012 2010/2011
in % 2012 2011 2010 2009 2008
Defined benefit obligation 0.1 ‐0.8 0.7 ‐0.2 ‐1.8
Plan assets ‐0.3 ‐2.6 1.7 ‐7.9 ‐7.5
30 September

Demag Cranes AG Annual Report 2011/2012 114
27. Other provisions
The restructuring provision is based on management’s best estimate of the present value of
expenditure directly associated with the restructuring and not attributable to operating activities.
Group companies give various product warranties under which they provide a warranty with a
specific warranty period for supplied products and rendered services. Provisions for expected costs
under product warranties are recognised when products are sold. The warranty provisions include
individual provisions and provisions recognised on a collective basis. The material warranty claims
will be settled in the next two years.
The provisions for customer complaints relate to known individual risks in connection with notified
defects.
in EUR thousand Current Non‐current Total Current Non‐current Total
Restructuring 4,235 – 4,235 2,478 – 2,478
Warranties and
customer complaints 15,544 2,681 18,225 13,331 9,217 22,548
Legal and
litigation 2,203 – 2,203
Other 915 – 915 1,304 – 1,304
Total 22,897 2,681 25,578 21,410 9,217 30,628
30 September 2012 30 September 2011
4,297 – 4,297
in EUR thousand Restructuring
Warranties and
customer
complaints
Legal and
litigation Other Total
Balance at 1 October 2010 8,692 23,592 6,469 971 39,723
Additional provisions
made 11 1,665 179 1,506 3,361
Amounts used ‐4,352 ‐1,732 ‐1,813 ‐1,013 ‐8,909
Unused amounts reversed ‐1870 ‐953 ‐333 ‐192 ‐3,348
Exchange difference ‐3 ‐14 ‐204 32 ‐189
Other changes – ‐11 – – ‐11
Balance at 30 September
2011 2,478 22,548 4,297 1,304 30,628
Balance at 1 October 2011 2,478 22,548 4,297 1,304 30,628
Change in the scope of the
Consolidated Financial
Statements ‐9 ‐578 ‐339 ‐46 ‐972
Additional provisions
made 4,227 8,708 286 512 13,734
Amounts used ‐1,829 ‐2,158 ‐1,405 ‐836 ‐6,228
Unused amounts reversed ‐494 ‐9,451 ‐129 ‐60 ‐10,135
Reclassification as
liabilities in connection
with assets held for sale ‐139 ‐1,042 ‐432 ‐21 ‐1,634
Exchange difference 1 198 ‐76 62 185
Other changes – – – – 0
Balance at 30 September
2012 4,235 18,225 2,203 915 25,578
Demag Cranes AG Annual Report 2011/2012 115
Provisions for risks of threatened and pending litigation against Demag Cranes Group companies are
recognised if it is more likely than not that a liability will result. Estimates of this probability
incorporate judgements of lawyers and appraisers representing the Company. The amount
recognised as a liability is the probable amount of any compensation claims and the probable cost of
any sanctions. Demag Cranes estimates that the litigation to which the provisions relate will not
result in costs significantly in excess of the provisions recognised as at 30 September 2012.
Uncertain obligations are presented separately from any reimbursement claims. Demag Cranes
recognises claims against third parties where the criteria for recognition of an asset are satisfied.
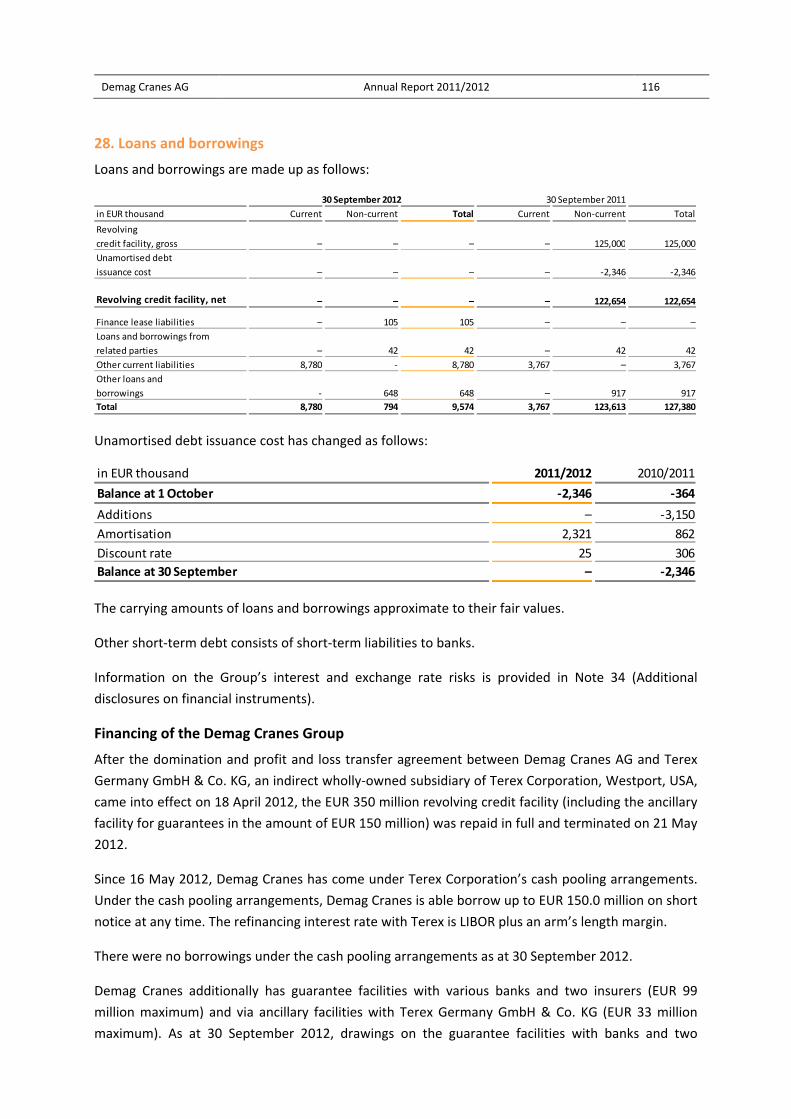
Demag Cranes AG Annual Report 2011/2012 116
28. Loans and borrowings
Loans and borrowings are made up as follows:
Unamortised debt issuance cost has changed as follows:
The carrying amounts of loans and borrowings approximate to their fair values.
Other short‐term debt consists of short‐term liabilities to banks.
Information on the Group’s interest and exchange rate risks is provided in Note 34 (Additional
disclosures on financial instruments).
Financing of the Demag Cranes Group
After the domination and profit and loss transfer agreement between Demag Cranes AG and Terex
Germany GmbH & Co. KG, an indirect wholly‐owned subsidiary of Terex Corporation, Westport, USA,
came into effect on 18 April 2012, the EUR 350 million revolving credit facility (including the ancillary
facility for guarantees in the amount of EUR 150 million) was repaid in full and terminated on 21 May
2012.
Since 16 May 2012, Demag Cranes has come under Terex Corporation’s cash pooling arrangements.
Under the cash pooling arrangements, Demag Cranes is able borrow up to EUR 150.0 million on short
notice at any time. The refinancing interest rate with Terex is LIBOR plus an arm’s length margin.
There were no borrowings under the cash pooling arrangements as at 30 September 2012.
Demag Cranes additionally has guarantee facilities with various banks and two insurers (EUR 99
million maximum) and via ancillary facilities with Terex Germany GmbH & Co. KG (EUR 33 million
maximum). As at 30 September 2012, drawings on the guarantee facilities with banks and two
in EUR thousand Current Non‐current Total Current Non‐current Total
Revolving
credit facility, gross
Unamortised debt
issuance cost
Revolving credit facility, net
Finance lease liabilities – 105 105 – – –
Loans and borrowings from
related parties
Other current liabilities 8,780 ‐ 8,780 3,767 – 3,767
Other loans and
borrowings
Total 8,780 794 9,574 3,767 123,613 127,380
‐2,346– ‐2,346
122,654
30 September 2012 30 September 2011
– – – 125,000– 125,000
–
– 122,654 –
– –
– –
– 917 917
–
‐ 648 648
42 42– 42 42
in EUR thousand 2011/2012 2010/2011
Balance at 1 October ‐2,346 ‐364
Additions – ‐3,150
Amortisation 2,321 862
Discount rate 25 306
Balance at 30 September – ‐2,346
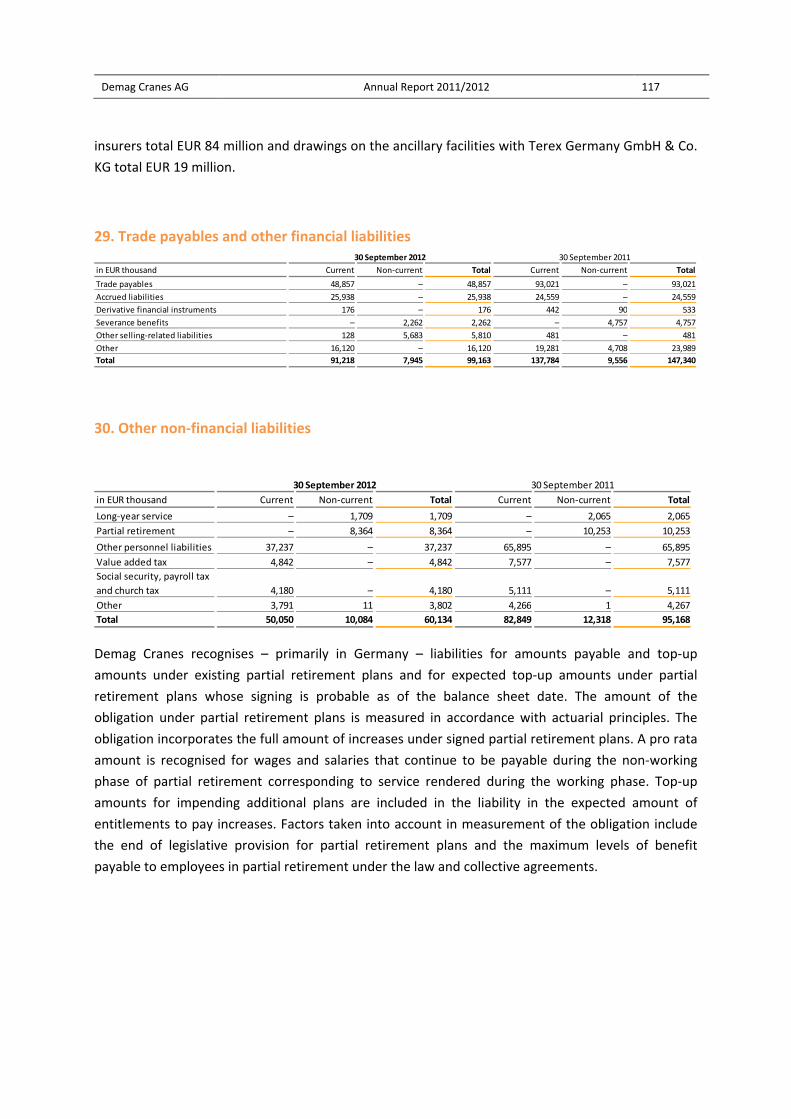
Demag Cranes AG Annual Report 2011/2012 117
insurers total EUR 84 million and drawings on the ancillary facilities with Terex Germany GmbH & Co.
KG total EUR 19 million.
29. Trade payables and other financial liabilities
30. Other non‐financial liabilities
Demag Cranes recognises – primarily in Germany – liabilities for amounts payable and top‐up
amounts under existing partial retirement plans and for expected top‐up amounts under partial
retirement plans whose signing is probable as of the balance sheet date. The amount of the
obligation under partial retirement plans is measured in accordance with actuarial principles. The
obligation incorporates the full amount of increases under signed partial retirement plans. A pro rata
amount is recognised for wages and salaries that continue to be payable during the non‐working
phase of partial retirement corresponding to service rendered during the working phase. Top‐up
amounts for impending additional plans are included in the liability in the expected amount of
entitlements to pay increases. Factors taken into account in measurement of the obligation include
the end of legislative provision for partial retirement plans and the maximum levels of benefit
payable to employees in partial retirement under the law and collective agreements.
in EUR thousand Current Non‐current Total Current Non‐current Total
Trade payables 48,857 – 48,857 93,021 – 93,021
Accrued liabilities 25,938 – 25,938 24,559 – 24,559
Derivative financial instruments 176 – 176 442 90 533
Severance benefits – 2,262 2,262 – 4,757 4,757
Other selling‐related liabilities 128 5,683 5,810 481 – 481
Other 16,120 – 16,120 19,281 4,708 23,989
Total 91,218 7,945 99,163 137,784 9,556 147,340
30 September 2012 30 September 2011
in EUR thousand Current Non‐current Total Current Non‐current Total
Long‐year service – 1,709 1,709 – 2,065 2,065
Partial retirement – 8,364 8,364 – 10,253 10,253
Other personnel liabilities 37,237 – 37,237 65,895 – 65,895
Value added tax 4,842 – 4,842 7,577 – 7,577
Social security, payroll tax
and church tax 4,180 – 4,180 5,111 – 5,111
Other 3,791 11 3,802 4,266 1 4,267
Total 50,050 10,084 60,134 82,849 12,318 95,168
30 September 2012 30 September 2011
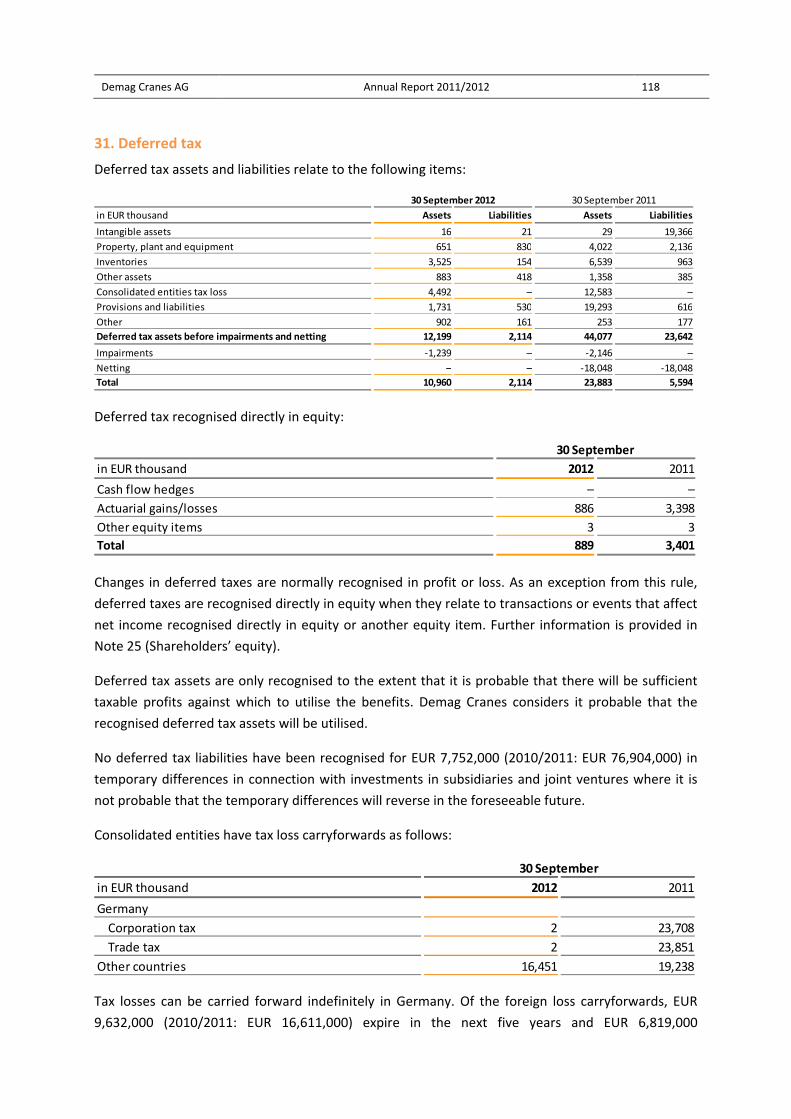
Demag Cranes AG Annual Report 2011/2012 118
31. Deferred tax
Deferred tax assets and liabilities relate to the following items:
Deferred tax recognised directly in equity:
Changes in deferred taxes are normally recognised in profit or loss. As an exception from this rule,
deferred taxes are recognised directly in equity when they relate to transactions or events that affect
net income recognised directly in equity or another equity item. Further information is provided in
Note 25 (Shareholders’ equity).
Deferred tax assets are only recognised to the extent that it is probable that there will be sufficient
taxable profits against which to utilise the benefits. Demag Cranes considers it probable that the
recognised deferred tax assets will be utilised.
No deferred tax liabilities have been recognised for EUR 7,752,000 (2010/2011: EUR 76,904,000) in
temporary differences in connection with investments in subsidiaries and joint ventures where it is
not probable that the temporary differences will reverse in the foreseeable future.
Consolidated entities have tax loss carryforwards as follows:
Tax losses can be carried forward indefinitely in Germany. Of the foreign loss carryforwards, EUR
9,632,000 (2010/2011: EUR 16,611,000) expire in the next five years and EUR 6,819,000
in EUR thousand Assets Liabilities Assets Liabilities
Intangible assets 16 21 29 19,366
Property, plant and equipment 651 830 4,022 2,136
Inventories 3,525 154 6,539 963
Other assets 883 418 1,358 385
Consolidated entities tax loss 4,492 – 12,583 –
Provisions and liabilities 1,731 530 19,293 616
Other 902 161 253 177
Deferred tax assets before impairments and netting 12,199 2,114 44,077 23,642
Impairments ‐1,239 – ‐2,146 –
Netting – – ‐18,048 ‐18,048
Total 10,960 2,114 23,883 5,594
30 September 2012 30 September 2011
in EUR thousand 2012 2011
Cash flow hedges – –
Actuarial gains/losses 886 3,398
Other equity items 3 3
Total 889 3,401
30 September
in EUR thousand 2012 2011
Germany
Corporation tax 2 23,708
Trade tax 2 23,851
Other countries 16,451 19,238
30 September
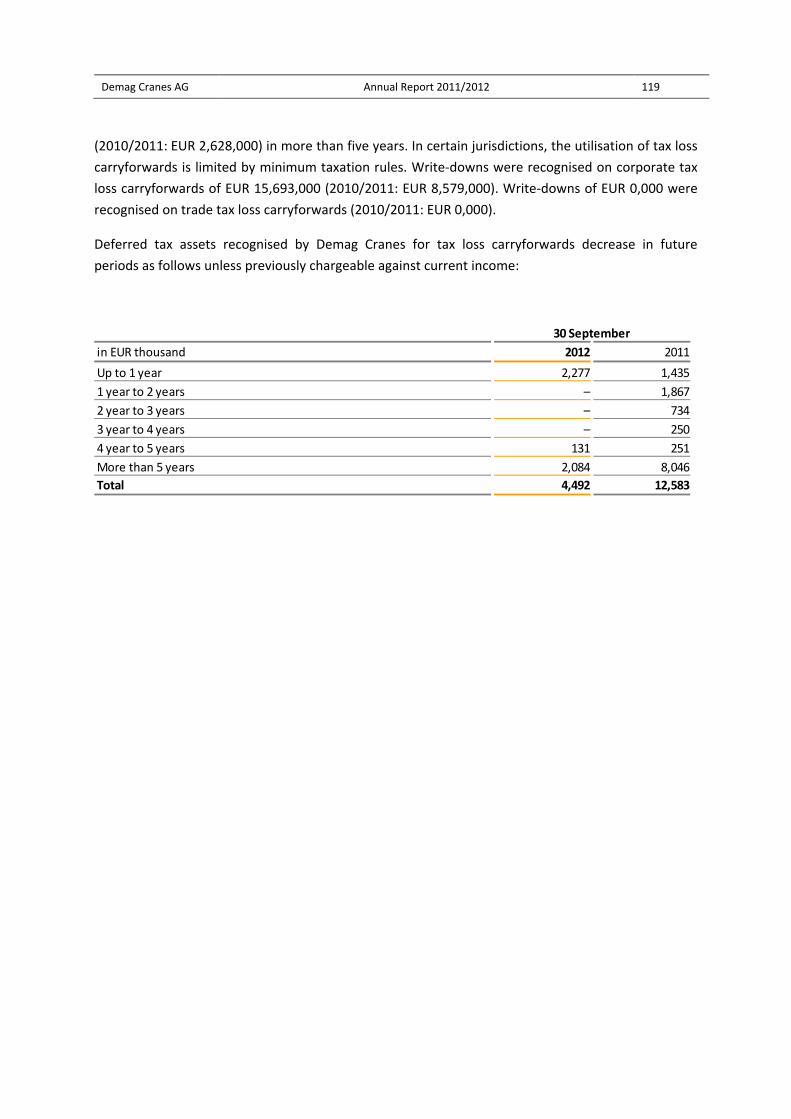
Demag Cranes AG Annual Report 2011/2012 119
(2010/2011: EUR 2,628,000) in more than five years. In certain jurisdictions, the utilisation of tax loss
carryforwards is limited by minimum taxation rules. Write‐downs were recognised on corporate tax
loss carryforwards of EUR 15,693,000 (2010/2011: EUR 8,579,000). Write‐downs of EUR 0,000 were
recognised on trade tax loss carryforwards (2010/2011: EUR 0,000).
Deferred tax assets recognised by Demag Cranes for tax loss carryforwards decrease in future
periods as follows unless previously chargeable against current income:
in EUR thousand 2012 2011
Up to 1 year 2,277 1,435
1 year to 2 years – 1,867
2 year to 3 years – 734
3 year to 4 years – 250
4 year to 5 years 131 251
More than 5 years 2,084 8,046
Total 4,492 12,583
30 September
Demag Cranes AG Annual Report 2011/2012 120
Other disclosures
32. Statement of cash flow
The Statement of cash flow shows changes in cash and cash equivalents due to inflows and outflows
during the reporting period. The statement shows cash flow from operating, investing and financing
activities and the resulting changes in cash and cash equivalents. Due to currency translation effects,
changes presented in it relating to items in the Statement of financial position cannot be inferred
directly from the Statement of financial position. The starting point for computing cash flow from
operating activities is net income after tax. Under the indirect method of reporting cash flow from
operating activities, non‐cash income items are eliminated and cash operating transactions that do
not affect profit or loss are added in. Cash flow from investing activities consists of payments for
investments and receipts from divestments. Cash flow from financing activities shows cash changes
in equity and debt capital from borrowing. Cash and cash equivalents include cash on hand and in
banks with a residual maturity of up to three months.
Cash flow from investing activities includes EUR 96.501,000 from the sale of the US companies. The
selling price for the two companies was EUR 102,433,000. This is after deduction of EUR 5,932,000 in
cash and cash equivalents.
The full EUR 125,000,000 in drawings on the revolving credit facility were repaid in the past financial
year (2010/2011: EUR 105,000,000). As at 30 September 2012, there were no borrowings under the
cash pooling arrangements with Terex begun in May. Loans and borrowings decreased by EUR
162,213,000 (2010/2011: increase of EUR 24,262,000). These figures are reported in cash flow from
financing activities under payments/proceeds from loans and borrowings. Further information on
financing is provided in Note 28.
Dividends of EUR 847,000 were paid out to shareholders of Demag Cranes AG in financial year
2011/2012 (2010/2011: EUR 12,704,000).
Demag Cranes AG Annual Report 2011/2012 121
33. Segment reporting
Segment reporting at Demag Cranes reflects internal reporting. For internal control of Demag Cranes,
the Management Board uses operating earnings before interest and tax (EBIT) adjusted to eliminate
the effects of acquisitions, restructuring and severance payments. Segment earnings and the
management adjustments are not defined in IFRS. They may differ from the definitions used by other
companies; this limits the usefulness of intercompany comparisons.
The Demag Cranes Group consists of three reportable segments based on type of product and
service: Industrial Cranes, Port Technology and Services. The Industrial Cranes segment integrates
the development, production, sale, assembly and delivery of Industrial Cranes, including components
and material handling solutions. Activities of the Port Technology segment consist of developing,
manufacturing, selling, assembling, delivering and maintaining Mobile Harbour Cranes and
automated container handling systems, including the provision of storage and integrated software
solutions. The Services segment comprises Industrial Cranes field service activities such as inspection,
maintenance, repairs and the refurbishment of used cranes, as well as the sale of spare parts. The
Unallocated item relates to holding company costs.
The segment information provides in summary form the disclosures without management
adjustments for each segment (revenue, earnings before interest and tax (EBIT), segment assets,
segment liabilities and segment capital expenditure). The reported amounts represent the portion of
IFRS‐basis Group figures that can be directly attributed to segments or can be allocated to them on a
reasonable basis. Disclosures on segments with management adjustments are prefixed “operating”
(operating depreciation, amortisation and impairments; operating earnings before interest and tax
(EBIT)).
Demag Cranes AG Annual Report 2011/2012 122
The table below presents the control parameters used to measure segment performance.
There was no material inter‐segment revenue in financial year 2011/2012 or 2010/2011.
Operating adjustments in financial year 2011/2012 mainly relate to the EUR 57,205,000 proceeds on
the sale of the US companies. This was countered by EUR 3,761,000 in restructuring costs and the
EUR 5,654,000 intra‐group transfer to Terex.
The adjustments to derive segment operating earnings mainly relate in financial year 2010/2011 to
costs in connection with the takeover offer from Terex Industrial Holding AG and refinancing costs.
The adjustments also include a EUR 1,759,000 reduction in restructuring provisions.
Material non‐cash expenses other than depreciation, amortisation and impairments in the financial
year amounted to EUR 0,000 (2010/2011: EUR 0,000). Restructuring costs in the financial year came
to EUR 488,000 (2010/2011: EUR 4,003,000).
in EUR thousand 2011/2012 2010/2011 2011/2012 2010/2011 2011/2012 2010/2011
Industrial Cranes 523,979 489,812 128,267 125,495 11,898 11,476
Of which from
investments accounted
for using the equity
method – – – – – –
Services 334,484 333,458 134,629 131,048 1,614 1,608
Industrial Cranes and
Services 858,463 823,271 262,897 256,543 13,511 13,084
Port Technology 264,804 238,985 54,010 51,530 4,514 4,822
Reportable segments 1,123,267 1,062,256 316,906 308,073 18,025 17,906
Unallocated – – – – 2,686 3,157
Group 1,123,267 1,062,256 316,906 308,073 20,711 21,062
1 October to 30 September 1 October to 30 September 1 October to 30 September
Revenue Gross profit
Operating depreciation, amortisation
and impairments
Demag Cranes AG Annual Report 2011/2012 123
Reconciliation to IFRS‐based Group EBIT:
The table below reconciles segment EBIT as represented by operating earnings before interest and
tax (EBIT) to Demag Cranes Group earnings before interest and tax (EBIT).
The table below reconciles earnings before interest and tax (EBIT) to Demag Cranes Group earnings
before tax (EBT).
The table below shows segment assets, segment liabilities and segment capital expenditure together
with their reconciliation to the Group figures.
The segment assets and segment liabilities do not include any effects relating to financing or to
current or deferred tax. The effects of pensions are only included to the extent they are directly
attributable to segments.
in EUR thousand 2011/2012 2010/2011 2011/2012 2010/2011 2011/2012 2010/2011
Industrial Cranes 13,640 10,836 26,648 478 40,288 11,314
Of which from
investments accounted
for using the equity
method 3,919 3,210 – – 3,919 3,210
Services 67,627 66,154 20,490 110 88,118 66,264
Industrial Cranes and
Services 81,268 76,990 47,138 588 128,406 77,578
Port Technology 13,369 9,181 ‐1,215 ‐99 12,155 9,082
Reportable segments 94,637 86,171 45,924 489 140,561 86,660
Unallocated ‐5,425 ‐10,477 ‐4,880 ‐32,296 ‐10,305 ‐42,773
Group 89,212 75,694 41,044 ‐31,807 130,256 43,887
1 October to 30 September 1 October to 30 September 1 October to 30 September
Operating earnings
Reconciliation Earnings before interest and tax (EBIT)
before interest
tax (EBIT)
in EUR thousand 2011/2012 2010/2011
Earnings before interest and tax (EBIT) 130,256 43,887
Interest and similar income 3,158 2,980
Interest and similar expenses ‐16,449 ‐14,878
Earnings before tax (EBT) 116,966 31,989
1 October to 30 September
in EUR thousand 2012 2011 2012 2011 2011/2012 2010/2011
Industrial Cranes 327,911 349,578 267,048 220,080 12,574 18,240
Of which from investments
accounted for using the equity
method 25,041 23,478 – – – –
Services 170,301 212,717 59,890 67,010 2,178 1,896
Industrial Cranes and Services 498,212 562,295 326,937 287,090 14,752 20,136
Port Technology 174,094 174,573 102,652 73,563 4,283 3,921
Reportable segments 672,306 736,868 429,590 360,652 19,035 24,057
Unallocated 130,193 158,075 96,784 284,259 3,236 2,631
Group 802,499 894,943 526,373 644,912 22,272 26,688
Segment assets Segment liabilities Segment capital expenditure
30 September 30 September 1 October to 30 September
Demag Cranes AG Annual Report 2011/2012 124
Geographical reporting
The table below provides supplementary information on the geographical distribution of the Demag
Cranes Group’s revenue and non‐current assets.
Revenue is allocated by region based on the destination country of goods sold.
in EUR thousand 2011/2012 2010/2011 2012 2011
Germany 226,748 204,608 203,947 201,202
Rest of Europe 328,457 311,205 36,320 42,227
North and South America 237,140 236,226 25,283 42,542
Other 330,922 310,216 16,714 22,026
Total 1,123,267 1,062,256 282,263 307,997
Revenue Non‐current assets
1 October to 30 September 30 September

Demag Cranes AG Annual Report 2011/2012 125
34. Additional disclosures on financial instrument
The tables that follow show the carrying amounts of financial instruments in each category defined in IAS 39 and state their fair values together with the source
of the valuation used for each class of financial instruments.
Of which (Continued)
Within the scope
of IFRS 7 Cost
Cash and cash
equivalents
Trade receivables
Other financial assets 6,234 6,234 5,750 6,234 – 484 –
Derivatives not in designated hedging
relationships 484 484 HfT – 484 – 484 –
Derivatives in designated hedging
relationships – – n/a – – – – –
Other financial assets 5,750 5,750 LaR 5,750 5,750 – – –
Other investments 733 733 10 723 723 – –
Investments in associates 10 10 AfS 10 – – – –
Long‐term securities 723 723 AfS – 723 723 – –
Total financial assets 210,775 210,775 209,568 210,765 723 484 –
Loans and borrowings 16,056 16,056 16,056 16,056 – – –
Revolving credit facility, net – – n/a – – – – –
Loans and borrowings
Loans and borrowings from related parties
Finance leases 105 105 AmC 105 105 – – –
Other financial liabilities 15,910 15,910 AmC 15,910 15,910 – – –
Trade payables
Other financial liabilities 50,307 50,307 50,130 50,307 – 176 –
Derivatives not in designated hedging
relationships 176 176 HfT – 176 – 176 –
Derivatives in designated hedging
relationships – – n/a – – – – –
Other financial liabilies 50,130 50,130 AmC 50,130 50,130 – – –
Total financial liabilities 115,219 115,219 115,043 115,219 – 176 –
30 September 2012 Fair value based on:
in EUR thousand Carrying amount
Categories of
measurement in
accordance with IAS
39 Fair value
Quoted market
value (level 1)
Other market
prices (level 2)
Non‐observable
market prices
(level 3)
55,947 55,947 LaR 55,947
147,861 147,861 LaR 147,861
– – 55,947 –
147,861 – – –
– –
– –
48,857 –
42 – 42 42 AmC 42
48,857 48,857 AmC 48,857
Demag Cranes AG Annual Report 2011/2012 126
Of which
Within the scope of
IFRS 7
Available‐for‐sale financial assets 733 733 AfS 10 723 723 – –
Loans and receivables 290,558 290,558 LaR 290,558 290,558 – – –
Held for trading (at fair value
through profit or loss)
Financial liabilities measured at amortised cost 115,043 115,043 AmC 115,043 115,043 – – –
Not applicable – – n/a – – – – –
30 September 2012 Fair value based on:
in EUR thousand Carrying amount
Categories of
measurement in
accordance with IAS
39
(Measured at)
amortised cost Fair value
Quoted market
value (level 1)
Other market
prices (level 2)
Non‐observable
market prices
(level 3)
308 –308 308 HfT – 308 –

Demag Cranes AG Annual Report 2011/2012 127
Of which (Continued)
Within the scope of
IFRS 7 Cost
Cash and cash equivalents 107,606 107,606 LaR 107,606 107,606 – – –
Trade receivables 194,205 194,205 LaR 194,205 194,205 – – –
Other financial assets 3,140 3,140 2,805 3,140 – 335 –
Derivatives not in designated hedging relationships 335 335 HfT – 335 – 335 –
Derivatives in designated hedging relationships – – n/a – – – – –
Other financial assets 2,805 2,805 LaR 2,805 2,805 – – –
Other investments 745 745 50 694 694 – –
Investment in associates 50 50 AfS 50 – – – –
Long‐term securities 694 694 AfS – 694 694 – –
Total financial assets 305,695 305,695 304,666 305,645 694 335 –
Loans and borrowings 127,380 127,380 127,380 127,380 – – –
Revolving credit facility, net 122,654 122,654 AmC 122,654 122,654 – – –
Loans and borrowings from related parties 42 42 AmC 42 42 – – –
Finance leases – – n/a – – – – –
Other financial liabilities 4,685 4,685 AmC 4,685 4,685 – – –
Trade payables 93,021 93,021 AmC 93,021 93,021 – – –
Other financial liabilities 54,319 54,319 53,787 54,319 – 533 –
Derivatives not in designated hedging relationships 533 533 HfT – 533 – 533 –
Derivatives in designated hedging relationships – – n/a – – – – –
Other financial liabilies 53,787 53,787 AmC 53,787 53,787 – – –
Total financial liabilities 274,721 274,721 274,188 274,721 – 533 –
30 September 2011 Fair value based on:
in EUR thousand Carrying amount
measurement in
accordance with IAS
39 Fair value
Quoted market value
(level 1)
Other market prices
(level 2)
Non‐observable
market prices (level
3)
Of which (Continued)
Within the scope
of IFRS 7 Cost
Available‐for‐sale financial assets 745 745 AfS 50 694 694 – –
Loans and receivables 304,616 304,616 LaR 304,616 304,616 – – –
Held for trading (at fair value
through profit or loss)
Financial liabilities measured at amortised cost 274,188 274,188 AmC 274,188 274,188 – – –
Not applicable – – n/a – – – – –
30 September 2011 Fair value based on:
in EUR thousand Carrying amount
Categories of
measurement in
accordance with
IAS 39 Fair value
Quoted market
value (level 1)
Other market
prices (level 2)
Non‐observable
market prices
(level 3)
198 –‐198 ‐198 HfT – ‐198 –
Demag Cranes AG Annual Report 2011/2012 128
Cash and cash equivalents, trade receivables and other financial assets mostly have short residual
maturities. Their carrying amount at the balance sheet date therefore approximates to fair value. The
same applies to trade payables and other financial liabilities. Where other investments are traded on
an active market, their fair value is the quoted market price. The fair value of long‐term debt not
traded on an active market and of interest‐bearing loans and borrowings is measured by discounting
the respective expected future cash flows. The discount rate used is the prevailing market rate of
interest for the applicable term to maturity. Individual features of financial instruments are taken
into account by applying market credit and liquidity spreads when measuring fair value. It is not
possible for investments in associates to be carried at fair value because their future cash flows
cannot be reliably determined and no information is available on recent transactions for similar
investments. The fair value of derivatives is based in the case of foreign exchange contracts on the
European Central Bank reference rates adjusted for the applicable interest rate differential (premium
or discount). The fair value of interest rate derivatives is measured using generally accepted interest
rate yield curves.
No reclassifications between fair value hierarchy levels were required in the past financial year.

Demag Cranes AG Annual Report 2011/2012 129
The tables that follow show the undiscounted contractual interest payments and payments on
principal for financial liabilities within the scope of IFRS 7:
For interest‐bearing loans and borrowings with variable rates of interest, interest payments in future
reporting periods are based on the interest rates prevailing at the balance sheet date. Financial
liabilities that can be repaid at any time are assigned to the earliest time band.
Outflow of
resources in the
next reporting
Outflow of
resources in the
next‐but‐one
Later outflow of
resources
Revolving credit facility, gross – – – –
Loans and borrowings from related parties 42 8 8 25
Finance lease liabilities 105 80 33 ‐
Other financial liabilities 15,910 15,407 235 267
Outflow of resources from loans and borrowings 16,056 15,496 277 292
Trade payables 48,857 48,857 – –
Derivatives not in designated hedging relationships 176 176 – –
Derivatives in designated hedging relationships – – – –
Other financial liabilies 50,130 38,476 178 7,260
Trade payables
and other financial liabilities
Outflow of resources from financial liabilities
within the scope of IFRS 7
Outflow of
resources in the
next reporting
period
Outflow of
resources in the
next‐but‐one
reporting period
Later outflow of
resources
Revolving credit facility, gross 125,000 19,101 3,609 118,421
Loans and borrowings from related parties 42 42 – –
Finance lease liabilities – – – –
Other financial liabilities 4,685 3,990 271 423
Outflow of resources from loans and borrowings 129,726 23,133 3,881 118,845
Trade payables 93,021 93,021 – –
Derivatives not in designated hedging relationships 533 442 – 90
Derivatives in designated hedging relationships – – – –
Other financial liabilies 53,787 38,806 359 13,274
Trade payables
and other financial liabilities
Outflow of resources from financial liabilities
within the scope of IFRS 7
30 September 2012
in EUR thousand Carrying amount
99,163 99,163 178 7,260
114,659 455
4,239
30 September 2011
115,219
359 13,365
14,519
in EUR thousand Carrying amount
147,341 132,269
132,209277,067 155,402
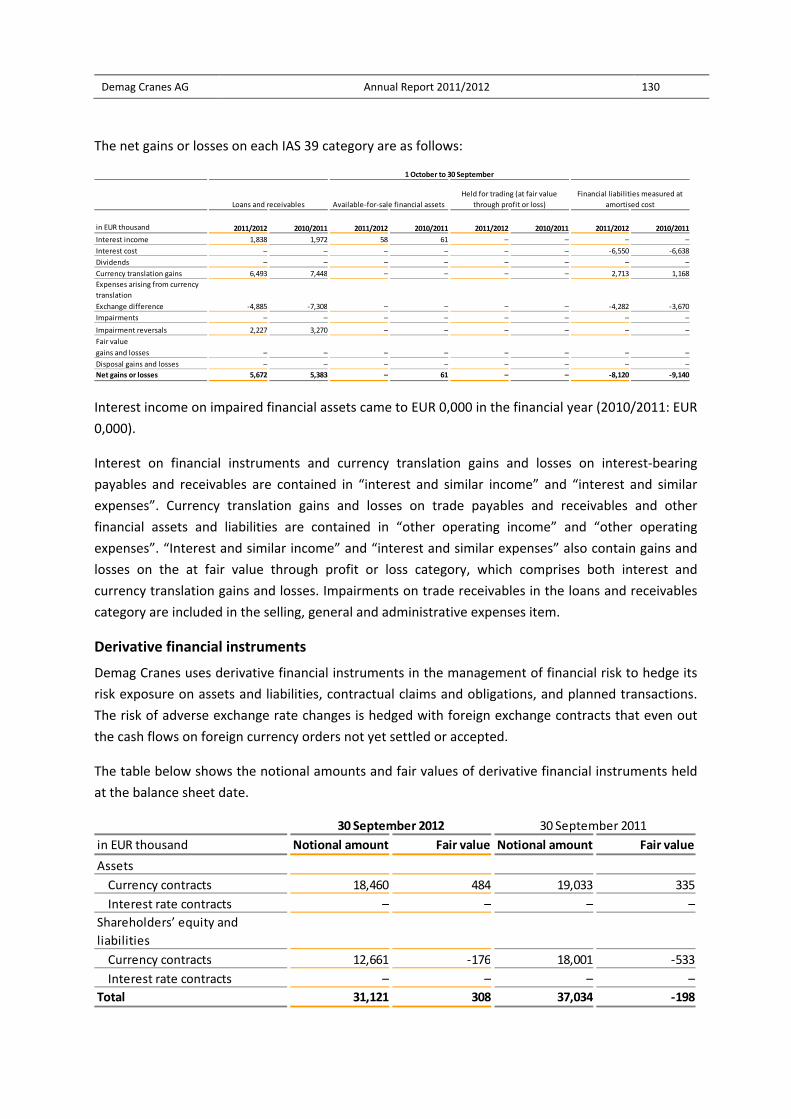
Demag Cranes AG Annual Report 2011/2012 130
The net gains or losses on each IAS 39 category are as follows:
Interest income on impaired financial assets came to EUR 0,000 in the financial year (2010/2011: EUR
0,000).
Interest on financial instruments and currency translation gains and losses on interest‐bearing
payables and receivables are contained in “interest and similar income” and “interest and similar
expenses”. Currency translation gains and losses on trade payables and receivables and other
financial assets and liabilities are contained in “other operating income” and “other operating
expenses”. “Interest and similar income” and “interest and similar expenses” also contain gains and
losses on the at fair value through profit or loss category, which comprises both interest and
currency translation gains and losses. Impairments on trade receivables in the loans and receivables
category are included in the selling, general and administrative expenses item.
Derivative financial instruments
Demag Cranes uses derivative financial instruments in the management of financial risk to hedge its
risk exposure on assets and liabilities, contractual claims and obligations, and planned transactions.
The risk of adverse exchange rate changes is hedged with foreign exchange contracts that even out
the cash flows on foreign currency orders not yet settled or accepted.
The table below shows the notional amounts and fair values of derivative financial instruments held
at the balance sheet date.
in EUR thousand
Interest income 1,838 1,972 58 61 – – – –
Interest cost – – – – – – ‐6,550 ‐6,638
Dividends – – – – – – – –
Currency translation gains 6,493 7,448 – – – – 2,713 1,168
Expenses arising from currency
translation
Exchange difference
Impairments – – – – – – – –
Impairment reversals
Fair value
gains and losses
Disposal gains and losses – – – – – – – –
Net gains or losses 5,672 5,383 – 61 – – ‐8,120 ‐9,140
2011/2012
– –
1 October to 30 September
Loans and receivables Available‐for‐sale financial assets
Held for trading (at fair value
through profit or loss)
Financial liabilities measured at
amortised cost
2010/2011 2011/2012 2010/2011
‐4,885 ‐7,308 – –
2010/2011 2011/2012 2010/2011 2011/2012
‐3,670
–
– –
‐4,282
– –
–2,227 3,270 – – –
– – – – –
in EUR thousand Notional amount Fair value Notional amount Fair value
Assets
Currency contracts 18,460 484 19,033 335
Interest rate contracts – – – –
Shareholders’ equity and
liabilities
Currency contracts 12,661 ‐176 18,001 ‐533
Interest rate contracts – – – –
Total 31,121 308 37,034 ‐198
30 September 2012 30 September 2011
Demag Cranes AG Annual Report 2011/2012 131
Positive fair values of derivative financial instruments are included in the Statement of financial
position in other financial assets, and negative fair values in other financial liabilities.
Financial risk management
Demag Cranes is exposed by its global business operations to various types of risk. These include
currency risk, credit risk and interest rate risk. Targeted financial risk management is used to
minimise any adverse impact of this risk on the Demag Cranes financial position, financial
performance and cash flows. Among other things, this involves the use of derivative financial
instruments. The risk management system is described in the Management Report.
Currency risk
Demag Cranes maintains global business relationships and does business in many different
currencies. The risk of adverse exchange rate changes is hedged with foreign exchange contracts that
even out the cash flows on foreign currency orders not yet settled or accepted. The accounting
treatment of hedges and the impact of valuation of derivative financial instruments are described in
Note 5.
Credit risk
Demag Cranes is exposed to credit risk equal to the carrying amount of derivative and non‐derivative
financial assets plus financial guarantees given in the amount of EUR 0,000 (2011: EUR 0,000).
Demag Cranes gives supplier credit in the normal course of business. The Company therefore
assesses debtors on an ongoing basis with regard to specific customer financial conditions but does
not generally require specific security for receivables. Doubtful debts are accounted for in a doubtful
debts allowance, taking into account credit risk based on collection experience and other
information. Demag Cranes counters specific credit risk by only doing business with parties with good
credit standing, primarily based on the ratings of national and international trade credit rating
agencies, and by rigorously observing the risk limit laid down by the trade credit insurer. An amount
of EUR 4,600,000 was held in security at 30 September 2012 (2011: EUR 13,262,000). This mostly
consisted of retentions of title.
Interest rate risk
Since May 2012, Demag Cranes has come under Terex Corporation’s cash pooling arrangements.
Funds are both borrowed and invested through the cash pooling arrangements. Short‐term variable
interest rates are applied in each instance on the basis of LIBOR plus an arm’s length margin. Demag
Cranes is exposed to interest rate risk in the amount of drawings under the cash pooling
arrangements.
Sensitivity analysis
The types of market risk to which Demag Cranes is exposed are currency risk and interest rate risk.
The Company has prepared a sensitivity analysis for each of these two types of risk showing how
profit or loss for the financial year and equity at the balance sheet date would have been affected by
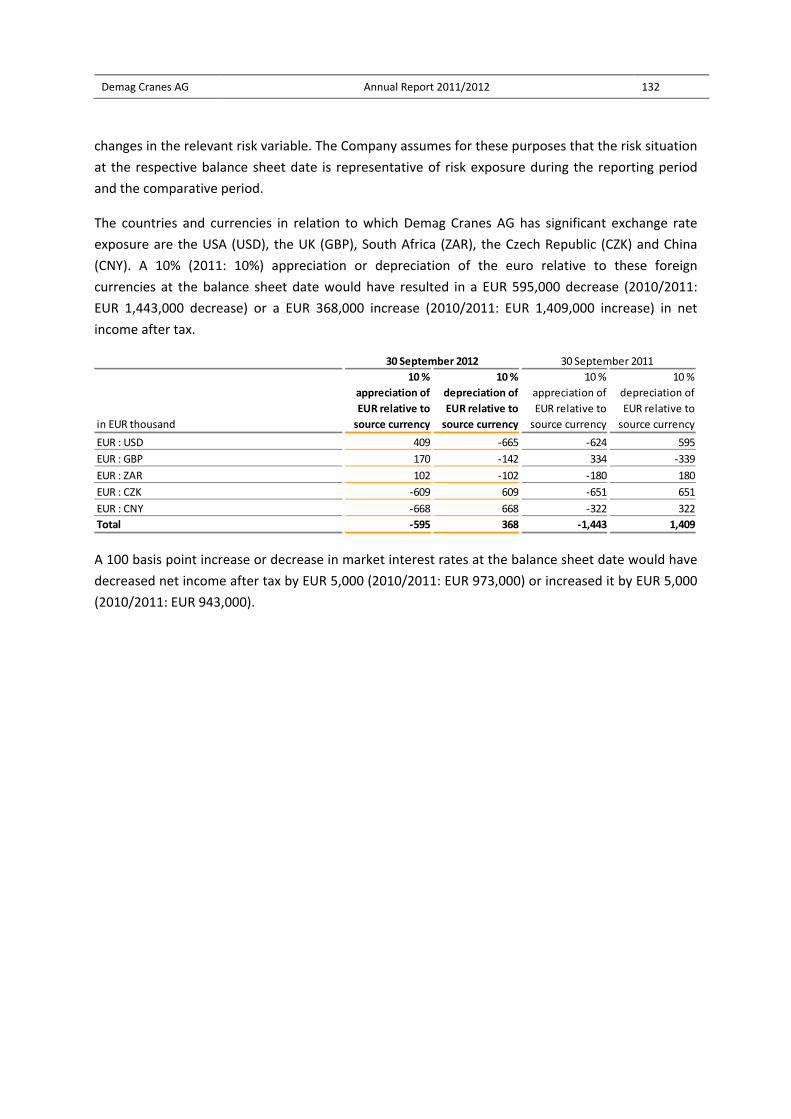
Demag Cranes AG Annual Report 2011/2012 132
changes in the relevant risk variable. The Company assumes for these purposes that the risk situation
at the respective balance sheet date is representative of risk exposure during the reporting period
and the comparative period.
The countries and currencies in relation to which Demag Cranes AG has significant exchange rate
exposure are the USA (USD), the UK (GBP), South Africa (ZAR), the Czech Republic (CZK) and China
(CNY). A 10% (2011: 10%) appreciation or depreciation of the euro relative to these foreign
currencies at the balance sheet date would have resulted in a EUR 595,000 decrease (2010/2011:
EUR 1,443,000 decrease) or a EUR 368,000 increase (2010/2011: EUR 1,409,000 increase) in net
income after tax.
A 100 basis point increase or decrease in market interest rates at the balance sheet date would have
decreased net income after tax by EUR 5,000 (2010/2011: EUR 973,000) or increased it by EUR 5,000
(2010/2011: EUR 943,000).
in EUR thousand
10 %
appreciation of
EUR relative to
source currency
10 %
depreciation of
EUR relative to
source currency
10 %
appreciation of
EUR relative to
source currency
10 %
depreciation of
EUR relative to
source currency
EUR : USD 409 ‐665 ‐624 595
EUR : GBP 170 ‐142 334 ‐339
EUR : ZAR 102 ‐102 ‐180 180
EUR : CZK ‐609 609 ‐651 651
EUR : CNY ‐668 668 ‐322 322
Total ‐595 368 ‐1,443 1,409
30 September 2012 30 September 2011
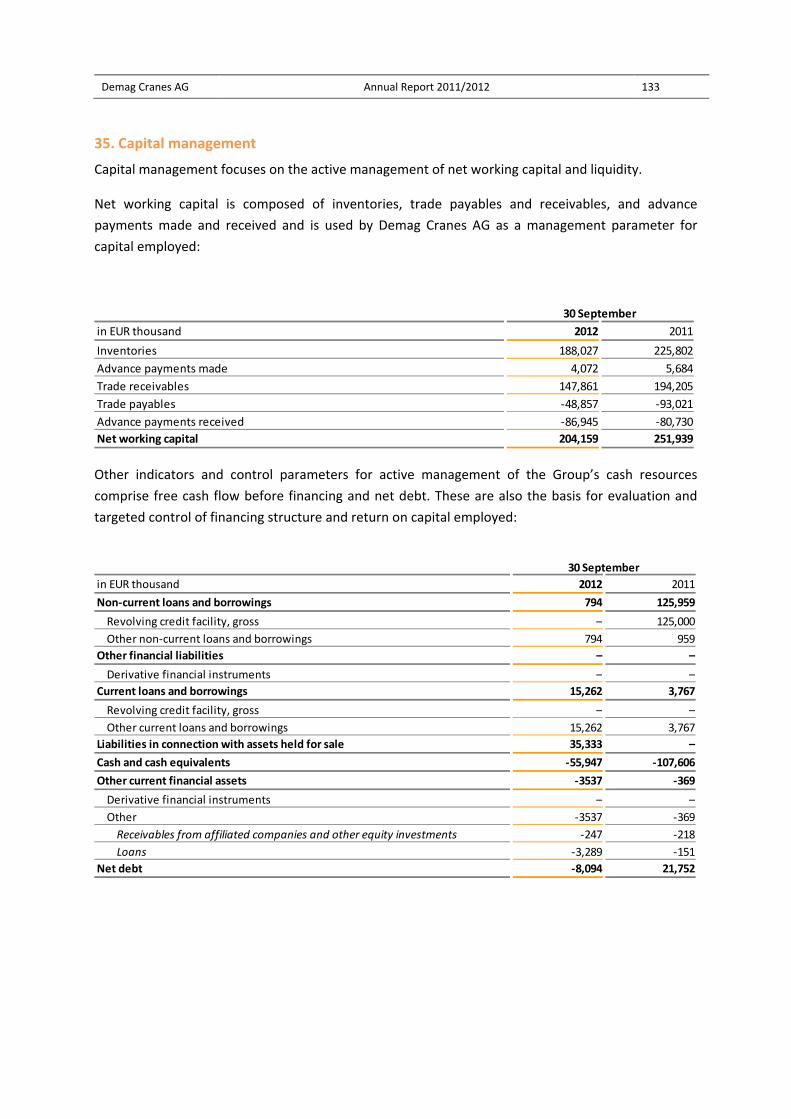
Demag Cranes AG Annual Report 2011/2012 133
35. Capital management
Capital management focuses on the active management of net working capital and liquidity.
Net working capital is composed of inventories, trade payables and receivables, and advance
payments made and received and is used by Demag Cranes AG as a management parameter for
capital employed:
Other indicators and control parameters for active management of the Group’s cash resources
comprise free cash flow before financing and net debt. These are also the basis for evaluation and
targeted control of financing structure and return on capital employed:
in EUR thousand 2012 2011
Inventories 188,027 225,802
Advance payments made 4,072 5,684
Trade receivables 147,861 194,205
Trade payables ‐48,857 ‐93,021
Advance payments received ‐86,945 ‐80,730
Net working capital 204,159 251,939
30 September
in EUR thousand 2012 2011
Non‐current loans and borrowings 794 125,959
Revolving credit facility, gross – 125,000
Other non‐current loans and borrowings 794 959
Other financial liabilities – –
Derivative financial instruments – –
Current loans and borrowings 15,262 3,767
Revolving credit facility, gross – –
Other current loans and borrowings 15,262 3,767
Liabilities in connection with assets held for sale 35,333 –
Cash and cash equivalents ‐55,947 ‐107,606
Other current financial assets ‐3537 ‐369
Derivative financial instruments – –
Other ‐3537 ‐369
Receivables from affiliated companies and other equity investments ‐247 ‐218
Loans ‐3,289 ‐151
Net debt ‐8,094 21,752
30 September
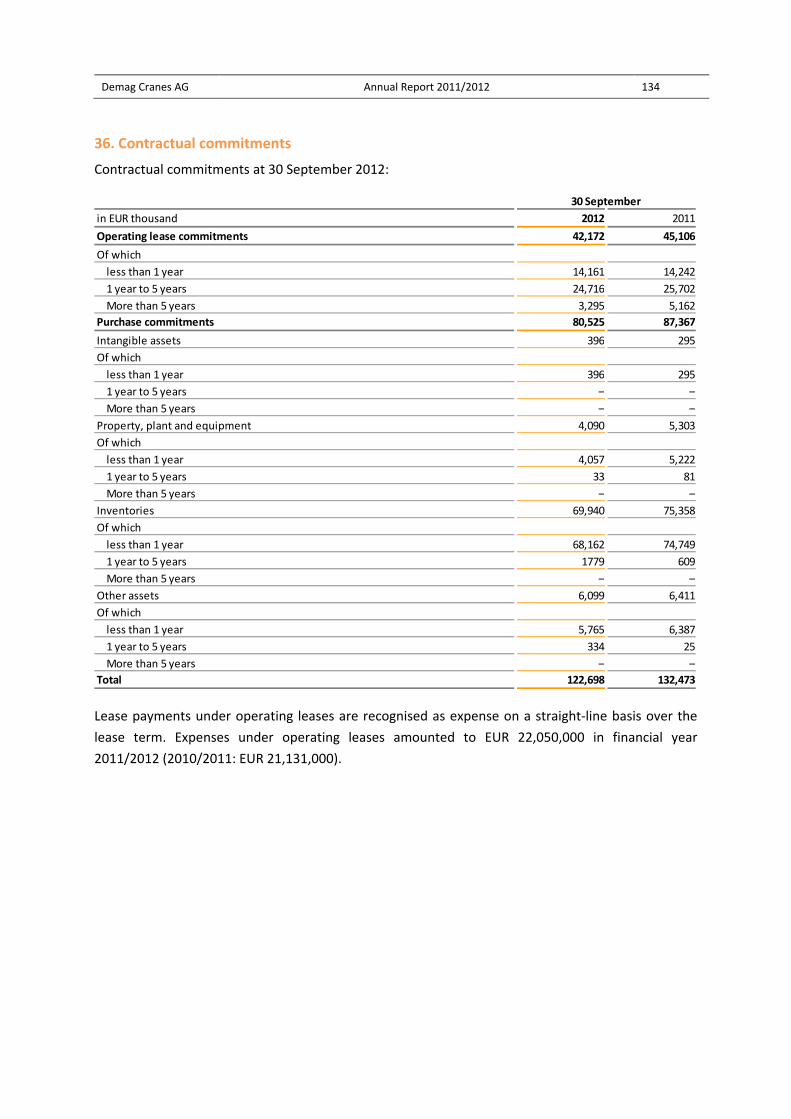
Demag Cranes AG Annual Report 2011/2012 134
36. Contractual commitments
Contractual commitments at 30 September 2012:
Lease payments under operating leases are recognised as expense on a straight‐line basis over the
lease term. Expenses under operating leases amounted to EUR 22,050,000 in financial year
2011/2012 (2010/2011: EUR 21,131,000).
in EUR thousand 2012 2011
Operating lease commitments 42,172 45,106
Of which
less than 1 year 14,161 14,242
1 year to 5 years 24,716 25,702
More than 5 years 3,295 5,162
Purchase commitments 80,525 87,367
Intangible assets 396 295
Of which
less than 1 year 396 295
1 year to 5 years – –
More than 5 years – –
Property, plant and equipment 4,090 5,303
Of which
less than 1 year 4,057 5,222
1 year to 5 years 33 81
More than 5 years – –
Inventories 69,940 75,358
Of which
less than 1 year 68,162 74,749
1 year to 5 years 1779 609
More than 5 years – –
Other assets 6,099 6,411
Of which
less than 1 year 5,765 6,387
1 year to 5 years 334 25
More than 5 years – –
Total 122,698 132,473
30 September
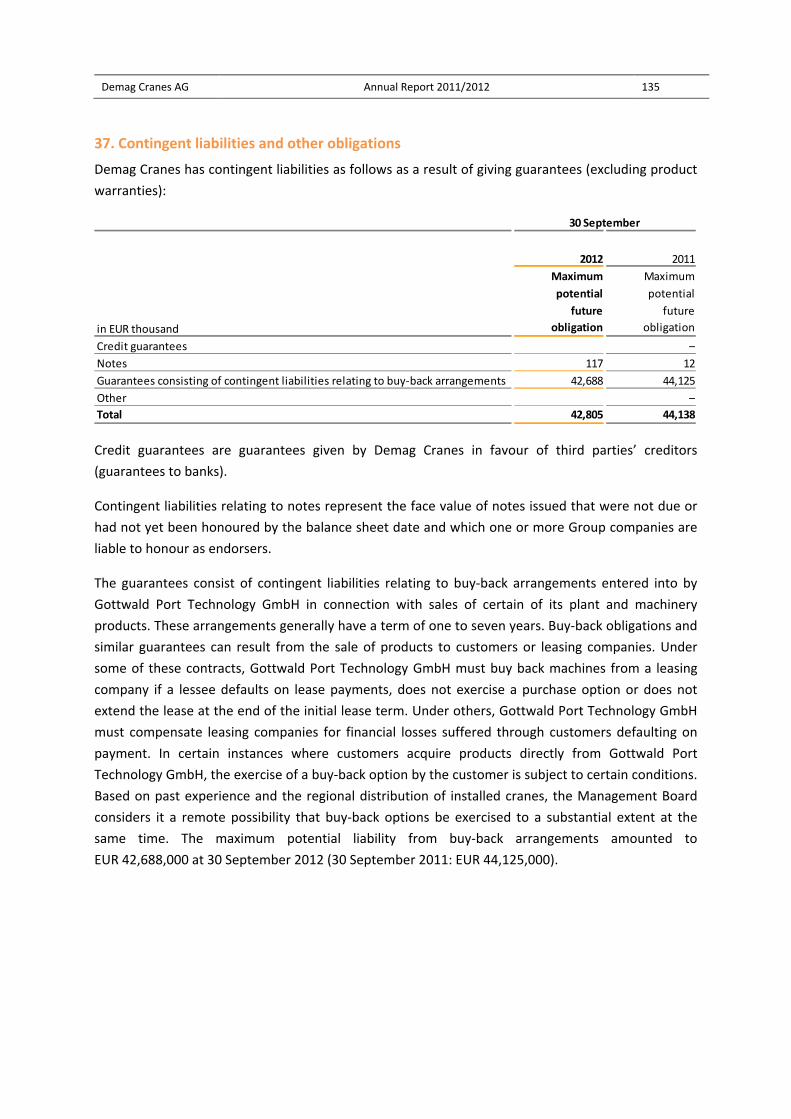
Demag Cranes AG Annual Report 2011/2012 135
37. Contingent liabilities and other obligations
Demag Cranes has contingent liabilities as follows as a result of giving guarantees (excluding product
warranties):
Credit guarantees are guarantees given by Demag Cranes in favour of third parties’ creditors
(guarantees to banks).
Contingent liabilities relating to notes represent the face value of notes issued that were not due or
had not yet been honoured by the balance sheet date and which one or more Group companies are
liable to honour as endorsers.
The guarantees consist of contingent liabilities relating to buy‐back arrangements entered into by
Gottwald Port Technology GmbH in connection with sales of certain of its plant and machinery
products. These arrangements generally have a term of one to seven years. Buy‐back obligations and
similar guarantees can result from the sale of products to customers or leasing companies. Under
some of these contracts, Gottwald Port Technology GmbH must buy back machines from a leasing
company if a lessee defaults on lease payments, does not exercise a purchase option or does not
extend the lease at the end of the initial lease term. Under others, Gottwald Port Technology GmbH
must compensate leasing companies for financial losses suffered through customers defaulting on
payment. In certain instances where customers acquire products directly from Gottwald Port
Technology GmbH, the exercise of a buy‐back option by the customer is subject to certain conditions.
Based on past experience and the regional distribution of installed cranes, the Management Board
considers it a remote possibility that buy‐back options be exercised to a substantial extent at the
same time. The maximum potential liability from buy‐back arrangements amounted to
EUR 42,688,000 at 30 September 2012 (30 September 2011: EUR 44,125,000).
Maximum Maximum
potential potential
future future
obligation obligation
Credit guarantees –
Notes 117 12
Guarantees consisting of contingent liabilities relating to buy‐back arrangements 42,688 44,125
Other –
Total 42,805 44,138
in EUR thousand
30 September
2012 2011
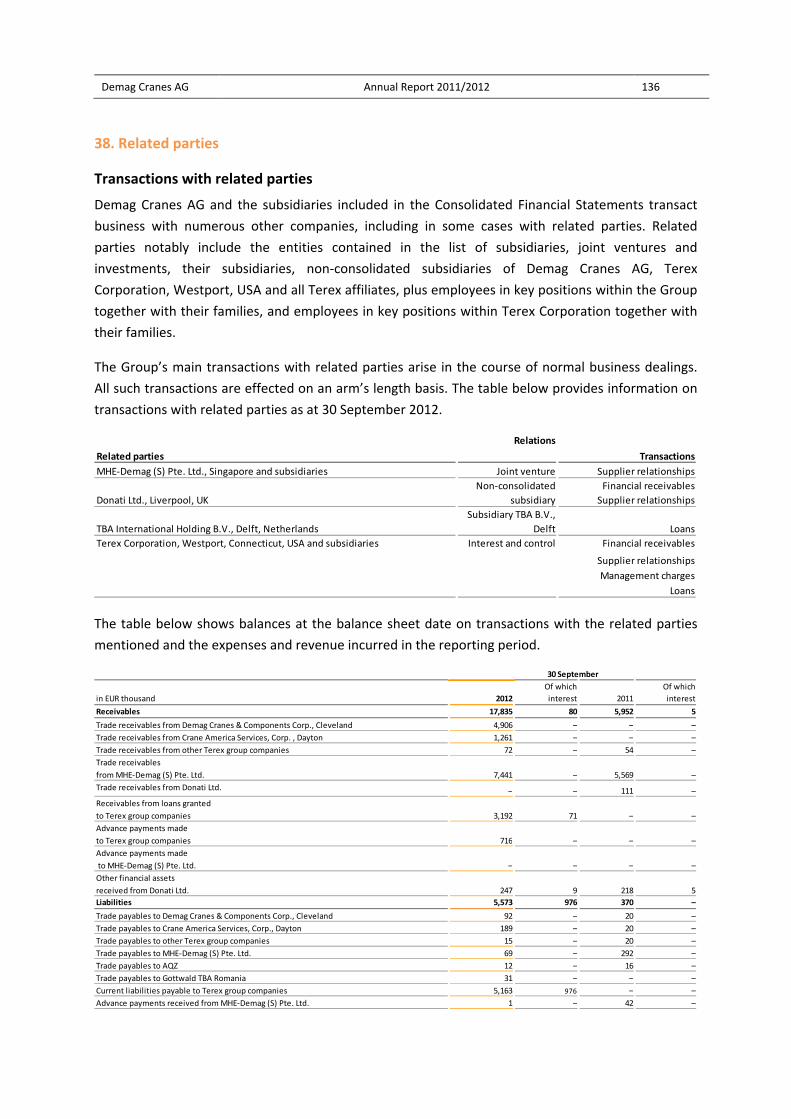
Demag Cranes AG Annual Report 2011/2012 136
38. Related parties
Transactions with related parties
Demag Cranes AG and the subsidiaries included in the Consolidated Financial Statements transact
business with numerous other companies, including in some cases with related parties. Related
parties notably include the entities contained in the list of subsidiaries, joint ventures and
investments, their subsidiaries, non‐consolidated subsidiaries of Demag Cranes AG, Terex
Corporation, Westport, USA and all Terex affiliates, plus employees in key positions within the Group
together with their families, and employees in key positions within Terex Corporation together with
their families.
The Group’s main transactions with related parties arise in the course of normal business dealings.
All such transactions are effected on an arm’s length basis. The table below provides information on
transactions with related parties as at 30 September 2012.
The table below shows balances at the balance sheet date on transactions with the related parties
mentioned and the expenses and revenue incurred in the reporting period.
Relations
MHE‐Demag (S) Pte. Ltd., Singapore and subsidiaries Joint venture Supplier relationships
Donati Ltd., Liverpool, UK
Non‐consolidated
subsidiary
Financial receivables
Supplier relationships
TBA International Holding B.V., Delft, Netherlands
Subsidiary TBA B.V.,
Delft Loans
Terex Corporation, Westport, Connecticut, USA and subsidiaries Interest and control Financial receivables
Supplier relationships
Management charges
Loans
Related parties Transactions
in EUR thousand 2012
Of which
interest 2011
Of which
interest
Receivables 17,835 80 5,952 5
Trade receivables from Demag Cranes & Components Corp., Cleveland 4,906 – – –
Trade receivables from Crane America Services, Corp. , Dayton 1,261 – – –
Trade receivables from other Terex group companies 72 – 54 –
Trade receivables
from MHE‐Demag (S) Pte. Ltd.
Trade receivables from Donati Ltd.
Receivables from loans granted
to Terex group companies
Advance payments made
to Terex group companies
Advance payments made
to MHE‐Demag (S) Pte. Ltd.
Other financial assets
received from Donati Ltd.
Liabilities 5,573 976 370 –
Trade payables to Demag Cranes & Components Corp., Cleveland 92 – 20 –
Trade payables to Crane America Services, Corp., Dayton 189 – 20 –
Trade payables to other Terex group companies 15 – 20 –
Trade payables to MHE‐Demag (S) Pte. Ltd. 69 – 292 –
Trade payables to AQZ 12 – 16 –
Trade payables to Gottwald TBA Romania 31 – – –
Current liabilities payable to Terex group companies 5,163 976 – –
Advance payments received from MHE‐Demag (S) Pte. Ltd. 1 – 42 –
30 September
7,441 – 5,569
–
3,192 71 –
218
716 – –
– –
–
– –
247
111 –
5
–
–
9
–
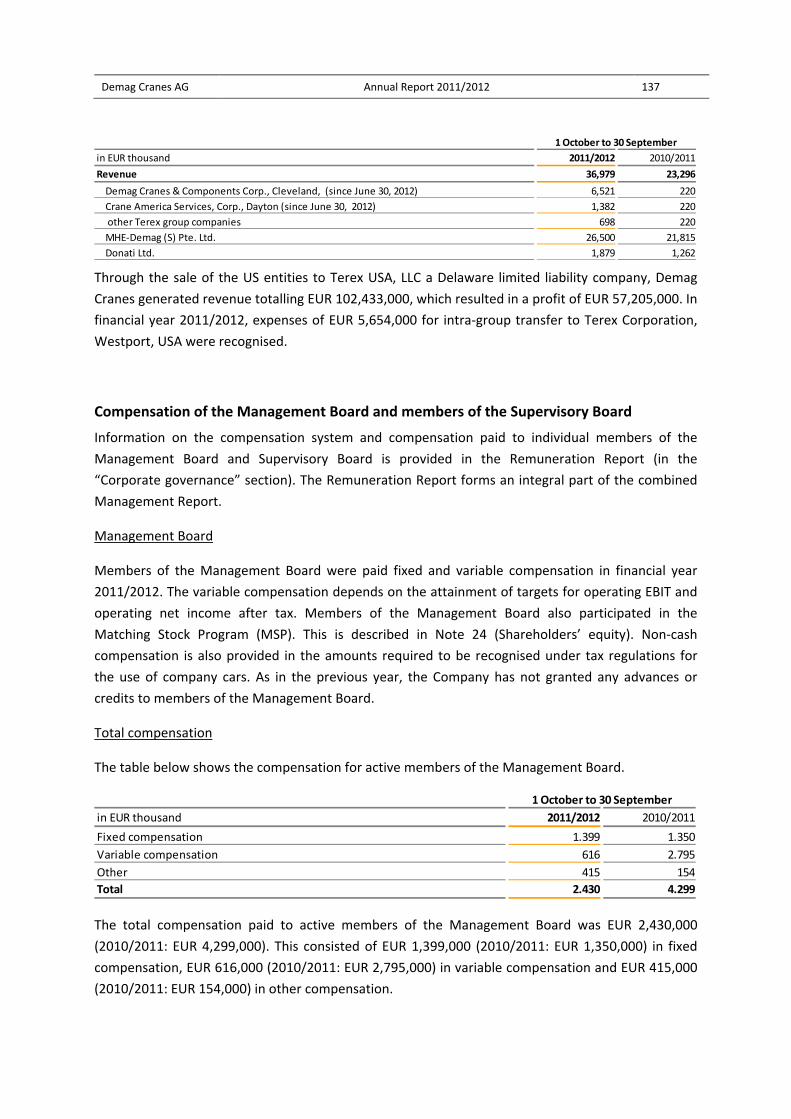
Demag Cranes AG Annual Report 2011/2012 137
Through the sale of the US entities to Terex USA, LLC a Delaware limited liability company, Demag
Cranes generated revenue totalling EUR 102,433,000, which resulted in a profit of EUR 57,205,000. In
financial year 2011/2012, expenses of EUR 5,654,000 for intra‐group transfer to Terex Corporation,
Westport, USA were recognised.
Compensation of the Management Board and members of the Supervisory Board
Information on the compensation system and compensation paid to individual members of the
Management Board and Supervisory Board is provided in the Remuneration Report (in the
“Corporate governance” section). The Remuneration Report forms an integral part of the combined
Management Report.
Management Board
Members of the Management Board were paid fixed and variable compensation in financial year
2011/2012. The variable compensation depends on the attainment of targets for operating EBIT and
operating net income after tax. Members of the Management Board also participated in the
Matching Stock Program (MSP). This is described in Note 24 (Shareholders’ equity). Non‐cash
compensation is also provided in the amounts required to be recognised under tax regulations for
the use of company cars. As in the previous year, the Company has not granted any advances or
credits to members of the Management Board.
Total compensation
The table below shows the compensation for active members of the Management Board.
The total compensation paid to active members of the Management Board was EUR 2,430,000
(2010/2011: EUR 4,299,000). This consisted of EUR 1,399,000 (2010/2011: EUR 1,350,000) in fixed
compensation, EUR 616,000 (2010/2011: EUR 2,795,000) in variable compensation and EUR 415,000
(2010/2011: EUR 154,000) in other compensation.
in EUR thousand 2011/2012 2010/2011
Revenue 36,979 23,296
Demag Cranes & Components Corp., Cleveland, (since June 30, 2012) 6,521 220
Crane America Services, Corp., Dayton (since June 30, 2012) 1,382 220
other Terex group companies 698 220
MHE‐Demag (S) Pte. Ltd. 26,500 21,815
Donati Ltd. 1,879 1,262
1 October to 30 September
in EUR thousand 2011/2012 2010/2011
Fixed compensation 1.399 1.350
Variable compensation 616 2.795
Other 415 154
Total 2.430 4.299
1 October to 30 September
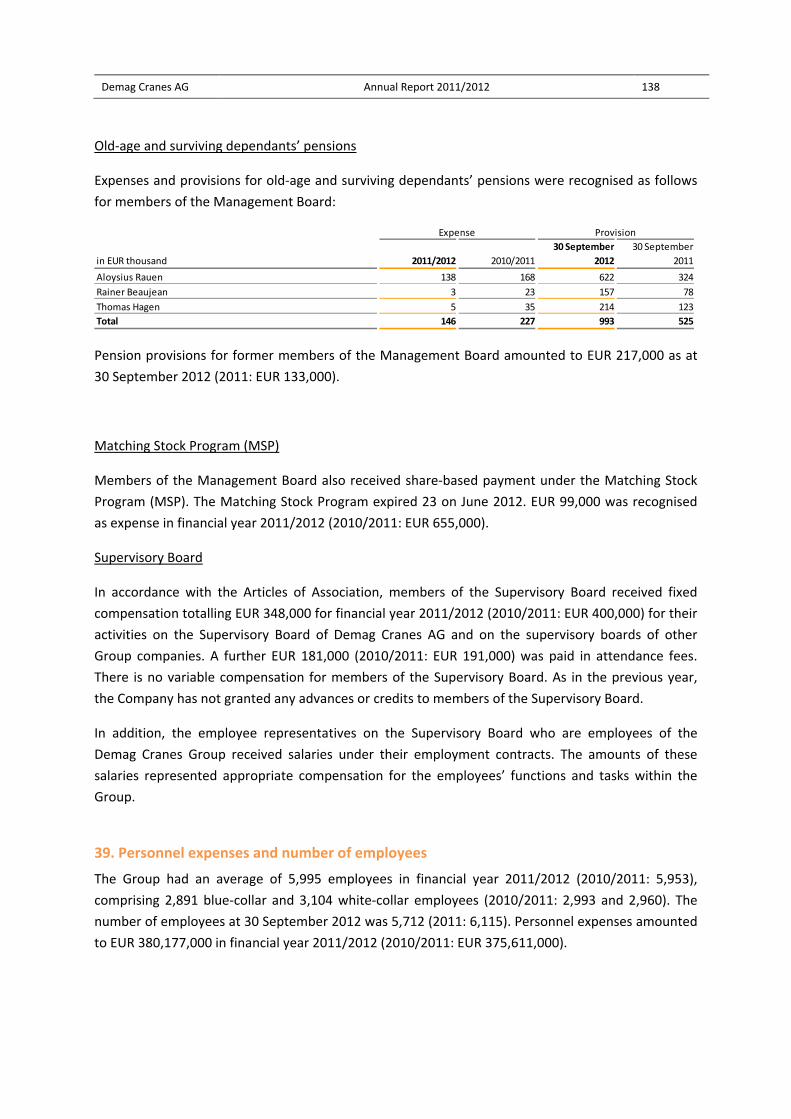
Demag Cranes AG Annual Report 2011/2012 138
Old‐age and surviving dependants’ pensions
Expenses and provisions for old‐age and surviving dependants’ pensions were recognised as follows
for members of the Management Board:
Pension provisions for former members of the Management Board amounted to EUR 217,000 as at
30 September 2012 (2011: EUR 133,000).
Matching Stock Program (MSP)
Members of the Management Board also received share‐based payment under the Matching Stock
Program (MSP). The Matching Stock Program expired 23 on June 2012. EUR 99,000 was recognised
as expense in financial year 2011/2012 (2010/2011: EUR 655,000).
Supervisory Board
In accordance with the Articles of Association, members of the Supervisory Board received fixed
compensation totalling EUR 348,000 for financial year 2011/2012 (2010/2011: EUR 400,000) for their
activities on the Supervisory Board of Demag Cranes AG and on the supervisory boards of other
Group companies. A further EUR 181,000 (2010/2011: EUR 191,000) was paid in attendance fees.
There is no variable compensation for members of the Supervisory Board. As in the previous year,
the Company has not granted any advances or credits to members of the Supervisory Board.
In addition, the employee representatives on the Supervisory Board who are employees of the
Demag Cranes Group received salaries under their employment contracts. The amounts of these
salaries represented appropriate compensation for the employees’ functions and tasks within the
Group.
39. Personnel expenses and number of employees
The Group had an average of 5,995 employees in financial year 2011/2012 (2010/2011: 5,953),
comprising 2,891 blue‐collar and 3,104 white‐collar employees (2010/2011: 2,993 and 2,960). The
number of employees at 30 September 2012 was 5,712 (2011: 6,115). Personnel expenses amounted
to EUR 380,177,000 in financial year 2011/2012 (2010/2011: EUR 375,611,000).
in EUR thousand 2011/2012 2010/2011
30 September
2012
30 September
2011
Aloysius Rauen 138 168 622 324
Rainer Beaujean 3 23 157 78
Thomas Hagen 5 35 214 123
Total 146 227 993 525
Expense Provision
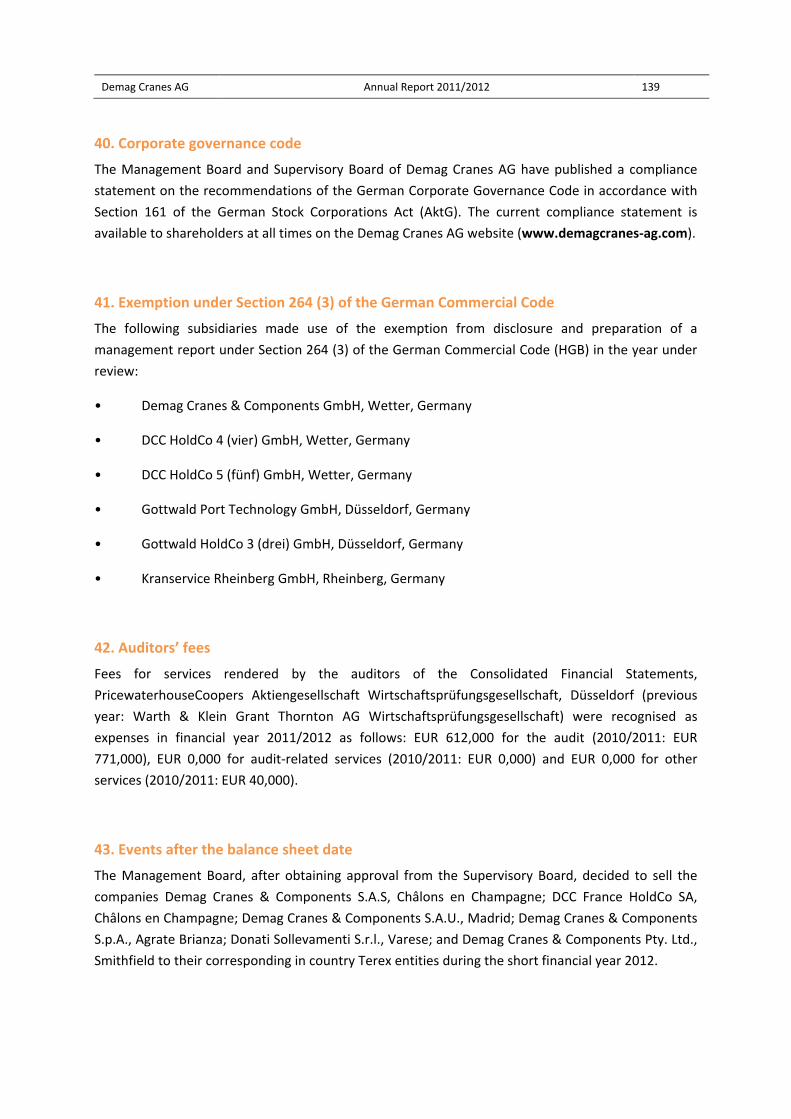
Demag Cranes AG Annual Report 2011/2012 139
40. Corporate governance code
The Management Board and Supervisory Board of Demag Cranes AG have published a compliance
statement on the recommendations of the German Corporate Governance Code in accordance with
Section 161 of the German Stock Corporations Act (AktG). The current compliance statement is
available to shareholders at all times on the Demag Cranes AG website (www.demagcranes‐ag.com).
41. Exemption under Section 264 (3) of the German Commercial Code
The following subsidiaries made use of the exemption from disclosure and preparation of a
management report under Section 264 (3) of the German Commercial Code (HGB) in the year under
review:
• Demag Cranes & Components GmbH, Wetter, Germany
• DCC HoldCo 4 (vier) GmbH, Wetter, Germany
• DCC HoldCo 5 (fünf) GmbH, Wetter, Germany
• Gottwald Port Technology GmbH, Düsseldorf, Germany
• Gottwald HoldCo 3 (drei) GmbH, Düsseldorf, Germany
• Kranservice Rheinberg GmbH, Rheinberg, Germany
42. Auditors’ fees
Fees for services rendered by the auditors of the Consolidated Financial Statements,
PricewaterhouseCoopers Aktiengesellschaft Wirtschaftsprüfungsgesellschaft, Düsseldorf (previous
year: Warth & Klein Grant Thornton AG Wirtschaftsprüfungsgesellschaft) were recognised as
expenses in financial year 2011/2012 as follows: EUR 612,000 for the audit (2010/2011: EUR
771,000), EUR 0,000 for audit‐related services (2010/2011: EUR 0,000) and EUR 0,000 for other
services (2010/2011: EUR 40,000).
43. Events after the balance sheet date
The Management Board, after obtaining approval from the Supervisory Board, decided to sell the
companies Demag Cranes & Components S.A.S, Châlons en Champagne; DCC France HoldCo SA,
Châlons en Champagne; Demag Cranes & Components S.A.U., Madrid; Demag Cranes & Components
S.p.A., Agrate Brianza; Donati Sollevamenti S.r.l., Varese; and Demag Cranes & Components Pty. Ltd.,
Smithfield to their corresponding in country Terex entities during the short financial year 2012.
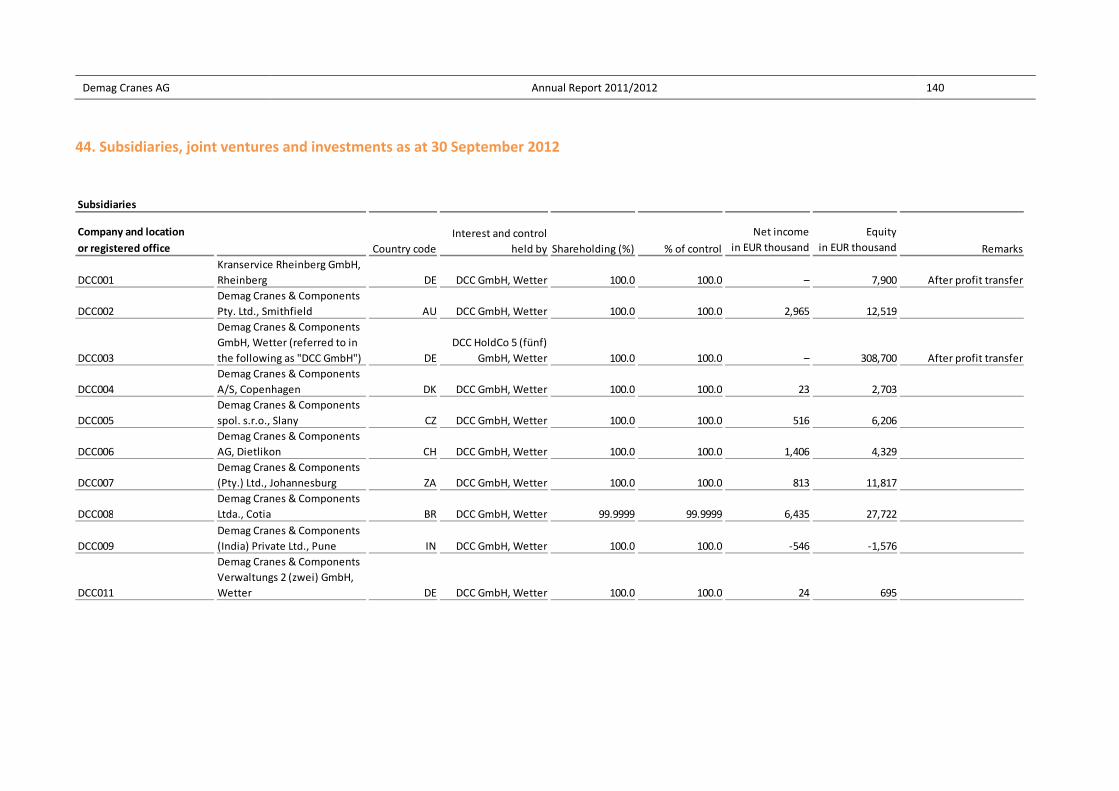
Demag Cranes AG Annual Report 2011/2012 140
44. Subsidiaries, joint ventures and investments as at 30 September 2012
Net income Equity
in EUR thousand in EUR thousand
DCC001
Kranservice Rheinberg GmbH,
Rheinberg DE DCC GmbH, Wetter 100.0 100.0 – 7,900 After profit transfer
DCC002
Demag Cranes & Components
Pty. Ltd., Smithfield AU DCC GmbH, Wetter 100.0 100.0 2,965 12,519
DCC003
Demag Cranes & Components
GmbH, Wetter (referred to in
the following as "DCC GmbH") DE
DCC HoldCo 5 (fünf)
GmbH, Wetter 100.0 100.0 – 308,700 After profit transfer
DCC004
Demag Cranes & Components
A/S, Copenhagen DK DCC GmbH, Wetter 100.0 100.0 23 2,703
DCC005
Demag Cranes & Components
spol. s.r.o., Slany CZ DCC GmbH, Wetter 100.0 100.0 516 6,206
DCC006
Demag Cranes & Components
AG, Dietlikon CH DCC GmbH, Wetter 100.0 100.0 1,406 4,329
DCC007
Demag Cranes & Components
(Pty.) Ltd., Johannesburg ZA DCC GmbH, Wetter 100.0 100.0 813 11,817
DCC008
Demag Cranes & Components
Ltda., Cotia BR DCC GmbH, Wetter 99.9999 99.9999 6,435 27,722
DCC009
Demag Cranes & Components
(India) Private Ltd., Pune IN DCC GmbH, Wetter 100.0 100.0 ‐546 ‐1,576
DCC011
Demag Cranes & Components
Verwaltungs 2 (zwei) GmbH,
Wetter DE DCC GmbH, Wetter 100.0 100.0 24 695
Subsidiaries
Company and location
Country code
Interest and control
held by Shareholding (%) % of control Remarksor registered office
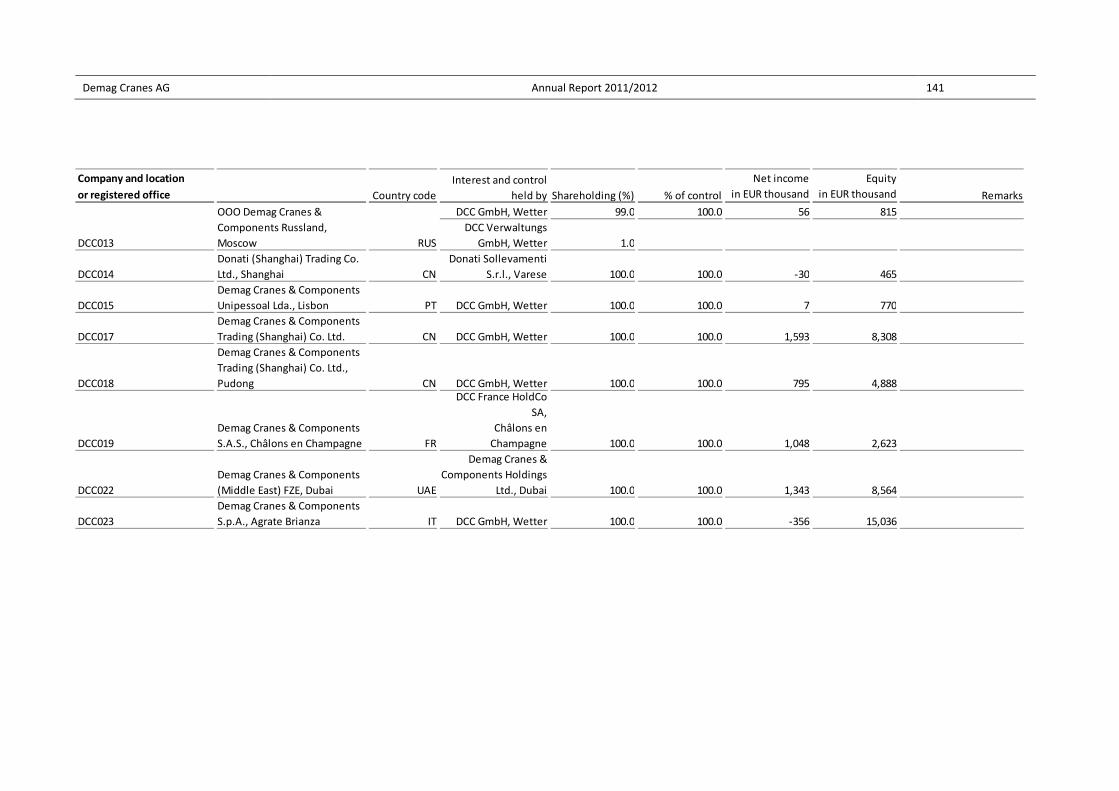
Demag Cranes AG Annual Report 2011/2012 141
Net income Equity
in EUR thousand in EUR thousand
DCC GmbH, Wetter 99.0 100.0 56 815
DCC013 RUS
DCC Verwaltungs
GmbH, Wetter 1.0
DCC014
Donati (Shanghai) Trading Co.
Ltd., Shanghai CN
Donati Sollevamenti
S.r.l., Varese 100.0 100.0 ‐30 465
DCC015
Demag Cranes & Components
Unipessoal Lda., Lisbon PT DCC GmbH, Wetter 100.0 100.0 7 770
DCC017
Demag Cranes & Components
Trading (Shanghai) Co. Ltd. CN DCC GmbH, Wetter 100.0 100.0 1,593 8,308
DCC018
Demag Cranes & Components
Trading (Shanghai) Co. Ltd.,
Pudong CN DCC GmbH, Wetter 100.0 100.0 795 4,888DCC France HoldCo
SA,
Châlons en
Champagne
DCC022
Demag Cranes & Components
(Middle East) FZE, Dubai UAE
Demag Cranes &
Components Holdings
Ltd., Dubai 100.0 100.0 1,343 8,564
DCC023
Demag Cranes & Components
S.p.A., Agrate Brianza IT DCC GmbH, Wetter 100.0 100.0 ‐356 15,036
% of control Remarksor registered office
OOO Demag Cranes &
Components Russland,
Moscow
100.0 1,048 2,623DCC019
Demag Cranes & Components
S.A.S., Châlons en Champagne FR 100.0
Company and location
Country code
Interest and control
held by Shareholding (%)
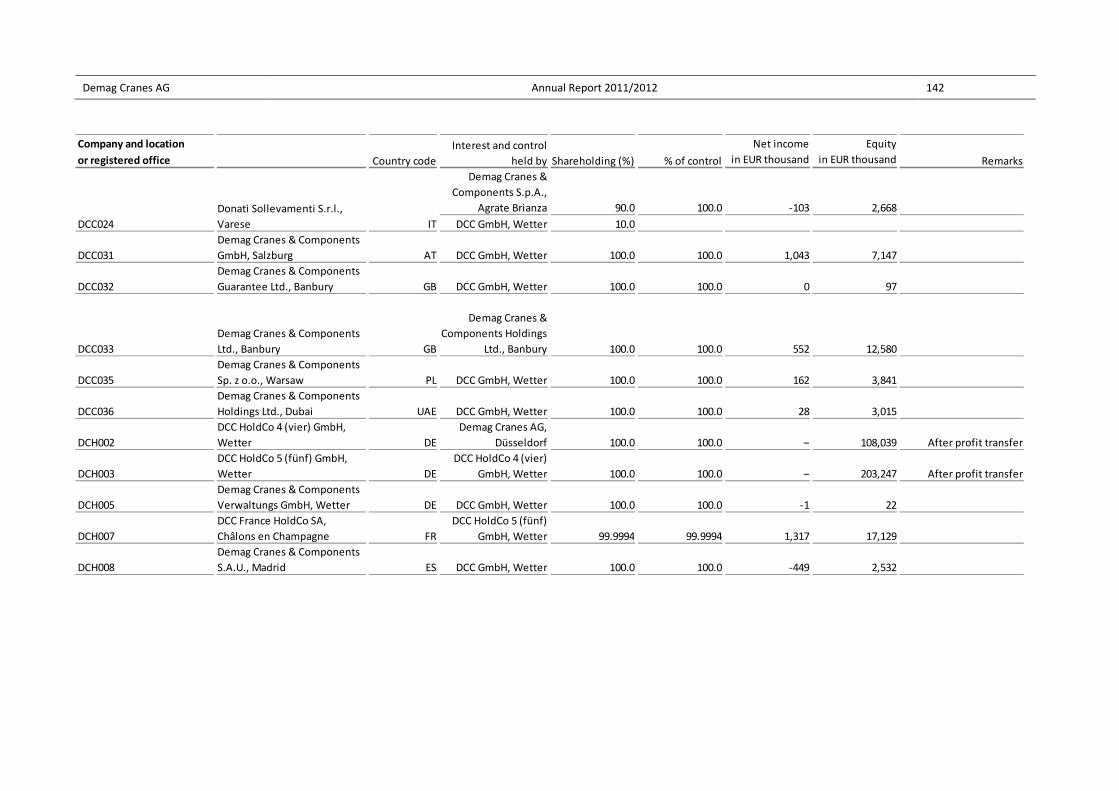
Demag Cranes AG Annual Report 2011/2012 142
Net income Equity
in EUR thousand in EUR thousand
Demag Cranes &
Components S.p.A.,
Agrate Brianza 90.0 100.0 ‐103 2,668
DCC024 IT DCC GmbH, Wetter 10.0
DCC031
Demag Cranes & Components
GmbH, Salzburg AT DCC GmbH, Wetter 100.0 100.0 1,043 7,147
DCC032
Demag Cranes & Components
Guarantee Ltd., Banbury GB DCC GmbH, Wetter 100.0 100.0 0 97
DCC033
Demag Cranes & Components
Ltd., Banbury GB
Demag Cranes &
Components Holdings
Ltd., Banbury 100.0 100.0 552 12,580
DCC035
Demag Cranes & Components
Sp. z o.o., Warsaw PL DCC GmbH, Wetter 100.0 100.0 162 3,841
DCC036
Demag Cranes & Components
Holdings Ltd., Dubai UAE DCC GmbH, Wetter 100.0 100.0 28 3,015
DCH002
DCC HoldCo 4 (vier) GmbH,
Wetter DE
Demag Cranes AG,
Düsseldorf 100.0 100.0 – 108,039 After profit transfer
DCH003
DCC HoldCo 5 (fünf) GmbH,
Wetter DE
DCC HoldCo 4 (vier)
GmbH, Wetter 100.0 100.0 – 203,247 After profit transfer
DCH005
Demag Cranes & Components
Verwaltungs GmbH, Wetter DE DCC GmbH, Wetter 100.0 100.0 ‐1 22
DCH007
DCC France HoldCo SA,
Châlons en Champagne FR
DCC HoldCo 5 (fünf)
GmbH, Wetter 99.9994 99.9994 1,317 17,129
DCH008
Demag Cranes & Components
S.A.U., Madrid ES DCC GmbH, Wetter 100.0 100.0 ‐449 2,532
% of control Remarksor registered office
Donati Sollevamenti S.r.l.,
Varese
Company and location
Country code
Interest and control
held by Shareholding (%)
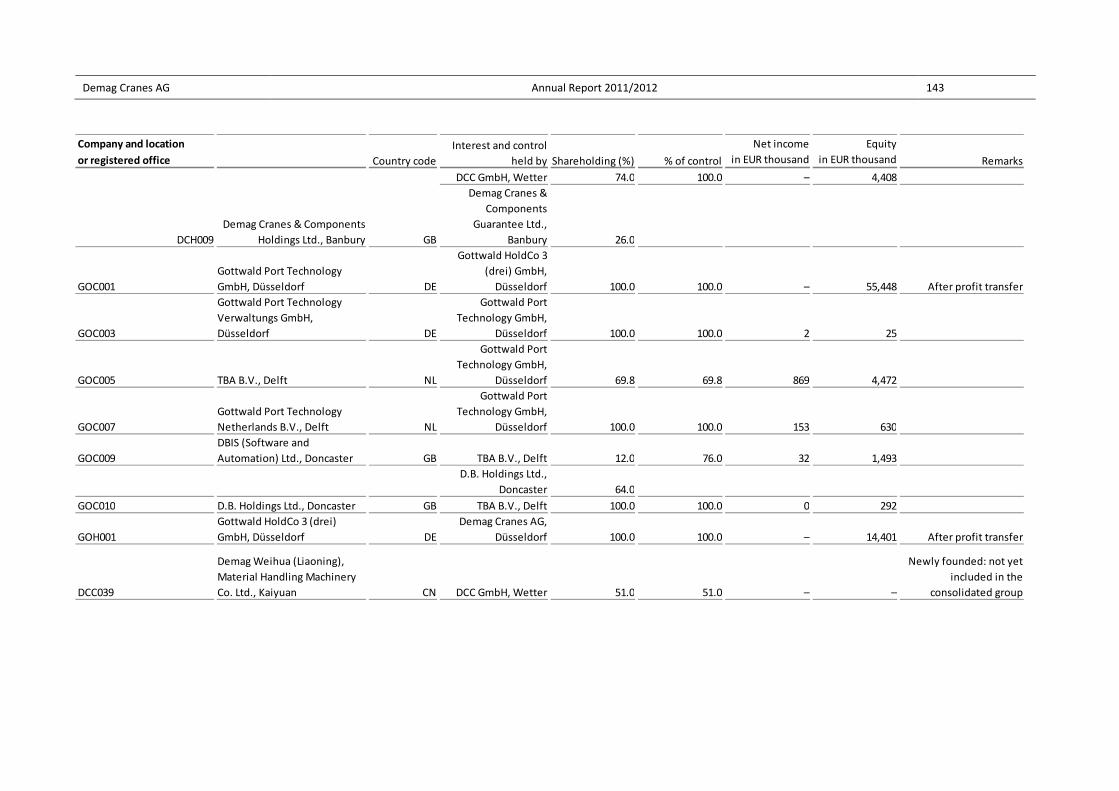
Demag Cranes AG Annual Report 2011/2012 143
Net income Equity
in EUR thousand in EUR thousand
DCC GmbH, Wetter 74.0 100.0 – 4,408
DCH009
Demag Cranes & Components
Holdings Ltd., Banbury GB
Demag Cranes &
Components
Guarantee Ltd.,
Banbury 26.0
GOC001
Gottwald Port Technology
GmbH, Düsseldorf DE
Gottwald HoldCo 3
(drei) GmbH,
Düsseldorf 100.0 100.0 – 55,448 After profit transfer
GOC003
Gottwald Port Technology
Verwaltungs GmbH,
Düsseldorf DE
Gottwald Port
Technology GmbH,
Düsseldorf 100.0 100.0 2 25
GOC005 TBA B.V., Delft NL
Gottwald Port
Technology GmbH,
Düsseldorf 69.8 69.8 869 4,472
GOC007
Gottwald Port Technology
Netherlands B.V., Delft NL
Gottwald Port
Technology GmbH,
Düsseldorf 100.0 100.0 153 630
GOC009
DBIS (Software and
Automation) Ltd., Doncaster GB TBA B.V., Delft 12.0 76.0 32 1,493
D.B. Holdings Ltd.,
Doncaster 64.0
GOC010 D.B. Holdings Ltd., Doncaster GB TBA B.V., Delft 100.0 100.0 0 292
GOH001
Gottwald HoldCo 3 (drei)
GmbH, Düsseldorf DE
Demag Cranes AG,
Düsseldorf 100.0 100.0 – 14,401 After profit transfer
DCC039
Demag Weihua (Liaoning),
Material Handling Machinery
Co. Ltd., Kaiyuan CN DCC GmbH, Wetter 51.0 51.0 – –
Newly founded: not yet
included in the
consolidated group
Company and location
Country code
Interest and control
held by Shareholding (%) % of control Remarksor registered office
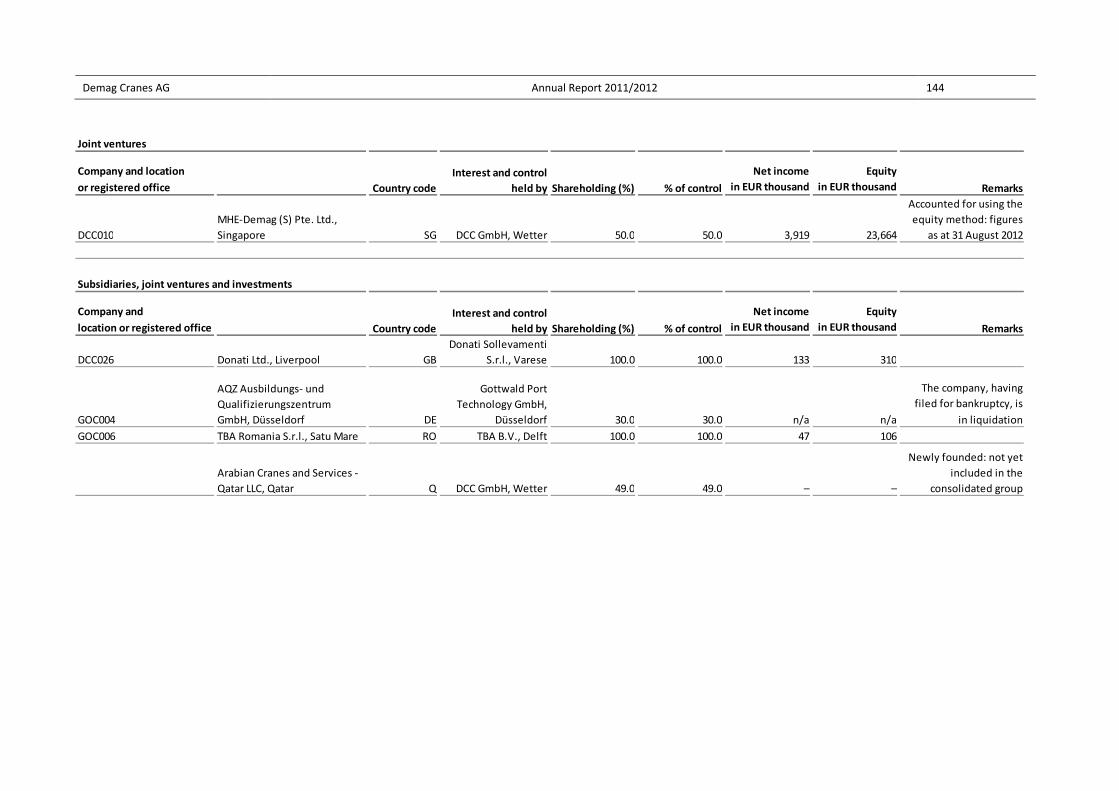
Demag Cranes AG Annual Report 2011/2012 144
Net income Equity
in EUR thousand in EUR thousand
DCC010
MHE‐Demag (S) Pte. Ltd.,
Singapore SG DCC GmbH, Wetter 50.0 50.0 3,919 23,664
Accounted for using the
equity method: figures
as at 31 August 2012
Net income Equity
in EUR thousand in EUR thousand
DCC026 Donati Ltd., Liverpool GB
Donati Sollevamenti
S.r.l., Varese 100.0 100.0 133 310
The company, having
filed for bankruptcy, is
in liquidation
GOC006 TBA Romania S.r.l., Satu Mare RO TBA B.V., Delft 100.0 100.0 47 106
Arabian Cranes and Services ‐
Qatar LLC, Qatar Q DCC GmbH, Wetter 49.0 49.0 – –
Newly founded: not yet
included in the
consolidated group
Joint ventures
Remarksor registered office
Company and location
Country code
Interest and control
held by Shareholding (%) % of control
n/a
Subsidiaries, joint ventures and investments
% of control Remarkslocation or registered office
GOC004 30.0 n/a
AQZ Ausbildungs‐ und
Qualifizierungszentrum
GmbH, Düsseldorf DE
Gottwald Port
Technology GmbH,
Düsseldorf 30.0
Company and
Country code
Interest and control
held by Shareholding (%)
Demag Cranes AG Annual Report 2011/2012 145
45. Mandates
Supervisory Board
Dr Michael W. Ernestus, New York, New York, USA
Chairman of the Supervisory Board G.C. Andersen Partner, LLC, New York, New York, USA (Partner)
Josef Berger*, Düsseldorf, Germany
Deputy Chairman of the Supervisory Board Demag Cranes & Components GmbH, Wetter, Germany (Chairman of the Works Council)
Membership of other supervisory boards:
Demag Cranes & Components GmbH, Wetter, Germany
Axel J. Arendt, Grünwald, Germany
(1 October 2011 – 5 December 2012 and from 16 May 2012) Axel Arendt Management Consulting GbR, Grünwald, Germany (Managing Director, executive consultant)
Membership of other supervisory boards:
Tognum AG, Friedrichshafen, Germany
Membership of other supervisory bodies:
Bilfinger Berger Industrial Services GmbH, Munich, Germany (Member of the Advisory Board) Tital GmbH, Bestwig, Germany (Member of the Advisory Board) Aerotech Peissenberg GmbH, Peissenberg, Germany (Member of the Advisory Board)
Kevin A. Barr, Wilton, Connecticut, USA
Terex Corporation, Westport, Connecticut, USA (Senior Vice President Human Resources)

Demag Cranes AG Annual Report 2011/2012 146
Gerd‐Uwe Boguslawski*, Northeim, Germany
Membership of other supervisory boards:
German Metalworkers Union (IG Metall) in southern Lower Saxony / Harz, Northeim, Germany (Former first authorised representative) Demag Cranes & Components GmbH, Wetter, Germany Sartorius AG, Göttingen, Germany
Giuseppe Di Lisa*, Duisburg, Germany
(since 1 May 2012) Demag Cranes AG, Düsseldorf, Germany (Senior Vice President Gottwald Port Technology GmbH)
Harry Hansen*, Monheim am Rhein, Germany
Gottwald Port Technology GmbH, Düsseldorf, Germany (Chairman of the Works Council) Membership of other supervisory boards:
Gottwald Port Technology GmbH, Düsseldorf, Germany
Brian J. Henry, Fairfield, Connecticut, USA
Terex Corporation, Westport, Connecticut, USA (Senior Vice President Finance & Business Development)
Dr Michael Leue, Hamburg, Germany
Bryan Cave LLP, Hamburg, Germany (Partner)
Membership of other supervisory boards:
initions innovative IT solutions AG, Hamburg, Germany (Chairman of the Supervisory Board) w2ha AG, Hamburg, Germany (Chairman of the Supervisory Board) trautmann, heumann, jochum und kemper ag (Chairman of the Supervisory Board)
Reinhard Möller*, Uslar, Germany
Demag Cranes & Components GmbH, Uslar plant, Uslar, Germany (Chairman of the Works Council)
Membership of other supervisory boards:
Demag Cranes & Components GmbH, Wetter, Germany
Demag Cranes AG Annual Report 2011/2012 147
Hubert Rosenthal*, Herdecke, Germany
German Metalworkers Union (IG Metall), Hagen administration office, Hagen, Germany (First authorised representative)
Membership of other supervisory boards:
Demag Cranes & Components GmbH, Wetter, Germany Guß Holding GmbH, Osnabrück, Germany Hoesch Hohenlimburg GmbH, Hagen‐Hohenlimburg, Germany Hoesch Schwerter Profile GmbH, Schwerte, Germany Thyssen Krupp Bilstein Suspension GmbH, Ennepetal, Germany Thyssen Krupp Federn und Stabilisatoren GmbH, Hagen‐Hohenlimburg, Germany
Fred Schumacher, Filderstadt, Germany
(15 December 2011 – 16 March 2012 and 29 March 2012 – 15 May 2012) German public auditor and accountant, Filderstadt, Germany (self‐employed management consultant)
Oren G. Shaffer, Naples, Florida, USA
Shaffer and Associates, Denver, Colorado, USA, (independent management consultant and Partner) Membership of other supervisory bodies:
Intermec, Inc., Everett, Washington, USA (Member of the Board of Directors) Terex Corporation, Westport, Connecticut, USA (Member of the Board of Directors) XPO Logistics, Inc., Buchanan, Michigan, USA (Member of the Board of Directors) Belgacom SA, Brussels, Belgium (Member of the Conseil d’administration)
Horst Thelen*, Koblenz, Germany
(until 30 April 2012)
Demag Cranes AG, Düsseldorf, Germany (Head of Investor Relations)
* Employee representative
Demag Cranes AG Annual Report 2011/2012 148
Management Board
Aloysius Rauen, Munich, Germany
Chief Executive Officer
Membership of other supervisory boards:
Demag Cranes & Components GmbH, Wetter, Germany
(since 1 November 2011, Chairman since 23 November 2011)
Gottwald Port Technology GmbH, Düsseldorf, Germany
(since 1 November 2011, Chairman since 25 November 2011)
Membership of other supervisory bodies:
MHE‐Demag (S) Pte. Ltd., Singapore, Singapore
Axel J. Arendt, Grünwald, Germany
Member of the Management Board and CFO (5 December 2011 – 15 May 2012)
Membership of other supervisory boards:
Tognum AG, Friedrichshafen, Germany
Membership of other supervisory bodies:
Bilfinger Berger Industrial Services GmbH, Munich, Germany (Member of the Advisory Board)
Tital GmbH, Bestwig, Germany (Member of the Advisory Board)
Aerotech Peissenberg GmbH, Peissenberg, Germany (Member of the Advisory Board)
Demag Cranes AG Annual Report 2011/2012 149
Rainer Beaujean, Meerbusch, Germany
Member of the Management Board and CFO (until 30 November 2011)
Membership of other supervisory boards:
Demag Cranes & Components GmbH, Wetter, Germany (until 30 November 2011)
Gottwald Port Technology GmbH, Düsseldorf, Germany (until 30 November 2011)
Membership of other supervisory bodies:
CIC GmbH & Co. KG, Dortmund, Germany
Lawrence J. Lockwood, Sammamish, Washington, USA
Member of the Management Board and CFO (from 16 May 2012)
Demag C
Düsseldo
Aloysius
Respon
To the
Consolid
and prof
developm
descript
Group.
Düsseldo
Aloysius
Cranes AG
orf, 28 Nove
Rauen
nsibility st
best of our
dated Financ
fit or loss of
ment and p
ion of the m
orf, 28 Nove
Rauen
mber 2012
tatement
r knowledge
ial Statemen
the Group,
performance
material oppo
mber 2012
, and in ac
nts give a tru
and the Com
of the bus
ortunities an
Annual Repor
L
ccordance w
ue and fair vi
mbined Man
siness and t
d risks assoc
L
rt 2011/2012
Lawrence Loc
with the app
iew of the as
agement Re
the position
ciated with t
Lawrence Loc
ckwood
plicable repo
ssets, liabilit
port include
of the Gro
he expected
ckwood
1
orting princi
ies, financia
es a fair revie
oup, togethe
d developme
150
ples, the
l position
ew of the
er with a
ent of the
Demag Cranes AG Annual Report 2011/2012 151
Auditors’ report
We have audited the consolidated financial statements prepared by Demag Cranes AG, Düsseldorf,
comprising the statement of comprehensive income, the statement of financial position, statement
of changes in equity, cash flow statement and the notes to the consolidated financial statements,
together with the group management report, which is combined with the management report of
Demag Cranes AG, Düsseldorf, for the business year from 1 October 2011 to 30 September 2012. The
preparation of the consolidated financial statements and the combined management report in
accordance with the IFRSs, as adopted by the EU, and the additional requirements of German
commercial law pursuant to § (Article) 315a Abs. (paragraph) 1 HGB ("Handelsgesetzbuch": German
Commercial Code) are the responsibility of the parent Company's Board of Managing Directors. Our
responsibility is to express an opinion on the consolidated financial statements and the combined
management report based on our audit.
We conducted our audit of the consolidated financial statements in accordance with § 317 HGB and
German generally accepted standards for the audit of financial statements promulgated by the
Institut der Wirtschaftsprüfer (Institute of Public Auditors in Germany) (IDW). Those standards
require that we plan and perform the audit such that misstatements materially affecting the
presentation of the net assets, financial position and results of operations in the consolidated
financial statements in accordance with the applicable financial reporting framework and in the
combined management report are detected with reasonable assurance. Knowledge of the business
activities and the economic and legal environment of the Group and expectations as to possible
misstatements are taken into account in the determination of audit procedures. The effectiveness of
the accounting‐related internal control system and the evidence supporting the disclosures in the
consolidated financial statements and the combined management report are examined primarily on
a test basis within the framework of the audit. The audit includes assessing the annual financial
statements of those entities included in consolidation, the determination of the entities to be
included in consolidation, the accounting and consolidation principles used and significant estimates
made by the Company´s Board of Managing Directors, as well as evaluating the overall presentation
of the consolidated financial statements and the combined management report. We believe that our
audit provides a reasonable basis for our opinion.
Our audit has not led to any reservations.
Demag Cranes AG Annual Report 2011/2012 152
In our opinion based on the findings of our audit the consolidated financial statements comply with
the IFRSs as adopted by the EU and the additional requirements of German commercial law pursuant
to § 315a Abs. 1 HGB and give a true and fair view of the net assets, financial position and results of
operations of the Group in accordance with these provisions. The combined management report is
consistent with the consolidated financial statements and as a whole provides a suitable view of the
Group's position and suitably presents the opportunities and risks of future development.
Düsseldorf, 28 November 2012
PricewaterhouseCoopers
Aktiengesellschaft
Wirtschaftsprüfungsgesellschaft
Bernd Boritzki ppa. Richard Hindmarsh
Wirtschaftsprüfer Wirtschaftsprüfer
(German Public Auditor) (German Public Auditor)
Demag Cranes AG Annual Report 2011/2012 153
Financial calendar 2013 You will find the Finacial Calender for 2013 on our website at www.demagcranes-ag.com Section Investor Relations Notice: A short fiscal year will be set for the period from 1 October 2012 to 31 December 2012. Beginning from 1 January 2013 the company’s fiscal year corresponds to the calendar year.
Publisher’s note Publisher: Demag Cranes AG Forststrasse 16 40597 Düsseldorf Germany Postfach 18 03 43 40570 Düsseldorf Phone +49 (0) 211 7102-1218 Fax +49 (0) 211 7102-1215 www.demagcranes-ag.com Design and Realisation: Demag Cranes AG Photo Credits: Demag Cranes AG This Annual Report contains forward-looking statements relating to the business, financial performance and earnings of Demag Cranes AG and its subsidiaries and associates. Forward-looking statements are not historical facts and are indicated by words and phrases such as 'believe', 'expect', forecast', 'intend', 'project', 'plan', 'estimate', 'aim', 'anticipate', 'assume', 'target' and similar. Forward-looking statements are based on current plans, estimates, projections and expectations and are therefore subject to risks and uncertainties, most of which are difficult to estimate and which in general are beyond the control of Demag Cranes AG. Consequently, actual developments as well as actual earnings and performance may differ materially from that which is explicitly or implicitly assumed in the forward-looking statements. Demag Cranes AG gives no guarantee that expectations and targets explicitly or implicitly assumed in forward-looking statements will be attained. Demag Cranes AG does not intend or accept any obligation to publish updates of these forward-looking statements incorporating events or circumstances subsequent to publication of this Annual Report. All figures are rounded to the nearest thousand euros unless otherwise stated. The amount shown for each individual item and total is the figure with the smallest rounding difference. Reported totals may therefore differ slightly from the sum of the individual reported amounts. Please note that, in the case of a legal dispute, only the official German version is legally binding. The English version is provided for information purposes only.
Demag Cranes AG Forststrasse 16 40597 Düsseldorf Germany Phone +49 (0) 211 7102-1218 Fax +49 (0) 211 7102-1215 www.demagcranes-ag.com