Embed Size (px)
Citation preview
A N N U A L R E P O R T 2 0 1 2
Key figures
2012 2011 in €m in €m
Earnings figuresRevenues 825.7 678.6EBITDA 94.9 85.5Operating income (EBIT) 47.0 38.9Net profit from continuing operations 20.6 21.5
Key balance sheet figuresBalance sheet total 917.9 818.5Equity 316.1 306.4Net debt 361.5 320.4
Cash flowCash flow from operating activities 75.8 57.3
CROSS Industries AG bondISIN AT0000A0WQ66Coupon 4.625%Maturity 2012–2018Issuing total € 75mDenomination € 500Listing Second Regulated Market of the Vienna Stock Exchange
CROSS Industries AG | Annual Report 2012
A N N U A L R E P O R T 2 0 12
CROSS Industries at a Glance 04Statement by the Management Board 04Bodies of the Company 06Group Structure 08Shareholdings 10Report of the Supervisory Board 22
Group Status Report 2012 23
Consolidated Financial Statements 2012 35Consolidated Balance Sheet 36Consolidated Income Statement 38Consolidated Statement of Comprehensive Income 39Consolidated Cash Flow Statement 40Schedule of Development of Shareholders’ Funds 42Notes to the Consolidated Financial Statements 44List of the Equity Interests 92Independent Auditor’s Report 96
Statement of all Legal Representatives 98
Imprint 99
statement by the management board4
CROSS Industries AG is an industrial group, strategically and operatively focusing on the automotive sector. It is divided into the core segments Complete Vehicle, with its shareholdings in KTM AG, KTM Technologies GmbH and Kiska GmbH; Light- weight Construction, with its shareholding in the Wethje Group as well as high Performance, with its shareholdings in Pankl Racing Systems AG and the WP Group.
Apart from the shareholdings in the automotive sector CROSS Industries AG holds shares in, among others, CROSS Immobilien AG as well as CROSS Informatik GmbH.
In business year 2012 the CROSS Group generated revenues of € 825.7m (previous year: € 678.6m) and an EBIT in the amount of € 47.0m (previous year: € 38.9m). The result from continued operations of the business year amounted to € 20.6m (previous year: € 21.5m).
In October 2012 CROSS Industries AG has successfully placed its 4.625% bond in the amount of € 75m with a term from 2012 to 2018. The bond is listed with a denomination of € 500.00 on the Second Regulated Market of the Vienna Stock Exchange. In connection with a bank financing, which was concluded in spring 2012, the future financial requirements of the group were hence structured and covered in the long-term.
A change of control, which led to mandatory offers of KTM AG and Pankl Racing Systems AG to their respective shareholders was agreed upon with the conclusion of a syndicate agree- ment between the two majority shareholders regarding the exercise of voting rights in CROSS Industries AG.
Despite difficult market conditions in Europe, Ktm ag managed to increase its revenues to € 612.0m (+16.2% compared to last year) and sales to 98,740 vehicles (+21.6% compared to last year). Under consideration of KTM motorcycles sold by the KTM partner Bajaj in India, 107,142 KTM motorcycles were sold globally in business year 2012.
This increase in sales was only realized through strong market share gains. The relevant market in Europe decreased by over 12% in 2012. KTM was able to increase its market share by about 33% and therefore reached a share of 7.5% on the European total market. Also in the USA, where the market has shown a slightly positive trend, market shares as well as sales and revenues increased by about 25% respectively.
In April 2012 KTM AG successfully placed a 4.375% bond with an emission volume in the amount of € 85m and a term from 2012 to 2017.
Also in April 2012 KTM AG decided to carry out a capital in- crease through the issue of 336,000 shares, which were taken over in total by CROSS Industries AG against the contribution of a claim in the amount of € 8.4m. Due to the above mentioned change of control a mandatory offer was made to the share-holders of KTM AG in June 2012. After the completion of the mandatory offer, the necessary free float of the KTM share was no longer shown on the Second Market. As a result the shares were withdrawn from the Second Market and have been traded on the Third Market (MTF) of the Vienna Stock Exchange since August 2012.
According to prognoses, the prospects for the European total market, which is relevant to the KTM Group will further deteriorate; the American total market however shows a stable to slightly positive development. In order to further pursue the growth course, KTM emphasizes the launch of new models in order to implement the global product strategy as well as further expansion in Asian markets.
Business year 2012 also developed very positively for the Cross motorsport systems group with its shareholdings in Pankl Racing Systems AG and the WP Group. The market environment was positive throughout the year in all segments. The consolidated total revenue of the group increased by 34% to € 235.4m. This extraordinary growth was carried by the massive expansion of revenues in the core segments as well as the integration of new business areas – especially at the WP Group. The profit situation was further significantly improved and the EBIT with € 14.1m more than doubled com- pared to the previous year.
In business year 2012 the Pankl group generated the biggest revenue plus (+21%), the biggest revenue (€ 127.7m) as well as the best operating result (€ 10.4m) in the company’s history. Intensive racing activities and comprehensive development contracts in all racing series enabled Pankl to significantly expand its business and gain important assignments in the high performance and aerospace segments, which led and will further lead to a significant expansion of business. In order to meet the increasing demand, the company has made consider-able investments in connection with the expansion of production capacities, which were mainly related to the plant expansions at the locations in Bruck upon Mur and Kapfenberg.
CROSS Industries AG | Annual Report 2012
5Statement by the Management Board
Pankl Racing Systems AG has made a mandatory offer to its shareholders as well, due to the above mentioned change of control in CROSS Industries AG, where 63,000 shares were delivered. After the completion of the mandatory offer CROSS Motorsport Systems AG owned 59.61% of the share capital of Pankl Racing Systems AG.
For 2013 the Pankl Group is expecting an increase in revenues in view of the good overall economic situation, the already concluded changes in regulations in racing for 2013 and 2014 and the herewith connected development- and testing activities. In business year 2012 important contracts were gained in the high performance- and aerospace segments, which will lead to further expansion of business in business year 2013. With the considerable investments in the past business year Pankl has created a basis for further growth.
In business year 2012 the WP group has further expanded its core business in a stable market environment. Through the acquisition of the exhaust- and frame production from KTM the business activities were expanded. Now the WP Group is able to develop, manufacture and test the whole chassis of a motorcycle. The continuous further development of products is a focal point of the WP Group.
The expansion of new product segments and the therefore broader market posture of the WP Group is a strategically important step towards securing the company’s future in the long-term.
The Wethje group – in which the CROSS Group holds 94% in total – has considerably expanded its business as well due to intensive racing activities and especially through new development orders in the automotive volume-production segment. In total, revenues increased by 15% to € 24.4m.
In 2012 the new RTM-technology (RTM = Resin Transfer Moulding) was considerably expanded at Wethje in order to strengthen the OEM series business. In summer 2012 the auto- motive RTM business of Schweizer Airex AG was taken over and relocated to Pleinting.
To guarantee the necessary capacities for the dispatched volume-production orders in the medium-term, the construction of a plant and the establishment of a technological invest- ment program at the location in Pleinting were started. The introduction of the new SAP ERP system constitutes a further important milestone in the company’s history.
Further shareholdings of the CROSS Group include Cross informatik gmbh with its shareholdings in the IT companies All for One Steeb AG, BRAIN FORCE HOLDING AG as well as Triplan AG.
One of the major projects of Cross immobilien ag – with its shareholding in Wirtschaftspark Wels Errichtungs- und Betriebs-Aktiengesellschaft – was the construction and the partial entry-into-service of a building for WP Performance Systems GmbH and WP Components GmbH in Munderfing in business year 2012.
The development of the CROSS Group depends on the develop-ment of the subsidiaries integrated in the group. We are trying to reach a position, which will make the CROSS Group more independent from the global economic developments in the long-term through the expansion of respective market shares in the individual core segments as well as strategic positioning.
The still present global economic risk will be accounted for by increased controlling- and analysis activities as well as monitoring of economic framework conditions, so changes of those conditions can be swiftly identified and reacted to in the short-term.
In its assessment for business year 2013 the Management anticipates further growth. The order situation for the first half of 2013 is on a good level. The company further puts great emphasis on continuous monitoring and critical assessment of the market situation in order to implement immediate measures for the stabilization of the striven profit situation, if needed. Following the improvement activities the company will further work on rationalization measures.
For 2013 a positive outlook can be given for all business seg- ments of the CROSS Group.
Wels, April 2013
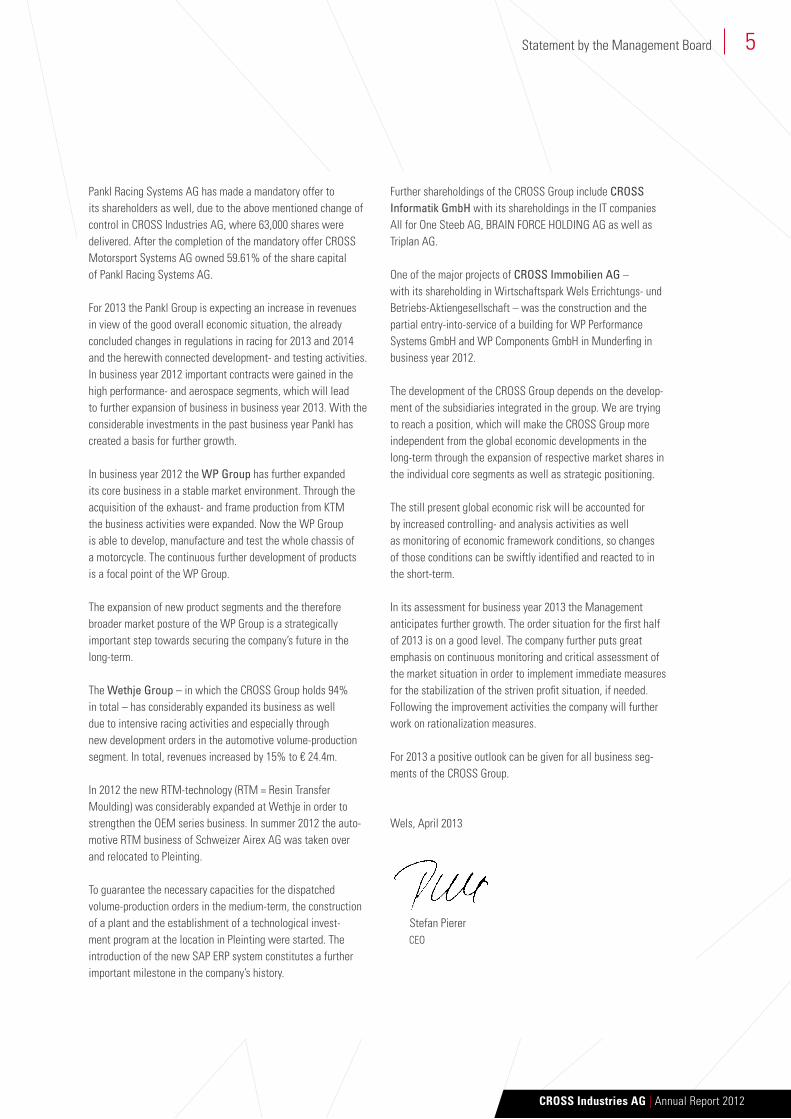
Stefan PiererCEO
bodies of the ComPany
MANAGEMENT BOARD
SUPERVISORy BOARD
6
Stefan Pierer (CEO) Appointed until 31 December 2016
After graduating from the Montan University in Leoben, Austria (Business and Energy Management), Stefan Pierer started his career as sales assistant at HOVAL GmbH in Marchtrenk in 1982 and later on as sales manager and authorized signatory. In 1987, he founded the CROSS Group in which he acts as share- holder and member of the Executive Board. He has been share- holder and member of the Executive Board of the KTM Group since 1992. In February 2010 he became Chairman of the Super- visory Board of CROSS Motorsport Systems AG (before he was member of the Management Board).
Other functions:
– Chairman of the Supervisory Board of Pankl Racing Systems AG
– Chairman of the Supervisory Board of BRAIN FORCE HOLDING AG
– Member of the Supervisory Board of Peguform GmbH
Rudolf Knünz Chairman, Entrepreneur
Josef Blazicek Deputy Chairman, Entrepreneur
Friedrich Roithner (CFO) Appointed until 30 June 2018
After graduating from the Johannes Kepler University, Linz (Business Administration), Friedrich Roithner started his career at Ernst & young GmbH. After three years he left the company and joined Austria Metall AG, where he worked as member of the Management Board from 2002 until 2006. From March 2008 until June 2010 Friedrich Roithner was member of the Management Board of Unternehmens Invest AG; in July 2010 he joined the Management Board of CROSS Industries AG, of CROSS Motorsport Systems AG as well as CROSS Immobilien GmbH. In January 2011 he was appointed CFO of KTM AG.
Other functions:
– Deputy Chairman of the Supervisory Board of
BRAIN FORCE HOLDING AG
– Member of the Supervisory Board of Pankl Racing Systems AG
(since 27 April 2012)
Ernst Chalupsky Member, Attorney (since 25 April 2012)
Gerald Kiska Member, Entrepreneur
Manfred De Bock Member (until 14 July 2012)
CROSS Industries AG | Annual Report 2012
7
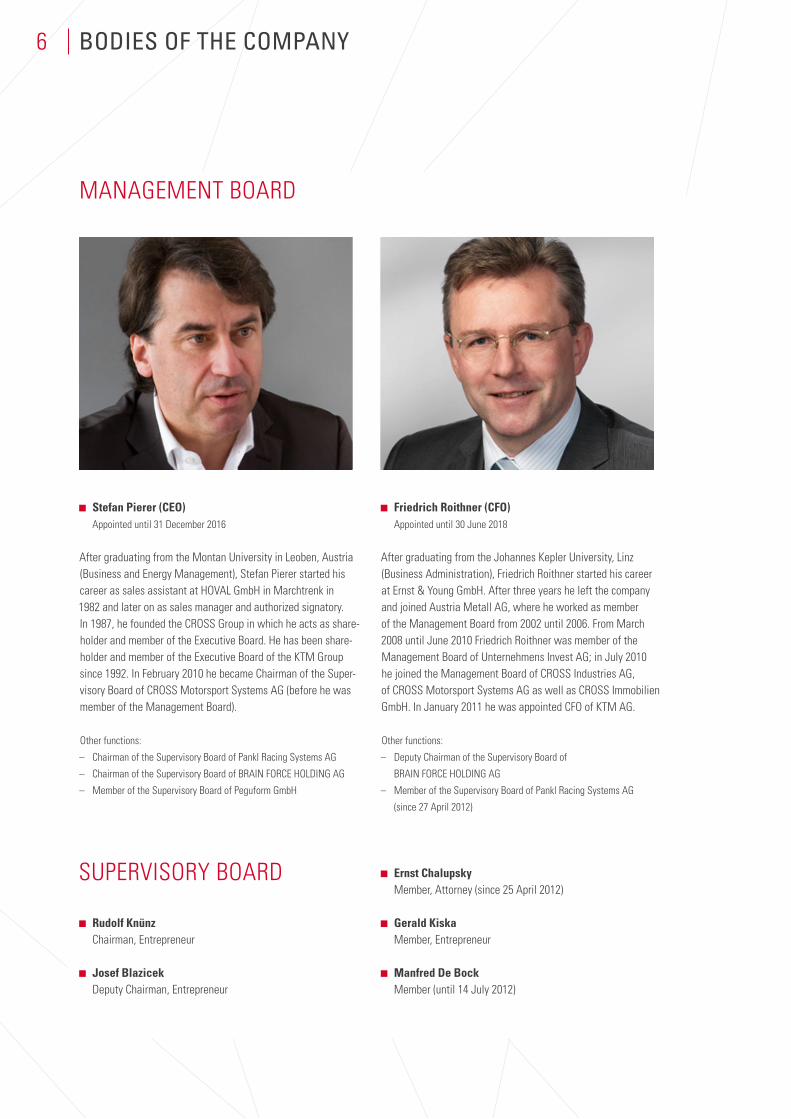
Alfred Hörtenhuber Appointed until 31 January 2018
After taking his school leaving exam Alfred Hörtenhuber began his career as sales assistant at K. Rosenbauer KG in Leonding in 1975 and afterwards as export manager for Western Europe. He completed a management training at the MZSG St. Gallen and the IMD Lausanne. In 1985 Alfred Hörtenhuber joined the Miba Group, where he started out as marketing manager. In 1990 he became member of the Management Board and was responsible for marketing, research and development of Miba Sintermetall AG. In 1998 he was appointed member of the Management Board of Miba AG and CEO of the Miba Friction Group. Since 2008 Alfred Hörtenhuber has been member of the Management Board of CROSS Motorsport Systems AG and since October 2010 also member of the Management Board of CROSS Industries AG.
Other functions:
– Member of the Supervisory Board of Pankl Racing Systems AG
– Member of the Supervisory Board of KTM AG
(since 26 September 2012)
Klaus Rinnerberger Appointed until 30 September 2013
After graduating from the University of Vienna (Law) Klaus Rinnerberger startet his career in 1987 at Arthur Andersen & Co as auditor and consultant. He had several executive positions in the automotive industry, e.g. member of the Management Board of Magna Automobiltechnik AG and Magna Steyr AG. In 2009 he became member of the Management Board of Polytec Holding AG and in October 2010 he became member of the Management Board of CROSS Industries AG.
Other functions:
– Member of the Supervisory Board of SMP Deutschland GmbH
Bodies of the Company
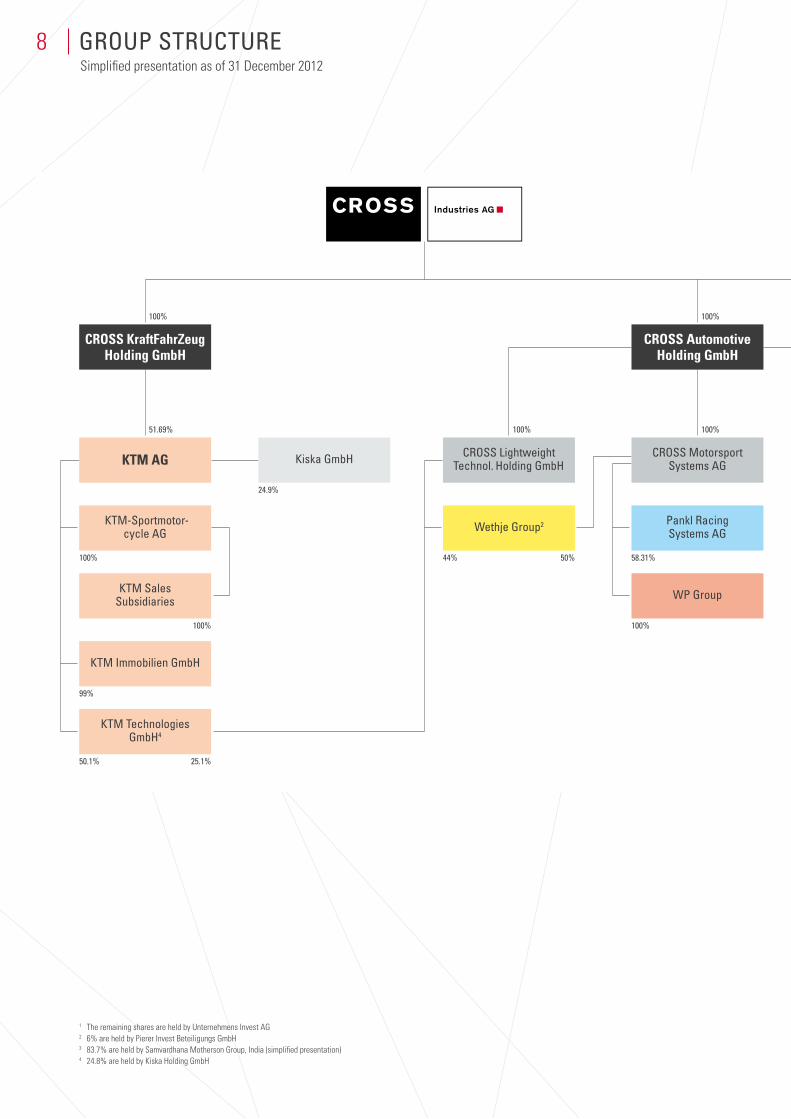
grouP struCture8Simplified presentation as of 31 December 2012
1 The remaining shares are held by Unternehmens Invest AG2 6% are held by Pierer Invest Beteiligungs GmbH3 83.7% are held by Samvardhana Motherson Group, India (simplified presentation)4 24.8% are held by Kiska Holding GmbH
Ktm salessubsidiaries
Ktm immobilien gmbh
Ktm technologies gmbh4
Ktm-sportmotor-cycle ag
CROSS KraftFahrZeugHolding GmbH
100%
99%
50.1% 25.1%
100%
100%
51.69%
44%
24.9%
50% 58.31%
100%
WP group
Cross Lightweight technol. holding gmbh
Cross motorsportsystems ag
CROSS Automotive Holding GmbH
Wethje group2 Pankl racing systems ag
100%
100% 100%
KTM AG Kiska gmbh
CROSS Industries AG | Annual Report 2012
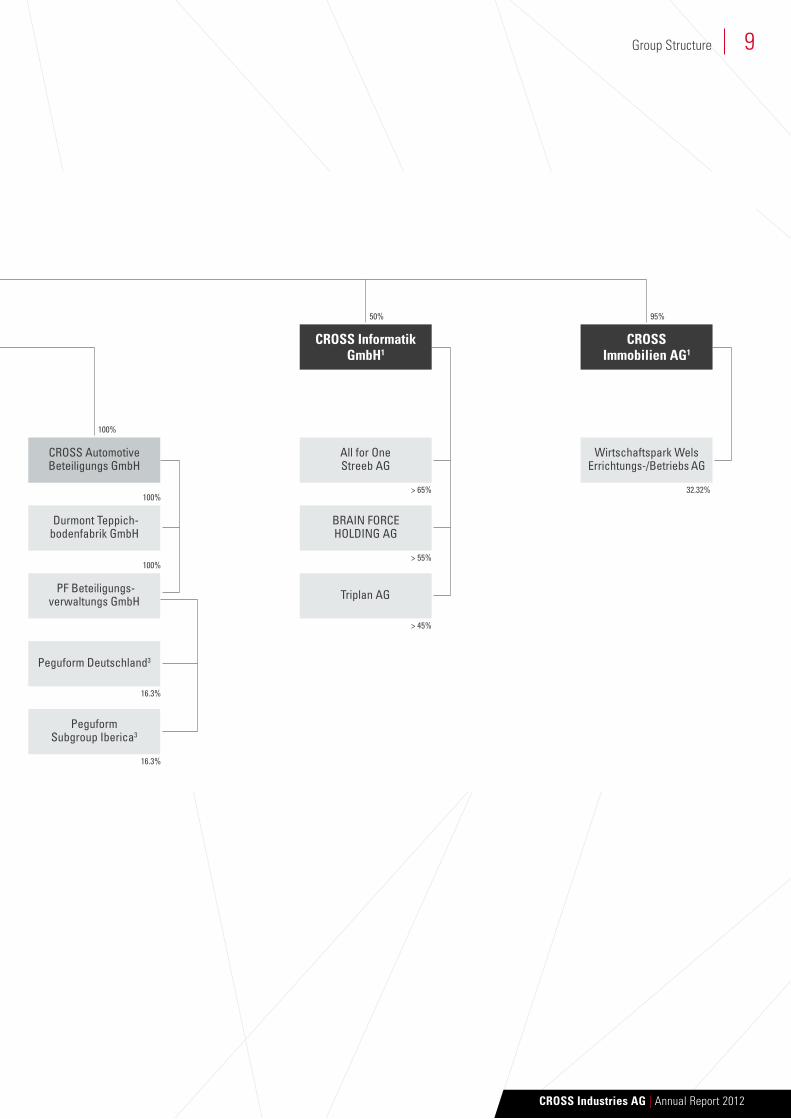
9Group Structure
triplan ag
CROSS Informatik GmbH1
CROSS Immobilien AG1
all for one streeb ag
Wirtschaftspark Wels errichtungs-/betriebs ag
brain forCe hoLding ag
> 65% 32.32%
> 55%
> 45%
50% 95%
100%
100%
16.3%
16.3%
Peguform deutschland3
durmont teppich- bodenfabrik gmbh
Cross automotive beteiligungs gmbh
Pf beteiligungs- verwaltungs gmbh
Peguform subgroup iberica3
100%
O N E S T O P T E C H N O L O G Y.
Ktm ag
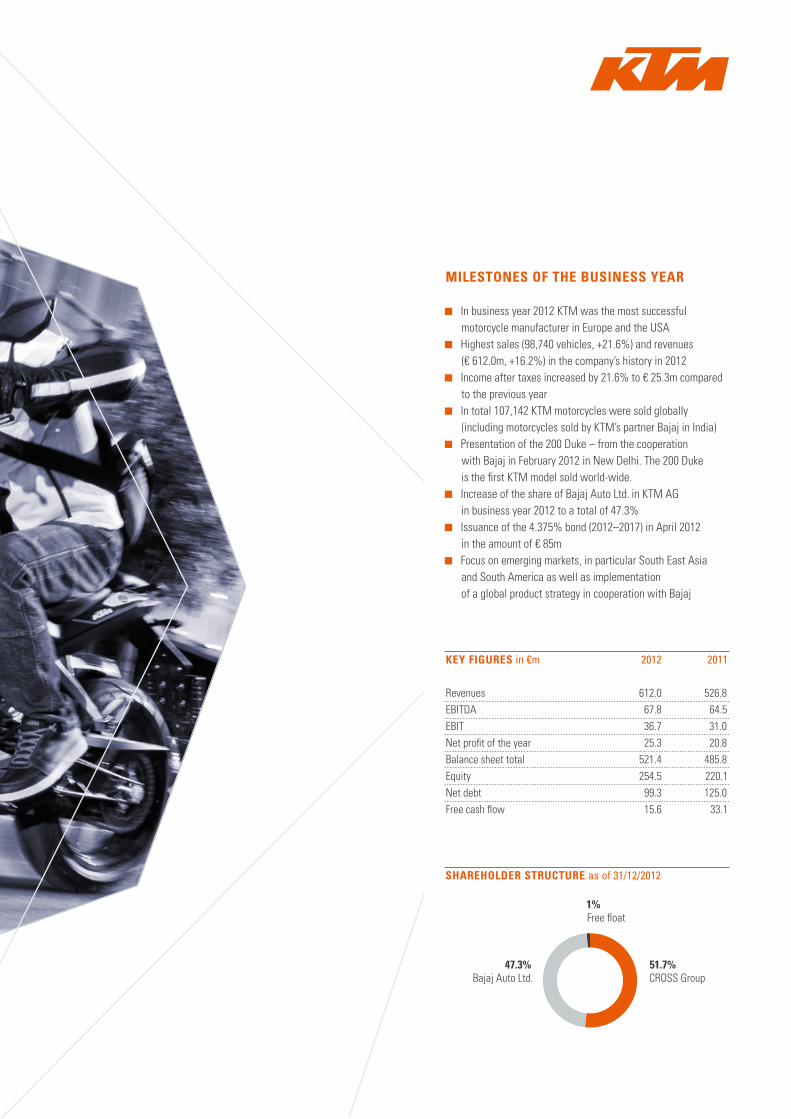
MILESTOnES OF THE BuSInESS yEAR
In business year 2012 KTM was the most successful motorcycle manufacturer in Europe and the USA
Highest sales (98,740 vehicles, +21.6%) and revenues (€ 612.0m, +16.2%) in the company’s history in 2012
Income after taxes increased by 21.6% to € 25.3m compared to the previous year
In total 107,142 KTM motorcycles were sold globally (including motorcycles sold by KTM’s partner Bajaj in India)
Presentation of the 200 Duke – from the cooperation with Bajaj in February 2012 in New Delhi. The 200 Duke is the first KTM model sold world-wide.
Increase of the share of Bajaj Auto Ltd. in KTM AG in business year 2012 to a total of 47.3%
Issuance of the 4.375% bond (2012–2017) in April 2012 in the amount of € 85m
Focus on emerging markets, in particular South East Asia and South America as well as implementation of a global product strategy in cooperation with Bajaj
KEy FIGuRES in €m 2012 2011
Revenues 612.0 526.8EBITDA 67.8 64.5EBIT 36.7 31.0Net profit of the year 25.3 20.8Balance sheet total 521.4 485.8Equity 254.5 220.1Net debt 99.3 125.0Free cash flow 15.6 33.1
SHAREHOLDER STRuCTuRE as of 31/12/2012
1%Free float
47.3%Bajaj Auto Ltd.
51.7%CROSS Group
O N E S T O P T E C H N O L O G Y.
PanKL raCin
g systems ag
MILESTOnES OF THE BuSInESS yEAR
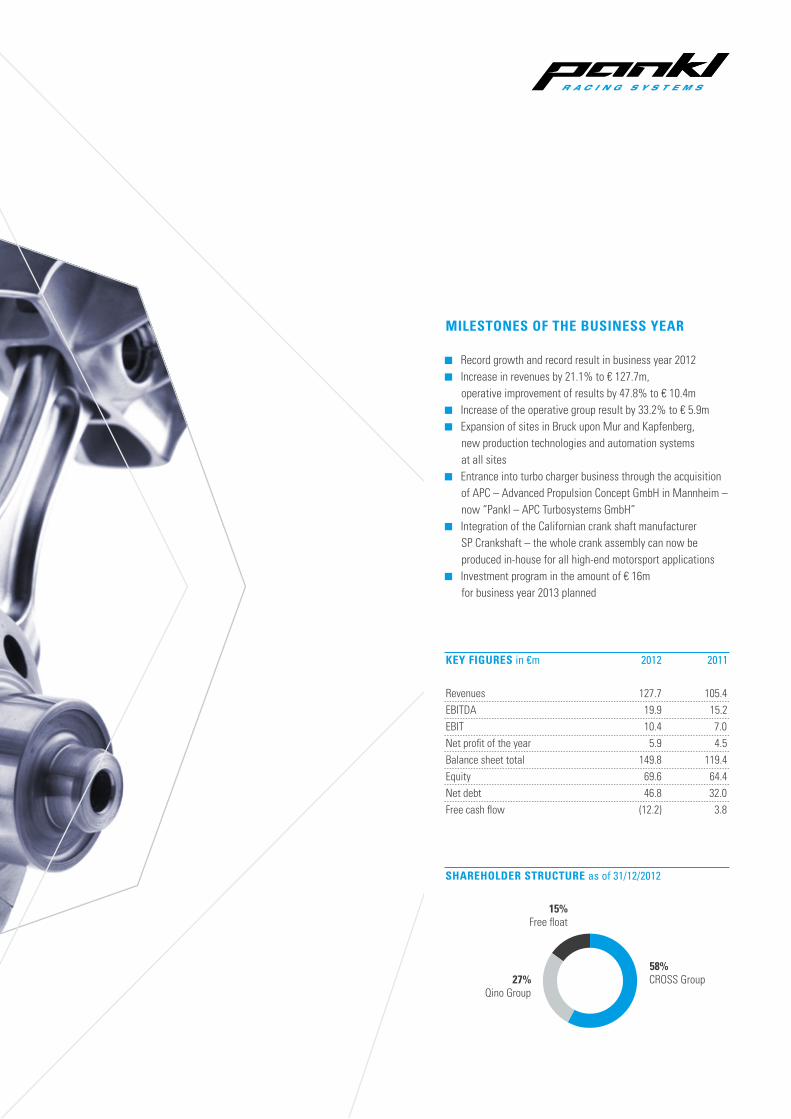
Record growth and record result in business year 2012 Increase in revenues by 21.1% to € 127.7m,
operative improvement of results by 47.8% to € 10.4m Increase of the operative group result by 33.2% to € 5.9m Expansion of sites in Bruck upon Mur and Kapfenberg,
new production technologies and automation systems at all sites
Entrance into turbo charger business through the acquisition of APC – Advanced Propulsion Concept GmbH in Mannheim – now “Pankl – APC Turbosystems GmbH”
Integration of the Californian crank shaft manufacturer SP Crankshaft – the whole crank assembly can now be produced in-house for all high-end motorsport applications
Investment program in the amount of € 16m for business year 2013 planned
KEy FIGuRES in €m 2012 2011
Revenues 127.7 105.4EBITDA 19.9 15.2EBIT 10.4 7.0Net profit of the year 5.9 4.5Balance sheet total 149.8 119.4Equity 69.6 64.4Net debt 46.8 32.0Free cash flow (12.2) 3.8
SHAREHOLDER STRuCTuRE as of 31/12/2012
15%Free float
27%Qino Group
58%CROSS Group
O N E S T O P T E C H N O L O G Y.
WP grouP
MILESTOnES OF THE BuSInESS yEAR
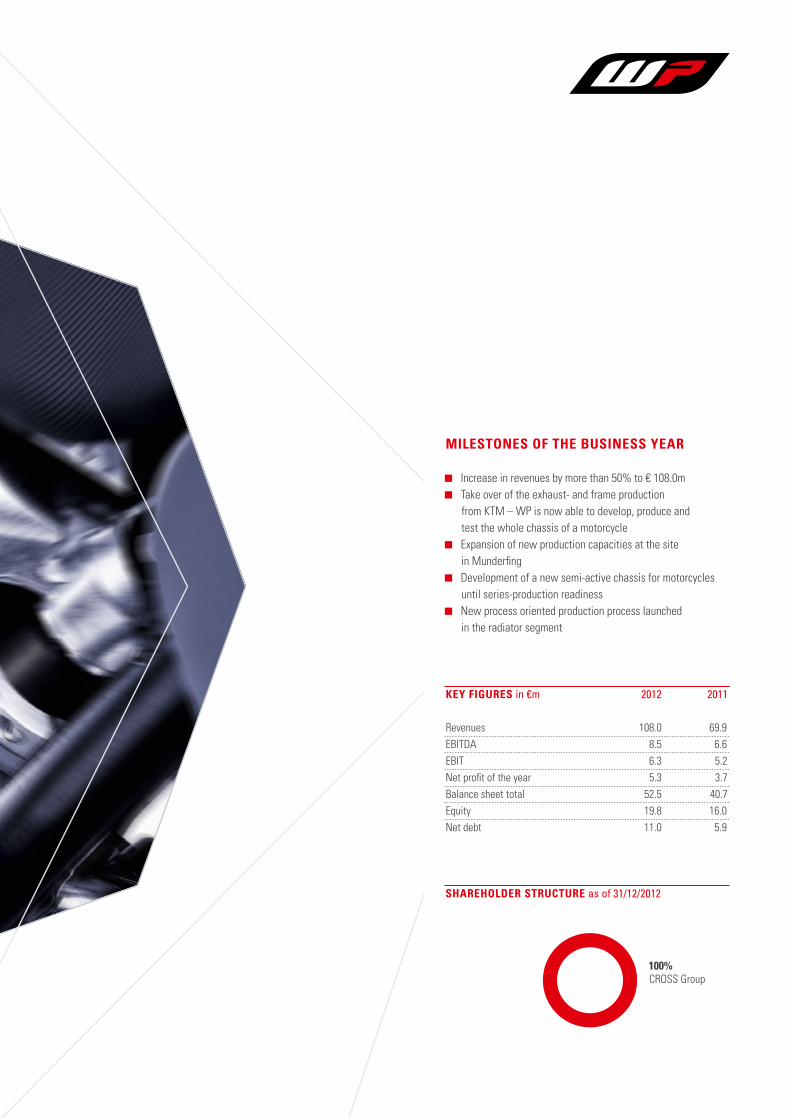
Increase in revenues by more than 50% to € 108.0m Take over of the exhaust- and frame production
from KTM – WP is now able to develop, produce and test the whole chassis of a motorcycle
Expansion of new production capacities at the site in Munderfing
Development of a new semi-active chassis for motorcycles until series-production readiness
New process oriented production process launched in the radiator segment
KEy FIGuRES in €m 2012 2011
Revenues 108.0 69.9EBITDA 8.5 6.6EBIT 6.3 5.2Net profit of the year 5.3 3.7Balance sheet total 52.5 40.7Equity 19.8 16.0Net debt 11.0 5.9
100%CROSS Group
SHAREHOLDER STRuCTuRE as of 31/12/2012
O N E S T O P T E C H N O L O G Y.
Wethje grouP
MILESTOnES OF THE BuSInESS yEAR
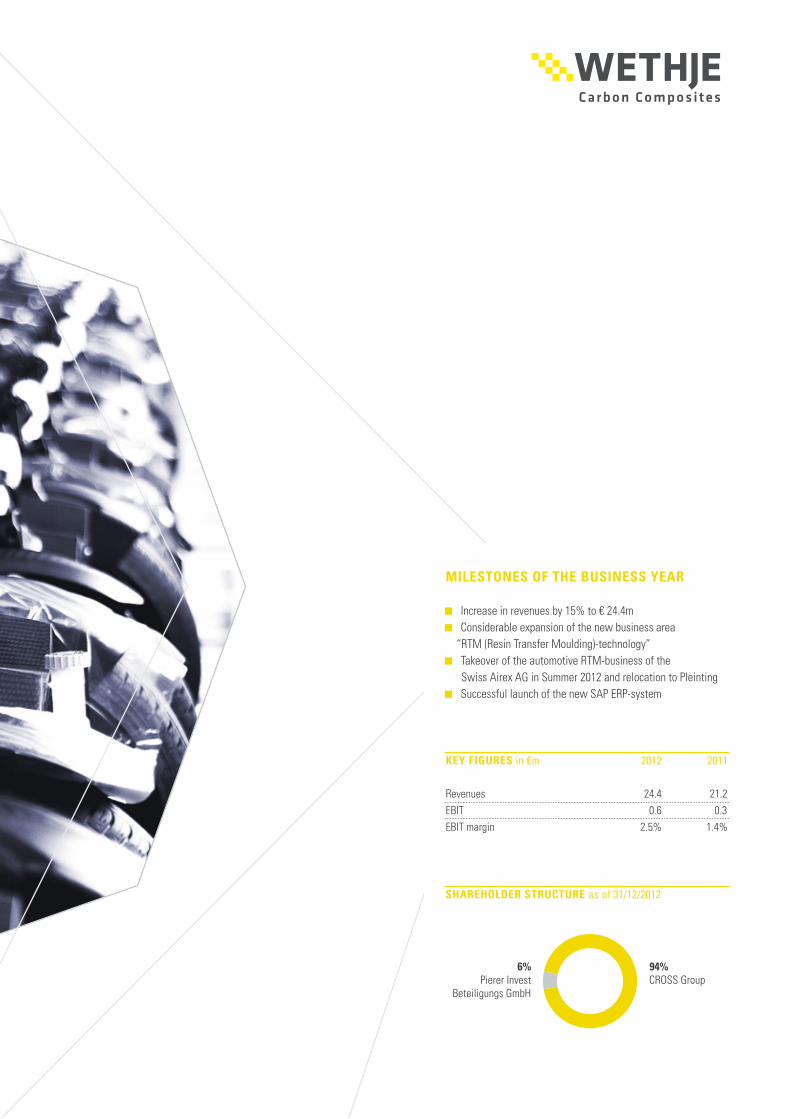
Increase in revenues by 15% to € 24.4m Considerable expansion of the new business area “RTM (Resin Transfer Moulding)-technology”
Takeover of the automotive RTM-business of the Swiss Airex AG in Summer 2012 and relocation to Pleinting
Successful launch of the new SAP ERP-system
KEy FIGuRES in €m 2012 2011
Revenues 24.4 21.2EBIT 0.6 0.3EBIT margin 2.5% 1.4%
94%CROSS Group
SHAREHOLDER STRuCTuRE as of 31/12/2012
6%Pierer Invest
Beteiligungs GmbH
O N E S T O P T E C H N O L O G Y.
Cross info
rmatiK gmbh
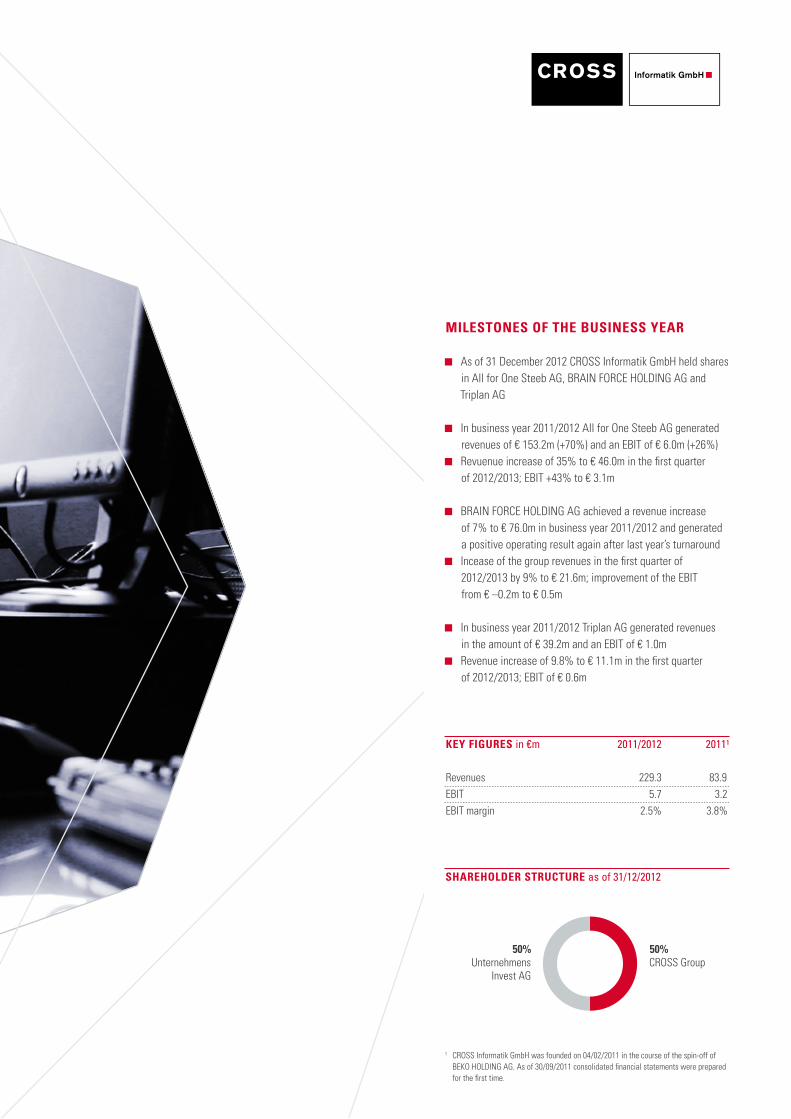
1 CROSS Informatik GmbH was founded on 04/02/2011 in the course of the spin-off of BEKO HOLDING AG. As of 30/09/2011 consolidated financial statements were prepared for the first time.
MILESTOnES OF THE BuSInESS yEAR
As of 31 December 2012 CROSS Informatik GmbH held shares in All for One Steeb AG, BRAIN FORCE HOLDING AG and Triplan AG
In business year 2011/2012 All for One Steeb AG generated revenues of € 153.2m (+70%) and an EBIT of € 6.0m (+26%)
Revuenue increase of 35% to € 46.0m in the first quarter of 2012/2013; EBIT +43% to € 3.1m
BRAIN FORCE HOLDING AG achieved a revenue increase of 7% to € 76.0m in business year 2011/2012 and generated a positive operating result again after last year’s turnaround
Incease of the group revenues in the first quarter of 2012/2013 by 9% to € 21.6m; improvement of the EBIT from € –0.2m to € 0.5m
In business year 2011/2012 Triplan AG generated revenues in the amount of € 39.2m and an EBIT of € 1.0m
Revenue increase of 9.8% to € 11.1m in the first quarter of 2012/2013; EBIT of € 0.6m
KEy FIGuRES in €m 2011/2012 20111
Revenues 229.3 83.9EBIT 5.7 3.2EBIT margin 2.5% 3.8%
50%CROSS Group
50%Unternehmens
Invest AG
SHAREHOLDER STRuCTuRE as of 31/12/2012
Informatik GmbH
O N E S T O P T E C H N O L O G Y.
Cross immobiLi
en ag
MILESTOnES OF THE BuSInESS yEAR
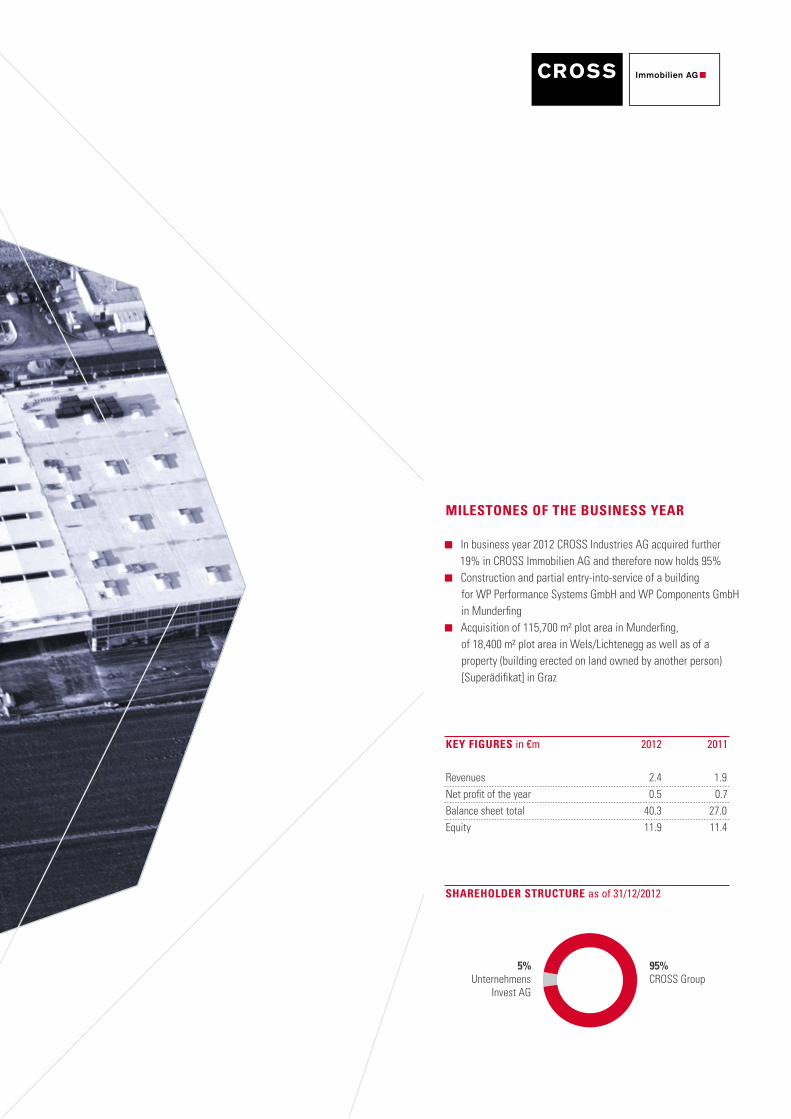
In business year 2012 CROSS Industries AG acquired further 19% in CROSS Immobilien AG and therefore now holds 95%
Construction and partial entry-into-service of a building for WP Performance Systems GmbH and WP Components GmbH in Munderfing
Acquisition of 115,700 m2 plot area in Munderfing, of 18,400 m2 plot area in Wels/Lichtenegg as well as of a property (building erected on land owned by another person) [Superädifikat] in Graz
KEy FIGuRES in €m 2012 2011
Revenues 2.4 1.9Net profit of the year 0.5 0.7Balance sheet total 40.3 27.0Equity 11.9 11.4
SHAREHOLDER STRuCTuRE as of 31/12/2012
95%CROSS Group
5%Unternehmens
Invest AG
rePort of the suPerVisory board22
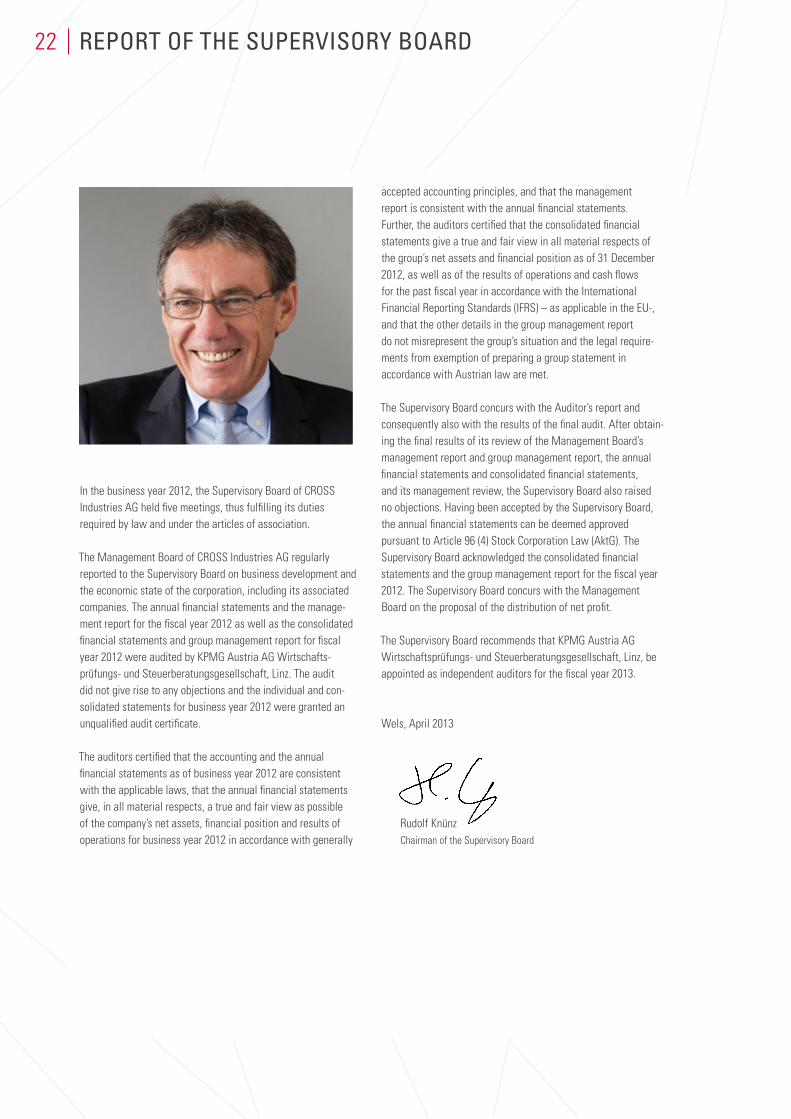
In the business year 2012, the Supervisory Board of CROSS Industries AG held five meetings, thus fulfilling its duties required by law and under the articles of association.
The Management Board of CROSS Industries AG regularly reported to the Supervisory Board on business development and the economic state of the corporation, including its associated companies. The annual financial statements and the manage-ment report for the fiscal year 2012 as well as the consolidated financial statements and group management report for fiscal year 2012 were audited by KPMG Austria AG Wirtschafts-prüfungs- und Steuerberatungsgesellschaft, Linz. The audit did not give rise to any objections and the individual and con- solidated statements for business year 2012 were granted an unqualified audit certificate.
The auditors certified that the accounting and the annual financial statements as of business year 2012 are consistent with the applicable laws, that the annual financial statements give, in all material respects, a true and fair view as possible of the company’s net assets, financial position and results of operations for business year 2012 in accordance with generally
accepted accounting principles, and that the management report is consistent with the annual financial statements. Further, the auditors certified that the consolidated financial statements give a true and fair view in all material respects of the group’s net assets and financial position as of 31 December 2012, as well as of the results of operations and cash flows for the past fiscal year in accordance with the International Financial Reporting Standards (IFRS) – as applicable in the EU-, and that the other details in the group management report do not misrepresent the group’s situation and the legal require- ments from exemption of preparing a group statement in accordance with Austrian law are met.
The Supervisory Board concurs with the Auditor’s report and consequently also with the results of the final audit. After obtain- ing the final results of its review of the Management Board’s management report and group management report, the annual financial statements and consolidated financial statements, and its management review, the Supervisory Board also raised no objections. Having been accepted by the Supervisory Board, the annual financial statements can be deemed approved pursuant to Article 96 (4) Stock Corporation Law (AktG). The Supervisory Board acknowledged the consolidated financial statements and the group management report for the fiscal year 2012. The Supervisory Board concurs with the Management Board on the proposal of the distribution of net profit.
The Supervisory Board recommends that KPMG Austria AG Wirtschaftsprüfungs- und Steuerberatungsgesellschaft, Linz, be appointed as independent auditors for the fiscal year 2013.
Wels, April 2013
Rudolf KnünzChairman of the Supervisory Board
CROSS Industries AG | Annual Report 2012
G R O U P S T A T U S R E P O R T 2 0 12
Table of Contents
Business Development and Company Status 24Financial Situation 26Human Resources 29Important Events after the Balance Sheet Date 29Risk Report 29Research and Development 31Quality and Sustainability 32Environment 32Corporate Social Responsibility 33Outlook 33
grouP status rePortfor Business year 2012
24
business deVeLoPment and ComPany status1.
ExPLAnATIOnS TO THE InvESTMEnT DEvELOPMEnT OF CROSS InDuSTRIES AG (PAREnT COMPAny AnD GROuP)
Regarding its strategic orientation CROSS Industries AG focuses on the automotive, industrial sector. The CROSS Group basically comprises the following strategic core areas:
the subarea “Complete Vehicle” with its 100% share in CROSS KraftFahrZeug Holding GmbH, which holds shares in the KTM Group (formerly: KTM Power Sports Group),
the subarea “High Performance” with its 100% share in the CROSS Motorsport Systems Group (with its share-holdings in Pankl Racing Systems AG, WP Performance Systems GmbH (formerly: WP Suspension Austria GmbH) and its subsidiary WP Components GmbH (formerly: WP Radiator GmbH) as well as
the subarea “Lightweight” with its 100% share in CROSS Lightweight Technologies Holding GmbH, which holds shares in the Wethje Group.
Furthermore, the company still holds 100% of shares in CROSS Automotive Beteiligungs GmbH with a 16.3% interest in the Peguform Group and a 100% interest in Durmont Teppich-bodenfabrik GmbH.
The conclusion of a syndicate agreement between Pierer GmbH and Knünz GmbH on 13 June 2012 led to dominant control of Pierer GmbH over Pierer Invest Beteiligungs GmbH and in the further course to a change of control in KTM AG and Pankl Racing Systems AG. As of 31 December 012 the CROSS Group held 51.69% in the share capital and voting rights in KTM AG indirectly through CROSS KraftFahrZeug Holding GmbH.
As of the reporting date on 31 December 2012 the CROSS Group held about 58.31% in Pankl Racing System AG’s share capital and voting rights. Furthermore, CROSS Motorsport Systems AG has issued a takeover bid to the shareholders on the reporting date of 31 December 2012.
After the conclusion of the share purchase agreement of 29 October 2012, 6% of shares in Wethje Holding GmbH (formerly: Wethje Carbon Composite GmbH) and Wethje Immo- bilien GmbH (formerly: Wethje-Entwicklungs GmbH) were respectively sold from CROSS Lightweight Technologies Holding GmbH to Pierer Invest Beteiligungs GmbH.
Upon the conclusion of the agreement of 20 November 2012 on the one hand the put option from Samvardhana Motherson Peguform GmbH (formerly: Forgu GmbH), from the agree- ment of 22 November 2011 was exercised and 50% of shares in the Wethje Group were purchased from PF Beteiligungs-verwaltungs GmbH instead of from CROSS Motorsport Systems AG; on the other hand respectively 3.72% of shares in SMP Deutschland GmbH (formerly: Peguform GmbH) and in SMP Automotive Technology Iberica, S.L. (formerly: Peguform Iberica S.L.) were sold by PF Beteiligungsverwaltungs GmbH.
As of the reporting date PF Beteiligungsverwaltungs GmbH holds respectively 16.3% of shares in SMP Automotive Technology Iberica, S.L. and in SMP Deutschland GmbH.
On the basis of the share purchase agreement of 13 December 2012 PF Beteiligungsverwaltungs GmbH has sold its 50% share in the Wethje Group to CROSS Motorsport Systems AG.
On the basis of the share purchase agreement of 31 Decem- ber 2012 on the one hand 44% of shares in Wethje Immobilien GmbH and on the other hand 50% of shares in Wethje Immo- bilien GmbH were sold by CROSS Motorsport Systems AG to Wethje Holding GmbH.
As of the reporting date of 31 December 2012 the CROSS Group held 94% of shares in Wethje Holding GmbH through CROSS Lightweight Technologies Holding GmbH and CROSS Motorsport System AG.
Furthermore, as of the reporting date of 31 December 2012 the company held 50% interest in CROSS Informatik GmbH in which the majority interests in BRAIN FORCE HOLDING AG and in All for One Steeb AG (formerly: All for One Mid- market AG) as well as the minority interests in Triplan AG are bundled. CROSS Informatik GmbH is included in the consoli- dated financial statements at equity.
CROSS Industries AG | Annual Report 2012
25Group Status Report
In business year 2012 CROSS Industries AG acquired further 19% of shares in CROSS Immobilien AG and holds 95% in the company as of the reporting date.
Moreover, CROSS Automotive Beteiligungs GmbH still holds 100% in Durmont Teppichbodenfabrik GmbH. CROSS Industries AG holds 100% of shares in CROSS Automotive Holding GmbH.
CROSS Industries AG still holds 100% of shares in CROSS Services GmbH, which is currently undergoing a liquidation process.
Further details regarding interest developments are explained in the notes to the annual financial statements as of 31 December 2012.
BuSInESS PERFORMAnCE
Despite a declining motorcycle market in Europe by about 12% Ktm group improved its revenues to € 612.0m (+16.2% compared to the previous year) and sales to 98,740 vehicles (+21.6% compared to the previous year). Taking into consider-ation the 200 Duke models sold by KTM’s partner Bajaj in India, 107,142 KTM motorcycles were sold worldwide in 2012.
Despite the further declining motorcycle market, this increase in revenues leads to significant market share growth, espe- cially in Europe. Although the market in Europe fell by more than 12% in 2012, KTM managed to increase sales and market shares by about 33%. KTM thus reached a share of 7.5% of the European total market.
In the USA, where the market has developed slightly positive with 1.2%, market shares, sales and revenues increased by about 25% respectively.
For the Cross motorsport systems group business year 2012 developed very satisfactory. Throughout the whole year the market environment developed positively in all segments. As a result the consolidated group revenues were increased by 34% to € 235.4m. This extreme growth can be attributed to a significant increase of revenues in the traditional segments as well as to the integration of new business areas, in particu- lar at the WP Group. Further the group managed to significantly improve the profit situation, compared to the previous year; the EBIT more than doubled with € 14.1m.
Through intensive racing activities and extensive development assignments in all racing series the Pankl group was able to considerable expand business. In the high performance segment as well as in the aerospace segment Pankl was able to win essential assignments, which led and will further lead to a significant expansion of business.
In total the Pankl Group increased revenues by 21% to € 127.7m. In order to meet the increasing demand, the company had to make considerable investments in the expansion of production capacities. This mainly regarded the expansion of the plants at the locations Bruck upon Mur and Kapfenberg.
In a stable market environment the WP group managed to further expand the core business in business year 2012. In addition business activities were also expanded through the acquisition of the exhaust- and frame production from KTM. Now WP is able to develop, test and produce the complete chassis of a motorcycle. One focal point of WP is also the con- tinuous development of products.
Through intensive activities in the racing segment and in par- ticular through new development assignments in the automotive series production segment, the Wethje group was able to considerably expand its business.
In 2012 the new business area, RTM-technology (RTM = Resin Transfer Moulding) was also considerably expanded and the newly installed capacities well utilized. In summer 2012 the automotive RTM business of the Swiss Airex AG was taken over and relocated to Pleinting. In order to secure the needed capacities for the dispatched serial orders in the mid-term, the construction of a new plant and the establishment of a technological investment program were started at the location in Pleinting. The introduction of the new SAP ERP-system is another important milestone in the company’s history.
26 The Company Group Status Report Consolidated Financial Statements Statement of all Legal Representatives
finanCiaL situation2.
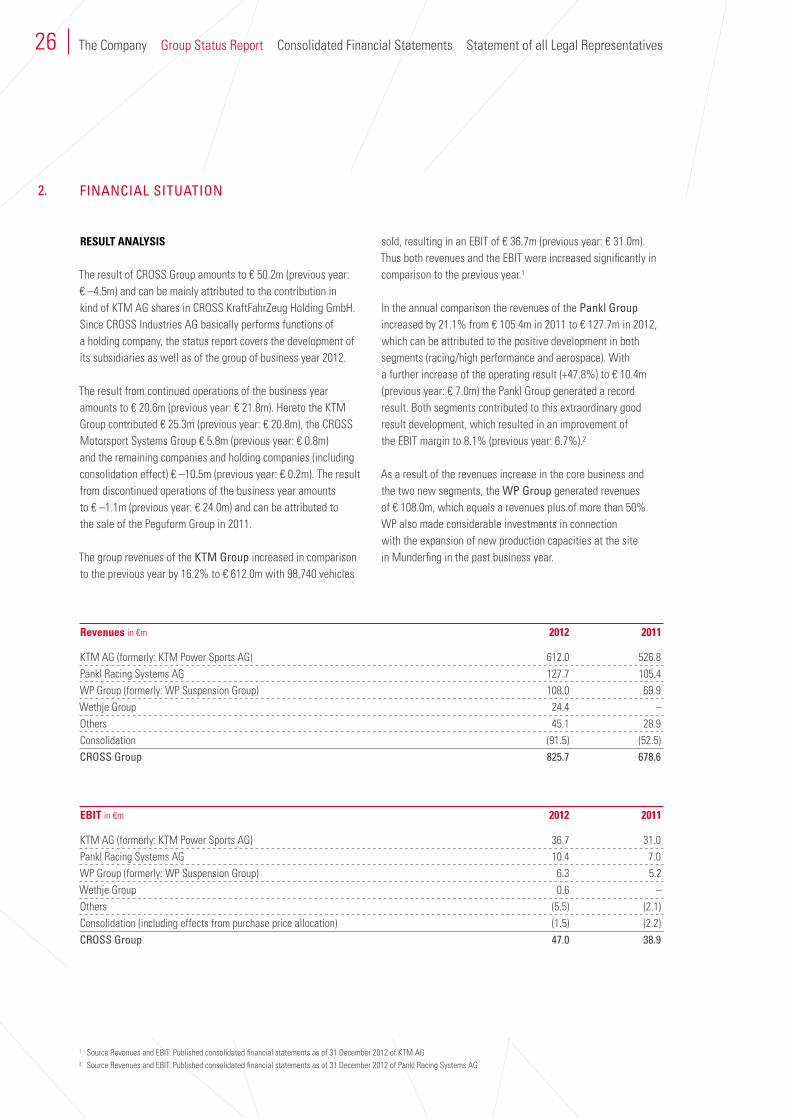
Revenues in €m 2012 2011
KTM AG (formerly: KTM Power Sports AG) 612.0 526.8Pankl Racing Systems AG 127.7 105.4WP Group (formerly: WP Suspension Group) 108.0 69.9Wethje Group 24.4 –Others 45.1 28.9Consolidation (91.5) (52.5)Cross group 825.7 678.6
EBIT in €m 2012 2011
KTM AG (formerly: KTM Power Sports AG) 36.7 31.0Pankl Racing Systems AG 10.4 7.0WP Group (formerly: WP Suspension Group) 6.3 5.2Wethje Group 0.6 –Others (5.5) (2.1)Consolidation (including effects from purchase price allocation) (1.5) (2.2)Cross group 47.0 38.9
RESuLT AnALySIS
The result of CROSS Group amounts to € 50.2m (previous year: € –4.5m) and can be mainly attributed to the contribution in kind of KTM AG shares in CROSS KraftFahrZeug Holding GmbH. Since CROSS Industries AG basically performs functions of a holding company, the status report covers the development of its subsidiaries as well as of the group of business year 2012.
The result from continued operations of the business year amounts to € 20.6m (previous year: € 21.8m). Hereto the KTM Group contributed € 25.3m (previous year: € 20.8m), the CROSS Motorsport Systems Group € 5.8m (previous year: € 0.8m) and the remaining companies and holding companies (including consolidation effect) € –10.5m (previous year: € 0.2m). The result from discontinued operations of the business year amounts to € –1.1m (previous year: € 24.0m) and can be attributed to the sale of the Peguform Group in 2011.
The group revenues of the Ktm group increased in comparison to the previous year by 16.2% to € 612.0m with 98,740 vehicles
sold, resulting in an EBIT of € 36.7m (previous year: € 31.0m). Thus both revenues and the EBIT were increased significantly in comparison to the previous year.1
In the annual comparison the revenues of the Pankl group increased by 21.1% from € 105.4m in 2011 to € 127.7m in 2012, which can be attributed to the positive development in both segments (racing/high performance and aerospace). With a further increase of the operating result (+47.8%) to € 10.4m (previous year: € 7.0m) the Pankl Group generated a record result. Both segments contributed to this extraordinary good result development, which resulted in an improvement of the EBIT margin to 8.1% (previous year: 6.7%).2
As a result of the revenues increase in the core business and the two new segments, the WP group generated revenues of € 108.0m, which equals a revenues plus of more than 50%. WP also made considerable investments in connection with the expansion of new production capacities at the site in Munderfing in the past business year.
1 Source Revenues and EBIT: Published consolidated financial statements as of 31 December 2012 of KTM AG2 Source Revenues and EBIT: Published consolidated financial statements as of 31 December 2012 of Pankl Racing Systems AG
CROSS Industries AG | Annual Report 2012
27Group Status Report
BALAnCE SHEET AnALySIS
In comparison to the same period in the previous year the balance sheet total increased from € 818.5m to € 917.9m, whereby this can be mainly attributed to the first time consoli-dation of the Wethje Group as well as the intensified invest- ment activities in the respective holding companies.
Cash and cash equivalents rose from € 28.3m to € 43.3m. Trade receivables increased by 2.8% to € 73.8m in 2012. Inventory levels increased as well by 8.5% to € 177.9m. Inventories in the amount of € 110.0m basically concern the KTM Group and € 59.5m can be attributed to the CROSS Motorsport Systems Group.
Other current assets and advance payments increased by € 3.8m to € 24.7m in 2012.
Non-current assets rose from € 532.6m to € 596.3m and make up 65.0% (previous year: 65.1%) of the balance sheet total. The increase of non-current assets can be attributed on the one hand to the first time consolidation of the Wethje Group and on the other hand to intensified investment activities in the area property, plant and equipment and intangible assets in 2012.
In comparison to the previous year financial assets decreased by 13.5% to € 69.8m. This is mainly related to the first time full consolidation of the Wethje Group and the reduction of shares in the Peguform Group in connection with this by 20% to 16.3%.
Tangible assets amounted to € 219.6m as of the balance sheet date and rose by € 59.3m compared to the previous year. This increase is mainly related to the first time consoli dation of the Wethje Group as well as increased investment activities in business year 2012. Tangible assets are attributed to the KTM Group with € 92.5m and the CROSS Motorsport Systems Group with € 73.1m.
In 2012 intangible assets increased by 10.4% to € 143.9m. In connection with this item € 61.1m (previous year: € 61.1m) can be attributed to the brand “KTM” and € 64.4m (previous year: € 53.8m) to capitalized development costs at KTM.
Other non-current assets remained almost unchanged in com- parison to the previous year with € 0.1m.
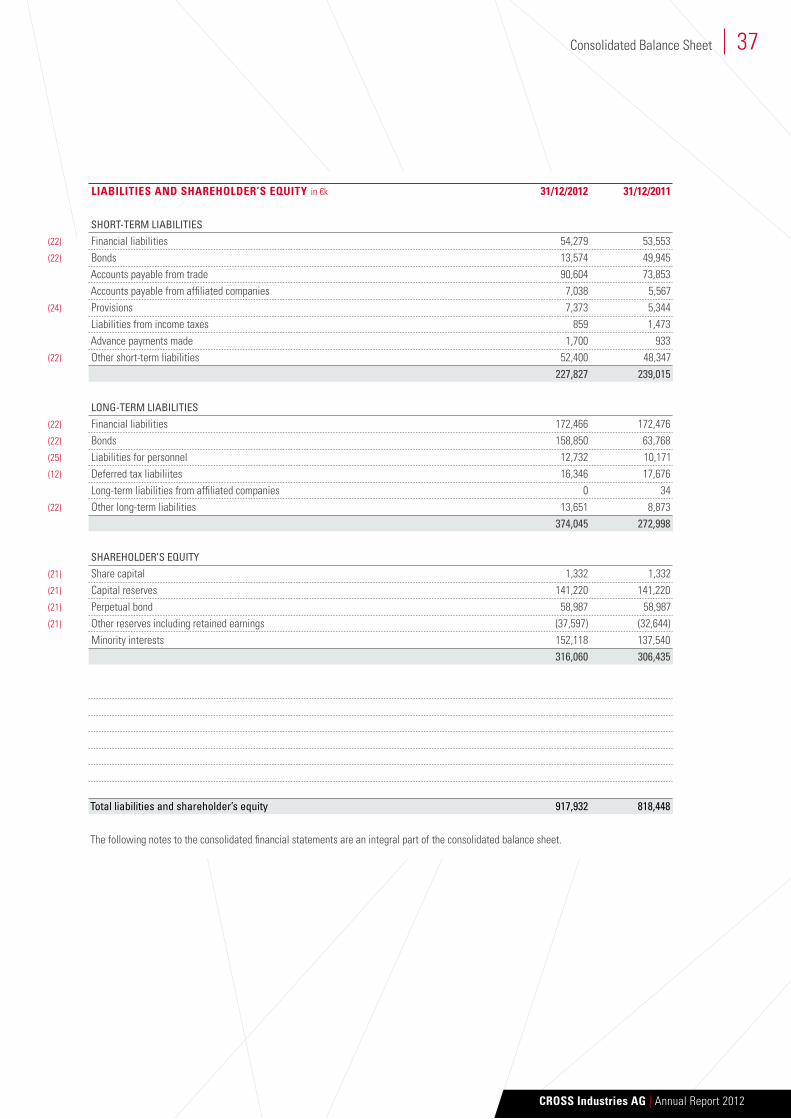
On the liabilities side the increase of the balance sheet total can be found in the following items:
Financial liabilities (current and non-current) remained almost unchanged and amount to € 226.7m as of the balance sheet date.
Bond liabilities (current and non-current) rose in business year 2012 by € 58.7m to € 172.4m. This increase can be attributed to the KTM AG bond, which was placed in April 2012 with a volume of € 85m and a term of five years as well as to the bond placed by CROSS Industries AG in October 2012 with a volume of € 75m and a term of six years. Furthermore, the bond of CROSS Industries AG (2007 to 2012) was redeemed in business year 2012. In business year 2012 a partial redemp-tion of the CROSS Motorsport Systems AG bond (2008 to 2013) with a volume of € 75m was carried out in business year 2012. The redemption of the bond was financed through the equity financing of the CROSS Group, which was concluded in April 2012.
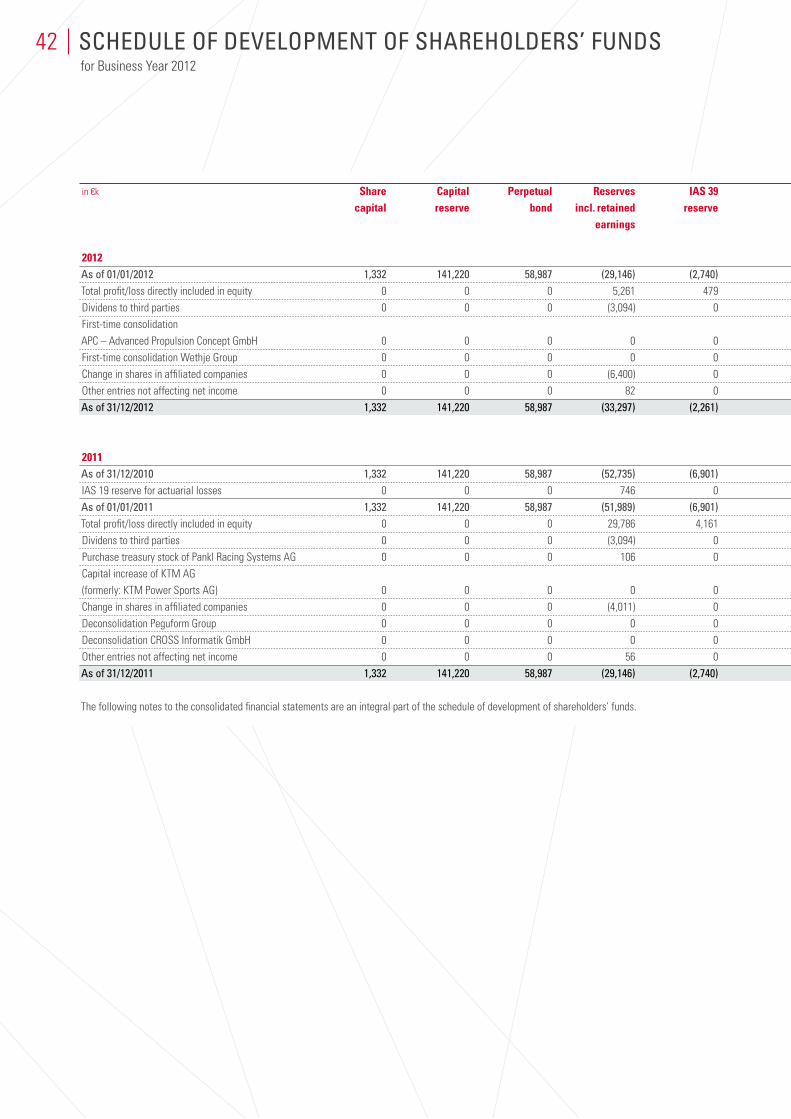
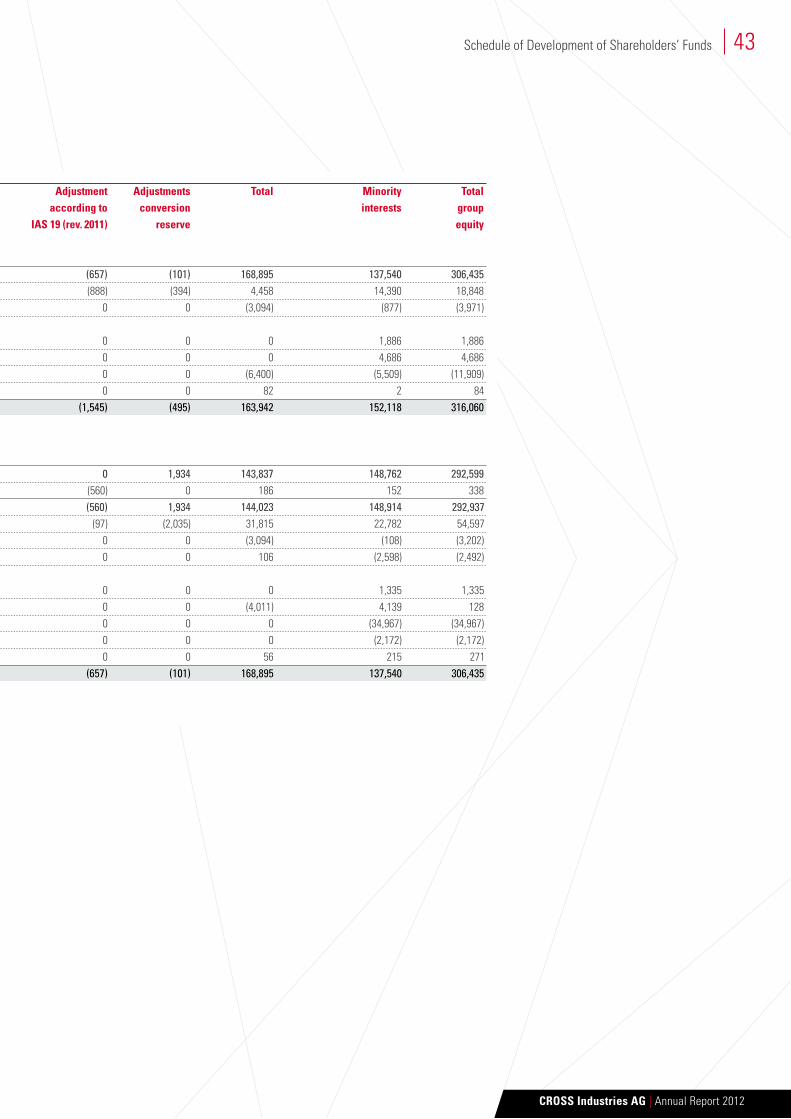
Equity capital rose by € 10.0m to € 326.1m compared to the previous year. In this connection, shares of non-controlling shareholders increased from € 137.5m to € 152.1m, which can be mainly attributed to the positive attributable annual group result. Equity capital of majority shareholders decreased in the previous year by € 5.0m to € 163.9m and mainly results from share purchases in subsidiaries. As of the reporting date the equity ratio amounted 34.4% (previous year: 37.4%).
LIquIDITy AnALySIS
The group cash flow from the operating business amounts to € 75.8m (previous year: € 57.3m) and is composed of the cash flow (€ 67.0m) as well as the changes in balance sheet items in the amount of € 8.8m, due to the positive result develop-ment in the respective subsidiaries. In this respect the KTM Group as well as the Pankl Group especially contributed to this positive development.
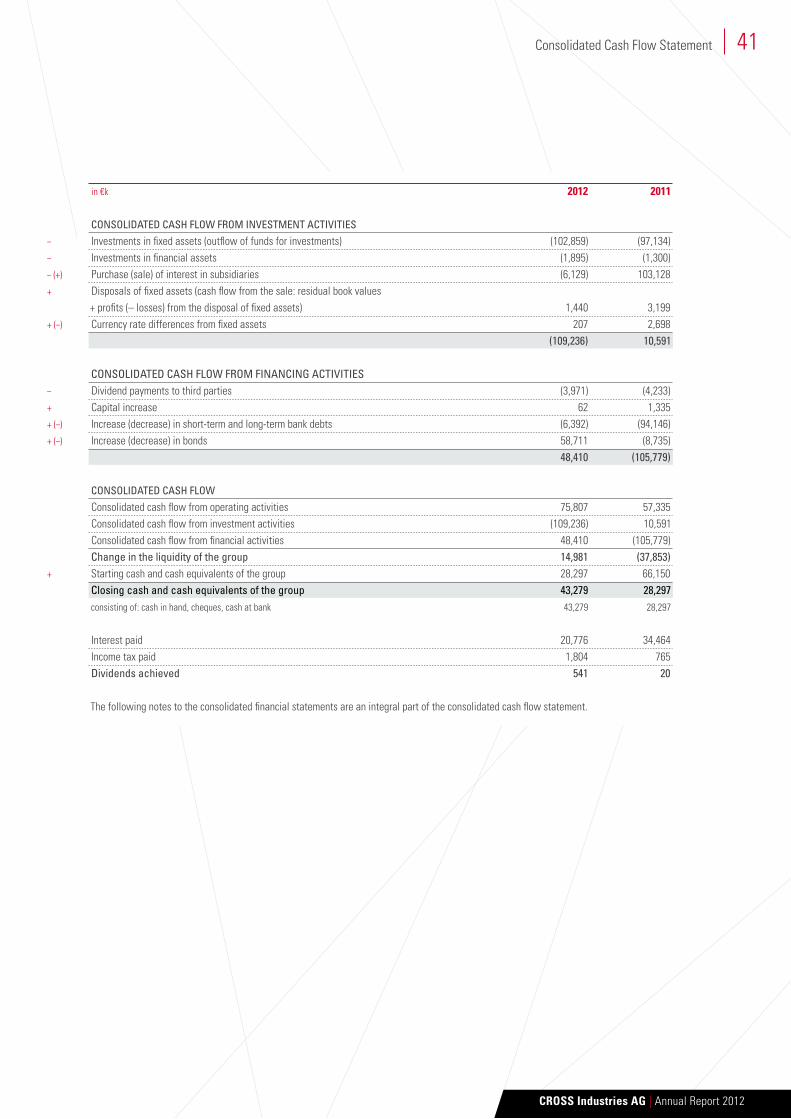
The cash flow from investments in the amount of € –109.2m (previous year: € 10.6m) mainly resulted from expenses for investments and property, plant and equipment as well as intangible assets (€ –102.9m), which are approximately on previous year’s level. In this respect the Pankl Group especially contributed to this figure as a result of the expansion of Austrian locations as well as investments in the engine com-
28 The Company Group Status Report Consolidated Financial Statements Statement of all Legal Representatives
ponents area with € 25.9m (previous year: € 7.8m). In the past business year CROSS Immobilien AG invested in further real estate and properties, apart from the newly constructed site in Munderfing/Mattighofen. In this connection the cash flow from investments amounted to € 16.8m. The total investments of the KTM Group amount to € 56.1m.
The group cash flow from financing activities amounts to € 48.4m (previous year: € –105.8m) and results from the increase of bonds.
InvESTMEnTS
In the past business year the CROSS Group invested € 102.8m in property, plant and equipment as well as intangible assets,
out of which about € 52.4m were taken from the KTM Group and € 27.8m (previous year: € 25.3m) resulted from the capitali- zation of serial production development costs. In this respect investments were made in the development as well as procure- ment of tools with the aim of further development of the already existing product range as well as new products in the off-road and street segments.
The CROSS Motorsport Systems Group has made investments in the amount of € 32.0m (previous year: € 9.7m) in property, plants and equipment as well as intangible assets. This consider- able increase mainly results from the expansion of sites of the Pankl Group in Bruck upon Mur and Kapfenberg, which was necessary in particular due to the good order situation in the aerospace segment and the upcoming large-scale projects in the high performance segment.
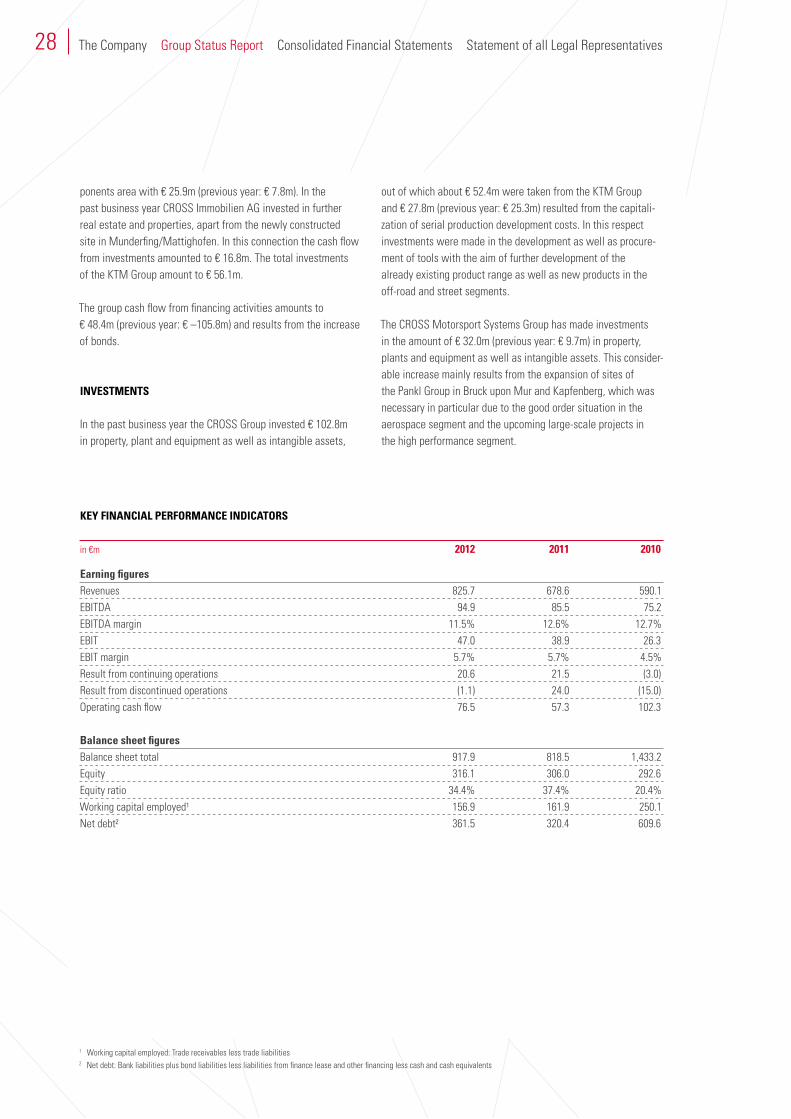
KEy FInAnCIAL PERFORMAnCE InDICATORS
in €m 2012 2011 2010
Earning figuresRevenues 825.7 678.6 590.1EBITDA 94.9 85.5 75.2EBITDA margin 11.5% 12.6% 12.7%EBIT 47.0 38.9 26.3EBIT margin 5.7% 5.7% 4.5%Result from continuing operations 20.6 21.5 (3.0)Result from discontinued operations (1.1) 24.0 (15.0)Operating cash flow 76.5 57.3 102.3
Balance sheet figuresBalance sheet total 917.9 818.5 1,433.2Equity 316.1 306.0 292.6Equity ratio 34.4% 37.4% 20.4%Working capital employed1 156.9 161.9 250.1Net debt2 361.5 320.4 609.6
1 Working capital employed: Trade receivables less trade liabilities2 Net debt: Bank liabilities plus bond liabilities less liabilities from finance lease and other financing less cash and cash equivalents
CROSS Industries AG | Annual Report 2012
29Group Status Report
imPortant eVents after the baLanCe sheet date
risK rePort
3.
4.
5.
As of December 31, 2012 the number of personnel amounted to 3,703 employees (previous year: 3,131 employees). KTM employed 1,647 people on average (31 December 2012: 1,702). As of the reporting date further 1,601 employees from the CROSS Motorsport Systems Group were integrated into the CROSS Group. Out of this number a significant part can be allocated to the Pankl Group with a number of personnel of 1,082 on annual average (31 December 2012: 1,142) as well as the WP Group with an average of 342 employees (31 Decem- ber 2012: 105 employees). Due to the consolidation of the Wethje Group further 279 employees are added to the group.
Our employees have always been the key factor for the com- pany’s success. This is also the reason, why we focus our attention on responsible human resource management. In this respect our apprenticeship program plays an important role, allowing our future technicians to learn and perfect company- specific processes. Moreover we try to fill management positions internally, which provides numerous career- and advancement opportunities for our staff. Apart from the employees’ commitment, another great benefit is that execu- tives already know and understand the company and the business environment.
ECOnOMIC DEvELOPMEnT OF THE MOTORCyCLE InDuSTRy
The production and sale of motorcycles (including spare parts) are dependent on economic trends and depend on general economic conditions, such as industrial production, interest rates, fuel costs as well as consumer spending and preferences on the motorcycle market. From year to year the volume of the OEM production including the demand for spare parts is subject to strong fluctuations in Europe and the rest of the world.
RISK PECuLIAR TO THE TRADE – RACInG
Demand on the racing market is strongly affected by changes of regulations. Since the racing season 2007 only homologated V8-engines may be used in Formula 1. In summer 2011 a
Regarding the important events after the balance sheet date please refer to the notes to the consolidated financial statements (item 29) of CROSS Industries AG.
As a global corporation, the CROSS Industries Group is con- fronted with a large number of potential risks. The Management and Supervisory Boards are regularly informed about any risks that could have a significant effect on business development. Regarding the risk report and the application of original and derivate financial instruments and risk management goals connected with this issue, please refer to the explanations in the notes, item 26.
CROSS InDuSTRIES AG AS A PAREnT COMPAny
The profit situation of CROSS Industries AG is characterized by expenses in connection with financing, share purchases as well as project expenses and mainly depends on the dividend policy of its holding companies. CROSS Industries AG’s interest in the KTM Group currently makes up the biggest and most essential interest.
human resourCes
30 The Company Group Status Report Consolidated Financial Statements Statement of all Legal Representatives
new resolution on a new Formula 1 engine (V6) as of 2014 was passed by the FIA World Motor Sport Council. Furthermore there will be an annual homologation cycle in the course of continuous improvement of efficiency. Especially in the next few years these changes in regulations will lead to high development- and testing activities in the respective racing teams.
In certain other racing classes new regulations and changes in regulations will lead to increased development- and testing activities as well. These changes already take into considera- tion the general trend of engine downsizing and hybridization in the automobile industry and thus represent a new techno-logical challenge for motorsport participants. In this connec- tion there might be the risk that the challenges may not be met in a sufficient manner, however it might be as well an opportunity for Pankl to further expand market shares and further strengthen their leading market position.
ECOnOMIC DEvELOPMEnT OF THE AuTOMOBILE- AnD AEROSPACE InDuSTRy
In general a growing interest in motorsport as a marketing platform can be observed due to the excellent economic situa- tion of automobile companies, allowing Pankl to profit from intensified racing activities. While automobile manufacturers reduced their motorsport budgets and individual manufacturers even dropped out of different racing series in 2008 due to the global economic crisis, more and more automobile manu- facturers started to engage themselves in racing again as of 2009/2010. Currently new development opportunities arise for Pankl through various changes in respective racing classes.
In comparison to the automobile industry, the aerospace industry belongs to a late-cyclic segment. After a recognizable recovery as of mid 2010, the aerospace industry experienced a trend reversal only in the second half of 2011. In particular at the civil helicopter manufacturers a sustainable, positive trend can be observed. This positive development in the aero- space segment is anticipated to continue for Pankl, enhanced through new components.
CHAnGES On THE PROCuREMEnT-, RAw MATERIAL- AnD SALES MARKETS
The procurement market poses a risk to the CROSS Group. This risk is relevant with regard to quantity, quality and prices. The CROSS Group reacts to these risks with continuous auditing of existing and potential suppliers as well as by concluding long-term offtake agreements. The quality of the provided materials is monitored on a regular basis.
The manufacturing company KTM in Mattighofen covers its demand to a great extent on the local procurement market, allowing KTM to play an active role in creating and maintaining regional added value. Aiming at minimizing risks and securing the availability of materials KTM puts great emphasis on selecting new suppliers according to fixed criteria as well as sustainable cooperation and development with already chosen suppliers. Since the quality of KTM products mainly depends on the quality and characteristics of subcomponents that have to be procured, the company puts great emphasis on finan- cial standing, works equipment and production processes of suppliers.
The Pankl Group needs high quality (raw-) materials such as high-grade steel, titanium- and aluminum alloys for the production of individual components. Timely availability of raw materials is – especially in the view of a reviving economy – depended on careful planning of future order volumes. A shortage of materials might lead to delays in production and deliveries or higher material expenses. Since Pankl buys the majority of raw materials abroad, the company is subject to numerous risks including economic or political disruptions, delays in transport or exchange rate fluctuations. Each of the above mentioned risks might have a negative impact on the company’s business operations.
At the WP Group the risk in connection with the procurement markets is currently considered to be high. The supply with certain raw materials (aluminum alloys, special steel and plastic) is currently very difficult and may lead to bottlenecks. The further price development of raw materials is difficult to predict, which may have effects on the WP Group.
CROSS Industries AG | Annual Report 2012
31Group Status Report
REPORTInG On THE ACCOunTInG-RELATED, InTERnAL COnTROL- AnD MAnAGEMEnT SySTEM
The responsibility for the establishment and organization of an accounting-related, internal control- and risk manage- ment system as well as for guaranteeing the adherence to all legal requirements lies with the Management Board. The group accounting of the CROSS corporation is organized within CROSS Industries AG and is under the direct control of the CFO.
The accounting manual of CROSS Industries AG, which is updated on a regular basis, forms the foundation for the group’s accounting and reporting. Therein specified are the uniform group key accounting- and reporting requirements according to IFRS.
Continuous review of goodwill values (impairment) and group assets, which can be allocated to respective corporate divisions, takes place at the corporate headquarters. Contin- uous review of goodwill values (impairment) for subsidiaries integrated into the subgroups is done directly at the group subsidiaries. Adherence to the applicable standards is ensured and monitored at management meetings on a regular basis.
All transactions of the group are recorded, settled and booked with different software solutions (ERP-systems). In smaller companies in some countries accounting is outsourced to local tax advisers. The companies provide the holding with report- ing packages comprising all relevant accounting data for the income statement, the balance sheet and cash flow on a quarterly basis. The information is then entered into the central consolidation system. Provided that the affiliates use the same system as the parent company, the data transfer takes place
In business year 2012 expenses for research and development of the CROSS Group amounted to € 27.5 m (previous year: € 24.2 m). The products of all group companies are on a very high performance level paired with customers’ expectations of consistent development and further development. The product life cycle is subject to strong deviations depending on individual customers.
automatically; only in national companies with other systems the recording is done manually. This information is reviewed and analyzed by CROSS Industries AG and forms the basis for reporting of the CROSS Group according to IFRS.
There is currently no individual internal revision unit. However, the above described internal control- and reporting system is set up to enable the Management Board to identify risks and quickly react to them.
For the internal management reporting we use a common planning- and reporting software or Excel. For the transfer of actual data from the primary system, automated interfaces were created for the most part. The data input for forecast calculations is partly done through a standardized process. Reporting is done for each group company and, if necessary also for various business areas. In addition to reporting on the operative result development for the respectively expired month, also a business year preview is prepared. These reports also provide a summary of the most important events or deviations from the budget figures, the previous year’s period as well as the respective previous forecast calculations and, if necessary, an updated assessment of individual risks.
The explained financial information in connection with the quarterly figures forms the basis of reporting by the Manage-ment Board to the Supervisory Board. At regular meetings the Supervisory Board is informed about the economic development by means of consolidated presentations comprising reporting, result development with budget- and previous year’s com-parisons, forecast calculations, consolidated financial reports, employee- and order developments as well as selected finan- cial indicators.
In business year 2012 the KTM Group employed 265 people on average (16.1% of the overall workforce). In particular in the racing segment, technology leadership is one of the key success factors. All components and systems have to be continuously developed and improved in order to meet highest customer requirements.
researCh and deVeLoPment6.
32 The Company Group Status Report Consolidated Financial Statements Statement of all Legal Representatives
Research and development services represent a main part of the strategic planning of the Pankl Group. Through the acqui- sition of a German turbocharger development company another competency was acquired in the area of advanced charging- and air management systems for combustion engines. Knowl-edge gained in the framework of research and development in the racing segment is systematically applied in the segments
The CROSS Group pursues a consistent and sustainable path in order to improve its quality management system as well as internal and external processes for product development. A quick reaction to market requirements is also of great impor- tance to the group.
KTM creates added value for society and shareholders with strategic leadership, focusing on developing core strengths, continuous improvement of work processes, treating employees and suppliers as partners, and the process-oriented quality management system. With 1,360 people on average work- ing at the facilities in Mattighofen, KTM is one of the largest employers in the region.
We take every opportunity we can to meet the sustainability demands of a modern company. The production and adminis- tration buildings, for example, are energy efficient and eco- nomical on resources, air conditioning for the testing rooms and the tool shop is controlled with groundwater, and we separate various materials for preliminary and finished products, and use returnable containers.
Environmentally responsible behavior and sustainable produc- tion are of great importance to the CROSS Group.
“high performance” and “aerospace” and therefore strengthens Pankl’s market position in these business areas.
Both the Pankl- and the WP Group pursue a consistent and sustainable path with regards to the improvement of their quality management systems and all internal and external processes for product manufacturing as well as quick reactions to market requirements.
The manufacturing company in Mattighofen uses locally sourced products for meeting most of its needs, which means that KTM plays a proactive role in creating and maintaining regional value added.
The development, production and distribution of high quality products are major constituents of the Pankl Racing Systems AG. Pankl secures highest quality standards via comprehensive quality management regarding product quality and process supervision. Additional certifications to meet the expectations of the automotive and aerospace industry are ensured by annual surveillance audits. According to the requirements of the automobile- and aerospace industry the Pankl Group has the following certifications: ISO 9001; ISO/TS 16949, VDA 6.1 and Aerospace license EN 9100.
In addition, Pankl increasingly devotes its attention to ensur- ing and adhering to the quality requirements through its own supply chain (“flow-down of requirements”).
As a manufacturing company, KTM is fully aware of its respon- sibility towards the environment. Setting an innovative example for the entire industry, we have developed a special KTM motorcycle logistic system on reusable metal plates, which dispenses with the need for additional packaging material.
7.
8.
QuaLity and sustainabiLity
enVironment
CROSS Industries AG | Annual Report 2012
33Group Status Report
KTM meets Euro3, the European emission standard for motor- cycles, with all off-road carburetors (EXC models). The standard not only applies to new, but also to already existing vehicle types. We primarily achieve compliance by using fuel injection systems.
In the previous business year there were no expenses in connection with the purchase of CO²-certificates. The Pankl Group is not registered for the national allocation plan (NAP).
For 2013 a positive outlook can be given for all business seg- ments of the CROSS Group.
According to prognoses the overall European market will further slightly recline for the Ktm group due to the overall economic crisis. The American overall market shows a stable to slightly positive development. Through the implementa- tion of new models KTM consistently pursues a global product strategy and further expansion into Asian markets.
A major focus in the Cross motorsport systems group is laid on the development of new products and components, which is a key factor for the successful development of the company in the future. Apart from that the expansion into new product areas and the herewith connected broader market positioning of the WP Group constitute a strategically important step for the long-term securing of the company.
Because of the good overall economic situation as well as already concluded changes in regulations in the racing segment for 2013 and 2014 and herewith connected development- and
9.
10.
KTM supports the Wings for Life Spinal Cord Research Foun- dation, which was set up by Heinz Kinigadner, in all marketing issues in connection with KTM. Wings for Life is a non-profit organization which follows the principle aim of promoting research worldwide in order to expedite scientific and clinical progress towards a putative cure for spinal cord injury (SCI) paralysis.
Our operating entities choose which social projects are supported by the company, because they know the local needs and requirements. Since we strive to assume socio-political responsibility, for many years we have been appointing BBRZ (education and rehabilitation center) to run the canteen of our Kapfenberg facility in order to help integrating handicapped persons.
The development of the CROSS Group strongly depends on the development of subsidiaries integrated in the corporation. The global economic development, triggered by the banking- and financial crisis led to a significant reduction in market value of major associate companies of the group already in business year 2008/2009, which however could already be made up for.
Due to the still challenging global economic development, the planning at group subsidiaries is subject to an increased planning risk, which has to be faced with enhanced monitor- ing of economic framework conditions.
For business year 2013 the management anticipates further growth. Although the order situation for the first half of 2013 is on a good level, framework conditions are still hard to predict in the long-term. Therefore a continuous verification and critical assessment of the market situation is emphasized to be able to implement immediate measures to stabilize the earning position if necessary. In individual segments we are still working on rationalization measures.
CorPorate soCiaL resPonsibiLity
outLooK
34 The Company Group Status Report Consolidated Financial Statements Statement of all Legal Representatives
testing activities, the Pankl group expects growing revenues in 2013. In business year 2012 the Pankl Group was able to win important orders in the aerospace segment, which will lead to further business expansion in the current business year. Thanks to high investments in the past business year Pankl formed the basis for further growth.
In business year 2013 the order situation at the WP group was slightly below previous year’s level, as a result of which we anticipate a slight decrease in revenues in the current year. A further recline of the industry is still possible in many European countries due to public budget consolidation measures. For the WP Group risks in connection with business development may occur due to the tense situation on the suppliers’ side.
As a result of the stable financial situation in all subsidiaries with high equity ratios and financing with matching maturities, new market opportunities will arise for companies of the CROSS Group in 2013.
As a result of the long-term equity financing concluded in busi- ness year 2012 as well as the issue of the KTM bond with a term of five years and the CROSS Industries bond with a term of six years, the future financing requirements of the CROSS Group can be secured.
Wels, 29 March 2013
The Management Board of CROSS Industries AG
Stefan Pierer Friedrich Roithner
Alfred Hörtenhuber Klaus Rinnerberger
C O N S O L I D A T E DF I N A N C I A L S TAT E M E N T S 2 012
Table of Contents
Consolidated Balance Sheet 36Consolidated Income Statement 38Consolidated Statement of Comprehensive Income 39Consolidated Cash Flow Statement 40Schedule of Development of Shareholders’ Funds 42
Notes to the Consolidated Financial Statements 44List of the Equity Interests 92
Independent Auditor’s Report 96
CROSS Industries AG | Annual Report 2012
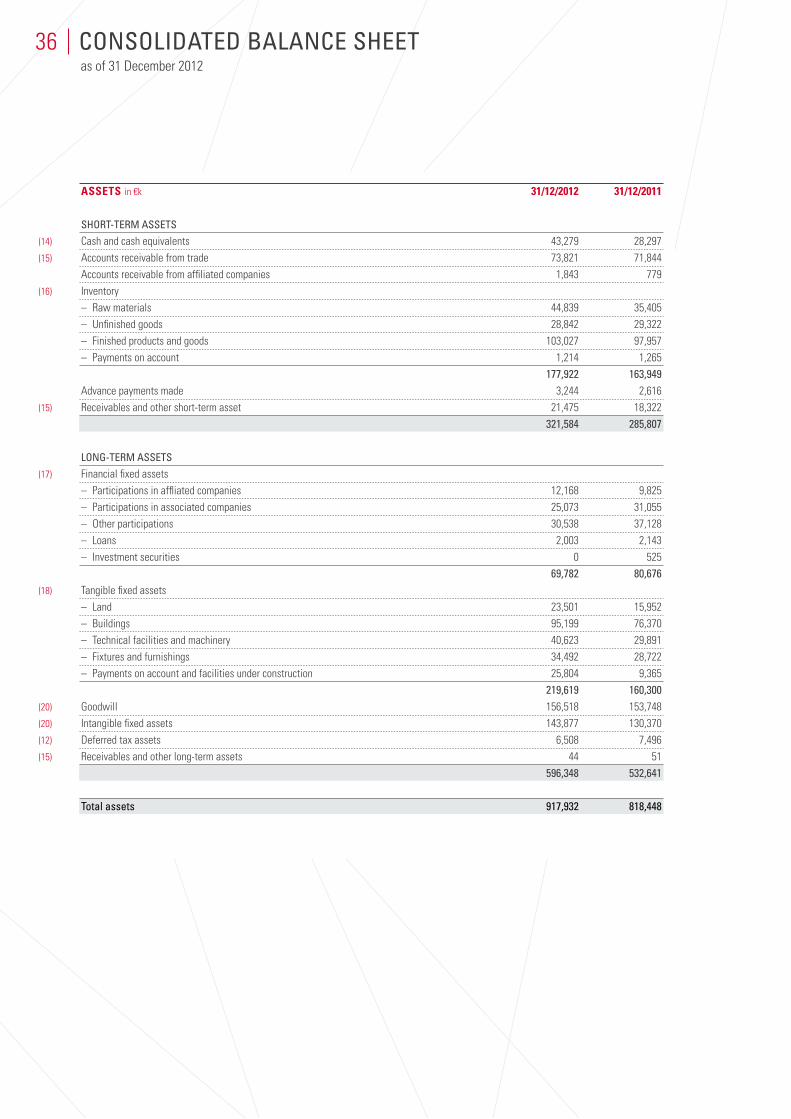
ASSeTS in €k 31/12/2012 31/12/2011
Short-term aSSetS
Cash and cash equivalents 43,279 28,297Accounts receivable from trade 73,821 71,844Accounts receivable from affiliated companies 1,843 779Inventory– Raw materials 44,839 35,405– Unfinished goods 28,842 29,322– Finished products and goods 103,027 97,957– Payments on account 1,214 1,265 177,922 163,949Advance payments made 3,244 2,616Receivables and other short-term asset 21,475 18,322 321,584 285,807
Long-term aSSetS
Financial fixed assets– Participations in affliated companies 12,168 9,825– Participations in associated companies 25,073 31,055– Other participations 30,538 37,128– Loans 2,003 2,143– Investment securities 0 525 69,782 80,676Tangible fixed assets– Land 23,501 15,952– Buildings 95,199 76,370– Technical facilities and machinery 40,623 29,891– Fixtures and furnishings 34,492 28,722– Payments on account and facilities under construction 25,804 9,365 219,619 160,300Goodwill 156,518 153,748Intangible fixed assets 143,877 130,370Deferred tax assets 6,508 7,496Receivables and other long-term assets 44 51 596,348 532,641
total assets 917,932 818,448
(14)
(15)
(16)
(15)
(17)
(18)
(20)
(20)
(12)
(15)
ConSoLidated BaLanCe Sheetas of 31 December 2012
36
(22)
(22)
(24)
(22)
(22)
(22)
(25)
(12)
(22)
(21)
(21)
(21)
(21)
37
CROSS Industries AG | Annual Report 2012
Consolidated Balance Sheet
lIAbIlITIeS And ShARehOldeR’S equITy in €k 31/12/2012 31/12/2011
Short-term LiaBiLitieS
Financial liabilities 54,279 53,553Bonds 13,574 49,945Accounts payable from trade 90,604 73,853Accounts payable from affiliated companies 7,038 5,567Provisions 7,373 5,344Liabilities from income taxes 859 1,473Advance payments made 1,700 933Other short-term liabilities 52,400 48,347 227,827 239,015
Long-term LiaBiLitieS
Financial liabilities 172,466 172,476Bonds 158,850 63,768Liabilities for personnel 12,732 10,171Deferred tax liabiliites 16,346 17,676Long-term liabilities from affiliated companies 0 34Other long-term liabilities 13,651 8,873 374,045 272,998
SharehoLder’S equity
Share capital 1,332 1,332Capital reserves 141,220 141,220Perpetual bond 58,987 58,987Other reserves including retained earnings (37,597) (32,644)Minority interests 152,118 137,540 316,060 306,435
total liabilities and shareholder’s equity 917,932 818,448
The following notes to the consolidated financial statements are an integral part of the consolidated balance sheet.
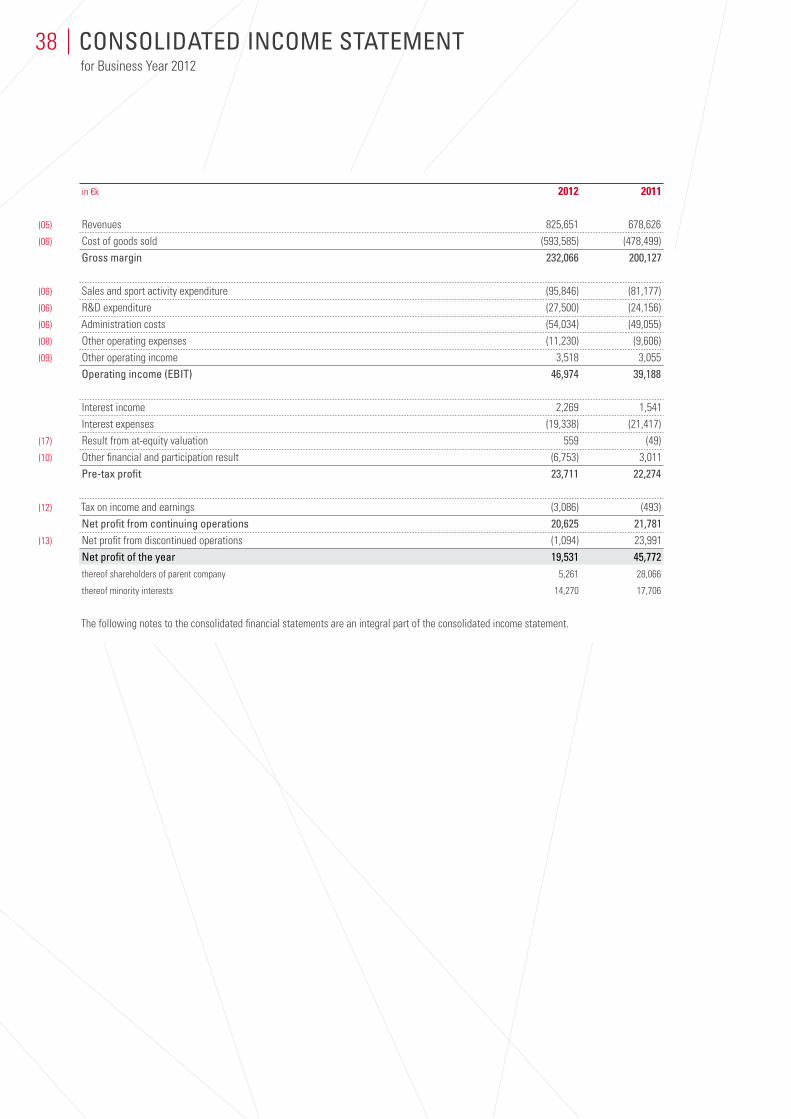
in €k 2012 2011
Revenues 825,651 678,626Cost of goods sold (593,585) (478,499)gross margin 232,066 200,127
Sales and sport activity expenditure (95,846) (81,177)R&D expenditure (27,500) (24,156)Administration costs (54,034) (49,055)Other operating expenses (11,230) (9,606)Other operating income 3,518 3,055operating income (eBit) 46,974 39,188
Interest income 2,269 1,541Interest expenses (19,338) (21,417)Result from at-equity valuation 559 (49)Other financial and participation result (6,753) 3,011Pre-tax profit 23,711 22,274
Tax on income and earnings (3,086) (493)net profit from continuing operations 20,625 21,781Net profit from discontinued operations (1,094) 23,991net profit of the year 19,531 45,772thereof shareholders of parent company 5,261 28,066
thereof minority interests 14,270 17,706
The following notes to the consolidated financial statements are an integral part of the consolidated income statement.
(05)
(06)
(06)
(06)
(06)
(08)
(09)
(17)
(10)
(12)
(13)
ConSoLidated inCome Statementfor Business Year 2012
38
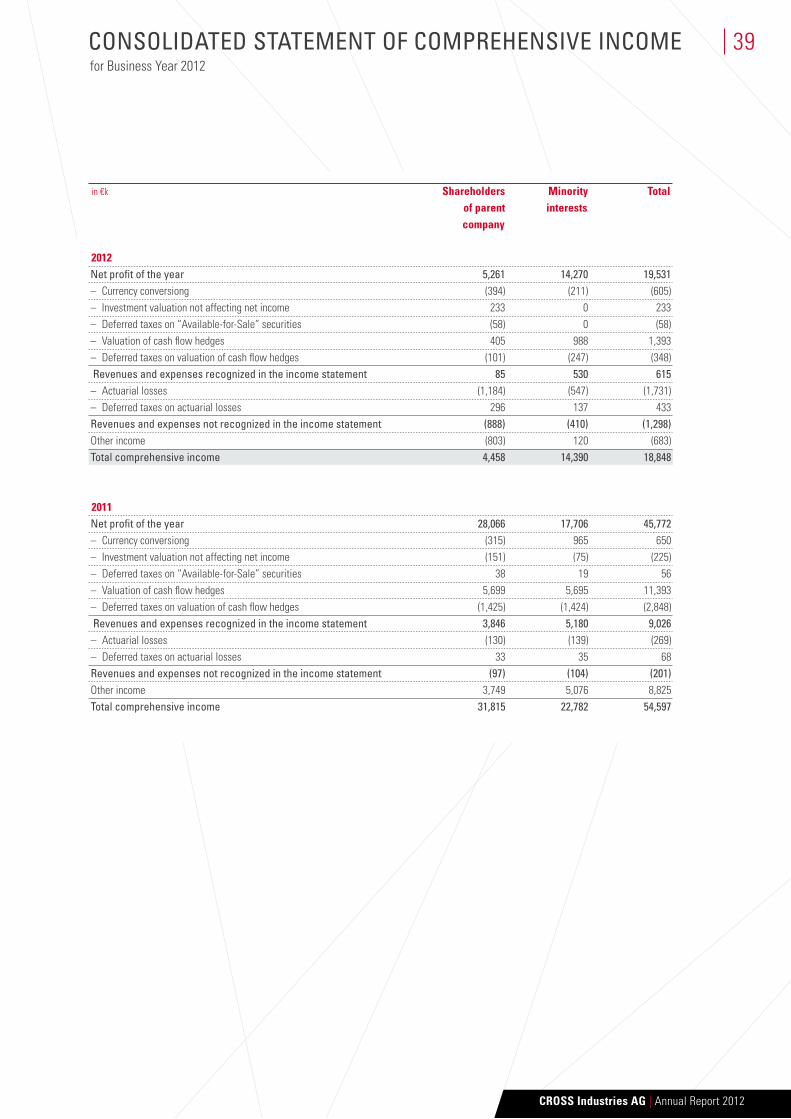
in €k Shareholders Minority Total of parent interests company
2012net profit of the year 5,261 14,270 19,531– Currency conversiong (394) (211) (605)– Investment valuation not affecting net income 233 0 233– Deferred taxes on “Available-for-Sale” securities (58) 0 (58)– Valuation of cash flow hedges 405 988 1,393– Deferred taxes on valuation of cash flow hedges (101) (247) (348) revenues and expenses recognized in the income statement 85 530 615– Actuarial losses (1,184) (547) (1,731)– Deferred taxes on actuarial losses 296 137 433revenues and expenses not recognized in the income statement (888) (410) (1,298)Other income (803) 120 (683)total comprehensive income 4,458 14,390 18,848
2011net profit of the year 28,066 17,706 45,772– Currency conversiong (315) 965 650– Investment valuation not affecting net income (151) (75) (225)– Deferred taxes on “Available-for-Sale” securities 38 19 56– Valuation of cash flow hedges 5,699 5,695 11,393– Deferred taxes on valuation of cash flow hedges (1,425) (1,424) (2,848) revenues and expenses recognized in the income statement 3,846 5,180 9,026– Actuarial losses (130) (139) (269)– Deferred taxes on actuarial losses 33 35 68revenues and expenses not recognized in the income statement (97) (104) (201)Other income 3,749 5,076 8,825total comprehensive income 31,815 22,782 54,597
ConSoLidated Statement of ComPrehenSive inComefor Business Year 2012
39
CROSS Industries AG | Annual Report 2012
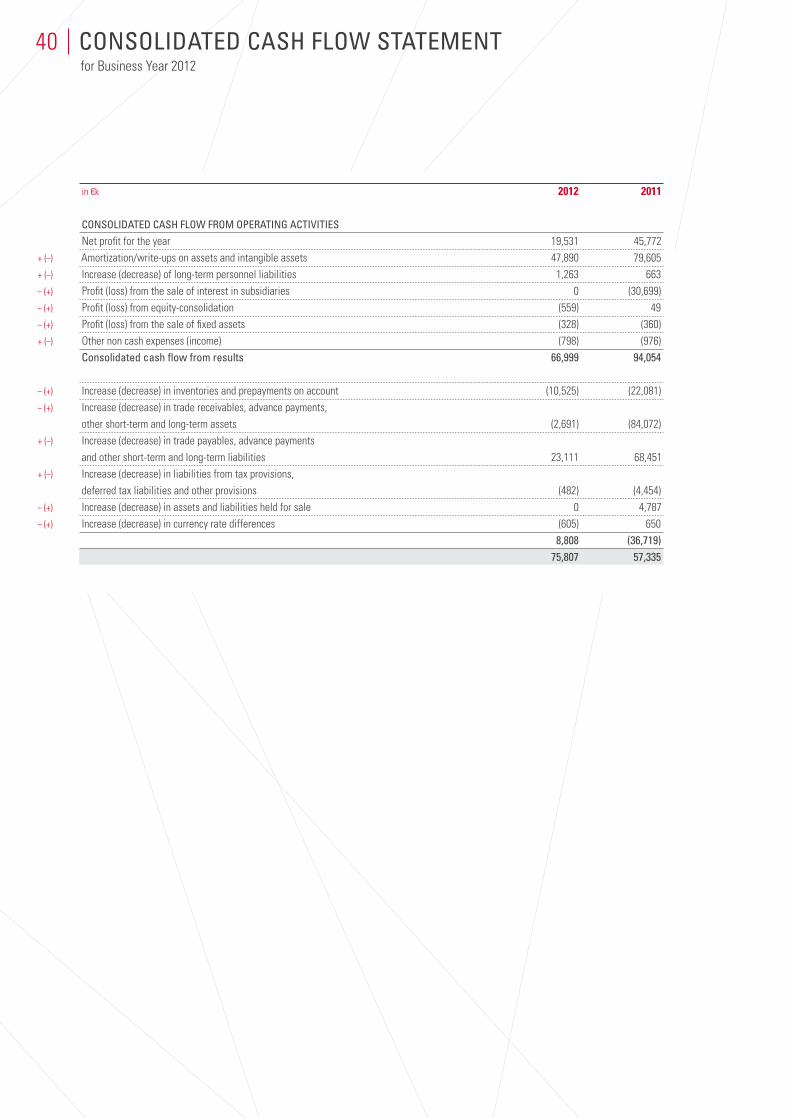
in €k 2012 2011
ConSoLidated CaSh fLow from oPerating aCtivitieS
Net profit for the year 19,531 45,772Amortization/write-ups on assets and intangible assets 47,890 79,605Increase (decrease) of long-term personnel liabilities 1,263 663Profit (loss) from the sale of interest in subsidiaries 0 (30,699)Profit (loss) from equity-consolidation (559) 49Profit (loss) from the sale of fixed assets (328) (360)Other non cash expenses (income) (798) (976)Consolidated cash flow from results 66,999 94,054
Increase (decrease) in inventories and prepayments on account (10,525) (22,081)Increase (decrease) in trade receivables, advance payments, other short-term and long-term assets (2,691) (84,072)Increase (decrease) in trade payables, advance payments and other short-term and long-term liabilities 23,111 68,451Increase (decrease) in liabilities from tax provisions, deferred tax liabilities and other provisions (482) (4,454)Increase (decrease) in assets and liabilities held for sale 0 4,787Increase (decrease) in currency rate differences (605) 650 8,808 (36,719) 75,807 57,335
+ (–)
+ (–)
– (+)
– (+)
– (+)
+ (–)
– (+)
– (+)
+ (–)
+ (–)
– (+)
– (+)
ConSoLidated CaSh fLow Statementfor Business Year 2012
40
in €k 2012 2011
ConSoLidated CaSh fLow from inveStment aCtivitieS
Investments in fixed assets (outflow of funds for investments) (102,859) (97,134)Investments in financial assets (1,895) (1,300)Purchase (sale) of interest in subsidiaries (6,129) 103,128Disposals of fixed assets (cash flow from the sale: residual book values + profits (– losses) from the disposal of fixed assets) 1,440 3,199Currency rate differences from fixed assets 207 2,698 (109,236) 10,591
ConSoLidated CaSh fLow from finanCing aCtivitieSDividend payments to third parties (3,971) (4,233)Capital increase 62 1,335Increase (decrease) in short-term and long-term bank debts (6,392) (94,146)Increase (decrease) in bonds 58,711 (8,735) 48,410 (105,779)
ConSoLidated CaSh fLow
Consolidated cash flow from operating activities 75,807 57,335Consolidated cash flow from investment activities (109,236) 10,591Consolidated cash flow from financial activities 48,410 (105,779)Change in the liquidity of the group 14,981 (37,853)Starting cash and cash equivalents of the group 28,297 66,150Closing cash and cash equivalents of the group 43,279 28,297consisting of: cash in hand, cheques, cash at bank 43,279 28,297
Interest paid 20,776 34,464Income tax paid 1,804 765dividends achieved 541 20
The following notes to the consolidated financial statements are an integral part of the consolidated cash flow statement.
–
–
– (+)
+
+ (–)
–
+
+ (–)
+ (–)
+
41
CROSS Industries AG | Annual Report 2012
Consolidated Cash Flow Statement
in €k Share Capital Perpetual Reserves IAS 39 Adjustment Adjustments Total Minority Total capital reserve bond incl. retained reserve according to conversion interests group earnings IAS 19 (rev. 2011) reserve equity
2012as of 01/01/2012 1,332 141,220 58,987 (29,146) (2,740) (657) (101) 168,895 137,540 306,435Total profit/loss directly included in equity 0 0 0 5,261 479 (888) (394) 4,458 14,390 18,848Dividens to third parties 0 0 0 (3,094) 0 0 0 (3,094) (877) (3,971)First-time consolidation APC – Advanced Propulsion Concept GmbH 0 0 0 0 0 0 0 0 1,886 1,886First-time consolidation Wethje Group 0 0 0 0 0 0 0 0 4,686 4,686Change in shares in affiliated companies 0 0 0 (6,400) 0 0 0 (6,400) (5,509) (11,909)Other entries not affecting net income 0 0 0 82 0 0 0 82 2 84as of 31/12/2012 1,332 141,220 58,987 (33,297) (2,261) (1,545) (495) 163,942 152,118 316,060
2011as of 31/12/2010 1,332 141,220 58,987 (52,735) (6,901) 0 1,934 143,837 148,762 292,599IAS 19 reserve for actuarial losses 0 0 0 746 0 (560) 0 186 152 338as of 01/01/2011 1,332 141,220 58,987 (51,989) (6,901) (560) 1,934 144,023 148,914 292,937Total profit/loss directly included in equity 0 0 0 29,786 4,161 (97) (2,035) 31,815 22,782 54,597Dividens to third parties 0 0 0 (3,094) 0 0 0 (3,094) (108) (3,202)Purchase treasury stock of Pankl Racing Systems AG 0 0 0 106 0 0 0 106 (2,598) (2,492)Capital increase of KTM AG (formerly: KTM Power Sports AG) 0 0 0 0 0 0 0 0 1,335 1,335Change in shares in affiliated companies 0 0 0 (4,011) 0 0 0 (4,011) 4,139 128Deconsolidation Peguform Group 0 0 0 0 0 0 0 0 (34,967) (34,967)Deconsolidation CROSS Informatik GmbH 0 0 0 0 0 0 0 0 (2,172) (2,172)Other entries not affecting net income 0 0 0 56 0 0 0 56 215 271as of 31/12/2011 1,332 141,220 58,987 (29,146) (2,740) (657) (101) 168,895 137,540 306,435
The following notes to the consolidated financial statements are an integral part of the schedule of development of shareholders’ funds.
SCheduLe of deveLoPment of SharehoLderS’ fundSfor Business Year 2012
42
in €k Share Capital Perpetual Reserves IAS 39 Adjustment Adjustments Total Minority Total capital reserve bond incl. retained reserve according to conversion interests group earnings IAS 19 (rev. 2011) reserve equity
2012as of 01/01/2012 1,332 141,220 58,987 (29,146) (2,740) (657) (101) 168,895 137,540 306,435Total profit/loss directly included in equity 0 0 0 5,261 479 (888) (394) 4,458 14,390 18,848Dividens to third parties 0 0 0 (3,094) 0 0 0 (3,094) (877) (3,971)First-time consolidation APC – Advanced Propulsion Concept GmbH 0 0 0 0 0 0 0 0 1,886 1,886First-time consolidation Wethje Group 0 0 0 0 0 0 0 0 4,686 4,686Change in shares in affiliated companies 0 0 0 (6,400) 0 0 0 (6,400) (5,509) (11,909)Other entries not affecting net income 0 0 0 82 0 0 0 82 2 84as of 31/12/2012 1,332 141,220 58,987 (33,297) (2,261) (1,545) (495) 163,942 152,118 316,060
2011as of 31/12/2010 1,332 141,220 58,987 (52,735) (6,901) 0 1,934 143,837 148,762 292,599IAS 19 reserve for actuarial losses 0 0 0 746 0 (560) 0 186 152 338as of 01/01/2011 1,332 141,220 58,987 (51,989) (6,901) (560) 1,934 144,023 148,914 292,937Total profit/loss directly included in equity 0 0 0 29,786 4,161 (97) (2,035) 31,815 22,782 54,597Dividens to third parties 0 0 0 (3,094) 0 0 0 (3,094) (108) (3,202)Purchase treasury stock of Pankl Racing Systems AG 0 0 0 106 0 0 0 106 (2,598) (2,492)Capital increase of KTM AG (formerly: KTM Power Sports AG) 0 0 0 0 0 0 0 0 1,335 1,335Change in shares in affiliated companies 0 0 0 (4,011) 0 0 0 (4,011) 4,139 128Deconsolidation Peguform Group 0 0 0 0 0 0 0 0 (34,967) (34,967)Deconsolidation CROSS Informatik GmbH 0 0 0 0 0 0 0 0 (2,172) (2,172)Other entries not affecting net income 0 0 0 56 0 0 0 56 215 271as of 31/12/2011 1,332 141,220 58,987 (29,146) (2,740) (657) (101) 168,895 137,540 306,435
The following notes to the consolidated financial statements are an integral part of the schedule of development of shareholders’ funds.
43
CROSS Industries AG | Annual Report 2012
Schedule of Development of Shareholders’ Funds
the ComPany
CROSS Industries AG, located in Wels, operates as a holding company, with a particular focus on the acquisition and administration of industrial companies as well as companies and investments in industrial companies, the management of companies and investments being part of the CROSS Group, the performance of services for these companies (group services) as well as, in general, services in the field of management consultancy. CROSS Industries AG is registered with the commercial register Wels, Austria, commercial register certificate FN 261823 i.
The following table shows the main fully consolidated group companies or subgroups, the interest held (taking direct and indirect interests into account), the voting rights held as well as the corporate purpose as of 31 December 2012.
Subsidiaries Share Voting rights Corporate purpose
KTM AG 51.69% 51.69% Development, production and distribution (formerly: KTM Power Sports AG) of motorized leisure equipment (Power Sports)CROSS Motorsport Systems AG 100.00% 100.00% Shareholdings in companies in the automotive sectorPankl Racing Systems AG 58.31% 58.31% Development, production and distribution of motor-, drivetrain and chassis parts for the racing industry, high performance vehicles and the aerospace industryWP Group 100.00% 100.00% Development, production and distribution of suspension units: manufacturing and distribution of radiators and parts for combustion enginesWethje Group 94.00% 94.00% Manufacturing of carbon composite parts for racing and the automotive premium sector
PrinCiPLeS of aCCounting and BaLanCing and vaLuation methodS
PRInCIPleS Of ACCOunTInG
The annual consolidated financial statement as of 31 December 2012 was prepared in accordance with the International Financial Reporting Standards (IFRS), issued by the International Accounting Standards Board (IASB), and the interpretations of the International Financial Reporting Interpretations Committee (IFRIC), to the extent used in the EU. According to article 245a, Austrian Business Enterprise Code (Unternehmensgesetzbuch, UGB), which was added in the framework of the Consolidated Financial Statement Law (Konzernabschlussgesetz), these consolidated financial statements based on IFRS fulfill all Austrian reporting requirements.
Changes in Reporting RulesThe following changes were passed by the IASB for already existing IFRS, and several new IFRS and IFRIC were enacted, which were already adopted by the EU Commission and are thus mandatory applicable as of 1 January 2012:
– IFRS 7 Financial Instruments: Disclosures – Offsetting Financial Assets and Financial Liabilities– Revisions in various IFRS resulting from the improvement process in 2011
noteS to the ConSoLidated finanCiaL StatementSfor Business Year 2012
44
i.
ii.
(01)
The first-time adaption of the listed IFRS had no major impact on the consolidated financial statements compared to the previous year. There were no major effects on the accounting- and valuation methods.
future Changes in Reporting RulesThe IASB and IFRIC have passed further standards and interpretations, which however are not yet binding in business year 2012 and have not yet been adopted by the EU Commission. These standards and interpretations are as follows.
Standard/Amendment Coming eu endorse- Coming into force ment into force IASb eu
IAS 1 Presentation of Financial Statements – Presentation of Items of Other Comprehensive Income 01/07/2012 yes 01/07/2012IAS 12 Income Taxes: Deferred Tax: Recovery of Underlying Assets 01/01/2012 yes 01/01/2013IAS 19 Employee Benefits – Amendments 01/01/2013 yes 01/01/2013IAS 27 Separate Financial Statements 01/01/2013 yes 01/01/2014IAS 28 (Amended 2011) Investments in Associates and Joint Ventures 01/01/2013 yes 01/01/2014IAS 32 Financial Instruments: Presentation – Balancing of Financial Assets and Liabilities 01/01/2014 yes 01/01/2014IFRS 1 First-Time Adoption of International Financial Reporting Standards – Hyperinflation and Elimination of the Fixed Conversion Moment for First-Time Adopters 01/07/2011 yes 01/01/2013IFRS 1 Government Loans 01/01/2013 yes 01/01/2013IFRS 7 Financial Instruments: Disclosures – Offsetting Financial Assets and Financial Liabilities 01/01/2013 yes 01/01/2013IFRS 9 Financial Instruments 01/01/2015 postponed –IFRS 10 Consolidation 01/01/2013 yes 01/01/2014IFRS 11 Joint Arrangements 01/01/2013 yes 01/01/2014IFRS 12 Information to the Notes to the Financial Statements 01/01/2013 yes 01/01/2014IFRS 13 Fair Value Measurement 01/01/2013 yes 01/01/2013IFRIC 20 Stripping Costs in the Production Phase of a Surface Mine 01/01/2013 yes 01/01/2013Investment Entities (Amendments to IFRS 10, IFRS 12 and IAS 27) 01/01/2014 no –Transition Guidance (Amendments to IFRS 10, IFRS 11 and IFRS 12) 01/01/2013 no –Annual Improvements to IFRS 2009–2011 (May 2012) 01/01/2013 no –
IAS 19 (rev. 2011) Employee Benefits – adopted by the EU on 5 June 2012 – is mandatory for business years that start on or after 1 January 2013. Early adoption is permissible; hence the CROSS Group has already applied IAS 19 (rev. 2011) in business year 2012 for the first time. The effect of the early adoption is described in the Accounting- and Valuation Methods.
Apart from this, IAS 1 Presentation of Financial Statements – Presentation of Items of Other Comprehensive Income is applied prema-turely as well.
In May 2011 IASB issued three new standards covering the handling of subsidiaries, joint arrangements and the disclosure of interests in other entities.
IFRS 10 builds on existing principles by identifying a comprehensive concept of control as the determining factor in whether an entity should be included in the consolidated financial statements. According to the new concept, an investor has control when the investor has the power to decide on relevant processes, has rights to variable returns from its involvement and has the ability to affect those returns through its power.
CROSS Industries AG | Annual Report 2012
45Notes to the Consolidated Financial Statements
IFRS 11 regulates the accounting of joint operations and joint ventures and replaces IAS 31. Joint arrangements are to be included in the consolidated financial statements using the at equity method in accordance with IAS 28. The option of proportionate consolidation will no longer apply.
IFRS 12 defines disclosure requirements regarding interests in subsidiaries, joint arrangements, interests in associates, structured entities and unconsolidated entities.
In May 2011 IASB issued IFRS 13 Fair Value Evaluation. This new standard defines fair value and standardizes disclosures of fair value evaluations of both financial and non-financial items.
In November 2009 the IASB issued IFRS 9 Financial Instruments changing the classification and the measurement of financial assets. It uses a single approach to determine whether a financial asset is measured at amortized cost or at fair value, replacing the different rules in IAS 39. The European Financial Reporting Advisory Group postponed its endorsement advice to adopt IFRS 9 in the EU to take more time to consider the output from the IASB project on the improvement of accounting of financial instruments.
Their effect on the consolidated financial statements of CROSS Group is not yet completely evaluated. No other major effects on the consolidated financial statements of CROSS Industries AG are expected.
basis of PreparationThe accounting of the companies included in the group financial statements is based on the standardized accounting principles. These principles were applied by all of the companies included. The companies included in the group financial statements set up their financial statements at the group’s balance sheet date (31 December).
The consolidated financial statements are set up in thousand euros (€k), rounded according to the commercial rounding method. Where rounded amounts and percentages are aggregated, rounding differences may occur due to the use of software.
The included financial statements for all the key, fully consolidated domestic and foreign companies that are subject to auditing under national regulations or undergo auditing voluntarily were audited by independent auditors and provided with unqualified audit certificates.
The valuation is based on the continuation of the company. Interest payments and operational expenses of CROSS Industries AG can be covered from the expected dividend yield.
In April 2012 CROSS Industries AG and its 100% subsidiary CROSS Motorsport Systems AG restructured their equity financing and established long-term loans to cover the future finance requirements of their companies and made a credit line in the amount of up to € 140m available. € 40m (short-term refinancing) will be repaid until 30 June 2014. € 100m (long-term refinancing) will be repaid until 31 December 2017 at the latest.
The new credit lines will also be used for the premature repayment of the bonds of CROSS Industries AG and CROSS Motorsport Systems AG. In May 2012 both CROSS Industries AG and CROSS Motorsport Systems AG submitted a voluntary offer to prematurely repay the bonds. In the course of the bond repurchase CROSS Industries AG repurchased bonds with a nominal value of € 26m and CROSS Motorsport Systems AG repurchased bonds with a nominal value of € 48m.
In October 2012 CROSS Industries AG issued a bond with a nominal value of € 75m, a coupon of 4.625% and a term until October 2018. Two-thirds of the issuing proceeds were used for the partial premature repayment of the long-term refinancing of the CROSS Group concluded in April 2012. One third of the issuing proceeds will be used within the CROSS Group for the financing of the planned organic business growth, including investments and any future acquisitions, as well as for general business purposes.
The operative companies of the CROSS Group are independently financed for the mid- and long-term.
46 The Company Group Status Report Consolidated Financial Statements Statement of all Legal Representatives
SCOPe Of COnSOlIdATIOn
The subsidiaries are included in the annual consolidated financial statements for the time during which the parent company exercises control over their assets and business.
In order to assess, if CROSS Industries AG controls a company and thus fully consolidates it, the principle of factual control shall be applicable.
The annual consolidated financial statements per 31 December 2012 consist of the annual financial statements of CROSS Industries AG and its subsidiaries.
CROSS Industries AG’s business year 2012 covers the period from 1 January to 31 December 2012.
The companies included in the consolidated financial statements are stated in the list of the equity interests per 31 December 2012 (see page 92).
Changes in the Scope of ConsolidationIn business year 2012 the scope of consolidation changed as follows:
fully Consolidated consolidated at-equity
As of 31/12/2011 40 5Additions to the scope of consolidation 7 0Disposal through liquidation (1) 0Disposals from the scope of consolidation 0 (2)as of 31/12/2011 46 3thereof foreign companies 22 1
CROSS Industries AG – as the parent company of the CROSS Group – was not considered in the above table.
Additions to the Consolidation Scopewethje group, hengersberg, germanyOn 23 November 2011 the CROSS Group sold 50% of the shares of Wethje Holding GmbH (formerly: Wethje Carbon Composite GmbH), Hengersberg, Germany, as well as 50% of the shares of Wethje Immobilien GmbH (formerly: Wethje-Entwicklungs GmbH), Vilshofer- Pleinting, Germany, to Forgu GmbH, Gelnhausen, Germany – a subsidiary of the Indian Samvardhana Motherson Group.
The joint venture agreement of 22 November 2011 determined that the management of Wethje Group will be provided until 31 Decem- ber 2014 by the CROSS Group. Thus, the CROSS Group has considerable influence on the business policy of the Wethje Group. As the Motherson Group had to approve important business cases, the CROSS Group did not exercise a dominating control over the Wethje Group.
In their management meeting of 25 June 2012 Motherson informed the shareholders that Motherson/Forgu intend to back out from the investment in Wethje and transfer their 50% share to the CROSS Group. Since the CROSS Group now solely determines the finance and business policy and has dominating control over the Wethje Group, the Wethje Group was first consolidated into the CROSS Group as of 25 June 2012.
The Wethje Group was allocated to the segment “Other”.
The acquisition had the following impact on the balance sheet:
CROSS Industries AG | Annual Report 2012
47Notes to the Consolidated Financial Statements
(02)
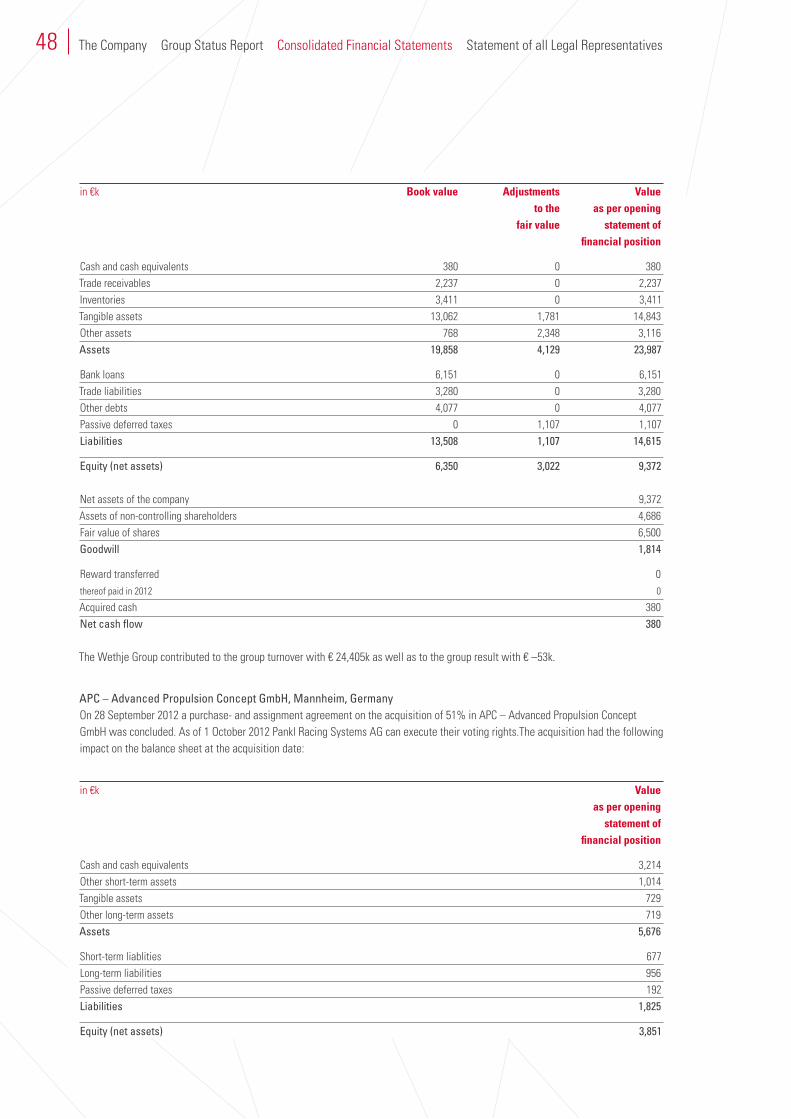
in €k book value Adjustments Value to the as per opening fair value statement of financial position
Cash and cash equivalents 380 0 380Trade receivables 2,237 0 2,237Inventories 3,411 0 3,411Tangible assets 13,062 1,781 14,843Other assets 768 2,348 3,116assets 19,858 4,129 23,987
Bank loans 6,151 0 6,151Trade liabilities 3,280 0 3,280Other debts 4,077 0 4,077Passive deferred taxes 0 1,107 1,107Liabilities 13,508 1,107 14,615
equity (net assets) 6,350 3,022 9,372
Net assets of the company 9,372Assets of non-controlling shareholders 4,686Fair value of shares 6,500goodwill 1,814
Reward transferred 0thereof paid in 2012 0
Acquired cash 380net cash flow 380
The Wethje Group contributed to the group turnover with € 24,405k as well as to the group result with € –53k.
aPC – advanced Propulsion Concept gmbh, mannheim, germanyOn 28 September 2012 a purchase- and assignment agreement on the acquisition of 51% in APC – Advanced Propulsion Concept GmbH was concluded. As of 1 October 2012 Pankl Racing Systems AG can execute their voting rights.The acquisition had the following impact on the balance sheet at the acquisition date:
in €k Value as per opening statement of financial position
Cash and cash equivalents 3,214Other short-term assets 1,014Tangible assets 729Other long-term assets 719assets 5,676
Short-term liablities 677Long-term liabilities 956Passive deferred taxes 192Liabilities 1,825
equity (net assets) 3,851
48 The Company Group Status Report Consolidated Financial Statements Statement of all Legal Representatives
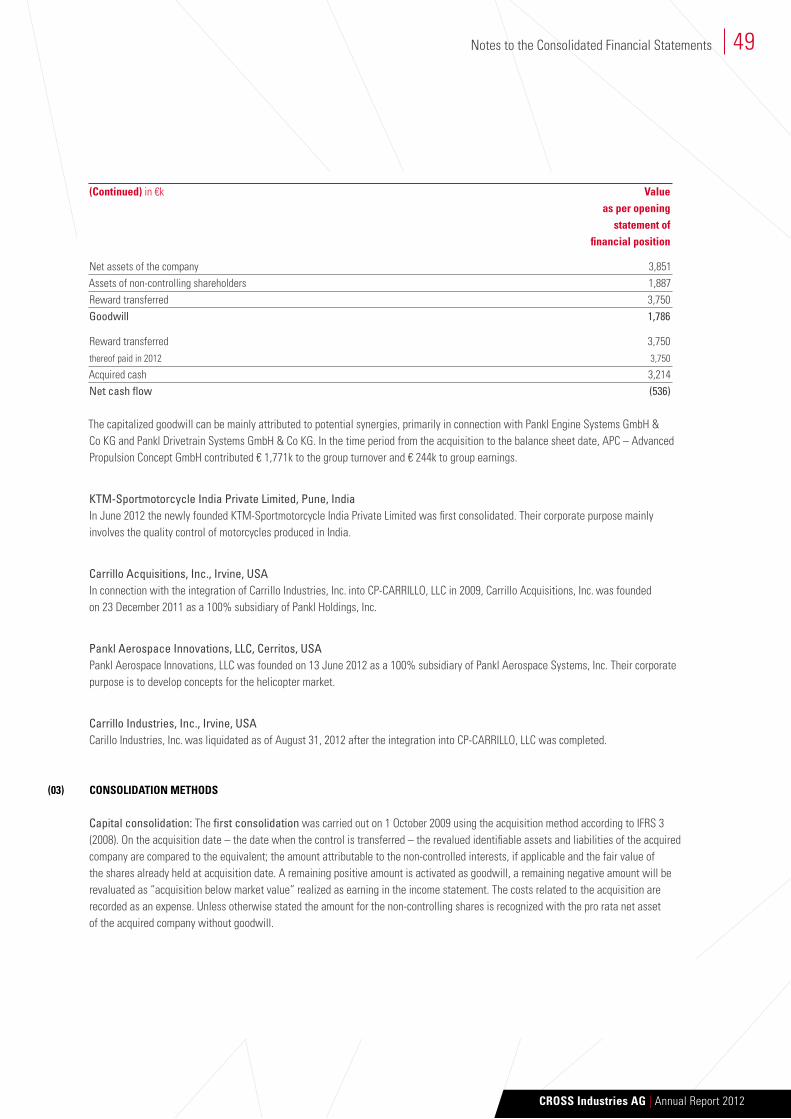
(Continued) in €k Value as per opening statement of financial position
Net assets of the company 3,851Assets of non-controlling shareholders 1,887Reward transferred 3,750goodwill 1,786
Reward transferred 3,750thereof paid in 2012 3,750
Acquired cash 3,214net cash flow (536)
The capitalized goodwill can be mainly attributed to potential synergies, primarily in connection with Pankl Engine Systems GmbH & Co KG and Pankl Drivetrain Systems GmbH & Co KG. In the time period from the acquisition to the balance sheet date, APC – Advanced Propulsion Concept GmbH contributed € 1,771k to the group turnover and € 244k to group earnings.
Ktm-Sportmotorcycle india Private Limited, Pune, indiaIn June 2012 the newly founded KTM-Sportmotorcycle India Private Limited was first consolidated. Their corporate purpose mainly involves the quality control of motorcycles produced in India.
Carrillo acquisitions, inc., irvine, uSaIn connection with the integration of Carrillo Industries, Inc. into CP-CARRILLO, LLC in 2009, Carrillo Acquisitions, Inc. was founded on 23 December 2011 as a 100% subsidiary of Pankl Holdings, Inc.
Pankl aerospace innovations, LLC, Cerritos, uSaPankl Aerospace Innovations, LLC was founded on 13 June 2012 as a 100% subsidiary of Pankl Aerospace Systems, Inc. Their corporate purpose is to develop concepts for the helicopter market.
Carrillo industries, inc., irvine, uSaCarillo Industries, Inc. was liquidated as of August 31, 2012 after the integration into CP-CARRILLO, LLC was completed.
COnSOlIdATIOn MeThOdS
Capital consolidation: The first consolidation was carried out on 1 October 2009 using the acquisition method according to IFRS 3 (2008). On the acquisition date – the date when the control is transferred – the revalued identifiable assets and liabilities of the acquired company are compared to the equivalent; the amount attributable to the non-controlled interests, if applicable and the fair value of the shares already held at acquisition date. A remaining positive amount is activated as goodwill, a remaining negative amount will be revaluated as “acquisition below market value” realized as earning in the income statement. The costs related to the acquisition are recorded as an expense. Unless otherwise stated the amount for the non-controlling shares is recognized with the pro rata net asset of the acquired company without goodwill.
49
CROSS Industries AG | Annual Report 2012
Notes to the Consolidated Financial Statements
(03)
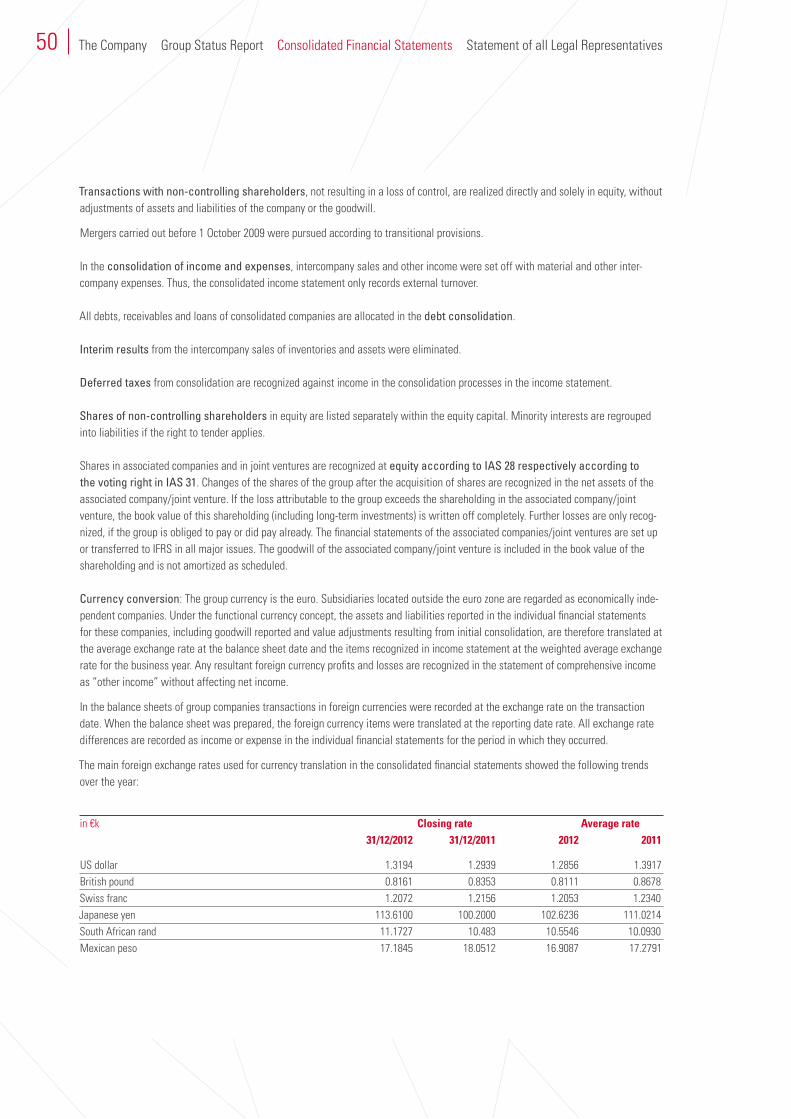
transactions with non-controlling shareholders, not resulting in a loss of control, are realized directly and solely in equity, without adjustments of assets and liabilities of the company or the goodwill.
Mergers carried out before 1 October 2009 were pursued according to transitional provisions.
In the consolidation of income and expenses, intercompany sales and other income were set off with material and other inter-company expenses. Thus, the consolidated income statement only records external turnover.
All debts, receivables and loans of consolidated companies are allocated in the debt consolidation.
interim results from the intercompany sales of inventories and assets were eliminated.
deferred taxes from consolidation are recognized against income in the consolidation processes in the income statement.
Shares of non-controlling shareholders in equity are listed separately within the equity capital. Minority interests are regrouped into liabilities if the right to tender applies.
Shares in associated companies and in joint ventures are recognized at equity according to iaS 28 respectively according to the voting right in iaS 31. Changes of the shares of the group after the acquisition of shares are recognized in the net assets of the associated company/joint venture. If the loss attributable to the group exceeds the shareholding in the associated company/joint venture, the book value of this shareholding (including long-term investments) is written off completely. Further losses are only recog- nized, if the group is obliged to pay or did pay already. The financial statements of the associated companies/joint ventures are set up or transferred to IFRS in all major issues. The goodwill of the associated company/joint venture is included in the book value of the shareholding and is not amortized as scheduled.
Currency conversion: The group currency is the euro. Subsidiaries located outside the euro zone are regarded as economically inde- pendent companies. Under the functional currency concept, the assets and liabilities reported in the individual financial statements for these companies, including goodwill reported and value adjustments resulting from initial consolidation, are therefore translated at the average exchange rate at the balance sheet date and the items recognized in income statement at the weighted average exchange rate for the business year. Any resultant foreign currency profits and losses are recognized in the statement of comprehensive income as “other income” without affecting net income.
In the balance sheets of group companies transactions in foreign currencies were recorded at the exchange rate on the transaction date. When the balance sheet was prepared, the foreign currency items were translated at the reporting date rate. All exchange rate differences are recorded as income or expense in the individual financial statements for the period in which they occurred.
The main foreign exchange rates used for currency translation in the consolidated financial statements showed the following trends over the year:
in €k Closing rate Average rate 31/12/2012 31/12/2011 2012 2011
US dollar 1.3194 1.2939 1.2856 1.3917British pound 0.8161 0.8353 0.8111 0.8678Swiss franc 1.2072 1.2156 1.2053 1.2340Japanese yen 113.6100 100.2000 102.6236 111.0214South African rand 11.1727 10.483 10.5546 10.0930Mexican peso 17.1845 18.0512 16.9087 17.2791
50 The Company Group Status Report Consolidated Financial Statements Statement of all Legal Representatives
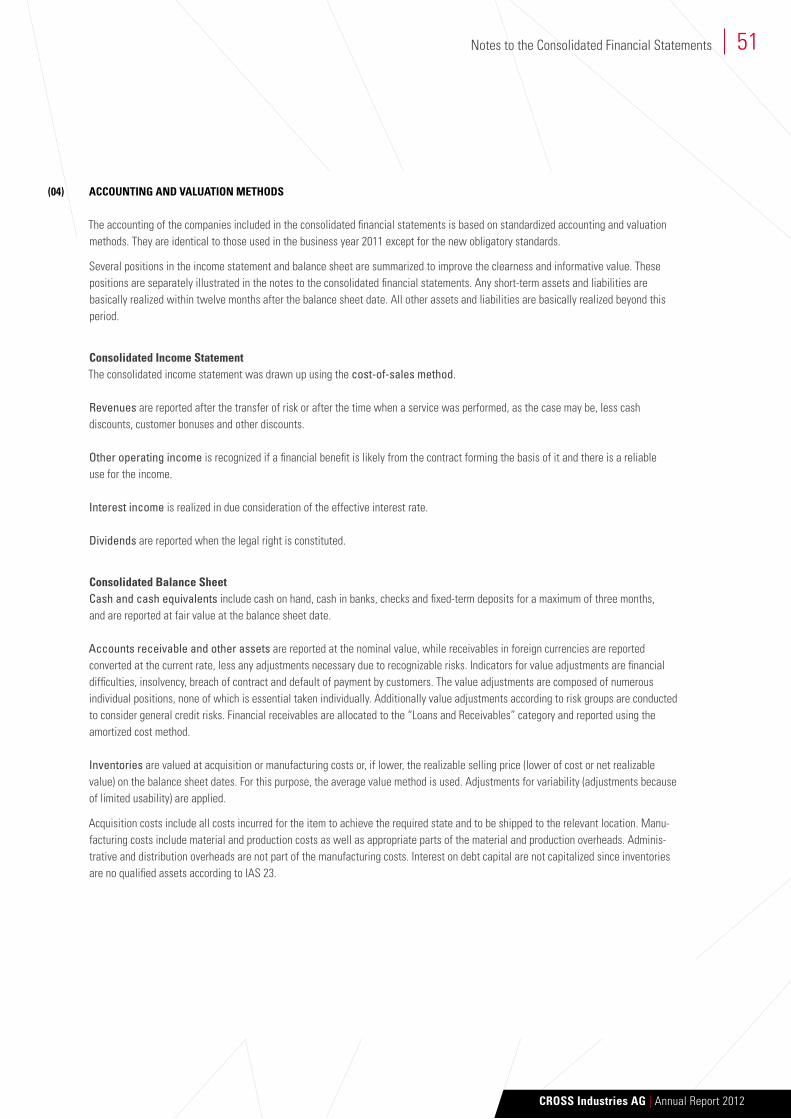
ACCOunTInG And VAluATIOn MeThOdS
The accounting of the companies included in the consolidated financial statements is based on standardized accounting and valuation methods. They are identical to those used in the business year 2011 except for the new obligatory standards.
Several positions in the income statement and balance sheet are summarized to improve the clearness and informative value. These positions are separately illustrated in the notes to the consolidated financial statements. Any short-term assets and liabilities are basically realized within twelve months after the balance sheet date. All other assets and liabilities are basically realized beyond this period.
Consolidated Income StatementThe consolidated income statement was drawn up using the cost-of-sales method.
revenues are reported after the transfer of risk or after the time when a service was performed, as the case may be, less cash discounts, customer bonuses and other discounts.
other operating income is recognized if a financial benefit is likely from the contract forming the basis of it and there is a reliable use for the income.
interest income is realized in due consideration of the effective interest rate.
dividends are reported when the legal right is constituted.
Consolidated balance SheetCash and cash equivalents include cash on hand, cash in banks, checks and fixed-term deposits for a maximum of three months, and are reported at fair value at the balance sheet date.
accounts receivable and other assets are reported at the nominal value, while receivables in foreign currencies are reported converted at the current rate, less any adjustments necessary due to recognizable risks. Indicators for value adjustments are financial difficulties, insolvency, breach of contract and default of payment by customers. The value adjustments are composed of numerous individual positions, none of which is essential taken individually. Additionally value adjustments according to risk groups are conducted to consider general credit risks. Financial receivables are allocated to the “Loans and Receivables” category and reported using the amortized cost method.
inventories are valued at acquisition or manufacturing costs or, if lower, the realizable selling price (lower of cost or net realizable value) on the balance sheet dates. For this purpose, the average value method is used. Adjustments for variability (adjustments because of limited usability) are applied.
Acquisition costs include all costs incurred for the item to achieve the required state and to be shipped to the relevant location. Manu- facturing costs include material and production costs as well as appropriate parts of the material and production overheads. Adminis-trative and distribution overheads are not part of the manufacturing costs. Interest on debt capital are not capitalized since inventories are no qualified assets according to IAS 23.
51
(04)
CROSS Industries AG | Annual Report 2012
Notes to the Consolidated Financial Statements
Securities serving as short-term investments (trading securities) are valued at their market price, and valuation changes are recorded in the income statement affecting income. Held-to-maturity securities (debt instruments) are recorded in the balance sheet at their acquisition cost less depreciation. The securities held in the category “At Fair Value through Profit or Loss” is recorded at market value affecting income. The remaining securities (financial assets available for sale) are recognized at market value at the balance sheet date. Valuation changes are recorded not affecting income, except for depreciation.
Shares in associated companies, unless they are fully consolidated, and investments in the category “Available for Sale” (at cost) are recognized in the financial assets at acquisition cost, as their fair value cannot reliably be determined. Loans are recognized in the category “Loans and Receivables” at amortized cost. Other financial assets are recognized in the category “Available for Sale” at fair value not affecting income.
Value adjustments are conducted if the future cash flows are below the current book value. Loans are discounted to the present value if their interest rate is lower than the prevailing market rate.
tangible assets are valued at acquisition or manufacturing costs, less scheduled depreciation. Scheduled depreciation is calculated according to the linear depreciation method with the following life expectancy:
effective life
Buildings 6 to 50 yearsMachines/Tools 2 to 15 yearsFixtures and Furnishings 2 to 15 years
All direct costs, including separable material and production overheads, are recorded in the manufacturing costs of self-constructed assets. Financing costs resulting from the direct allocation of borrowed capital or the application of an average capitalization interest rate to the expenses incurred are capitalized according to IAS 23.
Non-scheduled depreciation is carried out when the expected discounted earnings (future cash flows) fall short of the current book values.
Tangible assets include property held as financial investment (investment property). This includes property to obtain lease income and/or for value increase. They are recognized – corresponding to tangible assets – with their acquisition of manufacturing cost at cost method less scheduled and necessary depreciation, where applicable. The fair value is determined internally based on accredited valuation methods or is based on external expert testimony.
If tangible assets are financed with leasing contracts that give the company rights similar to those of an owner, the items are shown on the balance sheet. They are reported at the present value of the minimum lease payments to be expected in the future. At the same time, a corresponding liability is shown on the balance sheet as lease liabilities. Straight-line depreciation is used over the normal useful life of these tangible assets. Amortization is deducted from the lease liability. The interest component in the lease liability is directly recognized in the income statement.
goodwill is not subject to regular depreciation, but undergoes an annual impairment test and appropriate depreciation is taken into consideration in net income as required.
The depreciation requirement for the consolidated financial statements as per 31 December 2012 is calculated based on current planning according to the discounted cash flow method. Therefore the achievable amount (net profit on sales) of the cash generating units – i. e. the higher amount of the fair value less cost of sale and value in use – has to be estimated.
The calculation is based on the following parameters:
52 The Company Group Status Report Consolidated Financial Statements Statement of all Legal Representatives
WACC Mid-term Growth Interest planning parameters rate for follow- ing years
31/12/2012KTM Group 8.44% 2013–2017 2.00% 25%Pankl Group 8.03% 2013–2016 2.00% 27%WP Group 8.44% 2013–2015 1.00% 25%
31/12/2011KTM Group 7.73% 2012–2016 2.00% 25%Pankl Group 8.10% 2012–2015 2.00% 26%WP Group 7.73% 2012–2014 2.00% 25%
An evaluation of the goodwill did not result in an impairment loss (previous year: € 0k).
Assumptions are based on the valuation of future trends by the management and on internal and external resources. The management of the group companies set up middle and long-term planning, based on an economic recovery in the medium-term. Assessments regard- ing goodwill are especially sensitive in the following areas:
An increase of the discount rate by 1% would not have resulted in an impairment loss, just like in the previous year.
A decrease of the future planned cash flow by 10% would not have resulted in an impairment loss, just like in the previous year.
intangible assets are capitalized at acquisition- and manufacturing cost and valued less scheduled amortization. Scheduled deprecia-tion is calculated using the straight-line method based on the following periods of useful life:
effective life
Software 3 to 5 yearsSelf-constructed intangible assets 5 yearsOther intangible assets 1 to 16 years
In the case of self-constructed intangible assets, the manufacturing period is divided into a research, a development and a model upgrading phase. Costs incurred during the research and model upgrading phases are immediately recognized in the income state- ment. Costs incurred during the development phase are capitalized as intangible assets if certain conditions are met that confirm the future usefulness of the expenses incurred, in particular the technical feasibility of the developed product or process and its market-ability. The valuation of the self-constructed intangible assets is ascertained by calculating the manufacturing costs less scheduled and non-scheduled amortization.
Intangible assets with an indefinite useful life, as for example the brand names, capitalized during the original purchase price alloca- tion, are not amortized regularly, but are subjected to an annual impairment test and any depreciation recognized in the income state- ment. For this impairment test the same parameters as for the impairment test of goodwill are used.
allocations for active and passive deferred taxes are created for business transactions expected to have tax implications, and are either already reflected in the group financial statements or in tax balance sheet (timing differences). Deferred taxes for losses carried forward are set up according to their feasibility. Deferred tax items on both the asset and liability side are reported balanced out if they are subject to the same tax jurisdiction. Calculations are based on the normal income tax rate in the relevant country at the time of the anticipated reversal of the difference in value.
53
CROSS Industries AG | Annual Report 2012
Notes to the Consolidated Financial Statements
Liabilities are reported at the amounts repayable, while foreign currency liabilities are converted at the reporting date rate. Financial debts are allocated to the “Financial Liabilities at Amortized Cost” category. The difference between the received amount and the repayment is allocated according to the effective interest method until maturity and recognized in the financial result. Issuing costs for the bond are recognized over the entire term.
The social capital obligations consist of obligations for severance payments, pensions and anniversary bonuses. Moreover, statutory provisions require the CROSS Group to make severance payments to all employees in Austria whose employment contracts commenced before 1 January 2003 if the employer terminates the contract or the employee retires. This defined benefit obligation depends on the number of years of service and the income at the time of termination or retirement. For all employees in Austria whose contracts commenced after 31 December 2002, 1.53% of their salaries are paid monthly into a company employee benefit fund, where the con- tributions are saved in employees’ accounts and paid out to them on termination of their employment contract or transferred as credit to another fund. The group is only obliged to pay the contributions that are reported under expenses in the fiscal year for which they were paid (defined contribution obligation).
As a result of individual bargaining agreements, several group companies are obliged to pay retirement benefits (defined benefit obliga- tion). As a result of collective bargaining agreements companies of the CROSS Group are required to pay employees in Austria jubilee benefits once they have reached a certain number of years in service (minimum years of service: 25) (defined benefit obligation).
The value of defined benefit obligations for pensions and severance payments is determined using the projected unit credit method specified in IAS 19 Employee Benefits on the basis of actuarial assumptions. This projected unit credit method takes into consideration both the known benefits accrued at the balance sheet date and the increases in salaries and pensions to be expected in the future. It involves determining the present value of the defined benefit obligation (DBO) and offsetting it against the fair value of the existing plan assets at the balance sheet date if necessary.
Until now any differences at the end of the year (actuarial gains or losses) between the severance payment obligations calculated according to plan and the actual projected benefit obligations were recognized in the income statement. According to IAS 19 (rev. 2011) the difference less deferred taxes is recognized directly in the comprehensive income in business year 2012.
The voluntary premature application of IAS 19 (rev. 2011) changes the accounting method, which is considered retrospectively accord- ing to the transitional provision IAS 19.173. The amounts of the comparison period and of the opening statement as of 1 January 2011 were adjusted as follows:
The accumulated actuarial losses less deferred taxes as of 1 January 2011 in the amount of € 1,017k and actuarial losses less deferred taxes accrued in business year 2011 in the amount of € 201k were reclassified from the group profit respectively from the liabilities from deferred taxes into the IAS 19 reserve for actuarial profits and losses in the group equity. This results in an increase of equity capital as of 31 December 2011 of € 406k.
The retrospective application results in an increase of the comprehensive income for business year 2011 in the amount of € 86k.
The development of the IAS 19 reserve for actuarial profits and losses in the group equity:
in €k 2011
Accumulated actuarial losses as of 01/01 (1,355)less 25% deferred taxes 338iaS 19 reserve as of 01/01 (1,017)
Actuarial losses in business year (269)less 25% deferred taxes 68iaS 19 reserve as of 31/12 (1,218)
54 The Company Group Status Report Consolidated Financial Statements Statement of all Legal Representatives
Changes in group equity development, the group balance sheet and the group comprehensive income statement are as follows:
in €k liabilities Shareholders non- equity from of parent controlling deferred taxes company shareholders
As of 31/12/2010 36,508 143,837 148,762 292,599Adjustment IAS 19 (rev. 2011) (338) 186 152 338as of 01/01/2011, adjusted 36,170 144,023 148,914 292,937
Changes according to consolidated financial statements 2011 (18,426) 24,839 (11,409) 13,430Adjustment IAS 19 (rev. 2011) (68) 33 35 68as of 31/12/2011, adjusted 17,676 168,895 137,540 306,435
in €k 2011 Adjustment 2011 IAS 19 adjusted (rev. 2011)
Income statement 45,503 269 45,772Other income 9,026 (201) 8,825total income 54,529 68 54,597
Provisions for warranties are set up at the time the products are sold and thus affect net income.
other provisions are set up in case obligations towards third parties exist, insofar as the utilization of these provisions is more likely than not and the expected amount of the required provision can be estimated reliably.
government grants and subsidies are recognized as soon as it is certain that the group will receive them and the group can meet the specified requirements. Grants and subsidies are generally recognized in the income statement on the basis of a direct connection with the relevant costs that will be settled by the grant or subsidy.
investment grants from public funds that are shown as individual positions in the financial statements of the companies are shown in the consolidated financial statements under long-term borrowed funds.
Contingent liabilities are possible or present liabilities that are based on past events, where the discharge of resources is estimated to be possible but unlikely. According to IFRS, these liabilities have to be reported in the notes to the consolidated financial statements and not in the balance sheet.
derivative financial InstrumentsUnder IAS 39, derivatives must generally be valued at their market value. Depending on the degree of certainty that the transaction will take place, different rules apply regarding how the hedge connection between the underlying transaction and the derivative (hedge accounting) is shown in the balance sheet – separately for reported assets and liabilities – as well as for binding contracts (firm commitments) and expected transactions (forecasted transactions).
55
CROSS Industries AG | Annual Report 2012
Notes to the Consolidated Financial Statements
A fair value hedge exists when the assets, liabilities, and binding contracts in the balance sheet are hedged with a derivative. IAS 39 contains a series of premises concerning the underlying transaction to be secured on the one hand and the hedging connection on the other hand. In the case of a fair value hedge, fluctuations in the fair market value of the derivative are recorded in full in the operating result. Fluctuations in the fair market value of the underlying transaction are also recognized so that the hedged risk affects net income. This method of reporting automatically results in compensation in the group income statement. If the hedge is not effective, the ineffective component simultaneously affects the operating result.
A cash flow hedge exists when variable payment flows from assets, liabilities and expected business transactions that are subject to a fair value risk are hedged. If the requirements for a cash flow hedge are met, the effective component of the fair value fluctuations of the hedging instrument must be recognized in the group’s equity without affecting the operating result. It is only reported in the income statement when the transaction takes place. Eventual changes due to inefficiencies of these derivate financial instruments are reported in full and recognized in the income statement.
Hedging transactions that do not meet the criteria for hedging instruments defined in IAS 39 are classified as trading transactions and recognized in the financial assets “At Fair Value through Profit or Loss” category (held for trading). Fair market value changes are recognized in full in the income statement for the current period and reported in the financial results.
estimates and uncertainties in Cases of discretionary decisions and AssumptionsTo a certain extent, estimates and assumptions have to be made in the consolidated financial statements. These estimates have an impact on the balance sheet assets and liabilities, the disclosure of contingent liabilities at the balance sheet date, and the reporting of expenses and income in the business year. The subsequent actual amounts may then differ from such estimates. This applies in particular to the impairment of goodwill and intangible assets with an indefinite useful life and to the assets and liabilities reported at the time of initial consolidation, including purchase price allocations.
The most important balance sheet items, where the valuation related to the planned useful life is based on estimates, are tools (tangible assets) and capitalized development costs (intangible assets). Estimates are also based on deferred tax assets for losses carried forward regarding the period of utilization for the losses carried forward.
In addition, there are uncertainties regarding the valuation of receivables, inventories and the recognition and valuation of obligations for social capital and other provisions
noteS to the ConSoLidated inCome Statement and the ConSoLidated BaLanCe Sheet
neT SAleS
net Sales by regions
in €k 2012 2011
KTM products 612,008 526,801High performance components 235,400 175,864Others 68,551 27,731Consolidation (90,308) (51,770) 825,651 678,626
Sponsorship income, contributions and subsidies are deducted outright from the corresponding expenses.
56 The Company Group Status Report Consolidated Financial Statements Statement of all Legal Representatives
iii.
(05)
bReAkdOWn Of exPenSeS
Cost of Sales
in €k 2012 2011
Cost of materials and services for purchased services 446,803 367,942Personnel expenses 94,308 74,367Depreciation and amortization of tangible assets and intangible assets including low-value assets 20,848 19,726Other operating expenses 31,626 16,464 593,585 478,499
distribution- and motorsport expenses
in €k 2012 2011
Cost of materials and expenses for purchased services 33,417 30,575Personnel expenses 24,384 19,172Depreciation and amortization of tangible assets and intangible assets including low-value assets 3,297 2,839Other operating expenses 41,633 33,054Sponsorship income and other operating earnings (6,885) (4,463) 95,846 81,177
expenses for research and development
in €k 2012 2011
Cost of materials and expenses for purchased services 4,342 1,678Personnel expenses 8,128 5,068Depreciation and amortization of tangible assets and intangible assets including low-value assets 19,346 19,925Other operating expenses 783 2,920Subsidies and other operating earnings (5,099) (5,435) 27,500 24,156
administration expenses
in €k 2012 2011
Cost of materials and expenses for purchased services 620 1,261Personnel expenses 23,781 19,841Depreciation and amortization of tangible assets and intangible assets including low-value assets 4,311 4,019Other operating expenses 25,322 23,934 54,034 49,055
Scheduled depreciation and impairment on assets are shown in the income statement under their corresponding operating area (see above).
57
(06)
CROSS Industries AG | Annual Report 2012
Notes to the Consolidated Financial Statements
The expenses for the audit of the business year 2012 carried out by KPMG Austria AG Wirtschaftsprüfungs- und Steuerberatungs-gesellschaft can be broken down as follows:
in €k 2012 2011
Audit of separate financial statements 332 299Audit of consolidated financial statements 265 294Special audits 121 33Other services 67 154 785 780
MAnAGeMenT bOARd ReMuneRATIOn And STAff InfORMATIOn
The total salaries paid by the CROSS Industries Group for the Management Board’s activities and their administrative duties amounted to € 6,589k (previous year: € 5,418k). Severance payments in the amount of € 0k (previous year: € 284k) were made.
A remuneration totaling € 49k (previous year: € 26k) will be proposed for the Supervisory Board for the business year 2012 (to be paid in business year 2013).
As of the balance sheet date, there are no pending loans and advances granted to members of the Supervisory Board of CROSS Industries AG.
employees
2012
As of 01/01 3,131Additions to the scope of consolidation 302Changes in the business year 270as of 31/12 3,703thereof workers 2,099
thereof employees 1,604
Employee expenses in business year 2012 amounted to € 166,142k (previous year: € 130,771k).
OTheR OPeRATInG exPenSeS
Other operating expenses can be broken down as follows:
in €k 2012 2011
Guarantee expenses 10,505 9,442Other expenses 725 164 11,230 9,606
58
(07)
(08)
The Company Group Status Report Consolidated Financial Statements Statement of all Legal Representatives
OTheR OPeRATInG InCOMe
Other operating income can be broken down as follows:
in €k 2012 2011
Grants 1,007 1,419Income from the sale of fixed assets 421 360Insurance income 198 101Remaining other income 1,892 1,175 3,518 3,055
fInAnCIAl- And InVeSTMenT ReSulT
The financial- and investment result can be broken down as follows:
in €k 2012 2011
Interest income 2,269 1,541Interest expenses (19,338) (21,417)Result from at-equity holdings 559 (49)Other financial- and investment result (6,753) 3,011 (23,263) (16,914)
The financing and investment result includes expenses from financial instruments in the amount of € 1,134k (previous year: € 2,623k), expenses from the reversal of transaction cost (€ 2,451k) and expenses from shareholdings (€ 2,166k). In the previous year this item in- cluded income from the disposal of BEKO HOLDING AG from the demerger to fund CROSS Informatik GmbH in the amount of € 4,477k.
TAxeS On InCOMe
The group’s income tax income and expenses can be broken into current and deferred taxes as follows:
in €k 2012 2011
Current tax (4,169) (3,230)Deferred tax 1,083 2,737 (3,086) (493)
Taxes on income and earnings, which are paid or owed in the individual countries as well as deferred taxes are recognized as income taxes. The Austrian companies in the CROSS Group are subject to a corporation tax rate of 25.0%. Calculation of foreign income taxes is based on the laws passed or regulations applicable in the individual countries. The income tax rates applied to foreign companies vary from 10% to 40%.
59
(09)
(10)
(12)
CROSS Industries AG | Annual Report 2012
Notes to the Consolidated Financial Statements
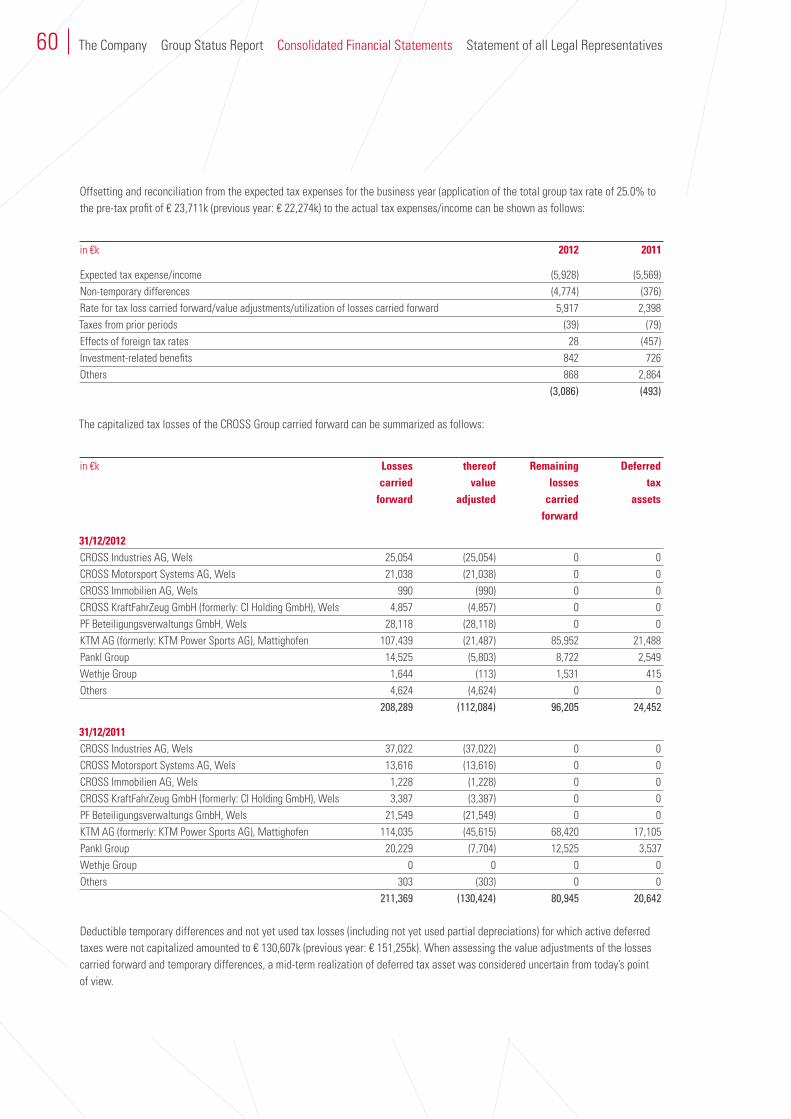
Offsetting and reconciliation from the expected tax expenses for the business year (application of the total group tax rate of 25.0% to the pre-tax profit of € 23,711k (previous year: € 22,274k) to the actual tax expenses/income can be shown as follows:
in €k 2012 2011
Expected tax expense/income (5,928) (5,569)Non-temporary differences (4,774) (376)Rate for tax loss carried forward/value adjustments/utilization of losses carried forward 5,917 2,398Taxes from prior periods (39) (79)Effects of foreign tax rates 28 (457)Investment-related benefits 842 726Others 868 2,864 (3,086) (493)
The capitalized tax losses of the CROSS Group carried forward can be summarized as follows:
in €k losses thereof Remaining deferred carried value losses tax forward adjusted carried assets forward
31/12/2012CROSS Industries AG, Wels 25,054 (25,054) 0 0CROSS Motorsport Systems AG, Wels 21,038 (21,038) 0 0CROSS Immobilien AG, Wels 990 (990) 0 0CROSS KraftFahrZeug GmbH (formerly: CI Holding GmbH), Wels 4,857 (4,857) 0 0PF Beteiligungsverwaltungs GmbH, Wels 28,118 (28,118) 0 0KTM AG (formerly: KTM Power Sports AG), Mattighofen 107,439 (21,487) 85,952 21,488Pankl Group 14,525 (5,803) 8,722 2,549Wethje Group 1,644 (113) 1,531 415Others 4,624 (4,624) 0 0 208,289 (112,084) 96,205 24,452
31/12/2011CROSS Industries AG, Wels 37,022 (37,022) 0 0CROSS Motorsport Systems AG, Wels 13,616 (13,616) 0 0CROSS Immobilien AG, Wels 1,228 (1,228) 0 0CROSS KraftFahrZeug GmbH (formerly: CI Holding GmbH), Wels 3,387 (3,387) 0 0PF Beteiligungsverwaltungs GmbH, Wels 21,549 (21,549) 0 0KTM AG (formerly: KTM Power Sports AG), Mattighofen 114,035 (45,615) 68,420 17,105Pankl Group 20,229 (7,704) 12,525 3,537Wethje Group 0 0 0 0Others 303 (303) 0 0 211,369 (130,424) 80,945 20,642
Deductible temporary differences and not yet used tax losses (including not yet used partial depreciations) for which active deferred taxes were not capitalized amounted to € 130,607k (previous year: € 151,255k). When assessing the value adjustments of the losses carried forward and temporary differences, a mid-term realization of deferred tax asset was considered uncertain from today’s point of view.
60 The Company Group Status Report Consolidated Financial Statements Statement of all Legal Representatives
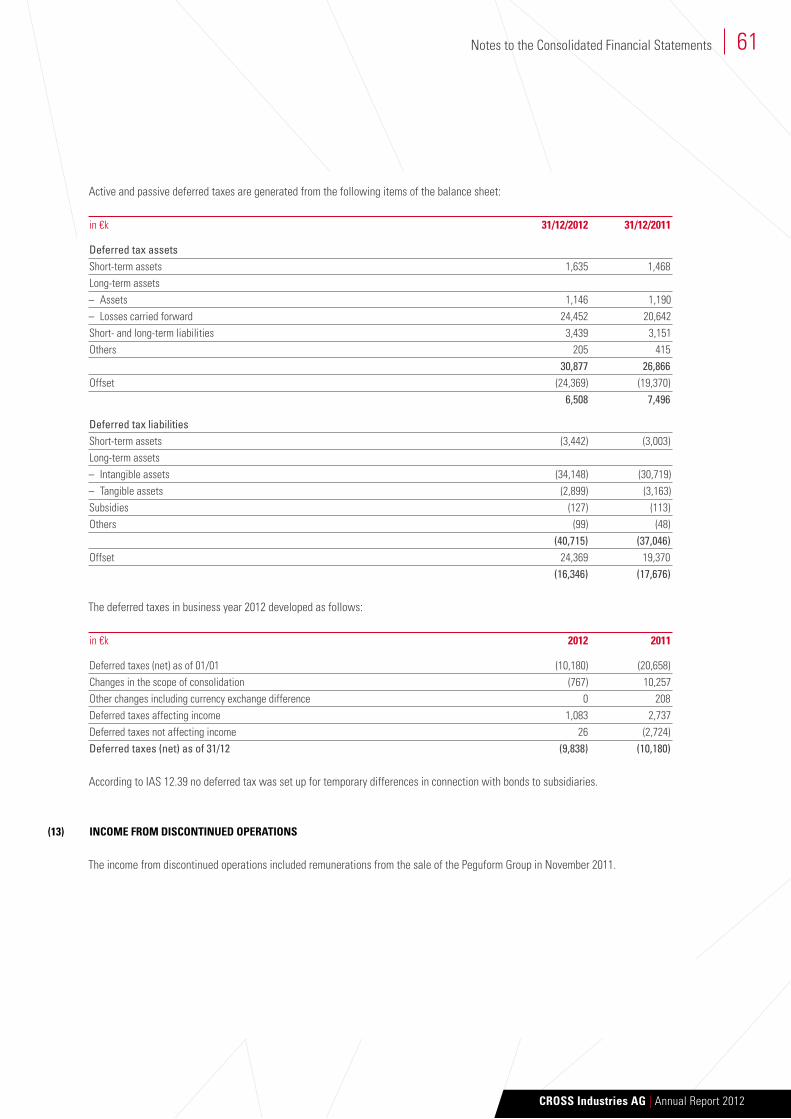
Active and passive deferred taxes are generated from the following items of the balance sheet:
in €k 31/12/2012 31/12/2011
deferred tax assetsShort-term assets 1,635 1,468Long-term assets– Assets 1,146 1,190– Losses carried forward 24,452 20,642Short- and long-term liabilities 3,439 3,151Others 205 415 30,877 26,866Offset (24,369) (19,370) 6,508 7,496
deferred tax liabilitiesShort-term assets (3,442) (3,003)Long-term assets– Intangible assets (34,148) (30,719)– Tangible assets (2,899) (3,163)Subsidies (127) (113)Others (99) (48) (40,715) (37,046)Offset 24,369 19,370 (16,346) (17,676)
The deferred taxes in business year 2012 developed as follows:
in €k 2012 2011
Deferred taxes (net) as of 01/01 (10,180) (20,658)Changes in the scope of consolidation (767) 10,257Other changes including currency exchange difference 0 208Deferred taxes affecting income 1,083 2,737Deferred taxes not affecting income 26 (2,724)deferred taxes (net) as of 31/12 (9,838) (10,180)
According to IAS 12.39 no deferred tax was set up for temporary differences in connection with bonds to subsidiaries.
InCOMe fROM dISCOnTInued OPeRATIOnS
The income from discontinued operations included remunerations from the sale of the Peguform Group in November 2011.
61
(13)
CROSS Industries AG | Annual Report 2012
Notes to the Consolidated Financial Statements
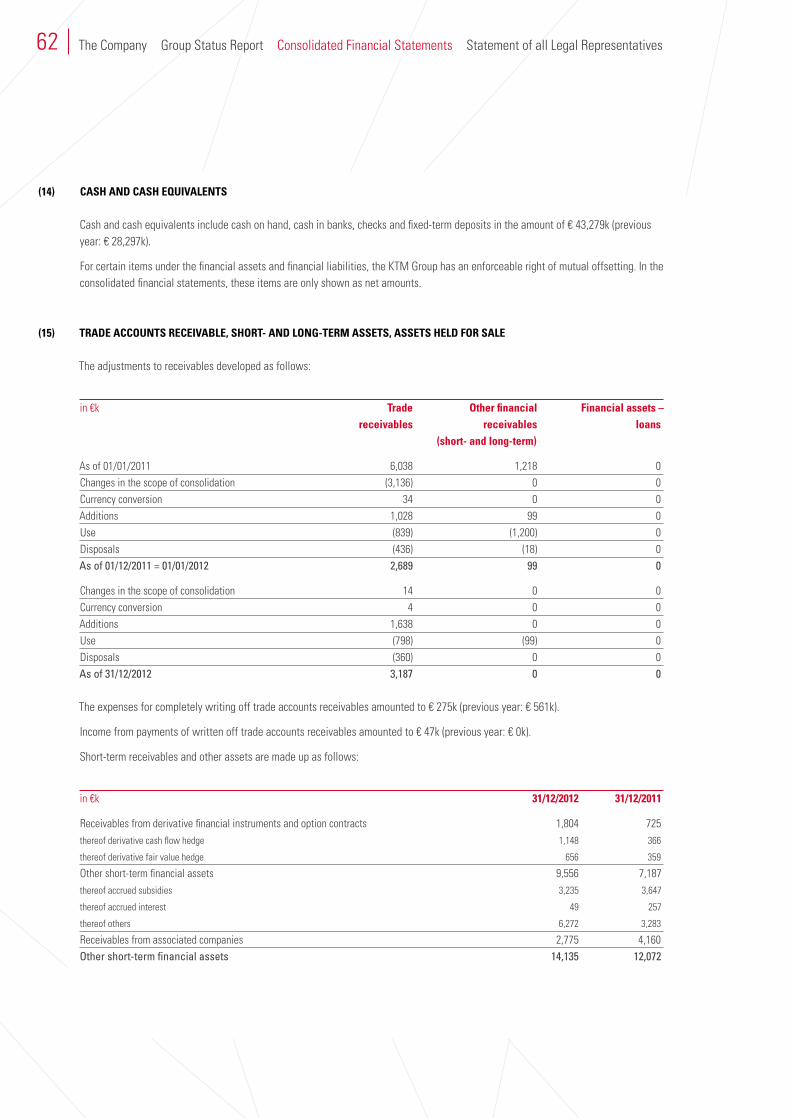
CASh And CASh equIVAlenTS
Cash and cash equivalents include cash on hand, cash in banks, checks and fixed-term deposits in the amount of € 43,279k (previous year: € 28,297k).
For certain items under the financial assets and financial liabilities, the KTM Group has an enforceable right of mutual offsetting. In the consolidated financial statements, these items are only shown as net amounts.
TRAde ACCOunTS ReCeIVAble, ShORT- And lOnG-TeRM ASSeTS, ASSeTS held fOR SAle
The adjustments to receivables developed as follows:
in €k Trade Other financial financial assets – receivables receivables loans (short- and long-term)
As of 01/01/2011 6,038 1,218 0Changes in the scope of consolidation (3,136) 0 0Currency conversion 34 0 0Additions 1,028 99 0Use (839) (1,200) 0Disposals (436) (18) 0as of 01/12/2011 = 01/01/2012 2,689 99 0
Changes in the scope of consolidation 14 0 0Currency conversion 4 0 0Additions 1,638 0 0Use (798) (99) 0Disposals (360) 0 0as of 31/12/2012 3,187 0 0
The expenses for completely writing off trade accounts receivables amounted to € 275k (previous year: € 561k).
Income from payments of written off trade accounts receivables amounted to € 47k (previous year: € 0k).
Short-term receivables and other assets are made up as follows:
in €k 31/12/2012 31/12/2011
Receivables from derivative financial instruments and option contracts 1,804 725thereof derivative cash flow hedge 1,148 366
thereof derivative fair value hedge 656 359
Other short-term financial assets 9,556 7,187thereof accrued subsidies 3,235 3,647
thereof accrued interest 49 257
thereof others 6,272 3,283
Receivables from associated companies 2,775 4,160other short-term financial assets 14,135 12,072
62
(14)
(15)
The Company Group Status Report Consolidated Financial Statements Statement of all Legal Representatives
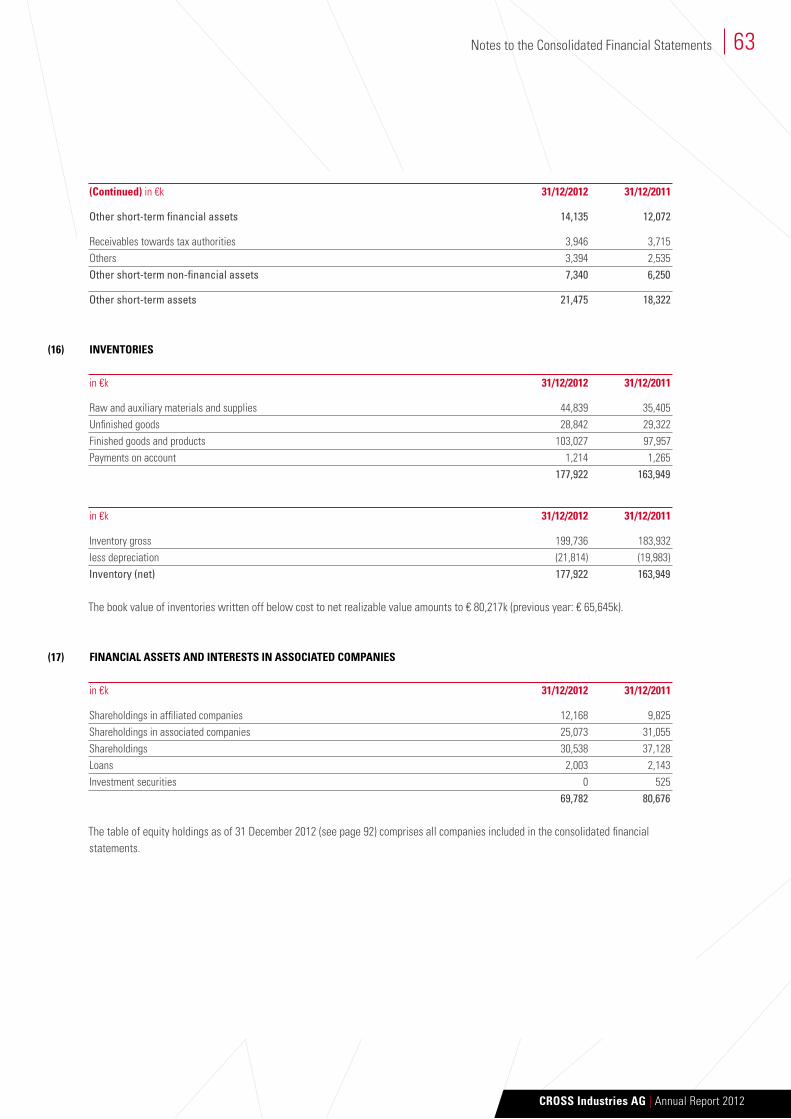
(Continued) in €k 31/12/2012 31/12/2011
other short-term financial assets 14,135 12,072
Receivables towards tax authorities 3,946 3,715Others 3,394 2,535other short-term non-financial assets 7,340 6,250
other short-term assets 21,475 18,322
InVenTORIeS
in €k 31/12/2012 31/12/2011
Raw and auxiliary materials and supplies 44,839 35,405Unfinished goods 28,842 29,322Finished goods and products 103,027 97,957Payments on account 1,214 1,265 177,922 163,949
in €k 31/12/2012 31/12/2011
Inventory gross 199,736 183,932less depreciation (21,814) (19,983)inventory (net) 177,922 163,949
The book value of inventories written off below cost to net realizable value amounts to € 80,217k (previous year: € 65,645k).
fInAnCIAl ASSeTS And InTeReSTS In ASSOCIATed COMPAnIeS
in €k 31/12/2012 31/12/2011
Shareholdings in affiliated companies 12,168 9,825Shareholdings in associated companies 25,073 31,055Shareholdings 30,538 37,128Loans 2,003 2,143Investment securities 0 525 69,782 80,676
The table of equity holdings as of 31 December 2012 (see page 92) comprises all companies included in the consolidated financial statements.
63
(16)
(17)
CROSS Industries AG | Annual Report 2012
Notes to the Consolidated Financial Statements
The book values of financial assets have developed as follows:
in €k As of Currency Additions disposals As of 01/01/2012 conversion 31/12 /2012
Shareholdings in affiliated companies 9,825 (1) 2,768 (424) 12,168Shareholdings in associated companies 31,055 0 559 (6,541) 25,073Shareholdings 37,128 0 64 (6,654) 30,538Loans 2,143 (43) 0 (97) 2,003Investment securities 525 0 0 (525) 0 80,676 (44) 3,391 (14,241) 69,782
The interests in associated companies comprise 16 KTM distribution subsidiaries, which were deconsolidated as of 31 May 2010 due to a lack of material interest and are now subject to an at-equity valuation. The profit share recorded in 2012 amounts to € 949k (pre- vious year: € 657k) and is stated under distribution expenses. The investment valuation as of 31 December 2012 amounts to € 5,976k (previous year: € 5,027k).
The turnover or result of these companies in 2012 amounted to € 23,291k and € 949k respectively. As of 31 December 2012 the assets amounted to € 12,104k and liabilities to € 6,890k.
The following investments were also reported at-equity:
in €k Profit share Investment Goodwill 2012 valuation 31/12/2012 31/12/2012
Shares in associated companiesCROSS Informatik GmbH, Wels 474 20,226 0Wirtschaftspark Wels Errichtungs- und Betriebs-Aktiengesellschaft, Wels 54 4,847 454KTM New Zealand Ltd., Auckland, New Zealand 31 0 0 559 25,073 454
The following chart shows the summarized financial information regarding interests in associated companies (100% respectively):
in €k balance sheet Sales Result Assets liabilities date
CROSS Informatik GmbH, Wels 30/09/2012 229,235 1,802 169,238 104,414Wirtschaftspark Wels Errichtungs-und Betriebs-Aktiengesellschaft, Wels 31/08/2012 3,110 170 28,445 18,731KTM New Zealand Ltd.,Auckland, New Zealand 30/06/2012 4,810 118 676 781
64 The Company Group Status Report Consolidated Financial Statements Statement of all Legal Representatives
TAnGIble ASSeTS
in €k Real buildings Technical factory- and Advanced Total estate equipment and business payments machinery equipment and facilities under construction2012acquisition- and manufacturing costAs of 01/01/2012 16,008 104,329 102,763 142,874 9,365 375,339Currency conversion (2) (95) (140) (186) (2) (425)Additions/disposals due to changes of consolidation scope 1,942 8,881 4,125 506 197 15,651Additions 7,772 5,109 12,310 11,893 34,332 71,416Transfers (2,162) 9,487 4,802 5,524 (17,889) (238)Disposals 0 (51) (2,889) (2,132) (199) (5,271)as of 31/12/2012 23,558 127,660 120,971 158,479 25,804 456,472
accumulated depreciationAs of 01/01/2012 56 27,959 72,872 114,152 0 215,039Currency conversion (1) (24) (125) (158) 0 (308)Additions/disposals due to changes of consolidation scope 0 0 51 27 0 78Additions 2 4,566 10,006 12,253 4 26,831Transfers 0 0 0 0 0 0Allocations 0 0 0 (256) 0 (256)Disposals 0 (40) (2,456) (2,031) (4) (4,531)as of 31/12/2012 57 32,461 80,348 123,987 0 236,853
Book value as of 31/12/2012 23,501 95,199 40,623 34,492 25,804 219,619Book value as of 31/12/2011 15,952 76,370 29,891 28,722 9,365 160,300
2011acquisition- and manufacturing costAs of 01/01/2011 44,180 213,979 324,100 153,631 29,592 765,482Currency conversion 56 164 (5,410) (217) (994) (6,401)Additions/disposals due to changes of consolidation scope (28,792) (113,039) (258,097) (21,588) (16,152) (437,668)Additions 539 1,977 32,178 9,151 24,703 68,548Transfers 371 1,973 18,172 5,225 (27,486) (1,745)Disposals (346) (725) (8,180) (3,328) (298) (12,877)as of 31/12/2011 16,008 104,329 102,763 142,874 9,365 375,339
65
(18)
CROSS Industries AG | Annual Report 2012
Notes to the Consolidated Financial Statements
(Continued) in €k Real buildings Technical factory- and Advanced Total estate equipment and business payments machinery equipment and facilities under constructionacquisition- and manufacturing cost as of 31/12/2011 16,008 104,329 102,763 142,874 9,365 375,339
accumulated depreciationAs of 01/01/2011 13,085 43,128 129,499 108,726 0 294,438Currency conversion 2 (40) (4,038) 526 0 (3,550)Additions/disposals due to changes of consolidation scope (13,008) (22,333) (77,638) (8,649) 0 (121,628)Additions 35 7,671 32,927 16,215 0 56,848Transfers (11) 12 7 (8) 0 0Disposals (47) (479) (7,885) (2,658) 0 (11,069)as of 31/12/2011 56 27,959 72,872 114,152 0 215,039
Book value as of 31/12/2011 15,952 76,370 29,891 28,722 9,365 160,300Book value as of 31/12/2010 31,095 170,851 194,601 44,905 29,592 471,044
As of 31 December 2012 government grants in the amount of € 1,709k (previous year: € 913k) were classified as a liability. Due to missing qualifying assets in the tangible assets no interests on debt capital are capitalized – as in the previous year.
The following items of the tangible fixed assets comprise capitalized capital lease:
in €k 31/12/2012 31/12/2011
Leasing machineryAcquisition cost 6,650 5,471Accumulated depreciation (2,904) (1,954)Book value 3,746 3,517
ReAl eSTATe held AS fInAnCIAl InVeSTMenT
Intangible assets comprise properties including buildings with a book value of € 15,147k (previous year: € 12,793k), which are not used for own purposes. The fair value of these properties, which has to be explained according to IAS 40, basically corresponds to the reported book values.
As of the balance sheet dates there were no contractual obligations apart from buying, establishing or developing real estate held as financial investments. There are also no obligations regarding repairs, maintenance or improvements.
InTAnGIble ASSeTS And GOOdWIll
In business year 2012 development costs in the amount of € 27,794k (previous year: € 25,332k) were capitalized. As of 31 December 2012 the item “intangible assets” comprised development costs with a book value of € 64,383k (previous year: € 53,858k). The depre- ciation period was set according to the expected useful life of five years. Moreover, as previous year, the intangible assets comprise the brand KTM with € 61,103k, set after the first-time consolidation of the group, with an indefinite useful life and thus subject to an annual impairment test.
66
(19)
(20)
The Company Group Status Report Consolidated Financial Statements Statement of all Legal Representatives
in €k Concessions, Customer base, Goodwill Advanced Total industrial property rights, brand value, payments similar rights and self-provided benefits as well as intangible licenses derived assets from them2012acquisition- and manufacturing costsAs of 01/01/2012 20,799 250,600 176,575 0 447,974Currency conversion (81) 6 (10) 0 (85)Additions/disposals due to changes of the consolidation scope 263 2,952 3,600 0 6,815Additions 2,525 28,918 0 0 31,443Transfers 238 0 0 0 238Disposals (402) (101,776) (813) 0 (102,991)as of 31/12/2012 23,342 180,700 179,352 0 383,394
accumulated depriciationAs of 01/01/2012 15,487 125,542 22,827 0 163,856Currency conversion (48) 3 7 0 (38)Additions/disposals due to changes of the consolidation scope 42 0 0 0 42Additions 2,010 19,305 0 0 21,315Transfers 0 0Disposals (400) (101,776) 0 0 (102,176)as of 31/12/2012 17,091 43,074 22,834 0 82,999
Book value as of 31/12/2012 6,251 137,626 156,518 0 300,395Book value as of 31/12/2011 5,312 125,058 153,748 0 284,118
2011acquisition- and manufacturing costsAs of 01/01/2011 23,545 228,709 207,563 0 459,817Currency conversion (121( 249 119 0 247Additions/disposals due to changes of the consolidation scope (6,990) (3,746) (3,754) 0 (14,490)Additions 3,244 25,332 10 0 28,586Transfers 1,380 365 0 0 1,745Disposals (259) (309) (27,363) 0 (27,931)as of 31/12/2011 20,799 250,600 176,575 0 447,974
67
CROSS Industries AG | Annual Report 2012
Notes to the Consolidated Financial Statements
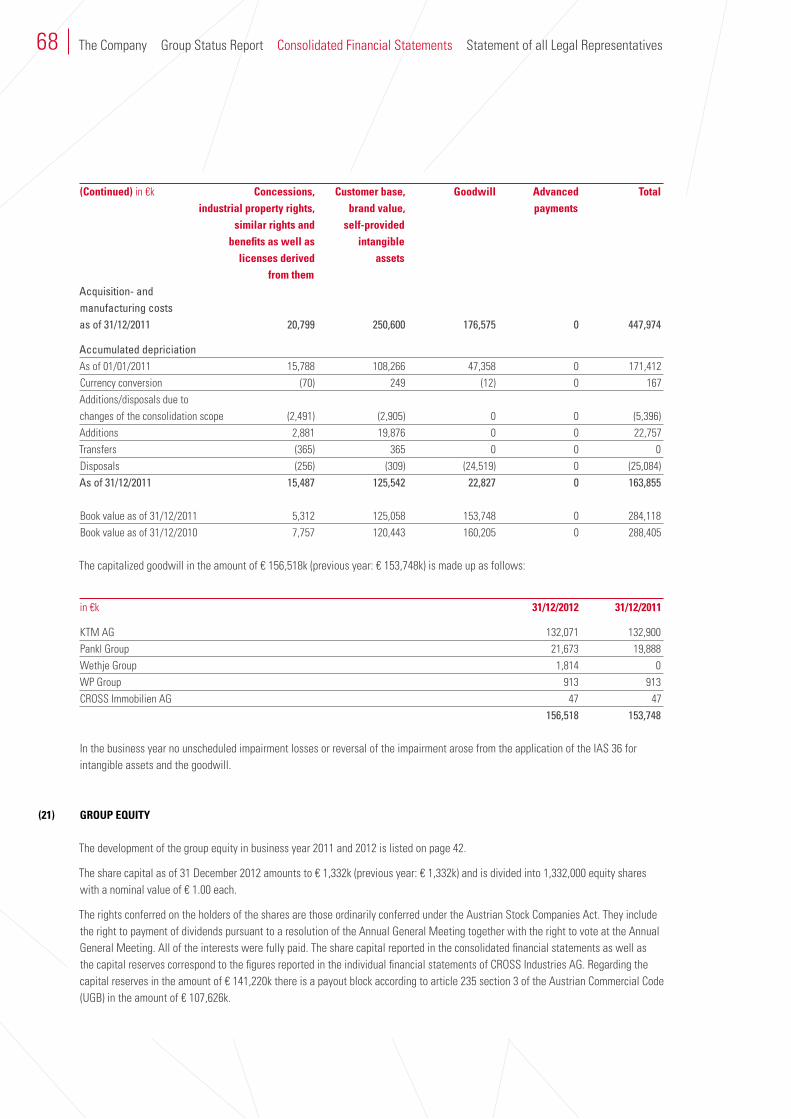
(Continued) in €k Concessions, Customer base, Goodwill Advanced Total industrial property rights, brand value, payments similar rights and self-provided benefits as well as intangible licenses derived assets from themacquisition- and manufacturing costs as of 31/12/2011 20,799 250,600 176,575 0 447,974
accumulated depriciationAs of 01/01/2011 15,788 108,266 47,358 0 171,412Currency conversion (70) 249 (12) 0 167Additions/disposals due to changes of the consolidation scope (2,491) (2,905) 0 0 (5,396)Additions 2,881 19,876 0 0 22,757Transfers (365) 365 0 0 0Disposals (256) (309) (24,519) 0 (25,084)as of 31/12/2011 15,487 125,542 22,827 0 163,855
Book value as of 31/12/2011 5,312 125,058 153,748 0 284,118Book value as of 31/12/2010 7,757 120,443 160,205 0 288,405
The capitalized goodwill in the amount of € 156,518k (previous year: € 153,748k) is made up as follows:
in €k 31/12/2012 31/12/2011
KTM AG 132,071 132,900Pankl Group 21,673 19,888Wethje Group 1,814 0WP Group 913 913CROSS Immobilien AG 47 47 156,518 153,748
In the business year no unscheduled impairment losses or reversal of the impairment arose from the application of the IAS 36 for intangible assets and the goodwill.
GROuP equITy
The development of the group equity in business year 2011 and 2012 is listed on page 42.
The share capital as of 31 December 2012 amounts to € 1,332k (previous year: € 1,332k) and is divided into 1,332,000 equity shares with a nominal value of € 1.00 each.
The rights conferred on the holders of the shares are those ordinarily conferred under the Austrian Stock Companies Act. They include the right to payment of dividends pursuant to a resolution of the Annual General Meeting together with the right to vote at the Annual General Meeting. All of the interests were fully paid. The share capital reported in the consolidated financial statements as well as the capital reserves correspond to the figures reported in the individual financial statements of CROSS Industries AG. Regarding the capital reserves in the amount of € 141,220k there is a payout block according to article 235 section 3 of the Austrian Commercial Code (UGB) in the amount of € 107,626k.
68
(21)
The Company Group Status Report Consolidated Financial Statements Statement of all Legal Representatives
In December 2005 a perpetual bond of CROSS Industries AG in the amount of € 60,000k was issued. This bond was adjusted by adding the agio and deducting transaction expenses; the associated deferred taxes are shown in the equity capital. The bond was reported as equity, since capital of CROSS Industries AG is available without limitation and there is further no call option on the part of the bond creditors. Under IAS 32.20 there is also no actual redemption commitment.
The perpetual bond is arranged as a not collateralized partial debenture, subordinate to all other current or future not collateralized, not subordinate liabilities of CROSS Industries AG. Interest shall be paid by CROSS Industries AG only, if a dividend or another payment to shareholders is resolved, if other subordinate liabilities or shareholder loans are redeemed or if interest is paid on shareholder loans. The resulting capital increase amounted to € 58,987k.
The group’s reserves include transactions from the capital consolidation, which strengthen the equity as well as other equity trans actions not affecting results including the revaluation of financial assets and the result of the business year. The revaluation reserve according to IAS 39 comprises the cash flow hedge reserve and the available-for-sale reserve.
The changes in value of derivate financial instruments from cash flow hedges are reported in the cash flow hedge reserve according to IAS 39, which is included in the consolidated balance sheet in the reserves including consolidated balance sheet profits. As of 31 December 2012 the cash flow hedge reserve including the shares of non-controlling shareholders amounted to € –4,058k (previous year: € –5,104k).
Changes in value not affecting results of stocks and shareholdings of the category available-for-sale are reported in the available-for-sale reserve, which is included in the reserves under IAS 39. As of 31 December 2012 the available-for-sale reserve including shares of non-controlling shareholders amounted to € 0k (previous year: € –201k).
The IAS 19 reserve includes actuarial losses from pension and severance pay provisions. As of 31 December 2012 the IAS 19 reserve – including shareholdings of non-controlling parties – amounts to € –2,516k (previous year: € –1,218k).
Reserves from exchange rate differences comprise all price differences resulting from the conversion of annual financial statements of consolidated subsidiaries, which have been prepared in foreign currencies.
The minority shareholdings comprise shareholdings of third parties in the equity of consolidated subsidiaries.
Capital ManagementThe aim of capital management is to maintain a strong capital basis so that an appropriate yield for the company’s shareholders reflect- ing the company’s risk situation can be further generated, the future development of the company ensured and also so that benefits for other stakeholders can be generated. Management views capital exclusively as book equity according to IFRS. As of the balance sheet date the equity ratio amounted to 34.4% (previous year: 37.4%).
The capital management of the CROSS Group aims at ensuring equity resources to its group companies that meet the local requirements.
ACCOunTS PAyAble
bondsIn April 2012 CROSS Industries AG – together with its 100% subsidiary CROSS Motorsport Systems AG – restructured its financing and entered into long-term loan arrangements to cover the future finance requirements of the companies. Additionally the bonds of CROSS Industries AG (maturity in December 2012) and CROSS Motorsport Systems AG (maturity in July 2013) should be repaid prema- turely. In this context CROSS Industries AG and CROSS Motorsport Systems AG issued a repurchase offer in May 2012. In the course of this repurchase offer bonds with a nominal value of € 26m of CROSS Industries AG and bonds with a nominal value of € 48m were repurchased. In addition bonds of CROSS Motorsport Systems AG with a nominal value of € 2.5 m were repurchased in 2012. In Decem- ber 2012 the remaining bonds of CROSS Industries AG in the amount of € 24m were repurchased according to plan.
69
(22)
CROSS Industries AG | Annual Report 2012
Notes to the Consolidated Financial Statements
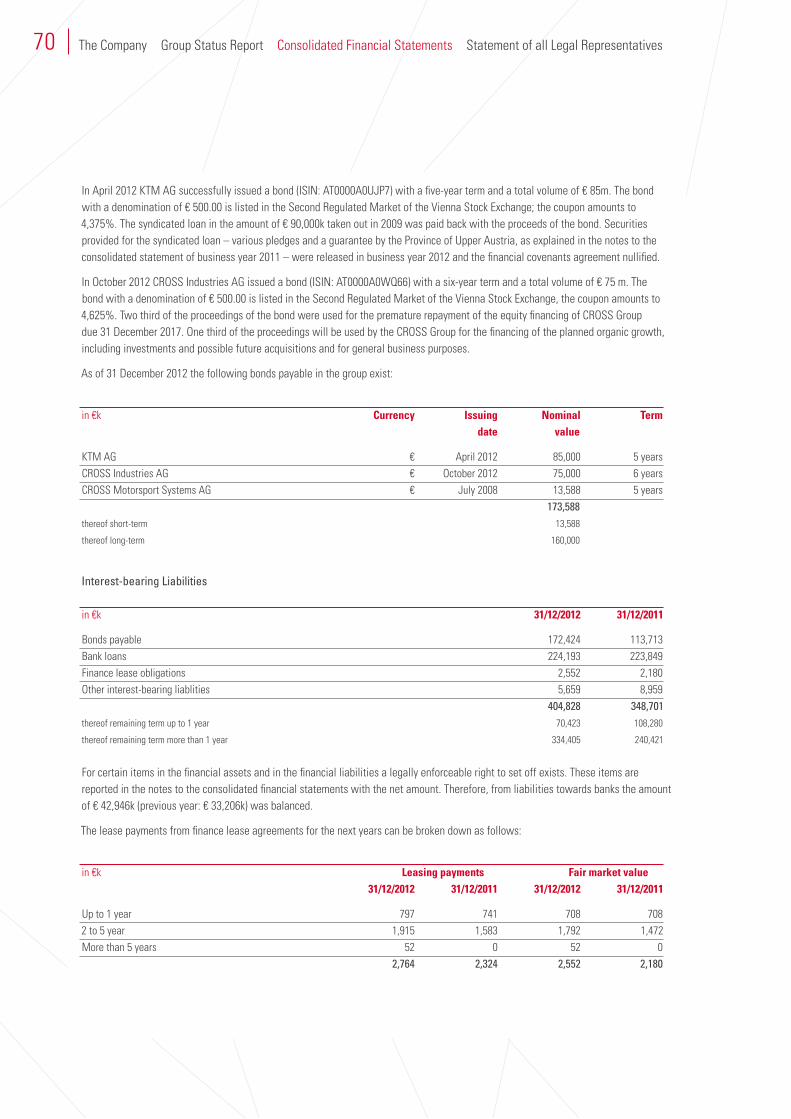
In April 2012 KTM AG successfully issued a bond (ISIN: AT0000A0UJP7) with a five-year term and a total volume of € 85m. The bond with a denomination of € 500.00 is listed in the Second Regulated Market of the Vienna Stock Exchange; the coupon amounts to 4,375%. The syndicated loan in the amount of € 90,000k taken out in 2009 was paid back with the proceeds of the bond. Securities provided for the syndicated loan – various pledges and a guarantee by the Province of Upper Austria, as explained in the notes to the consolidated statement of business year 2011 – were released in business year 2012 and the financial covenants agreement nullified.
In October 2012 CROSS Industries AG issued a bond (ISIN: AT0000A0WQ66) with a six-year term and a total volume of € 75 m. The bond with a denomination of € 500.00 is listed in the Second Regulated Market of the Vienna Stock Exchange, the coupon amounts to 4,625%. Two third of the proceedings of the bond were used for the premature repayment of the equity financing of CROSS Group due 31 December 2017. One third of the proceedings will be used by the CROSS Group for the financing of the planned organic growth, including investments and possible future acquisitions and for general business purposes.
As of 31 December 2012 the following bonds payable in the group exist:
in €k Currency Issuing nominal Term date value
KTM AG € April 2012 85,000 5 yearsCROSS Industries AG € October 2012 75,000 6 yearsCROSS Motorsport Systems AG € July 2008 13,588 5 years 173,588thereof short-term 13,588
thereof long-term 160,000
interest-bearing Liabilities
in €k 31/12/2012 31/12/2011
Bonds payable 172,424 113,713Bank loans 224,193 223,849Finance lease obligations 2,552 2,180Other interest-bearing liablities 5,659 8,959 404,828 348,701thereof remaining term up to 1 year 70,423 108,280
thereof remaining term more than 1 year 334,405 240,421
For certain items in the financial assets and in the financial liabilities a legally enforceable right to set off exists. These items are reported in the notes to the consolidated financial statements with the net amount. Therefore, from liabilities towards banks the amount of € 42,946k (previous year: € 33,206k) was balanced.
The lease payments from finance lease agreements for the next years can be broken down as follows:
in €k leasing payments fair market value 31/12/2012 31/12/2011 31/12/2012 31/12/2011
Up to 1 year 797 741 708 7082 to 5 year 1,915 1,583 1,792 1,472More than 5 years 52 0 52 0 2,764 2,324 2,552 2,180
70 The Company Group Status Report Consolidated Financial Statements Statement of all Legal Representatives
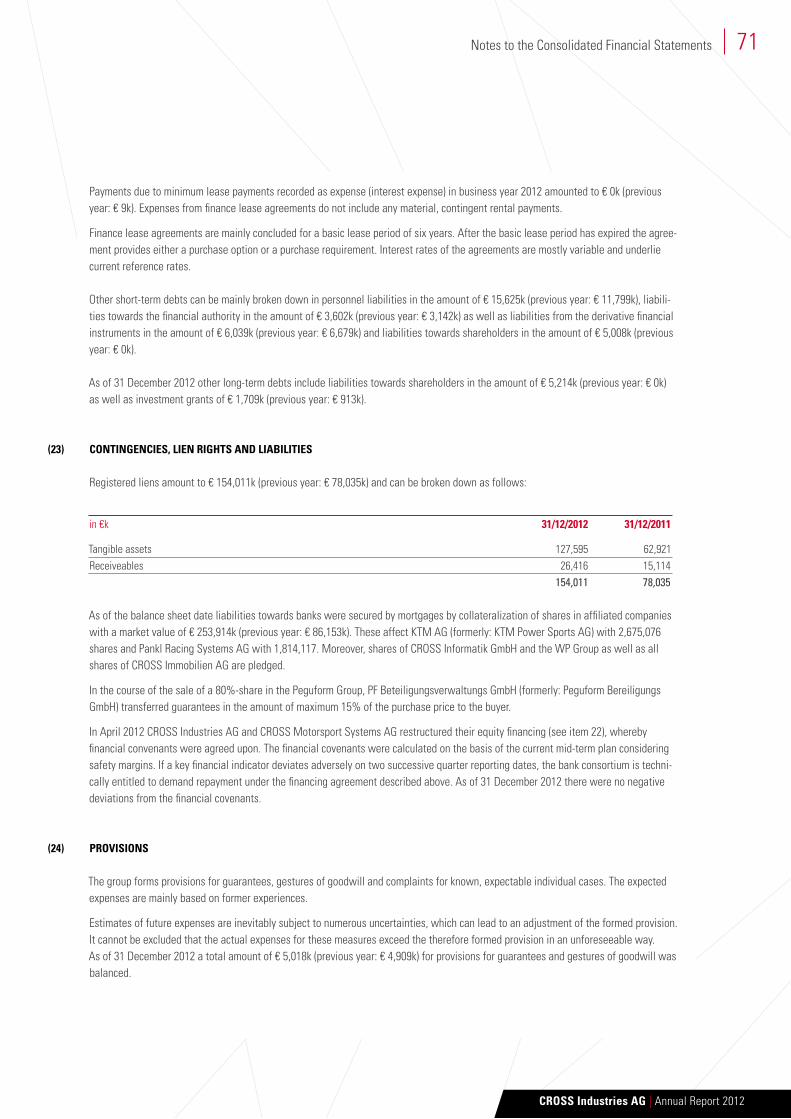
Payments due to minimum lease payments recorded as expense (interest expense) in business year 2012 amounted to € 0k (previous year: € 9k). Expenses from finance lease agreements do not include any material, contingent rental payments.
Finance lease agreements are mainly concluded for a basic lease period of six years. After the basic lease period has expired the agree- ment provides either a purchase option or a purchase requirement. Interest rates of the agreements are mostly variable and underlie current reference rates.
Other short-term debts can be mainly broken down in personnel liabilities in the amount of € 15,625k (previous year: € 11,799k), liabili- ties towards the financial authority in the amount of € 3,602k (previous year: € 3,142k) as well as liabilities from the derivative financial instruments in the amount of € 6,039k (previous year: € 6,679k) and liabilities towards shareholders in the amount of € 5,008k (previous year: € 0k).
As of 31 December 2012 other long-term debts include liabilities towards shareholders in the amount of € 5,214k (previous year: € 0k) as well as investment grants of € 1,709k (previous year: € 913k).
COnTInGenCIeS, lIen RIGhTS And lIAbIlITIeS
Registered liens amount to € 154,011k (previous year: € 78,035k) and can be broken down as follows:
in €k 31/12/2012 31/12/2011
Tangible assets 127,595 62,921Receiveables 26,416 15,114 154,011 78,035
As of the balance sheet date liabilities towards banks were secured by mortgages by collateralization of shares in affiliated companies with a market value of € 253,914k (previous year: € 86,153k). These affect KTM AG (formerly: KTM Power Sports AG) with 2,675,076 shares and Pankl Racing Systems AG with 1,814,117. Moreover, shares of CROSS Informatik GmbH and the WP Group as well as all shares of CROSS Immobilien AG are pledged.
In the course of the sale of a 80%-share in the Peguform Group, PF Beteiligungsverwaltungs GmbH (formerly: Peguform Bereiligungs GmbH) transferred guarantees in the amount of maximum 15% of the purchase price to the buyer.
In April 2012 CROSS Industries AG and CROSS Motorsport Systems AG restructured their equity financing (see item 22), whereby financial convenants were agreed upon. The financial covenants were calculated on the basis of the current mid-term plan considering safety margins. If a key financial indicator deviates adversely on two successive quarter reporting dates, the bank consortium is techni- cally entitled to demand repayment under the financing agreement described above. As of 31 December 2012 there were no negative deviations from the financial covenants.
PROVISIOnS
The group forms provisions for guarantees, gestures of goodwill and complaints for known, expectable individual cases. The expected expenses are mainly based on former experiences.
Estimates of future expenses are inevitably subject to numerous uncertainties, which can lead to an adjustment of the formed provision. It cannot be excluded that the actual expenses for these measures exceed the therefore formed provision in an unforeseeable way. As of 31 December 2012 a total amount of € 5,018k (previous year: € 4,909k) for provisions for guarantees and gestures of goodwill was balanced.
71
CROSS Industries AG | Annual Report 2012
Notes to the Consolidated Financial Statements
(23)
(24)
During the business year provisions have developed as follows:
in €k As of Currency Additions Changes in disposals use Reclassi- As of 01/01/2012 conversion the scope fication 31/12 /2012 of consoli- dationShort-term provisons for:Guaranties 4,066 0 4,076 86 (61) (3,965) 557 4,759Onerous contracts 135 0 2 0 0 (135) 0 2Restructuring measurements 126 2 106 0 0 (103) 0 131Litigation cost 417 0 110 14 (50) (429) 0 62Others 600 0 2,076 305 (43) (519) 0 2,419 5,344 2 6,370 405 (154) (5,151) 557 7,373
Long-term provisons for:Guaranties 843 0 0 0 0 (27) (557) 259Others 103 2 0 0 0 (105) 0 0 946 2 0 0 0 (132) (557) 259
SOCIAl CAPITAl OblIGATIOnS
Social capital obligations include provisions for:
in €k 31/12/2012 31/12/2011
Severance pay 10,887 9,205Anniversary bonus 1,333 964Retirement pay 512 2 12,732 10,171
During the business year social capital obligations developed as follows:
in €k 31/12/2012 31/12/2011
Projected benefit obligationAs of 01/01 10,395 13,840Service cost 848 688Interest expenses 538 441Payments made (858) (335)Actuarial loss 1,957 297Changes in the scope of consolidation 157 (4,536)as of 31/12 13,037 10,395
72
(25)
The Company Group Status Report Consolidated Financial Statements Statement of all Legal Representatives
(Continued) in €k 31/12/2012 31/12/2011
Projected benefit obligation as of 31/12 13,037 10,395
Plan assetsAs of 01/01 224 295Payments received 0 7Payments made (36) 0Changes in the scope of consolidation 117 (78)as of 31/12 305 224
net debt (projected benefit obligation less plan assets) 12,732 10,171
The defined benefit obligation of obligations after termination of the employment can be broken down as follows after its fund financing:
in €k 31/12/2012 31/12/2011
Projected benefit obligation covered by plan assets (gross) 817 224Market value of plan assets 305 224Projected benefit obligation covered by plan assets (net) 512 0
Projected benefit obligation not covered by plan assets 12,220 10,171total projected benefit obligations 12,732 10,171
Income and expenses for obligations after the termination of the employment recorded in the income statement are made up as follows:
in €k 31/12/2012 31/12/2011
Service expenses 848 688Interest expenses 538 441 1,386 1,129
The valuation of obligations is subject to the following assumptions:
31/12/2012 31/12/2011
Interest rate 4.00% 5.00%Wages and salary trend 3.00% 3.00%Pension age for women/men (with transition rule) 65 years 65 years
The actual income from the plan assets amount to € 0k (previous year: € 0k).
Taking the very long average terms and high average life expectancy into consideration, the interest rate was determined on the basis of market interest rates.
Staff fluctuation is determined for each company and taken into account depending on age/service. The actuarial assumptions are based on mortality tables for the individual country. The statutory retirement age for each country was selected as the retirement age.
73
CROSS Industries AG | Annual Report 2012
Notes to the Consolidated Financial Statements
Expenses for contribution-defined pension schemes mainly affect the employee provision fund in Austria and amount to € 1,367k (previous year: € 967k).
In the last five years the cash value of performance-oriented obligations developed as follows:
in €k 30/09/2009 31/12/2009 31/12/2010 31/12/2011 31/12/2012
Value of the obligations 15,726 12,394 13,545 10,171 12,732
A change (±0.5 percentage points) of the parameters “Interest rate” and “Wages and salary trend” had changed the present value of the future payments as follows:
in €k Change Change –0.5 percent- +0.5 percent- age points age points
Intereste rate 6.9% (6.2%)Wages and salary trend (5.9%) 6.4%
other exPLanationS
fInAnCIAl InSTRuMenTS And fInAnCIAl RISk MAnAGeMenT
basisThe CROSS Group holds primary and derivative financial instruments. Primary financial instruments mainly include financial assets, trade accounts receivable, deposits with banks, bank loans, trade accounts payable, financial liabilities and bonds. The amount of financial instruments is shown in the balance sheet and described in the notes to the consolidated financial statements.
Derivative financial instruments are generally used to hedge existing change in interest rate and foreign exchange risks. The use of derivative financial instruments is subject to appropriate authorization and control procedures in the group.
Acquisitions and sales of any financial instruments are recognized on the settlement date.
The financial instruments are generally valued at cost at the time of addition. The financial instruments are written off if the rights to payments from the investment have expired or have been transferred and the group has basically transferred all the risks and rewards that are involved in ownership.
book Values, fair Values and net Result of the financial InstrumentsThe book values, fair values and valuation techniques for financial assets (financial instruments on the asset side) can be broken down into the following classifications and categories according to IAS 39 and IAS 17:
74 The Company Group Status Report Consolidated Financial Statements Statement of all Legal Representatives
iv.
(26)
in €k book fair Amount stated acc. to IAS 39 Amount value value Continued Acquisition fair value fair value stated acquisition cost affecting not acc. to cost net income affecting IAS 17 net income31/12/2012Loans and receivables 133,272 133,272Cash and cash equivalents 43,279 43,279 ◊ – – – –Trade receivales 73,821 73,821 ◊ – – – –Receiveables towards affiliated companies 1,843 1,843 ◊ – – – –Other financial receivables (short- and long-term) 12,326 12,326 ◊ – – – –Financial assets – loans 2,003 2,003 ◊ – – – –
financial assets held-to-maturity 0 0Financial assets – investment securities (held-to-maturity) 0 0 ◊ – – – –
financial assets at fair value through profit or loss 0 0Other short-term assets – stocks (trading) 0 0 – – ◊ – –
financial assets available-for-sale 42,706 42,706Financial assets – holdings in affiliated companies 12,168 12,168 – ◊ – – –Financial assets – holdings 30,538 30,538 – ◊ – – –Other short-term assets – stocks 0 0 – – – ◊ –
others 1,804 1,804Other short-term assets – derivatives with positive market value (fair value hedge) 656 656 – – ◊ – –Other short-term assets – derivatives with positive market value (cash flow hedge) 1,148 1,148 – – – ◊ – 177,782 177,782
75
CROSS Industries AG | Annual Report 2012
Notes to the Consolidated Financial Statements
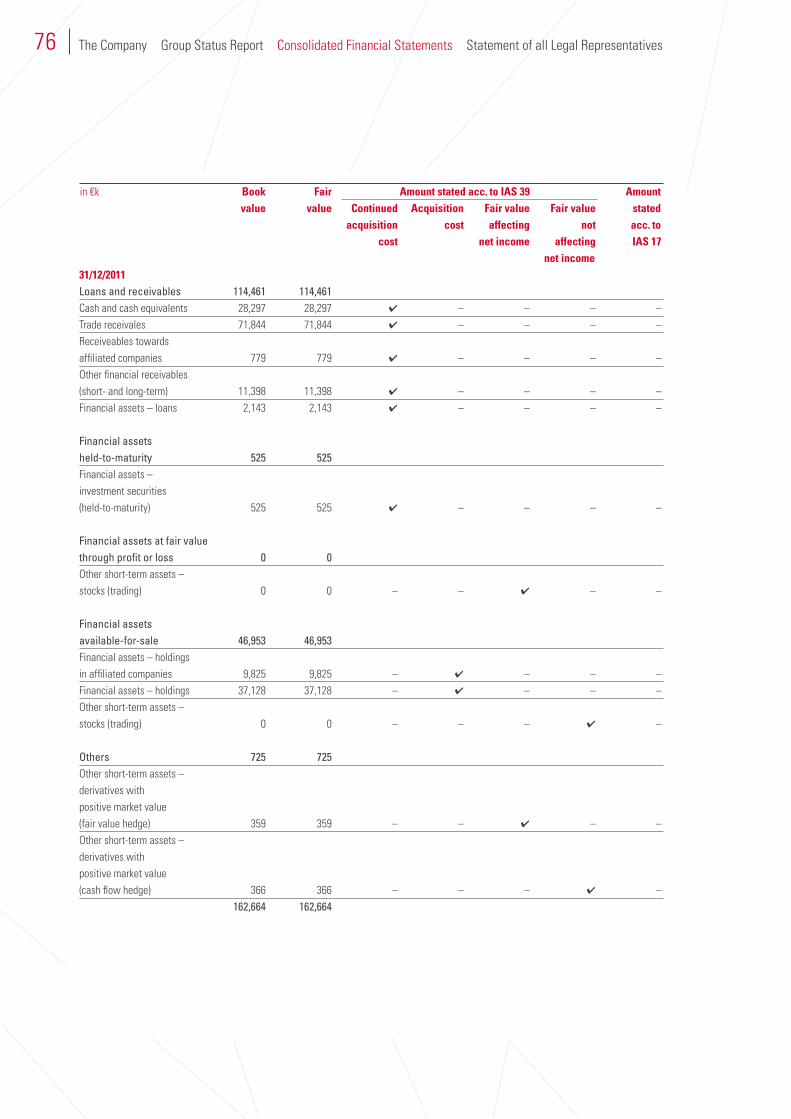
in €k book fair Amount stated acc. to IAS 39 Amount value value Continued Acquisition fair value fair value stated acquisition cost affecting not acc. to cost net income affecting IAS 17 net income31/12/2011Loans and receivables 114,461 114,461Cash and cash equivalents 28,297 28,297 ◊ – – – –Trade receivales 71,844 71,844 ◊ – – – –Receiveables towards affiliated companies 779 779 ◊ – – – –Other financial receivables (short- and long-term) 11,398 11,398 ◊ – – – –Financial assets – loans 2,143 2,143 ◊ – – – –
financial assets held-to-maturity 525 525Financial assets – investment securities (held-to-maturity) 525 525 ◊ – – – –
financial assets at fair value through profit or loss 0 0Other short-term assets – stocks (trading) 0 0 – – ◊ – –
financial assets available-for-sale 46,953 46,953Financial assets – holdings in affiliated companies 9,825 9,825 – ◊ – – –Financial assets – holdings 37,128 37,128 – ◊ – – –Other short-term assets – stocks (trading) 0 0 – – – ◊ –
others 725 725Other short-term assets – derivatives with positive market value (fair value hedge) 359 359 – – ◊ – –Other short-term assets – derivatives with positive market value (cash flow hedge) 366 366 – – – ◊ – 162,664 162,664
76 The Company Group Status Report Consolidated Financial Statements Statement of all Legal Representatives
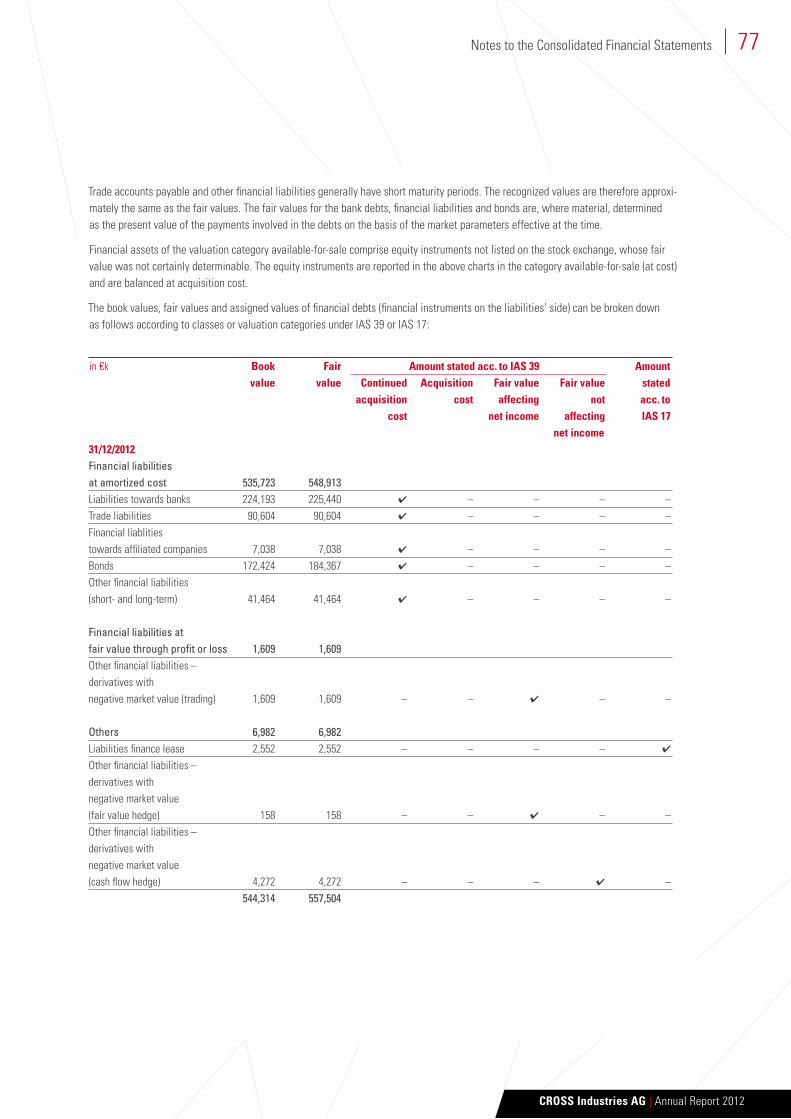
Trade accounts payable and other financial liabilities generally have short maturity periods. The recognized values are therefore approxi- mately the same as the fair values. The fair values for the bank debts, financial liabilities and bonds are, where material, determined as the present value of the payments involved in the debts on the basis of the market parameters effective at the time.
Financial assets of the valuation category available-for-sale comprise equity instruments not listed on the stock exchange, whose fair value was not certainly determinable. The equity instruments are reported in the above charts in the category available-for-sale (at cost) and are balanced at acquisition cost.
The book values, fair values and assigned values of financial debts (financial instruments on the liabilities’ side) can be broken down as follows according to classes or valuation categories under IAS 39 or IAS 17:
in €k book fair Amount stated acc. to IAS 39 Amount value value Continued Acquisition fair value fair value stated acquisition cost affecting not acc. to cost net income affecting IAS 17 net income31/12/2012financial liabilities at amortized cost 535,723 548,913Liabilities towards banks 224,193 225,440 ◊ – – – –Trade liabilities 90,604 90,604 ◊ – – – –Financial liablities towards affiliated companies 7,038 7,038 ◊ – – – –Bonds 172,424 184,367 ◊ – – – –Other financial liabilities (short- and long-term) 41,464 41,464 ◊ – – – –
financial liabilities at fair value through profit or loss 1,609 1,609Other financial liabilities – derivatives with negative market value (trading) 1,609 1,609 – – ◊ – –
others 6,982 6,982Liabilities finance lease 2,552 2,552 – – – – ◊
Other financial liabilities – derivatives with negative market value (fair value hedge) 158 158 – – ◊ – –Other financial liabilities – derivatives with negative market value (cash flow hedge) 4,272 4,272 – – – ◊ – 544,314 557,504
77
CROSS Industries AG | Annual Report 2012
Notes to the Consolidated Financial Statements
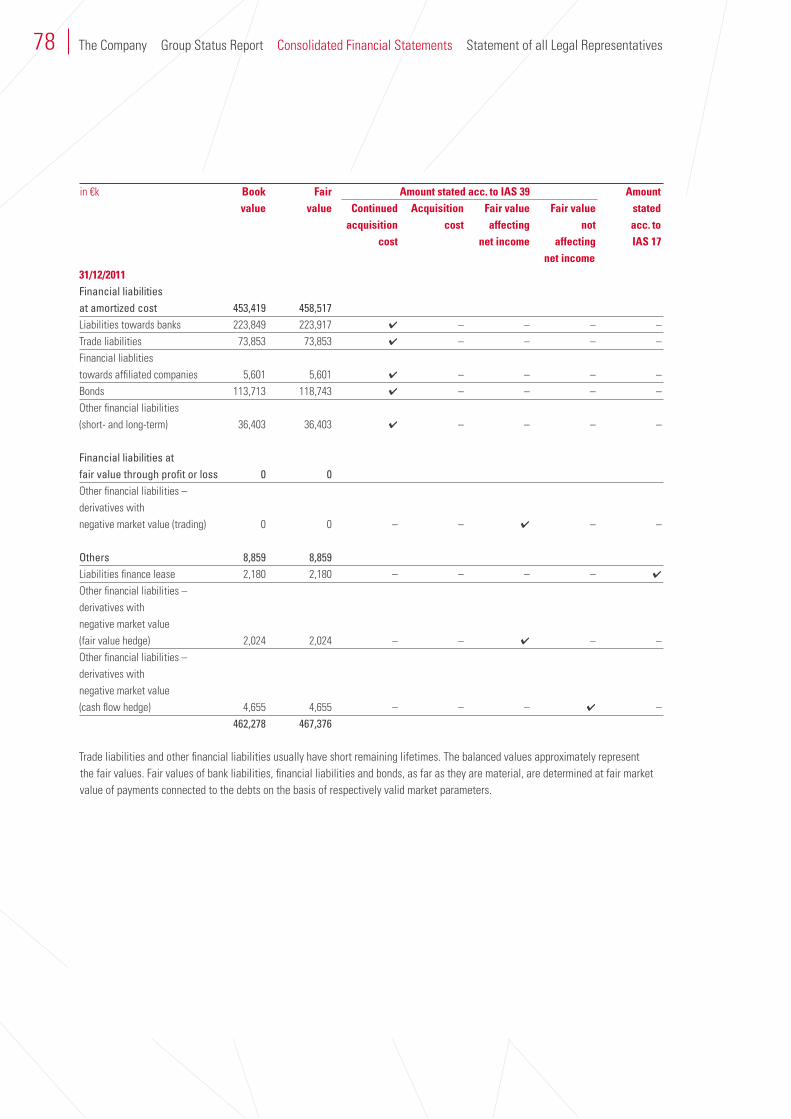
in €k book fair Amount stated acc. to IAS 39 Amount value value Continued Acquisition fair value fair value stated acquisition cost affecting not acc. to cost net income affecting IAS 17 net income31/12/2011financial liabilities at amortized cost 453,419 458,517Liabilities towards banks 223,849 223,917 ◊ – – – –Trade liabilities 73,853 73,853 ◊ – – – –Financial liablities towards affiliated companies 5,601 5,601 ◊ – – – –Bonds 113,713 118,743 ◊ – – – –Other financial liabilities (short- and long-term) 36,403 36,403 ◊ – – – –
financial liabilities at fair value through profit or loss 0 0Other financial liabilities – derivatives with negative market value (trading) 0 0 – – ◊ – –
others 8,859 8,859Liabilities finance lease 2,180 2,180 – – – – ◊
Other financial liabilities – derivatives with negative market value (fair value hedge) 2,024 2,024 – – ◊ – –Other financial liabilities – derivatives with negative market value (cash flow hedge) 4,655 4,655 – – – ◊ – 462,278 467,376
Trade liabilities and other financial liabilities usually have short remaining lifetimes. The balanced values approximately represent the fair values. Fair values of bank liabilities, financial liabilities and bonds, as far as they are material, are determined at fair market value of payments connected to the debts on the basis of respectively valid market parameters.
78 The Company Group Status Report Consolidated Financial Statements Statement of all Legal Representatives
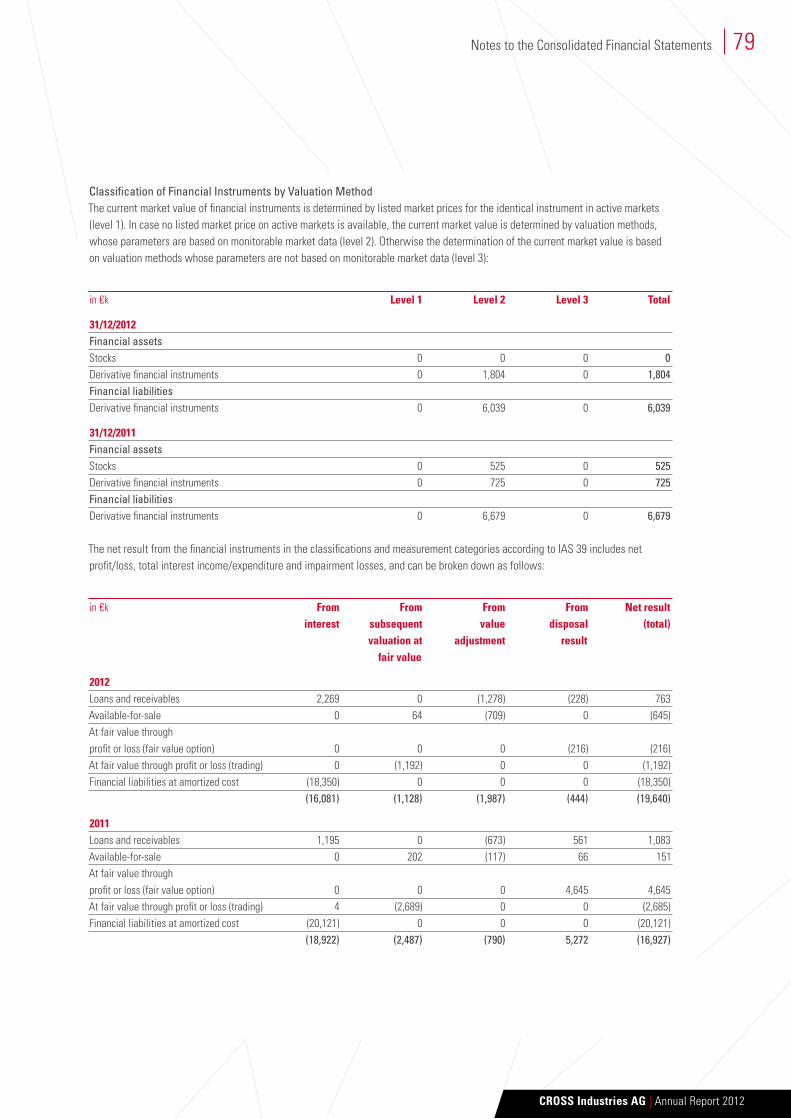
Classification of financial instruments by valuation methodThe current market value of financial instruments is determined by listed market prices for the identical instrument in active markets (level 1). In case no listed market price on active markets is available, the current market value is determined by valuation methods, whose parameters are based on monitorable market data (level 2). Otherwise the determination of the current market value is based on valuation methods whose parameters are not based on monitorable market data (level 3):
in €k level 1 level 2 level 3 Total
31/12/2012financial assetsStocks 0 0 0 0Derivative financial instruments 0 1,804 0 1,804financial liabilitiesDerivative financial instruments 0 6,039 0 6,039
31/12/2011financial assetsStocks 0 525 0 525Derivative financial instruments 0 725 0 725financial liabilitiesDerivative financial instruments 0 6,679 0 6,679
The net result from the financial instruments in the classifications and measurement categories according to IAS 39 includes net profit/loss, total interest income/expenditure and impairment losses, and can be broken down as follows:
in €k from from from from net result interest subsequent value disposal (total) valuation at adjustment result fair value
2012Loans and receivables 2,269 0 (1,278) (228) 763Available-for-sale 0 64 (709) 0 (645)At fair value through profit or loss (fair value option) 0 0 0 (216) (216)At fair value through profit or loss (trading) 0 (1,192) 0 0 (1,192)Financial liabilities at amortized cost (18,350) 0 0 0 (18,350) (16,081) (1,128) (1,987) (444) (19,640)
2011Loans and receivables 1,195 0 (673) 561 1,083Available-for-sale 0 202 (117) 66 151At fair value through profit or loss (fair value option) 0 0 0 4,645 4,645At fair value through profit or loss (trading) 4 (2,689) 0 0 (2,685)Financial liabilities at amortized cost (20,121) 0 0 0 (20,121) (18,922) (2,487) (790) 5,272 (16,927)
79
CROSS Industries AG | Annual Report 2012
Notes to the Consolidated Financial Statements
Changes of the value adjustment regarding loans and receivables is reported under other operating expenses. The part from the sub- sequent valuation not affecting income at fair value of financial assets available-for-sale is reported in the fair value provision Available-for-Sale stocks. Other components of the net income are included in financial income/financial expenses.
financial Risk ManagementPrinciples of financial risk managementRegarding its assets, debts and planned transactions, the CROSS Group is exposed to credit, market, currency and liquidity risks. The aim of financial risk management is therefore to control and limit these risks. The Management and Supervisory Boards are regularly informed about any risks that could have a significant effect on business development.
The basic principles of financial risk management are laid down and monitored by the Supervisory Board as well as the Management Board. Group treasury is in charge of implementation. The KTM Group, the Pankl Group as well as the real estate companies apply derivative financial instruments to hedge the financial risks described below. The aim is to hedge operative cash flows against fluctua-tions of foreign exchange rates and/or interest rates. The hedging scope usually encompasses currently still open items as well as planned transactions in the coming twelve months. In exceptional cases and in accordance with the Supervisory Board, also longer-term strategic hedge positions can be employed.
Currency risksAs a global corporation, the CROSS Group is also affected by general economic conditions, such as changes in monetary parities or developments on the world’s financial markets. The exchange rate trends for the US dollar in particular, which represents the highest individual foreign exchange risk for the KTM Group, play a significant role in the company’s sales and earnings performance. In the business year 2012 22% of the turnover (previous year: 23%) was generated by the KTM Group in US dollars. Currency risk management, especially hedging strategies, can compensate for exchange rate deviations to a great extent, at least over a model year. For business year 2013 the US dollar-business was hedged at a rate between 1.22 and 1.32 €/USD.
There are also currency risks for the group when financial assets and debts are in a currency that is not the local one for the company concerned. The group companies issue the majority of bills in their local currency and finance themselves to a large extent in the local currency. Investments are primarily in the national currency of the investing group company. As a result, the currency items are usually closed naturally.
Apart from investments in Austria, the CROSS Group also makes international investments outside the euro zone, however to a subordinate extent. Exchange rate fluctuations, in particular between the euro and the US dollar and between currencies of Austria’s neighboring countries can prove disadvantageous for the value of such interests.
Although the CROSS Group can also benefit from exchange rate fluctuations, they can as well have significant negative effects on the company’s business activity, the financial position as well as the business outlook.
Sensitivity analyses were carried out for the currency risks involved in financial instruments that show the impact of hypothetical changes in exchange rates on earnings (after tax) and equity. The balances affected at the balance sheet date were taken as basis. It was assumed for the analysis that the risk on the balance sheet date basically represents the risk during the business year. The group tax rate used was 25%. In addition, the analysis was also based on the assumption that all other variables, especially interest rates, remain constant. Included in the analysis were currency risks for financial instruments that are denominated in a currency deviating from the functional one and of a monetary nature. Currency risks from euro items in subsidiaries whose functional currency deviates from the euro were added to the currency risk for the functional currency of the relevant subsidiary. Risks involved in foreign currency items not in euros were aggregated at group level. Exchange rates differences resulting from converting financial statements into the group currency are not taken into account.
80 The Company Group Status Report Consolidated Financial Statements Statement of all Legal Representatives
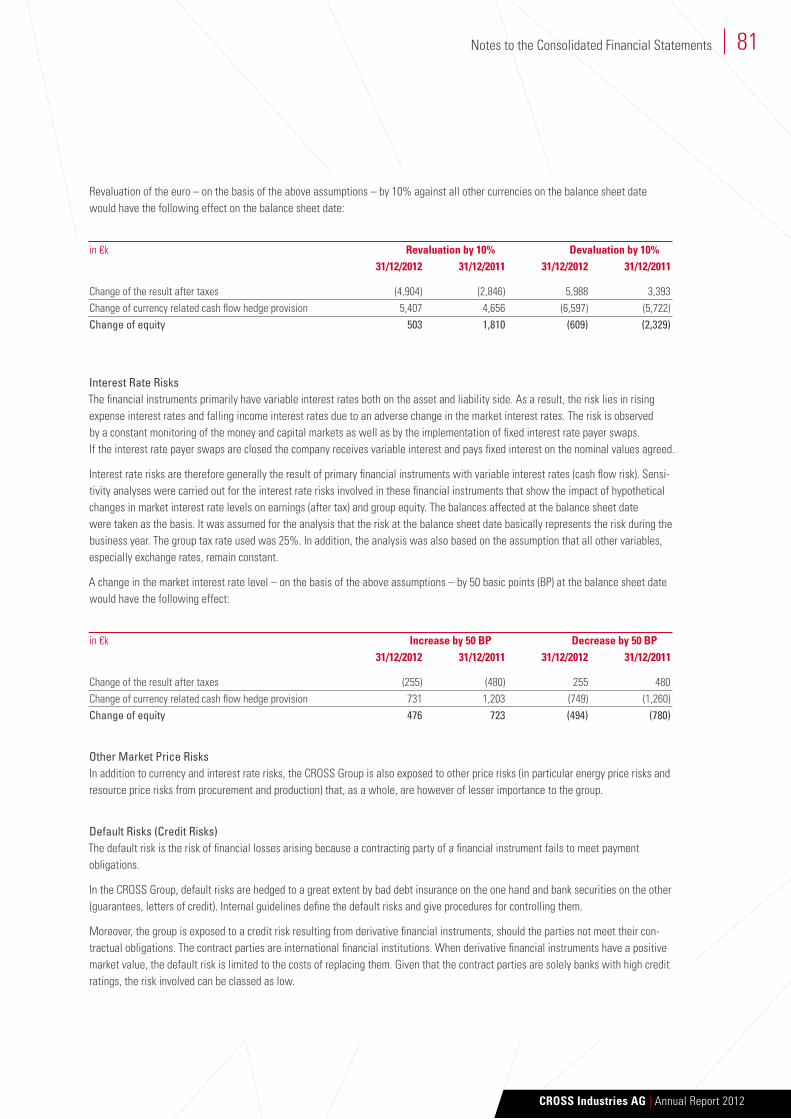
Revaluation of the euro – on the basis of the above assumptions – by 10% against all other currencies on the balance sheet date would have the following effect on the balance sheet date:
in €k Revaluation by 10% devaluation by 10% 31/12/2012 31/12/2011 31/12/2012 31/12/2011
Change of the result after taxes (4,904) (2,846) 5,988 3,393Change of currency related cash flow hedge provision 5,407 4,656 (6,597) (5,722)Change of equity 503 1,810 (609) (2,329)
interest rate risksThe financial instruments primarily have variable interest rates both on the asset and liability side. As a result, the risk lies in rising expense interest rates and falling income interest rates due to an adverse change in the market interest rates. The risk is observed by a constant monitoring of the money and capital markets as well as by the implementation of fixed interest rate payer swaps. If the interest rate payer swaps are closed the company receives variable interest and pays fixed interest on the nominal values agreed.
Interest rate risks are therefore generally the result of primary financial instruments with variable interest rates (cash flow risk). Sensi- tivity analyses were carried out for the interest rate risks involved in these financial instruments that show the impact of hypothetical changes in market interest rate levels on earnings (after tax) and group equity. The balances affected at the balance sheet date were taken as the basis. It was assumed for the analysis that the risk at the balance sheet date basically represents the risk during the business year. The group tax rate used was 25%. In addition, the analysis was also based on the assumption that all other variables, especially exchange rates, remain constant.
A change in the market interest rate level – on the basis of the above assumptions – by 50 basic points (BP) at the balance sheet date would have the following effect:
in €k Increase by 50 bP decrease by 50 bP 31/12/2012 31/12/2011 31/12/2012 31/12/2011
Change of the result after taxes (255) (480) 255 480Change of currency related cash flow hedge provision 731 1,203 (749) (1,260)Change of equity 476 723 (494) (780)
other market Price risksIn addition to currency and interest rate risks, the CROSS Group is also exposed to other price risks (in particular energy price risks and resource price risks from procurement and production) that, as a whole, are however of lesser importance to the group.
default risks (Credit risks)The default risk is the risk of financial losses arising because a contracting party of a financial instrument fails to meet payment obligations.
In the CROSS Group, default risks are hedged to a great extent by bad debt insurance on the one hand and bank securities on the other (guarantees, letters of credit). Internal guidelines define the default risks and give procedures for controlling them.
Moreover, the group is exposed to a credit risk resulting from derivative financial instruments, should the parties not meet their con- tractual obligations. The contract parties are international financial institutions. When derivative financial instruments have a positive market value, the default risk is limited to the costs of replacing them. Given that the contract parties are solely banks with high credit ratings, the risk involved can be classed as low.
81
CROSS Industries AG | Annual Report 2012
Notes to the Consolidated Financial Statements
On the basis of their ratings, carried out by highly respected agencies, the risk for the group can be regarded as low.
The default risk involved in receivables from customers can be considered low, as the risk rating of new and existing customers is checked regularly and security is demanded.
Some operational subsidiaries of the group show a significant level of dependency on individual, major customers. As a means of minimizing the impact on earnings resulting from a potential loss of customers, the company is continuously striving to expand its customer base and thus reduce its dependence on any individual customers.
On the asset side, the amounts shown represent the maximum default risk.
The book values of the receivables can be broken down as follows:
in €k book Thereof: Thereof: As of the reporting date not impaired Thereof value As of the and due in the following periods of time impaired reporting up to 30 to 60 to More than date neither 30 days 60 days 90 days 90 days impaired nor overdue
31/12/2012Trade receivables 73,821 43,267 16,186 2,256 1,859 5,683 4,570Receivables towards affiliated companies 1,843 1,843 0 0 0 0 0Other financial receivables (short- and long-term) 12,326 12,326 0 0 0 0 0Financial assets – loans 2,003 2,003 0 0 0 0 0 89,993 59,439 16,186 2,256 1,859 5,683 4,570
31/12/2011Trade receivables 71,844 49,270 5,776 3,114 5,127 4,878 3,679Receivables towards affiliated companies 779 779 0 0 0 0 0Other financial receivables (short- and long-term) 11,398 11,000 266 0 0 28 104Financial assets – loans 2,143 2,143 0 0 0 0 0 86,164 63,192 6,042 3,114 5,127 4,906 3,783
Regarding the recognized financial trade and other receivables that were neither written-off nor in default, there were no signs at the balance sheet date that the debtors may not fulfill their payment obligations.
Book values of financial assets that otherwise would have been reduced in value or overdue and the terms of which were renegotiated, amounted to € 0k (previous year: € 0k).
Liquidity risksA major aim of financial risk management in the CROSS Group is to ensure liquidity and financial flexibility at all times. For this pur- pose a liquidity reserve in the form of unused credit lines (cash and guaranteed credit) – and if required in the form of cash in hand – is held at banks with a high credit ranking. The long-term liquidity requirements are met by issuing company shares and bonds, taking out bank loans as well as by capital increases.
In April 2012 the equity financing of CROSS Industries AG and CROSS Motorsport Systems AG was restructured (see item 22). In the framework of this financing the company concluded financial covenants. The financial covenants were determined based on the current
82 The Company Group Status Report Consolidated Financial Statements Statement of all Legal Representatives
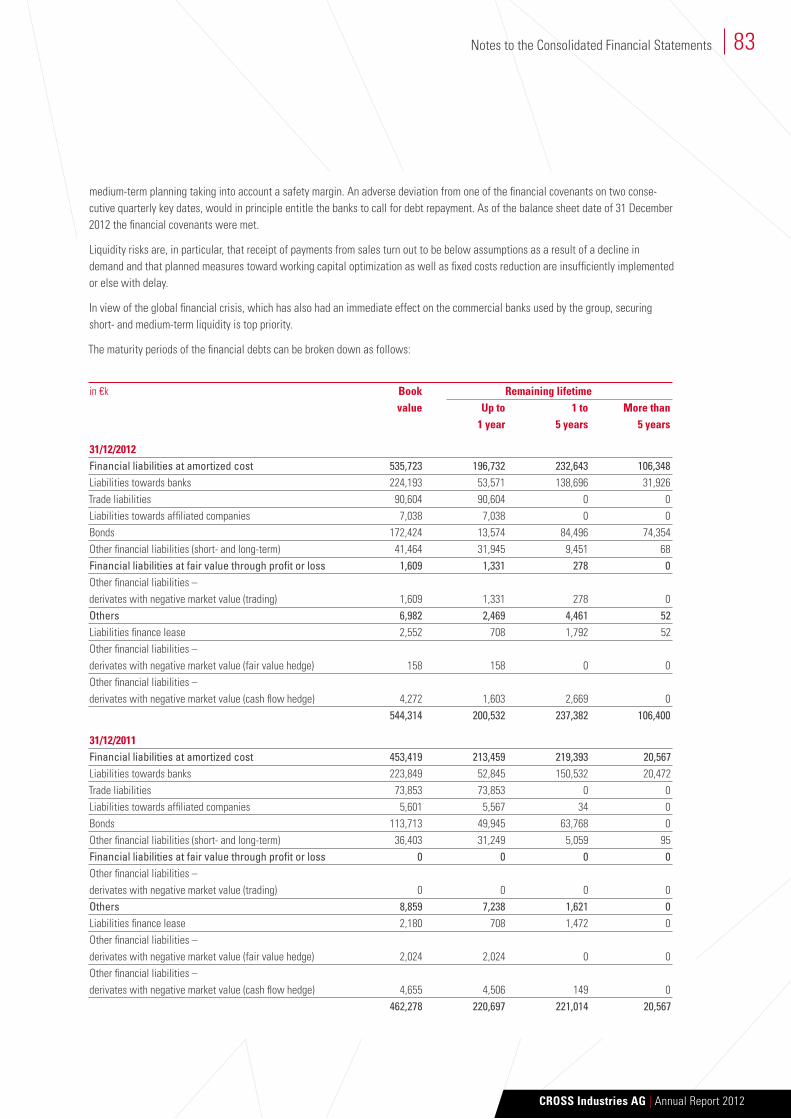
medium-term planning taking into account a safety margin. An adverse deviation from one of the financial covenants on two conse- cutive quarterly key dates, would in principle entitle the banks to call for debt repayment. As of the balance sheet date of 31 December 2012 the financial covenants were met.
Liquidity risks are, in particular, that receipt of payments from sales turn out to be below assumptions as a result of a decline in demand and that planned measures toward working capital optimization as well as fixed costs reduction are insufficiently implemented or else with delay.
In view of the global financial crisis, which has also had an immediate effect on the commercial banks used by the group, securing short- and medium-term liquidity is top priority.
The maturity periods of the financial debts can be broken down as follows:
in €k book Remaining lifetime value up to 1 to More than 1 year 5 years 5 years
31/12/2012financial liabilities at amortized cost 535,723 196,732 232,643 106,348Liabilities towards banks 224,193 53,571 138,696 31,926Trade liabilities 90,604 90,604 0 0Liabilities towards affiliated companies 7,038 7,038 0 0Bonds 172,424 13,574 84,496 74,354Other financial liabilities (short- and long-term) 41,464 31,945 9,451 68financial liabilities at fair value through profit or loss 1,609 1,331 278 0Other financial liabilities – derivates with negative market value (trading) 1,609 1,331 278 0others 6,982 2,469 4,461 52Liabilities finance lease 2,552 708 1,792 52Other financial liabilities – derivates with negative market value (fair value hedge) 158 158 0 0Other financial liabilities – derivates with negative market value (cash flow hedge) 4,272 1,603 2,669 0 544,314 200,532 237,382 106,400
31/12/2011financial liabilities at amortized cost 453,419 213,459 219,393 20,567Liabilities towards banks 223,849 52,845 150,532 20,472Trade liabilities 73,853 73,853 0 0Liabilities towards affiliated companies 5,601 5,567 34 0Bonds 113,713 49,945 63,768 0Other financial liabilities (short- and long-term) 36,403 31,249 5,059 95financial liabilities at fair value through profit or loss 0 0 0 0Other financial liabilities – derivates with negative market value (trading) 0 0 0 0others 8,859 7,238 1,621 0Liabilities finance lease 2,180 708 1,472 0Other financial liabilities – derivates with negative market value (fair value hedge) 2,024 2,024 0 0Other financial liabilities – derivates with negative market value (cash flow hedge) 4,655 4,506 149 0 462,278 220,697 221,014 20,567
83
CROSS Industries AG | Annual Report 2012
Notes to the Consolidated Financial Statements
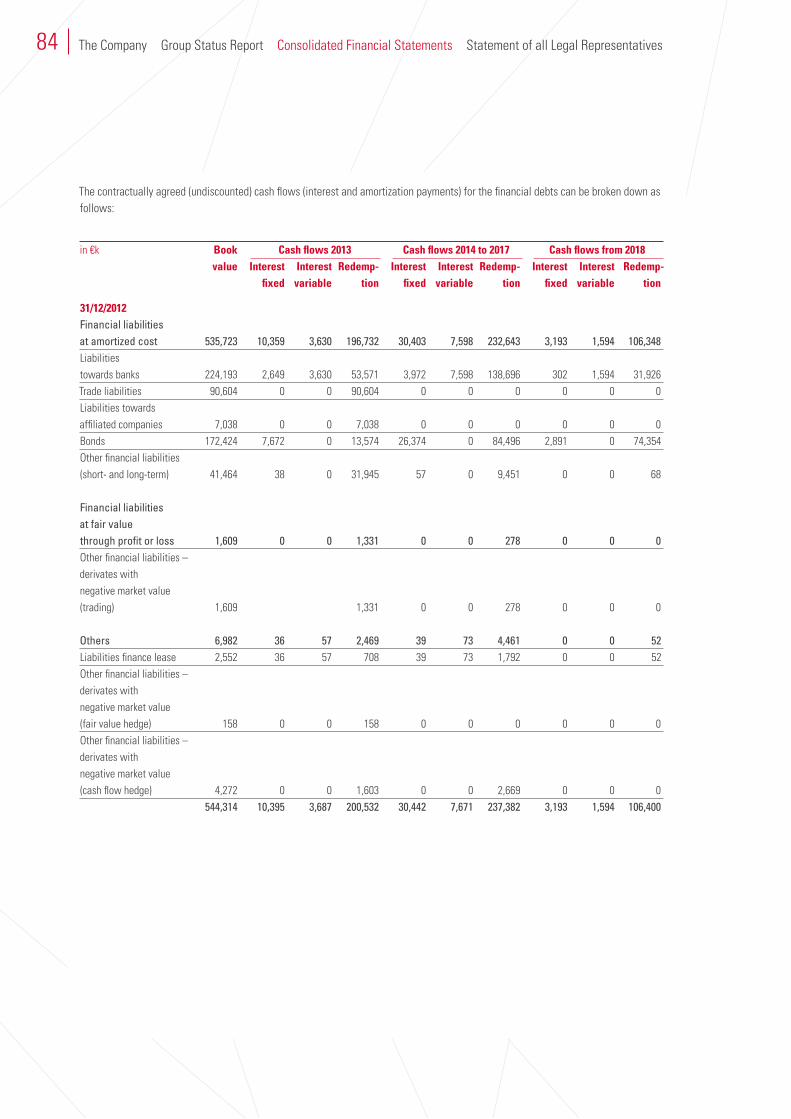
The contractually agreed (undiscounted) cash flows (interest and amortization payments) for the financial debts can be broken down as follows:
in €k book Cash flows 2013 Cash flows 2014 to 2017 Cash flows from 2018 value Interest Interest Redemp- Interest Interest Redemp- Interest Interest Redemp- fixed variable tion fixed variable tion fixed variable tion
31/12/2012financial liabilities at amortized cost 535,723 10,359 3,630 196,732 30,403 7,598 232,643 3,193 1,594 106,348Liabilities towards banks 224,193 2,649 3,630 53,571 3,972 7,598 138,696 302 1,594 31,926Trade liabilities 90,604 0 0 90,604 0 0 0 0 0 0Liabilities towards affiliated companies 7,038 0 0 7,038 0 0 0 0 0 0Bonds 172,424 7,672 0 13,574 26,374 0 84,496 2,891 0 74,354Other financial liabilities (short- and long-term) 41,464 38 0 31,945 57 0 9,451 0 0 68
financial liabilities at fair value through profit or loss 1,609 0 0 1,331 0 0 278 0 0 0Other financial liabilities – derivates with negative market value (trading) 1,609 1,331 0 0 278 0 0 0
others 6,982 36 57 2,469 39 73 4,461 0 0 52Liabilities finance lease 2,552 36 57 708 39 73 1,792 0 0 52Other financial liabilities – derivates with negative market value (fair value hedge) 158 0 0 158 0 0 0 0 0 0Other financial liabilities – derivates with negative market value (cash flow hedge) 4,272 0 0 1,603 0 0 2,669 0 0 0 544,314 10,395 3,687 200,532 30,442 7,671 237,382 3,193 1,594 106,400
84 The Company Group Status Report Consolidated Financial Statements Statement of all Legal Representatives
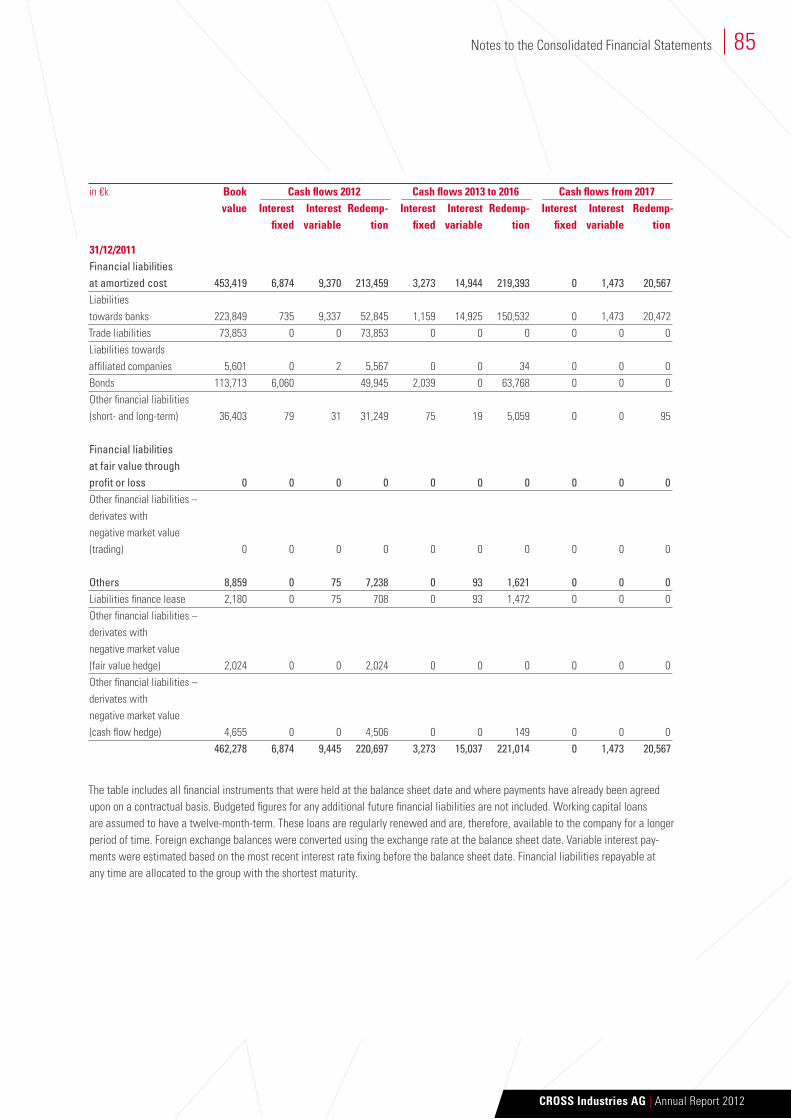
in €k book Cash flows 2012 Cash flows 2013 to 2016 Cash flows from 2017 value Interest Interest Redemp- Interest Interest Redemp- Interest Interest Redemp- fixed variable tion fixed variable tion fixed variable tion
31/12/2011financial liabilities at amortized cost 453,419 6,874 9,370 213,459 3,273 14,944 219,393 0 1,473 20,567Liabilities towards banks 223,849 735 9,337 52,845 1,159 14,925 150,532 0 1,473 20,472Trade liabilities 73,853 0 0 73,853 0 0 0 0 0 0Liabilities towards affiliated companies 5,601 0 2 5,567 0 0 34 0 0 0Bonds 113,713 6,060 49,945 2,039 0 63,768 0 0 0Other financial liabilities (short- and long-term) 36,403 79 31 31,249 75 19 5,059 0 0 95
financial liabilities at fair value through profit or loss 0 0 0 0 0 0 0 0 0 0Other financial liabilities – derivates with negative market value (trading) 0 0 0 0 0 0 0 0 0 0
others 8,859 0 75 7,238 0 93 1,621 0 0 0Liabilities finance lease 2,180 0 75 708 0 93 1,472 0 0 0Other financial liabilities – derivates with negative market value (fair value hedge) 2,024 0 0 2,024 0 0 0 0 0 0Other financial liabilities – derivates with negative market value (cash flow hedge) 4,655 0 0 4,506 0 0 149 0 0 0 462,278 6,874 9,445 220,697 3,273 15,037 221,014 0 1,473 20,567
The table includes all financial instruments that were held at the balance sheet date and where payments have already been agreed upon on a contractual basis. Budgeted figures for any additional future financial liabilities are not included. Working capital loans are assumed to have a twelve-month-term. These loans are regularly renewed and are, therefore, available to the company for a longer period of time. Foreign exchange balances were converted using the exchange rate at the balance sheet date. Variable interest pay- ments were estimated based on the most recent interest rate fixing before the balance sheet date. Financial liabilities repayable at any time are allocated to the group with the shortest maturity.
85
CROSS Industries AG | Annual Report 2012
Notes to the Consolidated Financial Statements
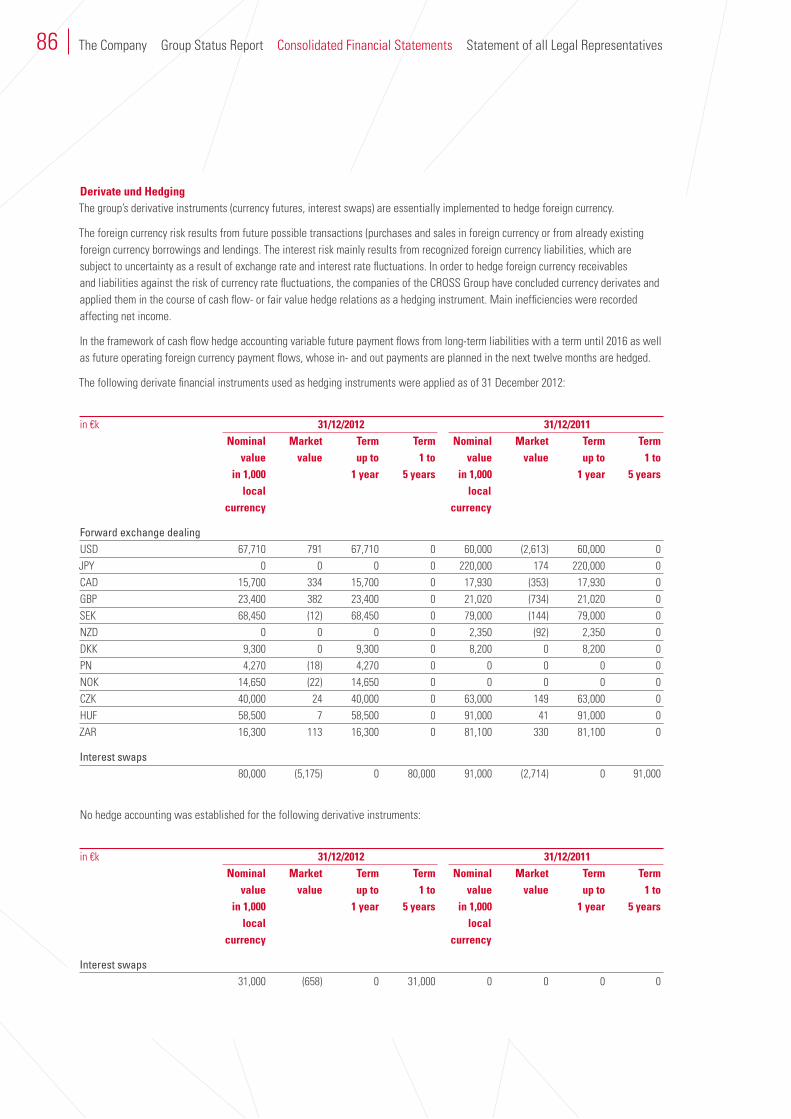
derivate und hedgingThe group’s derivative instruments (currency futures, interest swaps) are essentially implemented to hedge foreign currency.
The foreign currency risk results from future possible transactions (purchases and sales in foreign currency or from already existing foreign currency borrowings and lendings. The interest risk mainly results from recognized foreign currency liabilities, which are subject to uncertainty as a result of exchange rate and interest rate fluctuations. In order to hedge foreign currency receivables and liabilities against the risk of currency rate fluctuations, the companies of the CROSS Group have concluded currency derivates and applied them in the course of cash flow- or fair value hedge relations as a hedging instrument. Main inefficiencies were recorded affecting net income.
In the framework of cash flow hedge accounting variable future payment flows from long-term liabilities with a term until 2016 as well as future operating foreign currency payment flows, whose in- and out payments are planned in the next twelve months are hedged.
The following derivate financial instruments used as hedging instruments were applied as of 31 December 2012:
in €k 31/12/2012 31/12/2011 nominal Market Term Term nominal Market Term Term value value up to 1 to value value up to 1 to in 1,000 1 year 5 years in 1,000 1 year 5 years local local currency currency
forward exchange dealingUSD 67,710 791 67,710 0 60,000 (2,613) 60,000 0JPY 0 0 0 0 220,000 174 220,000 0CAD 15,700 334 15,700 0 17,930 (353) 17,930 0GBP 23,400 382 23,400 0 21,020 (734) 21,020 0SEK 68,450 (12) 68,450 0 79,000 (144) 79,000 0NZD 0 0 0 0 2,350 (92) 2,350 0DKK 9,300 0 9,300 0 8,200 0 8,200 0PN 4,270 (18) 4,270 0 0 0 0 0NOK 14,650 (22) 14,650 0 0 0 0 0CZK 40,000 24 40,000 0 63,000 149 63,000 0HUF 58,500 7 58,500 0 91,000 41 91,000 0ZAR 16,300 113 16,300 0 81,100 330 81,100 0
interest swaps 80,000 (5,175) 0 80,000 91,000 (2,714) 0 91,000
No hedge accounting was established for the following derivative instruments:
in €k 31/12/2012 31/12/2011 nominal Market Term Term nominal Market Term Term value value up to 1 to value value up to 1 to in 1,000 1 year 5 years in 1,000 1 year 5 years local local currency currency
interest swaps 31,000 (658) 0 31,000 0 0 0 0
86 The Company Group Status Report Consolidated Financial Statements Statement of all Legal Representatives
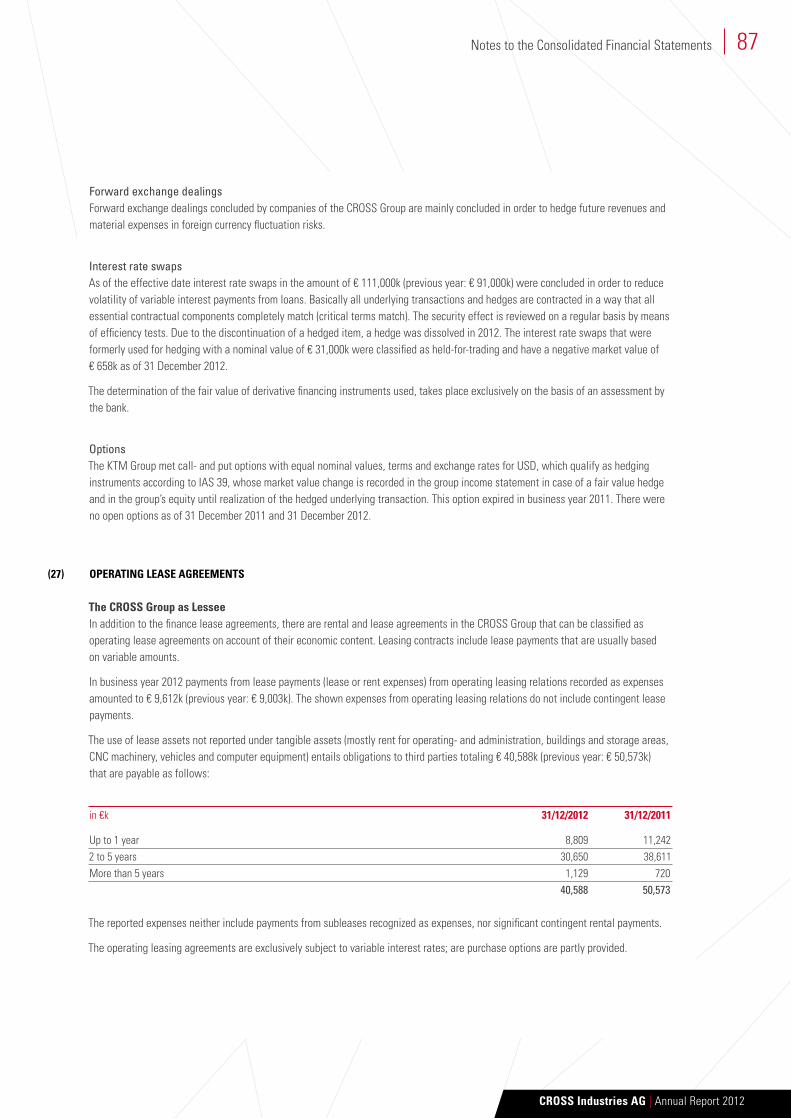
forward exchange dealingsForward exchange dealings concluded by companies of the CROSS Group are mainly concluded in order to hedge future revenues and material expenses in foreign currency fluctuation risks.
interest rate swapsAs of the effective date interest rate swaps in the amount of € 111,000k (previous year: € 91,000k) were concluded in order to reduce volatility of variable interest payments from loans. Basically all underlying transactions and hedges are contracted in a way that all essential contractual components completely match (critical terms match). The security effect is reviewed on a regular basis by means of efficiency tests. Due to the discontinuation of a hedged item, a hedge was dissolved in 2012. The interest rate swaps that were formerly used for hedging with a nominal value of € 31,000k were classified as held-for-trading and have a negative market value of € 658k as of 31 December 2012.
The determination of the fair value of derivative financing instruments used, takes place exclusively on the basis of an assessment by the bank.
optionsThe KTM Group met call- and put options with equal nominal values, terms and exchange rates for USD, which qualify as hedging instruments according to IAS 39, whose market value change is recorded in the group income statement in case of a fair value hedge and in the group’s equity until realization of the hedged underlying transaction. This option expired in business year 2011. There were no open options as of 31 December 2011 and 31 December 2012.
OPeRATInG leASe AGReeMenTS
The CROSS Group as lesseeIn addition to the finance lease agreements, there are rental and lease agreements in the CROSS Group that can be classified as operating lease agreements on account of their economic content. Leasing contracts include lease payments that are usually based on variable amounts.
In business year 2012 payments from lease payments (lease or rent expenses) from operating leasing relations recorded as expenses amounted to € 9,612k (previous year: € 9,003k). The shown expenses from operating leasing relations do not include contingent lease payments.
The use of lease assets not reported under tangible assets (mostly rent for operating- and administration, buildings and storage areas, CNC machinery, vehicles and computer equipment) entails obligations to third parties totaling € 40,588k (previous year: € 50,573k) that are payable as follows:
in €k 31/12/2012 31/12/2011
Up to 1 year 8,809 11,2422 to 5 years 30,650 38,611More than 5 years 1,129 720 40,588 50,573
The reported expenses neither include payments from subleases recognized as expenses, nor significant contingent rental payments.
The operating leasing agreements are exclusively subject to variable interest rates; are purchase options are partly provided.
87
CROSS Industries AG | Annual Report 2012
Notes to the Consolidated Financial Statements
(27)
CROSS as lessorApart from financing- and operating leasing relations, where the CROSS Group operates as the lessee, there are rent- an leasing relations in the CROSS Group, where the group, according to the economic content of the operating leasing relation, operates as the lessor. Operating leasing relations are concluded for a basic leasing period of 25 years. The leasing agreements include leasing installments, which are mostly based on variable interest.
Claims for maintaining minimum leasing payments from irredeemable operating leasing relations exist, which will be due as follows:
in €k 31/12/2012 31/12/2011
Up to 1 year 1,408 8312 to 5 years 5,043 5,168More than 5 years 212 851 6,663 6,850
In business year 2012 leasing agreements from operating leasing relations amounted to € 887k (previous year: € 734k).
SeGMenT RePORTInG
The business segments of the CROSS Group comprise power sports products of KTM AG (formerly: KMT Power Sports AG) (road and offroad motorcycles, Sportminicycles, ATV, the KTM sportscar X-Bow as well as spare parts and equipment) and the high performance component segment of the CROSS Motorsport Systems Group. The segment others include CROSS Industries AG, Durmont Teppich-bodenfabrik GmbH as well as all other holding companies.
in €k kTM high Others Consoli- Group – discontinued products performance dation continued operations components operations (automotive)
2012Revenue 612,008 235,400 68,551 (90,308) 825,651 0thereof inner-group 117 83,127 7,064 (90,308) 0 0
EBIT 36,716 14,148 (4,053) 163 46,974 (1,094)Interest expenses (8,187) (5,807) (6,516) 1,172 (19,338) 0Interest income 867 494 2,080 (1,172) 2,269 0
Assets 521,351 241,954 760,979 (606,352) 917,932 0Liabilities 266,828 192,756 242,302 (100,014) 601,872 0Investments 52,400 31,981 22,121 (3,643) 102,859 0Depreciation 31,111 13,367 3,412 0 47,890 0thereof unscheduled 0 0 0 0 0 0
88
(28)
The Company Group Status Report Consolidated Financial Statements Statement of all Legal Representatives
in €k kTM high Others Consoli- Group – discontinued products performance dation continued operations components operations (automotive)
2011Revenue 526,801 175,864 27,731 (51,770) 678,626 1,226,319thereof inner-group 201 43,239 8,330 (51,770) 0 0
EBIT 31,009 6,535 1,369 6 38,919 5,370Interest expenses (10,000) (7,201) (6,160) 1,944 (21,417) (14,254)Interest income 768 1,601 1,116 (1,944) 1,541 715
Assets 485,777 203,739 456,755 (327,823) 818,448 0Liabilities 266,000 159,599 125,077 (38,257) 512,419 0Investments 37,702 9,728 5,985 0 53,415 43,719Depreciation 33,369 12,042 1,173 0 46,584 33,021thereof unscheduled 0 0 0 0 0 0
RegionsThe distribution according to regions for external sales is made according to the location of the respective customer, in case of segment assets according to the place, where assets are located.
in €k europe north America Others 2012 2011 2012 2011 2012 2011
External sales 519,660 445,087 173,570 136,524 132,421 97,015
eVenTS AfTeR The bAlAnCe SheeT dATe
Events after 31 December 2012 that are of material interest for the assessment of assets and liabilities are either taken into account in the present report or not known.
buSIneSS RelATIOnS TO AffIlIATed COMPAnIeS And PeRSOnS
Knünz GmbH, Dornbirn, and Pierer GmbH, Wels, have concluded a syndicate agreement on the exercise of voting rights in Pierer Invest Beteiligungs GmbH, Wels, on 13 June 2012. The conclusion of the syndicate agreement led from mutual control of Pierer GmbH and Knünz GmbH over CROSS Industries AG to dominant control of Pierer GmbH over CROSS Industries AG. Since that date Pierer GmbH is the primary group company.
Shares of CROSS Industries AG are held by Pierer Invest Beteiligungs GmbH, Wels (50.05%), Pierer Industrie AG, Wels (25.03%), as well as Unternehmens Invest AG, Wels (24.92%). Shares of Pierer Invest Beteiligungs GmbH, Wels, are held by Pierer GmbH, Wels, and Knünz GmbH, Dornbirn (50.00% respectively), whereby 100% of voting rights are held by Pierer GmbH. Pierer Industrie AG is indirectly the 100% owner of Pierer GmbH, Wels. Sole shareholder and CEO of Pierer GmbH, Wels, is Mr. Stefan Pierer; shareholder and CEO of Knünz GmbH, Dornbirn is Mr. Rudolf Knünz.
In business year 2012 the shareholders have not received any dividend from the previous business year.
89
(29)
(30)
CROSS Industries AG | Annual Report 2012
Notes to the Consolidated Financial Statements
Mr. Stefan Pierer holds the following positions in the CROSS Group:– Chairman of the Management Board of CROSS Industries AG, Wels– Chairman of the Management Board of KTM AG, Mattighofen– Chairman of the Management Board of KTM-Sportmotorcycle AG, Mattighofen– Chief Executive Officer of PF Beteiligungsverwaltungs GmbH, Wels– Chief Executive Officer of CROSS Informatik GmbH, Wels– Chief Executive Officer of CROSS Services GmbH, Ursensollen, Germany (liquidated as of 31 December 2012)– Chairman of the Supervisory Board of CROSS Immobilien AG, Wels– Chairman of the Supervisory Board of CROSS Motorsport Systems AG, Wels– Chairman of the Supervisory Board of Pankl Racing Systems AG, Bruck upon Mur– Chairman of the Supervisory Board of BRAIN FORCE HOLDING AG, Vienna– Member of the Supervisory Board of SMP Deutschland GmbH (formerly: Peguform GmbH), Bötzingen, Germany– Chairman of the Supervisory Board of Wirtschaftspark Wels Errichtungs- und Betriebs-Aktiengesellschaft, Wels
Mr. rudolf Knünz holds the following positions in the CROSS Group:– Chairman of the Supervisory Board of CROSS Industries AG, Wels– Deputy Chairman of the Supervisory Board of KTM AG, Mattighofen– Deputy Chairman of the Supervisory Board of KTM-Sportmotorcycle AG, Mattighofen– Deputy Chairman of the Supervisory Board of CROSS Immobilien AG, Wels (until 12 September 2012)– Deputy Chairman of the Supervisory Board of CROSS Motorsport Systems AG, Wels (until 12 September 2012)– Deputy Chairman of the Supervisory Board of Pankl Racing Systems AG, Bruck upon der Mur (until 31 January 2013)
Mr. gerald Kiska is member of the Supervisory Board of CROSS Industries AG, Wels, and Chief Executive Officer of Kiska GmbH, Anif, in which KTM AG holds a 24.9% share. Kiska GmbH, Anif, provided consulting services for the group in the amount of € 4,209k (previous year: € 3,316k). As of 31 December 2012 there were open liabilities towards Kiska GmbH, Anif, in the amount of € 1,052k (previous year: € 1,065k).
Mr. ernst Chalupsky is member of the Supervisory Board of CROSS Industries AG, Wels, and partner in Saxinger, Chalupsky und Partner Rechtsanwälte GmbH, Wels. The group made use of consulting services from Saxinger, Chalupsky und Partner Rechtsanwälte GmbH, Wels, at standard market conditions in the amount of € 270k, which were approved by the Supervisory Board. As of the balance sheet date outstanding liabilities towards Saxinger, Chalupsky und Partner Rechtsanwälte GmbH, Wels, amounted to € 0k.
The material business transactions and the amount of outstanding balances with affiliated companies and persons can be broken down as follows:
in €k Receivables liabilities Income expense
2012Shareholder 845 2,915 970 102Associated companies 2,076 0 12,626 9,596Other affiliated companies 726 16,583 2,297 30,078Other affiliated persons 0 0 0 64 3,647 19,498 15,893 39,840
90 The Company Group Status Report Consolidated Financial Statements Statement of all Legal Representatives
in €k Receivables liabilities Income expense
2011Shareholder 47 2,543 1,577 6,922Associated companies 1,833 104 855 826Other affiliated companies 3,332 6,386 6,323 26,102Other affiliated persons 0 0 0 78 5,212 9,033 8,755 33,928
All transactions with affiliated companies and persons took place under standard market conditions.
equITy hOldInGS AS Of 31 deCeMbeR 2012
The list of equity holdings comprises all companies, which have been included in the consolidated financial statements apart from the parent company (see page 92).
bOdIeS Of CROSS InduSTRIeS AG
In business year 2012 the following members were appointed to the Supervisory Board:– Rudolf Knünz (Chairman)– Josef Blazicek (Deputy Chairman)– Gerald Kiska– Ernst Chalupsky (from 25 April 2012)– Manfred De Bock (until 14 July 2012)
In business year 2012 the following, collectively authorized members were appointed to the management Board:– Stefan Pierer (CEO)– Friedrich Roithner– Alfred Hörtenhuber– Klaus Rinnerberger
Wels, 29 March 2013
The Management Board of CROSS Industries AG
Stefan Pierer Friedrich Roithner
Alfred Hörtenhuber Klaus Rinnerberger
91
(31)
(32)
CROSS Industries AG | Annual Report 2012
Notes to the Consolidated Financial Statements
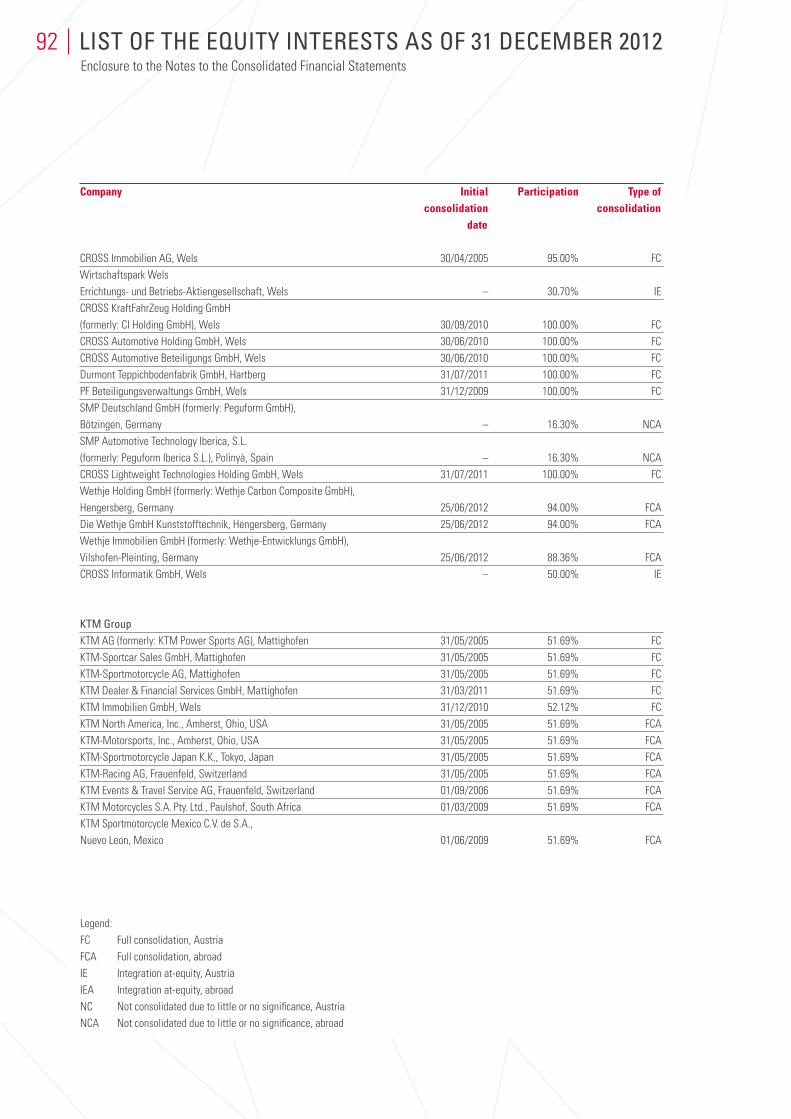
92 LiSt of the equity intereStS aS of 31 deCemBer 2012Enclosure to the Notes to the Consolidated Financial Statements
Company Initial Participation Type of consolidation consolidation date
CROSS Immobilien AG, Wels 30/04/2005 95.00% FCWirtschaftspark Wels Errichtungs- und Betriebs-Aktiengesellschaft, Wels – 30.70% IECROSS KraftFahrZeug Holding GmbH (formerly: CI Holding GmbH), Wels 30/09/2010 100.00% FCCROSS Automotive Holding GmbH, Wels 30/06/2010 100.00% FCCROSS Automotive Beteiligungs GmbH, Wels 30/06/2010 100.00% FCDurmont Teppichbodenfabrik GmbH, Hartberg 31/07/2011 100.00% FCPF Beteiligungsverwaltungs GmbH, Wels 31/12/2009 100.00% FCSMP Deutschland GmbH (formerly: Peguform GmbH), Bötzingen, Germany – 16.30% NCASMP Automotive Technology Iberica, S.L. (formerly: Peguform Iberica S.L.), Polinyà, Spain – 16.30% NCACROSS Lightweight Technologies Holding GmbH, Wels 31/07/2011 100.00% FCWethje Holding GmbH (formerly: Wethje Carbon Composite GmbH), Hengersberg, Germany 25/06/2012 94.00% FCADie Wethje GmbH Kunststofftechnik, Hengersberg, Germany 25/06/2012 94.00% FCAWethje Immobilien GmbH (formerly: Wethje-Entwicklungs GmbH), Vilshofen-Pleinting, Germany 25/06/2012 88.36% FCACROSS Informatik GmbH, Wels – 50.00% IE
Ktm groupKTM AG (formerly: KTM Power Sports AG), Mattighofen 31/05/2005 51.69% FCKTM-Sportcar Sales GmbH, Mattighofen 31/05/2005 51.69% FCKTM-Sportmotorcycle AG, Mattighofen 31/05/2005 51.69% FCKTM Dealer & Financial Services GmbH, Mattighofen 31/03/2011 51.69% FCKTM Immobilien GmbH, Wels 31/12/2010 52.12% FCKTM North America, Inc., Amherst, Ohio, USA 31/05/2005 51.69% FCAKTM-Motorsports, Inc., Amherst, Ohio, USA 31/05/2005 51.69% FCAKTM-Sportmotorcycle Japan K.K., Tokyo, Japan 31/05/2005 51.69% FCAKTM-Racing AG, Frauenfeld, Switzerland 31/05/2005 51.69% FCAKTM Events & Travel Service AG, Frauenfeld, Switzerland 01/09/2006 51.69% FCAKTM Motorcycles S.A. Pty. Ltd., Paulshof, South Africa 01/03/2009 51.69% FCAKTM Sportmotorcycle Mexico C.V. de S.A., Nuevo Leon, Mexico 01/06/2009 51.69% FCA
Legend:FC Full consolidation, AustriaFCA Full consolidation, abroadIE Integration at-equity, AustriaIEA Integration at-equity, abroadNC Not consolidated due to little or no significance, AustriaNCA Not consolidated due to little or no significance, abroad
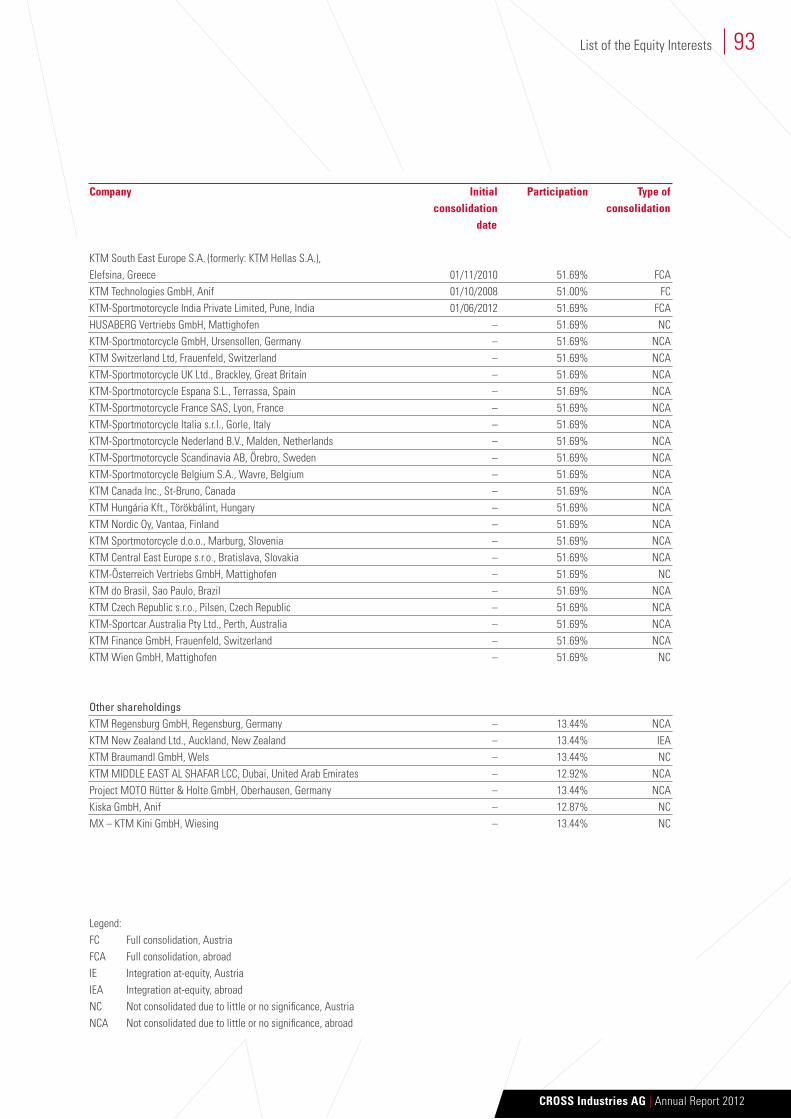
93
CROSS Industries AG | Annual Report 2012
Company Initial Participation Type of consolidation consolidation date
KTM South East Europe S.A. (formerly: KTM Hellas S.A.), Elefsina, Greece 01/11/2010 51.69% FCAKTM Technologies GmbH, Anif 01/10/2008 51.00% FCKTM-Sportmotorcycle India Private Limited, Pune, India 01/06/2012 51.69% FCAHUSABERG Vertriebs GmbH, Mattighofen – 51.69% NCKTM-Sportmotorcycle GmbH, Ursensollen, Germany – 51.69% NCAKTM Switzerland Ltd, Frauenfeld, Switzerland – 51.69% NCAKTM-Sportmotorcycle UK Ltd., Brackley, Great Britain – 51.69% NCAKTM-Sportmotorcycle Espana S.L., Terrassa, Spain – 51.69% NCAKTM-Sportmotorcycle France SAS, Lyon, France – 51.69% NCAKTM-Sportmotorcycle Italia s.r.l., Gorle, Italy – 51.69% NCAKTM-Sportmotorcycle Nederland B.V., Malden, Netherlands – 51.69% NCAKTM-Sportmotorcycle Scandinavia AB, Örebro, Sweden – 51.69% NCAKTM-Sportmotorcycle Belgium S.A., Wavre, Belgium – 51.69% NCAKTM Canada Inc., St-Bruno, Canada – 51.69% NCAKTM Hungária Kft., Törökbálint, Hungary – 51.69% NCAKTM Nordic Oy, Vantaa, Finland – 51.69% NCAKTM Sportmotorcycle d.o.o., Marburg, Slovenia – 51.69% NCAKTM Central East Europe s.r.o., Bratislava, Slovakia – 51.69% NCAKTM-Österreich Vertriebs GmbH, Mattighofen – 51.69% NCKTM do Brasil, Sao Paulo, Brazil – 51.69% NCAKTM Czech Republic s.r.o., Pilsen, Czech Republic – 51.69% NCAKTM-Sportcar Australia Pty Ltd., Perth, Australia – 51.69% NCAKTM Finance GmbH, Frauenfeld, Switzerland – 51.69% NCAKTM Wien GmbH, Mattighofen – 51.69% NC
other shareholdingsKTM Regensburg GmbH, Regensburg, Germany – 13.44% NCAKTM New Zealand Ltd., Auckland, New Zealand – 13.44% IEAKTM Braumandl GmbH, Wels – 13.44% NCKTM MIDDLE EAST AL SHAFAR LCC, Dubai, United Arab Emirates – 12.92% NCAProject MOTO Rütter & Holte GmbH, Oberhausen, Germany – 13.44% NCAKiska GmbH, Anif – 12.87% NCMX – KTM Kini GmbH, Wiesing – 13.44% NC
Legend:FC Full consolidation, AustriaFCA Full consolidation, abroadIE Integration at-equity, AustriaIEA Integration at-equity, abroadNC Not consolidated due to little or no significance, AustriaNCA Not consolidated due to little or no significance, abroad
List of the Equity Interests
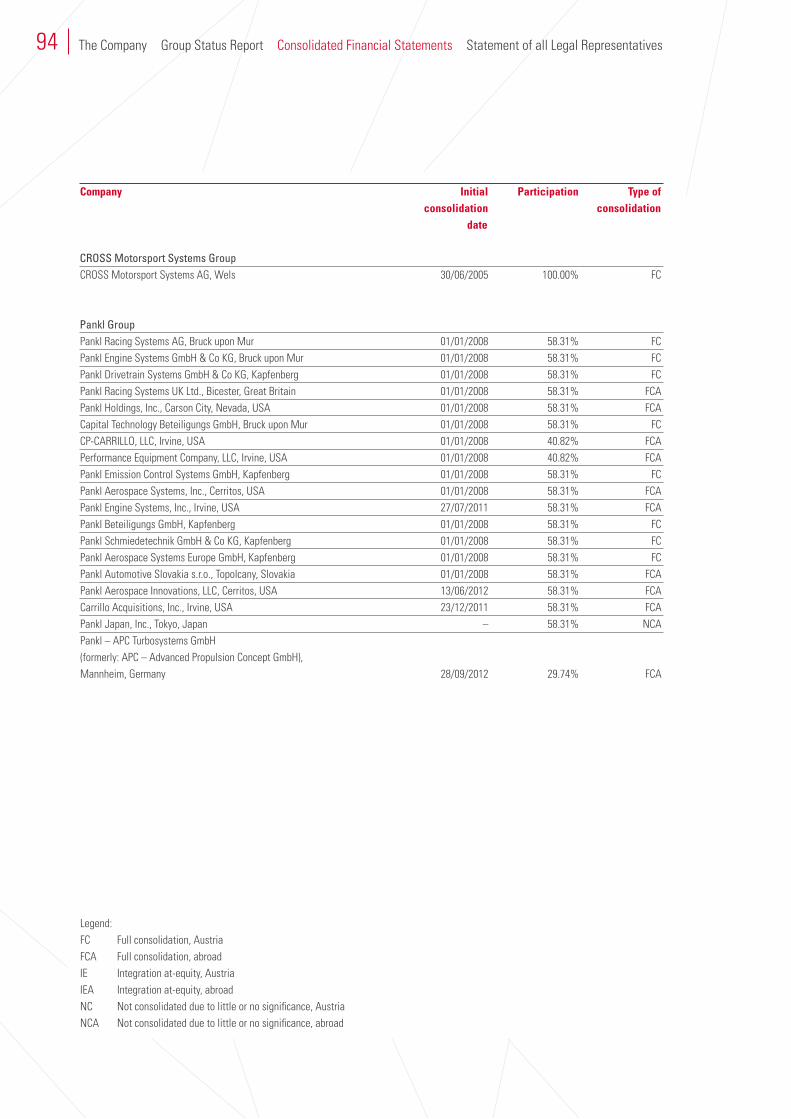
94 The Company Group Status Report Consolidated Financial Statements Statement of all Legal Representatives
Company Initial Participation Type of consolidation consolidation date
CroSS motorsport Systems groupCROSS Motorsport Systems AG, Wels 30/06/2005 100.00% FC
Pankl groupPankl Racing Systems AG, Bruck upon Mur 01/01/2008 58.31% FCPankl Engine Systems GmbH & Co KG, Bruck upon Mur 01/01/2008 58.31% FCPankl Drivetrain Systems GmbH & Co KG, Kapfenberg 01/01/2008 58.31% FCPankl Racing Systems UK Ltd., Bicester, Great Britain 01/01/2008 58.31% FCAPankl Holdings, Inc., Carson City, Nevada, USA 01/01/2008 58.31% FCACapital Technology Beteiligungs GmbH, Bruck upon Mur 01/01/2008 58.31% FCCP-CARRILLO, LLC, Irvine, USA 01/01/2008 40.82% FCAPerformance Equipment Company, LLC, Irvine, USA 01/01/2008 40.82% FCAPankl Emission Control Systems GmbH, Kapfenberg 01/01/2008 58.31% FCPankl Aerospace Systems, Inc., Cerritos, USA 01/01/2008 58.31% FCAPankl Engine Systems, Inc., Irvine, USA 27/07/2011 58.31% FCAPankl Beteiligungs GmbH, Kapfenberg 01/01/2008 58.31% FCPankl Schmiedetechnik GmbH & Co KG, Kapfenberg 01/01/2008 58.31% FCPankl Aerospace Systems Europe GmbH, Kapfenberg 01/01/2008 58.31% FCPankl Automotive Slovakia s.r.o., Topolcany, Slovakia 01/01/2008 58.31% FCAPankl Aerospace Innovations, LLC, Cerritos, USA 13/06/2012 58.31% FCACarrillo Acquisitions, Inc., Irvine, USA 23/12/2011 58.31% FCAPankl Japan, Inc., Tokyo, Japan – 58.31% NCAPankl – APC Turbosystems GmbH (formerly: APC – Advanced Propulsion Concept GmbH), Mannheim, Germany 28/09/2012 29.74% FCA
Legend:FC Full consolidation, AustriaFCA Full consolidation, abroadIE Integration at-equity, AustriaIEA Integration at-equity, abroadNC Not consolidated due to little or no significance, AustriaNCA Not consolidated due to little or no significance, abroad
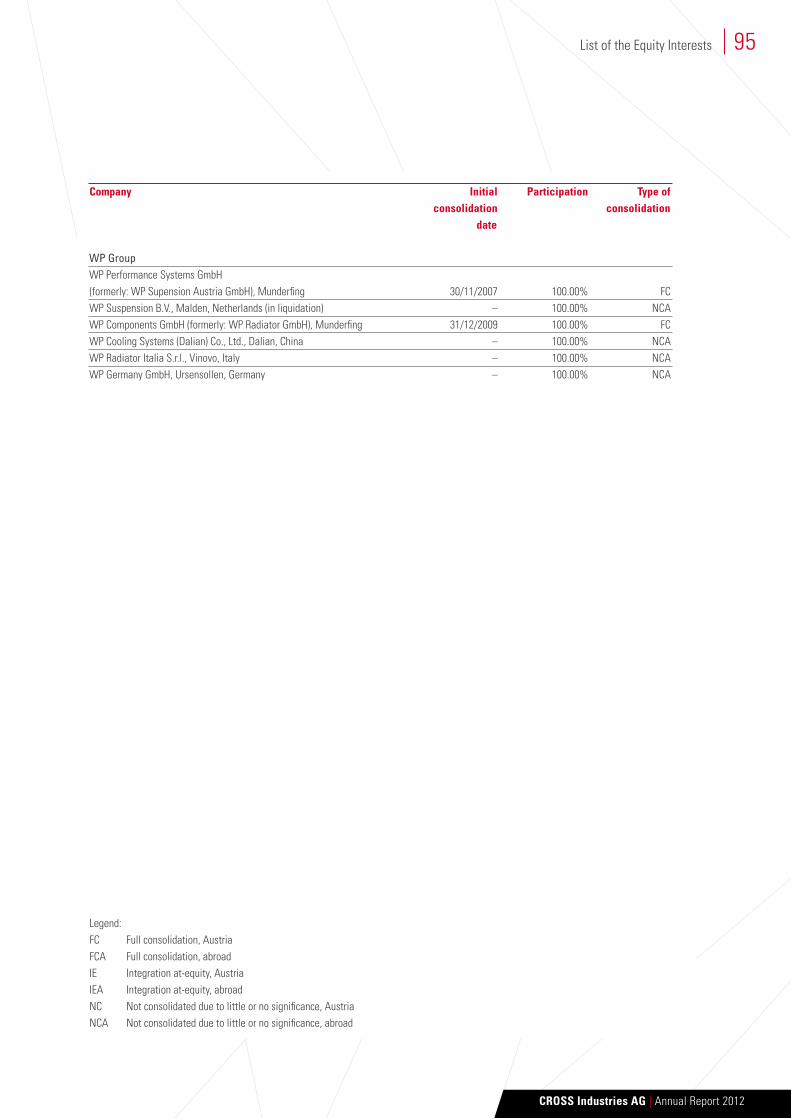
95
CROSS Industries AG | Annual Report 2012
Company Initial Participation Type of consolidation consolidation date
wP groupWP Performance Systems GmbH (formerly: WP Supension Austria GmbH), Munderfing 30/11/2007 100.00% FCWP Suspension B.V., Malden, Netherlands (in liquidation) – 100.00% NCAWP Components GmbH (formerly: WP Radiator GmbH), Munderfing 31/12/2009 100.00% FCWP Cooling Systems (Dalian) Co., Ltd., Dalian, China – 100.00% NCAWP Radiator Italia S.r.l., Vinovo, Italy – 100.00% NCAWP Germany GmbH, Ursensollen, Germany – 100.00% NCA
Legend:FC Full consolidation, AustriaFCA Full consolidation, abroadIE Integration at-equity, AustriaIEA Integration at-equity, abroadNC Not consolidated due to little or no significance, AustriaNCA Not consolidated due to little or no significance, abroad
List of the Equity Interests
96
RePORT On The COnSOlIdATed fInAnCIAl STATeMenTS
We have audited the accompanying consolidated financial statements of CROSS Industries AG, Wels, for the reporting period from 1 January 2012 to 31 December 2012. These consolidated financial statements comprise the balance sheet as at 31 December 2012, and the income statement, the consolidated statement of comprehensive income, the cash flow statement and the statement of changes in equity for the year then ended, and the notes.
Management’s Responsibility for the Consolidated financial Statements and Accounting System
Management is responsible for the accounting system and for the preparation and fair presentation of these consolidated financial statements in accordance with the International Financial Reporting Standards (IFRSs) as adopted by the EU. This responsibility includes: designing, implementing and maintaining internal control as management determines is necessary to enable the preparation of consoli-dated financial statements that are free from material misstatement, whether due to fraud or error; selecting and applying appropriate accounting policies; and making accounting estimates that are reasonable in the circumstances.
Auditor’s Responsibility
Our responsibility is to express an opinion on these consolidated financial statements based on our audit. We conducted our audit in accordance with laws and regulations applicable in Austria and International Standards on Auditing, issued by the International Auditing and Assurance Standards Board (IAASB) of the International Federation of Accountants (IFAC). Those standards require that we comply with ethical requirements and plan and perform the audit to obtain reasonable assurance about whether the financial statements are free from material misstatement.
An audit involves performing procedures to obtain audit evidence about the amounts and disclosures in the consolidated financial statements. The procedures selected depend on the auditor’s judgment, including the assessment of the risks of material misstatement of the consolidated financial statements, whether due to fraud or error. In making those risk assessments, the auditor considers internal control relevant to the entity’s preparation and fair presentation of the consolidated financial statements in order to design audit pro-cedures that are appropriate in the circumstances, but not for the purpose of expressing an opinion on the effectiveness of the group’s internal control. An audit also includes evaluating the appropriateness of accounting policies used and the reasonableness of account- ing estimates made by management, as well as evaluating the overall presentation of the consolidated financial statements.
We believe that the audit evidence we have obtained is sufficient and appropriate to provide a basis for our audit opinion.
indePendent auditor’S rePort
97
CROSS Industries AG | Annual Report 2012
Opinion
Our audit did not give rise to any objections. In our opinion, which is based on the results of our audit, the consolidated financial state-ments comply with legal requirements and present fairly, in all material respects, the financial position of the group as at 31 December 2012 and its financial performance for the period from 1 January 2012 to 31 December 2012 in accordance with generally accepted accounting principles in the International Financial Reporting Standards (IFRSs) as adopted by the EU.
RePORT On OTheR leGAl RequIReMenTS (GROuP MAnAGeMenT RePORT)
Austrian legal requirements require us to verify whether the group management report is consistent with the financial statements and whether the other disclosures made in the group management report do not give rise to misconception of the position of the group. The auditor’s report should also include a statement whether the group management report is consistent with the consolidated financial statements.
In our opinion, the group management report is consistent with the consolidated financial statements.
Linz, 29 March 2013
KPMG Austria GmbHWirtschaftsprüfungs- und Steuerberatungsgesellschaft
signed by:Ernst Pichler ppa Daniela KöberlWirtschaftsprüfer Wirtschaftsprüfer
(Austrian Chartered Accountant) (Austrian Chartered Accountant)
This report is a translation of the original report in German, which is solely valid. Publication of the consolidated financial statements together with our auditor’s opinion may only be made if the consolidated financial statements and the group management report are identical with the audited version attached to this report. Article 281 section 2 UGB applies.
Independent Auditor’s Report
98
We confirm to the best of our knowledge that the consolidated financial statements give a true and fair view of the assets, liabilities, financial position and profit or loss of the group as required by the applicable accounting standards and that the group management report gives a true and fair view of the development and performance of the business and the position of the group, together with a description of the principal risks and uncertainties the group faces.
We confirm to the best of our knowledge that the separate financial statements give a true and fair view of the assets, liabilities, finan- cial position and profit or loss of the parent company as required by the applicable accounting standards and that the management report gives a true and fair view of the development and performance of the business and the position of the company, together with a descrip-tion of the principal risks and uncertainties the company faces.
Wels, April 2013
The Management Board of CROSS Industries AG
Stefan Pierer Friedrich Roithner
Alfred Hörtenhuber Klaus Rinnerberger
Statement of aLL LegaL rePreSentativeS
99
CROSS Industries AG | Annual Report 2012
imPrint
Owner and publisher:CROSS Industries AGEdisonstrasse 14600 Wels, Austria
Registered at the Regional Court Wels: FN 261823 i
Concept and design: marchesani_kreativstudio, 1080 Vienna
Photos: CROSS archives
While every care was taken in compiling this Annual Report and checking that the data it contains is correct, slight differences in totals from adding up rounded amounts and percentages, typographical errors and misprints cannot be excluded.
This report and the forward-looking statements it contains were prepared on the basis of all the data and information available at the time of going to press. We wish to point out, however, that various factors may cause the actual results deviate from the forward-looking statements given in the report.
CROSS Industries AGEdisonstrasse 14600 Wels, Austria
T: +43 (0)7242 69402F: +43 (0)7242 [email protected]