Embed Size (px)
Citation preview
notes DnB livsforsikring annual report 2012 1
DNB LIVSFORSIKRING
Annual report 2012
– a company in the DNB Group
DnB livsforsikring annual report 2012 2
DNB Livsforsikring ASADNB Livsforsikring Group
TABLe of CoNTeNTS ANNuAL RepoRT 2012
03 annual statement
05 annual accounts
Overall
10 income statement
12 Balance sheet
14 changes in equity
15 cash flow analysis
15 investment yielD
General nOtes
16 note 1 accounting principles
21 note 2 significant accounting estimates anD Discretionary juDgements
23 note 3 amalgamation of Balance sheet items
incOme statement
24 note 4 profit anD loss accounts anD analyses DistriButeDBy segment
26 note 5 transfers
27 note 6 new premiums
27 note 7 net income from investments
29 note 8 specification of insurance relateD operating costs
29 note 9 numBer of employees/full time positions
29 note 10 pension liaBilities anD costs
33 note 11 tax costs
balance sheet – assets
34 note 12 classification of financial instruments
35 note 13 financial instruments at fair value
37 note 14 investment properties
39 note 15 shares in suBsiDiaries anD associateD companies
41 note 16 investments helD to maturity
42 note 17 shares, units anD primary capital certificates at fair value through the profit anD loss account
50 note 18 commercial paper, BonDs anD BonD funDs at fair
value
51 note 19 loans anD receivaBles
51 note 20 outstanDing Derivative contracts, nominal amounts, anD market values
51 note 21 other financial assets
52 note 22 assets in life insurance with investment choice
53 note 23 cash anD cash equivalents
53 note 24 intangiBle assets anD other assets
balance sheet – liabilities
54 note 25 insurance oBligations
56 note 26 changes in insurance oBligations
56 note 27 suBorDinateD loan capital/perpetual suBorDinateD
loans
infOrmatiOn reGardinG risk
57 note 28 risk exposure
59 note 29 insurance risk
63 note 30 capital aDequacy anD solvency margin capital
63 note 31 interest rate sensitivity
64 note 32 quantification of financial Derivatives
65 note 33 currency positions
66 note 34 liquiDity risk
66 note 35 creDit risk
Other infOrmatiOn
68 note 36 remuneration, etc.
73 note 37 relateD parties
74 note 38 other liaBilities anD oBligations
74 note 39 collateral
75 reports
79 Definitions
annual statement for 2012 DnB livsforsikring annual report 2012 3
business activities
DnB livsforsikring asa is a wholly-owned subsidiary of DnB asa. the company is dedicated to remaining an unsurpassed pension specialist as well as the preferred supplier of life insur-ance and pension savings products in norway. the company shall provide competitive returns to its customers and owners, as well as achieve profitable growth.
HIGHLIGHTS OF THE YEAR ▪ the sale of defined benefit pension and paid-up policies
was stopped ▪ good financial profits despite volatile markets ▪ reserved nok 3.8 billion for increased life expectancy ▪ good cost control and lower use of resources ▪ 35 per cent growth in assets under management in defined
contribution pension plans ▪ assets under management increased by 4.6 per cent to
nok 270 billion ▪ improved customer satisfaction for all segments ▪ changes and challenges in framework conditions
PRODUCTS AND MARKETat the end of 2012, DnB liv had approximately one million customers with individual and group agreements. the company had around 23,000 agreements with companies, municipalities and public sector enterprises.
the market share of customer funds under management in 2012 was 28.4 per cent at the end of september, as opposed to 29.2 per cent for the same period in the previous year.
the drop in market share is largely due to the growth in the public market.
in the private sector, DnB liv had a market share of 40.7 per cent of defined benefit pensions including paid-up policies, compared to 41.1 per cent for the same period in the previous year. the drop in market shares is mainly due to the sale of defined benefit pension products being stopped in the first quarter of 2012.
at the end on 2012, 89 per cent of customer funds in group pensions were benefit based, and 11 per cent were contribution based. the growth in customer funds within defined contribution pension plans was 35 per cent in 2012, and about 2 per cent of customers who had defined benefit pension plans at the beginning of the year have chosen to restructure, either partly or fully, to defined contribution pension plans. at the end of q3, the market share within defined contribution pension plans was at 29.0 per cent, a reduction from 29.2 per cent at the same time last year.
DnB liv maintained its position as the largest player within the individual pension savings market with a market share of 52.3 per cent at the end of q3, down from 53.5 per cent at the same time last year. the company’s main products are guaranteed savings products and fund savings through unit linked.
the life insurance industry is exposed to great changes in regula-tory framework. DnB liv will, on its own initiative and through fno, continue targeted efforts to contribute to good solutions for its customers and profitability for its owner.
ANNuAL STATemeNT foR 2012
DNB Livsforsikring ASA (DNB Liv) generated a pre-tax profit of NoK 1,263 million for 2012. Recorded and value-adjusted returns for the common portfolio were 5.7 and 5.4 per cent respectively. DNB Liv had total assets under management of NoK 270 billion as at 31 December 2012, an increase of 11.9 billion. The solvency capital increased by NoK 4.3 billion to 29.5 billion by the end of the year, and the company’s capital adequacy was at 16.7 per cent.
annual statement for 2012 DnB livsforsikring annual report 2012 4
DISTRIBUTIONthrough DnB, external partners and its own sales force, DnB liv has a strong distribution network that connects with all customer groups.
in the retail market, independent agents represented gross sales of nok 261 million, the company’s own insurers 553 million and advisors in DnB, 1,406 million. net sales are overall negative; in particular, there is significant departure for external partners, while the regulatory framework has an inhibiting effect on the sales.
in order to strengthen future sales one is working on simplifying product solutions and enrolment routines.
in total, minus nok 1,185 million is reported in net sold/trans-ferred premiums and capital in the corporate market. of these, minus 865 million is defined benefit pension plans in the public sector. otherwise the market is significantly characterized by hesitant customers, however, some transfer has taken place between companies, as well as restructuring from defined benefit to defined contribution pension plans. since contribution schemes characteristically have lower premium payments than benefit schemes, this gives an overall negative sales result.
FINANCIAL MANAGEMENT2012 was characterized by large movements in the financial markets. Despite the turmoil surrounding the euro crisis, the us budget cliff, the fear of a hard landing in china, the conflicts in the middle east and a somewhat weaker global growth, risky assets, including shares and credit bonds, have developed well in 2012. the good market outcomes in risky assets are mainly due to reduced risk premiums, as further monetary policy measures have countered the global risk of new system crises. towards the end of the year, there were also clearer, more positive signals for the global economic development.
the year gave an adjusted financial yield in the collective port-folio of nok 11,987 million. value adjusted finance gains were higher than the guaranteed interest in all sub-portfolios.
in order to adapt to the changed regulatory framework and reduce sensitivity towards large movements in the market, DnB liv’s collective portfolio has been conservatively oriented in 2012. this means that a significant part of DnB liv’s financial management is placed in assets which ensure a good, stable and predictable yield. 40.3 per cent of the portfolio is invested in bonds held to maturity, which gave a 5.0 per cent direct return in 2012. lower interest rates during the year have given capital gains and thus added value in relation to the maturity portfolio. the current bond portfolio, which accounts for 15.9 per cent of the portfolio, generated an 8.2 per cent return. parts of this yield stems from value increases in line with falling interest rates and a reduction in market credit spreads. shares accounted for 7.1 per cent of the portfolio, and gave a total return of 12.6 per cent. also, the real estate portfolio, which accounts for about 17.2 per cent of the portfolio, contributed with a 5.4 per cent total return. the total excess return associated with active mandates was
nok 853 million in 2012. Both fixed income investments and shares gave positive contributions.
Defined contribution pension plans are organized in investment profiles with varying levels of risk. we basically offer three standard investment profiles for defined contribution pension plans, DnB pension profile 30, DnB pension profile 50 and DnB pension profile 80, where 30, 50 and 80 reflect the equity portion of the profile. following the recovery in global stock markets, the 2012 returns have been the highest in the profiles with the highest equity portion. the returns in the profiles were 9.7 per cent, 11.7 per cent and 14.3 per cent respectively. the profiles have also had good excess return related to their respec-tive reference indexes, the excess return in the profiles were 1.7 per cent, 1.2 per cent and 0.3 per cent respectively in 2012.
assets managed associated with defined contribution pension plans are now approximately nok 20 billion, total assets increased by nok 4.9 billion in 2012.
During the past three years, DnB has delivered the highest return on defined contribution pension plans among the largest pension providers in norway. this is due to a combination of the profile composition of assets, currency hedging strategy and underlying active management.
RISK EXPOSUREgood risk management at DnB is a strategic tool for increasing value creation. risk is divided into six major categories which are subject to specific measurement and management: market, credit, insurance, operational, liquidity and business risk. risk adjusted profitability is followed up on both product and customer level.
During 2012, a new framework for risk appetite was implemented in the DnB group. for DnB liv risk measures has been established for capitalization, market risk and volatility in the ifrs result.
to ensure appropriate capitalization a plan exists which ensures fulfilment of future requirements for solvency margin under solvency ii. the capitalization plan is adjusted according to the development in the regulations of solvency ii. our current basis is that the quantitative minimum requirements for the solvency margin will not be in effect until 2015 the earliest.
the risk measure for market risk in DnB liv is assessed against other risk categories in the DnB group. the DnB group’s model for total risk is used to calculate market risk. market risk is primarily related to the company’s ability to fulfil the customers’ guaranteed interest.
to take a planned risk a risk measure for volatility in the ifrs result is set. the risk measure is expressed as a devia-tion from the expected result by 10 per cent probability (ear - earnings-at-risk).
the framework for financial risk is established annually by the
annual statement for 2012 DnB livsforsikring annual report 2012 5
Board of Directors in addition to the framework for risk appetite. this framework ensures sufficient diversification, maximum concentration risk towards a single issuer and specific limits for derivatives. the risk management unit monitors and follows up frameworks and guidelines. towards the implementation of solvency ii the loss potential is measure through a stress test against the buffer capital in addition to the legal requirements. this method is also utilised as a basis for the measurement of risk and the establishment of a framework for asset manage-ment risk.
Besides quantitative requirements, solvency ii contains qualita-tive requirements for business and risk management as well as extended requirements for external reporting. after a project phase, DnB liv now has implemented the necessary adaptations to meet the new solvency regulations. the focus on meeting the coming requirements is maintained towards implementation.
the insurance risk is monitored using stress tests, in order to compute potential losses in extreme situations. follow-up of operational and business risks also comprises an integrated part of DnB’s total risk management.
following the development in life expectancy for the popula-tion in general, it is necessary to strengthen reserves for future payments of retirement pension, both for individual contracts and for group occupational pensions. in 2012, DnB liv has strengthened the reserves for individual and group pensions with nok 0.4 billion and nok 3.3 billion respectively. the remaining provisions needed amount to nok 70 million, which will be allocated in 2013. the plan for additions to the reserves is approved by the financial supervisory authority of norway. the escalation plan and the remaining provisions needed are not yet clarified with the financial supervisory authority of norway.
every quarter, DnB liv performs a sufficiency test according to ifrs 4 phase 1, where reserves are measured at fair value, and not according to the reported calculation basis for discount rate and biometric assumptions. the sufficiency test has been performed per 31 December 2012 with positive margins. it will, however, be affected by possible changes in interest rates and assumptions about life expectancy development.
ANNuAL ACCouNTSDNB Liv’s profit before taxes was NOK 1,263 million. Recognised taxable income comprised NOK 371 million, and the profit after taxes was NOK 1,634 million. The market value adjustment reserve increased from NOK 409 to NOK 1,085 million during the course of 2012. DNB Liv’s consolidated accounts showed a profit before taxes of NOK 1,279 million. The tax income comprised NOK 355 million, and the profit after taxes was NOK 1,634 million.
the accounts have been submitted under the assumption of continued operation. the figures in parentheses are the corre-sponding figures for 2011.
PREMIUM INCOMEDnB liv’s premium income comprised nok 20,439 million (23,264), a reduction of 12 per cent from the previous year.
premium income from group defined benefit pensions comprised nok 12,516 million (14,903), a reduction of 16 per cent from the previous year. the premium income for group defined benefit pensions in the business market comprised nok 8,091 million (9,554). the premium income for group defined benefit pensions in the public sector comprised nok 4,425 million (5,349).
premium income for individual products totalled nok 3,716
million (4,947), a 25 per cent reduction. for individual products with guaranteed interest, premium income was nok 3,314 million (4,473), a 26 per cent reduction from the previous year.
premium income for products with investment choice comprised nok 4,608 million (3,888), an increase of 19 per cent from the previous year. premium income for defined contribu-tion pension nok 4,207 million (3,414), is a 23 per cent increase from the previous year. premium income for individual products with investment choice comprised nok 401 million (473), a decrease of 15 per cent from the previous year.
annual premiums due during the year and single premium payments for guaranteed products amounted to nok 14,680 million (14,746). total annual premiums due during the year and single premium payments comprised nok 18,478 million (18,203).
a flattening and gradual reduction in premium income from group pension schemes is expected in the future, in step with dismantling defined benefit pension schemes and establish-ment of new service pension products. among individual products, premium income will probably vary more from year to year, depending on trends in the economy and the framework conditions.
annual statement for 2012 DnB livsforsikring annual report 2012 6
RETURNSDnB liv’s value-adjusted and recorded returns for the common portfolio were 5.7 and 5.4 per cent respectively. an excess return of nok 853 million was achieved.
returns on the share capital were 3.1 per cent. DnB liv’s company portfolio is conservatively oriented with a money market share of 83.7 per cent.
the recorded financial result was nok 11,935 million (6,771).
for norwegian equities, the return was 12.3 per cent. this was 1.5 percentage point weaker than the reference index. for foreign shares, the return was 12.6 per cent measured in local currency, which is 0.7 percentage points better than the reference index.
returns on norwegian and foreign bonds comprised 7.3 and 9.4 per cent respectively. money market funds yielded returns of 2.5 per cent, whereas hold-to-maturity bonds had recorded returns of 5.0 per cent.
in 2012, the DnB liv real estate portfolio gave direct returns of nok 2,000 million, which comprises 5.1 per cent. positive value adjustment comprised nok 38 million, equivalent to 0.1 per cent. the total returns after value adjustment, capital gains and currency effects was nok 2,133 million, equivalent to 5,4 per cent.
after the value adjustments as at 31 December 2012, DnB liv’s investment properties have a total value of nok 37,967 million. in addition, units in foreign property funds and other net assets comprise nok 3,773 million.
COMPENSATION AND SURRENDERStotal compensation paid was nok 17,464 million (16,468). of the total surrenders of individual products, products with interest guarantees comprised nok 2,352 million (2,019) and products with investment choice nok 669 million (747). payments to policyholders (excluding surrenders) totalled nok 10,807 million (10,258).
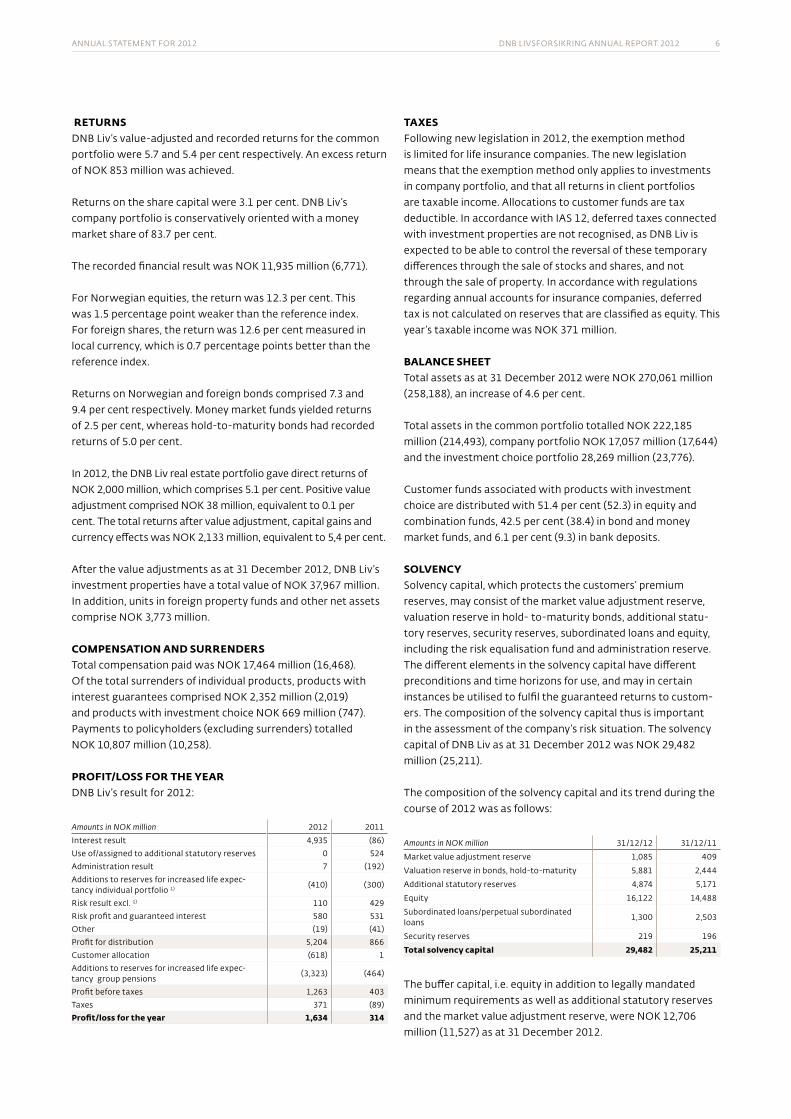
PROFIT/LOSS FOR THE YEARDnB liv’s result for 2012:
Amounts in NOK million 2012 2011
interest result 4,935 (86) use of/assigned to additional statutory reserves 0 524administration result 7 (192)additions to reserves for increased life expec-tancy individual portfolio 1) (410) (300)
risk result excl. 1) 110 429 risk profit and guaranteed interest 580 531 other (19) (41)profit for distribution 5,204 866 customer allocation (618) 1additions to reserves for increased life expec-tancy group pensions
(3,323) (464)
profit before taxes 1,263 403 taxes 371 (89)Profit/loss for the year 1,634 314
TAXESfollowing new legislation in 2012, the exemption method is limited for life insurance companies. the new legislation means that the exemption method only applies to investments in company portfolio, and that all returns in client portfolios are taxable income. allocations to customer funds are tax deductible . in accordance with ias 12, deferred taxes connected with investment properties are not recognised, as DnB liv is expected to be able to control the reversal of these temporary differences through the sale of stocks and shares, and not through the sale of property. in accordance with regulations regarding annual accounts for insurance companies, deferred tax is not calculated on reserves that are classified as equity. this year’s taxable income was nok 371 million.
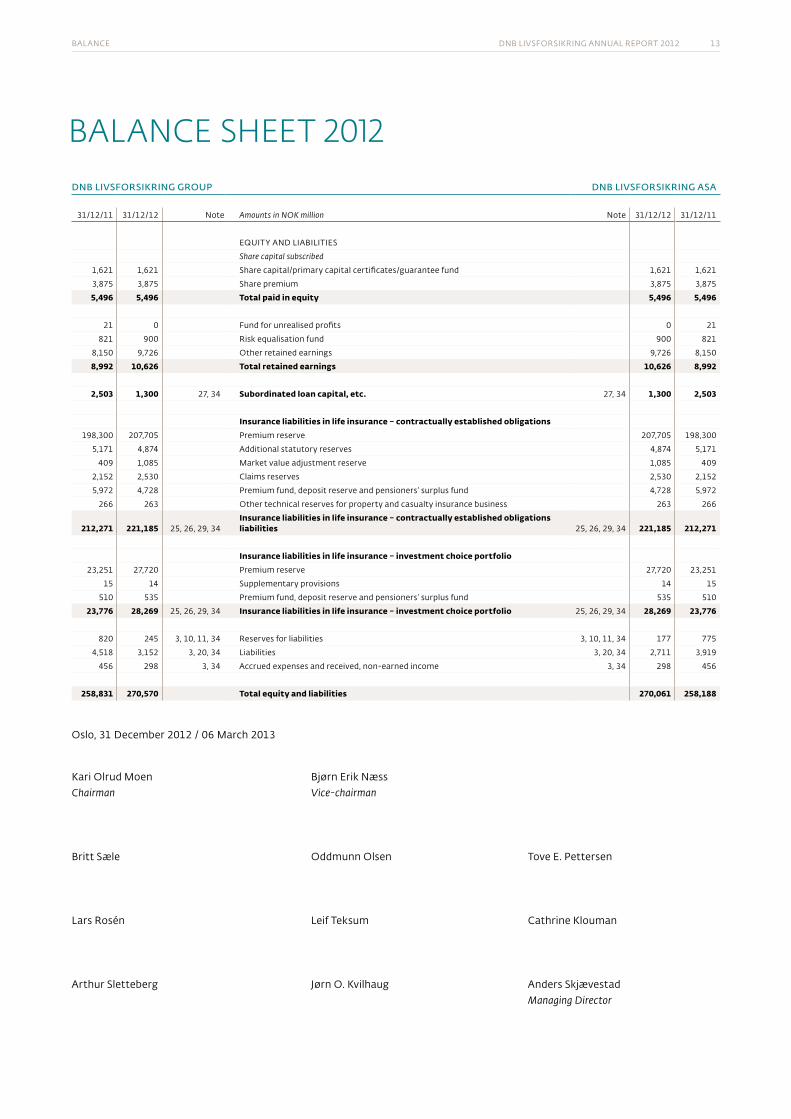
BALANCE SHEETtotal assets as at 31 December 2012 were nok 270,061 million (258,188), an increase of 4.6 per cent.
total assets in the common portfolio totalled nok 222,185 million (214,493), company portfolio nok 17,057 million (17,644) and the investment choice portfolio 28,269 million (23,776).
customer funds associated with products with investment choice are distributed with 51.4 per cent (52.3) in equity and combination funds, 42.5 per cent (38.4) in bond and money market funds, and 6.1 per cent (9.3) in bank deposits.
SOLVENCYsolvency capital, which protects the customers’ premium reserves, may consist of the market value adjustment reserve, valuation reserve in hold- to-maturity bonds, additional statu-tory reserves, security reserves, subordinated loans and equity, including the risk equalisation fund and administration reserve. the different elements in the solvency capital have different preconditions and time horizons for use, and may in certain instances be utilised to fulfil the guaranteed returns to custom-ers. the composition of the solvency capital thus is important in the assessment of the company’s risk situation. the solvency capital of DnB liv as at 31 December 2012 was nok 29,482 million (25,211).
the composition of the solvency capital and its trend during the course of 2012 was as follows:
Amounts in NOK million 31/12/12 31/12/11
market value adjustment reserve 1,085 409
valuation reserve in bonds, hold-to-maturity 5,881 2,444
additional statutory reserves 4,874 5,171
equity 16,122 14,488
subordinated loans/perpetual subordinated loans
1,300 2,503
security reserves 219 196
Total solvency capital 29,482 25,211
the buffer capital, i.e. equity in addition to legally mandated minimum requirements as well as additional statutory reserves and the market value adjustment reserve, were nok 12,706 million (11,527) as at 31 December 2012.
annual statement for 2012 DnB livsforsikring annual report 2012 7
provision for long life in 2012 improves the solvency position according to new solvency regulations (solvency ii). strengthening the premium reserves through future interest profit will improve the solvency position under solvency ii further.
CAPITAL ADEQUACY AND SOLVENCY MARGIN CAPITAL capital adequacy is a term referring to the company’s primary capital as a portion of the risk-weighted balance sheet. DnB liv’s eligible primary capital was as at 31 December 2012 a total of nok 16,021 million (14,869). the capital adequacy was 16.7 per cent (15.3).
solvency margin capital consists of primary capital with the addition of 50 per cent of additional statutory reserves, 50 per cent of the risk equalisation fund and security reserves in non-life insurance beyond 55% of minimum value. DnB liv’s solvency margin capital as at 31 December 2012 was nok 19,007 million (17,953) and the solvency margin requirement nok 9,726 million (9,332), representing 195.4 per cent of the requirement.
EMPLOYEESit is important for DnB liv to attract and retain talented employees. including subsidiaries, DnB liv had 817 employees (854) as at 31 December 2012. the number of full-time equiva-lent employees comprised 791 (828). the conditions for employ-ees of DnB liv are coordinated with guidelines in the DnB group in general. through 2012, the number of full-time equivalent temporary employees has been reduced from 74 to 40.
WORKING ENVIRONMENTemployee sick leave absences have increased in 2012. employee sick leave absence was 5.1 per cent (4.8). no serious injuries or accidents were recorded in 2012. DnB liv is working with systematic measures that can reduce employee sick leave absences.
DnB liv places a special focus on employees who have been on sick leave for long periods of time. By following up on employees on sick leave, more employees come back to jobs with accom-modating working conditions. DnB liv has a high level of activity in health, safety and environment work (hse). hse is reported in parallel with the other internal controls. DnB liv is an inclusive working life organisation and is certified as an environmental lighthouse organisation.
the management has regular meetings with union representa-tives for the employees organised under the finance sector union of norway.
GENDER EQUALITYthere are nearly identical numbers of female and male employ-ees at DnB liv. of managers with personnel responsibilities a total of 66 (71) are men and 52 (52) are women.
DnB liv is seeking to increase the number of women in lead-ing positions, including through the increased participation of women in programmes for personal development, management development and trainee programmes.
there is still some distance to go before DnB liv has the desired balance in the distribution of genders at the management level. throughout the DnB group, DnB liv will work actively with tangible measures and analyses connected to how women can be recruited to a greater extent for management positions.
CORPORATE RESPONSIBILITY together with the rest of the DnB group, DnB liv wants to be a model for sustainable value creation by integrating ethical, environmental and social considerations in business operations. thus DnB liv takes into account risks and possibilities which can be associated with climate change, shortage of resources, changed demographics and population growth.
DnB liv assumes responsibility for its effects on people and the environment. the responsibility applies for all parts of the company and covers products, services, marketing, acquisitions , owner-management and company management as well as the internal work with the working environment, ethics and environmental efficiency.
DnB liv follows DnB’s corporate policy for corporate responsi-bility which is based on acknowledged international guidelines, including the oecD guidelines for multinational companies and un’s global compact, where human rights, workers’ rights, environment and anti-corruption are central issues. to support corporate policy the group has guidelines and business models which aid the business and support areas in complying with the requirements for corporate responsibility. among other things, guidelines have been established for ethics, responsible invest-ments, loans and follow-up of suppliers’ corporate responsibility.
to strengthen ethical awareness within the group, an ethics programme has been developed with a focus on manager initiated discussions regarding ethics and ethical dilemmas. the programme has been revised in 2012.
in 2012, the DnB group supported sport, culture, non-profit organisations and other social causes with nok 119 million.
DnB liv works to have a high environmental standard and good energy solutions in the company’s offices and in the properties the company rents to other tenants. through DnB næringseiendom, the company has great focus on environ-mental control and energy management. when acquiring new buildings and in the event of major rehabilitation, there is a requirement for environmental certification in Breeam and requirements for ecolabels better than current legal require-ments. through a systematic focus on energy conservation, DnB liv has during the period 2007-2012 reduced energy consumption in their own buildings by 15 per cent or 40 gwh (equivalent to annual consumption of 2,500 houses).
ETHICAL PORTFOLIO MANAGEMENTDnB liv follows ethical guidelines in its management of its customer pension funds. the ethical guidelines establish mini-mum standards and are in line with DnB’s policy for corporate responsibility and international principles and conventions such
annual statement for 2012 DnB livsforsikring annual report 2012 8
as the un’s “global compact” and the oecD’s guidelines for multinational companies. the guidelines shall ensure that DnB liv does not contribute to the violation of human and work-ers’ rights, corruption, serious environmental damage or other actions which may be interpreted as unethical. the ethical guidelines also apply to external suppliers of equity manage-ment and mutual funds offered to customers in DnB liv. DnB liv shall not invest in companies that are involved in the production of tobacco, pornography, anti-personnel mines or cluster bombs, or which have the development and production of components for weapons of mass destruction as a signifi-cant part of their business operations (negative screening). at the end of 2012, 58 companies were excluded as a result of breaching the guidelines. in addition, DnB liv has an active ownership policy where a dialogue is carried out prior to a possible exclusion.
CUSTOMER SATISFACTIONDnB liv carries out an annual customer satisfaction survey with its personal and corporate customers. in 2012, corpo-rate customer satisfaction has increased to 74 (72) of which municipalities have a customer satisfaction of 79 (78). personal customer satisfaction has increased to 69 (63).
BOARD OF DIRECTORS AND MANAGEMENTDnB liv’s Board of Directors is chaired by kari olrud moen. rune Bjerke was chair until 13 february 2013. the Board otherwise consists of vice-chairman Bjørn erik næss, cathrine klouman, tove pettersen, lars rosén, arthur sletteberg (from 22/11/2012) and leif teksum (from 13/02/2013). the employee-elected Board members are jørn o. kvilhaug, oddmunn olsen and Britt sæle. rune selmar was a Board member until 30 july 2012.
in 2012, the company was headed by managing Director tom rathke. on 14 january 2013, anders skjævestad became managing Director. at the end of 2012, the management consisted of Deputy managing Director and Director of staff and Business Development anders skjævestad, Director of sales Division Bengt olav lund, Director of finance truls tollefsen, chief risk officer and chief actuary egil heilund, Director of operations and customer service geir sæbdal, and Director of public market Britt-iren spjeld.
FUTURE PROSPECTSthe global economic growth was weak in 2012, with some improvements in growth prospects towards the end of the year. growth is still well under full capacity utilization, inflation is low or falling and central banks continue to stimulate economies through low interest rates. in norway, there is a clear dichotomy in the economy where oil related activity is strong, while other industries struggle with high costs and slow growth among trading partners.
although several of the challenges and imbalances in the world economy are unsolved, low to moderate growth, low inflation and negative real interest rates support underlying earnings in businesses and promote risk taking. these surroundings can be good for the development in risky assets, but they also involve
a low threshold for unrest in the financial markets. compared to a continued expansive monetary policy there are prospect of continued low short term interest rates. in the long end of the interest curve there is a risk of interest rates rising from histori-cally low levels in step with improved growth prospects.
framework conditions for norwegian life insurance compa-nies will change significantly in the next two to three years. important elements are the need for additions to reserves for increased life expectancy assumptions, the introduction of solvency ii, new regulations for service pensions in the private sector and changes in regulations for paid-up policies. Both the framework conditions and customer preferences will involve a shift from products with guaranteed interest to products with investment choice. DnB liv’s business strategy supports this development, and new products directed towards the service pension market in the private sector will be less capital intensive.
for group pensions, there is a need to strengthen the premium reserve over the next few years. the total provision required may comprise 5-7 per cent of the premium reserve, depending on whether statistic norway’s low or middle alternative for future life expectancy assumption is used as a basis. so far, about 2.5 per cent of the premium reserve has been allocated. the financial supervisory authority of norway has given a general statement that expansion plans based on funding from future interest earnings will be allowed, but has at the same time indi-cated that it would also be necessary to charge the result to the owner. the level of provision, length of the expansion plan and the size of the contribution of equity is not clarified.
the eu is about to implement a new framework directive for life insurance referred to as solvency ii. the regulations will also apply to norwegian life insurance companies. the new solvency regulations will be based on a 3 pillar structure.
pillar 1 includes value assessment of assets and insurance obli-gations, capital and capital requirements. central to the regula-tions is that both assets and commitments shall be assessed at market value. pillar 2 contains rules for risk management and internal control as well as supervisory control and monitoring. pillar 3 shall ensure market discipline through disclosure require-ments towards the public and reporting requirements towards supervisory authorities.
the implementation of solvency ii has been postponed several times. primarily as a result of disagreement as to how long-term interest guarantees are to be appraised. the implementation time has been confirmed postponed by norwegian authorities at least until 01/01/2015. further postponement is expected, so that the new regulations will probably be in force from 01/01/2016 at the earliest.
the Banking law commission has proposed that paid up policies can be converted to investment choice without guaranteed interest where the policy owner chooses the allocation. investment choice shall contribute to better management of the pension funds, while the life insurance companies’ interest risk is
annual statement for 2012 DnB livsforsikring annual report 2012 9
reduced. investment choice basically includes the period up until pension payment. the regulations were adopted in 2012 with-out specifying the effective date. the regulations are expected to be effective from 01 january 2014.
the Banking law commission has proposed a new service pension law. a central part of the law is a new service pension product based on elements from both defined contribution pension and defined benefit service pension. the new product is substantially based on elements from new national insurance.
the new service pension products balance the risk between the employee, the employer and the life insurance companies in a better way that defined benefit pension does. through relatively generous deposit limits, the employees are ensured good pensions. DnB believes that the new service pension will be an attractive product primarily for companies which currently have defined benefit service pension.
the Banking law commission’s interim report regarding the basic model and standard model, dismantling of defined benefit pension and changes in regulations for paid-up policies shall according to plan be discussed in the storting in the autumn of 2013. in the same period, the ministry of finance shall deter-mine new maximum rates for defined contribution pension. if the schedule is complied with, a comprehensive regulatory framework for service pension in the private sector and paid-up policies will be established during 2013. it is uncertain when the regulatory framework will be effective. however, the legislative process in the autumn of 2013 implies that implementation can be postponed from 01 january 2014, which was originally planned, to 2015. extensive changes necessitate generous transitional regulations so that businesses and life insurance companies will have time to adapt to the changes.
at the beginning of 2012, the company chose to stop the sale of defined benefit schemes. this measure has been taken because the insecurity associated with the framework conditions is too great. we therefore chose to give priority to existing customers. this is a decision that remains firm at the beginning of 2013.
the exemption method was limited for life insurance companies’ investments in customer portfolios, effective from 01/01/2012.
this change has led to a higher expected future tax costs. the ministry of finance clarified in December 2012 that the limita-tion does not apply to shares owned by subsidiaries. the ministry also said that the changes in tax regulations for customer shares owned through subsidiaries will be evaluated.
there are on-going efforts to implement a national accounting standard for insurance obligations. according to the plan, the consultation document for a new standard is to be published in the first half of 2013. the time of implementation is currently not determined. the implementation of new principles will involve the measurement of insurance commitments at fair value.
persistently low interest rates and provisions for increased life expectancy means that earnings will be challenging for life insurance companies in the coming years. as a consequence, DnB liv has started to adapt its activities through the sale of less capital intensive products, as well as realising an exten-sive cost programme which is to be fully implemented during 2014. the company has adapted to new framework conditions through a conservative orientation of the equity management. in addition to company specific measures it is also neces-sary to make changes to framework conditions, especially for paid-up policies which will require a disproportionate amount of solvency capital when solvency ii is implemented. this is necessary in order to ensure that paid-up policies are to become an attractive product for both customers and life insurance companies in the future.
as part of efforts to strengthen the company’s equity and solvency position towards the implementation of solvency ii, the Board proposes that dividends are not paid for 2012.
DIVIDENDS AND ALLOCATIONSthe Board proposes that the year’s profit of nok 1,634 million be allocated as follows:
from the revaluation reserve (20)
risk equalization fund 78
other equity 1,576
Total 1,634
oslo, 06 march 2013
kari olrud moen Bjørn erik næss Chairman Vice-chairman
Britt sæle oddmunn olsen tove e. pettersen
lars rosén leif teksum cathrine klouman
arthur sletteberg jørn o. kvilhaug anders skjævestad Managing Director
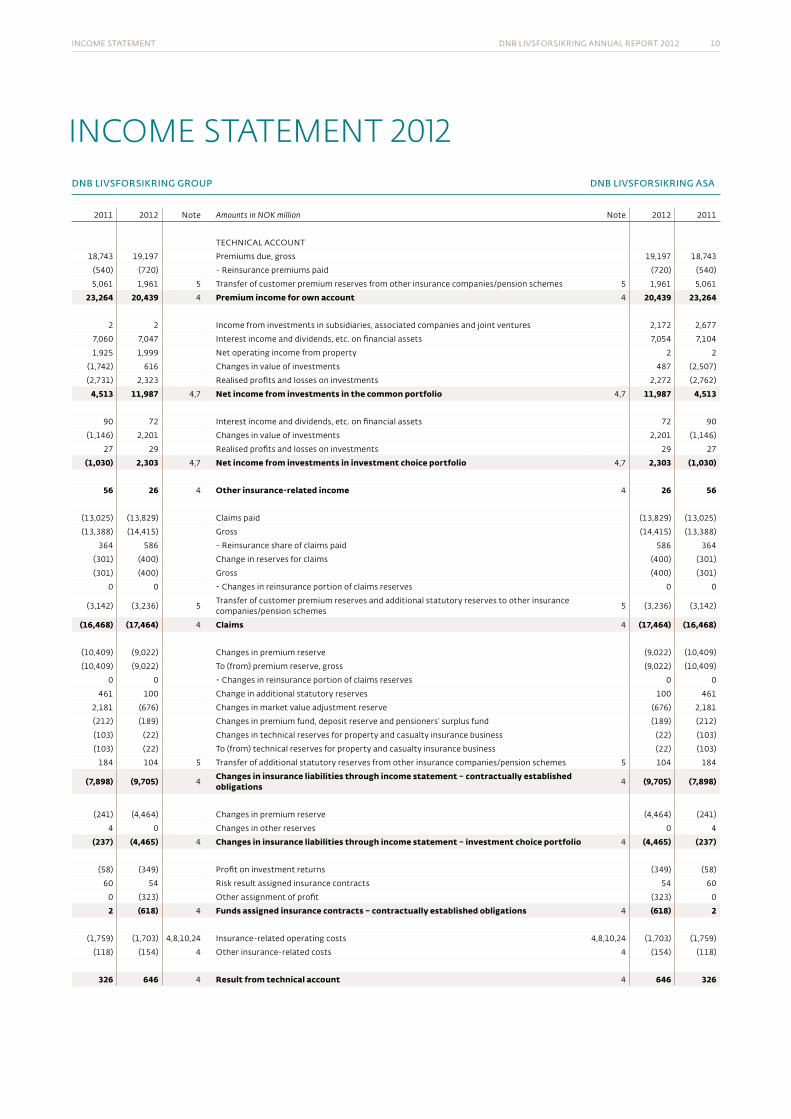
income statement DnB livsforsikring annual report 2012 10
dnb livsfOrsikrinG GrOup dnb livsfOrsikrinG asa
2011 2012 note Amounts in NOK million note 2012 2011
technical account
18,743 19,197 premiums due, gross 19,197 18,743
(540) (720) - reinsurance premiums paid (720) (540)
5,061 1,961 5 transfer of customer premium reserves from other insurance companies/pension schemes 5 1,961 5,061
23,264 20,439 4 Premium income for own account 4 20,439 23,264
2 2 income from investments in subsidiaries, associated companies and joint ventures 2,172 2,677
7,060 7,047 interest income and dividends, etc. on financial assets 7,054 7,104
1,925 1,999 net operating income from property 2 2
(1,742) 616 changes in value of investments 487 (2,507)
(2,731) 2,323 realised profits and losses on investments 2,272 (2,762)
4,513 11,987 4,7 Net income from investments in the common portfolio 4,7 11,987 4,513
90 72 interest income and dividends, etc. on financial assets 72 90
(1,146) 2,201 changes in value of investments 2,201 (1,146)
27 29 realised profits and losses on investments 29 27
(1,030) 2,303 4,7 Net income from investments in investment choice portfolio 4,7 2,303 (1,030)
56 26 4 Other insurance-related income 4 26 56
(13,025) (13,829) claims paid (13,829) (13,025)
(13,388) (14,415) gross (14,415) (13,388)
364 586 - reinsurance share of claims paid 586 364
(301) (400) change in reserves for claims (400) (301)
(301) (400) gross (400) (301)
0 0 - changes in reinsurance portion of claims reserves 0 0
(3,142) (3,236) 5transfer of customer premium reserves and additional statutory reserves to other insurance companies/pension schemes
5 (3,236) (3,142)
(16,468) (17,464) 4 Claims 4 (17,464) (16,468)
(10,409) (9,022) changes in premium reserve (9,022) (10,409)
(10,409) (9,022) to (from) premium reserve, gross (9,022) (10,409)
0 0 - changes in reinsurance portion of claims reserves 0 0
461 100 change in additional statutory reserves 100 461
2,181 (676) changes in market value adjustment reserve (676) 2,181
(212) (189) changes in premium fund, deposit reserve and pensioners’ surplus fund (189) (212)
(103) (22) changes in technical reserves for property and casualty insurance business (22) (103)
(103) (22) to (from) technical reserves for property and casualty insurance business (22) (103)
184 104 5 transfer of additional statutory reserves from other insurance companies/pension schemes 5 104 184
(7,898) (9,705) 4Changes in insurance liabilities through income statement – contractually established obligations 4 (9,705) (7,898)
(241) (4,464) changes in premium reserve (4,464) (241)
4 0 changes in other reserves 0 4
(237) (4,465) 4 Changes in insurance liabilities through income statement – investment choice portfolio 4 (4,465) (237)
(58) (349) profit on investment returns (349) (58)
60 54 risk result assigned insurance contracts 54 60
0 (323) other assignment of profit (323) 0
2 (618) 4 Funds assigned insurance contracts – contractually established obligations 4 (618) 2
(1,759) (1,703) 4,8,10,24 insurance-related operating costs 4,8,10,24 (1,703) (1,759)
(118) (154) 4 other insurance-related costs 4 (154) (118)
326 646 4 Result from technical account 4 646 326
INCome STATemeNT 2012
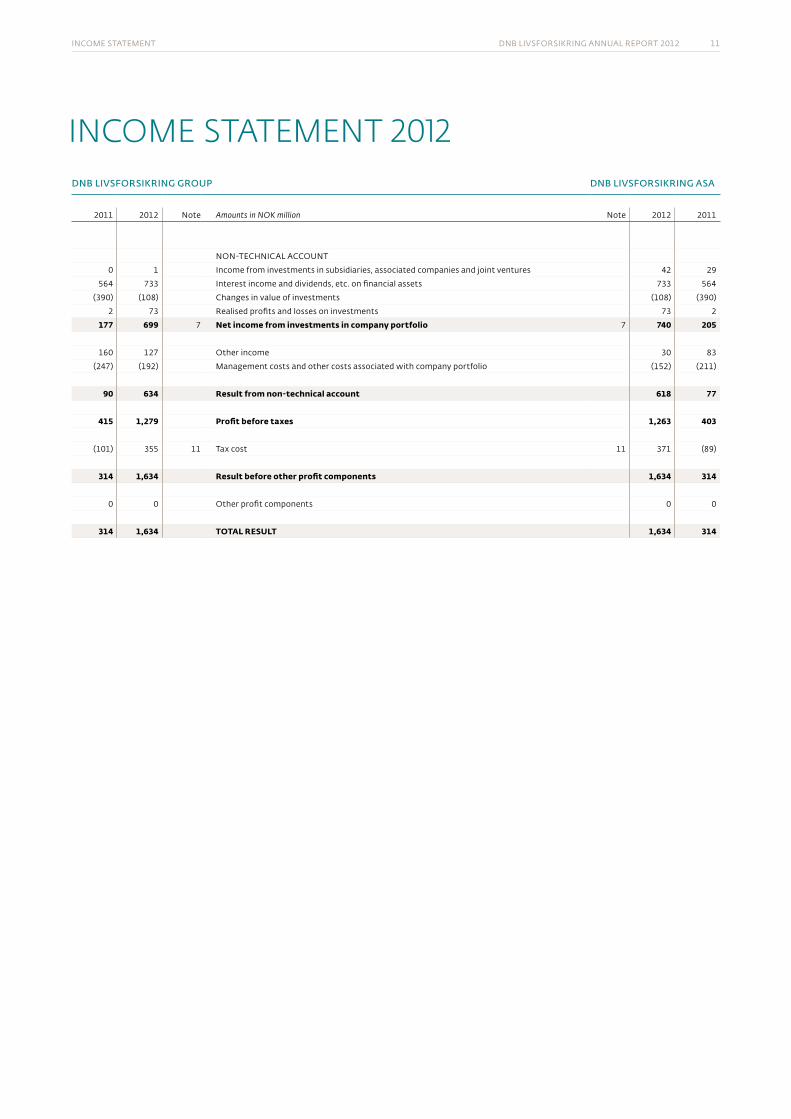
income statement DnB livsforsikring annual report 2012 11
dnb livsfOrsikrinG GrOup dnb livsfOrsikrinG asa
2011 2012 note Amounts in NOK million note 2012 2011
non-technical account
0 1 income from investments in subsidiaries, associated companies and joint ventures 42 29
564 733 interest income and dividends, etc. on financial assets 733 564
(390) (108) changes in value of investments (108) (390)
2 73 realised profits and losses on investments 73 2
177 699 7 Net income from investments in company portfolio 7 740 205
160 127 other income 30 83
(247) (192) management costs and other costs associated with company portfolio (152) (211)
90 634 Result from non-technical account 618 77
415 1,279 Profit before taxes 1,263 403
(101) 355 11 tax cost 11 371 (89)
314 1,634 Result before other profit components 1,634 314
0 0 other profit components 0 0
314 1,634 TOTAL RESULT 1,634 314
INCome STATemeNT 2012
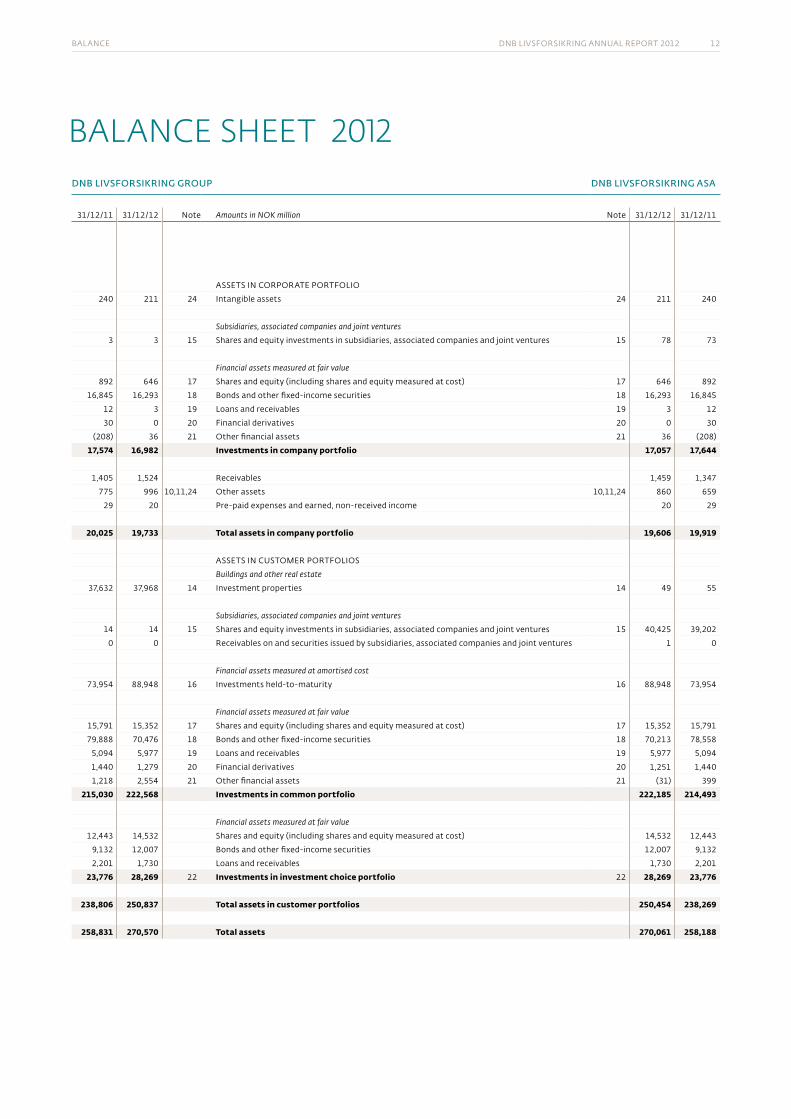
Balance DnB livsforsikring annual report 2012 12
dnb livsfOrsikrinG GrOup dnb livsfOrsikrinG asa
31/12/11 31/12/12 note Amounts in NOK million note 31/12/12 31/12/11
assets in corporate portfolio
240 211 24 intangible assets 24 211 240
Subsidiaries, associated companies and joint ventures
3 3 15 shares and equity investments in subsidiaries, associated companies and joint ventures 15 78 73
Financial assets measured at fair value
892 646 17 shares and equity (including shares and equity measured at cost) 17 646 892
16,845 16,293 18 Bonds and other fixed-income securities 18 16,293 16,845
12 3 19 loans and receivables 19 3 12
30 0 20 financial derivatives 20 0 30
(208) 36 21 other financial assets 21 36 (208)
17,574 16,982 Investments in company portfolio 17,057 17,644
1,405 1,524 receivables 1,459 1,347
775 996 10,11,24 other assets 10,11,24 860 659
29 20 pre-paid expenses and earned, non-received income 20 29
20,025 19,733 Total assets in company portfolio 19,606 19,919
assets in customer portfolios
Buildings and other real estate
37,632 37,968 14 investment properties 14 49 55
Subsidiaries, associated companies and joint ventures
14 14 15 shares and equity investments in subsidiaries, associated companies and joint ventures 15 40,425 39,202
0 0 receivables on and securities issued by subsidiaries, associated companies and joint ventures 1 0
Financial assets measured at amortised cost
73,954 88,948 16 investments held-to-maturity 16 88,948 73,954
Financial assets measured at fair value
15,791 15,352 17 shares and equity (including shares and equity measured at cost) 17 15,352 15,791
79,888 70,476 18 Bonds and other fixed-income securities 18 70,213 78,558
5,094 5,977 19 loans and receivables 19 5,977 5,094
1,440 1,279 20 financial derivatives 20 1,251 1,440
1,218 2,554 21 other financial assets 21 (31) 399
215,030 222,568 Investments in common portfolio 222,185 214,493
Financial assets measured at fair value
12,443 14,532 shares and equity (including shares and equity measured at cost) 14,532 12,443
9,132 12,007 Bonds and other fixed-income securities 12,007 9,132
2,201 1,730 loans and receivables 1,730 2,201
23,776 28,269 22 Investments in investment choice portfolio 22 28,269 23,776
238,806 250,837 Total assets in customer portfolios 250,454 238,269
258,831 270,570 Total assets 270,061 258,188
BALANCe SHeeT 2012
Balance DnB livsforsikring annual report 2012 13
dnb livsfOrsikrinG GrOup dnb livsfOrsikrinG asa
31/12/11 31/12/12 note Amounts in NOK million note 31/12/12 31/12/11
equity anD liaBilities
Share capital subscribed
1,621 1,621 share capital/primary capital certificates/guarantee fund 1,621 1,621
3,875 3,875 share premium 3,875 3,875
5,496 5,496 Total paid in equity 5,496 5,496
21 0 fund for unrealised profits 0 21
821 900 risk equalisation fund 900 821
8,150 9,726 other retained earnings 9,726 8,150
8,992 10,626 Total retained earnings 10,626 8,992
2,503 1,300 27, 34 Subordinated loan capital, etc. 27, 34 1,300 2,503
Insurance liabilities in life insurance – contractually established obligations 198,300 207,705 premium reserve 207,705 198,300
5,171 4,874 additional statutory reserves 4,874 5,171
409 1,085 market value adjustment reserve 1,085 409
2,152 2,530 claims reserves 2,530 2,152
5,972 4,728 premium fund, deposit reserve and pensioners’ surplus fund 4,728 5,972
266 263 other technical reserves for property and casualty insurance business 263 266
212,271 221,185 25, 26, 29, 34 Insurance liabilities in life insurance – contractually established obligations liabilities 25, 26, 29, 34 221,185 212,271
Insurance liabilities in life insurance – investment choice portfolio 23,251 27,720 premium reserve 27,720 23,251
15 14 supplementary provisions 14 15
510 535 premium fund, deposit reserve and pensioners’ surplus fund 535 510
23,776 28,269 25, 26, 29, 34 Insurance liabilities in life insurance – investment choice portfolio 25, 26, 29, 34 28,269 23,776
820 245 3, 10, 11, 34 reserves for liabilities 3, 10, 11, 34 177 775
4,518 3,152 3, 20, 34 liabilities 3, 20, 34 2,711 3,919
456 298 3, 34 accrued expenses and received, non-earned income 3, 34 298 456
258,831 270,570 Total equity and liabilities 270,061 258,188
oslo, 31 December 2012 / 06 march 2013
kari olrud moen Bjørn erik næss Chairman Vice-chairman
Britt sæle oddmunn olsen tove e. pettersen
lars rosén leif teksum cathrine klouman
arthur sletteberg jørn o. kvilhaug anders skjævestad Managing Director
BALANCe SHeeT 2012
statement of changes in equity DnB livsforsikring annual report 2012 14
paid-in capital retained earninGs
Amounts in NOK million share
capital share
premium
fund for unrealised
profit
risk equalisation
fund
admin. reser-ves property and casualty
insuranceother equity
total equity
Balance sheet as at 31 December 2010 1,321 1,175 414 661 40 8,802 12,413 Dissolution administration reserves property and casualty insurance 01 january 2011
(40) 29 (11)
changes in principles administration reserves property and casualty insurance
(29) (29)
Balance sheet as at 01 January 2011 1,321 1,175 414 661 0 8,802 12,374 increase in capital 300 2,700 3,000
profit/loss for the year (394) 160 548 314
group contribution (1,200) (1,200)
Balance sheet as at 31 December 2011 1 ,621 3,875 21 821 0 8,150 14,488 profit/loss for the year (21) 78 1,577 1,634
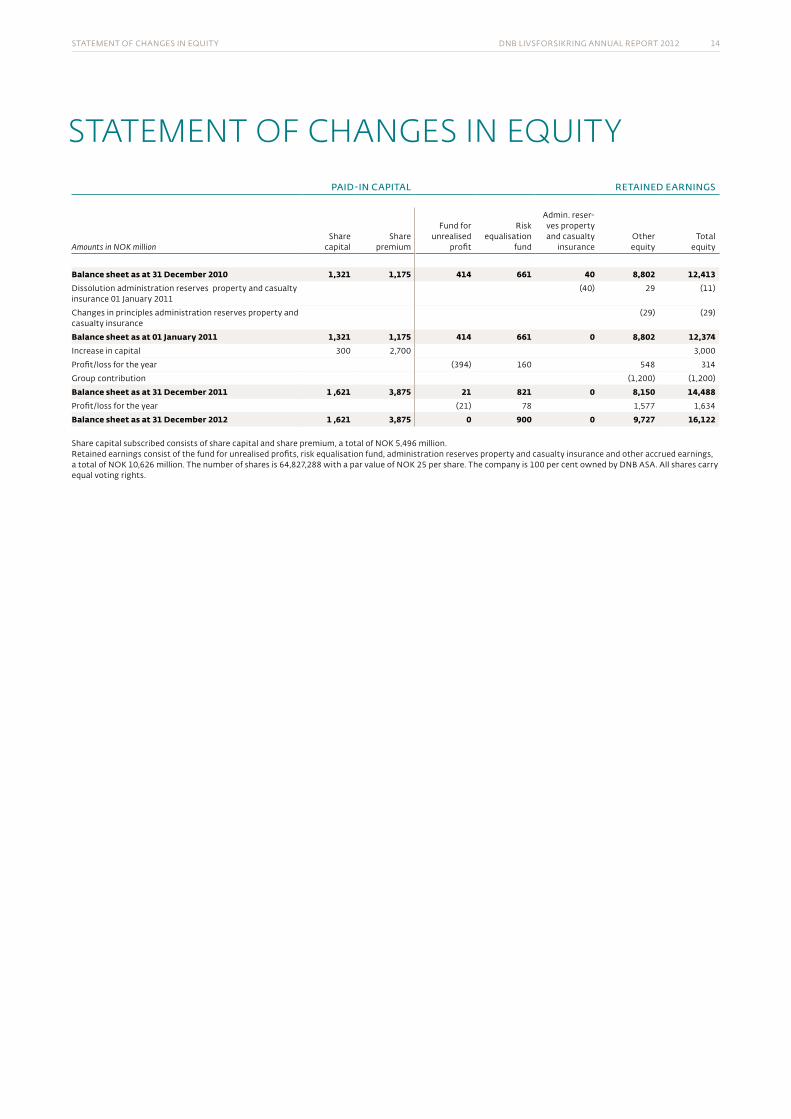
Balance sheet as at 31 December 2012 1 ,621 3,875 0 900 0 9,727 16,122 share capital subscribed consists of share capital and share premium, a total of nok 5,496 million.retained earnings consist of the fund for unrealised profits, risk equalisation fund, administration reserves property and casualty insurance and other accrued earnings, a total of nok 10,626 million. the number of shares is 64,827,288 with a par value of nok 25 per share. the company is 100 per cent owned by DnB asa. all shares carry equal voting rights.
STATemeNT of CHANGeS IN eQuITY
cash flow analysis/investment yielD DnB livsforsikring annual report 2012 15
CASH fLoW STATemeNTdnb livsfOrsikrinG GrOup
31/12/11 31/12/12 Amounts in NOK million 31/12/12 31/12/11
Cash flow from operational activities15,660 16,925 net receipts from premiums/premium fund 16,925 15,660
2,061 (987) net receipts/payments from transfers (987) 2,061
6,831 10,682 net receipts from investments 8,710 4,859
(954) 176 net receipts from life insurance with investment choice 176 (954)
(12,669) (13,466) compensation payments (13,466) (12,669)
(1,780) (1,712) payment for operations (1,712) (1,780)
(10) (221) taxes paid (221) (10)
9,138 11,397 A= Net cash flow from operational activities 9,425 7,166
Cash flow from investments made17,674 3,419 net investment in shares and other equity investments 2,391 17,970
(30,861) (7,259) net investment in bonds (7,259) (30,861)
(273) 1,273 net investment in loans 1,273 (273)
(270) (2,368) net investment in investment contracts (2,368) (270)
141 (414) net investment in properties 1 800
475 (148) net investment in other financial assets (153) 483
(5) 20 net investment in tangible fixed assets 20 (5)
(73) (77) net investment in intangible assets (77) (73)
(13,192) (5,554) B=Net cash flow from investments made (6,172) (12,229)
Cash flow from financing activities0 (1,175) repayment of subordinated loans (1,175) 0
213 (949) paid dividends/group contributions 0 213
(718) 263 changes from other financing activities 263 113
3,000 0 increase in capital 0 3,000
2,495 (1,861) C=Cash flow from financing activities (912) 3,326(1,560) 3,982 net liquidity change (a+B+c) 2,342 (1,737)
5,289 3,729 liquidity holding as at 01. january 2,992 4,729
3,729 7,711 Liquidity holding as at 31. December 5,333 2,992
INVeSTmeNT YIeLD
investment yield interest i in percent 2012 2011
common portfolio – low risk 5.1 3.5
common portfolio – moderate 5.6 3.5
common portfolio – high risk 6.2 2.8
public 1) 5.3
paid-up policies 2)
paid-up policies – low risk 5.4 3.4
paid-up policies – moderate 5.5 3.3
paid-up policies – high risk 5.7 1.9
individual products – old profit model 5.1 3.0
common portfolio 5.4 3.2
investment yield total portfolio in percent 2012 2011 2010 2009 2008
investment yield interest i 5.4 3.2 6.2 4.7 1.9
investment yield interest ii 5.7 2.1 6.8 5.4 0.3
investment yield interest iii 7.3 2.8 6.9 5.7 1.1
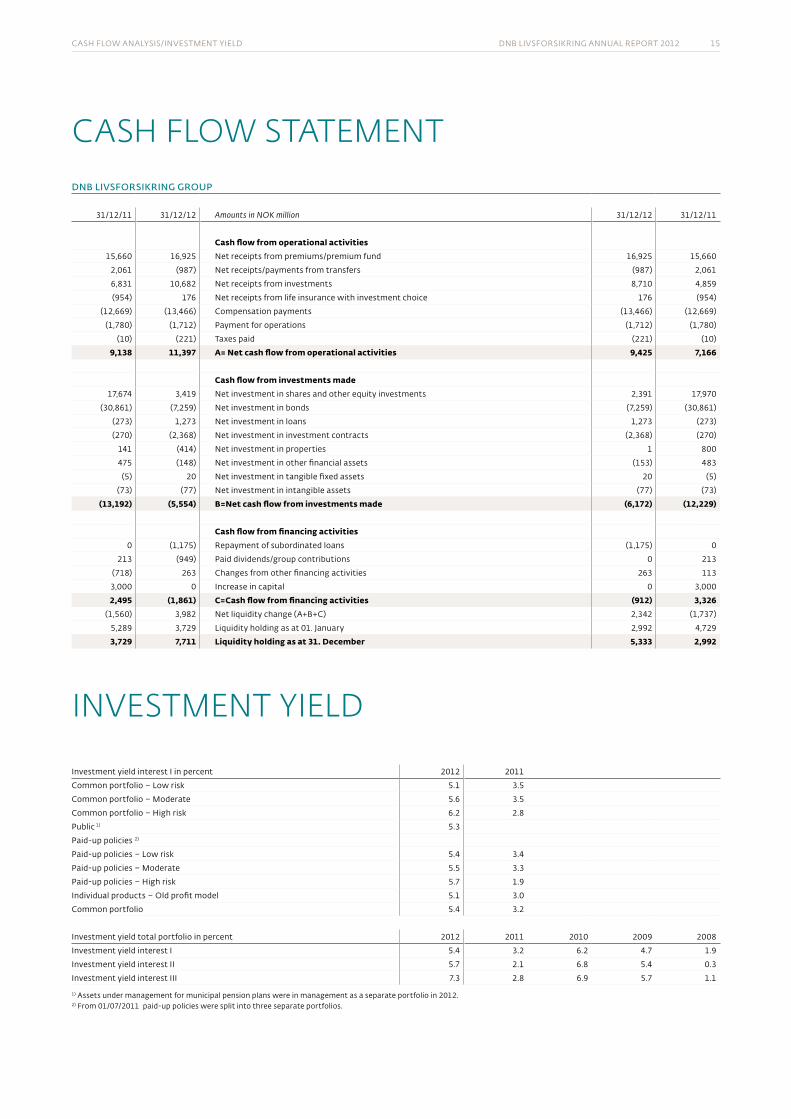
1) assets under management for municipal pension plans were in management as a separate portfolio in 2012.2) from 01/07/2011 paid-up policies were split into three separate portfolios.
notes DnB livsforsikring annual report 2012 16
NoTeS
NoTe 1 – ACCouNTING pRINCIpLeS
1. COMPANY INFORMATIONDnB livsforsikring asa is a wholly-owned subsidiary of DnB asa. the company’s main office’s visiting address is folke Bernadottes vei 40, Bergen.
2. BASIS FOR PREPARATION OF ACCOUNTS the accounts for DnB liv are submitted in accordance with the regulations for annual accounts etc. related to insurance companies, the norwegian accounting act of 1998, generally accepted accounting principles in norway (annual accounts regulations), as well as other regulations promulgated by the financial supervisory authority of norway.
the accounts consist of the consolidated accounts for the DnB liv group and separate accounts for DnB livsforsikring asa. the accounts are based on the historical cost principle with the exception of: financial assets and liabilities (including financial derivatives) measured at fair value through profit and loss and investment properties. the consolidated accounts are presented in nok. unless otherwise stated, the values are rounded to the nearest million.
3. CONSOLIDATIONin the consolidated accounts for DnB liv, real estate subsidiaries owned are included in the common portfolio, as well as subsidi-aries that are included in the company portfolio. the account-ing principles are applied consistently in the consolidation of ownership interests in subsidiaries, joint ventures and associated companies and are based upon the same reporting periods as for the parent company.
investments in subsidiaries owned through the company port-folio are fully consolidated and investments in joint ventures are consolidated proportionately. investments in associated compa-nies are recognised in accordance with the equity method. no subsidiaries have significant minority interests, neither individu-ally nor in total. for subsidiaries, joint ventures and associated companies held in the common portfolio, results before taxes are reported collectively under financial income, whereas the tax costs are reported as a part of the group’s tax costs.
in the preparation of the consolidated accounts, intra-group transactions, balances and unrealised profits and losses on transactions between entities in the group are eliminated. for subsidiaries that are owned in the company portfolio, but which in full or in part sell services that are recognized in the technical accounts, the profit for the year before taxes appears on one line under other income outside technical accounts. this primarily concerns DnB næringseiendom as.
subsidiaries are defined as companies that DnB liv controls through direct or indirect ownership interests. normally, it is presumed that DnB livsforsikring has control when the owner-ship interests in another company represent more than 50 per cent. DnB liv also assesses whether the group has de facto control. for companies where the ownership interest is under 50 per cent, DnB liv makes an assessment of whether other circumstances exist that deem that they in fact have control. subsidiaries are consolidated from the time control is transferred to the group. subsidiaries are consolidated until the time when control is transferred.
joint ventures represent investments in companies where DnB liv controls a company along with others. this type of collabo-ration is based upon an agreement that governs the central working relationship.
associated companies are companies where the group exercises significant influence, but not control and normally encompasses companies with ownership interest between 20 per cent and 50 per cent.
4. SUBSIDIARIESin the DnB liv accounts, subsidiaries, joint ventures and associ-ated companies are recognised in accordance with the equity method. the accounting principles of subsidiaries are applied consistently with the principles under which the accounts of the separate insurance company are prepared. income from investments in subsidiaries in the company portfolio is included before taxes. transactions with consolidated accounts are done in accordance with customary business conditions and princi-ples, such that income, costs, losses and profits are distributed between the companies in the group in the most correct manner possible.
5. CONVERSION OF TRANSACTIONS IN FOREIGN CURRENCIESthe group’s presentation currency and functional currency is norwegian krone (nok).
income and expenses in foreign currencies are converted to norwegian kroner by using the exchange rate at the point in time of the transaction. the exception is for income and expenses associated with the company’s properties abroad, which are converted to norwegian kroner based upon the aver-age exchange rate for each quarter.
financial assets, investment properties and subordinated loans in foreign currencies are converted to norwegian kroner in accordance with the exchange rate as at the date of the balance
notes DnB livsforsikring annual report 2012 17
sheet. changes in valuations due to changes in exchange rates between the date of the transaction and the date of the balance sheet are recognised in the income statement.
hold-to-maturity bonds recognised on the balance sheet at amor-tised cost in local currency, is converted to norwegian kroner using the exchange rate on the date of the balance sheet.
6. ENTRY OF INCOME AND EXPENSESinsurance premiums and claims are recognised in the income statement in the amounts that were due during the year.
net premium income encompasses the premiums due during the year, transferred premium reserves and reinsurance premi-ums paid. earned premiums are accrued to the premium reserve.
Transfer of premium reserves from account transfers the transfer of insurance contracts is recognised when the insurance risk is transferred. transfer of risk as at 31 December is recognised in the following year. the amounts transferred include the contracts’ share of additional statutory reserves, the market value adjustment reserve and the profit for the year.
transfers of premium reserves are accounted for as premium income for received reserves, and for disbursed reserves as claims for own account. received additional statutory reserves are recognised under the item change in insurance reserves – statutory reserves.
Recognised changes in insurance obligations guaranteed returns provided to insurance customers who have products with guaranteed interest are included under the item recognised changes in insurance obligations – contractually established obligations. other returns for these customers are recognised under the item funds assigned insurance contracts – contractually established obligations.
changes in the market value adjustment reserve in the group portfolio are included under recognised changes in insurance obligations for contractually established obligations.
interest income is recognised using the effective interest method and dividends from investments are recognised at the time the dividend is approved at the general meeting.
7. FINANCIAL INSTRUMENTSrecognition and derecognition of financial assets and liabilities are recognised at the time DnB livsforsikring becomes a party to the instruments’ contractual obligations.
financial assets are derecognised when the risks and rewards of ownership of assets is transferred. financial liabilities are derecognised at the time when the rights to the contractual conditions are fulfilled, cancelled or expired.
Classification of financial instrumentswhen financial assets are initially recognised, they are classi-fied in one of the following categories according to the type of
instrument and the purpose of the investment:
▪ financial assets designated as at fair value with changes in value recognised in the income statement
▪ Derivatives carried at fair value with changes in value recognised in the income statement
▪ hold-to-maturity investments, carried at amortised cost ▪ other financial liabilites, carried at amortised cost
Value measurement of financial instrumentsDerivatives and other financial assets designated as at fair value through profit and loss are recognised at fair value excluding transaction costs. fair value will normally be the transaction price, unless another value can be justified based on observed market transactions. see the section below regarding the determination of fair value and subsequent valuation. hold-to-maturity investments and other financial liabilities carried at amortised cost are recorded at amortised cost and included at the transaction price with additions for direct transaction costs. see the section below regarding the determination of fair value and subsequent measurement of value.
Determination of fair valuefair value is the amount that an asset can be traded for, or a liability settled, in a transaction between independent parties. in the calculation, the presumption of continued operation is taken as fundamental, and reserves for credit risks in the instrument are included in the valuation.
Instruments traded in an active marketfor instruments traded in an active market, the quoted price from an exchange, broker or price setting agency is used. a market is considered active if it is possible to obtain externally observable prices, rates or volatilities and such prices represent actual and frequent market transactions.
the majority of the company’s financial derivatives such as forward exchange contract transactions, contracts that secure a future interest rate, interest rate options, foreign exchange options, interest rate swaps and interest rate futures, are traded in an active market. in addition, some portion of the investments in shares, commercial paper and bonds are traded in active markets. if no prices are quoted for the instrument, it is decom-posed and valued on the basis of quoted prices on the individual components.
Instruments not traded in an active marketfinancial instruments not traded in an active market are valued according to different valuation techniques and are divided into two categories:
notes DnB livsforsikring annual report 2012 18
valuation based on observable market data: ▪ recently observed transactions in the relevant instrument
between informed, willing and independent parties ▪ instruments traded in an active market which is substantially
similar to the instrument that is valued ▪ other valuation techniques where key parameters are based
on observable market data
valuation based on other factors than observable market data: ▪ estimated cash flows ▪ valuation of assets and liabilities in companies ▪ models where at least one parameter of central significance
to the valuation is not based on observable market data ▪ possible industry standards
when using valuation techniques, values are adjusted for credit and liquidity risk. valuations are based on pricing of risk for similar instruments.
Subsequent measurement at amortised costfinancial instruments not recorded at fair value are recorded at amortised cost.
amortised cost is determined as the present value of contractual cash flows within the expected life of the instrument discounted at the effective interest rate.
Impairment of financial assetson each balance sheet date, DnB liv evaluates whether there are objective indications that a financial asset or group of finan-cial assets has been subjected to a decline in value.
objective indications for declines in value includes significant financial problems among debtors, breaches of payment or other significant contractual violations, instances where it is deemed probable that a debtor will initiate debt settlement proceedings or other special circumstances that have occured. write-downs of other financial assets are recognised on the income statement where they belong according to their nature.
Presentation in the balance sheetBonds and other fixed-income securitiesthis category includes commercial paper and bonds that the company has classified as fair value with changes in valuation on the income statement on initial recognition.
Shares and other equity instrumentsthis category includes shares, shares of unit trusts and bond funds designated at fair value in the income statement.
Financial derivativesfinancial derivatives are presented as assets if the value is positive and as liabilities if there is a negative value. offsetting is undertaken if the company has an enforceable right to set off the amounts and intends to settle assets and liabilities on a net basis or to realize the assets and liabilities collectively.
Loans and receivablesthis category includes loans that the company has classified as fair value with changes in valuation on the income statement on initial recognition.
Investments held-to-maturitythis category includes financial assets with a fixed maturity, which the company has a positive intention of holding until maturity, and which when recognised initially are not identi-fied as fair value with changes in value realised on the income statement. parts of the bonds portfolio in the common portfolio are classified as held-to-maturity and valued at amortized cost using the effective interest method.
Other financial assetsother financial assets consist of cash and cash equivalents as well as settlement accounts, and valued at fair value.
Other financial obligations recognised are amortised costother financial obligations mainly consist of subordinate loan capital valued at amortised cost in the balance sheet.
subordinated loan capital in foreign currencies is converted to norwegian kroner according to the exchange rate on the date of the balance sheet. Both realised and unrealised currency gains/losses for subordinated loan capital are realised as financial income/costs. interest expenses for the subordinated loans are recognised as other costs in the non-technical accounts.
Assets in life insurance with investment choiceassets in life insurance with investment choice consist of shares, bonds, commercial paper and financial contracts, units of unit trusts, bond funds, combined share and bond funds and bank funds. the instruments are valued together at market value. unrealised profits/losses are realised on an on-going basis by the customers.
8. INVESTMENT PROPERTIESproperties that are owned in order to achieve returns in customer portfolios by earning rental income and obtaining valuation increases are classified as investment properties.
investment properties are valued at cost price at initial recogni-tion, including acquisition expenses. in the following periods, investment properties are recognised at fair value. annual depreciations are not carried out on investment properties. internal and external real estate expertise is used in the valua-tion of properties. a selection of external valuations is collected for comparison with internal valuations. sensitivity analyses are carried out on various estimates for parameter values that are included in a total valuation.
rental income and operating costs are presented as “net operat-ing income from property”. the year’s realised change in market value and realised profits and losses on sales of properties are recognised on the income statement, respectively, as “changes in value of investments” and “realised profits and losses on invest-ments”. changes in market value in consequence of changes in
notes DnB livsforsikring annual report 2012 19
exchange rates for properties located abroad are presented as “changes in value of investments”.
in the DnB liv’s separate accounts, proportionate shares of the profit from consolidated property companies are presented as “income from investments in subsidiaries, associated companies and joint ventures”. the equivalent applies for changes in market value recognised on the income statement and realised profits/losses from such investments. interest income associated with internal loans to property subsidiaries are presented as “interest income and dividends, etc. from financial assets”.
9. INTANGIBLE ASSETSIT systems and softwarepurchased software is recorded at cost, in addition to expenses incurred to make the software ready for use. Directly identifiable expenses for self-developed software controlled by DnB liv and where it is likely that economic benefits cover the development expenses at the balance sheet date, are recorded as intangible assets. this presumes that the systems are controlled by the company; the probable economic benefits exceed the develop-ment expenses.
Direct expenses include employees directly involved with the software development, material costs and a portion of directly attributable overhead expenses. expenses associated with maintenance of software and it systems are expensed on an on-going basis on the income statement.
it systems and software recorded in the balance sheet, are depreciated linearly over their expected useful life.
10. FIXED ASSETSfixed assets are measured at cost less accumulated deprecia-tion deducted based on their expected useful life. fixed assets for own use are classified as other assets in the balance sheet. subsequent costs are capitalized on the relevant assets when it is probable that future economic benefits are related to the cost allocated to the group and these can be measured reliably. repairs and maintenance are expensed in the annual accounts on an on-going basis.
the assets’ residual values and useful lives are reviewed annually and adjusted if necessary.
11. DEPRECIATION OF TANGIBLE AND INTANGIBLE ASSETSat each reporting date, it is considered whether there are indica-tions of a fall in asset value. if any such indication exists, the recoverable amount is calculated. the recoverable amount is the higher of fair value less expenses and value in use. the recorded value of the asset is written down immediately if the value on the balance sheet is higher than the estimated recoverable amount.
12. INSURANCE PRINCIPLES Classification of contractsifrs 4 concerns the accounting treatment of insurance contracts. ifrs 4 defines contracts where the insurance risk
comprises a significant part of the product’s total risk as being insurance contracts. products offered by DnB liv include group pension insurance, group association insurance, individual endowment insurance, individual annuity and pension insurance, products with an investment choice and group life insurance. the insurance reserves in the accounts are in accordance with norwegian legislation in the area, as well as with ifrs 4.
Technical insurance reservestechnical insurance reserves at DnB liv include the premium reserve, additional statutory reserves, market value adjustment reserve, the claims reserve, the risk equalisation fund and other technical reserves. in addition, the premium fund, deposit fund and the pensioners’ surplus fund are included in insurance provi-sions. except for the risk equalisation fund, which is classified as equity, all insurance reserves are classified as customer liabilities.
the premium reserve is a reserve to secure future insurance liabilities to policyholders and insured persons. the premium reserve represents the technical cash value, i.e. the net present value, of the company’s total insurance liabilities including costs, less the cash value of future agreed premiums.
additional statutory reserves are a conditional allocation to policyholders where changes during the year are recognised in the income statement. the insurance act gives provisions regarding the application and size of the additional reserves. the maximum additional allocations per contract cannot exceed 12 per cent of the premium reserve for the contract. actual allocations for the individual years are determined in connection with year-end adjustments. additional allocations can be used to cover interest deficit when the annual yield is lower than the guaranteed interest.
the value adjustment reserve corresponds to the total unreal-ised gains on current financial assets included in the common portfolio. if the portfolio of current financial assets shows a net unrealised loss, the value adjustment reserve is set to zero.
unrealised profits and losses associated with changes in exchange rates on derivatives used to hedge exchange rates for properties, loans and hold-to-maturity bonds in foreign curren-cies are not included in the market value adjustment reserve.
the claims reserve shall cover the company’s anticipated compensation payments for insurance claims that have not been settled or advanced against the company at the end of the accounting year. the claims reserve represents only the funds that would have been disbursed during the accounting year if the processing of the insurance claims had been completed. from 01 january 2011 the claims reserve also includes indirect claims handling costs. from 01 january 2012 incurred claims handling costs are included in the risk result.
the risk equalisation fund can be used to cover negative risk results and strengthen the premium reserve in the event of changes in demographic assumptions in the calculation base. each year, up to 50 per cent of the company’s total risk result can
notes DnB livsforsikring annual report 2012 20
be allocated to the risk equalisation fund. the annual allocation is reviewed in connection with year-end adjustments.
the premium fund contains premiums prepaid by policyholders within individual and group pension insurance. a share of annual profits is allocated to the pensioners’ surplus fund and used to strengthen the premium reserve for pensioners in connection with adjustments in pension payments.
Classification of insurance obligations – investment choice portfoliothe insurance reserves for coverage of obligations associated with the value of investment choice portfolios must at all times correspond to the value of the investment portfolio that is assigned to the contract. the allocated portion of a positive risk result is included.
supplemental reserves for investment choice portfolios are reserves for coverage of guaranteed returns for these contracts that have such. the reserves must correspond to the anticipated disbursements from the company to the customer when retire-ment age is reached.
Assessment of liabilities to policyholdersliabilities should be in reasonable proportion to the associated risk. this is ensured through continual follow-ups and monitoring of existing contracts. furthermore, all premium rates prepared by the company must be reported to the financial supervisory authority of norway, which has overall responsibilities for controlling that adequate premiums are applied. on-going evalu-ations are made of the computational basis that is used.
with respect to group pension insurance, the basis for comput-ing premium reserves was changed on 01 january 2008 to include new assumptions for life expectancy and marital status. there is a need for additional provisions for the premium reserve for increased life expectancy. a clarification is expected shortly from the financial supervisory authority of norway of the level of provision, length of the expansion plan and the size of the contribution of equity.
with respect to existing individual pension insurance contracts, the calculation base used is changed due to new assumptions regarding life expectancy. financing of the change follows a stepping up plan approved by the financial supervisory authority of norway, which started on 01 january 2009 and ends in 2013.
the basis for calculating disability risk is more recent, taking into account the increase in disability observed in society at large. the base rate is used to calculate the present value of future premiums, payments and insurance reserves. the maximum base rate at any point in time is stipulated by the financial supervisory authority of norway, based on the yield on long-term government bonds. from 01 january 2012, the maximum base rate will be 2.5 per cent for future rights earned.
Adequacy testthe group carries out, in accordance with ifrs 4, a quarterly adequacy test to assess whether its premium reserve levels are adequate to cover its liabilities to policyholders. the test is described in more detail in note 29, insurance risk.
13. INCOME TAXtaxes for the year consist of payable taxes and the change for the year in deferred taxes. Deferred taxes are computed in the basis of differences between reported tax-related and accounting-related results that will be settled in the future. the assessment is based upon the tax positions at the date of the balance sheet.
in accordance with ias 12, no deferred taxes are recognized on investment properties based on the expectation that the prop-erties will be recovered through the sale of properties.
in accordance with the annual accounts regulations for insur-ance companies, deferred taxes associated with insurance reserves that are classified as equity in accordance with ifrs are not capitalised.
temporary differences that increase and decrease taxes and that are expected to be reversed during the same period are offset and netted. net deferred tax benefits are recognised on the balance sheet to the degree that it is probable that there will be taxable income that the temporary difference can be utilised.
unrealised profits/losses on investments that are encompassed by the market value adjustment reserve (current financial assets) are assessed in relation to the exemption method. unrealised profits/losses in the exemption method are treated as a permanent difference. unrealised profits/losses associ-ated with investments in investment choice portfolios are in their entirety treated as a temporary difference corresponding to the treatment of temporary differences associated with the customer commitments for the same portfolio.
14. PENSIONSDefined benefit schemein a defined benefit scheme, the employer is committed to providing future specified pension benefits.
the basis for calculating pension expenses is a linear distribution of pension entitlements measured against estimated accumu-lated commitments at the time of retirement. expenses are calculated on the basis of pension entitlements earned during the year with the deduction of the return on funds assigned to pensions.
pension commitments which are administered through life insurance companies are matched against funds within the scheme. when total pension funds exceed estimated pension commitments on the balance sheet date, the net value is clas-sified as an asset in the balance sheet if it has been rendered probable that the overfunding can be utilised to cover future commitments. when pension commitments exceed pension
notes DnB livsforsikring annual report 2012 21
funds, the net commitments are classified under liabilities in the balance sheet. each scheme is considered separately.
pension commitments represent the present value of estimated future pension payments that in the accounts are classified as accumulated on the balance sheet date. the calculation of pension commitments is based on actuarial and economic assumptions about life expectancy, rise in salaries and early retirement. the discount rate used is determined by reference to interest on preferential bonds (omf) on the balance sheet date, plus an addition that takes into account the relevant duration of the pension liabilities.
Deviations in estimates are recorded in the income statement over the average remaining service period when the difference exceeds the highest of 10 per cent of pension funds and 10 per cent of pension commitments.
the financial effects of changes in pension schemes are recorded as income or charged to expense on the date of the change, unless the rights under the new pension scheme are conditional on the employee remaining in service for a specified period.
pension expenses are based on assumptions determined at the start of the period. pension expenses are classified as personnel expenses in the income statement. employer’s contributions are included in pension expenses and pension commitments.
the company’s pension schemes are administrated through its own company. no eliminations are made with respect to the company’s pension commitments and pension funds or for pension expenses and premium income in the income statement.
Defined contribution schemein a defined contribution scheme, DnB liv does not promise a future pension of a given size, but pays an annual contribution to the employees’ group pension savings. the future pension will depend on the size of the contribution and the annual return on the pension savings. DnB liv has no further obligation
associated with work provided or after the annual contribution is paid. there are no allocations for accrued pension liabilities in such schemes. Defined contribution schemes are expensed directly.
15. EQUITYproposed dividends are included as a part of the equity until approved by the annual general meeting.
Risk equalisation fundthe purpose of the risk equalisation fund is to absorb fluctua-tions in the risk result over time, by this result, within more precisely defined limits, being able to be balanced against the risk equalisation fund. the reserve is not deemed to be associ-ated with the insurance company’s insurance risk for existing or future customers and must be classified as accrued earnings in the company’s balance sheet.
Fund for unrealised profitsthe fund for unrealised profits corresponds to the sum of unreal-ised profits on financial assets that are included in the company portfolio and are a parallel to the market value adjustment reserve in the common portfolio.
16. CASH FLOW STATEMENTSthe cash flow statements show net cash flows grouped accord-ing to source and use. cash is defined as cash, deposits with central banks and deposits with credit institutions.
17. NEW RULES FOR INSURANCE COMPANIESon 30 july 2010, iasB issued the exposure draft to the new ifrs 4, insurance contracts, which represented the first comprehen-sive proposal from iasB for accounting treatment of insurance contracts. the implementation date for ifrs 4, insurance contracts, was originally set to 01 january 2013, but has been postponed indefinitely.
NoTe 2 – SIGNIfICANT ACCouNTING eSTImATeS AND DISCReTIoNARY ASSeSSmeNTS
when preparing the consolidated accounts, management makes estimates and discretionary assessments and prepares assump-tions that influence the effect of the accounting principles applied. in turn, this will affect the recorded values of assets and liabilities, income and expenses.
estimates and discretionary judgements are subject to continual evaluation and are based on historical experience and other factors, including expectations of future events that are believed to be probable on the balance sheet date.
IMPAIRMENT OF BONDS HELD-TO-MATURITYif objective indications of decrease of value can be identified, impairment of bonds is calculated as the difference between recorded value on the balance sheet and present value of estimated future cash flows discounted with the bond’s effective interest rate. objective evidence of impairment includes significant financial difficulties of the debtor, defaulted payments or other material breach of contract cases where it is considered probable that the debtor will enter into debt negotiation or other circum-stances that have occurred. assessment of the future cash flow is based on the situation existing on the date of the balance sheet.
notes DnB livsforsikring annual report 2012 22
VALUATION OF PROPERTIESthe property portfolio is recorded at fair value. the property portfolio in norway is valued using the company’s own model based on the net present value of anticipated cash flows. in addition, internal valuations are benchmarked against independ-ent external appraisals. central parameters in the valuation model have been harmonised with external market information during q4.
changes in assumptions regarding the required rate of return and future rental levels subsequent to the contract period could result in a significant change in the value of the property portfolio. market rent is assessed individually for each property based on broad access of information, including external market statistics, external analyses and market assessments, own market view and internal information and competence with regard to local market conditions and the technical state of the properties. see note 14 investment properties for assumptions used in calculating the fair value of the property portfolio.
INSURANCE RESERVESfor insurance reserves, the significant risks and uncertainties are related to events like deaths and disability, as well as the inter-est rate. increasing life expectancy assumptions affect future expected payments and reserves. changes in such assumptions will affect the size of the liability which again may affect the owner’s result. the estimated payments are discounted with the corresponding guaranteed interest. see note 29 insurance risk.
FAIR VALUE OF FINANCIAL DERIVATIVES AND OTHER FINANCIAL INSTRUMENTSthe fair value of financial instruments that are not traded in an active market is determined by using different valuation techniques. the company considers and chooses techniques and assumptions that as far as possible are based on market conditions on the balance sheet date. when valuing financial instruments for which observable market data are not available, the company will make assumptions regarding what it expects the market to use as a basis for valuing corresponding financial instruments. the valuations require extensive use of judgement when calculating liquidity risk, credit risk and volatility. changes in these factors could affect the established fair value of the company’s financial instruments. see also note 13 financial instruments at fair value.
Pension liabilitiesthe net present value of pension liabilities depends on the deter-mination of financial and actuarial assumptions. any change
in these assumptions will affect the recorded amount for the pension liabilities and the pension cost. the estimation of the discount rate is subject to uncertainty with regard to sufficient depth and quality of the market for corporate bonds. it is considered that the norwegian market for covered bonds (omf) meets the requirements for corporate bonds with a sufficiently deep market. the discount rate at the end of 2012 determined on the basis of the interest rate on covered bonds (omf), with an addition for the consideration of the relevant time period for the liabilities. expected return on pension funds is determined on the basis of how the pension funds are invested and on historical returns.
other basic assumptions for the pension liabilities are annual wage growth, annual pension adjustments and expected adjust-ment of the g (national insurance basic amount) and mortality statistics.
the assumptions follow the updated guidelines on pension assumptions from the norwegian accounting standards Board. sensitivity analysis is shown in note 10 pensions.
Income tax, including deferred tax assets and uncertain tax liabilitiesunresolved tax law issues require the use of discretionary judge-ment in order to determine income tax, including assessment of recognition of deferred tax assets and uncertain liabilities.
the company recognises deferred tax assets with the amount which it probably will be able to use against future taxable income. extensive assessments must be made in order to determine the amount which can be recognised, including the expected time of utilisation, the level of taxable profit as well as strategies for tax planning and the existence of temporary tax differences.
for many transactions and calculations, there will be uncer-tainty associated with the final tax liability. the company recognises tax liabilities associated with future decisions in tax and dispute cases based on estimated for additional income tax, if any. when assessing the recognition of uncertain tax liabilities, an assessment is made of whether the liability is probable. the liability is calculated based on best estimate. if the final outcome of the cases deviates from the originally allocated amount, the deviation will affect the recognised income tax in the period where the deviation is determined.
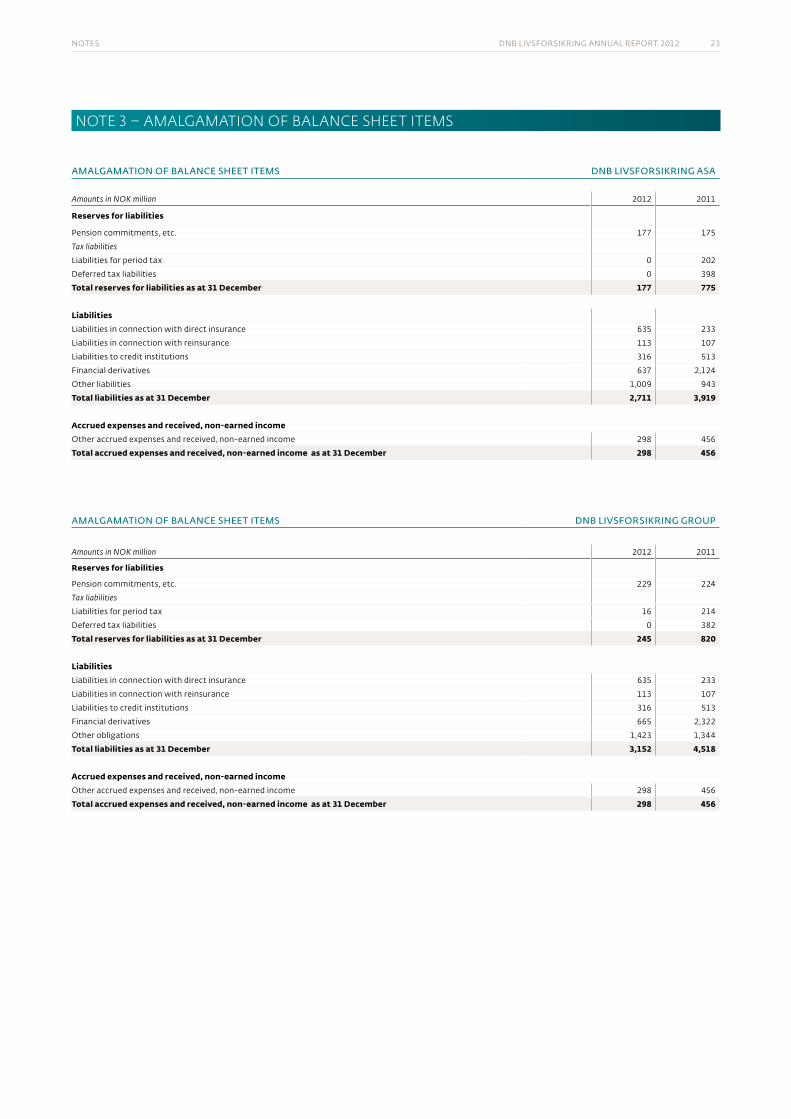
notes DnB livsforsikring annual report 2012 23
NoTe 3 – AmALGAmATIoN of BALANCe SHeeT ITemS
amalGamatiOn Of balance sheet items dnb livsfOrsikrinG asa
Amounts in NOK million 2012 2011
Reserves for liabilities
pension commitments, etc. 177 175
Tax liabilities
liabilities for period tax 0 202
Deferred tax liabilities 0 398
Total reserves for liabilities as at 31 December 177 775
Liabilitiesliabilities in connection with direct insurance 635 233
liabilities in connection with reinsurance 113 107
liabilities to credit institutions 316 513
financial derivatives 637 2,124
other liabilities 1,009 943
Total liabilities as at 31 December 2,711 3,919
Accrued expenses and received, non-earned incomeother accrued expenses and received, non-earned income 298 456
Total accrued expenses and received, non-earned income as at 31 December 298 456
amalGamatiOn Of balance sheet items dnb livsfOrsikrinG GrOup
Amounts in NOK million 2012 2011
Reserves for liabilities
pension commitments, etc. 229 224
Tax liabilities
liabilities for period tax 16 214
Deferred tax liabilities 0 382
Total reserves for liabilities as at 31 December 245 820
Liabilitiesliabilities in connection with direct insurance 635 233
liabilities in connection with reinsurance 113 107
liabilities to credit institutions 316 513
financial derivatives 665 2,322
other obligations 1,423 1,344
Total liabilities as at 31 December 3,152 4,518
Accrued expenses and received, non-earned incomeother accrued expenses and received, non-earned income 298 456
Total accrued expenses and received, non-earned income as at 31 December 298 456
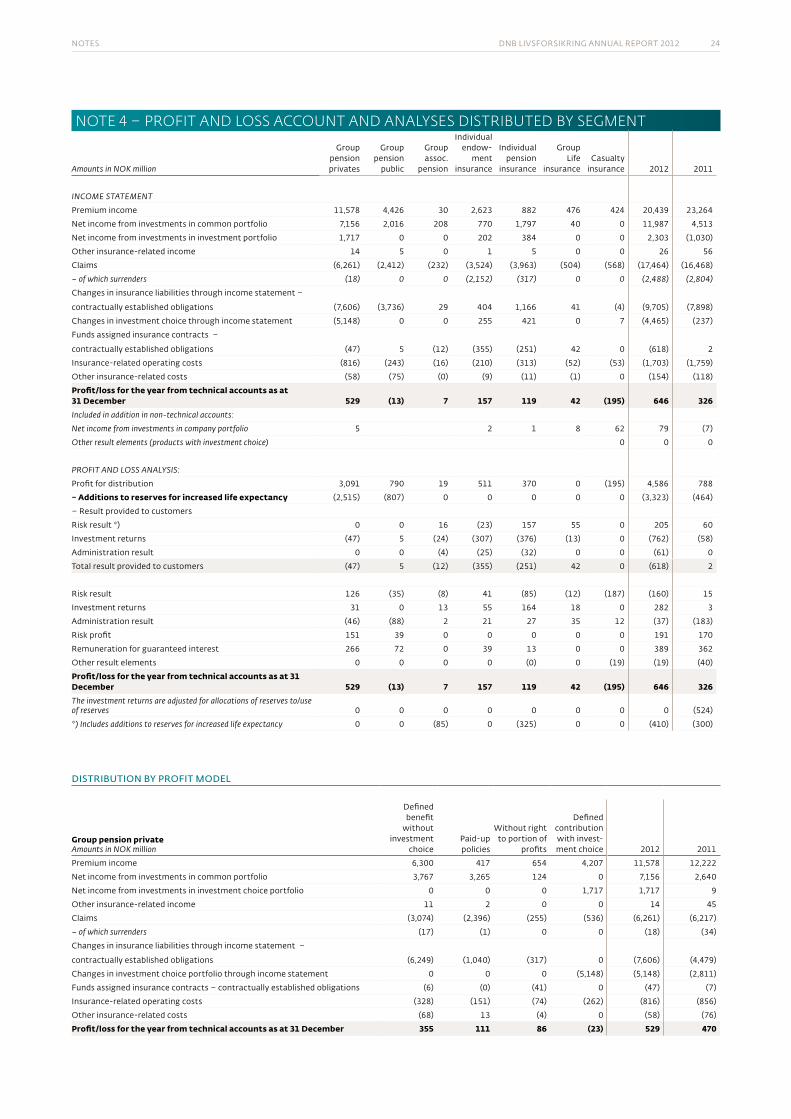
notes DnB livsforsikring annual report 2012 24
NoTe 4 – pRofIT AND LoSS ACCouNT AND ANALYSeS DISTRIBuTeD BY SeGmeNT
Amounts in NOK million
group pension privates
group pension
public
group assoc.
pension
individual endow-
ment insurance
individual pension
insurance
group life
insurancecasualty
insurance 2012 2011
INCOMe STATeMeNT
premium income 11,578 4,426 30 2,623 882 476 424 20,439 23,264
net income from investments in common portfolio 7,156 2,016 208 770 1,797 40 0 11,987 4,513
net income from investments in investment portfolio 1,717 0 0 202 384 0 0 2,303 (1,030)
other insurance-related income 14 5 0 1 5 0 0 26 56
claims (6,261) (2,412) (232) (3,524) (3,963) (504) (568) (17,464) (16,468)
– of which surrenders (18) 0 0 (2,152) (317) 0 0 (2,488) (2,804)
changes in insurance liabilities through income statement –
contractually established obligations (7,606) (3,736) 29 404 1,166 41 (4) (9,705) (7,898)
changes in investment choice through income statement (5,148) 0 0 255 421 0 7 (4,465) (237)
funds assigned insurance contracts –
contractually established obligations (47) 5 (12) (355) (251) 42 0 (618) 2
insurance-related operating costs (816) (243) (16) (210) (313) (52) (53) (1,703) (1,759)
other insurance-related costs (58) (75) (0) (9) (11) (1) 0 (154) (118)
Profit/loss for the year from technical accounts as at 31 December 529 (13) 7 157 119 42 (195) 646 326Included in addition in non-technical accounts:
Net income from investments in company portfolio 5 2 1 8 62 79 (7)
Other result elements (products with investment choice) 0 0 0
PROFIT AND LOSS ANALYSIS:
profit for distribution 3,091 790 19 511 370 0 (195) 4,586 788
– Additions to reserves for increased life expectancy (2,515) (807) 0 0 0 0 0 (3,323) (464)
– result provided to customers
risk result *) 0 0 16 (23) 157 55 0 205 60
investment returns (47) 5 (24) (307) (376) (13) 0 (762) (58)
administration result 0 0 (4) (25) (32) 0 0 (61) 0
total result provided to customers (47) 5 (12) (355) (251) 42 0 (618) 2
risk result 126 (35) (8) 41 (85) (12) (187) (160) 15
investment returns 31 0 13 55 164 18 0 282 3
administration result (46) (88) 2 21 27 35 12 (37) (183)
risk profit 151 39 0 0 0 0 0 191 170
remuneration for guaranteed interest 266 72 0 39 13 0 0 389 362
other result elements 0 0 0 0 (0) 0 (19) (19) (40)
Profit/loss for the year from technical accounts as at 31 December 529 (13) 7 157 119 42 (195) 646 326The investment returns are adjusted for allocations of reserves to/use of reserves 0 0 0 0 0 0 0 0 (524)
*) Includes additions to reserves for increased life expectancy 0 0 (85) 0 (325) 0 0 (410) (300)
distributiOn by prOfit mOdel
Group pension privateAmounts in NOK million
Defined benefit
without investment
choicepaid-up policies
without right to portion of
profits
Defined contribution with invest-ment choice 2012 2011
premium income 6,300 417 654 4,207 11,578 12,222
net income from investments in common portfolio 3,767 3,265 124 0 7,156 2,640
net income from investments in investment choice portfolio 0 0 0 1,717 1,717 9
other insurance-related income 11 2 0 0 14 45
claims (3,074) (2,396) (255) (536) (6,261) (6,217)
– of which surrenders (17) (1) 0 0 (18) (34)
changes in insurance liabilities through income statement –
contractually established obligations (6,249) (1,040) (317) 0 (7,606) (4,479)
changes in investment choice portfolio through income statement 0 0 0 (5,148) (5,148) (2,811)
funds assigned insurance contracts – contractually established obligations (6) (0) (41) 0 (47) (7)
insurance-related operating costs (328) (151) (74) (262) (816) (856)
other insurance-related costs (68) 13 (4) 0 (58) (76)
Profit/loss for the year from technical accounts as at 31 December 355 111 86 (23) 529 470
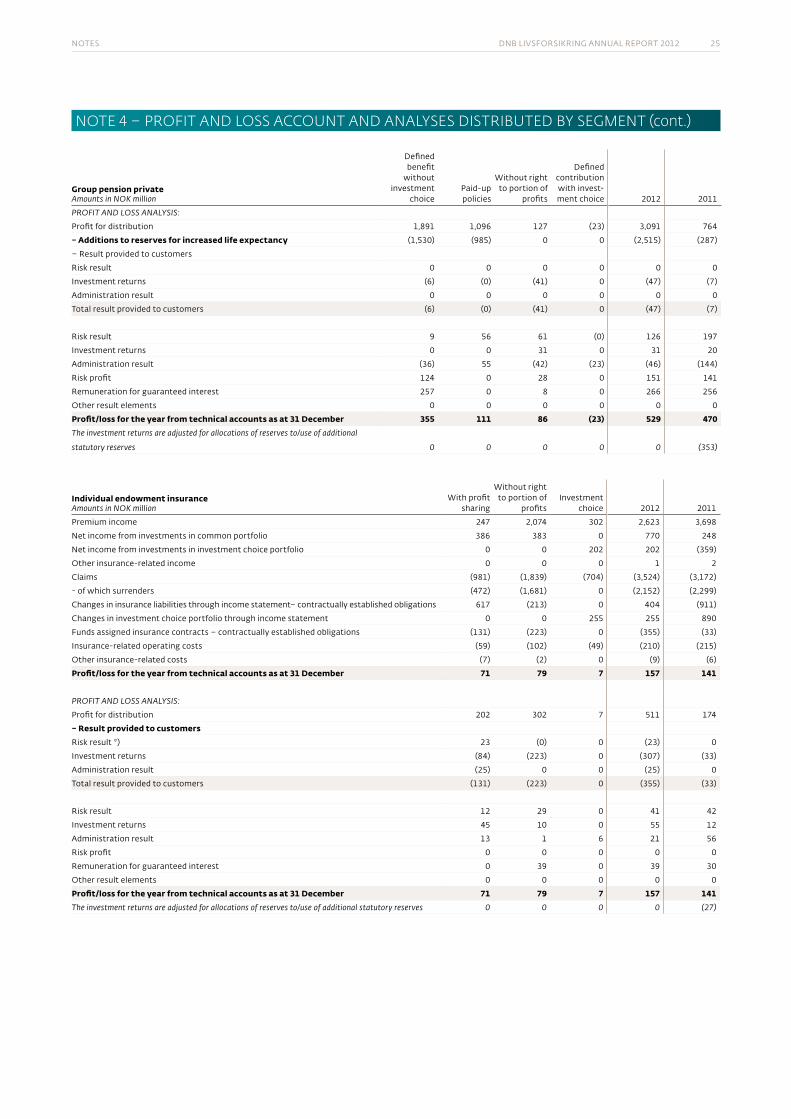
notes DnB livsforsikring annual report 2012 25
Group pension privateAmounts in NOK million
Defined benefit
without investment
choicepaid-up policies
without right to portion of
profits
Defined contribution with invest-ment choice 2012 2011
PROFIT AND LOSS ANALYSIS:
profit for distribution 1,891 1,096 127 (23) 3,091 764
– Additions to reserves for increased life expectancy (1,530) (985) 0 0 (2,515) (287)
– result provided to customers
risk result 0 0 0 0 0 0
investment returns (6) (0) (41) 0 (47) (7)
administration result 0 0 0 0 0 0
total result provided to customers (6) (0) (41) 0 (47) (7)
risk result 9 56 61 (0) 126 197
investment returns 0 0 31 0 31 20
administration result (36) 55 (42) (23) (46) (144)
risk profit 124 0 28 0 151 141
remuneration for guaranteed interest 257 0 8 0 266 256
other result elements 0 0 0 0 0 0
Profit/loss for the year from technical accounts as at 31 December 355 111 86 (23) 529 470The investment returns are adjusted for allocations of reserves to/use of additional
statutory reserves 0 0 0 0 0 (353)
Individual endowment insurance Amounts in NOK million
with profit sharing
without right to portion of
profitsinvestment
choice 2012 2011
premium income 247 2,074 302 2,623 3,698
net income from investments in common portfolio 386 383 0 770 248
net income from investments in investment choice portfolio 0 0 202 202 (359)
other insurance-related income 0 0 0 1 2
claims (981) (1,839) (704) (3,524) (3,172)
- of which surrenders (472) (1,681) 0 (2,152) (2,299)
changes in insurance liabilities through income statement– contractually established obligations 617 (213) 0 404 (911)
changes in investment choice portfolio through income statement 0 0 255 255 890
funds assigned insurance contracts – contractually established obligations (131) (223) 0 (355) (33)
insurance-related operating costs (59) (102) (49) (210) (215)
other insurance-related costs (7) (2) 0 (9) (6)
Profit/loss for the year from technical accounts as at 31 December 71 79 7 157 141
PROFIT AND LOSS ANALYSIS:
profit for distribution 202 302 7 511 174
– Result provided to customersrisk result *) 23 (0) 0 (23) 0
investment returns (84) (223) 0 (307) (33)
administration result (25) 0 0 (25) 0
total result provided to customers (131) (223) 0 (355) (33)
risk result 12 29 0 41 42
investment returns 45 10 0 55 12
administration result 13 1 6 21 56
risk profit 0 0 0 0 0
remuneration for guaranteed interest 0 39 0 39 30
other result elements 0 0 0 0 0
Profit/loss for the year from technical accounts as at 31 December 71 79 7 157 141The investment returns are adjusted for allocations of reserves to/use of additional statutory reserves 0 0 0 0 (27)
NoTe 4 – pRofIT AND LoSS ACCouNT AND ANALYSeS DISTRIBuTeD BY SeGmeNT (cont.)
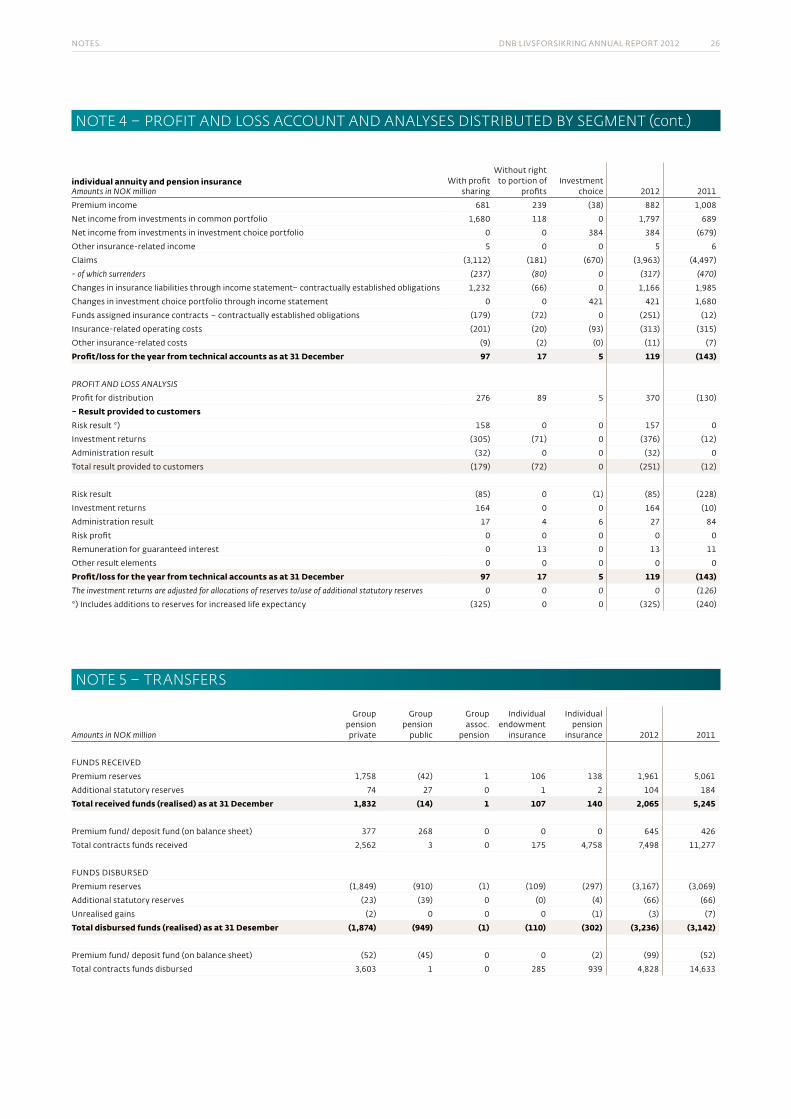
notes DnB livsforsikring annual report 2012 26
individual annuity and pension insurance Amounts in NOK million
with profit sharing
without right to portion of
profitsinvestment
choice 2012 2011
premium income 681 239 (38) 882 1,008
net income from investments in common portfolio 1,680 118 0 1,797 689
net income from investments in investment choice portfolio 0 0 384 384 (679)
other insurance-related income 5 0 0 5 6
claims (3,112) (181) (670) (3,963) (4,497)
- of which surrenders (237) (80) 0 (317) (470)
changes in insurance liabilities through income statement– contractually established obligations 1,232 (66) 0 1,166 1,985
changes in investment choice portfolio through income statement 0 0 421 421 1,680
funds assigned insurance contracts – contractually established obligations (179) (72) 0 (251) (12)
insurance-related operating costs (201) (20) (93) (313) (315)
other insurance-related costs (9) (2) (0) (11) (7)
Profit/loss for the year from technical accounts as at 31 December 97 17 5 119 (143)
PROFIT AND LOSS ANALYSIS
profit for distribution 276 89 5 370 (130)
– Result provided to customersrisk result *) 158 0 0 157 0
investment returns (305) (71) 0 (376) (12)
administration result (32) 0 0 (32) 0
total result provided to customers (179) (72) 0 (251) (12)
risk result (85) 0 (1) (85) (228)
investment returns 164 0 0 164 (10)
administration result 17 4 6 27 84
risk profit 0 0 0 0 0
remuneration for guaranteed interest 0 13 0 13 11
other result elements 0 0 0 0 0
Profit/loss for the year from technical accounts as at 31 December 97 17 5 119 (143)The investment returns are adjusted for allocations of reserves to/use of additional statutory reserves 0 0 0 0 (126)
*) includes additions to reserves for increased life expectancy (325) 0 0 (325) (240)
NoTe 5 – TRANSfeRS
Amounts in NOK million
group pension private
group pension
public
group assoc.
pension
individual endowment
insurance
individual pension
insurance 2012 2011
funDs receiveD
premium reserves 1,758 (42) 1 106 138 1,961 5,061
additional statutory reserves 74 27 0 1 2 104 184
Total received funds (realised) as at 31 December 1,832 (14) 1 107 140 2,065 5,245
premium fund/ deposit fund (on balance sheet) 377 268 0 0 0 645 426
total contracts funds received 2,562 3 0 175 4,758 7,498 11,277
funDs DisBurseD
premium reserves (1,849) (910) (1) (109) (297) (3,167) (3,069)
additional statutory reserves (23) (39) 0 (0) (4) (66) (66)
unrealised gains (2) 0 0 0 (1) (3) (7)
Total disbursed funds (realised) as at 31 Desember (1,874) (949) (1) (110) (302) (3,236) (3,142)
premium fund/ deposit fund (on balance sheet) (52) (45) 0 0 (2) (99) (52)
total contracts funds disbursed 3,603 1 0 285 939 4,828 14,633
NoTe 4 – pRofIT AND LoSS ACCouNT AND ANALYSeS DISTRIBuTeD BY SeGmeNT (cont.)
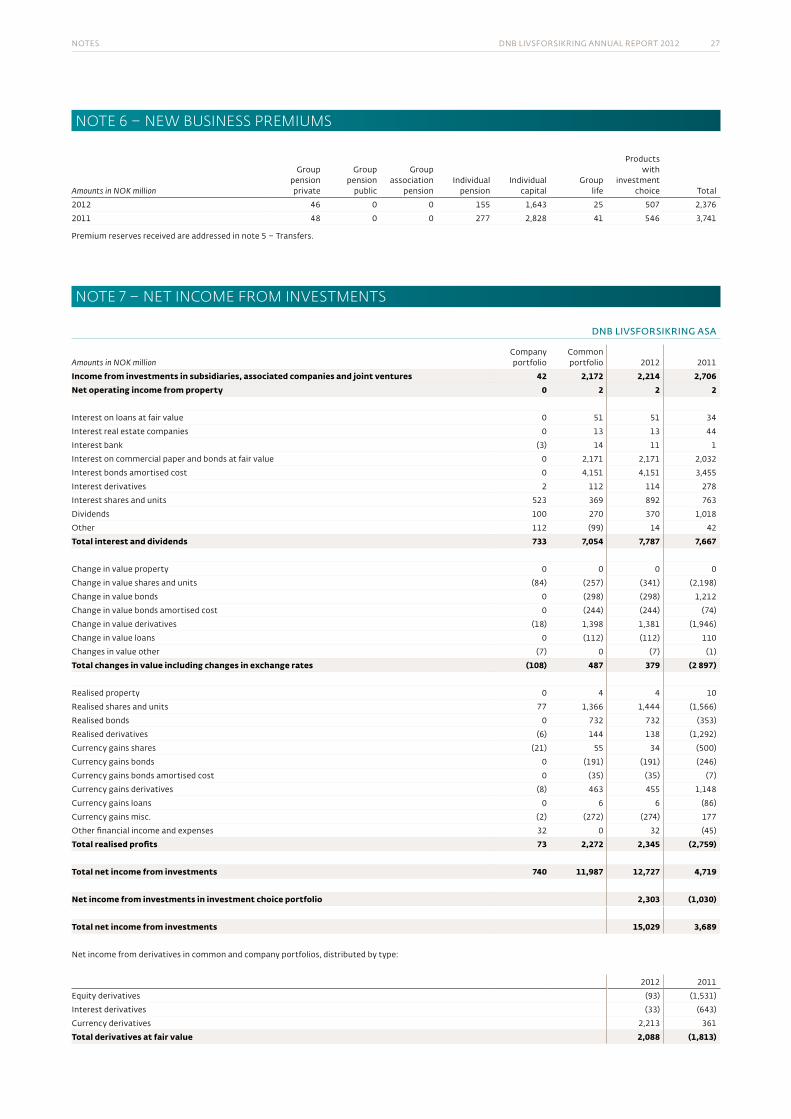
notes DnB livsforsikring annual report 2012 27
NoTe 6 – NeW BuSINeSS pRemIumS
Amounts in NOK million
group pension private
group pension
public
group association
pension individual
pension individual
capitalgroup
life
products with
investment choice total
2012 46 0 0 155 1,643 25 507 2,376
2011 48 0 0 277 2,828 41 546 3,741
premium reserves received are addressed in note 5 – transfers.
NoTe 7 – NeT INCome fRom INVeSTmeNTS
dnb livsfOrsikrinG asa
Amounts in NOK million company
portfolio common portfolio 2012 2011
Income from investments in subsidiaries, associated companies and joint ventures 42 2,172 2,214 2,706Net operating income from property 0 2 2 2
interest on loans at fair value 0 51 51 34
interest real estate companies 0 13 13 44
interest bank (3) 14 11 1
interest on commercial paper and bonds at fair value 0 2,171 2,171 2,032
interest bonds amortised cost 0 4,151 4,151 3,455
interest derivatives 2 112 114 278
interest shares and units 523 369 892 763
Dividends 100 270 370 1,018
other 112 (99) 14 42
Total interest and dividends 733 7,054 7,787 7,667
change in value property 0 0 0 0
change in value shares and units (84) (257) (341) (2,198)
change in value bonds 0 (298) (298) 1,212
change in value bonds amortised cost 0 (244) (244) (74)
change in value derivatives (18) 1,398 1,381 (1,946)
change in value loans 0 (112) (112) 110
changes in value other (7) 0 (7) (1)
Total changes in value including changes in exchange rates (108) 487 379 (2 897)
realised property 0 4 4 10
realised shares and units 77 1,366 1,444 (1,566)
realised bonds 0 732 732 (353)
realised derivatives (6) 144 138 (1,292)
currency gains shares (21) 55 34 (500)
currency gains bonds 0 (191) (191) (246)
currency gains bonds amortised cost 0 (35) (35) (7)
currency gains derivatives (8) 463 455 1,148
currency gains loans 0 6 6 (86)
currency gains misc. (2) (272) (274) 177
other financial income and expenses 32 0 32 (45)
Total realised profits 73 2,272 2,345 (2,759)
Total net income from investments 740 11,987 12,727 4,719
Net income from investments in investment choice portfolio 2,303 (1,030)
Total net income from investments 15,029 3,689
net income from derivatives in common and company portfolios, distributed by type:
2012 2011
equity derivatives (93) (1,531)
interest derivatives (33) (643)
currency derivatives 2,213 361
Total derivatives at fair value 2,088 (1,813)
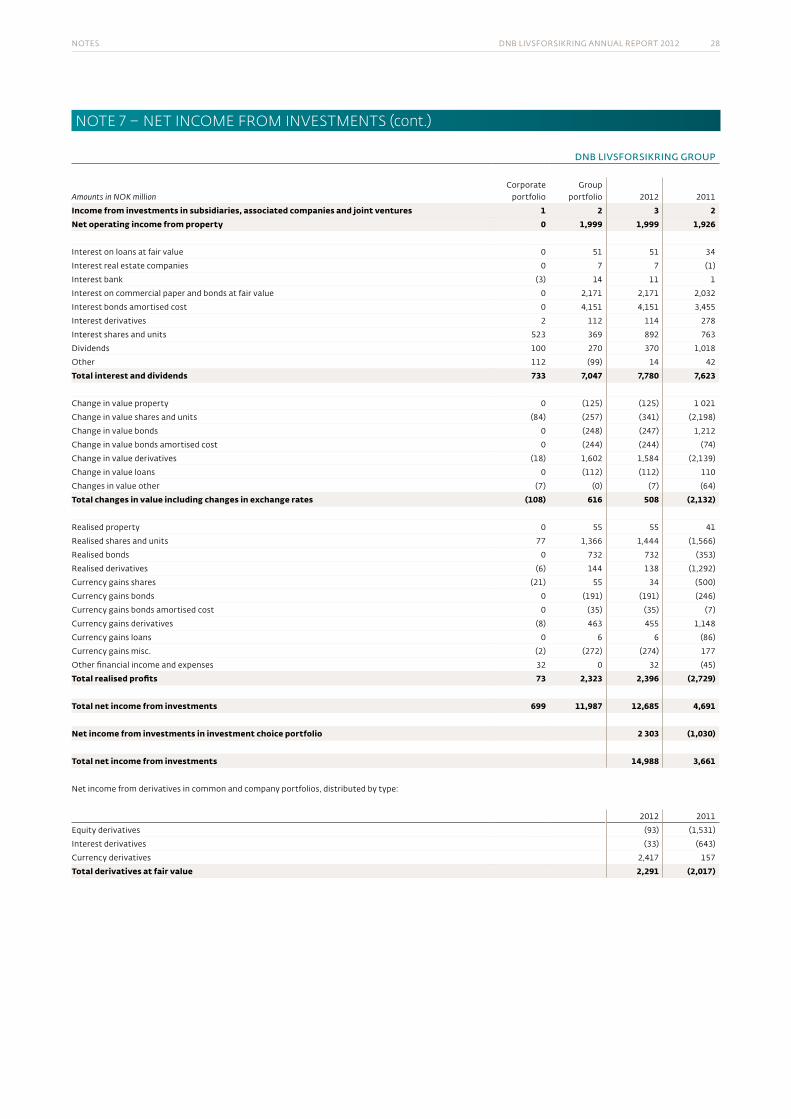
notes DnB livsforsikring annual report 2012 28
dnb livsfOrsikrinG GrOup
Amounts in NOK millioncorporate
portfolio group
portfolio 2012 2011
Income from investments in subsidiaries, associated companies and joint ventures 1 2 3 2 Net operating income from property 0 1,999 1,999 1,926
interest on loans at fair value 0 51 51 34
interest real estate companies 0 7 7 (1)
interest bank (3) 14 11 1
interest on commercial paper and bonds at fair value 0 2,171 2,171 2,032
interest bonds amortised cost 0 4,151 4,151 3,455
interest derivatives 2 112 114 278
interest shares and units 523 369 892 763
Dividends 100 270 370 1,018
other 112 (99) 14 42
Total interest and dividends 733 7,047 7,780 7,623
change in value property 0 (125) (125) 1 021
change in value shares and units (84) (257) (341) (2,198)
change in value bonds 0 (248) (247) 1,212
change in value bonds amortised cost 0 (244) (244) (74)
change in value derivatives (18) 1,602 1,584 (2,139)
change in value loans 0 (112) (112) 110
changes in value other (7) (0) (7) (64)
Total changes in value including changes in exchange rates (108) 616 508 (2,132)
realised property 0 55 55 41
realised shares and units 77 1,366 1,444 (1,566)
realised bonds 0 732 732 (353)
realised derivatives (6) 144 138 (1,292)
currency gains shares (21) 55 34 (500)
currency gains bonds 0 (191) (191) (246)
currency gains bonds amortised cost 0 (35) (35) (7)
currency gains derivatives (8) 463 455 1,148
currency gains loans 0 6 6 (86)
currency gains misc. (2) (272) (274) 177
other financial income and expenses 32 0 32 (45)
Total realised profits 73 2,323 2,396 (2,729)
Total net income from investments 699 11,987 12,685 4,691
Net income from investments in investment choice portfolio 2 303 (1,030)
Total net income from investments 14,988 3,661
net income from derivatives in common and company portfolios, distributed by type:
2012 2011
equity derivatives (93) (1,531)
interest derivatives (33) (643)
currency derivatives 2,417 157
Total derivatives at fair value 2,291 (2,017)
NoTe 7 – NeT INCome fRom INVeSTmeNTS (cont.)
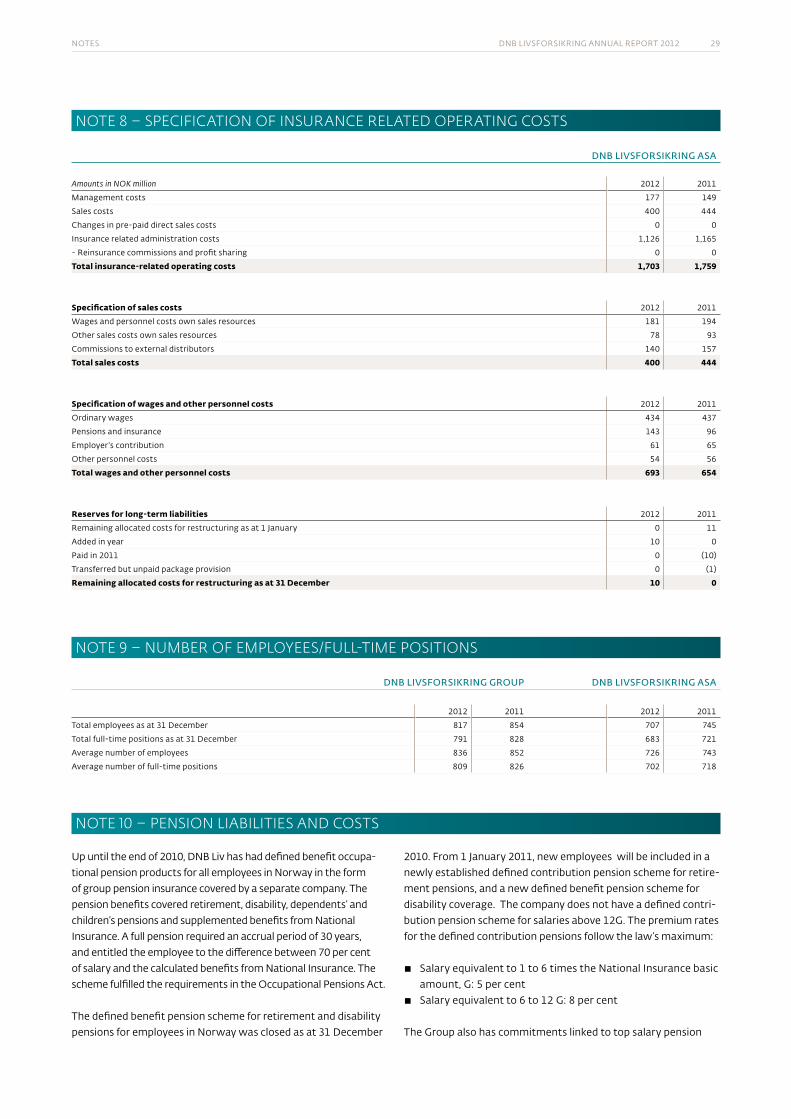
notes DnB livsforsikring annual report 2012 29
NoTe 8 – SpeCIfICATIoN of INSuRANCe ReLATeD opeRATING CoSTS
dnb livsfOrsikrinG asa
Amounts in NOK million 2012 2011
management costs 177 149
sales costs 400 444
changes in pre-paid direct sales costs 0 0
insurance related administration costs 1,126 1,165
- reinsurance commissions and profit sharing 0 0
Total insurance-related operating costs 1,703 1,759
Specification of sales costs 2012 2011
wages and personnel costs own sales resources 181 194
other sales costs own sales resources 78 93
commissions to external distributors 140 157
Total sales costs 400 444
Specification of wages and other personnel costs 2012 2011
ordinary wages 434 437
pensions and insurance 143 96
employer's contribution 61 65
other personnel costs 54 56
Total wages and other personnel costs 693 654
Reserves for long-term liabilities 2012 2011
remaining allocated costs for restructuring as at 1 january 0 11
added in year 10 0
paid in 2011 0 (10)
transferred but unpaid package provision 0 (1)
Remaining allocated costs for restructuring as at 31 December 10 0
NoTe 9 – NumBeR of empLoYeeS/fuLL-TIme poSITIoNS
dnb livsfOrsikrinG GrOup dnb livsfOrsikrinG asa
2012 2011 2012 2011
total employees as at 31 December 817 854 707 745
total full-time positions as at 31 December 791 828 683 721
average number of employees 836 852 726 743
average number of full-time positions 809 826 702 718
NoTe 10 – peNSIoN LIABILITIeS AND CoSTS
up until the end of 2010, DnB liv has had defined benefit occupa-tional pension products for all employees in norway in the form of group pension insurance covered by a separate company. the pension benefits covered retirement, disability, dependents’ and children’s pensions and supplemented benefits from national insurance. a full pension required an accrual period of 30 years, and entitled the employee to the difference between 70 per cent of salary and the calculated benefits from national insurance. the scheme fulfilled the requirements in the occupational pensions act.
the defined benefit pension scheme for retirement and disability pensions for employees in norway was closed as at 31 December
2010. from 1 january 2011, new employees will be included in a newly established defined contribution pension scheme for retire-ment pensions, and a new defined benefit pension scheme for disability coverage. the company does not have a defined contri-bution pension scheme for salaries above 12g. the premium rates for the defined contribution pensions follow the law’s maximum:
▪ salary equivalent to 1 to 6 times the national insurance basic amount, g: 5 per cent
▪ salary equivalent to 6 to 12 g: 8 per cent
the group also has commitments linked to top salary pension
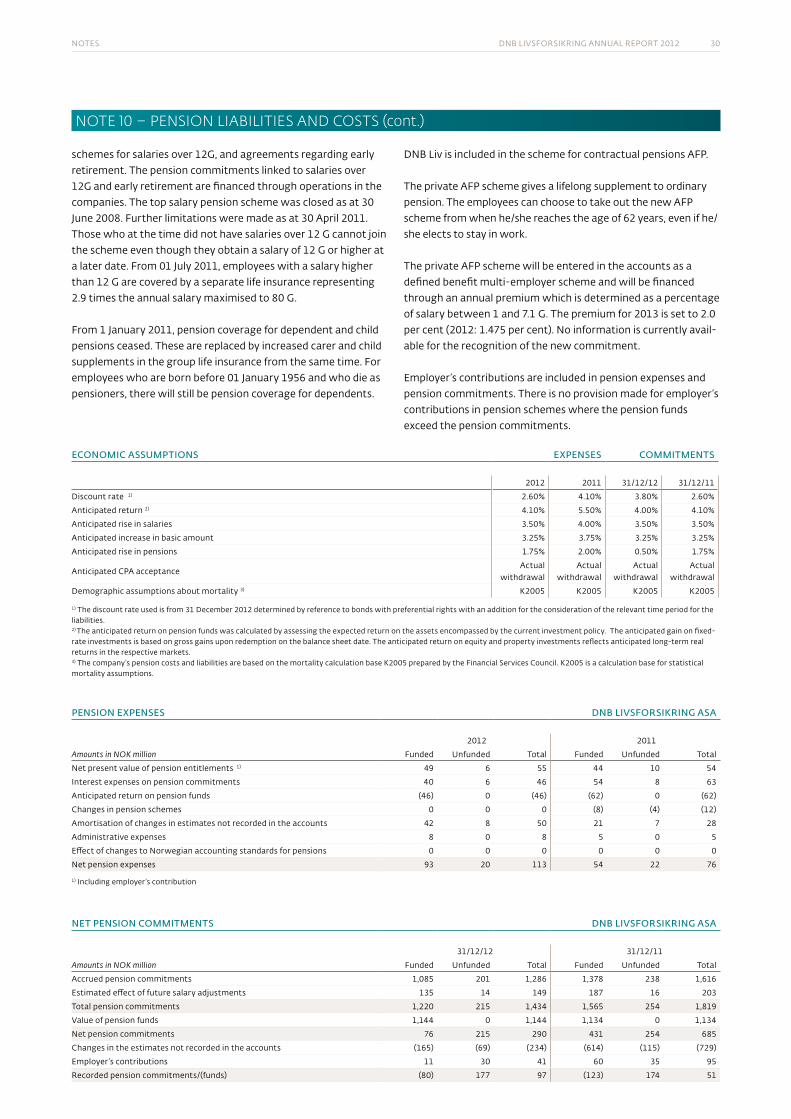
notes DnB livsforsikring annual report 2012 30
schemes for salaries over 12g, and agreements regarding early retirement. the pension commitments linked to salaries over 12g and early retirement are financed through operations in the companies. the top salary pension scheme was closed as at 30 june 2008. further limitations were made as at 30 april 2011. those who at the time did not have salaries over 12 g cannot join the scheme even though they obtain a salary of 12 g or higher at a later date. from 01 july 2011, employees with a salary higher than 12 g are covered by a separate life insurance representing 2.9 times the annual salary maximised to 80 g.
from 1 january 2011, pension coverage for dependent and child pensions ceased. these are replaced by increased carer and child supplements in the group life insurance from the same time. for employees who are born before 01 january 1956 and who die as pensioners, there will still be pension coverage for dependents.
DnB liv is included in the scheme for contractual pensions afp.
the private afp scheme gives a lifelong supplement to ordinary pension. the employees can choose to take out the new afp scheme from when he/she reaches the age of 62 years, even if he/she elects to stay in work.
the private afp scheme will be entered in the accounts as a defined benefit multi-employer scheme and will be financed through an annual premium which is determined as a percentage of salary between 1 and 7.1 g. the premium for 2013 is set to 2.0 per cent (2012: 1.475 per cent). no information is currently avail-able for the recognition of the new commitment.
employer’s contributions are included in pension expenses and pension commitments. there is no provision made for employer’s contributions in pension schemes where the pension funds exceed the pension commitments.
ecOnOmic assumptiOns expenses cOmmitments
2012 2011 31/12/12 31/12/11
Discount rate 1) 2.60% 4.10% 3.80% 2.60%
anticipated return 2) 4.10% 5.50% 4.00% 4.10%
anticipated rise in salaries 3.50% 4.00% 3.50% 3.50%
anticipated increase in basic amount 3.25% 3.75% 3.25% 3.25%
anticipated rise in pensions 1.75% 2.00% 0.50% 1.75%
anticipated cpa acceptanceactual
with drawal actual
with drawal actual
with drawal actual
with drawal
Demographic assumptions about mortality 3) k2005 k2005 k2005 k2005
1) the discount rate used is from 31 December 2012 determined by reference to bonds with preferential rights with an addition for the consideration of the relevant time period for the liabilities.2) the anticipated return on pension funds was calculated by assessing the expected return on the assets encompassed by the current investment policy. the anticipated gain on fixed-rate investments is based on gross gains upon redemption on the balance sheet date. the anticipated return on equity and property investments reflects anticipated long-term real returns in the respective markets.3) the company’s pension costs and liabilities are based on the mortality calculation base k2005 prepared by the financial services council. k2005 is a calculation base for statistical mortality assumptions.
pensiOn expenses dnb livsfOrsikrinG asa
2012 2011
Amounts in NOK million funded unfunded total funded unfunded total
net present value of pension entitlements 1) 49 6 55 44 10 54
interest expenses on pension commitments 40 6 46 54 8 63
anticipated return on pension funds (46) 0 (46) (62) 0 (62)
changes in pension schemes 0 0 0 (8) (4) (12)
amortisation of changes in estimates not recorded in the accounts 42 8 50 21 7 28
administrative expenses 8 0 8 5 0 5
effect of changes to norwegian accounting standards for pensions 0 0 0 0 0 0
net pension expenses 93 20 113 54 22 76
1) including employer’s contribution
net pensiOn cOmmitments dnb livsfOrsikrinG asa
31/12/12 31/12/11
Amounts in NOK million funded unfunded total funded unfunded total
accrued pension commitments 1,085 201 1,286 1,378 238 1,616
estimated effect of future salary adjustments 135 14 149 187 16 203
total pension commitments 1,220 215 1,434 1,565 254 1,819
value of pension funds 1,144 0 1,144 1,134 0 1,134
net pension commitments 76 215 290 431 254 685
changes in the estimates not recorded in the accounts (165) (69) (234) (614) (115) (729)
employer’s contributions 11 30 41 60 35 95
recorded pension commitments/(funds) (80) 177 97 (123) 174 51
NoTe 10 – peNSIoN LIABILITIeS AND CoSTS (cont.)
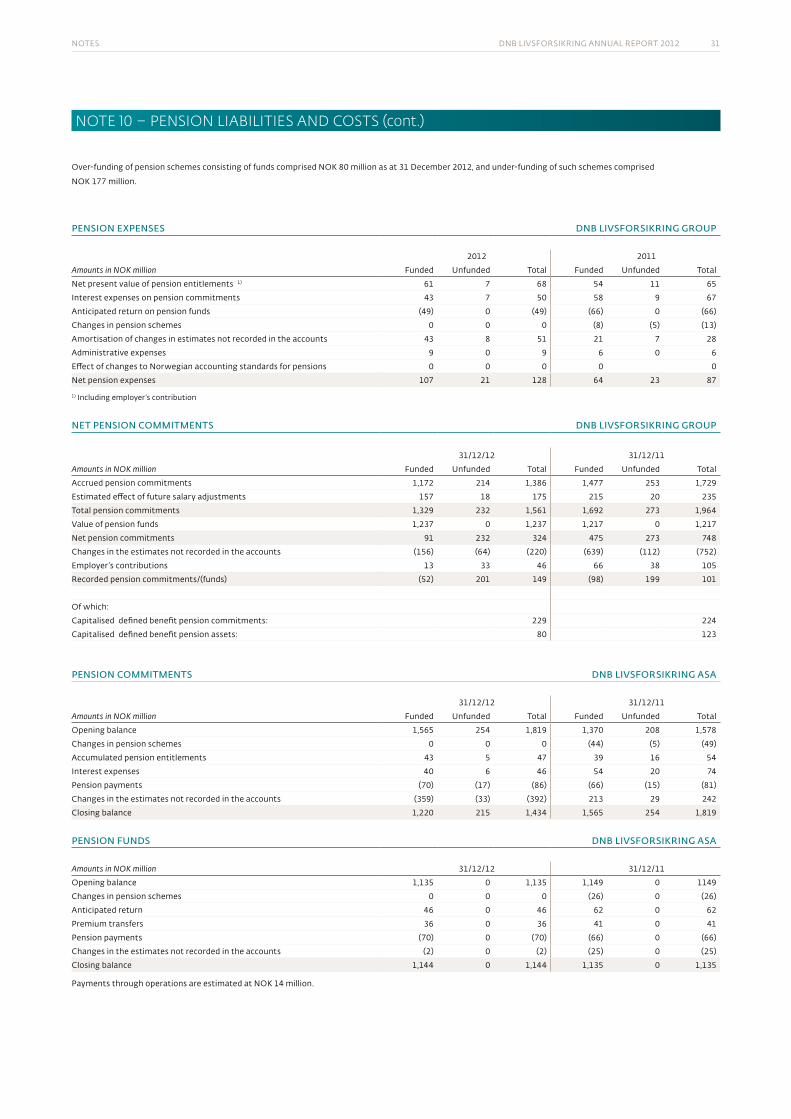
notes DnB livsforsikring annual report 2012 31
over-funding of pension schemes consisting of funds comprised nok 80 million as at 31 December 2012, and under-funding of such schemes comprised
nok 177 million.
pensiOn expenses dnb livsfOrsikrinG GrOup
2012 2011
Amounts in NOK million funded unfunded total funded unfunded total
net present value of pension entitlements 1) 61 7 68 54 11 65
interest expenses on pension commitments 43 7 50 58 9 67
anticipated return on pension funds (49) 0 (49) (66) 0 (66)
changes in pension schemes 0 0 0 (8) (5) (13)
amortisation of changes in estimates not recorded in the accounts 43 8 51 21 7 28
administrative expenses 9 0 9 6 0 6
effect of changes to norwegian accounting standards for pensions 0 0 0 0 0
net pension expenses 107 21 128 64 23 87
1) including employer’s contribution
net pensiOn cOmmitments dnb livsfOrsikrinG GrOup
31/12/12 31/12/11
Amounts in NOK million funded unfunded total funded unfunded total
accrued pension commitments 1,172 214 1,386 1,477 253 1,729
estimated effect of future salary adjustments 157 18 175 215 20 235
total pension commitments 1,329 232 1,561 1,692 273 1,964
value of pension funds 1,237 0 1,237 1,217 0 1,217
net pension commitments 91 232 324 475 273 748
changes in the estimates not recorded in the accounts (156) (64) (220) (639) (112) (752)
employer’s contributions 13 33 46 66 38 105
recorded pension commitments/(funds) (52) 201 149 (98) 199 101
of which:
capitalised defined benefit pension commitments: 229 224
capitalised defined benefit pension assets: 80 123
pensiOn cOmmitments dnb livsfOrsikrinG asa
31/12/12 31/12/11
Amounts in NOK million funded unfunded total funded unfunded total
opening balance 1,565 254 1,819 1,370 208 1,578
changes in pension schemes 0 0 0 (44) (5) (49)
accumulated pension entitlements 43 5 47 39 16 54
interest expenses 40 6 46 54 20 74
pension payments (70) (17) (86) (66) (15) (81)
changes in the estimates not recorded in the accounts (359) (33) (392) 213 29 242
closing balance 1,220 215 1,434 1,565 254 1,819
pensiOn funds dnb livsfOrsikrinG asa
Amounts in NOK million 31/12/12 31/12/11
opening balance 1,135 0 1,135 1,149 0 1149
changes in pension schemes 0 0 0 (26) 0 (26)
anticipated return 46 0 46 62 0 62
premium transfers 36 0 36 41 0 41
pension payments (70) 0 (70) (66) 0 (66)
changes in the estimates not recorded in the accounts (2) 0 (2) (25) 0 (25)
closing balance 1,144 0 1,144 1,135 0 1,135
payments through operations are estimated at nok 14 million.
NoTe 10 – peNSIoN LIABILITIeS AND CoSTS (cont.)
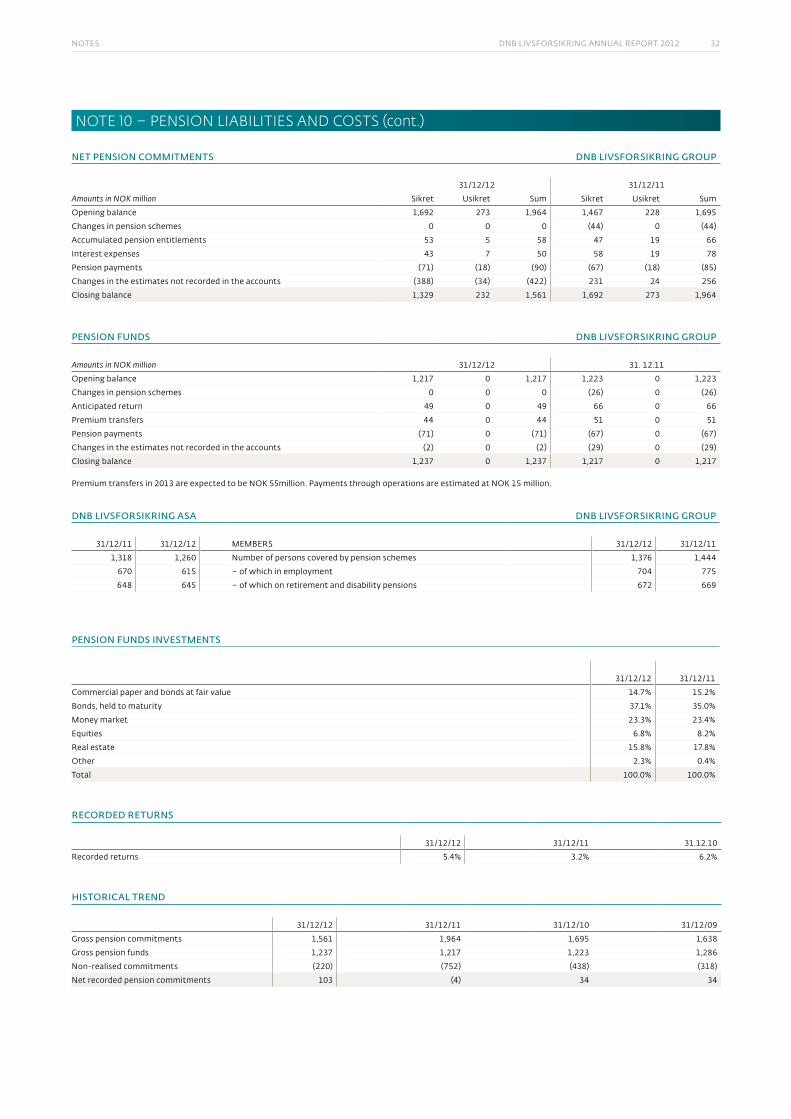
notes DnB livsforsikring annual report 2012 32
net pensiOn cOmmitments dnb livsfOrsikrinG GrOup
31/12/12 31/12/11
Amounts in NOK million sikret usikret sum sikret usikret sum
opening balance 1,692 273 1,964 1,467 228 1,695
changes in pension schemes 0 0 0 (44) 0 (44)
accumulated pension entitlements 53 5 58 47 19 66
interest expenses 43 7 50 58 19 78
pension payments (71) (18) (90) (67) (18) (85)
changes in the estimates not recorded in the accounts (388) (34) (422) 231 24 256
closing balance 1,329 232 1,561 1,692 273 1,964
pensiOn funds dnb livsfOrsikrinG GrOup
Amounts in NOK million 31/12/12 31. 12.11
opening balance 1,217 0 1,217 1,223 0 1,223
changes in pension schemes 0 0 0 (26) 0 (26)
anticipated return 49 0 49 66 0 66
premium transfers 44 0 44 51 0 51
pension payments (71) 0 (71) (67) 0 (67)
changes in the estimates not recorded in the accounts (2) 0 (2) (29) 0 (29)
closing balance 1,237 0 1,237 1,217 0 1,217
premium transfers in 2013 are expected to be nok 55million. payments through operations are estimated at nok 15 million.
dnb livsfOrsikrinG asa dnb livsfOrsikrinG GrOup
31/12/11 31/12/12 memBers 31/12/12 31/12/11
1,318 1,260 number of persons covered by pension schemes 1,376 1,444
670 615 – of which in employment 704 775
648 645 – of which on retirement and disability pensions 672 669
pensiOn funds investments
31/12/12 31/12/11
commercial paper and bonds at fair value 14.7% 15.2%
Bonds, held to maturity 37.1% 35.0%
money market 23.3% 23.4%
equities 6.8% 8.2%
real estate 15.8% 17.8%
other 2.3% 0.4%
total 100.0% 100.0%
recOrded returns
31/12/12 31/12/11 31.12.10
recorded returns 5.4% 3.2% 6.2%
histOrical trend
31/12/12 31/12/11 31/12/10 31/12/09
gross pension commitments 1,561 1,964 1,695 1,638
gross pension funds 1,237 1,217 1,223 1,286
non-realised commitments (220) (752) (438) (318)
net recorded pension commitments 103 (4) 34 34
NoTe 10 – peNSIoN LIABILITIeS AND CoSTS (cont.)
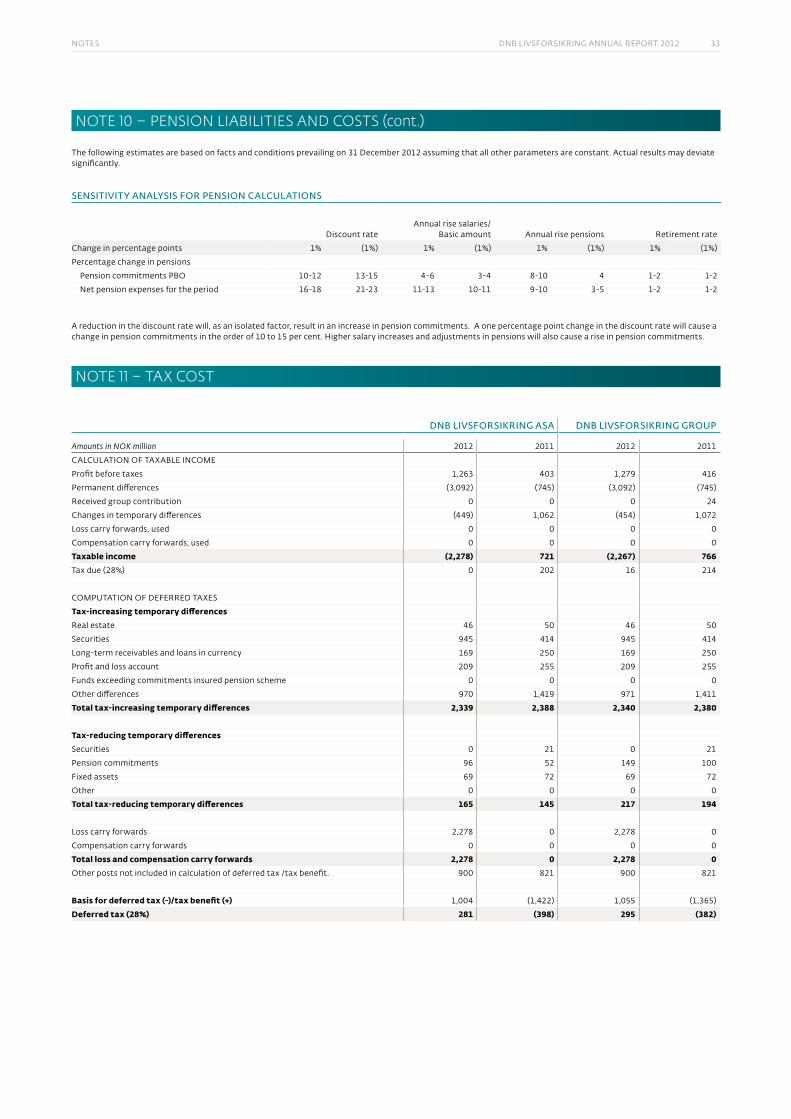
notes DnB livsforsikring annual report 2012 33
the following estimates are based on facts and conditions prevailing on 31 December 2012 assuming that all other parameters are constant. actual results may deviate significantly.
sensitivity analysis fOr pensiOn calculatiOns
Discount rateannual rise salaries/
Basic amount annual rise pensions retirement rate
change in percentage points 1% (1%) 1% (1%) 1% (1%) 1% (1%)
percentage change in pensions
pension commitments pBo 10-12 13-15 4-6 3-4 8-10 4 1-2 1-2
net pension expenses for the period 16-18 21-23 11-13 10-11 9-10 3-5 1-2 1-2
a reduction in the discount rate will, as an isolated factor, result in an increase in pension commitments. a one percentage point change in the discount rate will cause a change in pension commitments in the order of 10 to 15 per cent. higher salary increases and adjustments in pensions will also cause a rise in pension commitments.
NoTe 11 – TAX CoST
dnb livsfOrsikrinG asa dnb livsfOrsikrinG GrOup
Amounts in NOK million 2012 2011 2012 2011
calculation of taxaBle income
profit before taxes 1,263 403 1,279 416
permanent differences (3,092) (745) (3,092) (745)
received group contribution 0 0 0 24
changes in temporary differences (449) 1,062 (454) 1,072
loss carry forwards, used 0 0 0 0
compensation carry forwards, used 0 0 0 0
Taxable income (2,278) 721 (2,267) 766tax due (28%) 0 202 16 214
computation of DeferreD taxes
Tax-increasing temporary differencesreal estate 46 50 46 50
securities 945 414 945 414
long-term receivables and loans in currency 169 250 169 250
profit and loss account 209 255 209 255
funds exceeding commitments insured pension scheme 0 0 0 0
other differences 970 1,419 971 1,411
Total tax-increasing temporary differences 2,339 2,388 2,340 2,380
Tax-reducing temporary differencessecurities 0 21 0 21
pension commitments 96 52 149 100
fixed assets 69 72 69 72
other 0 0 0 0
Total tax-reducing temporary differences 165 145 217 194
loss carry forwards 2,278 0 2,278 0
compensation carry forwards 0 0 0 0
Total loss and compensation carry forwards 2,278 0 2,278 0other posts not included in calculation of deferred tax /tax benefit. 900 821 900 821
Basis for deferred tax (-)/tax benefit (+) 1,004 (1,422) 1,055 (1,365)
Deferred tax (28%) 281 (398) 295 (382)
NoTe 10 – peNSIoN LIABILITIeS AND CoSTS (cont.)
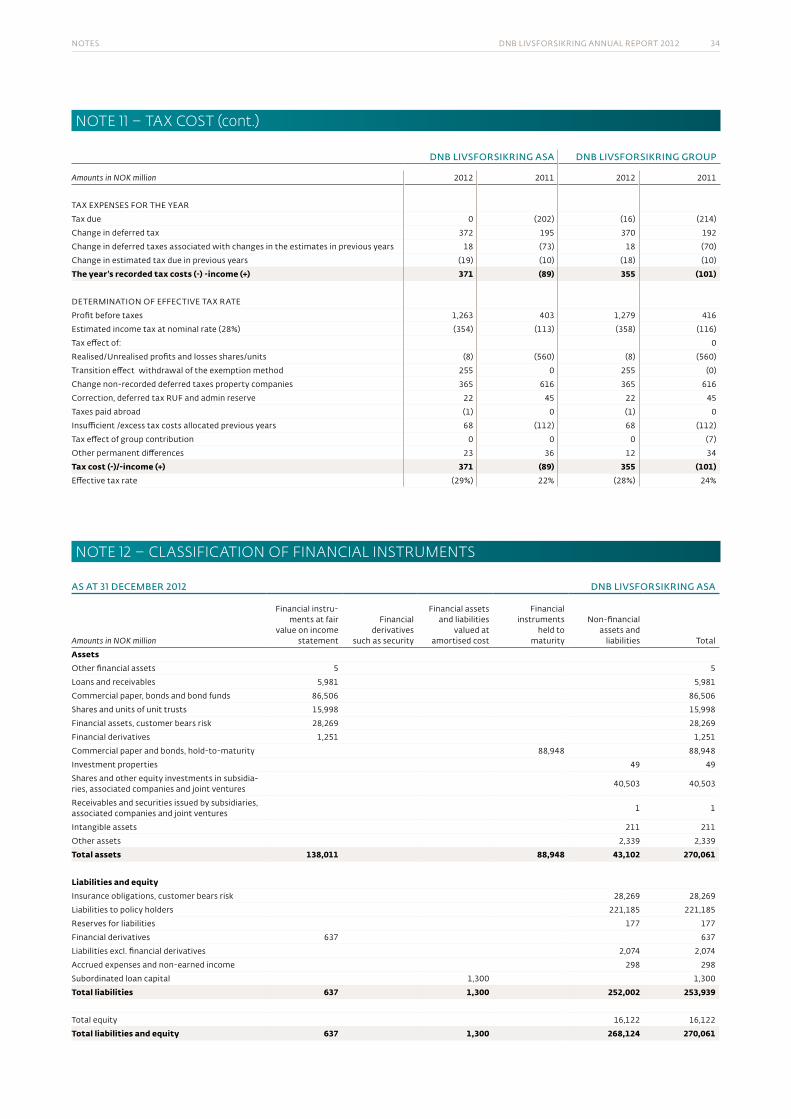
notes DnB livsforsikring annual report 2012 34
dnb livsfOrsikrinG asa dnb livsfOrsikrinG GrOup
Amounts in NOK million 2012 2011 2012 2011
tax expenses for the year
tax due 0 (202) (16) (214)
change in deferred tax 372 195 370 192
change in deferred taxes associated with changes in the estimates in previous years 18 (73) 18 (70)
change in estimated tax due in previous years (19) (10) (18) (10)
The year’s recorded tax costs (-) -income (+) 371 (89) 355 (101)
Determination of effective tax rate
profit before taxes 1,263 403 1,279 416
estimated income tax at nominal rate (28%) (354) (113) (358) (116)
tax effect of: 0
realised/unrealised profits and losses shares/units (8) (560) (8) (560)
transition effect withdrawal of the exemption method 255 0 255 (0)
change non-recorded deferred taxes property companies 365 616 365 616
correction, deferred tax ruf and admin reserve 22 45 22 45
taxes paid abroad (1) 0 (1) 0
insufficient /excess tax costs allocated previous years 68 (112) 68 (112)
tax effect of group contribution 0 0 0 (7)
other permanent differences 23 36 12 34
Tax cost (-)/-income (+) 371 (89) 355 (101)effective tax rate (29%) 22% (28%) 24%
NoTe 12 – CLASSIfICATIoN of fINANCIAL INSTRumeNTS
as at 31 december 2012 dnb livsfOrsikrinG asa
Amounts in NOK million
financial instru-ments at fair
value on income statement
financial derivatives
such as security
financial assets and liabilities
valued at amortised cost
financial instruments
held to maturity
non-financial assets and
liabilities total
Assetsother financial assets 5 5
loans and receivables 5,981 5,981
commercial paper, bonds and bond funds 86,506 86,506
shares and units of unit trusts 15,998 15,998
financial assets, customer bears risk 28,269 28,269
financial derivatives 1,251 1,251
commercial paper and bonds, hold-to-maturity 88,948 88,948
investment properties 49 49
shares and other equity investments in subsidia-ries, associated companies and joint ventures
40,503 40,503
receivables and securities issued by subsidiaries, associated companies and joint ventures
1 1
intangible assets 211 211
other assets 2,339 2,339
Total assets 138,011 88,948 43,102 270,061
Liabilities and equityinsurance obligations, customer bears risk 28,269 28,269
liabilities to policy holders 221,185 221,185
reserves for liabilities 177 177
financial derivatives 637 637
liabilities excl. financial derivatives 2,074 2,074
accrued expenses and non-earned income 298 298
subordinated loan capital 1,300 1,300
Total liabilities 637 1,300 252,002 253,939
total equity 16,122 16,122
Total liabilities and equity 637 1,300 268,124 270,061
NoTe 11 – TAX CoST (cont.)
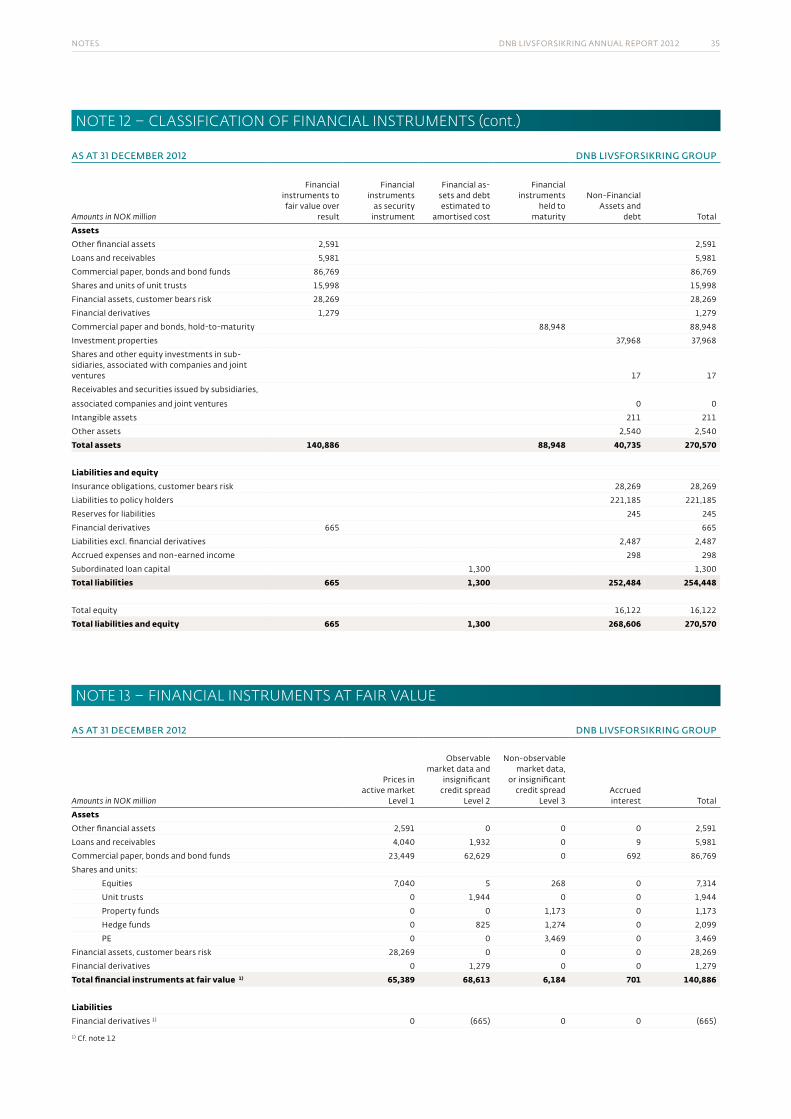
notes DnB livsforsikring annual report 2012 35
NoTe 12 – CLASSIfICATIoN of fINANCIAL INSTRumeNTS (cont.)
as at 31 december 2012 dnb livsfOrsikrinG GrOup
Amounts in NOK million
financial instruments to fair value over
result
financial instruments
as security instrument
financial as-sets and debt estimated to
amortised cost
financial instruments
held to maturity
non-financial assets and
debt total
Assetsother financial assets 2,591 2,591
loans and receivables 5,981 5,981
commercial paper, bonds and bond funds 86,769 86,769
shares and units of unit trusts 15,998 15,998
financial assets, customer bears risk 28,269 28,269
financial derivatives 1,279 1,279
commercial paper and bonds, hold-to-maturity 88,948 88,948
investment properties 37,968 37,968
shares and other equity investments in sub-sidiaries, associated with companies and joint ventures 17 17
receivables and securities issued by subsidiaries,
associated companies and joint ventures 0 0
intangible assets 211 211
other assets 2,540 2,540
Total assets 140,886 88,948 40,735 270,570
Liabilities and equityinsurance obligations, customer bears risk 28,269 28,269
liabilities to policy holders 221,185 221,185
reserves for liabilities 245 245
financial derivatives 665 665
liabilities excl. financial derivatives 2,487 2,487
accrued expenses and non-earned income 298 298
subordinated loan capital 1,300 1,300
Total liabilities 665 1,300 252,484 254,448
total equity 16,122 16,122
Total liabilities and equity 665 1,300 268,606 270,570
NoTe 13 – fINANCIAL INSTRumeNTS AT fAIR VALue
as at 31 december 2012 dnb livsfOrsikrinG GrOup
Amounts in NOK million
prices in active market
level 1
observable market data and
insignificant credit spread
level 2
non-observable market data,
or insignificant credit spread
level 3 accrued interest total
Assetsother financial assets 2,591 0 0 0 2,591
loans and receivables 4,040 1,932 0 9 5,981
commercial paper, bonds and bond funds 23,449 62,629 0 692 86,769
shares and units:
equities 7,040 5 268 0 7,314
unit trusts 0 1,944 0 0 1,944
property funds 0 0 1,173 0 1,173
hedge funds 0 825 1,274 0 2,099
pe 0 0 3,469 0 3,469
financial assets, customer bears risk 28,269 0 0 0 28,269
financial derivatives 0 1,279 0 0 1,279
Total financial instruments at fair value 1) 65,389 68,613 6,184 701 140,886
Liabilitiesfinancial derivatives 1) 0 (665) 0 0 (665)
1) cf. note 12
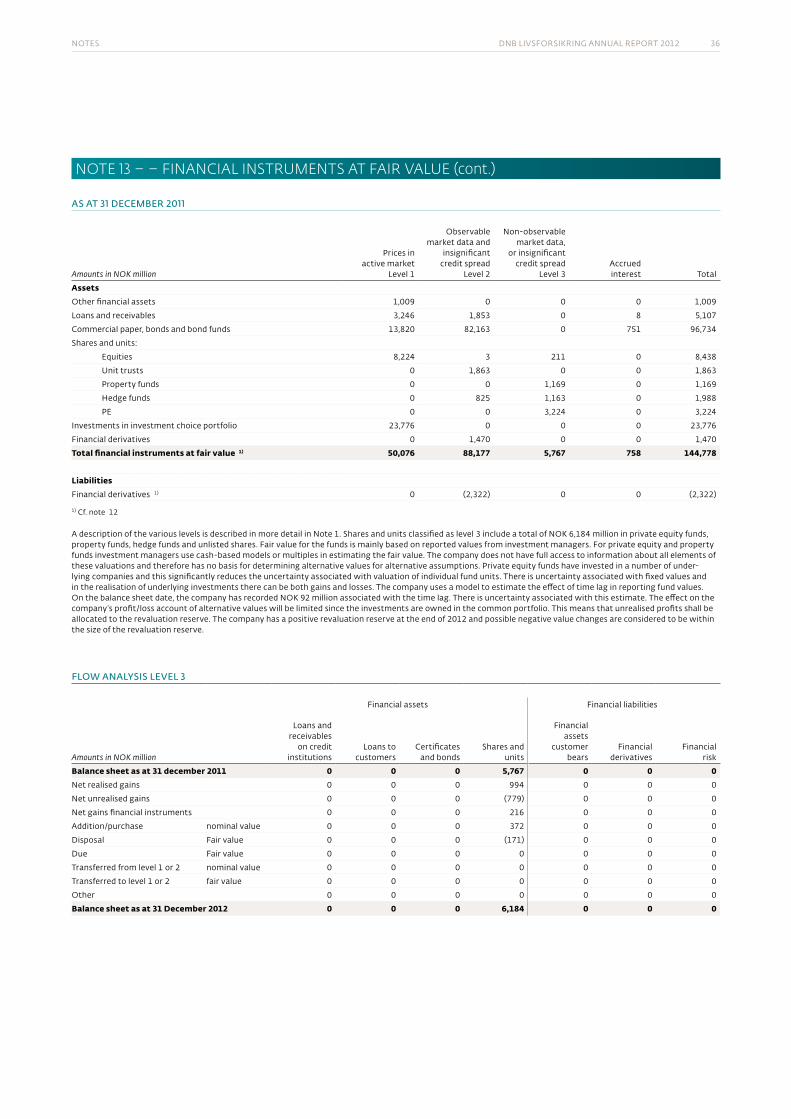
notes DnB livsforsikring annual report 2012 36
NoTe 13 – – fINANCIAL INSTRumeNTS AT fAIR VALue (cont.)
as at 31 december 2011
Amounts in NOK million
prices in active market
level 1
observable market data and
insignificant credit spread
level 2
non-observable market data,
or insignificant credit spread
level 3 accrued interest total
Assetsother financial assets 1,009 0 0 0 1,009
loans and receivables 3,246 1,853 0 8 5,107
commercial paper, bonds and bond funds 13,820 82,163 0 751 96,734
shares and units:
equities 8,224 3 211 0 8,438
unit trusts 0 1,863 0 0 1,863
property funds 0 0 1,169 0 1,169
hedge funds 0 825 1,163 0 1,988
pe 0 0 3,224 0 3,224
investments in investment choice portfolio 23,776 0 0 0 23,776
financial derivatives 0 1,470 0 0 1,470
Total financial instruments at fair value 1) 50,076 88,177 5,767 758 144,778
Liabilitiesfinancial derivatives 1) 0 (2,322) 0 0 (2,322)
1) cf. note 12
a description of the various levels is described in more detail in note 1. shares and units classified as level 3 include a total of nok 6,184 million in private equity funds, property funds, hedge funds and unlisted shares. fair value for the funds is mainly based on reported values from investment managers. for private equity and property funds investment managers use cash-based models or multiples in estimating the fair value. the company does not have full access to information about all elements of these valuations and therefore has no basis for determining alternative values for alternative assumptions. private equity funds have invested in a number of under-lying companies and this significantly reduces the uncertainty associated with valuation of individual fund units. there is uncertainty associated with fixed values and in the realisation of underlying investments there can be both gains and losses. the company uses a model to estimate the effect of time lag in reporting fund values. on the balance sheet date, the company has recorded nok 92 million associated with the time lag. there is uncertainty associated with this estimate. the effect on the company’s profit/loss account of alternative values will be limited since the investments are owned in the common portfolio. this means that unrealised profits shall be allocated to the revaluation reserve. the company has a positive revaluation reserve at the end of 2012 and possible negative value changes are considered to be within the size of the revaluation reserve.
flOW analysis level 3
financial assets financial liabilities
Amounts in NOK million
loans and receivables
on credit institutions
loans to customers
certificates and bonds
shares and units
financial assets
customer bears
financial derivatives
financial risk
Balance sheet as at 31 december 2011 0 0 0 5,767 0 0 0net realised gains 0 0 0 994 0 0 0
net unrealised gains 0 0 0 (779) 0 0 0
net gains financial instruments 0 0 0 216 0 0 0
addition/purchase nominal value 0 0 0 372 0 0 0
Disposal fair value 0 0 0 (171) 0 0 0
Due fair value 0 0 0 0 0 0 0
transferred from level 1 or 2 nominal value 0 0 0 0 0 0 0
transferred to level 1 or 2 fair value 0 0 0 0 0 0 0
other 0 0 0 0 0 0 0
Balance sheet as at 31 December 2012 0 0 0 6,184 0 0 0
notes DnB livsforsikring annual report 2012 37
NoTe 14 – INVeSTmeNT pRopeRTIeS
Fair valuethe properties of DnB liv are a part of the funds in the common portfolio and are owned with the intention to achieve long-term returns for policyholders. the property portfolio is recorded at fair value on the balance sheet date. fair value is the amount at which each property can be exchanged in a transaction at arm’s length between well informed, willing parties. the norwegian part of the portfolio is valued using an internal valuation model. as a supplement, external appraisals are obtained throughout the year for a representative selection of the portfolio on a roll-ing basis. the selection comprises nearly 90 per cent of the port-folio value. in q4 of 2012, a total of 17 properties representing 50 per cent of the portfolio value, are valuated externally. the purpose of the external appraisals is to benchmark the internal valuations against independent references. internal calculations and recorded values are within the acceptable reliability interval of +/- 5 per cent compared to the average of external apprais-als. the swedish part of the portfolio, as well as partially owned properties, is valuated based on external valuations.
Internal valuation modelthe internal model calculates fair value as present value of future cash flows in and after the contract period. the required rates of return in the model reflect the market risk. for the office and shopping centre portfolios there is a required rate of return of 8.5 per cent, while the required rate of return for the hotel portfolio is 8.75 per cent. after an individual evaluation, the required rate of return for some shopping centres has been adjusted in the interval – 0.3 to + 0.5 percentage points.
specific property risk is taken into account in the cash flow, including
▪ contractual rent and future market rent ▪ operating costs, required investments and tenant adjust-
ments at contract expiry ▪ likelihood of vacancies and adjustment of the growth factor
(cpi)
from 2011, the model uses a common required rate of return for cash flows both in and outside the contract period.
Development in market and contractual rentthe total contractual rent for the 100 per cent owned portfolio in norway increased by nok 3 million through 2012 to nok 1,564 million. in the same period, estimated market rent for the same portfolio dropped by nok 17 million to nok 1,621 million. adjusted for changes in the portfolio, contractual rent has increased by nok 47 million, while market rent has increased by nok 29.5 million.
Value development and sensitivitythe valuations resulted in total write-ups of nok 173 million in 2012. of this, write-ups on on-going projects represented nok 0 million. projects in DnB liv’s portfolio will normally be guaranteed through turnkey contracts, while income will gener-ally be ensured through contracts concluded before the projects are started.
valuations are particularly sensitive to changes in required rates of return and assumptions regarding future income flows. other things equal, a 0.25 percentage point drop in the required rate of return will change the value of the property portfolio by approx. 4.2 per cent (nok 1,026 million). other things equal, a 5 per cent change in future market rents will change the value of the property portfolio by 4.1 per cent (nok 1,007 million).
Vacancies and credit ratingthe economic vacancy rate in the portfolio was 2.8 per cent at the end of 2012 compared to 2.9 per cent at the end of 2011.
tenants in DnB liv’s properties are subject to a semi-annual credit evaluation. in q4 of 2012, the share of safe payers was 88.6 per cent compared to 89.9 per cent in 2011.
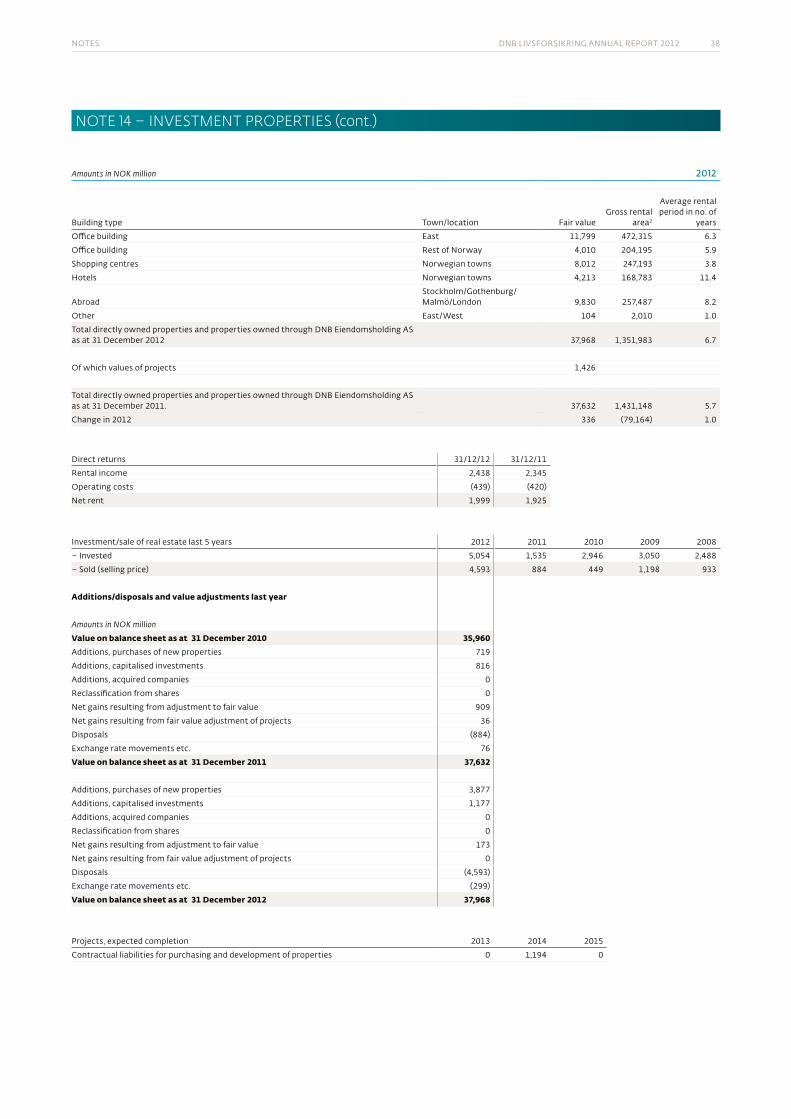
notes DnB livsforsikring annual report 2012 38
NoTe 14 – INVeSTmeNT pRopeRTIeS (cont.)
Amounts in NOK million 2012
Building type town/location fair value gross rental
area2
average rental period in no. of
years
office building east 11,799 472,315 6.3
office building rest of norway 4,010 204,195 5.9
shopping centres norwegian towns 8,012 247,193 3.8
hotels norwegian towns 4,213 168,783 11.4
abroadstockholm/gothenburg/malmö/london 9,830 257,487 8.2
other east/west 104 2,010 1.0
total directly owned properties and properties owned through DnB eiendomsholding as as at 31 December 2012 37,968 1,351,983 6.7
of which values of projects 1,426
total directly owned properties and properties owned through DnB eiendomsholding as as at 31 December 2011. 37,632 1,431,148 5.7
change in 2012 336 (79,164) 1.0
Direct returns 31/12/12 31/12/11
rental income 2,438 2,345
operating costs (439) (420)
net rent 1,999 1,925
investment/sale of real estate last 5 years 2012 2011 2010 2009 2008
– invested 5,054 1,535 2,946 3,050 2,488
– sold (selling price) 4,593 884 449 1,198 933
Additions/disposals and value adjustments last year
Amounts in NOK million
Value on balance sheet as at 31 December 2010 35,960additions, purchases of new properties 719
additions, capitalised investments 816
additions, acquired companies 0
reclassification from shares 0
net gains resulting from adjustment to fair value 909
net gains resulting from fair value adjustment of projects 36
Disposals (884)
exchange rate movements etc. 76
Value on balance sheet as at 31 December 2011 37,632
additions, purchases of new properties 3,877
additions, capitalised investments 1,177
additions, acquired companies 0
reclassification from shares 0
net gains resulting from adjustment to fair value 173
net gains resulting from fair value adjustment of projects 0
Disposals (4,593)
exchange rate movements etc. (299)
Value on balance sheet as at 31 December 2012 37,968
projects, expected completion 2013 2014 2015
contractual liabilities for purchasing and development of properties 0 1,194 0
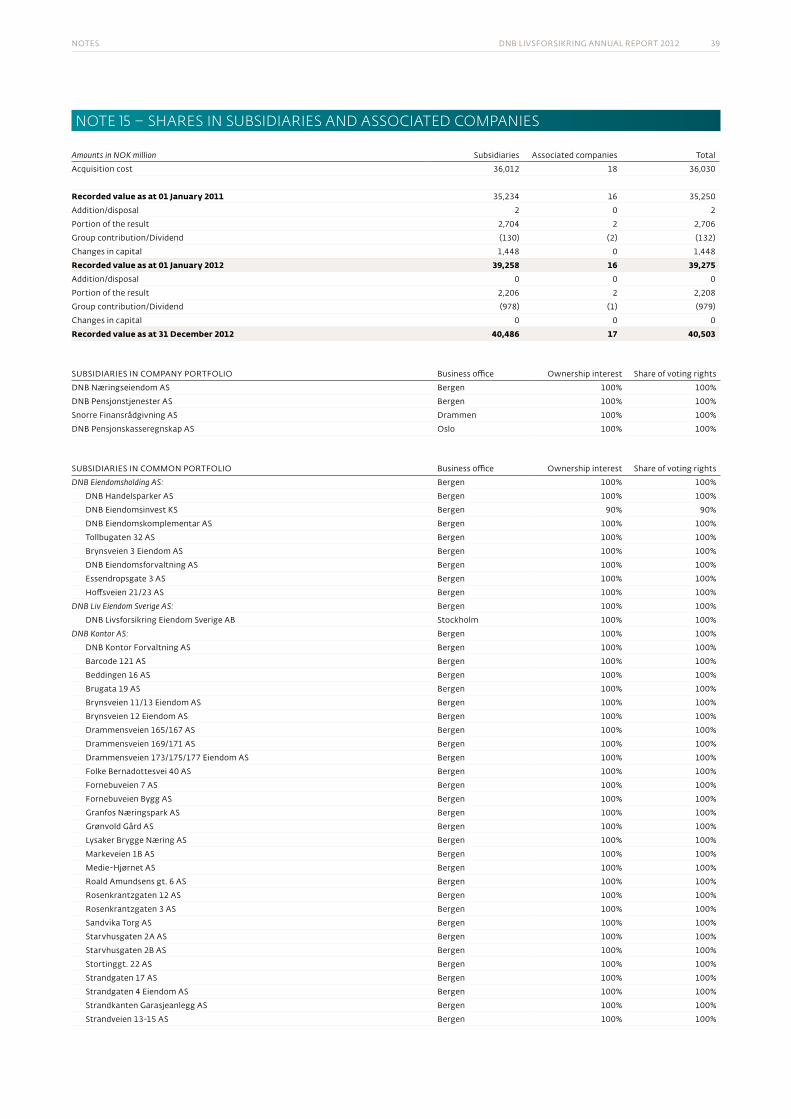
notes DnB livsforsikring annual report 2012 39
NoTe 15 – SHAReS IN SuBSIDIARIeS AND ASSoCIATeD CompANIeS
Amounts in NOK million subsidiaries associated companies total
acquisition cost 36,012 18 36,030
Recorded value as at 01 January 2011 35,234 16 35,250
addition/disposal 2 0 2
portion of the result 2,704 2 2,706
group contribution/Dividend (130) (2) (132)
changes in capital 1,448 0 1,448
Recorded value as at 01 January 2012 39,258 16 39,275addition/disposal 0 0 0
portion of the result 2,206 2 2,208
group contribution/Dividend (978) (1) (979)
changes in capital 0 0 0
Recorded value as at 31 December 2012 40,486 17 40,503
suBsiDiaries in company portfolio Business office ownership interest share of voting rights
DnB næringseiendom as Bergen 100% 100%
DnB pensjonstjenester as Bergen 100% 100%
snorre finansrådgivning as Drammen 100% 100%
DnB pensjonskasseregnskap as oslo 100% 100%
suBsiDiaries in common portfolio Business office ownership interest share of voting rights
DNB eiendomsholding AS: Bergen 100% 100%
DnB handelsparker as Bergen 100% 100%
DnB eiendomsinvest ks Bergen 90% 90%
DnB eiendomskomplementar as Bergen 100% 100%
tollbugaten 32 as Bergen 100% 100%
Brynsveien 3 eiendom as Bergen 100% 100%
DnB eiendomsforvaltning as Bergen 100% 100%
essendropsgate 3 as Bergen 100% 100%
hoffsveien 21/23 as Bergen 100% 100%
DNB Liv eiendom Sverige AS: Bergen 100% 100%
DnB livsforsikring eiendom sverige aB stockholm 100% 100%
DNB Kontor AS: Bergen 100% 100%
DnB kontor forvaltning as Bergen 100% 100%
Barcode 121 as Bergen 100% 100%
Beddingen 16 as Bergen 100% 100%
Brugata 19 as Bergen 100% 100%
Brynsveien 11/13 eiendom as Bergen 100% 100%
Brynsveien 12 eiendom as Bergen 100% 100%
Drammensveien 165/167 as Bergen 100% 100%
Drammensveien 169/171 as Bergen 100% 100%
Drammensveien 173/175/177 eiendom as Bergen 100% 100%
folke Bernadottesvei 40 as Bergen 100% 100%
fornebuveien 7 as Bergen 100% 100%
fornebuveien Bygg as Bergen 100% 100%
granfos næringspark as Bergen 100% 100%
grønvold gård as Bergen 100% 100%
lysaker Brygge næring as Bergen 100% 100%
markeveien 1B as Bergen 100% 100%
medie-hjørnet as Bergen 100% 100%
roald amundsens gt. 6 as Bergen 100% 100%
rosenkrantzgaten 12 as Bergen 100% 100%
rosenkrantzgaten 3 as Bergen 100% 100%
sandvika torg as Bergen 100% 100%
starvhusgaten 2a as Bergen 100% 100%
starvhusgaten 2B as Bergen 100% 100%
stortinggt. 22 as Bergen 100% 100%
strandgaten 17 as Bergen 100% 100%
strandgaten 4 eiendom as Bergen 100% 100%
strandkanten garasjeanlegg as Bergen 100% 100%
strandveien 13-15 as Bergen 100% 100%
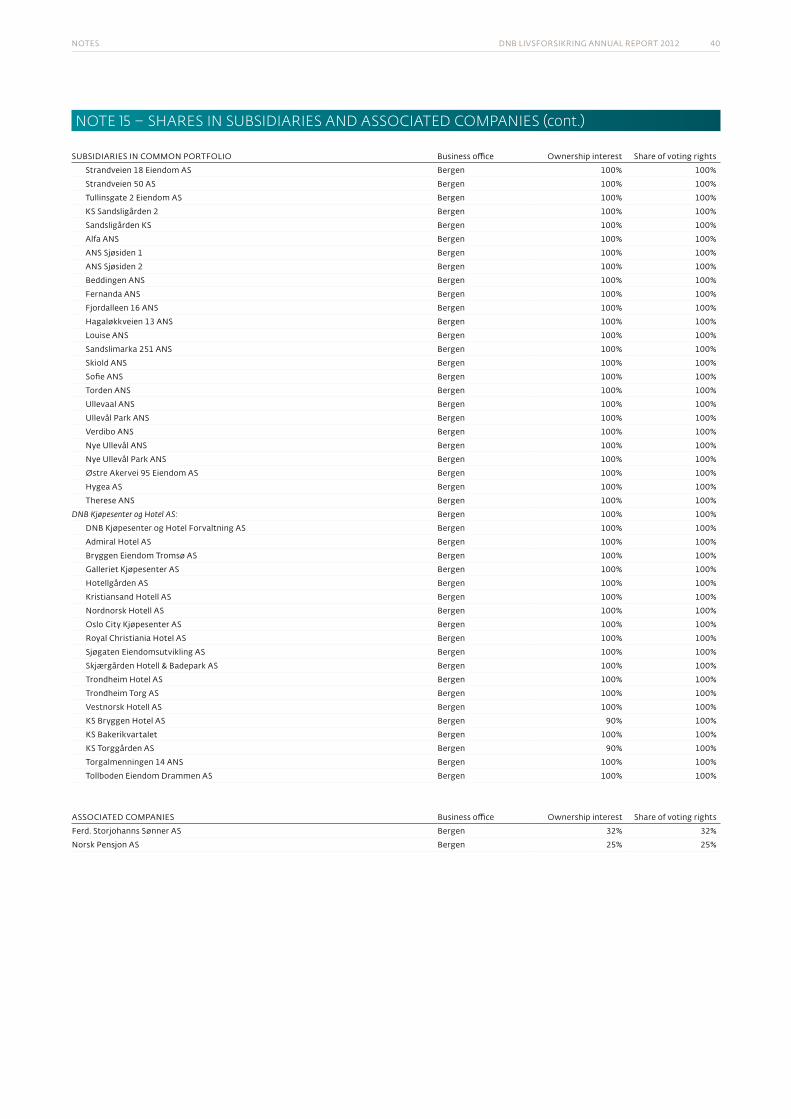
notes DnB livsforsikring annual report 2012 40
suBsiDiaries in common portfolio Business office ownership interest share of voting rights
strandveien 18 eiendom as Bergen 100% 100%
strandveien 50 as Bergen 100% 100%
tullinsgate 2 eiendom as Bergen 100% 100%
ks sandsligården 2 Bergen 100% 100%
sandsligården ks Bergen 100% 100%
alfa ans Bergen 100% 100%
ans sjøsiden 1 Bergen 100% 100%
ans sjøsiden 2 Bergen 100% 100%
Beddingen ans Bergen 100% 100%
fernanda ans Bergen 100% 100%
fjordalleen 16 ans Bergen 100% 100%
hagaløkkveien 13 ans Bergen 100% 100%
louise ans Bergen 100% 100%
sandslimarka 251 ans Bergen 100% 100%
skiold ans Bergen 100% 100%
sofie ans Bergen 100% 100%
torden ans Bergen 100% 100%
ullevaal ans Bergen 100% 100%
ullevål park ans Bergen 100% 100%
verdibo ans Bergen 100% 100%
nye ullevål ans Bergen 100% 100%
nye ullevål park ans Bergen 100% 100%
Østre akervei 95 eiendom as Bergen 100% 100%
hygea as Bergen 100% 100%
therese ans Bergen 100% 100%
DNB Kjøpesenter og Hotel AS: Bergen 100% 100%
DnB kjøpesenter og hotel forvaltning as Bergen 100% 100%
admiral hotel as Bergen 100% 100%
Bryggen eiendom tromsø as Bergen 100% 100%
galleriet kjøpesenter as Bergen 100% 100%
hotellgården as Bergen 100% 100%
kristiansand hotell as Bergen 100% 100%
nordnorsk hotell as Bergen 100% 100%
oslo city kjøpesenter as Bergen 100% 100%
royal christiania hotel as Bergen 100% 100%
sjøgaten eiendomsutvikling as Bergen 100% 100%
skjærgården hotell & Badepark as Bergen 100% 100%
trondheim hotel as Bergen 100% 100%
trondheim torg as Bergen 100% 100%
vestnorsk hotell as Bergen 100% 100%
ks Bryggen hotel as Bergen 90% 100%
ks Bakerikvartalet Bergen 100% 100%
ks torggården as Bergen 90% 100%
torgalmenningen 14 ans Bergen 100% 100%
tollboden eiendom Drammen as Bergen 100% 100%
associateD companies Business office ownership interest share of voting rights
ferd. storjohanns sønner as Bergen 32% 32%
norsk pensjon as Bergen 25% 25%
NoTe 15 – SHAReS IN SuBSIDIARIeS AND ASSoCIATeD CompANIeS (cont.)
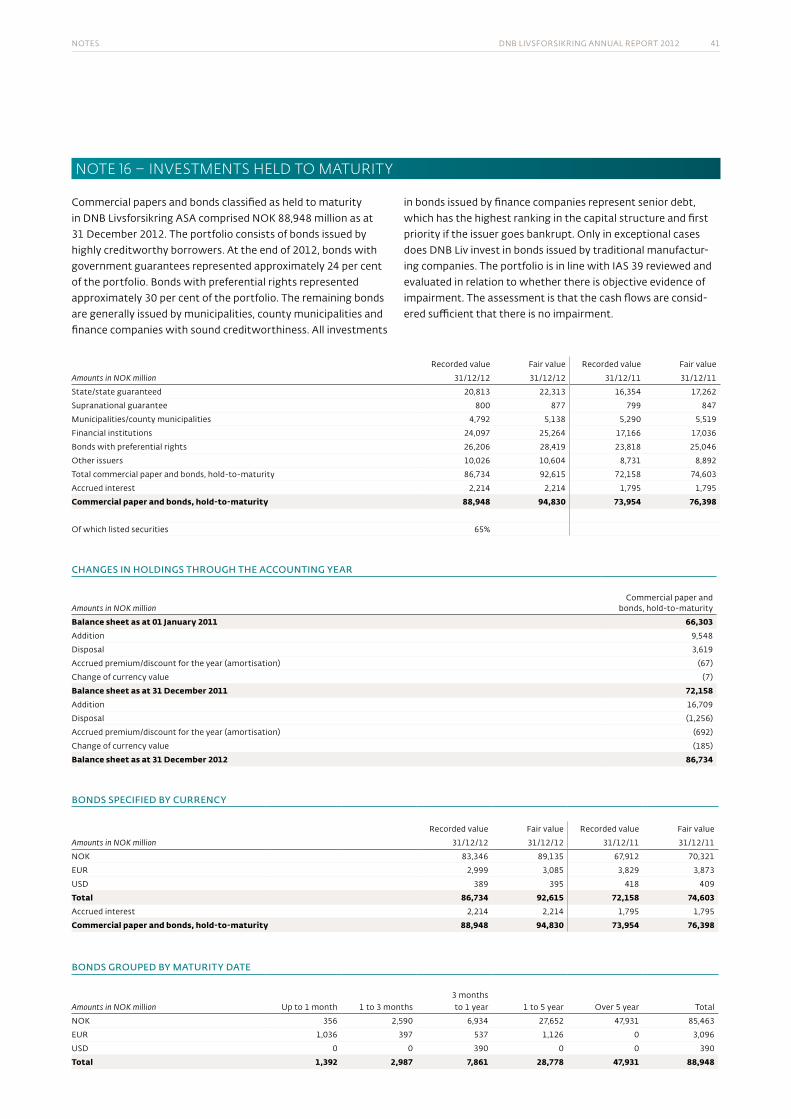
notes DnB livsforsikring annual report 2012 41
NoTe 16 – INVeSTmeNTS HeLD To mATuRITY
commercial papers and bonds classified as held to maturity in DnB livsforsikring asa comprised nok 88,948 million as at 31 December 2012. the portfolio consists of bonds issued by highly creditworthy borrowers. at the end of 2012, bonds with government guarantees represented approximately 24 per cent of the portfolio. Bonds with preferential rights represented approximately 30 per cent of the portfolio. the remaining bonds are generally issued by municipalities, county municipalities and finance companies with sound creditworthiness. all investments
in bonds issued by finance companies represent senior debt, which has the highest ranking in the capital structure and first priority if the issuer goes bankrupt. only in exceptional cases does DnB liv invest in bonds issued by traditional manufactur-ing companies. the portfolio is in line with ias 39 reviewed and evaluated in relation to whether there is objective evidence of impairment. the assessment is that the cash flows are consid-ered sufficient that there is no impairment.
recorded value fair value recorded value fair value
Amounts in NOK million 31/12/12 31/12/12 31/12/11 31/12/11
state/state guaranteed 20,813 22,313 16,354 17,262
supranational guarantee 800 877 799 847
municipalities/county municipalities 4,792 5,138 5,290 5,519
financial institutions 24,097 25,264 17,166 17,036
Bonds with preferential rights 26,206 28,419 23,818 25,046
other issuers 10,026 10,604 8,731 8,892
total commercial paper and bonds, hold-to-maturity 86,734 92,615 72,158 74,603
accrued interest 2,214 2,214 1,795 1,795
Commercial paper and bonds, hold-to-maturity 88,948 94,830 73,954 76,398
of which listed securities 65%
chanGes in hOldinGs thrOuGh the accOuntinG year
Amounts in NOK millioncommercial paper and
bonds, hold-to-maturity
Balance sheet as at 01 January 2011 66,303addition 9,548
Disposal 3,619
accrued premium/discount for the year (amortisation) (67)
change of currency value (7)
Balance sheet as at 31 December 2011 72,158addition 16,709
Disposal (1,256)
accrued premium/discount for the year (amortisation) (692)
change of currency value (185)
Balance sheet as at 31 December 2012 86,734
bOnds specified by currency
recorded value fair value recorded value fair value
Amounts in NOK million 31/12/12 31/12/12 31/12/11 31/12/11
nok 83,346 89,135 67,912 70,321
eur 2,999 3,085 3,829 3,873
usD 389 395 418 409
Total 86,734 92,615 72,158 74,603accrued interest 2,214 2,214 1,795 1,795
Commercial paper and bonds, hold-to-maturity 88,948 94,830 73,954 76,398
bOnds GrOuped by maturity date
Amounts in NOK million up to 1 month 1 to 3 months3 months to 1 year 1 to 5 year over 5 year total
nok 356 2,590 6,934 27,652 47,931 85,463
eur 1,036 397 537 1,126 0 3,096
usD 0 0 390 0 0 390
Total 1,392 2,987 7,861 28,778 47,931 88,948
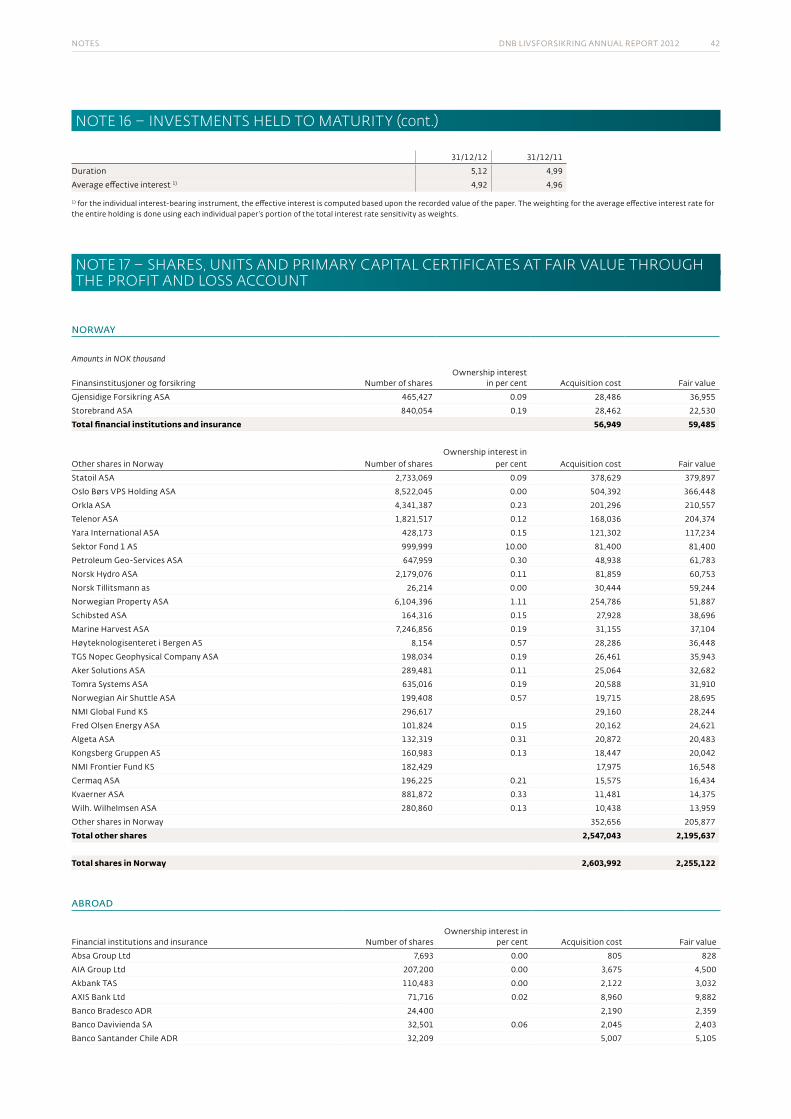
notes DnB livsforsikring annual report 2012 42
31/12/12 31/12/11
Duration 5,12 4,99
average effective interest 1) 4,92 4,96
1) for the individual interest-bearing instrument, the effective interest is computed based upon the recorded value of the paper. the weighting for the average effective interest rate for the entire holding is done using each individual paper’s portion of the total interest rate sensitivity as weights.
NoTe 17 – SHAReS, uNITS AND pRImARY CApITAL CeRTIfICATeS AT fAIR VALue THRouGHTHe pRofIT AND LoSS ACCouNT
nOrWay
Amounts in NOK thousand
finansinstitusjoner og forsikring number of sharesownership interest
in per cent acquisition cost fair value
gjensidige forsikring asa 465,427 0.09 28,486 36,955
storebrand asa 840,054 0.19 28,462 22,530
Total financial institutions and insurance 56,949 59,485
other shares in norway number of sharesownership interest in
per cent acquisition cost fair value
statoil asa 2,733,069 0.09 378,629 379,897
oslo Børs vps holding asa 8,522,045 0.00 504,392 366,448
orkla asa 4,341,387 0.23 201,296 210,557
telenor asa 1,821,517 0.12 168,036 204,374
yara international asa 428,173 0.15 121,302 117,234
sektor fond 1 as 999,999 10.00 81,400 81,400
petroleum geo-services asa 647,959 0.30 48,938 61,783
norsk hydro asa 2,179,076 0.11 81,859 60,753
norsk tillitsmann as 26,214 0.00 30,444 59,244
norwegian property asa 6,104,396 1.11 254,786 51,887
schibsted asa 164,316 0.15 27,928 38,696
marine harvest asa 7,246,856 0.19 31,155 37,104
høyteknologisenteret i Bergen as 8,154 0.57 28,286 36,448
tgs nopec geophysical company asa 198,034 0.19 26,461 35,943
aker solutions asa 289,481 0.11 25,064 32,682
tomra systems asa 635,016 0.19 20,588 31,910
norwegian air shuttle asa 199,408 0.57 19,715 28,695
nmi global fund ks 296,617 29,160 28,244
fred olsen energy asa 101,824 0.15 20,162 24,621
algeta asa 132,319 0.31 20,872 20,483
kongsberg gruppen as 160,983 0.13 18,447 20,042
nmi frontier fund ks 182,429 17,975 16,548
cermaq asa 196,225 0.21 15,575 16,434
kvaerner asa 881,872 0.33 11,481 14,375
wilh. wilhelmsen asa 280,860 0.13 10,438 13,959
other shares in norway 352,656 205,877
Total other shares 2,547,043 2,195,637
Total shares in Norway 2,603,992 2,255,122
abrOad
financial institutions and insurance number of sharesownership interest in
per cent acquisition cost fair value
absa group ltd 7,693 0.00 805 828
aia group ltd 207,200 0.00 3,675 4,500
akbank tas 110,483 0.00 2,122 3,032
axis Bank ltd 71,716 0.02 8,960 9,882
Banco Bradesco aDr 24,400 2,190 2,359
Banco Davivienda sa 32,501 0.06 2,045 2,403
Banco santander chile aDr 32,209 5,007 5,105
NoTe 16 – INVeSTmeNTS HeLD To mATuRITY (cont.)
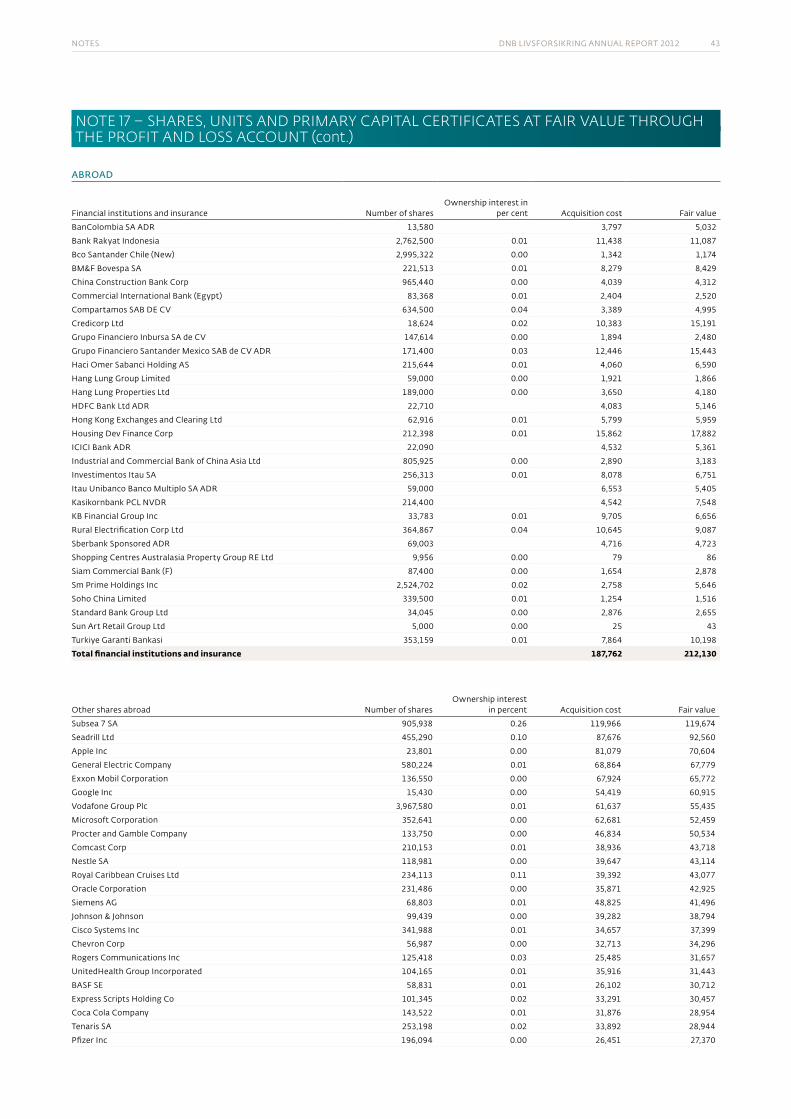
notes DnB livsforsikring annual report 2012 43
abrOad
financial institutions and insurance number of sharesownership interest in
per cent acquisition cost fair value
Bancolombia sa aDr 13,580 3,797 5,032
Bank rakyat indonesia 2,762,500 0.01 11,438 11,087
Bco santander chile (new) 2,995,322 0.00 1,342 1,174
Bm&f Bovespa sa 221,513 0.01 8,279 8,429
china construction Bank corp 965,440 0.00 4,039 4,312
commercial international Bank (egypt) 83,368 0.01 2,404 2,520
compartamos saB De cv 634,500 0.04 3,389 4,995
credicorp ltd 18,624 0.02 10,383 15,191
grupo financiero inbursa sa de cv 147,614 0.00 1,894 2,480
grupo financiero santander mexico saB de cv aDr 171,400 0.03 12,446 15,443
haci omer sabanci holding as 215,644 0.01 4,060 6,590
hang lung group limited 59,000 0.00 1,921 1,866
hang lung properties ltd 189,000 0.00 3,650 4,180
hDfc Bank ltd aDr 22,710 4,083 5,146
hong kong exchanges and clearing ltd 62,916 0.01 5,799 5,959
housing Dev finance corp 212,398 0.01 15,862 17,882
icici Bank aDr 22,090 4,532 5,361
industrial and commercial Bank of china asia ltd 805,925 0.00 2,890 3,183
investimentos itau sa 256,313 0.01 8,078 6,751
itau unibanco Banco multiplo sa aDr 59,000 6,553 5,405
kasikornbank pcl nvDr 214,400 4,542 7,548
kB financial group inc 33,783 0.01 9,705 6,656
rural electrification corp ltd 364,867 0.04 10,645 9,087
sberbank sponsored aDr 69,003 4,716 4,723
shopping centres australasia property group re ltd 9,956 0.00 79 86
siam commercial Bank (f) 87,400 0.00 1,654 2,878
sm prime holdings inc 2,524,702 0.02 2,758 5,646
soho china limited 339,500 0.01 1,254 1,516
standard Bank group ltd 34,045 0.00 2,876 2,655
sun art retail group ltd 5,000 0.00 25 43
turkiye garanti Bankasi 353,159 0.01 7,864 10,198
Total financial institutions and insurance 187,762 212,130
other shares abroad number of sharesownership interest
in percent acquisition cost fair value
subsea 7 sa 905,938 0.26 119,966 119,674
seadrill ltd 455,290 0.10 87,676 92,560
apple inc 23,801 0.00 81,079 70,604
general electric company 580,224 0.01 68,864 67,779
exxon mobil corporation 136,550 0.00 67,924 65,772
google inc 15,430 0.00 54,419 60,915
vodafone group plc 3,967,580 0.01 61,637 55,435
microsoft corporation 352,641 0.00 62,681 52,459
procter and gamble company 133,750 0.00 46,834 50,534
comcast corp 210,153 0.01 38,936 43,718
nestle sa 118,981 0.00 39,647 43,114
royal caribbean cruises ltd 234,113 0.11 39,392 43,077
oracle corporation 231,486 0.00 35,871 42,925
siemens ag 68,803 0.01 48,825 41,496
johnson & johnson 99,439 0.00 39,282 38,794
cisco systems inc 341,988 0.01 34,657 37,399
chevron corp 56,987 0.00 32,713 34,296
rogers communications inc 125,418 0.03 25,485 31,657
unitedhealth group incorporated 104,165 0.01 35,916 31,443
Basf se 58,831 0.01 26,102 30,712
express scripts holding co 101,345 0.02 33,291 30,457
coca cola company 143,522 0.01 31,876 28,954
tenaris sa 253,198 0.02 33,892 28,944
pfizer inc 196,094 0.00 26,451 27,370
NoTe 17 – SHAReS, uNITS AND pRImARY CApITAL CeRTIfICATeS AT fAIR VALue THRouGHTHe pRofIT AND LoSS ACCouNT (cont.)
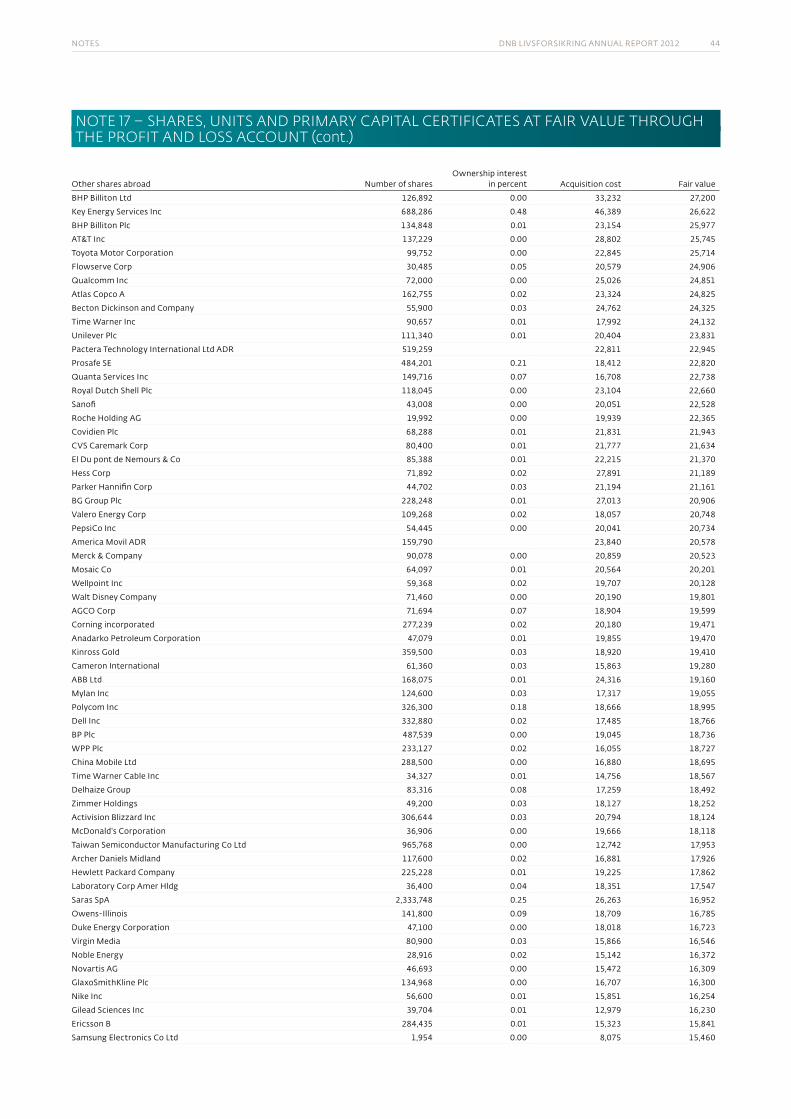
notes DnB livsforsikring annual report 2012 44
other shares abroad number of sharesownership interest
in percent acquisition cost fair value
Bhp Billiton ltd 126,892 0.00 33,232 27,200
key energy services inc 688,286 0.48 46,389 26,622
Bhp Billiton plc 134,848 0.01 23,154 25,977
at&t inc 137,229 0.00 28,802 25,745
toyota motor corporation 99,752 0.00 22,845 25,714
flowserve corp 30,485 0.05 20,579 24,906
qualcomm inc 72,000 0.00 25,026 24,851
atlas copco a 162,755 0.02 23,324 24,825
Becton Dickinson and company 55,900 0.03 24,762 24,325
time warner inc 90,657 0.01 17,992 24,132
unilever plc 111,340 0.01 20,404 23,831
pactera technology international ltd aDr 519,259 22,811 22,945
prosafe se 484,201 0.21 18,412 22,820
quanta services inc 149,716 0.07 16,708 22,738
royal Dutch shell plc 118,045 0.00 23,104 22,660
sanofi 43,008 0.00 20,051 22,528
roche holding ag 19,992 0.00 19,939 22,365
covidien plc 68,288 0.01 21,831 21,943
cvs caremark corp 80,400 0.01 21,777 21,634
el Du pont de nemours & co 85,388 0.01 22,215 21,370
hess corp 71,892 0.02 27,891 21,189
parker hannifin corp 44,702 0.03 21,194 21,161
Bg group plc 228,248 0.01 27,013 20,906
valero energy corp 109,268 0.02 18,057 20,748
pepsico inc 54,445 0.00 20,041 20,734
america movil aDr 159,790 23,840 20,578
merck & company 90,078 0.00 20,859 20,523
mosaic co 64,097 0.01 20,564 20,201
wellpoint inc 59,368 0.02 19,707 20,128
walt Disney company 71,460 0.00 20,190 19,801
agco corp 71,694 0.07 18,904 19,599
corning incorporated 277,239 0.02 20,180 19,471
anadarko petroleum corporation 47,079 0.01 19,855 19,470
kinross gold 359,500 0.03 18,920 19,410
cameron international 61,360 0.03 15,863 19,280
aBB ltd 168,075 0.01 24,316 19,160
mylan inc 124,600 0.03 17,317 19,055
polycom inc 326,300 0.18 18,666 18,995
Dell inc 332,880 0.02 17,485 18,766
Bp plc 487,539 0.00 19,045 18,736
wpp plc 233,127 0.02 16,055 18,727
china mobile ltd 288,500 0.00 16,880 18,695
time warner cable inc 34,327 0.01 14,756 18,567
Delhaize group 83,316 0.08 17,259 18,492
Zimmer holdings 49,200 0.03 18,127 18,252
activision Blizzard inc 306,644 0.03 20,794 18,124
mcDonald's corporation 36,906 0.00 19,666 18,118
taiwan semiconductor manufacturing co ltd 965,768 0.00 12,742 17,953
archer Daniels midland 117,600 0.02 16,881 17,926
hewlett packard company 225,228 0.01 19,225 17,862
laboratory corp amer hldg 36,400 0.04 18,351 17,547
saras spa 2,333,748 0.25 26,263 16,952
owens-illinois 141,800 0.09 18,709 16,785
Duke energy corporation 47,100 0.00 18,018 16,723
virgin media 80,900 0.03 15,866 16,546
noble energy 28,916 0.02 15,142 16,372
novartis ag 46,693 0.00 15,472 16,309
glaxosmithkline plc 134,968 0.00 16,707 16,300
nike inc 56,600 0.01 15,851 16,254
gilead sciences inc 39,704 0.01 12,979 16,230
ericsson B 284,435 0.01 15,323 15,841
samsung electronics co ltd 1,954 0.00 8,075 15,460
NoTe 17 – SHAReS, uNITS AND pRImARY CApITAL CeRTIfICATeS AT fAIR VALue THRouGHTHe pRofIT AND LoSS ACCouNT (cont.)
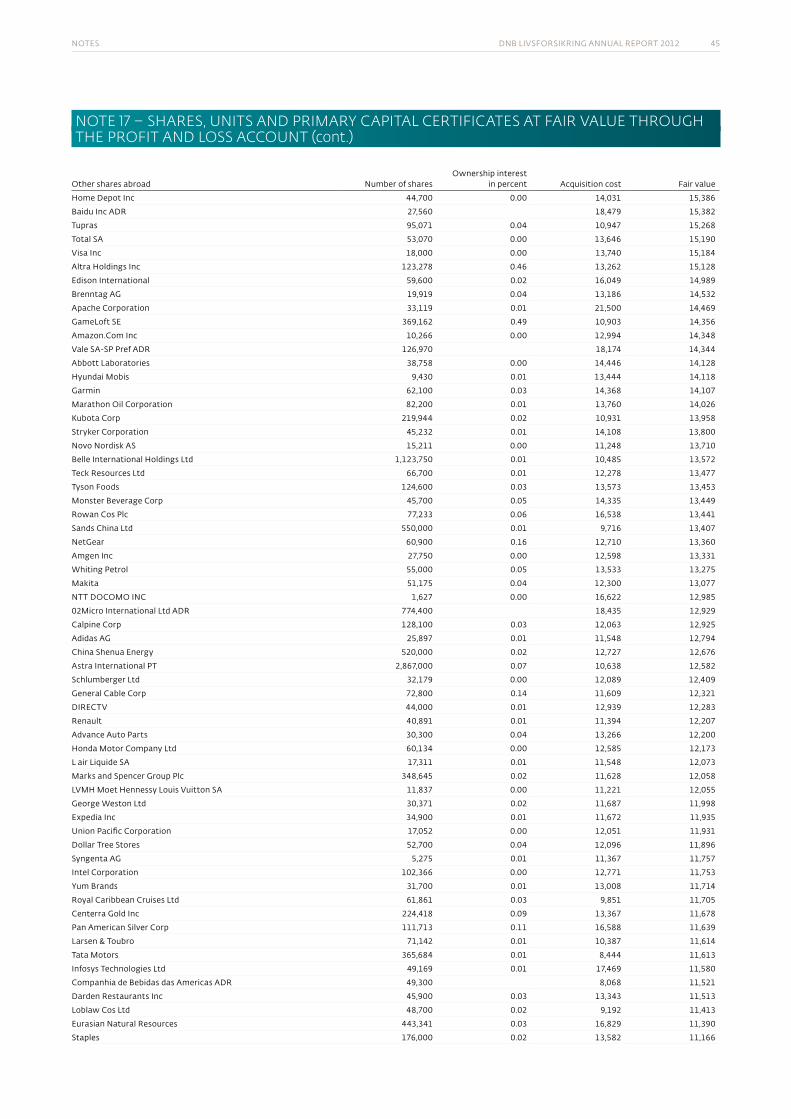
notes DnB livsforsikring annual report 2012 45
other shares abroad number of sharesownership interest
in percent acquisition cost fair value
home Depot inc 44,700 0.00 14,031 15,386
Baidu inc aDr 27,560 18,479 15,382
tupras 95,071 0.04 10,947 15,268
total sa 53,070 0.00 13,646 15,190
visa inc 18,000 0.00 13,740 15,184
altra holdings inc 123,278 0.46 13,262 15,128
edison international 59,600 0.02 16,049 14,989
Brenntag ag 19,919 0.04 13,186 14,532
apache corporation 33,119 0.01 21,500 14,469
gameloft se 369,162 0.49 10,903 14,356
amazon.com inc 10,266 0.00 12,994 14,348
vale sa-sp pref aDr 126,970 18,174 14,344
abbott laboratories 38,758 0.00 14,446 14,128
hyundai mobis 9,430 0.01 13,444 14,118
garmin 62,100 0.03 14,368 14,107
marathon oil corporation 82,200 0.01 13,760 14,026
kubota corp 219,944 0.02 10,931 13,958
stryker corporation 45,232 0.01 14,108 13,800
novo nordisk as 15,211 0.00 11,248 13,710
Belle international holdings ltd 1,123,750 0.01 10,485 13,572
teck resources ltd 66,700 0.01 12,278 13,477
tyson foods 124,600 0.03 13,573 13,453
monster Beverage corp 45,700 0.05 14,335 13,449
rowan cos plc 77,233 0.06 16,538 13,441
sands china ltd 550,000 0.01 9,716 13,407
netgear 60,900 0.16 12,710 13,360
amgen inc 27,750 0.00 12,598 13,331
whiting petrol 55,000 0.05 13,533 13,275
makita 51,175 0.04 12,300 13,077
ntt Docomo inc 1,627 0.00 16,622 12,985
02micro international ltd aDr 774,400 18,435 12,929
calpine corp 128,100 0.03 12,063 12,925
adidas ag 25,897 0.01 11,548 12,794
china shenua energy 520,000 0.02 12,727 12,676
astra international pt 2,867,000 0.07 10,638 12,582
schlumberger ltd 32,179 0.00 12,089 12,409
general cable corp 72,800 0.14 11,609 12,321
Directv 44,000 0.01 12,939 12,283
renault 40,891 0.01 11,394 12,207
advance auto parts 30,300 0.04 13,266 12,200
honda motor company ltd 60,134 0.00 12,585 12,173
l air liquide sa 17,311 0.01 11,548 12,073
marks and spencer group plc 348,645 0.02 11,628 12,058
lvmh moet hennessy louis vuitton sa 11,837 0.00 11,221 12,055
george weston ltd 30,371 0.02 11,687 11,998
expedia inc 34,900 0.01 11,672 11,935
union pacific corporation 17,052 0.00 12,051 11,931
Dollar tree stores 52,700 0.04 12,096 11,896
syngenta ag 5,275 0.01 11,367 11,757
intel corporation 102,366 0.00 12,771 11,753
yum Brands 31,700 0.01 13,008 11,714
royal caribbean cruises ltd 61,861 0.03 9,851 11,705
centerra gold inc 224,418 0.09 13,367 11,678
pan american silver corp 111,713 0.11 16,588 11,639
larsen & toubro 71,142 0.01 10,387 11,614
tata motors 365,684 0.01 8,444 11,613
infosys technologies ltd 49,169 0.01 17,469 11,580
companhia de Bebidas das americas aDr 49,300 8,068 11,521
Darden restaurants inc 45,900 0.03 13,343 11,513
loblaw cos ltd 48,700 0.02 9,192 11,413
eurasian natural resources 443,341 0.03 16,829 11,390
staples 176,000 0.02 13,582 11,166
NoTe 17 – SHAReS, uNITS AND pRImARY CApITAL CeRTIfICATeS AT fAIR VALue THRouGHTHe pRofIT AND LoSS ACCouNT (cont.)
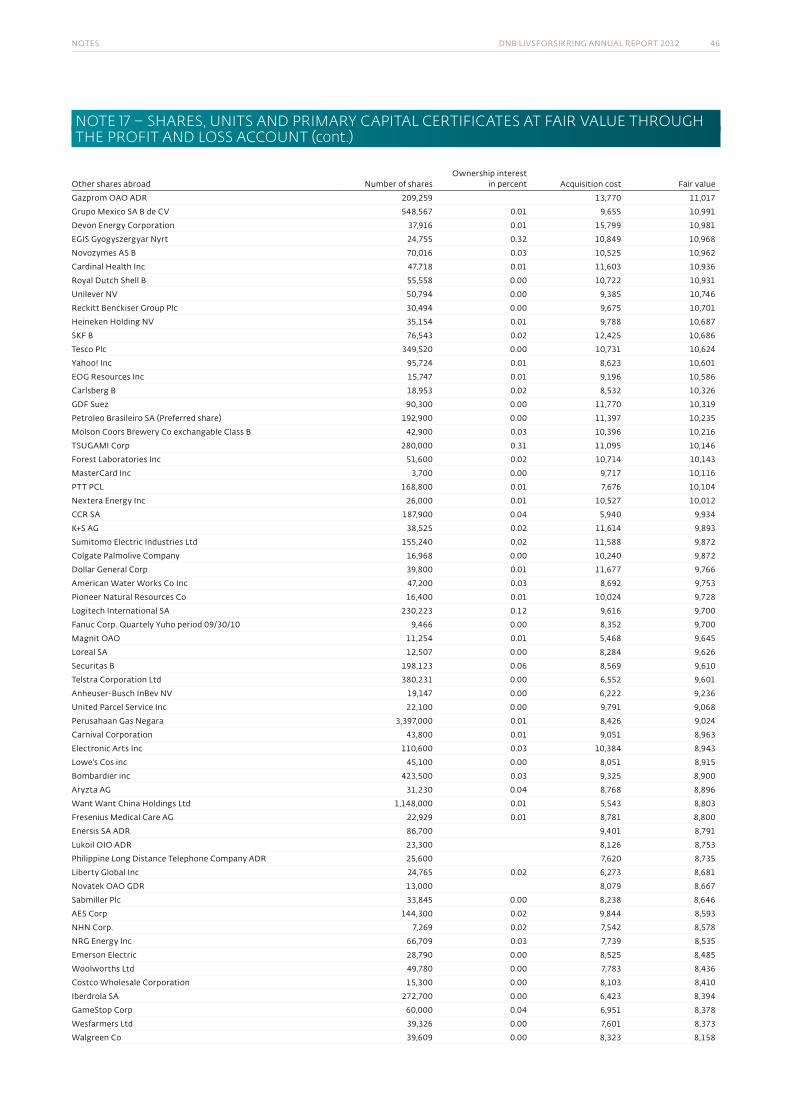
notes DnB livsforsikring annual report 2012 46
other shares abroad number of sharesownership interest
in percent acquisition cost fair value
gazprom oao aDr 209,259 13,770 11,017
grupo mexico sa B de cv 548,567 0.01 9,655 10,991
Devon energy corporation 37,916 0.01 15,799 10,981
egis gyogyszergyar nyrt 24,755 0.32 10,849 10,968
novozymes as B 70,016 0.03 10,525 10,962
cardinal health inc 47,718 0.01 11,603 10,936
royal Dutch shell B 55,558 0.00 10,722 10,931
unilever nv 50,794 0.00 9,385 10,746
reckitt Benckiser group plc 30,494 0.00 9,675 10,701
heineken holding nv 35,154 0.01 9,788 10,687
skf B 76,543 0.02 12,425 10,686
tesco plc 349,520 0.00 10,731 10,624
yahoo! inc 95,724 0.01 8,623 10,601
eog resources inc 15,747 0.01 9,196 10,586
carlsberg B 18,953 0.02 8,532 10,326
gDf suez 90,300 0.00 11,770 10,319
petroleo Brasileiro sa (preferred share) 192,900 0.00 11,397 10,235
molson coors Brewery co exchangable class B 42,900 0.03 10,396 10,216
tsugami corp 280,000 0.31 11,095 10,146
forest laboratories inc 51,600 0.02 10,714 10,143
mastercard inc 3,700 0.00 9,717 10,116
ptt pcl 168,800 0.01 7,676 10,104
nextera energy inc 26,000 0.01 10,527 10,012
ccr sa 187,900 0.04 5,940 9,934
k+s ag 38,525 0.02 11,614 9,893
sumitomo electric industries ltd 155,240 0.02 11,588 9,872
colgate palmolive company 16,968 0.00 10,240 9,872
Dollar general corp 39,800 0.01 11,677 9,766
american water works co inc 47,200 0.03 8,692 9,753
pioneer natural resources co 16,400 0.01 10,024 9,728
logitech international sa 230,223 0.12 9,616 9,700
fanuc corp. quartely yuho period 09/30/10 9,466 0.00 8,352 9,700
magnit oao 11,254 0.01 5,468 9,645
loreal sa 12,507 0.00 8,284 9,626
securitas B 198,123 0.06 8,569 9,610
telstra corporation ltd 380,231 0.00 6,552 9,601
anheuser-Busch inBev nv 19,147 0.00 6,222 9,236
united parcel service inc 22,100 0.00 9,791 9,068
perusahaan gas negara 3,397,000 0.01 8,426 9,024
carnival corporation 43,800 0.01 9,051 8,963
electronic arts inc 110,600 0.03 10,384 8,943
lowe's cos inc 45,100 0.00 8,051 8,915
Bombardier inc 423,500 0.03 9,325 8,900
aryzta ag 31,230 0.04 8,768 8,896
want want china holdings ltd 1,148,000 0.01 5,543 8,803
fresenius medical care ag 22,929 0.01 8,781 8,800
enersis sa aDr 86,700 9,401 8,791
lukoil oio aDr 23,300 8,126 8,753
philippine long Distance telephone company aDr 25,600 7,620 8,735
liberty global inc 24,765 0.02 6,273 8,681
novatek oao gDr 13,000 8,079 8,667
sabmiller plc 33,845 0.00 8,238 8,646
aes corp 144,300 0.02 9,844 8,593
nhn corp. 7,269 0.02 7,542 8,578
nrg energy inc 66,709 0.03 7,739 8,535
emerson electric 28,790 0.00 8,525 8,485
woolworths ltd 49,780 0.00 7,783 8,436
costco wholesale corporation 15,300 0.00 8,103 8,410
iberdrola sa 272,700 0.00 6,423 8,394
gamestop corp 60,000 0.04 6,951 8,378
wesfarmers ltd 39,326 0.00 7,601 8,373
walgreen co 39,609 0.00 8,323 8,158
NoTe 17 – SHAReS, uNITS AND pRImARY CApITAL CeRTIfICATeS AT fAIR VALue THRouGHTHe pRofIT AND LoSS ACCouNT (cont.)
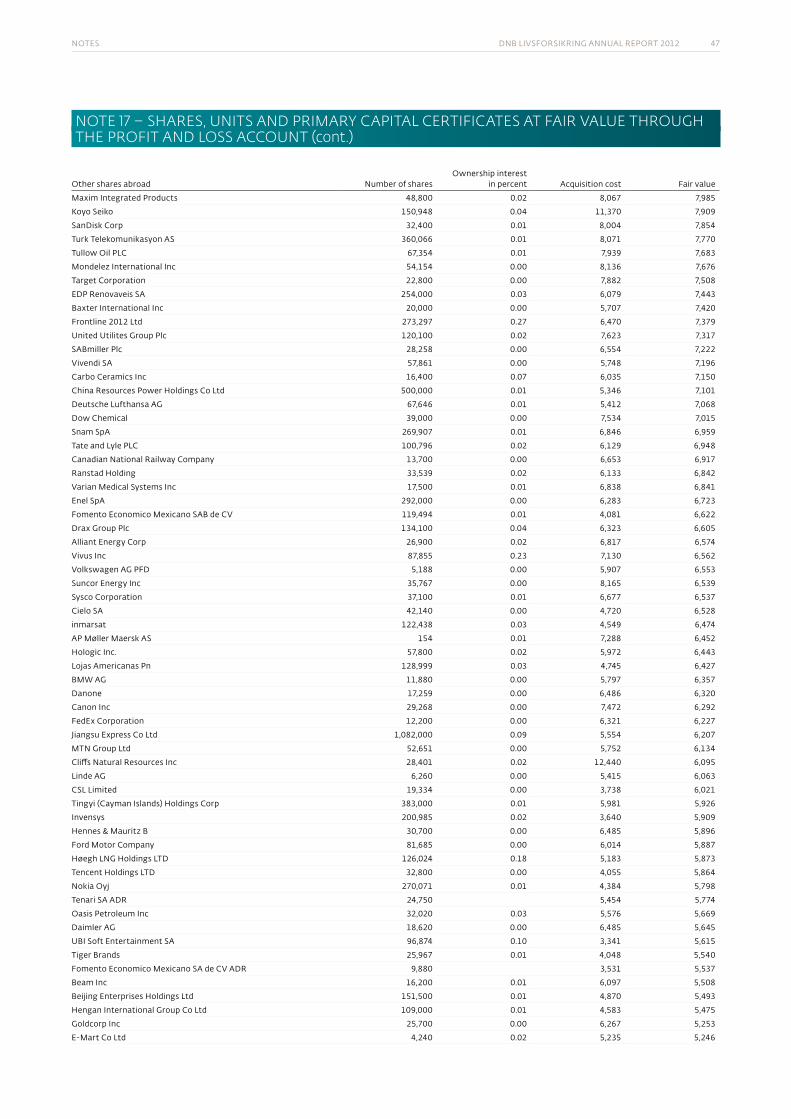
notes DnB livsforsikring annual report 2012 47
other shares abroad number of sharesownership interest
in percent acquisition cost fair value
maxim integrated products 48,800 0.02 8,067 7,985
koyo seiko 150,948 0.04 11,370 7,909
sanDisk corp 32,400 0.01 8,004 7,854
turk telekomunikasyon as 360,066 0.01 8,071 7,770
tullow oil plc 67,354 0.01 7,939 7,683
mondelez international inc 54,154 0.00 8,136 7,676
target corporation 22,800 0.00 7,882 7,508
eDp renovaveis sa 254,000 0.03 6,079 7,443
Baxter international inc 20,000 0.00 5,707 7,420
frontline 2012 ltd 273,297 0.27 6,470 7,379
united utilites group plc 120,100 0.02 7,623 7,317
saBmiller plc 28,258 0.00 6,554 7,222
vivendi sa 57,861 0.00 5,748 7,196
carbo ceramics inc 16,400 0.07 6,035 7,150
china resources power holdings co ltd 500,000 0.01 5,346 7,101
Deutsche lufthansa ag 67,646 0.01 5,412 7,068
Dow chemical 39,000 0.00 7,534 7,015
snam spa 269,907 0.01 6,846 6,959
tate and lyle plc 100,796 0.02 6,129 6,948
canadian national railway company 13,700 0.00 6,653 6,917
ranstad holding 33,539 0.02 6,133 6,842
varian medical systems inc 17,500 0.01 6,838 6,841
enel spa 292,000 0.00 6,283 6,723
fomento economico mexicano saB de cv 119,494 0.01 4,081 6,622
Drax group plc 134,100 0.04 6,323 6,605
alliant energy corp 26,900 0.02 6,817 6,574
vivus inc 87,855 0.23 7,130 6,562
volkswagen ag pfD 5,188 0.00 5,907 6,553
suncor energy inc 35,767 0.00 8,165 6,539
sysco corporation 37,100 0.01 6,677 6,537
cielo sa 42,140 0.00 4,720 6,528
inmarsat 122,438 0.03 4,549 6,474
ap møller maersk as 154 0.01 7,288 6,452
hologic inc. 57,800 0.02 5,972 6,443
lojas americanas pn 128,999 0.03 4,745 6,427
Bmw ag 11,880 0.00 5,797 6,357
Danone 17,259 0.00 6,486 6,320
canon inc 29,268 0.00 7,472 6,292
fedex corporation 12,200 0.00 6,321 6,227
jiangsu express co ltd 1,082,000 0.09 5,554 6,207
mtn group ltd 52,651 0.00 5,752 6,134
cliffs natural resources inc 28,401 0.02 12,440 6,095
linde ag 6,260 0.00 5,415 6,063
csl limited 19,334 0.00 3,738 6,021
tingyi (cayman islands) holdings corp 383,000 0.01 5,981 5,926
invensys 200,985 0.02 3,640 5,909
hennes & mauritz B 30,700 0.00 6,485 5,896
ford motor company 81,685 0.00 6,014 5,887
høegh lng holdings ltD 126,024 0.18 5,183 5,873
tencent holdings ltD 32,800 0.00 4,055 5,864
nokia oyj 270,071 0.01 4,384 5,798
tenari sa aDr 24,750 5,454 5,774
oasis petroleum inc 32,020 0.03 5,576 5,669
Daimler ag 18,620 0.00 6,485 5,645
uBi soft entertainment sa 96,874 0.10 3,341 5,615
tiger Brands 25,967 0.01 4,048 5,540
fomento economico mexicano sa de cv aDr 9,880 3,531 5,537
Beam inc 16,200 0.01 6,097 5,508
Beijing enterprises holdings ltd 151,500 0.01 4,870 5,493
hengan international group co ltd 109,000 0.01 4,583 5,475
goldcorp inc 25,700 0.00 6,267 5,253
e-mart co ltd 4,240 0.02 5,235 5,246
NoTe 17 – SHAReS, uNITS AND pRImARY CApITAL CeRTIfICATeS AT fAIR VALue THRouGHTHe pRofIT AND LoSS ACCouNT (cont.)
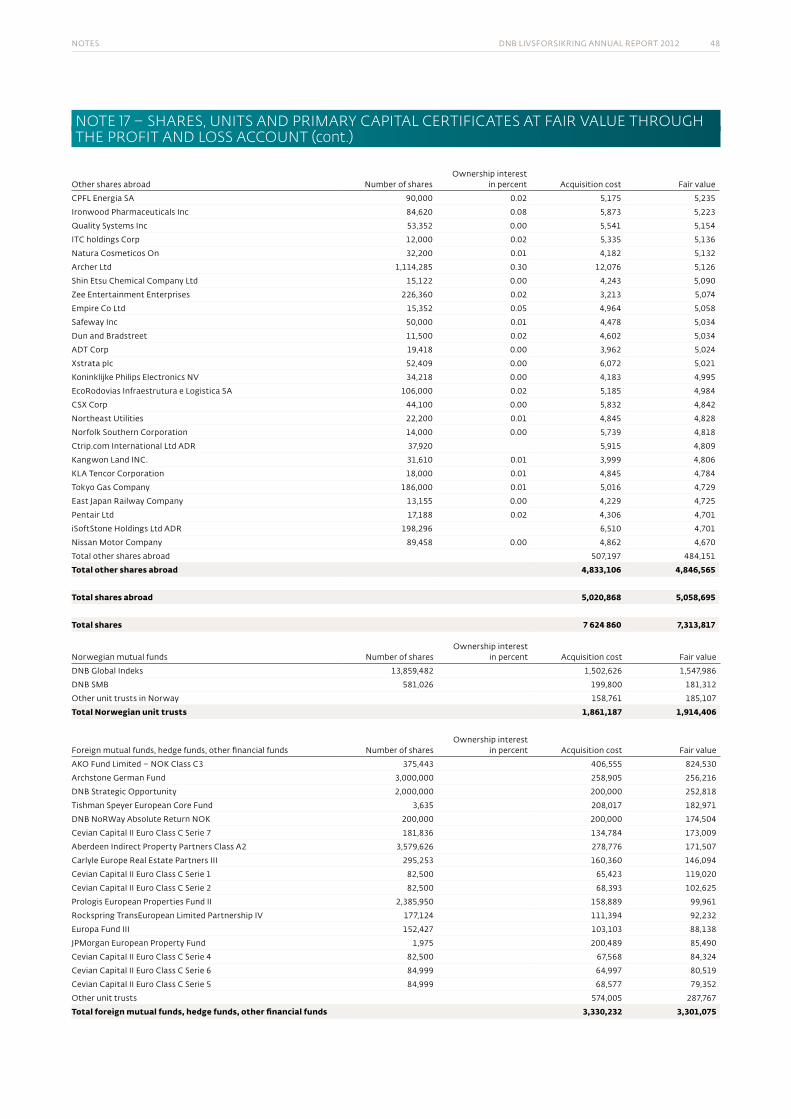
notes DnB livsforsikring annual report 2012 48
other shares abroad number of sharesownership interest
in percent acquisition cost fair value
cpfl energia sa 90,000 0.02 5,175 5,235
ironwood pharmaceuticals inc 84,620 0.08 5,873 5,223
quality systems inc 53,352 0.00 5,541 5,154
itc holdings corp 12,000 0.02 5,335 5,136
natura cosmeticos on 32,200 0.01 4,182 5,132
archer ltd 1,114,285 0.30 12,076 5,126
shin etsu chemical company ltd 15,122 0.00 4,243 5,090
Zee entertainment enterprises 226,360 0.02 3,213 5,074
empire co ltd 15,352 0.05 4,964 5,058
safeway inc 50,000 0.01 4,478 5,034
Dun and Bradstreet 11,500 0.02 4,602 5,034
aDt corp 19,418 0.00 3,962 5,024
xstrata plc 52,409 0.00 6,072 5,021
koninklijke philips electronics nv 34,218 0.00 4,183 4,995
ecorodovias infraestrutura e logistica sa 106,000 0.02 5,185 4,984
csx corp 44,100 0.00 5,832 4,842
northeast utilities 22,200 0.01 4,845 4,828
norfolk southern corporation 14,000 0.00 5,739 4,818
ctrip.com international ltd aDr 37,920 5,915 4,809
kangwon land inc. 31,610 0.01 3,999 4,806
kla tencor corporation 18,000 0.01 4,845 4,784
tokyo gas company 186,000 0.01 5,016 4,729
east japan railway company 13,155 0.00 4,229 4,725
pentair ltd 17,188 0.02 4,306 4,701
isoftstone holdings ltd aDr 198,296 6,510 4,701
nissan motor company 89,458 0.00 4,862 4,670
total other shares abroad 507,197 484,151
Total other shares abroad 4,833,106 4,846,565
Total shares abroad 5,020,868 5,058,695
Total shares 7 624 860 7,313,817
norwegian mutual funds number of sharesownership interest
in percent acquisition cost fair value
DnB global indeks 13,859,482 1,502,626 1,547,986
DnB smB 581,026 199,800 181,312
other unit trusts in norway 158,761 185,107
Total Norwegian unit trusts 1,861,187 1,914,406
foreign mutual funds, hedge funds, other financial funds number of sharesownership interest
in percent acquisition cost fair value
ako fund limited – nok class c3 375,443 406,555 824,530
archstone german fund 3,000,000 258,905 256,216
DnB strategic opportunity 2,000,000 200,000 252,818
tishman speyer european core fund 3,635 208,017 182,971
DnB norway absolute return nok 200,000 200,000 174,504
cevian capital ii euro class c serie 7 181,836 134,784 173,009
aberdeen indirect property partners class a2 3,579,626 278,776 171,507
carlyle europe real estate partners iii 295,253 160,360 146,094
cevian capital ii euro class c serie 1 82,500 65,423 119,020
cevian capital ii euro class c serie 2 82,500 68,393 102,625
prologis european properties fund ii 2,385,950 158,889 99,961
rockspring transeuropean limited partnership iv 177,124 111,394 92,232
europa fund iii 152,427 103,103 88,138
jpmorgan european property fund 1,975 200,489 85,490
cevian capital ii euro class c serie 4 82,500 67,568 84,324
cevian capital ii euro class c serie 6 84,999 64,997 80,519
cevian capital ii euro class c serie 5 84,999 68,577 79,352
other unit trusts 574,005 287,767
Total foreign mutual funds, hedge funds, other financial funds 3,330,232 3,301,075
NoTe 17 – SHAReS, uNITS AND pRImARY CApITAL CeRTIfICATeS AT fAIR VALue THRouGHTHe pRofIT AND LoSS ACCouNT (cont.)
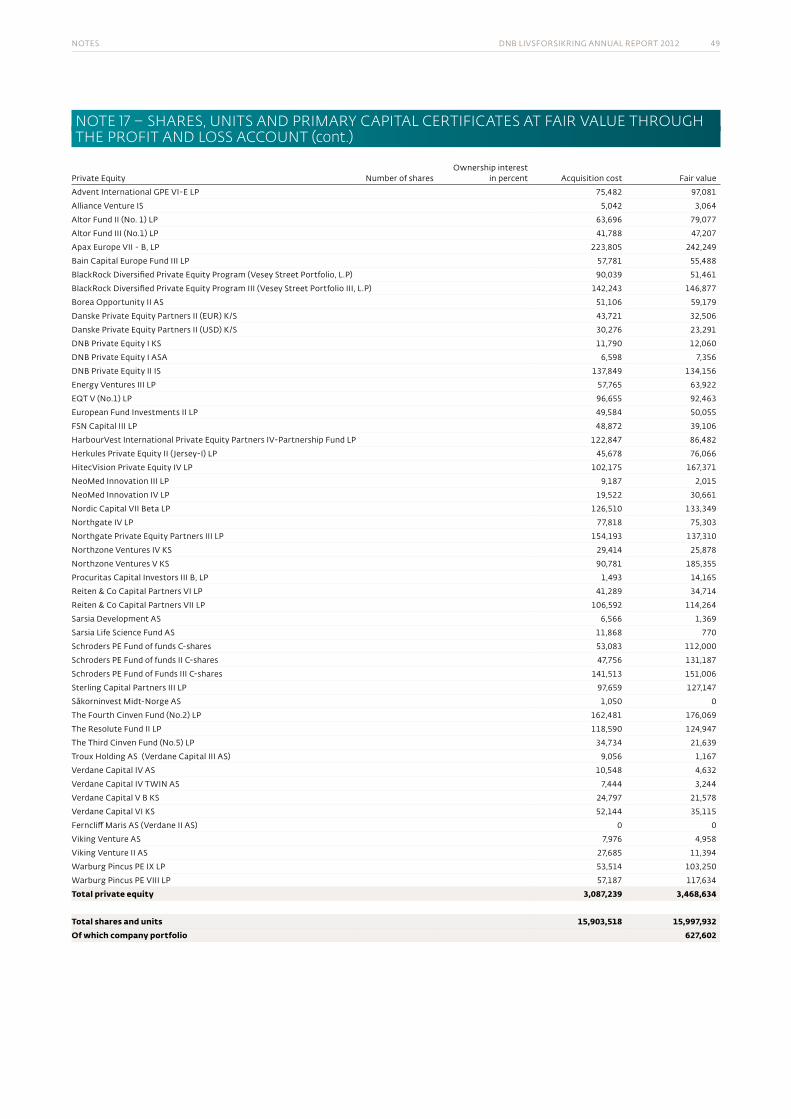
notes DnB livsforsikring annual report 2012 49
private equity number of sharesownership interest
in percent acquisition cost fair value
advent international gpe vi-e lp 75,482 97,081
alliance venture is 5,042 3,064
altor fund ii (no. 1) lp 63,696 79,077
altor fund iii (no.1) lp 41,788 47,207
apax europe vii - B, lp 223,805 242,249
Bain capital europe fund iii lp 57,781 55,488
Blackrock Diversified private equity program (vesey street portfolio, l.p) 90,039 51,461
Blackrock Diversified private equity program iii (vesey street portfolio iii, l.p) 142,243 146,877
Borea opportunity ii as 51,106 59,179
Danske private equity partners ii (eur) k/s 43,721 32,506
Danske private equity partners ii (usD) k/s 30,276 23,291
DnB private equity i ks 11,790 12,060
DnB private equity i asa 6,598 7,356
DnB private equity ii is 137,849 134,156
energy ventures iii lp 57,765 63,922
eqt v (no.1) lp 96,655 92,463
european fund investments ii lp 49,584 50,055
fsn capital iii lp 48,872 39,106
harbourvest international private equity partners iv-partnership fund lp 122,847 86,482
herkules private equity ii (jersey-i) lp 45,678 76,066
hitecvision private equity iv lp 102,175 167,371
neomed innovation iii lp 9,187 2,015
neomed innovation iv lp 19,522 30,661
nordic capital vii Beta lp 126,510 133,349
northgate iv lp 77,818 75,303
northgate private equity partners iii lp 154,193 137,310
northzone ventures iv ks 29,414 25,878
northzone ventures v ks 90,781 185,355
procuritas capital investors iii B, lp 1,493 14,165
reiten & co capital partners vi lp 41,289 34,714
reiten & co capital partners vii lp 106,592 114,264
sarsia Development as 6,566 1,369
sarsia life science fund as 11,868 770
schroders pe fund of funds c-shares 53,083 112,000
schroders pe fund of funds ii c-shares 47,756 131,187
schroders pe fund of funds iii c-shares 141,513 151,006
sterling capital partners iii lp 97,659 127,147
såkorninvest midt-norge as 1,050 0
the fourth cinven fund (no.2) lp 162,481 176,069
the resolute fund ii lp 118,590 124,947
the third cinven fund (no.5) lp 34,734 21,639
troux holding as (verdane capital iii as) 9,056 1,167
verdane capital iv as 10,548 4,632
verdane capital iv twin as 7,444 3,244
verdane capital v B ks 24,797 21,578
verdane capital vi ks 52,144 35,115
ferncliff maris as (verdane ii as) 0 0
viking venture as 7,976 4,958
viking venture ii as 27,685 11,394
warburg pincus pe ix lp 53,514 103,250
warburg pincus pe viii lp 57,187 117,634
Total private equity 3,087,239 3,468,634
Total shares and units 15,903,518 15,997,932Of which company portfolio 627,602
NoTe 17 – SHAReS, uNITS AND pRImARY CApITAL CeRTIfICATeS AT fAIR VALue THRouGHTHe pRofIT AND LoSS ACCouNT (cont.)
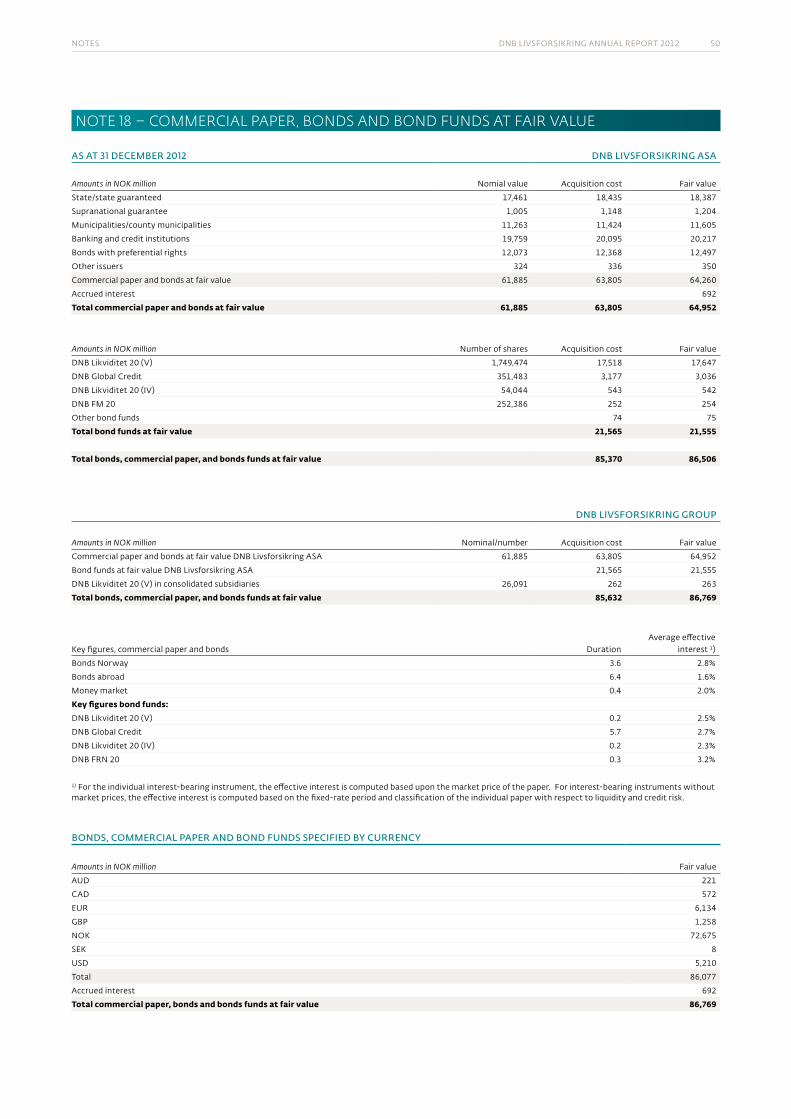
notes DnB livsforsikring annual report 2012 50
NoTe 18 – CommeRCIAL pApeR, BoNDS AND BoND fuNDS AT fAIR VALue
as at 31 december 2012 dnb livsfOrsikrinG asa
Amounts in NOK million nomial value acquisition cost fair value
state/state guaranteed 17,461 18,435 18,387
supranational guarantee 1,005 1,148 1,204
municipalities/county municipalities 11,263 11,424 11,605
Banking and credit institutions 19,759 20,095 20,217
Bonds with preferential rights 12,073 12,368 12,497
other issuers 324 336 350
commercial paper and bonds at fair value 61,885 63,805 64,260
accrued interest 692
Total commercial paper and bonds at fair value 61,885 63,805 64,952
Amounts in NOK million number of shares acquisition cost fair value
DnB likviditet 20 (v) 1,749,474 17,518 17,647
DnB global credit 351,483 3,177 3,036
DnB likviditet 20 (iv) 54,044 543 542
DnB fm 20 252,386 252 254
other bond funds 74 75
Total bond funds at fair value 21,565 21,555
Total bonds, commercial paper, and bonds funds at fair value 85,370 86,506
dnb livsfOrsikrinG GrOup
Amounts in NOK million nominal/number acquisition cost fair value
commercial paper and bonds at fair value DnB livsforsikring asa 61,885 63,805 64,952
Bond funds at fair value DnB livsforsikring asa 21,565 21,555
DnB likviditet 20 (v) in consolidated subsidiaries 26,091 262 263
Total bonds, commercial paper, and bonds funds at fair value 85,632 86,769
key figures, commercial paper and bonds Durationaverage effective
interest 1)
Bonds norway 3.6 2.8%
Bonds abroad 6.4 1.6%
money market 0.4 2.0%
Key figures bond funds:DnB likviditet 20 (v) 0.2 2.5%
DnB global credit 5.7 2.7%
DnB likviditet 20 (iv) 0.2 2.3%
DnB frn 20 0.3 3.2%
1) for the individual interest-bearing instrument, the effective interest is computed based upon the market price of the paper. for interest-bearing instruments without market prices, the effective interest is computed based on the fixed-rate period and classification of the individual paper with respect to liquidity and credit risk.
bOnds, cOmmercial paper and bOnd funds specified by currency
Amounts in NOK million fair value
auD 221
caD 572
eur 6,134
gBp 1,258
nok 72,675
sek 8
usD 5,210
total 86,077
accrued interest 692
Total commercial paper, bonds and bonds funds at fair value 86,769
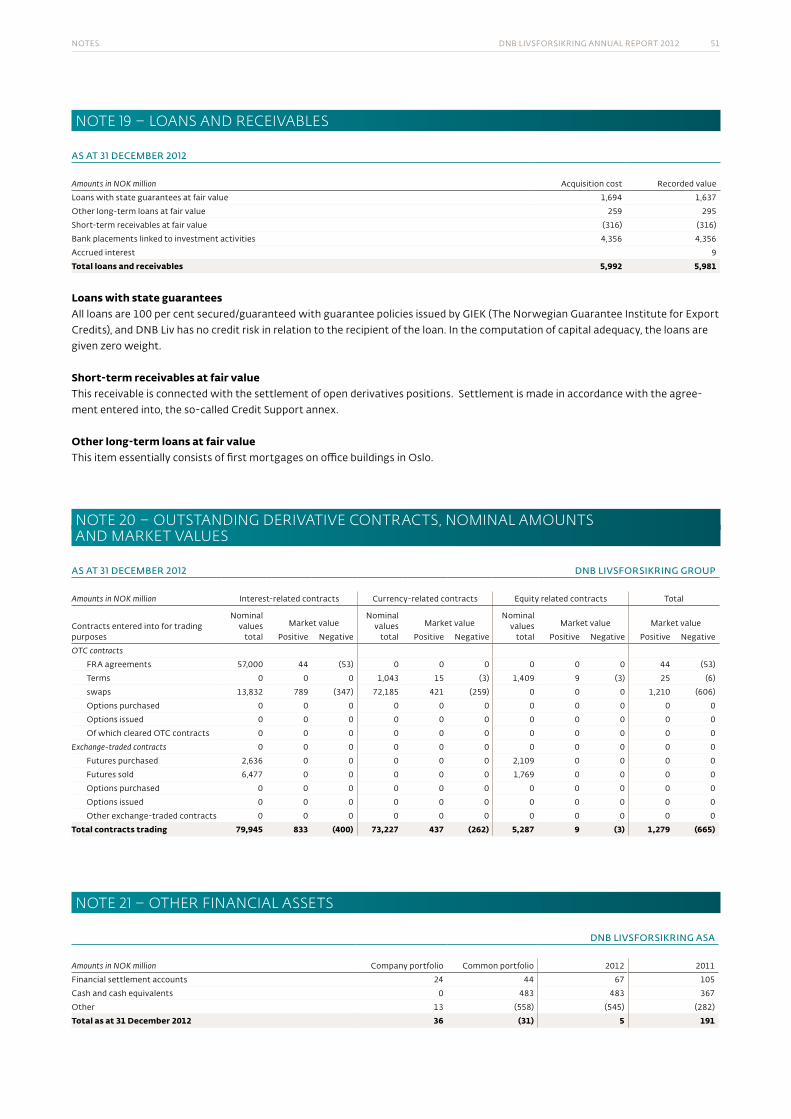
notes DnB livsforsikring annual report 2012 51
NoTe 19 – LoANS AND ReCeIVABLeS
as at 31 december 2012
Amounts in NOK million acquisition cost recorded value
loans with state guarantees at fair value 1,694 1,637
other long-term loans at fair value 259 295
short-term receivables at fair value (316) (316)
Bank placements linked to investment activities 4,356 4,356
accrued interest 9
Total loans and receivables 5,992 5,981
Loans with state guaranteesall loans are 100 per cent secured/guaranteed with guarantee policies issued by giek (the norwegian guarantee institute for export credits), and DnB liv has no credit risk in relation to the recipient of the loan. in the computation of capital adequacy, the loans are given zero weight.
Short-term receivables at fair valuethis receivable is connected with the settlement of open derivatives positions. settlement is made in accordance with the agree-ment entered into, the so-called credit support annex.
Other long-term loans at fair value this item essentially consists of first mortgages on office buildings in oslo.
NoTe 20 – ouTSTANDING DeRIVATIVe CoNTRACTS, NomINAL AmouNTS AND mARKeT VALueS
as at 31 december 2012 dnb livsfOrsikrinG GrOup
Amounts in NOK million interest-related contracts currency-related contracts equity related contracts total
contracts entered into for trading purposes
nominal values
total
market value
nominal values
total
market valuenominal
values total
market value market value
positive negative positive negative positive negative positive negative
OTC contracts
fra agreements 57,000 44 (53) 0 0 0 0 0 0 44 (53)
terms 0 0 0 1,043 15 (3) 1,409 9 (3) 25 (6)
swaps 13,832 789 (347) 72,185 421 (259) 0 0 0 1,210 (606)
options purchased 0 0 0 0 0 0 0 0 0 0 0
options issued 0 0 0 0 0 0 0 0 0 0 0
of which cleared otc contracts 0 0 0 0 0 0 0 0 0 0 0
exchange-traded contracts 0 0 0 0 0 0 0 0 0 0 0
futures purchased 2,636 0 0 0 0 0 2,109 0 0 0 0
futures sold 6,477 0 0 0 0 0 1,769 0 0 0 0
options purchased 0 0 0 0 0 0 0 0 0 0 0
options issued 0 0 0 0 0 0 0 0 0 0 0
other exchange-traded contracts 0 0 0 0 0 0 0 0 0 0 0
Total contracts trading 79,945 833 (400) 73,227 437 (262) 5,287 9 (3) 1,279 (665)
NoTe 21 – oTHeR fINANCIAL ASSeTS
dnb livsfOrsikrinG asa
Amounts in NOK million company portfolio common portfolio 2012 2011
financial settlement accounts 24 44 67 105
cash and cash equivalents 0 483 483 367
other 13 (558) (545) (282)
Total as at 31 December 2012 36 (31) 5 191
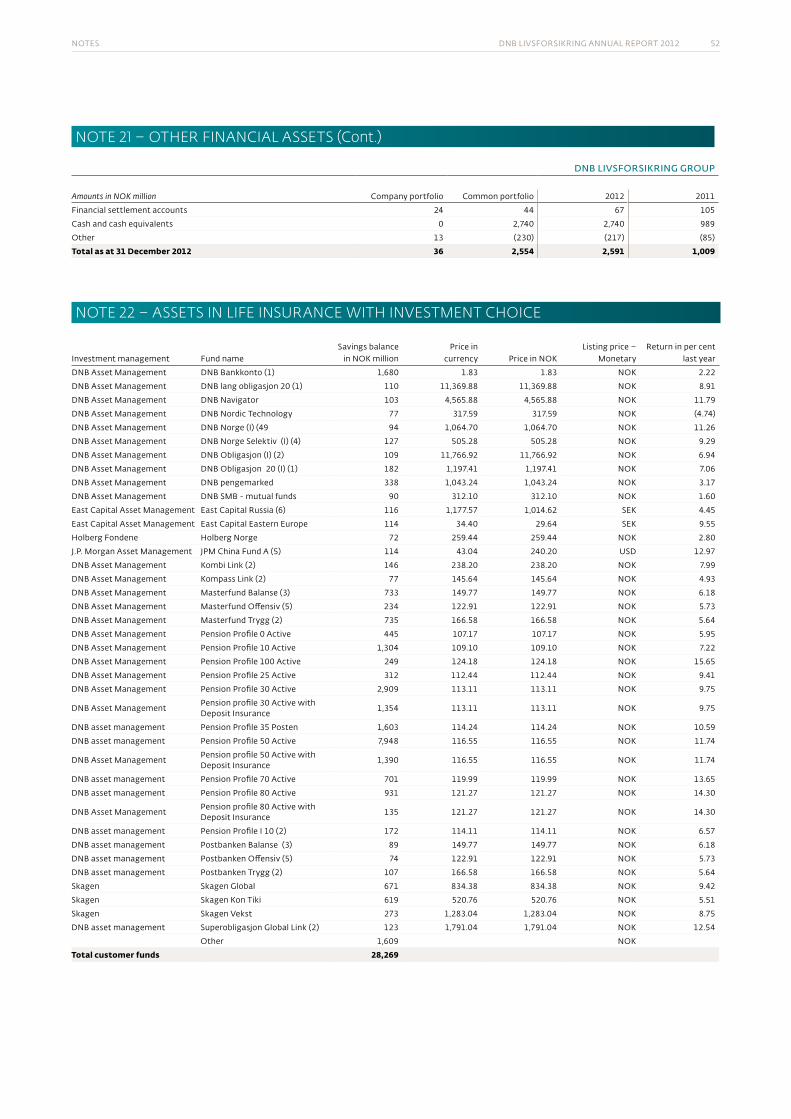
notes DnB livsforsikring annual report 2012 52
NoTe 21 – oTHeR fINANCIAL ASSeTS (Cont.)
dnb livsfOrsikrinG GrOup
Amounts in NOK million company portfolio common portfolio 2012 2011
financial settlement accounts 24 44 67 105
cash and cash equivalents 0 2,740 2,740 989
other 13 (230) (217) (85)
Total as at 31 December 2012 36 2,554 2,591 1,009
NoTe 22 – ASSeTS IN LIfe INSuRANCe WITH INVeSTmeNT CHoICe
investment management fund namesavings balance
in nok millionprice in
currency price in nok listing price –
monetaryreturn in per cent
last year
DnB asset management DnB Bankkonto (1) 1,680 1.83 1.83 nok 2.22
DnB asset management DnB lang obligasjon 20 (1) 110 11,369.88 11,369.88 nok 8.91
DnB asset management DnB navigator 103 4,565.88 4,565.88 nok 11.79
DnB asset management DnB nordic technology 77 317.59 317.59 nok (4.74)
DnB asset management DnB norge (i) (49 94 1,064.70 1,064.70 nok 11.26
DnB asset management DnB norge selektiv (i) (4) 127 505.28 505.28 nok 9.29
DnB asset management DnB obligasjon (i) (2) 109 11,766.92 11,766.92 nok 6.94
DnB asset management DnB obligasjon 20 (i) (1) 182 1,197.41 1,197.41 nok 7.06
DnB asset management DnB pengemarked 338 1,043.24 1,043.24 nok 3.17
DnB asset management DnB smB - mutual funds 90 312.10 312.10 nok 1.60
east capital asset management east capital russia (6) 116 1,177.57 1,014.62 sek 4.45
east capital asset management east capital eastern europe 114 34.40 29.64 sek 9.55
holberg fondene holberg norge 72 259.44 259.44 nok 2.80
j.p. morgan asset management jpm china fund a (5) 114 43.04 240.20 usD 12.97
DnB asset management kombi link (2) 146 238.20 238.20 nok 7.99
DnB asset management kompass link (2) 77 145.64 145.64 nok 4.93
DnB asset management masterfund Balanse (3) 733 149.77 149.77 nok 6.18
DnB asset management masterfund offensiv (5) 234 122.91 122.91 nok 5.73
DnB asset management masterfund trygg (2) 735 166.58 166.58 nok 5.64
DnB asset management pension profile 0 active 445 107.17 107.17 nok 5.95
DnB asset management pension profile 10 active 1,304 109.10 109.10 nok 7.22
DnB asset management pension profile 100 active 249 124.18 124.18 nok 15.65
DnB asset management pension profile 25 active 312 112.44 112.44 nok 9.41
DnB asset management pension profile 30 active 2,909 113.11 113.11 nok 9.75
DnB asset managementpension profile 30 active with Deposit insurance
1,354 113.11 113.11 nok 9.75
DnB asset management pension profile 35 posten 1,603 114.24 114.24 nok 10.59
DnB asset management pension profile 50 active 7,948 116.55 116.55 nok 11.74
DnB asset managementpension profile 50 active with Deposit insurance
1,390 116.55 116.55 nok 11.74
DnB asset management pension profile 70 active 701 119.99 119.99 nok 13.65
DnB asset management pension profile 80 active 931 121.27 121.27 nok 14.30
DnB asset managementpension profile 80 active with Deposit insurance
135 121.27 121.27 nok 14.30
DnB asset management pension profile i 10 (2) 172 114.11 114.11 nok 6.57
DnB asset management postbanken Balanse (3) 89 149.77 149.77 nok 6.18
DnB asset management postbanken offensiv (5) 74 122.91 122.91 nok 5.73
DnB asset management postbanken trygg (2) 107 166.58 166.58 nok 5.64
skagen skagen global 671 834.38 834.38 nok 9.42
skagen skagen kon tiki 619 520.76 520.76 nok 5.51
skagen skagen vekst 273 1,283.04 1,283.04 nok 8.75
DnB asset management superobligasjon global link (2) 123 1,791.04 1,791.04 nok 12.54
other 1,609 nok
Total customer funds 28,269
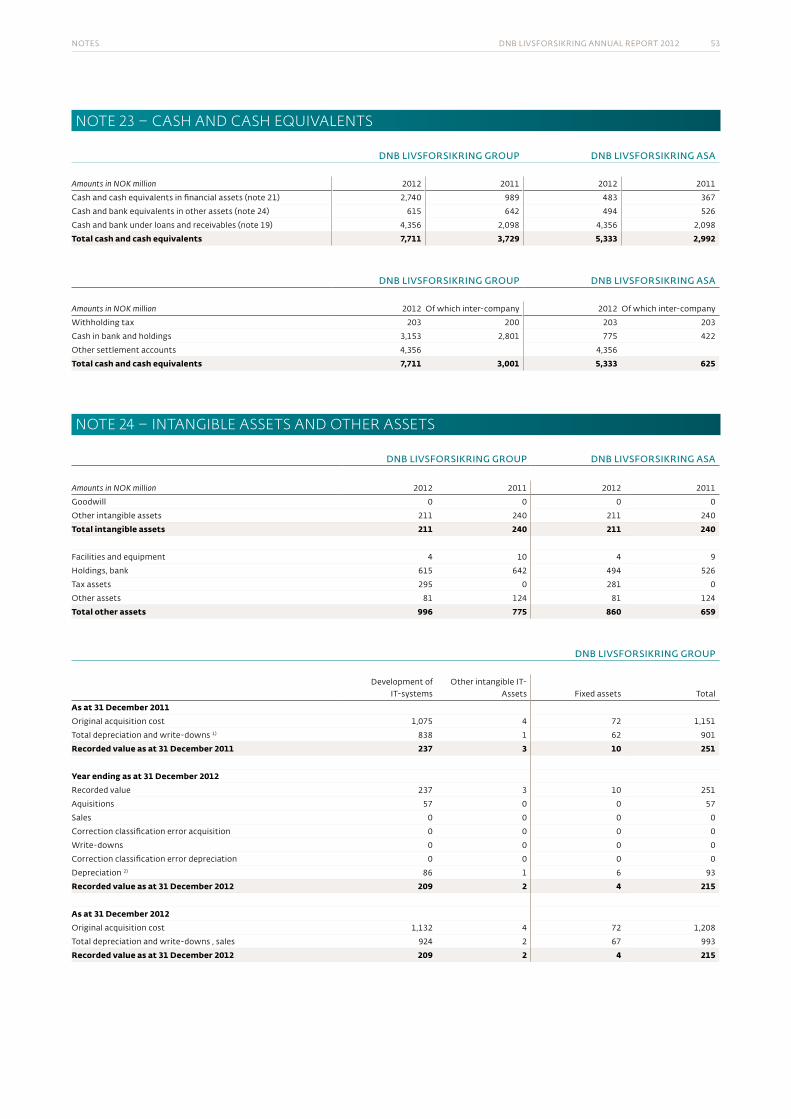
notes DnB livsforsikring annual report 2012 53
NoTe 23 – CASH AND CASH eQuIVALeNTS
dnb livsfOrsikrinG GrOup dnb livsfOrsikrinG asa
Amounts in NOK million 2012 2011 2012 2011
cash and cash equivalents in financial assets (note 21) 2,740 989 483 367
cash and bank equivalents in other assets (note 24) 615 642 494 526
cash and bank under loans and receivables (note 19) 4,356 2,098 4,356 2,098
Total cash and cash equivalents 7,711 3,729 5,333 2,992
dnb livsfOrsikrinG GrOup dnb livsfOrsikrinG asa
Amounts in NOK million 2012 of which inter-company 2012 of which inter-company
withholding tax 203 200 203 203
cash in bank and holdings 3,153 2,801 775 422
other settlement accounts 4,356 4,356
Total cash and cash equivalents 7,711 3,001 5,333 625
NoTe 24 – INTANGIBLe ASSeTS AND oTHeR ASSeTS
dnb livsfOrsikrinG GrOup dnb livsfOrsikrinG asa
Amounts in NOK million 2012 2011 2012 2011
goodwill 0 0 0 0
other intangible assets 211 240 211 240
Total intangible assets 211 240 211 240
facilities and equipment 4 10 4 9
holdings, bank 615 642 494 526
tax assets 295 0 281 0
other assets 81 124 81 124
Total other assets 996 775 860 659
dnb livsfOrsikrinG GrOup
Development of it-systems
other intangible it-assets fixed assets total
As at 31 December 2011original acquisition cost 1,075 4 72 1,151
total depreciation and write-downs 1) 838 1 62 901
Recorded value as at 31 December 2011 237 3 10 251
Year ending as at 31 December 2012recorded value 237 3 10 251
aquisitions 57 0 0 57
sales 0 0 0 0
correction classification error acquisition 0 0 0 0
write-downs 0 0 0 0
correction classification error depreciation 0 0 0 0
Depreciation 2) 86 1 6 93
Recorded value as at 31 December 2012 209 2 4 215
As at 31 December 2012original acquisition cost 1,132 4 72 1,208
total depreciation and write-downs , sales 924 2 67 993
Recorded value as at 31 December 2012 209 2 4 215
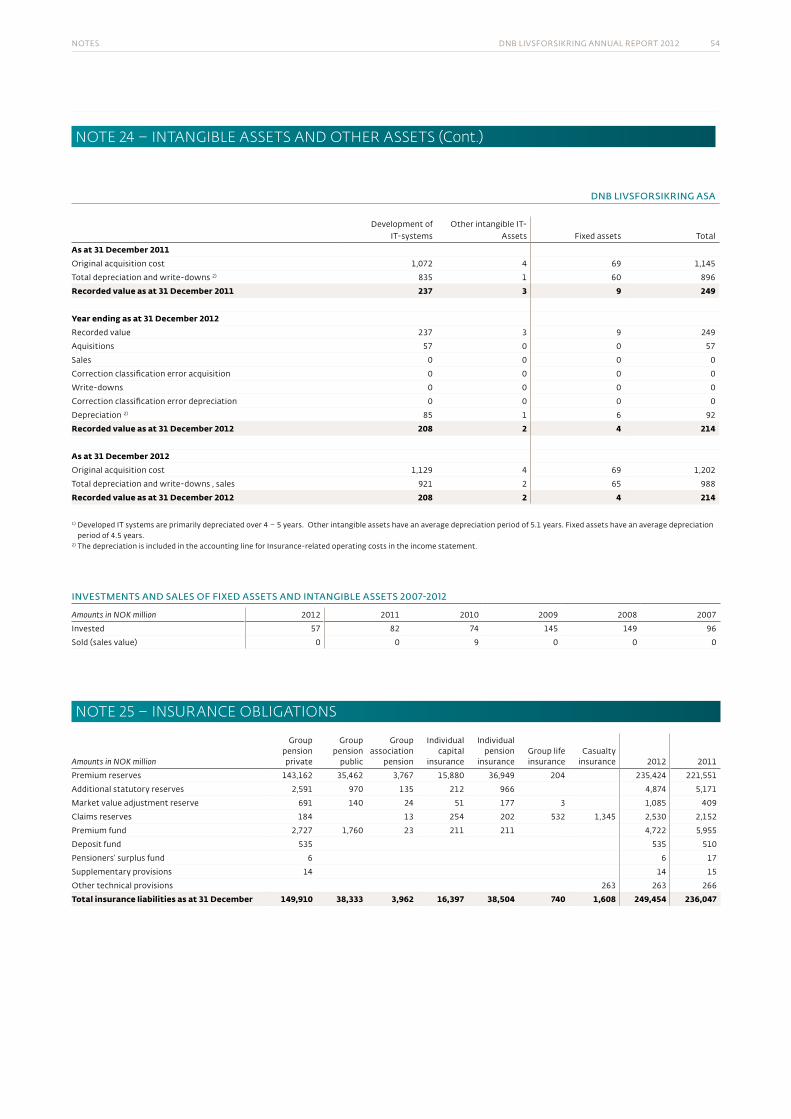
notes DnB livsforsikring annual report 2012 54
NoTe 24 – INTANGIBLe ASSeTS AND oTHeR ASSeTS (Cont.)
dnb livsfOrsikrinG asa
Development of it-systems
other intangible it-assets fixed assets total
As at 31 December 2011original acquisition cost 1,072 4 69 1,145
total depreciation and write-downs 2) 835 1 60 896
Recorded value as at 31 December 2011 237 3 9 249
Year ending as at 31 December 2012recorded value 237 3 9 249
aquisitions 57 0 0 57
sales 0 0 0 0
correction classification error acquisition 0 0 0 0
write-downs 0 0 0 0
correction classification error depreciation 0 0 0 0
Depreciation 2) 85 1 6 92
Recorded value as at 31 December 2012 208 2 4 214
As at 31 December 2012original acquisition cost 1,129 4 69 1,202
total depreciation and write-downs , sales 921 2 65 988
Recorded value as at 31 December 2012 208 2 4 214
1) Developed it systems are primarily depreciated over 4 – 5 years. other intangible assets have an average depreciation period of 5.1 years. fixed assets have an average depreciation period of 4.5 years.
2) the depreciation is included in the accounting line for insurance-related operating costs in the income statement.
investments and sales Of fixed assets and intanGible assets 2007-2012
Amounts in NOK million 2012 2011 2010 2009 2008 2007
invested 57 82 74 145 149 96
sold (sales value) 0 0 9 0 0 0
NoTe 25 – INSuRANCe oBLIGATIoNS
Amounts in NOK million
group pension private
group pension
public
group association
pension
individual capital
insurance
individual pension
insurancegroup life insurance
casualty insurance 2012 2011
premium reserves 143,162 35,462 3,767 15,880 36,949 204 235,424 221,551
additional statutory reserves 2,591 970 135 212 966 4,874 5,171
market value adjustment reserve 691 140 24 51 177 3 1,085 409
claims reserves 184 13 254 202 532 1,345 2,530 2,152
premium fund 2,727 1,760 23 211 211 4,722 5,955
Deposit fund 535 535 510
pensioners’ surplus fund 6 6 17
supplementary provisions 14 14 15
other technical provisions 263 263 266
Total insurance liabilities as at 31 December 149,910 38,333 3,962 16,397 38,504 740 1,608 249,454 236,047
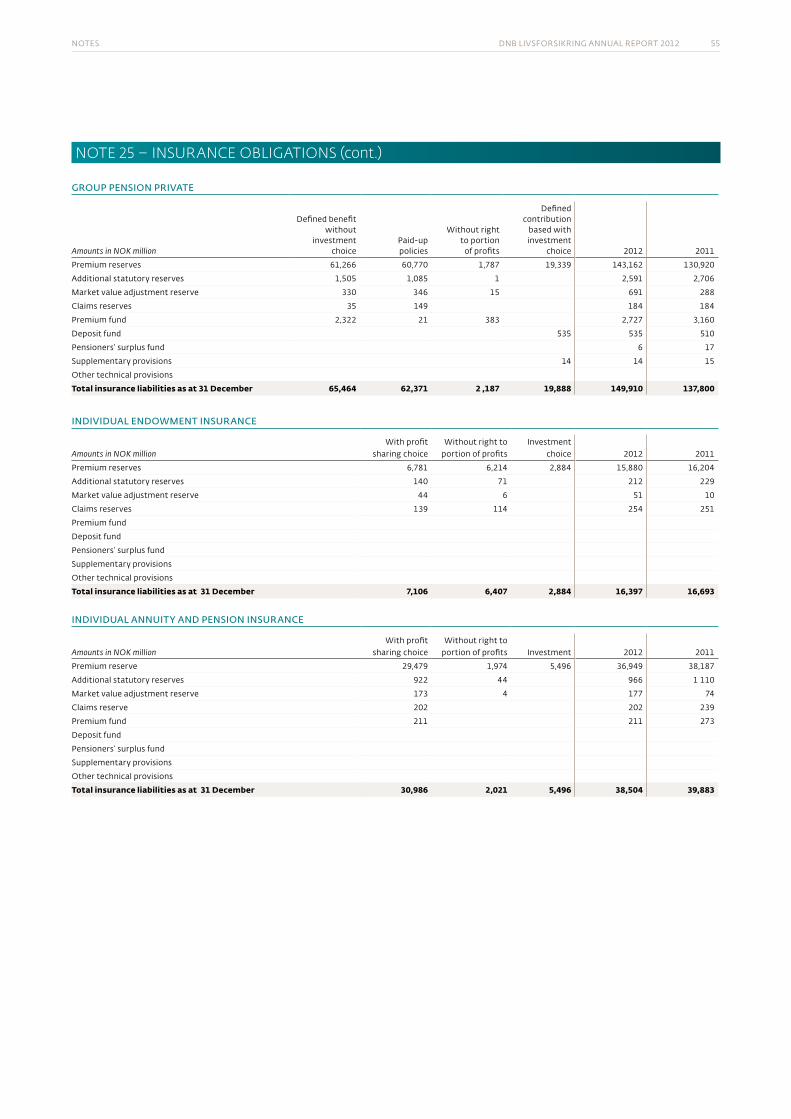
notes DnB livsforsikring annual report 2012 55
NoTe 25 – INSuRANCe oBLIGATIoNS (cont.)
GrOup pensiOn private
Amounts in NOK million
Defined benefit without
investment choice
paid-up policies
without right to portion of profits
Defined contribution
based with investment
choice 2012 2011
premium reserves 61,266 60,770 1,787 19,339 143,162 130,920
additional statutory reserves 1,505 1,085 1 2,591 2,706
market value adjustment reserve 330 346 15 691 288
claims reserves 35 149 184 184
premium fund 2,322 21 383 2,727 3,160
Deposit fund 535 535 510
pensioners’ surplus fund 6 17
supplementary provisions 14 14 15
other technical provisions
Total insurance liabilities as at 31 December 65,464 62,371 2 ,187 19,888 149,910 137,800
individual endOWment insurance
Amounts in NOK millionwith profit
sharing choicewithout right to
portion of profitsinvestment
choice 2012 2011
premium reserves 6,781 6,214 2,884 15,880 16,204
additional statutory reserves 140 71 212 229
market value adjustment reserve 44 6 51 10
claims reserves 139 114 254 251
premium fund
Deposit fund
pensioners’ surplus fund
supplementary provisions
other technical provisions
Total insurance liabilities as at 31 December 7,106 6,407 2,884 16,397 16,693
individual annuity and pensiOn insurance
Amounts in NOK millionwith profit
sharing choicewithout right to
portion of profits investment 2012 2011
premium reserve 29,479 1,974 5,496 36,949 38,187
additional statutory reserves 922 44 966 1 110
market value adjustment reserve 173 4 177 74
claims reserve 202 202 239
premium fund 211 211 273
Deposit fund
pensioners’ surplus fund
supplementary provisions
other technical provisions
Total insurance liabilities as at 31 December 30,986 2,021 5,496 38,504 39,883
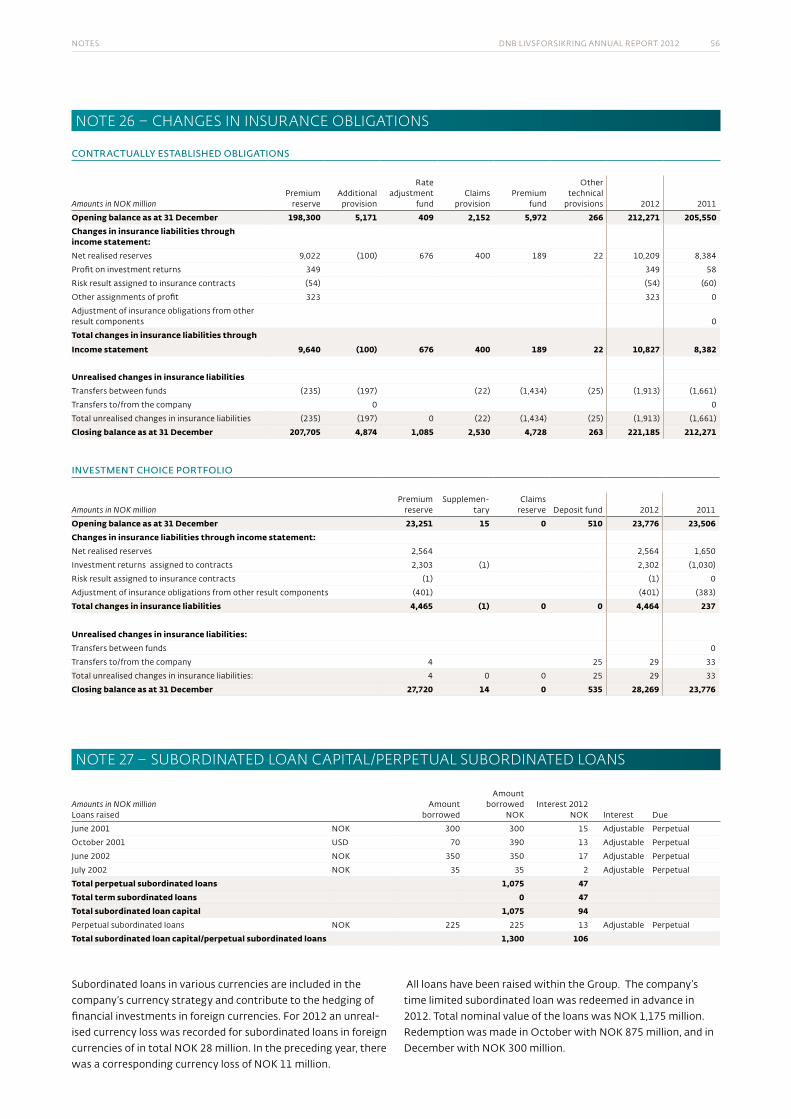
notes DnB livsforsikring annual report 2012 56
NoTe 26 – CHANGeS IN INSuRANCe oBLIGATIoNS
cOntractually established ObliGatiOns
Amounts in NOK millionpremium
reserveadditional
provision
rate adjustment
fund claims
provision premium
fund
other technical
provisions 2012 2011
Opening balance as at 31 December 198,300 5,171 409 2,152 5,972 266 212,271 205,550Changes in insurance liabilities through income statement:net realised reserves 9,022 (100) 676 400 189 22 10,209 8,384
profit on investment returns 349 349 58
risk result assigned to insurance contracts (54) (54) (60)
other assignments of profit 323 323 0
adjustment of insurance obligations from other result components 0
Total changes in insurance liabilities through
Income statement 9,640 (100) 676 400 189 22 10,827 8,382
Unrealised changes in insurance liabilitiestransfers between funds (235) (197) (22) (1,434) (25) (1,913) (1,661)
transfers to/from the company 0 0
total unrealised changes in insurance liabilities (235) (197) 0 (22) (1,434) (25) (1,913) (1,661)
Closing balance as at 31 December 207,705 4,874 1,085 2,530 4,728 263 221,185 212,271
investment chOice pOrtfOliO
Amounts in NOK millionpremium
reservesupplemen-
taryclaims
reserve Deposit fund 2012 2011
Opening balance as at 31 December 23,251 15 0 510 23,776 23,506Changes in insurance liabilities through income statement:net realised reserves 2,564 2,564 1,650
investment returns assigned to contracts 2,303 (1) 2,302 (1,030)
risk result assigned to insurance contracts (1) (1) 0
adjustment of insurance obligations from other result components (401) (401) (383)
Total changes in insurance liabilities 4,465 (1) 0 0 4,464 237
Unrealised changes in insurance liabilities:transfers between funds 0
transfers to/from the company 4 25 29 33
total unrealised changes in insurance liabilities: 4 0 0 25 29 33
Closing balance as at 31 December 27,720 14 0 535 28,269 23,776
NoTe 27 – SuBoRDINATeD LoAN CApITAL/peRpeTuAL SuBoRDINATeD LoANS
Amounts in NOK millionloans raised
amount borrow ed
amount borrowed
nokinterest 2012
nok interest Due
june 2001 nok 300 300 15 adjustable perpetual
october 2001 usD 70 390 13 adjustable perpetual
june 2002 nok 350 350 17 adjustable perpetual
july 2002 nok 35 35 2 adjustable perpetual
Total perpetual subordinated loans 1,075 47Total term subordinated loans 0 47Total subordinated loan capital 1,075 94perpetual subordinated loans nok 225 225 13 adjustable perpetual
Total subordinated loan capital/perpetual subordinated loans 1,300 106
subordinated loans in various currencies are included in the company’s currency strategy and contribute to the hedging of financial investments in foreign currencies. for 2012 an unreal-ised currency loss was recorded for subordinated loans in foreign currencies of in total nok 28 million. in the preceding year, there was a corresponding currency loss of nok 11 million.
all loans have been raised within the group. the company’s time limited subordinated loan was redeemed in advance in 2012. total nominal value of the loans was nok 1,175 million. redemption was made in october with nok 875 million, and in December with nok 300 million.
notes DnB livsforsikring annual report 2012 57
the perpetual loans may at the initiative of the borrower be redeemed after 5 to10 years as computed from the date the loan was granted. any possible redemptions of subordinated loans prior to their ordinary due dates require the consent of the financial supervisory authority of norway.
perpetual subordinated loans of nok 225 million, granted in 2002, count as a part of the company’s core capital.
NoTe 28 – RISKS
Risk management and reporting:management of DnB liv’s risks is a part of the company’s strategy adopted by the Board. the risk situation at DnB liv is considered in the context of the DnB group’s overall risk profile periodically by the group’s asset and liability committee (alco). the company’s managing Director and Board of Directors shall contribute to the appropriate co-ordination of risk management with strategy at DnB liv and in the group’s risk profile. the risk analysis and control unit reports on, monitors and follows up on DnB liv’s total risk. this unit is organised independent of the financial management and the business areas.
Capital conditions:processes have been established at the DnB group in order to assess capital requirements in relation to risk profile and the quality of established risk management and control systems. expansions of the level of capital is a central quantity that is taken into consideration in the long-term financial planning. there is a requirement by the government authorities that there be such a self-assessment of risk profile and capital require-ments within the DnB group called the icaap (internal capital adequacy assessment process). DnB liv is a part of this process, where a separate evaluation is performed of the capital require-ments at DnB liv, adopted by the Board of DnB liv. the self-assessment is evaluated annually by the financial supervisory authority of norway through srep (supervisory review and evaluation process). in this assessment, the financial supervisory authority of norway provides feedback on the DnB group’s capitalisation, thus also including DnB liv.
good risk management is a strategic tool for increasing value creation. the DnB group has a stated goal of having a low risk profile and wishes to maintain a rating on long-term ordinary borrowings by the bank corresponding to the aa level. the group’s risk is quantified in the form of a risk-adjusted capital requirement in which DnB liv is included. the capital require-ment reflects the market, insurance, operational and business risks. primary capital in DnB liv is held to a sufficient level in comparison with risk-adjusted capital, however the capitalisa-tion must also ensure the necessary buffers against the regula-tory minimum requirements for capital adequacy and solvency margin. in the capitalisation of DnB liv, consideration is made for the fact that the company is a part of the DnB group and that the DnB group’s equity reserves will also be able to be utilised for the benefit of DnB liv.
risk-adjusted capital (rk) for DnB liv was nok 12.2 billion by the end of 2012 compared to nok 12.0 billion at the end of 2011.
of the nok 12.2 billion, approximately 75 per cent comprises market risk, 8 per cent insurance risk, 14 per cent operational risk and the remaining 3 per cent business risk. regard is paid to diversification effects between the different risk categories.
the authorities have put a stronger focus on life insurance companies preparing and planning capitalisation with regard to the new solvency ii regulations. stress test 1 indicates a higher capital requirement under the new regulations. DnB liv will make adjustments to the new regulations through asset allocation and product adaptation. customer-funded provi-sions to buffer capital or longevity provisions will also reduce the capital requirement under the coming solvency regulations. the regulations of solvency ii are still being created, and the time of implementation is not decided. the uncertainty is mainly associated with the capital requirement for products with long-term guarantees.
for an overview of capital beyond the regulatory minimum, please see note 30 on capital adequacy and solvency margin capital.
Risk at DNB Liv:risk at DnB liv consists of market, credit, liquidity, insurance, operational and business risks. market risk consists of risks associated with share prices, changes in interest rates and real estate, overviews of the holdings of shares and interest bearing instruments are given in notes 16, 17 and 18. credit, liquidity and insurance risk are described in notes 34, 35 and 29 respectively. DnB liv has entered into reinsurance contracts which protect against concentration of insurance risks on individual customers should catastrophic events occur.
an internal stress test has been defined at DnB liv for the computation of all loss potentials for market, credit, insurance, business and operational risks. in the establishment of the risk tolerance for total risk, this loss potential is measured against the buffer capital beyond the regulatory requirements. this method is also used as a basis for the measurement and establishment of the framework for market and credit risk in asset management.
in computing the loss potential for market and credit risks, a stress test is incorporated for shares, interest rates, currencies, real estate, spread risks and counterparty risks respectively.
in 2012, a new framework for risk appetite has been imple-mented in the DnB group. for DnB liv a risk measure for capitalisation, market risk and volatility in the ifrs result has
notes DnB livsforsikring annual report 2012 58
been established. to ensure appropriate capitalisation there is a plan to ensure fulfilment of coming requirements for solvency margin under solvency ii. the plan for capitalisation is adjusted according to the development of the solvency ii regulations. it is now assumed that the quantitative minimum solvency margin do not become effective until 2015. the risk measure for market risk in DnB liv is evaluated against other risk categories in the DnB group. the DnB group’s model for total risk is used to calculate market risk. the market risk is mainly associated with the company’s ability to fulfil the customers’ guaranteed interest. to take a planned risk a risk measure for volatility in the ifrs result is set. the risk measure is expressed as a deviation from the expected result by 10 per cent probability (ear - earnings-at-risk). every year the Board determines the framework for financial risk in addition to the framework for risk appetite. this framework ensures sufficient diversification, maximum concentration risk towards an individual issuer and special framework for derivatives. the unit for risk manage-ment monitors and follows up on the framework and guidelines. in anticipation of the implementation of solvency ii the loss potential is measured through a stress test with regard to the buffer capital beyond statutory requirements. this method is also utilised as a basis for the measurement of risk and the establish-ment of a framework for asset management risk.
Besides quantitative requirements, solvency ii contains qualita-tive requirements for business and risk management as well as extended requirements for external reporting. after a project phase DnB liv now has implemented the necessary adaptations to meet the new solvency regulations. the focus on meeting the coming requirements is maintained towards implementation.
financial derivatives are used to be able to effectuate a market-view/allocations through a quick and cost effective asset and market exposure. Derivatives are also used in order to conduct active risk management of market risk. Derivatives are also used to differentiate sub portfolios and hedge currency . Both linear and non-linear derivatives on interest rates and shares may be utilised in asset management. an overview of the derivative positions is given in note 32.
Sensitivity analysis:in order to address considerations for minimum diversifica-tion, frameworks have been put in place for each asset class. the frameworks also limit the concentration risk against a single issuer. a separate framework has been prepared for use of derivatives in asset management. all frameworks for asset management are established annually by the Board.
the table below shows the change in value and effects on results at year-end of a price change of 20 percent for shares, an interest rate change of 1.5 percentage points and a valuation change of 12 per cent for real estate. the sensitivities have been computed individually. the effect of the change in value on the result is also shown in the table. the effect on the result depends on the level of additional statutory reserves and adjustment reserves.
Amounts in NOK million
market risk value adjustment effect on result
equities 20% 2 967 369
equities (20%) (2 967) (319)
interest +1,5 pp (2 499) (256)
interest -1,5 pp 2 499 519
real estate 12% 4 857 607
real estate (12%) (4 857) (345)
three stress scenarios are presented below that show a simulated price drop in shares, an interest rate increase and a drop in value of real estate. Diversifications are not taken into account. in comparison with the prior year, the loss potential is reduced and reflects decreased buffer capital through the year. credit risk consists primarily of counterparty risks in derivative contracts and spread risk associated with interest instruments. at the end of the year this comprised 10 per cent of total risk at DnB liv measured as per the financial supervisory authority of norway’s stress test ii.
Amounts in NOK million total loss
equities interest real estate 31/12/12 31/12/11
scenario 1 (20%) +0,3 pp (5%) 5 491 5 877
scenario 2 (20%) +0,5 pp (12%) 8 657 9 025
scenario 3 (20%) +1,5 pp (12%) 10 323 10 571
management of market risk is performed through on-going adjustments of the portfolio for the company’s buffer capital. analyses show that this will improve the risk-adjusted returns over time. the probability of an extremely negative outcome is reduced, while at the same time the possibilities for participating in an upturn in the share markets are good.
at the end of 2012, total exposure in bonds in the group portfolio against the piigs countries was nok 5.2 billion. of these, nok 4.4 billion were classified as hold-to-maturity. of these, 65 per cent constituted exposure against spain, mainly against the government and covered bonds. in the company portfolio there were no bonds with exposure in piigs countries at that point.
NoTe 28 – RISKS (cont.)
notes DnB livsforsikring annual report 2012 59
NoTe 29 – INSuRANCe RISK
Analysis of insurance obligations, investment choice and contractually established obligations
Amounts in NOK millioninvestment choice
obligationsliabilities
traditional products
Balance sheet as at 31 December 2010 23,506 205,550Deposits 3,457 13,324
returns (1,030) 4,541
addition of reserves 508 4,843
Disposal of reserves (985) (2,447)
insurance payments (1,330) (11,695)
other changes (350) (1,844)
Balance sheet as at 31 December 2011 23,776 212,271Deposits 3,798 13,498
returns 2,303 11,987
addition of reserves 834 1,284
Disposal of reserves (827) (2,566)
insurance payments (1,241) (12,587)
other changes (373) (2,701)
Balance sheet as at 31 December 2012 28 269 221 185
Description of insurance productsthe company offers traditional life and pension insurance, unit-linked insurance and non-life insurance. a calculation rate is used to determine provisions and premiums for the traditional products. the highest calculation rate is set by the financial supervisory authority of norway. this interest rate is often called the base rate, and is 2.5 per cent for new contracts. the base rate is the annual guaranteed rate of return on policyhold-ers’ funds. in most unit-linked insurance products, policyholders bear the financial risk. non-life insurance policies are products generating payments related to policyholders’ life and health. these products are not subject to profit sharing and are re-priced annually.
Group contractsunder group defined benefit pensions, pension payments are disbursed from an agreed age and until the death of the policyholder. it can also be agreed that the pension payments cease at a certain age. a defined benefit pension may include a retirement pension, disability pension, dependent’s pension and children’s pension. group defined benefit pensions follow the regulations for the insurance industry effective from 1 january 2008, meaning that policyholders pay in advance an annual premium for interest rate risk, insurance risk and administra-tion. the company is entitled to change the premium annually. interest in excess of the guaranteed rate of return is awarded to policyholders in its entirety. if the interest is between 0 and the guaranteed rate of return, the company can use additional allocations to meet the guaranteed rate of return, otherwise the company must cover the deficit. a positive risk result may either be used to increase the risk equalisation fund or be distributed to the policyholders. no more than 50 per cent of annual profits may be allocated to the risk equalisation fund. the company must cover any remaining losses after the risk equalisation fund has been used. the administration result is allocated in
its entirety to the company. for one year agreements with disability pensions and dependent’s pensions without savings, the risk result is settled directly with the company.
paid-up policies occur when a member exits a pension contract or the pension contract expires. accrued rights at the time of withdrawal continue in paid-up policies. paid-up policies have their own profit model where the customer will be assigned a minimum of 80 per cent of the profit. profit for distribution consists of interest result and risk result. the administration result is allocated in its entirety to the company.
group association insurance is pension insurance taken out by associations for their members. association insurance can comprise retirement pensions, disability pensions, dependent pensions and children’s pensions.
Individual contractsindividual annuity and pension insurance policies are savings schemes whereby the company disburses monthly amounts up until the death of the policyholder, or until the policyholder reaches an agreed age. this usually includes retirement pension, disability pension, dependent’s pension and children’s pension.
individual endowment insurance policies are contracts whereby the company disburses an agreed amount upon the death of the policyholder or when the policyholder attains an agreed age. individual endowment insurance may also include disability cover, which is a one-off benefit for permanent disability.
for individual contracts sold prior to 1 january 2008, the past profit sharing scheme applies. this then implies that the interest result, the risk result and the administration result are included in the profits to be distributed between policyholders and the company. the customer shall have at least 65 per cent of the annual profits. for contracts sold after/from 01 january 2008, new business rules apply as described under group benefit pension.
Contracts in investment choice portfolioDefined-contribution pensions are group pension schemes where the employees bear the financial risk. however, full or partial hedging of the paid amount can be bought.
individual unit-linked insurance polices are endowment insur-ance policies or annuity insurance polices where policyholders bear the financial risk.
Other sectorsgroup life insurance policies are death-risk insurance policies taken out by employers or associations for their employees or members and, where applicable, also for their spouses and children. the amount recoverable under the policy is disbursed upon the death of the policyholder. group life insurance may also comprise disability cover, which is a one-off benefit for
notes DnB livsforsikring annual report 2012 60
permanent disability.
employer’s liability insurance is a one-year risk product which companies link to their pension agreements. this may be corpo-rate group life insurance or accident insurance. occupational injury insurance is mandatory for all enterprises.
Insurance riskinsurance risk at DnB liv is divided, in varying degrees, between policyholders and the company. with respect to the non-life insurance products employers’ liability insurance and certain pure risk products, the company is exposed to insurance risk. for group pension agreements and new individual pension and endowment insurance products, the company’s risk represents its obligation to cover a possible negative risk result, and is credited up to 50 per cent of any positive risk result in the form of allocations to the risk equalisation fund.
the risk result arises when empirical data for mortality, disability and exit risk deviate from the assumptions underlying the calculation base for premiums and provisions. when the risk result generates a surplus, the surplus can be allocated to the risk equalisation fund. the risk equalisation fund cannot exceed 150 per cent of the company’s total risk premiums for the accounting year. if there is a deficit on the risk result, the risk equalisation fund can be used. the risk equalisation fund does not apply to risk insurance with a maximum term of one year, disability pensions and dependent’s pensions without savings, paid-up policies or individual contracts subject to the former profit sharing model.
risk for DnB livsforsikring asa related to changes in mortality rates is twofold. with respect to mortality risk coverage (mainly dependants’ and children’s pensions) lower mortality rates will give an improved risk result and a more limited need for provi-sions. for pensions that are currently payable, lower mortality rates will result in extended disbursement periods and thus require greater provisions. pursuant to sections 9-11 and 9-25 of the norwegian insurance act, it will be possible to cover the required increase in reserves relating to insurance risk by profits from future surpluses on investment results. pure endowment risk, together with disability risk, dominates the company’s insurance risk.
Due to higher life expectancy, DnB liv has strengthened recorded premium reserves by nok 3,733 million in 2012. the provision is split between nok 410 million for individual pensions and nok 3,323 million for group pensions. for individual pensions another nok 70 million will be allocated in 2013, and individual pensions will then be fully funded. the allocations for individual pensions are part of the risk result. for group pensions there is a need for further strengthen-ing of the premium reserve over the next few years. the total provision required may comprise 5-7 per cent of the premium reserve including an allocation already made, depending on whether statistic norway’s low or middle alternative for future
life expectancy assumption is used as basis. the financial supervisory authority of norway has given a general statement that expansion plans based on funding from future interest earnings will be allowed, but has at the same time indicated that it would also be necessary to charge the result to the owner. the level of provision, length of the expansion plan and the size of the contribution of equity is still not clarified.
Disability risk is more exposed to short-term changes. allocations covering incurred, unsettled insurance claims are under continuous review. no further needs for strengthen-ing existing provisions relating to disability pensions or other disability products have been identified.
with respect to existing contracts, insurance risk is subject to continual review by analysing and monitoring risk results within each industry. in addition, the company applies reinsurance as an instrument to reduce insurance risk. the company’s current reinsurance contracts cover catastrophes and significant indi-vidual risks within group and individual insurance. the reinsur-ance agreements imply that DnB liv is responsible for risk up to a certain level, while the reinsurer covers excess risk up to a maximum defined limit.
in order to reduce insurance risk exposure, it is mandatory that policyholders undergo a health check before entering into a contract for individual risk products. individual health checks are also required under small-scale group schemes. in connec-tion with the sale of disability pensions, policyholders are divided into risk categories based on a tangible risk assessment in each individual case.
DnB liv’s operations are concentrated in norway. in this market, the portfolio is well diversified and without any concentrations of risk in specific geographical areas or industries.
NoTe 29 – INSuRANCe RISK (cont.)
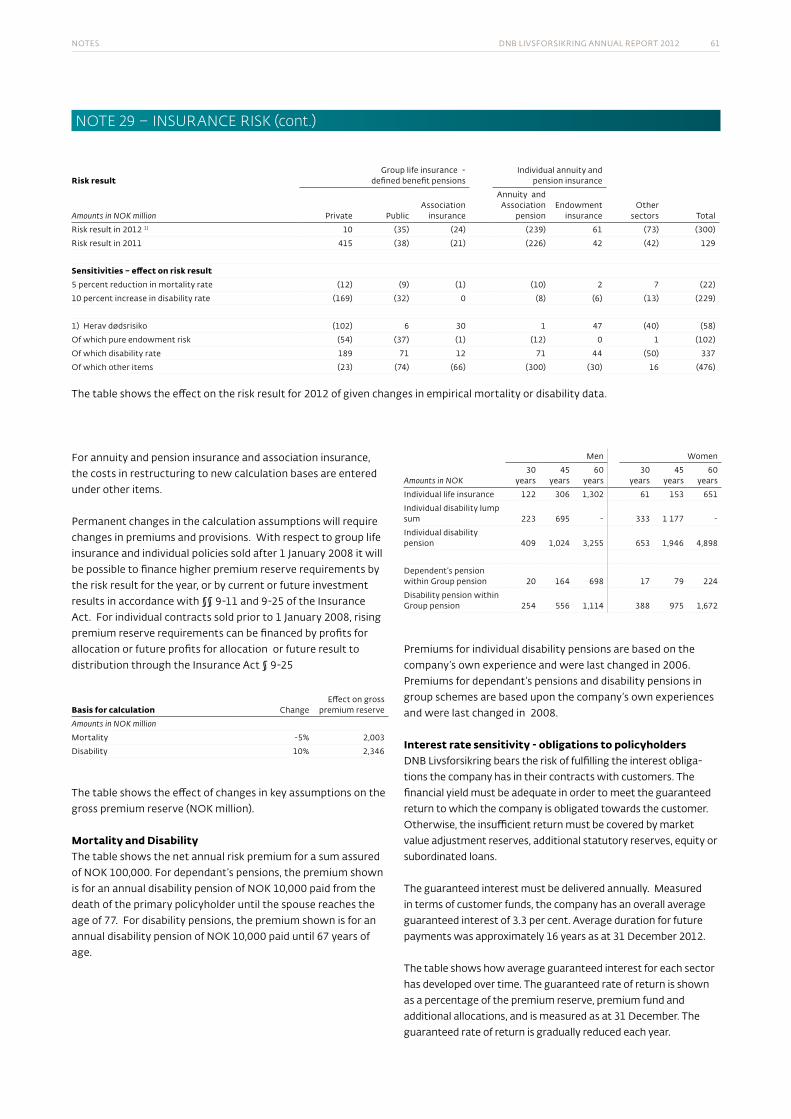
notes DnB livsforsikring annual report 2012 61
Risk resultgroup life insurance -
defined benefit pensionsindividual annuity and
pension insurance
Amounts in NOK million private public association
insurance
annuity and association
pensionendowment
insuranceother
sectors total
risk result in 2012 1) 10 (35) (24) (239) 61 (73) (300)
risk result in 2011 415 (38) (21) (226) 42 (42) 129
Sensitivities – effect on risk result5 percent reduction in mortality rate (12) (9) (1) (10) 2 7 (22)
10 percent increase in disability rate (169) (32) 0 (8) (6) (13) (229)
1) herav dødsrisiko (102) 6 30 1 47 (40) (58)
of which pure endowment risk (54) (37) (1) (12) 0 1 (102)
of which disability rate 189 71 12 71 44 (50) 337
of which other items (23) (74) (66) (300) (30) 16 (476)
the table shows the effect on the risk result for 2012 of given changes in empirical mortality or disability data.
for annuity and pension insurance and association insurance, the costs in restructuring to new calculation bases are entered under other items.
permanent changes in the calculation assumptions will require changes in premiums and provisions. with respect to group life insurance and individual policies sold after 1 january 2008 it will be possible to finance higher premium reserve requirements by the risk result for the year, or by current or future investment results in accordance with §§ 9-11 and 9-25 of the insurance act. for individual contracts sold prior to 1 january 2008, rising premium reserve requirements can be financed by profits for allocation or future profits for allocation or future result to distribution through the insurance act § 9-25
Basis for calculation changeeffect on gross
premium reserve
Amounts in NOK million
mortality -5% 2,003
Disability 10% 2,346
the table shows the effect of changes in key assumptions on the gross premium reserve (nok million).
Mortality and Disabilitythe table shows the net annual risk premium for a sum assured of nok 100,000. for dependant’s pensions, the premium shown is for an annual disability pension of nok 10,000 paid from the death of the primary policyholder until the spouse reaches the age of 77. for disability pensions, the premium shown is for an annual disability pension of nok 10,000 paid until 67 years of age.
men women
Amounts in NOK30
years45
years 60
years30
years 45
years 60
years
individual life insurance 122 306 1,302 61 153 651
individual disability lump sum 223 695 - 333 1 177 -
individual disability pension 409 1,024 3,255 653 1,946 4,898
Dependent’s pension within group pension 20 164 698 17 79 224
Disability pension within group pension 254 556 1,114 388 975 1,672
premiums for individual disability pensions are based on the company’s own experience and were last changed in 2006. premiums for dependant’s pensions and disability pensions in group schemes are based upon the company’s own experiences and were last changed in 2008.
Interest rate sensitivity - obligations to policyholders DnB livsforsikring bears the risk of fulfilling the interest obliga-tions the company has in their contracts with customers. the financial yield must be adequate in order to meet the guaranteed return to which the company is obligated towards the customer. otherwise, the insufficient return must be covered by market value adjustment reserves, additional statutory reserves, equity or subordinated loans.
the guaranteed interest must be delivered annually. measured in terms of customer funds, the company has an overall average guaranteed interest of 3.3 per cent. average duration for future payments was approximately 16 years as at 31 December 2012.
the table shows how average guaranteed interest for each sector has developed over time. the guaranteed rate of return is shown as a percentage of the premium reserve, premium fund and additional allocations, and is measured as at 31 December. the guaranteed rate of return is gradually reduced each year.
NoTe 29 – INSuRANCe RISK (cont.)
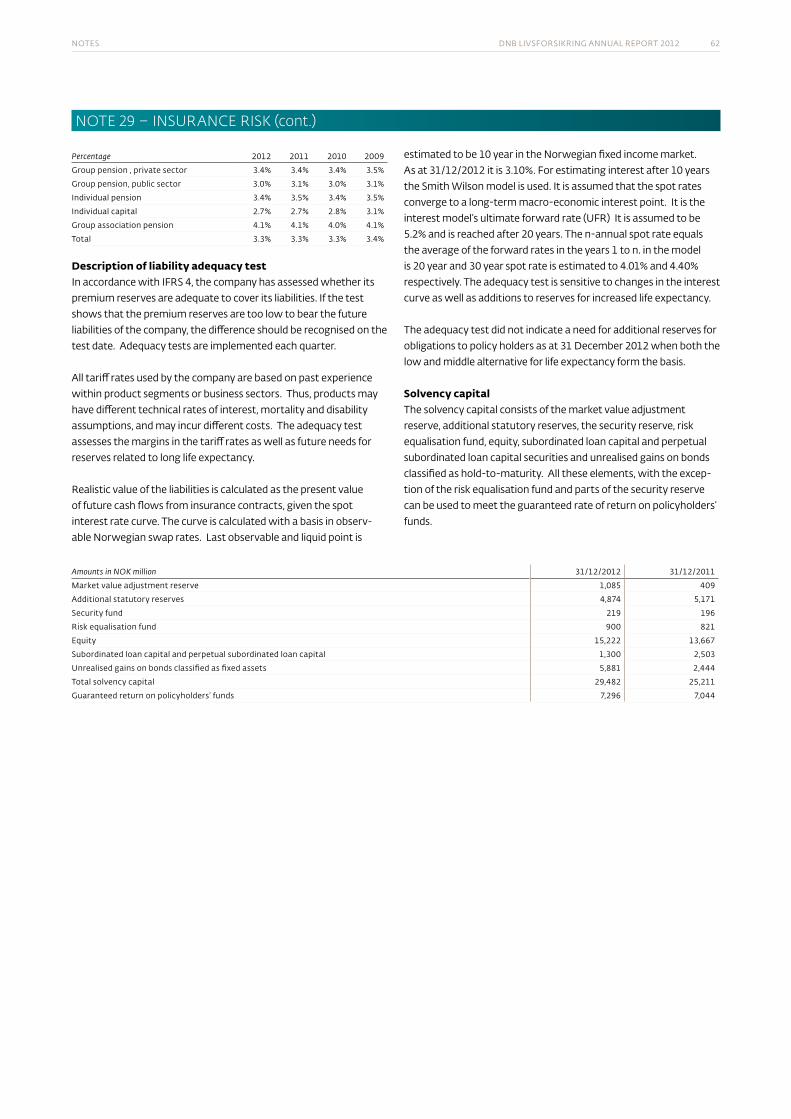
notes DnB livsforsikring annual report 2012 62
Percentage 2012 2011 2010 2009
group pension , private sector 3.4% 3.4% 3.4% 3.5%
group pension, public sector 3.0% 3.1% 3.0% 3.1%
individual pension 3.4% 3.5% 3.4% 3.5%
individual capital 2.7% 2.7% 2.8% 3.1%
group association pension 4.1% 4.1% 4.0% 4.1%
total 3.3% 3.3% 3.3% 3.4%
Description of liability adequacy testin accordance with ifrs 4, the company has assessed whether its premium reserves are adequate to cover its liabilities. if the test shows that the premium reserves are too low to bear the future liabilities of the company, the difference should be recognised on the test date. adequacy tests are implemented each quarter.
all tariff rates used by the company are based on past experience within product segments or business sectors. thus, products may have different technical rates of interest, mortality and disability assumptions, and may incur different costs. the adequacy test assesses the margins in the tariff rates as well as future needs for reserves related to long life expectancy.
realistic value of the liabilities is calculated as the present value of future cash flows from insurance contracts, given the spot interest rate curve. the curve is calculated with a basis in observ-able norwegian swap rates. last observable and liquid point is
estimated to be 10 year in the norwegian fixed income market. as at 31/12/2012 it is 3.10%. for estimating interest after 10 years the smith wilson model is used. it is assumed that the spot rates converge to a long-term macro-economic interest point. it is the interest model’s ultimate forward rate (ufr) it is assumed to be 5.2% and is reached after 20 years. the n-annual spot rate equals the average of the forward rates in the years 1 to n. in the model is 20 year and 30 year spot rate is estimated to 4.01% and 4.40% respectively. the adequacy test is sensitive to changes in the interest curve as well as additions to reserves for increased life expectancy.
the adequacy test did not indicate a need for additional reserves for obligations to policy holders as at 31 December 2012 when both the low and middle alternative for life expectancy form the basis.
Solvency capitalthe solvency capital consists of the market value adjustment reserve, additional statutory reserves, the security reserve, risk equalisation fund, equity, subordinated loan capital and perpetual subordinated loan capital securities and unrealised gains on bonds classified as hold-to-maturity. all these elements, with the excep-tion of the risk equalisation fund and parts of the security reserve can be used to meet the guaranteed rate of return on policyholders’ funds.
Amounts in NOK million 31/12/2012 31/12/2011
market value adjustment reserve 1,085 409
additional statutory reserves 4,874 5,171
security fund 219 196
risk equalisation fund 900 821
equity 15,222 13,667
subordinated loan capital and perpetual subordinated loan capital 1,300 2,503
unrealised gains on bonds classified as fixed assets 5,881 2,444
total solvency capital 29,482 25,211
guaranteed return on policyholders’ funds 7,296 7,044
NoTe 29 – INSuRANCe RISK (cont.)
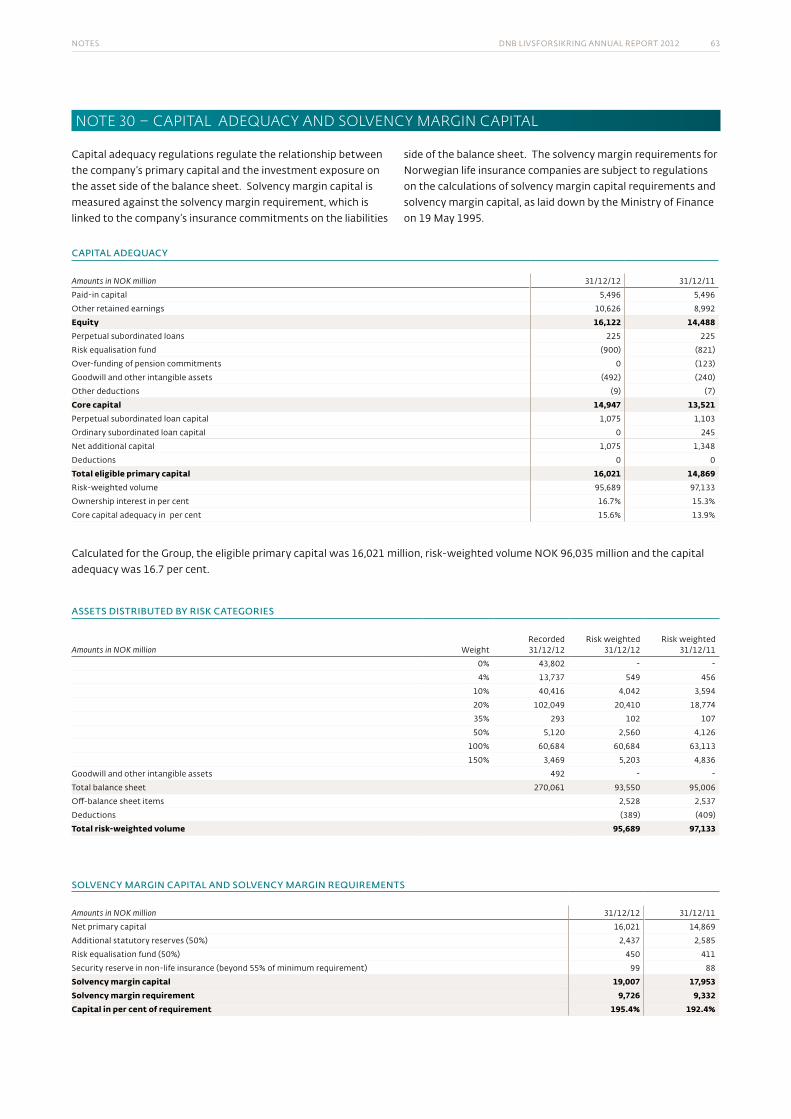
notes DnB livsforsikring annual report 2012 63
NoTe 30 – CApITAL ADeQuACY AND SoLVeNCY mARGIN CApITAL
capital adequacy regulations regulate the relationship between the company’s primary capital and the investment exposure on the asset side of the balance sheet. solvency margin capital is measured against the solvency margin requirement, which is linked to the company’s insurance commitments on the liabilities
side of the balance sheet. the solvency margin requirements for norwegian life insurance companies are subject to regulations on the calculations of solvency margin capital requirements and solvency margin capital, as laid down by the ministry of finance on 19 may 1995.
capital adequacy
Amounts in NOK million 31/12/12 31/12/11
paid-in capital 5,496 5,496
other retained earnings 10,626 8,992
Equity 16,122 14,488perpetual subordinated loans 225 225
risk equalisation fund (900) (821)
over-funding of pension commitments 0 (123)
goodwill and other intangible assets (492) (240)
other deductions (9) (7)
Core capital 14,947 13,521perpetual subordinated loan capital 1,075 1,103
ordinary subordinated loan capital 0 245
net additional capital 1,075 1,348
Deductions 0 0
Total eligible primary capital 16,021 14,869risk-weighted volume 95,689 97,133
ownership interest in per cent 16.7% 15.3%
core capital adequacy in per cent 15.6% 13.9%
calculated for the group, the eligible primary capital was 16,021 million, risk-weighted volume nok 96,035 million and the capital adequacy was 16.7 per cent.
assets distributed by risk cateGOries
Amounts in NOK million weightrecorded 31/12/12
risk weighted 31/12/12
risk weighted 31/12/11
0% 43,802 - -
4% 13,737 549 456
10% 40,416 4,042 3,594
20% 102,049 20,410 18,774
35% 293 102 107
50% 5,120 2,560 4,126
100% 60,684 60,684 63,113
150% 3,469 5,203 4,836
goodwill and other intangible assets 492 - -
total balance sheet 270,061 93,550 95,006
off-balance sheet items 2,528 2,537
Deductions (389) (409)
Total risk-weighted volume 95,689 97,133
sOlvency marGin capital and sOlvency marGin requirements
Amounts in NOK million 31/12/12 31/12/11
net primary capital 16,021 14,869
additional statutory reserves (50%) 2,437 2,585
risk equalisation fund (50%) 450 411
security reserve in non-life insurance (beyond 55% of minimum requirement) 99 88
Solvency margin capital 19,007 17,953Solvency margin requirement 9,726 9,332Capital in per cent of requirement 195.4% 192.4%
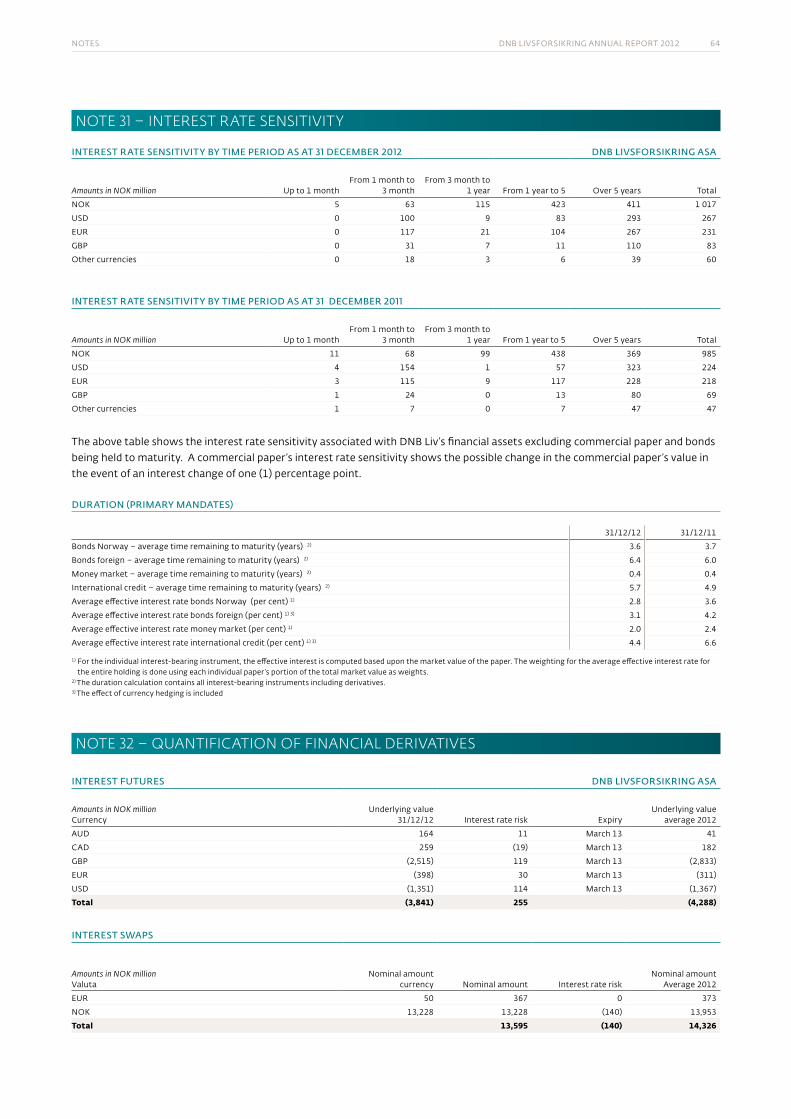
notes DnB livsforsikring annual report 2012 64
NoTe 31 – INTeReST RATe SeNSITIVITY
interest rate sensitivity by time periOd as at 31 december 2012 dnb livsfOrsikrinG asa
Amounts in NOK million up to 1 monthfrom 1 month to
3 monthfrom 3 month to
1 year from 1 year to 5 over 5 years total
nok 5 63 115 423 411 1 017
usD 0 100 9 83 293 267
eur 0 117 21 104 267 231
gBp 0 31 7 11 110 83
other currencies 0 18 3 6 39 60
interest rate sensitivity by time periOd as at 31 december 2011
Amounts in NOK million up to 1 monthfrom 1 month to
3 monthfrom 3 month to
1 year from 1 year to 5 over 5 years total
nok 11 68 99 438 369 985
usD 4 154 1 57 323 224
eur 3 115 9 117 228 218
gBp 1 24 0 13 80 69
other currencies 1 7 0 7 47 47
the above table shows the interest rate sensitivity associated with DnB liv’s financial assets excluding commercial paper and bonds being held to maturity. a commercial paper’s interest rate sensitivity shows the possible change in the commercial paper’s value in the event of an interest change of one (1) percentage point.
duratiOn (primary mandates)
31/12/12 31/12/11
Bonds norway – average time remaining to maturity (years) 2) 3.6 3.7
Bonds foreign – average time remaining to maturity (years) 2) 6.4 6.0
money market – average time remaining to maturity (years) 2) 0.4 0.4
international credit – average time remaining to maturity (years) 2) 5.7 4.9
average effective interest rate bonds norway (per cent) 1) 2.8 3.6
average effective interest rate bonds foreign (per cent) 1) 3) 3.1 4.2
average effective interest rate money market (per cent) 1) 2.0 2.4
average effective interest rate international credit (per cent) 1) 3) 4.4 6.6
1) for the individual interest-bearing instrument, the effective interest is computed based upon the market value of the paper. the weighting for the average effective interest rate for the entire holding is done using each individual paper’s portion of the total market value as weights.
2) the duration calculation contains all interest-bearing instruments including derivatives.3) the effect of currency hedging is included
NoTe 32 – QuANTIfICATIoN of fINANCIAL DeRIVATIVeS
interest futures dnb livsfOrsikrinG asa
Amounts in NOK millioncurrency
underlying value 31/12/12 interest rate risk expiry
underlying value average 2012
auD 164 11 march 13 41
caD 259 (19) march 13 182
gBp (2,515) 119 march 13 (2,833)
eur (398) 30 march 13 (311)
usD (1,351) 114 march 13 (1,367)
Total (3,841) 255 (4,288)
interest sWaps
Amounts in NOK millionvaluta
nominal amount currency nominal amount interest rate risk
nominal amount average 2012
eur 50 367 0 373
nok 13,228 13,228 (140) 13,953
Total 13,595 (140) 14,326
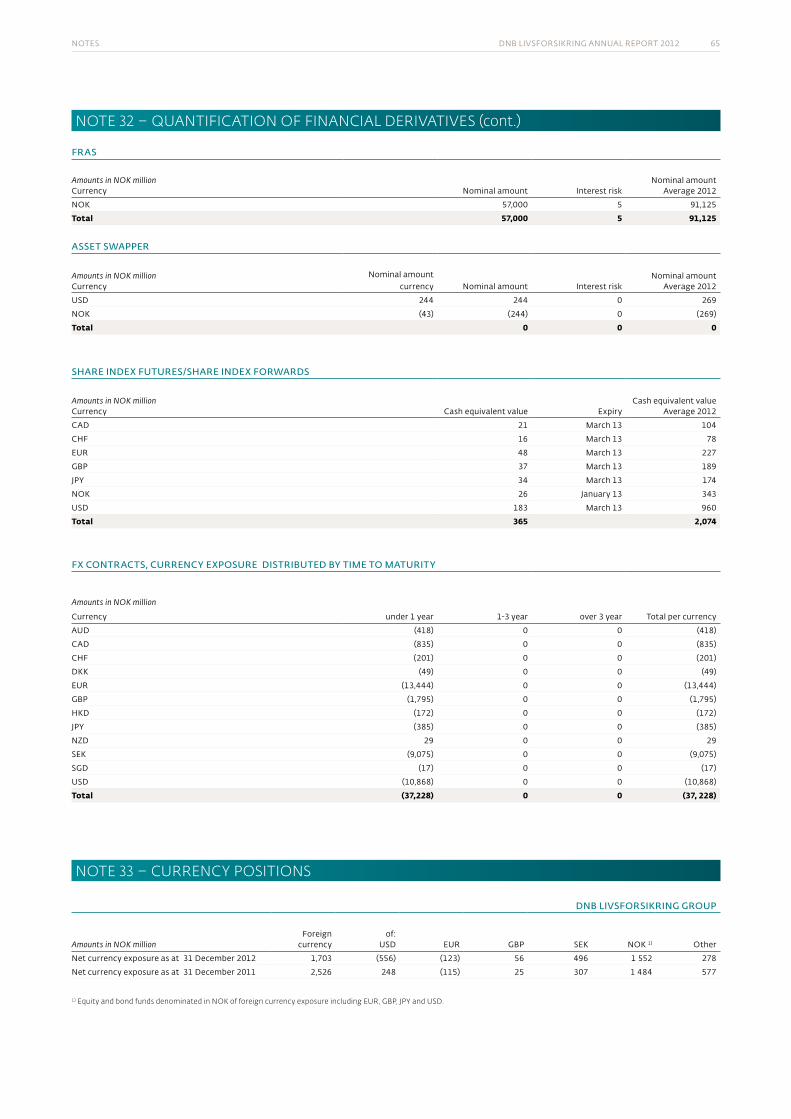
notes DnB livsforsikring annual report 2012 65
fras
Amounts in NOK million currency nominal amount interest risk
nominal amount average 2012
nok 57,000 5 91,125
Total 57,000 5 91,125
asset sWapper
Amounts in NOK million currency
nominal amount currency nominal amount interest risk
nominal amount average 2012
usD 244 244 0 269
nok (43) (244) 0 (269)
Total 0 0 0
share index futures/share index fOrWards
Amounts in NOK million currency cash equivalent value expiry
cash equivalent value average 2012
caD 21 march 13 104
chf 16 march 13 78
eur 48 march 13 227
gBp 37 march 13 189
jpy 34 march 13 174
nok 26 january 13 343
usD 183 march 13 960
Total 365 2,074
fx cOntracts, currency expOsure distributed by time tO maturity
Amounts in NOK million
currency under 1 year 1-3 year over 3 year total per currency
auD (418) 0 0 (418)
caD (835) 0 0 (835)
chf (201) 0 0 (201)
Dkk (49) 0 0 (49)
eur (13,444) 0 0 (13,444)
gBp (1,795) 0 0 (1,795)
hkD (172) 0 0 (172)
jpy (385) 0 0 (385)
nZD 29 0 0 29
sek (9,075) 0 0 (9,075)
sgD (17) 0 0 (17)
usD (10,868) 0 0 (10,868)
Total (37,228) 0 0 (37, 228)
NoTe 33 – CuRReNCY poSITIoNS
dnb livsfOrsikrinG GrOup
Amounts in NOK millionforeign
currency of:
usD eur gBp sek nok 1) other
net currency exposure as at 31 December 2012 1,703 (556) (123) 56 496 1 552 278
net currency exposure as at 31 December 2011 2,526 248 (115) 25 307 1 484 577
1) equity and bond funds denominated in NoK of foreign currency exposure including euR, GBp, JpY and uSD.
NoTe 32 – QuANTIfICATIoN of fINANCIAL DeRIVATIVeS (cont.)
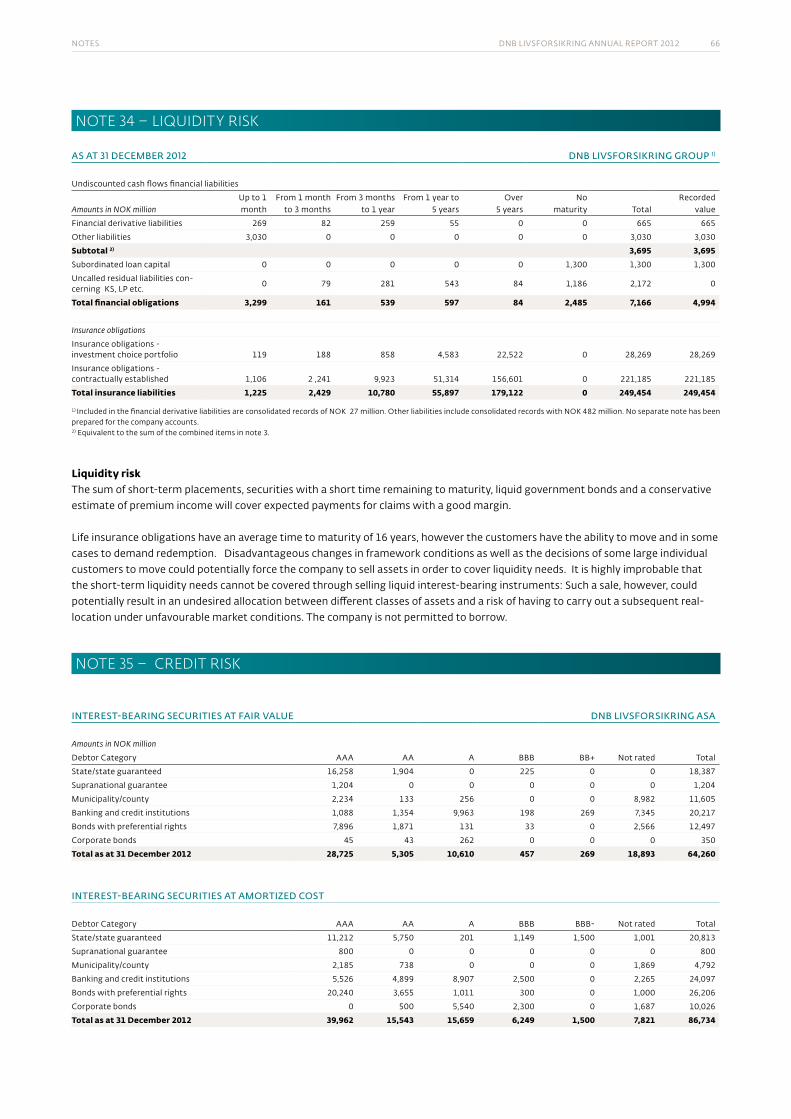
notes DnB livsforsikring annual report 2012 66
NoTe 34 – LIQuIDITY RISK
as at 31 december 2012 dnb livsfOrsikrinG GrOup 1)
undiscounted cash flows financial liabilities
Amounts in NOK millionup to 1 month
from 1 month to 3 months
from 3 months to 1 year
from 1 year to 5 years
over5 years
no maturity total
recorded value
financial derivative liabilities 269 82 259 55 0 0 665 665
other liabilities 3,030 0 0 0 0 0 3,030 3,030
Subtotal 2) 3,695 3,695subordinated loan capital 0 0 0 0 0 1,300 1,300 1,300
uncalled residual liabilities con-cerning ks, lp etc.
0 79 281 543 84 1,186 2,172 0
Total financial obligations 3,299 161 539 597 84 2,485 7,166 4,994
Insurance obligations
insurance obligations - investment choice portfolio 119 188 858 4,583 22,522 0 28,269 28,269
insurance obligations - contractually established 1,106 2 ,241 9,923 51,314 156,601 0 221,185 221,185
Total insurance liabilities 1,225 2,429 10,780 55,897 179,122 0 249,454 249,454
1) included in the financial derivative liabilities are consolidated records of nok 27 million. other liabilities include consolidated records with nok 482 million. no separate note has been prepared for the company accounts.2) equivalent to the sum of the combined items in note 3.
Liquidity risk the sum of short-term placements, securities with a short time remaining to maturity, liquid government bonds and a conservative estimate of premium income will cover expected payments for claims with a good margin.
life insurance obligations have an average time to maturity of 16 years, however the customers have the ability to move and in some cases to demand redemption. Disadvantageous changes in framework conditions as well as the decisions of some large individual customers to move could potentially force the company to sell assets in order to cover liquidity needs. it is highly improbable that the short-term liquidity needs cannot be covered through selling liquid interest-bearing instruments: such a sale, however, could potentially result in an undesired allocation between different classes of assets and a risk of having to carry out a subsequent real-location under unfavourable market conditions. the company is not permitted to borrow.
NoTe 35 – CReDIT RISK
interest-bearinG securities at fair value dnb livsfOrsikrinG asa
Amounts in NOK million
Debtor category aaa aa a BBB BB+ not rated total
state/state guaranteed 16,258 1,904 0 225 0 0 18,387
supranational guarantee 1,204 0 0 0 0 0 1,204
municipality/county 2,234 133 256 0 0 8,982 11,605
Banking and credit institutions 1,088 1,354 9,963 198 269 7,345 20,217
Bonds with preferential rights 7,896 1,871 131 33 0 2,566 12,497
corporate bonds 45 43 262 0 0 0 350
Total as at 31 December 2012 28,725 5,305 10,610 457 269 18,893 64,260
interest-bearinG securities at amOrtized cOst
Debtor category aaa aa a BBB BBB- not rated total
state/state guaranteed 11,212 5,750 201 1,149 1,500 1,001 20,813
supranational guarantee 800 0 0 0 0 0 800
municipality/county 2,185 738 0 0 0 1,869 4,792
Banking and credit institutions 5,526 4,899 8,907 2,500 0 2,265 24,097
Bonds with preferential rights 20,240 3,655 1,011 300 0 1,000 26,206
corporate bonds 0 500 5,540 2,300 0 1,687 10,026
Total as at 31 December 2012 39,962 15,543 15,659 6,249 1,500 7,821 86,734
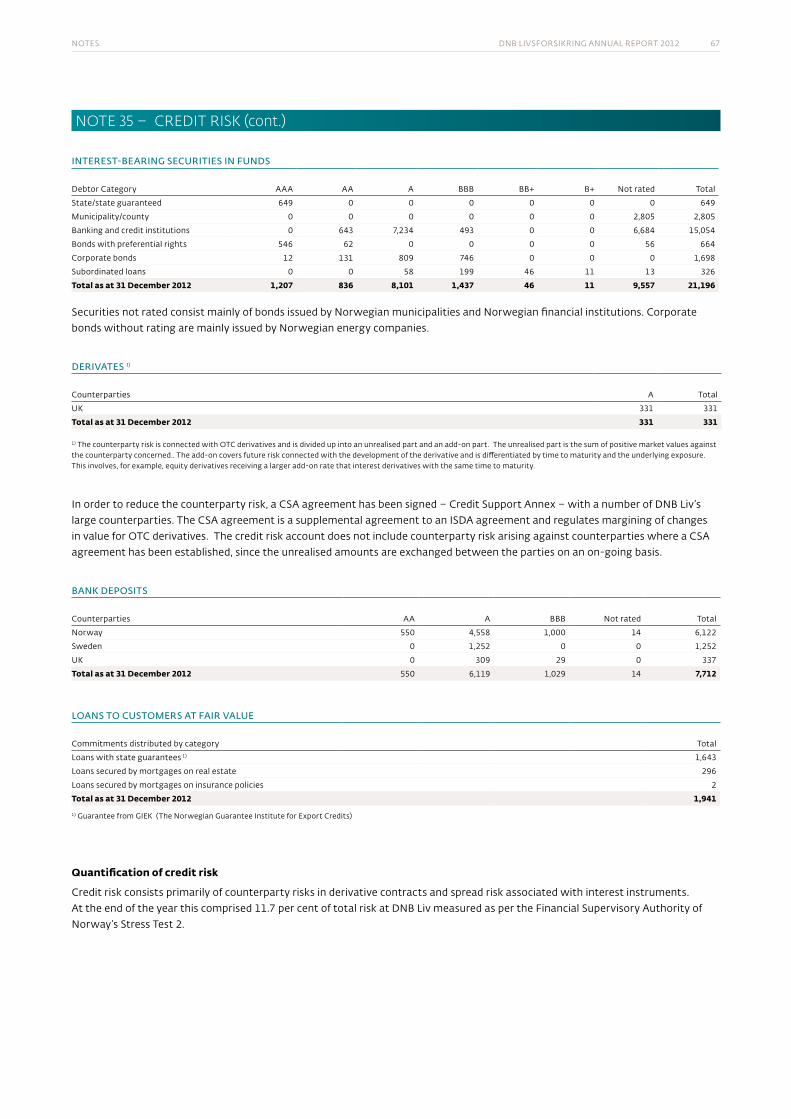
notes DnB livsforsikring annual report 2012 67
NoTe 35 – CReDIT RISK (cont.)
interest-bearinG securities in funds
Debtor category aaa aa a BBB BB+ B+ not rated total
state/state guaranteed 649 0 0 0 0 0 0 649
municipality/county 0 0 0 0 0 0 2,805 2,805
Banking and credit institutions 0 643 7,234 493 0 0 6,684 15,054
Bonds with preferential rights 546 62 0 0 0 0 56 664
corporate bonds 12 131 809 746 0 0 0 1,698
subordinated loans 0 0 58 199 46 11 13 326
Total as at 31 December 2012 1,207 836 8,101 1,437 46 11 9,557 21,196
securities not rated consist mainly of bonds issued by norwegian municipalities and norwegian financial institutions. corporate bonds without rating are mainly issued by norwegian energy companies.
derivates 1)
counterparties a total
uk 331 331
Total as at 31 December 2012 331 331
1) the counterparty risk is connected with otc derivatives and is divided up into an unrealised part and an add-on part. the unrealised part is the sum of positive market values against the counterparty concerned.. the add-on covers future risk connected with the development of the derivative and is differentiated by time to maturity and the underlying exposure. this involves, for example, equity derivatives receiving a larger add-on rate that interest derivatives with the same time to maturity.
in order to reduce the counterparty risk, a csa agreement has been signed – credit support annex – with a number of DnB liv’s large counterparties. the csa agreement is a supplemental agreement to an isDa agreement and regulates margining of changes in value for otc derivatives. the credit risk account does not include counterparty risk arising against counterparties where a csa agreement has been established, since the unrealised amounts are exchanged between the parties on an on-going basis.
bank depOsits
counterparties aa a BBB not rated total
norway 550 4,558 1,000 14 6,122
sweden 0 1,252 0 0 1,252
uk 0 309 29 0 337
Total as at 31 December 2012 550 6,119 1,029 14 7,712
lOans tO custOmers at fair value
commitments distributed by category total
loans with state guarantees 1) 1,643
loans secured by mortgages on real estate 296
loans secured by mortgages on insurance policies 2
Total as at 31 December 2012 1,941
1) guarantee from giek (the norwegian guarantee institute for export credits)
Quantification of credit risk
credit risk consists primarily of counterparty risks in derivative contracts and spread risk associated with interest instruments. at the end of the year this comprised 11.7 per cent of total risk at DnB liv measured as per the financial supervisory authority of norway’s stress test 2.
notes DnB livsforsikring annual report 2012 68
NoTe 36 – RemuNeRATIoN, eTC.
INFORMATION ON DNB’S REMUNERATION SCHEMEregulation on remuneration schemes in financial institutions , etc., established by the ministry of finance 1 December 2010, the remuneration regulation, states that the company shall make public information on the main principles for determina-tion of remuneration, criteria for determination of variable remuneration, if any, as well as quantitative information on remuneration of senior management, of employees with responsibilities of particular significance for the company’s risk exposure, of employees with supervisory responsibilities and elected representatives with corresponding remuneration. the information in this note, including the Board’s statement on determination of salary and other remuneration to senior management set out below, comprises such information as follows by the remuneration regulation.
corporate guidelines for remunerations in the DnB group apply to total remunerations for all employees in the DnB group. the guidelines comprise monetary remunerations (basic salary, short- and long-term incentives), employee benefits (pension, personnel insurance and other employee benefits) as well as development and career (training and development programmes, career programmes and other non-monetary remunerations).
the guidelines determine that total remunerations shall be given based on an overall assessment of the group’s results as well as the unit’s and each employee’s contribution to value creation. total remuneration shall be designed in such a way that it does not contribute to cause the group unwanted risk. the remuner-ation shall be competitive, but at the same time cost-effective for the group.
the guidelines also determine that monetary remuneration shall consist of a basic salary as well as a variable portion where appropriate. the basic salary shall be remuneration for the responsibility, demands and complexity associated with the position, while variable salary shall stimulate additional perfor-mance and desired behaviour.
in 2011, DnB implemented new corporate guidelines for variable remuneration in order to ensure compliance with the remunera-tion regulation. hereunder are adopted separate guidelines for variable remuneration for senior management, employees with responsibilities of particular significance for the company’s risk exposure (risk takers) as well as employees responsible for independent supervisory functions. the separate guidelines shall contribute to discouraging excessive risk-taking and promote a healthy and efficient risk handling.
variable remuneration in DnB shall promote long-term profit-ability and be determined on the basis of target figures based on financial and non-financial measurements. otherwise a comprehensive assessment shall take placed based on, among other things, compliance with group values and manage-ment principles. the variable remuneration schemes shall be
documented in a process consisting of establishing, follow-up and evaluation of goals and goal achievement, and a process for allocation and payment of variable remuneration.
The Board will submit the following guidelines for compen-sation for voting at the Annual General Meeting in accord-ance with the Public Limited Companies Act § 6-16a:
“The Board’s declaration on determination of salary and other remuneration to senior management.”
DnB’s guidelines for determination of remuneration to the group chief executive and other senior executives shall at all times support the prevailing strategy and core values and contribute to attaining the group’s goals. the remuneration shall promote behaviour which builds the desired culture in relation to performance and result orientation. the Board has, in connection with submitting this declaration, made a decision which involves changes to the principles for determination of variable remuneration compared to previously submitted declarations.
Decision-making processthe Board of Directors in DnB asa has established a compensa-tion committee consisting of three members: the chairman of the Board, the vice-chairman and one board member.
the compensation committee prepares matters for the Board of Directors and has the following main responsibilities:
▪ annually evaluate and present its recommendations regar-ding the total remuneration awarded to the group chief executive
▪ annually prepare a recommendation for the group chief executive’s score card
▪ Based on suggestions from the group chief executive, decide the remuneration and other key benefits awarded to the group executive vice president, group audit
▪ act in an advisory capacity to the group chief executive regarding remunerations and other key benefits for members of the group management team and, when applicable, for others who report to the group chief executive
▪ consider other matters as decided by the Board of Directors and/or the compensation committee
▪ evaluate other personnel-related issues which can be assumed to entail great risk to the group’s reputation
A. GUIDELINES FOR THE COMING ACCOUNTING YEARRemuneration to the Group chief executivethe total remuneration to the group chief executive consists of basic salary (main element), benefits in kind, variable salary, and pension and insurance schemes. the total remuneration is determined based on a total evaluation, and the variable part of the salary is primarily based on the following elements: financial risk-adjusted performance, corporate return on equity, customer satisfaction, corporate core tier capital (core equity tier 1 - ratio), corporate nominal charges and measurement of the DnB
notes DnB livsforsikring annual report 2012 69
group’s customer satisfaction and reputation. in addition, the total evaluation will be linked to adherence to the group’s vision, values, ethical guidelines and management principles.
the basic salary is subject to an annual evaluation and is deter-mined based on general salary levels in the labour market and especially in the financial industry.
variable salary to the group chief executive is determined based on specific performance measurements of defined target areas stipulated in the group chief executive’s score card and an overall discretionary assessment. variable salary cannot exceed 50 per cent of fixed salary. the group chief executive is not awarded performance-based payments other than the stated bonus.
in addition to variable salary, the group chief executive can be granted benefits in kind such as company car, newspapers/periodicals and telephone schemes. Benefits in kind should be relevant to the group chief executive’s function or in line with market practice, and should not be significant relative to the group chief executive’s basic salary.
the Board of Directors will respect the agreement entered into with the group chief executive, whereby his retirement age is 60 years with a pension representing 70 per cent of fixed salary. if employment is terminated prior to the age of 60, the pension will be paid from the age of 60 with the deduction of 1/14 of the pension amount for each full year remaining until the age of 60. according to the agreement, the group chief executive is entitled to a termination payment for two years if employ-ment is terminated prior to the age of 60. if, during this period, the group chief executive receives income from other employ-ment, the termination payment will be reduced by an amount corresponding to the salary received from this employment. additional benefits are retained for a period of three months.
Remuneration to other senior executivesthe group chief executive determines the remunerations to senior executives in agreement with the chairman of the Board of Directors. the Board of Directors will honour existing binding agreements.
the total remuneration to senior executives consists of basic salary (main element), benefits in kind, variable salary, and pension and insurance schemes. the total remuneration is determined on the basis of the need to give competitive condi-tions in the various business areas. the remunerations should promote the group’s competitiveness in the relevant labour market, as well as the group’s profitability, including the desired trend in income and costs. the total remuneration must neither pose a threat to DnB’s reputation nor be market-leading, but should ensure that DnB attracts and retains senior executives with the desired skills and experience.
the basic salary is subject to an annual evaluation and is
determined based on general salary levels in the labour market and especially in the financial industry.
Benefits in kind may be offered to senior executives to the extent the benefits have a relevant connection to the employee’s func-tion in the group or are in line with market practice. the benefits should not be substantial in relation to the employee’s fixed salary.
Corporate guidelines for variable remunerationDnB has in 2011 implemented new corporate guidelines for variable remuneration in order to ensure compliance to the remuneration regulation and the financial supervisory authority of norway’s circular no. 11/2011 on remuneration schemes in financial institutions, securities firms and fund management companies, dated 21 february 2011.
the purpose of DnB’s variable remuneration scheme is to reward behaviour and influence culture which ensure long-term value creation. the scheme is designed in accordance with the group’s reward policy and general guidelines adopted by the Board’s compensation committee. the group chief executive has the overall operational responsibility for the group’s scheme in accordance with the prevailing guidelines.
for the group’s international branches and subsidiaries, the respective national authorities have determined local laws, regulations and guidelines. there may be legal challenges for the group’s international affiliates and subsidiaries, since there will be cases where the norwegian regulation and guidelines do not correspond with local laws and local rules for remuneration in financial institutions. in such instances, the group will seek advice from the financial supervisory authority of norway, and international expertise, to ensure a practice that is in accordance with both norwegian and local regulations.
variable salary is determined based on specific performance measurements of defined target areas stipulated in the execu-tive’s scorecard and an overall discretionary judgement linked to adherence to the group’s vision, values, ethical guidelines and management principles. the scheme should be performance-based without being risk-promoting. further it should prevent exposing the group to unwanted risk as well as promote healthy and efficient risk handling in DnB. there is an upper limit for payment of variable remuneration (bonus) of up to 50 per cent of fixed salary for senior executives.
the corporate guidelines for variable remuneration shall ensure that the group’s schemes prevent excessive risk-taking as well as achieve and maintain a healthy and robust capital adequacy and long-term profitability. the scheme shall promote healthy and efficient risk handling in DnB. the scheme shall ensure that the total remuneration supports the group’s strategy and interests.
DnB’s variable remuneration scheme is global, although non-norwegian branches and subsidiaries will be subject to local legislation, regulations and guidelines.
NoTe 36 – RemuNeRATIoN, eTC. (cont.)
notes DnB livsforsikring annual report 2012 70
Goal structure 2013the Board’s compensation committee approves the overall criteria, principles and framework for variable remuneration. the Board’s compensation committee has for 2013 decided that recorded returns, core capital and cost level shall be the group’s key figures. in addition to the financial key figures, measurement of the group’s customer satisfaction and reputation are used.
the group’s financial target figures are broken down into relevant variables for the various business and support areas and corporate staff, in order to support the implementation of new regulations associated with capital adequacy and liquidity as much as possible.
the above mentioned goal will form the basis for the score cards and will be the fundamental elements when the accrued variable remuneration for 2013 is to be calculated and paid. all financial variables are defined and communicated to the relevant busi-ness and support areas and corporate staff as part of the work with the score cards for 2013.
Calculation of variable remuneration for 2013calculation of accrued variable remuneration for 2013 will consist of the following elements:
▪ fixed individual maximum limits for variable remuneration ▪ calculation of goal achievement on established criteria in the
score card ▪ comprehensive assessment which evaluates compliance with
core values, management principles and general evaluation of the individual’s contribution to the unit’s goal achievement.
the Board will set an upper total limit for bonuses for the group based on achievement of corporate goals, combined with an overall assessment of other important parameters as well as the group’s financial capacity.
Additional requirements for senior executives, identified risk takers and independent control functionsDnB has developed and implemented special guidelines for identified risk takers, independent control functions and senior management, hereinafter referred to as risk takers. the special guidelines complement the general corporate guidelines for variable remuneration and are designed in accordance with the remuneration regulation.
for risk takers, the following main principles for variable remu-neration apply:
▪ two-year vesting period ▪ a minimum of 50 per cent of the accrued variable remune-
ration is paid deferred and conditional in DnB equities. the equities portion is divided into 3 parts with a holding period (deferred and conditional) with 1/3 each year over three years. the deferred and conditional payment will follow the provisions of the remuneration regulation.
Pensions, etc.pension schemes and any agreements on termination payments
etc. should be considered relative to other remuneration and should ensure competitive terms. the various components in pension schemes and severance pay, either alone or together, must not be such that they could pose a threat to DnB’s reputation.
as a main rule, senior executives are entitled to a pension at the age of 65, though this can be deviated from. in accordance with the group’s pension scheme for all employees, defined-benefit pension entitlements should not exceed 70 per cent of fixed salary and should comprise maximum 12 times the national insurance basic amount. however, the DnB group will honour existing agreements. with effect from 1 january 2011, a defined contribu-tion based pension plan was introduced to the group, limited to a maximum of pensionable income up to 12 times the basic amount. at the same time, the group’s defined benefit based pension plan was closed for new members from 31 December 2010.
as a main rule, no termination payment agreements will be signed. however, the DnB group will honour existing agreements.
when entering into new agreements, the guidelines generally apply and comprise all senior executives.
see table of remunerations for senior executives.
B. BINDING GUIDELINES FOR SHARES, SUBSCRIPTION RIGHTS, OPTIONS, ETC. FOR THE COMING ACCOUNTING YEARan amount corresponding to 50 per cent of the gross earned variable salary of the group chief executive and senior execu-tives is invested in shares in DnB asa with a minimum holding period of one year for one third, two years for one third, and three years for one third.
no additional shares, subscription rights, options or other forms of remuneration only linked to shares or only to developments in the share price of the company or other companies within the group, will be awarded to the group chief executive or senior executives. however, the ceo and senior executives receive, like other employees in the DnB group, the opportunity to partici-pate in a subscription programme for employees.
C. STATEMENT ON THE SENIOR EXECUTIVE SALARY POLICY IN THE PREVIOUS ACCOUNTING YEARcorporate guidelines determined in 2011 have been followed.
D. STATEMENT ON THE EFFECTS FOR THE COMPANY AND THE SHAREHOLDERS OF REMUNERATION AGREEMENTS AWARDING SHARES, SUBSCRIPTION RIGHTS, OPTIONS, ETC. of variable salary accrued in 2012 to group chief executive and senior executives, an amount corresponding to 50 per cent of the accrued variable salary is invested in shares in DnB asa measured in the total number of shares. in the company, the Board of Directors believes that the awarding of shares to senior executives will have no negative consequences for the company or the shareholders.
NoTe 36 – RemuNeRATIoN, eTC. (cont.)

notes DnB livsforsikring annual report 2012 71
remuneratiOn, etc. fOr 2012the table is set up to show the rights accrued during period.
Amounts in thousand NOK
Basic annual salary
31/12/12 1)
paid remune-
ration 2012 2)
paid salary 2012 3)
Bonus earned in
2012
Benefits in-kind and other kind
in 2012
total benefits
earned in 2012
Bonus earned in
2011
loans as at 31 Dec. 2012 4)
accrued pension costs 5)
present value of pension
agreement 5)
Board of Directors of DNB rune Bjerke, chairman 4,920 5,213 1 713 272 7,198 1,655 262 4,987 20,202
Bjørn erik næss, vice-chairman 3,511 3,684 1 217 177 5,079 1,233 2,027 5,301 18,394
cathrine klouman 2,314 2,434 730 178 3,341 803 3,203 1,472 9,063
lars rosén 210 210
tove e. pettersen 210 210 1,853
rune selmar (until 30/07/12) 103 103
arthur sletteberg (from 22/11/12) 117 117 2
karin Bing orgland 2,960 3,077 912 178 4,168 879 3,794 1,510 18,659
jørn kvilhaug, employee elected 1,045 223 1,058 18 15 1,314 98 653 198 5,217
oddmunn johan olsen, employee elected
598 210 632 18 11 872 18 2,069 65 1,539
Britt sæle, employee elected 396 220 403 18 15 656 18 27 47 210
Senior management group of DNB Livsforsikringtom rathke, Director 6) 3,086 3,396 1,042 181 4,619 991 4,413 2,570 16,909
anders skjævestad, Deputy managing Director 1,730 1,786 329 152 2,267 298 4,370 617 3,929
truls cook tollefsen, Director of finance 1,595 1,670 437 156 2,263 427 4,075 410 2,357
hanne langseth, Director of products (until 31/01/12)
1,260 1,307 18 35 1,360 18 1,640 394 3,904
Britt iren spjeld, Director of Distribution 1,240 1,270 176 147 1,592 174 10 408 2,870
geir sæbdal, Director of operations and customer service
1,285 1,327 207 145 1,679 214 2,266 371 3,502
Bengt olav lund, Director of sales 1,555 1,464 549 140 2,153 518 12
egil heilund (from 26/04/12) 1,325 1,355 18 134 1,507 37 2,858 167 699
Control Committeefrode hassel, chairman 395 395
thorstein Øverland, vice-chairman 283 21 304 246
svein norvald eriksen (until 25/04/12) 82 82 1,733
karl olav hovden 263 270 533 0 3,254
svein Brustad (until 25/04/12) 82 82
merete smith 289 289
vigdis merete almestad (from 25/04/12) 181 181 0
ida espolin johnson (from 25/04/12) 181 181 61
Total supervisory boards 1,039 1,039
1) Basic annual salary at the end of the year for employees who were members of the Board of Directors, the senior management group or supervisory Board during the year.2) includes remuneration received from all companies within the DnB group for service on Boards of Directors and committees.3) includes salary payments for the entire year and holiday pay on bonuses. some employees were members of the Board of Directors, the senior management group or supervisory
Board for only parts of the year.4) as of 31/12/2012 loans are provided by sister company DnB Bank asa.
loans to employees in the DnB group are provided on official conditions, which are close to ordinary customer conditions.5) the net present value of pension agreements represents accrued pension commitments excluding payments into funded pension schemes. assumptions used in actuarial calculations
of accrued pension expenses and the present value of pension agreements are shown in note 10 pensions. the change in present value of pension schemes is largely due to the change in discount rate.
6) the employment relationship may be terminated by both sides with six months written notice, computed from the end of the calendar month in which the termination takes place (notice period). if the employment relationship is brought to an end by the employer due to reasons that are not a basis for dismissal, the managing Director, based upon an agreement previously entered into, has a claim for his salary for up to a year after the expiry of the notice period. other income from employment during the one year period after the expiry of the notice period will be deducted.
Other information on pension agreementstom rathke has a pension agreement that involves a pension equal to 70 per cent of his salary from when he attains 62 years of age. anders skjævestad has a pension agreement that involves a pension equal to 70 per cent of his salary from when he attains 65 years of age.
Subscription rights programme for employeesthere was no subscription rights programme for employees in the DnB group at year-end 2012
Remuneration to auditorremuneration to the auditor encompasses fees associated with DnB livsforsikring, subsidiaries and directly owned property companies.
NoTe 36 – RemuNeRATIoN, eTC. (cont.)
notes DnB livsforsikring annual report 2012 72
Amounts in thousand NOK 2012 2011
statutory audit 1) 3,481 3,550
other certification services 237 220
tax-related advice 0 40
other services outside of audit 1,082 700
Total remuneration to the statutory auditor 4,800 4,510
financial auditing group auditing 715 700
1) Distribution of statutory auditing at DnB livsforsikring
fees DnB livsforsikring 825 815
subsidiaries of DnB livsforsikring 196 162
property companies 2,459 2,573
remuneratiOn, etc. fOr 2011the table is set up to show the rights accrued during period.
Amounts in thousand NOK
Basic an-nual salary
31/12/11 1)
paid remunera-
tifion in
2011 2)
paid salary
2011 3)
Bonus earned in
2011
Benefits in-kind in
2011
total remune-ration in
2011
Bonus earned in
2010 4) 5)
loans as at 31.12.
2011 6)
accrued pension ex-
penses 7)
present value of
agreement 7)
Board of Directors of DNB Livsforsikringrune Bjerke, chairman 4,753 4,901 1,655 250 6,805 1,890 158 3,957 21,055
Bjørn erik næss, vice-chairman 3,393 3,520 1,233 181 4,934 1,468 1,990 4,678 19,019
cathrine klouman 2,234 2,333 803 183 3,318 1,011 3,335 1,212 11,205
lars rosén 200 200
tove e. pettersen 200 200 1,899
rune selmar 200 200
kari olrud moen (until 16/06/2011) 1,700 1,682 707 160 2,548 700 573 3,850
karin Bing orgland (from 16/06/2011) 2,861 2,975 879 181 4,035 989 2 1,380 24,647
jørn kvilhaug, employee elected 1,000 330 1,141 18 23 1,512 20 761 173 7,076
oddmunn johan olsen, employee elected 577 200 618 18 11 847 30 1,117 64 1,790
Britt sæle, employee elected 381 207 441 18 13 679 20 9 33 252
Senior management group of DNB Livsforsikringtom rathke, managing Director 5) 8) 2,982 3,280 991 198 4,469 1,282 4,036 2,326 21,317
anders skjævestad, Deputy managing Director
1,670 1,726 193 150 2,070 442 2,971 536 5,060
truls cook tollefsen, Director of finance 5) 1,540 1,614 211 157 1,982 668 3,624 228 3,011
hanne langseth, Director of products 1,243 1,290 18 144 1,452 270 1,724 360 5,073
Britt iren spjeld, Director of Distribution 1,199 1,231 108 145 1,484 264 345 3,644
geir sæbdal, Director of operations and customer service 1,241 1,281 122 148 1,552 333 2,450 353 4,121
otto munthe-kaas (until 15/08/2011) 966 1,063 268 127 1,458 289 2,000 205 3,016
Bengt olav lund, Director of sales (from 15/08/2011) 1,500 608 518 52 1,178
Control Committeefrode hassel, chairman 384 384
thorstein Øverland, vice-chairman 283 21 304 1 287
svein norvald eriksen 251 251 1,614
karl olav hovden 251 255 506 3,358
svein Brustad 251 251
merethe smith 276 276
Total Supervisory Board 951 951
1) Basic annual salary at the end of the year for employees who were members of the Board of Directors, the senior management group or supervisory Board during the year.2) includes remuneration received from all companies within the DnB group for service on Boards of Directors and committees.3) includes salary payments for the entire year and holiday pay on bonuses. some employees were members of the Board of Directors, the senior management group or supervisory
Board for only parts of the year.4) 20 per cent of variable salary for group-elected representatives is paid in the form of shares at market price on the date of allocation. the shares have a holding period of two years.
the date of allocation for bonuses earned in 2010 was 06 may 2011, and a total of 13,241 shares were purchased in the market at a price of nok 79.73 per share.5) 20 per cent of variable salary for tom rathke and truls cook tollefsen is paid in the form of shares on the date of allocation. the shares have a holding period of two years. for bonus
earned in 2010 the managing Director invested in 3,167 DnB shares at nok 79.73 per share. for bonus earned in 2010 the Director of finance invested in 1,524 DnB shares at nok 85.27 per share.
6) as of 31/12/2011 loans are provided by sister company DnB Bank asa. loans to employees in the DnB group are provided on official conditions, which are close to ordinary customer conditions
7) the net present value of pension agreements represents accrued pension commitments excluding payments into funded pension schemes. assumptions used in actuarial calculations of accrued pension expenses and the present value of pension agreements is shown in note 10 pensions.
8) the employment relationship may be terminated by both sides with six months written notice, computed from the end of the calendar month in which the termination takes place (notice period). if the employment relationship is brought to an end by the employer due to reasons that are not a basis for dismissal, the managing Director, based upon an agre-ement previously entered into, is entitled to salary for up to a year after the expiry of the notice period. other income from employment during the one year period after the expiry of the notice period will be deducted.
NoTe 36 – RemuNeRATIoN, eTC. (cont.)
notes DnB livsforsikring annual report 2012 73
Other information on pension agreements tom rathke has a pension agreement that involves a pension equal to 70 per cent of his salary from when he attains 62 years of age. anders skjævestad has a pension agreement that involves a pension equal to 70 per cent of his salary from when he attains 65 years of age.
Subscription rights programme for employees there was no subscription rights programme for employees in the DnB group at year-end 2011.
NoTe 37 – ReLATeD pARTIeS
DnB asa owns 100 per cent of the shares of DnB livsforsikring asa.
Purchases and sales of services with related parties in the DNB Group:in 2012 DnB livsforsikring asa had sales to other companies within the DnB group of nok 179 million. at the same time it purchased nok 949 million worth of services from companies in the DnB group. corresponding figures for 2011 were nok 91 million and nok 1,010 million respectively. comments are given below on the largest items:
DnB Bank asa is a sister company of DnB livsforsikring asa and has an agreement on subscribing to insurance with DnB livsforsikring asa. for individual insurance including unit linked, new sales through DnB Bank asa comprised 61 per cent of total new sales as against 64 per cent in 2011. commissions paid by DnB livsforsikring asa to DnB Bank asa were nok 96 million as against nok 102 million in 2011.
DnB livsforsikring asa has an agreement on equity management with its sister company DnB asset management as. total fees for 2012 were nok 151 million against nok 117 million in 2011.
Inter-company accounts between related parties:DnB Bank asa is the lender for the company’s total subordinated loans of nok 1,075 million and perpetual subordinated loans of nok 225 million, as against nok 2,278 million and perpetual subordinated loans of nok 225 million in 2011.
DnB livsforsikring asa has receivables from other companies in the group amounting to a total of nok 279 million, as against nok 464 million as at 31 December 2011, as well as owing other companies in group nok 450 million, as against nok 752 as at 31 December 2011.
norwegian companies in the DnB group have pension schemes with DnB livsforsikring asa, and estimated funds as at 31 December 2012 comprise nok 9.6 billion against nok 9.2 billion as at 31 December 2011.
Purchase and sale of financial assets between related parties:DnB livsforsikring asa owns bonds issued by DnB Boligkreditt. the recorded value of the bonds as at 31 December 2012 is nok 5,226 million.
DnB markets is a significant counterparty for DnB livsforsikring asa. therefore a csa agreement was signed with markets in order to reduce the counterparty risk.
Purchases and sales of services with related parties in the DNB Livsforsikring Group:in 2012 DnB livsforsikring asa had sales to subsidiaries of DnB livsforsikring asa totalling nok 27 million, while at the same time it purchased nok 63 million of services from subsidiaries. corresponding figures for 2011 were nok 26 million and nok 74 million, respectively.
DnB livsforsikring has no long-term loans to property company subsidiaries as at 31 December 2012.
interest income from loans to subsidiaries in 2012 was nok 13.5 million, as against nok 43 million in 2011.
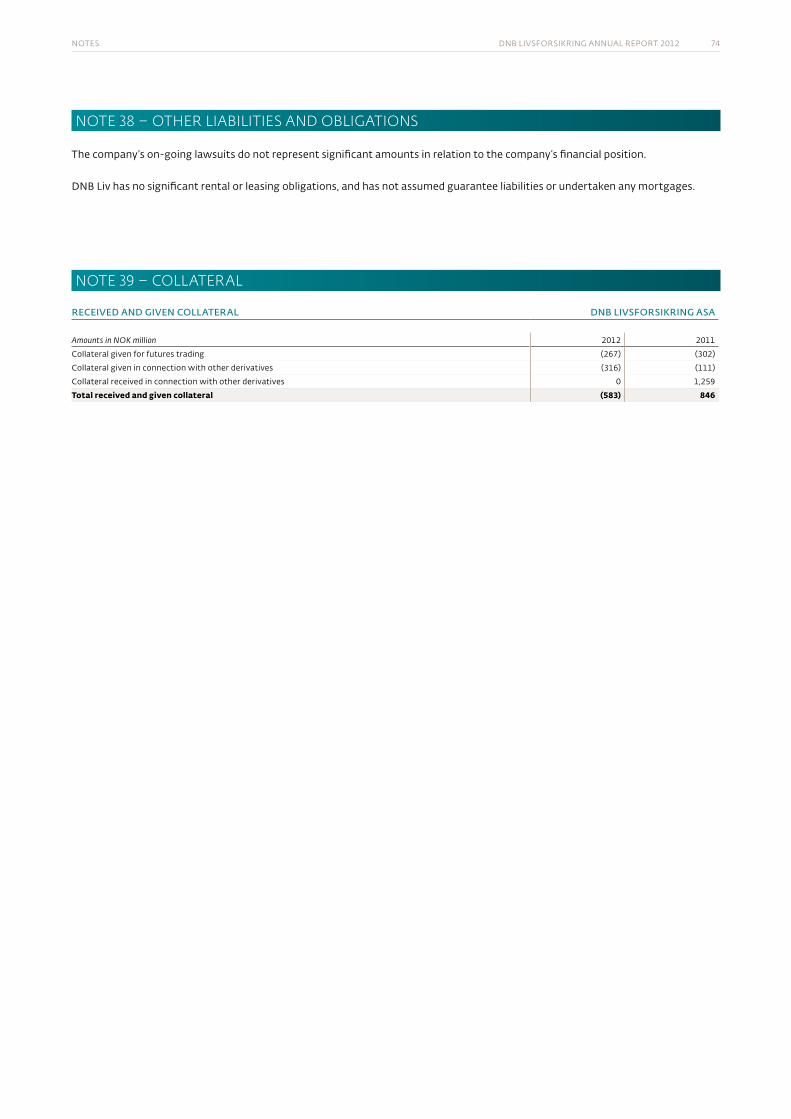
notes DnB livsforsikring annual report 2012 74
NoTe 38 – oTHeR LIABILITIeS AND oBLIGATIoNS
the company’s on-going lawsuits do not represent significant amounts in relation to the company’s financial position.
DnB liv has no significant rental or leasing obligations, and has not assumed guarantee liabilities or undertaken any mortgages.
NoTe 39 – CoLLATeRAL
received and Given cOllateral dnb livsfOrsikrinG asa
Amounts in NOK million 2012 2011
collateral given for futures trading (267) (302)
collateral given in connection with other derivatives (316) (111)
collateral received in connection with other derivatives 0 1,259
Total received and given collateral (583) 846
reports DnB livsforsikring annual report 2012 75
AuDIToR’S RepoRT
reports DnB livsforsikring annual report 2012 76
reports DnB livsforsikring annual report 2012 77
CoNTRoL CommITTee’S RepoRT
To the Supervisory Board and Annual General Meeting of DNB Livsforsikring ASA
the control committee has carried out supervision of DnB livsforsikring asa in accordance with law and instructions laid down by the supervisory Board.
in connection with the closing of the accounts for the 2012 financial year, the control committee has examined the Directors’ report, the annual accounts, the statement of chief actuary and the auditor’s report for DnB livsforsikring asa and the group.
the committee finds that the Board of Directors’ assessment of the financial position of the company is adequate and recommends the approval of the Directors’ report and annual accounts for the 2012 financial year.
oslo, 13 march 2013
frode hassel thorstein Øverland (chairman) (vice-chairman)
vigdis merete almestad karl olav hovden
ida miriam espolin johnson merete smith (substitute) (substitute)
reports DnB livsforsikring annual report 2012 78
eXeRpT fRom BoARD meeTINGmINuTeS 06 mARCH 2013
Item 20/2013
Decision:the Board of Directors approved the submitted annual accounts with notes, proposal for disposition of the year’s results and the Directors’ report issued by the Board.
06 march 2013
Definitions DnB livsforsikring annual report 2012 79
DefINITIoNS
refer also to the accounting principles.
RESULTS AND INVESTMENT YIELDSAdministration resultthe results of the period’s operating costs deviating from the assumptions in the premium tariff.
Interest result:investment returns, less the base rate.
Risk result:the result of the period’s mortality and disability deviating from the assumptions in the premium tariff.
Investment yield I:recorded returns.
Investment yield II:recorded returns + unrealised changes in value that are allocated to the market value adjustment reserve.
Investment yield III:recorded returns + unrealised changes in value that are allocated to the market value adjustment reserve + changes in value in the hold-to-maturity portfolio.
Base rate:the company offers traditional life and pension insurance, unit-linked insurance and non-life insurance. a calculation rate is used to determine provisions and premiums for the traditional products.
the highest calculation rate is set by the financial supervisory authority of norway. this interest is often called the base rate. for new contracts, the maximum base rate is 2.5 per cent. the base rate is the annual guaranteed rate of return on policyholders ’ funds. in most unit-linked insurance products, policyholders bear the financial risk.
non-life insurance policies are products generating payments related to policyholders’ life and health. these products are not subject to profit sharing and are re-priced annually.
INSURANCE PRODUCTS Group contractsGroup defined benefit pensions:under group defined benefit pensions, pension payments are disbursed from an agreed age and until the death of the policy-holder. it can also be agreed that the pension payments cease at a certain age.
a defined benefit pension may include a retirement pension,
disability pension, dependent’s pension and children’s pension. group defined benefit pension follows new regulations for the insurance industry effective from 1 january 2008, which means that policyholders pay in advance an annual premium for inter-est rate risk, insurance risk and administration. the company may change the premium annually. interest profit beyond the guaranteed interest is allocated to the customer in its entirety. if the interest is between 0 per cent and the guaranteed rate of return, the company can use additional allocations to meet the guaranteed rate of return; otherwise the company must cover the deficit.
a positive risk result may either be used to increase the risk equalisation fund or be distributed to the policyholders. no more than 50 per cent of annual profits may be allocated to the risk equalisation fund. the company must cover any remaining losses after the risk equalisation fund has been used. the administra-tion result is allocated in its entirety to the company.
Paid-up policies:when a member terminates a pension agreement or a pension agreement ends, he or she is entitled to a paid-up policy. rights earned on the termination date are continued in paid-up policies. paid-up policies have a separate profit model where a minimum of 80 per cent of profits are distributed to policyholders.
a positive risk result may either be used to increase the risk equalisation fund or be distributed to the policyholders. no more than 50 per cent of annual profits may be allocated to the risk equalisation fund. the company must cover any remain-ing losses after the risk equalisation fund has been used. the administration result is allocated in its entirety to the company.
Group association insurance:group association insurance is pension insurance taken out by associations for their members. association insurance can comprise retirement pensions, disability pensions, dependent pensions and children’s pensions.
Individual contractsIndividual annuity and pension insurance:individual annuity and pension insurance policies are savings schemes whereby the company disburses monthly amounts up until the death of the policyholder, or until the policyholder reaches an agreed age. this usually comprises a retirement pension, disability pension, dependent’s pension and children’s pension.
Individual endowment insurance:individual endowment insurance policies are contracts whereby the company disburses an agreed amount upon the death of
Definitions DnB livsforsikring annual report 2012 80
the policyholder or when the policyholder attains an agreed age. individual endowment insurance may also include disability cover, which is a one-off benefit for permanent disability.
for individual contracts sold prior to 1 january 2008, the past profit sharing scheme applies. this then implies that the interest result, the risk result and the administration result are included in the profits to be distributed between policyholders and the company. the customer shall have at least 65 per cent of the annual profits. for contracts sold as at 1. january 2008 new business rules apply.
Contracts where the customer bears the riskDefined-contribution pensions:Defined-contribution pensions are group pension schemes where the employees bear the financial risk. however, full or partial hedging of the paid amount can be bought upon retire-ment age.
Individual unit-linked insurance:individual unit-linked insurance policies are endowment insur-ance policies or annuity insurance policies where policyholders bear the financial risk.
Other sectorsGroup life insurance:group life insurance policies are death-risk insurance policies taken out by employers or associations for their employees or members and, where applicable, also for their spouses and children. the amount recoverable under the policy is disbursed upon the death of the policyholder. group life insurance may also comprise disability cover, which is a one-off benefit for perma-nent disability.
employer’s liability insurance:employer’s liability insurance is a one-year risk product which companies link to their pension agreements. this may be corpo-rate group life insurance or accident insurance. occupational injury insurance is mandatory for all enterprises.
Premiums and claimsSingle premium payment:the total amount that is to be paid for the insurance is paid once for all.
Claim:the amount the company is to pay in relation to the insurance contract when an insured incident occurs.
Reinsurance:transfer of a part of the risk to another insurance company.
Repurchase:when the policyholder terminates the insurance relationship and the repurchase value is paid out.
Transferred reserves:transferred premium reserves and additional statutory reserves to/from other insurance companies/pension schemes.
Financial derivativesShare index futures:share index futures are agreements to buy or sell an index at a specific price at a specific point of time in the future. the contracts are standardized and listed. Daily settlements of gains/losses are performed based upon changes in the closing price.
Share Index Forwards:share index forwards is an agreement on purchase or sale of an index at a specific price at a specific time in the future. the contracts are not standardised, and there are no daily settlements.
Share index options:share index options involve one-sided rights to buy or sell shares at a predetermined price. the options are associated with share indexes.
Forward Rate Agreement (FRA):an fra contract is a contract on paying or receiving the differ-ence between a fixed, agreed interest rate and a future interest rate on a set amount for a specific time in the future. this differ-ence is settled in the beginning of the future period.
Interest rate futures:interest rate futures can most easily be described as standard-ised and exchange-listed future interest rate agreements. gains and losses on differences between the contract interest rate and market rates are settled daily through a clearing centre.
Interest rate swaps:an agreement between two parties to exchange interest condi-tions on a security for an amount agreed upon in advance during a specified future period.
Asset swap:an asset swap consists of an interest rate swap in combination with an interest-bearing instrument/bond. an asset swap involves that one transforms a fixed interest-bearing instrument to a liquid interest-bearing instrument, or a liquid interest-bearing instrument to a fixed interest-bearing instrument. alternatively, the interest payment and/or principal can be swapped over to another currency.
Currency forward contracts/currency swaps (FX contracts):contract to sell/buy an agreed currency amount at an estab-lished exchange rate for delivery at a future point in time. forward exchange contract transactions normally have a short time to maturity, i.e. three months to one year. the contracts are primarily used to hedge shares, bonds and other holdings in foreign currencies.
Definitions DnB livsforsikring annual report 2012 81
Capital adequacy and solvency margin capitalCapital adequacy rules:regulations concerning requirements for primary capital at financial institutions. the rules specify the computation and level of primary capital measured against the risk-weighted balance sheet. the result is termed capital adequacy.
Primary capital:primary capital consists of core capital and additional capital.
Core capital:the core capital for an insurance company primarily consists of paid-in equity and accrued earnings.
Additional capital:consists primarily of subordinated loan capital.
Subordinated loan capital:loans that the company takes out and which under specific conditions are included in the total primary capital. special permission from the authorities is required in order to take out
subordinated loans, and they have special rules for their terms and repayment. subordinated loans are uninsured, and is inferior to other liabilities.
Capital adequacy:eligible primary capital in per cent of the risk-weighted balance sheet.
Solvency margin capital:the capital which can be included to cover the solvency and margin requirement. the capital consists of primary capital, 50 per cent of additional statutory reserves, 50 per cent of the risk equalisation fund and the security reserve in non-life insurance beyond 55 per cent of its minimum value.
Solvency margin requirement:an indication of the risk associated with insurance obligations. the solvency margin requirement is computed in accordance with more detailed rules with a point of departure based in the individual groups of insurance contracts, and is summed for the company as a whole.

notes DnB livsforsikring annual report 2012 82
DN
B PRO
FIL & D
ESIGN
WEI Q
ING
DNB Livsforsikring ASA Mailing address:P.O.Box 7500N-5020 Bergen Visiting address:Folke Bernadottesvei 40Fyllingsdalen, Bergen dnb.no