Embed Size (px)
Citation preview

1
Annual Report 2012 Table of Contents I. Business Report ………………………………………………………………3
II. Company Overview
A. Company Introduction……………………………………………………….8
B. Company Structure and the Subsidiaries ……………………………………..10
III. Corporate governance
A. Directors and Supervisors ……………………………………………….…12
B. Personnel data of the general manager, vice general manager, assistant vice
general manager, chief of divisions ………………………………13
C.Corporate governance and variations with management principles of
publicly-listed companies and reasons ………………………………………14
IV. Capitals and Stocks
A. Source of Capitals ……………………………………………………………22
B. Shareholders structures ………………………………………………………22
C. Data on share price, net value, profit, and dividend of the past two years …22
D. Company’s dividend policy and its current implementation status ………23
E. Employee bonus and rewards for directors and auditors …………………24
F. Buying back company stocks ………………………………………………25
G. Convertible Corporate Bond ………………………………………………27
H. Employee stock option handling………………………………………………28
V. Business Information
A. Business Contents …………………………………………………………...29
B. Marketing & Sales Situation …………………………………….……….38
C. Employees’ average years in service, age, and educational background
distribution of the past two years. . . . . . . . . . . . . . . . . . . . . . . . .47
D. Data on our environmental protection expense ……………………………47
E. Employer/Employee Relation ………………………………………………50
VI. An Overview of the Company’s Financial Status
A. Abbreviated Balance Sheets and P/L Statements for the Past 5 Years ……53
B. Financial Analysis for the past 5 Years …………………………………..55
C. Financial Statements for the most Recent years, including an auditor’s
Report Prepared by a CPA ………….…………………………………….61
D. Consolidated Financial Statement for the Parent Company and its
Subsidiaries for the most recent year, Certified by a CPA …………………123
2
Vision Statement To provide the frequency controlled application products for the computer, communication, optical, and automotive industry so as to become, the most outstanding company in FCP industry judged by performance matrix and managerial capability.
Mission Statement Through the continuous improvement and the urge for discipline and execution to enhance the productivity to interact with tier one vendors' requests by promoting company's professionalism and globalization framework.
Quality Policy In accordance with the principles of customer orientation, problem prevention, and the pursuit of zero defect, TXC management team commits to deploy the quality policy as follows:
(1)Technological innovation (2)Reliable quality (3)Continuous improvement (4)Customer satisfaction
Green Product Policy Based upon the most rigid legitimate rules or the requirements of our customers to set TXC’s
green product policy in order to be the fittest green products partner of our customer.
Documented the environmental policy in details to promote the overall awareness of the
environmental protection concept and the implementation methods.
Through company-wide various activities to ensure the quality of our green products will meet or
exceed the regulated or expected requirements.
Continuously improving environmental management system through periodic auditing and
system inspection.
TXC’s company policy, aimed at everlasting, is based upon the corner stones of green products
designing, environmental protection, and customer satisfaction.
3
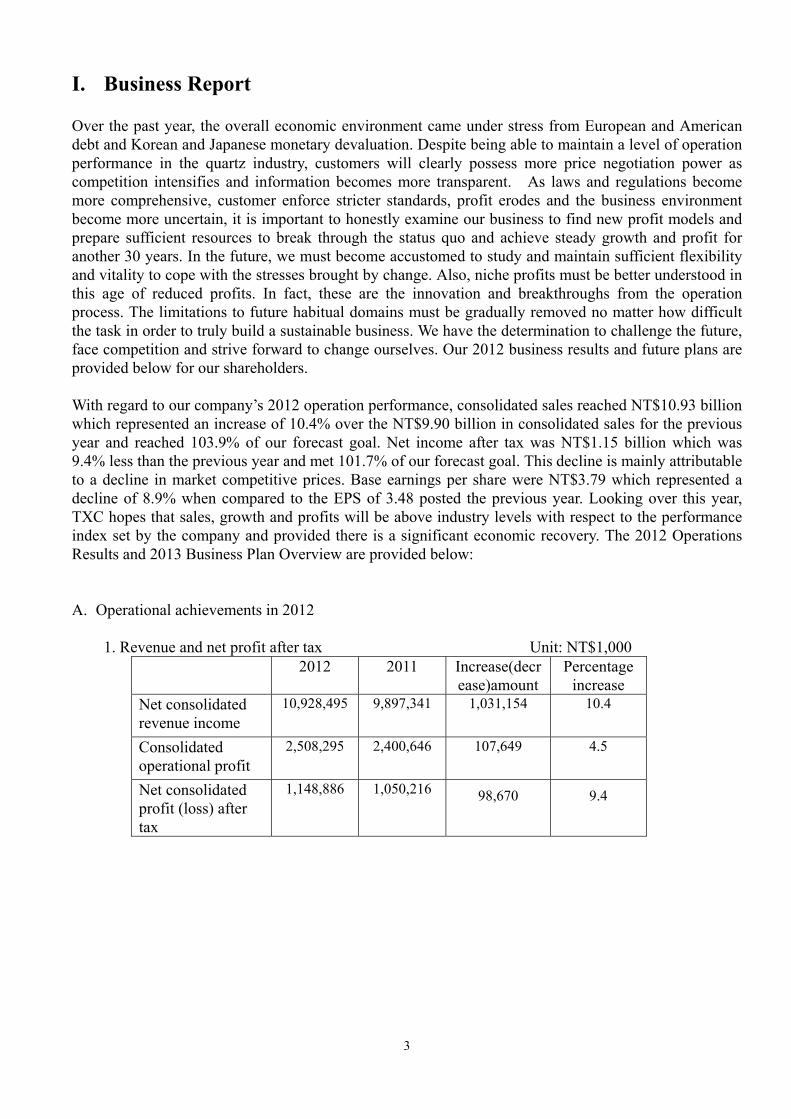
I. Business Report Over the past year, the overall economic environment came under stress from European and American debt and Korean and Japanese monetary devaluation. Despite being able to maintain a level of operation performance in the quartz industry, customers will clearly possess more price negotiation power as competition intensifies and information becomes more transparent. As laws and regulations become more comprehensive, customer enforce stricter standards, profit erodes and the business environment become more uncertain, it is important to honestly examine our business to find new profit models and prepare sufficient resources to break through the status quo and achieve steady growth and profit for another 30 years. In the future, we must become accustomed to study and maintain sufficient flexibility and vitality to cope with the stresses brought by change. Also, niche profits must be better understood in this age of reduced profits. In fact, these are the innovation and breakthroughs from the operation process. The limitations to future habitual domains must be gradually removed no matter how difficult the task in order to truly build a sustainable business. We have the determination to challenge the future, face competition and strive forward to change ourselves. Our 2012 business results and future plans are provided below for our shareholders. With regard to our company’s 2012 operation performance, consolidated sales reached NT$10.93 billion which represented an increase of 10.4% over the NT$9.90 billion in consolidated sales for the previous year and reached 103.9% of our forecast goal. Net income after tax was NT$1.15 billion which was 9.4% less than the previous year and met 101.7% of our forecast goal. This decline is mainly attributable to a decline in market competitive prices. Base earnings per share were NT$3.79 which represented a decline of 8.9% when compared to the EPS of 3.48 posted the previous year. Looking over this year, TXC hopes that sales, growth and profits will be above industry levels with respect to the performance index set by the company and provided there is a significant economic recovery. The 2012 Operations Results and 2013 Business Plan Overview are provided below: A. Operational achievements in 2012
1. Revenue and net profit after tax Unit: NT$1,000 2012 2011 Increase(decr
ease)amountPercentage
increase Net consolidated revenue income
10,928,495 9,897,341 1,031,154 10.4
Consolidated operational profit
2,508,295 2,400,646 107,649 4.5
Net consolidated profit (loss) after tax
1,148,886 1,050,216 98,670 9.4

4
2. Revenue income and expenditure and profitability: Revenue income and expenditure and profitability:
Year 2012 2011
Finance Structure (%)
Liability vs asset ratio 37.63 37.87 Longterm fund vs fixed asset ratio
274.49 261.85
Debt-paying Capability (%)
Liquidity ratio 163.47 185.13 Quick ratio 130.78 145.45
Profitability (%)
Return on assets ratio (%)
9.71 9.80
Return on shareholders equities ratio (%)
15.28 15.34
Earnings per basic share(NT$)
3.79 3.48
Consolidated revenue income and expenditure and profitability:
Year 2012 2011
Finance Structure (%)
Liability vs asset ratio 39.36 40.05 Longterm fund vs fixed asset ratio
164.03 162.54
Debt-paying Capability (%)
Liquidity ratio 195.52 218.31 Quick ratio 150.24 170.70
Profitability (%)
Return on assets ratio (%)
9.45 9.35
Return on shareholders equities ratio (%)
15.28 15.34
Earnings per basic share(NT$)
3.79 3.48
3. Budget Implementation Status:
Only internal budget targets were set at the company for 2012 and financial forecasts were not announced externally. Over 100% of the overall sales, profit and business goals set by the company were reached.
4. Research and Development Status: Our company has focused its R&D and investment in crystal miniaturization and specification enhancement technology for frequency element products. Dimension / specification design and applications have reached the world class levels. Quartz crystal and quartz oscillator series products all display exceptional technical prowess. As for product development results, 1612 dimension specification has been successfully developed in the XO field. For VCXO, 5032 specification has been sold to a multinational corporation and we are continuing development of 3225 dimension. With regard to TCXO, the 1612 specification has entered pilot production and efforts are being made to develop the next generation dimension applications. For OCXO, 3627 / 2525 / 2020 dimension specifications have been successfully developed. For MO, 7050 / 5032 / 3225 / 2520 dimension specifications have been developed. In the future, TXC will continue to conduct research in the directions of low cost, low energy consumption, high vibration resistance and broader frequency range and follow our original product planning and development roadmap as well as focus resources on making advances towards high end high-frequency and automotive product development.

5
5. Implementation Results for Other Projects: (1) Green Enterprise:
Having passed BSI external audit and certification, TXC completed the ISO 14064-1 greenhouse gas inventory, PAS 2050 product carbon footprint inventory and PAS 2060 neutralization certification declaration in July, August and September of 2012 and obtained TEEMA carbon reduction label certification in December of the same year. In addition, TXC conducts annual inventories of public facilities, process machinery / equipment and other energy use to understand energy consumption at the company so to achieve management and control goals. ISO 50001 energy management system certification was also completed by BSI. With regard to low carbon activities, the company has obtained no. 10200125 and no. 10200180 symbols from the Environmental Protection Administration. TXC is the first company in the quartz industry to have conducted inventories for the above systems. In August 2012, TXC received green sustainable enterprise award from BSI. In the future, the company will continue to make efforts in the fields of green and environmental protection to fulfill our corporate social responsibility.
(2) Occupational Safety and Health: Under the guidance of the Occupational Safety and Health Committee and Labor / Management Meeting, TXC passed Council on Labor Affairs Occupational Safety and Health Performance Recognition in 2009 and earned OHSAS 18001 Occupational Safety and Health Management System certification from BSI in 2010. In September 2012, TXC passed CNS 15506 Taiwan Occupational Safety and Health Management System certification and received Occupational Safety and Health Performance Recognition in September 2013. A total of 18 health promotion activities were held in 2012. In addition, an EICC VAP audit was conducted and certification received. In the future, the company will continue to strive to create a safe work environment so to offer the maximum assurance of safety to our employees.
(3) System Certification: In 2012, TXC passed BSI audits and obtained ISO 140001 environmental system certification in September, ISO 9001 quality system, ISO/TS16949 automotive quality system and IECQ/QC080000 hazardous substance management system certification in December and purchased a scanning electron microscope (SEM) to speed up engineering analysis. Chinese RoHS and CESI certification was granted for our 5032 oscillator and 3225 crystal products. Obtaining the above certification ensures that our product quality meets international standards. In order to ensure the safety of our operations, TXC passed the ISO 27001 audit with an outstanding record of zero deficiencies in 2012 and plans to introduce the ISO 27001: 2013 version this year to guarantee the security of company information control measures and protect the rights of company stakeholders.
(4) Skill Upgrading:
In 2012, TXC formally launched Design for Six Sigma (DFSS) classes and introduced Theory of Inventive Problems Solving (TRIZ/TIPS) innovative design methods to complete the introduction of five major programs to further raise the R&D standards of the company.
(5) Corporate Governance and Corporate Social Responsibility: As a result of our efforts in the fields of corporate governance and corporate social responsibility, TXC was awarded Authorized Economic Operator (AEO) by the MOF Customs Administration in March 2013, received an A+ grade for our CSR report in June and was honored with a Information Disclosure and Transparency Ranking of A++ in July. In addition,

6
the voluntary disclosure status of TXC has been consecutively rated as transparent. The company was given the Corporate Citizenship Award by Commonwealth Magazine in September and stood out from hundreds of public listed companies to win the first annual Mittelstand Award from the Industrial Development Bureau in February 2013.
B. 2012 Business Plan Overview: 1、 Operation Direction and Major Policy: (1) Risk Management:
In 2013, TXC continued to introduce the risk identification and control ISO 31000 risk management system and ISO 22301 business continuity management system to quickly respond to major changes and provide continuous service to customers.
(2) Quality Defect Cost Improvement: In 2013, quality defect cost discussion and improvement plans has been in use since 2011. An information collection system was also completed to show the quality defect cost for five major items. The quality of each process can be effectively control and system improvements can be discussed to achieve superior operation quality.
(3) Financial and Information System Establishment: In 2013, TXC continued to make fine adjustments to IFRS related Oracle R12 computer system to make internal operations more smooth and efficient. A Oracle PeopleSoft skill management application system was established. In addition, PLM (Product Lifetime Management) module was formally established to strengthen project schedule and process controls to raise communication and work efficiency.
(4) Management System:
In 2013, TXC continued to maintain and introduce energy conservation and carbon reduction ISO 14064-1, PAS 2050, PAS 2060 systems and system inventories. The new version of ISO 27001:2013 serves as a standard for the establishment of an information security system that is protected against possible hacker attacks.
(5) Corporate Governance and Corporate Responsibility:
TXC, which previously received Taiwan Corporate Governance Association CG6005 certification, introduced CG6008 advanced version this year. In June, the audit committee was established to provide this corporate governance function. In addition, TXC completed CSR report certification based on AA 1000 and GR I3.1 standards and continues to work towards information disclosure and fulfill corporate social responsibility.
(6) Plant Expansion:
TXC completed the expansion of our manufacturing plant and started trial production in Chongqing, China in the fourth quarter of 2012. A monthly production capacity of 20KK is initially planned to diversify the production risk at Pingzhen and Ningbo plants. Following the establishment of the new energy division, in addition to original sapphire growing, pattern sapphire substrate process production capacity has been expanded in order to achieve a breakthrough in our LED business.
2、Forecast Quantity of Sales and Basis: The global economy has finally started to rebound as the economic stimulus from U.S. quantitative easing continues in 2012, the European stability mechanism brings the European

7
debt problems under control and Japan joins the loose monetary policy club at the end of the year. In the midst of this uncertain global political and economic climate, TXC was able to post impressive growth of 10.4% and reached a market share of 10.8%. As a result, the Company continues to adopt a cautiously optimistic stance in our 2013 sales forecasts. In addition to cooperating further with major international firms, TXC plans to actively develop new customers and products in response to future industry development requirements. Furthermore, future development will focus on high-end products to raise profit margins and profitability. Additional production capacity expansion is planned for 2013. Entry in the automotive industry as well as ongoing customer certification and approval of high frequency precision products are expected to help boost company sales and profits. Also, the products developed by our new energy division will gradually bring in more business after a year of technical research and customer development. As for the global economy in 2013, the U.S. economic data has been showing improvement so the quantitative easing stimulus policy will be gradually withdrawn and the economy will need to be driven by fundamentals. Deficit reduction efforts in Europe are resulting in austerity measures. In addition, the expanded quantitative easing stimulus by Japan has spurred competitive devaluation among Asian currencies to stimulate exports. The future political and economic development direction was set during the meeting of the National People's Congress in China and the Chinese economy should recover under the 8 percent growth target. In general, TXC focus on miniaturized, high frequency and low consumption precision fields in product development is already seeing results. Also, our new energy division has started to generate sales and profits. As the global economy strengthens, total sales quantities in 2013 are forecast to exceed 2.5 billion and TMX market share is expected to increase to 11 – 12% which will make the company one of the top two manufacturers in the quartz industry.
Faced with business environment challenges and industry competition, TXC not only needs to be accustomed to respond quickly, but also has to strive to make breakthroughs, innovate, accept challenges and erode habitual domains that obstruct progress as profits come under pressure. By getting back to basics as stated last year “face improvement of human resource quality, allocate and integrate resources, reorganize, simplify and eliminate procedures once again”, and honestly engage in self-reflection in order to achieve company business sustainability.
Reflecting on the outcome of receiving the Mittelstand Award, self-examination through people-oriented corporate culture, practical dream building operation strategy, profit sharing / collaborative spirit, customer oriented service attitude and information transparency governance model and continue to strive for success by following the example of Tadashi Yanai “one-day success can be discarded”.
Looking back over the past three decades since the establishment of TXC, the challenges that we have faced and the appreciation deep in our hearts allows us to stay dedicated to our upward striving spirit. With regard to the frequent and hard-to-predict changes in the marketplace, we need to be even more diligent, focused and steadfast in achieving our set targets with a spirit of dedication, speed and efficiency and with modesty and a positive attitude. Success can only be attained by staying focused on our vision. There is no guarantee of success. As we look towards the future, quality improvement gives us the capability to enter the automotive market and security related products. As for technical progress, we must establish a position capable of attack and defense together with intellectual property. With respect to cultivation of human resources, we need to develop the professional and management skills of more people. In this way, we can honestly face ourselves, challenge the future and usher in another three decades of competitiveness.

8
II.Company Overview A.Company Introduction
1. Date of the company´s incorporation
TXC Corporation, founded in 1983, is a leading professional frequency control product manufacturer. We have devoted to the research, design, manufacture, and sale of Dual-Inline-Package (DIP) and Surface Mount Device (SMD) quartz crystal products. TXC now specializes in five categories of products such as high quality Quartz Unit Crystal, Automotive Crystal, Crystal Oscillator (CXO), Surface Acoustic Wave (SAW) Filter, and Timing Module (TM). In addition, to expand the Group's future development, the application of the core technical capabilities in the 2011 Q2 to import the LED substrate and wafer process, formal entry into the sapphire LED field. Our goal is to add value to our customers by providing a complete solution of frequency devices and modules, design-in service to fully satisfy various needs of the esteemed customers. We believe based upon the competence of cost effectiveness, quality, lead-time, and customer service TXC will go beyond customers' expectation. TXC has now been highly recognized as the first-class crystal provider by our customers and TXC Corporation will continue striving for excellence not to meet but to exceed the most rigid customers' standards.
2. Company History 1983 Founded in Taiwan with US$95,000 capital. 1984 Began production on DIP type crystals and oscillators in Peitou factory. 1993 ISO9002 certified. 1995 Winner of the 4th National Award of Small and Medium Enterprises. 1997 Began production of SMD type crystals and oscillators in Taoyuan factory. 1998 Began production os SAW devices. Implemented Oracle ERP system. 1999 Established US sales office. 2000 Increased capital to US$25.3 million. 2001 IPO’ed with capital increased to US$37 million. 2002 Listed in the Taiwan Stock Exchange(Code-3042) ISO14001 certified. Ranked among the top 10 worldwide frequency control product manufacturers. 2003 Began to offer value-added products(HF CXO/VCXO,OCXO,FX,etc.) for the telecom market. Began production in new factory in NIngbo, China. 2004 Implemented QoS and 6-Sigma management systems. QS9000 certified. Established US Technology Center. 2005 ISO/TS16949 certified. Ranked number 6 among the worldwide frequency control product manufacturers. 2006 Expanding Tauouan factory. Adding production lines in Taiwan and China. The capacity reached to 70
million units per month. Authorized Capital: US$57.9 million. 2007 New factory in Pingzhen inaugurated, factory expansion project in Ningbo factory launched, Intel
presented the Preferred Quality Supplier, promotion of the Six Sigma project to Ningbo plant green belt training, procurement of the Shenzhen office, implementation of employee stock option, CB conversion, and recapitalization of surplus to NT$2,415,530,000.
2008 Simultaneously expanded factories in Pingzhen, Taiwan and Ningbo, China; won Intel’s Supplier

9
Continuous Quality Improvement (SCQI) Award; won A+ evaluation for information disclosure and top 10 potential golden torch award; continued to promote the 6-Sigma black belt training program at Ningbo and Pingzhen plants. Set up sales operations in Osaka, Japan and Singapore to promote sales. Issued employee options and implement the treasury stock system. Set up subsidiary TXC Hongkong; execute employee option, CB conversion, surplus conversion to increase capitalization to NT$2,716,980,000.
2009 Second phase of Taiwan Pingchen and China Ningbo plant expansion initiated, received A+ ranking and top 10 award at sixth annual Information Disclosure and Transparency Ranking, on-the-job training plan launched for personnel at Ningbo and Pingchen plants, received Preferred Quality Supplier Award recognition again from Intel, strengthen company internal controls to ensure corporate governance effectiveness, promoted transparency of corporate governance information, exercised employee stock warrants, convertible bonds, capital increase by retained earnings to NT$2,887.27 million.
2010 Issued third convertible bond, received corporate governance system evaluation certification from the Taiwan Corporate Governance Associations, received industry model award for the Technology Industry B group from Commonwealth Magazine, awarded National Quality Award from Executive Yuan, continued to implement 6-Sigma black belt training plan for Ningpo and Pingchen plants, set up sales office in Europe to expand business, purchased offices in Shanghai and Suzhou, started third phase of plant expansion for Taiwan PCF, purchased 5,733 level ground of land, built the factories for new energy business unit, execute employee stock option and increase capital out of earning to 2.971 billion NT dollars.
2011 Completion and launch of Taiwan Pingzhen Third-Stage plant expansion and New Energy Division plant, establishment if TXC (Chongqing) Electronics Co., Ltd. production site, established TXC (Chongqing) Corporation and Ningbo Jingyu Company Limited, expansion of European subsidiary, receives A+ grade and top 10 award at Eighth Annual Information Disclosure and Evaluation, passed CGR report review, received Energy Conservation Elite, Outstanding Innovation Award and Commonwealth Corporate Citizen Award, received Taoyuan County Corporate Innovation Award, received ISO50001 Energy Management System, ISO28000 Supplier Chain Management System, ISO27001 Information Security Management System certification, Oracle ERP system upgraded to R12 version, valid assessment of remuneration fairness combined with performance evaluation, establishment of remuneration committee, exercise of employee stock warrants, NT$3,022,420,000 capital increase by capital surplus.
2012 TXC (Chongqing) Corporation plant construction, awarded Authorized Economic Operator (AEO) by the MOF Customs Administration, passed BSI greenhouse gas (ISO 14064-1), product carbon footprint (PAS 2050) inventory, product carbon neutralization (PAS 2060) inventory, given Corporate Citizenship Award by Commonwealth Magazine, received green sustainable enterprise award from BSI, external certification of CSR Report conformed to GRI G3.1 A+ and AA 1000 standards, passed CNS 15506 TOSHMS, awarded ninth annual Information Disclosure and Transparency A++ and top ten ranking, exercised employee stock options, convertible bond and NT$3,097,579,000 capital increase.
2013 Issued 4th convertible bond, TXC (Chongqing) Corporation started formal mass production, received 1st annual Mittelstand Award from the Industrial Development Bureau and applied for Development of Products of New Leading Industries R&D funding from the Industrial Development Bureau.

10
B、Company Structure and the Subsidiaries 1.The chart of TXC corporation and the subsidiaries

11
2.The basic data of the subsidiaries 2013.03.31
Name Incorporated Address Capital Business Nature
Taiwan Crystal Technology International Limited 1998.12.23 WESTERN SAMOA USD45,835,294 Investment holding
Growing Profits Trading Ltd 1999.03.09 BRITISH VIRGIN ISLANDS USD 50,000 National trading
TXC (NGB) Electronic Co., Ltd. corporation 1999.03.12
No.189, Huangshan Xi Rd., Economic & Technical Development Zone,Ningbo Zhejiang, China
USD45,835,294 Manufacture and sales of electronics products
TXC Technology Inc 2000.12.01 431 Lambert Road,Suite 306 Brea,California 92812, U.S.A.
USD 300,000 Marketing activities
TXC Japan Corporation 2005.09.13
Davinici-shin-yokohama
Bldg.,1-3-1, Shin-yokohama, Kohoku-ku,Yokohama,222-0033 Japan
YEN 21,000,000 Marketing activities
TXC (HK) LTD
2008.03.31
ROOM C.21/F.,CAPITAL TRADE CENTRE, 62,TSUN YIP ST.,KWUN TONG,KOWLOON, H.K.
HKD 200,000 National trading
TAIWAN CRYSTAL TECHNOLOGY (HK) LIMITED
2010.07.06 Rm.804, Sino Centre, 582-592 Nathan Rd.,Kln.H.K
USD 10,080,000 Investment holding
TXC (Chongqing) Electronic Co., Ltd. corporation
2010.10.11JinFeng Industrial Region, Jiulongpo District, Chongqing City, China
RMB 106,842,032 Manufacture and sales of electronics products
Chongqing All Suns Company Limited
2011.02.14 Jiulongpo District, Chongqing, China Jinfeng Road 108,
RMB 66,000,000
Marketing activities
Ningbo Jingyu Company Limited
2011.09.07 No.189, Huangshan Xi Rd., Economic & Technical Development Zone,Ningbo Zhejiang, China
RMB 1,000,000 Purchasing and selling electronic component
12
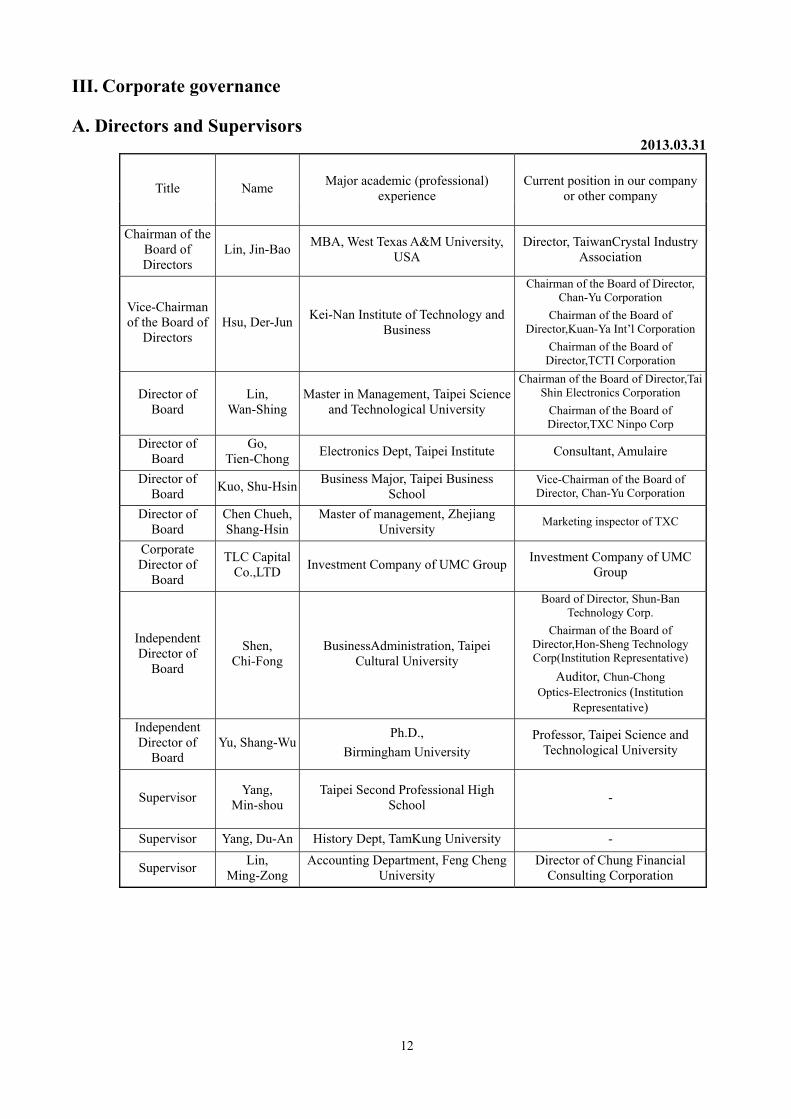
III. Corporate governance A. Directors and Supervisors
2013.03.31
Title Name Major academic (professional)
experience Current position in our company
or other company
Chairman of the Board of Directors
Lin, Jin-Bao MBA, West Texas A&M University,
USA Director, TaiwanCrystal Industry
Association
Vice-Chairman of the Board of
Directors Hsu, Der-Jun
Kei-Nan Institute of Technology and Business
Chairman of the Board of Director, Chan-Yu Corporation
Chairman of the Board of Director,Kuan-Ya Int’l Corporation
Chairman of the Board of Director,TCTI Corporation
Director of Board
Lin, Wan-Shing
Master in Management, Taipei Science and Technological University
Chairman of the Board of Director,Tai Shin Electronics Corporation
Chairman of the Board of Director,TXC Ninpo Corp
Director of Board
Go, Tien-Chong
Electronics Dept, Taipei Institute Consultant, Amulaire
Director of Board
Kuo, Shu-Hsin Business Major, Taipei Business
School Vice-Chairman of the Board of Director, Chan-Yu Corporation
Director of Board
Chen Chueh, Shang-Hsin
Master of management, Zhejiang University
Marketing inspector of TXC
Corporate Director of
Board
TLC Capital Co.,LTD
Investment Company of UMC GroupInvestment Company of UMC
Group
Independent Director of
Board
Shen, Chi-Fong
BusinessAdministration, Taipei Cultural University
Board of Director, Shun-Ban Technology Corp.
Chairman of the Board of Director,Hon-Sheng Technology Corp(Institution Representative)
Auditor, Chun-Chong Optics-Electronics (Institution
Representative)
Independent Director of
Board Yu, Shang-Wu
Ph.D.,
Birmingham University Professor, Taipei Science and
Technological University
Supervisor Yang,
Min-shou Taipei Second Professional High
School -
Supervisor Yang, Du-An History Dept, TamKung University -
Supervisor Lin,
Ming-Zong Accounting Department, Feng Cheng
University Director of Chung Financial
Consulting Corporation

13
B. Personnel data of the general manager, vice general manager, assistant vice general manager, chief of divisions
2013.04.21
Title Name Date of employment Major academic (professional) Other part time position
with other companies
General Manager Lin, Wan-Hsing 1989.11.11
Master in Management, Taipei Science and Technological University
Chairman of the Board of Director, Tai-Shin Electronics Corp
Chairman of the Board of Director, TXC Ninpo Corp
Vice General Manager
Chen Chueh,Shan-hs
ing 2002.04.01
Master of management, Zhejiang University
President of TXC Ninpo Corp
Chairman of the Board of Director, Shin Mau Electronics Corp
Vice General Manager
CS Lam
2011.01.03 PhD, Prinston University
President ofTXC Technology
Chief Technology Officer of TXC Corporation
Vice General Manager
Chang,
Qi-Zhong 2006.04.01
Lunghwa University of Science and Technology
-
Vice General Manager Kuo, Ya-Ping 2009.08.01
BOSTON
UNIVERSITY, MBA -
Vice General Manager Adam Lee
2011.01.31
Ph.D., National Taiwan University of Science & Technology, Department of Business Administration
Vice President, Sequel Technology, Inc.
-
Vice President Manager Colin Chang
2012.01.01
City University of Macau, MBA
Plant Manager, Taitien Electronics Co., Ltd.
Assistant Vice General Manager
Kuo,
Ya Han 2009.08.01
West Coast University, MBA
Sales & Marketing Center TXC Corp. -
Assistant Vice General Manager
Lin,
Sufen 2010.07.01
Electrical Department of Kaohsiung Institute
Director, OEM Product Division, TXC Corp.
-
Assistant Vice General Manager
Lin,
Shi Bo 2011.01.31
Master of Physics, UC, Riverside, USA
Director, Marketing Center, TXC Corp. -
Assistant Vice General Manager
Su
Zheming 2011.01.31
Department of Electrical Engineering, National Taiwan Ocean University
Director, Manufacturing Center, TXC Corp.
-
Assistant Vice General Manager
M.K. Chao 2012.01.01
Ph.D., Naval Architecture & Ocean Engineering, National Taiwan University
Engineer, Biomedical Engineering Center, ITRI
Assistant Vice General Manager
Stephen You 2012.0101
Department of Electronic Engineering, Oriental Institute of Technology
Special Assistant, Sales/Marketing Center, TXC Corp.
Chief of Finance Hong, Gon-Wen 2003.03.11
MBA, National Taipei University
Financial Manager, TXC Corp. -
Note 1: The shareholdings listed in the table include shares under trust with discretion reserved.
Note 2: The tenures of VP Colin Chang, AVP Stephen You, AVP M.K. Chao began on January 1, 2012
14
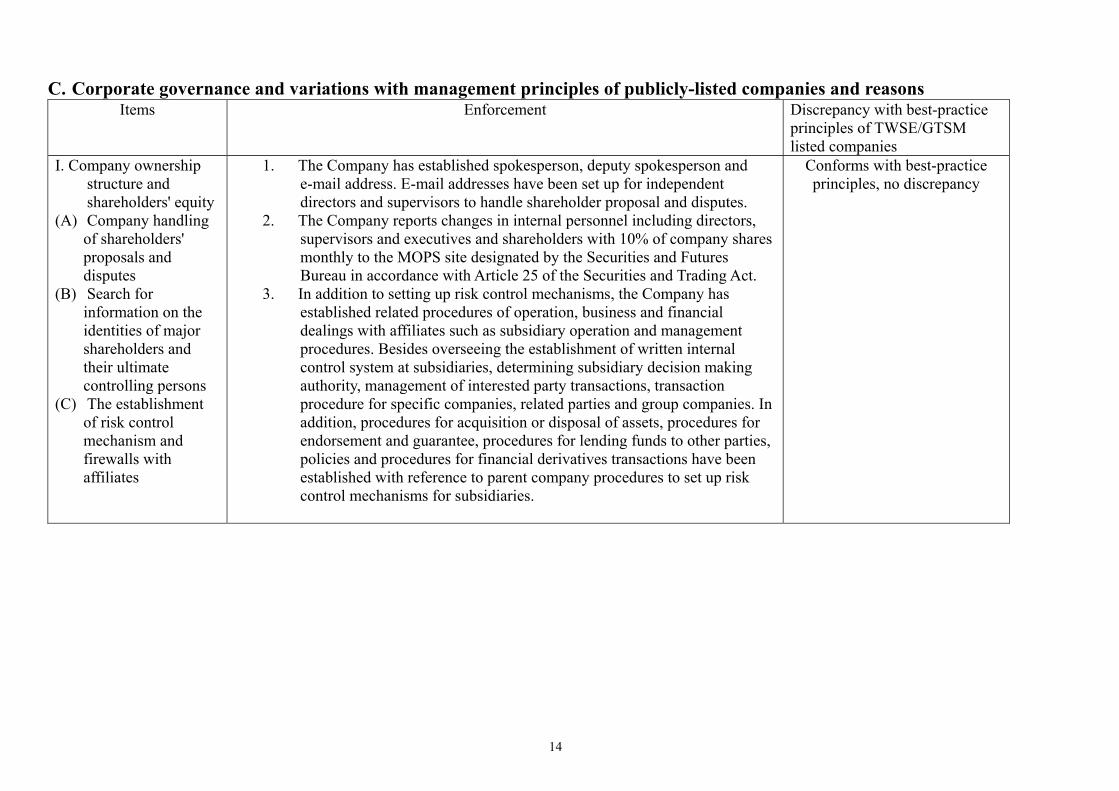
C. Corporate governance and variations with management principles of publicly-listed companies and reasons Items
Enforcement
Discrepancy with best-practice principles of TWSE/GTSM listed companies
I. Company ownership structure and shareholders' equity
(A) Company handling of shareholders' proposals and disputes
(B) Search for information on the identities of major shareholders and their ultimate controlling persons
(C) The establishment of risk control mechanism and firewalls with affiliates
1. The Company has established spokesperson, deputy spokesperson and e-mail address. E-mail addresses have been set up for independent directors and supervisors to handle shareholder proposal and disputes.
2. The Company reports changes in internal personnel including directors, supervisors and executives and shareholders with 10% of company shares monthly to the MOPS site designated by the Securities and Futures Bureau in accordance with Article 25 of the Securities and Trading Act.
3. In addition to setting up risk control mechanisms, the Company has established related procedures of operation, business and financial dealings with affiliates such as subsidiary operation and management procedures. Besides overseeing the establishment of written internal control system at subsidiaries, determining subsidiary decision making authority, management of interested party transactions, transaction procedure for specific companies, related parties and group companies. In addition, procedures for acquisition or disposal of assets, procedures for endorsement and guarantee, procedures for lending funds to other parties, policies and procedures for financial derivatives transactions have been established with reference to parent company procedures to set up risk control mechanisms for subsidiaries.
Conforms with best-practice principles, no discrepancy

15
II. The composition and
duties of board of directors
(A) Company independent director placement
(B) Regularly evaluation
of CPA independence
1. The company elected two directors who conformed to independent director criteria at the 2010 shareholders' meeting convened on June 15, 2010 and amended the articles of incorporation in line with the Securities and Exchange Act to include independent directors. The academic background, operating beliefs, declarations and commitments of the two independent directors and the election process and complete results are posted on the company website. The related important statements made by the independent directors during the board meetings are recorded in the board meeting minutes.
2. The Company conducts an annual internal evaluation of the competence of CPA to strengthen CPA independence and familiarity with company business and makes regular (every 1 – 2 years) reports to the board to evaluate the independence of CPAs. A CPA performance evaluation procedure was passed on April 29, 2013 which utilizes the audit committee to strengthen evaluation functions. Before the CPA is replaced, the Chairman and President first understand the reason and circumstances of the replacement and interview the CPA successor. Following the evaluation, the resume of the CPA is sent to the audit committee for review and the matter is reported to the board for discussion. If necessary, the CPA may be requested from time to time to attend board meetings. Reports were made to board for discussion of independence and competence at the two most recent board meetings on January 5, 2010 and August 27, 2012.
Conforms with best-practice principles, no discrepancy
III. Establishment of communication channels with stakeholders
The Company has established a spokesperson system, website and other channels to provide the latest company information and create channels for communication. A dedicated shareholder mailbox has also been set up to serve as a contact window for business management and operation items so stakeholder replies can be handled appropriately.
Conforms with best-practice principles, no discrepancy
16
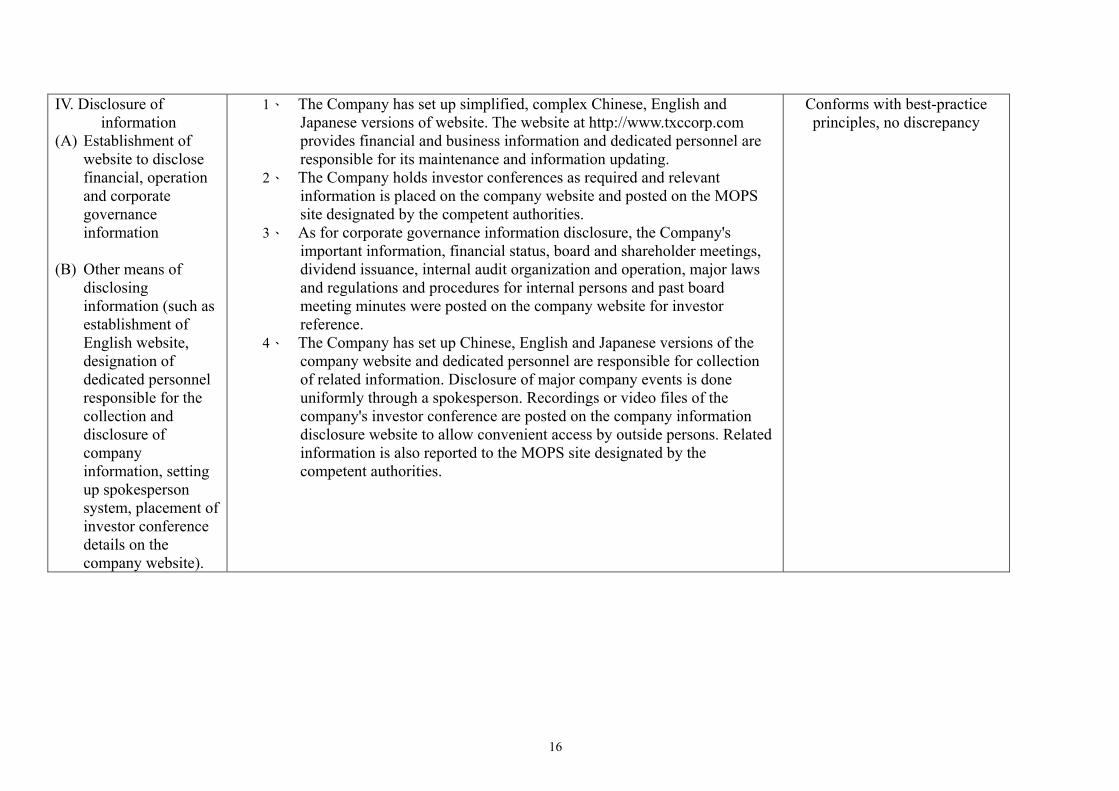
IV. Disclosure of
information (A) Establishment of
website to disclose financial, operation and corporate governance information
(B) Other means of
disclosing information (such as establishment of English website, designation of dedicated personnel responsible for the collection and disclosure of company information, setting up spokesperson system, placement of investor conference details on the company website).
1、 The Company has set up simplified, complex Chinese, English and Japanese versions of website. The website at http://www.txccorp.com provides financial and business information and dedicated personnel are responsible for its maintenance and information updating.
2、 The Company holds investor conferences as required and relevant information is placed on the company website and posted on the MOPS site designated by the competent authorities.
3、 As for corporate governance information disclosure, the Company's important information, financial status, board and shareholder meetings, dividend issuance, internal audit organization and operation, major laws and regulations and procedures for internal persons and past board meeting minutes were posted on the company website for investor reference.
4、 The Company has set up Chinese, English and Japanese versions of the company website and dedicated personnel are responsible for collection of related information. Disclosure of major company events is done uniformly through a spokesperson. Recordings or video files of the company's investor conference are posted on the company information disclosure website to allow convenient access by outside persons. Related information is also reported to the MOPS site designated by the competent authorities.
Conforms with best-practice principles, no discrepancy

17
V. Company
establishment, nomination or operation of other functional committees
The Company's board of directors passed a resolution on December 28, 2011 to establish a remuneration committee and convened meetings on January 16, 2012, August 27, 2012 and December 24, 2012. Three supervisor and two independent director positions have been established in accordance with the Securities and Exchange Act. One of them conforms to independent supervisor criteria. Related duties including nomination of committee members and setting remuneration committee attributes. Its operations comply with Best-Practice Principles of TWSE/GTSM Listed Companies. The supervisor system will be abolished during the 2013 board of directors election and a audit committee will be established in its place in accordance with related laws and regulations.
To establish supervisor, audit committee or other function committees in accordance with the law, it will be proposed to revoke the supervisor system and elect three independent and establish an audit committee at the June 19, 2013 shareholders' meeting.
VI. If your Company has established corporate governance principles according to Best-Practice Principles of TWSE/GTSM Listed
Companies, describe any discrepancies between them: 1. The Company's board of directors passed the initial version of Corporate Governance Best-Practice Principles on October 27, 2009.
Amendments were made on April 29, 2013. Actual operations of the Company comply with Corporate Governance Best-Practice Principles. Its enforcement principles are: (1) Encourage shareholder participation and corporate governance (2) Establish corporate governance relations between the Company and affiliated companies (3) Strength board of directors functions (4) Plan to establish audit committee to replace supervisor positions in 2013 (5) Set board resolution rules and decision making procedures (6) Exercise remuneration committee and audit committee functions (7) Respect rights of stakeholders (8) Raise information transparency (9) Improve corporate government disclosure
2. In order to enhance corporate governance content and spirit, the Company will continue to establish more detailed and concrete rules and procedures, the code of conduct, management of transactions with interested parties, procedure for transactions with designated companies, interested parties and group companies and major internal information guidelines, scope of duties of independent directors, code of ethical business management, corporate social responsibility best-practice principles have been passed at board of directors and shareholders' meetings and are implemented by the Company.

18
VII. Other major information that is helpful to understand corporate governance enforcement (such as employee rights, employee concern, investor
relations, supplier relations, stakeholder rights, director and supervisor continuing studies, risk management policy and risk weighing criterion implementation conditions, consumer protection or customer policy implementation conditions, purchase of liability insurance for company directors and supervisors): 1. Employee rights: The Company has set up employee welfare measures, retirement system, continuing studies and various employee rights
based upon the Labor Standards Act. 2. Employee concern: The Company has set up a medical office with professional medical staff, established a labor safety and health
committee to govern employee safety and health matters and offers employee assistance programs including psychological, medical and health. Many communication channels have been opened for employees to submit suggestions and recommendations to create excellent two-way communication channels.
3. Supplier relations, stakeholders’ rights: Procedures are followed for each aspect of company work. Cooperation with companies is conducted in accordance with contract provisions to uphold the legal rights of both parties. As of today, no related litigation has arisen.
4. Investor relations: The Company is very concerned about investor rights. In addition to reporting related information to the MOPS site designed by the competent authorities and posting related information on the company website, the Company received an A+ rating for four consecutive years by the Securities & Futures Institute information disclosure and evaluation system, awarded the voluntary disclosure and transparent company honors for eight consecutive years and given an A++ rating for the ninth annual rating period.
5. The Company's directors and supervisors attend continuing education finance and business classes on a non-regular basis. See the director and supervisor education & training table of the Company's Annual Report.
6. Company risk management policy and risk weighing criterion implementation: See the Company's Annual Report for related company risk management policy, organization framework and related risk control work. In addition, the Company conducts analysis, tracks and devises countermeasures for business targets that could result in high risks to establish a sound risk control mechanism.
7. Consumer protection and customer policy implementation: Customer first, mission accomplishment shows TXC commitment and determination to create a customer-oriented business. Our dedication towards quality has earned deep customer recognition over the years. The outstanding supplier awards given to us by numerous customers are a source of pride and encouragement.
8. The Company has purchased liability insurance for directors and supervisors in 2004. In 2008, the policy was increased to US$5 million.

19
9. Corporate governance instruction, training and continuing education for executive officers:
Position Name
Training Period
Continuing Education Date Organizer Name of Course
Start Finish
President Peter Lin
3 hrs 07/23/2012 07/23/2012Taiwan Corporate
Governance Association Taiwan Corporate Acquisition Legal System and Frequent Disputes
Vice President Yapin Guo
Vice President C.S. Lam
Vice President Colin Chang
Vice President Adam Lee
Marketing Principal
Levi Chen
Audit Supervisor Chang Wei-Han
6 hrs 5/22/2012 5/22/2012
Taiwan Development & Research Academia of Economic & Technology
Lecture on Supervision and Auditing of Chinese Subsidiaries of Taiwan Businesses
6 hrs 5/23/2012 5/23/2012
Taiwan Development & Research Academia of Economic & Technology
China Taxation and Accounting Internal Audit Case Study Seminar
Financial Controller
Vivien Hong
3 hrs 07/23/2012 07/23/2012Taiwan Corporate Governance Association
Taiwan Corporate Acquisition Legal System and Frequent Disputes
12 hrs 10/18/2012 10/19/2012Accounting Research and Development Foundation
Issuer Securities Exchange Accounting Supervisor Continuing Education Course
3 hrs 12/05/2012 12/05/2012Securities and Futures Institute
International Financial Reporting Standard (IFRS) Coming Times and How Enterprises Should Respond
20
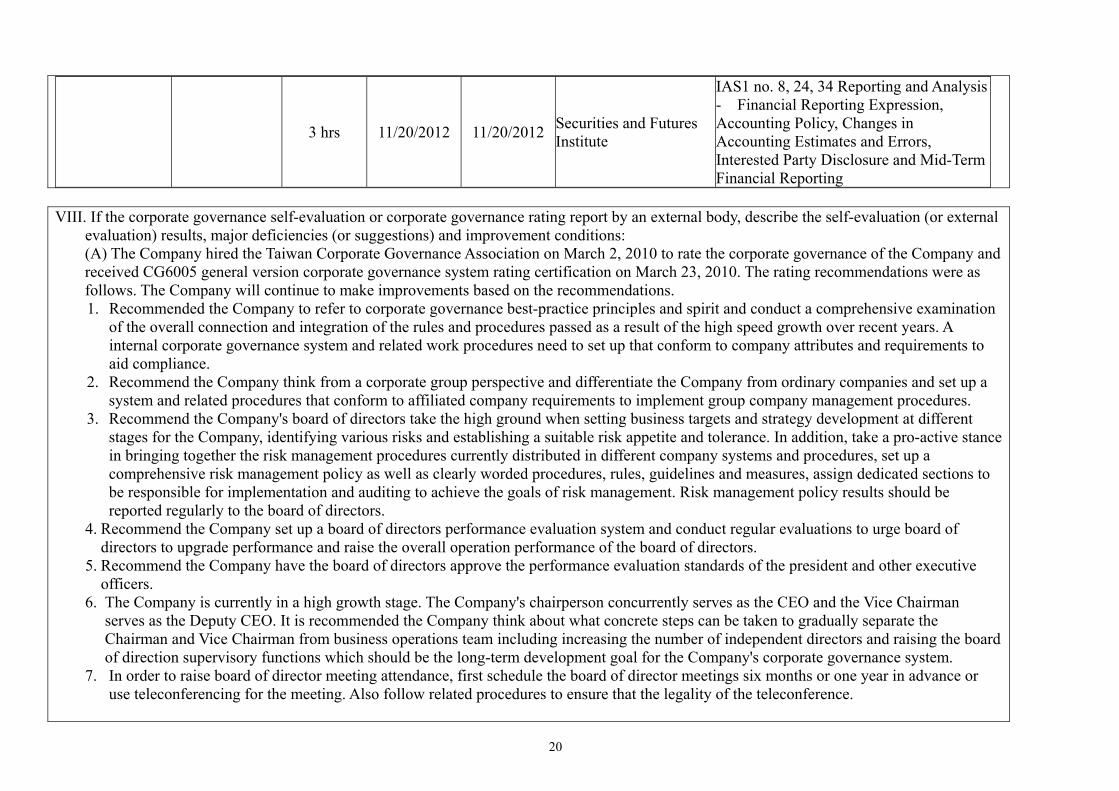
3 hrs 11/20/2012 11/20/2012Securities and Futures Institute
IAS1 no. 8, 24, 34 Reporting and Analysis - Financial Reporting Expression, Accounting Policy, Changes in Accounting Estimates and Errors, Interested Party Disclosure and Mid-Term Financial Reporting
VIII. If the corporate governance self-evaluation or corporate governance rating report by an external body, describe the self-evaluation (or external
evaluation) results, major deficiencies (or suggestions) and improvement conditions: (A) The Company hired the Taiwan Corporate Governance Association on March 2, 2010 to rate the corporate governance of the Company and received CG6005 general version corporate governance system rating certification on March 23, 2010. The rating recommendations were as follows. The Company will continue to make improvements based on the recommendations.
1. Recommended the Company to refer to corporate governance best-practice principles and spirit and conduct a comprehensive examination of the overall connection and integration of the rules and procedures passed as a result of the high speed growth over recent years. A internal corporate governance system and related work procedures need to set up that conform to company attributes and requirements to aid compliance.
2. Recommend the Company think from a corporate group perspective and differentiate the Company from ordinary companies and set up a system and related procedures that conform to affiliated company requirements to implement group company management procedures.
3. Recommend the Company's board of directors take the high ground when setting business targets and strategy development at different stages for the Company, identifying various risks and establishing a suitable risk appetite and tolerance. In addition, take a pro-active stance in bringing together the risk management procedures currently distributed in different company systems and procedures, set up a comprehensive risk management policy as well as clearly worded procedures, rules, guidelines and measures, assign dedicated sections to be responsible for implementation and auditing to achieve the goals of risk management. Risk management policy results should be reported regularly to the board of directors.
4. Recommend the Company set up a board of directors performance evaluation system and conduct regular evaluations to urge board of directors to upgrade performance and raise the overall operation performance of the board of directors.
5. Recommend the Company have the board of directors approve the performance evaluation standards of the president and other executive officers.
6. The Company is currently in a high growth stage. The Company's chairperson concurrently serves as the CEO and the Vice Chairman serves as the Deputy CEO. It is recommended the Company think about what concrete steps can be taken to gradually separate the Chairman and Vice Chairman from business operations team including increasing the number of independent directors and raising the board of direction supervisory functions which should be the long-term development goal for the Company's corporate governance system.
7. In order to raise board of director meeting attendance, first schedule the board of director meetings six months or one year in advance or use teleconferencing for the meeting. Also follow related procedures to ensure that the legality of the teleconference.

21
8. Based on the spirit of corporate governance, when a director or supervisor has a conflict of interest involving a matter before the board of directors, the independent director shall fulfill their decision-making responsibility and oversee related director recusal at board meetings. For effective implementation, the board secretary can be responsible for reminding the meeting chairperson and have the independent directors supervise the recusal procedure and work.
9. The Company's information disclosure system is very effective but it is recommended that procedures set up for reporting major information to the board, independent directors and supervisors including reporting period, type of information reported and reporting method to ensure board members are familiar with major company information and directors and supervisors are able to fulfill their duties.
10. It is recommended that the Company set up regular / formal meeting or communication channels between independent directors, supervisors and CPA outside of board meetings. Appropriate meeting minutes should be made of the meeting and communications to conduct tracking and oversight of financial record quality and internal control system and operation results.
(2) The Company hired the Taiwan Corporate Governance Association to conduct a CG6008 advanced version rating of our corporate governance system in 2013.
Note 1: For continuing education of directors and supervisors, refer to the Directions for the Implementation of Continuing Education for Directors and Supervisors of TWSE Listed and GTSM Listed Companies issued by the Taiwan Stock Exchange.
Note 2: If a securities firm, securities investment trust, securities investment consulting firm or futures operator, describe risk management policy, risk weighing criterion and consumer protection or customer policy implementation.
Note 3: What is referred to as corporate governance self-evaluation reports is a self-evaluation and description of corporate governance self-evaluation items by the company and a report of the company's current operation and enforcement status of each self-evaluation item.
22
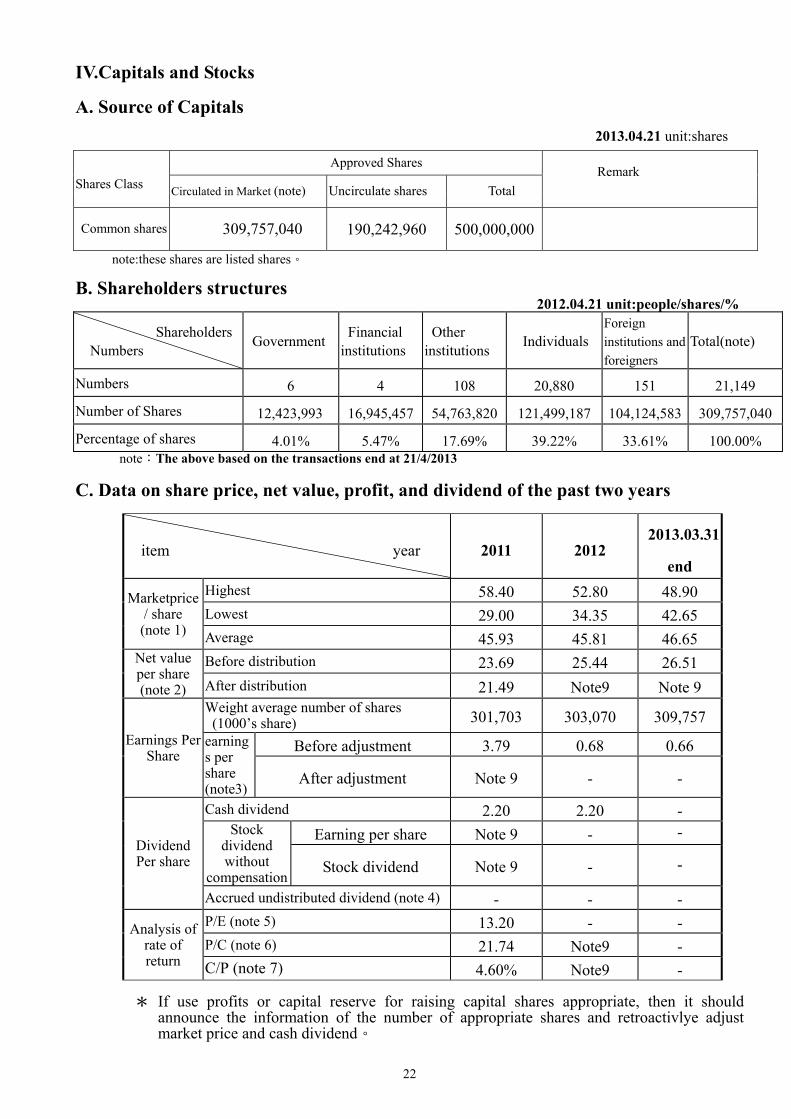
IV.Capitals and Stocks
A. Source of Capitals
2013.04.21 unit:shares
note:these shares are listed shares。
B. Shareholders structures 2012.04.21 unit:people/shares/%
Shareholders Numbers
Government Financial
institutions Other
institutions Individuals
Foreign
institutions and
foreigners
Total(note)
Numbers 6 4 108 20,880 151 21,149
Number of Shares 12,423,993 16,945,457 54,763,820 121,499,187 104,124,583 309,757,040
Percentage of shares 4.01% 5.47% 17.69% 39.22% 33.61% 100.00% note︰The above based on the transactions end at 21/4/2013
C. Data on share price, net value, profit, and dividend of the past two years
item year 2011 2012 2013.03.31
end
Marketprice / share (note 1)
Highest 58.40 52.80 48.90 Lowest 29.00 34.35 42.65 Average 45.93 45.81 46.65
Net value per share (note 2)
Before distribution 23.69 25.44 26.51
After distribution 21.49 Note9 Note 9
Earnings Per Share
Weight average number of shares (1000’s share) 301,703 303,070 309,757
earnings per share (note3)
Before adjustment 3.79 0.68 0.66
After adjustment Note 9 - -
Dividend Per share
Cash dividend 2.20 2.20 - Stock
dividend without
compensation
Earning per share Note 9 - -
Stock dividend Note 9 - -
Accrued undistributed dividend (note 4) - - -
Analysis of rate of return
P/E (note 5) 13.20 - - P/C (note 6) 21.74 Note9 - C/P (note 7) 4.60% Note9 -
* If use profits or capital reserve for raising capital shares appropriate, then it should
announce the information of the number of appropriate shares and retroactivlye adjust market price and cash dividend。
Shares Class
Approved Shares Remark
Circulated in Market (note) Uncirculate shares Total
Common shares 309,757,040 190,242,960 500,000,000

23
note1:list the hightest and lowest price of the common stocks in that year, and the average market price for that year is calculated based on the transaction values and transaction amounts。
note2:Use the number of circulated shares at the end of the year as the base, then the dividend
distributed determined in the coming year’s stockholders’ meeting。 note3:If there is any retroactive adjustment from the stock dividend without compensation,
then it should list earning per share on before and after adjustment。 note4:If the equity investment has constraint that limits the undistributed dividend for that year
and it is cumulated until to later profitable year. Then it should disclose the cumulative undistributed dividend up to that year。
note5:P/E=current year average share price at closing/earning per share。 note6:P/C=current year average share price at closing/cash dividend per share。 note7:C/P= cash dividend per share/current year average share price。 note8︰The financial statements of TXC Corporation were audited or view or certified by
CPA. note9︰Up to 2013.03.31,The retain earnings of 2012 has not yet admitted by the
stockholders’ meeting. D. Company’s dividend policy and its current implementation status
1.Dividend policy as defined in the articles of incorporation:
If there is a profit at the final settling of accounts after paying all taxes and offsetting of losses from previous years, the Company shall first set aside ten percent of the profits as legal reserve. This shall not apply when the legal reserve amounts to the total authorized capital. Director remuneration shall be no more than 2% and employee bonus shall be no lower than 3% of the special reserve allocated from the profits in accordance with the law or after reversal. The remainder together with undistributed earnings from previous periods after an appropriate amount is reserved depending on operating conditions is distributed as shareholder dividends as resolved by the shareholders' meeting. The board of directors is authorized to determine the counterparts for employee stock dividend distribution which include those company employees that conform to certain conditions. The Company's dividend distribution policy is made in consideration of factors such as industry development being in a growth phase, long-term financial planning and shareholder cashflow requirements. Therefore, the earnings available for distribution for that year, after allocation of the legal reserve and special reserve in accordance with the law, shall be distributed as provided in the previous paragraph. Of this, the cash dividend portion of shareholder dividends shall not be lower than 20% of total dividends.
24
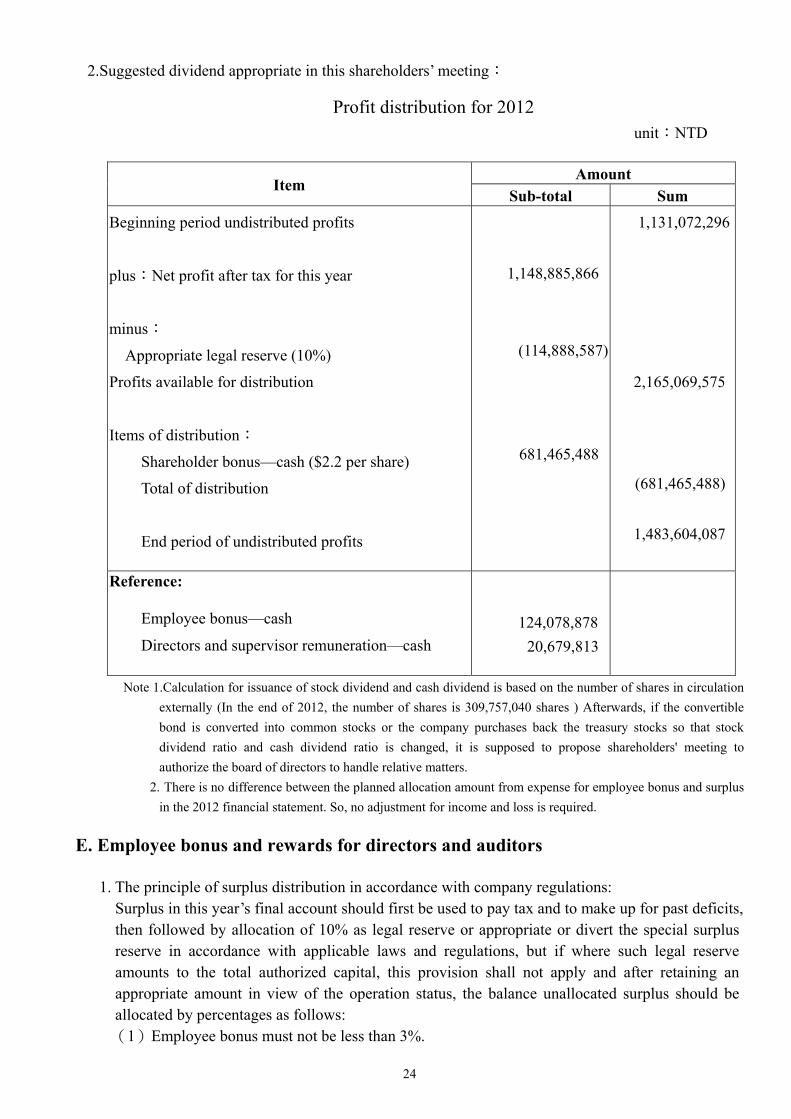
2.Suggested dividend appropriate in this shareholders’ meeting:
Profit distribution for 2012
unit:NTD
Item Amount
Sub-total Sum
Beginning period undistributed profits
plus:Net profit after tax for this year
minus:
Appropriate legal reserve (10%)
Profits available for distribution
Items of distribution:
Shareholder bonus—cash ($2.2 per share)
Total of distribution
End period of undistributed profits
1,148,885,866
(114,888,587)
681,465,488
1,131,072,296
2,165,069,575
(681,465,488)
1,483,604,087
Reference:
Employee bonus—cash
Directors and supervisor remuneration—cash
124,078,878
20,679,813
Note 1.Calculation for issuance of stock dividend and cash dividend is based on the number of shares in circulation
externally (In the end of 2012, the number of shares is 309,757,040 shares ) Afterwards, if the convertible
bond is converted into common stocks or the company purchases back the treasury stocks so that stock
dividend ratio and cash dividend ratio is changed, it is supposed to propose shareholders' meeting to
authorize the board of directors to handle relative matters.
2. There is no difference between the planned allocation amount from expense for employee bonus and surplus
in the 2012 financial statement. So, no adjustment for income and loss is required.
E. Employee bonus and rewards for directors and auditors
1. The principle of surplus distribution in accordance with company regulations: Surplus in this year’s final account should first be used to pay tax and to make up for past deficits, then followed by allocation of 10% as legal reserve or appropriate or divert the special surplus reserve in accordance with applicable laws and regulations, but if where such legal reserve amounts to the total authorized capital, this provision shall not apply and after retaining an appropriate amount in view of the operation status, the balance unallocated surplus should be allocated by percentages as follows: (1)Employee bonus must not be less than 3%.

25
(2)Reward for directors and auditors must not be over 2%. Moreover, the objects of employee bonus should comprise employees of affiliated companies under specific conditions and authorize the board of directors to formulate the stipulations.
2. Proposal by the Board of Directors for surplus distribution in 2012:
As proposed by the Board of Directors on 29 April, 2013 surplus distribution for employee bonus and reward for directors and auditors are as follows: (1) Propose to allocate employee cash bonus amounting to NT$124,078,878 and cash reward for
directors and auditors amonting to NT$20,679,813. There is no difference between the planned allocation amount from expense for employee bonus and surplus in the 2012 financial statement. So, no adjustment for income and loss is required.
(2) Propose to allocate employee bonus and reward for directors and auditors in accordance with par value setting earnings per share at: NT$3.79
3. The Company Board of Directors on surplus allocation in 2011:
The actual surplus allocation of employee bonus and reward for directors and auditors according to resolution adopted by the shareholders meeting on 13 June, 2012. (1) Actual reward for employee、 directors and supervisors in cash respectively: NT$113,316,786
and NT$18,886,131. (2) No difference between the proposed allocation adopted by the Board of Directors and the resolution by
shareholders meeting.
F. Buying back company stocks: None
G. Convertible Corporate Bond:
Convertible Corporate bond data
Type of corporate bond (note 2) 3rd domestic convertible bond (note 5) 4th domestic convertible bond ( note 5)
Date of issuance January 11, 2010 January 25, 2013
Face value NT$100,000.00 NT$100,000.00
Location of issuance and trade (note 3) N/A N/A
Issuance price Issued at face value Issued at face value
Total amount NT$800,000,000.00 NT$800,000,000.00
Interest rate Coupon rate 0% Coupon rate 0%
Term Three-year term Due date: January
11, 2013
Three-year term Due date: January 25,
2016
Guarantee institute N/A N/A
Trustee Chinatrust Commercial Bank Chinatrust Commercial Bank
Underwriter Yuanta Securities Co., Ltd. Yuanta Securities Co., Ltd.
Attorney Chen Ching-shang Chiu Ya-wen
CPA Deloitte & Touche CPAs Gong
Shuang-hsiung, Yang Ching-chen
Deloitte & Touche CPAs Gong
Shuang-hsiung, Wong Bo-ren
26
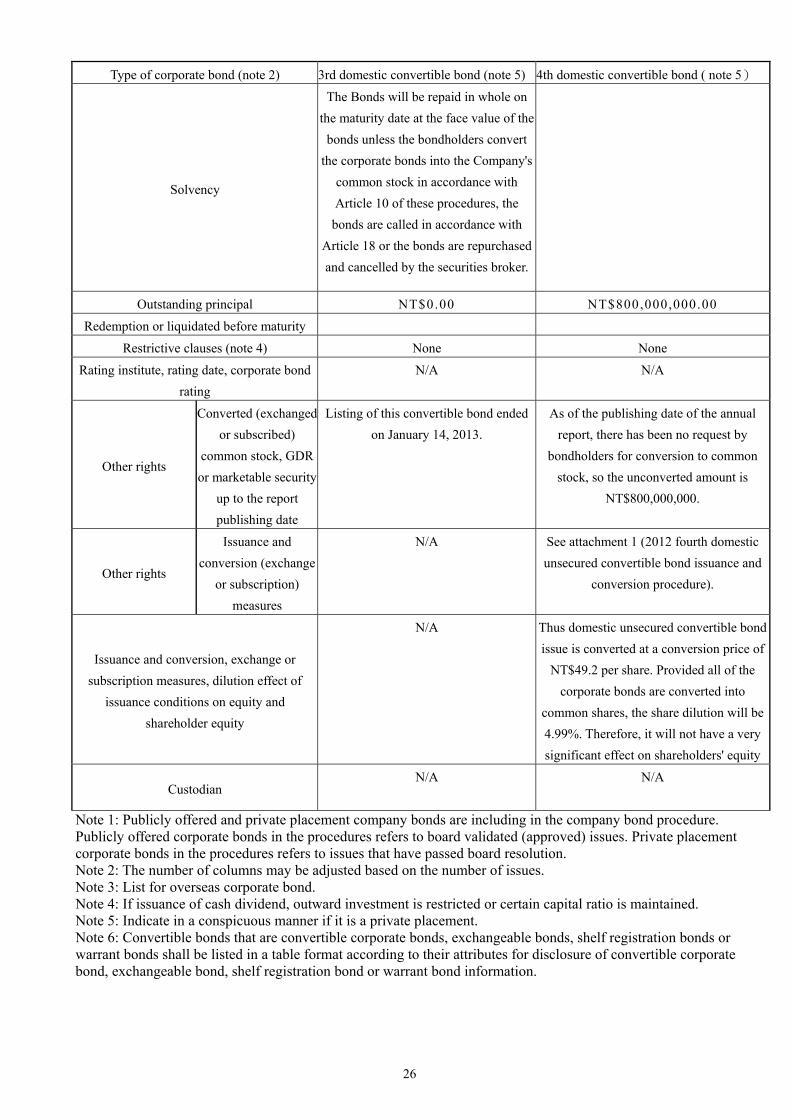
Type of corporate bond (note 2) 3rd domestic convertible bond (note 5) 4th domestic convertible bond ( note 5)
Solvency
The Bonds will be repaid in whole on
the maturity date at the face value of the
bonds unless the bondholders convert
the corporate bonds into the Company's
common stock in accordance with
Article 10 of these procedures, the
bonds are called in accordance with
Article 18 or the bonds are repurchased
and cancelled by the securities broker.
Outstanding principal NT$0.00 NT$800,000,000.00
Redemption or liquidated before maturity
Restrictive clauses (note 4) None None
Rating institute, rating date, corporate bond
rating
N/A N/A
Other rights
Converted (exchanged
or subscribed)
common stock, GDR
or marketable security
up to the report
publishing date
Listing of this convertible bond ended
on January 14, 2013.
As of the publishing date of the annual
report, there has been no request by
bondholders for conversion to common
stock, so the unconverted amount is
NT$800,000,000.
Other rights
Issuance and
conversion (exchange
or subscription)
measures
N/A See attachment 1 (2012 fourth domestic
unsecured convertible bond issuance and
conversion procedure).
Issuance and conversion, exchange or
subscription measures, dilution effect of
issuance conditions on equity and
shareholder equity
N/A Thus domestic unsecured convertible bond
issue is converted at a conversion price of
NT$49.2 per share. Provided all of the
corporate bonds are converted into
common shares, the share dilution will be
4.99%. Therefore, it will not have a very
significant effect on shareholders' equity
Custodian N/A N/A
Note 1: Publicly offered and private placement company bonds are including in the company bond procedure. Publicly offered corporate bonds in the procedures refers to board validated (approved) issues. Private placement corporate bonds in the procedures refers to issues that have passed board resolution. Note 2: The number of columns may be adjusted based on the number of issues. Note 3: List for overseas corporate bond. Note 4: If issuance of cash dividend, outward investment is restricted or certain capital ratio is maintained. Note 5: Indicate in a conspicuous manner if it is a private placement. Note 6: Convertible bonds that are convertible corporate bonds, exchangeable bonds, shelf registration bonds or warrant bonds shall be listed in a table format according to their attributes for disclosure of convertible corporate bond, exchangeable bond, shelf registration bond or warrant bond information.

27
Type of corporate bond
domestic 3rd unsecured convertible corporate bond
domestic 4th unsecured convertible corporate bond
Year Item
2012 As of April 21, 2013
As of April 21, 2013
Convertible corporate
bond market price
Highest 109.90 100 104.75
Lowest 98.40 99.75 100.50
Average 103.87 99.83 103.09
Conversion price NT$50.4 / NT$48 NT$48 NT$49.2
Issuance (handling) date & conversion price at issuance
2010.01.11,NT$57.6 2010.01.11,NT$57.6
2013.01.25,NT$49.2
H. Employee stock option handling:
(1) Handling of unmatured employee stock option receipts and impact on shareholder equity
2013.04.21
Type of employee stock option receipts 2007 employee stock option receipts
Approval date of competent authority 2007.11.09
Issuance (handling) date 2007.12.10
Issuance unit qty (thousand shares/unit) 8,000
Proportion of warranted shares to total issued shares (%) 2.58%
Warrant period 2009.12.10~2012.12.09
Fulfillment Issue new shares
Restricted warrant period and ratio (%) Over 2 years 50% Over 3 years 75% Over 4 years 100%
Acquired no. of shares 7,155 thousand shares
Implemented warrant amount 300,942,400 dollars
Unimplemented warrant quantity 845 thousand shares
Per share warrnt price of unimplemented warrant NT$ 37.8
Proportion of unimplemented warrant shares to total issued shares (%) 0.27%
Impact on shareholder equity
Employee stock option receipts must over 2 years before purchasing stock option by scheduled stage as stipulated by the company therefore no major impact on shareholder equity.

28
V、Business Information
A、Business Contents
1、Business Scope
(1). The Major Business Contents TXC Corporation, founded in 1983, is a leading professional frequency control product
manufacturer. We have devoted to the research, design, manufacture, and sale of Dual-Inline-Package (DIP) and Surface Mount Device (SMD) quartz crystal products. TXC now specializes in five categories of products such as high quality Quartz Unit Crystal, Automotive Crystal, Crystal Oscillator (CXO), Surface Acoustic Wave (SAW) Filter, and Timing Module (TM). In addition, to expand the Group's future development, the application of the core technical capabilities in the 2011 Q2 to import the LED substrate and wafer process, formal entry into the sapphire LED field. Our goal is to add value to our customers by providing a complete solution of frequency devices and modules, design-in service to fully satisfy various needs of the esteemed customers. We believe based upon the competence of cost effectiveness, quality, lead-time, and customer service TXC will go beyond customers' expectation. TXC has now been highly recognized as the first-class crystal provider by our customers and TXC Corporation will continue striving for excellence not to meet but to exceed the most rigid customers' standards.
(2). Business Proportions
(unit NT$ 1000’s)
22001122 CCoonnssoolliiddaatteedd RReevveennuuee
NNTTDD1100,,992288,,449955 tthhoouussaanndd ddoollllaarrss
22001111 CCoonnssoolliiddaatteedd RReevveennuuee
NNTTDD99,,889977,,334411tthhoouussaanndd ddoollllaarrss
22001122 PPaarreenntt RReevveennuuee
NNTTDD 99,,447777,,448811 tthhoouussaanndd ddoollllaarrss 22001111 PPaarreenntt RReevveennuuee
NNTTDD88,,991188,,002233 tthhoouussaanndd ddoollllaarrss

29
(3). Company’s current products
Product type Type Product description Product picture
Crystals
DIP HC-49U / HC49S / HC-49S SMD
Glass Sealed
Crystal 5*3.2mm /3*2.5mm / 2.5*2mm
Seam Sealed
Crystal
5*3.2mm / 3.2*2.5mm / 2.5*2mm/2*1.6mm/
1.6*1.2mm/1.2*1.0mm
Seam Temperature
Sensing Crystal 2.5*2mm/2*1.6mm
Tuning Fork Type 6.9*1.4mm/3.2*1.5mm /
2.0*1.2mm/1.6*1mm
Crystal
Oscillators)
XO 14.4*9.5mm / 7*5mm / 5*3.2mm /
3.2*2.5mm / 2.5*2mm /2*1.6mm
RTC XO 7*5mm/5*3.2mm/3.2*2.5mm
VCXO 14*9mm / 7*5mm / 5*3.2mm/3.2*2.5mm
SO 7*5mm/5*3.2mm
TCXO 3.2*2.5mm / 2.5*2.0mm /
2*1.6mm/1.6*1.2mm
OCXO 36*27mm/25*25mm/20*20mm/21*13mm
Timing Module 25.4*20.3mm
Automotive
DIP / Glass Sealed
Crystal / Seam
Sealed
HC49S / HC-49S SMD / 8*4.5mm /
5*3.2mm / 3.2*2.5mm / 2.5*2 mm

30
Product type Type Product description Product picture
Crystal /XO
Sapphire
2”/4”/6” Single-side / Double-side Polished Sapphire Wafer 2”/ 4” PSS wafer
430 um / 650 um / 900 um / 1000 um / 1300
um
(4). Scheduled new products development The Company will invest more resources to develop new products to expand our market share for high-end application and high added value products and actively cross over into technical R&D in the optics, microelectromechanics, sensor and medical electronics fields. Due to adherence to sustainable business concepts, the Company will continue to make advancements in basic research. Faced with domestic and foreign competition, the Company's new product and technology development will extend in the following directions:
(1) SMD miniaturized product development and process technology upgrading: Having worked for many years on quartz element miniaturization, the
Company has completed development of a 1.2x1.0x0.35mm quartz element. In order to meet future product miniaturization and advanced deployment of process technology requirements as well as make progress towards 1.0 x 0.8 x 0.35mm quartz crystal element development, TXC will continue to focus on the development of higher precision process technology to pursue research towards lower costs, reduced energy consumption, high vibration resistance and enlarge frequency range.
(2) Automotive product development The Company received TS-16949 advanced product quality planning system
certification in 2006 and completed the conversion to ISO/TS16949-2009 version. Automotive product is now entering a growth period. TXC will continue to raise product technology, safety and quality to the highest grade 1 quality and reliability rank.
(3) High-end oscillator and module product development TXC will continue to develop high-end products such as special TCXO for
telecommunication use, VCSO for optical fiber telecommunication modules, HFF VCXO, VCXO for high frequency communications and high precision frequency temperature controllers (OCXO) for base station use. These products can meet the brisk demand for telecommunication systems in Asia and emerging countries.

31
(d).Basic Research
Effectively integrate company internal engineering department technical problems, upgrade basic research capability and speed up new production market entry time through our technical team cross-functional platform.
2、The Industry
(1). Current industry status and development
The current domestic quartz industries are mainly for producing components such as crystals, crystal oscillators, and crystal filters. The basic manufacturing process of making crystals starts from cutting the quartz, and then after grinding and polish to the desired sizes; followed by depositing thin metal film electrodes on its surface under the vaccum, and subsequently, it is connected with condut wires; afterward it is packaged. In addition, by assembling and packaging the crystal components with IC oscillators then it will result the crystal oscillators. Assembling and packaging the crystal components and capacitors, wires, and resistors then it will be the crystal filters.
When you comparing the three crystal technologies: frequency, precision, and size dimension you can see that the European and US manufacturers are strong in the frequencies development. It was because of their development of the wireless technology that it gives them an advantage in the design and development; but production efficiency is lower. Japan manufacturers are the technology leaders and they are excellent in the precision and the scale size of the products. They have the advantages of products improvement, and can further to make it in mass production and automatic production. To the Taiwanese manufacturers, most of them are buying the material & know-how, machinery equipments, or purchasing the manufacturing process of which usually lead to a faster time in marketing the product. But recently, the manufacturers have improved their manufacturing process, and the manufacturing equipments; also the learning of the manufacturing process further improves it. Presently, the mainland manufacturers mainly produce low-end products wherein 80% of them are for export and their products still have not effectively satisfied the demand of their massive domestic market. In recent years Chinese manufacturers are aggressively to promote their technology abilities and to advance to the middle and high end. Below table is a comparison of advantages/disadvantages of competitions from the major producers.
Key technology
European, USAmanufactures
Japanese manufactures
Taiwanese manufactures
China manufactures
Frequency high High High-middle Middle-low Precision high Very high High-middle Middle-low
Sizes High-middle High High-middle Middle-low
Currently, in Taiwan the major crystal manufacturers are TXC Corp, Siward Crystal Technology, Harmony Electronics, Taitien Electronics, Tai-Saw Technology, and EChina Technology. TXC Corp has the highest market share and Harmony Electronics is next.
(2). Market relationship of up, middle, and down stream companies Crystal components are our major product and it is also the basic electronics parts. Our

32
upstream industries include crystal growth, material manufacturing, and precision machinery. The downstream applications include information technology, wire and wireless communications, consumer electronics, and network products etc. The relationship between the up, middle, and downstream manufacturers is given in the below diagram:
3. Development Trend of Crystal Industry
Crystal products are important components in the electronics products. To sponsor the future 3C growth and trend, the future product style, its size, and the precision will have the following trend:
(3). Production trend:
(a). Slim down and usage of SMD In terms of the technology aspect, we have achieved the slim down level for use the single crystal IC, crystal design & manufacturing, and packaging & testing etc. For example take the case of SMD quartz crystal, its dimension has downsized from 11.8×5.5mm、8×4.5mm、7×5mm to 6×3.5mm、5×3.2mm,and further to 4×2.5mm、3×2.5mm、2.5×2.0mm、2.0×1.6mm、even to the dimension of 2.0*1.6mm、1.6*1.2mm、1.2*1.0;its height has also improved from 2mm、1.8mm、1.5mm、1.2mm to 1mm、0.9mm、0.8mm、0.7mm、0.5mm、0.35mm、0.30mm. By the effective SMD scale down improvement, we are also toning with the development trend of Chipset, design trend of brand clients and the SMT production from our downstream clients.
Upstream suppliers ‧ Crystal growth-
Manufacturing man-made crystals
‧ Materials manufacturing- Crystal bar, wafer/crystal disk、metal and cermic package materials(top cover、base cover)、plastic、
IC… ‧ precision machinary-
cleaning/plating、fine tuning/package、
examing/testing (photo-mask manufacturing、vaccum plating machine、yellowish light plating equipments、testing instruments、jug & fixture…)
Manufacturers of Crystal .crystal gridding .circuit design .crystal/oscillator package
crystal/oscillator testing
Downstream clients .Wire, wireless communication
industry .Consumer electronics industry.Mobile communication
industry .Basestation and equipments
industry .Automotives electronics
industry
Potential entrants ‧ Electronics components channels ‧ Other non frequency electronics
components manufacturers
Substitutes .Silicon Timing Devices .self-stimulatedLCVariable frequency filter,、
oscillator .Dielectric Resonance (DR Oscillator) .FilmBody Accoustic (FBAR) .MEMS technooogy .Green Clock
33
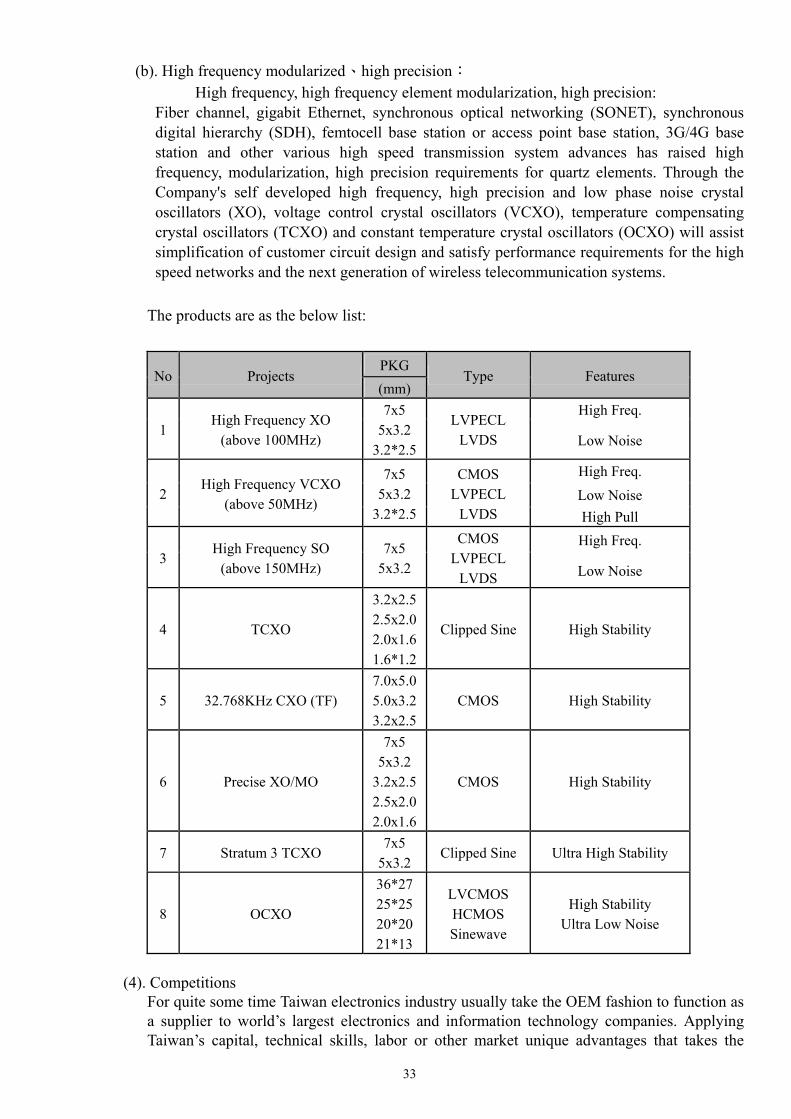
(b). High frequency modularized、high precision: High frequency, high frequency element modularization, high precision: Fiber channel, gigabit Ethernet, synchronous optical networking (SONET), synchronous digital hierarchy (SDH), femtocell base station or access point base station, 3G/4G base station and other various high speed transmission system advances has raised high frequency, modularization, high precision requirements for quartz elements. Through the Company's self developed high frequency, high precision and low phase noise crystal oscillators (XO), voltage control crystal oscillators (VCXO), temperature compensating crystal oscillators (TCXO) and constant temperature crystal oscillators (OCXO) will assist simplification of customer circuit design and satisfy performance requirements for the high speed networks and the next generation of wireless telecommunication systems.
The products are as the below list:
No Projects PKG
Type Features (mm)
1 High Frequency XO
(above 100MHz)
7x5 5x3.2
3.2*2.5
LVPECL LVDS
High Freq.
Low Noise
2 High Frequency VCXO
(above 50MHz)
7x5 5x3.2
3.2*2.5
CMOS LVPECL
LVDS
High Freq.
Low Noise
High Pull
3 High Frequency SO
(above 150MHz) 7x5
5x3.2
CMOS LVPECL
LVDS
High Freq.
Low Noise
4 TCXO
3.2x2.52.5x2.02.0x1.61.6*1.2
Clipped Sine High Stability
5 32.768KHz CXO (TF) 7.0x5.05.0x3.23.2x2.5
CMOS High Stability
6 Precise XO/MO
7x5 5x3.2
3.2x2.52.5x2.02.0x1.6
CMOS High Stability
7 Stratum 3 TCXO 7x5
5x3.2 Clipped Sine Ultra High Stability
8 OCXO
36*27 25*25 20*20 21*13
LVCMOS HCMOS Sinewave
High Stability Ultra Low Noise
(4). Competitions
For quite some time Taiwan electronics industry usually take the OEM fashion to function as a supplier to world’s largest electronics and information technology companies. Applying Taiwan’s capital, technical skills, labor or other market unique advantages that takes the

34
advantages of ”global labor division”、”regional labor division” to achieve the vertical integration purpose。With the advance of Taiwanese electronics manufacturer’s technical level, their business operatios have transformed from the parts assembled in the early days, to the OEM, and even promoted to the ODM scale. In order to gain a more added value, many Taiwan electronics companies, reposition their value chain locations, and have gradually extended themselves from manufacturing to product R&D, design and even further to sales and marketing, post-sale and brand management; and amid the global work divisions, have stance in a unique place . The major global companies with their procurement arranging, are team with Taiwan electronics companies in value creations; and themselves would be able to intend more on their brand and sales management. This ends up in a win-win situation for both parties.
With Taiwanese electronics industry forms in the nature cluster groups, and it thus has a demand of 30% of the global crystal component product. But Taiwanese manufactures can only produce no more than the 20% of total global production, and this China domestic market would provide growing space for Taiwanese companies. But the crystal component industries are in the border of oligopoly competition since the ten largest manufacturers in the world have a total combination of production of 75% and more. This illustrates the great differences of the manufacturers in this industry, and this can be said it is a oligopoly competition market. But because the wide applications of the products, each manufacturer emphasizes its own product and the market. The lower end, and mature market has a stronger tendency in cutting price to competition. This results a very strong competition market.
In the global crystal component industry, Japan is still the largest producer and it has about 60% of the worldwide productions. Our domestic competitors are SiWard Crystal Corporation, EChina Technology, Harmony Electronics, Taitien Electronics, and Tai-Saw Technology and Hosonic Electronics. Each corporation differentiates by specializing in different products and market. Our company has the highest market share which demonstrates our leading role in the crystal component industry.
3. Technology and Recent Research and Development
(1) Ratio of R&D expense in Total Operating Cost during recent years up to 2013.03.31
units:NT$ 1,000’s,% Year 2011 2012 2013.03.31
Net Operating Cost 8,918,023 9,477,481 2,056,884 Cost for Research and
Development 344,468 297,829 67,957
R&D cost/net operating Cost(%) 3.86% 3.14% 3.30%
(2). Research and Development Results
Products development
1. SMD Crystals 1.6 × 2.0 mm for SIP.
2. SMD 5.0 × 3.2 mm TF CXO for variable applications.
3. SAW-based Oscillator for SAN applications.
4. SMD Seam CXO 2.0 × 1 .6 mm 2~54 MHz for digital camera, Portable TV.
5. SMD 3.2 x 2.5 mm TCXO for GPS and WiMAX applications.
6. SMD 2.5 x 2.0 mm TCXO for GPS and WiMAX applications SMD 2.0 x 1.6 mm
TCXO for GPS and WiMAX applications.
8. SMD 1.6 x 1.2 mm TCXO for GPS and WiMAX applications.

35
9. SMD 5.0 x 3.2 mm Stratum-3 VC-TCXO for Base Station, Small-cell, Networking
Infrastructure applications.
10. SMD Crystal 1.2×1.0mm for future application.
11. SMD 5.0 × 3.2 mm TF CXO for variable applications.
12. Inverted MESA BLK 1.6 × 1.14mm
13. Inverted MESA BLK 2.49 × 1.83mm
14. SMD 2.0 x 1.6 mm TSX for GPS
15. SMD 2.5 x 2.0 mm TSX for GPS
16. SMD 3.2 x 1.5 mm Tuning Fork
17. SMD 3.2 x 1.5 mm Tuning Fork for Automotive applications.
18. SMD 2.0 x 1.2 mm Tuning Fork
19. SMD 1.6 x 1.0 mm Tuning Fork
20. SMD 7.0 x 5.0 mm Oscillator for HCSL
21. SMD 5.0 x 3.2 mm Oscillator for HCSL
22. DIP 25 x 25 mm OCXO for stratum-level and base-station applications.
23. DIP 20 x 20 mm OCXO for telecommunication applications.
24. 2” Single-side Polished Sapphire Wafer for LED application
25. 2” Double-side Polished Sapphire Wafer for LED application
26. 4” Single-side Polished Sapphire Wafer for LED application
27. 4” Double-side Polished Sapphire Wafer for LED application
28. 6” Single-side Polished Sapphire Wafer for LED application
29. 6” Double-side Polished Sapphire Wafer for LED application
Patents and
Academic publications
Patent︰ 1. Electrode of the piezoelectric crystal oscillator components 2. Vacuum gas-tight system integration package structure 3. Structure and production method of the piezoelectric quartz oscillator
chip 4. The production of piezoelectric quartz oscillator chip 5. quartz crystal oscillator 6. Crystal oscillator with layout structure for the miniaturization of size 7. Piezoelectric material thinning device 8. Grooved resonator unit packaging structure 9. Light sensor chip packaging structure 10. Stacked light sensor chip packaging structure 11. Thru-hole resonator device wafer level packaging structure 12. Thru-hole resonator device wafer level packaging structure
manufacturing method
For the patents or possible patents of TXC, please refer to relative patent database
http://www.tipo.gov.tw/ch/
Paper︰
1. A Brief View of the Current State of the Development and Aging Performance of
Fixed Frequency Surface Acoustic Wave (SAW) Oscillator (English), 2012.
2. Properties of Miniature X- and Z’-Elongated Rectangular AT-CUT Quartz
Resonators of Different Sizes (English), 2012.
3. Vibration Mode Identification and Coupling Assessment with the Mindlin Plate
Equations and Measurements is a Quartz Crystal Plate (English), 2012.
4. Aging Performance of Small Size MHz Quartz Crystal Under High Drive
(English),2011
5. Inharmonic Overtones in Partially Plated AT-cut Quartz Crystal Plates
(English),2011
6. The Study of Activation Energy (Ea) by Aging and High Temperature Storage for
Quartz Resonators' Life Evaluation (English), 2011.
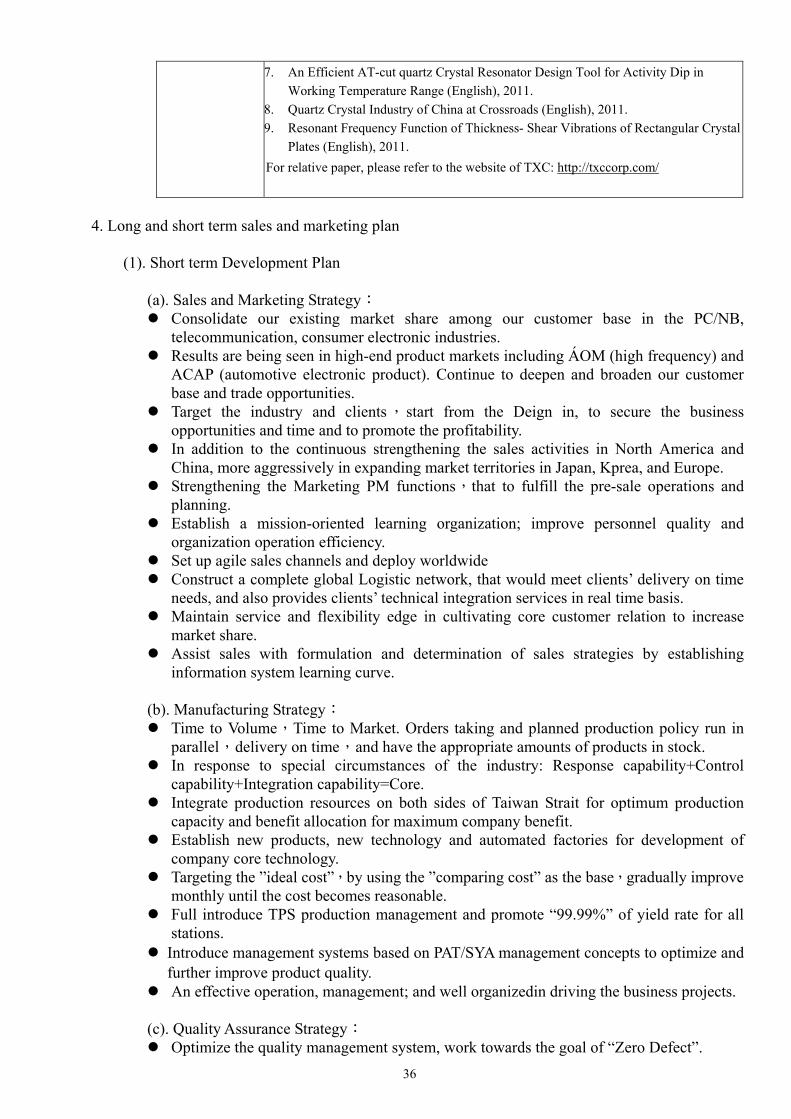
36
7. An Efficient AT-cut quartz Crystal Resonator Design Tool for Activity Dip in
Working Temperature Range (English), 2011.
8. Quartz Crystal Industry of China at Crossroads (English), 2011.
9. Resonant Frequency Function of Thickness- Shear Vibrations of Rectangular Crystal
Plates (English), 2011.
For relative paper, please refer to the website of TXC: http://txccorp.com/
4. Long and short term sales and marketing plan
(1). Short term Development Plan
(a). Sales and Marketing Strategy: Consolidate our existing market share among our customer base in the PC/NB,
telecommunication, consumer electronic industries. Results are being seen in high-end product markets including ÁOM (high frequency) and
ACAP (automotive electronic product). Continue to deepen and broaden our customer base and trade opportunities.
Target the industry and clients,start from the Deign in, to secure the business opportunities and time and to promote the profitability.
In addition to the continuous strengthening the sales activities in North America and China, more aggressively in expanding market territories in Japan, Kprea, and Europe.
Strengthening the Marketing PM functions,that to fulfill the pre-sale operations and planning.
Establish a mission-oriented learning organization; improve personnel quality and organization operation efficiency.
Set up agile sales channels and deploy worldwide Construct a complete global Logistic network, that would meet clients’ delivery on time
needs, and also provides clients’ technical integration services in real time basis. Maintain service and flexibility edge in cultivating core customer relation to increase
market share. Assist sales with formulation and determination of sales strategies by establishing
information system learning curve.
(b). Manufacturing Strategy: Time to Volume,Time to Market. Orders taking and planned production policy run in
parallel,delivery on time,and have the appropriate amounts of products in stock. In response to special circumstances of the industry: Response capability+Control
capability+Integration capability=Core. Integrate production resources on both sides of Taiwan Strait for optimum production
capacity and benefit allocation for maximum company benefit. Establish new products, new technology and automated factories for development of
company core technology. Targeting the ”ideal cost”,by using the ”comparing cost” as the base,gradually improve
monthly until the cost becomes reasonable. Full introduce TPS production management and promote “99.99%” of yield rate for all
stations. Introduce management systems based on PAT/SYA management concepts to optimize and
further improve product quality. An effective operation, management; and well organizedin driving the business projects.
(c). Quality Assurance Strategy: Optimize the quality management system, work towards the goal of “Zero Defect”.

37
Improve global environmental protection awareness related green product and process service provision to ensure that all product, production processes and work environments at the company conform to international standards and requirements.
Launch COPQ (quality failure cost) analysis refinement and improvement response. Launch basic and advanced job training of quality tools on the basis of continuous
improvement Reinforce reliable equipment and personnel analysis, satisfy with the goal of
miniaturization, high precision, and high stability and meet the operation of verification and monitoring.
To our suppliers and outsourcing partners we need to further raise their quality requirements and management level. Looking for the SCM system implementation,and further in link up with global companies.
Audit development of professional personnel to re-strength product quality and system Promote quality system of security product of automotive industry to re-create new
decade of TXC corporation
(d). Product R&D Strategy: According to the marketing & sales strategy and needs; we need to map the direction of
the product that it should go. We will aim the product’s specifications meet the clients’ needs.
According to the new specifications from the clients, our RD or engineering can provide the product within the scheduled time frame that will help us to win the business opportunity.
According to our business strategy and planning; our RD will fix on the product development or work as team with other company in the industry that we could bring the new product to the market.
Execute the scheduled progress RD project management,effectively monitoring and managing the RD development that to shorten the RD time.
Continuously to strengthen the RD staff, conduct the effective training and upgrade the overall professional attribute.
Cooperation between the industry and the academic circle, cooperative development with schools and research institutes, strengthening of R&D technological capability.
Have an effective RD management practice, reasonable reward system, and to motivate the group’s efficiency and attitude.
(2). Long term Development Plan
(a)Assertively developing the applications of Fiber Channel 、 Gigabit Ethernet 、SDH-SONET(synchronous fiber optics transmission)、and Femtocell and frequency controlled component used in terminal communications.
(b)Actively developing frequency controlled component used in automobile accessories; and the primary goal would be their converge to the strict high quality requirements.
(c)Continuously expanding sales and services offices. Need to strengthen the marketing & sales phase in Europe and North America; and to add the marketing & sales centers in South China (ShenZhen, WuHam, Chongqing), and East China (Suzhou, Shanghai, Beijing). Successively set up new operations in Japan (Yokohama, Osaka) , Europe, United States and Singapore to provide market demand and service for China, Japan, Singapore, India and Vietnam. It can also expand the China market share and setup as a foundation for future expansion in China. Eventually the above approach will help us to position into the top three worldwide of the crystal components manufacturers.
(d) Continuously seeking alliance that would provide good joint opportunities, and this would strengthen our overall competitiveness.

38
B、Marketing & Sales Situation 1、Market Analysis
(1).Market for our major products The product trend is toward to small and light . The products that use the SMD crystal will have a higher percentage than others. In the future, Asia still is the major OEM center, and the products from Asia are still very high. TXC would still need to work hard on the market expansion in America and Europe.
Regional sales distribution of our major products in the past two years:
unit: Thousand NT$
Region
year
2011 (consolidated) 2012 (consolidated)
$ dollars % $ dollars %
America 204,297 2.06 275,479 2.52
Europe 140,791 1.42 120,181 1.10
Asia 8,441,217 85.29 9,896,578 90.56
Domestic 1,111,036 11.23 636,257 5.82
Total 9,897,341 100.00 10,928,495 100.00
(2). Market share
unit:million USD

39
(3). Market future demand and supply condition, and its growth potential
(a) Industry The global economy rebounded gradually in 2012. Global quartz crystal and oscillator market demand grew a modest 2% in 2012. Influenced by faster than expected declines in the ASP for XO/VCXO/OCXO high-unit price products, global sales for the quartz crystal and oscillator market declined by 1.4%. According to CS&A market survey institute forecasts, positive growth should return in 2013 and a CAGR of 1.8% shall be maintained until 2015.
Unit: pcs
Source:CS&A, 2013.04
Unit: US Dallor
Source:CS&A, 2013.04
(b) Markets
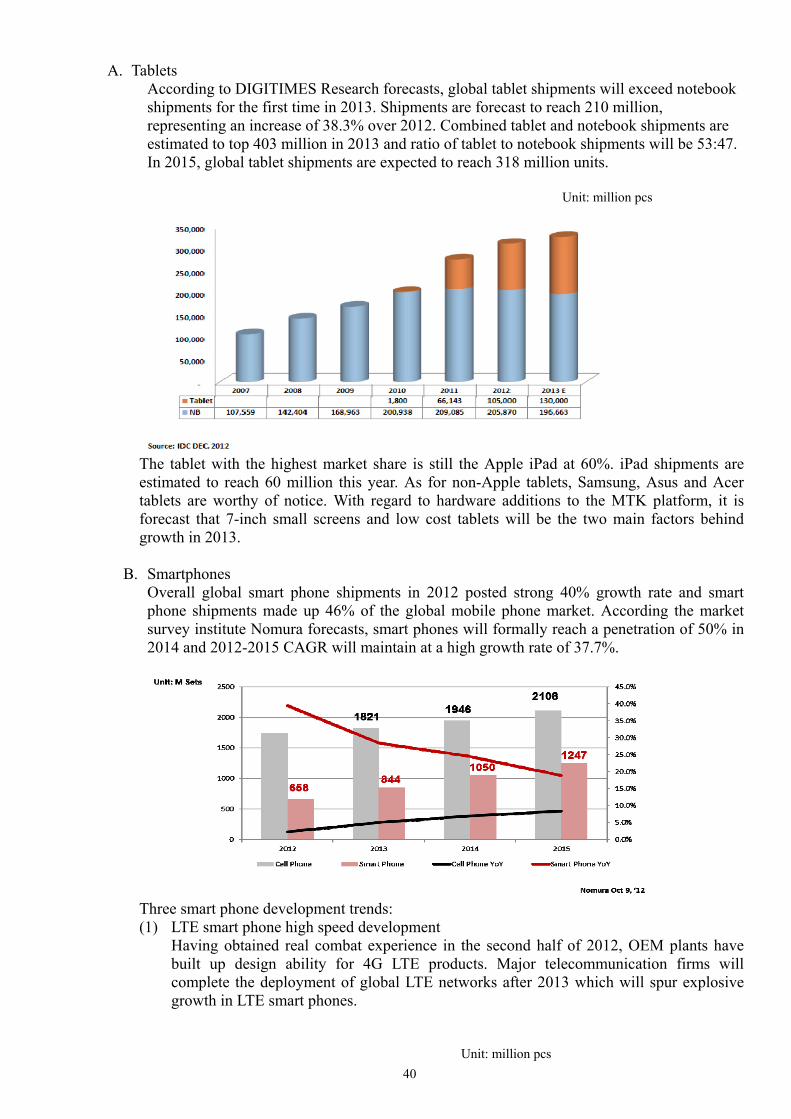
40
A. Tablets According to DIGITIMES Research forecasts, global tablet shipments will exceed notebook shipments for the first time in 2013. Shipments are forecast to reach 210 million, representing an increase of 38.3% over 2012. Combined tablet and notebook shipments are estimated to top 403 million in 2013 and ratio of tablet to notebook shipments will be 53:47. In 2015, global tablet shipments are expected to reach 318 million units.
Unit: million pcs
The tablet with the highest market share is still the Apple iPad at 60%. iPad shipments are estimated to reach 60 million this year. As for non-Apple tablets, Samsung, Asus and Acer tablets are worthy of notice. With regard to hardware additions to the MTK platform, it is forecast that 7-inch small screens and low cost tablets will be the two main factors behind growth in 2013.
B. Smartphones Overall global smart phone shipments in 2012 posted strong 40% growth rate and smart phone shipments made up 46% of the global mobile phone market. According the market survey institute Nomura forecasts, smart phones will formally reach a penetration of 50% in 2014 and 2012-2015 CAGR will maintain at a high growth rate of 37.7%.
Three smart phone development trends: (1) LTE smart phone high speed development
Having obtained real combat experience in the second half of 2012, OEM plants have built up design ability for 4G LTE products. Major telecommunication firms will complete the deployment of global LTE networks after 2013 which will spur explosive growth in LTE smart phones.
Unit: million pcs

41
Resource: MIC
(2) Emergence of low price smart phones Smart phone penetration in North American and Western European markets is already over 70%. As a result, the center of market growth is moving to China and emerging markets. It is forecast that retail sales of USD 300 and under models will exceed 300 million units in 2013 so these markets will be a battleground for major brands.
(3) Rapid growth of IOT technology
The emergence of GPS and mobile payment applications has spurred the growth of end-user IOT technology including the spread and development of GPS and NFC technology. In 2013, NFC mobile phone sales targets are 10 million units and service providers that support NFC service will expand to over 3 million.
Unit:Millions of US Dollar
Source: MIC, 201304
C. Base Station/Smart Cell
4G-LTE will be deployed in 48 countries and commercially operated by 105 operators. There will be significant growth in 4G infrastructure starting from 2013. CMCC Active deployment by CMCC will begin in the second half of 2012. One hundred Chinese cities are now purchasing TD-LTE equipment. It is forecast that over 200,000 TD-LTE base stations will be installed in 2013.
Global Mobile Payment Market

42
(4). Niches competition, the advantages/disadvantages of the future development, and the response strategies.
SWOT analysis
Advantages Disadvantages 1. Have been in the industry for long time, and a higher market share, have good knowledge of customers and their production base, can team with their design and technical service。 2. High flexible in adjust production line, has large and complete capability in production lines, excellent manufacturing improvement ability, efficient in production, and good competitness in unit cost。 3. more miniaturized sizes and more stringent specifications close the gap in technology with the advanced US and Japanese quartz component manufacturers. 4. Global operation management, fast product delivery, a good customer service team, wide product line, can satisfy clients’ one stop shop。 5. High technical in vertical integration; better quality management and fast response in proposing total solution to clients application needs。
1. It is insufficient channel in America and Europe。
2. Insufficient guidance in areas of critical materials, equipment development。
3. Extent of Automation is limited in the front end manufacturing process。
4. With a comparative edge in brand recognition, control of raw material production and technology capability, the Japanese manufacturers have comparative advantage in cost structure.
5. The material and labor cost is higher than before.
Opportunities Threatens 1. China service outlets can supply to nearby downstream
customers. 2. Automotive electronics supply chain has moved offshore
to China and has the competitive advantages of price and sharing same the cultural and ethnicity.
3. Upgrading of mobile phone functions has spurred related demand.
4. New generation of products will drive further demand growth.
5. Robust wireless telecommunication growth brings market growth.
6. High-end, high precision products and market deployment are reaching maturity which should significantly raise profits.
7. Received Middelstadt award, CSR, National Quality
1. Low price competition 2. Customers can switch from high priced
products to lower priced products due to customer cost considerations.
3. End user product design may reduce quartz element use amounts due to cost consideration.
4. MEMS products have started to threaten some low-end applications.

43
Award, AEO certification, passed greenhouse gas inventory report, product carbon footprint inventory report and BSI ISO14064-1 and PAS2050 audit honors to raise of brand exposure and aid company image establishment.
Respond Strategies 1. Enhance abroad sales teams,actively seeking Europe, USA,Japan and Korea etc Tier 1 clients。
2. Develop the market agreesively and expect to be the largest brand in China
3. Enhance the engineering technlolist of NGB factory, train material handling/ manufacture process automatic
professionals in China。
4. Continuously to hire domestic trained as well as from abroad the research scientists and professionals in the
communication and automobile parts industries.
5. Create more advantageous products,may take strategic alliance and partnership in some of the products for
cost reduction。
6. Enhance product R&D ability,develop smaller size and high end products that to improve the overall
profitability。
7. Enhance the development of quartz crystal modularized products。
8. Exercise stringent control over receivables and timely and closely verify demand on the customer side to
facilitate flexible allocation.
2、Major products’ important applications and their manufacturing process (1). Major products’ important applications
Crystal components product Major Applications
Crystals
Mobile phone、 wireless equipment、W-LAN、wireless telephone、WiFi Module、Sip Module、 bluetooth、telephone terminal equipment 、 intelligent transport(ITS)、car accessories、LCD projector、coping machine、computer、printer、scanner、audio-visual equipments、camera、games、beeper
Crystal Oscillators
CXO
base、wireless equipments、W-LAN、coxial cable communication 、 fiber optics communication 、telphony terminal equipments、counter/sythesizers、intelligent transport(ITS) 、 computer 、 storage device、printer、audio-isual device、camera、games
VC-TCXO、TCXO
Mobile phone、basestation、wireless equipment、satellitecommunication、W-LAN、bluetooth、global positioning systems、coaxial cable communication、fiber optics communication
VCXO
base、wireless equipments、satellite communication、W-LAN、coaxial cable communication、fiber optics communication 、 phony terminal equipment 、counter/synthesizer

44
OCXO
base、wireless equipments、satellite communication、global positioning systems 、 coaxial cable communication 、 fiber optics communication 、counter/synthesizer
Tuning Fork mobile phone 、 digital home 、 camera 、 wireless networking、computers 、automotives
Sapphire
With the technology of GaN by MOCVD (metal organic vapor phase epitaxy), producehigh-brightness blue LED. Applied to the LED backlight and lighting systems.
(2). Manufacturing Process
Steps for crystal components manufacturing are: first we need to manufacture the quartz crysal needed for the electrical material. It involves the cutting, polish, cleaning of the wafer form. Then with the mechanical arms to place the wafer on the base and fixed with the silver based glue. Then package it under vaccum. For oscillators it is necessary to add one more unit of oscillating circuit IC with golden line conduction via amplified output of crystal chip oscillation. It requires more IC placement and wire bonding process compared to the quartz crystal. (a). Pre-manufacturing process-quartz crystal.
(b). Post-manufacturing process-quartz crystal (use silver, gold, nickel for electroplating, and the process would reduce crystal frequency. Fine tuning the electroplating that would reduce frequency error to 3~10ppm)
Crystal cleaning
Electroplating Crude freq adjustment
Base fixed
Glue and bake to fix the crystal
Fine tuning frequency,
plating with silver
Base, outside prebaking/weld
ing, seal
Aging/electrical/temperature
testing
Final check and storage
Crystal bar
cut
Crystal grinding (machines to bar or
round shape)
grinding (crude、medium、fine)
Differentiate frequencyClean Store

45
(c). Post manufacturing process-crystal oscillator (use silver, gold, nickel for electroplating, and the process would reduce crystal frequency.)
(3)、Sapphire substrate process
(3)、State of the major materials suppliers
The major materials for crystal and crystal oscillators include the base, wire bond, IC package, crystal slice and crystal bars。The main raw material of the sapphire substrate such as alumina. (a). All the materials come from the at least three suppliers, and this would minimize the
risk of all materials coming from a single supplier. Our company’s procurement depends on the buying terms, state of supply, and specifications; before the materials to be ordered. And, it also depends on some special conditions that we would adjust the ratio of buying materials and this approach would help us not too concentrated the ordering from a single supplier, or running the risks of the orders being interrupted。
(b). All the suppliers have long term relationship with us. And, our friendship is good.
With our company is growing strongly, these suppliers would also take highest priority to satisfy our company needs。Annually, we also meet with our suppliers on regular or irregular base to review our purchasing terms and any room for the improvement. This also helps a stable and continuous relationship in the materials supply。
(c). In considering the steady material supply, our company will provide the Rolling
Forecast,to the suppliers and the production preparations. This can shorten the
Crystal cleaning
electroplating IC placement
(assembly electronic component)
Crystal placement (assembly crystal)
Base, shell prebake/weldi
ng, seal Check for gas
leaking
Aging/electrical/temperature
testing Add barcode test barcode
Final check and storage
Crystal growth
Boule dig
Fixed angle and flat side
Cutting and grinding
CMP Polishing
Cleaning and inspection
Storage
Fixed angle and flat side
Exposure and development
Clearing and testing
Storage

46
delivery time and an assurance of on time delivery. If there is any unusual situation, these suppliers will accommodate our needs to assure a stable supply.
(4)、The suppliers and customers over than 10% of the past two years:
(a). Ten largest supplier
unit:NT$1,000
2011 2012
Company amount The Percentage of
annual procurement
(%)
Company amount The Percentage of
annual
procurement (%)
TXC(NINGBO) CORPORATION
2,309,451 38.26% TXC(NINGB0)CORPORATION
2,417,255 34.15%
K Company 762,245 12.63% K Company 656,105 9.27%
Other 2,965,007 49.11% Other 4,005,471 56.58%
Total 6,036,703 100.00% Total 7,078,831 100.00%
(b). Ten largest clients
unit:NT$ 1,000’s
2011 2012
Name of client Amount Percentage of annual sale (%)
Name of Client amount percentage of annual sale (%)
H Group 2,450,848 27.48% H Group 1,774,450 18.72%
Q Group 928,321 10.41% Q Group 646,073 6.82%
Other 5,538,854 62.11% Other 7,056,958 74.46%
Total 8,918,023 100.00% Total 9,477,481 100.00%
(5)、Production and monetary values for the past two years Year
Major products
2011 2012
capacity Production value capacity production value
DIP Crystal product 330,000 320,946 489,822 280,000 243,315 381,087
SM Crystal products 1,800,000 1,688,230 6,661,702 2,200,000 1,983,218 6,860,769Others 0 565,720 468,611 - 734,230 499,787Total 2,130,000 2,574,896 7,620,135 2,480,000 2,960,763 7,741,643
(6)、Volumes of sales and monetary values of the past two years
unit1000’s, $1000’s
year
Major products
2011 2012
Domestic sales export Domestic sales Export
quantity value quantity value quantity value quantity value
DIP Crystal product 30,793 68,433 299,495 545,581 26,528 59,563 215,987 411,113
SM Crystal products 88,698 505,274 1,653,647 7,626,342 98,602 519,468 1,864,518 8,192,003
Others 301 6,735 172,000 165,658 457 57,226 508,656 238,108
total 119,792 580,442 2,125,142 8,337,581 125,587 636,257 2,589,162 8,841,224

47
C、Employees’ average years in service, age, and educational background
distribution of the past two years
Year 2011 2012 2013/03/31
Total number
employees
engineer 193 203 201 administrative 196 205 205 Sales 75 72 72 Technicians/operators 560 545 532 total 1024 1025 1010
Average age 33.52 34.37 34.66 Average years in service 5.4 5.95 6.2
Distribution of
educational background
Ph.D. 1.37% 1.27% 1.39%
M.S. 10.06% 12.10% 12.18%
B.S. 48.63% 46.44% 45.94%
High School 36.62% 36.59% 36.83%
Below High School 3.32% 3.60% 3.66%
D、Data on our environmental protection expense
1. In recent years and as of the date of annual report publishing, the Company fixed pollution source installation was not operated within the scope of the permit in 2012 which resulted in non-conformance with related air pollution control laws. Considering that the non-conformity was relatively slight, the Taoyuan County government levied the minimum fine. In addition, a power trip on the wastewater pre-treatment facility collection system prevented the water pump from being activated and the wastewater in the collection and storage area overflowed in the storm drain and then into the industrial park storm sewer system. Though the water quality test results conformed to wastewater discharge standards, it was still deemed a violation of Article 18 of the Water Pollution Control Act and Article 21 of the Water Pollution Control Measures and Test Reporting Management Regulations. Since it was short-term emergency, the Taoyuan County government decided to levy the minimum fine. The total fine amount for the above two violations was NT$110,000. Response measures and expenditures: Improvement costs including submersible pump, catch basin project, new wastewater basin project. Total amount was NT$2,190,000.
2. The environmental protection regulatory requires the permit for pollution control equipments,
or the permission to discharge, or a fee charged for the pollution prevention, or designated personnel for the environment protection affairs. To illustrate the filing, pay fee or implementation as follows:
Item Description ───────────── ──────────────────────────── Permit for air pollution equipment has applied to Taoyun county, environ protection agency Paid fee for pollution prevention monthly pollution treatment fee is about NT$346,973
Designated environment protection According to law, our company doesn’t need to personnel designate personnel for environment protection affair
──────────── ────────────────────────────
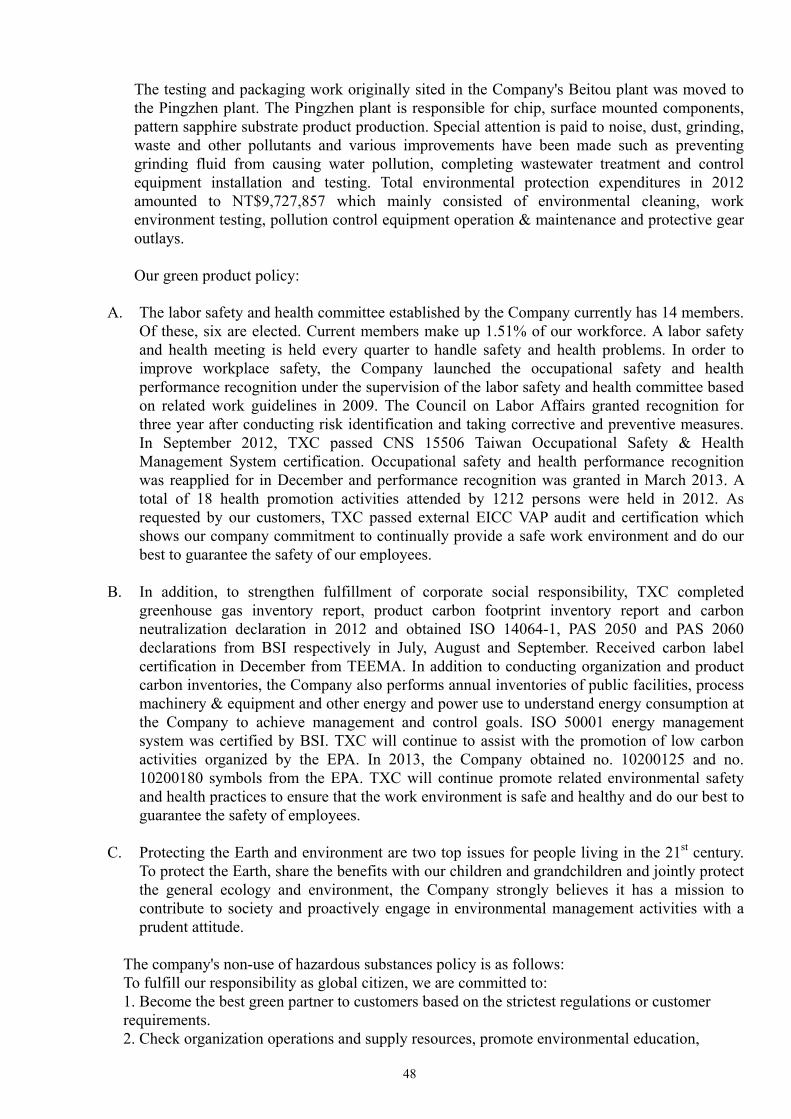
48
The testing and packaging work originally sited in the Company's Beitou plant was moved to the Pingzhen plant. The Pingzhen plant is responsible for chip, surface mounted components, pattern sapphire substrate product production. Special attention is paid to noise, dust, grinding, waste and other pollutants and various improvements have been made such as preventing grinding fluid from causing water pollution, completing wastewater treatment and control equipment installation and testing. Total environmental protection expenditures in 2012 amounted to NT$9,727,857 which mainly consisted of environmental cleaning, work environment testing, pollution control equipment operation & maintenance and protective gear outlays.
Our green product policy:
A. The labor safety and health committee established by the Company currently has 14 members.
Of these, six are elected. Current members make up 1.51% of our workforce. A labor safety and health meeting is held every quarter to handle safety and health problems. In order to improve workplace safety, the Company launched the occupational safety and health performance recognition under the supervision of the labor safety and health committee based on related work guidelines in 2009. The Council on Labor Affairs granted recognition for three year after conducting risk identification and taking corrective and preventive measures. In September 2012, TXC passed CNS 15506 Taiwan Occupational Safety & Health Management System certification. Occupational safety and health performance recognition was reapplied for in December and performance recognition was granted in March 2013. A total of 18 health promotion activities attended by 1212 persons were held in 2012. As requested by our customers, TXC passed external EICC VAP audit and certification which shows our company commitment to continually provide a safe work environment and do our best to guarantee the safety of our employees.
B. In addition, to strengthen fulfillment of corporate social responsibility, TXC completed
greenhouse gas inventory report, product carbon footprint inventory report and carbon neutralization declaration in 2012 and obtained ISO 14064-1, PAS 2050 and PAS 2060 declarations from BSI respectively in July, August and September. Received carbon label certification in December from TEEMA. In addition to conducting organization and product carbon inventories, the Company also performs annual inventories of public facilities, process machinery & equipment and other energy and power use to understand energy consumption at the Company to achieve management and control goals. ISO 50001 energy management system was certified by BSI. TXC will continue to assist with the promotion of low carbon activities organized by the EPA. In 2013, the Company obtained no. 10200125 and no. 10200180 symbols from the EPA. TXC will continue promote related environmental safety and health practices to ensure that the work environment is safe and healthy and do our best to guarantee the safety of employees.
C. Protecting the Earth and environment are two top issues for people living in the 21st century.
To protect the Earth, share the benefits with our children and grandchildren and jointly protect the general ecology and environment, the Company strongly believes it has a mission to contribute to society and proactively engage in environmental management activities with a prudent attitude.
The company's non-use of hazardous substances policy is as follows: To fulfill our responsibility as global citizen, we are committed to: 1. Become the best green partner to customers based on the strictest regulations or customer requirements. 2. Check organization operations and supply resources, promote environmental education,

49
strengthen environmental awareness and goals of all employees and supplier partners. 3. Design green products and emphasize products and production processes that do not use hazardous substances. 4. Make continuous improvement through related company activities to achieve the sustainable business goals of the Company. · TXC complies with RoHS (Restriction of Hazardous Substances in Electrical and Electronic Equipment) 2011/65/EU, WEEE (Waste Electrical and Electronic Equipment) 2012/19/EU, PFOS 2006/122/EC, REACH (Registration, Evaluation, Authorization and Restriction of Chemicals) (EC) No 1907/2006 requirements. Starting from July 1, 2006, TXC has been in compliance with international standards banning the use of substances containing Pb, Cd, Hg, Cr6+, PBB, PBDE and PFOS. In addition to receiving ISO 14001: 2004 environmental management system and IECQ/QC 080000: 2005 hazardous material management system certifications, the company through the efforts of our employees passed Sony Green Partner, Samsung ECO-Partner and Huawei Green Partner certification. Voluntary Certification on the Pollution Control of Electronic Information Products was obtained from China RoHS in accordance with electronic and information product pollution control management regulations. Building upon the foundation of mutual understanding and joint introduction of environment improvements, green purchasing activities serve as a basis for the continuous provision of green products. In order to ensure that product quality conforms to the related green and environmental protection regulations, the company strictly prohibits the use of banned substances in its production processes and instructs our suppliers not to use banned substances in either products or production so that the requirements of non-use, non-containment and non-contamination are complied with at each stage from product design and manufacturing to delivery so to reduce the environmental impact of our products and services.
In order to strengthen supplier green product requirements, TXC encourages suppliers to
introduce the basic ISO 9001 quality management system as well as the QC 080000 system to implement environmentally safe material controls. In our supplier management procedure, major raw material suppliers are requested to sign a green product and environmental protection declaration and stricter MSDS sheet requirements have been implemented for upstream and downstream supplier environmental safety. All MSDS sheets used throughout the plant have both English and Chinese instructions to ensure full comprehension and appropriate handling. In addition, TXC has issued a Environmental Safety and Health Management Manual to request further compliance with international environmental, safety, health related standards so that we can work jointly with our suppliers to conform to the highest international production condition and environmental protection standards.
Related introduction and tracking of environmental protection is listed in detail on the
company website. Refer to http://www.txc.com.tw/tw/i_esh/02.html
. E、Employer/Employee Relation
1. The Company has maintained harmonious employer/employee relation since its establishment. In recent years and since the closing date for publication of the annual report, there are no losses due to employer/employee disputes and there have never been any major employer/employee disputes since its establishment. Aside from holding employor/employee meetings and discussion meetings for new employees and for foreign nationals, and conducting employee satisfaction investigation, we have also set up an employee opinions mailbox and other channels for reflecting their opinions. We have spared no efforts toward employee benefits. We have often stressed the importance of employees and have provided employee bonus in stock allotment, stock options, and cash for wedding/funeral/other

50
festive occasions, emergency relief fund, group insurance/medical checkup, subsidies for tour at home or abroad, as well as discounts for books, magazines and special convenience stores; and sponsor birthday celebrations, sports competition, year-end party and luck draw, various recreational activities and commendation of senior and outstanding employees; also provide canteen, hostel and parking lots, table tennis table, pool table and other facilities. It is hoped that through coordination of the employee welfare committee with the Company to promote employer/employee harmony and guarantee employee benefits and health in a bid for win-win for both the employer and the employees.
Insurance and
retirement Labor, health, group insurance (occupation injury), pension reserve fund
Profit sharing
Stock dividends, stock options, convertible corporate bonds, treasury stock systems
Gifts Cash gifts for three major holidays, birthdays, weddings, births, hospitalization and white card consolation gifts (cash or a blasket of flower)
Medical insurance
Group insurance: Major disease insurance, accident injury insurance, emergency medical treatment, group hospitalization treatment and occupational injury insurance. Regular health exams: Physical exam, complete blood count (CBC), vision exam, hearing exam, liver function exam, blood fat exam, urine examination, chest X-rays, seasonal flu vaccine inoculation subsidy. Manager insurance
Activities
Domestic and international travel activities, birthday parties, employee athletic meets, year-end banquet and employee drawing, ball sport competitions, painting contests, photography contests, contracted merchant discounts, book reading club, a variety of employee social club activities and group purchase of movie ticket, art activies, course or activity for employee’s anti-pressure, and course for anti-smoking and anti-weight
Emergency relief
Grants allocated based on real-life conditions experienced by employees
Book reading
Regularly purchase books, magazine, newspapers for the reading enjoyment of company personnel, and VCD/DVD multimedia for employees to watch
Other welfare
Solid promotion channels, overseas assignment development opportunities for outstanding employees, performance bonuses issued based on operation status, recognition of veteran and exceptional personnel, top ten outstanding project commendations, incentives for employee project proposals, bonuses for emplyees’ child, bonsus for patents and proposal
Facilities
Employee cafeteria, employee dormitory, car and motorcycle parking spaces, table tennis room, billiards room, badminton court, fitness room, breast-feeding room, medical service office, employee welfare association, lounge bar, soga room, shooting machines, and KTV
2. Employee education and training:
The Company provides employees a multiple learning environment. Colleagues can continually challenge their growth limit through internal/external training, OJT, KM(knowledge management system), reading clubs, online/physical library, and supervisor/peer instruction. At the same time, through the new employees/professional technology/supervisor coaching/general knowledge course/self-development education and training system to bring maximun satisfaction for employees! On the other hand, through planning of

51
job category/job level, work rotation, project allocation and overseas assignments to integrate their lives with their careers and enable them enjoy the happiness of growth in knowledge and skills and develop a bright future.
The Company has formulated management regulations for employee education and training and mapped out relevant training courses in view of job function and professional requirements in order to enhance the knowledge and raise the quality of employees for better operation performance. The relevant education and training results in 2012 are as follows:
Item No. of Class
Total No. of
sessions
Total No of
Trainees Total No. of Hours
Total Expense
1. General Knowledge Training 19 52 2,673 3,664 57,185
2. Management Level Training 13 19 602 1,728 479,951
3. New employees training 27 27 240 3,149 0
4. Job Function Training 1 9 490 3,486 414,855
5. Self Heuristic Growth Training Course 380 934 12428 10,860 468,661
Total 14 14 484 441 6,600
(1)The Company’s finance supervisor qualified for Professional Certification of Finance and
Accounting Supervisor of Publicly-listed Companies sponsored by the R.O.C. Accounting Research Development Fund.
(2)Two financial staffs of the Company acquired the Internal Auditor Certificate issued by the Internal Auditing Association.
(3)One financial staff of the Company acquired the Certified Public Accountant issued by the Ministry of Examination.
(4)One financial staff of the Company acquired the Stock Professional Services certification test issued by the Securities and Futures Bureau , Financial Supervisory Commission.
(5)One financial staff of the Company acquired the Certified Accountant issued by the Ministry of Examination.
(6)Two financial staffs of the Company acquired the Certificate of Securities Salespeerson issued by the Ministry of Examination.
3. The Company has formulated employment retirement regulations in accordance with the Labor Standards Law, and regularly appropriated retirement contributions for deposit into the Central Trust of China according to the law. The employee retirement contribution supervisory committee will be responsible for management and use of the retirement fund. The pension costs recognized in 2012 and 2011 by the Company were respectively NT$8,146 thousand and NT$4,028 thousand. The Legislative Yuan passed the third reading on June 11, 2004 and started from July 1, 2005, in accordance with the labor retirement regulations, and in collaboration with the new system of monthly appropriation of retirement pension for depositing into the personal labor pension account set up at the Bureau of Labor Insurance, the Company recognized retirement pension costs in 2011 and 2010 respectively at NT$22,867 thousand and NT$23,626 thousand. And in January 2007 the director employee retirement fund was set up to guarantee retirement planning of professional directors.
4. To protect employees with work safety the Company has formulated the following control methods regarding the work environment and employee body safety protection and call on employees for thorough implementation: Besides, establish the “Environmental and Occupational Safety and Health Committee” and hold the meeting regularly to review the effectiveness of business development and related matters of environmental safety and health. Aside from purchasing yearly group insurance, sponsoring regular work safety seminars, and dispatched employees to attend relevant industrial safety courses, it has revised the TXC Contingency Plan in Octomber, 2009 and issued the manual for Environmental Safety and Health Management to ensure employee life security and handling of contingency incidents.
52
Please go to website: www.txccorp.com. To achieve the zero disaster goal, the company regularly revised the annual contingency plan and formulated detailed implementation operation according to contents of the plan. The business units shall implement the schedule and contents of the plan, and find out shortcomings via the auditing system to formulate the contingency plan for the coming year, and review and revise the implementation processes and auditing operation from time to time and lower risk of disasters by the business units to achieve the final goal of zero disaster.
5. Fulfillment of Social Responsibility: In line with humanitarian conviction of care for the disadvantaged, the Company would compile budget every year for feeding back to society. In performing our corporate social responsibility, every year the Company will continue to donate to basic education and education business for the disadvantaged and contribute to public charity. Our company was listed by the Global Views Monthly among the top 50 enterprises for corporate social responsibility. In August 2011, TXC was ranked second for the mid-sized enterprise category in Commonweath Magazine’s Corporate Citizen Award, the Energy Conservation Elite, Outstanding Innovation Award presented by the Bureau of Energy and received ISO50001 Energy Management System certification. Moreover, TXC published its corporate social accountability report in January 2009
http://www.txc.com.tw/download/other/Social%20Responsibility.pdf. and has strived to fulfill its corporate social accountability by making contributions to society. Please refer to information in the Company website: http://www.txc.com.tw/tw/h_csr/02.html.

53
VI. An Overview of the Company’s Financial Status A. Abbreviated Balance Sheets and P/L Statements for the Past 5 Years
(1)、Abbreviated Balance Sheets (IFRS) Unit:NT$ 1,000
Year Item
Financial information for the post 5 years U p t o 2 0 1 2 . 0 3 . 3 1
2008 2009 2010 2011 2012
Current assets
Note 2
7,280,011 Property, plant and equipment
5,553,851
Intangible assets 0 Other assets 741,640 Total assets 13,575,502
Current liabilities
Beforedistribution
3,115,300
After distribution
0
Long-term liabilities 2,248,184
Total liabilities
Beforedistribution
5,363,484
After distribution
0
Interests attributable to parent company
8,212,018
Common stock 3,097,570 Capital surplus 1,662,181
Retained earnings
Beforedistribution
3,452,266
After distribution
0
Other interests 1 Treasury Stock 0 Non-controlling interests 0 Total stockholders’ equity
Beforedistribution
8,212,018
After distribution
0
B. Note 1:The financial statements of TXC Corporation were audited or viewed or certified by CPA. Note 2: See Table (2) for the Condensed Consolidated Balance Sheet financial information over the past five years, condensed income statement - ROC financial accounting standards. (ROC financial accounting standards used)

54
(2)、Abbreviated Balance Sheets (GAAP) Unit:NT$ 1,000
Year Item
Financial information for the post 5 years 2008 2009 2010 2011 2012
Current assets 3,539, 804 4,278,622 4,660,207 4,476,212 5,188,324Long-term equity investments
1,902,741 2,155,217 2,646,768 3,572,912 4,033,572
Property, plant and equipment
2,592,594 2,247,824 2,967,919 3,450,973 3,394,698
Intangible assets 7,947 0 0 0 0Other assets 48,160 29,623 38,878 24,972 18,424Total assets 8,091,246 8,711,286 10,313,772 11,525,069 12,635,018
Current liabilities
Before distribution
1,490,000 2,012,901 2,229,042 2,417,825 3,173,779
After distribution 1,490,000 2,012,901 2,229,042 2,417,825 Note 2
Long-term liabilities 965,877 692,437 1,543,117 1,875,805 1,437,500Other liabilities 10,055 85,020 12,798 67,527 139,731
Total liabilities
Before distribution
2,465,932 2,790,358 3,784,957 4,364,669 4,754,522
After distribution 2,465,932 2,790,358 3,784,957 4,364,669 Note 2
Common stock 2,716,981 2,887,272 2,971,831 3,022,423 3,022,423Capital surplus 1,092,215 1,168,416 1,302,853 1,356,078 1,616,549
Retained earnings
Before distribution
1,708,180 1,818,658 2,375,441 2,545,465 3,029,417
After distribution 1,036,435 1,185,263 1,575,417 1,880,532 Note 2
Unrea l ized ga ins on financial instruments 49 0 (3,235) (18,133) (13,105)
Cumulative translation adjustments 229,680 168,373 3,716 264,762 167,431
Asset revaluation increment(note 3) 5,442 5,442 5,442 5,442 5,442
Treasure Stock (127,233) (127,233) (127,233) 0 0Total stockholders’ equity
Before distribution
5,625,314 5,920,928 6,528,815 7,160,400 7,880,496
After distribution 5,087,918 5,345,114 5,788,052 6,495,466 Note 2
Note 1:The financial statements of TXC Corporation were audited or viewed or certified by CPA.
Note 2:Up to 2013.03.31,The retain earnings of 2012 has not yet admitted by the stockholders’ meeting.

55
(3)、Abbreviated P/L Statements (IFRS)
Unit:NT$ 1,000 Year Item
Financial information for the post 5 years (Note 1)
Up to 2013.03.312008 2009 2010 2011 2012
Net operating revenue
Note 3
2,326,980 Gross profit 521,710 Operating income 219,869 Nonoperating gains and losses
19,003
Income before income tax
238,872
Continuing operations net Income
238,872
Discontinuing operations net Loss
0
Net income (loss) 209,434 Other comprehensive income (net amount)
110,437
Total comprehensive income
319,871
Net income attributable to parent company
209,434
Net income attributable to non-controlling interests
0
Comprehensive income attributable to parent company
319,871
Comprehensive income attributable to non-controlling interests
0
Earnings per share 0.68
Note 1:The financial statements of TXC Corporation were audited or viewed or certified by CPA.
Note 2: Earnings per share prior to retroaction adjustment.
Note 3: See Table (4) for the Condensed Consolidated Income Statement financial information over the past five years,
condensed income statement - ROC financial accounting standards. (ROC financial accounting standards used)

56
(4)、Abbreviated P/L Statements (GAAP) Unit:NT$ 1,000
Year
Item
Financial information for the post 5 years (Note 1)
2008 2009 2010 2011 2012
Net operating revenue 6,547,340 6,557,116 8,156,933 8,918,023 9,477,481
Gross profit 1,536,196 1,267,998 1,702,014 1,658,329 1,708,304
Operating income 769,980 552,205 805,521 744,212 866,519
Nonoperating income and
gains
790,985 642,550 911,040 771,533 449,511
Nonoperating expenses and
losses
510,489 283,205 471,131 356,557 57,327
Income before income tax 1,050,476 911,550 1,245,430 1,159,188 1,258,703
Net income before
cumulative effect of change
in accounting principles
951,817 782,223 1,190,178 1,050,216 1,148,886
Cumulative effect of change
in accounting principles 0 0 0 0 0
Net income 951,817 782,223 1,190,178 1,050,216 1,148,886
Earnings per share 3.56 2.75 4.06 3.48 3.79
Note 1:The financial statements of TXC Corporation were audited or viewed or certified by CPA.

57
B、Financial Analysis for the past 5 Years
( 1)Financial Analysis (IFRS)
Year Item
Financial analysis for the post 5 years
2008 2009 2010 2011 2012 Up to
2013.03.31 Capital
Structure Analysis
(%)
Debt ratio (%)
Note 2
39.51
Long-term fund to fixed asstes ratio (%)
188.34
Liquidity Analysis(%)
Current Ratio (%) 233.69
Quick Ration (%) 171.55
Times interest earned (%) 2,461
Operating performace
Analysis (%)
Average collection turnover(times)
2.89
Days sales outstanding 126.27
Average inventory turnover(times)
4.37
Average payment turnover(times)
4.42
Average inventory turnover(days)
83.56
Fixed assets turnover(times) 0.42
Total assets turnover(times) 0.17
Profitability Analysis (%)
Turn on total assets (%) 1.64
Turn on total equity (%) 2.61
Paid-in capital ratio (%)
Operating income 7.10
Pre-tax income 7.71
Net margin (%) 9.00
Earnings per share(Basic) Note I
0.68
Earnings per share(Diluted) Note I
0.65
Cash Flow
Cash flow ratio (%) 21.24
Cash flow adequacy ratio (%) 68.25
Cash flow reinvestment ration (%)
5.20
Leverage Operating leverage 1.98
Financial Leverage 1.04
Please explain the reasons of changes in financial ratio for the post two years (No needs for analysis if change of financial ratio is less than 20%)
Note I:The financial statements of TXC Corporation were audited and certified by CPA. EPS is before retroactively adjust.
58
NoteII:Glossary: 1. Capital StructureAnalysis
(1) Debt ratio=Total liabilities/Total assets (2) Long-term fund to fixed asstes ratio=(Total stockholders’ equity+Long-term liabilities)
/Net Fixed Assets 2. Liquidity Analysis (1) Current Ratio=current assets/current liabilities (2) Quick Ration=(current assets-Inventories-Prepaid expenses)/current liabilities (3) Times interest earned=Earnings before interest and taxs/Interest expenses 3. Operating performace Analysis
(1) Average collection turnover= Net sales/Average trade Receivables
(2) Days sales outstanding=365/Average collection turnover (3) Average inventory turnover=Cost of good sold/Average inventory。 (4) Average payment turnover=Cost of good sold/Average trade Payables (5) Average inventory turnover(Days)=365/Average inventory turnover (6) Fixed assets turnover=Net sales/Net Fixed Assets (7) Total assets turnover=Net sales/Total assets 4. Profitability Analysis
(1) Turn on total assets=[Net income+Interest expenses×(1-Effective tax rate)]/Average total assets。
(2) Turn on total equit=Net income/Average stockholders’ equit。 (3) Net margin=Net income/net sales。 (4) Earnings per share=(Net income-Perferred stock dividend)/ Weighted average
number of shares outstanding 5. Cash Flow (1) Cash flow ratio=Net cash provided by operating activities/current liabilities (2) Cash flow adequacy ratio=Five-year sum of cash from operations/Five-year sum of
capital expenditures, inventory additions, and cash dividend. (3) Cash flow reinvestment ration=(Cash provided from operating activities – Cash dividend)
/(Grosss fixed assets + investment + Other assets + Working capital) 6. Leverage (1) Operating leverage=(Net sales – Variable cost)/Income from operations (2) Financial Leverage=Income from operations /(Income from operations-Interest
expenses)

59
( 2)Financial Analysis (GAAP)
Year
Item Financial Analysis for the past 5 Years
2008 2009 2010 2011 2012
Capital StructureAn
alysis
Debt ratio (%) 30.48 32.03 36.7 37.87 37.63
Long-term fund to fixed asstes ratio (%)
254.23 294.21 271.97 261.85 274.49
Liquidity Analysis
Current Ratio (%) 237.57 212.56 209.07 185.13 163.47
Quick Ration (%) 186.21 171.81 166.04 145.45 130.78
Times interest earned (%) 3,584.00 4,497.01 6,230.00 5,013 4,409
Operating performace
Analysis
Average collection turnover(times) 3.10 3.11 3.65 3.45 3.23
Days sales outstanding 117.74 117.45 100.00 105.92 113.14
Average inventory turnover(times) 7.22 7.38 7.51 7.54 7.73
Average payment turnover(times) 5.78 6.01 6.19 6.08 5.57
Average inventory turnover(days) 50.55 49.45 48.57 48.42 47.24
Fixed assets turnover(times) 2.53 2.92 2.75 2.58 2.79
Total assets turnover(times) 0.81 0.75 0.79 0.77 0.75
Profitability Analysis
Turn on total assets (%) 12.57 9.42 12.69 9.8 9.71
Turn on total equity (%) 17.72 13.55 19.12 15.34 15.28
Paid-in capital ratio (%)
Operating income 29.22 19.22 27.11 28.67 28.67 Pre-tax income 38.66 31.72 41.91 41.65 41.65
Net margin (%) 14.54 11.93 14.59 11.78 12.12
Earnings per share(Basic) Note I 3.56 2.75 4.06 3.48 3.79
Earnings per share(Diluted) Note I 3.50 2.73 3.85 3.29 3.58
Cash Flow
Cash flow ratio (%) 76.05 58.44 56.24 45.34 39.8
Cash flow adequacy ratio (%) 92.07 108.40 84.24 77.14 74.99
Cash flow reinvestment ration (%) 7.83 7.21 6.49 3.08 5.77
Leverage Operating leverage 1.75 2.12 1.70 1.78 1.58
Financial Leverage 1.03 1.02 1.03 1.03 1.03
Note I:The financial statements of TXC Corporation were audited and certified by CPA. EPS is before retroactively adjust.
NoteII:Glossary:
1. Capital StructureAnalysis (1) Debt ratio=Total liabilities/Total assets
(2) Long-term fund to fixed asstes ratio=(Total stockholders’ equity+Long-term liabilities)/Net Fixed Assets
2. Liquidity Analysis (1) Current Ratio=current assets/current liabilities (2) Quick Ration=(current assets-Inventories-Prepaid expenses)/current liabilities (3) Times interest earned=Earnings before interest and taxs/Interest expenses 3. Operating performace Analysis
(1) Average collection turnover= Net sales/Average trade Receivables

60
(2) Days sales outstanding=365/Average collection turnover (3) Average inventory turnover=Cost of good sold/Average inventory。 (4) Average payment turnover=Cost of good sold/Average trade Payables (5) Average inventory turnover(Days)=365/Average inventory turnover (6) Fixed assets turnover=Net sales/Net Fixed Assets (7) Total assets turnover=Net sales/Total assets 4. Profitability Analysis
(1) Turn on total assets=[Net income+Interest expenses×(1-Effective tax rate)]/Average total assets。
(2) Turn on total equit=Net income/Average stockholders’ equit。 (3) Net margin=Net income/net sales。 (4) Earnings per share=(Net income-Perferred stock dividend)/ Weighted average
number of shares outstanding 5. Cash Flow (1) Cash flow ratio=Net cash provided by operating activities/current liabilities (2) Cash flow adequacy ratio=Five-year sum of cash from operations/Five-year sum of
capital expenditures, inventory additions, and cash dividend. (3) Cash flow reinvestment ration=(Cash provided from operating activities – Cash dividend)
/(Grosss fixed assets + investment + Other assets + Working capital) 6. Leverage (1) Operating leverage=(Net sales – Variable cost)/Income from operations (2) Financial Leverage=Income from operations /(Income from operations-Interest
expenses)

- 61 -
INDEPENDENT AUDITORS’ REPORT The Board of Directors and Stockholders TXC Corporation We have audited the accompanying balance sheets of TXC Corporation (the “Corporation”) as of December 31, 2012 and 2011, and the related statements of income, changes in stockholders’ equity, and cash flows for the years then ended. These financial statements are the responsibility of the Corporation’s management. Our responsibility is to express an opinion on these financial statements based on our audits. We conducted our audits in accordance with the Rules Governing the Audit of Financial Statements by Certified Public Accountants and auditing standards generally accepted in the Republic of China. Those rules and standards require that we plan and perform the audit to obtain reasonable assurance about whether the financial statements are free of material misstatement. An audit includes examining, on a test basis, evidence supporting the amounts and disclosures in the financial statements. An audit also includes assessing the accounting principles used and significant estimates made by management, as well as evaluating the overall financial statement presentation. We believe that our audits provide a reasonable basis for our opinion. In our opinion, the financial statements referred to above present fairly, in all material respects, the financial position of TXC Corporation as of December 31, 2012 and 2011, and the results of its operations and its cash flows for the years then ended, in conformity with the Guidelines Governing the Preparation of Financial Reports by Securities Issuers, requirements of the Business Accounting Law and Guidelines Governing Business Accounting relevant to financial accounting standards, and accounting principles generally accepted in the Republic of China. We have also audited the accompanying schedules of significant accounts, provided for supplementary analysis, by applying the same procedures described above. In our opinion, such schedules are consistent, in all material respects, with the financial statements referred to above. We have also audited the consolidated financial statements of TXC Corporation and subsidiaries as of and for the years ended December 31, 2012 and 2011, and expressed unqualified opinion on such financial statements. March 25, 2013
Notice to Readers The accompanying financial statements are intended only to present the financial position, results of operations and cash flows in accordance with accounting principles and practices generally accepted in the Republic of China and not those of any other jurisdictions. The standards, procedures and practices to audit such financial statements are those generally accepted and applied in the Republic of China. For the convenience of readers, the auditors’ report and the accompanying financial statements have been translated into English from the original Chinese version prepared and used in the Republic of China. If there is any conflict between the English version and the original Chinese version or any difference in the interpretation of the two versions, the Chinese-language auditors’ report and financial statements shall prevail.

- 62 -
TXC CORPORATION BALANCE SHEETS DECEMBER 31, 2012 AND 2011 (In Thousands of New Taiwan Dollars)
2012 2011 2012 2011 ASSETS Amount % Amount % LIABILITIES AND STOCKHOLDERS’ EQUITY Amount % Amount % CURRENT ASSETS CURRENT LIABILITIES
Cash and cash equivalents (Notes 2 and 4) $ 1,012,212 8 $ 537,594 5 Short-term loans (Note 13) $ 135,332 1 $ 294,419 3Financial assets at fair value through profit or loss - current Financial liabilities at fair value through profit or loss - current (Notes 2 and 5) - - 3,922 - (Notes 2 and 5) 26,019 - 7,758 -Available-for-sale financial assets - current (Notes 2 and 6) 46,895 - 71,867 1 Notes payable (Note 2) - - 73,714 1Notes receivable, net (Notes 2 and 7) 515 - 327 - Notes payable - related parties (Notes 2 and 24) - - 285 -Accounts receivable, net (Notes 2, 3 and 7) 2,969,463 24 2,765,484 24 Accounts payable (Note 2) 726,007 6 668,794 6Accounts receivable - related parties, net (Notes 2, 3, 7 and 24) 54,710 1 48,055 - Accounts payable - related parties (Notes 2 and 24) 727,470 6 595,854 5Other receivable 28,066 - 38,682 - Income tax payable (Notes 2 and 20) 63,155 - 57,404 -Other receivable - related party, net (Note 24) 33,069 - 50,869 1 Accrued expenses (Note 16) 471,434 4 479,350 4Inventories, net (Notes 2 and 8) 1,022,967 8 923,476 8 Other payables - related parties (Note 24) 86 - - -Deferred income tax assets - current (Notes 2 and 20) 5,697 - 1,614 - Current portion of long-term bonds (Notes 2 and 14) 556,079 4 - -Other current assets 14,730 - 34,322 - Current portion of long-term loans (Note 15) 448,938 4 227,750 2
Other current liabilities 19,259 - 12,497 -Total current assets 5,188,324 41 4,476,212 39
Total current liabilities 3,173,779 25 2,417,825 21LONG-TERM INVESTMENTS
Financial assets carried at cost - noncurrent (Notes 2 and 9) 253,242 2 245,445 2 LONG-TERM LIABILITIES Investments accounted for by the equity method (Notes 2 and 10) 3,780,330 30 3,327,467 29 Bonds payable (Notes 2 and 14) - - 789,367 7
Long-term loans (Note 15) 1,437,500 12 1,086,438 9Total long-term investments 4,033,572 32 3,572,912 31
Total long-term liabilities 1,437,500 12 1,875,805 16PROPERTY, PLANT AND EQUIPMENT (Notes 2, 11 and 25)
Cost RESERVES Land 598,145 5 598,145 5 Reserve for land value increment tax (Notes 2 and 11) 3,512 - 3,512 -Land improvements 151 - 593 - Buildings 1,469,923 11 1,598,916 14 OTHER LIABILITIES Machinery and equipment 2,241,611 18 3,732,866 33 Accrued pension cost (Notes 2 and 17) 14,028 - 9,349 -Transportation equipment - - 2,557 - Guarantee deposits received 26,829 - 11,664 -Office equipment 90,318 1 141,243 1 Deferred income tax liabilities - noncurrent (Notes 2 and 20) 98,874 1 46,514 1Land - revaluation increment 8,954 - 8,954 -
Cost and revaluation increment 4,409,102 35 6,083,274 53 Total other liabilities 139,731 1 67,527 1Less accumulated depreciation (1,156,252) (9) (2,752,299) (24) Construction in progress and prepayments for equipment 141,848 1 119,998 1 Total liabilities 4,754,522 38 4,364,669 38
Property, plant and equipment, net 3,394,698 27 3,450,973 30 STOCKHOLDERS’ EQUITY (Note 18)
Capital stock OTHER ASSETS Common stock 3,022,423 24 3,022,423 26
Assets leased to others (Notes 2 and 12) 6,807 - 7,636 - Advance receipts for common stock 75,147 - - -Refundable deposits 910 - 925 - Capital surplus 1,616,549 13 1,356,078 12Deferred charges (Note 2) 10,707 - 16,411 - Retained earnings
Legal reserve 749,459 6 644,438 6Total other assets 18,424 - 24,972 - Unappropriated earnings 2,279,958 18 1,901,027 16
Total retained earnings 3,029,417 24 2,545,465 22 Other equity (Note 2) Cumulative translation adjustments 167,431 1 264,762 2 Net loss not recognized as pension cost (Note 17) (22,808) - (15,637) - Unrealized loss on financial instrument (13,105) - (18,133) - Unrealized revaluation increment (Note 11) 5,442 - 5,442 - Total other equity 136,960 1 236,434 2 Total stockholders’ equity 7,880,496 62 7,160,400 62 TOTAL $ 12,635,018 100 $ 11,525,069 100 TOTAL $ 12,635,018 100 $ 11,525,069 100 The accompanying notes are an integral part of the financial statements.

- 63 -
TXC CORPORATION STATEMENTS OF INCOME YEARS ENDED DECEMBER 31, 2012 AND 2011 (In Thousands of New Taiwan Dollars, Except Earnings Per Share) 2012 2011 Amount % Amount % OPERATING REVENUE (Note 2) $ 9,607,721 101 $ 8,981,786 101 LESS: SALES RETURNS (23,147) - (15,639) - LESS: SALES ALLOWANCES (107,093) (1) (48,124) (1) NET OPERATING REVENUE 9,477,481 100 8,918,023 100 OPERATING COSTS (7,769,177) (82) (7,259,694) (82) GROSS PROFIT 1,708,304 18 1,658,329 18 REALIZED INTER-COMPANY GAIN - - - - REALIZED GROSS PROFIT 1,708,304 18 1,658,329 18 OPERATING EXPENSES
Selling expenses (350,801) (4) (377,574) (4)General and administrative expenses (193,155) (2) (192,075) (2)Research and development expenses (297,829) (3) (344,468) (4)
Total operating expenses (841,785) (9) (914,117) (10)
OPERATING INCOME 866,519 9 744,212 8 NONOPERATING INCOME AND GAINS
Interest income 4,697 - 4,734 -Investment income recognized under equity method
(Note 10) 359,392 4 358,541 4Dividend income 3,954 - 4,031 -Gain on disposal of property, plant and equipment 231 - 10,617 -Gain on sale of investments 1,094 - 822 -Exchange gains 42,004 1 42,736 1Reversal of impairment loss - - 4,873 -Miscellaneous income 38,139 - 31,272 -
Total nonoperating income and gains 449,511 5 457,626 5
(Continued)
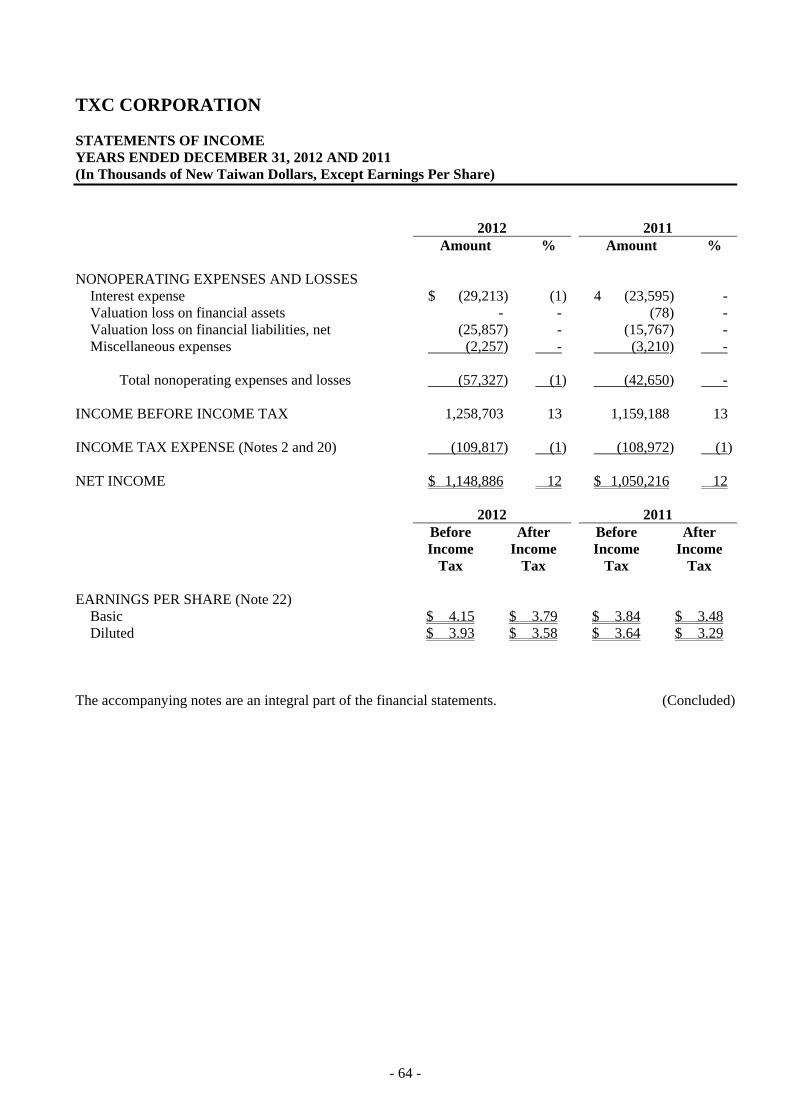
- 64 -
TXC CORPORATION STATEMENTS OF INCOME YEARS ENDED DECEMBER 31, 2012 AND 2011 (In Thousands of New Taiwan Dollars, Except Earnings Per Share) 2012 2011 Amount % Amount % NONOPERATING EXPENSES AND LOSSES
Interest expense $ (29,213) (1) 4 (23,595) -Valuation loss on financial assets - - (78) -Valuation loss on financial liabilities, net (25,857) - (15,767) -Miscellaneous expenses (2,257) - (3,210) -
Total nonoperating expenses and losses (57,327) (1) (42,650) -
INCOME BEFORE INCOME TAX 1,258,703 13 1,159,188 13 INCOME TAX EXPENSE (Notes 2 and 20) (109,817) (1) (108,972) (1) NET INCOME $ 1,148,886 12 $ 1,050,216 12 2012 2011 Before
Income Tax
After Income
Tax
Before Income
Tax
After Income
Tax EARNINGS PER SHARE (Note 22)
Basic $ 4.15 $ 3.79 $ 3.84 $ 3.48 Diluted $ 3.93 $ 3.58 $ 3.64 $ 3.29
The accompanying notes are an integral part of the financial statements. (Concluded)

- 65 -
TXC CORPORATION STATEMENTS OF CHANGES IN STOCKHOLDERS' EQUITY YEARS ENDED DECEMBER 31, 2012 AND 2011 (In Thousands of New Taiwan Dollars)
Others Equity Capital Stock Unrealized Advance Retained Earnings Cumulative Net Loss Not Gain (Loss) on Unrealized Receipts for Unappropriated Translation Recognized as Financial Revaluation Common Stock Common Stock Capital Surplus Legal Reserve Earnings Adjustments Pension Cost Instruments Increment Treasury Stock Total BALANCE, JANUARY 1, 2011 $ 2,971,831 $ - $ 1,302,853 $ 525,420 $ 1,850,021 $ 3,716 $ - $ (3,235) $ 5,442 $ (127,233) $ 6,528,815 Appropriation of 2010 earnings
Legal reserve - - - 119,018 (119,018) - - - - - - Stock dividends 59,261 - - - (59,261) - - - - - - Cash dividends - - - - (740,763) - - - - - (740,763)
Retirement of treasury stock (30,000) - (17,065) - (80,168) - - - - 127,233 - Exercise of employee stock options 21,220 - 69,814 - - - - - - - 91,034 Conversion of convertible bonds 111 - 476 - - - - - - - 587 Change in net loss not recognized as pension cost - - - - - - (15,637) - - - (15,637) Net income for the year ended December 31, 2011 - - - - 1,050,216 - - - - - 1,050,216 Changes in unrealized gain on available-for-sale financial assets - - - - - - - (14,898) - - (14,898) Changes in translation adjustments - - - - - 261,046 - - - - 261,046 BALANCE, DECEMBER 31, 2011 3,022,423 - 1,356,078 644,438 1,901,027 264,762 (15,637) (18,133) 5,442 - 7,160,400 Appropriation of 2011 earnings
Legal reserve - - - 105,021 (105,021) - - - - - - Cash dividends - - - - (664,934) - - - - - (664,934)
Exercise of employee stock options - 24,460 67,999 - - - - - - - 92,459 Conversion of convertible bonds - 50,687 192,472 - - - - - - - 243,159 Net loss not recognized as pension cost - - - - - - (7,171) - - - (7,171) Net income for the year ended December 31, 2012 - - - - 1,148,886 - - - - - 1,148,886 Changes in unrealized loss on available-for-sale financial assets - - - - - - - 5,028 - - 5,028 Changes in translation adjustments - - - - - (97,331) - - - - (97,331) BALANCE, DECEMBER 31, 2012 $ 3,022,423 $ 75,147 $ 1,616,549 $ 749,459 $ 2,279,958 $ 167,431 $ (22,808) $ (13,105) $ 5,442 $ - $ 7,880,496 The accompanying notes are an integral part of the financial statements.
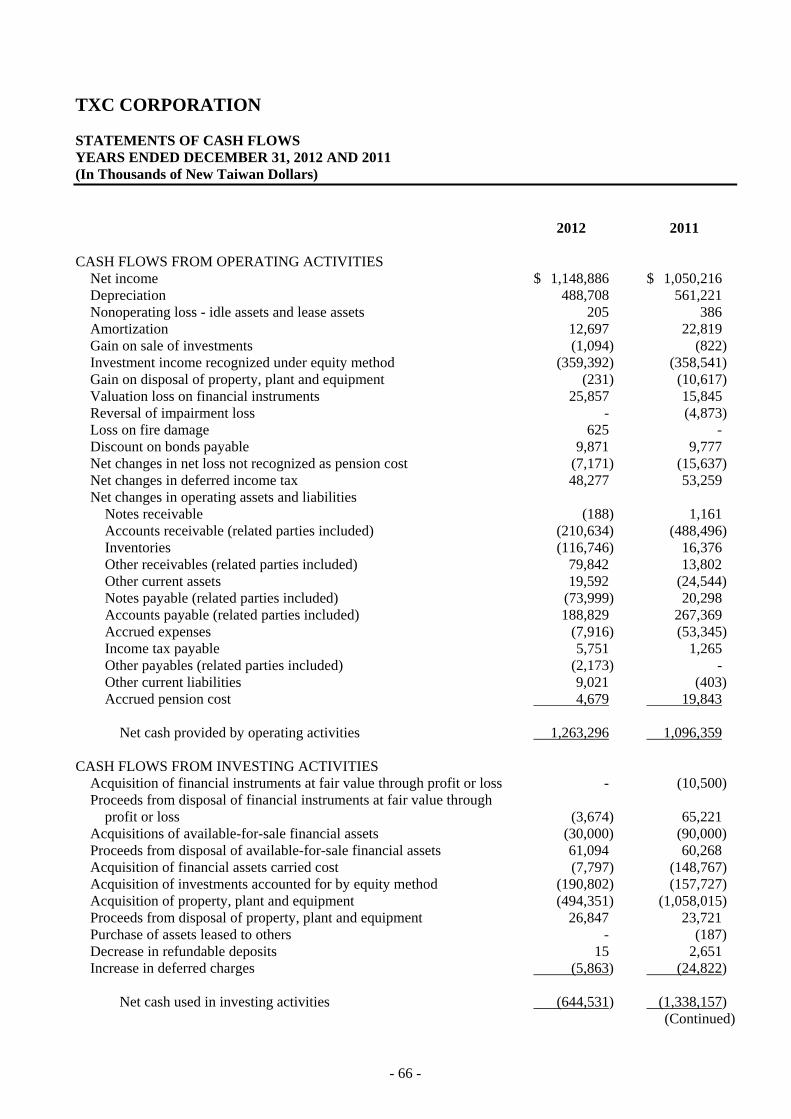
- 66 -
TXC CORPORATION STATEMENTS OF CASH FLOWS YEARS ENDED DECEMBER 31, 2012 AND 2011 (In Thousands of New Taiwan Dollars) 2012 2011 CASH FLOWS FROM OPERATING ACTIVITIES
Net income $ 1,148,886 $ 1,050,216 Depreciation 488,708 561,221 Nonoperating loss - idle assets and lease assets 205 386 Amortization 12,697 22,819 Gain on sale of investments (1,094) (822)Investment income recognized under equity method (359,392) (358,541)Gain on disposal of property, plant and equipment (231) (10,617)Valuation loss on financial instruments 25,857 15,845 Reversal of impairment loss - (4,873)Loss on fire damage 625 - Discount on bonds payable 9,871 9,777 Net changes in net loss not recognized as pension cost (7,171) (15,637)Net changes in deferred income tax 48,277 53,259 Net changes in operating assets and liabilities
Notes receivable (188) 1,161 Accounts receivable (related parties included) (210,634) (488,496)Inventories (116,746) 16,376 Other receivables (related parties included) 79,842 13,802 Other current assets 19,592 (24,544)Notes payable (related parties included) (73,999) 20,298 Accounts payable (related parties included) 188,829 267,369 Accrued expenses (7,916) (53,345)Income tax payable 5,751 1,265 Other payables (related parties included) (2,173) - Other current liabilities 9,021 (403)Accrued pension cost 4,679 19,843
Net cash provided by operating activities 1,263,296 1,096,359
CASH FLOWS FROM INVESTING ACTIVITIES
Acquisition of financial instruments at fair value through profit or loss - (10,500)Proceeds from disposal of financial instruments at fair value through
profit or loss (3,674) 65,221 Acquisitions of available-for-sale financial assets (30,000) (90,000)Proceeds from disposal of available-for-sale financial assets 61,094 60,268 Acquisition of financial assets carried cost (7,797) (148,767)Acquisition of investments accounted for by equity method (190,802) (157,727)Acquisition of property, plant and equipment (494,351) (1,058,015)Proceeds from disposal of property, plant and equipment 26,847 23,721 Purchase of assets leased to others - (187)Decrease in refundable deposits 15 2,651 Increase in deferred charges (5,863) (24,822)
Net cash used in investing activities (644,531) (1,338,157)
(Continued)
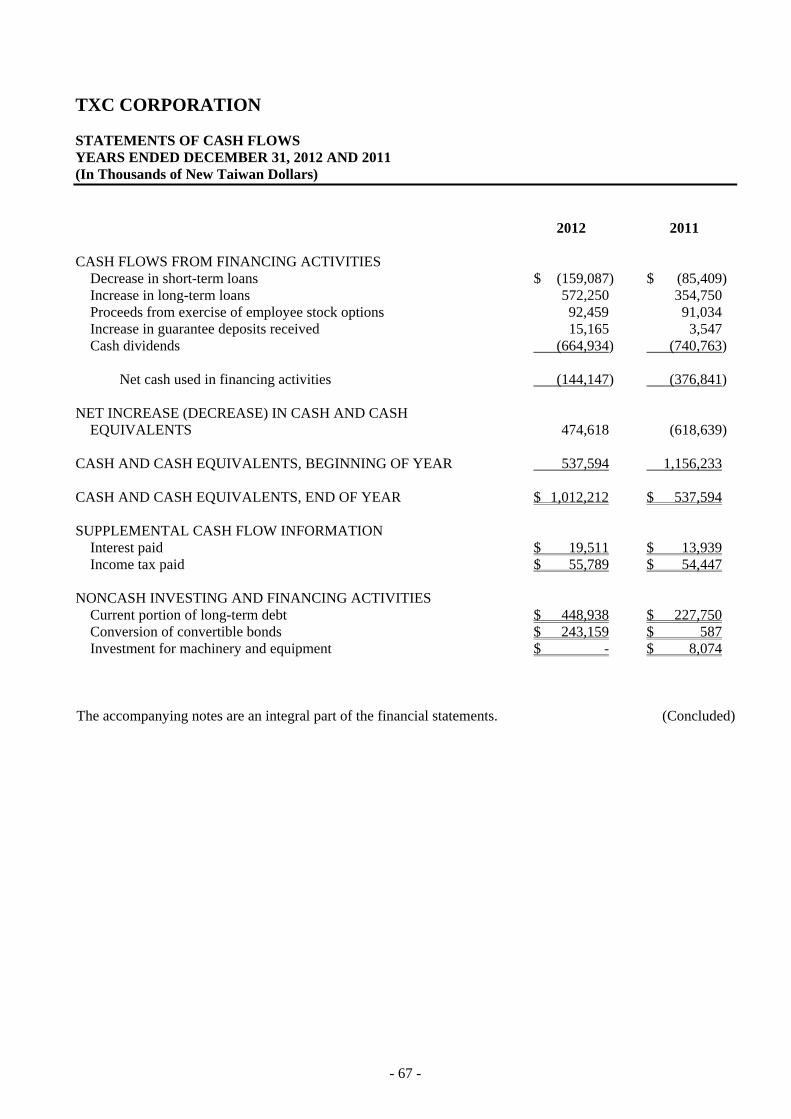
- 67 -
TXC CORPORATION STATEMENTS OF CASH FLOWS YEARS ENDED DECEMBER 31, 2012 AND 2011 (In Thousands of New Taiwan Dollars) 2012 2011 CASH FLOWS FROM FINANCING ACTIVITIES
Decrease in short-term loans $ (159,087) $ (85,409)Increase in long-term loans 572,250 354,750 Proceeds from exercise of employee stock options 92,459 91,034 Increase in guarantee deposits received 15,165 3,547 Cash dividends (664,934) (740,763)
Net cash used in financing activities (144,147) (376,841)
NET INCREASE (DECREASE) IN CASH AND CASH
EQUIVALENTS 474,618 (618,639) CASH AND CASH EQUIVALENTS, BEGINNING OF YEAR 537,594 1,156,233 CASH AND CASH EQUIVALENTS, END OF YEAR $ 1,012,212 $ 537,594 SUPPLEMENTAL CASH FLOW INFORMATION
Interest paid $ 19,511 $ 13,939 Income tax paid $ 55,789 $ 54,447
NONCASH INVESTING AND FINANCING ACTIVITIES
Current portion of long-term debt $ 448,938 $ 227,750 Conversion of convertible bonds $ 243,159 $ 587 Investment for machinery and equipment $ - $ 8,074
The accompanying notes are an integral part of the financial statements. (Concluded)

- 68 -
TXC CORPORATION NOTES TO FINANCIAL STATEMENTS YEARS ENDED DECEMBER 31, 2012 AND 2011 (In Thousands of New Taiwan Dollars, Unless Stated Otherwise) 1. ORGANIZATION AND OPERATIONS
TXC Corporation (the Corporation) was incorporated on December 28, 1983 under the Company Law and other related regulations of the Republic of China (ROC). The Corporation specializes in five categories of products such as high quality Quartz Unite Crystal, Automotive Crystal, Crystal Oscillator (CXO) Surface Acoustic Wave (SAW) Filter, and Timing Module (TM), and provides complete solution in frequency devices and modules, and design service to fully satisfy various needs of the customers. On August 26, 2002, the Corporation’s shares began to be traded on the Taiwan Stock Exchange. As of December 31, 2012 and 2011, the Corporation had 1,028 and 1,025 employees, respectively.
2. SIGNIFICANT ACCOUNTING POLICIES
For readers’ convenience, the accompanying financial statements have been translated into English from the original Chinese version prepared and used in the ROC. If inconsistencies arise between the English version and the Chinese version or if differences arise in the interpretations between the two versions, the Chinese version of the financial statements shall prevail. The financial statements have been prepared in conformity with the Guidelines Governing the Preparation of Financial Reports by Securities Issuers, Business Accounting Law, Guidelines Governing Business Accounting, and accounting principles generally accepted in the ROC. Foreign Currencies Non-derivative foreign-currency transactions are recorded in New Taiwan dollars at the rates of exchange in effect when the transactions occur. Exchange differences arising from settlement of foreign-currency assets and liabilities are recognized in profit or loss. At the balance sheet date, foreign-currency monetary assets and liabilities are revalued using prevailing exchange rates and the exchange differences are recognized in profit or loss. If the functional currency of an equity-method investee is a foreign currency, translation adjustments will result from the translation of the investee’s financial statements into the reporting currency of the Corporation. Such adjustments are accumulated and reported as a separate component of shareholders’ equity. Accounting Estimates Under above guidelines, law and principles, certain estimates and assumptions have been used for the allowance for doubtful accounts, allowance for loss on inventories, depreciation of property, plant and equipment, income tax, pension cost, bonuses to employees, directors and supervisors, etc. Actual results may differ from these estimates.
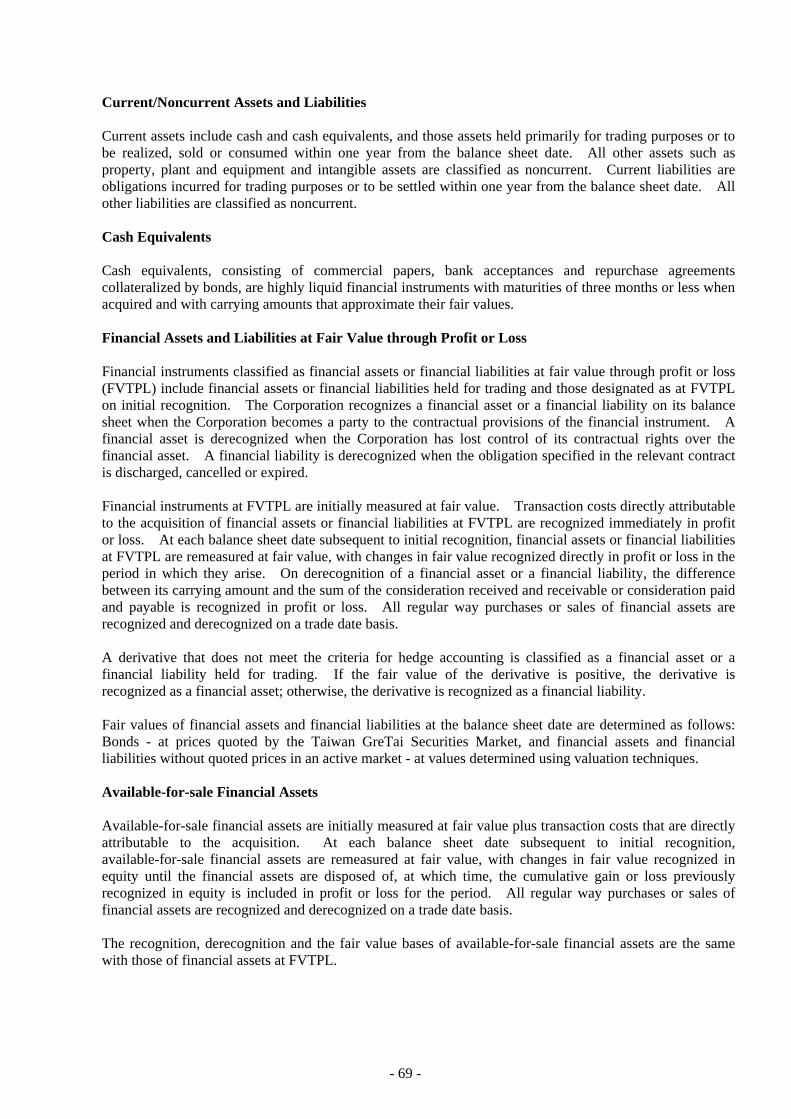
- 69 -
Current/Noncurrent Assets and Liabilities Current assets include cash and cash equivalents, and those assets held primarily for trading purposes or to be realized, sold or consumed within one year from the balance sheet date. All other assets such as property, plant and equipment and intangible assets are classified as noncurrent. Current liabilities are obligations incurred for trading purposes or to be settled within one year from the balance sheet date. All other liabilities are classified as noncurrent. Cash Equivalents Cash equivalents, consisting of commercial papers, bank acceptances and repurchase agreements collateralized by bonds, are highly liquid financial instruments with maturities of three months or less when acquired and with carrying amounts that approximate their fair values. Financial Assets and Liabilities at Fair Value through Profit or Loss Financial instruments classified as financial assets or financial liabilities at fair value through profit or loss (FVTPL) include financial assets or financial liabilities held for trading and those designated as at FVTPL on initial recognition. The Corporation recognizes a financial asset or a financial liability on its balance sheet when the Corporation becomes a party to the contractual provisions of the financial instrument. A financial asset is derecognized when the Corporation has lost control of its contractual rights over the financial asset. A financial liability is derecognized when the obligation specified in the relevant contract is discharged, cancelled or expired. Financial instruments at FVTPL are initially measured at fair value. Transaction costs directly attributable to the acquisition of financial assets or financial liabilities at FVTPL are recognized immediately in profit or loss. At each balance sheet date subsequent to initial recognition, financial assets or financial liabilities at FVTPL are remeasured at fair value, with changes in fair value recognized directly in profit or loss in the period in which they arise. On derecognition of a financial asset or a financial liability, the difference between its carrying amount and the sum of the consideration received and receivable or consideration paid and payable is recognized in profit or loss. All regular way purchases or sales of financial assets are recognized and derecognized on a trade date basis. A derivative that does not meet the criteria for hedge accounting is classified as a financial asset or a financial liability held for trading. If the fair value of the derivative is positive, the derivative is recognized as a financial asset; otherwise, the derivative is recognized as a financial liability. Fair values of financial assets and financial liabilities at the balance sheet date are determined as follows: Bonds - at prices quoted by the Taiwan GreTai Securities Market, and financial assets and financial liabilities without quoted prices in an active market - at values determined using valuation techniques. Available-for-sale Financial Assets Available-for-sale financial assets are initially measured at fair value plus transaction costs that are directly attributable to the acquisition. At each balance sheet date subsequent to initial recognition, available-for-sale financial assets are remeasured at fair value, with changes in fair value recognized in equity until the financial assets are disposed of, at which time, the cumulative gain or loss previously recognized in equity is included in profit or loss for the period. All regular way purchases or sales of financial assets are recognized and derecognized on a trade date basis. The recognition, derecognition and the fair value bases of available-for-sale financial assets are the same with those of financial assets at FVTPL.

- 70 -
An impairment loss is recognized when there is objective evidence that the financial asset is impaired. Any subsequent decrease in impairment loss for an equity instrument classified as available-for-sale is recognized directly in equity. If the fair value of a debt instrument classified as available-for-sale subsequently increases as a result of an event which occurred after the impairment loss was recognized, the decrease in impairment loss is reversed to profit. Fair value of financial assets at the balance sheet date is determined as follows: Open-end mutual funds - at net asset values. Financial Assets Carried at Cost Investments in equity instruments with no quoted prices in an active market and with fair values that cannot be reliably measured, such as non-publicly traded stocks and stocks traded in the Emerging Stock Market, are measured at their original cost. The accounting treatment for dividends on financial assets carried at cost is the same with that for dividends on available-for-sale financial assets. An impairment loss is recognized when there is objective evidence that the asset is impaired. A reversal of this impairment loss is disallowed. Impairment of Accounts Receivable An allowance for doubtful accounts is provided on the basis of a review of the collectibility of accounts receivable. The Corporation assesses the probability of collections of accounts receivable by examining the aging analysis of the outstanding receivables and assessing the value of the collateral provided by customers. As discussed in Note 3 to the financial statements, on January 1, 2011, the Corporation adopted the third-time revised Statement of Financial Accounting Standards (SFAS) No. 34, “Financial Instruments: Recognition and Measurement.” One of the main revisions is that impairment of receivables originated by the Corporation should be covered by SFAS No. 34. Accounts receivable are assessed for impairment at the end of each reporting period and considered to be impaired when there is objective evidence that, as a result of one or more events that occurred after the initial recognition of the accounts receivable, the estimated future cash flows of the asset have been affected. Objective evidence of impairment could include: Significant financial difficulty of the debtor; Accounts receivable becoming overdue; or It is becoming probable that the debtor will enter bankruptcy or financial re-organization. Accounts receivable that are assessed as not impaired individually are further assessed for impairment on a collective basis. Objective evidence of impairment for a portfolio of accounts receivable could include the Corporation’s past experience in the collection of payments, an increase in the number of delayed payments, as well as observable changes in national or local economic conditions that correlate with defaults on receivables. The amount of the impairment loss recognized is the difference between the asset carrying amount and the present value of estimated future cash flows, after taking into account the related collateral and guarantees, discounted at the receivable’s original effective interest rate. The carrying amount of the accounts receivable is reduced through the use of an allowance account. When accounts receivable are considered uncollectible, they are written off against the allowance account. Recoveries of amounts previously written off are credited to the allowance account. Changes in the carrying amount of the allowance account are recognized as bad debt in profit or loss.
- 71 -
Impairment of Assets If the recoverable amount of an asset (mainly property, plant and equipment, idle assets, leased assets and investments accounted for by the equity method) is estimated to be less than its carrying amount, the carrying amount of the asset is reduced to its recoverable amount. An impairment loss is charged to earnings unless the asset is carried at a revalued amount, in which case the impairment loss is first treated as a deduction to the unrealized revaluation increment and any remaining loss is charged earnings. If an impairment loss subsequently reverses, the carrying amount of the asset is increased accordingly, but the increased carrying amount may not exceed the carrying amount that would have been determined had no impairment loss been recognized on the asset in prior years. A reversal of an impairment loss is recognized in earnings, unless the asset is carried at a revalued amount, in which case the reversal of the impairment loss is first recognized as gains to the extent that an impairment loss on the same revalued asset was previously charged to earnings. Inventories Inventories consist of raw materials, supplies and spare parts, work-in-process, finished goods and merchandise and are stated at the lower of cost or net realizable value. Inventory write-downs are made item by item, except where it may be appropriate to group similar or related items. Net realizable value is the estimated selling price of inventories less all estimated costs of completion and costs necessary to make the sale. Inventories are recorded at weighted-average cost on the balance sheet date. Investments Accounted for by the Equity Method Investments in which the Corporation holds 20 percent or more of the investees’ voting shares or exercises significant influence over the investees’ operating and financial policy decisions are accounted for by the equity method. Profits from downstream transactions with an equity-method investee are eliminated in proportion to the Corporation’s percentage of ownership in the investee; however, if the Corporation has control over the investee, all the profits are eliminated. Profits from upstream transactions with an equity-method investee are eliminated in proportion to the Corporation’s percentage of ownership in the investee. Property, Plant and Equipment, Assets Leased to Others and Idle Assets Property, plant and equipment and assets leased to others are stated at cost plus revaluation increment less accumulated depreciation. Borrowing costs directly attributable to the acquisition or construction of property, plant and equipment are capitalized as part of the cost of those assets. Major additions and improvements to property, plant and equipment are capitalized, while costs of repairs and maintenance are expensed currently. Depreciation is provided on a straight-line basis over the estimated useful lives as follows: buildings - 4 to 51 years; machinery and equipment - 4 to 15 years; transportation equipment - 3 to 6 years; office equipment - 2 to 6 years; assets leased to others - 4 to 61 years. Property, plant and equipment and assets leased to others still in use beyond their original estimated useful lives are further depreciated over their new estimated useful lives. Depreciation of revaluated assets is provided on a straight-line basis over their remaining estimated useful lives determined at the time of revaluation. The related cost (including revaluation increment), accumulated depreciation, accumulated impairment losses and any unrealized revaluation increment of an item of property, plant and equipment are derecognized from the balance sheet upon its disposal. Any gain or loss on disposal of the asset is included in nonoperating gains or losses in the period of disposal.

- 72 -
Convertible Bonds For convertible bonds issued on or after January 1, 2006, the Corporation first determines the carrying amount of the liability component by measuring the fair value of a similar liability that does not have an associated equity component, then determines the carrying amount of the equity component, representing the equity conversion option, by deducting the fair value of the liability component from the fair value of the convertible bonds as a whole. The liability component (excluding the embedded derivatives) is measured at amortized cost using the effective interest method, while the embedded non-equity derivatives are measured at fair value. Upon conversion, the Corporation uses the aggregate carrying amount of the liability and equity components of the bonds at the time of conversion as a basis to record the common shares issued. Pension Cost Pension cost under a defined benefit plan is determined by actuarial valuations. Contributions made under a defined contribution plan are recognized as pension cost during the period in which employees render services. Curtailment or settlement gains or losses of the defined benefit plan are recognized as part of the net periodic pension cost for the period. Income Tax The Corporation applies the intra-period and inter-period allocation methods to its income tax, whereby (1) a portion of income tax expense is allocated to the cumulative effect of changes in accounting principles; and (2) deferred income tax assets and liabilities are recognized for the tax effects of temporary differences, unused loss carryforward and unused tax credits. Valuation allowance is provided to the extent, if any, that it is more likely than not that deferred income tax assets will not be realized. A deferred tax asset or liability is classified as current or noncurrent in accordance with the classification of its related asset or liability. However, if a deferred income tax asset or liability does not relate to an asset or liability in the financial statements, then it is classified as either current or noncurrent based on the expected length of time before it is realized or settled. If the Corporation can control the timing of the reversal of a temporary difference between the book value and the tax basis of a long-term equity investment in a foreign subsidiary or joint venture and if the temporary difference is not expected to reverse in the foreseeable future and will, in effect, exist indefinitely, then a deferred tax liability or asset is not recognized. Tax credits for purchases of machinery, equipment and technology, research and development expenditures, and personnel training expenditures are recognized using the flow-through method. Adjustments of prior years’ tax liabilities are added to or deducted from the current period’s tax provision. According to the Income Tax Law, an additional tax at 10% of unappropriated earnings is provided for as income tax in the year the shareholders approve to retain the earnings. Stock-based Compensation Employee stock options granted between January 1, 2004 and December 31, 2007 were accounted for under the interpretations issued by the Accounting Research and Development Foundation (“ARDF”). The Corporation adopted the intrinsic value method, under which compensation cost is recognized on a straight-line basis over the vesting period.

- 73 -
Treasury Stock Treasury stock is stated at cost and shown as a deduction in shareholders’ equity. Revenue Recognition Revenue from sales of goods is recognized when the Corporation has transferred to the buyer the significant risks and rewards of ownership of the goods, primarily upon shipment, because the earnings process has been completed and the economic benefits associated with the transaction have been realized or are realizable. The Corporation does not recognize sales revenue on materials delivered to subcontractors because this delivery does not involve a transfer of risks and rewards of materials ownership. Revenue is measured at the fair value of the consideration received or receivable and represents amounts agreed between the Corporation and the customers for goods sold in the normal course of business, net of sales discounts and volume rebates. For trade receivables due within one year from the balance sheet date, as the nominal value of the consideration to be received approximates its fair value and transactions are frequent, fair value of the consideration is not determined by discounting all future receipts using an imputed rate of interest.
Reclassifications
Certain accounts in the financial statements as of and for the year ended December 31, 2011 have been reclassified to conform to the presentation of the financial statements as of and for the year ended December 31, 2012.
3. EFFECTS OF CHANGES IN ACCOUNTING PRINCIPLES
Financial Instruments On January 1, 2011, the Corporation adopted the newly revised Statement of Financial Accounting Standards (SFAS) No. 34, “Financial Instruments: Recognition and Measurement.” The main revisions include (1) finance lease receivables are now covered by SFAS No. 34; (2) the scope of the applicability of SFAS No. 34 to insurance contracts is amended; (3) loans and receivables originated by the Corporation are now covered by SFAS No. 34; (4) additional guidelines on impairment testing of financial assets carried at amortized cost when a debtor has financial difficulties and the terms of obligations have been modified; and (5) accounting treatment by a debtor for modifications in the terms of obligations. The adoption did not have effect on the net income for the year ended December 31, 2011.
4. CASH AND CASH EQUIVALENTS
December 31 2012 2011 Cash on hand $ 652 $ 1,098 Checking accounts and demand deposits 664,560 353,496 Time deposits - 140,000 Cash equivalents
Repurchase agreements collateralized by bonds 347,000 43,000 $ 1,012,212 $ 537,594
The interest rates of repurchase agreements collateralized by bonds were 0.8%-0.825% and 0.76% for the years ended December 31, 2012 and 2011.

- 74 -
5. FINANCIAL INSTRUMENTS AT FAIR VALUE THROUGH PROFIT OR LOSS
December 31 2012 2011 Financial assets at FVTPL Convertible bonds $ - $ 3,922 Financial liabilities at FVTPL Forward exchange contracts $ 26,019 $ 7,758 The Corporation entered into derivative contracts during the years ended December 31, 2012 and 2011 to manage exposures related to exchange rate and interest rate fluctuations. The financial risk management objective of the Corporation is to minimize risks due to change in fair value or cash flows. Outstanding forward contracts as of December 31, 2012 and 2011 were as follows: Contract Amount Currency Maturity Date (In Thousands) December 31, 2012 Sell USD/NTD January 2, 2013 to
March 26, 2013 USD24,500/NTD714,837
Sell USD/JPY January 4, 2013 to March 5, 2013
USD19,000/JPY1,561,562
Buy JPY/NTD January 10, 2013 to February 20, 2013
JPY160,000/NTD58,484
December 31, 2011 Sell USD/NTD January 3, 2012 to
April 9, 2012 USD55,000/NTD1,656,290
Sell USD/JPY January 4, 2012 to March 9, 2012
USD21,000/JPY1,629,455
Sell NTD/JPY January 4, 2012 to February 6, 2012
NTD141,889/JPY360,000
Net loss on financial instruments held for trading for the years ended December 31, 2012 and 2011 was $25,857 thousand and $15,845 thousand, respectively.
6. AVAILABLE-FOR-SALE FINANCIAL ASSETS
December 31 2012 2011 Mutual funds $ 46,895 $ 71,867

- 75 -
7. NOTES RECEIVABLE AND ACCOUNTS RECEIVABLE
December 31 2012 2011 Notes receivable, third parties $ 518 $ 360Less: Allowance for doubtful accounts (3) (33) $ 515 $ 327 Accounts receivable, third parties $ 2,988,689 $ 2,783,280Accounts receivable, related parties 54,795 48,086 3,043,484 2,831,366Less: Allowance for doubtful accounts, third parties (19,226) (17,796)
Allowance for doubtful accounts, related parties (85) (31) $ 3,024,173 $ 2,813,539
Movements of allowance for doubtful accounts were as follows:
Years Ended December 31 2012 2011
Notes
Receivable Accounts
Receivable Notes
Receivable Accounts
Receivable Balance, beginning of year $ 33 $ 17,827 $ 8 $ 17,827Add (deduct): Provision for
(reversal of) doubtful accounts
(30) 1,677 25 - Deduct: Amounts written off - (193) - - Balance, end of year $ 3 $ 19,311 $ 33 $ 17,827
8. INVENTORIES
December 31 2012 2011 Raw materials $ 143,955 $ 116,924 Supplies and spare parts 38,547 45,789 Work in process 237,584 162,837 Finished goods 257,249 294,333 Merchandise 330,830 302,721 Goods in transit 14,802 872 $ 1,022,967 $ 923,476 As of December 31, 2012 and 2011, the allowance for inventory devaluation was $32,507 thousand and $31,949 thousand, respectively. The cost of inventories recognized as cost of goods sold for the years ended December 31, 2012 and 2011 was $7,769,177 thousand and $7,259,694 thousand, respectively, which included $18,366 thousand and $33,097 thousand, respectively, due to write-downs of inventories and loss on physical inventory.

- 76 -
9. FINANCIAL ASSETS CARRIED AT COST
December 31 2012 2011 Domestic emerging market stocks $ 54,997 $ 47,200 Domestic unquoted common stocks 101,000 101,000 Overseas unquoted common stocks 97,245 97,245 $ 253,242 $ 245,445
The above equity investments, which had no quoted prices in an active market and of which fair value could not be reliably measured were carried at cost.
10. INVESTMENTS ACCOUNTED FOR BY THE EQUITY METHOD
December 31 2012 2011
Carrying Amount
% of Ownership
Carrying Amount
% of Ownership
Unlisted companies
Taiwan Crystal Technology International Ltd. $ 3,470,395 100 $ 3,188,189 100
TXC Technology Inc. 11,378 100 12,942 100 TXC Japan Corporation 11,517 100 14,863 100 Taiwan Crystal Technology
International (HK) Limited 287,040 100 111,473 100 $ 3,780,330 $ 3,327,467
The Corporation invested in Taiwan Crystal Technology International (HK) Limited in June 2011. The purpose of the investment is to reinvest in TXC (Chongqing) Corporation. In 2012, the Corporation increased its capital by cash in the amount of $190,802 thousand (US$6,480 thousand). Investment income (loss) recognized under the equity method was as follows:
Years Ended December 31 2012 2011 Taiwan Crystal Technology International Ltd. $ 373,818 $ 354,557 TXC Technology Inc. (1,082) 2,308 TXC Japan Corporation (1,449) 2,843 Taiwan Crystal Technology International (HK) Limited (11,895) (1,167) $ 359,392 $ 358,541
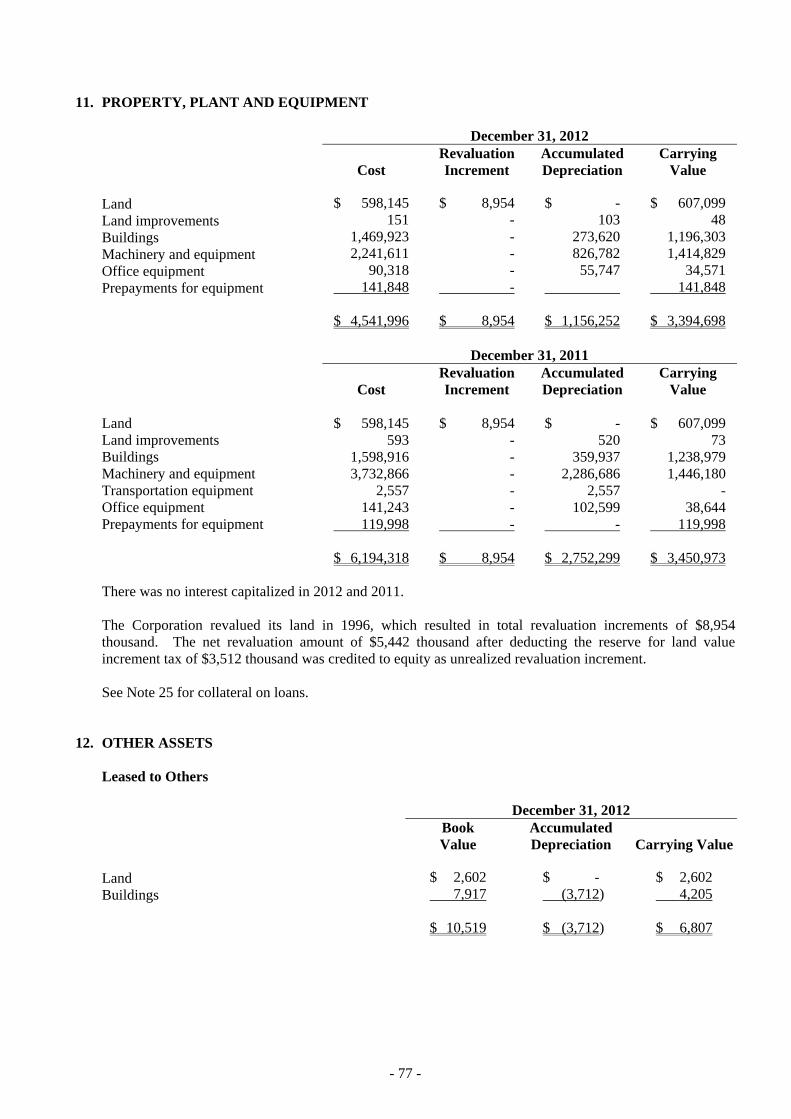
- 77 -
11. PROPERTY, PLANT AND EQUIPMENT
December 31, 2012
Cost Revaluation Increment
Accumulated Depreciation
Carrying Value
Land $ 598,145 $ 8,954 $ - $ 607,099Land improvements 151 - 103 48Buildings 1,469,923 - 273,620 1,196,303Machinery and equipment 2,241,611 - 826,782 1,414,829Office equipment 90,318 - 55,747 34,571Prepayments for equipment 141,848 - 141,848 $ 4,541,996 $ 8,954 $ 1,156,252 $ 3,394,698
December 31, 2011
Cost Revaluation Increment
Accumulated Depreciation
Carrying Value
Land $ 598,145 $ 8,954 $ - $ 607,099Land improvements 593 - 520 73Buildings 1,598,916 - 359,937 1,238,979Machinery and equipment 3,732,866 - 2,286,686 1,446,180Transportation equipment 2,557 - 2,557 -Office equipment 141,243 - 102,599 38,644Prepayments for equipment 119,998 - - 119,998 $ 6,194,318 $ 8,954 $ 2,752,299 $ 3,450,973 There was no interest capitalized in 2012 and 2011. The Corporation revalued its land in 1996, which resulted in total revaluation increments of $8,954 thousand. The net revaluation amount of $5,442 thousand after deducting the reserve for land value increment tax of $3,512 thousand was credited to equity as unrealized revaluation increment. See Note 25 for collateral on loans.
12. OTHER ASSETS
Leased to Others December 31, 2012
Book Value
Accumulated Depreciation Carrying Value
Land $ 2,602 $ - $ 2,602Buildings 7,917 (3,712) 4,205 $ 10,519 $ (3,712) $ 6,807

- 78 -
December 31, 2011
Book Value
Accumulated Depreciation Carrying Value
Land $ 2,602 $ - $ 2,602 Buildings 11,632 (6,598) 5,034 $ 14,234 $ (6,598) $ 7,636 Idle Assets Idle assets are land, building and equipment retired from active use.
December 31 2012 2011
Book value $ 283 $ 4,038 Accumulated impairment (283) (4,038) $ - $ -
13. SHORT-TERM LOANS
December 31 2012 2011
Interest Rate
% Amounts Interest Rate
% Amounts Unsecured bank loans 0.96-1.024 $ 135,332 0.60-1.25 $ 294,419
14. BONDS PAYABLE
December 31 2012 2011 Third unsecured domestic convertible bonds $ 556,100 $ 799,400 Less: Discount on bonds payable (21) (10,033) Less: Current portion (556,079) - $ - $ 789,367 Third Unsecured Domestic Convertible Bonds On January 11, 2010, the Corporation issued third unsecured domestic convertible bonds with an aggregate value of $800,000 thousand. According to Statement of Financial Accounting Standards No. 36, “Disclosure and Presentation of Financial Instruments,” these unsecured domestic convertible bonds were separated into convertible options, equity, and bonds payable. Other details of the bond issuance are summarized as follows: a. Issue date: January 11, 2010. b. Total issue amount: $800,000 thousand.

- 79 -
c. Issue price: 100%. d. Par value: $100 thousand. e. Coupon rate: 0%. f. Repayment term: The bonds are repayable on January 11, 2013 upon the maturity of the bonds. g. Conversion right: Holder can request for conversion of the bonds to the Corporation’s common stock. h. Conversion period: From February 12, 2010 to January 1, 2013. i. Conversion price: The original conversion price per share is $57.6. The conversion price is subject
to adjustment based on a certain formula if there are changes in outstanding shares or execution of conversion below market price. The conversion price per share is $48 on December 31, 2012.
j. Redemption of bonds
1) Redemption on the maturity date: On the maturity date, the Corporation will redeem the bonds at the principal amounts.
2) Early redemption on the maturity date:
a) During the period of time between one month after issuance and the 40th day before maturity, if the closing price of the Corporation’s shares reaches 30% of the conversion price for 30 consecutive trading days, the Corporation may redeem the remaining bonds at a price of their book value.
b) During the period of time between one month after issuance and the 40th day before maturity,
when over 90% of the bonds had been redeemed, bought back or converted, the Corporation may redeem the remaining bonds at a price of their book value.
k. Converted bonds: As of December 31, 2012, bonds with a book value of $243,900 thousand had been
converted into 5,080 thousand common shares. 15. LONG-TERM LOANS
December 31 Nature of Loans Repayment Period 2012 2011
Secured bank loans Maturity on July 24, 2013, repayable from
July 2008 in quarterly installments $ 43,688 $ 101,938
Secured bank loans Maturity on July 24, 2013, repayable from April 2009 in quarterly installments
5,250 12,250
Secured bank loans Maturity on August 17, 2016, repayable from November 2012 in quarterly installments
562,500 600,000
Unsecured bank loans Maturity on October 13, 2016, repayable from January 2013 in quarterly installments
500,000 -
Unsecured bank loans Repayable at maturity on July 26, 2014 200,000 - Unsecured bank loans Repayable at maturity on August 20, 2014 100,000 -
(Continued)

- 80 -
December 31
Nature of Loans Repayment Period 2012 2011 Unsecured bank loans Repayable at maturity on June 15, 2014 $ 100,000 $ 100,000 Unsecured bank loans Maturity on October 28, 2015, repayable
from October 2011 in quarterly installment
375,000
500,000
1,886,438 1,314,188 Less current portion (448,938) (227,750) $ 1,437,500 $ 1,086,438 Interest rate (%) 1,10%-1.28% 0.9%-1.107%
(Concluded) See Note 25 for collaterals on long-term loans.
16. ACCRUED EXPENSES
December 31 2012 2011 Payroll $ 36,070 $ 32,229 Bonus 44,765 125,811 Bonus to employees, directors and supervisors 144,759 132,203 Commission 58,234 65,249 Others 187,606 123,858 $ 471,434 $ 479,350
17. PENSION PLANS
The pension plan under the Labor Pension Act (the “LPA”) is a defined contribution plan. Based on the LPA, the Corporation makes monthly contributions to employees’ individual pension accounts at not less than 6% of monthly salaries and wages. Such pension costs were $22,867 thousand and $23,626 thousand for the years ended December 31, 2012 and 2011, respectively. The Corporation has set up appointed manager’s pension fund and contributes monthly an amount of not less than 8% of the appointed manager’s monthly salaries and wages to the Bank of Taiwan. Such pension costs were $1,030 thousand and $701 thousand for the years ended December 31, 2012 and 2011, respectively. Based on the defined benefit plan under the LSL, pension benefits are calculated on the basis of the length of service and average monthly salaries of the six months before retirement. The Corporation contributes amounts equal to 2% of total monthly salaries and wages to a pension fund administered by the pension fund monitoring committee. The pension fund is deposited in the Bank of Taiwan in the committee’s name. The Corporation recognized pension costs of $4,028 thousand and $8,146 thousand for the years ended December 31, 2012 and 2011, respectively.
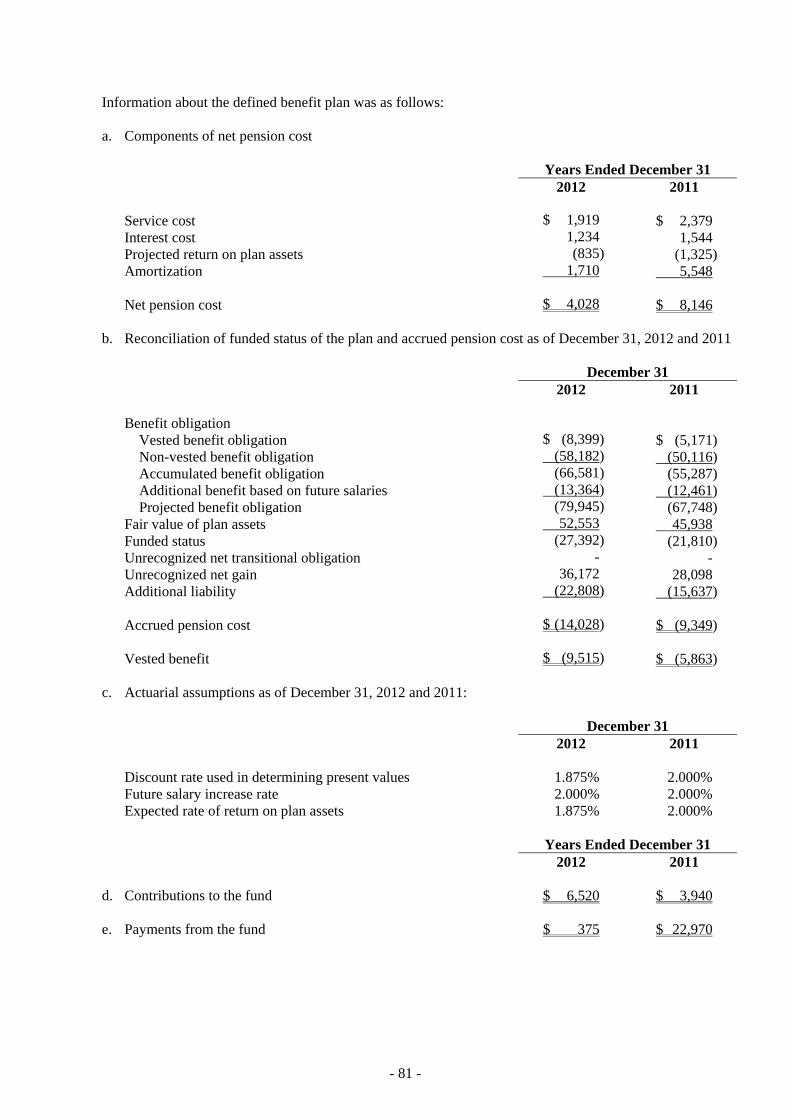
- 81 -
Information about the defined benefit plan was as follows: a. Components of net pension cost
Years Ended December 31 2012 2011 Service cost $ 1,919 $ 2,379 Interest cost 1,234 1,544 Projected return on plan assets (835) (1,325) Amortization 1,710 5,548 Net pension cost $ 4,028 $ 8,146
b. Reconciliation of funded status of the plan and accrued pension cost as of December 31, 2012 and 2011
December 31 2012 2011 Benefit obligation
Vested benefit obligation $ (8,399) $ (5,171) Non-vested benefit obligation (58,182) (50,116) Accumulated benefit obligation (66,581) (55,287) Additional benefit based on future salaries (13,364) (12,461) Projected benefit obligation (79,945) (67,748)
Fair value of plan assets 52,553 45,938 Funded status (27,392) (21,810) Unrecognized net transitional obligation - - Unrecognized net gain 36,172 28,098 Additional liability (22,808) (15,637) Accrued pension cost $ (14,028) $ (9,349) Vested benefit $ (9,515) $ (5,863)
c. Actuarial assumptions as of December 31, 2012 and 2011:
December 31 2012 2011
Discount rate used in determining present values 1.875% 2.000% Future salary increase rate 2.000% 2.000% Expected rate of return on plan assets 1.875% 2.000%
Years Ended December 31 2012 2011 d. Contributions to the fund $ 6,520 $ 3,940 e. Payments from the fund $ 375 $ 22,970

- 82 -
18. STOCKHOLDERS’ EQUITY
Capital Stock The Corporation’s authorized capital was $5,000,000 thousand and $4,000,000 thousand at December 31, 2012 and 2011 ($10.00 par value per share). As of December 31, 2012 and 2011, the Corporation’s issued capital stock was $3,022,423 thousand divided into 302,242 thousand shares, at NT$10.00 par value each. Exercised stock options in the amount of $24,460 thousand and convertible bonds in the amount of $50,687 thousand have not been registered; therefore they are classified into advance receipts for common stock. Employee Stock Options In December 2007, 8,000 options were granted to qualified employees of the Corporation and its subsidiaries. Each option entitles the holder to subscribe for one thousand common shares of the Corporation when exercisable. The options granted are valid for 5 years and exercisable at certain percentages after the second anniversary year from the grant date. The options were granted at an exercise price equal to the closing price of the Corporation’s common shares listed on the TSE on the grant date. For any subsequent changes in the Corporation’s paid-in capital, the exercise price is adjusted accordingly. Information related to employee stock option plans was as follows: Years Ended December 31 2012 2011
Number of Options (In Thousands)
Weighted-average Exercise
Price (NT$)
Number of Options (In Thousands)
Weighted-average Exercise
Price (NT$)
Balance, beginning of year 2,627 $ 39.7 4,954 $ 42.9 Options granted - - - - Options forfeited - - - - Options exercised (2,446) 37.8 (2,122) 42.9 Options expired (181) - (205) - Balance, end of year - - 2,627 39.7 Options exercisable, end of year - 2,627 Options granted during the year 2007 were priced using the Black-Scholes pricing model and the inputs to the model were as follows: Grant-date share price (NT$) 58.8 Exercise price (NT$) 58.8 Expected volatility 43.5% Expected life (years) 3.875 years Risk-free interest rate 2.42% Expected dividend yield - The pro forma information for the years ended December 31, 2012 and 2011 assuming employee stock options granted before January 1, 2008 were accounted for under SFAS No. 39 is as follows:
2012 2011 Net income $ 1,148,886 $ 1,050,216 After income tax basic earnings per share (NT$) $3.79 $3.48
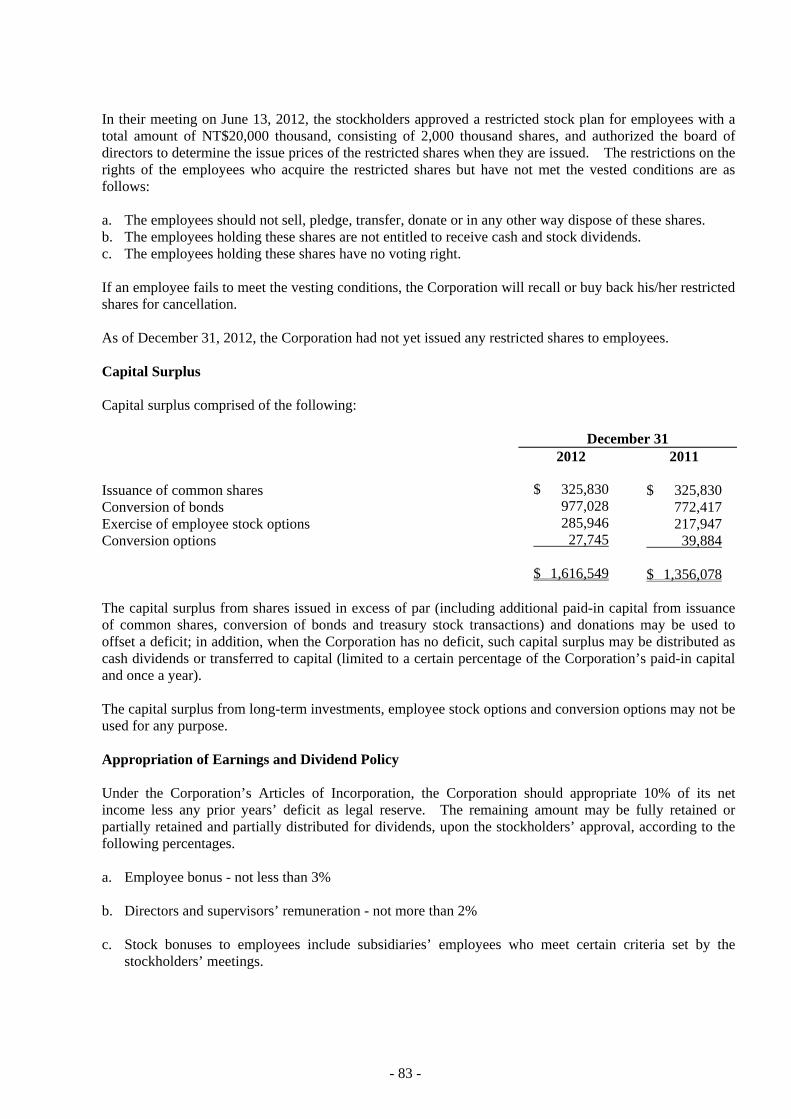
- 83 -
In their meeting on June 13, 2012, the stockholders approved a restricted stock plan for employees with a total amount of NT$20,000 thousand, consisting of 2,000 thousand shares, and authorized the board of directors to determine the issue prices of the restricted shares when they are issued. The restrictions on the rights of the employees who acquire the restricted shares but have not met the vested conditions are as follows: a. The employees should not sell, pledge, transfer, donate or in any other way dispose of these shares. b. The employees holding these shares are not entitled to receive cash and stock dividends. c. The employees holding these shares have no voting right. If an employee fails to meet the vesting conditions, the Corporation will recall or buy back his/her restricted shares for cancellation. As of December 31, 2012, the Corporation had not yet issued any restricted shares to employees. Capital Surplus Capital surplus comprised of the following: December 31 2012 2011 Issuance of common shares $ 325,830 $ 325,830 Conversion of bonds 977,028 772,417 Exercise of employee stock options 285,946 217,947 Conversion options 27,745 39,884 $ 1,616,549 $ 1,356,078 The capital surplus from shares issued in excess of par (including additional paid-in capital from issuance of common shares, conversion of bonds and treasury stock transactions) and donations may be used to offset a deficit; in addition, when the Corporation has no deficit, such capital surplus may be distributed as cash dividends or transferred to capital (limited to a certain percentage of the Corporation’s paid-in capital and once a year). The capital surplus from long-term investments, employee stock options and conversion options may not be used for any purpose. Appropriation of Earnings and Dividend Policy Under the Corporation’s Articles of Incorporation, the Corporation should appropriate 10% of its net income less any prior years’ deficit as legal reserve. The remaining amount may be fully retained or partially retained and partially distributed for dividends, upon the stockholders’ approval, according to the following percentages. a. Employee bonus - not less than 3% b. Directors and supervisors’ remuneration - not more than 2% c. Stock bonuses to employees include subsidiaries’ employees who meet certain criteria set by the
stockholders’ meetings.
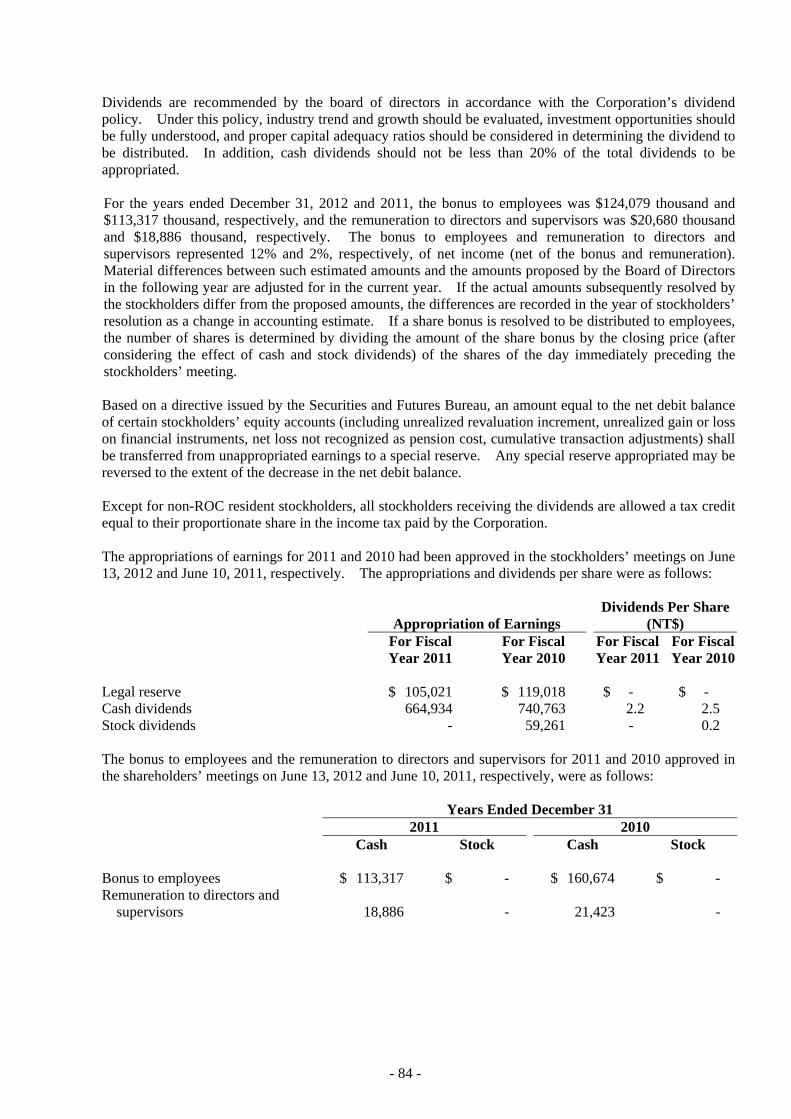
- 84 -
Dividends are recommended by the board of directors in accordance with the Corporation’s dividend policy. Under this policy, industry trend and growth should be evaluated, investment opportunities should be fully understood, and proper capital adequacy ratios should be considered in determining the dividend to be distributed. In addition, cash dividends should not be less than 20% of the total dividends to be appropriated. For the years ended December 31, 2012 and 2011, the bonus to employees was $124,079 thousand and $113,317 thousand, respectively, and the remuneration to directors and supervisors was $20,680 thousand and $18,886 thousand, respectively. The bonus to employees and remuneration to directors and supervisors represented 12% and 2%, respectively, of net income (net of the bonus and remuneration). Material differences between such estimated amounts and the amounts proposed by the Board of Directors in the following year are adjusted for in the current year. If the actual amounts subsequently resolved by the stockholders differ from the proposed amounts, the differences are recorded in the year of stockholders’ resolution as a change in accounting estimate. If a share bonus is resolved to be distributed to employees, the number of shares is determined by dividing the amount of the share bonus by the closing price (after considering the effect of cash and stock dividends) of the shares of the day immediately preceding the stockholders’ meeting. Based on a directive issued by the Securities and Futures Bureau, an amount equal to the net debit balance of certain stockholders’ equity accounts (including unrealized revaluation increment, unrealized gain or loss on financial instruments, net loss not recognized as pension cost, cumulative transaction adjustments) shall be transferred from unappropriated earnings to a special reserve. Any special reserve appropriated may be reversed to the extent of the decrease in the net debit balance. Except for non-ROC resident stockholders, all stockholders receiving the dividends are allowed a tax credit equal to their proportionate share in the income tax paid by the Corporation. The appropriations of earnings for 2011 and 2010 had been approved in the stockholders’ meetings on June 13, 2012 and June 10, 2011, respectively. The appropriations and dividends per share were as follows:
Appropriation of Earnings Dividends Per Share
(NT$) For Fiscal For Fiscal For Fiscal For Fiscal Year 2011 Year 2010 Year 2011 Year 2010 Legal reserve $ 105,021 $ 119,018 $ - $ - Cash dividends 664,934 740,763 2.2 2.5 Stock dividends - 59,261 - 0.2 The bonus to employees and the remuneration to directors and supervisors for 2011 and 2010 approved in the shareholders’ meetings on June 13, 2012 and June 10, 2011, respectively, were as follows: Years Ended December 31 2011 2010 Cash Stock Cash Stock Bonus to employees $ 113,317 $ - $ 160,674 $ - Remuneration to directors and
supervisors 18,886 - 21,423 -

- 85 -
Years Ended December 31 2011 2010
Bonus to
Employees
Remuneration to Directors
and Supervisors
Bonus to Employees
Remuneration to Directors
and Supervisors
Amounts approved in shareholders’
meetings
$ 113,317 $ 18,886 $ 160,674 $ 21,423 Amounts recognized in respective
financial statements
113,317 18,886 160,674 21,423 $ - $ - $ - $ - There are no differences between the approved amounts of the bonus to employees and the remuneration to directors and supervisors and the accrual amounts reflected in the financial statements for the year ended December 31, 2011 and 2010. Information on the bonus to employees, directors and supervisors is available on the Market Observation Post System website of the Taiwan Stock Exchange.
19. TREASURY STOCK
(Shares in Thousands)
Purpose of Treasury Stock
Number of Shares,
Beginning of Year
Addition During the
Year
Reduction During the
Year
Number of Shares, End of Year
Year ended December 31, 2012: None Year ended December 31, 2011 For transfer to employees 3,000 - (3,000) -
Under the Securities and Exchange Act, the Corporation shall neither pledge treasury stock nor exercise stockholders’ rights on these shares, such as rights to dividends and to vote.
20. INCOME TAX
A reconciliation of income tax expense based on income before income tax at the statutory rate and income tax expense was as follows:
Years Ended December 31 2012 2011 Income tax expense at the statutory rate $ 213,979 $ 197,045 Tax effect on adjusting items:
Permanent differences (61,983) (60,361) Temporary differences 3,659 (7,400) Tax-exempt income for five years (57,373) (41,590)
(Continued)

- 86 -
Years Ended December 31 2012 2011 Additional 10% income tax on unappropriated earnings $ 28,026 $ 27,114 Investment tax credits used (63,154) (57,404) Current income tax expense 63,154 57,404 Deferred income tax expenses (benefit)
Temporary difference (14,877) 9,831 Investment tax credits 63,154 43,428 Effect of law changes on deferred income tax - -
Adjustment for prior years’ tax (1,614) (1,691) $ 109,817 $ 108,972
(Concluded)
Deferred income tax assets (liabilities) were as follows:
2012 2011 Current
Deferred income tax assets Unrealized allowance for loss on inventories $ 5,527 $ 5,431Unrealized exchange losses 2,051 250Unrealized valuation loss on financial instrument 4,423 1,319Others 220 - 12,221 7,000
Less: Valuation allowance - - 12,221 7,000
Deferred income tax liabilities Unrealized exchange gain (6,524) (5,386)
$ 5,697 $ 1,614 Noncurrent
Deferred income tax assets Accrued pension cost $ 517 $ 940Impairment loss - 3,312Investment tax credits 25,045 73,457Others - 213
25,562 77,922Less: Valuation allowance - - 25,562 77,922Deferred income tax liabilities
Investment income recognized on overseas equity-method investments (124,436) (124,436)
$ (98,874) $ (46,514)

- 87 -
As of December 31, 2012, investment tax credits comprised of:
Laws and Statutes Tax Credit Source
Total Creditable
Amount
Remaining Creditable
Amount Expiry Year
Statute for Upgrading
Industries Purchase of machinery and
equipment $ 62,163 $ 25,045 2014-2016
Research and development expenditures
40,300
-
-
$ 102,463 $ 25,045
As of December 31, 2012, profits attributable to the following expansion and construction projects were exempted from income tax for five years:
Expansion and Construction Project Tax-exempt
Year Acquisition of equipment in 2005 2010 to 2014 Acquisition of equipment in 2009 2014 to 2018
The Corporation’s income tax returns through 2007 have been examined and approved by the tax authorities. Information about integrated income tax was as follows:
December 31 2012 2011 Balance of ICA $ 67,545 $ 57,779
2012
(Estimate) 2011
(Actual) The creditable ratio for distribution 5.73% 5.98%
December 31 2012 2011 Unappropriated earnings generated before January 1, 1998 $ - $ - Unappropriated earnings generated on and after January 1, 1998 2,279,958 1,901,027 $ 2,279,958 $ 1,901,027 For distribution of earnings generated after January 1, 1998, the ratio for the imputation credits allocated to stockholders of the Corporation is based on the balance of the ICA as of the date of dividend distribution. The expected creditable ratio for the 2012 earnings may be adjusted, depending on the ICA balance on the date of dividend distribution.

- 88 -
21. PERSONNEL, DEPRECIATION AND AMORTIZATION EXPENSES
Function
Expense Item
Years Ended December 31 2012 2011
Classified as Operating
Costs
Classified as Operating Expenses
Total Classified as Operating
Costs
Classified as Operating Expenses
Total
Personnel Salary $ 426,933 $ 299,765 $ 726,698 $ 419,954 $ 320,276 $ 740,230 Pension 16,910 11,015 27,925 16,664 15,809 32,473 Insurance 32,898 16,277 49,175 32,094 17,318 49,412 Others - - - - - -
Depreciation 402,473 86,235 488,708 458,917 102,304 561,221 Amortization 958 11,739 12,697 238 22,581 22,819
22. EARNINGS PER SHARE (EPS)
Years Ended December 31 2012 2011 Before
Tax After Tax Before
Tax After Tax Basic earnings per share (NT$)
From continuing operations $ 4.15 $ 3.79 $ 3.84 $ 3.48 Income for the year $ 4.15 $ 3.79 $ 3.84 $ 3.48
Diluted earnings per share (NT$) From continuing operations $ 3.93 $ 3.58 $ 3.64 $ 3.29 Income for the year $ 3.93 $ 3.58 $ 3.64 $ 3.29
The numerators and denominators used in calculating basic and diluted EPS were as follows:
EPS (NT$) Amounts (Numerator) Shares Before After
Before
Income TaxAfter
Income Tax(Denominator) (In Thousands)
Income Tax
Income Tax
Year ended December 31, 2012 Net income $ 1,258,703 $ 1,148,886 Basic EPS (NT$)
Income for the year attributable to common stockholders $ 1,258,703 $ 1,148,886 303,070 $ 4.15 $ 3.79
Effect of dilutive potential common stock Employee stock option - - 514 Convertible bonds 9,871 8,193 16,589 Bonus to employees - - 2,595
Diluted EPS
Income for the year attributable to common stockholders plus effect of potential dilutive common stock $ 1,268,574 $ 1,157,079 322,768 $ 3.93 $ 3.58
(Continued)

- 89 -
EPS (NT$) Amounts (Numerator) Shares Before After
Before
Income TaxAfter
Income Tax(Denominator) (In Thousands)
Income Tax
Income Tax
Year ended December 31, 2011 Net income $ 1,159,188 $ 1,050,216 Basic EPS (NT$)
Income for the year attributable to common stockholders $ 1,159,188 $ 1,050,216 301,703 $ 3.84 $ 3.48
Effect of dilutive potential common stock Employee stock option - - 489 Convertible bonds 9,777 8,115 15,867 Bonus to employees - - 3,266
Diluted EPS
Income for the year attributable to common stockholders plus effect of potential dilutive common stock $ 1,168,965 $ 1,058,331 321,325 $ 3.64 $ 3.29
(Concluded) The ARDF issued Interpretation 2007-052 that requires companies to recognize bonuses paid to employees, directors and supervisors as compensation expenses beginning January 1, 2008. These bonuses were previously recorded as appropriations from earnings. If the Corporation may settle the bonus to employees by cash or shares, the Corporation should presume that the entire amount of the bonus will be settled in shares and the resulting potential shares should be included in the weighted average number of shares outstanding used in the calculation of diluted EPS, if the shares have a dilutive effect. The number of shares is estimated by dividing the entire amount of the bonus by the closing price of the shares at the balance sheet date. Such dilutive effect of the potential shares should be included in the calculation of diluted EPS until the stockholders resolve the number of shares to be distributed to employees at their meeting in the following year.
23. FINANCIAL INSTRUMENTS
Fair values of financial instruments:
December 31 2012 2011
Carrying Amount
Fair Value
Carrying Amount
Fair Value
Financial assets
Financial assets at FVTPL, current $ - $ - $ 3,922 $ 3,922Available-for-sale financial assets,
current 46,895 46,895 71,867 71,867Financial assets carried at cost 253,242 - 245,445 - Financial liabilities Financial liabilities at FVTPL,
current 26,019 26,019 7,758 7,758Bonds payable 556,079 556,079 789,367 789,367Long-term debt (including current
portion) 1,886,438 1,886,438 1,314,188 1,314,188
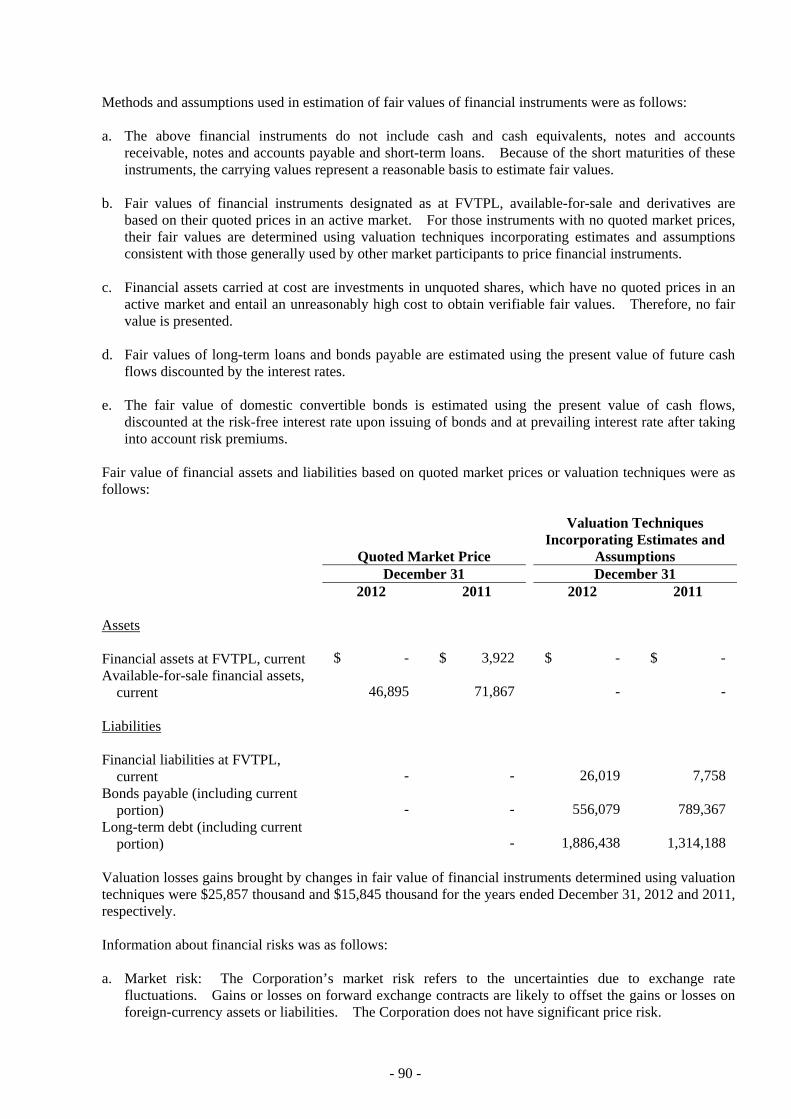
- 90 -
Methods and assumptions used in estimation of fair values of financial instruments were as follows:
a. The above financial instruments do not include cash and cash equivalents, notes and accounts receivable, notes and accounts payable and short-term loans. Because of the short maturities of these instruments, the carrying values represent a reasonable basis to estimate fair values.
b. Fair values of financial instruments designated as at FVTPL, available-for-sale and derivatives are
based on their quoted prices in an active market. For those instruments with no quoted market prices, their fair values are determined using valuation techniques incorporating estimates and assumptions consistent with those generally used by other market participants to price financial instruments.
c. Financial assets carried at cost are investments in unquoted shares, which have no quoted prices in an
active market and entail an unreasonably high cost to obtain verifiable fair values. Therefore, no fair value is presented.
d. Fair values of long-term loans and bonds payable are estimated using the present value of future cash
flows discounted by the interest rates.
e. The fair value of domestic convertible bonds is estimated using the present value of cash flows, discounted at the risk-free interest rate upon issuing of bonds and at prevailing interest rate after taking into account risk premiums.
Fair value of financial assets and liabilities based on quoted market prices or valuation techniques were as follows:
Quoted Market Price
Valuation Techniques Incorporating Estimates and
Assumptions December 31 December 31 2012 2011 2012 2011
Assets Financial assets at FVTPL, current $ - $ 3,922 $ - $ -Available-for-sale financial assets,
current 46,895 71,867 - - Liabilities Financial liabilities at FVTPL,
current - - 26,019 7,758Bonds payable (including current
portion) - - 556,079 789,367 Long-term debt (including current
portion) - 1,886,438 1,314,188 Valuation losses gains brought by changes in fair value of financial instruments determined using valuation techniques were $25,857 thousand and $15,845 thousand for the years ended December 31, 2012 and 2011, respectively. Information about financial risks was as follows: a. Market risk: The Corporation’s market risk refers to the uncertainties due to exchange rate
fluctuations. Gains or losses on forward exchange contracts are likely to offset the gains or losses on foreign-currency assets or liabilities. The Corporation does not have significant price risk.

- 91 -
b. Credit risk: Credit risk represents the potential loss that would be incurred by the Corporation if the counterparties breached contracts. The counterparties to the foregoing financial instruments are reputable financial institutions and business organizations. Management does not expect the Corporation’s exposure to default by those parties to be material.
c. Liquidity risk: The Corporation’s operating funds are deemed sufficient to meet the cash flow
demand; therefore, liquidity risk is not considered to be significant. d. Cash flow interest rate risk: The Corporation’s short term and long term loans are floating-rate loans.
When the market interest rate increases by one percentage point, the Corporation’s cash outflow will increase by $20,218 thousand a year.
24. RELATED-PARTY TRANSACTIONS
Related parties and their relationships with the Corporation:
Related Party Relationship with the Corporation Tai-Shing Electronics Components Corporation (Tai-Shing) Chairman is the Corporation’s general
manager TXC Technology Inc. Equity-method investee TXC Japan Corporation Equity-method investee Taiwan Crystal Technology International Ltd. (TCTI) Equity-method investee Growing Profits Trading Ltd. (GPT) Subsidiary’s equity-method investee TXC (Ningbo) Corporation (NGB) Subsidiary’s equity-method investee TXC (Chongging) Corporation (CKG) Subsidiary’s equity-method investee TXC (HK) Limited (TXC HK) Subsidiary’s equity-method investee TSE Technology (Ningbo) Co., Ltd. (TSE Technology) Subsidiary’s equity-method investee Ningbo Jingyu Company Limited (Ningbo Jingyu) Subsidiary’s equity-method investee
Significant transactions with related parties:
Sales
Years Ended December 31 2012 2011
Related Party Amount
% to TotalAccountBalance Amount
% to TotalAccountBalance
NGB $ 198,436 2 $ 130,241 1 Tai-Shing 31,563 - 25,474 - TXC Technology Inc. 2,792 - 1,080 - TXC Japan Corporation 1,651 - 7,721 - CKG 858 - - -TXC HK - - 120 - $ 235,300 2 $ 164,636 1

- 92 -
Purchases
Years Ended December 31 2012 2011
Related Party Amount
% to TotalAccountBalance Amount
% to TotalAccountBalance
NGB $ 2,417,255 34 $ 2,309,451 39 GPT 105,376 1 35,809 1 TXC Japan Corporation 12,888 - 12,973 - Tai-Shing 27 - 9 - Ningbo Jingyu 23,982 - - - TSE Technology 248 - 183 - $ 2,559,776 35 $ 2,358,425 40
Consulting Fee
Years Ended December 31 2012 2011
Related Party Amount
% to TotalAccountBalance Amount
% to TotalAccountBalance
TXC Technology Inc. $ 50,578 50 $ 45,307 47 TXC Japan Corporation 51,854 50 50,523 53 $ 102,432 100 $ 95,830 100
Other Expenses
Years Ended December 31 2012 2011
Related Party Amount
% to TotalAccountBalance Amount
% to TotalAccountBalance
Tai-Shing $ 3,128 - $ 1,972 - TXC Technology Inc. 405 - 64 - TXC Japan Corporation 79 - 155 - $ 3,612 - $ 2,191 -
In 2012 and 2011, the selling price and purchasing price were not significantly different from those with third parties, except those for NGB, GPT, CKG, Ningbo Jingyu and TXC HK whose trading price depends on its function within the group. Consulting fee was paid to related parties for agency service.

- 93 -
Receivable from and Payable to Related Parties
December 31 2012 2011
Item Related Party Amount
% to Total AccountBalance Amount
% to TotalAccountBalance
Accounts receivable NGB $ 42,870 1 $ 41,314 2 Tai-Shing 10,551 - 6,183 - TXC Technology Inc. 517 - 115 - CKG 857 - - - TXC Japan Corporation - - 474 - $ 54,795 1 $ 48,086 2 Notes payable Tai-Shing $ - - $ 285 - Accounts payable NGB $ 688,074 47 $ 576,326 46 Ningbo Jingyu 1,086 - Tai-Shing 2,054 - - - TXC Japan Corporation 1,732 - - - GPT 34,524 2 19,528 1 $ 727,470 49 $ 595,854 47 Other payable Tai-Shing $ 12 - $ - - TXC Japan Corporation 74 - - - $ 86 - $ - - The collection term and payment term to related parties were not significantly different from third parties. Other Receivables
December 31 2012 2011
Related Party Amount
% to TotalAccountBalance Amount
% to TotalAccountBalance
NGB $ 33,069 54 $ 50,869 57 As of December 31, 2012 and 2011, other receivables were that the Corporation purchase machinery and equipment for NGB. Property Transactions Year ended December 31, 2012 The Corporation sold machinery with a net book value of $26,550 thousand for $26,550 thousand to NGB. The Corporation purchased computer from Tai-Shing for $692 thousand.

- 94 -
Year ended December 31, 2011 The Corporation sold machinery with a net book value of $3,166 thousand for $3,166 thousand to NGB. The Corporation purchased machinery from NGB for $727 thousand. The Corporation purchased computer from Tai-Shing for $564 thousand. Compensation of Directors, Supervisors and Management Personnel Years Ended December 31 2012 2011 Salaries $ 12,170 $ 10,507 Incentives and special compensation 7,511 2,150 Professional fee 1,440 1,440 Bonus 25,880 26,886 $ 47,001 $ 40,983
25. MORTGAGED OR PLEDGED ASSETS
December 31 2012 2011
Property, plant and equipment
Land $ 573,770 $ 573,770 Buildings, net 1,193,664 1,236,306
$ 1,767,434 $ 1,810,076
26. SIGNIFICANT COMMITMENTS AND CONTINGENCIES
As of December 31, 2012, unused letters of credit amounted to approximately JPY189,462 thousand and EUR99 thousand. As of December 31, 2012, the Corporation’s commitments were as follows:
Commitment
Total Dollars Amount of Contract Dollars Paid Dollars Unpaid
Mechanical and electrical engineering $ 96,131 $ 55,456 $ 40,675
27. SUBSEQUENT EVENTS
For acquisition of property, plant and equipment and repayment of loans, on January 7, 2013, the Corporation issued fourth unsecured domestic convertible bonds with an aggregate value of $800,000 thousand.

- 95 -
28. SEGMENT, GEOGRAPHIC AREA, EXPORT SALES AND MAJOR CUSTOMER INFORMATION
The Corporation has provided the operating segment financial information in consolidated financial statements.
29. EXCHANGE RATE INFORMATION OF FOREIGN-CURRENCY FINANCIAL ASSETS AND LIABILITIES
Significant foreign-currency financial asset and liabilities were as follows: December 31 2012 2011
Foreign
Currencies Exchange
Rate New Taiwan
Dollars Foreign
Currencies Exchange
Rate New Taiwan
Dollars Financial assets Monetary items
USD $ 119,729 29.136 $ 3,488,436 $ 99,906 30.29 $ 3,024,885JPY 148,631 0.3375 50,163 287,359 0.3905 112,214
Investment accounted for by entity method
USD 129,352 29.136 3,768,813 110,337 30.29 3,342,096JPY 34,125 0.3375 11,517 38,062 0.3905 14,863
Financial liabilities Monetary items
USD 39,464 29.136 1,149,819 35,481 30.29 1,074,712JPY 1,176,234 0.3375 396,979 1,395,595 0.3905 544,980
30. ADDITIONAL DISCLOSURES
Following are the additional disclosures required by the SFB for the Corporation and its investees: a. Financing provided: None. b. Endorsement/guarantee provided: None. c. Marketable securities held: Tables 1 and 5 (attached). d. Marketable securities acquired and disposed of at costs or prices of at least $100 million or 20% of the
paid-in capital: Tables 2 and 6 (attached). e. Acquisition of individual real estate at costs of at least $100 million or 20% of the paid-in capital:
Table 7 (attached). f. Disposal of individual real estate at prices of at least $100 million or 20% of the paid-in capital: None. g. Total purchases from or sales to related parties of at least $100 million or 20% of the paid-in capital:
Tables 3 and 8 (attached). h. Receivables from related parties amounting to at least NT$100 million or 20% of the paid-in capital:
Table 9 (attached). i. Names, locations, and related information of investees on which the Corporation exercises significant
influence: Table 4 (attached).

- 96 -
j. Derivative transactions: Please refer to Note 5 and Table 10 (attached). k. Information on investment in Mainland China: Table 11 (attached).
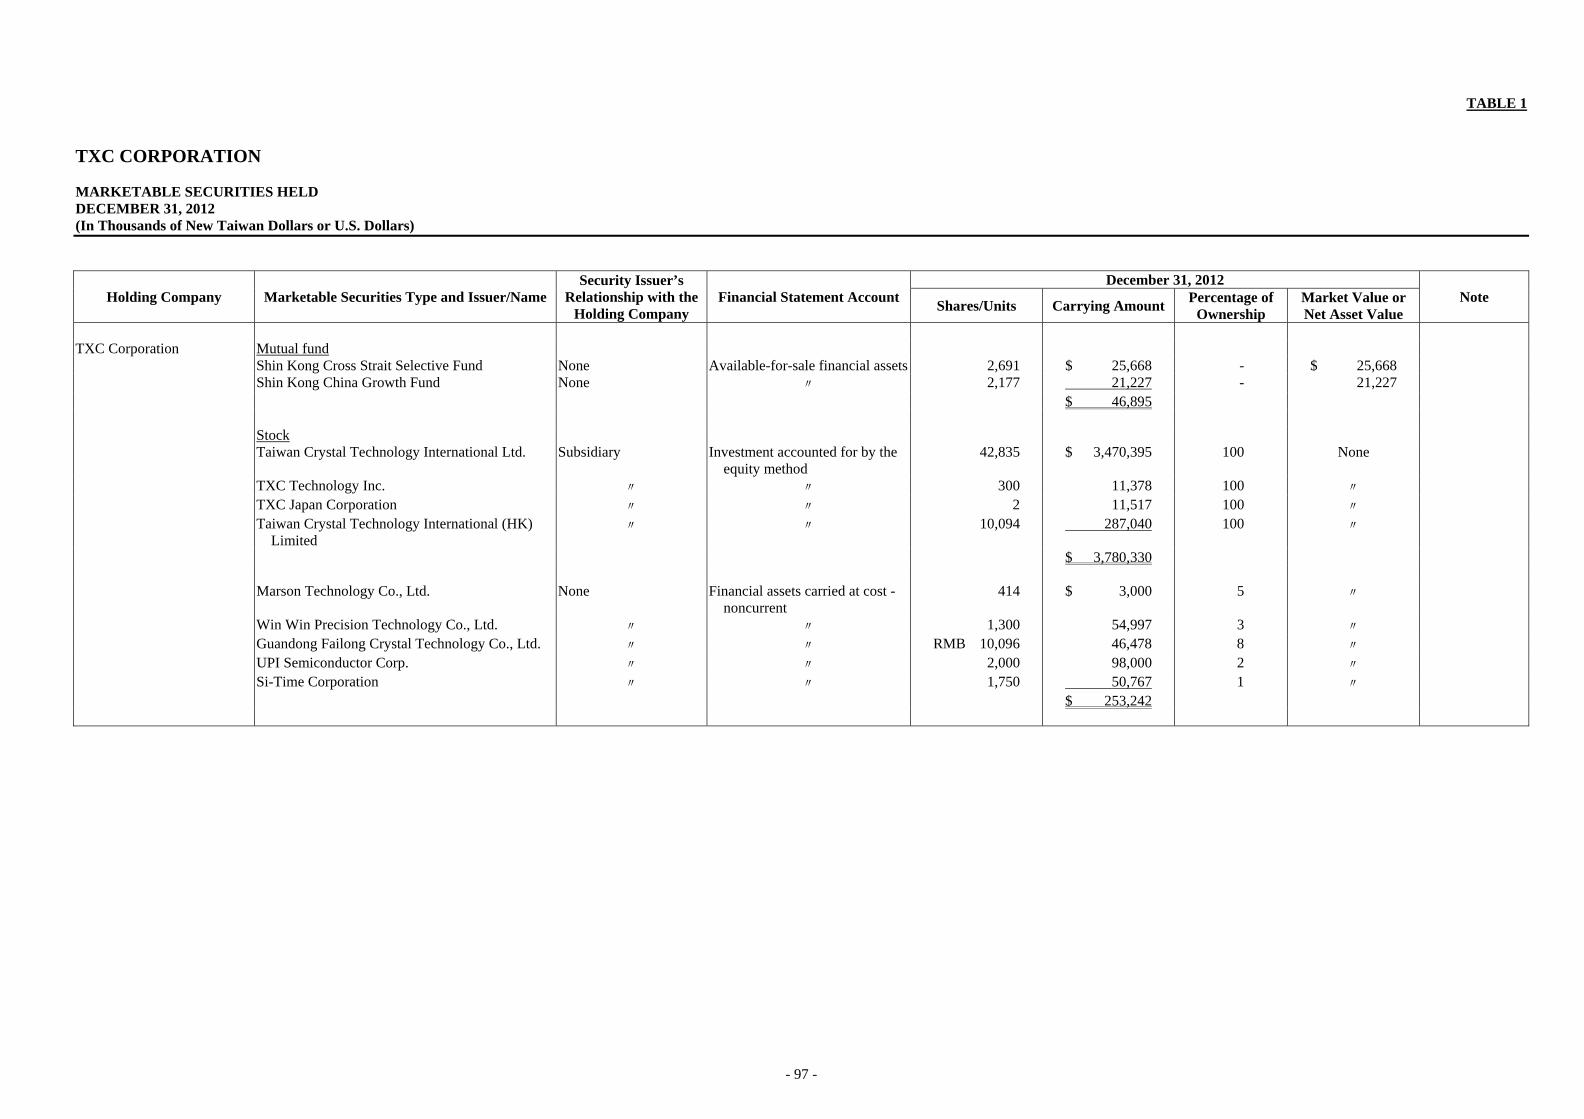
- 97 -
TABLE 1
TXC CORPORATION MARKETABLE SECURITIES HELD DECEMBER 31, 2012 (In Thousands of New Taiwan Dollars or U.S. Dollars)
Holding Company Marketable Securities Type and Issuer/Name Security Issuer’s
Relationship with the Holding Company
Financial Statement AccountDecember 31, 2012
Note Shares/Units Carrying Amount
Percentage of Ownership
Market Value or Net Asset Value
TXC Corporation Mutual fund Shin Kong Cross Strait Selective Fund None Available-for-sale financial assets 2,691 $ 25,668 - $ 25,668 Shin Kong China Growth Fund None 〃 2,177 21,227 - 21,227 $ 46,895 Stock Taiwan Crystal Technology International Ltd. Subsidiary Investment accounted for by the
equity method 42,835 $ 3,470,395 100 None
TXC Technology Inc. 〃 〃 300 11,378 100 〃 TXC Japan Corporation 〃 〃 2 11,517 100 〃 Taiwan Crystal Technology International (HK)
Limited 〃 〃 10,094 287,040 100 〃
$ 3,780,330 Marson Technology Co., Ltd. None Financial assets carried at cost -
noncurrent 414 $ 3,000 5 〃
Win Win Precision Technology Co., Ltd. 〃 〃 1,300 54,997 3 〃 Guandong Failong Crystal Technology Co., Ltd. 〃 〃 RMB 10,096 46,478 8 〃 UPI Semiconductor Corp. 〃 〃 2,000 98,000 2 〃 Si-Time Corporation 〃 〃 1,750 50,767 1 〃 $ 253,242
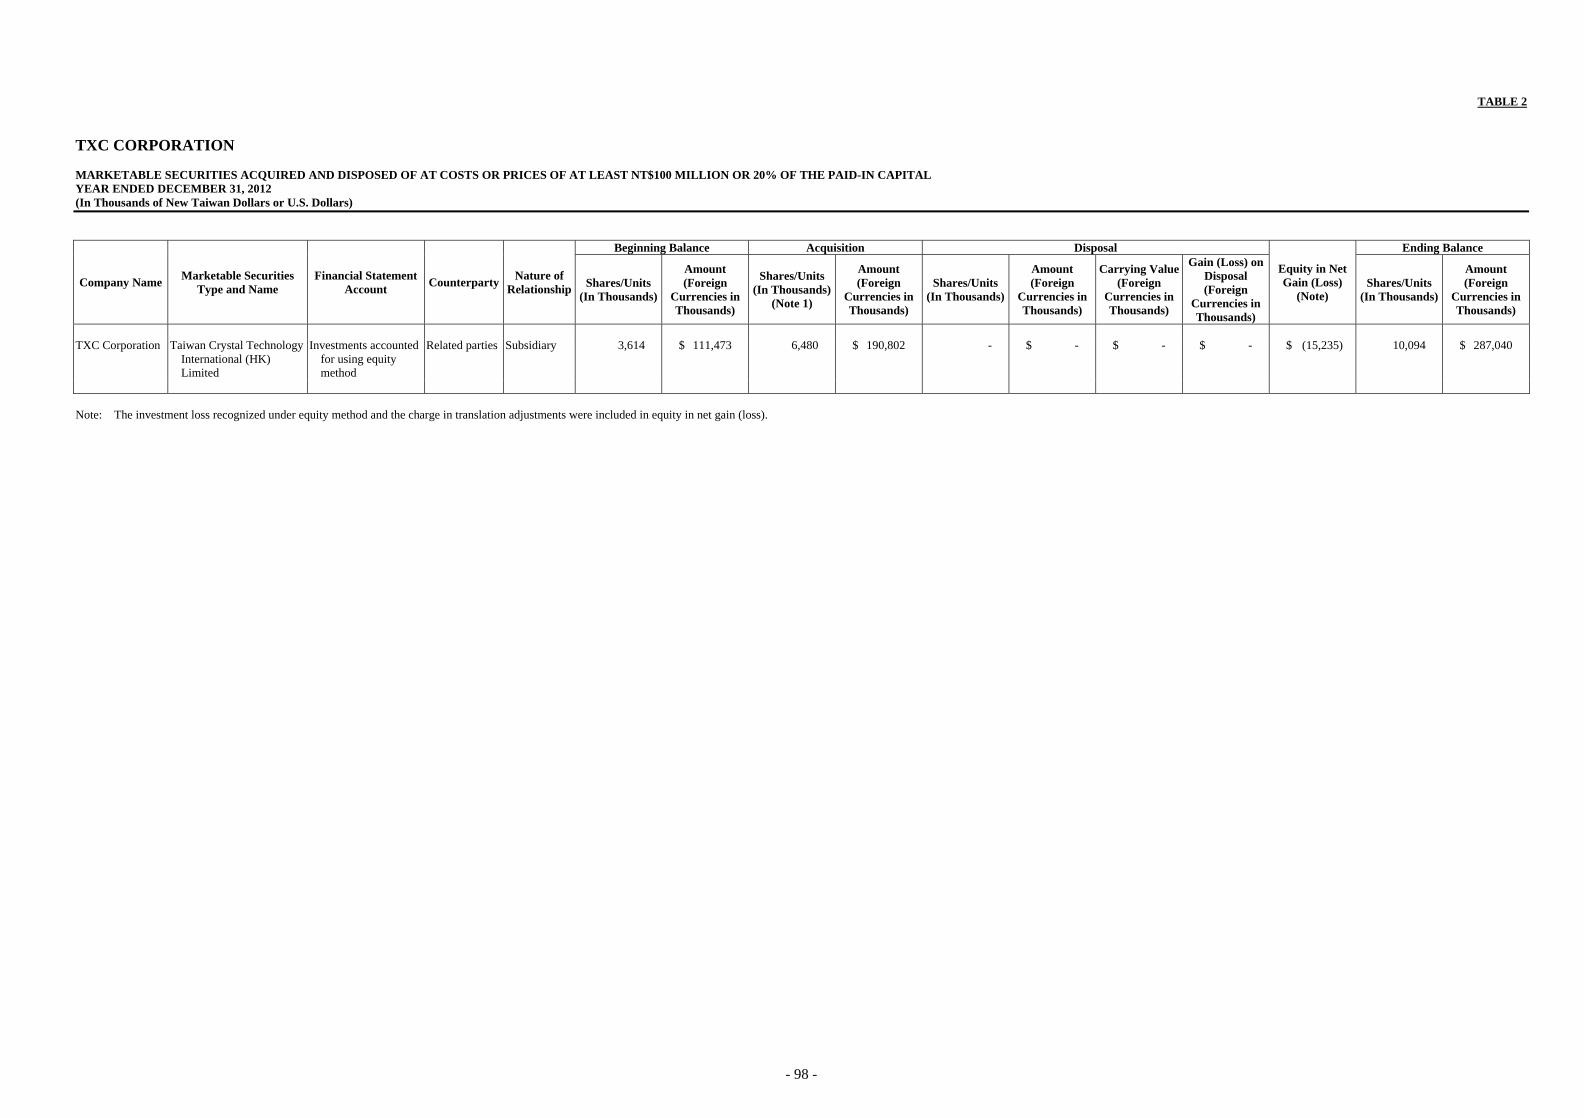
- 98 -
TABLE 2
TXC CORPORATION MARKETABLE SECURITIES ACQUIRED AND DISPOSED OF AT COSTS OR PRICES OF AT LEAST NT$100 MILLION OR 20% OF THE PAID-IN CAPITAL YEAR ENDED DECEMBER 31, 2012 (In Thousands of New Taiwan Dollars or U.S. Dollars)
Company Name Marketable Securities
Type and Name Financial Statement
Account Counterparty
Nature of Relationship
Beginning Balance Acquisition Disposal
Equity in Net Gain (Loss)
(Note)
Ending Balance
Shares/Units (In Thousands)
Amount (Foreign
Currencies in Thousands)
Shares/Units(In Thousands)
(Note 1)
Amount (Foreign
Currencies in Thousands)
Shares/Units(In Thousands)
Amount (Foreign
Currencies in Thousands)
Carrying Value (Foreign
Currencies in Thousands)
Gain (Loss) on Disposal (Foreign
Currencies in Thousands)
Shares/Units(In Thousands)
Amount (Foreign
Currencies in Thousands)
TXC Corporation Taiwan Crystal Technology
International (HK) Limited
Investments accounted for using equity method
Related parties Subsidiary 3,614 $ 111,473 6,480 $ 190,802 - $ - $ - $ - $ (15,235) 10,094 $ 287,040
Note: The investment loss recognized under equity method and the charge in translation adjustments were included in equity in net gain (loss).

- 99 -
TABLE 3
TXC CORPORATION TOTAL PURCHASES FROM OR SALES TO RELATED PARTIES OF AT LEAST NT$100 MILLION OR 20% OF THE PAID-IN CAPITAL YEAR ENDED DECEMBER 31, 2012 (In Thousands of New Taiwan Dollars or U.S. Dollars)
Company Name Related Party Nature of Relationship Transaction Details Abnormal Transaction
Notes/Accounts Payable or Receivable
Note Purchase/
Sale Amount
% to Total
Payment Terms (Note)
Unit Price Payment Terms Ending Balance% to Total
TXC Corporation TXC (Ningbo) Corporation Subsidiary Purchase $ 2,417,255 34 Note Its trading price depends on
its function within the group.
- $ (688,074) (47)
TXC (Ningbo) Corporation Subsidiary Sales 198,436 2 〃 〃 - 42,870 1 Growing Profit Trading Ltd. Subsidiary Purchase 105,376 1 〃 〃 - (34,524) (2) Note: The terms of purchases from related parties were not significantly different from those with third parties.

- 100 -
TABLE 4
TXC CORPORATION NAMES, LOCATIONS, AND RELATED INFORMATION OF INVESTEES ON WHICH THE COMPANY EXERCISES SIGNIFICANT INFLUENCE DECEMBER 31, 2012 (In Thousands of New Taiwan Dollars or U.S. Dollars)
Investor Company Investee Company Location Main Businesses and Products Original Investment Amount Balance as of December 31, 2012 Net Income
(Losses) of the Investee
Equity in the Earnings (Losses)
Note December 31, 2012
December 31, 2011
Shares (In Thousands)
Percentage of Ownership
Carrying Value
TXC Corporation Taiwan Crystal Technology International
Ltd. WESTERN SAMOA Investment $ 1,390,461
(US$ 42,835 ) $ 1,390,461 (US$ 42,835 )
42,835 100 $ 3,470,395 $ 378,203 $ 373,818 Difference from upstream transactions $4,385 thousand
TXC Technology Inc. U.S.A. Marketing activities 9,879 (US$ 300 )
9,879 (US$ 300 )
300 100 11,378 (1,082 ) (1,082 )
TXC Japan Corporation Japan Marketing activities 6,172 (JPY 21,000 )
6,172 (JPY 21,000 )
2 100 11,517 (1,449 ) (1,449 )
Taiwan Crystal Technology International (HK) Limited
Hong Kong Investment 298,776 (US$ 10,094 )
107,974 (US$ 3,614 )
10,094 100 287,040 (11,895 ) (11,895 )
Taiwan Crystal Technology
International Ltd. Growing Profit Trading Ltd. B.V.I. International trading 1,691
(US$ 50 ) 1,691 (US$ 50 )
50 100 193,578 (US$ 6,644 )
76,155 (US$ 2,575 )
76,155 (US$ 2,575 )
TXC (Ningbo) Corporation Ningbo Manufacture and sales of electronics products 1,487,211 (US$ 45,835 )
1,487,211 (US$ 45,835 )
US$ 45,835 100 3,310,471 (US$ 113,621 )
301,975 (US$ 10,211 )
301,975 (US$ 10,211 )
TXC (Ningbo) Corporation TXC (HK) Limited Hong Kong International trading 846
(HK$ 200 ) 846 (HK$ 200 )
HK$ 200 100 11,675 (RMB 2,519 )
127 (RMB 27 )
127 (RMB 27 )
TXC (Chongqing) Corporation Chongqing Manufacture and sales of electronics products 201,823 (RMB 42,710 )
48,072 (RMB 10,000 )
RMB 42,710 100 189,820 (RMB 40,954 )
(19,285 ) (RMB -4,116 )
(7,714 ) (RMB -1,647 )
Chongqing All Sun Company Limited Chongqing Market activities 321,644 (RMB 66,00 )
38,458 (RMB 8,000 )
RMB 66,000 40 305,423 (RMB 65,895 )
55 (RMB 12 )
55 (RMB 12 )
Ningbo Jingyu Company Limited Ningbo International trading 4,807 (RMB 1,000 )
4,807 (RMB 1,000 )
RMB 1,000 100 6,426 (RMB 1,386 )
1,849 (RMB 395 )
1,849 (RMB 395 )
Taiwan Crystal Technology
International (HK) Limited TXC (Chongqing) Limited Chongqing Manufacture and sales of electronics products 298,362
(US$ 10,080 ) 107,560 (US$ 3,600 )
US$ 10,080 60 287,040 (US$ 9,853 )
(19,285 ) (RMB -4,116 )
(11,571 ) (RMB -2,469 )
TXC Europe SRL Europe Market activities 414 (EUR 10 )
414 (EUR 10 )
EUR 10 100 - (US$ - )
(407 ) (US$ -14 )
(407 ) (US$ -14 )
Note
Note: TXC Europe SRL applied for cancellation of registration in 2012. As of December 31, 2012, it has not yet received the approval from the government.

- 101 -
TABLE 5
TXC CORPORATION MARKETABLE SECURITIES HELD FOR ITS INVESTEES DECEMBER 31, 2012 (In Thousands of New Taiwan Dollars or U.S. Dollars)
Holding Company Marketable Securities Type and
Issuer/Name
Security Issuer’s Relationship with the
Holding Company Financial Statement Account
December 31, 2012 Note
Shares/Units Carrying AmountPercentage of
Ownership Market Value or Net Asset Value
Taiwan Crystal Technology Stock International Ltd. Growing Profit Trading Ltd. Subsidiary Investment accounted for by the
equity method US$ 50 $ 193,578
(US$ 6,644) 100 None
TXC (Ningbo) Corporation 〃 〃 US$ 45,835 3,310,471 (US$ 113,621)
100 〃
TXC (Ningbo) Corporation TXC (HK) Limited 〃 〃 HK$ 200 11,675
(RMB 2,519) 100 〃
TSE Technology (Ninbo) Co., Ltd. 〃 〃 RMB 6,828 45,950 (RMB 9,831)
23 〃
TXC (Chongqing) Corporation 〃 〃 RMB 42,710 189,820 (RMB 40,954)
40 〃
Chongqing All Sun Co., Ltd. 〃 〃 RMB 66,000 305,423 (RMB 65,895)
100 〃
Ningbo Jingyu Company Limited 〃 〃 RMB 1,000 6,426 (RMB 1,386)
100 〃
Taiwan Crystal Technology
International (HK) Limited TXC (Chongqing) Corporation 〃 〃 US$ 10,080 287,040
(US$ 9,853) 60 〃
TXC Europe SRL EUR 10 - - 〃

- 102 -
TABLE 6
TXC CORPORATION MARKETABLE SECURITIES ACQUIRED AND DISPOSED OF AT COSTS OR PRICES OF AT LEAST NT$100 MILLION OR 20% OF THE PAID-IN CAPITAL FOR ITS INVESTEES YEAR ENDED DECEMBER 31, 2012 (In Thousands of New Taiwan Dollars or U.S. Dollars)
Company Name Marketable Securities
Type and Name Financial Statement
Account Counterparty
Nature of Relationship
Beginning Balance Acquisition Disposal
Equity in Net Gain (Loss)
(Note)
Ending Balance
Shares/Units (In Thousands)
Amount (Foreign
Currencies in Thousands)
Shares/Units(In Thousands)
(Note 1)
Amount (Foreign
Currencies in Thousands)
Shares/Units(In Thousands)
Amount (Foreign
Currencies in Thousands)
Carrying Value (Foreign
Currencies in Thousands)
Gain (Loss) on Disposal (Foreign
Currencies in Thousands)
Shares/Units(In Thousands)
Amount (Foreign
Currencies in Thousands)
TXC (Ningbo)
Corporation TXC (Chongqing)
Corporation Investments accounted
for using equity method
Related parties Subsidiary - $ 47,545 - $ 153,751 - $ - $ - $ - $ (11,476) - $ 189,820
Taiwan Crystal
Technology International (HK) Limited
TXC (Chongqing) Corporation
Investments accounted for using equity method
〃 Subsidiary - 111,056 - 190,802 - - - - (14,818) - 287,040
TXC (Ningbo)
Corporation Chongqing All Sun
Company Limited Investments accounted
for using equity method
〃 Subsidiary - 37,896 - 274,186 - - - - (6,659) - 305,423
Note: The investment loss recognized under equity method and the charge in translation adjustments were included in equity in net gain (loss).

- 103 -
TABLE 7
TXC CORPORATION AND SUBSIDIARIES ACQUISITION OF INDIVIDUAL REAL ESTATE AT COSTS OF AT LEAST $100 MILLION OR 20% OF THE PAID-IN CAPITAL YEAR ENDED DECEMBER 31, 2011 (In Thousands of New Taiwan Dollars)
Company Name
Types of Property Transaction Date Transaction
Amount Payment Term Counterparty
Nature of Relationship
Prior Transaction of Related Counterparty Price Reference
Purpose of Acquisition
Other TermsOwner Relationship
Transfer Date
Amount
Chongqing All
Sun Company Limited
Land June 2012 - July 2012
$ 200,435 Normal Chongqing Government
None - - - $ - Bargain by buyer and seller
Real estate development and sell
-

- 104 -
TABLE 8
TXC CORPORATION TOTAL PURCHASES FROM OR SALES TO RELATED PARTIES OF AT LEAST NT$100 MILLION OR 20% OF THE PAID-IN CAPITAL FOR ITS INVESTEES YEAR ENDED DECEMBER 31, 2012 (In Thousands of New Taiwan Dollars or U.S. Dollars)
Company Name Related Party Nature of Relationship Transaction Details Abnormal Transaction
Notes/Accounts Payable or Receivable
Note Purchase/
Sale Amount
% to Total
Payment Terms (Note)
Unit Price Payment Terms Ending Balance% to Total
TXC (Ningbo)
Corporation Growing Profits Trading
Ltd. Subsidiary Purchase $ 447,973 26 Note Its trading price depends on
its function within the group
Note $ (119,024) (23)
Note: The terms of purchases from related parties were not significantly different from those with third parties.

- 105 -
TABLE 9
TXC CORPORATION RECEIVABLES FROM RELATED PARTIES AMOUNTING TO AT LEAST NT$100 MILLION OR 20% OF THE PAID-IN CAPITAL DECEMBER 31, 2012 (In Thousands of New Taiwan Dollars or U.S. Dollars)
Company Name Related Party Nature of Relationship Ending Balance Turnover RateOverdue Amounts Received
in Subsequent YearAllowance for
Bad Debts Amounts Action Taken TXC (Ningbo) Corporation TXC Corporation Ultimate parent $ 688,074 3.82 $ - - $ 487,562
(US$ 16,734) $ -
Growing Profits Trading Ltd. TXC (Ningbo) Corporation Subsidiary 119,024 4.28 - - 30,796
(US$ 1,057) -

- 106 -
TABLE 10
TXC CORPORATION DERIVATIVE TRANSACTIONS OF INVESTEES OVER WHICH THE CORPORATION HAS A CONTROLLING INTEREST DECEMBER 31, 2012 (In Thousands of New Taiwan Dollars or U.S. Dollars) NGB entered into derivative transactions during the year ended December 31, 2012 to manage exposures related to foreign exchange rate fluctuations. Outstanding forward contracts as of December 31, 2012:
Currency Maturity Contract Amount
(In Thousands) December 31, 2012 Sell USD/RMB 2013.01.30-2013.04.26 US$17,500/RMB110,115

- 107 -
TABLE 11
TXC CORPORATION INFORMATION ON INVESTMENT IN MAINLAND CHINA YEAR ENDED DECEMBER 31, 2012 (In Thousands of New Taiwan Dollars or U.S. Dollars) 1. Name of the investees in Mainland China, main businesses and products, paid-in capital, method of investment, information on inflow or outflow of capital, percentage of ownership, investment income or loss, ending balance of investment, dividends remitted by the
investee, and the limit of investment in Mainland China:
Investee Company Main Businesses and Products Total Amount of Paid-in Capital
Method of Investment
Accumulated Outflow of
Investment from Taiwan as of
January 1, 2012 (US$ in
Thousand)
Investment Flows Accumulated Outflow of
Investment from Taiwan as of December 31, 2012 (US$ in Thousand)
Percentage of Ownership
Investment Income (Loss)
Recognized (Note)
Carrying Amount
as of December 31,
2012
Accumulated Inward
Remittance of Earnings as ofDecember 31,
2012
Outflow Inflow
TXC (Ningbo) Corporation Manufacturing and sales of crystal
and crystal oscillator $ 1,487,211 (US$ 45,835)
Indirect investment of the Corporation in Mainland China through the Corporation’s subsidiary in a third region
$ 1,427,630 (US$ 44,000)
$ - $ - $ 1,427,630 (US$ 44,000)
100 $ 301,975 (US$ 10,211)
$ 3,310,471 (US$ 113,621)
$ 256,146 (US$ 7,897)
Guandong Failong Crystal
Technology Co., Ltd. Manufacturing and sales of new
electronic components 580,947 (RMB 126,194)
Direct investment of the Corporation in Mainland China
46,478 (RMB 10,096)
-
- 46,478 (RMB 10,096)
8 - 46,478 (RMB 10,096)
-
TSE Technology (Ningbo)
Co., Ltd. Manufacturing and sales of
electronic devices and hardware components
139,177 (RMB 29,723)
Other investment of the Corporation Mainland China
- -
- - 23 9,365 (RMB 1,999)
45,950 (RMB 9,831)
-
TXC (Chongqing)
Corporation Manufacturing and sales of
electronic devices and hardware components
500,185 (RMB 106,842)
Indirect investment of the Corporation in Mainland China through the Corporation’s subsidiary in a third region
107,560 (US$ 3,600)
190,802 (US$ 6,480)
- 298,362 (US$ 10,080)
100 (19,285) (RMB -4,116)
476,860 (RMB 102,364)
Chongqing All Suns
Company Limited Real estate intermediary service,
real estate management and electronic product wholesale
312,644 (RMB 66,000)
Other investment of the Corporation Mainland China
- - - - 100 55 (RMB 12)
305,423 (RMB 65,895)
Ningbo Jingyu Company
Limited Purchasing and selling electronic
component 4,807 (RMB 1,000)
Other investment of the Corporation Mainland China
- - - - 100 1,849 (RMB 395)
6,426 (RMB 1,386)
(Continued)

- 108 -
Accumulated Investment in Mainland China
as of December 31, 2012 (US$ in Thousand)
Investment Amounts Authorized by Investment Commission, MOEA
(US$ in Thousand) Upper Limit on Investment
$ 1,772,470 (US$ 55,560)
$ 1,832,878 (US$ 57,395)
$ 4,728,297 (Note)
Note: The investment in Mainland China is limited to 60% of stockholders’ equity or consolidated stockholders’ equity whichever is higher. 2. Significant direct or indirect transactions with the investees, prices and terms of payment, unrealized gain or loss:
Company Name Related arty Nature of Relationship Transaction Details Accounts/Notes Receivable/Payable
Unrealized Gain or Loss Purchase/Sale Price Payment Term
Compared with Terms of Third Parties
Balance %
TXC Corporation NGB Subsidiary Purchase $2,417,255 Its trading price depends on
its function within the group
Similar with third parties
Its trading price depends on its function within the group
$ (688,074) (47) $ 33,877
Sale 198,436 〃 Similar with third parties
〃 42,870 1 -
GPT NGB Subsidiary Sale 447,973 〃 Similar with third
parties 〃 119,024 26 -
3. Endorsements guarantees or collateral directly or indirectly provided to the investees: None 4. Financings directly or indirectly provided to the investees: None 5. Other transactions that significantly impacted current year’s profit or loss or financial position: None
(Concluded)

- 109 -
SCHEDULE 1
TXC CORPORATION CASH AND CASH EQUIVALENTS DECEMBER 31, 2012 (In Thousands of New Taiwan Dollars, and Foreign Currency)
Item Amount Cash
Cash on hand Including US$5 thousand @29.136; JPY353 thousand @0.3375; HK$4 thousand @3.7586; and RMB58 thousand @4.6741
$ 652
Cash in banks Checking accounts and demand
deposits 184,546
Foreign-currency deposits Including US$15,057 thousand @29.136; JPY121,886 thousand @0.3375; and HK$45 thousand @3.7586
480,014
Cash equivalents Repurchase agreements collateralized
by bonds Due date 2012.12.13-2013.2.22, interest rate at
0.8%-0.825% 347,000
$ 1,012,212

- 110 -
SCHEDULE 2
TXC CORPORATION ACCOUNTS RECEIVABLE DECEMBER 31, 2012 (In Thousands of New Taiwan Dollars)
Item Explanation Amount Related parties
NGB For goods $ 42,870 CKG 〃 857 Tai-Shing 〃 10,551 TXC Technology Inc. 〃 517
54,795 Less: Allowance for doubtful accounts (85)
54,710 Third parties
A Company For goods 249,759 B Company 〃 165,744 C Company 〃 147,321 Others (Note) 〃 2,425,865 2,988,689 Less: Allowance for doubtful accounts (19,226) 2,969,463
$ 3,024,173 Note: Each of the accounts was less than 5% of the total account balance.

- 111 -
SCHEDULE 3
TXC CORPORATION INVENTORIES DECEMBER 31, 2012 (In Thousands of New Taiwan Dollars)
Item Explanation Cost Market Value
(Note)
Raw materials $ 150,580 $ 143,955 Supplies and spare parts 39,045 38,547 Work in process 241,382 237,584 Finished goods 275,110 257,249 Merchandise 334,555 330,830 Goods in transit 14,802 14,802 1,055,474 $ 1,022,967 Less allowance for loss (32,507) $ 1,022,967 Note: The market value is based on net realizable value.

- 112 -
SCHEDULE 4
TXC CORPORATION CHANGES IN FINANCIAL ASSETS AT COST - NONCURRENT YEAR ENDED DECEMBER 31, 2012 (In Thousands of New Taiwan Dollars and Shares) Ending Balance Market Price or Beginning Balance Increase Decrease % of Net Asset Value Valuation Pledge or Shares Amount Shares Amount Shares Amount Shares Ownership Amount Unit Price Amount Method Security Cost method
Emerging market company Win Win Precision Technology Co.,
Ltd. 1,144 $ 47,200 156 $ 7,797 - $ - 1,300 3 $ 54,997 - $ - Cost method None
Unlisted company Marson Technology Ltd. 414 3,000 - - - - 414 5 3,000 - - Cost method None Guandong Failong Crystal Technology
Co., Ltd. - 46,478 - - - - - 8 46,478 - - Cost method None
Power Intellect Co., Ltd. 2,000 98,000 - - - - 2,000 2 98,000 - - Cost method None Si-Time 1,750 50,767 - - - - 1,750 1 50,767 - - Cost method None $ 245,445 $ 7,797 $ - $ 253,242
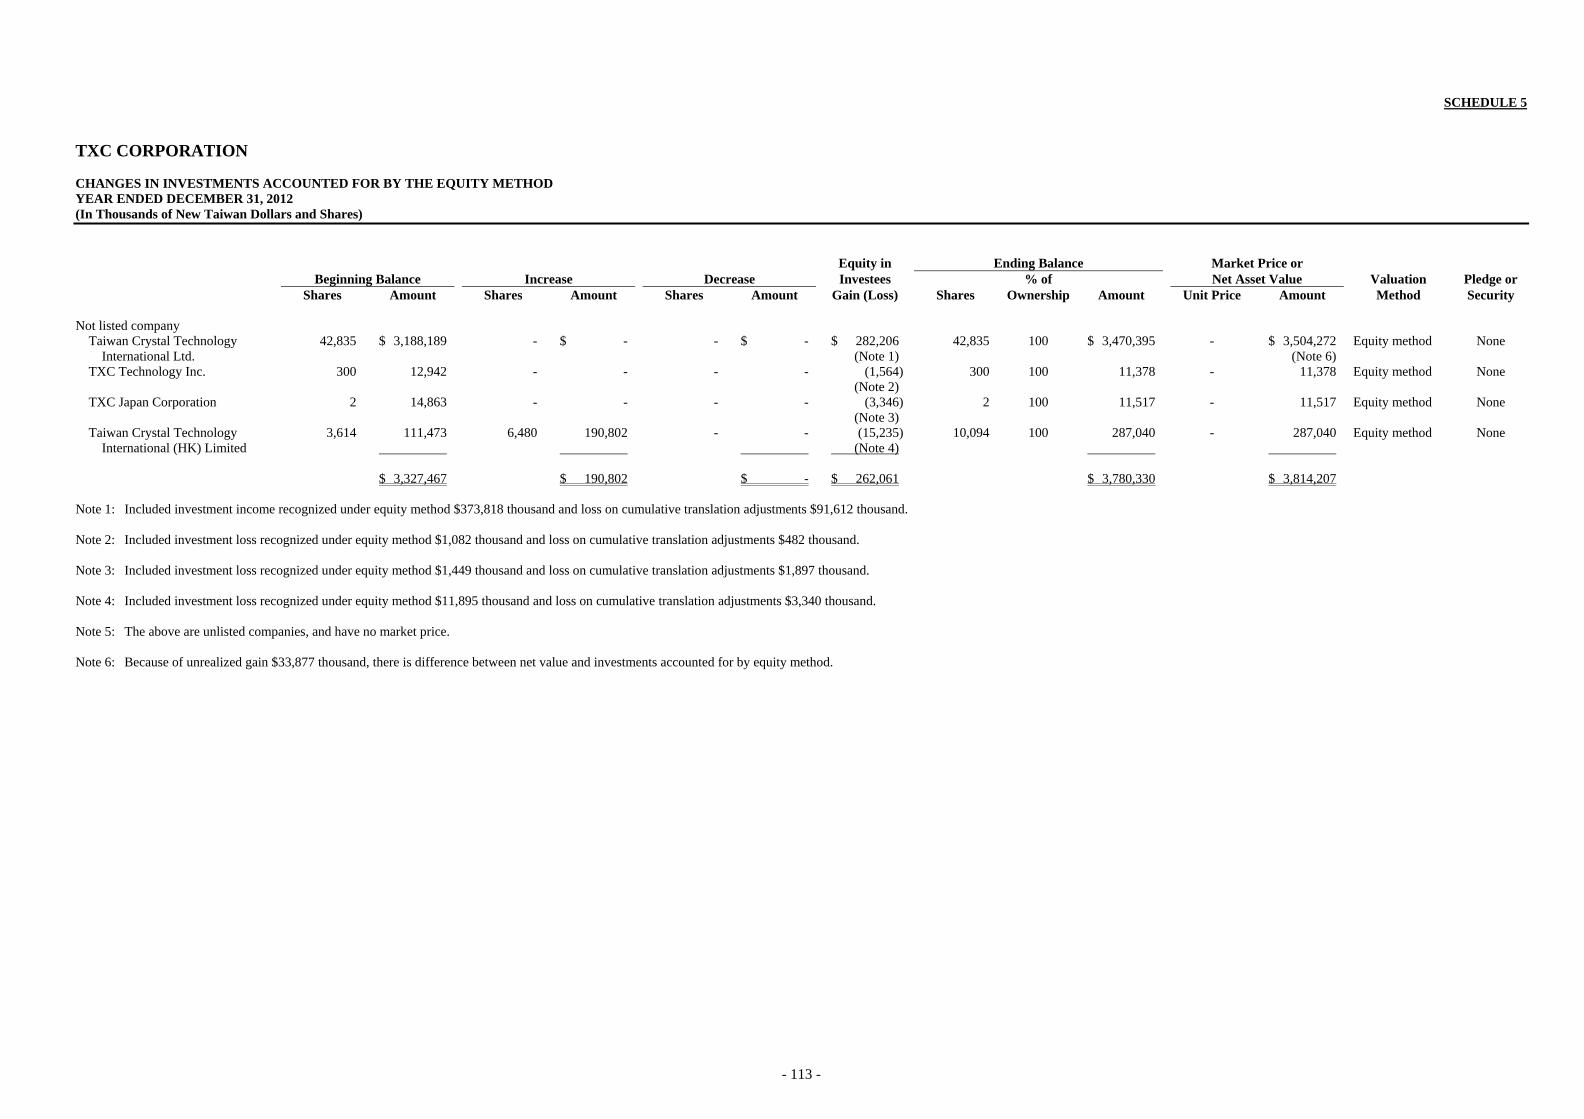
- 113 -
SCHEDULE 5
TXC CORPORATION CHANGES IN INVESTMENTS ACCOUNTED FOR BY THE EQUITY METHOD YEAR ENDED DECEMBER 31, 2012 (In Thousands of New Taiwan Dollars and Shares)
Equity in Ending Balance Market Price or Beginning Balance Increase Decrease Investees % of Net Asset Value Valuation Pledge or Shares Amount Shares Amount Shares Amount Gain (Loss) Shares Ownership Amount Unit Price Amount Method Security Not listed company
Taiwan Crystal Technology International Ltd.
42,835 $ 3,188,189 - $ - - $ - $ 282,206 (Note 1)
42,835 100 $ 3,470,395 - $ 3,504,272 (Note 6)
Equity method None
TXC Technology Inc. 300 12,942 - - - - (1,564) (Note 2)
300 100 11,378 - 11,378
Equity method None
TXC Japan Corporation 2 14,863 - - - - (3,346) (Note 3)
2 100 11,517 - 11,517
Equity method None
Taiwan Crystal Technology International (HK) Limited
3,614 111,473
6,480 190,802
- -
(15,235) (Note 4)
10,094 100 287,040
- 287,040
Equity method None
$ 3,327,467 $ 190,802 $ - $ 262,061 $ 3,780,330 $ 3,814,207
Note 1: Included investment income recognized under equity method $373,818 thousand and loss on cumulative translation adjustments $91,612 thousand. Note 2: Included investment loss recognized under equity method $1,082 thousand and loss on cumulative translation adjustments $482 thousand. Note 3: Included investment loss recognized under equity method $1,449 thousand and loss on cumulative translation adjustments $1,897 thousand. Note 4: Included investment loss recognized under equity method $11,895 thousand and loss on cumulative translation adjustments $3,340 thousand. Note 5: The above are unlisted companies, and have no market price. Note 6: Because of unrealized gain $33,877 thousand, there is difference between net value and investments accounted for by equity method.
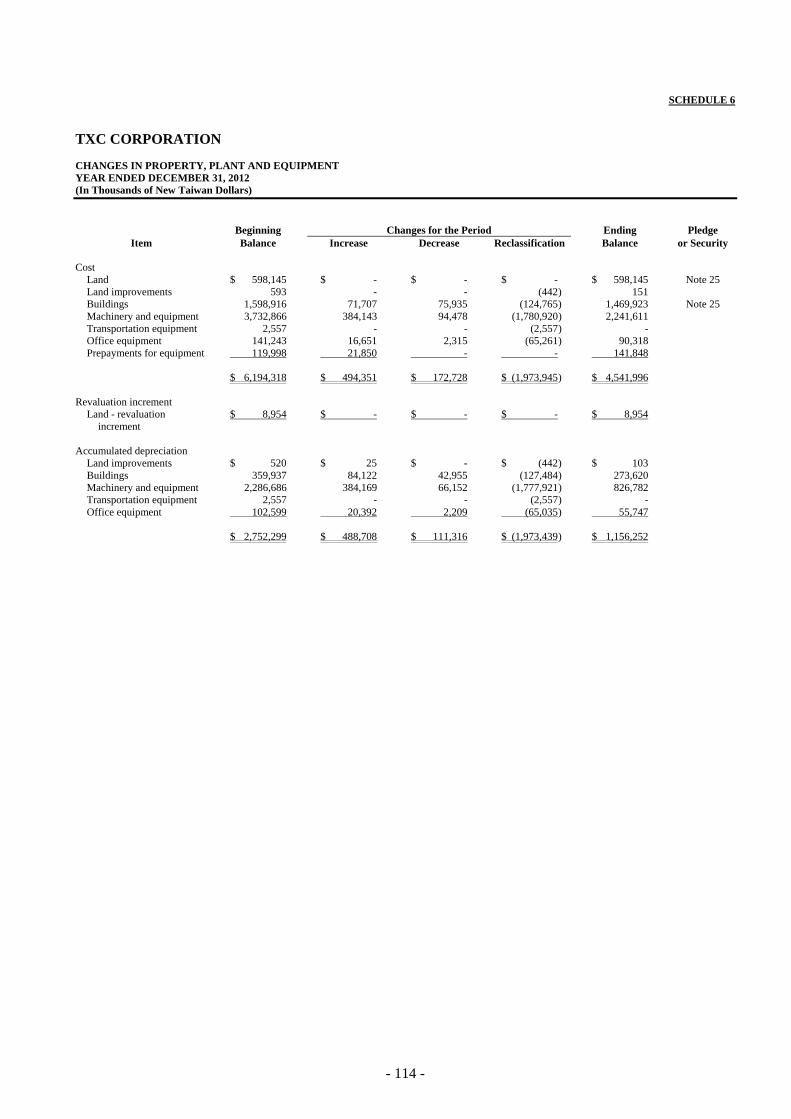
- 114 -
SCHEDULE 6
TXC CORPORATION CHANGES IN PROPERTY, PLANT AND EQUIPMENT YEAR ENDED DECEMBER 31, 2012 (In Thousands of New Taiwan Dollars)
Beginning Changes for the Period Ending Pledge Item Balance Increase Decrease Reclassification Balance or Security
Cost
Land $ 598,145 $ - $ - $ - $ 598,145 Note 25 Land improvements 593 - - (442 ) 151 Buildings 1,598,916 71,707 75,935 (124,765 ) 1,469,923 Note 25 Machinery and equipment 3,732,866 384,143 94,478 (1,780,920 ) 2,241,611 Transportation equipment 2,557 - - (2,557 ) - Office equipment 141,243 16,651 2,315 (65,261 ) 90,318 Prepayments for equipment 119,998 21,850 - - 141,848 $ 6,194,318 $ 494,351 $ 172,728 $ (1,973,945 ) $ 4,541,996
Revaluation increment
Land - revaluation increment
$ 8,954 $ - $ - $ - $ 8,954
Accumulated depreciation
Land improvements $ 520 $ 25 $ - $ (442 ) $ 103 Buildings 359,937 84,122 42,955 (127,484 ) 273,620 Machinery and equipment 2,286,686 384,169 66,152 (1,777,921 ) 826,782 Transportation equipment 2,557 - - (2,557 ) - Office equipment 102,599 20,392 2,209 (65,035 ) 55,747 $ 2,752,299 $ 488,708 $ 111,316 $ (1,973,439 ) $ 1,156,252

- 115 -
SCHEDULE 7
TXC CORPORATION SHORT-TERM LOANS DECEMBER 31, 2012 (In Thousands of New Taiwan Dollars)
Creditor Nature of Loan Amount Due Date Interest Rate % Pledge or Security
DBS Bank Usance letter of credit $ 69,455 Six months 0.98% - Bank of Taiwan 〃 54,132 〃 1.024% - ANZ Bank 〃 11,745 〃 0.96% - $ 135,332
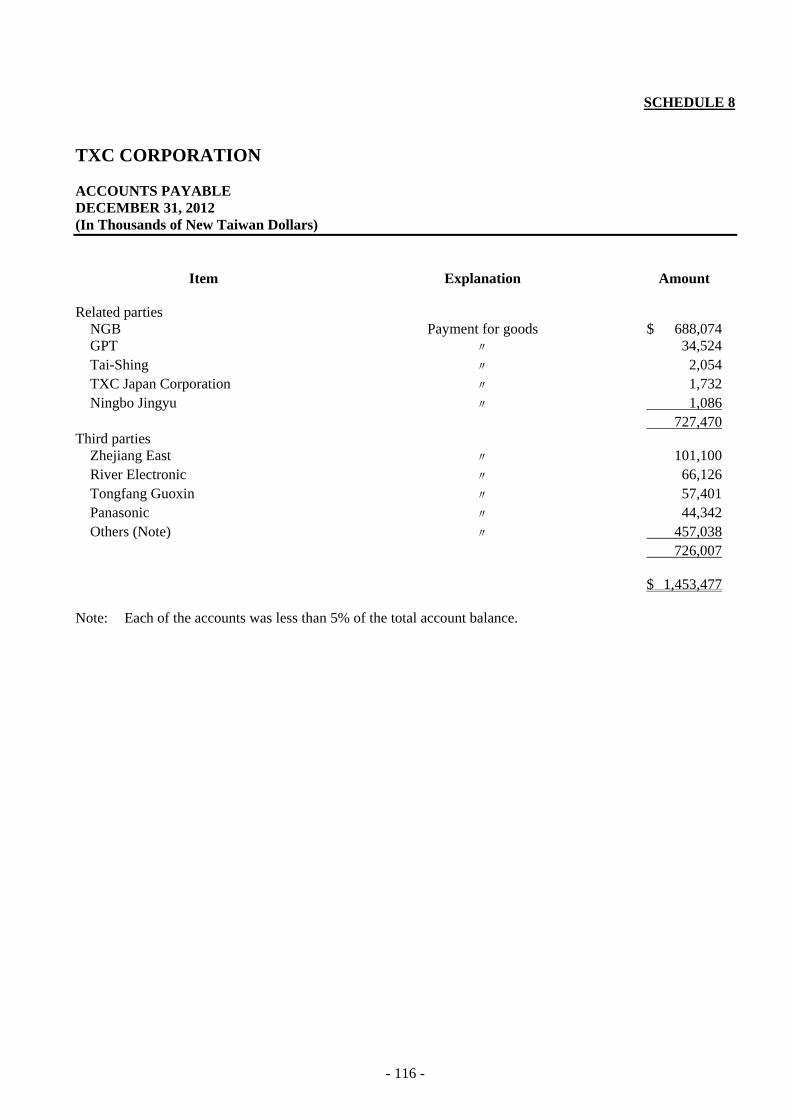
- 116 -
SCHEDULE 8
TXC CORPORATION ACCOUNTS PAYABLE DECEMBER 31, 2012 (In Thousands of New Taiwan Dollars)
Item Explanation Amount Related parties
NGB Payment for goods $ 688,074 GPT 〃 34,524 Tai-Shing 〃 2,054 TXC Japan Corporation 〃 1,732 Ningbo Jingyu 〃 1,086 727,470
Third parties Zhejiang East 〃 101,100 River Electronic 〃 66,126 Tongfang Guoxin 〃 57,401 Panasonic 〃 44,342 Others (Note) 〃 457,038 726,007 $ 1,453,477
Note: Each of the accounts was less than 5% of the total account balance.

- 117 -
SCHEDULE 9
TXC CORPORATION BONDS PAYABLE DECEMBER 31, 2012 (In Thousands of New Taiwan Dollars)
Amount
Bond Type Trustees Date of
Issuance Payment Terms
Interest Rate
Issuance Amount Conversion Redemption Ending Balance
Unamortized Premium (Discount) Carrying Value
Repayment Method Securities
3rd unsecured domestic convertible
bonds Chinatrust 2010.1.11-
2013.1.11 - - $ 800,000 $ 243,900 $ - $ 556,100 $ (21) $ 556,079 Note 14 None
Add: (Asset) liability component of convertible bonds - noncurrent
(556,079)
$ -

- 118 -
SCHEDULE 10
TXC CORPORATION LONG-TERM LOANS DECEMBER 31, 2012 (In Thousands of New Taiwan Dollars)
Amount
Repayment Period Repayment Method Interest Rate % Current Portion
Noncurrent Portion Total Amount Pledge or Security
Bank of Taiwan 2008.07.30-2013.07.24 Repayable from July 2008 in
quarterly installment 1.155 $ 43,688 $ - $ 43,688 Note 25
2009.04.24-2013.07.24 Repayable from April 2009 in quarterly installment
1.155 5,250 - 5,250 Note 25
2010.10.29-2015.10.28 Repayable from October 2011 in quarterly installment
1.200 125,000 250,000 375,000 -
2012.08.06-2016.10.13 Repayable from January 2013 in quarterly installment
1.255 125,000 375,000 500,000 -
China Trust 2012.07.26-2014.07.26 Repayable upon maturity 1.280 - 200,000 200,000 - Hua Nan Bank 2011.08.17-2016.08.17 Repayable from November 2012 in
quarterly installment 1.250 150,000 412,500 562,500 Note 25
2012.06.15-2014.06.15 Repayable upon maturity 1.100 - 100,000 100,000 - 2012.08.20-2014.08.20 Repayable upon maturity 1.250 - 100,000 100,000 - $ 448,938 $ 1,437,500 $ 1,886,438

- 119 -
SCHEDULE 11
TXC CORPORATION OPERATING REVENUES YEAR ENDED DECEMBER 31, 2012 (In Thousands of New Taiwan Dollars) Item Amount Quartz Crystal Products $ 9,545,111 New Energy Products 62,610 9,607,721 Less sales returns (23,147)Less sales allowances (107,093) $ 9,477,481
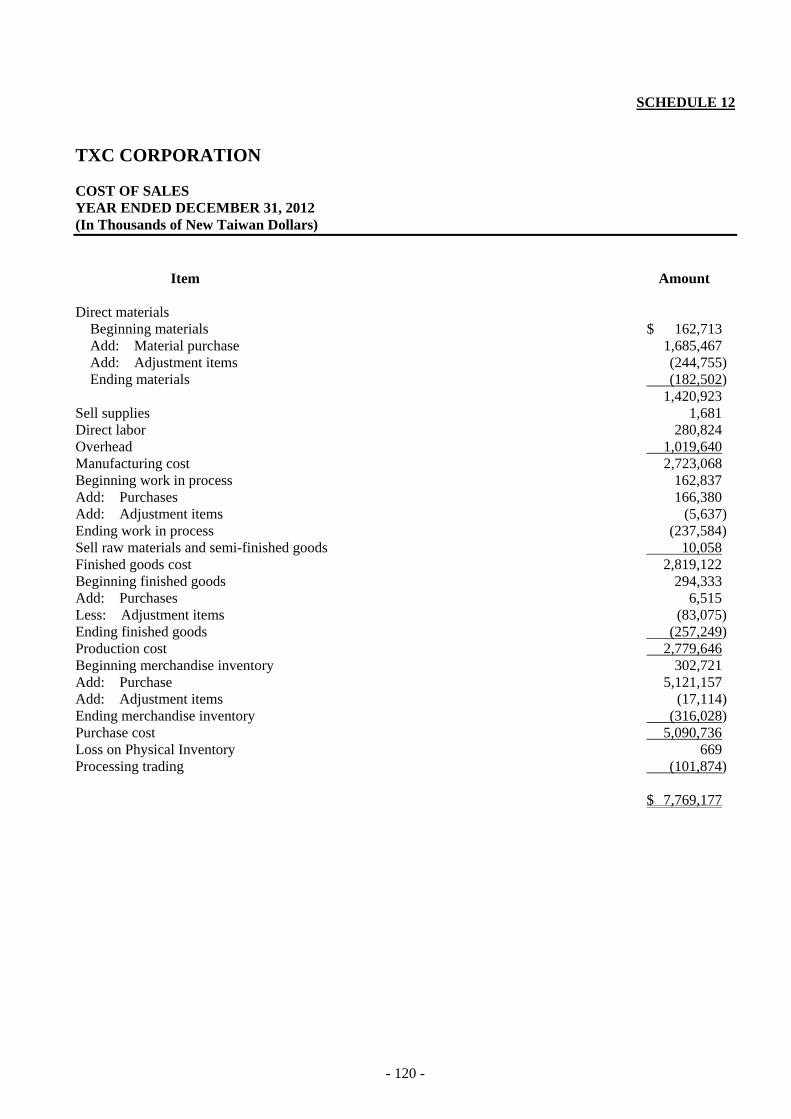
- 120 -
SCHEDULE 12
TXC CORPORATION COST OF SALES YEAR ENDED DECEMBER 31, 2012 (In Thousands of New Taiwan Dollars) Item Amount Direct materials
Beginning materials $ 162,713 Add: Material purchase 1,685,467 Add: Adjustment items (244,755)Ending materials (182,502)
1,420,923 Sell supplies 1,681 Direct labor 280,824 Overhead 1,019,640 Manufacturing cost 2,723,068 Beginning work in process 162,837 Add: Purchases 166,380 Add: Adjustment items (5,637)Ending work in process (237,584)Sell raw materials and semi-finished goods 10,058 Finished goods cost 2,819,122 Beginning finished goods 294,333 Add: Purchases 6,515 Less: Adjustment items (83,075)Ending finished goods (257,249)Production cost 2,779,646 Beginning merchandise inventory 302,721 Add: Purchase 5,121,157 Add: Adjustment items (17,114)Ending merchandise inventory (316,028)Purchase cost 5,090,736 Loss on Physical Inventory 669 Processing trading (101,874) $ 7,769,177

- 121 -
SCHEDULE 13
TXC CORPORATION OVERHEAD EXPENSES YEAR ENDED DECEMBER 31, 2012 (In Thousands of New Taiwan Dollars) Item Explanation Amount Indirect labor Including salary and wages, pension, food stipend, employee
benefits, and insurance etc. $ 214,458
Indirect materials 162,369 Depreciation 402,473 Utilities 82,456 Maintenance expense 66,454 Others 91,430 $ 1,019,640

- 122 -
SCHEDULE 14
TXC CORPORATION OPERATING EXPENSES YEAR ENDED DECEMBER 31, 2012 (In Thousands of New Taiwan Dollars)
Item Explanation Sales and
Marketing General and
Administration Research and Development
Salary $ 58,465 $ 86,875 $ 154,425 Depreciation 834 24,396 61,005 Research expense - - 47,000 Commission 80,284 - - Import and export expense 46,845 2 18 Others 164,373 81,882 35,381 $ 350,801 $ 193,155 $ 297,829

- 123 -
REPRESENTATION LETTER The entities that are required to be included in the combined financial statements of TXC
Corporation as of and for the year ended December 31, 2012, under the Criteria Governing the
Preparation of Affiliation Reports, Consolidated Business Reports and Consolidated Financial
Statements of Affiliated Enterprises are the same as those included in the consolidated financial
statements prepared in conformity with the revised Statement of Financial Accounting Standards
No. 7, “Consolidated Financial Statements”. In addition, the information required to be disclosed
in the combined financial statements is included in the consolidated financial statements.
Consequently, TXC Corporation and subsidiaries do not prepare a separate set of combined
financial statements.
Very truly yours, TXC CORPORATION By PAUL LIN Chairman March 25, 2013

- 124 -
INDEPENDENT AUDITORS’ REPORT The Board of Directors and Stockholders TXC Corporation We have audited the accompanying consolidated balance sheets of TXC Corporation and subsidiaries (the “Corporation”) as of December 31, 2012 and 2011, and the related consolidated statements of income, changes in stockholders’ equity, and cash flows for the years then ended. These consolidated financial statements are the responsibility of the Corporation’s management. Our responsibility is to express an opinion on these financial statements based on our audits. We conducted our audits in accordance with the Rules Governing the Audit of Financial Statements by Certified Public Accountants and auditing standards generally accepted in the Republic of China. Those rules and standards require that we plan and perform the audit to obtain reasonable assurance about whether the financial statements are free of material misstatement. An audit includes examining, on a test basis, evidence supporting the amounts and disclosures in the financial statements. An audit also includes assessing the accounting principles used and significant estimates made by management, as well as evaluating the overall financial statement presentation. We believe that our audits provide a reasonable basis for our opinion. In our opinion, the consolidated financial statements referred to above present fairly, in all material respects, the consolidated financial position of TXC Corporation and subsidiaries as of December 31, 2012 and 2011, and the consolidated results of their operations and their consolidated cash flows for the years then ended, in conformity with the Guidelines Governing the Preparation of Financial Reports by Securities Issuers and accounting principles generally accepted in the Republic of China. March 25, 2013
Notice to Readers The accompanying consolidated financial statements are intended only to present the financial position, results of operations and cash flows in accordance with accounting principles and practices generally accepted in the Republic of China and not those of any other jurisdictions. The standards, procedures and practices to audit such consolidated financial statements are those generally accepted and applied in the Republic of China. For the convenience of readers, the auditors’ report and the accompanying consolidated financial statements have been translated into English from the original Chinese version prepared and used in the Republic of China. If there is any conflict between the English version and the original Chinese version or any difference in the interpretation of the two versions, the Chinese-language auditors’ report and consolidated financial statements shall prevail.
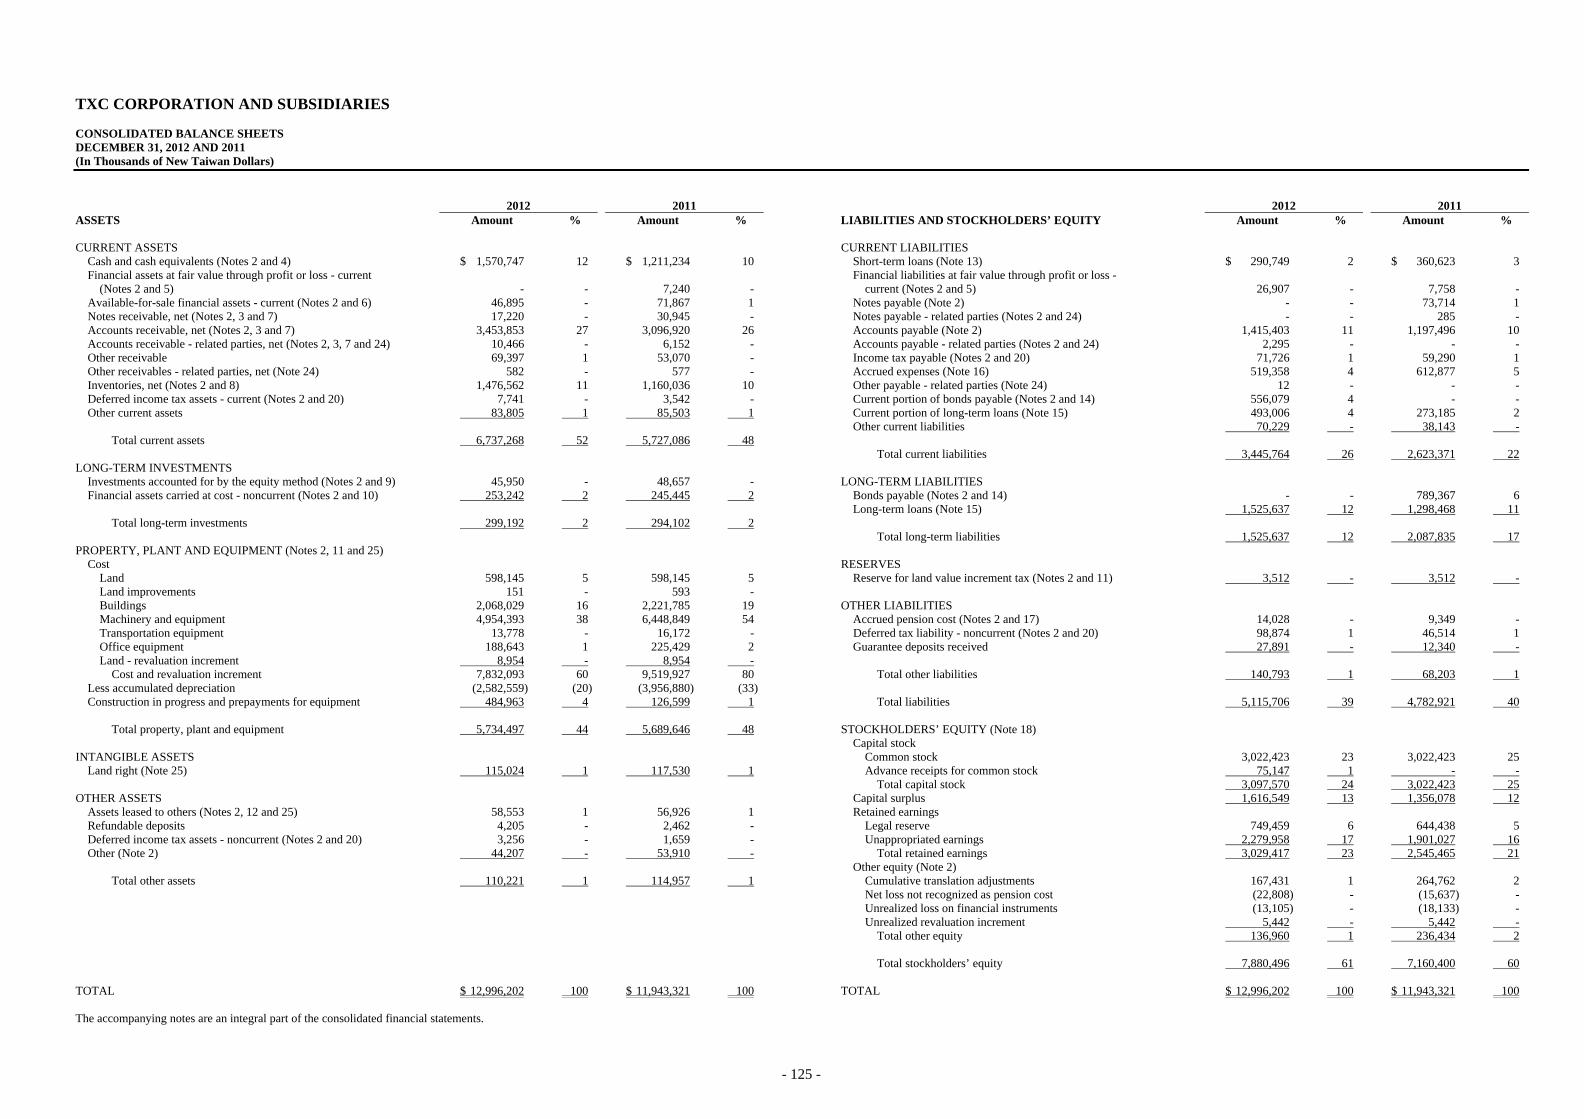
- 125 -
TXC CORPORATION AND SUBSIDIARIES CONSOLIDATED BALANCE SHEETS DECEMBER 31, 2012 AND 2011 (In Thousands of New Taiwan Dollars)
2012 2011 2012 2011 ASSETS Amount % Amount % LIABILITIES AND STOCKHOLDERS’ EQUITY Amount % Amount % CURRENT ASSETS CURRENT LIABILITIES
Cash and cash equivalents (Notes 2 and 4) $ 1,570,747 12 $ 1,211,234 10 Short-term loans (Note 13) $ 290,749 2 $ 360,623 3Financial assets at fair value through profit or loss - current Financial liabilities at fair value through profit or loss - (Notes 2 and 5) - - 7,240 - current (Notes 2 and 5) 26,907 - 7,758 -Available-for-sale financial assets - current (Notes 2 and 6) 46,895 - 71,867 1 Notes payable (Note 2) - - 73,714 1Notes receivable, net (Notes 2, 3 and 7) 17,220 - 30,945 - Notes payable - related parties (Notes 2 and 24) - - 285 -Accounts receivable, net (Notes 2, 3 and 7) 3,453,853 27 3,096,920 26 Accounts payable (Note 2) 1,415,403 11 1,197,496 10Accounts receivable - related parties, net (Notes 2, 3, 7 and 24) 10,466 - 6,152 - Accounts payable - related parties (Notes 2 and 24) 2,295 - - -Other receivable 69,397 1 53,070 - Income tax payable (Notes 2 and 20) 71,726 1 59,290 1Other receivables - related parties, net (Note 24) 582 - 577 - Accrued expenses (Note 16) 519,358 4 612,877 5Inventories, net (Notes 2 and 8) 1,476,562 11 1,160,036 10 Other payable - related parties (Note 24) 12 - - -Deferred income tax assets - current (Notes 2 and 20) 7,741 - 3,542 - Current portion of bonds payable (Notes 2 and 14) 556,079 4 - -Other current assets 83,805 1 85,503 1 Current portion of long-term loans (Note 15) 493,006 4 273,185 2
Other current liabilities 70,229 - 38,143 -Total current assets 6,737,268 52 5,727,086 48
Total current liabilities 3,445,764 26 2,623,371 22LONG-TERM INVESTMENTS
Investments accounted for by the equity method (Notes 2 and 9) 45,950 - 48,657 - LONG-TERM LIABILITIES Financial assets carried at cost - noncurrent (Notes 2 and 10) 253,242 2 245,445 2 Bonds payable (Notes 2 and 14) - - 789,367 6
Long-term loans (Note 15) 1,525,637 12 1,298,468 11Total long-term investments 299,192 2 294,102 2
Total long-term liabilities 1,525,637 12 2,087,835 17PROPERTY, PLANT AND EQUIPMENT (Notes 2, 11 and 25)
Cost RESERVES Land 598,145 5 598,145 5 Reserve for land value increment tax (Notes 2 and 11) 3,512 - 3,512 -Land improvements 151 - 593 - Buildings 2,068,029 16 2,221,785 19 OTHER LIABILITIES Machinery and equipment 4,954,393 38 6,448,849 54 Accrued pension cost (Notes 2 and 17) 14,028 - 9,349 -Transportation equipment 13,778 - 16,172 - Deferred tax liability - noncurrent (Notes 2 and 20) 98,874 1 46,514 1Office equipment 188,643 1 225,429 2 Guarantee deposits received 27,891 - 12,340 -Land - revaluation increment 8,954 - 8,954 -
Cost and revaluation increment 7,832,093 60 9,519,927 80 Total other liabilities 140,793 1 68,203 1Less accumulated depreciation (2,582,559) (20) (3,956,880) (33) Construction in progress and prepayments for equipment 484,963 4 126,599 1 Total liabilities 5,115,706 39 4,782,921 40
Total property, plant and equipment 5,734,497 44 5,689,646 48 STOCKHOLDERS’ EQUITY (Note 18)
Capital stock INTANGIBLE ASSETS Common stock 3,022,423 23 3,022,423 25
Land right (Note 25) 115,024 1 117,530 1 Advance receipts for common stock 75,147 1 - - Total capital stock 3,097,570 24 3,022,423 25OTHER ASSETS Capital surplus 1,616,549 13 1,356,078 12
Assets leased to others (Notes 2, 12 and 25) 58,553 1 56,926 1 Retained earnings Refundable deposits 4,205 - 2,462 - Legal reserve 749,459 6 644,438 5Deferred income tax assets - noncurrent (Notes 2 and 20) 3,256 - 1,659 - Unappropriated earnings 2,279,958 17 1,901,027 16Other (Note 2) 44,207 - 53,910 - Total retained earnings 3,029,417 23 2,545,465 21
Other equity (Note 2) Total other assets 110,221 1 114,957 1 Cumulative translation adjustments 167,431 1 264,762 2
Net loss not recognized as pension cost (22,808) - (15,637) - Unrealized loss on financial instruments (13,105) - (18,133) - Unrealized revaluation increment 5,442 - 5,442 - Total other equity 136,960 1 236,434 2 Total stockholders’ equity 7,880,496 61 7,160,400 60 TOTAL $ 12,996,202 100 $ 11,943,321 100 TOTAL $ 12,996,202 100 $ 11,943,321 100 The accompanying notes are an integral part of the consolidated financial statements.

- 126 -
TXC CORPORATION AND SUBSIDIARIES CONSOLIDATED STATEMENTS OF INCOME YEARS ENDED DECEMBER 31, 2012 AND 2011 (In Thousands of New Taiwan Dollars, Except Earnings Per Share) 2012 2011 Amount % Amount % OPERATING REVENUE (Note 2) $ 11,069,155 101 $ 9,961,104 101 LESS: SALES RETURNS (33,567) - (15,639) - LESS: SALES ALLOWANCES (107,093) (1) (48,124) (1) NET OPERATING REVENUE 10,928,495 100 9,897,341 100 OPERATING COSTS (8,420,200) (77) (7,496,695) (76) GROSS PROFIT 2,508,295 23 2,400,646 24 OPERATING EXPENSES
Selling expenses (449,277) (4) (460,181) (4)General and administrative expenses (378,749) (3) (325,641) (3)Research and development expenses (422,614) (4) (463,303) (5)
Total operating expenses (1,250,640) (11) (1,249,125) (12)
OPERATING INCOME 1,257,655 12 1,151,521 12 NONOPERATING INCOME AND GAINS
Interest income 14,195 - 14,612 -Investment income recognized under equity method
(Note 9) 9,365 - 11,658 -Dividend revenue 3,954 - 4,031 -Gain on disposal of property, plant and equipment 2,953 - 10,784 -Gain on sale of investments 1,094 - 822 -Exchange gain 51,912 - 43,675 -Miscellaneous income 75,715 1 59,437 1
Total nonoperating income and gains 159,188 1 145,019 1
NONOPERATING EXPENSES AND LOSSES
Interest expense (35,555) (1) (31,154) (1)Loss on disposal of property, plant and equipment (3,802) - (3,265) -Impairment loss (22,430) - (19,942) -Valuation loss on financial assets - - (78) -Valuation loss on financial liabilities (26,747) - (12,627) -Miscellaneous expenses (25,690) - (16,264) -
Total nonoperating expenses and losses (114,224) (1) (83,330) (1)
(Continued)

- 127 -
TXC CORPORATION AND SUBSIDIARIES CONSOLIDATED STATEMENTS OF INCOME YEARS ENDED DECEMBER 31, 2012 AND 2011 (In Thousands of New Taiwan Dollars, Except Earnings Per Share) 2012 2011 Amount % Amount % INCOME BEFORE INCOME TAX $ 1,302,619 12 $ 1,213,210 12 INCOME TAX EXPENSE (Notes 2 and 20) (153,733) (1) (162,994) (1) NET INCOME $ 1,148,886 11 $ 1,050,216 11 2012 2011 Before
Income Tax
After Income
Tax
Before Income
Tax
After Income
Tax CONSOLIDATED EARNINGS PER SHARE
(Note 22) Basic $ 4.15 $ 3.79 $ 3.84 $ 3.48 Diluted $ 3.93 $ 3.58 $ 3.64 $ 3.29
The accompanying notes are an integral part of the consolidated financial statements. (Concluded)
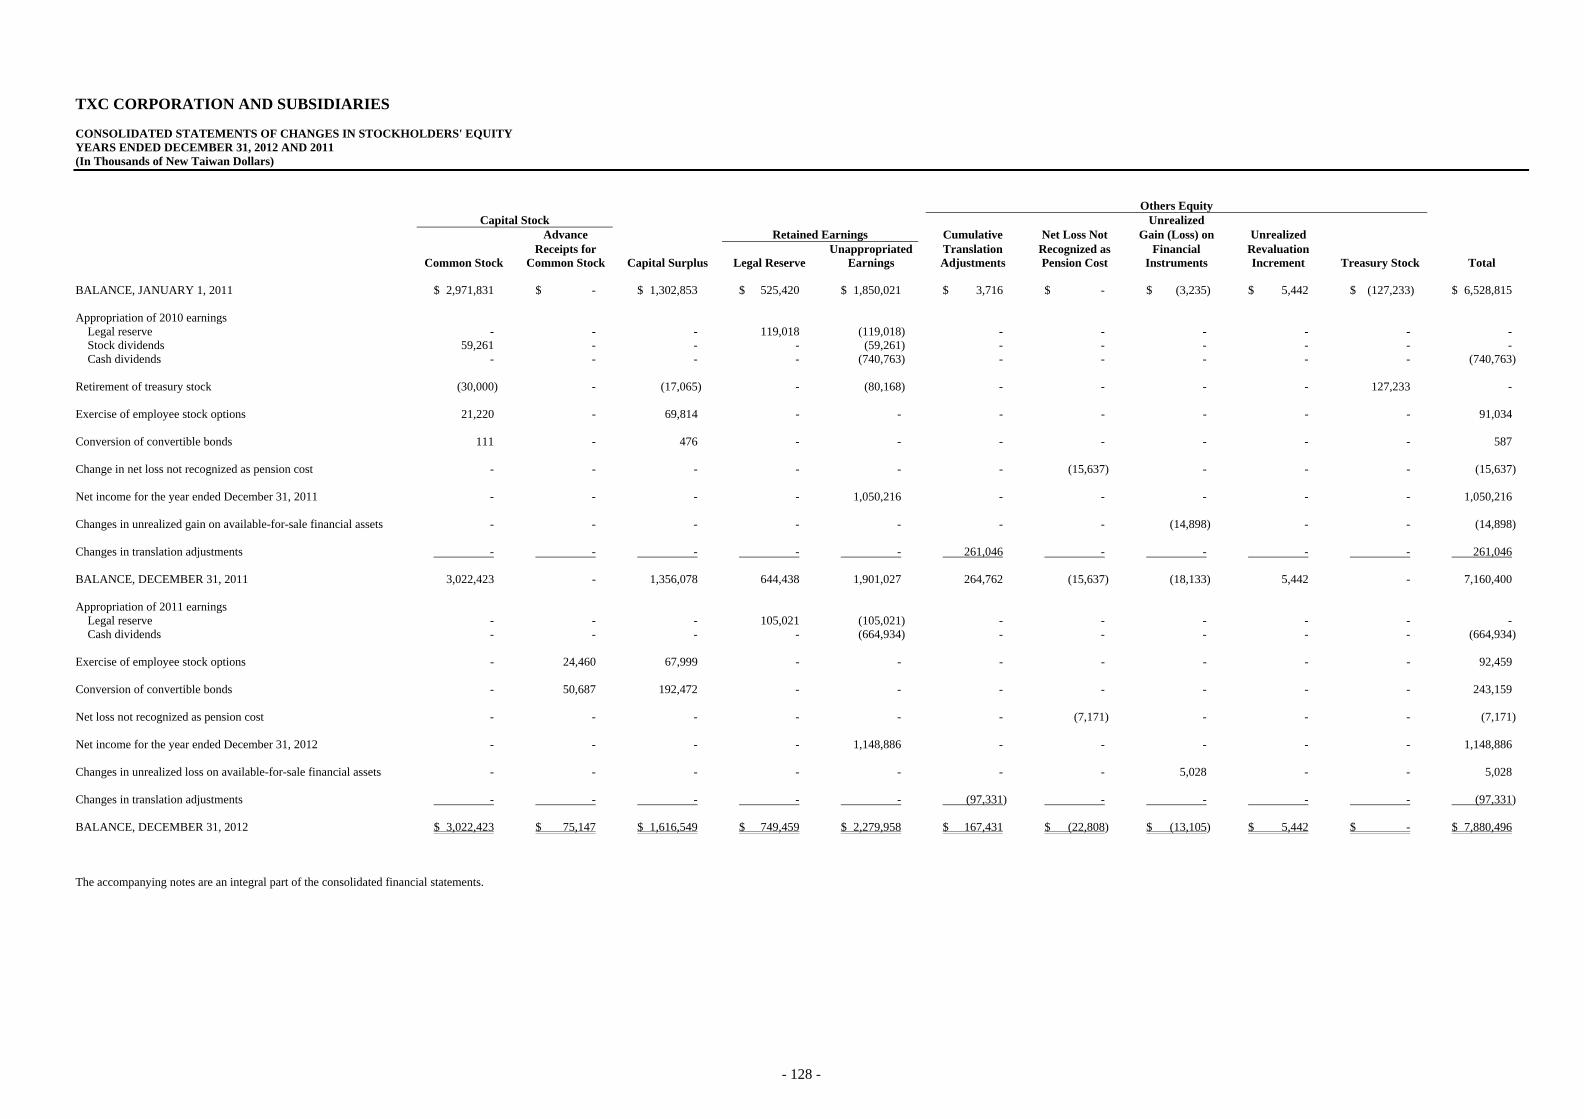
- 128 -
TXC CORPORATION AND SUBSIDIARIES CONSOLIDATED STATEMENTS OF CHANGES IN STOCKHOLDERS' EQUITY YEARS ENDED DECEMBER 31, 2012 AND 2011 (In Thousands of New Taiwan Dollars)
Others Equity Capital Stock Unrealized Advance Retained Earnings Cumulative Net Loss Not Gain (Loss) on Unrealized Receipts for Unappropriated Translation Recognized as Financial Revaluation Common Stock Common Stock Capital Surplus Legal Reserve Earnings Adjustments Pension Cost Instruments Increment Treasury Stock Total BALANCE, JANUARY 1, 2011 $ 2,971,831 $ - $ 1,302,853 $ 525,420 $ 1,850,021 $ 3,716 $ - $ (3,235) $ 5,442 $ (127,233) $ 6,528,815 Appropriation of 2010 earnings
Legal reserve - - - 119,018 (119,018) - - - - - - Stock dividends 59,261 - - - (59,261) - - - - - - Cash dividends - - - - (740,763) - - - - - (740,763)
Retirement of treasury stock (30,000) - (17,065) - (80,168) - - - - 127,233 - Exercise of employee stock options 21,220 - 69,814 - - - - - - - 91,034 Conversion of convertible bonds 111 - 476 - - - - - - - 587 Change in net loss not recognized as pension cost - - - - - - (15,637) - - - (15,637) Net income for the year ended December 31, 2011 - - - - 1,050,216 - - - - - 1,050,216 Changes in unrealized gain on available-for-sale financial assets - - - - - - - (14,898) - - (14,898) Changes in translation adjustments - - - - - 261,046 - - - - 261,046 BALANCE, DECEMBER 31, 2011 3,022,423 - 1,356,078 644,438 1,901,027 264,762 (15,637) (18,133) 5,442 - 7,160,400 Appropriation of 2011 earnings
Legal reserve - - - 105,021 (105,021) - - - - - - Cash dividends - - - - (664,934) - - - - - (664,934)
Exercise of employee stock options - 24,460 67,999 - - - - - - - 92,459 Conversion of convertible bonds - 50,687 192,472 - - - - - - - 243,159 Net loss not recognized as pension cost - - - - - - (7,171) - - - (7,171) Net income for the year ended December 31, 2012 - - - - 1,148,886 - - - - - 1,148,886 Changes in unrealized loss on available-for-sale financial assets - - - - - - - 5,028 - - 5,028 Changes in translation adjustments - - - - - (97,331) - - - - (97,331) BALANCE, DECEMBER 31, 2012 $ 3,022,423 $ 75,147 $ 1,616,549 $ 749,459 $ 2,279,958 $ 167,431 $ (22,808) $ (13,105) $ 5,442 $ - $ 7,880,496 The accompanying notes are an integral part of the consolidated financial statements.

- 129 -
TXC CORPORATION AND SUBSIDIARIES CONSOLIDATED STATEMENTS OF CASH FLOWS YEARS ENDED DECEMBER 31, 2012 AND 2011 (In Thousands of New Taiwan Dollars) 2012 2011 CASH FLOWS FROM OPERATING ACTIVITIES
Net income $ 1,148,886 $ 1,050,216 Depreciation 838,549 881,607 Nonoperating loss - idle assets and lease assets 13,669 9,319 Amortization 26,075 31,541 Investment income recognized under equity method (9,365) (11,658)Cash dividends received from equity method investees 10,767 - Gain on sale of investments (1,094) (822)Loss (gain) on disposal of property, plant and equipment 849 (7,519)Valuation loss on financial instruments 26,747 12,705 Impairment loss 22,430 19,942 Loss on fire damage 625 - Discount on bonds payable 9,871 9,777 Net changes in net loss not recognized as pension cost (7,171) (15,637)Net changes in deferred income tax 46,564 49,672 Net changes in operating assets and liabilities
Notes receivable (related parties included) 13,725 (25,278)Accounts receivable (related parties included) (361,247) (321,545)Inventories (333,781) (32,336)Other receivables (related parties included) 35,094 38,437 Other current assets 1,698 (47,295)Notes payable (related parties included) (73,999) 20,298 Accounts payable (related parties included) 220,202 (59,017)Accrued expenses (5,952) (24,864)Income tax payable 12,436 (10,835)Other payables (related parties included) 12 - Other current liabilities 32,086 (23,061)Accrued pension cost 4,679 19,843
Net cash provided by operating activities 1,672,355 1,563,490
CASH FLOWS FROM INVESTING ACTIVITIES
Acquisition of financial instruments at fair value through profit or loss - (10,500)Proceeds from disposal of financial instruments at fair value through
profit or loss (440) 67,238 Acquisitions of available-for-sale financial assets (30,000) (90,000)Proceeds from disposal of available-for-sale financial assets 61,094 60,268 Acquisition of financial assets carried at cost (7,797) (148,767)Acquisitions of property, plant and equipment (1,135,305) (1,308,083)Proceeds from disposal of property, plant and equipment 27,943 25,642 (Increase) decrease in refundable deposits (1,743) 2,525 Purchase of assets leased to others - (187)Acquisition of land right (18,963) (101,385)Increase in deferred charges (14,036) (42,827)
Net cash used in investing activities (1,119,247) (1,546,076)
(Continued)
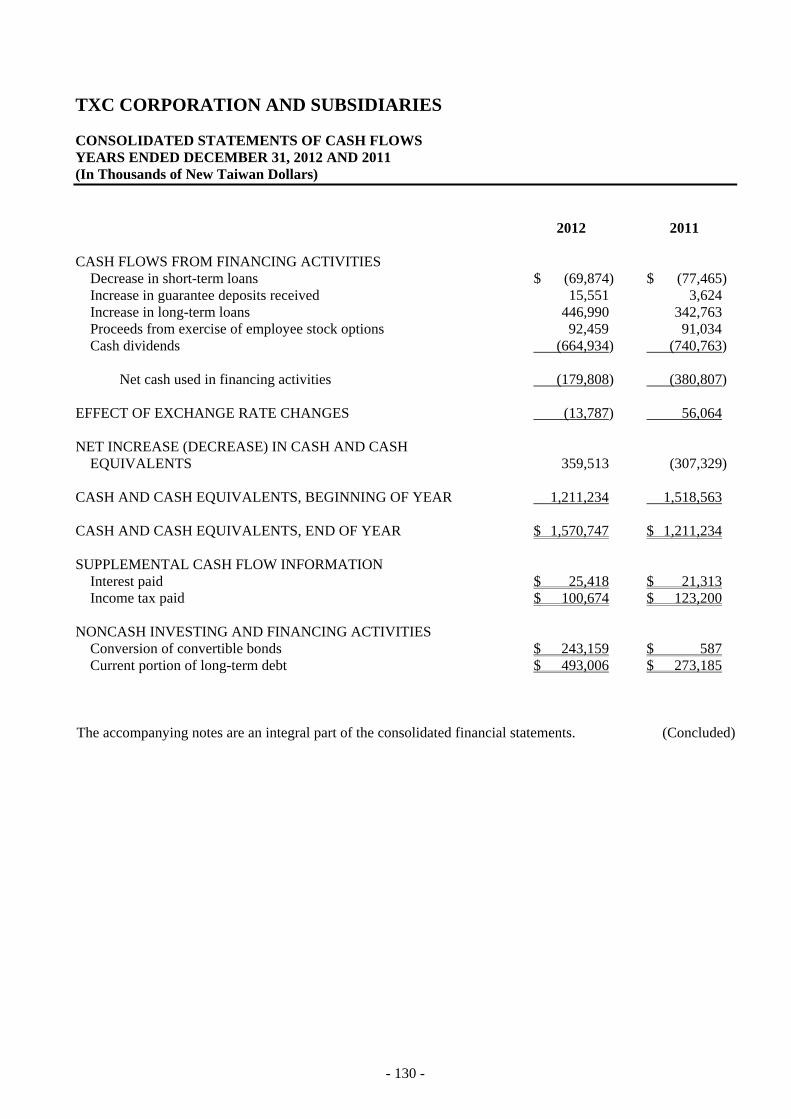
- 130 -
TXC CORPORATION AND SUBSIDIARIES CONSOLIDATED STATEMENTS OF CASH FLOWS YEARS ENDED DECEMBER 31, 2012 AND 2011 (In Thousands of New Taiwan Dollars) 2012 2011 CASH FLOWS FROM FINANCING ACTIVITIES
Decrease in short-term loans $ (69,874) $ (77,465)Increase in guarantee deposits received 15,551 3,624 Increase in long-term loans 446,990 342,763 Proceeds from exercise of employee stock options 92,459 91,034 Cash dividends (664,934) (740,763)
Net cash used in financing activities (179,808) (380,807)
EFFECT OF EXCHANGE RATE CHANGES (13,787) 56,064 NET INCREASE (DECREASE) IN CASH AND CASH
EQUIVALENTS 359,513 (307,329) CASH AND CASH EQUIVALENTS, BEGINNING OF YEAR 1,211,234 1,518,563 CASH AND CASH EQUIVALENTS, END OF YEAR $ 1,570,747 $ 1,211,234 SUPPLEMENTAL CASH FLOW INFORMATION
Interest paid $ 25,418 $ 21,313 Income tax paid $ 100,674 $ 123,200
NONCASH INVESTING AND FINANCING ACTIVITIES
Conversion of convertible bonds $ 243,159 $ 587 Current portion of long-term debt $ 493,006 $ 273,185
The accompanying notes are an integral part of the consolidated financial statements. (Concluded)

- 131 -
TXC CORPORATION AND SUBSIDIARIES NOTES TO CONSOLIDATED FINANCIAL STATEMENTS YEARS ENDED DECEMBER 31, 2012 AND 2011 (In Thousands of New Taiwan Dollars, Unless Stated Otherwise) 1. ORGANIZATION AND OPERATIONS
TXC Corporation (TXC) was incorporated on December 28, 1983 under the Company Law and other related regulations of the Republic of China (ROC). TXC specializes in five categories of products such as high quality Quartz Unite Crystal, Automotive Crystal, Crystal Oscillator (CXO) Surface Acoustic Wave (SAW) Filter, and Timing Module (TM), and provides complete solution in frequency devices and modules, and design service to fully satisfy various needs of the customers. On August 26, 2002, TXC’s shares began to be traded on the Taiwan Stock Exchange. As of December 31, 2012 and 2011, TXC and its subsidiaries had 2,518 and 2,291 employees, respectively.
2. SIGNIFICANT ACCOUNTING POLICIES
For readers’ convenience, the accompanying consolidated financial statements have been translated into English from the original Chinese version prepared and used in the ROC. If inconsistencies arise between the English version and the Chinese version or if differences arise in the interpretations between the two versions, the Chinese version of the consolidated financial statements shall prevail. The consolidated financial statements have been prepared in conformity with the Guidelines Governing the Preparation of Financial Reports by Securities Issuers and accounting principles generally accepted in the ROC. Significant accounting policies are summarized as follows: Principles of Consolidation The consolidated financial statements have been prepared in accordance with Statement of Financial Accounting Standards (SFAS) No. 7 “Consolidated Financial Statements” and include the financial statements of TXC, its direct and indirect subsidiaries with at least 50% shareholding, and other investees in which it has controlling interest. The consolidated entities were as follows:
Percentage of Ownership at December 31
Investor Investee Business Nature 2012 2011 Note TXC Corporation Taiwan Crystal Technology International
Limited (TCTI) Investment holding 100% 100% a
TXC Technology, Inc. Marketing activities 100% 100% b TXC Japan Corporation Marketing activities 100% 100% c Taiwan Crystal Technology International
(HK) Limited (TCTI-HK) Investment holding 100% 100% g
Taiwan Crystal Technology International Limited
Growing Profits Trading Ltd. (GPT) International trading 100% 100% d
TXC (Ningbo) Corporation (NGB) Manufacture and sales of electronic products
100% 100% e
(Continued)

- 132 -
Percentage of Ownership at December 31
Investor Investee Business Nature 2012 2011 Note TXC (Ningbo) Corporation TXC (HK) Limited (TXC HK) International trading 100% 100% f TXC (Chongqing) Corporation
(Chongqing) Manufacture and sales of
electronic products 40% 30% h
Chongqing All Sun Company Limited (Chongqing All sun)
Marketing activities 100% 100% i
Ningbo Jingyu Company Limited (Ningbo Jingyu)
Purchasing and selling electronic component
100% 100% j
Taiwan Crystal Technology International (HK) Limited
TXC (Chongqing) Corporation (Chongqing)
Manufacture and sales of electronic products
60% 70% h
TXC Europe SRL Marketing activities 100% 100% k
(Concluded) a. Taiwan Crystal Technology International Limited was incorporated on December 23, 1998 in Samoa. b. TXC Technology, Inc. was incorporated on December 1, 2000 in California, U.S.A. c. TXC Japan Corporation was incorporated on September 13, 2005 in Yokohama, Japan. d. Growing Profits Limited was incorporated on March 9, 1999 in the British Virgin Islands. e. TXC (Ningbo) Corporation was incorporated on March 12, 1999 in Ningbo, China. f. TXC (HK) Limited was incorporated on March 31, 2008 in Hong Kong Special Administrative Region,
China. g. Taiwan Crystal Technology International (HK) Limited was incorporated on July 16, 2010 in Hong
Kong Special Administrative Region, China. h. TXC (Chongqing) Corporation was incorporated on October 11, 2010 in Chongqing, China. i. Chongqing All Sun Corporation was incorporated on February 10, 2011 in Chongqing, China. j. Ningbo Jingyu Company Limited was incorporated on September 7, 2011 in Ningbo, China. k. TXC Europe SRL was incorporated on November 14, 2011 in Europe and applied for cancellation of
registration in 2012. As of December 31, 2012, it has not yet received the approval from the government.
TXC Corporation and its consolidated subsidiaries, listed above, are hereinafter collectively referred to as the “Corporation”. Foreign Currencies The financial statements of foreign operations are translated into New Taiwan dollars at the following exchange rates: a. Assets and liabilities - at exchange rates prevailing on the balance sheet date; b. Shareholders’ equity - at historical exchange rates; c. Dividends - at the exchange rate prevailing on the dividend declaration date; and d. Income and expenses - at average exchange rates for the year. Exchange differences arising from the translation of the financial statements of foreign operations are recognized as a separate component of shareholders’ equity. Such exchange differences are recognized in profit or loss in the year in which the foreign operations are disposed of.
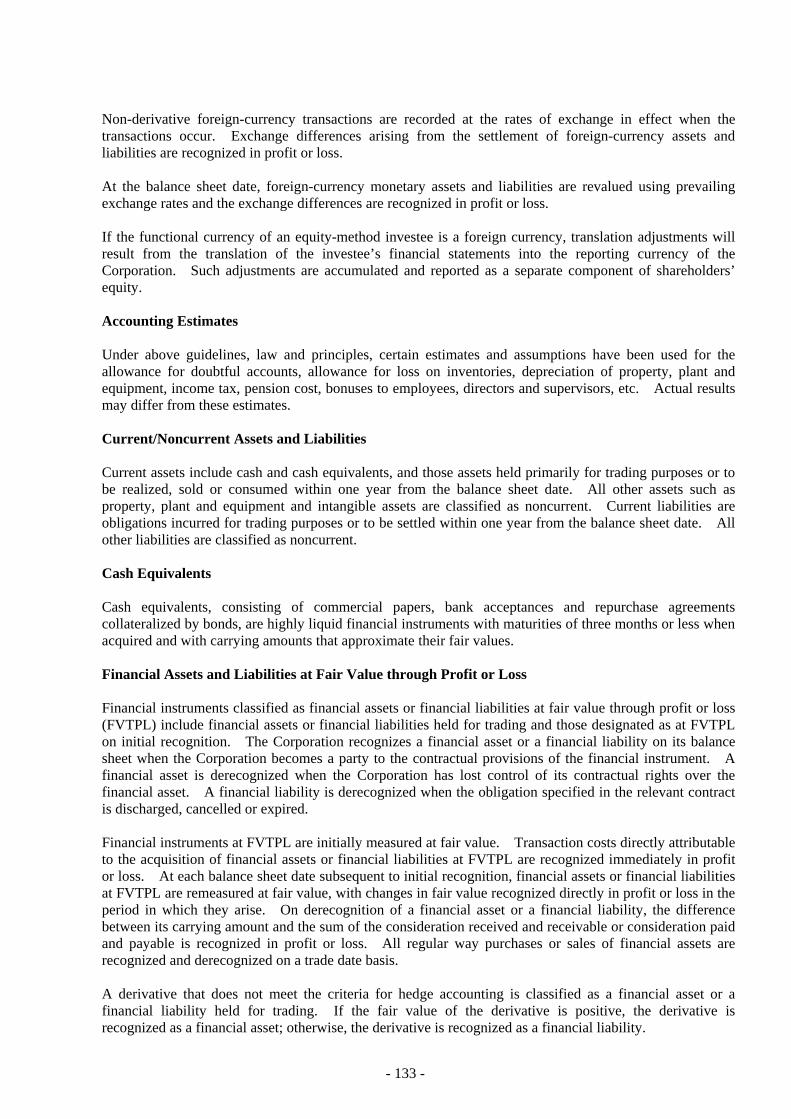
- 133 -
Non-derivative foreign-currency transactions are recorded at the rates of exchange in effect when the transactions occur. Exchange differences arising from the settlement of foreign-currency assets and liabilities are recognized in profit or loss. At the balance sheet date, foreign-currency monetary assets and liabilities are revalued using prevailing exchange rates and the exchange differences are recognized in profit or loss. If the functional currency of an equity-method investee is a foreign currency, translation adjustments will result from the translation of the investee’s financial statements into the reporting currency of the Corporation. Such adjustments are accumulated and reported as a separate component of shareholders’ equity. Accounting Estimates Under above guidelines, law and principles, certain estimates and assumptions have been used for the allowance for doubtful accounts, allowance for loss on inventories, depreciation of property, plant and equipment, income tax, pension cost, bonuses to employees, directors and supervisors, etc. Actual results may differ from these estimates. Current/Noncurrent Assets and Liabilities Current assets include cash and cash equivalents, and those assets held primarily for trading purposes or to be realized, sold or consumed within one year from the balance sheet date. All other assets such as property, plant and equipment and intangible assets are classified as noncurrent. Current liabilities are obligations incurred for trading purposes or to be settled within one year from the balance sheet date. All other liabilities are classified as noncurrent. Cash Equivalents Cash equivalents, consisting of commercial papers, bank acceptances and repurchase agreements collateralized by bonds, are highly liquid financial instruments with maturities of three months or less when acquired and with carrying amounts that approximate their fair values. Financial Assets and Liabilities at Fair Value through Profit or Loss Financial instruments classified as financial assets or financial liabilities at fair value through profit or loss (FVTPL) include financial assets or financial liabilities held for trading and those designated as at FVTPL on initial recognition. The Corporation recognizes a financial asset or a financial liability on its balance sheet when the Corporation becomes a party to the contractual provisions of the financial instrument. A financial asset is derecognized when the Corporation has lost control of its contractual rights over the financial asset. A financial liability is derecognized when the obligation specified in the relevant contract is discharged, cancelled or expired. Financial instruments at FVTPL are initially measured at fair value. Transaction costs directly attributable to the acquisition of financial assets or financial liabilities at FVTPL are recognized immediately in profit or loss. At each balance sheet date subsequent to initial recognition, financial assets or financial liabilities at FVTPL are remeasured at fair value, with changes in fair value recognized directly in profit or loss in the period in which they arise. On derecognition of a financial asset or a financial liability, the difference between its carrying amount and the sum of the consideration received and receivable or consideration paid and payable is recognized in profit or loss. All regular way purchases or sales of financial assets are recognized and derecognized on a trade date basis. A derivative that does not meet the criteria for hedge accounting is classified as a financial asset or a financial liability held for trading. If the fair value of the derivative is positive, the derivative is recognized as a financial asset; otherwise, the derivative is recognized as a financial liability.

- 134 -
Fair values of financial assets and financial liabilities at the balance sheet date are determined as follows: Bonds - at prices quoted by the Taiwan GreTai Securities Market, and financial assets and financial liabilities without quoted prices in an active market - at values determined using valuation techniques. Available-for-sale Financial Assets Available-for-sale financial assets are initially measured at fair value plus transaction costs that are directly attributable to the acquisition. At each balance sheet date subsequent to initial recognition, available-for-sale financial assets are remeasured at fair value, with changes in fair value recognized in equity until the financial assets are disposed of, at which time, the cumulative gain or loss previously recognized in equity is included in profit or loss for the period. All regular way purchases or sales of financial assets are recognized and derecognized on a trade date basis. The recognition, derecognition and the fair value bases of available-for-sale financial assets are the same with those of financial assets at FVTPL. An impairment loss is recognized when there is objective evidence that the financial asset is impaired. Any subsequent decrease in impairment loss for an equity instrument classified as available-for-sale is recognized directly in equity. If the fair value of a debt instrument classified as available-for-sale subsequently increases as a result of an event which occurred after the impairment loss was recognized, the decrease in impairment loss is reversed to profit. Fair value of financial assets at the balance sheet date is determined as follows: Open-end mutual funds - at net asset values. Financial Assets Carried at Cost Investments in equity instruments with no quoted prices in an active market and with fair values that cannot be reliably measured, such as non-publicly traded stocks and stocks traded in the Emerging Stock Market, are measured at their original cost. The accounting treatment for dividends on financial assets carried at cost is the same with that for dividends on available-for-sale financial assets. An impairment loss is recognized when there is objective evidence that the asset is impaired. A reversal of this impairment loss is disallowed. Impairment of Accounts Receivable An allowance for doubtful accounts is provided on the basis of a review of the collectibility of accounts receivable. The Corporation assesses the probability of collections of accounts receivable by examining the aging analysis of the outstanding receivables and assessing the value of the collateral provided by customers. As discussed in Note 3 to the financial statements, on January 1, 2011, the Corporation adopted the third-time revised Statement of Financial Accounting Standards (SFAS) No. 34, “Financial Instruments: Recognition and Measurement.” One of the main revisions is that impairment of receivables originated by the Corporation should be covered by SFAS No. 34. Accounts receivable are assessed for impairment at the end of each reporting period and considered to be impaired when there is objective evidence that, as a result of one or more events that occurred after the initial recognition of the accounts receivable, the estimated future cash flows of the asset have been affected. Objective evidence of impairment could include: Significant financial difficulty of the debtor; Accounts receivable becoming overdue; or It is becoming probable that the debtor will enter bankruptcy or financial re-organization.

- 135 -
Accounts receivable that are assessed as not impaired individually are further assessed for impairment on a collective basis. Objective evidence of impairment for a portfolio of accounts receivable could include the Corporation’s past experience in the collection of payments, an increase in the number of delayed payments, as well as observable changes in national or local economic conditions that correlate with defaults on receivables. The amount of the impairment loss recognized is the difference between the asset carrying amount and the present value of estimated future cash flows, after taking into account the related collateral and guarantees, discounted at the receivable’s original effective interest rate. The carrying amount of the accounts receivable is reduced through the use of an allowance account. When accounts receivable are considered uncollectible, they are written off against the allowance account. Recoveries of amounts previously written off are credited to the allowance account. Changes in the carrying amount of the allowance account are recognized as bad debt in profit or loss. Impairment of Assets If the recoverable amount of an asset (mainly property, plant and equipment, idle assets, leased assets and investments accounted for by the equity method) is estimated to be less than its carrying amount, the carrying amount of the asset is reduced to its recoverable amount. An impairment loss is charged to earnings unless the asset is carried at a revalued amount, in which case the impairment loss is first treated as a deduction to the unrealized revaluation increment and any remaining loss is charged earnings. If an impairment loss subsequently reverses, the carrying amount of the asset is increased accordingly, but the increased carrying amount may not exceed the carrying amount that would have been determined had no impairment loss been recognized for the asset in prior years. A reversal of an impairment loss is recognized in earnings, unless the asset is carried at a revalued amount, in which case the reversal of the impairment loss is first recognized as gains to the extent that an impairment loss on the same revalued asset was previously charged to earnings. Inventories Inventories consist of raw materials, supplies and spare parts, work-in-process, finished goods and merchandise and are stated at the lower of cost or net realizable value. Inventory write-downs are made item by item, except where it may be appropriate to group similar or related items. Net realizable value is the estimated selling price of inventories less all estimated costs of completion and costs necessary to make the sale. Inventories are recorded at weighted-average cost on the balance sheet date. Investments Accounted for by the Equity Method Investments in which the Corporation holds 20 percent or more of the investees’ voting shares or exercises significant influence over the investees’ operating and financial policy decisions are accounted for by the equity method. Profits from downstream transactions with an equity-method investee are eliminated in proportion to the Corporation’s percentage of ownership in the investee; however, if the Corporation has control over the investee, all the profits are eliminated. Profits from upstream transactions with an equity-method investee are eliminated in proportion to the Corporation’s percentage of ownership in the investee. Property, Plant and Equipment, Assets Leased to Others and Idle Assets Property, plant and equipment and assets leased to others are stated at cost plus revaluation increment less accumulated depreciation. Borrowing costs directly attributable to the acquisition or construction of property, plant and equipment are capitalized as part of the cost of those assets. Major additions and improvements to property, plant and equipment are capitalized, while costs of repairs and maintenance are expensed currently.

- 136 -
Depreciation is provided on a straight-line basis over the estimated useful lives as follows: buildings - 2 to 55 years; machinery and equipment - 3 to 14 years; transportation equipment - 3 to 8 years; office equipment - 2 to 6 years; assets leased to others - 4 to 61 years. Property, plant and equipment and assets leased to others still in use beyond their original estimated useful lives are further depreciated over their new estimated useful lives. Depreciation of revaluated assets is provided on a straight-line basis over their remaining estimated useful lives determined at the time of revaluation. The related cost (including revaluation increment), accumulated depreciation, accumulated impairment losses and any unrealized revaluation increment of an item of property, plant and equipment are derecognized from the balance sheet upon its disposal. Any gain or loss on disposal of the asset is included in nonoperating gains or losses in the period of disposal. Convertible Bonds For convertible bonds issued on or after January 1, 2006, the Corporation first determines the carrying amount of the liability component by measuring the fair value of a similar liability that does not have an associated equity component, then determines the carrying amount of the equity component, representing the equity conversion option, by deducting the fair value of the liability component from the fair value of the convertible bonds as a whole. The liability component (excluding the embedded derivatives) is measured at amortized cost using the effective interest method, while the embedded non-equity derivatives are measured at fair value. Upon conversion, the Corporation uses the aggregate carrying amount of the liability and equity components of the bonds at the time of conversion as a basis to record the common shares issued. Pension Cost Pension cost under a defined benefit plan is determined by actuarial valuations. Contributions made under a defined contribution plan are recognized as pension cost during the period in which employees render services. Curtailment or settlement gains or losses of the defined benefit plan are recognized as part of the net periodic pension cost for the period. Income Tax The Corporation applies the intra-period and inter-period allocation method to its income tax, whereby (1) a portion of income tax expense is allocated to the cumulative effect of changes in accounting principles; and (2) deferred income tax assets and liabilities are recognized for the tax effects of temporary differences, unused loss carryforward and unused tax credits. Valuation allowances is provided to the extent, if any, that it is more likely than not that deferred income tax assets will not be realized. A deferred tax asset or liability is classified as current or noncurrent in accordance with the classification of its related asset or liability. However, if a deferred income tax asset or liability does not relate to an asset or liability in the financial statements, then it is classified as either current or noncurrent based on the expected length of time before it is realized or settled. If the Corporation can control the timing of the reversal of a temporary difference between the book value and the tax basis of a long-term equity investment in a foreign subsidiary or joint venture and if the temporary difference is not expected to reverse in the foreseeable future and will, in effect, exist indefinitely, then a deferred tax liability or asset is not recognized. Tax credits for purchases of machinery, equipment and technology, research and development expenditures, and personnel training expenditures are recognized using the flow-through method.

- 137 -
Adjustments of prior years’ tax liabilities are added to or deducted from the current period’s tax provision. According to the Income Tax Law, an additional tax at 10% of unappropriated earnings is provided for as income tax in the year the shareholders approve to retain the earnings. TCTI and GPT are tax-exempt companies incorporated in Samoa and the British Virgin Islands. The Corporation’s other subsidiaries, including TXC Technology, Inc., TXC Japan Corporation, and TXC Europe, are subject to their respective country’s income tax law. TXC (H.K.) Limited and TCTI-HK are subject to income tax at the rate of 17.5% on income generated in Hong Kong; otherwise, income tax rate is 0%. According to “Enterprise Income Tax Law of the People’s Republic of China”, enterprises within the territory of the People’s Republic of China are subject to income tax at the rate of 25%. For State-encouraged new technology and high technology enterprises such as NGB, income tax rate is reduced to 15%. Stock-based Compensation Employee stock options granted between January 1, 2004 and December 31, 2007 were accounted for under the interpretations issued by the Accounting Research and Development Foundation (“ARDF”). The Corporation adopted the intrinsic value method, under which compensation cost is recognized on a straight-line basis over the vesting period. Treasury Stock Treasury stock is stated at cost and shown as a deduction from shareholders’ equity. Revenue Recognition Revenue from sales of goods is recognized when the Corporation has transferred to the buyer the significant risks and rewards of ownership of the goods, primarily upon shipment, because the earnings process has been completed and the economic benefits associated with the transaction have been realized or are realizable. The Corporation does not recognize sales revenue on materials delivered to subcontractors because this delivery does not involve a transfer of risks and rewards of materials ownership. Revenue is measured at the fair value of the consideration received or receivable and represents amounts agreed between the Corporation and the customers for goods sold in the normal course of business, net of sales discounts and volume rebates. For trade receivables due within one year from the balance sheet date, as the nominal value of the consideration to be received approximates its fair value and transactions are frequent, fair value of the consideration is not determined by discounting all future receipts using an imputed rate of interest. Reclassifications Certain accounts in the financial statements as of and for the year ended December 31, 2011 have been reclassified to conform to the presentation of the financial statements as of and for the year ended December 31, 2012.
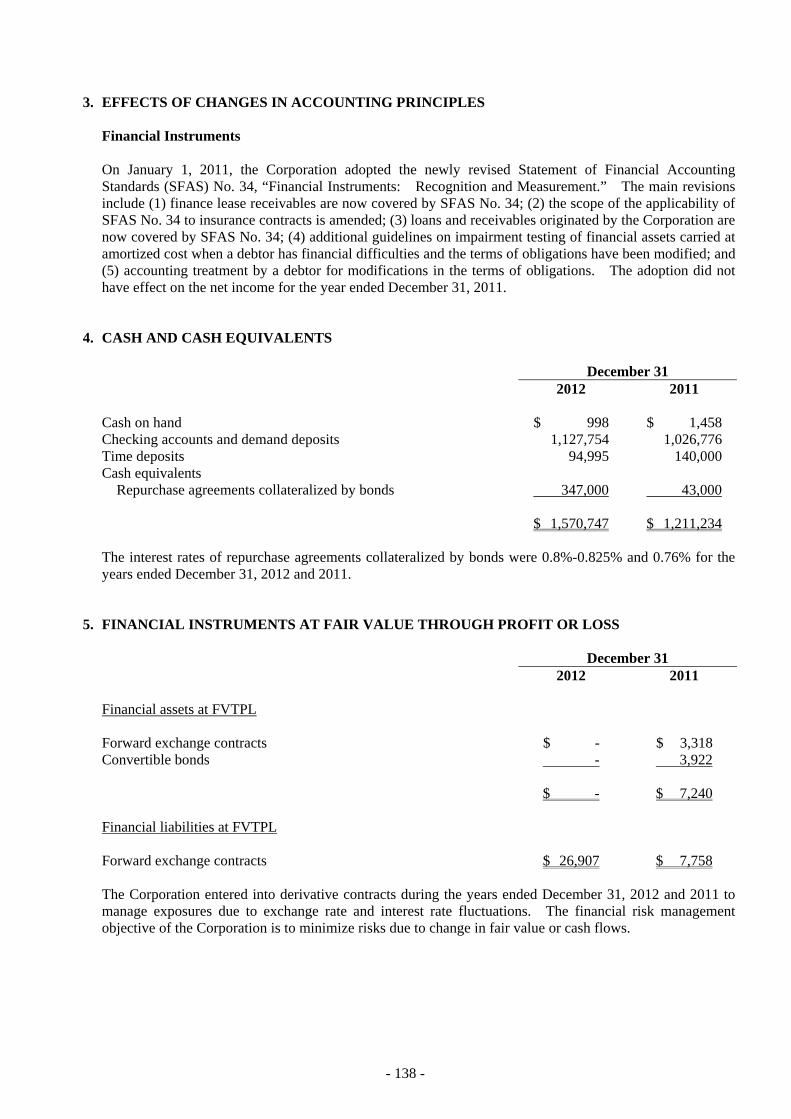
- 138 -
3. EFFECTS OF CHANGES IN ACCOUNTING PRINCIPLES Financial Instruments On January 1, 2011, the Corporation adopted the newly revised Statement of Financial Accounting Standards (SFAS) No. 34, “Financial Instruments: Recognition and Measurement.” The main revisions include (1) finance lease receivables are now covered by SFAS No. 34; (2) the scope of the applicability of SFAS No. 34 to insurance contracts is amended; (3) loans and receivables originated by the Corporation are now covered by SFAS No. 34; (4) additional guidelines on impairment testing of financial assets carried at amortized cost when a debtor has financial difficulties and the terms of obligations have been modified; and (5) accounting treatment by a debtor for modifications in the terms of obligations. The adoption did not have effect on the net income for the year ended December 31, 2011.
4. CASH AND CASH EQUIVALENTS
December 31 2012 2011 Cash on hand $ 998 $ 1,458 Checking accounts and demand deposits 1,127,754 1,026,776 Time deposits 94,995 140,000 Cash equivalents
Repurchase agreements collateralized by bonds 347,000 43,000 $ 1,570,747 $ 1,211,234 The interest rates of repurchase agreements collateralized by bonds were 0.8%-0.825% and 0.76% for the years ended December 31, 2012 and 2011.
5. FINANCIAL INSTRUMENTS AT FAIR VALUE THROUGH PROFIT OR LOSS
December 31 2012 2011 Financial assets at FVTPL Forward exchange contracts $ - $ 3,318 Convertible bonds - 3,922 $ - $ 7,240 Financial liabilities at FVTPL Forward exchange contracts $ 26,907 $ 7,758 The Corporation entered into derivative contracts during the years ended December 31, 2012 and 2011 to manage exposures due to exchange rate and interest rate fluctuations. The financial risk management objective of the Corporation is to minimize risks due to change in fair value or cash flows.

- 139 -
Outstanding forward contracts as of December 31, 2012 and 2011 were as follows:
Currency Maturity Date Contract Amount
(In Thousands) December 31, 2012 Sell USD/NTD January 2, 2013 to March 26, 2013 USD24,500/NTD714,837 Sell USD/JPY January 4, 2013 to March 5, 2013 USD19,000/JPY1,561,562Buy JPY/NTD January 10, 2013 to February 20, 2013 JPY160,000/NTD58,484 Sell USD/RMB January 30, 2013 to April 26, 2013 USD17,500/RMB110,115 December 31, 2011 Sell USD/NTD January 3, 2012 to April 9, 2012 USD55,000/NTD1,656,290Sell USD/JPY January 4, 2012 to March 9, 2012 USD21,000/JPY1,629,455Sell NTD/JPY January 4, 2012 to February 6, 2012 NTD141,889/JPY360,000 Sell USD/RMB January 5, 2012 to May 29, 2012 USD23,000/RMB146,059 Net losses on financial instruments held for trading for the years ended December 31, 2012 and 2011 were $26,747 thousand and $12,705 thousand, respectively.
6. AVAILABLE-FOR-SALE FINANCIAL ASSETS
December 31 2012 2011 Mutual funds $ 46,895 $ 71,867
7. NOTES RECEIVABLE AND ACCOUNTS RECEIVABLE
December 31 2012 2011 Notes receivable, third parties $ 17,223 $ 30,978 Less: Allowance for doubtful accounts (3) (33) $ 17,220 $ 30,945 Accounts receivable, third parties $ 3,474,882 $ 3,121,283 Accounts receivable, related parties 10,551 6,183 3,485,433 3,127,466 Less: Allowance for doubtful accounts, third parties (21,029) (24,363)
Allowance for doubtful accounts, related parties (85) (31) $ 3,464,319 $ 3,103,072

- 140 -
Movements of allowance for doubtful accounts were as follows:
Years Ended December 31 2012 2011
Notes
Receivable Accounts
Receivable Notes
Receivable Accounts
Receivable Balance, beginning of year $ 33 $ 24,394 $ 8 $ 23,908 Add (deduct): Provision for
(reversal of) doubtful accounts
(30) (2,915) 25 - Deduct: Amounts written off - (193) - - Add (deduct): Effect of exchange
rate changes
- (172) - 486 Balance, end of year $ 3 $ 21,114 $ 33 $ 24,394
8. INVENTORIES
December 31 2012 2011 Raw materials $ 236,125 $ 221,584 Supplies and spare parts 53,017 56,312 Work in process 297,817 191,649 Finished goods 373,686 404,539 Merchandise 315,482 285,952 Prepayment for land purchases 200,435 - $ 1,476,562 $ 1,160,036 Prepayment for land purchases is the payment made by Chongqing All Sum to acquire the land use right in Chongqing Gao-Shing District to develop and sell real estate. As of December 31, 2012, the price has been paid and the transfer of ownership is in process. As of December 31, 2012 and 2011, the allowance for inventory devaluation was $42,131 thousand and $41,848 thousand, respectively. The cost of inventories recognized as cost of goods sold for the years ended December 31, 2012 and 2011 were $8,420,200 thousand and $7,496,695 thousand, respectively, which included $21,885 thousand and $36,514 thousand, respectively, due to write-downs of inventories and loss on physical inventory.
9. INVESTMENT ACCOUNTED FOR BY THE EQUITY METHOD
December 31 2012 2011
Carrying Amount
% of Ownership
Carrying Amount
% of Ownership
Unlisted companies
TSE Technology (Ningbo) Co., Ltd. $ 45,950 23 $ 48,657 23
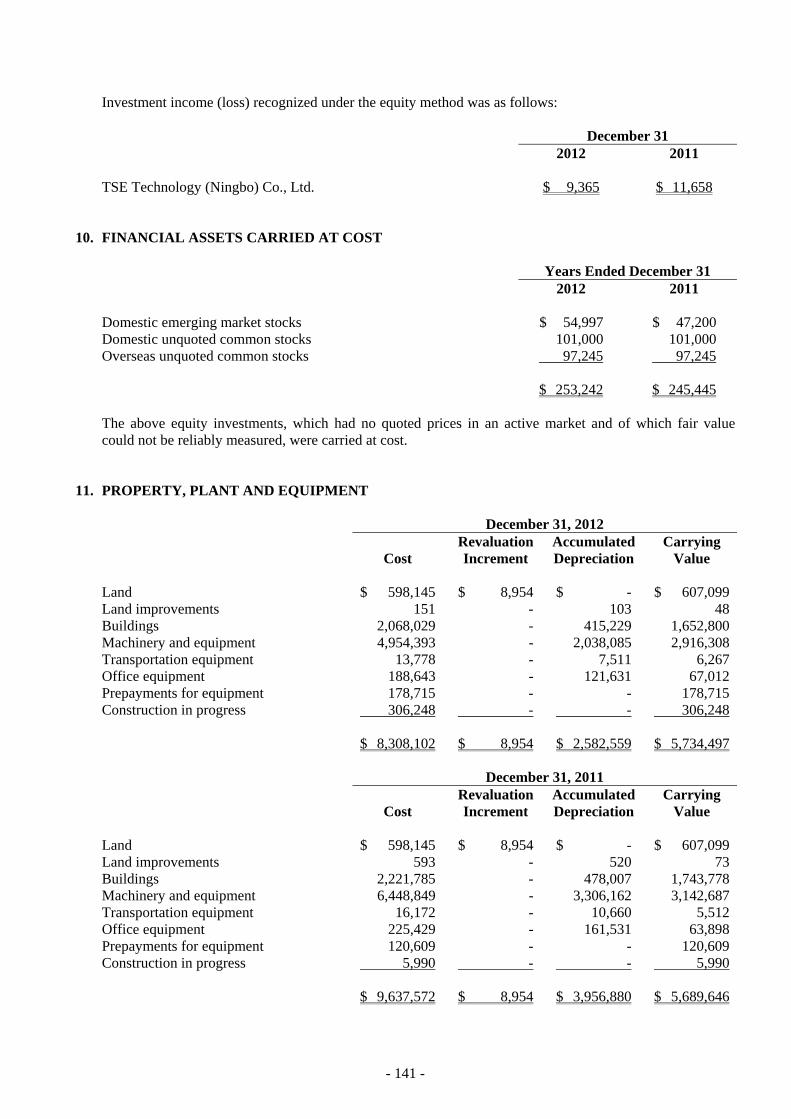
- 141 -
Investment income (loss) recognized under the equity method was as follows: December 31 2012 2011 TSE Technology (Ningbo) Co., Ltd. $ 9,365 $ 11,658
10. FINANCIAL ASSETS CARRIED AT COST
Years Ended December 31 2012 2011 Domestic emerging market stocks $ 54,997 $ 47,200 Domestic unquoted common stocks 101,000 101,000 Overseas unquoted common stocks 97,245 97,245 $ 253,242 $ 245,445 The above equity investments, which had no quoted prices in an active market and of which fair value could not be reliably measured, were carried at cost.
11. PROPERTY, PLANT AND EQUIPMENT
December 31, 2012
Cost Revaluation Increment
Accumulated Depreciation
Carrying Value
Land $ 598,145 $ 8,954 $ - $ 607,099Land improvements 151 - 103 48Buildings 2,068,029 - 415,229 1,652,800Machinery and equipment 4,954,393 - 2,038,085 2,916,308Transportation equipment 13,778 - 7,511 6,267Office equipment 188,643 - 121,631 67,012Prepayments for equipment 178,715 - - 178,715Construction in progress 306,248 - - 306,248 $ 8,308,102 $ 8,954 $ 2,582,559 $ 5,734,497
December 31, 2011
Cost Revaluation Increment
Accumulated Depreciation
Carrying Value
Land $ 598,145 $ 8,954 $ - $ 607,099Land improvements 593 - 520 73Buildings 2,221,785 - 478,007 1,743,778Machinery and equipment 6,448,849 - 3,306,162 3,142,687Transportation equipment 16,172 - 10,660 5,512Office equipment 225,429 - 161,531 63,898Prepayments for equipment 120,609 - - 120,609Construction in progress 5,990 - - 5,990 $ 9,637,572 $ 8,954 $ 3,956,880 $ 5,689,646

- 142 -
There was no interest capitalized in 2012 and 2011. The Corporation revalued its land in 1996, which resulted in total revaluation increments of $8,954 thousand. The net revaluation amount of $5,442 thousand after deducting the reserve for land value increment tax of $3,512 thousand was credited to equity as unrealized revaluation increment. See Note 25 for collaterals on loans.
12. OTHER ASSETS Leased to Others December 31, 2012
Book Value Accumulated Impairment Carrying Value
Land $ 2,602 $ - $ 2,602 Buildings 74,449 (18,498) 55,951 $ 77,051 $ (18,498) $ 58,553 December 31, 2011
Book Value Accumulated Impairment Carrying Value
Land $ 2,602 $ - $ 2,602 Buildings 72,335 (18,011) 54,324 $ 74,937 $ (18,011) $ 56,926 Idle Assets Idle assets are land, building and equipment retired from active use. December 31 2012 2011 Book value $ 36,617 $ 36,293 Accumulated impairment (36,617) (36,293) $ - $ - The part of equipment not used in operating activities was reclassified into idle assets and deducted with valuation loss $22,430 thousand and $19,942 thousand for the years ended December 31, 2012 and 2011, respectively.

- 143 -
13. SHORT-TERM LOANS
December 31 2012 2011
Interest Rate
% Amounts Interest Rate
% Amounts Unsecured bank loans 0.96-2.23 $ 247,266 0.60-1.25 $ 294,419 Secured bank loans 0.611-0.616 43,483 1.58-1.867 66,204 $ 290,749 $ 360,623 See Note 25 for details of pledged assets.
14. BONDS PAYABLE
December 31 2012 2011 Third unsecured domestic convertible bonds $ 556,100 $ 799,400 Less: Discount on bonds payable (21) (10,033) Less: Current portion (556,079) - $ - $ 789,367 Third Unsecured Domestic Convertible Bonds On January 11, 2010, the Corporation issued third unsecured domestic convertible bonds with an aggregate value of $800,000 thousand. According to Statement of Financial Accounting Standards No. 36, “Disclosure and Presentation of Financial Instruments,” these unsecured domestic convertible bonds were separated into convertible options, equity, and bonds payable. Other details of the bond issuance are summarized as follows: a. Issue date: January 11, 2010. b. Total issue amount: $800,000 thousand. c. Issue price: 100%. d. Par value: $100 thousand. e. Coupon rate: 0%. f. Repayment term: The bonds are repayable on January 11, 2013 upon the maturity of the bonds. g. Conversion right: Holder can request for conversion of the bonds to the Corporation’s common stock. h. Conversion period: From February 12, 2010 to January 1, 2013. i. Conversion price: The original conversion price per share is $57.6. The conversion price is subject
to adjustment based on a certain formula if there are changes in outstanding shares or execution of conversion below market price. The conversion price per share is $48 on December 31, 2012.
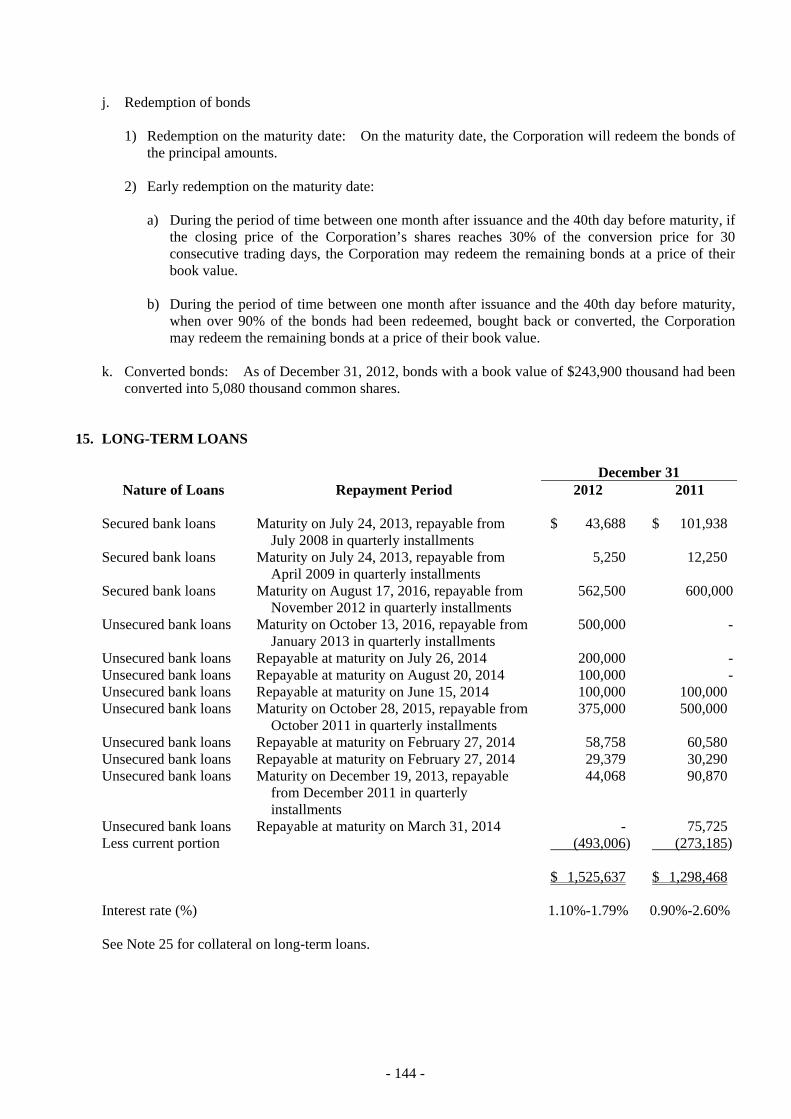
- 144 -
j. Redemption of bonds
1) Redemption on the maturity date: On the maturity date, the Corporation will redeem the bonds of the principal amounts.
2) Early redemption on the maturity date:
a) During the period of time between one month after issuance and the 40th day before maturity, if the closing price of the Corporation’s shares reaches 30% of the conversion price for 30 consecutive trading days, the Corporation may redeem the remaining bonds at a price of their book value.
b) During the period of time between one month after issuance and the 40th day before maturity,
when over 90% of the bonds had been redeemed, bought back or converted, the Corporation may redeem the remaining bonds at a price of their book value.
k. Converted bonds: As of December 31, 2012, bonds with a book value of $243,900 thousand had been
converted into 5,080 thousand common shares. 15. LONG-TERM LOANS
December 31Nature of Loans Repayment Period 2012 2011
Secured bank loans Maturity on July 24, 2013, repayable from
July 2008 in quarterly installments $ 43,688 $ 101,938
Secured bank loans Maturity on July 24, 2013, repayable from April 2009 in quarterly installments
5,250 12,250
Secured bank loans Maturity on August 17, 2016, repayable from November 2012 in quarterly installments
562,500 600,000
Unsecured bank loans Maturity on October 13, 2016, repayable from January 2013 in quarterly installments
500,000 -
Unsecured bank loans Repayable at maturity on July 26, 2014 200,000 -Unsecured bank loans Repayable at maturity on August 20, 2014 100,000 -Unsecured bank loans Repayable at maturity on June 15, 2014 100,000 100,000Unsecured bank loans Maturity on October 28, 2015, repayable from
October 2011 in quarterly installments 375,000 500,000
Unsecured bank loans Repayable at maturity on February 27, 2014 58,758 60,580Unsecured bank loans Repayable at maturity on February 27, 2014 29,379 30,290Unsecured bank loans Maturity on December 19, 2013, repayable
from December 2011 in quarterly installments
44,068 90,870
Unsecured bank loans Repayable at maturity on March 31, 2014 - 75,725Less current portion (493,006) (273,185) $ 1,525,637 $ 1,298,468 Interest rate (%) 1.10%-1.79% 0.90%-2.60% See Note 25 for collateral on long-term loans.
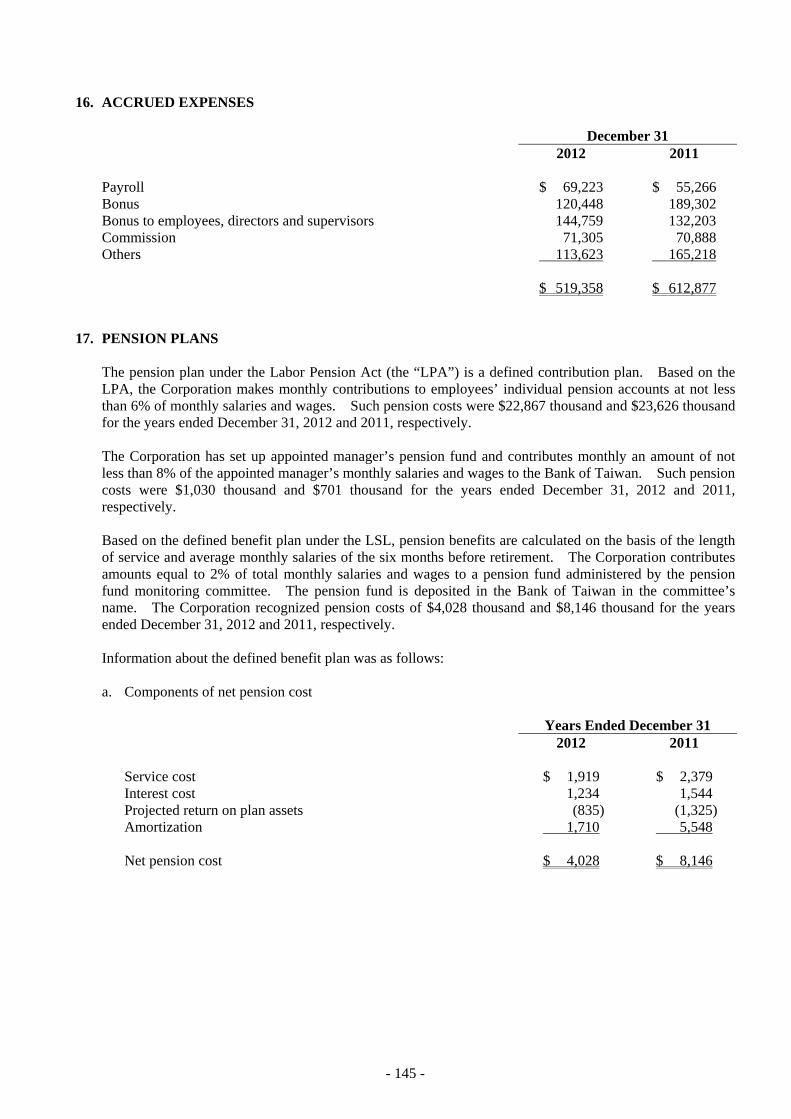
- 145 -
16. ACCRUED EXPENSES
December 31 2012 2011 Payroll $ 69,223 $ 55,266 Bonus 120,448 189,302 Bonus to employees, directors and supervisors 144,759 132,203 Commission 71,305 70,888 Others 113,623 165,218 $ 519,358 $ 612,877
17. PENSION PLANS
The pension plan under the Labor Pension Act (the “LPA”) is a defined contribution plan. Based on the LPA, the Corporation makes monthly contributions to employees’ individual pension accounts at not less than 6% of monthly salaries and wages. Such pension costs were $22,867 thousand and $23,626 thousand for the years ended December 31, 2012 and 2011, respectively. The Corporation has set up appointed manager’s pension fund and contributes monthly an amount of not less than 8% of the appointed manager’s monthly salaries and wages to the Bank of Taiwan. Such pension costs were $1,030 thousand and $701 thousand for the years ended December 31, 2012 and 2011, respectively. Based on the defined benefit plan under the LSL, pension benefits are calculated on the basis of the length of service and average monthly salaries of the six months before retirement. The Corporation contributes amounts equal to 2% of total monthly salaries and wages to a pension fund administered by the pension fund monitoring committee. The pension fund is deposited in the Bank of Taiwan in the committee’s name. The Corporation recognized pension costs of $4,028 thousand and $8,146 thousand for the years ended December 31, 2012 and 2011, respectively. Information about the defined benefit plan was as follows: a. Components of net pension cost
Years Ended December 31 2012 2011 Service cost $ 1,919 $ 2,379 Interest cost 1,234 1,544 Projected return on plan assets (835) (1,325) Amortization 1,710 5,548 Net pension cost $ 4,028 $ 8,146
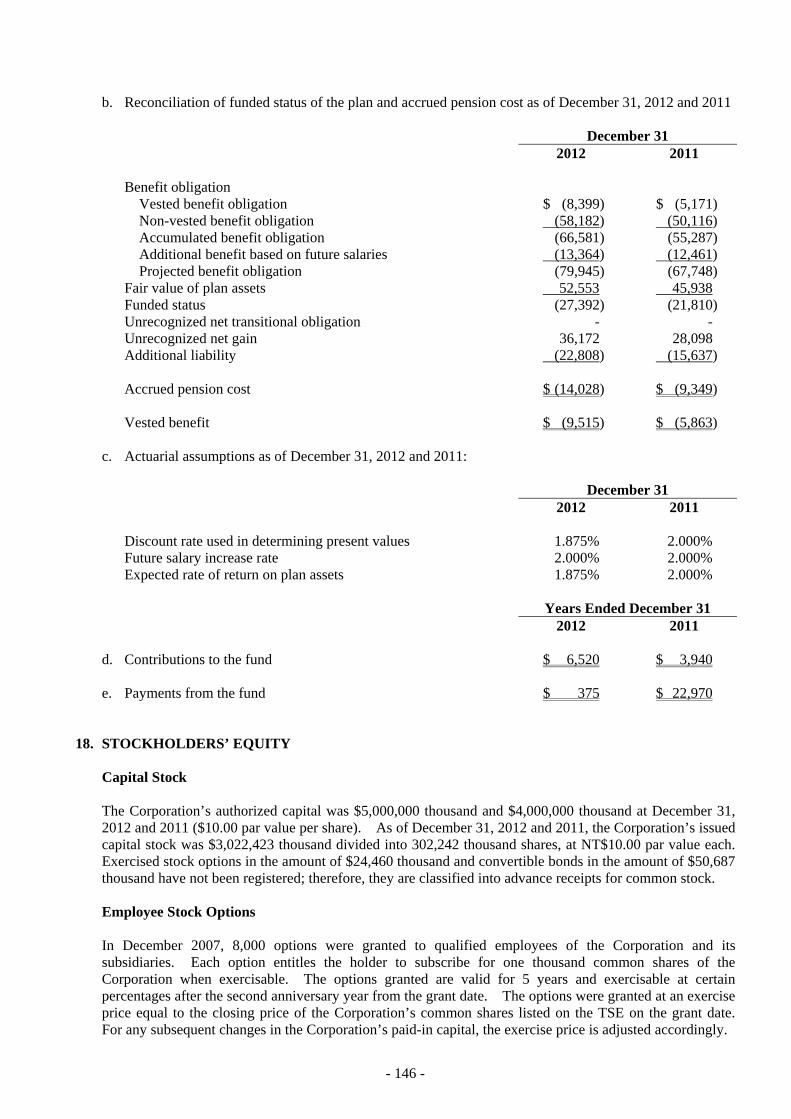
- 146 -
b. Reconciliation of funded status of the plan and accrued pension cost as of December 31, 2012 and 2011
December 31 2012 2011 Benefit obligation
Vested benefit obligation $ (8,399) $ (5,171) Non-vested benefit obligation (58,182) (50,116) Accumulated benefit obligation (66,581) (55,287) Additional benefit based on future salaries (13,364) (12,461) Projected benefit obligation (79,945) (67,748)
Fair value of plan assets 52,553 45,938 Funded status (27,392) (21,810) Unrecognized net transitional obligation - - Unrecognized net gain 36,172 28,098 Additional liability (22,808) (15,637) Accrued pension cost $ (14,028) $ (9,349) Vested benefit $ (9,515) $ (5,863)
c. Actuarial assumptions as of December 31, 2012 and 2011:
December 31 2012 2011
Discount rate used in determining present values 1.875% 2.000% Future salary increase rate 2.000% 2.000% Expected rate of return on plan assets 1.875% 2.000%
Years Ended December 31 2012 2011 d. Contributions to the fund $ 6,520 $ 3,940 e. Payments from the fund $ 375 $ 22,970
18. STOCKHOLDERS’ EQUITY
Capital Stock The Corporation’s authorized capital was $5,000,000 thousand and $4,000,000 thousand at December 31, 2012 and 2011 ($10.00 par value per share). As of December 31, 2012 and 2011, the Corporation’s issued capital stock was $3,022,423 thousand divided into 302,242 thousand shares, at NT$10.00 par value each. Exercised stock options in the amount of $24,460 thousand and convertible bonds in the amount of $50,687 thousand have not been registered; therefore, they are classified into advance receipts for common stock. Employee Stock Options In December 2007, 8,000 options were granted to qualified employees of the Corporation and its subsidiaries. Each option entitles the holder to subscribe for one thousand common shares of the Corporation when exercisable. The options granted are valid for 5 years and exercisable at certain percentages after the second anniversary year from the grant date. The options were granted at an exercise price equal to the closing price of the Corporation’s common shares listed on the TSE on the grant date. For any subsequent changes in the Corporation’s paid-in capital, the exercise price is adjusted accordingly.

- 147 -
Information related to employee stock option plans was as follows: Years Ended December 31 2012 2011
Number of Options (In Thousands)
Weighted-average Exercise
Price (NT$)
Number of Options (In Thousands)
Weighted-average Exercise
Price (NT$)
Balance, beginning of year 2,627 $ 39.7 4,954 $ 42.9 Options granted - - - - Options forfeited - - - - Options exercised (2,446) 37.8 (2,122) 42.9 Options expired (181) - (205) - Balance, end of year - - 2,627 39.7 Options exercisable, end of year - 2,627 Options granted during the year 2007 were priced using the Black-Scholes pricing model and the inputs to the model were as follows: Grant-date share price (NT$) 58.8 Exercise price (NT$) 58.8 Expected volatility 43.5% Expected life (years) 3.875 years Risk-free interest rate 2.42% Expected dividend yield - The pro forma information for the years ended December 31, 2012 and 2011 assuming employee stock options granted before January 1, 2008 were accounted for under SFAS No. 39 is as follows:
2012 2011 Net income $ 1,148,886 $ 1,050,216 After income tax basic earnings per share (NT$) $3.79 $3.48 In their meeting on June 13, 2012, the stockholders approved a restricted stock plan for employees with a total amount of NT$20,000 thousand, consisting of 2,000 thousand shares, and authorized the board of directors to determine the issue prices of the restricted shares when they are issued. The restrictions on the rights of the employees who acquire the restricted shares but have not met the vested conditions are as follows: a. The employees should not sell, pledge, transfer, donate or in any other way dispose of these shares. b. The employees holding these shares are not entitled to receive cash and stock dividends. c. The employees holding these shares have no voting right. If an employee fails to meet the vesting conditions, the Corporation will recall or buy back his/her restricted shares for cancellation. As of December 31, 2012, the Corporation had not yet issued any restricted shares to employees.

- 148 -
Capital Surplus Capital surplus comprised of the following: December 31 2012 2011 Issuance of common shares $ 325,830 $ 325,830 Conversion of bonds 977,028 772,417 Exercise of employee stock options 285,946 217,947 Conversion options 27,745 39,884 $ 1,616,549 $ 1,356,078 The capital surplus from shares issued in excess of par (including additional paid-in capital from issuance of common shares, conversion of bonds and treasury stock transactions) and donations may be used to offset a deficit; in addition, when the Corporation has no deficit, such capital surplus may be distributed as cash dividends or transferred to capital (limited to a certain percentage of the Corporation’s paid-in capital and once a year). The capital surplus from long-term investments, employee stock options and conversion options may not be used for any purpose. Appropriation of Earnings and Dividend Policy Under the Corporation’s Articles of Incorporation, the Corporation should appropriate 10% of its net income less any prior years’ deficit as legal reserve. The remaining amount may be fully retained or partially retained and partially distributed for dividends, upon the stockholders’ approval, according to the following percentages. a. Employee bonus - not less than 3% b. Directors and supervisors’ remuneration - not more than 2% c. Stock bonuses to employees include subsidiaries’ employees who meet certain criteria set by the
stockholders’ meetings.
Dividends are recommended by the board of directors in accordance with the Corporation’s dividend policy. Under this policy, industry trend and growth should be evaluated, investment opportunities should be fully understood, and proper capital adequacy ratios should be considered in determining the dividend to be distributed. In addition, cash dividends should not be less than 20% of the total dividends to be appropriated. For the years ended December 31, 2012 and 2011, the bonus to employees was $124,079 thousand and $113,317 thousand, respectively, and the remuneration to directors and supervisors was $20,680 thousand and $18,886 thousand, respectively. The bonus to employees and remuneration to directors and supervisors represented 12% and 2%, respectively, of net income (net of the bonus and remuneration). Material differences between such estimated amounts and the amounts proposed by the Board of Directors in the following year are adjusted for in the current year. If the actual amounts subsequently resolved by the stockholders differ from the proposed amounts, the differences are recorded in the year of stockholders’ resolution as a change in accounting estimate. If a share bonus is resolved to be distributed to employees, the number of shares is determined by dividing the amount of the share bonus by the closing price (after considering the effect of cash and stock dividends) of the shares of the day immediately preceding the stockholders’ meeting.
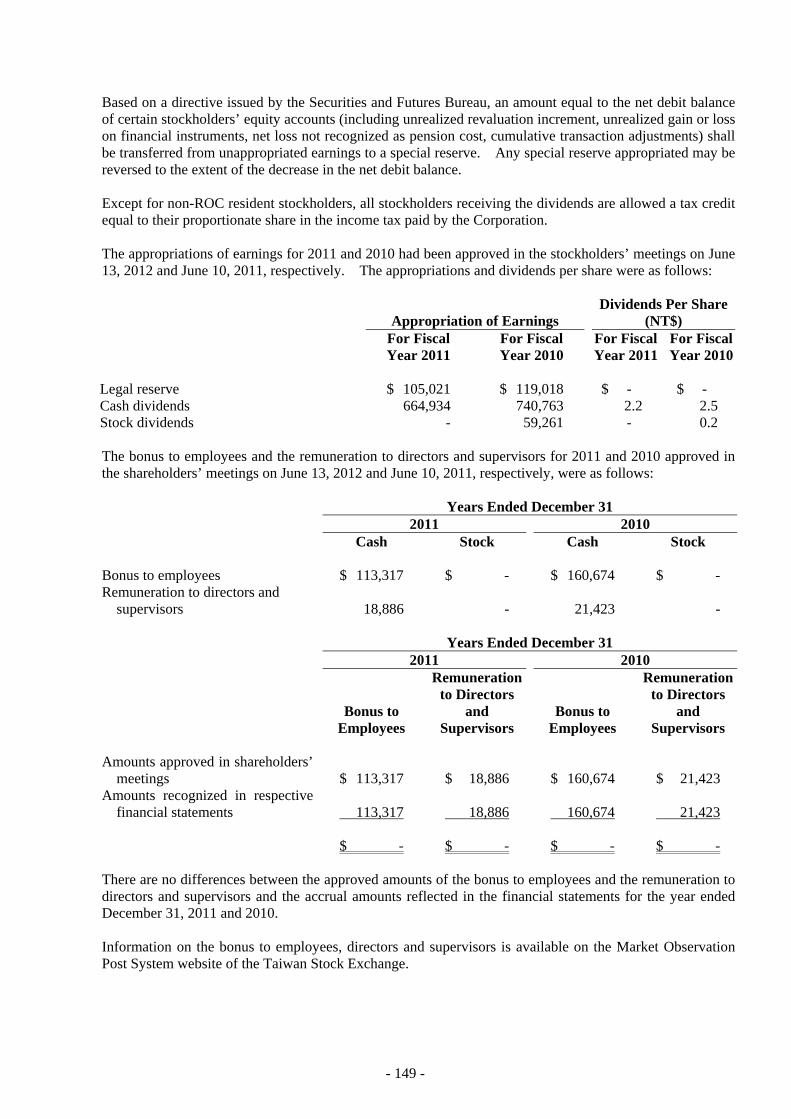
- 149 -
Based on a directive issued by the Securities and Futures Bureau, an amount equal to the net debit balance of certain stockholders’ equity accounts (including unrealized revaluation increment, unrealized gain or loss on financial instruments, net loss not recognized as pension cost, cumulative transaction adjustments) shall be transferred from unappropriated earnings to a special reserve. Any special reserve appropriated may be reversed to the extent of the decrease in the net debit balance. Except for non-ROC resident stockholders, all stockholders receiving the dividends are allowed a tax credit equal to their proportionate share in the income tax paid by the Corporation. The appropriations of earnings for 2011 and 2010 had been approved in the stockholders’ meetings on June 13, 2012 and June 10, 2011, respectively. The appropriations and dividends per share were as follows:
Appropriation of Earnings Dividends Per Share
(NT$) For Fiscal For Fiscal For Fiscal For Fiscal Year 2011 Year 2010 Year 2011 Year 2010 Legal reserve $ 105,021 $ 119,018 $ - $ - Cash dividends 664,934 740,763 2.2 2.5 Stock dividends - 59,261 - 0.2 The bonus to employees and the remuneration to directors and supervisors for 2011 and 2010 approved in the shareholders’ meetings on June 13, 2012 and June 10, 2011, respectively, were as follows: Years Ended December 31 2011 2010 Cash Stock Cash Stock Bonus to employees $ 113,317 $ - $ 160,674 $ - Remuneration to directors and
supervisors 18,886 - 21,423 - Years Ended December 31 2011 2010
Bonus to
Employees
Remuneration to Directors
and Supervisors
Bonus to Employees
Remuneration to Directors
and Supervisors
Amounts approved in shareholders’
meetings
$ 113,317 $ 18,886 $ 160,674 $ 21,423 Amounts recognized in respective
financial statements
113,317 18,886 160,674 21,423 $ - $ - $ - $ - There are no differences between the approved amounts of the bonus to employees and the remuneration to directors and supervisors and the accrual amounts reflected in the financial statements for the year ended December 31, 2011 and 2010. Information on the bonus to employees, directors and supervisors is available on the Market Observation Post System website of the Taiwan Stock Exchange.
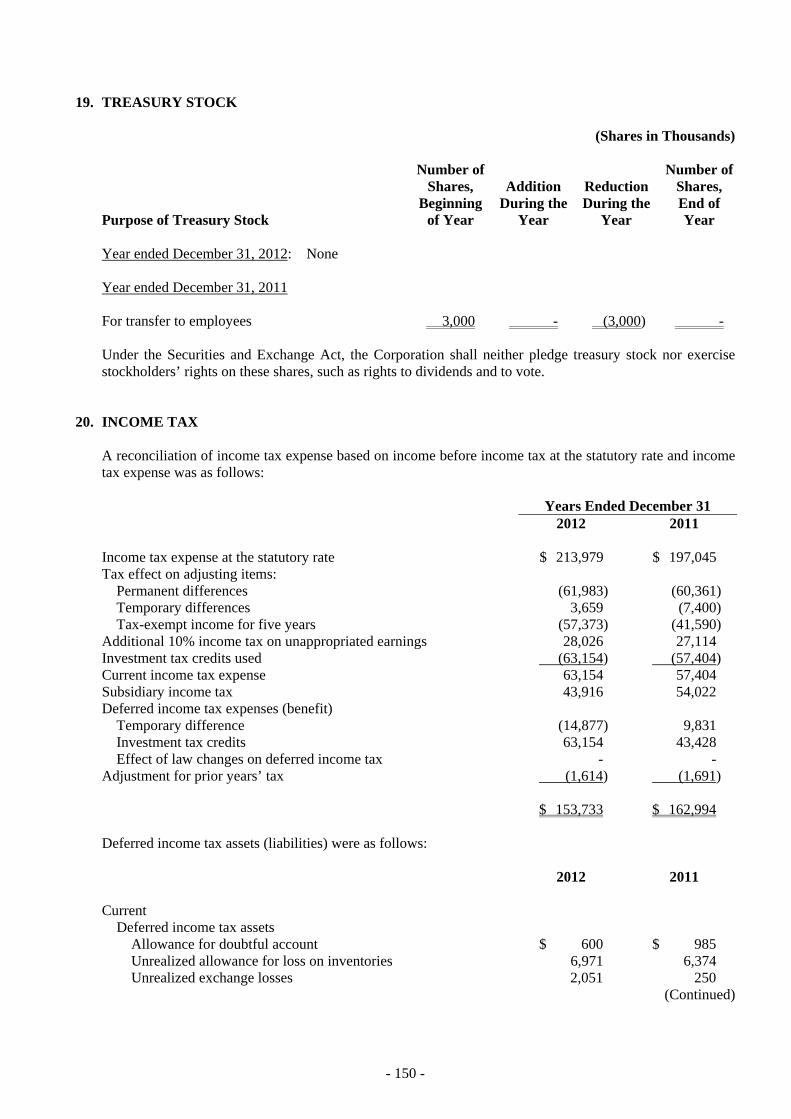
- 150 -
19. TREASURY STOCK
(Shares in Thousands)
Purpose of Treasury Stock
Number of Shares,
Beginning of Year
Addition During the
Year
Reduction During the
Year
Number of Shares, End of Year
Year ended December 31, 2012: None Year ended December 31, 2011 For transfer to employees 3,000 - (3,000) - Under the Securities and Exchange Act, the Corporation shall neither pledge treasury stock nor exercise stockholders’ rights on these shares, such as rights to dividends and to vote.
20. INCOME TAX
A reconciliation of income tax expense based on income before income tax at the statutory rate and income tax expense was as follows:
Years Ended December 31 2012 2011 Income tax expense at the statutory rate $ 213,979 $ 197,045 Tax effect on adjusting items:
Permanent differences (61,983) (60,361) Temporary differences 3,659 (7,400) Tax-exempt income for five years (57,373) (41,590)
Additional 10% income tax on unappropriated earnings 28,026 27,114 Investment tax credits used (63,154) (57,404) Current income tax expense 63,154 57,404 Subsidiary income tax 43,916 54,022 Deferred income tax expenses (benefit)
Temporary difference (14,877) 9,831 Investment tax credits 63,154 43,428 Effect of law changes on deferred income tax - -
Adjustment for prior years’ tax (1,614) (1,691) $ 153,733 $ 162,994 Deferred income tax assets (liabilities) were as follows:
2012 2011
Current
Deferred income tax assets Allowance for doubtful account $ 600 $ 985 Unrealized allowance for loss on inventories 6,971 6,374 Unrealized exchange losses 2,051 250
(Continued)

- 151 -
2012 2011
Unrealized gain on transactions with investees $ 4,423 $ 1,319 Others 220 - 14,265 8,928
Less: Valuation allowance - - 14,265 8,928
Deferred income tax liabilities Unrealized exchange gain (6,524) (5,386)
$ 7,741 $ 3,542 Noncurrent
Deferred income tax assets Accrued pension cost $ 517 $ 940 Impairment loss - 3,312 Investment tax credits 25,045 73,457 Others - 213
25,562 77,922 Less: Valuation allowance - - 25,562 77,922 Deferred income tax liabilities
Investment income recognized on overseas equity-method investments (124,436) (124,436)
$ (98,874) $ (46,514)
Subsidiary deferred income tax assets Impairment loss $ 5,450 $ 3,465 Investment income recognized on overseas equity-method
investments (2,194) (1,806) $ 3,256 $ 1,659
(Concluded) As of December 31, 2012, investment tax credits comprised of:
Laws and Statutes Tax Credit Source
Total Creditable
Amount
Remaining Creditable
Amount Expiry Year
Statute for Upgrading
Industries Purchase of machinery and
equipment $ 62,163 $ 25,045 2014-2016
Research and development expenditures
40,300
-
$ 102,463 $ 25,045 As of December 31, 2012, profits attributable to the following expansion and construction projects were exempted from income tax for five years: Expansion and Construction Project Tax-Exempt Year
Acquisition of equipment in 2005 2010 to 2014 Acquisition of equipment in 2009 2014 to 2018

- 152 -
The Corporation’s income tax returns through 2007 have been examined and approved by the tax authorities. Information about integrated income tax was as follows: December 31 2012 2011 Balance of ICA $ 67,545 $ 57,799
2012
(Estimate) 2011
(Actual) The creditable ratio for distribution 5.73% 5.98% December 31 2012 2011 Unappropriated earnings generated before January 1, 1998 $ - $ - Unappropriated earnings generated on and after January 1, 1998 2,279,958 1,901,027 $ 2,279,958 $ 1,901,027 For distribution of earnings generated after January 1, 1998, the ratio for the imputation credits allocated to stockholders of the Corporation is based on the balance of the ICA as of the date of dividend distribution. The expected creditable ratio for the 2012 earnings may be adjusted, depending on the ICA balance on the date of dividend distribution.
21. PERSONNEL, DEPRECIATION AND AMORTIZATION EXPENSES
Function
Expense Item
Years Ended December 31 2012 2011
Classified as Cost of Sales
Classified as Operating Expenses
Total Classified as Cost of Sales
Classified as Operating Expenses
Total
Labor cost Salary $ 640,358 $ 503,272 $ 1,143,630 $ 597,451 $ 485,223 $ 1,082,674Insurance 50,107 31,575 81,682 47,762 29,504 77,266Pension 16,910 11,015 27,925 16,664 15,809 32,473Others 6,394 3,633 10,027 3,887 2,748 6,635
Depreciation 724,980 113,569 838,549 753,468 128,139 881,607Amortization 9,534 16,541 26,075 5,831 25,710 31,541
22. EARNINGS PER SHARE (EPS)
Years Ended December 31 2012 2011 Before
Tax After Tax Before
Tax After Tax Basic earnings per share (NT$) for the year attributable
to common stockholders From continuing operations $ 4.15 $ 3.79 $ 3.84 $ 3.48 Income for the year $ 4.15 $ 3.79 $ 3.84 $ 3.48
(Continued)
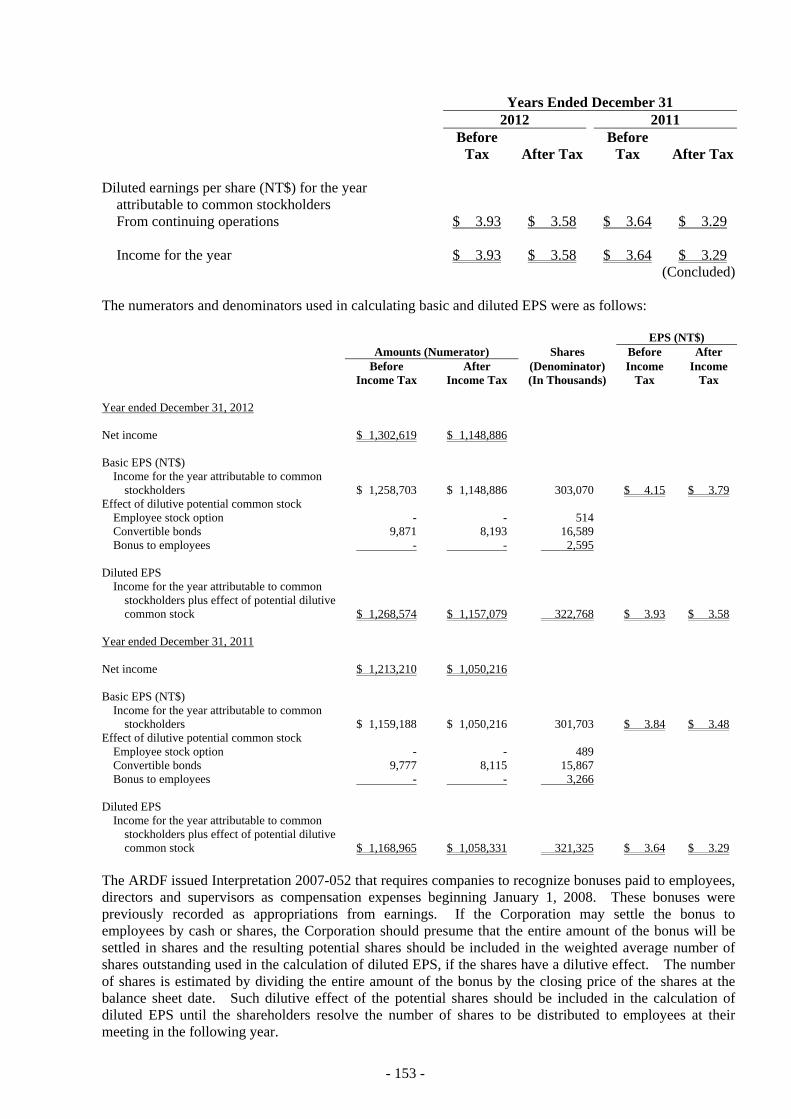
- 153 -
Years Ended December 31 2012 2011 Before
Tax After Tax Before
Tax After Tax Diluted earnings per share (NT$) for the year
attributable to common stockholders From continuing operations $ 3.93 $ 3.58 $ 3.64 $ 3.29 Income for the year $ 3.93 $ 3.58 $ 3.64 $ 3.29
(Concluded) The numerators and denominators used in calculating basic and diluted EPS were as follows: EPS (NT$) Amounts (Numerator) Shares Before After
Before
Income TaxAfter
Income Tax(Denominator) (In Thousands)
Income Tax
Income Tax
Year ended December 31, 2012 Net income $ 1,302,619 $ 1,148,886 Basic EPS (NT$)
Income for the year attributable to common stockholders $ 1,258,703 $ 1,148,886 303,070 $ 4.15 $ 3.79
Effect of dilutive potential common stock Employee stock option - - 514 Convertible bonds 9,871 8,193 16,589 Bonus to employees - - 2,595
Diluted EPS
Income for the year attributable to common stockholders plus effect of potential dilutive common stock $ 1,268,574 $ 1,157,079 322,768 $ 3.93 $ 3.58
Year ended December 31, 2011 Net income $ 1,213,210 $ 1,050,216 Basic EPS (NT$)
Income for the year attributable to common stockholders $ 1,159,188 $ 1,050,216 301,703 $ 3.84 $ 3.48
Effect of dilutive potential common stock Employee stock option - - 489 Convertible bonds 9,777 8,115 15,867 Bonus to employees - - 3,266
Diluted EPS
Income for the year attributable to common stockholders plus effect of potential dilutive common stock $ 1,168,965 $ 1,058,331 321,325 $ 3.64 $ 3.29
The ARDF issued Interpretation 2007-052 that requires companies to recognize bonuses paid to employees, directors and supervisors as compensation expenses beginning January 1, 2008. These bonuses were previously recorded as appropriations from earnings. If the Corporation may settle the bonus to employees by cash or shares, the Corporation should presume that the entire amount of the bonus will be settled in shares and the resulting potential shares should be included in the weighted average number of shares outstanding used in the calculation of diluted EPS, if the shares have a dilutive effect. The number of shares is estimated by dividing the entire amount of the bonus by the closing price of the shares at the balance sheet date. Such dilutive effect of the potential shares should be included in the calculation of diluted EPS until the shareholders resolve the number of shares to be distributed to employees at their meeting in the following year.
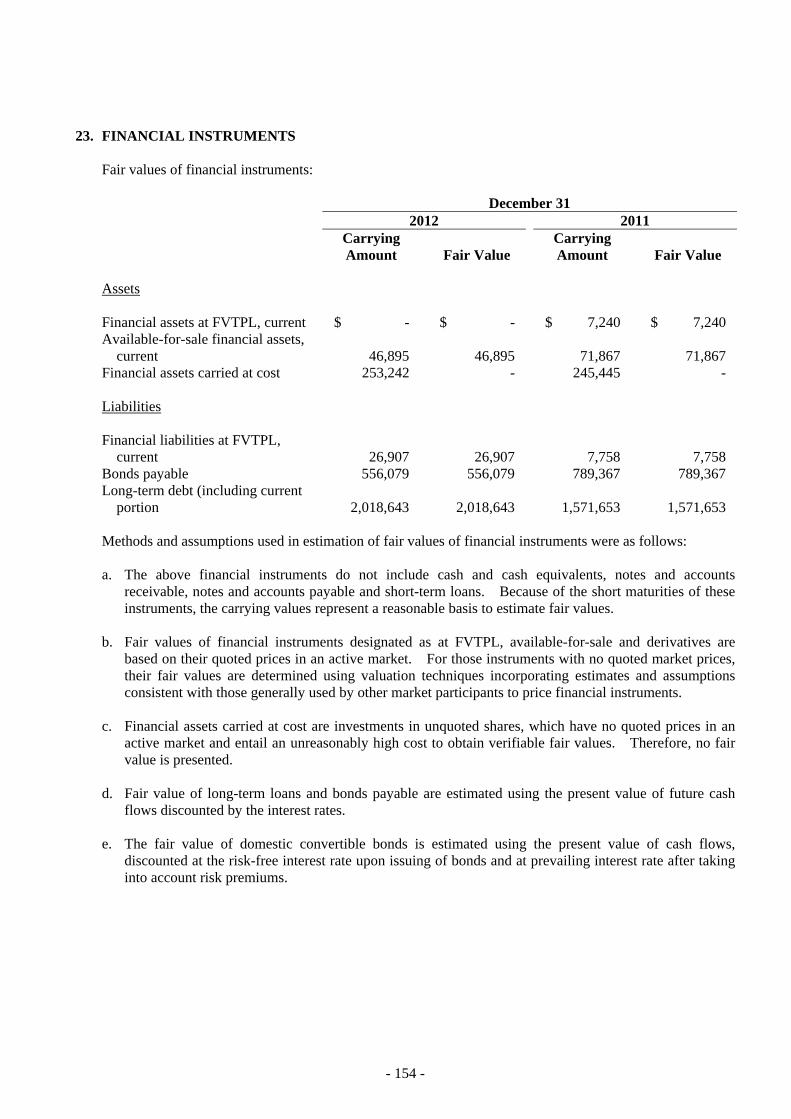
- 154 -
23. FINANCIAL INSTRUMENTS
Fair values of financial instruments:
December 31 2012 2011
Carrying Amount Fair Value
Carrying Amount Fair Value
Assets Financial assets at FVTPL, current $ - $ - $ 7,240 $ 7,240Available-for-sale financial assets,
current 46,895 46,895 71,867 71,867Financial assets carried at cost 253,242 - 245,445 - Liabilities Financial liabilities at FVTPL,
current 26,907 26,907 7,758 7,758Bonds payable 556,079 556,079 789,367 789,367Long-term debt (including current
portion 2,018,643 2,018,643 1,571,653 1,571,653 Methods and assumptions used in estimation of fair values of financial instruments were as follows: a. The above financial instruments do not include cash and cash equivalents, notes and accounts
receivable, notes and accounts payable and short-term loans. Because of the short maturities of these instruments, the carrying values represent a reasonable basis to estimate fair values.
b. Fair values of financial instruments designated as at FVTPL, available-for-sale and derivatives are
based on their quoted prices in an active market. For those instruments with no quoted market prices, their fair values are determined using valuation techniques incorporating estimates and assumptions consistent with those generally used by other market participants to price financial instruments.
c. Financial assets carried at cost are investments in unquoted shares, which have no quoted prices in an
active market and entail an unreasonably high cost to obtain verifiable fair values. Therefore, no fair value is presented.
d. Fair value of long-term loans and bonds payable are estimated using the present value of future cash
flows discounted by the interest rates. e. The fair value of domestic convertible bonds is estimated using the present value of cash flows,
discounted at the risk-free interest rate upon issuing of bonds and at prevailing interest rate after taking into account risk premiums.
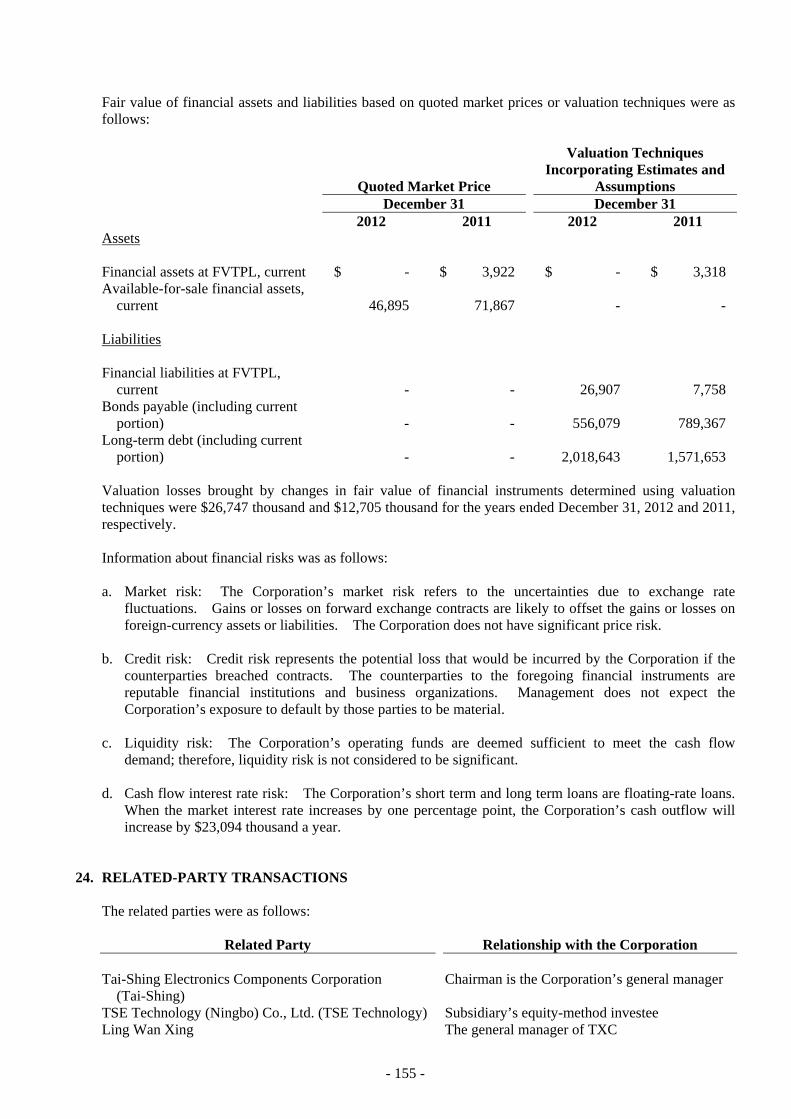
- 155 -
Fair value of financial assets and liabilities based on quoted market prices or valuation techniques were as follows:
Quoted Market Price
Valuation Techniques Incorporating Estimates and
Assumptions December 31 December 31 2012 2011 2012 2011
Assets Financial assets at FVTPL, current $ - $ 3,922 $ - $ 3,318Available-for-sale financial assets,
current 46,895 71,867 - - Liabilities Financial liabilities at FVTPL,
current - - 26,907 7,758Bonds payable (including current
portion) - - 556,079 789,367Long-term debt (including current
portion) - - 2,018,643 1,571,653 Valuation losses brought by changes in fair value of financial instruments determined using valuation techniques were $26,747 thousand and $12,705 thousand for the years ended December 31, 2012 and 2011, respectively. Information about financial risks was as follows: a. Market risk: The Corporation’s market risk refers to the uncertainties due to exchange rate
fluctuations. Gains or losses on forward exchange contracts are likely to offset the gains or losses on foreign-currency assets or liabilities. The Corporation does not have significant price risk.
b. Credit risk: Credit risk represents the potential loss that would be incurred by the Corporation if the
counterparties breached contracts. The counterparties to the foregoing financial instruments are reputable financial institutions and business organizations. Management does not expect the Corporation’s exposure to default by those parties to be material.
c. Liquidity risk: The Corporation’s operating funds are deemed sufficient to meet the cash flow
demand; therefore, liquidity risk is not considered to be significant. d. Cash flow interest rate risk: The Corporation’s short term and long term loans are floating-rate loans.
When the market interest rate increases by one percentage point, the Corporation’s cash outflow will increase by $23,094 thousand a year.
24. RELATED-PARTY TRANSACTIONS
The related parties were as follows:
Related Party Relationship with the Corporation Tai-Shing Electronics Components Corporation
(Tai-Shing) Chairman is the Corporation’s general manager
TSE Technology (Ningbo) Co., Ltd. (TSE Technology) Subsidiary’s equity-method investee Ling Wan Xing The general manager of TXC

- 156 -
Significant transactions with related parties: Sales
Years Ended December 31 2012 2011
Related Party Amount
% to TotalAccount Balance Amount
% to TotalAccount Balance
Tai-Shing $ 31,563 - $ 25,474 - Selling prices to related parties were similar to those for third parties. Purchases
Years Ended December 31 2012 2011
Related Party Amount
% to TotalAccount Balance Amount
% to TotalAccount Balance
Tai-Shing $ 27 - $ 9 - TSE Technology 248 - 891 - $ 275 - $ 900 - Terms of purchases from related parties were similar to those for third parties. Other Expenses
Years Ended December 31 2012 2011
Related Party Amount
% to TotalAccount Balance Amount
% to TotalAccount Balance
Tai-Shing $ 3,128 - $ 1,972 - Rental Income
Years Ended December 31 2012 2011
Related Party Amount
% to TotalAccount Balance Amount
% to TotalAccount Balance
TES Technology $ 3,119 - $ 2,684 -
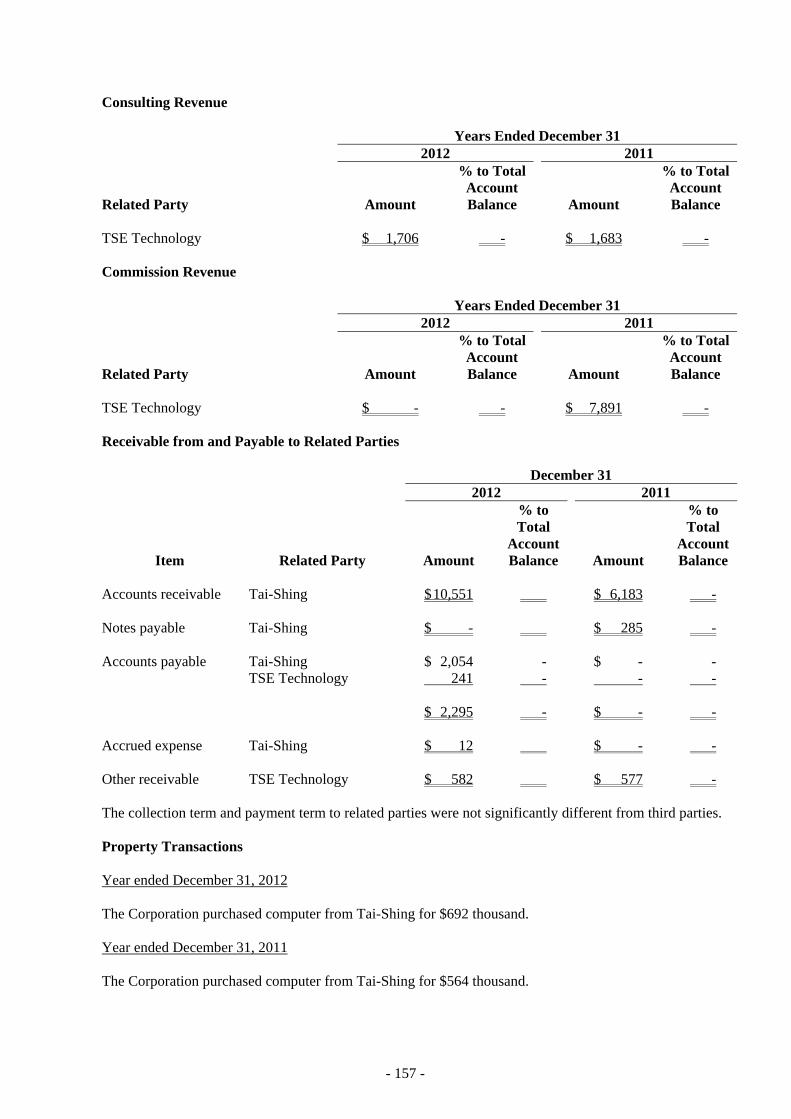
- 157 -
Consulting Revenue
Years Ended December 31 2012 2011
Related Party Amount
% to TotalAccount Balance Amount
% to TotalAccount Balance
TSE Technology $ 1,706 - $ 1,683 -
Commission Revenue
Years Ended December 31 2012 2011
Related Party Amount
% to TotalAccount Balance Amount
% to TotalAccount Balance
TSE Technology $ - - $ 7,891 -
Receivable from and Payable to Related Parties
December 31 2012 2011
Item Related Party Amount
% to Total
Account Balance
Amount
% to Total
AccountBalance
Accounts receivable Tai-Shing $ 10,551 $ 6,183 - Notes payable Tai-Shing $ - $ 285 - Accounts payable Tai-Shing $ 2,054 - $ - - TSE Technology 241 - - - $ 2,295 - $ - - Accrued expense Tai-Shing $ 12 $ - - Other receivable TSE Technology $ 582 $ 577 - The collection term and payment term to related parties were not significantly different from third parties. Property Transactions Year ended December 31, 2012 The Corporation purchased computer from Tai-Shing for $692 thousand. Year ended December 31, 2011 The Corporation purchased computer from Tai-Shing for $564 thousand.

- 158 -
Endorsement/Guarantee Provided As of December 31, 2012, Ling, Wan Xing was a joint guarantor for parts of loans of NGB. Compensation of Directors, Supervisors and Management Personnel Years Ended December 31 2012 2011 Salaries $ 21,884 $ 19,600 Incentives and special compensation 14,180 6,299 Professional fee 1,440 1,440 Bonus 25,880 26,886 $ 63,384 $ 54,225
25. MORTGAGED OR PLEDGED ASSETS
December 31 2012 2011 Property, plant and equipment
Land $ 573,770 $ 573,770 Buildings, net 1,505,559 1,577,020 Intangible assets - land right 15,303 16,145 Leased assets 45,269 33,950
$ 2,139,901 $ 2,200,885 26. SIGNIFICANT COMMITMENTS AND CONTINGENCIES
Unused letters of credit amounted to approximately JPY189,462 thousand and EUR99 thousand. As of December 31, 2012, the Corporation’s guarantee for loan of its subsidiary was follows:
Commitment
Total Dollars Amount of Contract Dollars Paid Dollars Unpaid
Machinery and equipment $ 46,971 $ 34,493 $ 12,478 Machinery and equipment US$ 420 US$ 336 US$ 84 Machinery and equipment EUR 990 EUR 297 EUR 693 Machinery and equipment RMB 4,898 RMB - RMB 4,898 Machinery and equipment US$ 4,745 US$ - US$ 4,745
27. SUBSEQUENT EVENTS
For acquisition of property, plant and equipment and repayment of loans, on January 7, 2013, the Corporation issued fourth unsecured domestic convertible bonds with an aggregate value of $800,000 thousand.

- 159 -
28. OPERATING SEGMENT FINANCIAL INFORMATION
Information reported to the chief operating decision maker for the purposes of resource allocation and assessment of segment performance focuses on types of goods or service delivered or provided. The Corporation’s reportable segments under SFAS No. 41 are therefore as follows: Crystal and others. The Corporation uses the income before tax as the measurement for segment profit and the basis of performance assessment. There was no material inconsistency between the accounting policies of the operating segment and the accounting policies described in Note 2. a. Segment revenues and results
The analysis of the Corporation’s revenue from continuing operations by reportable segment was as follows:
Segment Revenue Segment Profit Years Ended December 31 Years Ended December 31 2012 2011 2012 2011 Crystal $ 10,865,885 $ 9,891,013 $ 1,284,699 $ 1,161,864Others 62,610 6,328 (27,044) (10,343) $ 10,928,495 $ 9,897,341 1,257,655 1,151,521Investment income recognized
under equity method 9,365 11,658Interest income 14,195 14,612Gain (loss) on disposal of
property, plant and equipment (849) 7,519
Exchange gain 51,912 43,675 Valuation (loss) gain on
financial instruments (26,747) (12,705)Other nonoperating income and
gains 32,643 28,084Interest expense (35,555) (31,154) Income before tax $ 1,302,619 $ 1,213,210 Segment revenue reported above represents revenue generated from external customers. There were no inter-segment sales during the years ended December 31, 2012 and 2011. Segment profit represents the profit earned by each segment without allocation of central administration costs and directors’ compensation, investment income or loss recognized under the equity method, gain or loss on disposal of investments accounted for by the equity method, rental revenue, interest income, gain or loss on disposal of property, plant and equipment, gain or loss on sale of investments, exchange gain or loss, valuation gain or loss on financial instruments, interest expense and income tax expense. This is the measure reported to the chief operating decision maker for the purposes of resource allocation and assessment of segment performance.

- 160 -
b. Revenue from major products and services
2012 2011 Crystal $ 10,865,885 $ 9,891,013Others 62,610 6,328
$ 10,928,495 $ 9,897,341
Assets and liabilities not used by the chief operating decision maker in the allocation of resources and assessment of performance of segments are not disclosed.
c. Geographical information The Corporation’s revenue from continuing operations from external customers and information about its noncurrent assets by geographical location are detailed below: Revenue from
External Customers Noncurrent Assets December 31 December 31 2012 2011 2012 2011 Taiwan $ 10,224,677 $ 9,259,471 $ 3,325,554 $ 3,475,945China 685,054 618,472 2,625,468 2,440,757Others 18,764 19,398 5,464 3,772 $ 10,928,495 $ 9,897,341 $ 5,956,486 $ 5,920,474 Noncurrent assets included property, plant and equipment, intangible assets and other assets but excluded deferred tax assets.
Major Customer Information Major customer did not account for 10% or more of sales in 2012 and 2011.
29. EXCHANGE RATE INFORMATION OF FOREIGN-CURRENCY FINANCIAL ASSETS AND LIABILITIES Significant foreign-currency financial assets and liabilities were as follows: December 31 2012 2011
Foreign
Currencies Exchange
Rate New Taiwan
Dollars Foreign
Currencies Exchange
Rate New Taiwan
Dollars Financial assets Monetary items
USD $ 139,665 29.136 $ 4,069,285 $ 108,798 30.29 $ 3,294,216JPY 189,653 0.3375 64,014 308,047 0.3905 120,292RMB 125,804 4.6741 588,022 154,462 4.8072 742,544
Investment accounted for by entity method
RMB 9,831 4.6741 45,950 10,121 4.8072 48,657(Continued)

- 161 -
December 31 2012 2011
Foreign
Currencies Exchange
Rate New Taiwan
Dollars Foreign
Currencies Exchange
Rate New Taiwan
Dollars Financial liabilities Monetary items
USD $ 37,404 29.136 $ 1,089,813 $ 35,869 30.29 $ 1,086,380JPY 1,280,537 0.3375 432,226 1,465,391 0.3905 572,235RMB 96,253 4.6741 449,896 93,196 4.8072 448,019
(Concluded) 30. PRE-DISCLOSURE FOR ADOPTION OF INTERNATIONAL FINANCIAL REPORTING
STANDARDS Under Rule No. 0990004943 issued by the Financial Supervisory Commission (FSC) on February 2, 2010, the Corporation’s pre-disclosure information on the adoption of International Financial Reporting Standards (IFRSs) was as follows: a. On May 14, 2009, the FSC announced the “Framework for Adoption of International Financial
Reporting Standards by Companies in the ROC.” In this framework, starting 2013, companies with shares listed on the TSE or traded on the Taiwan GreTai Securities Market or Emerging Stock Market should prepare their financial statements in accordance with the Guidelines Governing the Preparation of Financial Reports by Securities Issuers, International Financial Reporting Standards, International Accounting Standards, Interpretations and related guidance translated by the ARDF and issued by the FSC. To comply with this framework, the Corporation has set up a project team and made a plan to adopt the IFRSs. The main contents of the plan, anticipated schedule and status of execution as of December 31, 2012 were as follows
Contents of Plan Responsible Department Status of Execution
1) Establish the IFRSs taskforce Office of the chairman Completed 2) Identify differences between the existing
accounting policies and IFRSs Finance and accounting Completed
3) Identify consolidated entities under IFRSs Finance and accounting Completed 4) Evaluate potential effect to business
operations Finance and accounting Completed
5) Complete the evaluation of resources and
budget needed for IFRSs adoption Finance and accounting Completed
6) Internal IFRSs training for employees -
First stage Finance and accounting Completed
7) Determine IFRSs accounting policies Finance and accounting Completed 8) Assessment of the impact of each
exemption and option under IFRSs Finance and accounting, office
of the president Completed
(Continued)

- 162 -
Contents of Plan Responsible Department Status of Execution
9) Assessment of changes required in the
information system and internal control related to adoption of IFRSs
Finance and accounting Completed
10) Develop financial statement template
under IFRSs Finance and accounting Completed
11) Complete evaluation, configuration and
testing of the IT systems Finance and accounting,
information technology Completed
12) Communicate with related parties on the
impact of IFRSs adoption Office of the chairman In progress
13) Internal IFRSs training for employees -
second stage Finance and accounting In progress
14) Complete the preparation of the statement
of financial position by opening date under IFRSs
Finance and accounting Completed
15) Complete the manual of IFRSs accounting
policies and internal control Finance and accounting, office
of the president In progress
(Concluded) b. As of December 31, 2012, the material differences between the existing accounting policies and the
accounting policies to be adopted under IFRSs and their effects were as follows:
1) Reconciliation of consolidated balance sheet items as of January 1, 2012
Item ROC GAAP
Effect of Transition to
IFRSs IFRSs Note Assets Deferred income tax assets - current $ 3,542 $ (3,542) $ - 6) a) Intangible assets 117,530 (99,745) 17,785 6) e), 6) h) Long-term prepayments - 126,599 126,599 6) g) Long-term prepaid rent - 117,530 117,530 6) h) Deferred charges 53,910 (53,910) - 6) e) Property, plant and equipment 5,689,646 (99,428) 5,590,218 6) e), 6) g), 5) a) Deferred income tax assets -
noncurrent 1,659 12,040 13,699
6) a), 6) b), 6) c)
Liabilities Accrued expenses 612,877 18,588 631,465 6) b) Accrued pension cost 9,349 16,242 25,591 6) c) Reserve for land value increment tax 3,512 (3,512) - 5) a) Stockholders’ equity Cumulative translation adjustments 264,762 (264,762) - 5) c) Retained earnings 2,545,465 222,793 2,768,258 5) b), 5) c), 6) b),
6) c), 4 Unrealized revaluation increment 5,442 (5,442) - 5) a) Net loss not recognized as pension cost (15,637) 15,637 - 5) b), 6) c)

- 163 -
2) Reconciliation of consolidated balance sheet items as of December 31, 2012
Item ROC GAAP
Effect of Transition to
IFRSs IFRSs Note Assets Deferred income tax assets - current $ 7,741 $ (7,741) $ - 6) a) Intangible assets 115,024 (103,940) 11,084 6) e), 6) h) Long-term prepaid rent - 115,024 115,024 6) h) Long-term prepayments - 484,963 484,963 6) g) Deferred charges 44,207 (44,207) - 6) e) Property, plant and equipment 5,734,497 (460,794) 5,273,703 6) e), 6) g), 5) a) Deferred income tax assets -
noncurrent 3,256 16,131 19,387 6) a), 6) b), 6) c)
Liabilities Accrued expenses 519,358 19,535 538,893 6) b) Accrued pension cost 14,028 17,394 31,422 6) c) Reserve for land value increment tax 3,512 (3,512) - 5) a) Stockholders’ equity Cumulative translation adjustments 167,431 (264,762) (97,331) 5) c) Retained earnings 3,029,417 213,415 3,242,832 5) b), 5) c), 6) b),
6) c), 4 Unrealized revaluation increment 5,442 (5,442) - 5) a) Net loss not recognized as pension cost (22,808) 22,808 - 5) b), 6) c)
3) Reconciliation of consolidated statement of comprehensive income items for the year ended
December 31, 2012
Item ROC GAAP
Effect of Transition to
IFRSs IFRSs Note Operating expenses $ (1,250,640) $ (91) $ (1,250,731) 6) b), 6) c), 6) d) Others 44,964 849 45,813 6) d) Income tax expense (153,733) (110) (153,843) 6) b),6 c) Other comprehensive income Actuarial gains and losses of employee
benefits - (10,026) (10,026) 6) c)
4) Special reserve at the date of transition to IFRSs
In accordance with the order VI-1010012865 issued by the FSC on April 6, 2012, at the first-time adoption of IFRSs, in case an entity elects to use exemption options specified in IFRS 1 and resets unrealized revaluation increment and cumulative translation differences in stockholders’ equity to zero by a credit to retained earnings, the same amount from retained earnings will be transferred to special reserve provided that such amount is less than the aggregate amount of IFRS adjustments. If the amount of retained earnings brought by IFRSs adjustments at the first-time adoption of IFRS is less than the total of revaluation increment and cumulative translation differences, the amount transferred to special reserve is limited to the amount of retained earnings from IFRS adjustments. The special reserve will be reversed proportionally as the related assets are used, disposed of or reclassified to other accounts. The Corporation appropriated $222,793 thousand, the increase in retained earnings from all IFRSs adjustments at the first-time adoption of IFRSs, to special reserve.
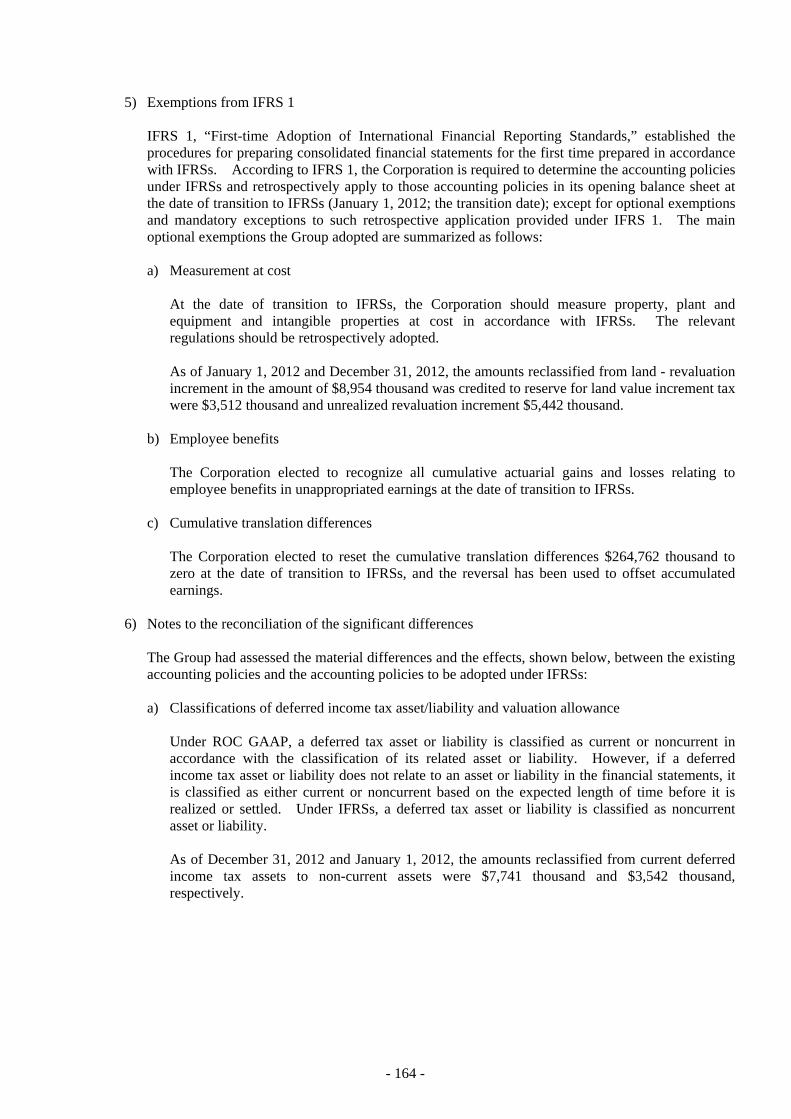
- 164 -
5) Exemptions from IFRS 1 IFRS 1, “First-time Adoption of International Financial Reporting Standards,” established the procedures for preparing consolidated financial statements for the first time prepared in accordance with IFRSs. According to IFRS 1, the Corporation is required to determine the accounting policies under IFRSs and retrospectively apply to those accounting policies in its opening balance sheet at the date of transition to IFRSs (January 1, 2012; the transition date); except for optional exemptions and mandatory exceptions to such retrospective application provided under IFRS 1. The main optional exemptions the Group adopted are summarized as follows: a) Measurement at cost
At the date of transition to IFRSs, the Corporation should measure property, plant and equipment and intangible properties at cost in accordance with IFRSs. The relevant regulations should be retrospectively adopted. As of January 1, 2012 and December 31, 2012, the amounts reclassified from land - revaluation increment in the amount of $8,954 thousand was credited to reserve for land value increment tax were $3,512 thousand and unrealized revaluation increment $5,442 thousand.
b) Employee benefits
The Corporation elected to recognize all cumulative actuarial gains and losses relating to employee benefits in unappropriated earnings at the date of transition to IFRSs.
c) Cumulative translation differences
The Corporation elected to reset the cumulative translation differences $264,762 thousand to zero at the date of transition to IFRSs, and the reversal has been used to offset accumulated earnings.
6) Notes to the reconciliation of the significant differences
The Group had assessed the material differences and the effects, shown below, between the existing accounting policies and the accounting policies to be adopted under IFRSs: a) Classifications of deferred income tax asset/liability and valuation allowance
Under ROC GAAP, a deferred tax asset or liability is classified as current or noncurrent in accordance with the classification of its related asset or liability. However, if a deferred income tax asset or liability does not relate to an asset or liability in the financial statements, it is classified as either current or noncurrent based on the expected length of time before it is realized or settled. Under IFRSs, a deferred tax asset or liability is classified as noncurrent asset or liability. As of December 31, 2012 and January 1, 2012, the amounts reclassified from current deferred income tax assets to non-current assets were $7,741 thousand and $3,542 thousand, respectively.

- 165 -
b) Employee benefits - accumulated compensated absences
Accumulated compensated absences account is not addressed in existing ROC GAAP; thus, the Corporation has not recognized the expected cost of employee benefits in the form of accumulated compensated absences at the end of reporting periods. However, under IFRSs, when the employees render services that increase their entitlement to future compensated absences, an entity should recognize the expected cost of employee benefits at the end of reporting periods. As of December 31, 2012 and January 1, 2012, the IFRS adjustment increased accrued expenses by $19,535 thousand and $18,588 thousand, respectively; deferred income tax assets - noncurrent increased by $3,258 thousand and $3,078 thousand, respectively. Retained earnings decreased by $16,277 thousand and $15,510 thousand, respectively. Salaries and income tax expense for the year ended December 31, 2012 increased by $947 thousand and decreased by $180 thousand, respectively.
c) Employee benefits-defined benefit plans
The Corporation had previously applied an actuarial valuation on its defined benefit obligation and recognized the related pension cost and retirement benefit obligation in conformity with ROC GAAP. Under IFRSs, the Group should carry out actuarial valuation on defined benefit obligation in accordance with IAS No. 19, “Employee Benefits.” In addition, under ROC GAAP, it is not allowed to recognize actuarial gains and losses from defined benefit plans directly to equity; instead, actuarial gains and losses should be accounted for under the corridor approach which requires in the deferral of gains and losses. When using the corridor approach, actuarial gains and losses should be amortized over the expected average remaining working lives of the participating employees. Under IAS No. 19, “Employee Benefits,” the Corporation elects to recognize actuarial gains and losses immediately in full in the period in which they occur, as other comprehensive income. The subsequent reclassification to earnings is not permitted. At the transition date, the Corporation performed the actuarial valuation under IAS No. 19 - “Employee Benefits,” and recognized the valuation difference directly in retained earnings under the requirement of IFRS 1. As of December 31, 2012 and January 1, 2012, the IFRSs adjustment increased accrued pension cost by $17,394 thousand and $16,242 thousand, decreased net loss not recognized as pension cost by $22,808 thousand and $15,637 thousand, increased deferred income tax assets – noncurrent by $5,132 thousand and $5,420 thousand, and decreased retained earnings by $35,070 thousand and $26,459 thousand, respectively. Salaries, income tax expenses and actuarial gains and losses decreased by $1,705 thousand, increased by $290 thousand, and increased by $10,026 thousand, respectively.
d) Classification of line items in the consolidated statement of comprehensive income
Under IFRSs, based on the nature of operating transactions, gain on disposal of property, plant and equipment of $849 thousand was reclassified to operating expenses.
e) Classification of deferred charges
Under ROC GAAP, deferred charges are classified under other assets. Under IFRSs, the items in deferred charges are classified as property, plant and equipment, intangible assets and prepayments - noncurrent (recorded under other assets) according to their nature.
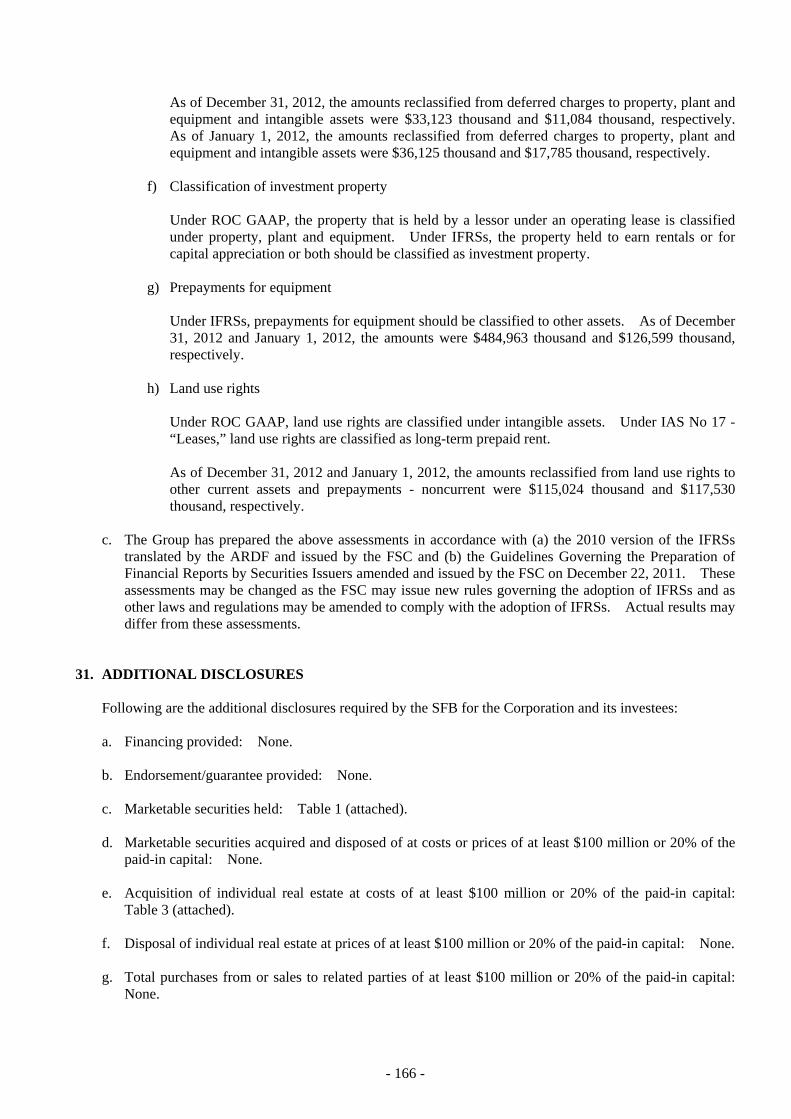
- 166 -
As of December 31, 2012, the amounts reclassified from deferred charges to property, plant and equipment and intangible assets were $33,123 thousand and $11,084 thousand, respectively. As of January 1, 2012, the amounts reclassified from deferred charges to property, plant and equipment and intangible assets were $36,125 thousand and $17,785 thousand, respectively.
f) Classification of investment property Under ROC GAAP, the property that is held by a lessor under an operating lease is classified under property, plant and equipment. Under IFRSs, the property held to earn rentals or for capital appreciation or both should be classified as investment property.
g) Prepayments for equipment Under IFRSs, prepayments for equipment should be classified to other assets. As of December 31, 2012 and January 1, 2012, the amounts were $484,963 thousand and $126,599 thousand, respectively.
h) Land use rights Under ROC GAAP, land use rights are classified under intangible assets. Under IAS No 17 - “Leases,” land use rights are classified as long-term prepaid rent. As of December 31, 2012 and January 1, 2012, the amounts reclassified from land use rights to other current assets and prepayments - noncurrent were $115,024 thousand and $117,530 thousand, respectively.
c. The Group has prepared the above assessments in accordance with (a) the 2010 version of the IFRSs translated by the ARDF and issued by the FSC and (b) the Guidelines Governing the Preparation of Financial Reports by Securities Issuers amended and issued by the FSC on December 22, 2011. These assessments may be changed as the FSC may issue new rules governing the adoption of IFRSs and as other laws and regulations may be amended to comply with the adoption of IFRSs. Actual results may differ from these assessments.
31. ADDITIONAL DISCLOSURES
Following are the additional disclosures required by the SFB for the Corporation and its investees: a. Financing provided: None. b. Endorsement/guarantee provided: None. c. Marketable securities held: Table 1 (attached). d. Marketable securities acquired and disposed of at costs or prices of at least $100 million or 20% of the
paid-in capital: None. e. Acquisition of individual real estate at costs of at least $100 million or 20% of the paid-in capital:
Table 3 (attached). f. Disposal of individual real estate at prices of at least $100 million or 20% of the paid-in capital: None. g. Total purchases from or sales to related parties of at least $100 million or 20% of the paid-in capital:
None.
- 167 -
h. Receivables from related parties amounting to at least NT$100 million or 20% of the paid-in capital: None.
i. Names, locations, and related information of investees on which the Corporation exercises significant
influence: Table 2 (attached). j. Derivative transactions: Please refer to Notes 5. k. Information investment in Mainland China: Table 4 (attached). l. Intercompany relationships and significant intercompany transactions: Table 5 (attached). m. List of the subsidiaries: Note 2 and Table 6 (attached). n. Changes in the subsidiaries: Table 7 (attached).

- 168 -
TABLE 1
TXC CORPORATION AND SUBSIDIARIES MARKETABLE SECURITIES HELD DECEMBER 31, 2012 (In Thousands of New Taiwan Dollars or U.S. Dollars)
Holding Company Marketable Securities Type and Issuer/Name Security Issuer’s
Relationship with the Holding Company
Financial Statement AccountDecember 31, 2012
Note Shares/Units Carrying Amount
Percentage of Ownership
Market Value or Net Asset Value
TXC Corporation Mutual fund Shin Kong Cross Strait Selective Fund None Available-for-sale financial assets 2,691 $ 25,668 - $ 25,668 Shin Kong China Growth Fund None 〃 2,177 21,227 - 21,227 $ 46,895 Stock Marson Technology Co., Ltd. None Financial assets carried at cost -
noncurrent 414 $ 3,000 5 None
Win Win Precision Technology Co., Ltd. 〃 〃 1,300 54,997 3 〃 Guandong Failong Crystal Technology Co., Ltd. 〃 〃 RMB 10,096 46,478 8 〃 UPI Semiconductor Corp. 〃 〃 2,000 98,000 2 〃 Si-Time Corporation 〃 〃 1,750 50,767 1 〃 $ 253,242 NGB TSE Technology co. Subsidiary Investment accounted for by the
equity method RMB 6,828 $ 45,950 23 〃

- 169 -
TABLE 2
TXC CORPORATION AND SUBSIDIARIES NAMES, LOCATIONS, AND RELATED INFORMATION OF INVESTEES ON WHICH THE COMPANY EXERCISES SIGNIFICANT INFLUENCE DECEMBER 31, 2012 (In Thousands of New Taiwan Dollars or U.S. Dollars)
Investor Company Investee Company Location Main Businesses and Products Original Investment Amount Balance as of December 31, 2012 Net Income
(Losses) of the Investee
Equity in the Earnings (Losses)
Note December 31, 2012
December 31, 2011
Shares (In Thousands)
Percentage of Ownership
Carrying Value
TXC Corporation Taiwan Crystal Technology
International Ltd. Western Samoa Investment $ 1,390,461
(US$ 42,835) $ 1,390,461 (US$ 42,835)
42,835 100 $ 3,470,395 $ 378,203 $ 373,818 Difference from upstream transactions $4,385 thousand
TXC Technology Inc. U.S.A. Marketing activities 9,879 (US$ 300)
9,879 (US$ 300)
300 100 11,378 (1,082) (1,082)
TXC Japan Corporation Japan Marketing activities 6,172 (JPY 21,000)
6,172 (JPY 21,000)
2 100 11,517 (1,449) (1,449)
Taiwan Crystal Technology International (HK) Limited
Hong Kong Investment 298,776 (US$ 10,094)
107,974(US$ 3,614)
10,094 100 287,040 (11,895) (11,895)
Taiwan Crystal Technology
International Ltd. Growing Profit Trading Ltd. B.V.I. International trading 1,691
(US$ 50) 1,691 (US$ 50)
50 100 193,578 (US$ 6,644)
76,155 (US$ 2,575)
76,155 (US$ 2,575)
TXC (Ningbo) Corporation Ningbo Manufacture and sales of electronics products 1,487,211 (US$ 45,835)
1,487,211 (US$ 45,835)
US$ 45,835 100 3,310,471 (US$ 113,621)
301,975 (US$ 10,211)
301,975 (US$ 10,211)
TXC (Ningbo) Corporation TXC (HK) Limited Hong Kong International trading 846
(HK$ 200) 846 (HK$ 200)
HK$ 200 100 11,675 (RMB 2,519)
127 (RMB 27)
127 (RMB 27)
TXC (Chongqing) Corporation Chongqing Manufacture and sales of electronics products 201,823 (RMB 42,710)
48,072 (RMB 10,000)
RMB 42,710 100 189,820 (RMB 40,954)
(19,285) (RMB 4,116)
(7,714) (RMB 1,647)
Chongqing All Sun Company Limited Chongqing Market activities 321,644 (RMB 66,000)
38,458 (RMB 8,000)
RMB 66,000 40 305,423 (RMB 65,895)
55 (RMB 12)
55 (RMB 12)
Ningbo Jingyu Company Limited Ningbo International trading 4,807 (RMB 1,000)
4,807 (RMB 1,000)
RMB 1,000 100 6,426 (RMB 1,386)
1,849 (RMB 395)
1,849 (RMB 395)
Taiwan Crystal Technology
International (HK) Limited TXC (Chongqing) Limited Chongqing Manufacture and sales of electronics products 298,362
(US$ 10,080) 107,560 (US$ 3,600)
US$ 10,080 60 287,040 (US$ 9,853)
(19,285) (RMB -4,116)
(11,571) (RMB -2,469)
TXC Europe SRL Europe Market activities 414 (EUR 10)
414 (EUR 10)
EUR 10 100 - (US$ -)
(407) (US$ -14)
(407) (US$ -14)
Note
Note: TXC Europe SRL applied for cancellation of registration in 2012. As of December 31, 2012, it has not yet received the approval from the government.

- 170 -
TABLE 3
TXC CORPORATION AND SUBSIDIARIES ACQUISITION OF INDIVIDUAL REAL ESTATE AT COSTS OF AT LEAST $100 MILLION OR 20% OF THE PAID-IN CAPITAL YEAR ENDED DECEMBER 31, 2011 (In Thousands of New Taiwan Dollars)
Company Name
Types of Property Transaction Date Transaction
Amount Payment Term Counterparty
Nature of Relationship
Prior Transaction of Related Counterparty Price Reference
Purpose of Acquisition
Other TermsOwner Relationship
Transfer Date
Amount
Chongqing All
Sun Company Limited
Land June 2012 - July 2012
$ 200,435 Normal Chongqing Government
None - - - $ - Bargain by buyer and seller
Real estate development and sell
-

- 171 -
TABLE 4
TXC CORPORATION AND SUBSIDIARIES INFORMATION ON INVESTMENT IN MAINLAND CHINA YEAR ENDED DECEMBER 31, 2012 (In Thousands of New Taiwan Dollars or U.S. Dollars) 1. Name of the investees in Mainland China, main businesses and products, paid-in capital, method of investment, information on inflow or outflow of capital, percentage of ownership, investment income or loss, ending balance of investment, dividends remitted by the
investee, and the limit of investment in Mainland China:
Investee Company Main Businesses and Products Total Amount of Paid-in Capital
Method of Investment
Accumulated Outflow of
Investment from Taiwan as of
January 1, 2012 (US$ in
Thousand)
Investment Flows Accumulated Outflow of
Investment from Taiwan as of December 31, 2012 (US$ in Thousand)
Percentage of Ownership
Investment Income (Loss)
Recognized (Note)
Carrying Amount as of December 31,
2012
Accumulated Inward
Remittance of Earnings as ofDecember 31,
2012
Outflow Inflow
TXC (Ningbo) Corporation Manufacturing and sales of crystal
and crystal oscillator $ 1,487,211 (US$ 45,835)
Indirect investment of the Corporation in Mainland China through the Corporation’s subsidiary in a third region
$ 1,427,630 (US$ 44,000)
$ - $ - $ 1,427,630 (US$ 44,000)
100 $ 301,975 (US$ 10,211)
$ 3,310,471 (US$ 113,621)
$ 256,146 (US$ 7,897)
Guandong Failong Crystal
Technology Co., Ltd. Manufacturing and sales of new
electronic components 580,947 (RMB 126,194)
Direct investment of the Corporation in Mainland China
46,478 (RMB 10,096)
-
- 46,478 (RMB 10,096)
8 - 46,478 (RMB 10,096)
-
TSE Technology (Ningbo)
Co., Ltd. Manufacturing and sales of
electronic devices and hardware components
139,177 (RMB 29,723)
Other investment of the Corporation Mainland China
- -
- - 23 9,365 (RMB 1,999)
45,950 (RMB 9,831)
-
TXC (Chongqing)
Corporation Manufacturing and sales of
electronic devices and hardware components
500,185 (RMB 106,842)
Indirect investment of the Corporation in Mainland China through the Corporation’s subsidiary in a third region
107,560 (US$ 3,600)
190,802 (US$ 6,480)
- 298,362 (US$ 10,080)
100 (19,285) (RMB 4,116)
476,860 (RMB 102,364)
-
Chongqing All Suns
Company Limited Real estate intermediary service,
real estate management and electronic product wholesale
312,644 (RMB 66,000)
Other investment of the Corporation Mainland China
- - - - 100 55 (RMB 12)
305,423 (RMB 65,895)
-
Ningbo Jingyu Company
Limited Purchasing and selling electronic
component 4,807 (RMB 1,000)
Other investment of the Corporation Mainland China
- - - - 100 1,849 (RMB 395)
6,426 (RMB 1,386)
-
(Continued)
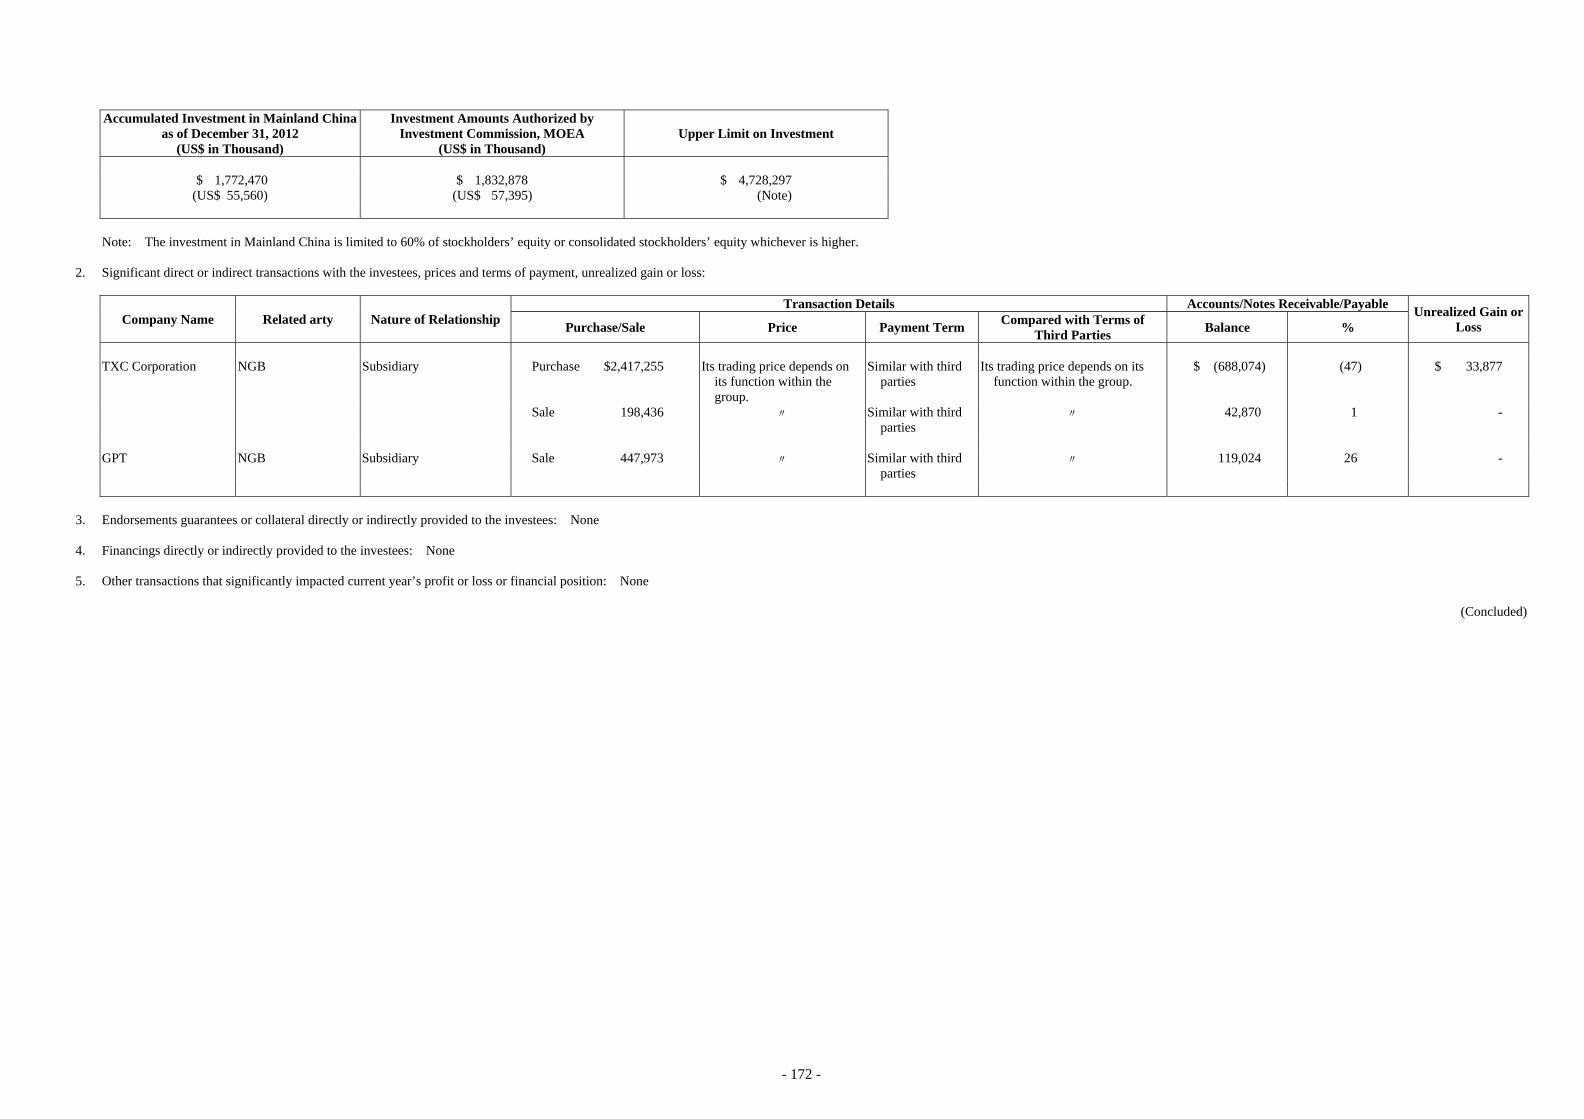
- 172 -
Accumulated Investment in Mainland China
as of December 31, 2012 (US$ in Thousand)
Investment Amounts Authorized by Investment Commission, MOEA
(US$ in Thousand) Upper Limit on Investment
$ 1,772,470 (US$ 55,560)
$ 1,832,878 (US$ 57,395)
$ 4,728,297 (Note)
Note: The investment in Mainland China is limited to 60% of stockholders’ equity or consolidated stockholders’ equity whichever is higher. 2. Significant direct or indirect transactions with the investees, prices and terms of payment, unrealized gain or loss:
Company Name Related arty Nature of Relationship Transaction Details Accounts/Notes Receivable/Payable
Unrealized Gain or Loss Purchase/Sale Price Payment Term
Compared with Terms of Third Parties
Balance %
TXC Corporation NGB Subsidiary Purchase $2,417,255 Its trading price depends on
its function within the group.
Similar with third parties
Its trading price depends on its function within the group.
$ (688,074) (47) $ 33,877
Sale 198,436 〃 Similar with third parties
〃 42,870 1 -
GPT NGB Subsidiary Sale 447,973 〃 Similar with third
parties 〃 119,024 26 -
3. Endorsements guarantees or collateral directly or indirectly provided to the investees: None 4. Financings directly or indirectly provided to the investees: None 5. Other transactions that significantly impacted current year’s profit or loss or financial position: None
(Concluded)

- 173 -
TABLE 5
TXC CORPORATION AND SUBSIDIARIES INTERCOMPANY RELATIONSHIPS AND SIGNIFICANT INTERCOMPANY TRANSACTIONS YEARS ENDED DECEMBER 31, 2012 AND 2011 (In Thousands of New Taiwan Dollars) Year ended December 31, 2012
No. Company Name Counterparty Natural of
Relationship (Note 1)
Intercompany Transactions
Accounts Amount Terms (Note 2) Percentage of Consolidated Total Gross Sales or Total Assets (%)
0 TXC Corporation TXC Technology, Inc. 1 Sales $ 2,792 - - Other expense - consulting expense 50,578 - - Other expense 405 - - Accounts receivable 517 - - TXC Japan Corporation 1 Sales 1,651 - - Other expense - consulting expense 51,854 - - Other expense 79 - - Purchase 12,888 - - Accounts payable 1,732 - - Other receivable 74 - - TXC (Ningbo) Corporation 1 Sales 198,436 - 2 Purchase 2,417,255 - 22 Accounts receivable 42,870 - - Accounts payable 688,074 - 5 TXC (Chongqing) Corporation 1 Sales 858 - - Accounts receivable 857 - - Growing profits Trading Ltd. Purchase 105,376 - 1 Accounts payable 34,524 - - Ningbo Jingyu Company Limited Purchase 23,982 - - Accounts payable 1,086 - -
1 TXC (Ningbo) Corporation Growing profits Trading Ltd. 3 Sales 447,973 - 4 Accounts receivable 119,024 - 1 Ningbo Jingyu Company Limited 3 Sales 43,357 - - Accounts receivable 9,381 - - Rental income 56 - - TXC (Chongqing) Corporation 1 Other receivable 94,484 - 1
(Continued)

- 174 -
Year ended December 31, 2011
No. Company Name Counterparty Natural of
Relationship (Note 1)
Intercompany Transactions
Accounts Amount Terms (Note 2) Percentage of Consolidated Total Gross Sales or Total Assets (%)
0 TXC Corporation TXC Technology, Inc. 1 Sales $ 1,080 - - Other expense - consulting expense 45,307 - 1 Other expense 64 - - Accounts receivable 115 - - TXC Japan Corporation 1 Sales 7,721 - - Other expense - consulting expense 50,523 - 1 Other expense 155 - - Purchase 12,973 - - Accounts receivable 474 - - TXC (NGB) Corporation 1 Sales 130,241 - 1 Purchase 2,309,451 - 23 Accounts receivable 41,314 - - Accounts payable 576,326 - 5 Other receivable 50,869 - - TXC (H.K.) Limited 1 Sales 120 - - Growing Profits Trading Ltd. Purchase 35,809 - - Accounts payable 19,528 - -
1 Growing Profits Trading Ltd. TXC (NGB) Corporation 3 Sales 210,818 - 2 Accounts receivable 90,658 - 1
2 TXC (NGB) Corporation TXC (H.K.) Limited 3 Sales 923 - - Ningbo Jingyu Company Limited 1 Rental revenue 29 - - Other receivable 29 - - TXC (Chongqing) Corporation 1 Other receivable 269 - -
Note 1: 1. Represent the transactions from parent company to subsidiary.
3. Represent the transactions between subsidiaries. Note 2: In 2012 and 2011, the selling price and purchasing price were not significantly different from those with third parties, except those for NGB, GPT, and TXC (HK) Limited which use cost-adjusted price according to the agreed terms.
(Concluded)
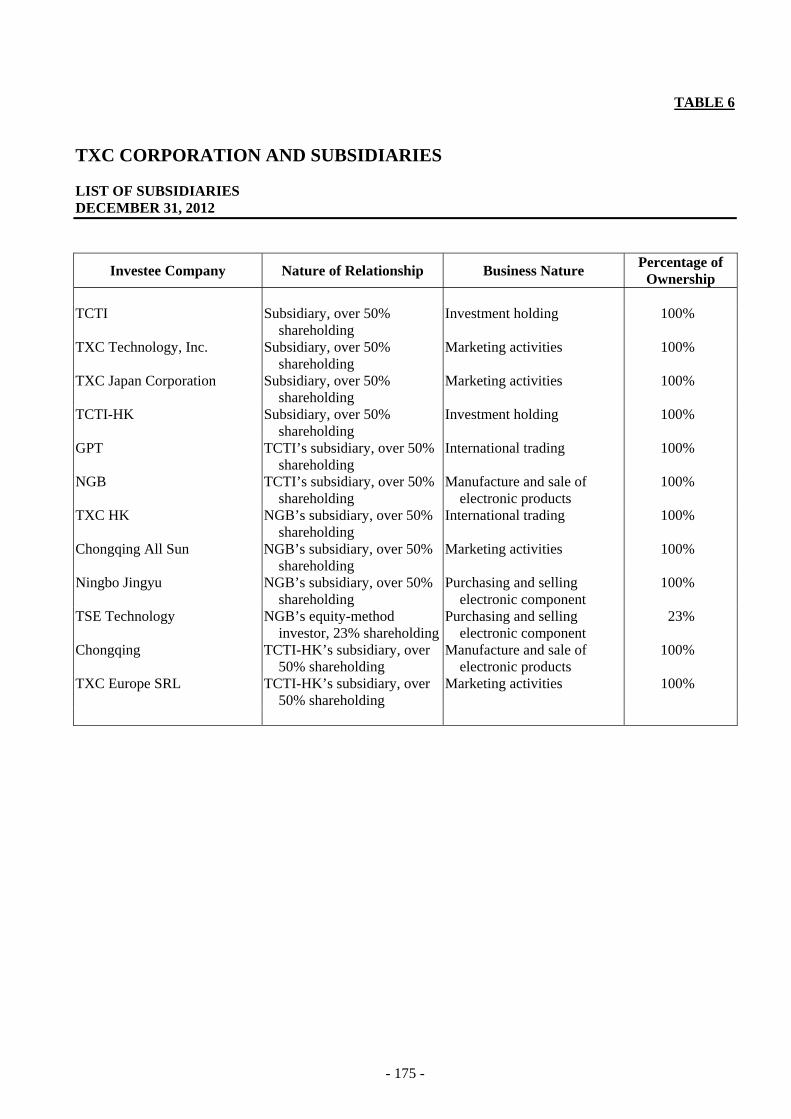
- 175 -
TABLE 6
TXC CORPORATION AND SUBSIDIARIES LIST OF SUBSIDIARIES DECEMBER 31, 2012
Investee Company Nature of Relationship Business Nature Percentage of
Ownership TCTI Subsidiary, over 50%
shareholding Investment holding 100%
TXC Technology, Inc. Subsidiary, over 50% shareholding
Marketing activities 100%
TXC Japan Corporation Subsidiary, over 50% shareholding
Marketing activities 100%
TCTI-HK Subsidiary, over 50% shareholding
Investment holding 100%
GPT TCTI’s subsidiary, over 50% shareholding
International trading 100%
NGB TCTI’s subsidiary, over 50% shareholding
Manufacture and sale of electronic products
100%
TXC HK NGB’s subsidiary, over 50% shareholding
International trading 100%
Chongqing All Sun NGB’s subsidiary, over 50% shareholding
Marketing activities 100%
Ningbo Jingyu NGB’s subsidiary, over 50% shareholding
Purchasing and selling electronic component
100%
TSE Technology NGB’s equity-method investor, 23% shareholding
Purchasing and selling electronic component
23%
Chongqing TCTI-HK’s subsidiary, over 50% shareholding
Manufacture and sale of electronic products
100%
TXC Europe SRL TCTI-HK’s subsidiary, over 50% shareholding
Marketing activities 100%

- 176 -
TABLE 7
TXC CORPORATION AND SUBSIDIARIES CHANGES IN THE SUBSIDIARIES DECEMBER 31, 2012 Consolidated Subsidiaries at
Beginning of Year Addition Disposal
Consolidated Subsidiaries at End of Year
TCTI - - TCTI TXC Technology, Inc. - - TXC Technology, Inc. TXC Japan Corporation - - TXC Japan Corporation TCTI-HK - - TCTI-HK GPT - - GPT NGB - - NGB TXC (HK) - - TXC (HK) Chongqing All Sun - - Chongqing All Sun Ningbo Jingyu - - Ningbo Jingyu TSE Technology - - TSE Technology Chongqing - - Chongqing TXC Europe SRL - - TXC Europe SRL