Embed Size (px)
Citation preview

HE
XAG
ON
ANN
UAL R
EPO
RT 2014
ANNUAL REPORT 2014
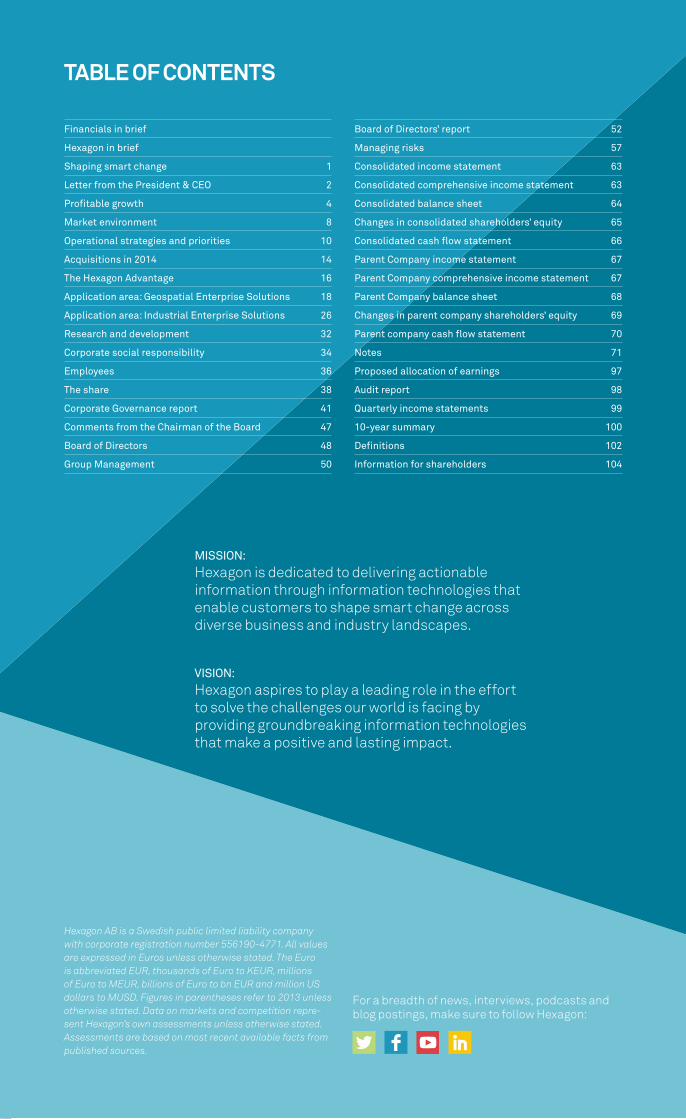
TABLE OF CONTENTS
Financials in brief
Hexagon in brief
Shaping smart change 1
Letter from the President & CEO 2
Profitable growth 4
Market environment 8
Operational strategies and priorities 10
Acquisitions in 2014 14
The Hexagon Advantage 16
Application area: Geospatial Enterprise Solutions 18
Application area: Industrial Enterprise Solutions 26
Research and development 32
Corporate social responsibility 34
Employees 36
The share 38
Corporate Governance report 41
Comments from the Chairman of the Board 47
Board of Directors 48
Group Management 50
Board of Directors’ report 52
Managing risks 57
Consolidated income statement 63
Consolidated comprehensive income statement 63
Consolidated balance sheet 64
Changes in consolidated shareholders’ equity 65
Consolidated cash flow statement 66
Parent Company income statement 67
Parent Company comprehensive income statement 67
Parent Company balance sheet 68
Changes in parent company shareholders’ equity 69
Parent company cash flow statement 70
Notes 71
Proposed allocation of earnings 97
Audit report 98
Quarterly income statements 99
10-year summary 100
Definitions 102
Information for shareholders 104
Hexagon AB is a Swedish public limited liability company with corporate registration number 556190-4771. All values are expressed in Euros unless otherwise stated. The Euro is abbreviated EUR, thousands of Euro to KEUR, millions of Euro to MEUR, billions of Euro to bn EUR and million US dollars to MUSD. Figures in parentheses refer to 2013 unless otherwise stated. Data on markets and competition repre-sent Hexagon’s own assessments unless otherwise stated. Assessments are based on most recent available facts from published sources.
For a breadth of news, interviews, podcasts and blog postings, make sure to follow Hexagon:
MISSION: Hexagon is dedicated to delivering actionable information through information technologies that enable customers to shape smart change across diverse business and industry landscapes.
VISION: Hexagon aspires to play a leading role in the effort to solve the challenges our world is facing by providing groundbreaking information technologies that make a positive and lasting impact.
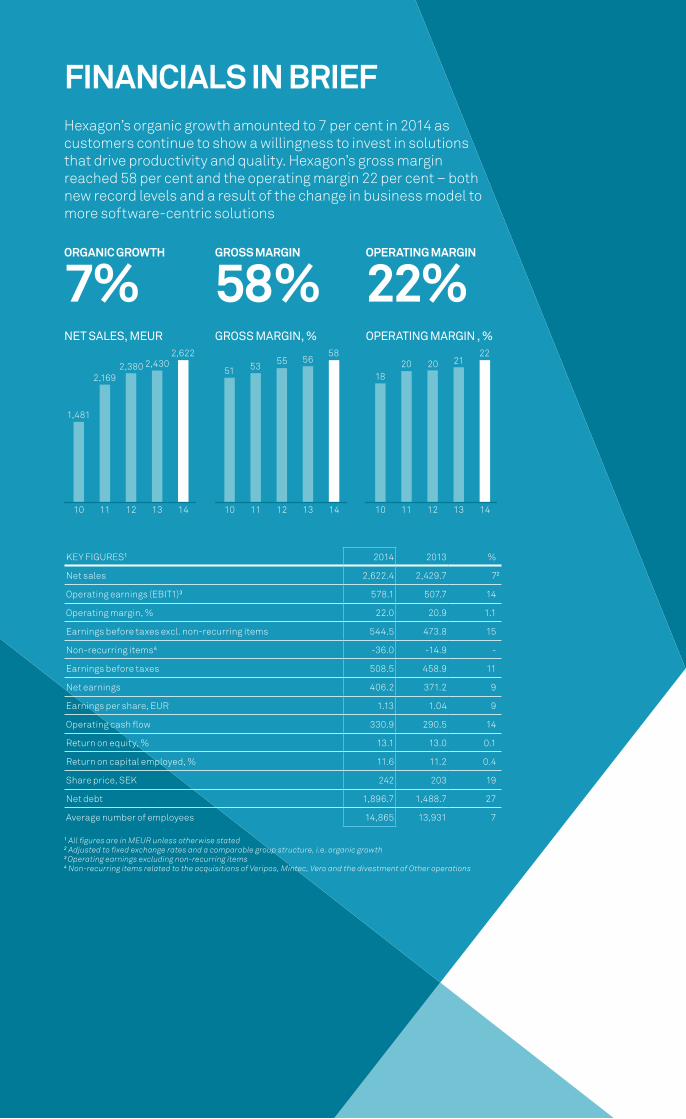
FINANCIALS IN BRIEFHexagon’s organic growth amounted to 7 per cent in 2014 as customers continue to show a willingness to invest in solutions that drive productivity and quality. Hexagon’s gross margin reached 58 per cent and the operating margin 22 per cent – both new record levels and a result of the change in business model to more software-centric solutions
KEY FIGURES1 2014 2013 %
Net sales 2,622.4 2,429.7 72
Operating earnings (EBIT1)3 578.1 507.7 14
Operating margin, % 22.0 20.9 1.1
Earnings before taxes excl. non-recurring items 544.5 473.8 15
Non-recurring items4 -36.0 -14.9 -
Earnings before taxes 508.5 458.9 11
Net earnings 406.2 371.2 9
Earnings per share, EUR 1.13 1.04 9
Operating cash flow 330.9 290.5 14
Return on equity, % 13.1 13.0 0.1
Return on capital employed, % 11.6 11.2 0.4
Share price, SEK 242 203 19
Net debt 1,896.7 1,488.7 27
Average number of employees 14,865 13,931 7
1 All figures are in MEUR unless otherwise stated 2 Adjusted to fixed exchange rates and a comparable group structure, i.e. organic growth3 Operating earnings excluding non-recurring items4 Non-recurring items related to the acquisitions of Veripos, Mintec, Vero and the divestment of Other operations
ORGANIC GROWTH
7%GROSS MARGIN
58 % OPERATING MARGIN
22%
1413121110
1,481
2,1692,380 2,430
2,622
1413121110
51 53 55 5658
1413121110
1820 20 21
22
GROSS MARGIN, % NET SALES, MEUR OPERATING MARGIN , %
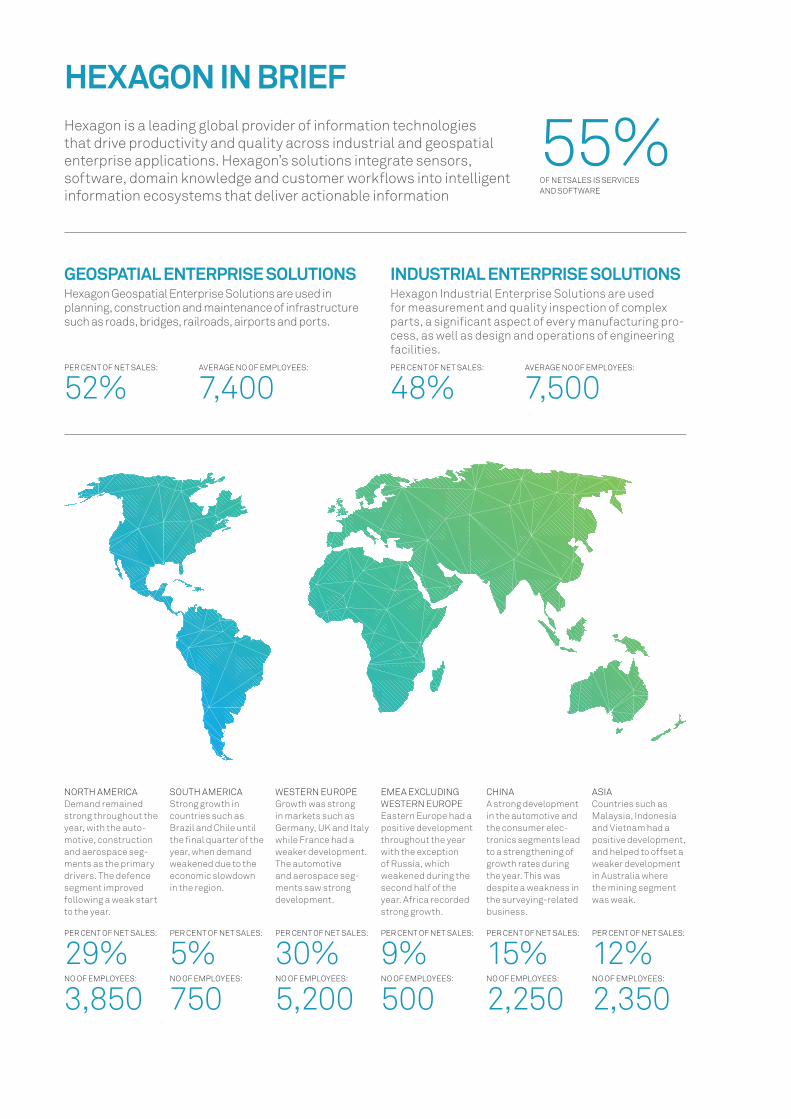
Hexagon is a leading global provider of information technologies that drive productivity and quality across industrial and geospatial enterprise applications. Hexagon’s solutions integrate sensors, software, domain knowledge and customer workflows into intelligent information ecosystems that deliver actionable information
HEXAGON IN BRIEF
NORTH AMERICA Demand remained strong throughout the year, with the auto-motive, construction and aerospace seg-ments as the primary drivers. The defence segment improved following a weak start to the year.
PER CENT OF NET SALES:
29% NO OF EMPLOYEES:
3,850
SOUTH AMERICA Strong growth in countries such as Brazil and Chile until the final quarter of the year, when demand weakened due to the economic slowdown in the region.
PER CENT OF NET SALES:
5% NO OF EMPLOYEES:
750
WESTERN EUROPE Growth was strong in markets such as Germany, UK and Italy while France had a weaker development. The automotive and aerospace seg-ments saw strong development.
PER CENT OF NET SALES:
30% NO OF EMPLOYEES:
5,200
EMEA EXCLUDING WESTERN EUROPE Eastern Europe had a positive development throughout the year with the exception of Russia, which weakened during the second half of the year. Africa recorded strong growth.
PER CENT OF NET SALES:
9% NO OF EMPLOYEES:
500
CHINA A strong development in the automotive and the consumer elec-tronics segments lead to a strengthening of growth rates during the year. This was despite a weakness in the surveying-related business.
PER CENT OF NET SALES:
15% NO OF EMPLOYEES:
2,250
ASIA Countries such as Malaysia, Indonesia and Vietnam had a positive development, and helped to offset a weaker development in Australia where the mining segment was weak.
PER CENT OF NET SALES:
12% NO OF EMPLOYEES:
2,350
GEOSPATIAL ENTERPRISE SOLUTIONSHexagon Geospatial Enterprise Solutions are used in planning, construction and maintenance of infrastructure such as roads, bridges, railroads, airports and ports.
INDUSTRIAL ENTERPRISE SOLUTIONSHexagon Industrial Enterprise Solutions are used for measurement and quality inspection of complex parts, a significant aspect of every manufacturing pro-cess, as well as design and operations of engineering facilities.
PER CENT OF NET SALES:
52%AVERAGE NO OF EMPLOYEES:
7,400PER CENT OF NET SALES:
48%AVERAGE NO OF EMPLOYEES:
7,500
55%OF NETSALES IS SERVICES AND SOFTWARE
SHAPING SMART CHANGEAs a leading global provider of information technologies, Hexagon is focused on helping customers view global challenges as a source of innovation and growth.
That means challenging the status quo – providing innovations that disrupt existing business models and deliver new ways to create value. Big data … cloud … real time … connectivity. These are just a few of the topics and trends fuelling solutions essential to our future. Hexagon’s reach extends to these areas and more.
Together with our customers, we share a collective purpose – to shape smart change by investing in groundbreaking concepts that will transform the world we know today into a viable and sustainable world of the future.
1
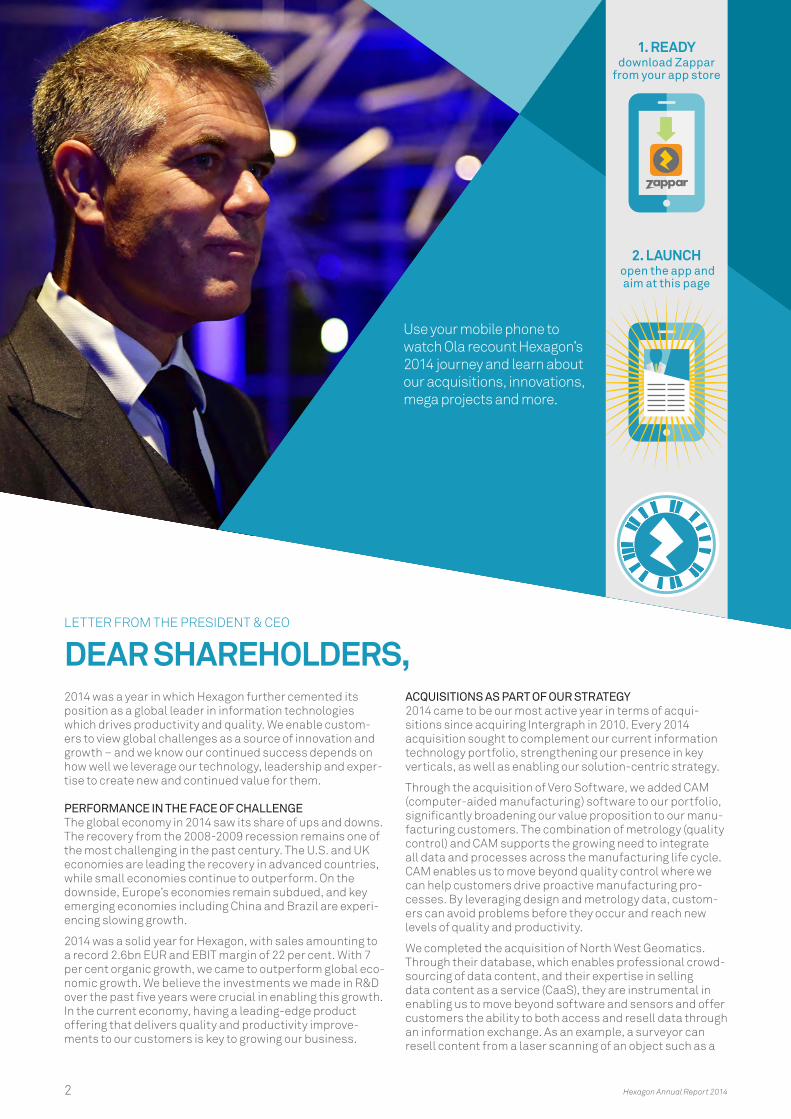
LETTER FROM THE PRESIDENT & CEO
DEAR SHAREHOLDERS, 2014 was a year in which Hexagon further cemented its position as a global leader in information technologies which drives productivity and quality. We enable custom-ers to view global challenges as a source of innovation and growth – and we know our continued success depends on how well we leverage our technology, leadership and exper-tise to create new and continued value for them.
PERFORMANCE IN THE FACE OF CHALLENGE The global economy in 2014 saw its share of ups and downs. The recovery from the 2008-2009 recession remains one of the most challenging in the past century. The U.S. and UK economies are leading the recovery in advanced countries, while small economies continue to outperform. On the downside, Europe’s economies remain subdued, and key emerging economies including China and Brazil are experi-encing slowing growth.
2014 was a solid year for Hexagon, with sales amounting to a record 2.6bn EUR and EBIT margin of 22 per cent. With 7 per cent organic growth, we came to outperform global eco-nomic growth. We believe the investments we made in R&D over the past five years were crucial in enabling this growth. In the current economy, having a leading-edge product offering that delivers quality and productivity improve-ments to our customers is key to growing our business.
ACQUISITIONS AS PART OF OUR STRATEGY2014 came to be our most active year in terms of acqui-sitions since acquiring Intergraph in 2010. Every 2014 acquisition sought to complement our current information technology portfolio, strengthening our presence in key verticals, as well as enabling our solution-centric strategy.
Through the acquisition of Vero Software, we added CAM (computer-aided manufacturing) software to our portfolio, significantly broadening our value proposition to our manu-facturing customers. The combination of metrology (quality control) and CAM supports the growing need to integrate all data and processes across the manufacturing life cycle. CAM enables us to move beyond quality control where we can help customers drive proactive manufacturing pro-cesses. By leveraging design and metrology data, custom-ers can avoid problems before they occur and reach new levels of quality and productivity.
We completed the acquisition of North West Geomatics. Through their database, which enables professional crowd-sourcing of data content, and their expertise in selling data content as a service (CaaS), they are instrumental in enabling us to move beyond software and sensors and offer customers the ability to both access and resell data through an information exchange. As an example, a surveyor can resell content from a laser scanning of an object such as a
1. READYdownload Zappar
from your app store
2. LAUNCH open the app and aim at this page
Use your mobile phone to watch Ola recount Hexagon’s 2014 journey and learn about our acquisitions, innovations, mega projects and more.
2 Hexagon Annual Report 2014
bridge, reducing the need to make multiple measurements of the same object.
Another cornerstone of our growth strategy is to increase the number and breadth of our end-to-end vertical solu-tions for specific target industries. Mining and agriculture are good examples of that. In 2014, we made strides in the growth of our vertical-specific operations, acquiring leading companies in these industries.
We acquired SAFEmine, a provider of comprehensive traffic safety solutions for vehicles operating in open-pit mines, and Mintec (Minesight), a software developer and service provider for mining. Following these acquisitions we formed a new organisation, Hexagon Mining, combining the innova-tive technologies of Devex Mining, Leica Geosystems Mining, MineSight and SAFEmine. Hexagon Mining integrates mine planning, design, fleet and production management, optimi-sation, fatigue monitoring and collision avoidance software into one comprehensive solution, which will make it possible to have a real-time assessment of all activities within the mine at any given time. This will enable customers to improve quality, safety and productivity.
Within agriculture we acquired Arvus, a manufacturer of precision agriculture solutions for closer, more site-specific management of the factors affecting crop production, and iLab Sistemas, a leading provider of planning and optimisa-tion solutions for the agriculture sector, with special focus on the sugar and ethanol industries. Arvus and iLab, together with the agriculture business unit of Geosystems, form the backbone of our Smart Agriculture solutions. Mining and agri-culture are just two examples of our focus on building end-to-end vertical solutions.
We also completed the acquisition of Veripos in 2014. Through its network of Global Navigation Satellite System (GNSS) reference stations, Veripos provides precise naviga-tion and positioning for key areas of the offshore industry. Moving forward, its state-of-the-art positioning technologies will empower and strengthen many of our onshore offerings and geospatial solutions, such as surveying and agriculture.
BIG IDEAS AT WORKLeveraging years of R&D investments, Hexagon Metrology introduced the revolutionary 360° Smart Inline Measure-ment Solutions (SIMS), a family of measurement solutions that can be fully integrated into demanding automotive production lines to serve manufacturers during launch, ramp-up and ongoing production. Lifting time constraint restrictions, the solution enables car manufacturers to move from measuring less than one per cent of all vehicles to full inspection of every single car body, which significantly increases productivity, quality and cost savings.
These investments also brought optical measurement to a new dimension with the release of Hexagon Metrology’s HP-O solution. This solution leverages the power of non-con-tact metrology technology, which not only enables you to measure more and faster, but also to measure surfaces that were previously inaccessible. This is especially important in industries such as aerospace, where newer manufacturing methods have led to more complex designs and harder-to-reach surfaces.
We also proved our strength and purpose through our involvement in several mega projects around the world. Belo Monte Consortium (the 10 largest construction companies in Brazil) is working with Hexagon to monitor more than 900 mobile assets used in constructing the third-largest hydro-electric plant in the world. With real-time information about valuable assets such as trucks and bulldozers, Belo Monte is able to increase productivity of transport equipment and improve queue management.
In a joint venture with Korean Daewoo E&C and Hyundai E&C, EPC giant Fluor chose Hexagon’s cloud solution for a Kuwait National Petroleum Company project aimed at upgrading and expanding refineries at Mina Abdulla and Mina Al-Ahmadi. Fluor and its partners will execute the project globally on a multi-office basis and will have round-the-clock access to Hexagon’s portfolio of integrated appli-cation software. This initiative marks the start of enabling major multi-office “mega EPC projects” executing their work via the cloud.
SOLUTION-CENTRIC STRATEGY ALIGNMENT2014 marked an important year in strengthening our solution-centric strategy and portfolio. To better align our financial reporting with this strategy moving forward, we’ve created new reporting segments for 2015. The new Geospatial Enterprise Solutions (GES) segment will include companies that capture, manage and leverage geospatial and positioning information (e.g. Hexagon Geosystems, Intergraph SG&I and Hexagon Positioning). The Industrial Enterprise Solutions (IES) segment will consist of our man-ufacturing and engineering focused businesses, Hexagon Metrology and Intergraph PP&M. While both segments share a common goal of delivering actionable information, linking isolated silos of information across entire organisa-tions and supply networks, each specialises in its own mix of hardware, software and services.
The GES segment includes software and hardware such as laser instruments, GNSS and airborne imaging sensors for capturing and recording the world around us – whether a small object, large structure or complete environment – and understanding and acting upon that geo-referenced data. Our geospatial solutions leverage GIS (Geographic Information Systems) and mapping software to derive actionable informa-tion from complex data.
The IES segment includes metrology systems that incorpo-rate the latest in laser and sensor technology for fast and accurate measurements, as well as CAD (computer-aided design) and CAM (computer-aided manufacturing) software to facilitate design, manufacturing, and other processes. Our industrial solutions optimise processes and throughput in manufacturing facilities and create and leverage engi-neering information critical to the planning, construction and operation of plants and process facilities.
SMART BUSINESS THROUGH INNOVATION AND DEDICATED PEOPLE A strong and innovative R&D programme is a prerequisite for Hexagon’s industry leadership and is vital to maintaining our expertise. Transformative technologies and disciplines that shape change and disrupt existing business models – from automation to the cloud – remain an integral part of our strategy. We are committed to protecting and extending our leadership position, spending 11 per cent of sales on R&D.
Last, we recognise our employees as one of our most important assets. More than 15,000 Hexagon employees worldwide work each day on behalf of our shareholders to make Hexagon stronger. Together, our people, global foot-print, integrated technology portfolio and ability to innovate allow us to perform on a scale few others can match.
I thank our shareholders, customers and partners for their continued confidence and loyalty, and I look forward to what the future will bring.
Ola RollénPresident and Chief Executive Officer Stockholm, Sweden, March 2015
Hexagon Annual Report 2014 3
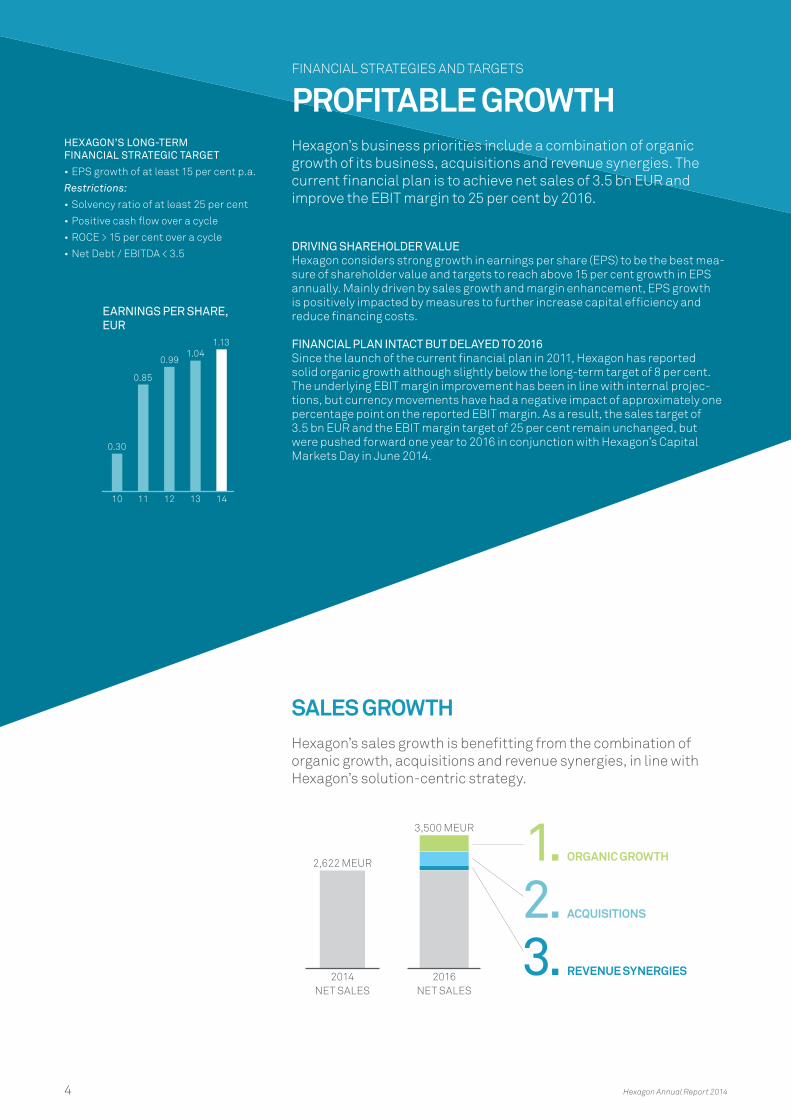
FINANCIAL STRATEGIES AND TARGETS
PROFITABLE GROWTHHexagon’s business priorities include a combination of organic growth of its business, acquisitions and revenue synergies. The current financial plan is to achieve net sales of 3.5 bn EUR and improve the EBIT margin to 25 per cent by 2016.
DRIVING SHAREHOLDER VALUEHexagon considers strong growth in earnings per share (EPS) to be the best mea-sure of shareholder value and targets to reach above 15 per cent growth in EPS annually. Mainly driven by sales growth and margin enhancement, EPS growth is positively impacted by measures to further increase capital efficiency and reduce financing costs.
FINANCIAL PLAN INTACT BUT DELAYED TO 2016Since the launch of the current financial plan in 2011, Hexagon has reported solid organic growth although slightly below the long-term target of 8 per cent. The underlying EBIT margin improvement has been in line with internal projec-tions, but currency movements have had a negative impact of approximately one percentage point on the reported EBIT margin. As a result, the sales target of 3.5 bn EUR and the EBIT margin target of 25 per cent remain unchanged, but were pushed forward one year to 2016 in conjunction with Hexagon’s Capital Markets Day in June 2014.
SALES GROWTHHexagon’s sales growth is benefitting from the combination of organic growth, acquisitions and revenue synergies, in line with Hexagon’s solution-centric strategy.
HEXAGON’S LONG-TERM FINANCIAL STRATEGIC TARGET
•EPS growth of at least 15 per cent p.a.
Restrictions:
•Solvency ratio of at least 25 per cent
•Positive cash flow over a cycle
•ROCE > 15 per cent over a cycle
•Net Debt / EBITDA < 3.5
1. ORGANIC GROWTH
2. ACQUISITIONS
3. REVENUE SYNERGIES2014 NET SALES
2,622 MEUR
2016 NET SALES
3,500 MEUR
EARNINGS PER SHARE, EUR
1413121110
0.30
0.85
0.991.04
1.13
4 Hexagon Annual Report 2014
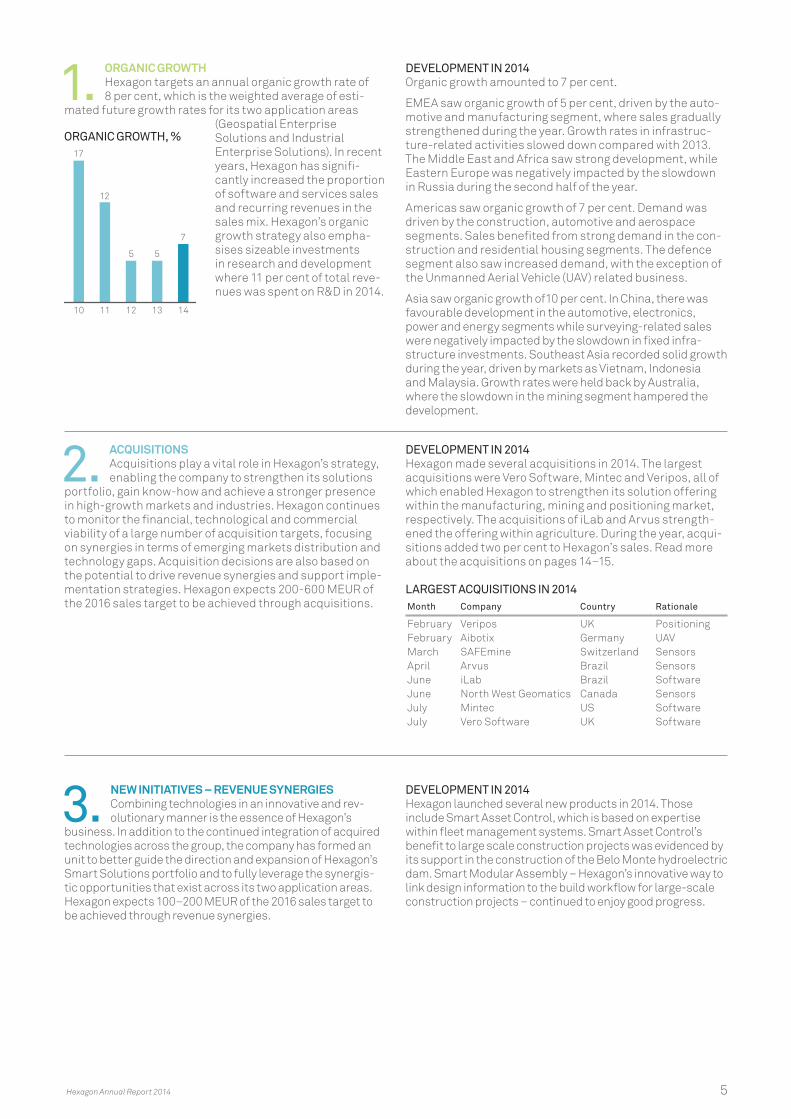
1. ORGANIC GROWTHHexagon targets an annual organic growth rate of 8 per cent, which is the weighted average of esti-
mated future growth rates for its two application areas (Geospatial Enterprise Solutions and Industrial Enterprise Solutions). In recent years, Hexagon has signifi-cantly increased the proportion of software and services sales and recurring revenues in the sales mix. Hexagon’s organic growth strategy also empha-sises sizeable investments in research and development where 11 per cent of total reve-nues was spent on R&D in 2014.
DEVELOPMENT IN 2014Organic growth amounted to 7 per cent.
EMEA saw organic growth of 5 per cent, driven by the auto-motive and manufacturing segment, where sales gradually strengthened during the year. Growth rates in infrastruc-ture-related activities slowed down compared with 2013. The Middle East and Africa saw strong development, while Eastern Europe was negatively impacted by the slowdown in Russia during the second half of the year.
Americas saw organic growth of 7 per cent. Demand was driven by the construction, automotive and aerospace segments. Sales benefited from strong demand in the con-struction and residential housing segments. The defence segment also saw increased demand, with the exception of the Unmanned Aerial Vehicle (UAV) related business.
Asia saw organic growth of10 per cent. In China, there was favourable development in the automotive, electronics, power and energy segments while surveying-related sales were negatively impacted by the slowdown in fixed infra-structure investments. Southeast Asia recorded solid growth during the year, driven by markets as Vietnam, Indonesia and Malaysia. Growth rates were held back by Australia, where the slowdown in the mining segment hampered the development.
2. ACQUISITIONSAcquisitions play a vital role in Hexagon’s strategy, enabling the company to strengthen its solutions
portfolio, gain know-how and achieve a stronger presence in high-growth markets and industries. Hexagon continues to monitor the financial, technological and commercial viability of a large number of acquisition targets, focusing on synergies in terms of emerging markets distribution and technology gaps. Acquisition decisions are also based on the potential to drive revenue synergies and support imple-mentation strategies. Hexagon expects 200-600 MEUR of the 2016 sales target to be achieved through acquisitions.
DEVELOPMENT IN 2014Hexagon made several acquisitions in 2014. The largest acquisitions were Vero Software, Mintec and Veripos, all of which enabled Hexagon to strengthen its solution offering within the manufacturing, mining and positioning market, respectively. The acquisitions of iLab and Arvus strength-ened the offering within agriculture. During the year, acqui-sitions added two per cent to Hexagon’s sales. Read more about the acquisitions on pages 14–15.
LARGEST ACQUISITIONS IN 2014 Month Company Country Rationale
February Veripos UK PositioningFebruary Aibotix Germany UAVMarch SAFEmine Switzerland SensorsApril Arvus Brazil SensorsJune iLab Brazil SoftwareJune North West Geomatics Canada SensorsJuly Mintec US SoftwareJuly Vero Software UK Software
3. NEW INITIATIVES – REVENUE SYNERGIESCombining technologies in an innovative and rev-olutionary manner is the essence of Hexagon’s
business. In addition to the continued integration of acquired technologies across the group, the company has formed an unit to better guide the direction and expansion of Hexagon’s Smart Solutions portfolio and to fully leverage the synergis-tic opportunities that exist across its two application areas. Hexagon expects 100–200 MEUR of the 2016 sales target to be achieved through revenue synergies.
DEVELOPMENT IN 2014Hexagon launched several new products in 2014. Those include Smart Asset Control, which is based on expertise within fleet management systems. Smart Asset Control’s benefit to large scale construction projects was evidenced by its support in the construction of the Belo Monte hydroelectric dam. Smart Modular Assembly – Hexagon’s innovative way to link design information to the build workflow for large-scale construction projects – continued to enjoy good progress.
ORGANIC GROWTH, %
1413121110
17
12
5 5
7
Hexagon Annual Report 2014 5
MARGIN EXPANSION, ROAD TO 25 PER CENT EBITHexagon has seen margins expand due to operating leverage as well as the shift in Hexagon’s business model – from a product-centric to a solution-centric supplier of applications. In effect, the shift towards higher-value and more profitable solutions is contributing toward the 2016 EBIT margin target of 25 per cent. In addition, areas with above-average growth rates are producing above-average EBIT margins. While acquisitions historically have led to a dilutive effect on the margin, the increasing focus on software has resulted in more instances where the acquired company’s margin is in line with or higher than Hexagon’s.
DEVELOPMENT IN 2014Hexagon’s operating margin expanded to a record level in 2014 due to the organic growth and the shift in portfolio mix (products to solutions). The positive impact from these factors more than offset the negative impact from the increased amortization costs related to the investments made over the past years. The gross margin was 57.8 per cent (55.5) and the EBIT margin was 22.0 per cent (20.9). The operating margin also benefitted from acquisitions made while cur-rency movements during the year had a negative impact on profitability.
SOLUTION-CENTRIC STRATEGY SUPPORTS MARGIN TARGET
Operating profit
D&A
OPEX
Cost of goods sold
2011 2014 FINANCIAL TARGET 2016
EBIT margin 20%
EBIT margin 22%
EBIT margin 25%
EBITDA margin 25%
EBITDA margin 28%
EBITDA margin
Gross margin 53%
Gross margin 59%
Gross margin 60%
Hexagon Annual Report 20146
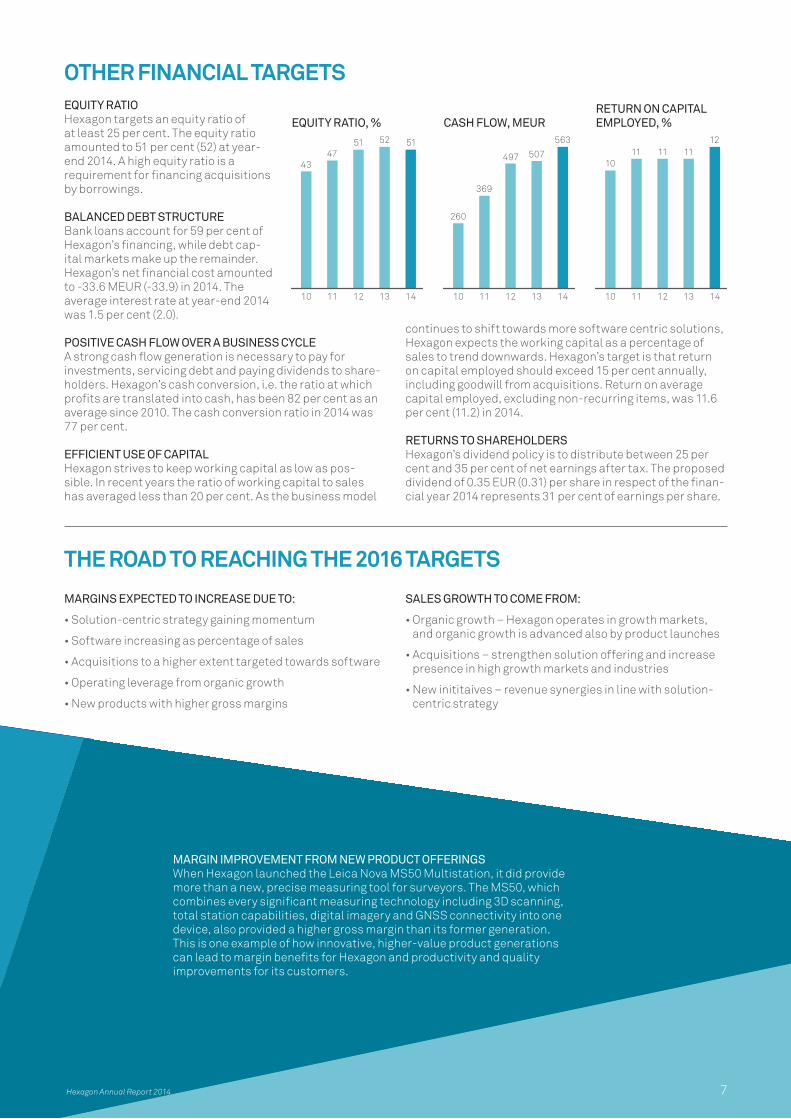
OTHER FINANCIAL TARGETSEQUITY RATIO Hexagon targets an equity ratio of at least 25 per cent. The equity ratio amounted to 51 per cent (52) at year-end 2014. A high equity ratio is a requirement for financing acquisitions by borrowings.
BALANCED DEBT STRUCTUREBank loans account for 59 per cent of Hexagon’s financing, while debt cap-ital markets make up the remainder. Hexagon’s net financial cost amounted to -33.6 MEUR (-33.9) in 2014. The average interest rate at year-end 2014 was 1.5 per cent (2.0).
POSITIVE CASH FLOW OVER A BUSINESS CYCLEA strong cash flow generation is necessary to pay for investments, servicing debt and paying dividends to share-holders. Hexagon’s cash conversion, i.e. the ratio at which profits are translated into cash, has been 82 per cent as an average since 2010. The cash conversion ratio in 2014 was 77 per cent.
EFFICIENT USE OF CAPITALHexagon strives to keep working capital as low as pos-sible. In recent years the ratio of working capital to sales has averaged less than 20 per cent. As the business model
continues to shift towards more software centric solutions, Hexagon expects the working capital as a percentage of sales to trend downwards. Hexagon’s target is that return on capital employed should exceed 15 per cent annually, including goodwill from acquisitions. Return on average capital employed, excluding non-recurring items, was 11.6 per cent (11.2) in 2014.
RETURNS TO SHAREHOLDERSHexagon’s dividend policy is to distribute between 25 per cent and 35 per cent of net earnings after tax. The proposed dividend of 0.35 EUR (0.31) per share in respect of the finan-cial year 2014 represents 31 per cent of earnings per share.
THE ROAD TO REACHING THE 2016 TARGETS
MARGINS EXPECTED TO INCREASE DUE TO:
•Solution-centricstrategygainingmomentum
•Softwareincreasingaspercentageofsales
•Acquisitionstoahigherextenttargetedtowardssoftware
•Operatingleveragefromorganicgrowth
•Newproductswithhighergrossmargins
SALES GROWTH TO COME FROM:
•Organicgrowth–Hexagonoperatesingrowthmarkets,and organic growth is advanced also by product launches
•Acquisitions–strengthensolutionofferingandincreasepresence in high growth markets and industries
•Newinititaives–revenuesynergiesinlinewithsolution-centric strategy
MARGIN IMPROVEMENT FROM NEW PRODUCT OFFERINGS When Hexagon launched the Leica Nova MS50 Multistation, it did provide more than a new, precise measuring tool for surveyors. The MS50, which combines every significant measuring technology including 3D scanning, total station capabilities, digital imagery and GNSS connectivity into one device, also provided a higher gross margin than its former generation. This is one example of how innovative, higher-value product generations can lead to margin benefits for Hexagon and productivity and quality improvements for its customers.
EQUITY RATIO, %
1413121110
4347
51 52 51
CASH FLOW, MEUR
1413121110
260
369
497 507
563
RETURN ON CAPITAL EMPLOYED, %
1413121110
1011 11 11
12
7 Hexagon Annual Report 2014
MARKET ENVIRONMENT
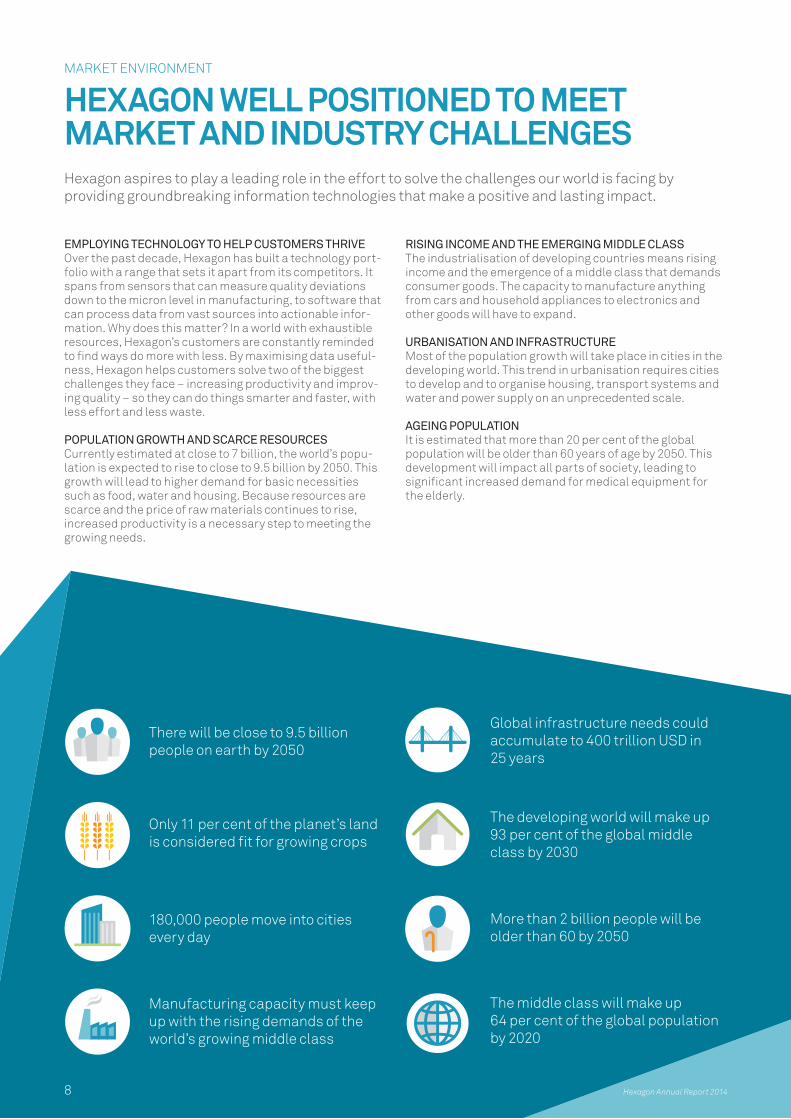
HEXAGON WELL POSITIONED TO MEET MARKET AND INDUSTRY CHALLENGESHexagon aspires to play a leading role in the effort to solve the challenges our world is facing by providing groundbreaking information technologies that make a positive and lasting impact.
EMPLOYING TECHNOLOGY TO HELP CUSTOMERS THRIVEOver the past decade, Hexagon has built a technology port-folio with a range that sets it apart from its competitors. It spans from sensors that can measure quality deviations down to the micron level in manufacturing, to software that can process data from vast sources into actionable infor-mation. Why does this matter? In a world with exhaustible resources, Hexagon’s customers are constantly reminded to find ways do more with less. By maximising data useful-ness, Hexagon helps customers solve two of the biggest challenges they face – increasing productivity and improv-ing quality – so they can do things smarter and faster, with less effort and less waste.
POPULATION GROWTH AND SCARCE RESOURCESCurrently estimated at close to 7 billion, the world’s popu-lation is expected to rise to close to 9.5 billion by 2050. This growth will lead to higher demand for basic necessities such as food, water and housing. Because resources are scarce and the price of raw materials continues to rise, increased productivity is a necessary step to meeting the growing needs.
RISING INCOME AND THE EMERGING MIDDLE CLASSThe industrialisation of developing countries means rising income and the emergence of a middle class that demands consumer goods. The capacity to manufacture anything from cars and household appliances to electronics and other goods will have to expand.
URBANISATION AND INFRASTRUCTUREMost of the population growth will take place in cities in the developing world. This trend in urbanisation requires cities to develop and to organise housing, transport systems and water and power supply on an unprecedented scale.
AGEING POPULATIONIt is estimated that more than 20 per cent of the global popu lation will be older than 60 years of age by 2050. This development will impact all parts of society, leading to significant increased demand for medical equipment for the elderly.
There will be close to 9.5 billion people on earth by 2050
Only 11 per cent of the planet’s land is considered fit for growing crops
180,000 people move into cities every day
Manufacturing capacity must keep up with the rising demands of the world’s growing middle class
Global infrastructure needs could accumulate to 400 trillion USD in 25 years
The developing world will make up 93 per cent of the global middle class by 2030
More than 2 billion people will be older than 60 by 2050
The middle class will make up 64 per cent of the global population by 2020
Hexagon Annual Report 20148
INDUSTRIES AND MARKET TRENDS Hexagon continues to see a shift toward comprehensive solutions, where more and more customers expect suppliers to deliver solutions that adress their entire workflow. This could range from the sensor that collects information to the software that processes that information.
INDUSTRIAL MARKET TRENDSThe use of automation technologies has sharply increased as manufacturers continue to look for ways to increase productivity, improve quality and reduce costs by automat-ing human tasks that involve hard physical or monotonous labour. Solutions that incorporate quality control in the shop floor environment and automate the measuring pro-cess, target this trend. An emerging trend entails manufac-turers looking to make the quality data provided by sensors an accessible and actionable and integrated part of their product lifecycle management systems. Through analys-ing these large data sets – often referred to as ‘big data’ – Hexagon’s customers can do things smarter and faster, with less effort and less waste.
Within process industries such as oil and gas and chemi-cals, there is a need to accelerate project completion and ensure operational efficiency. Yet industry data indicates that nearly half of all engineering projects fall victim to completion deadlines. With project organisations becoming more geographically dispersed and project size increas-ing in scope and complexity, engineering companies and owner/operators are seeking new and innovative ways to improve productivity and reduce the risk for delays and cost overruns in the design and construction phase of their engin eering projects.
GEOSPATIAL MARKET TRENDSMeasurements and positioning are becoming more exact and precise as sensors and positioning services become
more advanced. The ability to turn the growing amount of data provided by increasingly advanced sensors into action-able information is a challenge for surveyors. To overcome it they must seek solutions that focus on improving data man-agement and processing across their entire workflow.
A transformational trend on the rise are non-traditional sensors, such as unmanned aerial vehicles (UAVs) and mobile systems. In the case of personal devices such as smart phones, people can act as sensors, using outlets like social media to make information available to the masses. These trends are transforming how organisations gather and leverage geospatial information.
Within the construction sector, Building Information Modelling (BIM) is a trend where sensors are used to cap-ture existing building information so that construction projects such as renovations and retrofits can be digitally laid in the field. BIM is also used to perform quality assur-ance checks during construction for improved accuracy and reduced rework.
Domiciled
Listed
Geospatial
Industrial
COMPETITIVE LANDSCAPEHexagon’s competitive landscape includes global compa-nies of varying sizes and specialisations. However, unlike Hexagon, the majority operate within only one phase of an industry workflow or are limited to only sensors or software. To maintain its competitive advantage and meet increasing customer demand for solution-centric, enterprise-wide applications, Hexagon continues to heavily invest in its core technologies, with special emphasis on strengthening its software capabilities.
KEY COMPETITORSThe table on the right summarises Hexagon’s most import-ant competitors within each of its two application areas: Geospatial Enterprise Solutions and Industrial Enterprise Solutions.
Company
Autodesk USA P P P
AVEVA UK P P P
Bentley Systems USA P P
Carl Zeiss Germany P
Dassault Systèmes France P P
ESRI USA P
Faro Technologies USA P P P
Mitutoyo Japan P
Nikon Japan P P
Renishaw UK P P
South Survey China P
Topcon Japan P P
Trimble USA P P
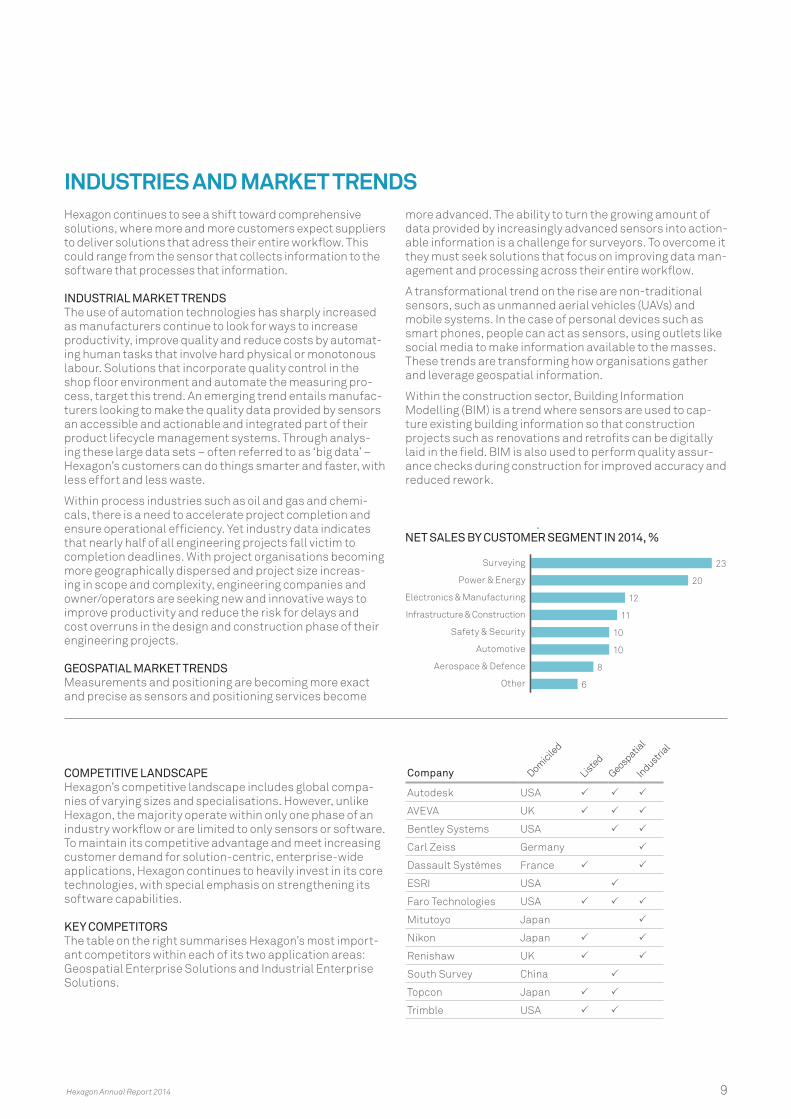
NET SALES BY CUSTOMER SEGMENT IN 2014, %
Surveying
Power & Energy
Electronics & Manufacturing
Infrastructure & Construction
Safety & Security
Automotive
Aerospace & Defence
Other
23
20
12
11
10
10
8
6
Hexagon Annual Report 2014 9
OPERATIONAL STRATEGIES AND PRIORITIES
IMPROVING CUSTOMER PRODUCTIVITY THROUGH INNOVATIVE SOLUTIONSTo be a market leader, Hexagon knows that it has to be strategic and innovative in developing new products. Hexagon also knows that it must be a cost leader as well as staffing its organisation with highly qualified individuals committed to helping the company maintain its position as a leading supplier of geospatial and industrial enterprise solutions.
MARKET SHARE GROWTHHexagon has determined that it is necessary to be a market leader in the indus-tries it serves. This is a position that the company has reached for its two applica-tion areas, Geospatial Enterprise Solutions and Industrial Enterprise Solutions. To continue to grow its market share, Hexagon aims to introduce new and inno-vative products to its markets, as well as develop cross-selling opportunities. An example of this is the establishment of a solution-centric strategy for Hexagon’s mining activities with the formation of a dedicated organisation for the vertical. Through this, Hexagon identified opportunities to sell its portfolio of fleet man-agement systems and safety solutions to the users of mine planning software, and conversely.
LONG-TERM COST LEADERSHIPA competitive cost structure is necessary to defend a leading market position, enhance an organisation’s position as a challenger or more easily manage fluctu-ations in demand. Relative to its peers, Hexagon has a strong operating margin, which is proof of a cost-efficient organisation. This enables Hexagon to invest
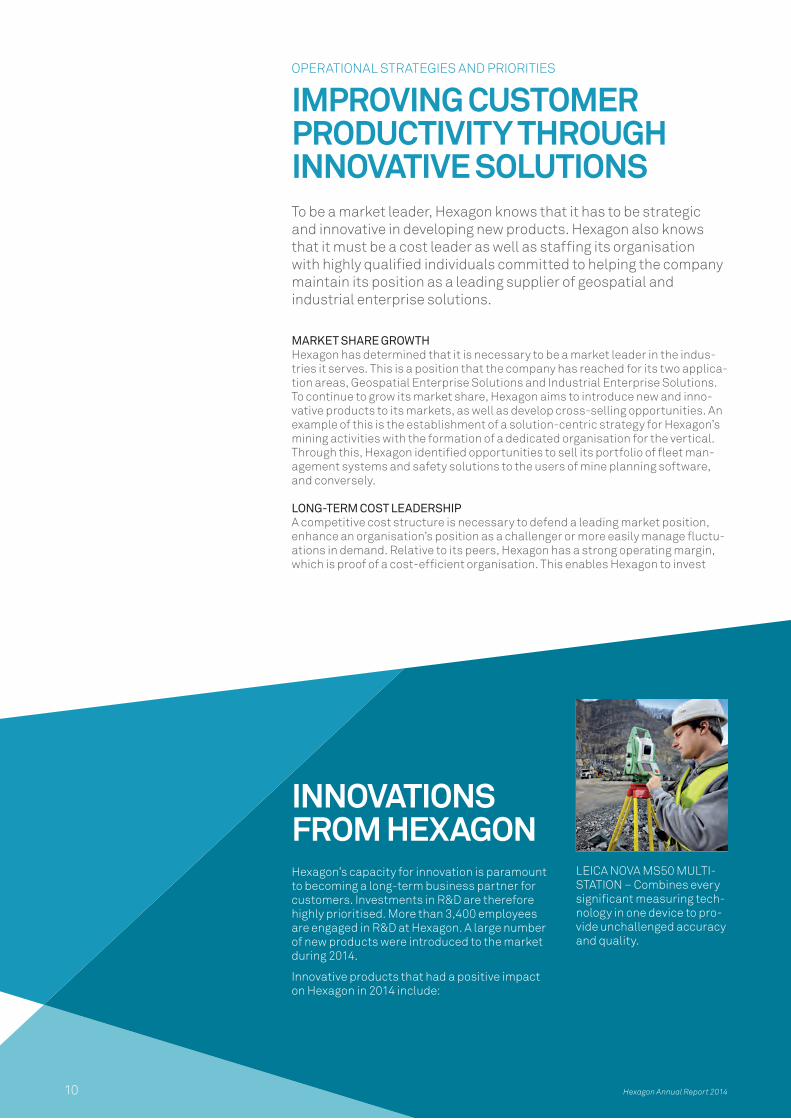
LEICA NOVA MS50 MULTI-STATION – Combines every significant measuring tech-nology in one device to pro-vide unchallenged accuracy and quality.
INNOVATIONS FROM HEXAGONHexagon’s capacity for innovation is paramount to becoming a long-term business partner for customers. Investments in R&D are therefore highly prioritised. More than 3,400 employees are engaged in R&D at Hexagon. A large number of new products were introduced to the market during 2014.
Innovative products that had a positive impact on Hexagon in 2014 include:
Hexagon Annual Report 201410
more resources than many of its peers in R&D. Scale has become an important factor in achieving long-term cost leadership. Sharing R&D efforts and the route to market in new geographies, enables Hexagon to achieve a better cost position than many of its peers. For example, the development of the Metrology Manage-ment System, a new software platform that turns gathered measurement data into actionable information, is a collaborative effort between Metrology and Intergraph using Intergraph’s SmartPlant Foundation platform.
IMPORTANCE OF KNOWLEDGEABLE EMPLOYEESEmployee know-how and experience are essential to the successful operation of Hexagon, which is why Hexagon recruits local personnel that know and under-stand their respective geographical markets. From a group leadership point of view, Hexagon aims to have the required competences to grow the business. On average, the group management of Hexagon has 11 years of experience in the company. From an employee point of view, Hexagon encourages and offers opportunities for further development, as illustrated by the launch of the Hexagon Leadership Development Programme in 2014.
SPEED MANAGEMENTAs the pace of the innovation cycle increases, short and fast decision-making processes along with time-efficient implementation, become a requirement for enhancing competitiveness and raising organisational capacity. Hexagon strives for a work environment with clear responsibilities, a flat hierarchy and minimal bureaucracy. Hexagon’s organisation is decentralised, creating a sound basis for committed and motivated employees, enabling Hexagon to make fast operational decisions.
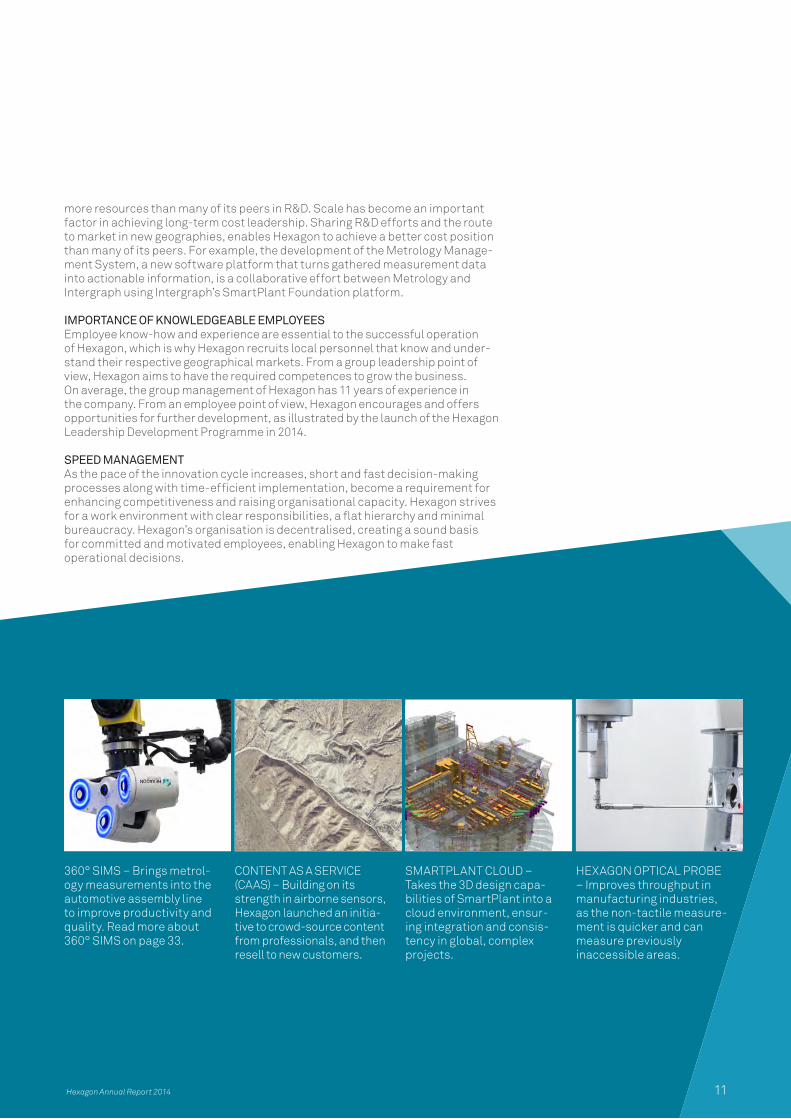
360° SIMS – Brings metrol-ogy measurements into the automotive assembly line to improve productivity and quality. Read more about 360° SIMS on page 33.
CONTENT AS A SERVICE (CAAS) – Building on its strength in airborne sensors, Hexagon launched an initia-tive to crowd-source content from professionals, and then resell to new customers.
SMARTPLANT CLOUD – Takes the 3D design capa-bilities of SmartPlant into a cloud environment, ensur-ing integration and consis-tency in global, complex projects.
HEXAGON OPTICAL PROBE – Improves throughput in manufacturing industries, as the non-tactile measure-ment is quicker and can measure previously inaccessible areas.
11 Hexagon Annual Report 2014
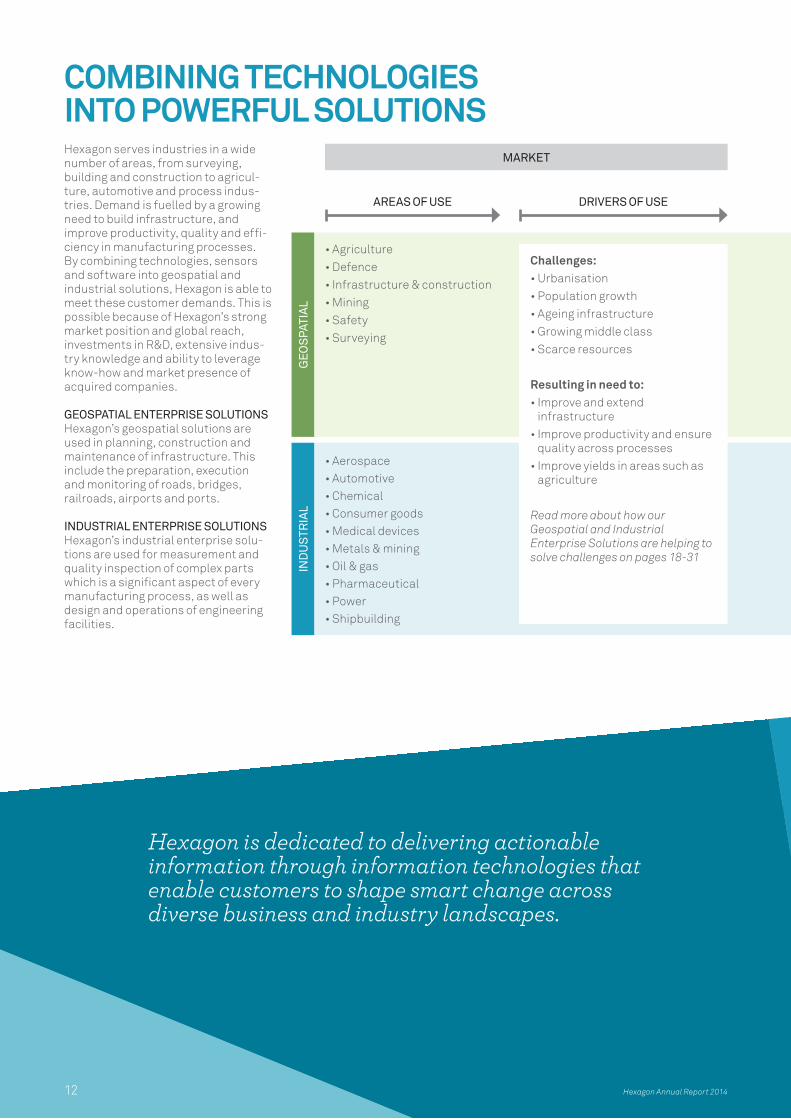
MARKET
DRIVERS OF USEAREAS OF USE
•Agriculture•Defence•Infrastructure&construction•Mining•Safety•Surveying
•Aerospace•Automotive•Chemical•Consumergoods•Medicaldevices•Metals&mining•Oil&gas•Pharmaceutical•Power•Shipbuilding
Challenges:•Urbanisation•Populationgrowth•Ageinginfrastructure•Growingmiddleclass•Scarceresources
Resulting in need to:•Improveandextend
infrastructure•Improveproductivityandensure
quality across processes•Improveyieldsinareassuchas
agriculture
Read more about how our Geospatial and Industrial Enterprise Solutions are helping to solve challenges on pages 18-31
GEO
SPA
TIA
LIN
DU
STR
IAL
COMBINING TECHNOLOGIES INTO POWERFUL SOLUTIONSHexagon serves industries in a wide number of areas, from surveying, building and construction to agricul-ture, automotive and process indus-tries. Demand is fuelled by a growing need to build infrastructure, and improve productivity, quality and effi-ciency in manufacturing processes. By combining technologies, sensors and software into geospatial and industrial solutions, Hexagon is able to meet these customer demands. This is possible because of Hexagon’s strong market position and global reach, investments in R&D, extensive indus-try knowledge and ability to leverage know-how and market presence of acquired companies.
GEOSPATIAL ENTERPRISE SOLUTIONSHexagon’s geospatial solutions are used in planning, construction and maintenance of infrastructure. This include the preparation, execution and monitoring of roads, bridges, railroads, airports and ports.
INDUSTRIAL ENTERPRISE SOLUTIONSHexagon’s industrial enterprise solu-tions are used for measurement and quality inspection of complex parts which is a significant aspect of every manufacturing process, as well as design and operations of engineering facilities.
Hexagon is dedicated to delivering actionable information through information technologies that enable customers to shape smart change across diverse business and industry landscapes.
Hexagon Annual Report 201412
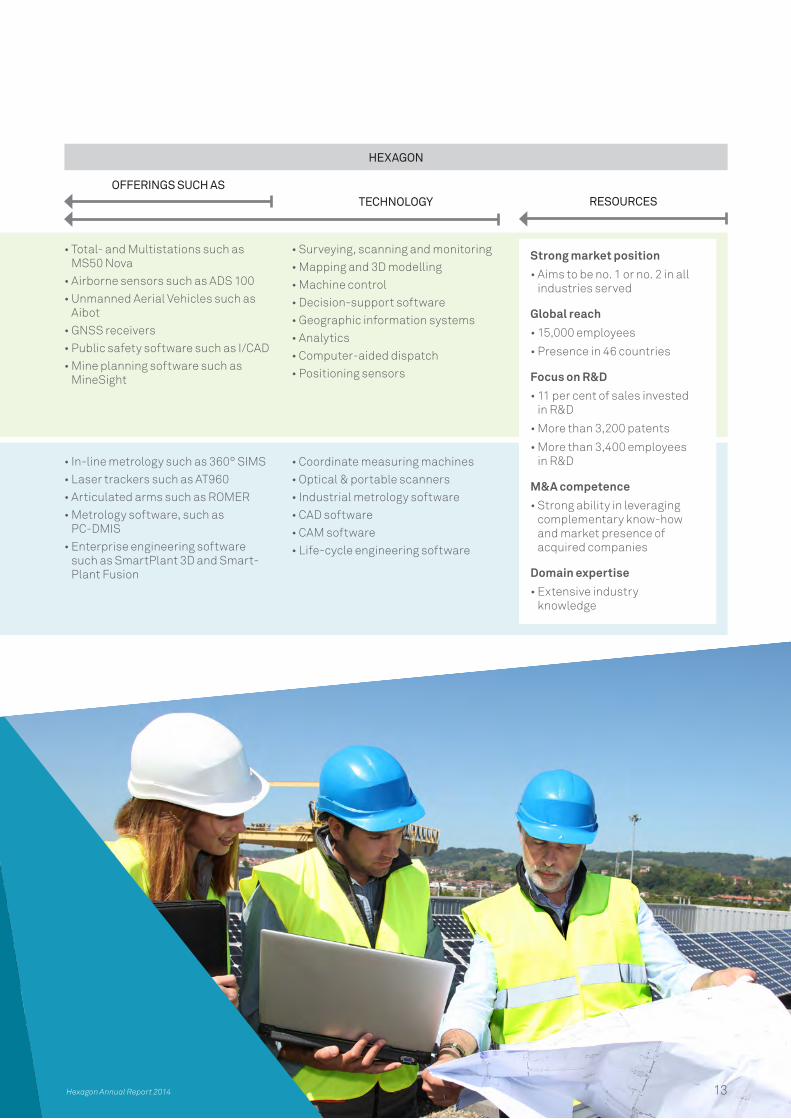
TECHNOLOGY RESOURCESOFFERINGS SUCH AS
HEXAGON
•Total-andMultistationssuchasMS50 Nova
•AirbornesensorssuchasADS100•UnmannedAerialVehiclessuchas
Aibot•GNSSreceivers•PublicsafetysoftwaresuchasI/CAD•Mineplanningsoftwaresuchas
MineSight
•In-linemetrologysuchas360°SIMS•LasertrackerssuchasAT960•ArticulatedarmssuchasROMER•Metrologysoftware,suchas
PC-DMIS•Enterpriseengineeringsoftware
such as SmartPlant 3D and Smart-Plant Fusion
•Surveying,scanningandmonitoring•Mappingand3Dmodelling•Machinecontrol•Decision-supportsoftware•Geographicinformationsystems•Analytics•Computer-aideddispatch•Positioningsensors
•Coordinatemeasuringmachines•Optical&portablescanners•Industrialmetrologysoftware•CADsoftware•CAMsoftware•Life-cycleengineeringsoftware
Strong market position•Aimstobeno.1orno.2inall
industries served
Global reach•15,000employees
•Presencein46countries
Focus on R&D•11percentofsalesinvested
in R&D
•Morethan3,200patents
•Morethan3,400employees in R&D
M&A competence•Strongabilityinleveraging
complementary know-how and market presence of acquired companies
Domain expertise•Extensiveindustry
knowledge
13 Hexagon Annual Report 2014
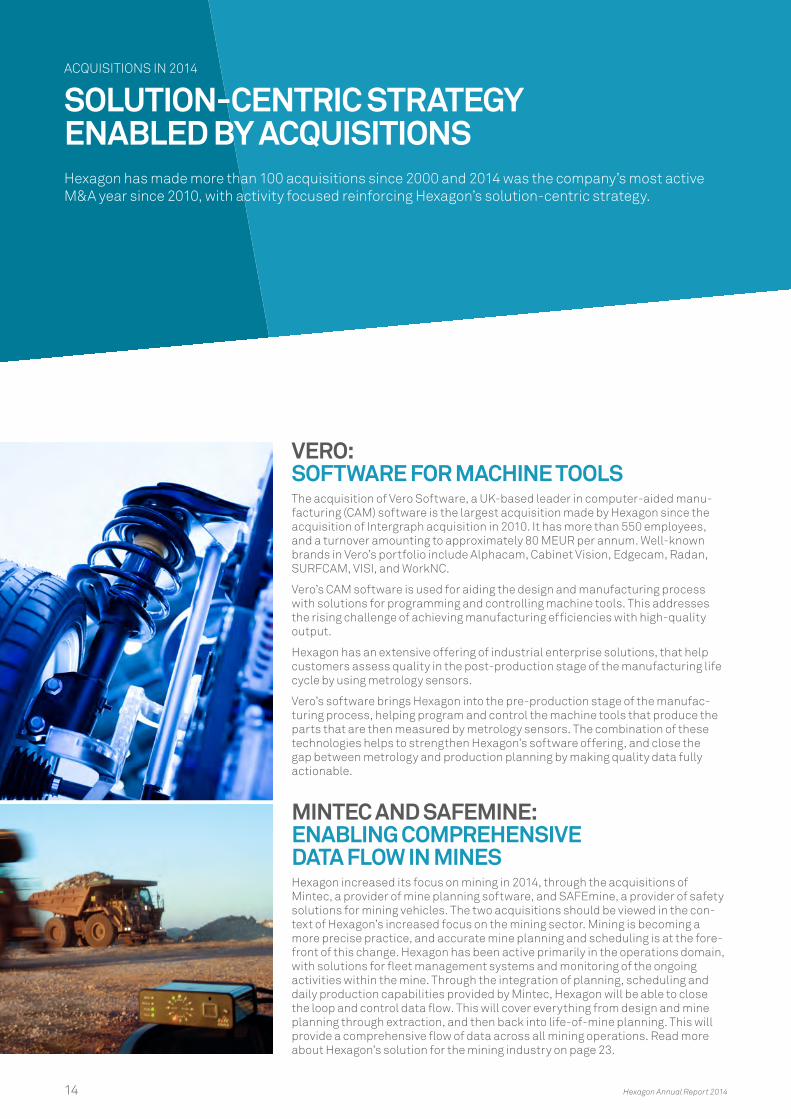
VERO: SOFTWARE FOR MACHINE TOOLSThe acquisition of Vero Software, a UK-based leader in computer-aided manu-facturing (CAM) software is the largest acquisition made by Hexagon since the acquisition of Intergraph acquisition in 2010. It has more than 550 employees, and a turnover amounting to approximately 80 MEUR per annum. Well-known brands in Vero’s portfolio include Alphacam, Cabinet Vision, Edgecam, Radan, SURFCAM, VISI, and WorkNC.
Vero’s CAM software is used for aiding the design and manufacturing process with solutions for programming and controlling machine tools. This addresses the rising challenge of achieving manufacturing efficiencies with high-quality output.
Hexagon has an extensive offering of industrial enterprise solutions, that help customers assess quality in the post-production stage of the manufacturing life cycle by using metrology sensors.
Vero’s software brings Hexagon into the pre-production stage of the manufac-turing process, helping program and control the machine tools that produce the parts that are then measured by metrology sensors. The combination of these technologies helps to strengthen Hexagon’s software offering, and close the gap between metrology and production planning by making quality data fully actionable.
MINTEC AND SAFEMINE: ENABLING COMPREHENSIVE DATA FLOW IN MINESHexagon increased its focus on mining in 2014, through the acquisitions of Mintec, a provider of mine planning software, and SAFEmine, a provider of safety solutions for mining vehicles. The two acquisitions should be viewed in the con-text of Hexagon’s increased focus on the mining sector. Mining is becoming a more precise practice, and accurate mine planning and scheduling is at the fore-front of this change. Hexagon has been active primarily in the operations domain, with solutions for fleet management systems and monitoring of the ongoing activities within the mine. Through the integration of planning, scheduling and daily production capabilities provided by Mintec, Hexagon will be able to close the loop and control data flow. This will cover everything from design and mine planning through extraction, and then back into life-of-mine planning. This will provide a comprehensive flow of data across all mining operations. Read more about Hexagon’s solution for the mining industry on page 23.
ACQUISITIONS IN 2014
SOLUTION-CENTRIC STRATEGY ENABLED BY ACQUISITIONSHexagon has made more than 100 acquisitions since 2000 and 2014 was the company’s most active M&A year since 2010, with activity focused reinforcing Hexagon’s solution-centric strategy.
14 Hexagon Annual Report 2014
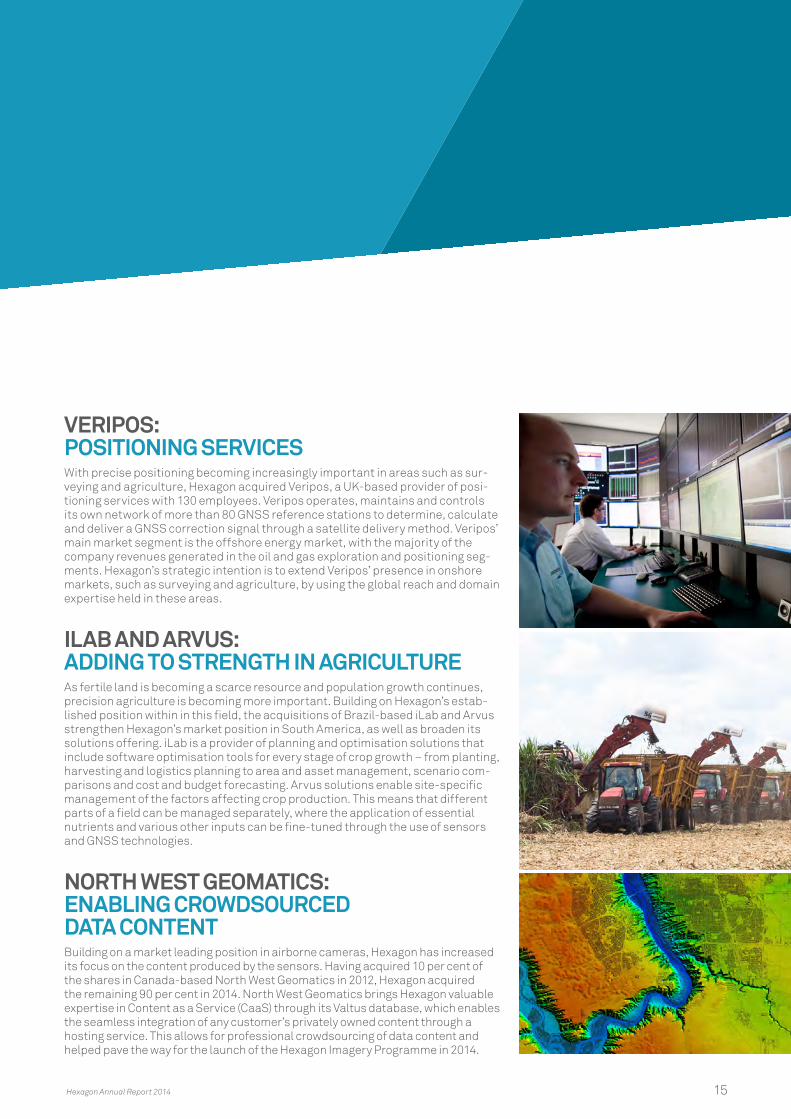
VERIPOS: POSITIONING SERVICESWith precise positioning becoming increasingly important in areas such as sur-veying and agriculture, Hexagon acquired Veripos, a UK-based provider of posi-tioning services with 130 employees. Veripos operates, maintains and controls its own network of more than 80 GNSS reference stations to determine, calculate and deliver a GNSS correction signal through a satellite delivery method. Veripos’ main market segment is the offshore energy market, with the majority of the company revenues generated in the oil and gas exploration and positioning seg-ments. Hexagon’s strategic intention is to extend Veripos’ presence in onshore markets, such as surveying and agriculture, by using the global reach and domain expertise held in these areas.
ILAB AND ARVUS: ADDING TO STRENGTH IN AGRICULTURE As fertile land is becoming a scarce resource and population growth continues, precision agriculture is becoming more important. Building on Hexagon’s estab-lished position within in this field, the acquisitions of Brazil-based iLab and Arvus strengthen Hexagon’s market position in South America, as well as broaden its solutions offering. iLab is a provider of planning and optimisation solutions that include software optimisation tools for every stage of crop growth – from planting, harvesting and logistics planning to area and asset management, scenario com-parisons and cost and budget forecasting. Arvus solutions enable site-specific management of the factors affecting crop production. This means that different parts of a field can be managed separately, where the application of essential nutrients and various other inputs can be fine-tuned through the use of sensors and GNSS technologies.
NORTH WEST GEOMATICS: ENABLING CROWDSOURCED DATA CONTENTBuilding on a market leading position in airborne cameras, Hexagon has increased its focus on the content produced by the sensors. Having acquired 10 per cent of the shares in Canada-based North West Geomatics in 2012, Hexagon acquired the remaining 90 per cent in 2014. North West Geomatics brings Hexagon valuable expertise in Content as a Service (CaaS) through its Valtus database, which enables the seamless integration of any customer’s privately owned content through a hosting service. This allows for professional crowdsourcing of data content and helped pave the way for the launch of the Hexagon Imagery Programme in 2014.
Hexagon Annual Report 2014 15
FUELLED BY INFORMATIONInformation technologies are a driving force behind many of the transformative solutions shaping our future. These include the increased use of robotics and automation and the increasing connectivity of people and objects through the Internet, where even the physical world becomes an information system. All these technologies require the ability to generate, store and retrieve information in unconventional ways that improve productivity and quality across virtually any industry.
Hexagon’s extensive and industry-leading information technology portfolio pro-vides forward-thinking organisations the information they need to evolve tradi-tional ways of managing their business. We enable organisations to capture, fuse and transform dynamic data into actionable information that can be shared and delivered to the right people at the right time – that’s the Hexagon Advantage.
Sensors and software feed the Hexagon Advantage. The combination of sensors and software into solutions is fundamental to delivering productivity and quality improvements across customer organisations.
Our sensors continually capture the world as-is or as-built to generate corre-sponding digital depictions, and our software interprets the captured data. When linked to accurate representations of real-world circumstances, the actions taken, whether human or machine-driven, are smarter and more effective.
The value of that connection increases exponentially when it is part of an intelligent information ecosystem – where isolated islands of information are connected across entire organisations and supply networks. In this environment, actionable information that is packaged in an easily digestible format empowers the system – from people to machines – to act and react faster and more intelligently.
OUR SOLUTIONSHexagon’s solutions are concentrated in two primary enterprise application areas: Geospatial and Industrial. Both treat information as a critical resource in the operation and management of customer organisations. Both respect the timely availability of relevant information as the vital link to ensuring productivity and quality improvements and the most desired outcome. They’re similar in a number of ways, but where they differ is in the kind of data they capture and man-age to drive the decision-making process and the context of those decisions.
Hexagon Annual Report 201416
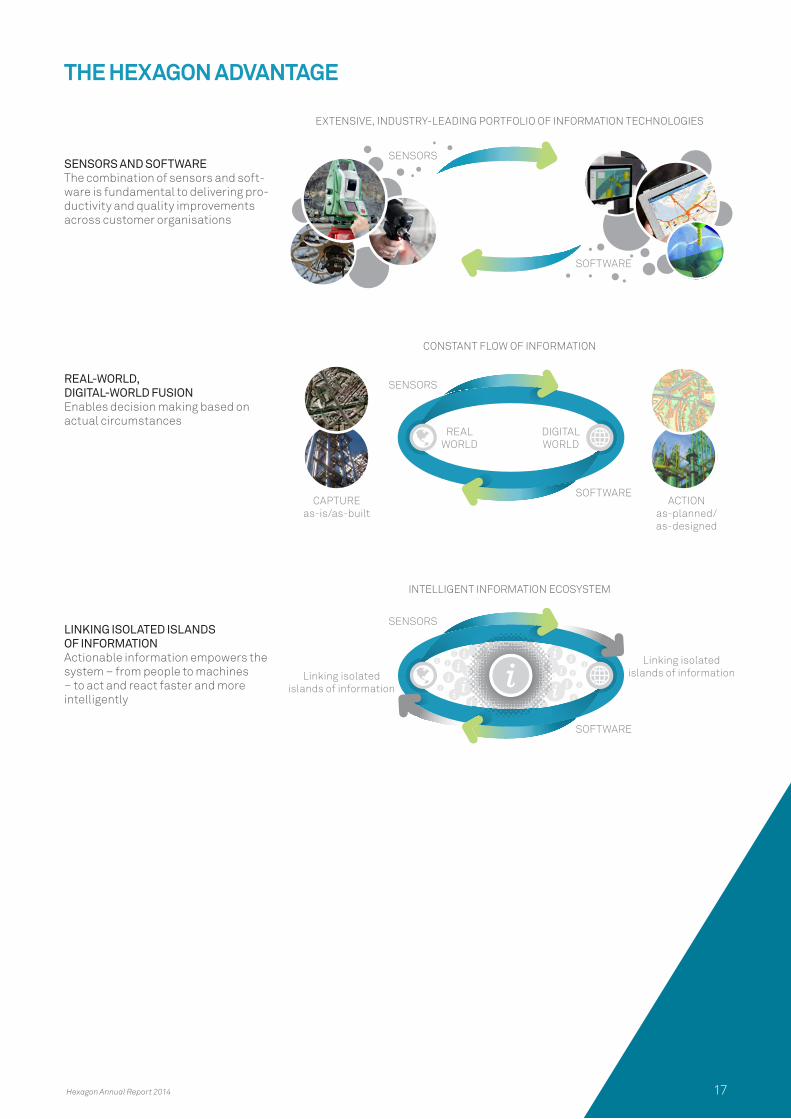
THE HEXAGON ADVANTAGE
SENSORS AND SOFTWARE The combination of sensors and soft-ware is fundamental to delivering pro-ductivity and quality improvements across customer organisations
EXTENSIVE, INDUSTRY-LEADING PORTFOLIO OF INFORMATION TECHNOLOGIES
SENSORS
SENSORS
SENSORS
CAPTURE as-is/as-built
ACTION as-planned/ as-designed
Linking isolated islands of informationLinking isolated
islands of information
REAL WORLD
DIGITAL WORLD
SOFTWARE
SOFTWARE
SOFTWARE
CONSTANT FLOW OF INFORMATION
INTELLIGENT INFORMATION ECOSYSTEM
REAL-WORLD, DIGITAL-WORLD FUSIONEnables decision making based on actual circumstances
LINKING ISOLATED ISLANDS OF INFORMATIONActionable information empowers the system – from people to machines – to act and react faster and more intelligently
Hexagon Annual Report 2014 17

APPLICATION AREA
GEOSPATIAL ENTERPRISE SOLUTIONSHexagon Geospatial Enterprise Solutions holds a world-leading portfolio of sensors for capturing data from land and air as well as sensors for positioning via satellites. In addition to this, Hexagon has software (GIS) for the creation of 3D maps and models which are used for decision-making in a range of software applications, covering areas such as surveying, public safety and agriculture.
Captured content focuses on situational awareness and changes in our surroundings. Data is often derived from multiple sources and can include survey data, point clouds, imagery and video. Every area, structure or object captured is related to a geographical location such as a place, road or building.
The solutions are focused on simplifying the process of deriving information about the things connected in the sys-tem, from smart meters in energy grids to traffic congestion in transportation systems to irrigation needs in agricultural crops. The connectivity drives improvements in planning, response, productivity and quality output.
HEXAGON GEOSYSTEMSHexagon Geosystems supplies sensors and software that are used to survey the world around us, such as terrain, buildings and other architectural features. Geosystems’ sensors capture large quantities of data through the use of total stations, 3D scanners and airborne cameras. Software provided by Hexagon enables this data to be processed, stored, analysed and presented with high precision and accuracy.
HELPING SURVEYORS SUPPORT INFRASTRUCTURE AND CONSTRUCTIONSurveying is paramount when it comes to planning and executing construction and infrastructure projects, from buildings to bridges. For many complex construction proj-ects, surveyors must conduct and inspect measurements throughout every phase of their lifetime. Hexagon has the broadest and most advanced portfolio of surveying solu-tions on the market, and by using these advanced solutions, measurement data can be collected with fewer personnel in the field, increasing productivity and speed of data acquisi-tion while reducing costs.
MONITORING AND DOCUMENTING INFRASTRUCTURE Hexagon’s sensors are used to track the movement of man-made objects such as dams, bridges and buildings. They also monitor areas which are subject to the risk of natural phenomena such as potentially dangerous landslides. They aid in environment monitoring and help public agencies improve disaster management and rapid response.
Using Hexagon’s 3D scanners, customers also can create precise 3D models of objects – such as an oil rig or a histor-ical building. This 3D documentation is helping owners of facilities to reduce cost for maintenance, and is a vital part in the growth of Building Information Modelling (BIM).
18 Hexagon Annual Report 2014
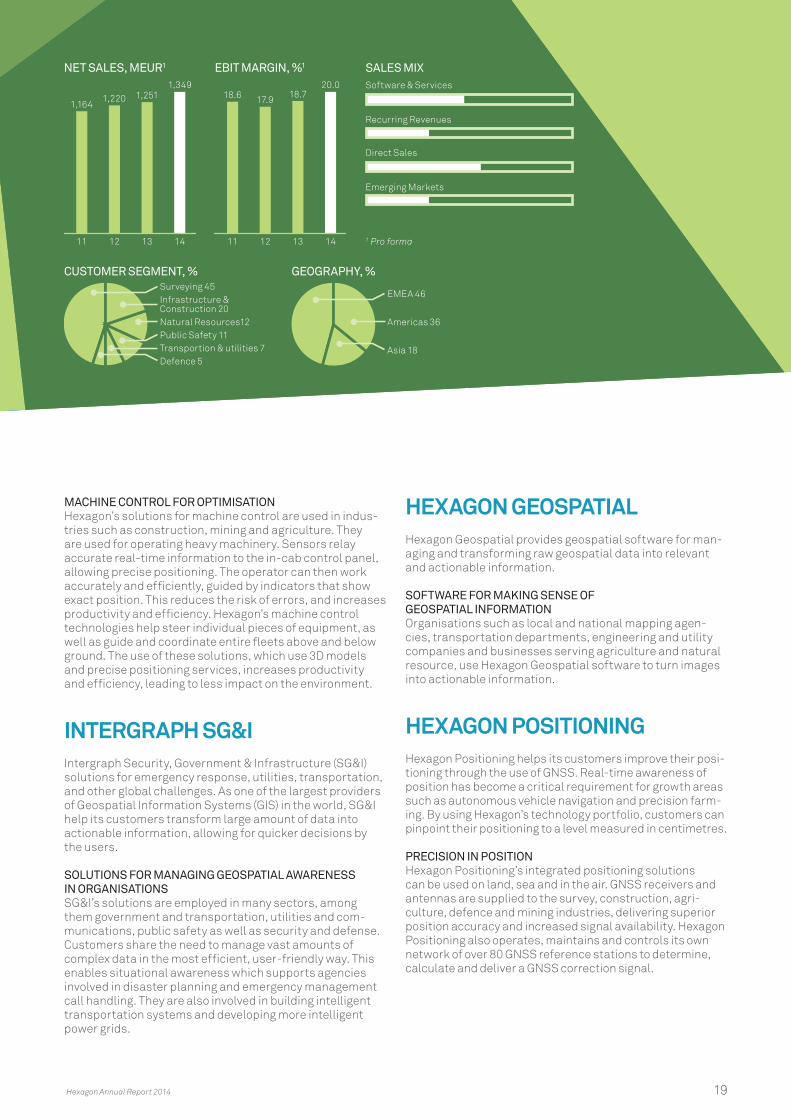
CUSTOMER SEGMENT, %Surveying 45Infrastructure & Construction 20Natural Resources12Public Safety 11Transportion & utilities 7 Defence 5
GEOGRAPHY, %
EMEA 46
Americas 36
Asia 18
MACHINE CONTROL FOR OPTIMISATIONHexagon’s solutions for machine control are used in indus-tries such as construction, mining and agriculture. They are used for operating heavy machinery. Sensors relay accurate real-time information to the in-cab control panel, allowing precise positioning. The operator can then work accurately and efficiently, guided by indicators that show exact position. This reduces the risk of errors, and increases productivity and efficiency. Hexagon’s machine control technologies help steer individual pieces of equipment, as well as guide and coordinate entire fleets above and below ground. The use of these solutions, which use 3D models and precise positioning services, increases productivity and efficiency, leading to less impact on the environment.
INTERGRAPH SG&IIntergraph Security, Government & Infrastructure (SG&I) solutions for emergency response, utilities, transportation, and other global challenges. As one of the largest providers of Geospatial Information Systems (GIS) in the world, SG&I help its customers transform large amount of data into actionable information, allowing for quicker decisions by the users.
SOLUTIONS FOR MANAGING GEOSPATIAL AWARENESS IN ORGANISATIONSSG&I’s solutions are employed in many sectors, among them government and transportation, utilities and com-munications, public safety as well as security and defense. Customers share the need to manage vast amounts of complex data in the most efficient, user-friendly way. This enables situational awareness which supports agencies involved in disaster planning and emergency management call handling. They are also involved in building intelligent transportation systems and developing more intelligent power grids.
HEXAGON GEOSPATIAL Hexagon Geospatial provides geospatial software for man-aging and transforming raw geospatial data into relevant and actionable information.
SOFTWARE FOR MAKING SENSE OF GEOSPATIAL INFORMATIONOrganisations such as local and national mapping agen-cies, transportation departments, engineering and utility companies and businesses serving agriculture and natural resource, use Hexagon Geospatial software to turn images into actionable information.
HEXAGON POSITIONINGHexagon Positioning helps its customers improve their posi-tioning through the use of GNSS. Real-time awareness of position has become a critical requirement for growth areas such as autonomous vehicle navigation and precision farm-ing. By using Hexagon’s technology portfolio, customers can pinpoint their positioning to a level measured in centimetres.
PRECISION IN POSITIONHexagon Positioning’s integrated positioning solutions can be used on land, sea and in the air. GNSS receivers and antennas are supplied to the survey, construction, agri-culture, defence and mining industries, delivering superior position accuracy and increased signal availability. Hexagon Positioning also operates, maintains and controls its own network of over 80 GNSS reference stations to determine, calculate and deliver a GNSS correction signal.
SALES MIXSoftware & Services
Direct Sales
Recurring Revenues
Emerging Markets
14131211
18.6 17.9 18.720.0
EBIT MARGIN, %1
14131211
1,1641,220 1,251
1,349
NET SALES, MEUR1
1 Pro forma
Hexagon Annual Report 2014 19

APPLICATION AREA
GEOSPATIAL ENTERPRISE SOLUTIONS
Industry: AGRICULTURE
SWEET RESULTS WITH SMART AGRICULTURE SOLUTIONHexagon’s Smart Agriculture solution helped Guaíra Sugar Mill in Brazil increase its sugarcane crop yield and optimise the performance of workers and machines through improved production and plantation designs based on available land, topography and ideal planting time.
The Smart Agriculture solution not only optimises the utilisation of land and water, but also fertilisers, pesticides, seeds and other farming resources. Through Hexagon geo-processing software and steering solutions, Smart Agriculture keeps farmers abreast of crop management and production with digital workflows created from geo-enabled data.
Smart Agriculture helped Guaíra Sugar Mill map land for electricity and waste management in a geo-referenced database with precise representation of field limits, water resources, roads and infrastructure. The topography of the land was optimised to create manageable farming areas.
Planting lines should follow the topography of the terrain to guarantee a proper water supply for the sugarcane. Smart Agriculture helped the mill’s designer create multiple line alternatives and select the best set of lines to be sent to the autopilots. By integrating with the automatic pilot, Guaíra Sugar Mill was able to increase the number of lines for crop rows, increasing the amount of sugarcane produced.
CUSTOMERGuaíra Sugar Mill
CHALLENGE Increasing crop yield and
optimising resources
SOLUTION Smart Agriculture
RESULTGuaíra Sugar Mill achieved an average
productivity of 82.4 tons/ha, 23 per cent higher than 68.3 tons/ha, the average
Brazilian productivity in sugarcane for the same period
20 Hexagon Annual Report 2014

Industry: AEROSPACE
IN THE EYE OF THE STORMWhen a hurricane makes its way to shore, the damage it brings can be devastat-ing. While technology may provide plenty of warning when a hurricane is on the way, it’s more difficult to predict how intense the storm will be once it arrives.
NASA Goddard has taken steps to help analyse this issue by using its Global Hawk Unmanned Aircraft System to help study storm intensity. These robotic planes can fly up to an altitude of 20,000 metres, making them perfect for study-ing hurricanes that develop far from shore.
NASA equipped a Global Hawk with Synchronised Position Attitude Navigation (SPAN) technology from Hexagon to obtain accurate navigation and Doppler radar data that will allow scientists to better predict how intense a hurricane will be once it makes landfall and what factors cause it to intensify. The aircraft’s HIWRAP (High-Altitude Imaging Wind and Rain Airborne Profiler) maps 3D winds and precipitation within hurricanes and other severe weather events. A Hexagon receiver located near the HIWRAP instrument helped improve measurement accuracy and easily obtained the most accurate attitude and positioning data possible.
Knowing what causes hurricanes to intensify will eventually help improve hurri-cane forecasts, potentially reducing their damage and the lives they take.
CUSTOMERNASA Goddard
CHALLENGEFinding accurate
data to help predict hurricane intensity
SOLUTIONSynchronised
Position Attitude Navigation (SPAN)
technology
RESULTImproved measure-ment accuracy and
highly accurate attitude and
positioning data
Hexagon Annual Report 2014 21
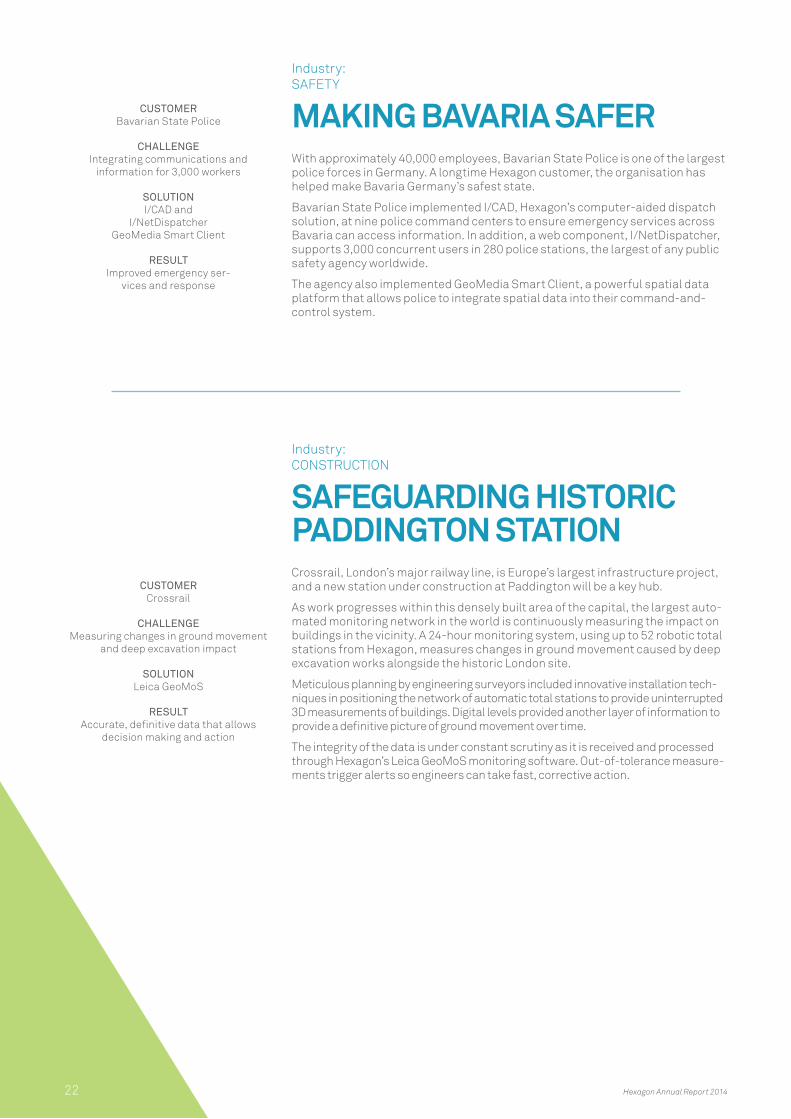
Industry: CONSTRUCTION
SAFEGUARDING HISTORIC PADDINGTON STATION Crossrail, London’s major railway line, is Europe’s largest infrastructure project, and a new station under construction at Paddington will be a key hub.
As work progresses within this densely built area of the capital, the largest auto-mated monitoring network in the world is continuously measuring the impact on buildings in the vicinity. A 24-hour monitoring system, using up to 52 robotic total stations from Hexagon, measures changes in ground movement caused by deep excavation works alongside the historic London site.
Meticulous planning by engineering surveyors included innovative installation tech-niques in positioning the network of automatic total stations to provide uninterrupted 3D measurements of buildings. Digital levels provided another layer of information to provide a definitive picture of ground movement over time.
The integrity of the data is under constant scrutiny as it is received and processed through Hexagon’s Leica GeoMoS monitoring software. Out-of-tolerance measure-ments trigger alerts so engineers can take fast, corrective action.
Industry: SAFETY
MAKING BAVARIA SAFERWith approximately 40,000 employees, Bavarian State Police is one of the largest police forces in Germany. A longtime Hexagon customer, the organisation has helped make Bavaria Germany’s safest state.
Bavarian State Police implemented I/CAD, Hexagon’s computer-aided dispatch solution, at nine police command centers to ensure emergency services across Bavaria can access information. In addition, a web component, I/NetDispatcher, supports 3,000 concurrent users in 280 police stations, the largest of any public safety agency worldwide.
The agency also implemented GeoMedia Smart Client, a powerful spatial data platform that allows police to integrate spatial data into their command-and- control system.
CUSTOMER Crossrail
CHALLENGE Measuring changes in ground movement
and deep excavation impact
SOLUTION Leica GeoMoS
RESULT Accurate, definitive data that allows
decision making and action
CUSTOMERBavarian State Police
CHALLENGEIntegrating communications and
information for 3,000 workers
SOLUTIONI/CAD and
I/NetDispatcher GeoMedia Smart Client
RESULTImproved emergency ser-
vices and response
Hexagon Annual Report 201422
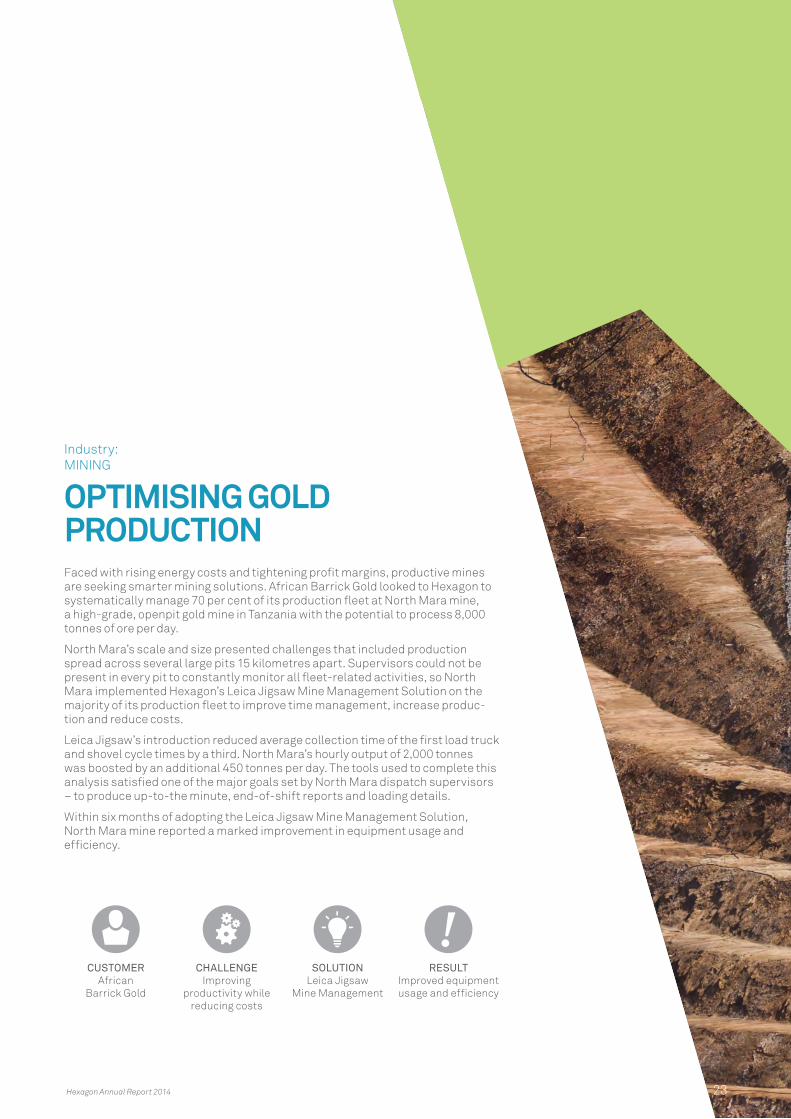
Industry: MINING
OPTIMISING GOLD PRODUCTIONFaced with rising energy costs and tightening profit margins, productive mines are seeking smarter mining solutions. African Barrick Gold looked to Hexagon to systematically manage 70 per cent of its production fleet at North Mara mine, a high-grade, openpit gold mine in Tanzania with the potential to process 8,000 tonnes of ore per day.
North Mara’s scale and size presented challenges that included production spread across several large pits 15 kilometres apart. Supervisors could not be present in every pit to constantly monitor all fleet-related activities, so North Mara implemented Hexagon’s Leica Jigsaw Mine Management Solution on the majority of its production fleet to improve time management, increase produc-tion and reduce costs.
Leica Jigsaw’s introduction reduced average collection time of the first load truck and shovel cycle times by a third. North Mara’s hourly output of 2,000 tonnes was boosted by an additional 450 tonnes per day. The tools used to complete this analysis satisfied one of the major goals set by North Mara dispatch supervisors – to produce up-to-the minute, end-of-shift reports and loading details.
Within six months of adopting the Leica Jigsaw Mine Management Solution, North Mara mine reported a marked improvement in equipment usage and efficiency.
CUSTOMERAfrican
Barrick Gold
CHALLENGEImproving
productivity while reducing costs
SOLUTIONLeica Jigsaw
Mine Management
RESULTImproved equipment usage and efficiency
Hexagon Annual Report 2014 23
Industry: SURVEYING
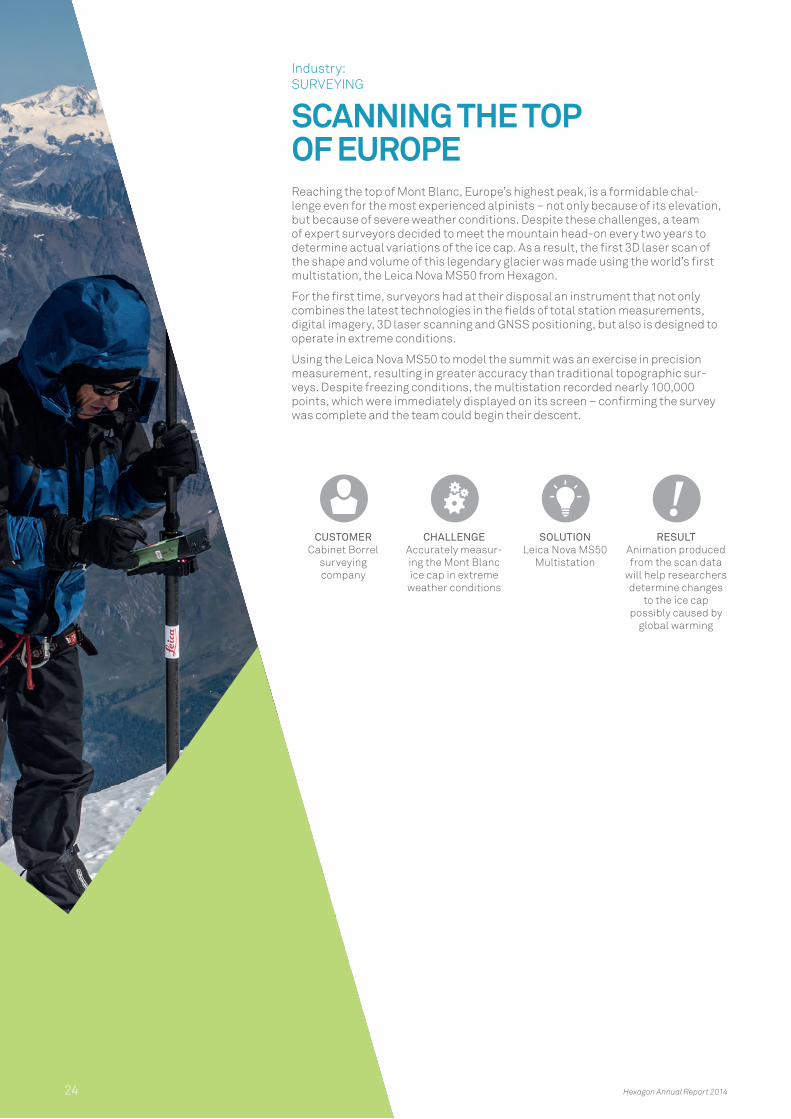
SCANNING THE TOP OF EUROPEReaching the top of Mont Blanc, Europe’s highest peak, is a formidable chal-lenge even for the most experienced alpinists – not only because of its elevation, but because of severe weather conditions. Despite these challenges, a team of expert surveyors decided to meet the mountain head-on every two years to determine actual variations of the ice cap. As a result, the first 3D laser scan of the shape and volume of this legendary glacier was made using the world’s first multistation, the Leica Nova MS50 from Hexagon.
For the first time, surveyors had at their disposal an instrument that not only combines the latest technologies in the fields of total station measurements, digital imagery, 3D laser scanning and GNSS positioning, but also is designed to operate in extreme conditions.
Using the Leica Nova MS50 to model the summit was an exercise in precision measurement, resulting in greater accuracy than traditional topographic sur-veys. Despite freezing conditions, the multistation recorded nearly 100,000 points, which were immediately displayed on its screen – confirming the survey was complete and the team could begin their descent.
CUSTOMERCabinet Borrel
surveying company
CHALLENGEAccurately measur-ing the Mont Blanc ice cap in extreme
weather conditions
SOLUTIONLeica Nova MS50
Multistation
RESULTAnimation produced from the scan data
will help researchers determine changes
to the ice cap possibly caused by
global warming
Hexagon Annual Report 201424
Industry: SAFETY
HELPING EMERGENCY MANAGEMENT HELP THOSE IN NEEDParts of southern France were devastated by floods in September 2014 that left the city of Montpellier under water and resulted in a disaster declaration for 60 municipalities. A record 300 millimetres of rain fell in 36 hours, flooding cities, roads and railways.
Hexagon technologies helped SDIS 34, the fire and rescue department for Hérault, respond quickly and efficiently to this natural disaster. Supported by Hexagon’s computer-aided dispatch system, fire and rescue personnel worked tirelessly to aid citizens in need.
The Hexagon solution enabled information sharing between the main command- and-control room, local response centers, mobile command posts, equipment and staff. Deployed just four months earlier, the system helped the agency manage a record number of incidents during the flooding, including 13,000 emergency calls.
Industry: TRANSPORTATION
SMOOTH RIDE FOR NOTTINGHAM TRAM EXTENSIONNottingham, England, is laying the foundation for future prosperity with an expansion of its existing tram network. The city council’s investment in clean, convenient public transport supports a commitment to reduce carbon emis-sions by 26 per cent by 2020, as well as provides increased mobility for a growing population.
The extension to the Nottingham Express Transit (NET) is being constructed using Appitrack, a pioneering mechanised system developed by Alstom Trans-port using integrated machine control technology from Hexagon. The speed, certainty and high precision of Appitrack, guided by Hexagon’s Leica PaveSmart 3D, allow the track to be built despite the construction constraints often found in a bustling city.
Following the process of paving and base plate installation, Alstom has devel-oped an innovative method of rail installation and adjustment. Instead of a final phase of intensive manual adjustment, time spent onsite is reduced and errors minimised by using survey data to pre-determine the shims that are required. A colour-coded shim plan is created that workers follow to ensure the track is in its correct final position.
The technology delivers consistent and reliable millimetre accuracy during the building process to allow for successful linking of separate sections during the rail laying stage. The system uses Hexagon’s total stations and Leica PaveSmart 3D software to ensure design calculations, surveying and guidance meet the project’s demands for the highest tolerances in speed and comfort.
CUSTOMERSDIS 34 Fire and Rescue
CHALLENGEProviding immediate aid
to flood victims
SOLUTIONHexagon’s computer-aided
dispatch system
RESULT Fast and efficient
information sharing among emergency response agencies
CUSTOMER Alstom Transport
CHALLENGE Building an extended tram
network with speed and accuracy
SOLUTION Leica PaveSmart 3D
RESULT Rails that are accurately
positioned and linked
Hexagon Annual Report 2014 25

APPLICATION AREA
INDUSTRIAL ENTERPRISE SOLUTIONSOur industrial enterprise solutions leverage 3D modelling and CAD (computer-aided design) platforms and are focused on optimising manufacturing facility throughput and large-scale engineering projects. Here, the importance of linking design information to the build workflow is of utmost importance to assure quality control.
Sensors in these solutions focus more on real-world com-parisons with the as-planned and as-designed. Captured content can determine deviations to plans or provide accu-rate dimensions and other details of existing structures and facilities that have no record of this information.
In many ways, these solutions focus on automating human decisions and tasks, from the simplicity of reordering miss-ing parts to the sophistication of transforming unstructured engineering documents into fully digitised information assets. With enterprise solutions, there is an ability to accelerate project completion without sacrificing quality control and efficiency. In addition, complexities that arise from geographic disbursement of all entities involved are lessened through cloud-enabled technologies, where everyone has access to the same information.
In this environment, organisations are better able to con-tinuously reevaluate conditions and reprioritise actions.
HEXAGON METROLOGYHexagon Metrology solutions are used to optimise and control manufacturing processes in order to improve qual-ity and productivity. These solutions rely on dimensional precision and accuracy, using stationary sensors such as
coordinate measuring machines and portable sensors such as articulated arms and laser trackers. Customers use metrology solutions to measure, inspect and control manu-factured components of all sizes, from aircrafts and cars to small parts in medical devices.
THE INDUSTRIES METROLOGY SERVE ARE VITALMetrology solutions also are used in the manufacturing of high-precision parts and components, helping compa-nies bring products from concept to full production more quickly and efficiently. In the automotive industry, Metrolo-gy’s constantly evolving quality control technologies assist with body, powertrain and component production, helping automakers build cars better, faster and with higher qual-ity. In the aerospace industry, Metrology’s solutions are used to analyse and inspect each and every part, including complex, large scale components such as the wings of the aircraft, mitigating the need for continuous and costly rework. In the consumer electronics industry, metrology solutions are used to inspect the quality of devices such as smart phones and wearables, ensuring quality in a mass-production environment.
SOFTWARE AND HIGH-QUALITY SERVICESAs the largest software developer in the metrology indus-try, Hexagon offers a wide range of configurable software packages that allow users to intelligently acquire, analyse
26 Hexagon Annual Report 2014
SALES MIXSoftware & Services
Direct Sales
and manage collected data to process and present results quickly and effectively. During 2014, Hexagon acquired Vero Software, which added Computer Aided Manufacturing (CAM) software to the offering.
Hexagon Metrology has 70 precision centers around the world that offer comprehensive service programme. Those programmes include courses to in how to optimise a sys-tem’s productivity and calibration to maximize the accuracy and repeatability of a system.
BEING A PART OF THE SHOP FLOORAs manufacturers have sought to increase the use of auto-mation, metrology sensors have increasingly become an integrated part of the manufacturing line. This is due to an improvement in the sensor capabilities as well as the deployment of more advanced software. This software processes the data collected at the speed of the manufac-turing line, and it helps customers to inspect each and every part that is being produced, ensuring that the throughput is as intended.
INTERGRAPH PP&MIntergraph Process, Power & Marine (PP&M) is the leading global provider of enterprise engineering, construction and data management software. This software is used in the design, construction and operation of process and power plants, ships and offshore facilities.
PRESENT IN EVERY STAGE OF THE ASSET LIFECYCLEThe software is used for engineering and schematics design, 3D modeling and visualisation, stress analysis,
procurement, fabrication, construction and information management. Enterprise-level information management capabilities allow engineering companies and facility own-ers to capture and integrate engineering knowledge, reduc-ing risk while improving efficiency and cost effectiveness throughout all stages of the engineering life cycle – from early project phases through operations and maintenance and up to decommissioning.
SOLVING CHALLENGES FOR PROCESS INDUSTRIESPP&M serves a wide spectrum of industries including nuclear and power generation, oil and gas, shale gas, off-shore, chemical, consumer goods, marine, metals and mining, pharmaceutical and shipbuilding. These industries share the need to create and manage complex engineering information to speed project completion and ensure opera-tional efficiency.
IMPROVING DESIGN PROCESS AND ASSET KNOW-HOWThe complexity of engineering projects has increased in recent years as the average project size has increased. Design teams are more often geographically dispersed. This has led to challenges for engineering companies. Surveys have shown that nearly half of all engineering projects fall victim to their completion deadlines, leading to costly delays. The ability to quickly access asset information once the project is com-pleted is another challenge. Surveys have shown that more than half of all owner operators lack confidence in their ability to access information about their facilities in an emergency situation. Using Intergraph’s market-leading SmartPlant Cloud software and information management solutions such as SmartPlant Foundation, design team and facility owners can solve these challenges.
Recurring Revenues
Emerging Markets
14131211
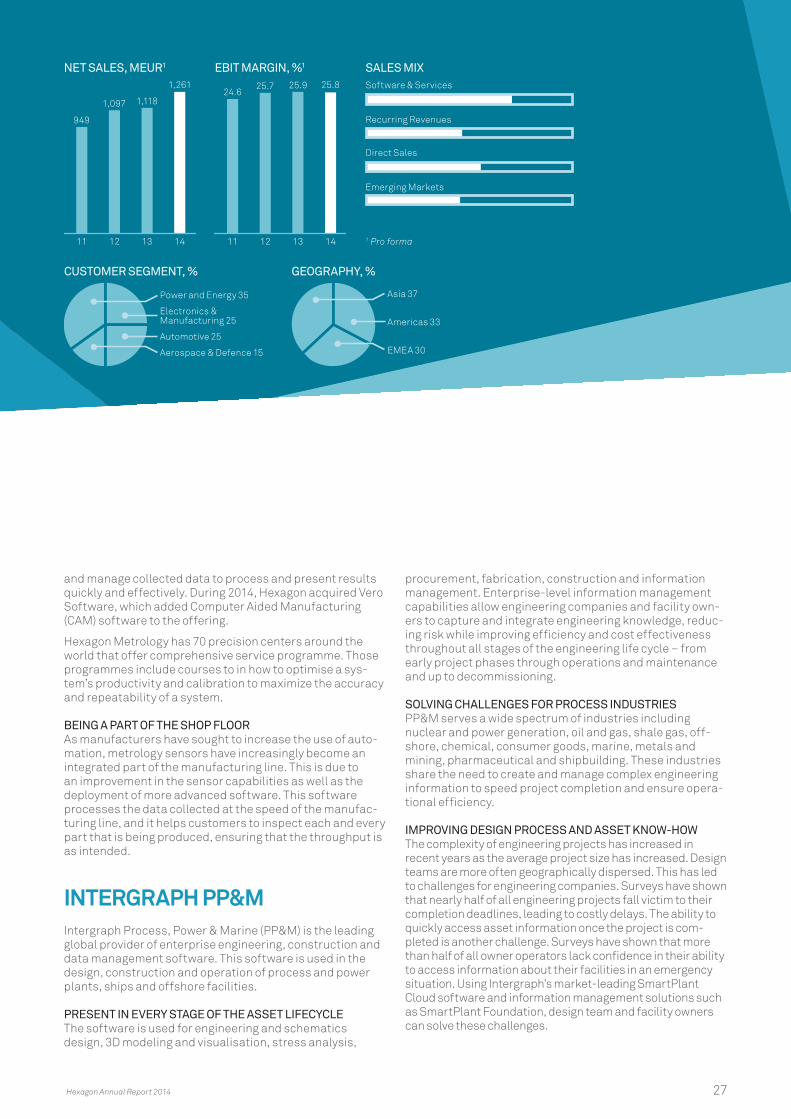
24.625.7 25.9 25.8
EBIT MARGIN, %1
14131211
949
1,097 1,118
1,261
NET SALES, MEUR1
CUSTOMER SEGMENT, %
Power and Energy 35
Electronics & Manufacturing 25
Automotive 25
Aerospace & Defence 15
GEOGRAPHY, %
Asia 37
Americas 33
EMEA 30
1 Pro forma
Hexagon Annual Report 2014 27
APPLICATION AREA
INDUSTRIAL ENTERPRISE SOLUTIONS
Industry: OTHER
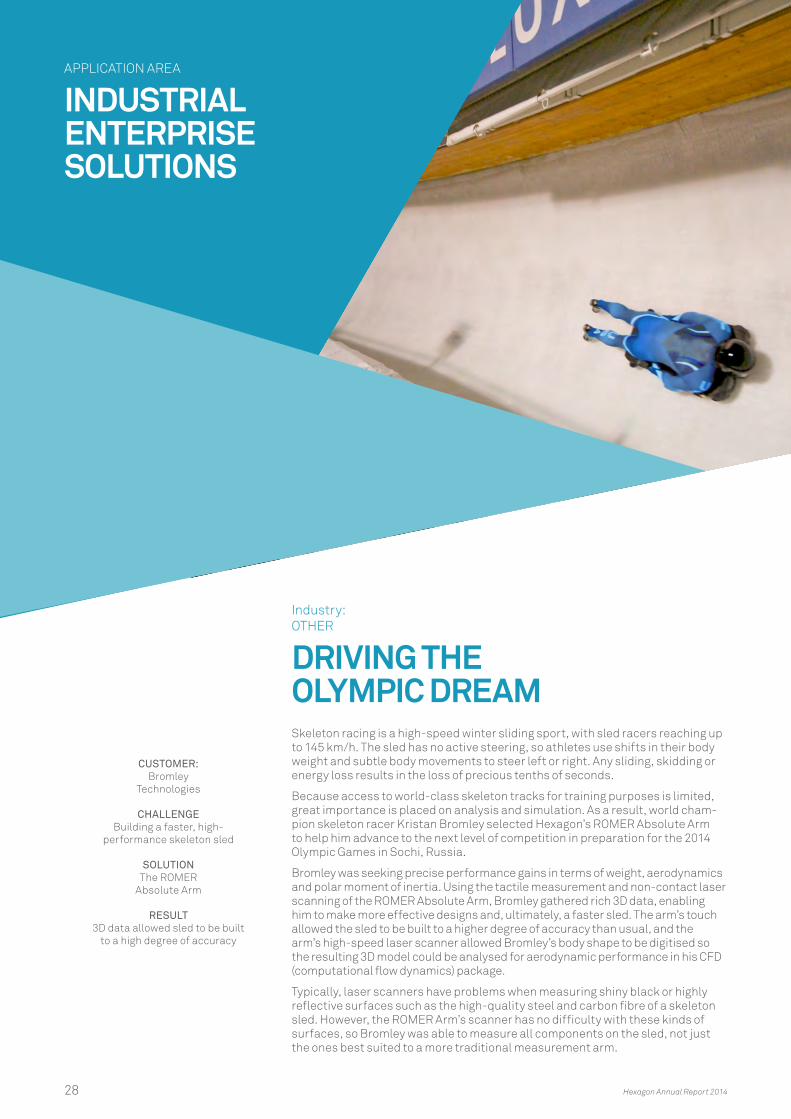
DRIVING THE OLYMPIC DREAM Skeleton racing is a high-speed winter sliding sport, with sled racers reaching up to 145 km/h. The sled has no active steering, so athletes use shifts in their body weight and subtle body movements to steer left or right. Any sliding, skidding or energy loss results in the loss of precious tenths of seconds.
Because access to world-class skeleton tracks for training purposes is limited, great importance is placed on analysis and simulation. As a result, world cham-pion skeleton racer Kristan Bromley selected Hexagon’s ROMER Absolute Arm to help him advance to the next level of competition in preparation for the 2014 Olympic Games in Sochi, Russia.
Bromley was seeking precise performance gains in terms of weight, aerodynamics and polar moment of inertia. Using the tactile measurement and non-contact laser scanning of the ROMER Absolute Arm, Bromley gathered rich 3D data, enabling him to make more effective designs and, ultimately, a faster sled. The arm’s touch allowed the sled to be built to a higher degree of accuracy than usual, and the arm’s high-speed laser scanner allowed Bromley’s body shape to be digitised so the resulting 3D model could be analysed for aerodynamic performance in his CFD (computational flow dynamics) package.
Typically, laser scanners have problems when measuring shiny black or highly reflective surfaces such as the high-quality steel and carbon fibre of a skeleton sled. However, the ROMER Arm’s scanner has no difficulty with these kinds of surfaces, so Bromley was able to measure all components on the sled, not just the ones best suited to a more traditional measurement arm.
CUSTOMER: Bromley
Technologies
CHALLENGE Building a faster, high-
performance skeleton sled
SOLUTIONThe ROMER
Absolute Arm
RESULT3D data allowed sled to be built
to a high degree of accuracy
28 Hexagon Annual Report 2014
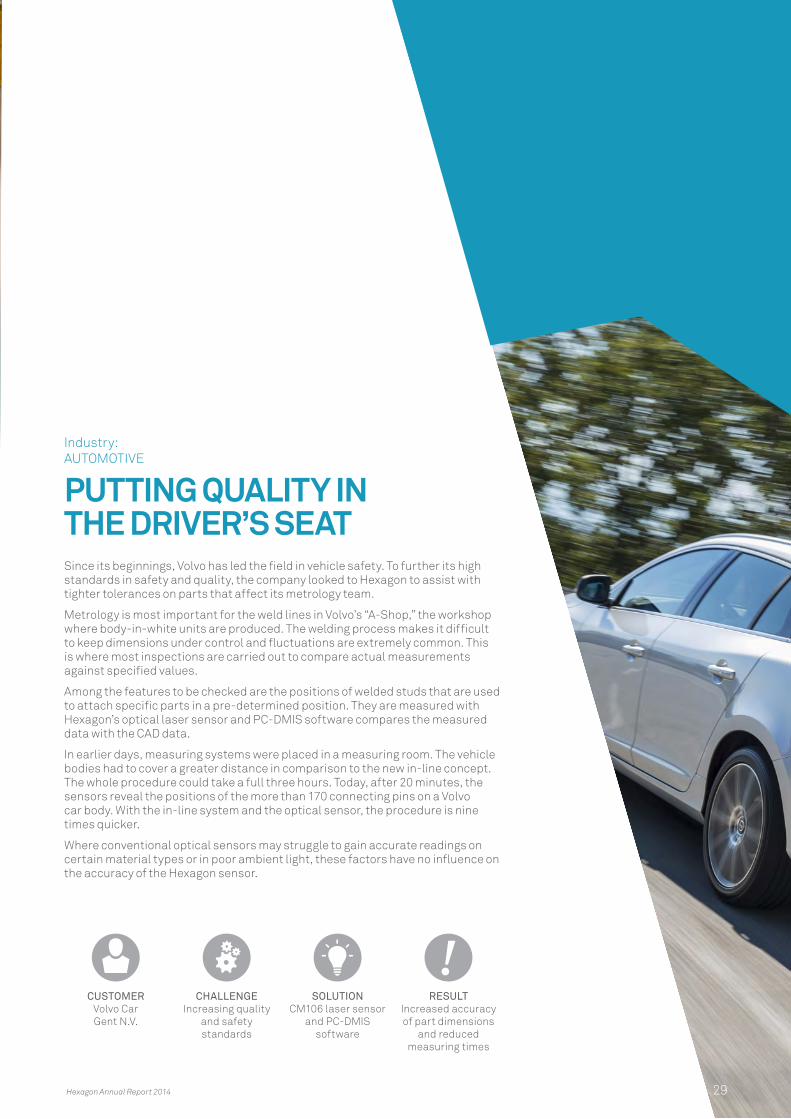
Industry: AUTOMOTIVE
PUTTING QUALITY IN THE DRIVER’S SEAT Since its beginnings, Volvo has led the field in vehicle safety. To further its high standards in safety and quality, the company looked to Hexagon to assist with tighter tolerances on parts that affect its metrology team.
Metrology is most important for the weld lines in Volvo’s “A-Shop,” the workshop where body-in-white units are produced. The welding process makes it difficult to keep dimensions under control and fluctuations are extremely common. This is where most inspections are carried out to compare actual measurements against specified values.
Among the features to be checked are the positions of welded studs that are used to attach specific parts in a pre-determined position. They are measured with Hexagon’s optical laser sensor and PC-DMIS software compares the measured data with the CAD data.
In earlier days, measuring systems were placed in a measuring room. The vehicle bodies had to cover a greater distance in comparison to the new in-line concept. The whole procedure could take a full three hours. Today, after 20 minutes, the sensors reveal the positions of the more than 170 connecting pins on a Volvo car body. With the in-line system and the optical sensor, the procedure is nine times quicker.
Where conventional optical sensors may struggle to gain accurate readings on certain material types or in poor ambient light, these factors have no influence on the accuracy of the Hexagon sensor.
CUSTOMERVolvo Car Gent N.V.
CHALLENGEIncreasing quality
and safety standards
SOLUTIONCM106 laser sensor
and PC-DMIS software
RESULTIncreased accuracy of part dimensions
and reduced measuring times
Hexagon Annual Report 2014 29
Industry: POWER AND ENERGY
MANAGING INFORMATION FOR MEGA PROJECTS Energy pioneer Santos is at the helm of the Gladstone LNG (GLNG) project in Queensland, Australia, one of the world’s first projects to process coal seam gas into liquefied natural gas (LNG) for sale to world markets. It involves ongoing gas field development in the Surat and Bowen Basins, a 420-kilometre gas transmission pipeline, and the construction of an LNG plant.
The GLNG project is one of great scope and complexity, so Santos decided to update its existing operations. It established an engineering data management (EDM) program to not only support the project, but also its existing greenfield and brownfield projects.
Santos selected Hexagon’s SmartPlant Enterprise because of its integrated life cycle approach. The new information management system was established using SmartPlant Enterprise for Owner Operators (SPO), which was integrated with other SmartPlant Enterprise design and engineering solutions.
With the integrated suite of SmartPlant solutions, Santos is able to view, manage and control the continuously changing engineering design basis more easily. An integrated system ensures synchronisation of information, so the “virtual plant,” along with in-plant documentation and IT systems, is always consistent, accurate and up-to-date. The system is accessible to all users across the Santos network, providing easy and secure access to accurate, integrated plant engineering knowl-edge. Based on SmartPlant Enterprise, the EDM program has enabled Santos to improve its business processes.
Industry: POWER AND ENERGY
DIGITISING FACILITIES FOR IMPROVED INFORMATION ACCESS To help unlock the power of information in its brownfield operations, Eskom, the largest electricity producer in Africa, turned to Hexagon to help transform unstructured engineering documents into a fully digitised information asset.
The project took place at the world’s largest dry-cooled generation facility, Eskom Matimba Power Plant in Ellisras, South Africa. and heavily leveraged tech-nologies from Hexagon’s geospatial and industrial enterprise solutions.
Hexagon’s high-definition laser scanning technology was used to capture the “as-is” plant configuration and SmartPlant Fusion software was used to rapidly capture, organise, augment and link unstructured engineering documents. The documents and laser scan were fused into an electronic engineering information portal, allowing plant workers to quickly and intuitively access all relevant plant information to support their daily work processes.
CUSTOMER Santos
CHALLENGE Improving management and use
of engineering information
SOLUTION SmartPlant Enterprise for
Owner Operators
RESULT Increased accuracy and quality of
engineering data, improved project execution, integrated engineering
across entire plant life cycle
CUSTOMER: Eskom
CHALLENGE Improving information
access in the Matimba Power Plant, South Africa
SOLUTIONHexagon high-definition
laser scanning and SmartPlant Fusion software
RESULTBetter productivity and effi-ciency among plant workers
30 Hexagon Annual Report 2014
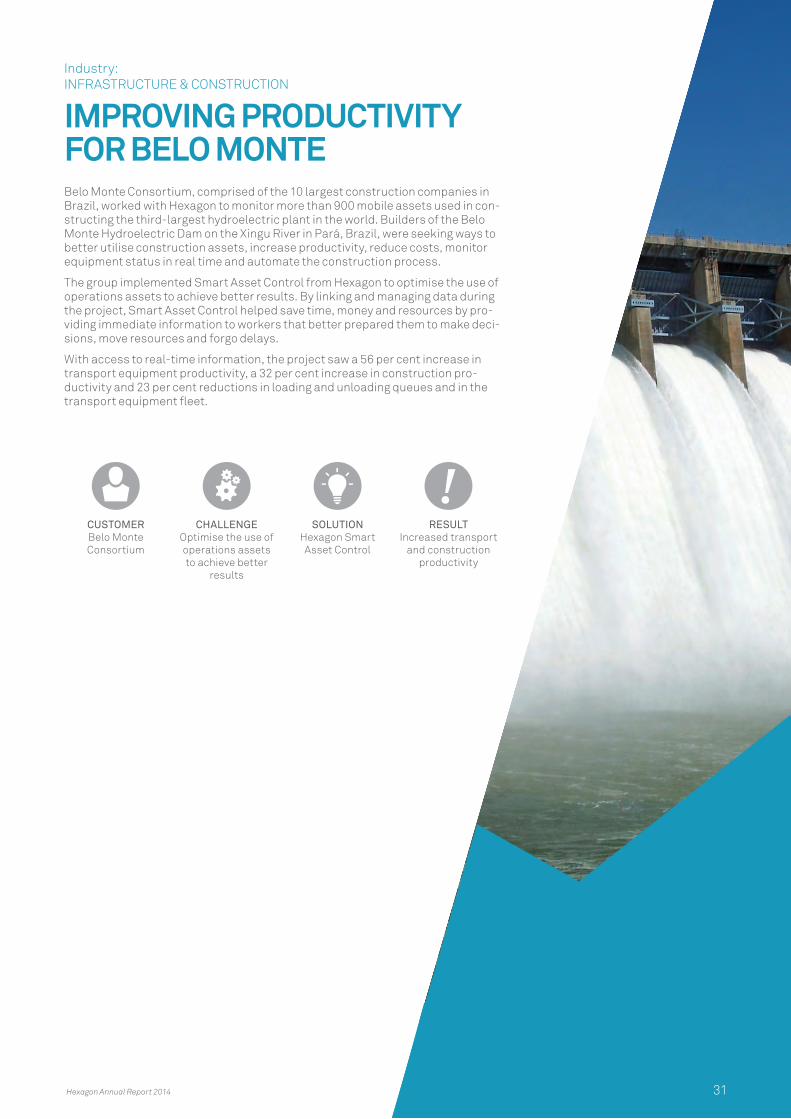
Industry: INFRASTRUCTURE & CONSTRUCTION
IMPROVING PRODUCTIVITY FOR BELO MONTEBelo Monte Consortium, comprised of the 10 largest construction companies in Brazil, worked with Hexagon to monitor more than 900 mobile assets used in con-structing the third-largest hydroelectric plant in the world. Builders of the Belo Monte Hydroelectric Dam on the Xingu River in Pará, Brazil, were seeking ways to better utilise construction assets, increase productivity, reduce costs, monitor equipment status in real time and automate the construction process.
The group implemented Smart Asset Control from Hexagon to optimise the use of operations assets to achieve better results. By linking and managing data during the project, Smart Asset Control helped save time, money and resources by pro-viding immediate information to workers that better prepared them to make deci-sions, move resources and forgo delays.
With access to real-time information, the project saw a 56 per cent increase in transport equipment productivity, a 32 per cent increase in construction pro-ductivity and 23 per cent reductions in loading and unloading queues and in the transport equipment fleet.
CUSTOMERBelo Monte Consortium
CHALLENGEOptimise the use of operations assets to achieve better
results
SOLUTIONHexagon Smart
Asset Control
RESULTIncreased transport
and construction productivity
Hexagon Annual Report 2014 31
11%OF SALES INVESTED IN R&D DURING 2014
1.2BN EUR IN ACCUMULATED
R&D INVESTMENT IN THE PAST FIVE YEARS
RESEARCH AND DEVELOPMENT
AT THE FOREFRONT OF INNOVATIONInnovation is the fundamental driver for Hexagon’s technological leadership. With more than 3,400 engineers engaged in R&D, more than 3,200 patents and nearly 11 per cent of net sales invested in R&D, Hexagon has created a portfolio of innovative products and solutions.
PRODUCT DEVELOPMENT FOCUSED ON MARKET DEMANDSHexagon seeks to create a continuous flow of new products and technologies through its innovation process. The high success rate in new product launches is greatly due to the Hexagon Innovation Process, an established framework for development projects, from initial R&D to market introduction.
This process involves a concrete set of rules, phases and milestones that help identify product innovations for large-scale production and enable simultaneous parallel development. Clearly defined roles foster agile knowledge sharing among teams and divisions, creating company-wide synergies across the organisation.
Every product development project is based on a business case with clearly defined technical, commercial and cost targets, and is run in close collaboration with customers and partners.
NEW TECHNOLOGIESLeveraging external and internal expertise is central when exploring new technol-ogies. Hexagon’s corporate technology centre works with research departments of leading universities around the world. The corporate R&D centre also ensures that technologies developed in one division of Hexagon can be used throughout the organisation to fully leverage the synergistic opportunities that exist across all businesses.
TECHNOLOGY ACQUISITIONAcquisitions fill technology gaps, thereby securing Hexagon’s market leading posi-tion. In line with Hexagon’s solution-centric focus, software technology acquisi-tions, which can create synergies, are of primary importance.
R&D EXPENSESIn 2014, R&D expenses were 293.4 MEUR (273.6), corresponding to 11 per cent (11) of total net sales. Development expenses are capitalised only if they pertain to new products, the cost is significant and the product is believed to have major earnings potential. In 2014, 53 (53) per cent of R&D spend was capitalised.
PATENTSEach year, Hexagon submits a large number of patent applications to protect its innovations. In 2014 Hexagon submitted 85 patent applications. Hexagon’s patent portfolio consists of approximately 3,240 active patents worldwide.
32 Hexagon Annual Report 2014
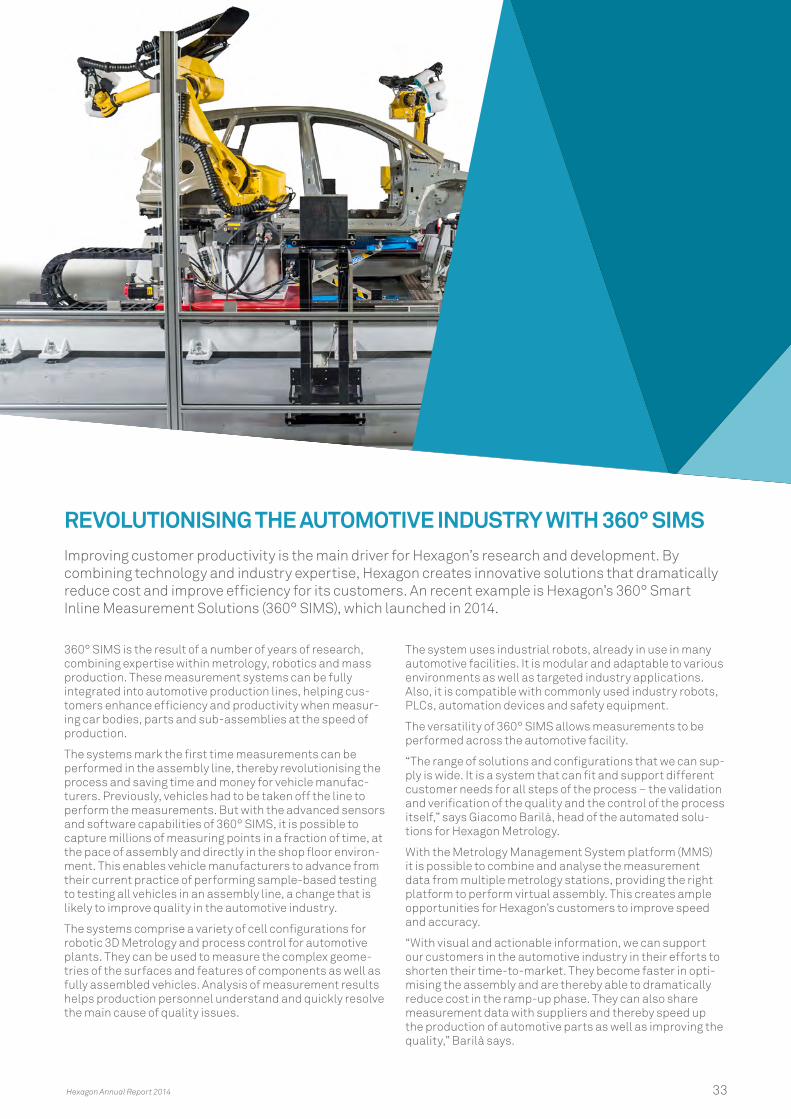
REVOLUTIONISING THE AUTOMOTIVE INDUSTRY WITH 360° SIMSImproving customer productivity is the main driver for Hexagon’s research and development. By combining technology and industry expertise, Hexagon creates innovative solutions that dramatically reduce cost and improve efficiency for its customers. An recent example is Hexagon’s 360° Smart Inline Measurement Solutions (360° SIMS), which launched in 2014.
360° SIMS is the result of a number of years of research, combining expertise within metrology, robotics and mass production. These measurement systems can be fully integrated into automotive production lines, helping cus-tomers enhance efficiency and productivity when measur-ing car bodies, parts and sub-assemblies at the speed of production.
The systems mark the first time measurements can be performed in the assembly line, thereby revolutionising the process and saving time and money for vehicle manufac-turers. Previously, vehicles had to be taken off the line to perform the measurements. But with the advanced sensors and software capabilities of 360° SIMS, it is possible to capture millions of measuring points in a fraction of time, at the pace of assembly and directly in the shop floor environ-ment. This enables vehicle manufacturers to advance from their current practice of performing sample-based testing to testing all vehicles in an assembly line, a change that is likely to improve quality in the automotive industry.
The systems comprise a variety of cell configurations for robotic 3D Metrology and process control for automotive plants. They can be used to measure the complex geome-tries of the surfaces and features of components as well as fully assembled vehicles. Analysis of measurement results helps production personnel understand and quickly resolve the main cause of quality issues.
The system uses industrial robots, already in use in many automotive facilities. It is modular and adaptable to various environments as well as targeted industry applications. Also, it is compatible with commonly used industry robots, PLCs, automation devices and safety equipment.
The versatility of 360° SIMS allows measurements to be performed across the automotive facility.
“The range of solutions and configurations that we can sup-ply is wide. It is a system that can fit and support different customer needs for all steps of the process – the validation and verification of the quality and the control of the process itself,” says Giacomo Barilà, head of the automated solu-tions for Hexagon Metrology.
With the Metrology Management System platform (MMS) it is possible to combine and analyse the measurement data from multiple metrology stations, providing the right platform to perform virtual assembly. This creates ample opportunities for Hexagon’s customers to improve speed and accuracy.
“With visual and actionable information, we can support our customers in the automotive industry in their efforts to shorten their time-to-market. They become faster in opti-mising the assembly and are thereby able to dramatically reduce cost in the ramp-up phase. They can also share measurement data with suppliers and thereby speed up the production of automotive parts as well as improving the quality,” Barilà says.
Hexagon Annual Report 2014 33
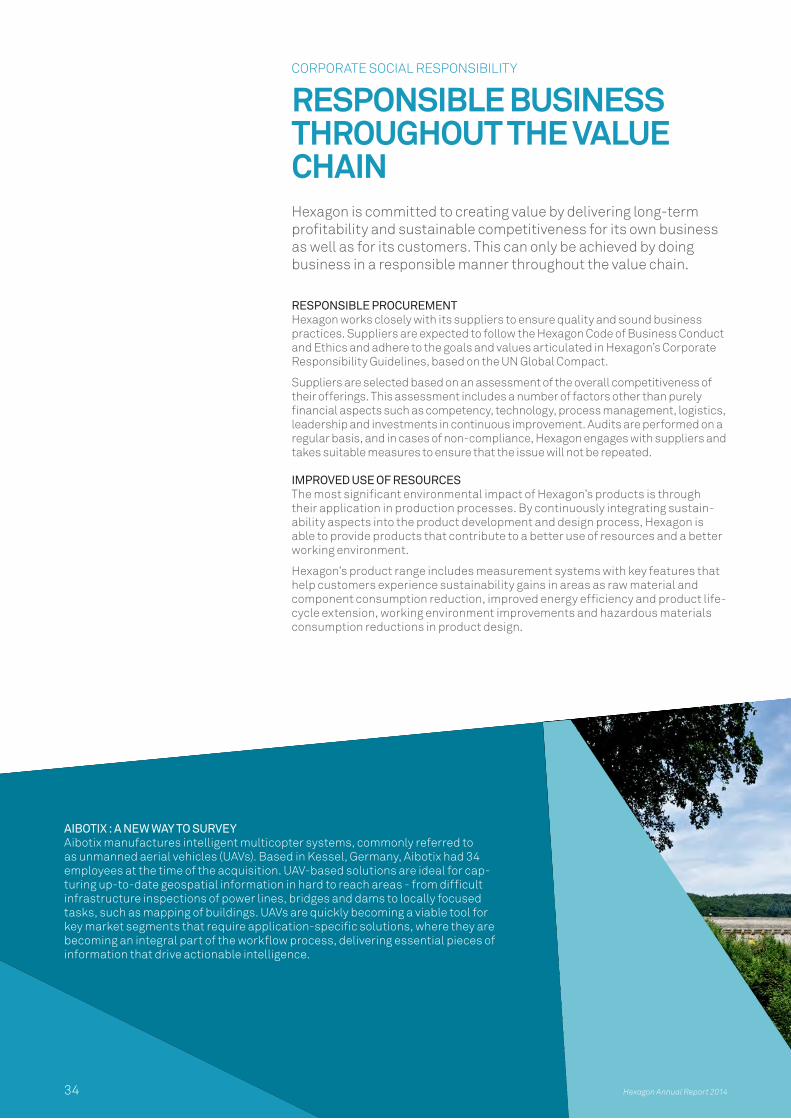
CORPORATE SOCIAL RESPONSIBILITY
RESPONSIBLE BUSINESS THROUGHOUT THE VALUE CHAINHexagon is committed to creating value by delivering long-term profitability and sustainable competitiveness for its own business as well as for its customers. This can only be achieved by doing business in a responsible manner throughout the value chain.
RESPONSIBLE PROCUREMENTHexagon works closely with its suppliers to ensure quality and sound business practices. Suppliers are expected to follow the Hexagon Code of Business Conduct and Ethics and adhere to the goals and values articulated in Hexagon’s Corporate Responsibility Guidelines, based on the UN Global Compact.
Suppliers are selected based on an assessment of the overall competitiveness of their offerings. This assessment includes a number of factors other than purely financial aspects such as competency, technology, process management, logistics, leadership and investments in continuous improvement. Audits are performed on a regular basis, and in cases of non-compliance, Hexagon engages with suppliers and takes suitable measures to ensure that the issue will not be repeated.
IMPROVED USE OF RESOURCESThe most significant environmental impact of Hexagon’s products is through their application in production processes. By continuously integrating sustain-ability aspects into the product development and design process, Hexagon is able to provide products that contribute to a better use of resources and a better working environment.
Hexagon’s product range includes measurement systems with key features that help customers experience sustainability gains in areas as raw material and component consumption reduction, improved energy efficiency and product life-cycle extension, working environment improvements and hazardous materials consumption reductions in product design.
AIBOTIX : A NEW WAY TO SURVEY Aibotix manufactures intelligent multicopter systems, commonly referred to as unmanned aerial vehicles (UAVs). Based in Kessel, Germany, Aibotix had 34 employees at the time of the acquisition. UAV-based solutions are ideal for cap-turing up-to-date geospatial information in hard to reach areas - from difficult infrastructure inspections of power lines, bridges and dams to locally focused tasks, such as mapping of buildings. UAVs are quickly becoming a viable tool for key market segments that require application-specific solutions, where they are becoming an integral part of the workflow process, delivering essential pieces of information that drive actionable intelligence.
Hexagon Annual Report 201434

SUSTAINABLE MANUFACTURINGHexagon has operations in 46 countries worldwide, and has research laboratories and manufacturing and assembly plants in 12 countries: Brazil, China, Denmark, France, Germany, India, Israel, Italy, Japan, Singapore, Switzerland and USA.
In its own manufacturing operations, Hexagon implements programmes designed to ensure that environmental standards are in compliance with laws, regulations and directives and has obtained ISO 14001 certification of its major production facilities. By minimising consumption of materials and maximising recycling, Hexagon strives to limit the use of natural resources. The company utilises safe and environmentally friendly installations in its manufacturing processes and promotes energy efficiency in buildings, pro-duction plants and performance of services.
Lean manufacturing is a key initiative to ensure a cost- optimised manufacturing process. Hexagon applies the most efficient processes to ensure flexibility and on-time delivery at minimum inventory. The primary focus is to integrate key suppliers into an efficient supply chain and to not restrict optimisation to Hexagon’s in-house production only. Employees participate in on-going improvement pro-grammes to optimise processes and workflows.
ENVIRONMENT OF LIFE-LONG LEARNINGMotivated employees are essential for Hexagon’s success. Hexagon strives to offer a stimulating and challenging work environment that supports life-long learning. The company seeks to actively recruit, continually develop and retain talented people from diverse backgrounds and origins. All employees are to be treated with equal respect and to be given equal opportunity to contribute to the company’s success based on their individual skills and interests.
OPEN AND TRANSPARENT COMMUNICATIONHexagon’s goal is to be transparent, open and proactive in its communications with all its stakeholders. Communica-tion and collaboration are encouraged across divisions and geographic boundaries to ensure the best possible use of available knowledge and expertise.
The whistleblower function ensures that each employee is encouraged and expected to report any incidents of non-compliance, with the assurance that there will be no retaliation or other negative consequences for persons acting in good faith.
COUNTERACTING CORRUPTIONHexagon’s Compliance Programme provides tools and guidelines for counteracting bribery and corruption in the daily business. The programme covers all operations, and 230 of Hexagon’s senior managers have an assigned responsibility to make sure that employees adhere to com-pany routines regarding corruption. Hexagon organises courses on an annual basis to keep employees abreast of routines to counteract corruption.
BOARD OF DIRECTORS ARE RESPONSIBLE FOR SUSTAINABILITYHexagon’s Board of Directors has laid down Corporate Responsibility Guidelines that serve as a framework for Hexagon’s approach.
STEERING DOCUMENTSHexagon’s Code of Business Conduct and Ethics defines the duty of all Hexagon employees to uphold high standards for ethical conduct. The Code also aims to ensure a safe work environment and that all employees are treated equally and fairly. Corporate Responsibility Guidelines support and adhere to the core values expressed in the United Nations Global Compact’s 10 principles in the areas of human rights, labour rights, environment and anti-corruption.
35 Hexagon Annual Report 2014
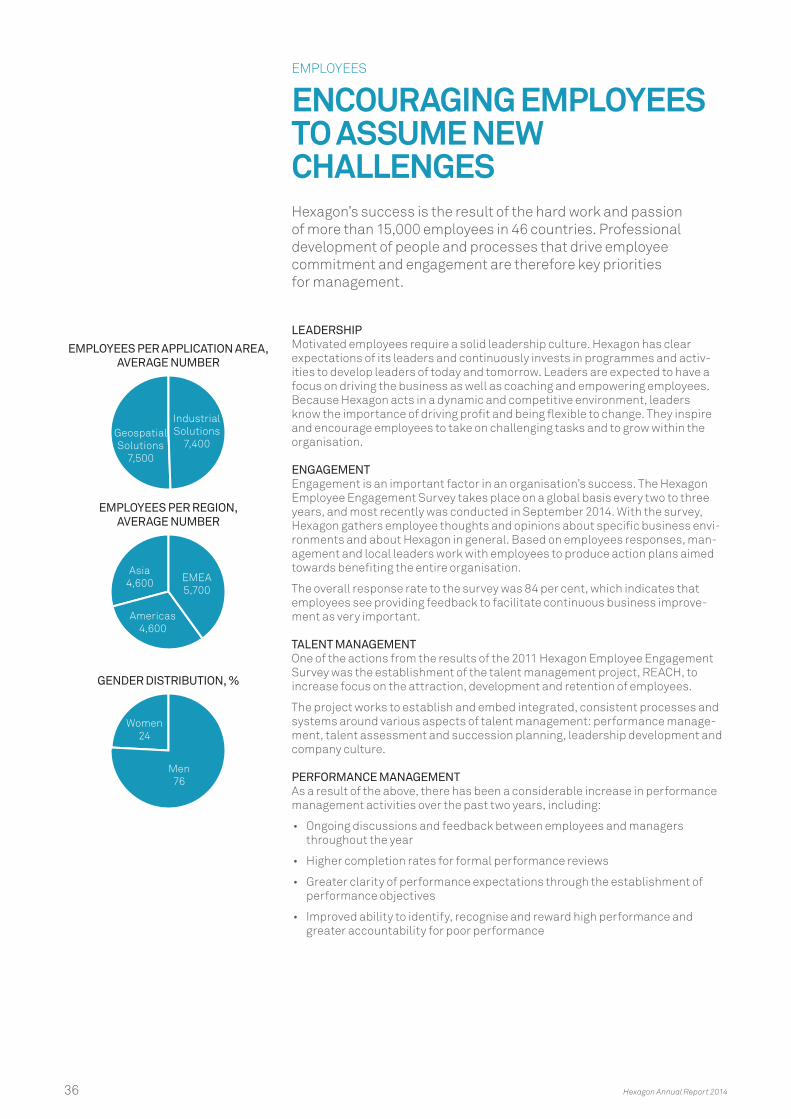
EMPLOYEES PER APPLICATION AREA, AVERAGE NUMBER
EMPLOYEES PER REGION, AVERAGE NUMBER
GENDER DISTRIBUTION, %
EMPLOYEES
ENCOURAGING EMPLOYEES TO ASSUME NEW CHALLENGESHexagon’s success is the result of the hard work and passion of more than 15,000 employees in 46 countries. Professional development of people and processes that drive employee commitment and engagement are therefore key priorities for management.
LEADERSHIPMotivated employees require a solid leadership culture. Hexagon has clear expectations of its leaders and continuously invests in programmes and activ-ities to develop leaders of today and tomorrow. Leaders are expected to have a focus on driving the business as well as coaching and empowering employees. Because Hexagon acts in a dynamic and competitive environment, leaders know the importance of driving profit and being flexible to change. They inspire and encourage employees to take on challenging tasks and to grow within the organisation.
ENGAGEMENT Engagement is an important factor in an organisation’s success. The Hexagon Employee Engagement Survey takes place on a global basis every two to three years, and most recently was conducted in September 2014. With the survey, Hexagon gathers employee thoughts and opinions about specific business envi-ronments and about Hexagon in general. Based on employees responses, man-agement and local leaders work with employees to produce action plans aimed towards benefiting the entire organisation.
The overall response rate to the survey was 84 per cent, which indicates that employees see providing feedback to facilitate continuous business improve-ment as very important.
TALENT MANAGEMENT One of the actions from the results of the 2011 Hexagon Employee Engagement Survey was the establishment of the talent management project, REACH, to increase focus on the attraction, development and retention of employees.
The project works to establish and embed integrated, consistent processes and systems around various aspects of talent management: performance manage-ment, talent assessment and succession planning, leadership development and company culture.
PERFORMANCE MANAGEMENTAs a result of the above, there has been a considerable increase in performance management activities over the past two years, including:
• Ongoingdiscussionsandfeedbackbetweenemployeesandmanagersthroughout the year
• Highercompletionratesforformalperformancereviews
• Greaterclarityofperformanceexpectationsthroughtheestablishmentofperformance objectives
• Improvedabilitytoidentify,recogniseandrewardhighperformanceandgreater accountability for poor performance
Geospatial Solutions
7,500
Asia 4,600
Women 24
Americas 4,600
Industrial Solutions
7,400
EMEA 5,700
Men 76
36 Hexagon Annual Report 2014

PROFIT DRIVENWe value performance over procedure, setting measurable goals and working collaboratively to achieve the results we seek.
CUSTOMER FOCUSEDWe know our customers’ success is paramount to our own and is based on our ability to talk openly and set clear targets to meet their needs.
ENGAGEDOur spirited energy and engagement is evident in our commitment to our work, passion for what we do and the speed by which we achieve it.
INNOVATIVEWe understand the importance of innova-tion in meeting the ever-changing needs of our customers, and that opportunities must be nurtured and developed quickly.
PROFESSIONALWe are honest professionals who under-stand the importance of knowing our business, exceeding expectations and avoiding politics along the way.
ENTREPRENEURIALWe are not afraid to try new things and leverage our decentralised structure to make speedy decisions, take calculated risks and find new opportunities.
HEXAGON’S CORE VALUESHexagon’s core values unite all employees under one shared purpose of accountability and in meeting the high standards they expect from themselves and their peers.
LEADERSHIP DEVELOPMENT PROGRAMMEThe Hexagon Leadership Development Programme was established in 2014 to provide an employee training curric-ulum for intensive professional growth. These programmes utilise world-renowned leadership methodologies designed to provide the tools required to be a successful leader and reinforce core values.
TALENT REVIEW AND SUCCESSION PLANNING More widespread reviews of employees have been imple-mented, increasing visibility of the effectiveness of the workforce and highlighting areas in need of further devel-opment. Succession planning meetings have been held in parts of the business to identify potential gaps in the talent pipeline as well as potential career opportunities.
EMERGING TALENTHexagon reaps the benefit of investment in emerging talent, through the participation in vocational training and employ-ment programmes such as apprenticeships, internships, traineeships, graduate programmes, and work experience.
EMPLOYER BRANDINGBased on survey results and job market analysis, Hexagon has undertaken a campaign to increase brand awareness through the promotion of who we are, what we stand for and how employees can build a rewarding career within the company. By reinforcing Hexagon’s position as an employer of choice to existing employees as well as the external job market, Hexagon enhances the ability to attract, recruit, and retain talent. Representatives from the company reg-ularly attend career fairs and industry conferences to pro-vide prospectice employees an introduction to Hexagon and the benefits of working for an employer of choice.
TURNOVERThe annual employee turnover is approximately 10 per cent, in line with the industry average.
37 Hexagon Annual Report 2014
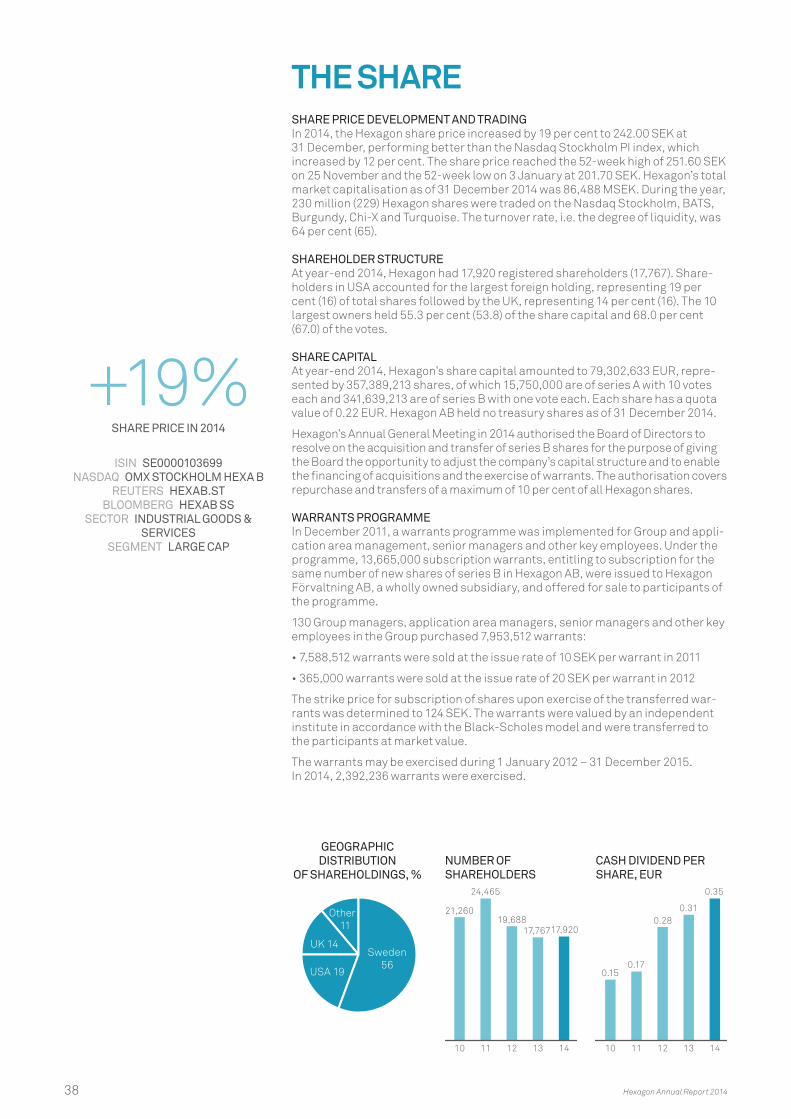
THE SHARE SHARE PRICE DEVELOPMENT AND TRADING In 2014, the Hexagon share price increased by 19 per cent to 242.00 SEK at 31 December, performing better than the Nasdaq Stockholm PI index, which increased by 12 per cent. The share price reached the 52-week high of 251.60 SEK on 25 November and the 52-week low on 3 January at 201.70 SEK. Hexagon’s total market capitalisation as of 31 December 2014 was 86,488 MSEK. During the year, 230 million (229) Hexagon shares were traded on the Nasdaq Stockholm, BATS, Burgundy, Chi-X and Turquoise. The turnover rate, i.e. the degree of liquidity, was 64 per cent (65).
SHAREHOLDER STRUCTURE At year-end 2014, Hexagon had 17,920 registered shareholders (17,767). Share-holders in USA accounted for the largest foreign holding, representing 19 per cent (16) of total shares followed by the UK, representing 14 per cent (16). The 10 largest owners held 55.3 per cent (53.8) of the share capital and 68.0 per cent (67.0) of the votes.
SHARE CAPITAL At year-end 2014, Hexagon’s share capital amounted to 79,302,633 EUR, repre-sented by 357,389,213 shares, of which 15,750,000 are of series A with 10 votes each and 341,639,213 are of series B with one vote each. Each share has a quota value of 0.22 EUR. Hexagon AB held no treasury shares as of 31 December 2014.
Hexagon’s Annual General Meeting in 2014 authorised the Board of Directors to resolve on the acquisition and transfer of series B shares for the purpose of giving the Board the opportunity to adjust the company’s capital structure and to enable the financing of acquisitions and the exercise of warrants. The authorisation covers repurchase and transfers of a maximum of 10 per cent of all Hexagon shares.
WARRANTS PROGRAMMEIn December 2011, a warrants programme was implemented for Group and appli-cation area management, senior managers and other key employees. Under the programme, 13,665,000 subscription warrants, entitling to subscription for the same number of new shares of series B in Hexagon AB, were issued to Hexagon Förvaltning AB, a wholly owned subsidiary, and offered for sale to participants of the programme.
130 Group managers, application area managers, senior managers and other key employees in the Group purchased 7,953,512 warrants:
•7,588,512 warrants were sold at the issue rate of 10 SEK per warrant in 2011
•365,000 warrants were sold at the issue rate of 20 SEK per warrant in 2012
The strike price for subscription of shares upon exercise of the transferred war-rants was determined to 124 SEK. The warrants were valued by an independent institute in accordance with the Black-Scholes model and were transferred to the participants at market value.
The warrants may be exercised during 1 January 2012 – 31 December 2015. In 2014, 2,392,236 warrants were exercised.
+19%SHARE PRICE IN 2014
ISIN SE0000103699 NASDAQ OMX STOCKHOLM HEXA B
REUTERS HEXAB.ST BLOOMBERG HEXAB SS
SECTOR INDUSTRIAL GOODS & SERVICES
SEGMENT LARGE CAP
GEOGRAPHIC DISTRIBUTION
OF SHAREHOLDINGS, %
UK 14
Other 11
USA 19
Sweden 56
NUMBER OF SHAREHOLDERS
1413121110
21,260
24,465
19,68817,76717,920
CASH DIVIDEND PER SHARE, EUR
1413121110
0.150.17
0.28
0.35
0.31
38 Hexagon Annual Report 2014
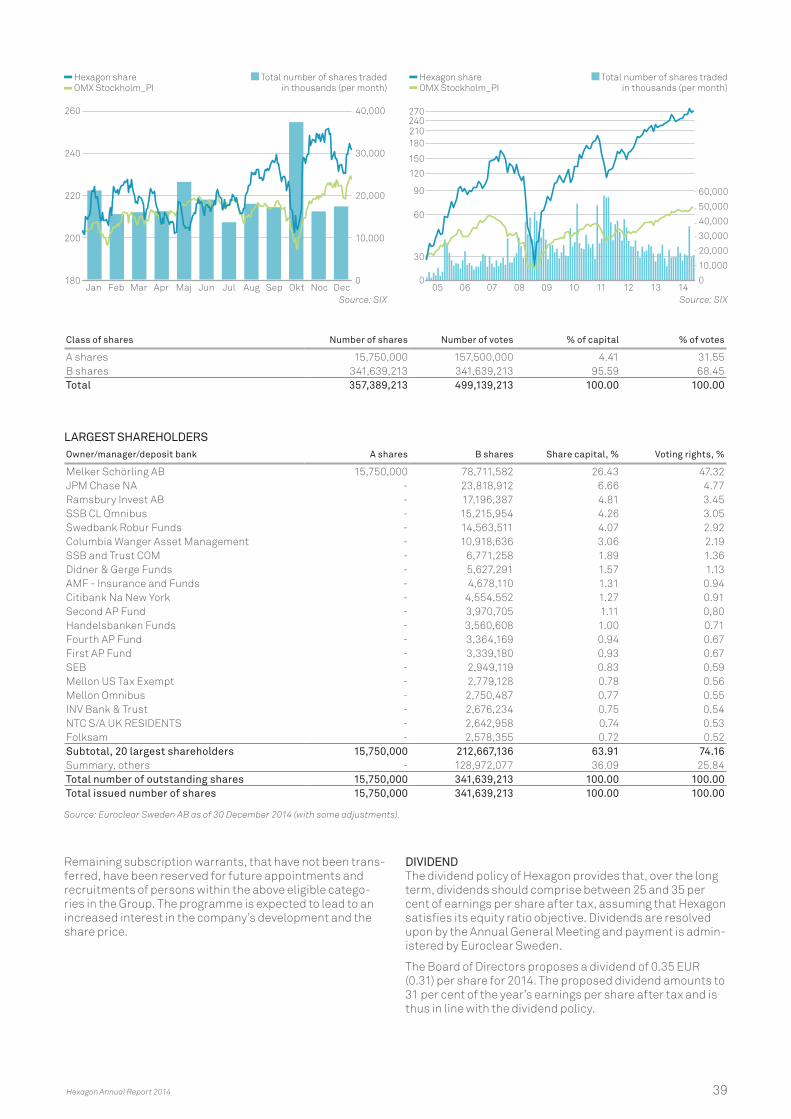
Remaining subscription warrants, that have not been trans-ferred, have been reserved for future appointments and recruitments of persons within the above eligible catego-ries in the Group. The programme is expected to lead to an increased interest in the company’s development and the share price.
DIVIDENDThe dividend policy of Hexagon provides that, over the long term, dividends should comprise between 25 and 35 per cent of earnings per share after tax, assuming that Hexagon satisfies its equity ratio objective. Dividends are resolved upon by the Annual General Meeting and payment is admin-istered by Euroclear Sweden.
The Board of Directors proposes a dividend of 0.35 EUR (0.31) per share for 2014. The proposed dividend amounts to 31 per cent of the year’s earnings per share after tax and is thus in line with the dividend policy.
Hexagon share Total number of shares traded OMX Stockholm_PI in thousands (per month)
Hexagon share Total number of shares traded OMX Stockholm_PI in thousands (per month)
Class of shares Number of shares Number of votes % of capital % of votes
A shares 15,750,000 157,500,000 4.41 31.55B shares 341,639,213 341,639,213 95.59 68.45Total 357,389,213 499,139,213 100.00 100.00
LARGEST SHAREHOLDERSOwner/manager/deposit bank A shares B shares Share capital, % Voting rights, %
Melker Schörling AB 15,750,000 78,711,582 26.43 47.32JPM Chase NA - 23,818,912 6.66 4.77Ramsbury Invest AB - 17,196,387 4.81 3.45SSB CL Omnibus - 15,215,954 4.26 3.05Swedbank Robur Funds - 14,563,511 4.07 2.92Columbia Wanger Asset Management - 10,918,636 3.06 2.19SSB and Trust COM - 6,771,258 1.89 1.36Didner & Gerge Funds - 5,627,291 1.57 1.13AMF - Insurance and Funds - 4,678,110 1.31 0.94Citibank Na New York - 4,554,552 1.27 0.91Second AP Fund - 3,970,705 1.11 0,80Handelsbanken Funds - 3,560,608 1.00 0.71Fourth AP Fund - 3,364,169 0.94 0.67First AP Fund - 3,339,180 0.93 0.67SEB - 2,949,119 0.83 0.59Mellon US Tax Exempt - 2,779,128 0.78 0.56Mellon Omnibus - 2,750,487 0.77 0.55INV Bank & Trust - 2,676,234 0.75 0.54NTC S/A UK RESIDENTS - 2,642,958 0.74 0.53Folksam - 2,578,355 0.72 0.52Subtotal, 20 largest shareholders 15,750,000 212,667,136 63.91 74.16Summary, others - 128,972,077 36.09 25.84Total number of outstanding shares 15,750,000 341,639,213 100.00 100.00Total issued number of shares 15,750,000 341,639,213 100.00 100.00
Source: Euroclear Sweden AB as of 30 December 2014 (with some adjustments).
Source: SIX Source: SIX
260
240
220
200
180
40,000
30,000
20,000
10,000
0
60,000
50,000
40,000
30,000
20,000
10,000
0
270240210180
150
120
90
60
30
0Jan Feb Mar Apr Maj Jun Jul Aug Sep Okt Noc Dec 05 06 07 08 09 10 11 12 13 14
Hexagon Annual Report 2014 39
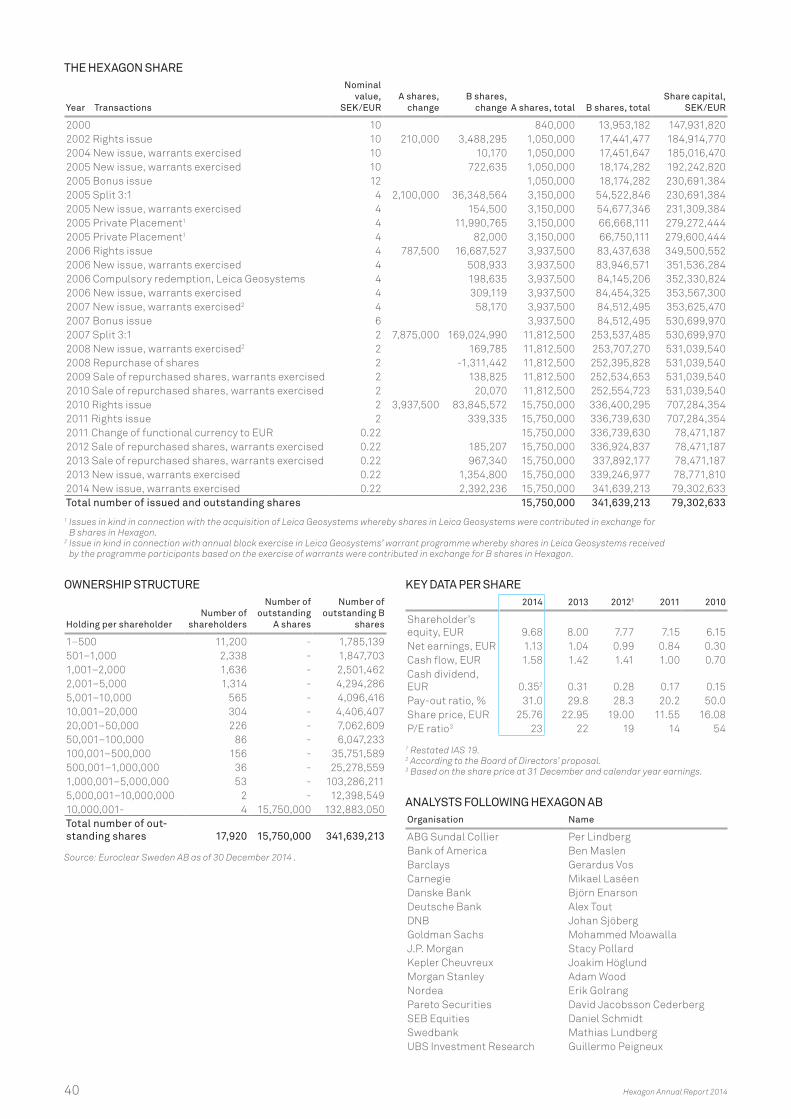
THE HEXAGON SHARE
Year Transactions
Nominal value,
SEK/EUR A shares,
changeB shares,
change A shares, total B shares, total Share capital,
SEK/EUR
2000 10 840,000 13,953,182 147,931,8202002 Rights issue 10 210,000 3,488,295 1,050,000 17,441,477 184,914,7702004 New issue, warrants exercised 10 10,170 1,050,000 17,451,647 185,016,4702005 New issue, warrants exercised 10 722,635 1,050,000 18,174,282 192,242,8202005 Bonus issue 12 1,050,000 18,174,282 230,691,3842005 Split 3:1 4 2,100,000 36,348,564 3,150,000 54,522,846 230,691,3842005 New issue, warrants exercised 4 154,500 3,150,000 54,677,346 231,309,3842005 Private Placement1 4 11,990,765 3,150,000 66,668,111 279,272,4442005 Private Placement1 4 82,000 3,150,000 66,750,111 279,600,4442006 Rights issue 4 787,500 16,687,527 3,937,500 83,437,638 349,500,5522006 New issue, warrants exercised 4 508,933 3,937,500 83,946,571 351,536,2842006 Compulsory redemption, Leica Geosystems 4 198,635 3,937,500 84,145,206 352,330,8242006 New issue, warrants exercised 4 309,119 3,937,500 84,454,325 353,567,3002007 New issue, warrants exercised2 4 58,170 3,937,500 84,512,495 353,625,4702007 Bonus issue 6 3,937,500 84,512,495 530,699,9702007 Split 3:1 2 7,875,000 169,024,990 11,812,500 253,537,485 530,699,9702008 New issue, warrants exercised2 2 169,785 11,812,500 253,707,270 531,039,5402008 Repurchase of shares 2 -1,311,442 11,812,500 252,395,828 531,039,5402009 Sale of repurchased shares, warrants exercised 2 138,825 11,812,500 252,534,653 531,039,5402010 Sale of repurchased shares, warrants exercised 2 20,070 11,812,500 252,554,723 531,039,5402010 Rights issue 2 3,937,500 83,845,572 15,750,000 336,400,295 707,284,3542011 Rights issue 2 339,335 15,750,000 336,739,630 707,284,3542011 Change of functional currency to EUR 0.22 15,750,000 336,739,630 78,471,1872012 Sale of repurchased shares, warrants exercised 0.22 185,207 15,750,000 336,924,837 78,471,1872013 Sale of repurchased shares, warrants exercised 0.22 967,340 15,750,000 337,892,177 78,471,1872013 New issue, warrants exercised 0.22 1,354,800 15,750,000 339,246,977 78,771,8102014 New issue, warrants exercised 0.22 2,392,236 15,750,000 341,639,213 79,302,633Total number of issued and outstanding shares 15,750,000 341,639,213 79,302,633 1 Issues in kind in connection with the acquisition of Leica Geosystems whereby shares in Leica Geosystems were contributed in exchange for
B shares in Hexagon.2 Issue in kind in connection with annual block exercise in Leica Geosystems’ warrant programme whereby shares in Leica Geosystems received
by the programme participants based on the exercise of warrants were contributed in exchange for B shares in Hexagon.
OWNERSHIP STRUCTURE
Holding per shareholderNumber of
shareholders
Number of outstanding
A shares
Number of outstanding B
shares
1–500 11,200 - 1,785,139501–1,000 2,338 - 1,847,7031,001–2,000 1,636 - 2,501,4622,001–5,000 1,314 - 4,294,2865,001–10,000 565 - 4,096,41610,001–20,000 304 - 4,406,40720,001–50,000 226 - 7,062,60950,001–100,000 86 - 6,047,233100,001–500,000 156 - 35,751,589500,001–1,000,000 36 - 25,278,5591,000,001–5,000,000 53 - 103,286,2115,000,001–10,000,000 2 - 12,398,54910,000,001- 4 15,750,000 132,883,050Total number of out-standing shares 17,920 15,750,000 341,639,213
Source: Euroclear Sweden AB as of 30 December 2014 .
KEY DATA PER SHARE2014 2013 20121 2011 2010
Shareholder’s equity, EUR 9.68 8.00 7.77 7.15 6.15Net earnings, EUR 1.13 1.04 0.99 0.84 0.30Cash flow, EUR 1.58 1.42 1.41 1.00 0.70Cash dividend, EUR 0.352 0.31 0.28 0.17 0.15Pay-out ratio, % 31.0 29.8 28.3 20.2 50.0Share price, EUR 25.76 22.95 19.00 11.55 16.08P/E ratio3 23 22 19 14 54
1 Restated IAS 19.2 According to the Board of Directors’ proposal.3 Based on the share price at 31 December and calendar year earnings.
ANALYSTS FOLLOWING HEXAGON ABOrganisation Name
ABG Sundal Collier Per LindbergBank of America Ben MaslenBarclays Gerardus VosCarnegie Mikael LaséenDanske Bank Björn EnarsonDeutsche Bank Alex ToutDNB Johan SjöbergGoldman Sachs Mohammed MoawallaJ.P. Morgan Stacy PollardKepler Cheuvreux Joakim HöglundMorgan Stanley Adam WoodNordea Erik GolrangPareto Securities David Jacobsson CederbergSEB Equities Daniel SchmidtSwedbank Mathias LundbergUBS Investment Research Guillermo Peigneux
40 Hexagon Annual Report 2014
CORPORATE GOVERNANCE REPORTHexagon AB is a public company listed on Nasdaq Stock-holm exchange. The corporate governance in Hexagon is based on Swedish legislation, primarily the Swedish Com-panies Act, Hexagon’s Articles of Association, the Board of Directors’ internal rules, the rules and regulations of the stock exchange, the Swedish Code of Corporate Governance (“the Code”) and regulations and recommendations issued by relevant organisations.
Hexagon applies the Code, which is based on the principle “comply or explain”. Hexagon does not report any deviations from the Code for the financial year 2014.
This corporate governance report has been prepared in accordance with the provisions of the Annual Accounts Act and the Code and has, by virtue of Section 6, paragraph 8 of the Annual Accounts Act, been drawn up as a document separate from the Annual Report.
OWNERSHIP STRUCTURE AND SHARE INFORMATION At 31 December 2014, Hexagon’s share capital was EUR 79,302,633.44, represented by 357,389,213 shares, of which 15,750,000 are of series A with 10 votes each and 341,639,213 are of series B with one vote each. Hexagon AB held no treasury shares at year end. The Annual Gen-eral Meeting 2014 authorised the Board of Directors (“the Board”) to resolve on purchases and divestments of own shares equal to no more than 10 per cent of the total num-ber of issued shares in the company.
Melker Schörling AB, the single largest shareholder in Hexagon, held a total of 15,750,000 series A shares and 78,711,582 series B shares at year-end 2014, representing 47.32 per cent of the votes and 26.43 per cent of the capital. No other shareholder has any direct or indirect shareholding representing more than 10 per cent of the total votes.
To the best of the Board’s knowledge there are no share-holder agreements or similar agreements between the shareholders of Hexagon with the purpose of exercising joint control of the company. Neither is the Board aware of any agreements that could lead to a change of control in the company.
As far as the Board is aware, there is no shareholder agree-ment that could prevent the transfer of shares.
Nor are there agreements between the company, directors or employees, other than as described in Note 30, which stipulate the right to compensation if such person volun-tarily leaves the company, is dismissed with cause or if such person’s employment is terminated as a result of a public offer for shares in the company.
ANNUAL GENERAL MEETING (AGM) The General Meeting is Hexagon’s supreme executive body in which all shareholders are entitled to participate. The Articles of Association of the company contain no restric-tions regarding the number of votes that may be cast by a shareholder at general meetings. Hexagon issues the notice convening the AGM no later than four weeks prior to the meeting. The AGM is held in Stockholm, Sweden, usually in the month of May. At the AGM, the Board presents the Annual Report (including the consolidated accounts) and the audit report. The AGM resolves on a number of issues, such as the adoption of the income statement and balance sheet, the allocation of the company’s profit and discharge from liability to the company for the Board members and the President and CEO, remuneration of the Board and auditors, the principles for remuneration and employment
terms for the President and CEO and other senior execu-tives, election of members and Chairman of the Board of Directors, election of auditor and any amendments to the Articles of Association, etc.
NOMINATION COMMITTEE The AGM has resolved that the Nomination Committee’s assignment shall comprise the preparation and presen-tation of proposals to the shareholders at the AGM on the election of Board members, Chairman of the Board and Chairman of the Meeting and the company’s auditors. In addition, the Nomination Committee presents proposals regarding remuneration of the Board of Directors (including for committee work) and the auditors.
The Nomination Committee shall consist of representatives for major shareholders of the company elected by the AGM. In case a shareholder, who a member of the Nomination Committee represents, is no longer one of the major share-holders of Hexagon, or if a member of the Nomination Com-mittee is no longer employed by such shareholder, or for any other reason leaves the Committee before the next AGM, the Committee is entitled to appoint another representative among the major shareholders to replace such member. No fees are paid to the members of the Nomination Committee.
BOARD OF DIRECTORSIn accordance with the Articles of Association, the Board of Directors of Hexagon shall consist of no less than three and not more than nine members, elected annually by the AGM for the period until the end of the next AGM. The Articles of Association of the company contain no special provisions regarding the election and discharge of Board members or regarding changes of the Articles of Association. The AGM 2014 elected six members, including the President and Chief Executive Officer. The Chief Financial Officer and Executive Vice President, Hexagon’s General Counsel, the Chief Strategy Officer and the Chief Technical Officer par-ticipate in the Board meetings. Other Hexagon employees participate in the Board meetings to make presentations on particular matters if requested.
The Nomination Committee’s assessment of the board members’ independence in relation to the company, its management and major shareholders is presented on page 43. According to the requirements set out in the Code, the majority of the Board members elected by the General Meeting must be independent in relation to the company and its management, and at least two of such Board mem-bers shall also be independent in relation to the company’s major shareholders.
The Board of Directors is responsible for determining Hexagon’s overall objectives, developing and monitoring the overall strategy, deciding on major acquisitions, divest-ments and investments and ongoing monitoring of opera-tions. The Board is also responsible for ongoing evaluation of management, as well as systems for monitoring the inter-nal control and the company’s financial position. The Board ensures that the company’s external disclosure of informa-tion is characterised by openness and that it is accurate, relevant and clear. Procedural rules and instructions for the Board and the President and CEO govern issues requiring Board approval and financial information and other report-ing to be submitted to the Board.
The Chairman directs the Board’s activities to ensure that they are conducted pursuant to the Swedish Companies
Hexagon Annual Report 2014 41
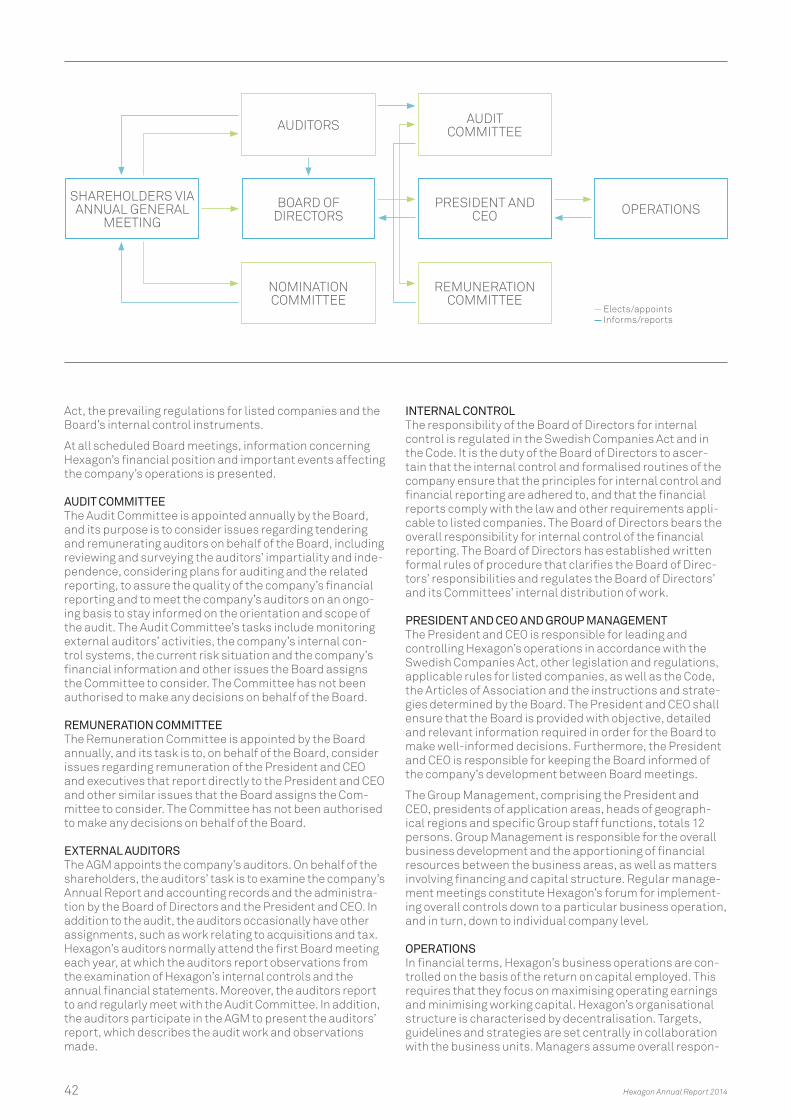
Act, the prevailing regulations for listed companies and the Board’s internal control instruments.
At all scheduled Board meetings, information concerning Hexagon’s financial position and important events affecting the company’s operations is presented.
AUDIT COMMITTEEThe Audit Committee is appointed annually by the Board, and its purpose is to consider issues regarding tendering and remunerating auditors on behalf of the Board, including reviewing and surveying the auditors’ impartiality and inde-pendence, considering plans for auditing and the related reporting, to assure the quality of the company’s financial reporting and to meet the company’s auditors on an ongo-ing basis to stay informed on the orientation and scope of the audit. The Audit Committee’s tasks include monitoring external auditors’ activities, the company’s internal con-trol systems, the current risk situation and the company’s financial information and other issues the Board assigns the Committee to consider. The Committee has not been authorised to make any decisions on behalf of the Board.
REMUNERATION COMMITTEEThe Remuneration Committee is appointed by the Board annually, and its task is to, on behalf of the Board, consider issues regarding remuneration of the President and CEO and executives that report directly to the President and CEO and other similar issues that the Board assigns the Com-mittee to consider. The Committee has not been authorised to make any decisions on behalf of the Board.
EXTERNAL AUDITORSThe AGM appoints the company’s auditors. On behalf of the shareholders, the auditors’ task is to examine the company’s Annual Report and accounting records and the administra-tion by the Board of Directors and the President and CEO. In addition to the audit, the auditors occasionally have other assignments, such as work relating to acquisitions and tax. Hexagon’s auditors normally attend the first Board meeting each year, at which the auditors report observations from the examination of Hexagon’s internal controls and the annual financial statements. Moreover, the auditors report to and regularly meet with the Audit Committee. In addition, the auditors participate in the AGM to present the auditors’ report, which describes the audit work and observations made.
INTERNAL CONTROL The responsibility of the Board of Directors for internal control is regulated in the Swedish Companies Act and in the Code. It is the duty of the Board of Directors to ascer-tain that the internal control and formalised routines of the company ensure that the principles for internal control and financial reporting are adhered to, and that the financial reports comply with the law and other requirements appli-cable to listed companies. The Board of Directors bears the overall responsibility for internal control of the financial reporting. The Board of Directors has established written formal rules of procedure that clarifies the Board of Direc-tors’ responsibilities and regulates the Board of Directors’ and its Committees’ internal distribution of work.
PRESIDENT AND CEO AND GROUP MANAGEMENT The President and CEO is responsible for leading and controlling Hexagon’s operations in accordance with the Swedish Companies Act, other legislation and regulations, applicable rules for listed companies, as well as the Code, the Articles of Association and the instructions and strate-gies determined by the Board. The President and CEO shall ensure that the Board is provided with objective, detailed and relevant information required in order for the Board to make well-informed decisions. Furthermore, the President and CEO is responsible for keeping the Board informed of the company’s development between Board meetings.
The Group Management, comprising the President and CEO, presidents of application areas, heads of geograph-ical regions and specific Group staff functions, totals 12 persons. Group Management is responsible for the overall business development and the apportioning of financial resources between the business areas, as well as matters involving financing and capital structure. Regular manage-ment meetings constitute Hexagon’s forum for implement-ing overall controls down to a particular business operation, and in turn, down to individual company level.
OPERATIONS In financial terms, Hexagon’s business operations are con-trolled on the basis of the return on capital employed. This requires that they focus on maximising operating earnings and minimising working capital. Hexagon’s organisational structure is characterised by decentralisation. Targets, guidelines and strategies are set centrally in collaboration with the business units. Managers assume overall respon-
SHAREHOLDERS VIA ANNUAL GENERAL
MEETINGBOARD OF
DIRECTORS
NOMINATION COMMITTEE
REMUNERATION COMMITTEE
AUDITORS AUDIT COMMITTEE
PRESIDENT AND CEO OPERATIONS
Elects/appoints Informs/reports
42 Hexagon Annual Report 2014
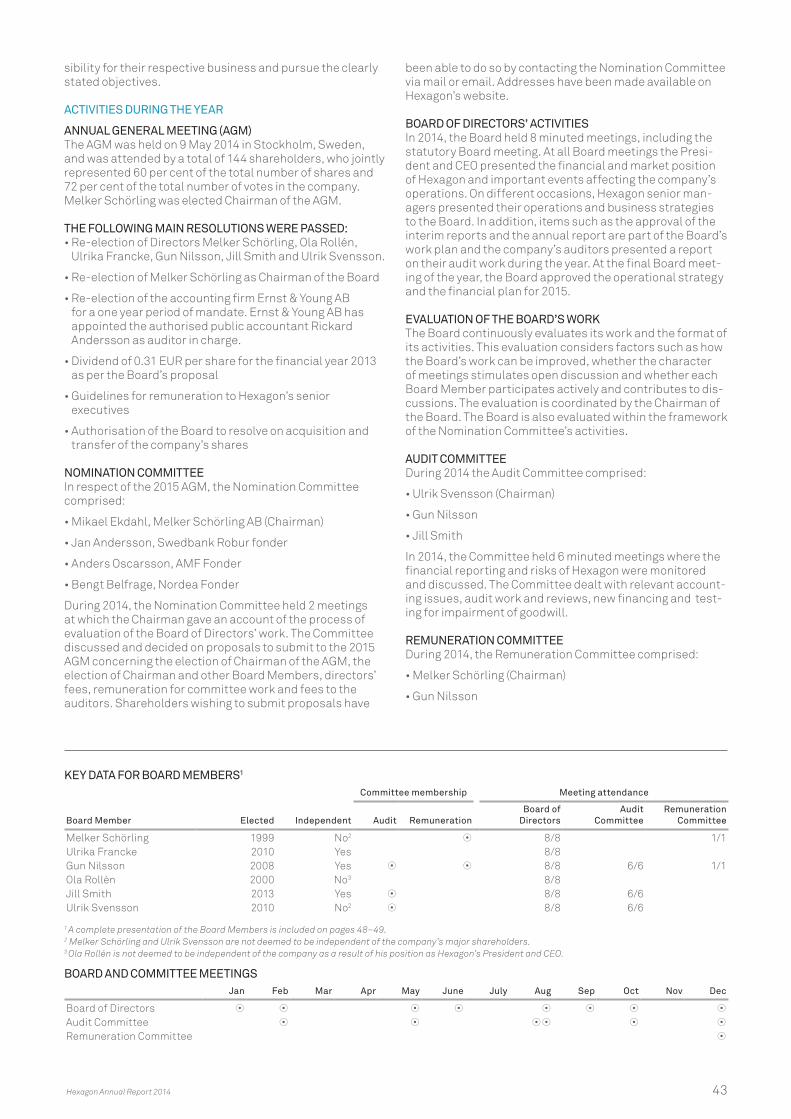
sibility for their respective business and pursue the clearly stated objectives.
ACTIVITIES DURING THE YEAR
ANNUAL GENERAL MEETING (AGM) The AGM was held on 9 May 2014 in Stockholm, Sweden, and was attended by a total of 144 shareholders, who jointly represented 60 per cent of the total number of shares and 72 per cent of the total number of votes in the company. Melker Schörling was elected Chairman of the AGM.
THE FOLLOWING MAIN RESOLUTIONS WERE PASSED: •Re-electionofDirectorsMelkerSchörling,OlaRollén,
Ulrika Francke, Gun Nilsson, Jill Smith and Ulrik Svensson.
•Re-electionofMelkerSchörlingasChairmanoftheBoard
•Re-electionoftheaccountingfirmErnst&YoungABfor a one year period of mandate. Ernst & Young AB has appointed the authorised public accountant Rickard Andersson as auditor in charge.
•Dividendof0.31EURpershareforthefinancialyear2013as per the Board’s proposal
•GuidelinesforremunerationtoHexagon’sseniorexecutives
•AuthorisationoftheBoardtoresolveonacquisitionandtransfer of the company’s shares
NOMINATION COMMITTEE In respect of the 2015 AGM, the Nomination Committee comprised:
•MikaelEkdahl,MelkerSchörlingAB(Chairman)
•JanAndersson,SwedbankRoburfonder
•AndersOscarsson,AMFFonder
•BengtBelfrage,NordeaFonder
During 2014, the Nomination Committee held 2 meetings at which the Chairman gave an account of the process of evaluation of the Board of Directors’ work. The Committee discussed and decided on proposals to submit to the 2015 AGM concerning the election of Chairman of the AGM, the election of Chairman and other Board Members, directors’ fees, remuneration for committee work and fees to the auditors. Shareholders wishing to submit proposals have
been able to do so by contacting the Nomination Committee via mail or email. Addresses have been made available on Hexagon’s website.
BOARD OF DIRECTORS’ ACTIVITIES In 2014, the Board held 8 minuted meetings, including the statutory Board meeting. At all Board meetings the Presi-dent and CEO presented the financial and market position of Hexagon and important events affecting the company’s operations. On different occasions, Hexagon senior man-agers presented their operations and business strategies to the Board. In addition, items such as the approval of the interim reports and the annual report are part of the Board’s work plan and the company’s auditors presented a report on their audit work during the year. At the final Board meet-ing of the year, the Board approved the operational strategy and the financial plan for 2015.
EVALUATION OF THE BOARD’S WORKThe Board continuously evaluates its work and the format of its activities. This evaluation considers factors such as how the Board’s work can be improved, whether the character of meetings stimulates open discussion and whether each Board Member participates actively and contributes to dis-cussions. The evaluation is coordinated by the Chairman of the Board. The Board is also evaluated within the framework of the Nomination Committee’s activities.
AUDIT COMMITTEEDuring 2014 the Audit Committee comprised:
•UlrikSvensson(Chairman)
•GunNilsson
•JillSmith
In 2014, the Committee held 6 minuted meetings where the financial reporting and risks of Hexagon were monitored and discussed. The Committee dealt with relevant account-ing issues, audit work and reviews, new financing and test-ing for impairment of goodwill.
REMUNERATION COMMITTEEDuring 2014, the Remuneration Committee comprised:
•MelkerSchörling(Chairman)
•GunNilsson
KEY DATA FOR BOARD MEMBERS1
Committee membership Meeting attendance
Board Member Elected Independent Audit RemunerationBoard of
DirectorsAudit
CommitteeRemuneration
Committee
Melker Schörling 1999 No2 8/8 1/1Ulrika Francke 2010 Yes 8/8Gun Nilsson 2008 Yes 8/8 6/6 1/1Ola Rollén 2000 No3 8/8Jill Smith 2013 Yes 8/8 6/6Ulrik Svensson 2010 No2 8/8 6/6
1 A complete presentation of the Board Members is included on pages 48–49.2 Melker Schörling and Ulrik Svensson are not deemed to be independent of the company’s major shareholders.3 Ola Rollén is not deemed to be independent of the company as a result of his position as Hexagon’s President and CEO.
BOARD AND COMMITTEE MEETINGSJan Feb Mar Apr May June July Aug Sep Oct Nov Dec
Board of Directors Audit Committee Remuneration Committee
Hexagon Annual Report 2014 43
In 2014, the Committee held 1 minuted meeting where remuneration and other employment terms and conditions for the President and CEO and others senior executives were discussed. The Remuneration Committee also mon-itored and evaluated the ongoing programmes for variable remuneration to senior executives as well as the application of the guidelines for remuneration to senior executives and the structure and levels of remuneration in the company.
EXTERNAL AUDITORSThe 2014 AGM re-elected the accounting firm Ernst & Young AB as auditor for a one year period of mandate. Ernst & Young AB has appointed authorised public accountant Rickard Andersson as auditor in charge. In addition to Hexagon, Rickard Andersson conducts auditing assignments for such companies as Autoliv Inc., Proact IT Group AB and NAXS Nordic Access Buyout Fund AB.
Hexagon’s auditors attended the first Board meeting of the year, at which they reported observations from their exam-ination of Hexagon’s internal controls and the annual finan-cial statements. The auditors met with the Audit Committee on 6 occasions during 2014. The address of the auditors is Ernst & Young AB, P.O. Box 7850, SE-103 99, Stockholm, Sweden.
REMUNERATION PRINCIPLES The following principles for remuneration to senior execu-tives in Hexagon were adopted by the AGM 2014.
The guidelines for remuneration to senior executives princi-pally entail that the remuneration shall consist of a basic sal-ary, a variable remuneration, other benefits and pension and that all in all this remuneration shall be competitive and in accordance with market practice. The variable remuneration shall be maximised to 60 per cent of the basic remuneration, related to the earnings trend on which the individual may have an impact and based on the outcome in relation to indi-vidual targets. However, in relation to two senior executives employed in the USA, a cap of 200 per cent in relation to the basic remuneration currently applies for the variable part of the salary, and will apply going forward.
The Board annually considers whether a share or share price related incentive programme shall be proposed to the AGM.
The notice period shall normally be six months on the part of the employee. In case of notice of termination by the com-pany, the notice period and the period during which sever-ance payment is paid shall, all in all, not exceed 24 months. The pension benefits shall be either benefit or fee-based, or a combination of both, with an individual pension age not lower than 60 years.
It is proposed to the AGM 2015 to resolve on substantially the same guidelines as above concerning the remuneration of senior executives. However, the variable remuneration for six senior executives shall be maximised to 70 to 200 per cent in relation to the basic remuneration according to previously made agreements. Also, the last sentence of the principles set out above shall be replaced with the following clarification:
Pension benefits shall, as a main rule, be fee based. Currently all senior executives have fee based pension plans. The com-pany may deviate from the main rule if a new senior executive is appointed, and such senior executive’s previous employ-ment agreement included a benefit based pension plan.
REMUNERATION OF GROUP MANAGEMENT Remuneration of the President and CEO and other senior executives is presented in Note 30 on page 95.
WARRANTS PROGRAMME Details of the warrants programme are presented on page 38 (The Share section) and in Note 30 on page 95.
REMUNERATION OF BOARD OF DIRECTORS Remuneration of the Board of Directors is resolved by the AGM upon proposal from the Nomination Committee. During 2014, the Chairman of the Board and other Board Members received remuneration totalling 381.5 KEUR. Remuneration of the Board of Directors is presented in Note 30 on page 95.
REMUNERATION OF EXTERNAL AUDITORS Remuneration for services in addition to auditing services primarily refers to work related to acquisitions and tax. Remuneration of the external auditors is presented in Note 31 on page 96.
44 Hexagon Annual Report 2014
INTERNAL CONTROL PERTAINING TO FINANCIAL REPORTINGThe Annual Accounts Act and the Code stipulate that the Board of Directors must submit a report on the key aspects of the company’s systems for internal controls and risk management regarding financial reports. Internal control pertaining to financial reporting is a process that involves the Board, Company Management and other personnel. The process has been designed so that it provides assurance of the reliability of the external reporting. According to a gen-erally accepted framework that has been established for this purpose, internal control is usually described from five different perspectives:
1. CONTROL ENVIRONMENTHexagon’s organisation is designed to facilitate rapid decision making. Accordingly, operational decisions are taken at the business area or subsidiary level, while decisions concerning strategies, acquisitions and company-wide financial matters are taken by the company’s Board and Group Management. The organisation is characterised by well-defined allocation of responsibility and well-functioning and well-established governance and control systems, which apply to all Hexagon units. The basis for the internal control pertaining to financial reporting is comprised of an overall control environment in which the organisation, decision-making routes, authorities and responsibilities have been documented and communi-cated in control documents, such as Hexagon’s finance policy and reporting instructions and in accordance with the authori-sation arrangements established by the President and CEO.
Hexagon’s functions for financial control are integrated by means of a group-wide reporting system. Hexagon’s financial control unit engages in close and well-functioning cooperation with the subsidiaries’ controllers in terms of the financial statements and the reporting process. The Board’s monitoring of the company’s assessment of its internal con-trol includes contacts with the company’s auditor. Hexagon has no internal audit function, since the functions described above, in combination with the work completed by auditors, satisfy this need. All of Hexagon’s subsidiaries report com-plete financial statements on a monthly basis. This reporting provides the basis for Hexagon’s consolidated financial reporting. Each legal entity has a controller responsible for the financial control and for ensuring that the financial reports are correct, complete and delivered in time for con-solidated financial reporting.
2. RISK ASSESSMENTThe significant risks affecting the internal control of finan-cial reporting are identified and managed at Group, busi-ness area, subsidiary and unit level. Within the Board, the Audit Committee is responsible for ensuring that significant financial risks and the risk of error in financial reporting are identified and managed in a manner that ensures correct financial reporting. Special priority has been assigned to identifying processes that, to some extent, give rise to a higher risk of significant error due to the complexity of the process or of the contexts in which major values are involved.
3. CONTROL ACTIVITIESThe risks identified with respect to the financial reporting process are managed via the company’s control activities, which are designed to prevent, uncover and correct errors and non-conformities. Their management is conducted by means of manual controls in the form of, for example, reconciliations, automatic controls using IT systems and general controls conducted in the underlying IT environment. Detailed anal-yses of financial results and follow-ups in relation to budget and forecasts supplement the business-specific controls and provide general confirmation of the quality of the financial reporting.
4. INFORMATION AND COMMUNICATIONTo ensure the completeness and correctness of financial reporting, Hexagon has formulated information and com-munication guidelines designed to ensure that relevant and significant information is exchanged within the business, within the particular unit and to and from management and the Board. Guidelines, handbooks and job descriptions per-taining to the financial process are communicated between management and personnel and are accessible electroni-cally and/or in a printed format. The Board receives regular feedback in respect of the internal control process from the Audit Committee. To ensure that the external commu-nication of information is correct and complete, Hexagon complies with a Board approved information policy that stipulates what may be communicated, by whom and in what manner.
5. MONITORING ACTIVITIESThe efficiency of the process for risk assessment and the implementation of control activities are followed up continuously. The follow-up pertains to both formal and informal procedures used by the officers responsible at each level. The procedures incorporate the follow-up of financial results in relation to budget and plans, analyses and key figures. The Board obtains current and regular reports on Hexagon’s financial position and performance. At each Board meeting, the company’s financial position is addressed and, on a monthly basis, management analyses the company’s financial reporting at a detailed level. The Audit Committee follows up the financial reporting at its meetings and receives reports from the auditors describing their observations.
Hexagon Annual Report 2014 45
AUDITOR’S REPORT ON THE CORPORATE GOVERNANCE REPORTTo the annual meeting of the shareholders of Hexagon AB, corporate identity number 556190-4771.
It is the board of directors who is responsible for the corporate governance state-ment for the year 2014 on pages 41–45 and that it has been prepared in accor-dance with the Annual Accounts Act.
We have read the corporate governance statement and based on that reading and our knowledge of the company and the group we believe that we have a suf-ficient basis for our opinions. This means that our statutory examination of the corporate governance statement is different and substantially less in scope than an audit conducted in accordance with International Standards on Auditing and generally accepted auditing standards in Sweden.
In our opinion, the corporate governance statement has been prepared and its statutory content is consistent with the annual accounts and the consolidated accounts.
Stockholm, Sweden 27 March 2015
Ernst & Young AB
Rickard Andersson, Authorised Public Accountant
46 Hexagon Annual Report 2014

COMMENTS FROM THE CHAIRMAN OF THE BOARD MELKER SCHÖRLING I am honored to stand in leadership of an organisation of skilled and dedicated individuals who build Hexagon’s stan-dard of excellence. This annual report is a tribute to the suc-cess and stability of Hexagon and our mission of delivering actionable information through technologies that empower our customers.
In 2014, Hexagon advanced its vision of shaping smart change, which was powerfully articulated through major acquisitions and advancements within our offerings. Due to our modern product portfolio and strong development in key markets such as North America and China, Hexagon reached an organic growth of 7 per cent and a net earnings growth of 13 per cent.
For years, Hexagon has worked to pave a legacy of global leadership across geospatial and enterprise applications. In today’s interconnected world, we believe the foundation we set in innovative discoveries and research has proven beneficial throughout the year. In 2014, we made key progress in strength-ening our product portfolio through purposeful acquisitions. The result of our investments in acquiring Aibotix, Arvus, iLab, Mintec, Northwest Geomatics, SAFEmine, Vero Software and Veripos, while still being determined, will undoubtedly have a direct impact on the level of expertise we offer customers as Hexagon’s comprehensive solutions continue to make a steady contribution to increased rates of productivity.
Within any company, especially one with as broad a base as Hexagon, there are challenges. However, we have encoun-tered our challenges with confidence. We are pleased to say that we continually assess our risks and develop strategic plans to minimise those of an operational, financial and legal nature. Further, the beliefs set in our core values that unite customers, partners and more than 15,000 employees, will guide us through these complexities.
I have been a member of the Hexagon board for 15 years, and each year it brings me great pleasure to reflect on our gains as well as opportunities for new growth and devel-opment. This annual report serves as a powerful reminder of the importance of Hexagon’s work. On behalf of my colleagues on the Board of Directors, I thank our share-holders for continued support and look forward to the upcoming years of development as Hexagon continues its development.
Stockholm, Sweden, March 2015
Melker SchörlingChairman of the Board
On behalf of my colleagues on the Board of Directors, I thank our shareholders for continued support and look forward to the upcoming years of development
Hexagon Annual Report 2014 47
BOARD OF DIRECTORSMELKER SCHÖRLINGBorn in 1947 Chairman of the Board since 1999 Chairman of Remuneration Committee
Education: B.Sc. (Econ.)
Work experience: President and CEO Securitas AB, President and CEO Skanska AB.
Other assignments: Chairman of Melker Schörling AB, AAK AB, Securitas AB and Hexpol AB. Board Member of Hennes & Mauritz AB.
Previous assignments in the past five years: -
Shareholding1: 15,750,000 shares of series A and 78,711,582 shares of series B through Melker Schörling AB.
Independent of the company and its management.
ULRIKA FRANCKEBorn in 1956 Member of the Board since 2010
Education: University studies
Work experience: City Planning Direc-tor and Street and Property Director City of Stockholm and CEO SBC.
Other assignments: CEO Tyréns AB, Board Member of Stockholm Stads-teater AB and Swedbank AB.
Previous assignments in the past five years: -
Shareholding1: 4,000 shares of series B.
Independent of the company, its man-agement and major shareholders.
GUN NILSSONBorn in 1955 Member of the Board since 2008 Member of Audit Committee and Remuneration Committee
Education: B.Sc. (Econ.)
Work experience: CFO Nobia Group, CEO Gambro Holding AB, Deputy CEO and Executive Vice President and CFO Duni AB.
Other assignments: Executive Vice President and CFO Sanitec Group. Board member of Capio AB, Chairman of the board Ifö AB, deputy board member Art Photo Foundation and Vinpröjsarn AB.
Previous assignments in the past five years: Board Member of Duni AB and Board Member of Husqvarna AB.
Shareholding1: 9,666 shares of series B.
Independent of the company, its man-agement and major shareholders.
OLA ROLLÉNBorn in 1965 President and Chief Executive Officer since 2000 Member of the Board since 2000
Education: B.Sc. (Econ.)
Work experience: President Sandvik Materials Technology, Executive Vice President Avesta-Sheffield AB and President of Kanthal AB.
Other assignments: –
Previous assignments in the past five years: Board Member of Vestas Wind Systems A/S.
Shareholding1: 1,000,000 shares of series B
Independent of major shareholders.
JILL SMITH Born in 1958 Member of the Board since 2013 Member of Audit Committee
Education: M.Sc. (Business Adminis-tration), B.A. (Business Studies)
Work experience: CEO DigitalGlobe Inc., CEO eDial Inc., COO Micron Tech-nology, Inc., Managing Director Treacy & Company LLC, CEO SRDS Inc.
Other assignments: Board Member of J.M. Huber Corp., Endo Health Solu-tions, Inc.
Previous assignments in the past five years: Board Member of Elster GmbH, SoundBite Inc.
Shareholding1: 3,500 shares of series B.
Independent of the company, its man-agement and major shareholders.
ULRIK SVENSSONBorn in 1961 Member of the Board since 2010 Chairman of Audit Committee
Education: B.Sc. (Econ.)
Work experience: CFO Esselte AB and CFO Swiss International Air Lines.
Other assignments: CEO of Melker Schörling AB, Board Member of Assa Abloy AB, AAK AB, Loomis AB, Hexpol AB and Flughafen Zürich AG.
Previous assignments in the past five years: Board Member of Securitas Direct AB and Niscayah Group AB.
Shareholding1: 6,000 shares of series B via capital insurance.
Independent of the company and its management.
1 Shareholdings and warrant holdings based on information per 23 March 2015.
48 Hexagon Annual Report 2014

From left: Ulrik Svensson, Ulrika Francke, Melker Schörling, Gun Nilsson, Ola Rollén and Jill Smith.
49 Hexagon Annual Report 2014
GROUP MANAGEMENTOLA ROLLÉNBorn in 1965. President and Chief Executive Officer since 2000. Employed since 2000.Education: B.Sc. (Econ.)Work experience: President Sandvik Materials Technology, Executive Vice President Avesta-Sheffield and Presi-dent of Kanthal.Other assignments: –Previous assignments in the past five years: Board Member of Vestas Wind Systems A/S.Shareholding1: 1,000,000 shares of series B.
JOHNNY ANDERSSONBorn in 1965. General Counsel. Retained since 2011.Education: M.Sc. (Law) Work experience: Partner Mannheimer Swartling Advokatbyrå.Other assignments: Member of the Swedish Bar Association and the International Bar Association.Previous assignments in the past five years: –Shareholding1: –
ROBERT BELKICBorn in 1970. Chief Financial Offi-cer and Executive Vice President. Employed since 2009.Education: B.Sc. (Business Adminis-tration and Economics)Work experience: Group Treasurer at Hexagon AB, Group Treasurer at EF Education First Ltd and Assistant Group Treasurer at Autoliv Inc.Other assignments: –Previous assignments in the past five years: –Shareholding1: –
KRISTIN CHRISTENSENBorn in 1971. Chief Marketing Officer. Employed since 2004.Education: MBA (Marketing)Work experience: Vice President, Cor-porate Communications Hexagon AB and marketing management positions at Intergraph, Solution 6 and various other software companies.Other assignments: –.Previous assignments in the past five years: –Shareholding1: –
STEVEN COSTBorn in 1967. President of Intergraph Security, Government & Infrastruc-ture. Employed since 2007.Education: B.Sc. (Accounting), MBA Work experience: Intergraph Chief Accountant Officer/Controller/Trea-surer, Senior management positions with Adtran, AVEX Electronics and Benchmark Electronics.Other assignments: –Previous assignments in the past five years: –Shareholding1: –
JÜRGEN DOLDBorn in 1962. President of Hexagon Geosystems. Employed since 1995.Education: M.Sc., PhD (Engineering)Work experience: Academic coun-sel at the Technical University of Braunschweig, Germany, and various management positions within Leica Geosystems AG. Other assignments: –Previous assignments in the past five years: –Shareholding1:30,000 shares of series B.
NORBERT HANKEBorn in 1962. President of Hexagon Metrology. Employed since 2001.Education: B.Sc. (Econ.)Work experience: Various positions within Kloeckner Group, Chief Finan-cial Officer Brown & Sharpe.Other assignments: –Previous assignments in the past five years: –Shareholding1: 44,529 shares of series B.
EDGAR PORTERBorn in 1959. Chief Human Resources Officer. Employed since 2004.Education: B.Sc. (Business Administration)Work experience: Executive Vice Presi-dent of Human Resources, Intergraph. Vice president of human resources at Solution 6 North America.Other assignments: –Previous assignments in the past five years: –Shareholding1: –
LI HONGQUANBorn in 1966. Vice President and Pres-ident of Hexagon China. Employed since 2001.Education: M.Sc. (Engineering)Work experience: President Qingdao Brown & Sharpe Qianshao Technology Co. Ltd. Operation Manager, VP, Presi-dent Qingdao Qianshao Indivers Tech-nology Co. Ltd. Mechanical Designer, Quality Dept. Manager Qingdao Qian-shao Precision Machinery Company.Other assignments: –Previous assignments in the past five years: –Shareholding1: 120,000 shares of series B.
GERHARD SALLINGERBorn in 1952. President of Intergraph Process, Power & Marine. Employed since 1985.Education: B.Sc. (Chemical engineering)Work experience: Various positions in the process industry and owner of an engineering firm.Other assignments: –Previous assignments in the past five years: –Shareholding1: –
MATTIAS STENBERGBorn in 1977. Chief Strategy Officer. Employed since 2009.Education: B.Sc. (Econ.)Work experience: Vice President Strat-egy and Communications Hexagon AB and Investor Relations positions at Teleca AB and Autoliv Inc. Other assignments: –Previous assignments in the past five years: –Shareholding1: –
CLAUDIO SIMÃOBorn in 1957. Chief Innovation Officer. Employed since 2002.Education: M.Sc. (Mechanical Engi-neering ) and B.Sc. (Physics)Work experience: President of Hexagon South America, President of Hexagon Metrology Asia-PacificOther assignments: –Previous assignments in the past five years: –Shareholding1: –1 Shareholdings and warrant holdings based on
information per 23 March 2015.
50 Hexagon Annual Report 2014
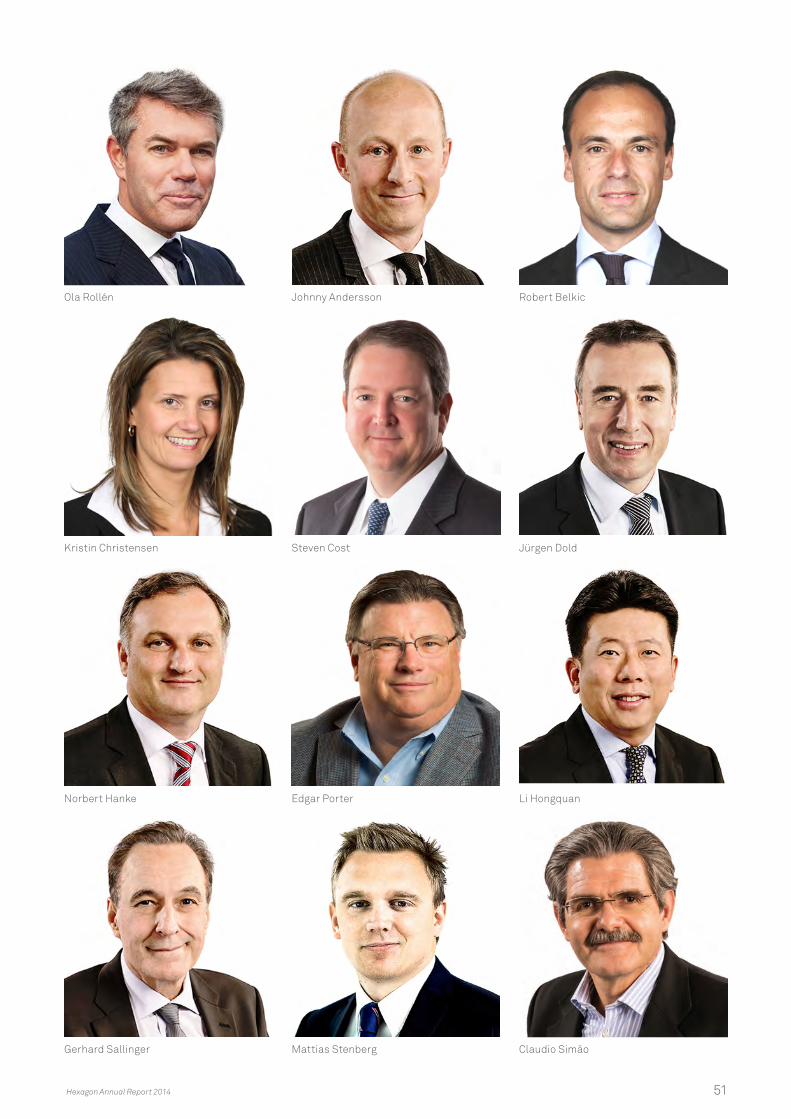
Ola Rollén Johnny Andersson Robert Belkic
Kristin Christensen Steven Cost Jürgen Dold
Norbert Hanke Edgar Porter Li Hongquan
Gerhard Sallinger Mattias Stenberg Claudio Simão
Hexagon Annual Report 2014 51
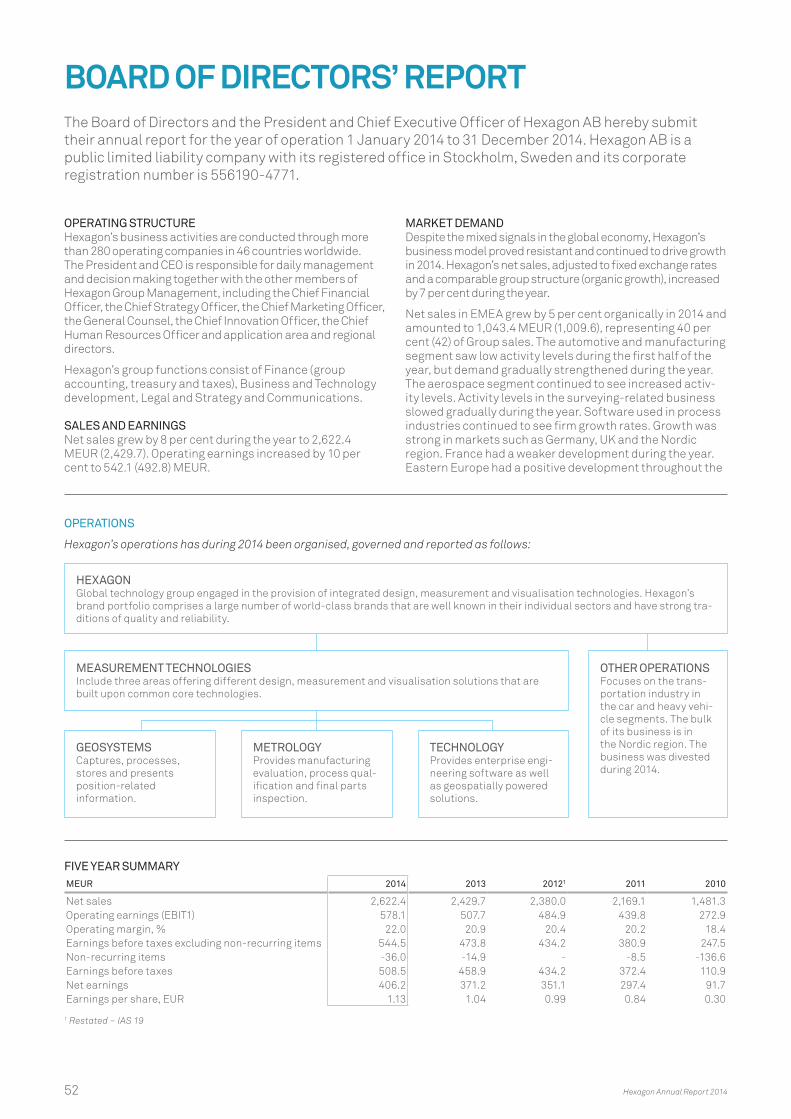
OPERATIONS
Hexagon’s operations has during 2014 been organised, governed and reported as follows:
BOARD OF DIRECTORS’ REPORTThe Board of Directors and the President and Chief Executive Officer of Hexagon AB hereby submit their annual report for the year of operation 1 January 2014 to 31 December 2014. Hexagon AB is a public limited liability company with its registered office in Stockholm, Sweden and its corporate registration number is 556190-4771.
OPERATING STRUCTURE Hexagon’s business activities are conducted through more than 280 operating companies in 46 countries worldwide. The President and CEO is responsible for daily management and decision making together with the other members of Hexagon Group Management, including the Chief Financial Officer, the Chief Strategy Officer, the Chief Marketing Officer, the General Counsel, the Chief Innovation Officer, the Chief Human Resources Officer and application area and regional directors.
Hexagon’s group functions consist of Finance (group accounting, treasury and taxes), Business and Technology development, Legal and Strategy and Communications.
SALES AND EARNINGS Net sales grew by 8 per cent during the year to 2,622.4 MEUR (2,429.7). Operating earnings increased by 10 per cent to 542.1 (492.8) MEUR.
MARKET DEMAND Despite the mixed signals in the global economy, Hexagon’s business model proved resistant and continued to drive growth in 2014. Hexagon’s net sales, adjusted to fixed exchange rates and a comparable group structure (organic growth), increased by 7 per cent during the year.
Net sales in EMEA grew by 5 per cent organically in 2014 and amounted to 1,043.4 MEUR (1,009.6), representing 40 per cent (42) of Group sales. The automotive and manufacturing segment saw low activity levels during the first half of the year, but demand gradually strengthened during the year. The aerospace segment continued to see increased activ-ity levels. Activity levels in the surveying-related business slowed gradually during the year. Software used in process industries continued to see firm growth rates. Growth was strong in markets such as Germany, UK and the Nordic region. France had a weaker development during the year. Eastern Europe had a positive development throughout the
FIVE YEAR SUMMARY MEUR 2014 2013 20121 2011 2010
Net sales 2,622.4 2,429.7 2,380.0 2,169.1 1,481.3Operating earnings (EBIT1) 578.1 507.7 484.9 439.8 272.9Operating margin, % 22.0 20.9 20.4 20.2 18.4Earnings before taxes excluding non-recurring items 544.5 473.8 434.2 380.9 247.5Non-recurring items -36.0 -14.9 - -8.5 -136.6Earnings before taxes 508.5 458.9 434.2 372.4 110.9Net earnings 406.2 371.2 351.1 297.4 91.7Earnings per share, EUR 1.13 1.04 0.99 0.84 0.30
1 Restated – IAS 19
MEASUREMENT TECHNOLOGIESInclude three areas offering different design, measurement and visualisation solutions that are built upon common core technologies.
HEXAGONGlobal technology group engaged in the provision of integrated design, measurement and visualisation technologies. Hexagon’s brand portfolio comprises a large number of world-class brands that are well known in their individual sectors and have strong tra-ditions of quality and reliability.
OTHER OPERATIONSFocuses on the trans-portation industry in the car and heavy vehi-cle segments. The bulk of its business is in the Nordic region. The business was divested during 2014.
GEOSYSTEMSCaptures, processes, stores and presents position-related information.
TECHNOLOGYProvides enterprise engi-neering software as well as geospatially powered solutions.
METROLOGYProvides manufacturing evaluation, process qual-ification and final parts inspection.
52 Hexagon Annual Report 2014
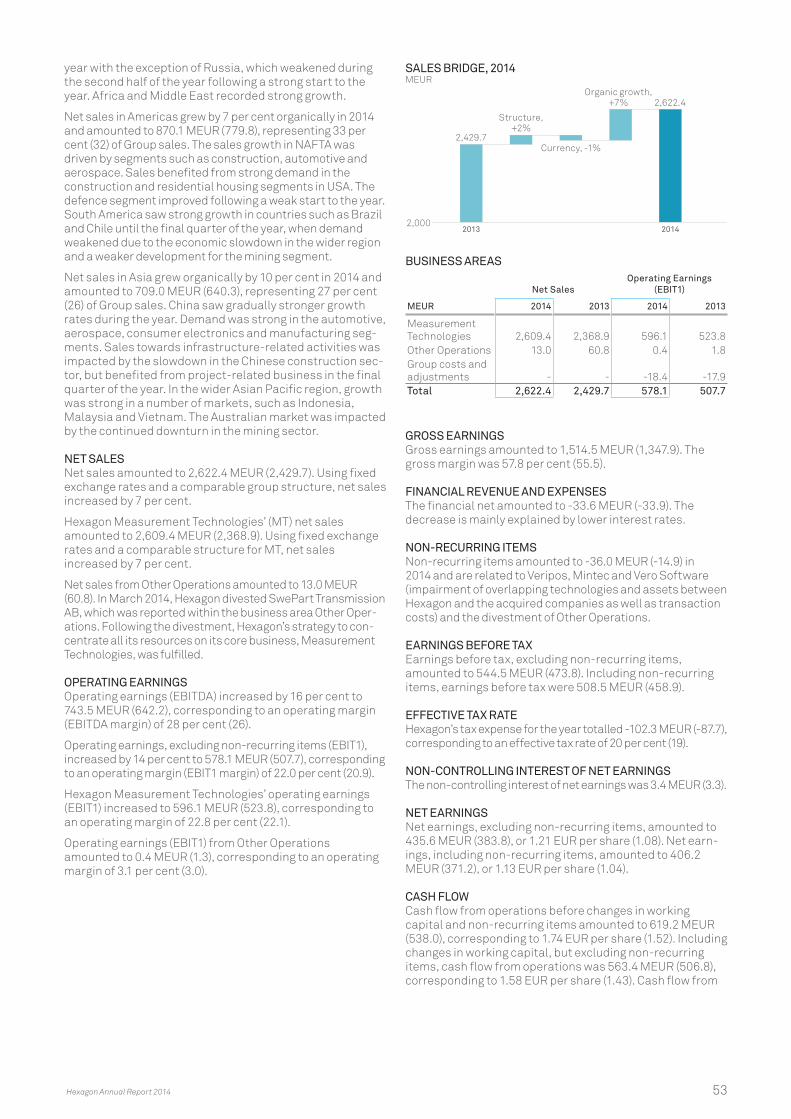
year with the exception of Russia, which weakened during the second half of the year following a strong start to the year. Africa and Middle East recorded strong growth.
Net sales in Americas grew by 7 per cent organically in 2014 and amounted to 870.1 MEUR (779.8), representing 33 per cent (32) of Group sales. The sales growth in NAFTA was driven by segments such as construction, automotive and aerospace. Sales benefited from strong demand in the construction and residential housing segments in USA. The defence segment improved following a weak start to the year. South America saw strong growth in countries such as Brazil and Chile until the final quarter of the year, when demand weakened due to the economic slowdown in the wider region and a weaker development for the mining segment.
Net sales in Asia grew organically by 10 per cent in 2014 and amounted to 709.0 MEUR (640.3), representing 27 per cent (26) of Group sales. China saw gradually stronger growth rates during the year. Demand was strong in the automotive, aerospace, consumer electronics and manufacturing seg-ments. Sales towards infrastructure-related activities was impacted by the slowdown in the Chinese construction sec-tor, but benefited from project-related business in the final quarter of the year. In the wider Asian Pacific region, growth was strong in a number of markets, such as Indonesia, Malaysia and Vietnam. The Australian market was impacted by the continued downturn in the mining sector.
NET SALESNet sales amounted to 2,622.4 MEUR (2,429.7). Using fixed exchange rates and a comparable group structure, net sales increased by 7 per cent.
Hexagon Measurement Technologies’ (MT) net sales amounted to 2,609.4 MEUR (2,368.9). Using fixed exchange rates and a comparable structure for MT, net sales increased by 7 per cent.
Net sales from Other Operations amounted to 13.0 MEUR (60.8). In March 2014, Hexagon divested SwePart Transmission AB, which was reported within the business area Other Oper-ations. Following the divestment, Hexagon’s strategy to con-centrate all its resources on its core business, Measurement Technologies, was fulfilled.
OPERATING EARNINGSOperating earnings (EBITDA) increased by 16 per cent to 743.5 MEUR (642.2), corresponding to an operating margin (EBITDA margin) of 28 per cent (26).
Operating earnings, excluding non-recurring items (EBIT1), increased by 14 per cent to 578.1 MEUR (507.7), corresponding to an operating margin (EBIT1 margin) of 22.0 per cent (20.9).
Hexagon Measurement Technologies’ operating earnings (EBIT1) increased to 596.1 MEUR (523.8), corresponding to an operating margin of 22.8 per cent (22.1).
Operating earnings (EBIT1) from Other Operations amounted to 0.4 MEUR (1.3), corresponding to an operating margin of 3.1 per cent (3.0).
BUSINESS AREAS
Net SalesOperating Earnings
(EBIT1)
MEUR 2014 2013 2014 2013
Measurement Technologies 2,609.4 2,368.9 596.1 523.8Other Operations 13.0 60.8 0.4 1.8Group costs and adjustments - - -18.4 -17.9Total 2,622.4 2,429.7 578.1 507.7
GROSS EARNINGSGross earnings amounted to 1,514.5 MEUR (1,347.9). The gross margin was 57.8 per cent (55.5).
FINANCIAL REVENUE AND EXPENSESThe financial net amounted to -33.6 MEUR (-33.9). The decrease is mainly explained by lower interest rates.
NON-RECURRING ITEMS Non-recurring items amounted to -36.0 MEUR (-14.9) in 2014 and are related to Veripos, Mintec and Vero Software (impairment of overlapping technologies and assets between Hexagon and the acquired companies as well as transaction costs) and the divestment of Other Operations.
EARNINGS BEFORE TAXEarnings before tax, excluding non-recurring items, amounted to 544.5 MEUR (473.8). Including non-recurring items, earnings before tax were 508.5 MEUR (458.9).
EFFECTIVE TAX RATEHexagon’s tax expense for the year totalled -102.3 MEUR (-87.7), corresponding to an effective tax rate of 20 per cent (19).
NON-CONTROLLING INTEREST OF NET EARNINGSThe non-controlling interest of net earnings was 3.4 MEUR (3.3).
NET EARNINGSNet earnings, excluding non-recurring items, amounted to 435.6 MEUR (383.8), or 1.21 EUR per share (1.08). Net earn-ings, including non-recurring items, amounted to 406.2 MEUR (371.2), or 1.13 EUR per share (1.04).
CASH FLOW Cash flow from operations before changes in working capital and non-recurring items amounted to 619.2 MEUR (538.0), corresponding to 1.74 EUR per share (1.52). Including changes in working capital, but excluding non-recurring items, cash flow from operations was 563.4 MEUR (506.8), corresponding to 1.58 EUR per share (1.43). Cash flow from
SALES BRIDGE, 2014MEUR
20142013
2,429.7
Structure, +2%
Organic growth, +7%
Currency, -1%
2,622.4
2,000
Hexagon Annual Report 2014 53
other investment activities was -550.0 MEUR (-73.1). Cash flow after other investments amounted to -233.3 MEUR (213.0). The change in borrowings was 353.4 MEUR (-105.8). Cash dividends to the Parent Company shareholders amounted to -110.1 MEUR (-98.8), corresponding to 0.31 EUR per share (0.28).
PROFITABILITY Capital employed, defined as total assets less non-interest bearing liabilities, increased to 5,674.0 MEUR (4,511.0). Return on average capital employed, excluding non-recurring items, for the last 12 months was 11.6 per cent (11.2). Return on aver-age shareholders’ equity for the last 12 months was 13.1 per cent (13.0). The capital turnover rate was 0.5 times (0.5).
FINANCING AND FINANCIAL POSITION Shareholders’ equity, including non-controlling interest, increased to 3,470.2 MEUR (2,846.3). The equity ratio decreased to 51 per cent (52).
Hexagon’s main sources of financing consist of:
1) A multicurrency revolving credit facility (RCF) established during Q3 2014. The RCF amounts to 2,000 MEUR with a tenor of 5+1+1 years
2) A Swedish Medium Term Note Programme (MTN) estab-lished during Q2 2014. The MTN programme amounts to 10,000 MSEK with tenor up to 5 years
3) A Swedish Commercial Paper Programme (CP) estab-lished during 2012. The CP programme amounts to 8,000 MSEK with tenor up to 12 months
On 31 December 2014, cash and unutilised credit limits totalled 1,006.8 MEUR (390.1). Hexagon’s net debt was 1,896.7MEUR (1,488.7). The net indebtedness was 0.50 times (0.49). Interest coverage ratio was 14.3 times (12.7).
INVESTMENTS Ordinary investments consist mainly of investments in production facilities, production equipment and intangible assets, primarily capitalised development expenses. Of the ordinary investments of 240.5 MEUR (218.4) during 2014, approximately 64 per cent (66) were capitalised expenses for development work. Development work is primarily per-formed in Hexagon’s R&D centres with its primary units located in Switzerland, China and the USA, and results in products and services that are sold worldwide. The remain-ing part of the ordinary investments, approximately 36 per cent, comprised mostly investments in buildings, busi-ness equipment and machines. The largest investment in buildings in 2014 was the construction of a new facility for the Intergraph operations in Huntsville, Alabama, USA. All ordinary investments during the year have been financed by cash flow from operations. Investments corresponded to 9 per cent (9) of net sales. Hexagon does not expect any mate-rial change in the near future to current ordinary investment levels as a percentage of net sales. Depreciation and amor-tisation during the year amounted to -192.9 MEUR (-134.5).
INVESTMENTS MEUR 2014 2013
Investments in intangible fixed assets 163.2 155.9Investments in tangible fixed assets 77.3 62.5Divestments of intangible fixed assets - -0.6Divestments of tangible fixed assets -8.0 -1.5Total ordinary investments 232.5 216.3
Investments in subsidiaries 556.3 35.2Divestments of subsidiaries -19.1 -0.2Investments of financial fixed assets 17.1 43.2Divestments of financial fixed assets -4.3 -5.1Total other investments 550.0 73.1Total investments 782.5 289.4
INTANGIBLE FIXED ASSETS As of 31 December 2014, Hexagon’s carrying value of intan-gible fixed assets was 4,998.8 MEUR (3,906.6). Amortisation of intangible fixed assets for the 2014 financial year was -121.2 MEUR (-95.7). Impairment tests are made to deter-mine whether the value of goodwill and/or similar intangible assets is justifiable or whether there is any impairment need in full or in part. Such a test was conducted at the end of 2014 and no impairment requirement arose. Goodwill at 31 December 2014 amounted to 3,418.4 MEUR (2,596.4), corresponding to 50 per cent (47) of total assets.
GOODWILLMEUR 2014 2013
Measurement Technologies 3,418.4 2,595.0Other Operations - 1.4Total 3,418.4 2,596.4
ACQUISITIONS Demand for Hexagon’s products drives organic growth but acquisitions are key to Hexagon’s long-term growth strategy. During 2014, Hexagon acquired the following companies:
•GT Strudl (USA) in February
•Aibotix (Germany) in February
•Veripos (UK) in February
•SAFEmine (Switzerland) in March
•Arvus (Brazil) in April
•iLab (Brazil) in June
•North West Geomatics (Canada) in June
•Mintec (USA) in July
•Vero Software (UK) in July
•Geodata (France) in July
OTHER GROUP INFORMATION Research and development (R&D)Hexagon places a high priority on investment in research and development. Being the most innovative supplier in the industry, it is important not only to improve and adapt existing products, but also to identify new applications and thereby increase the total market for Hexagon’s products and services. Total expenditure for research and development during 2014 amounted to 293.4 MEUR (273.6), corresponding to 11 per cent (11) of net sales. Development expenses are capitalised only if they pertain to new products, the cost is significant and the product is believed to have considerable earnings potential. The current level of R&D costs is in line with other leading suppliers in the industry.
54 Hexagon Annual Report 2014
R&D COSTMEUR 2014 2013
Capitalised 154.1 144.0Expensed (excluding amortisation) 139.3 129.6Total 293.4 273.6
ENVIRONMENTAL IMPACT Hexagon’s research and development team develops prod-ucts and systems that comply with customer requirements for being able to measure with considerable precision in one, two or three dimensions. High quality measurement systems contribute to increased quality, productivity, efficiency and reduced waste and thus to a decreased consumption of materials and raw materials. Hexagon’s products and ser-vices are used in thousands of applications that all have one thing in common: making various processes more efficient, cheaper and more environmentally friendly. This may involve measuring the quality in production processes, using a plot of land in an optimal way or reducing waste and loss in the construction industry. Our efforts in research and develop-ment create solutions that contribute to solving the great challenges of our time: the need for food, cleaner solutions and a more resource-efficient society. Hexagon develops and assembles high-technology products under laboratory-like conditions. Major plants have been ISO 14001 certified and a programme for monitoring the suppliers is in place.
Hexagon aims for development of sustainable products and uses environmentally friendly resources in production to the extent possible. Hexagon satisfies environmental requirements pursuant to legislation, ordinances and international accords. Decisions regarding operations that affect the environment are guided by what is ecologically justifiable, technically feasible and economically viable. Hexagon’s subsidiaries have ISO quality accreditation wher-ever this is warranted.
SHARE CAPITAL AND OWNERSHIPAt year-end 2014, Hexagon’s share capital was 79,302,633 EUR, represented by 357,389,213 issued shares. Total issued shares was 15,750,000 class A shares, each carrying 10 votes, and 341,639,213 class B shares, each carrying one vote. Melker Schörling AB, the single largest shareholder in Hexagon, held a total of 15,750,000 class A shares and 78,711,582 class B shares, representing 47.3 per cent of the votes and 26.4 per cent of the capital.
SHARE REPURCHASESThe Annual General Meeting on 9 May 2014 authorised Hexagon’s Board of Directors to acquire or sell the company’s own shares for the purpose of, among other things, providing the Board with the possibility to adapt the company’s capital structure and to enable the financing of acquisitions and the exercise of warrants. The authorisation to repurchase totals a maximum of 10 per cent of all outstanding shares in the company. No (967,340) treasury shares were sold in 2014 for the exercise of warrants. By year-end 2014 Hexagon held no treasury shares.
SIGNIFICANT AGREEMENTS To the best of the Board’s knowledge there are no shareholder agreements or similar agreements between the shareholders of Hexagon with the purpose of exercising joint control of the company. Neither is the Board aware of any agreements that could lead to a change of control of the company.
As far as the Board knows there is no shareholder agree-ment that could prevent the transfer of shares. Nor are there agreements between the company, directors or employees, other than as described in Note 30 on page 95,
which stipulate the right to compensation if such a person voluntarily leaves the company, is dismissed with cause or if such a person’s employment is terminated as a result of a public offer for shares of the company.
MANAGEMENT OF HEXAGON’S CAPITALHexagon’s reported shareholders’ equity, including non-controlling interest, was 3,470.2 MEUR (2,846.3) at year-end. Hexagon’s overall long-term objective is to increase earnings per share by at least 15 per cent annually and to achieve a return on capital employed of at least 15 per cent. Another Group objective is to achieve an equity ratio of 25 per cent as Hexagon is seeking to minimise the weighted average cost of capital for the company’s financing.
Hexagon has undertaken to comply with certain require-ments regarding key financial ratios (covenants) towards lenders. The key financial ratios are reported to lenders in conjunction with the quarterly reports. If the requirements are not complied with, the terms and conditions are renego-tiated and there is a risk of a temporary increase in borrow-ing costs. In addition, lenders have a right to terminate loan agreements. Hexagon has not breached any covenants in 2014 or in prior years.
The company’s strategy, as well as its financial position and other financial objectives, are taken into account in connection with the annual decision concerning dividend payments.
CORPORATE GOVERNANCEIn accordance with the Swedish Annual Accounts Act, Hexagon has prepared a Corporate Governance report separate from the annual report. It can be found in this document on pages 41–44. The Corporate Governance report contains the Board of Directors’ report on internal control.
DIVIDEND The dividend policy of Hexagon provides that, over the long term, dividends should comprise 25 to 35 per cent of earnings per share after tax, assuming that Hexagon satisfies its equity ratio objective.
The Board of Directors proposes a dividend of 0.35 EUR per share, corresponding to 31 per cent of earnings per share after tax and to 22 per cent of cash flow from oper-ating activities per share. The dividend is expected to total approximately 125.1 MEUR (110.1). The proposed dividend is in line with the dividend policy. The proposed record date for dividend payments is 8 May 2015.
REMUNERATION OF SENIOR EXECUTIVES The Annual General Meeting 2014 resolved, as proposed by the Board, on the adoption of guidelines for remuneration to senior executives principally entailing that the remu-neration shall consist of a basic remuneration, a variable remuneration, other benefits and pension and all in all be competitive and in accordance with market practice. The variable remuneration shall be maximized to 60 per cent in relation to the basic remuneration, related to the earnings trend which the relevant individual may influence and based on the outcome in relation to individual targets. However, in relation to two senior executives employed in the USA, a cap of 200 per cent in relation to the basic remuneration currently applies for the variable part of the salary, and will apply going forward.
The Board annually considers whether a share or share price related incentive programme shall be proposed to the Annual General Meeting.
The notice period shall normally be six months on the part of the employee. In case of notice of termination by the com-
Hexagon Annual Report 2014 55
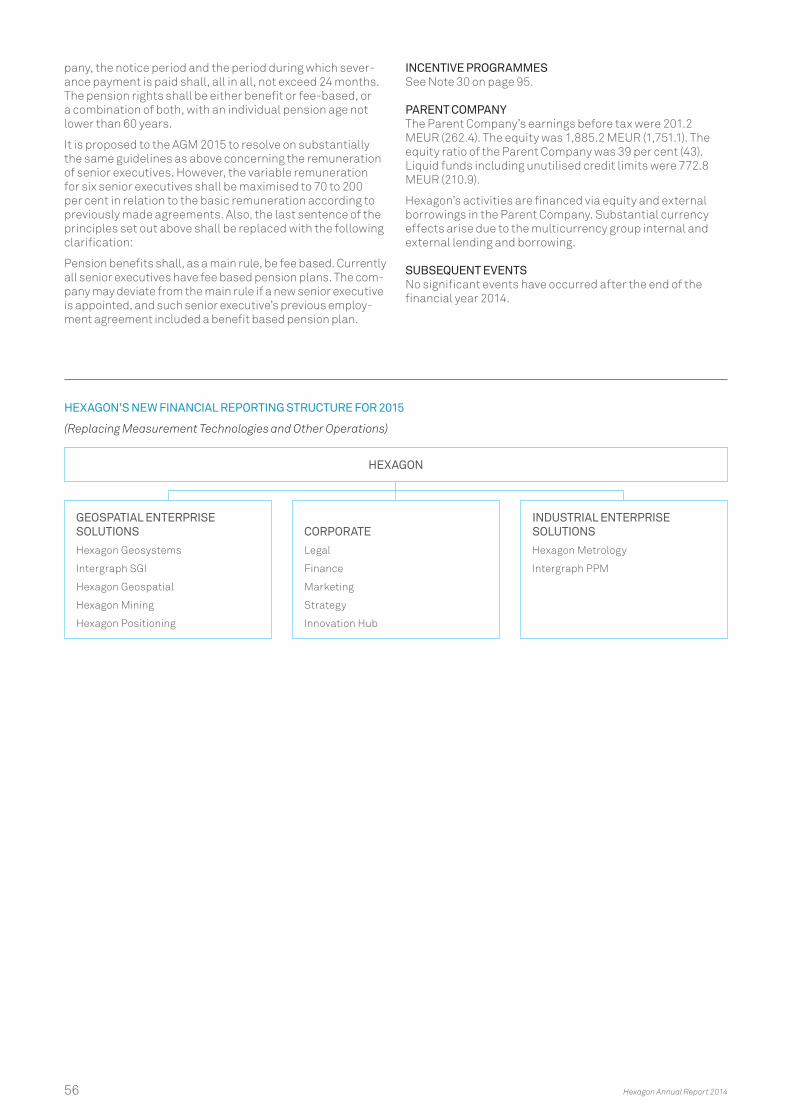
pany, the notice period and the period during which sever-ance payment is paid shall, all in all, not exceed 24 months. The pension rights shall be either benefit or fee-based, or a combination of both, with an individual pension age not lower than 60 years.
It is proposed to the AGM 2015 to resolve on substantially the same guidelines as above concerning the remuneration of senior executives. However, the variable remuneration for six senior executives shall be maximised to 70 to 200 per cent in relation to the basic remuneration according to previously made agreements. Also, the last sentence of the principles set out above shall be replaced with the following clarification:
Pension benefits shall, as a main rule, be fee based. Currently all senior executives have fee based pension plans. The com-pany may deviate from the main rule if a new senior executive is appointed, and such senior executive’s previous employ-ment agreement included a benefit based pension plan.
INCENTIVE PROGRAMMES See Note 30 on page 95.
PARENT COMPANY The Parent Company’s earnings before tax were 201.2 MEUR (262.4). The equity was 1,885.2 MEUR (1,751.1). The equity ratio of the Parent Company was 39 per cent (43). Liquid funds including unutilised credit limits were 772.8 MEUR (210.9).
Hexagon’s activities are financed via equity and external borrowings in the Parent Company. Substantial currency effects arise due to the multicurrency group internal and external lending and borrowing.
SUBSEQUENT EVENTS No significant events have occurred after the end of the financial year 2014.
HEXAGON’S NEW FINANCIAL REPORTING STRUCTURE FOR 2015
(Replacing Measurement Technologies and Other Operations)
HEXAGON
GEOSPATIAL ENTERPRISE SOLUTIONS
Hexagon Geosystems
Intergraph SGI
Hexagon Geospatial
Hexagon Mining
Hexagon Positioning
INDUSTRIAL ENTERPRISE SOLUTIONS
Hexagon Metrology
Intergraph PPM
CORPORATE
Legal
Finance
Marketing
Strategy
Innovation Hub
56 Hexagon Annual Report 2014

MANAGING RISKSHexagon’s risk management activities are designed to identify, control and reduce risks associated with its business. The majority of these activities are managed within each subsidiary of Hexagon. However, certain legal, strategic and financial risks are managed at the Group level.
MARKET RISK MANAGEMENT Market risk concerns risks such as economic trends, competition and risks related to acquisitions and integrations. Market’s risks are primarily managed within each subsidiary of Hexagon.
RISK RISK MANAGEMENT
ACQUISITIONS AND INTEGRATIONS
An important part of Hexagon’s strategy is to work actively with acquisitions of companies and businesses. Strategic acquisitions will continue to be part of Hexagon’s growth strategy going forward. It cannot be guaranteed, however, that Hexagon will be able to find suitable acquisition targets, nor can it be guaranteed that the necessary financing for future acquisition targets can be obtained on terms accept-able to Hexagon. This may lead to a decreasing growth rate for Hexagon.
Acquisitions entail risk. The acquired entities’ relations with customers, suppliers and key personnel may be negatively affected. There is also a risk that integration processes may prove more costly or more time consuming than estimated and that anticipated synergies in whole or in part fail to materialise.
Hexagon monitors a large number of companies to find acquisitions that can strengthen the Group’s product port-folio or improve its distribution network. Potential targets are regularly evaluated on financial, technological and com-mercial grounds. Every acquisition candidate’s potential place in the Group is determined on the basis of synergy simulations and implementation strategies. Thorough due diligence is performed to evaluate potential risks.
From 2000 to 2014, Hexagon made some 100 acquisitions, including the key strategic acquisitions of Brown & Sharpe (2001), Leica Geosystems (2005), NovAtel (2007) and Intergraph (2010). Based on extensive experience of acquisitions and integration, and clear strategies and goals, Hexagon is strongly positioned to successfully integrate acquired companies into the Group.
IMPACT OF THE ECONOMY
Hexagon engages in worldwide operations that are depen-dent on general economic trends and conditions that are unique for certain countries or regions. As in virtually all businesses, general market conditions affect the inclina-tion and the capabilities of Hexagon’s existing and potential customers to invest in design, measurement and visuali-sation technologies. A weak economic trend in the whole or part of the world may therefore result in lower market growth that falls below expectations.
Hexagon’s business is widely spread geographically, with a broad customer base within numerous market segments. Potential negative effects of a downturn in the developed world may for example be partially off-set by growth in emerging markets and vice versa.
COMPETITION AND PRICE PRESSURE
Parts of Hexagon’s operations are carried out in sectors which are subject to price pressure and rapid technolog-ical change. Hexagon’s ability to compete in the market environment by introducing new and successful products with enhanced functionality while simultaneously cutting costs on new and existing products is of the utmost impor-tance in order to avoid erosion of market share. Research and development efforts are costly and new product development always entails a risk of unsuccessful product launches or commercialisation, which could have material consequences.
Hexagon invests annually approximately 11 per cent of net sales in research and development. A total of about 3,400 employees are engaged in research and development at Hexagon. The objective for Hexagon’s R&D division is to transform customer needs into products and services and to detect market and technological opportunities early on.
Hexagon Annual Report 2014 57
OPERATIONAL RISK MANAGEMENTOperational risks concern risks related to reception of new products and services, dependence on suppliers and risks related to human capital. Since the majority of operational risks are attributable to Hexagon’s customer and supplier relations, ongoing risk analysis of customers and suppliers are conducted to assess business risks. Operational risks are primarily managed within each subsidiary of Hexagon.
RISK RISK MANAGEMENT
CUSTOMERS
Hexagon’s business activities are conducted in a large num-ber of markets with multiple customer categories. In 2014, Surveying was the single largest customer category and accounted for 23 per cent of net sales. For Hexagon, this customer category may involve certain risks as a downturn or weak development in the surveying sector can have a negative impact on Hexagon’s business. Surveying is fol-lowed by customer categories Power and Energy with 20 per cent, Electronics and Manufacturing with 12 per cent and Infrastructure and Construction with 11 per cent.
Hexagon has a favourable risk diversification in products and geographical areas, and dependence of a single customer or customer category is not decisive for the Group’s perfor-mance. The largest customer represents approximately 2.1 per cent of the Group’s total net sales. Credit risk in customer receivables account for the majority of Hexagon’s counter-party risk. Hexagon believes there is no significant concen-tration of counterparty risk.
SUPPLIERS
Hexagon’s products consist of components from several different suppliers. To be in a position to sell and deliver solutions to customers, Hexagon is dependent upon deliveries from third parties in accordance with agreed requirements relating to, for example, quantity, quality and delivery times. Erroneous or default deliveries by suppliers can cause delay or default in Hexagon’s deliveries, which can result in reduced sales.
Hexagon has a favourable risk diversification and depen-dence of a single supplier is not decisive for the Group’s per-formance. The largest supplier accounts for approximately 0.8 per cent of Hexagon’s total net sales. To minimise the risk of shortages in the supply or of excessive price varia-tions among suppliers, Hexagon works actively to coordi-nate sourcing within the Group and to identify alternative suppliers for strategic components. Supplier risk surveys are performed (by Hexagon’s external partner) in order to identify and mitigate risks associated with the suppliers’ operations.
HUMAN CAPITAL
The resignation of key employees or Hexagon’s failure to attract skilled personnel may have an adverse impact on the Group’s operations.
Since future success is largely dependent on the capacity to retain, recruit and develop skilled staff, being an attractive employer is an important success factor for Hexagon. Group and business area management jointly handle risks associ-ated with human capital.
PRODUCTION UNITS AND DISTRIBUTION CENTERS
Hexagon’s production units and distribution centers are exposed to risks (fire, explosion, natural hazards, machinery damages, etc.) that could lead to property damages and business interruption.
Risk grading surveys are performed (by Hexagon’s external partner) in order to identify and mitigate risks as well as support local management in their loss prevention work. Surveys are conducted in line with a long term planning together with each subsidiary.
58 Hexagon Annual Report 2014
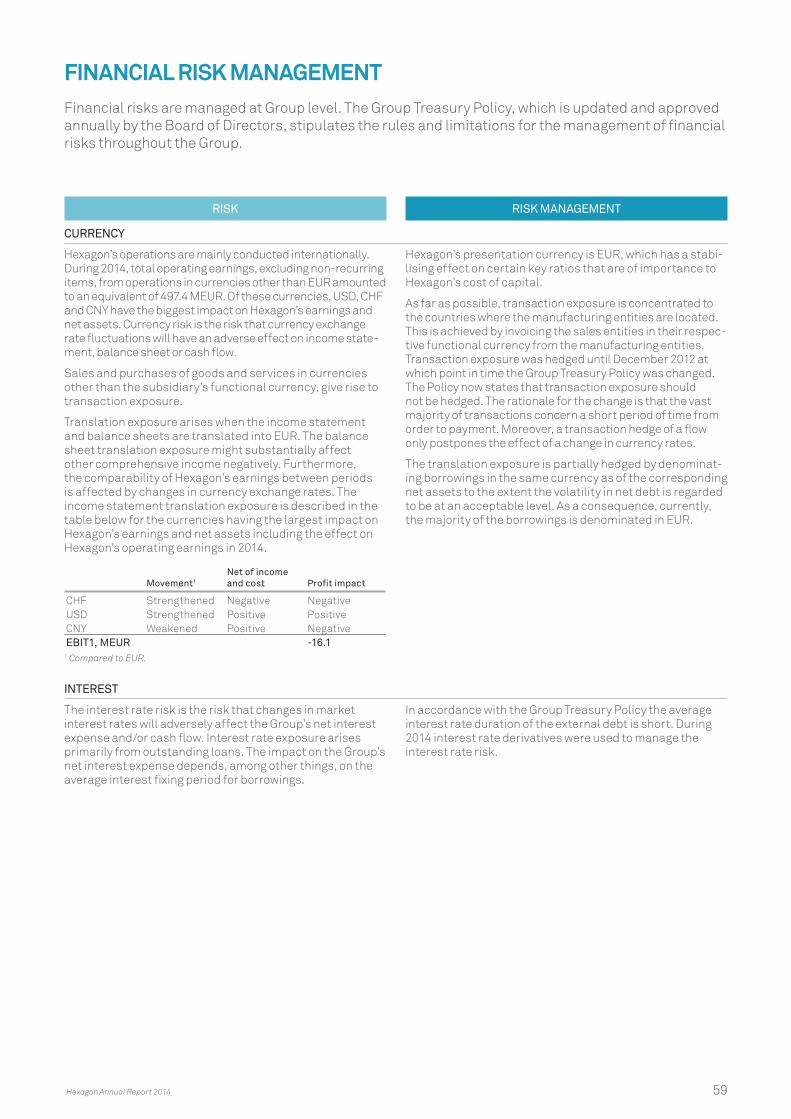
FINANCIAL RISK MANAGEMENTFinancial risks are managed at Group level. The Group Treasury Policy, which is updated and approved annually by the Board of Directors, stipulates the rules and limitations for the management of financial risks throughout the Group.
RISK RISK MANAGEMENT
CURRENCY
Hexagon’s operations are mainly conducted internationally. During 2014, total operating earnings, excluding non-recurring items, from operations in currencies other than EUR amounted to an equivalent of 497.4 MEUR. Of these currencies, USD, CHF and CNY have the biggest impact on Hexagon’s earnings and net assets. Currency risk is the risk that currency exchange rate fluctuations will have an adverse effect on income state-ment, balance sheet or cash flow.
Sales and purchases of goods and services in currencies other than the subsidiary’s functional currency, give rise to transaction exposure.
Translation exposure arises when the income statement and balance sheets are translated into EUR. The balance sheet translation exposure might substantially affect other comprehensive income negatively. Furthermore, the comparability of Hexagon’s earnings between periods is affected by changes in currency exchange rates. The income statement translation exposure is described in the table below for the currencies having the largest impact on Hexagon’s earnings and net assets including the effect on Hexagon’s operating earnings in 2014.
Movement1Net of income and cost Profit impact
CHF Strengthened Negative NegativeUSD Strengthened Positive PositiveCNY Weakened Positive NegativeEBIT1, MEUR -16.1
1 Compared to EUR.
Hexagon’s presentation currency is EUR, which has a stabi-lising effect on certain key ratios that are of importance to Hexagon’s cost of capital.
As far as possible, transaction exposure is concentrated to the countries where the manufacturing entities are located. This is achieved by invoicing the sales entities in their respec-tive functional currency from the manufacturing entities. Transaction exposure was hedged until December 2012 at which point in time the Group Treasury Policy was changed. The Policy now states that transaction exposure should not be hedged. The rationale for the change is that the vast majority of transactions concern a short period of time from order to payment. Moreover, a transaction hedge of a flow only postpones the effect of a change in currency rates.
The translation exposure is partially hedged by denominat-ing borrowings in the same currency as of the corresponding net assets to the extent the volatility in net debt is regarded to be at an acceptable level. As a consequence, currently, the majority of the borrowings is denominated in EUR.
INTEREST
The interest rate risk is the risk that changes in market interest rates will adversely affect the Group’s net interest expense and/or cash flow. Interest rate exposure arises primarily from outstanding loans. The impact on the Group’s net interest expense depends, among other things, on the average interest fixing period for borrowings.
In accordance with the Group Treasury Policy the average interest rate duration of the external debt is short. During 2014 interest rate derivatives were used to manage the interest rate risk.
Hexagon Annual Report 2014 59

FINANCIAL RISK MANAGEMENTHexagon’s internal bank coordinates the management of financial risks and is also responsible for the Group’s external borrowing and its internal financing. Centralisation generates substantial economies of scale, lower financing costs, as well as better control and management of the Group’s financial risks.
RISK RISK MANAGEMENT
CREDIT
Credit risk, i.e., the risk that customers may be unable to fulfill their payment obligations, account for the majority of Hexagon’s counterparty risk.
Financial credit risk is the exposure to default of counter-parties with which Hexagon has invested cash or with which it has entered into forward exchange contracts or other financial instruments.
Through a combination of geographical and industry diver-sification of customers the risk for significant credit losses is reduced.
To reduce Hexagon’s financial credit risk, surplus cash is only invested with a limited number of approved banks and derivative transactions are only conducted with counter-parties where an ISDA (International Swaps and Derivatives Association) netting agreement has been established. As Hexagon is a net borrower, excess liquidity is primarily used to repay external debt and therefore the average surplus cash invested with banks is kept as low as possible.
LIQUIDITY
Liquidity risk is the risk of not being able to meet payment obligations in full as they become due or only being able to do so at materially disadvantageous terms due to lack of cash resources.
The Group Treasury Policy states that the total liquidity reserve shall at all times be at least 10 per cent of fore-casted annual net sales. At year-end, cash and unutilised credit limits totalled 1,006.8 MEUR (390.1).
REFINANCING
Refinancing risk refers to the risk that Hexagon does not have sufficient financing available when needed to refinance maturing debt, because existing lenders decline extending or difficulties arise in procuring new lines of credit at a given point in time. Hexagon’s ability to satisfy future capital needs is to a large degree dependent on successful sales of the company’s products and services. There is no guarantee that Hexagon will be able to raise the necessary capital. In this regard, the general development on the capital and credit markets is also of major importance. Hexagon, moreover, requires sufficient financing in order to refinance maturing debt. Securing these requirements demands a strong finan-cial position in the Group, combined with active measures to ensure access to credit. There is no guarantee that Hexagon will be able to raise the sufficient funds in order to refinance maturing debt.
In order to ensure that appropriate financing is in place, and to decrease the refinancing risk, no more than 20 per cent of the Group’s gross debt, including committed credit facili-ties, is allowed to mature within the succeeding 12 months, unless replacement facilities have been entered into.
•Amulticurrencyrevolvingcreditfacility(RCF)establishedduring Q3 2014. The RCF amounts to 2,000 MEUR with a tenor of 5+1+1 years
•ASwedishMediumTermNoteProgramme(MTN)estab-lished during Q2 2014. The MTN programme amounts to 10,000 MSEK with tenor up to 5 years
•ASwedishCommercialPaperProgramme(CP)establishedduring 2012. The CP programme amounts to 8,000 MSEK with tenor up to 12 months
INSURABLE RISK
Hexagon’s operations, assets and staff are to a certain degree exposed to various risk of damages, losses and inju-ries which could tentatively threaten the Group’s business continuity, earnings, financial assets and personnel.
To ensure a well-balanced insurance coverage and finan-cial economies of scale, Hexagon’s insurance programme includes among other things group-wide property and liability insurance, travel insurance, errors and omissions insurance and transport insurance combined with local insurance coverage wherever needed. The insurance programme is periodically amended so that own risk and insured risk are optimally balanced.
60 Hexagon Annual Report 2014
LEGAL RISK MANAGEMENTLegal risks are primarily managed within each subsidiary of Hexagon. The group legal function supports the subsidiaries and manages certain legal risks at group level.
RISK RISK MANAGEMENT
LEGISLATION AND REGULATION
Hexagon’s main markets are subject to extensive regula-tion. Hexagon’s operations may be affected by regulatory changes, changes to customs duties and other trading obstacles, pricing and currency controls, as well as other government legislation and restrictions in the countries where Hexagon is active.
Hexagon closely monitors legislation, regulations and applicable ordinances in each market and seeks to adapt the business to identified future changes in the area. To manage country-specific risks, Hexagon observes local legislation and monitors political development in the coun-tries where the Group conducts operations. To this effect, Hexagon has adopted a worldwide compliance programme across the Group to ensure that its subsidiaries at all times comply with all applicable legislation, rules and ordinances.
INTELLECTUAL PROPERTY RIGHTS
Patent infringement and plagiarism are risks to which Hexagon is exposed. There is no guarantee that Hexagon will be able to protect obtained patents, trademarks and other intellectual property rights or that submitted applications for registration will be granted. Furthermore, there is a risk that new technolo-gies and products are developed which circumvent or replace Hexagon’s intellectual property rights. Infringement disputes can, like disputes in general, be costly and time consuming and may therefore adversely affect Hexagon’s business.
Hexagon seeks to protect its technological innovations to safeguard the returns on the resources that Hexagon assigns to research and development. The Group strives to protect its technical innovations through patents and protects its intellectual property through legal proceedings when warranted.
ENVIRONMENT
Certain companies within Hexagon have operations that have environmental impact. Stricter regulation of environ-mental matters can result in increased costs or further investments for the companies within Hexagon which are subject to such regulation.
Hexagon complies with all applicable laws and obligations, and obtains relevant approvals where needed. Hexagon continuously monitors anticipated and implemented changes in legislation in the countries in which it operates.
TAX
Hexagon operates through subsidiaries in a number of juris-dictions and all cross-border transactions are normally a tax risk because there are no global transfer pricing rules. Local tax authorities have their local transfer pricing rules to follow and authorities interpret transfer pricing guide-lines differently.
Hexagon’s interpretation of prevailing tax law, tax treaties, OECD guidelines and agreements entered into with foreign tax authorities may be challenged by tax authorities in some countries. Rules and guidelines may also be subject to future changes which can have an effect on the Group’s tax position. Furthermore, a change of the business or part of the business can have an impact on agreements entered into with tax authorities in some tax jurisdictions.
The tax rate may increase if large acquisitions are made in high tax jurisdictions or if the corporate tax rates change in countries where Hexagon carries out substantial business.
Transactions between Group companies are carried out in accordance with Hexagon’s interpretation of prevailing tax laws, tax treaties, OECD’s guidelines and agreements entered into with foreign tax authorities and are normally at arm’s length.
Hexagon does not implement artificial tax planning vehicles and consequently believes its tax transactions are carried out in accordance with the OECD’s guidelines.
Hexagon Annual Report 2014 61
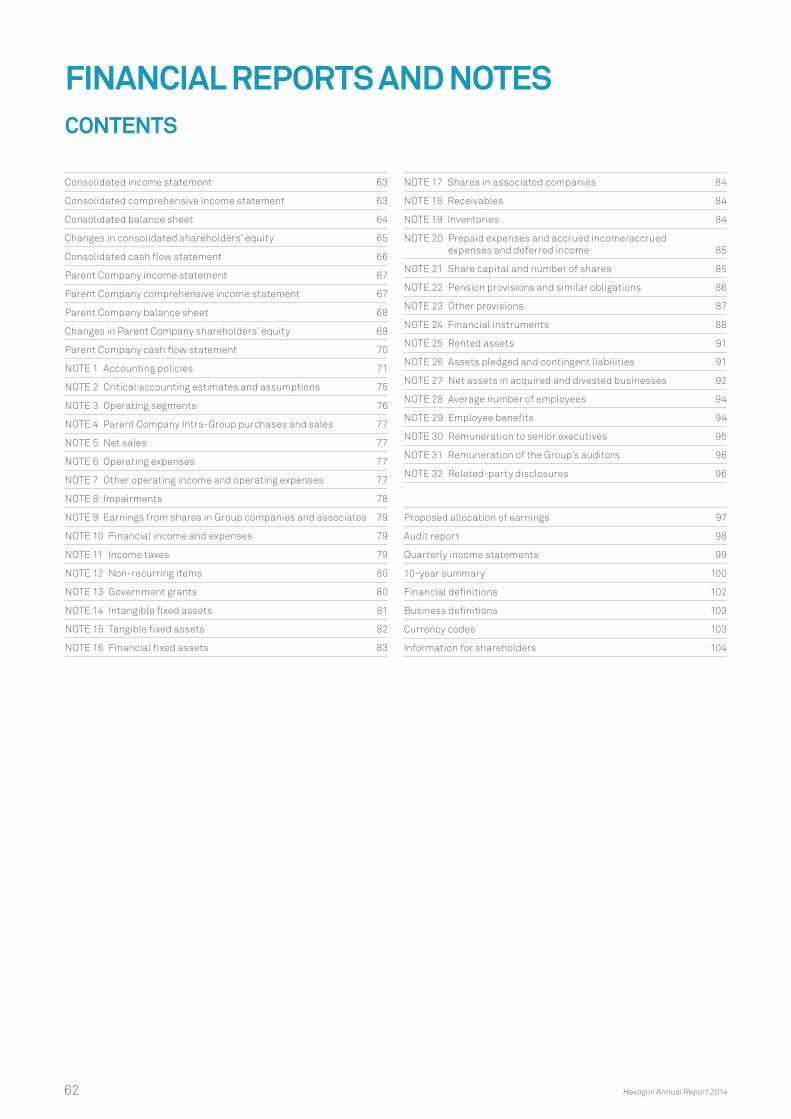
FINANCIAL REPORTS AND NOTESCONTENTS
Consolidated income statement 63
Consolidated comprehensive income statement 63
Consolidated balance sheet 64
Changes in consolidated shareholders’ equity 65
Consolidated cash flow statement 66
Parent Company income statement 67
Parent Company comprehensive income statement 67
Parent Company balance sheet 68
Changes in Parent Company shareholders’ equity 69
Parent Company cash flow statement 70
NOTE 1 Accounting policies 71
NOTE 2 Critical accounting estimates and assumptions 75
NOTE 3 Operating segments 76
NOTE 4 Parent Company Intra-Group purchases and sales 77
NOTE 5 Net sales 77
NOTE 6 Operating expenses 77
NOTE 7 Other operating income and operating expenses 77
NOTE 8 Impairments 78
NOTE 9 Earnings from shares in Group companies and associates 79
NOTE 10 Financial income and expenses 79
NOTE 11 Income taxes 79
NOTE 12 Non-recurring items 80
NOTE 13 Government grants 80
NOTE 14 Intangible fixed assets 81
NOTE 15 Tangible fixed assets 82
NOTE 16 Financial fixed assets 83
NOTE 17 Shares in associated companies 84
NOTE 18 Receivables 84
NOTE 19 Inventories 84
NOTE 20 Prepaid expenses and accrued income/accrued expenses and deferred income 85
NOTE 21 Share capital and number of shares 85
NOTE 22 Pension provisions and similar obligations 86
NOTE 23 Other provisions 87
NOTE 24 Financial instruments 88
NOTE 25 Rented assets 91
NOTE 26 Assets pledged and contingent liabilities 91
NOTE 27 Net assets in acquired and divested businesses 92
NOTE 28 Average number of employees 94
NOTE 29 Employee benefits 94
NOTE 30 Remuneration to senior executives 95
NOTE 31 Remuneration of the Group’s auditors 96
NOTE 32 Related-party disclosures 96
Proposed allocation of earnings 97
Audit report 98
Quarterly income statements 99
10-year summary 100
Financial definitions 102
Business definitions 103
Currency codes 103
Information for shareholders 104
62 Hexagon Annual Report 2014
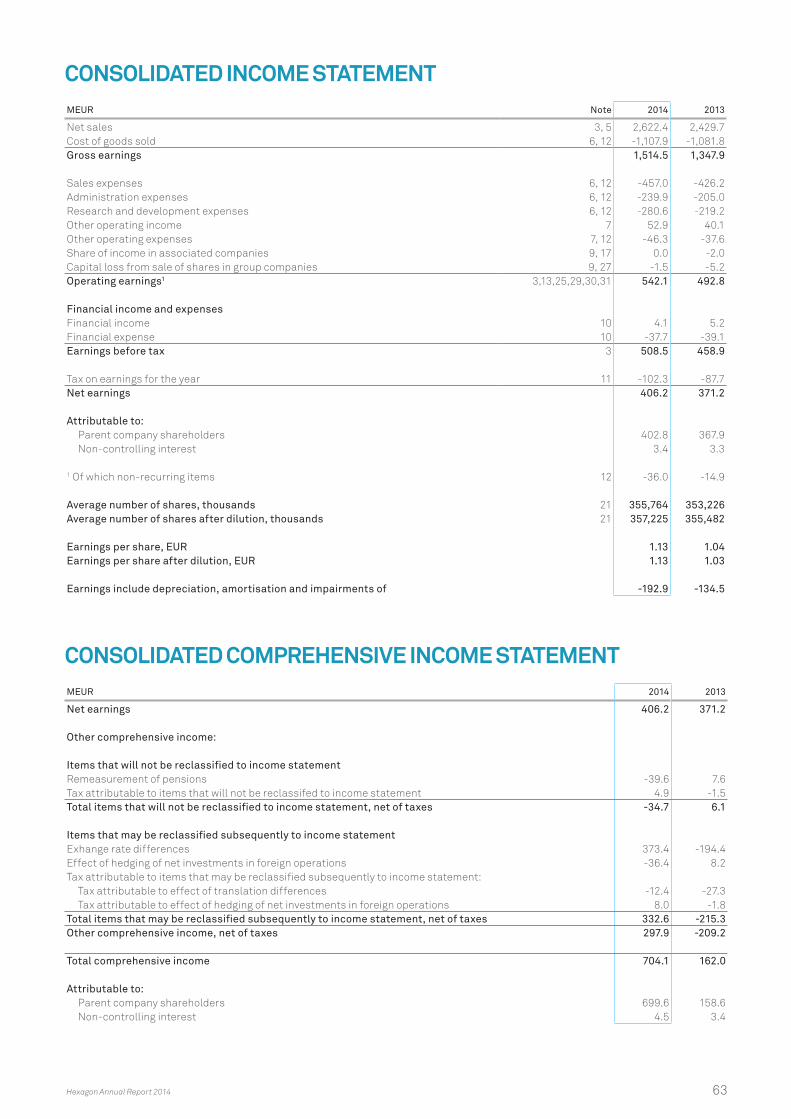
CONSOLIDATED INCOME STATEMENTMEUR Note 2014 2013
Net sales 3, 5 2,622.4 2,429.7Cost of goods sold 6, 12 -1,107.9 -1,081.8Gross earnings 1,514.5 1,347.9
Sales expenses 6, 12 -457.0 -426.2Administration expenses 6, 12 -239.9 -205.0Research and development expenses 6, 12 -280.6 -219.2Other operating income 7 52.9 40.1Other operating expenses 7, 12 -46.3 -37.6Share of income in associated companies 9, 17 0.0 -2.0Capital loss from sale of shares in group companies 9, 27 -1.5 -5.2Operating earnings1 3,13,25,29,30,31 542.1 492.8
Financial income and expensesFinancial income 10 4.1 5.2Financial expense 10 -37.7 -39.1Earnings before tax 3 508.5 458.9
Tax on earnings for the year 11 -102.3 -87.7Net earnings 406.2 371.2
Attributable to: Parent company shareholders 402.8 367.9Non-controlling interest 3.4 3.3
1 Of which non-recurring items 12 -36.0 -14.9
Average number of shares, thousands 21 355,764 353,226Average number of shares after dilution, thousands 21 357,225 355,482
Earnings per share, EUR 1.13 1.04Earnings per share after dilution, EUR 1.13 1.03
Earnings include depreciation, amortisation and impairments of -192.9 -134.5
CONSOLIDATED COMPREHENSIVE INCOME STATEMENT MEUR 2014 2013
Net earnings 406.2 371.2
Other comprehensive income:
Items that will not be reclassified to income statementRemeasurement of pensions -39.6 7.6Tax attributable to items that will not be reclassifed to income statement 4.9 -1.5Total items that will not be reclassified to income statement, net of taxes -34.7 6.1
Items that may be reclassified subsequently to income statementExhange rate differences 373.4 -194.4Effect of hedging of net investments in foreign operations -36.4 8.2Tax attributable to items that may be reclassified subsequently to income statement:
Tax attributable to effect of translation differences -12.4 -27.3Tax attributable to effect of hedging of net investments in foreign operations 8.0 -1.8
Total items that may be reclassified subsequently to income statement, net of taxes 332.6 -215.3Other comprehensive income, net of taxes 297.9 -209.2
Total comprehensive income 704.1 162.0
Attributable to: Parent company shareholders 699.6 158.6Non-controlling interest 4.5 3.4
Hexagon Annual Report 2014 63
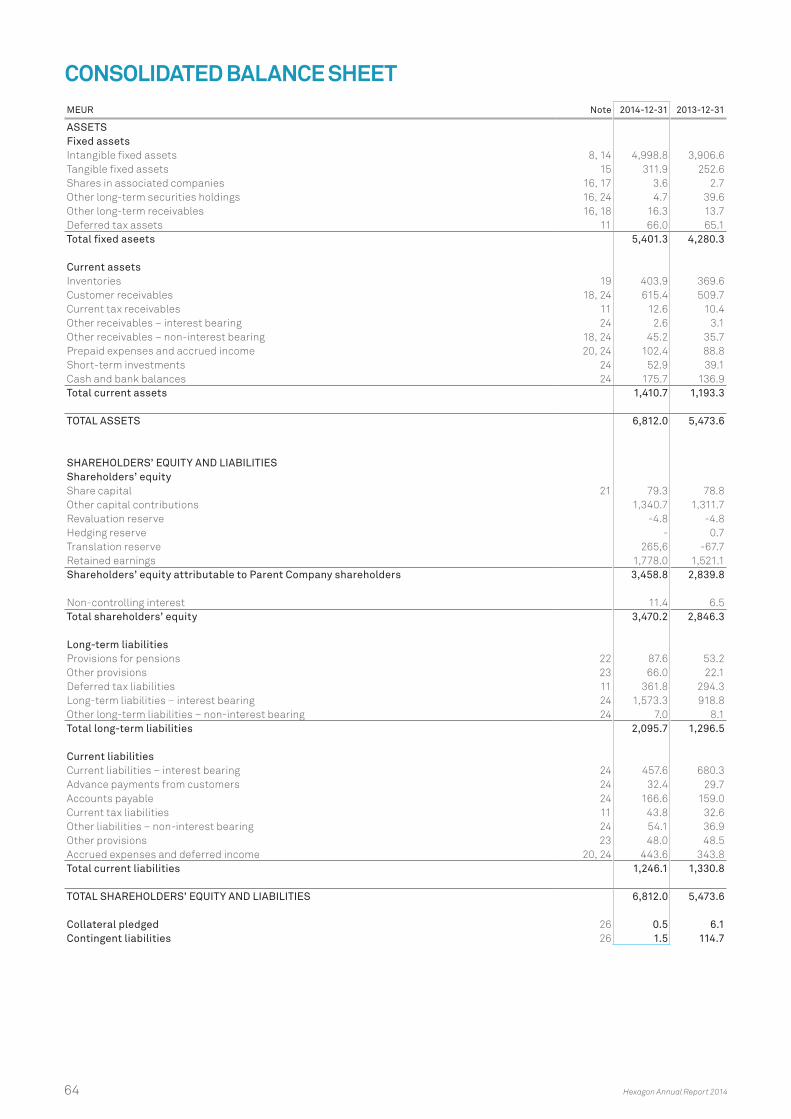
CONSOLIDATED BALANCE SHEETMEUR Note 2014-12-31 2013-12-31
ASSETSFixed assetsIntangible fixed assets 8, 14 4,998.8 3,906.6Tangible fixed assets 15 311.9 252.6Shares in associated companies 16, 17 3.6 2.7Other long-term securities holdings 16, 24 4.7 39.6Other long-term receivables 16, 18 16.3 13.7Deferred tax assets 11 66.0 65.1Total fixed aseets 5,401.3 4,280.3
Current assetsInventories 19 403.9 369.6Customer receivables 18, 24 615.4 509.7Current tax receivables 11 12.6 10.4Other receivables – interest bearing 24 2.6 3.1Other receivables – non-interest bearing 18, 24 45.2 35.7Prepaid expenses and accrued income 20, 24 102.4 88.8Short-term investments 24 52.9 39.1Cash and bank balances 24 175.7 136.9Total current assets 1,410.7 1,193.3
TOTAL ASSETS 6,812.0 5,473.6
SHAREHOLDERS’ EQUITY AND LIABILITIESShareholders’ equityShare capital 21 79.3 78.8Other capital contributions 1,340.7 1,311.7Revaluation reserve -4.8 -4.8Hedging reserve - 0.7Translation reserve 265,6 -67.7Retained earnings 1,778.0 1,521.1Shareholders’ equity attributable to Parent Company shareholders 3,458.8 2,839.8
Non-controlling interest 11.4 6.5Total shareholders’ equity 3,470.2 2,846.3
Long-term liabilitiesProvisions for pensions 22 87.6 53.2Other provisions 23 66.0 22.1Deferred tax liabilities 11 361.8 294.3Long-term liabilities – interest bearing 24 1,573.3 918.8Other long-term liabilities – non-interest bearing 24 7.0 8.1Total long-term liabilities 2,095.7 1,296.5
Current liabilitiesCurrent liabilities – interest bearing 24 457.6 680.3Advance payments from customers 24 32.4 29.7Accounts payable 24 166.6 159.0Current tax liabilities 11 43.8 32.6Other liabilities – non-interest bearing 24 54.1 36.9Other provisions 23 48.0 48.5Accrued expenses and deferred income 20, 24 443.6 343.8Total current liabilities 1,246.1 1,330.8
TOTAL SHAREHOLDERS’ EQUITY AND LIABILITIES 6,812.0 5,473.6
Collateral pledged 26 0.5 6.1Contingent liabilities 26 1.5 114.7
64 Hexagon Annual Report 2014
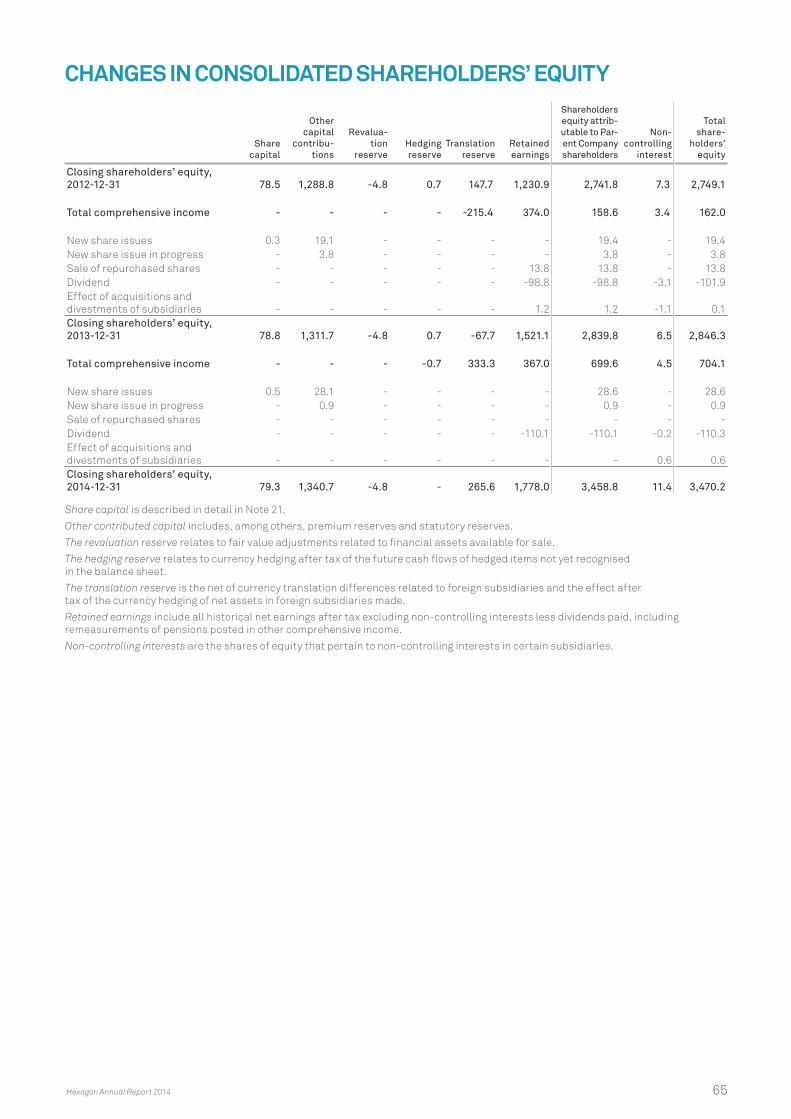
CHANGES IN CONSOLIDATED SHAREHOLDERS’ EQUITY
Share capital
Other capital
contribu-tions
Revalua-tion
reserveHedging reserve
Translation reserve
Retained earnings
Share holders equity attrib-utable to Par-ent Company share holders
Non- controlling
interest
Total share-
holders’ equity
Closing shareholders’ equity, 2012-12-31 78.5 1,288.8 -4.8 0.7 147.7 1,230.9 2,741.8 7.3 2,749.1
Total comprehensive income - - - - -215.4 374.0 158.6 3.4 162.0
New share issues 0.3 19.1 - - - - 19.4 - 19.4New share issue in progress - 3.8 - - - - 3.8 - 3.8Sale of repurchased shares - - - - - 13.8 13.8 - 13.8Dividend - - - - - -98.8 -98.8 -3.1 -101.9Effect of acquisitions and divestments of subsidiaries - - - - - 1.2 1.2 -1.1 0.1Closing shareholders’ equity, 2013-12-31 78.8 1,311.7 -4.8 0.7 -67.7 1,521.1 2,839.8 6.5 2,846.3
Total comprehensive income - - - -0.7 333.3 367.0 699.6 4.5 704.1
New share issues 0.5 28.1 - - - - 28.6 - 28.6New share issue in progress - 0.9 - - - - 0.9 - 0.9Sale of repurchased shares - - - - - - - - -Dividend - - - - - -110.1 -110.1 -0.2 -110.3Effect of acquisitions and divestments of subsidiaries - - - - - - - 0.6 0.6Closing shareholders’ equity, 2014-12-31 79.3 1,340.7 -4.8 - 265.6 1,778.0 3,458.8 11.4 3,470.2
Share capital is described in detail in Note 21.
Other contributed capital includes, among others, premium reserves and statutory reserves.
The revaluation reserve relates to fair value adjustments related to financial assets available for sale.
The hedging reserve relates to currency hedging after tax of the future cash flows of hedged items not yet recognised in the balance sheet.
The translation reserve is the net of currency translation differences related to foreign subsidiaries and the effect after tax of the currency hedging of net assets in foreign subsidiaries made.
Retained earnings include all historical net earnings after tax excluding non-controlling interests less dividends paid, including remeasurements of pensions posted in other comprehensive income.
Non-controlling interests are the shares of equity that pertain to non-controlling interests in certain subsidiaries.
Hexagon Annual Report 2014 65
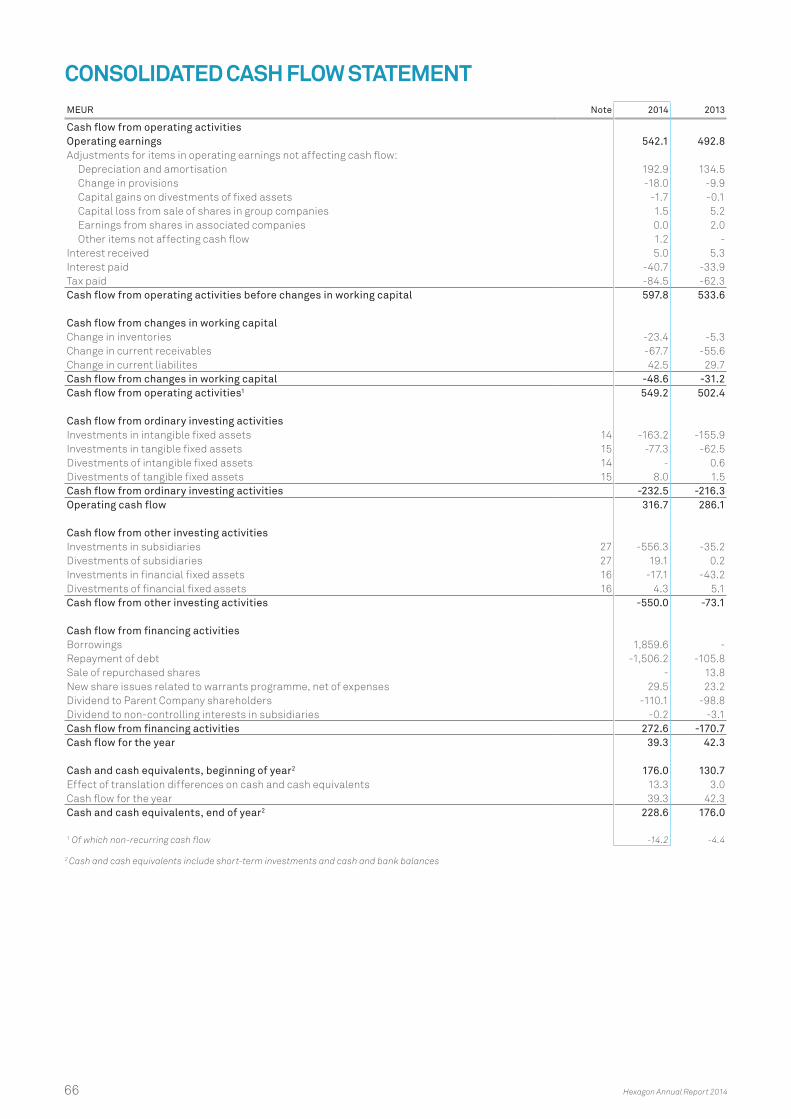
CONSOLIDATED CASH FLOW STATEMENTMEUR Note 2014 2013
Cash flow from operating activitiesOperating earnings 542.1 492.8Adjustments for items in operating earnings not affecting cash flow:
Depreciation and amortisation 192.9 134.5Change in provisions -18.0 -9.9Capital gains on divestments of fixed assets -1.7 -0.1Capital loss from sale of shares in group companies 1.5 5.2Earnings from shares in associated companies 0.0 2.0Other items not affecting cash flow 1.2 -
Interest received 5.0 5.3Interest paid -40.7 -33.9Tax paid -84.5 -62.3Cash flow from operating activities before changes in working capital 597.8 533.6
Cash flow from changes in working capitalChange in inventories -23.4 -5.3Change in current receivables -67.7 -55.6Change in current liabilites 42.5 29.7Cash flow from changes in working capital -48.6 -31.2Cash flow from operating activities1 549.2 502.4
Cash flow from ordinary investing activitiesInvestments in intangible fixed assets 14 -163.2 -155.9Investments in tangible fixed assets 15 -77.3 -62.5Divestments of intangible fixed assets 14 - 0.6Divestments of tangible fixed assets 15 8.0 1.5Cash flow from ordinary investing activities -232.5 -216.3Operating cash flow 316.7 286.1
Cash flow from other investing activitiesInvestments in subsidiaries 27 -556.3 -35.2Divestments of subsidiaries 27 19.1 0.2Investments in financial fixed assets 16 -17.1 -43.2Divestments of financial fixed assets 16 4.3 5.1Cash flow from other investing activities -550.0 -73.1
Cash flow from financing activitiesBorrowings 1,859.6 -Repayment of debt -1,506.2 -105.8Sale of repurchased shares - 13.8New share issues related to warrants programme, net of expenses 29.5 23.2Dividend to Parent Company shareholders -110.1 -98.8Dividend to non-controlling interests in subsidiaries -0.2 -3.1Cash flow from financing activities 272.6 -170.7Cash flow for the year 39.3 42.3
Cash and cash equivalents, beginning of year2 176.0 130.7Effect of translation differences on cash and cash equivalents 13.3 3.0Cash flow for the year 39.3 42.3Cash and cash equivalents, end of year2 228.6 176.0
1 Of which non-recurring cash flow -14.2 -4.4
2 Cash and cash equivalents include short-term investments and cash and bank balances
66 Hexagon Annual Report 2014
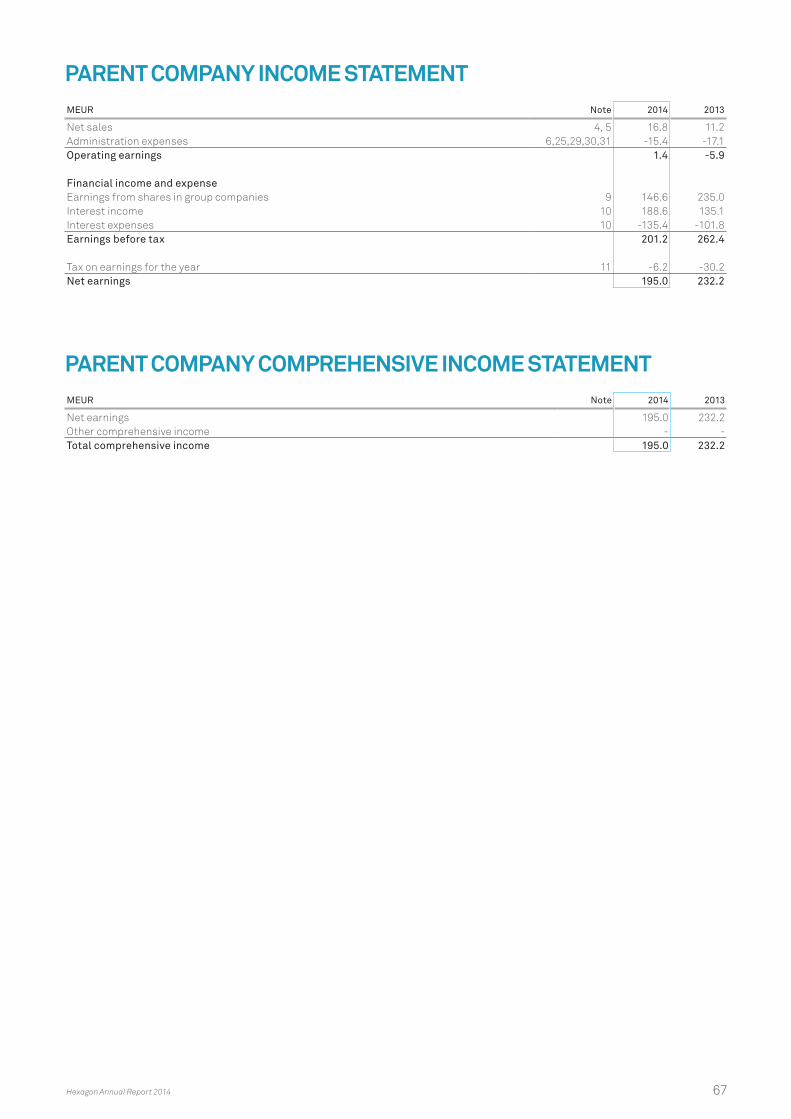
PARENT COMPANY INCOME STATEMENTMEUR Note 2014 2013
Net sales 4, 5 16.8 11.2Administration expenses 6,25,29,30,31 -15.4 -17.1Operating earnings 1.4 -5.9
Financial income and expenseEarnings from shares in group companies 9 146.6 235.0Interest income 10 188.6 135.1Interest expenses 10 -135.4 -101.8Earnings before tax 201.2 262.4
Tax on earnings for the year 11 -6.2 -30.2Net earnings 195.0 232.2
PARENT COMPANY COMPREHENSIVE INCOME STATEMENTMEUR Note 2014 2013
Net earnings 195.0 232.2Other comprehensive income - -Total comprehensive income 195.0 232.2
Hexagon Annual Report 2014 67
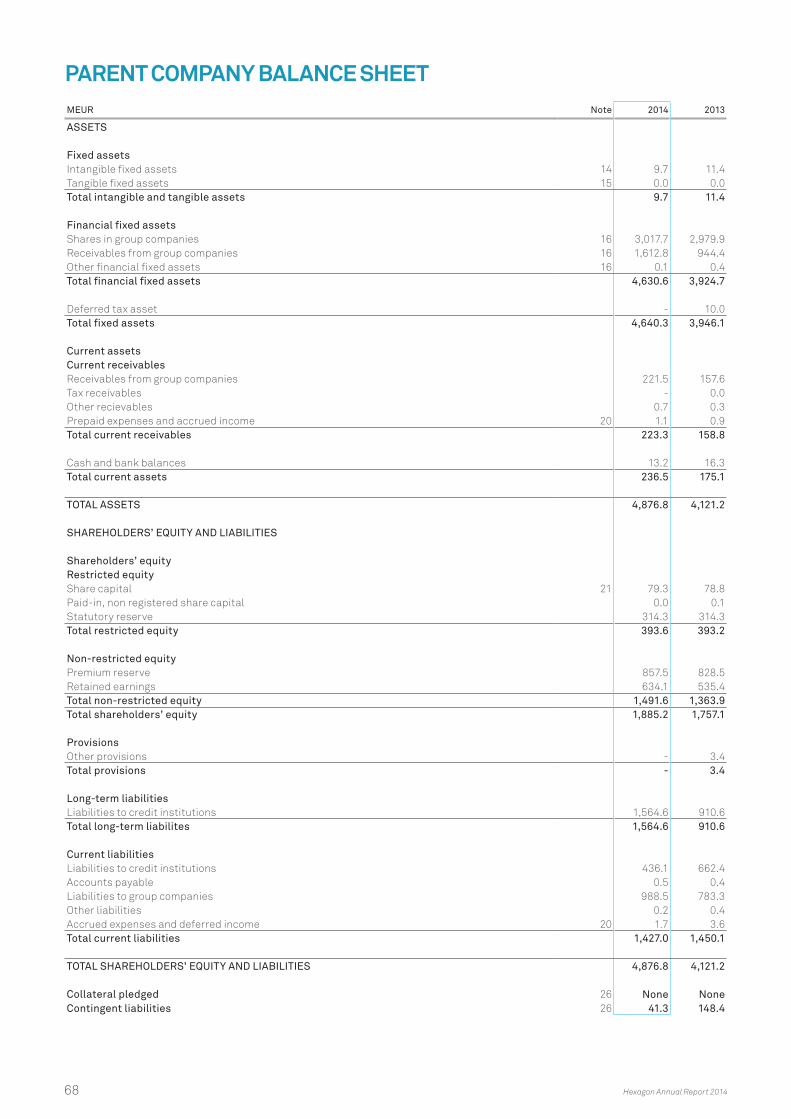
PARENT COMPANY BALANCE SHEETMEUR Note 2014 2013
ASSETS
Fixed assetsIntangible fixed assets 14 9.7 11.4Tangible fixed assets 15 0.0 0.0Total intangible and tangible assets 9.7 11.4
Financial fixed assetsShares in group companies 16 3,017.7 2,979.9Receivables from group companies 16 1,612.8 944.4Other financial fixed assets 16 0.1 0.4Total financial fixed assets 4,630.6 3,924.7
Deferred tax asset - 10.0Total fixed assets 4,640.3 3,946.1
Current assetsCurrent receivablesReceivables from group companies 221.5 157.6Tax receivables - 0.0Other recievables 0.7 0.3Prepaid expenses and accrued income 20 1.1 0.9Total current receivables 223.3 158.8
Cash and bank balances 13.2 16.3Total current assets 236.5 175.1
TOTAL ASSETS 4,876.8 4,121.2
SHAREHOLDERS’ EQUITY AND LIABILITIES
Shareholders’ equityRestricted equityShare capital 21 79.3 78.8Paid-in, non registered share capital 0.0 0.1Statutory reserve 314.3 314.3Total restricted equity 393.6 393.2
Non-restricted equityPremium reserve 857.5 828.5Retained earnings 634.1 535.4Total non-restricted equity 1,491.6 1,363.9Total shareholders’ equity 1,885.2 1,757.1
ProvisionsOther provisions - 3.4Total provisions - 3.4
Long-term liabilitiesLiabilities to credit institutions 1,564.6 910.6Total long-term liabilites 1,564.6 910.6
Current liabilitiesLiabilities to credit institutions 436.1 662.4Accounts payable 0.5 0.4Liabilities to group companies 988.5 783.3Other liabilities 0.2 0.4Accrued expenses and deferred income 20 1.7 3.6Total current liabilities 1,427.0 1,450.1
TOTAL SHAREHOLDERS’ EQUITY AND LIABILITIES 4,876.8 4,121.2
Collateral pledged 26 None NoneContingent liabilities 26 41.3 148.4
68 Hexagon Annual Report 2014
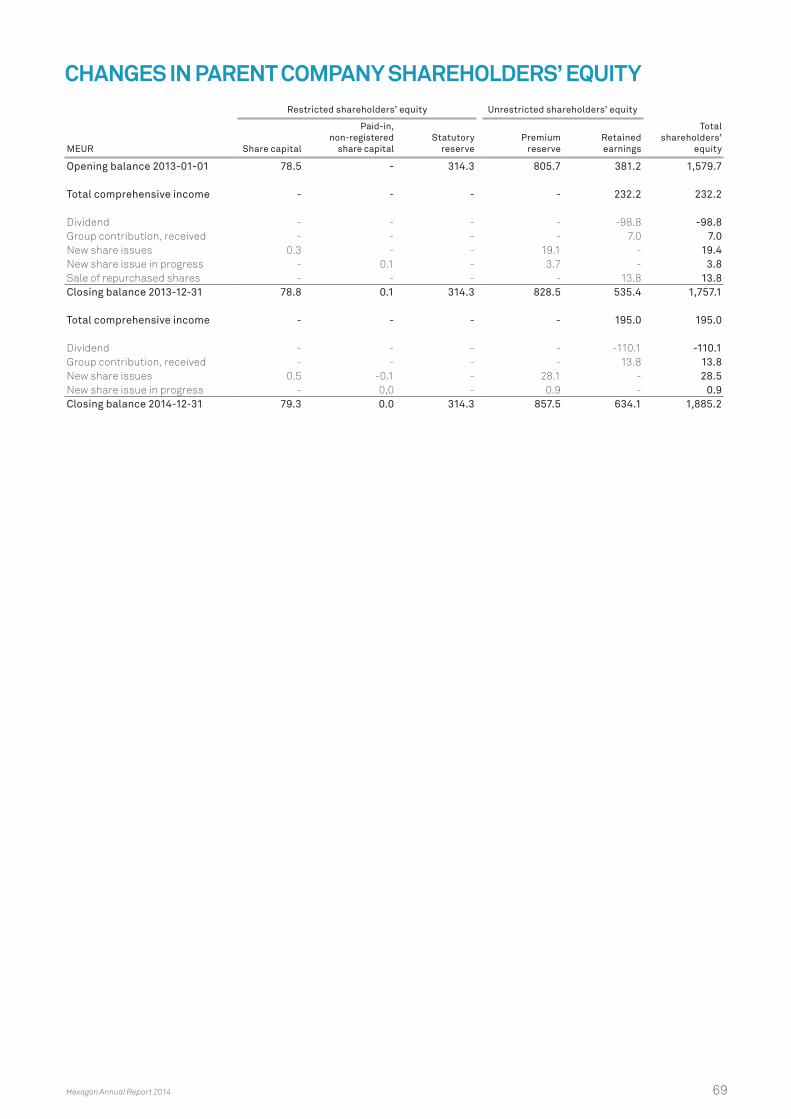
CHANGES IN PARENT COMPANY SHAREHOLDERS’ EQUITY Restricted shareholders’ equity Unrestricted shareholders’ equity
Total shareholders’
equityMEUR Share capital
Paid-in, non-registered
share capitalStatutory
reservePremium
reserveRetained earnings
Opening balance 2013-01-01 78.5 - 314.3 805.7 381.2 1,579.7
Total comprehensive income - - - - 232.2 232.2
Dividend - - - - -98.8 -98.8Group contribution, received - - - - 7.0 7.0New share issues 0.3 - - 19.1 - 19.4New share issue in progress - 0.1 - 3.7 - 3.8Sale of repurchased shares - - - - 13.8 13.8Closing balance 2013-12-31 78.8 0.1 314.3 828.5 535.4 1,757.1
Total comprehensive income - - - - 195.0 195.0
Dividend - - - - -110.1 -110.1Group contribution, received - - - - 13.8 13.8New share issues 0.5 -0.1 - 28.1 - 28.5New share issue in progress - 0,0 - 0.9 - 0.9Closing balance 2014-12-31 79.3 0.0 314.3 857.5 634.1 1,885.2
Hexagon Annual Report 2014 69
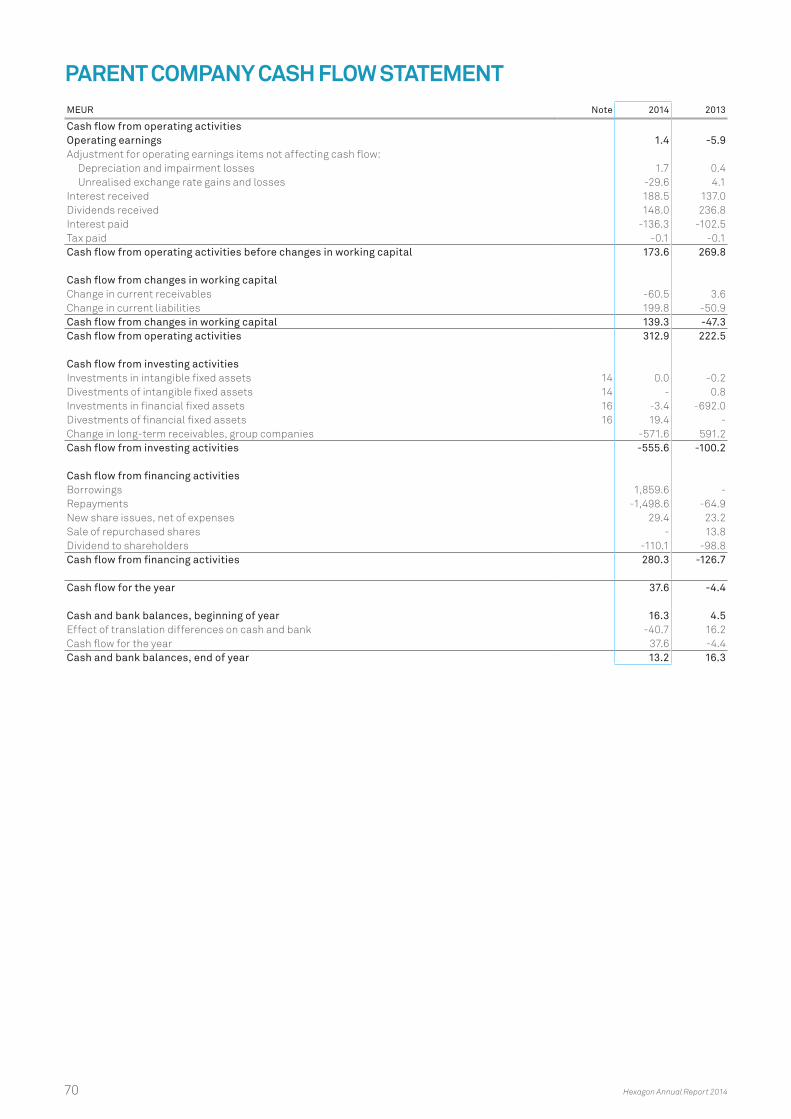
PARENT COMPANY CASH FLOW STATEMENT MEUR Note 2014 2013
Cash flow from operating activitiesOperating earnings 1.4 -5.9Adjustment for operating earnings items not affecting cash flow:
Depreciation and impairment losses 1.7 0.4Unrealised exchange rate gains and losses -29.6 4.1
Interest received 188.5 137.0Dividends received 148.0 236.8Interest paid -136.3 -102.5Tax paid -0.1 -0.1Cash flow from operating activities before changes in working capital 173.6 269.8
Cash flow from changes in working capitalChange in current receivables -60.5 3.6Change in current liabilities 199.8 -50.9Cash flow from changes in working capital 139.3 -47.3Cash flow from operating activities 312.9 222.5
Cash flow from investing activitiesInvestments in intangible fixed assets 14 0.0 -0.2Divestments of intangible fixed assets 14 - 0.8Investments in financial fixed assets 16 -3.4 -692.0Divestments of financial fixed assets 16 19.4 -Change in long-term receivables, group companies -571.6 591.2Cash flow from investing activities -555.6 -100.2
Cash flow from financing activitiesBorrowings 1,859.6 -Repayments -1,498.6 -64.9New share issues, net of expenses 29.4 23.2Sale of repurchased shares - 13.8Dividend to shareholders -110.1 -98.8Cash flow from financing activities 280.3 -126.7
Cash flow for the year 37.6 -4.4
Cash and bank balances, beginning of year 16.3 4.5Effect of translation differences on cash and bank -40.7 16.2Cash flow for the year 37.6 -4.4Cash and bank balances, end of year 13.2 16.3
70 Hexagon Annual Report 2014
NOTES
NOTE 1 ACCOUNTING POLICIESThe consolidated accounts have been prepared in accordance with the International Financial Reporting Standards (IFRS) issued by the International Accounting Standards Board (IASB) and inter-pretation statements by the International Financial Reporting Interpretations Committee (IFRIC), which have been approved by the European Commission for application within the EU.
Furthermore, the recommendation RFR 1 Supplementary accounting rules for corporate groups issued by the Swedish Financial Reporting Board have been applied.
The Parent Company applies the Annual Accounts Act and the recommendation RFR 2 Accounting for legal entities. The rec-ommendation means that the Parent Company applies the same accounting policies as the Group, except in those cases when the Annual Accounts Act or current tax rules limits the opportunities to apply IFRS. Differences between the accounting principles applied by the Parent Company and the Group are outlined under Accounting Policies in the Parent Company below.
The accounting policies and calculation methods applied by the Group are consistent with those of the previous financial year except as follows.
On 26 March 2015, the Board of Directors and the President approved this annual report and consolidated accounts for publi-cation, and they will be presented to the Annual General Meeting on 6 May 2015 for adoption.
APPLICATION OF NEW AND AMENDED ACCOUNTING RULESThe Group has introduced the following new and amended stan-dards and interpretations from IASB and IFRIC, respectively, as of 1 January 2014.
IFRS 10 Consolidated Financial Statements – the standard has replaced IAS 27 and SIC-12 about consolidation and provides a single model to identify whether control exists or not. An entity or investment should be included within the consolidated financial statements by identifying the concept of control as a determining factor. The standard has not had any significant impact on the financial statements of Hexagon.
IFRS 11 Joint Arrangements – the standard has replaced IAS 31 Interests in Joint Ventures. Joint arrangements shall according to the standard be divided into two categories, joint venture or joint operation. Different accounting principles shall be applied for these categories. The standard has not had any significant impact on the financial statements of Hexagon.
IFRS 12 Disclosure of Interests in Other Entities – provides new disclosure requirements for all types of investments entities, in which the group has control over, regardless of the investment is included in the consolidated financial statements or not.
Amendment to IAS 32 Financial Instruments – the amendment in IAS 32 introduces clarifications on the application of the offset-ting rules. The purpose of the amendment is to clarify the impact of offsetting in entities´ balance sheets. The standard has not had any significant impact on the financial statements of Hexagon.
STANDARDS ISSUED BUT NOT YET EFFECTIVENew standards, amended standards and interpretations that have not entered into force, have not been applied in advance in the financial reports of Hexagon. The following standards enter into force on 1 January 2015 or later.
IFRS 9 Financial instruments – the standard replaces IAS 39 Financial Instruments: Recognition and Measurement and pro-vides a logical model for classification and measurement, a single, forward-looking ‘expected loss’ impairment model and a substan-tially-reformed approach to hedge accounting. The standard will be applied as of 1 January 2018. The standard is not expected to have any significant impact on Hexagons financial statements.
IFRS 15 Revenue from contracts with customers – the standard replaces IAS 11 Construction contracts, IAS 18 Revenue, IFRIC 13 Customer loyalty programs, IFRIC 15 Agreements for the construction of real estate, IFRIC 18 Transfer of assets from cus-tomers and SIC 31 Revenue – Barter Transactions Involving Adver-tising Services. The new standard provides a five-step model to determine when to recognize revenue. According to the now pres-ent standards, revenues are to be recognized when the essential risk and rewards associated with the goods or services are trans-fered to the buyer. The new model specifies that revenue should be recognized when (or as) an entity transfers control of goods or services to a customer at the amount to which the entity expects to be entitled. Depending on whether certain criteria are met, rev-enue is then recognized. The standard will be applied as of 1 Jan-uary 2017. Hexagon has not yet finalized the analysis of potential impacts on the financial statements but the current assessment is that the new standard will not have any significant impact.
Other changes in standards and interpretations that enter into force from 1 January, 2015 are not expected to have any impact on the financial statements of Hexagon.
BASIS OF REPORTING FOR THE PARENT COMPANY AND THE GROUPThe functional currency of the Parent Company is EUR as is the presentation currency for the Parent Company and the Group. The financial reports are presented in EUR. All amounts, unless indi-cated otherwise, are rounded off to the nearest million. All num-bers are rounded to the nearest million with one decimal, unless otherwise stated.
Assets and liabilities are reported at historical cost with the exception of certain financial instruments which are reported at fair value.
Receivables and liabilities or income and liabilities are only offset if required or explicitly permitted by an accounting standard.
Preparing the financial statements in compliance with IFRS requires that Management make judgements and estimates as well as make assumptions that affect the application of account-ing principles and the amounts recognised as assets, liabilities, income and expenses. The actual outcome may diverge from these estimates and assumptions.
Estimates and assumptions are reviewed continuously. Changes of estimates are recognised in the period when the change is made if the change only affects current period, or in that period when the change is made and coming periods if the change affects both current period and coming periods.
Judgements made by Management for the application of IFRS that have a substantial impact on the financial reports and estimates made that may lead to significant adjustments in coming years’ financial reports are described in more detail in Note 2.
CLASSIFICATIONFixed assets and long-term liabilities essentially consist of amounts expected to be realised or settled after twelve months from the balance sheet date. Current assets and short-term lia-bilities essentially consist only of amounts expected to be realised or settled within twelve months from the balance sheet date. The Group’s operating cycle is assessed to be less than one year.
CONSOLIDATED FINANCIAL STATEMENTSThe consolidated financial statements consolidate the Parent Company and the other companies in which the Parent Company has a controlling influence.
Companies or businesses acquired (acquisitions) are accounted for under the purchase method. The method involves a business combination to be regarded as a transaction in which the Group indirectly acquires the assets of the business and assumes its liabilities and contingent liabilities. The Group’s acquisition cost
Hexagon Annual Report 2014 71
is determined through a purchase price allocation in connection with the acquisition. The acquisition cost is the sum of the fair value at the acquisition date of what is paid in cash, assumed liabilities or issue of own shares. Contingent considerations are included in the acquisition cost and carried at their fair value at the acquisition date. Revaluations of contingent considerations are recorded in the income statement. Transaction costs are expensed in the income statement when incurred.
Identifiable assets acquired and liabilities assumed are rec-ognised initially at their fair values at the acquisition date. Excep-tions to this rule are made for acquired tax assets and liabilities, employee benefits, stock-based compensation and assets held for sale, valued in accordance with the principles described for each item in the section below.
Goodwill recorded represents the difference between the acquisi-tion cost of Group companies’ shares, the value of non-controlling interest in the acquired business and the fair value of previously owned shares and on the other hand, the purchase price alloca-tion of the assets acquired and liabilities assumed. Goodwill is recognised in accordance with the section Goodwill and other intangible assets below. Non-controlling interests are recognised at the acquisition date, either at its fair value or at its proportion-ate share of the carrying value of the acquires identifiable assets and liabilities. Acquisition of non-controlling interest is reported as transactions between shareholders, i.e. in equity.
Group companies’ financial statements are included in the con-solidated accounts as of the date when control occurs (acquisition date) until the control ceases. When control of the group company ceases, but the Group retains shares in the company, remain-ing shares are initially reported at fair value. The gain or loss is recorded in the income statement.
ASSOCIATED COMPANIES AND JOINT VENTURESHexagon applies the equity method for accounting associated companies and joint ventures. Associated companies are those companies over which Hexagon, directly or indirectly, has a mate-rial influence. Joint ventures are defined as companies over which Hexagon, through partnership agreements with one or more par-ties, exercises a joint controlling influence over the operational and financial control.
Any difference between the acquisition value and equity value at the time of acquisition is termed goodwill, and is included in the acquisition value. In the consolidated balance sheet, holdings in associated companies are recognised at acquisition value adjusted for dividends; share in profits or losses during the hold-ing period and accumulated impairment losses. The consolidated income statement includes share in associated companies’ earn-ings after elimination of any inter-company gains.
For accounting of shares in associated companies the most recent available financial reports from the associated company are used. For some of the associated companies the financial reports from the previous quarter are used which is available at the time of publishing the interim reports of Hexagon.
TRANSLATION OF FINANCIAL REPORTS TO EURHexagon applies the current method meaning that assets and liabilities in operations with a functional currency other than EUR are translated at the closing day exchange rate and income state-ments are translated at average exchange rates for the period. The resulting translation differences are recognised directly in other comprehensive income. The amount is recognised sepa-rately as a translation reserve in equity. In case of divestment of an operation with a functional currency other than EUR the accu-mulated translation differences related to the divested operation are reclassified from equity to income statement at the time of recognition of capital gain or loss from the divestment.
Monetary long-term items towards businesses with a functional currency other than EUR, for which settlement is not planned or will probably not occur within the foreseeable future, are part of the company’s net investment. Translation differences on such monetary items, which comprise part of the company’s net invest-ment are recognised in other comprehensive income and accumu-lated in the translation reserve in equity.
TRANSACTIONS, ASSETS AND LIABILITIES OTHER CURRENCIES THAN EURTransactions in non-EUR currencies are recognised in the func-tional currency at the exchange rate on the transaction day. Mone-tary assets and liabilities are translated to the functional currency on the closing day at the exchange rate then in effect. Exchange rate differences that arise through these translations are rec-ognised in the income statement.
ELIMINATED TRANSACTIONSIntra-Group receivables and liabilities, revenue or expenses, and gains or losses that arise from transactions between Group companies are eliminated in their entirety in the preparation of the consolidated accounts. Gains that arise from transactions with associated companies and joint ventures are eliminated to an extent corresponding to the Group’s ownership interest in the company. Losses are eliminated in the same way as gains, but only to the extent that there is no impairment loss.
SEGMENT REPORTINGHexagon’s Board of Directors is responsible for determining the Group’s overall objectives, developing and monitoring the overall strategy, decisions on major acquisitions, divestments and invest-ments, and ongoing monitoring of operations.
The President is responsible for leading and controlling Hexagon’s operations in accordance with the strategy determined by the Board. The President is therefore the Group’s chief operating deci-sion maker and is the function that internally within the Hexagon Group allocates resources and evaluates results. The Group’s chief operating decision maker assesses the performance in the operating segments based on earnings before financial items, excluding non-recurring items. Financial items and taxes are reported for the Group as a whole.
Hexagon’s operations are organised, governed and reported on the basis of the two operating segments Hexagon Measurement Technologies and Other Operations. The operating segment Hexa-gon Measurement Technologies which offer design, measurement and visualisation solutions that are built upon common core technologies. The operating segment Other Operations is mainly focused towards the transportation industry including cars as well as heavy vehicles. Other Operations conducts its business in the Nordic region.
The two segments have separate product offerings, customer groups and geographical exposure and hence differentiated risk composition. No sales between the two operating segments exist. Both segments are applying the same accounting principles as the Group. Hexagon’s internal reporting, representing the base for detailed review and analysis, is designed in alignment with the described division into operating segments. Sales within each operating segment are additionally analysed geographically.
REVENUESHexagon applies the following principles for revenue recognition:
Sales of goodsRevenues from sales of goods are recognised when all the follow-ing conditions are satisfied:
•The company has transferred the essential risks and benefits associated with the ownership of the goods to the buyer;
•The company does not retain any commitment in ongoing man-agement usually associated with ownership, and nor does the company exert any actual control over the goods that have been sold;
Revenues can be reliably calculated if;•It is likely that the financial benefits for the seller associated
with the transaction will accrue to the seller;
• The expenditure that has arisen or is expected to arise as a con-sequence of the transaction can be reliably calculated;
•Installation revenues comprise an insignificant portion of total revenues for equipment sold with a commitment to install the equipment.
NOTE 1 Accounting Policies, cont.
72 Hexagon Annual Report 2014
Sales of services/contracts and similar assignmentsIncome from the sale of services is recognised on the basis of the degree of completion at the balance sheet date, when all the fol-lowing conditions are satisfied:
•Income attributable to the assignment can be reliably calcu-lated;
•It is likely that the financial benefits to the contractor associated with the assignment will accrue to the contractor;
•The percentage of completion can be reliably calculated;
•The expenditure that has arisen and the expenditure that remains to complete the assignment can be reliably calculated.
The percentage of completion is determined by comparing the expenditure that has arisen in relation with the total estimated expenditure for the assignment. If the degree of completion can-not be reliably determined, only those amounts corresponding to the expenditure that has arisen are recognised as revenues, but only to the extent that it is likely that they will be remunerated by the buyer. If it appears likely that all the expenditure for an assign-ment will exceed total revenues, the probable loss is accounted immediately, and fully, as an expense.
RESEARCH AND DEVELOPMENT EXPENDITUREExpenditure for research is expensed as incurred, while expen-diture for development is capitalised as follows: Capitalisation of development expenses in the Group are only applied to new prod-ucts where significant development costs are involved, where the products have a probable earnings potential that Hexagon may benefit from, and the costs are clearly distinguishable from ongo-ing product development expenditure.
GOVERNMENT GRANTSHexagon accounts for government grants that were decided and paid out during the year. Government grants have been reported as a reduction of the Group’s expenses in the function where the expenses occurred.
LEASINGThe Group has entered into financial as well as operational leases. The agreements are classified in accordance with their financial implication when they were entered into. Financial leases are not material and primarily relate to vehicles. For operational leases, the lease payments are expensed straight-line over the shorter of the asset’s useful life and the lease term. For capital leases the leased asset is carried on the balance sheet with a corresponding liability for future lease payments. The leased asset is depreci-ated over the same period as for assets of the same kind owned by the Group. The liability for future lease payments is interest bearing.
OTHER OPERATING REVENUES/EXPENSESOther operating revenues/expenses primarily consist of gains/losses from sales of fixed assets, currency exchange gains and losses related to operating assets and liabilities and revenues for letting of premises and other assets.
FINANCIAL ASSETS AND LIABILITIES AND OTHER INSTRUMENTSFinancial instruments recognised in the balance sheet include, on the asset side, cash and bank, accounts receivables, shares, loans receivable and derivatives. Liabilities include trade accounts payable, loans payable and derivatives. Supplementary payments for acquired companies are recognised as provisions.
Financial instruments are initially recognised at cost, correspond-ing to the instrument’s fair value plus transaction expenses for all financial instruments with the exception of those in the category financial assets at fair value through profit or loss. Subsequent measurement at fair value or amortised cost depends on how they are classified, as indicated below. Fair value of listed financial assets and liabilities are determined at market prices. Hexagon also applies different valuation methods to determine the fair value of financial assets and liabilities that are managed in an inactive market. These valuation methods are based on the valu-ation of similar instruments, discounted cash flows or accepted valuation models.
Amortised cost is determined using the effective interest rate cal-culated on the date of acquisition.
Financial assets and liabilities are classified in one of the following categories:Financial assets and liabilities at fair value through profit or lossFinancial derivative instruments are recognised at fair value, with changes in fair value recognised in profit and loss, apart from cases where the derivative fulfils the requirement for cash flow hedging, in which case the change in value is recognised directly in other comprehensive income until the hedged transaction has been recognised in income statement.
Available for saleHexagon considers listed holdings of securities as being available for sale, which means that the change in value up to the sell-ing date is recognised directly in other comprehensive income. Unlisted shares and participations whose value cannot be deter-mined reliably are recognised at acquisition cost.
Held-to-maturity investmentsAssets held to maturity are valued at amortised costs, applying the effective interest rate method. No financial instruments were classified in this category during 2014 and 2013.
Loans receivable and accounts receivable Accounts receivable are recognised at the amount expected to be received based on an individual valuation. Accounts receiv-able have a short maturity, due to which they are recognised at their nominal amount without discounting. Impairment losses on accounts receivable are recognised in operating expenses.
Other receivables are receivables that arise when the company provides money without the intent to trade its claim.
Other financial liabilitiesBank loans classified as other financial liabilities are initially recognised at the amount received after deducting transaction expenses. After acquisition, the loans are carried at amortised cost, according to the effective rate method.
Trade accounts payable are carried at amortised cost. Trade accounts payable have a short expected maturity and are carried without discounting at their nominal amount.
Cash and bank Cash and bank consist of cash and cash equivalents, immediately accessible balances with banks and similar institutions, and short-term liquid investments with a maturity from acquisition date of less than three months, which are exposed to no more than an insignificant risk of fluctuation in value.
DERIVATIVES AND HEDGE ACCOUNTINGBalances and transactions are to some extent hedged, and hedge accounting is applied if the hedging actions taken have the stated objective of constituting a hedge, have a direct correlation to the hedged item and effectively hedge the item. An effective hedge generates financial effects that offset those that arise through the hedged position. When hedging fair value, the change in the fair value of the hedging instrument is recognised in the income statement together with the change in the value of the liability or asset to which the risk hedging applies. When hedging cash flow, the change in value of the hedging instrument is recognised directly in other comprehensive income until the hedged transac-tion has been recognised.
The value of the net assets of subsidiaries whose functional cur-rency is not EUR, including goodwill and other intangible assets, is partly hedged, mainly through currency loans. Currency forward contracts are used to a lesser extent. In the consolidated financial statements, the after-tax effects of hedging are offset against those translation differences that were recognised directly in other comprehensive income regarding the international opera-tions.
BORROWING COSTSBorrowing costs in the form of interest expense are included in an asset’s acquisition value for certain qualifying assets only. Since
NOTE 1 Accounting Policies, cont.
Hexagon Annual Report 2014 73
Hexagon normally does not construct the types of assets that would permit this, no such borrowing costs have been capitalised, instead they have been expensed as incurred.
PENSION AND SIMILAR COMMITMENTSExpenditure for defined contribution plans are expensed as incurred.
Expected expenditure under defined benefit plans are recognised as a liability calculated in accordance with actuarial models, consisting of an estimate of future benefits that employees have earned through their employment during the current and prior periods. This benefit is discounted to its present value. The discount rate is the yield on high-quality corporate bonds or if there is no deep market for such bonds, government bonds – that have maturity dates approximating the terms of the Group’s obligations. Changes of the defined benefit obligation related to changed actuarial assumptions and experience based adjustment are reported in other comprehensive income. Pension expense for the year consists of pensions earned in the current period and pensions earned from prior periods resulting from any changes in the plan. Net interest is accounted for as a financial expense and consists of interest expense on the defined benefit liability less calculated return on plan assets. Obligations related to defined benefit plans are recognised net in the balance sheet (as a provi-sion), meaning after a deduction of the value of any plan assets.
Defined benefit plans for which the insurer (Alecta) cannot specify Hexagon’s share of the total plan assets and pension obligations, pending this information becoming available, are recognised as defined contribution plans.
TERMINATION BENEFITSWhen employment is terminated, a provision is recognised only when the entity is demonstrably committed either to terminate the employment of an employee or a group of employees before the normal retirement age or provide termination benefits as a result of an offer made to encourage voluntary redundancy. In the latter case, a liability and an expense are recognised if it is prob-able that the offer will be accepted and the number of employees that will accept the offer can be reliably estimated.
PROVISIONSA provision is recognised in the balance sheet when the Group has a legal or constructive obligation as a result of a past event, and it is probable that an outflow of resources will be required to settle the obligation, and a reliable estimate of the amount can be made. If the effect is material, the provision is determined by discount-ing the expected future cash flows at a pre-tax rate that reflects the current market assessments of the time value of money and, where appropriate, the risks specific to the liability.
WarrantiesA provision for warranties is recognised when the underlying products or services are sold. The provision is based on historical warranty data and a weighing of all possible outcomes with their associated probabilities.
RestructuringA provision for restructuring is recognised when the Group has approved a detailed and formal restructuring plan, and the restructuring has either commenced or has been publicly announced. No provision is posted for future operating losses.
Onerous contractsA provision for onerous contracts is recognised when the expected benefits to be derived by the Group are lower than the unavoidable cost of meeting its obligations under the contract.
INCOME TAXESIncome taxes comprise:•Current tax, meaning the tax calculated on taxable earnings for
the period, and adjustments regarding prior periods;
•Deferred tax, meaning the tax attributable to taxable temporary differences to be paid in the future, and the tax that represents a reduction of future tax attributable to deductible temporary differences, deductible loss carry-forwards and other tax deductions.
The income tax expenses for the year consist of current and deferred tax. Transactions recognised in other comprehensive income are including tax effects, i.e. tax related to these transac-tions are also posted in other comprehensive income.
INVENTORIESInventories are accounted according to the FIFO (first-in first-out) principle. Raw materials and purchased finished and semi-fin-ished goods are recognised at the lower of cost and net real-isable value. Manufactured finished and semi-finished goods are recognised at the lower of manufacturing cost (including a reasonable portion of indirect manufacturing costs) and fair value. Market terms are applied for intra-Group transactions. The necessary provisions and eliminations are made for obsolescence and intra-Group gains.
GOODWILL AND OTHER INTANGIBLE FIXED ASSETSGoodwill comprises the difference between the acquisition cost and fair value of the Group’s share of acquired companies’ identi-fiable net assets on the date of acquisition. Goodwill is recognised at acquisition value less accumulated impairment losses. Other acquisition-related intangible assets primarily comprise various types of intellectual rights such as brands, patents and customer relations.
Both acquisition-related and other intangible assets are reported at acquisition value less accumulated amortisation and impair-ment losses, if any. Acquisition-related intangible assets with an indefinite life are not amortised, but are tested for impairment on an annual basis.
TANGIBLE FIXED ASSETSTangible fixed assets are recognised at acquisition value less accumulated depreciations and impairment losses. Acquisition value includes expenditure that is directly attributable to acquisi-tion of the asset.
Gains/losses on the divestment of a tangible fixed asset are rec-ognised in the income statement as other operating income/cost and comprise the difference between the sales revenue and the carrying amount.
Amounts that can be depreciated comprise acquisition value less estimated residual value. The assets’ carrying value and use-ful life are impairment tested on every balance-sheet date and adjusted if necessary.
DEPRECIATION AND AMORTISATIONDepreciation and amortisation is calculated on the original acqui-sition value and based on the asset’s estimated useful life. The depreciation terms for various asset classes are:
•Capitalised development expenditure 2-6 years
•Patents and trademarks1 5 years
•Other intangible assets 2–20 years
•Computers 3–8 years
•Machinery and equipment 3–15 years
•Office buildings 20–50 years
•Industrial buildings 20–50 years
•Land improvements 5–25 years
1 The value of trademarks obtained via acquired operations is determined by means of the acquisition analysis. If the trademark can be used without any time limitations, it is not subject to amortisation according to plan. The right to use the name Leica derives from a contractual useful life under an agree-ment that expires in 89 years’ time. The agreement contains clauses stip-ulating extension opportunities. Since Hexagon is of the opinion that there is reason to believe that it will be possible to extend the agreement without considerable expenditure, the value of the right to use the name Leica is not subject to amortisation.
IMPAIRMENTGoodwill and other intangible assets with an indefinite life are sub-ject to annual impairment testing. Other tangible and intangible assets are impairment tested if indications of an impairment require-ment arise, meaning if the recognised value of an asset exceeds its recoverable value. If an impairment need is identified, the item is impaired to an amount corresponding to the recoverable value.
NOTE 1 Accounting Policies, cont.
74 Hexagon Annual Report 2014
The recoverable value is the higher of the asset’s net realisable value and the value in use, meaning the discounted present value of future cash flows. Previous impairments are reversed by rel-evant amounts matching the degree to which the impairment is no longer warranted, although goodwill impairments are never reversed.
If independent cash flows cannot be isolated for individual assets, the assets are grouped at the lowest level where independent cash flows can be identified (cash-generating units).
CASH-GENERATING UNITSThe definition of cash-generating units complies with the Group’s organisation, whereby assessments of whether there are any impairment requirements are made at the sub-segment level within each particular operating segment. Intangible assets that are common to a specific cash generating unit are allocated to this cash generating unit. The recoverable value is generally set at the value in use.
EARNINGS PER SHAREThe calculation of earnings per share is based on net earnings attributable to the Parent Company shareholders and on the weighted number of shares outstanding during the year. The cal-culation of earnings per share after dilution takes into account the quarterly calculated dilutive effect from any potential common shares stemming from options issued to employees. Dilution occurs only when the strike price is lower than the share price.
ACCOUNTING POLICIES IN THE PARENT COMPANYThe Parent Company applies the same accounting policies as the Group with the following exceptions:
•The Parent Company does not apply IAS 39.
•In the Parent Company, all leases are treated as operational leases.
•In the Parent Company, the shares in subsidiaries are recognised at acquisition value less any impairment.
•Acquisition of shares in subsidiaries includes transaction costs and contingent consideration.
Non-monetary assets acquired in other currencies than EUR are recognised at the historical exchange rate. Other assets and liabilities are recognised at the exchange rate prevailing on the balance sheet date.
DIVIDENDSThe dividend proposed by the Board of Directors reduces earnings available for distribution and is recognised as a liability when the Annual General Meeting has approved the dividend.
APPROVAL OF ACCOUNTSThe Parent Company’s and the consolidated financial statements will be presented to the Annual General Meeting for approval on 6 May 2015.
NOTE 2 CRITICAL ACCOUNTING ESTIMATES AND ASSUMPTIONS
The critical accounting estimates and assumptions that are addressed in this section are those that Company Management and the Board of Directors regard as the most important for understanding Hexagon’s financial reporting. The information is limited to areas that are significant considering the degree of impact and underlying uncertainty. Hexagon’s accounting estimates and assumptions are based on historical experience and assumptions that company management and the Board of Directors regard as reasonable under the current circumstances. The conclusions based on these accounting estimates constitute the foundation for the carrying amounts of assets and liabilities, in the event that they cannot be established through information from other sources. The actual outcome may differ from these accounting estimates and assumptions.
Parts of Hexagon’s sales derive from major and complex customer contractsIn order to establish the amounts that are to be recognised as income and whether any loss provision should be posted, com-pany management makes estimates of completed performance in relation to the contractual terms and conditions, the estimated total contractual costs and the proportion of the contract that has been completed.
Intangible assetsIntangible assets within Hexagon concern essentially pertain to patents, trademarks and goodwill. Goodwill and other acquired intangible assets with an indefinite life are not subject to annual amortisation, while other intangible assets are amortised. Insofar as the underlying operations develop negatively, an impairment requirement may arise. Such intangible assets are subject to annual impairment testing, which is essentially based on the value in use, making assumptions about the sales trend, the Group’s profit margins, on-going investments, changes in working capital and discount interest rate. The assumptions made by the Board of Directors are presented above. Company management considers the assumptions applied to be compatible with the data received from external sources of information or from previous experi-ence. Hexagon’s goodwill at 31 December amounted to 3,418 MEUR (2,596). Other intangible assets not subject to amortisation amount to 822 (699) MEUR as of this date. Impairment tests per-formed did not give rise to any impairment.
Tax assets and liabilitiesThe Board of Directors and Company Management continuously assess the carrying amount of both current and deferred tax assets and liabilities. For deferred tax assets, Hexagon has to assess the probability of whether it will be possible to utilise the deductible temporary differences that give rise to deferred tax assets to offset future taxable profits. In addition, in certain situations, the value of the deferred tax assets and liabilities may be uncertain due to ongoing tax processes, for example. Accordingly, the value of deferred tax assets and liabilities may deviate from these estimates due to a change in future earning capacity, changed tax regulations or the outcome of examinations by authorities or tax courts of issued or not yet issued tax returns. When assessing the value of deferred tax assets and liabilities, Hexagon has to form an opinion of the tax rate that will apply at the time of the reversal of the temporary differences. Hexagon recognised deferred tax liabilities, net in an amount of 295.8 MEUR (229.2), net, at the end of 2014. At the same date, the Group had tax-loss carry-forwards with a value of 79.3 MEUR (79.3) that were not recognised as assets. These assets could not be cap-italised based on assessments of the opportunity to utilise the tax deficits. In comparison with the final outcome, the estimates made concerning both deferred tax assets and liabilities could have either a positive or a negative impact on earnings.
Pension obligationsWithin Hexagon, there are defined-benefit pension schemes based on significant assumptions concerning future benefits pertaining to either the current or prior workforce. When calcu-lating the pension liability, a number of actuarial assumptions are of major significance to the outcome of the calculation. The most critical pertain to the discount interest rate on the obligation and the anticipated return on the plan assets. Other significant assumptions include the rate of pay increases, employee turnover and estimated length of life. A reduced discount interest rate increases the recognised pension liability. The actual outcome could deviate from the recognised amount if the applied assump-tions prove to be wrong.
NOTE 1 Accounting Policies, cont.
Hexagon Annual Report 2014 75
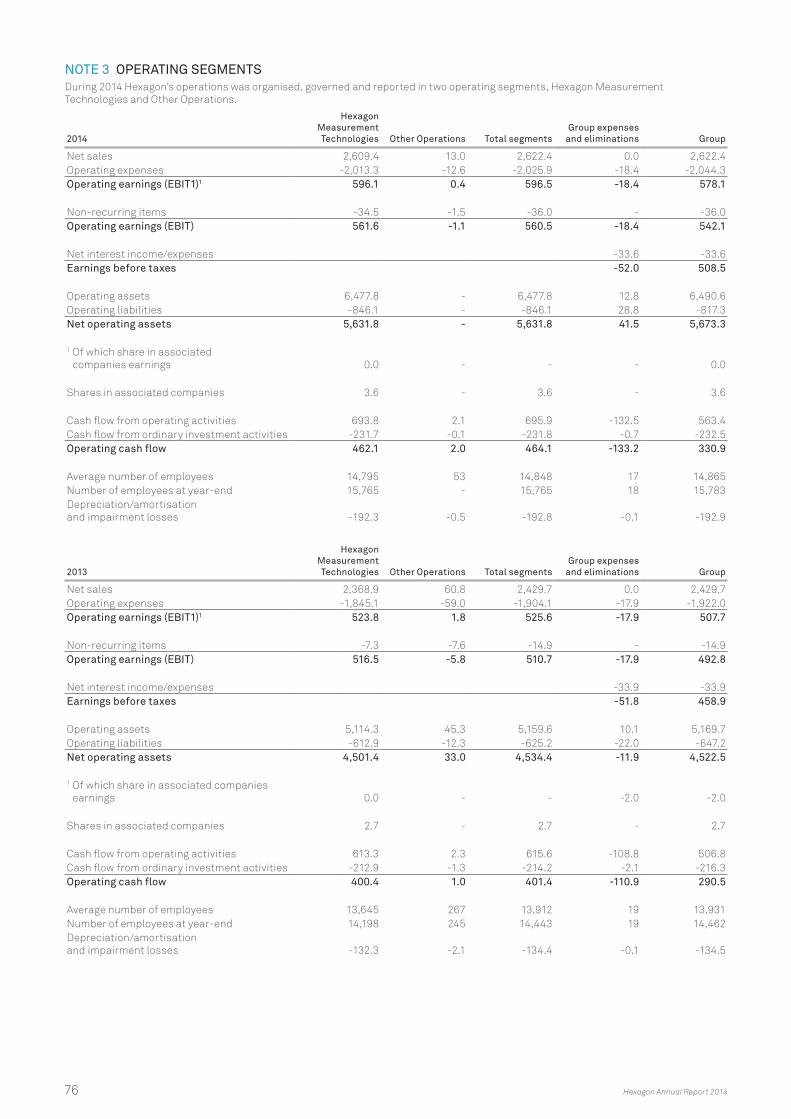
NOTE 3 OPERATING SEGMENTS During 2014 Hexagon’s operations was organised, governed and reported in two operating segments, Hexagon Measurement Technologies and Other Operations.
2014
Hexagon Measurement Technologies Other Operations Total segments
Group expenses and eliminations Group
Net sales 2,609.4 13.0 2,622.4 0.0 2,622.4Operating expenses -2,013.3 -12.6 -2,025.9 -18.4 -2,044.3Operating earnings (EBIT1)1 596.1 0.4 596.5 -18.4 578.1
Non-recurring items -34.5 -1.5 -36.0 - -36.0Operating earnings (EBIT) 561.6 -1.1 560.5 -18.4 542.1
Net interest income/expenses -33.6 -33.6Earnings before taxes -52.0 508.5
Operating assets 6,477.8 - 6,477.8 12.8 6,490.6Operating liabilities -846.1 - -846.1 28.8 -817.3Net operating assets 5,631.8 - 5,631.8 41.5 5,673.3
1 Of which share in associated companies earnings 0.0 - - - 0.0
Shares in associated companies 3.6 - 3.6 - 3.6
Cash flow from operating activities 693.8 2.1 695.9 -132.5 563.4Cash flow from ordinary investment activities -231.7 -0.1 -231.8 -0.7 -232.5Operating cash flow 462.1 2.0 464.1 -133.2 330.9
Average number of employees 14,795 53 14,848 17 14,865Number of employees at year-end 15,765 - 15,765 18 15,783Depreciation/amortisation and impairment losses -192.3 -0.5 -192.8 -0.1 -192.9
2013
Hexagon Measurement Technologies Other Operations Total segments
Group expenses and eliminations Group
Net sales 2,368.9 60.8 2,429.7 0.0 2,429.7Operating expenses -1,845.1 -59.0 -1,904.1 -17.9 -1,922.0Operating earnings (EBIT1)1 523.8 1.8 525.6 -17.9 507.7
Non-recurring items -7.3 -7.6 -14.9 - -14.9Operating earnings (EBIT) 516.5 -5.8 510.7 -17.9 492.8
Net interest income/expenses -33.9 -33.9Earnings before taxes -51.8 458.9
Operating assets 5,114.3 45.3 5,159.6 10.1 5,169.7Operating liabilities -612.9 -12.3 -625.2 -22.0 -647.2Net operating assets 4,501.4 33.0 4,534.4 -11.9 4,522.5
1 Of which share in associated companies earnings 0.0 - - -2.0 -2.0
Shares in associated companies 2.7 - 2.7 - 2.7
Cash flow from operating activities 613.3 2.3 615.6 -108.8 506.8Cash flow from ordinary investment activities -212.9 -1.3 -214.2 -2.1 -216.3Operating cash flow 400.4 1.0 401.4 -110.9 290.5
Average number of employees 13,645 267 13,912 19 13,931Number of employees at year-end 14,198 245 14,443 19 14,462Depreciation/amortisation and impairment losses -132.3 -2.1 -134.4 -0.1 -134.5
76 Hexagon Annual Report 2014
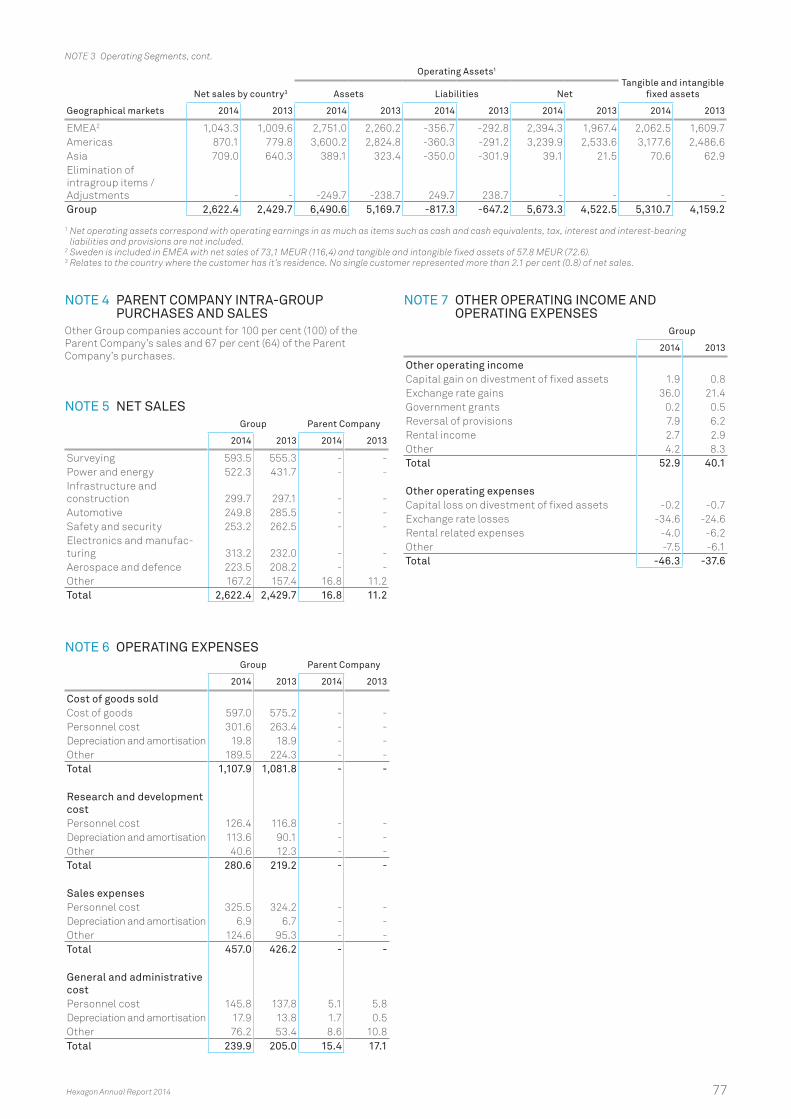
Net sales by country3
Operating Assets1
Tangible and intangible fixed assetsAssets Liabilities Net
Geographical markets 2014 2013 2014 2013 2014 2013 2014 2013 2014 2013
EMEA2 1,043.3 1,009.6 2,751.0 2,260.2 -356.7 -292.8 2,394.3 1,967.4 2,062.5 1,609.7Americas 870.1 779.8 3,600.2 2,824.8 -360.3 -291.2 3,239.9 2,533.6 3,177.6 2,486.6Asia 709.0 640.3 389.1 323.4 -350.0 -301.9 39.1 21.5 70.6 62.9Elimination of intragroup items / Adjustments - - -249.7 -238.7 249.7 238.7 - - - -Group 2,622.4 2,429.7 6,490.6 5,169.7 -817.3 -647.2 5,673.3 4,522.5 5,310.7 4,159.2
1 Net operating assets correspond with operating earnings in as much as items such as cash and cash equivalents, tax, interest and interest-bearing liabilities and provisions are not included.
2 Sweden is included in EMEA with net sales of 73,1 MEUR (116,4) and tangible and intangible fixed assets of 57.8 MEUR (72.6). 3 Relates to the country where the customer has it’s residence. No single customer represented more than 2.1 per cent (0.8) of net sales.
NOTE 4 PARENT COMPANY INTRA-GROUP PURCHASES AND SALES
Other Group companies account for 100 per cent (100) of the Parent Company’s sales and 67 per cent (64) of the Parent Company’s purchases.
NOTE 5 NET SALES Group Parent Company
2014 2013 2014 2013
Surveying 593.5 555.3 - -Power and energy 522.3 431.7 - -Infrastructure and construction 299.7 297.1 - -Automotive 249.8 285.5 - -Safety and security 253.2 262.5 - -Electronics and manufac-turing 313.2 232.0 - -Aerospace and defence 223.5 208.2 - -Other 167.2 157.4 16.8 11.2Total 2,622.4 2,429.7 16.8 11.2
NOTE 7 OTHER OPERATING INCOME AND OPERATING EXPENSES
Group
2014 2013
Other operating incomeCapital gain on divestment of fixed assets 1.9 0.8Exchange rate gains 36.0 21.4Government grants 0.2 0.5Reversal of provisions 7.9 6.2Rental income 2.7 2.9Other 4.2 8.3Total 52.9 40.1
Other operating expensesCapital loss on divestment of fixed assets -0.2 -0.7Exchange rate losses -34.6 -24.6Rental related expenses -4.0 -6.2Other -7.5 -6.1Total -46.3 -37.6
NOTE 3 Operating Segments, cont.
NOTE 6 OPERATING EXPENSESGroup Parent Company
2014 2013 2014 2013
Cost of goods soldCost of goods 597.0 575.2 - -Personnel cost 301.6 263.4 - -Depreciation and amortisation 19.8 18.9 - -Other 189.5 224.3 - -Total 1,107.9 1,081.8 - -
Research and development costPersonnel cost 126.4 116.8 - -Depreciation and amortisation 113.6 90.1 - -Other 40.6 12.3 - -Total 280.6 219.2 - -
Sales expensesPersonnel cost 325.5 324.2 - -Depreciation and amortisation 6.9 6.7 - -Other 124.6 95.3 - -Total 457.0 426.2 - -
General and administrative costPersonnel cost 145.8 137.8 5.1 5.8Depreciation and amortisation 17.9 13.8 1.7 0.5Other 76.2 53.4 8.6 10.8Total 239.9 205.0 15.4 17.1
Hexagon Annual Report 2014 77
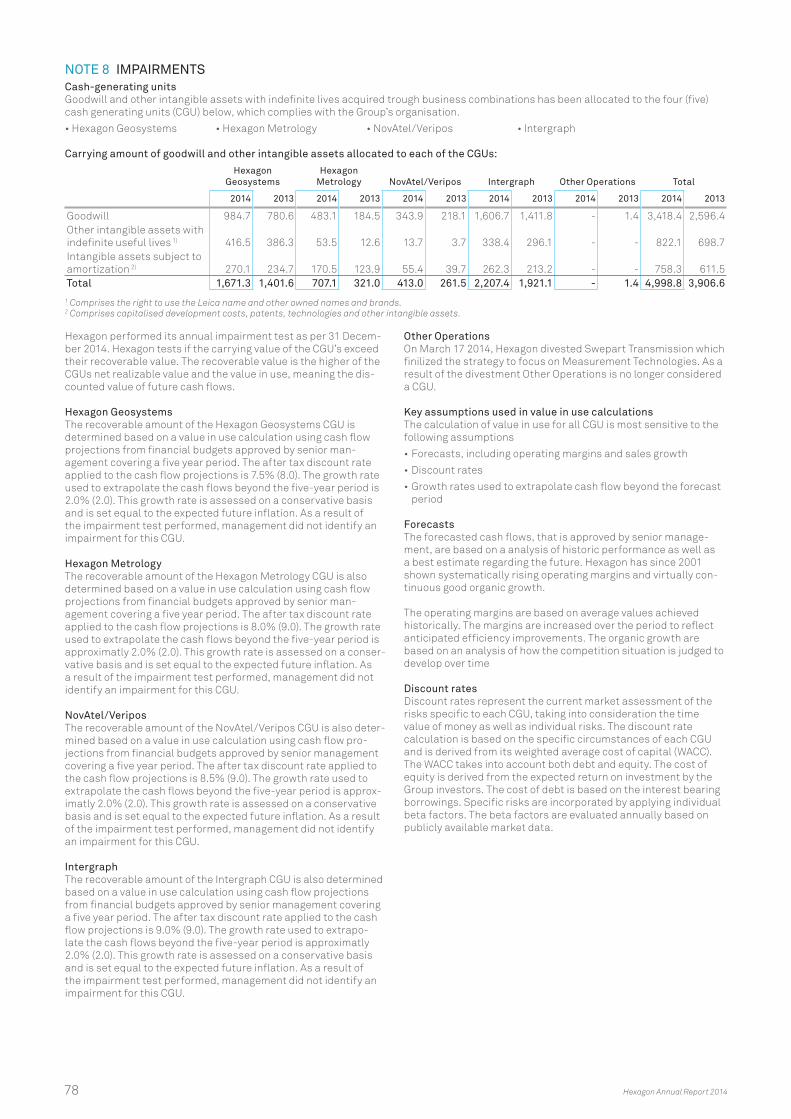
NOTE 8 IMPAIRMENTS Cash-generating units Goodwill and other intangible assets with indefinite lives acquired trough business combinations has been allocated to the four (five) cash generating units (CGU) below, which complies with the Group’s organisation.
•HexagonGeosystems •HexagonMetrology •NovAtel/Veripos •Intergraph
Carrying amount of goodwill and other intangible assets allocated to each of the CGUs:
Hexagon Geosystems
Hexagon Metrology NovAtel/Veripos Intergraph Other Operations Total
2014 2013 2014 2013 2014 2013 2014 2013 2014 2013 2014 2013
Goodwill 984.7 780.6 483.1 184.5 343.9 218.1 1,606.7 1,411.8 - 1.4 3,418.4 2,596.4Other intangible assets with indefinite useful lives 1) 416.5 386.3 53.5 12.6 13.7 3.7 338.4 296.1 - - 822.1 698.7Intangible assets subject to amortization 2) 270.1 234.7 170.5 123.9 55.4 39.7 262.3 213.2 - - 758.3 611.5Total 1,671.3 1,401.6 707.1 321.0 413.0 261.5 2,207.4 1,921.1 - 1.4 4,998.8 3,906.6
1 Comprises the right to use the Leica name and other owned names and brands.2 Comprises capitalised development costs, patents, technologies and other intangible assets.
Hexagon performed its annual impairment test as per 31 Decem-ber 2014. Hexagon tests if the carrying value of the CGU’s exceed their recoverable value. The recoverable value is the higher of the CGUs net realizable value and the value in use, meaning the dis-counted value of future cash flows.
Hexagon GeosystemsThe recoverable amount of the Hexagon Geosystems CGU is determined based on a value in use calculation using cash flow projections from financial budgets approved by senior man-agement covering a five year period. The after tax discount rate applied to the cash flow projections is 7.5% (8.0). The growth rate used to extrapolate the cash flows beyond the five-year period is 2.0% (2.0). This growth rate is assessed on a conservative basis and is set equal to the expected future inflation. As a result of the impairment test performed, management did not identify an impairment for this CGU.
Hexagon Metrology The recoverable amount of the Hexagon Metrology CGU is also determined based on a value in use calculation using cash flow projections from financial budgets approved by senior man-agement covering a five year period. The after tax discount rate applied to the cash flow projections is 8.0% (9.0). The growth rate used to extrapolate the cash flows beyond the five-year period is approximatly 2.0% (2.0). This growth rate is assessed on a conser-vative basis and is set equal to the expected future inflation. As a result of the impairment test performed, management did not identify an impairment for this CGU.
NovAtel/Veripos The recoverable amount of the NovAtel/Veripos CGU is also deter-mined based on a value in use calculation using cash flow pro-jections from financial budgets approved by senior management covering a five year period. The after tax discount rate applied to the cash flow projections is 8.5% (9.0). The growth rate used to extrapolate the cash flows beyond the five-year period is approx-imatly 2.0% (2.0). This growth rate is assessed on a conservative basis and is set equal to the expected future inflation. As a result of the impairment test performed, management did not identify an impairment for this CGU.
Intergraph The recoverable amount of the Intergraph CGU is also determined based on a value in use calculation using cash flow projections from financial budgets approved by senior management covering a five year period. The after tax discount rate applied to the cash flow projections is 9.0% (9.0). The growth rate used to extrapo-late the cash flows beyond the five-year period is approximatly 2.0% (2.0). This growth rate is assessed on a conservative basis and is set equal to the expected future inflation. As a result of the impairment test performed, management did not identify an impairment for this CGU.
Other Operations On March 17 2014, Hexagon divested Swepart Transmission which finilized the strategy to focus on Measurement Technologies. As a result of the divestment Other Operations is no longer considered a CGU.
Key assumptions used in value in use calculationsThe calculation of value in use for all CGU is most sensitive to the following assumptions
•Forecasts, including operating margins and sales growth
•Discount rates
•Growth rates used to extrapolate cash flow beyond the forecast period
ForecastsThe forecasted cash flows, that is approved by senior manage-ment, are based on a analysis of historic performance as well as a best estimate regarding the future. Hexagon has since 2001 shown systematically rising operating margins and virtually con-tinuous good organic growth.
The operating margins are based on average values achieved historically. The margins are increased over the period to reflect anticipated efficiency improvements. The organic growth are based on an analysis of how the competition situation is judged to develop over time
Discount ratesDiscount rates represent the current market assessment of the risks specific to each CGU, taking into consideration the time value of money as well as individual risks. The discount rate calculation is based on the specific circumstances of each CGU and is derived from its weighted average cost of capital (WACC). The WACC takes into account both debt and equity. The cost of equity is derived from the expected return on investment by the Group investors. The cost of debt is based on the interest bearing borrowings. Specific risks are incorporated by applying individual beta factors. The beta factors are evaluated annually based on publicly available market data.
78 Hexagon Annual Report 2014
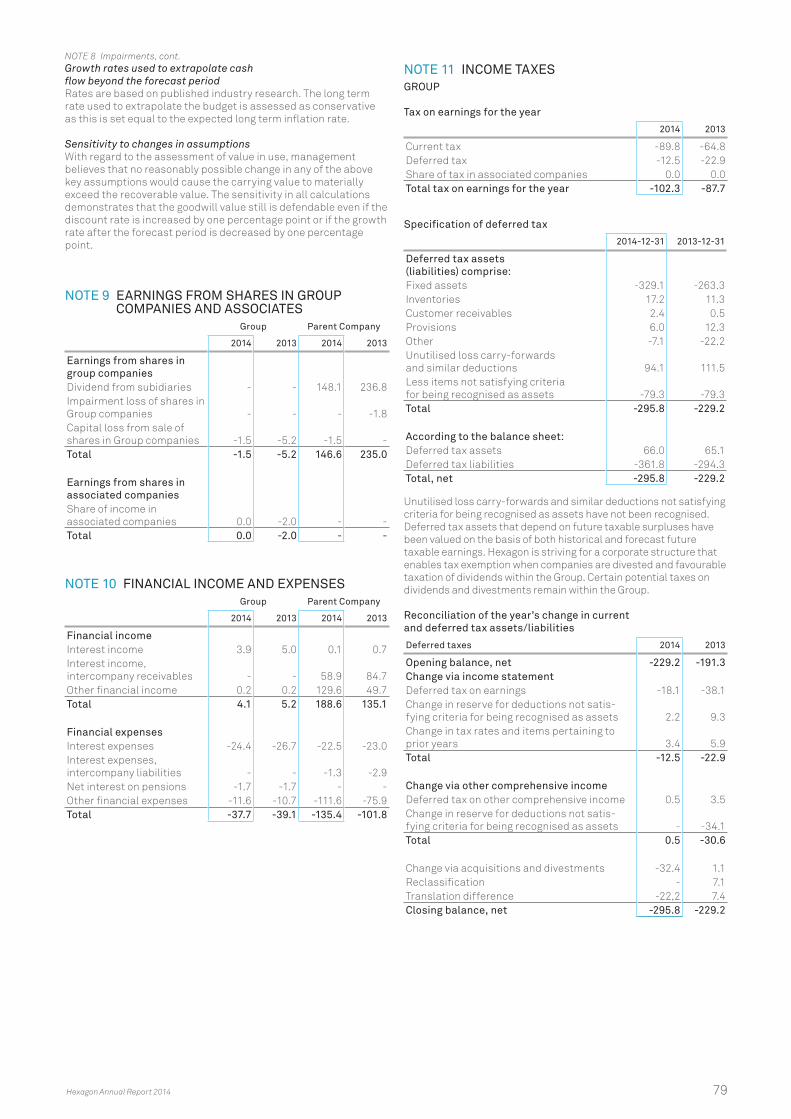
Growth rates used to extrapolate cash flow beyond the forecast periodRates are based on published industry research. The long term rate used to extrapolate the budget is assessed as conservative as this is set equal to the expected long term inflation rate.
Sensitivity to changes in assumptionsWith regard to the assessment of value in use, management believes that no reasonably possible change in any of the above key assumptions would cause the carrying value to materially exceed the recoverable value. The sensitivity in all calculations demonstrates that the goodwill value still is defendable even if the discount rate is increased by one percentage point or if the growth rate after the forecast period is decreased by one percentage point.
NOTE 9 EARNINGS FROM SHARES IN GROUP COMPANIES AND ASSOCIATES
Group Parent Company
2014 2013 2014 2013
Earnings from shares in group companiesDividend from subidiaries - - 148.1 236.8Impairment loss of shares in Group companies - - - -1.8Capital loss from sale of shares in Group companies -1.5 -5.2 -1.5 -Total -1.5 -5.2 146.6 235.0
Earnings from shares in associated companiesShare of income in associated companies 0.0 -2.0 - -Total 0.0 -2.0 - -
NOTE 10 FINANCIAL INCOME AND EXPENSESGroup Parent Company
2014 2013 2014 2013
Financial incomeInterest income 3.9 5.0 0.1 0.7Interest income, intercompany receivables - - 58.9 84.7Other financial income 0.2 0.2 129.6 49.7Total 4.1 5.2 188.6 135.1
Financial expensesInterest expenses -24.4 -26.7 -22.5 -23.0Interest expenses, intercompany liabilities - - -1.3 -2.9Net interest on pensions -1.7 -1.7 - -Other financial expenses -11.6 -10.7 -111.6 -75.9Total -37.7 -39.1 -135.4 -101.8
NOTE 11 INCOME TAXESGROUP Tax on earnings for the year
2014 2013
Current tax -89.8 -64.8Deferred tax -12.5 -22.9Share of tax in associated companies 0.0 0.0Total tax on earnings for the year -102.3 -87.7
Specification of deferred tax
2014-12-31 2013-12-31
Deferred tax assets (liabilities) comprise:Fixed assets -329.1 -263.3Inventories 17.2 11.3Customer receivables 2.4 0.5Provisions 6.0 12.3Other -7.1 -22.2Unutilised loss carry-forwards and similar deductions 94.1 111.5Less items not satisfying criteria for being recognised as assets -79.3 -79.3Total -295.8 -229.2
According to the balance sheet:Deferred tax assets 66.0 65.1Deferred tax liabilities -361.8 -294.3Total, net -295.8 -229.2
Unutilised loss carry-forwards and similar deductions not satisfying criteria for being recognised as assets have not been recognised. Deferred tax assets that depend on future taxable surpluses have been valued on the basis of both historical and forecast future taxable earnings. Hexagon is striving for a corporate structure that enables tax exemption when companies are divested and favourable taxation of dividends within the Group. Certain potential taxes on dividends and divestments remain within the Group.
Reconciliation of the year’s change in current and deferred tax assets/liabilities
Deferred taxes 2014 2013
Opening balance, net -229.2 -191.3Change via income statementDeferred tax on earnings -18.1 -38.1Change in reserve for deductions not satis-fying criteria for being recognised as assets 2.2 9.3Change in tax rates and items pertaining to prior years 3.4 5.9Total -12.5 -22.9
Change via other comprehensive incomeDeferred tax on other comprehensive income 0.5 3.5Change in reserve for deductions not satis-fying criteria for being recognised as assets - -34.1Total 0.5 -30.6
Change via acquisitions and divestments -32.4 1.1Reclassification - 7.1Translation difference -22,2 7.4Closing balance, net -295.8 -229.2
NOTE 8 Impairments, cont.
Hexagon Annual Report 2014 79
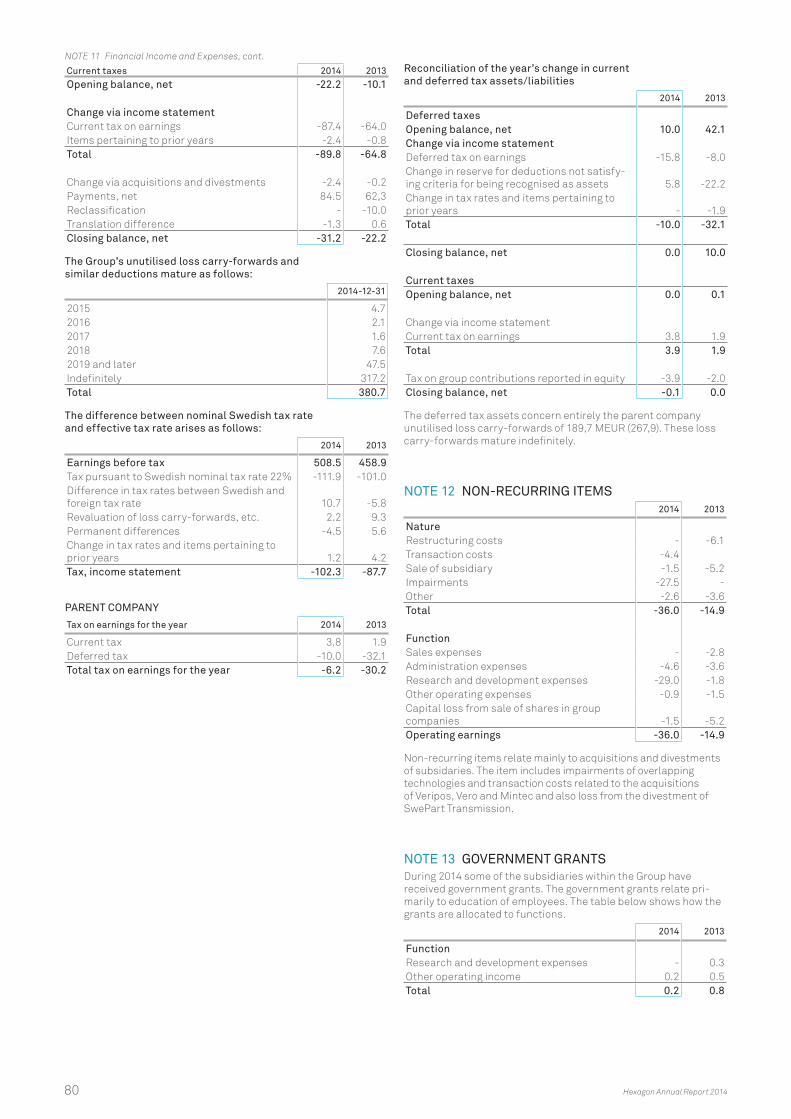
Current taxes 2014 2013Opening balance, net -22.2 -10.1
Change via income statementCurrent tax on earnings -87.4 -64.0Items pertaining to prior years -2.4 -0.8Total -89.8 -64.8
Change via acquisitions and divestments -2.4 -0.2Payments, net 84.5 62,3Reclassification - -10.0Translation difference -1.3 0.6Closing balance, net -31.2 -22.2
The Group’s unutilised loss carry-forwards and similar deductions mature as follows:
2014-12-31
2015 4.72016 2.12017 1.62018 7.62019 and later 47.5Indefinitely 317.2Total 380.7
The difference between nominal Swedish tax rate and effective tax rate arises as follows:
2014 2013
Earnings before tax 508.5 458.9Tax pursuant to Swedish nominal tax rate 22% -111.9 -101.0Difference in tax rates between Swedish and foreign tax rate 10.7 -5.8Revaluation of loss carry-forwards, etc. 2.2 9.3Permanent differences -4.5 5.6Change in tax rates and items pertaining to prior years 1.2 4.2Tax, income statement -102.3 -87.7
PARENT COMPANY
Tax on earnings for the year 2014 2013
Current tax 3.8 1.9Deferred tax -10.0 -32.1Total tax on earnings for the year -6.2 -30.2
Reconciliation of the year’s change in current and deferred tax assets/liabilities
2014 2013
Deferred taxesOpening balance, net 10.0 42.1Change via income statementDeferred tax on earnings -15.8 -8.0Change in reserve for deductions not satisfy-ing criteria for being recognised as assets 5.8 -22.2Change in tax rates and items pertaining to prior years - -1.9Total -10.0 -32.1
Closing balance, net 0.0 10.0
Current taxesOpening balance, net 0.0 0.1
Change via income statementCurrent tax on earnings 3.8 1.9Total 3.9 1.9
Tax on group contributions reported in equity -3.9 -2.0Closing balance, net -0.1 0.0
The deferred tax assets concern entirely the parent company unutilised loss carry-forwards of 189,7 MEUR (267,9). These loss carry-forwards mature indefinitely.
NOTE 12 NON-RECURRING ITEMS2014 2013
NatureRestructuring costs - -6.1Transaction costs -4.4Sale of subsidiary -1.5 -5.2Impairments -27.5 -Other -2.6 -3.6Total -36.0 -14.9
FunctionSales expenses - -2.8Administration expenses -4.6 -3.6Research and development expenses -29.0 -1.8Other operating expenses -0.9 -1.5Capital loss from sale of shares in group companies -1.5 -5.2Operating earnings -36.0 -14.9
Non-recurring items relate mainly to acquisitions and divestments of subsidaries. The item includes impairments of overlapping technologies and transaction costs related to the acquisitions of Veripos, Vero and Mintec and also loss from the divestment of SwePart Transmission.
NOTE 13 GOVERNMENT GRANTS
During 2014 some of the subsidiaries within the Group have received government grants. The government grants relate pri-marily to education of employees. The table below shows how the grants are allocated to functions.
2014 2013
FunctionResearch and development expenses - 0.3Other operating income 0.2 0.5Total 0.2 0.8
NOTE 11 Financial Income and Expenses, cont.
80 Hexagon Annual Report 2014
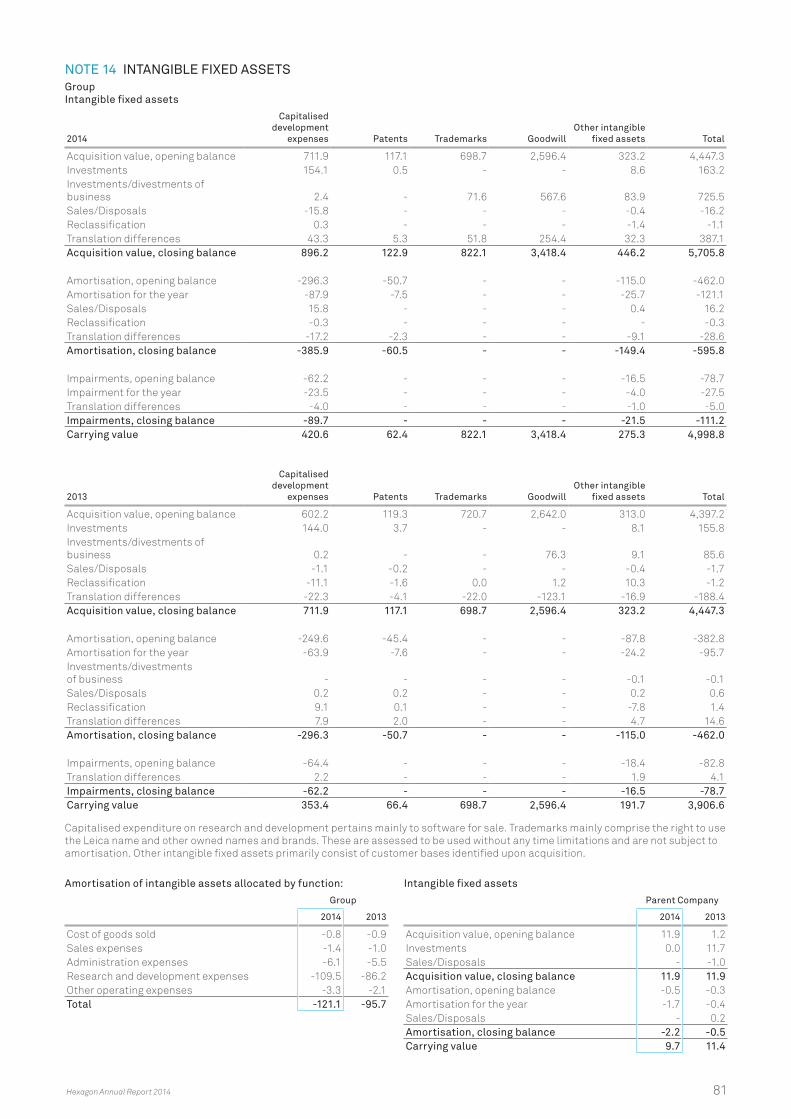
NOTE 14 INTANGIBLE FIXED ASSETS GroupIntangible fixed assets
2014
Capitalised develop ment
expenses Patents Trademarks GoodwillOther intangible
fixed assets Total
Acquisition value, opening balance 711.9 117.1 698.7 2,596.4 323.2 4,447.3Investments 154.1 0.5 - - 8.6 163.2Investments/divestments of business 2.4 - 71.6 567.6 83.9 725.5Sales/Disposals -15.8 - - - -0.4 -16.2Reclassification 0.3 - - - -1.4 -1.1Translation differences 43.3 5.3 51.8 254.4 32.3 387.1Acquisition value, closing balance 896.2 122.9 822.1 3,418.4 446.2 5,705.8
Amortisation, opening balance -296.3 -50.7 - - -115.0 -462.0Amortisation for the year -87.9 -7.5 - - -25.7 -121.1Sales/Disposals 15.8 - - - 0.4 16.2Reclassification -0.3 - - - - -0.3Translation differences -17.2 -2.3 - - -9.1 -28.6Amortisation, closing balance -385.9 -60.5 - - -149.4 -595.8
Impairments, opening balance -62.2 - - - -16.5 -78.7Impairment for the year -23.5 - - - -4.0 -27.5Translation differences -4.0 - - - -1.0 -5.0Impairments, closing balance -89.7 - - - -21.5 -111.2Carrying value 420.6 62.4 822.1 3,418.4 275.3 4,998.8
2013
Capitalised develop ment
expenses Patents Trademarks GoodwillOther intangible
fixed assets Total
Acquisition value, opening balance 602.2 119.3 720.7 2,642.0 313.0 4,397.2Investments 144.0 3.7 - - 8.1 155.8Investments/divestments of business 0.2 - - 76.3 9.1 85.6Sales/Disposals -1.1 -0.2 - - -0.4 -1.7Reclassification -11.1 -1.6 0.0 1.2 10.3 -1.2Translation differences -22.3 -4.1 -22.0 -123.1 -16.9 -188.4Acquisition value, closing balance 711.9 117.1 698.7 2,596.4 323.2 4,447.3
Amortisation, opening balance -249.6 -45.4 - - -87.8 -382.8Amortisation for the year -63.9 -7.6 - - -24.2 -95.7Investments/divestments of business - - - - -0.1 -0.1Sales/Disposals 0.2 0.2 - - 0.2 0.6Reclassification 9.1 0.1 - - -7.8 1.4Translation differences 7.9 2.0 - - 4.7 14.6Amortisation, closing balance -296.3 -50.7 - - -115.0 -462.0
Impairments, opening balance -64.4 - - - -18.4 -82.8Translation differences 2.2 - - - 1.9 4.1Impairments, closing balance -62.2 - - - -16.5 -78.7Carrying value 353.4 66.4 698.7 2,596.4 191.7 3,906.6
Capitalised expenditure on research and development pertains mainly to software for sale. Trademarks mainly comprise the right to use the Leica name and other owned names and brands. These are assessed to be used without any time limitations and are not subject to amortisation. Other intangible fixed assets primarily consist of customer bases identified upon acquisition.
Amortisation of intangible assets allocated by function:
Group
2014 2013
Cost of goods sold -0.8 -0.9Sales expenses -1.4 -1.0Administration expenses -6.1 -5.5Research and development expenses -109.5 -86.2Other operating expenses -3.3 -2.1Total -121.1 -95.7
Intangible fixed assets
Parent Company
2014 2013
Acquisition value, opening balance 11.9 1.2Investments 0.0 11.7Sales/Disposals - -1.0Acquisition value, closing balance 11.9 11.9Amortisation, opening balance -0.5 -0.3Amortisation for the year -1.7 -0.4Sales/Disposals - 0.2Amortisation, closing balance -2.2 -0.5Carrying value 9.7 11.4
Hexagon Annual Report 2014 81
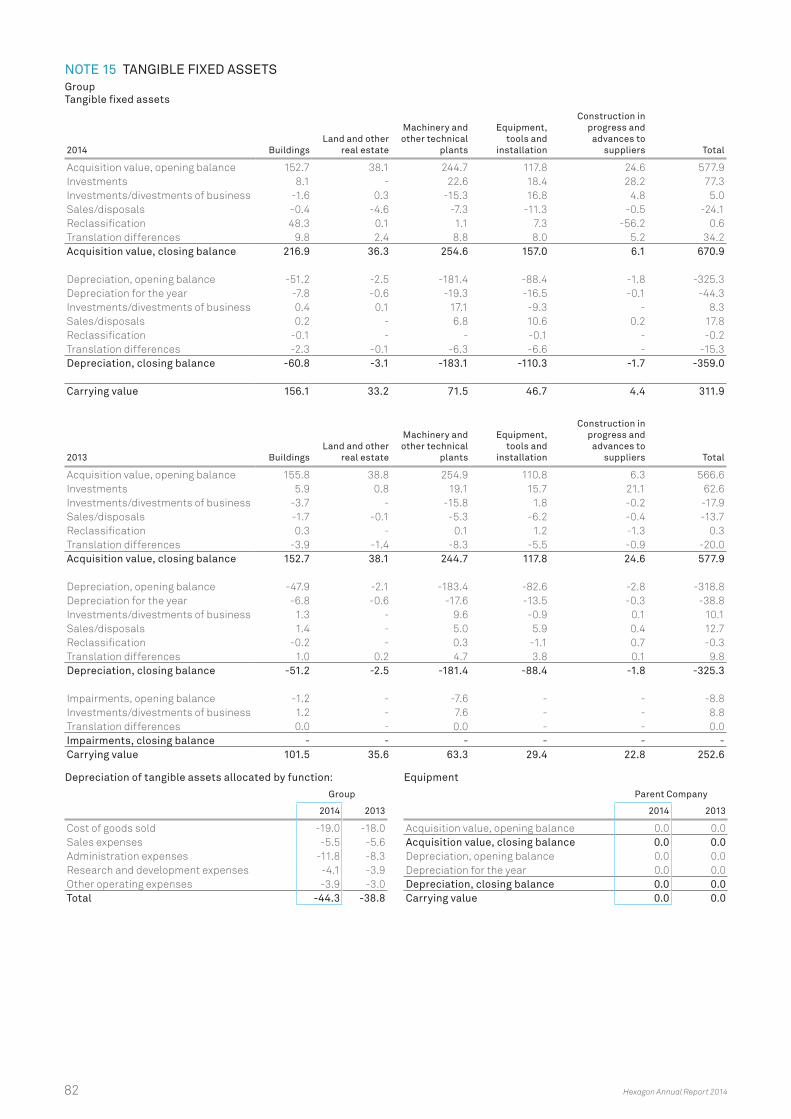
NOTE 15 TANGIBLE FIXED ASSETSGroup Tangible fixed assets
2014 BuildingsLand and other
real estate
Machinery and other technical
plants
Equipment, tools and
installation
Construction in progress and
advances to suppliers Total
Acquisition value, opening balance 152.7 38.1 244.7 117.8 24.6 577.9Investments 8.1 - 22.6 18.4 28.2 77.3Investments/divestments of business -1.6 0.3 -15.3 16.8 4.8 5.0Sales/disposals -0.4 -4.6 -7.3 -11.3 -0.5 -24.1Reclassification 48.3 0.1 1.1 7.3 -56.2 0.6Translation differences 9.8 2.4 8.8 8.0 5.2 34.2Acquisition value, closing balance 216.9 36.3 254.6 157.0 6.1 670.9
Depreciation, opening balance -51.2 -2.5 -181.4 -88.4 -1.8 -325.3Depreciation for the year -7.8 -0.6 -19.3 -16.5 -0.1 -44.3Investments/divestments of business 0.4 0.1 17.1 -9.3 - 8.3Sales/disposals 0.2 - 6.8 10.6 0.2 17.8Reclassification -0.1 - - -0.1 - -0.2Translation differences -2.3 -0.1 -6.3 -6.6 - -15.3Depreciation, closing balance -60.8 -3.1 -183.1 -110.3 -1.7 -359.0
Carrying value 156.1 33.2 71.5 46.7 4.4 311.9
2013 BuildingsLand and other
real estate
Machinery and other technical
plants
Equipment, tools and
installation
Construction in progress and
advances to suppliers Total
Acquisition value, opening balance 155.8 38.8 254.9 110.8 6.3 566.6Investments 5.9 0.8 19.1 15.7 21.1 62.6Investments/divestments of business -3.7 - -15.8 1.8 -0.2 -17.9Sales/disposals -1.7 -0.1 -5.3 -6.2 -0.4 -13.7Reclassification 0.3 - 0.1 1.2 -1.3 0.3Translation differences -3.9 -1.4 -8.3 -5.5 -0.9 -20.0Acquisition value, closing balance 152.7 38.1 244.7 117.8 24.6 577.9
Depreciation, opening balance -47.9 -2.1 -183.4 -82.6 -2.8 -318.8Depreciation for the year -6.8 -0.6 -17.6 -13.5 -0.3 -38.8Investments/divestments of business 1.3 - 9.6 -0.9 0.1 10.1Sales/disposals 1.4 - 5.0 5.9 0.4 12.7Reclassification -0.2 - 0.3 -1.1 0.7 -0.3Translation differences 1.0 0.2 4.7 3.8 0.1 9.8Depreciation, closing balance -51.2 -2.5 -181.4 -88.4 -1.8 -325.3
Impairments, opening balance -1.2 - -7.6 - - -8.8Investments/divestments of business 1.2 - 7.6 - - 8.8Translation differences 0.0 - 0.0 - - 0.0Impairments, closing balance - - - - - -Carrying value 101.5 35.6 63.3 29.4 22.8 252.6
Depreciation of tangible assets allocated by function:
Group
2014 2013
Cost of goods sold -19.0 -18.0Sales expenses -5.5 -5.6Administration expenses -11.8 -8.3Research and development expenses -4.1 -3.9Other operating expenses -3.9 -3.0Total -44.3 -38.8
Equipment
Parent Company
2014 2013
Acquisition value, opening balance 0.0 0.0Acquisition value, closing balance 0.0 0.0Depreciation, opening balance 0.0 0.0Depreciation for the year 0.0 0.0Depreciation, closing balance 0.0 0.0Carrying value 0.0 0.0
82 Hexagon Annual Report 2014
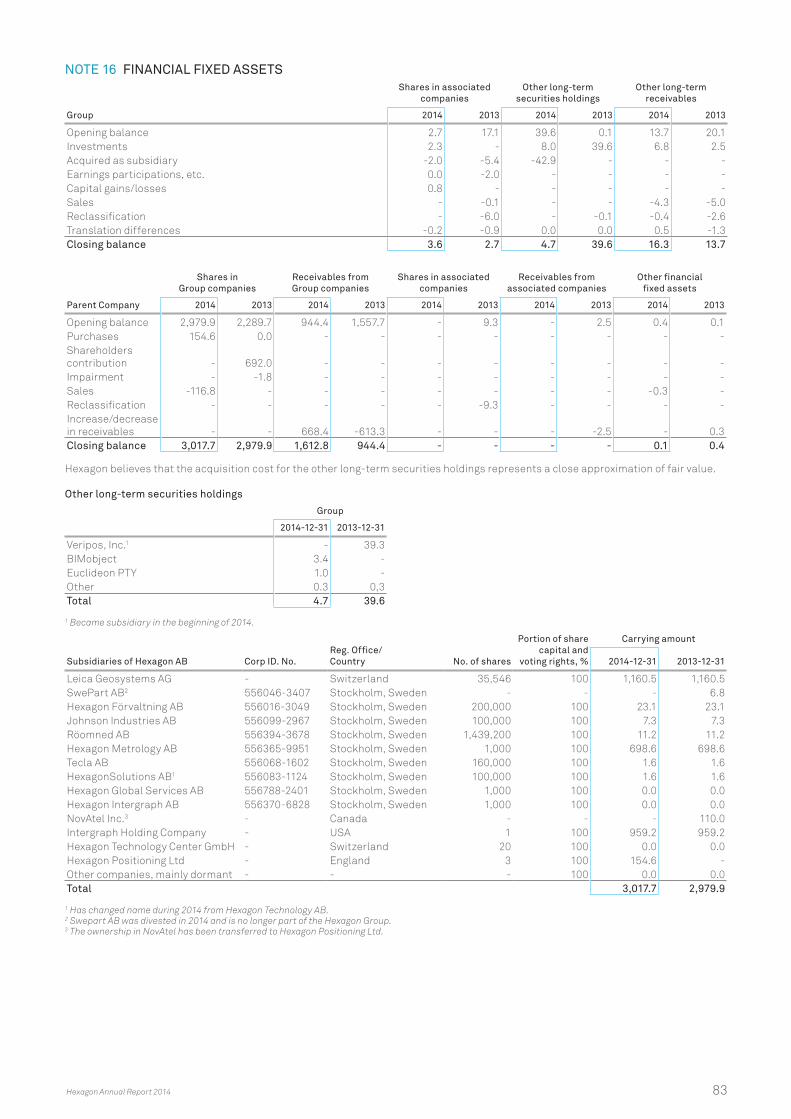
NOTE 16 FINANCIAL FIXED ASSETS Shares in associated
companiesOther long-term
securities holdingsOther long-term
receivables
Group 2014 2013 2014 2013 2014 2013
Opening balance 2.7 17.1 39.6 0.1 13.7 20.1Investments 2.3 - 8.0 39.6 6.8 2.5Acquired as subsidiary -2.0 -5.4 -42.9 - - -Earnings participations, etc. 0.0 -2.0 - - - -Capital gains/losses 0.8 - - - - -Sales - -0.1 - - -4.3 -5.0Reclassification - -6.0 - -0.1 -0.4 -2.6Translation differences -0.2 -0.9 0.0 0.0 0.5 -1.3Closing balance 3.6 2.7 4.7 39.6 16.3 13.7
Shares in Group companies
Receivables from Group companies
Shares in associated companies
Receivables from associated companies
Other financial fixed assets
Parent Company 2014 2013 2014 2013 2014 2013 2014 2013 2014 2013
Opening balance 2,979.9 2,289.7 944.4 1,557.7 - 9.3 - 2.5 0.4 0.1Purchases 154.6 0.0 - - - - - - - -Shareholders contribution - 692.0 - - - - - - - -Impairment - -1.8 - - - - - - - -Sales -116.8 - - - - - - - -0.3 -Reclassification - - - - - -9.3 - - - -Increase/decrease in receivables - - 668.4 -613.3 - - - -2.5 - 0.3Closing balance 3,017.7 2,979.9 1,612.8 944.4 - - - - 0.1 0.4
Hexagon believes that the acquisition cost for the other long-term securities holdings represents a close approximation of fair value.
Other long-term securities holdings
Group
2014-12-31 2013-12-31
Veripos, Inc.1 - 39.3BIMobject 3.4 -Euclideon PTY 1.0 -Other 0.3 0,3Total 4.7 39.6
1 Became subsidiary in the beginning of 2014.
Subsidiaries of Hexagon AB Corp ID. No.Reg. Office/ Country No. of shares
Portion of share capital and
voting rights, %
Carrying amount
2014-12-31 2013-12-31
Leica Geosystems AG - Switzerland 35,546 100 1,160.5 1,160.5SwePart AB2 556046-3407 Stockholm, Sweden - - - 6.8Hexagon Förvaltning AB 556016-3049 Stockholm, Sweden 200,000 100 23.1 23.1Johnson Industries AB 556099-2967 Stockholm, Sweden 100,000 100 7.3 7.3Röomned AB 556394-3678 Stockholm, Sweden 1,439,200 100 11.2 11.2Hexagon Metrology AB 556365-9951 Stockholm, Sweden 1,000 100 698.6 698.6Tecla AB 556068-1602 Stockholm, Sweden 160,000 100 1.6 1.6HexagonSolutions AB1 556083-1124 Stockholm, Sweden 100,000 100 1.6 1.6Hexagon Global Services AB 556788-2401 Stockholm, Sweden 1,000 100 0.0 0.0Hexagon Intergraph AB 556370-6828 Stockholm, Sweden 1,000 100 0.0 0.0NovAtel Inc.3 - Canada - - - 110.0Intergraph Holding Company - USA 1 100 959.2 959.2Hexagon Technology Center GmbH - Switzerland 20 100 0.0 0.0Hexagon Positioning Ltd - England 3 100 154.6 -Other companies, mainly dormant - - - 100 0.0 0.0Total 3,017.7 2,979.9
1 Has changed name during 2014 from Hexagon Technology AB.2 Swepart AB was divested in 2014 and is no longer part of the Hexagon Group. 3 The ownership in NovAtel has been transferred to Hexagon Positioning Ltd.
Hexagon Annual Report 2014 83
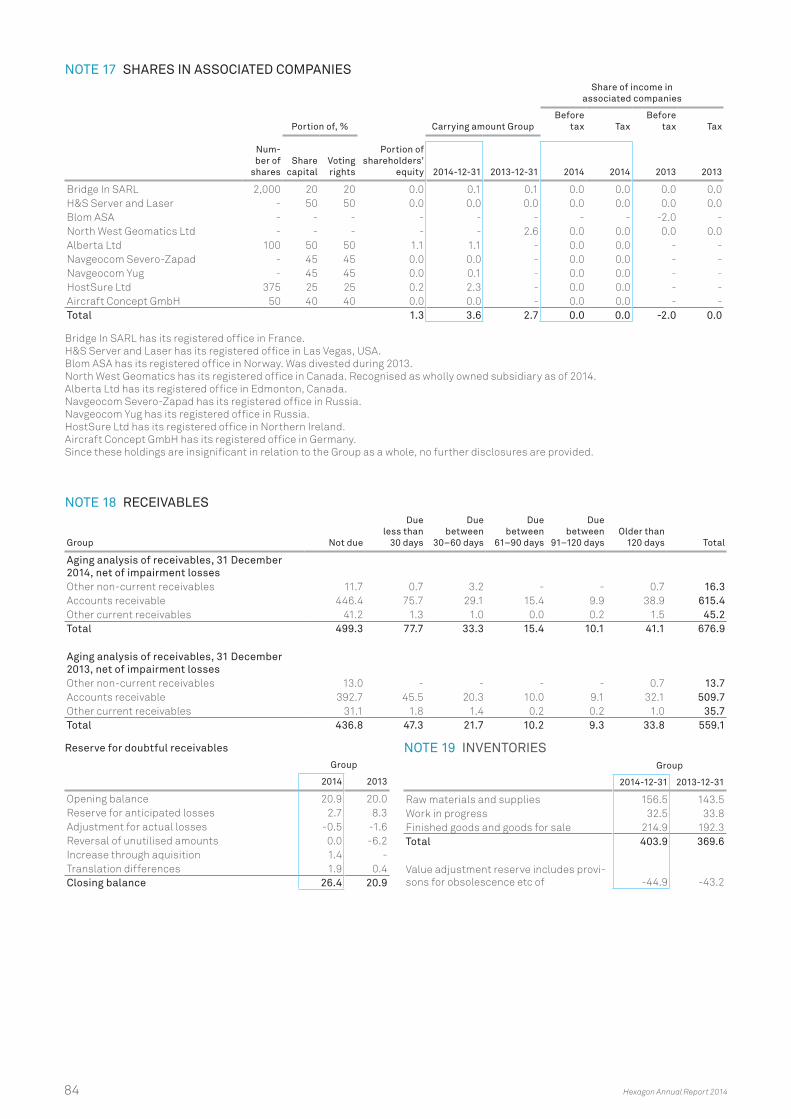
NOTE 17 SHARES IN ASSOCIATED COMPANIES
Share of income in associated companies
Portion of, % Carrying amount GroupBefore
tax TaxBefore
tax Tax
Num-ber of
sharesShare
capitalVoting rights
Portion of shareholders’
equity 2014-12-31 2013-12-31 2014 2014 2013 2013
Bridge In SARL 2,000 20 20 0.0 0.1 0.1 0.0 0.0 0.0 0.0H&S Server and Laser - 50 50 0.0 0.0 0.0 0.0 0.0 0.0 0.0Blom ASA - - - - - - - - -2.0 -North West Geomatics Ltd - - - - - 2.6 0.0 0.0 0.0 0.0Alberta Ltd 100 50 50 1.1 1.1 - 0.0 0.0 - -Navgeocom Severo-Zapad - 45 45 0.0 0.0 - 0.0 0.0 - -Navgeocom Yug - 45 45 0.0 0.1 - 0.0 0.0 - -HostSure Ltd 375 25 25 0.2 2.3 - 0.0 0.0 - -Aircraft Concept GmbH 50 40 40 0.0 0.0 - 0.0 0.0 - -Total 1.3 3.6 2.7 0.0 0.0 -2.0 0.0
Bridge In SARL has its registered office in France. H&S Server and Laser has its registered office in Las Vegas, USA. Blom ASA has its registered office in Norway. Was divested during 2013. North West Geomatics has its registered office in Canada. Recognised as wholly owned subsidiary as of 2014. Alberta Ltd has its registered office in Edmonton, Canada. Navgeocom Severo-Zapad has its registered office in Russia. Navgeocom Yug has its registered office in Russia. HostSure Ltd has its registered office in Northern Ireland. Aircraft Concept GmbH has its registered office in Germany. Since these holdings are insignificant in relation to the Group as a whole, no further disclosures are provided.
NOTE 18 RECEIVABLES
Group Not due
Due less than
30 days
Due between
30–60 days
Due between
61–90 days
Due between
91–120 daysOlder than
120 days Total
Aging analysis of receivables, 31 December 2014, net of impairment lossesOther non-current receivables 11.7 0.7 3.2 - - 0.7 16.3Accounts receivable 446.4 75.7 29.1 15.4 9.9 38.9 615.4Other current receivables 41.2 1.3 1.0 0.0 0.2 1.5 45.2Total 499.3 77.7 33.3 15.4 10.1 41.1 676.9
Aging analysis of receivables, 31 December 2013, net of impairment lossesOther non-current receivables 13.0 - - - - 0.7 13.7Accounts receivable 392.7 45.5 20.3 10.0 9.1 32.1 509.7Other current receivables 31.1 1.8 1.4 0.2 0.2 1.0 35.7Total 436.8 47.3 21.7 10.2 9.3 33.8 559.1
Reserve for doubtful receivables
Group
2014 2013
Opening balance 20.9 20.0Reserve for anticipated losses 2.7 8.3Adjustment for actual losses -0.5 -1.6Reversal of unutilised amounts 0.0 -6.2Increase through aquisition 1.4 -Translation differences 1.9 0.4Closing balance 26.4 20.9
NOTE 19 INVENTORIES Group
2014-12-31 2013-12-31
Raw materials and supplies 156.5 143.5Work in progress 32.5 33.8Finished goods and goods for sale 214.9 192.3Total 403.9 369.6
Value adjustment reserve includes provi-sons for obsolescence etc of -44.9 -43.2
84 Hexagon Annual Report 2014
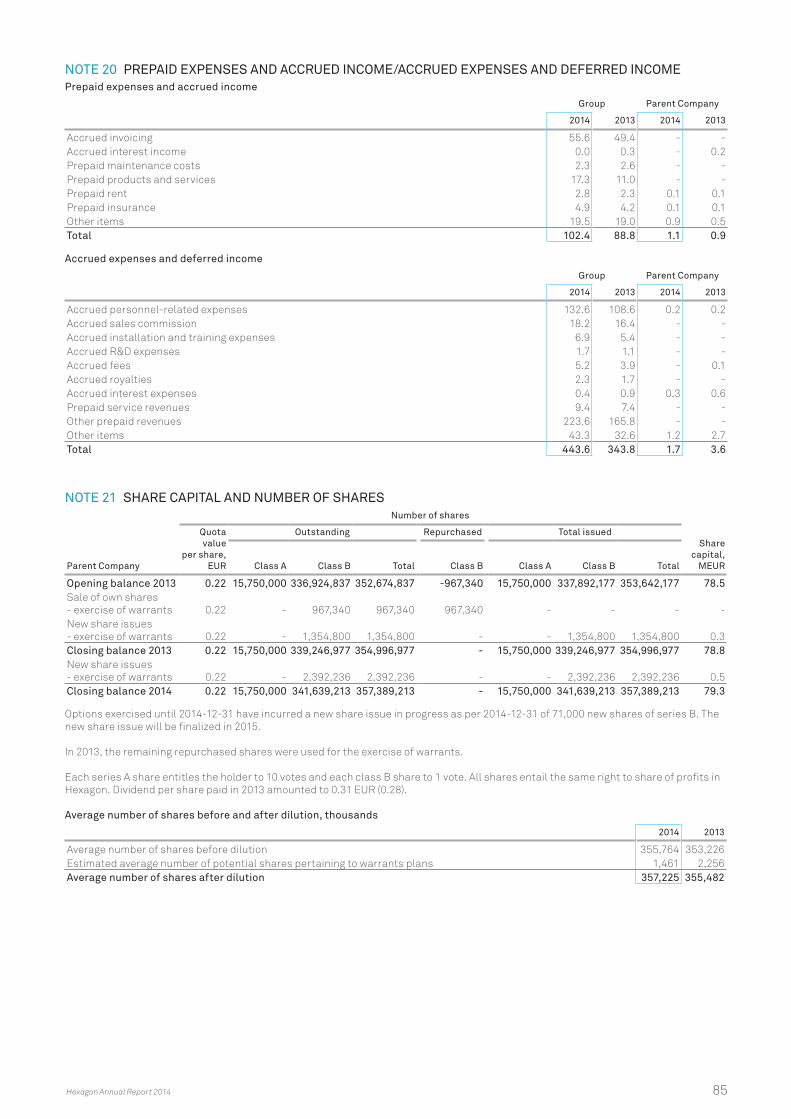
NOTE 20 PREPAID EXPENSES AND ACCRUED INCOME/ACCRUED EXPENSES AND DEFERRED INCOMEPrepaid expenses and accrued income
Group Parent Company
2014 2013 2014 2013
Accrued invoicing 55.6 49.4 - -Accrued interest income 0.0 0.3 - 0.2Prepaid maintenance costs 2.3 2.6 - -Prepaid products and services 17.3 11.0 - -Prepaid rent 2.8 2.3 0.1 0.1Prepaid insurance 4.9 4.2 0.1 0.1Other items 19.5 19.0 0.9 0.5Total 102.4 88.8 1.1 0.9
Accrued expenses and deferred income
Group Parent Company
2014 2013 2014 2013
Accrued personnel-related expenses 132.6 108.6 0.2 0.2Accrued sales commission 18.2 16.4 - -Accrued installation and training expenses 6.9 5.4 - -Accrued R&D expenses 1.7 1.1 - -Accrued fees 5.2 3.9 - 0.1Accrued royalties 2.3 1.7 - -Accrued interest expenses 0.4 0.9 0.3 0.6Prepaid service revenues 9.4 7.4 - -Other prepaid revenues 223.6 165.8 - -Other items 43.3 32.6 1.2 2.7Total 443.6 343.8 1.7 3.6
NOTE 21 SHARE CAPITAL AND NUMBER OF SHARES
Parent Company
Number of shares
Share capital,
MEUR
Quota value
per share, EUR
Outstanding Repurchased Total issued
Class A Class B Total Class B Class A Class B Total
Opening balance 2013 0.22 15,750,000 336,924,837 352,674,837 -967,340 15,750,000 337,892,177 353,642,177 78.5Sale of own shares - exercise of warrants 0.22 - 967,340 967,340 967,340 - - - -New share issues - exercise of warrants 0.22 - 1,354,800 1,354,800 - - 1,354,800 1,354,800 0.3Closing balance 2013 0.22 15,750,000 339,246,977 354,996,977 - 15,750,000 339,246,977 354,996,977 78.8New share issues - exercise of warrants 0.22 - 2,392,236 2,392,236 - - 2,392,236 2,392,236 0.5Closing balance 2014 0.22 15,750,000 341,639,213 357,389,213 - 15,750,000 341,639,213 357,389,213 79.3
Options exercised until 2014-12-31 have incurred a new share issue in progress as per 2014-12-31 of 71,000 new shares of series B. The new share issue will be finalized in 2015.
In 2013, the remaining repurchased shares were used for the exercise of warrants.
Each series A share entitles the holder to 10 votes and each class B share to 1 vote. All shares entail the same right to share of profits in Hexagon. Dividend per share paid in 2013 amounted to 0.31 EUR (0.28).
Average number of shares before and after dilution, thousands
2014 2013
Average number of shares before dilution 355,764 353,226Estimated average number of potential shares pertaining to warrants plans 1,461 2,256Average number of shares after dilution 357,225 355,482
Hexagon Annual Report 2014 85

NOTE 22 PENSION PROVISIONS AND SIMILAR OBLIGATIONS
OVERVIEWProvisions – Defined-benefit pension plans
2014-12-31 2013-12-31
Pension obligations 575.5 507.3Fair value of plan assets -489.4 -454.6Pension obligations less plan assets 86.1 52.7Unrecognised assets 1.3 0.3Pension provision 87.4 53.0
Pension expenses - Defined-benefit plans
2014 2013
Current service cost 21.2 20.1Interest expense 13.4 11.8Calculated interest income -11.7 -10.1Change in terms and conditions1 -11.2 -2.8Employees’ own contribution -9.3 -8.5Pension expenses – defined-benefit plans 2.4 10.5
1 In one of the Swiss plans, the so called conversion rate for calculating the retirement pension was reduced in 2014.
Total pension expenses impact on the income statement
2014 2013
Operating expenses - defined-benefit plans 0.7 8.8Operating expenses - defined contibution plans 33.5 25.9Operating earnings impact 34.2 34.7Net interest expenses - defined-benefit plans 1.7 1.7Earnings before tax impact 35.9 36.4
DEFINED-BENEFIT OBLIGATIONS
2014-12-31Plan
assetsPension
obligations Net
Switzerland 441.5 -489.0 47.5Other countries 47.9 84.4 38.6Total (fair/present value) 489.4 -575.5 -86.1
Unrecognised assets 1.3Pensions provisions, net -87.4
Of which:Reported as asset (other non-current receivables) 0.2Reported as liability -87.6
2013-12-31Plan
assetsPension
obligations Net
Switzerland 415.5 -437.9 -22.4Other countries 39.1 -69.4 -30.3Total (fair/present value) 454.6 -507.3 -52.7
Unrecognised assets -0.3Pensions provisions, net -53.0
Of which:Reported as asset (other non-current receivables) 0.2Reported as liability -53.2
Three year summary
2014-12-31 2013-12-31 2012-12-31
Fair value of plan assets 489.4 454.6 438.3Pension obligations -575.5 -507.3 -500.0Net -86.1 -52.7 -61.7Unrecognised assets -1.3 -0.3 -1.1Book-value -87.4 -53.0 -62.8
Pension obligations
2014 2013
Opening balance 507.3 500.0Change in terms and conditions -11.2 -2.8Current service cost 21.2 20.1Interest expense 13.4 11.8Benefits paid -27.6 -22.5Acquired/divested subsidiaries 3.1 -0.1Settlement of pension obligations -0.2 -0.1Reclassification 2.8 -Actuarial gains/losses - Financial assumptions 51.3 -6.5Actuarial gains/losses - Demographic assumptions 5.8 -1.0Actuarial gains/losses - Experience adjustments -2.0 17.1Currency translation differences 11.6 -8.7Closing balance 575.5 507.3
Plan assets
2014 2013
Opening balance 454.6 438.3Calculated interest income 11.7 10.1Contributions – employer 12.0 10.5Contributions – employee 9.3 8.5Benefits paid -27.6 -22.0Acquired/divested subsidiaries 2.7 -Return on plan assets excluding calculated interest income as above 15.5 17.2Currency translation differences 11.2 -8.0Closing balance 489.4 454.6
86 Hexagon Annual Report 2014
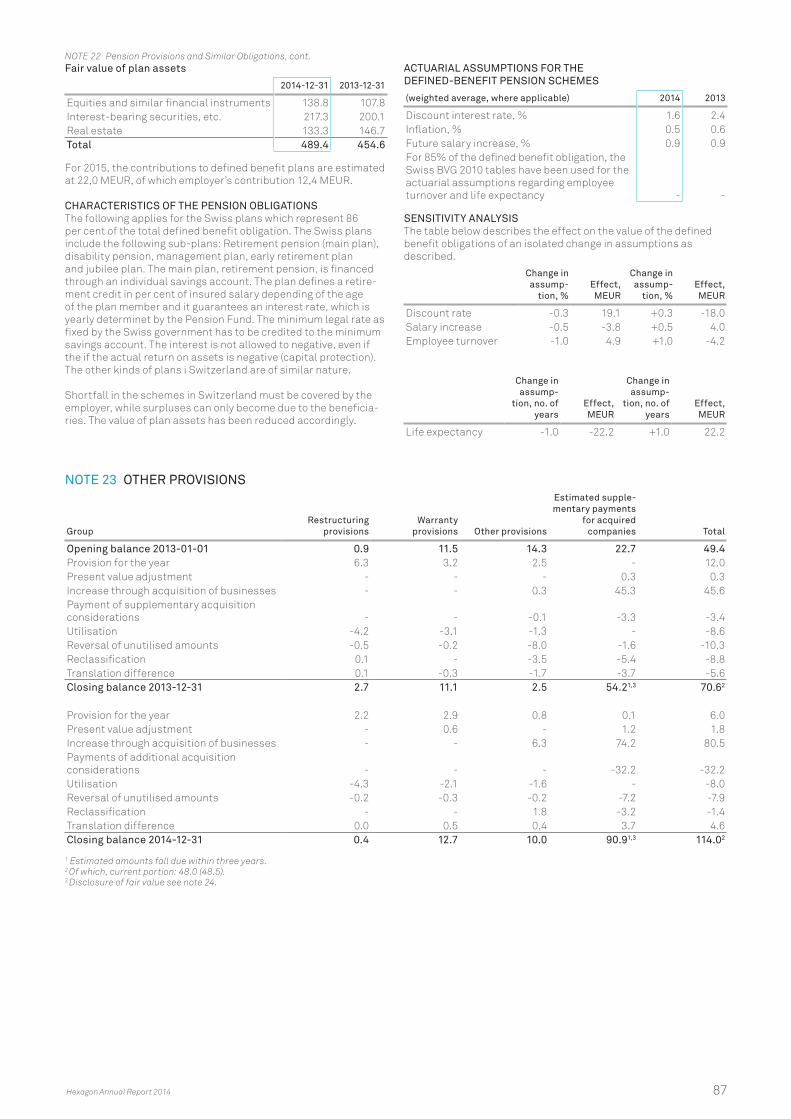
Fair value of plan assets
2014-12-31 2013-12-31
Equities and similar financial instruments 138.8 107.8Interest-bearing securities, etc. 217.3 200.1Real estate 133.3 146.7Total 489.4 454.6
For 2015, the contributions to defined benefit plans are estimated at 22,0 MEUR, of which employer’s contribution 12,4 MEUR.
CHARACTERISTICS OF THE PENSION OBLIGATIONSThe following applies for the Swiss plans which represent 86 per cent of the total defined benefit obligation. The Swiss plans include the following sub-plans: Retirement pension (main plan), disability pension, management plan, early retirement plan and jubilee plan. The main plan, retirement pension, is financed through an individual savings account. The plan defines a retire-ment credit in per cent of insured salary depending of the age of the plan member and it guarantees an interest rate, which is yearly determinet by the Pension Fund. The minimum legal rate as fixed by the Swiss government has to be credited to the minimum savings account. The interest is not allowed to negative, even if the if the actual return on assets is negative (capital protection). The other kinds of plans i Switzerland are of similar nature.
Shortfall in the schemes in Switzerland must be covered by the employer, while surpluses can only become due to the beneficia-ries. The value of plan assets has been reduced accordingly.
ACTUARIAL ASSUMPTIONS FOR THE DEFINED-BENEFIT PENSION SCHEMES
(weighted average, where applicable) 2014 2013
Discount interest rate, % 1.6 2.4Inflation, % 0.5 0.6Future salary increase, % 0.9 0.9For 85% of the defined benefit obligation, the Swiss BVG 2010 tables have been used for the actuarial assumptions regarding employee turnover and life expectancy - -
SENSITIVITY ANALYSISThe table below describes the effect on the value of the defined benefit obligations of an isolated change in assumptions as described.
Change in assump-
tion, %Effect, MEUR
Change in assump-
tion, %Effect, MEUR
Discount rate -0.3 19.1 +0.3 -18.0Salary increase -0.5 -3.8 +0.5 4.0Employee turnover -1.0 4.9 +1.0 -4.2
Change in assump-
tion, no. of years
Effect, MEUR
Change in assump-
tion, no. of years
Effect, MEUR
Life expectancy -1.0 -22.2 +1.0 22.2
NOTE 23 OTHER PROVISIONS
GroupRestructuring
provisionsWarranty
provisions Other provisions
Estimated supple-mentary payments
for acquired companies Total
Opening balance 2013-01-01 0.9 11.5 14.3 22.7 49.4Provision for the year 6.3 3.2 2.5 - 12.0Present value adjustment - - - 0.3 0.3Increase through acquisition of businesses - - 0.3 45.3 45.6Payment of supplementary acquisition considerations - - -0.1 -3.3 -3.4Utilisation -4.2 -3.1 -1.3 - -8.6Reversal of unutilised amounts -0.5 -0.2 -8.0 -1.6 -10.3Reclassification 0.1 - -3.5 -5.4 -8.8Translation difference 0.1 -0.3 -1.7 -3.7 -5.6Closing balance 2013-12-31 2.7 11.1 2.5 54.21,3 70.62
Provision for the year 2.2 2.9 0.8 0.1 6.0Present value adjustment - 0.6 - 1.2 1.8Increase through acquisition of businesses - - 6.3 74.2 80.5Payments of additional acquisition considerations - - - -32.2 -32.2Utilisation -4.3 -2.1 -1.6 - -8.0Reversal of unutilised amounts -0.2 -0.3 -0.2 -7.2 -7.9Reclassification - - 1.8 -3.2 -1.4Translation difference 0.0 0.5 0.4 3.7 4.6Closing balance 2014-12-31 0.4 12.7 10.0 90.91,3 114.02
1 Estimated amounts fall due within three years.2 Of which, current portion: 48.0 (48.5).3 Disclosure of fair value see note 24.
NOTE 22 Pension Provisions and Similar Obligations, cont.
Hexagon Annual Report 2014 87
NOTE 24 FINANCIAL INSTRUMENTS Hexagon is a net borrower and has extensive international opera-tions and is therefore exposed to various financial risks. The Group Treasury Policy, approved by the Board, stipulates the rules and limitations for the management of the different financial risks within the Group. Hexagon’s treasury operations are centralised to the Group’s internal bank, which is in charge of coordinating the financial risk management. The internal bank is also responsible for the Group’s external borrowing and its internal financing. Cen-tralisation entails substantial economies of scale, lower financing cost and better control and management of the Group’s financial risks. The internal bank has no mandate to conduct independent trading in currencies and interest rate instruments. All relevant exposures are monitored continuously and are reported to the Group Management and the Board of Directors on a regular basis.
CURRENCY RISKCurrency risk is the risk that exchange rate fluctuations will have an adverse effect on income statement, balance sheet and cash flow. Furthermore, the comparability of Hexagon’s earnings between periods will be affected by changes in currency exchange rates. Hexagon’s operations are mainly conducted internationally and sales, costs and net assets are therefore denominated in a number of currencies. As of 1 January 2011 the presentation cur-rency is EUR for the Group. The change decreases the currency exposure in both the income statement and balance sheet as well as in other comprehensive income. It also allows the Hexagon Group to better match debt to net assets. Currency exposure orig-inates both from transactions in non-domestic currencies in the individual operating entities, i.e. transaction exposure, and from translation of earnings and net assets into EUR upon consolida-tion of the Group, i.e. translation exposure.
Transaction Exposure Sales and purchase of goods and services in currencies other than respective subsidiary’s functional currency give rise to transac-tion exposure. Transaction exposure is, as far as possible, concen-trated to the countries where manufacturing entities are located. This is achieved by invoicing the sales entities in their respective functional currency.
Transaction exposure was hedged until December 2012 at which point in time the Group Treasury Policy was changed. The Policy now states that transaction exposure should not be hedged.
Currency derivatives used for hedging operating cash flows
2015 2016 and later Total
2014-12-311 Sold Bought Sold Bought Sold Bought Net
- - - - - - - -Total - - - - - - -
Currency derivatives used for hedging operating cash flows
2014 2015 and later Total
2013-12-311 Sold Bought Sold Bought Sold Bought Net
BRL - 1.2 - - - 1.2 1.2EUR -1.3 - - - -1.3 - -1.3Total -1.3 1.2 - - -1.3 1.2 -0.1
1 Translated from local currency to EUR with balance sheet closing rate.
Translation Exposure – Balance SheetTranslation exposure arise when the net assets are translated into EUR upon consolidation. Translation exposure is partly hedged with external debt in corresponding currencies, mainly USD, in accordance with the Group Treasury Policy. Translation differ-ences from net assets in other currencies than EUR reported in other comprehensive income during 2014 were 373.4 MEUR (-194.4). Other postings in other comprehensive income relate to revaluation of external loans to hedge net assets in subsidaries and amounted to -36.4 MEUR (8.2).
Net exposure per currency
2014-12-31 Hedging rate
USD 2,681.5 6%CHF 1,157.5 0%GBP 367.8 1%CAD 306.4 1%CNY 218.8 -BRL 170.9 2%SEK 63.0 -1%Other 215.4 7%Total 5,181.3 4%
Translation Exposure – Income StatementThe consolidated operating income and expense is mainly gener-ated in subsidiaries outside the Euro-area. Changes in exchange rates therefore have a significant impact on the Group’s earnings when the income statements are translated into EUR. Translation exposure related to actual and forecasted earnings is not hedged.
Net sales per currency
2014 2013
USD 880.3 792.6EUR 591.6 538.3CNY 289.4 254.6CHF 122.4 129.7GBP 117.0 88.2CAD 80.7 79.4Other 541.0 546.9Total 2,622.4 2,429.7
INTEREST RATE RISKThe interest rate risk is the risk that changes in interest rates will adversely affect the Group’s net interest expense and/or cash flow. Interest rate exposure arise primarily from the external interest bearing debt. In accordance with the Group Treasury Policy the average interest rate duration for the external debt should be short.
During 2014 interest rate derivatives were used in order to manage the interest rate risk.
Financial income and expenses
2014 2013
Interest income 3.9 5.0Interest expense -26.1 -28.4Other financial income and expense -11.4 -10.5Net -33.6 -33.9
88 Hexagon Annual Report 2014
CREDIT RISKCredit risk is the risk that counterparts may be unable to ful-fil their payment obligations. Financial credit risk arise when investing cash and cash equivalents and when trading in financial instruments. To reduce the Group’s financial credit risk, surplus cash is only invested with a limited number of by the company approved banks and derivative transactions are only conducted with counterparts where an ISDA netting agreement has been established.
As the Group is a net borrower, excess liquidity is primarily used to amortise external debt and therefore the average surplus cash invested with banks is kept as low as possible.
Credit risk also includes the risk that customers will not pay receivables that the company has invoiced or intends to invoice.
Through a combination of geographical and business segmental diversification of the customers the risk for significant customer credit losses is reduced. An aging analysis of the receivables can be found in Note 18.
LIQUIDITY RISKLiquidity risk is the risk of not being able to meet the Group’s pay-ment obligations in full as they fall due or can only do so at mate-rially disadvantageous terms due to lack of cash resources. To minimise the liquidity risk, the Group Treasury Policy states that total liquidity reserves shall at all times be at least 10 per cent of the Group’s forecasted annual net sales.
On 31 December 2014, cash and unutilised credit limits totalled 1,006.8 MEUR (390.1).
Group’s maturity structure of interest-bearing financial liabilities - undiscounted cash flowsThe table below presents the undiscounted cash flows of the Group’s interest-bearing liabilities related to financial instruments based on the remaining period at the balance sheet to the contractual maturity date. Floating interest cash flows with future fixing dates are based on the actual interest rates at year-end. Any cash flow in foreign currency is translated to EUR using the exchange rate at year-end.
2015 2016-2017 2018 and later Total
Capital Interest Capital Interest Capital Interest Capital Interest
Liabilities to credit institutionsRevolving Credit 398.0 7.4 - 11.2 732.0 9.7 1,130.0 28.3MTN loan - 2.6 - 5.1 216.8 4.9 216.8 12.6Commercial paper1 - 4.2 - 6.3 615.7 5.5 615.7 16.0Other lenders 57.6 1.3 2.3 0.2 1.9 0.1 61.8 1.6Total liabilities to credit institutions 455.6 15.5 2.3 22.8 1,566.4 20.2 2,024.3 58.5
Other interest-bearing liabilities 2.0 0.3 1.5 0.4 3.1 0.3 6.6 1.0Total interest-bearing liabilities 457.6 15.8 3.8 23.2 1,569.5 20.5 2,030.9 59.5
1 The Commercial Paper Program is supported by long term loan facilites as back-up and therefore classified as long term.
There were interest rate derivatives pertaining to borrowing at 31 December 2014. The agreement governing the Revolving Credit Facility include a financial covenants for Net debt/EBITDA to be fulfilled to avoid additional financing costs.
Currency composition pertaining to interest-bearing liabilities
2014-12-31 2013-12-31
EUR 91% 85%USD 8% 14%INR 0% 0%CHF 0% 0%Other 1% 1%Total 100% 100%
REFINANCING RISKRefinancing risk refers to the risk that Hexagon does not have suffi-cient financing available when needed to refinance maturing debt, due to existing lenders do not extend or Hexagon has difficulties in procuring new lines of credit at a given point in time. Securing these requirements demands a strong financial position in the Group, combined with active measures to ensure access to credit.
In order to ensure that appropriate financing is in place and to decrease the refinancing risk, no more than 20 per cent of the Group’s gross debt, including unutilised credit facilities, is allowed to mature within the next 12 months without replacing facilities agreed.
Following a refinancing in 2014, Hexagon’s main sources of financ-ing consist of:
1) A multicurrency revolving credit facility (RCF) established during Q3 2014. The RCF amounts to 2,000 MEUR with a tenor of 5+1+1 years.
2) A Swedish Medium Term Note Programme (MTN) established during Q2 2014. The MTN programme enables Hexagon to issue MTN up to a total amount of 10,000 MSEK. On 31 Decem-ber 2014, Hexagon had issued MTN of a total amount of 2,000 MSEK, consisting of a 2,000 MSEK MTN with a tenor of 5 year and maturity in November 2019.
3) A Swedish Commercial Paper Program (CP) established during 2012. The CP programme enables Hexagon to issue commercial paper up to a total amount of 8,000 MSEK. Commercial paper with tenor up to 12 months can be issued under the programme. On 31 December 2014, Hexagon had issued commercial paper of a total amount of 5,517 MSEK (5,589). A multicurrency revolv-ing credit facility of 400 MEUR with maturity in July 2015 have been establised to together with the 2,000 MEUR multicurrency revolving facility support the commercial paper programme.
NOTE 24 Financial Instruments, cont.
Hexagon Annual Report 2014 89
Group’s capital structure
2014-12-31 2013-12-31
Interest-bearing liabilities and provisions 2,125.3 1,664.7Cash, bank and short-term investments -228.6 -176.0Net Debt 1,896.7 1,488.7
Shareholders' equity 3,470.2 2,846.3
SENSITIVITY ANALYSISThe Group’s earnings are affected by changes in certain key factors, as described below. The calculations proceed from the conditions prevailing in 2014 and the effects are expressed on an annualised basis. Earnings in non-EUR subsidiaries are converted into EUR based on average exchange rates for the period when the earnings arise.
During the second part of 2014 there was significant changes to the exchange rates of currencies that have the biggest impact on Hexagon’s earnings and net assets, namely USD, CHF and CNY. The EUR has weakened against USD, CHF and CNY. Since Hexagon has a majority of the operating earnings denominated in USD and CNY, this had a positive impact on operating earnings. The strengthening of the CHF had a negative impact since a con-siderable part of the costs are denominated in CHF. An isolated strengthening in the exchange rate for EUR by 1 per cent for all assets and liabilities denominated in non-EUR currencies would have had an immaterial effect on net income but a negative effect on equity of 49.9 MEUR (39.5) net, and vice versa, after the impact of hedging.
During 2014, total operating earnings, excluding non-recurring items, from operations in other currencies than EUR amounted to an equivalent of 497.4 MEUR (459.1). An isolated change in the exchange rate for EUR by 1 per cent against all other currencies would have a net effect on operating earnings of approximately 5.0 MEUR (4.6).
Based on the average interest fixing period of less than one year in the Group’s total loan portfolio as of year-end 2014, a simultane-ous 1 percentage point change in interest rates in all of Hexagon’s funding currencies would entail a pre-tax impact of about 6.0 MEUR (12.8) in the coming 12 months earnings.
FINANCIAL INSTRUMENTS – fair value
2014-12-31 2013-12-31
AssetsCarrying amount
Fair value
Carrying amount
Fair value
Available-for-sale financial assetsOther long-term securities holdings 4.7 4.7 39.6 39.6
Loan receivables and accounts receivablesLong-term receivables 16.3 16.3 13.7 13.7Accounts receivable 615.4 615.4 509.7 509.7Other current receivables 45.2 45.2 35.7 35.7Accrued income 55.6 55.6 49.4 49.4Accrued interest 0.0 0.0 0.3 0.3Short-term investments 52.9 52.9 39.1 39.1Cash and bank balances 175.7 175.7 136.9 136.9
Financial instruments at fair value through other comprehensive incomeDerivatives - - -0.1 -0.1Total 965.8 965.8 824.3 824.3
2014-12-31 2013-12-31
LiabilitiesCarrying amount
Fair value
Carrying amount
Fair value
Financial liabilities valued at fair value through income statement Estimated supplementary payments for acquired companies 90.9 90.9 54.3 54.3Financial liabilities valued at accrued acquisition valueLong-term liabilities - interest bearing1 1,573.3 1,573.7 918.8 918.8Other long-term liabilities - non interest-bearing 7.0 7.0 8.1 8.1Current liabilities - interest bearing1 457.6 457.6 680.3 684.9Accounts payable 166.6 166.6 159.0 159.0Other current non interest-bearing liabilities 86.4 86.4 66.6 66.6Accrued expenses 210.2 210.2 169.7 169.7Accrued interest 0.4 0.4 0.9 0.9Total 2,592.4 2,592.8 2,057.7 2,062.3
1 Commercial papers and bond have with currency forward and swap con-tract been swapped from SEK to EUR and USD. The fair value of the deriva-tives are included in the current and long-term interest bearing liabilities.
Financial assets at fair value
2014-12-31 2013-12-31
Level 1 Level 2 Level 3 Level 1 Level 2 Level 3
- Currency forward and swap contracts - -35.4 - - 4.5 -
- Estimated supplementary payments for acquired companies - - -90.9 - - -54.3
- Other long-term securities holdings - 4.4 0.3 - 39.3 0.3
Total - -31.0 -90.6 - 43.8 -54.0
The Group uses the following hierarchy for determining and disclos-ing the fair value of financial instruments by valuation technique:
Level 1: Quoted (unadjusted) prices in active markets for identical assets or liabilites
Level 2: Other techniques for which all inputs which have a sig-nificant effect on the recorded fair value are observable, either directly or indirectly.
Level 3: Techniques which use inputs that have a significant effect on the recorded fair value that are not based on observable mar-ket data.
For further information about estimated supplementary pay-ments for acquired companies see note 23.
During the reporting period ending 31 December 2014, there were no transfers between levels.
NOTE 24 Financial Instruments, cont.
90 Hexagon Annual Report 2014
NOTE 25 RENTED ASSETSLeasing/rental agreements of an operational nature
Group Parent Company
2014-12-31Machinery,
equipment, etc.Prem-
isesMachinery,
equipment, etc.Prem-
ises
Expenses due for payment in2015 12.5 25.5 0.0 0.32016-2019 17.8 55.8 0.0 0.32020 or later 0.9 25.1 - -Total 31.2 106.5 0.0 0.6
Group Parent Company
2013-12-31Machinery,
equipment, etc.Prem-
isesMachinery,
equipment, etc.Prem-
ises
Expenses due for payment in2014 10.1 25.7 0.0 0.42015-2018 15.2 52.4 0.1 0.32019 or later 1.4 20.2 - 0.0Total 26.7 98.3 0.1 0.7 The amounts are undiscounted minimum undertakings pursuant to contract. Costs for leasing/rents for the financial year were 45.9 MEUR (38.2).
Leasing/rental agreements of a financial nature
Group Parent Company
2014-12-31Machinery,
equipment, etc.Prem-
isesMachinery,
equipment, etc.Prem-
ises
Expenses due for payment in2015 0.9 0.1 - -2016-2019 1.0 0.1 - -2020 or later 0.0 0.0 - -Total 1.9 0.2 - -
Group Parent Company
2013-12-31Machinery,
equipment, etc.Prem-
isesMachinery,
equipment, etc.Prem-
ises
Expenses due for payment in2014 1.3 0.3 - -2015-2018 1.0 0.3 - -2019 or later 0.0 - - -Total 2.3 0.6 - -
The amounts are undiscounted minimum undertakings pursuant to contract. There are no individual leasing agreements of material importance. Nor are there any individual sale/leaseback agree-ments of material importance.
NOTE 26 ASSETS PLEDGED AND CONTINGENT LIABILITIES
Pledged assets to credit institutions for loans, bank overdrafts and guarantees
Group Parent Company
December 31 2014 2013 2014 2013
Real estate mortgages - 0.8 - -Chattel mortgages - 4.8 - -Other 0.5 0.5 - -Total 0.5 6.1 - -
Contingent liabilities
Group Parent Company
December 31 2014 2013 2014 2013
Guarantees in favour of Group companies - - 41.0 40.3Letters of credit - 6.0 0.0 -Other contingent liabilities 1.5 108.7 0.3 108.1Total 1.5 114.7 41.3 148.4
Other contingent liabilities reported in 2013 referred mainly to a guarantee to Oslo Stock Exchange for the acquisition of Veripos in the beginning of 2014.
Hexagon Annual Report 2014 91
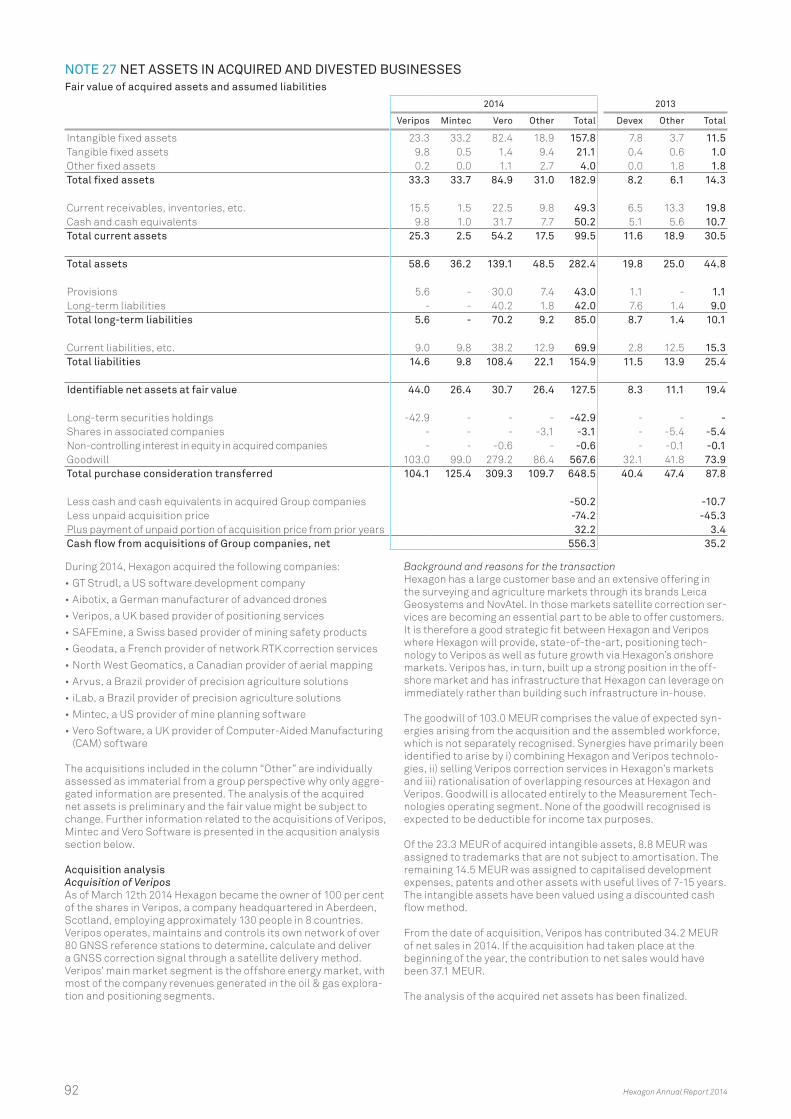
NOTE 27 NET ASSETS IN ACQUIRED AND DIVESTED BUSINESSESFair value of acquired assets and assumed liabilities
2014 2013
Veripos Mintec Vero Other Total Devex Other Total
Intangible fixed assets 23.3 33.2 82.4 18.9 157.8 7.8 3.7 11.5Tangible fixed assets 9.8 0.5 1.4 9.4 21.1 0.4 0.6 1.0Other fixed assets 0.2 0.0 1.1 2.7 4.0 0.0 1.8 1.8Total fixed assets 33.3 33.7 84.9 31.0 182.9 8.2 6.1 14.3
Current receivables, inventories, etc. 15.5 1.5 22.5 9.8 49.3 6.5 13.3 19.8Cash and cash equivalents 9.8 1.0 31.7 7.7 50.2 5.1 5.6 10.7Total current assets 25.3 2.5 54.2 17.5 99.5 11.6 18.9 30.5
Total assets 58.6 36.2 139.1 48.5 282.4 19.8 25.0 44.8
Provisions 5.6 - 30.0 7.4 43.0 1.1 - 1.1Long-term liabilities - - 40.2 1.8 42.0 7.6 1.4 9.0Total long-term liabilities 5.6 - 70.2 9.2 85.0 8.7 1.4 10.1
Current liabilities, etc. 9.0 9.8 38.2 12.9 69.9 2.8 12.5 15.3Total liabilities 14.6 9.8 108.4 22.1 154.9 11.5 13.9 25.4
Identifiable net assets at fair value 44.0 26.4 30.7 26.4 127.5 8.3 11.1 19.4
Long-term securities holdings -42.9 - - - -42.9 - - -Shares in associated companies - - - -3.1 -3.1 - -5.4 -5.4Non-controlling interest in equity in acquired companies - - -0.6 - -0.6 - -0.1 -0.1Goodwill 103.0 99.0 279.2 86.4 567.6 32.1 41.8 73.9Total purchase consideration transferred 104.1 125.4 309.3 109.7 648.5 40.4 47.4 87.8
Less cash and cash equivalents in acquired Group companies -50.2 -10.7Less unpaid acquisition price -74.2 -45.3Plus payment of unpaid portion of acquisition price from prior years 32.2 3.4Cash flow from acquisitions of Group companies, net 556.3 35.2
During 2014, Hexagon acquired the following companies:
•GT Strudl, a US software development company
•Aibotix, a German manufacturer of advanced drones
•Veripos, a UK based provider of positioning services
•SAFEmine, a Swiss based provider of mining safety products
•Geodata, a French provider of network RTK correction services
•North West Geomatics, a Canadian provider of aerial mapping
•Arvus, a Brazil provider of precision agriculture solutions
•iLab, a Brazil provider of precision agriculture solutions
•Mintec, a US provider of mine planning software
•Vero Software, a UK provider of Computer-Aided Manufacturing (CAM) software
The acquisitions included in the column “Other” are individually assessed as immaterial from a group perspective why only aggre-gated information are presented. The analysis of the acquired net assets is preliminary and the fair value might be subject to change. Further information related to the acquisitions of Veripos, Mintec and Vero Software is presented in the acqusition analysis section below.
Acquisition analysis Acquisition of VeriposAs of March 12th 2014 Hexagon became the owner of 100 per cent of the shares in Veripos, a company headquartered in Aberdeen, Scotland, employing approximately 130 people in 8 countries. Veripos operates, maintains and controls its own network of over 80 GNSS reference stations to determine, calculate and deliver a GNSS correction signal through a satellite delivery method. Veripos’ main market segment is the offshore energy market, with most of the company revenues generated in the oil & gas explora-tion and positioning segments.
Background and reasons for the transactionHexagon has a large customer base and an extensive offering in the surveying and agriculture markets through its brands Leica Geosystems and NovAtel. In those markets satellite correction ser-vices are becoming an essential part to be able to offer customers. It is therefore a good strategic fit between Hexagon and Veripos where Hexagon will provide, state-of-the-art, positioning tech-nology to Veripos as well as future growth via Hexagon’s onshore markets. Veripos has, in turn, built up a strong position in the off-shore market and has infrastructure that Hexagon can leverage on immediately rather than building such infrastructure in-house.
The goodwill of 103.0 MEUR comprises the value of expected syn-ergies arising from the acquisition and the assembled workforce, which is not separately recognised. Synergies have primarily been identified to arise by i) combining Hexagon and Veripos technolo-gies, ii) selling Veripos correction services in Hexagon’s markets and iii) rationalisation of overlapping resources at Hexagon and Veripos. Goodwill is allocated entirely to the Measurement Tech-nologies operating segment. None of the goodwill recognised is expected to be deductible for income tax purposes.
Of the 23.3 MEUR of acquired intangible assets, 8.8 MEUR was assigned to trademarks that are not subject to amortisation. The remaining 14.5 MEUR was assigned to capitalised development expenses, patents and other assets with useful lives of 7-15 years. The intangible assets have been valued using a discounted cash flow method.
From the date of acquisition, Veripos has contributed 34.2 MEUR of net sales in 2014. If the acquisition had taken place at the beginning of the year, the contribution to net sales would have been 37.1 MEUR.
The analysis of the acquired net assets has been finalized.
92 Hexagon Annual Report 2014
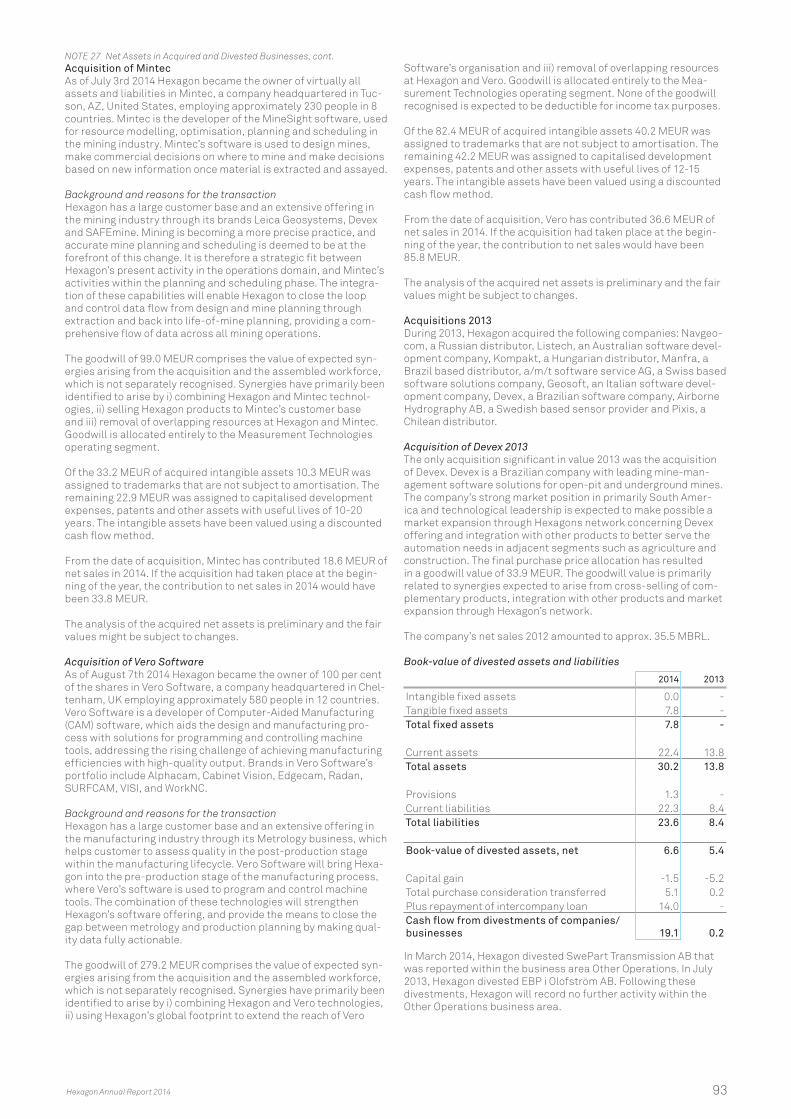
Acquisition of MintecAs of July 3rd 2014 Hexagon became the owner of virtually all assets and liabilities in Mintec, a company headquartered in Tuc-son, AZ, United States, employing approximately 230 people in 8 countries. Mintec is the developer of the MineSight software, used for resource modelling, optimisation, planning and scheduling in the mining industry. Mintec’s software is used to design mines, make commercial decisions on where to mine and make decisions based on new information once material is extracted and assayed.
Background and reasons for the transactionHexagon has a large customer base and an extensive offering in the mining industry through its brands Leica Geosystems, Devex and SAFEmine. Mining is becoming a more precise practice, and accurate mine planning and scheduling is deemed to be at the forefront of this change. It is therefore a strategic fit between Hexagon’s present activity in the operations domain, and Mintec’s activities within the planning and scheduling phase. The integra-tion of these capabilities will enable Hexagon to close the loop and control data flow from design and mine planning through extraction and back into life-of-mine planning, providing a com-prehensive flow of data across all mining operations.
The goodwill of 99.0 MEUR comprises the value of expected syn-ergies arising from the acquisition and the assembled workforce, which is not separately recognised. Synergies have primarily been identified to arise by i) combining Hexagon and Mintec technol-ogies, ii) selling Hexagon products to Mintec’s customer base and iii) removal of overlapping resources at Hexagon and Mintec. Goodwill is allocated entirely to the Measurement Technologies operating segment.
Of the 33.2 MEUR of acquired intangible assets 10.3 MEUR was assigned to trademarks that are not subject to amortisation. The remaining 22.9 MEUR was assigned to capitalised development expenses, patents and other assets with useful lives of 10-20 years. The intangible assets have been valued using a discounted cash flow method.
From the date of acquisition, Mintec has contributed 18.6 MEUR of net sales in 2014. If the acquisition had taken place at the begin-ning of the year, the contribution to net sales in 2014 would have been 33.8 MEUR.
The analysis of the acquired net assets is preliminary and the fair values might be subject to changes.
Acquisition of Vero SoftwareAs of August 7th 2014 Hexagon became the owner of 100 per cent of the shares in Vero Software, a company headquartered in Chel-tenham, UK employing approximately 580 people in 12 countries. Vero Software is a developer of Computer-Aided Manufacturing (CAM) software, which aids the design and manufacturing pro-cess with solutions for programming and controlling machine tools, addressing the rising challenge of achieving manufacturing efficiencies with high-quality output. Brands in Vero Software’s portfolio include Alphacam, Cabinet Vision, Edgecam, Radan, SURFCAM, VISI, and WorkNC.
Background and reasons for the transactionHexagon has a large customer base and an extensive offering in the manufacturing industry through its Metrology business, which helps customer to assess quality in the post-production stage within the manufacturing lifecycle. Vero Software will bring Hexa-gon into the pre-production stage of the manufacturing process, where Vero’s software is used to program and control machine tools. The combination of these technologies will strengthen Hexagon’s software offering, and provide the means to close the gap between metrology and production planning by making qual-ity data fully actionable.
The goodwill of 279.2 MEUR comprises the value of expected syn-ergies arising from the acquisition and the assembled workforce, which is not separately recognised. Synergies have primarily been identified to arise by i) combining Hexagon and Vero technologies, ii) using Hexagon’s global footprint to extend the reach of Vero
Software’s organisation and iii) removal of overlapping resources at Hexagon and Vero. Goodwill is allocated entirely to the Mea-surement Technologies operating segment. None of the goodwill recognised is expected to be deductible for income tax purposes.
Of the 82.4 MEUR of acquired intangible assets 40.2 MEUR was assigned to trademarks that are not subject to amortisation. The remaining 42.2 MEUR was assigned to capitalised development expenses, patents and other assets with useful lives of 12-15 years. The intangible assets have been valued using a discounted cash flow method.
From the date of acquisition, Vero has contributed 36.6 MEUR of net sales in 2014. If the acquisition had taken place at the begin-ning of the year, the contribution to net sales would have been 85.8 MEUR.
The analysis of the acquired net assets is preliminary and the fair values might be subject to changes.
Acquisitions 2013During 2013, Hexagon acquired the following companies: Navgeo-com, a Russian distributor, Listech, an Australian software devel-opment company, Kompakt, a Hungarian distributor, Manfra, a Brazil based distributor, a/m/t software service AG, a Swiss based software solutions company, Geosoft, an Italian software devel-opment company, Devex, a Brazilian software company, Airborne Hydrography AB, a Swedish based sensor provider and Pixis, a Chilean distributor.
Acquisition of Devex 2013The only acquisition significant in value 2013 was the acquisition of Devex. Devex is a Brazilian company with leading mine-man-agement software solutions for open-pit and underground mines. The company’s strong market position in primarily South Amer-ica and technological leadership is expected to make possible a market expansion through Hexagons network concerning Devex offering and integration with other products to better serve the automation needs in adjacent segments such as agriculture and construction. The final purchase price allocation has resulted in a goodwill value of 33.9 MEUR. The goodwill value is primarily related to synergies expected to arise from cross-selling of com-plementary products, integration with other products and market expansion through Hexagon’s network.
The company’s net sales 2012 amounted to approx. 35.5 MBRL.
Book-value of divested assets and liabilities
2014 2013
Intangible fixed assets 0.0 -Tangible fixed assets 7.8 -Total fixed assets 7.8 -
Current assets 22.4 13.8Total assets 30.2 13.8
Provisions 1.3 -Current liabilities 22.3 8.4Total liabilities 23.6 8.4
Book-value of divested assets, net 6.6 5.4
Capital gain -1.5 -5.2Total purchase consideration transferred 5.1 0.2Plus repayment of intercompany loan 14.0 -Cash flow from divestments of companies/businesses 19.1 0.2
In March 2014, Hexagon divested SwePart Transmission AB that was reported within the business area Other Operations. In July 2013, Hexagon divested EBP i Olofström AB. Following these divestments, Hexagon will record no further activity within the Other Operations business area.
NOTE 27 Net Assets in Acquired and Divested Businesses, cont.
Hexagon Annual Report 2014 93
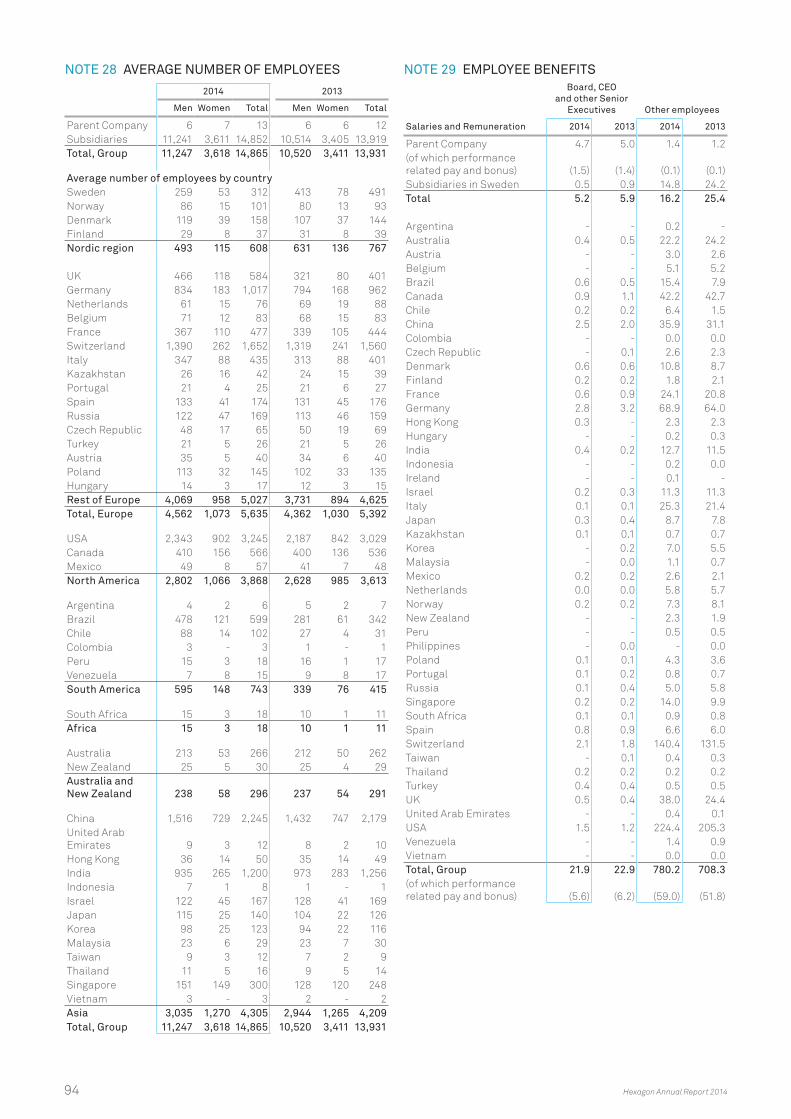
NOTE 28 AVERAGE NUMBER OF EMPLOYEES
2014 2013
Men Women Total Men Women Total
Parent Company 6 7 13 6 6 12Subsidiaries 11,241 3,611 14,852 10,514 3,405 13,919Total, Group 11,247 3,618 14,865 10,520 3,411 13,931
Average number of employees by countrySweden 259 53 312 413 78 491Norway 86 15 101 80 13 93Denmark 119 39 158 107 37 144Finland 29 8 37 31 8 39Nordic region 493 115 608 631 136 767
UK 466 118 584 321 80 401Germany 834 183 1,017 794 168 962Netherlands 61 15 76 69 19 88Belgium 71 12 83 68 15 83France 367 110 477 339 105 444Switzerland 1,390 262 1,652 1,319 241 1,560Italy 347 88 435 313 88 401Kazakhstan 26 16 42 24 15 39Portugal 21 4 25 21 6 27Spain 133 41 174 131 45 176Russia 122 47 169 113 46 159Czech Republic 48 17 65 50 19 69Turkey 21 5 26 21 5 26Austria 35 5 40 34 6 40Poland 113 32 145 102 33 135Hungary 14 3 17 12 3 15Rest of Europe 4,069 958 5,027 3,731 894 4,625Total, Europe 4,562 1,073 5,635 4,362 1,030 5,392
USA 2,343 902 3,245 2,187 842 3,029Canada 410 156 566 400 136 536Mexico 49 8 57 41 7 48North America 2,802 1,066 3,868 2,628 985 3,613
Argentina 4 2 6 5 2 7Brazil 478 121 599 281 61 342Chile 88 14 102 27 4 31Colombia 3 - 3 1 - 1Peru 15 3 18 16 1 17Venezuela 7 8 15 9 8 17South America 595 148 743 339 76 415
South Africa 15 3 18 10 1 11Africa 15 3 18 10 1 11
Australia 213 53 266 212 50 262New Zealand 25 5 30 25 4 29Australia and New Zealand 238 58 296 237 54 291
China 1,516 729 2,245 1,432 747 2,179United Arab Emirates 9 3 12 8 2 10Hong Kong 36 14 50 35 14 49India 935 265 1,200 973 283 1,256Indonesia 7 1 8 1 - 1Israel 122 45 167 128 41 169Japan 115 25 140 104 22 126Korea 98 25 123 94 22 116Malaysia 23 6 29 23 7 30Taiwan 9 3 12 7 2 9Thailand 11 5 16 9 5 14Singapore 151 149 300 128 120 248Vietnam 3 - 3 2 - 2Asia 3,035 1,270 4,305 2,944 1,265 4,209Total, Group 11,247 3,618 14,865 10,520 3,411 13,931
NOTE 29 EMPLOYEE BENEFITSBoard, CEO
and other Senior Executives Other employees
Salaries and Remuneration 2014 2013 2014 2013
Parent Company 4.7 5.0 1.4 1.2(of which performance related pay and bonus) (1.5) (1.4) (0.1) (0.1)Subsidiaries in Sweden 0.5 0.9 14.8 24.2Total 5.2 5.9 16.2 25.4
Argentina - - 0.2 -Australia 0.4 0.5 22.2 24.2Austria - - 3.0 2.6Belgium - - 5.1 5.2Brazil 0.6 0.5 15.4 7.9Canada 0.9 1.1 42.2 42.7Chile 0.2 0.2 6.4 1.5China 2.5 2.0 35.9 31.1Colombia - - 0.0 0.0Czech Republic - 0.1 2.6 2.3Denmark 0.6 0.6 10.8 8.7Finland 0.2 0.2 1.8 2.1France 0.6 0.9 24.1 20.8Germany 2.8 3.2 68.9 64.0Hong Kong 0.3 - 2.3 2.3Hungary - - 0.2 0.3India 0.4 0.2 12.7 11.5Indonesia - - 0.2 0.0Ireland - - 0.1 -Israel 0.2 0.3 11.3 11.3Italy 0.1 0.1 25.3 21.4Japan 0.3 0.4 8.7 7.8Kazakhstan 0.1 0.1 0.7 0.7Korea - 0.2 7.0 5.5Malaysia - 0.0 1.1 0.7Mexico 0.2 0.2 2.6 2.1Netherlands 0.0 0.0 5.8 5.7Norway 0.2 0.2 7.3 8.1New Zealand - - 2.3 1.9Peru - - 0.5 0.5Philippines - 0.0 - 0.0Poland 0.1 0.1 4.3 3.6Portugal 0.1 0.2 0.8 0.7Russia 0.1 0.4 5.0 5.8Singapore 0.2 0.2 14.0 9.9South Africa 0.1 0.1 0.9 0.8Spain 0.8 0.9 6.6 6.0Switzerland 2.1 1.8 140.4 131.5Taiwan - 0.1 0.4 0.3Thailand 0.2 0.2 0.2 0.2Turkey 0.4 0.4 0.5 0.5UK 0.5 0.4 38.0 24.4United Arab Emirates - - 0.4 0.1USA 1.5 1.2 224.4 205.3Venezuela - - 1.4 0.9Vietnam - - 0.0 0.0Total, Group 21.9 22.9 780.2 708.3(of which performance related pay and bonus) (5.6) (6.2) (59.0) (51.8)
94 Hexagon Annual Report 2014

All employees
Social security expenses 2014 2013
Parent Company 1.7 2.3(of which pension expenses) 0.9 1.4Subsidiaries 120.9 117.9(of which pension expenses) 33.3 33.4Total, Group 122.6 120.2(of which pension expenses) 34.2 34.8
Pension expenses for Boards of Directors and Chief Executive Officers in the Group amounted to 2.7 MEUR (3.2). Pension com-mitments to Boards of Directors and Chief Executive Officers in the Group were 3.8 MEUR (4.1).
At year-end, three Board members were women and three were men. The President and Chief Executive Officer and other senior executives were all men. Of all the Group’s Board members and Presidents, 33 were women and 441 were men.
NOTE 30 REMUNERATION TO SENIOR EXECUTIVESPursuant to resolutions by the Annual General Meeting, the Chair-man of the Board and Board members were paid remuneration of totaling 381.5 KEUR (363.6). The Chairman of the Board received 109.9 KEUR and other Board members 52.3 KEUR each. The Presi-dent and Chief Executive Officer of Hexagon AB did not receive any director fees. In addition to ordinary director fees, remuneration is paid for work on committees. The Chairman of the Remunera-tion Committee received 9.3 KEUR and each member received 6.5 KEUR. The Chairman of the Audit Committee received 19.2 and each member received 13.7 KEUR. No Board member received any remuneration in addition to director fees or remuneration for com-mittee work. Remuneration to the President and Chief Executive Officer, as well as other senior executives, comprises basic salary, variable remuneration, other benefits and pension. The President and Chief Executive Officer total remuneration is recognised in note 29 in Parent Company. Ola Rollén has received remuneration as President of the Parent Company and as Chief Executive Officer of the Group according to a separate employment contract with a Group Company.
Other senior executives are Robert Belkic, Chief Financial Officer and Executive Vice President Hexagon AB, Johnny Andersson, General Counsel, Bo Pettersson, Chief Technology Officer, Mattias Stenberg, Chief Strategy Officer, Li Hongquan, President Hexagon China, Jürgen Dold, President Hexagon Geosystems, Norbert Hanke, President Hexagon Metrology, Steven Cost, President Intergraph SG&I and Gerhard Sallinger, President Intergraph PP&M.
Beginning of 2015 the Group Management has been extended with Kristin Christensen, Chief Marketing Officer, Edgar Porter, Chief Human Resources Officer and Claudio Simão, Chief Innovation Officer. Bo Pettersson, Chief Technology Officer, is no longer part of Group Management.
Variable remuneration is based on the Group’s profitability. Pen-sions and other benefits received by the President and other senior executives are paid as part of their total remuneration.
REMUNERATION AND OTHER BENEFITS 2014
KEURBasic salary/ Director fees
Variable remuneration
Other benefits1
Pension expenses Total
Melker Schörling, Chairman of the Board 119.2 - - - 119.2Gun Nilsson 72.5 - - - 72.5Jill Smith 66.0 - - - 66.0Ulrika Francke 52.3 - - - 52.3Ulrik Svensson 71.5 - - - 71.5Ola Rollén, President and Chief Executive Officer 2,344.0 1,172.0 - 468.8 3,984.8Other senior executives (nine people) 4,899.6 2,073.9 184.0 359.2 7,516.7Total 7,625.1 3,245.9 184.0 828.0 11,883.0
1 Other benefits comprise company car, housing rent and insurance (excluding pension insurance).
REMUNERATION AND OTHER BENEFITS 2013
KEURBasic salary/ Director fees
Variable remuneration
Other benefits1
Pension expenses Total
Melker Schörling, Chairman of the Board 113.9 - - - 113.9Gun Nilsson 73.4 - - - 73.4Jill Smith 52.0 - - - 52.0Ulrika Francke 52.0 - - - 52.0Ulrik Svensson 72.3 - - - 72.3Ola Rollén, President and Chief Executive Officer 2,380.7 1,190.3 - 476.1 4,047.1Other senior executives (nine people)2 4,586.1 1,566.4 46.4 396.3 6,595.2Total 7,330.4 2,756.7 46.4 872.4 11,005.9
1 Other benefits comprise company car, housing rent and insurance (excluding pension insurance).2 Including costs for part of the year for senior executives who acceded their positions 1st of February 2013 and 1st of December 2013 and left their positions
1st of October 2013 and 1st of December 2013.
NOTE 29 Employee Benefits, cont.
Hexagon Annual Report 2014 95
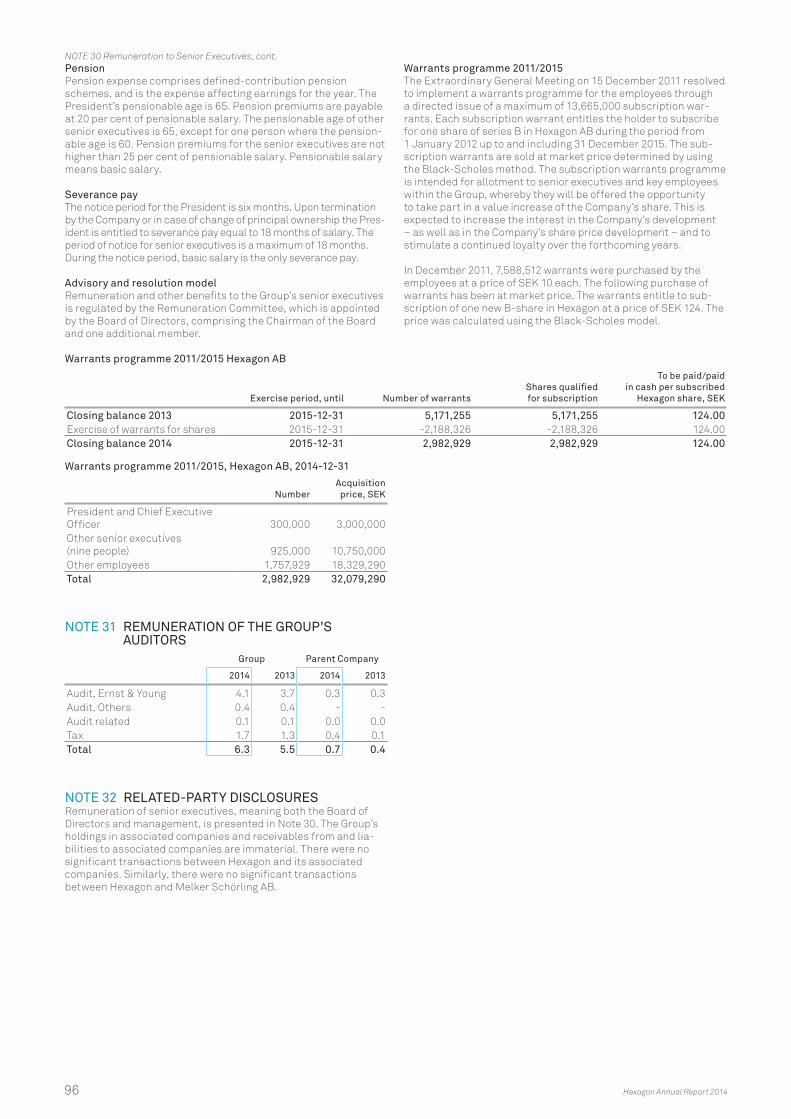
PensionPension expense comprises defined-contribution pension schemes, and is the expense affecting earnings for the year. The President’s pensionable age is 65. Pension premiums are payable at 20 per cent of pensionable salary. The pensionable age of other senior executives is 65, except for one person where the pension-able age is 60. Pension premiums for the senior executives are not higher than 25 per cent of pensionable salary. Pensionable salary means basic salary.
Severance payThe notice period for the President is six months. Upon termination by the Company or in case of change of principal ownership the Pres-ident is entitled to severance pay equal to 18 months of salary. The period of notice for senior executives is a maximum of 18 months. During the notice period, basic salary is the only severance pay.
Advisory and resolution modelRemuneration and other benefits to the Group’s senior executives is regulated by the Remuneration Committee, which is appointed by the Board of Directors, comprising the Chairman of the Board and one additional member.
Warrants programme 2011/2015The Extraordinary General Meeting on 15 December 2011 resolved to implement a warrants programme for the employees through a directed issue of a maximum of 13,665,000 subscription war-rants. Each subscription warrant entitles the holder to subscribe for one share of series B in Hexagon AB during the period from 1 January 2012 up to and including 31 December 2015. The sub-scription warrants are sold at market price determined by using the Black-Scholes method. The subscription warrants programme is intended for allotment to senior executives and key employees within the Group, whereby they will be offered the opportunity to take part in a value increase of the Company’s share. This is expected to increase the interest in the Company’s development – as well as in the Company’s share price development – and to stimulate a continued loyalty over the forthcoming years.
In December 2011, 7,588,512 warrants were purchased by the employees at a price of SEK 10 each. The following purchase of warrants has been at market price. The warrants entitle to sub-scription of one new B-share in Hexagon at a price of SEK 124. The price was calculated using the Black-Scholes model.
Warrants programme 2011/2015 Hexagon AB
Exercise period, until Number of warrantsShares qualified for subscription
To be paid/paid in cash per subscribed
Hexagon share, SEK
Closing balance 2013 2015-12-31 5,171,255 5,171,255 124.00Exercise of warrants for shares 2015-12-31 -2,188,326 -2,188,326 124.00Closing balance 2014 2015-12-31 2,982,929 2,982,929 124.00
Warrants programme 2011/2015, Hexagon AB, 2014-12-31
NumberAcquisition
price, SEK
President and Chief Executive Officer 300,000 3,000,000Other senior executives (nine people) 925,000 10,750,000Other employees 1,757,929 18,329,290Total 2,982,929 32,079,290
NOTE 31 REMUNERATION OF THE GROUP’S AUDITORS
Group Parent Company
2014 2013 2014 2013
Audit, Ernst & Young 4.1 3.7 0.3 0.3Audit, Others 0.4 0.4 - -Audit related 0.1 0.1 0.0 0.0Tax 1.7 1.3 0.4 0.1Total 6.3 5.5 0.7 0.4
NOTE 32 RELATED-PARTY DISCLOSURESRemuneration of senior executives, meaning both the Board of Directors and management, is presented in Note 30. The Group’s holdings in associated companies and receivables from and lia-bilities to associated companies are immaterial. There were no significant transactions between Hexagon and its associated companies. Similarly, there were no significant transactions between Hexagon and Melker Schörling AB.
NOTE 30 Remuneration to Senior Executives, cont.
96 Hexagon Annual Report 2014
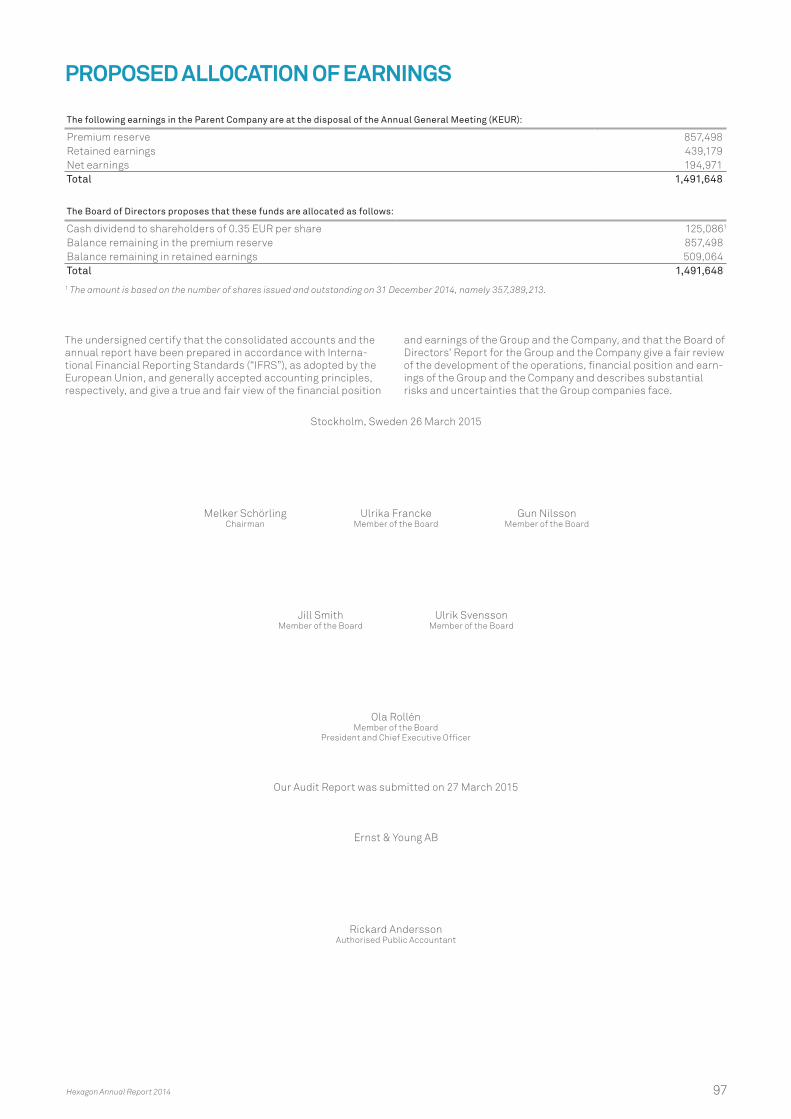
PROPOSED ALLOCATION OF EARNINGS
The following earnings in the Parent Company are at the disposal of the Annual General Meeting (KEUR):
Premium reserve 857,498Retained earnings 439,179Net earnings 194,971Total 1,491,648
The Board of Directors proposes that these funds are allocated as follows:
Cash dividend to shareholders of 0.35 EUR per share 125,0861
Balance remaining in the premium reserve 857,498Balance remaining in retained earnings 509,064Total 1,491,648
1 The amount is based on the number of shares issued and outstanding on 31 December 2014, namely 357,389,213.
The undersigned certify that the consolidated accounts and the annual report have been prepared in accordance with Interna-tional Financial Reporting Standards (“IFRS”), as adopted by the European Union, and generally accepted accounting principles, respectively, and give a true and fair view of the financial position
and earnings of the Group and the Company, and that the Board of Directors’ Report for the Group and the Company give a fair review of the development of the operations, financial position and earn-ings of the Group and the Company and describes substantial risks and uncertainties that the Group companies face.
Stockholm, Sweden 26 March 2015
Melker Schörling Ulrika Francke Gun Nilsson Chairman Member of the Board Member of the Board
Jill Smith Ulrik Svensson Member of the Board Member of the Board
Ola Rollén Member of the Board
President and Chief Executive Officer
Our Audit Report was submitted on 27 March 2015
Ernst & Young AB
Rickard Andersson Authorised Public Accountant
Hexagon Annual Report 2014 97
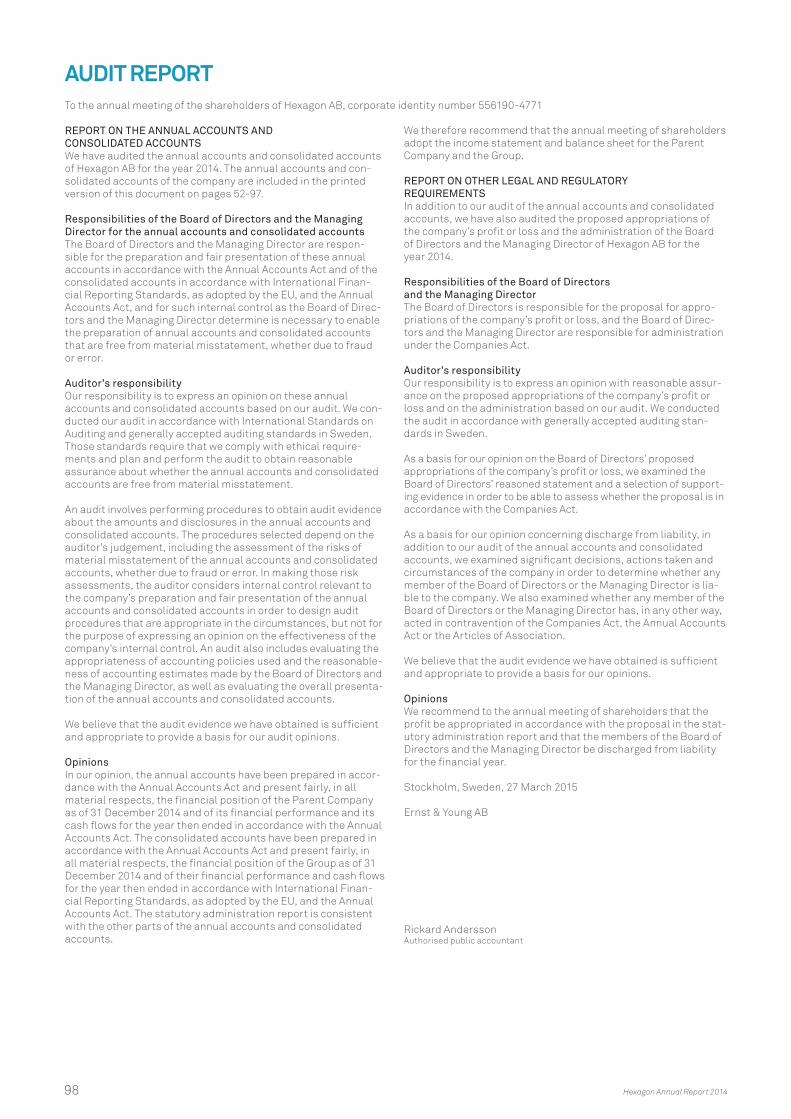
AUDIT REPORTTo the annual meeting of the shareholders of Hexagon AB, corporate identity number 556190-4771
REPORT ON THE ANNUAL ACCOUNTS AND CONSOLIDATED ACCOUNTSWe have audited the annual accounts and consolidated accounts of Hexagon AB for the year 2014. The annual accounts and con-solidated accounts of the company are included in the printed version of this document on pages 52-97.
Responsibilities of the Board of Directors and the Managing Director for the annual accounts and consolidated accountsThe Board of Directors and the Managing Director are respon-sible for the preparation and fair presentation of these annual accounts in accordance with the Annual Accounts Act and of the consolidated accounts in accordance with International Finan-cial Reporting Standards, as adopted by the EU, and the Annual Accounts Act, and for such internal control as the Board of Direc-tors and the Managing Director determine is necessary to enable the preparation of annual accounts and consolidated accounts that are free from material misstatement, whether due to fraud or error.
Auditor’s responsibilityOur responsibility is to express an opinion on these annual accounts and consolidated accounts based on our audit. We con-ducted our audit in accordance with International Standards on Auditing and generally accepted auditing standards in Sweden. Those standards require that we comply with ethical require-ments and plan and perform the audit to obtain reasonable assurance about whether the annual accounts and consolidated accounts are free from material misstatement.
An audit involves performing procedures to obtain audit evidence about the amounts and disclosures in the annual accounts and consolidated accounts. The procedures selected depend on the auditor’s judgement, including the assessment of the risks of material misstatement of the annual accounts and consolidated accounts, whether due to fraud or error. In making those risk assessments, the auditor considers internal control relevant to the company’s preparation and fair presentation of the annual accounts and consolidated accounts in order to design audit procedures that are appropriate in the circumstances, but not for the purpose of expressing an opinion on the effectiveness of the company’s internal control. An audit also includes evaluating the appropriateness of accounting policies used and the reasonable-ness of accounting estimates made by the Board of Directors and the Managing Director, as well as evaluating the overall presenta-tion of the annual accounts and consolidated accounts.
We believe that the audit evidence we have obtained is sufficient and appropriate to provide a basis for our audit opinions.
OpinionsIn our opinion, the annual accounts have been prepared in accor-dance with the Annual Accounts Act and present fairly, in all material respects, the financial position of the Parent Company as of 31 December 2014 and of its financial performance and its cash flows for the year then ended in accordance with the Annual Accounts Act. The consolidated accounts have been prepared in accordance with the Annual Accounts Act and present fairly, in all material respects, the financial position of the Group as of 31 December 2014 and of their financial performance and cash flows for the year then ended in accordance with International Finan-cial Reporting Standards, as adopted by the EU, and the Annual Accounts Act. The statutory administration report is consistent with the other parts of the annual accounts and consolidated accounts.
We therefore recommend that the annual meeting of shareholders adopt the income statement and balance sheet for the Parent Company and the Group.
REPORT ON OTHER LEGAL AND REGULATORY REQUIREMENTSIn addition to our audit of the annual accounts and consolidated accounts, we have also audited the proposed appropriations of the company’s profit or loss and the administration of the Board of Directors and the Managing Director of Hexagon AB for the year 2014.
Responsibilities of the Board of Directors and the Managing DirectorThe Board of Directors is responsible for the proposal for appro-priations of the company’s profit or loss, and the Board of Direc-tors and the Managing Director are responsible for administration under the Companies Act.
Auditor’s responsibilityOur responsibility is to express an opinion with reasonable assur-ance on the proposed appropriations of the company’s profit or loss and on the administration based on our audit. We conducted the audit in accordance with generally accepted auditing stan-dards in Sweden.
As a basis for our opinion on the Board of Directors’ proposed appropriations of the company’s profit or loss, we examined the Board of Directors’ reasoned statement and a selection of support-ing evidence in order to be able to assess whether the proposal is in accordance with the Companies Act.
As a basis for our opinion concerning discharge from liability, in addition to our audit of the annual accounts and consolidated accounts, we examined significant decisions, actions taken and circumstances of the company in order to determine whether any member of the Board of Directors or the Managing Director is lia-ble to the company. We also examined whether any member of the Board of Directors or the Managing Director has, in any other way, acted in contravention of the Companies Act, the Annual Accounts Act or the Articles of Association.
We believe that the audit evidence we have obtained is sufficient and appropriate to provide a basis for our opinions.
OpinionsWe recommend to the annual meeting of shareholders that the profit be appropriated in accordance with the proposal in the stat-utory administration report and that the members of the Board of Directors and the Managing Director be discharged from liability for the financial year.
Stockholm, Sweden, 27 March 2015
Ernst & Young AB
Rickard Andersson Authorised public accountant
98 Hexagon Annual Report 2014
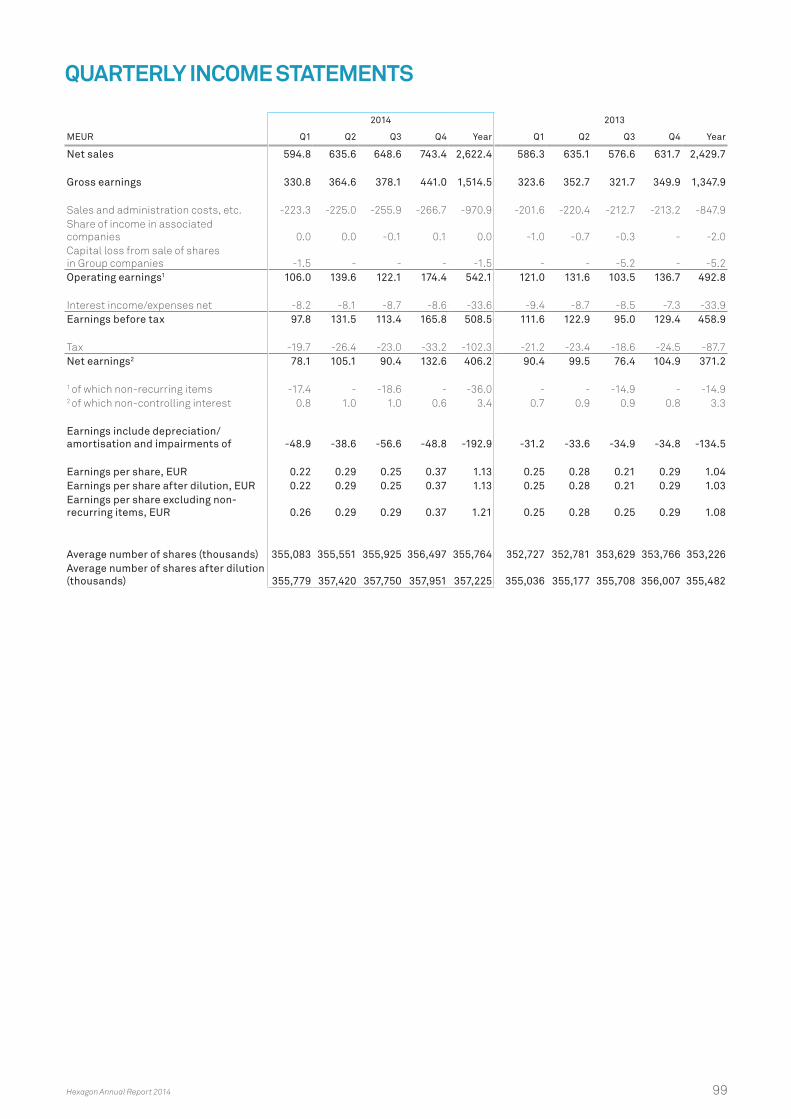
QUARTERLY INCOME STATEMENTS
2014 2013
MEUR Q1 Q2 Q3 Q4 Year Q1 Q2 Q3 Q4 Year
Net sales 594.8 635.6 648.6 743.4 2,622.4 586.3 635.1 576.6 631.7 2,429.7
Gross earnings 330.8 364.6 378.1 441.0 1,514.5 323.6 352.7 321.7 349.9 1,347.9
Sales and administration costs, etc. -223.3 -225.0 -255.9 -266.7 -970.9 -201.6 -220.4 -212.7 -213.2 -847.9Share of income in associated companies 0.0 0.0 -0.1 0.1 0.0 -1.0 -0.7 -0.3 - -2.0Capital loss from sale of shares in Group companies -1.5 - - - -1.5 - - -5.2 - -5.2Operating earnings1 106.0 139.6 122.1 174.4 542.1 121.0 131.6 103.5 136.7 492.8
Interest income/expenses net -8.2 -8.1 -8.7 -8.6 -33.6 -9.4 -8.7 -8.5 -7.3 -33.9Earnings before tax 97.8 131.5 113.4 165.8 508.5 111.6 122.9 95.0 129.4 458.9
Tax -19.7 -26.4 -23.0 -33.2 -102.3 -21.2 -23.4 -18.6 -24.5 -87.7Net earnings2 78.1 105.1 90.4 132.6 406.2 90.4 99.5 76.4 104.9 371.2
1 of which non-recurring items -17.4 - -18.6 - -36.0 - - -14.9 - -14.92 of which non-controlling interest 0.8 1.0 1.0 0.6 3.4 0.7 0.9 0.9 0.8 3.3
Earnings include depreciation/ amortisation and impairments of -48.9 -38.6 -56.6 -48.8 -192.9 -31.2 -33.6 -34.9 -34.8 -134.5
Earnings per share, EUR 0.22 0.29 0.25 0.37 1.13 0.25 0.28 0.21 0.29 1.04Earnings per share after dilution, EUR 0.22 0.29 0.25 0.37 1.13 0.25 0.28 0.21 0.29 1.03Earnings per share excluding non-recurring items, EUR 0.26 0.29 0.29 0.37 1.21 0.25 0.28 0.25 0.29 1.08
Average number of shares (thousands) 355,083 355,551 355,925 356,497 355,764 352,727 352,781 353,629 353,766 353,226Average number of shares after dilution (thousands) 355,779 357,420 357,750 357,951 357,225 355,036 355,177 355,708 356,007 355,482
Hexagon Annual Report 2014 99
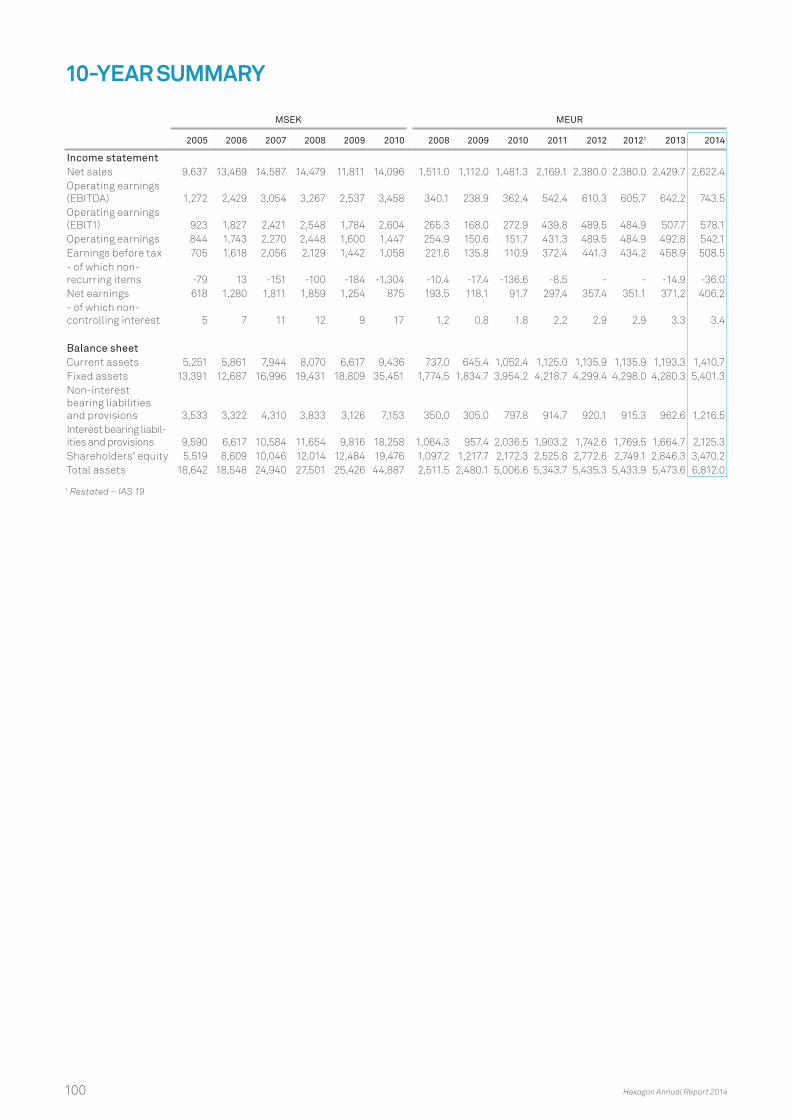
10-YEAR SUMMARY
MSEK MEUR
2005 2006 2007 2008 2009 2010 2008 2009 2010 2011 2012 20121 2013 2014
Income statementNet sales 9,637 13,469 14,587 14,479 11,811 14,096 1,511.0 1,112.0 1,481.3 2,169.1 2,380.0 2,380.0 2,429.7 2,622.4Operating earnings (EBITDA) 1,272 2,429 3,054 3,267 2,537 3,458 340.1 238.9 362.4 542.4 610.3 605.7 642.2 743.5Operating earnings (EBIT1) 923 1,827 2,421 2,548 1,784 2,604 265.3 168.0 272.9 439.8 489.5 484.9 507.7 578.1Operating earnings 844 1,743 2,270 2,448 1,600 1,447 254.9 150.6 151.7 431.3 489.5 484.9 492.8 542.1Earnings before tax 705 1,618 2,056 2,129 1,442 1,058 221.6 135.8 110.9 372.4 441.3 434.2 458.9 508.5- of which non- recurring items -79 13 -151 -100 -184 -1,304 -10.4 -17.4 -136.6 -8.5 - - -14.9 -36.0Net earnings 618 1,280 1,811 1,859 1,254 875 193.5 118.1 91.7 297.4 357.4 351.1 371.2 406.2- of which non- controlling interest 5 7 11 12 9 17 1.2 0.8 1.8 2.2 2.9 2.9 3.3 3.4
Balance sheetCurrent assets 5,251 5,861 7,944 8,070 6,617 9,436 737.0 645.4 1,052.4 1,125.0 1,135.9 1,135.9 1,193.3 1,410.7Fixed assets 13,391 12,687 16,996 19,431 18,809 35,451 1,774.5 1,834.7 3,954.2 4,218.7 4,299.4 4,298.0 4,280.3 5,401.3Non-interest bearing liabilities and provisions 3,533 3,322 4,310 3,833 3,126 7,153 350.0 305.0 797.8 914.7 920.1 915.3 962.6 1,216.5Interest bearing liabil-ities and provisions 9,590 6,617 10,584 11,654 9,816 18,258 1,064.3 957.4 2,036.5 1,903.2 1,742.6 1,769.5 1,664.7 2,125.3Shareholders' equity 5,519 8,609 10,046 12,014 12,484 19,476 1,097.2 1,217.7 2,172.3 2,525.8 2,772.6 2,749.1 2,846.3 3,470.2Total assets 18,642 18,548 24,940 27,501 25,426 44,887 2,511.5 2,480.1 5,006.6 5,343.7 5,435.3 5,433.9 5,473.6 6,812.0
1 Restated – IAS 19
100 Hexagon Annual Report 2014
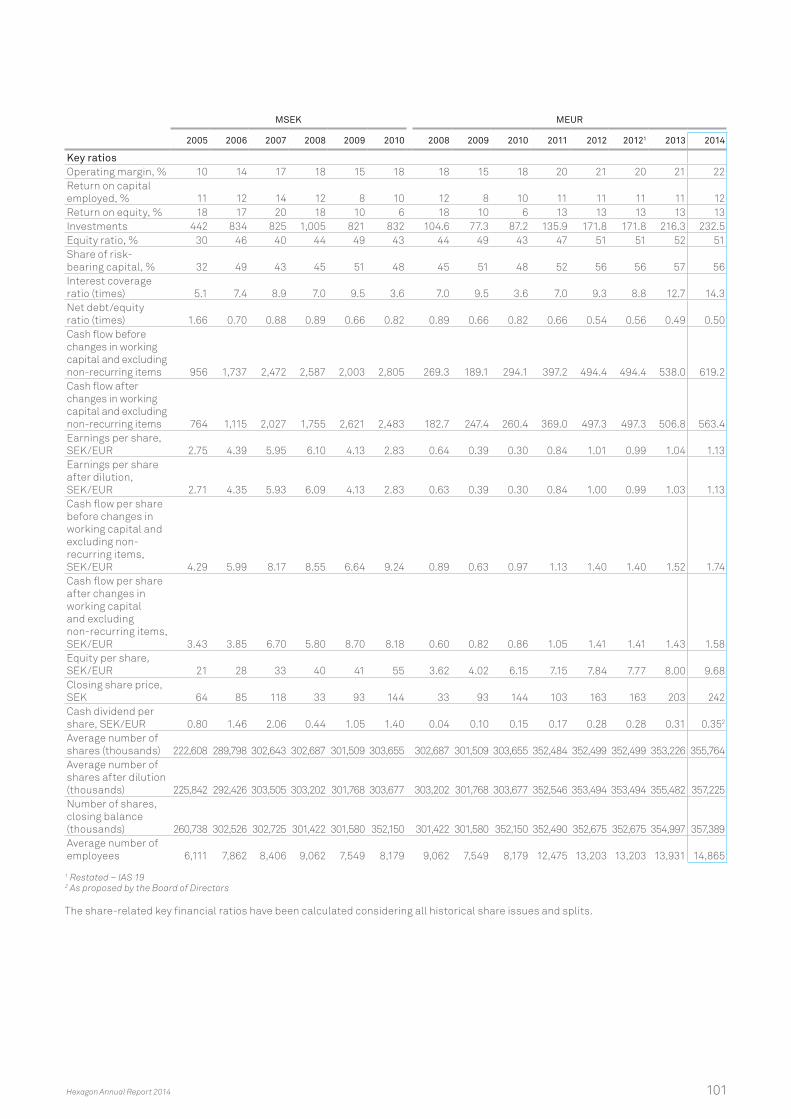
MSEK MEUR
2005 2006 2007 2008 2009 2010 2008 2009 2010 2011 2012 20121 2013 2014
Key ratiosOperating margin, % 10 14 17 18 15 18 18 15 18 20 21 20 21 22Return on capital employed, % 11 12 14 12 8 10 12 8 10 11 11 11 11 12Return on equity, % 18 17 20 18 10 6 18 10 6 13 13 13 13 13Investments 442 834 825 1,005 821 832 104.6 77.3 87.2 135.9 171.8 171.8 216.3 232.5Equity ratio, % 30 46 40 44 49 43 44 49 43 47 51 51 52 51Share of risk- bearing capital, % 32 49 43 45 51 48 45 51 48 52 56 56 57 56Interest coverage ratio (times) 5.1 7.4 8.9 7.0 9.5 3.6 7.0 9.5 3.6 7.0 9.3 8.8 12.7 14.3Net debt/equity ratio (times) 1.66 0.70 0.88 0.89 0.66 0.82 0.89 0.66 0.82 0.66 0.54 0.56 0.49 0.50Cash flow before changes in working capital and excluding non-recurring items 956 1,737 2,472 2,587 2,003 2,805 269.3 189.1 294.1 397.2 494.4 494.4 538.0 619.2Cash flow after changes in working capital and excluding non-recurring items 764 1,115 2,027 1,755 2,621 2,483 182.7 247.4 260.4 369.0 497.3 497.3 506.8 563.4Earnings per share, SEK/EUR 2.75 4.39 5.95 6.10 4.13 2.83 0.64 0.39 0.30 0.84 1.01 0.99 1.04 1.13Earnings per share after dilution, SEK/EUR 2.71 4.35 5.93 6.09 4.13 2.83 0.63 0.39 0.30 0.84 1.00 0.99 1.03 1.13Cash flow per share before changes in working capital and excluding non- recurring items, SEK/EUR 4.29 5.99 8.17 8.55 6.64 9.24 0.89 0.63 0.97 1.13 1.40 1.40 1.52 1.74Cash flow per share after changes in working capital and excluding non-recurring items, SEK/EUR 3.43 3.85 6.70 5.80 8.70 8.18 0.60 0.82 0.86 1.05 1.41 1.41 1.43 1.58Equity per share, SEK/EUR 21 28 33 40 41 55 3.62 4.02 6.15 7.15 7.84 7.77 8.00 9.68Closing share price, SEK 64 85 118 33 93 144 33 93 144 103 163 163 203 242Cash dividend per share, SEK/EUR 0.80 1.46 2.06 0.44 1.05 1.40 0.04 0.10 0.15 0.17 0.28 0.28 0.31 0.352
Average number of shares (thousands) 222,608 289,798 302,643 302,687 301,509 303,655 302,687 301,509 303,655 352,484 352,499 352,499 353,226 355,764Average number of shares after dilution (thousands) 225,842 292,426 303,505 303,202 301,768 303,677 303,202 301,768 303,677 352,546 353,494 353,494 355,482 357,225Number of shares, closing balance (thousands) 260,738 302,526 302,725 301,422 301,580 352,150 301,422 301,580 352,150 352,490 352,675 352,675 354,997 357,389Average number of employees 6,111 7,862 8,406 9,062 7,549 8,179 9,062 7,549 8,179 12,475 13,203 13,203 13,931 14,865
1 Restated – IAS 192 As proposed by the Board of Directors
The share-related key financial ratios have been calculated considering all historical share issues and splits.
Hexagon Annual Report 2014 101

FINANCIAL DEFINITIONS
Amortization of surplus valuesWhen a company is acquired, the purchase consideration is allocated to the identified assets and liabilities of the company. The amortization of surplus values is defined as the difference between the amortization of such identified intangible assets and what the amortization would have been in the acquired company had the acquisition not taken place at all.
Capital employedTotal assets less non-interest bearing liabilities.
Capital turnover rateNet sales for the year divided by average capital employed for the year.
Cash conversionOperating cash flow excluding interest, tax payments and non- recurring items divided by operating earnings (EBIT1).
Cash flowCash flow from operations before change in working capital and excluding non-recurring items.
Cash flow per shareCash flow from operations before change in working capital and excluding non-recurring items divided by average number of shares.
Commercial paperAn unsecured promissory note with a fixed maturity of 1 to 365 days.
Dividend yieldDividend per share as a percentage of share price.
Earnings per shareNet earnings, excluding non-controlling interests, divided by average number of shares.
Equity ratioShareholders’ equity including non-controlling interests as a percentage of total assets.
Interest coverage ratioEarnings after financial items plus financial expenses divided by financial expenses.
InvestmentsPurchases less sales of tangible and intangible fixed assets excluding those included in acquisitions and divestments of subsidiaries.
Operating earnings (EBIT1)Operating earnings excluding non-recurring items.
Operating earnings (EBITDA)Operating earnings excluding non-recurring items and amortisation and depreciation of fixed assets.
Operating marginOperating earnings (EBIT1) as a percentage of net sales for the year.
Pay-out ratioDividend per share in per cent of net earnings per share.
P/E ratioShare price divided by earnings per share.
Return on capital employedTwelve months to end of period earnings after financial items, excluding non-recurring items, plus financial expenses as a percentage of twelve months to end of period average capital employed.
Return on equityTwelve months to end of period net earnings excluding non-controlling interests as a percentage of twelve months to end of period average shareholders’ equity excluding non-controlling interests.
Revolving credit facilityA loan facility where the borrower may increase and reduce the size of outstanding debt up to the available limit during the term of the loan.
Shareholders’ equity per shareShareholders’ equity excluding non-controlling interests divided by the number of shares at year-end.
Share of risk-bearing capitalThe total of shareholders’ equity including non-controlling interests and tax provisions as a percentage of total assets.
Share priceLast settled transaction on the NASDAQ OMX Stockholm stock exchange on the last business day for the year.
Term loanA fixed amount loan with a maturity date of more than one year and with a specified repayment schedule where the borrower is not entitled to re-borrow any amount which it has repaid.
102 Hexagon Annual Report 2014
BUSINESS DEFINITIONS
AmericasNorth America, South America and Central America.
AsiaAsia (excluding Middle East), Australia and New Zealand.
BIMBuilding Information Modeling. A process which increases the use of technology in construction.
CADComputer Aided Design. Software for creating technical drawings.
CaaSContent as a Service.
CAMComputer Aided Manufacturing. Software for controlling machine tools.
CMMCoordinate Measuring Machine.
CSRCorporate Social Responsibility.
EMEAEurope, Middle East and Africa.
Emerging marketsEastern Europe, Middle East, South America, Africa and Asia excluding Australia, New Zealand, Japan and Korea.
EPCEngineering, Procurement and Construction companies.
GISGeographic Information Systems.
GNSSGlobal Navigation Satellite System.
GPSGlobal Positioning System.
ISDA International Swaps and Derivatives Association
Laser trackerA portable measurement system that uses a laser.
LiDARLight Detection and Ranging. A technology to collect topographic data using laser.
MultistationAn integrated total station and laser scanner.
MTHexagon’s core operations Measurement Technologies.
NAFTANorth American Free Trade Agreement.
OECDOrganisation of Economic Cooperation and Development.
OEMOriginal Equipment Manufacturer.
Other OperationsHexagon’s segment that focuses on the transportation industry, mainly in the Nordic region.
PC-DMISHexagon’s CAD-enabled metrology software.
PP&MIntergraph’s division Process, Power & Marine.
R&DResearch and development.
SG&IIntergraph’s division Security, Government & Infrastructure.
Total stationAn electronic theodolite with an integrated distance meter.
UAVUnmanned Aerial Vehicle.
CURRENCY CODES
AUD Australian Dollar
BRL Brazilian Real
CAD Canadian Dollar
CHF Swiss Franc
CNY Chinese Yuan
DKK Danish Kronor
EUR Euro
GBP British Pound
HUF Hungarian Forint
INR Indian Rupee
JPY Japanese Yen
KRW Korean Won
NOK Norwegian Kronor
PLN Polish Zloty
SEK Swedish Kronor
SGD Singapore Dollar
USD US Dollar
Hexagon Annual Report 2014 103
INFORMATION FOR SHAREHOLDERS
ANNUAL GENERAL MEETING 2015 The Annual General Meeting will be held on Wednesday 6 May 2015 at 17:00 CET at City Conference Center, Drottninggatan 71 B, Stockholm, Sweden.
SHAREHOLDERS WHO WISH TO ATTEND THE ANNUAL GENERAL MEETING MUST: (i) be recorded in the share register maintained by Euroclear Swe-den AB on Wednesday 29 April 2015. To be eligible to participate, shareholders with nominee-registered holdings should tempo-rarily have their shares registered in their own names through the agency of their nominees so that they are recorded in the share register well before 29 April 2015.
(ii) notify the Company of their intention to attend the Annual General Meeting by filling out a form on Hexagon’s website, www.hexagon.com or by post to: Hexagon AB, “Annual General Meeting”, P.O. Box 3692, SE-103 59 Stockholm, Sweden or by e-mail to: [email protected] by Wednesday 29 April 2015 at the latest.
Notifications should state the shareholder’s name, personal/corpo-rate identity number, address and telephone number. Shareholders wishing to be represented by proxy should send a power-of-attorney to Hexagon before the Annual General Meeting.
DIVIDEND The Board of Directors proposes that a dividend of 0.35 EUR per share be declared for the financial year 2014.
As record day for right to receive dividend, the Board of Direc-tors proposes Friday 8 May 2015. If the Annual General Meeting resolves in accordance with the proposal, the dividend is expected to be paid through Euroclear Sweden AB starting on Monday 18 May 2015.
Payment is made in EUR, provided that EUR can be received on the shareholder’s yield account; if not, payment will be distribu ted in SEK, whereby currency exchange is made in accordance with Euroclear Sweden AB’s applicable procedures.
FINANCIAL INFORMATION 2015Hexagon will issue information concerning the financial year 2015 on the following dates:
Annual General Meeting 2015 6 May 2015
Q1 Interim Report 6 May 2015
Q2 Interim Report 7 August 2015
Q3 Interim Report 27 October 2015
Year-End Report 2015 5 February 2016
DISTRIBUTION POLICYThe Hexagon Annual Report is sent to all shareholders who have not informed the Company that they do not wish to receive the Annual Report. Hexagon’s Annual Reports from 1997 and onwards are available at www.hexagon.com.
ADDRESS Hexagon AB P. O. Box 3692 SE-103 59 Stockholm, Sweden
VISITING ADDRESS Lilla Bantorget 15, Stockholm
Telephone: +46 8 601 26 20 Fax: +46 8 601 26 21 E-mail: [email protected] Website: www.hexagon.com
104 Hexagon Annual Report 2014

This report contains forward-looking statements based on Hexagon management’s current expectations. Although management considers expectations expressed in such future-oriented information as reasonable, no assurance can be given that these expectations will prove correct. Consequently, actual future results can differ considerably from those implied in the forward-looking statements as a result of factors such as changed conditions in the economy, market and competition, changes in legal requirements and other political measures, fluctuations in exchange rates and other factors.
Produced by Hexagon in cooperation with Intellecta Corporate. Print: Åtta45, Solna. Photo: Hexagon, Shutterstock.

HE
XAG
ON
ANN
UAL R
EPO
RT 2014
HEXAGON ABP.O. Box 3692SE-103 59 Stockholm, Sweden
VISITING ADDRESSLilla Bantorget 15, Stockholm
TELEPHONE: +46 8 601 26 20FAX: +46 8 601 26 21E-MAIL: [email protected]: hexagon.com