Embed Size (px)
Citation preview
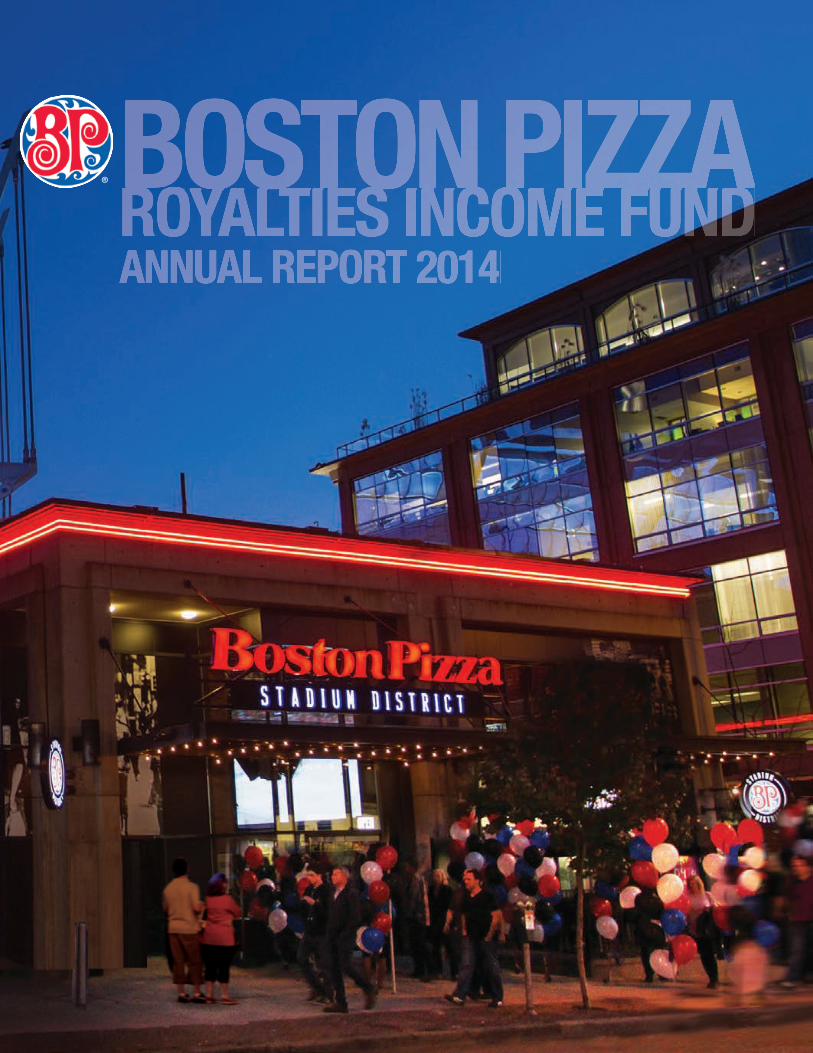
BOSTON PIZZAROYALTIES INCOME FUNDBOSTON PIZZAROYALTIES INCOME FUNDBOSTON PIZZAANNUAL REPORT 2014
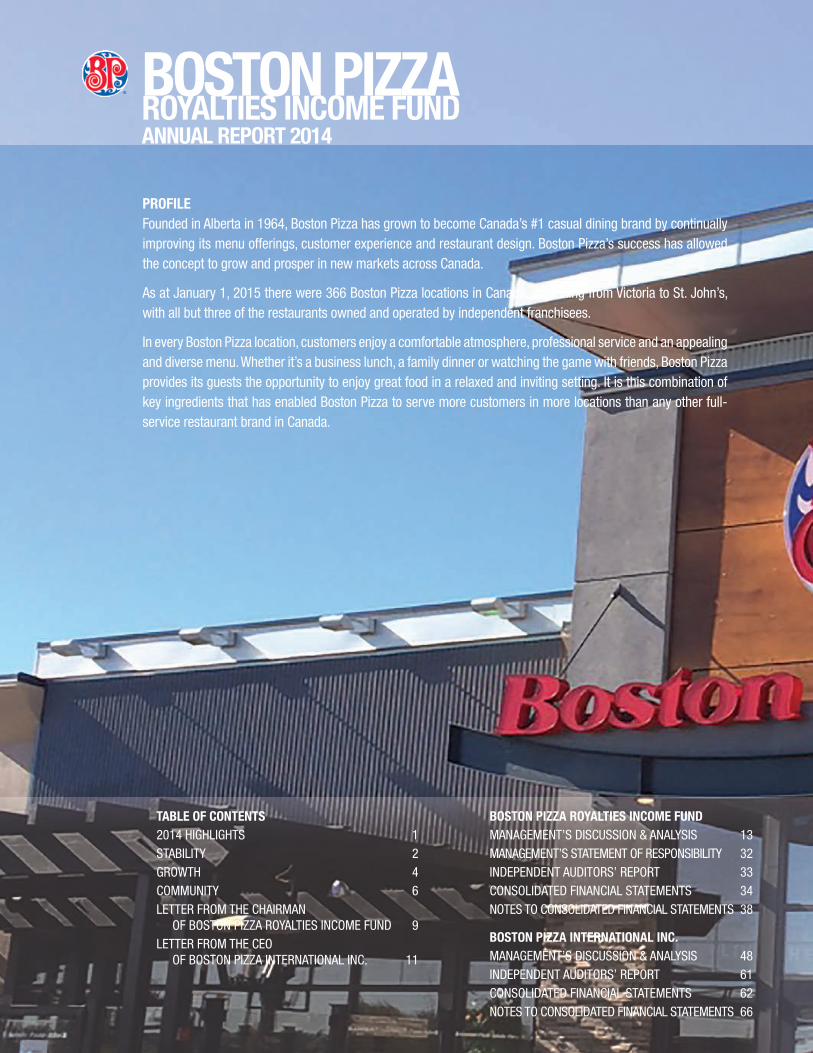
PROFILEFounded in Alberta in 1964, Boston Pizza has grown to become Canada’s #1 casual dining brand by continually improving its menu offerings, customer experience and restaurant design. Boston Pizza’s success has allowed the concept to grow and prosper in new markets across Canada.
As at January 1, 2015 there were 366 Boston Pizza locations in Canada, stretching from Victoria to St. John’s, with all but three of the restaurants owned and operated by independent franchisees.
In every Boston Pizza location, customers enjoy a comfortable atmosphere, professional service and an appealing and diverse menu. Whether it’s a business lunch, a family dinner or watching the game with friends, Boston Pizza provides its guests the opportunity to enjoy great food in a relaxed and inviting setting. It is this combination of key ingredients that has enabled Boston Pizza to serve more customers in more locations than any other full-service restaurant brand in Canada.
TABLE OF CONTENTS2014 HIGHLIGHTS 1STABILITY 2GROWTH 4 COMMUNITY 6LETTER FROM THE CHAIRMAN OF BOSTON PIZZA ROYALTIES INCOME FUND 9LETTER FROM THE CEO OF BOSTON PIZZA INTERNATIONAL INC. 11
BOSTON PIZZA ROYALTIES INCOME FUNDMANAGEMENT’S DISCUSSION & ANALYSIS 13MANAGEMENT’S STATEMENT OF RESPONSIBILITY 32INDEPENDENT AUDITORS’ REPORT 33CONSOLIDATED FINANCIAL STATEMENTS 34NOTES TO CONSOLIDATED FINANCIAL STATEMENTS 38
BOSTON PIZZA INTERNATIONAL INC.MANAGEMENT’S DISCUSSION & ANALYSIS 48INDEPENDENT AUDITORS’ REPORT 61CONSOLIDATED FINANCIAL STATEMENTS 62NOTES TO CONSOLIDATED FINANCIAL STATEMENTS 66
BOSTON PIZZAROYALTIES INCOME FUNDANNUAL REPORT 2014
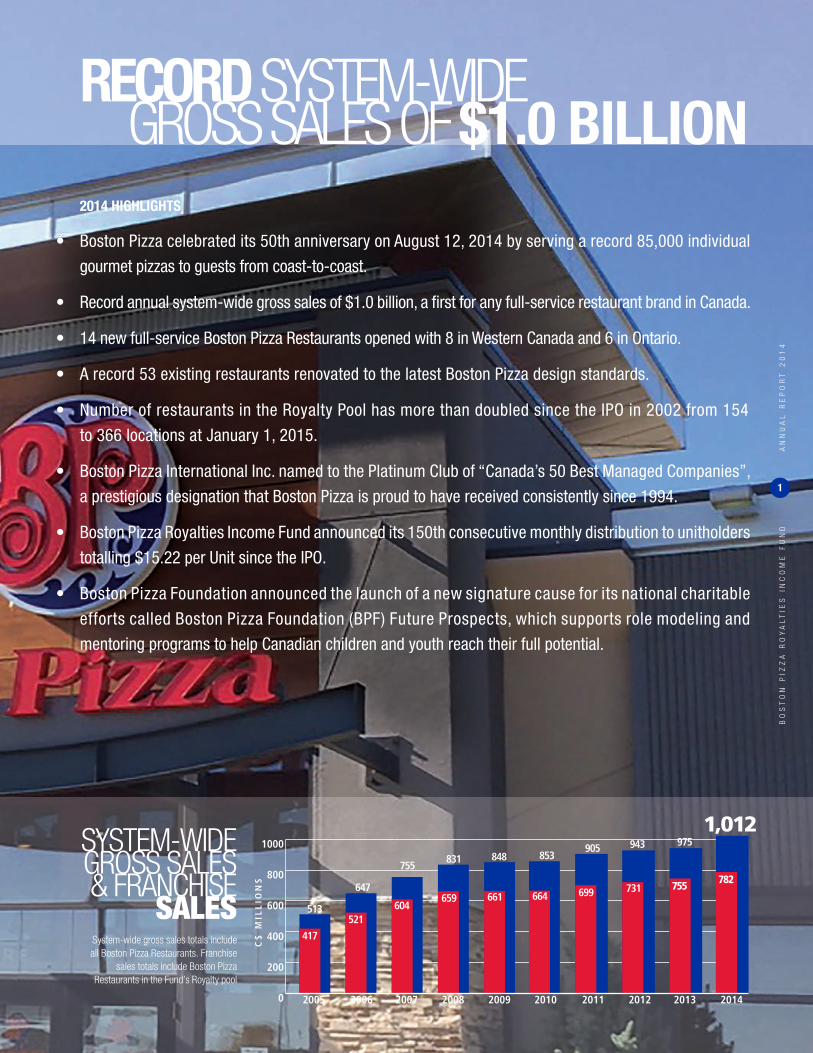
2014 HIGHLIGHTS
• Boston Pizza celebrated its 50th anniversary on August 12, 2014 by serving a record 85,000 individual
gourmet pizzas to guests from coast-to-coast.
• Record annual system-wide gross sales of $1.0 billion, a fi rst for any full-service restaurant brand in Canada.
• 14 new full-service Boston Pizza Restaurants opened with 8 in Western Canada and 6 in Ontario.
• A record 53 existing restaurants renovated to the latest Boston Pizza design standards.
• Number of restaurants in the Royalty Pool has more than doubled since the IPO in 2002 from 154
to 366 locations at January 1, 2015.
• Boston Pizza International Inc. named to the Platinum Club of “Canada’s 50 Best Managed Companies”,
a prestigious designation that Boston Pizza is proud to have received consistently since 1994.
• Boston Pizza Royalties Income Fund announced its 150th consecutive monthly distribution to unitholders
totalling $15.22 per Unit since the IPO.
• Boston Pizza Foundation announced the launch of a new signature cause for its national charitable
efforts called Boston Pizza Foundation (BPF) Future Prospects, which supports role modeling and
mentoring programs to help Canadian children and youth reach their full potential.
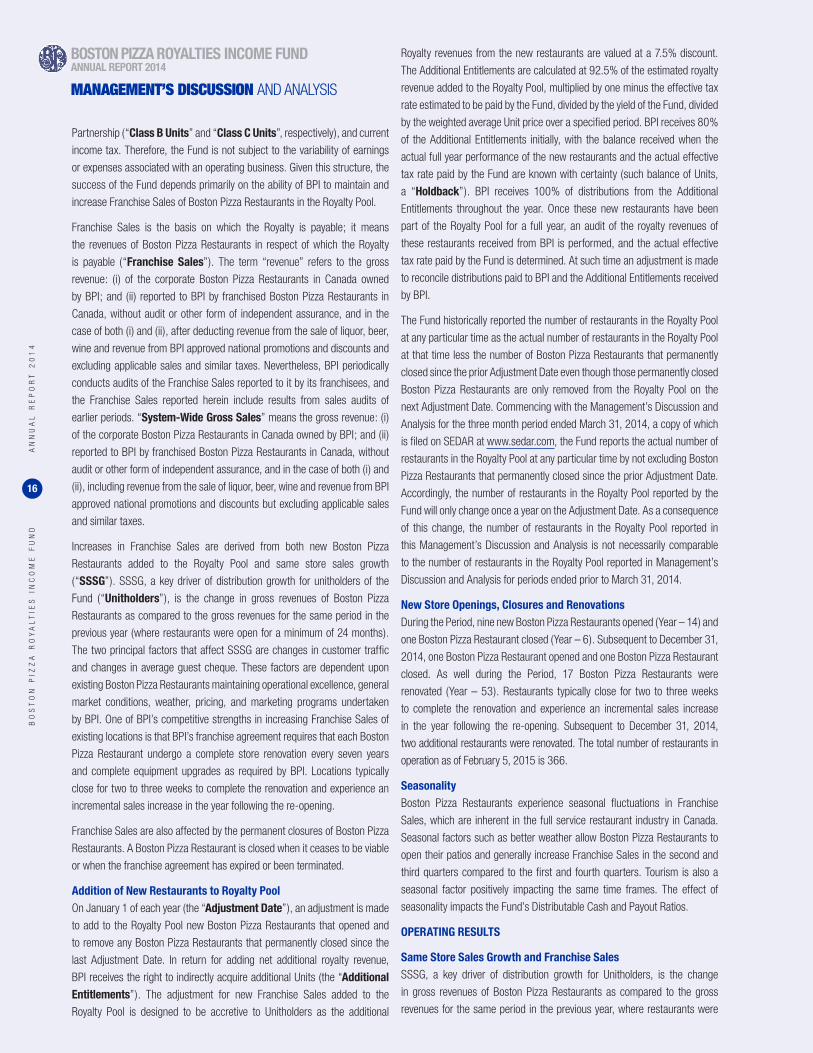
RECORD SYSTEM-WIDE GROSS SALES OF $1.0 BILLION
BO
ST
ON
PIZ
ZA
RO
YA
LT
IES
IN
CO
ME
FU
ND
AN
NU
AL
RE
PO
RT
20
14
1
0
200
400
600
800
1000
C$
MIL
LIO
NS
664
417
521604
659 661 699
513
647
755831 853848
905
731
943
755
975
2005 2006 2007 2008 2009 2010 2011 2012 2013 2014
782
1,012SYSTEM-WIDE GROSS SALES& FRANCHISE
SALESSystem-wide gross sales totals include all Boston Pizza Restaurants. Franchise
sales totals include Boston Pizza Restaurants in the Fund’s Royalty pool
BOSTON PIZZA ROYALTIES INCOME FUNDANNUAL REPORT 2014
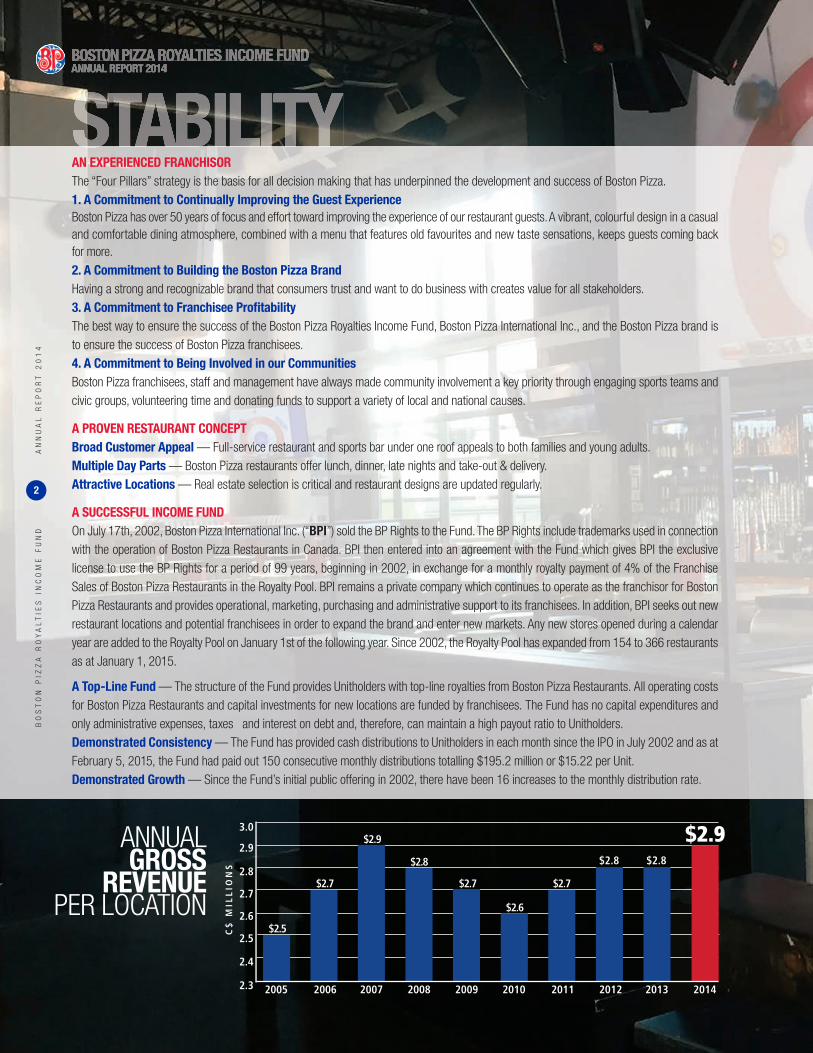
2.3
2.5
2.6
2.7
2.8
2.9
3.0
$2.5
$2.7
$2.9
$2.8
$2.7
$2.6
$2.7
$2.8
C$
MIL
LIO
NS $2.8
2005 2006 2007 2008 2009 2010 2011 2012 2013 2014
$2.9
2.4
ANNUALGROSS
REVENUE PER LOCATION
AN EXPERIENCED FRANCHISORThe “Four Pillars” strategy is the basis for all decision making that has underpinned the development and success of Boston Pizza.1. A Commitment to Continually Improving the Guest ExperienceBoston Pizza has over 50 years of focus and effort toward improving the experience of our restaurant guests. A vibrant, colourful design in a casual and comfortable dining atmosphere, combined with a menu that features old favourites and new taste sensations, keeps guests coming back for more.2. A Commitment to Building the Boston Pizza BrandHaving a strong and recognizable brand that consumers trust and want to do business with creates value for all stakeholders.3. A Commitment to Franchisee Profi tabilityThe best way to ensure the success of the Boston Pizza Royalties Income Fund, Boston Pizza International Inc., and the Boston Pizza brand is to ensure the success of Boston Pizza franchisees.4. A Commitment to Being Involved in our CommunitiesBoston Pizza franchisees, staff and management have always made community involvement a key priority through engaging sports teams and civic groups, volunteering time and donating funds to support a variety of local and national causes.
A PROVEN RESTAURANT CONCEPTBroad Customer Appeal — Full-service restaurant and sports bar under one roof appeals to both families and young adults.Multiple Day Parts — Boston Pizza restaurants offer lunch, dinner, late nights and take-out & delivery.Attractive Locations — Real estate selection is critical and restaurant designs are updated regularly.
A SUCCESSFUL INCOME FUNDOn July 17th, 2002, Boston Pizza International Inc. (“BPI”) sold the BP Rights to the Fund. The BP Rights include trademarks used in connection with the operation of Boston Pizza Restaurants in Canada. BPI then entered into an agreement with the Fund which gives BPI the exclusive license to use the BP Rights for a period of 99 years, beginning in 2002, in exchange for a monthly royalty payment of 4% of the Franchise Sales of Boston Pizza Restaurants in the Royalty Pool. BPI remains a private company which continues to operate as the franchisor for Boston Pizza Restaurants and provides operational, marketing, purchasing and administrative support to its franchisees. In addition, BPI seeks out new restaurant locations and potential franchisees in order to expand the brand and enter new markets. Any new stores opened during a calendar year are added to the Royalty Pool on January 1st of the following year. Since 2002, the Royalty Pool has expanded from 154 to 366 restaurants as at January 1, 2015.
A Top-Line Fund — The structure of the Fund provides Unitholders with top-line royalties from Boston Pizza Restaurants. All operating costs for Boston Pizza Restaurants and capital investments for new locations are funded by franchisees. The Fund has no capital expenditures and only administrative expenses, taxes and interest on debt and, therefore, can maintain a high payout ratio to Unitholders.Demonstrated Consistency — The Fund has provided cash distributions to Unitholders in each month since the IPO in July 2002 and as at February 5, 2015, the Fund had paid out 150 consecutive monthly distributions totalling $195.2 million or $15.22 per Unit.Demonstrated Growth — Since the Fund’s initial public offering in 2002, there have been 16 increases to the monthly distribution rate.
STABILITYSTABILITYB
OS
TO
N P
IZZ
A R
OY
AL
TIE
S I
NC
OM
E F
UN
D
A
NN
UA
L R
EP
OR
T 2
01
4
2

SAME STORES A L E SGROWTH W
AS1.7%
FRANCHISE SALESROYALTY POOL RESTAURANTS
FROM$782M
BO
ST
ON
PIZ
ZA
RO
YA
LT
IES
IN
CO
ME
FU
ND
AN
NU
AL
RE
PO
RT
20
14
3
SAME STORES A L E SGROWTH W
AS1.7%
BOSTON PIZZA ROYALTIES INCOME FUNDANNUAL REPORT 2014
1964 – First Boston Pizza opens in Edmonton, Alberta.
1968 – Jim Treliving leaves his job as an R.C.M.P. officer and opens his first Boston Pizza restaurant in Penticton, B.C.
1973 – George Melville, an accountant with Peat Marwick Mitchell & Co. in Penticton, B.C., becomes business partners with Jim Treliving and the two begin opening Boston Pizza franchises across B.C.
1983 – Jim and George, partners in 16 Boston Pizza Restaurants, think that buying the chain of 44 Boston Pizza locations is a “great idea” and do it. They sell all their franchises except one and become the new owners of the franchisor, Boston Pizza International Inc.
1986 – Boston Pizza debuts on the world stage as the official pizza supplier for Expo ’86 in Vancouver, B.C. generating more than $8 million in sales.
1990 – The Boston Pizza Foundation is established to raise funds to make a difference in the lives of those in need across Canada and around the world.
1993 – Boston Pizza receives 25-Year Award from The International Franchise Association.
1994 – Named one of Canada’s 50 Best Managed Companies by the Financial Post, a recognition for which Boston Pizza has been awarded every subsequent year.
1996 – Boston Pizza opens its 100th store in Cold Lake, Alberta on September 24th, 1996.
1998 – Mark Pacinda joins Boston Pizza and opens a regional offi ce in Mississauga, Ontario to support expansion in Eastern Canada. In addition, two locations open in the U.S. under the banner “Boston’s The Gourmet Pizza.”
1999 – Jim Treliving and George Melville earn the Ernst & Young Entrepreneur of the Year Award for commitment to hospitality and tourism.
2002 – Boston Pizza Royalties Income Fund is created and begins trading on the TSX under the symbol BPF. UN following the initial public offering on July 17, 2002.
2003 – Boston Pizza is named as a Platinum Club Member of “Canada’s 50 Best Managed Companies” and has been awarded Platinum status every subsequent year.
2004 – Boston Pizza celebrates its 40th anniversary and begins expansion into Quebec with the opening of a corporate offi ce in Laval.
2005 – Boston Pizza locations across Canada serve more than 30 million customers and the 200th location opens in Kitchener, Ontario.
2006 – Boston Pizza opens its fi rst locations in Newfoundland and P.E.I., making Boston Pizza truly coast-to-coast.
2011 – Mark Pacinda named President and Chief Executive Offi cer of Boston Pizza International Inc.
2012 – Boston Pizza Royalties Income Fund celebrates its 10-year anniversary on the Toronto Stock Exchange.
2013 – The 350th Boston Pizza location opens in Devon, Alberta.
2014 – Boston Pizza International Inc. achieves record system-wide sales of $1.0 billion and celebrates the brand’s 50th anniversary on August 12, 2014 by serving a record 85,000 individual gourmet pizzas to loyal guests from coast-to-coast.
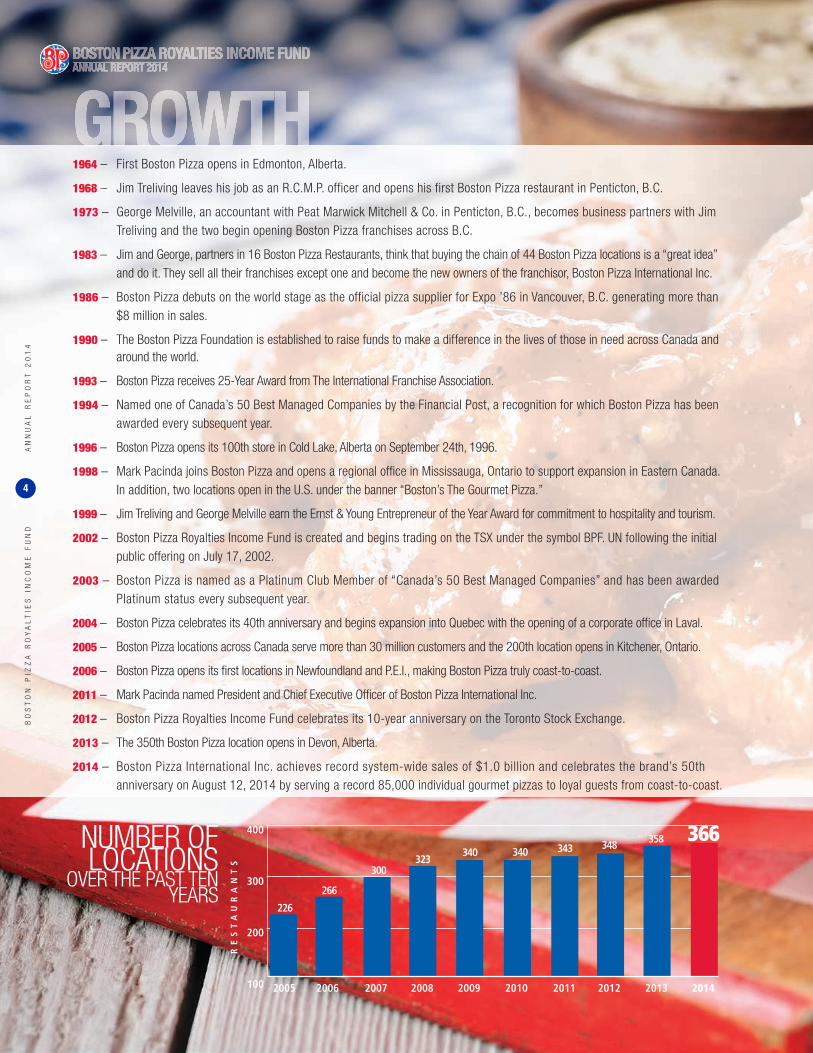
GROWTHGROWTHR
ES
TA
UR
AN
TS
2005 2006 2007 2008 2009 2010 2011 2012 2013 2014
323
226
266
300
340 340 343 348 358 366400
300
200
100
NUMBER OFLOCATIONS
OVER THE PAST TEN YEARS
BO
ST
ON
PIZ
ZA
RO
YA
LT
IES
IN
CO
ME
FU
ND
AN
NU
AL
RE
PO
RT
20
14
4

14 NEW FULL-SERVICE RESTAURANTS OPENED IN 2014
366LOCATIONSACROSS CANADA
BO
ST
ON
PIZ
ZA
RO
YA
LT
IES
IN
CO
ME
FU
ND
AN
NU
AL
RE
PO
RT
20
14
5
BOSTON PIZZA ROYALTIES INCOME FUNDANNUAL REPORT 2014
COMMUNITYCOMMUNITYSince Boston Pizza fi rst opened its doors in Edmonton, Alberta in 1964, a spirit of giving back to the communities in which we operate has been a philosophy and value we
hold dear. To formalize the fi rst 25 years of charitable activity, Boston Pizza in 1990 established the Boston Pizza Foundation, a public foundation focused on raising funds to
make a difference in the lives of those in need across Canada and around the world.
The Boston Pizza Foundation is dedicated to programs and promotions that range from charity golf tournaments to national marketing programs, such as our Valentine’s Day
Heart-Shaped Pizza promotion and BP Kids Cards program, that all help raise much needed funds.
Since its inception in 1990, the Boston Pizza Foundation has raised and donated more than $20.6 million to directly improve the health and well-being of children and families.
On January 15, 2014, the Boston Pizza Foundation announced the launch of a new signature cause for its national fundraising and charitable efforts called Boston Pizza
Foundation (BPF) Future Prospects. BPF Future Prospects works with leading organizations across Canada to raise money and awareness for role modeling and mentoring
programs that help Canadian children and youth reach their full potential.
“Boston Pizza believes that strong role models inspire kids to be great,” said Cheryl Treliving, Executive Director of Boston Pizza Foundation. “With the launch of BPF Future
Prospects we are committed to working with our franchisees from coast-to-coast to address the growing need to provide kids with access to mentors and role models that
inspire them to thrive, succeed and realize their individual goals.”
In 2014, BPF Future Prospects announced a fi ve-year pledge to donate a minimum of $1.5 million in support of mentoring programs that help increase the number of ‘Bigs’
participating in Big Brothers Big Sisters. In addition, BPF Future Prospects announced a commitment of $1.0 million over fi ve years to support the Rick Hansen School
Program, a national initiative that inspires, empowers and engages children to make a difference in their local communities and build awareness of the importance of
accessibility and inclusion.
This new direction for the Boston Pizza Foundation is the result of a deeply held and long-standing commitment to mentorship by Jim Treliving and George Melville, Boston
Pizza’s owners and chairmen, who recognize the value of mentorship, from both an individual and a community level.
“For over 50 years, Boston Pizza has been involved with causes that are important to us as an organization as well as to our people,” said George Melville, Co-Owner and
Co-Chairman of BPI. “We see the impact and benefi t of strong mentorship in our restaurants every day as more than 23,000 young people are employed at Boston Pizza
Restaurants from coast-to-coast.”
“If you ask any successful individual in business, sports, the arts or the public sector, they’ll tell you that they couldn’t have got to where they are today without the support
and guidance of a role model or mentor,” said Jim Treliving, Co-Owner and Co-Chairman of Boston Pizza International Inc. “We are very proud to launch BPF Future Prospects
and not only give back to the community, but invest in the future of Canadian kids and inspire a new generation of leaders.”
BPF Future Prospects has also committed $1 million in support of Live Different, a Canadian not-for-profi t organization that delivers motivational school assemblies, workshops
and leadership training programs through Canada’s middle and secondary schools. BPF Future Prospects will also continue working with long-standing partners Kids Help
Phone to ensure young people will have ongoing access to its essential, professional and innovative counselling and support services 24/7 and the JDRF Ambassador and
Leadership program which provides youth and teens with type 1 diabetes opportunities for leadership, mentoring, and presentation training.
TO DATE, THE BOSTON PIZZA FOUNDATION HAS RAISED AND DONATED OVER $20 MILLION TO CHARITIES IN CANADA AND AROUND THE WORLD
BO
ST
ON
PIZ
ZA
RO
YA
LT
IES
IN
CO
ME
FU
ND
AN
NU
AL
RE
PO
RT
20
14
6

BO
ST
ON
PIZ
ZA
RO
YA
LT
IES
IN
CO
ME
FU
ND
AN
NU
AL
RE
PO
RT
20
14
7
BOSTON PIZZA CELEBRATED ITS 50TH ANNIVERSARY IN 2014
SERVING A RECORD 85,000 GOURMET PIZZAS IN ONE DAY
THE FUND HAS PAID OUT 150 CONSECUTIVE MONTHLY DISTRIBUTIONS TO UNITHOLDERS TOTALLING $15.22 PER UNIT
-4
-2
0
2
4
6
8
10
PE
RC
EN
T
2005 2006 2007 2008 2009 2010 2011 2012 2013 2014
-4.0%
3.3%
8.0% 8.4%
5.7%
0.7%
-1.3%
4.9%
1.5%
10-year average = 2.9%
1.7%
SAME STORESALES
GROWTH
BO
ST
ON
PIZ
ZA
RO
YA
LT
IES
IN
CO
ME
FU
ND
AN
NU
AL
RE
PO
RT
20
14
8
BO
ST
ON
PIZ
ZA
RO
YA
LT
IES
IN
CO
ME
FU
ND
AN
NU
AL
RE
PO
RT
20
14
9
LETTER FROM THE CHAIRMANOF BOSTON PIZZA ROYALTIES INCOME FUND
BOSTON PIZZA BOSTON PIZZA ROYALTIES INCOME FUNDROYALTIES INCOME FUNDANNUAL REPORT 2014 ANNUAL REPORT 2014
On behalf of the Trustees, I am pleased to present the fourth quarter report
for Boston Pizza Royalties Income Fund (the “Fund”). This report covers the
period from October 1, 2014 to December 31, 2014 (the “Period”) and the
period from January 1, 2014 to December 31, 2014 (the “Year”).
HIGHLIGHTS• System-Wide Gross Sales1 of $260.2 million for the Period and
$1.0 billion for the Year.
• Franchise Sales2 from royalty pool restaurants of $197.5 million
for the Period and $781.9 million for the Year.
• Same store sales growth of 5.3% for the Period and 1.7% for
the Year.
• Distributable Cash3 per Unit increase of 5.8% for the Period and
1.7% for the Year.
• Boston Pizza opened eight net new full service restaurants and
completed a record 53 restaurant renovations in 2014.
• Fund announces its 150th consecutive monthly distribution to
unitholders totalling $15.22 per Unit since the IPO.
• Trustees declare January 2015 distribution to unitholders of 10.2
cents per Unit.
Readers are cautioned that they should refer to the annual consolidated
fi nancial statements and Management’s Discussion and Analysis of the
Fund for the Period and Year, available on SEDAR at www.sedar.com and on
the Fund’s website at www.bpincomefund.com, for a full description of the
Fund’s fi nancial results.
FINANCIAL HIGHLIGHTSSame store sales growth (“SSSG”), a key driver of distribution growth for
unitholders of the Fund, was 5.3% for the Period and 1.7% for the Year
compared with negative 1.5% and positive 1.5%, respectively, for the same
periods in 2013. Franchise Sales, the basis upon which royalties are paid by
Boston Pizza International Inc. (“BPI”) to the Fund, exclude revenue from the
sale of liquor, beer, wine and approved national promotions and discounts.
On a Franchise Sales basis, SSSG was 5.3% for the Period and 1.4% for the
Year compared with negative 2.3% and positive 1.4%, respectively, for the
same periods in 2013. SSSG for the Period was principally due to an increase
in take-out and delivery sales, higher customer traffi c, and better weather
compared with the same period in 2013. SSSG for the Year was principally
due to an increase in take-out and delivery sales resulting from continued
promotion of Boston Pizza’s online ordering system and menu re-pricing
partially offset by a higher number of temporary closures due to restaurant
renovations compared with the same period one year ago.
Franchise Sales of restaurants in the royalty pool were $197.5 million for the
Period and $781.9 million for the Year compared with $183.7 million and
$755.4 million in the same periods, respectively, in 2013. The increases in
Franchise Sales for the Period and Year are attributed to SSSG and the addition
of 10 net new restaurants to the Fund’s royalty pool on January 1, 2014.
The Fund’s net income and comprehensive income was $2.6 million for
the Period and $16.5 million for the Year compared with $8.2 million and
$14.8 million, respectively, for the same periods in 2013. The changes in
net income for the Period and Year were mainly driven by the change in
the fair value adjustments on the class B general partner units of Boston
Pizza Royalties Limited Partnership (the “Class B Unit liability”) and
higher royalty income. The Fund’s net income under International Financial
Reporting Standards (“IFRS”) contains non-cash items, such as the fair
value adjustment on the Class B Unit liability, that do not affect the Fund’s
business operations or its ability to pay distributions to unitholders. In the
Fund’s view, net income is not the only or most meaningful measurement
of the Fund’s ability to pay distributions. Consequently, the Fund reports
the non-IFRS metrics of Distributable Cash and Payout Ratio4 to provide
investors with more meaningful information regarding the amount of cash
that the Fund has generated to pay distributions. Readers are cautioned that
Distributable Cash and Payout Ratio are non-IFRS fi nancial measures that
do not have standardized meanings prescribed by IFRS and therefore may
not be comparable to similar measures presented by other issuers. For a
reconciliation between cash fl ow from operating activities (the most directly
comparable IFRS measure) and Distributable Cash see the “Summary of
Quarterly Results” section in the Fund’s Management’s Discussion and
Analysis for the Period and Year. For a detailed discussion on the Fund’s
Distributable Cash and Payout Ratio, please see the “Operating Results
– Distributable Cash / Payout Ratio” section in the Fund’s Management’s
Discussion and Analysis for the Period and Year.
The Fund’s Distributable Cash was $4.8 million or $0.309 per unit of the Fund
(“Unit”) for the Period compared with $4.4 million or $0.292 per Unit for the
fourth quarter in 2013, representing increases of 8.9% and 5.8% respectively.
The Fund generated Distributable Cash of $19.1 million or $1.229 per Unit for
the Year compared with $18.4 million or $1.208 per Unit for the same period
in 2013, representing increases of 3.5% and 1.7% respectively. The increases
in Distributable Cash and Distributable Cash per Unit for the Period and Year
compared with the same periods one year ago are primarily attributable to the
increase in cash fl ow from operating activities due to an increase in royalty
income. The percentage increase in Distributable Cash for the Period and
Year was larger than the percentage increase in Distributable Cash per Unit
for the Period and Year, respectively, due to the combined effects of the Fund
repurchasing and cancelling Units under its normal course issuer bids and BPI
having exchanged Class B General Partner Units of Boston Pizza Royalties
Limited Partnership for 790,006 Units on March 10, 2014. Distributions for the
Period and Year were funded entirely by cash fl ow from operations. No debt was
incurred at any point during the Period or Year to fund distributions.
The Fund’s Payout Ratio was 99.0% for the Period compared with 104.9%
in the same period one year ago. The Fund’s Payout Ratio was 99.9% for the
Year compared with 100.8% in 2013. The Fund’s Payout Ratio for the Period
and the Year decreased compared with the same periods, respectively, one
year ago due to the increases in Distributable Cash, as discussed above,
exceeding the increase in distributions paid in respect of the period. The
increases in distributions paid in respect of the Period and the Year compared
with the same periods, respectively, one year ago were due to the increase in
the number of Fund Units outstanding resulting from the Exchange, partially
offset by the Fund repurchasing and cancelling Fund Units under its normal
course issuer bid activities. The Fund strives to provide unitholders with regular
monthly distributions, and as a result, the Fund will generally experience
seasonal fl uctuations in its Payout Ratio. The Fund’s Payout Ratio is likely to
be higher in the fi rst and fourth quarters compared with the second and third
quarters since Boston Pizza restaurants experience higher Franchise Sales
during the summer months when restaurants open their patios and benefi t from
increased tourist traffi c. Higher Franchise Sales generally results in increases in
Distributable Cash. A key feature of the Fund is that it is a “top line” structure,
in which BPI pays the Fund a royalty equal to 4% of Franchise Sales from
restaurants in the Fund’s royalty pool. Accordingly, Fund unitholders are not
directly exposed to changes in the operating costs or profi tability of BPI or of
individual Boston Pizza restaurants. Given this structure, and that the Fund has
no current mandate to retain capital for other purposes, it is expected that the
Fund will maintain a Payout Ratio close to 100% over time as the trustees of
the Fund continue to distribute all available cash in order to maximize returns
to unitholders.
The trustees of the Fund announced a cash distribution to unitholders of
10.2 cents per Unit for January 2015. The distribution will be payable to
unitholders of record at the close of business on February 21, 2015 and will be
paid on February 27, 2015. The Fund periodically reviews distribution levels
based on its policy of stable and sustainable distribution fl ow to unitholders.
Since the Fund’s initial public offering in 2002, unitholders have received 16
distribution increases. Including the January 2015 distribution, which will be
paid in February 2015, the Fund will have paid out 151 consecutive monthly
distributions totalling $196.8 million or $15.32 per Unit.
OUTLOOKBoston Pizza is well positioned for future growth and should continue to strengthen
its position as the number one casual dining brand in Canada by continuing to
achieve positive SSSG and opening new Boston Pizza locations across Canada.
The two principal factors that affect SSSG are changes in customer traffi c
and changes in average guest cheque. BPI’s strategies to drive higher guest
traffi c include attracting a wide variety of guests into the restaurant, sports
bar and take-out/delivery parts of each location, offering a compelling value
proposition to our guests and leveraging a larger marketing budget versus
the previous year along with a revised calendar of national and local store
promotions. Increased average cheque levels are expected to be achieved
through a combination of culinary innovation and annual menu re-pricing. In
addition, BPI’s franchise agreement requires that each Boston Pizza Restaurant
undergo a complete store renovation every seven years. Restaurants typically
close for two to three weeks to complete the renovation and experience an
incremental sales increase in the year following the re-opening.
Boston Pizza remains well positioned for future expansion as evidenced by
the eight net new Boston Pizza Restaurants that opened in 2014. There
are currently three new locations under construction with more planned for
later in 2015. BPI’s management believes that Boston Pizza will continue to
strengthen its position as the number one casual dining brand in Canada by
pursuing further restaurant development opportunities across the country.
On behalf of the Board of Trustees,
William C. BrownChairman, Boston Pizza Royalties Income Fund
Notes:1) “System-Wide Gross Sales” means the gross revenue: (i) of the corporate Boston Pizza restaurants in Canada owned by BPI; and (ii) reported to BPI by franchised Boston Pizza restaurants in Canada, without audit or other
form of independent assurance, and in the case of both (i) and (ii), including revenue from the sale of liquor, beer, wine and revenue from BPI approved national promotions and discounts and excluding applicable sales and similar taxes.
2) Franchise sales is the basis on which the royalty is payable; it means the revenues of Boston Pizza restaurants in respect of which the royalty is payable (“Franchise Sales”). The term “revenue” refers to the gross revenue: (i) of the corporate Boston Pizza restaurants in Canada owned by BPI; and (ii) reported to BPI by franchised Boston Pizza restaurants in Canada, without audit or other form of independent assurance, and in the case of both (i) and (ii), after deducting revenue from the sale of liquor, beer, wine and revenue from BPI approved national promotions and discounts and excluding applicable sales and similar taxes. Nevertheless, BPI periodically conducts audits of the Franchise Sales reported to it by its franchisees, and the Franchise Sales reported herein include results from sales audits of earlier periods.
3) Distributable Cash is a non-IFRS fi nancial measure that does not have a standardized meaning prescribed by IFRS and therefore may not be comparable to similar measures presented by other issuers. This non-IFRS fi nancial measure provides useful information to investors regarding the amount of cash the Fund has generated for distribution on the Units. Investors are cautioned that this should not be construed as an alternative net income measure of profi tability. The Fund’s Management’s Discussion and Analysis for the Period and Year provides a reconciliation from this non-IFRS fi nancial measure to cash fl ows from operating activities, which is the most directly comparable IFRS measure. For additional information regarding this fi nancial metric, see the heading “Description of Non-IFRS and Additional IFRS Measures” in the Fund’s Management’s Discussion and Analysis for the Period and Year.
4) Payout Ratio is calculated by dividing the distributions payable by the Fund in respect of the applicable period by the Distributable Cash generated in that period. Payout Ratio is a non-IFRS fi nancial measure that does not have a standardized meaning prescribed by IFRS and therefore may not be comparable to similar measures presented by other issuers. This non-IFRS fi nancial measure provides investors with useful information regarding the extent to which the Fund distributes cash on the Units. Investors are cautioned that this should not be construed as an alternative net income measure of profi tability. As the Payout Ratio is calculated from a formula which includes Distributable Cash, which is a non-IFRS measure, a reconciliation of Payout Ratio to an IFRS measure is not possible. For additional information regarding this fi nancial metric, see the heading “Description of Non-IFRS and Additional IFRS Measures” in the Fund’s Management’s Discussion and Analysis for the Period and Year.
Certain information in this letter constitutes “forward-looking information” that involves known and unknown risks, uncertainties, future expectations and other factors which may cause the actual results, performance or achievements of the Fund, Boston Pizza Holdings Trust, the Partnership, Boston Pizza Holdings Limited Partnership, Boston Pizza Holdings GP Inc., Boston Pizza GP Inc., BPI, Boston Pizza restaurants, or industry results, to be materially different from any future results, performance or achievements expressed or implied by such forward-looking information. All statements, other than statements of historical facts, included in this letter that address activities, events or developments that the Fund or management of BPI expects or anticipates will or may occur in the future, including such things as, seasonal fl uctuations in the Payout Ratio, the Payout Ratio is likely to be higher in the fi rst and fourth quarters, higher Franchise Sales generally result in increases in Distributable Cash, a Payout Ratio close to 100% will be maintained, trustees of the Fund will continue to distribute all available cash in order to maximize returns to unitholders, Boston Pizza being well positioned for future growth, the strengthening of Boston Pizza’s position as the number one casual dining brand in Canada, the achievement of positive SSSG, opening of new restaurants, increases in average guest cheques levels, incremental sales increasing after store renovations, plans to pursue restaurant development opportunities and other such matters are forward-looking information. When used in this letter, forward-looking information may include words such as “anticipate”, “estimate”, “may”, “will”, “expect”, “believe”, “plan”, “should”, “continue” and other similar terminology. The material factors and assumptions used to develop the forward-looking information contained in this letter include the following: future results being similar to historical results, expectation related to future general economic conditions, business plans, receipt of franchise fees and other amounts, franchisees access to fi nancing, pace of commercial real estate development, protection of intellectual property rights of the Partnership and absence of changes of laws. Risks, uncertainties and other factors that may cause actual results, performance or achievements to be materially different from any future results, performance or achievement expressed or implied by the forward-looking information contained herein, relate to (among others) competition, demographic trends, consumer preferences and discretionary spending patterns, business and economic conditions, legislation and regulation, Distributable Cash and reliance on operating revenues, accounting policies and practices, the results of operations and fi nancial condition of BPI and the Fund, as well as those factors discussed under the heading “Risks and Uncertainties” in the most recent Annual Information Form of the Fund. This information refl ects current expectations regarding future events and operating performance and speaks only as of the date of this letter. Except as required by law, the Fund and BPI assume no obligation to update previously disclosed forward-looking information. For a complete list of the risks associated with forward-looking information and our business, please refer to the “Risks and Uncertainties” and “Note Regarding Forward-Looking Information” sections included in the Fund’s Management’s Discussion and Analysis for the Period and Year available at www.sedar.com and www.bpincomefund.com. The trustees of the Fund have approved the contents of this letter.
BOSTON PIZZA BOSTON PIZZA ROYALTIES INCOME FUNDROYALTIES INCOME FUNDANNUAL REPORT 2014 ANNUAL REPORT 2014
BO
ST
ON
PIZ
ZA
RO
YA
LT
IES
IN
CO
ME
FU
ND
AN
NU
AL
RE
PO
RT
20
14
10
BO
ST
ON
PIZ
ZA
IN
TE
RN
AT
ION
AL
IN
C.
AN
NU
AL
RE
PO
RT
20
14
11
LETTER FROM THE CHIEF EXECUTIVE OFFICEROF BOSTON PIZZA INTERNATIONAL INC.
On behalf of Boston Pizza International Inc. (“BPI”), its board of directors,
management team and employees, I am pleased to present our 2014 Annual
Report. This report covers the fiscal period of October 1, 2014 to December 31,
2014 (the “Period”) and January 1, 2014 to December 31, 2014 (the “Year”).
HIGHLIGHTS• Celebrated Boston Pizza’s 50th anniversary on August 12, 2014 by
serving a record 85,000 individual gourmet pizzas to our guests from
coast-to-coast.
• Achieved record annual system-wide gross sales of $1.0 billion in
2014, an increase of 3.8% compared to 2013.
• 14 new Boston Pizza locations opened during 2014 and 8 net new
locations were added to the Fund’s royalty pool on January 1, 2015
bringing the total to 366 restaurants nationwide.
• Key operational and marketing initiatives drive record top-line results for
BPI in 2014.
Readers are cautioned that they should refer to the consolidated financial
statements and Management’s Discussion and Analysis of BPI for the
Period and the Year, available on SEDAR at www.sedar.com and on the
Fund’s website at www.bpincomefund.com, for a full description of BPI’s
financial results.
We are very pleased with BPI’s performance in 2014 and particularly proud
of two significant milestones achieved during the Year. First was the 50th
anniversary of the Boston Pizza brand, which was celebrated on August 12,
2014 by serving a record 85,000 individual gourmet pizzas to our guests
from coast-to-coast. The 50th anniversary celebration included many other
events throughout the Year, which were all made possible by the dedication
and support of our franchisees, corporate and restaurant staff members, and
our suppliers and partners. The second major achievement in 2014 was our
annual system-wide sales total of $1.0 billion, a record level for Boston Pizza
and in fact for any full-service restaurant brand in Canadian history. While
bigger isn’t always better, we view this record sales level as further evidence
that Boston Pizza is strengthening its position as Canada’s #1 casual dining
brand by focusing on our “four pillars” strategy of continually improving the
guest experience, building the Boston Pizza brand, focusing on franchisee
profitability and getting involved in our communities. We are excited to start
the next 50 years at Boston Pizza.
OPERATIONAL HIGHLIGHTSBoston Pizza began 2014 by focusing on families and our dining room
business. In January, we launched a new BP Kids Pack and offered a
new lineup of kids meals for $6.99. The focus on families continued in
February with our annual Valentine’s Day heart-shaped pizza fundraiser in
support of Boston Pizza Foundation (BPF) Future Prospects. BPF Future
Prospects launched in January, and signified a new focus for the Boston
Pizza Foundation around role modeling and mentoring programs supporting
Canadian youth. The annual Valentine’s Day campaign raised more than
$384,000 for organizations like Big Brothers Big Sisters Canada, Kids Help
Phone, Live Different, JDRF and the Rick Hansen Foundation.
Food news and menu innovation was front and centre in the second quarter
with a focus on BP’s core menu category. The “Pizza Game Changers”
campaign featured a number of exciting and innovative pizza-themed items
including the Pizza Taco, PizzaBurger™ Sliders, Sriracha Chicken Pizza, and
the Spicy Steak and Potato Pizza. The accompanying integrated marketing
campaign positioned Boston Pizza as a leading pizza innovator and the digital
campaign asked guests to vote on the next big innovation from Boston Pizza.
The clear-cut winner was the “Pizza Cake” – a conceptual six-layer pizza
creation that received international media attention and social media buzz.
In Québec, Boston Pizza continued to raise awareness for the brand and
establish BP as the destination sports bar in the province. Just in time for
the 2014 NHL Playoffs, we announced a multi-year partnership with popular
Montreal Canadiens defenseman P.K. Subban. The partnership launched with a
new French-language TV commercial and an out-of-home billboard campaign.
On August 12, 2014, Boston Pizza proudly celebrated its 50th anniversary
by offering guests $5.00 individual size pizzas throughout the day. It was an
amazing celebration of the brand and Boston Pizza sold more than 85,000
individual pizzas to guests across Canada. In addition, Boston Pizza gave away
50 Pizza Parties to guests from coast-to-coast allowing them to celebrate their
own milestones with us in true Boston Pizza fashion.
In September, Boston Pizza brought back the popular Kids Cards program
where guests donated $5 to BPF Future Prospects in exchange for a Kids Card
and five free kids meals. The campaign was extremely successful with more
than 134,000 Kids Cards sold during the six-week campaign and more than
$745,000 donated to BPF Future Prospects.
In the Fall, Boston Pizza launched a new digital program called MyBP. MyBP
provides guests with enhanced online ordering tools and also serves as a loyalty
platform serving up relevant offers and promotions just for members. Initially,
guests received a free appetizer just for signing up while other offers are added
to user accounts along with personalized communications and better, faster
and easier online ordering tools. To date, more than 188,000 guests have
signed up for MyBP.
On the development front, Boston Pizza continued to open traditional locations
in new markets across the country while also opening new development
opportunities as part of a multi-channel development strategy. Over the past
year, we set a new annual record for restaurant renovations (53), and opened
the highest number of new Boston Pizza locations in the past five years (14). As
part of the development strategy, Boston Pizza also began converting existing
independent or other casual dining restaurants to Boston Pizza locations.
In 2014, Boston Pizza converted five existing restaurants in markets like
Sherkston Shores, Port Elgin and Kingston, Ontario.
In 2015, Boston Pizza begins a new chapter for the brand. After 50 years
in business, Boston Pizza remains Canada’s #1 casual dining brand and
sports bar, but there’s still more to accomplish. In the first quarter of 2015,
we’ll launch a new brand platform and advertising campaign. “We’ll Make
You A Fan” is more than just a new tagline for Boston Pizza; it’s a promise
to our guests that we’ll do what it takes to provide them with exceptional
BOSTON PIZZA INTERNATIONAL INC.ANNUAL REPORT 2014
service, delicious and craveable food and the perfect guest experience in our
restaurants from coast-to-coast.
OUTLOOKBoston Pizza is well positioned for future growth and should continue to
strengthen its position as the number one casual dining brand in Canada by
continuing to achieve positive SSSG and opening new Boston Pizza locations
across Canada.
The two principal factors that affect SSSG are changes in customer traffic
and changes in average guest cheque. BPI’s strategies to drive higher guest
traffic include attracting a wide variety of guests into the restaurant, sports
bar and take-out/delivery parts of each location, offering a compelling value
proposition to our guests and leveraging a larger marketing budget versus
the previous year along with a revised calendar of national and local store
promotions. Increased average cheque levels are expected to be achieved
through a combination of culinary innovation and annual menu re-pricing. In
addition, BPI’s franchise agreement requires that each Boston Pizza Restaurant
undergo a complete store renovation every seven years. Restaurants typically
close for two to three weeks to complete the renovation and experience an
incremental sales increase in the year following the re-opening.
Boston Pizza remains well positioned for future expansion as evidenced by
the eight net new Boston Pizza Restaurants that opened in 2014. There are
currently three new locations under construction with more planned for later in
2015. BPI’s management believes that Boston Pizza will continue to strengthen
its position as the number one casual dining brand in Canada by pursuing
further restaurant development opportunities across the country.
On behalf of Boston Pizza International Inc.,
MARK PACINDA,President & Chief Executive Officer,
Boston Pizza International Inc.
Certain information in this letter constitutes “forward-looking information” that involves known and unknown risks, uncertainties, future expectations and other factors which may cause the actual results, performance or achievements of BPI, the Fund, Boston Pizza Holdings Trust, Boston Pizza Royalties Limited Partnership, Boston Pizza Holdings Limited Partnership, Boston Pizza Holdings GP Inc., Boston Pizza GP Inc., Boston Pizza Restaurants, or industry results, to be materially different from any future results, performance or achievements expressed or implied by such forward-looking information. When used in this letter, forward-looking information may include words such as “anticipate”, “estimate”, “may”, “will”, “should”, “expect”, “believe”, “plan” and other similar terminology. This information reflects current expectations regarding future events and operating performance and speaks only as of the date of this letter. The material factors and assumptions used to develop the forward-looking information contained in this letter include the following: future results being similar to historical results, expectation related to future general economic conditions, business plans, receipt of franchise fees and other amounts, franchisees access to financing, pace of commercial real estate development, protection of intellectual property rights of Boston Pizza Royalties Limited Partnership and absence of changes of laws. Risks, uncertainties and other factors that may cause actual results, performance or achievements to be materially different from any future results, performance or achievement expressed or implied by the forward-looking information contained herein, relate to (among others) competition, demographic trends, consumer preferences and discretionary spending patterns, business and economic conditions, legislation and regulation, Distributable Cash and reliance on operating revenues, accounting policies and practices, the results of operations and financial condition of BPI and the Fund, as well as those factors discussed under the heading “Risks and Uncertainties” in the most recent Annual Information Form of the Fund. This information reflects current expectations regarding future events and operating performance and speaks only as of the date of this letter. Except as required by law, the Fund and BPI assume no obligation to update previously disclosed forward-looking information. For a complete list of the risks associated with forward-looking information and our business, please refer to the “Risks and Uncertainties” and “Note Regarding Forward-Looking Information” sections included in BPI’s Management’s Discussion and Analysis for the Period and Year available at www.sedar.com and www.bpincomefund.com.
BOSTON PIZZA INTERNATIONAL INC.ANNUAL REPORT 2014
BO
ST
ON
PIZ
ZA
IN
TE
RN
AT
ION
AL
IN
C.
AN
NU
AL
RE
PO
RT
20
14
12
BO
ST
ON
PIZ
ZA
RO
YA
LT
IES
IN
CO
ME
FU
ND
AN
NU
AL
RE
PO
RT
20
14
13
MANAGEMENT’S DISCUSSION AND ANALYSISFOR THE PERIOD AND THE YEAR ENDED DECEMBER 31, 2014
FINANCIAL HIGHLIGHTSThe tables below set out selected information from the annual consolidated fi nancial statements of Boston Pizza Royalties Income Fund (the “Fund”), which
includes the accounts of Boston Pizza Royalties Limited Partnership (the “Partnership”), together with other data and should be read in conjunction with
the annual consolidated fi nancial statements of the Fund for years ended December 31, 2014 and 2013. The fi nancial information in the tables included in
this Management’s Discussion and Analysis are reported in accordance with International Financial Reporting Standards (“IFRS”).
For the years ended December 31
(in thousands of dollars – except restaurants, SSSG, Payout Ratio and per Unit items) 2014 2013 2012
System-Wide Gross Sales 1,011,966 974,837 943,053
Number of restaurants in Royalty Pool 358 348 343
Franchise Sales reported by restaurants in the Royalty Pool 781,915 755,420 731,455
Royalty income 31,277 30,217 29,258
Interest income 1,811 1,811 1,814
Total revenue 33,088 32,028 31,072
Administrative expenses (1,022 ) (1,050 ) (1,126 )
Interest expense on debt (1,301 ) (1,054 ) (941 )
Interest expense on Class B Unit and Class C Unit liabilities (5,023 ) (5,525 ) (6,295 )
Profi t before fair value adjustments and income taxes 25,742 24,399 22,710
Fair value adjustment on Class B Unit liability (2,115 ) (3,424 ) (14,867 )
Fair value adjustment on interest rate swaps (401 ) 227 136
Current and deferred income tax expense (6,773 ) (6,389 ) (5,933 )
Net income and comprehensive income for the year 16,453 14,813 2,046
Basic earnings per Unit 1.06 0.97 0.14
Diluted earnings per Unit 1.06 0.97 0.14
Distributable Cash / Distributions / Payout Ratio
Cash fl ows from operating activities 25,557 24,908 19,062
Class C Unit distributions to BPI (1,800 ) (1,800 ) (1,800 )
BPI Class B Unit entitlement (3,266 ) (3,725 ) (4,495 )
Interest paid on long-term debt (1,355 ) (1,002 ) (887 )
SIFT Tax on Units (64 ) 49 5,492
Distributable Cash 19,072 18,430 17,372
Distributions paid in respect of the year 19,055 18,569 17,244
Payout Ratio 99.9 % 100.8 % 99.3 %
Distributable Cash per Unit 1.229 1.208 1.184
Distributions per Unit 1.224 1.220 1.170
Other
Same store sales growth 1.7 % 1.5 % 3.3 %
Number of restaurants opened during the year 14 12 7
Number of restaurants closed during the year 6 2 2
As at December 31 2014 2013 2012
Total assets 278,821 268,945 264,632
Total liabilities 123,153 119,726 99,353
Notes:1) Capitalized terms used in these tables are defi ned in this Management’s Discussion and Analysis.2) Profi t before fair value adjustments and income taxes is considered an additional IFRS measure. For additional information regarding this fi nancial metric, see the heading “Description of Non-IFRS and Additional IFRS Measures” in this Management’s Discussion and Analysis.3) Distributable Cash and Payout Ratio are non-IFRS measures and as such, do not have standardized meanings under IFRS. For additional information regarding these fi nancial metrics, see the heading “Description of Non-IFRS and Additional IFRS Measures” in this Management’s Discussion and Analysis.
BOSTON PIZZA BOSTON PIZZA ROYALTIES INCOME FUNDROYALTIES INCOME FUNDANNUAL REPORT 2014 ANNUAL REPORT 2014
BO
ST
ON
PIZ
ZA
RO
YA
LT
IES
IN
CO
ME
FU
ND
AN
NU
AL
RE
PO
RT
20
14
14
SUMMARY OF QUARTERLY RESULTS
(in thousands of dollars – except restaurants, SSSG, Payout Ratio and per Unit items) Q4 2014 Q3 2014 Q2 2014 Q1 2014
System-Wide Gross Sales 260,240 258,716 255,002 238,008
Number of restaurants in Royalty Pool 358 358 358 358
Franchise Sales reported by restaurants in the Royalty Pool 197,531 201,369 196,627 186,388
Royalty income 7,902 8,054 7,865 7,456
Interest income 454 452 453 452
Total revenue 8,356 8,506 8,318 7,908
Administrative expenses (262 ) (237 ) (263 ) (260 )
Interest expense on debt (370 ) (331 ) (307 ) (293 )
Interest expense on Class B Unit and Class C Unit liabilities (1,637 ) (1,247 ) (1,194 ) (945 )
Profit before fair value adjustments and income taxes 6,087 6,691 6,554 6,410
Fair value adjustment on Class B Unit liability (1,672 ) 19 (2,392 ) 1,930
Fair value adjustment on interest rate swaps (101 ) 7 (37 ) (270 )
Current and deferred income tax expense (1,684 ) (1,715 ) (1,681 ) (1,693 )
Net income and comprehensive income for the period 2,630 5,002 2,444 6,377
Basic earnings per Unit 0.17 0.32 0.16 0.42
Diluted earnings per Unit 0.17 0.28 0.16 0.25
Distributable Cash / Distributions / Payout Ratio
Cash flows from operating activities 6,369 6,909 6,458 5,821
Class C Unit distributions to BPI (450 ) (450 ) (450 ) (450 )
BPI Class B Unit entitlement (779 ) (833 ) (741 ) (913 )
Interest paid on long-term debt (374 ) (332 ) (299 ) (350 )
SIFT Tax on Units 10 (60 ) (41 ) 27
Distributable Cash 4,776 5,234 4,927 4,135
Distributions paid in respect of the period 4,727 4,769 4,799 4,760
Payout Ratio 99.0 % 91.1 % 97.4 % 115.1 %
Distributable Cash per Unit 0.309 0.335 0.313 0.272
Distributions per Unit 0.306 0.306 0.306 0.306
Other
Same store sales growth 5.3 % 3.1 % (0.1 %) (1.7 %)
Number of restaurants opened during the period 9 3 2 0
Number of restaurants closed during the period 1 2 1 2
BOSTON PIZZA ROYALTIES INCOME FUNDANNUAL REPORT 2014
MANAGEMENT’S DISCUSSION AND ANALYSIS
BO
ST
ON
PIZ
ZA
RO
YA
LT
IES
IN
CO
ME
FU
ND
AN
NU
AL
RE
PO
RT
20
14
15
(in thousands of dollars – except restaurants, SSSG, Payout Ratio and per Unit items) Q4 2013 Q3 2013 Q2 2013 Q1 2013
System-Wide Gross Sales 241,488 246,627 250,398 236,324
Number of restaurants in Royalty Pool 348 348 348 348
Franchise Sales reported by restaurants in the Royalty Pool 183,742 191,510 193,830 186,338
Royalty income 7,350 7,660 7,753 7,454
Interest income 453 453 452 453
Total revenue 7,803 8,113 8,205 7,907
Administrative expenses (274 ) (250 ) (263 ) (263 )
Interest expense on debt (298 ) (295 ) (247 ) (214 )
Interest expense on Class B Unit and Class C Unit liabilities (1,897 ) (1,365 ) (1,365 ) (898 )
Profit before fair value adjustments and income taxes 5,334 6,203 6,330 6,532
Fair value adjustment on Class B Unit liability 4,598 (1,166 ) (1,144 ) (5,712 )
Fair value adjustment on interest rate swaps (198 ) (136 ) 60 (89 )
Current and deferred income tax expense (1,501 ) (1,589 ) (1,816 ) (1,483 )
Net income and comprehensive income (loss) for the period 8,233 3,312 4,020 (752 )
Basic earnings per Unit 0.55 0.22 0.26 (0.05 )
Diluted earnings per Unit 0.23 0.22 0.26 (0.05 )
Distributable Cash / Distributions / Payout Ratio
Cash flows from operating activities 6,039 6,482 6,572 5,815
Class C Unit distributions to BPI (450 ) (450 ) (450 ) (450 )
BPI Class B Unit entitlement (992 ) (915 ) (915 ) (903 )
Interest paid on long-term debt (297 ) (276 ) (216 ) (213 )
SIFT Tax on Units 85 53 (156 ) 67
Distributable Cash 4,385 4,894 4,835 4,316
Distributions paid in respect of the period 4,599 4,605 4,673 4,692
Payout Ratio 104.9 % 94.1 % 96.6 % 108.7 %
Distributable Cash per Unit 0.292 0.324 0.315 0.277
Distributions per Unit 0.306 0.306 0.306 0.302
Other
Same store sales growth (1.5 %) 0.8 % 3.6 % 3.2 %
Number of restaurants opened during the period 7 1 4 0
Number of restaurants closed during the period 0 1 1 0
1) BP Rights are the trademarks that as at July 17, 2002 were registered or the subject of pending applications for registration under the Trade-Marks Act (Canada), and other trademarks and the trade names which are confusingly similar to any of the registered or pending trademarks. The BP Rights purchased do not include the rights outside of Canada to any trademarks or trade names used by BPI or any affiliated entities in its business, and in particular do not include the rights outside of Canada to the trademarks registered or pending registration under the Trade-Marks Act (Canada).
OVERVIEW
GeneralThis Management’s Discussion and Analysis covers the three month period
from October 1, 2014 to December 31, 2014 (the “Period”) and the twelve
month period from January 1, 2014 to December 31, 2014 (the “Year”) and
is dated February 5, 2015. It provides additional analysis of the operations,
financial position and financial performance of the Fund and should be read
in conjunction with the Fund’s applicable annual consolidated financial
statements and accompanying notes. The annual consolidated financial
statements are in Canadian dollars and have been prepared in accordance
with IFRS.
This Management’s Discussion and Analysis has been configured to align
the disclosure with financial statement line items in order to assist the reader
to better understand the Fund’s annual consolidated financial statements.
The Fund is a limited purpose open-ended trust established in July 2002,
and the units of the Fund (the “Units”) trade on the Toronto Stock Exchange
(“TSX”) under the symbol BPF.UN. The Fund was created to acquire, indirectly
through the Partnership and Boston Pizza Holdings Trust (the “Trust”), the
Canadian trademarks owned by Boston Pizza International Inc. (“BPI”) used
in connection with the operation of Boston Pizza restaurants in Canada
(collectively the “BP Rights”1) and the business of BPI, its affiliated entities
and franchisees (herein referred to as “Boston Pizza”). The Partnership
licenses the BP Rights to BPI in return for a 4% royalty (“Royalty”) of
Franchise Sales (defined below) of those restaurants (“Boston Pizza Restaurants”) included in the specific royalty pool (the “Royalty Pool”).
As of December 31, 2014, there were 358 restaurants in the Royalty Pool.
A key attribute of the Fund’s structure is that it is a “top-line” fund.
Royalty revenue of the Fund is based on Franchise Sales of Royalty Pool
restaurants and is not determined by the profitability of either BPI or the
Boston Pizza Restaurants in the Royalty Pool. The Fund’s only cash expenses
are administrative expenses, interest expenses on debt, amounts paid by
the Partnership on the Class B and Class C general partner units of the
BO
ST
ON
PIZ
ZA
RO
YA
LT
IES
IN
CO
ME
FU
ND
AN
NU
AL
RE
PO
RT
20
14
16
Partnership (“Class B Units” and “Class C Units”, respectively), and current
income tax. Therefore, the Fund is not subject to the variability of earnings
or expenses associated with an operating business. Given this structure, the
success of the Fund depends primarily on the ability of BPI to maintain and
increase Franchise Sales of Boston Pizza Restaurants in the Royalty Pool.
Franchise Sales is the basis on which the Royalty is payable; it means
the revenues of Boston Pizza Restaurants in respect of which the Royalty
is payable (“Franchise Sales”). The term “revenue” refers to the gross
revenue: (i) of the corporate Boston Pizza Restaurants in Canada owned
by BPI; and (ii) reported to BPI by franchised Boston Pizza Restaurants in
Canada, without audit or other form of independent assurance, and in the
case of both (i) and (ii), after deducting revenue from the sale of liquor, beer,
wine and revenue from BPI approved national promotions and discounts and
excluding applicable sales and similar taxes. Nevertheless, BPI periodically
conducts audits of the Franchise Sales reported to it by its franchisees, and
the Franchise Sales reported herein include results from sales audits of
earlier periods. “System-Wide Gross Sales” means the gross revenue: (i)
of the corporate Boston Pizza Restaurants in Canada owned by BPI; and (ii)
reported to BPI by franchised Boston Pizza Restaurants in Canada, without
audit or other form of independent assurance, and in the case of both (i) and
(ii), including revenue from the sale of liquor, beer, wine and revenue from BPI
approved national promotions and discounts but excluding applicable sales
and similar taxes.
Increases in Franchise Sales are derived from both new Boston Pizza
Restaurants added to the Royalty Pool and same store sales growth
(“SSSG”). SSSG, a key driver of distribution growth for unitholders of the
Fund (“Unitholders”), is the change in gross revenues of Boston Pizza
Restaurants as compared to the gross revenues for the same period in the
previous year (where restaurants were open for a minimum of 24 months).
The two principal factors that affect SSSG are changes in customer traffic
and changes in average guest cheque. These factors are dependent upon
existing Boston Pizza Restaurants maintaining operational excellence, general
market conditions, weather, pricing, and marketing programs undertaken
by BPI. One of BPI’s competitive strengths in increasing Franchise Sales of
existing locations is that BPI’s franchise agreement requires that each Boston
Pizza Restaurant undergo a complete store renovation every seven years
and complete equipment upgrades as required by BPI. Locations typically
close for two to three weeks to complete the renovation and experience an
incremental sales increase in the year following the re-opening.
Franchise Sales are also affected by the permanent closures of Boston Pizza
Restaurants. A Boston Pizza Restaurant is closed when it ceases to be viable
or when the franchise agreement has expired or been terminated.
Addition of New Restaurants to Royalty PoolOn January 1 of each year (the “Adjustment Date”), an adjustment is made
to add to the Royalty Pool new Boston Pizza Restaurants that opened and
to remove any Boston Pizza Restaurants that permanently closed since the
last Adjustment Date. In return for adding net additional royalty revenue,
BPI receives the right to indirectly acquire additional Units (the “Additional Entitlements”). The adjustment for new Franchise Sales added to the
Royalty Pool is designed to be accretive to Unitholders as the additional
Royalty revenues from the new restaurants are valued at a 7.5% discount.
The Additional Entitlements are calculated at 92.5% of the estimated royalty
revenue added to the Royalty Pool, multiplied by one minus the effective tax
rate estimated to be paid by the Fund, divided by the yield of the Fund, divided
by the weighted average Unit price over a specified period. BPI receives 80%
of the Additional Entitlements initially, with the balance received when the
actual full year performance of the new restaurants and the actual effective
tax rate paid by the Fund are known with certainty (such balance of Units,
a “Holdback”). BPI receives 100% of distributions from the Additional
Entitlements throughout the year. Once these new restaurants have been
part of the Royalty Pool for a full year, an audit of the royalty revenues of
these restaurants received from BPI is performed, and the actual effective
tax rate paid by the Fund is determined. At such time an adjustment is made
to reconcile distributions paid to BPI and the Additional Entitlements received
by BPI.
The Fund historically reported the number of restaurants in the Royalty Pool
at any particular time as the actual number of restaurants in the Royalty Pool
at that time less the number of Boston Pizza Restaurants that permanently
closed since the prior Adjustment Date even though those permanently closed
Boston Pizza Restaurants are only removed from the Royalty Pool on the
next Adjustment Date. Commencing with the Management’s Discussion and
Analysis for the three month period ended March 31, 2014, a copy of which
is filed on SEDAR at www.sedar.com, the Fund reports the actual number of
restaurants in the Royalty Pool at any particular time by not excluding Boston
Pizza Restaurants that permanently closed since the prior Adjustment Date.
Accordingly, the number of restaurants in the Royalty Pool reported by the
Fund will only change once a year on the Adjustment Date. As a consequence
of this change, the number of restaurants in the Royalty Pool reported in
this Management’s Discussion and Analysis is not necessarily comparable
to the number of restaurants in the Royalty Pool reported in Management’s
Discussion and Analysis for periods ended prior to March 31, 2014.
New Store Openings, Closures and RenovationsDuring the Period, nine new Boston Pizza Restaurants opened (Year – 14) and
one Boston Pizza Restaurant closed (Year – 6). Subsequent to December 31,
2014, one Boston Pizza Restaurant opened and one Boston Pizza Restaurant
closed. As well during the Period, 17 Boston Pizza Restaurants were
renovated (Year – 53). Restaurants typically close for two to three weeks
to complete the renovation and experience an incremental sales increase
in the year following the re-opening. Subsequent to December 31, 2014,
two additional restaurants were renovated. The total number of restaurants in
operation as of February 5, 2015 is 366.
SeasonalityBoston Pizza Restaurants experience seasonal fluctuations in Franchise
Sales, which are inherent in the full service restaurant industry in Canada.
Seasonal factors such as better weather allow Boston Pizza Restaurants to
open their patios and generally increase Franchise Sales in the second and
third quarters compared to the first and fourth quarters. Tourism is also a
seasonal factor positively impacting the same time frames. The effect of
seasonality impacts the Fund’s Distributable Cash and Payout Ratios.
OPERATING RESULTS
Same Store Sales Growth and Franchise SalesSSSG, a key driver of distribution growth for Unitholders, is the change
in gross revenues of Boston Pizza Restaurants as compared to the gross
revenues for the same period in the previous year, where restaurants were
BOSTON PIZZA ROYALTIES INCOME FUNDANNUAL REPORT 2014
MANAGEMENT’S DISCUSSION AND ANALYSIS
BO
ST
ON
PIZ
ZA
RO
YA
LT
IES
IN
CO
ME
FU
ND
AN
NU
AL
RE
PO
RT
20
14
19
BO
ST
ON
PIZ
ZA
RO
YA
LT
IES
IN
CO
ME
FU
ND
AN
NU
AL
RE
PO
RT
20
14
17
open for a minimum of 24 months. The two principal factors that affect SSSG
are changes in customer traffic and changes in average guest cheque.
Period
SSSG was 5.3% for the Period compared with negative 1.5% SSSG reported
in the fourth quarter of 2013. Franchise Sales, the basis upon which the
Royalty is paid by BPI to the Fund, exclude revenue from sales of liquor,
beer, wine and approved national promotions and discounts. On a Franchise
Sales basis, SSSG was 5.3% for the Period compared with negative 2.3%
for the fourth quarter of 2013. SSSG for the Period was principally due to
higher take-out and delivery sales resulting from continued promotion
of Boston Pizza’s online ordering system, increased customer traffic, and
better weather compared to the fourth quarter of 2013. Other key marketing
campaigns in the Period included the Kids Cards campaign which raised a
record amount for the Boston Pizza Foundation, the Festive Favourites holiday
menu which increased customer traffic during the holiday season, and the
“Pep-peroni Talks” campaign which brought increased awareness to take-
out and delivery.
Franchise Sales of Boston Pizza Restaurants in the Royalty Pool were $197.5
million for the Period compared with $183.7 million for the fourth quarter of
2013. The $13.8 million increase in Franchise Sales for the Period was due
to strong SSSG for the Period and additional Franchise Sales from 10 net
new Boston Pizza Restaurants added to the Royalty Pool on January 1, 2014.
Year
SSSG was 1.7% for the Year compared with 1.5% SSSG in 2013. On a
Franchise Sales basis, SSSG was 1.4% for the Year, unchanged from 1.4%
in 2013. SSSG for the Year was principally due to higher take-out and delivery
sales resulting from continued promotion of Boston Pizza’s online ordering
system and menu repricing, partially offset by a higher number of temporary
closures due to restaurant renovations compared with the same period one
year ago.
Franchise Sales of Boston Pizza Restaurants in the Royalty Pool were $781.9
million for the Year compared with $755.4 million in 2013. The $26.5 million
increase in Franchise Sales for the Year compared to the same period one year
ago was due to SSSG for the Year and additional Franchise Sales from 10 net
new Boston Pizza Restaurants added to the Royalty Pool on January 1, 2014.
Royalty IncomePeriod
Royalty income earned by the Fund was $7.9 million for the Period compared
with $7.4 million earned in the fourth quarter of 2013. Royalty income
was based on the Royalty Pool of 358 Boston Pizza Restaurants reporting
Franchise Sales of $197.5 million for the Period. In the fourth quarter of
2013, Royalty income was based on the Royalty Pool of 348 Boston Pizza
Restaurants reporting Franchise Sales of $183.7 million. The $0.5 million
increase in Royalty income for the Period was due to positive SSSG for the
Period and the addition of 10 net new restaurants to the Royalty Pool on
January 1, 2014.
Year
Royalty income earned by the Fund was $31.3 million for the Year compared
with $30.2 million in 2013. Royalty income was based on the Royalty Pool
of 358 Boston Pizza Restaurants reporting Franchise Sales of $781.9 million
for the Year. For the same period in 2013, Royalty income was based on
the Royalty Pool of 348 Boston Pizza Restaurants reporting Franchise Sales
of $755.4 million. The $1.1 million increase in Royalty income for the Year
was due to positive SSSG and the addition of 10 net new restaurants to the
Royalty Pool on January 1, 2014.
Interest IncomeInterest income earned by the Fund was $0.5 million for the Period, relatively
unchanged from the fourth quarter of 2013. The Fund’s interest income was
mainly derived from the $24.0 million loan from the Fund to BPI, which bears
interest at a rate of 7.5% per annum and is paid monthly by BPI in arrears
(the “BP Loan”). Interest income earned by the Fund was $1.8 million for the
Year, unchanged from 2013.
Administrative ExpensesAdministrative expenses incurred by the Fund were $0.3 million for the
Period, relatively unchanged from the fourth quarter of 2013. Administrative
expenses are comprised of professional fees, trustee fees and expenses, the
administration charge payable to BPI and other general and administrative
expenses. Administrative expenses incurred by the Fund were $1.0 million
for the Year, relatively unchanged from 2013.
Interest and Financing ExpensesPeriod
Interest and financing expenses incurred by the Fund totaled $2.0 million
for the Period, comprised of interest on long-term debt of $0.4 million and
interest on Class B Unit and Class C Unit liabilities of $1.6 million. Interest
and financing expenses incurred by the Fund were $2.2 million for the fourth
quarter of 2013, comprised of interest on long-term debt of $0.3 million,
and interest on Class B Unit and Class C Unit liabilities of $1.9 million.
The Class B Units and Class C Units are classified under IFRS as financial
liabilities and therefore, amounts paid by the Partnership to BPI in respect
of the Class B Units and Class C Units are classified as interest expense
and not distributions. The decrease in interest and financing expenses in the
Period was due to a decrease in interest on Class B Units and Class C Units
resulting from a decrease in Additional Entitlements held by BPI as a result of
the Exchange (as defined herein) relative to the comparable period, partially
offset by an increase in interest on long-term debt resulting from a higher
outstanding debt balance during the Period in comparison to the outstanding
debt balance during the same period in 2013.
Year
Interest and financing expenses incurred by the Fund totaled $6.3 million
for the Year, comprised of interest on long-term debt of $1.3 million and
interest on Class B Unit and Class C Unit liabilities of $5.0 million. For the
same period in 2013, interest and financing expenses incurred by the Fund
was $6.6 million, comprised of interest on long-term debt of $1.1 million, and
interest on Class B Unit and Class C Unit liabilities of $5.5 million. Interest and
financing expenses for the Year were $0.3 million lower than the same period
in 2013 due to a decrease in interest on Class B Units and Class C Units
resulting from a decrease in Additional Entitlements held by BPI as a result of
the Exchange relative to the comparable period, partially offset by an increase
in interest on long-term debt arising from a higher outstanding debt balance
compared to the outstanding debt balance during the same period in 2013.
Profit before Fair Value Adjustments and Income TaxesPeriod
The Fund’s profit before fair value adjustments and income taxes was $6.1
million for the Period compared with $5.3 million for the fourth quarter of 2013.
The $0.8 million increase in profit before fair value adjustments and income
taxes during the Period was principally due to the increase in Royalty income.
BO
ST
ON
PIZ
ZA
RO
YA
LT
IES
IN
CO
ME
FU
ND
AN
NU
AL
RE
PO
RT
20
14
18
Year
The Fund’s profit before fair value adjustments and income taxes was $25.7
million for the Year compared with $24.4 million in 2013. The $1.3 million
increase in profit before fair value adjustments and income taxes during the
Year was primarily due to the increase in Royalty income.
Fair Value AdjustmentsThe Class B Unit liability is classified as a financial liability at fair value and
the interest rate swaps are classified as derivative instruments. As such, fair
value adjustments are recorded in the Fund’s statements of comprehensive
income in accordance with IFRS. For additional information regarding interest
rate swaps, refer to the “Interest Rate Swaps” section in this Management’s
Discussion and Analysis.
Period
The Fund estimates the fair value of the Class B Unit liability by multiplying
the issued and outstanding Additional Entitlements (including Holdback) held
by BPI at the end of the Period by the closing price of the Units at the end
of the Period (or previous business day, if such day is not a business day).
As at December 31, 2014, the Fund’s closing price was $21.61 per Unit
(September 30, 2014 – $20.75 per Unit) while the number of issued and
outstanding Additional Entitlements (including Holdback) held by BPI was
1,944,863 (September 30, 2014 – 1,944,863). BPI’s ownership of the
Fund (on a fully-diluted basis) was calculated to be valued at $42.0 million
(September 30, 2014 – $40.4 million). In general, the Fund’s Class B Unit
liability will increase as the market price of the Unit increases and vice versa.
The difference between the Class B Unit liability at the end of the Period and
September 30, 2014 results in a fair value loss of $1.7 million for the Period.
The Fund recorded a fair value loss of $0.1 million in the Period as a result
of the decrease in the fair value of the Swaps from September 30, 2014 to
December 31, 2014 due to changes in interest rates during the Period. For
the same period in 2013, the Fund recorded a loss of $0.2 million as a result
of the decrease in the fair value of the Swaps from September 30, 2013 to
December 31, 2013.
Year
As at December 31, 2013 the Fund’s closing price was $20.71 per Unit while
the number of issued and outstanding Additional Entitlements (including
Holdback) held by BPI was 2,242,735. BPI’s ownership of the Fund (on a
fully-diluted basis) as at December 31, 2013 was calculated to be valued at
$46.4 million. As discussed above, BPI’s ownership of the Fund (on a fully-
diluted basis) as at the end of the Year was calculated to be valued at $42.0
million. The difference between the Class B Unit liability at the end of the Year
and December 31, 2013 is a decrease of $4.4 million. This change was due
to a $16.7 million decrease from BPI completing the Exchange, offset by a
$10.1 million increase from BPI being granted Additional Entitlements and a
fair value adjustment of $2.1 million.
The Fund recorded a fair value loss of $0.4 million for the Year as a result
of the decrease in the fair value of the Swaps from December 31, 2013 to
December 31, 2014 due principally to changes in interest rates during the
Year. For the same period in 2013, the Fund recorded a fair value gain of
$0.2 million as a result of the increase in the fair value of the Swaps from
December 31, 2012 to December 30, 2013.
Income TaxesOn January 1, 2011, the Fund became subject to specified investment
flow-through tax (“SIFT Tax”), which is the Fund’s only current income tax
expense. The payment of SIFT Tax reduces the amount of cash available
for distributions to Unitholders. Such distributions are treated as eligible
dividends received from a taxable Canadian corporation. Eligible dividend
treatment for distributions to Unitholders will generally be beneficial to
Canadian resident investors holding their Units in taxable accounts compared
to the characterization prior to SIFT Tax primarily as ordinary income.
Non-cash deferred income taxes are recorded on the temporary
differences arising between the accounting and tax bases of balance sheet
assets and liabilities.
Period
The Fund’s income tax expense for the Period was $1.7 million, comprised
of $1.6 million in current income tax expense and $0.1 million of non-cash
deferred income taxes. The Fund’s income tax expense for the fourth quarter
of 2013 was $1.5 million comprised of $1.4 million of current income tax
expense and $0.1 million of non-cash deferred income taxes. The increase
in current income tax expense is a result of the increase in the Fund’s profit
before fair value adjustments and income taxes for the Period.
Year
The Fund’s income tax expense for the Year was $6.8 million, comprised of
$6.4 million of current income tax expense and non-cash deferred income
taxes of $0.4 million. The Fund’s income tax expense for the same period
in 2013 was $6.4 million comprised of $6.0 million of current income tax
expenses and $0.4 million of non-cash deferred income taxes. The increase
in current income tax expense is a result of the increase in the Fund’s profit
before fair value adjustments and income taxes for the Year.
Net Income and Comprehensive Income / Basic and Diluted EarningsPeriod
The Fund’s net income and comprehensive income was $2.6 million for the
Period compared with $8.2 million for the fourth quarter of 2013. The Fund’s
basic and diluted earnings per Unit was $0.17 for the Period compared with
basic earnings per Unit of $0.55 and diluted earnings Per Unit of $0.23
for the fourth quarter of 2013. The $5.6 million decrease in the Fund’s net
income and comprehensive income compared with the fourth quarter of
2013 was due to the net $6.2 million change in the fair value adjustments,
the $0.2 million increase in income taxes, offset by the $0.6 million increase
in Royalty income and the $0.2 million decrease in interest on Class B Unit
and Class C Unit liabilities.
Year
The Fund’s net income and comprehensive income was $16.5 million for
the Year compared with $14.8 million in 2013. The Fund’s basic and diluted
earnings per Unit was $1.06 for the Year compared with $0.97 in 2013. The
$1.7 million increase in the Fund’s net income and comprehensive income
compared with the same period in 2013 was due to the net $0.7 million
change in the fair value adjustments, the $1.1 million increase in Royalty
income and the $0.5 million decrease in interest on Class B Unit and Class
C Unit liabilities, offset by a $0.4 million increase in income taxes and a $0.2
million increase in interest on long-term debt.
BOSTON PIZZA ROYALTIES INCOME FUNDANNUAL REPORT 2014
MANAGEMENT’S DISCUSSION AND ANALYSIS
BO
ST
ON
PIZ
ZA
RO
YA
LT
IES
IN
CO
ME
FU
ND
AN
NU
AL
RE
PO
RT
20
14
19
DistributionsPeriod
During the Period, the Fund declared distributions on the Units in the
aggregate amount of $6.3 million or $0.408 per Unit, compared with $6.1
million or $0.408 per Unit during the same period in 2013. The increase
in the aggregate amount of distributions declared on the Units during the
Period compared with the same period in 2013 was due to the increase in
outstanding Units as a result of the Exchange.
Year
The Fund declared distributions on the Units in the aggregate amount of
$19.1 million or $1.224 per Unit for the Year, compared with $18.6 million
or $1.220 per Unit in 2013. The increase in the aggregate amount of
distributions declared on the Units for the Year compared with the same
period in 2013 was due to the increase in the monthly distribution effective
for the February 2013 distributions and the increase in outstanding Units as
a result of the Exchange.
On February 5, 2015, the trustees of the Fund approved a monthly cash
distribution to Unitholders of $0.102 per Unit in respect of the period from
January 1, 2015 to January 31, 2015. The January 2015 distribution will
be payable to Unitholders of record at the close of business on February 21,
2015, and will be paid on February 27, 2015.
Unitholders have received 16 distribution2 increases since the Fund’s initial
public offering of Units in 2002. As at February 5, 2015, the Fund had paid
out 150 consecutive monthly distributions2 totaling $195.2 million or $15.22
per Unit.
Under the declaration of trust governing the Fund (the “Declaration of Trust”), the Fund pays distributions on the Units in respect of any particular
calendar month not later than the last business day of the immediately
subsequent month. Accordingly, distributions on the Units in respect of
the calendar month of January are paid no later than the last business day
of February, distributions on the Units in respect of the calendar month of
February are paid no later than the last business day of March and so forth.
Consequently, distributions payable by the Fund on the Units in respect of the
Period were the October 2014 distribution (which was paid on November 28,
2014), the November 2014 distribution (which was paid on December 31,
2014), and the December 2014 distribution (which was paid on January 30,
2015). Similarly, the distributions payable by the Fund on the Units in respect
of any other period are the distributions paid in the immediately subsequent
month of each month comprising such other period.
Distributions for the Year were as follows:
PERIOD PAYMENT DATE AMOUNT/UNIT
January 1 – 31, 2014 February 28, 2014 10.20¢
February 1 – 28, 2014 March 31, 2014 10.20¢
March 1 – 31, 2014 April 30, 2014 10.20¢
April 1 – 30, 2014 May 30, 2014 10.20¢
May 1 – 31, 2014 June 30, 2014 10.20¢
June 1 – 30, 2014 July 31, 2014 10.20¢
July 1 – 31, 2014 August 29, 2014 10.20¢
August 1 – 31, 2014 September 30, 2014 10.20¢
September 1 – 30, 2014 October 31, 2014 10.20¢
October 1 – 31, 2014 November 28, 2014 10.20¢
November 1 – 30, 2014 December 31, 2014 10.20¢
December 1 – 31, 2014 January 30, 2015* 10.20¢
* Paid subsequent to the Period and the Year.
2) This assumes that Units are classified as equity and not financial liabilities and that amounts paid by the Fund on Units are classified as distributions and not interest expense.
Distributions for the Period and the Year were funded entirely by cash flows
from operations. No debt was incurred at any point during the Period and the
Year to fund distributions.
Distributable Cash / Payout Ratio
Distributable Cash
Period
The Fund generated Distributable Cash of $4.8 million or $0.309 per Unit
for the Period compared with $4.4 million or $0.292 per Unit for the fourth
quarter of 2013. The increases in Distributable Cash and Distributable Cash
per Unit of 8.9% and 5.8%, respectively, are primarily attributable to the
increase in cash flow from operating activities due to an increase in Royalty
income. The percentage increase in Distributable Cash for the Period was
larger than the percentage increase in Distributable Cash per Unit for the
Period due to the combined effects of the Fund repurchasing and cancelling
Units under its normal course issuer bids and the Exchange.
Year
The Fund generated Distributable Cash of $19.1 million or $1.229 per Unit
for the Year compared with $18.4 million or $1.208 per Unit in 2013. The
increases in Distributable Cash and Distributable Cash per Unit of 3.5% and
1.7%, respectively, are primarily attributable to the increase in cash flow from
operating activities due to an increase in Royalty income. The percentage
increase in Distributable Cash for the Year was larger than the percentage
increase in Distributable Cash per Unit for the Year due to the combined
effects of the Fund repurchasing and cancelling Units under its normal course
issuer bids and the Exchange.
The Fund’s Distributable Cash and Distributable Cash per Unit
since January 1, 2011, generated in each financial quarter, are as follows:
Distributable Cash Q1 Q2 Q3 Q4 Annual
2014 $4.1 million $4.9 million $5.2 million $4.8 million $19.1 million2013 $4.3 million $4.8 million $4.9 million $4.4 million $18.4 million
2012 $4.0 million $4.3 million $4.5 million $4.5 million $17.4 million
2011 $3.6 million $4.1 million $4.3 million $4.1 million $16.1 million
Distributable Cash per Unit Q1 Q2 Q3 Q4 Annual
2014 $0.272 $0.313 $0.335 $0.309 $1.2292013 $0.277 $0.315 $0.324 $0.292 $1.208
2012 $0.274 $0.293 $0.311 $0.303 $1.184
2011 $0.247 $0.280 $0.294 $0.281 $1.104
Payout Ratio
Period
The Fund’s Payout Ratio for the Period was 99.0% compared with 104.9%
in the same period one year ago. The decrease in the Fund’s Payout Ratio
for the Period compared with the same period one year ago was due to
the increases in Distributable Cash, as discussed above, exceeding the
increase in distributions paid in respect of the period. The increase in
distributions paid in respect of the Period compared with the fourth quarter
of 2013 was due to the increase in the number of Fund Units outstanding
BO
ST
ON
PIZ
ZA
RO
YA
LT
IES
IN
CO
ME
FU
ND
AN
NU
AL
RE
PO
RT
20
14
20
resulting from the Exchange partially offset by the Fund repurchasing and
cancelling Fund Units under its normal course issuer bid activities.
Year
The Fund’s Payout Ratio for the Year was 99.9% compared with 100.8% in
the same period one year ago. The decrease in the Fund’s Payout Ratio for
the Year compared with 2013 was due to the increases in Distributable Cash,
as discussed above, exceeding the increase in distributions paid in respect of
the period. The increase in distributions paid in respect of the Year compared
with 2013 was due to the increase in the number of Fund Units outstanding
resulting from the Exchange partially offset by the Fund repurchasing and
cancelling Fund Units under its normal course issuer bid activities.
A key feature of the Fund is that it is a “top line” structure, in which BPI
pays the Fund a Royalty equal to 4% of Franchise Sales from Boston Pizza
Restaurants in the Royalty Pool. Accordingly, Unitholders are not directly
exposed to changes in the operating costs or profitability of BPI or of
individual Boston Pizza Restaurants. Given this structure, and that the Fund
has no current mandate to retain capital for other purposes, it is expected
that the Fund will maintain a Payout Ratio close to 100% over time as the
Trustees continue to distribute all available cash in order to maximize returns
to Unitholders. The Fund’s quarterly and annual Payout Ratios with respect to
each financial quarter since January 1, 2011 are as follows:
Q1 Q2 Q3 Q4 Annual
2014 115.1% 97.4% 91.1% 99.0% 99.9%2013 108.7% 96.6% 94.1% 104.9% 100.8%
2012 105.0% 100.2% 94.6% 98.7% 99.3%
2011 102.0% 89.9% 93.7% 98.3% 95.7%
Because the Fund strives to provide Unitholders with regular monthly
distributions, the Fund will generally experience seasonal fluctuations in its
Payout Ratio. The Fund’s Payout Ratio is likely to be higher in the first and
fourth quarters compared to the second and third quarters since Boston Pizza
Restaurants experience higher Franchise Sales levels during the summer
months when restaurants open their patios and benefit from increased tourist
traffic. Higher Franchise Sales generally result in increases in Distributable
Cash. Distributable Cash and Payout Ratio are non-IFRS financial measures.
For additional information regarding these financial metrics, refer to the
section “Description of Non-IFRS and Additional IFRS Measures” in this
Management’s Discussion and Analysis.
New Restaurants Added to the Royalty Pool
Boston Pizza Restaurants Added to Royalty Pool on January 1, 2014
On January 1, 2014, 12 new Boston Pizza Restaurants that opened across
Canada between January 1, 2013 and December 31, 2013 were added to the
Royalty Pool and the two restaurants that permanently closed during 2013
were removed from the Royalty Pool. The estimated annual Franchise Sales
for the 12 new Boston Pizza Restaurants that opened less the revenue from
the two permanent closures was $19.8 million. The estimated 4% Royalty
revenue the Fund was expected to receive in 2014 from these additional
12 new restaurants, less revenue from the two permanent closures, was
$0.8 million. The pre-tax Royalty revenue for the purposes of calculating the
Additional Entitlements, therefore, was $0.7 million or 92.5% of $0.8
million. The estimated effective tax rate that the Fund paid in the calendar
year 2014 was 26.0%. Accordingly, the after-tax Royalty revenue for the
purposes of calculating the Additional Entitlements was $0.5 million ($0.7
million x (1 – 0.26)). In return for adding the Royalty revenue from these
12 new restaurants, less Royalty revenue from the two permanent closures,
to the Royalty Pool, BPI received the right to acquire an additional 355,750
Units, representing 80% of the Additional Entitlements with the balance to
be received when the actual full year performance of the new restaurants
and the actual effective tax rate paid by the Fund for 2014 are known with
certainty. The 355,750 Additional Entitlements represented 2.0% of the total
outstanding Units on a fully diluted basis on January 1, 2014. 88,938 Units,
representing the remaining 20% of the Additional Entitlements, were “held
back” until such time as the actual performance of these new Royalty Pool
restaurants and the actual effective tax rate paid by the Fund for 2014 were
known. BPI also received an increase in monthly distributions based on 100%
of the Additional Entitlements, subject to a reconciliation of the distributions
paid to BPI in respect of these Additional Entitlements that occurred once
the actual performance of these new Royalty Pool restaurants and the actual
effective tax rate paid by the Fund for 2014 were known. See “Subsequent
Events” below.
Audit of Boston Pizza Restaurants Added to Royalty Pool on January 1, 2013
In January 2014, an audit of the Royalty revenues of the seven new restaurants
that were added to the Royalty Pool on January 1, 2013 was performed and
the actual effective tax rate paid by the Fund for 2013 was determined.
The purpose of this was to compare the actual Royalty revenue from these
seven new restaurants to the estimated amount of Royalty revenue the Fund
expected to receive for 2013 and to compare the actual effective tax rate paid
by the Fund for 2013 to the estimated effective tax rate the Fund expected
to pay for 2013. The original Royalty revenue the Fund expected to receive
from these seven new restaurants less the Royalty revenue from the two
permanent closures that occurred in 2012 was $0.3 million and the actual
Royalty revenue that the Fund received was $0.1 million greater. The original
effective tax rate the Fund expected to pay for 2013 was 25.0% and the
actual effective tax rate paid by the Fund for 2013 was 24.4%. As a result, the
Partnership made a nominal payment to BPI to reconcile distributions payable
on the full number of Additional Entitlements and the effective tax rate. BPI
received only 80% of the Additional Entitlements at the Adjustment Date in
2013. Following the audit, BPI received 86,336 Additional Entitlements.
Subsequent Events
Boston Pizza Restaurants Added to Royalty Pool on January 1, 2015
On January 1, 2015, 14 new Boston Pizza Restaurants that opened across
Canada between January 1, 2014 and December 31, 2014 were added
to the Royalty Pool and the six restaurants that permanently closed during
2014 were removed from the Royalty Pool. The estimated annual Franchise
Sales for the 14 new Boston Pizza Restaurants that opened less the revenue
from the six permanent closures was $16.7 million. The estimated 4%
Royalty revenue the Fund will receive in 2015 from these additional 14
new restaurants, less revenue from the six permanent closures, was $0.7
million. The pre-tax Royalty revenue for the purposes of calculating the
Additional Entitlements, therefore, was $0.6 million or 92.5% of $0.7 million.
The estimated effective tax rate that the Fund will pay in the calendar year
2015 is 26.0%. Accordingly, the after-tax Royalty revenue for the purposes
of calculating the Additional Entitlements was $0.5 million ($0.6 million x
(1 – 0.26)). In return for adding the Royalty revenue from these 14 new
BOSTON PIZZA ROYALTIES INCOME FUNDANNUAL REPORT 2014
MANAGEMENT’S DISCUSSION AND ANALYSIS
BO
ST
ON
PIZ
ZA
RO
YA
LT
IES
IN
CO
ME
FU
ND
AN
NU
AL
RE
PO
RT
20
14
21
restaurants, less Royalty revenue from the six permanent closures, to
the Royalty Pool, BPI received the right to acquire an additional 298,818
Units, representing 80% of the Additional Entitlements with the balance to
be received when the actual full year performance of the new restaurants
and the actual effective tax rate paid by the Fund for 2015 are known with
certainty. The 298,818 Additional Entitlements represented 1.7% of the
total outstanding Units on a fully diluted basis on January 1, 2015. 74,705
Units, representing the remaining 20% of the Additional Entitlements, have
been “held back” until such time as the actual performance of these new
Royalty Pool restaurants and the actual effective tax rate paid by the Fund
for 2015 are known. BPI also receives an increase in monthly distributions
based on 100% of the Additional Entitlements, subject to a reconciliation of
the distributions paid to BPI in respect of these Additional Entitlements that
will occur once the actual performance of these new Royalty Pool restaurants
and the actual effective tax rate paid by the Fund for 2015 are known. Once
both the actual performance of these new restaurants for 2015 and the
actual effective tax rate paid by the Fund for 2015 are known, the number of
Additional Entitlements will be adjusted in 2016 to reflect the actual Royalty
revenue received by the Fund in 2015 and actual effective tax rate paid by
the Fund in 2015. As of January 1, 2015, there were 366 restaurants in the
Royalty Pool.
Audit of Boston Pizza Restaurants Added to Royalty Pool on January 1, 2014
In January 2015, an audit of the Royalty revenues of the 12 new restaurants
that were added to the Royalty Pool on January 1, 2014 was performed and
the Fund’s actual effective tax rate for 2014 was determined. The purpose of
this was to compare the actual Royalty revenue from these 12 new restaurants
to the estimated amount of Royalty revenue the Fund expected to receive for
2014 and to compare the actual effective tax rate paid by the Fund for 2014
to the estimated effective tax rate the Fund expected to pay for 2014. The
original Royalty revenue the Fund expected to receive from these 12 new
restaurants less the Royalty revenue from the two permanent closures that
occurred in 2013 was $19.8 million and the actual Royalty revenue that the
Fund received was $0.9 million less. The original effective tax rate for the
Fund was expected to be 26.0% and the actual effective tax rate for the Fund
for 2014 was 25.5%. As a result, the Partnership reduced distributions paid
to BPI in January 2015 to reconcile the difference paid on the full number of
Additional Entitlements and the effective tax rate. BPI received only 80% of
the Additional Entitlements at the Adjustment Date in 2014. Following the
audit, BPI received 72,627 Additional Entitlements.
Interest Rate Swaps
Effective February 4, 2015, the Fund entered into an interest rate swap under
the ISDA (defined below) to fix the interest rate at 1.51% plus between 1.00%
and 1.50% per annum (depending upon debt to EBITDA ratios) on $13.9
million of debt drawn by the Partnership on Facility C (defined below) for a
term ending on February 1, 2022. See the “Interest Rate Swaps” section in
this Management’s Discussion and Analysis for more details on the Fund’s
interest rate swaps.
Normal Course Issuer BidsOn September 12, 2013, the Fund announced that it had received TSX
approval of a Notice of Intention to Make a Normal Course Issuer Bid through
the facilities of the TSX or other Canadian marketplaces from September 16,
2013 to no later than September 15, 2014 (the “2013 NCIB”). The 2013
NCIB permitted the Fund to repurchase for cancellation up to 1,393,078
Units, being approximately 9.3% of the Fund’s issued and outstanding Units
(as at September 6, 2013) and approximately 10.0% of its public float, then
comprised of 13,930,780 Units. The 2013 NCIB expired on September 15,
2014. The Fund acquired 237,100 Units under the 2013 NCIB at an average
price of $20.33 per unit. The 237,100 Units acquired under the 2013 NCIB
were cancelled.
On September 22, 2014, the Fund announced that it had received TSX
approval of a Notice of Intention to make a Normal Course Issuer Bid through
the facilities of the TSX or other Canadian marketplaces from September 25,
2014 to no later than September 24, 2015 (the “2014 NCIB”). The 2014
NCIB permits the Fund to repurchase for cancellation up to 1,385,023 Units,
being approximately 8.9% of the Fund’s issued and outstanding Units (as
at September 19, 2014) and approximately 10.0% of its public float, then
comprised of 13,850,231 Units. Unitholders may obtain, without charge, a copy
of the Notice of Intention to Make a Normal Course Issuer Bid that the Fund filed
with the TSX by contacting the Senior Vice President of Investor Relations for
the Fund. All Units acquired under the 2014 NCIB will be cancelled.
The Fund has established an automatic securities purchase plan (the “ASPP”)
with its broker to allow for the repurchase of Units under the 2014 NCIB at
any time, including when it ordinarily would not be active in the market due to
its own internal trading blackout periods, insider trading rules or otherwise.
The plan will terminate on the earliest of: (a) the date on which the purchase
limits specified in the plan have been attained, (b) the date on which the
2014 NCIB terminates, (c) the date on which the Fund terminates the plan
in accordance with the terms of the plan, in which case the Fund will issue
a press release announcing such termination, and (d) September 24, 2015.
All purchases under the ASPP will be made on the open market through the
facilities of the TSX in accordance with the requirements of the TSX or other
Canadian marketplaces by registered investment dealers.
Between the inception of the 2014 NCIB and December 31, 2014, the Fund
acquired 134,300 Units at an average price of $20.82 per Unit. Between
January 1, 2015 and February 5, 2015, the Fund acquired 4,000 Units at
an average price of $21.02 per Unit. The Fund financed purchases under
the 2013 NCIB and 2014 NCIB by drawing on the Fund’s Facility C (defined
below) that is included as part of the Credit Facilities (defined below). As of
February 5, 2015, the Fund had drawn down Facility C by $20.0 million.
See the “Liquidity & Capital Resources – Indebtedness” section of this
Management’s Discussion and Analysis for more details.
Exchange of UnitsOn March 10, 2014, BPI exchanged 2,036,135 Class B Units for 790,006
Units (the “Exchange”) in accordance with the Amended and Restated
Exchange Agreement dated September 22, 2008 among the Fund, BPI,
Boston Pizza GP Inc. (“BPGP”), the Trust and Boston Pizza Holdings Limited
Partnership (“Holdings LP”). Following the completion of the Exchange, BPI
sold the 790,006 Units to a syndicate of investment dealers for net proceeds
of $16.0 million. As the Class B Units are carried at fair value through profit or
loss, no gain or loss was recognized on this transaction as the values of the
Class B Units and Units were equal.
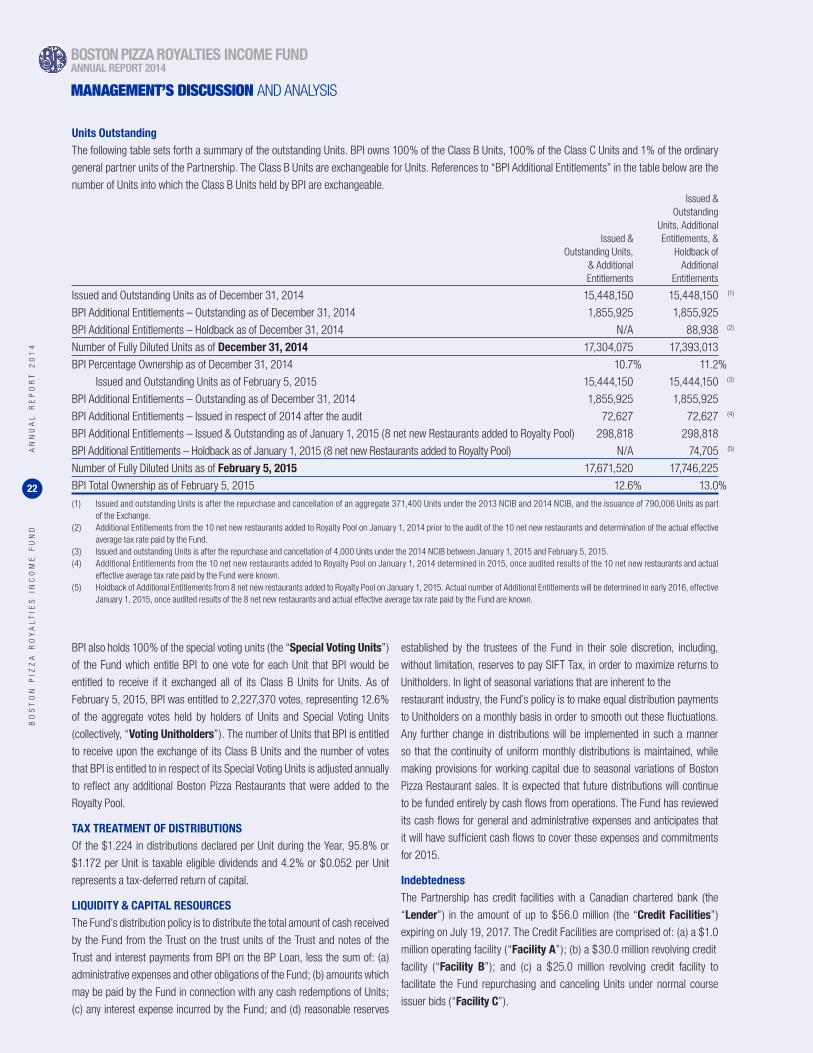
BO
ST
ON
PIZ
ZA
RO
YA
LT
IES
IN
CO
ME
FU
ND
AN
NU
AL
RE
PO
RT
20
14
22
BPI also holds 100% of the special voting units (the “Special Voting Units”)
of the Fund which entitle BPI to one vote for each Unit that BPI would be
entitled to receive if it exchanged all of its Class B Units for Units. As of
February 5, 2015, BPI was entitled to 2,227,370 votes, representing 12.6%
of the aggregate votes held by holders of Units and Special Voting Units
(collectively, “Voting Unitholders”). The number of Units that BPI is entitled
to receive upon the exchange of its Class B Units and the number of votes
that BPI is entitled to in respect of its Special Voting Units is adjusted annually
to reflect any additional Boston Pizza Restaurants that were added to the
Royalty Pool.
TAX TREATMENT OF DISTRIBUTIONSOf the $1.224 in distributions declared per Unit during the Year, 95.8% or
$1.172 per Unit is taxable eligible dividends and 4.2% or $0.052 per Unit
represents a tax-deferred return of capital.
LIQUIDITY & CAPITAL RESOURCESThe Fund’s distribution policy is to distribute the total amount of cash received
by the Fund from the Trust on the trust units of the Trust and notes of the
Trust and interest payments from BPI on the BP Loan, less the sum of: (a)
administrative expenses and other obligations of the Fund; (b) amounts which
may be paid by the Fund in connection with any cash redemptions of Units;
(c) any interest expense incurred by the Fund; and (d) reasonable reserves
Units OutstandingThe following table sets forth a summary of the outstanding Units. BPI owns 100% of the Class B Units, 100% of the Class C Units and 1% of the ordinary
general partner units of the Partnership. The Class B Units are exchangeable for Units. References to “BPI Additional Entitlements” in the table below are the
number of Units into which the Class B Units held by BPI are exchangeable. Issued & Outstanding Units, Additional Issued & Entitlements, & Outstanding Units, Holdback of & Additional Additional Entitlements Entitlements
Issued and Outstanding Units as of December 31, 2014 15,448,150 15,448,150 (1)
BPI Additional Entitlements – Outstanding as of December 31, 2014 1,855,925 1,855,925
BPI Additional Entitlements – Holdback as of December 31, 2014 N/A 88,938 (2)
Number of Fully Diluted Units as of December 31, 2014 17,304,075 17,393,013
BPI Percentage Ownership as of December 31, 2014 10.7 % 11.2 %
Issued and Outstanding Units as of February 5, 2015 15,444,150 15,444,150 (3)
BPI Additional Entitlements – Outstanding as of December 31, 2014 1,855,925 1,855,925
BPI Additional Entitlements – Issued in respect of 2014 after the audit 72,627 72,627 (4)
BPI Additional Entitlements – Issued & Outstanding as of January 1, 2015 (8 net new Restaurants added to Royalty Pool) 298,818 298,818
BPI Additional Entitlements – Holdback as of January 1, 2015 (8 net new Restaurants added to Royalty Pool) N/A 74,705 (5)
Number of Fully Diluted Units as of February 5, 2015 17,671,520 17,746,225
BPI Total Ownership as of February 5, 2015 12.6 % 13.0 %
(1) Issued and outstanding Units is after the repurchase and cancellation of an aggregate 371,400 Units under the 2013 NCIB and 2014 NCIB, and the issuance of 790,006 Units as part of the Exchange. (2) Additional Entitlements from the 10 net new restaurants added to Royalty Pool on January 1, 2014 prior to the audit of the 10 net new restaurants and determination of the actual effective average tax rate paid by the Fund.(3) Issued and outstanding Units is after the repurchase and cancellation of 4,000 Units under the 2014 NCIB between January 1, 2015 and February 5, 2015.(4) Additional Entitlements from the 10 net new restaurants added to Royalty Pool on January 1, 2014 determined in 2015, once audited results of the 10 net new restaurants and actual effective average tax rate paid by the Fund were known.(5) Holdback of Additional Entitlements from 8 net new restaurants added to Royalty Pool on January 1, 2015. Actual number of Additional Entitlements will be determined in early 2016, effective January 1, 2015, once audited results of the 8 net new restaurants and actual effective average tax rate paid by the Fund are known.
established by the trustees of the Fund in their sole discretion, including,
without limitation, reserves to pay SIFT Tax, in order to maximize returns to
Unitholders. In light of seasonal variations that are inherent to the
restaurant industry, the Fund’s policy is to make equal distribution payments
to Unitholders on a monthly basis in order to smooth out these fluctuations.
Any further change in distributions will be implemented in such a manner
so that the continuity of uniform monthly distributions is maintained, while
making provisions for working capital due to seasonal variations of Boston
Pizza Restaurant sales. It is expected that future distributions will continue
to be funded entirely by cash flows from operations. The Fund has reviewed
its cash flows for general and administrative expenses and anticipates that
it will have sufficient cash flows to cover these expenses and commitments
for 2015.
IndebtednessThe Partnership has credit facilities with a Canadian chartered bank (the
“Lender”) in the amount of up to $56.0 million (the “Credit Facilities”)
expiring on July 19, 2017. The Credit Facilities are comprised of: (a) a $1.0
million operating facility (“Facility A”); (b) a $30.0 million revolving credit
facility (“Facility B”); and (c) a $25.0 million revolving credit facility to
facilitate the Fund repurchasing and canceling Units under normal course
issuer bids (“Facility C”).
BOSTON PIZZA ROYALTIES INCOME FUNDANNUAL REPORT 2014
MANAGEMENT’S DISCUSSION AND ANALYSIS
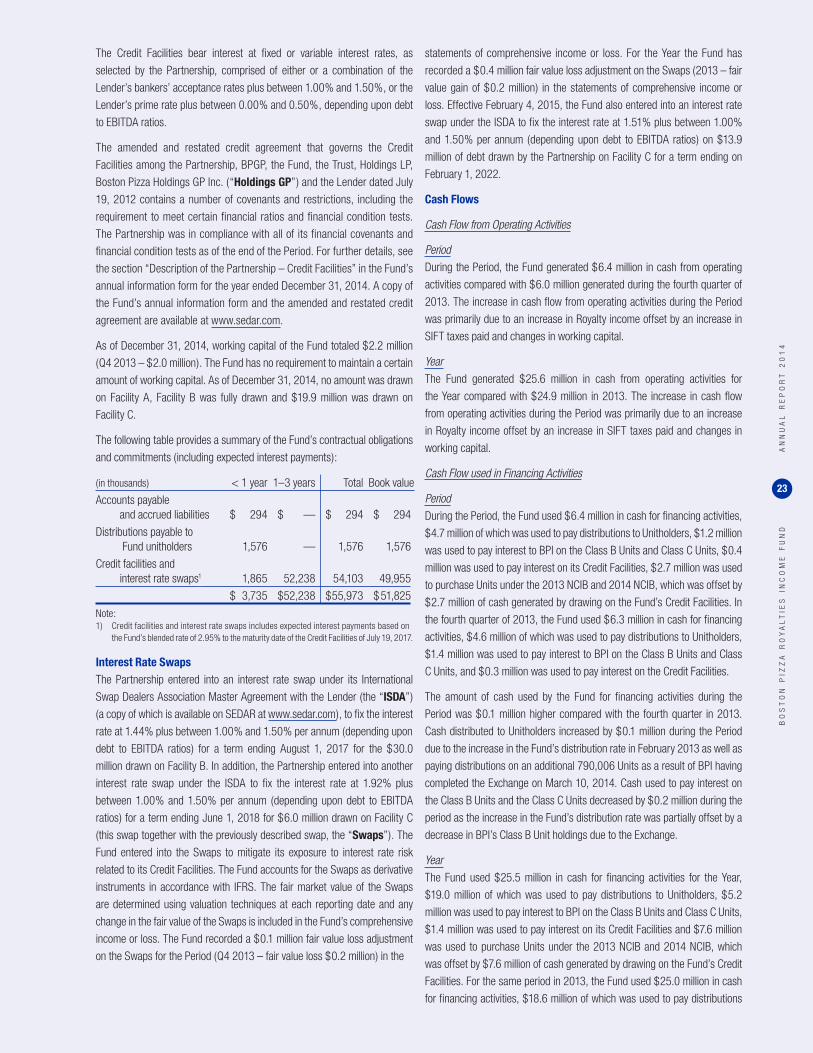
BO
ST
ON
PIZ
ZA
RO
YA
LT
IES
IN
CO
ME
FU
ND
AN
NU
AL
RE
PO
RT
20
14
23
The Credit Facilities bear interest at fixed or variable interest rates, as
selected by the Partnership, comprised of either or a combination of the
Lender’s bankers’ acceptance rates plus between 1.00% and 1.50%, or the
Lender’s prime rate plus between 0.00% and 0.50%, depending upon debt
to EBITDA ratios.
The amended and restated credit agreement that governs the Credit
Facilities among the Partnership, BPGP, the Fund, the Trust, Holdings LP,
Boston Pizza Holdings GP Inc. (“Holdings GP”) and the Lender dated July
19, 2012 contains a number of covenants and restrictions, including the
requirement to meet certain financial ratios and financial condition tests.
The Partnership was in compliance with all of its financial covenants and
financial condition tests as of the end of the Period. For further details, see
the section “Description of the Partnership – Credit Facilities” in the Fund’s
annual information form for the year ended December 31, 2014. A copy of
the Fund’s annual information form and the amended and restated credit
agreement are available at www.sedar.com.
As of December 31, 2014, working capital of the Fund totaled $2.2 million
(Q4 2013 – $2.0 million). The Fund has no requirement to maintain a certain
amount of working capital. As of December 31, 2014, no amount was drawn
on Facility A, Facility B was fully drawn and $19.9 million was drawn on
Facility C.
The following table provides a summary of the Fund’s contractual obligations
and commitments (including expected interest payments):
(in thousands) < 1 year 1–3 years Total Book value
Accounts payable and accrued liabilities $ 294 $ — $ 294 $ 294
Distributions payable to Fund unitholders 1,576 — 1,576 1,576
Credit facilities and interest rate swaps1 1,865 52,238 54,103 49,955
$ 3,735 $ 52,238 $ 55,973 $ 51,825
Note:1) Credit facilities and interest rate swaps includes expected interest payments based on the Fund’s blended rate of 2.95% to the maturity date of the Credit Facilities of July 19, 2017.
Interest Rate SwapsThe Partnership entered into an interest rate swap under its International
Swap Dealers Association Master Agreement with the Lender (the “ISDA”)
(a copy of which is available on SEDAR at www.sedar.com), to fix the interest
rate at 1.44% plus between 1.00% and 1.50% per annum (depending upon
debt to EBITDA ratios) for a term ending August 1, 2017 for the $30.0
million drawn on Facility B. In addition, the Partnership entered into another
interest rate swap under the ISDA to fix the interest rate at 1.92% plus
between 1.00% and 1.50% per annum (depending upon debt to EBITDA
ratios) for a term ending June 1, 2018 for $6.0 million drawn on Facility C
(this swap together with the previously described swap, the “Swaps”). The
Fund entered into the Swaps to mitigate its exposure to interest rate risk
related to its Credit Facilities. The Fund accounts for the Swaps as derivative
instruments in accordance with IFRS. The fair market value of the Swaps
are determined using valuation techniques at each reporting date and any
change in the fair value of the Swaps is included in the Fund’s comprehensive
income or loss. The Fund recorded a $0.1 million fair value loss adjustment
on the Swaps for the Period (Q4 2013 – fair value loss $0.2 million) in the
statements of comprehensive income or loss. For the Year the Fund has
recorded a $0.4 million fair value loss adjustment on the Swaps (2013 – fair
value gain of $0.2 million) in the statements of comprehensive income or
loss. Effective February 4, 2015, the Fund also entered into an interest rate
swap under the ISDA to fix the interest rate at 1.51% plus between 1.00%
and 1.50% per annum (depending upon debt to EBITDA ratios) on $13.9
million of debt drawn by the Partnership on Facility C for a term ending on
February 1, 2022.
Cash Flows
Cash Flow from Operating Activities
Period
During the Period, the Fund generated $6.4 million in cash from operating
activities compared with $6.0 million generated during the fourth quarter of
2013. The increase in cash flow from operating activities during the Period
was primarily due to an increase in Royalty income offset by an increase in
SIFT taxes paid and changes in working capital.
Year
The Fund generated $25.6 million in cash from operating activities for
the Year compared with $24.9 million in 2013. The increase in cash flow
from operating activities during the Period was primarily due to an increase
in Royalty income offset by an increase in SIFT taxes paid and changes in
working capital.
Cash Flow used in Financing Activities
Period
During the Period, the Fund used $6.4 million in cash for financing activities,
$4.7 million of which was used to pay distributions to Unitholders, $1.2 million
was used to pay interest to BPI on the Class B Units and Class C Units, $0.4
million was used to pay interest on its Credit Facilities, $2.7 million was used
to purchase Units under the 2013 NCIB and 2014 NCIB, which was offset by
$2.7 million of cash generated by drawing on the Fund’s Credit Facilities. In
the fourth quarter of 2013, the Fund used $6.3 million in cash for financing
activities, $4.6 million of which was used to pay distributions to Unitholders,
$1.4 million was used to pay interest to BPI on the Class B Units and Class
C Units, and $0.3 million was used to pay interest on the Credit Facilities.
The amount of cash used by the Fund for financing activities during the
Period was $0.1 million higher compared with the fourth quarter in 2013.
Cash distributed to Unitholders increased by $0.1 million during the Period
due to the increase in the Fund’s distribution rate in February 2013 as well as
paying distributions on an additional 790,006 Units as a result of BPI having
completed the Exchange on March 10, 2014. Cash used to pay interest on
the Class B Units and the Class C Units decreased by $0.2 million during the
period as the increase in the Fund’s distribution rate was partially offset by a
decrease in BPI’s Class B Unit holdings due to the Exchange.
Year
The Fund used $25.5 million in cash for financing activities for the Year,
$19.0 million of which was used to pay distributions to Unitholders, $5.2
million was used to pay interest to BPI on the Class B Units and Class C Units,
$1.4 million was used to pay interest on its Credit Facilities and $7.6 million
was used to purchase Units under the 2013 NCIB and 2014 NCIB, which
was offset by $7.6 million of cash generated by drawing on the Fund’s Credit
Facilities. For the same period in 2013, the Fund used $25.0 million in cash
for financing activities, $18.6 million of which was used to pay distributions
BO
ST
ON
PIZ
ZA
RO
YA
LT
IES
IN
CO
ME
FU
ND
AN
NU
AL
RE
PO
RT
20
14
24
to Unitholders, $5.4 million was used to pay interest to BPI on the Class B
Units and Class C Units, $1.0 million was used to pay interest on the Credit
Facilities and $12.3 million was used to purchase Units, offset by $12.3
million in proceeds from long-term debt.
The amount of cash used by the Fund for financing activities during the
Year was $0.5 million higher compared with the same period in 2013. Cash
distributed to Unitholders increased by $0.5 million for the Year due to the
increase in the Fund’s distribution rate in February 2013 as well as paying
distributions on an additional 790,006 Units as a result of BPI having completed
the Exchange on March 10, 2014. Cash used to pay interest on the Class B
Units and the Class C Units decreased by $0.3 million for the Year as the
increase in the Fund’s distribution rate was partially offset by a decrease in
BPI’s Class B Unit holdings due to the Exchange. Cash used to pay interest on
the Credit Facilities increased by $0.4 million due to a higher outstanding debt
balance for the Year in comparison to the same period in 2013.
Related Party TransactionsBPI is considered to be a related party of the Fund by virtue of the common
officers and directors of BPI and BPGP, and is party to the following
transactions with the Fund:
• The Fund has engaged the Partnership, its administrator, to provide
certain administrative services on behalf of the Fund. In turn, certain of
the administrative services are performed by BPI as a general partner
of the Partnership. Under the terms of the partnership agreement
governing the Partnership, BPI is entitled to be reimbursed for certain
out-of-pocket expenses incurred in performing these services. The
total amount paid to BPI in respect of these services for the Period
was $0.1 million (Q4 2013 – $0.1 million) and for the Year was $0.3
million (2013 – $0.3 million).
• As at December 31, 2014, interest payable by the Fund to BPI in
respect of the Class B Units and Class C Units was $0.4 million
(December 31, 2013 – $0.5 million).
• As at December 31, 2014, Royalty receivable from BPI was
$2.8 million (Q4 2013 – $2.6 million). See the “Distributions” section
of this Management’s Discussion and Analysis for more details.
• On March 10, 2014, BPI effected the Exchange. See the “Exchange”
section of this Management’s Discussion and Analysis for more details.
DISCLOSURE CONTROLS AND PROCEDURESAND INTERNAL CONTROLS OVER FINANCIAL REPORTINGThe Chief Executive Officer (“CEO”) and the Chief Financial Officer (“CFO”)
of BPGP, managing general partner of the Partnership, administrator of
the Fund have designed or caused to be designed under their supervision
disclosure controls and procedures to provide reasonable assurance that
all relevant information is gathered and reported to senior management,
including the CEO and CFO, on a timely basis, particularly during the period
in which the annual filings are being prepared, so that appropriate decisions
can be made regarding public disclosure.
An evaluation of the effectiveness of the Fund’s disclosure controls and
procedures, as defined in National Instrument 52-109 Certification of
Disclosure in Issuers’ Annual and Interim Filings, was carried out under the
supervision of, and with the participation of, management including the CEO
and CFO. Based on that evaluation, the CEO and CFO have concluded that
the design and operation of these disclosure controls and procedures were
effective in providing reasonable assurance that: (a) information required to
be disclosed by the Fund in its annual filings, interim filings or other reports
filed and submitted by it under applicable securities legislation is recorded,
processed, summarized and reported within the prescribed time periods
specified in securities legislation, and (b) material information regarding the
Fund is accumulated and communicated to the Fund’s administrator, the
Partnership, including BPGP’s CEO and CFO in a timely manner, particularly
during the period in which the interim filings are being prepared.
During the Period, there was no change in the Fund’s internal control
over financial reporting that has materially affected, or is reasonably likely
to materially affect, the Fund’s internal control over financial reporting. In
May 2013, the Committee of Sponsoring Organizations of the Treadway
Commission (“COSO”) released “Internal Control – Integrated Framework:
2013”. The Fund transitioned to the updated framework during the Period.
Management has assessed the impact of this transition and there were no
significant changes to the Fund’s internal controls over financial reporting.
CRITICAL ACCOUNTING ESTIMATES The preparation of the Fund’s annual consolidated financial statements in
accordance with IFRS requires management to make judgments, estimates
and assumptions that affect the application of accounting policies and the
reported amounts of assets, liabilities, income, and expenses. Actual results
may differ from these estimates.
Estimates and underlying assumptions are reviewed on an ongoing basis.
Revisions to accounting estimates are recognized in the period in which the
estimates are revised.
Significant areas requiring the use of management judgement and estimates
relate to the determination of the following:
Judgement – Consolidation
Applying the criteria outlined in IFRS 10, judgment is required in determining
whether the Fund controls the Partnership. Making this judgment involves
taking into consideration the concepts of power over the Partnership,
exposure and rights to variable returns, and the ability to use power to direct
the relevant activities of the Partnership so as to generate economic returns.
Using these criteria, management has determined that the Fund ultimately
controls the Partnership through its 80% ownership of the managing general
partner, BPGP.
Estimate – Intangible Assets – BP Rights
The Fund carries the BP Rights at historical cost comprising the amount of
consideration paid for the BP Rights in 2002, as well as the value of additional
Boston Pizza Restaurants rolled into the Royalty Pool to date. The value of
additional Boston Pizza Restaurants added to the Royalty Pool is determined
on a formula basis that is designed to estimate the present value of the cash
flows that would ultimately be payable to the Fund as a result of the new
Boston Pizza Restaurants being added to the Royalty Pool. The addition of
these restaurants results in changes to the Intangible assets – BP Rights
line item as well as the Units line item on the statements of financial position.
As such, the calculation is dependent on a number of different variables
including the estimated long-term sales of the new restaurants, the discount
rate and the tax rate. The value assigned to the new restaurants, and as a
result, the value assigned to the BP Rights, could differ from actual results.
BOSTON PIZZA ROYALTIES INCOME FUNDANNUAL REPORT 2014
MANAGEMENT’S DISCUSSION AND ANALYSIS
BO
ST
ON
PIZ
ZA
RO
YA
LT
IES
IN
CO
ME
FU
ND
AN
NU
AL
RE
PO
RT
20
14
25
The Fund tests the BP Rights for impairment annually, which requires that
the Fund use a valuation technique to determine if impairment exists. This
valuation technique may not represent the actual fair value less costs to sell
the Fund expects the BP Rights to generate.
Estimate – Class B Unit Fair Value Adjustment
The Fund records its Class B Unit liabilities at fair value, which may result
in changes to the fair value adjustment on the Class B Unit liability line on
the statements of financial position, the fair value gain (loss) on the Class B
Unit liability line on the statements of comprehensive income (loss), and the
corresponding non-cash adjustment line on the statements of cash flows.
This requires that the Fund use a valuation technique to determine the value
of the Class B Unit liability at each reporting date. The Fund estimates the fair
value of the Class B Unit liability by multiplying the issued and outstanding
Additional Entitlements (including Holdback) held by BPI at the end of the
Period by the closing price of the Units at the end of the Period (or previous
business day, if such day is not a business day). As at December 31, 2014,
the Fund’s closing price was $21.61 per Unit (September 30, 2014 – $20.75
per Unit) while the number of issued and outstanding Additional Entitlements
(including Holdback) held by BPI was 1,944,863 (September 30, 2014
– 1,944,863). BPI’s ownership of the Fund (on a fully-diluted basis) was
calculated to be valued at $42.0 million (September 30, 2014 – $40.4
million). This valuation technique may not represent the actual value of the
financial liability should such Class B Units be extinguished and changes in
the distribution rate on the Class B Units and the yield of the Fund’s Units
could materially impact the Fund’s financial position and net income.
ADOPTION OF NEW ACCOUNTING POLICIES Prior to January 1, 2014 the International Accounting Standards Board
(“IASB”) issued a number of new standards in addition to amendments to
existing standards. In accordance with IFRS, the standards and amendments
required and adopted by the Fund on January 1, 2014 is provided below.
Annual Improvements to IFRS (2010 – 2012) and (2011 – 2013) cycles
In December 2013, the IASB issued narrow-scoped amendments to a total
of nine standards as part of its annual improvements process. The IASB
uses the annual improvements process to make non-urgent but necessary
amendments to IFRS. Most amendments will apply prospectively for annual
periods beginning on or after July 1, 2014; earlier application is permitted,
in which case, the related consequential amendments to other IFRSs would
also apply. The Fund adopted these amendments in its financial statements
beginning on January 1, 2014 and determined that the amendments do not
have a material impact on the annual consolidated financial statements.
Amendments to IAS 32, Offsetting Financial Assets and Liabilities,
clarify when an entity has a legally enforceable right to set-off and when
settlement mechanism provides for net settlement or gross settlement that
is equivalent to net settlement. The Fund adopted these amendments in its
financial statements beginning on January 1, 2014 and determined that
the amendments do not have a material impact on the annual consolidated
financial statements.
DESCRIPTION OF NON-IFRS AND ADDITIONAL IFRS MEASURES
Non-IFRS MeasuresManagement believes that disclosing certain non-IFRS financial measures
provides readers of this Management’s Discussion and Analysis with important
information regarding the Fund’s financial performance and its ability to pay
distributions. By considering these measures in combination with the most
closely comparable IFRS measure, management believes that investors are
provided with additional and more useful information about the Fund than
investors would have if they simply considered IFRS measures alone.
The non-IFRS financial measures do not have standardized meanings
prescribed by IFRS and therefore are unlikely to be comparable to similar
measures presented by other issuers. Investors are cautioned that non-IFRS
measures should not be construed as a substitute or an alternative to cash
flows from operating activities as determined in accordance with IFRS.
Distributable Cash
“Distributable Cash” is defined to be, in respect of any particular period, the
Fund’s cash flow from operations for that period minus (a) BPI’s Class C Unit
distribution in respect of the period, minus (b) BPI’s entitlement in respect
of its Class B Units in respect of the period, minus (c) interest expense on
long-term debt, minus (d) the SIFT Tax expense in respect of the period, plus
(e) SIFT Tax paid during the period (the sum of (d) and (e) being SIFT Tax
on Units). Management believes that Distributable Cash provides investors
with useful information about the amount of cash the Fund has generated
for distribution on the Units during the Period. The preceding tables under
the heading “Financial Highlights” provide a reconciliation from this non-IFRS
financial measure to cash flows from operating activities, which is the most
directly comparable IFRS measure. In reconciling Distributable Cash to cash
flow from operating activities, the Fund uses actual financial results for the
components of (i) BPI’s Class C Unit distribution in respect of the period,
and (ii) interest expense on long-term debt. The remaining components in
the reconciliation, being BPI’s entitlement in respect of its Class B Units
in respect of the period and SIFT Tax on Units, have been prepared using
reasonable and supportable assumptions, all of which reflect the Fund’s
planned courses of action given management’s judgment about the most
probable set of economic conditions. Investors are cautioned that actual
results for these components may vary, perhaps materially, from the
amounts used in the reconciliation.
Payout Ratio
“Payout Ratio” is calculated by dividing the aggregate distributions payable
by the Fund in respect of the applicable period by the Distributable Cash
generated in that period. For the purpose of calculating the Payout Ratio for
the Period, the distributions payable by the Fund on the Units in respect of
the Period were the October 2014 distribution (which was paid on November
28, 2014), the November 2014 distribution (which was paid on December
31, 2014) and the December 2014 distribution (which was paid on January
30, 2015). Similarly, for the purpose of calculating the Payout Ratio for any
other period, the distributions payable by the Fund on the Units in respect of
such other period would be used, which would be the distributions paid in the
immediately subsequent month of each month comprising such other period.
Management believes that the Payout Ratio provides investors with useful
information on the extent to which the Fund distributes cash on Units. As the
Payout Ratio is calculated from a formula which includes Distributable Cash,
which is a non-IFRS financial measure, a reconciliation of Payout Ratio to an
IFRS measure is not possible.
Additional IFRS MeasuresIFRS mandates certain minimum line items for financial statements and
requires presentation of additional line items, headings and subtotals when
such presentation is relevant to an understanding of the issuer’s financial
position or performance. IFRS also requires that notes to the financial
statements provide information that is not presented elsewhere in the
BO
ST
ON
PIZ
ZA
RO
YA
LT
IES
IN
CO
ME
FU
ND
AN
NU
AL
RE
PO
RT
20
14
26
financial statements, but is relevant to understanding them. Such financial
measures outside the minimum mandated line items are considered
additional IFRS measures. The annual consolidated financial statements
of the Fund and the notes thereto include certain additional IFRS
measures where management considers such information to be useful to
understanding the Fund’s financial results.
Profit Before Fair Value Adjustments and Income Taxes
Management believes that it is useful to provide investors with the sub-total
of profit before fair value adjustments and income taxes to assist investors
with understanding the “top-line” structure of the Fund and its financial
impact especially since the fair value adjustments are non-cash items.
Management uses this additional IFRS measure to monitor changes in the
Fund’s operating income.
OUTLOOK
The information contained in “Outlook” is forward-looking information.
Please see “Note Regarding Forward-Looking Information” and “Risks &
Uncertainties” for a discussion of the risks and uncertainties in connection
with forward-looking information.
Boston Pizza is well positioned for future growth and should continue to
strengthen its position as the number one casual dining brand in Canada by
continuing to achieve positive SSSG and opening new Boston Pizza locations
across Canada.
The two principal factors that affect SSSG are changes in customer traffic
and changes in average guest cheque. BPI’s strategies to drive higher guest
traffic include attracting a wide variety of guests into the restaurant, sports
bar and take-out/delivery parts of each location, offering a compelling
value proposition to our guests and leveraging a larger marketing budget
versus the previous year along with a revised calendar of national and
local store promotions. Increased average cheque levels are expected
to be achieved through a combination of culinary innovation and annual
menu re-pricing. In addition, BPI’s franchise agreement requires that each
Boston Pizza Restaurant undergo a complete store renovation every seven
years. Restaurants typically close for two to three weeks to complete
the renovation and experience an incremental sales increase in the year
following the re-opening.
Boston Pizza remains well positioned for future expansion as evidenced by
the eight net new Boston Pizza Restaurants that opened in 2014. There
are currently three new locations under construction with more planned for
later in 2015. BPI’s management believes that Boston Pizza will continue to
strengthen its position as the number one casual dining brand in Canada by
pursuing further restaurant development opportunities across the country.
RISKS & UNCERTAINTIES
Risks Related to the Business of BPI
The Restaurant Industry and its Competitive Nature
The performance of the Fund is directly dependent upon the Royalty and
interest payments received from BPI on the BP Loan. The amount of the
Royalty received by the Partnership from BPI is dependent on various factors
that may affect the casual dining sector of the restaurant industry. The
restaurant industry generally, and in particular the casual dining sector, is
intensely competitive with respect to price, service, location and food quality.
Competitors include national and regional chains, as well as independently
owned restaurants. If BPI and the Boston Pizza franchisees are unable to
successfully compete in the casual dining sector, Franchise Sales may be
adversely affected; the amount of the Royalty reduced and the ability of
BPI to pay the Royalty or interest on the BP Loan may be impaired. The
restaurant industry is also affected by adverse weather conditions, changes
in demographic trends, traffic patterns, and the type, number, and location of
competing restaurants. In addition, factors such as government regulations,
smoking bylaws, inflation, publicity from any food borne illnesses, increased
food, labour and benefits costs, continuing operations of key suppliers and
the availability of experienced management and hourly employees may
adversely affect the restaurant industry in general and therefore potentially
affect Franchise Sales. BPI’s success also depends on numerous factors
affecting discretionary consumer spending, including economic conditions,
disposable consumer income and consumer confidence. Adverse changes in
these factors could reduce guest traffic or impose practical limits on pricing,
either of which could reduce revenue and operating income, which could
adversely affect Franchise Sales, the Royalty and the ability of BPI to pay the
Royalty to the Partnership or interest on the BP Loan to the Fund.
Growth of the Royalty
The growth of the Royalty and other amounts payable by BPI to the Partnership
under the License and Royalty Agreement between the Partnership and BPI
(for the license to use the BP Rights in Canada for 99 years, commencing on
July 17, 2002) is dependent upon the ability of BPI to (i) maintain and grow its
franchised restaurants, (ii) locate new restaurant sites in prime locations, and
(iii) obtain qualified operators to become Boston Pizza franchisees. BPI faces
competition for restaurant locations and franchisees from its competitors
and from franchisors of other businesses. BPI’s inability to successfully
obtain qualified franchisees could adversely affect its business development.
The opening and success of a Boston Pizza Restaurant is dependent on a
number of factors, including: availability of suitable sites; negotiations of
acceptable lease or purchase terms for new locations; availability, training
and retention of management and other employees necessary to staff new
Boston Pizza Restaurants; adequately supervising construction; securing
suitable financing; and other factors, some of which are beyond the control
of BPI. Boston Pizza franchisees may not have all the business abilities or
access to financial resources necessary to open a Boston Pizza Restaurant
or to successfully develop or operate a Boston Pizza Restaurant in their
franchise areas in a manner consistent with BPI’s standards. BPI provides
training and support to Boston Pizza franchisees, but the quality of franchised
operations may be diminished by any number of factors beyond BPI’s control.
Consequently, Boston Pizza franchisees may not successfully operate
restaurants in a manner consistent with BPI’s standards and requirements,
or may not hire and train qualified managers and other restaurant personnel.
If they do not, the image and reputation of BPI may suffer, and gross revenue
and results of operations of the Boston Pizza Restaurants could decline.
The Closure of Boston Pizza Restaurants May Affect the Amount of the Royalty
The amount of the Royalty payable to the Partnership by BPI is dependent
upon the Franchise Sales, which is dependent on the number of Boston Pizza
Restaurants that are included in the Royalty Pool and the Franchise Sales
of those Boston Pizza Restaurants. Each year, a number of Boston Pizza
BOSTON PIZZA ROYALTIES INCOME FUNDANNUAL REPORT 2014
MANAGEMENT’S DISCUSSION AND ANALYSIS

BO
ST
ON
PIZ
ZA
RO
YA
LT
IES
IN
CO
ME
FU
ND
AN
NU
AL
RE
PO
RT
20
14
27
Restaurants may close and there is no assurance that BPI will be able to open
sufficient new Boston Pizza Restaurants to replace the Franchise Sales of the
Boston Pizza Restaurants that have closed.
BPI Revenue
The ability of BPI to pay the Royalty is dependent on (i) Boston Pizza
franchisees’ ability to generate revenue and to pay royalties to BPI, (ii) BPI’s
ability to enter into arrangements with suppliers and distributors to generate
competitive pricing for franchisees and revenue for BPI and (iii) BPI’s receipt
of amounts for other franchise fees (including initial and renewal franchise
fees). Failure of BPI to achieve adequate levels of collection from Boston Pizza
franchisees or the loss of BPI revenues from arrangements with suppliers and
distributors could have a serious effect on the ability of BPI to pay the Royalty
or interest on the BP Loan.
Intellectual Property
The ability of BPI to maintain or increase its Franchise Sales will depend
on its ability to maintain “brand equity” through the use of the BP Rights
licensed from the Partnership. If the Partnership fails to enforce or maintain
any of its intellectual property rights, BPI may be unable to capitalize on its
efforts to establish brand equity. All registered trademarks in Canada can be
challenged pursuant to provisions of the Trade-marks Act (Canada) and if any
BP Rights are ever successfully challenged, this may have an adverse impact
on Franchise Sales and therefore on the Royalty. The Partnership owns the
BP Rights in Canada. However it does not own identical or similar trademarks
owned by parties not related to BPI or the Partnership in other jurisdictions.
Third parties may use such trademarks in jurisdictions other than Canada
in a manner that diminishes the value of such trademarks. If this occurs,
the value of the BP Rights may suffer and gross revenue by Boston Pizza
Restaurants could decline. Similarly, negative publicity or events associated
with such trademarks in jurisdictions outside of Canada may negatively affect
the image and reputation of Boston Pizza Restaurants in Canada, resulting in
a decline in gross revenue by Boston Pizza Restaurants.
Government Regulation
BPI is subject to various federal, provincial and local laws affecting its
business. Each Boston Pizza Restaurant is subject to licensing and regulation
by a number of governmental authorities, which may include alcoholic
beverage control, smoking laws, health and safety and fire agencies.
Difficulties in obtaining or failures to obtain the required licenses or approvals
could delay or prevent the development of a new Boston Pizza Restaurant in a
particular area or limit the operations of an existing Boston Pizza Restaurant.
Regulations Governing Food Service and Alcoholic Beverages
Boston Pizza Restaurants are subject to various federal, provincial and local
government regulations, including those relating to the sale of food and
alcoholic beverages. Such regulations are subject to change from time to
time. The failure to obtain and maintain these licenses, permits and approvals
could adversely affect the operations of a Boston Pizza Restaurant. Typically,
licenses must be renewed annually and may be revoked, suspended or denied
renewal for cause at any time if governmental authorities determine that the
Boston Pizza Restaurant’s conduct violates applicable regulations. Difficulties
or failures to maintain or obtain the required licenses and approvals could
adversely affect existing Boston Pizza Restaurants and delay or result in a
decision to cancel the opening of new Boston Pizza Restaurants, which would
adversely affect BPI’s business.
In addition, the ability of Boston Pizza Restaurants to serve alcoholic
beverages is an important factor in attracting customers. Alcoholic beverage
control regulations require each Boston Pizza Restaurant to apply to provincial
or municipal authorities for a license or permit to sell alcoholic beverages
on the premises and, in certain locations, to provide service for extended
hours and on Sundays. Typically, licenses must be renewed annually and
may be revoked or suspended for cause at any time. Alcoholic beverage
control regulations relate to numerous aspects of daily operations of Boston
Pizza Restaurants, including minimum age of patrons and employees, hours
of operation, advertising, wholesale purchasing, inventory control, and
handling, storage and dispensing of alcoholic beverages. The failure of BPI
or a Boston Pizza franchisee to retain a license to serve liquor for a Boston
Pizza Restaurant would adversely affect that restaurant’s operations. BPI or
a Boston Pizza franchisee may be subject to legislation in certain provinces,
which may provide a person injured by an intoxicated person the right to
recover damages from an establishment that wrongfully served alcoholic
beverages to the intoxicated person. BPI carries host liquor liability coverage
as part of its existing comprehensive general liability insurance. There is no
assurance that such insurance coverage will be adequate.
Laws Concerning Employees
The operations of Boston Pizza Restaurants are also subject to minimum
wage laws governing such matters as working conditions, overtime and
tip credits, as well as rules and regulations regarding the employment of
temporary foreign workers. Significant numbers of Boston Pizza Restaurants’
food service and preparation personnel are paid at rates related to the
minimum wage and, accordingly, further increases in the minimum wage
could increase Boston Pizza Restaurants’ labour costs. In some regions of
Canada, Boston Pizza Restaurants employ temporary foreign workers – the
supply of labour in such regions could be reduced by regulations concerning
the employment of temporary foreign workers.
Sales Tax Regulations
While there are variations in studies about the extent to which sales taxes
impact retail sales, the increase in the after-tax price of goods and services
has a negative effect on the customer’s perception of spending on restaurant
dining. Such negative perception can potentially reduce either the frequency
of guest visits to restaurants, the total amount which guests spend per
restaurant visit, or both. Price elasticity appears to have less impact on
densely-populated and market-dominant areas such as urban or downtown
restaurants. However, as customer perception of disposable spending is
adversely affected by increased after-tax prices, Franchise Sales is at risk
of declining.
Franchise Regulation Risk
The complete failure to provide a disclosure document as required by the
franchise disclosure laws and regulations of the provinces of Alberta, Manitoba,
Ontario, New Brunswick and Prince Edward Island (or the provision of a
disclosure document that is materially non-compliant) provides a franchisee
with a two year absolute right of rescission. If a disclosure document is
not provided within the time required by applicable provincial legislation, a
franchisee is provided with sixty days from receipt of the disclosure document
in which to rescind the franchise agreement. The statutory right of rescission
gives a franchisee the right to receive back all monies paid, and to recover
for its losses, if any. Franchise legislation also provides a franchisee with a
statutory right of action to sue if a franchisee suffers a loss because of a
misrepresentation contained in the disclosure document, or as a result of the
BO
ST
ON
PIZ
ZA
RO
YA
LT
IES
IN
CO
ME
FU
ND
AN
NU
AL
RE
PO
RT
20
14
28
franchisor’s failure to comply with its disclosure obligations. These rights are
in addition to any rights that might exist at common law. Claims arising from
any non-compliance with franchise disclosure laws may adversely affect the
ability of BPI to pay the Royalty to the Partnership or interest on the BP Loan
to the Fund.
Potential Litigation and Other Complaints
BPI and Boston Pizza franchisees may be the subject of complaints or
litigation from guests alleging food related illness, injuries suffered on the
premises or other food quality, health or operational concerns. Adverse
publicity resulting from such allegations may materially affect the sales by
Boston Pizza Restaurants, regardless of whether such allegations are true or
whether BPI or a Boston Pizza franchisee is ultimately held liable.
Insurance
BPI maintains insurance coverage to protect it from liabilities in incurs in the
course of its business. There is no assurance that such insurance coverage
will respond to, or be adequate to protect it from, such liabilities. Additionally,
in the future, BPI’s insurance premiums may increase and it may not be able to
obtain similar levels of insurance on reasonable terms or at all. Any substantial
inadequacy of, or inability to obtain insurance coverage could materially
adversely affect BPI’s business, financial condition and results of operations.
Furthermore, there are types of losses BPI may incur that cannot be insured
against or that are not economically reasonable to insure. Such losses could
have a material adverse effect on BPI’s business and results of operations.
Dependence on Key Personnel
The success of the Fund depends upon the personal efforts of senior
management of BPI, including their ability to retain and attract appropriate
franchisee candidates. The loss of the services of such key personnel could
have a material adverse effect on the performance of the Fund.
Security of Confidential Consumer Information
BPI or Boston Pizza franchisees may incur unanticipated costs resulting from
breaches of security of confidential consumer information related to their
electronic processing of credit and debit card transactions. The majority of
sales occurring in Boston Pizza Restaurants are paid for via credit or debit
cards. Other restaurants and retailers have experienced security breaches in
which credit and debit card information, or personal information of customers,
has been stolen. BPI or Boston Pizza franchisees may in the future become
subject to claims for purportedly fraudulent transactions arising out of the
actual or alleged theft of credit or debit card information, and BPI or Boston
Pizza franchisees may also be subject to lawsuits or other proceedings
relating to these types of incidents. In addition, most provinces have enacted
legislation requiring notification of security breaches involving personal
information, including credit and debit card information. Any such claims
or proceedings could cause BPI to incur significant unplanned expenses,
which could have an adverse impact on its financial condition and results of
operations. Furthermore, adverse publicity resulting from these allegations
may have a material adverse effect on Franchise Sales, the Royalty and the
ability of BPI to pay the Royalty to the Partnership or interest on the BP Loan
to the Fund.
Reliance on Technology
BPI and Boston Pizza franchisees rely heavily upon information systems,
including point-of-sale processing in Boston Pizza Restaurants, for
management of their supply chain, payment of obligations, collection of cash,
credit and debit card transactions and other processes and procedures,
including the taking and sending of orders to Boston Pizza Restaurants. BPI’s
ability to efficiently and effectively manage its business depends significantly
on the reliability and capacity of these systems. BPI’s operations depend
upon its ability to protect its computer equipment and systems against
damage from physical theft, fire, power loss, telecommunications failure
or other catastrophic events, as well as from internal and external security
breaches, viruses and other disruptive problems. The failure of these systems
to operate effectively, maintenance problems, upgrading or transitioning to
new platforms, expanding BPI’s systems as it grows or a breach in security
of these systems could result in delays in customer service and reduce
efficiency in BPI’s operations. Remediation of such problems could result in
significant, unplanned capital investments.
Risks Related to the Structure of the Fund
Investment Eligibility
There can be no assurance that the Units will continue to be qualified
investments for registered retirement savings plans, registered retirement
income funds, deferred profit sharing plans, registered education savings plans,
registered disability savings plans or tax-free savings accounts under the Tax
Act. In addition, a Unit may be a prohibited investment in respect of a registered
retirement savings plan, registered retirement income fund or tax-free savings
account where, in general terms, the holder or annuitant (as the case may
be) does not deal at arm’s length with the Fund or has a “significant interest”
(as defined in the Tax Act) in the Fund. The Tax Act imposes penalties for the
acquisition or holding of non-qualified or prohibited investments.
Dependence of the Fund on the Trust, Holdings LP and BPI
The cash distributions to the Unitholders are entirely dependent on the ability
of the Trust to pay its interest obligations, if any, under the Series 1 Trust
Notes, Series 2 Trust Notes and Series 3 Trust Notes (collectively, the “Trust Notes”), and to make distributions on the units of the Trust (the “Trust Units”) and upon the ability of BPI to pay the interest on the BP Loan and the
ability of Holdings LP to meet its obligations to assume payment of the BP
Loan as consideration for the purchase of Class C general partner units of the
Partnership held by BPI or any related party or Class C limited partner units of
the Partnership acquired by Holdings LP or a permitted transferee pursuant to
the exchange agreement, as the case may be. The ability of the Trust to pay
its interest obligations or make distributions on Trust Units held by the Fund
is entirely dependent upon the ability of Holdings LP to make distributions
on the limited partner units of Holdings LP held by the Trust. The ability of
Holdings LP to make distributions on limited partner units held by the Trust is
entirely dependent upon the ability of the Partnership to make distributions on
the limited partner units of the Partnership held by Holdings LP.
The sole source of revenue of the Partnership, and ultimately the Fund, is the
Royalty payable to the Partnership and the interest on the BP Loan payable to
the Fund by BPI. BPI collects franchise fees and other amounts from Boston
Pizza franchisees and generates revenues from its corporate restaurants.
In the conduct of the business, BPI pays expenses and incurs debt and
obligations to third parties. These expenses, debts and obligations could
impact the ability of BPI to pay the Royalty to the Partnership and interest on
the BP Loan to the Fund.
BOSTON PIZZA ROYALTIES INCOME FUNDANNUAL REPORT 2014
MANAGEMENT’S DISCUSSION AND ANALYSIS
BO
ST
ON
PIZ
ZA
RO
YA
LT
IES
IN
CO
ME
FU
ND
AN
NU
AL
RE
PO
RT
20
14
29
The Partnership and the Fund are each entirely dependent upon the
operations and assets of BPI to pay the Royalty to the Partnership and interest
on the BP Loan to the Fund, and each is subject to the risks encountered by
BPI in the operation of its business, including the risks relating to the casual
dining restaurant industry referred to above and the results of operations and
financial condition of BPI.
Leverage: Restrictive Covenants
The Partnership has third-party debt service obligations under the Credit
Facilities. The degree to which the Partnership is leveraged could have
important consequences to Unitholders, including: (i) a portion of the
Partnership’s cash flow from operations could be dedicated to the payment
of the principal of and interest on its indebtedness, thereby reducing funds
available for distribution to the Fund; and (ii) certain of the Partnership’s
borrowings are at variable rates of interest, which exposes the Partnership to
the risk of increased interest rates. The Credit Facilities are due on July 19,
2017, at which time the Partnership will need to refinance such loans. There
can be no assurance that refinancing of this indebtedness will be available
to the Partnership, or available to the Partnership on acceptable terms. If
the Partnership cannot refinance this indebtedness on acceptable terms
upon maturity, it will negatively impact the ability of the Partnership to make
distributions on the partnership securities, which in turn will negatively impact
Distributable Cash and the Fund’s ability to make distributions on the Units.
The Partnership’s ability to make scheduled payments of principal or interest
on, or to refinance, its indebtedness depends on future cash flows, which is
dependent on the Royalty payments it receives from BPI, prevailing economic
conditions, prevailing interest rate levels, and financial, competitive, business
and other factors, many of which are beyond its control.
The Credit Facilities contain numerous restrictive covenants that limit the
discretion of the Partnership’s management with respect to certain business
matters. These covenants place restrictions on, among other things, the
ability of the Partnership to incur additional indebtedness, to create liens or
other encumbrances, to pay distributions or make certain other payments,
investments, loans and guarantees, to sell or otherwise dispose of assets,
to allow a change of control, to change the terms of the Partnership’s limited
partnership agreement and to merge or consolidate with another entity. A
failure to comply with the obligations in the Credit Facilities could result in an
event of default which, if not cured or waived, could result in the acceleration
of the relevant indebtedness. If the indebtedness under the Credit Facilities
were to be accelerated, there can be no assurance that the Partnership’s and
the Trust’s assets would be sufficient to repay that indebtedness.
Current and future borrowings by BPI could adversely affect BPI’s ability to
pay the Royalty and interest on the BP Loan.
Cash Distributions are Not Guaranteed and Will Fluctuate with the Partnership’s
Performance
Although the Fund’s policy is to distribute the total amount of cash received
by the Fund from the Trust on the Trust Units and the Trust Notes and from
BPI on the BP Loan, less the sum of: (a) administrative expenses and other
obligations of the Fund; (b) amounts which may be paid by the Fund in
connection with any cash redemptions of Units; (c) any interest expense
incurred by the Fund; and (d) reasonable reserves established by the trustees
of the Fund in their sole discretion, including, without limitation, reserves
established to pay SIFT Tax, in order to maximize returns to Unitholders, there
can be no assurance regarding the amounts of income to be generated by the
Fund or the Partnership. The actual amount distributed in respect of the Units
will depend upon numerous factors, including amount of and payment of the
Royalty and interest on the BP Loan by BPI.
Restrictions on Certain Unitholders and Liquidity of Units
The Declaration of Trust imposes various restrictions on Unitholders.
Unitholders that are non-residents of Canada for the purposes of the Tax Act
(“Non-residents”) and partnerships that are not Canadian partnerships for
purposes of the Tax Act are prohibited from beneficially owning more than
50% of the Units (on a non-diluted and a fully-diluted basis). These restrictions
may limit (or inhibit the exercise of) the rights of certain Unitholders, including
Non-residents, to acquire Units, to exercise their rights as Unitholders and
to initiate and complete take-over bids in respect of the Units. As a result,
these restrictions may limit the demand for Units from certain Unitholders
and thereby adversely affect the liquidity and market value of the Units held
by the public.
Fund not a Corporation
Investors are cautioned that the Fund is not generally regulated by established
corporate law and Unitholders’ rights are governed primarily by the specific
provisions of the Declaration of Trust of the Fund, which address such items
as the nature of the Units, the entitlement of Unitholders to cash distributions,
restrictions respecting non-resident holdings, meetings of Unitholders,
delegation of authority, administration, Fund governance and liabilities and
duties of the trustees to Unitholders. As well, under certain existing legislation
such as the Bankruptcy and Insolvency Act and the Companies’ Creditor
Arrangement Act, the Fund is not a legally recognized entity within the
definitions of these statutes. In the event of an insolvency or restructuring of
the Fund, the rights of Unitholders will be different from those of shareholders
of an insolvent or restructuring corporation.
Nature of Units
Securities such as the Units are hybrids in that they share certain attributes
common to both equity securities and debt instruments. The Units do not
represent a direct investment in the Trust, the Partnership or Holdings LP and
should not be viewed by investors as units in the Trust, the Partnership or
Holdings LP. Unitholders will not have the statutory rights normally associated
with ownership of shares of a corporation including, for example, the right to
bring “oppression” or “derivative” actions. The Units represent a fractional
interest in the Fund. The Fund’s only assets are Series 1 Trust Notes, Trust
Units, the BP Loan, common shares of BPGP and common shares of Holdings
GP. The price per Unit is a function of the anticipated amount of distributions.
Possible Unitholder Liability
The Declaration of Trust of the Fund provides that no Unitholder will be subject
to any liability whatsoever to any person in connection with the holding of
Units. However, there remains a risk, which is considered by the Fund to
be remote in the circumstances, that a Unitholder could be personally liable
despite such statement in the Declaration of Trust for the obligations of the
Fund to the extent that claims are not satisfied out of the assets of the Fund.
It is intended that the affairs of the Fund will be conducted to seek to minimize
such risk wherever possible. There is legislation under the laws of British
Columbia (discussed below) and certain other provinces which is intended to
provide protection for beneficial owners of trusts.
On March 30, 2006, the Income Trust Liability Act (British Columbia) came
into force. This legislation creates a statutory limitation on the liability
of beneficiaries of British Columbia income trusts such as the Fund. The
BO
ST
ON
PIZ
ZA
RO
YA
LT
IES
IN
CO
ME
FU
ND
AN
NU
AL
RE
PO
RT
20
14
30
legislation provides that a unitholder of a trust will not be, as a beneficiary,
liable for any act, default, obligation or liability of the trustees. However, this
legislation has not been judicially considered and it is possible that reliance
on the legislation by a Unitholder could be successfully challenged on
jurisdictional or other grounds.
Distribution of Securities on Redemption of Units or Termination of the Fund
Upon a redemption of Units or termination of the Fund, the trustees may
distribute Series 2 Trust Notes and Series 3 Trust Notes directly to the
Unitholders, subject to obtaining all required regulatory approvals. There
is currently no market for Series 2 Trust Notes or Series 3 Trust Notes. In
addition, the Series 2 Trust Notes and Series 3 Trust Notes are not freely
tradable and are not currently listed on any stock exchange. Securities of
the Trust so distributed may not be qualified investments for trusts governed
by registered retirement savings plans, registered retirement income
funds, deferred profit sharing plans, registered education savings plans,
registered disability savings plans or tax free savings accounts and may be
prohibited investments for registered retirement savings plans, registered
retirement income funds and tax free savings accounts, depending upon the
circumstances at the time.
The Fund May Issue Additional Units Diluting Existing Unitholders’ Interests
The Declaration of Trust authorizes the Fund to issue an unlimited number
of Units and Special Voting Units for such consideration and on such terms
and conditions as shall be established by the trustees of the Fund without the
approval of any Unitholders. Additional Units will be issued by the Fund upon
the exchange of the Class B Units held by BPI or any related party.
Income Tax Matters
There can be no assurance that Canadian federal income tax laws will not
be changed in a manner that adversely affects the Fund and the Unitholders.
If the Fund ceases to qualify as a “mutual fund trust” under the Tax Act,
the income tax treatment afforded to Unitholders would be materially and
adversely different in certain respects.
Distributions on the Trust Units and interest on the BP Loan accrue at the
Fund level for income tax purposes whether or not actually paid. Similarly, the
Royalty may accrue at the Partnership level for income tax purposes whether
or not actually paid. As a result, the income of the Partnership allocated to the
Fund (through the Trust and Holdings LP), in respect of a particular fiscal year
may exceed the cash distributed by the Partnership to the Fund (through the
Trust and Holdings LP) in such year. The Declaration of Trust provides that the
trustees of the Fund may declare distributions to Unitholders in such amounts
as the trustees may determine from time to time. Where, in a particular year,
the Fund does not have sufficient available cash to distribute the amounts so
declared to Unitholders (for instance, where distributions on the Trust Units or
interest payments on the BP Loan are due but not paid in whole or in part),
the Declaration of Trust provides that additional Units may be distributed to
Unitholders in lieu of cash distributions. Unitholders will generally be required
to include an amount equal to the fair market value of those distributed Units
in their taxable income.
On January 1, 2011, the Fund became liable to pay the SIFT Tax. The payment
of the SIFT Tax reduces the amount of cash available for distributions to
Unitholders. The SIFT Tax may also adversely affect the marketability of the
Units and the ability of the Fund to undertake financings and acquisitions.
Internal Control Over Financial Reporting
All internal control systems contain inherent limitations, no matter how well
designed. As a result, management acknowledges that its internal controls
over financial reporting will not prevent or detect all misstatements due to
error or fraud. In addition, management’s evaluation of internal controls can
provide only reasonable, not absolute, assurance that all internal control
issues that may result in material misstatements, if any, have been detected.
ADDITIONAL INFORMATIONAdditional information relating to the Fund, the Partnership, BPGP, the Trust,
Holdings LP, Holdings GP and BPI, including the annual information form of
the Fund, is available on SEDAR at www.sedar.com or on the Fund’s website
at www.bpincomefund.com.
NOTE REGARDING FORWARD-LOOKING INFORMATIONCertain information in this Management’s Discussion and Analysis
constitutes “forward-looking information” that involves known and unknown
risks, uncertainties, future expectations and other factors which may cause
the actual results, performance or achievements of BPI, the Fund, the Trust,
the Partnership, Holdings LP, Holdings GP, BPGP, Boston Pizza Restaurants,
or industry results, to be materially different from any future results,
performance or achievements expressed or implied by such forward-looking
information. When used in this Management’s Discussion and Analysis,
forward-looking information may include words such as “anticipate”, “intend”,
“estimate”, “may”, “will”, “expect”, “believe”, “plan”, “should” and other
similar terminology. This information reflects current expectations regarding
future events and operating performance and speaks only as of the date of
this Management’s Discussion and Analysis.
BOSTON PIZZA ROYALTIES INCOME FUNDANNUAL REPORT 2014
MANAGEMENT’S DISCUSSION AND ANALYSIS

BO
ST
ON
PIZ
ZA
RO
YA
LT
IES
IN
CO
ME
FU
ND
AN
NU
AL
RE
PO
RT
20
14
31
Forward-looking information in this Management’s Discussion and Analysis
includes, but is not limited to, such things as:
• future distributions and dates distributions are to be paid or payable;
• adjustments to Additional Entitlements that are to occur in the future
and when such adjustments will occur;
• the future cancellation of Units acquired under the 2014 NCIB;
• how changes in distributions will be implemented;
• how distributions will be funded;
• expectations that cash flow will be sufficient to pay distributions;
• the future expansion of Boston Pizza Restaurants;
• Boston Pizza is well positioned for future growth and should continue
to strengthen its position as the number one casual dining brand
in Canada by achieving positive SSSG and continuing to open new
Boston Pizza locations across Canada;
• the Fund maintaining a Payout Ratio close to 100% over time; and
• the Fund financing purchases under the 2014 NCIB by drawing on the
Credit Facilities.
The forward-looking information disclosed herein is based on a number of
assumptions including, among other things:
• absence of amendments to material contracts;
• no strategic changes of direction occurring;
• absence of changes in law;
• protection of BP Rights;
• pace of commercial real estate development;
• franchisees’ access to financing;
• franchisees’ duly paying franchise fees and other amounts;
• there will be no closures of Boston Pizza Restaurants that
materially affect the amount of Royalty paid by BPI to the Fund;
• future results being similar to historical results; and
• expectations related to future general economic conditions.
This forward-looking information involves a number of risks, uncertainties
and future expectations including, but not limited to:
• competition;
• weather;
• changes in demographic trends;
• changes in consumer preferences and discretionary spending
patterns;
• changes in national and local business and economic conditions;
• legislation and government regulation;
• cash distributions are not guaranteed;
• accounting policies and practices; and
• the results of operations and financial conditions of BPI and the Fund.
The foregoing list of factors is not exhaustive and should be considered in
conjunction with the risks and uncertainties set out in this Management’s
Discussion and Analysis.
This Management’s Discussion and Analysis discusses some of the factors
that could cause actual results to differ materially from those expressed in or
underlying such forward-looking information. Forward-looking information is
provided as of the date hereof and, except as required by law, we assume
no obligation to update or revise forward-looking information to reflect new
events or circumstances.
BO
ST
ON
PIZ
ZA
RO
YA
LT
IES
IN
CO
ME
FU
ND
AN
NU
AL
RE
PO
RT
20
14
32
MANAGEMENT’S STATEMENT OF RESPONSIBILITY
The accompanying consolidated financial statements are the responsibility of management and have been reviewed and approved by the Board of Directors
of Boston Pizza GP Inc. and the Trustees of Boston Pizza Royalties Income Fund (the “Fund”). The consolidated financial statements have been prepared by
management in accordance with International Financial Reporting Standards and, where appropriate, reflect management’s best estimates and judgments.
Management maintains appropriate policies, procedures and systems of internal control which provide reasonable assurance that the Fund’s assets are
safeguarded and the financial records are relevant, reliable, and provide a proper basis for the preparation of the consolidated financial statements and other
financial information.
The Board of Directors of Boston Pizza GP Inc. and the Trustees of the Fund ensure that management fulfills its responsibilities for financial reporting and
internal control through the Audit Committee. The Audit Committee meets with management and meets independently with the external auditors to satisfy
itself that management’s responsibilities are properly discharged. The Audit Committee also reviews the consolidated financial statements and reports to the
Board of Directors of Boston Pizza GP Inc. and the Trustees of the Fund. The Fund’s external auditors have full and direct access to the Audit Committee.
The consolidated financial statements have been independently audited by KPMG LLP in accordance with Canadian generally accepted auditing standards.
Their report follows and expresses their opinion on the Fund’s consolidated financial statements.
Mark PacindaChief Executive Officer, Boston Pizza GP Inc.
on behalf of the Board of Directors
William C. BrownChairman, Boston Pizza Royalties Income Fund
on behalf of the Trustees
February 5, 2015
BOSTON PIZZA ROYALTIES INCOME FUNDANNUAL REPORT 2014
BO
ST
ON
PIZ
ZA
RO
YA
LT
IES
IN
CO
ME
FU
ND
AN
NU
AL
RE
PO
RT
20
14
33
INDEPENDENT AUDITORS’ REPORT
To the Unitholders of Boston Pizza Royalties Income Fund
We have audited the accompanying consolidated financial statements of Boston Pizza Royalties Income Fund (“the Fund”) which comprise the consolidated
statements of financial position as at December 31, 2014 and December 31, 2013, the consolidated statements of comprehensive income, changes in equity
and cash flows for the years then ended, and notes, comprising of a summary of significant accounting policies and other explanatory information.
Managements Responsibility for the Consolidated Financial StatementsManagement is responsible for the preparation and fair presentation of these consolidated financial statements in accordance with International Financial
Reporting Standards and for such internal control as management determines is necessary to enable the preparation of consolidated financial statements
that are free from material misstatement, whether due to fraud or error.
Auditors’ ResponsibilityOur responsibility is to express an opinion on these consolidated financial statements based on our audits. We conducted our audits in accordance with
Canadian generally accepted auditing standards. Those standards require that we comply with ethical requirements and plan and perform the audit to obtain
reasonable assurance about whether the consolidated financial statements are free from material misstatement.
An audit involves performing procedures to obtain audit evidence about the amounts and disclosures in the consolidated financial statements. The procedures
selected depend on our judgment, including the assessment of the risks of material misstatement of the consolidated financial statements, whether due to
fraud or error. In making those risk assessments, we consider internal control relevant to the Fund’s preparation and fair presentation of the consolidated
financial statements in order to design audit procedures that are appropriate in the circumstances, but not for the purpose of expressing an opinion on the
effectiveness of the Fund’s internal control. An audit also includes evaluating the appropriateness of accounting policies used and the reasonableness of
accounting estimates made by management, as well as evaluating the overall presentation of the consolidated financial statements.
We believe that the audit evidence we have obtained in our audits is sufficient and appropriate to provide a basis for our audit opinion.
OpinionIn our opinion, the consolidated financial statements present fairly, in all material respects, the consolidated financial position of the Fund as at December 31, 2014
and December 31, 2013, its consolidated financial performance, and its consolidated cash flows for the years then ended in accordance with International
Financial Reporting Standards.
Chartered Accountants
February 5, 2015
Vancouver, Canada
BOSTON PIZZA ROYALTIES INCOME FUNDANNUAL REPORT 2014
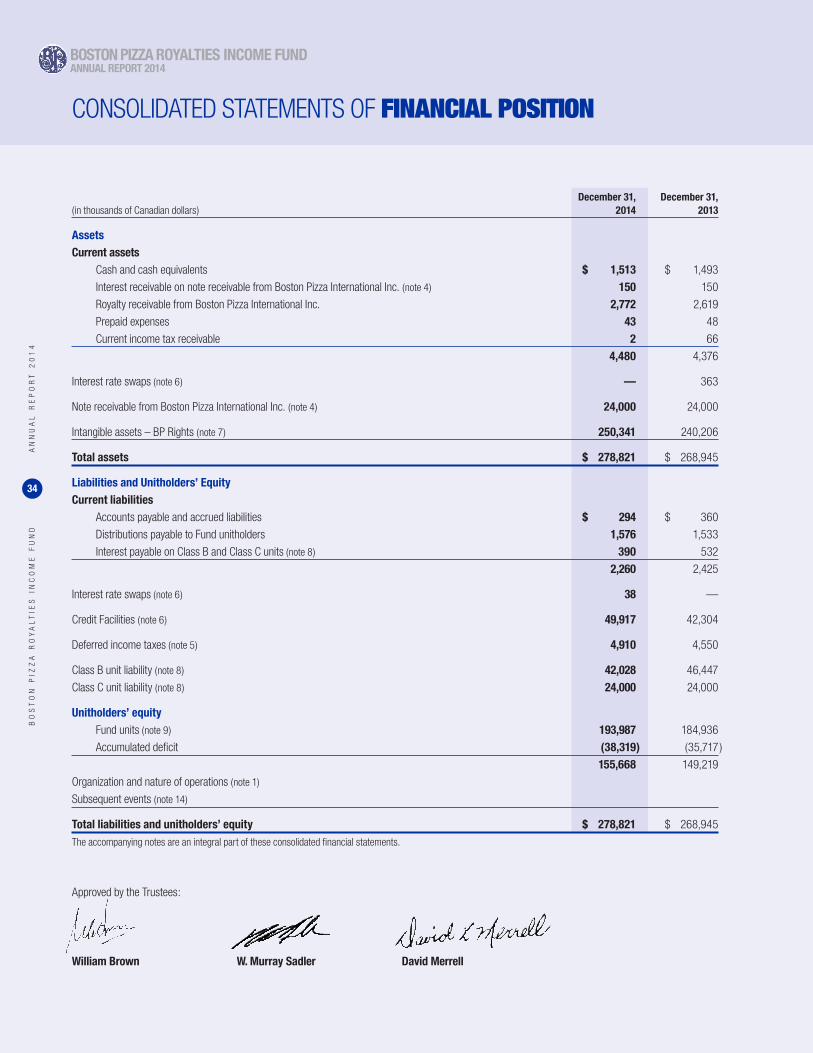
BO
ST
ON
PIZ
ZA
RO
YA
LT
IES
IN
CO
ME
FU
ND
AN
NU
AL
RE
PO
RT
20
14
34
CONSOLIDATED STATEMENTS OF FINANCIAL POSITION
December 31, December 31,(in thousands of Canadian dollars) 2014 2013
Assets
Current assets
Cash and cash equivalents $ 1,513 $ 1,493
Interest receivable on note receivable from Boston Pizza International Inc. (note 4) 150 150
Royalty receivable from Boston Pizza International Inc. 2,772 2,619
Prepaid expenses 43 48
Current income tax receivable 2 66
4,480 4,376
Interest rate swaps (note 6) — 363
Note receivable from Boston Pizza International Inc. (note 4) 24,000 24,000
Intangible assets – BP Rights (note 7) 250,341 240,206
Total assets $ 278,821 $ 268,945
Liabilities and Unitholders’ Equity Current liabilities
Accounts payable and accrued liabilities $ 294 $ 360
Distributions payable to Fund unitholders 1,576 1,533
Interest payable on Class B and Class C units (note 8) 390 532
2,260 2,425
Interest rate swaps (note 6) 38 —
Credit Facilities (note 6) 49,917 42,304
Deferred income taxes (note 5) 4,910 4,550
Class B unit liability (note 8) 42,028 46,447
Class C unit liability (note 8) 24,000 24,000
Unitholders’ equity Fund units (note 9) 193,987 184,936
Accumulated deficit (38,319 ) (35,717 )
155,668 149,219
Organization and nature of operations (note 1)
Subsequent events (note 14)
Total liabilities and unitholders’ equity $ 278,821 $ 268,945
The accompanying notes are an integral part of these consolidated financial statements.
Approved by the Trustees:
William Brown W. Murray Sadler David Merrell
BOSTON PIZZA ROYALTIES INCOME FUNDANNUAL REPORT 2014
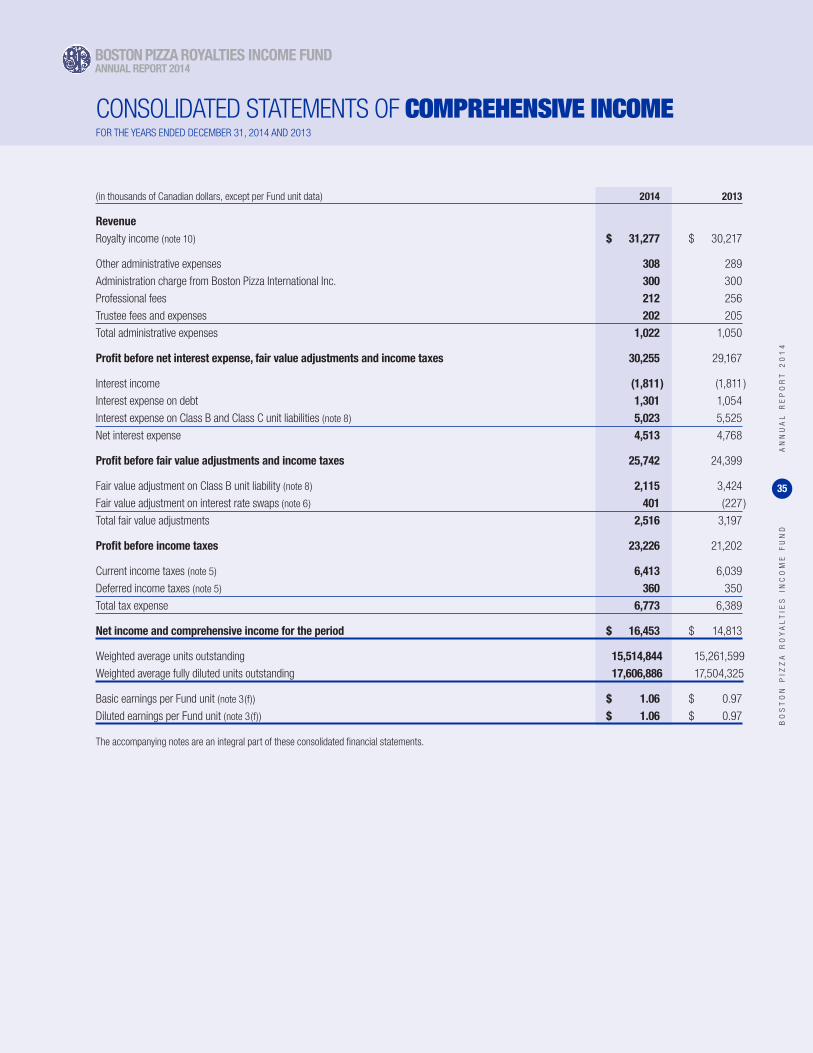
BO
ST
ON
PIZ
ZA
RO
YA
LT
IES
IN
CO
ME
FU
ND
AN
NU
AL
RE
PO
RT
20
14
35
CONSOLIDATED STATEMENTS OF COMPREHENSIVE INCOMEFOR THE YEARS ENDED DECEMBER 31, 2014 AND 2013
(in thousands of Canadian dollars, except per Fund unit data) 2014 2013
Revenue
Royalty income (note 10) $ 31,277 $ 30,217
Other administrative expenses 308 289
Administration charge from Boston Pizza International Inc. 300 300
Professional fees 212 256
Trustee fees and expenses 202 205
Total administrative expenses 1,022 1,050
Profit before net interest expense, fair value adjustments and income taxes 30,255 29,167
Interest income (1,811 ) (1,811 )
Interest expense on debt 1,301 1,054
Interest expense on Class B and Class C unit liabilities (note 8) 5,023 5,525
Net interest expense 4,513 4,768
Profit before fair value adjustments and income taxes 25,742 24,399
Fair value adjustment on Class B unit liability (note 8) 2,115 3,424
Fair value adjustment on interest rate swaps (note 6) 401 (227 )
Total fair value adjustments 2,516 3,197
Profit before income taxes 23,226 21,202
Current income taxes (note 5) 6,413 6,039
Deferred income taxes (note 5) 360 350
Total tax expense 6,773 6,389
Net income and comprehensive income for the period $ 16,453 $ 14,813
Weighted average units outstanding 15,514,844 15,261,599
Weighted average fully diluted units outstanding 17,606,886 17,504,325
Basic earnings per Fund unit (note 3(f)) $ 1.06 $ 0.97
Diluted earnings per Fund unit (note 3(f)) $ 1.06 $ 0.97
The accompanying notes are an integral part of these consolidated financial statements.
BOSTON PIZZA ROYALTIES INCOME FUNDANNUAL REPORT 2014
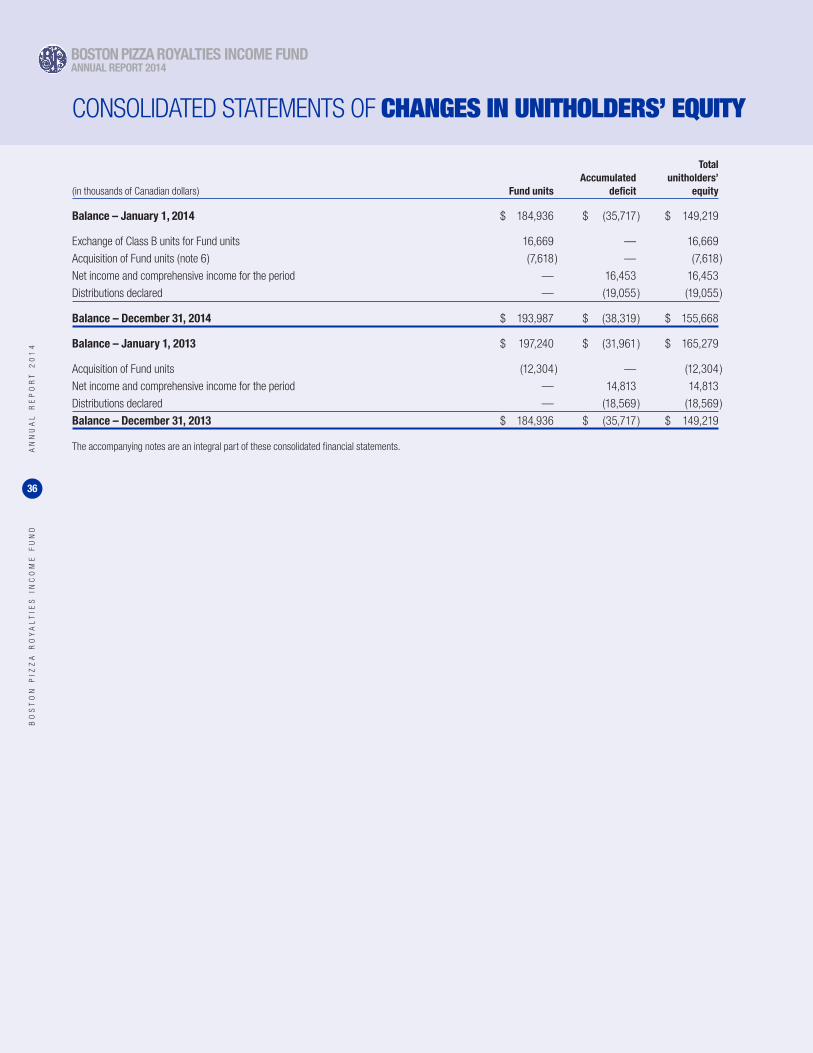
BO
ST
ON
PIZ
ZA
RO
YA
LT
IES
IN
CO
ME
FU
ND
AN
NU
AL
RE
PO
RT
20
14
36
CONSOLIDATED STATEMENTS OF CHANGES IN UNITHOLDERS’ EQUITY
Total Accumulated unitholders’(in thousands of Canadian dollars) Fund units deficit equity
Balance – January 1, 2014 $ 184,936 $ (35,717 ) $ 149,219
Exchange of Class B units for Fund units 16,669 — 16,669
Acquisition of Fund units (note 6) (7,618 ) — (7,618 )
Net income and comprehensive income for the period — 16,453 16,453
Distributions declared — (19,055 ) (19,055 )
Balance – December 31, 2014 $ 193,987 $ (38,319 ) $ 155,668
Balance – January 1, 2013 $ 197,240 $ (31,961 ) $ 165,279
Acquisition of Fund units (12,304 ) — (12,304 )
Net income and comprehensive income for the period — 14,813 14,813
Distributions declared — (18,569 ) (18,569 )
Balance – December 31, 2013 $ 184,936 $ (35,717 ) $ 149,219
The accompanying notes are an integral part of these consolidated financial statements.
BOSTON PIZZA ROYALTIES INCOME FUNDANNUAL REPORT 2014
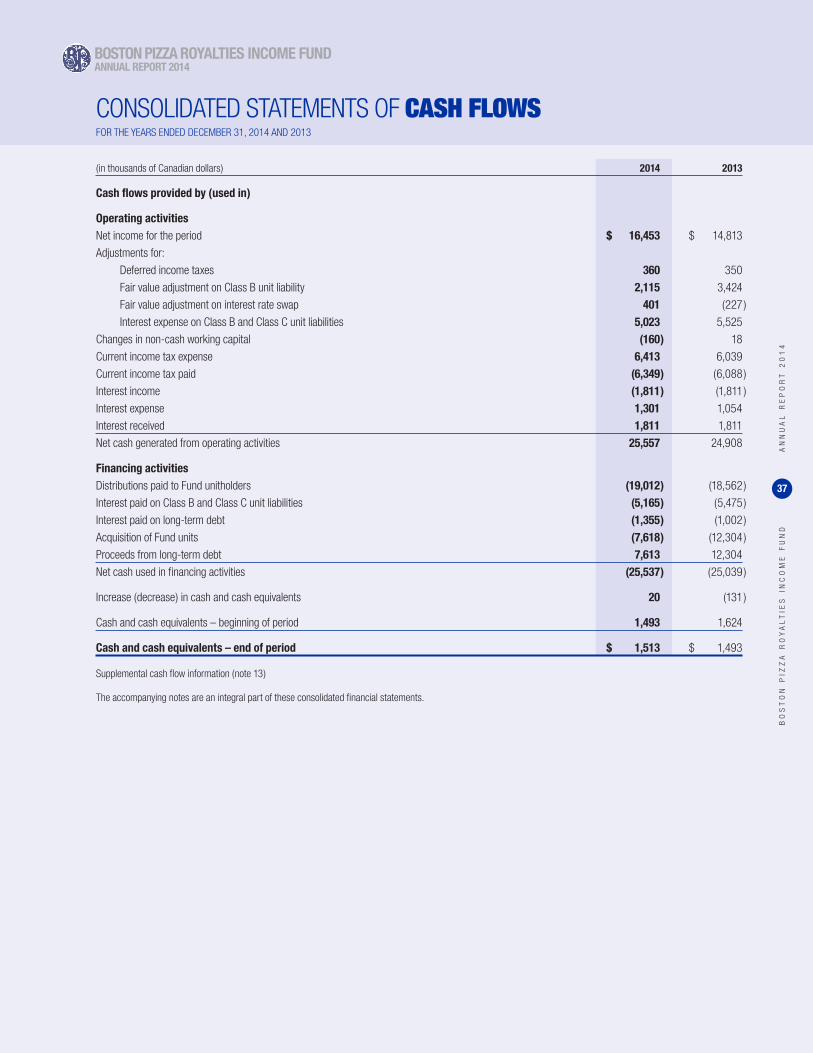
BO
ST
ON
PIZ
ZA
RO
YA
LT
IES
IN
CO
ME
FU
ND
AN
NU
AL
RE
PO
RT
20
14
37
CONSOLIDATED STATEMENTS OF CASH FLOWSFOR THE YEARS ENDED DECEMBER 31, 2014 AND 2013
(in thousands of Canadian dollars) 2014 2013
Cash flows provided by (used in)
Operating activities Net income for the period $ 16,453 $ 14,813
Adjustments for:
Deferred income taxes 360 350
Fair value adjustment on Class B unit liability 2,115 3,424
Fair value adjustment on interest rate swap 401 (227 )
Interest expense on Class B and Class C unit liabilities 5,023 5,525
Changes in non-cash working capital (160 ) 18
Current income tax expense 6,413 6,039
Current income tax paid (6,349 ) (6,088 )
Interest income (1,811 ) (1,811 )
Interest expense 1,301 1,054
Interest received 1,811 1,811
Net cash generated from operating activities 25,557 24,908
Financing activities Distributions paid to Fund unitholders (19,012 ) (18,562 )
Interest paid on Class B and Class C unit liabilities (5,165 ) (5,475 )
Interest paid on long-term debt (1,355 ) (1,002 )
Acquisition of Fund units (7,618 ) (12,304 )
Proceeds from long-term debt 7,613 12,304
Net cash used in financing activities (25,537 ) (25,039 )
Increase (decrease) in cash and cash equivalents 20 (131 )
Cash and cash equivalents – beginning of period 1,493 1,624
Cash and cash equivalents – end of period $ 1,513 $ 1,493
Supplemental cash flow information (note 13)
The accompanying notes are an integral part of these consolidated financial statements.
BOSTON PIZZA ROYALTIES INCOME FUNDANNUAL REPORT 2014
BO
ST
ON
PIZ
ZA
RO
YA
LT
IES
IN
CO
ME
FU
ND
AN
NU
AL
RE
PO
RT
20
14
38
NOTES TO THE CONSOLIDATED FINANCIAL STATEMENTSFOR THE YEARS ENDED DECEMBER 31, 2014 AND 2013
1. General information: (a) Organization:
Boston Pizza Royalties Income Fund together with its subsidiaries
(note 3(b)) (the “Fund”) is an unincorporated open-ended limited
purpose trust established under the laws of the Province of British
Columbia, Canada, and is governed by the Declaration of Trust signed
June 10, 2002, and as amended and restated on July 17, 2002,
September 22, 2008, and December 7, 2010. The Fund’s principal
business office is located at 10760 Shellbridge Way, Richmond, BC.
The Fund was established to indirectly, through the Boston Pizza
Royalties Limited Partnership (the “Partnership”), acquire the
trademarks and trade names owned by Boston Pizza International
Inc. (“BPI”) used in connection with the operation of Boston Pizza
restaurants in Canada (collectively, the “BP Rights”). The BP Rights
do not include the rights outside of Canada to any trademarks or
trade names used by BPI or any affiliated entities in its business,
and in particular do not include the rights outside of Canada to the
trademarks registered or pending registration under the Trade-Marks
Act (Canada).
The Fund was also established to acquire, directly from a bank, the
BPI loan (the “BP Loan”) in the principal amount of $24.0 million.
(b) Nature of operations:
The Fund, as indirect owner of the BP Rights, has granted BPI
exclusive license to the use of the BP Rights for a term of 99 years
beginning in July, 2002 (the “License and Royalty Agreement”).
In return, BPI pays the Fund a Royalty of 4% of franchise sales of
Boston Pizza restaurants in the Royalty Pool. There are 358 Boston
Pizza Restaurants in the Royalty Pool as at December 31, 2014
(December 31, 2013 – 348). BPI carries on business as a franchisor
of casual dining pizza and pasta restaurants and operates only in
Canada. The rights to operations outside of Canada are owned by an
affiliated company.
Substantially all of the Fund’s revenues are earned from certain
operations of BPI and, accordingly, the revenues of the Fund and its
ability to pay distributions to Fund unitholders is dependent on the
ongoing ability of BPI to generate and pay royalties to the Fund.
2. Basis of preparation:(a) Statement of compliance:
These consolidated financial statements have been prepared in
accordance with International Financial Reporting Standards (“IFRS”)
as issued by the International Accounting Standards Board (“IASB”).
The consolidated financial statements were authorized for issue by
the Trustees on February 5, 2015.
(b) Functional and presentation currency:
These consolidated financial statements are presented in Canadian
dollars, which is the Fund’s functional currency.
(c) Use of estimates and judgments:
The preparation of the consolidated financial statements in
accordance with IFRS requires management to make judgments,
estimates and assumptions that affect the application of accounting
policies and the reported amounts of assets, liabilities, income, and
expenses. Actual results may differ from these estimates.
Estimates and underlying assumptions are reviewed on an ongoing
basis. Revisions to accounting estimates are recognized in the period
in which the estimates are revised.
Significant areas requiring the use of management judgment and
estimates relate to the determination of the following:
Judgment
• Consolidation
Applying the criteria outlined in IFRS 10, judgment is required in
determining whether the Fund controls the Partnership. Making
this judgment involves taking into consideration the concepts
of power over the Partnership, exposure and rights to variable
returns, and the ability to use power to direct the relevant
activities of the Partnership so as to generate economic returns.
Using these criteria, management has determined that the Fund
ultimately controls the Partnership through its 80% ownership of
the managing general partner, Boston Pizza GP Inc. (“BPGP”).
Estimates
• Intangible Assets – the BP Rights (note 7)
The Fund carries the BP Rights at historical cost comprising the
amount of consideration paid for the BP Rights in 2002, as well
as the value of additional Boston Pizza Restaurants rolled into
the Royalty Pool to date. The value of additional Boston Pizza
Restaurants added to the Royalty Pool is determined on a formula
basis that is designed to estimate the present value of the cash
flows that would ultimately be payable to the Fund as a result of
the new Boston Pizza Restaurants being added to the Royalty Pool.
As such, the calculation is dependent on a number of different
variables including the estimated long-term sales of the new
restaurants, discount rate, and the tax rate. The value assigned
to the new Boston Pizza Restaurants, and as a result, the value
assigned to the BP Rights, could differ from actual results.
The Fund tests the BP Rights for impairment annually, which
requires that the Fund use a valuation technique to determine
if impairment exists. This valuation technique may not represent
the actual fair value less costs to sell that the Fund expects the
BP Rights to generate.
• Class B Unit Fair Value Adjustment (note 8)
The Fund records its Class B unit liabilities at fair value. This
requires that the Fund use a valuation technique to determine the
value of the Class B unit liability at each reporting date. The Fund
BOSTON PIZZA ROYALTIES INCOME FUNDANNUAL REPORT 2014
BO
ST
ON
PIZ
ZA
RO
YA
LT
IES
IN
CO
ME
FU
ND
AN
NU
AL
RE
PO
RT
20
14
39
estimates the fair value of the Class B unit liability by multiplying
the issued and outstanding Additional Entitlements (including
Holdback) held by BPI at the end of the period by the closing price
of the Units at the end of the period (or previous business day).
This valuation technique may not represent the actual value of the
financial liability should such units be extinguished and changes
in the distribution rate on the Class B units and the yield of the
Fund’s units could materially impact the Fund’s financial position
and net income.
3. Significant accounting policies:The significant accounting policies used in the preparation of these
consolidated financial statements are described below.
(a) Basis of measurement:
The consolidated financial statements have been prepared on the
historical cost basis except for the following material items in the
statements of financial position:
• Class B unit liability is measured at fair value through the statement of
comprehensive income.
• The Fund holds derivative financial instruments to manage its
interest rate exposure. Financial derivatives not using hedge
accounting are recognized initially at fair value; attributable transaction
costs are recognized in profit and loss as incurred. Subsequent to
initial recognition, financial derivatives are recognized at fair value
and changes therein are accounted for through the statement of
comprehensive income.
(b) Consolidation:
These consolidated financial statements include the accounts of the
Fund, its wholly-owned subsidiaries Boston Pizza Holdings Trust (the
“Trust”), Boston Pizza Holdings GP Inc. and Boston Pizza Holdings
Limited Partnership (“Holdings LP”), its 80%-owned subsidiary
BPGP, and its interest in the Partnership. BPGP is the managing
general partner of the Partnership and BPI is a general partner of the
Partnership. The 20% residual ownership of BPGP is either directly
or indirectly owned by BPI.
Subsidiaries are those entities which the Fund controls by having the
power to govern the financial and operating policies of such entities
so as to obtain economic benefits from their relevant activities. The
existence and effect of potential voting rights that are currently
exercisable or convertible are considered when assessing whether
the Fund directs the activities of another entity.
(c) Cash and cash equivalents:
Cash and cash equivalents consist of cash on hand, balances on
deposit with banks, and short-term investments with terms of three
months or less.
(d) Revenue:
Royalty revenue and interest revenue are recognized on an accrual
basis as earned.
(e) Distributions on Fund Units:
Declarations of distributions from the Fund are at the discretion of the
Trustees of the Fund. For the year ended, December 31, 2014, $19.1
million (2013 - $18.6 million) in discretionary cash distributions were
paid to Fund unitholders.
The amount of cash available to be distributed to Fund unitholders is
determined with reference to the Fund’s cash flow from operations
adjusted for items such as BPI’s Class C Unit distribution, BPI’s
entitlement in respect of its Class B Units, specified investment flow-
through tax (“SIFT”) tax expense and SIFT tax paid.
Distributions are recorded when declared and are subject to the
Fund retaining such reasonable working capital reserves as may be
considered appropriate by the trustees of the Fund.
(f) Basic and diluted earnings per Fund unit:
Basic earnings per Fund unit is based on the weighted average
number of Fund units outstanding during the period. Diluted earnings
per Fund unit is based on the weighted average number of Fund units
and Additional Entitlements (note 8) outstanding during the period.
Diluted earnings per Fund unit includes the Additional Entitlements
(note 8) and is calculated by adjusting the weighted average number
of Fund units outstanding to assume conversion of all Additional
Entitlements. For the year ended December 31, 2014, the Additional
Entitlements are anti-dilutive. Accordingly, the diluted earnings per
Fund unit is equal to the basic earnings per Fund unit.
The following reconciles the basic earnings to the diluted earnings:
(in thousands, except per Fund unit data) 2014 2013
Net income for the period $ 16,453 $ 14,813
Adjusted for:
Decrease in interest expense on Class B unit liability 3,223 3,725
Fair value adjustment on Class B unit liability 2,115 3,424
Increase in Fund’s current and deferred income taxes (1,491 ) (1,471 )
Fund’s diluted earnings 20,300 20,491
Weighted average fully diluted units outstanding 17,606,886 17,504,325
Diluted earnings per Fund unit $ 1.06 $ 0.97
(g) Financial instruments:
Financial assets and liabilities are recognized when the Fund
becomes a party to the contractual provisions of the instrument.
Financial assets are derecognized when the rights to receive cash
flows from the assets have expired or have been transferred and the
Fund has transferred substantially all risks and rewards of ownership.
Financial assets and liabilities are offset and the net amount is
reported in the balance sheet when there is a legally enforceable
right to offset the recognized amounts and there is an intention
to settle on a net basis or realize the asset and settle the liability
simultaneously.
At initial recognition, the Fund classifies its financial instruments in
the following categories depending on the purposes for which the
instruments were acquired:
• Financial assets and liabilities at fair value through profit or loss: A
financial asset or liability is generally classified in this category if
acquired principally for the purposes of selling or repurchasing in the
short-term. Derivative financial instruments are also included in this
category unless they are designated as hedges.
BO
ST
ON
PIZ
ZA
RO
YA
LT
IES
IN
CO
ME
FU
ND
AN
NU
AL
RE
PO
RT
20
14
40
Financial instruments in this category are recognized initially and
subsequently at fair value and transaction costs are expensed in the
statement of comprehensive income in the period incurred. Gains
and losses arising from changes in fair value are presented in the
statement of comprehensive income in the period in which they arise.
Financial assets and liabilities at fair value through profit or loss are
classified as current except for the portion expected to be realized
or paid beyond twelve months of the balance sheet date, which is
classified as non-current.
The Class B unit liability is classified as a financial liability at fair value
through profit or loss due to the terms of the instrument permitting
the exchange of Class B units into Fund units at the holders’ option.
• Derivative financial instruments: The requirement of the Fund to settle
its note receivable from BPI in exchange for Class C general
partner units (“Class C Units”, note 8) is classified as a derivative
instrument. The Fund has reviewed the net impact of this potential
exchange requirement on its cash flows and has determined there is
no significant value applicable to this feature. Additionally, the Fund
has classified the interest rate swaps as derivative instruments which
are accounted for at fair value through profit and loss.
• Loans and receivables: Loans and receivables are non-derivative
financial assets with fixed or determinable payments that are not
quoted in an active market. Cash and cash equivalents, interest
receivable on the note receivable from BPI, royalties receivable, and
the note receivable from BPI are included in this category.
Loans and receivables are initially recognized at the amount expected
to be received less, when material, a discount to reduce the loans and
receivables to fair value.
Subsequently, loans and receivables are measured at amortized cost
using the effective interest method.
• Financial liabilities at amortized cost: Financial liabilities at amortized
cost include accounts payable and accrued liabilities, distributions
payable to Fund unitholders, interest payable on Class B and C
units, Class C unit liability, and the amount drawn on the Fund’s
Credit Facilities. These items are initially recognized at the amount
required to be paid less, when material, a discount to reduce the
payables to fair value or transaction costs incurred. Subsequently,
these items are measured at amortized cost using the effective
interest rate method.
Financial liabilities are classified as current liabilities if payment is
due within twelve months. Otherwise, they are presented as non-
current liabilities.
The Fund must classify fair value measurements according to a
hierarchy that reflects the significance of the inputs used in performing
such measurements. The Fund’s fair value hierarchy comprises the
following levels:
• Level 1 – quoted prices are available in active markets for identical
assets or liabilities as of the reporting date. Active markets are those
in which transactions occur in sufficient frequency and volume to
provide pricing information on an ongoing basis.
• Level 2 – pricing inputs are other than quoted in active markets
included in Level 1. Prices in Level 2 are either directly or indirectly
observable as of the reporting date.
• Level 3 – valuations in this level are those with inputs for the asset or
liability that are not based on observable data.
The fair value of the Class B unit liability and the interest rate swaps are
determined using Level 2 inputs.
The following table presents the carrying amounts of each category of
financial assets and liabilities:
December 31, December 31, (in thousands) 2014 2013
Assets carried at fair value
Fair value of interest rate swaps $ — $ 363
Assets carried at amortized cost
Cash and cash equivalents $ 1,513 $ 1,493
Interest receivable on note from Boston Pizza International Inc. 150 150
Royalty receivable from Boston Pizza International Inc. 2,772 2,619
Note receivable from Boston Pizza International Inc. 24,000 24,000
$ 28,435 $ 28,262
December 31, December 31, (in thousands) 2014 2013
Liabilities carried at fair value
Fair value of interest rate swaps $ 38 $ —
Class B unit liability 42,028 46,447
$ 42,066 $ 46,447
Liabilities carried at amortized cost Accounts payable and accrued liabilities $ 294 $ 360
Distributions payable to Fund unitholders 1,576 1,533
Interest payable on Class B and Class C units 390 532
Credit Facilities 49,917 42,304
Class C unit liability 24,000 24,000
$ 76,177 $ 68,729
Unless otherwise noted, the fair values on instruments noted
approximate their carrying amount largely due to the short-term
maturities of these instruments.
The Fund has recorded the Credit Facilities at amortized cost as noted
above. The Partnership uses interest rate swap agreements to manage
risks from fluctuations in interest rates on $36.0 million of this balance,
and any changes in the fair value of the interest rate swaps are recorded in
the statement of comprehensive income in the period in which they arise.
Without factoring in the interest rate swaps, the fair value of the $36.0
million of the Credit Facilities approximates its carrying amount since the
debt has variable interest rates at terms that the Fund believes are reflective
of those currently available.
BOSTON PIZZA ROYALTIES INCOME FUNDANNUAL REPORT 2014
NOTES TO THE CONSOLIDATED FINANCIAL STATEMENTS
BO
ST
ON
PIZ
ZA
RO
YA
LT
IES
IN
CO
ME
FU
ND
AN
NU
AL
RE
PO
RT
20
14
41
The fair value of the remaining Credit Facilities balance, which equals
the carrying amount, is $13.9 million (December 31, 2013 – $6.3
million) since this debt also has variable interest rates at terms that
the Fund believes are reflective of those currently available.
(h) Impairment of financial assets:
At each reporting date, the Fund assesses whether there is objective
evidence that a financial asset is impaired.
The criteria used to determine if objective evidence of an impairment
loss exists include:
• Significant financial difficulty of the Fund’s counterparty;
• Delinquencies in interest or principal payments; and
• It becomes probable that the borrower will enter into bankruptcy or
other financial reorganization.
If such evidence exists, the Fund recognizes an impairment loss as follows:
• Financial assets carried at amortized cost: the loss is the difference
between the amortized costs of the loan or receivable and the
present value of the estimated future cash flows, discounted using
the instrument’s original effective interest rate.
• Impairment losses on financial assets carried at amortized cost are
reversed in subsequent periods if the amount of the loss decreases
and the decrease can be related objectively to an event occurring
after the impairment was recognized. The reversal is limited to an
amount that does not state the asset at more than what its amortized
cost would have been in the absence of impairment.
• The Fund has reviewed its interest receivable on note receivable from
BPI, the royalty receivable from BPI, and the note receivable from BPI
and has determined that no indicators of impairment exist.
(i) Impairment of non-financial assets:
Long-lived assets are tested for impairment when events or changes
in circumstances indicate that the carrying amount may not be
recoverable. Long-lived assets that are not amortized, such as the
BP Rights, are subject to an annual impairment test (note 7). For
the purpose of measuring recoverable amounts, assets are grouped
at the lowest levels for which there are separately identifiable cash
flows. The recoverable amount is the higher of an asset’s fair value
less costs to sell and value in use (being the present value of the
expected future cash flows of the relevant asset). An impairment loss
is recognized for the amount by which the asset’s carrying amount
exceeds its recoverable amount. Impairment losses may be reversed
if the fair value of the asset is determined to be greater than its
carrying amount.
The Fund tested the BP Rights for impairment at December 31, 2014
and determined no impairment exists (note 7).
(j) Financial risk management:
The Fund is primarily exposed to credit risk, liquidity risk and interest
rate risk as they relate to the identified financial instruments.
Credit risk
Credit risk is defined as an unexpected loss in cash and earnings
if another party is unable to pay its obligations in due time. The
Fund’s exposure to credit risk arises from its royalties receivable,
interest receivable and notes receivable, all being due from BPI.
The outstanding balances in these accounts represent the Fund’s
maximum credit exposure. The Fund monitors this risk through its
regular review of operating and financing activities of BPI. Since its
inception, the Fund has never failed to collect its interest or royalties
receivable on a timely basis.
The performance of the Fund is directly dependent upon the royalty
and interest payments received from BPI. The amount of royalty
received from BPI is dependent on various factors that may affect the
casual dining sector of the restaurant industry including competition
and general economic conditions. In general, the restaurant industry,
and in particular the casual dining sector, is intensely competitive
with respect to price, service, location, and food quality. If BPI and
its franchisees are unable to successfully compete in the casual
dining sector or the economy is weak for an extended period of
time, Franchise Sales, the basis on which royalties are paid, may be
adversely affected. The reduction of royalties may impact BPI’s ability
to pay royalties or interest due to the Fund.
As at December 31, 2014, the Fund had no provision for credit risk
recorded in its financial statements.
Liquidity risk
Liquidity risk results from the Fund’s potential inability to meet its
financial obligations. Beyond effective net working capital and cash
management, the Fund constantly monitors its operations and
cash flows to ensure that current and future distributions to Fund
unitholders will be met. At December 31, 2014, all current liabilities
had a maturity of less than three months.
The Fund’s capital resources are comprised of its cash and cash
equivalents, the interest receivable on its note receivable from BPI,
its royalty receivable from BPI, and its undrawn Facility A (note 6).
(in thousands)
Cash and cash equivalents $ 1,513
Interest receivable on note receivable from BPI 150
Royalty receivable from BPI 2,772
Undrawn Facility A 1,000
$ 5,435
The Fund’s obligations under the Credit Facilities, as detailed in
note 6, are secured by a first charge over the assets of the Fund,
mature July 19, 2017, and have no scheduled repayment terms
before maturity.
The Fund is subject to certain guarantor covenants and reporting
requirements arising from the Credit Facilities and are further
described in note 3(l).
The Fund’s capital resources are comprised of cash and cash flow
from operating activities. The maturities of the Fund’s financial
liabilities are as follows:
(in thousands) Value Maturity
Accounts payable and accrued liabilities $ 294 < 1 year
Distributions payable to Fund unitholders 1,576 < 1 year
Interest payable on Class B and Class units 390 < 1 year
Credit facilities 49,917 2017
BO
ST
ON
PIZ
ZA
RO
YA
LT
IES
IN
CO
ME
FU
ND
AN
NU
AL
RE
PO
RT
20
14
42
Interest rate risk
The Fund’s exposure to interest rate risk is mainly through the Credit
Facilities. The Fund has entered into interest rate swaps under the
International Swap Dealers Association Master Agreement (the “ISDA Agreement”) to manage interest rate risk on $36.0 million of its long-
term debt and these swaps are detailed in note 6. Therefore, the Fund’s
interest rate risk is mainly related to its $13.9 million floating rate debt. A
1% change in short-term interest rates would change interest expense
by $0.1 million based on the Fund’s floating rate debt at December 31,
2014. Other amounts impacted by interest rate risk include the interest-
bearing note receivable from BPI. The note receivable has a fixed
interest rate of 7.5%, is from a related party, and is due in July 2042.
(k) Identifiable long-lived assets:
Long-lived assets consist of the BP Rights (note 7). The long-lived
assets are indefinite life assets and are not amortized but tested for
impairment on an annual basis.
(l) Capital disclosures:
The Fund’s objective when managing capital is to safeguard its ability
to continue as a going concern so that it can continue to provide
distributions to unitholders and benefits for other stakeholders.
The Fund includes its Credit Facilities and unitholders’ equity, in its
definition of capital.
The Fund seeks to maintain a balance between the higher returns
that might be possible with the leverage afforded by higher borrowing
levels and the security afforded by a sound capital structure. It does
this by maintaining appropriate debt levels in relation to its cash flows,
working capital and other assets in order to provide the maximum
distributions to unitholders commensurate with the level of risk. Also,
the Fund utilizes its debt capabilities to buy back Fund units, when
appropriate, in order to maximize cash distribution rates for remaining
Fund unitholders.
The Fund maintains formal financial policies to manage its capital
structure that are adjusted to respond to changes in economic
conditions, the underlying risks inherent in its operations, and
capital requirements to maintain and grow its operations. In order
to maintain or adjust its capital structure, the Fund may adjust the
amount of distributions paid to unitholders, purchase Fund units in
the market, or issue new Fund units. The Fund’s policy is to distribute
all available cash from operations to Fund unitholders after provisions
for cash required for working capital and other reserves considered
advisable by the Fund’s trustees. The Fund has eliminated the impact
of seasonal fluctuations by equalizing monthly distributions.
The Fund had debt of $49.9 million at December 31, 2014 (December
31, 2013 - $42.3 million). In addition, the Fund’s banking covenants
currently require it to limit its funded debt to rolling 12 month EBITDA
to 2.00:1. The Fund’s funded debt to EBITDA ratio at December 31,
2014 was 1.65:1 (December 31, 2013 – 1.45:1) which is below its
banking covenant requirements. The Fund is in compliance with its
covenants as at December 31, 2014.
The Fund is not subject to any other statutory capital requirements
and has no commitments to sell or otherwise issue Fund units, other
than the commitment to exchange Class B units held by BPI for Fund
units, as described in notes 8 and 9.
(m) Accounting standards and amendments adopted by the Fund:
Effective January 1, 2014, the following standards and amendments
were adopted by the Fund:
(i) Annual Improvements to IFRS (2010 – 2012) and (2011 – 2013)
In December 2013, the IASB issued narrow-scope amendments
to a total of nine standards as part of its annual improvements
process. The IASB uses the annual improvements process to
make non-urgent but necessary amendments to IFRS. Most
amendments will apply prospectively for annual periods beginning
on or after July 1, 2014; earlier application is permitted, in
which case, the related consequential amendments to other
IFRSs would also apply. The Fund adopted these amendments
in its financial statements beginning on January 1, 2014 and
determined that the amendments do not have a material impact
on the consolidated financial statements.
( ii ) Amendments to IAS 32, Offsetting Financial Assets and
Liabilities, clarify when an entity has a legally enforceable
right to set-off and when a settlement mechanism provides
for net settlement or gross settlement that is equivalent to net
settlement. The Fund adopted these amendments in its financial
statements beginning on January 1, 2014 and determined that the
amendments do not have a material impact on the consolidated
financial statements.
(n) Accounting standards and amendments issued but not yet adopted:
Unless otherwise noted, the following revised standards and
amendments are effective for annual periods beginning on or after
January 1, 2015 with earlier adoption permitted. The Fund has not
yet assessed the impact of these standards and amendments or
determined whether they will be adopted early.
(i) On July 24, 2014, the IASB issued IFRS 9, Financial Instruments,
and the IASB subsequently published amendments to IFRS 9. IFRS
9 (2009) introduces new requirements for the classification and
measurement of financial assets. Under IFRS 9 (2009), financial
assets are classified and measured based on the business model
in which they are held and the characteristics of their contractual
cash flows. IFRS 9 (2010) introduces additional changes relating
to financial liabilities. IFRS 9 (2014) includes finalized guidance
on the classification and measurement of financial assets. The
final standard also amends the impairment model by introducing
a new ‘expected credit loss’ model for calculating impairment,
and new general hedge accounting requirements. The IASB has
deferred the mandatory effective date of the existing chapters of
IFRS 9 to annual periods beginning on or after January 1, 2018
and must be applied retrospectively with some exemptions.
Earlier application is permitted.
( ii ) On May 28, 2014, the IASB issued IFRS 15, Revenue from
Contracts with Customers. IFRS 15 will replace IAS 18, Revenue.
The standard contains a single model that applies to contracts
BOSTON PIZZA ROYALTIES INCOME FUNDANNUAL REPORT 2014
NOTES TO THE CONSOLIDATED FINANCIAL STATEMENTS
BO
ST
ON
PIZ
ZA
RO
YA
LT
IES
IN
CO
ME
FU
ND
AN
NU
AL
RE
PO
RT
20
14
43
with customers and two approaches to recognizing revenue: at a
point in time or over time. The model features a contract-based,
five-step analysis of transactions to determine whether, how
much and when revenue is recognized. New estimates and
judgmental thresholds have been introduced, which may affect
the amount and/or timing of revenue recognized. The new
standard is effective for annual periods beginning on or after
January 1, 2017. Earlier application is permitted.
4. Note receivable from Boston Pizza International Inc.: December 31, December 31, (in thousands) 2014 2013
Note receivable with interest payable monthly at 7.5% per annum, due July 17, 2042 $ 24,000 $ 24,000
The note originated at the time of the Fund’s indirect acquisition of the BP
Rights from BPI in July 2002 and is secured by a general security agreement.
The note may not be assigned without the prior consent of BPI.
BPI, as the holder of 2,400,000 Class C Units, has the right to transfer the
Class C Units to the Fund in consideration for the assumption by the Fund
of, and the concurrent release of BPI of its obligations with respect to, an
amount of the indebtedness under the BP Loan equal to $10.00 for each
Class C Unit transferred.
Interest receivable on the note receivable was $0.2 million at December 31,
2014 (December 31, 2013 – $0.2 million).
5. Income taxes:The Fund has recorded current income tax expense of $6.4 million for the
year ended December 31, 2014 (2013 – $6.0 million) and a corresponding
change in the current income tax asset. The current income tax receivable
is the cumulative result of the Fund’s SIFT tax installments exceeding the
Fund’s SIFT tax expense.
The Fund has recorded a deferred income tax expense of $0.4 million for the
year ended December 31, 2014 (2013 - $0.4 million) and a corresponding
change in the future income tax liability from $4.6 million at December 31,
2013 to $4.9 million at December 31, 2014. The deferred income tax liability
arises mainly as a result of the Fund recording, in the current period, its
cumulative share of the temporary differences between the accounting and
tax bases of the BP Rights owned by the Partnership generated since the
inception of the Fund. This expense had no impact on the Fund’s cash flow
for the period.
The reconciliation to statutory tax rate is as follows:
(in thousands, except tax rate) 2014 2013
Profit before income taxes $ 23,226 $ 21,202
Combined Canadian federal and provincial rate 26.0 % 25.8 %
Computed expected tax expense $ 6,039 $ 5,460
Decreased by:
Current year’s earnings not taxable (1,586 ) (1,668 )
Increased by:
Current year’s earnings that are taxable 1,960 2,247
Change in the tax base of the BP Rights 360 350
Total tax expense per statement of income $ 6,773 $ 6,389
The tax effect of the temporary differences that gives rise to the deferred
income tax liability is as follows:
December 31, December 31, (in thousands) 2014 2013
Deferred income tax liabilities:
Difference related to the BP Rights $ 4,910 $ 4,550
Net deferred tax liability $ 4,910 $ 4,550
6. Operating line of credit, term loan and NCIB credit facilities:The Partnership has credit facilities with a Canadian chartered bank (the
“Lender”) in the amount of up to $56.0 million (the “Credit Facilities”)
having a five year term expiring on July 19, 2017. The Credit Facilities are
comprised of: (a) a $1.0 million operating facility (“Facility A”); (b) a $30.0
million revolving credit facility (“Facility B”); and (c) a $25.0 million revolving
credit facility to facilitate the Fund repurchasing and cancelling additional
units of the Fund under normal course issuer bids (“Facility C”).
The Credit Facilities bear interest at fixed or variable interest rates, as
selected by the Fund, comprised of either, or a combination of, the Lender’s
bankers’ acceptance rates plus between 1.0% and 1.5%, or the prime rate
plus between 0.0% and 0.5%, depending on the amount drawn on the Credit
Facilities and the Fund’s funded debt to EBITDA ratio.
The Fund is subject to certain guarantor covenants and reporting requirements
arising from the Credit Facilities which are described in note 3(l). The Fund
is additionally subject to commitment fees at rates of 0.2% to 0.3% on any
unused portions of the Credit Facilities, payable on a quarterly basis.
The Partnership previously entered into an interest rate swap under the
International Swap Dealers Association Master Agreement with the Lender
to fix the interest rate at 2.9% per annum (assuming existing debt to EBITDA
levels are maintained) for a term of five years for the $30.0 million drawn on
Facility B. In addition, previously the Partnership entered into another interest
rate swap to fix the interest rate at 3.4% per annum (assuming existing debt
to EBITDA levels are maintained) for a term of five years for $6.0 million
drawn on Facility C (this swap together with the previously described swap,
the “Swaps”). The Fund recorded a nominal financial derivative liability
based on the fair value of the Swaps at December 31, 2014 (December
31, 2013 – derivative asset of $0.4 million) in accordance with accounting
for derivatives under IFRS. The Fund intends to hold the Swaps to maturity.
On September 12, 2013, the Fund announced that it had received Toronto
Stock Exchange (“TSX”) approval of a Notice of Intention to make a Normal
Course Issuer Bid through the facilities of the TSX or other Canadian
marketplaces from September 16, 2013 to no later than September 15,
2014 (the “2013 NCIB”). The 2013 NCIB permitted the Fund to repurchase
for cancellation up to 1,393,078 units, being 9.3% of the Fund’s issued and
outstanding units (as at September 6, 2013) and approximately 10.0% of its
public float, then comprised of 13,930,780 units. The 2013 NCIB expired on
September 15, 2014. All units acquired under the 2013 NCIB were cancelled.
On September 22, 2014, the Fund announced that it had received TSX
approval of a Notice of Intention to make a Normal Course Issuer Bid through
the facilities of the TSX or other Canadian marketplaces from September
25, 2014 to no later than September 24, 2015 (the “2014 NCIB”). The
2014 NCIB permits the Fund to repurchase for cancellation up
to 1,385,023 Units, being approximately 8.9% of the Fund’s issued and
outstanding units (as at September 19, 2014) and approximately 10.0% of
its public float, then comprised of 13,850,231 units. All Units acquired under
the 2014 NCIB have been cancelled.
BO
ST
ON
PIZ
ZA
RO
YA
LT
IES
IN
CO
ME
FU
ND
AN
NU
AL
RE
PO
RT
20
14
44
The Fund has established an automatic securities purchase plan with its
broker to allow for the repurchase of Units under the 2014 NCIB at any time,
including when it ordinarily would not be active in the market due to its own
internal trading blackout periods, insider trading rules or otherwise. The plan
will terminate on the earliest of: (a) the date on which the purchase limits
specified in the plan have been attained, (b) the date on which the 2014 NCIB
terminates, (c) the date on which the Fund terminates the plan in accordance
with the terms of the plan, in which case the Fund will issue a press release
announcing such termination, and (d) September 24, 2015. All purchases will
be made on the open market through facilities of the TSX or other Canadian
marketplaces in accordance with the requirements of the TSX and applicable
securities laws.
From January 1, 2014 to December 31, 2014, the Fund acquired 371,400
Units at an average price of $20.51 per Unit (total of $7.6 million). As at
December 31, 2014, all of the repurchased units were cancelled. The Fund
financed purchases under the 2013 and 2014 NCIB by drawing on the $25.0
million Facility C that is included as part of the Fund’s Credit Facilities. As at
December 31, 2014, the Fund had drawn down Facility C by $19.9 million
(December 31, 2013 – $12.3 million).
December 31, December 31,(in thousands) 2014 2013
Bank of Montreal Credit Facility B bearing interest at 1.44% plus between 1.00% and 1.50% per annum, with a maturity date of July 19, 2017 $ 30,000 $ 30,000
Bank of Montreal Credit Facility C bearing interest at 1.92% plus between 1.00% and 1.50% per annum, with a maturity date of July 19, 2017 6,000 6,000
Bank of Montreal Credit Facility C bearing interest at bankers’ acceptance rate (1.28% at December 31, 2014) plus between 1.00% and 1.50% per annum, with a maturity date of July 19, 2017 13,917 6,304
$ 49,917 $ 42,304
The fair value of the Fund’s debt is $49.9 million since the debt has variable
interest rates at terms that the Fund believes are reflective of those currently
available. Accordingly, the impact of a 1% change in the prime rate would not
result in any change in the fair value of the debt.
Principal repayments on debt for the years ending December 31 are as
follows:
(in thousands)
2015 $ —
2016 —
2017 49,917
2018 and thereafter —
$ 49,917
The Fund plans to refinance its long-term debt before maturity and does not
expect to be required to repay any portion of the principal amount outstanding
prior to maturity.
7. Intangible assets – BP Rights:The BP Rights are trademarks registered in Canada including “Boston Pizza”
and other similar related terms, logos and designs that are the property
of the Partnership. The Partnership and BPI entered into a license and
royalty agreement to allow BPI the use of the BP Rights for a term of 99
years beginning in July 2002, for which BPI pays a royalty equal to 4% of
the franchise revenues of the restaurants in the Royalty Pool. Since the
trademarks may remain in force indefinitely, the BP Rights have an indefinite
life, are recognized at cost and are not amortized but are tested for indicators
of impairment at each reporting date and tested for impairment annually on
December 31. In January of each year, new restaurants are added to the
Royalty Pool. In exchange for adding new stores into the Royalty Pool, BPI
is granted the Additional Entitlements (note 8), the fair value of which are
determined using the expected annual sales of the new stores discounted
by the yield of the Fund’s units. The value of the Additional Entitlements is
adjusted in the following year once the annual sales of the new stores are
known for certain.
The fair values of the Additional Entitlements are recognized as an internally
generated intangible asset and are added to the carrying value of the BP Rights.
(in thousands)
Balance – January 1, 2013 $ 235,850
Additional Entitlements for net 5 new restaurants opened in 2012 and added to the Royalty Pool in 2013 – granted January 1, 2013 3,722
Adjustment to prior year Additional Entitlements for actual performance of new restaurants opened in 2011 and added to the Royalty Pool in 2012 634
Balance – December 31, 2013 $ 240,206
Additional Entitlements for net 10 new restaurants opened in 2013 and added to the Royalty Pool in 2014 – granted January 1, 2014 9,227
Adjustment to prior year Additional Entitlements for actual performance of new restaurants opened in 2012 and added to the Royalty Pool in 2013 908
Balance – December 31, 2014 $ 250,341
Each year on December 31, the Fund tests the carrying value of the BP
Rights for impairment. Impairment exists if the carrying value of the BP Rights
exceeds the fair value less costs to sell (the “recoverable amount”).
The Fund determines the recoverable amount of the BP Rights based on its
fair value less costs to sell. Management first determines the fair value of
the Fund, and then deducts from this value the fair value of all of the Fund’s
other assets and liabilities. The fair value of the Fund is determined based
on the current market price of the outstanding units. Based on the nature of
the other assets and liabilities, management has determined that there are
no material differences between the book value and fair value of these other
assets and liabilities. Management estimates the costs to sell based on past
experience with the previous sale and exchange of its units.
As at December 31, 2014, the Fund has tested the BP Rights for impairment
in the manner described above and has determined that the recoverable
amount exceeds the carrying value. The Fund has determined that no
impairment exists.
BOSTON PIZZA ROYALTIES INCOME FUNDANNUAL REPORT 2014
NOTES TO THE CONSOLIDATED FINANCIAL STATEMENTS
BO
ST
ON
PIZ
ZA
RO
YA
LT
IES
IN
CO
ME
FU
ND
AN
NU
AL
RE
PO
RT
20
14
45
8. Partnership unit liabilities:(a) Class B units:
“Class B units” are those units which have been issued to and are held
by BPI and are presented in the Fund’s financial statements as a result
of the Fund consolidating the accounts of the Partnership under IFRS.
The Class B units are classified as a financial liability and are initially and
subsequently reported at fair value. The determination of the fair value of
the Class B unit liability is described later in this note.
BPI has the right to exchange Class B units for a number of Fund units
based, at any time, on a defined calculation which is based in part on
the net franchise sales from restaurants added to the Royalty Pool. On
January 1 of each year (the “Adjustment Date”), an adjustment is made
to add to the Royalty Pool new Boston Pizza Restaurants that opened and
to remove any Boston Pizza Restaurants that permanently closed since
the previous Adjustment Date. In return for adding net additional royalty
revenue, BPI receives the right to indirectly acquire additional Fund units
(the “Additional Entitlements”). BPI receives 80% of the Additional
Entitlements on the Adjustment Date with the balance (the “Holdback”)
received once the performance of the new stores and the actual effective
average tax rate paid by the Fund are known for certain. BPI receives
100% of the distributions from the Additional Entitlements throughout
the year. Once the new restaurants have been in the Royalty Pool for a
full year, an audit of the royalty revenues of the new restaurants received
from BPI is performed. At such time, an adjustment is made to reconcile
the number of Additional Entitlements and associated distributions to
the actual performance of the new stores. Class B units held by BPI
carry voting rights equivalent to the number of fully entitled Additional
Entitlements outstanding at that time.
On January 1, 2014, 12 new Boston Pizza restaurants that opened
during the period from January 1, 2013 to December 31, 2013 were
added to the Royalty Pool while two restaurants that closed during 2013
were removed. The Franchise Sales of these 10 net new restaurants has
been estimated at $19.8 million. The total number of restaurants in the
Royalty Pool was increased to 358. As a result of the contribution of
the additional net sales to the Royalty Pool, and assuming 100% of the
Additional Entitlements, BPI’s Additional Entitlements are equivalent to
444,688 (2013 – 194,449) Fund units.
BPI will also receive a proportionate increase in monthly distributions from
the Partnership. Of the Additional Entitlements, 20% (2014 – 88,938
units; 2013 – 38,890 units), remain unissued and are not eligible for
conversion to Fund units until January 1, 2015 (2013 units – January 1,
2014) based on the actual performance of the new stores.
In early 2014, adjustments to royalty payments and Additional
Entitlements were made based on the actual performance of five net
new additional restaurants added to the Royalty Pool on January 1, 2013.
Based on these adjustments, BPI received its pro rata portion of the
remaining Additional Entitlements, 86,336 Fund units.
On March 10, 2014, BPI exchanged Class B Partnership units for
790,006 Fund units (the “Exchange”). As a result of the Exchange, the
Fund’s Class B unit liability decreased by $16.7 million, which was based
on the market value of the Units at the time of the Exchange. As the Class
B units are carried at fair value through profit or loss, no gain or loss was
recognized on this transaction as the values of the Class B units and Fund
units was equal.
Issued and outstanding Issued and Additional outstanding Entitlements Additional including Class B unit(in thousands, except unit data) Entitlements Holdback liability
Balance at December 31, 2012 1,959,875 2,003,508 $ 38,667
Additional Entitlements for addition of 5 net new restaurants to the Royalty Pool in 2012 – granted January 1, 2013 155,559 194,449 3,722
Adjustment to prior year Additional Entitlements for actual performance of new restaurants added to Royalty Pool in 2011 88,411 44,778 634
Fair value adjustment — — 3,424
Balance at December 31, 2013 2,203,845 2,242,735 $ 46,447
Additional Entitlements for addition of 10 net new restaurants to the Royalty Pool in 2013 – granted January 1, 2014 355,750 444,688 9,227
Adjustment to prior year Additional Entitlements for actual performance of new restaurants added to Royalty Pool in 2012 86,336 47,446 908
Exchange of Class B Units for Fund Units (790,006 ) (790,006 ) (16,669 )
Fair value adjustment — — 2,115
Balance at December 31, 2014 1,855,925 1,944,863 $ 42,028
The fair value of the Class B unit liability is determined at each period end by
multiplying the issued and outstanding Additional Entitlements (including
Holdback) held by BPI at the end of the period by the closing price of the
Units at the end of the period (or previous business day). As at December
31, 2014, the Fund’s closing price was $21.61 per Unit (December 31,
2013 - $20.71 per Unit) resulting in a market capitalization of $375.9
million (December 31, 2013 - $357.7 million). BPI’s 11.2% ownership
(December 31, 2013 – 13.0%) of the Fund (on a fully-diluted basis) was
calculated to be valued at $42.0 million (December 31, 2013 - $46.4
million). The Fund has no obligation to settle this financial liability in cash.
If BPI were to exchange all of its Additional Entitlements for Fund units on
December 31, 2014, the Fund would issue the equivalent number of Fund
units and the Class B unit liability would be extinguished.
(b) Class C units:
“Class C units” are those 2,400,000 units which have been issued to
and are held by BPI. These units have an obligation to pay the Class
C distribution of $0.0625 per unit on a monthly basis as long as the
note receivable from BPI (note 4) is outstanding. Accordingly, this item is
classified as a financial liability and is measured at amortized cost.
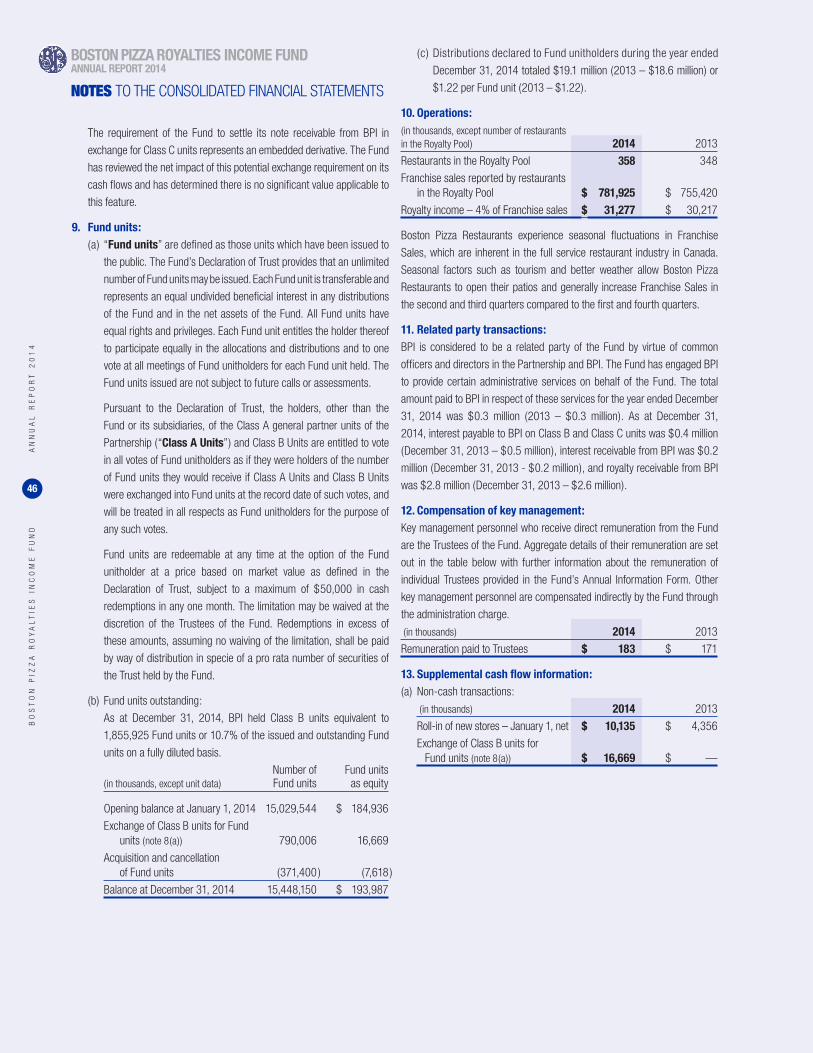
BO
ST
ON
PIZ
ZA
RO
YA
LT
IES
IN
CO
ME
FU
ND
AN
NU
AL
RE
PO
RT
20
14
46
The requirement of the Fund to settle its note receivable from BPI in
exchange for Class C units represents an embedded derivative. The Fund
has reviewed the net impact of this potential exchange requirement on its
cash flows and has determined there is no significant value applicable to
this feature.
9. Fund units:(a) “Fund units” are defined as those units which have been issued to
the public. The Fund’s Declaration of Trust provides that an unlimited
number of Fund units may be issued. Each Fund unit is transferable and
represents an equal undivided beneficial interest in any distributions
of the Fund and in the net assets of the Fund. All Fund units have
equal rights and privileges. Each Fund unit entitles the holder thereof
to participate equally in the allocations and distributions and to one
vote at all meetings of Fund unitholders for each Fund unit held. The
Fund units issued are not subject to future calls or assessments.
Pursuant to the Declaration of Trust, the holders, other than the
Fund or its subsidiaries, of the Class A general partner units of the
Partnership (“Class A Units”) and Class B Units are entitled to vote
in all votes of Fund unitholders as if they were holders of the number
of Fund units they would receive if Class A Units and Class B Units
were exchanged into Fund units at the record date of such votes, and
will be treated in all respects as Fund unitholders for the purpose of
any such votes.
Fund units are redeemable at any time at the option of the Fund
unitholder at a price based on market value as defined in the
Declaration of Trust, subject to a maximum of $50,000 in cash
redemptions in any one month. The limitation may be waived at the
discretion of the Trustees of the Fund. Redemptions in excess of
these amounts, assuming no waiving of the limitation, shall be paid
by way of distribution in specie of a pro rata number of securities of
the Trust held by the Fund.
(b) Fund units outstanding:
As at December 31, 2014, BPI held Class B units equivalent to
1,855,925 Fund units or 10.7% of the issued and outstanding Fund
units on a fully diluted basis.
Number of Fund units (in thousands, except unit data) Fund units as equity
Opening balance at January 1, 2014 15,029,544 $ 184,936
Exchange of Class B units for Fund units (note 8(a)) 790,006 16,669
Acquisition and cancellation of Fund units (371,400 ) (7,618 )
Balance at December 31, 2014 15,448,150 $ 193,987
(c) Distributions declared to Fund unitholders during the year ended
December 31, 2014 totaled $19.1 million (2013 – $18.6 million) or
$1.22 per Fund unit (2013 – $1.22).
10. Operations:(in thousands, except number of restaurants in the Royalty Pool) 2014 2013
Restaurants in the Royalty Pool 358 348
Franchise sales reported by restaurants in the Royalty Pool $ 781,925 $ 755,420
Royalty income – 4% of Franchise sales $ 31,277 $ 30,217
Boston Pizza Restaurants experience seasonal fluctuations in Franchise
Sales, which are inherent in the full service restaurant industry in Canada.
Seasonal factors such as tourism and better weather allow Boston Pizza
Restaurants to open their patios and generally increase Franchise Sales in
the second and third quarters compared to the first and fourth quarters.
11. Related party transactions:BPI is considered to be a related party of the Fund by virtue of common
officers and directors in the Partnership and BPI. The Fund has engaged BPI
to provide certain administrative services on behalf of the Fund. The total
amount paid to BPI in respect of these services for the year ended December
31, 2014 was $0.3 million (2013 – $0.3 million). As at December 31,
2014, interest payable to BPI on Class B and Class C units was $0.4 million
(December 31, 2013 – $0.5 million), interest receivable from BPI was $0.2
million (December 31, 2013 - $0.2 million), and royalty receivable from BPI
was $2.8 million (December 31, 2013 – $2.6 million).
12. Compensation of key management:Key management personnel who receive direct remuneration from the Fund
are the Trustees of the Fund. Aggregate details of their remuneration are set
out in the table below with further information about the remuneration of
individual Trustees provided in the Fund’s Annual Information Form. Other
key management personnel are compensated indirectly by the Fund through
the administration charge.
(in thousands) 2014 2013
Remuneration paid to Trustees $ 183 $ 171
13. Supplemental cash flow information:(a) Non-cash transactions:
(in thousands) 2014 2013
Roll-in of new stores – January 1, net $ 10,135 $ 4,356
Exchange of Class B units for Fund units (note 8(a)) $ 16,669 $ —
BOSTON PIZZA ROYALTIES INCOME FUNDANNUAL REPORT 2014
NOTES TO THE CONSOLIDATED FINANCIAL STATEMENTS
BO
ST
ON
PIZ
ZA
RO
YA
LT
IES
IN
CO
ME
FU
ND
AN
NU
AL
RE
PO
RT
20
14
47
(b) Reconciliation of changes in non-cash working capital:
(in thousands) 2014 2013
Change in:
Royalty receivable from Boston Pizza International Inc. $ (153 ) $ 197
Prepaid expenses 5 (9 )
Accounts payable and accrued liabilities (66 ) (118 )
Adjusted for:
Interest expense (1,301 ) (1,054 )
Interest paid on long-term debt 1,355 1,002
Changes in non-cash working capital $ (160 ) $ 18
14. Subsequent events:(a) On January 1, 2015, 14 new Boston Pizza restaurants that opened
during the period from January 1, 2014 to December 31, 2014
were added to the Royalty Pool while six restaurants that closed
during 2014 were removed. The Franchise Sales of these 8 net new
restaurants has been estimated at $16.7 million. The total number
of restaurants in the Royalty Pool was increased to 366. As a result
of the contribution of the additional net sales to the Royalty Pool,
and assuming 100% of the Additional Entitlements, BPI’s Additional
Entitlements are equivalent to 373,523 (2013 – 444,688) Fund units.
BPI will also receive a proportionate increase in monthly distributions
from the Partnership. Of the Additional Entitlements, 20% (2015 –
74,705 units; 2014 – 88,938 units), remain unissued and are not
eligible for conversion to Fund units until the first quarter of 2016
(2014 units – first quarter of 2015) based on the actual performance
of the new stores.
(b) In the first quarter of 2015, adjustments to royalty payments and
Additional Entitlements were made based on the actual performance
of ten net new additional restaurants added to the Royalty Pool on
January 1, 2014. Based on these adjustments, BPI received its
remaining 72,627 Additional Entitlements.
(c) Effective February 4, 2015, the Fund entered into an interest rate
swap under the ISDA Agreement to fix the interest rate at 1.51%
plus between 1.00% and 1.50% per annum (depending upon debt to
EBITDA ratios) on $13.9 million of debt drawn by the Partnership on
Facility C for a term ending on February 1, 2022.
(d) Subsequent to December 31, 2014, the Fund acquired 4,000 Units
at an average price of $21.02 per Unit for total consideration of $0.1
million. The Fund financed the repurchase of these Units by drawing
on the $25.0 million Facility C that is included as part of the Fund’s
Credit Facilities.
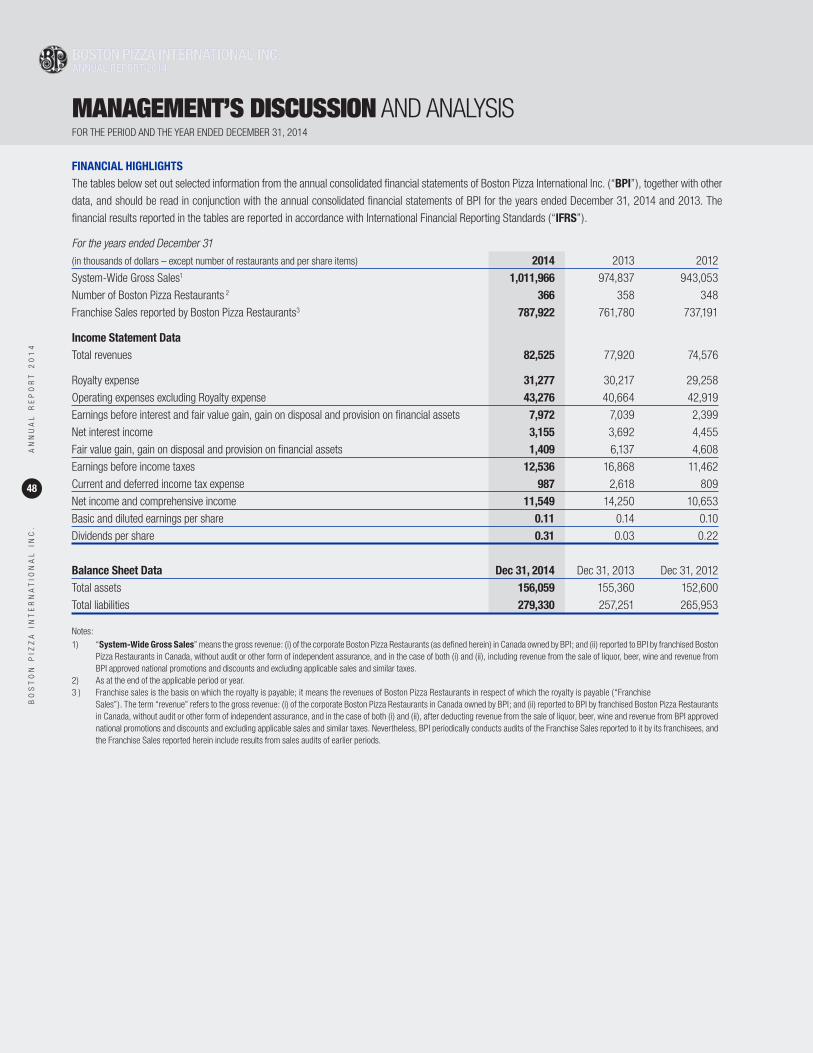
BO
ST
ON
PIZ
ZA
IN
TE
RN
AT
ION
AL
IN
C.
AN
NU
AL
RE
PO
RT
20
14
48
MANAGEMENT’S DISCUSSION AND ANALYSISFOR THE PERIOD AND THE YEAR ENDED DECEMBER 31, 2014
BOSTON PIZZA BOSTON PIZZA INTERNATIONAL INC.INTERNATIONAL INC.ANNUAL REPORT 2014 ANNUAL REPORT 2014
FINANCIAL HIGHLIGHTSThe tables below set out selected information from the annual consolidated fi nancial statements of Boston Pizza International Inc. (“BPI”), together with other
data, and should be read in conjunction with the annual consolidated fi nancial statements of BPI for the years ended December 31, 2014 and 2013. The
fi nancial results reported in the tables are reported in accordance with International Financial Reporting Standards (“IFRS”).
For the years ended December 31
(in thousands of dollars – except number of restaurants and per share items) 2014 2013 2012
System-Wide Gross Sales1 1,011,966 974,837 943,053
Number of Boston Pizza Restaurants 2 366 358 348
Franchise Sales reported by Boston Pizza Restaurants3 787,922 761,780 737,191
Income Statement Data
Total revenues 82,525 77,920 74,576
Royalty expense 31,277 30,217 29,258
Operating expenses excluding Royalty expense 43,276 40,664 42,919
Earnings before interest and fair value gain, gain on disposal and provision on fi nancial assets 7,972 7,039 2,399
Net interest income 3,155 3,692 4,455
Fair value gain, gain on disposal and provision on fi nancial assets 1,409 6,137 4,608
Earnings before income taxes 12,536 16,868 11,462
Current and deferred income tax expense 987 2,618 809
Net income and comprehensive income 11,549 14,250 10,653
Basic and diluted earnings per share 0.11 0.14 0.10
Dividends per share 0.31 0.03 0.22
Balance Sheet Data Dec 31, 2014 Dec 31, 2013 Dec 31, 2012
Total assets 156,059 155,360 152,600
Total liabilities 279,330 257,251 265,953
Notes:
1) “System-Wide Gross Sales” means the gross revenue: (i) of the corporate Boston Pizza Restaurants (as defi ned herein) in Canada owned by BPI; and (ii) reported to BPI by franchised Boston Pizza Restaurants in Canada, without audit or other form of independent assurance, and in the case of both (i) and (ii), including revenue from the sale of liquor, beer, wine and revenue from BPI approved national promotions and discounts and excluding applicable sales and similar taxes.
2) As at the end of the applicable period or year.3 ) Franchise sales is the basis on which the royalty is payable; it means the revenues of Boston Pizza Restaurants in respect of which the royalty is payable (“Franchise
Sales”). The term “revenue” refers to the gross revenue: (i) of the corporate Boston Pizza Restaurants in Canada owned by BPI; and (ii) reported to BPI by franchised Boston Pizza Restaurants in Canada, without audit or other form of independent assurance, and in the case of both (i) and (ii), after deducting revenue from the sale of liquor, beer, wine and revenue from BPI approved national promotions and discounts and excluding applicable sales and similar taxes. Nevertheless, BPI periodically conducts audits of the Franchise Sales reported to it by its franchisees, and the Franchise Sales reported herein include results from sales audits of earlier periods.

BO
ST
ON
PIZ
ZA
IN
TE
RN
AT
ION
AL
IN
C.
AN
NU
AL
RE
PO
RT
20
14
49
(in thousands of dollars – except number of restaurants and per share items) Q4 2014 Q3 2014 Q2 2014 Q1 2014
System-Wide Gross Sales1 260,240 258,716 255,002 238,008Number of Boston Pizza Restaurants2 366 358 357 356Franchise Sales reported by Boston Pizza Restaurants3 201,337 202,923 197,274 186,388
Income Statement Data Total revenues 21,656 21,137 20,630 19,102
Royalty expense 7,902 8,054 7,865 7,456Operating expenses excluding Royalty expense 10,695 10,284 12,141 10,156Earnings before interest and fair value gain (loss) on financial assets 3,059 2,799 624 1,490Net interest income 1,172 774 728 481Fair value gain (loss) on financial assets 1,673 (19 ) 2,392 (2,637 )Earnings (loss) before income taxes 5,904 3,554 3,744 (666 )Current and deferred income tax expense (recovery) 1,245 1,008 424 (1,690 )Net income and comprehensive income 4,659 2,546 3,320 1,024Basic and diluted earnings per share 0.04 0.02 0.03 0.01
(in thousands of dollars – except number of restaurants and per share items) Q4 2013 Q3 2013 Q2 2013 Q1 2013
System-Wide Gross Sales1 241,488 246,627 250,398 236,324
Number of Boston Pizza Restaurants2 358 351 351 348
Franchise Sales reported by Boston Pizza Restaurants3 187,046 193,940 195,268 185,526
Income Statement Data Total revenues 19,268 19,651 20,023 18,978
Royalty expense 7,350 7,660 7,753 7,454
Operating expenses excluding Royalty expense 9,089 10,058 10,851 10,666
Earnings before interest and fair value gain (loss) and gain on disposal of financial assets 2,829 1,933 1,419 858
Net interest income 1,432 909 909 442
Fair value gain (loss) and gain on disposal of financial assets (4,598 ) 3,879 1,144 5,712
Earnings (loss) before income taxes (337 ) 6,721 3,472 7,012
Current and deferred income tax expense (recovery) 94 1,035 (169 ) 1,658
Net income (loss) and comprehensive income (loss) (431 ) 5,686 3,641 5,354
Basic and diluted earnings (loss) per share (0.01 ) 0.05 0.03 0.05
BO
ST
ON
PIZ
ZA
IN
TE
RN
AT
ION
AL
IN
C.
AN
NU
AL
RE
PO
RT
20
14
50
OVERVIEWGeneralThis Management’s Discussion and Analysis covers the three month period
from October 1, 2014 to December 31, 2014 (the “Period”) and the twelve
month period from January 1, 2014 to December 31, 2014 (the “Year”) and
is dated February 5, 2014.
BPI is a privately controlled company and is the franchisor of the Boston Pizza
(as defined herein) concept in Canada. BPI competes in the casual dining
sector of the restaurant industry and Boston Pizza is the number one casual
dining brand in Canada. With 366 restaurants stretching from Victoria to St.
John’s, Boston Pizza has more locations and serves more customers annually
than any other casual dining restaurant chain in Canada.
BPI charges a 7% royalty fee on Franchise Sales for full-service and fast
casual Boston Pizza restaurants open in Canada and a 5% royalty fee on
Franchise Sales for Boston Pizza quick express restaurants that are open in
Canada (collectively, the “Boston Pizza Restaurants”). BPI pays Boston
Pizza Royalties Limited Partnership (the “Partnership”), an entity controlled
by Boston Pizza Royalties Income Fund (the “Fund”), a 4% royalty fee (the
“Royalty”) on Franchise Sales from the Boston Pizza Restaurants in the
royalty pool (the “Royalty Pool”) for the use of the Boston Pizza trademarks
in Canada (the “BP Rights”1). As at December 31, 2014, there were
3582 Boston Pizza Restaurants in the Royalty Pool and 366 Boston Pizza
Restaurants in operation.
Addition of New Restaurants to Royalty PoolOn January 1 of each year (the “Adjustment Date”), an adjustment is made
to add to the Royalty Pool new Boston Pizza Restaurants that opened and
to remove any Boston Pizza Restaurants that permanently closed since the
last Adjustment Date. In return for adding net additional royalty revenue,
BPI receives the right (the “Additional Entitlements”) to indirectly acquire
additional units of the Fund (“Units”). The adjustment for new Franchise
Sales added to the Royalty Pool is designed to be accretive to unitholders
of the Fund (“Unitholders”). The Additional Entitlements are calculated at
92.5% of the estimated royalty revenue added to the Royalty Pool, multiplied
by one minus the effective average tax rate estimated to be paid by the Fund,
divided by the yield of the Fund, divided by the weighted average Unit price
over a specified period. BPI receives 80% of the Additional Entitlements
initially, with the balance received when the actual full year performance of
the new restaurants and the actual effective average tax rate paid by the
Fund are known with certainty. BPI receives 100% of distributions from the
Additional Entitlements throughout the year. Once these new restaurants
have been part of the Royalty Pool for a full year, an audit of the royalty
revenues of these restaurants received from BPI is performed, and the actual
effective tax rate paid by the Fund is determined. At such time an adjustment
is made to reconcile distributions paid to BPI and the Additional Entitlements
received by BPI.
Business StrategyThe success of the business of BPI, its affiliated entities and franchisees
(“Boston Pizza”) can be attributed to four simple underlying principles that are
the foundation for all strategic decision-making – the “Four Pillars” strategy.
• The commitment to franchisee profitability
• The commitment to continually enhance the Boston Pizza brand
• The commitment to continually improve the guest experience
• The commitment to engage with communities
BPI realizes that its franchisees have to be profitable to succeed. To enhance
profitability and to facilitate the growth of Boston Pizza, BPI aggressively
enhances and promotes the Boston Pizza brand through national television
and radio advertising, and national and local promotions. The costs associated
with national marketing of Boston Pizza are paid for by Boston Pizza Co-op
Advertising (the “Co-op”). Franchisees pay 3% of Franchise Sales into the
Co-op; 76% of these funds are used to purchase television and radio media
advertising, and the remaining 24% is used for production of materials and
administration. Both Boston Pizza franchisees and the corporate support
staff continuously find new ways to improve the guests’ experience so
that they will return to Boston Pizza again and again. Boston Pizza and its
franchisees connect with their communities by hosting events, engaging with
local organizations, and supporting philanthropic causes. Management is
confident that this “Four Pillars” strategy will continue to focus BPI’s efforts
and develop new markets and continue to strengthen Boston Pizza’s position
as Canada’s number one casual dining brand.
The following information provides additional analysis of the operations and
financial position of BPI and should be read in conjunction with the annual
consolidated financial statements and accompanying notes. The annual
consolidated financial statements are in Canadian dollars and have been
prepared in accordance with IFRS.
OPERATING RESULTS
Same Store Sales Growth (“SSSG”)SSSG, a key driver of distribution growth for Unitholders, is the change
in gross revenues of Boston Pizza Restaurants as compared to the gross
revenues for the same period in the previous year, where restaurants were Notes:1) BP Rights are the trademarks that as at July 17, 2002 were registered or the subject of pending applications for registration under the Trade-Marks Act (Canada), and other trademarks
and the trade names which are confusing with the registered or pending trademarks. The BP Rights purchased do not include the rights outside of Canada to any trademarks or trade names used by BPI or any affiliated entities in its business, and in particular do not include the rights outside of Canada to the trademarks registered or pending registration under the Trade-Marks Act (Canada).
2) The number of restaurants in the Royalty Pool (as defined herein) is adjusted once each year on January 1 to add new Boston Pizza Restaurants that opened, and to remove any Boston Pizza Restaurants that permanently closed, since the prior January 1. However, the Fund and BPI historically reported the number of restaurants in the Royalty Pool at any particular time as the actual number of restaurants in the Royalty Pool at that time less the number of Boston Pizza Restaurants that permanently closed since the prior January 1 even though those permanently closed Boston Pizza Restaurants are only removed from the Royalty Pool on the next January 1. Commencing with the Management’s Discussion and Analysis for the three month period ended March 31, 2014, a copy of which is filed on SEDAR at www.sedar.com, the Fund and BPI report the actual number of restaurants in the Royalty Pool at any particular time by not excluding Boston Pizza Restaurants that permanently closed since the prior Adjustment Date. Accordingly, the number of restaurants in Royalty Pool reported by the Fund and BPI will only change once a year on the Adjustment Date. As a consequence of this change, the number of restaurants in the Royalty Pool reported in this Management’s Discussion and Analysis is not necessarily comparable to the number of restaurants in the Royalty Pool reported in Management’s Discussion and Analysis, for periods ended prior to March 31, 2014.
BOSTON PIZZA INTERNATIONAL INC.ANNUAL REPORT 2014
MANAGEMENT’S DISCUSSION AND ANALYSIS
BO
ST
ON
PIZ
ZA
IN
TE
RN
AT
ION
AL
IN
C.
AN
NU
AL
RE
PO
RT
20
14
51
open for a minimum of 24 months. The two principal factors that affect SSSG
are changes in customer traffic and changes in average guest cheque.
Period
SSSG was 5.3% for the Period compared with negative 1.5% SSSG reported
in the fourth quarter of 2013. Franchise Sales, the basis upon which the
Royalty is paid by BPI to the Fund, exclude revenue from sales of liquor,
beer, wine and approved national promotions and discounts. On a Franchise
Sales basis, SSSG was 5.3% for the Period compared with negative 2.3%
for the fourth quarter of 2013. SSSG for the Period was principally due to
higher take-out and delivery sales resulting from continued promotion
of Boston Pizza’s online ordering system, increased customer traffic, and
better weather compared to the fourth quarter of 2013. Other key marketing
campaigns in the Period included the Kids Cards campaign which raised a
record amount for the Boston Pizza Foundation, the Festive Favourites holiday
menu which increased customer traffic during the holiday season, and the
“Pep-peroni Talks” campaign which brought increased awareness to take-
out and delivery.
Year
SSSG was 1.7% for the Year compared with 1.5% SSSG in 2013. On a
Franchise Sales basis, SSSG was 1.4% for the Year, unchanged from 1.4%
in 2013. SSSG for the Year was principally due to higher take-out and delivery
sales resulting from continued promotion of Boston Pizza’s online ordering
system and menu repricing, partially offset by a higher number of temporary
closures due to restaurant renovations compared with the same period one
year ago.
New Store Openings, Closures and RenovationsDuring the Period, nine new Boston Pizza Restaurants opened (Year – 14) and
one Boston Pizza Restaurant closed (Year – 6). Subsequent to December 31,
2014, one Boston Pizza Restaurant opened and one Boston Pizza Restaurant
closed. As well during the Period, 17 Boston Pizza Restaurants were
renovated (Year – 53). Restaurants typically close for two to three weeks
to complete the renovation and experience an incremental sales increase in
the year following the re-opening. Subsequent to December 31, 2014, two
additional restaurants were renovated. The total number of restaurants in
operation as of February 5, 2015 is 366.
SeasonalityBoston Pizza Restaurants experience seasonal fluctuations in Franchise
Sales, which are inherent in the full service restaurant industry in Canada.
Seasonal factors such as better weather allow Boston Pizza Restaurants to
open their patios and generally increase Franchise Sales in the second and
third quarters compared with the first and fourth quarters. Tourism is also a
seasonal factor positively impacting the same time frames.
Revenues
Period
BPI’s total revenue was $21.7 million for the Period compared with $19.3
million for the fourth quarter of 2013. BPI’s revenue is principally derived
from royalty revenue from franchised Boston Pizza Restaurants, sales from
corporately owned restaurants, initial franchise fees, supplier contributions
and franchise renewal fees. The increase in total revenue earned by BPI
during the Period was primarily due to increased royalty revenue resulting
from SSSG in the Period and the additional royalty revenue from the opening
of new Boston Pizza Restaurants since the prior year.
Year
BPI’s total revenue was $82.5 million for the Year compared with $77.9 million
in 2013. The increase in total revenue earned by BPI for the Year was primarily
due to increased royalty revenue resulting from positive SSSG for the Year and
the opening of new Boston Pizza Restaurants since the prior year.
Royalty Expense and Operating Expenses
Period
BPI’s Royalty expense to the Partnership (being 4% of the Franchise Sales
from the Boston Pizza Restaurants in the Royalty Pool) was $7.9 million for the
Period compared with $7.4 million for the fourth quarter in 2013. The increase
in Royalty expense was a result of positive SSSG and the impact of adding 10
net new Boston Pizza Restaurants into the Royalty Pool on January 1, 2014.
BPI’s operating expenses excluding Royalty expense was $10.7 million for the
Period compared with $9.1 million for the fourth quarter in 2013. Operating
expenses excluding Royalty expense include compensation of $4.8 million
(Q4 2013 – $4.4 million), other costs associated with services provided to
franchised Boston Pizza Restaurants of $3.4 million (Q4 2013 – $2.1 million),
the operational costs of the three corporately owned restaurants of $1.8
million (Q4 2013 – $1.8 million), depreciation and amortization of $0.9 million
(Q4 2013 – $0.7 million), and management fees for services rendered by
companies under common control of $0.4 million (Q4 2013 – $0.7 million).
This was partially offset by the amortization of deferred gain on the sale of BP
Rights to the Partnership of $0.6 million (Q4 2013 – $0.6 million).
The increase in operating expenses excluding Royalty expense for the Period
was due to higher compensation expenses, consulting costs, travel costs
associated with new Boston Pizza Restaurant openings and renovations,
increased depreciation and amortization expense due to timing of purchases,
offset by lower management fees in the fourth quarter of 2014 due to a
reassessment of management fee allocation at the end of 2013.
Year
BPI’s Royalty expense was $31.3 million for the Year compared with $30.2
million in 2013. The increase in Royalty expense was a result of positive
SSSG and the impact of adding 10 net new Boston Pizza Restaurants into the
Royalty Pool on January 1, 2014.
BPI’s operating expenses excluding Royalty expense was $43.3 million for
the Year compared with $40.7 million in 2013. Operating expenses excluding
Royalty expense include compensation of $19.9 million (2013 – $19.7
million), other costs associated with services provided to franchised Boston
Pizza Restaurants of $14.1 million (2013 – $11.6 million), the operational
costs of the three corporately owned restaurants of $7.4 million (2013 – $7.3
million), depreciation and amortization of $2.6 million (2013 – $2.6 million),
and management fees for services rendered by companies under common
control of $1.7 million (2013 – $1.7 million). This was partially offset by the
amortization of deferred gain on the sale of BP Rights to the Partnership of
$2.4 million (2013 – $2.3 million).
The increase in operating expenses excluding Royalty expense was due
to higher consulting costs, travel costs associated with new Boston Pizza
Restaurant openings and renovations, costs associated with the bi-annual
franchisee conference focusing on celebrating the 50th Anniversary of Boston
Pizza, partially offset by higher amortization of the deferred gain associated
with BPI’s original sale of the BP Rights to the Partnership as part of the
Funds’ initial public offering and Additional Entitlements received by BPI for
adding new Boston Pizza Restaurants into the Royalty Pool each January 1.
BO
ST
ON
PIZ
ZA
IN
TE
RN
AT
ION
AL
IN
C.
AN
NU
AL
RE
PO
RT
20
14
52
The deferred gain is amortized over 99 years beginning in 2002 for the term
of the License and Royalty Agreement between the Partnership and BPI. The
net deferred gain as at December 31, 2014 was $210.1 million (December
31, 2013 – $202.4 million).
Earnings before interest and fair value gain (loss) on financial assetsBPI’s earnings before interest and fair value gain (loss) on financial assets
was $3.1 million for the Period compared with $2.8 million for the fourth
quarter of 2013.
BPI’s earnings before interest and fair value gain (loss) on financial assets was
$8.0 million for the Year compared with $7.0 million in 2013. The increase
was primarily due to higher revenues resulting from SSSG and new store
openings partially offset by higher consulting costs and costs associated
with the bi-annual franchisee conference focusing on celebrating the 50th
Anniversary of Boston Pizza.
Net Interest Income
Period
BPI’s net interest income during the Period was $1.2 million, comprised
mainly of $1.6 million of interest income received by BPI on its Class B
and Class C general partner units of the Partnership (“Class B Units” and
“Class C Units”, respectively), partially offset by $0.5 million of interest
paid by BPI to the Fund on the BP Loan (defined below). BPI’s net interest
income for the fourth quarter of 2013 was $1.4 million, comprised of $1.9
million of interest income received by BPI on the Class B Units and Class C
Units, partially offset by $0.5 million of interest paid by BPI to the Fund on
the BP Loan. The decrease in net interest income for the Period compared
with the same period in 2013 was mainly due to decreased distributions
from the Partnership resulting from the Exchange (as defined herein),
partially offset by increased distributions from the Partnership resulting
from Additional Entitlements received by BPI for adding new Boston Pizza
Restaurants into the Royalty Pool on January 1, 2014. See the “Operating
Results – Exchange of Units” section of this Management’s Discussion and
Analysis for more details.
Year
BPI’s net interest income for the Year was $3.2 million, comprised mainly of
$5.0 million of interest income received by BPI on the Class B Units and Class
C Units, partially offset by $1.8 million of interest paid by BPI to the Fund on
the BP Loan. For the same period in 2013, BPI’s net interest income was
$3.7 million, comprised mainly of $5.5 million of interest income received by
BPI on the Class B Units and Class C Units, partially offset by $1.8 million of
interest paid by BPI to the Fund on the BP Loan. The decrease in net interest
income for the Year compared with year-to-date in 2013 was mainly due to
decreased distributions from the Partnership resulting from the Exchange,
partially offset by increased distributions from the Partnership resulting
from Additional Entitlements received by BPI for adding new Boston Pizza
Restaurants into the Royalty Pool on January 1, 2014.
Fair Value Gain (Loss) on Financial Assets
Period
During the Period, BPI recorded a fair value gain on financial assets of $1.7
million compared with a loss of $4.6 million for the same period in 2013. The
change in fair value was principally due to the change in the price of Units into
which Class B Units are exchangeable, partially offset by the change in BPI’s
percentage ownership of the Partnership following the Exchange.
BPI estimates the fair value of the Class B Units by multiplying the issued
and outstanding Additional Entitlements (including Holdback) held by BPI
at the end of the Period by the closing price of the Fund Units at the end
of the Period (or previous business day). As at December 31, 2014, the
Fund’s closing price was $21.61 per Unit (September 30, 2014 – $20.75
per Unit) while the number of issued and outstanding Additional Entitlements
(including Holdback) were 1,944,863 (September 30, 2014 – 1,944,863).
BPI’s ownership of the Fund (on a fully-diluted basis) was calculated to be
valued at $42.0 million (September 30, 2014 – $40.4 million). In general,
the value of the Class B Units will increase as the market price of the Units
increases and vice versa.
Year
BPI recorded a fair value gain on financial assets of $1.4 million for the
Year compared with a gain of $6.1 million in 2013. The decrease in fair
value is principally due to the change in BPI’s percentage ownership of the
Partnership following the Exchange and the change in the price of Units into
which Class B Units are exchangeable. The current year fair value gain also
includes $0.7 million in transaction costs incurred in connection with the
Exchange. In addition, there was a $2.7 million gain recognized on disposal
of long-term investments in the prior year that did not occur in 2014.
As at December 31, 2014, the Fund’s closing price was $21.61 per Unit
(December 31, 2013 – $20.71 per Unit) while the number of issued and
outstanding Additional Entitlements (including Holdback) were 1,944,863
(December 31, 2013 – 2,242,735). BPI’s ownership of the Fund (on a fully-
diluted basis) was calculated to be valued at $42.0 million (December 31,
2013 – $46.4 million). In general, the value of the Class B Units will increase
as the market price of the Units increases and vice versa.
Earnings before Income TaxesGiven the combined effects of the above-noted factors, BPI had earnings
before income taxes of $5.9 million for the Period compared with a loss before
income taxes of $0.3 million for the fourth quarter of 2013. The increase in
earnings before taxes for the Period was mainly due to the change in fair
value gain (loss) on financial assets and an increase in revenues, partially
offset by an increase in expenses for the Period.
BPI had earnings before income taxes of $12.5 million for the Year compared
with earnings of $16.9 million in 2013. The decrease in earnings before
taxes for the Year was mainly due to the change in fair value gain (loss) on
financial assets and an increase in expenses, partially offset by an increase
in revenues.
Income Taxes
Period
BPI recorded a $0.9 million current income tax expense for the Period, relatively
unchanged compared with $1.0 million for the fourth quarter in 2013.
BPI recorded a deferred income tax expense of $0.3 million for the Period
compared with a deferred income tax recovery of $0.9 million for the fourth
quarter of 2013. The increase in deferred income tax expense for the Period
was mainly due to the tax impact from the change in fair value gain on
financial assets.
BOSTON PIZZA INTERNATIONAL INC.ANNUAL REPORT 2014
MANAGEMENT’S DISCUSSION AND ANALYSIS
BO
ST
ON
PIZ
ZA
IN
TE
RN
AT
ION
AL
IN
C.
AN
NU
AL
RE
PO
RT
20
14
53
Year
BPI recorded a $4.7 million current income tax expense for the Year
compared with $1.2 million in 2013. The increase in income tax expense for
the Year compared with the same period in 2013 was mainly due to tax on
the Exchange and higher taxable earnings in the Year.
BPI recorded a deferred income tax recovery of $3.7 million for the Year
compared with a deferred income tax expense of $1.4 million in 2013. The
increase in deferred income tax recovery for the Year was mainly due to the
deferred tax impact of the Exchange and the change in fair value gain on
financial assets.
Net Income
Period
BPI’s net earnings during the Period were $4.7 million compared with a
net loss of $0.4 million during the same period in 2013. The increase in
net earnings for the Period was mainly due to an increase in fair value gain
on BPI’s Class B Units, and an increase in revenues, partially offset by an
increase in expenses, and an increase in net tax expenses for the Period.
Year
BPI’s net earnings for the Year were $11.5 million compared with net earnings
of $14.3 million in 2013. The decrease in net earnings for the Year was mainly
due to the decrease in fair value gain on BPI’s Class B Units, an increase in
expenses, partially offset by an increase in revenue and decrease in net taxes
recoverable.
New Restaurants Added to the Royalty Pool
Boston Pizza Restaurants Added to Royalty Pool on January 1, 2014
On January 1, 2014, 12 new Boston Pizza Restaurants that opened across
Canada between January 1, 2013 and December 31, 2013 were added to the
Royalty Pool and the two restaurants that permanently closed during 2013
were removed from the Royalty Pool. The estimated annual Franchise Sales
for the 12 new Boston Pizza Restaurants that opened less the revenue from
the two permanent closures was $19.8 million. The estimated 4% Royalty
revenue the Fund was expected to receive in 2014 from these additional
12 new restaurants, less revenue from the two permanent closures, was
$0.8 million. The pre-tax Royalty revenue for the purposes of calculating
the Additional Entitlements, therefore, was $0.7 million or 92.5% of $0.8
million. The estimated effective tax rate that the Fund paid in the calendar
year 2014 was 26.0%. Accordingly, the after-tax Royalty revenue for the
purposes of calculating the Additional Entitlements was $0.5 million ($0.7
million x (1 – 0.26)). In return for adding the Royalty revenue from these
12 new restaurants, less Royalty revenue from the two permanent closures,
to the Royalty Pool, BPI received the right to acquire an additional 355,750
Units, representing 80% of the Additional Entitlements with the balance to
be received when the actual full year performance of the new restaurants
and the actual effective tax rate paid by the Fund for 2014 are known with
certainty. The 355,750 Additional Entitlements represented 2.0% of the total
outstanding Units on a fully diluted basis on January 1, 2014. 88,938 Units,
representing the remaining 20% of the Additional Entitlements, were “held
back” until such time as the actual performance of these new Royalty Pool
restaurants and the actual effective tax rate paid by the Fund for 2014 were
known. BPI also received an increase in monthly distributions based on 100%
of the Additional Entitlements, subject to a reconciliation of the distributions
paid to BPI in respect of these Additional Entitlements that occurred once
the actual performance of these new Royalty Pool restaurants and the actual
effective tax rate paid by the Fund for 2014 were known. See “Subsequent
Events” below.
Audit of Boston Pizza Restaurants Added to Royalty Pool on January 1, 2013
In January 2014, an audit of the Royalty revenues of the seven new restaurants
that were added to the Royalty Pool on January 1, 2013 was performed and
the actual effective tax rate paid by the Fund for 2013 was determined.
The purpose of this was to compare the actual Royalty revenue from these
seven new restaurants to the estimated amount of Royalty revenue the Fund
expected to receive for 2013 and to compare the actual effective tax rate paid
by the Fund for 2013 to the estimated effective tax rate the Fund expected
to pay for 2013. The original Royalty revenue the Fund expected to receive
from these seven new restaurants less the Royalty revenue from the two
permanent closures that occurred in 2012 was $0.3 million and the actual
Royalty revenue that the Fund received was $0.1 million greater. The original
effective tax rate the Fund expected to pay for 2013 was 25.0% and the
actual effective tax rate paid by the Fund for 2013 was 24.4%. As a result, the
Partnership made a nominal payment to BPI to reconcile distributions payable
on the full number of Additional Entitlements and the effective tax rate. BPI
received only 80% of the Additional Entitlements at the Adjustment Date in
2013. Following the audit, BPI received 86,336 Additional Entitlements.
Subsequent Events
Boston Pizza Restaurants Added to Royalty Pool on January 1, 2015
On January 1, 2015, 14 new Boston Pizza Restaurants that opened across
Canada between January 1, 2014 and December 31, 2014 were added
to the Royalty Pool and the six restaurants that permanently closed during
2014 were removed from the Royalty Pool. The estimated annual Franchise
Sales for the 14 new Boston Pizza Restaurants that opened less the revenue
from the six permanent closures was $16.7 million. The estimated 4%
Royalty revenue the Fund will receive in 2015 from these additional 14
new restaurants, less revenue from the six permanent closures, was $0.7
million. The pre-tax Royalty revenue for the purposes of calculating the
Additional Entitlements, therefore, was $0.6 million or 92.5% of $0.7 million.
The estimated effective tax rate that the Fund will pay in the calendar year
2015 is 26.0%. Accordingly, the after-tax Royalty revenue for the purposes
of calculating the Additional Entitlements was $0.5 million ($0.6 million x
(1 – 0.26)). In return for adding the Royalty revenue from these 14 new
restaurants, less Royalty revenue from the six permanent closures, to
the Royalty Pool, BPI received the right to acquire an additional 298,818
Units, representing 80% of the Additional Entitlements with the balance to
be received when the actual full year performance of the new restaurants
and the actual effective tax rate paid by the Fund for 2015 are known with
certainty. The 298,818 Additional Entitlements represented 1.7% of the
total outstanding Units on a fully diluted basis on January 1, 2015. 74,705
Units, representing the remaining 20% of the Additional Entitlements, have
been “held back” until such time as the actual performance of these new
Royalty Pool restaurants and the actual effective tax rate paid by the Fund
for 2015 are known. BPI also receives an increase in monthly distributions
based on 100% of the Additional Entitlements, subject to a reconciliation of
the distributions paid to BPI in respect of these Additional Entitlements that
will occur once the actual performance of these new Royalty Pool restaurants
and the actual effective tax rate paid by the Fund for 2015 are known. Once
both the actual performance of these new restaurants for 2015 and the
actual effective tax rate paid by the Fund for 2015 are known, the number of
Additional Entitlements will be adjusted in 2016 to reflect the actual Royalty
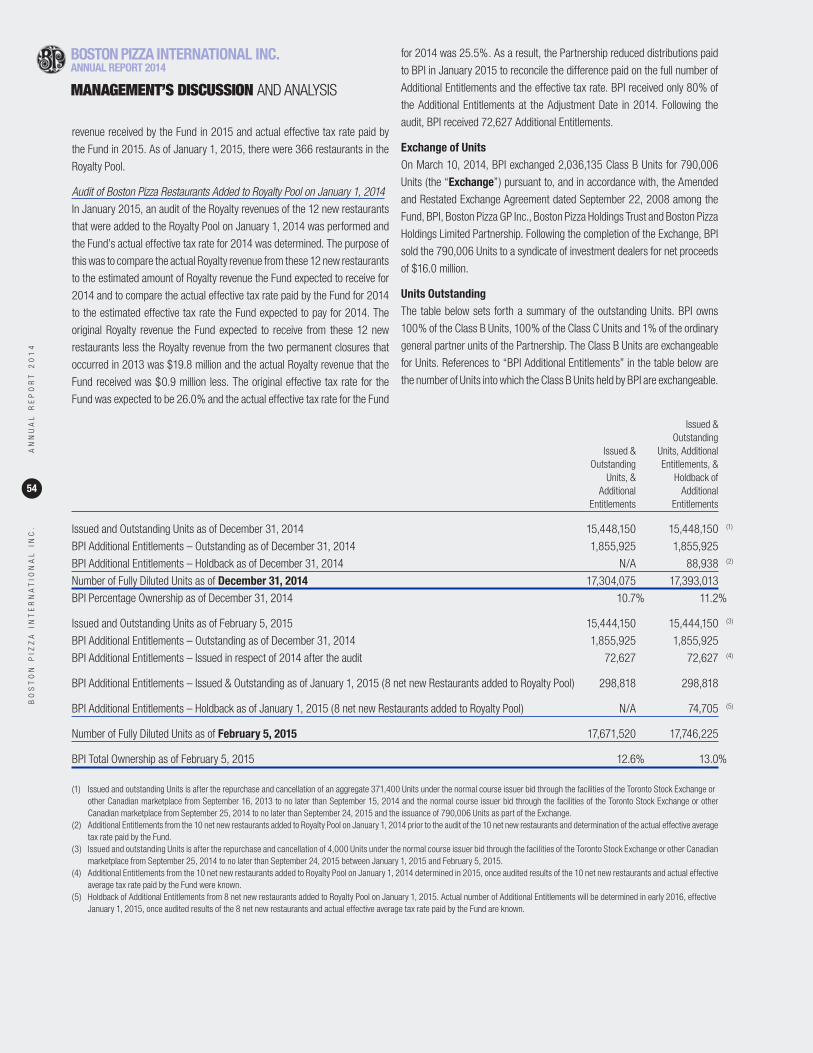
BO
ST
ON
PIZ
ZA
IN
TE
RN
AT
ION
AL
IN
C.
AN
NU
AL
RE
PO
RT
20
14
54
revenue received by the Fund in 2015 and actual effective tax rate paid by
the Fund in 2015. As of January 1, 2015, there were 366 restaurants in the
Royalty Pool.
Audit of Boston Pizza Restaurants Added to Royalty Pool on January 1, 2014
In January 2015, an audit of the Royalty revenues of the 12 new restaurants
that were added to the Royalty Pool on January 1, 2014 was performed and
the Fund’s actual effective tax rate for 2014 was determined. The purpose of
this was to compare the actual Royalty revenue from these 12 new restaurants
to the estimated amount of Royalty revenue the Fund expected to receive for
2014 and to compare the actual effective tax rate paid by the Fund for 2014
to the estimated effective tax rate the Fund expected to pay for 2014. The
original Royalty revenue the Fund expected to receive from these 12 new
restaurants less the Royalty revenue from the two permanent closures that
occurred in 2013 was $19.8 million and the actual Royalty revenue that the
Fund received was $0.9 million less. The original effective tax rate for the
Fund was expected to be 26.0% and the actual effective tax rate for the Fund
Issued & Outstanding Issued & Units, Additional Outstanding Entitlements, & Units, & Holdback of Additional Additional Entitlements Entitlements
Issued and Outstanding Units as of December 31, 2014 15,448,150 15,448,150 (1)
BPI Additional Entitlements – Outstanding as of December 31, 2014 1,855,925 1,855,925
BPI Additional Entitlements – Holdback as of December 31, 2014 N/A 88,938 (2)
Number of Fully Diluted Units as of December 31, 2014 17,304,075 17,393,013
BPI Percentage Ownership as of December 31, 2014 10.7 % 11.2 %
Issued and Outstanding Units as of February 5, 2015 15,444,150 15,444,150 (3)
BPI Additional Entitlements – Outstanding as of December 31, 2014 1,855,925 1,855,925
BPI Additional Entitlements – Issued in respect of 2014 after the audit 72,627 72,627 (4)
BPI Additional Entitlements – Issued & Outstanding as of January 1, 2015 (8 net new Restaurants added to Royalty Pool) 298,818 298,818
BPI Additional Entitlements – Holdback as of January 1, 2015 (8 net new Restaurants added to Royalty Pool) N/A 74,705 (5)
Number of Fully Diluted Units as of February 5, 2015 17,671,520 17,746,225
BPI Total Ownership as of February 5, 2015 12.6 % 13.0 %
(1) Issued and outstanding Units is after the repurchase and cancellation of an aggregate 371,400 Units under the normal course issuer bid through the facilities of the Toronto Stock Exchange or
other Canadian marketplace from September 16, 2013 to no later than September 15, 2014 and the normal course issuer bid through the facilities of the Toronto Stock Exchange or other Canadian marketplace from September 25, 2014 to no later than September 24, 2015 and the issuance of 790,006 Units as part of the Exchange.
(2) Additional Entitlements from the 10 net new restaurants added to Royalty Pool on January 1, 2014 prior to the audit of the 10 net new restaurants and determination of the actual effective average tax rate paid by the Fund.(3) Issued and outstanding Units is after the repurchase and cancellation of 4,000 Units under the normal course issuer bid through the facilities of the Toronto Stock Exchange or other Canadian marketplace from September 25, 2014 to no later than September 24, 2015 between January 1, 2015 and February 5, 2015.(4) Additional Entitlements from the 10 net new restaurants added to Royalty Pool on January 1, 2014 determined in 2015, once audited results of the 10 net new restaurants and actual effective average tax rate paid by the Fund were known.(5) Holdback of Additional Entitlements from 8 net new restaurants added to Royalty Pool on January 1, 2015. Actual number of Additional Entitlements will be determined in early 2016, effective January 1, 2015, once audited results of the 8 net new restaurants and actual effective average tax rate paid by the Fund are known.
for 2014 was 25.5%. As a result, the Partnership reduced distributions paid
to BPI in January 2015 to reconcile the difference paid on the full number of
Additional Entitlements and the effective tax rate. BPI received only 80% of
the Additional Entitlements at the Adjustment Date in 2014. Following the
audit, BPI received 72,627 Additional Entitlements.
Exchange of UnitsOn March 10, 2014, BPI exchanged 2,036,135 Class B Units for 790,006
Units (the “Exchange”) pursuant to, and in accordance with, the Amended
and Restated Exchange Agreement dated September 22, 2008 among the
Fund, BPI, Boston Pizza GP Inc., Boston Pizza Holdings Trust and Boston Pizza
Holdings Limited Partnership. Following the completion of the Exchange, BPI
sold the 790,006 Units to a syndicate of investment dealers for net proceeds
of $16.0 million.
Units OutstandingThe table below sets forth a summary of the outstanding Units. BPI owns
100% of the Class B Units, 100% of the Class C Units and 1% of the ordinary
general partner units of the Partnership. The Class B Units are exchangeable
for Units. References to “BPI Additional Entitlements” in the table below are
the number of Units into which the Class B Units held by BPI are exchangeable.
BOSTON PIZZA INTERNATIONAL INC.ANNUAL REPORT 2014
MANAGEMENT’S DISCUSSION AND ANALYSIS
BO
ST
ON
PIZ
ZA
IN
TE
RN
AT
ION
AL
IN
C.
AN
NU
AL
RE
PO
RT
20
14
55
BPI also holds 100% of the special voting units (the “Special Voting Units”)
of the Fund which entitle BPI to one vote for each Unit that BPI would be
entitled to receive if it exchanged all of its Class B Units for Units. As of
February 5, 2015, BPI was entitled to 2,227,370 votes, representing 12.6%
of the aggregate votes held by holders of Units and Special Voting Units
(collectively, “Voting Unitholders”). The number of Units that BPI is entitled
to receive upon the exchange of its Class B Units and the number of votes
that BPI is entitled to in respect of its Special Voting Units is adjusted annually
to reflect any additional Boston Pizza Restaurants that were added to the
Royalty Pool.
LIQUIDITY & CAPITAL RESOURCESBPI is an entirely franchised business except for three corporate restaurants.
For 2015, BPI has forecasted capital requirements of approximately $2.1
million, which consist mainly of the development of software applications,
computer equipment and a corporate restaurant renovation. BPI believes
it has sufficient cash and capital resources to cover expenditures, capital
requirements, commitments and repayments for 2015. BPI constantly
monitors its operations and cash flows to ensure that current and future
obligations will be met. The Company believes its current sources of liquidity
are sufficient to cover its currently known short and long-term obligations.
Cash Flows
Cash Flow from Operating Activities
Period
During the Period, operating activities generated $2.9 million of cash,
compared with $1.0 million of cash generated during the same period in
2013. The principal reasons for the increase in cash generated during the
Period were higher earnings before interest and fair value gain (loss) on
financial assets, and timing of working capital items, partially offset by higher
tax payments.
Year
Operating activities generated $6.7 million of cash for the Year, compared
with $2.7 million of cash generated in 2013. The principal reasons for the
increase in cash generated for the Year were higher earnings before interest
and fair value gain (loss) on financial assets, and timing of working capital
items, partially offset by higher tax payments.
Cash Flow from Financing Activities
Period
During the Period, financing activities used $0.5 million of cash compared
with $2.4 million of cash used during the same period in 2013. The decrease
in net cash used for the Period was mainly due to lower repayments of
indebtedness by BPI to its parent company compared with the same period
in 2013.
Year
Financing activities used $21.0 million of cash for the Year compared with
$5.9 million of cash used in 2013. The increase in net cash used for the Year
compared with 2013 was mainly due to higher repayments of indebtedness
by BPI to its parent company and higher proceeds received from long-term
debt in 2013 for renovations at BPI’s corporately owned restaurants.
Cash Flow from Investing Activities
Period
During the Period, investing activities generated $0.4 million of cash
compared with $0.7 million of cash generated during the same period in
2013. Cash generated from investing activities represents distributions
received by BPI on the Class B Units and Class C Units, partially offset by
capital and intangible asset purchases. The decrease in cash generated
during the Period was due to higher purchases of property and equipment
and intangible assets, partially offset by decreased distributions received on
Class B Units as a result of the Exchange.
Year
Investing activities generated $18.7 million of cash for the Year compared
with $3.0 million of cash generated in 2013. Cash generated from investing
activities represents proceeds from the sale of Units following the Exchange,
distributions received by BPI on the Class B Units and Class C Units, partially
offset by capital and intangible asset purchases. The increase in cash
generated during the Year was mainly due to net proceeds from the Exchange
of $16.0 million.
Operating Credit FacilityBPI has an available line of credit with a Canadian chartered bank in the
amount of $7.5 million with a 180 day term to cover BPI’s day-to-day
operating requirements through normal seasonal variations in the business if
needed. The line of credit bears interest at the bank’s prime rate and is due
upon demand. As at December 31, 2014, the line of credit was not drawn
(December 31, 2013 – nil). BPI was in compliance with all of the financial
covenants and financial condition tests governing the line of credit as of the
end of the Period.
Long-Term Debt Obligations
BP Loan
BPI owes the Fund $24.0 million pursuant to a credit agreement that was
acquired by the Fund as part of the Fund’s initial public offering of Units that
occurred on July 17, 2002 (the “BP Loan”). Interest accrues on all amounts
outstanding under the BP Loan at the rate of 7.5% per annum and interest
is payable in arrears by BPI to the Fund on the first day of each month. The
principal amount, together with all accrued and unpaid interest, outstanding
under the BP Loan will become due and payable on July 17, 2042. The BP
Loan is secured by all present and after acquired property of BPI except: (i)
Units held by BPI; and (ii) equity and debt investments of BPI in affiliates that
operate pizza / pasta restaurants in the USA or Mexico and do not operate or
franchise Boston Pizza Restaurants in Canada.
Other Long-Term Debt
BPI’s long-term debt obligations also include equipment financing that is
secured by specific assets of BPI. These term loans are secured by a general
assignment of book debts and certain guarantees from related companies.
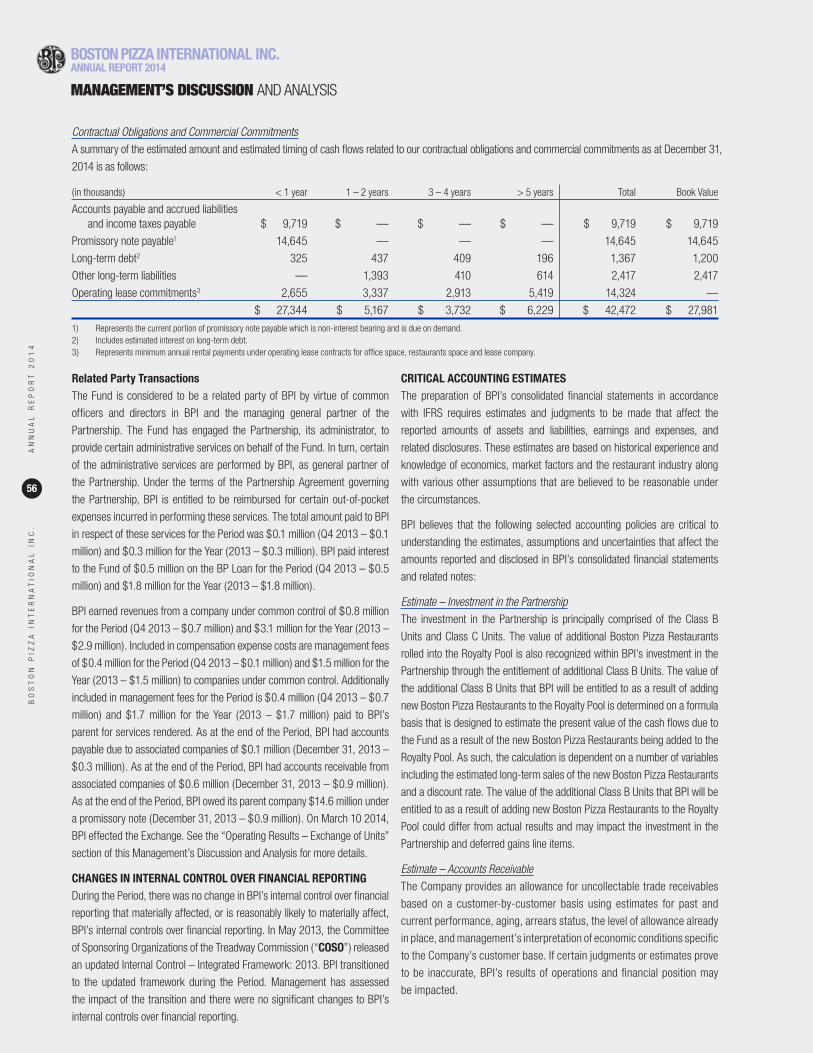
BO
ST
ON
PIZ
ZA
IN
TE
RN
AT
ION
AL
IN
C.
AN
NU
AL
RE
PO
RT
20
14
56
Contractual Obligations and Commercial Commitments
A summary of the estimated amount and estimated timing of cash flows related to our contractual obligations and commercial commitments as at December 31,
2014 is as follows:
(in thousands) < 1 year 1 – 2 years 3 – 4 years > 5 years Total Book Value
Accounts payable and accrued liabilities and income taxes payable $ 9,719 $ — $ — $ — $ 9,719 $ 9,719
Promissory note payable1 14,645 — — — 14,645 14,645
Long-term debt2 325 437 409 196 1,367 1,200
Other long-term liabilities — 1,393 410 614 2,417 2,417
Operating lease commitments3 2,655 3,337 2,913 5,419 14,324 —
$ 27,344 $ 5,167 $ 3,732 $ 6,229 $ 42,472 $ 27,981
1) Represents the current portion of promissory note payable which is non-interest bearing and is due on demand.2) Includes estimated interest on long-term debt. 3) Represents minimum annual rental payments under operating lease contracts for office space, restaurants space and lease company.
Related Party TransactionsThe Fund is considered to be a related party of BPI by virtue of common
officers and directors in BPI and the managing general partner of the
Partnership. The Fund has engaged the Partnership, its administrator, to
provide certain administrative services on behalf of the Fund. In turn, certain
of the administrative services are performed by BPI, as general partner of
the Partnership. Under the terms of the Partnership Agreement governing
the Partnership, BPI is entitled to be reimbursed for certain out-of-pocket
expenses incurred in performing these services. The total amount paid to BPI
in respect of these services for the Period was $0.1 million (Q4 2013 – $0.1
million) and $0.3 million for the Year (2013 – $0.3 million). BPI paid interest
to the Fund of $0.5 million on the BP Loan for the Period (Q4 2013 – $0.5
million) and $1.8 million for the Year (2013 – $1.8 million).
BPI earned revenues from a company under common control of $0.8 million
for the Period (Q4 2013 – $0.7 million) and $3.1 million for the Year (2013 –
$2.9 million). Included in compensation expense costs are management fees
of $0.4 million for the Period (Q4 2013 – $0.1 million) and $1.5 million for the
Year (2013 – $1.5 million) to companies under common control. Additionally
included in management fees for the Period is $0.4 million (Q4 2013 – $0.7
million) and $1.7 million for the Year (2013 – $1.7 million) paid to BPI’s
parent for services rendered. As at the end of the Period, BPI had accounts
payable due to associated companies of $0.1 million (December 31, 2013 –
$0.3 million). As at the end of the Period, BPI had accounts receivable from
associated companies of $0.6 million (December 31, 2013 – $0.9 million).
As at the end of the Period, BPI owed its parent company $14.6 million under
a promissory note (December 31, 2013 – $0.9 million). On March 10 2014,
BPI effected the Exchange. See the “Operating Results – Exchange of Units”
section of this Management’s Discussion and Analysis for more details.
CHANGES IN INTERNAL CONTROL OVER FINANCIAL REPORTING During the Period, there was no change in BPI’s internal control over financial
reporting that materially affected, or is reasonably likely to materially affect,
BPI’s internal controls over financial reporting. In May 2013, the Committee
of Sponsoring Organizations of the Treadway Commission (“COSO”) released
an updated Internal Control – Integrated Framework: 2013. BPI transitioned
to the updated framework during the Period. Management has assessed
the impact of the transition and there were no significant changes to BPI’s
internal controls over financial reporting.
CRITICAL ACCOUNTING ESTIMATES The preparation of BPI’s consolidated financial statements in accordance
with IFRS requires estimates and judgments to be made that affect the
reported amounts of assets and liabilities, earnings and expenses, and
related disclosures. These estimates are based on historical experience and
knowledge of economics, market factors and the restaurant industry along
with various other assumptions that are believed to be reasonable under
the circumstances.
BPI believes that the following selected accounting policies are critical to
understanding the estimates, assumptions and uncertainties that affect the
amounts reported and disclosed in BPI’s consolidated financial statements
and related notes:
Estimate – Investment in the Partnership
The investment in the Partnership is principally comprised of the Class B
Units and Class C Units. The value of additional Boston Pizza Restaurants
rolled into the Royalty Pool is also recognized within BPI’s investment in the
Partnership through the entitlement of additional Class B Units. The value of
the additional Class B Units that BPI will be entitled to as a result of adding
new Boston Pizza Restaurants to the Royalty Pool is determined on a formula
basis that is designed to estimate the present value of the cash flows due to
the Fund as a result of the new Boston Pizza Restaurants being added to the
Royalty Pool. As such, the calculation is dependent on a number of variables
including the estimated long-term sales of the new Boston Pizza Restaurants
and a discount rate. The value of the additional Class B Units that BPI will be
entitled to as a result of adding new Boston Pizza Restaurants to the Royalty
Pool could differ from actual results and may impact the investment in the
Partnership and deferred gains line items.
Estimate – Accounts Receivable
The Company provides an allowance for uncollectable trade receivables
based on a customer-by-customer basis using estimates for past and
current performance, aging, arrears status, the level of allowance already
in place, and management’s interpretation of economic conditions specific
to the Company’s customer base. If certain judgments or estimates prove
to be inaccurate, BPI’s results of operations and financial position may
be impacted.
BOSTON PIZZA INTERNATIONAL INC.ANNUAL REPORT 2014
MANAGEMENT’S DISCUSSION AND ANALYSIS
BO
ST
ON
PIZ
ZA
IN
TE
RN
AT
ION
AL
IN
C.
AN
NU
AL
RE
PO
RT
20
14
57
Estimate – Class B Units Fair Value Adjustment
BPI has elected under IFRS to measure the Class B Units as a financial asset
at fair value through profit and loss. The fair value of the Class B Units asset
for BPI mirrors the fair value of the Class B Units liability recorded by the
Fund for any particular period. The Class B Units are exchangeable into Units,
and thus, it is estimated that their fair values approximate each other. BPI
estimates the fair value of the Class B Units by multiplying the number of
issued and outstanding Additional Entitlements (including Holdback) at the
end of the Period by the closing price of the Fund Units at the end of the
Period (or previous business day). This valuation technique may not represent
the actual value of the financial asset should such Class B Units be exchanged
and may impact the investment in the Partnership and the fair value gain, gain
on disposal, and provision for financial assets line items.
Judgment – Consolidation
Applying the criteria outlined in IFRS 10, judgment is required in determining
whether BPI controls the Partnership. Making this judgment involves taking
into consideration the concepts of power over the Partnership, exposure
and rights to variable returns, and the ability to use power to direct the
relevant activities of the Partnership so as to generate economic returns.
Using these criteria, management has determined that BPI does not
ultimately control the Partnership.
ADOPTION OF NEW ACCOUNTING POLICIES Prior to January 1, 2014 the International Accounting Standards Board
(“IASB”) issued improvements and amendments to existing standards. In
accordance with IFRS, a list of the standards and amendments required and
adopted by BPI on January 1, 2014 is provided below.
Annual Improvements to IFRS (2010 – 2012) and (2011 – 2013)
In December 2013, the IASB issued narrow-scope amendments to a total
of nine standards as part of its annual improvements process. The IASB
uses the annual improvements process to make non-urgent but necessary
amendments to IFRS. Most amendments will apply prospectively for annual
periods beginning on or after July 1, 2014; earlier application is permitted,
in which case, the related consequential amendments to other IFRSs would
also apply. BPI has adopted these amendments in its financial statements
beginning on January 1, 2014 and determined that the amendments do not
have a material impact on the consolidated financial statements.
IAS 32, Offsetting Financial Assets and Liabilities
This standard was amended to clarify that an entity currently has a legally
enforceable right to set-off and when a settlement mechanism provides for
net settlement or gross settlement that is equivalent to net settlement. BPI
adopted these amendments in its financial statements beginning on January
1, 2014 and determined that the amendments do not have a material impact
on the consolidated financial statements.
OUTLOOK
The information contained in “Outlook” is forward-looking information.
Please see “Note Regarding Forward-Looking Information” and “Risks &
Uncertainties” for a discussion of the risks and uncertainties in connection
with forward-looking information.
Boston Pizza is well positioned for future growth and should continue to
strengthen its position as the number one casual dining brand in Canada by
continuing to achieve positive SSSG and opening new Boston Pizza locations
across Canada.
The two principal factors that affect SSSG are changes in customer traffic
and changes in average guest cheque. BPI’s strategies to drive higher guest
traffic include attracting a wide variety of guests into the restaurant, sports
bar and take-out/delivery parts of each location, offering a compelling value
proposition to our guests and leveraging a larger marketing budget versus
the previous year along with a revised calendar of national and local store
promotions. Increased average cheque levels are expected to be achieved
through a combination of culinary innovation and annual menu re-pricing. In
addition, BPI’s franchise agreement requires that each Boston Pizza Restaurant
undergo a complete store renovation every seven years. Restaurants typically
close for two to three weeks to complete the renovation and experience an
incremental sales increase in the year following the re-opening.
Boston Pizza remains well positioned for future expansion as evidenced by
the eight net new Boston Pizza Restaurants that opened in 2014. There
are currently three new locations under construction with more planned for
later in 2015. BPI’s management believes that Boston Pizza will continue to
strengthen its position as the number one casual dining brand in Canada by
pursuing further restaurant development opportunities across the country.
RISKS & UNCERTAINTIES
Risks Related to the Business of BPI
The Restaurant Industry and its Competitive Nature
The performance of the Fund is directly dependent upon the Royalty and
interest payments received from BPI on the BP Loan. The amount of the
Royalty received by the Partnership from BPI is dependent on various factors
that may affect the casual dining sector of the restaurant industry. The
restaurant industry generally, and in particular the casual dining sector, is
intensely competitive with respect to price, service, location and food quality.
Competitors include national and regional chains, as well as independently
owned restaurants. If BPI and the Boston Pizza franchisees are unable to
successfully compete in the casual dining sector, Franchise Sales may be
adversely affected; the amount of the Royalty reduced and the ability of
BPI to pay the Royalty or interest on the BP Loan may be impaired. The
restaurant industry is also affected by adverse weather conditions, changes
in demographic trends, traffic patterns, and the type, number, and location of
competing restaurants. In addition, factors such as government regulations,
smoking bylaws, inflation, publicity from any food borne illnesses, increased
food, labour and benefits costs, continuing operations of key suppliers and
the availability of experienced management and hourly employees may
adversely affect the restaurant industry in general and therefore potentially
affect Franchise Sales. BPI’s success also depends on numerous factors
affecting discretionary consumer spending, including economic conditions,
disposable consumer income and consumer confidence. Adverse changes in
these factors could reduce guest traffic or impose practical limits on pricing,
either of which could reduce revenue and operating income, which could
adversely affect Franchise Sales, the Royalty and the ability of BPI to pay the
Royalty to the Partnership or interest on the BP Loan to the Fund.
Growth of the Royalty
The growth of the Royalty and other amounts payable by BPI to the Partnership
under the License and Royalty Agreement between the Partnership and BPI
(for the license to use the BP Rights in Canada for 99 years, commencing on
July 17, 2002) is dependent upon the ability of BPI to (i) maintain and grow its
franchised restaurants, (ii) locate new restaurant sites in prime locations, and
(iii) obtain qualified operators to become Boston Pizza franchisees. BPI faces
BO
ST
ON
PIZ
ZA
IN
TE
RN
AT
ION
AL
IN
C.
AN
NU
AL
RE
PO
RT
20
14
58
competition for restaurant locations and franchisees from its competitors
and from franchisors of other businesses. BPI’s inability to successfully
obtain qualified franchisees could adversely affect its business development.
The opening and success of a Boston Pizza Restaurant is dependent on a
number of factors, including: availability of suitable sites; negotiations of
acceptable lease or purchase terms for new locations; availability, training
and retention of management and other employees necessary to staff new
Boston Pizza Restaurants; adequately supervising construction; securing
suitable financing; and other factors, some of which are beyond the control
of BPI. Boston Pizza franchisees may not have all the business abilities or
access to financial resources necessary to open a Boston Pizza Restaurant
or to successfully develop or operate a Boston Pizza Restaurant in their
franchise areas in a manner consistent with BPI’s standards. BPI provides
training and support to Boston Pizza franchisees, but the quality of franchised
operations may be diminished by any number of factors beyond BPI’s control.
Consequently, Boston Pizza franchisees may not successfully operate
restaurants in a manner consistent with BPI’s standards and requirements,
or may not hire and train qualified managers and other restaurant personnel.
If they do not, the image and reputation of BPI may suffer, and gross revenue
and results of operations of the Boston Pizza Restaurants could decline.
The Closure of Boston Pizza Restaurants May Affect the Amount of the Royalty
The amount of the Royalty payable to the Partnership by BPI is dependent
upon the Franchise Sales, which is dependent on the number of Boston Pizza
Restaurants that are included in the Royalty Pool and the Franchise Sales
of those Boston Pizza Restaurants. Each year, a number of Boston Pizza
Restaurants may close and there is no assurance that BPI will be able to open
sufficient new Boston Pizza Restaurants to replace the Franchise Sales of the
Boston Pizza Restaurants that have closed.
BPI Revenue
The ability of BPI to pay the Royalty is dependent on (i) Boston Pizza
franchisees’ ability to generate revenue and to pay royalties to BPI, (ii) BPI’s
ability to enter into arrangements with suppliers and distributors to generate
competitive pricing for franchisees and revenue for BPI and (iii) BPI’s receipt
of amounts for other franchise fees (including initial and renewal franchise
fees). Failure of BPI to achieve adequate levels of collection from Boston Pizza
franchisees or the loss of BPI revenues from arrangements with suppliers and
distributors could have a serious effect on the ability of BPI to pay the Royalty
or interest on the BP Loan.
Intellectual Property
The ability of BPI to maintain or increase its Franchise Sales will depend
on its ability to maintain “brand equity” through the use of the BP Rights
licensed from the Partnership. If the Partnership fails to enforce or maintain
any of its intellectual property rights, BPI may be unable to capitalize on its
efforts to establish brand equity. All registered trademarks in Canada can be
challenged pursuant to provisions of the Trade-marks Act (Canada) and if any
BP Rights are ever successfully challenged, this may have an adverse impact
on Franchise Sales and therefore on the Royalty. The Partnership owns the
BP Rights in Canada. However it does not own identical or similar trademarks
owned by parties not related to BPI or the Partnership in other jurisdictions.
Third parties may use such trademarks in jurisdictions other than Canada
in a manner that diminishes the value of such trademarks. If this occurs,
the value of the BP Rights may suffer and gross revenue by Boston Pizza
Restaurants could decline. Similarly, negative publicity or events associated
with such trademarks in jurisdictions outside of Canada may negatively affect
the image and reputation of Boston Pizza Restaurants in Canada, resulting in
a decline in gross revenue by Boston Pizza Restaurants.
Government Regulation
BPI is subject to various federal, provincial and local laws affecting its
business. Each Boston Pizza Restaurant is subject to licensing and regulation
by a number of governmental authorities, which may include alcoholic
beverage control, smoking laws, health and safety and fire agencies.
Difficulties in obtaining or failures to obtain the required licenses or approvals
could delay or prevent the development of a new Boston Pizza Restaurant in a
particular area or limit the operations of an existing Boston Pizza Restaurant.
Regulations Governing Food Service and Alcoholic Beverages
Boston Pizza Restaurants are subject to various federal, provincial and local
government regulations, including those relating to the sale of food and
alcoholic beverages. Such regulations are subject to change from time to
time. The failure to obtain and maintain these licenses, permits and approvals
could adversely affect the operations of a Boston Pizza Restaurant. Typically,
licenses must be renewed annually and may be revoked, suspended or denied
renewal for cause at any time if governmental authorities determine that the
Boston Pizza Restaurant’s conduct violates applicable regulations. Difficulties
or failures to maintain or obtain the required licenses and approvals could
adversely affect existing Boston Pizza Restaurants and delay or result in a
decision to cancel the opening of new Boston Pizza Restaurants, which would
adversely affect BPI’s business.
In addition, the ability of Boston Pizza Restaurants to serve alcoholic
beverages is an important factor in attracting customers. Alcoholic beverage
control regulations require each Boston Pizza Restaurant to apply to provincial
or municipal authorities for a license or permit to sell alcoholic beverages
on the premises and, in certain locations, to provide service for extended
hours and on Sundays. Typically, licenses must be renewed annually and
may be revoked or suspended for cause at any time. Alcoholic beverage
control regulations relate to numerous aspects of daily operations of Boston
Pizza Restaurants, including minimum age of patrons and employees, hours
of operation, advertising, wholesale purchasing, inventory control, and
handling, storage and dispensing of alcoholic beverages. The failure of BPI
or a Boston Pizza franchisee to retain a license to serve liquor for a Boston
Pizza Restaurant would adversely affect that restaurant’s operations. BPI or
a Boston Pizza franchisee may be subject to legislation in certain provinces,
which may provide a person injured by an intoxicated person the right to
recover damages from an establishment that wrongfully served alcoholic
beverages to the intoxicated person. BPI carries host liquor liability coverage
as part of its existing comprehensive general liability insurance. There is no
assurance that such insurance coverage will be adequate.
Laws Concerning Employees
The operations of Boston Pizza Restaurants are also subject to minimum
wage laws governing such matters as working conditions, overtime and
tip credits, as well as rules and regulations regarding the employment of
temporary foreign workers. Significant numbers of Boston Pizza Restaurants’
food service and preparation personnel are paid at rates related to the
BOSTON PIZZA INTERNATIONAL INC.ANNUAL REPORT 2014
MANAGEMENT’S DISCUSSION AND ANALYSIS
BO
ST
ON
PIZ
ZA
IN
TE
RN
AT
ION
AL
IN
C.
AN
NU
AL
RE
PO
RT
20
14
59
minimum wage and, accordingly, further increases in the minimum wage
could increase Boston Pizza Restaurants’ labour costs. In some regions of
Canada, Boston Pizza Restaurants employ temporary foreign workers – the
supply of labour in such regions could be reduced by regulations concerning
the employment of temporary foreign workers.
Sales Tax Regulations
While there are variations in studies about the extent to which sales taxes
impact retail sales, the increase in the after-tax price of goods and services
has a negative effect on the customer’s perception of spending on restaurant
dining. Such negative perception can potentially reduce either the frequency
of guest visits to restaurants, the total amount which guests spend per
restaurant visit, or both. Price elasticity appears to have less impact on
densely-populated and market-dominant areas such as urban or downtown
restaurants. However, as customer perception of disposable spending is
adversely affected by increased after-tax prices, Franchise Sales is at risk
of declining.
Franchise Regulation Risk
The complete failure to provide a disclosure document as required by the
franchise disclosure laws and regulations of the provinces of Alberta, Manitoba,
Ontario, New Brunswick and Prince Edward Island (or the provision of a
disclosure document that is materially non-compliant) provides a franchisee
with a two year absolute right of rescission. If a disclosure document is
not provided within the time required by applicable provincial legislation, a
franchisee is provided with sixty days from receipt of the disclosure document
in which to rescind the franchise agreement. The statutory right of rescission
gives a franchisee the right to receive back all monies paid, and to recover
for its losses, if any. Franchise legislation also provides a franchisee with a
statutory right of action to sue if a franchisee suffers a loss because of a
misrepresentation contained in the disclosure document, or as a result of the
franchisor’s failure to comply with its disclosure obligations. These rights are
in addition to any rights that might exist at common law. Claims arising from
any non-compliance with franchise disclosure laws may adversely affect the
ability of BPI to pay the Royalty to the Partnership or interest on the BP Loan
to the Fund.
Potential Litigation and Other Complaints
BPI and Boston Pizza franchisees may be the subject of complaints or
litigation from guests alleging food related illness, injuries suffered on the
premises or other food quality, health or operational concerns. Adverse
publicity resulting from such allegations may materially affect the sales by
Boston Pizza Restaurants, regardless of whether such allegations are true or
whether BPI or a Boston Pizza franchisee is ultimately held liable.
Insurance
BPI maintains insurance coverage to protect it from liabilities in incurs
in the course of its business. There is no assurance that such insurance
coverage will respond to, or be adequate to protect it from, such liabilities.
Additionally, in the future, BPI’s insurance premiums may increase and it
may not be able to obtain similar levels of insurance on reasonable terms
or at all. Any substantial inadequacy of, or inability to obtain insurance
coverage could materially adversely affect BPI’s business, financial
condition and results of operations. Furthermore, there are types of losses
BPI may incur that cannot be insured against or that are not economically
reasonable to insure. Such losses could have a material adverse effect on
BPI’s business and results of operations.
Dependence on Key Personnel
The success of the Fund depends upon the personal efforts of senior
management of BPI, including their ability to retain and attract appropriate
franchisee candidates. The loss of the services of such key personnel could
have a material adverse effect on BPI’s business and results of operations.
Security of Confidential Consumer Information
BPI or Boston Pizza franchisees may incur unanticipated costs resulting from
breaches of security of confidential consumer information related to their
electronic processing of credit and debit card transactions. The majority of
sales occurring in Boston Pizza Restaurants are paid for via credit or debit
cards. Other restaurants and retailers have experienced security breaches in
which credit and debit card information, or personal information of customers,
has been stolen. BPI or Boston Pizza franchisees may in the future become
subject to claims for purportedly fraudulent transactions arising out of the
actual or alleged theft of credit or debit card information, and BPI or Boston
Pizza franchisees may also be subject to lawsuits or other proceedings
relating to these types of incidents. In addition, most provinces have enacted
legislation requiring notification of security breaches involving personal
information, including credit and debit card information. Any such claims
or proceedings could cause BPI to incur significant unplanned expenses,
which could have an adverse impact on its financial condition and results of
operations. Furthermore, adverse publicity resulting from these allegations
may have a material adverse effect on Franchise Sales, the Royalty and the
ability of BPI to pay the Royalty to the Partnership or interest on the BP Loan
to the Fund.
Reliance on Technology
BPI and Boston Pizza franchisees rely heavily upon information systems,
including point-of-sale processing in Boston Pizza Restaurants, for
management of their supply chain, payment of obligations, collection of cash,
credit and debit card transactions and other processes and procedures,
including the taking and sending of orders to Boston Pizza Restaurants. BPI’s
ability to efficiently and effectively manage its business depends significantly
on the reliability and capacity of these systems. BPI’s operations depend
upon its ability to protect its computer equipment and systems against
damage from physical theft, fire, power loss, telecommunications failure
or other catastrophic events, as well as from internal and external security
breaches, viruses and other disruptive problems. The failure of these systems
to operate effectively, maintenance problems, upgrading or transitioning to
new platforms, expanding BPI’s systems as it grows or a breach in security
of these systems could result in delays in customer service and reduce
efficiency in BPI’s operations. Remediation of such problems could result in
significant, unplanned capital investments.
Internal Control Over Financial Reporting
All internal control systems contain inherent limitations, no matter how well
designed. As a result, management acknowledges that its internal controls
over financial reporting will not prevent or detect all misstatements due to
error or fraud. In addition, management’s evaluation of internal controls can
provide only reasonable, not absolute, assurance that all internal control
issues that may result in material misstatements, if any, have been detected.
ADDITIONAL INFORMATIONAdditional Information relating to BPI, the Partnership and the Fund,
including the annual information form of the Fund, is available on SEDAR
at www.sedar.com or on the Fund’s website at www.bpincomefund.com.

BO
ST
ON
PIZ
ZA
IN
TE
RN
AT
ION
AL
IN
C.
AN
NU
AL
RE
PO
RT
20
14
60
NOTE REGARDING FORWARD-LOOKING INFORMATIONCertain information in this Management’s Discussion and Analysis
constitutes “forward-looking information” that involves known and unknown
risks, uncertainties, future expectations and other factors which may
cause the actual results, performance or achievements of BPI, the Fund,
Boston Pizza Holdings Trust, the Partnership, Boston Pizza Holdings Limited
Partnership, Boston Pizza Holdings GP Inc., Boston Pizza GP Inc., Boston
Pizza Restaurants, or industry results, to be materially different from any
future results, performance or achievements expressed or implied by such
forward-looking information. When used in this Management’s Discussion
and Analysis, forward-looking information may include words such as
“anticipate”, “estimate”, “may”, “will”, “should”, “expect”, “believe”, “plan”
and other similar terminology. This information reflects current expectations
regarding future events and operating performance and speaks only as of the
date of this Management’s Discussion and Analysis.
All statements, other than statements of historical facts, included herein
that address events or developments that management of BPI expects or
anticipates will or may occur in the future are forward-looking information.
Forward-looking information in this Management’s Discussion and Analysis
includes, but is not limited to, such things as:
• that Boston Pizza will continue to serve more customers annually than
any other casual dining restaurant chain in Canada;
• adjustments to Additional Entitlements that are to occur in the future
and when such adjustments will occur;
• belief that BPI has sufficient cash and capital resources for 2015;
• the future expansion of Boston Pizza Restaurants;
• expected increases in average guest cheque levels; and
• Boston Pizza is well positioned for future growth and should continue
to strengthen its position as the number one casual dining brand in
Canada by achieving annual positive SSSG and continuing to open
new Boston Pizza Restaurants across Canada.
The forward-looking information disclosed herein is based on a number of
assumptions including, among other things:
• absence of amendments to material contracts;
• no strategic changes of direction occurring;
• absence of changes in law;
• protection of BP Rights;
• pace of commercial real estate development;
• franchisees’ access to financing;
• franchisees duly paying franchise fees and other amounts;
• there will be no closures of Boston Pizza Restaurants that materially
affect the amount of Royalty paid by BPI to the Partnership;
• future results being similar to historical results; and
• expectations related to future general economic conditions.
This forward-looking information involves a number of risks, uncertainties and
other factors that may cause actual results, performance or achievements
to be materially different from any results, performance or achievements
expressed or implied by the forward looking information contained herein
including, but not limited to:
• competition;
• weather;
• changes in demographic trends;
• changes in consumer preferences and discretionary spending patterns;
• changes in national and local business and economic conditions;
• legislation and government regulation;
• cash distributions are not guaranteed;
• accounting policies and practices; and
• the results of operations and financial conditions of BPI and the Fund.
The foregoing list of factors is not exhaustive and should be considered in
conjunction with the risks and uncertainties set out in this Management’s
Discussion and Analysis.
This Management’s Discussion and Analysis discusses some of the factors
that could cause actual results to differ materially from those expressed in or
underlying such forward-looking information. Forward-looking information is
provided as of the date hereof and, except as required by law, we assume
no obligation to update or revise forward-looking information to reflect new
events or circumstances.
BOSTON PIZZA INTERNATIONAL INC.ANNUAL REPORT 2014
MANAGEMENT’S DISCUSSION AND ANALYSIS
BO
ST
ON
PIZ
ZA
IN
TE
RN
AT
ION
AL
IN
C.
AN
NU
AL
RE
PO
RT
20
14
61
INDEPENDENT AUDITORS’ REPORTBOSTON PIZZA INTERNATIONAL INC.FOR THE YEARS ENDED DECEMBER 31, 2014 AND 2013
To the Shareholders of Boston Pizza International Inc.
We have audited the accompanying consolidated financial statements of Boston Pizza International Inc. (“the Entity”) which comprise the consolidated
statements of financial position as at December 31, 2014 and December 31, 2013, the consolidated statements of comprehensive income, changes
in shareholders’ deficiency and cash flows for the years then ended, and notes, comprising a summary of significant accounting policies and other
explanatory information.
Management’s Responsibility for the Consolidated Financial StatementsManagement is responsible for the preparation and fair presentation of these consolidated financial statements in accordance with International Financial
Reporting Standards and for such internal control as management determines is necessary to enable the preparation of consolidated financial statements
that are free from material misstatement, whether due to fraud or error.
Auditors’ ResponsibilityOur responsibility is to express an opinion on these consolidated financial statements based on our audits. We conducted our audits in accordance with
Canadian generally accepted auditing standards. Those standards require that we comply with ethical requirements and plan and perform the audit to obtain
reasonable assurance about whether the consolidated financial statements are free from material misstatement.
An audit involves performing procedures to obtain audit evidence about the amounts and disclosures in the consolidated financial statements. The procedures
selected depend on our judgment, including the assessment of the risks of material misstatement of the consolidated financial statements, whether due to
fraud or error. In making those risk assessments, we consider internal control relevant to the Entity’s preparation and fair presentation of the consolidated
financial statements in order to design audit procedures that are appropriate in the circumstances, but not for the purpose of expressing an opinion on the
effectiveness of the Entity’s internal control. An audit also includes evaluating the appropriateness of accounting policies used and the reasonableness of
accounting estimates made by management, as well as evaluating the overall presentation of the consolidated financial statements.
We believe that the audit evidence we have obtained in our audits is sufficient and appropriate to provide a basis for our audit opinion.
OpinionIn our opinion, the consolidated financial statements present fairly, in all material respects, the consolidated financial position of the Entity as at December
31, 2014 and December 31, 2013, and its consolidated financial performance and its consolidated cash flows for the years then ended in accordance with
International Financial Reporting Standards.
Chartered Accountants
February 5, 2015
Vancouver, Canada
BOSTON PIZZA INTERNATIONAL INC.ANNUAL REPORT 2014
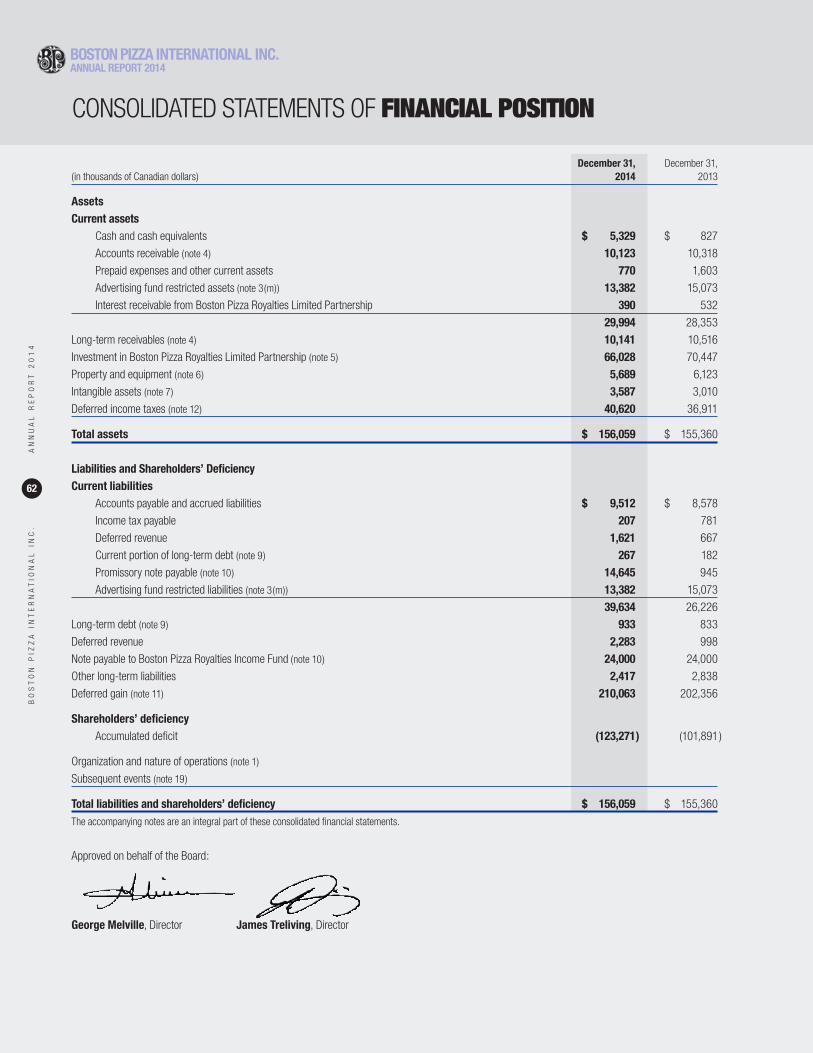
BO
ST
ON
PIZ
ZA
IN
TE
RN
AT
ION
AL
IN
C.
AN
NU
AL
RE
PO
RT
20
14
62
CONSOLIDATED STATEMENTS OF FINANCIAL POSITION
December 31, December 31,(in thousands of Canadian dollars) 2014 2013
Assets
Current assets
Cash and cash equivalents $ 5,329 $ 827
Accounts receivable (note 4) 10,123 10,318
Prepaid expenses and other current assets 770 1,603
Advertising fund restricted assets (note 3(m)) 13,382 15,073
Interest receivable from Boston Pizza Royalties Limited Partnership 390 532
29,994 28,353
Long-term receivables (note 4) 10,141 10,516
Investment in Boston Pizza Royalties Limited Partnership (note 5) 66,028 70,447
Property and equipment (note 6) 5,689 6,123
Intangible assets (note 7) 3,587 3,010
Deferred income taxes (note 12) 40,620 36,911
Total assets $ 156,059 $ 155,360
Liabilities and Shareholders’ Deficiency Current liabilities
Accounts payable and accrued liabilities $ 9,512 $ 8,578
Income tax payable 207 781
Deferred revenue 1,621 667
Current portion of long-term debt (note 9) 267 182
Promissory note payable (note 10) 14,645 945
Advertising fund restricted liabilities (note 3(m)) 13,382 15,073
39,634 26,226
Long-term debt (note 9) 933 833
Deferred revenue 2,283 998
Note payable to Boston Pizza Royalties Income Fund (note 10) 24,000 24,000
Other long-term liabilities 2,417 2,838
Deferred gain (note 11) 210,063 202,356
Shareholders’ deficiency Accumulated deficit (123,271 ) (101,891 )
Organization and nature of operations (note 1)
Subsequent events (note 19)
Total liabilities and shareholders’ deficiency $ 156,059 $ 155,360
The accompanying notes are an integral part of these consolidated financial statements.
Approved on behalf of the Board:
George Melville, Director James Treliving, Director
BOSTON PIZZA INTERNATIONAL INC.ANNUAL REPORT 2014
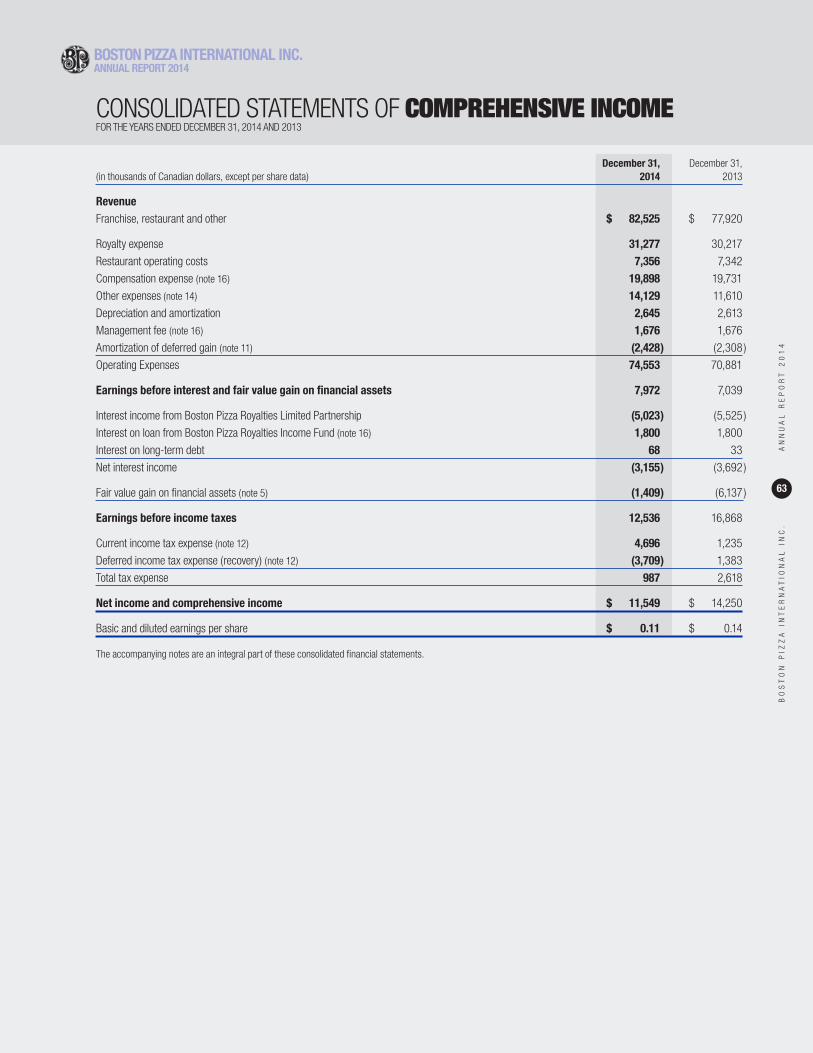
BO
ST
ON
PIZ
ZA
IN
TE
RN
AT
ION
AL
IN
C.
AN
NU
AL
RE
PO
RT
20
14
63
CONSOLIDATED STATEMENTS OF COMPREHENSIVE INCOMEFOR THE YEARS ENDED DECEMBER 31, 2014 AND 2013
December 31, December 31,(in thousands of Canadian dollars, except per share data) 2014 2013
RevenueFranchise, restaurant and other $ 82,525 $ 77,920
Royalty expense 31,277 30,217
Restaurant operating costs 7,356 7,342
Compensation expense (note 16) 19,898 19,731
Other expenses (note 14) 14,129 11,610
Depreciation and amortization 2,645 2,613
Management fee (note 16) 1,676 1,676
Amortization of deferred gain (note 11) (2,428 ) (2,308 )
Operating Expenses 74,553 70,881
Earnings before interest and fair value gain on financial assets 7,972 7,039
Interest income from Boston Pizza Royalties Limited Partnership (5,023 ) (5,525 )
Interest on loan from Boston Pizza Royalties Income Fund (note 16) 1,800 1,800
Interest on long-term debt 68 33
Net interest income (3,155 ) (3,692 )
Fair value gain on financial assets (note 5) (1,409 ) (6,137 )
Earnings before income taxes 12,536 16,868
Current income tax expense (note 12) 4,696 1,235
Deferred income tax expense (recovery) (note 12) (3,709 ) 1,383
Total tax expense 987 2,618
Net income and comprehensive income $ 11,549 $ 14,250
Basic and diluted earnings per share $ 0.11 $ 0.14
The accompanying notes are an integral part of these consolidated financial statements.
BOSTON PIZZA INTERNATIONAL INC.ANNUAL REPORT 2014
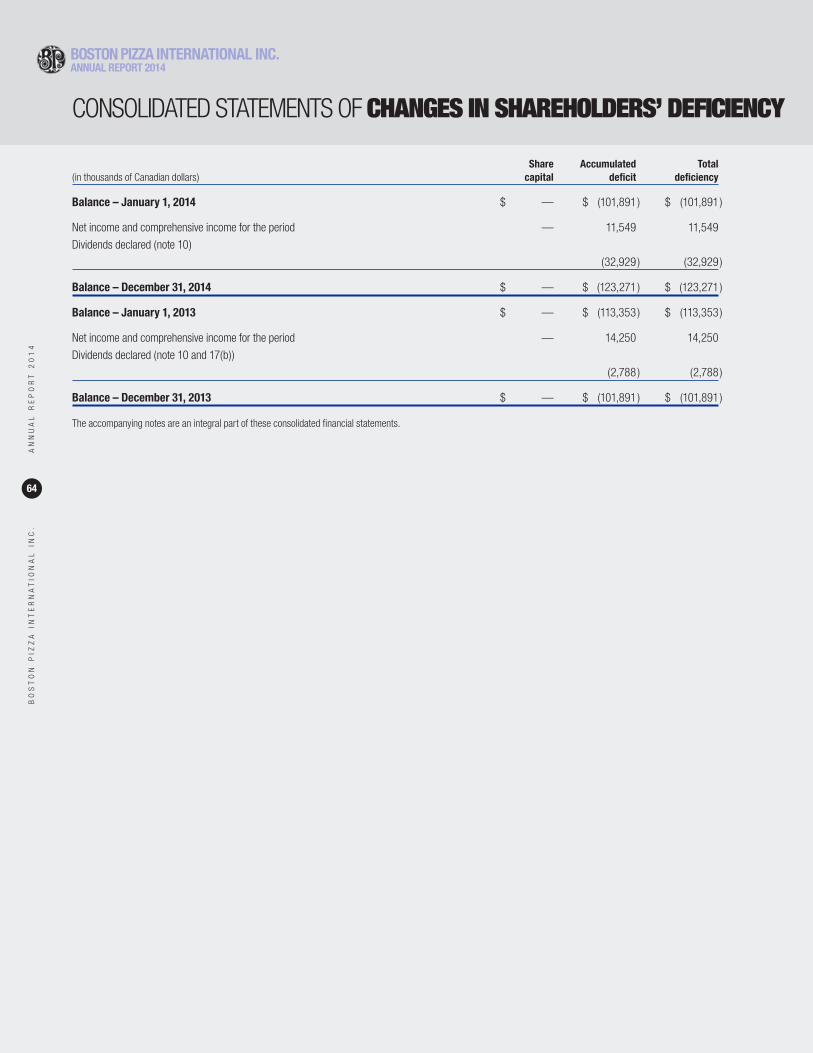
BO
ST
ON
PIZ
ZA
IN
TE
RN
AT
ION
AL
IN
C.
AN
NU
AL
RE
PO
RT
20
14
64
CONSOLIDATED STATEMENTS OF CHANGES IN SHAREHOLDERS’ DEFICIENCY
Share Accumulated Total(in thousands of Canadian dollars) capital deficit deficiency
Balance – January 1, 2014 $ — $ (101,891 ) $ (101,891 )
Net income and comprehensive income for the period — 11,549 11,549
Dividends declared (note 10)
(32,929 ) (32,929 )
Balance – December 31, 2014 $ — $ (123,271 ) $ (123,271 )
Balance – January 1, 2013 $ — $ (113,353 ) $ (113,353 )
Net income and comprehensive income for the period — 14,250 14,250
Dividends declared (note 10 and 17(b))
(2,788 ) (2,788 )
Balance – December 31, 2013 $ — $ (101,891 ) $ (101,891 )
The accompanying notes are an integral part of these consolidated financial statements.
BOSTON PIZZA INTERNATIONAL INC.ANNUAL REPORT 2014
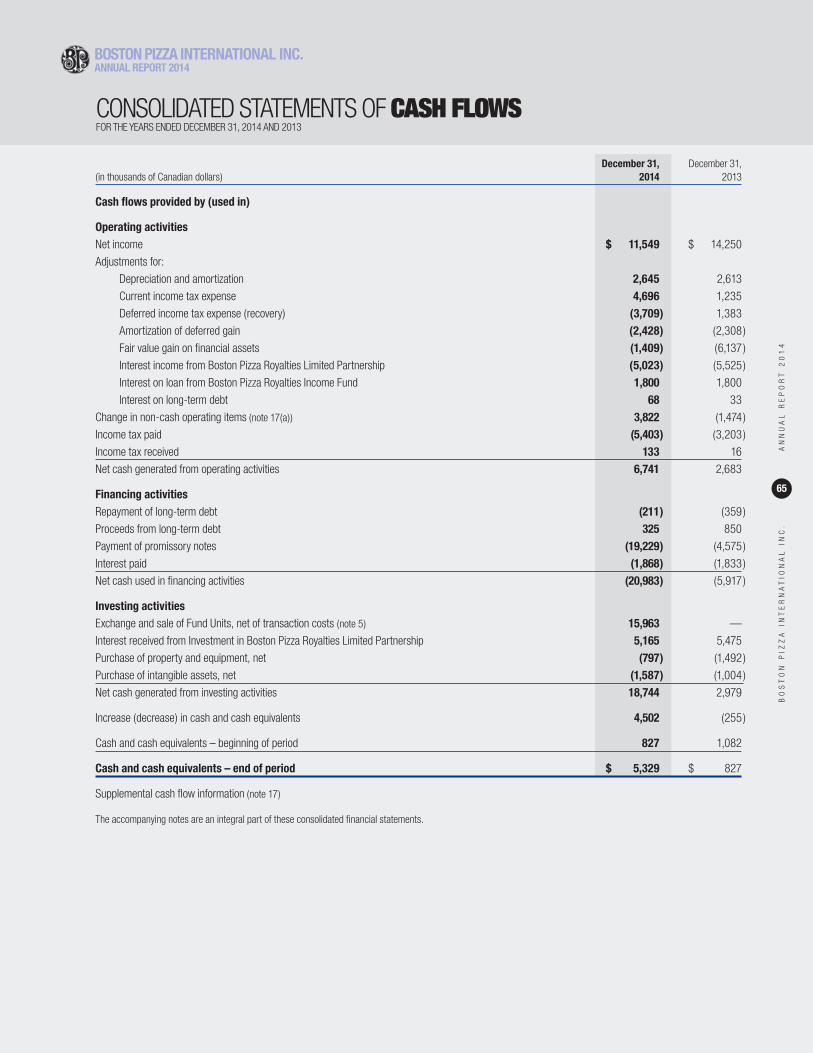
BO
ST
ON
PIZ
ZA
IN
TE
RN
AT
ION
AL
IN
C.
AN
NU
AL
RE
PO
RT
20
14
65
CONSOLIDATED STATEMENTS OF CASH FLOWSFOR THE YEARS ENDED DECEMBER 31, 2014 AND 2013
December 31, December 31,(in thousands of Canadian dollars) 2014 2013
Cash flows provided by (used in)
Operating activities Net income $ 11,549 $ 14,250
Adjustments for:
Depreciation and amortization 2,645 2,613
Current income tax expense 4,696 1,235
Deferred income tax expense (recovery) (3,709 ) 1,383
Amortization of deferred gain (2,428 ) (2,308 )
Fair value gain on financial assets (1,409 ) (6,137 )
Interest income from Boston Pizza Royalties Limited Partnership (5,023 ) (5,525 )
Interest on loan from Boston Pizza Royalties Income Fund 1,800 1,800
Interest on long-term debt 68 33
Change in non-cash operating items (note 17(a)) 3,822 (1,474 )
Income tax paid (5,403 ) (3,203 )
Income tax received 133 16
Net cash generated from operating activities 6,741 2,683
Financing activities
Repayment of long-term debt (211 ) (359 )
Proceeds from long-term debt 325 850
Payment of promissory notes (19,229 ) (4,575 )
Interest paid (1,868 ) (1,833 )
Net cash used in financing activities (20,983 ) (5,917 )
Investing activities
Exchange and sale of Fund Units, net of transaction costs (note 5) 15,963 —
Interest received from Investment in Boston Pizza Royalties Limited Partnership 5,165 5,475
Purchase of property and equipment, net (797 ) (1,492 )
Purchase of intangible assets, net (1,587 ) (1,004 )
Net cash generated from investing activities 18,744 2,979
Increase (decrease) in cash and cash equivalents 4,502 (255 )
Cash and cash equivalents – beginning of period 827 1,082
Cash and cash equivalents – end of period $ 5,329 $ 827
Supplemental cash flow information (note 17)
The accompanying notes are an integral part of these consolidated financial statements.
BOSTON PIZZA INTERNATIONAL INC.ANNUAL REPORT 2014
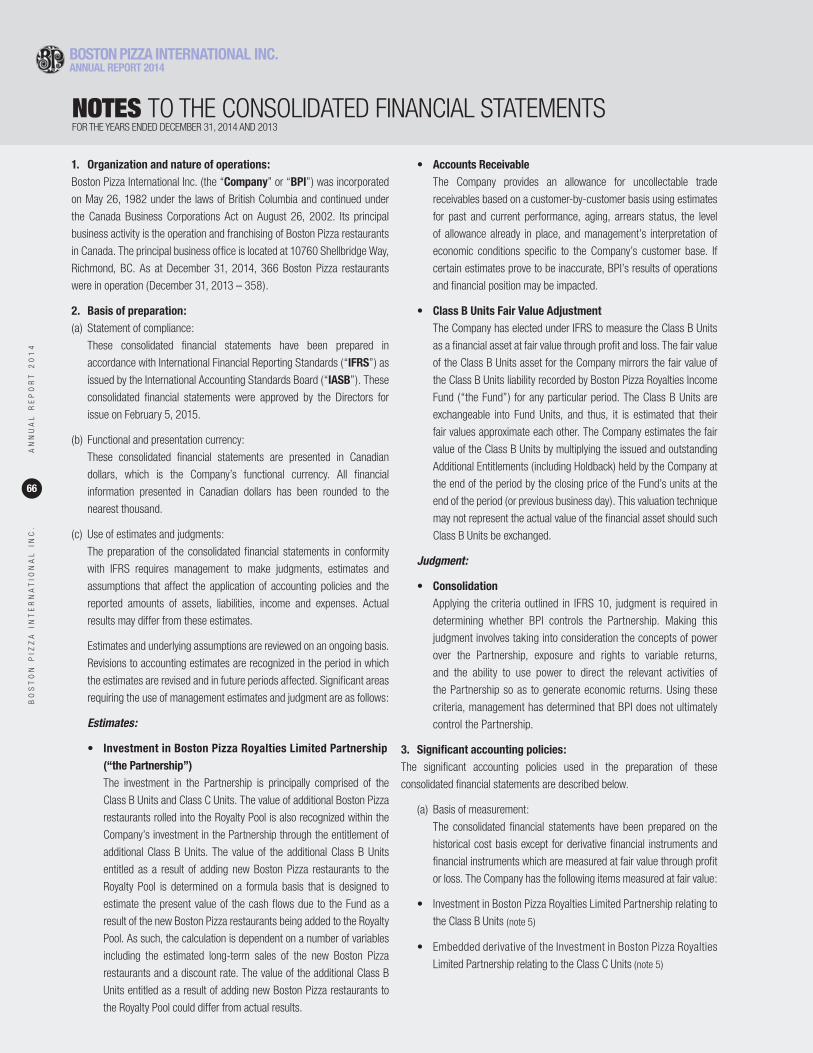
BO
ST
ON
PIZ
ZA
IN
TE
RN
AT
ION
AL
IN
C.
AN
NU
AL
RE
PO
RT
20
14
66
NOTES TO THE CONSOLIDATED FINANCIAL STATEMENTSFOR THE YEARS ENDED DECEMBER 31, 2014 AND 2013
1. Organization and nature of operations:Boston Pizza International Inc. (the “Company” or “BPI”) was incorporated
on May 26, 1982 under the laws of British Columbia and continued under
the Canada Business Corporations Act on August 26, 2002. Its principal
business activity is the operation and franchising of Boston Pizza restaurants
in Canada. The principal business office is located at 10760 Shellbridge Way,
Richmond, BC. As at December 31, 2014, 366 Boston Pizza restaurants
were in operation (December 31, 2013 – 358).
2. Basis of preparation:(a) Statement of compliance:
These consolidated financial statements have been prepared in
accordance with International Financial Reporting Standards (“IFRS”) as
issued by the International Accounting Standards Board (“IASB”). These
consolidated financial statements were approved by the Directors for
issue on February 5, 2015.
(b) Functional and presentation currency:
These consolidated financial statements are presented in Canadian
dollars, which is the Company’s functional currency. All financial
information presented in Canadian dollars has been rounded to the
nearest thousand.
(c) Use of estimates and judgments:
The preparation of the consolidated financial statements in conformity
with IFRS requires management to make judgments, estimates and
assumptions that affect the application of accounting policies and the
reported amounts of assets, liabilities, income and expenses. Actual
results may differ from these estimates.
Estimates and underlying assumptions are reviewed on an ongoing basis.
Revisions to accounting estimates are recognized in the period in which
the estimates are revised and in future periods affected. Significant areas
requiring the use of management estimates and judgment are as follows:
Estimates:
• Investment in Boston Pizza Royalties Limited Partnership (“the Partnership”)
The investment in the Partnership is principally comprised of the
Class B Units and Class C Units. The value of additional Boston Pizza
restaurants rolled into the Royalty Pool is also recognized within the
Company’s investment in the Partnership through the entitlement of
additional Class B Units. The value of the additional Class B Units
entitled as a result of adding new Boston Pizza restaurants to the
Royalty Pool is determined on a formula basis that is designed to
estimate the present value of the cash flows due to the Fund as a
result of the new Boston Pizza restaurants being added to the Royalty
Pool. As such, the calculation is dependent on a number of variables
including the estimated long-term sales of the new Boston Pizza
restaurants and a discount rate. The value of the additional Class B
Units entitled as a result of adding new Boston Pizza restaurants to
the Royalty Pool could differ from actual results.
• Accounts Receivable The Company provides an allowance for uncollectable trade
receivables based on a customer-by-customer basis using estimates
for past and current performance, aging, arrears status, the level
of allowance already in place, and management’s interpretation of
economic conditions specific to the Company’s customer base. If
certain estimates prove to be inaccurate, BPI’s results of operations
and financial position may be impacted.
• Class B Units Fair Value AdjustmentThe Company has elected under IFRS to measure the Class B Units
as a financial asset at fair value through profit and loss. The fair value
of the Class B Units asset for the Company mirrors the fair value of
the Class B Units liability recorded by Boston Pizza Royalties Income
Fund (“the Fund”) for any particular period. The Class B Units are
exchangeable into Fund Units, and thus, it is estimated that their
fair values approximate each other. The Company estimates the fair
value of the Class B Units by multiplying the issued and outstanding
Additional Entitlements (including Holdback) held by the Company at
the end of the period by the closing price of the Fund’s units at the
end of the period (or previous business day). This valuation technique
may not represent the actual value of the financial asset should such
Class B Units be exchanged.
Judgment:
• ConsolidationApplying the criteria outlined in IFRS 10, judgment is required in
determining whether BPI controls the Partnership. Making this
judgment involves taking into consideration the concepts of power
over the Partnership, exposure and rights to variable returns,
and the ability to use power to direct the relevant activities of
the Partnership so as to generate economic returns. Using these
criteria, management has determined that BPI does not ultimately
control the Partnership.
3. Significant accounting policies:The significant accounting policies used in the preparation of these
consolidated financial statements are described below.
(a) Basis of measurement:
The consolidated financial statements have been prepared on the
historical cost basis except for derivative financial instruments and
financial instruments which are measured at fair value through profit
or loss. The Company has the following items measured at fair value:
• Investment in Boston Pizza Royalties Limited Partnership relating to
the Class B Units (note 5)
• Embedded derivative of the Investment in Boston Pizza Royalties
Limited Partnership relating to the Class C Units (note 5)
BOSTON PIZZA INTERNATIONAL INC.ANNUAL REPORT 2014
BO
ST
ON
PIZ
ZA
IN
TE
RN
AT
ION
AL
IN
C.
AN
NU
AL
RE
PO
RT
20
14
67
(b) Consolidation:
These consolidated financial statements include the accounts of the
following operating entities:
Boston Pizza International Inc. and subsidiaries:
Lansdowne Holdings Ltd. 100%
Winston Churchill Pizza Ltd. 100%
Laval Corporate Training Centre Inc. 100%
The parent company of BPI is T&M Management Services Ltd.
All intercompany transactions, balances and unrealized gains and losses
from intercompany transactions are eliminated on consolidation.
Subsidiaries are those entities (including special purpose entities) which
the Company controls by having the power to govern the financial and
operating policies of such entities so as to obtain economic benefits from
their activities. The existence and effect of potential voting rights that
are currently exercisable or convertible are considered when assessing
whether the Company controls another entity.
(c) Investment in Boston Pizza Royalties Limited Partnership:
The investment in the Partnership is principally comprised of Class B Units
and Class C Units. The Class B Units are accounted for as a financial
asset which is measured each reporting date at fair value. The Class C
Units are accounted for as a financial asset at amortized cost with its
embedded derivative being measured at a fair value of nil. The statement
of comprehensive income includes interest revenue as earned, and the
impact of the fair value adjustments on the Class B Units. The fair value
of the Class B Units is determined by calculating the Company’s share
(Additional Entitlements including holdback) of Boston Pizza Royalties
Income Fund as determined by the Fund’s closing market price on the
reporting date.
The Partnership was established to hold the trademarks and trade
names used in connection with the operation of Boston Pizza restaurants
in Canada (collectively, the “BP Rights”). The Partnership and the
Company also entered into a license and royalty agreement to allow the
Company the use of the BP Rights for a term of 99 years, for which
the Company pays the Partnership a royalty expense, being 4% of the
Franchise Revenues (as defined) of certain restaurants located in Canada
(the “Royalty Pool”).
(d) Cash and cash equivalents:
Cash and cash equivalents consist of cash on hand, balances with banks,
and short-term investments with a term of three months or less.
(e) Property and equipment:
Property and equipment are measured at cost less accumulated
depreciation and accumulated impairment losses.
Cost includes expenditures that are directly attributable to the acquisition
of the asset. Subsequent costs are included in the asset’s carrying
amount or recognized as a separate asset, as appropriate, only when it is
probable that future economic benefits associated with the item will flow
to the Company and the costs can be measured reliably. The carrying
amount of a replaced asset is derecognized when replaced. Repairs
and maintenance costs are charged to the statement of comprehensive
income during the period in which they are incurred.
The Company allocates the amount initially recognized in respect of
property and equipment to its significant parts and depreciates each such
part. Residual values, methods of depreciation and useful lives of the
assets are reviewed annually and adjusted if appropriate.
Gains and losses on disposals of property and equipment are determined
by comparing the proceeds with the carrying amount of the asset and are
included as other expense in the statement of comprehensive income.
(f) Depreciation and amortization:
Depreciation is calculated over the depreciable amount, which is the cost
of an asset, or other amount substituted for cost, less its residual value.
The Company provides for depreciation of property and equipment over
their estimated useful lives as follows:
Assets Basis Rate
Office furniture and equipment Declining balance 20 – 30%
Office furniture and equipment under capital lease Straight-line at up to 3 years various rates shorter of term of Leasehold improvements Straight-line the lease or useful life
(g) Intangible assets:
Intangible assets include computer software costs which are amortized
on a declining balance basis at a rate of 30% per year. Amortization
of intangible assets is charged to depreciation and amortization on the
statement of comprehensive income.
(h) Revenue recognition and deferred revenue:
(i) Franchise revenues:
Monthly franchise fee:
Monthly franchise fees are recorded as they are earned.
Franchise fee deposits:
Franchise fee deposits are deferred and recorded net of expenses
incurred relating to the sale of the franchise. When the franchise
commences operations, the franchise deposits are recorded as
franchise revenue and the related costs are included as an expense.
(ii) Corporately owned restaurant revenues:
Corporately owned restaurant revenues are recognized at the time of
sale and when services are rendered.
(iii) Supplier contributions:
The Company receives supplier contributions from franchisee
suppliers to be used for various franchise activities. Supplier
contributions are recorded as other revenue as they are earned.
(i) Earnings per share:
The Company presents basic and diluted earnings per share (EPS) data
for its common shares. Basic EPS is calculated by dividing the profit or
loss attributable to common shareholders of the Company by the weighted
average number of common shares outstanding during the period.
Diluted EPS is determined by adjusting the profit or loss attributable to
common shareholders and the weighted average number of common
shares outstanding for the effects of all dilutive potential common shares.
There are no dilutive factors effecting EPS for the Company.
BO
ST
ON
PIZ
ZA
IN
TE
RN
AT
ION
AL
IN
C.
AN
NU
AL
RE
PO
RT
20
14
68
(j) Income taxes:
Income tax comprises current and deferred tax. Current tax is the
expected tax payable on taxable income for the period, using tax rates
enacted, or substantively enacted, at the end of the reporting period, and
any adjustments in respect of previous periods.
In general, deferred tax is recognized in respect of temporary differences
arising between the tax bases of assets and liabilities and their carrying
amounts in the consolidated financial statements. Deferred income tax is
determined on a non-discounted basis using tax rates and laws that have
been enacted or substantively enacted at the balance sheet date and
are expected to apply when the deferred tax asset or liability is settled.
Deferred tax assets are recognized to the extent that it is probable that
the assets can be recovered.
Deferred income tax is primarily provided on temporary differences arising
on the investment in the Partnership, the deferred gain, subsequent
additional entitlements and unit sales.
Deferred income tax assets and liabilities are netted and presented as
non-current.
In determining the amount of current and deferred tax the Company
takes into account the impact of uncertain tax positions and whether
additional taxes and interest may be due. The Company believes that its
accruals for tax liabilities are adequate based on many factors, including
interpretations of tax law and prior experience. This assessment relies on
estimates and assumptions and may involve a series of judgments about
future events. New information may become available that causes the
Company to change its judgment regarding the adequacy of existing tax
liabilities; such changes to tax liabilities would impact tax expenses in the
period that such a determination is made.
(k) Deferred gain:
The gain realized on the sale of the BP Rights is being deferred and
amortized over the 99 year term of the license and royalty agreement.
Amortization of the gain on BP Rights is charged to amortization of
deferred gain on the statement of comprehensive income. Annually, on
January 1, the number of Boston Pizza restaurants in the Royalty Pool on
which the Company pays a royalty to the Fund are adjusted to include the
adjusted Franchise Sales from new Boston Pizza restaurants opened on
or before December 31 of the prior year, less Franchise Sales from any
Boston Pizza restaurants that have permanently closed during the year.
In return for adding this net Franchise Sales to the Royalty Pool, Boston
Pizza receives the right to indirectly acquire additional Fund units (the
“Additional Entitlements”). The Additional Entitlements are included
in the Deferred gain.
(l) Gift cards:
The Company has a gift card program (the “Gift Card Program”) which
allows customers to prepay for future purchases at participating Boston
Pizza restaurants by loading a dollar value onto their gift card through
cash or credit card, when and as needed.
The purpose of the Gift Card Program is to expand the Boston Pizza brand
through increased exposure, as well as to increase Franchise Sales. The
restricted cash related to the gift cards recorded in Advertising Fund
restricted assets represents the prepaid amounts not yet redeemed by
customers. These cash balances as well as the outstanding customer
obligations for these gift cards are recorded as Advertising Fund restricted
assets and liabilities on the consolidated statement of financial position.
When a customer uses a gift card to purchase product at a corporately
owned and operated Boston Pizza restaurant, the Company recognizes
the revenue from the sale of the product.
When a customer uses a gift card at a franchised restaurant, the
Company recognizes revenues, in the form of royalties, arising from the
sale of the product.
The Advertising Fund recognizes income on unredeemed gift cards
(“Gift Card Breakage”) when it can determine that the likelihood
of the gift certificate being redeemed is remote and that there is no
legal obligation to remit the unredeemed gift card value to relevant
jurisdictions. The Company determines Gift Card Breakage based on
historical redemption patterns. Based on historical information, the
likelihood of a gift card remaining unredeemed can be determined 24
months after the gift card is issued. At that time, breakage income is
recognized by the Advertising Fund.
(m) Advertising fund:
The Company participates in an Advertising Fund (the “Advertising Fund”) established to collect and administer funds contributed for use
in advertising and promotional programs designed to increase sales
and enhance the reputation of the Company and its franchise owners.
In accordance with IAS 18 – Revenue, the revenue, expenses and
cash flows of the Advertising Fund are not included in the Company’s
statement of comprehensive income and cash flows because the
contributions to the Advertising Fund are segregated, designated for
specific purposes, and the Company acts, in substance, as an agent
with regard to these contributions.
The assets and liabilities held by the Advertising Fund are considered
restricted and are recorded as such on the Company’s statement of
financial position. The Company collects 3% of Franchise Sales from
franchisees and Company-operated restaurants for contribution to
the Advertising Fund. These contributions are used for local, regional
and national advertising, promotional programs, brand protection
and to administer the gift card program. The deficit balance of the
Advertising Fund as at December 31, 2014 was $5.1 million ($5.5
million at December 31, 2013), which was included in Advertising Fund
restricted assets.
(n) Financial instruments:
Financial assets and liabilities are recognized when the Company
becomes a party to the contractual provisions of the instrument. Financial
assets are derecognized when the rights to receive cash flows from the
assets have expired or have been transferred and the Company has
transferred substantially all risks and rewards of ownership.
Financial assets and liabilities are offset and the net amount is reported
on the statement of financial position when there is a legally enforceable
right to offset the recognized amounts and there is an intention to settle
on a net basis, or realize the asset and settle the liability simultaneously.
BOSTON PIZZA INTERNATIONAL INC.ANNUAL REPORT 2014
NOTES TO THE CONSOLIDATED FINANCIAL STATEMENTS
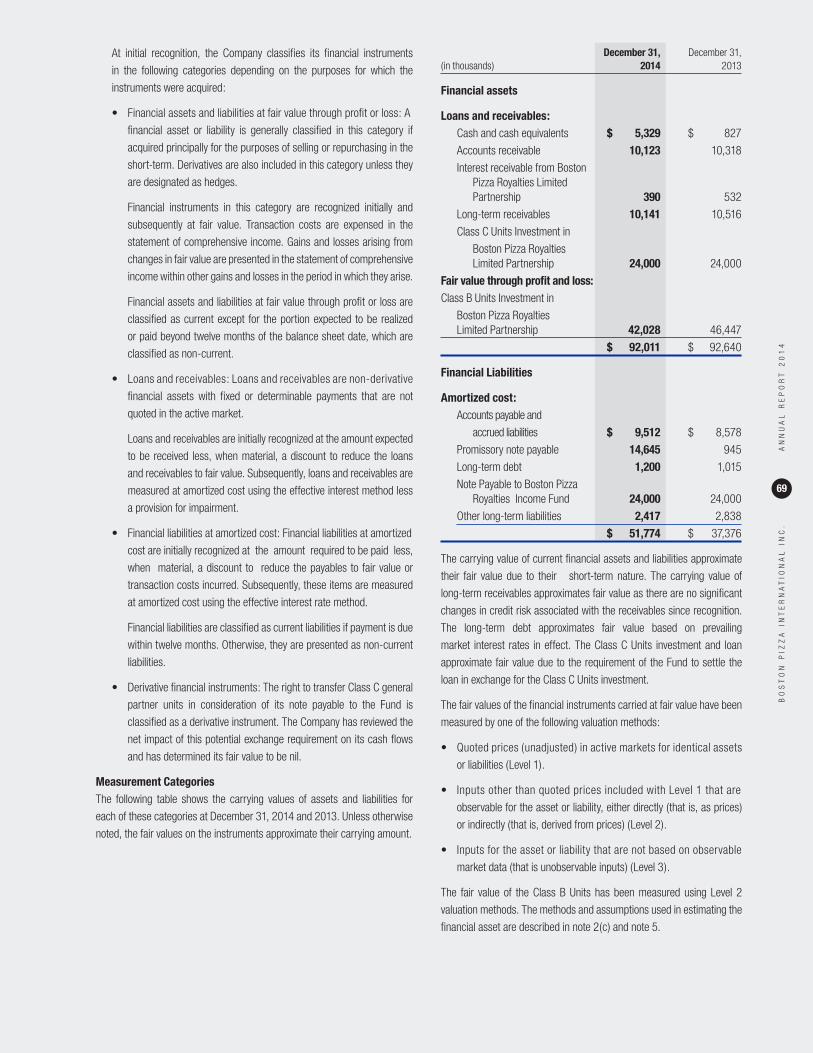
BO
ST
ON
PIZ
ZA
IN
TE
RN
AT
ION
AL
IN
C.
AN
NU
AL
RE
PO
RT
20
14
69
At initial recognition, the Company classifies its financial instruments
in the following categories depending on the purposes for which the
instruments were acquired:
• Financial assets and liabilities at fair value through profit or loss: A
financial asset or liability is generally classified in this category if
acquired principally for the purposes of selling or repurchasing in the
short-term. Derivatives are also included in this category unless they
are designated as hedges.
Financial instruments in this category are recognized initially and
subsequently at fair value. Transaction costs are expensed in the
statement of comprehensive income. Gains and losses arising from
changes in fair value are presented in the statement of comprehensive
income within other gains and losses in the period in which they arise.
Financial assets and liabilities at fair value through profit or loss are
classified as current except for the portion expected to be realized
or paid beyond twelve months of the balance sheet date, which are
classified as non-current.
• Loans and receivables: Loans and receivables are non-derivative
financial assets with fixed or determinable payments that are not
quoted in the active market.
Loans and receivables are initially recognized at the amount expected
to be received less, when material, a discount to reduce the loans
and receivables to fair value. Subsequently, loans and receivables are
measured at amortized cost using the effective interest method less
a provision for impairment.
• Financial liabilities at amortized cost: Financial liabilities at amortized
cost are initially recognized at the amount required to be paid less,
when material, a discount to reduce the payables to fair value or
transaction costs incurred. Subsequently, these items are measured
at amortized cost using the effective interest rate method.
Financial liabilities are classified as current liabilities if payment is due
within twelve months. Otherwise, they are presented as non-current
liabilities.
• Derivative financial instruments: The right to transfer Class C general
partner units in consideration of its note payable to the Fund is
classified as a derivative instrument. The Company has reviewed the
net impact of this potential exchange requirement on its cash flows
and has determined its fair value to be nil.
Measurement CategoriesThe following table shows the carrying values of assets and liabilities for
each of these categories at December 31, 2014 and 2013. Unless otherwise
noted, the fair values on the instruments approximate their carrying amount.
December 31, December 31,(in thousands) 2014 2013
Financial assets
Loans and receivables:Cash and cash equivalents $ 5,329 $ 827
Accounts receivable 10,123 10,318
Interest receivable from Boston Pizza Royalties Limited Partnership 390 532
Long-term receivables 10,141 10,516
Class C Units Investment in
Boston Pizza Royalties Limited Partnership 24,000 24,000
Fair value through profit and loss:Class B Units Investment in
Boston Pizza Royalties Limited Partnership 42,028 46,447
$ 92,011 $ 92,640
Financial Liabilities
Amortized cost:Accounts payable and
accrued liabilities $ 9,512 $ 8,578
Promissory note payable 14,645 945
Long-term debt 1,200 1,015
Note Payable to Boston Pizza Royalties Income Fund 24,000 24,000
Other long-term liabilities 2,417 2,838
$ 51,774 $ 37,376
The carrying value of current financial assets and liabilities approximate
their fair value due to their short-term nature. The carrying value of
long-term receivables approximates fair value as there are no significant
changes in credit risk associated with the receivables since recognition.
The long-term debt approximates fair value based on prevailing
market interest rates in effect. The Class C Units investment and loan
approximate fair value due to the requirement of the Fund to settle the
loan in exchange for the Class C Units investment.
The fair values of the financial instruments carried at fair value have been
measured by one of the following valuation methods:
• Quoted prices (unadjusted) in active markets for identical assets
or liabilities (Level 1).
• Inputs other than quoted prices included with Level 1 that are
observable for the asset or liability, either directly (that is, as prices)
or indirectly (that is, derived from prices) (Level 2).
• Inputs for the asset or liability that are not based on observable
market data (that is unobservable inputs) (Level 3).
The fair value of the Class B Units has been measured using Level 2
valuation methods. The methods and assumptions used in estimating the
financial asset are described in note 2(c) and note 5.
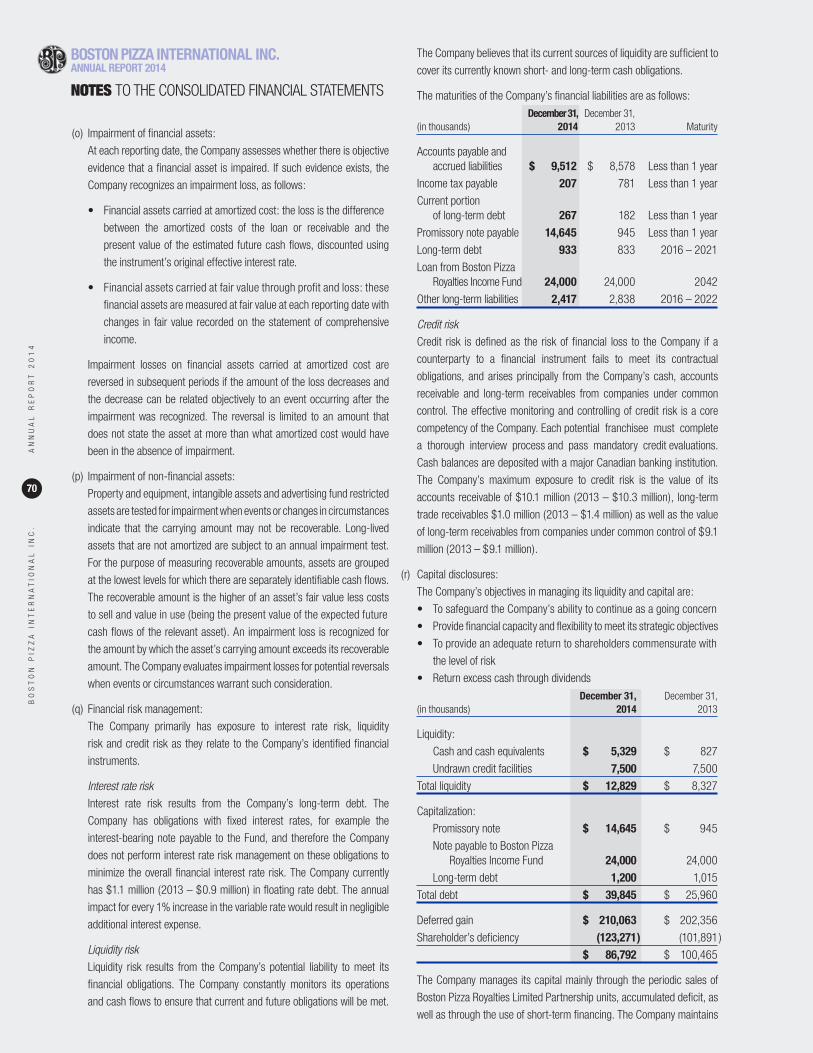
BO
ST
ON
PIZ
ZA
IN
TE
RN
AT
ION
AL
IN
C.
AN
NU
AL
RE
PO
RT
20
14
70
(o) Impairment of financial assets:
At each reporting date, the Company assesses whether there is objective
evidence that a financial asset is impaired. If such evidence exists, the
Company recognizes an impairment loss, as follows:
• Financial assets carried at amortized cost: the loss is the difference
between the amortized costs of the loan or receivable and the
present value of the estimated future cash flows, discounted using
the instrument’s original effective interest rate.
• Financial assets carried at fair value through profit and loss: these
financial assets are measured at fair value at each reporting date with
changes in fair value recorded on the statement of comprehensive
income.
Impairment losses on financial assets carried at amortized cost are
reversed in subsequent periods if the amount of the loss decreases and
the decrease can be related objectively to an event occurring after the
impairment was recognized. The reversal is limited to an amount that
does not state the asset at more than what amortized cost would have
been in the absence of impairment.
(p) Impairment of non-financial assets:
Property and equipment, intangible assets and advertising fund restricted
assets are tested for impairment when events or changes in circumstances
indicate that the carrying amount may not be recoverable. Long-lived
assets that are not amortized are subject to an annual impairment test.
For the purpose of measuring recoverable amounts, assets are grouped
at the lowest levels for which there are separately identifiable cash flows.
The recoverable amount is the higher of an asset’s fair value less costs
to sell and value in use (being the present value of the expected future
cash flows of the relevant asset). An impairment loss is recognized for
the amount by which the asset’s carrying amount exceeds its recoverable
amount. The Company evaluates impairment losses for potential reversals
when events or circumstances warrant such consideration.
(q) Financial risk management:
The Company primarily has exposure to interest rate risk, liquidity
risk and credit risk as they relate to the Company’s identified financial
instruments.
Interest rate risk
Interest rate risk results from the Company’s long-term debt. The
Company has obligations with fixed interest rates, for example the
interest-bearing note payable to the Fund, and therefore the Company
does not perform interest rate risk management on these obligations to
minimize the overall financial interest rate risk. The Company currently
has $1.1 million (2013 – $0.9 million) in floating rate debt. The annual
impact for every 1% increase in the variable rate would result in negligible
additional interest expense.
Liquidity risk
Liquidity risk results from the Company’s potential liability to meet its
financial obligations. The Company constantly monitors its operations
and cash flows to ensure that current and future obligations will be met.
The Company believes that its current sources of liquidity are sufficient to
cover its currently known short- and long-term cash obligations.
The maturities of the Company’s financial liabilities are as follows:
December 31, December 31,(in thousands) 2014 2013 Maturity
Accounts payable and accrued liabilities $ 9,512 $ 8,578 Less than 1 year
Income tax payable 207 781 Less than 1 year
Current portion of long-term debt 267 182 Less than 1 year
Promissory note payable 14,645 945 Less than 1 year
Long-term debt 933 833 2016 – 2021
Loan from Boston Pizza Royalties Income Fund 24,000 24,000 2042
Other long-term liabilities 2,417 2,838 2016 – 2022
Credit risk
Credit risk is defined as the risk of financial loss to the Company if a
counterparty to a financial instrument fails to meet its contractual
obligations, and arises principally from the Company’s cash, accounts
receivable and long-term receivables from companies under common
control. The effective monitoring and controlling of credit risk is a core
competency of the Company. Each potential franchisee must complete
a thorough interview process and pass mandatory credit evaluations.
Cash balances are deposited with a major Canadian banking institution.
The Company’s maximum exposure to credit risk is the value of its
accounts receivable of $10.1 million (2013 – $10.3 million), long-term
trade receivables $1.0 million (2013 – $1.4 million) as well as the value
of long-term receivables from companies under common control of $9.1
million (2013 – $9.1 million).
(r) Capital disclosures:
The Company’s objectives in managing its liquidity and capital are:
• To safeguard the Company’s ability to continue as a going concern
• Provide financial capacity and flexibility to meet its strategic objectives
• To provide an adequate return to shareholders commensurate with
the level of risk
• Return excess cash through dividends
December 31, December 31,(in thousands) 2014 2013
Liquidity:
Cash and cash equivalents $ 5,329 $ 827
Undrawn credit facilities 7,500 7,500
Total liquidity $ 12,829 $ 8,327
Capitalization:
Promissory note $ 14,645 $ 945
Note payable to Boston Pizza Royalties Income Fund 24,000 24,000
Long-term debt 1,200 1,015
Total debt $ 39,845 $ 25,960
Deferred gain $ 210,063 $ 202,356
Shareholder’s deficiency (123,271 ) (101,891 )
$ 86,792 $ 100,465
The Company manages its capital mainly through the periodic sales of
Boston Pizza Royalties Limited Partnership units, accumulated deficit, as
well as through the use of short-term financing. The Company maintains
BOSTON PIZZA INTERNATIONAL INC.ANNUAL REPORT 2014
NOTES TO THE CONSOLIDATED FINANCIAL STATEMENTS
BO
ST
ON
PIZ
ZA
IN
TE
RN
AT
ION
AL
IN
C.
AN
NU
AL
RE
PO
RT
20
14
71
formal policies to manage capital. Liquidity and capital structure are
managed by adjusting for changes to economic conditions, understanding
the underlying risks inherent in its operations and managing the capital
requirements to maintain and grow its operations.
The Company is not subject to any statutory capital requirements and has
no commitments to sell or otherwise issue common shares.
The Company’s credit facility includes a $7.5 million unsecured line of
credit which is subject to certain financial covenants (note 8).
The Company’s long-term debt includes credit facility agreements that
are subject to certain financial covenants.
As at December 31, 2014, the Company is in compliance with all financial
covenants.
(s) Accounting standards adopted as of January 1, 2014:
(i) Annual Improvements to IFRS (2010 – 2012) and (2011 – 2013).
In December 2013, the IASB issued narrow-scope amendments to a
total of nine standards as part of its annual improvements process.
The IASB uses the annual improvements process to make non-
urgent but necessary amendments to IFRS. Most amendments will
apply prospectively for annual periods beginning on or after July 1,
2014; earlier application is permitted, in which case, the related
consequential amendments to other IFRSs would also apply. BPI has
adopted these amendments in its financial statements beginning on
January 1, 2014 and determined that the amendments do not have a
material impact on the consolidated financial statements.
(ii) Amendments to IAS 32, Offsetting Financial Assets and Liabilities,
clarify that an entity currently has a legally enforceable right to set-off
and when a settlement mechanism provides for net settlement or
gross settlement that is equivalent to net settlement. BPI adopted
these amendments in its financial statements beginning on January
1, 2014 and determined that the amendments do not have a material
impact on the consolidated financial statements.
(t) Accounting standards and amendments issued but not yet adopted:
(i) On July 24, 2014, the IASB issued IFRS 9, Financial Instruments, and
the IASB subsequently published amendments to IFRS 9. IFRS 9 (2009)
introduces new requirements for the classification and measurement
of financial assets. Under IFRS 9 (2009), financial assets are
classified and measured based on the business model in which they
are held and the characteristics of their contractual cash flows. IFRS
9 (2010) introduces additional changes relating to financial liabilities.
IFRS 9 (2014) includes finalized guidance on the classification and
measurement of financial assets. The final standard also amends
the impairment model by introducing a new ‘expected credit loss’
model for calculating impairment, and new general hedge accounting
requirements. The IASB has deferred the mandatory effective date
of the existing chapters of IFRS 9 to annual periods beginning on or
after January 1, 2018 and must be applied retrospectively with some
exemptions. Earlier application is permitted.
(ii) On May 28, 2014, the IASB issued IFRS 15, Revenue from Contracts
with Customers. IFRS 15 will replace IAS 18, Revenue. The standard
contains a single model that applies to contracts with customers
and two approaches to recognizing revenue: at a point in time or
over time. The model features a contract-based, five-step analysis
of transactions to determine whether, how much and when revenue
is recognized. New estimates and judgmental thresholds have been
introduced, which may affect the amount and/or timing of revenue
recognized. The new standard is effective for annual periods
beginning on or after January 1, 2017. Earlier application is permitted.
4. Accounts and other receivables: December 31, December 31,(in thousands) 2014 2013
Trade receivables due from related parties $ 579 $ 888
Other trade receivables 9,544 9,430
$ 10,123 $ 10,318
Long-term receivables:
Advances to affiliated companies, non-interest bearing, unsecured with no specified terms of repayment $ 614 $ 614
Long-term trade receivables (net of allowance) 1,005 1,380
Promissory note due from affiliated company 8,522 8,522
$ 10,141 $ 10,516
The promissory note is receivable from a company related through common
control. Although the promissory note has no specific terms of repayment,
the Company has classified it as a long-term receivable as repayment is
expected over a period longer than 12 months. No interest income was
recorded in the current or prior year on the note as interest was waived.
The Company tests this receivable for impairment at every reporting date
under IFRS.
Trade receivables from franchisees are classified as long-term when payment
is expected to take longer than twelve months. The Company continues to
make every effort to collect all long-term receivable balances, including
establishing payment plans with existing franchisees.
The aging of trade receivables at the reporting dates are as follows:
December 31, December 31,(in thousands) 2014 2013
Current $ 8,041 $ 7,392
Past due 1-30 days 1,316 1,399
Past due 31-60 days 398 993
Past due 61-90 days 265 381
Past due over 91 days 1,108 1,533
$ 11,128 $ 11,698
The allowance for doubtful accounts was $1.3 million as at December 31,
2014 (December 31, 2013 – $1.3 million) and had been applied entirely
against long-term trade receivables. The Company’s collections policy is to
first apply cash receipts against the oldest outstanding invoices.
5. Investment in Boston Pizza Royalties Limited Partnership:The Company’s total investment in the Partnership is comprised of the
Class B Units measured at fair value through profit and loss, Class C Units
measured at amortized cost, as well as twenty shares of Boston Pizza GP
Inc., and one general Partnership Unit. The Company’s equity investment in
the Partnership is represented by the shares of Boston Pizza GP Inc. and the
general Partnership unit. The value of the equity investment in the Partnership
BO
ST
ON
PIZ
ZA
IN
TE
RN
AT
ION
AL
IN
C.
AN
NU
AL
RE
PO
RT
20
14
72
is nominal, as substantially all of the cash flows from the Partnership are attributable to Partnership units such as the Class B and Class C Units, while the
shares of Boston Pizza GP Inc. and the general Partnership unit are not entitled to distributions. The value of the Class C Units included in the Investment in
Boston Pizza Royalties Limited Partnership measured at amortized cost was $24.0 million as at December 31, 2014 and 2013.
The investment in the Partnership is considered an unconsolidated equity interest in a structured entity. The Fund controls the relevant activities of the
Partnership through a contractual arrangement. The value of the investment has exposure to variability as it relates to the Company’s ownership of the Class
B units measured at fair value using the closing unit price of the Fund.
As at December 31, 2014, the Fund Units closing price was $21.61 per Unit (December 31, 2013 – $20.71 per Unit) and issued and outstanding Additional
Entitlements totaled 1,944,863 (2013 – 2,242,735) resulting in a Class B Unit valuation of $42.0 million (2013 – $46.4 million).
The investment in the Partnership is comprised of:
(in thousands) 2014 2013
Class B Units, at fair value $ 42,028 $ 46,447
Class C Units, at amortized cost 24,000 24,000
$ 66,028 $ 70,447
The Class B Units are comprised of the following:
Issued and outstanding Issued and Additional outstanding Entitlements Additional including Class B Unit (in thousands, except unit data) Entitlements Holdback Entitlement
Opening – January 1, 2013 1,959,875 2,003,508 $ 38,667
Additional Entitlements for addition of 5 net new restaurants to the Royalty Pool in 2012
– granted January 1, 2013 (note 11) 155,559 194,449 3,722
Adjustment to prior year Additional Entitlements for actual performance of new restaurants
added to Royalty Pool in 2011 (note 11) 88,411 44,778 634
Fair value gain on Class B units — — 3,424
Ending – December 31, 2013 2,203,845 2,242,735 $ 46,447
Additional Entitlements for addition of 10 net new restaurants to the Royalty Pool in 2013
– granted January 1, 2014 (note 11) 355,750 444,688 9,227
Adjustment to prior year Additional Entitlements for actual performance of new restaurants
added to Royalty Pool in 2012 (note 11) 86,336 47,446 908
Exchange of Class B Units for Fund Units (790,006 ) (790,006 ) (16,669 )
Fair value gain on Class B units — — 2,115
Ending – December 31, 2014 1,855,925 1,944,863 $ 42,028
On March 10, 2014, the Company exchanged Class B Partnership units for 790,006 Fund Units. Following the exchange, the Company sold these Fund Units
to a syndicate of investment dealers for gross proceeds of $16.7 million. BPI received cash of $16.0 million, net of transaction costs. The transaction costs of
$0.7 million are included in the fair value gain on financial assets in the consolidated financial statements of comprehensive income.
BOSTON PIZZA INTERNATIONAL INC.ANNUAL REPORT 2014
NOTES TO THE CONSOLIDATED FINANCIAL STATEMENTS
BO
ST
ON
PIZ
ZA
IN
TE
RN
AT
ION
AL
IN
C.
AN
NU
AL
RE
PO
RT
20
14
73
6. Property and equipment: Office Office furniture furniture and and equipment Leasehold Cost (in thousands) equipment under capital lease improvements Total
Opening – January 1, 2013 $ 8,858 $ 2,647 $ 8,389 $ 19,894
Additions for the year 742 93 833 1,668
Disposals (1,160 ) — — (1,160 )
Ending – December 31, 2013 8,440 2,740 9,222 20,402
Net additions for the year 422 71 388 881
Ending – December 31, 2014 $ 8,862 $ 2,811 $ 9,610 $ 21,283
Office Office furnitureAccumulated furniture and and equipment LeaseholdDepreciation (in thousands) equipment under capital lease improvements Total
Opening – January 1, 2013 $ 6,528 $ 2,472 $ 5,016 $ 14,016
Depreciation for the year 667 133 538 1,338
Disposals (1,075 ) — — (1,075 )
Ending – December 31, 2013 6,120 2,605 5,554 14,279
Depreciation for the year 607 89 619 1,315
Ending – December 31, 2014 $ 6,727 $ 2,694 $ 6,173 $ 15,594
Net book valueAt December 31, 2013 $ 2,320 $ 135 $ 3,668 $ 6,123
At December 31, 2014 2,135 117 3,437 5,689
7. Intangible assets: Computer software andCost (in thousands) other
Opening – January 1, 2013 $ 8,081
Additions for the year 1,004
Ending – December 31, 2013 9,085
Net additions for the year 1,907
Ending – December 31, 2014 $ 10,992
Computer software andAmortization (in thousands) other
Opening – January 1, 2013 $ 4,800
Amortization for the year 1,275
Ending – December 31, 2013 6,075
Amortization for the year 1,330
Ending – December 31, 2014 $ 7,405
Net book valueAt December 31, 2013 $ 3,010
At December 31, 2014 3,587
8. Line of credit:The Company has an available line of credit in the amount of $7.5 million with
a 364 day term to cover the Company’s day-to-day operating requirements
through normal seasonal variations in the business if needed. The line of
credit bears interest at prime and is due upon demand. The line of credit
facility is secured by a first charge over the Company’s assets other than
the following assets: the royalty payments received by the Company from
its franchisees, the Class C general partnership units held by the Company
and the monthly distribution by the Partnership on those Class C general
partnership units. The Fund and its subsidiaries will continue to have a first
charge over these assets.
The Company has, as part of the security granted to the Bank, agreed to
pledge a minimum number of Class B general partner units held by the
Company which are convertible into units of the Fund which would have
value, at any time equal to at least 125% of the amount outstanding on the
Line of Credit.
On December 31, 2014 and 2013, there were no amounts outstanding under
the line of credit.
BO
ST
ON
PIZ
ZA
IN
TE
RN
AT
ION
AL
IN
C.
AN
NU
AL
RE
PO
RT
20
14
74
9. Long-term debt:Long-term debt consists of: December 31, December 31,(in thousands) 2014 2013
GE Canada Equipment Financing G.P. term loans bearing variable interest at bankers’ acceptance plus 4.55% per annum and due in 2020-2021 secured by restaurant equipment and cross guarantees by subsidiaries $ 1,029 $ 829
GE Canada Equipment Financing G.P. term loans bearing variable interest at bankers’ acceptance plus 2.75% per annum and due in 2015 secured by restaurant equipment 56 61
Capital leases 115 125
1,200 1,015
Current portion 267 182
$ 933 $ 833
During the year, the Company’s wholly-owned subsidiary, Lansdowne
Holdings Ltd. entered into a credit facility agreement with GE Canada Equipment
Financing G.P. (“GE”) to borrow $0.3 million. The credit facility bears interest
at Bankers’ Acceptance Rate plus 4.55% per annum, is due in 2021, and is
secured by restaurant equipment and cross guarantees among the subsidiaries.
As at December 31, 2014, funding of $0.3 million was received.
The fair value of the Company’s long-term debt is $1.2 million (December 31,
2013 – $1.0 million) which was determined by completing a net present
value calculation of long-term debt using current lending rates. The impact of
a 1% increase in the variable rate would result in a minimal impact on the fair
market value and the statement of comprehensive income.
Principal repayments on long-term debt and capital lease obligations are as
follows: December 31,(in thousands) 2014
Long-term debt:
2015 2062016 1582017 1672018 1772019 and thereafter 377 1,085Capital lease obligations:
2015 612016 392017 15 115 $ 1,200
10. Notes payable: December 31, December 31,(in thousands) 2014 2013
Note Payable to Boston Pizza Royalties Income Fund with interest payable monthly at 7.5% per annum, due July 17, 2042 $ 24,000 $ 24,000
Promissory note payable to the parent company, non-interest bearing and due on demand 14,645 945
38,645 24,945
Current portion 14,645 945
$ 24,000 $ 24,000
The loan from the Fund arose at the time of the sale of the trademarks and
trade names from the Company in July 2002 and is secured by a general
security agreement. The loan may not be assigned without the prior consent
of the Company.
The Company, as the holder of 2,400,000 class C general partnership units,
has the right to transfer such class C general partnership units to the Boston
Pizza Holdings Limited Partnership in consideration for the assumption
of the Boston Pizza Holdings Limited Partnership of, and the concurrent
release of the Company of its obligations with respect to, an amount of the
indebtedness under the BP loan equal to $10.00 for each Class C general
partnership unit transferred.
During the year, the Company settled $32.9 million (2013 – $2.8 million) of
dividends declared through issuance of additional promissory notes payable
with the same terms. During the year, the Company made payments of $19.2
million (2013 – $4.6 million) against the non-interest bearing, due upon
demand, promissory note payable to its parent company.
11. Deferred gain: December 31, December 31,(in thousands) 2014 2013
Balance, beginning of year $ 202,356 $ 200,308
Additional Entitlements 10,135 4,356
Amortization of deferred gain (2,428 ) (2,308 )
Balance, end of year $ 210,063 $ 202,356
The Additional Entitlements are calculated as 92.5% of the Franchise Sales
added to the Royalty Pool, multiplied by one minus the effective average tax
rate estimated to be paid by the Fund, divided by the yield of the Fund, divided
by the weighted average Unit price.
The Company receives 80% of the Additional Entitlements initially with
the balance received when the actual full year performance of the new
restaurants and the actual effective average tax rate is known with certainty.
Monthly distributions from the Fund are based on full Additional Entitlements,
and are subject to adjustment on January 1 of the next fiscal year when full
performance of the restaurants is known with certainty.
On January 1, 2014, 12 new Boston Pizza restaurants that opened during
the period from January 1, 2013 to December 31, 2013 were added to the
Royalty Pool while two restaurants that closed during 2013 were removed.
The Franchise Sales of these 10 net new restaurants have been estimated
at $19.8 million. The total number of restaurants in the Royalty Pool has
increased to 358. As a result of the contribution of the additional net sales
BOSTON PIZZA INTERNATIONAL INC.ANNUAL REPORT 2014
NOTES TO THE CONSOLIDATED FINANCIAL STATEMENTS
BO
ST
ON
PIZ
ZA
IN
TE
RN
AT
ION
AL
IN
C.
AN
NU
AL
RE
PO
RT
20
14
75
to the Royalty Pool, and assuming 100% of the Additional Entitlement,
the Company’s Additional Entitlement is equivalent to 444,688 (2013 –
194,449) Fund units. The Company will also receive a proportionate increase
in monthly distributions from the Partnership. Of the Additional Entitlement,
20% (2014 – 88,938 units; 2013 – 38,890 units), remain unissued and
are not eligible for exchange into Fund units until January 1, 2015 (2013
units – January 1, 2014) based on the actual performance of the new stores
(the “Holdback”).
In early 2014, adjustments to royalty payments and Additional Entitlements
were made based on the actual performance of five net new restaurants
added to the Royalty Pool on January 1, 2013. Based on these adjustments,
the Company received its pro rata portion of the remaining Additional
Entitlements, 86,336 Fund units.
12. Income taxes:Income tax expense as reported differs from the amount that would be
computed by applying the combined Federal and Provincial statutory income
tax rates to earnings before income taxes. The reasons for the differences
are as follows:
(in thousands) 2014 2013
Earnings before income taxes $ 12,536 $ 16,868
Combined Canadian federal and provincial tax rates 26.2 % 26.1 %
Computed expected tax expense 3,284 4,403
Increased (reduced) by:
Permanent differences 280 (468 )
Difference from rates other than statutory rate (2,569 ) (238 )
Change in statutory tax rates (8 ) (1,079 )
Income tax expense $ 987 $ 2,618
The tax effects of temporary differences that give rise to significant portions
of the deferred income tax assets and liabilities are:
December 31, December 31,(in thousands) 2014 2013
Future income tax assets (liabilities):
Investment in Boston Pizza Royalties Limited Partnership $ (15,746 ) $ (16,830 )
Deferred gain 55,093 53,063
Deferred revenue 730 67
Other 543 611
$ 40,620 $ 36,911
13. Share capital: The Company has an unlimited number of Class A Common Shares without
par value authorized of which 104,600,000 are issued and outstanding.
14. Other expenses: The following are the components of other expenses:
December 31, December 31,(in thousands) 2014 2013
Marketing and advertising $ 3,636 $ 2,773
Travel 2,766 2,633
Office, rent & utilities 2,325 2,407
Research & Development 2,017 420
Professional Fees 427 401
Other 2,958 2,976
$ 14,129 $ 11,610
15. Commitments: The Company is committed under operating lease contracts for office space,
restaurant space and advertising contracts. The minimum annual rental
payments under these leases for the next five years ending December 31
and thereafter are as follows: December 31,(in thousands) 2014
2015 2,6552016 1,7892017 1,5482018 1,5522019 1,3612020 and thereafter 5,419
16. Related party and subsidiary transactions:The Company earned revenues of $3.1 million (2013 – $2.9 million) from a
company under common control.
Included in compensation expense costs are management fees of $1.5 million
(2013 – $1.5 million) to companies under common control. Additionally
included in management fees is $1.7 million (2013 – $1.7 million) paid to
the Company’s parent for services rendered.
Key management personnel include the senior management team that
oversees the strategic direction and operations of the Company. Key
management personnel compensation was $5.5 million for the year ended
December 31, 2014 (2013 – $5.9 million).
Included in accounts payable is $0.1 million (2013 – $0.3 million) due to
associated companies. Included in accounts receivable is $0.6 million (2013
– $0.9 million) due from associated companies.
The Company paid interest on a note payable to the Fund of $1.8 million
(2013 – $1.8 million) and incurred royalty expenses of $31.3 million (2013
– $30.2 million).
As at December 31, 2014, the Company owes $14.6 million (2013 – $0.9
million) in a promissory note payable to the parent company.
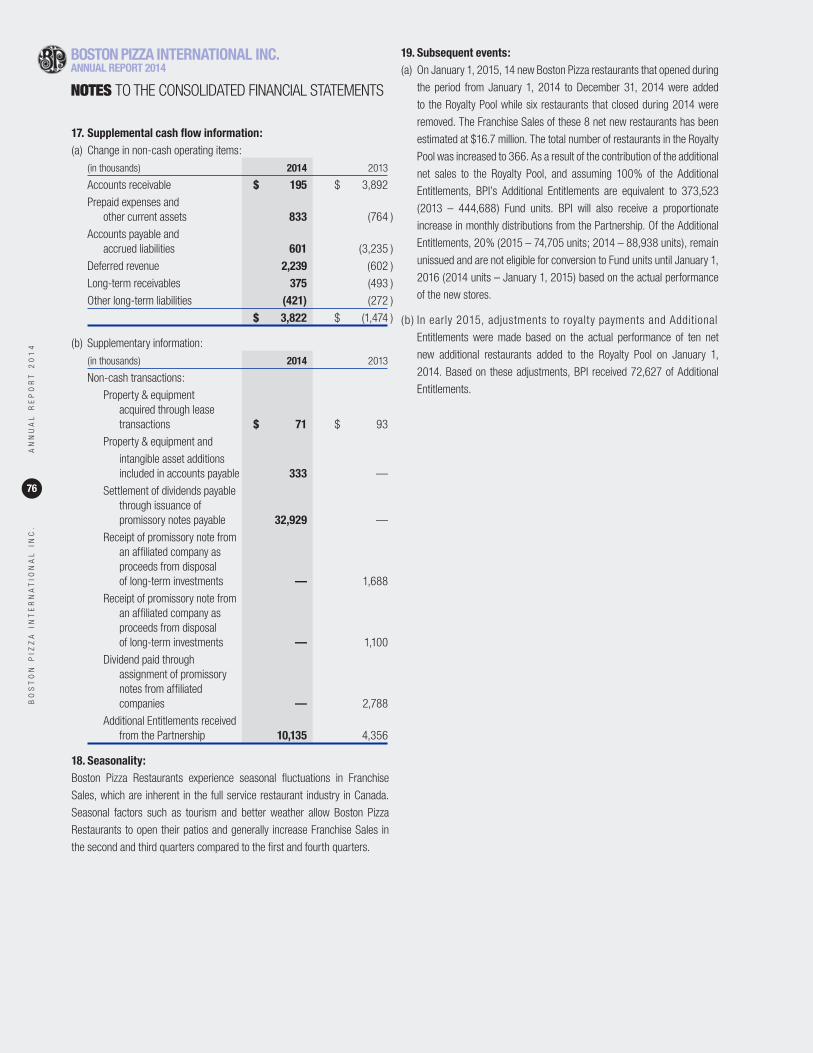
BO
ST
ON
PIZ
ZA
IN
TE
RN
AT
ION
AL
IN
C.
AN
NU
AL
RE
PO
RT
20
14
76
17. Supplemental cash flow information:(a) Change in non-cash operating items:
(in thousands) 2014 2013
Accounts receivable $ 195 $ 3,892
Prepaid expenses and other current assets 833 (764 )
Accounts payable and accrued liabilities 601 (3,235 )
Deferred revenue 2,239 (602 )
Long-term receivables 375 (493 )
Other long-term liabilities (421) (272 )
$ 3,822 $ (1,474 )
(b) Supplementary information:
(in thousands) 2014 2013
Non-cash transactions:
Property & equipment acquired through lease transactions $ 71 $ 93
Property & equipment and
intangible asset additions included in accounts payable 333 —
Settlement of dividends payable through issuance of promissory notes payable 32,929 —
Receipt of promissory note from an affiliated company as proceeds from disposal of long-term investments — 1,688
Receipt of promissory note from an affiliated company as proceeds from disposal of long-term investments — 1,100
Dividend paid through assignment of promissory notes from affiliated companies — 2,788
Additional Entitlements received from the Partnership 10,135 4,356
18. Seasonality:Boston Pizza Restaurants experience seasonal fluctuations in Franchise
Sales, which are inherent in the full service restaurant industry in Canada.
Seasonal factors such as tourism and better weather allow Boston Pizza
Restaurants to open their patios and generally increase Franchise Sales in
the second and third quarters compared to the first and fourth quarters.
19. Subsequent events:(a) On January 1, 2015, 14 new Boston Pizza restaurants that opened during
the period from January 1, 2014 to December 31, 2014 were added
to the Royalty Pool while six restaurants that closed during 2014 were
removed. The Franchise Sales of these 8 net new restaurants has been
estimated at $16.7 million. The total number of restaurants in the Royalty
Pool was increased to 366. As a result of the contribution of the additional
net sales to the Royalty Pool, and assuming 100% of the Additional
Entitlements, BPI’s Additional Entitlements are equivalent to 373,523
(2013 – 444,688) Fund units. BPI will also receive a proportionate
increase in monthly distributions from the Partnership. Of the Additional
Entitlements, 20% (2015 – 74,705 units; 2014 – 88,938 units), remain
unissued and are not eligible for conversion to Fund units until January 1,
2016 (2014 units – January 1, 2015) based on the actual performance
of the new stores.
(b ) In early 2015, adjustments to royalty payments and Additional
Entitlements were made based on the actual performance of ten net
new additional restaurants added to the Royalty Pool on January 1,
2014. Based on these adjustments, BPI received 72,627 of Additional
Entitlements.
BOSTON PIZZA INTERNATIONAL INC.ANNUAL REPORT 2014
NOTES TO THE CONSOLIDATED FINANCIAL STATEMENTS

BO
ST
ON
PIZ
ZA
IN
TE
RN
AT
ION
AL
IN
C.
AN
NU
AL
RE
PO
RT
20
14
79
BOSTON PIZZA INTERNATIONAL INC. SEN IOR EXECUT IVE TEAM
Left to right: Wes Bews, George Melville, Jim Treliving, Mark Pacinda
BOSTON PIZZA ROYALTIES INCOME FUND TRUSTEES
Left to right: David L. Merrell, William C. Brown, W. Murray Sadler
UNITHOLDER INFORMATION
CORPORATE OFFICE#100 – 10760 Shellbridge Way
Richmond, BC, V6X 3H1
INVESTOR RELATIONS#100 – 10760 Shellbridge Way
Richmond, BC, V6X 3H1
Tel: 604-270-1108
Fax: 604-270-4188
Email: [email protected]
Web: www.bpincomefund.com
TRUSTEES OF THE FUND
William C. BrownCorporate Director
W. Murray SadlerCorporate Director
David L. MerrellCorporate Director
TRANSFER AGENTComputershare Investor Services Inc.
STOCK EXCHANGE LISTINGToronto Stock Exchange: BPF.UN
AUDITORSKPMG LLP
BOSTON PIZZA INTERNATIONAL INC.BOSTON PIZZA ROYALTIES INCOME FUND
SHAREHOLDER INFORMATION
CORPORATE OFFICE#100 – 10760 Shellbridge Way
Richmond, BC, V6X 3H1
EASTERN OFFICESuite 708 – 1 City Centre Drive
Mississauga, ON L5B 1M2
QUÉBEC OFFICE3030 boulevard Le Carrefour
bureau 802, Laval, PQ, H7P 2P5
MANAGEMENT TEAM
Jim TrelivingChairman & Owner
George MelvilleChairman & Owner
Mark PacindaPresident and Chief Executive Officer
Wes BewsChief Financial Officer
LEGAL COUNSELBorden Ladner Gervais LLPRegistered and Records Office
#1200 – 200 Burrard Street
Vancouver, BC V7X 1T2
DIRECTORS OF BOSTON PIZZA GP INC. –THE MANAGING GENERAL PARTNER OF BOSTON PIZZA ROYALTIES LIMITED PARTNERSHIP
William C. BrownDirector*Corporate Director
W. Murray SadlerDirector*Corporate Director
David L. MerrellDirector*Corporate Director
Mark PacindaDirectorChief Executive Officer
Wes BewsDirectorChief Financial Officer
*Audit Committee and Governance Committee

® Boston Pizza Royalties Limited Partnership. All Boston Pizza registered Canadian trademarks and unregistered Canadian trademarkscontaining the words “Boston”, “BP”, and/or “Pizza” are trademarks owned by the Boston Pizza Royalties Limited Partnership and licensed by the Boston Pizza Royalties Limited Partnership to Boston Pizza International Inc. Boston Pizza Foundation is a registered trademark of Boston Pizza Royalties Limited Partnership, used under license. Future Prospects Role Models For Life and design are trademarks of Boston Pizza Foundation. © Boston Pizza International Inc. 2015
Printed in Canada