Embed Size (px)
Citation preview

Annual Report
2014 Advancing Security through New Technology

This is a translation of the original Swedish Annual Report. In the event of diff erences between the English translation andthe Swedish original, the Swedish Annual Report shall prevail.
CEO statement 2–4
Markets 6–7
Strategy 8–9
Off ering 10–13
Operations 14–19
Overview – business segments 14–15
Security Services North America 16
Security Services Europe 17
Security Services Ibero-America 18
Africa, Middle East and Asia 19
Securitas’ responsibilities 21–26
Corporate Governance and Management 28–49
Corporate Governance 29–33
Securitas management model – Toolbox 29
Compliance with the Code 30
Board of Directors 34–35
Group Management 36–37
Enterprise risk management (ERM)and internal control
38–48
Auditors 49
Auditor’s report onCorporate Governance Statement
49
Annual Report 50–127
Securitas’ fi nancial model 50–51
Report of the Board of Directors 53–61
Consolidated fi nancial statements 62–68
Notes and comments to the consolidatedfi nancial statements
69–115
Five-year overview 114–115
Parent Company fi nancial statements 116–118
Notes and comments to theParent Company fi nancial statements
119–125
Signatures of the Board of Directors 126
Auditor’s report 127
Quarterly data 128–129
The Securitas share 130–131
Financial information and invitationto the Annual General Meeting
132
Our servicesSecuritas serves a wide range of customers in a variety of industries and customer segments. Customers vary in size from the ‘shop on the corner’ to global multibillion industries. The service offering categories are specialized guarding and mobile services, monitoring, technical solutions and consulting and investigations. Securitas provides tailored solutions based on customer-specific needs.
This report contains a number of examples of how Securitas’ services have assisted customers in strengthening their level of security. For a detailed account of how Securitas’ offering delivers integrated security solutions, continue reading on page 10.
Organic sales growth increased to 3 percent.
Organic sales growth, %
SizeSecuritas employs close to 320 000 people in 53 countries. In 2014, total sales amounted to MSEK 70 217 and operating income to MSEK 3 505.
Read more on pages 12–19.
MarketsSecuritas operates in 53 countries throughout North America, Europe, Latin America, Africa, the Middle East and Asia. Securitas is organized into three business segments: Security Services North America, Security Services Europe and Security Services Ibero-America.
Read more on pages 6–13.
Earnings per share rose from SEK 5.07 to SEK 5.67, an increase of 12 percent.
Financial targetsSecuritas has two fi nancial targets. The fi rst target is related to the income statement: an annual average increase in earnings per share of 10 percent. The second target is related to the balance sheet: a free cash fl ow to net debt ratio of at least 0.20.
Read more on pages 50–51 and 76–77.
The free cash flow to net debt ratio decreased from 0.22 to 0.18.
Swedish shareholders held 64 per cent of the votes.
The shareThe number of shareholders in Securitas was 24 274. Institutional investors and other corporate entities accounted for 96 percent of the total share capital. Shareholders outside Sweden accounted for 52 percent of the capital and 36 percent of the votes. The principal shareholders in Securitas are Gustaf Douglas and Melker Schörling, who, through their companies and families, hold 10.9 percent and 5.6 percent of the capital, respectively.
Read more on pages 130–131.
64 05761 340
65 70066 458 70 217
1%
3 %
0%
3 %
1%
12 13 1410 11
SizeSize Markets
Security Services North America 36%
Security Services Europe 50%
Security Services Ibero-America 13%
Other 1%
Financial targets
5.714,67 5.07
5.67
3.22
4.11*
12 13 1410 11
Financial targets
0.24 0.21
0.08
0.18
0.22
12 13 1410 11
The share
USA 11%
United Kingdom 11%
France 3%
Luxembourg 4%
Rest of world 7% Sweden 64%
Shareholders per country, votes.
* Adjusted for items aff ecting comparability and impairment losses.
Security Services in North America and Europe represent 86 percent of total sales.
Annual Report
2014

Enables Efficient Solutions
Security Expertise
#1Securitas relies on a solid foundation of expertise and know-how. Combined with tools and equipment that utilize technology, this gives us the ability to create security solutions that add value for our customers. For customers with several different sites, our security solutions are designed to replace their often fragmented equipment and systems with open systems and smart solutions. Fully understanding our customers’ needs at both the operational and strategic level is therefore key in delivering efficient solutions.
To learn more about how Securitas’ security solutions address our customers’ needs, see case #2 on page 5, case #3 on page 20, and case #4 on page 27.

CEO statement
The security industry is undergoing an enormous transformation – a develop-ment that is moving faster than most people realize, and will move even faster in years to come. Securitas is at the forefront of this change.
Performance 2014In 2014, organic sales growth continued to show a positive trend driven by successful sales efforts, our strategy of security solutions and technology offerings and an improved macroeconomic climate in the USA. All business segments improved compared with last year. All in all, Securitas is well prepared to accelerate the security solutions process.
Security market growthDue to current market dynamics and a gradual increase in the integration of technology with security solutions, the security market in mature markets is no longer expected to grow 1 to 2 percent faster than GDP – as it has historically – but rather at the same pace as GDP. In the future, this trend could be improved through increased outsourcing of currently insourced guarding activities, and by allowing the private security industry to take over services performed by public authorities and governments. In the USA, we have witnessed how the relative share of the outsourced market increased in 2014, which has not happened for a long time. It is too early to know whether this is a trend, but as the optimization of security solutions becomes more and more complex, it is only logical that the outsourced market will grow at the expense of the insourced market.
In 2014, the US security market is estimated to have grown by 3 percent, and Securitas’ organic sales growth was 3 percent in the business seg-ment Security Services North America. A strength-ened US economy will continue to support a growing security market in 2015 of 3–4 percent.
After two years of decline, the European security market recovered in 2014. Although the trend is slightly positive, the outlook is uncertain, due to macroeconomic fragility in Europe and the growing budget deficits and high levels of debt in some countries. In 2014, Securitas’ organic sales growth in Security Services Europe was 2 percent.
In Security Service Ibero-America, the organic sales growth was 8 percent in 2014. There was strong organic sales growth in Latin America while the growth remained negative in Spain at -7 per-cent. Due to the recovery of the Spanish economy, we reached -4 percent in the last quarter. We expect the Spanish security market to remain flat in 2015.
Technology is reshaping the security industryThere is a clear trend in the security industry: labor is becoming more expensive and complex, with new rules and regulations every year. Technology is developing fast and becoming less expensive, and in combination with a new generation of high-capacity telecom networks, the transmission of images and
Organic sales growth and operating margin, per quarter
Operating margin Organic sales growth
Q4Q3Q2Q1Q4Q3Q2Q1Q4Q3Q2Q1Q4Q3Q2Q1Q4Q3Q2Q1–4–20246%
2010 2011 2012 2013 2014
On Track for the Paradigm Shift
Total sales MSEK 70 217 (65 700)
Income before taxes MSEK 2 909 (2 643)
Net income MSEK 2 072 (1 856)
Organic sales growth 3 percent (1)
Operating margin 5.0 percent (5.1)
Securitas Annual Report 20142

CEO statement
videos is becoming more viable and secure. This is enabling us to change our service content
and offer better security at a lower or equal cost, which is a critical shift in those countries where salary costs are relatively high. In addition, video analytics and intelligent cameras are enabling us to determine suspicious or dangerous behavior at an early stage, thereby minimizing the risk of business interruption.
In short, we can detect potential crime before it happens, and do it more cost-efficiently than before. A pretty good value proposition!
This combination creates a paradigm shift and a brilliant opportunity for security companies that are able to make investments in technology, monitoring and response capacity, and have the financial strength to invest in the required equipment. Secu-rity companies that do nothing will not survive over the long term – and this will simply be a matter of time, since creating customer value by only selling guarding hours will become increasingly difficult.
In 2012, sales of security solutions and technol-ogy accounted for some 6 percent of Group sales.
By the last quarter of 2014, the relative share of total sales in Securitas had risen to 10 percent. More impressively, total sales in security solutions and technology have grown by 28 percent in 2014 compared with 2013, and we estimate that we can continue to grow the security solutions and tech-nology sales in at least the same range in 2015.
The degree to which technology is being inte-grated into security solutions varies from country to country in Securitas’ markets. However, as the pace accelerates, we are confident that we will be able to gain market shares by having a stronger and more cost-efficient offering than many traditional guarding companies. We have already seen proof of this in markets where we are well equipped to offer security solutions, and where we have grown faster than the security market average.
The paradigm shift requires a balance sheet that can support investments in technology. We usually own the technology at the customer site and amortize it over the length of the contract. Our assessment is that we need to make additional investments of about MSEK 350–400 per year to
“As the pace accelerates, we are confident that we will be able to gain market shares by having a stronger and more cost-efficient offering than many traditional guarding companies.Alf Göransson, President and CEO
3Securitas Annual Report 2014

achieve this goal. These are the best investments a company can make, since they are literally “invest-ments in the customer.” We will finance this through our free cash flow, and a slower pace of acquisition compared with recent years. We are no longer inter-ested in acquiring traditional guarding companies in mature markets, but are now focused on businesses that can strengthen our ability to accelerate our strategy.
To support our global strategy, we therefore made some key acquisitions in 2014, such as the Belgian security and critical communications sys-tems integrator SAIT, and 24 percent of the shares in the US remote video services company Iverify.
In certain new markets, we can envisage acquiring guarding companies in order to serve our large, global customers, and there are some 10 countries on our wish list.
Accelerating the processThis development also requires internal changes. In Security Services Europe, we have discontinued our former divisions and are now approaching cus-tomers as one company. As a result, we are work-ing more effectively and cross-functionally, with common targets, goals and incentives, and no internal mark-up or competition.
In 2014, we invested in more sales tools, sales training and a sales activity reporting structure for measurement and follow-up. We also recruited more resources in order to become more proactive in our security solutions sales. We will also increase our focus on leadership and coaching, as the relation-ship between leadership and change is obvious.
Over the past three years, we have strengthened our technological know-how and continued recruiting specialists. In an increasingly demanding security market, we know that the decisive factor will be having a critical mass of knowledge and the ability to create innovative solutions that provide greater benefits for customers. Today, Securitas has some 2 500 employees specialized in technology.
A responsible businessAs a responsible player in the security industry, we are actively adding value to our brand, reducing our exposure to the risks identified in the enterprise risk management process, and promoting sustainable growth and profit.
In 2014, we continued our extensive training in Securitas’ Values and Ethics Code throughout the entire organization. Securitas Integrity Line has been implemented in 50 of the countries in which we operate, and reported cases of non-compliance with the Code are being followed up in a structured manner. Our due diligence process was further developed. We continued the stakeholder dialogue process, which aims to monitor expectations with regard to Securitas’ sustainability performance. We submitted a complete GRI report for 2014. Read more about our responsibility on pages 21–26.
Securitas is preparedWe have been preparing for this paradigm shift for the past three to four years. Our strategy is clear: to integrate on-site, remote and mobile guarding ser-vices with technology solutions to achieve a higher level of customer satisfaction through cost-effi-ciency and added value. The result will be longer customer relationships, improved earnings and sus-tainable shareholder value. This strategy will enable us to grow faster than the security market average in the coming years.
I firmly believe that our fantastic brand, our strong culture, our employees who are making a difference every day, our security leadership and our strategy will create value for our customers, and music to our shareholders’ ears, for years to come.
CEO statement
Stockholm, March 13, 2015
Alf Göransson President and CEO Securitas AB
Securitas Annual Report 20144

Security Solutions in a Sensitive EnvironmentSecuritas has many customers operating in sectors that are dependent on functioning advanced tech-nology. One of them is Medicon Village, a life science park in the city of Lund in the south of Sweden. Covering an area of approximately 80 000 square meters, with laboratories accounting for about 40 000 square meters, Medicon Village accommo-dates more than 1 100 people in 100 different organizations – from researchers to innovators and business entrepreneurs.
Here, the smallest of companies enjoy the bene-fits of a large company’s resources by being part of a larger community; and new possibilities are created in the interface and collaboration between regional organizations, universities and the business commu-nity contributing to people’s health and well-being.
In this highly sensitive, high-risk research envi-ronment, security and safety are vital. It is crucial that Securitas and the customer work closely together and continuously refine the security solution. The
Medicon Village security solution includes on-site and remote guarding, fire and safety services, and a remote video solution. Additionally, Securitas’ security officers perform several different safety operations to prevent risk in the life science park’s daily business. This includes fire protection, checking residual-current circuit breakers and control of the burglar alarms, as well as training the park’s tenants in safety protocol. Securitas also conducted a risk analysis of one of the laboratories in order to develop a state-of-the-art security solution, and is responsible for testing and implementing new safety working procedures and technology installations.
Working with highly sensitive information in an around-the-clock business environment requires a flexible yet solid security solution. Delivering advanced security while ensuring operations are sustainable is a testament to our capabilities. Securitas is proud to provide security for life science parks of tomorrow.
#2
5Securitas Annual Report 2014

We are in the midst of a paradigm shift whereby technology is rapidly becoming smarter, more cost efficient and increasingly applicable in security solutions. As the industry as a whole faces more intense pressure in terms of costs and efficiency requirements, intelligent security is becoming a prioritized choice.
The number of areas requiring professional security is on the rise. At the same time, more operations are experiencing a sensitivity to disturbances. The private security market is also being given an opportunity to grow as the public sector begins to recognize the potential gains of outsourcing security responsibility for work presently performed by the police or other authorities.
However, while the global economic environment is demanding greater efficiency, it is also becoming increasingly cost conscious. The steadily rising cost of manpower in many mature markets, combined with more companies competing for contracts, means that market conditions are challenging.
Technology development is changing the security industry entirely. As better infrastructure continues to improve connectivity between hardware, software and people, technology is creating growth opportu-nities. While developments affect the entire industry, certain markets are more technically mature than others.
Securitas has identified these opportunities and is working to improve the profitability of customer
contracts with a higher level of technology and value-added services. Our focus on developing new security solutions with advanced technology content means that we are well prepared to meet market developments and demand.
On the whole, the global security services sector employs several million people and the market for private guarding services is projected to reach USD 149 billion by 2018. The regional markets differ significantly in terms of maturity and pace of growth. Demand for security services is closely linked to global economic development, the general perception that there is a threat to society, as well as social and demographic trends. The predomi-nantly mature security markets in North America and Europe have moved from growing 1–2 percent faster than GDP to growing at the same pace as GDP. Growth rates in emerging markets in Latin America, Africa, the Middle East and Asia still tend to outpace GDP. While growth is generally higher in emerging economies, volumes and large contracts are still confined to relatively mature markets.
Opportunities for Growth in a Challenging Market
Europe
29USD billion
North America
19USD billion
Latin America
15USD billion
…technology is creating growth opportunities.
Security services, market size 2014 (outsourced guarding)Source: Securitas and Freedonia
Asia*
19USD billion
Africa / Middle East
14USD billion * Excluding Japan
Securitas Annual Report 20146
Markets

Market drivers
Global urbanization, leading to increased population density, widening socioeconomic inequalities and rising crime rates.
Demand for efficient security solutions remains high. More sectors and areas of operation are highly sensitive to disturbances.
Rising levels of economic activity and prosperity in developing regions are resulting in more facilities and places of business requiring security.
Infrastructural development resulting in demand for qualified security solutions and services for growing public transportation systems and public property.
Previously insourced security is increasingly awarded to private sector security firms.
Heightened levels of tension across the globe, with social and political unrest, natural disasters and political instability is amplifying the need for flexible and efficient security.
Driving demand> Need for tailored sector and customer-specific security solutions
> Increased security awareness among private companies and public sector authorities. Understanding the potential losses that can arise from not prioritizing security
> Cost consciousness requires security companies to be efficient, well managed and innovative
> Customer requirements and expectations with respect to sustainability and transparency are increasing
CompetitorsThe security services market is highly diver-sified and predomi-nately comprises smaller players active in their respective regions. Although our offering and primary markets differ, our main competitors are G4S, Prosegur and Allied Barton.
No. of employees
Securitas G4S Prosegur Allied Barton
Sales
Securitas G4S Prosegur Allied Barton
Source: Public information
7Securitas Annual Report 2014
Markets

Advanced Technology – Key in Security Solutions
Strategic priorities
> Create increased and sustainable shareholder value through growth in sales of security solutions, especially solutions with a higher technology content
> Increase profitability and capture market shares by offering higher-quality and more cost-efficient security solutions than our competitors
> Work proactively to expand the security market by assuming responsibility for security that currently is insourced
> Make selective acquisitions of technology companies that support the strategy and of guarding companies in emerging markets
Strategic initiatives and results in 2014
> Earnings per share SEK 5.67
> Free cash flow to net debt ratio 0.18 percent
> Sales of security solutions and technology represented 10 percent of Group sales at year-end 2014
> Total sales of security solutions and tech-nology increased by 28 percent compared with 2013
> Longer and stronger customer relations through a higher degree of technology in our security solutions
> Continued strengthening of our technology competence through new hires and training. At year-end 2014, approximately 2 500 people worked with technology and related services
> Acquisitions of technology companies in the USA and Belgium
Our strategy is clear: integrate on-site, remote and mobile guarding services with technology solutions. This enables us to be more efficient, deliver added value and strengthen customer relations while improving profitability – ultimately resulting in increased shareholder value.
Securitas’ strategic priority – to be the leading pro-vider of integrated security solutions that include advanced technology – holds true. Our target of increasing sales of security solutions remains firm.
While guarding still represents the foundation of Securitas’ business, we are determined to capitalize on the possibilities created by utilizing advanced
technology. By continuously working to optimize on-site, remote and mobile guarding services by integrating technology, we can offer our customers better security at a lower cost.
Securitas is leading the industry, and has the financial strength and persistence to maintain this position by continuing to invest in advanced tech-
Sales, MSEK
14130
24
48
72
1413
Earnings per share, SEK
0
2.0
4.0
6.0
1413
Operating margin, %
0
2.0
4.0
6.0
Securitas Annual Report 20148
Strategy

Targets and strategic initiatives in 2015
> An average increase in earnings per share of 10 percent compared with the preceding year
> A free cash flow to net debt ratio of at least 0.20
> Total sales of security solutions and technology to increase in at least the same range as in 2014
> Be the leading provider of integrated security solutions in our main markets
> Be the first choice for customers who value sustainability
> Be an active voice in local markets to develop the security industry
> Be a preferred employer
nology. One example is the company’s recent acquisition of 24 percent of the shares in the state-of-the-art remote video services company Iverify in the USA. Providing security for many of the world’s leading telecom and IT companies, research facili-ties, fine electronics companies and global network providers is further proof of our ability.
Advanced technology also plays a key role in Securitas’ efforts to be proactive. Our ambition is to prevent incidents from happening. Should an incident occur, Securitas provides prompt investiga-tion and guidance, while launching immediate countermeasures. This proactive approach delivers added value and strengthens security through deterrence and prevention.
From a strategic market perspective, Securitas is working to broaden the private security market by adapting our offering to suit customers looking to outsource their security services. Developing new security solutions with a higher technology content and improved cost efficiency will allow the private security industry to expand the market by assum-ing responsibility for contracts currently managed by the public sector.
By integrating technology, we can offer our customers better security at a lower cost.
9Securitas Annual Report 2014
Strategy

Securitas serves a wide range of customers in a variety of industries and customer segments. Our security solutions, developed together with our customers, are designed to incorporate a high degree of technology content. While manned guarding still represents the cornerstone of Securitas, we continuously work to develop our offering. This enables us to meet customer-specific demands at a competitive price.
Securitas’ approach to security solutions means incorporating systems, people and equipment into one high-performing solution. From there, each aspect of the security solution is scaled to match the needs of the specific customer and situation.
Investing in our customersSecuritas invests in the technology installed at the customer’s site. This means that we take full responsibility for technology investments, on-site installations and maintenance of security equipment, as well as operations and monitoring services. Securitas owns the equipment and the cost is included in the monthly fixed service fee charged to the customer. This results in planning reliability, a considerable quality improvement and a closer and longer relationship with the customer.
Securitas’ security solutions are flexible, which enables us to work with many different technology suppliers. To ensure high quality, we have general agreements with some of the world’s leading sup-pliers of cameras and other security technology.
Single point of contactSecuritas is the single point of contact for the cus-tomer’s entire security solution, which adds value for the customer. At the Security Operating Center, specialized operators manage on-site guarding, mobile patrols, monitoring services and remote video solutions. The operators working at these nationwide communications and coordination service hubs are experts in quickly addressing different problems and solving them in accordance with our customers’ requests. Securitas’ high density of security officers and role as the single point of contact ensure immediate attention, for example, in the form of a mobile patrol or a security officer at the customer site.
Our customer relationships always start with a thorough analysis of the requirements and needs for the specific situation. Some security solutions are tailor-made for a specific customer, while others are offered as part of a packaged service.
Manned guarding remains the cornerstone of Securitas, yet we are focusing on developing our technology-driven solutions. Today, some 2 500 people work with technology and related services in Securitas.
Tailored securitySecuritas is expected to identify and respond to customer-specific security challenges, provide spe-cialist know-how and dedicate resources. To meet these expectations, our offering is designed with a high degree of flexibility. In-depth risk analysis and assessment is therefore important in selecting the individual security components in the tailored solu-
We Deliver Efficient Integrated Solutions
Our customer relationships always start with a thorough analysis of the security needs.
Securitas Annual Report 201410
Offering

The Security Operating Center – the core of our integrated solutions
Securitas is the single point of contact for the customer’s entire security solution. The solution is managed at the Security Operating Center, where specialized operators coordinate all security services, as well as providing statistics, analysis and other customer support.
Alarm servicesSecuritas offers security alarm solutions and services, applicable in both corporate and home environments.
Canine servicesSecurity officers perform guarding services with the help of specially trained dogs.
Corporate investigationsCorporate investigation services, including background screening of personnel and fraud investigations.
Executive protectionMitigating risk exposure through personal protection by specially trained security officers.
Loss prevention Services aimed at minimizing disruptions, theft and loss. Also includes prevention services specifically designed for store and retail environments.
Mobile servicesOne security officer serves multiple customers within a limited geographical area and carries out beat patrol, call-out services, and opens and closes business premises.
Receptionist/concierge servicesA security officer performs a combination of services including access control, reception and customer service.
Remote video solutionsIncludes remote security services such as alarm verification, entry/exit management, escorts, patrolling and perimeter protection.
Response/call-out servicesAn alarm response officer responds to various types of disruptions and emergencies.
Safety servicesIncludes, among other services, fire prevention, medical aid, evacuation assistance, emergency planning, crisis manage ment and traffic safety.
ScreeningWhen strict access control is needed, Securitas offers tailored screening services for both people and objects.
Security consultingSecuritas offers various degrees of security consulting, normally including thorough risk analysis and detailed security planning.
Specialized guardingSpecially trained security officers perform services tailored to the customer’s business and security requirements.
Track and traceTracking moving objects using a high-tech global positioning system (GPS).
11Securitas Annual Report 2014
Offering

Restructuring to facilitate investments in technology
Costs for technology investments at customer sites
Securitas’ investments in technology-based security solutions contribute to positive value creation through improved profita-bility, longer contract durations and a better position to win new assignments. In doing so, we create an opportunity to compensate for the price pressure in the market. At the same time, this shift requires increased investments in new technology.
Increased technology content adds value
tion, such as specialized guarding services, tech-nology solutions, and consulting and investigations.
Specialized guarding includes a variety of services from airport security and customized services for certain segments to receptionist services. Technol-ogy solutions such as electronic systems (intrusion alarms, access control and surveillance cameras), physical security (fences, turnstiles and gates) and software (reporting, communication, logging and verification systems) are always deployed in combi-nation with qualified security officers. Consulting and investigation services include a range of specialized services, such as due diligence, back-ground checks, security assessments, brand pro-tection, intellectual property protection, executive protection, investigations, cyber surveillance and computer forensics.
Sharing knowledgeSecuritas’ customers range from one-guard-solu-tions for the shop around the corner to complex security solutions for international airports and nuclear power plants. As a global company operating in 53 countries, we therefore utilize our strength and the breadth of our network to share know ledge. We are continuously sharing experiences and high-lighting best practices across accounts and markets to further our competitive edge, for example through our global internal web, My Securitas.
PreventionBy providing a security solution, we have the ability to prevent incidents or even crimes, but must always comply with local laws and regulations regarding, for example, data privacy. The advanced software used in security cameras can be set to trigger an alarm if someone starts cutting a fence or enters a restricted area. Choosing our security solutions means that prevention is strengthened and busi-ness disruptions are less likely to occur.
We utilize our strength and the breadth of our network to share knowledge.
Securitas Annual Report 201412
Offering

Increased market shares by taking the lead in offering competitive security solutions with advanced technology
Improved profitability in customer contracts with higher level of technology
Longer contract durations improve customer loyalty Price pressure
in the market
Specialized services
Securitas has developed a specialized service offering to accommodate the complex security needs of customers with highly sensitive or exposed operations. These services are designed to secure and protect all aspects of major areas of operation.
Securitas is one of the few security providers with the expertise, capacity and capabilities to protect these core functions of society. Due to public dependencies and prevailing threats of disruption, protecting these areas from external influence is a top priority.
• Airports• Data storage sites• Large public events• Nuclear power plants• Ports and harbors• Public transport
13Securitas Annual Report 2014
Offering

Global Reach, Extensive Local Expertise
Security Services North America Page 16 ▷Security Services North America provides security services in the USA, Canada and Mexico, and comprises 13 business units: the national and global accounts organization, five geographical regions and five specialized business units in the USA – critical infrastructure, healthcare, Pinkerton Corporate Risk Management, mobile and technology – plus Canada and Mexico. In total, there are approximately 640 branch managers.
Security Services Europe Page 17 ▷Security Services Europe provides security services for large and medium-sized customers in 27 countries, and airport security in 15 countries. The service offering also includes mobile security services for small and medium-sized businesses and residential sites, and electronic alarm surveillance services. In total, the organization has 800 branch managers.
Security Services Ibero-America Page 18 ▷Security Services Ibero-America provides security services for large and medium-sized customers in seven Latin American countries, as well as in Portugal and Spain in Europe. Security Services Ibero-America has a combined total of approximately 190 branch managers.
Africa, Middle East and Asia Page 19 ▷Securitas provides security services in Africa, the Middle East and Asia (AMEA). Some of these markets are relatively new for Securitas. The operations are included under Other in the segment reporting. See note 9 on pages 89–92.
Securitas offers specialized guarding, security solutions and technology to large and small customers, and to most industries. The combination of the company’s global reach, extensive expertise and decentralized organization promotes close and long-term relationships with customers.
Securitas Annual Report 201414
OperationsOverview – business segments
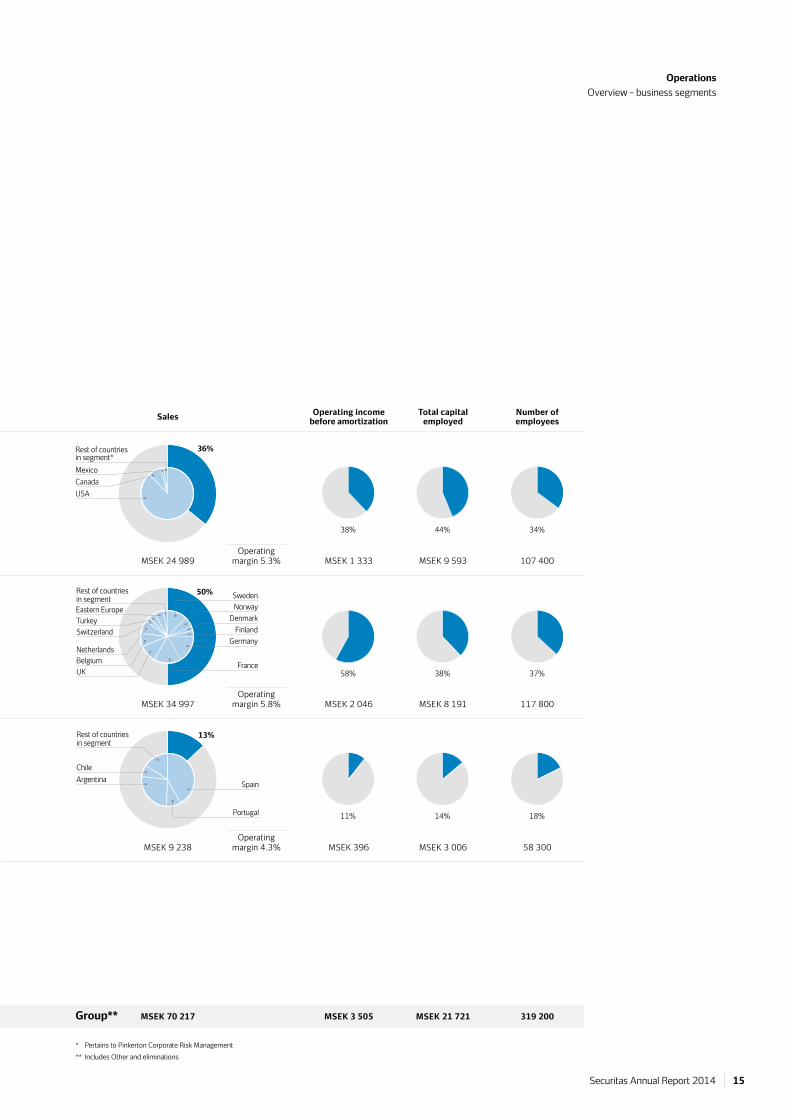
Sales Operating income before amortization
Total capital employed
Number of employees
MSEK 24 989 MSEK 1 333 MSEK 9 593 107 400
MSEK 34 997 MSEK 2 046 MSEK 8 191 117 800
MSEK 9 238 MSEK 396 MSEK 3 006 58 300
MSEK 70 217 MSEK 3 505 MSEK 21 721 319 200Group**
Operating margin 5.3%
Operating margin 5.8%
Operating margin 4.3%
Security Services North America
36%
USA
Mexico
Rest of countries in segment*
Canada
38% 44% 34%
58% 38% 37%
11% 14% 18%
Security Services Europe
Sweden Norway
DenmarkFinland
France
Germany
UKBelgiumNetherlands
SwitzerlandTurkeyEastern Europe
Rest of countries in segment
50%
Security Services Ibero-America
Portugal
Chile
Spain
13%Rest of countries in segment
Argentina
* Pertains to Pinkerton Corporate Risk Management** Includes Other and eliminations
15Securitas Annual Report 2014
OperationsOverview – business segments

16 OperationsSecurity Services North America
Security Services North AmericaTechnology is increasingly becoming an integral part of our service offering.Securitas can offer complete security solutions with on-site, mobile and remote guarding.
Highlights 2014Highlights include a very positive trend in new sales, resulting in organic sales growth in our five guarding regions. Integrated guarding – complete security solutions with on-site, mobile and remote guarding – is developing satisfactorily and we are seeing signs of success with sales coming from both conversions of existing contracts and new sales. A technology department has been created, and some of these resources are also part of the regional organization. We now have the ability to increase our integrated guarding sales, while also being an active player in the technology market. To further support the strategy, 24 percent of the shares in the remote video services company Iverify were acquired in 2014.
Market situationThe security market remains highly price competitive and while several competitors are now speaking of technology, none is able to offer the complete package of on-site, mobile and remote guarding that we do. Customers want to optimize their security spending – and we can fulfil their requirements.
Market trendsTechnology is increasingly becoming an integral part of our service offering. Our managers are being trained to look at the customer’s entire security oper-ation and develop a total approach to their security needs, including both guarding and technology needs. Our Mobile operations are also expected to continue growing over the next few years, which will enhance our footprint and enable us to a greater extent to include this service as part of our inte-grated guarding offering.
Main opportunities and main challenges We believe that our integrated guarding capabilities will enable us to maintain our market-leading posi-tion. We have a strong and stable management team and dedicated employees.
The guarding industry is evolving due to tech-nological advancements. One example is within mobile services, where real-time web-based reporting of all services is offered to both customers and Securitas branch managers. The ongoing education of our field staff, to update their know-ledge of our products and capabilities, is more important than ever.
Training, development and sustainabilityWe have implemented additional training programs, both classroom training and e-learning, for all field management members. We also developed an Inte-grated Guarding Support group to assist our field managers with training, sales and implementation.
We have begun the introduction of eco-friendly cars and other vehicles (bicycles and three wheel vehicles, T3s) to reduce our greenhouse gas emis-sions. We also use videoconferencing to minimize business travel, when appropriate, and reduce paper transactions by using electronic transmis-sions or recycled paper options.
Customers want the most efficient use of their security dollars.Santiago Galaz, Divisional President, Security Services North America
Securitas Annual Report 201416

17OperationsSecurity Services Europe
Security Services EuropeConfident in the knowledge that we can offer our customers better security at the same or lower cost, our main focus is on working together with our customers to optimize their security solutions.
Highlights 2014To optimize the security solutions we offer to our customers, Security Services Europe has continued to strengthen its organization in all countries of operation. Now, with the structure in place, approxi-mately 1 700 employees are dedicated to working with technology and security solutions. The main focus has been on converting existing customer contracts into security solutions and winning new contracts by using the capabilities and methods developed over the past three years.
In 2014, SAIT – a leading company in security and critical communications system integration – was acquired in Belgium. Securitas also won two private security airport contracts in Croatia and a major oil and gas contract in Norway. Some large Aviation contracts were renewed during the year.
Market situationIn 2014, the security market in Europe started recovering slowly, after two years of decline. The overall market situation remains challenging and highly price competitive.
Market trendsWe believe that the security market will move towards an increased use of technology in security solutions in order to improve services, as well as cost efficiency. This will likely result in a consolida-tion of the industry in many countries.
Main opportunities and challengesWe are confident that we can offer our customers better security at the same or lower cost by creating security solutions that combine technology with on-site guarding, mobile services and remote guarding. Securitas has the financial strength to invest in the technology to be used at the customers’ sites, at the same time as we have a large number of security officers with specialized training who can respond quickly to situations when they arise.
Increasingly, we also offer our customers a review of their security expenses, as well as complementary services in which our security officers perform services presently offered by other suppliers. Securitas is also the only truly pan-European security company.
Although the security market in Europe recovered in 2014, its future development is still uncertain due to the fragile European macroeconomics.
Training, development and sustainabilityEmployees at all levels receive training – from basic introductory training to highly specialized training, for example, for security officers in the aviation segment. Managers can participate in Securitas Management Training, a year-long program focusing on business and leadership.
In 2014, an employee survey was carried out in the business segment. The results indicated a strong understanding of and belief in Securitas’ technology strategy among all employee categories. The survey also revealed that managers who had the ability to continuously implement improve-ments received the highest leadership scores. Consequently, even more focus will be devoted to strengthening our leaders in the coming year.
CSR and sustainability are an integral part of the operations. In all countries, we also participate in projects to support the local community.
The main focus is on strengthening the organization in order to optimize the equation of technology, on-site guarding, remote guarding and mobile patrols.Alf Göransson, President and CEO of Securitas AB and Divisional President, Security Services Europe
17Securitas Annual Report 2014

18 OperationsSecurity Services Ibero-America
Security Services Ibero-AmericaSecuritas is further driving the consolidation and integration of technology and security solutions with state-of-the-art Security Operating Centers as the core of its operations.
Highlights 2014During 2014, the main focus was on the consoli-dation and integration of security solutions and technology in all countries. In addition, the imple-mentation and increased activity of Security Operating Centers also helped to differentiate our offering. In 2014, organic sales growth improved compared with the preceding year. We recovered some of the sales volume lost in Spain, and imple-mented an organization adapted to the needs of the market, which is experiencing severe price pressure.
Market situationThe business segment contains mature markets where customers appreciate the added value that security solutions bring, with more and better security at a lower cost, as well as technology and product innovation. In the emerging markets, customers still mainly ask for manned guarding.
Market trendsWhile the market is expected to continue exerting pressure on prices for traditional guarding services, we are also seeing indications that customers are beginning to appreciate the benefits of security solutions. Being able to offer a full range of services and products will be key in the near future as the market begins to value innovation and specialization.
Main opportunities and challengesSecuritas will continue pursuing its strategy to increase its market share in emerging markets and to regain market shares in Spain and Portugal.
The company’s strategy requires strong local leadership, effective communication of local targets and clear support from each manager.
Training, development and sustainabilityThrough the Securitas Institute, which exists in all countries, we arrange training programs for our managers and security officers using both tradi-tional methods and e-learning.
In each country, we have people in our organiza-tion focusing full time on corporate social responsi-bility, with programs ranging from the inclusion of people with physical disabilities to social programs for our employees, as well as collaboration with the local communities in which we operate.
The company’s security solutions strategy requires strong local leadership.Luis Posadas, Divisional President, Security Services Ibero-America
Securitas Annual Report 201418

Africa, Middle East and AsiaSecuritas is growing in new geographical markets to serve our global customers in these regions. In 2014, the countries in these new markets were organized in one division: Africa, Middle East and Asia (AMEA).
South AsiaSecuritas is, under a partnership with Walsons Ser-vices, one of the leading security services providers in India, with a presence in over 180 cities. Services include specialized guarding, executive protection, transport security, fire and safety, and event secu-rity.
In Sri Lanka, Securitas offers guarding services to embassies, international non-governmental organizations (NGOs), commercial sites and resi-dential customers nationwide.
China and South East AsiaSecuritas’ organization in China is designed to serve as a platform for growth.
In Hong Kong, Securitas conducts operations in a variety of key customer segments, including residential, transport and logistics, finance and education. Operations in Thailand, which include technical security services, are particularly strong in the hotel and tourism segment, but include customers in several other segments as well. In Vietnam, Securitas operates throughout the country under a partnership with Long Hai Security, providing mainly specialized guarding services to multinational companies.
Securitas is one of the main providers of unarmed private security services in Singapore. The customer portfolio is well-diversified across customer seg-ments and between public and private sectors. In Indonesia, Securitas mainly offers guarding services to embassies. Operations in Cambodia include guarding services to international companies. Securitas entered the security services market in South Korea in August 2014.
Middle East and Africa In the Middle East and Africa, Securitas conducts security services operations in Egypt, Jordan, Morocco (moved from Security Services Europe to AMEA in 2015), Saudi Arabia, South Africa and the United Arab Emirates.
Most customers in Egypt are multinational companies and the operations are displaying strong continuous growth.
In Morocco, Securitas mainly operates in the industrial segment, and in Jordan, most customers are international companies.
The South African operations are continuing to grow and Securitas is investing in training and sharing best practices in order to raise industry standards. Securitas has operations in guarding, mobile, alarm monitoring, remote video surveillance, technology, forensics and risk management services in South Africa.
In the United Arab Emirates, Securitas has nationwide operations and customers across a variety of segments.
Africa, Middle East and Asia is included under Other in our segment reporting.
Country Number of employeesIndia 19 300Sri Lanka 1 000China 400Hong Kong 1 200Thailand 2 000Vietnam 2 000Singapore 700Indonesia 1 200Cambodia 300South Korea 50Egypt 1 700Jordan 600Morocco 2 200Saudi Arabia 60South Africa 3 600United Arab Emirates 1 400
19Securitas Annual Report 2014

#3Utilizing Our Global ReachAs an international company, Securitas has the ability to provide security services for highly demanding customers on a global scale. Yet our worldwide operations are adapted to also deliver security solu-tions for smaller customers with a presence in only a few locations. One such example is an educational institution with campuses on two continents. Teams in both countries collaborated to provide the customer with a tailor-made solution, meeting
very specific needs. By seamlessly incorporating the technology interface from both locations, Securitas’ offering proved to be unmatched thanks to the gains it offered in terms of efficiency and control. Our ability to identify, assess and act on the customer’s needs using our global reach once again shows we have the expertise required to tailor state-of-the-art security solutions.
Securitas Annual Report 201420

At Securitas, sustainable operations are the foundation for our long-term growth. The business must be sustainable, not only financially, but also socially and environmentally. For us, corporate social responsibility (CSR) is an integral part of our everyday work.
Securitas operates in 53 countries and employs almost 320 000 people globally. Being a responsi-ble and solid employer is a priority, but we must also conduct our business in an ethical manner, consider our environmental impact and offer high-quality services. Only then will all areas of our operations become sustainable.
The security business is characterized by low margins and fierce price competition in many mar-kets. To keep prices down, some guarding compa-nies have a lower wage level. Securitas’ strategy is to move up the value chain and offer security solu-tions instead of only guarding hours. This enables us to avoid competing solely on the basis of price and to pay wages that are in line with our stan-dards. The shift towards including more technology in the security solutions we sell does not necessar-ily mean that the number of employees must be reduced. It works to our advantage to have many security officers. When an alarm sounds, we can immediately dispatch a mobile patrol, or the secu-rity officer at the Security Operating Center can intervene. It is also an opportunity for employee development, as we need more security officers with specialized training. With more qualified employees, we can offer more specialized and qualified services – services that add value for our customers and increase profitability for us.
Driving the security industryIn markets where Securitas is one of the largest security companies, we use our position to drive the industry towards better standards. Through industry associations, we work together with authorities and unions to achieve mandatory basic training for security officers, wages that meet or exceed legal or industry minimums, and mandatory authorization for security companies.
Training to gain a competitive advantageTraining our employees at all levels is key to Securitas’ ability to provide high-quality professional security services. We believe it is a way to gain a competitive advantage.
To meet customer demands, Securitas has train-ing centers in most countries and provides both basic and highly specialized training for employees at all different levels. In some countries, it is not mandatory to complete basic training before being allowed to work as a security officer, but Securitas ensures that all new employees receive at least basic security training. In other countries, training is required and Securitas often plays an active role in developing this education.
All employees are trained in Securitas’ Values and Ethics Code, and at year-end 2014, approxi-mately 90 percent of all managers and office staff and close to 70 percent of the security officers had completed the course.
Well-structured reporting processSecuritas encourages all employees to report inci-dents of non-compliance with Securitas’ Values and Ethics Code. We have a well-structured process for handling reports, with different reporting channels to ensure that employees find a channel with which they feel comfortable. For example, employees can report to a manager or HR person locally, to a divi-sional legal manager, to the Group CSR Officer or through the Group reporting system, known as the Securitas Integrity Line. There are clear instructions detailing who can investigate a case, depending on the type of allegation and the individual the report concerns. The instructions also include information about data privacy and handling times.
Responsible Business Promotes Sustainable Growth
Read more atwww.securitas.com
21Securitas Annual Report 2014
Securitas’ responsibilities
Risk assessmentNon-compliance with Securitas’ Values and Ethics Code is considered a risk, and as such, it has been classified as one of seven prioritized risks in the Group’s enterprise risk management process. This means that all countries of operation must complete an annual self-assessment concerning processes and routines pertaining to implementation of and compliance with the Code and related policies and activities. The results are analyzed and the entities’ presidents are asked to provide action plans to address any deviations. Some subsidiaries are visited as a follow-up, especially newly acquired companies. During these visits, the self-assessment answers are followed up and processes and routines are checked. If required, internal or external audits are carried out.
Before acquiring a company in a country where Securitas does not conduct operations, a compre-hensive risk assessment of the conditions in the country is carried out. This assessment addresses such areas as corruption and human rights, and is based on various sources, including reports from Transparency International and Human Rights Watch. If the assessment shows that it will be very difficult to conduct business in an acceptable way, we will not enter that market. Securitas does not operate in so-called complex environments, for example, war zones.
If the conditions are satisfactory and the decision is taken to proceed with an acquisition, the custom-ary due diligence process is supplemented with, for example, background checks of key personnel and verification against sanction lists.
A new governance, risk and compliance (GRC) system has been implemented in early-2015. The system will for example be used for data collection for the sustainability report.
Read more about Securitas’ enterprise risk man-agement on pages 38–48.
Anti-corruptionAs a complement to Securitas’ Values and Ethics Code, an anti-corruption policy was implemented in 2013. The policy provides definitions and gives examples and assistance in evaluating benefits to determine compliance with Securitas’ zero-toler-ance policy against all forms of bribery and corrup-tion, including facility payments. Securitas’ Values and Ethics Code and the anti-corruption policy set out minimum requirements that ensure compliance with the law, including legislation with extraterrito-rial application, such as the UK Bribery Act and the US Foreign Corrupt Policies Act. Local entities are asked to create their own detailed policies for gifts and business entertainment. An e-learning course in the anti-corruption policy will be launched at the beginning of 2015. The course will be mandatory for relevant managers and administrative staff.
Sustainability reportingIn 2013, Securitas started measuring and disclosing a number of key performance indicators defined by the Global Reporting Initiative (GRI). This work has continued towards presenting a full GRI report for 2014 in order to meet the requirements of customers and other key stakeholders regarding transparency and communication. The 2014 stake-holder dialog confirmed that measuring and dis-closing key figures for working conditions and labor relations is a top priority for Securitas.
Working conditions
Sustainable operations
High ethical
business standards
Opera-tional
excellence
With almost 320 000 employees, working conditions are key. But we must also operate in an ethical manner and offer high- quality services. Only then will all areas of our operations become sustainable.
Securitas Annual Report 201422
Securitas’ responsibilities

Priorities and results 2014 Priorities 2015
Securitas’ Values and Ethics Code
> The self-assessment questionnaire was further developed and the results regarding the implementation of and compliance with Securitas’ Values and Ethics Code and related policies and activities were followed up. Where the results were not satisfactory, the countries in question were asked to present action plans. Six country visits were conducted
> The implementation of a new governance, risk and compliance (GRC) system to manage the enterprise risk management process, including self-assessment questionnaires
> 38 countries have completed the training for managers and office personnel and in total, approximately 90 percent of the managers and office personnel have completed the course. 34 countries have trained more than 50 percent of their security officers and in total, close to 70 percent of the security officers have completed the course
> Ensure that the training is completed in all countries
> Securitas Integrity Line was introduced in one additional country and is now implemented in 50 countries
> Introduce Securitas Integrity Line in the remaining three countries
> The launch of an e-learning course in Securitas’ anti-corruption policy
Employee relations
> An employee survey was conducted in all countries in Security Services Europe
> After analyzing the results of the employee survey, local action plans are to be prepared and followed up
> Three meetings were held with UNI Global Union (UNI) and the European Works Council (EWC)
> Pursue constructive dialog with UNI and EWC
CO2 emissions
> Average CO2 emissions were reduced by 1.4 percent for cars and 2.7 percent for minivans
> Further reducing emissions from company-owned and leased cars and minivans
Reporting > New stakeholder consultations were held, including an investor meeting focusing on sustainability issues
> Continued and improved stakeholder dialog
> A full GRI G4 report was completed > Further improve the data quality for the GRI report, getting all countries of operation up to speed
> Securitas scored 84 of a possible 100 points in the CDLI section of the 2014 CDP, compared with 74 in 2013. In 2014, the level remained at C in CPLI (A is the highest level)
> Use results in CDP to drive change towards lower emissions
Business practice
> Continued work with refinement of the processes for due diligence for acquisitions and investigations of cases of non-compliance with the Code
> Further develop the Group guidelines for risk assessment of suppliers, including a due diligence process
> Update the fair competition policy and launch an e-learning course about the policy
International codes of conduct
> Securitas applied for membership in the International Code of Conduct Association (ICoCA) and signed the International Code of Conduct for Private Security Providers
Sustainability progress
23Securitas Annual Report 2014
Securitas’ responsibilities

Our stakeholdersSecuritas aims to be a responsible, honest and transparent company. We encourage an ongoing dialog with our stakeholders in order to better understand their expectations in the areas of sustainability work and communication and to identify areas in which there is room for improvement. We meet many of our stakeholders regularly during the course of our daily work, and once a year, key stakeholders are also invited to participate in a survey. Listed below are Securitas’ key stakeholders and a description of how we engage with them.
Customers We must have an in-depth understanding of our customers’ needs and industry-specific requirements, both to be able to provide optimal and cost-effective security solutions and to meet the customers’ sustainability
requirements as a supplier. Securitas’ employees at different levels meet the customer frequently and we have daily contact with our customers’ clients. In addition, we conduct customer satisfaction surveys.
Employees and employee represen tatives As a service company, our 320 000 employees are our most valuable asset. Securitas strives to be a reliable and attractive employer by utilizing such tools as solid recruit-ment and onboarding processes, training at all levels of the company – including training in Securitas’ Values and Ethics Code for all employees – talent management, employee surveys and various reporting channels for reporting cases of non-compliance with the Code.
Securitas values proactive relationships and a construc-tive dialog with UNI Global Union (UNI), the European Works Council (EWC) and local unions. Securitas and UNI meet at least twice a year to discuss current issues, and members of Group Management and EWC delegates get together at an annual meeting.
Shareholders, investors and analysts An ongoing dialog with our shareholders and investors assures the long-term development of our business. We publish interim reports and other continuous financial
information, organize Investor Days and other investor and analyst meetings, roadshows and conferences. At the Annual General Shareholders’ Meeting, all shareholders are able to exercise their influence.
Suppliers To ensure that our suppliers understand our requirements concerning values and ethics, we provide them with information regarding Securitas’ Values and Ethics Code and, as far as possible, include compliance
with the Code in our supplier contracts. We also have specific guidelines and standards for suppliers and conduct supplier risk assessments, when required.
Industry organizations As one of the largest companies in the security industry, Securitas is a driving force in raising standards and levels of professionalism in the industry, improving the status of security officers, raising wage levels and intensifying skills development efforts. This is done through membership in local and global industry organizations, such as the Ligue Internationale de
Societés de Surveillance, the American Society of Industrial Security (ASIS), the Confederation of European Security Services (CoESS) and the Aviation Security Services Association-International (ASSA-I). Securitas has applied for membership in the International Code of Conduct Association (ICoCA) and has signed the International Code of Conduct for Private Security Providers.
Communities By providing security solutions for companies and communities, Securitas allows its customers to focus on their core business and prosper. We also par-
ticipate in local projects, such as security training in schools and mentorships for young people encountering difficulties in entering the work market.
Policy makers and authorities Securitas cooperates with authorities at local and national levels to
improve our business conditions and works proactively to achieve better conditions in the security business.
Securitas Annual Report 201424
Securitas’ responsibilities

Gender distribution, average number of yearly employees
10080604020
010 11 12 13 14
■■ Women■■ Men
%
Gross direct and indirect emissions of CO2 equivalent, 2014*
■ Security Services North America■ Security Services Europe■ Security Services Ibero-America■ Africa, Middle East and Asia■ Other
Direct (Scope 1)
Indirect (Scope 2)
Total
100 00080 00060 00040 00020 000
0
Tonnes
* Reporting countries represent 99% of total sales (94) / 99 % of total number of employees (87) Definitions according to GRI G4
Max CO2 gram per km for new minivans (6–7 seater) Max CO2 gram per km for new company cars (max 5 seater) Average CO2 emissions from vehicles ■■ Number of vehicles
Average CO2 emissions from vehicles
12 000 11 00010 000
9 0008 0007 000
10 11 12 13 14
Gram/km No. of vehicles 230210190170150130
Sustainability reporting Securitas has completed a sustainability report prepared according to the G4 Sustainability Reporting Guidelines of the Global Reporting Initiative (GRI) for 2014. Below are some of the key indicators. The entire GRI report is found at www.securitas.com, including the GRI index and more detailed information about the key indicators presented below.
Training hours*
2013 2014Total number of hours of training 3 541 571 3 691 266Average number of hours of training per employee 17.10 11.57* Reporting countries represent 96% of total sales (83) /
88% of total number of employees (75) The 2013 figures have been corrected due to a reporting error Definitions according to GRI G4
Work-related injuries*
2013 2014Actual number of work-related injuries 4 848 5 651Injury rate 2.4 1.8Actual number of work-related fatalities 8 15* Reporting countries represent 98% of total sales (73) /
95% of total number of employees (70) Definitions according to GRI G4
Number of employees per business segment
Security Services North America 103 825 107 424Security Services Europe 117 309 117 843Security Services Ibero-America 56 620 58 273Other 31 870 35 667Total 309 624 319 207
■ Security Services North America, 34%■ Security Services Europe, 37% ■ Security Services Ibero-America, 18%■ Other, 11%
2013 2014
Employee turnover, %
303234363840
10 11 12 13 14
%
New employees
150 000120 000
90 00060 00030 000
0
595653504744
% of average number of yearly employees ■■ Actual number
% Number
10 11 12 13 14
Share of employees covered by collective bargaining agreements*
* Reporting countries represent 98% of total sales (N/A) / 95% of total number of employees (N/A) Definitions according to GRI G4
25Securitas Annual Report 2014
Securitas’ responsibilities

Securitas is a global company that is close to the local communities in which it operates. Being a stable and responsible employer is important to us and we participate in a number of initiatives designed to improve working conditions. Below are some examples.
DenmarkTogether with a number of municipalities and private companies in Denmark, Securitas is partici-pating in a mentor project. Security officers act as mentors to young people encountering problems entering the work force or with criminal backgrounds. The mentor prepares an action plan for the daily work and then accompanies the young person to the workplace, for example, at a construction site, as support.
EgyptIn Egypt, Securitas has a clear strategy to pay higher wages to security officers than its competitors. We concentrate on customer segments such as embassies and multinational enterprises and avoid competing on price. If we cannot agree with a potential customer on a price that covers the cost for the security officers’ wages, we decline the assignment.
Hong KongIn an initiative to reduce the company’s environ-mental impact, Securitas in Hong Kong recycles old uniforms. If the uniforms are in good shape, they are stripped of company logos and given to a charity organization.
India In India, extensive efforts have been made to improve the information provided to employees. Wages are paid on time and all employees receive individual text messages with information about their wages and benefits. Help desks are also available at large customer sites. A dedicated toll-free HR Helpline has been introduced for all employees nationally, which tracks and handles issues within a short time frame.
IndonesiaSecuritas Indonesia has the lowest employee turnover rate of all companies in the region at less than 10 percent. Many small security companies in Indonesia do not provide minimum wages and benefits. Securitas pays at least minimum wages and provides other statutory benefits, as well as medical benefits for our employees and their families.
PeruSecuritas in Peru works together with customers, authorities and non-profit organizations to create employment opportunities for disabled people, both as security officers and administrators. The model has been successful and more customers are expected to join the project.
USATogether with other companies, Securitas has participated for several years in a national initiative to create jobs for military veterans. Since 2012 Securitas has hired more than 15 000 veterans.
Securitas Cares about the Community
Securitas Annual Report 201426
Securitas’ responsibilities

Flexible and Tailor-made Security SolutionsSecuritas always strives to incorporate highly secure, yet seamless security solutions for its customers. Responding to the needs of a large manufacturing company in Europe, with two factories at separate locations, we developed a scalable and flexible tailor-made security solution. Prior to contacting Securitas, the customer used only manned guarding at the sites, at the same time as they encountered several problems and disturbances, such as break-ins, thefts from the warehouse and losses in relation
to transport. Securitas started by conducting a thorough risk analysis and carefully designing the best solution – considering not only the security requirements, but also the sensitivity of the customer’s daily operations. The solution, which is representative of many of our high profile manu-facturing contracts, combines on-site and remote guarding, mobile services and several different advanced technology systems.
#427Securitas Annual Report 2014

Corporate Governance and Management 28–49
Securitas management model – Toolbox 29Compliance with the Code 30Significant shareholders 30Annual General Meeting 30Nomination Committee 31Board of Directors 31Remuneration Committee 32Facts on Board of Directors 34–35Facts on Group Management 36–37Enterprise risk management (ERM) and Internal control 38Organization of ERM and Internal control 46Auditors 49Auditors report on Corporate Governance Statement 49
Governance and Management
Compliance with the Swedish Corporate Governance Code (the Code) The governance report is prepared in accordance with Chapter 6, Section 6 and 8 of the Swedish Annual Accounts Act, provides key information concerning compliance with the Swedish Corporate Governance Code, shareholders, the Annual General Meeting, Nomination Committee, Board of Directors and their work including committees, remuneration and the division of responsibilities throughout the governance structure. This section also covers Securitas’ system of internal control and risk management, which is the responsibility of the Board of Directors according to the Swedish Companies Act and the Swedish Corporate Governance Code. This description does not form part of the Annual Report.In the Internal control section pertaining to risk, we have opted to widen the scope of our description and explain how enterprise risk management works in the broader perspective regardless of the type of risk, which means that our focus is not confined to risk related to internal controls over financial reporting. Fulfilling our strategies and objectives while maintaining appropriate risk level is imperative, which is why risk management procedures span all levels of the organization.
Read more at www.securitas.com / corporate-governanceSecuritas has published its principles for corporate governance in previous annual reports. A separate section on the Group website contains the Articles of Association and other key company documents.
Securitas Annual Report 201428
Governance and managementIntroduction

Securitas promotes management based on local responsibility in close proximity to customers and employees. This unique and decentralized organization encourages entrepreneurship, but requires a solid governance and management system. Securitas’ structure for governance serves not only to protect stake-holder interests, but also to ensure value creation.
An effective governance structure requires that all components interact in order to reach the set strategic objectives, and that governance and risk management permeate all layers of the organi-zation.
Securitas has a decentralized organizational model that promotes entrepreneurship and focuses on the approximately 1 700 branch managers who run the company’s daily operations in 53 countries.
The company’s customer offerings improve when decisions are made in close proximity to customers and the employees who perform the services. Local decisions are therefore promoted but made within a well-controlled environment.
The branch offices are run by qualified manag-ers with considerable freedom to develop and con-duct operations. Each branch has its own statement of income, for which they are fully responsible. Incentive programs are used to further encourage personal dedication to the operating and financial performance of the company. Securitas’ extensive decentralization promotes a high degree of per-sonal entrepreneurship.
Securitas’ Toolbox management model has a methodical structure comprising several well-defined areas or “tools” that serve as a guide at all levels and is maintained through continuous train-ing and discussion forums. Each area of the model describes how Securitas’ managers are to conduct themselves in various aspects and stages of the company’s operations. The model also describes the approach we are expected to take with regard to the market, our customers and employees.
A key function of the Toolbox is to convey our corporate culture and create a shared platform,
which is primarily symbolized by a focus on Securitas’ values: Integrity, Vigilance and Helpfulness. It also ensures that work methods, management philosophy and customer perspective are shared throughout the organization. All Securitas employees are expected to assume responsibility for their customers and operations and our shared values. Responsibility is clarified through the measurement and systematic evaluation of results.
Group ManagementGroup Management is charged with overall respon-sibility for conducting the business of the Securitas Group in line with the strategy and long-term goals adopted by the Board of Directors of Securitas AB. The primary tool used by Group Management to measure accomplishment of strategies and to guide the employees and organization toward achieving its objectives is the financial framework and the financial model.
In 2014, Group Management comprised the President and CEO and ten executives with repre-sentatives from the divisions. For further information on Group Management, see pages 36–37.
A financial model that is easy to understandAs part of our decentralized management, we are required to set and follow up on strict financial tar-gets by continuously measuring and monitoring the Group’s performance. Financial control is not simply about implementing controls, it also functions as an incentive for those employees who are in a position to personally influence Securitas’ financial results.
The financial framework and model continu-ously measures the Group’s performance, from the branch offices through to Group level.
The Toolbox
Clear and Effective Governance Structure
Read more atwww.securitas.com
29Securitas Annual Report 2014
Governance and managementBoard of Directors’ report on corporate governance and internal control

The financial model makes it possible to monitor a number of key figures that can be understood by all managers. It also helps managers understand the connection between risks and opportunities, and how various factors impact their areas of responsibility, as well as how we can monitor and control these factors. It visualizes the direct link between income and expenses in the statement of income, capital employed in the balance sheet and the generation of free cash flow (refer to the fact box on page 50 for more information).
Securitas has two financial targets. The first target is related to the income statement: an annual average earnings per share growth rate of 10 percent. The second target is related to the balance sheet: a free cash flow to net debt ratio of at least 0.20. Transparent and accurate financial reporting is also the basis of sound management. The aim of the Group’s financial reporting is to produce the most timely and accurate information possible to enable managers and employees to make the decisions necessary for achieving profitable growth in line with Securitas’ strategies, and to control risks to ensure that the company’s objectives are achieved. Financial reporting also forms the basis for sound internal control.
Significant shareholdersAt the top of the governance structure sharehold-ers influence the overall direction of the company. Strong principal shareholders provide considerable attention and interest in our business, and establish commitment to the success of the business.
On December 31, 2014, the principal sharehold-ers in Securitas were Gustaf Douglas who, through his family and companies in the Investment AB Latour Group and Förvaltnings AB Wasatornet, held 10.9 percent (10.9) of the capital and 29.6 percent (29.6) of the votes, and Melker Schörling who, through his family and Melker Schörling AB, held 5.6 percent (5.6) of the capital and 11.8 percent (11.8) of the votes. For more detailed information about shareholders, see the table on page 131.
Annual General MeetingAll shareholders are able to exercise their influence at the Annual General Meeting, which is the com-pany’s highest decision-making body. The General Meeting decides on changes of the Articles of Association. The Articles of Association contain no limitation on the number of votes that each share-holder may exercise at a shareholders’ meeting. Each shareholder may thus vote for all shares held
Compliance with the Swedish Corporate Governance Code (the Code)As a Swedish public company listed on Nasdaq Stockholm, Securitas applies the Swedish Corporate Governance Code (the Code). Securitas complies with the Code principle of “comply or explain” and has two deviations to explain for 2014.
Code Rule 7.3 An audit committee is to comprise no fewer than three board members.
Comment: The Board of Directors deems that two members is sufficient to correctly address Securitas’ most important areas in regard to risk and audit issues, and that the incumbent members have long-standing and extensive experience in these areas from other major listed companies.
Code Rule 9.8 For share-based incentive programs, the vesting period, or the period from the commencement of an agreement to the date on which the shares are acquired, is to be no less than three years.
Comment: Securitas’ share-based incentive scheme was implemented in 2010 and has been renewed annually since then. It was based on the then-existing bonus struc-ture of the Securitas Group. In simple terms, the bonus potential was increased in exchange for a one-time salary freeze and one third of the cash bonus outcome was to be received in shares in March of the year following the year in which the cash bonus would have been paid out, provided that the person remained employed by Securitas at such time.
Since the program replaces an immediate cash bonus payout and is not granted in addition to already existing bonus rights, the Board deems that the two-year period from the commencement of the program until the release of the shares is well motivated and reasonable in order to achieve the purpose of the program.
Securitas Annual Report 201430
Governance and managementBoard of Directors’ report on corporate governance and internal control

at the shareholders’ meeting. The Annual General Meeting of Securitas AB was held on May 5, 2014, and the minutes are available on www.securitas.com, where all resolutions passed can be found. One of the resolutions passed in 2014, was the authoriza-tion for the Board to resolve upon acquisition of the company’s own shares. Shareholders representing 58.7 percent (62.0) of the votes attended either personally or by proxy. For infor mation about elec-tion and remuneration of Board members, see sec-tion Board of Directors below.
Nomination CommitteeThe Nomination Committee is a body established by the Annual General Meeting with the task of preparing motions regarding the election of Board members, the Chairman of the Board and remuner-ation to Board members and Board committees. Before each Annual General Meeting, where the election of auditors takes place, the Nomination Committee also prepares motions regarding the election of auditors and decisions about fees to auditors and other related matters, following con-sultation with the Board of Directors and the Audit Committee.
In 2014, Gustaf Douglas was re-elected as Chairman of the Nomination Committee. The Annual General Meeting 2014 resolved that in the event that a shareholder represented on the Nomi-nation Committee ceases to be one of the major shareholders of Securitas (based on votes), or if a member of the Nomination Committee is no longer employed by such a shareholder, or for any other reason leaves the Committee before the Annual General Meeting 2015, the Committee is entitled to appoint another representative of another major shareholder to replace this member.
The Committee has adopted working instructions which governs the work in the Committee. The Committee should hold meetings as often as nec-essary to ful fill its duties. However, the Committee should hold at least one meeting annually. The Committee met one time in 2014.
Board of DirectorsAccording to the Articles of Association, the Board of Directors should have between five and ten Board members elected by the Annual General Meeting, with no more than two Deputy Directors. The Directors and Deputy Directors are elected by the Annual General Meeting for the period up to
and including the first Annual General Meeting to be held in the year after the Director or Deputy Director was elected. Securitas’ Board of Directors has eight members elected by the Annual General Meeting, three employee representatives and two deputy employee representatives.
The Annual General Meeting 2014 re-elected Fredrik Cappelen, Carl Douglas, Marie Ehrling, Annika Falkengren, Alf Göransson, Fredrik Palm-stierna, Melker Schörling and Sofia Schörling Högberg. The Annual General Meeting re-elected Melker Schörling as Chairman of the Board and Carl Douglas as Vice Chairman. Mikael Ekdahl, attorney-at-law, is the secretary of the Board. For further information about the members of the Board of Directors and the President and CEO, see pages 34–35. It was resolved that the fees to the Board should total SEK 4 975 000 (including fees of SEK 525 000 for committee work), to be distributed among the Board members as follows: Chairman of the Board: SEK 1 200 000; Vice Chair-man of the Board: SEK 750 000; and each of the other Board members (except the President and CEO and employee representatives): SEK 500 000.
Responsibilities of the Board of DirectorsThe Board of Directors is responsible for the orga-nization and administration of the company and the Group in accordance with the Swedish Companies Act and also appoints the President and CEO, the Audit Committee and the Remuneration Committee.
In addition, the Board of Directors determines the President and CEO’s salary and other remuner-ation. The Board meets a minimum of six times annually. The Group’s auditors participate in the meeting of the Board of Directors that is held in conjunction with the yearly closing of the books.
The Board of Directors of Securitas AB have approved a number of policies that apply to gover-nance. Examples of policies of interest within this context are described on page 43.
The Board ensures the quality of financial reporting through Group Policies, procedures and frameworks, clear structures with defined responsi-bilities and through documented delegation of authority, which is further described in the enter-prise risk management and internal control report, beginning on page 38. The board has formed a Remuneration Committee (further described below) and an Audit Committee (further described on page 33).
Elected members,1
Nomination Committee
■ Gustaf Douglas, major shareholder, 29.58%2
■ Mikael Ekdahl, Melker Schörling AB (major shareholder), 11.75%2 ■ Jan Andersson, Swedbank Robur Funds, 2.35%2
■ Henrik Didner, Didner & Gerge, 2.08%2
■ Johan Strandberg, SEB Investment Management, 2.19%2
■ Share of votes not represented in the Nomination Committee, 52.05%2
1 At the Annual General Meeting held on May 5, 2014.2 Share of votes as of May 5, 2014.
% of voting rights
Annual General Meeting attendance 2010–2014
10 11 12 13 14
100
80604020
0
Number of shareholders 2010–20142010 31 4582011 27 0112012 27 2222013 26 0542014 24 274
31Securitas Annual Report 2014
Governance and managementBoard of Directors’ report on corporate governance and internal control
Remuneration CommitteeThe Board has formed a Remuneration Committee to prepare decisions related to salaries, bonuses, share-based incentive schemes and other forms of compensation for Group Management, as well as other management levels if the Board of Directors so decides. The Committee presents its proposals to the Board, for the Board’s decision. The Commit-tee held two meetings during 2014. For details regarding members and attendance, refer to the table on pages 34–35.
A share-based incentive scheme was adopted at the Annual General Meeting 2014, enabling the Group to gradually have approximately 2 500 of Securitas’ top managers as shareholders, thereby strengthening employee commitment to Securitas’ future success and development for the benefit of all shareholders. In principal, the adopted incentive scheme entails that one third of any annual bonus, earned under the performance-based cash bonus schemes, is converted into a right to receive shares, with delayed allotment and subject to continued employment. For more information on the actual outcome of the share-based incentive scheme in 2014, see note 12 on page 94.
The guidelines for remuneration to senior man-agement that were adopted at the Annual General Meeting 2014 primarily entailed that remuneration to senior management and their terms of employ-ment should be competitive and comply with market conditions, to ensure that Securitas is able to attract and retain competent managers. The total remuneration to Group Management should consist of a fixed basic salary, variable remuneration, pen-sions and other benefits.
Thus, in addition to a fixed annual salary, Group Management may also receive a variable remunera-tion, which will be based on the outcome of set financial goals and growth targets within the indi-vidual area of responsibility (Group or division). The remuneration should be determined in a manner consistent with shareholder interests.
The variable remuneration should amount to a maximum of 60 percent of the fixed annual salary for the President and CEO, and a maximum of 42 to 200 percent of the fixed annual salary for other members of Group Management. The undertakings of the Group as regards variable remuneration to Group Management may, at maximum within all divisions during 2014, amount to MSEK 55. The complete guidelines for remuneration can be found on www.securitas.com.
Additional information on remuneration to the Board of Directors and Group Management, includ-ing the outcome, is disclosed in the Notes and comments to the consolidated financial statements 2014. See note 8 on pages 86–89.
Securitas Annual Report 201432
Governance and managementBoard of Directors’ report on corporate governance and internal control

Jan
Q1Feb
Mar
Apr
Q2May
Jun
Jul
Q3Aug
Sep
Oct
Q4Nov
Dec
The work of the Board of DirectorsThe activities of the Board of Directors and the division of responsibility between the Board and Group Management are governed by formal procedures documented in a written instruction, which is adopted by the Board each year after the Annual General Meeting. According to these procedures, the Board should determine, among other things, the Group’s overall strategy, corporate acquisitions and property investments above a certain level, and establish a framework for the Group’s operations through the Group’s business plan.
The procedures include a work instruction for the President and CEO, as well as instructions for financial reporting. The procedures also prescribe that an annual evaluation of the work of the Board of Directors should be carried out.
The Board held eight meetings in 2014, of which two were held per capsulam. The auditors participated in the Board meeting in February 2014, where they presented the audit.
The work of the Audit CommitteeThe Board of Directors has established and appointed an Audit Committee, which operates under the instructions for the Audit Committee and meets with Securitas’ auditors at least four times per year. The Committee supports the Board’s quality-control work in terms of financial reports, and its internal control over financial reporting.
Specifically, the Committee monitors the financial reporting, the effec-tiveness of internal control, internal audit activities and the risk manage-ment system. The Committee also stays informed about annual statutory audits. It assesses the external auditor’s independence and approves the performance of non-audit services.
The Committee presents its findings and proposals to the Board, prior to the Board’s decision. For details regarding members, independence and attendance, refer to the table on pages 34–35. The Committee met four times during 2014. The major topics discussed are listed above.
* In addition to the topics listed, other areas are discussed continuously, such as operational performance, updates from divisions, strategy, market and competition, acquisitions, insurance, credit risk, tax matters, legal matters, funding and refinancing.
** Topics based on a set rolling agenda format with updates on accounting, treasury, acquisitions, risk/insurance, legal, tax, internal control, enterprise risk management, audit/consultancy costs and auditor independence.
*** Held per capsulam.
Board of Directors Audit Committee
(MA) Management Assurance
Q3 meeting*• Q3 interim report• Update from Audit Committee• Business plan 2015• Security solutions and technology• Smart Home service
Statutory meeting• Appointment of committee members• Authorization to sign for the company• Work procedures (Board, Audit and
Remuneration Committees)
Q1 meeting*• Q1 interim report• Update from Audit Committee• Acquisitions• Approval of Group Policies
Q1 meeting• Q1 interim report• Updates**• External auditor audit plan and fees• Internal (MA) Q1 2014 audit activities• Internal (MA) audit plan 2014• Financial planning process
Q2 meeting• Q2 interim report• Updates**• External auditor half-year report• Emerging markets• Internal (MA) Q2 2014 audit activities
Q3 meeting• Q3 interim report• Updates**• Impairment test• Corporate governance report• Internal audit function assessment• External auditor early warning report• Internal (MA) Q3 2014 audit activities• Reporting security solutions
and technology development
Meeting and operational visit• Divisional business plans 2015• Operational visit / presentation
Q4 meeting*• Q4 and full-year report• Update from Audit Committee• Audit report• Three year plan for Securitas• Remuneration• AGM preparation• Divided • External report
Q4 meeting• Q4 interim report and full-year report• Updates**• Corporate governance report• External auditor report• Internal (MA) Q4 2013 audit activities and
action plans
Meeting***• Annual Report
Q2 meeting*• Q2 interim report• Update from Audit Committee• Acquisitions
Meeting***• Remuneration
guidelines• Share bonus
scheme proposal• Notice convening
the AGM 2014• Proposal regarding
acquisition of own shares
33Securitas Annual Report 2014
Governance and managementBoard of Directors’ report on corporate governance and internal control
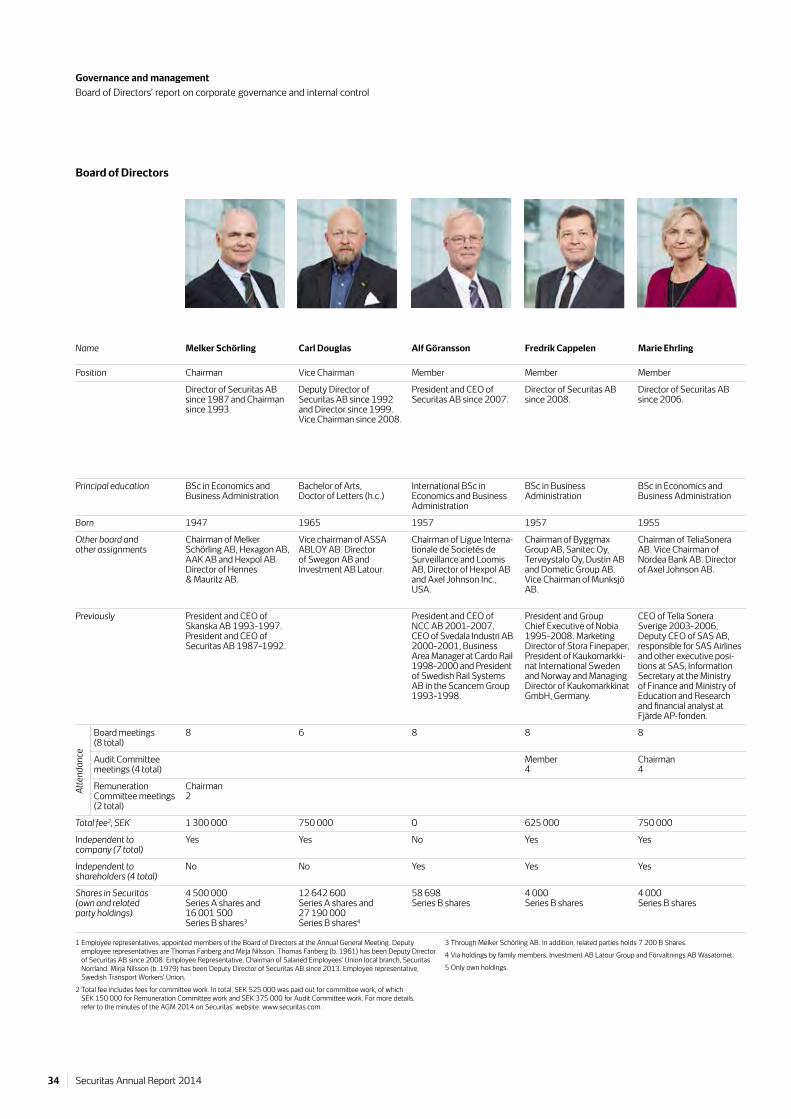
Employee representatives1
Name Melker Schörling Carl Douglas Alf Göransson Fredrik Cappelen Marie Ehrling Annika Falkengren Sofia Schörling Högberg Fredrik Palmstierna Susanne Bergman Israelsson
Åse Hjelm Jan Prang
Position Chairman Vice Chairman Member Member Member Member Member Member Member Member Member
Director of Securitas AB since 1987 and Chairman since 1993.
Deputy Director of Securitas AB since 1992 and Director since 1999. Vice Chairman since 2008.
President and CEO of Securitas AB since 2007.
Director of Securitas AB since 2008.
Director of Securitas AB since 2006.
Director of Securitas AB since 2003.
Director of Securitas AB since 2005.
Director of Securitas AB since 1985.
Director of Securitas AB since 2004.Employee Representative, Chairman of Swedish Transport Workers’ Union local branch 19, Norra Mälardalen.
Director of Securitas AB since 2008. Deputy Director of Securitas AB since 2007. Employee Representative, Vice chairman of Salaried Employees’ Union local branch, Norrland, Chairman of the Securitas Council for Salaried Employees.
Director of Securitas AB since 2008. Employee Representative, Chairman of Swedish Transport Workers’ Union local branch, Securitas Göteborg.
Principal education BSc in Economics and Business Administration
Bachelor of Arts, Doctor of Letters (h.c.)
International BSc in Economics and BusinessAdministration
BSc in Business Administration
BSc in Economics and Business Administration
BSc in Economics BSc in Economics and Business Administration
BSc in Economics and Business Administration, MBA
Born 1947 1965 1957 1957 1955 1962 1978 1946 1958 1962 1959
Other board and other assignments
Chairman of Melker Schörling AB, Hexagon AB, AAK AB and Hexpol AB. Director of Hennes & Mauritz AB.
Vice chairman of ASSA ABLOY AB. Director of Swegon AB and Investment AB Latour.
Chairman of Ligue Interna-tionale de Societés de Surveillance and Loomis AB, Director of Hexpol AB and Axel Johnson Inc., USA.
Chairman of Byggmax Group AB, Sanitec Oy, Terveystalo Oy, Dustin AB and Dometic Group AB. Vice Chairman of Munksjö AB.
Chairman of TeliaSonera AB. Vice Chairman of Nordea Bank AB. Director of Axel Johnson AB.
President and CEO of SEB. Director of SEB. Member of the Supervisory Boards of Volkswagen AG.
Director of Melker Schörling AB.
Chairman of InvestmentAB Latour. Director ofAB Fagerhult, HultaforsAB, Nobia AB, Academic Work AB and Stiftelsen Viktor Rydbergs Skolor.
Previously President and CEO of Skanska AB 1993–1997. President and CEO of Securitas AB 1987–1992.
President and CEO of NCC AB 2001–2007, CEO of Svedala Industri AB 2000–2001, Business Area Manager at Cardo Rail 1998–2000 and President of Swedish Rail Systems AB in the Scancem Group 1993–1998.
President and Group Chief Executive of Nobia 1995–2008. Marketing Director of Stora Finepaper, President of Kaukomarkki-nat International Sweden and Norway and Managing Director of Kaukomarkkinat GmbH, Germany.
CEO of Telia Sonera Sverige 2003–2006, Deputy CEO of SAS AB, responsible for SAS Airlines and other executive posi-tions at SAS, Information Secretary at the Ministry of Finance and Ministry of Education and Research and financial analyst at Fjärde AP-fonden.
Several executive positions at SEB.
Atte
ndan
ce
Board meetings (8 total)
8 6 8 8 8 8 8 7 8 8 8
Audit Committee meetings (4 total)
Member4
Chairman4
Remuneration Committee meetings (2 total)
Chairman 2
Member 2
Total fee2, SEK 1 300 000 750 000 0 625 000 750 000 550 000 500 000 500 000 0 0 0
Independent to company (7 total)
Yes Yes No Yes Yes Yes Yes Yes – – –
Independent to share holders (4 total)
No No Yes Yes Yes Yes No No – – –
Shares in Securitas(own and related party holdings)
4 500 000 Series A shares and 16 001 500 Series B shares3
12 642 600 Series A shares and 27 190 000 Series B shares4
58 698 Series B shares
4 000 Series B shares
4 000 Series B shares
7 500 Series B shares
2 400 Series B shares5
17 200 Series B shares
– 120 Series B shares
–
1 Employee representatives, appointed members of the Board of Directors at the Annual General Meeting. Deputy employee representatives are Thomas Fanberg and Mirja Nilsson. Thomas Fanberg (b. 1961) has been Deputy Director of Securitas AB since 2008. Employee Representative, Chairman of Salaried Employees’ Union local branch, Securitas Norrland. Mirja Nilsson (b. 1979) has been Deputy Director of Securitas AB since 2013. Employee representative, Swedish Transport Workers’ Union.
2 Total fee includes fees for committee work. In total, SEK 525 000 was paid out for committee work, of which SEK 150 000 for Remuneration Committee work and SEK 375 000 for Audit Committee work. For more details, refer to the minutes of the AGM 2014 on Securitas’ website: www.securitas.com.
3 Through Melker Schörling AB. In addition, related parties holds 7 200 B Shares.
4 Via holdings by family members, Investment AB Latour Group and Förvaltnings AB Wasatornet.
5 Only own holdings.
All figures refer to holdings on December 31, 2014.
For comparative information about remuneration to the Board of Directors and senior management, please see note 8 on pages 86–89.
Board of Directors
Securitas Annual Report 201434
Governance and managementBoard of Directors’ report on corporate governance and internal control

Employee representatives1
Name Melker Schörling Carl Douglas Alf Göransson Fredrik Cappelen Marie Ehrling Annika Falkengren Sofia Schörling Högberg Fredrik Palmstierna Susanne Bergman Israelsson
Åse Hjelm Jan Prang
Position Chairman Vice Chairman Member Member Member Member Member Member Member Member Member
Director of Securitas AB since 1987 and Chairman since 1993.
Deputy Director of Securitas AB since 1992 and Director since 1999. Vice Chairman since 2008.
President and CEO of Securitas AB since 2007.
Director of Securitas AB since 2008.
Director of Securitas AB since 2006.
Director of Securitas AB since 2003.
Director of Securitas AB since 2005.
Director of Securitas AB since 1985.
Director of Securitas AB since 2004.Employee Representative, Chairman of Swedish Transport Workers’ Union local branch 19, Norra Mälardalen.
Director of Securitas AB since 2008. Deputy Director of Securitas AB since 2007. Employee Representative, Vice chairman of Salaried Employees’ Union local branch, Norrland, Chairman of the Securitas Council for Salaried Employees.
Director of Securitas AB since 2008. Employee Representative, Chairman of Swedish Transport Workers’ Union local branch, Securitas Göteborg.
Principal education BSc in Economics and Business Administration
Bachelor of Arts, Doctor of Letters (h.c.)
International BSc in Economics and BusinessAdministration
BSc in Business Administration
BSc in Economics and Business Administration
BSc in Economics BSc in Economics and Business Administration
BSc in Economics and Business Administration, MBA
Born 1947 1965 1957 1957 1955 1962 1978 1946 1958 1962 1959
Other board and other assignments
Chairman of Melker Schörling AB, Hexagon AB, AAK AB and Hexpol AB. Director of Hennes & Mauritz AB.
Vice chairman of ASSA ABLOY AB. Director of Swegon AB and Investment AB Latour.
Chairman of Ligue Interna-tionale de Societés de Surveillance and Loomis AB, Director of Hexpol AB and Axel Johnson Inc., USA.
Chairman of Byggmax Group AB, Sanitec Oy, Terveystalo Oy, Dustin AB and Dometic Group AB. Vice Chairman of Munksjö AB.
Chairman of TeliaSonera AB. Vice Chairman of Nordea Bank AB. Director of Axel Johnson AB.
President and CEO of SEB. Director of SEB. Member of the Supervisory Boards of Volkswagen AG.
Director of Melker Schörling AB.
Chairman of InvestmentAB Latour. Director ofAB Fagerhult, HultaforsAB, Nobia AB, Academic Work AB and Stiftelsen Viktor Rydbergs Skolor.
Previously President and CEO of Skanska AB 1993–1997. President and CEO of Securitas AB 1987–1992.
President and CEO of NCC AB 2001–2007, CEO of Svedala Industri AB 2000–2001, Business Area Manager at Cardo Rail 1998–2000 and President of Swedish Rail Systems AB in the Scancem Group 1993–1998.
President and Group Chief Executive of Nobia 1995–2008. Marketing Director of Stora Finepaper, President of Kaukomarkki-nat International Sweden and Norway and Managing Director of Kaukomarkkinat GmbH, Germany.
CEO of Telia Sonera Sverige 2003–2006, Deputy CEO of SAS AB, responsible for SAS Airlines and other executive posi-tions at SAS, Information Secretary at the Ministry of Finance and Ministry of Education and Research and financial analyst at Fjärde AP-fonden.
Several executive positions at SEB.
Atte
ndan
ce
Board meetings (8 total)
8 6 8 8 8 8 8 7 8 8 8
Audit Committee meetings (4 total)
Member4
Chairman4
Remuneration Committee meetings (2 total)
Chairman 2
Member 2
Total fee2, SEK 1 300 000 750 000 0 625 000 750 000 550 000 500 000 500 000 0 0 0
Independent to company (7 total)
Yes Yes No Yes Yes Yes Yes Yes – – –
Independent to share holders (4 total)
No No Yes Yes Yes Yes No No – – –
Shares in Securitas(own and related party holdings)
4 500 000 Series A shares and 16 001 500 Series B shares3
12 642 600 Series A shares and 27 190 000 Series B shares4
58 698 Series B shares
4 000 Series B shares
4 000 Series B shares
7 500 Series B shares
2 400 Series B shares5
17 200 Series B shares
– 120 Series B shares
–
1 Employee representatives, appointed members of the Board of Directors at the Annual General Meeting. Deputy employee representatives are Thomas Fanberg and Mirja Nilsson. Thomas Fanberg (b. 1961) has been Deputy Director of Securitas AB since 2008. Employee Representative, Chairman of Salaried Employees’ Union local branch, Securitas Norrland. Mirja Nilsson (b. 1979) has been Deputy Director of Securitas AB since 2013. Employee representative, Swedish Transport Workers’ Union.
2 Total fee includes fees for committee work. In total, SEK 525 000 was paid out for committee work, of which SEK 150 000 for Remuneration Committee work and SEK 375 000 for Audit Committee work. For more details, refer to the minutes of the AGM 2014 on Securitas’ website: www.securitas.com.
3 Through Melker Schörling AB. In addition, related parties holds 7 200 B Shares.
4 Via holdings by family members, Investment AB Latour Group and Förvaltnings AB Wasatornet.
5 Only own holdings.
All figures refer to holdings on December 31, 2014.
For comparative information about remuneration to the Board of Directors and senior management, please see note 8 on pages 86–89.
35Securitas Annual Report 2014
Governance and managementBoard of Directors’ report on corporate governance and internal control

Group Management
Alf GöranssonPresident and CEO of Securitas AB and Divisional President, Security Services Europe. Born: 1957. Employed: 2007Education: International BSc in Economics and Business Administration from the School of Business, Economics and Law, University of Gothenburg, Sweden.Shares in Securitas: 58 698 Series B shares.*
Bart AdamChief Financial Officer. Born: 1965Employed: 1999Education: Commercial Engineer at K. University Leuven, Belgium, Quantitative Applied Economics and Information Technology, with Distinction.Shares in Securitas: 20 405 Series B shares.*
William BarthelemyChief Operating Officer, Security Services North America. Born: 1954 Employed: 1999Education: Degree in Criminology from Indiana University of Pennsylvania, USA. Shares in Securitas: 21 652 Series B shares.*
Santiago GalazDivisional President, Security Services North America. Born: 1959 Employed: 1995Shares in Securitas: 92 424 Series B shares.*
Gisela Lindstrand Senior Vice President, Corporate Communications and Public Affairs. Born: 1962 Employed: 2007Education: Degree in Political Science from Uppsala University, Sweden. Shares in Securitas: 2 017 Series B shares.*
Jan LindströmSenior Vice President, Finance. Born: 1966 Employed: 1999Education: BSc in Economics and Business Administration from Uppsala University, Sweden. Shares in Securitas: 5 600 Series B shares.*
Securitas Annual Report 201436
Governance and managementBoard of Directors’ report on corporate governance and internal control

Aimé LyagreChief Operating Officer and Chief Tech-nology Officer, Security Service Europe. Born: 1959Employed: 2004Education: Degree in Business Adminis-tration and masters degree in Industrial Management and Markering Management.Shares in Securitas: 16 200 Series B shares.*
Marc Pissens President Aviation and Divisional President Africa, Middle East and Asia. Born: 1950Employed: 1999Education: Degree in Engineering from the Engineering Institute of Brussels, Belgium.Shares in Securitas: 11 677 Series B shares.*
Luis PosadasDivisional President, Security Services Ibero-America. Born: 1958Employed: 1995Education: Law at the University Complutense in Madrid, Spain.Shares in Securitas: 20 396 Series B shares.*
Antonio Villaseca LòpezSenior Vice President, Technical Solutions. Born: 1954Employed: 1995 and 2011Education: Economics at the UNED University in Madrid, Spain and courses in telecommunications, networks and security system design.Shares in Securitas: 990 Series B shares.*
Henrik Zetterberg
Senior Vice President, General Counsel Born: 1976Employed: 2014Education: Master of Law from Lund University, Sweden.Shares in Securitas: 0*
For more information about Group Management, visit www.securitas.com
* The actual allocation of shares to Group Management under the Securitas share-based incentive scheme 2013 can be found on page 89, and the total potential allocation of shares to Group Management under the Securitas share-based incentive scheme 2014 can be found on page 87.
Åsa Thunman left her position as Senior Vice President, General Counsel and Group Risk Manager on September 23, 2014.
37Securitas Annual Report 2014
Governance and managementBoard of Directors’ report on corporate governance and internal control

Securitas’ process for enterprise risk management (ERM) seeks to identify, prioritize and manage the key risks to our business at all levels and in all parts of the business. Securitas’ internal control system is designed to manage, rather than eliminate, the risk of failing to achieve business objectives. The system provides reasonable, but not absolute, assurance against material misstatement or loss, as well as compliance with the main policies.
Internal control over financial reporting is included as a part of the overall internal control of Securitas and constitutes a central part of the Group’s corpo-rate governance. The description below covers a broader perspective on how Securitas’ internal control is organized, using a structure based on the COSO model (1992 Framework), but also makes specific reference to items pertaining directly to internal control over financial reporting. Pages 41–45 describe the company’s enterprise risk management process, which sets the overall process for Securitas’ proactive and continuous work with risk manage-ment and internal control. Securitas’ insurance and claims strategy is to “act as if uninsured”. Refer to page 48 for more information about insurance as a risk management tool.
Control environmentThe key features of the control environment include: clear terms of reference for the Board and each of its committees, a clear organizational structure with documented delegation of authority from the Board to President and CEO and further to Group Management, the competence of employees and a series of Group policies, procedures and frameworks. The policies are all periodically reviewed and updated by Group Management and adopted by the Board of Directors.
Delegation of authority is documented in an approval matrix, which provides clear directions for managers at all levels.
Emphasis lies on the competence and abilities of the Group’s employees, with continuous training and development actively encouraged through a wide variety of schemes and programs.
The Group has three fundamental values – Integrity, Vigilance and Helpfulness – to help its
employees exercise good judgment and make decisions on a consistent basis.
Policies that apply to internal control over finan-cial reporting are described in Securitas’ Group Policies and Guidelines, which includes the compa-ny’s model for financial control (for more detailed information on the model, refer to pages 50–51), and in the Securitas Reporting Manual, which spe-cifically focuses on reporting matters to ensure compliance with reporting requirements and rules. This creates an environment that supports reliable and accurate reporting.
Risk assessmentAt the highest level, the Board considers where future strategic opportunities and risks lie, and helps shape the corporate strategy. Balanced and focused risk management is necessary for the ful-fillment of Securitas’ strategies and the achievement of its corporate objectives.
Enterprise risk management (ERM) is an integral component of Securitas’ operations, and risk awareness is part of the company culture. Risk assessments are conducted within the framework of the Securitas ERM process, regardless whether the assessments pertain to operational risks or financial reporting risks. Securitas does not classify compliance risk as a separate category. Instead, it is included in the operational category. Risk assess-ment is a dynamic process that aims to identify and analyze risks in relation to Securitas’ objectives and serves as the basis for implementing mitigating actions after considering the controls in place (reduce, transfer/share or accept the risk in question). See page 42 for more details on the risk assess-ment and planning process.
Proactive Risk Management and Internal Control
Securitas Annual Report 201438
Governance and managementBoard of Directors’ report on corporate governance and internal control
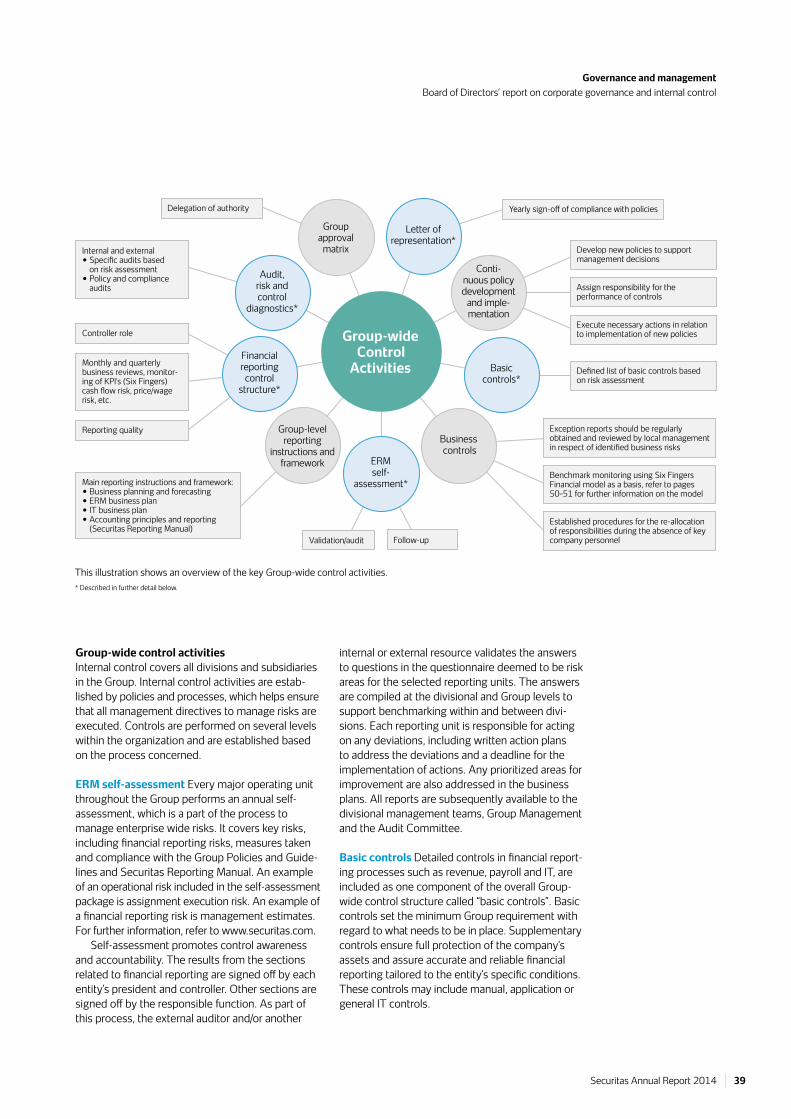
Group-wide control activitiesInternal control covers all divisions and subsidiaries in the Group. Internal control activities are estab-lished by policies and processes, which helps ensure that all management directives to manage risks are executed. Controls are performed on several levels within the organization and are established based on the process concerned.
ERM self-assessment Every major operating unit throughout the Group performs an annual self-assessment, which is a part of the process to manage enterprise wide risks. It covers key risks, including financial reporting risks, measures taken and compliance with the Group Policies and Guide-lines and Securitas Reporting Manual. An example of an operational risk included in the self-assessment package is assignment execution risk. An example of a financial reporting risk is management estimates. For further information, refer to www.securitas.com.
Self-assessment promotes control awareness and accountability. The results from the sections related to financial reporting are signed off by each entity’s president and controller. Other sections are signed off by the responsible function. As part of this process, the external auditor and/or another
internal or external resource validates the answers to questions in the questionnaire deemed to be risk areas for the selected reporting units. The answers are compiled at the divisional and Group levels to support benchmarking within and between divi-sions. Each reporting unit is responsible for acting on any deviations, including written action plans to address the deviations and a deadline for the implementation of actions. Any prioritized areas for improvement are also addressed in the business plans. All reports are subsequently available to the divisional management teams, Group Management and the Audit Committee.
Basic controls Detailed controls in financial report-ing processes such as revenue, payroll and IT, are included as one component of the overall Group-wide control structure called “basic controls”. Basic controls set the minimum Group requirement with regard to what needs to be in place. Supplementary controls ensure full protection of the company’s assets and assure accurate and reliable financial reporting tailored to the entity’s specific conditions. These controls may include manual, application or general IT controls.
This illustration shows an overview of the key Group-wide control activities.* Described in further detail below.
Group-wide Control
Activities
Letter of representation*
Conti- nuous policy development
and imple - mentation
Audit,risk and control
diagnostics*
Financial reportingcontrol
structure*
Group-level reporting
instructions and framework ERM
self- assessment*
Business controls
Basic controls*
Group approval
matrix
Defined list of basic controls based on risk assessment
Benchmark monitoring using Six Fingers Financial model as a basis, refer to pages 50–51 for further information on the model
Delegation of authority
Controller role
Monthly and quarterly business reviews, monitor-ing of KPI’s (Six Fingers) cash flow risk, price/wage risk, etc.
Reporting quality
Main reporting instructions and framework:• Business planning and forecasting • ERM business plan• IT business plan• Accounting principles and reporting
(Securitas Reporting Manual)Validation/audit Follow-up
Established procedures for the re-allocation of responsibilities during the absence of key company personnel
Exception reports should be regularly obtained and reviewed by local management in respect of identified business risks
Execute necessary actions in relation to implementation of new policies
Assign responsibility for the performance of controls
Develop new policies to support management decisions
Internal and external• Specific audits based
on risk assessment• Policy and compliance
audits
Yearly sign-off of compliance with policies
39Securitas Annual Report 2014
Governance and managementBoard of Directors’ report on corporate governance and internal control

Key areas covered:• protection of company assets • completeness and timeliness of customer invoicing • credit collection procedures• contract management• validity of payments to third parties • accuracy of general ledger• timeliness and accuracy of Group reporting and;• compliance with local requirements
Audit, risk and control diagnostics The Group performs risk and control diagnostics in functional areas which, by nature, have a high degree of inher-ent risk. These diagnostics are performed in addition to the recurring areas in the self-assessment ques-tionnaire and aim to ensure compliance with key policies such as the Contract Management policy and Securitas’ Values and Ethics. Securitas develops this audit and review process on a continuous basis.
Financial reporting control structure Control activities specifically aimed at managing risks related to financial reporting include methods and activities for securing assets, controlling the accuracy and reliability of internal and external financial reports, and ensuring compliance with defined guidelines.
Regular analyses of the financial results at the various levels of the organization using the financial model ensure that financial information maintains a level of high quality. Securitas’ financial reporting is based on the following foundations:• Group Policies and Guidelines, which comprises
the Board of Directors’ policies and guidelines for financial planning and reporting, long-term financing and treasury, risks and insurance, communications, branding, legal issues and IT
• Guidelines in Securitas’ financial model, which create the framework for a simple and clear internal reporting method, including timely and accurate follow-up of financial key figures (Securitas Six Fingers)
• Securitas’ Reporting Manual, which provides all managers and financial staff with detailed instructions and definitions for financial reporting
• The controller, who is responsible for continuously ensuring that the financial information provided is accurate, transparent, relevant and up to date
Controllers at all levels hold a key role in terms of integrity, professionalism and the ability to work in teams in order to create the environment that is needed to achieve transparent, relevant and timely financial information. Local controllers are responsible for ensuring compliance with the approved set of policies and frameworks, and for ensuring that internal controls pertaining to financial reporting processes are implemented.
The controller is also responsible for reporting financial information that is correct, complete and timely. The controller receives continuous feedback from the Group regarding reporting quality, which is an effective tool for enhanced reporting. In addition, each division has a divisional controller with corre-sponding responsibilities at the divisional level.
Letter of representation The Group has a repre-sentation process in which operating unit presidents and controllers sign a letter of representation in connection with the year-end report, stating their opinion on whether or not the internal control over financial reporting and the reporting packages give a true and fair view of the financial position.
The letter also covers the broader perspective of internal control, including compliance with the full set of Group Policies.
Information and communicationSecuritas’ channels for information and communi-cation are constantly developed to ensure that all staff are given clear objectives and are made aware of the parameters that constitute acceptable business practices, as well as the expectations of the Board in managing risks, in order to achieve set goals and objectives. This provides a clear definition of the Group’s purpose and goals, accountabilities and the scope of permitted activities of employees. The Group Policies and Guidelines are available in a Group-wide database.
Systems and procedures have been implemented that support complete, accurate and timely financial reporting and provide management with the neces-sary reports on business performance relative to the established objectives. The Group reporting depart-ment regularly issues guidance on reporting matters and the reporting manual is available in a Group-wide database. Reporting units regularly prepare financial and management reports that are discussed at review meetings at different levels. These include an analysis of financial performance and risks in order for the organization to understand their responsibility with regard to internal control and its impact in rela-tion to risks, goals and objectives.
MonitoringMonitoring is performed at different levels and by different functions within the organization depending on whether it is related to operational or financial reporting matters. Key functions include the Board of Directors, the Audit Committee, Group Manage-ment, functional committees, management assur-ance, the Group legal function, the Group risk organization, and local and divisional management. For an organizational overview of this structure, refer to pages 46–47.
Securitas Annual Report 201440
Governance and managementBoard of Directors’ report on corporate governance and internal control

Securitas’ enterprise risk management process (ERM) is engrained in the business and based on a close cooperation between operative manage-ment and all functions working with the different parts of the risk management process. The process starts with risk identification and prioritization during the ERM planning process. The Group Policies and Guidelines as well as local processes, rules and procedures establish the framework for day-to-day risk management. The identified risks and adopted policies also set the structure for all compliance monitoring in the Group. The ultimate responsibility for governance of risk management lies with the Board of Directors, but the work involved in minimizing risks takes place through a structured process of assigning responsibility to all levels of the organization.
Securitas is exposed to various types of risks in its daily business. When providing security services, Securitas manages not only its own risks, but also risks on behalf of its customers. Minimizing the risk of a loss occurring, and thereby protecting our stakeholders, is an important objective. Securitas’ risks have been classified into three main categories: contract and acquisition risks, operational assignment risks and financial risks. The categories are based on the natural flow of the business – entering into a contract, execution of the assignment and the financial result. Similar risk categories are also relevant for acquisitions, but are then classified as acquisition risks, operational integration risks and financial integration risks.
All of the risks in these categories can impact the Group’s financial performance and position if they are not managed in a structured way. This is why Securitas has developed its four-step process approach for managing enterprise risks. The four steps and current actions are described in further detail on the following pages.
Four-step process for managing enterprise risk
Risk
-bas
ed
In
put and risk Policy
mon
itorin
g
i
dentifi cation development
activities
Risk management
Contractand
acquisition
Operational
Financial/Financial reporting
41Securitas Annual Report 2014
Governance and managementBoard of Directors’ report on corporate governance and internal control

Input and risk identificationThe ERM system is integrated into Group’s business planning and performance monitoring processes, regardless of the risk category concerned. As part of the overall annual business plan process, each level of the organization prepared an ERM business plan.
The ERM business plan includes risk assessment, controls, risk management activities and action plans. It determines the main focus and priorities for operational risk management at the country, division and the Group level for the coming year. Securitas’ ERM business plan risk assessment tool is used to facilitate the risk assessment process, as well as action planning, depending on the level of risk and controls that are in place.
Key risk determination The yearly risk assess-ment process is coordinated by the Group risk organization, which is also responsible for main-taining the risk register. The risk register contains
about 50 risks and is updated annually, primarily based on the country ERM business plans, but also on other sources of input such as audits, self-assessment results and management input. Out of the 50 risks, about 15 are selected as top risks that will be subject to monitoring activities. Out of these, seven risks are currently considered Group key risks and have been assigned primary focus for the coming year. For examples of these risks and how they are managed, refer to www.securitas.com.
The ultimate prioritization of key risks for each year is decided by Group Management.
Examples of activities during 2014The top seven key Group risks and a minimum of two country/division-specific risks are assessed in the ERM business plan risk assessment tool. This analysis forms the basis of the ERM business plan, which also includes action plans for how to further mitigate the risks with the highest remaining exposure. In 2014, Securitas intensified its focus on action plans for the assessed risks, with the aim of identifying the areas in which the countries will need to modify their current mitigating controls in the coming year.
Risk
-bas
ed
In
put and risk Policy
mon
itorin
g
i
dentifi cation development
activities
Contractand
acquisition
Operational
Financial/Financial reporting
Seven key risks 2014• Customer
contract risk• Acquisition risk• Assignment
execution risk• Compliance
(regulatory and other) risk
• IT failure risk• Price risk• Securitas’ Values
and Ethics compliance risk
Part of the risk assessment tool (example)
40
35
30
25
20
15
10
5
0
Action plan to mitigate risk
Ensure that controls work
– audit/ assurance
Keep your eye on – monitor
Evaluate controls
• CONTRACT
• ASSIGNMENT EXECUTION
• IT FAILURE
• ACQUISITION
• VALUES AND ETHICS
1 2 3 4 5 6Low remaining risk (high control)
High remaining risk (low control)
• PRICE RISK
Management control effectiveness (Remaining risk – level of control)
Gro
ss ri
sk sc
ore
Low gross risk score
High gross risk score
Net Risk
• COMPLIANCE
Risk management
Securitas Annual Report 201442
Governance and managementBoard of Directors’ report on corporate governance and internal control

Policy developmentOne of the cornerstones of the ERM process is the Group Policies and Guidelines that establish the framework for all policies and compliance monitoring in the Group. The Group policies are developed by management and are approved by the Board.
After performing the yearly risk assessment and establishing risk business plans, decisions are made as to whether to create new policies or amend existing policies based on that input. A general policy update is released after the statutory Board meeting in May every year, but specific policies are also issued when necessary throughout the year.
Some of the key policies adopted by Securitas that are relevant from a governance perspective are:• Contract policy which sets out the process and
main principles for managing customer contract risk, based on standard terms, a full customer and contract risk evaluation, as well as a frame-work of key policies for contracting security ser-vices and solutions. The objective is to manage the risks arising from customer contracts, and to ensure that all customer contracts have a fair and reasonable allocation of responsibility and risk between the customer and Securitas and that the price reflects the risk taken on by Securitas.
• The Securitas’ Values and Ethics Code ensures that the company upholds and promotes the highest ethical business standards. Securitas’ basic requirement is to act within the framework of laws and international conventions, such as the United Nations Universal Declaration of Human Rights. This means that Securitas respects and complies with competition rules, environ-mental legislation, labor market regulations, agreements and safety requirements and any other provisions that set the parameters of our operations. For further information on Securitas’ initiatives and responsibility with regard to social, economical and environmental issues, refer to pages 21–26.
• Communication policy in accordance with the stock market’s requirements for information with the aim of ensuring that the company fulfills these requirements.
• Competition law compliance policy with the aim of ensuring that Securitas and its subsidiaries or affiliates are committed to full compliance with all competition laws and regulations.
• Insider policy as a complement to the insider legislation in force in Sweden.
Risk
-bas
ed
In
put and risk Policy
mon
itorin
g
i
dentifi cation development
activities
Operational
Contractand
acquisition
Financial/Financial reporting
Securitas’ Values and Ethics Code
Examples of activities during 2014The Board adopted an updated version of Securitas’ Values and Ethics Code, which now specifically includes compliance with economic and trade sanctions. As a consequence, the Board has also adopted a geographical scope policy, which defines the conditions under which Securitas is permitted to
establish a permanent or temporary presence in a country where it has not done business before. Each new country should be assessed based on its suitability, taking into consideration a values and ethics perspective, possible economic and trade sanctions, and whether or not it is a conflict zone.
Risk management
43Securitas Annual Report 2014
Governance and managementBoard of Directors’ report on corporate governance and internal control

Examples of activities during 2014ERM training was introduced for divisional risk managers in May 2014. This program uses a “train-the-trainer” structure, with the divisional risk managers assuming responsibility for training the country risk managers who in turn will train their local organizations. The purpose of the training
is to raise awareness, understanding and know-ledge of risk and enterprise risk management in the organization and to improve the managers’ confidence in applying the risk management process at the divisional and country level.
Risk management activitiesGroup Management sets the risk management policies for the entire Group. Accountability for managing risks is clearly assigned to all Group, divisional and local management.
Group Management has overall responsibility for the management of risks, and for the implementation and maintenance of control systems in accordance with the Board’s policies. Specifically, divisional man-agement and established functional committees are responsible for ensuring that a process for creating risk awareness exists throughout the division. The divisional presidents are responsible for all aspects of the operations in their divisions, including opera-tional risk management and risk minimization. Oper-ating unit managers and country risk managers are responsible for ensuring that risk management is part of the local corporate culture at all levels within a country.
Accountability for managing risks is clearly assigned to Group, divisional and local management.
To be successful, all of Securitas’ branch managers must understand the risks associated with providing services and be able to assess and control these risks. Securitas actively pursues different risk man-agement activities to increase awareness and knowledge. One important tool is the business risk evaluation model “The Scale”. For further information on this, refer to www.securitas.com.
Risk
-bas
ed
In
put and risk Policy
mon
itorin
g
i
dentifi cation development
activities
RISK RESPONSIBILITIES
Principal activitiesBranch / area
Country / division Group
Risk assessment ■ ■ ■
Contract management ■ ■ ■
Loss prevention ■ ■
Claims settlement ■ ■
Insurance purchasing ■
Risk management
Assignment• Customer• Job to be done• New or existing service• Requirements
Risk• Customer risk category• Customer financial
status• Insurance cover• Regulations
Contract• Standard or
non-standard contract• Liability cap• Consequential losses• Customer identification
for third-party claims
Profitability• Profitability• Investments• Payment terms• Off-balance sheet
exposures
Securitas Annual Report 201444
Governance and managementBoard of Directors’ report on corporate governance and internal control
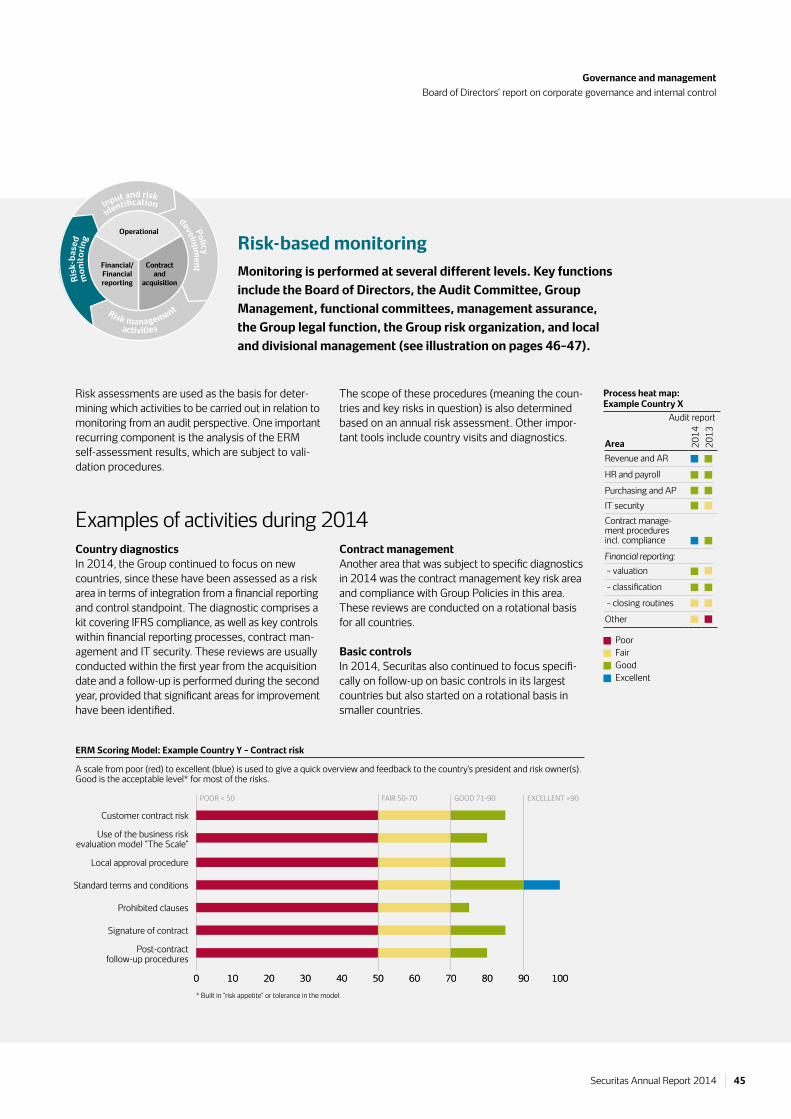
Risk-based monitoringMonitoring is performed at several different levels. Key functions include the Board of Directors, the Audit Committee, Group Management, functional committees, management assurance, the Group legal function, the Group risk organization, and local and divisional management (see illustration on pages 46–47).
Risk
-bas
ed
In
put and risk Policy
mon
itorin
g
i
dentifi cation development
activities
Risk management
Risk assessments are used as the basis for deter-mining which activities to be carried out in relation to monitoring from an audit perspective. One important recurring component is the analysis of the ERM self-assessment results, which are subject to vali-dation procedures.
The scope of these procedures (meaning the coun-tries and key risks in question) is also determined based on an annual risk assessment. Other impor-tant tools include country visits and diagnostics.
Examples of activities during 2014Country diagnosticsIn 2014, the Group continued to focus on new countries, since these have been assessed as a risk area in terms of integration from a financial reporting and control standpoint. The diagnostic comprises a kit covering IFRS compliance, as well as key controls within financial reporting processes, contract man-agement and IT security. These reviews are usually conducted within the first year from the acquisition date and a follow-up is performed during the second year, provided that significant areas for improvement have been identified.
Contract managementAnother area that was subject to specific diagnostics in 2014 was the contract management key risk area and compliance with Group Policies in this area. These reviews are conducted on a rotational basis for all countries.
Basic controlsIn 2014, Securitas also continued to focus specifi-cally on follow-up on basic controls in its largest countries but also started on a rotational basis in smaller countries.
* Built in “risk appetite” or tolerance in the model.
Audit report
Area 2014
2013
Revenue and AR
HR and payroll
Purchasing and APIT securityContract manage- ment procedures incl. compliance
Financial reporting: – valuation
– classification
– closing routines
Other
Process heat map: Example Country X
0 10 20 30 40 50 60 70 80 90 100
Customer contract risk
Use of the business riskevaluation model “The Scale”
Local approval procedure
Standard terms and conditions
Prohibited clauses
Signature of contract
Post-contract follow-up procedures
0 10 20 30 40 50 60 70 80 90 100
POOR < 50 FAIR 50–70 GOOD 71–90 EXCELLENT >90
Poor Fair Good Excellent
ERM Scoring Model: Example Country Y – Contract risk
A scale from poor (red) to excellent (blue) is used to give a quick overview and feedback to the country’s president and risk owner(s). Good is the acceptable level* for most of the risks.
45Securitas Annual Report 2014
Governance and managementBoard of Directors’ report on corporate governance and internal control

Operational management
(country / region, branch manager)
Functional committeesThe Group has established a number of func-tional committees and work groups, including the functions for Finance / Tax and Assurance, Corporate Finance / Treasury and Legal / Risk and Insurance. These committees include the CFO, Senior Vice President Finance, Senior Vice President General Counsel and the appropriate functional area experts. The main purpose of these functional committees is to determine appropriate policies, communicate the policies and ensure local understanding (including training) of the policies, as well as monitoring key issues within each area of responsibility. Quarterly meetings are held with the President and CEO, at which topics that must be reported to the Audit Committee are discussed.
President and CEO and Group ManagementThe President and CEO and Group Management review performance through a comprehensive reporting system based on regular business reviews of actual results, analysis of variances, key performance indicators (Securitas’ model for financial control, refer to pages 50–51) and reg-ular forecasting. This reporting is also reviewed by the Board.
Group legal functionThe Group legal function is responsible for maintaining an adequate infrastructure to ensure that legal matters are brought to the attention of Group Management in an appropri-ate and timely manner. This function is headed by the Senior Vice President General Counsel. The legal function also monitors and manages legal risk exposures identified by the operating units and reports regularly to Group Manage-ment and Audit Committee on legal risks and ongoing disputes.
Local and divisional management responsibilities Since Securitas’ philosophy is to work in a decentralized environment, local management is primarily responsible for monitoring and ensuring compliance by local units with the Group Policies and Guidelines approved by the Board of Directors, including any division-specific policies and guide-lines. Local management is responsible for the establish-ment and continued operations of a system of procedures and controls that ensures the reliability of the company’s management and financial reporting information in the most economical and efficient manner possible. This includes ensuring a minimum of basic and supervisory controls in order to mitigate relevant risks. Local management reports to Group Management through divisional management on operational matters and local controllers report through divisional controllers on financial reporting matters. In order for this to work, Securitas has established a close link between these different levels of the organization.
Group risk organizationThe Group risk organization owns and manages the pro-cess which provides tools and helps management iden-tify and manage the risks inherent in Securitas’ line of business. Risk management is an integral part of the Securitas culture and is imperative for achieving Securitas’ strategies and goals. The risk management process is continuously developing.
Organization of ERM and internal control
Shareholders
CFO
Divisional management
Divisional controllers
Local controllers
External audit Division auditor
External audit Local auditor
SVP Finance
Group Management
SVP GeneralCounsel
Audit Committee
Group legal
Group risk organization
Board of Directors
Direct line of reportingCoordination responsibility
1. Ownership of risk
2. A strong controller organization
3. Monitoring of internal control
4. Audit
Group activities
Divisional activities
Local activities
Risk and control diagnostics
performed by external parties
External audit Group auditor
President and CEO
Functional committees
Management Assurance function for monitoring
internal control
Securitas Annual Report 201446
Governance and managementBoard of Directors’ report on corporate governance and internal control

Board of DirectorsThe activities of the Board of Directors, and the division of responsibility between the Board and the President and CEO and Group Management, are governed by formal pro-cedures. The Board considers risk assessment and control fundamental to achieving its corporate objectives with an acceptable risk/reward profile. The Board plays an impor-tant role in the ongoing process of identifying and evaluat-ing significant risks faced by the Group and the effective-ness of related controls. The processes used by the Board in order to review the effectiveness of the system of inter-nal control include:· Discussion with Group Management regarding risk areas
identified by Group Management and the performed risk assessment procedures
· Review of significant issues arising from external audits and other reviews/investigations
The Board of Directors has established an Audit Commit-tee in order to monitor the effectiveness of the Group’s ERM process and internal control systems and financial reporting process.
Audit CommitteeThe Audit Committee reviews all annual and quarterly financial reports before recommending their publication on behalf of the Board. The Audit Committee, in particular, discusses the significant accounting policies, estimates and judgments that have been applied in preparing the reports. The Audit Committee monitors the effectiveness of the Group’s ERM and internal control systems as well as the financial reporting process. The Audit Committee supervises the quality and independence of the external auditors.
Management AssuranceThe Group has a coordinating and monitoring function in relation to certain internal control activities at Group level. The Management Assurance staff function operates as the Group’s internal audit function and reports directly to the Senior Vice President Finance with an open line of com-munication to the Audit Committee.
This function prepares an annual plan for its work, which is approved by the Audit Committee. The results of the function’s work, which includes the execution and coordi-nation of internal audit-related activities during the year, are presented at the Audit Committee meetings. The Management Assurance function participated in all Audit Committee meetings during 2014.
In line with one of the Group’s fundamental principles, this function has continued to develop step-by-step improvements of the Group’s internal control through vari-ous activities throughout the year, including fine-tuning of follow-up procedures and reporting, identification of risks related to financial reporting and examination of the effec-tiveness of related internal controls. In 2014, specific focus lay on diagnostics in new market countries and new busi-nesses. Sharing knowledge through different activities is also a key part of improving the control environment. The function utilizes a combination of internal resources and external resources in the form of external auditors, consul-tants and experts, depending on the specific situation and area. This enables greater flexibility and responsiveness to the risks faced by the Group, which fits Securitas’ business model. For more information on the current responsibilities of the Management Assurance function, refer to www.securitas.com.
The function is subject to an annual assessment by the Board to ensure that the activities undertaken enable a well-functioning monitoring structure, together with the other components of the Group’s internal control described within this report.
47Securitas Annual Report 2014
Governance and managementBoard of Directors’ report on corporate governance and internal control

Insurance as a risk management toolSecuritas’ insurance and claims strategy is to “act as if uninsured.” This means that while external insur-ance is used to protect the balance sheet and mini-mize fluctuations in earnings, our day-to-day task is to perform our assignment as if we do not have any insurance in place.
One important part of our risk management work involves taking a proactive approach to contracts and assignment instructions in order to prevent claims from occurring. From a risk management perspective, it is important that the contract clearly defines the assignment to be performed by Securitas and that our employees’ assignment instructions mirror the contract. Our contract management process strives to find a fair distribution of risk between Securitas and our customers.
Another significant part of Securitas’ risk man-agement work involves active claims management, as well as ongoing claims analysis of frequent and large losses with the aim of identifying the under-lying driving forces. Claims reports with updated information on claims and reserves are sent to all local risk managers and controllers on a monthly basis, and the claims are analyzed to find out if there are certain types of services, contracts, regions and so forth that cause insurance claims. Regular meetings are also held with the insurance compa-nies and loss adjusters with the aim of continuously developing the claims handling process and claims prevention measures. As the Group’s external insur-
ance premiums are partly determined by the historic loss record, a favorable loss record will contribute to lower premiums and a lower cost of risk.
Insurance programs are procured with the objective of creating a balanced and cost-efficient protection against negative financial impact. Securitas seeks to achieve economies of scale through coordinated insurance programs and the optimal utilization of the Group’s insurance captives. The strategy is to cover the more frequent claims arising in Securitas’ own books. First, a local deductible is charged to the branch that has caused the claim; after that, our own insurance companies (captives) cover part of the cost. Using insurance captives gives the Group an opportunity to handle part of the claims process internally, and provides Group Management with an option to establish some independence from the cyclical nature of commercial insurance markets (see the graph below).
The design and purchase of all insurance pro-grams is based on the risk exposure identified using the business risk evaluation model. The following types of insurance are strategically impor-tant to the Group and are the subject of central purchasing: liability insurance, including aviation liability and aviation war liability, crime insurance, directors’ and officers’ liability insurance, fiduciary liability insurance and employment practice liability insurance. Catastrophe exposure is protected by insurance companies with a minimum rating of A (Standard & Poor’s).
Schematic illustration of distribution of risk with respect to claims
GROUP RETENTION
FREQ
UEN
CY
SEVERITY
The costs for high-frequency claims with a low value are charged to the local subsidiaries as a “local deductible cost” and to Securitas’ insurance captives. Non-frequent and larger claims costs are absorbed by the external insurance companies.
Local deductible Captive retention External insurance
Securitas Annual Report 201448
Governance and managementBoard of Directors’ report on corporate governance and internal control

AuditorsThe Annual General Meeting 2014 elected Price-waterhouseCoopers AB (PwC) as the Group’s audit firm, with authorized public accountant Peter Nyllinge as auditor in charge, for a period of one year.
The auditors’ work is based on an audit plan, which is agreed upon in consultation with the Audit Committee and the Board of Directors. The audi-tors participate in all meetings of the Audit Com-mittee and present their findings from the annual audit at the Board meeting held in February. In addition, the auditors should inform the Audit Com-mittee on an annual basis of any services rendered, other than audit assignments, and any auditing fees received for such services or other circumstances that might affect the evaluation of the auditors’
independence. The auditors should also participate in the Annual General Meeting to present the audit report and its conclusions.
The audit is performed in compliance with the Swedish Companies Act, generally accepted auditing standards in Sweden and International Standards on Auditing (ISA).
Auditor in chargePeter Nyllinge, born 1966, Authorized Public Accountant, Auditor in charge, Pricewaterhouse-Coopers AB. Peter Nyllinge has been auditor in charge of Securitas AB since 2008. Other audit assignments: Skandinaviska Enskilda Banken AB and Telefonaktiebolaget LM Ericsson.
Auditor Peter Nyllinge
Auditor’s report on the Corporate Governance Statement (translation of the Swedish original)
To the Annual General Meeting of the shareholders of Securitas AB, corporate identity number 556302-7241It is the Board of Directors who is responsible for the Corporate Governance Statement for the year 2014 on pages 28–49 and that it has been prepared in accordance with the Annual Accounts Act.
We have read the Corporate Governance Statement and based on that reading and our knowledge of the company and the Group we believe that we have a sufficient basis for
our opinions. This means that our statutory examination of the Corporate Governance Statement is different and substantially less in scope than an audit conducted in accordance with International Standards on Auditing and generally accepted auditing standards in Sweden.
In our opinion, the Corporate Governance Statement has been prepared and its statutory content is consistent with the annual accounts and the consolidated accounts.
Stockholm, March 13, 2015PricewaterhouseCoopers AB
Peter Nyllinge, Authorized Public Accountant
Audit fees and reimbursement (PwC) to auditors have been paid for audit assignments and other reviews in accordance with existing laws, and for advice and assistance in connection with reviews undertaken. Fees have also been paid for independent advice. This advice mainly pertains to audit-related consultations for accounting and tax matters concerning restructuring work.
Group Parent CompanyMSEK 2014 2013 2014 2013Audit assignments 31.7 29.4 5.7 6.6Additional audit assignments 2.4 1.1 1.4 0.6Tax assignments 16.0 11.6 0.6 1.2Other assignments1 6.9 5.1 2.2 2.3Total PwC 57.0 47.2 9.9 10.7
1 Fees for other assignments performed by PwC include fees for audit-related advisory services relating to accounting, including IFRS, IT, acquisitions, divestitures and matters relating to the Group’s internal bank.
Stockholm, March 13, 2015
The Board of Directors of Securitas AB
49Securitas Annual Report 2014
Governance and managementBoard of Directors’ report on corporate governance and internal control

Securitas Annual Report 201450
Securitas’ financial model – six fingers
How to Read and Understand our FinancesSecuritas’ model focuses on the factors that impact profit, and are clearly linked to operations. Factors are grouped into three categories: volume-related factors, efficiency-related factors and capital-usage-related factors.
These factors are then assigned key figures that are measured continuously, allowing managers to make decisions based on facts, enabling them to make quick adjustments if needed. The model is also used when analyzing acquisition targets. The factors and key figures are used throughout our operations from branch level to Group level.
Volume-related factorsThe first two key figures, New sales (of contracts) and Net change (of contract portfolio), relate to the development of the customer contract portfolio. New sales are newly signed con-tracts that will increase the monthly fixed sales. Net change in the customer contract port folio refers to new starts (a newly signed contract that has started) plus increased sales in existing contracts, less terminated customer contracts and reduced sales in existing contracts. Price changes are measured sepa-rately and added to Net change to determine the period’s clos-ing balance of the contract portfolio. The closing balance is the total value of monthly invoicing on our monthly fixed contracts at the closing date for the current period. The third key figure, taken from the statement of income, is Total sales, which in addition to contract-based sales, includes short-term assign-ments.
Efficiency-related factorsThe efficiency-related key figures provide managers with tools to monitor service efficiency and cost trends. The fourth and fifth key figures are: Gross margin, which is defined as total sales less direct expenses as a percentage of total sales, and Indirect expenses, which pertain to the organization and include sales and administrative expenses (costs of branch, area and regional / country offices). Gross income less Indirect expenses equals operating income before amortization of acquisition-related intangible assets and acquisition-related costs. When this is expressed as a percentage of total sales, it indicates the Group’s operating margin, which in Securitas’ financial model, comes before acquisition-related items.
Capital-usage-related factorsIn general, Securitas’ operations are not capital intensive. Accounts receivable tie up the most capital. The sixth key figure is Days of sales outstanding (DSO). Payment terms and effective collection procedures are decisive in determining how much capital is tied up in accounts receivable. These figures are followed up on an ongoing basis at all levels in the organization.
GROUP OPERATIONS
New sales Gross margin on new salesTerminations Gross margin on terminationsNet changePrice changeOrganic sales growth
Total sales
Organic sales growth Acquired sales growthReal sales growthTotal sales
Employee turnover Wage cost increase Gross margin Indirect expenses Operating marginOperating margin
Income before taxEarnings per share
Days of sales outstandingOperating capital employed as % of salesCash flow from operating activities as % of operating income before amortization
Return on capital employed
Operating capital employed as % of salesCash flow from operating activities as % of operating income before amortizationFree cash flowReturn on capital employedFree cash flow in relation to net debt
SECURITAS’ MODEL FOR FINANCIAL KEY FIGURES
Annual ReportManagement and financial control

51Securitas Annual Report 2014
This picture shows the connection between the statement of income, the statement of cash flow and the balance sheet. Different colors are used for the sake of clarity. ■ Operating items ■ Net-debt-related items ■ Goodwill, taxes and non-operating Items ■ Items related to shareholders’ equity
Total sales Operating income before amortization Operating non-current tangible and intangible assets
Organic sales growth, % Investments in non-current tangible and intangible assets Accounts receivable
Production expenses Reversal of depreciation Other operating capital employed
Gross income Net investments in non-current tangible and intangible assets Operating capital employed
Gross margin, % Change in accounts receivable
Branch office expenses Change in other operating capital employed
Other selling and administrative expenses Cash flow from operating activities
Operating income before amortization Net financial items paid
Operating margin, % Current taxes paid
Free cash flow
Acquisitions Shareholders Amortization of net debt
RELATIONSHIP BETWEEN INCOME, CASH FLOW AND BALANCE SHEET
Statement of incomeThe statement of income is broken down according to function, making responsibility for each profit level clear. Managers with operational responsibility can easily see what is expected of them and concentrate on the factors they can affect. Gross margin and operating margin are key indicators, and used in reviewing operations at both divisional and Group level. Amortization of acquisition-related intangible assets, acquisi-tion-related costs, financial items and taxes are monitored separately.
Statement of cash flowIn principle, operating income should generate the same amount of cash flow from operating activities. The cash flow is affected by invest-ments in non-current tangible and intangible assets used in operations and by changes in
working capital. Cash flow from operating activities is an important indicator at operational level. It is defined as operating income less investments in non-current tangible and intangi-ble assets (including equipment for solution contracts) plus reversal of depreciation, change in accounts receivable and change in other operating capital employed.
Free cash flow is cash flow from operating activities less net financial items paid and cur-rent taxes paid. Cash flow for the year is arrived at when cash flow relating to acquisitions and shareholders’ equity is deducted from free cash flow. The consolidation of net debt in foreign currencies usually generates a translation differ-ence that is reported separately. In addition, accounting standards require that certain elements of the net debt are revalued to market value after the initial recognition and this revalu-
ation is also reported separately. The change in net debt corresponds to cash flow for the year plus the change in loans, translation differences and also the revaluation of financial instruments.
Balance sheetSecuritas uses the terms “capital employed” and “financing of capital employed” to describe the balance sheet and financial position. Capital employed consists of operating capital employed plus goodwill, acquisition-related intangible assets and shares in associated com-panies.
Operating capital employed, which consists of operating non-current tangible and intangible assets and working capital, is continuously moni tored at the operating level to avoid un - necessary tied-up capital. Capital employed is financed by net debt and shareholders’ equity.
Six key figures represent the backbone of the Six Fingers model (highlighted in the text and table), but there are comple-mentary key figures used by all divisions, such as organic sales growth and operating margin. There are also complimentary key figures tailored to measure the business in prioritized areas such as within security solutions and technology. These key figures
include volume-, efficiency- and capital-usage-related factors that hold specific bearing on the Group’s progress. Examples are: the number of remote video solution installations, gross margin on security solution contracts (compared to traditional guarding contracts) and the investment in security equipment.
Annual ReportManagement and financial control

Securitas Annual Report 201452
The formal annual accounts and the consolidated accounts comprise pages 53–127
Report of the Board of Directors 53
Consolidated financial statementsConsolidated statement of income 62Consolidated statement of comprehensive income 62Consolidated statement of cash flow 64Consolidated balance sheet 66Consolidated statement of changes in shareholders’ equity 68
Notes and comments to the consolidated financial statements 69
Parent Company financial statementsParent Company statement of income 116Parent Company statement of comprehensive income 116Parent Company statement of cash flow 116Parent Company balance sheet 117Parent Company statement of changes in shareholders’ equity 118
Notes and comments to the Parent Company financial statements 119
Signatures of the Board of Directors 126
Auditor’s report 127
Quarterly data 128
The Securitas share 130
Financial information and invitation to the Annual General Meeting 132
Note 1 General corporate information 69Note 2 Accounting principles 69Note 3 Definitions, calculation of key ratios and
exchange rates 76Note 4 Critical estimates and judgments 78Note 5 Events after the balance sheet date 79Note 6 Financial risk management 79Note 7 Transactions with related parties 86Note 8 Remuneration to the Board of Directors
and senior management 86Note 9 Segment reporting 89Note 10 Allocation of revenue 92Note 11 Operating income 92Note 12 Personnel 94Note 13 Depreciation and amortization 95Note 14 Net financial items 95Note 15 Taxes 95Note 16 Acquisitions of subsidiaries
and associated companies 98Note 17 Goodwill and impairment testing 100Note 18 Acquisition related intangible assets 101Note 19 Other intangible assets 101Note 20 Tangible non-current assets 102Note 21 Shares in associated companies 102Note 22 Interest-bearing financial non-current assets 102Note 23 Other long-term receivables 102Note 24 Inventories 103Note 25 Accounts receivable 103Note 26 Other current receivables 103Note 27 Other interest-bearing current assets 103Note 28 Liquid funds 103Note 29 Shareholders’ equity 103Note 30 Long-term liabilities excluding provisions 104Note 31 Provisions for pensions and similar
commitments 105Note 32 Other long-term provisions 111Note 33 Short-term loan liabilities 111Note 34 Other current liabilities 111Note 35 Short-term provisions 112Note 36 Pledged assets 112Note 37 Contingent liabilities 112Note 38 Financial five year overview 114
Note 39 Accounting principles 119Note 40 Transactions with related parties 120Note 41 Financial risk management 120Note 42 Administrative expenses and
other operating income 122Note 43 Personnel 122Note 44 Other financial income and expenses, net 123Note 45 Taxes 123Note 46 Intangible assets 123Note 47 Machinery and equipment 123Note 48 Shares in subsidiaries 124Note 49 Shares in associated companies 125Note 50 Prepaid expenses and accrued income 125Note 51 Liquid funds 125Note 52 Shareholders’ equity 125Note 53 Long-term liabilities 125Note 54 Accrued expenses and prepaid income 125Note 55 Pledged assets 125Note 56 Contingent liabilities 125
Annual Report

53Securitas Annual Report 2014
Annual ReportReport of the Board of Directors
Report of the Board of Directors
The Board of Directors and the President of Securitas AB (publ.), corporate registration number 556302-7241, with its registered office in Stockholm, hereby submit the Annual Report and consolidated financial statements for the 2014 financial year.
Securitas’ core business is integrated security solutions and the main service offering categories are specialized guarding and mobile services, monitoring, technical solutions and consulting and investigations. Securitas operates in 53 countries in North America, Europe, Latin America, Africa, the Middle East and Asia, with close to 320 000 employees.
In 2014 the Securitas Group consisted of the business seg-ments Security Services North America, Security Services Europe and Security Services Ibero-America. In addition to these business segments, the Group conducts guarding operations in Africa, the Middle East and Asia, which are included under the heading Other in the segment report in note 9. There were no changes to the operational structure nor any change in accounting principles compared with 2013 and consequently no change in either seg-ment or Group comparatives.
Organic sales growth continued to show a positive trend driven by successful sales efforts, our strategy of security solu-tions and technology offerings and an improved macro economic climate in the USA. All business segments improved compared with last year and the organic sales growth was 3 percent.
In real terms earnings per share improved with 8 percent in 2014. The operating income improved compared with last year. A re-organization in Spain has been implemented during the fourth quarter for which a one-off restructuring cost of MSEK -19 (MEUR -2) was recognized.
The employer mandate of the Affordable Care Act (ACA) has taken effect on January 1, 2015 in the USA. We are compliant with ACA, and we do not expect any negative impact on our results as we have been able to mitigate the cost impact. Less customers than anticipated at the outset have chosen the security solutions alternative, opting rather for rate increases or some reductions of the security scope. We estimate a positive net organic sales growth effect, coming from the ACA implementation, of approximately 1 percent in 2015 in Security Services North America.
In 2012, sales of security solutions and technology repre-sented 6 percent of Group sales. Our target is to increase it to a run rate of 18 percent by the end of 2015 and in the fourth quarter it reached 10 percent. Significant progress has been made since early 2012 and many markets have contributed well to this achievement. Security Services Ibero-America is over-achieving their target, Security Services Europe is close to theirs, but Security Services North-America is lagging behind. This is mainly due to the good organic sales growth in guarding con-
tracts and the outcome of the Affordable Care Act in the USA. Consequently this impacts the ability of the Group to reach the target of 18 percent run rate by the end of 2015. The target is likely out of reach, although we will have come a long way and internally the target has been a strong driver for change.
SalesSales amounted to MSEK 70 217 (65 700) and organic sales growth was 3 percent (1), with a positive development across all business segments. In Security Services North America, the improved US economy, as well as a strengthened sales organiza-tion, were key factors behind the development. Countries such as France, Norway and Turkey were the main drivers in Security Services Europe during the year. Argentina was a major contributor in Security Services Ibero-America, however several countries showed good organic sales growth and Spain continued to improve.
Real sales growth, including acquisitions and adjusted for changes in exchange rates, was 4 percent (2).
SALES JANUARY – DECEMBER
MSEK 2014 2013 %Total sales 70 217 65 700 7Acquisitions / divestitures -353 -34Currency change from 2013 -2 032 –Organic sales 67 832 65 666 3
Operating income before amortizationOperating income before amortization was MSEK 3 505 (3 329) which, adjusted for changes in exchange rates, represented a real change of 3 percent. The full year effect from the Argentinian peso exchange rate had a negative impact of MSEK -63.
The Group’s operating margin was 5.0 percent (5.1), nega-tively impacted mainly by Spain in Security Services Ibero-America. Total price adjustments in the Group were lower than wage cost increases, primarily explained by new labor related taxes in Spain.
OPERATING INCOME JANUARY – DECEMBER
MSEK 2014 2013 %Operating income before amortization 3 505 3 329 5Currency change from 2013 -92 –Currency adjusted operating income before amortization 3 413 3 329 3

Securitas Annual Report 201454
Annual ReportReport of the Board of Directors
Operating income after amortizationOperating income after amortization was MSEK 3 237 (3 028).
Amortization of acquisition related intangible assets amounted to MSEK -251 (-274).
Acquisition related costs were MSEK -17 (-27). For further information refer to note 11.
Financial income and expensesFinancial income and expenses amounted to MSEK -328 (-385). The finance net was positively impacted by the repayment of the MEUR 500 bond loan in April 2013.
Income before taxesIncome before taxes was MSEK 2 909 (2 643) which, adjusted for changes in exchange rates, represented a real change of 7 percent.
Taxes, net income and earnings per shareThe Group’s tax rate was 28.8 percent (29.8). The change in the tax rate is mainly based on a reassessment of the full year tax rate including also the recent outcome of tax court cases. We expect that the tax rate will be on the same level for 2015.
Net income was MSEK 2 072 (1 856). Earnings per share amounted to SEK 5.67 (5.07), a total change of 12 percent compared with last year. Real change of earnings per share was 8 percent in 2014.
CONDENSED STATEMENT OF INCOME ACCORDING TO SECURITAS’ FINANCIAL MODEL
MSEK 2014 2013Total sales 70 217.1 65 700.1Organic sales growth, % 3 1Production expenses -58 010.1 -54 276.6Gross income 12 207.0 11 423.5Selling and administrative expenses -8 726.6 -8 112.4Other operating income 15.9 13.5Share in income of associated companies 8.4 4.4Operating income before amortization 3 504.7 3 329.0Operating margin, % 5.0 5.1Amortization of acquisition related intangible assets -250.8 -273.7Acquisition related costs -17.1 -26.8Operating income after amortization 3 236.8 3 028.5Financial income and expenses -327.6 -385.0Income before taxes 2 909.2 2 643.5Taxes -837.7 -787.9Net income for the year 2 071.5 1 855.6
Securitas’ financial model is described on pages 50–51.n n n Operating items. n n n Net debt-related items. n n n Goodwill, taxes and non-operating items. n n n Items related to shareholders’ equity.
Development in the Group’s business segmentsSecurity Services North America
SALES AND INCOME
MSEK 2014 2013Total,
% Real,
%Total sales 24 989 22 841 9 3Organic sales growth, % 3 0Share of Group sales, % 36 35Operating income before amortization 1 333 1 177 13 6Operating margin, % 5.3 5.2Share of Group operating income, % 38 35
Further information regarding the statement of income, cash flow and capital employed is provided in note 9.
The organic sales growth was 3 percent (0). This positive devel-opment in organic sales growth was seen within all business units, resulting from a strengthened sales organization operating in an improved macroeconomic environment. The driver behind organic sales growth has shifted during the year, with more of the organic sales growth coming from the five guarding regions and less from the business unit critical infrastructure (includes federal government services and defense and aerospace).
The operating margin was 5.3 percent (5.2). The US healthcare reform came into force on January 1, 2015.
The expected cost impact has been mitigated. The Swedish krona exchange rate weakened versus the US
dollar and thus had a positive effect on the operating income in Swedish kronor. The real change was 6 percent during the year.
The client retention rate was 90 percent (86). The employee turnover rate in the business segment was 55 percent (551).1 The employee turnover rate comparative has been restated.
Security Services Europe
SALES AND INCOME
MSEK 2014 2013Total,
% Real,
%Total sales 34 997 32 716 7 3Organic sales growth, % 2 0Share of Group sales, % 50 50Operating income before amortization 2 046 1 954 5 1Operating margin, % 5.8 6.0Share of Group operating income, % 58 59
Further information regarding the statement of income, cash flow and capital employed is provided in note 9.
Organic sales growth was 2 percent (0), an improvement driven by the development in France, Norway and Turkey. Germany contributed to organic sales growth while Belgium and the United Kingdom hampered organic sales growth.
The operating margin was 5.8 percent (6.0). A few renegotiated aviation contracts during the year had a negative impact on the operating margin.
The Swedish krona exchange rate weakened versus the euro and thus had a positive effect on the operating income in Swedish kronor. The real change was 1 percent during the year.
The client retention rate was 93 percent (92). The employee turnover was 26 percent (27).

55Securitas Annual Report 2014
Annual ReportReport of the Board of Directors
Security Services Ibero-America
SALES AND INCOME
MSEK 2014 2013Total,
% Real,
%Total sales 9 238 9 266 0 8Organic sales growth, % 8 4Share of Group sales, % 13 14Operating income before amortization 396 480 -18 -5Operating margin, % 4.3 5.2Share of Group operating income, % 11 14
Further information regarding the statement of income, cash flow and capital employed is provided in note 9.
Organic sales growth was 8 percent (4) in the business segment. Organic sales growth in Latin America was 23 percent, where mainly Argentina contributed mostly through price increases. Several countries, such as Chile, Peru and Uruguay, showed good organic sales growth. Organic sales growth in Spain was -7 percent (-12), reflecting a slowly improving macroeconomic environment. Security solutions and technology sales in Spain continued to grow, but not yet enough to compensate for the highly price competitive guarding business.
The operating margin was 4.3 percent (5.2), a decline related to Spain. The main reasons were a restructuring cost of MSEK -19 (MEUR -2) in the fourth quarter, the labor related charges introduced in December 2013, volume losses and a lower oper-ating margin after contract renewals in the aviation customer segment. The operating margin improved in Latin America.
In the third quarter, a collective bargaining agreement was signed in Spain effective as of January 1, 2015 stipulating a wage increase of 0.5 percent for 2015.
The Swedish krona exchange rate weakened against the euro. The Argentinian peso also weakened and impacted operating income before amortization negatively with MSEK -63. The real change in the segment was -5 percent during the year.
The client retention rate was 91 percent (87). The employee turnover was 26 percent (291).1 The employee turnover rate comparative has been restated.
Cash flowOperating income before amortization amounted to MSEK 3 505 (3 329). Net investments in non-current tangible and intangible assets amounted to MSEK -146 (142).
Changes in accounts receivable were MSEK -115 (1), with a positive impact from a slight decrease of days of sales outstanding (DSO) compared with December last year, but also affected negatively by the increased organic sales growth. Changes in other operating capital employed were MSEK -381 (-242).
Cash flow from operating activities amounted to MSEK 2 863 (3 230), equivalent to 82 percent (97) of operating income before amortization.
Financial income and expenses paid amounted to MSEK -311 (-532). Last year financial items paid were significantly impacted by the MEUR 500 Eurobond loan that matured in April 2013. Current taxes paid amounted to MSEK -697 (-610). Payments of final taxes for the previous year and preliminary taxes for the current year were higher than last year.
Free cash flow was MSEK 1 855 (2 088), equivalent to 75 percent (93) of adjusted income. The free cash flow is affected from the net investments in non-current tangible and intangible assets, reflecting our strategy to increase the sales in security solutions and technology.
Cash flow from investing activities, acquisitions, was MSEK -385 (-295).
Cash flow from items affecting comparability was MSEK -73 (-307), whereof MSEK -65 (-205) was related to the cost savings program, MSEK -5 (-12) was related to overtime compensation in Spain, MSEK -3 (-2) was related to premises in Germany and MSEK 0 (-88) was related to payment to Deutsche Bank in Germany.
Cash flow from financing activities was MSEK -2 108 (-2 271).Cash flow for the year was MSEK -711 (-785).
CONDENSED STATEMENT OF CASH FLOW ACCORDING TO SECURITAS’ FINANCIAL MODEL
MSEK 2014 2013Operating income before amortization 3 504.7 3 329.0Investments in non-current tangible and intangible assets -1 113.2 -804.0Reversal of depreciation 966.9 945.6Net investments in non-current tangible and intangible assets -146.3 141.6Change in accounts receivable -114.5 1.0Change in other operating capital employed -381.2 -241.5Cash flow from operating activities 2 862.7 3 230.1Cash flow from operating activities, % 82 97Financial income and expenses paid -311.4 -532.0Current taxes paid -696.6 -610.4Free cash flow 1 854.7 2 087.7Free cash flow, % 75 93Cash flow from investing activities, acquisitions -385.0 -294.7Cash flow from items affecting comparability -72.8 -307.5Cash flow from financing activities -2 107.8 -2 270.5Cash flow for the year -710.9 -785.0
Securitas’ financial model is described on pages 50–51.n n n Operating items. n n n Net debt-related items. n n n Goodwill, taxes and non-operating items.

Securitas Annual Report 201456
Annual ReportReport of the Board of Directors
Capital employed and financingCapital employed The Group’s operating capital employed was MSEK 3 924 (3 181) corresponding to 6 percent (5) of sales, adjusted for the full year sales figures of acquired units.
Acquisitions increased operating capital employed by MSEK 58 during the year.
The annual impairment test of all cash generating units (CGU), which is required under IFRS, took place during the third quarter 2014 in conjunction with the business plan process for 2015. None of the CGUs tested for impairment had a carrying amount that exceeded the recoverable amount. Consequently no impair-ment losses have been recognized in 2014. No impairment losses were recognized in 2013 either.
Acquisitions increased consolidated goodwill by MSEK 77. After translation differences of MSEK 1 789, total goodwill for the Group amounted to MSEK 16 228 (14 362).
Acquisitions have increased acquisition related intangible assets by MSEK 75. After amortization of MSEK –251 and trans-lation differences of MSEK 104, acquisition related intangible assets amounted to MSEK 1 244 (1 316).
The Group’s total capital employed was MSEK 21 721 (18 991). The translation of foreign capital employed to Swedish kronor increased the Group’s capital employed by MSEK 2 315.
The return on capital employed was 16 percent (18).
FinancingThe Group’s net debt amounted to MSEK 10 422 (9 610). Acqui-sitions and acquisition related payments increased the Group’s net debt by MSEK 385, of which purchase price payments accounted for MSEK 353, assumed net debt for MSEK 11 and acquisition related costs paid accounted for MSEK 21. The Group’s net debt increased by MSEK 1 113 due to the translation of net debt in foreign currency to Swedish kronor.
A dividend of MSEK 1 095 (1 095) was paid to the share-holders in May 2014.
The free cash flow to net debt ratio amounted to 0.18 (0.22).The main capital market instruments drawn as of the end
of December 2014 were ten bonds issued under the Group’s Euro Medium Term Note Program, with maturity dates between January 2015 and September 2021.
At the end of the year, Securitas had access to committed bank financing through a Revolving Credit Facility maturing in 2016, which comprised of two respective tranches of MUSD 550 and MEUR 420 (MUSD 1 100 in total). There was no drawing as of the end of December 2014, leaving the full amount available. On January 8, 2015 Securitas signed a new Revolving Credit Facility. The new credit facility comprises of two respective tranches of MUSD 550 and MEUR 440, for an initial five year period, with the possibility to extend for a further two years. The Revolving Credit Facility maturing in 2016 was cancelled at around the same time.
The Group also has access to a MSEK 5 000 Swedish Commercial Paper Program for short-term borrowing needs, under which MSEK 1 170 has been issued. Further information regarding financial instruments and credit facilities is provided in note 6.
Securitas has ample liquidity headroom under the committed credit facilities in line with established policies, which combined with the strong free cash flow generation means that the future liquidity requirements for the Company’s operations are met.
Standard & Poor’s rating for Securitas is BBB with stable out-look. The Group’s liquidity position is regarded as strong.
The interest cover ratio amounted to 10.4 (7.9). Shareholders’ equity amounted to MSEK 11 299 (9 381).
The translation of foreign assets and liabilities into Swedish kronor increased shareholders’ equity by MSEK 1 202 after taking into account net investment hedging of MSEK 139 and MSEK 1 063 before net investment hedging. Refer to the statement of comprehensive income on page 62 for further information.
The total number of outstanding shares amounted to 365 058 897 as of December 31, 2014.
CONDENSED CAPITAL EMPLOYED AND FINANCING ACCORDING TO SECURITAS’ FINANCIAL MODEL
MSEK 2014 2013Operating capital employed 3 924.0 3 180.9Operating capital employed as % of sales 6 5Goodwill 16 228.1 14 361.9Acquisition related intangible assets 1 244.2 1 315.6Shares in associated companies 324.5 132.7Total capital employed 21 720.8 18 991.1Return on capital employed, % 16 18
Net debt 10 421.6 9 609.8Shareholders’ equity 11 299.2 9 381.3Total financing 21 720.8 18 991.1
Securitas’ financial model is described on pages 50–51.n n n Operating items. n n n Net debt-related items. n n n Goodwill, taxes and non-operating items. n n n Items related to shareholders’ equity.
NET DEBT DEVELOPMENT
MSEK 2014 2013Opening balance January 1 -9 609.8 -9 864.6
Cash flow from operating activities 2 862.7 3 230.1Financial income and expenses paid -311.4 -532.0Current taxes paid -696.6 -610.4Free cash flow 1 854.7 2 087.7
Cash flow from investing activities, acquisitions -385.0 -294.7Cash flow from items affecting comparability -72.8 -307.5Dividend paid -1 095.2 -1 095.2Change in net debt before revaluation and translation 301.7 390.3
Revaluation of financial instruments -0.4 10.9Translation differences -1 113.1 -146.4Change in net debt -811.8 254.8
Closing balance December 31 -10 421.6 -9 609.8

57Securitas Annual Report 2014
Annual ReportReport of the Board of Directors
All acquisition calculations are finalized no later than one year after the acquisition is made. Transactions with non-controlling interests are specified in the statement of changes in share- holders’ equity. Transaction costs and revaluation of deferred considerations can be found in note 11.
For further information regarding acquisitions in 2014, refer to note 16.
Other significant eventsAuthorization to repurchase shares in Securitas ABIn order to be able to contribute to shareholder value, the Board considers it beneficial for the company to be able to adjust the company’s capital structure as appropriate at each point in time. The Board has therefore decided to propose to the Annual General Meeting on May 8, 2015, that the Board be authorized to be able to resolve on the acquisition of the company’s shares for a period until the next Annual General Meeting, up to a maximum of ten (10) percent of the issued shares in the com-pany. For this purpose, the Board intends to propose that any shares that have been repurchased as per such an authorization be cancelled.
Spain – tax auditThe Spanish tax authority has in 2009 and 2012 rejected certain interest deductions for the years 2003–2005 respectively 2006–2007, which have been appealed to the Spanish courts. If finally upheld by the courts the resolutions would result in a tax of MEUR 27 including interest.
Similar to the rejected interest deductions for the years 2003–2005 and 2006–2007 the Spanish tax authority has now, in connection with an ongoing audit of Securitas Spain, challenged interest payments for the years 2008–2009. The tax for these years amounts to MEUR 14, including interest up to December
2014. There exists no further exposure for similar rejected interest deductions after 2009. The tax authority has also challenged a deduction for a currency related liquidation loss in the year 2010, relating to a company that was acquired in 2004. The tax amounts to MEUR 16, including interest up to December 2014.
Securitas has recently won in the Spanish national court Audiencia Nacional the case concerning interest deductions for the years 2003–2005, due to that the years 2003 and 2004 were judged to be time-barred. The tax for these years amounts to MEUR 11 (which is part of the MEUR 27 exposure described above), including interest up to December 2014. Further, in its judgment the court referred to a recent judgment by the Supreme Court, meaning that interest or any other expenses as a result of a transaction in a time-barred year cannot be disallowed in later years. Provided that the Supreme Court will decide in Securitas case in accordance with their recent judgment, referred to by the Audiencia Nacional, then all exposure for interest 2003–2005, 2006–2007 and 2008–2009 and for the currency related liquidation loss 2010, should cease.
The Spanish tax authority has appealed the Audiencia Nacional’s judgment regarding 2003–2005 to the Supreme Court.
Securitas believes it has acted in accordance with applicable law and will defend its position in the courts. However, the tax resolution causes some uncertainty and it may take a long time until a final judgment is made.
For further information refer to note 37.
USA – tax auditThe US tax authority has in 2010 rejected certain insurance premium deductions for the years 2003–2004. Securitas has won the case in the US Tax Court and the judgment has not been appealed.
For further information refer to note 37.
ACQUISITIONS JANUARY-DECEMBER 2014 (MSEK)
Company Business segment1Included
fromAcquired
share2Annual
sales3Enterprise
value4 Goodwill
Acq. related intangible
assetsOpening balance 14 362 1 316Iverify, USA8 Security Services North America Jun 1 24 – 148 – –SAIT, Belgium7 Security Services Europe Nov 1 100 228 111 75 50Other acquisitions5, 7 59 105 2 25Total acquisitions January–December 2014 287 364 77 6 75Amortization of acquisition related intangible assets – -251Exchange rate differences 1 789 104Closing balance 16 228 1 244
1 Refers to business segment with main responsibility for the acquisition. 2 Refers to voting rights for acquisitions in the form of share purchase agreements. For asset deals
no voting rights are stated.3 Estimated annual sales. 4 Purchase price paid plus acquired net debt, but excluding any deferred considerations.5 Related to other acquisitions for the period and updated previous year acquisition calculations for the
following entities: Grupo Argos, Mexico, Interseco, the Netherlands, G4S – Alesund (contract portfolio), Norway, Vagt DK and TS Alarm (contract portfolio), Denmark, Vartiointipalvelu P. Kauppila (contract portfolio) and Sastamalan Vartiointi (contract portfolio), Finland, Ave Lat Sargs, Latvia, EKS Technik, Germany, SEIV, France, IBBC, Poland, Tehnomobil, Croatia, Sensormatic, Turkey, Vigilancias y Seguridad, Fuego Red, El Guardian, Trailback and Consultora Videco, Argentina, Pandyr, Selectron and Urulac, Uruguay, Ubiq, Peru, Security Alliance Limited, Hong Kong, Security Standard Group, Cambodia and Rentsec and Vamsa, South Africa. Related also to deferred considerations paid in Mexico, Denmark, Latvia, France, Austria, Croatia, Turkey, Argentina, Uruguay, Hong Kong and Indonesia.
6 Goodwill that is expected to be tax deductible has decreased by net MSEK 6 during the year.7 Deferred considerations have been recognized mainly based on an assessment of the future profitability
development in the acquired entities for an agreed period. The net of new deferred considerations, payments made from previously recognized deferred considerations and revaluation of deferred consid-erations in the Group was MSEK -60. Total deferred considerations, short-term and long-term, in the Group’s balance sheet amount to MSEK 541.
8 Accounted for as associated company in the Group’s balance sheet.
Acquisitions

Securitas Annual Report 201458
Annual ReportReport of the Board of Directors
Other significant events after the balance sheet dateAs described above under the heading Financing, Securitas signed a new Revolving Credit Facility on January 8, 2015. The Revolving Credit Facility maturing in 2016 was cancelled at around the same time.
As described above under the heading Other significant events, USA – tax audit, the judgment relating to certain insur-ance premium deductions in favor of Securitas in the US Tax Court has not been appealed and consequently the contingent liability for this case has ceased to exist.
In order to hedge the share portion of Securitas share-based incentive scheme 2014, the Group entered into a swap agree-ment with a third party in the beginning of March 2015.
There have been no other significant events with effect on the financial reporting after the balance sheet date.
Change in Group ManagementErik-Jan Jansen, Chief Operating Officer of Security Services Europe, left Securitas and Securitas Group Management on March 31, 2014.
Henrik Zetterberg, Senior Vice President General Counsel, is as of September 24, 2014 a member of Securitas Group Management. He has succeeded Åsa Thunman, who left Securitas in the end of September 2014.
Aimé Lyagre, Chief Operating Officer and Chief Technology Officer, Security Services Europe, is as of November 4, 2014 a member of Securitas Group Management.
Risk and uncertaintiesManaging risk is necessary for Securitas to be able to fulfill its strategies and achieve its corporate objectives. Securitas’ approach to enterprise risk management is described in more detail on pages 38–48.
Securitas’ risks fall into three main categories: contract risks, operational assignment risks and financial risks.
Contract risksThis category encompasses the risks related to entering into a customer contract and also those risks related to the acquisition of new businesses.
When entering into a contract with a customer a balanced allocation of responsibilities and risks between Securitas and the customer is essential. Standardized contracts are the norm. Reasonable caps on potential liability and indemnification for third-party claims are important. Significant focus is devoted to contract risks and the management of contract risks. Each seg-ment has developed policies and procedures tailored to their specific needs. These policies are all based on the contract policies approved by the Board of Directors in the Group Policies and Guidelines.
In addition to organic growth resulting from new and / or increased customer contracts the Group has grown by a signifi-cant number of acquisitions over the years and will, as part of the Group’s strategy, continue to acquire security companies. The integration of new companies always carries certain risks. To a higher degree than previously, such acquisitions are also
taking place in new markets such as Latin America, Africa, the Middle East and Asia or relate to acquisitions of security compa-nies active within technology and integrated security solutions. The profitability of the acquired company may be lower than expected and / or certain costs in connection with the acquisition may be higher than expected.
The acquisitions made during 2014 are described under the heading Acquisitions above and in note 16.
Operational assignment risksOperational assignment risks are risks associated with daily operations and the services we provide to our customers, for example, when services do not meet the required standards and result in loss of property, damage to property or bodily injury. Proper recruitment, training and supervision of security officers are important to mitigate these risks. Another type of operational assignment risk which may impact profitability is the risk that Securitas will not be able to increase prices to be paid by customers in order to compensate fully for increases in wages and related costs.
Financial risksFinancial risks are mainly managed through continuous measure-ment and follow-up of financial performance, with the help of Securitas’ financial model. This model identifies certain key figures that are vital to the profitability of the operations, and facilitates the detection and handling of risks. The financial model is described in more detail on pages 50–51. In addition, financial risks (other than relating to financial reporting) arise because the Group has external financing needs and operates in a number of foreign currencies. The risks are mainly interest rate risk, foreign currency risk, financing and liquidity risk and credit /counterparty risk.
The customer credit risk, that is the risk of Securitas’ customers not being able to fulfill their obligation of paying invoices for services being provided, increased during the current macro-economic situation. The risk is reduced by the fact that the numerous customers are spread over many business sectors and geographies, and by established routines for monitoring and collecting of accounts receivable within the organization. Further information regarding financial risk management is provided above under the section Capital employed and financing / Financing and in note 6.
The preparation of financial reports requires the Board of Directors and Group Management to make estimates and judg-ments. Estimates and judgments will impact both the statement of income and the balance sheet, as well as disclosures such as contingent liabilities. Actual results may differ from these estimates and judgments under different circumstances and conditions. Further information regarding critical estimates and judgments is provided in note 4.
For the forthcoming twelve month period, the financial impact of certain previously recognized items affecting comparability, provisions and contingent liabilities, as described in note 32, note 35 and note 37 respectively, may vary from the current financial estimates and provisions made by management. This could affect the profitability and the financial position of the Group.

59Securitas Annual Report 2014
Annual ReportReport of the Board of Directors
PersonnelWith close to 320 000 employees in 53 countries, Securitas number one responsibility is to be a solid, trustworthy and stable employer to all our employees, striving to offer good working conditions, fair wages and opportunities for personal develop-ment. Our basic requirement is to act within the framework of laws and international conventions. This means that we respect and comply with labor market laws, agreements and safety requi-rements and other provisions that set the parameters for our operations.
The foundation for our work with responsibility issues is our ethics code, Securitas’ Values and Ethics, which upholds and pro-motes high ethical business standards. Securitas’ Values and Ethics is based on our three fundamental values: Integrity, Vigi-lance and Helpfulness. Integrity means being honest and also the right to openly express one’s opinion. Vigilance entails striving to be attentive and able to observe, listen and evaluate. Helpfulness is about our employees always being ready to assist within the context of a particular assignment.
Taking responsibility as an employer starts with the very basics: Securitas does not employ or accept any form of child labor or forced or bonded labor and we respect the right of all employees to choose whether or not to be represented by a trade union and to form and join trade unions. Securitas is also an equal-opportunity employer and does not tolerate any form of harassment, bullying or abuse. Our employees are our most important resource and we promote relationships based on mutual respect and dignity. Securing the basic rights of the employees is fundamental. Securitas has for a long time been a driving force in raising the standards and level of professionalism in the security industry, improving the status of the security offi-cer profession as well as wage levels. Improved status makes it easier to recruit and retain qualified employees with experience.
There are numerous opportunities for career advancement at Securitas, for example by specializing in a particular discipline at local, regional or national level. There are several training pro-grams in place. In most countries there are specialized training programs geared towards specific customer segments, such as aviation, retail and gated communities. In all countries where Securitas has operations, we run local training centers. On a senior management level, Securitas has offered a one-year training program for many years. This program has been designed for sharing best practices and refining our operations. In addition to our social responsibility as an employer, we work with social projects where we see a pressing need of strengthening the local community. For further information, see pages 21–26.
For information regarding the average number of yearly employees, the distribution between women and men and the total staff costs, refer to note 12.
Research and developmentSecuritas is a service company and does not carry out any research activities as defined in IAS 38 Intangible assets. The service offering of the Group is continuously being developed, not least as an integrated item when carrying out the service delivery to the customers. Technical solutions are an important part of the integrated security solutions that Securitas offers. In order to support this development a Chief Technology Officer
(CTO) position with supporting staff is implemented in all major countries as well as on divisional and Group level. Securitas has also invested in a competence center in Malmö, Sweden within the Remote Video Solutions area with the aim of developing security solutions and supporting the country organizations, mainly in Security Services Europe.
As of December 31, 2014 the Group had no capitalized research expenditures.
EnvironmentEnvironmentally, our most important responsibility is to minimize transportation emissions. We also purchase products, thereby creating an environmental impact. One large category of pro-ducts we purchase is uniforms for security officers. On the whole Securitas is a service company with relatively low environmental impact compared to a manufacturing company. The operations of the Group do not require a permit under the Swedish Environ-mental Code.
Securitas Group Emissions Policy sets emission limits for new company cars and new minivans, respectively. The limits are reduced on a yearly basis and from December 1, 2014, the limits are 140 and 180 gram CO2 per kilometer for new company cars and minivans, respectively. Trucks, buses and specialist vehicles are not defined as company cars or minivans. The environmental target is set to decrease exhaust emissions year by year. On an average, the more than 12 500 company cars and minivans that Securitas owns or leases worldwide, emitted approximately 149 gram CO2 per kilometer (150) in 2014. For further information see pages 23 and 25.
Information regarding the Securitas shareInformation about the Securitas share regarding the number of shares of Series A and Series B, differences between shares in Series A and Series B as well as information on major sharehold-ers can be found in note 29. Further information regarding the Securitas share can also be found on pages 130–131.
In order to be able to contribute to shareholder value, the Board considers it beneficial for the company to be able to adjust the company’s capital structure as appropriate at each point in time. The Board has therefore decided to propose to the Annual General Meeting on May 8, 2015, that the Board be authorized to be able to resolve on the acquisition of the company’s shares for a period until the next Annual General Meeting, up to a maximum of ten (10) percent of the issued shares in the company. For this purpose, the Board intends to propose that any shares that have been repurchased as per such an authorization be cancelled. There is currently an authorization by the Annual General Meeting held on May 5, 2014, to the Board of Directors to repurchase Securitas shares with the same terms and limitations as proposed to the Annual General Meeting for 2015. The Board of Directors has as of the date of this Annual Report, not taken any decisions to repurchase shares.
A shareholders’ agreement that among other items comprises preemption rights for the sale of Series A shares by any part exists among Gustaf Douglas, Melker Schörling and companies closely related to them. Apart from this, the Board of Directors of Securitas AB is not aware of any shareholders’ agreements or other arrangements between shareholders of Securitas AB.

Securitas Annual Report 201460
Annual ReportReport of the Board of Directors
Group developmentThe Group will during 2015 continue to focus on integrated security solutions. Our recipe for success involves developing optimal, cost-effective security solutions that integrate all of our areas of competence and result in improved margins, optimal solutions for the customers and stronger, more long-term customer relationships. The key is finding the right balance between opera-tions done by security officers on site and operations done by specially trained security officers from a monitoring center, and to what extent security officers or technology solutions should be used. Securitas’ plan is to move up the value chain, from traditional guarding to complete security solutions.
The sales of security solutions and technology represented approximately 6 percent of Group total sales in 2012. It has increased to a run rate of 10 percent by the end of 2014, which represented an increase of 28 percent compared to total security solutions and technology sales in 2013. We believe that we can continue to increase these sales also in 2015 at least in the same range.
In 2014, we improved earnings per share in real terms with 8 percent. We achieved a good cash flow and reduced our net debt in real terms, but due to the weakened Swedish krona during the latter part of 2014, the net debt increased in SEK. Our financial target free cash flow in relation to net debt of at least 0.20 would have been achieved if we would have had the same exchange rates in the statement of income as we had at year end in the balance sheet. Now we reached 0.18. However, we will continue to be restrictive regarding acquisitions, with the exception of technology operations that create synergies and competence along our strategic path or acquisitions that strengthen our position in growth markets.
Parent Company operationsThe Group’s Parent Company, Securitas AB, is not involved in any operating activities. Securitas AB consists of Group Management and support functions for the Group.
The Parent Company’s income amounted to MSEK 970 (870) and mainly relates to license fees and other income from subsid-iaries.
Financial income and expenses amounted to MSEK 395 (104). The increase of financial income and expenses compared with last year is mainly explained by a write-down of shares in sub-sidiaries made last year that had a negative effect on financial income and expenses.
Income before taxes amounted to MSEK 472 (703). Income before taxes includes dividends from subsidiaries of MSEK 1 088 (1 119), interest income of MSEK 165 (165), interest expense of MSEK -365 (-476) and other financial income and expenses, net, of MSEK -493 (-704). Included in other financial income and expenses, net, are impairment losses relating to shares in subsidiaries of MSEK -33 (-554). Impairment losses in 2014 were recognized in conjunction with the Parent Company having received dividend from a subsidiary, for another subsidiary as a consequence of a capital contribution to the subsidiary and finally for a third subsidiary in conjunction with the adjustment of the carrying value of intangible assets in the subsidiary. Impairment losses in 2013 were recognized in conjunction with the Parent Company having received dividend from a subsidiary and for the shares in another subsidiary as a consequence of a capital contribution to the subsidiary.
Net income was MSEK 599 (696).Cash flow for the year amounted to MSEK 60 (1 983).The Parent Company’s non-current assets amounted to
MSEK 38 535 (38 043) and mainly comprise shares in subsidiaries of MSEK 37 258 (37 183). Current assets amounted to MSEK 6 199 (5 675) of which liquid funds amounted to MSEK 2 068 (2 008).
Shareholders’ equity amounted to MSEK 25 027 (25 052). A dividend of MSEK 1 095 (1 095) was paid to the shareholders in May 2014.
The Parent Company’s liabilities amounted to MSEK 19 707 (18 666) and mainly consist of interest-bearing debt.
For further information, refer to the Parent Company’s financial statements and the accompanying notes and comments.
Proposed guidelines for remuneration to senior management in Securitas for 2015The Board of Directors of Securitas AB (publ.) proposes that the Annual General Meeting on 8 May 2015 adopts guidelines for remuneration to senior management in accordance with the following;
The fundamental principle is that remuneration and other terms of employment for senior management shall be competitive and in accordance with market conditions, in order to ensure that the Securitas Group will be able to attract and keep competent senior management employees.
The total remuneration to senior management shall consist of a fixed basic salary, variable remuneration, pensions and other benefits. In addition to a fixed annual salary the Group Manage-ment may also receive variable remuneration, which shall be based on the outcome in relation to financial goals within the individual area of responsibility (Group or division) and which shall agree with the interest of the shareholders. The variable remuneration shall amount to a maximum of 60 percent of the fixed annual salary for the President and CEO and a maximum of 42–200 percent of the fixed annual salary for other individuals of the Group Management. If cash payment of variable remuneration has been effected on grounds later proven to be obviously inaccurate, the company shall have the possibility to reclaim such paid remuneration.
The Board of Directors shall each year consider whether to propose that the General Meeting resolves upon a share or share price based incentive program.
The undertakings of the company as regards variable remu-neration to the Group Management may, at maximum outcome during 2015, amount to a total of MSEK 70. Information on previously decided remuneration which has not yet been paid can be found in note 8 in this Annual Report.
The pension rights of senior management employees shall be applicable as from the age of 65 at the earliest and the entire Group Management shall be subject to defined contribution pension plans for which insurance premiums are transferred from the individual’s total remuneration and paid by the company during the term of employment. Variable compensation shall not qualify for pension purposes unless local regulations provide otherwise.

61Securitas Annual Report 2014
Annual ReportReport of the Board of Directors
Other benefits, such as company car, special health insurance or occupational health service shall be provided to the extent this is considered customary for senior management employees holding equivalent positions on the employment market where the senior management employee is active.
At dismissal, the notice period for all senior management employees shall amount to a maximum of 12 months with a right to redundancy payment after the end of the notice period, equivalent to a maximum of 100 percent of the fixed salary for a period not exceeding 12 months. At resignation by a senior management employee, the notice period shall amount to a maximum of six months.
These guidelines shall apply to individuals who are included in the Group Management during the term of application of these guidelines. The guidelines shall apply to agreements entered into after the adoption by the Annual General Meeting, and to changes made in existing agreements after this date. The Board shall be entitled to deviate from the guidelines in individual cases if there are particular grounds for such deviation.
Proposed allocation of earningsThe statements of income and the balance sheets of the Parent Company and the Group are subject to adoption by the Annual General Meeting on May 8, 2015.
Retained earnings in the Parent Company available for distribution:
SEK Hedging reserve -399 322 Translation reserve 850 727 038Retained earnings 15 849 997 943Net income for the year1 598 652 327Total 17 298 977 9861 Includes Group contributions to subsidiaries of SEK 284 413 000.
The Board of Directors propose that the earnings are allocated as follows:
SEK a dividend to the shareholders of SEK 3.00 per share 1 095 176 691 retained earnings to be carried forward 16 203 801 295Total 17 298 977 986
The Board’s statement on the proposed dividendWith reference to the Board’s dividend proposal, the Board of Directors hereby makes the following statement pursuant to Chapter 18, section 4 of the Swedish Companies Act.
The Company’s unappropriated earnings as per December 31, 2014 amount to SEK 16 700 325 659. The net income for the year amounts to SEK 598 652 327 of which SEK 284 413 000 is related to Group contributions to subsidiaries and SEK -598 746 is the result of financial instruments being valued pursuant to Chapter 4, section 14 a of the Swedish Annual Accounts Act.
The Company’s equity would not have been impacted as per December 31, 2014 if financial instruments, having been valued at fair value pursuant to Chapter 4, section 14 a of the Swedish Annual Accounts Act, had instead been valued at the lower of cost or market as there is no difference as of this date.
Unappropriated earnings of SEK 17 298 977 986 are there-fore at the Annual General Meeting’s disposal.
Provided that the 2015 Annual General Meeting resolves to allocate the earnings in accordance with the Board’s proposal, SEK 16 203 801 295 will be carried forward. After distribution of the proposed dividend and group contributions, there will be full coverage for the Company’s restricted equity.
The Board has considered the Company’s and the Group’s consolidation requirements and liquidity through a comprehen-sive assessment of the financial position of the Company and the Group, as well as the possibilities of the Company and the Group to discharge at sight its obligations. The proposed dividend and Group contributions to subsidiaries does not jeopardize the Com-pany’s ability to make the investments that have been deemed necessary. The Company’s financial position does not give rise to any other assessment than that the Company can continue its operations and that the Company is expected to comply with its obligations in a short as well as long term perspective. In addition to the assessment of the Company’s consolidation requirements and liquidity, the Board has also taken into consideration all other known circumstances that may impact the Company’s financial position.
With reference to the above, the Board makes the assessment that the dividend and Group contributions are justifiable consid-ering the requirements that the nature, scope and risks of the operations pose on the size of the Company’s and the Group’s equity as well as the Company’s and the Group’s consolidation requirements, liquidity and position in general.
As regards the Company’s and the Group’s result and position in general, refer to the statements of income, statements of com-prehensive income, balance sheets and statements of cash flow as well as notes and comments.
Proposal on record date for dividendAs record date for dividend, the Board proposes May 12, 2015. If the Annual General Meeting so resolves, the dividend is expected to be distributed by Euroclear Sweden AB starting May 18, 2015.
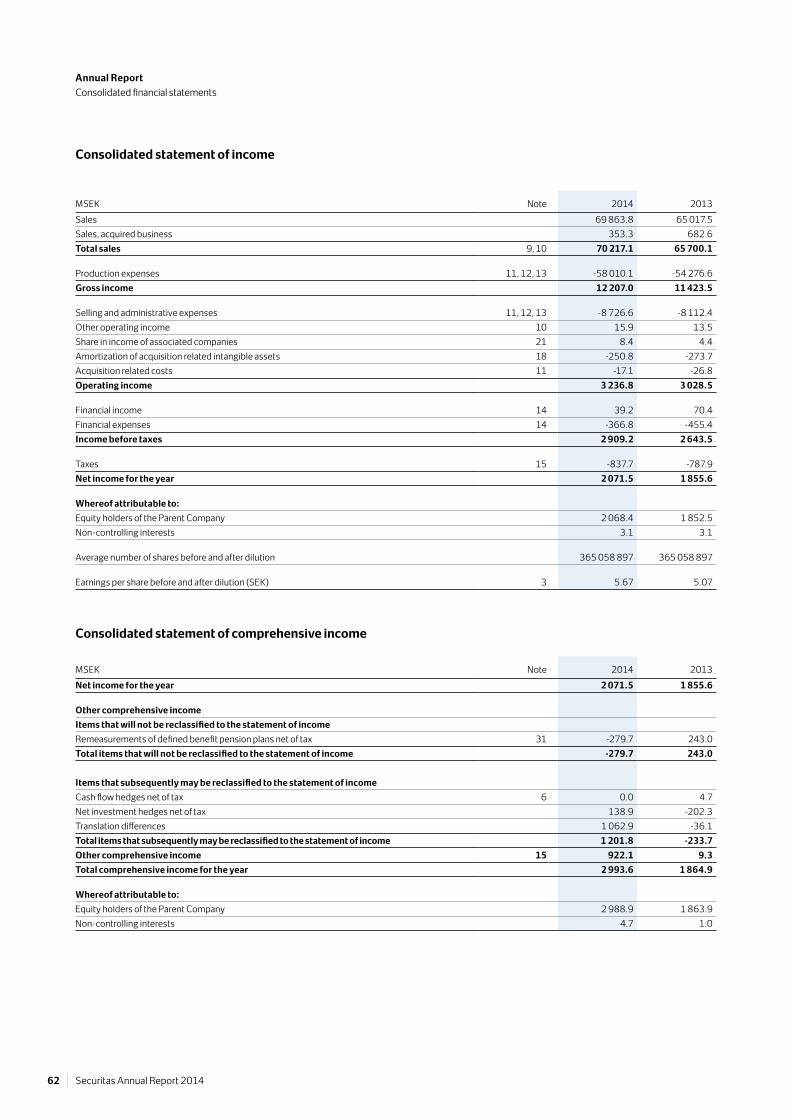
Securitas Annual Report 201462
Annual ReportConsolidated financial statements
Consolidated statement of income
MSEK Note 2014 2013Sales 69 863.8 65 017.5Sales, acquired business 353.3 682.6Total sales 9, 10 70 217.1 65 700.1
Production expenses 11, 12, 13 -58 010.1 -54 276.6Gross income 12 207.0 11 423.5
Selling and administrative expenses 11, 12, 13 -8 726.6 -8 112.4Other operating income 10 15.9 13.5Share in income of associated companies 21 8.4 4.4Amortization of acquisition related intangible assets 18 -250.8 -273.7Acquisition related costs 11 -17.1 -26.8Operating income 3 236.8 3 028.5
Financial income 14 39.2 70.4Financial expenses 14 -366.8 -455.4Income before taxes 2 909.2 2 643.5
Taxes 15 -837.7 -787.9Net income for the year 2 071.5 1 855.6
Whereof attributable to:Equity holders of the Parent Company 2 068.4 1 852.5Non-controlling interests 3.1 3.1
Average number of shares before and after dilution 365 058 897 365 058 897
Earnings per share before and after dilution (SEK) 3 5.67 5.07
Consolidated statement of comprehensive income
MSEK Note 2014 2013Net income for the year 2 071.5 1 855.6
Other comprehensive incomeItems that will not be reclassified to the statement of incomeRemeasurements of defined benefit pension plans net of tax 31 -279.7 243.0Total items that will not be reclassified to the statement of income -279.7 243.0
Items that subsequently may be reclassified to the statement of incomeCash flow hedges net of tax 6 0.0 4.7Net investment hedges net of tax 138.9 -202.3Translation differences 1 062.9 -36.1Total items that subsequently may be reclassified to the statement of income 1 201.8 -233.7Other comprehensive income 15 922.1 9.3Total comprehensive income for the year 2 993.6 1 864.9
Whereof attributable to:Equity holders of the Parent Company 2 988.9 1 863.9Non-controlling interests 4.7 1.0

63Securitas Annual Report 2014
Annual ReportConsolidated financial statements
Securitas’ financial model – consolidated statement of income
Supplementary information
MSEK 2014 2013Sales 69 863.8 65 017.5Sales, acquired business 353.3 682.6Total sales 70 217.1 65 700.1Organic sales growth, % 3 1Production expenses -58 010.1 -54 276.6 Gross income 12 207.0 11 423.5Gross margin, % 17.4 17.4Expenses for branch offices -3 945.0 -3 690.3Other selling and administrative expenses -4 781.6 -4 422.1Total expenses -8 726.6 -8 112.4Other operating income 15.9 13.5Share in income of associated companies 8.4 4.4Operating income before amortization 3 504.7 3 329.0Operating margin, % 5.0 5.1Amortization of acquisition related intangible assets -250.8 -273.7Acquisition related costs -17.1 -26.8Operating income after amortization 3 236.8 3 028.5Financial income and expenses -327.6 -385.0Income before taxes 2 909.2 2 643.5Net margin, % 4.1 4.0Taxes -837.7 -787.9Net income for the year 2 071.5 1 855.6
Operating items. Net debt-related items. Goodwill, taxes and non-operating items. Items related to shareholders’ equity. Securitas’ financial model is described on pages 50–51.

Securitas Annual Report 201464
Annual ReportConsolidated financial statements
Consolidated statement of cash flow
MSEK Note 2014 2013OperationsOperating income 3 236.8 3 028.5Adjustment for effect on cash flow from items affecting comparability 11 -72.8 -307.5Adjustment for effect on cash flow from acquisition related costs 11 -4.1 -28.4Reversal of depreciation 18, 19, 20 1 217.7 1 219.3Financial items received 39.4 70.6Financial items paid -350.8 -602.6Current taxes paid -696.6 -610.4Change in accounts receivable -114.5 1.0Change in other operating capital employed -381.2 -241.5Cash flow from operations 2 873.9 2 529.0
Investing activitiesInvestments in non-current tangible and intangible assets -1 113.2 -804.0Acquisition of subsidiaries and associated companies 16 -363.8 -239.5Cash flow from investing activities -1 477.0 -1 043.5
Financing activitiesDividend paid to shareholders of the Parent Company -1 095.2 -1 095.2Proceeds from bond loans 30, 33 713.4 3 629.9Redemption of bond loans 30, 33 -1 858.2 -5 176.5Change in other interest-bearing net debt excluding liquid funds 132.2 371.3Cash flow from financing activities -2 107.8 -2 270.5
Cash flow for the year -710.9 -785.0Liquid funds at beginning of year 4 049.8 4 880.7Translation differences on liquid funds 86.2 -45.9Liquid funds at year-end 28 3 425.1 4 049.8

65Securitas Annual Report 2014
Annual ReportConsolidated financial statements
Securitas’ financial model – consolidated statement of cash flow
Supplementary information
MSEK 2014 2013Operating income before amortization 3 504.7 3 329.0Investments in non-current tangible and intangible assets -1 113.2 -804.0Reversal of depreciation 966.9 945.6Net investments in non-current tangible and intangible assets -146.3 141.6Change in accounts receivable -114.5 1.0Change in other operating capital employed -381.2 -241.5Cash flow from operating activities 2 862.7 3 230.1Cash flow from operating activities as % of operating income before amortization 82 97Financial income and expenses paid -311.4 -532.0Current taxes paid -696.6 -610.4Free cash flow 1 854.7 2 087.7Free cash flow as % of adjusted income 75 93Acquisition of subsidiaries and associated companies -363.8 -239.5Acquisition related costs paid -21.2 -55.2Cash flow from items affecting comparability -72.8 -307.5Cash flow from financing activities -2 107.8 -2 270.5Cash flow for the year -710.9 -785.0
Operating items. Net debt-related items. Goodwill, taxes and non-operating items. Securitas’ financial model is described on pages 50–51.

Securitas Annual Report 201466
Annual ReportConsolidated financial statements
Consolidated balance sheet
MSEK Note 2014 2013ASSETSNon-current assetsGoodwill 17 16 228.1 14 361.9Acquisition related intangible assets 18 1 244.2 1 315.6Other intangible assets 19 398.3 325.2Buildings and land 20 300.0 310.4Machinery and equipment 20 2 257.1 1 959.0Shares in associated companies 21 324.5 132.7Deferred tax assets 15 1 441.9 1 391.1Interest-bearing financial non-current assets 22 434.5 150.9Other long-term receivables 23 685.9 605.6Total non-current assets 23 314.5 20 552.4
Current assetsInventories 24 151.1 131.1Accounts receivable 25 10 815.5 9 676.4Current tax assets 15 412.8 355.9Other current receivables 26 2 797.5 2 412.1Other interest-bearing current assets 27 167.3 59.5Liquid funds 28 3 425.1 4 049.8Total current assets 17 769.3 16 684.8
TOTAL ASSETS 41 083.8 37 237.2
SHAREHOLDERS’ EQUITY AND LIABILITIESShareholders’ equityShare capital 365.1 365.1Other capital contributed 7 362.6 7 362.6Other reserves -412.5 -1 612.7Retained earnings 3 965.1 3 250.3Shareholders’ equity attributable to equity holders of the Parent Company 11 280.3 9 365.3
Non-controlling interests 18.9 16.0Total shareholders’ equity 29 11 299.2 9 381.3
Long-term liabilitiesLong-term loan liabilities 30 11 700.7 11 509.8Other long-term liabilities 30 550.7 487.3Provisions for pensions and similar commitments 31 1 450.2 1 024.6Deferred tax liabilities 15 759.6 747.4Other long-term provisions 32 772.0 691.8Total long-term liabilities 15 233.2 14 460.9
Current liabilitiesShort-term loan liabilities 33 2 747.8 2 360.2Accounts payable 1 104.6 959.4Current tax liabilities 15 450.6 362.8Other current liabilities 34 9 359.2 8 902.2Short-term provisions 35 889.2 810.4Total current liabilities 14 551.4 13 395.0
TOTAL SHAREHOLDERS’ EQUITY AND LIABILITIES 41 083.8 37 237.2

67Securitas Annual Report 2014
Annual ReportConsolidated financial statements
Securitas’ financial model – consolidated capital employed and financing
Supplementary information
MSEK 2014 2013Operating capital employedOther intangible assets 398.3 325.2Buildings and land 300.0 310.4Machinery and equipment 2 257.1 1 959.0Deferred tax assets 1 441.9 1 391.1Other long-term receivables 685.9 605.6Inventories 151.1 131.1Accounts receivable 10 815.5 9 676.4Current tax assets 412.8 355.9Other current receivables 2 797.5 2 412.1Total assets 19 260.1 17 166.8Other long-term liabilities 550.7 487.3Provisions for pensions and similar commitments 1 450.2 1 024.6Deferred tax liabilities 759.6 747.4Other long-term provisions 772.0 691.8Accounts payable 1 104.6 959.4Current tax liabilities 450.6 362.8Other current liabilities 9 359.2 8 902.2Short-term provisions 889.2 810.4Total liabilities 15 336.1 13 985.9Total operating capital employed 3 924.0 3 180.9Goodwill 16 228.1 14 361.9Acquisition related intangible assets 1 244.2 1 315.6Shares in associated companies 324.5 132.7Total capital employed 21 720.8 18 991.1Operating capital employed as % of sales 6 5Return on capital employed, % 16 18
Net debtInterest-bearing financial non-current assets 434.5 150.9Other interest-bearing current assets 167.3 59.5Liquid funds 3 425.1 4 049.8Total interest-bearing assets 4 026.9 4 260.2Long-term loan liabilities 11 700.7 11 509.8Short-term loan liabilities 2 747.8 2 360.2Total interest-bearing liabilities 14 448.5 13 870.0Total net debt 10 421.6 9 609.8Net debt equity ratio, multiple 0.92 1.02Shareholders’ equityShare capital 365.1 365.1Other capital contributed 7 362.6 7 362.6Other reserves -412.5 -1 612.7Retained earnings 3 965.1 3 250.3Non-controlling interests 18.9 16.0Total shareholders’ equity 11 299.2 9 381.3Total financing 21 720.8 18 991.1
Operating items. Net debt-related items. Goodwill, taxes and non-operating items. Items related to shareholders’ equity. Securitas’ financial model is described on pages 50–51.

Securitas Annual Report 201468
Annual ReportConsolidated financial statements
MSEKShare
capital
Other capital
contributedHedgingreserve
Translationreserve
Retainedearnings Total
Non- controllinginterests1
Totalshare-
holders’equity
Opening balance 2013 365.1 7 362.6 -5.1 -1 376.0 2 241.7 8 588.3 13.9 8 602.2Net income for the year – – – – 1 852.5 1 852.5 3.1 1 855.6Other comprehensive incomeItems that will not be reclassified to the statement of incomeRemeasurements of defined benefit pension plans net of tax – – – – 243.0 243.0 – 243.0Total items that will not be reclassified to the statement of income – – – – 243.0 243.0 – 243.0Items that subsequently may be reclassified to the statement of incomeCash flow hedges2
Total change of hedging reserve before tax – – 10.4 – – 10.4 – 10.4Deferred tax on total change of hedging reserve – – -5.7 – – -5.7 – -5.7
Net investment hedges net of tax – – – -202.3 – -202.3 – -202.3Translation differences – – – -34.0 – -34.0 -2.1 -36.1Total items that subsequently may be reclassified to the statement of income – – 4.7 -236.3 – -231.6 -2.1 -233.7Other comprehensive income – – 4.7 -236.3 243.0 11.4 -2.1 9.3Total comprehensive income for the year – – 4.7 -236.3 2 095.5 1 863.9 1.0 1 864.9Transactions with non-controlling interests1 – – – – -2.0 -2.0 1.1 -0.9Share-based incentive scheme1 – – – – 10.3 10.3 – 10.3Dividend paid to shareholders of the Parent Company – – – – -1 095.2 -1 095.2 – -1 095.2Closing balance 2013 365.1 7 362.6 -0.4 -1 612.3 3 250.3 9 365.3 16.0 9 381.3
Opening balance 2014 365.1 7 362.6 -0.4 -1 612.3 3 250.3 9 365.3 16.0 9 381.3Net income for the year – – – – 2 068.4 2 068.4 3.1 2 071.5Other comprehensive incomeItems that will not be reclassified to the statement of incomeRemeasurements of defined benefit pension plans net of tax – – – – -279.7 -279.7 – -279.7Total items that will not be reclassified to the statement of income – – – – -279.7 -279.7 – -279.7Items that subsequently may be reclassified to the statement of incomeCash flow hedges2
Total change of hedging reserve before tax – – 0.0 – – 0.0 – 0.0Deferred tax on total change of hedging reserve – – 0.0 – – 0.0 – 0.0
Net investment hedges net of tax – – – 138.9 – 138.9 – 138.9Translation differences – – – 1 061.3 – 1 061.3 1.6 1 062.9Total items that subsequently may be reclassified to the statement of income – – 0.0 1 200.2 – 1 200.2 1.6 1 201.8Other comprehensive income – – 0.0 1 200.2 -279.7 920.5 1.6 922.1Total comprehensive income for the year – – 0.0 1 200.2 1 788.7 2 988.9 4.7 2 993.6Transactions with non-controlling interests1 – – – – -0.6 -0.6 -1.8 -2.4Share-based incentive scheme1 – – – – 21.9 21.9 – 21.9Dividend paid to shareholders of the Parent Company – – – – -1 095.2 -1 095.2 – -1 095.2Closing balance 2014 365.1 7 362.6 -0.4 -412.1 3 965.1 11 280.3 18.9 11 299.2
1 Further information is provided in note 29.2 A specification can be found in note 6, table revaluation of financial instruments.
Shareholders’ equity attributable to equity holders of the Parent Company1Consolidated statement of changes in shareholders’ equity
Annual ReportNotes and comments to the consolidated financial statements
69Securitas Annual Report 2014
NOTE 1 General corporate information
Operations Securitas’ service offering categories are specialized guarding and mobile services, monitoring, technical solutions and consulting and investigations. Securitas operates in North America, Europe, Latin America, Africa, the Middle East and Asia and employs close to 320 000 employees in 53 countries.
Information regarding Securitas ABSecuritas AB, corporate registration number 556302-7241, is a Swedish public company and has its registered office in Stockholm, Sweden. The address of the head office is:
Securitas ABLindhagensplan 70SE-102 28 Stockholm
Securitas AB is listed on Nasdaq Stockholm on the Large Cap List. The Securitas share is included in for example the OMX Stockholm Price Index and the OMX Stockholm 30 Index. Securitas has been listed on the stock exchange since 1991.
Information regarding the Annual Report and the consolidated financial statementsThis Annual Report including the consolidated financial statements was signed by the Board of Directors of Securitas AB and also approved for publication on March 13, 2015.
The statements of income and balance sheets for the Parent Company and the Group included in the Annual Report and the consolidated financial statements are subject to adoption by the Annual General Meeting on May 8, 2015.
NOTE 2 Accounting principles
Basis of preparationSecuritas’ consolidated financial statements are prepared in accordance with International Financial Reporting Standards (IFRS) as endorsed by the European Union (EU), the Swedish Annual Accounts Act and the Swedish Financial Reporting Board’s standard RFR 1 Supplementary Accounting Rules for Groups. The consolidated financial statements have been prepared in accordance with the historical cost convention method except where a fair value measurement is required according to IFRS. Examples of assets and liabilities measured at fair value are financial assets or financial liabilities (including derivatives) at fair value through profit or loss and plan assets related to defined benefit pension plans.
Estimates and judgments Note 4The preparation of financial reports requires the Board of Directors and Group Management to make estimates and judgments. Estimates and judgments will impact both the statement of income and the balance sheet as well as disclosures such as contingent liabilities. Actual outcome may differ from these judgments under different assumptions or conditions.
Adoption and impact of new and revised IFRS for 2014IFRS 10 Consolidated Financial statements, IFRS 11 Joint arrangements and IFRS 12 Disclosures of interests in other entities have been adopted by Securitas as of the financial year 2014. IFRS 10 has not led to any changes of the companies that are consolidated and there has been no other effect on the Group’s financial statements due to the adoption of these standards.
None of the other published standards and interpretations that are mandatory for the Group’s financial year 2014 has had any impact on the Group’s financial statements.
Introduction and effect of new and revised IFRS that are not yet effective and have not been early adopted by SecuritasNone of the published standards and interpretations that are mandatory for the Group’s financial year 2015 is assessed to have any impact on the Group’s financial statements.
The effect on the Group’s financial statements from standards and interpretations that are mandatory for the Group’s financial year 2016 or later remain to be assessed.
The acquisition method (IFRS 3) Note 11, 16, 17 and 18The acquisition method is used to account for the acquisitions of subsid-iaries and operations by the Group. All payments to acquire a business are recorded at fair value at the acquisition date, with contingent consid-erations and acquisition related option liabilities classified as debt subse-quently re-measured through the statement of income. There is a choice on an acquisition-by-acquisition basis to measure the non-controlling interest in the acquiree at fair value or at the non-controlling interest’s pro-portionate share of the acquiree’s net assets. All acquisition related trans-action costs are expensed. These costs are in the Group accounted for on a line in the statement of income named acquisition related costs. Costs accounted for on this line are transaction costs, revaluation (including discounting) of contingent considerations and acquisition related option liabilities, revaluation to fair value of previously acquired shares in step acquisitions and acquisition related restructuring and integration costs.
The excess of the cost of acquisition over the fair value of the Group’s share of the identifiable net assets acquired is recorded as goodwill. If the cost of acquisition is less than the fair value of the net assets of the sub-sidiary acquired, the difference is recognized directly in the consolidated statement of income.
Scope of the consolidated financial statements (IFRS 10 and IFRS 12) Note 16 and 48The consolidated financial statements relate to the Parent Company Securitas AB and all subsidiaries. Subsidiaries are all companies where the Group has control, which is the case where the Group is exposed, or has rights, to variable returns from its involvement with the company and has the ability to affect those returns through its power over the company.
The consolidated financial statements include companies acquired with effect from the date that the Group obtains control. Companies divested are excluded with effect from the date that the Group ceases to have control.
Pricing of deliveries among Group companies is based on normal business principles. Inter-company transactions, balances and unreal-ized gains between Group companies are eliminated. Unrealized losses are also eliminated, but indicate the need for an impairment of the asset transferred.
Notes

Annual ReportNotes and comments to the consolidated financial statements
Securitas Annual Report 201470
The Group’s subsidiary in Argentina has limited possibilities to settle its liabilities with companies within the Group due to local regulations restricting export of capital from Argentina. Cash and bank and short-term investments in Argentina are thus excluded from liquid funds in the Group’s financial statements and instead included in other interest-bearing current assets.
Non-controlling interests (IFRS 3 and IFRS 10) Note 29The Group treats transactions with non-controlling interests as transac-tions with equity owners of the Group. For acquisitions from non-controlling interests, the difference between any consideration paid and the relevant share acquired of the carrying value of net assets of the subsidiary is recorded in equity on the line transactions with non-controlling interests in the consolidated statement of changes in shareholders’ equity.
Gains or losses on disposals to non-controlling interests are also recorded in equity on the same line. When the Group ceases to have control, any retained interest in the entity is remeasured to its fair value, with the change in carrying amount recognized in the statement of income. The fair value is the initial carrying amount for the purposes of subsequently accounting for the retained interest.
Investments in associates (IAS 28) Note 21 and 49Associates are entities in which Securitas can exert a significant influence, generally accompanying a shareholding of between 20 percent and 50 percent of the voting rights. The equity method is used to account for these shareholdings. All payments to acquire a business are recorded at fair value at the acquisition date, with contingent considerations and acquisition related option liabilities classified as debt subsequently re-measured through the statement of income. All acquisition related transaction costs are expensed.
The excess of the cost of acquisition over the fair value of the Group’s share of the identifiable net assets acquired is attributed to goodwill, which is included in investments in associates in the consolidated balance sheet. If the cost of acquisition is less than the fair value of the net assets of the associate acquired, the difference is recognized directly in the consolidated statement of income.
The consolidated financial statements include associates with effect from the date of the acquisition. Associates divested are excluded with effect from the divestment date. If the ownership interest in an associate is reduced but significant influence is retained, only a proportionate share of the amounts previously recognized in other comprehensive income are reclassified to the statement of income where appropriate.
Transactions, balances and unrealized gains between the Group and its associates are eliminated to the extent of the Group’s interest in the associate. Unrealized losses are also eliminated, but indicate the need for an impairment of the asset transferred.
Share in income of associates is recognized in the consolidated state-ment of income. Depending on the purpose of the investment share in income of associates is included either in operating income, if it is related to associates that have been acquired to contribute to the operations (operational), or in income before taxes as a separate line within net finan-cial items, if it is related to associates that have been acquired as part of the financing of the Group (financial investments). In both cases the share in income of associates are net of tax. All associates in the Group are currently classified as operational associates.
In the consolidated balance sheet, investments in associates are stated at cost including the cost of the acquisition that is attributed to goodwill, adjusted for dividends and the share of income after the acquisition date.
Translation of foreign subsidiaries (IAS 21) Note 29The functional currency of each Group company, that is the currency in which the company primarily generates and expends cash, is determined by the primary economic environment in which the company operates. The functional currency of the Parent Company and the presentation currency of the Group, that is the currency in which the financial statements are presented, is Swedish kronor (SEK).
When translating the financial statements of each foreign subsidiary, each month’s statement of income is translated using the exchange rate prevailing on the last day of the month. This means that income for each month is not affected by foreign exchange fluctuations during subsequent periods. Balance sheets are translated using exchange rates prevailing at each balance sheet date. Translation differences arising in the conversion of balance sheets are posted directly to other comprehensive income and thus do not affect net income for the year. The translation difference arising because statements of income are translated using average rates, while balance sheets are translated using exchange rates prevailing at each balance sheet date, is posted directly to other comprehensive income. Where loans have been raised to reduce the Group’s foreign exchange / translation exposure in foreign net assets, and qualify for the hedge accounting criteria, exchange rate differences on such loans are recognized together with the exchange rate differences arising from the translation of foreign net assets in other comprehensive income. The accumulated translation differences are accounted for in translation reserve in equity. When a foreign operation or part thereof is sold, such exchange differences are recognized in the statement of income as part of the gain or loss on sale.
Goodwill and fair value adjustments arising on the acquisition of a foreign entity are treated as assets and liabilities of the foreign entity and translated using exchange rates prevailing at each balance sheet date.
Transactions, receivables and liabilities in foreign currency (IAS 21) Note 11 and 14Transactions in foreign currency are translated into the functional cur-rency in accordance with the exchange rates prevailing at the date of the transaction. Exchange differences on monetary items are recognized in the statement of income when they arise, with the exception of net invest-ment hedges recognized via other comprehensive income (see above under the section Translation of foreign subsidiaries). Exchange differ-ences from operating items are recognized as either production expenses or selling and administrative expenses, while exchange differences from financial items are recognized as financial income or financial expenses.
When preparing the financial statements of individual companies, foreign currency denominated receivables and liabilities are translated to the functional currency of the individual company using the exchange rates prevailing at each balance sheet date.

Annual ReportNotes and comments to the consolidated financial statements
71Securitas Annual Report 2014
Revenue recognition (IAS 11 and IAS 18) Note 10, 14 and 42The Group’s revenue is generated mainly from various types of security services. Security services are based on customer contracts and these can comprise sales based on hours of work performed with fixed monthly, quarterly or yearly invoicing and also including service level agreements. Sales based on customer contracts can also comprise events such as intervention services. In addition to sales based on customer contracts there is extra sales to either contract customers or event based sales. There is also revenue from the sale of alarm products and, to a limited extent, cash handling services. Revenue from services is recognized in the period in which the services have been performed. Alarm installations are recognized in revenue as they are completed, in accordance with the percentage of completion method. According to this method, revenue, expenses and income are recognized in the period in which the work was performed. The determination of the percentage of alarm installations that can be recognized as revenue is based on the time spent in relation to the total estimated time.
Trademark fees from the former subsidiary Securitas Direct AB, relat-ing to the use of the Securitas trademark, are recognized on an accrual basis in accordance with the substance of the agreement, and are based on the sales recognized by Securitas Direct AB.
Interest income is recognized in the statement of income in the period to which it is attributable.
Operating segments (IFRS 8) Note 9Operating segments are business activities that may earn revenues or incur expenses, whose operating results are regularly reviewed by the chief operating decision maker, the President and CEO, and for which discrete financial information is available. Operating segments constitute the operational structure for governance, monitoring and reporting. A combination of factors has been used in order to identify the Group’s segments. Most important is the characteristic of the services provided and the geographical split.
According to the conditions in IFRS 8, certain of the Group’s operating segments have been aggregated in the financial reporting. The Group’s operations are consequently divided into three reportable segments and Other:
• Security Services North America
• Security Services Europe
• Security Services Ibero-America
• Other (consisting of an aggregation of all other operating segments)
These segments are also referred to as business segments in the Group’s financial reports.
Other includes all other operating segments as well as general admin-istrative expenses, expenses for head offices and other central expenses. All other operating segments comprise the guarding operations in Africa, the Middle East and Asia as well as certain operations within security consulting that report directly to the chief operating decision maker.
The assets and liabilities of each segment include only those items that have been utilized or arisen in ongoing operations. Non-operational balance sheet items, primarily current tax, deferred tax, and provisions for taxes, are accounted for under the Other heading in the table Capital employed and financing in note 9. In the table Assets and liabilities in the same note, these items are accounted for as unallocated non-interest bearing assets and unallocated non-interest bearing liabilities. A reconcili-ation between total segments and the Group is disclosed in note 9.
Geographical information related to sales and non-current assets is disclosed in note 9 for Sweden (which is Securitas’ country of domicile) and for all individual countries where the sales or non-current assets exceed 10 percent of the total amount for the Group.
The geographical split of sales is based on the location of the sales. The location of the sales corresponds in all material aspects to the location of the customers. There are no sales to any individual customer that are deemed to represent a significant portion of the Group’s total sales.
Accounting for government grants and disclosure of government assistance (IAS 20)Securitas, like other employers, is eligible for a variety of grants relating to employees. These grants relate to training, incentives for hiring new staff, reduction of working hours, etc. All grants are accounted for in the statement of income as a cost reduction in the same period as the related underlying cost.
Taxes (IAS 12) Note 15 and 45Deferred income tax is provided in full, using the liability method, on tem-porary differences arising between the tax bases of assets and liabilities and their carrying amounts in the consolidated financial statements. However, if the deferred income tax arises from initial recognition of an asset or liability in a transaction other than a business combination that at the time of the transaction affects neither accounting nor taxable profit or loss, it is not accounted for. Deferred income tax is determined using tax rates (and laws) that have been enacted or substantially enacted by the balance sheet date and are expected to apply when the related deferred income tax asset is realized or the deferred income tax liability is settled.
A deferred tax asset is recognized when it is probable that sufficient taxable income will arise that the deferred tax asset can be offset against. Deferred tax assets are valued as of the balance sheet date, and any potential previously unvalued deferred tax asset is recognized when it is expected to be usable, or correspondingly, reduced when it is expected to be wholly or partly unusable against future taxable income.
Current and deferred taxes are posted directly to other comprehensive income if the relevant underlying transaction or event is posted directly to other comprehensive income in the period, or previous period if it pertains to an adjustment of an opening balance of retained earnings as the result of a change in accounting principle. Changes in current and deferred taxes that relate to exchange rate differences in the translation of the balance sheets of foreign subsidiaries are posted to translation differences in other comprehensive income.
Provisions are allocated for estimated taxes in the case dividends are anticipated and paid from subsidiaries to a Parent Company in the following year.
Deferred income tax is provided on temporary differences arising on investments in subsidiaries and associates, except where the timing of the reversal of the temporary difference is controlled by the Group and it is probable that the temporary difference will not be reversed in the foreseeable future.
Statement of cash flow (IAS 7) Note 28 and 51The statement of cash flow has been prepared in accordance with the indirect method. Liquid funds include short-term investments with a max-imum duration of 90 days that are readily convertible to a known amount of cash and subject to an insignificant risk of change in value. Liquid funds also include cash and bank deposits.

Annual ReportNotes and comments to the consolidated financial statements
Securitas Annual Report 201472
Goodwill and other acquisition related intangible assets (IFRS 3, IAS 36 and IAS 38) Note 17 and 18Goodwill represents the excess of the cost of an acquisition over the fair value of the Group’s share of the identifiable net assets of the acquired subsidiary / operations at the date of acquisition. Goodwill is tested annu-ally for impairment and carried at cost less accumulated impairment losses. Gains and losses on the disposal of an entity include the carrying amount of goodwill relating to the entity or operations sold.
Other acquisition related intangible assets arising from acquisitions can include various types of intangible assets such as marketing-related, customer-related, contract-related, brand-related and technology-based intangible assets. Other acquisition related intangible assets normally have a definite useful life. These assets are recognized at fair value on the date of acquisition and subsequently carried at cost less accumulated amortization and any accumulated impairment losses. Amortization is calculated using the linear method to allocate the cost of assets over their estimated useful lives. Securitas’ acquisition related intangible assets mainly relate to customer contract portfolios and the related customer relationships. The valuation of the customer contract portfolios and the related customer relationships is based on the Multiple Excess Earnings Method (MEEM) which is a valuation model based on discounted cash flows. The valuation is based on the churn rates and profitability of the acquired portfolio at the time of the acquisition. In the model a specific charge – a contributory asset charge – is applied as a cost or return require-ment for the assets supporting the intangible asset. Cash flows are dis-counted using the Weighted Average Cost of Capital (WACC) adjusted for local interest rate levels in the countries of acquisition. The useful life of customer contract portfolios and the related customer relationships is based on the churn rate of the acquired portfolio and is normally between 3 and 10 years, corresponding to a yearly amortization of between 10.0 percent and 33.3 percent. Brand-related intangible assets are calculated using the relief of royalty method. The useful life of these brands is nor-mally between 5 and 10 years, corresponding to a yearly amortization of between 10 and 20 percent.
A deferred tax liability is calculated at the local tax rate on the differ-ence between the book value and tax value of the intangible asset. The deferred tax liability is reversed over the same period as the intangible asset is amortized, which means that it neutralizes the impact of the amortization of the intangible asset on the full tax rate percentage on the income after tax. The initial recognition of this deferred tax liability increases the amount of goodwill.
Goodwill and other acquisition related intangible assets are allocated to cash-generating units (CGU) per country in a segment. This allocation is also the basis for the yearly impairment testing.
Amortization and impairment of acquisition related intangible assets are disclosed on the line amortization and impairment of acquisition related intangible assets in the statement of income.
Acquisition related restructuring and integration costs (IAS 37) Note 11Acquisition related restructuring costs are costs relating to the restructuring and / or integration of acquired operations into the Group. Restructuring costs are costs that are recognized based on the specific criteria for restructuring provisions in IAS 37 (see further under the section Provi-sions below). Restructuring costs can cover several activities that are necessary to prepare acquired operations for integration into the Group, such as redundancy payments, provisions for rented premises that will not be utilized or sublet below cost or other non-cancellable leasing con-tracts that will not be utilized. Integration costs normally cover activities that do not qualify to be recognized as provisions. Such activities could be re-branding (changing logotypes on buildings, vehicles, uniforms, etc.), but could also cover personnel costs for example training, recruitment, relocation and travel, certain customer related costs and other incremental costs to transform the acquired operation into the acquirer’s format. Classifying expenses as costs relating to integration of acquired opera-tions must also fulfill the criteria below:
• The cost would not have been incurred if the acquisition not had taken place
• The cost relate to a project identified and controlled by management as part of an integration program set up at the time of acquisition or as a direct consequence of an immediate post-acquisition review
Items affecting comparability Note 11This item includes events and transactions with significant effects, which are relevant for understanding the financial performance when comparing income for the current period with previous periods. They include:
• Capital gains and losses arising from the disposal of material cash generating units
• Material impairment losses and bad debt losses
• Material litigations and insurance claims
• Other material income and expense items of a non-recurring nature
Provisions, impairment losses, bad debt losses or other material non-recurring items that are classified as items affecting comparability in a period are accounted for consistently in future periods by treating any reversal of provisions, impairment losses, bad debt losses or other non-recurring items as items affecting comparability.
Other intangible assets (IAS 36 and IAS 38) Note 19 and 46Other intangible assets are recognized if it is probable that the expected future economic benefits that are attributable to the asset will flow to the Group and that the cost of the asset can be measured reliably. Other intangible assets include the trade mark Securitas, which is estimated to have an indefinite useful life. The trademark has been capitalized only in those cases where it has been acquired from a third party. This trademark is not amortized but tested annually for impairment.
Other items in other intangible assets have a definite useful life. These assets are recognized at cost and subsequently carried at cost less accumulated amortization and any accumulated impairment losses.
Linear amortization is used for all asset classes. The amortization rates are normally:Software licenses 10.0–33.3 percentOther intangible assets 10.0–33.3 percent
Rental rights and similar rights are amortized over the same period as the underlying contractual period.

Annual ReportNotes and comments to the consolidated financial statements
73Securitas Annual Report 2014
Tangible non-current assets (IAS 16 and IAS 36) Note 20 and 47Tangible non-current assets are recognized at cost and subsequently carried at cost less accumulated depreciation and any accumulated impairment losses. Depreciation is based on historical cost and the useful life of the asset.
Linear depreciation is used for all asset classes. The depreciation rates are normally:Machinery and equipment 10–50 percentBuildings and land improvements 2–10 percentLand 0 percent
Impairment (IAS 36) Note 17Assets that have an indefinite useful life are not subject to amortization and are tested annually for impairment. In addition to goodwill, these assets are limited to the brand name Securitas in one of the Group’s countries of operations. Assets that are subject to depreciation or amor-tization are reviewed for impairment whenever events or changes in circumstances indicate that the carrying amount may not be recoverable. An impairment loss is recognized in the amount by which the asset’s car-rying amount exceeds its recoverable amount. The recoverable amount is the higher of an asset’s fair value less costs to sell and value in use. Value in use is measured as expected future discounted cash flows. The calculation of value in use necessitates that a number of assumptions and estimates are made. The main assumptions concern the organic sales growth, the development of the operating margin and the necessary operating capital employed requirement as well as the relevant WACC (Weighted Average Cost of Capital) rate used to discount future cash flows. For the purposes of impairment testing, assets are grouped at the lowest levels for which there are separately identifiable cash flows (CGU).
Previously recognized impairment losses, with the exception of impair-ment losses related to goodwill, are reversed only if a change has occurred regarding the assumptions that formed the basis for determining the recov-erable amount when the impairment loss was recognized. If this is the case, a reversal of the impairment loss is carried out in order to increase the book value of the impaired asset to its recoverable amount. A reversal of a previous impairment loss is only recognized to the extent that the new book value does not exceed what should have been the book value (after depre-ciation and amortization) if the impairment loss had not been recognized in the first place. Impairment losses related to goodwill are never reversed.
Leasing contracts (IAS 17) Note 11 and 20When a leasing contract means that the Group, as the lessee, essentially receives the economic benefits and bears the economic risk associated with the leased asset – termed finance leases – the asset is recognized as a non-current asset in the consolidated balance sheet. The net present value of the corresponding obligation to pay leasing fees in the future is recognized as a liability. In the consolidated statement of income, leasing payments are divided into depreciation and interest. The Group has no significant finance leases where it is the lessor.
Operational leases, where the Group is the lessee, are recognized as an operating expense on a linear basis over the period of the lease in the consolidated statement of income. In cases where the Group is the les-sor, revenue is recognized on a linear basis and included in total sales in the consolidated statement of income. Depreciation is recognized under operating income.
Accounts receivable (IAS 39) Note 25Accounts receivable are accounted for at nominal value net after provi-sions for probable bad debt. Probable and recognized bad debt losses are included in the line production expenses in the statement of income. Pay-ments received in advance are accounted under other current liabilities.
Inventories (IAS 2) Note 24Inventories are valued at the lower of cost and net realizable value. Cost is determined according to the first-in, first-out principle. The cost of finished goods and work in progress comprises material, direct labor and other direct costs. Net realizable value is the estimated selling price in the ordinary course of business, less applicable variable selling expenses.
Financial instruments (IFRS 7 / IFRS 13 / IAS 32 / IAS 39) Note 6, 14, 22, 27, 30 and 33A financial instrument is any contract that gives rise to a financial asset of one entity and a financial liability or equity instrument of another entity. The definition of financial instruments thus includes equity instruments of another entity but also for example contractual rights to receive cash such as accounts receivable.
Financial instruments are recorded initially at fair value with the subse-quent measurement depending on the designation of the instrument.
The Group designates its financial instruments in the following categories:• Financial assets or financial liabilities at fair value through profit or loss
(including derivatives not designated as hedging instruments)
• Loans and receivables
• Held-to-maturity investments
• Available-for-sale financial assets
• Financial liabilities designated as hedged item in a fair value hedge
• Other financial liabilities
• Derivatives designated for hedging
The designation depends on the purpose for which the financial instru-ment is acquired. Management determines the designation of its financial instruments at initial recognition and re-evaluates this designation at each reporting date. There were no transfers between categories in the years 2014 and 2013.
Most of the Group’s current assets are loans and receivables (including accounts receivable and most other current receivables). Financial assets or financial liabilities at fair value through profit or loss (with exception for derivatives), held-to-maturity investments and available-for-sale financial assets are normally categories in which the Group has no or very limited positions. Financial liabilities designated as the hedged item in a fair value hedge include both long-term and short-term loans designated as hedged items that are hedged effectively via derivatives designated for hedge accounting. Other financial liabilities comprise all other financial liabilities, including such items as accounts payable and other current liabilities, and also any long-term and short-term loans not included in the category financial liabilities designated as hedged item.
Further information regarding carrying and fair values is provided in the table Financial instruments by category – carrying and fair values in note 6 as well as in the definitions of the categories below. Note 6 also includes further information on the Groups hedging activities.

Annual ReportNotes and comments to the consolidated financial statements
Securitas Annual Report 201474
Financial assets or financial liabilities at fair value through profit or lossFinancial assets at fair value through profit or loss have two sub-categories: financial assets held for trading, and those designated at fair value through profit or loss at inception. A financial asset is classified in this category if acquired principally for the purpose of selling in the short-term or if so designated by management. Fair value derivative assets are also categorized as held for trading unless they qualify for hedge accounting. Assets in this category are classified as current assets if they are either held for trading or are expected to be realized within 12 months of the balance sheet date. Financial liabilities at fair value are trading securities with negative fair value; normally derivative liabilities unless they qualify for hedge accounting.
Loans and receivablesLoans and receivables are non-derivative financial assets with fixed or determinable payments that are not quoted in an active market. They arise when the Group provides money, goods or services directly to a debtor with no intention of trading the receivable. They are included in current assets, except for loans and receivables with maturities later than 12 months after the balance sheet date.
Held-to-maturity investmentsHeld-to-maturity investments are non-derivative financial assets with fixed or determinable payments and fixed maturities that the Group’s management has the positive intention and ability to hold to maturity.
Available-for-sale financial assetsAvailable-for-sale financial assets are non-derivatives that are either designated in this category or not classified in any of the other categories. They are included in non-current assets unless management intends to dispose of the investment within 12 months of the balance sheet date.
Financial liabilities designated as hedged item in a fair value hedgeThis category includes financial liabilities designated as hedged item in a fair value hedge. The hedging instruments are included in the category derivatives designated for hedging. Financial liabilities designated as hedged item in a fair value hedge are included in current liabilities except for liabilities with maturities later than 12 months from the balance sheet date.
Other financial liabilitiesOther financial liabilities are any financial liabilities that are not included in either of the categories financial liabilities designated as hedged item in a fair value hedge or financial liabilities at fair value through profit or loss. They are included in current liabilities except for liabilities with maturities later than 12 months from the balance sheet date.
Derivatives designated for hedgingThe Group normally only enters into derivative contracts when they either qualify for hedge accounting or when there is a natural offset in the accounting. This category includes the first type of derivatives. Deriva-tives where the hedged item or the item for which a natural offset in the accounting is sought has a maturity within 12 months after the balance sheet date are either included in current assets on the line other interest-bearing current assets, or in current liabilities on the line other short-term loan liabilities. Derivatives where the hedged item or the item for which a natural offset in the accounting is sought has a maturity later than 12 months after the balance sheet date are either included in non-current assets on the line interest-bearing financial non-current assets, or in long-term liabilities on the line other long-term loan liabilities.
Recognition and subsequent measurementPurchases and sales of financial instruments are recognized on the trade date – the date on which the Group commits to purchase or sell the instrument.
Financial assets and liabilities are initially recognized at fair value. Any transaction costs are charged to the statement of income.
Financial assets are derecognized when the rights to receive cash flows from the instruments have expired or have been transferred and the Group has transferred substantially all risks and rewards of ownership. Financial liabilities are removed when the obligation is discharged, cancelled or has expired.
Financial assets or financial liabilities at fair value through profit or loss and available-for-sale financial assets are subsequently carried at fair value. Loans and receivables and held-to-maturity investments are car-ried at amortized cost using the effective interest method. Realized and unrealized gains and losses arising from changes in the fair value of the financial assets or liabilities at fair value through profit or loss category are included in financial income or financial expenses in the statement of income in the period in which they arise.
Financial liabilities with the exception of financial liabilities at fair value through profit or loss and financial liabilities designated as hedged item are subsequently carried at amortized cost.
Financial liabilities designated as the hedged item in a fair value hedge are carried at amortized cost but are adjusted for changes in the fair value due to the hedged risk. Changes in the fair value are included in financial income or financial expenses in the statement of income in the period in which they arise. The corresponding gain or loss from re-measuring the hedging instrument at fair value is also included in financial income or financial expenses in the statement of income in the same period as that in which the gain or loss on the hedged item arises.
Cash flow hedging instruments are carried at fair value in the balance sheet. The gains or losses from re-measuring the hedging instruments at fair value are recognized in the hedging reserve in other comprehensive income with a reversal from the hedging reserve to the statement of income in the period in which the cash flow of the hedged item impacts the statement of income. Exchange rate gains and losses on derivatives that are part of a net investment hedge relationship are recognized in other comprehensive income. Any ineffectiveness is recognized in the statement of income.
Actual cash flows (accruals) that arise from interest-rate derivative contracts are recognized as interest income and / or interest expense in the statement of income in the period to which they relate. Changes in fair value (after accruals) for both the hedged item and the hedging instrument (derivative) are recognized separately as revaluation of financial instru-ments. The line revaluation of financial instruments is included within financial income and / or financial expense.
The fair values of quoted financial instruments are based on current bid prices. If the market for a financial instrument is not active (and for unlisted securities), the Group establishes fair value by using valuation techniques. These include the use of recent arm’s length transactions, reference to other instruments that are substantially the same, discounted cash flow analysis, and option pricing models refined to reflect the issuer’s specific circumstances.
Impairment of financial assetsThe Group assesses at each balance sheet date whether there is objective evidence that a financial asset or a group of financial assets is impaired. There has been no impairment of financial assets in 2014 or 2013.
Annual ReportNotes and comments to the consolidated financial statements
75Securitas Annual Report 2014
Employee benefits (IAS 19) Note 23 and 31The Group operates or participates in a number of defined benefit and defined contribution pension and other long-term employee benefit plans. Other plans primarily relate to healthcare benefits. A defined contribution plan is a pension plan under which the Group pays fixed con-tributions into a separate entity. The Group has no legal or constructive obligations to pay further contributions if the fund does not hold sufficient assets to pay all employees the benefits relating to employee service in the current and prior periods. Contributions are recognized as expenses when they fall due for payment. Other pension plans are defined benefit plans.
Calculations for the defined benefit plans that exist within Securitas are carried out by independent actuaries.
Costs related to defined benefit plans are recognized in operating income. The calculation of service cost is based on the projected unit credit method in a way that distributes the cost over the employee’s working life. The net interest cost is estimated by applying the discount rate to the net defined benefit obligation. Administration costs are recognized in operating income in the period which they occur.
The net defined benefit obligation recognized in the balance sheet is the present value of the defined benefit obligation at the end of the reporting period less the fair value of plan assets. The obligations are valued at the present value of the expected future cash flows using a discount rate corresponding to the interest rate on high quality corporate bonds or government bonds with a remaining term that is approximately the same as the obligations.
Remeasurements of post-employment benefit plans and reimburse-ment rights are recognized in other comprehensive income in the period which they occur. Remeasurements of other long-term employee benefit plans as well as past service costs are recognized immediately in the statement of income.
If accounting for a defined benefit plan results in a balance sheet asset, this is reported as a net asset in the consolidated balance sheet under other long-term receivables. Otherwise it is reported as a provision under provisions for pensions and similar commitments. Provisions for pensions and similar commitments are not included in net debt.
When it is virtually certain that another party will reimburse some or all of the expenditure required to settle a defined benefit obligation, the right to reimbursement is recognized. This reimbursement right is measured at fair value and classified as a long-term receivable.
Share-based payments (IFRS 2) Note 8 and 12IFRS 2 requires that fair value of the equity settled schemes should be accounted for as an expense in the statement of income with the corre-sponding entry accounted for as equity. The expense should be accrued on a linear basis over the vesting period. For cash settled schemes IFRS 2 also requires that the fair value of the scheme should be recognized as an expense in the statement of income on a linear basis over the vesting period, but with the corresponding entry recognized as a liability rather than as equity. Furthermore if the incentive scheme lapses without settle-ment, this will result in a reversal of the accrued cost for cash settled schemes only. For equity settled schemes, no reversal will occur after the vesting date since no adjustment to the net assets is required.
Securitas has a share-based incentive scheme where the participants in the scheme receive a bonus where two thirds are payable in cash in the beginning of the year after the bonus has been accrued. The remain-ing one third of the bonus is used to acquire shares at market value. These shares are delivered to the participants in the beginning of the year after they have been acquired if the participants still are employed by Securitas. The cost for Securitas, including social security expenses, is accounted for in the statement of income during the vesting period. However, the share-based portion of the bonus is classified as equity and not as a liability. At the end of the program, a revaluation is made of the original estimates and the final outcome of social security expenses is determined. Any deviation due to the revaluation, for example due to any participant leaving the Group and not receiving allocated shares, is accounted for in the statement of income. Corresponding adjustments are made to retained earnings in equity up until the vesting date.
In order to hedge the share portion of Securitas share-based incentive scheme 2013, the Group has entered into a swap agreement with a third party. The swap agreement represents an obligation for the Parent Com-pany to purchase its own shares at a predetermined price. The swap agreement is consequently classified as an equity instrument and accounted for in equity as a reduction of retained earnings. A swap agree-ment was also entered into to hedge the share portion of Securitas share-based incentive scheme 2012. That swap agreement settled during 2014 in conjunction with the delivery of the shares to the participants upon vesting.
Provisions (IAS 37) Note 32 and 35Provisions are recognized when the Group has a legal or constructive obligation as a result of a past event, and it is more probable than not that an outflow of resources embodying economic benefits will be required to settle the obligation, and a reliable estimate can be made of the amount of the obligation. Provisions for restructuring are recognized when a detailed, formal plan for measures has been established and valid expectations that the restructuring will take place have been raised by those affected by the measures. No provisions are recognized for future operating losses.
Claims reserves are calculated on the basis of a combination of case reserves, which represent claims reported, and IBNR (incurred but not reported) reserves. Actuarial calculations are performed quarterly to assess the adequacy of the reserves based on open claims and historical IBNR.

Annual ReportNotes and comments to the consolidated financial statements
Securitas Annual Report 201476
NOTE 3 Definitions, calculation of key ratios and exchange rates
DEFINITIONS
Statement of income according to Securitas’ financial model
Production expenses1
Wages and related costs, the cost of equipment used when performing professional duties, and all other costs directly related the performance of services invoiced.
Selling and administrative expenses1
All costs of selling, administration and management including branch office expenses. The primary function of the branch offices is to provide the production with administrative support as well as to serve as a sales channel.
Gross marginGross income as a percentage of total sales.
Operating income before amortizationOperating income before amortization and impairment of acquisition related intangible assets, acquisition related costs and items affecting comparability, but including amortization and depreciation of other intangible assets, buildings and land and machinery and equipment.
Operating marginOperating income before amortization as a percentage of total sales.
Operating income after amortizationOperating income after amortization and impairment of acquisition related intangible assets, acquisition related costs, items affecting comparability and including amortization and depreciation of other intangible assets, buildings and land and machinery and equipment.
Adjusted incomeOperating income before amortization, adjusted for financial income and expenses (excluding revaluation of financial instruments according to IAS 39) and current taxes.
Net marginIncome before taxes as a percentage of total sales.
Real changeChange adjusted for changes in exchange rates.
Statement of cash flow according to Securitas’ financial model
Cash flow from operating activitiesOperating income before amortization adjusted for depreciation/amor-tization less capital expenditures in non-current tangible and intangible assets (excluding acquisition of subsidiaries), change in accounts receivable and changes in other operating capital employed.
Free cash flowCash flow from operating activities adjusted for financial income and expenses paid and current taxes paid.
Cash flow for the year1
Free cash flow adjusted for acquisition of subsidiaries, acquisition related costs paid, cash flow from items affecting comparability, dividends, new issues and change in interest-bearing net debt excluding liquid funds.
Balance sheet according to Securitas’ financial model
Operating capital employed Capital employed less goodwill, acquisition related intangible assets and shares in associated companies.
Capital employedNon interest-bearing non-current and current assets less non interest-bearing long-term and current liabilities.
Net debtInterest-bearing non-current and current assets less long-term and short-term interest-bearing loan liabilities.
CALCULATION OF KEY RATIOS 2014
Acquired sales growth: 1%This year’s sales from acquired business as a percentage of the previous year’s total sales. Calculation: 353.3 / 65 700.1 = 1%
Organic sales growth: 3%Total sales for the year adjusted for acquisitions and changes in exchange rates as a percentage of the previous year’s total sales adjusted for divestitures.Calculation: ((70 217.1-353.3-2 031.7)/(65 700.1-33.8))-1 = 3%
Real sales growth: 4%Total sales for the year including acquisitions and adjusted for changes in exchange rates as a percentage of the previous year’s total sales.Calculation: ((70 217.1-2 031.7) / 65 700.1)-1 = 4%
Operating margin: 5.0%Operating income before amortization as a percentage of total sales.Calculation: 3 504.7 / 70 217.1 = 5.0%
Earnings per share before dilution2,3: SEK 5.67 (5.07)Net income for the year attributable to equity holders of the ParentCompany in relation to the average number of shares before dilution.Calculation 2014: ((2 071.5-3.1) / 365 058 897) x 1 000 000 = SEK 5.67Calculation 2013: ((1 855.6-3.1) / 365 058 897) x 1 000 000 = SEK 5.07
Cash flow from operating activities as % of operating income before amortization: 82%Cash flow from operating activities as a percentage of operating income before amortization.Calculation: 2 862.7 / 3 504.7 = 82%
Free cash flow as % of adjusted income: 75%Free cash flow as a percentage of adjusted income.Calculation: 1 854.7 / (3 504.7-327.2-710.7) = 75%
Free cash flow in relation to net debt: 0.18Free cash flow in relation to closing balance net debt.Calculation: 1 854.7 / 10 421.6 = 0.18
1 The definition is also valid for the formal primary statements – the statement of income and the statement of cash flow. 2 There are no convertible debenture loans. Consequently there is no difference between earnings per share before and after dilution.3 Number of shares includes shares related to the Group’s share-based incentive scheme that have been hedged through a swap agreement.

Annual ReportNotes and comments to the consolidated financial statements
77Securitas Annual Report 2014
Operating capital employed as % of total sales: 6%Operating capital employed as a percentage of total sales adjusted for full year sales of acquisitions.Calculation: 3 924.0 / (70 217.1+227.8) = 6%
Return on capital employed: 16%Operating income before amortization plus items affecting comparability as a percentage of the closing balance of capital employed.Calculation: (3 504.7-0.0) / 21 720.8 = 16%
Net debt equity ratio: 0.92Net debt in relation to shareholders’ equity.Calculation: 10 421.6 / 11 299.2 = 0.92
Interest coverage ratio: 10.4Operating income before amortization plus interest income in relation to interest expense.Calculation: (3 504.7+38.0) / 342.0 = 10.4
Return on equity: 20%Net income for the year as a percentage of average shareholders’ equity.Calculation: 2 071.5 / ((11 299.2+9 381.3) / 2) = 20%
Equity ratio: 28%Shareholders’ equity as a percentage of total assets.Calculation: 11 299.2 / 41 083.8 = 28%
EXCHANGE RATES USED IN THE CONSOLIDATED FINANCIAL STATEMENTS 2013–2014
2014 2013
Weighted average
End-rateDecember
Weighted average
End-rateDecember
Argentina ARS 1 0.84 0.91 1.17 1.00Bosnia and Herzegovina BAM 1 4.67 4.85 4.44 4.55Canada CAD 1 6.27 6.71 6.30 6.04Chile CLP 100 1.21 1.29 1.31 1.23China CNY 1 1.13 1.26 1.06 1.07Colombia COP 100 0.34 0.33 0.35 0.34Costa Rica CRC 100 1.29 1.44 1.30 1.28Croatia HRK 1 1.20 1.24 1.15 1.17Czech Republic CZK 1 0.33 0.34 0.33 0.32Denmark DKK 1 1.23 1.27 1.16 1.19Egypt EGP 1 0.98 1.09 0.95 0.93EMU Countries EUR 1 9.13 9.48 8.68 8.90Hong Kong HKD 1 0.89 1.00 0.84 0.83Hungary HUF 100 2.95 3.01 2.91 3.00India INR 1 0.11 0.12 0.11 0.10Indonesia IDR 100 0.06 0.06 0.06 0.05Jordan JOD 1 9.81 10.99 9.20 9.13Mexico MXN 1 0.52 0.53 0.51 0.49Morocco MAD 1 0.82 0.86 0.78 0.79Norway NOK 1 1.09 1.05 1.10 1.06Peru PEN 1 2.44 2.60 2.40 2.31Poland PLN 1 2.18 2.20 2.06 2.14Romania RON 1 2.06 2.11 1.96 1.99Saudi Arabia SAR 1 1.83 2.08 1.74 1.72Serbia RSD 1 0.08 0.08 0.08 0.08Singapore SGD 1 5.43 5.89 5.21 5.10South Africa ZAR 1 0.64 0.67 0.67 0.62South Korea KRW 100 0.69 0.71 – –Sri Lanka LKR 100 5.30 5.94 5.04 4.94Switzerland CHF 1 7.53 7.88 7.06 7.25Taiwan TWD 1 0.22 0.25 0.22 0.22Thailand THB 1 0.21 0.24 0.21 0.20Turkey TRY 1 3.17 3.37 3.38 3.03United Arab Emirates AED 1 1.92 2.12 1.78 1.76United Kingdom GBP 1 11.37 12.11 10.20 10.65Uruguay UYU 1 0.30 0.32 0.32 0.31USD countries USD 1 6.95 7.79 6.52 6.47Vietnam VND 100 0.03 0.04 0.03 0.03

Annual ReportNotes and comments to the consolidated financial statements
Securitas Annual Report 201478
NOTE 4 Critical estimates and judgments
The preparation of financial reports requires the Board of Directors and Group Management to make estimates and judgments using certain assumptions. Estimates and judgments will impact both the statement of income and the balance sheet as well as disclosures such as contingent liabilities. Actual results may differ from these estimates and judgments under different assumptions and conditions.
Acquisition of subsidiaries / operations and deferred considerationsThe valuation of identifiable assets and liabilities in connection with the acquisition of subsidiaries or operations involves that items in the acquired company’s balance sheet as well as items that have not been recognized in the acquired company’s balance sheet, such as customer relations, should be valued at fair value. In normal circumstances, as quoted market prices are not available for the assets and liabilities that are to be valued, different valuation methods have to be used. These valu-ation methods are based on a number of assumptions. For a personnel intensive company like Securitas, employee related items such as accrued salaries, accrued social benefits, holiday pay, long-term employee benefits and post-employment benefits are significant items in the bal-ance sheet that can be difficult to value. Accounts receivable is another example of a significant balance sheet item where it can be difficult to value the amount of bad debt and thus to what extent they will be col-lected. Other items that can be difficult both to identify as well as to value are contingent liabilities that could have arisen in the acquired company in connection with for example litigations. The valuation of identifiable assets and liabilities is also dependent on the accounting environment that the acquired company / operations have been active in. This is true for example for the basis of preparation for the financial reporting and consequently the extent of adjustments that are necessary in order to follow the Group’s accounting principles, the frequency for which clos-ings have been prepared and the availability of different types of data that can be necessary in order to value identifiable assets and liabilities. All balance sheet items are thus subject to estimates and judgments. This also means that the initial accounting may have to be provisionally determined and subsequently adjusted. All acquisition calculations are finalized no later than one year after the acquisition is made. Considering the above description including the practicability to compile and disclose all individual adjustments in a manner that will benefit the reader of the financial statements, Securitas has chosen not to state the reasons to why the initial accounting of the business combination is provisional nor which assets and liabilities for which the initial accounting is provisional for each individual business combination unless it is a material adjustment.
All payments to acquire a subsidiary / operation are recorded at fair value at the acquisition date, including debt related to deferred or con-tingent considerations and acquisition related option liabilities (referred to collectively as deferred considerations). This debt is measured at fair value in subsequent periods with re-measurement through the statement of income. The final outcome of deferred considerations often depends on one or more events which only will be confirmed by a future develop-ment, such as the future profitability development for an agreed period. The final outcome can therefore either be lower or higher than the initially recognized amount. Short-term deferred considerations, which amount to MSEK 96.6 (141.6) and is included in other current liabilities (note 34) and long-term deferred considerations, which amount to MSEK 444.1 (390.3) and is included in other long-term liabilities (note 30), are thus subject to critical estimates and judgments.
Further information regarding acquisitions is provided in note 16 and regarding revaluation of deferred considerations in note 11.
Impairment testing of goodwill, other acquisition related intangible assets and shares in associated companiesIn connection with the impairment testing of goodwill, other acquisition related intangible assets and shares in associated companies, the book value is compared with the recoverable value. The recoverable value is determined by the higher of an asset’s net realizable value and its value in use. Since under normal circumstances no quoted market prices are available to assess an asset’s net realizable value, the book value is nor-mally compared with the value in use. The calculation of the value in use is based on assumptions and judgments. The most important assumptions are the organic sales growth, the development of the operating margin, the operating working capital requirements and the relevant WACC, which is used to discount future cash flows. All in all, this means that the valuation of the balance sheet items goodwill, which amounts to MSEK 16 228.1 (14 361.9), acquisition related intangible assets, which amounts to MSEK 1 244.2 (1 315.6) and shares in associated companies, which amounts to MSEK 324.5 (132.7) are subject to critical estimates and judgments. A sensitivity analysis regarding the organic sales growth, the operating margin and the WACC is provided in note 17.
Valuation of accounts receivable and the provision for bad debt lossesAccounts receivable, which amounts to MSEK 10 815.5 (9 676.4), is one of the most significant balance sheet items. Accounts receivable are accounted for at nominal value net after provisions for probable bad debt. The provision for bad debt losses, which amounts to MSEK -471.2 (-488.8), is thus subject to critical estimates and judgments. As stated above, accounts receivable is often an important item in relation to the acquisition of subsidiaries / operations. Further information regarding the credit risk in accounts receivable is provided in note 6. Information regarding the ageing of accounts receivable and the development of the provision for bad debt losses during the year is provided in note 25.
Actuarial calculations regarding employee benefits such as pensions and medical benefitsFor defined benefit plans relating to benefits particularly for pensions and medical benefits and where the payment to the employee is several years into the future, actuarial calculations are required. These calculations are based on assumptions regarding economic variables such as the discount rate, salary increases, inflation rate, pension increases and the inflation rate for medical benefits, but also on demographic variables such as the expected life span. All in all, the balance sheet item pension balances for defined benefit plans which amounts to MSEK 8.8 (7.0) and which is stated under other long-term receivables (note 23), and the balance sheet item provisions for pensions and similar commitments, which amounts to MSEK 1 450.2 (1 024.6), is subject to critical estimates and judgments. The Group’s opinion is that the most important assumptions are the discount rate, the inflation rate and the expected life span. A sensitivity analysis regarding these three variables is provided in note 31.
Actuarial calculations regarding claims reserves and timing of outflowsThe Group is exposed to various types of risks in the day-to-day running of the business. The operational risks can result in the need to recognize reserves for damages resulting from property claims, personal injuries as well as workers’ compensation claims relating to the Group’s employees. Claims reserves are calculated based on a combination of case reserves and incurred but not reported reserves. Actuarial calculations are per-formed on a quarterly basis to assess the adequacy of the reserves based on open claims and historical data for incurred but not reported claims. Actuarial calculations are based on several assumptions. Claims reserves comprise a large number of individual insurance cases, where some cases are compensated with a lump-sum payment and others are paid over a longer period of time. It is thus not possible to disclose any detailed information regarding the timing of outflows from claims reserves.

Annual ReportNotes and comments to the consolidated financial statements
79Securitas Annual Report 2014
All in all, this means that the balance sheet items short-term liability insurance-related claims reserves, which amounts to MSEK 702.5 (574.4) and is included in short-term provisions (note 35), and liability insurance-related claims reserves, which amounts to MSEK 455.2 (374.0) and is included in other long-term provisions (note 32), are subject to critical estimates and judgments.
Calculation of taxes and timing of outflowsDeferred tax is calculated on temporary differences between the car-rying amounts and the tax values of assets and liabilities. Assumptions and assessments affect recognized deferred tax, partly to determine the carrying amounts of the different assets and liabilities, and partly related to forecasts regarding future taxable profits, where future utiliza-tion of deferred tax assets depends on this. Significant assessments and assumptions are also made regarding recognition of provisions and con-tingent liabilities relating to tax risks and the potential impact of ongoing tax audits. Tax audits are often lengthy processes that go on for several years. It is thus not possible to disclose any detailed information regarding the timing of outflows from taxes.
The balance sheet includes deferred tax assets which amounts to MSEK 1 441.9 (1 391.1), deferred tax liabilities which amounts to MSEK 759.6 (747.4) and provisions for taxes which amounts to MSEK 202.0 (208.4) included in other long-term provisions (note 32), which are all subject to critical estimates and judgments. Further information regarding taxes is provided in note 15, note 32 and note 37.
The impact on the Group’s financial position of ongoing litigations and the valuation of contingent liabilitiesOver the years, the Group has made a number of acquisitions in different countries. As a result of such acquisitions, certain contingent liabilities of the businesses acquired have been assumed. Companies within the Group are also involved in a number of other legal proceedings and tax audits arising out of the operations. The accounting for litigations, legal proceedings and tax audits are subject to critical estimates and judg-ments. Further information is provided in note 32, note 35 and note 37.
NOTE 5 Events after the balance sheet date
Approval of the Annual Report and Consolidated Financial Statements for 2014This Annual Report including the Consolidated Financial Statements was approved by the Board of Directors of Securitas AB on March 13, 2015.
Other significant events after the balance sheet date On January 8, 2015, Securitas signed a new Revolving Credit Facility. The Revolving Credit Facility maturing in 2016 was cancelled at around the same time.
In the USA, the judgment in 2014 in favor of Securitas in the US Tax Court relating to certain insurance premium deductions, has not been appealed. Consequently the contingent liability for this case has ceased to exist.
In order to hedge the share portion of Securitas share-based incentive scheme 2014, the Group entered into a swap agreement with a third party in the beginning of March 2015.
There have been no other significant events with effect on the financial reporting after the balance sheet date.
NOTE 6 Financial risk management
Financial risk factorsThe Group’s business activities create exposure to financial risks, such as interest rate risk, foreign currency risk, financing and liquidity risk and credit / counterparty risk, as detailed in the sections below. The Group’s overall financial risk management program focuses on the unpredictability of the financial markets and aims to minimize potential adverse effects on the financial performance of the Group.
Treasury organization and activitiesThe aim of the treasury organization in Securitas is to support business operations by identifying, quantifying and minimizing financial risks and to the extent possible, to take advantage of economies of scale in the treasury operations.
Business segmentsTreasury operations in the business segments concentrate on improving cash flow by focusing on profitability in the business operations, reducing capital tied-up in accounts receivable, and in the most efficient way handling both investments and local cash management.
CountriesIn countries with extensive operations, liquidity surpluses and liquidity deficits in local subsidiaries are matched at country level with the help of local cash-pooling solutions. In addition, Securitas operates an overall cash-pooling structure incorporating countries in the Eurozone, UK and USA. All local long-term financial requirements are financed directly from the Group’s internal bank, Group Treasury Centre (GTC), in Dublin.
Group Treasury CentreBy concentrating the financial risk management in a single location, the Group can readily monitor and control these risks and benefit from the expertise of dedicated treasury personnel. Also, by concentrating internal and external financing through GTC, economies of scale can be used to obtain the best possible pricing of investments and loans. GTC also has responsibility for matching local liquidity surpluses and deficits between countries and cash-pools. GTC identifies, evaluates and hedges financial risks in co-operation with the operating units. The Board of Directors of Securitas AB establishes policies for overall risk management, as well as policies covering specific areas such as foreign exchange risks, interest rate risk, credit risk, use of derivative financial instruments and investing excess liquidity.
Derivatives are used for the following main purposes: hedging the interest rate element of external debt and changing its currency profile, gearing ratio hedging and hedging of internal borrowings and investments.
Interest rate riskInterest rate risk is the risk that the Group’s net income will be affected by changes in interest payable and/or receivable arising from changes in market interest rates. The Group has raised fixed and floating rate debt predominately in USD, EUR and SEK. Detailed information on long-term borrowings is provided in note 30. The Group uses interest rate deriva-tives in designated fair value and cash flow hedges to hedge changes in the risk free rate, converting the interest rate profile of this debt. As at December 31, 2014 MEUR 623 and MSEK 400 of issued debt is swapped from fixed to floating. MUSD 237 is swapped from floating to fixed.
Information on the Group’s debt profile is provided in the table below as well as information on interest rate fixings.
The target for the free cash flow to net debt ratio is always to exceed 0.20. Free cash flow to net debt as of December 31, 2014 was 0.18 (0.22). The free cash flow is affected from the net investments in non-current tangible and intangible assets, reflecting our strategy to increase the sales in security solutions and technology. The Group’s interest cover-age ratio, a measure of its ability to pay interest costs, was 10.4 (7.9) as of December 31, 2014.
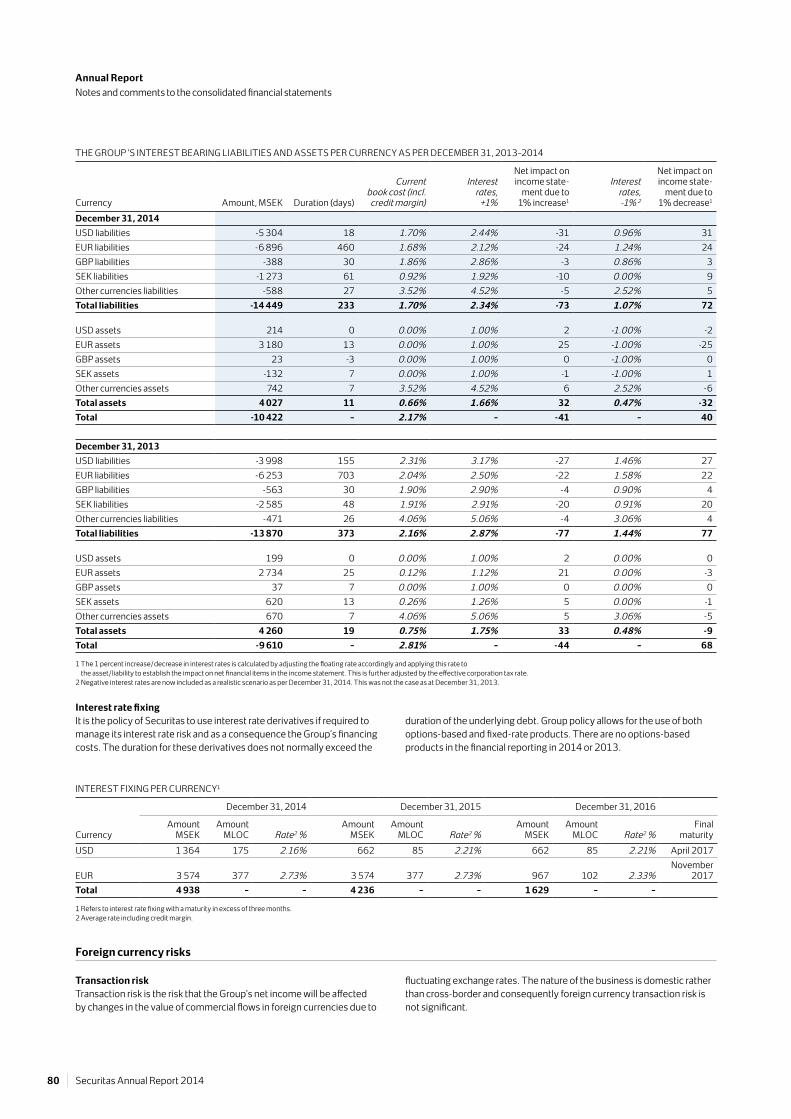
Annual ReportNotes and comments to the consolidated financial statements
Securitas Annual Report 201480
Interest rate fixing It is the policy of Securitas to use interest rate derivatives if required to manage its interest rate risk and as a consequence the Group’s financing costs. The duration for these derivatives does not normally exceed the
duration of the underlying debt. Group policy allows for the use of both options-based and fixed-rate products. There are no options-based products in the financial reporting in 2014 or 2013.
INTEREST FIXING PER CURRENCY1
December 31, 2014 December 31, 2015 December 31, 2016
CurrencyAmount
MSEKAmount
MLOC Rate2 %Amount
MSEKAmount
MLOC Rate2 %Amount
MSEKAmount
MLOC Rate2 %Final
maturityUSD 1 364 175 2.16% 662 85 2.21% 662 85 2.21% April 2017
EUR 3 574 377 2.73% 3 574 377 2.73% 967 102 2.33%November
2017Total 4 938 – – 4 236 – – 1 629 – – 1 Refers to interest rate fixing with a maturity in excess of three months.2 Average rate including credit margin.
THE GROUP ’S INTEREST BEARING LIABILITIES AND ASSETS PER CURRENCY AS PER DECEMBER 31, 2013–2014
Currency Amount, MSEK Duration (days)
Currentbook cost (incl.credit margin)
Interest rates,
+1%
Net impact onincome state-
ment due to1% increase1
Interest rates,-1% 2
Net impact onincome state-
ment due to1% decrease1
December 31, 2014USD liabilities -5 304 18 1.70% 2.44% -31 0.96% 31EUR liabilities -6 896 460 1.68% 2.12% -24 1.24% 24GBP liabilities -388 30 1.86% 2.86% -3 0.86% 3SEK liabilities -1 273 61 0.92% 1.92% -10 0.00% 9Other currencies liabilities -588 27 3.52% 4.52% -5 2.52% 5Total liabilities -14 449 233 1.70% 2.34% -73 1.07% 72
USD assets 214 0 0.00% 1.00% 2 -1.00% -2EUR assets 3 180 13 0.00% 1.00% 25 -1.00% -25GBP assets 23 -3 0.00% 1.00% 0 -1.00% 0SEK assets -132 7 0.00% 1.00% -1 -1.00% 1Other currencies assets 742 7 3.52% 4.52% 6 2.52% -6Total assets 4 027 11 0.66% 1.66% 32 0.47% -32Total -10 422 – 2.17% – -41 – 40
December 31, 2013USD liabilities -3 998 155 2.31% 3.17% -27 1.46% 27EUR liabilities -6 253 703 2.04% 2.50% -22 1.58% 22GBP liabilities -563 30 1.90% 2.90% -4 0.90% 4SEK liabilities -2 585 48 1.91% 2.91% -20 0.91% 20Other currencies liabilities -471 26 4.06% 5.06% -4 3.06% 4Total liabilities -13 870 373 2.16% 2.87% -77 1.44% 77
USD assets 199 0 0.00% 1.00% 2 0.00% 0EUR assets 2 734 25 0.12% 1.12% 21 0.00% -3GBP assets 37 7 0.00% 1.00% 0 0.00% 0SEK assets 620 13 0.26% 1.26% 5 0.00% -1Other currencies assets 670 7 4.06% 5.06% 5 3.06% -5Total assets 4 260 19 0.75% 1.75% 33 0.48% -9Total -9 610 – 2.81% – -44 – 68
1 The 1 percent increase / decrease in interest rates is calculated by adjusting the floating rate accordingly and applying this rate to the asset / liability to establish the impact on net financial items in the income statement. This is further adjusted by the effective corporation tax rate.
2 Negative interest rates are now included as a realistic scenario as per December 31, 2014. This was not the case as at December 31, 2013.
Foreign currency risks
Transaction riskTransaction risk is the risk that the Group’s net income will be affected by changes in the value of commercial flows in foreign currencies due to
fluctuating exchange rates. The nature of the business is domestic rather than cross-border and consequently foreign currency transaction risk is not significant.

Annual ReportNotes and comments to the consolidated financial statements
81Securitas Annual Report 2014
CAPITAL EMPLOYED AND FINANCING PER CURRENCY AS PER DECEMBER 31, 2013–2014
MSEK EUR USD GBPOther
currenciesTotal foreign
currencies SEK Total GroupTotal Group
+10%1Total Group
-10%1
December 31, 2014Capital employed 7 481 9 526 1 259 3 325 21 591 130 21 721 23 880 19 562Net debt before foreign exchange swaps -6 621 -1 935 23 742 -7 791 -2 631 -10 422 -11 201 -9 643Foreign exchange swaps 2 905 -3 155 -388 -588 -1 226 1 226 0 -123 123Net debt -3 716 -5 090 -365 154 -9 017 -1 405 -10 422 -11 324 -9 520Non-controlling interests 6 – – 13 19 – 19 21 17Net exposure 3 759 4 436 894 3 466 12 555 -1 275 11 280 12 535 10 025Net debt to equity ratio 0.99 1.15 0.41 -0.04 0.72 -1.10 0.92 0.90 0.95
December 31, 2013Capital employed 7 275 7 370 1 270 2 941 18 856 135 18 991 20 877 17 105Net debt before foreign exchange swaps -6 564 -1 322 38 682 -7 166 -2 444 -9 610 -10 327 -8 893Foreign exchange swaps 3 048 -2 466 -563 -471 -452 452 0 -45 45Net debt -3 516 -3 788 -525 211 -7 618 -1 992 -9 610 -10 372 -8 848Non-controlling interests 4 – – 12 16 – 16 17 14Net exposure 3 755 3 582 745 3 140 11 222 -1 857 9 365 10 488 8 243Net debt to equity ratio 0.94 1.06 0.70 -0.07 0.68 -1.07 1.02 0.99 1.07 1 Changes in capital employed due to changes in foreign exchange rates are accounted for in other comprehensive income. Consequently, they do not impact net income.
Net debt The table below details the changes to net debt during the year.
CHANGE IN INTEREST-BEARING NET DEBT AS PER DECEMBER 31, 2013–2014
2014 2013
MSEK Liquid fundsLoans and
other net debt Total Liquid fundsLoans and
other net debt TotalOpening balance 4 050 -13 660 -9 610 4 880 -14 745 -9 865Cash flow from operating activities 2 863 – 2 863 3 230 – 3 230Financial income and expenses paid -311 – -311 -532 – -532Current taxes paid -697 – -697 -610 – -610Payments for acquisition related items -385 – -385 -295 – -295Payments for items affecting comparability -73 – -73 -307 – -307Dividend paid -1 095 – -1 095 -1 095 – -1 095Bond proceeds 713 -713 – 3 630 -3 630 –Bond redemption -1 858 1 858 – -5 176 5 176 –Other changes 132 -132 – 371 -371 –Real change -711 1 013 302 -784 1 175 391Revaluation of financial instruments1 – -1 -1 – 11 11Translation2 86 -1 199 -1 113 -46 -101 -147Closing balance 3 425 -13 847 -10 422 4 050 -13 660 -9 610 1 Relates to unrealized gains and losses on fair value hedges and cash flow hedges including hedge ineffectiveness.2 Whereof MSEK -788.5 (30.7) is related to USD and MSEK -226.2 (-124.1) is related to EUR.
Financing of foreign assets – translation riskTranslation risk is the risk that the SEK value of foreign currency equity will fluctuate due to changes in foreign exchange rates.
Securitas’ foreign currency capital employed as of December 31, 2014 was MSEK 21 591 (18 856). Capital employed is financed by loans in local currency and shareholders’ equity. This means that Securitas, from a Group perspective, has shareholders’ equity in foreign currency that is exposed to changes in exchange rates. This exposure gives rise to a translation risk and consequently unfavourable changes in exchange rates could have a negative effect on the Group’s foreign net assets when translated into SEK. With the object of minimizing the impact of changes in exchange rates on the Group’s net debt to equity ratio, Securitas aims to maintain a long-term debt to equity ratio in USD and EUR that is close
to the Group’s total debt to equity ratio. Foreign exchange swaps are used to change the currency of the underlying debt where required in order to achieve this. Net investment hedge accounting is applied to these swaps.
The tables below show how the Group’s capital employed is distributed by currency, and its financing, including derivatives. They also show the sensitivity of the net debt and capital employed to changes in the SEK exchange rate.
The consolidated statement of income is affected by the translation to SEK of the statements of income of foreign subsidiaries. As these subsid-iaries essentially operate only in local currency, their competitive situation is not affected by changes in exchange rates and since the Group as a whole is geographically diversified, this exposure is not hedged.

Annual ReportNotes and comments to the consolidated financial statements
Securitas Annual Report 201482
Financing and liquidity riskThe Group’s short-term liquidity is ensured by maintaining a liquidity reserve (cash and bank deposits, short-term investments and the unutilized portion of committed credit facilities), which should correspond to a minimum of 5 percent of consolidated annual sales. As of December 31, 2014 the short-term liquidity reserve corresponded to 13 percent (14) of the Group’s annual sales.
The Group’s long-term financing risk is minimized by ensuring that the level of long-term financing (shareholders’ equity, long-term committed loan facilities and long-term bond loans) at least matches the Group’s cap-ital employed. Per December 31, 2014 long-term financing corresponded to 142 percent (148) of the Group’s capital employed.
Long-term financing of the Group should be well balanced among different sources. The aim is that long-term committed loan facilities and long-term bond loans should have an average maturity of more than 3.5 years. As per December 31, 2014 the average maturity was two years and eight months. The following tables summarize the Group’s liquidity risk at end 2014 and 2013 respectively.
LIQUIDITY REPORT AS PER DECEMBER 31, 2013–2014
MSEK Total < 1 year
Between 1 year and
5 years > 5 yearsDecember 31, 2014Borrowings, principal amount -13 792 -2 481 -7 214 -4 097Borrowings, interest amount -1 193 -276 -740 -177Derivatives outflows – interest rate hedge -51 -22 -26 -3Other derivatives outflows -10 010 -10 010 – –Finance leases -99 -56 -43 –Accounts payable -1 105 -1 105 – –Total outflows3 -26 250 -13 950 -8 023 -4 277Investments, principal amount 2 112 2 112 – –Investments, interest amount – – – –Derivatives receipts – interest rate hedge 506 104 299 103Other derivatives receipts 9 866 9 866 – –Accounts receivable 10 816 10 816 – –Total inflows3 23 300 22 898 299 103Net cash flows, total1, 2 -2 950 8 948 -7 724 -4 174
December 31, 2013Borrowings, principal amount -13 577 -2 144 -7 768 -3 665Borrowings, interest amount -1 347 -242 -859 -246Derivatives outflows – interest rate hedge -108 -27 -61 -20Other derivatives outflows -9 200 -9 200 – –Finance leases -75 -44 -31 –Accounts payable -959 -959 – –Total outflows3 -25 266 -12 616 -8 719 -3 931Investments, principal amount 2 797 2 797 – –Investments, interest amount – – – –Derivatives receipts – interest rate hedge 531 60 326 145Other derivatives receipts 9 209 9 209 – –Accounts receivable 9 676 9 676 – –Total inflows3 22 213 21 742 326 145Net cash flows, total1, 2 -3 053 9 126 -8 393 -3 786 1 All contractual cash flows per the balance sheet date are included, including future interest payments.2 Variable rate cash flows have been estimated using the relevant yield curve.3 Refers to gross cash flows.
Long-term committed loan facilities consist of a Multi Currency Revolving Credit Facility comprising two respective tranches of MUSD 550 and MEUR 420. It was signed in January 2011 with a syndicate of 12 interna-tional banks and originally had a maturity date in January 2016. Drawings under this facility were priced at the relevant prevailing market interest rate for the term selected. In January 2015 Securitas signed a new Revolving Credit Facility. The new credit facility comprises of two respective tranches of MUSD 550 and MEUR 440, for an initial five year period, with the possibility to extend for a further two years. The Revolving Credit Facility that was due to mature in 2016 was cancelled at around the same time.
Securitas also has a Euro Medium Term Note Program (EMTN) with a limit of MEUR 2 000 under which public and private funding can be raised on international capital markets. As of December 31, 2014 there were ten outstanding bond loans with maturities ranging from 2015 to 2021.
In January 2002, Securitas established a short-term Swedish commercial paper program in the amount of MSEK 5 000. The objective is to obtain access to short-term financing at competitive prices. Pricing is based on the prevailing market rates at time of issuance.
The table below shows a summary of the credit facilities as of December 31, 2014.
CREDIT FACILITIES AS PER DECEMBER 31, 2014
Type Currency
Facilityamount(million)
Availableamount(million) Maturity
EMTN 3.45% fixed SEK 400 0 2015EMTN FRN private placement SEK 600 0 2015EMTN FRN private placement USD 40 0 2015Multi Currency Revolving Credit Facility
USD (or equivalent) 550 550 2016
Multi Currency Revolving Credit Facility
EUR (or equivalent) 420 420 2016
EMTN Eurobond, 2.75% fixed EUR 350 0 2017EMTN FRN private placement USD 50 0 2018EMTN Eurobond, 2.25% fixed EUR 300 0 2018EMTN FRN private placement USD 85 0 2019EMTN FRN private placement USD 40 0 2020EMTN FRN private placement USD 60 0 2021EMTN Eurobond, 2.625% fixed EUR 350 0 2021Commercial Paper (uncommitted) SEK 5 000 3 830 n/a
In combination with Securitas’ strong cash flow, these sources of financing provide liquidity on a short and long-term basis as well as flexibility to finance the Group’s expansion.
The table below shows the maturity profile as of December 31, 2014 for the Group’s interest-bearing debt.
7 5006 0004 5003 0001 5000
MSEK
2021202020192018201720162015
■■ SEK bond/PP ■■ USD/PP ■■ 2016 RCF (undrawn) ■■ EUR bond/PP

Annual ReportNotes and comments to the consolidated financial statements
83Securitas Annual Report 2014
Credit / counterparty risks
Counterparty risk – accounts receivableThe Group has generally low risk in the accounts receivables for a number of reasons. A large proportion of sales are based on contracts with well known large and medium sized customers with an established and long-term relationship. This provides for transparent and safe collection of invoices. New customers are duly reviewed in terms of credit worthiness.
The contract portfolio sales are also diversified in several ways, of which the most important is that there are few / no clients that represent a significant portion of total sales. Default by a single customer then has little overall effect. In addition, Securitas provides its services to geo-graphically dispersed customers in a large number of sectors including governments, utilities, financial sector, travel, logistics and industrial. Hence, the exposure to financial distress in any particular sector or region is relatively limited.
Securitas’ services are also, although vital in many aspects, mostly ancillary to the business of the customers. This means that the cost of security services represents a small fraction of total costs of running clients’ business, making Securitas less exposed to payment defaults than suppli-ers of services or goods more directly involved in the value chain.
All of this provides for secure collection of the sales generated, which is evidenced by low bad debt losses averaging below 0.2 percent of sales over the past two years.
Counterparty risk – liquid funds The credit quality of interest-bearing receivables is described below. 77 percent (86) of interest-bearing receivables have a rating of A1/P1.
CREDIT QUALITY INTEREST-BEARING RECEIVABLES
MSEK 2014 2013A1 / P1 3 108 3 661Other 919 599Total interest-bearing receivables 4 027 4 260
The Group has policies in place that limit the amount of credit exposure to any one financial institution. Investments of liquid funds may only be made in government paper or with financial institutions with a high credit rating. As of December 31, 2014 the weighted average credit rating of these institutions was short-term A1 / P1. The largest total exposure for all instrument types to any one institution was MSEK 1 648 (1 442).
RatingIn order to access international debt capital markets in an effective manner, Securitas has obtained long-term and short-term credit ratings from Standard & Poor’s. The long-term rating is BBB with “Stable Outlook” and the short-term rating is A-2. The Nordic short-term rating is K-2.
Fair value of financial instrumentsThe methods and assumptions used by the Group in estimating the fair value of the financial instruments are:
• Cash and bank deposits and short-term investments: carrying amounts approximate fair values.
• Derivative and other financial instruments: fair values are estimated based on quoted market prices, on prices provided by independent brokers, or are calculated on best market prices. The prices used are fair values stated excluding accrued interest.
• Debt: fair values of fixed rate debt are based on either quoted prices or are estimated using discounted cash flow calculations based upon the Group’s current incremental borrowing rates for similar types of bor-rowings with maturities consistent with those remaining for the debt being valued. The fair value of floating rate debt is assumed to equal the carrying value of the debt.
REVALUATION OF FINANCIAL INSTRUMENTS
MSEK 2014 2013Recognized in the statement of incomeFinancial income1 -0.8 0.7Financial expenses1 0.4 -0.2Deferred tax 0.1 -0.1Impact on net income for the year -0.3 0.4
Recognized in other comprehensive incomeTransfer to hedging reserve before tax -4.5 -3.9Deferred tax on transfer to hedging reserve 1.0 -2.64
Transfer to hedging reserve net of tax -3.5 -6.5
Transfer to statement of income before tax 4.5 14.3Deferred tax on transfer to statement of income -1.0 -3.1Transfer to statement of income net of tax 3.5 11.2
Total change of hedging reserve before tax2 0.0 10.4Deferred tax on total change of hedging reserve2 0.0 -5.74
Total change of hedging reserve net of tax 0.0 4.7
Total impact on shareholders’ equity as specified aboveTotal revaluation before tax3 -0.4 10.9Deferred tax on total revaluation3 0.1 -5.8Total revaluation after tax -0.3 5.1 1 Related to financial assets and financial liabilities at fair value through profit or loss. There was no
significant ineffectiveness in the fair value hedges or in the cash flow hedges.2 Total of transfer to hedging reserve and transfer from hedging reserve to statement of income.3 Total revaluation and deferred tax recognized via statement of income and via other comprehensive
income.4 Includes an adjustment of opening balance deferred tax of MSEK -3.5 due to a change in the Swedish
tax rate from 26.3 percent to 22.0 percent.
FAIR VALUE – HIERARCHY AS PER DECEMBER 311
Quoted market prices
Valuation techniquesusing observable
market data
Valuation techniquesusing non-observable
market data Total
MSEK 2014 2013 2014 2013 2014 2013 2014 2013Financial assets at fair value through profit or loss – – 6.2 59.5 – – 6.2 59.5Financial liabilities at fair value through profit or loss – – -149.2 -50.5 – – -149.2 -50.5Derivatives designated for hedging with positive fair value – – 330.1 41.9 – – 330.1 41.9Derivatives designated for hedging with negative fair value – – -0.6 -7.8 – – -0.6 -7.8
1 There have been no transfers between any of the valuation levels during the year.

Annual ReportNotes and comments to the consolidated financial statements
Securitas Annual Report 201484
The table below discloses carrying values and fair values of financial instruments according to the categories in note 2.
FINANCIAL INSTRUMENTS BY CATEGORY – CARRYING AND FAIR VALUES
2014 2013
MSEK Carrying value Fair value Carrying value Fair valueAssetsFinancial assets at fair value through profit or lossOther interest-bearing current assets (note 27) 6.2 6.2 59.5 59.5Total 6.2 6.2 59.5 59.5
Loans and receivablesInterest-bearing financial non-current assets (note 22) 104.6 104.6 109.0 109.0Other long-term receivables (note 23)1 436.0 436.0 368.0 368.0Accounts receivable 10 815.5 10 815.5 9 676.4 9 676.4Other current receivables (note 26)2 2 082.1 2 082.1 1 757.1 1 757.1Other interest-bearing current assets (note 27) 160.9 160.9 – –Liquid funds (note 28) 3 425.1 3 425.1 4 049.8 4 049.8Total 17 024.2 17 024.2 15 960.3 15 960.3
LiabilitiesFinancial liabilities at fair value through profit or lossShort-term loan liabilities (note 33) 149.2 149.2 50.5 50.5Total 149.2 149.2 50.5 50.5
Financial liabilities designated as hedged item in a fair value hedgeShort-term loan liabilities (note 33)5 400.3 400.3 – –Long-term loan liabilities (note 30)6 9 770.2 10 045.8 9 284.2 9 376.4Total 10 170.5 10 446.1 9 284.2 9 376.4
Other financial liabilitiesLong-term loan liabilities (note 30) 1 930.2 1 930.2 2 217.9 2 217.9Long-term liabilities (note 30)3 452.0 452.0 400.4 400.4Short-term loan liabilities (note 33)5 2 198.0 2 198.0 2 309.6 2 309.6Accounts payable 1 104.6 1 104.6 959.4 959.4Other current liabilities (note 34)4 3 187.6 3 187.6 2 974.4 2 974.4Total 8 872.4 8 872.4 8 861.7 8 861.7
Derivatives designated for hedgingInterest-bearing financial current assets (note 27) 0.2 0.2 – –Interest-bearing financial non-current assets (note 22) 329.9 329.9 41.9 41.9Total assets 330.1 330.1 41.9 41.9Interest-bearing financial current liabilities (note 33) 0.3 0.3 0.1 0.1Interest-bearing financial long-term liabilities (note 30) 0.3 0.3 7.7 7.7Total liabilities 0.6 0.6 7.8 7.8Net total 329.5 329.5 34.1 34.1
1 Excluding all pension balances and reimbursement rights (note 23) 249.9 249.9 237.6 237.6
2 Excluding prepaid expenses 715.4 715.4 655.0 655.0
3 Excluding pension balances (note 30) 98.7 98.7 86.9 86.9
4 Excluding employee-related accrued expenses and prepaid income 6 171.6 6 171.6 5 927.8 5 927.8
5 Carrying value equals fair value due to the impending maturity of the MSEK 400 bond in January 2015.6 The difference between the carrying value and fair value of long-term loan liabilities
is due to the credit margin in the discount rate.

Annual ReportNotes and comments to the consolidated financial statements
85Securitas Annual Report 2014
Offsetting financial assets and financial liabilitiesFor the financial assets and liabilities subject to enforceable master net-ting arrangements or similar arrangements, each agreement between the Group and the counterparty allows for net settlement of the relevant financial assets and liabilities when both elect to settle on a net basis. In the absence of such an election, financial assets and liabilities will be settled on a gross basis. However, each party to the master netting agreement or
similar agreement will have the option to settle all such amounts on a net basis in the event of default of the other party. Per the terms of each agree-ment, an event of default includes failure by a party to make payment when due, failure by a party to perform any obligation required by the agreement (other than payment) if such failure is not remedied within periods of 30 to 60 days after notice of such failure is given to the party, or bankruptcy.
Financial assets The following financial assets are subject to offsetting, enforceable master netting arrangements or similar agreements.
MSEK
Gross amounts of recognized
financial assets
Gross amounts ofrecognized financial
liabilities set off in the balance sheet
Net amounts offinancial assets
presented in the balance sheet
Financial instruments
not set off in the balance sheet Net amount
December 31, 2014Derivative financial assets 336.3 – 336.3 97.3 239.0Total 336.3 – 336.3 97.3 239.0
December 31, 2013Derivative financial assets 101.4 – 101.4 55.9 45.5 Total 101.4 – 101.4 55.9 45.5
Financial liabilities The following financial liabilities are subject to offsetting, enforceable master netting arrangements or similar agreements.
MSEK
Gross amounts of recognized
financial liabilities
Gross amounts ofrecognized financial
assets set off in the balance sheet
Net amounts offinancial liabilities
presented in the balance sheet
Financial instruments not set off in
the balance sheet Net amountDecember 31, 2014Derivative financial liabilities 149.8 – 149.8 97.3 52.5 Total 149.8 – 149.8 97.3 52.5
December 31, 2013Derivative financial liabilities 58.3 – 58.3 55.9 2.4 Total 58.3 – 58.3 55.9 2.4

Annual ReportNotes and comments to the consolidated financial statements
Securitas Annual Report 201486
NOTE 7 Transactions with related parties
Guarantees on behalf of related parties amount to MSEK 4.9 (4.2). Information on the remuneration to the Board of Directors and Senior
Management is provided in note 8. Information on total payroll expenses for the Board of Directors and the Presidents of the Group is provided in note 12.
For information on the Parent Company’s transactions with related parties, refer to note 40 and note 43.
NOTE 8 Remuneration to the Board of Directors and senior management
General
PrinciplesThe Chairman of the Board and the Directors receive fees in accordance with the decision of the Annual General Meeting. Separate fees are paid for committee work. Neither the President and CEO nor the employee representatives receive Directors’ fees.
The Annual General Meeting on May 5, 2014 decided upon guidelines for remuneration to senior management regarding 2014 in accordance with the following:
The fundamental principle is that remuneration and other terms of employment for senior management shall be competitive and in accor-dance with market conditions, in order to ensure that the Securitas Group will be able to attract and keep competent senior management employees.
The total remuneration to senior management shall consist of a fixed basic salary, variable remuneration, pensions and other benefits.
In addition to a fixed annual salary, the Group Management may also receive variable remuneration, which shall be based on the outcome in relation to financial goals within the individual area of responsibility (Group or division) and which shall agree with the interest of the share-holders. The variable remuneration shall amount to a maximum of 60 per-cent of the fixed annual salary for the President and CEO and a maximum of 42–200 percent of the fixed annual salary for other individuals of the Group Management. If cash payment of variable remuneration has been effected on grounds later proven to be obviously inaccurate, the company shall have the possibility to reclaim such paid remuneration.
The Board of Directors shall each year consider whether to propose that the General Meeting resolves upon a share or share price based incentive program.
The undertakings of the company as regards variable remuneration to Group Management may, at maximum outcome during 2014, amount to a total of MSEK 55. Information on previously decided remuneration that has not yet been paid can be found in note 8 of the Annual Report for 2013.
The pension rights of senior management employees shall be applicable as from the age of 65 at the earliest and the entire Group Management shall be subject to defined contribution pension plans for which insurance premiums are transferred from the individual’s total remuneration and paid by the company during the term of employment. Variable compen-sation shall not qualify for pension purposes unless local regulations provide otherwise.
Other benefits, such as company car, special health insurance or occu-pational health service shall be provided to the extent this is considered customary for senior management employees holding equivalent positions on the employment market where the senior management employee is active.
At dismissal, the notice period for all senior management employees shall amount to a maximum of 12 months with a right to redundancy pay-ment after the end of the notice period, equivalent to a maximum of 100 percent of the fixed salary for a period not exceeding 12 months. At resig-nation by a senior management employee, the notice period shall amount to a maximum of six months.
These guidelines shall apply to individuals who are included in Group Management during the term of application of these guidelines. The guidelines shall apply to agreements entered into after the adoption by the Annual General Meeting, and to changes made in existing agreements after this date. The Board shall be entitled to deviate from the guidelines in individual cases if there are particular grounds for such deviation.
The Board of Directors proposal to the Annual General Meeting in May 2015 on guidelines for remuneration to senior management regarding 2015 is presented in the Report of the Board of Directors, in this Annual Report.
Planning and decision-making processThe Board’s remuneration committee deals with all the above matters regarding the President and CEO and other members of Group Manage-ment, as well as other management levels if the committee so decides. The committee presents its proposals to the Board of Directors, which takes all decisions. The members of the remuneration committee are Melker Schörling (chairman) and Annika Falkengren. The committee has held two meetings in 2014.
Board of DirectorsFor the 2014 financial year, the Chairman Melker Schörling received a director’s fee, including committee work fee, of MSEK 1.3. The other Directors received an aggregate director’s fee, including committee work fee, of MSEK 3.7. The remuneration for each member of the Board of Directors is disclosed in the tables below. The Board of Directors is other-wise not entitled to any other compensation except for travel and lodging expenses.
President and Chief Executive OfficerThe President and CEO, also serving as Divisional President for Security Services Europe, Alf Göransson’s salary in the financial year 2014, amounted to MSEK 14.9. The amount includes a MSEK 2.4 temporary remuneration for additional responsibility as Divisional President for Security Services Europe during 2014. Other salary benefits amounted to MSEK 0.1.
The President and CEO has a defined contribution pension plan amounting to 30 percent of his annual fixed salary. The retirement age for the President and CEO is 65. In 2014 the pension costs for the President and CEO amounted to MSEK 4.4, whereof MSEK 0.7 refer to the temporary remuneration as per above. No pension benefit is conditioned by future employment.
Upon dismissal, the notice period for the President and CEO amount to 12 months with a right to a severance pay after the end of the notice period, equivalent to 12 months fixed salary.

Annual ReportNotes and comments to the consolidated financial statements
87Securitas Annual Report 2014
Other members of Group ManagementThe other Group Management consisted by the end of 2014 of the following ten members: Bart Adam (Chief Financial Officer), William Barthelemy (Chief Operating Officer, Security Services North America), Santiago Galaz (Divisional President, Security Services North America), Gisela Lindstrand (Senior Vice President Corporate Communications and Public Affairs), Jan Lindström (Senior Vice President Finance), Aimé Lyagre, as from November 4, 2014 (Chief Operating Officer and Chief Technology Officer,Security Services Europe), Marc Pissens (President Aviation and Divisional President, Africa, Middle East and Asia), Luis Posadas (Divisional President, Security Services Ibero-America), Antonio Villaseca Lòpez (Senior Vice President Technical Solutions) and Henrik Zetterberg as from September 24, 2014 (Senior Vice President General Counsel).
Two members has left the Group Management during 2014; Erik-Jan Jansen, on March 31, 2014 (Chief Operating Officer, Security Services Europe) and Åsa Thunman, on September 23 (Senior Vice President General Counsel and Group Risk Manager).
In the 2014 financial year the other members of Group Management aggregate fixed salaries amounted to MSEK 43.8, and other salary benefits to MSEK 2.5 (including the members who left during the year).
The other members of Group Management have individual pension plans. The retirement age varies from country to country and pension plan. The retirement age is 65 years for five members and for five members no retirement age is agreed.
As described under Principles above, members can allocate part of their remuneration to a defined contribution pension plan. All members have defined contribution pension plans for which pension premiums are allocated from the member’s total remuneration and paid by the company during the term of employment. These premiums may vary but are lim-ited to amounts deductible for tax purposes by the company. In 2014 the pension costs for these members of Group Management amounted to MSEK 5.9. No pension benefits are conditioned by future employment.
Three members have a Swedish defined benefit pension plan (ITP), but can also allocate part of their remuneration to a defined contribution plan. The Swedish defined benefit plan guarantees a lifetime pension from the age of 65. The pension compensation corresponds to a certain percentage of the final salary, and the maximum pensionable income is MSEK 1.7 per employee. This pension benefit is funded through annual premiums paid by the company during the term of employment, and the pension cost for these three members in 2014 was MSEK 1.1 (included in the total pension cost for other Group Management stated in the table below).
Upon dismissal, the notice period and a right to a severance pay after the end of the notice period, is equivalent to a maximum of 24 months fixed salary, for members of Group Management.
IncentivesIncentives for eligible employees in Securitas include clearly measur-able performance based targets that are set as close to the local busi-ness as possible and aim for long-term profitability of the Group. The performance targets that are required to achieve maximum bonus, vary depending on the position of the employee, but are as a principle based on year-on-year improvement of the operating result (EBITA) in the area of responsibility and targets based on improvement of cash flow.
For the President and CEO as well as the four members of Group Management responsible for staff functions, the incentive is based on year-on-year real improvement of the earnings per share.
The President and CEO and the other members of Group Management are included in the Securitas share-based incentive schemes 2013 and 2014 respectively, which were approved by the Annual General Meetings in these years. These incentive schemes are paid by two thirds in cash in the beginning of the year following the performance year, and the remain-ing one third is used to acquire Series B shares in Securitas AB over the stock market. These shares are allocated to Group Management in March, two years following the performance year, conditioned by a continuous employment during the vesting period. See further information in note 2 and 12. Information regarding the final allocation of shares to the Group Management in March 2015 under the 2013 share-based incentive scheme, as well as the potential allocation of shares in 2016 under the 2014 share-based incentive scheme and the fair value of these shares, are disclosed in the tables below.
For the President and CEO the variable compensation relating to the 2014 performance amounted to MSEK 7.4, whereof MSEK 2.5 will be allocated in shares in 2016 and MSEK 4.9 will be paid in cash in 2015.
The aggregate variable compensation relating to the 2014 performance to the other members of Group management amounted to MSEK 27.6, whereof MSEK 7.6 will be allocated in shares in 2016 and MSEK 20.0 will be paid in cash in 2015.
ALLOCATION OF SHARES TO GROUP MANAGEMENT RELATING TO SECURITAS SHARE-BASED INCENTIVE SCHEME 2014
Number of shares1 Fair value2, MSEK
2014 2014Alf Göransson, President and CEO 20 954 2.5Other members of Group Management 74 372 8.7Total holdings 95 326 11.2 1 Potential allocation of shares 2016, according to Securitas share-based incentive scheme 2014,
according to purchase prices for Securitas Series B shares in March 2015. 2 Fair value of potential allocation of shares based on Securitas Series B share purchase prices in
March 2015.

Annual ReportNotes and comments to the consolidated financial statements
Securitas Annual Report 201488
Remuneration to the Board of Directors and Group Management
REMUNERATION RELATED TO 2014
KSEKBase
salary / feeOther
benefitsVariable
compensation3 Pension Total remunerationMelker Schörling, Chairman of the Board1 1 300 – – – 1 300Carl Douglas, vice Chairman 750 – – – 750Fredrik Cappelen1 625 – – – 625Marie Ehrling1 750 – – – 750Annika Falkengren1 550 – – – 550Fredrik Palmstierna 500 – – – 500Sofia Schörling Högberg 500 – – – 500Subtotal Board of Directors 4 975 – – – 4 975Alf Göransson, President and CEO2 14 877 104 7 355 4 398 26 734Other members of Group Management4 43 824 2 487 27 560 5 938 79 809Subtotal President and CEO and Group Management 58 701 2 591 34 915 10 336 106 543Total 63 676 2 591 34 915 10 336 111 518
Above information refers to full year remuneration for the current Group Management, unless stated otherwise. The Board of Directors has no pension benefits.
1 Including remuneration for committee work.2 Whereof KSEK 2 400 refers to temporary remuneration and KSEK 720 refers to pension cost for additional responsibility as
Divisional President for Security Services Europe during 2014.3 Refer to the cost for 2014 for Securitas incentive scheme for cash and share-based bonus, see also separate table for the
share-based part.4 The compensation for two members who left and two members who joined the Group Management during 2014 refers up to
and as from these dates respectively.
REMUNERATION RELATED TO 2013
KSEKBase
salary / feeOther
benefitsVariable
compensation2 Pension Total remunerationMelker Schörling, Chairman of the Board1 1 100 – – – 1 100Carl Douglas, vice Chairman 750 – – – 750Fredrik Cappelen1 600 – – – 600Marie Ehrling1 700 – – – 700Annika Falkengren1 550 – – – 550Fredrik Palmstierna 500 – – – 500Sofia Schörling Högberg 500 – – – 500Subtotal Board of Directors 4 700 – – – 4 700Alf Göransson, President and CEO 11 924 89 0 3 504 15 517Other members of Group Management 42 448 2 048 26 667 5 915 77 078Subtotal President and CEO and Group Management 54 372 2 137 26 667 9 419 92 595Total 59 072 2 137 26 667 9 419 97 295
Above information refers to full year remuneration for the current Group Management, unless stated otherwise. The Board of Directors has no pension benefits.
1 Including remuneration for committee work.2 Refer to the cost for 2013 for Securitas incentive scheme for cash and share-based bonus, see also separate table for the
share-based part.3 Refer to the cost for 2013, please find further reference under the section short- and long-term incentives.

Annual ReportNotes and comments to the consolidated financial statements
89Securitas Annual Report 2014
NOTE 9 Segment reporting
Segment structureThe Group’s operations are divided into three reportable segments: Security Services North America, Security Services Europe and Security Services Ibero-America.
All segments apply the accounting principles explained in note 2. The segment reporting follows the format of Securitas’ financial model, which provides a foundation for financial planning and reporting from branch office level up to the Board of Directors. Acquisitions of subsidiaries are therefore excluded from the operating cash flow. All material acquisitions are stated at business segment level in the report of the Board of Directors under the heading Acquisitions.
Security Services North AmericaSecurity Services North America provides security services in the USA, Canada and Mexico and comprises 13 business units: the national and global accounts organization, five geographical regions and five specialized business units – critical infrastructure, healthcare, Pinkerton Corporate Risk Management, mobile and technology – in the USA, plus Canada and Mexico. In total, there are approximately 107 000 employees and about 640 branch managers.
Security Services EuropeSecurity Services Europe provides security services for large and medium-sized customers in 27 countries, and airport security in 15 countries. Security Services Europe offers mobile security services for small and medium-sized businesses and residential sites and electronic alarm surveillance services. In total, the organization has approximately 118 000 employees and 800 branch managers.
Security Services Ibero-America Security Services Ibero-America provides security services for large and medium-sized customers in seven Latin American countries as well as Portugal and Spain in Europe. Security Services Ibero-America has a combined total of approximately 58 000 employees and 190 branch managers.
OtherOther includes all other operating segments as well as general adminis-trative expenses, expenses for head offices and other central expenses. All other operating segments comprise the guarding operations in Africa, the Middle East and Asia as well as certain operations within security consulting that report directly to the chief operating decision maker.
ShareholdingsThe Board of Director’s and Group Management’s shareholdings through acquisitions on the stock market as well as the allocation of shares tothe Group Management according to Securitas share-based incentive scheme 2014 are detailed in the table below.
BOARD OF DIRECTORS ’ AND GROUP MANAGEMENT’S HOLDINGS OF SECURITAS SERIES A AND B SHARES1
A shares A shares B shares B shares B shares
2014 2013 20146 20136Allocation
March 20157
Melker Schörling, Chairman of the Board2 4 500 000 4 500 000 16 001 500 16 001 500 –Carl Douglas, vice Chairman3 12 642 600 12 642 600 27 190 000 27 190 000 –Fredrik Cappelen – – 4 000 4 000 –Marie Ehrling – – 4 000 4 000 –Annika Falkengren – – 7 500 7 500 –Fredrik Palmstierna – – 17 200 17 200 –Sofia Schörling Högberg – – 2 400 2 400 –Alf Göransson, President and CEO – – 58 698 58 698 0Bart Adam – – 20 405 15 264 0William Barthelemy – – 21 652 20 040 13 764Santiago Galaz – – 92 424 86 546 50 778Erik-Jan Jansen5 – – - 4 385 –Gisela Lindstrand – – 2 017 2 017 0Jan Lindström – – 5 600 5 600 0Aimé Lyagre4 - – 16 200 – 2 138Marc Pissens – – 11 677 0 22 170Luis Posadas – – 20 396 17 911 1 750Åsa Thunman5 – – – 653 –Antonio Villaseca Lòpez – – 990 0 0Henrik Zetterberg4 – – 0 – –Total holdings 17 142 600 17 142 600 43 476 659 43 437 714 90 600 1 Information refers to shareholdings as of December 31, 2014 and 2013.2 Holdings through Melker Schörling AB.3 Holdings private and through Investment AB Latour Group and Förvaltnings AB Wasatornet.4 Has joined the Group management during 2014, why earlier holdings is not applicable.5 Has left the Group Management during 2014, why current holdings as per December 31 or allocation
in March 2015 is not applicable.
6 Holdings per December 31 excluding potential allocation of shares according to Securitas share-based incentive scheme (see footnote 7 below).
7 Actual allocation of shares in March 2015 according to Securitas share-based incentive scheme 2013, including shares corresponding to dividend decided related to potential allocation of shares during 2014. The gross number of allocated shares is stated, of which part of the shares may have been sold to cover tax on the benefit. Other holdings of Securitas Series B shares in March 2015 are not included.
Diagram_BV_sid 91 / 1
Sales per segment
■ Security Services North America 36%■ Security Services Europe 50%■ Security Services Ibero-America 13%■ Other 1%
Diagram_BV_sid 91 / 2
Number of employees per segment
■ Security Services North America 34%■ Security Services Europe 37%■ Security Services Ibero-America 18%■ Other 11%

Annual ReportNotes and comments to the consolidated financial statements
Securitas Annual Report 201490
JANUARY – DECEMBER 2014
MSEK
SecurityServices
North America
SecurityServices
Europe
Security Services
Ibero-America OtherTotal
segments Eliminations GroupIncomeSales, external 24 977 34 996 9 238 1 006 70 217 – 70 217Sales, intra-group 12 1 – 0 13 -13 –Total sales 24 989 34 997 9 238 1 006 70 230 -13 70 217Organic sales growth, % 3 2 8 – – – 3Operating income before amortization1 1 333 2 046 396 -270 3 505 – 3 505of which share in income of associated companies 0 0 – 8 8 – 8Operating margin, % 5.3 5.8 4.3 – 5.0 – 5.0Amortization of acquisition related intangible assets -26 -146 -65 -14 -251 – -251Acquisition related costs -2 -12 -2 -1 -17 – -17Operating income after amortization 1 305 1 888 329 -285 3 237 – 3 237Financial income and expenses – – – – – – -328Income before taxes – – – – – – 2 909Taxes – – – – – – -837Net income for the year – – – – – – 2 072
Operating cash flowOperating income before amortization 1 333 2 046 396 -270 3 505 – 3 505Investments in non-current tangible and intangible assets -181 -725 -180 -27 -1 113 – -1 113Reversal of depreciation1 171 666 119 11 967 – 967Change in operating capital employed -484 42 66 -120 -496 – -496Cash flow from operating activities 839 2 029 401 -406 2 863 – 2 863Cash flow from operating activities, % 63 99 101 – – – 82
Capital employed and financingOperating non-current assets 841 2 077 526 197 3 641 – 3 641Accounts receivable 3 595 5 023 2 086 154 10 858 -43 10 815Other assets 1 329 1 076 423 1 976 4 804 – 4 804Other liabilities -3 607 -8 071 -1 784 -1 917 -15 379 43 -15 336Total operating capital employed 2 158 105 1 251 410 3 924 – 3 924Operating capital employed as % of sales 9 0 14 – – – 6Goodwill 7 185 7 259 1 472 312 16 228 – 16 228Acquisition related intangible assets 70 796 283 95 1 244 – 1 244Shares in associated companies 180 31 – 114 325 – 325Total capital employed 9 593 8 191 3 006 931 21 721 – 21 721Return on capital employed, % 14 26 13 – – – 16Net debt – – – – – – -10 422Shareholders’ equity – – – – – – 11 299Total financing – – – – – – 21 721Net debt equity ratio, multiple – – – – – – 0.92
Assets and liabilitiesNon-interest-bearing assets 13 200 16 262 4 790 993 35 245 -43 35 202Unallocated non-interest-bearing assets2 – – – – – – 1 855Unallocated interest-bearing assets – – – – – – 4 027Total assets – – – – – – 41 084Shareholders’ equity – – – – – – 11 299Non-interest-bearing liabilities 3 607 8 071 1 784 353 13 815 -43 13 772Unallocated non-interest-bearing liabilities2 – – – – – – 1 564Unallocated interest-bearing liabilities – – – – – – 14 449Total liabilities – – – – – – 29 785Total shareholders’ equity and liabilities – – – – – – 41 084 1 Depreciation and amortization of tangible and non-acquisition related intangible assets per segment are specified on the line Reversal of depreciation in the statement of cash flow above.
Further information regarding depreciation and amortization is provided in note 13.2 Included in Other in the table Capital employed and financing.

Annual ReportNotes and comments to the consolidated financial statements
91Securitas Annual Report 2014
JANUARY – DECEMBER 2013
MSEK
SecurityServices
North America
SecurityServices
Europe
Security Services
Ibero-America OtherTotal
segments Eliminations GroupIncomeSales, external 22 834 32 716 9 266 884 65 700 – 65 700Sales, intra-group 7 – – 2 9 -9 –Total sales 22 841 32 716 9 266 886 65 709 -9 65 700Organic sales growth, % 0 0 4 – – – 1Operating income before amortization1 1 177 1 954 480 -282 3 329 – 3 329of which share in income of associated companies 1 0 – 3 4 – 4Operating margin, % 5.2 6.0 5.2 – – – 5.1Amortization of acquisition related intangible assets -33 -147 -70 -24 -274 – -274Acquisition related costs 0 -24 -9 6 -27 – -27Operating income after amortization 1 144 1 783 401 -300 3 028 – 3 028Financial income and expenses – – – – – – -385Income before taxes – – – – – – 2 643Taxes – – – – – – -787Net income for the year – – – – – – 1 856
Operating cash flowOperating income before amortization 1 177 1 954 480 -282 3 329 – 3 329Investments in non-current tangible and intangible assets -117 -565 -137 15 -804 – -804Reversal of depreciation1 163 657 112 14 946 – 946Change in operating capital employed -50 -344 121 32 -241 – -241Cash flow from operating activities 1 173 1 702 576 -221 3 230 – 3 230Cash flow from operating activities, % 100 87 120 – – – 97
Capital employed and financingOperating non-current assets 715 1 869 444 172 3 200 – 3 200Accounts receivable 2 781 4 822 1 991 107 9 701 -25 9 676Other assets 1 057 953 436 1 845 4 291 – 4 291Other liabilities -3 116 -7 468 -1 729 -1 698 -14 011 25 -13 986Total operating capital employed 1 437 176 1 142 426 3 181 – 3 181Operating capital employed as % of sales 6 1 12 – – – 5Goodwill 5 976 6 687 1 450 249 14 362 – 14 362Acquisition related intangible assets 84 810 338 83 1 315 – 1 315Shares in associated companies 3 29 – 101 133 – 133Total capital employed 7 500 7 702 2 930 859 18 991 – 18 991Return on capital employed, % 16 25 16 – – – 18Net debt – – – – – – -9 610Shareholders’ equity – – – – – – 9 381Total financing – – – – – – 18 991Net debt equity ratio, multiple – – – – – – 1.02
Assets and liabilitiesNon-interest-bearing assets 10 616 15 170 4 659 810 31 255 -25 31 230Unallocated non-interest-bearing assets2 – – – – – – 1 747Unallocated interest-bearing assets – – – – – – 4 260Total assets – – – – – – 37 237Shareholders’ equity – – – – – – 9 381Non-interest-bearing liabilities 3 116 7 468 1 729 243 12 556 -25 12 531Unallocated non-interest-bearing liabilities2 – – – – – – 1 455Unallocated interest-bearing liabilities – – – – – – 13 870Total liabilities – – – – – – 27 856Total shareholders’ equity and liabilities – – – – – – 37 237 1 Depreciation and amortization of tangible and non-acquisition related intangible assets per segment are specified on the line Reversal of depreciation in the statement of cash flow above.
Further information regarding depreciation and amortization is provided in note 13.2 Included in Other in the table Capital employed and financing.

Annual ReportNotes and comments to the consolidated financial statements
Securitas Annual Report 201492
GEOGRAPHICAL INFORMATION
Total sales fromexternal customers1
Non-currentassets2
MSEK 2014 2013 2014 2013USA 22 364 20 381 7 832 6 356France – 3 – 3 2 058 1 978The Netherlands – 3 – 3 – 3 1 913Sweden4 4 262 4 223 1 072 1 007All other countries5 43 591 41 096 10 467 7 750Total countries 70 217 65 700 21 429 19 004Non-current assets not listed by country2 – – 1 885 1 548Total non-current assets – – 23 314 20 552 1 Based on the location of sales offices and corresponds in all material aspects to the geographical
location of the customers.2 Financial instruments, deferred tax assets and post-employment benefit assets are not specified
by country. These are instead reported on the line Non-current assets not listed by country.3 Not disclosed as amount is less than 10 percent of sales or non-current assets.4 Disclosed as Sweden is the company’s country of domicile.5 Including elimination of intra-group sales.
NOTE 10 Allocation of revenue
SalesThe Group’s revenue is generated mainly from various types of security services. Security services are based on customer contracts and these can comprise sales based on hours of work performed with fixed monthly, quarterly or yearly invoicing and also including service level agreements. Sales based on customer contracts can also comprise events such as intervention services. In addition to sales based on customer contracts there is extra sales to either contract customers or event based sales. There is also revenue from the sale of alarm products and, to a limited extent, cash handling services. The breakdown of sales by segment is provided in note 9.
Security solutions and technology sales was 10 percent (8) of Group sales in the fourth quarter 2014.
Other operating incomeOther operating income consists in its entirety of trade mark fees from Securitas Direct AB.
Financial incomeInterest income is accounted for in the statement of income in the period to which it is attributable. Financial income and expenses are specified in note 14.
NOTE 11 Operating income
Statement of incomeThe table below illustrates the statement of income in summary classified according to type of cost.
MSEK 2014 2013Total sales 70 217.1 65 700.1
Other operating income 15.9 13.5
Salaries (note 12) -46 469.8 -43 255.5Social benefits (note 12) -10 584.8 -10 052.0Depreciation and amortization (notes 13, 18, 19, 20) -1 217.7 -1 219.3Bad debt losses (note 25) -87.7 -78.0Other operating expenses -8 636.2 -8 080.3Total operating expenses -66 996.2 -62 685.1
Operating income 3 236.8 3 028.5
Exchange rate differences Exchange rate differences included in operating income amounted to MSEK -3.0 (-11.0).
Exchange rate differences included in net financial items are specified in note 14.
Items affecting comparabilityThe table below specifies the cash flow impact from items affecting com-parability.
MSEK 2014 2013Restructuring payments -65.1 -205.0Spain – overtime compensation -4.5 -12.0Germany – Deutsche Bank – -88.5Germany – premises -3.2 -2.0Total cash flow impact -72.8 -307.5

Annual ReportNotes and comments to the consolidated financial statements
93Securitas Annual Report 2014
Acquisition related costs The tables below specify what acquisition related costs are related to and how they would have been classified per function in the statement of income if the items had not been disclosed separately on the face of the statement of income. The tables also specify how the acquisition related costs are split by segment. There is also a specification of the cash flow impact from acquisition related costs.
MSEK 2014 2013Restructuring and integration costs -0.8 -25.8Transaction costs -11.31 -10.9Revaluation of deferred considerations -5.0 9.9Total acquisition related costs -17.1 -26.8 1 Transaction costs for the major acquisitions are specified per acquisition in note 16.
ACQUISITION RELATED COSTS ALLOCATED PER FUNCTION
MSEK 2014 2013Production expenses -1.0 -11.3Selling and administrative expenses1 -16.1 -15.5Total acquisition related costs allocated per function -17.1 -26.8 1 All transaction costs and revaluation of deferred considerations would have been classified
as selling and administrative expenses in the statement of income if they had not been disclosed separately on the face of the statement of income.
ACQUISITION RELATED COSTS ALLOCATED PER SEGMENT
MSEK 2014 2013Security Services North America -2.0 0.1Security Services Europe -12.6 -23.3Security Services Ibero-America -1.9 -9.4Other -0.6 5.8Total acquisition related costs allocated per segment -17.1 -26.8
CASH FLOW IMPACT FROM ACQUISITION RELATED COSTS
MSEK 2014 2013Acquisition related costs according to the statement of income -17.1 -26.8Cash flow -21.2 -55.2Adjustment for effect on cash flow from acquisition related costs -4.1 -28.4
Audit fees and reimbursements The table below specifies what audit fees and reimbursements are related to.
MSEK 2014 2013PwC– audit assignments 31.7 29.4– additional audit assignments 2.4 1.1– tax assignments 16.0 11.6– other assignments1 6.9 5.1Total PwC 57.0 47.2
Other auditors– audit assignments 2.7 2.3Total 59.7 49.5 1 Fees for other assignments performed by PwC include fees for audit related advisory services
relating to accounting including IFRS, IT, acquisitions, divestments and matters relating to the Group’s internal bank.
Operating leasing contracts and rental contractsFees expensed during the year for operating leases for buildings, vehicles and machinery and equipment amounted to MSEK 955.5 (838.0).
The table below specifies how the nominal value of contractual future minimum lease payments is distributed.
MSEK 2014 2013Maturity < 1 year 789.8 657.1Maturity 1–5 years 1 476.6 1 404.7Maturity > 5 years 542.7 588.7

Annual ReportNotes and comments to the consolidated financial statements
Securitas Annual Report 201494
NOTE 12 PersonnelAVERAGE NUMBER OF YEARLY EMPLOYEES: DISTRIBUTION BETWEEN WOMEN AND MEN1
Women Men Total
2014 2013 2014 2013 2014 2013Security Services North America 28 365 23 503 69 192 72 114 97 557 95 617Security Services Europe 18 819 18 092 90 940 92 924 109 759 111 016Security Services Ibero-America 8 652 8 123 47 564 47 693 56 216 55 816Other 1 627 1 501 12 279 11 819 13 906 13 320Total 57 463 51 219 219 975 224 550 277 438 275 769 1 Average number of yearly employees exclude employees in associated companies. A complete specification of the average number of yearly employees by country is provided in the Annual Report submitted to
the Swedish Companies Registration Office.
In 2014, the number of Board members and Presidents was 96 (91), of whom 9 (8) were women.
STAFF COSTS FOR BOARD OF DIRECTORS AND PRESIDENTS
2014 2013 Of which bonuses
MSEK SalariesSocial
benefits(of which
pensions) SalariesSocial
benefits(of which
pensions) 2014 2013Security Services North America 74.0 22.7 (12.5) 68.8 19.2 (9.7) 25.6 24.3Security Services Europe 81.2 23.4 (6.4) 66.1 16.1 (4.9) 22.9 15.4Security Services Ibero-America 22.0 2.8 (0.1) 18.6 2.6 (0.0) 6.4 4.3Other 78.0 26.5 (8.1) 54.3 20.5 (8.0) 21.5 1.8Total 255.2 75.4 (27.1) 207.8 58.4 (22.6) 76.4 45.8
STAFF COSTS FOR OTHER EMPLOYEES
2014 2013
SalariesSocial
benefits(of which
pensions) SalariesSocial
benefits(of which
pensions)Security Services North America 18 272.9 3 236.2 (240.2) 16 734.7 2 999.6 (200.6)Security Services Europe 21 344.1 5 622.4 (606.0) 19 816.7 5 403.1 (565.2)Security Services Ibero-America 5 817.9 1 567.3 (16.6) 5 807.6 1 529.9 (17.1)Other 779.7 83.5 (22.2) 688.7 61.0 (19.0)Total 46 214.6 10 509.4 (885.0) 43 047.7 9 993.6 (801.9)
TOTAL STAFF COSTS: BOARD OF DIRECTORS, PRESIDENTS AND OTHER EMPLOYEES
2014 2013
SalariesSocial
benefits(of which
pensions) SalariesSocial
benefits(of which
pensions)Security Services North America 18 346.9 3 258.9 (252.7) 16 803.5 3 018.8 (210.3)Security Services Europe 21 425.3 5 645.8 (612.4) 19 882.8 5 419.2 (570.1)Security Services Ibero-America 5 839.9 1 570.1 (16.7) 5 826.2 1 532.5 (17.1)Other 857.7 110.0 (30.3) 743.0 81.5 (27.0)Total 46 469.8 10 584.8 (912.1) 43 255.5 10 052.0 (824.5) Further information regarding the Group’s pensions and other long-term employee benefits is provided in note 31.
Securitas share-based incentive schemeSecuritas’ Annual General Meeting May 5, 2014 resolved on a share and cash bonus scheme, a similar incentive scheme that the Annual General Meeting 2013 resolved on. The participants in the scheme have a variable remuneration based on performance. Two thirds of the variable remu-neration / bonus will, according to the incentive scheme, be settled in cash the year after the performance year, while shares will be purchased for the remaining one third. The bonus criteria is based on individual performance and / or the performance for the part of the Group that the individual is responsible for. For Securitas there are no other material costs than the allotted bonus and related social benefits.
The share purchase in Securitas will be handled by trading on the Nasdaq Stockholm exchange through a swap agreement. Shares are purchased corresponding to one third of the total achieved bonus amount. The purchased shares will be allotted to the participants approximately one year after purchase, given that they are still employed by the Group. Securitas will not issue any new shares or similar due to this incentive scheme. The purpose is to replace cash bonus with shares in Securitas AB and thus increase the employees’ ownership in Securitas.
The incentive scheme includes 1 106 participants (934) that are entitled to receive the share part according to the scheme. The total sharebased remuneration for these participants amount to MSEK 87.5 (63.0) and is accounted for as a share-based remuneration in equity. In March 2015, shares in Securitas AB have been purchased corresponding to the value of the total share-based remuneration. The shares have been purchased through a swap agreement, based on the current market price at the time. The number of shares that have been purchased amount to a total of 780 750 (932 761) at a value of MSEK 91.3 (65.6). The shares will be allotted to the participants during the first quarter 2016, provided that they are still employed by the Group.
COSTS FOR SHARE-BASED INCENTIVE SCHEME: PRESIDENTS AND OTHER EMPLOYEES
MSEK 2014 2013Bonus costs for incentive schemes 87.5 63.0Social benefits for incentive schemes 28.2 18.1Total 115.7 81.1

Annual ReportNotes and comments to the consolidated financial statements
95Securitas Annual Report 2014
NOTE 13 Depreciation and amortization
MSEK 2014 2013Software licenses 69.3 63.7Other intangible assets 28.2 36.3Buildings 13.7 13.0Machinery and equipment 855.7 832.6Total depreciation and amortization 966.9 945.6
DEPRECIATION AND AMORTIZATION FOR THE YEAR IS DISTRIBUTED IN THE STATEMENT OF INCOME AS BELOW
MSEK 2014 2013Depreciation of tangible non-current assetsProduction expenses 553.1 564.8Selling and administrative expenses 316.3 280.8Total depreciation of tangible non-current assets 869.4 845.6
Amortization of intangible assetsProduction expenses 51.4 60.3Selling and administrative expenses 46.1 39.7Total amortization of intangible assets 97.5 100.0
Total depreciation and amortization 966.9 945.6
NOTE 14 Net financial items
MSEK 2014 2013Interest income from financial assets at fair value through profit or loss 17.1 38.1Interest income from loans and receivables 20.9 29.6Total interest income 38.0 67.7Revaluation of financial instruments – 0.5Other financial income 0.6 2.2Exchange rate differences, net1 0.6 –Total financial income 39.2 70.4Interest expenses from financial liabilities at fair value through profit or loss -31.4 -42.6Interest expenses from financial liabilities designated as hedged item in a fair value hedge -155.4 -110.2Interest expenses from derivatives designated for hedging 59.8 25.7Interest expenses from other financial liabilities -215.0 -301.4Total interest expenses -342.0 -428.5Revaluation of financial instruments -0.4 –Other financial expenses -24.4 -25.5Exchange rate differences, net1 – -1.4Total financial expenses -366.8 -455.4Net financial items -327.6 -385.0Of which revaluations estimated with the use of valuation methods -0.4 0.5 1 Exchange rate differences included in operating income are reported in note 11.
NOTE 15 Taxes
Statement of income
TAX EXPENSE
MSEK 2014 % 2013 %Tax on income before taxes– current taxes -710.7 -24.4 -708.6 -26.8– deferred taxes -127.0 -4.4 -79.3 -3.0Total tax expense -837.7 -28.8 -787.9 -29.8
The Swedish corporate tax rate was 22.0 percent. Securitas’ tax rate was 28.8 percent (29.8).
The change in the tax rate is mainly based on a reassessment of the full year tax rate including also the recent outcome of tax court cases. Deferred taxes for the year include the change in deferred tax assets and deferred tax liabilities, translation differences and deferred taxes related to items accounted for in equity.
DIFFERENCE BETWEEN STATUTORY SWEDISH TAX RATE AND ACTUAL TAX EXPENSE FOR THE GROUP
MSEK 2014 % 2013 %Income before taxes according to the statement of income 2 909 2 643Tax based on Swedish tax rate -640 -22.0 -581 -22.0Difference between tax rate in Sweden and weighted tax rates for foreign subsidiaries -122 -4.2 -208 -7.9Tax related to previous years 1 0.0 15 0.6Recognition of previously unvalued tax losses 10 0.3 14 0.5Revaluation of deferred tax following a change in tax rate -2 -0.1 -2 -0.1Other non-deductible items -92 -3.2 -46 -1.7Other tax exempt items 7 0.2 20 0.8Actual tax expense -838 -28.8 -788 -29.8
Tax expense that may arise from dividends out of the distributable earnings have not been provided for. If distributed the tax expense arising would amount to MSEK 11 (10).
Other comprehensive income
TAX ON OTHER COMPREHENSIVE INCOME
MSEK 2014 2013Deferred tax on actuarial gains and losses 125.6 -115.2Deferred tax on cash flow hedges 0.0 -5.7Deferred tax on net investment hedges -39.2 34.1Deferred tax on other comprehensive income 86.4 -86.8

Annual ReportNotes and comments to the consolidated financial statements
Securitas Annual Report 201496
Balance sheet
CURRENT TAX ASSETS / LIABILITIES
MSEK 2014 2013Current tax assets 412.8 355.9Current tax liabilities 450.6 362.8Current tax assets / liabilities, net -37.8 -6.9
DEFERRED TAX ASSETS WERE ATTRIBUTABLE TO
MSEK 2014 2013Pension provisions and employee-related liabilities 783.5 585.7Liability insurance-related claims reserves 4.7 4.7Tax loss carryforwards 361.8 523.8Acquisition related intangible assets 103.8 107.2Machinery and equipment 151.3 126.5Other temporary differences 187.5 162.0Total deferred tax assets 1 592.6 1 509.9Whereof deferred tax assets expected to be used within 12 months 544.1 478.1Net accounting1 -150.7 -118.8Total deferred tax assets according to the balance sheet 1 441.9 1 391.1
DEFERRED TAX LIABILITIES WERE ATTRIBUTABLE TO
MSEK 2014 2013Pension provisions and employee-related liabilities 38.4 34.4Acquisition related intangible assets 316.2 319.9Machinery and equipment 30.3 27.9Other temporary differences 525.4 484.0Total deferred tax liabilities 910.3 866.2Whereof deferred tax liabilities expected to be used within 12 months 182.5 166.8Net accounting1 -150.7 -118.8Total deferred tax liabilities according to the balance sheet 759.6 747.4Deferred tax assets / liabilities, net 682.3 643.7 1 Deferred tax assets and liabilities are reported in the balance sheet partly on a net basis after
considering the set-off possibilities.
DEFERRED TAX ASSETS CHANGE ANALYSIS
MSEK 2014 2013Opening balance deferred tax assets 1 509.9 1 669.9Change due to:Deferred tax recognized in the statement of income -105.1 -52.8Changed tax rate 0.0 -1.9Acquisitions 11.3 1.1Recognized in other comprehensive income 125.6 -115.2Translation differences 50.9 8.8Closing balance deferred tax assets 1 592.6 1 509.9Change during the year 82.7 -160.0
DEFERRED TAX LIABILITIES CHANGE ANALYSIS
MSEK 2014 2013Opening balance deferred tax liabilities 866.2 847.1Change due to:Deferred tax recognized in the statement of income 7.1 11.7Changed tax rate 2.9 -1.6Acquisitions 23.2 18.0Translation differences 10.9 -9.0Closing balance deferred tax liabilities 910.3 866.2Change during the year 44.1 19.1

Annual ReportNotes and comments to the consolidated financial statements
97Securitas Annual Report 2014
DEFERRED TAX ASSETS CHANGE ANALYSIS PER CATEGORY IN 2014
MSEKOpeningbalance
Deferred taxrecognized in the
statement of income Acquisitions
Recognized in other compre-
hensive incomeTranslationdifferences
Closingbalance
Pension provisions and employee-related liabilities 585.7 34.8 – 125.6 37.4 783.5Liability insurance-related claims reserves 4.7 0.0 – – – 4.7Tax loss carryforwards 523.8 -180.5 7.8 – 10.7 361.8Acquisition related intangible assets 107.2 -7.8 4.4 – – 103.8Machinery and equipment 126.5 24.8 – – – 151.3Other temporary differences 162.0 23.6 -0.9 – 2.8 187.5Total deferred tax assets 1 509.9 1 592.6Change during the year -105.1 11.3 125.6 50.9 82.7
DEFERRED TAX LIABILITIES CHANGE ANALYSIS PER CATEGORY IN 2014
MSEKOpeningbalance
Deferred taxrecognized in the
statement of incomeChanged
tax rate AcquisitionsTranslationdifferences
Closingbalance
Pension provisions and employee-related liabilities 34.4 1.0 2.8 – 0.2 38.4Acquisition related intangible assets 319.9 -25.5 – 23.2 -1.4 316.2Machinery and equipment 27.9 1.2 – – 1.2 30.3Other temporary differences 484.0 30.4 0.1 – 10.9 525.4Total deferred tax liabilities 866.2 910.3Change during the year 7.1 2.9 23.2 10.9 44.1
Changes in deferred taxes between 2013 and 2014 are mainly explained by pension provisions, tax loss carryforwards and acquisition related intangible assets. There are no unrecognized temporary differences
related to subsidiaries or associated companies. Provisions for taxes are reported in note 32.
Tax loss carryforwards
On December 31, 2014 subsidiaries in primarily Sweden and Germany had tax loss carryforwards of MSEK 2 773 (3 117). These tax loss carry-forwards expire as follows:
TAX LOSS CARRYFORWARDS
2015 32016 62017 342018– 144Unlimited duration 2 586Total tax loss carryforwards 2 773
Deferred tax assets related to tax losses are accounted for when it is probable that they can be utilized by future profits. As of December 31, 2014, tax loss carryforwards for which deferred tax assets had been recognized amounted to MSEK 1 389 (2 122) and deferred tax assets related to the tax losses amounted to MSEK 362 (524). Tax losses can be used to reduce future taxable income and tax payments.

Annual ReportNotes and comments to the consolidated financial statements
Securitas Annual Report 201498
NOTE 16 Acquisitions of subsidiaries and associated companies
Acquisition calculations are subject to final adjustment up to one year after the date of acquisition.
MSEKPurchase
price paid7Acquirednet debt
Enterprisevalue Goodwill3
Acquisitionrelated
intangibleassets
Operatingcapital
employed
Shares in associated companies
Totalcapital
employed
Share-holders’
equity TotalIverify, USA -147.9 – -147.9 – – – 147.9 147.9 – 147.9SAIT, Belgium4 -99.7 -10.9 -110.6 74.8 50.2 -14.4 – 110.6 – 110.6Other acquisitions1,4 -23.5 -0.2 -23.7 16.9 24.9 -18.7 – 23.1 0.65 23.7Adjustments2,4 -81.6 0.0 -81.6 -14.3 – 90.9 – 76.6 5.06 81.6Total acquisitions -352.7 -11.1 -363.8 77.4 75.1 57.8 147.9 358.2 5.6 363.8Liquid funds according to acquisition analyses -0.1Total effect on Group’s liquid funds -352.8 1 Related to other acquisitions for the period: G4S – Alesund (contract portfolio), Norway, Vagt DK and
TS Alarm (contract portfolio), Denmark, Vartiointipalvelu P. Kauppila (contract portfolio) and Sasta-malan Vartiointi (contract portfolio), Finland, EKS Technik, Germany, SEIV, France, Urulac, Uruguay and Ubiq, Peru.
2 Related to updated previous year acquisition calculations for the following entities: Grupo Argos, Mexico, Interseco, the Netherlands, Ave Lat Sargs, Latvia, IBBC, Poland, Tehnomobil, Croatia, Sen-sormatic, Turkey, Vigilancias y Seguridad, Fuego Red, El Guardian, Trailback and Consultora Videco, Argentina, Pandyr and Selectron, Uruguay, Security Alliance Limited, Hong Kong, Security Standard Group, Cambodia and Rentsec and Vamsa, South Africa. Related also to deferred considerations paid in Mexico, Latvia, France, Austria, Croatia, Turkey, Argentina, Uruguay, Hong Kong and Indonesia.
3 Goodwill that is expected to be tax deductible has decreased by net MSEK 6.0 during the year. 4 Deferred considerations have been recognized mainly based on an assessment of the future profit-
ability development in the acquired entities for an agreed period. The net of new deferred consid-erations, payments made from previously recognized deferred considerations and revaluation of deferred considerations was MSEK -59.5. Total deferred considerations, short-term and long-term, in the Group’s balance sheet amount to MSEK 540.7.
5 Income statement amounts to MSEK 0.0 and retained earnings to MSEK 0.6.6 Income statement amounts to MSEK 5.0 and retained earnings to MSEK 0.0.7 No equity instruments have been issued in connection with the acquisitions.
Acquisition of the business in Iverify, USASecuritas has acquired 24 percent of the shares in the remote video ser-vices company Iverify in the USA. Simultaneously Iverify has acquired 100 percent of the shares in the technology solutions company TransAlarm. Iverify is one of the leading remote video services companies in the United States and operates a state-of-the-art remote video operations monitoring center, one of the largest of its kind and headquartered in Charlotte, North Carolina. TransAlarm is a security technology integrator headquartered in Minnesota, operating a large network of over 400 installers capable of covering the entire United States, Puerto Rico and Canada. The joint operation employs 300 people. The acquisition is included in the segment Security Services North America.
SUMMARY BALANCE SHEET AS OF ACQUISITION DATE JUNE 1, 2014
MSEKFair value
acquisition balanceShares in associated companies 147.9Total capital employed 147.9Net debt –Total acquired net assets 147.9
Purchase price paid -147.9Liquid funds in accordance with acquisition analysis –Total impact on the Group’s liquid funds -147.9
OTHER DISCLOSURES IVERIFY, USA
Acquired share, % 24.01
Transaction costs, MSEK 4.0
1 The acquisition is accounted for as an associated company.
The following definitions are used in the tables below
Full year sales What the contribution to total sales would have been if the acquisition had been consolidated from January 1, 2014.
Contribution to total sales What the acquisition has contributed to total sales for the year.
Full year net income What the contribution to net income would have been if the acquisition had been consolidated from January 1, 2014.
Contribution to net income What the acquisition has contributed to net income for the year.
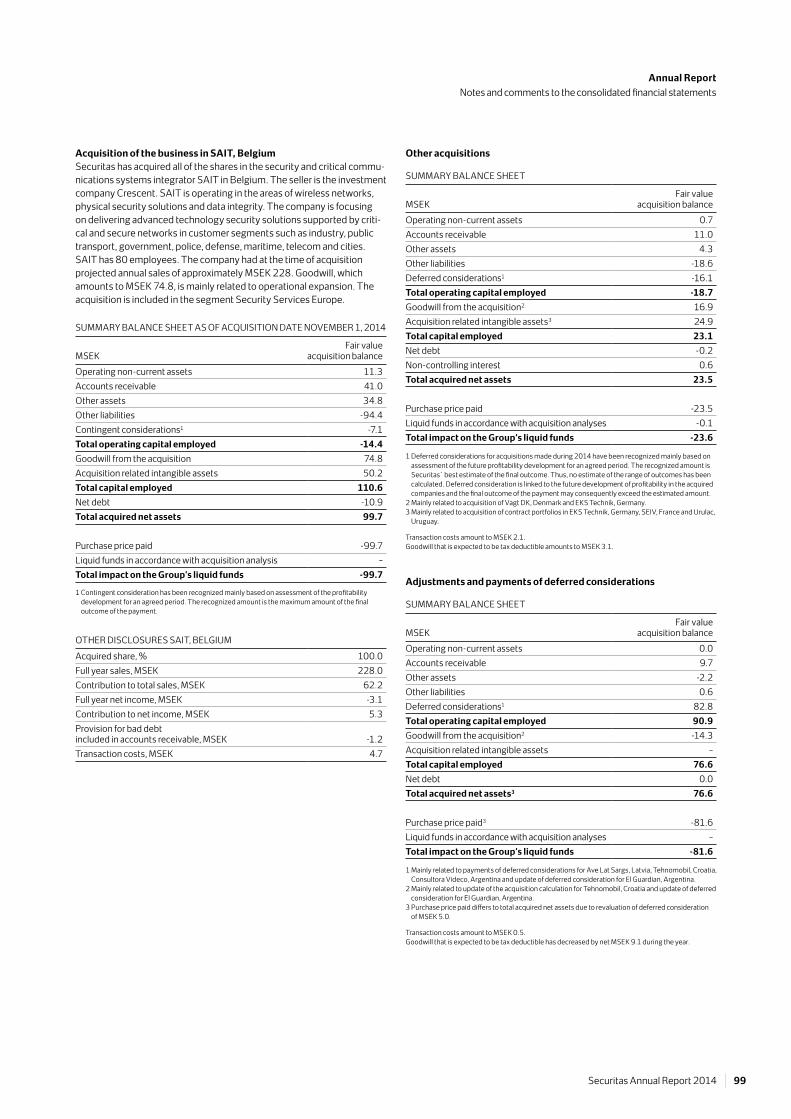
Annual ReportNotes and comments to the consolidated financial statements
99Securitas Annual Report 2014
Acquisition of the business in SAIT, BelgiumSecuritas has acquired all of the shares in the security and critical commu-nications systems integrator SAIT in Belgium. The seller is the investment company Crescent. SAIT is operating in the areas of wireless networks, physical security solutions and data integrity. The company is focusing on delivering advanced technology security solutions supported by criti-cal and secure networks in customer segments such as industry, public transport, government, police, defense, maritime, telecom and cities. SAIT has 80 employees. The company had at the time of acquisition projected annual sales of approximately MSEK 228. Goodwill, which amounts to MSEK 74.8, is mainly related to operational expansion. The acquisition is included in the segment Security Services Europe.
SUMMARY BALANCE SHEET AS OF ACQUISITION DATE NOVEMBER 1, 2014
MSEKFair value
acquisition balanceOperating non-current assets 11.3Accounts receivable 41.0Other assets 34.8Other liabilities -94.4Contingent considerations1 -7.1Total operating capital employed -14.4Goodwill from the acquisition 74.8Acquisition related intangible assets 50.2Total capital employed 110.6Net debt -10.9Total acquired net assets 99.7
Purchase price paid -99.7Liquid funds in accordance with acquisition analysis –Total impact on the Group’s liquid funds -99.7
1 Contingent consideration has been recognized mainly based on assessment of the profitability development for an agreed period. The recognized amount is the maximum amount of the final outcome of the payment.
OTHER DISCLOSURES SAIT, BELGIUM
Acquired share, % 100.0Full year sales, MSEK 228.0Contribution to total sales, MSEK 62.2Full year net income, MSEK -3.1Contribution to net income, MSEK 5.3Provision for bad debt included in accounts receivable, MSEK -1.2Transaction costs, MSEK 4.7
Other acquisitions SUMMARY BALANCE SHEET
MSEKFair value
acquisition balanceOperating non-current assets 0.7Accounts receivable 11.0Other assets 4.3Other liabilities -18.6Deferred considerations1 -16.1Total operating capital employed -18.7Goodwill from the acquisition2 16.9Acquisition related intangible assets3 24.9Total capital employed 23.1Net debt -0.2Non-controlling interest 0.6Total acquired net assets 23.5
Purchase price paid -23.5Liquid funds in accordance with acquisition analyses -0.1Total impact on the Group’s liquid funds -23.6 1 Deferred considerations for acquisitions made during 2014 have been recognized mainly based on
assessment of the future profitability development for an agreed period. The recognized amount is Securitas´ best estimate of the final outcome. Thus, no estimate of the range of outcomes has been calculated. Deferred consideration is linked to the future development of profitability in the acquired companies and the final outcome of the payment may consequently exceed the estimated amount.
2 Mainly related to acquisition of Vagt DK, Denmark and EKS Technik, Germany.3 Mainly related to acquisition of contract portfolios in EKS Technik, Germany, SEIV, France and Urulac,
Uruguay.
Transaction costs amount to MSEK 2.1. Goodwill that is expected to be tax deductible amounts to MSEK 3.1.
Adjustments and payments of deferred considerations SUMMARY BALANCE SHEET
MSEKFair value
acquisition balanceOperating non-current assets 0.0Accounts receivable 9.7Other assets -2.2Other liabilities 0.6Deferred considerations1 82.8Total operating capital employed 90.9Goodwill from the acquisition2 -14.3Acquisition related intangible assets –Total capital employed 76.6Net debt 0.0Total acquired net assets3 76.6
Purchase price paid3 -81.6Liquid funds in accordance with acquisition analyses –Total impact on the Group’s liquid funds -81.6
1 Mainly related to payments of deferred considerations for Ave Lat Sargs, Latvia, Tehnomobil, Croatia, Consultora Videco, Argentina and update of deferred consideration for El Guardian, Argentina.
2 Mainly related to update of the acquisition calculation for Tehnomobil, Croatia and update of deferred consideration for El Guardian, Argentina.
3 Purchase price paid differs to total acquired net assets due to revaluation of deferred consideration of MSEK 5.0.
Transaction costs amount to MSEK 0.5.Goodwill that is expected to be tax deductible has decreased by net MSEK 9.1 during the year.

Annual ReportNotes and comments to the consolidated financial statements
Securitas Annual Report 2014100
NOTE 17 Goodwill and impairment testing
MSEK 2014 2013Opening balance 14 716.9 14 617.6Capital expenditures 77.4 150.9Translation difference 1 811.9 -51.6Closing accumulated balance 16 606.2 14 716.9
Opening impairment losses -355.0 -342.2Translation difference -23.1 -12.8Closing accumulated impairment losses -378.1 -355.0
Closing residual value 16 228.1 14 361.9
GOODWILL ALLOCATED PER SEGMENT
MSEK 2014 2013Security Services North America 7 184.9 5 976.3Security Services Europe 7 258.6 6 687.0Security Services Ibero-America 1 472.1 1 449.6Other 312.5 249.0Total goodwill 16 228.1 14 361.9
Impairment testing
For the purpose of impairment testing, assets are grouped at the lowest levels for which there are separately identifiable cash flows (Cash Gener-ating Unit), that is, per country in a segment.
Goodwill and intangible assets with indefinite useful lifeGoodwill is tested on an annual basis for possible impairment. Securitas also carries out impairment testing for other intangible assets for which there is an indefinite useful life. Currently these assets are limited to MSEK 15.9 (15.9) and relates to the consideration paid for the brand Securitas in one of the Group’s countries of operations. The annual impairment test of all Cash Generating Units (CGUs), which is required under IFRS, took place during the third quarter 2014 in conjunction with the business plan pro-cess for 2015. During this year’s assessment a total number of 55 CGUs were tested for impairment of goodwill.
Valuation methodologyValue in use is measured as expected future discounted cash flows and is based upon a maximum of three steps: Gordon growth model* and a five or ten year discounted cash flow model.
The purpose of using the Gordon growth is to exclude any CGU that even with this simplified methodology will pass the impairment test, in order to proceed with an in-depth analysis of the remaining CGUs with a carrying amount that exceeds the recoverable amount when employing this simplified model. In addition to this, units whose carrying amount is less than the recoverable amount by a small margin and/or whose financial plans are regarded to be more uncertain will also be a subject of an in-depth analysis. In this subsequent step the cash flows have been calculated based on financial plans developed in each country. The financial plans are built upon the regular business plan for the next financial year which has been ascertained by Group Management and has been presented to the Board of Directors. These financial plans normally cover a forecasted period of five years and include the organic sales growth, the development of operating margin, and changes in the level of operating capital employed. Cash flows beyond the five year forecast have been extrapolated using an estimated growth rate of 2–5 percent for all countries.
A long-term growth rate of 2 percent for guarding services in mature markets is at present regarded as being a reasonable estimate in view of the business areas’ historical organic growth rate and also taking into consideration external estimates of the future. Freedonia for example, estimates that the market for guarding services in Europe will grow at an average rate of some 4 percent per annum during the period 2013 to 2023. The corresponding figure for the North American market is around 5 percent. The market for integrated security solutions is estimated to grow faster than traditional guarding. In developing markets such as Eastern Europe, Latin America, Africa, the Middle East and Asia the growth rate for guarding services is estimated at 5 percent.
Material assumptionsThe estimate for the value in use is based on assumptions and estimates in addition to the estimated growth after the forecasted period. The most significant of these relate to the organic sales growth, the development of the operating margin, the change in operating capital employed as well as the relevant WACC (Weighted Average Cost of Capital) used to discount the future cash flows. These assumptions and judgments are also based on financial plans developed in each country and business segment and are built upon the regular business plan for the next financial year which has been ascertained by Group Management and presented to the Board of Directors. In addition to this, the assumptions and judgments are based on each country’s and each line of business’ growth and profitability level. The assumptions are also verified by reviewing external sources such as Freedonia. Assumptions relating to WACC are calculated locally meaning that both risk free rate of return and the implicit risk premium are local.
The table below shows the assumptions and estimates that have formed the base for the impairment testing in summary and by segment.
Estimated growth rate beyond
forecasted period, % WACC, %2014Security Services North America1 2.0 6.6–9.8Security Services Europe1 2.0 5.2–13.0Security Services Ibero-America 2.0–5.0 6.9–22.2Other2 2.0–5.0 6.0–15.4
2013Security Services North America1 2.0 6.4–9.7Security Services Europe1 2.0 5.2–14.0Security Services Ibero-America 2.0–5.0 5.9–22.0Other2 2.0–5.0 6.3–17.0 1 Mexico and Eastern Europe is considered to have a higher growth rate beyond forecasted period
(2.0-5.0%). These regions represent a minority of the respective segments, hence the growth rate of the segments are reported as 2.0%.
2 The operations in Africa, the Middle East and Asia are included in Other.
Impairment testing of goodwill and intangible assets with indefinite useful lifeThe annual impairment test showed that none of the CGUs tested for impairment had a carrying amount that exceeded the recoverable amount. During this year’s assessment seven CGUs in Security Services Europe, four CGUs in Security Services Ibero-America and seven CGUs included in Other were tested in accordance with an in-depth analysis. Consequently no impairment losses have been recognized in 2014. No impairment losses of goodwill or other acquisition related intangible assets were recognized in 2013 either.

Annual ReportNotes and comments to the consolidated financial statements
101Securitas Annual Report 2014
NOTE 18 Acquisition related intangible assets1
MSEK 2014 2013Opening balance 2 419.5 2 348.8Capital expenditures 75.1 130.6Derecognition of fully amortized assets2 -182.1 -4.5Translation difference 194.7 -55.4Closing accumulated balance 2 507.2 2 419.5
Opening amortization -1 093.9 -837.3Reversal of amortization on derecognized assets2 182.1 4.5Amortization for the year -250.8 -273.7Translation difference -89.8 12.6Closing accumulated amortization -1 252.4 -1 093.9
Opening impairment losses -10.0 -9.6Translation difference -0.6 -0.4Closing accumulated impairment losses -10.6 -10.0
Closing residual value 1 244.2 1 315.6 1 The balance consists mainly of contract portfolios and related customer relations.2 The Group derecognizes fully amortized acquisition related intangible assets if a reliable estimate
of future cash flows cannot be established. The net impact of such derecognition on the closing residual value is nil.
NOTE 19 Other intangible assets
Software licenses Other intangible assets1
MSEK 2014 2013 2014 2013Opening balance 791.4 733.8 182.5 276.5Acquisitions 17.4 1.5 – -1.2Capital expenditures 128.0 80.2 36.6 26.3Disposals / write-offs -22.6 -15.6 -31.1 -54.9Reclassification 1.1 -19.7 -5.2 -69.6Translation difference 37.0 11.2 5.2 5.4Closing accumulated balance 952.3 791.4 188.0 182.5
Opening amortization -550.5 -493.7 -98.2 -148.5Acquisitions -9.5 -1.5 – 0.4Disposals / write-offs 20.3 10.0 25.5 20.0Reclassification 0.7 9.3 0.9 69.6Amortization for the year -69.3 -63.7 -28.2 -36.3Translation difference -30.4 -10.9 -3.3 -3.4Closing accumulated amortization -638.7 -550.5 -103.3 -98.2
Closing residual value 313.6 240.9 84.7 84.3 1 Mainly related to individual customer contracts within Security Services Europe.
Furthermore the brand name Securitas in one of the Group’s countries of operations is included with MSEK 15.9 (15.9).
Sensitivity analysisThe following sensitivity analyses have been made of the estimates of value in use in connection with impairment testing, assumption by assumption: general reduction of 1 percentage point in the organic sales growth rate during the forecasting period; general reduction of 0.5 per-centage points in the operating margin; general increase of 0.5 percentage points in the WACC and general decrease of the estimated growth after the forecasted period by 0.5 percentage points. A sensitivity analysis for changes in the assumptions used in the impairment testing has been established for the units that have been tested in accordance with the in-depth analysis of a five or ten year discounted cash flow model. The rationale is that the first step in the test, which is based on the Gordon growth model, is only employed to retrieve the number of units that require an in-depth analysis and the model itself does not incorporate the financial plans that have been adopted for the forecasting period and so the establishment of a sensitivity analysis is not deemed relevant.
For conducted sensitivity analyses, the conclusion is that a reduction of the organic sales growth by 1 percentage point during the forecasting period would result in an impairment loss of goodwill of totally MSEK -2 for one CGU in Security Services Europe and MSEK -4 for two CGUs in Other. Moreover, a reduction of 0.5 percentage points in the operating margin would result in an impairment loss of goodwill of MSEK -5 for one CGU in Security Services Europe and MSEK -8 for two CGUs in Other. An increase in the WACC for conducted sensitivity analyses of 0.5 per-centage points would result in an impairment loss of goodwill of totally MSEK -0.2 for one CGU in Security Services Europe and MSEK -5 for two CGUs in Other. A general decrease of the estimated growth after the forecasted period for conducted sensitivity analyses by 0.5 percentage points would result in an impairment loss of goodwill of totally MSEK -2 for two CGUs in Other. Aside from this, the conducted sensitivity analyses showed that none of the adjustments stand alone would result in an impairment loss in any CGU.
* Gordon’s growth model is the geometrical sum of the eternal future cash flows, which are used to determine the terminal value in a discounted cash flow model. The model is less sophisticated than a five or ten year discounted cash flow model as it excludes the forecasting period.
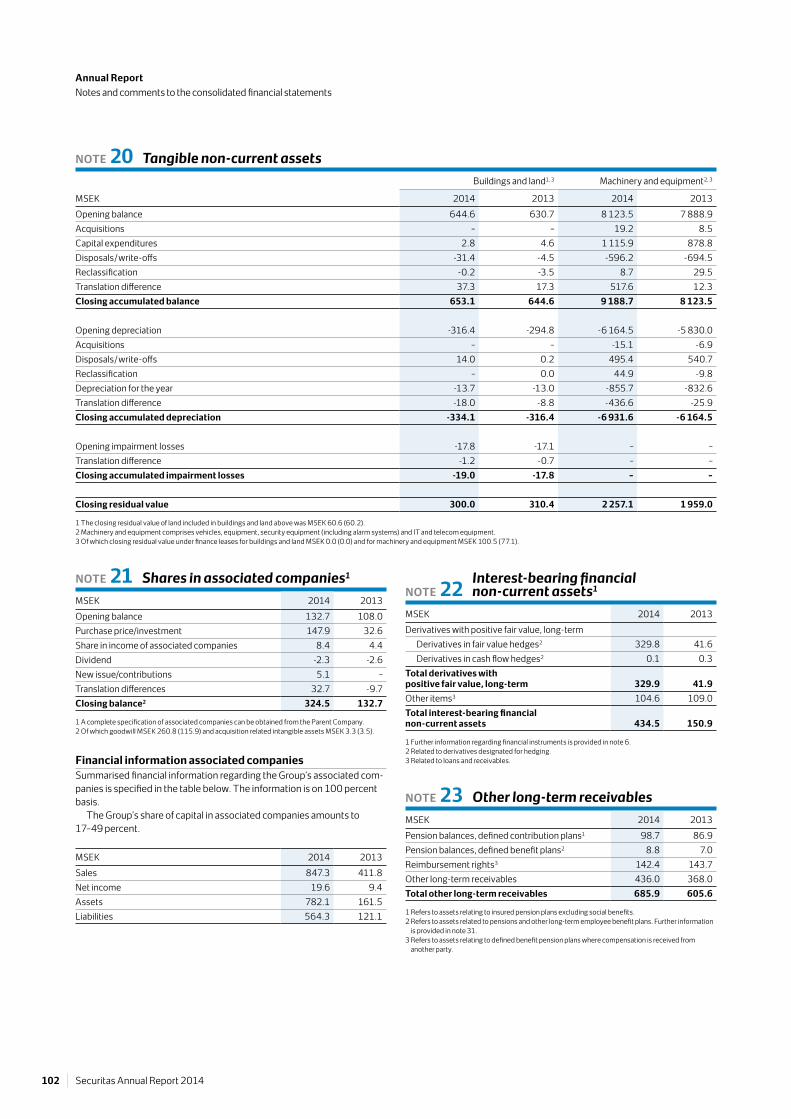
Annual ReportNotes and comments to the consolidated financial statements
Securitas Annual Report 2014102
NOTE 20 Tangible non-current assets
Buildings and land1, 3 Machinery and equipment2, 3
MSEK 2014 2013 2014 2013Opening balance 644.6 630.7 8 123.5 7 888.9Acquisitions – – 19.2 8.5Capital expenditures 2.8 4.6 1 115.9 878.8Disposals / write-offs -31.4 -4.5 -596.2 -694.5Reclassification -0.2 -3.5 8.7 29.5Translation difference 37.3 17.3 517.6 12.3Closing accumulated balance 653.1 644.6 9 188.7 8 123.5
Opening depreciation -316.4 -294.8 -6 164.5 -5 830.0Acquisitions – – -15.1 -6.9Disposals / write-offs 14.0 0.2 495.4 540.7Reclassification – 0.0 44.9 -9.8Depreciation for the year -13.7 -13.0 -855.7 -832.6Translation difference -18.0 -8.8 -436.6 -25.9Closing accumulated depreciation -334.1 -316.4 -6 931.6 -6 164.5
Opening impairment losses -17.8 -17.1 – –Translation difference -1.2 -0.7 – –Closing accumulated impairment losses -19.0 -17.8 – –
Closing residual value 300.0 310.4 2 257.1 1 959.0 1 The closing residual value of land included in buildings and land above was MSEK 60.6 (60.2).2 Machinery and equipment comprises vehicles, equipment, security equipment (including alarm systems) and IT and telecom equipment.3 Of which closing residual value under finance leases for buildings and land MSEK 0.0 (0.0) and for machinery and equipment MSEK 100.5 (77.1).
NOTE 21 Shares in associated companies1
MSEK 2014 2013Opening balance 132.7 108.0Purchase price/investment 147.9 32.6Share in income of associated companies 8.4 4.4Dividend -2.3 -2.6New issue/contributions 5.1 –Translation differences 32.7 -9.7Closing balance2 324.5 132.7 1 A complete specification of associated companies can be obtained from the Parent Company.2 Of which goodwill MSEK 260.8 (115.9) and acquisition related intangible assets MSEK 3.3 (3.5).
Financial information associated companiesSummarised financial information regarding the Group’s associated com-panies is specified in the table below. The information is on 100 percent basis.
The Group’s share of capital in associated companies amounts to 17–49 percent.
MSEK 2014 2013Sales 847.3 411.8Net income 19.6 9.4Assets 782.1 161.5Liabilities 564.3 121.1
NOTE 22 Interest-bearing financial non-current assets1
MSEK 2014 2013Derivatives with positive fair value, long-term
Derivatives in fair value hedges2 329.8 41.6Derivatives in cash flow hedges2 0.1 0.3
Total derivatives with positive fair value, long-term 329.9 41.9Other items3 104.6 109.0Total interest-bearing financial non-current assets 434.5 150.9 1 Further information regarding financial instruments is provided in note 6.2 Related to derivatives designated for hedging.3 Related to loans and receivables.
NOTE 23 Other long-term receivables
MSEK 2014 2013Pension balances, defined contribution plans1 98.7 86.9Pension balances, defined benefit plans2 8.8 7.0Reimbursement rights3 142.4 143.7Other long-term receivables 436.0 368.0Total other long-term receivables 685.9 605.6
1 Refers to assets relating to insured pension plans excluding social benefits.2 Refers to assets related to pensions and other long-term employee benefit plans. Further information
is provided in note 31.3 Refers to assets relating to defined benefit pension plans where compensation is received from
another party.

Annual ReportNotes and comments to the consolidated financial statements
103Securitas Annual Report 2014
NOTE 24 Inventories
MSEK 2014 2013Material and consumables 139.8 113.6Work in progress – 9.3Advance payments to suppliers 11.3 8.2Total inventories 151.1 131.1
NOTE 25 Accounts receivable
MSEK 2014 % 2013 %Accounts receivable before deduction of provisions for bad debt losses 11 286.7 100 10 165.2 100Provisions for bad debt losses -471.2 -4 -488.8 -5Total accounts receivable 10 815.5 96 9 676.4 95
Opening balance provision for bad debt losses -488.8 -474.6Provision for expected losses -186.2 -113.2Reversed provisions 99.5 32.9Actual losses 135.6 84.9Acquisitions 10.2 -10.7Translation differences -41.5 -8.1Closing balance provision for bad debt losses1 -471.2 -488.8 1 Expenses for bad debt losses amounted to MSEK 87.7 (78.0).
AGEING OF ACCOUNTS RECEIVABLE BEFORE DEDUCTION OF PROVISION FOR BAD DEBT LOSSES
MSEK 2014 % 2013 %Overdue 1–30 days 2 168.0 19 1 828.7 18Overdue 31–90 days 791.8 7 700.7 7Overdue 91–180 days 231.5 2 226.6 2Overdue >180 days 471.2 4 518.5 5Total overdue 3 662.5 32 3 274.5 32
NOTE 26 Other current receivables
MSEK 2014 2013Accrued sales income 1 528.3 1 186.9Prepaid expenses and other accrued income 781.9 692.8Insurance-related receivables 22.1 13.2Value added tax 113.9 102.7Other items 351.3 416.5Total other current receivables 2 797.5 2 412.1
NOTE 27 Other interest-bearing current assets1
MSEK 2014 2013Derivatives with positive fair value, short-term
Derivatives in fair value hedges2 0.2 –Derivatives in net investment hedges2 0.1 –Other derivatives3 6.1 59.5
Total derivatives with positive fair value, short-term 6.4 59.5Other interest-bearing current assets 160.9 –Total other interest-bearing current assets 167.3 59.5 1 Further information regarding financial instruments is provided in note 6.2 Related to derivatives designated for hedging.3 Related to financial assets at fair value through profit or loss.
NOTE 28 Liquid funds1
MSEK 2014 2013Short-term investments2 2 081.9 2 827.8Cash and bank deposits3 1 343.2 1 222.0Total liquid funds 3 425.1 4 049.8 1 Liquid funds include short-term investments with a maximum duration of 90 days that are readily
convertible to a known amount of cash and subject to an insignificant risk of change in value. Liquid funds also include cash and bank deposits.
2 Short-term investments refer to fixed interest rate bank deposits.3 The net position in Group country cash-pool accounts is reported as cash and bank deposits where
netting reflects the legal structure of the arrangement.
NOTE 29 Shareholders’ equity
Number of shares outstanding December 31, 2014MSEK
Series A 17 142 600each share with a
quota value of SEK 1.00 17.1
Series B 347 916 297each share with a
quota value of SEK 1.00 348.0Total 365 058 897 365.1
The number of Series A and Series B shares is unchanged in relation to December 31, 2013. As of December 31, 2014 there were no outstanding convertible debenture loans that could result in any dilution of the share capital.
Each Series A share carries ten votes and each Series B share one vote. This is the only difference between the two series of shares.
Shareholders with more than 10 percent of the votesThe principal shareholders are Gustaf Douglas, who through family and the companies within the Investment AB Latour Group and Förvaltnings AB Wasatornet holds 10.9 percent of the capital and 29.6 percent of the votes, and Melker Schörling, who through family and Melker Schörling AB holds 5.6 percent of the capital and 11.8 percent of the votes.
DividendThe Board of Directors propose a dividend to the shareholders of the Parent Company of SEK 3.00 per share, or a total of MSEK 1 095.2. The dividend to the shareholders for the financial year 2013, which was paid in 2014, was SEK 3.00 per share, or a total of MSEK 1 095.2.

Annual ReportNotes and comments to the consolidated financial statements
Securitas Annual Report 2014104
Presentation of shareholders’ equityAccording to IAS 1 a company should as a minimum present issued capital and other reserves in the balance sheet. Securitas has chosen to specify shareholders’ equity into further components as per below:
• Share capital
• Other capital contributed
• Other reserves
• Retained earningsShare capital shows the registered share capital of the Parent Company. There were no changes in the share capital in 2014.
In other capital contributed, the total amount of all transactions Securitas AB has had with its shareholders is included. Transactions that have taken place with shareholders are issued capital to premium. The amount presented in this sub-component corresponds to capital received (reduced by commission costs) in excess of par value of issued capital. There were no changes in other capital contributed in 2014.
Other reserves show income and expense items that according to certain standards should be recognized in other comprehensive income. In the case of Securitas, other reserves consist of translation differences attributable to the translation of foreign subsidiaries according to IAS 21, and of the hedging reserve of cash flow hedges. The amount in the hedging reserve will be transferred to the statement of income over the following three years.
Retained earnings corresponds to the accumulated profits earned and losses incurred in total for the Group. Retained earnings also include effects of the Group’s share-based incentive scheme as well as remea-surements of post-employment benefits posted in other comprehensive income. Retained earnings are further reduced by dividend paid to shareholders of the Parent Company. Transactions with non-controlling interests are also recorded in retained earnings.
Share-based incentive schemeSecuritas’ share-based incentive scheme has had the following impact on retained earnings:
MSEK 2014 2013Swap agreement1 -65.6 -52.7Share-based remuneration to employees 87.5 63.0Total 21.9 10.3 1 The number of shares that have been hedged in this swap agreement amount to a total of
932 761 (859 579) and have been allotted to the participants during the first quarter 2015, provided that they were still employed by the Group at that time.
Non-controlling interestsThe table below specifies the Group’s non-controlling interests:
MSEK 2014 2013Opening balance 16.0 13.9Acquisitions/investments 1.7 0.9Disposals 0.1 0.1Dividend -3.6 -2.6New issue/contributions – 2.7Total transactions with non-controlling interests -1.8 1.1Share in net income 3.1 3.1Share in other comprehensive income, translation differences 1.6 -2.1Total comprehensive income for the year 4.7 1.0Closing balance 18.9 16.0
NOTE 30 Long-term liabilities excluding provisions1
MSEK 2014 2013EMTN Nom MEUR 350, 2013 / 2021, Annual 2.625%2 3 546.5 3 091.0EMTN Nom MEUR 350, 2012 / 2017, Annual 2.75%2 3 328.5 3 117.1EMTN Nom MEUR 300, 2012 / 2018, Annual 2.25%2 2 895.2 2 673.6EMTN Nom MSEK 600, 2012 / 2015, FRN Quarterly2 – 599.8EMTN Nom MSEK 400,2012 / 2015, Annual 3.45%2 – 402.5EMTN Nom MUSD 62,2010 / 2015, FRN Semi Annual2 – 400.8EMTN Nom MUSD 40,2010 / 2015, FRN Semi Annual2 – 258.6EMTN Nom MUSD 50,2011 / 2018, FRN Quarterly2 389.5 323.0EMTN Nom MUSD 85,2013 / 2019, FRN Quarterly2 661.8 548.7EMTN Nom MUSD 40, 2014 / 2020, FRN Quarterly 2 311.3 –EMTN Nom MUSD 60, 2014 / 2021, FRN Quarterly2 466.9 –Finance leases 43.4 30.8Other long-term loans 57.3 56.2Total long-term loan liabilities excluding derivatives 11 700.4 11 502.1Derivatives with negative fair value, long-term
Derivatives in fair value hedges3 _ 7.0Derivatives in cash flow hedges3 0.3 0.7
Total derivatives with negative fair value, long-term 0.3 7.7Total long-term loan liabilities 11 700.7 11 509.8Pensions balances, defined contribution plans4 98.7 86.9Deferred considerations5 444.1 390.3Other long-term liabilities 7.9 10.1Total other long-term liabilities 550.7 487.3Total long-term liabilities 12 251.4 11 997.1 1 For further information regarding financial instruments, refer to note 6.2 Issued by the Parent Company.3 Related to derivatives designated for hedging.4 Refers to liability for insured pension plan excluding social costs.5 Recognized at fair value.
LONG-TERM LIABILITIES FALL DUE FOR PAYMENT AS FOLLOWS
MSEK 2014 2013Maturity < 5 years 7 804.9 8 125.0Maturity > 5 years 4 446.5 3 872.1Total long-term liabilities 12 251.4 11 997.1

Annual ReportNotes and comments to the consolidated financial statements
105Securitas Annual Report 2014
Diagram_BV_sid 109 / 1
Defined benefit obligations
■ USA MSEK 1 561, 39%■ Switzerland MSEK 929, 24%■ Norway MSEK 528, 13%■ Other countries1 MSEK 940, 24%■ Total MSEK 3 958
1 In total 17 countries.
Diagram_BV_sid 109 / 2
Plan assets
■ USA MSEK 972, 39%■ Switzerland MSEK 799, 32%■ Norway MSEK 368, 14%■ Other countries1 MSEK 378, 15%■ Total MSEK 2 517
Diagram_BV_sid 109 / 3
Pension costs
■ USA MSEK 24, 17%■ Switzerland MSEK 33, 24%■ Norway MSEK 20, 15%■ Other countries1 MSEK 61, 44%■ Total MSEK 138
Diagram_BV_sid 109 / 4
Employer contributions
■ USA MSEK 88, 40%■ Switzerland MSEK 41, 19%■ Norway MSEK 30, 14%■ Other countries1 MSEK 60, 27%■ Total MSEK 219
NOTE 31 Provisions for pensions and similar commitments
OverviewThe Group operates or participates in a number of defined benefit and defined contribution pension and other long-term employee benefit plans throughout the world. These plans are structured in accordance with local rules and practices.
The graphs below provide an overview of the Group’s defined benefit plans.
The table below shows a specification of the members in the Group’s significant defined benefit plans, the plans’ duration and life expectancy for the members.
DECEMBER 31, 2014
USA Switzerland NorwayActive members 202 1 592 461Deferred members 1 779 – –Pensioner members 4 372 144 634Total number of members 6 353 1 736 1 095
Duration of plans (years) 10 14 17
Number of years current pensioners are expected to live beyond age 65:
Men 21 21 21Women 24 23 24
Number of years future pensioners currently aged 45 are expected to live beyond age 65:
Men 23 21 24Women 25 23 27
The Group’s significant defined benefit plans are described below.
USAThe Group’s US operations participate in two defined benefit pension plans as the named plan sponsor. One of these plans is funded and the other is unfunded. Both plans are closed to new entrants and any future benefit accrual.
The benefits provided constitute pension payments to previous employees and their spouses in the form of annuities or lump sums. The particulars of the benefits and the benefit calculations depend on the original plan to which the plan participant belonged as the current funded plan is an amalgamation of several previous pension plans. The unfunded plan is constituted by a formally adopted and documented plan plus some individual arrangements that, for the purpose of this disclosure, are treated as one plan. In general the benefits are monthly pensions based on earnings and years of service. These benefits are defined with the only uncertainties being how long they will be paid, whether benefits will be paid as a lump sum versus annuity and in the case of the funded plan also regarding investment return. Plan contributions are determined annually.
Both pension plans are governed by the Executive Compensation and Benefits Review Committee (ECBRC) which is made up of local Securitas US management representatives. Administration is outsourced to an external service provider. Since the US pension plans are closed to new entrants and any future benefit accrual and are in a run-off mode, a liability matching approach is applied by the ECBRC in order to de-risk the funded plan. As the funding target attainment percentage increases, this results in a shift from growth assets, such as equities, into fixed income invest-ments. Independent investment managers are utilized and evaluated by independent investment advisors. Assets are pooled with those of other plans in order to reduce the cost.
The pension plans are covered under the US Employee Retirement Income Security Act of 1974 (ERISA). Various parts of the ERISA legislation are governed by the Department of Labor, the Internal Revenue Service and the Department of Treasury. The funded plan also pays contributions to the Pension Benefit Guaranty Corporation which insures private pension plans in the case the sponsor defaults.
1 In total 17 countries. Most of these countries have unfunded plans. Further information is provided in the section Other countries below.

Annual ReportNotes and comments to the consolidated financial statements
Securitas Annual Report 2014106
During 2014 the US Society of Actuaries (SOA) issued new mortality tables. This was a major overhaul and also included a more sophisticated calculation methodology. The plan has adopted these new mortality tables as of December 31, 2014 for accounting purposes. It is expected that the new mortality tables will become federal law in 2017 and thus impact the funding valuation. The new mortality tables in combina-tion with the reduction in discount rates during 2014 have significantly increased the obligation. The introduction of the new mortality tables increased the defined benefit obligation by MUSD 9. Under IAS 19 the funded ratio was 77 percent based on a defined benefit obligation of MUSD 162 and plan assets of MUSD 125. A funding valuation would result in a significantly higher funding target attainment as the new mortality tables have not come into force for funding target calculations yet. There is also certain legislation enacted in order to soften the impact resulting from the increase in defined benefit obligations. This means that the increase in defined benefit obligations will not immediately trigger increased contributions. It is difficult to quantify the impact on the plan over time as this depends both on the development of economic and demographic assumptions as well as asset performance. The strategy to de-risk the funded plan still remains. The book value under IAS 19 for the defined benefit obligation for the unfunded plan was MUSD 37 as of December 31, 2014.
The US operations also participate in a defined contribution plan, generally known as a 401(k) plan. There are also a few multi-employer plans, which are governed by collective bargaining agreements. These plans, in most cases, require the employees to contribute to the plan, typically with the employee contributions being partially matched by the employer. In relation to the overall workforce the take up rates are generally low, with voluntary participation rates of approximately five percent. In the federal government sector, Securitas’ subsidiary participates on a modified basis, subject to special rules, in the same 401(k). Securitas’ subsidiary in the federal government sector also participates in a few union-sponsored defined contribution plans of a similar type. Due to the provisions of the federal Service Contract Act under which Securitas’ subsidiary in the federal government sector operates, hourly allowances must be paid to employees that can be used for various elected benefits, such as health and disability, with unused portions of the allowances contributed to the 401(k) plan, without additional employer contributions.
SwitzerlandThe Group’s Swiss operations participate in a plan that is a defined benefit plan according to IAS 19 as a result of the residual risk described below. The Swiss operations have chosen to set up an own-foundation which means that the foundation only covers employees of Securitas’ Swiss operations. The plan is open to new employees of Securitas’ Swiss operations and benefits are being accrued under the plan. There are no terminated vested members in the plan since pension obligations are transferred to the new employer upon termination.
The benefits provided constitute pension benefits, disability benefits and death-in-service pension to previous employees and their spouses. The pension benefits are normally paid as an annuity based on capital conversion rates that differ between men and women. The disability benefits are calculated as a maximum of the pensionable salary and the death-in-service benefit is in its turn calculated as a percentage of the disability pension. Plan contributions are subject to legal minimum requirements. Rates increase with age and at least half must be paid by the employer while the employee pays the remainder. In the case of Securitas’ Swiss subsidiary, the contributions in the plan are split equally with half paid by the company and the other half by the employee. Contri-butions payable to the plan are calculated each month as a fixed percent-age based on the annual salary and age.
Although the contribution levels are defined, there is still a risk of a shortfall in the pension fund as the minimum requirements for interest on capital and conversion to pension need to be met. If there is a shortfall the fund will take steps before asking the company for additional con-tributions. These steps could include changing plan benefits, lowering returns credited to employees or changing the conversion rate, where possible. The fund has several years to balance a shortfall and payments will never be required from the company for past periods. This means that the actions can be planned and budgeted for. If additional contributions are required from the company, this is also required from the employees.
The pension plan is governed by the board of the pension fund which is made up of an equal number of employer and employee representatives. The administration is run in-house by a pension fund expert. The pension fund chooses how and where to invest the assets. Swiss law limits both the total share of assets that should be held in certain categories, and for individual asset holdings. The fund has given mandates to manage the investments to three banks and retains an investment committee, a sub-committee of the main fund board. The investment committee compares and reviews the performance of these mandates on a regular basis. The pension plan is covered under federal Swiss law that regulates the so called second pillar of the pension system, the pension benefits arising from employment.
The latest funding valuation was carried out on December 31, 2013 and resulted in a funding target attainment of 110 percent based on a defined benefit obligation for funding purposes of MCHF 81 and plan assets for funding purposes of MCHF 89.
NorwayThe Group’s Norwegian operations participate in several defined benefit plans that are both funded and unfunded. All plans are closed to new entrants and currently cover about 12 percent of the employees. New employees are instead covered by defined contribution plans. The AFP-plan (collective pension agreement) is a multi-employer defined benefit plan. Since the administrator is unable to separately identify the compa-ny’s share of the total plan assets and total defined benefit obligations, it is accounted for on a defined contribution basis. Premiums paid to the plan in 2014 amounted to MNOK 22 (18). The contribution for the next annual reporting period is expected to be broadly in line with the current year’s premium. Securitas’ share of total premiums to the plan is approximately 0.5 percent. The level of consolidation in this plan, calculated under the plan rules, was 49 percent (42) as of December 31, 2014.
The particulars of the benefits and the benefit calculations vary from plan to plan. In general the benefits are monthly pensions based on earn-ings and years of service. Since employees are still accruing benefits under these plans, the plans are impacted by expected salary increases, pension increases, uncertainty of how long the benefits will be paid and in the case of the funded plans also return on plan assets.
All funded plans are insured with an insurance company and the plan contributions are determined by the insurance provider, based on salary and membership data reported from the company. If a company decides to change insurance company, the liabilities and the assets are moved to the new insurance company.
The funded plans are minimum regulation plans, which means that future pensions depend on the actual return on assets in the insurance company. There is a guaranteed minimum return on plan assets. If the actual return is lower than the guaranteed minimum return, the insurance company will provide the difference.
The pension plans are covered by Norwegian pension laws, corporate laws and insurance laws. The board of directors and management of the Norwegian operations are responsible for the running of the pension plans even if they are outsourced, as part of their overall corporate gover-nance responsibilities under Norwegian company law. Since the funded plans are insured it means that the investment decisions are taken by the investment managers of the insurance provider.

Annual ReportNotes and comments to the consolidated financial statements
107Securitas Annual Report 2014
Other countriesThere are also less significant defined benefit arrangements in countries other than those accounted for above. These plans are located in Canada (both funded and unfunded plans providing pension and medical ben-efits), France (unfunded plans providing retirement indemnities under French law), Germany (unfunded arrangements for pensions and jubilee plans), the Netherlands (funded and unfunded plans providing pension and jubilee benefits for our consultancy operations only) and the United Kingdom (funded plan providing pension and death-in-service benefits). The Group also currently has plans that are not significant in 12 other countries.
The defined benefit arrangement for clerical staff in the guarding oper-ations in the Netherlands is accounted for as a defined contribution plan, which is closed to new entrants. New employees are enrolled in another defined contribution plan. The security officers in the guarding operations in the Netherlands also participate in a multi-employer defined benefit plan that is mandatory for all guards from the age of 21 and up. The super-vision and administration of the plan is carried out by a collective pension foundation for the security industry. This foundation determines the annual premium. Premiums paid to the plan in 2014 amounted to MEUR 8 (6). The contribution for the next annual reporting period is expected to be broadly in line with the current year’s premium. Securitas’ share of total premiums to the plan is approximately 21 percent. This plan covers around 4 400 active employees and around 5 500 previous employees and retirees. Since the administrator is unable to separately identify the company’s share of the total plan assets and total defined benefit obliga-tions for this arrangement, the plan is accounted for on a defined contribu-tion basis. The level of consolidation in this plan, calculated under the plan rules, was 111 percent (116) as of December 31, 2014.
Sweden Security officers in Sweden are covered by the SAF-LO collective pension plan, an industry-wide multi-employer defined contribution arrangement. Clerical workers are covered by the ITP plan, which is also based on a collective agreement and operated industry-wide on a multi-employer basis. According to a statement (UFR 3) issued by the Swedish Financial Reporting Board this is a multi-employer defined benefit plan. Alecta, the insurance company that operates this plan, has been unable to provide Securitas, or other Swedish companies, with sufficient information to determine its share of the total assets and liabilities for this arrange ment. Consequently this arrangement is accounted for on a defined contribution basis. The cost for 2014 amounts to MSEK 20 (25). The contribution for the next annual reporting period is expected to be broadly in line with the current year’s premium. Securitas’ share of Alecta’s total premiums amounts to approximately 0.1 percent. The surplus in Alecta can be allo-cated to the insured employer and / or the insured employees. Alecta’s level of consolidation, calculated under the plan rules, was 143 percent (148) as of December 31, 2014.
Consolidated statement of income The table below shows expense (+) and income (-) from the Group’s defined benefit and defined contribution plans.
MSEK 2014 2013Current service cost 98.4 87.8Administration cost 24.3 13.8Interest income or expense 36.1 37.9Remeasurements of other long-term employee benefits 0.3 -0.3Past service cost and gains and losses arising from settlements -21.61 -5.8Total pension costs for defined benefit plans 137.5 133.4Pension costs for defined contribution plans 774.6 691.1Total pension costs 912.1 824.5
1 Mainly related to curtailment gains in the Netherlands and in the USA.
The table below shows costs for defined benefit plans allocated per function.
MSEK 2014 2013Production expenses 81.0 90.7Selling and administrative expenses 56.5 42.7Total pension costs for defined benefit plans 137.5 133.4
Consolidated balance sheet The table below shows how the net defined benefit obligations have been determined. It also shows the Group’s reimbursement rights.
MSEK 2014 2013Present value of the defined benefit obligations 3 958.0 3 190.8Fair value of plan assets -2 516.6 -2 173.2Defined benefit obligations, net1 1 441.4 1 017.6Reimbursement rights (note 23) 142.4 143.7 1 Related to the net of plans reported under provisions for pensions and similar commitments,
MSEK 1 450.2 (1 024.6), and plans reported under other long-term receivables (note 23), MSEK -8.8 (-7.0).
The reimbursement rights are related to a contractual agreement where Securitas provide security services at a customer site in Canada. The agreement requires Securitas to make provisions for post-retirement medical benefits. The costs of this benefit are carried by Securitas who, in turn, are reimbursed by the customer. This reimbursement right is accounted for as an other long term receivable in note 23.
The table below shows how remeasurements net of taxes recognized in other comprehensive income have been determined.
MSEK 2014 2013Remeasurements of provisions for pensions and similar commitments before tax 379.4 -385.3Remeasurements of reimbursement rights before taxes 25.9 27.1Taxes -125.6 115.2Total remeasurements recognized in other comprehensive income 279.7 -243.0

Annual ReportNotes and comments to the consolidated financial statements
Securitas Annual Report 2014108
Movement in provisions for pensions and similar commitments2014 2013
MSEK Obligations Plan assets Net Obligations Plan assets NetOpening balance 3 190.8 -2 173.2 1 017.6 3 551.8 -2 083.1 1 468.7Current service cost 98.4 – 98.4 87.8 – 87.8Administration cost 24.3 – 24.3 13.8 – 13.8Interest income (-) or expense (+) 125.3 -89.2 36.1 99.0 -61.1 37.9Remeasurements of other long-term employee benefits 0.3 – 0.3 -0.3 – -0.3Past service cost and gains and losses arising from settlements -182.0 160.4 -21.6 -62.7 56.9 -5.8Total pension costs included in the consolidated statement of income 66.3 71.2 137.5 137.6 -4.2 133.4Remeasurements of post-employment benefits:
Return on plan assets, excluding amount included in interest income or expense – -141.4 -141.4 – -133.0 -133.0Actuarial gains (-) and losses (+) from changes in demographic assumptions 71.4 – 71.4 64.4 – 64.4Actuarial gains (-) and losses (+) from changes in financial assumptions 481.3 – 481.3 -307.2 – -307.2Actuarial gains (-) and losses (+) due to experience -31.9 – -31.9 -9.5 – -9.5
Total remeasurements of post-employment benefits1 520.8 -141.4 379.4 -252.3 -133.0 -385.3Contributions by employers2 – -218.6 -218.6 – -168.8 -168.8Contributions by plan participants 38.9 -38.9 – 34.5 -34.5 –Benefits paid to plan participants -224.2 224.2 – -197.6 197.6 –Administration costs paid -24.3 24.3 – -14.0 14.0 –Acquisitions / divestitures / reclassifications 4.5 – 4.5 5.7 -5.7 –Translation difference 385.2 -264.2 121.0 -74.9 44.5 -30.4Closing balance 3 958.0 -2 516.6 1 441.4 3 190.8 -2 173.2 1 017.6 1 Included net of taxes in other comprehensive income.2 Contributions by employers expected to be paid in 2015 are estimated to be on the same level as in 2014.

Annual ReportNotes and comments to the consolidated financial statements
109Securitas Annual Report 2014
Plan assetsThe table below presents a breakdown of the various types of investments in which the assets of the Group’s funded benefit arrangements are invested.
MSEK 2014 % 2013 %Equity instruments
USA 250.4 310.4Switzerland 138.5 132.3Canada 60.3 54.5UK 13.7 26.2Other countries 227.5 210.8
Total equity instruments 690.4 28 734.2 34
Debt instruments Government bonds 794.6 605.6 Corporate bonds, investment grade (AAA to BBB-) 267.8 153.3 Corporate bonds, non-investment grade (below BBB-) 76.9 235.4
Total debt instruments 1 139.3 45 994.3 46
Property 220.1 9 245.5 11
Qualifying insurance policies 431.4 17 44.5 2
Cash and cash equivalents 35.4 1 154.7 7Total plan assets 2 516.6 100 2 173.2 100
The plan assets are well diversified on countries and industries, so the failure of any single investment is not estimated to have a material impact on the overall level of assets.
The plan assets do not include any property owned by Securitas or finan-cial instruments issued by Securitas. The share of unquoted plan assets is non-material.
Actuarial assumptions and sensitivity analysisThe table below shows the significant financial actuarial assumptions used for the determining the defined benefit obligations at the end of the year as well as in determining the pension costs for the coming year.
%, per annum Discount rate Salary increases Inflation Pension increases Mortality2014
USA 3.30–3.50 n/a n/a n/a
RP-2014 white collar/blue collar,
with MP-2014 improvements
Switzerland 0.90 1.00 1.00 0.00 LPP 2010Norway 2.00 2.75 n/a 0.00–2.50 K 2013Eurozone 0.50–1.80 2.75 1.75–2.00 0.00–1.75 –Other countries 3.60–4.00 2.50–3.00 2.00–3.20 0.00–3.20 –
2013
USA 3.80–4.40 n/a n/a n/aRP-2000
projected to 2014Switzerland 2.20 1.00 1.00 0.00 LPP 2010Norway 3.30 3.75 n/a 0.60–3.50 K 2013Eurozone 2.25–3.50 2.75–3.50 1.75–2.00 0.00–1.75 –Other countries 4.50–4.90 3.00–3.35 2.10–3.50 0.00–3.50 –

Annual ReportNotes and comments to the consolidated financial statements
Securitas Annual Report 2014110
The table below shows the methods used to set significant actuarial assumptions for the Group’s main defined benefit plans.
Discount rate Salary increases Inflation Pension increases Mortality
USACash flow matching approach
applied to the Citigroup yield curve n/a n/a n/aLatest tables
available
SwitzerlandChamber of
Pensions ActuariesCompany’s
best estimateLong-term expectations
in SwitzerlandWhen financially bearable
by pension planLatest tables
available
Norway NRS guidance NRS guidance n/a NRS guidanceLatest tables
available
Assumptions are set by the company based on actuarial advice and the company’s experience in each territory.
The table below indicates the sensitivity to changes in significant assumptions for provisions for pensions and similar commitments.
MSEK Increase (+) / decrease (-) in provisionDiscount rate – pension plans increase of 0.1 percentage points -51.6
decrease of 0.1 percentage points 52.6
Inflation – pension plans increase of 0.1 percentage points 5.4
decrease of 0.1 percentage points -5.0
Life expectancy – pension plans one year increase 73.5
Health-care cost rate – medical plans increase of 1 percentage point 25.51
decrease of 1 percentage point -19.82
1 The corresponding effect on the statement of income is an increase of costs of MSEK 2.9.2 The corresponding effect on the statement of income is a decrease of costs of MSEK -2.1.
The sensitivity analysis has been determined based on reasonably pos-sible changes of the respective assumptions occurring at the end of the reporting period and may not be representative of the actual change. The sensitivity analysis is further based on a change in one assumption while holding all other assumptions constant, although in reality changes in some assumptions may be correlated.
The same method used to calculate the provisions for pensions and similar commitments, that is the projected unit credit method, is used for calculating the sensitivities.
There have been no changes in the methods and assumption changes used in preparing the sensitivity analysis compared with the previous year.
RisksThe table below shows significant risks that the Group is exposed to through its defined benefit plans.
Asset volatility The plan liabilities are calculated using a discount rate set with reference to corporate bond yields. If plan assets underperform this yield, a deficit will be created. In a long-term perspective, equities are expected to outperform corporate bonds, but in the short-term perspective the yield on the Group’s equity instruments may cause volatility.
Changes in bond yields A decrease in corporate bond yields will increase plan liabilities, although this will be partially offset by an increase in the value of the plans’ bond holdings. In the USA, an asset-liability matching approach is practiced to mitigate the risks associated with changes in bond yields as far as possible.
Inflation risk Some of the Group’s pension obligations are linked to inflation, and higher inflation will lead to higher liabilities. However, the Group’s plans in the USA and Norway are not linked to inflation, which makes the inflation risk less significant for the Group.
Life expectancy The majority of the plans’ obligations are to provide benefits for the life of the member, so increases in life expectancy will result in an increase in the plans’ liabilities. In some countries, the benefit provided at retirement is a lump sum payment and therefore increases in life expectancy do not impact liabilities in these countries.

Annual ReportNotes and comments to the consolidated financial statements
111Securitas Annual Report 2014
NOTE 32 Other long-term provisions The movement in the balance sheet for provisions for pensions and similar commitments is provided in note 31. The movement in the balance sheet for deferred tax liabilities is provided in note 15.
DECEMBER 31, 2014
MSEK Claims reserves Provisions for taxes Other provisions TotalOpening balance 374.0 208.4 109.4 691.8Reclassification 5.4 -48.9 -10.0 -53.5New / increased provisions 9.5 – 20.7 30.2Utilized provisions – -0.1 -12.9 -13.0Reversal of unutilized provisions -10.6 – -0.5 -11.1Translation differences 76.9 42.6 8.1 127.6Closing balance 455.2 202.0 114.8 772.0
Claims reservesLiability insurance-related claims reserves primarily consist of provisions for the portion of claims payable by the Group, that is its self-retention. Claims reserves comprise a large number of individual insurance cases where some cases are compensated with a lump-sum payment and others are paid over a longer period of time. It is thus not possible to disclose any detailed information regarding the timing of outflows from claims reserves.
Provisions for taxesProvisions for taxes primarily consist of provisions related to ongoing tax audits. Tax audits are often lengthy processes that go on for several years. It is thus not possible to disclose any detailed information regarding the timing of outflows from taxes.
Other provisionsOther provisions include various long-term items, among them provisions related to litigations. Other provisions are difficult to assess from a timing perspective. It is thus not possible to disclose any detailed information regarding the timing of outflows from other provisions.
NOTE 33 Short-term loan liabilities1
MSEK 2014 2013EMTN Nom MEUR 45, 2009 / 2014, FRN Quarterly2 – 400.5EMTN Nom MSEK 500, 2010 / 2014, FRN Quarterly2 – 499.8EMTN Nom MSEK 500, 2010 / 2014, FRN Semi Annual2 – 499.7EMTN Nom MSEK 600, 2012 / 2015, FRN Quarterly2 600.0 –EMTN Nom MSEK 400, 2012 / 2015, Annual 3.45%2 400.3 –EMTN Nom MUSD 40, 2010 / 2015, FRN Semi Annual2 311.8 –Commercial paper issued3 1 168.8 743.0Finance leases 55.6 44.3Other short-term loans 61.8 122.3Total short-term loan liabilities excluding derivatives 2 598.3 2 309.6Derivatives with negative fair value, short-term
Derivatives in cash flow hedges4 0.3 0.1Derivatives in net investment hedges4 22.7 –Other derivatives5 126.5 50.5
Total derivatives with negative fair value, short-term 149.5 50.6Total short-term loan liabilities 2 747.8 2 360.2 1 For further information regarding financial instruments refer to note 6.2 Issued by the Parent Company.3 Commercial paper is issued by the Parent Company within the framework of a MSEK 5 000 Swedish
commercial paper program. Commercial paper is accounted for at the issued amount, that is below par.4 Related to derivatives designated for hedging.5 Related to financial liabilities at fair value through profit or loss.
NOTE 34 Other current liabilities
MSEK 2014 2013Employee-related items1 6 051.3 5 797.3Accrued interest and financial expenses 151.6 135.9Other accrued expenses and deferred income 1 153.3 1 070.9Value added tax 1 238.3 1 125.3Deferred considerations 96.6 141.6Other items 668.1 631.2Total other current liabilities 9 359.2 8 902.2
1 Accounted for net of government grants when applicable.

Annual ReportNotes and comments to the consolidated financial statements
Securitas Annual Report 2014112
NOTE 35 Short-term provisionsDECEMBER 31, 2014
MSEK Claims reservesSpain – overtime
compensationCost savings
program Other provisions TotalOpening balance 574.4 29.1 96.0 110.9 810.4Reclassification -5.5 – – 6.9 1.4New / increased provisions 481.7 – – 69.4 551.1Utilized provisions -454.6 -4.5 -65.1 -40.6 -564.8Reversal of unutilized provisions -5.6 – – -22.7 -28.3Translation differences 112.1 1.7 2.0 3.6 119.4Closing balance 702.5 26.3 32.9 127.5 889.2
Claims reservesLiability insurance-related claims reserves primarily consist of provisions for the portion of claims payable by the Group, that is its self-retention.
Spain – overtime compensationAll major security companies in Spain have been compensating their employees in respect of overtime work in accordance with a labor agree-ment covering the period 2005 to 2008. In February 2007, the Spanish Supreme Court ruled that the overtime compensation under the existing labor agreement was not in compliance with Spanish law.
The potential exposure in respect of overtime compensation payable to employees of the security services and guarding companies in Spain historically increased due to the failure of the major security companies and the local unions to negotiate a settlement agreement on the over-time compensation. A petition was lodged with a lower court in Spain seeking specific guidance as to how overtime compensation should be calculated. A judgment was rendered in January 2008 giving guidelines on calculation of overtime pay, which substantially accepted the views of the employers. This judgment was appealed by the local unions. In December 2009 the Spanish Supreme Court overruled the court deci-sion from January 2008. The Supreme Court confirmed its decision from February 2007 which meant that each claim for overtime pay should be tried on a case by case basis. The Supreme Court thereby changed the basis for the computation of overtime compensation. The Supreme Court judgment cannot be appealed. The Court’s decision meant that Securitas had to prepare for several suits from employees and former employees in respect of historic overtime compensation.
In the absence of final guidance on overtime compensation, Securitas has chosen to apply the guidelines given by the court in January 2008 for salary payments paid in 2008 and 2009. These guidelines have during 2012 been confirmed by a new decision by the Supreme Court in Spain and Securitas will continue to apply these guidelines. A legal opinion, requested by the industry association in Spain in which Securitas is a member, has concluded that the time for filing a claim for the subject overtime matters ended on December 4, 2010 due to the statute of limi-tation. During the years 2011–2014 more than 11 000 cases for overtime pay has been adjudicated by court. In cases where Securitas has lost the case compensation has been paid. As a result of the increasing number of adjudicated claims during 2012, Securitas obtained a better visibility regarding the exposure and the probable outflow that was necessary in order to settle the remaining overtime compensation claims. Based on this, Securitas decided to release MSEK 22.7 (MEUR 2.6) from the provision at the end of 2012. Subsequent to this release there have been no adjustments to the provision. During 2014 a total of MSEK -4.5 has been paid out for overtime compensation after which the provision, also adjusted for translation differences of MSEK 1.7, amounts to MSEK 26.3 as of December 31, 2014. This is deemed sufficient for the remaining exposure. Securitas also estimates that the majority of the remaining part of the provision will be utilized during the coming twelve month period and has consequently kept the short-term classification.
Cost savings programThe cost savings program refers to the remaining balance of the restructur-ing provisions of MSEK 458.0 recognized in 2012.
NOTE 36 Pledged assets
MSEK 2014 2013Pension balances, defined contribution plans 98.7 86.9Finance leases 100.9 77.1Total pledged assets 199.6 164.0
NOTE 37 Contingent liabilities
MSEK 2014 2013Sureties and guarantees1 26.9 22.8Guarantees related to discontinued operations 18.0 16.8Total contingent liabilities 44.9 39.6 1 Guarantees on behalf of related parties are disclosed in note 7.
In addition to the contingent liabilities accounted for in the table, the following contingent liabilities, for which no amount can be determined, also exist:
Brazil – Estrela AzulIn connection with the efforts of Securitas to expand its activities in Latin America, Securitas entered into an agreement in 2005 with respect to the possible acquisition of a guarding company in Brazil. In order to support this company while required governmental approvals were sought, Securitas provided a bank guarantee for the benefit of the subject com-pany. The governmental approvals took much longer time than antici-pated to obtain and during such period the financial condition of the target company substantially deteriorated. Given the decline in the financial condition of the company, in December 2006 Securitas exercised its right not to complete the acquisition. The governmental approval had then been received. In view of the decision not to complete the subject trans-action, a provision in the amount of the bank guarantee was recognized as of December 31, 2006.
The target company in 2007 filed for protection from its creditors under Brazilian legislation providing for a judicial restructuring process. Securitas, having applied to be registered as a creditor in the insolvency matter, objected to the company’s restructuring plan proposed in the judicial restructuring process. The insolvency judge decided against Securitas’ objections and this decision was appealed by Securitas in 2008. The Court of Appeal upheld the lower courts’ decision. The com-pany has thereafter, on November 9, 2009, been declared bankrupt and the restructuring process has been replaced by bankruptcy proceedings. The bankruptcy process continues and efforts to sell the estates assets are ongoing. Various attempts by the Trustee to increase the liability of Securitas in the bankruptcy will be vigorously rejected.

Annual ReportNotes and comments to the consolidated financial statements
113Securitas Annual Report 2014
In connection with the judicial restructuring process, the company (now in bankruptcy) asserted a claim of MSEK 982 against Securitas, alleging that Securitas is responsible for the company’s financial failure. Securitas denies all responsibility for such claim. The defense of these cases has been entrusted to one of the leading law firms in Brazil. In a decision by the first instance court in Brazil the claim was fully rejected. The judgment was appealed by the bankruptcy estate to the Brazilian Court of Appeals and this Court decided on formal grounds to nullify the judgment and to remand the case to the first instance court for retrial. In accordance with the Court of Appeals decision the first instance court has decided to allow new evidence in the case. The Court has appointed an Expert to assist the Court in investigating parts of the claim. Securitas maintains its previous position to the claim.
In addition, several former employees of Estrela Azul have sued Securitas and other parties in court and claim inter alia wages and other compensations in pending labor suits. The number of labor law cases involving Securitas continued to decrease during 2013 and the number of new cases where Securitas is a named defendant decreased signifi-cantly also in 2014. The claimed amounts are in average relatively low. The defense of these labor cases has been entrusted to one of the leading labor law firms in Brazil – specializing in labor law matters. Securitas denies all responsibility for such labor claims.
Spain – tax auditThe Spanish tax authority has in connection with an audit of Securitas Spain challenged certain interest payments and in tax resolutions in 2009, 2012 and 2014 decided to reject interest deductions made for the financial years 2003–2005, 2006–2007 and 2008–2009 respectively. The 2012 and 2014 resolutions were expected as a consequence of the resolution received in 2009.
If finally upheld by Spanish courts, the resolution by the Spanish tax authorities would result in a tax of MEUR 41, including interest up to December 31, 2014. There exists no further exposure for similar rejected interest deductions after the financial year 2009 as the Group in 2009 adjusted the capitalization of Securitas Spain to avoid future challenges of interest deductions.
The tax authority has also in 2014 challenged a deduction for a currency related liquidation loss in the financial year 2010, relating to a company that was acquired in 2004. If finally upheld by Spanish courts, the resolution by the Spanish tax authorities would result in a tax of MEUR 16, including interest up to December 2014.
Securitas has in 2014 won in the Spanish national court Audiencia Nacional the case concerning interest deductions for the financial years 2003–2005, due to that the years 2003 and 2004 were judged to be time-barred. The tax for the financial years 2003–2005 amounts to MEUR 11, including interest up to December 2014 (which is part of the MEUR 41 exposure described above). Further, in its judgment the court referred to a recent judgment by the Supreme Court, meaning that interest or any other expenses as a result of a transaction in a time-barred year cannot be disallowed in later years.
The Spanish tax authority has appealed the Audiencia Nacional’s judgment regarding the financial years 2003–2005 to the Supreme Court.
Provided that the Supreme Court will decide in Securitas case in accordance with their recent judgment, referred to by the Audiencia Nacional, then all exposure for interest for the financial years 2003–2005, 2006–2007 and 2008–2009 and for the currency related liquidation loss for the financial year 2010 should cease.
The Spanish tax authority has in connection with an audit of Securitas Spain, challenged and in 2013 decided to reject a tax exemption for the demerger of the Spanish Systems company in connection with Securitas AB’s distribution of the shares in Securitas Systems AB to its shareholders and listing on the Stockholm Stock Exchange in 2006. Securitas has appealed the tax assessment received in 2013 to the court, Tribunal Económico Administrativo Central. If finally upheld by Spanish
courts, the resolution by the Spanish tax authorities would result in tax of MEUR 19, including interest up to December 31, 2014.
Securitas believes it has acted in accordance with applicable law and will defend its position in the courts. However, the tax resolutions causes some uncertainty and it may take a long time until final judgments are made.
USA – the events of September 11, 2001A detailed account of the developments surrounding the events of September 11, 2001 has been presented in press releases and interim and annual reports for 2001 to 2013.
All injury and fatality cases against Securitas subsidiary Globe Aviation Services Corporation (“Globe”) and other Securitas companies as a result of the September 11 events have been dismissed or settled. Globe and other Group companies, together with the relevant airline and other par-ties, remain defendants in one lawsuit regarding property and business damage pertaining to the events of September 11, 2001. Through a settlement agreement with the majority of the plaintiffs in the property damage claims in the September 11 case, the majority of such claims was settled. The settlement agreement has been confirmed by the Court of Appeals and became thereby final and binding.
The remaining property damage claim is such that the value of the claims filed can exceed the insurance coverage estimated to exist as a potential source of recovery. Globe and the other Group companies and the other defendants in the property damage case are challenging the claim in all material respects. This property and business interruption claim was decided by the Trial Court in New York, NY, USA on August 1, 2013. In its judgment, the Court rejected plaintiffs claim for damages from Globe and the other defendants for the destruction of the World Trade Center properties in all material respects. The decision has been appealed by the plaintiff. The case is now at the Court of Appeals but no final decision on the merits of the case has been delivered by this Court. Due to the statutory liability cap in relation to the events of September 11, 2001, such liability will be limited to the amount of liability insurance coverage maintained at the time of the incident.
All coverage disputes with the relevant September 11, 2001 insurers have been resolved. The proceedings against other Securitas Group companies than Globe have, with the consent of the Court and the Plaintiffs, been temporarily stayed. Any liabilities arising out of the September 11, 2001 litigation are not expected to materially impact Securitas’ business operation or financial position.
USA – tax auditAs disclosed in the 2013 Annual Report, the US tax authority has in 2010 rejected certain insurance premium deductions for the years 2003–2004. Securitas has won the case in the US Tax Court in 2014 and the judgment has not been appealed. Consequently the contingent liability that was earlier disclosed for this case of MUSD 60 plus interest has ceased to exist.
Other proceedingsOver the years, Securitas has made a number of acquisitions in different countries. As a result of such acquisitions, certain contingent liabilities of the businesses acquired have been assumed. The risks relating to such contingent liabilities are covered by contractual indemnification, insurance or adequate reserves.
Companies within the Securitas Group are also involved in a number of other legal proceedings and tax audits arising out of the business. Any liabilities arising out of such proceedings are not expected to be material to the business operations or the financial position of the Group.

Annual ReportNotes and comments to the consolidated financial statements
Securitas Annual Report 2014114
NOTE 38 Financial five year overview1
MSEK 2010 2011 2012 2013 2014
INCOME Total sales 61 339.8 64 057.1 66 458.2 65 700.1 70 217.1
of which acquired business 2 242.3 5 061.5 2 418.4 682.6 353.3 Acquired sales growth, % 4 8 4 1 1 Organic sales growth, % 1 3 0 1 3 Real sales growth, % 5 11 4 2 4
Operating income before amortization 3 724.2 3 335.1 3 027.7 3 329.0 3 504.7 Operating margin, % 6.1 5.2 4.6 5.1 5.0
Amortization and impairment of acquisition related intangible assets -164.3 -218.2 -297.1 -273.7 -250.8Acquisition related costs -89.6 -193.5 -49.5 -26.8 -17.1Items affecting comparability – – -424.3 – –Financial income and expenses -502.3 -493.0 -573.0 -385.0 -327.6 Income before taxes 2 968.0 2 430.4 1 683.8 2 643.5 2 909.2
Taxes -887.2 -721.7 -509.2 -787.9 -837.7Net income for the year 2 080.8 1 708.7 1 174.6 1 855.6 2 071.5
– whereof attributable to non-controlling interests -2.3 2.9 0.4 3.1 3.1Average number of shares after dilution (‘000) 365 059 365 059 365 059 365 059 365 059 Earnings per share after dilution (SEK) 5.71 4.67 3.22 5.07 5.67
CASH FLOWOperating income before amortization 3 724.2 3 335.1 3 027.7 3 329.0 3 504.7Investments in non-current tangible and intangible assets -901.9 -1 009.8 -1 039.2 -804.0 -1 113.2Reversal of depreciation 900.7 902.0 946.1 945.6 966.9Change in accounts receivable -768.4 -722.6 205.4 1.0 -114.5Changes in other operating capital employed 312.8 -397.3 60.8 -241.5 -381.2Cash flow from operating activities 3 267.4 2 107.4 3 200.8 3 230.1 2 862.7 as % of operating income before amortization 88 63 106 97 82
Financial income and expenses paid -521.7 -475.1 -531.9 -532.0 -311.4Current taxes paid -735.1 -763.9 -583.3 -610.4 -696.6 Free cash flow 2 010.6 868.4 2 085.6 2 087.7 1 854.7
as % of adjusted income 81 40 108 93 75Free cash flow per share 5.51 2.38 5.71 5.72 5.08Cash flow from investing activities, acquisitions and divestitures -1 359.0 -1 882.0 -677.3 -294.7 -385.0Cash flow from items affecting comparability -62.5 -23.7 -193.8 -307.5 -72.8Cash flow from financing activities -424.5 968.9 1 222.7 -2 270.5 -2 107.8Cash flow for the year 164.6 -68.4 2 437.2 -785.0 -710.9Interest-bearing net debt at beginning of year -8 387.7 -8 208.9 -10 348.8 -9 864.6 -9 609.8Change in loans -670.7 -2 064.1 -2 317.9 1 175.3 1 012.6Revaluation of financial instruments 67.6 7.5 10.6 10.9 -0.4Translation differences on interest-bearing net debt 617.3 -14.9 354.3 -146.4 -1 113.1Interest-bearing net debt at year-end -8 208.9 -10 348.8 -9 864.6 -9 609.8 -10 421.6
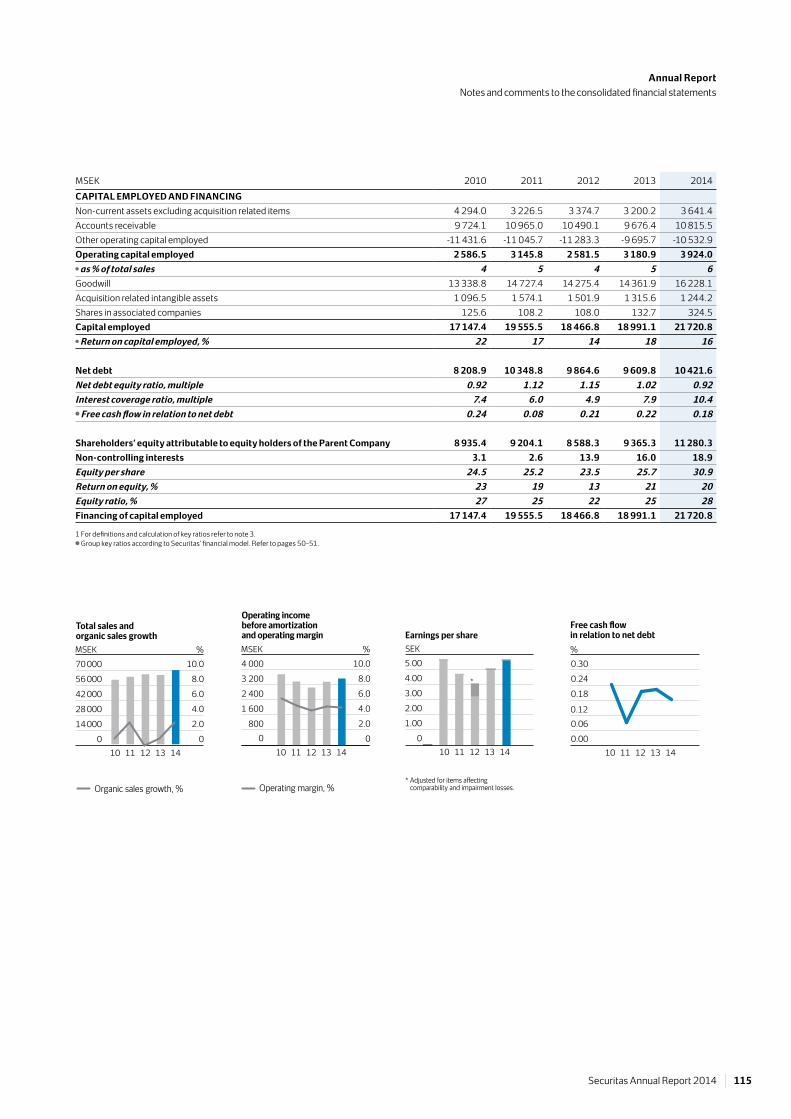
Annual ReportNotes and comments to the consolidated financial statements
115Securitas Annual Report 2014
MSEK 2010 2011 2012 2013 2014CAPITAL EMPLOYED AND FINANCINGNon-current assets excluding acquisition related items 4 294.0 3 226.5 3 374.7 3 200.2 3 641.4Accounts receivable 9 724.1 10 965.0 10 490.1 9 676.4 10 815.5Other operating capital employed -11 431.6 -11 045.7 -11 283.3 -9 695.7 -10 532.9Operating capital employed 2 586.5 3 145.8 2 581.5 3 180.9 3 924.0 as % of total sales 4 5 4 5 6
Goodwill 13 338.8 14 727.4 14 275.4 14 361.9 16 228.1Acquisition related intangible assets 1 096.5 1 574.1 1 501.9 1 315.6 1 244.2Shares in associated companies 125.6 108.2 108.0 132.7 324.5Capital employed 17 147.4 19 555.5 18 466.8 18 991.1 21 720.8 Return on capital employed, % 22 17 14 18 16
Net debt 8 208.9 10 348.8 9 864.6 9 609.8 10 421.6Net debt equity ratio, multiple 0.92 1.12 1.15 1.02 0.92Interest coverage ratio, multiple 7.4 6.0 4.9 7.9 10.4
Free cash flow in relation to net debt 0.24 0.08 0.21 0.22 0.18
Shareholders’ equity attributable to equity holders of the Parent Company 8 935.4 9 204.1 8 588.3 9 365.3 11 280.3Non-controlling interests 3.1 2.6 13.9 16.0 18.9Equity per share 24.5 25.2 23.5 25.7 30.9Return on equity, % 23 19 13 21 20Equity ratio, % 27 25 22 25 28Financing of capital employed 17 147.4 19 555.5 18 466.8 18 991.1 21 720.8 1 For definitions and calculation of key ratios refer to note 3.
Group key ratios according to Securitas’ financial model. Refer to pages 50–51.
Diagram_BV_sid 117 / 1
Total sales and organic sales growth
0
14 000
28 000
42 000
56 000
70 000
10 11 12 13 140
2.0
4.0
6.0
8.0
10.0%
Organic sales growth, %
MSEK
Diagram_BV_sid 117 / 2
Operating income before amortization and operating margin
0800
1 600
2 400
3 200
4 000
0
2.0
4.0
6.0
8.0
10.0%
10 11 12 13 14
Operating margin, %
MSEK
Diagram_BV_sid 117 / 3
Earnings per share
0
1.00
2.00
3.00
4.00
5.00
10 11 12 13 14
* Adjusted for items affecting comparability and impairment losses.
*
SEK
Diagram_BV_sid 117 / 4
Free cash flow in relation to net debt
0.00
0.060.12
0.18
0.24
0.30
10 11 12 13 14
%

Securitas Annual Report 2014116
Annual ReportParent Company financial statements
Parent Company statement of income MSEK Note 2014 2013License fees and other income 40 970.3 870.2Gross income 970.3 870.2
Administrative expenses 42, 43 -629.2 -552.0Other operating income 42 15.9 13.5Operating income 357.0 331.7
Result of financial investmentsDividend 40 1 087.7 1 118.5Interest income 40 165.6 165.5Interest expenses 40 -365.2 -475.9Other financial income and expenses, net 44 -493.1 -703.9Total financial income and expenses 395.0 104.2Income after financial items 752.0 435.9
AppropriationsGroup contributions from subsidiaries 40 4.6 267.4Group contributions to subsidiaries 40 -284.4 -0.3Total appropriations -279.8 267.1Income before taxes 472.2 703.0
Current taxes 45 -14.3 -8.4Deferred taxes 45 140.8 1.2Net income for the year 598.7 695.8
Parent Company statement of comprehensive income MSEK Note 2014 2013Net income for the year 598.7 695.8
Other comprehensive incomeItems that subsequently may be reclassified to the statement of incomeCash flow hedges net of tax 41 0.0 4.7Net investment hedges net of tax 484.5 -98.5Total items that subsequently may be reclassified to the statement of income 484.5 -93.8Other comprehensive income 45 484.5 -93.8Total comprehensive income for the year 1 083.2 602.0
Parent Company statement of cash flow MSEK Note 2014 2013OperationsOperating income 357.0 331.7Reversal of depreciation 46, 47 15.4 13.0Financial items received 1 253.7 2 463.3Financial items paid -367.0 -638.5Current taxes paid -10.3 -13.2Change in other operating capital employed 489.6 94.1Cash flow from operations 1 738.4 2 250.4
Investing activitiesInvestments in non-current tangible and intangible assets 46, 47 -27.1 -11.8Shares in subsidiaries 48 -107.3 -584.8Cash flow from investing activities -134.4 -596.6
Financing activitiesDividend paid 52 -1 095.2 -1 095.2Proceeds from bond loans 713.4 3 629.9Redemption of bond loans -1 858.2 -5 176.5Change in other interest-bearing net debt excluding liquid funds 696.1 2 970.8Cash flow from financing activities -1 543.9 329.0
Cash flow for the year 60.1 1 982.8Liquid funds at beginning of year 2 007.7 24.9Liquid funds at year-end 51 2 067.8 2 007.7

117Securitas Annual Report 2014
Annual ReportParent Company financial statements
Parent Company balance sheet MSEK Note 2014 2013ASSETSNon-current assetsIntangible assets 46 117.2 105.5Machinery and equipment 47 9.9 9.9Shares in subsidiaries 48 37 257.5 37 183.0Shares in associated companies 49 112.1 112.1Interest-bearing financial non-current assets 41 902.9 509.4Deferred tax assets 45 23.4 19.3Other long-term receivables 111.8 104.2Total non-current assets 38 534.8 38 043.4
Current assetsCurrent receivables from subsidiaries 71.4 321.0Interest-bearing current receivables from subsidiaries 41 3 996.6 3 260.6Other current receivables 32.7 14.2Current tax assets 0.6 4.4Prepaid expenses and accrued income 50 25.8 20.3Other interest-bearing current assets 41 3.6 47.0Cash and bank deposits 51 2 067.8 2 007.7Total current assets 6 198.5 5 675.2
TOTAL ASSETS 44 733.3 43 718.6
SHAREHOLDERS’ EQUITY AND LIABILITIESShareholders’ equityRestricted equityShare capital 365.1 365.1Legal reserve 7 362.6 7 362.6Total restricted equity 7 727.7 7 727.7
Non-restricted equityHedging reserve -0.4 -0.4Translation reserve 850.7 366.2Retained earnings 15 849.9 16 262.3Net income for the year 598.7 695.8Total non-restricted equity 17 298.9 17 323.9
Total shareholders’ equity 52 25 026.6 25 051.6
Long-term liabilitiesLong-term loan liabilities 41 11 591.1 11 405.3Other long-term liabilities 159.1 160.7Total long-term liabilities 53 11 750.2 11 566.0
Current liabilitiesCurrent liabilities to subsidiaries 466.7 116.1Interest-bearing current liabilities to subsidiaries 41 4 047.5 3 833.2Group account bank overdraft 628.5 779.2Other short-term loan liabilities 41 2 566.0 2 178.1Accounts payable 22.1 11.7Accrued expenses and prepaid income 54 210.0 164.9Other current liabilities 15.7 17.8Total current liabilities 7 956.5 7 101.0
TOTAL SHAREHOLDERS’ EQUITY AND LIABILITIES 44 733.3 43 718.6
Pledged assets 55 98.7 86.9Contingent liabilities 56 42.2 36.8

Securitas Annual Report 2014118
Annual ReportParent Company financial statements
Parent Company statement of changes in shareholders’ equity
MSEKShare
capital1Legal
reserveHedgingreserve
Translationreserve
Retainedearnings and
net incomefor the year
Total share-holders’
equityOpening balance 2013 365.1 7 362.6 -5.1 464.7 17 358.1 25 545.4Net income for the year – – – – 695.8 695.8Other comprehensive incomeItems that subsequently may be reclassified to the statement of incomeCash flow hedges2
Total change of hedging reserve before tax – – 10.4 – – 10.4Deferred tax on total change of hedging reserve – – -5.7 – – -5.7
Net investment hedges net of tax – – – -98.5 – -98.5Total items that subsequently may be reclassified to the statement of income – – 4.7 -98.5 – -93.8Other comprehensive income – – 4.7 -98.5 – -93.8Total comprehensive income for the year – – 4.7 -98.5 695.8 602.0Share-based incentive scheme1 – – – – -0.6 -0.6Dividend paid to shareholders of the Parent Company – – – – -1 095.2 -1 095.2Closing balance 2013 365.1 7 362.6 -0.4 366.2 16 958.1 25 051.6
Opening balance 2014 365.1 7 362.6 -0.4 366.2 16 958.1 25 051.6Net income for the year – – – – 598.7 598.7Other comprehensive incomeItems that subsequently may be reclassified to the statement of incomeCash flow hedges2
Total change of hedging reserve before tax – – 0.0 – – 0.0Deferred tax on total change of hedging reserve – – 0.0 – – 0.0
Net investment hedges net of tax – – – 484.5 – 484.5Total items that subsequently may be reclassified to the statement of income – – 0.0 484.5 – 484.5Other comprehensive income – – 0.0 484.5 – 484.5Total comprehensive income for the year – – 0.0 484.5 598.7 1 083.2Share-based incentive scheme1 – – – – -13.0 -13.0Dividend paid to shareholders of the Parent Company – – – – -1 095.2 -1 095.2Closing balance 2014 365.1 7 362.6 -0.4 850.7 16 448.6 25 026.6 1 Further information is provided in note 52.2 A specification can be found in note 41, table revaluation of financial instruments.

119Securitas Annual Report 2014
Annual ReportNotes and comments to the Parent Company financial statements
NOTE 39 Accounting principles
The Parent Company’s financial statements are prepared in accordance with the Swedish Annual Accounts Act and the Swedish Financial Report-ing Board’s standard RFR 2 Accounting for Legal Entities. The Parent Company thus follows the same accounting principles as the Group, which are described in note 2, when relevant and except in the cases stated below. The differences that exist between the Parent Company’s and the Group’s accounting principles are a result of the restrictions that the Swedish Annual Accounts Act, the Swedish Act on Safeguarding of Pension Commitments and the options that RFR 2 allow for IFRS in the Parent Company.
RFR 2: IFRS 3 Business combinationsThe Parent Company measures the acquisition cost as the sum of the acquisition-date fair values of assets transferred, liabilities incurred or transferred and all costs that are directly attributable to the acquisition. Contingent considerations are recognized as part of the acquisition cost if it is probable that they will be realized. The acquisition cost is adjusted in subsequent periods if the initial assessment needs to be revised.
RFR 2: IAS 18 RevenueAnticipated dividend from a subsidiary is recognized as income in the Parent Company in accordance with RFR 2 if the Parent Company has the exclusive right to decide the amount of the dividend from the subsidiary. The Parent Company must furthermore ensure that the dividend is in line with the subsidiary’s dividend capacity. Dividend from a subsidiary that has not been anticipated is accounted for on a cash basis.
RFR 2: IAS 19 Employee benefitsAccounting for defined benefit plans according to the Swedish Act on Safeguarding of Pension Commitments leads to differences between the accounting in the Parent Company and the Group. These differences have no material impact on the employee benefits relating to the employees of the Parent Company. Pension solutions either fall within the framework of the ITP–plan that is insured via Alecta, which is described in note 31, or in all material aspects consist of other defined contribution plans.
RFR 2: IAS 21 The effects of changes in foreign exchange ratesParagraph 32 in IAS 21 states that exchange differences that form part of a reporting entity’s net investments in a foreign operation shall be recog-nized via the statement of income in the separate financial statements of the reporting entity. RFR 2 states that such exchange differences instead should be recognized directly in shareholders’ equity in accordance with paragraph 14 d in chapter 4 of the Swedish Annual Accounts Act. Securitas AB follows RFR 2 and recognizes exchange differences that fulfil the criteria for net investment hedges, that is for which settlement is neither planned nor likely to occur in the foreseeable future, via the translation reserve in equity.
RFR 2: IAS 27 Consolidated and separate financial statements The Parent Company applies the alternative rule in RFR 2 IAS 27 related to Group contributions, which means that Group contributions from subsidiaries as well as Group contributions to subsidiaries are accounted for as appropriations in the statement of income.
RFR 2: IAS 39 Financial instruments: Recognition and measurementThe Parent Company follows IAS 39 with the exception of financial guarantees in relation to subsidiaries. For further information refer to the accounting principles adopted by the Group for recognition and measurement of financial instruments in note 2.
Capital contributionsShareholders’ capital contributions are accounted for as an increase of the balance sheet item shares in subsidiaries. An assessment whether any impairment write-down is required in shares in subsidiaries is subsequently made.
Securitas’ share-based incentive schemeIn addition to the Group’s accounting principles for share-based payments (IFRS 2) as described in note 2 Accounting principles, the following has been applied in the Parent Company’s financial statements. The Parent Company has secured the delivery of shares according to Securitas share-based incentive scheme by entering into a swap agreement with a third party regarding purchase of shares. To the extent that shares according to the swap agreement is subject to delivery to employees in other Group companies than the Parent Company, a liability to Group companies has been recorded in the Parent Company’s accounts. This liability is recorded at the value of the commitment that Securitas AB has to the subsidiaries to deliver shares, that is the number of shares to be delivered according to the swap agreement at the latest share price for Securitas AB’s series B share. Social security expenses are calculated based on the market value of the shares that potentially will be allocated. Fluctuations in the share price for these shares thus lead to changes in social security expenses that impact the Parent Company’s and Group’s income. This is the only impact on the Parent Company’s and Group’s income due to fluctuations in the share price for the shares that potentially will be allocated. This means that any possible increase or decrease of the liability to Group companies has not been accounted for in the Parent Company’s income statement.
Notes

Securitas Annual Report 2014120
Annual ReportNotes and comments to the Parent Company financial statements
NOTE 40 Transactions with related parties Transactions between the Parent Company and subsidiaries are priced in accordance with business principles.
THE PARENT COMPANY’S TRANSACTIONS WITH RELATED PARTIES COMPRISE
MSEK 2014 2013License fees from subsidiaries 968.9 868.6Other income from subsidiaries 1.4 1.6Dividends from subsidiaries 1 087.7 1 118.5Group contributions from subsidiaries 4.6 267.4Group contributions to subsidiaries -284.4 -0.3Interest income from subsidiaries 154.0 138.2Interest expenses to subsidiaries -62.2 -84.4Guarantees issued on behalf of subsidiaries 2 139.6 1 797.8Guarantees issued on behalf of associated companies 4.9 4.2
NOTE 41 Financial risk management
The Parent Company follows, as stated in note 39, IAS 39 Financial instruments: Recognition and measurement. Refer to note 2 and note 6 for further information about financial risks that are applicable also for the Parent Company.
LIQUIDITY REPORT AS PER DECEMBER 31, 2013–2014
MSEK Total < 1 yearBetween 1 year
and 5 years > 5 yearsDecember 31, 2014Borrowings -17 820 -5 592 -7 954 -4 274Derivatives outflows -15 588 -15 559 -26 -3Accounts payable -22 -22 – –Total outflows -33 430 -21 173 -7 980 -4 277Investments 6 106 6 016 90 –Derivatives receipts 16 029 15 627 299 103Accounts receivable 6 6 – –Total inflows 22 141 21 649 389 103Net cash flows, total1 -11 289 476 -7 591 -4 174
December 31, 2013Borrowings -17 689 -5 151 -8 627 -3 911Derivatives outflows -14 797 -14 716 -61 -20Accounts payable -12 -12 – –Total outflows -32 498 -19 879 -8 688 -3 931Investments 5 426 5 302 124 –Derivatives receipts 15 190 14 719 326 145Accounts receivable – – – –Total inflows 20 616 20 021 450 145Net cash flows, total1 -11 882 142 -8 238 -3 786 1 Variable rate cash flows have been estimated using the relevant yield curve.

121Securitas Annual Report 2014
Annual ReportNotes and comments to the Parent Company financial statements
REVALUATION OF FINANCIAL INSTRUMENTS
MSEK 2014 2013Recognized in the statement of incomeFinancial income and expenses -0.8 0.8Deferred tax 0.2 -0.2Impact on net income for the year -0.6 0.6
Recognized via hedging reserve in other comprehensive incomeTransfer to hedging reserve before tax -4.5 -3.9Deferred tax on transfer to hedging reserve 1.0 -2.63
Transfer to hedging reserve net of tax -3.5 -6.5
Transfer to statement of income before tax 4.5 14.3Deferred tax on transfer to statement of income -1.0 -3.1Transfer to statement of income net of tax 3.5 11.2
Total change of hedging reserve before tax1 0.0 10.4Deferred tax on total change of hedging reserve1 0.0 -5.73
Total change of hedging reserve net of tax 0.0 4.7
Total impact on shareholders' equity as specified aboveTotal revaluation before tax2 -0.8 11.2Deferred tax on total revaluation2 0.2 -5.9Total revaluation after tax -0.6 5.3 1 Total of transfer to hedging reserve and transfer from hedging reserve to statement of income.2 Total revaluation and deferred tax recognized via statement of income and via other comprehensive income. 3 Includes an adjustment of opening balance deferred tax of MSEK -3.5 due to a change in the Swedish tax rate from 26.3 percent to 22.0 percent.
DERIVATIVES IN THE BALANCE SHEET
MSEK 2014 2013Interest-bearing financial non-current assetsFair value hedges 329.8 41.6Cash flow hedges 0.1 0.3Total derivatives included in interest-bearing financial non-current assets 329.9 41.9
Interest-bearing current receivables from subsidiariesOther derivative positions 72.6 –Total derivatives included in interest-bearing current receivables from subsidiaries 72.6 –
Other interest-bearing current assetsFair value hedges 0.2 –Other derivative positions 3.4 47.0Total derivatives included in other interest-bearing current assets 3.6 47.0
Long-term loan liabilitiesFair value hedges – 7.0Cash flow hedges 0.3 0.7Total derivatives included in long-term loan liabilities 0.3 7.7
Interest-bearing current liabilities to subsidiariesOther derivative positions 4.3 40.0Total derivatives included in interest-bearing current liabilities to subsidiaries 4.3 40.0
Other short-term loan liabilitiesCash flow hedges 0.3 0.1Other derivative positions 84.9 36.0Total derivatives included in other short-term loan liabilities 85.2 36.1

Securitas Annual Report 2014122
Annual ReportNotes and comments to the Parent Company financial statements
NOTE 42 Administrative expenses and other operating income
Administrative expenses
AUDIT FEES AND REIMBURSEMENTS
MSEK 2014 2013PwC– audit assignments 5.7 6.6– additional audit assignments 1.4 0.6– tax assignments 0.6 1.2– other assignments1 2.2 2.3Total 9.9 10.7 1 The cost of other assignments carried out by PwC includes fees for audit-related advisory services
relating to accounting, including IFRS, IT, acquisitions, divestments and matters concerning the Group’s internal bank.
Other operating incomeOther operating income consists in its entirety of trade mark fees from Securitas Direct AB.
NOTE 43 PersonnelAVERAGE NUMBER OF YEARLY EMPLOYEES: DISTRIBUTION BETWEEN WOMEN AND MEN
Women Men Total
2014 2013 2014 2013 2014 2013Board of Directors 3 3 4 4 7 7President – – 1 1 1 1Other employees, Sweden 25 23 23 24 48 47
STAFF COSTS
2014 2013 Of which bonuses
MSEK SalariesSocial
benefits(of which
pensions) SalariesSocial
benefits(of which
pensions) 2014 2013Board of Directors and President1, 2 27.3 14.0 (4.4) 16.7 9.6 (3.5) 7.4 0.0Other employees 57.5 33.0 (11.5) 45.2 28.4 (11.1) 11.8 1.0Total 84.8 47.0 (15.9) 61.9 38.0 (14.6) 19.2 1.0 1 Refer to note 8 for further information regarding remuneration to the Board of Directors and President.2 Whereof MSEK 2.4 refers to temporary remuneration and MSEK 0.7 refers to pension cost to the
President for additional responsibility as Divisional President for Security Services Europe during 2014.
FAIR VALUE – HIERARCHY AS PER DECEMBER 31
Quotedmarket prices
Valuation techniquesusing observable
market data
Valuation techniquesusing non-observable
market data Total
MSEK 2014 2013 2014 2013 2014 2013 2014 2013Financial assets at fair value through profit or loss – – 76.0 47.0 – – 76.0 47.0Financial liabilities at fair value through profit or loss – – -89.2 -76.0 – – -89.2 -76.0Derivatives designated for hedging with positive fair value – – 330.1 41.9 – – 330.1 41.9Derivatives designated for hedging with negative fair value – – -0.6 -7.8 – – -0.6 -7.8

123Securitas Annual Report 2014
Annual ReportNotes and comments to the Parent Company financial statements
NOTE 44 Other financial income and expenses,net
MSEK 2014 2013Impairment losses, shares in subsidiaries1 -32.8 -554.0Exchange rate differences, net -442.7 -133.3Bank costs and similar income / expense items -16.8 -17.4Revaluation of financial instruments (IAS 39) -0.8 0.8Total other financial income and expenses, net -493.1 -703.9 1 Impairment losses of shares in subsidiaries in 2014 were recognized in conjunction with the Parent
Company having received dividend from a subsidiary, for another subsidiary as a consequence of a capital contribution to the subsidiary and finally for a third subsidiary in conjunction with the adjustment of the carrying value of intangible assets in the subsidiary. Impairment losses of shares in subsidiaries in 2013 were recognized in conjunction with the Parent Company having received dividend from a subsidiary and for the shares in another subsidiary as a consequence of a capital contribution to the subsidiary.
NOTE 45 Taxes
Statement of income
TAX EXPENSE
MSEK 2014 2013Tax on income before taxes– current taxes -14.3 -8.4– deferred taxes 140.8 1.2Total tax expense 126.5 -7.2 The Swedish corporate tax rate was 22.0 percent in 2014 and 2013.
DIFFERENCE BETWEEN STATUTORY SWEDISH TAX RATE AND ACTUAL TAX EXPENSE FOR THE PARENT COMPANY
MSEK 2014 2013Income before taxes according to the statement of income 472 703Tax based on Swedish tax rate -104 -155Tax related to previous years -2 5Tax related to non-taxable income 241 266Tax related to non-deductible expenses -8 -123Actual tax expense 127 -7
Tax related to non-taxable income mainly relates to dividends fromsubsidiaries. Tax related to non-deductible expenses mainly relates towrite-down of shares in subsidiaries.
Other comprehensive income
TAX ON OTHER COMPREHENSIVE INCOME
MSEK 2014 2013Deferred tax on cash flow hedges 0.0 -5.7Deferred tax on net investment hedges -136.7 4.8Deferred tax on other comprehensive income -136.7 -0.9
Balance sheetDeferred tax assets are attributable to employee related debt.
Tax loss carryforwardsThe tax loss carryforwards for the Parent Company amounted to MSEK 0 (0) as of December 31, 2014.
NOTE 46 Intangible assets1
MSEK 2014 2013Opening balance 189.1 195.7Capital expenditures 24.4 11.8Reclassification – -18.4Closing accumulated balance 213.5 189.1
Opening amortization -83.6 -80.9Reclassification – 7.6Amortization for the year -12.7 -10.3Closing accumulated amortization -96.3 -83.6
Closing residual value 117.2 105.5 1 Mainly related to Securitas Guard Management System, which is a system used for communicating,
coordinating, performing and reporting services. The estimated useful life is 15 years, based on how similar communication systems are used. The amortization rate is set to the corresponding period. Furthermore the brand name Securitas in one of the Group’s countries of operations is included with MSEK 15.9 (15.9). The trademark is tested annually for impairment. Refer to note 17 section impairment testing for further information.
NOTE 47 Machinery and equipment
MSEK 2014 2013Opening balance 33.7 15.3Capital expenditures 2.7 0.1Disposals – -0.1Reclassification – 18.4Closing accumulated balance 36.4 33.7
Opening depreciation -23.8 -13.5Reclassification – -7.6Depreciation for the year -2.7 -2.7Closing accumulated depreciation -26.5 -23.8
Closing residual value 9.9 9.9

Securitas Annual Report 2014124
Annual ReportNotes and comments to the Parent Company financial statements
NOTE 48 Shares in subsidiaries1
Subsidiary name Corporate identity no. DomicileNumber of
shares 2014% of share capital /voting rights 2014
Book value 2014, MSEK
Book value 2013, MSEK
Alert Services Holding NV2 RPR617707 Brussels 3 311 669 53.01 576.4 576.4Grupo Securitas Mexico S A de C V3 GSM930817U48 Monterrey 4 999 99.98 14.5 14.5Ozon Project d.o.o4 MBS 080011254 Zagreb 1 65 0.8 0.7Protectas S.A. CH–550–0084385–3 Lausanne 50 000 100 32.8 32.8Seccredo Holding AB 556734–1283 Stockholm 1 000 100 36.9 36.9Securitas Alert Services Polska Sp.z o.o. KRS 0000289244 Warsaw 5 000 100 10.0 10.0Securitas Argentina S.A.5 1587929 Buenos Aires 282 399 20 13.5 13.5Securitas Asia Holding AB 556691–8800 Stockholm 100 000 100 227.0 197.0Securitas BH d.o.o. 65-01-0503-11 Sarajevo – 100 86.8 86.8Securitas Biztonsági Szolgáltatások Magyarország Kft Cg.01–09–721946 Budapest – 100 14.3 18.6Securitas Canada Ltd 036580–6 Toronto 4 004 100 85.6 85.6Securitas CR sro 43872026 Prague – 100 185.5 176.5Securitas Eesti AS 10188743 Tallinn 1 371 100 32.1 32.1Securitas Egypt LLC 17556 Cairo 30 000 100 10.0 5.2Securitas Group Reinsurance Ltd 317030 Dublin 2 000 000 100 576.5 576.5Securitas Holding GmbH HRB 33348 Düsseldorf 1 100 2 572.3 2 572.3Securitas Holdings Inc. 95–4754543 Parsippany 100 100 2 208.0 2 208.0Securitas Hrvatska d.o.o 33679708526 Zagreb 1 100 121.9 121.8Securitas Invest AB 556630–3995 Stockholm 1 000 100 7.1 7.1Securitas Middle East and Africa Holding AB 556771–4406 Stockholm 100 000 100 97.7 97.7Securitas Montenegro d.o.o. 02387620 Niksic – 100 0.8 0.8Securitas Nordic Holding AB 556248–3627 Stockholm 1 000 000 100 9 269.5 9 269.5Securitas N V6 0427.388.334 Brussels 999 99.90 272.8 272.8Securitas Polska Sp. z o. o. 000036743 Warsaw 18 000 100 27.4 27.4Securitas Rental AB 556376–3829 Stockholm 1 000 100 3.6 3.6Securitas Safety & Consulting SRL7 J40/13561/2007 Bucharest 1 5 0.0 0.0Securitas SA Holdings Pty Ltd 2008/028411/07 Johannesburg 70 70 55.6 55.6Securitas Security Consulting Holding AB 556087–1468 Stockholm 1 000 100 37.3 37.3Securitas Security Services Ireland Ltd 275069 Dublin 2 410 002 100 28.9 –Securitas Seguridad Holding SL B83446831 Madrid 7 023 100 8 042.8 8 042.8Securitas Services d.o.o. 17487809 Belgrade – 100 131.0 132.5Securitas Services Holding U.K. Ltd 05759961 London 34 000 400 100 976.2 976.2Securitas Services International BV 33287487 Amsterdam 25 000 100 1 535.1 1 535.1Securitas Services Romania SRL J40 / 2222 / 2001 Bucharest 21 980 100 49.5 49.5Securitas Sicherheitsdienstleistungen GmbH FN148202w Vienna – 100 92.3 76.2Securitas SK sro8 36768073 Prievidza – 4.65 0.8 0.8Securitas Transport Aviation Security AB 556691–8917 Stockholm 5 100 000 100 272.6 259.6Securitas Treasury Ireland Ltd 152440 Dublin 21 075 470 100 9 475.0 9 497.0Securitas UAE LLC9 615702 Dubai 5 725 49 / 51 10.6 10.6Tehnomobil d.o.o4 MBS 080011254 Zagreb 1 65 66.0 65.7Total shares in subsidiaries 37 257.5 37 183.0
1 The main business in the subsidiaries is specialized guarding and mobile services, monitoring, technical solutions and consulting and investigations. The subsidiaries also comprise of the Group’s internal bank, Securitas Treasury Ireland Ltd, as well as the Group’s internal insurance company, Securitas Group Reinsurance Ltd. A complete specification of the subsidiaries can be obtained from the Parent Company.
2 Through the holdings in Securitas Seguridad Holding SL, the remaining 46.99 percent of Alert Services Holding NV are held.
3 The remaining 0.02 percent of Grupo Securitas Mexico S.A. de CV are held by Securitas Rental AB.4 Securitas has an option to acquire the remaining shares.5 The remaining 80 percent of Securitas Argentina S.A. are held by Securitas Seguridad Holding SL.6 The remaining 0.1 percent of Securitas NV are held by Securitas Rental AB.7 The remaining 95 percent of Securitas Safety & Consulting SRL are held by Securitas Services
Romania SRL.8 The remaining 95.35 percent of Securitas SK sro are held by Securitas CR sro.9 Securitas AB appoints the majority of the Board of Directors and has a controlling interest through
a shareholders’ agreement.
CHANGE ANALYSIS OF SHARES IN SUBSIDIARIES
MSEK 2014 2013Opening balance 37 183.0 37 156.3Acquisitions 31.5 68.7Capital contributions 75.8 516.1Impairment losses1 -32.8 -554.0Revaluation of deferred considerations – -4.1Closing balance 37 257.5 37 183.0
1 Impairment losses of shares in subsidiaries in 2014 were recognized in conjunction with the Parent Company having received dividend from a subsidiary, for another subsidiary as a consequence of a capital contribution to the subsidiary and finally for a third subsidiary in conjunction with the adjustment of the carrying value of intangible assets in the subsidiary. Impairment losses of shares in subsidiaries in 2013 were recognized in conjunction with the Parent Company having received dividend from a subsidiary and for the shares in another subsidiary as a consequence of a capital contribution to the subsidiary.

125Securitas Annual Report 2014
Annual ReportNotes and comments to the Parent Company financial statements
NOTE 49 Shares in associated companiesHOLDINGS 2013–2014
Company DomicileShare in
equity, %Voting
rights, %Book value,
MSEKWalsons Services Pvt Ltd Delhi 49 49 112.1Holdings 2014 112.1
Walsons Services Pvt Ltd Delhi 49 49 112.1Holdings 2013 112.1
NOTE 50 Prepaid expenses and accrued income
MSEK 2014 2013Prepaid software licenses and support costs 12.3 8.0Prepaid insurance premiums 1.1 1.6Other prepaid expenses and accrued income 12.4 10.7Total prepaid expenses and accrued income 25.8 20.3
NOTE 51 Liquid funds
Liquid funds include short-term investments with a maximum duration of 90 days that are readily convertible to a known amount of cash and subject to an insignificant risk of change in value. Liquid funds also include cash and bank deposits. Short-term investments refer to fixed interest rate bank deposits.
In the Parent Company’s balance sheet, utilized internal credits in the Swedish cash-pool account are reported under the Group account bank overdraft.
NOTE 52 Shareholders’ equity
Number of shares outstanding December 31, 2014MSEK
Series A 17 142 600 each share with a quota value of SEK 1.00 17.1Series B 347 916 297 each share with a quota value of SEK 1.00 348.0Total 365 058 897 365.1 The number of Series A and Series B shares is unchanged in relation to December 31, 2013. As of December 31, 2014 there were no outstand-ing convertible debenture loans that could result in any dilution of the share capital.
Each Series A share carries ten votes and each Series B share one vote.This is the only difference between the two series of shares.
Shareholders with more than 10 percent of the votesThe principal shareholders are Gustaf Douglas, who through family and the companies within the Investment AB Latour Group and Förvaltnings AB Wasatornet holds 10.9 percent of the capital and 29.6 percent of the votes, and Melker Schörling, who through family and Melker Schörling AB holds 5.6 percent of the capital and 11.8 percent of the votes.
DividendThe Board of Directors propose a dividend to the shareholders of the Parent Company of SEK 3.00 per share, or a total of MSEK 1 095.2. The dividend to the shareholders for the financial year 2013, which was paid in 2014, was SEK 3.00 per share, or a total of MSEK 1 095.2.
Share-based incentive schemeSecuritas’ share-based incentive scheme has had the following impact on retained earnings:
MSEK 2014 2013Swap agreement1, 2 -65.6 -52.7Redemption of previous year's swap agreement1 52.7 52.1Share-based remuneration to employees3 0.3 0.5Settlement of previous year's sharebased remuneration to employees3 -0.4 -0.5Total -13.0 -0.6 1 Related to the whole Group’s share-based incentive scheme.2 The number of shares that have been hedged in this swap agreement amount to a total of 932 761
(859 579) and have been allotted to the participants during the first quarter 2015, provided that they were still employed by the Group at that time.
3 Related to share-based remuneration for Securitas AB’s employees only.
NOTE 53 Long-term liabilities LONG-TERM LIABILITIES FALL DUE FOR PAYMENT AS FOLLOWS
MSEK 2014 2013Maturity < 5 years 7 383.9 7 762.1Maturity > 5 years 4 366.3 3 803.9Total long-term liabilities 11 750.2 11 566.0
NOTE 54 Accrued expenses and prepaid income
MSEK 2014 2013Employee-related items 41.0 11.3Accrued interest expenses 151.6 135.9Other accrued expenses 17.4 17.7Total accrued expenses and prepaid income 210.0 164.9
NOTE 55 Pledged assets
MSEK 2014 2013Pension balances, defined contribution plans 98.7 86.9Total pledged assets 98.7 86.9
NOTE 56 Contingent liabilities
MSEK 2014 2013Sureties and guarantees 24.2 20.0Guarantees related to discontinued operations 18.0 16.8Total contingent liabilities1 42.2 36.8 1 Guarantees on behalf of subsidiaries are disclosed in note 40.

Securitas Annual Report 2014126
Annual ReportSignatures of the Board of Directors
The Board of Directors and the President declare that the consolidated financial statements have been prepared in accordance with IFRS as adopted by the EU and give a true and fair view of the Group’s financial position and results of operations. The financial statements of the Parent Company have been prepared in accordance with generally accepted accounting principles in Sweden and give a true and fair view of the Parent Company’s financial position and results of operations.
The statutory administration report of the Group and the Parent Company provides a fair review of the development of the Group’s and the Parent Company’s operations, financial position and results of operations and describes material risks and uncertainties facing the Parent Company and the companies included in the Group.
The statements of income and balance sheets of the Parent Company and the Group are subject to adoption by the Annual General Meeting on May 8, 2015.
Stockholm, March 13, 2015
Melker SchörlingChairman
Carl Douglas Fredrik Cappelen Marie Ehrling Vice Chairman Director Director
Annika Falkengren Sofia Schörling Högberg Fredrik Palmstierna Director Director Director
Susanne Bergman Israelsson Åse Hjelm Jan Prang Director Director Director Employee Representative Employee Representative Employee Representative
Alf GöranssonPresident and Chief Executive Officer, Director
Our audit report has been submitted on March 13, 2015PricewaterhouseCoopers AB
Peter NyllingeAuthorized Public Accountant

127Securitas Annual Report 2014
Stockholm, March 13, 2015PricewaterhouseCoopers AB
Peter NyllingeAuthorized Public Accountant
Annual ReportAuditor’s report
Auditor’s reportTo the Annual General Meeting of the shareholders of Securitas AB, corporate identity number 556302-7241
Report on the annual accounts and consolidated accountsWe have audited the annual accounts and consolidated accounts of Securitas AB for the year 2014. The annual accounts and consolidated accounts of the company are included in the printed version of this document on pages 53–126.
Responsibilities of the Board of Directors and the CEO and President (“President”) for the annual accounts and consolidated accounts The Board of Directors and the President are responsible for the prepa-ration and fair presentation of these annual accounts and consolidated accounts in accordance with International Financial Reporting Standards, as adopted by the EU, and the Annual Accounts Act, and for such internal control as the Board of Directors and the President determine is necessary to enable the preparation of annual accounts and consolidated accounts that are free from material misstatement, whether due to fraud or error.
Auditor’s responsibility Our responsibility is to express an opinion on these annual accounts and consolidated accounts based on our audit. We conducted our audit in accordance with International Standards on Auditing and generally accepted auditing standards in Sweden. Those standards require that we comply with ethical requirements and plan and perform the audit to obtain reasonable assurance about whether the annual accounts and consolidated accounts are free from material misstatement.
An audit involves performing procedures to obtain audit evidence about the amounts and disclosures in the annual accounts and consoli-dated accounts. The procedures selected depend on the auditor’s judg-ment, including the assessment of the risks of material misstatement of the annual accounts and consolidated accounts, whether due to fraud or error. In making those risk assessments, the auditor considers internal control relevant to the company’s preparation and fair presentation of the annual accounts and consolidated accounts in order to design audit pro-cedures that are appropriate in the circumstances, but not for the purpose of expressing an opinion on the effectiveness of the company’s internal control. An audit also includes evaluating the appropriateness of account-ing policies used and the reasonableness of accounting estimates made by the Board of Directors and the President, as well as evaluating the overall presentation of the annual accounts and consolidated accounts.
We believe that the audit evidence we have obtained is sufficient and appropriate to provide a basis for our audit opinion.
OpinionsIn our opinion, the annual accounts have been prepared in accordance with the Annual Accounts Act and present fairly, in all material respects, the financial position of the Parent Company as of December 31, 2014 and of its financial performance and its cash flows for the year then ended
in accordance with the Annual Accounts Act. The consolidated accounts have been prepared in accordance with the Annual Accounts Act and present fairly, in all material respects, the financial position of the Group as of December 31, 2014 and of their financial performance and cash flows for the year then ended in accordance with International Financial Reporting Standards, as adopted by the EU, and the Annual Accounts Act. The statutory administration report is consistent with the other parts of the annual accounts and consolidated accounts.
We therefore recommend that the annual meeting of shareholders adopt the income statement and balance sheet for the Parent Company and the Group.
Report on other legal and regulatory requirements In addition to our audit of the annual accounts and consolidated accounts, we have also audited the proposed appropriations of the company’s profit or loss and the administration of the Board of Directors and the President of Securitas AB for the year 2014.
Responsibilities of the Board of Directors and the PresidentThe Board of Directors is responsible for the proposal for appropriations of the company’s profit or loss, and the Board of Directors and the President are responsible for administration under the Companies Act.
Auditor’s responsibility Our responsibility is to express an opinion with reasonable assurance on the proposed appropriations of the company’s profit or loss and on the administration based on our audit. We conducted the audit in accordance with generally accepted auditing standards in Sweden.
As a basis for our opinion on the Board of Directors’ proposed appro-priations of the company’s profit or loss, we examined the Board of Directors’ reasoned statement and a selection of supporting evidence in order to be able to assess whether the proposal is in accordance with the Companies Act.
As a basis for our opinion concerning discharge from liability, in addi-tion to our audit of the annual accounts and consolidated accounts, we examined significant decisions, actions taken and circumstances of the company in order to determine whether any member of the Board of Directors or the President is liable to the company. We also examined whether any member of the Board of Directors or the President has, in any other way, acted in contravention of the Companies Act, the Annual Accounts Act or the Articles of Association.
We believe that the audit evidence we have obtained is sufficient and appropriate to provide a basis for our opinions.
OpinionsWe recommend to the annual meeting of shareholders that the profit be appropriated in accordance with the proposal in the statutory administration report and that the members of the Board of Directors and the President be discharged from liability for the financial year.
(Translation of the Swedish original)

Securitas Annual Report 2014128
Quarterly data
Statement of income 20141 MSEK Q1 2014 Q2 2014 Q3 2014 Q4 2014Sales 15 995.2 17 001.5 17 966.9 18 900.2Sales, acquired business 116.0 118.5 35.8 83.0Total sales 16 111.2 17 120.0 18 002.7 18 983.2Organic sales growth, % 2 3 4 5Production expenses -13 342.9 -14 214.8 -14 877.1 -15 575.3Gross income 2 768.3 2 905.2 3 125.6 3 407.9Selling and administrative expenses -2 034.3 -2 122.9 -2 170.8 -2 398.6Other operating income 3.8 3.7 4.0 4.4Share in income of associated companies 0.4 1.9 2.7 3.4Operating income before amortization 738.2 787.9 961.5 1 017.1Operating margin, % 4.6 4.6 5.3 5.4Amortization of acquisition related intangible assets -61.5 -59.5 -60.9 -68.9Acquisition related costs -4.1 -7.4 -1.1 -4.5Operating income after amortization 672.6 721.0 899.5 943.7Financial income and expenses -80.9 -81.7 -82.4 -82.6Income before taxes 591.7 639.3 817.1 861.1Net margin, % 3.7 3.7 4.5 4.5Current taxes -147.9 -159.9 -204.2 -198.7Deferred taxes -28.4 -30.6 -39.4 -28.6Net income for the period 415.4 448.8 573.5 633.8
Whereof attributable to:Equity holders of the Parent Company 414.1 448.0 571.9 634.4Non-controlling interests 1.3 0.8 1.6 -0.6
Earnings per share before and after dilution (SEK) 1.13 1.23 1.57 1.74
Statement of cash flow 20141 MSEK Q1 2014 Q2 2014 Q3 2014 Q4 2014Operating income before amortization 738.2 787.9 961.5 1 017.1Investments in non-current tangible and intangible assets -258.4 -298.4 -260.4 -296.0Reversal of depreciation 233.6 235.6 246.8 250.9Change in accounts receivable -116.0 -188.4 -123.3 313.2Change in other operating capital employed -540.9 -19.1 222.4 -43.6Cash flow from operating activities 56.5 517.6 1 047.0 1 241.6Cash flow from operating activities, % 8 66 109 122Financial income and expenses paid -183.7 -35.5 -53.0 -39.2Current taxes paid -103.9 -283.8 -178.6 -130.3Free cash flow -231.1 198.3 815.4 1 072.1Free cash flow, % -45 36 121 146Cash flow from investing activities, acquisitions -23.6 -201.6 -14.7 -145.1Cash flow from items affecting comparability -19.4 -26.8 -15.2 -11.4Cash flow from financing activities -1 227.3 -322.4 -753.4 195.3Cash flow for the period -1 501.4 -352.5 32.1 1 110.9
Capital employed and financing 20141 MSEK March 31, 2014 June 30, 2014 September 30, 2014 December 31, 2014Operating capital employed 3 788.9 4 258.6 4 220.9 3 924.0Operating capital employed as % of sales 6 6 6 6Return on operating capital employed, % 95 89 91 99Goodwill 14 328.9 14 800.5 15 328.2 16 228.1Acquisition related intangible assets 1 247.7 1 234.2 1 196.3 1 244.2Shares in associated companies 135.5 287.2 301.8 324.5Capital employed 19 501.0 20 580.5 21 047.2 21 720.8Return on capital employed, % 17 16 16 16Net debt -9 932.1 -11 319.7 -10 861.4 -10 421.6Shareholders’ equity 9 568.9 9 260.8 10 185.8 11 299.2Net debt equity ratio, multiple 1.04 1.22 1.07 0.92 1 For definitions and calculation of key ratios refer to note 3.

129Securitas Annual Report 2014
Quarterly data
Statement of income 20131 MSEK Q1 2013 Q2 2013 Q3 2013 Q4 2013Sales 15 674.4 16 371.0 16 418.2 16 553.9Sales, acquired business 185.7 138.6 186.9 171.4Total sales 15 860.1 16 509.6 16 605.1 16 725.3Organic sales growth, % 0 1 1 1Production expenses -13 166.1 -13 649.7 -13 720.7 -13 740.1Gross income 2 694.0 2 859.9 2 884.4 2 985.2Selling and administrative expenses -1 948.7 -2 055.3 -1 997.6 -2 110.8Other operating income 3.5 3.1 3.6 3.3Share in income of associated companies 0.7 1.0 1.1 1.6Operating income before amortization 749.5 808.7 891.5 879.3Operating margin, % 4.7 4.9 5.4 5.3Amortization of acquisition related intangible assets -64.0 -64.3 -64.5 -80.9Acquisition related costs -8.2 -6.0 -5.0 -7.6Operating income after amortization 677.3 738.4 822.0 790.8Financial income and expenses -135.8 -80.5 -83.1 -85.6Income before taxes 541.5 657.9 738.9 705.2Net margin, % 3.4 4.0 4.4 4.2Current taxes -135.9 -149.4 -184.6 -238.7Deferred taxes -25.5 -46.7 -35.6 28.5Net income for the period 380.1 461.8 518.7 495.0
Whereof attributable to:Equity holders of the Parent Company 379.9 461.1 517.6 493.9Non-controlling interests 0.2 0.7 1.1 1.1
Earnings per share before and after dilution (SEK) 1.04 1.26 1.42 1.35
Statement of cash flow 20131 MSEK Q1 2013 Q2 2013 Q3 2013 Q4 2013Operating income before amortization 749.5 808.7 891.5 879.3Investments in non-current tangible and intangible assets -193.9 -226.9 -152.3 -230.9Reversal of depreciation 234.3 241.1 231.5 238.7Change in accounts receivable -34.9 -152.1 44.7 143.3Change in other operating capital employed -602.3 -377.3 533.5 204.6Cash flow from operating activities 152.7 293.5 1 548.9 1 235.0Cash flow from operating activities, % 20 36 174 140Financial income and expenses paid -158.9 -261.7 -63.0 -48.4Current taxes paid -117.0 -158.3 -131.3 -203.8Free cash flow -123.2 -126.5 1 354.6 982.8Free cash flow, % -26 -22 217 177Cash flow from investing activities, acquisitions -50.2 -83.8 -64.2 -96.5Cash flow from items affecting comparability -165.4 -72.8 -32.1 -37.2Cash flow from financing activities 2 132.4 -4 212.5 -654.0 463.6Cash flow for the period 1 793.6 -4 495.6 604.3 1 312.7
Capital employed and financing 20131 MSEK March 31, 2013 June 30, 2013 September 30, 2013 December 31, 2013Operating capital employed 3 304.6 4 300.1 3 469.4 3 180.9Operating capital employed as % of sales 5 6 5 5Return on operating capital employed, % 89 79 91 116Goodwill 14 053.7 14 545.3 14 087.6 14 361.9Acquisition related intangible assets 1 417.8 1 384.9 1 335.3 1 315.6Shares in associated companies 109.2 107.3 97.2 132.7Capital employed 18 885.3 20 337.6 18 989.5 18 991.1Return on capital employed, % 14 13 15 18Net debt -10 060.8 -11 770.6 -10 293.1 -9 609.8Shareholders’ equity 8 824.5 8 567.0 8 696.4 9 381.3Net debt equity ratio, multiple 1.14 1.37 1.18 1.02 1 For definitions and calculation of key ratios refer to note 3.

Securitas Annual Report 2014130
The Securitas share
The Securitas Share
At year-end, the closing price of the Securitas share on Nasdaq Stockholm was SEK 94.45, corresponding to a market capitalization of MSEK 32 861 (23 780). Earnings per share amounted to SEK 5.67 (5.07), up 12 percent compared with 2013. Adjusted for the strengthening of the Swedish krona, earnings per share improved 8 percent compared with the preceding year. The Board proposes that a dividend of SEK 3.00 (3.00) per share be paid to shareholders.
Performance of the share in 2014 At year-end, the closing price of the Securitas share was SEK 94.45 (68.35). The share price increased by 38 percent in 2014, compared with the OMX Stockholm Price index, which increased 12 percent. The highest price paid for a Securitas share in 2014 was SEK 95.80, which was noted on Decem-ber 29, and the lowest price paid was SEK 65.20, which was noted on February 10.
At the end of 2014, Securitas’ weight in the OMX Stockholm Price index was 0.62 percent (0.49) and 0.90 percent (0.71) in the OMX Stockholm 30 index. During the year, the OMX Stockholm Price index increased by 12 percent and the OMX Stockholm 30 index increased by 10 percent.
Market capitalization for Securitas at year-end was MSEK 32 861 (23 780), which corresponded to 0.62 percent of the total value of Nasdaq Stockholm.
TradingA total of 334 million (341) Securitas shares were traded on Nasdaq Stockholm, representing a value of MSEK 25 696 (22 007). The turnover velocity in 2014 was 94 percent (97), compared with a turnover rate of 67 percent (67) for the entire Nasdaq Stockholm. The average number of Securitas shares traded each day was 1 342 000.
The trading on Nasdaq Stockholm represented 64 percent of all traded Securitas shares on lit venues in 2014 and 39 percent of total trades in all categories of venues (includes, for example, dark pools and off-book). In addition to the trading on Nasdaq Stockholm, Securitas shares were traded on lit venues such as BATS Chi-X Europe and Turquoise.
Share capital and shareholder structureAt December 31, 2014, the share capital amounted to SEK 365 058 897, distributed between an equal number of shares, each with a quota value of SEK 1.00. Of these shares, 17 142 600 are Series A shares and 347 916 297 are Series B shares. Each Series A share carries ten votes and each Series B share carries one vote. The free float of the Securitas share is 88 percent.
At December 31, 2014, Securitas had 24 274 shareholders (26 054). In terms of the number of shareholders, private individuals make up the largest shareholder category with 21 126 shareholders, corresponding to 87 percent of the total number of shareholders. In terms of capital and votes, institutional and other corporate entities dominate with 96 and 98 percent, respectively.
Shareholders based in Sweden hold 48 percent of the capital and 64 per-cent of the votes. Compared with 2013, the proportion of foreign share-holders in the shareholder base has increased. At December 31, 2014, shareholders outside Sweden owned 52 percent (47) of the capital and 36 percent (33) of the votes. The largest shareholdings held by foreign shareholders are in the USA and the United Kingdom, with 16 percent of the capital and 11 percent of the votes in the USA and 15 percent of the capital and 11 percent of the votes in the United Kingdom. Foreign share-holders are not always recorded in the share register. Foreign banks and other custodians may be recorded for multiple customers’ shares and the actual owners are then not displayed in the register.
At December 31, 2014, the principal shareholders in Securitas were Gustaf Douglas, who through his family and the companies Investment AB Latour Group and Förvaltnings AB Wasatornet holds 10.9 percent (10.9) of the capital and 29.6 percent (29.6) of the votes, and Melker Schörling, who through his family and the company Melker Schörling AB holds 5.6 percent (5.6) of the capital and 11.8 percent (11.8) of the votes. These shareholders are represented on the Board of Directors by Carl Douglas, Fredrik Palmstierna, Melker Schörling and Sofia Schörling Högberg.
Dividend policy and cash dividend The dividend policy was reworded in 2014: With a balanced growth strategy comprising both organic and acquisition-driven growth and continued invest-ments in technology and security solutions, Securitas should be able to sustain a dividend level in the range of 50–60 percent of the annual net income. The Board of Directors proposes a dividend of SEK 3.00 (3.00) per share, corresponding to 53 percent of net income. Based on the share price at the end of 2014, the dividend yield for 2014 amounted to 3.2 percent.
Authorization to repurchase shares in Securitas ABThe 2014 Annual General Meeting resolved to authorize the Board to resolve upon the acquisition of the company’s own shares up to a maximum of 10 percent of the outstanding shares and for a period up to the Annual General Meeting in 2015.
Securitas share in briefSeries B Securitas shares are traded on Nasdaq Stockholm, part of Nasdaq Nordic, and on other trading venues such as BATS Chi-X Europe. Securitas is listed on Nasdaq Stockholm on the Large Cap List for companies, which includes large companies with a market capitalization of more than MEUR 1 000, and is included in the Industrial Goods & Services sector. The ISIN code for the Securitas share on Nasdaq Stockholm is SE0000163594. The ticker code for the Securitas share is SECU B on Nasdaq Stockholm, SECUB:SS on Bloomberg and SECUb.ST on Reuters. Securitas has been listed on the stock exchange since 1991.
SHAREHOLDER SPREAD AT DECEMBER 31, 2014
Number of sharesNumber of
shareholders Number of
Series A shares Number of
Series B shares % of
capital% of
votes1–500 17 099 0 2 708 962 0.74 0.52501–1 000 2 939 0 2 467 084 0.68 0.481 001–5 000 2 882 0 6 647 497 1.82 1.285 001–10 000 449 0 3 432 805 0.94 0.6610 001–15 000 172 0 2 240 220 0.61 0.4315 001–20 000 100 0 1 811 721 0.50 0.3520 001– 633 17 142 600 328 608 008 94.71 96.28Total 24 274 17 142 600 347 916 297 100.00 100.00
Source: Euroclear Sweden

131Securitas Annual Report 2014
The Securitas share
10 000
30 000
50 000
70 000
2010 2011 2012 2013 201440
50
60
70
80
90
100
110
120 SEK
Share prices for Securitas, January 1 – December 31, 2010 – 2014
Securitas BOMX Stockholm PIOMX Stockholm 30
Number of traded shares, thousands
© NASDAQ OMX
LARGEST SHAREHOLDERS AT DECEMBER 31, 2014
Shareholder Series A shares Series B shares % of capital % of votesGustaf Douglas, companies and family1 12 642 600 27 190 000 10.9 29.6Melker Schörling, companies and family2 4 500 000 16 008 700 5.6 11.8SEB Investment Management 0 15 197 799 4.2 2.9CBNY Norges Bank 0 9 879 357 2.7 1.9AMF 0 9 547 474 2.6 1.8Swedbank Robur Funds 0 8 322 166 2.3 1.6CA CIB Treatey Account 0 8 000 000 2.2 1.5Prudential Assurance Co Ltd 0 7 074 784 1.9 1.3Clearstream Banking S.A. 0 6 602 298 1.8 1.3Carnegie Fonder 0 6 080 000 1.7 1.2Total, ten largest shareholders 17 142 600 113 902 578 35.9 54.9Total, rest of owners 0 234 013 719 64.1 45.1Total as of December 31, 2014 17 142 600 347 916 297 100.0 100.01 Includes the holdings of family members, Investment AB Latour Group and Förvaltnings AB Wasatornet. 2 Includes the holdings of family members and Melker Schörling AB.
Free cash flow per share: Free cash flow in relation to the number of shares outstanding.
Market capitalization: The number of shares outstanding times the market price of the share price at year-end.
P/E ratio (Price/Earnings): The share price at the end of each year relative to earnings per share after taxes.
Turnover velocity: Turnover during the year relative to the average market capitalization during the same period.
Yield: Dividend relative to share price at the end of each year. For 2014, the proposed dividend is used.
Source: Euroclear Sweden
DATA PER SHARE
SEK / share 2014 2013 2012 2011 2010Earnings per share4, 5 5.67 5.07 4.11 1 4.67 5.71Dividend 3.00 2 3.00 3.00 3.00 3.00Dividend as % of earnings per share 53 3 59 73 64 53Yield, % 3.2 3 4.4 5.3 5.1 3.8Free cash flow per share 5.08 5.72 5.71 2.38 5.51Share price at end of period 94.45 68.35 56.70 59.40 78.65Highest share price 95.80 75.00 67.30 82.00 79.95Lowest share price 65.20 55.30 47.85 45.75 67.15Average share price 76.94 64.68 55.80 63.79 73.62P / E ratio 17 13 14 1 13 14Number of shares outstanding (000s)4 365 059 365 059 365 059 365 059 365 059Average number of shares outstanding (000s)4 365 059 365 059 365 059 365 059 365 059
1 Calculated excluding items affecting comparability as well as impairment losses of goodwill and other acquisition-related intangible assets.
2 Proposed dividend.3 Calculated on proposed dividend.
4 There are no outstanding convertible debenture loans. Consequently, there is no potential dilution.5 Number of shares used for calculation of earnings per share includes shares related to the Group’s
share-based incentive schemes that have been hedged through swap agreements.
DefinitionsShare prices for Securitas, January 1 – December 31, 2010–2014

Securitas Annual Report 2014132
Financial information and invitation to the Annual General Meeting
Reporting datesSecuritas will release financial information for 2015 as follows:
Interim Reports 2015January – March May 8, 2015January – June August 5, 2015January – September November 4, 2015January – December February 9, 2016
Financial informationAll financial information is available both in English and in Swedish and may be requested from:
Securitas ABInvestor RelationsP.O. Box 12307SE-102 28 StockholmSweden
Telephone: +46 10 470 30 00Fax: +46 10 470 31 22E-mail: [email protected]
Investor Relations activities conducted in 2014Securitas participated in investor meetings, investor conferences and roadshows in Frankfurt, Helsinki, London, Milan, San Francisco and Stockholm throughout the year. Securitas also participated in shareholders’ meetings arranged by the Swedish Shareholders’ Association.
Financial analysts who cover SecuritasCOMPANY NAME NAME
AlphaValue Hélène CoumesBank of America Merrill Lynch Nicholas de la GrenseBarclays Paul CheckettsCarnegie Mikael LaséenCiti Ed SteeleCredit Suisse Andrew GroblerDanske Equities Mikael HolmDeutsche Bank Sylvia FotevaExane BNP Paribas Laurent BrunelleHandelsbanken Staffan ÅbergHSBC Rajesh KumarJP Morgan Cazenove Robert PlantJyske Markets Robert JakobsenMorgan Stanley Allen WellsNordea Henrik NilssonRBC Capital Markets Andrew BrookeSEB Enskilda Stefan AnderssonUBS Rory McKenzie
At year-end 2014, the following bankers or brokers were in process of analyst changeover: Goldman Sachs, Kepler Cheuvreux and Swedbank.
Annual General Meeting of shareholders in Securitas AB (publ.)The shareholders in Securitas AB are hereby invited to attend the Annual General Meeting (AGM) to be held at 3.00 p.m. CET on Friday May 8, 2015 at Hilton Stockholm Slussen Hotel, Guldgränd 8, Stockholm, Sweden. Reg-istration for the AGM begins at 2.00 p.m. CET.
Notice of attendanceShareholders who wish to attend the AGM must:(i) be recorded in the share register maintained by Euroclear Sweden AB (Euroclear), made as of Saturday, May 2, 2015,and(ii) notify Securitas AB of their intent to participate in the AGM at the address:
Securitas AB, “AGM”P.O. Box 7842, SE-103 98 Stockholm, Sweden orby telephone +46 10 470 31 30or via the company website www.securitas.com / agm2015,by Monday, May 4, 2015, at the latest.
On giving notice of attendance, the shareholder shall state name, personal identity number or equivalent (corporate identity number), address and telephone number. A proxy form is available on the company website www.securitas.com / agm2015 and will be sent by mail to shareholders informing the company of their address and their wish to receive a copy of the proxy form. Proxy and representative of a legal person shall submit papers of authorization prior to the AGM. As confirmation of the notification, Securitas AB will send an entry card, which should be presented at registration for the AGM.
In order to participate in the proceedings of the AGM, owners with nominee-registered shares must request their bank or broker to have their shares temporarily owner-registered with Euroclear. Such registration must be made as of Saturday, May 2, 2015 and the banker or broker should therefore be notified in due time before said date.
Financial Information and Invitation to the Annual General Meeting

Production: Securitas AB in cooperation with Intellecta Corporate.Print: TMG Sthlm, Stockholm, Sweden, 2015.Photo: Ingemar Lindewall: Cover, inside front cover, pages 1, 3, 4, 7 (photo 2, 3), 9, 14, 16–19, 26–27, 34–37. Shutterstock: Pages 5, 7 (photo 1, 4, 5, 6).Joakim S. Enger: Page 11.Raf Ketelslagers: Page 13.Lena Granfelt: Page 20.Peter Jönsson: Page 49.Photo editing: Lena Hoxter.
341 376
NO
RD
IC
ENVIRONMENTALLA
BE
L
PRINTED MATTER

Securitas Annual Report 2014
Securitas ABP.O. Box 12307SE-102 28 StockholmSwedenVisiting address:Lindhagensplan 70www.securitas.com