Embed Size (px)
Citation preview

ANNUAL REPORT 2015

Steamships Annual Report 2015 1
Brief Profile of Steamships Trading Company Limited . . . 2
Financial Highlights . . . . . . . . . . . . . . . . . . . . 4
Chairman’s Report . . . . . . . . . . . . . . . . . . . . . 6
Directors’ Review . . . . . . . . . . . . . . . . . . . . . 7
Review of Operations - LOGISTICS . . . . . . . . . . . . 8
Consort Express Lines . . . . . . . . . . . . . . . . 8
Pacific Towing . . . . . . . . . . . . . . . . . . . . 9
Transport & Port Services . . . . . . . . . . . . . 10
Review of Operations - PROPERTY . . . . . . . . . . . 11
Coral Sea Hotels . . . . . . . . . . . . . . . . . . 11
Pacific Palms Property . . . . . . . . . . . . . . . 12
Review of Operations - COMMERCIAL . . . . . . . . . 13
Laga Industries . . . . . . . . . . . . . . . . . . . 13
Colgate Palmolive . . . . . . . . . . . . . . . . . 13
Sustainability . . . . . . . . . . . . . . . . . . . . . . . 14
Corporate Governance . . . . . . . . . . . . . . . . . . 14
Financial Section . . . . . . . . . . . . . . . . . . . . . 15
Statements of Comprehensive Income . . . . . . . 15
Statement of Changes in Equity . . . . . . . . . . 16
Balance Sheets . . . . . . . . . . . . . . . . . . . 17
Statements of Cash Flows . . . . . . . . . . . . . 18
Notes to the Financial Statements . . . . . . . . . 19
Independent Auditor’s Report . . . . . . . . . . . 50
Directors’ Report . . . . . . . . . . . . . . . . . . 52
Stock Exchange Information . . . . . . . . . . . . 56
Company Directory . . . . . . . . . . . . . . . . . . . IBC
CONTENTS

2 Steamships Annual Report 2015
BRIEF PROFILE OF STEAMSHIPS GROUP
Integral to this vision are the following business strategies:
• The long-term development of a diversified range of businesses in which shareholder value can be created,
• Employment of staff who we believe will further our strategic objectives and will be committed to the group for the long term and providing them with rewarding careers,
• Operational excellence in the way we conduct our business,
• Doing business in a sustainable manner, and
• Commitment to the highest standards of corporate governance.
The Group employs over 4,000 PNG citizens and non-citizens in 6 diverse divisions grouped under the 3 operating categories of Logistics, Property and Commercial.
Steamships core values include the following:
• Safety – We prioritise safety awareness and compliance to ensure our business operations are conducted safely.
• Integrity – Taking the more ethical and honest path; honouring our commitments and delivering on our promises; creating a bond of trust that sustains relationships with our staff, customers, shareholders, business partners and the communities in which we do business.
• Excellence – Our customers and colleagues expect us to deliver high quality goods and services. If something is to be done, we believe it should be done in the best possible way.
• Customer Focus – Our customers are the final judges of our success or failure. We understand and respond to the needs of our customers.
• People Development – We value a working environment that fosters innovation and encourages personal development and learning.
• Humility – We believe in the need to respect and to learn from others. To do this we must be aware of our own limitations and to seek to understand other perspectives. Humility guides our approach to colleagues, customers and partners. This does not mean that we lack self-confidence but that we act with humble pride.
• Continuity – We take a long term view. We grow our business sustainably and create enduring value that earns the respect of our customers, our staff, our communities and our shareholders.
Steamships is aware of its prominent position in the community and its responsibility to serve that community. The Group continues to be one of PNG’s largest private sector employers and one of the largest supporters of community initiatives in education, health and social welfare. Steamships ensures that core sustainability concepts are embedded in its business models and systems. The Group is wholly aware that its business goals cannot be achieved unless this is the case. Steamships cannot succeed without the engagement and support of the people it employs, the loyalty and satisfaction of its customers, the local communities and the environment in which it operates.
Ninety-seven years on, Steamships is still showing it has the resources and capacity, vision and capability to meet the dynamic needs of a growing country.
Steamships Trading Company (Steamships) is a committed investor in Papua New Guinea with a near 100 year history. The group is a well-established business conglomerate with diverse commercial interests and listings on both the Australian and Port Moresby Stock Exchanges.
Steamships has a vision to build a valuable and profitable business that is widely respected as being the best group to work for and with which to do business.

STEAMSHIPS’ ORGANISATIONAL STRUCTURE
BRIEF PROFILE OF STEAMSHIPS TRADING COMPANY LTD
Steamships Annual Report 2015 3
STEAMSHIPS’ ORGANISATIONAL STRUCTURE
BRIEF PROFILE OF STEAMSHIPS TRADING COMPANY LTD
Steamships Annual Report 2015 3
STEAMSHIPS TRADING COMPANY
LOGISTICS PROPERTY COMMERCIAL
X3 JV PropertyDevelopment Co’s

4 Steamships Annual Report 2015
FINANCIAL HIGHLIGHTS
2015 2014 Change K’000 K’000 %
Revenue (including discontinued operations) 773,535 941,708 -18%Profit attributable to shareholders 98,979 88,655 12%Cash generated from operations 202,821 222,512 -8%Net cash inflow/(outflow) before financing 121,601 13,193 822%Shareholders’ funds 789,087 735,964 7%External Borrowings 644,667 700,883 -8% Earnings per share (toea) 319 286 12%Dividends per share (toea) 130 140 -7%Shareholders’ funds per share (toea) 2,545 2,373 7% Underlying profit attributable to shareholders 80,651 108,808 -26%Underlying earnings per share (toea) 260 351 -26% Gearing ratio 43.5% 47.8% -9%Interest cover 6.3 5.8 9%Dividend cover 2.5 2.0 20%
2015 FINANCIAL HIGHLIGHTS

Steamships Annual Report 2015 5
FINANCIAL HIGHLIGHTS
SUMMARY OF PAST PEFORMANCE
2006 2007 2008 2009 2010 2011 2012 2013 2014 2015 K’000 K’000 K’000 K’000 K’000 K’000 K’000 K’000 K’000 K’000INCOME STATEMENT (including discontinued operations) Revenue 333,966 404,592 462,972 495,976 789,918 920,357 986,310 930,934 941,708 773,535Profit before tax 53,502 91,208 111,615 120,602 180,834 233,967 265,574 79,747 134,789 136,042Share of associates profit 15,115 15,029 16,837 16,732 11,416 13,859 14,188 9,697 3,843 3,062Income tax expense (18,357) (27,869) (32,808) (34,637) (53,935) (67,727) (81,414) (14,042) (38,487) (37,710)Minority interests (2,781) (4,211) (5,418) (6,137) (21,870) (21,838) (20,648) 38,609 (11,490) (2,415)Net profit attributable to shareholders* 47,479 74,157 90,226 96,560 116,445 158,261 177,700 114,011 88,655 98,979Depreciation transfer 1,467 1,467 159 0 0 (1,061) 0 0 0 0Equity adjustment 0 0 0 0 0 0 0 (8,994) 0 2,206Dividends paid or provided (31,008) (38,760) (45,272) (45,272) (31,008) (58,916) (88,373) (57,365) (43,411) (40,311)Earnings retained this year 17,938 36,864 45,113 51,288 85,437 98,284 89,327 47,652 45,244 60,874 *Underlying profit attributable to shareholders 35,067 49,926 67,770 85,120 113,597 153,566 156,213 128,367 108,808 80,651 BALANCE SHEET SHARE CAPITAL & RESERVES Issued Capital 24,200 24,200 24,200 24,200 24,200 24,200 24,200 24,200 24,200 24,200Retained Earnings 218,833 254,230 302,595 353,883 428,157 554,349 652,978 689,777 711,764 764,887Shareholders’ funds 243,033 278,430 326,795 378,083 452,357 578,549 677,178 713,977 735,964 789,087Minority Shareholder’s Interest 11,094 13,684 18,336 43,854 62,851 75,365 84,322 22,907 30,773 47,515EQUITY 254,127 292,114 345,131 421,937 515,208 653,914 761,500 736,884 766,737 836,602 Fixed Assets / Investment Properties 227,773 263,276 353,261 664,196 786,510 938,709 1,023,861 1,066,393 1,115,123 1,072,955Investments in Associated Companies 16,839 22,225 33,337 17,939 15,416 28,445 38,687 31,471 33,193 36,458Future Income Tax Benefit 12,944 5,358 4,150 7,305 9,282 0 0 21,081 33,521 36,914Goodwill 3,568 3,568 7,578 17,183 17,183 17,183 17,183 93,617 80,491 80,491Current assets 98,006 137,623 154,508 203,480 294,203 299,634 411,920 352,549 366,479 400,480TOTAL ASSETS 359,130 432,050 552,834 910,103 1,122,595 1,283,971 1,491,651 1,565,111 1,628,807 1,627,298 Current Liabilities 98,517 134,941 122,562 236,847 273,055 283,445 370,396 230,390 190,621 541,292Non-Current Liabilities 6,486 4,995 85,141 251,319 334,331 346,612 359,755 597,837 671,449 249,404TOTAL LIABILITIES 105,003 139,936 207,703 488,166 607,386 630,057 730,151 828,227 862,070 790,696 NET ASSETS 254,127 292,114 345,131 421,937 515,208 653,914 761,500 736,884 766,737 836,602 RATIOS Current assets to current liabilities 0.99 1.02 1.26 0.86 1.08 1.06 1.11 1.53 1.92 0.74Borrowings to shareholders funds 10.6% 13.6% 34.8% 89.1% 89.7% 70.1% 72.6% 89.7% 95.2% 81.7%Gearing 9.2% 11.5% 24.8% 44.4% 44.0% 38.3% 39.2% 46.5% 47.8% 43.5%Tangible net asset backing per share (toea) 8.08 9.31 10.89 13.05 16.06 20.53 24.00 20.75 22.13 24.38Net profit to revenue % 14.1% 18.2% 19.4% 19.3% 14.5% 16.9% 17.1% 12.2% 9.4% 12.8%Net profit to shareholders’ funds % 19.5% 26.6% 27.6% 25.5% 25.7% 27.4% 26.2% 16.0% 12.0% 12.5%Underlying profit to shareholders’ funds % 14.4% 17.9% 20.7% 22.5% 25.1% 26.5% 23.1% 18.0% 14.8% 10.2%Dividends per share (toea) 100 125 146 146 100 190 285 185 140 130EPS (toea) 153 239 291 311 376 510 573 368 286 319Underlying EPS (toea) 113 161 219 275 366 495 504 414 351 260Earnings retained % 37.8% 49.7% 50.0% 53.1% 73.4% 62.1% 50.3% 41.8% 51.0% 61.5% Notes Earnings per share = profit attributable to shareholders / average shares in issueGearing = debt / debt plus equity Interest cover = earnings before interest and tax / net finance charge Dividend cover = profit attributable to shareholders / total dividend paid and provided

6 Steamships Annual Report 2015
CHAIRMAN’S REPORT
Trading conditions remained challenging across all sectors in 2015 as anticipated. Whilst cocoa and copra prices remained firm, coffee and palm oil prices continued to decline which together with the arguably overvalued Kina took their toll on the non-resource sector of the economy which supports the vast majority of Papua New Guinea’s citizens.
The collapse in oil and gas prices brings uncertainty to anticipated projects but the quality of PNG resources should mean that it is a question of when not if development will commence. Signs of early works on the Total SA-led Papuan LNG project, and on the delayed feasibility study for the Wafi-Golpu gold project in Morobe Province will be a welcome relief if they materialise. Also encouraging is the reopening of the Ok Tedi copper mine in March 2016.
Hitherto government infrastructure expenditure has kept PNG’s economy ticking over since the completion of the PNG LNG Project in 2014. With a national budget deficit due to reduced revenues there is a more restrained 2016 outlook which combined with subdued gas and mining investment will likely see another difficult year in 2016.
With Port Moresby hosting the APEC economic leaders meeting in November 2018 there will be many related satellite events in the lead up years and we can expect to see more activity. This will be supplemented by the recently secured ACP Group Leaders Summit to be hosted by PNG in 2016.
A continued lack of foreign currency is restricting imports and making further domestic capital investment difficult; a sovereign bond ‘circuit breaker’ is hoped to replenish reserves.
Within Steamships the logistics businesses undertook a significant restructuring in 2015 with the merger of our two shipping divisions into one, and the merger of our two land side logistics divisions into one. Both of these initiatives foresaw the need to reduce structural costs to enhance competitiveness. Investment in newer marine tonnage in 2014 paid dividends in the year improving cost efficiency and reliability.
Our property division remained largely resilient by virtue of its investments in scale and strategic locations; these attributes have positioned the business to ride out the stresses created by over-supply in some sectors. Unfortunately we suffered a material fire loss at the Central
Waigani complex, albeit fully insured – redevelopment works are expected to complete by the end of 2017.
Our Hotels division continues to invest significantly in the upgrade of its product and service standards to better attract and retain custom in an increasingly competitive market. The division implemented some, and continues to review, expansion plans for leisure dining in anticipation of increasing disposable incomes over the medium term.
Management of the transition of Laga from a manufacturer of a variety of consumer goods to a business more focused upon ice cream manufacturing, sales and distribution was achieved during the year by new management, applying a more disciplined and structured approach to delivering the basics .
The overall pace of capital investment was consciously decelerated in 2015 as the economic downturn is digested. This has allowed a strengthening of the balance sheet through reduced gearing and positions Steamships well to capitalise on opportunities that could arise.
Steamships remain confident in the longer term prospects for the PNG economy. In the short term a degree of caution will continue to be exercised and disciplines applied that have assisted Steamships over 97 years to navigate the occasional bumpy road on PNG’s journey of development.
Steamships will continue to invest in the training and development of its staff despite the slowdown. We intend to be well positioned for when the economy regathers steam and our team can continue to grow Steamships. I thank all our staff for their commitment and hard work which have been and will remain critical to the success of Steamships .
GL CundleChairman
31 March 2016

Steamships Annual Report 2015 7
DIRECTORS’ REVIEW
The Directors of Steamships Trading Company Limited advise a profit after tax and minority interests of K99.0 million for the 12 months to December 2015, compared to a profit of K88.7 million for the same period in 2014 (a 11.6% increase). However, adjusting for significant items the underlying profit attributable to shareholders decreased 25.9% from K108.8 million in 2014 to K80.7 million in 2015 as shown below:
The year on year result reflects the expected continued weakening in economic conditions; the latter half of the year in particular was adversely effected not only by the continued collapse in oil prices (withering resources sector investment), but also by the affects of the El Nino with its consequent impact on our riverine shipping activity in the Western Gulf. As a consequence 2015 sales declined 12% to K773.5 million against last year’s K879.3 million on a continuing basis.
Depreciation in 2015 was K102.1 million (excluding impairments) against K104.7 million in 2014, and interest on borrowings (excluding capitalised interest) was K26.0 million against K28.9 million in 2014. Capital expenditure for the 12 months was K109.7 million (with capitalised interest of K1.5 million) against K201.3 million (with capitalised interest of K4.9 million) in 2014 reflecting a conscious slowdown in project activity in the economic climate. The group’s net operating cash flow generation declined 8.8% to K202.8 million against K222.5 million in 2014 .
A final dividend of 35 toea per share will be paid after the annual general meeting on the 13th of May 2015, subject to our ability to secure foreign exchange for non PNG shareholders. This brings the total dividend for the year to 130 toea per share (2014 = 140 toea per share) representing 50% of profit after tax as adjusted for non-cash exceptional items. The dividend is unfranked and there is no conduit foreign income.
As a result of reduced capital spend borrowings declined 8% to K645 million and gearing improved 9% to 43.5%. Interest cover remains at a comfortable 6.3 times. Certain of the Group’s banking facilities mature at the end of 2016 and the Directors are currently negotiating renewals of all the Group’s facilities for a further three to five year period under a Common Terms Deed, together with refinancing of joint venture borrowing arrangements where possible off balance sheet .
2015 2014 Km’s Km’s Change Net profit attributable to shareholders 99.0 88.7 11.6%
Add back/(less) impact of significant (post tax and minority interest)Unrealised gain on change in control of Pacific Rumana (18.9) -Impairment of coastal slipway 1.3 -Impairment of fleet and equipment (post highway closure) (0.7) 15.7Gain on sale of Datec (PNG) Ltd - (7.1)Trade Winds impairment 0.9 4.0Laga office and amenities impairment (1.0) 4.6Laga inventory impairment - 1.5Other - 1.5Total impact of significant items (18.3) 20.2
Underlying profit attributable to shareholders 80.7 108.8 -25.9%

8 Steamships Annual Report 2015
REVIEW OF OPERATIONS - LOGISTICS
During 2015 the group merged its shipping interests together with the sale of Steamships Coastal Shipping to Consort Express Lines. The combined division operates a fleet of 21 coastal vessels (7 geared, multi-purpose deep water vessels and 14 shallow water landing craft, tugs and barges). All are PNG flagged and manned with all safety and technical specifications maintained according to Lloyds international standards.
LINER SERVICES
Consort connects 15 ports in PNG and provides an international service to Townsville, Australia. The Division has scheduled services to the North Coast (Madang, Basamuk, Wewak, Vanimo), South Coast (Port Moresby, Oro Bay, Alotau), New Guinea Islands (Kimbe, Rabaul, Kavieng), Bougainville (Buka, Kieta), Australia (Townsville) and to Western Province (Daru, Kiunga). Consort proudly serves the people of PNG by providing the sole supply link to many of the communities on its routes.
The division can carry a range of cargoes including containerised, break-bulk, reefer, LCL and project cargo. Consort transports cargo for a diverse customer base from domestic manufacturers and wholesalers to international liner carriers transhipping cargoes to outports.
In addition to owning and operating ships, Consort provides complementary depot services to customers at its Lae hub (including bond yard, container storage and wash bay facilities) and is a shareholder and manager of stevedoring operations at five PNG ports (Riback Stevedoring, Lae; United Stevedoring Limited, Lae; United Stevedoring Limited, Port Moresby; Makerio Stevedoring, Buka; Nikana Stevedoring, Kieta). These stevedoring companies are partnerships between Consort and local landowner companies and provide significant employment opportunities for the nearby communities .
PROJECT CHARTERS
Consort provides short and long term vessel charters specialising in shallow water river shipping, and together with the Transport & Port Services Division develops, implements and supports intermodal logistics solutions linked to land based services such as road transport, cargo handling, storage, agencies, customs clearance, lay down areas and warehousing.
As expected the continued slowing activity levels across our logistics businesses forced a 2015 assessment to reduce structural costs and enhance competitiveness. As a result on the 1st July 2015, in the face of significantly reduced marine project charters and reduced liner margins in the face of competition for limited cargos, the group merged its shipping interests together with the sale of Steamships Coastal Shipping to Consort Express Lines. The combination targets efficiency alignment and synergistic cost savings in the competitive economic environment.
Consort Express Lines had to effect a painful short notice move from its Port Moresby main wharf to Motukea in September 2015 following PNG Ports acquisition of the same, whilst the long awaited and delayed completion of the 1st stage Lae Tidal Basin and redevelopment of the Kimbe wharf brought much needed congestion relief to shipping liner operations towards the latter part of the year.
The investment in two larger capacity 8,000 dwt vessels (Gazelle Coast and Bougainville Coast) at the end of 2014 and early 2015 has enabled improved and more reliable scheduling, despite congestion challenges. Consort also continues to invest in the expansion and upgrading of its container fleet with 2,000 new boxes delivered in 2015.
As in 2014, it was a challenging year for Project Charters as demand for landing craft was weak with the continued fall in exploratory activity for resource companies as a result of weakening oil prices. This was particularly disappointing given the anticipated developments on the Papuan LNG, Pn’yang, Stanley and Frieda projects, and the division’s 2014 investment in new shallow draft and double bottom capacity for the same. The El Nino weather event started to be felt in July 2015 and almost immediately Ok Tedi moved their operations into care and maintenance mode, substantially impacting the economy of Kiunga. Our ‘Kiunga Chief’ remained employed but spent several months stranded on the Fly River, as did certain of our liner vessels, as water levels dropped; relief has only come in early 2016. The Directors nonetheless remain confident that the division is well placed to capitalise on demand as it manifests and pleasingly as the year ended we saw our first vessel go on charter to Total.
Stevedoring tonnages for its associates were broadly level on 2014 with cost savings delivering an overall better contribution .
The year culminated with the retirement of a long serving General Manager and the appointment of a new General Manager from his previous role as Chief Operating Officer and architect of the shipping merger.
CONSORT EXPRESS LINES

Steamships Annual Report 2015 9
REVIEW OF OPERATIONS - LOGISTICS
Pacific Towing is the leading provider of harbour towage and mooring services in PNG and offers coastal and ocean towage services. It also retains a fast responder salvage capability complemented by a comprehensive range of commercial dive services. As an ancillary service the company also provides life raft leasing & servicing and is developing fire services capability.
Pacific Towing is headquartered in Port Moresby and operates 11 tugs and 12 associated support vessels, in five ports across PNG (Port Moresby, Lae, Rabaul, Kimbe and Madang). Dedicated harbour towage services were extended to the Solomon Islands in 2013 through a newly formed subsidiary company operating in Honiara.
Pacific Towing experienced a 21% decline in its principal harbour towage jobs, but positive non-harbour towage, salvage and diving activity meant that the division posted a respectable result .
The division enhanced its salvage capability at the start of 2015 through a cooperation agreement with Perrott Salvage, and acquired the life raft sales & servicing business of Steamships Coastal Shipping mid-year to which expanded services are now being offered. A work experience program has also been developed with Hong Kong Salvage & Towage which will see two employees placed for a month in Hong Kong in early 2016. Pacific Towing’s divers likewise attend the Professional Diving Academy in Sydney.
During 2015 one salvage (POAVOSA WISDOM) was settled albeit the same was already materially accrued within the fair value accounting of the 50% Svitzer acquisition in late 2013. In 2015 a further three salvages were responded to (HELENE RICKMERS, FOXHOUND and TAO MARINER) which when settled are expected to realise a profit of approximately K3 million.
At the end of 2015 Pacific Towing secured the purchase of a 62tbp tug, KEERA, to position the business with Puma Fuels for their intended introduction of Suezmax vessels, while also increasing capacity for salvages and long haul towage opportunities.
PACIFIC TOWING

10 Steamships Annual Report 2015
TRANSPORT & PORT SERVICES
REVIEW OF OPERATIONS - LOGISTICS
During 2015 the group combined the management of its transport and port services interests together again with the objective of securing efficiency alignment and synergistic cost savings in the competitive economic environment.
EAST WEST TRANSPORT (EWT)
EWT is one of the country’s main multifaceted transport and logistics companies with a presence in Lae, Port Moresby, Kimbe, Rabaul, Madang, Wewak and Kavieng. The division has a sizable fleet of prime movers, heavy trucks, light trucks, forklifts and reach stackers ranging from 2.5 to 45 tons in capacity. All equipment is supported by localised workshop facilities, safety and emergency vehicles and in house training programs.
EWT operates across a wide spectrum of transport-related activities including bulk fuel, containerised cargoes, bulk grain, sawdust and coffee along with break-bulk cargoes and depot services such as equipment hire, warehousing and yard storage. EWT also offers a licensed customs cargo clearance service in Lae and Port Moresby. The Division capitalises on its close relationship with its sister shipping company by offering specialised project solutions for the mining, oil and gas sectors.
JV PORT SERVICES (JVPS)
Our eight JVPS businesses offer a full range of stevedoring and handling facilities. They operate in the ports of Port Moresby, Lae, Alotau, Oro, Madang, Kimbe, Kavieng and Kiunga. With a fleet of specialist equipment the businesses handle all types of containers, as well as project cargo, break-bulk, RO-RO, LO-LO and grains. Local trucking businesses are also operated at several locations. The stevedoring companies are joint ventures between Steamships and local landowner groups at the respective ports. Each joint venture employs a local workforce and is structured in a manner so that a share of earnings is able to filter back into the community.
As reported last year in early 2015 a decision was taken to close the Highlands Highway operations of East West Transport due to over overcapacity and unsustainable margins. Consequently in May 2015 the residual transport business, which focuses on customs clearances, town cartage and fuel distribution in seven locations was merged with that of the eight Steamships Joint Venture Port Services businesses to form a new combined division called Transport and Port Services (together operating in ten locations, seven being complementary).
Competition in the transport market remains fierce with the ongoing excess of equipment; this was exacerbated in the year by certain traditionally Lae based transport operators establishing a presence in Port Moresby. The Kimbe operation was as expected also negatively affected by a reduction in fertiliser imports for 2015 as palm oil growers sought to reduce input costs.
JV Port Services volumes remained broadly static in 2015, however, the business faces uncertainty in respect of the International Terminal Operator concession tender issued by PNG Ports in the latter part of the year. JV Port Services were, in our and our joint venture land owner partners’ view, unfairly excluded despite many decades of service to PNG at comparable international efficiency and tariff rate levels under challenging infrastructure circumstances. The business now foresees a junior partnership role in these ports alongside an overseas operator.
The division moves into 2016 with a formidable array of experience through a strong, well trained employee base of 1,300 staff and a significant range of fit for purpose equipment, and thus is well placed to meet the challenges head on.

Steamships Annual Report 2015 11
REVIEW OF OPERATIONS - PROPERTY
Coral Sea Hotels (CSH) operates nine hotel and apartment complexes offering full hotel facilities and serviced apartments as well as extensive meeting, conference and banqueting facilities.
CSH remains the largest hotel group in PNG, offering 646 hotel rooms and 135 apartments. The Group comprises the Grand Papua Hotel, the Gateway Hotel and Apartments, the Ela Beach Hotel and Whittaker Apartments in Port Moresby; the Huon Gulf Hotel and Apartments and Melanesian Hotel and Apartments in Lae; the Highlander Hotel and Apartments in Mount Hagen; the Bird of Paradise Hotel and Apartments in Goroka, and the Coastwatchers Hotel in Madang.
Margin declined as average revenue per available asset for both rooms and apartments declined 6% and 7% respectively on the prior year with the impact of a slower economy on business travel, growing competition in Port Moresby and Lae, budget constraints on government department expenditure and reduced consumer discretionary spend in restaurants all being contributory factors. The Port Moresby hotels did however benefit from the Steamships Gold sponsorship of the Pacific Games and designation as “Preferred Accommodation Provider of the Event”.
Investment was maintained in the upgrade of room standards, Project Cambridge, with the Ela Beach Hotel being the initial beneficiary. The project will be extended to the Gateway through 2016 and then to other properties.
Investment in complementary food & beverage facilities saw the opening of the Grand Papua Douglas Street Café mid-year and the Jacksons Bar & Gaming in early 2016. In addition Coral Sea Hotels is partnering with the Ok Tedi Development Foundation to build and operate a new 45 bed hotel (the Cassowary) in Kiunga due to open in 2017.
Significant investment continues in staff training to enhance the quality of service offering for customers, together with the introduction of a website booking engine and a free wi-fi service through most of the division’s hotels in the year. A Pacific Privilege membership scheme was launched mid-year with strong uptake. A number of 2015 World Luxury Hotel Awards in the Australasia and Oceania category are testament to all these initiatives.
Plans for 2016 onwards include redevelopment of the Melanesian and Huon Gulf Hotels in Lae, extensions for the Highlander Hotel in Mt Hagen and a new restaurant outlet for the Grand Papua Hotel. The year is expected to remain competitive, especially in Port Moresby with the opening of a new Hotel mid-year.
CORAL SEA HOTELS

12 Steamships Annual Report 2015
REVIEW OF OPERATIONS - PROPERTY
PACIFIC PALMS PROPERTY
Pacific Palms Property is one of the largest and most dynamic property developers in PNG. The Division provides residential, commercial, retail and industrial property throughout the country.
Pacific Palms Property has two separate streams of business activity. The development team manages land acquisition, investment assessment and construction management, while the lettings team manages marketing, tenant placements, rental collections and property maintenance.
Building and land assets are located in Port Moresby, Lae, Madang, Wewak, Goroka, Mt Hagen, Popondetta and Rabaul. The Division currently holds a total lettable space (inclusive of its joint venture arrangements) of 25,488m2 of commercial property, 193,184m2 of industrial property, 36,949m2 of retail property and 160 residential townhouses and apartments.
In recent years Pacific Palms Property has focused investment in developments of scale and quality in good strategic locations. These attributes have largely positioned the business to ride out stresses created by over-supply in some property sectors in Port Moresby and consequently revenues held firm in 2015.
Residential rates continue to compress but occupancy for Pacific Palms remains strong reflecting the quality of product, especially the new Windward East apartments which remained full throughout the year. A refurbishment of the original Windward West apartments is nearing completion which will see 26 upgraded apartments back in the market by early 2016.
The Retail category was steady throughout the year except for the unfortunate electrical fire that broke out in our new Central Waigani development in July 2015 with extensive damage to the rear of the property; both the build and loss of profits are fully insured and a rebuild should be completed by the end of 2016.
In the Industrial category at the end of 2015 a second phase development at Baruni was completed, together with a refurbishment of the initial phase that was damaged in early year civil unrest – when the new coastal and Gerehu link roads are completed, together with the continuing port move to Motukea, it is anticipated this will become an increasingly attractive location. During the year the government ‘commandeered’ a significant proportion of our Coastal Wharf facility for the new Paga Hill ring road development for which compensation is expected.
The Commercial category saw the commissioning in June 2015 of our joint venture Harbourside Development and by the end of 2015 a 99% occupancy had been secured for both commercial and food & beverage outlets, albeit the latter have been slow to complete fit outs. Within this development Pacific Palms launched its own short stay and serviced offices offering daily, weekly and monthly options including administrative services.
Prospects for 2016 are expected to be relatively stable for all categories albeit demand for older residential units is expected to remain under pressure and leasing of industrial units in Baruni will likely be slow until road works are complete. A selective disposal of less strategic properties is being undertaken and the division is partnering in two joint ventures to develop mixed use retail/commercial centres in Madang and Hagen to open in mid-2016 and the end of 2017 respectively. The Directors are also considering plans to commence a complementary Harbourside South development.

Steamships Annual Report 2015 13
REVIEW OF OPERATIONS - COMMERCIAL
LAGA INDUSTRIES
COLGATE PALMOLIVE
Headquartered in Lae, Laga Industries is one of PNG’s largest consumer goods businesses manufacturing and distributing ice creams, vegetable oils, drink powders, condiments and spirits .
Brands include Gala Ice Cream, distributed from the Gala Parlours found in most leading retail supermarkets, Laga and Highlands Meadow oils, Kools drinking powders, and Trade Winds spirits including popular ready-to-drink (RTD) premixed beverages. Laga Industries also bottles pure drinking water.
Operationally, the Division has a fully integrated production facility in Lae and has a freezer and dry goods distribution facility in Port Moresby, with sales offices in Madang, Wewak, Goroka, Mt Hagen, Kimbe, Kavieng, Rabaul and Buka.
Laga Industries saw a significant turnaround in fortunes following the appointment of a new General Manager who oversaw a ‘back to basics’ approach and the completion of an ice cream production facility transformation with a K10 million investment in a new plant and freezer capacity. Aside from securing a significant gross margin improvement through improved formulation this doubled ice cream production capacity to become the largest facility in the Pacific, setting a positive sales and distribution challenge for 2016.
The Food services category continued to perform well with line extensions under review.
Vegetable oil is a commoditised product but Laga’s Highlands Meadow Grand continues to command loyalty; the strategy to cease domestic bottling and transition to overseas sourcing finally bedded down in the year with out-of-stocks only arising due to foreign exchange issues. 2016 sees the introduction of a second supplier to diversify risk .
A divestment of the Trade Winds business failed at the end of 2015 and management are now reviewing alternative options .
Aside from continuing unreliable power and telecommunications, the overhead base of the business was significantly cut through the year, helping the division in the face of increased competition.
While the division remains short of producing the returns desired for the shareholders, 2015 was an important step in re-establishing the business as PNG’s premier consumer goods operator.
2016 is expected to see a continuing tight consumer market and thus modest growth is anticipated, however, new product development and production efficiency opportunities will be pursued across all areas and investment in physical and human assets will achieve these .
Steamships holds a 50 per cent beneficial interest in Colgate-Palmolive (PNG) Ltd (Colgate), a company that markets and distributes oral, personal, home and fabric care products in PNG. Joint control is exercised by the board however day to day management is performed by Colgate-Palmolive Australia .
Colgate Palmolive, a PNG joint venture, saw improved trade volumes in Oral, Personal and Fabric Care categories, with only the Home Care category seeing sales compression. Margins improved principally with declining soap chip costs .
A continuing improvement in in-store execution and an
enhanced distribution presence in second tier markets had a positive impact on sales. The division continued to strengthen supply chain processes and stock control avoiding product availability problems seen in past years. Marketing focus was maintained on consumer education programmes in all media to promote the health benefits of oral and personal hygiene. The “Bright Smiles, Bright Futures” campaign for Colgate toothpaste involved a direct interaction between Colgate Palmolive’s oral health ambassadors and 245,000 consumers (the majority being schoolchildren) across PNG, up from 146,000 in 2014.
Like Laga Industries 2016 is expected to see a continuing tight consumer market and thus modest growth is anticipated.

14 Steamships Annual Report 2015
SUSTAINABILITY
Steamships remains committed to the principles of Sustainable Development. Our People remain our key asset and focus on their health, safety and security is paramount in all we do.
Steamships will continue to invest in the training and development of its staff despite the slower economy. We intend to be well positioned for when the economy regathers steam and our team can continue to grow Steamships .
We continue to promote community engagement initiatives and are acutely aware of the need to minimise
our environmental footprint. We continue for a second year to report against the Global Reporting Initiative measures at the C level.
Steamships’ full annual Sustainability Report can be found at http://www.steamships.com.pg/sustainability/sustainability-reporting
CORPORATE GOVERNANCE
Steamships and its Board are committed to achieving and demonstrating the highest standards of corporate governance and ethical behaviour, and they expect these standards from all employees. The Group believes that the maximisation of long term returns to shareholders is best achieved by acting in a socially responsible manner that recognises the interests of community stakeholders.
Steamships is committed to:
• Ensuring the safety and wellbeing of employees and others with whom the Group has contact;
• Providing high-quality products and services to meet customers’ needs;
• Maintaining high standards of business ethics and corporate governance; and
• Promoting sustainable business practice.
Steamships reports against the Australian Stock Exchange (ASX) recommendations by addressing each key principle in the order it is listed in the ASX guidelines. Each section
addressing a key principle includes references to relevant information that appears elsewhere in the 2015 Annual Report or on the Steamships’ website.
Steamships believes it complied with the Australian Stock Exchange Corporate Governance Principles (the third edition) during the twelve months ended 31 December 2015, except where noted in the annual Corporate Governance Report.
Steamships’ full annual Board approved Corporate Governance Report can be found at http://www.steamships.com.pg/aboutus/corporategoverance

Steamships Annual Report 2015 15
STATEMENTS OF COMPREHENSIVE INCOMESteamships Trading Company Limited Year Ended 31 December 2015 (Amounts in Kina 000’s)
Consolidated Parent Entity
Note 2015 2014 2015 2014Continuing Operations
Revenue 3(a) 773,535 879,267 38,044 78,347
Other income 3(a) 48,285 11,674 5,432 21,568
Operating expenses 3(b) (660,082) (730,630) (4,142) (4,706)
OPERATING PROFIT 161,738 160,311 39,334 95,209
Finance income/(costs) - net 3(e) (25,696) (28,808) 72 417
Share of profit of associates and joint ventures 4(b) 3,062 3,844 - -
PROFIT BEFORE INCOME TAX 139,104 135,347 39,406 95,626
Income tax expense 5(a) (37,710) (37,295) (519) (70)
PROFIT FROM CONTINUING OPERATIONS 101,394 98,052 38,887 95,556
Profit after tax from discontinued operations 24 - 2,093 - -
TOTAL COMPREHENSIVE INCOME FOR THE YEAR* 101,394 100,145 38,887 95,556
Attributable to:
Non-controlling interests 2,415 11,490 - -
Shareholders 98,979 88,655 38,887 95,556
101,394 100,145 38,887 95,556
Basic and Diluted Earnings per share
Continuing & discontinued (toea) 3(f) 319t 286t
Continuing (toea) 3(f) 319t 279t
* There is no other comprehensive income for the consolidated group or the parent entity.
These Statements of Comprehensive Income are to be read in conjunction with the accompanying notes.

16 Steamships Annual Report 2015
STATEMENT OF CHANGES IN EQUITYSteamships Trading Company Limited Year Ended 31 December 2015 (Amounts in Kina 000’s)
Non- Share Retained Other Total Capital Controlling Total Capital Earnings Reserves & Reserves Interest Equity
BALANCE AT 1 JANUARY 2014 24,200 698,771 (8,994) 713,977 22,907 736,884
Profit for the year - 88,655 - 88,655 11,490 100,145
Dividends paid 2014 - (66,668) - (66,668) (3,624) (70,292)
BALANCE AT 31 DECEMBER 2014 24,200 720,758 (8,994) 735,964 30,773 766,737
Profit for the year - 98,979 - 98,979 2,415 101,394
Dividends paid 2015 - (48,062) - (48,062) (2,795) (50,857)
Equity adjustment due to deconsolidation - 2,206 - 2,206 17,122 19,328
BALANCE AT 31 DECEMBER 2015 24,200 773,881 (8,994) 789,087 47,515 836,602
This Statement of Changes in Equity is to be read in conjunction with the accompanying notes.
No Statement of Changes in Equity is presented for the Parent Entity as the only movement in equity is represented by the retained earnings as shown in the statement of comprehensive income and dividend movements as reflected above for the Group.
There is no other comprehensive income.

Steamships Annual Report 2015 17
BALANCE SHEETSSteamships Trading Company Limited As At 31 December 2015 (Amounts in Kina 000’s)
Consolidated Parent Entity Note 2015 2014 2015 2014Current assets Cash and cash equivalents 6 11,538 15,273 1,660 765Trade and other receivables 7 147,830 160,551 1,705 3,376Inventories 8 41,008 37,060 - -Loans to related companies 9 159,755 - - - 360,131 212,884 3,365 4,141Non-current assets Property, plant and equipment 10 731,596 714,630 26,160 26,820Investment properties 11 341,359 400,493 - -Investments in related companies 4(a) 36,458 33,193 195,360 128,319Loans to related companies 9 40,349 153,595 5,712 5,712Intangible assets 12 80,491 80,491 - -Deferred tax assets 5(c) 36,914 33,521 182 701 1,267,167 1,415,923 227,414 161,552TOTAL ASSETS 1,627,298 1,628,807 230,779 165,693
Current liabilities Trade and other payables 13 89,456 101,181 - 17Provisions for other liabilities and charges 14 9,970 12,411 - -Loans from related companies 9 26,690 13,579 182,592 108,110Loan from minority shareholder 15 22,933 17,615 - -Borrowings 15 390,836 42,014 - -Income tax payable 5(e) 1,407 3,821 - - 541,292 190,621 182,592 108,127Non-current liabilities Deferred tax liabilities 5(c) 33,426 32,106 - -Provisions for other liabilities and charges 14 11,770 11,836 - -Borrowings 15 204,208 627,507 - - 249,404 671,449 - -TOTAL LIABILITIES 790,696 862,070 182,592 108,127NET ASSETS 836,602 766,737 48,187 57,566 EQUITY Issued capital 16 24,200 24,200 24,200 24,200Reserves 764,887 711,764 23,987 33,366Capital and reserves attributable to theCompany’s shareholders 789,087 735,964 48,187 57,566Non-controlling interests 47,515 30,773 - -TOTAL EQUITY 836,602 766,737 48,187 57,566
These Balance Sheets are to be read in conjunction with the accompanying notes.
For and on behalf of the Board:
G.L. Cundle P.W. Langslow31 March 2016 Chairman Managing Director

18 Steamships Annual Report 2015
STATEMENTS OF CASH FLOWSSteamships Trading Company Limited Year Ended 31 December 2015 (Amounts in Kina 000’s)
Consolidated Parent Entity
Note 2015 2014 2015 2014CASH FLOWS FROM OPERATING ACTIVITIES
Receipts from customers 797,587 933,365 1,966 2,303
Payments to suppliers and employees (525,266) (631,622) (2,148) (2,288)
Interest received 13,952 91 72 417
Interest and other finance costs paid (41,194) (28,899) - -
Income tax paid 5(e) (42,258) (50,423) - -
Net cash provided by/(used in) operating activities 18 202,821 222,512 (110) 432
CASH FLOWS FROM INVESTING ACTIVITIES
Purchase of property, plant & equipment (108,116) (201,328) - (610)
Proceeds from sales of property, plant & equipment 8,608 11,414 - -
Loans repaid/(extended) to associated companies 13,219 (50,494) 11,024 (46,164)
Dividends received 5,067 2,122 38,044 78,337
Proceeds from sale of subsidiary - 28,967 - 34,795
Net cash (used in)/provided by investing activities (81,222) (209,319) 49,068 66,358
CASH FLOWS FROM FINANCING ACTIVITIES
Proceeds from borrowings 9,208 92,626 - -
Repayments of borrowings (75,612) (16,490) - -
Dividends paid (50,857) (70,292) (48,063) (66,668)
Net cash (used in)/ provided by financing activities (117,261) 5,844 (48,063) (66,668)
NET INCREASE IN CASH HELD 4,338 19,037 895 122
NET CASH AT BEGINNING OF THE YEAR (10,941) (29,978) 765 643
NET CASH AT END OF THE YEAR (6,603) (10,941) 1,660 765
CASH COMPRISES:
Cash and cash equivalents 6 11,538 15,273 1,660 765
Bank overdrafts 15 (18,141) (26,214) - -
(6,603) (10,941) 1,660 765
These Statements of Cash Flows are to be read in conjunction with the accompanying notes.

Steamships Annual Report 2015 19
NOTES TO THE FINANCIAL STATEMENTSSteamships Trading Company Limited Year Ended 31 December 2015 (Amounts in Kina 000’s)
1. Summaryofsignificantaccountingpolicies
The Company is a company limited by shares and is incorporated and domiciled in Papua New Guinea.
These Group consolidated financial statements were authorised for issue by the Board of Directors on 31 March 2016.
The Board of Directors has the power to amend the financial statements after their issue.
The financial statements have been prepared in accordance with International Financial Reporting Standards (“IFRS”).
Changesinaccountingpolicyanddisclosures
i. Standards, amendment and interpretations effective in the year ended 31 December 2015
The following new standards and amendments were applicable for the first time during the accounting period beginning 1 January 2015, but did not have a significant impact.
• Annual improvements 2012 (effective 1 July 2014) makes minor changes to IFRS 2, IFRS 3, IFRS 8, IFRS 13, IAS 16, IAS 37 and IAS 39.
• Annual improvements 2013 (effective 1 July 2014) makes minor changes to IFRS 1, IFRS 3, IFRS 13 and IAS 40.
ii. New standards, amendment and interpretations issued but not yet effective for the year ended 31 December 2015 or adopted early
A number of new standards, amendments and interpretations to existing standards have been published and are mandatory for the entity’s accounting periods beginning on or after 1 January 2016 or later periods, but the entity has not early adopted them. None of these is expected to have a significant effect in the consolidated financial statements, but their potential full impact has yet to be assessed.
• Amendment to IFRS 11 “Joint arrangements” on acquisition of an interest in a joint operation (effective 1 January 2016). These amendments provide new guidance on how to account for the acquisition of an interest in a joint operation that constitutes a business .
• Amendments to IAS 27 “Separate financial statements” on the equity method (effective 1 January 2016). These amendments allow entities to use the equity method to account for investments in subsidiaries, joint ventures and associates in their separate financial statements.
• Amendments to IFRS 10 “Consolidated financial statements” and IAS 28 “Investments in associates and joint ventures” (original effective date of 1 January 2016 now postponed ) in relation to the sale or contribution of assets between an investor and its associate or joint venture. The main consequence of the amendments is that a full gain or loss is recognised when a transaction involves a business (whether it is housed in a subsidiary or not). A partial gain or loss is recognised when a transaction involves assets that do not constitute a business, even if these assets are housed in a subsidiary.
• Annual improvements 2014 (effective 1 January 2016) makes minor changes to IFRS 5, IFRS 7, IAS 19, and IAS 34.
• Amendments to IAS 1 “Presentation of Financial Statements” (effective 1 January 2016) clarify guidance in IAS 1 on materiality and aggregation, the presentation of subtotals, the structure of financial statements and the disclosure of accounting policies. The amendments form a part of the IASB’s Disclosure Initiative, which explores how financial statement disclosures can be improved.
• Amendment to IFRS 10 and IAS 28 (effective 1 January 2016) on investment entities applying the consolidation exemption. The amendments to IFRS 10 clarify that the exception from preparing consolidated financial statements is available to intermediate parent entities which are subsidiaries of investment entities. The exception is available when the investment entity parent measures its subsidiaries at fair value. The amendments to IAS 28 allow an entity which is not an investment entity, but has an interest in an associate or joint venture which is an investment entity, a policy choice when applying the equity method of accounting.
• IFRS 15 “Revenue from contracts with customers” (effective 1 January 2018) is a converged standard from the IASB and FASB on revenue recognition. The standard will improve the financial reporting of revenue and improve comparability of the top line in financial statements globally.
• IFRS 9, “Financial Instruments” (effective 1 January 2018) replaces the guidance in IAS 39 with a standard that is less complex and principles based. The new standard addresses the classification, measurement and derecognition of financial assets and financial liabilities, relaxes the requirements for hedge accounting and introduces an expected credit losses model that replaces the current incurred loss impairment model.

20 Steamships Annual Report 2015
NOTES TO THE FINANCIAL STATEMENTSSteamships Trading Company Limited Year Ended 31 December 2015 (Amounts in Kina 000’s)
• IFRS 16, “Leases” (effective 1 January 2019) replaces IAS 17 “Leases” and removes the classification of leases as either operating or finance leases, treating all leases as finance leases. All leases will be brought onto the balance sheet except for leases less than 12 months or leases of low-value assets.
There are no other IFRS’s or IFRIC interpretations that are not yet effective that would be expected to have a material impact on the Group.
(a) Basisofpreparation
The consolidated financial statements of the Group have been prepared in accordance with International Financial Reporting Standards (IFRS) and IFRIC interpretations. The consolidated financial statements have been prepared under the historical cost convention as modified by financial assets and liabilities at fair value through profit and loss.
The preparation of financial statements in conformity with IFRS requires the use of certain critical accounting estimates. It also requires management to exercise its judgement in the process of applying the Group’s accounting policies. The areas involving a higher degree of judgement or complexity, or areas where assumptions and estimates are significant to the consolidated financial statements are disclosed in note 1 (z).
(b) Foreigncurrency
The Company’s functional and presentation currency is the Papua New Guinea Kina. Transactions in foreign currencies have been translated into the functional currency at rates ruling at the date of the transaction. Amounts payable to and by the Group in foreign currencies have been translated to the functional currency at rates of exchange ruling at the year end. Gains and losses arising from movements in foreign exchange rates are recognised in the statement of comprehensive income when they arise.
(c) Principlesofconsolidation
(i) Subsidiaries
The consolidated financial statements incorporate the assets and liabilities of all subsidiaries of the Steamships Trading Company Limited as at 31 December 2015 and the results of all subsidiaries for the year then ended. Steamships Trading Company Limited and its subsidiaries together are referred to as the Group or the consolidated entity.
Subsidiaries are all entities over which the Group
has control that is when the Group is exposed to or has rights to, variable returns from its involvement with the entity and has the ability to affect those returns through its power over the entity.
Subsidiaries are fully consolidated from the date on which control is transferred to the Group. They are de-consolidated from the date that control ceases .
The acquisition method of accounting is used to account for business combinations by the Group (refer to note 1d).
Intercompany transactions, balances and unrealised gains on transactions between group companies are eliminated. Unrealised losses are also eliminated unless the transaction provides evidence of the impairment of the asset transferred. Accounting policies of subsidiaries have been changed where necessary to ensure consistency with the policies adopted by the Group.
Non-controlling interests in the results and equity of subsidiaries are shown separately in the consolidated statement of comprehensive income, statement of changes in equity and balance sheet respectively.
(ii) Associates
Associates are all entities over which the Group has significant influence but not control generally accompanying a shareholding of between 20% and 50% of the voting rights. Investments in associates are accounted for using the equity method of accounting, after initially being recognised at cost. The Group’s investment in associates includes goodwill identified on acquisition (refer to note 13).
The Group’s share of its associates’ post-acquisition profits or losses is recognised in profit or loss, and its share of post-acquisition other comprehensive income is recognised in other comprehensive income. The cumulative post-acquisition movements are adjusted against the carrying amount of the investment. Dividends receivable from associates are recognised as a reduction in the carrying amount of the investment.
When the Group’s share of losses in an associate equals or exceeds its interest in the associate, including any other unsecured long-term receivables, the Group does not recognise further losses, unless it has incurred obligations or made payments on behalf of the associate.

Steamships Annual Report 2015 21
NOTES TO THE FINANCIAL STATEMENTSSteamships Trading Company Limited Year Ended 31 December 2015 (Amounts in Kina 000’s)
Unrealised gains on transactions between the Group and its associates are eliminated to the extent of the Group’s interest in the associates. Unrealised losses are also eliminated unless the transaction provides evidence of an impairment of the asset transferred. Accounting policies of associates have been changed where necessary to ensure consistency with the policies adopted by the Group.
(iii) Joint ventures
Joint venture entities
The interest in a joint venture is accounted for using the equity method after initially being recognised at cost as for associates.
(iv) Changes in ownership interests
The Group treats transactions with non-controlling interests that do not result in a loss of control as transactions with equity owners of the Group. A change in ownership interest results in an adjustment between the carrying amounts of the controlling and non-controlling interests to reflect their relative interests in the subsidiary. Any difference between the amount of the adjustment to non-controlling interests and any consideration paid or received is recognised in a separate reserve within equity attributable to shareholders.
When the Group ceases to have control or significant influence, any retained interest in the entity is re-measured to its fair value with the change in carrying amount recognised in profit or loss. This fair value becomes the initial carrying amount for the purposes of subsequently accounting for the retained interest as an associate or financial asset. In addition, any amounts previously recognised in other comprehensive income in respect of that entity are accounted for as if the Group had directly disposed of the related assets or liabilities. This may mean that amounts previously recognised in other comprehensive income are reclassified to profit or loss.
If the ownership interest in a jointly-controlled entity or an associate is reduced but significant influence is retained, only a proportionate share of the amounts previously recognised in other comprehensive income are reclassified to profit or loss where appropriate.
(d) Businesscombinations
The acquisition method of accounting is used to account for all business combinations, regardless of whether equity instruments or other assets are acquired. The consideration transferred for
the acquisition of a subsidiary comprises the fair values of the assets transferred, the liabilities incurred and the equity interests issued by the Group. The consideration transferred also includes the fair value of any asset or liability resulting from a contingent consideration arrangement and the fair value of any pre-existing equity interest in the subsidiary. Acquisition-related costs are expensed as incurred. Identifiable assets acquired and liabilities and contingent liabilities assumed in a business combination are measured initially at their fair values at the acquisition date. On an acquisition-by-acquisition basis, the Group recognises any non-controlling interest in the acquiree either at fair value or at the non-controlling interest’s proportionate share of the acquiree’s net identifiable assets.
The excess of the consideration transferred, the amount of any non-controlling interest in the acquiree and the acquisition date fair value of any previous equity interest in the acquiree over the fair value of the Group’s share of the net identifiable assets acquired is recorded as goodwill. If those amounts are less than the fair value of the net identifiable assets of the subsidiary acquired and the measurement of all amounts has been reviewed, the difference is recognised directly in determining profit or loss as a bargain purchase.
Where settlement of any part of cash consideration is deferred, the amounts payable in the future are discounted to their present value as at the date of exchange. The discount rate used is the entity’s incremental borrowing rate, being the rate at which a similar borrowing could be obtained from an independent financier under comparable terms and conditions.
Contingent consideration is classified either as equity or a financial liability. Amounts classified as a financial liability are subsequently re-measured to fair value with changes in fair value recognised in profit or loss.
(e) Revenuerecognition
The Group recognises revenue when the amount of revenue can be reliably measured, it is probable that future economic benefits will flow to the entity and specific criteria have been met for each of the Group’s activities as described below. The Group bases its estimates on historical results, taking into consideration the type of customer, the type of transaction and the specifics of each arrangement.
22 Steamships Annual Report 2015
NOTES TO THE FINANCIAL STATEMENTSSteamships Trading Company Limited Year Ended 31 December 2015 (Amounts in Kina 000’s)
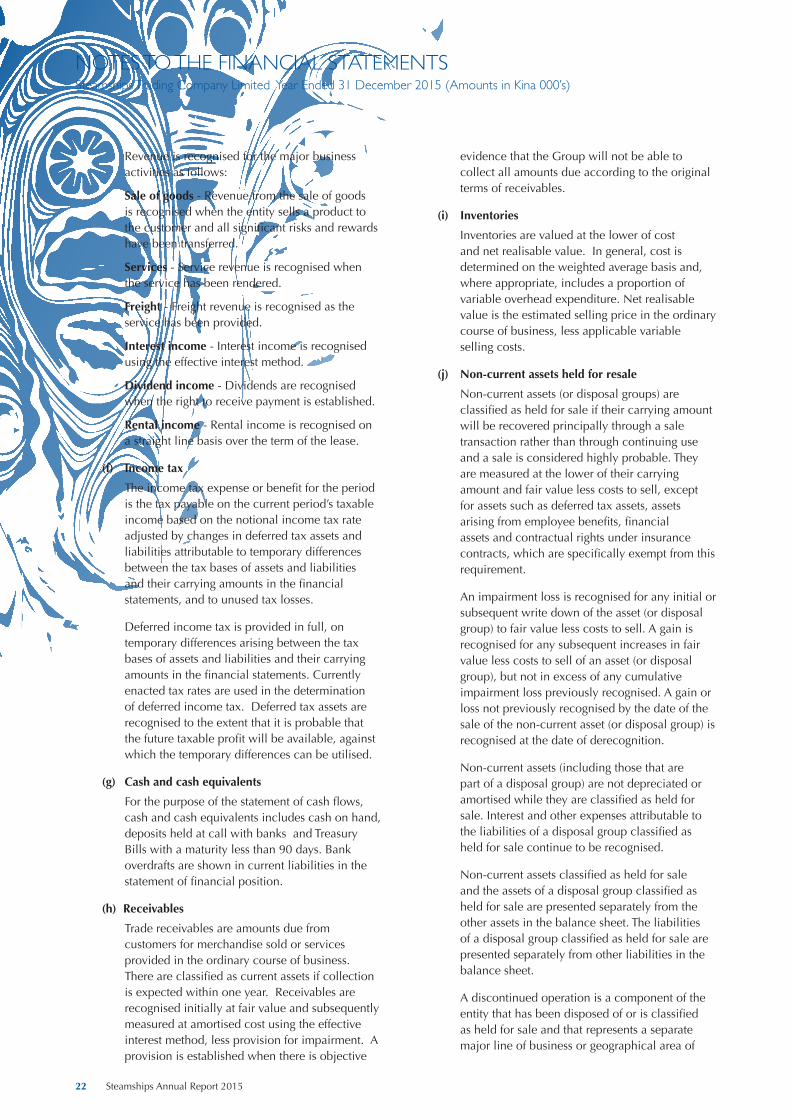
Revenue is recognised for the major business activities as follows:
Sale of goods - Revenue from the sale of goods is recognised when the entity sells a product to the customer and all significant risks and rewards have been transferred.
Services - Service revenue is recognised when the service has been rendered.
Freight - Freight revenue is recognised as the service has been provided.
Interestincome - Interest income is recognised using the effective interest method.
Dividendincome - Dividends are recognised when the right to receive payment is established.
Rentalincome - Rental income is recognised on a straight line basis over the term of the lease.
(f) Incometax
The income tax expense or benefit for the period is the tax payable on the current period’s taxable income based on the notional income tax rate adjusted by changes in deferred tax assets and liabilities attributable to temporary differences between the tax bases of assets and liabilities and their carrying amounts in the financial statements, and to unused tax losses.
Deferred income tax is provided in full, on temporary differences arising between the tax bases of assets and liabilities and their carrying amounts in the financial statements. Currently enacted tax rates are used in the determination of deferred income tax. Deferred tax assets are recognised to the extent that it is probable that the future taxable profit will be available, against which the temporary differences can be utilised.
(g) Cashandcashequivalents
For the purpose of the statement of cash flows, cash and cash equivalents includes cash on hand, deposits held at call with banks and Treasury Bills with a maturity less than 90 days. Bank overdrafts are shown in current liabilities in the statement of financial position.
(h)Receivables
Trade receivables are amounts due from customers for merchandise sold or services provided in the ordinary course of business. There are classified as current assets if collection is expected within one year. Receivables are recognised initially at fair value and subsequently measured at amortised cost using the effective interest method, less provision for impairment. A provision is established when there is objective
evidence that the Group will not be able to collect all amounts due according to the original terms of receivables.
(i) Inventories
Inventories are valued at the lower of cost and net realisable value. In general, cost is determined on the weighted average basis and, where appropriate, includes a proportion of variable overhead expenditure. Net realisable value is the estimated selling price in the ordinary course of business, less applicable variable selling costs.
(j) Non-currentassetsheldforresale
Non-current assets (or disposal groups) are classified as held for sale if their carrying amount will be recovered principally through a sale transaction rather than through continuing use and a sale is considered highly probable. They are measured at the lower of their carrying amount and fair value less costs to sell, except for assets such as deferred tax assets, assets arising from employee benefits, financial assets and contractual rights under insurance contracts, which are specifically exempt from this requirement.
An impairment loss is recognised for any initial or subsequent write down of the asset (or disposal group) to fair value less costs to sell. A gain is recognised for any subsequent increases in fair value less costs to sell of an asset (or disposal group), but not in excess of any cumulative impairment loss previously recognised. A gain or loss not previously recognised by the date of the sale of the non-current asset (or disposal group) is recognised at the date of derecognition.
Non-current assets (including those that are part of a disposal group) are not depreciated or amortised while they are classified as held for sale. Interest and other expenses attributable to the liabilities of a disposal group classified as held for sale continue to be recognised.
Non-current assets classified as held for sale and the assets of a disposal group classified as held for sale are presented separately from the other assets in the balance sheet . The liabilities of a disposal group classified as held for sale are presented separately from other liabilities in the balance sheet .
A discontinued operation is a component of the entity that has been disposed of or is classified as held for sale and that represents a separate major line of business or geographical area of

Steamships Annual Report 2015 23
NOTES TO THE FINANCIAL STATEMENTSSteamships Trading Company Limited Year Ended 31 December 2015 (Amounts in Kina 000’s)
operations, is part of a single coordinated plan to dispose of such a line of business or area of operations, or is a subsidiary acquired exclusively with a view to resale. The results of discontinued operations are presented separately in the income statement .
(k) Financialassets
Classification
The Group classifies its financial assets in the following categories: at fair value through profit or loss and loans and receivables. The Group does not hold any held to maturity investments or available for sale financial assets. The classification depends on the purpose for which the financial assets were acquired. Management determines the classification of its financial assets at initial recognition.
(i) Financialassetsatfairvaluethroughprofitorloss
Financial assets at fair value through profit or loss are financial assets held for trading. A financial asset is classified in this category if acquired principally for the purpose of selling in the short term. Derivatives are also categorised as held for trading unless they are designated as hedges. Assets in this category are classified as current assets .
(ii) Loans and receivables
Loans and receivables are non-derivative financial assets with fixed or determinable payments that are not quoted in an active market. They are included in current assets, except for maturities greater than 12 months after the balance sheet date. These are classified as non-current assets. The Group’s loans and receivables comprise ‘trade and other receivables’ and ‘cash and cash equivalents’ in the balance sheet.
Recognition and measurement
Regular purchases and sales of financial assets are recognised on the trade date – the date on which the Group commits to purchase or sell the asset .
Financial assets carried at fair value through profit or loss are initially recognised at fair value, and transaction costs are expensed in the income statement . Financial assets are derecognised when the rights to receive cash flows from the investments have expired or have been transferred and the Group has transferred substantially all risks and rewards of ownership. Loans and receivables are carried at amortised cost using the effective interest method.
Gains or losses arising from changes in the fair value of the ‘financial assets at fair value through profit or loss’ category are presented in the income statement within ‘other (losses)/gains – net’ in the period in which they arise. Dividend income from financial assets at fair value through profit or loss is recognised in the income statement as part of other income when the Group’s right to receive payments is established.
The Group assesses at each balance sheet date whether there is objective evidence that a financial asset or a group of financial assets is impaired. Impairment testing of trade receivables is described in note 1(h).
(l) Property,plantandequipment
All property, plant and equipment are initially recorded at cost. Borrowing costs directly attributable to the acquisition or construction of qualifying assets are added to the cost of those assets until the assets are ready for their intended use. Depreciation is calculated on the straight-line method to write off the cost of each asset to their residual values using the below rates which is reflective of their estimated useful life as follows:
Land and buildings 0 - 10% Ships 5 - 10% Plant and fittings 10 - 33% Motor vehicles 20 - 33%
Where the carrying amount of an asset is greater than its estimated recoverable amount, it is written down immediately to its recoverable amount. Gains and losses on disposal of property, plant and equipment are determined by reference to their carrying amount and are taken into account in determining operating profit.
Subsequent costs are included in the asset’s carrying amount or recognised as a separate asset, as appropriate, only when it is probable that future economic benefits associated with the item will flow to the Group and the cost of the item can be measured reliably. All other repairs and maintenance are charged to the statements of comprehensive income during the financial period in which they are incurred.
(m)Investmentproperties
Investment properties include land held for long-term capital appreciation and buildings leased out under operating leases. Properties that comprise a portion held to earn rentals and a portion for own use or occupation will only be classified as investment property if

24 Steamships Annual Report 2015
NOTES TO THE FINANCIAL STATEMENTSSteamships Trading Company Limited Year Ended 31 December 2015 (Amounts in Kina 000’s)
an insignificant portion is held for own use of occupation. Investment properties are recognised when it is probable that future economic benefits associated with the property will flow to the Group and the cost of the investment property can be reliably measured. Investment properties are stated at cost less accumulated depreciation and accumulated impairment losses. Transaction costs are included on initial measurement. Borrowing costs directly attributable to the acquisition or construction of qualifying assets are added to the cost of those assets until the assets are ready for their intended use. The fair values of investment properties are disclosed in the Note 11. These are assessed using internationally accepted valuation methods, such as taking comparable properties as a guide to current market prices or by applying the discounted cash flow method. Like property, plant and equipment, investment properties are normally depreciated using the straight-line method over similar useful lives.
(n) Goodwill
Goodwill represents the excess of the cost of an acquisition over the fair value of the Group’s share of the net identifiable assets of the acquired business at the date of acquisition.
Goodwill is capitalised and assessed for impairment annually or more frequently if events or changes in circumstances indicate a potential for impairment and is carried at cost less impairment losses. Any impairment is recognised immediately as an expense and is not subsequently reversed.
Gains and losses on the disposal of an entity include the carrying amount of goodwill relating to the entity sold. Goodwill is allocated to cash-generating units for the purpose of impairment testing.
(o) Tradeandotherpayables
These amounts represent obligations to pay for goods and services that have been acquired in the ordinary course of business from suppliers. They are classified as current liabilities if payment is due within one year or less. Trade payables are recognised initially at fair value and subsequently measured at amortised cost using the effective interest method. The amounts are unsecured and are usually paid within 30 days of recognition.
(p) Provisions
Provisions are recognised when the Group has a present legal or constructive obligation as a result of past events; it is probable that an outflow of
resource embodying economic benefits will be required to settle the obligation; and a reliable estimate of the amount of the obligation can be made.
A liability for annual leave is recognised and measured at the amount of unpaid leave at amounts expected to be paid to settle the present entitlements. A liability for long service leave is recognised taking into consideration expected future wage and salary levels, experience of employee departures and periods of service, discounted to present values.
A provision for estimated ship dry docking costs is only recognised where the Group has a contractual obligation under a Bare Boat charter agreement in from a third party. Dry docking costs relating to ships not under third party long term charter agreements are only recognised as incurred, and are capitalised to the extent that the previously assessed economic benefits associated with the asset are restored.
(q) Employeebenefits
(i) Short term obligations
Liabilities for wages and salaries, including non-monetary benefits, annual leave and accumulating sick leave expected to be settled within 12 months after the end of the period in which the employees render the related service are recognised in respect of employees’ services up to the end of the reporting period and are measured at the amounts expected to be paid when the liabilities are settled. The liability for annual leave and accumulating sick leave is recognised in the provision for employee benefits. All other short term employee benefit obligations are presented as payables.
(ii) Otherlong-termemployeebenefitobligations
The liability for long service leave and annual leave which is not expected to be settled within 12 months after the end of period in which the employees render the related service is recognised in the provision for the employee benefits and measured as the present value of expected future payments to be made in respect of services provided by employees up to the end of the reporting period using the projected unit credit method. Consideration is given to expected future wage and salary levels, experience of employee departments and periods of service. Expected future payments are discounted using the market yields at the end of the reporting period on national government bonds with terms to maturity and currency that match, as closely as possible, the estimated future cash outflows.

Steamships Annual Report 2015 25
NOTES TO THE FINANCIAL STATEMENTSSteamships Trading Company Limited Year Ended 31 December 2015 (Amounts in Kina 000’s)
(iii)Terminationbenefits
Termination benefits are payable when employment is terminated by the Group before the normal retirement date, or whenever an employee accepts voluntary redundancy in exchange for these benefits. The Group recognises termination benefits at the earlier of the following dates: (a) when the Group can no longer withdraw the offer of those benefits; and (b) when the entity recognises costs for a restructuring that is within the scope of IAS 37 and involves the payment of termination benefits. In the case of an offer made to encourage voluntary redundancy, the termination benefits are measured based on the number of employees expected to accept the offer. Benefits falling due more than 12 months after the end of the reporting period are discounted to their present value.
(r) Borrowings
Borrowings are recognised initially at fair value, net of any transaction costs incurred, and are subsequently measured at amortised cost using the effective interest method. Borrowings are classified as current liabilities unless the Group has an unconditional right to defer settlement of the liability for at least 12 months after the end of the reporting period.
(s) Impairmentofassets
Assets that have an indefinite useful life are not subject to amortisation and are tested annually for impairment. Assets that are subject to depreciation or amortisation are reviewed for impairment whenever events or changes in circumstances indicate that the carrying amount may not be recoverable. An impairment loss is recognised for the amount by which the asset’s carrying value exceeds its fair value less costs to sell. For the purpose of assessing impairment, assets are grouped at the lowest levels for which there are separately identifiable cash flow (cash generating units).
(t) Borrowingcosts
Borrowing costs incurred for the construction of qualifying assets which are assets that take a substantial period of time to get ready for their intended use or sale, are capitalised during the period of time that is required to complete and prepare the asset for its intended use or sale. Other borrowing costs are expensed.
The capitalisation rate used to determine the amount of borrowing costs to be capitalised is the weighted average interest rate applicable to the entity’s outstanding borrowings during the year, in this case 5.7% (2014 – 5.7%).
(u) Segmentreporting
Operating segments are reported in a manner consistent with the internal reporting provided to the chief operating decision maker. The chief operating decision maker who is responsible for allocating resources and assessing performance of the operating segments, has been identified as the Strategic Steering Committee.
(v) Earningspershare
Basic earnings per share is calculated by dividing the profit attributable to equity holders of the Group, by the weighted average number of ordinary shares outstanding during the financial year. There are no potential ordinary shares on issue and hence the diluted earnings per share is equal to the basic earnings per share..
(w) Goodsandservicestax(GST)
Revenues, expenses and assets are recognised net of the amount of associated GST unless an exempted item. Receivables and payables are stated inclusive of GST. The amount of GST recoverable from, or payable to, the Taxation authority is included with other receivables or payables in the balance sheet.
(x) Leases
Leases under which the Group assumes substantially all the risks and rewards incidental to ownership have been classified as finance leases and are capitalised. The asset and corresponding liability are recorded at inception of the lease at the fair value of the leased asset, at amounts equivalent to the discounted present value of minimum lease payments including residual values.
The finance cost is charged to the profit or loss over the lease period so as to produce a constant periodic rate of interest on the remaining balance of the liability for each period.
Capitalised leased assets are depreciated over their expected lives in accordance with rates established for other similar assets.
Operating lease payments are representative of the pattern of benefits derived from the leased assets and accordingly are charged to the profit and loss account in the periods in which they are incurred.
(y) Roundingofamounts
Amounts in the financial statements have been rounded off to the nearest thousand Kina.

26 Steamships Annual Report 2015
NOTES TO THE FINANCIAL STATEMENTSSteamships Trading Company Limited Year Ended 31 December 2015 (Amounts in Kina 000’s)
(z) Criticalaccountingestimatesandjudgments
Estimates and judgments are continually evaluated and are based on historical experience and other factors, including expectations of future events that may have a financial impact on the entity and that are believed to be reasonable under the circumstances.
The Group makes estimates and assumptions concerning the future. The resulting accounting estimates will, by definition, seldom equal the related actual results. The estimates and assumptions that have a significant risk of causing a material adjustment to the carrying amounts of assets and liabilities within the next financial year are discussed below:
(i) Estimated impairment of goodwill
The Group tests annually whether goodwill has suffered any impairment. The recoverable amounts of cash-generating units have been determined based on value-in-use calculations.
(ii) Estimated fair values of investments
The Group carries an indirect investment in an unlisted entity with changes in fair value being recognised in profit or loss. At the end of each reporting period, a future maintainable earnings calculation is performed, or if available, non-observable market information is used to determine the appropriate fair value of the investment.
(iii) Provision for dry docking
For vessels on long term bare boat charter agreement from a third party, and where the Group has a contractual obligation for dry docking costs, the cost of future dry dockings is provided. The cost of dry docking is not accurately known until the vessels are surveyed and assessed at the commencement of docking. Estimates are based on the dry docking interval (i.e. Special or Interim), repairs considered necessary, its age and docking history. Docking intervals are assumed to be every 4 to 5 years.
Docking costs are often incurred in either AUD, USD or SGD currencies. The costings are updated monthly for the foreign exchange rate.
(iv) Estimated impairment of ships and other plant and equipment
Impairment losses have been recognised in relation to ships, plant and vehicles. The impairment of these ships arose from changes
in expectations of future freight volumes and pricing and changes in ship replacement strategy. A change in the freight market and consequent vehicle replacement policy gave rise to an impairment charge in 2014 for vehicles, while a change in manufacturing strategy has resulted in an impairment charge for plant. Recoverable amounts have been determined using the higher of fair value less cost to sell and its value in use. Fair value has been determined using market based information from observable inputs while value in use has been determined using a post-tax discount rate of 16% (pre-tax approximately 21%).
2. Financialriskmanagement The Group’s activities expose it to a variety of
financial risks including market risk (including currency, and interest rate risk), credit risk, liquidity risk and capital risk. The Group’s overall risk management program focuses on the unpredictability of financial markets and seeks to minimise potential adverse effects on the financial performance of the Group. Risk management is carried out under policies approved by the Board of Directors.
(a) Marketrisk
(i) Foreign exchange risk
The Group engages in international purchase transactions and is exposed to foreign exchange risk arising from various currency exposures, primarily with respect to the Australian dollar. Foreign exchange risk arises from recognised assets and liabilities.
The Group’s foreign currency purchases do not represent a significant proportion of the Group’s costs and as such exposure to foreign currency risk is minimal. It is not the Group’s policy to hedge foreign currency risk. As the foreign currency exposure is minimal no sensitivity analysis is provided.
(ii) Price risk
The Group is not significantly exposed to equity securities or commodities price risk.
(iii)Cashflowinterestraterisk
The Group’s interest rate risk arises from long-term borrowings. Borrowings issued at variable rates expose the Group to cash flow and fair value interest rate risk. Borrowings issued at fixed rates expose the Group to fair value interest rate risk. Long term borrowings are a mix of fixed and variable rate interest. It is not the Group’s policy to hedge cash flow and interest rate risk.

Steamships Annual Report 2015 27
NOTES TO THE FINANCIAL STATEMENTSSteamships Trading Company Limited Year Ended 31 December 2015 (Amounts in Kina 000’s)
At 31 December 2015, if interest rates on PNG Kina-denominated borrowings had been 1% higher/lower with all other variables held constant, post-tax profit for the year would have been K4,089,000 (2014: K4,580,000) lower/higher, mainly as a result of higher/lower interest expense on floating rate borrowings.
(b) Creditrisk
The Group has no significant concentration of credit risk and it is not the Group’s policy to hedge credit risk. The Group has policies in place to ensure that sales of products and services are made to customers with an appropriate credit history and has policies that limit the amount of credit exposure to any one customer. Where credit limits were exceeded during the reporting period management has made provision for amounts considered uncollectible.
(c) Liquidityrisk
Prudent liquidity risk management implies maintaining sufficient cash and the availability of funding through an adequate amount
of committed credit facilities. The Group manages liquidity risk by maintaining sufficient bank balances to fund its operations and the availability of funding through committed credit facilities .
Management monitors rolling forecasts of the Group’s liquidity reserve on the basis of expected cash flows.
Undrawn finance facilities as of 31 December were as follows:
2015 2014 K’000 K’000
Undrawn Facilities 83,000 56,000
The table below analyses the Group’s financial liabilities which will be settled on a net basis into relevant maturity groupings based on the remaining period at the balance sheet date to the contractual maturity date. The amounts disclosed in the table are the contractual undiscounted cash flows.
Steamships Annual Report 2015 27
NOTES TO THE FINANCIAL STATEMENTS
facilities.
2015 2014 K’000 K’000
1 year & 2 years & 5 years years Total K’000 K’000 K’000 K’000 K’000

28 Steamships Annual Report 2015
NOTES TO THE FINANCIAL STATEMENTSSteamships Trading Company Limited Year Ended 31 December 2015 (Amounts in Kina 000’s)
(d) Capitalriskmanagement
The Group’s objectives when managing capital are to safeguard the Group’s ability to continue as a going concern in order to provide returns to shareholders and benefits for other stakeholders and to maintain an optimal capital structure to reduce the cost of capital.
In order to maintain or adjust the capital structure, the Group may adjust the amount of dividends paid to shareholders, return capital to shareholders, issue new shares or sell assets to reduce debt.
The Group monitors capital on the basis of the gearing ratio. This ratio is calculated as net debt divided by total capital. Net debt is calculated as external borrowings and unsecured loans less cash and cash equivalents. Total capital is calculated as capital and reserves attributable to the Company’s shareholders plus net debt.
The gearing ratios at each balance date were as follows:
2015 2014 K’000 K’000
Total external borrowing & unsecured loans 644,667 700,715
Less: Cash & Cash equivalents 11,538 15,273
Net debt 633,129 685,442
Total equity 836,602 766,737
Total capital 1,469,731 1,452,179
Gearing ratio 43% 47%
(e) Fairvalueestimation
IFRS 7 ”Financial Instruments: Disclosures” requires disclosure of fair value measurements by level of the following fair value measurement hierarchy:
Quoted prices (unadjusted) in active markets for identical assets or liabilities (level 1).
Inputs other than quoted prices included within level 1 that are observable for the asset or liability, either directly (that is, as prices) or indirectly (that is, derived from prices) (level 2).
Inputs for the asset or liability that are not based on observable market data (that is, unobservable inputs) (level 3).
If one or more of the significant inputs is not based on observable market data, the instrument is included in level 3.
The parent entity does not hold any financial assets other than cash and receivables.

Steamships Annual Report 2015 29
NOTES TO THE FINANCIAL STATEMENTSSteamships Trading Company Limited Year Ended 31 December 2015 (Amounts in Kina 000’s)
3. Operatingresults Consolidated Parent Entity
2015 2014 2015 2014 (a) Revenue and other income comprises:
Revenue from sale of goods 114,754 114,729 - -
Revenue from provision of services 658,781 764,538 - -
Dividend income - - 38,044 78,347
Total Revenue 773,535 879,267 38,044 78,347
Other income * 48,285 11,674 5,432 21,568
* Other income principally represents a gain on deconsolidation of K18.8M and an insurance claim of K27.5M (2014: a gain of K7M on the sale of Datec Limited on a consolidated basis and a gain of K17M for the parent entity).
(b) Expenses comprise:
Cost of sales 135,708 187,369 - -
Staff costs (note 3c) 158,760 162,680 - -
Depreciation and amortisation 102,142 104,723 2,214 2,613
Impairment of fixed assets 29,441 20,865 - -
Impairment of other assets 916 9,725 - -
Impairment of goodwill - 4,010 - -
Electricity and fuel 57,959 78,989 - -
Other operating expenses 175,156 162,269 1,928 2,093
Total Operating expense 660,082 730,630 4,142 4,706
(c) Staff costs:
Wages and salaries 115,926 120,986 - -
Retirement benefit contributions 7,645 7,453 - -
Accommodation and other benefits 35,189 34,241 - -
158,760 162,680 - -
Number of staff employed by the
Group at year end:
Full Time 4,292 4,159 - -

30 Steamships Annual Report 2015
NOTES TO THE FINANCIAL STATEMENTSSteamships Trading Company Limited Year Ended 31 December 2015 (Amounts in Kina 000’s)
3. Operatingresults(continued) Consolidated Parent Entity
2015 2014 2015 2014 (d) The operating profit before income tax is arrived at after charging and crediting the following specific items:
After charging:
Audit fees 995 1,050 10 10
Fees for non-audit services to Auditors 675 679 - -
Bad and doubtful debts 1,099 1,764 - -
Donations 1,618 2,366 - -
Impairment of fixed assets* 29,441 20,865 - -
Impairment of goodwill - 4,010 - -
Impairment of other assets 916 9,725 - -
Loss on sale of property, plant and equipment - 3,365 - -
After crediting:
Gain on deconsolidation 18,867 - - -
Gain on sale of property, plant and equipment 1,595 - - -
Gain on disposal of subsidiary - 7,079 - 17,548
Net foreign exchange transaction gains 38 1,455 - -
Insurance receivable* 27,500 - - -
* The impairment includes a property fire loss for which an insurance recovery is expected.
(e) Cost of financing – net:
Expense* 39,648 28,899 - -
Income (13,952) (91) (72) (417)
Net finance costs 25,696 28,808 (72) (417)
* The interest expense excludes capitalised interest of K1.5M.
(f) Earnings per share
Basic earnings per share are calculated by dividing the net profit attributable to shareholders by the average number of ordinary shares on issue during the year. There is no difference between the basic and diluted earnings per share.
Net profit attributable to shareholders 98,979 88,655
Average number of ordinary shares on issue (thousands) 31,008 31,008
Basic earnings per share (continuing & discontinued operations) 319t 286t
Basic earnings per share (continuing operations) 319t 279t

Steamships Annual Report 2015 31
NOTES TO THE FINANCIAL STATEMENTSSteamships Trading Company Limited Year Ended 31 December 2015 (Amounts in Kina 000’s)
4. Investmentsinsubsidiaries,associatesandjointventures Consolidated Parent Entity
2015 2014 2015 2014 (a) Investments are accounted for in accordance with the policy set out in Note 1(c) and relate to:
Investments in subsidiary companies (note 20) - - 171,537 108,268
Investments in associates (note 21) 20,607 17,636 - -
Investments in joint ventures (note 22) 15,851 15,557 23,823 20,051
36,458 33,193 195,360 128,319
(b) Share of after tax profit in associates and joint ventures
Share of profit in associates 3,039 1,808 - -
Share of profit in joint ventures 23 2,036 - -
3,062 3,844 - -
5. IncomeTax Consolidated Parent Entity
2015 2014 2015 2014 (a) Income tax expense Current tax 39,783 45,339 - -
Deferred tax (2,073) (8,044) 519 70
37,710 37,295 519 70
(b) The income tax in the Statement of Comprehensive Income is determined in accordance with the policy set out in note 1(f). The effective rate of tax charged differs from the statutory rate of 30% for the following reasons.
Prima facie tax on profit before income tax 41,731 40,604 11,822 28,688
Tax effect of rebateable dividends - - (11,413) (28,871)
Expenses not deductible for tax 6,967 4,596 110 (38)
Deductible expenses not recognised for accounting purposes (1,737) (448) - -
Income not assessable for tax (8,665) (2,373) - -
Prior year (over)/under provisions (586) (5,084) - 291
37,710 37,295 519 70
(c) The deferred tax (liability)/ asset comprises: Provisions 10,108 14,318 - 5
Tax losses 26,729 19,773 - -
Prepayments (8,891) (2,284) - -
Property, plant and equipment (24,458) (30,392) 182 696
3,488 1,415 182 701
Comprising of
Deferred tax asset 36,914 33,521 182 701
Deferred tax liability (33,426) (32,106) - -
3,488 1,415 182 701

32 Steamships Annual Report 2015
NOTES TO THE FINANCIAL STATEMENTSSteamships Trading Company Limited Year Ended 31 December 2015 (Amounts in Kina 000’s)
5. Incometax(continued) Beginning Charge to Ending Balance profit Balance (d) The gross movement on the deferred tax account is as follows:
Consolidated Provisions 14,318 (4,210) 10,108 Tax losses 19,773 6,956 26,729 Prepayments (2,284) (6,607) (8,891) Property, plant and equipment (30,392) 5,934 (24,458) Total 1,415 2,073 3,488
Parent Company Provisions 5 (5) - Property, plant and equipment 696 (514) 182 Total 701 (519) 182
(e) Income tax payable is represented as by: Consolidated Parent Entity
2015 2014 2015 2014 At 1 January 3,821 7,713 - - Income tax provision 39,783 45,339 - - Income tax under/over provided (586) 3,032 - - De-recognition of subsidiary (610) - - - Others 1,257 (1,840) - - Tax payments made (42,258) (50,423) - - At 31 December 1,407 3,821 - -
6. Cashandcashequivalents Consolidated Parent Entity
2015 2014 2015 2014 Cash and short term deposits 11,538 15,273 1,660 765 11,538 15,273 1,660 765
The maximum exposure to credit risk at the reporting date is the fair value of cash and cash equivalents on the balance sheet. Cash
and short term deposits are held with the Bank of South Pacific and Westpac PNG who have Standard and Poor’s long term credit ratings of B+ and AA- respectively.
7. Tradeandotherreceivables Consolidated Parent Entity
2015 2014 2015 2014 Trade and other receivables Trade receivables 79,075 104,227 - - Provision for impairment (6,082) (5,305) - - 72,993 98,922 - - Other receivables & prepayments 74,837 61,629 1,705 3,376 147,830 160,551 1,705 3,376

Steamships Annual Report 2015 33
NOTES TO THE FINANCIAL STATEMENTSSteamships Trading Company Limited Year Ended 31 December 2015 (Amounts in Kina 000’s)
7. Tradeandotherreceivables(continued) Consolidated Parent Entity
2015 2014 2015 2014 (i) Impaired trade receivables
As at 31 December 2015, trade receivables of K6.1M (2014: K5.3M) relating to trade debtors were considered impaired and were provided for by management. The ageing of these receivables is as follows:
3 to 6 months 777 1,084 - -
Over 6 months 5,305 4,221 - -
6,082 5,305 - -
Movement in the provision for impairment of trade receivables is as follows:
Opening balance 5,305 6,415 - -
Impairments recognised during the year 1,099 1,764 - -
Provision released (322) (2,874) - -
Total 6,082 5,305 - -
The creation and release of the provision for impaired receivables is included in operating expenses in the statement of comprehensive income. Amounts charged to the provision account are generally written off when there is no expectation of recovering the balance outstanding.
(ii) Past due but not impaired
As at 31 December 2015, trade receivables of K3M (2014: K2.9M) were past due but not impaired. These relate to a number of independent customers for whom there is no recent history of default. The ageing analysis of these trade receivables is as follows:
3 to 6 months 586 546 - -
Over 6 months 2,481 2,310 - -
3,067 2,856 - -
The other classes within trade and other receivables do not contain impaired assets and are not past due. The maximum exposure to credit risk at the reporting date is the fair value of each class of receivable mentioned above. The Group does not hold any collateral as security in relation to these receivables.
(iii) Other receivables and prepayments
Other receivables generally arise from transactions outside the usual operating activities of the Group. Interest may be charged at commercial rates where the terms of repayment exceed three months. Collateral is not normally obtained.
Prepayments relate to advance payments for expenses not yet incurred.

34 Steamships Annual Report 2015
NOTES TO THE FINANCIAL STATEMENTSSteamships Trading Company Limited Year Ended 31 December 2015 (Amounts in Kina 000’s)
8. Inventories Consolidated Parent Entity
2015 2014 2015 2014
Raw materials 3,650 2,720 - -
Work in progress 25 - - -
Finished goods 40,659 37,380 - -
Provision for obsolescence (3,326) (3,040) - -
41,008 37,060 - -
Inventories recognised as an expense during the year ended 31 December 2015 and included in cost of sales and cost of providing services amounted to K80.3M (2014: K77.3M). The provision for obsolescence of inventories during the year increased by K0.3M (2014: by K1.7M increase).
9. Loansto/(from)relatedcompanies Consolidated Parent Entity
2015 2014 2015 2014 Current
Harbourside Development Limited 159,755 - - -
Non-Current
Harbourside Development Limited - 152,305 - -
Colgate Palmolive (PNG) Limited 500 500 500 500
Kelton Investments Limited - 790 - -
Pacific Rumana Limited 39,849 - - -
40,349 153,595 500 500
Loans to subsidiaries - - 5,212 5,212
40,349 153,595 5,712 5,712
Current
Loans from associates and joint ventues:
Consort Express Lines Limited’s associates (26,690) (13,579) - -
(26,690) (13,579) - -
Loans from subsidiaries - - (182,592) (108,110)
(26,690) (13,579) (182,592) (108,110)
The loan to Harbourside Development Limited is secured and at a commercial fixed rate of 6.5% p.a. maturing in December 2016 at which point the Directors intend to refinance with an external bank. The loan to Pacific Rumana Limited is unsecured and at a commercial variable rate of 9.25%.

Steamships Annual Report 2015 35
NOTES TO THE FINANCIAL STATEMENTSSteamships Trading Company Limited Year Ended 31 December 2015 (Amounts in Kina 000’s)
10. Property,plant&equipment Plant and Property Ships Vehicles Total
Consolidated 2015
Cost 479,944 312,797 510,953 1,303,694
Accumulated depreciation (including impairment losses) (86,338) (173,008) (312,752) (572,098)
Net book value 393,606 139,789 198,201 731,596
Opening value 355,626 157,699 201,305 714,630
Additions 36,510 13,338 49,925 99,773
Disposals - (6,003) (2,777) (8,780)
Depreciation (19,369) (25,245) (49,641) (94,255)
Impairment of fixed assets 580 - (611) (31)
Transfers from investment properties 20,259 - - 20,259
Closing value 393,606 139,789 198,201 731,596
2014
Cost 464,285 445,022 414,901 1,324,208
Accumulated depreciation (including impairment losses) (108,659) (287,323) (213,596) (609,578)
Net book value 355,626 157,699 201,305 714,630
Opening value 376,605 114,566 231,564 722,735
Additions - 68,497 66,102 134,599
Sale of Subsidiary (150) - (10,778) (10,928)
Disposals - (251) (13,900) (14,152)
Depreciation (14,075) (25,113) (50,818) (90,006)
Transfers (6,754) - - (6,754)
Impairment losses - - (20,865) (20,865)
Closing value 355,626 157,699 201,305 714,630
Parent
2015
Cost 73,206 - 5,686 78,892
Accumulated depreciation (48,657) - (4,075) (52,732)
Net book value 24,549 - 1,611 26,160
Opening value 25,370 - 1,450 26,820
Additions 997 - 695 1,692
Transfers (147) - 9 (138)
Depreciation (1,671) - (543) (2,214)
Closing value 24,549 - 1,611 26,160

36 Steamships Annual Report 2015
NOTES TO THE FINANCIAL STATEMENTSSteamships Trading Company Limited Year Ended 31 December 2015 (Amounts in Kina 000’s)
10. Property,plant&equipment(continued) Plant and Property Ships Vehicles Total
Parent
2014
Cost 74,580 - 6,118 80,698
Accumulated depreciation (49,210) - (4,668) (53,878)
Net book value 25,370 - 1,450 26,820
Opening value 27,296 - 1,648 28,944
Additions 224 - 386 610
Disposals (109) - (12) (121)
Depreciation (2,041) - (572) (2,613)
Closing value 25,370 - 1,450 26,820
(a) Assets in the course of construction
The carrying amounts of the assets disclosed above include the following expenditure recognised in relation to property, plant and equipment and investment properties which are in the course of construction:
Consolidated Parent Entity
2015 2014 2015 2014 Property (classified as investment properties in note 11) 52,733 34,918 - -
Ships 6,649 31,531 - -
Plant and vehicles 20,068 20,892 - -
Total assets in the course of construction 79,450 87,341 -
The cost of additions in 2015 includes capitalised borrowing costs of K1.5M (2014: K4.9M) in relation to qualifying assets.
(b) Impairment losses
During the year the Directors performed an impairment review on all key assets of the Group. As a result of this assessment the impaired charge includes Knil (2014: K20.9M) impairment on vehicles and K24.9M (2014: K3.9M) on plant and buildings. The latter principally arose from fire damage to a building in 2015.
During 2014 impairment losses have been recognised in relation to property, plant and vehicles. A decision to close the Highlands Highway operations of East West Transport led to an impairment charge for vehicles, while a change in manufacturing strategy resulted in an impairment charge for plant.
There are no other further conditions that indicate impairment of property, plant and equipment as at 31 December 2015.

Steamships Annual Report 2015 37
NOTES TO THE FINANCIAL STATEMENTSSteamships Trading Company Limited Year Ended 31 December 2015 (Amounts in Kina 000’s)
11. Investmentproperties Investment properties represent the Group’s residential and commercial properties that are available for external lease rather than
internal use. Properties used by the Group are shown in ‘Property’ within note 10.
Consolidated Parent Entity
2015 2014 2015 2014
Cost 469,342 497,697 - - Accumulated depreciation (127,983) (97,204) - - Net book value 341,359 400,493 - - Opening value 400,493 343,658 - - Additions 9,889 66,729 - - De-recognition of subsidiary (5,738) - - - Disposals (5,728) (1,932) - - Transfers to property, plant & equipment (20,259) 6,754 - - Impairment (29,410) - - - Depreciation (7,888) (14,716) - - Closing value 341,359 400,493 - -
(a) Amounts recognised in profit/loss for investment properties Consolidated Parent Entity
2015 2014 2015 2014 Rental income 125,104 112,927 - -
Repairs and maintenance attributable to rental properties under non-cancellable leases (949) (3,607) - - Operating expenses directly attributable to rental properties under non-cancellable leases (2,535) (11,408) - -
(b) Valuation basis
Properties include commercial and residential properties occupied by Group businesses together with commercial and residential investment properties which are available for external lease. An analysis of the carrying amount and estimated range of fair values for each category of property is shown below. Fair values have been estimated internally, based on market evidence of property values, supported by independent professional valuations as at December 2015 for a selected sample of representative properties and discounted value in use assessments for hotel properties.
Included in properties are the following: Valuation Range NBV Lower Higher
Investment properties 341,359 758,730 947,987 Other properties (note 10) 393,606 872,823 1,090,538
Total 734,965 1,631,553 2,038,525
The independent valuer utilised certain historical facts and relevant market data available up to the date of valuation in reaching their opinion to the valuation of the properties, including use of comparable sales and capitalisation rates.
(c) Non-current assets pledged as security
Refer to note 15 for information on non-current assets pledged as security by the Group.
(d) Contractual receivables
Minimum lease receivables under non-cancellable operating leases of investment properties not recognised in the financial statements are receivable as follows:
Consolidated Parent Entity
2015 2014 2015 2014 Within one year 142,686 110,728 - - Later than one year but not later than five years 144,072 116,264 - - Later than five years 183,876 148,385 - - 470,634 375,377 - -

38 Steamships Annual Report 2015
NOTES TO THE FINANCIAL STATEMENTSSteamships Trading Company Limited Year Ended 31 December 2015 (Amounts in Kina 000’s)
12. Intangibleassets Consolidated Parent Entity
2015 2014 2015 2014
Opening value 80,491 93,617 -
Disposal of subsidiary - (9,116) - -
Impairment during the year - (4,010) - -
Closing value 80,491 80,491 - -
Goodwill is allocated to the Group’s cash-generating units (CGUs) identified according to operating segment. The goodwill balance of K80.5M (2014: K80.5M) is attributable to various business acquisitions in the logistics and commercial segments including Consort (K0.5M), Laga Industries (K3.6M), Pacific Towing (K67.4M) and New Britain Shipping (K9M). The recoverable amount of a CGU is determined based on value-in-use calculations. These calculations use pre-tax cash flow projections based on financial budgets approved by management covering a three year period. Growth beyond year three for the purpose of the impairment testing is set at 5.1%. A post-tax discount rate of 16.0% (2014: 15.9%) has been used and reflects specific risks relating to the operating segment.
13. Tradeandotherpayables Consolidated Parent Entity
2015 2014 2015 2014
Trade Payables 48,737 49,921 - -
Accruals 38,418 34,036 - -
Other payables 2,301 17,224 - 17
89,456 101,181 - 17
All trade and other payables are due and payable within 12 months and are recorded at their carrying value.
14. Provisionsforotherliabilitiesandcharges
Employee Dry Other 2015 2014 Dock Total Total
Opening value 18,409 4,146 1,692 24,247 22,193
Charged to profit & loss 7,451 3,158 - 10,609 18,445
Write off during sale of business unit - - - - (2,326)
Utilised during year (7,967) (3,457) (1,692) (13,116) (14,065)
Closing value 17,893 3,847 - 21,740 24,247
Current 6,123 3,847 - 9,970 12,411
Non-current 11,770 - - 11,770 11,836
17,893 3,847 - 21,740 24,247
A description of employee and dry dock provisions is disclosed in note 1p.

Steamships Annual Report 2015 39
NOTES TO THE FINANCIAL STATEMENTSSteamships Trading Company Limited Year Ended 31 December 2015 (Amounts in Kina 000’s)
15. Borrowings Consolidated Parent Entity
2015 2014 2015 2014 Current:
Bank overdrafts (secured) 18,141 26,214 - -
Bank loans (secured) 237,695 15,800 - -
Other loans (unsecured) 22,933 17,615 - -
Other loans (secured) 135,000 -
413,769 59,629 - -
Non-current:
Other loans (secured) - 135,000 - -
Bank loans (secured) 204,208 492,507 - -
204,208 627,507 - -
Total Borrowings 617,977 687,136 - -
Mortgages over certain of the Group’s properties and a registered equitable charge over the remainder of the Group’s assets, undertakings and uncalled capital are held by the Group’s bankers as security for the bank overdrafts and secured loans.
Interest is paid on all loans at commercial rates at a discount to Indicator Lending Rates. The effective interest rate on bank facilities at the balance sheet date was 5.7% (2014: 5.7%). Bank overdrafts are interest-only with no agreed repayment schedule. Bank loans are secured loans with varying terms. The effective interest rate on other loans is 5.7% (2014: 6.2%).
The fair value of borrowings approximates their carrying amounts. Borrowing terms, margins and credit risk factors approximate currently obtainable levels for similar facilities.
Certain borrowing facilities mature in 2016 and the Directors are currently negotiating renewal terms under a Common Deed Terms agreement with underlying bilateral facilities. It is anticipated that renewals will be secured for a 3 to 5 year term.
16. Issuedcapital Consolidated Parent Entity
2015 2014 2015 2014
(a) Issued and paid up capital
Ordinary shares 24,200 24,200 24,200 24,200
(b) Number of shares
Number of shares Number of shares (000’s)
Ordinary shares 31,008 31,008 31,008 31,008
In accordance with the Papua New Guinea Companies Act 1997 the shares have no par value.
The Company’s securities consist of ordinary shares which have equal participation and voting rights.

40 Steamships Annual Report 2015
NOTES TO THE FINANCIAL STATEMENTSSteamships Trading Company Limited Year Ended 31 December 2015 (Amounts in Kina 000’s)
17.Relatedpartydisclosures
(a) Parent entity
The Group is controlled by John Swire & Sons (PNG) Limited, which owns 72.12% of the Company’s shares. The ultimate Holding Company is John Swire & Sons Limited, incorporated in England.
(b) Interest in subsidiaries, associates and joint ventures:
These are set out in notes 20, 21 and 22 respectively.
(c) Directors:
G.L. Cundle, P.W. Langslow and S.C.Pelling are directors of John Swire & Sons (PNG) Limited.
(d) Remuneration:
Income received or due and receivable both by Directors and senior managers in connection with the management of the
Group companies is shown in the Directors’ Report.
Consolidated Parent Entity
2015 2014 2015 2014
Key management personnel disclosure
Wages and salaries 9,931 10,258 - -
Other short term benefits 1,159 1,415 - -
Long-term benefits 21 342 - -
(e) Material transactions:
Sales of goods and services - Associates & joint ventures 60,575 56,981 - - - Key Management 278 21 - - - Associated Groups 45,237 29,146 - - Lease and rental income - Associated Groups 1,338 3,287 - - Dividends received - Subsidiaries, associates & joint ventures 5,067 2,935 38,044 78,337 Management fees income - Associates & joint ventures - 868 - - - Key Management - 6 - - Purchase of goods and services - Associates & joint ventures (43,236) (31,653) - - - Associated Groups (5,105) (106) - - - Shareholders of associated companies - - - - Management fees paid - Associates & joint ventures (421) (100) - - - Other shareholders - (1,548) - - Purchase of assets - Associates & joint ventures (1,138) (830) - - Lease rental expense - Other Shareholders (6,672) (291) - - Container/Charter hire fee
- Other Shareholders (145) (15,334) - -

Steamships Annual Report 2015 41
NOTES TO THE FINANCIAL STATEMENTSSteamships Trading Company Limited Year Ended 31 December 2015 (Amounts in Kina 000’s)
17.Relatedpartydisclosures(continued)
Consolidated Parent Entity
2015 2014 2015 2014
Finance Cost
- Other shareholders - (3,533) - -
Dividends paid
- Other shareholders (minority interest) (2,795) (3,624) - -
- Controlling shareholder (34,605) (48,080) (34,605) (48,080)
- Significant shareholder (9,608) (13,367) (9,608) (13,367)
Loans to/(from) related companies
- Other shareholders (106,628) (62,586) - -
Insurance premiums
- Affiliated party (11,474) (14,396) - -
All transactions with related parties are made on normal commercial terms and conditions.
Loans from related companies:
Associates and joint ventures:
Consort associates (note 9) (26,690) (13,579) - -
Consort shareholders (note 15) (22,773) (17,455) - -
Basilok Limited (note 15) (160) (160) - -
Loans to related companies:
Colgate Palmolive Limited (note 9) 500 500 500 500
Harbourside Development Limited (note 9) 159,755 152,305 - -
Kelton Investments (note 9) - 790 - -
Subsidiary Companies (note 9) - - 5,212 5,212
Pacific Rumana Limited (note 9) 39,849 - - -

42 Steamships Annual Report 2015
NOTES TO THE FINANCIAL STATEMENTSSteamships Trading Company Limited Year Ended 31 December 2015 (Amounts in Kina 000’s)
18.Reconciliationofprofitafterincometaxtonetcashinflowfromoperatingactivities
Consolidated Parent Entity
2015 2014 2015 2014
Profit for the year after tax 101,394 100,145 38,887 95,556
Depreciation and impairment 131,583 127,689 2,215 2,613
Dividend and interest income - (91) (38,044) (78,347)
Net loss (gain) on sale of fixed assets (1,595) 3,365 139 -
Goodwill impairment - 4,010 - -
Gain on sale of investment - (7,097) - (17,548)
Gain on deconsolidation (18,867) - - -
Share of profit of associates and joint ventures (3,062) (3,844) - -
Income tax expense 37,710 37,295 - -
Change in operating assets and liabilities, net of effects from purchase of controlled entity
(Increase)/decrease in trade debtors (8,548) (1,939) (3,843) (1,717)
(Increase)/decrease in inventory (3,948) 28,818 - -
(Increase)/decrease in deferred tax asset (3,393) (12,440) 519 70
(Increase)/decrease in operating assets (12,431) (37,391) - -
Increase/(decrease) in trade creditors (1,184) (14,005) 17 (195)
(Decrease)/increase in other operating liabilities (13,744) (2,507) - -
(Decrease)/increase in provision for income tax payable (2,414) (3,892) - -
Increase/(decrease) in deferred tax liability 1,320 4,396 - -
Net cash inflow from operating activities 202,821 222,512 (110) 432
19.Retirementbenefitplans
The total cost of retirement benefits of the Group in 2015 was K7.6M (2014: K7.4M). The Group participates in the National Superannuation Fund of Papua New Guinea, a multi-employer defined contribution fund, on behalf of all citizen employees with minimum employer and employee contribution rates established by legislation. The Group also contributes to a defined contribution superannuation plan on behalf of expatriates. The defined contribution superannuation plan was established in 2002.
The parent entity does not employ staff directly; consequently there was no charge during the year

Steamships Annual Report 2015 43
NOTES TO THE FINANCIAL STATEMENTSSteamships Trading Company Limited Year Ended 31 December 2015 (Amounts in Kina 000’s)
20. Investmentinsubsidiaries
Significant investments in subsidiaries
The consolidated financial statements incorporate the assets, liabilities and results of the following subsidiaries in accordance with the accounting policy described in Note 1 (c):
Equity Equity Holdings* Holdings* Name of Entity Country of Incorporation Class of Shares 2015 2014
Consort Express Lines Limited Papua New Guinea Ordinary 70.2 51
Kavieng Port Services Limited Papua New Guinea Ordinary 60 60
Kiunga Stevedoring Company Limited Papua New Guinea Ordinary 100 100
Lae Port Services Limited Papua New Guinea Ordinary 51 51
Laga Industries Limited Papua New Guinea Ordinary 100 100
Madang Port Services Limited Papua New Guinea Ordinary 60 60
Middle Fly Shipping Limited**** Papua New Guinea Ordinary - 50
New Britain Shipping Limited** Papua New Guinea Ordinary 50 50
Oro Port Services Limited Papua New Guinea Ordinary 100 100
Pacific Towing (PNG) Limited Papua New Guinea Ordinary 100 100
Pacific Rumana Limited*** Papua New Guinea Ordinary - 50
Pacific Rumana Mobile Investments Limited Papua New Guinea Ordinary 79.8 79.8
Palm Stevedoring & Transport Limited Papua New Guinea Ordinary 56.7 50.3
Port Services PNG Limited Papua New Guinea Ordinary 54 54
Steamships Limited Papua New Guinea Ordinary 100 100
Windward Apartments Limited Papua New Guinea Ordinary 100 100
*The portion of ownership is equal to the proportion of voting power held.
** Consolidated by virtue of control over the operating decisions and returns. As at December 31, 2015 Steamships Trading Company still has control over this entity.
*** Loss of management control from 1 January 2015 (refer to note 22).
**** Amalgamated to Steamships Limited on 30 November 2015.
Shares in subsidiary companies have been stated at cost or fair value on acquisition less dividends received from pre-acquisition profits.
Steamships Trading Company Limited has granted a call option to a minority shareholder of Consort Express Lines in the event of any recovery under a charter performance guarantee to enforce a proportional equity capital buy back. At 31 December 2015 the performance guarantee obligations were substantially met.

44 Steamships Annual Report 2015
NOTES TO THE FINANCIAL STATEMENTSSteamships Trading Company Limited Year Ended 31 December 2015 (Amounts in Kina 000’s)
21. Investmentinassociates
(a) Movement in carrying amounts
Consolidated Parent Entity
2015 2014 2015 2014
Opening value 17,636 16,449 - -
Share of profits before tax 4,341 2,583 - -
Income tax expense (1,302) (775) - -
Dividends received (68) (621) - -
Closing value 20,607 17,636 - -
The equity method is used to account for all interests in associates on a consolidated basis.
(b) Summarised financial information of equity accounted associates.
The Group’s share of the results of its principal associates and its aggregated assets (including goodwill) and liabilities are as follows:
Ownerships Assets Liabilities Carrying Revenue Profit Interest Value 2015 %
Makerio Stevedoring Limited 31.7 1,374 469 905 447 194
Nikana Stevedoring Limited 31.7 1,230 177 1,053 326 167
Riback Stevedoring Limited 34.4 25,597 7,004 18,593 10,924 2,667
United Stevedoring Limited 16.9 421 365 56 2,770 11
28,622 8,015 20,607 14,467 3,039
Ownerships Assets Liabilities Carrying Revenue Profit Interest Value 2014 %
Makerio Stevedoring Limited 23.3 916 138 779 686 291
Nikana Stevedoring Limited 23.3 933 48 885 364 198
Riback Stevedoring Limited 25.1 18,437 2,510 15,927 8,620 1,311
United Stevedoring Limited 12.4 179 134 45 2,208 8
20,465 2,830 17,636 11,878 1,808
The associates provide stevedoring services to various external and Group shipping entities.
All associated companies are incorporated and operate in Papua New Guinea.
There are no contingent liabilities relating to the Group’s interest in the associates.

Steamships Annual Report 2015 45
NOTES TO THE FINANCIAL STATEMENTSSteamships Trading Company Limited Year Ended 31 December 2015 (Amounts in Kina 000’s)
22. Investmentinjointventures
(a) Movement in carrying amounts
Consolidated Parent Entity
2015 2014 2015 2014
Opening value 15,557 15,021 20,051 20,051
Share of profits before tax 33 2,907 - -
Income tax expense (10) (871) - -
Dividends received (5,000) (1,500) - -
New joint ventures 5,271 - 3,772 -
Closing value 15,851 15,557 23,823 20,051
The interest in joint ventures is accounted for in the financial statements using the equity method of accounting.
(b) Information relating to the joint ventures is set out below.
Ownership Assets Liabilities Carrying Revenue Profit Interest Value 2015 %
Colgate Palmolive (PNG) Limited 50 12,391 7,196 5,195 37,016 2,496
Harbourside Development 50 9,596 5,127 4,469 3,026 (3,390)
Pacific Rumana Limited 50 4,220 1,805 2,415 7,375 917
Viva No. 31 Limited 50 3,772 - 3,772 - -
29,979 14,128 15,851 47,417 23
Ownership Assets Liabilities Carrying Revenue Profit Interest Value 2014 %
Colgate Palmolive (PNG) Limited 50 11,393 3,695 7,698 32,989 2,036
Harbourside Development 50 7,859 - 7,859 - -
19,252 3,695 15,557 32,989 2,036
Viva No. 31 Limited is a new joint venture company and is currently developing a commercial property in Madang. Colgate Palmolive (PNG) Limited is a long held investment providing investment returns to the Group. Harbourside Development is a property investment company that also has commercial property in Port Moresby. Starting 1 January 2015, the Company no longer controls the governing of financial and operating policies of Pacific Rumana Limited due to increased participation of the Joint Venture partner, accordingly the Company has recognised the deconsolidated related interests of Pacific Rumana Limited and instead recognised the equity accounted investment at fair value. A gain on deconsolidation of K18.9M was recognised for which no consideration was received. The Group’s share of the capital commitments of joint ventures at 31 December 2015 is K2.2M (2014: K11.1 M).
There are no contingent liabilities arising from the Group’s interests in the joint ventures.

46 Steamships Annual Report 2015
NOTES TO THE FINANCIAL STATEMENTSSteamships Trading Company Limited Year Ended 31 December 2015 (Amounts in Kina 000’s)
23.Businesscombinations
Increase in shareholding in Consort Express Lines
On 1 July 2015, the Group merged Steamships Coastal Shipping (SCS), a division of Steamships Limited, with Consort Express Lines Limited (CELL) and increased its shareholding from 51 % to 70.2%.
The equity (merged assets) contributed by SCS amounted to K63.5M, with the fair value of these net assets amounting to K58.5M resulting in goodwill recorded of K5.0M. The goodwill is attributable to existing project charter arrangements. Internal goodwill is eliminated on consolidation.
24.DiscontinuedOperations
On 31 July 2014, the Group disposed of its 100% interest in Datec (PNG) Ltd to Telikom PNG Ltd.
The 31 December 2014 results from the discontinued activities were derived from:
a) Profit & loss for the period were:
7 Months 2014
Revenue 62,441
Operating expenses (59,156)
Profit before tax 3,285
Profit after tax 2,093
b) The subsequent sale for cash consideration of K36M resulted in a capital gain for the Group of K7M (parent K17M).
c) Cash flows for the period were:
Operating cash flows 10,814
Investing cash flows 2,048
Financing cash flows (4,998)
7,864

Steamships Annual Report 2015 47
NOTES TO THE FINANCIAL STATEMENTSSteamships Trading Company Limited Year Ended 31 December 2015 (Amounts in Kina 000’s)
25.Segmentalreporting
(a) Description of segments
The Board considers the business from a product perspective and have identified four reportable segments. A brief description of each segment is outlined below:
• Commercial – consists the manufacture and distribution of consumer products.
• Hotels and property – consists of the hotels owned and operated by the Group and also its property leasing division. The assets are stated at historical cost net of accumulated depreciation and includes new assets in the course of construction.
• Logistics – consists of shipping and land based freight transport and related services divisions.
• Finance and investment – consists of the head office administration function.
(b) Segment information
The segment information provided to the Board for the reportable segments for the year ended 31 December 2015 is as follows:
Commercial Hotels & Logistics Finance & Total Property Investment
2015
External revenue 114,754 273,024 382,747 3,010 773,535
Intersegmental revenue 822 31,493 3,157 - 35,472
Interest revenue - - 255 13,697 13,952
Interest expense (2) (8) (9,721) (29,917) (39,648)
Depreciation and amortisation (4,834) (43,229) (51,596) (2,483) (102,142)
Segment results 3,086 107,838 6,594 18,524 136,042
Share of joint ventures and associates profit 2,495 (2,472) 3,039 - 3,062
Total tax expense (2,015) (33,864) (20) (1,811) (37,710)
Profit from continuing operations 3,566 71,502 9,613 16,713 101,394
Segment assets 96,326 730,913 507,575 292,484 1,627,298
Segment liabilities (74,954) (358,506) (238,795) (118,441) (790,696)
Net assets 21,372 372,407 268,780 173,913 836,602
Total assets includes investment in joint ventures 5,195 10,656 20,607 - 36,458 and associates
Capital expenditure 7,145 55,501 36,598 10,418 109,662
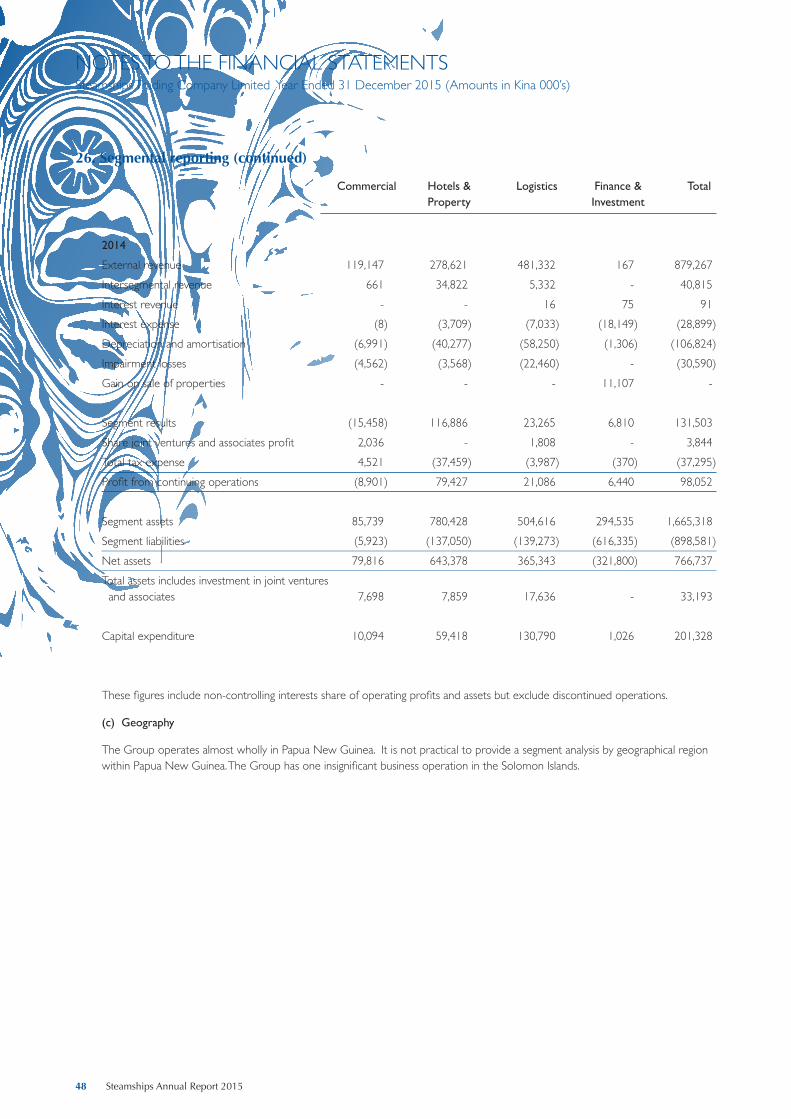
48 Steamships Annual Report 2015
NOTES TO THE FINANCIAL STATEMENTSSteamships Trading Company Limited Year Ended 31 December 2015 (Amounts in Kina 000’s)
26.Segmentalreporting(continued)
Commercial Hotels & Logistics Finance & Total Property Investment
2014
External revenue 119,147 278,621 481,332 167 879,267
Intersegmental revenue 661 34,822 5,332 - 40,815
Interest revenue - - 16 75 91
Interest expense (8) (3,709) (7,033) (18,149) (28,899)
Depreciation and amortisation (6,991) (40,277) (58,250) (1,306) (106,824)
Impairment losses (4,562) (3,568) (22,460) - (30,590)
Gain on sale of properties - - - 11,107 -
Segment results (15,458) 116,886 23,265 6,810 131,503
Share joint ventures and associates profit 2,036 - 1,808 - 3,844
Total tax expense 4,521 (37,459) (3,987) (370) (37,295)
Profit from continuing operations (8,901) 79,427 21,086 6,440 98,052
Segment assets 85,739 780,428 504,616 294,535 1,665,318
Segment liabilities (5,923) (137,050) (139,273) (616,335) (898,581)
Net assets 79,816 643,378 365,343 (321,800) 766,737
Total assets includes investment in joint ventures and associates 7,698 7,859 17,636 - 33,193
Capital expenditure 10,094 59,418 130,790 1,026 201,328
These figures include non-controlling interests share of operating profits and assets but exclude discontinued operations.
(c) Geography
The Group operates almost wholly in Papua New Guinea. It is not practical to provide a segment analysis by geographical region within Papua New Guinea. The Group has one insignificant business operation in the Solomon Islands.

Steamships Annual Report 2015 49
NOTES TO THE FINANCIAL STATEMENTSSteamships Trading Company Limited Year Ended 31 December 2015 (Amounts in Kina 000’s)
26.Contingentliabilities
There were contingent liabilities at the Balance Sheet date as follows:
(a) The parent entity has given a secured guarantee in respect of the bank overdrafts of certain subsidiaries.
(b) The parent entity has given letters of continuing financial support in respect of certain subsidiaries, associates and joint ventures.
No losses are anticipated in respect of these guarantees.
27.Commitments
(a) Capital commitments
Consolidated Parent Entity
2015 2014 2015 2014
Contracts outstanding for capital expenditure:
- less than 12 months 8,936 25,404 - -
- 1-5 years - 23,433 - -
8,936 48,837 - -
(b) Lease commitments: Group as lessee
The Group leases various properties under non-cancellable operating leases. The leases have varying terms and renewal rights. On renewal, the terms of the lease are renegotiated.
Commitments for minimum lease payments in relation to non-cancellable operating leases are payable as follows:
Within one year 2,513 2,779 - -
Later than one year but not later than five years - - - -
Later than five years - - - -
2,513 2,779 - -
28.Subsequentevents
In March 2016 the Directors declared a final dividend of 35 toea per share payable immediately after the Annual General Meeting
on 13 May 2016 amounting to K10.8M.

50 Steamships Annual Report 2015
INDEPENDENT AUDITOR’S REPORTto the Shareholders of Steamships Trading Company Limited
ReportonthefinancialstatementsWe have audited the accompanying financial statements of Steamships Trading Company Limited (the Company), which comprise the balance sheets as at 31 December 2015, the statements of comprehensive income, statement of changes in equity and statements of cash flows for the year then ended, and the notes to the financial statements that include a summary of significant accounting policies and other explanatory information for both the Company and the Group. The Group comprises the Company and the entities it controlled at 31 December 2015 or from time to time during the financial year.
Directors’responsibilityforthefinancialstatementsThe Directors are responsible for the preparation of these financial statements such that they give a true and fair view in accordance with generally accepted accounting practice in Papua New Guinea and the Companies Act 1997 and for such internal controls as the Directors determine are necessary to enable the preparation of financial statements that are free from material misstatement, whether due to fraud or error.
Auditor’sresponsibilityOur responsibility is to express an opinion on these financial statements based on our audit. We conducted our audit in accordance with International Standards on Auditing. These standards require that we comply with relevant ethical requirements and plan and perform the audit to obtain reasonable assurance about whether the financial statements are free from material misstatement .
An audit involves performing procedures to obtain audit evidence about the amounts and disclosures in the financial statements. The procedures selected depend on the auditor’s judgement, including the assessment of the risks of material misstatement of the financial statements, whether due to fraud or error. In making those risk assessments, the auditor considers the internal controls relevant to the Company and the Group’s preparation of financial statements that give a true and fair view of the matters to which they relate, in order to design audit procedures that are appropriate in the circumstances, but not for the purpose of expressing an opinion on the effectiveness of the Company and the Group’s internal control. An audit also includes evaluating the appropriateness of accounting policies used and the reasonableness of accounting estimates, as well as evaluating the overall presentation of the financial statements.
We believe that the audit evidence we have obtained is sufficient and appropriate to provide a basis for our audit opinion.
OpinionIn our opinion, the accompanying financial statements:
1. comply with International Financial Reporting Standards and other generally accepted accounting practice in Papua New Guinea; and
2. give a true and fair view of the financial position of the Company and the Group as at 31 December 2015, and their financial performance and cash flows for the year then ended.

Steamships Annual Report 2015 51
INDEPENDENT AUDITOR’S REPORTto the Shareholders of Steamships Trading Company Limited
ReportonotherlegalandregulatoryrequirementsThe Companies Act 1997 requires in carrying out our audit we consider and report on the following matters. We confirm in relation to our audit of the financial statements for the year ended 31 December 2015:
1. we have obtained all the information and explanations that we have required;
2. in our opinion, proper accounting records have been kept by the Company as far as appears from an examination of those records; and
3. we have no relationships with or interests in the Company or any of its subsidiaries other than in our capacities as auditor and tax advisor. These services have not impaired our independence as auditor of the Company and the Group.
RestrictionondistributionoruseThis report is made solely to the Company’s shareholders, as a body, in accordance with the Companies Act 1997. Our audit work has been undertaken so that we might state to the Company’s shareholders those matters which we are required to state to them in an auditor’s report and for no other purpose. We do not accept or assume responsibility to anyone other than the Company and the Company’s shareholders, as a body, for our audit work, for this report or for the opinions we have formed.
PricewaterhouseCoopers
Grant Burns PartnerRegistered under the Accountants Act 1996Port Moresby31 March 2016

52 Steamships Annual Report 2015
DIRECTORS’ REPORTSteamships Trading Company Limited Year ended 31 December 2015
SteamshipsTradingCompanyLimitedandSubsidiaryCompanies
The Directors submit their Annual Report for the year ended 31 December 2015 for the Company and its subsidiaries.
PrincipalActivitiesandReviewofOperations
Full details of the Group’s activities are given in the Directors’ Review on page 7. The Group continues to operate in the segments of Commercial, Hotels and Property, and Logistics.
The Directors believe that there will be no significant changes in the Group’s activities for the foreseeable future.
ChangesinAccountingPolicies
There are no changes in Accounting Policies in the year.
Result
The Group operating profit for the year attributable to shareholders was K98,979,000 (2014: K88,655,000).
Dividend
The Directors advise that a final dividend of 35 toea per share will be paid immediately after the Annual General Meeting on 13 May 2016. This brings the total dividend declared for the year to 130 toea per share. Dividends payable to shareholders resident outside of Papua New Guinea will be converted to Australian Dollars at the prevailing rate which the Company is able to secure .
Rounding Off
Amounts in the Directors’ Report and accounts have been rounded off to the nearest thousand Kina.

Steamships Annual Report 2015 53
DIRECTORS’ REPORTSteamships Trading Company Limited Year ended 31 December 2015
Experience&InterestsRegister
Directors serving at the date of this report have disclosed the following experience and interests in shares in the Company and provided general disclosure of companies in which the Director is to be regarded as interested as set out below:
G.L. Cundle
Appointed Chairman on 28th February 2015 following W.L. Rothery’s retirement
Managing Director from 1st January 2013 to 12th January 2015
Member of the Remuneration Committee
Member of the Strategic Planning Committee
Director since 2013
Mr Cundle joined the Swire Group in 1979 and has extensive corporate experience having worked with the Group in various divisions in Hong Kong, Australia, Korea, Japan and Papua New Guinea. He was a Non-Executive Director of Steamships in 2006-2007 and Steamships Shipping General Manager from 1989-1992. He is a director of John Swire & Sons (PNG) Ltd. He was the Managing Director of Steamships Trading Company Limited from 1st January 2013 to 12th January 2015 .
P.AitsiMBE
Director since 17th November 2014
Mr Aitsi is currently the PNG Country Manager for Newcrest Mining Limited and serves as a director for various Newcrest PNG entities including the position of Chairman of Lihir Gold Limited. He was formerly the country manager for GHD (an engineering firm), former chairman of Transparency International PNG (currently a board member) and the founder Chairman of Digicel Foundation. He also serves on the boards of PNGFM, City Pharmacy Group, Leadership PNG and IPBC.
G.AopiCBE
Director since 1997
Mr Aopi is an Executive Director of Oil Search Ltd, where he is also Executive General Manager of External & Government Affairs and Sustainability. He has substantial public service and corporate experience in Papua New Guinea currently serving as the Chairman of the PNG Chamber of Mines and Petroleum. He is a Director of Port Moresby Stock Exchange Ltd, Marsh Ltd, Bank of South Pacific Limited, CDI Foundation, Wahinemo Ltd and various other private companies. He is a former Chairman of Telikom PNG Ltd and Independent Public Business Corporation.
Sir M.R. Bromley KBE
Member of the Audit and Risk Committee
Member of the Remuneration Committee
Member of the Strategic Planning Committee
Director, 1986 to 1996
Director since 2000
Sir Michael Bromley has extensive international business experience from over 40 years of operating and advising companies in countries including Singapore, Indonesia, Australia, Russia, China and Papua New Guinea, principally in retail and logistics operations. He is Chairman of Heli Niugini Ltd and AAB Holdings Pty Ltd, and a Director of Pegasus Print Group Pty Ltd, Fasteners & More Pty Ltd, New Guinea Energy Limited, Sonway Asia Ltd, Chemica Ltd, Sig No.1 Ltd, Glock No. 1 Ltd, Broman Ltd, Maps Tuna Ltd, Sek No. 35 Ltd, Hoia Investment Ltd, Venture Ltd and Viva No.31 Ltd.
Relevant Interest in the Company’s shares: 19.99%

54 Steamships Annual Report 2015
DIRECTORS’ REPORTSteamships Trading Company Limited Year ended 31 December 2015
D.H.CoxOL,OBE
Managing Director 2004 to 2012
Member of the Audit & Risk Committee (wef 2015)
Member of the Strategic Planning Committee (wef 2015)
Director since 2003
Mr Cox joined Steamships as a Manager in 1992, rising to become Managing Director from 2004-2012. He has extensive experience in the PNG business environment. He is also a Director of Telikom PNG Ltd.
G.J.Dunlop
Chairman of the Audit and Risk Committee
Member of the Strategic Planning Committee
Managing Director 2000 to 2003
Director since 1995
Mr Dunlop is a chartered accountant with extensive experience in the Pacific region. He is a Director of City Pharmacy Group Ltd, Credit Corporation (PNG) Ltd, Hardware Haus Pty Ltd and Mainland Holdings Ltd.
LadyW.T.KamitCBE
Member of the Audit and Risk Committee
Director since 2005
Lady Winifred Kamit is a former Senior Partner, and currently a consultant at Gadens Lawyers in Port Moresby. She is a Councillor of the Papua New Guinea Institute of National Affairs and Chairperson of Coalition for Change PNG. She is a Director & Secretary of Bunowen Services Ltd and Gadens Administration Services Ltd, and a Director of Newcrest Mining Ltd, Nautilus Minerals Niugini Ltd, Kamchild Ltd, ANZ Banking Group (PNG) Ltd and South Pacific Post Ltd.
P.W. Langslow
Managing Director from 12th January 2015
Mr Langslow joined the Swire group in September 1984 and has been with Cathay Pacific since 1985. Prior to his present appointment, he has held a number of positions in the airline, including country and regional management roles in India, Italy, Canada and Taiwan, as well General Manager Inflight Services and General Manager Airports. He is a director of John Swire & Sons (PNG) Ltd and various Steamships Trading Company subsidiaries, joint ventures and associate companies.
S.C. Pelling
Finance Director & Company Secretary since 2012
Mr Pelling is a chartered accountant who was previously Finance Director for agricultural operations in Africa with James Finlay Ltd, a wholly-owned subsidiary of John Swire & Sons Ltd. He is a Director of John Swire & Sons (PNG) Ltd and various Steamships Trading Company subsidiaries, joint ventures and associated companies.
B.N. Swire
Director from 1 January 2015
Mr. Swire joined John Swire & Sons in 1985 and has since worked at various times in Hong Kong, Papua New Guinea and Japan, concentrating on the Group’s marine businesses. He returned to the London Head Office in 1994 and is now the Chairman of John Swire & Sons Ltd., as well as the Non-Executive Chairman of the China Navigation Co. Ltd., and of Swire Oilfield Services Ltd., and a Non-Executive Director of Swire Pacific Offshore Ltd.
Direct and indirect beneficial interest 4.47%
J.H. Woodrow
Director from 7 September 2015
Mr Woodrow is Managing Director of the China Navigation Company Pte Limited (Swire Shipping). He was formerly Director Cargo for Cathay Pacific (2013-2015) and General Manager Cargo Sales & Marketing for Cathay Pacific (2010-2013). He joined John Swire and Sons in September 1990 and spent 15 years in the sea freight industries in Japan and Australia. He was also a director of various companies across Asia including Air Hong Kong Ltd, Air China Cargo Ltd, Cathay Pacific China Cargo Holdings Ltd, Cathay Pacific Services Limited.

Steamships Annual Report 2015 55
DIRECTORS’ REPORTSteamships Trading Company Limited Year ended 31 December 2015
RemunerationofDirectors
Directors remuneration received or receivable from the Company as Directors during the year, is as follows:
2015 2014 K’000 K’000
P. Aitsi 89 11 G. Aopi 89 99 T.J. Blackburn (retired) 44 99 M.R. Bromley 221 152 D.H.Cox 177 99 G.L. Cundle (Chairman) 221 - G.J.Dunlop 199 129 J.W. Hughes-Hallett (retired) - 99 W.T. Kamit 133 197 P.W. Langslow * - - S.C. Pelling * - - W.L. Rothery (retired) - 246 B.N. Swire 89 - J.H. Woodrow 44 - 1,306 1,131
* Executive Directors receive no fees for their services as Directors during the year.
RemunerationofEmployees
The number of employees other than Directors, whose remuneration and other benefits was within the specified bands are as follows:
Remuneration 2015 2014 Remuneration 2015 2014 Remuneration 2015 2014K’000 No. No. K’000 No. No. K’000 No. No.
100-110 7 - 330-340 2 1 590-600 1 -110-120 12 13 340-350 - 1 600-610 - 1120-130 6 14 350-360 2 3 610-620 2 1130-140 2 6 360-370 1 6 620-630 1 -140-150 3 5 370-380 1 2 630-640 1 -150-160 4 9 380-390 2 - 650-660 - 1160-170 6 7 390-400 4 1 670-680 - 1170-180 4 6 400-410 2 1 680-690 - 1180-190 - 2 410-420 - 4 700-710 - 2190-200 4 3 420-430 4 5 710-720 - 1200-210 2 2 430-440 1 - 730-740 1 -210-220 2 5 440-450 1 2 740-750 1 -220-230 3 3 450-460 - 1 750-760 - 1230-240 - 2 460-470 1 - 790-800 - 2240-250 1 3 470-480 1 1 820-830 2 -250-260 2 1 490-500 2 1 890-900 1 -260-270 5 1 500-510 2 2 950-960 2 1270-280 2 6 520-530 1 1 970-980 1 1280-290 1 6 530-540 2 2 1,030-1,040 - 1290-300 1 1 540-550 1 2 1,050-1,060 1 -300-310 1 2 550-560 1 - 1,070-1,080 - 1310-320 1 1 560-570 - 2 1,700-1,800 - 1320-330 3 - 580-590 1 1
For and on behalf of the Board:
Port Moresby G.L. Cundle P.W. Langslow 31 March 2016 Chairman Managing Director
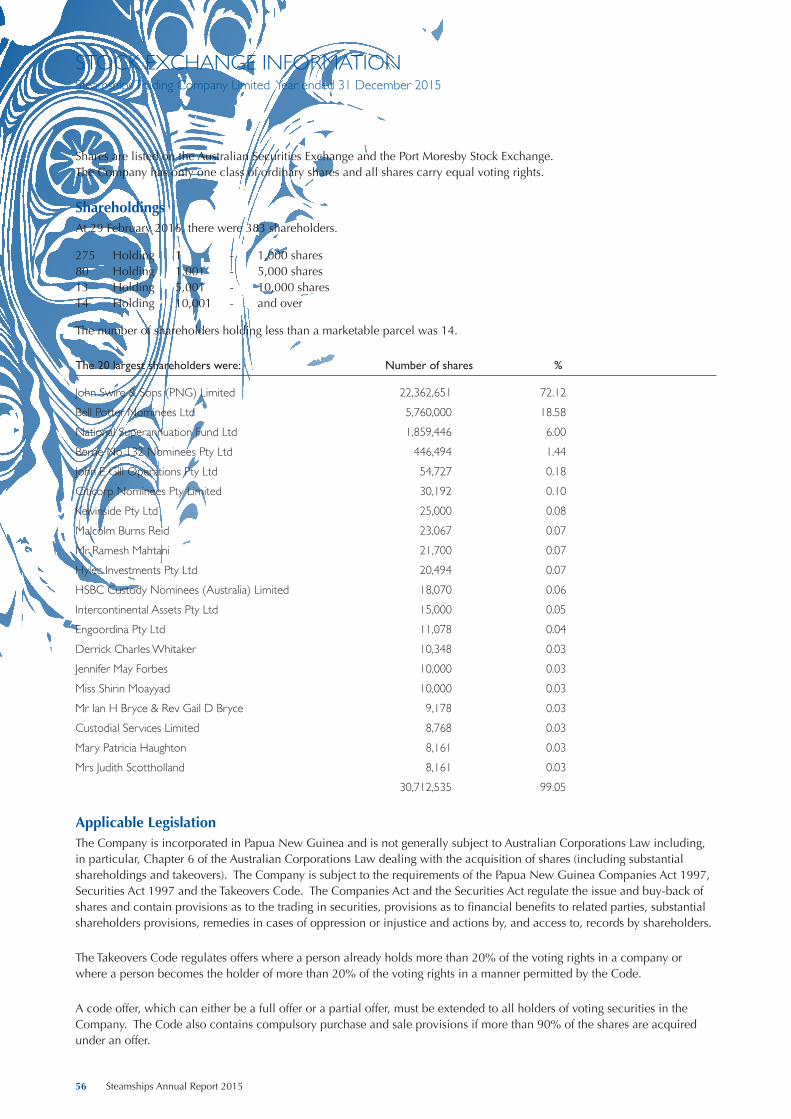
56 Steamships Annual Report 2015
STOCK EXCHANGE INFORMATIONSteamships Trading Company Limited Year ended 31 December 2015
Shares are listed on the Australian Securities Exchange and the Port Moresby Stock Exchange.The Company has only one class of ordinary shares and all shares carry equal voting rights.
ShareholdingsAt 29 February 2016, there were 383 shareholders.
275 Holding 1 - 1,000 shares80 Holding 1,001 - 5,000 shares13 Holding 5,001 - 10,000 shares 14 Holding 10,001 - and over
The number of shareholders holding less than a marketable parcel was 14.
The 20 largest shareholders were: Number of shares %
John Swire & Sons (PNG) Limited 22,362,651 72.12
Bell Potter Nominees Ltd 5,760,000 18.58
National Superannuation Fund Ltd 1,859,446 6.00
Berne No 132 Nominees Pty Ltd 446,494 1.44
John E Gill Operations Pty Ltd 54,727 0.18
Citicorp Nominees Pty Limited 30,192 0.10
Kelvinside Pty Ltd 25,000 0.08
Malcolm Burns Reid 23,067 0.07
Mr Ramesh Mahtani 21,700 0.07
Hylec Investments Pty Ltd 20,494 0.07
HSBC Custody Nominees (Australia) Limited 18,070 0.06
Intercontinental Assets Pty Ltd 15,000 0.05
Engoordina Pty Ltd 11,078 0.04
Derrick Charles Whitaker 10,348 0.03
Jennifer May Forbes 10,000 0.03
Miss Shirin Moayyad 10,000 0.03
Mr Ian H Bryce & Rev Gail D Bryce 9,178 0.03
Custodial Services Limited 8,768 0.03
Mary Patricia Haughton 8,161 0.03
Mrs Judith Scottholland 8,161 0.03
30,712,535 99.05
ApplicableLegislationThe Company is incorporated in Papua New Guinea and is not generally subject to Australian Corporations Law including, in particular, Chapter 6 of the Australian Corporations Law dealing with the acquisition of shares (including substantial shareholdings and takeovers). The Company is subject to the requirements of the Papua New Guinea Companies Act 1997, Securities Act 1997 and the Takeovers Code. The Companies Act and the Securities Act regulate the issue and buy-back of shares and contain provisions as to the trading in securities, provisions as to financial benefits to related parties, substantial shareholders provisions, remedies in cases of oppression or injustice and actions by, and access to, records by shareholders.
The Takeovers Code regulates offers where a person already holds more than 20% of the voting rights in a company or where a person becomes the holder of more than 20% of the voting rights in a manner permitted by the Code.
A code offer, which can either be a full offer or a partial offer, must be extended to all holders of voting securities in the Company. The Code also contains compulsory purchase and sale provisions if more than 90% of the shares are acquired under an offer.

Steamships Annual Report
COMPANY DIRECTORY
CHAIRMANG. L. Cundle §&
MANAGING DIRECTOR P.W. Langslow
FINANCE DIRECTOR S. C. Pelling
NON-EXECUTIVE DIRECTORSP. Aitsi MBEG. Aopi CBESir M.R. Bromley KBE §+&D. Cox OL, OBE +&G. J. Dunlop +&Lady W. T. Kamit, CBE +B.N. SwireJ. H. Woodrow
+ Member of the Audit and Risk Committee § Member of the Remuneration Committee & Member of the Strategic Planning Committee
SECRETARYS. C. Pelling
REGISTERED OFFICELevel 5, Harbourside West, Stanley EsplanadeTelephone: +675 313 7400P.O. Box 1Port Moresby, NCDPapua New Guinea
AUDITORSPricewaterhouseCoopersP.O. Box 484Port Moresby Papua New Guinea
SHARE REGISTRARSComputershare Investor Services Pty LimitedGPO Box 2975Melbourne VIC 3001AUSTRALIATelephone: (Aus) 1300 85 05 05(Overseas) +61 (0)3 9415 4000Fax: +61 3 9473 2500
STOCK EXCHANGEShares are listed on both the Port Moresby Stock Exchange Limited and the Australian Securities Exchange Limited.
A. R. B. N.055 836 952