Embed Size (px)
Citation preview

ANNUAL REPORT 2015
A global lithium producer
OROCOBRELIMITEDF
or p
erso
nal u
se o
nly

PROFILE
Orocobre is building a substantial Argentine based industrial
chemicals company through its portfolio of lithium, potash and
boron assets.
In partnership with Toyota Tsusho Corporation and JEMSE, Orocobre has built and
is now operating the world’s first commercial, brine-based lithium operation
constructed in over 20 years with Stage One design production rate of 17,500tpa
lithium carbonate for sale to industrial and battery markets.
The Company also owns Borax Argentina, a well-established boron chemical and
mineral producer with extensive operations and a fifty year production history.
Orocobre is dual listed on the Australian Securities Exchange (ASX: ORE) and the
Toronto Stock Exchange (TSX: ORL) and is included in the S&P/ASX 300 Index.
For
per
sona
l use
onl
y

CONTENTS
Highlights
Lithium and the Market
Boron and the Market
Chairman's Letter
Chief Executive Officer's Report
Review of Operations
Social Responsibility & Community Relations
Directors' Report
Auditor's Independence Declaration
Financial Statements
ASX Additional Information
Corporate Directory
2
4
6
8
10
14
36
40
75
76
116
129
Orocobre Limited I Annual Report 2015 1
For
per
sona
l use
onl
y

Salar de Olaroz Lithium Facility
! Construction and commissioning completed and commercial sales commenced
! Debottlenecking is in the final stages following a slower than expected ramp up. Nameplate production run rate is expected to be reached in December 2015 with the Olaroz Lithium Facility sold out of production for calendar year 2015
! Excellent market fundamentals for lithium with strong demand growth, tightening supply and rising prices
! Sales de Jujuy received accreditation for ISO 9001:2008 (Quality Management), ISO 1400:2004 (Environmental Management) and OHSAS 18001:2007 (Safety and Occupational Healthcare) management systems
HIGHLIGHTS2014-2015
2
For
per
sona
l use
onl
y

Borax Argentina S.A.
! EBITDA was (A$1.725M) (FY2014 A$3.152M) due to challenging market conditions, particularly in Brazil, and impacts from a slower than expected ramp up of the borax decahydrate plant following its relocation to Tincalayu resulting in a higher proportion of lower value mineral sales
! Tincalayu upgraded to JORC compliant with a considerably larger resource with considerable exploration potential
! Successfully produced boric acid from hydroboracite feed which will result in significantly lower boric acid production costs
Corporate
! In November 2014 Sales de Jujuy was awarded “Mining Company of the Year” by Argentina Mining Magazine Panorama Minero and the Fundacion para el Desarrollo de la Mineria Argentina (Foundation for Development of Argentina Mining)
! The Orocobre Group received an award in September 2014 for being an “Outstanding CSR Mining Company” by the Committee of Argentina Mining
! Raised over A$82 million during the 2015 calendar year and in early FY16
Orocobre Limited I Annual Report 2015 3
For
per
sona
l use
onl
y

Olaroz Lithium
Lithium
No new projects in construction phase
Lithium supply is tightening
Prices are increasing
Existing producers are at capacity
Delays on others’ expansion plans
NOW THE SUPPLYING GLOBAL
LITHIUM MARKET
4
For
per
sona
l use
onl
y

... and the market
From our homeBUILDS
DRIVES
POWERS
to our office
glass, ceramics
cars, busses,drones, bikes, forklifts
phones, laptops,power tools, grid storage
LITHIUM
20% ... our future
Tesla, BYD, Foxconn, Boston Power, Panasonic are all planning to expand or build large scale battery plants
market growth in the battery sector
10%OVERALL MARKET
GROWTH
Orocobre Limited I Annual Report 2015 5
For
per
sona
l use
onl
y

Watch it
Treat it
Mould it
Wear it
Grease it
Clean it
Stick it
Cool it
Tan it
Snap it
Set it
Shield it
Feed it
Used in more than 300 applications boron is an
essential mineral which is part of life foreveryday everyone everywhere
Boron
6
For
per
sona
l use
onl
y

20142000 2001 2002 2003 2004 2005 2006 2007 2008 2009 2010 2011 2012 2013
Global imports of borates
grew to a record year in 2014at 3.49 million
tonnes
Natural borates Boric Acid Refined borates Perborates
4,000,000mt
3,500,000mt
3,000,000mt
2,500,000mt
2,000,000mt
1,500,000mt
1,000,000mt
500,000mt
0mt
forecast in line with GDPWith future growth
... and the market
Orocobre Limited I Annual Report 2015 7
For
per
sona
l use
onl
y

Dear Shareholders,
During the past twelve months we have achieved our fundamental goal of becoming a lithium carbonate producer, joining the ranks of only a handful of established lithium companies. By the end of 2014 the Company had materially finalised the construction of the Olaroz Lithium Facility and by the end of January 2015 all circuits had been commissioned. Since then, our focus has been on achieving nameplate production run rate by the end of calendar year 2015, and continuing to develop robust supply relationships with a global network of customers. The project has experienced a number of challenges in ramping up, but we believe we now have a clear pathway to achieving full production by the end of the year. In our opinion, given the reality of supply and demand, there has never been a better time to enter the lithium market. The effect of supply tightening and demand growing, has created an ideal market environment for Orocobre with customers becoming less price sensitive and placing increased value in securing long-term supply.
It is once again time to reflect on another year at Orocobre and look back at the milestones achieved as we grow our industrial chemicals company.
CHAIRMAN’S LETTER
8
For
per
sona
l use
onl
y

Our Borax Argentina Company began the financial year with the relocation of their borax chemical plant from Campo Quijano to Tincalayu. Unfortunately, tough conditions in our main market, Brazil, and a slower than expected ramp-up at the relocated Tincalayu plant has had negative effect on Borax Argentina’s financial results during the year. Our market diversification strategy which was being developed in prior years has mitigated some of the impact. After the success of the Tincalayu resource upgrade, we will continue with our plans to bring the remainder of the Borax Argentina deposits into JORC compliance, with an aim to grow the business in the most suitable and cost-effective manner possible.
Orocobre remains committed to upholding a strong culture of corporate responsibility in the way we conduct business and how we progress our operations. We were very proud to be presented in September 2014 with Mining Argentina’s annual award for “Outstanding CSR Mining Company”. Additionally in November 2014 the Orocobre group of companies was once again awarded “Mining Company of the Year” by Argentina mining magazine Panorama Minero and the Fundacion para el Desarrollo de la Mineria Argentina. Orocobre understands the importance of creating a sustainable future for our Company and for the communities in which we operate. The mutually beneficial relationships which we have formed with local stakeholders, communities and workers has been one of the major contributing factors behind the success we have achieved at our Olaroz Lithium Facility.
I would like to express my sincere appreciation to the executive management team and my fellow directors who have shown the greatest amount of support, strength and wisdom in this challenging but rewarding year. I would also like to thank the continuing support and ongoing engagement from our shareholders, and in particular the support provided by our shareholders during capital raising, who without, we would not be where we are today.
My Best Regards,
James CalawayChairman
The effect of supply tightening and demand growing, has created an ideal market environment for Orocobre with customers becoming less price sensitive and placing increased value in securing long-term supply.
Orocobre Limited I Annual Report 2015 9
For
per
sona
l use
onl
y

CHIEF EXECUTIVE OFFICER’S REPORT
This year has been both a challenging and satisfying year for Orocobre. The Olaroz Lithium Facility made its first commercial dispatch of lithium carbonate in late April and continues to ramp up production. Borax Argentina has had a challenging year with the slower than anticipated Tincalayu plant ramp up and unfavourable market conditions but the focus continues on production optimisation projects and market diversification.
Significant progress has been made in the learning journey and we are now in the final stages of de-bottlenecking and improvement in the monthly production ramp up performance. The management and staff at Olaroz have demonstrated tremendous commitment over the past year and we look forward to achieving nameplate production run rate by the end of this calendar year. We recognise the role of our Shared Value policy and the engagement and support of local stakeholders who are now firm partners in our projects. The Olaroz Lithium Facility is recognised as providing a significant long term economically and environmentally sustainable benefit to the community.
The financial result for Borax Argentina was down on last year due to the slower ramp up of the relocated borax decahydrate plant and tough market conditions, particularly in Brazil. It has been a year of hard work by all employees and management at Borax Argentina and the result would have been worse without the diversification of the customer base and the benefits of lower Borax decahydrate operational costs in the second half, after production ramp up. We will see more benefits of these initiatives and others recently announced in FY16 and beyond.
Over the past year the Company has continued on the course set for Borax Argentina with production ramping up at the relocated borax decahydrate plant at Tincalayu. The slower than anticipated ramp up did impact on the sales performance of the business. Unlike Olaroz’s lithium markets that were robust, Borax Argentina’s main markets, like so many other commodity markets around the world, were not favourable this year, with the economic downturn in Brazil and a poor local agricultural season significantly impacting on the business’ expected results. However, we recognise that these are cyclical events and we continue to work on structuring the business to be able to manage through the cyclical downturns and take advantage of the cyclical peaks. Globally the boron market is growing strongly and our exposure to Brazil has been ameliorated by a diversification strategy that has been developed over previous years both in terms of geography and application split. For example, Borax Argentina is now supplying products into the oil and gas industry.
The last twelve months at the Olaroz Lithium Facility have been focused on commissioning and early operation. Moving from construction into production always presents challenges and we have experienced our own set of unique challenges in getting into production, identifying and rectifying production issues and bottlenecks and developing good operational practice. Our success is not only about equipment performance, mechanics and chemistry of running a plant but also the human element. The Olaroz Lithium Facility is the first of its kind in almost 20 years and operates at an elevation of nearly 4000m. Gaining an operational understanding of the process and the interrelating circuits of the plant, diagnosing and rectifying deficiencies and bottlenecks, documenting operational processes and educating operational management and staff is a learning experience.
10
For
per
sona
l use
onl
y

Strategy and Growth
At the Olaroz Lithium Facility, our focus is to implement good operating practice, deliver product to customers within specification and achieve the nameplate monthly production run rate by the end of the calendar year.
The strategy for growth is still to consider:
1) expanded production of lithium carbonate at Olaroz in line with the projected growth profile of the lithium market
Following upgrade of the Porvenir resource in the previous year, the Tincalayu resource was upgraded to a JORC compliant resource during the year. The resource size was much larger than the previous historical estimate and has the potential to support a much larger project, on which studies have commenced. The Company will continue the process of upgrading the geological interpretation and re-estimation of the other Borax Argentina deposits and will consider the priorities for investment into additional production capacity and down-stream product development.
A project came to fruition in recent months which aimed to improve the efficiency and lower the cost per unit of production at the boric acid plant by using hydroboracite rather than ulexite as the feedstock mineral. This has resulted in the plant now using 100% hydroboracite feed. The hydroboracite used are tailings produced from the Sijes concentrator with stockpiles of tailings at the mine suitable for 3 to 4 years feed. We will continue to focus on identifying low input, high output operational efficiency improvements as well as step change opportunities.
2) the potential for new products such as lithium hydroxide and
3) extracting other chemicals from the brine such as boron and potassium.
At Borax Argentina our strategy over time is to significantly increase the business scale, based around a hub in the Tincalayu, Sijes and Diablillos area and at the same time decreasing unit costs with economies of scale and modern practices. In particular, we see potential for growth from increased production of sodium borate refined chemicals from Tincalayu, hydroboracite minerals from Sijes and boric acid production from lower grade beds of hydroboracite from Sijes. Our objective is to establish Borax Argentina as a sustainable and growing enterprise, making a material contribution to Orocobre's bottom line.
Orocobre Limited I Annual Report 2015 11
For
per
sona
l use
onl
y

Health Safety and Community
During the year Sales de Jujuy joined Borax Argentina in receiving ISO accreditation for ISO 31000 Risk Management, ISO 9001 Quality Control and ISO 14001 Environmental Management. Both subsidiary companies have also implemented the OHSAS 18001 Occupational Health and Safety Management System.
The Company fosters a “zero harm” approach when it comes to the safety of our employees and project contractors. Orocobre’s goal regarding the safety of our operations is to continuously improve the reporting of and reduction in workplace risks and incidents. The safety statistics for Borax Argentina and Sales de Jujuy employees and contractors is presented in the table below (TRIFR = Total Recordable Injury Frequency Rate):
This is a significant improvement on the prior year and a result of a major focus by management.
Within Argentina, the Company operates a wide range of programs aimed at improving the health and education of our personnel and that of the local communities, as well as fostering the entrepreneurial skills of local businesses. Year-round health care programs are conducted that provide dentistry, ophthalmology, cardiology and paediatric services for both our employees and the local community. Additionally, the Company has undertaken a number of campaigns which focus on creating awareness for the prevention and early-detection of conditions such as breast cancer and substance dependency. The Company has also been actively involved in community initiatives which focus on improving the formal education graduation rate at primary, high school and speciality levels.
Partnerships
Orocobre is supported by our valuable partnerships with Toyota Tsusho Corporation (“TTC”), Japan Oil Gas and Metals National Corporation (“JOGMEC”), Mizuho Bank, the Jujuy Provincial Government Energy and Mining Company (“JEMSE”), and the local people and local businesses who provide services for our projects. I would like to acknowledge the importance of our partners who contribute to our success and thank them for all their ongoing support and involvement.
Borax Argentina
Sales de Jujuy
7.4
10.1
EmployeeTRIFR
3.7
EmployeeTRIFR
ContractorTRIFR
16.5
33.3
2015 2014 2014Contractor
TRIFR
7.4
2015
24.6
14.2
12
For
per
sona
l use
onl
y

Market Outlook
Acknowledgements
The current market environment for lithium carbonate producers is extremely favourable. Independent consultants (such as Roskill and Benchmark Mineral Intelligence) are predicting overall growth in the lithium industry at ~10% year-on-year, for at least the next 2 to 3 years. Demand for lithium is largely being driven by the growth of the rechargeable lithium-ion battery market, which alone is growing at 20% annually. Large-scale lithium-ion battery factories have been announced by numerous multinationals including Tesla, BYD, Foxconn, Samsung and LG. Lithium demand for use in industrial applications such as in glass and ceramics is also optimistic, growing at above GDP levels. With supply of lithium products beginning to tighten due to delays in bringing new production on stream and market demand growing, the industry is seeing an increase in product prices with customers placing increased importance on the security of supply.
The market for boron is very diverse with over 300 uses for the mineral. However, the largest market by far is in glass and ceramics which account for almost two-thirds of global boron consumption. Other common applications include use in the manufacturing of insulation and as an agricultural fertiliser. Despite the market diversity, demand for boron is largely driven by two major factors, these being an increase in population and political and societal pressures for environmental sustainability. While Borax Argentina has experienced some challenging market conditions as a result of the downturn in the Brazilian market, the Company remains focused on a diversification strategy for our boron business in terms of both geography and application in order to minimise the impact of cyclical market movements.
Globally, the outlook for both the lithium market and the boron market is positive in the short and long term. However, the Company understands the importance of creating a sustainable business based on low-cost operations and strategic expansions. With growing global population, strong political and societal agendas for the reduction of pollution and improvements to energy efficiency we expect to see growing demand for lithium and boron for many years to come.
It is with great appreciation that I give thanks to the many parties who have individually and collectively contributed to our Company this year. I acknowledge the amazing efforts of employees, contractors and service providers, who are the boots on the ground responsible for turning our grand visions into reality. Thank you also, to our respected Chairman, board members and executive management team who have always provided strong leadership and support even in the most challenging times. My appreciation to our esteemed project partners, with whom we thank for sharing in our vision and believing in our future. And finally, thank you to our shareholders, who have remained patient, devoted and supportive throughout this year as we have edged ever closer to achieving profitability.
Best Regards,
Richard SevilleCEO & Managing Director
Orocobre Limited I Annual Report 2015 13
For
per
sona
l use
onl
y

Orocobre has interests in a portfolio of large brine exploration groupings in Argentina as well as mines and processing plants for boron minerals and lithium carbonate production.
The Company’s brine assets can be split into two groups. The first group of properties is owned and held by 66.5% (effective) Argentine operating company, Sales de Jujuy S.A (“SDJ”) and contain those properties associated with the Olaroz Lithium Facility. Orocobre’s partners in SDJ are Toyota Tsusho Corporation (25%) and JEMSE (8.5%). The ownership structure is explained in the following description of the Olaroz Lithium Facility. The second group of brine assets is owned by South American Salar S.A (85% effective owned by the Company) which has properties in a number of salt lakes in Salta and Jujuy provinces, including the Salar de Cauchari lithium-potash project and Salar de Salinas Grandes potash-lithium project. The Company’s boron mineral assets are held through its 100% owned subsidiary, Borax Argentina S.A.
0 500km
A
R
G
E
N
T
I
N
A
Salta
BUENOS AIRES
MendozaLEGEND
South American Salars Project
Salar
Orocobre Lithium Project
Borax Argentina Mine / Project
Borax Argentina Plant
Salta
San Salvadorde Jujuy
OlarozGuayatoyoc
Salinas Grandes
Cauchari
Pocitos
Diablillos
Ratones
Tincalayu
Sijes - Monte Amarillo
Sijes - Santa Rosa
Porvenir (plant not in operation)
0 25 50km
Campo Quijano
REVIEW OF OPERATIONS
N
14
For
per
sona
l use
onl
y

Olaroz Lithium FacilityOrocobre 66.5%
Holding Company - Sales de Jujuy Pte. Ltd.(Singapore)
Project Company - Sales de Jujuy S.A.(Jujuy, Argentina)
JEMSE(Jujuy, Argentina)
Lender(Mizuho)
Guarantor(JOGMEC)
72.68% (SDJ S.A. 66.5%)
100%
27.32% (SDJ S.A. 25.0%)
SPC - Toyotsu Lithium PTE.Ltd.(Singapore)
8.5% (Class B Share)
Debt Guarantee
91.5% (Common Share)
The Olaroz Lithium Facility is located in the Puna region of Jujuy Province in northern Argentina, approximately 230 kilometres northwest of the capital city of Jujuy at an altitude of 3,900 metres above sea level.
Together with partners, TTC and JEMSE, Orocobre is in the early operations and production stage of the first large scale “green fields” lithium brine project in approximately 20 years. It has a design capacity of 17,500tpa of battery grade lithium carbonate and is forecast to achieve the nameplate monthly production run rate by the end of CY2015. The Olaroz Lithium Facility Joint Venture is managed through the operating company, SDJ. The shareholders are Sales de Jujuy Pte Ltd (“SDJ PTE”, a Singaporean company that is the joint venture vehicle for Orocobre and TTC and JEMSE, the mining investment company owned by the provincial government of Jujuy, Argentina. The effective equity interest in the Olaroz Lithium Facility Joint Venture is Orocobre 66.5%, TTC 25.0% and JEMSE 8.5%.
Orocobre(Australia)
ToyotaTsusho(Japan)
Orocobre Limited I Annual Report 2015 15
For
per
sona
l use
onl
y

Toyota Tsusho Corporation Equity and Project Financing
In October 2012, the Joint Venture Agreement between Orocobre Limited and Toyota Tsusho Corporation to finance and build the flagship Olaroz Lithium Project was signed. The companies executed the finance documentation for the Olaroz Lithium Project in December 2012.
Under the terms of the Joint Venture Agreement, TTC and Orocobre have contributed project equity of US$82.8 million (A$107.7 million) (inclusive of JEMSE contribution), equating to approximately 30% of the loan facility with Mizuho Bank of US$191.9M. TTC’s investment in the project was approximately US$55 million net of adjustments made to take into account financing support arrangements to be provided by TTC to Orocobre prior to completion of construction. Orocobre has funded JEMSE through an interest free loan for its capital contribution and will be re-paid with one-third of the anticipated dividend stream to JEMSE. TTC has a 25% indirect interest in the Olaroz project, JEMSE 8.5% and Orocobre 66.5%.
TTC, as part of its obligations under the January 2010 agreement also arranged project debt funding for the Olaroz Lithium Project. The finance documents were executed in December 2012 and provided a facility of US$191.9 million (A$249.6 million) which has been fully drawn. The term is 10 years with a 2 year grace period on principal repayments and the borrower may pay dividends bi-annually after meeting debt service provisions to Mizuho Bank Ltd. Upon completion, JOGMEC will provide guarantees for 82.4% of the outstanding debt upon satisfaction of the completion tests under the project financing arrangements. Standby Letters of Credit (SBLCs) to the value of approximately US$50m have been provided to fund the joint venture through the commissioning and early operations stage by the joint venture shareholders on a pro-rata basis. In addition shareholder loans from TTC and Orocobre totalling US$7.8M (A$10.1 million) had been provided to fund working capital as of June 30, 2015. The SBLCs to provide working capital to SDJ SA are denominated in USD. A SBLC allows Orocobre to provide working capital to SDJ SA by depositing funds in USD as security in a restricted term deposit. This allows a SBLC to be issued which in turn allows SDJ SA to draw down funds in Argentina to the equivalent ARS value. After payment of project debt commitments the ARS drawn down amount in Argentina will begin to be repaid from free cash flow which will in turn allow the SBLCs to be released back to the Company. Continued ARS devaluation against the USD would allow SDJ to either have further funds available on the US$ SBLCs backed facility it has in Argentina or the ARS devaluation would reduce the amount required to be held in the US$ SBLCs, subsequently releasing US$ back to the Company. However, should the ARS strengthen any time against the USD additional funds may need to be provided through the SBLCs.
16
For
per
sona
l use
onl
y

Area
Thickness
Measured Resource 93
Indicated Resource
Measured andIndicated Resource
Resource Category
Meanspecific
yield
Brinevolume
Lithium Potassium Boron Lithium Potassium Boron
2km metres %cubickms
mg/L mg/L mg/L MillionTonnes
MillionTonnes
MillionTonnes
Concentration Tonnes of Contained Metal
54 8.5% 0.42 632 4,930 927 0.27 2.08 0.39
93
143 10.0% 1.33 708 6,030 1,100 0.94 8.02 1.46
93
197 9.6% 1.75 690 5,730 1,050 1.21 10.10 1.85
Brine Body Parameters
Terms of the Shareholder Agreement
Olaroz Resource Estimate
The joint venture with TTC is being operated as an incorporated joint venture through the Singaporean holding company, SDJ PTE. The board of the holding company is responsible for the delivery of the Olaroz Project. Both parties can appoint three board members with Orocobre appointing the Chairman. Voting on normal matters is according to equity shareholding interest. The agreement also provides for certain matters which are “Reserved Matters” and require more than 80% of the vote, or TTC approval, whilst there is a liability under any guarantee. The agreement includes various mechanisms for budget approvals, budget variations and for deadlock. The agreement also provides the parties with pre-emptive rights on each other’s interests in the event of a sale.
Existing management in the Argentine operating company, SDJ, operates the Olaroz Lithium Facility according to set authorisation limits and reports regularly to the joint venture company’s Chairman. In addition, Orocobre has entered into a service arrangement with SDJ.
TTC acts as exclusive agent to market the lithium carbonate production from Stage One of the development for a period of 10 years.
In 2011, the Company announced a measured and indicated resource of 1,752 million cubic metres of brine at 690 mg/L lithium, 5,730 mg/L potassium and 1,050 mg/L boron at the Olaroz Project, which is equivalent to 6.4 million tonnes of lithium carbonate and 19.3 million tonnes of potash (potassium chloride) based on 5.32 tonnes of lithium carbonate being equivalent to 1 tonne of lithium and 1.91 tonnes of potash being equivalent to one tonne of potassium.
Details of the measured and indicated resources are given in the table below.
Orocobre Limited I Annual Report 2015 17
For
per
sona
l use
onl
y

Area
Thickness
20%
Li K ContainedK
Potash Boron
2kmmetres
(to 323m depth)mg/L mg/L Million
TonnesMillionTonnes
2,000 700 1.4 7.5 5,400 10.9 20.8 1,200 2.4
6%
605 500 0.3 1.6 4,000 2.4 4.6 900 0.5
Olaroz Defined Exploration Target
The exploration target described below is between 1.6 and 7.5 million tonnes of lithium carbonate equivalent between 197m and 323m depth. The basin is potentially 600m deep and additional targets to the north and the south of the exploration target area. It must be stressed that an exploration target is not a mineral resource. The potential quantity and grade of the exploration target is conceptual in nature, and there has been insufficient exploration to define a Mineral Resource in the volume where the Exploration Target is outlined. It is uncertain if further exploration drilling will result in the determination of a Mineral Resource in this volume.
It is anticipated that additional drilling would be conducted after nameplate production run rate is achieved, to further evaluate the exploration target and to assist longer term development planning.
As part of the bore field development during construction, one bore was drilled to 304m, the deepest hole to date by the Company in Olaroz. Resource drilling was previously only carried out to a maximum depth of 200m, with the resource only extending to a depth of 197m below surface. This hole (P301) intersected a continuous sand plus halite aquifer from 255m to the end of the hole at 304m.
Because of the results of P301, a final production bore P302 was drilled to a depth of 323m. The hole intersected a continuous sand unit from 220m to 323m. These results are highly significant as this thick sand sequence may extend laterally beneath much of the defined brine resource and also to greater depths. Sands of this type have free draining porosity of between 20% and 25% based on previous test work and the sand unit could hold significant volumes of lithium-bearing brine which could be added to the resource base by future drilling. In addition, due to the thickness of the sand, any production bore drilled into this unit will be high yielding compared to bores only in the top 200m.
There is the potential for additional brine from 323m to the bottom of the basin which geophysical surveys suggest is up to 600m deep and additional targets to the north and the south of the exploration target area.
The deeper sand unit has the characteristics to support high volume brine production, with lithium concentrations and chemistry comparable to other operating wells. This will significantly reduce the capital cost for additional brine supply and pipeline systems which will be needed for the first expansion at Olaroz.
Meanspecific
yield
%
Brinevolume
cubickms
ContainedLi
MillionTonnes
LiCarbonate
MillionTonnes
MillionTonnes
Boron
mg/L
80
80
126
126
Upper Assumption Estimate
Lower Assumption Estimate
18
For
per
sona
l use
onl
y

Project Progress
Construction of the Olaroz lithium project officially began on 21 November, 2012. Sinclair Knight Merz, with the assistance of INFA, a well-respected Argentine engineering group, completed detailed engineering for all areas of the operation including brine extraction, transport and evaporation, the lithium carbonate plant and key areas of the re-purification and micronizing circuits. The project implementation has been through an EPCM (Engineering, Procurement and Construction Management) approach with INFA as the construction manager. The strategy involved using a high proportion of local involvement through construction and supply contracts and local employment. The community and Shared Value policy has been and continues to be a key success factor.
The construction phase was complete at the end of 2014 and by the end of January 2015 commissioning had occurred on all circuits. Over the past two years, a substantial brine inventory has been built, equivalent to approximately 30,000 tonnes of lithium carbonate equivalent. At a 75% recovery rate this is equivalent to approximately 22,500 tonnes of lithium carbonate tonnes as finished product.
During recent months, while debottlenecking the facility, we have continued to manage the distribution of brine inventory towards what will be required to sustain nameplate production over the long term.
The first sale of lithium carbonate from the Olaroz Lithium Facility occurred in late April. Production ramp up has been slower than anticipated with 126 tonnes of saleable lithium carbonate produced in the June quarter, 93 tonnes produced in July and 143 tonnes produced in August.
Over the past months, priority has been given to the identification and implementation of long term solutions for operational challenges and debottlenecking rather than maximizing daily production. This approach has necessitated periods of test work and equipment trials with consequent reduced flowrates through the Facility. This has had a direct impact on the production performance of the plant versus forecast.
Significant progress has been made in the de-bottlenecking program.
Heat Exchangers: Elevated temperatures in the return solutions had made the absorption part of the purification circuit approximately 10 degrees higher than target, thus limiting lithium carbonate dissolution. Design engineering work for the required cooling system in the purification circuit have been completed. Modifications to the circuit were effected using existing heat exchangers rather than using cooling towers as originally considered.
Polishing Filters and Centrifuges: Work undertaken to improve the operational performance of the polishing filters in the primary circuit, which remove calcium and magnesium precipitates, did not increase the filtering capacity to a sufficient level. Flow rates were being further reduced by higher crystal loads caused by colder weather restricting flow rates through the plant. A solution to this capacity constraint was found with the successful trialling of a centrifuge sourced from Borax Argentina’s Tincalayu plant, which has the capacity to separate lithium solids from liquids by its rapid spinning and use of centrifugal force without clogging. This centrifuge has a capacity of 40m3/hr. and was quickly installed on an existing platform. To reach the nameplate flowrate a second centrifuge, which is already on site, will be installed in October.
!
!
Orocobre Limited I Annual Report 2015 19
For
per
sona
l use
onl
y

The installation of both centrifuges will allow the flow rates through the Facility to reach nameplate capacity.
The Outotec polishing filters are being reassigned to provide additional filtering capacity in the recovery of lithium carbonate solids remaining in the circuit prior to their discharge from the plant, thus improving overall recovery rates for the Facility. The change in piping has been completed.
Boiler Increase: Engineering studies undertaken during the design of the cooling requirements in the absorption part of the purification circuit discussed above identified heat deficiency on the crystallizer end of the circuit. Additional boiler capacity will be added during November to address this deficiency. The increase in boiler capacity will permit the crystallizers to meet full capacity.
The centrifuges and additional boiler will cost approximately US$1m bringing the total cost for rectification work to US$8m (A$10.4M).
The progress in debottlenecking through the quarter to date has been very pleasing and the Company is now confident that all significant issues have been identified with solutions to the problem either having been made or in the process of being implemented.
The following key factors will enable the planned ramp up in the production profile to be achieved:
Completion of debottlenecking activities which will allow the Facility to operate at its design flow rates.
Brine profile - as disclosed in the June quarterly report it is expected that by October 2015 there will be sufficient quantities of concentrated brine to supply the Facility at full capacity. In particular, during October, the brine feeding the plant is forecast to reach the design grade of approximately 0.7%, enhanced by increasing evaporation rates. Recoveries of lithium carbonate from the plant are directly proportional to the feed grade. Consequently, lithium recovery in the plant will increase as grades rise to the designed 0.7%. Ongoing engineering improvements such as the reassignment of the polishing filters to bolster existing filters will increase recovery of lithium carbonate solids from the plant discharge.
Ongoing operational improvements being achieved from a workforce becoming increasingly experienced and knowledgeable in plant processes.
Taking into account the aforementioned drivers, ramp up will continue to accelerate to reach nameplate run rate in December.
The Olaroz Lithium Facility will reach breakeven point on an operating cost basis (net of taxes paid or reimbursed), when production reaches approximately 650 tonnes per month, subject to variability in sales price. This level of production is expected to be achieved in October 2015.
!
!
!
!
!
Reaching Nameplate Production
20
For
per
sona
l use
onl
y

The Olaroz Lithium Facility is producing both battery grade and technical grade lithium carbonate to fulfil sample and customer order requirements. By the end of July, samples for final approval and sales orders had been supplied to a total of 32 customers, including 19 battery market customers and 13 industrial market customers.
Commercial shipments of lithium carbonate have continued to be dispatched from the Olaroz Lithium Facility to Europe, Japan and the USA. Samples have also been sent to battery and industrial sector customers as the final stage of product qualification. The median specification values achieved for lithium carbonate (Li2CO3) in the months of May and June was 99.98% - 99.99%.
All forecast production for CY2015 has now been fully committed and customers are awaiting delivery.
Market Conditions
Lithium market conditions continue to tighten. Supply side constraints coupled with strong market demand is resulting in upward pressure on market prices for lithium carbonate. Prices in recent times have been steadily increasing over US$6,000/tonne. The traditional annual fixed price contracts are now being replaced by shorter bi-annual, quarterly and even monthly (load by load) pricing arrangements. FMC Corporation, one of the world’s largest producers of lithium products, has announced a 15% price increase effective from 1 October 2015, noting that “continued market growth is outpacing current industry supply capabilities for most of our product lines”.
The market growth rate projected by independent consultants is ~10% year on year for at least the next few years (Roskill forecast to 2017, IHS forecast to 2025). These market growth rate projections were published prior to announcements by Tesla, Foxconn, Samsung LG and BYD for new and expanded battery factories.
There is increasing momentum in the electric vehicle (EV) sector with increasing participation by mainstream brands, a growing focus on grid power storage at a commercial and residential scale, improving viability of solar-lithium battery systems and continued growth in the demand for mobile devices, underpinned by the growth in emerging markets.
Orocobre Limited I Annual Report 2015 21
For
per
sona
l use
onl
y

Joint Venture Reporting
The following statements detail the Joint Venture Company (SDJ Pte) key financials, Profit and Loss, Cash Flow and Balance Sheet.
Total revenueCOGS and operating expensesCorporate and admin expensesFinance Income/(Costs)Foreign Currency Gain/(loss)Net loss after tax(Subtract)/add back: Income tax (credit)/chargeAdd back: Depreciation(Subtract)/add back: Net interestEBITDA
SDJ PTE Key FinancialsSDJ Pte Profit & loss
259,208258,712
73,678150
269,356342,388
-997150
341,541
AUD
---
-
194-
34,57774,833
514,363473,913
-1,381
74,833547,365
-
--
--
259,014258,712
39,10174,683
245,007131,525
-384
74,683205,824
--
--
--
2015 2014 Change
22
For
per
sona
l use
onl
y
190,652 546,169 355,517
30,251,678 1,682,313
28,569,365
1,009,891 83,314,776 57,048,501
7,100,241 1,470,057
19,626,201
8,587,648
4,347,266
3,156,046
1,084,336
Revenue (Sales, Interest)Costs (Corporate, Interest, etc)Cash from operating activities
Capitalised Exploration ExpenditureAcquisition of subsidiaryCash from investing activities
Proceeds from issue of sharesProceeds from loans and borrowingsProceeds from overdraft facilityFunds provided under joint venture agreementRepayment of borrowingsCash from financing activities
Net increase in cash held
Cash & Cash Equivalents at beginning of year
Effect of exchange rates on cash holdings in foreign currencies
Cash at year end
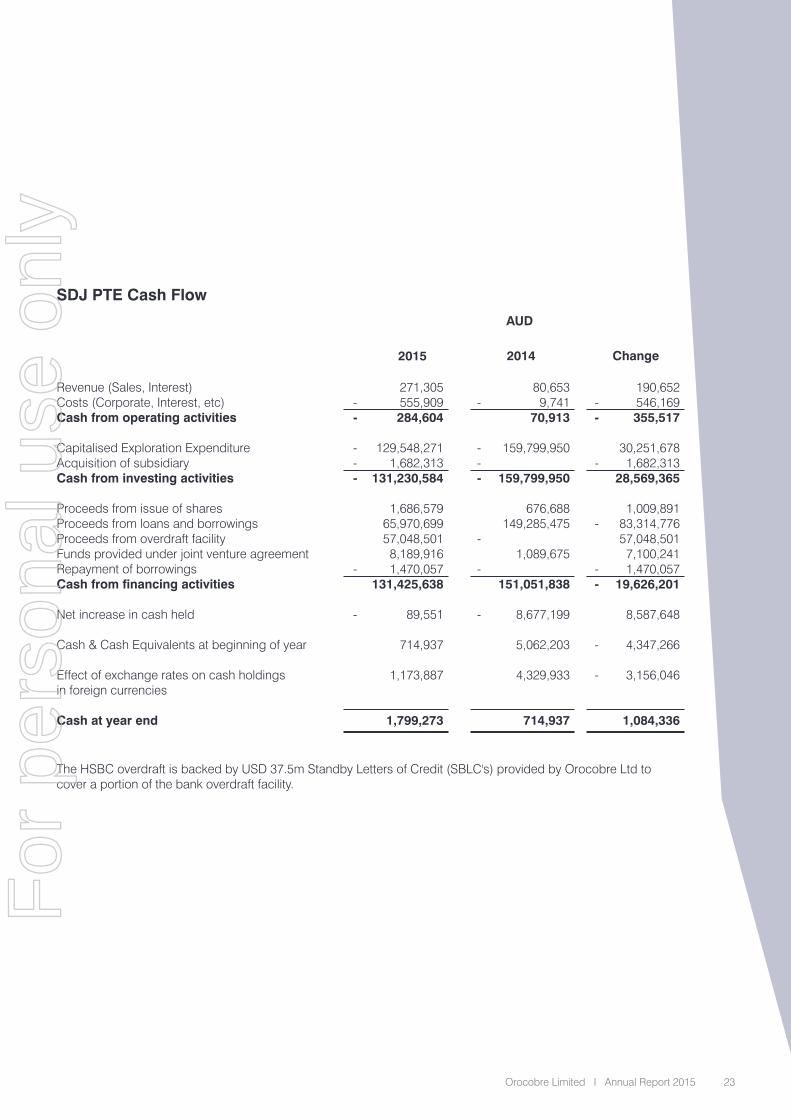
The HSBC overdraft is backed by USD 37.5m Standby Letters of Credit (SBLC's) provided by Orocobre Ltd to cover a portion of the bank overdraft facility.
271,305 555,909 284,604
129,548,271 1,682,313
131,230,584
1,686,579 65,970,699 57,048,501
8,189,916 1,470,057
131,425,638
89,551
714,937
1,173,887
1,799,273
80,653 9,741
70,913
159,799,950
159,799,950
676,688 149,285,475
1,089,675
151,051,838
8,677,199
5,062,203
4,329,933
714,937
--
---
-
-
-
---
-
-
-
--
-
-
--
-
-
SDJ PTE Cash Flow
2015 2014 Change
AUD
Orocobre Limited I Annual Report 2015 23
For
per
sona
l use
onl
y

1,084,336 10,583,481
3,082,513 14,793,149
282,543,527 94,038,278
14,004,625 14,536,283
217,517,070
81,747,629 2,206,568 3,082,523
11,805,766 84,369,672
6,293,444 18,930,651
208,436,253
9,080,817
Cash, cash equivalentsReceivablesIntangible assetsInventoriesProperty, plant & equipmentExploration & Evaluation assetVAT ReceivableOther assetsTotal assets
Short term borrowingsPayablesTaxes payable and deferredRelated Party loansLong term debtDerivativeOther liabilitiesTotal liabilities
Equity
1,799,273 1,419,309
35,268,267 31,719,642
483,503,195 -
35,550,791 7,607,718
596,868,195
21,490,157 23,916,933 35,268,386 93,583,914
228,251,618 12,259,938 29,714,523
444,485,469
152,382,726
714,937 850,414
32,185,754 -
217,886,161 94,038,278 11,531,580 22,144,001
379,351,125
647,368 21,710,365 32,185,863 20,873,308
143,881,946 5,966,494
10,783,872 236,049,216
143,301,909
-
-
SDJ PTE Balance Sheet
2015 2014 Change
AUD
24
For
per
sona
l use
onl
y

The funds for the project during the construction phase were drawn down in US$ as required by the operating company SDJ, the project company in Argentina and held in US$ until required. This allowed the Company to limit the funds held in Argentine Peso (ARS) and successfully manage the impact of inflation and ARS devaluation.
The Standby Letters of Credit (SBLCs) to provide working capital to SDJ are also denominated in US$. A SBLC allows Orocobre to provide working capital to SDJ by depositing funds in US$ as security in a restricted term deposit. This allows a SBLC to be issued, which in turn allows SDJ to draw down funds in Argentina to the equivalent ARS value.
Once SDJ becomes cash flow positive, the funds drawn down will begin to be repaid and the amount required to be held as security in the SBLC facility will also begin to reduce, resulting in cash flow in US$ back to Orocobre. Such repayment in Argentina and release of the SBLC in Australia will always occur after project debt commitments have been met. Therefore, the funds are restricted but recoverable and also earn a nominal rate of interest while held as security in the term deposit.
Shareholder loans and sales contracts for lithium carbonate ex-Olaroz are also denominated in US$.
Continued ARS devaluation against the US$ would allow SDJ to either have further funds available on the US$ SBLC backed facility it has in Argentina or the ARS devaluation would reduce the amount required to be held in the US$ SBLCs, subsequently releasing US$ back to the Company. However, should the ARS strengthen at any time against the USD additional funds may need to be provided through the SBLCs.
A devaluing ARS benefits SDJ as ARS costs become cheaper in US$ and US$ sales revenues translate to more ARS. A downside of a devaluing ARS is that recoverable VAT reduces in US$ terms.
Value Added Tax (VAT) is charged on services and goods (including capital) goods at rates between 10.5% and 27%, with 21% being the standard charge. VAT is claimed back based on 21% of export sales and can also be recouped against VAT on local sales, if any. Hence the recovery of VAT, that has been paid on CAPEX and expenses to date, will be recovered in coming years. The delays in recovery of the VAT has required funding from the shareholders. VAT recoverable is A$35.5M (US$27.3M) which has been fair valued and hence discounted. Nominal value of VAT was US$40M.
Orocobre Limited I Annual Report 2015 25
For
per
sona
l use
onl
y

The Cauchari Lithium-Potash Project has an inferred resource estimated to contain approximately 470,000 tonnes of lithium carbonate equivalent and 1.6 million tonnes of potash based on 5.32 tonnes of lithium carbonate being equivalent to one tonne of lithium and 1.91 tonnes of potash being equivalent to one tonne of potassium.
Details are given in the table below.
The maiden resource is based on five diamond holes in Orocobre’s eastern Cauchari properties and is only to an average depth of 170m in the northern resource area and 50m in the southern resource area.
Lithium and potassium mineralisation was encountered to the base of drilling at 249m in hole CAU001D. An adjacent property owner, Lithium Americas Corp (TSX:LAC), drilled to a 464m depth and therefore future Orocobre drilling could substantially increase the maiden resource.
An exploration target of between 0.2 million and 2.6 million tonnes of lithium carbonate equivalent and 0.5 million and 9.2 million tonnes of potash has been estimated beneath the maiden resource based on a range of porosity and grade possibilities to between 220m and 350m depth.
Whilst a lower grade than Olaroz, the brine chemistry is similar to that at Olaroz, with an attractive low Mg/Li ratio (2.8) and high K/Li ratio (10). Initial evaluation of the process route suggests the brine could be processed in an expanded Olaroz plant. Cauchari is located approximately 20kms south of the Olaroz Lithium Facility.
Cauchari ProjectOrocobre 85%
Area
AverageThickness
North 170m deep 19.69
South 50m deep
Inferred ResourceArea
Meanspecific
yield
Brinevolume
Lithium Potassium Boron Lithium Potassium Boron
2km metres %million
3mmg/L mg/L mg/L Tonnes Tonnes Tonnes
Average ResourceConcentrations
Tonnes of Contained Metal
170 6.1% 204.5 399 3,833 547 81,497 783,829 111,901
11.35
50 4.6% 26.0 264 2,502 421 6,851 64,932 10,916
31.05
- - 230.4 383 2,683 533 88,348 848,761 122,817
Brine Body Parameters
Combined
26
For
per
sona
l use
onl
y

0 500km
A
R
G
E
N
T
I
N
A
Salta
BUENOS AIRESMendoza
West East
Ordovician
Sediments Halite & fineclastic sediments
Silts & clays
Sand
MioceneSijes Formation
Cauchari salar - Lithium brine
OROCOBRE
PE17 PE22 CAU001
0 2 4km
Irregular samplingvalues 400 - 600Li
245m230m
249m
All Li values in mg/l
17m @ 601 Li107m @ 696 Li32m @ 729 Li
244m @ 548 Li
SalarOlaroz
SalarCauchari
Cauchari Project
Olaroz Lithium Plant
20km
N
0 10 20km
Considering the similarities between the Cauchari and Olaroz projects and their close proximity, there are compelling synergies between the projects, including the expected use of shared infrastructure and processing plants and the likelihood that any future development of the Cauchari brine would use the Olaroz facilities at a relatively low incremental capital cost. Consequently, the Company considers the Cauchari project and its brine body to be part of the larger Olaroz project.
This information in regard to Cauchari was prepared and first disclosed under the JORC Code 2004. It has not been updated since to comply with the JORC Code 2012 on the basis that the information has not materially changed since it was last reported.
Orocobre Limited I Annual Report 2015 27
For
per
sona
l use
onl
y

The proximity of Salinas Grandes to the Olaroz Facility provides potential operating synergies, including the option to process concentrated Salinas Grandes lithium brine at an expanded lithium carbonate plant at Olaroz.
Salinas Grandes has an inferred resource, to a depth of 13.3m, estimated to contain 56.5 million cubic metres of brine at 795 mg/L lithium and 9,550 mg/L potassium, which is equivalent to 239,200 tonnes of lithium carbonate and 1.03 million tonnes of potash (potassium chloride) based on 5.32 tonnes of lithium carbonate being equivalent to 1 tonne of lithium and 1.91 tonnes of potash being equivalent to one tonne of potassium. Details are provided in the table below.
The shallow brine body has attractive grades and chemistry with a low magnesium to lithium ratio of 2.5, a high potassium to lithium ratio of 12.5 and a low sulphate to lithium ratio of 5.8 in the central area of drilling, rising to 10.6. Test work since late 2010 suggests high recoveries of both potassium and lithium could be expected using a simple, low operating cost, process route. Laboratory scale testing has produced potassium (82%-89% KCl), prior to washing to obtain +95% KCl.
The low sulphate levels of the Salinas Grandes brine indicate that potash recovery would be high as a co-product of lithium carbonate production with potentially eight tonnes of potash produced for each tonne of lithium carbonate.
The work completed at Salinas Grandes to date confirms the potential that brine can be extracted from the shallow resources at potentially commercial rates and with stable grades that could allow for modest annual production of potassium and lithium to augment the Olaroz project.
This information in regard to Salinas Grandes was prepared and first disclosed under the JORC Code 2004. It has not been updated since to comply with the JORC Code 2012 on the basis that the information has not materially changed since it was last reported.
Salinas GrandesPotassium-Lithium Project Orocobre 85%
Salinas Grandes is located 70 kilometres southeast of the Olaroz Lithium Facility in Salta province. Through South American Salar SA, Orocobre holds an 85% interest in the project.
AreaAverage
thickness
Inferred Resource 116.2
Resource CategoryMean
specificyield
Brinevolume
Lithium Potassium Boron Lithium Potassium Boron
2km metres % mg/L mg/L mg/L Tonnes Tonnes Tonnes
Concentration Tonnes of Contained Metal
13.3 4.1% 56.5 795 9,547 283 44,960 539,850 12,100
Brine Body Parameters
million3m
28
For
per
sona
l use
onl
y

Together with partners, TTC and JEMSE, Orocobre is in the early operations and production stage of the first large scale “green fields”lithium brine project in approximately 20 years.
Orocobre Limited I Annual Report 2015 29
For
per
sona
l use
onl
y

Borax Argentina has operated in the Salta-Jujuy region for over 50 years and is well established as a reliable supplier of boron products to the industrial and agricultural sectors in Brazil, Argentina, Chile and now into new more distant international markets.
Orocobre considers that Borax Argentina has promising organic growth prospects given its large asset base, strong production infrastructure and local community support. The healthy long-term market outlook for boron related minerals is a strategic fit with the objective of being a substantial industrial chemicals and industrial minerals company.
Borax Argentina’s operations, include three open pit mines, concentrators, refining capacity and significant land holdings. The mining operations are located in Tincalayu, Porvenir and Sijes. The Company announced the upgrade of historical estimates to a Measured and Indicated Resource for the Porvenir borate deposit in April 2014 and the Tincalayu deposit in November 2014. Work is currently underway on the Sijes deposits to be followed by Diablillos.
The products produced by Borax Argentina can be divided into three groups being: minerals, refined products and boric acid. The minerals produced are ulexite, colemanite and hydroboracite. Ulexite has traditionally been used as a feedstock for the production of boric acid, whereas hydroboracite and colemanite are supplied into the ceramic market and more recently hydroboracite into agricultural and oil and gas markets. The refined products comprise of borax decahydrate, borax pentahydrate and borax anhydrous. These refined products have applications in a wide range of markets from agriculture, ceramics,
Borax ArgentinaOrocobre 100%
Salta
San Salvadorde Jujuy
Olaroz
Guayatoyoc
Salinas Grandes
Cauchari
Pocitos
Diablillos
Ratones
Tincalayu
Sijes - Monte Amarillo
Sijes - Santa Rosa
Porvenir (plant not in operation)
0 50km
N
500km
A
R
G
E
N
T
I
N
A
Salta
BUENOS AIRESMendoza
LEGEND
South American Salars Project
Salar
Orocobre Lithium Project
Borax Argentina Mine / Project
Borax Argentina Plant
30
For
per
sona
l use
onl
y

glass, insulation fibreglass, textile fibreglass, gold assay and smelting fluxes, wood protection and a number of specialty applications. The production of boric acid was traditionally achieved through the acidification of ulexite using sulphuric acid but ulexite has now been replaced with hydroboracite tailings from Sijes.
Sales volume was up 10.7% on last year, however this includes sales of lower value tincal ore to compensate for lower sales of refined products due to the slower than anticipated ramp up of the relocated borax decahydrate plant. EBITDA was (A$1.725M) (FY14 –A$3.152M)
Combined Product Sales Volume Year on Year*
Financial Year
June 2015
Combined ProductSales (tonnes)
44,398
*Combined product sales volumes include boraxchemicals, boric acid and boron minerals andincludes sales of tincal ore of 4,021 tonnes inSeptember 2014 quarter, 4,225 tonnes in theDecember 2014 quarter and 2,061 tonnes inthe June 2015 quarter.
June 2014 40,098
Sales, which are US$ denominated or US$ pegged, reduced 13.1% on a US$ basis from the prior year whilst cost of goods sold and corporate and administration expenses reduced by 4.9% and 7.4% respectively. A substantial portion of Borax’s costs are Argentine based and hence the devaluation of the *average ARS rate against the US$ during FY2015 of 29% only flowed through to some extent given inflation was of a similar order. The average rate for the current is ARS8.59:US$1 ( FY14 ARS6.66:US$1). (*Opening and closing rate of each month divided by two and then all summed and divided by twelve). In A$, there are substantial dollar increases versus the prior year on all categories due to the weakening by 22.4% of the A$ against the US$ on a spot basis. The A$ has also weakened 8.7% against the ARS on a spot basis versus the prior year.
A devaluing ARS benefits Borax as ARS costs become cheaper in US$ and $A, and US$ sales revenues translate to more ARS. A downside of a devaluing ARS is that recoverable VAT reduces in US$ and $A terms.
The relocation of the Tincalayu borax decahydrate plant was completed in July 2014. However, the ramp up of production was slower than expected which resulted in a shortage of inventory and the need to sell an increased volume of tincal mineral in order to offset the softer sales of refined products from the Tincalayu facility, particularly in the September and December quarters. The Tincalayu plant has more recently been operating at 70 tonnes per day and building inventory of borax decahydrate.
Orocobre Limited I Annual Report 2015 31
For
per
sona
l use
onl
y

As a result of the borax plant relocation significant benefits are expected to be achieved over time in both the reduction of operating unit costs and an increase in overall mineral recovery from the mine. Previously, run-of-mine ore at 17% B O was concentrated at Tincalayu using dry 2 3
magnetic separation at about 60% recovery to produce a 21% grade, which was then transported 350kms to Campo Quijano for further production into borax chemicals. Relocating the borax plant to the Tincalayu mine site allows for the direct processing of run-of-mine ore at a 15% head grade without the need for magnetic separation and associated mineral losses, plus it improves transport efficiency and cost by carting a 37% refined product rather than the 21% grade concentrate.
Borax Argentina has been experiencing some challenging market conditions as a result of soft economic conditions in Brazil, historically its largest market. The downturn in the Brazilian economy and a poor agriculture season has resulted in increased competition and downward pressure on market prices for all borates products.
Borax Argentina has been pursuing an ongoing geographic and product diversification strategy in order to better insulate the business from localised economic and market cycles and this has lessened the impact of the economic challenges in Brazil. In addition to its traditional markets, the Company now has customers in USA, Australia, New Zealand, UK, Colombia, Spain, Egypt, Canada, Portugal, Thailand and Bangladesh. The diversification is not only geographical but also application specific with Borax Argentina now selling into the oil and gas industries. Borax Argentina sales contracts are denominated in, or pegged to, the US$.
Borax Argentina has now successfully produced boric acid at the Campo Quijano boric acid plant using hydroboracite in place of ulexite. The hydroboracite used was tailings from the Sijes concentrator, grading approximately 28%-30% , which is a higher grade than the ulexite mined at Porvenir.
The objective of the trial was to confirm previous test work and produce boric acid from hydroboracite without affecting kinetics and production rate. Hydroboracite has lower chloride levels than ulexite thus reducing the bleed of mother liquor from the plant while increasing recoveries and environmental benefits. The lower chloride levels in hydroboracite will also reduce plant maintenance. The cost of producing boric acid from ulexite is relatively high cost because the mining involves extraction of thin beds, with drying and screening taking place before transporting to the plant. To be able to use tailings in the future will result in significantly lower boric acid costs with estimated savings of approximately US$200/tonne. The plant is now running on 100% hydroboracite feed.
B O2 3
B O2 3
B O B O2 3 2 3
B O2 3
Initiatives
32
For
per
sona
l use
onl
y

The current boric acid plant at Campo Quijano has a production capacity of 9,000tpa. Work has commenced on increasing production by an estimated 20% through modest changes to the circuit. These changes involve the introduction of press filters subsequently making a boiler and centrifuge redundant. The boiler and centrifuge can be relocated to Tincalayu to increase the capacity of borax decahydrate production by 30tpd. The pentahydrate conversion circuit at Campo Quijano will also be relocated to Tincalayu.
Following the upgrading of the Porvenir historical estimate to a JORC compliance Measured and Indicated resource in 2014, the Tincalayu resource upgrade was completed this year. The program is continuing with the Sijes deposit to be followed by Diablillos.
The Tincalayu resource estimate was much larger than expected. An Indicated and Inferred Resource of 6.5 million tonnes at 13.9% is estimated at the marginal cut-off of 5.6% appropriate to the current production capacity of 30,000tpa borax decahydrate. At a marginal cut-off of 2.8% , appropriate for a possible expanded production rate of 100,000tpa borax decahydrate there is an Indicated and Inferred Resource of 17.8 million tonnes at 11% . This compares to a superseded historical estimate of 1.85 million tonnes at 17.2% estimated at a 12% cut-off and adjusted for mining depletion to 2011. The superseded historical estimate was originally reported on the 21st of August 2012 at the time of the announcement of the Company’s purchase of Borax Argentina.
Whittle 4D modelling indicates that for both scenarios there is a potential mining life in excess of 30 years based on optimum discounted cash flow criterion. Technical studies are underway to investigate expansion options.
Summary of resource estimate figures and cut-offs used:
JORC Compliance Programme
B O B O2 3 2 3
B O2 3
B O2 3
B O2 3
B O2 3
Indicated
Inferred
Indicated + Inferred
Resource Category Cut-off Tonnes
(Mt)
Expanded Production 100 Ktpa
5.6 6.9 13.9
5.6 9.9 10.2
5.6 16.8 11.7
Current Production 30 Ktpa
Soluble
B O (%)3
Cut-off Tonnes
(Mt)
2.8 6.9 13.8
2.8 13.8 8.5
2.8 20.7 10.3
Soluble
B O (%)2 3
Global Resources (not limited to a pit shell) – with Marginal Cut-off
Indicated
Inferred
Indicated + Inferred
5.6 5.1 14.7
5.6 1.4 11.0
5.6 6.5 13.9
2.8 6.8 13.8
2.8 11.0 9.3
2.8 17.8 11.0
Maximum DCF In-pit Resource – with Marginal Cut-off
2
Orocobre Limited I Annual Report 2015 33
For
per
sona
l use
onl
y

Properties
Borax Argentina also owns the tenure on all or parts of the lithium projects being progressed by other lithium exploration companies, including Lithium Americas Corporation Ltd. (TSX:LAC) at Salar de Cauchari, Rodinia Lithium Ltd. (TSX-V: RM) at Diablillos, and Galaxy Resources Ltd (ASX:GXY) at Sal de Vida, (formerly Lithium One’s project). As one of the conditions to extract brines, these companies are required to make payments to Borax Argentina either as fixed annual payments or a royalty related to production. The terms of these agreements are detailed below.
LithiumAmericasCorporation
Company
Cauchari
ProjectAffected
$200,000 per annum payable until 18 May 2041 irrespective of production. Remaining period of 26 years and 9 months, at which time the brine rights revert to Borax Argentina..
Areas ofProperties(hectares)
Date ofContract
Type ofContract
RemainingPayments
RoyaltyPayableon brine
extraction
Period ofUsufruct*
(end ofdate term)
Comments
DiablilosRodinia Lithium
GalaxyResources/Lithium One
Lithea Inc
Rodinia Lithium
Rodinia Lithium
Rodinia Lithium
Diablilos
Centenario& Ratones
LosRatones
Sal de Vida
Pozuelos
4,130
2,700
2,700
630
600
1,100
2,488
19 May 11
14 Jan 10
14 Jan 10
14 Jan 10
14 Jan 10
6 Jan 10
14 Jan 10
Usufruct
3yr Exploration
right & optionto usufruct
Usufruct
Purchase
Purchase
Exploration& Usufruct
Purchase
$5,400,000
None
None
None
None
None
None
None
n/a
1.5%
1.0%
1.0%
1.0%
1.0%
40yrs plus40yrs
Indefinite
Indefinite
Indefinite
Indefinite
18 May 41
Royalty can be purchasedby Rodinia at any time for $1,500,000
Royalty can be purchased byRodinia for $1,000,000
Royalty can be purchased byRodinia for $1,000,000. BoraxArgentina has the right to mine borates.
Royalty can be purchased byGalaxy for $1,000,000
Royalty can be purchased byLithea for $1,000,000. BoraxArgentina has the right to mine borates.
*Usufruct – legal right afforded to a person or party that confers the temporary right to use and derive income or benefit from someone else's property.
34
For
per
sona
l use
onl
y

The healthy long-term market outlook for boronrelated minerals is a strategic fit with the objective of being a substantial industrial chemicals and industrial minerals company.
Orocobre Limited I Annual Report 2015 35
For
per
sona
l use
onl
y

SOCIAL RESPONSIBILITY
Orocobre ́s Corporate Social Responsibility forms a key part of the Company's management strategy. This is reflected in various relationships the Company maintains with employees, business partners, local communities and government and regulatory authorities.
Sales de Jujuy S.A and Borax Argentina are now both accredited for ISO 9001 Quality Control, ISO 14001 Environmental Management and OHSAS 18001 Occupational Health and Safety Management with each company also operating on the ISO 31000 Risk Management System. Additionally, Sales de Jujuy has received accreditation for the European REACH management system.
Orocobre aims to sustainably develop the Company’s assets in a responsible and committed manner, compatible with the local communities in which we operate. In order to achieve our goals of sustainability, the Company abides by a number of policy measures which promote mutual benefit for our Company and the local communities. Additionally, the local operating companies in Argentina run regular programs in the areas of education, health, employment, business development and environmental conservation which promote community engagement and participation.
AND COMMUNITY RELATIONS
36
For
per
sona
l use
onl
y
Community Relationships
Education
Business Development
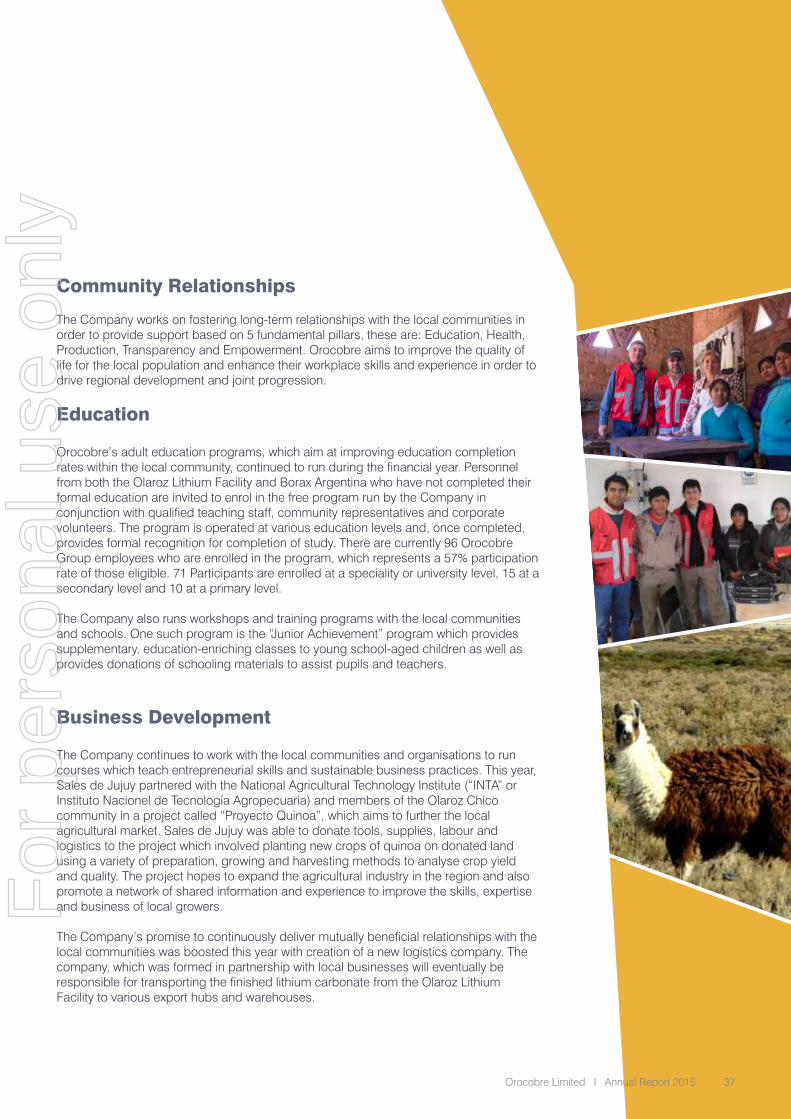
The Company works on fostering long-term relationships with the local communities in order to provide support based on 5 fundamental pillars, these are: Education, Health, Production, Transparency and Empowerment. Orocobre aims to improve the quality of life for the local population and enhance their workplace skills and experience in order to drive regional development and joint progression.
Orocobre’s adult education programs, which aim at improving education completion rates within the local community, continued to run during the financial year. Personnel from both the Olaroz Lithium Facility and Borax Argentina who have not completed their formal education are invited to enrol in the free program run by the Company in conjunction with qualified teaching staff, community representatives and corporate volunteers. The program is operated at various education levels and, once completed, provides formal recognition for completion of study. There are currently 96 Orocobre Group employees who are enrolled in the program, which represents a 57% participation rate of those eligible. 71 Participants are enrolled at a speciality or university level, 15 at a secondary level and 10 at a primary level.
The Company also runs workshops and training programs with the local communities and schools. One such program is the “Junior Achievement” program which provides supplementary, education-enriching classes to young school-aged children as well as provides donations of schooling materials to assist pupils and teachers.
The Company continues to work with the local communities and organisations to run courses which teach entrepreneurial skills and sustainable business practices. This year, Sales de Jujuy partnered with the National Agricultural Technology Institute (“INTA” or Instituto Nacionel de Tecnología Agropecuaria) and members of the Olaroz Chico community in a project called “Proyecto Quinoa”, which aims to further the local agricultural market. Sales de Jujuy was able to donate tools, supplies, labour and logistics to the project which involved planting new crops of quinoa on donated land using a variety of preparation, growing and harvesting methods to analyse crop yield and quality. The project hopes to expand the agricultural industry in the region and also promote a network of shared information and experience to improve the skills, expertise and business of local growers.
The Company’s promise to continuously deliver mutually beneficial relationships with the local communities was boosted this year with creation of a new logistics company. The company, which was formed in partnership with local businesses will eventually be responsible for transporting the finished lithium carbonate from the Olaroz Lithium Facility to various export hubs and warehouses.
Orocobre Limited I Annual Report 2015 37
For
per
sona
l use
onl
y
Labour Exchange
Health
Volunteering
Environment
The Company previously developed a Labour Exchange in collaboration with the communities of Susques (Jujuy). This programme is intended to proportionately distribute the labour available in local communities among the local suppliers. This assesses the needs of these communities and current skill sets in order to implement appropriate training courses. Additionally, the Company works with COPRETI (“La Comisión Provincial para la Erradicación del Trabajo Infantil“) to promote awareness and undertake actions to prevent the use of child labour in the region.
The Company fosters a “zero harm” approach when it comes to the safety of our employees and project contractors. Orocobre’s Argentina based projects operate on a self-derived OH&S management system which incorporates the accredited ISO system principles. Orocobre’s goal regarding the safety of our operations is to continuously improve the reporting of and reduction in workplace risks and incidents.
The Company has also been active in the area of preventive health, jointly with the “Beñen Hospital” in Susques (Jujuy Province) and the Hospital of San Antonio de los Cobres, Salta Province. The “Programa de Prevencion en Salud” (Prevention Program in Health) offers local towns and villages’ paediatric, ophthalmology, dentistry, audiology and nutrition services previously not available. The program is also run internally within Orocobre’s Argentina operations. During the period the health care program saw 277 cases handled relating to dental care, resulting in a 48% decrease in tooth decay, 187 cases handled relating to cardiology, with 12% of cases requiring treatment and 235 cases relating to ophthalmology of which 65% of cases required and received treatment.
The Company also provides preventative health education programs such as the “Calidad de Vida” (Quality of Life) program which promotes the prevention and treatment of alcohol and substance addiction. addiction.
The Company offers a variety of volunteering opportunities for Orocobre Group personnel to participate. The volunteering opportunities range from accompanying tutors and doctors in the health, community and schooling education programs to ad hoc participation in sporting, religious or community events. Overall, the Company has a 44% participation rate in volunteering programs.
This year the Company’s Jujuy IT department lead a program which assisted the local Olaroz High School students with their study by donating a number of laptops as well as utilising their expertise and equipment to establish an internet connection at the school.
Environmental monitoring program are regularly conducted with the contribution of local suppliers and is open to Jujuy community participation. In schools, Orocobre Group Companies provide workshops on environmental care, treatment of waste and its reprocessing. There have been no reportable environmental events under the regulations in Jujuy or Salta due to the Company’s activities. Further detail is available in the Directors Report under Environmental Regulation and Performance.
38
For
per
sona
l use
onl
y

Orocobre aims to improve the quality of life for the local population and enhance their workplace skills and experience in order to drive regional development and joint progression
Orocobre Limited I Annual Report 2015 39
For
per
sona
l use
onl
y

James D. Calaway Non-Executive Chairman
Richard P. SevilleManaging Director & CEO
John W. Gibson, Jr.Non-Executive Director
Your Directors present their report and financial statements of the Group, being the Company and its controlled entities for the financial year ended 30 June, 2015. Directors have been in office since the start of the financial year to the date of this report unless indicated otherwise.
DIRECTORS’ REPORT
Courtney PrattNon-Executive Director
40
For
per
sona
l use
onl
y

Non-Executive Director
Federico Nicholson
Fernando Oris de RoaNon-Executive Director
Robert HubbardNon-Executive Director
Orocobre Limited I Annual Report 2015 41
For
per
sona
l use
onl
y

Directors Report
The Company’s directors have significant public company management experience, together with a strong background in
mineral exploration and management, project development, financial markets, accounting and finance. Their experience
covers many resource sectors within Australia and internationally. The names and qualifications of the Directors in office
during or since the financial year are summarized below:
James D. Calaway BA (Econ), MA (PP&E)
Non-Executive Chairman
Mr Calaway was appointed a Director in May 2009 and has served as Chairman since. Mr Calaway is a respected
businessman and civic leader in Houston, Texas. He has considerable experience and success in building young
companies into successful commercial enterprises. Mr Calaway and his family have played major roles in the development
of both public and private companies in the United States, including companies engaged in oil and gas exploration and
production and alternative energy development. Mr Calaway currently serves as Chairman of the Board of Distributed Power
Partners, a leader in clustered distributed solar power development, and has served as a Director on several other U.S.
corporate boards.
Mr. Calaway is active in the Houston community recently serving as the Chairman of the Board of the Centre for Houston's
Future, and the Chairman of the Houston independent School District Foundation, among others.
Mr Calaway is a graduate of the University of Texas and the University of Oxford. He is a member of the Remuneration
Committee.
Directorships held in other ASX listed companies in the last three years:
Elementos Limited (Jan 2011 – Oct 2013)
Richard P. Seville BSc (Hons) Mining Geology, MEngSc Rock Engineering, MAusIMM, ARSM
Managing Director and Chief Executive Officer
Mr. Seville was appointed a Director in April 2007. Mr. Seville is a mining geologist and geotechnical engineer with over 30
years’ minerals sector experience covering exploration, mine development and mine operations. He has had significant
corporate experience, having had many years in the role of Operations Director and/or CEO in ASX/AIM listed mining
companies. Mr. Seville is a graduate of the Royal School of Mines, Imperial College and James Cook University North
Queensland.
Directorships held in other ASX listed companies in the last three years:
Leyshon Resources Ltd (Feb 2007 - Present)
Elementos Limited (Nov 2013 - Present)
42
For
per
sona
l use
onl
y

Directors Report
John W. Gibson BSc Geology, MSc Geology
Non-Executive Director
Mr. Gibson was appointed a Director in March 2010. Mr. Gibson, is a recognised leader in the energy technology and
services industry with more than 25 years of global energy experience. Mr. Gibson was until recently the Chief Executive
Officer of Tervita Corporation and is currently a Director of Tervita, a major Canadian environmental and oil field services
company.
Prior to joining Tervita, Mr. Gibson served as Chief Executive Officer of an enterprise software solutions company serving oil
and gas industry clients and has held senior positions with the Halliburton Group of Companies, most recently as President
of Halliburton’s Energy Services Group. Mr. Gibson serves on the Boards of Directors for Tervita, Blue Spark Energy Inc., and
I-Pulse Inc. He is a member of the University of Houston Energy Advisory Committee, and Houston Baptist University Board
of Trustees.
Mr. Gibson holds a Bachelor of Science from Auburn University and a Master of Science from the University of Houston and
is a member of several professional societies. He is a member of the Audit Committee.
Directorships held in other ASX listed companies in the last three years: Nil
Courtney Pratt
Non-Executive Director/Lead Independent Director
Mr. Pratt was appointed a Director in March 2010. Mr. Pratt has enjoyed a 40-year career at the helm of some of Canada’s
top industrial businesses, particularly in the energy, minerals, and mining sectors. From 2004 to 2006, he was President and
CEO of Stelco, a major Canadian steel producer, guiding it through a court supervised restructuring, and then served as
Stelco’s Chairman until the company’s sale to the US Steel Corporation in 2007. Earlier, Mr. Pratt served as the President
and CEO of Toronto Hydro, North America’s largest municipally owned electricity distributor. He also served as President
and subsequently as Chairman of Noranda Inc., a global diversified natural resource company headquartered in Toronto. In
this capacity he served as a Director of Noranda Minerals Inc., Falconbridge Ltd., Battle Mountain Gold Company, Noranda
Forest Inc., (Chairman), Norcen Energy Resources Limited and Canadian Hunter Exploration Limited. Mr. Pratt served as
Chairman and Chief Executive Officer of the Toronto Region Research Alliance to March 2010. He is also a board member of
MD Financial Holdings and Chairman of CMA Holdings, the physician services arm of the Canadian Medical Association. Mr.
Pratt was awarded the Order of Canada in January 1999. He is Lead Independent Director, Chairman of the Remuneration
Committee and was previously a member of the Audit Committee.
Directorships held in other ASX listed companies in the last three years: Nil
Fernando Oris de Roa MPA
Non-Executive Director
Mr Oris de Roa was appointed a Director in June 2010. Mr Oris de Roa is a highly successful business leader with a history
of developing and operating large enterprises within Argentina and has a reputation for upholding integrity and social
Orocobre Limited I Annual Report 2015 43
For
per
sona
l use
onl
y
Directors Report
responsibility in his business practices. In 1970, Mr Oris de Roa began his career with large trading company Continental
Grain, working in the USA, Spain, Switzerland, Brazil and Argentina eventually rising through the ranks to be responsible for
all of Latin America. As Chief Executive of S.A. San Miguel, Mr. Oris de Roa was widely credited with turning the company
into the largest and most profitable lemon products company in the world. The process of restructuring included listing S.A.
San Miguel on the Buenos Aires Stock Exchange in 1997.
Mr Oris de Roa was Chief Executive and significant shareholder of Avex S.A. from 2004 to 2012. He has also held the role of
Director of Patagonia Gold Ltd. He holds a Masters of Public Administration from The Kennedy School of Government at
Harvard University.
During 2015, Mr. Oris de Roa has been leading the turnaround of the largest fruit exporter Expofrut S.A. (apples, pears and
grapes) implementing a new business model and redesigning the organization accordingly.
Mr. Oris de Roa is a member of the Audit Committee and was previously a member of the Remuneration Committee.
Directorships held in other ASX listed companies in the last three years: Nil
Federico Nicholson LLB
Non-Executive Director
Mr. Nicholson was appointed Director in September, 2010. From 1991 until June 2014 Mr. Nicholson served as Executive
Director and is presently a member of the board for Ledesma S.A.A.I. (Ledesma), a diversified Argentine agro-industrial
producer of sugar, alcohol, bioethanol, paper, notebooks, corn syrups and starches, fruits, juices, livestock and grains.
Mr. Nicholson was Vice President of the Argentine Industrial Union (UIA), the country’s leading business advocacy group, for
fourteen consecutive years (1999-2013) and currently serves as President of the Argentine North Regional Sugar Centre. Mr.
Nicholson also occupies the position of First Vice President of CEADS (Consejo Empresario Argentino para el Desarrollo
Sustentable) an Argentinian local division of WBCSD (World Business Council for Sustainable Development). Mr. Nicholson
is also a member of the board for several other Argentina based companies. Additional positions held during his career
include, Vice President of the Argentine Pulp and Paper Association, Deputy Secretary of the Food Industries Association,
President of the National Industrial Movement and Vice President of the Argentine Corn Starch and Syrups Chamber.
Mr. Nicholson is a law graduate from the University of Buenos Aires, Argentina. He is a member of the Remuneration
Committee.
Directorships held in other ASX listed companies in the last three years: Nil
Robert Hubbard BA (Hons), FCA, MAICD
Non-Executive Director
Mr. Hubbard was appointed a Director in November 2012. Mr Hubbard was a partner at PricewaterhouseCoopers for over 20
years until 2013. During his time as a PwC partner, he served as auditor and adviser for some of Australia’s largest resource
companies with activities throughout Australia, Papua New Guinea, West Africa and South America. His experience has
covered a range of commodities including base metals, gold, oil and gas and thermal and metallurgical coal.
44
For
per
sona
l use
onl
y

Directors Report
Mr. Hubbard also serves as a non-executive Director in various community and commercial focussed organisations. He is
currently Chairman of Opera Queensland, a Director of JK Tech Pty Ltd and MS Research Australia and Council member of
the University of the Sunshine Coast. Mr Hubbard is a non-executive Director of Bendigo and Adelaide Bank Limited, Primary
Health Care Limited and Chairman of Central Petroleum Limited.
Mr Hubbard chairs the Company’s Audit Committee.
Directorships held in other ASX listed companies in the last three years:
Bendigo and Adelaide Bank Ltd (Apr 2013 - Present)
Central Petroleum Limited (Dec 2013 - Present)
Primary Health Care Limited (December 2014 – Present)
Company Secretaries
Neil Kaplan BAcc, CA
Chief Financial Officer and Joint Company Secretary
Mr. Kaplan was appointed Chief Financial Officer on 7 January 2013 and Company Secretary on 1 July 2013. Mr. Kaplan is a
Chartered Accountant and brings a wealth of knowledge to the Company with over 20 years of experience in managerial and
finance positions obtained on four different continents. Mr. Kaplan’s experience in the resources sector was achieved
working in executive financial roles for Glencore International and formerly TSX listed company Coalcorp Mining, both based
in Colombia. Mr. Kaplan holds a Bachelor of Accountancy degree from the University of the Witwatersrand in South Africa
and is a member of both the Institute of Chartered Accountants in Australia (ICAA) and South African Institute of Chartered
Accountants (SAICA).
Rick Anthon BA LLB FAIM MAICD
Joint Company Secretary and General Counsel
Mr Anthon was appointed Joint Company Secretary on 10 March 2015. Mr Anthon is a practicing lawyer with over 30 years'
experience in both corporate and commercial law. Mr Anthon also has extensive experience in the resource sector, as a
director of a number of resource companies and as legal adviser, including project acquisition and development, capital
raising and corporate governance.
Dividends
No dividend has been proposed or paid since the start of the year.
Orocobre Limited I Annual Report 2015 45
For
per
sona
l use
onl
y

Directors Report
Shares and Share Options
The relevant interest of each Director held directly or indirectly in shares and options issued by The Company at the date of
this report is as follows:
Directors Shares Options
J. Calaway 8,841,563 150,000
R.P. Seville 5,076,500 See below
J.W. Gibson 25,000 100,000
C. Pratt - 100,000
F. Oris de Roa - 100,000
F. Nicholson - 100,000
R. Hubbard 22,183 -
Performance Rights and Options
Employee Year Granted Performance Rights Options
RP Seville FY2013 140,792 301,092 RP Seville FY2014* 160,658 RP Seville FY2015 150,039 Total 451,489 301,092
*Such grant took place in FY2015 however related to FY2014. Further detail on Performance Rights and Options is available in the Remuneration Report.
Unissued Shares
As at 30 June 2015 there were 1,901,092 unissued ordinary shares under options and 1,200,673 unissued ordinary shares
under performance rights (PR). Since the end of the financial year, there have been no unissued ordinary shares under
performance rights or options that have lapsed in accordance with the terms of their grant. Refer to the Remuneration Report
for further details of the options outstanding and to Additional Information for further details on the unissued ordinary shares
under options and the corresponding lapse dates. Option and PR holders do not have any right, by virtue of the instrument,
to participate in any share issue of the Company or any related body corporate.
Shares Issued as a Result of the Exercise of Options
During the financial year, employees and executives have not exercised any options.
Directors
The Directors of the Company at any time during or since the end of the financial year are listed below. During the year there
were 15 Board meetings. The Board and Committee meetings attended by each Director were:
46
For
per
sona
l use
onl
y

Directors Report
Directors Board Audit Committee Remuneration Committee
Meetings Attendance Meetings Attendance Meetings Attendance
James Calaway 15 15 - - 2 2 Richard Seville 15 15 - - - - John Gibson 15 14 3 3 - - Courtney Pratt 15 15 - - 2 2 Fernando Oris de Roa 15 13 3 3 - - Federico Nicholson 15 12 - - 2 2 Robert Hubbard 15 12 3 3 - -
Committee Membership
At the date of this report the Company has an Audit Committee and a Remuneration Committee. Members are as follows:
Audit Committee Remuneration Committee
R. Hubbard (c) C. Pratt (c)
J. Gibson J. Calaway
F. Oris de Roa F. Nicholson
(c) Designed the Chairman of the committee
Indemnification of Officers
During the financial year the Company paid an insurance premium in respect of a contract insuring the Company’s past,
present and future Directors, secretary or officer of the Company against liabilities arising as a result of work performed in
their capacity as Director, secretary or officer of the Company. The Directors have not included details of the nature of the
liabilities covered or the amount of the premium paid in respect of Directors and officers liability insurance contracts as such
disclosure is prohibited under the terms of the contract. The Company Constitution also contains an indemnity provision in
favour of each Director, Company Secretary and executive officers (or former officers) against liability incurred in this
capacity, to the extent permitted by law.
Indemnification of auditors
The Company’s auditor is Ernst & Young. The Company has agreed with Ernst & Young, as part of its terms of engagement,
to indemnify Ernst & Young against certain liabilities to third parties arising from the audit engagement. The indemnity does
not extend to any liability resulting from a negligent, wrongful or wilful act or omission by Ernst & Young.
During the financial year, the Company has not paid any premium in respect to any insurance for Ernst & Young or a body
corporate related to Ernst & Young and there were no officers of the Company who were former partners or directors of Ernst
& Young, whilst Ernst & Young conducted audits of the Company.
Orocobre Limited I Annual Report 2015 47
For
per
sona
l use
onl
y
Directors Report
Principal Activities
The principal activities of the Group during the year were in the commissioning of the Company’s flagship Olaroz Lithium
Facility and the operation of Borax Argentina SA.
Operating and Financial Review
The group’s operating profit/(loss) for the year, after applicable income tax and non-controlling interests was ($1,014,689)
(2014:($5,459,041)). Group exploration and evaluation expenditure for the year totalled $376,653 (2014:$386,025). The
Olaroz Joint Venture is operated through SDJ a 91.5% owned subsidiary of SDJ PTE, a Singaporean company that both
Orocobre (72.68%) and TTC (27.32%) are shareholders in directly and indirectly respectively. The effective Olaroz Lithium
Facility equity interest is Orocobre 66.5%, TTC 25.0% and Jujuy Energia y Minera Sociedad del Estado (JEMSE) 8.5%. A
diagram of the joint venture is contained in the Review of Operations.
Since the creation of the joint venture between the Company and TTC, the Company has recognised its interest in the joint
venture as an equity accounted investment. Under the equity method of accounting, Orocobre’s interest in the joint venture
is recognised on the balance sheet at fair value. This carrying amount is then adjusted for subsequent equity investments,
the Company’s share of profit or loss of the joint venture and any dividends received. As a result capital expenditure by the
joint venture and draw downs on the project financing facility will not be recognised directly in the Groups financial
statements.
Financial Position
The net assets of the Orocobre group increased to $211,820,906 (2014:$159,586,253) during the year to 30 June 2015,
including cash balances of $9,439,319 (2014:$26,302,392). The main reasons for the increase in net assets is due to Capital
Raising which took part during the year as well as the upswing in book values of assets in Argentina being accounted for in
Argentine pesos and these values then being converted to Australian dollars, and the devaluation of the $A against the US$
(please see the Company’s foreign currency translation policy as detailed in Note 1 “Summary of Significant Accounting
Policies”).
Significant Changes in the State of Affairs
Other than matters mentioned in this report, there were no significant changes in the state of affairs of the Company during
the financial year.
Pending Arbitration
The Company has advised Rio Tinto PLC that it considered Rio Tinto PLC to be in breach of certain warranties provided by
Rio Tinto PLC to the Company pursuant to the Share Purchase Agreement for the acquisition of the shares of Borax
Argentina S.A. The quantum of any damages that the Company may have suffered is currently being quantified. Rio Tinto
PLC has referred the matter to arbitration. The hearing of the arbitration has been set for 14th December 2015. As a result of
48
For
per
sona
l use
onl
y
Directors Report
the alleged breach of warranties by Rio Tinto PLC the Company declined to make a payment to Rio Tinto PLC of US$
1,000,000 due on 21 August 2014, and a payment of US$ 629,013 due 21 August 2015.
Significant Events after Balance Sheet Date
In June 2015, the Company raised $32.3M through placement to institutional and sophisticated investors. Such funds were
received post year end on 3 July 2015.
Post year end, Borax Argentina received a loan of ARS $29m (approximately US$ 3M) to fund productive asset
improvements including the expansion of the boric acid plant.
Likely Developments and Expected Results
The main area of the Company’s activity is the ramp up of production at the Olaroz Lithium Facility. There are a number of
mechanical bottlenecks still to be overcome and the operation also needs to develop good operating practice to achieve its
objectives. The relocation of the Borax Argentina refining plant to the Tincalayu mine was completed. During the coming year
it is expected that the borax decahydrate to pentahydrate plant will also be relocated to Tincalayu and decahydrate
production capacity increased by 30tpd. A modest expansion of the boric acid plant by 6tpd is also planned. Local
financing has been procured for both of these projects.
The Company has been conducting a program in Borax Argentina to bring the historical estimates into line with JORC
compliance. The program was completed at Porvenir in FY2014 and at Tincalayu this year. The focus has now turned to Sijes
and will then lastly consider Diablillos which has been affected by flooding resulting from drilling by the local subsidiary of
Rodinia Lithium undertaken prior to the purchase of Borax Argentina from RTM. Studies have commenced into a significant
production expansion at Tincalayu based on the new resource. The significance of this program is that the upgrading of
resources from historical estimates to JORC compliant resources and the development of an understanding of the overall
geological setting, allows the Company to rank the growth options for the Company as well as allowing the reporting of
studies.
Following commissioning and achieving steady state production at the Olaroz lithium carbonate plant, the development of
the strategy for the next stage of expansion will be considered. The Company has a number of organic growth opportunities
to consider in addition to expansion of production at Olaroz. These include the production of lithium hydroxide and the
extraction of boron and potash from the brine at Olaroz. All of these potential organic growth opportunities need to be
assessed and prioritised in order to deliver the best strategic outcome for the Company and to maximise return to
shareholders.
The Company is also cognisant of continuing to be aware of growth opportunities outside of organic growth opportunities.
The cyclical nature of markets creates opportunities for acquisition and joint venture arrangements when asset values and
capital availability are in the low point of the cycle.
Orocobre Limited I Annual Report 2015 49
For
per
sona
l use
onl
y

Directors Report
Risk Management
Orocobre’s business faces certain risks that could affect the success of the strategies and the outlook for future financial
years. These include, but are not limited to, rectification of bottlenecks and development of good operating practice and the
associated production ramp up and production of product within the required specification at the Olaroz Lithium Facility and
the timing thereof; the achievement of the design production rate for lithium carbonate, the expected brine grade and the
expected operating costs and recoveries at the Olaroz Lithium Facility and the comparison of such costs to expected global
operating costs, the ongoing working relationship between Orocobre and the Province of Jujuy (JEMSE), TTC and Mizuho
Bank. With respect to Borax Argentina the risks associated with the business are the weaknesses in the company’s
traditional markets and strong competition from other producers in these markets, challenges in developing new markets,
and the implementation of unit cost reduction measures, local inflation and production. Other risks include Argentina
sovereign risk, changes in government regulations, policies or legislation, fluctuations or decreases in product prices and
currency, the impact of inflation on local costs, the impact of devaluation of the AR$, risks associated with weather patterns
and the impact on production rate. Readers are cautioned that the foregoing list is not exhaustive of all factors and
assumptions which may have been used. Please also refer to the Caution Regarding Forward Looking Information
statement.
The Company has in place risk management policies and systems to mitigate these risks wherever possible, including
monitoring ongoing exploration results, monthly construction progress against timeframes and cost, monthly review of
operational results for Borax Argentina SA and continued discussions with JV partners and the government of Argentina.
Within its’ operations in Argentina, the Company has instituted ISO 31000, Risk Management, to act comprehensively on all
its areas of activity.
Environmental Regulation and Performance
The Company has operations in two provinces in Argentina, Jujuy and Salta.
In Salta, the applicable legislation is Provincial Constitution (art.30), Environmental Protection Provincial Law No. 7070 and
Provincial Decree No 3097/00 and 1587/03, Provincial Law No 7141 of the Mining Procedure Code, National Constitution (art
41), General National Environmental Law No. 25.675 and National Law 24.585. The applicable authority in Salta is the Mining
Secretary of the Province of Salta and Environmental Secretary of the Province of Salta.
In Jujuy there are both provincial and national environmental regulations: Provincial Constitution (art.22), Water Code of
Jujuy, Law 3820 Wildlife Reserve of Fauna & Flora, Law 6002 Dangerous Residues Regulation, Decree 5772-P-2010,
Provincial Environmental Law No. 5063, National Constitution (art 41), General National Environmental Law No. 25.675,
National Law 24.585 and National Law 24.051 Dangerous Residues Regulation.
The applicable authority in Jujuy is the Provincial Department of Mining and Energy Resources (Dirección Provincial de
Mineria y Recursos Energeticos) and the Provincial Department of Environmental Quality (Dirección Provincial de Calidad
Ambiental).
There have been no reportable environmental events under the regulations in Jujuy or Salta due to the Company’s activities.
However, surface water has accumulated at Diablillos from the flow of brine from drill holes which were drilled prior to the
purchase of Borax Argentina by the local operating subsidiary of Rodinia Lithium Ltd. Rodinia’s subsidiary has received a
50
For
per
sona
l use
onl
y

Directors Report
fine from the Salta government and has been stopped from exploring until the issue is rectified. Rodinia has advised the
Company that it is attending to remediation of the drill holes.
Within its’ operations in Argentina, the Company has instituted ISO 31000, Risk Management. This complements ISO 9001,
Quality Assurance, ISO 14001 Environmental Management BS OHSAS 18001 Occupational Health and Safety Management
System which had already been implemented in FY2012. Borax Argentina is already accredited under ISO 9001.
Non-audit Services
The Group’s auditor, Ernst & Young, did not undertake any non-audit services for Orocobre Limited during the current or
prior year.
Auditor Independence
A copy of the auditor’s independence declaration as required under section 307C of the Corporations Act 2001 is set out on
page 75 of the report.
Corporate Governance Statements
The Company’s Corporate Governance Statement is available to view publically on the Company’s website at
www.orocobre.com.
Orocobre Limited I Annual Report 2015 51
For
per
sona
l use
onl
y

Directors Report
Remuneration Report – Chairman’s Letter
Dear Shareholder,
We are writing this letter to provide some introductory comments to this year’s report. I want to start by saying that we were
again pleased with the 99% yes vote for last year’s report. Following the 99% yes vote the previous year, we now feel
confident that our work has addressed past concerns and that we have your support for our remuneration philosophy, plans
and practices.
Once again, we engaged I. Crichton & Associates Pty Ltd (“Crichton”) to assist us in our work during the past year. The work
of Crichton’s and the associated compensation are outlined in the report. Following the remuneration adjustments made in
FY14, it was the view of the Committee, supported by our advisors, that no significant adjustments were required in FY15.
We continue with a philosophy that our KMP’s and our non-executive directors should be remunerated at the median level of
our analysis for relatively sized companies. Our goal is to provide the appropriate reward and incentive to ensure that we
continue to retain the best talent available for our Company. We did increase the size of our KMP group this year with the
valuable addition of Rick Anton, General Counsel and Joint Company Secretary, as of 1 January 2015.
We continue to be committed to communicating KMP and non-executive director remuneration arrangements in a simple,
clear and transparent fashion. We consider the question and answer format to be particularly effective in this respect. This
year, we have added detail on our LTI PROP plan, with an emphasis on clarifying goals and vesting arrangements. The latter
are in line with ASX best practices.
We again assure you that the responsibility for governance and remuneration lies solely with the Board, supported by the
Remuneration Committee. The objectives of this governance approach are to ensure that the practices and processes of the
Company are sound and are driven by our guiding principles to deliver a world class, low cost industrial minerals and
chemicals company for the benefit of our shareholders and other stakeholders.
The 2015 Remuneration Report follows this letter. The report forms part of the Directors’ Report and has been audited in
accordance with Section 308(C) of the Corporations Act 2001. In addition to the statutory requirements, sections
summarising remuneration for the year ended 30 June 2015 and anticipated changes for FY2016 have been included where
appropriate.
The Board remains strongly committed to remuneration philosophy, policies and practices that are fair, competitive and
responsible and to their transparent and clear communication. We will continue to work diligently to ensure that these
standards are met.
Courtney Pratt
Non-Executive Director
Chairman, Remuneration Committee/ Lead Independent Director
52
For
per
sona
l use
onl
y

Directors Report
Remuneration Report (Audited)
This Remuneration Report outlines the overall remuneration strategy, framework and practices adopted by Orocobre
Limited (“Orocobre or the Company”). It has been prepared in accordance with section 300A of the Corporations Act 2001.
Details of remuneration are disclosed for Non-Executive Directors and for executive Key Management Personnel (KMP). In
addition to the Non-executive Directors, the executive KMP had the authority and responsibility for planning, directing and
controlling the activities of Orocobre, directly or indirectly, during the year ended 30 June 2015.
The remuneration report is set out under the following main headings:
A Remuneration overview
B Role of the Remuneration Committee
C Non-executive Directors’ Remuneration
D Managing Director and other executive KMP remuneration
E Relationship of incentives to Orocobre operating and financial performance
F Service agreements
G Details of remuneration
H Share-based compensation issues to the Managing Director and other executives
The format of this Remuneration Report is consistent with the format first adopted for year ended June 2013. In
particular:
• A “question and answer” format. This provides a mechanism by which the Company can answer questions which have been asked previously by shareholders and other stakeholders.
• Remuneration information for executive KMP is reported in A$. • The executive team has increased in 2015 with the appointment of Rick Anthon as General Counsel on 1st
January 2015 and Joint Company Secretary from 10th March 2015. The current KMP are;
- Richard Seville – CEO / Managing Director - Neil Kaplan – CFO / Joint Company Secretary - David Hall – Business Development Manager - Rick Anthon – General Counsel / Joint Company Secretary
• The Non-Executive Directors remain the same for FY15; - James Calaway – Board Chairman and Remuneration Committee Member - John Gibson - Audit Committee Member - Courtney Pratt –Remuneration Committee Chairman - Fernando Oris de Roa – Audit Committee Member - Federico Nicholson – Remuneration Committee Member - Robert Hubbard –Audit Committee Chairman
A. Remuneration Overview
Orocobre’s remuneration philosophy is articulated in Orocobre’s Corporate Governance Charter Section D -
Remuneration Committee Charter which provides that the Remuneration Committee will in accordance with clause D4
(a) of this Charter, ensure that the remuneration policies:
(1) Motivate Directors and Management to pursue the long-term growth and success of the Company within an
appropriate control framework; and
Orocobre Limited I Annual Report 2015 53
For
per
sona
l use
onl
y

Directors Report
(2) Demonstrate a clear relationship between key executive performance and remuneration.
Under clause D3(b) paragraph (1) and (3) the Charter also state that:
(1) Management should be remunerated at an appropriate balance of fixed remuneration and performance
based remuneration; and
(3) Any performance based remuneration should be clearly linked to specific performance targets which aligned
to the Company’s short and long-term performance objectives.
During the last 3 years the Remuneration Committee has undertaken a detailed evaluation of its remuneration
practices. The Committee engaged the services of CRA Plan Managers Pty Limited (CRA) until October 2014 and then
from October 2014 onwards Crichton & Associates Pty Ltd to advise on all aspects of Board and executive KMP
remuneration, including equity incentive strategies.
Key initiatives included:
• an independent assessment and evaluation of the Remuneration Report;
• an independent benchmarking review of Board and KMP remuneration; and
• the design of the STI and LTI plans for the KMP’s.
Following this comprehensive review process a number of changes were adopted. A summary of these changes are
as follows:
1. Appropriate performance conditions were adopted as an integral component of all executive KMP LTI.
2. A minimum three (3) years’ service vesting condition was confirmed for executive KMP LTI.
3. STI awards for executive KMP are based on a financial year.
4. Non-executive Directors will not participate in any incentive programs including the LTI program.
5. Non-executive Director fees were not increased.
6. The key performance indicators (KPI) applied to the KMP’s STI and LTI’s have been disclosed.
7. Percentage limits of base salary related to the LTI have been disclosed.
Orocobre endeavours to adopt a fair and equitable approach to all remuneration decisions, mindful of the complexities of
retaining and motivating an experienced team operating across diverse geographies in a complex operating environment.
In implementing this philosophy, Orocobre needs to consider many variables, including:
(a) the remuneration paid by the Company’s peers (by reference to industry, market capitalisation and where
relevant geographic location);
(b) the Company’s performance over the relevant period;
(c) how to link remuneration to successful implementation of the Company’s strategy, including the annual
targets which need to be achieved to implement that strategy;
(d) internal relativities and differentiation of pay based on performance;
(e) the size, scale, location and complexity of the operations of the Company; and
(f) market developments and changes in remuneration practices.
54
For
per
sona
l use
onl
y

Directors Report
In 2015 the Company undertook a review of the remuneration levels for directors and KMPs.
B. Role of the Remuneration Committee
In accordance with best practice, the Remuneration Committee is comprised of Non-Executive Directors of which a majority
are independent. It is chaired by an Independent Non-Executive Director other than the Chairman. The membership of the
committee is comprised of Mr Courtney Pratt – Committee Chair, Mr James Calaway and Mr Federico Nicholson as detailed
in the Directors’ Report. The Remuneration Committee’s role and interaction with the Board, internal and external advisors, is
further illustrated below:
Table 1
The Board Reviews, applies judgment and, as appropriate, approves the Remuneration Committee’s recommendations
For each annual remuneration review cycle, the Remuneration Committee considers whether to appoint a remuneration
consultant and, if so, their scope of work. The table below provides details with respect to the remuneration consultant who
provided remuneration recommendations and other remuneration related advice in relation to the remuneration outcomes
set out in this Remuneration Report.
External Consultants Internal Resources
The Remuneration Committee The Remuneration Committee operates under the delegated authority of the Board.
The Remuneration Committee is able to source internal resources and to obtain independent professional advice it considers necessary to enable it to make recommendations to the Board on the following:
• Remuneration Policy, strategy, quantum and mix of remuneration for executive KMP • Remuneration policy for Non-Executive Directors • People and talent management, policies and practices • Superannuation arrangements • Performance target setting and measurement for executive KMP • Design and approval of employee and executive short and long term incentive programs
Orocobre Limited I Annual Report 2015 55
For
per
sona
l use
onl
y

Directors Report Question Response
Did a remuneration consultant provide a remuneration recommendation in relation to any of the KMP for the financial year?
Ian Crichton, remuneration consultant, with Crichton & Associates Pty Ltd (Crichton), formerly with CRA, and CRA Plan Managers Pty Limited (CRA) provided remuneration recommendations and remuneration related advice to the Remuneration Committee, including in relation to: the structure of remuneration packages, the proportion of different components of remuneration, benchmarking against the Company’s peers, the maximum aggregate fee pool for Non-Executive Directors, valuation of long term incentives and advice on market trends relating to remuneration practices. The Remuneration Consultant has advised that there was no undue influence from any Committee Member or executive KMP on any of their work during the year (Crichton & Associates Pty Ltd is an Australian proprietary company experienced in Board and Executive remuneration).
What was the remuneration consultant paid by the Company for remuneration related services?
Crichton was paid a total of A$14,393.56. CRA was paid a total of A$1,268.44
Did the remuneration consultant provide any other advice to the Company?
Yes, CRA / Boardroom and Crichton provided other advice to the Company.
What was the remuneration consultant paid by the Company for other advice (not related to remuneration)?
CRA/Boardroom was paid A$127,348.29 for other services. These services related to the provision of;
• Maintenance of Plan Register • Hosting of Orocobre Performance Rights and Options Plan data on CRA
database • Preparation of work files for external audit and tax returns • Institutional shareholder advice • Mailing of AGM material • Shareholder Placement Plan & DVP settlement of share placement • Share registry services for shares listed on the ASX
Crichton was paid A$761.06 for advice relating to offshore employees. (CRA and Boardroom are wholly owned subsidiaries of Boardroom Limited, a Singaporean Company listed on SGX). From October 2014 Crichton was used for remuneration issues.
What arrangements did the Company make to ensure that the making of the remuneration recommendation would be free from undue influence by the KMP?
The Company made the following arrangements: • The recommendations are solely made by the Remuneration
Committee with limited liaison between Crichton and the CEO. • The Company has implemented a procedure requiring the
Remuneration Committee to have direct contact with Crichton for procuring advice relating to KMP remuneration. The procedure contained a process whereby the Remuneration Committee is responsible for the engagement, formally and in writing, of any remuneration consultants, the provision of information to the remuneration consultant, and the direct communication of remuneration recommendations, in writing.
• The remuneration consultant agreed to adhere to the protocol procedures and was required to advise the Remuneration Committee whether or not it had been subjected to undue influence.
Is the Board satisfied that the remuneration recommendation was free from any such undue influence? What are the reasons for the Board being so satisfied?
Yes, the Board is satisfied. The reasons are as follows: • The protocol with respect to the procurement of remuneration related
advice was adhered to, including with respect to engagement of the remuneration consultant, the provision of information to the remuneration consultant and the communication of remuneration recommendations.
• The Remuneration Committee consulted on several occasions with the remuneration consultant in the absence of the executive KMPs. There were no concerns raised by the remuneration consultant with respect to any undue influence being exerted by the executive KMP.
• The Remuneration Committee did not observe any evidence that undue influence had been applied.
56
For
per
sona
l use
onl
y

Directors Report
C. Non-Executive Director’s Remuneration
Objective
The objective is to set remuneration at a level which attracts and retains Non-Executive Directors of the requisite expertise
and experience at a cost acceptable to shareholders.
Structure
The maximum aggregate remuneration of Non-Executive Directors is determined by the shareholders at a general meeting.
The current aggregate fee pool is A$600,000 which was established and approved at the 2012 AGM.
Effective 1st January 2014 the board, mindful of Orocobre’s business transition and the increasing demands and time
commitment placed on the Directors, approved an increase in Chairman, Non-Executive Directors, Managing Director
and Chief Executive Officer (CEO) and Chief Financial Officer (CFO) fees and salaries. The Chairman fee increased from
A$75,000pa. to A$150,000pa. The Non-Executive Directors increased from A$40,000pa. to A$80,000pa. These
increases, while substantial, are within the current aggregate fee pool as detailed above. The CEO and CFO increases are
detailed in Section D of this report. All increases moved fees and salaries to about the 50th percentile level identified in
the peer benchmarking exercise. Previous fees were under market reflecting the early stage nature of Orocobre’s
business.
In addition to his Director remuneration the Chairman is paid a fee per annum for the performance of special functional
duties additional to the normal scope of a Non-Executive Chairman. These duties include corporate development and
investor relations services, particularly in North America where the Company is listed and has substantial shareholder and
analyst coverage. Details of additional duties are shown below.
Other Non-Executive Directors are paid a base fee only.
In 2013 the Board decided that in future Non-Executive Directors would not participate in any short or long term incentive
schemes, including the LTI, of the Company.
On appointment to the Board, all Non-Executive Directors enter into a service agreement with the Company in the form of a
letter of appointment which details remuneration arrangements.
Orocobre Limited I Annual Report 2015 57
For
per
sona
l use
onl
y

Directors Report
Fees
Annualised fees for the relevant periods were as follows:
From 1 July 2014 to 30 June 2015
From 1 July 2013 to 30 June 2014
Position – Non-Executive Directors
Chairman A$150,000 A$112,500
Other Non-Executive Directors A$80,000 A$60,000
Committee fees
Committee Chairman A$NIL A$NIL
Committee member A$NIL A$NIL
Additional Fees
Chairman A$100,000 A$112,500¹
¹ The additional fees paid to the Chairman would be considered unusual for a Chairman under normal corporate governance. However the Board considers that, at this stage of development of the Company and taking into account the geographical spread of the Company’s activities, the complex nature of its business and the challenging political environment in which its operations occur, a more active involvement of the Chairman is warranted. The additional fee is to compensate Mr. James Calaway for his time, skills and expertise in undertaking a range of tasks on behalf of Orocobre, including:
1. Mr. Calaway was actively involved with the management team in the process of obtaining the approvals and agreements in Argentina which allowed the Olaroz Lithium Facility to proceed. Since then, Mr Calaway continues to be the principal relationship for the Company with a number of key government officials within Argentina, building on the strong relationships developed in the prior years.
2. Due to the fact that the Company is dual listed in Canada and Australia, Mr. Calaway has been the primary Investor relations person supporting the North American markets. Mr. Calaway’s extensive knowledge of the Company and his proximity to North American markets has allowed the CEO to spend considerably less time and expense to support the Company’s dual listing while having a principal interface (Mr. Calaway) with this important market.
3. Mr Calaway also has provided leadership on a number of possible corporate development opportunities which have arisen from the North American business sector.
These tasks are in addition to Mr Calaway’s responsibilities as Chairman. During the last year, the executive management
team has continued to develop as the Company has advanced the Olaroz Lithium Facility from construction to production
and the restructure of its Borax operations. Mr. Calaway has increasingly focused on the growing demands of
Chairmanship, corporate development and investor relations in North America. The change to the structure of Mr
Calaway’s remuneration reflects these changes.
The table below provides further information in relation to fees paid to Non-Executive Directors and other relevant issues.
58
For
per
sona
l use
onl
y

Directors Report
Question Response
Why was the maximum aggregate fee pool increased from A$400,000 to A$600,000
The aggregate fee pool was first established at the August 2007 AGM at a value of A$200,000. This was reviewed and increased to A$400,000 at the November 2010 AGM. Since then, the Company has graduated into the S&P/ASX 300 Index, expanded in South America through the acquisition of Borax Argentina SA, commenced joint venture partnership with Toyota Tsusho and continued to advance a number of existing projects in South America. The previous fee pool limit of A$400,000 left no room for an increase in Non-Executive Director fees or for the appointment of additional directors based on existing fees.
Has there been an increase in the fees paid to Non-Executive Directors considered since 2014?
No. There has been no change to the fees in FY2015.
How does the Company determine the appropriate level of fees?
The Company obtained external advice from a remuneration consultant, CRA Plan Managers Pty Ltd / Crichton, in relation to Non-Executive Director fees. The Board considered the fees paid by selected relevant comparator companies in determining Non-Executive Director fees. This is the correlated with the skills, expertise and time commitment of each Director to ensure it is appropriate.
Why is the Chairman’s fee more than the base fee for Non-Executive Directors?
The Chairman’s fee also incorporates a component for duties which are considered more onerous than a Non-Executive Director. The responsibilities and time commitments of the other Non-Executive Directors are less onerous than those of the Chairman.
Are the Non-Executive Directors paid any incentive or equity based payments or termination/ retirement benefits?
No. The Non-Executive Directors were not entitled to any short term incentives, long term incentives, equity based remuneration or termination/retirement benefits in FY2015. The Non-Executive Directors do not participate in such schemes.
Are the Special Functional Duties fees paid to the Chairman included as part of the aggregate fee pool for Non-Executive Directors?
No. The additional special function fees paid in accordance with the Company’s constitution are considered as “special exertion” fees under the definition of ASX Listing Rule 10.17 and are excluded from the aggregate fee pool.
Have the Non-Executive Directors been paid any incentive or equity based payments or termination/ retirement benefits?
In accordance with the shareholder approved 2011 AGM Resolutions 6 to11 the Non-Executive Chairman and certain Directors were granted options for no consideration so as to better align the interests of the Company and these directors by providing an incentive to them to remain with the Company and increase Shareholder value. All Options issued have vested and will expire 30th Nov. 2016 unless exercised. The Non-Executive Directors have not since participated in any further issues and were not entitled to any short term incentives, long term incentives, equity based remuneration or termination/retirement benefits.
If Non-Executive Directors are paid additional fees, how are these additional fees calculated?
From time to time, Non-Executive Directors may be requested to provide additional services. In any such case, these additional fees are paid to the Non-Executive Director in accordance with the expected additional days deemed necessary to perform these services and only after approval by the CEO and the Remuneration Committee.
Are Non-Executive Directors’ fees going to increase in FY2016?
No. There are no plans to increase the Director’s fees during this coming financial year.
Is Superannuation included in Non-Executive Director fees?
Yes. Statutory superannuation is paid to Australian resident Non-Executive Directors and included in total fees paid up to the statutory maximum.
Are Non-Executive Directors entitled to participate in Orocobre’s equity incentive schemes?
The Board is aware that the provision of equity incentives is contrary to the ASX Corporate Governance guidelines. Accordingly, the Non-Executive Directors do not participate in such schemes.
What other benefits are provided to Non-Executive Directors?
Non-Executive Directors receive reimbursement for any costs incurred directly related to Orocobre business on an approved basis.
Orocobre Limited I Annual Report 2015 59
For
per
sona
l use
onl
y

Directors Report
Minimum shareholding guidelines
The Board has no approved minimum shareholding guidelines for Non-Executive Directors at the date of this Report.
D. Managing Director and Other Executive KMP Remuneration
Objective
As indicated in Table 1, Orocobre’s objective in structuring its remuneration for executive KMPs is to cultivate a performance
based culture where competitive remuneration, benefits and rewards are aligned with Orocobre’s objectives and where merit
forms the basis of performance based pay and promotion. In addition, Orocobre seeks to attract, engage and retain high-calibre
employees to meet the Company’s current and future business needs.
Structure
Remuneration consists of the following key elements:
(i) Fixed Remuneration (FR);
(ii) Short Term Incentive (STI); and
(iii) Long Term Incentive (LTI).
The amount and relative proportion of Fixed Remuneration (which includes superannuation contributions), STI and LTI is
established for each executive following consideration by the Remuneration Committee of market levels of remuneration for
comparable executive roles and the internal relativities between executive roles.
For the annual remuneration review which resulted in the outcomes detailed in this remuneration report, the Remuneration
Committee received expert advice from Crichton and CRA as its independent external remuneration consultant.
Objectives
Orocobre’s executive KMP remuneration objectives and their interactions can be illustrated as follows:
60
For
per
sona
l use
onl
y

Directors Report
Orocobre executive KMP Remuneration Objectives
Attract, motivate and retain executives
capable of operating across diverse
An appropriate balance of ‘fixed’ and ‘at risk’ components
Reward differentiation to drive performance, values and behaviours
Shareholder value creation
Total target remuneration (TTR) is set by reference to the relevant markets and geographies
Fixed remuneration (FR)
FR is set based on relevant market relativities, reflecting
responsibilities, performance, qualifications, experience and
geographic location
Base salary plus any fixed allowances related to local
markets, plus superannuation or their local market equivalents
Remuneration will be delivered as:
At risk
Short-term incentives (STI) Long-term incentives (LTI)
Paid in cash at the end of the relevant performance period subject to Board approval.
Long term equity incentives will be provided as options and/or
performance rights. All equity is held subject to service and
performance criteria set at the time of grant. The equity is at risk
until vesting.
Strategic intent and market positioning
Short term incentives are directed to achieving Board
approved targets each year that reflect market circumstances
and Orocobre’s stage of development.
Total target remuneration TTR is intended to be positioned in the 2nd quartile compared to relevant market benchmark comparisons. First
quartile TTR may result if superior outperformance is achieved.
Fixed
STI is set as a % of FR with performance criteria determined by the Board at the start of the
performance year
LTI is set as a % of FR with equity allocations, subject to
specified service and performance criteria set by the
Board each year
FR will generally be positioned at the median to 62.5th
percentile compared to relevant market based data considering expertise and performance in
the role
LTI is intended to reward executive KMP for sustainable long-term growth aligned to shareholders’ interests. LTI
allocation values will be positioned in line with market
expectations
Orocobre Limited I Annual Report 2015 61
For
per
sona
l use
onl
y

Directors Report
Remuneration Mix
As set out in the remuneration objectives above Orocobre intends to provide an appropriate mix of remuneration
components balanced between fixed and ‘at risk’ components. The broad remuneration composition mix for Orocobre
executive KMP in FY2015 and proposed for FY2016 can be illustrated as follows:
Current Remuneration Mix – FY15
Position FR STI LTI
CEO / Managing Director 40% 30% 30% Other Executives
• Chief Financial Officer
• Business Development Manager
• General Counsel
53%
55%
53%
16%
17%
16%
31%
28%
31%
Proposed Remuneration Mix – FY16
Position FR STI LTI
CEO / Managing Director 50-80% 20-40% 20-40%
Other Executives 50-80% 10-25% 20-40%
The remuneration mix will be assessed each year to ensure an appropriate weighting between fixed and variable ‘at risk’
elements and to ensure executive KMP remuneration is aligned to Orocobre’s short, medium and long term objectives.
An explanation of the individual elements of executive KMP remuneration is as follows:
(i) Fixed Remuneration (FR)
At Orocobre, the purpose of Fixed Remuneration is to provide a base level of remuneration which is market competitive and
appropriate. Fixed Remuneration is inclusive of superannuation. Executive KMP are given the opportunity to receive their
Fixed Remuneration as either base salary (if based overseas) or base salary and superannuation.
Fixed Remuneration is reviewed annually. Any adjustments to the Fixed Remuneration for the CEO and executive KMP must
be approved by the Board which considers the recommendations of the Remuneration Committee.
(ii) Short Term Incentives (STI)
Question Response
What is the STI?
The STI is the annual cash component of the “at-risk” reward opportunity, based predominantly on a mix of Company, operational and individual targets. The purpose is to link the achievement of the Company’s annual targets with the remuneration received by the responsible executive KMP.
When is the STI paid?
The STI is calculated based on a financial year and the resulting value of the STI will be paid in October 2015 to all eligible participants who satisfied specific performance measures and hurdles set for FY2015 following the assessment process. For the FY2015 year, no STIs were paid to KMPs as KPIs were not met.
How does the Company’s STI structure support achievement of the Company’s strategy?
The STI strengthens the link between pay and performance. Annual targets are established by reference to the Company’s strategy of: growth through discovery, acquisition and development, operations that meet performance targets, optimisation of shareholder value and adherence to core values.
62
For
per
sona
l use
onl
y

Directors Report
How are the performance conditions determined?
At the beginning of each financial year, a number of critical tasks linked to the Company’s strategy, including financial and non-financial measures of performance, are identified. The extent to which those targets are achieved determines the amount of STI paid.
Is a portion of STI deferred? Has the Board considered proposing claw-back provisions?
No. At this stage, the Board does not consider it appropriate to defer a portion of the STI. This is because key performance indicators are largely objective. However, the matter is considered on an annual basis. For similar reasons, the Board has thus far considered it unnecessary to include any claw-back arrangements.
What were the performance conditions under the STI for executive KMP in FY2015?
The STI performance hurdles (and weighting %) for FY15 are set out in the table below for the applicable KMP.
• Chief Executive Officer/Managing Director – Richard Seville • Chief Financial Officer / Joint Company Secretary – Neil Kaplan • Business Development Manager – David Hall • General Counsel / Joint Company Secretary– Rick Anthon
How are actual results measured against the performance hurdles?
For each performance hurdle the Remuneration Committee assesses the actual performance against the set targets and allocates the achieved percentage. Further information is provided in table 2 below.
Table 2
STI Performance Conditions Weighting %
Richard Seville Neil Kaplan David Hall Rick Anthon
OLAROZ – Achieve a defined OPEX unit cost for the period Jan’15 to Jun’15
20% 20% 20% 20%
OLAROZ – Produce a defined number of tonnes of Lithium Carbonate during FY15
20% 20% 20% 20%
BORAX Argentina - EBITDA 20% 20% 20% 20%
Discretionary¹ 40% 40% 40% 40%
Total 100% 100% 100% 100%
¹ The discretionary conditions incorporate an assessment of progress towards the achievement of a number of sub-conditions that work towards greater development and maintenance of the operations of Orocobre Limited.
Note - For the FY2015 year, no STIs were paid to KMPs as KPIs were not met.
(iii) Long Term Incentives (LTI)
The LTI is the equity component of the at-risk reward opportunity of total remuneration. The objective of the LTI is:
• to provide an incentive to executive KMPs which promotes both the long term performance and growth of the
Company;
• encourages the retention of the Company’s executives ,and
• the attraction of new executives and/or officers to the group.
For FY2015, the Company provided the LTI to executive KMPs through the Performance Rights and Option Plan (PROP).
This plan was approved by shareholders at the 2012 Annual General Meeting. The Managing Director’s LTI grant was
approved at a General Meeting of shareholders held on 16th March 2015.
Table 7 in section H provide details of LTI grants to executive KMPs. The tables also detail the vesting periods and lapses
under the PROP. The Table under E below summarises the key features of the LTI issued to the executive KMPs for the year
ended 30 June 2015.
Orocobre Limited I Annual Report 2015 63
For
per
sona
l use
onl
y

Directors Report
Table 3 Question Response
What is the PROP?
Introduced in November 2012, the PROP is a contemporary equity incentive plan which allows the Company to provide either Performance Rights or Options to eligible and invited employees, subject to the terms of the plan. PROP is supported by the Orocobre Employee Share Scheme Trust which has been established to facilitate and manage the issue or acquisition of shares on the settlement of vested Rights or Options, if any.
How does the PROP align the interests of shareholders and executives?
The PROP links rewards for executives to the Company’s strategy which drives the creation of long term shareholder wealth – the greater the performance of the Company, the greater the return to the executives; and vesting of shares only occurs with the successful completion of performance requirements and time based conditions as determined by the Board.
How does the PROP support the retention of executives?
An objective of offering equity incentives under the PROP is to assist in the reward, retention and motivation of eligible and invited key executives. If an executive resigns they would forfeit the benefit of those unvested rewards unless the Board determines otherwise. There is a 3 year vesting period.
What are the principal terms of the issue made under the PROP in 2015?
Under the PROP in 2015 the KMP’s were invited to apply for Performance Rights. The rights were granted on 21st January 2015. The vesting date for the performance rights is the later of 31 August 2017 or date of release of the company’s financial results for the 2016/2017 financial year. Vesting of the January 2015 Performance Rights are subject to the matrix of outcomes as set out in the tables below. The shares acquired on vesting of Performance Rights, if any, will be at no cost to the KMP’s as long as they meet the conditions.
Can performance conditions be retested?
No. Performance conditions will be tested at the vesting date and if the performance conditions have not been met, the Options and/or Rights will lapse.
Can participants secure or mortgage Rights or Options under PROP?
No. Participants cannot secure, mortgage or create a lien in respect of their interests in PROP.
Does the executive obtain the benefit of dividends paid on shares issued under the PROP?
No. Options and Performance Rights are not entitled to dividends or other distributions. Shares acquired on vesting and exercise of Performance Rights or Options will be ordinary securities and entitled to dividends, if any. No dividends apply before vesting and exercise.
In what circumstances would the PROP entitlements be forfeited?
Unless the Board otherwise determines, the Rights and Options will lapse on the earlier of: 1. The cessation of the employment of the participant. 2. The vesting conditions are not achieved or are incapable of being achieved by
the participant. 3. The Board determines that the vesting conditions have not been met prior to the
expiry date. 4. The expiry date (last exercise date).
What happens to LTI entitlements upon a change of control in the Company?
In the event of a takeover or change of control, any unvested Performance Rights will vest immediately.
Do shares issued under the PROP dilute existing shareholders’ equity?
The issue of shares can have a small dilutionary impact upon other shareholders. The number of Performance Rights or Options granted under this Plan must not exceed when aggregated with any shares issued during the previous 5 years pursuant to any other employee share scheme operated by the Company, a maximum of 5% of the total issued capital of the Company at the time of the grant, excluding unregulated offers. The new Class Order 14/1000 (effective from October 2014) issue limits may also apply.
Are the shares issued on exercise of Options or Rights under the PROP bought on market?
Whether the Company settles Options or Rights from a new issue or by on-market purchase will usually be determined by the Board, at the time of vesting and exercise.
What other rights does the holder of the shares have?
Subject to the conditions and restrictions attaching to the shares, acquired on vesting and exercise of Rights and Options, the holder of the shares has the same rights as any other holder of ordinary shares. This includes voting rights, a right to dividends, dividend reinvestment, bonus shares, rights issues and notice of meetings.
64
For
per
sona
l use
onl
y

Directors Report
Does the Company have Executive Share Ownership Guidelines? The Company does not have a formal policy requiring executives to own shares.
Can executive KMP hedge to ensure that they obtain a benefit from unvested LTI’s?
No. All executive KMP have been advised that under section 206J of the Corporations Act it is an offence for them to hedge unvested grants made under the PROP.
E. Relationship of Incentives To Orocobre’s Operating and Financial Performance
The fundamental aim of Orocobre is to create benefit for shareholders by establishing operations that produce high
quality products from relatively low capital and low operating cost operations. The Company is equally committed to
achieving excellence in sustainability practices ensuring the safety, health and wellbeing of its employees, and responsibly
managing the impacts to the communities and the environment within which it operates. Accordingly, remuneration is
linked to sustainability performance at all levels of the organisation to reinforce sustainability as a core value.
In terms of Orocobre’s performance over the course of FY2015, the following should be noted:
• Orocobre’s share price fluctuated over the course of FY15, ending the year at A$2.10 per share and the 52 week
daily closing share price ranged from A$2.00 to A$3.20 per share.
• Construction of the Olaroz project under a joint venture agreement of Orocobre, Toyota Tsusho Corporation (TTC)
and Jujuy Energia y Mineria Sociedad del Estado (JEMSE) concluded in FY15. The Olaroz Lithium Facility has
experienced a number of bottlenecks resulting in production below expectations requiring the raising of additional
equity capital.
• The relocation and construction of Borax Argentina’s chemical plant from Campo Quijano to Tincalayu Mine was
also finalised during FY15. The ramp up in production from the relocated plant was slower than expected which
reduced saleable Borax product inventories and associated sales.
Table 4 below shows the performance for the Company as measured by its share price and market capitalisation over the
last nine financial years. The graph below shows the complete historical movement in the share price and market
capitalisation. Over the past 12 months the market capitalisation has increased by 7% and closing share price has
decreased by 7% in comparison to the prior year. A capital raising was completed in February /March 2015 with the issue
of 19,611,766 ordinary shares at an issue price of $2.55. The Company has taken a conservative approach to
remuneration and no increases were awarded in FY15.
Table 4
Year 26-Nov-07 (IPO)
30-Jun-08
30-Jun-09
30-Jun-10
30-Jun-11
30-Jun-12
30-Jun-13
30-Jun-14
30-Jun-15
A$ per share $0.25 $0.46 $0.59 $1.70 $2.06 $1.85 $1.39 $2.26 $2.10 A$ market capitalisation (‘000)
13.030 19.230 39.409 154.762 212.291 190.911 163.666 298.415 318.473
Basic Earnings/Loss Per Share (EPS) (A cents)*
N/A $(1.04) $(2.80) $(5.56) $(1.88) $(2.74) $85.26 $(4.32) (0.73)
A$ profit/(loss) (‘000) N/A $(435) $(1,486) $(4,164) $(1,790) $(2,830) $95,685 $(5,459) $(1,015)
S&P ASX 300 6486 5219 3949 4293 4608 4084 4759 5339 5401
* Basic EPS is calculated as net profit / (Loss) after tax and non-controlling interests (statutory profit / (loss)) divided by the weighted average number of ordinary shares
Orocobre Limited I Annual Report 2015 65
For
per
sona
l use
onl
y

Directors Report
Relationship of executive KMP remuneration and performance
The CEO / Managing Director, Mr Richard Seville, the Chief Financial Officer, Mr Neil Kaplan, the Business Development
Manager, Mr David Hall and the General Council, Mr Rick Anthon are the executive KMP who are to receive performance
based remuneration for FY15. The relationship between their ‘at risk’ remuneration and Orocobre’s performance can be
explained as follows:
Short Term Incentives
Please note that 2015 is a year of transition and that the periods differ for each executive differ, as noted.
Position FY STI Opportunity STI Accrued /Paid %
Achieved Forfeited
Seville (CEO) 2015 $408,750 (75% of FR) $0 1 0% 100%
2014 $331,875 (75% of FR) $199,125 2 60% 40%
Kaplan (CFO) 2015 $96,000 (30% of FR) $0 1 0% 100%
2014 $144,000 **(30% of FR) $96,600 3 67% 33%
Hall (BDM) 2015 $72,000 (30% of FR) $0 1 0% 100%
2014 $108,000 **(30% of FR) $72,900 3 67% 33%
Anthon (GC) 2015 $47,250 *(30% of FR) $0 1 0% 100%
2014 N/A N/A N/A N/A
¹ Due to STI KPIs not being met, no bonuses for FY2015 will be paid to KMPs
2 Actual STI for FY14 represented a 12 month period
3 FY2014 accrued bonus was paid during FY2015
* STI Opportunities represent 6 month period
** STI Opportunities represent 18 month period
0
50,000,000
100,000,000
150,000,000
200,000,000
250,000,000
300,000,000
350,000,00026
/11/
2007
(IP
O)
30-J
un-0
8
30-J
un-0
9
30-J
un-1
0
30-J
un-1
1
30-J
un-1
2
30-J
un-1
3
30-J
un-1
4
30-J
un-1
5
$0.00
$0.50
$1.00
$1.50
$2.00
$2.50
Orocobre Historical Share Price and Market Cap
A$ market capitalisation A$ per share
66
For
per
sona
l use
onl
y

Directors Report
Basis of assessment of performance – FY2015
• Olaroz – Achieve an OPEX unit cost of US$2,700/t for the period January to June 2015 (CEO, CFO, BDM,GC); • Olaroz - Produce 7,500 metric tonnes of Lithium Carbonate during FY 2015 (CEO, CFO, BDM, GC); • Borax Argentina – Results achieved against EBITDA FY15 (CEO, CFO, BDM,GC); and • Achievement of specific objectives and strategies set by the Board (CEO, CFO, BDM, GC).
Basis of assessment of performance – FY2014
• Olaroz Construction - Results achieved against budgeted threshold of US$229.4M (excluding finance, marketing and Brisbane charges (CEO, CFO, BDM);
• Olaroz Production – Results achieved against target of first processing of brine through plant to produce primary lithium carbonate (CEO, BDM);
• Borax Argentina – Results achieved against EBITDA FY14(CEO, CFO, BDM); • Borax Argentina – Results achieved based on successful relocation of the plant on time and on budget (CEO,
CFO, BDM); • SDJ/Borax ERP – Results achieved based on successful implementation of SAP on time and on budget (CFO
only); • Borax Argentina – Results achieved on the development of specific marketing initiatives (BDM only); and • Achievement of specific objectives and strategies set by the Board (CEO, CFO, BDM).
Long Term Incentives
Long term equity incentive grants to selected key executives, including executive KMP, are considered on an annual basis.
The Fair Value of LTI grants are calculated on a set percentage of FR (excluding superannuation). LTI grants outstanding at
the date of this report to executive KMP are summarised as follows:
Position FY Fair Value of LTI Granted during the year Maximum LTI as a % of FR
Value as a % of FR
Seville (CEO) 2015 $666,779 (1) 75% 68% 2014 - 75% -
Kaplan (CFO) 2015 $125,519 60% 39% 2014 $379,481 (3) 60% 82%
Hall (BDM) 2015 $78,449 50% 33% 2014 $250,988 (3) 50% 70%
Anthon (GC) 2015 $123,559 60% 78% (2) 2014 - - -
1. LTI granted to the CEO was for a 2 year period (FY14 & FY15). The LTI granted for FY14 was not approved until the Nov’14 AGM and allocated in FY15 along with the FY15 LTI.
2. The value of FR for the GC is for a 6 month period. 3. The LTI granted in FY14 was based on FR for an 18 month period.
Orocobre Limited I Annual Report 2015 67
For
per
sona
l use
onl
y

Directors Report
LTI and Company performance At the date of this report the 2013 LTI grants have vested. All grants remain subject to demanding service and performance conditions set down and which are in-line with contemporary market standards. The performance conditions applicable to each grant are summarised as follows:
(1) 100% - ORE TSR outperformance relative to the S&P/ASX 300 Index; (2) 75% - Complete construction of Olaroz Project within 10% of Development Budget and achieve
satisfactory completion tests in accordance with Banking Agreements, and 25% - Achieve Group NPAT of $5M or more in FY15;
(3) 8.33% - Olaroz construction cost results achieved against defined thresholds; 8.33% - Olaroz operating cost results achieved against defined thresholds; 8.34% - Olaroz design production rates achieved against defined thresholds; 25% - Borax Argentina results achieved against EBITA for FY16 50% - ORE TSR outperformance relative to the ASX 300 Resources Index,
(4) 50% - ORE TSR outperformance relative to the ASX 300 Resources Index, and 50% - Achievement of specific cost, production and earnings hurdles for Olaroz and Borax projects.
(5) 50% - ORE TSR performance over the measured period and subject to meeting compound annual rate thresholds, and
50% - ORE TSR outperformance relative to the constituent companies of the ASX 300 Resource Index and subject to set thresholds
Achievement against the targets set will be independently assessed at the first available dates to determine the vesting percentages, if any. The amounts are included in the remuneration tables at G. Details of remuneration reflect the assessed ‘fair value’ of these equity LTI expensed over the relevant service period determined in accordance with AASB-2 and therefore may represent an accumulation of multiple years.
F. Service Agreements
Remuneration and other key terms of employment for the CEO and other executive KMP are formalised in a service
agreement. Table 8 below provides a high level overview of conditions relating to the term of the contract, the notice
period to terminate and the termination benefit.
Table 5
Name and Title Term of
Agreement Notice Period by
Either Party Termination Benefit
Richard Seville, CEO/Managing Director Open 3 months 12 months fixed remuneration Neil Kaplan, Chief Financial Officer Open 3 months 3 months fixed remuneration David Hall, Business Development Manager
Open 1 month 1 month fixed remuneration
Rick Anthon, General Counsel Open 3 months 3 months fixed remuneration
Position Date of Grant Type
Exercise Price Number
First Available Date
Performance Conditions
Seville (CEO) 21/3/13 Option $2.20 301,092 31/8/15 (1) Seville (CEO) 21/3/13 Right $0.00 140,792 31/8/15 (2) Seville (CEO) 21/11/14 Right $0.00 160,658 31/8/16 (3) Seville (CEO) 21/1/15 Right $0.00 150,039 31/8/17 (5) Kaplan (CFO) 30/4/14 Right $0.00 197,080 31/8/16 (4) Kaplan (CFO) 21/1/15 Right $0.00 70,477 31/8/17 (5) Hall (BDM) 30/4/14 Right $0.00 131,387 31/8/16 (4) Hall (BDM) 21/1/15 Right $0.00 44,048 31/8/17 (5) Anthon (GC) 21/1/15 Right $0.00 69,376 31/8/17 (5)
68
For
per
sona
l use
onl
y

Directors Report
Terms of agreement and associated benefits were agreed at the time the executive KMP commenced with Orocobre or
upon promotion. Termination Benefits are voided when termination arises due to breach of agreement, serious
misconduct, criminal offence or negligence.
G. Details of Remuneration
Details of the nature and amount of each major element of the remuneration of each KMP stated in A$ is as follows:
Short-term Employee Benefits Sub-total Non-cash Benefits Accrued
Name
Directors’ Fees/Base
Salary A$ (1)
Short Term
Incentive A$ (1) (5)
Retirement Benefits/
Superannuation A$ (1)
Cash Benefits Received
A$ (1)
Annual Leave/LSL/ Termination
Benefits A$(1)/(2)
Equity Settled Options A$ (1)
Long Term
Incentives A$ (1)/(3)
Total Remuneration
A$ (1)
Non-Executive Directors
James Calaway 2015 250,000 - - 250,000 - - 250,000 2014 225,000 - - 225,000 - 12,386 - 237,386
Courtney Pratt 2015 80,000 - - 80,000 - - 80,000 2014 60,000 - - 60,000 - 8,258 - 68,258
John Gibson 2015 80,000 - - 80,000 - - 80,000 2014 60,000 - - 60,000 - 8,258 - 68,258
Fernando Oris de Roa
2015 80,000 - - 80,000 - - 80,000 2014 60,000 - - 60,000 - 8,258 - 68,258
Federico Nicholson 2015 80,000 - - 80,000 - - 80,000 2014 60,000 - - 60,000 - 8,258 - 68,258
Robert Hubbard 2015 65,409 - 6,941 (4) 72,350 - - - 72,350 2014 60,000 - - 60,000 - - - 60,000
Total Non-Executive Directors
2015 635,409 - 6,941 642,350 - - - 642,350 2014 525,000 - - 525,000 - 45,418 - 570,418
CEO/Managing Director
Richard Seville 2015 570,888 - 25,887 596,775 14,684 - 438,093 1,049,552 2014 465,085 199,125 18,346 682,556 63,923 - 119,716 866,195
Other Executive KMP
Neil Kaplan 2015 325,450 - 24,950 350,400 13,545 - 195,724 559,669 2014 313,683 96,600 24,992 435,275 14,213 - 26,892 476,380
David Hall 2015 240,000 - 22,800 262,800 5,543 - 129,032 397,375 2014 240,000 72,900 22,200 335,100 2,774 - 17,928 355,802
Rick Anthon (Appointed 1 January 2015)
2015 157,500 - 9,392 166,892 - 34,272 201,164
2014 - - - - - - - -
Total Managing Director & Other Exec. KMP
2015 1,293,838 - 83,029 1,376,867 33,772 - 797,121 2,207,760
2014 1,018,768 368,625 65,538 1,452,931 80,910 - 164,536 1,698,377
Notes to previous tables:
‡ The CEO received an increase in base salary to effective January 2014 to reflect the growth and increasing complexity of the Company. This increase was only proposed by the Board after careful consideration, including external independent assessment and in recognition of the increasing complexity of the role. The uplift brings the CEO’s fixed remuneration in line with approximately the median of the market and takes into account the success of the incumbent CEO in the role, the broader and ‘’deeper’’ workload required as a result of moving through very exacting transitions in a complex geographical environment and the Company now being on the cusp of production at Olaroz. The Board believes the revised level of remuneration for the CEO is both fair and reasonable, all things considered
1) Payments to the Non-Executive Directors, the CEO and other senior executives are paid in Australian dollars. The Company has followed a conservative remuneration strategy, especially whilst in the development stage, and such increases are due to the complex transitions and challenges the Board and executive KMP have overcome in reaching the cusp of production, whilst ensuring the levels of remuneration are at or about the midpoint of comparative companies. The Directors and KMP base salaries FY 2014 and related
Orocobre Limited I Annual Report 2015 69
For
per
sona
l use
onl
y

Directors Report
superannuation and annual leave benefits reflect the half year impact of this change in base salaries effective 1st January 2014. 2) Annual leave/LSL/Termination benefits represent the net movement in amounts provided for annual leave during the year ended 30 June
2015. LSL are the net movement in amounts recorded for LSL when they become applicable. Termination benefits are those referred to under Section F Service Agreements of this Remuneration Report. Termination benefits are payable when an executive KMP leaves the employment of the Company (other than for gross misconduct) are included in the table when applicable.
3) The value for Long Term Incentives presented in the tables above is calculated in accordance with AASB 2 Share Based Payments and represents securities issued under the LTI equity plans that have been expensed during the current year. The fair values of long term incentives have been calculated by an independent third party.
4) The Non-Executive Director fees paid to Robert Hubbard have been adjusted by $5,550 for FY14 and $2,100 for FY13 as a result of an overpayment. These amounts were repaid by Mr Hubbard within the first quarter of FY15.
5) The STI for FY15 is nil, based on STI KPIs not being met. The STI for FY14 accrued in total was $368,625. The actual total STI for FY14 achieved was $413,860 and this was paid in FY15.
Table 6 below shows the proportion of the total actual remuneration that is linked to performance and the proportion that is fixed: Table 6
Name
Fixed remuneration
At risk - STI At risk - LTI Total
2015 2014 2015 2014 2015 2014 2015 2014
% % % % % % $ $
Non-executive Directors
James Calaway 100% 95% - - - 5% 100.00% 100.00%
John Gibson 100% 88% - - - 12% 100.00% 100.00%
Courtney Pratt 100% 88% - - - 12% 100.00% 100.00%
Fernando Oris de Roa 100% 88% - - - 12% 100.00% 100.00%
Federico Nicholson 100% 88% - - - 12% 100.00% 100.00%
Rob Hubbard 100% 100% - - - - 100.00% 100.00%
CEO/Managing Director
Richard Seville 58% 63% - 23% 42% 14% 100.00% 100.00%
Other executive KMP
Neil Kaplan 65% 74% - 20% 35% 6% 100.00% 100.00%
David Hall 67% 74% - 21% 33% 5% 100.00% 100.00%
Rick Anthon 83% - - - 17% - 100.00% -
70
For
per
sona
l use
onl
y

Directors Report
H. Share-Based Compensation Issues to the Non-Executive Directors and Executive KMP
Table 7 below highlights the movement in rights for the Non-executive Directors and executive KMP in 2015.
Table 7
Movement during the year As at 30 June 2015
Grant Date
Type Balance at
1 July 2014
Rights granted (ii)/(v)
Rights exercised
(i)/(iii)
Rights lapsed
(iv)
Balance at 30 June
2015
Vested & Exercisable
Unvested Loan
Amount $A
James Calaway 30/11/11 Options 150,000 - - - 150,000 150,000 - Nil
Total number 150,000 150,000 150,000
Total value $113,850 $113,850 $113,850
John Gibson 30/11/11 Options 100,000 - - - 100,000 100,000 - Nil
Total number 100,000 100,000 100,000
Total value $75,900 $75,900 $75,900
Courtney Pratt 30/11/11 Options 100,000 - - - 100,000 100,000 - Nil
Total number 100,000 100,000 100,000
Total value $75,900 $75,900 $75,900
Fernando Oris de Roa
30/11/11 Options 100,000 - - - 100,000 100,000 - Nil
Total number 100,000 100,000 100,000
Total value $75,900 $75,900 $75,900
Federico Nicholson 30/11/11 Options 100,000 - - - 100,000 100,000 - Nil
Total number 100,000 100,000 100,000
Total value $75,900 $75,900 $75,900
Orocobre Limited I Annual Report 2015 71
For
per
sona
l use
onl
y
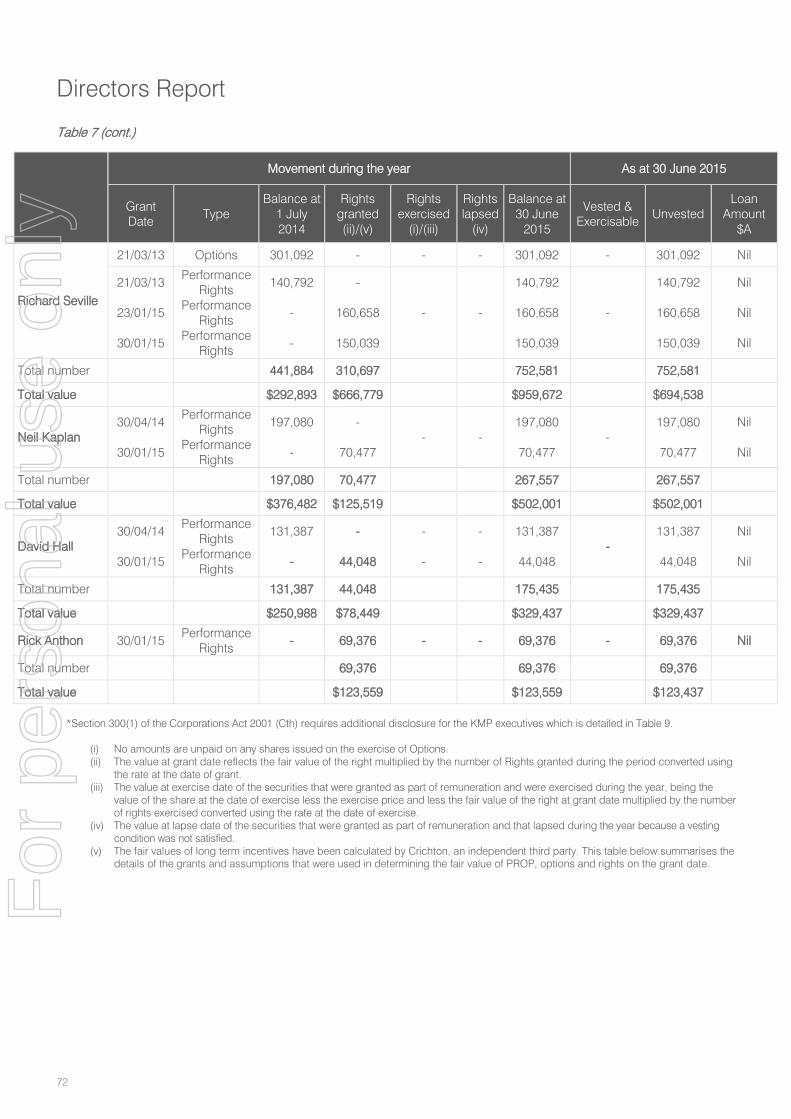
Directors Report
Table 7 (cont.)
Movement during the year As at 30 June 2015
Grant Date Type
Balance at 1 July 2014
Rights granted (ii)/(v)
Rights exercised
(i)/(iii)
Rights lapsed
(iv)
Balance at 30 June
2015
Vested & Exercisable Unvested
Loan Amount
$A
Richard Seville
21/03/13 Options 301,092 - - - 301,092 - 301,092 Nil
21/03/13
23/01/15
30/01/15
Performance Rights
Performance Rights
Performance Rights
140,792 - -
-
160,658
150,039
-
-
140,792
160,658
150,039
-
140,792
160,658
150,039
Nil
Nil
Nil
Total number 441,884 310,697 752,581 752,581
Total value $292,893 $666,779 $959,672 $694,538
Neil Kaplan 30/04/14
30/01/15
Performance Rights
Performance Rights
197,080 -
-
70,477 - -
197,080
70,477 -
197,080
70,477
Nil
Nil
Total number 197,080 70,477 267,557 267,557
Total value $376,482 $125,519 $502,001 $502,001
David Hall 30/04/14
30/01/15
Performance Rights
Performance Rights
131,387 -
-
44,048
- -
- -
131,387
44,048 -
131,387
44,048
Nil
Nil
Total number 131,387 44,048 175,435 175,435
Total value $250,988 $78,449 $329,437 $329,437
Rick Anthon 30/01/15 Performance Rights
- 69,376 - - 69,376 - 69,376 Nil
Total number 69,376 69,376 69,376
Total value $123,559 $123,559 $123,437 *Section 300(1) of the Corporations Act 2001 (Cth) requires additional disclosure for the KMP executives which is detailed in Table 9.
(i) No amounts are unpaid on any shares issued on the exercise of Options. (ii) The value at grant date reflects the fair value of the right multiplied by the number of Rights granted during the period converted using
the rate at the date of grant. (iii) The value at exercise date of the securities that were granted as part of remuneration and were exercised during the year, being the
value of the share at the date of exercise less the exercise price and less the fair value of the right at grant date multiplied by the number of rights exercised converted using the rate at the date of exercise.
(iv) The value at lapse date of the securities that were granted as part of remuneration and that lapsed during the year because a vesting condition was not satisfied.
(v) The fair values of long term incentives have been calculated by Crichton, an independent third party. This table below summarises the details of the grants and assumptions that were used in determining the fair value of PROP, options and rights on the grant date.
72
For
per
sona
l use
onl
y

Directors Report
Table 8
Input Variable Options Performance Rights
Options Performance Rights
Performance Rights
Issue Date 21/3/13 21/3/13 30/4/14 30/4/14 30/4/14
Vesting Date 31/8/15 31/8/15 11/10/16 31/8/16 31/8/16
Valuation Model Monte Carlo Simulation
Binomial Approximation
Binomial Approximation
Binomial Approximation
Monte Carlo Simulation
Exercise Price $2.20 $0.00 $2.53 $0.00 $0.00
Share Price (Date terms agreed)
$1.36 $1.36 $2.23 $2.23 $2.23
Expected Life (Days) 893 893 1,250 854 854
Expected Volatility 60% 60% 50% 50% 50%
Expected Dividend Yield 0% 0% 0% 0% 0%
Expected Risk Free Rate 3.03% 3.03% 2.84% 2.84% 2.84%
Performance Conditions Market Non-Market Non-Market Non-Market Market
Fair Value (Average) $0.3365 $1.36 $0.774 $2.23 $1.59
Input Variable Performance Rights
Performance Rights
Performance Rights
Performance Rights
Performance Rights
Performance Rights
Issue Date 31/8/13 31/8/13 31/8/14 31/8/14 31/8/14 31/8/14
Vesting Date 31/8/16 31/8/16 31/8/17 31/8/17 31/8/17 31/8/17
Valuation Model Binomial
Approximation Monte Carlo Simulation
Monte Carlo Simulation
Monte Carlo Simulation
Monte Carlo Simulation
Monte Carlo Simulation
Exercise Price $0.00 $0.00 $0.00 $0.00 $0.00 $0.00
Share Price (Date terms agreed) $2.67 $2.67 $2.67 $2.67 $2.74 $2.74
Expected Life (Days) 1,095 1,095 1,095 1,095 1,095 1,095
Expected Volatility 50% 50% 50% 50% 50% 50%
Expected Dividend Yield 0% 0% 0% 0% 0% 0%
Expected Risk Free Rate 2.50% 2.50% 2.53% 2.53% 2.09% 2.09%
Performance Conditions Non-Market Market Market (TSR
Absolute) Market
(TSR Relative) Market (TSR
Absolute) Market
(TSR Relative)
Fair Value (Average) $2.67 $2.33 $1.58 $1.95 $1.59 $1.98
Orocobre Limited I Annual Report 2015 73
For
per
sona
l use
onl
y

Directors Report
Table 9
Shareholdings of Key Management Personnel
Opening Balance 1/07/2014 Options Converted Compensation Purchased/Sold
Closing Balance 30/06/2015
James D. Calaway 8,574,000 - - 267,563 8,841,563
Richard P. Seville 4,976,500 - - 100,000 5,076,500
John W. Gibson 25,000 - - - 25,000
Courtney Pratt - - - - - Fernando Oris de Roa
- - - - -
Federico Nicholson - - - - -
Robert Hubbard - - - 22,183 22,183
Neil Kaplan 20,000 - - 5,883 25,883
David Hall - - - - -
Rick Anthon 665,378 - - 37,149 702,527
Total 14,260,878 - - 432,778 14,693,656 The Director’s Report incorporating the Remuneration Report is signed in accordance with a resolution of the Board of
Directors.
James D Calaway Richard P. Seville
Chairman Managing Director
Signed: 23rd September 2015
74
For
per
sona
l use
onl
y

A member firm of Ernst & Young Global Limited Liability limited by a scheme approved under Professional Standards Legislation
Ernst & Young 111 Eagle Street Brisbane QLD 4000 Australia GPO Box 7878 Brisbane QLD 4001
Tel: +61 7 3011 3333 Fax: +61 7 3011 3100 ey.com/au
Auditor’s independence declaration to the Directors of Orocobre Limited
In relation to our audit of the financial report of Orocobre Limited for the financial year ended 30 June 2015, to the best of my knowledge and belief, there have been no contraventions of the auditor independence requirements of the Corporations Act 2001 or any applicable code of professional conduct.
Ernst & Young Kellie McKenzie Partner 23 September 2015
Orocobre Limited I Annual Report 2015 75
For
per
sona
l use
onl
y
2015 FINANCIAL REPORT
76
For
per
sona
l use
onl
y

CONTENTS
Consolidated Statement of Comprehensive Income
Consolidated Statement of Financial Position
Consolidated Statement of Changes in Equity
Consolidated Statement of Cash Flows
Notes to the Financial Statements
Directors’ Declaration
Independent Auditor’s Report
78
79
80
81
82
113
114
Orocobre Limited I Annual Report 2015 77
For
per
sona
l use
onl
y

CONSOLIDATED STATEMENT OF COMPREHENSIVE INCOMEfor the period ended 30 June 2015
Note 30 June 30 June2015 2014
$ $
Sale of goods 23,312,235 23,166,834 Cost of goods sold (23,074,407) (20,943,300)
Gross profit/(loss) 237,828 2,223,534
Other income 2a 3,767,986 3,601,156 Corporate & administrative expenses (14,739,754) (10,895,217) Finance income 2b 1,288,841 1,145,781 Finance costs 2c (2,752,574) (1,029,847) Share of net losses of joint venture 14 (227,696) (315,162) Foreign currency gain/(loss) 10,418,510 (410,064)
Profit/(Loss) before income tax (2,006,859) (5,679,819)
Income tax benefit/(expense) 3 961,905 124,305
Profit/(Loss) for the year (1,044,954) (5,555,514)
Other comprehensive income/(loss)(Items that may be reclassified subsequently to profit and loss)Translation gain/(loss) on foreign operations 9,421,445 (45,309,563) Net gain/(loss) on revaluation of derivative 19 (3,294,730) (2,566,737) Other comprehensive income/(loss) for the period, net of tax 6,126,715 (47,876,300)
Total comprehensive income/(loss) for the period 5,081,761 (53,431,814)
Profit/(Loss) attributable to:Members of the parent entity (1,014,689) (5,459,041) Non-controlling interest (30,265) (96,473)
(1,044,954) (5,555,514)
Total comprehensive income/(loss) attributable to:Members of the parent entity 4,997,806 (52,266,849) Non-controlling interest 83,955 (1,164,965)
5,081,761 (53,431,814)
Basic earnings per share (cents per share) 4 (0.73) (4.32) Diluted earnings per share (cents per share) 4 (0.73) (4.32)
The accompanying notes form part of these financial statements.
Consolidated Group
78
For
per
sona
l use
onl
y

CONSOLIDATED STATEMENT OF FINANCIAL POSITIONas at 30 June 2015
Note 30 June 30 June2015 2014
$ $
CURRENT ASSETS
Cash and cash equivalents 6 9,439,319 26,302,392 Trade and other receivables 7 9,533,299 7,388,112 Inventory 8 11,076,850 5,514,244 Other 9 16,685 502,822 Total Current Assets 30,066,153 39,707,570
NON-CURRENT ASSETS
Financial assets 10 48,806,955 24,464 Property, plant and equipment 11 17,104,429 13,364,136 Exploration and evaluation asset 12 11,148,806 10,065,419 Investment in joint ventures 14 100,536,358 94,454,572 Inventory 8 150,901 318,934 Deferred tax asset 3 2,715,790 1,466,917 Trade and other receivables 7 41,271,924 27,840,216 Total Non-Current Assets 221,735,163 147,534,658
TOTAL ASSETS 251,801,316 187,242,228
CURRENT LIABILITIES
Trade and other payables 15 18,034,456 8,881,373 Loans and borrowings 10 2,716,050 1,362,116 Employee benefit liabilities 17 1,134,867 507,987 Total Current Liabilities 21,885,373 10,751,476
NON-CURRENT LIABILITIES
Trade and other payables 15 1,477,299 2,896,815 Loans and borrowings 10 797,006 1,352,063 Employee benefit liabilities 17 2,036,276 626,459 Deferred tax liability 3 1,531,382 2,158,194 Provisions 16 12,253,075 9,870,968 Total Non-Current Liabilities 18,095,038 16,904,499
TOTAL LIABILITIES 39,980,411 27,655,975
NET ASSETS 211,820,905 159,586,253
EQUITY
Issued capital 18 176,488,844 130,139,019 Reserves 19 (41,662,893) (48,478,454) Retained profits 78,060,177 79,074,866 Parent interest 212,886,128 160,735,431 Non controlling interest (1,065,223) (1,149,178) TOTAL EQUITY 211,820,905 159,586,253
The accompanying notes form part of these financial statements.
Consolidated Group
Orocobre Limited I Annual Report 2015 79
For
per
sona
l use
onl
y

CONSOLIDATED STATEMENT OF CHANGES IN EQUITYfor the period ended 30 June 2015
Issued Capital
Retained Profits/
(Accumulated Losses)
Option Reserve
Foreign Currency
Translation Reserve
Wealth Tax Reserve
Cash Flow Hedge Reserve
Non controlling Interests
Total
Note 18 Note 19 Note 19 Note 19 Note 19 $ $ $ $ $ $ $ $
Balance at 1 July 2013 101,712,005 84,533,907 1,344,180 (3,397,720) - - 15,787 184,208,159
- (5,459,041) - - - - - (5,459,041)
- - - - - - (96,473) (96,473)
- - - (44,241,071) - (2,566,737) (1,068,492) (47,876,300) - (5,459,041) - (44,241,071) - (2,566,737) (1,164,965) (53,431,814)
30,023,218 - - - - - - 30,023,218 (1,596,204) - - - - - - (1,596,204)
- - 382,894 - - - - 382,894 Balance at 30 June 2014 130,139,019 79,074,866 1,727,074 (47,638,791) - (2,566,737) (1,149,178) 159,586,253
- (1,014,689) - - - - - (1,014,689)
- - - - - - (30,265) (30,265)
- - - 9,307,225 - (3,294,730) 114,220 6,126,715 - (1,014,689) - 9,307,225 - (3,294,730) 83,955 5,081,761
50,009,219 - - - - - - 50,009,219 (3,659,394) - - - - - - (3,659,394)
- - 1,135,252 - - - - 1,135,252 Increase in wealth tax - - - - (332,186) - (332,186) Balance at 30 June 2015 176,488,844 78,060,177 2,862,326 (38,331,566) (332,186) (5,861,467) (1,065,223) 211,820,905
The accompanying notes form part of these financial statements.
Options expensed during the yearTransaction costs
Options expensed during the yearTransaction costs
Profit/(loss) attributable to members of the companyProfit/(loss) attributable to non controlling interestsOther comprehensive income/(loss) for the yearTotal comprehensive income/(loss)
Shares issued during the year
Profit/(loss) attributable to members of the companyProfit/(loss) attributable to non controlling interestsOther comprehensive income/(loss) for the yearTotal comprehensive income/(loss)
Shares issued during the year
80
For
per
sona
l use
onl
y
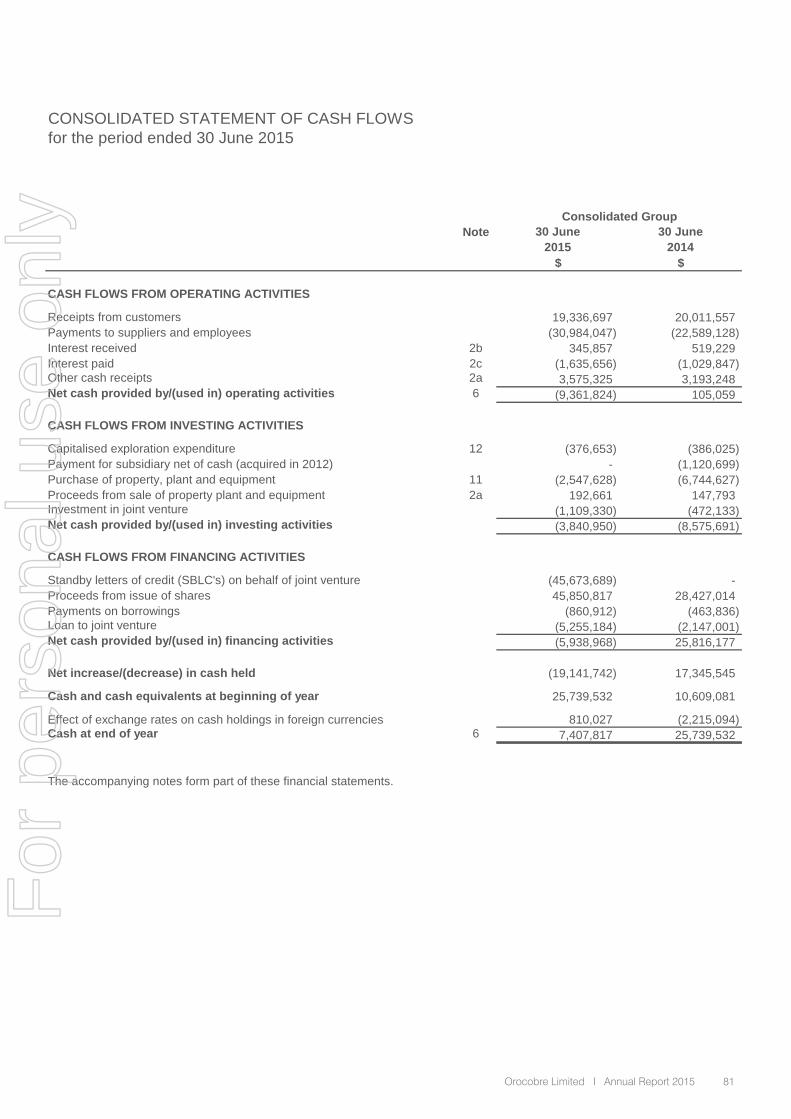
CONSOLIDATED STATEMENT OF CASH FLOWSfor the period ended 30 June 2015
Note 30 June 30 June2015 2014
$ $
CASH FLOWS FROM OPERATING ACTIVITIES
Receipts from customers 19,336,697 20,011,557 Payments to suppliers and employees (30,984,047) (22,589,128) Interest received 2b 345,857 519,229 Interest paid 2c (1,635,656) (1,029,847) Other cash receipts 2a 3,575,325 3,193,248 Net cash provided by/(used in) operating activities 6 (9,361,824) 105,059
CASH FLOWS FROM INVESTING ACTIVITIES
Capitalised exploration expenditure 12 (376,653) (386,025) Payment for subsidiary net of cash (acquired in 2012) - (1,120,699) Purchase of property, plant and equipment 11 (2,547,628) (6,744,627) Proceeds from sale of property plant and equipment 2a 192,661 147,793 Investment in joint venture (1,109,330) (472,133) Net cash provided by/(used in) investing activities (3,840,950) (8,575,691)
CASH FLOWS FROM FINANCING ACTIVITIES
Standby letters of credit (SBLC's) on behalf of joint venture (45,673,689) - Proceeds from issue of shares 45,850,817 28,427,014 Payments on borrowings (860,912) (463,836) Loan to joint venture (5,255,184) (2,147,001) Net cash provided by/(used in) financing activities (5,938,968) 25,816,177
Net increase/(decrease) in cash held (19,141,742) 17,345,545
Cash and cash equivalents at beginning of year 25,739,532 10,609,081
Effect of exchange rates on cash holdings in foreign currencies 810,027 (2,215,094) Cash at end of year 6 7,407,817 25,739,532
The accompanying notes form part of these financial statements.
Consolidated Group
Orocobre Limited I Annual Report 2015 81
For
per
sona
l use
onl
y

NOTES TO THE FINANCIAL STATEMENTSfor the period ended 30 June 2015
NOTE 1: Summary of Significant Accounting Policies
Basis of preparation
Spot Rates 30 June 2015 30 June 2014 Movement (%)Peso -> USD 1 9.0880 8.1330 (11.74%)Peso -> AUD 1 6.9872 7.6533 8.70%AUD -> USD 1 1.3007 1.0622 (22.44%)
Average Rates (12 months) 30 June 2015 30 June 2014 Movement (%)Peso -> USD 1 8.5995 6.6600 (29.12%)Peso -> AUD 1 7.1799 6.1143 (17.43%)AUD -> USD 1 1.2017 1.0897 (10.28%)
Basis of Consolidation
Except for cash flow information, the financial statements have been prepared on an accruals basis and are based on historical costs, modified, where applicable, by the measurement at fair value of selected non-current assets, financial assets and financial liabilities.
The financial report is presented in Australian dollars and all values are rounded to the nearest dollar unless otherwise stated.
In preparation of the financial statements the following exchange rates have been used:
Compliance with IFRS
The financial report also complies with International Financial Reporting Standards (IFRS) as issued by the International Accounting Standards Board.
These consolidated financial statements and notes represent those of Orocobre Limited (the "Company" or the "Parent") and Controlled Entities (the "consolidated Group" or "Group").
The separate financial statements of the parent entity, Orocobre Limited, have not been presented within this financial report as permitted by the Corporations Act 2001.
The financial statements were authorised for issue on 23 September 2015 by the directors of the company.
The nature of the operations and principal activities of the Group are described in the directors' report.
The financial report is a general purpose financial report that has been prepared in accordance with Australian Accounting Standards, other authoritive pronouncements of the Australian Accounting Standards Board (AASB) and the Australian Corporations Act 2001. The Group is a for-profit entity for financial reporting purposes under Australian Accounting Standards.
Australian Accounting Standards set out accounting policies that the AASB has concluded would result in a financial statements containing relevant and reliable information about transactions, events and conditions. Material accounting policies adopted in the preparation of these financial statements are presented below and have been consistently applied unless stated otherwise.
- Power over the investee (i.e. existing rights that give it the current ability to direct the relevant activities of the investee)- Exposure, or rights, to variable returns from its involvement with the investee, and- The ability to use its power over the investee to affect its returns
The financial statements have been prepared on a going concern basis which contemplates continuity of normal business activities and the realisation of assets and liabilities in the ordinary course of business. The Company continually monitors its cash flow requirements to ensure that sufficient funds are available to fund its activities. The working capital requirements of the Olaroz project fundamentally depend upon achieving commercial levels of production. The Directors believe that until commercial levels of production occur additional sources of funding may be necessary and should be available either through the equity markets, strategic investors or its joint venture partners. Consequently the financial statements have been prepared on a going concern basis.
The consolidated financial statements comprise the financial statements of the Group and its subsidiaries as at 30 June 2015. Control is achieved when the Group is exposed, or has rights, to variable returns from its involvement with the investee and has the ability to affect those returns through its power over the investee. Specifically, the Group controls an investee if and only if the Group has:
- The Group's voting rights and potential voting rights
The Group re-assesses whether or not it controls an investee if facts and circumstances indicate that there are changes to one or more of the three elements of control. Consolidation of a subsidiary begins when the Group obtains control over the subsidiary and ceases when the Group loses control of the subsidiary. Assets, liabilities, income and expenses of a subsidiary acquired or disposed of during the year are included in the consolidated financial statements from the date the Group gains control until the date the Group ceases to control the subsidiary.
Profit or loss and each component of other comprehensive income (OCI) are attributed to the equity holders of the parent of the Group and to the non-controlling interests, even if this results in the non-controlling interests having a deficit balance. When necessary, adjustments are made to the financial statements of subsidiaries to bring their accounting policies into line with the Group's accounting policies. All intra-Group assets and liabilities, equity, income, expenses and cash flows relating to transactions between members of the Group are eliminated in full on consolidation.
Generally, there is a presumption that a majority of voting rights results in control. To support this presumption, and when the Group has less than a majority of the voting or similar rights of an investee, the Group considers all relevant facts and circumstances in assessing whether it has power over an investee, including:- The contractual arrangement(s) with the other vote holders of the investee- Rights arising from other contractual arrangements
82
For
per
sona
l use
onl
y
NOTES TO THE FINANCIAL STATEMENTSfor the period ended 30 June 2015
NOTE 1: Summary of Significant Accounting Policies (continued)
Where goodwill has been allocated to a cash-generating unit and part of the operation within that unit is disposed of, the goodwill associated with the disposed operation is included in the carrying amount of the operation when determining the gain or loss on disposal. Goodwill disposed in these circumstances is measured based on the relative values of the disposed operation and the portion of the cash-generating unit retained.
Taxes
Current income taxCurrent income tax assets and liabilities for the current period are measured at the amount expected to be recovered from or paid to the taxation authorities. The tax rates and tax laws used to compute the amount are those that are enacted or substantively enacted, at the reporting date in the countries where the Group operates and generates taxable income.
Current income tax relating to items recognised directly in equity is recognised in equity and not in the statement of comprehensive income. Management periodically evaluates positions taken in the tax returns with respect to situations in which applicable tax regulations are subject to interpretation and establishes provisions where appropriate.
Deferred tax
Business combinations are accounted for using the acquisition method. The cost of an acquisition is measured as the aggregate of the consideration transferred, measured at acquisition date fair value and the amount of any non-controlling interest in the acquiree. For each business combination, the Group elects whether to measure the non-controlling interest in the acquiree at fair value or at the proportionate share of the acquiree’s identifiable net assets. Acquisition related costs are expensed as incurred and included in administrative expenses.
When the Group acquires a business, it assesses the financial assets and liabilities assumed for appropriate classification and designation in accordance with the contractual terms, economic circumstances and pertinent conditions as at the acquisition date. This includes the separation of embedded derivatives in host contracts by the acquiree.
If the business combination is achieved in stages, the previously held equity interest is remeasured at its acquisition date fair value and any resulting gain or loss is recognised in profit or loss.
Any contingent consideration to be transferred by the acquirer will be recognised at fair value at the acquisition date. Contingent consideration classified as an asset or liability that is a financial instrument and within the scope of AASB 139 Financial Instruments: Recognition and Measurement , is measured at fair value with changes in fair value recognised either in either profit or loss or as a change to other comprehensive income. If the contingent consideration is not within the scope of AASB 139, it is measured in accordance with the appropriate Australian Accounting Standard. Contingent consideration that is classified as equity is not remeasured and subsequent settlement is accounted for within equity.
Goodwill is initially measured at cost, being the excess of the aggregate of the consideration transferred and the amount recognised for non-controlling interests, and any previous interest held, over the net identifiable assets acquired and liabilities assumed. If the fair value of the net assets acquired is in excess of the aggregate consideration transferred, the Group re-assesses whether it has correctly identified all of the assets acquired and all of the liabilities assumed and reviews the procedures used to measure the amounts to be recognised at the acquisition date. If the re-assessment still results in an excess of the fair value of net assets acquired over the aggregate consideration transferred, then the gain is recognised in profit or loss.
After initial recognition, goodwill is measured at cost less any accumulated impairment losses. For the purpose of impairment testing, goodwill acquired in a business combination is, from the acquisition date, allocated to each of the Group’s cash-generating units that are expected to benefit from the combination, irrespective of whether other assets or liabilities of the acquiree are assigned to those units.
Business combinations and goodwill
A change in the ownership interest of a subsidiary, without a loss of control, is accounted for as an equity transaction. If the Group loses control over a subsidiary, it derecognises the related assets (including goodwill), liabilities, non-controlling interest and other components of equity while any resultant gain or loss is recognised in profit or loss. Any investment retained is recognised at fair value.
- In respect of deductible temporary differences associated with investments in subsidiaries, associates and interests in joint ventures, deferred tax assets are recognised only to the extent that it is probable that the temporary differences will reverse in the foreseeable future and taxable profit will be available against which the temporary differences can be utilised.
Deferred tax is provided using the liability method on temporary differences between the tax bases of assets and liabilities and their carrying amounts for financial reporting purposes at the reporting date.
Deferred income tax liabilities are recognised for all taxable temporary differences except:- When the deferred income tax liability arises from the initial recognition of goodwill or of an asset or liability in a transaction that is not a business combination and that, at the time of the transaction, affects neither the accounting profit nor taxable profit or loss.- In respect of taxable temporary differences associated with investments in subsidiaries, associates and interests in joint ventures, when the timing of the reversal of the temporary differences can be controlled and it is probable that the temporary differences will not reverse in the foreseeable future.
Deferred tax assets are recognised for all deductible temporary differences, the carry forward of unused tax credits and any unused tax losses. Deferred tax assets are recognised to the extent that it is probable that taxable profit will be available against which the deductible temporary differences, and the carry forward of unused tax credits and unused tax losses can be utilised, except:- When the deferred tax asset relating to the deductible temporary difference arises from the initial recognition of an asset or liability in a transaction that is not a business combination and, at the time of the transaction, affects neither the accounting profit nor taxable profit or loss.
Orocobre Limited I Annual Report 2015 83
For
per
sona
l use
onl
y

NOTES TO THE FINANCIAL STATEMENTSfor the period ended 30 June 2015
NOTE 1: Summary of Significant Accounting Policies (continued)
Tax consolidation legislation
The carrying amount of deferred tax assets is reviewed at each reporting date and reduced to the extent that it is no longer probable that sufficient taxable profit will be available to allow all or part of the deferred tax asset to be utilised. Unrecognised deferred tax assets are reassessed at each reporting date and are recognised to the extent that it has become probable that future taxable profits will allow the deferred tax asset to be recovered.
Deferred tax assets and liabilities are measured at the tax rates that are expected to apply in the year when the asset is realised or the liability is settled, based on tax rates (and tax laws) that have been enacted or substantively enacted at the reporting date.
Deferred tax relating to items recognised outside profit or loss is recognised outside profit or loss. Deferred tax items are recognised in correlation to the underlying transaction either in other comprehensive income or directly in equity.
Deferred tax assets and deferred tax liabilities are offset if a legally enforceable right exists to set off current tax assets against current income tax liabilities and the deferred taxes relate to the same taxable entity and the same taxation authority.
Tax benefits acquired as part of a business combination, but not satisfying the criteria for separate recognition at that date, are recognised subsequently if new information about facts and circumstances change. The adjustment is either treated as a reduction to goodwill (as long as it does not exceed goodwill) if it was incurred during the measurement period or recognised in profit or loss.
Revenues, expenses and assets are recognised net of the amount of GST (or overseas, Value-Added Tax (VAT)), except: - When the GST incurred on a sale or a purchase of assets or services is not payable to or recoverable from the taxation authority, in which case the GST is recognised as part of the revenue or the expense item or as part of the cost of acquisition of the asset, as applicable- When receivables and payables are stated with the amount of GST included
The net amount of GST recoverable from, or payable to, the taxation authority is included as part of receivables or payables in the statement of financial position. Commitments and contingencies are disclosed net of the amount of GST (or VAT) recoverable from, or payable to, the taxation authority.
Cash flows are included in the statement of cash flows on a gross basis and the GST component of cash flows arising from investing or financing activities, which is recoverable from, or payable to, the taxation authority is classified as part of operating cash flows.
Inventories
Orocobre Limited and its wholly-owned Australian controlled entities implemented the tax consolidation legislation as of 1 July 2005.
The head entity, Orocobre Limited and the controlled entities in the tax consolidated Group continue to account for their own current and deferred tax amounts. The Group has applied the Group allocation approach in determining the appropriate amount of current taxes and deferred taxes to allocate to members of the tax consolidated Group.
In addition to its own current and deferred tax amounts, Orocobre Limited also recognises the current tax liabilities (or assets) and the deferred tax assets arising from unused tax losses and unused tax credits assumed from controlled entities in the tax consolidated Group.
Assets or liabilities arising under tax funding agreements with the tax consolidated entities are recognised as amounts receivable from or payable to other entities in the Group.
Any difference between the amounts assumed and amounts receivable or payable under the tax funding agreement are recognised as contribution to (or distribution from) wholly-owned tax consolidated entities.
Goods and Services Tax (GST)
Inventories are valued at the lower of cost and net realisable value. Cost comprises direct materials, direct labour and an appropriate proportion of variable and fixed overhead expenditure, the latter being allocated on the basis of normal operating capacity. Costs are assigned to individual items of inventory on the basis of weighted average costs. Costs of purchased inventory are determined after deducting rebates and discounts.
Net realisable value tests are performed at each reporting date and represent the estimated future sales price of the product the entity expects to realise when the product is processed and sold, less estimated costs to complete production and bring the product to sale. Where the time value of money is material, these future prices and costs to complete are discounted.
Property, Plant and Equipment
Property, plant and equipment is stated at cost, net of accumulated depreciation and accumulated impairment losses, if any. Such cost includes the cost of replacing part of the property, plant and equipment and borrowing costs for long-term construction projects if the recognition criteria are met. When significant parts of property, plant and equipment are required to be replaced at intervals, the Group depreciates them separately based on their specific useful lives. Likewise, when a major inspection is performed, its cost is recognised in the carrying amount of the plant and equipment as a replacement if the recognition criteria are satisfied. All other repair and maintenance costs are recognised in profit or loss as incurred. The present value of the expected cost for the decommissioning of an asset after its use is included in the cost of the respective asset if the recognition criteria for a provision are met.
Refer to critical accounting estimates and judgements (Note 1) and provisions (Note 16) for further information about the recognised decommissioning provision.
84
For
per
sona
l use
onl
y

NOTES TO THE FINANCIAL STATEMENTSfor the period ended 30 June 2015
NOTE 1: Summary of Significant Accounting Policies (continued)
Depreciation is calculated on a straight-line basis over the estimated useful lives of the assets as follows:- Buildings: 20 to 30 years- Plant and equipment: 5 to 10 years
An item of property, plant and equipment and any significant part initially recognised is derecognised upon disposal or when no future economic benefits are expected from its use or disposal. Any gain or loss arising on derecognition of the asset (calculated as the difference between the net disposal proceeds and the carrying amount of the asset) is included in the statement of comprehensive income when the asset is derecognised.
The residual values, useful lives and methods of depreciation of property, plant and equipment are reviewed at each financial year end and adjusted prospectively, if appropriate.
Exploration, Evaluation and Development Expenditure
The considerations made in determining significant influence or joint control are similar to those necessary to determine control over subsidiaries.
The Group’s investment in its joint venture is accounted for using the equity method.
Under the equity method, the investment in a joint venture is initially recognised at cost. The carrying amount of the investment is adjusted to recognise changes in the Group’s share of net assets of the joint venture since the acquisition date. Goodwill relating to the joint venture is included in the carrying amount of the investment and is neither amortised nor individually tested for impairment.
The statement of comprehensive income reflects the Group’s share of the results of operations of the joint venture. Any change in other comprehensive income of those investees is presented as part of the Group's other comprehensive income. In addition, when there has been a change recognised directly in the equity of the joint venture, the Group recognises its share of any changes, when applicable, in the statement of changes in equity. Unrealised gains and losses resulting from transactions between the Group and the joint venture are eliminated to the extent of the interest in the joint venture.
The aggregate of the Group’s share of profit or loss of a joint venture is shown on the face of the statement of comprehensive income outside operating profit and represents profit or loss after tax and non-controlling interests in the subsidiaries of the joint venture.
The financial statements of the joint venture are prepared for the same reporting period as the Group. When necessary, adjustments are made to bring the accounting policies in line with those of the Group.
Exploration, evaluation and development expenditures incurred are capitalised in respect of each identifiable area of interest. These costs are only capitalised to the extent that they are expected to be recovered through the successful development of the area or where activities in the area have not yet reached a stage that permits reasonable assessment of the existence of economically recoverable reserves.
Accumulated costs in relation to an abandoned area are written off in full against profit in the year in which the decision to abandon the area is made.
When production commences, the accumulated costs for the relevant area of interest are amortised over the life of the area according to the rate of depletion of the economically recoverable reserves.
A regular review is undertaken of each area of interest to determine the appropriateness of continuing to capitalise costs in relation to that area of interest. If, after expenditure is capitalised, information becomes available suggesting that the recovery of expenditure is unlikely, the amount capitalised is written off in profit or loss in the period when the new information becomes available.
A joint venture is a type of joint arrangement whereby the parties that have joint control of the arrangement have rights to the net assets of the joint venture. Joint control is the contractually agreed sharing of control of an arrangement, which exists only when decisions about the relevant activities require unanimous consent of the parties sharing control.
Investment in joint ventures
- Expected to be realised within twelve months after the reporting period, or- Cash or cash equivalent unless restricted from being exchanged or used to settle a liability for at least twelve months after the reporting period
The Group classifies all other assets as non-current.
After application of the equity method, the Group determines whether it is necessary to recognise an impairment loss on its investment in its joint venture. At each reporting date, the Group determines whether there is objective evidence that the investment in the joint venture is impaired. If there is such evidence, the Group calculates the amount of impairment as the difference between the recoverable amount of the joint venture and its carrying value, then recognises the loss as ‘Share of profit of a joint venture’ in the statement of comprehensive income.
Upon loss of joint control over the joint venture, the Group measures and recognises any retained investment at its fair value. Any difference between the carrying amount of the joint venture upon loss of joint control and the fair value of the retained investment and proceeds from disposal is recognised in profit or loss.
Current versus Non-Current classification
The Group presents assets and liabilities in statement of financial position based on current/non-current classification. An asset as current when it is:- Expected to be realised or intended to sold or consumed in the Group's normal operating cycle- Held primarily for the purpose of trading
Orocobre Limited I Annual Report 2015 85
For
per
sona
l use
onl
y

NOTES TO THE FINANCIAL STATEMENTSfor the period ended 30 June 2015
NOTE 1: Summary of Significant Accounting Policies (continued)
A liability is current when:- It is expected to be settled in the Group's normal operating cycle- It is held primarily for the purpose of trading- It is due to be settled within twelve months after the reporting period, or
Initial recognition and measurementFinancial assets are classified, at initial recognition, as financial assets at fair value through profit or loss, loans and receivables, held-to-maturity investments, available-for-sale financial assets, or as derivatives designated as hedging instruments in an effective hedge, as appropriate.
All financial assets are recognised initially at fair value plus, in the case of financial assets not subsequently measured at fair value through profit or loss, transaction costs that are attributable to the acquisition of the financial asset.
Purchases or sales of financial assets that require delivery of assets within a time frame established by regulation or convention in the market place (regular way trades) are recognised on the trade date, i.e., the date that the Group commits to purchase or sell the asset.
Subsequent measurementThe subsequent measurement of financial assets depends on their classification as described below:
- There is no unconditional right to defer the settlement of the liability for at least twelve months after the reporting period
The Group classifies all other liabilities as non-current.
Deferred tax assets and liabilities are classified as non-current assets and liabilities.
Financial Instruments - initial recognition and subsequent measurement
A financial instrument is any contract that gives rise to a financial asset of one entity and a financial liability or equity instrument of another entity.
i) Financial assets
Held-to-maturity investmentsNon-derivative financial assets with fixed or determinable payments and fixed maturities are classified as held to maturity when the Group has the positive intention and ability to hold them to maturity. After initial measurement, held to maturity investments are measured at amortised cost using the EIR, less impairment. Amortised cost is calculated by taking into account any discount or premium on acquisition and fees or costs that are an integral part of the EIR. The EIR amortisation is included as finance income in the statement of comprehensive income. The losses arising from impairment are recognised in the statement of comprehensive income in finance costs.
Available for sale (AFS) financial investmentsAFS financial investments include equity investments and debt securities. Equity investments classified as AFS are those that are neither classified as held for trading nor designated at fair value through profit or loss. Debt securities in this category are those that are intended to be held for an indefinite period of time and that may be sold in response to needs for liquidity or in response to changes in the market conditions.
After initial measurement, AFS financial investments are subsequently measured at fair value with unrealised gains or losses recognised as other comprehensive income and credited in the AFS reserve until the investment is derecognised, at which time the cumulative gain or loss is recognised in other operating income in the profit or loss, or the investment is determined to be impaired when the cumulative loss is reclassified from the AFS reserve to the statement of comprehensive income in finance costs. Interest earned whilst holding AFS financial assets is reported as interest income using the EIR method in the statement of comprehensive income.
Financial assets at fair value through profit or lossFinancial assets at fair value through profit or loss include financial assets held for trading and financial assets designated upon initial recognition at fair value through profit or loss. Financial assets are classified as held for trading if they are acquired for the purpose of selling or repurchasing in the near term. Derivatives, including separated embedded derivatives are also classified as held for trading unless they are designated as effective hedging instruments as defined by AASB 139.
The Group has not designated any financial assets at fair value through profit or loss. Financial assets at fair value through profit or loss are carried in the statement of financial position at fair value with net changes in fair value presented as finance costs (negative net changes in fair value) or finance income (positive net changes in fair value) in the statement of comprehensive income.
Derivatives embedded in host contracts are accounted for as separate derivatives and recorded at fair value if their economic characteristics and risks are not closely related to those of the host contracts and the host contracts are not held for trading or designated at fair value though profit or loss. These embedded derivatives are measured at fair value with changes in fair value recognised in profit and loss. Re-assessment only occurs if there is either a change in the terms of the contract that significantly modifies the cash flows that would otherwise be required or a reclassification of a financial asset out of the fair value through profit or loss.
Loans and receivablesLoans and receivables are non-derivative financial assets with fixed or determinable payments that are not quoted in an active market. After initial measurement, such financial assets are subsequently measured at amortised cost using the effective interest rate (EIR) method, less impairment. Amortised cost is calculated by taking into account any discount or premium on acquisition and fees or costs that are an integral part of the EIR. The EIR amortisation is included in finance income in the statement of comprehensive income. The losses arising from impairment are recognised in the statement of comprehensive income in finance costs for loans and finance income for receivables.
86
For
per
sona
l use
onl
y

NOTES TO THE FINANCIAL STATEMENTSfor the period ended 30 June 2015
NOTE 1: Summary of Significant Accounting Policies (continued)
Derecognition
Continuing involvement that takes the form of a guarantee over the transferred asset is measured at the lower of the original carrying amount of the asset and the maximum amount of consideration that the Group could be required to pay.
Financial assets carried at amortised costFor financial assets carried at amortised cost, the Group first assesses whether impairment exists individually for financial assets that are individually significant, or collectively for financial assets that are not individually significant. If the Group determines that no objective evidence of impairment exists for an individually assessed financial asset, whether significant or not, it includes the asset in a Group of financial assets with similar credit risk characteristics and collectively assesses them for impairment. Assets that are individually assessed for impairment and for which an impairment loss is, or continues to be, recognised are not included in a collective assessment of impairment.
The amount of any impairment loss identified is measured as the difference between the asset’s carrying amount and the present value of estimated future cash flows (excluding future expected credit losses that have not yet been incurred). The present value of the estimated future cash flows is discounted at the financial asset’s original EIR.
The carrying amount of the asset is reduced through the use of an allowance account and the loss is recognised in the statement of comprehensive income. Interest income (recorded as finance income on the statement of comprehensive income) continues to be accrued on the reduced carrying amount and is accrued using the rate of interest used to discount the future cash flows for the purpose of measuring the impairment loss. Loans together with the associated allowance, are written off when there is no realistic prospect of future recovery and all collateral has been realised or has been transferred to the Group. If, in a subsequent year, the amount of the estimated impairment loss increases or decreases because of an event occurring after the impairment was recognised, the previously recognised impairment loss is increased or reduced by adjusting the allowance account. If a write-off is later recovered, the recovery is credited to finance costs in the statement of comprehensive income.
Available for sale (AFS) financial investmentsFor AFS financial investments, the Group assesses at each reporting date whether there is objective evidence that an investment or a Group of investments is impaired.
The determination of what is "significant" or "prolonged" requires judgement. In making this judgement, the Group evaluates, among other factors, the duration or extent to which the fair value of an investment is less than its cost.
A financial asset (or, where applicable, a part of a financial asset or part of a Group of similar financial assets) is primarily de-recognised (i.e. removed from the Group's consolidated statement of financial position) when:- The rights to receive cash flows from the asset have expired; or- The Group has transferred its rights to receive cash flows from the asset or has assumed an obligation to pay the received cash flows in full without material delay to a third party under a ”pass-through” arrangement; and either (a) the Group has transferred substantially all the risks and rewards of the asset, or (b) the Group has neither transferred nor retained substantially all the risks and rewards of the asset, but has transferred control of the asset.
When the Group has transferred its rights to receive cash flows from an asset or has entered into a passthrough arrangement, it evaluates if and to what extent it has retained the risks and rewards of ownership. When it has neither transferred nor retained substantially all of the risks and rewards of the asset, nor transferred control of the asset, the Group continues to recognise the transferred asset to the extent of the Group’s continuing involvement. In that case, the Group also recognises an associated liability. The transferred asset and the associated liability are measured on a basis that reflects the rights and obligations that the Group has retained.
ii) Impairment of financial assets
The Group assesses, at each reporting date, whether there is objective evidence that a financial asset or a Group of financial assets is impaired. An impairment exists if one or more events that has occurred since the initial recognition of the asset (an incurred ‘loss event’) has an impact on the estimated future cash flows of the financial asset or the Group of financial assets that can be reliably estimated. Evidence of impairment may include indications that the debtors or a Group of debtors is experiencing significant financial difficulty, default or delinquency in interest or principal payments, the probability that they will enter bankruptcy or other financial reorganisation and observable data indicating that there is a measurable decrease in the estimated future cash flows, such as changes in arrears or economic conditions that correlate with defaults.
In the case of equity investments classified as AFS, objective evidence would include a significant or prolonged decline in the fair value of the investment below its cost. ”Significant” is evaluated against the original cost of the investment and ”prolonged” against the period in which the fair value has been below its original cost. When there is evidence of impairment, the cumulative loss – measured as the difference between the acquisition cost and the current fair value, less any impairment loss on that investment previously recognised in the statement of comprehensive income – is removed from other comprehensive income and recognised in the statement of comprehensive income. Impairment losses on equity investments are not reversed through the statement of comprehensive income; increases in their fair value after impairment are recognised directly in other comprehensive income.
iii) Financial liabilities
Initial recognition and measurementFinancial liabilities are classified, at initial recognition, as financial liabilities at fair value through profit or loss, loans and borrowings, payables, or as derivatives designated as hedging instruments in an effective hedge, as appropriate. All financial liabilities are recognised initially at fair value and, in the case of loans and borrowings and payables, net of directly attributable transaction costs.
The Group’s financial liabilities include trade and other payables, loans and borrowings, including bank overdrafts, financial guarantee contracts, and derivative financial instruments.
Orocobre Limited I Annual Report 2015 87
For
per
sona
l use
onl
y
NOTES TO THE FINANCIAL STATEMENTSfor the period ended 30 June 2015
NOTE 1: Summary of Significant Accounting Policies (continued)
Subsequent measurementThe measurement of financial liabilities depends on their classification, described as follows:
Financial liabilities at fair value through profit or lossFinancial liabilities at fair value through profit or loss include financial liabilities held for trading and financial liabilities designated upon initial recognition as at fair value through profit or loss. Financial liabilities are classified as held for trading if they are incurred for the purpose of repurchasing in the near term. This category includes derivative financial instruments entered into by the Group that are not designated as hedging instruments in hedge relationships as defined by AASB 139. Separated embedded derivatives are also classified as held for trading unless they are designated as effective hedging instruments.
Gains or losses on liabilities held for trading are recognised in the statement of comprehensive income.
DerecognitionA financial liability is derecognised when the obligation under the liability is discharged or cancelled, or expires. When an existing financial liability is replaced by another from the same lender on substantially different terms, or the terms of an existing liability are substantially modified, such an exchange or modification is treated as the derecognition of the original liability and the recognition of a new liability. The difference in the respective carrying amounts is recognised in the statement of comprehensive income.
iv) Offsetting of financial instruments
Financial assets and financial liabilities are offset and the net amount is reported in the consolidated statement of financial position if there is a currently enforceable legal right to offset the recognised amounts and there is an intention to settle on a net basis, to realise the assets and settle the liabilities simultaneously.
Derivative financial instruments and hedge accounting
Financial liabilities designated upon initial recognition at fair value through profit or loss are designated at the initial date of recognition, and only if the criteria in AASB 139 are satisfied. The Group has not designated any financial liability as at fair value through profit or loss.
Loans and borrowingsAfter initial recognition, interest bearing loans and borrowings are subsequently measured at amortised cost using the EIR method. Gains and losses are recognised in profit or loss when the liabilities are derecognised as well as through the EIR amortisation process.
Amortised cost is calculated by taking into account any discount or premium on acquisition and fees or costs that are an integral part of the EIR. The EIR amortisation is included in finance costs in the statement of comprehensive income.
Financial guarantee contractsFinancial guarantee contracts issued by the Group are those contracts that require a payment to be made to reimburse the holder for a loss it incurs because the specified debtor fails to make a payment when due in accordance with the terms of a debt instrument. Financial guarantee contracts are recognised initially as a liability at fair value, adjusted for transaction costs that are directly attributable to the issuance of the guarantee. Subsequently, the liability is measured at the higher of the best estimate of the expenditure required to settle the present obligation at the reporting date and the amount recognised less cumulative amortisation.
- Hedges of a net investment in a foreign operation
At the inception of a hedge relationship, the Group formally designates and documents the hedge relationship to which it wishes to apply hedge accounting and the risk management objective and strategy for undertaking the hedge. The documentation includes identification of the hedging instrument, the hedged item or transaction, the nature of the risk being hedged and how the entity will assess the effectiveness of changes in the hedging instrument's fair value in offsetting the exposure to changes in the hedged item's fair value or cash flows attributable to the hedged risk. Such hedges are expected to be highly effective in achieving offsetting changes in fair value or cash flows and are assessed on an ongoing basis to determine that they actually have been highly effective throughout the financial reporting periods for which they were designated.
Hedges that meet the strict criteria for hedge accounting are accounted for as described below:
Cash flow hedgesThe effective portion of the gain or loss on the hedging instrument is recognised in other comprehensive income in the cash flow hedge reserve, while any ineffective portion is recognised immediately in the statement of comprehensive income as other operating expenses.
Initial recognition and subsequent measurementThe Group uses derivative financial instruments, such as interest rate swaps, to hedge its interest rate risks. Such derivative financial instruments are initially recognised at fair value on the date on which a derivative contract is entered into and are subsequently re-measured at fair value. Derivatives are carried as financial assets when the fair value is positive and as financial liabilities when the fair value is negative.
Any gains or losses arising from changes in the fair value of derivatives are taken directly to profit or loss, except for the effective portion of cash flow hedges, which is recognised in other comprehensive income and later reclassified to profit or loss when the hedge item affects profit or loss.
For the purpose of hedge accounting, hedges are classified as:- Fair value hedges: when hedging the exposure to changes in the fair value of a recognised asset or liability or an unrecognised firm commitment- Cash flow hedges: when hedging the exposure to variability in cash flows that is either attributable to a particular risk associated with a recognised asset or liability or a highly probable forecast transaction or the foreign currency risk in an unrecognised firm commitment
88
For
per
sona
l use
onl
y

NOTES TO THE FINANCIAL STATEMENTSfor the period ended 30 June 2015
NOTE 1: Summary of Significant Accounting Policies (continued)
The Group uses interest rate swaps as hedges of its exposure to interest rate risk in forecast transactions. The ineffective portion relating to interest rate swap contracts is recognised in finance costs.
- In the absence of a principal market, in the most advantageous market for the asset or liability
The principal or the most advantageous market must be accessible by the Group.
The fair value of an asset or a liability is measured using the assumptions that market participants would use when pricing the asset or liability, assuming that market participants act in their economic best interest.
A fair value measurement of a non-financial asset takes into account a market participant's ability to generate economic benefits by using the asset in its highest and best use or by selling it to another market participant that would use the asset in its highest and best use.
The Group uses valuation techniques that are appropriate in the circumstances and for which sufficient data are available to measure fair value, maximising the use of relevant observable inputs and minimising the use of unobservable inputs.
All assets and liabilities for which fair value is measured or disclosed in the financial statements are categorised within the fair value hierarchy, described as follows, based on the lowest level input that is significant to the fair value measurement as a whole:
Amounts recognised as other comprehensive income are transferred to profit or loss when the hedged transaction affects profit or loss, such as when the hedged financial income or financial expense is recognised. When the hedged item is the cost of a non-financial asset or non-financial liability, the amounts recognised as other comprehensive income are transferred to the initial carrying amount of the non-financial asset or liability.
If the hedging instrument expires or is sold, terminated or exercised without replacement or rollover (as part of the hedging strategy), or if its designation as a hedge is revoked, or when the hedge no longer meets the criteria for hedge accounting, any cumulative gain or loss previously recognised in other comprehensive income remains separately in equity until the forecast transaction occurs or the foreign currency firm commitment is met.
Fair Value Measurement
The Group measures certain financial instruments, such as, available for sale assets and derivatives, at fair value at each reporting date.
Fair value is the price that would be received to sell an asset or paid to transfer a liability in an orderly transaction between market participants at the measurement date. The fair value measurement is based on the presumption that the transaction to sell the asset or transfer the liability takes place either:- In the principal market for the asset or liability, or
In the current period and prior periods, the Group had no direct derivative financial instrument, but recorded its share of the joint venture's cash flow hedge revaluation through other comprehensive income.
Impairment of Non-Financial Assets
The Group assesses, at each reporting date, whether there is an indication that an asset may be impaired. If any indication exists, or when annual impairment testing for an asset is required, the Group estimates the asset’s recoverable amount. An asset’s recoverable amount is the higher of an asset’s or cash-generating unit’s (CGU) fair value less costs of disposal and its value in use. Recoverable amount is determined for an individual asset, unless the asset does not generate cash inflows that are largely independent of those from other assets or Groups of assets. When the carrying amount of an asset or CGU exceeds its recoverable amount, the asset is considered impaired and is written down to its recoverable amount.
In assessing value in use, the estimated future cash flows are discounted to their present value using a pre-tax discount rate that reflects current market assessments of the time value of money and the risks specific to the asset. In determining fair value less costs of disposal, recent market transactions are taken into account. If no such transactions can be identified, an appropriate valuation model is used. These calculations are corroborated by valuation multiples, quoted share prices for publicly traded companies or other available fair value indicators.
The Group bases its impairment calculation on budgets and forecast calculations, which are prepared separately for each of the Group’s CGUs to which the individual assets are allocated.
Impairment losses of continuing operations, including impairment on inventories, are recognised in the statement of comprehensive income in expense categories consistent with the function of the impaired asset.
- Level 1 — Quoted (unadjusted) market prices in active markets for identical assets or liabilities- Level 2 — Valuation techniques for which the lowest level input that is significant to the fair value measurement is directly or indirectly observable- Level 3 — Valuation techniques for which the lowest level input that is significant to the fair value measurement is unobservable
For assets and liabilities that are recognised in the financial statements at fair value on a recurring basis, the Group determines whether transfers have occurred between levels in the hierarchy by re-assessing categorisation (based on the lowest level input that is significant to the fair value measurement as a whole) at the end of each reporting period.
At each reporting date, movements in the values of assets and liabilities which are required to be re-measured or re-assessed as per the Group’s accounting policies are analysed by the audit committee.
For the purpose of fair value disclosures, the Group has determined classes of assets and liabilities on the basis of the nature, characteristics and risks of the asset or liability and the level of the fair value hierarchy as explained above.
Orocobre Limited I Annual Report 2015 89
For
per
sona
l use
onl
y

NOTES TO THE FINANCIAL STATEMENTSfor the period ended 30 June 2015
NOTE 1: Summary of Significant Accounting Policies (continued)
Cash and Cash Equivalents
Revenue and Other Income
Interest income
Provisions
For assets excluding goodwill, an assessment is made at each reporting date to determine whether there is an indication that previously recognised impairment losses no longer exist or have decreased. If such indication exists, the Group estimates the asset’s or CGU’s recoverable amount. A previously recognised impairment loss is reversed only if there has been a change in the assumptions used to determine the asset’s recoverable amount since the last impairment loss was recognised. The reversal is limited so that the carrying amount of the asset does not exceed its recoverable amount, nor exceed the carrying amount that would have been determined, net of depreciation, had no impairment loss been recognised for the asset in prior years. Such reversal is recognised in the statement of comprehensive income unless the asset is carried at a revalued amount, in which case, the reversal is treated as a revaluation increase.
Cash and short-term deposits in the statement of financial position comprise cash at banks and on hand and short-term deposits with a maturity of three months or less, which are subject to an insignificant risk of changes in value.
For the purpose of the consolidated statement of cash flows, cash and cash equivalents consist of cash and short-term deposits as defined above, net of outstanding bank overdrafts as they are considered an integral part of the Group's cash management.
Issued Capital
Ordinary shares are classified as equity. Transaction costs arising on the issue of ordinary shares are recognised in equity as a reduction of the share proceeds received.
Share Based Payments - Equity-settled transactions
The cost of equity-settled transactions is determined by the fair value at the date when the grant is made using an appropriate valuation model. That cost is recognised, together with a corresponding increase in other capital reserves in equity, over the period in which the performance and/or service conditions are fulfilled in employee benefits expense (Note 2e). The cumulative expense recognised for equity-settled transactions at each reporting date until the vesting date reflects the extent to which the vesting period has expired and the Group’s best estimate of the number of equity instruments that will ultimately vest. The statement of comprehensive income expense or credit for a period represents the movement in cumulative expense recognised as at the beginning and end of that period and is recognised in employee benefits expense (Note 2e).
For all financial instruments measured at amortised cost and interest-bearing financial assets classified as available-for-sale, interest income or expense is recorded using the effective interest rate (EIR). EIR is the rate that exactly discounts the estimated future cash payments or receipts over the expected life of the financial instrument or a shorter period, where appropriate, to the net carrying amount of the financial asset or liability. Interest income is included in finance income in the statement of comprehensive income.
Provisions are recognised when the Group has a present obligation (legal or constructive) as a result of a past event, it is probable that an outflow of resources embodying economic benefits will be required to settle the obligation and a reliable estimate can be made of the amount of the obligation. When the Group expects some or all of a provision to be reimbursed, for example, under an insurance contract, the reimbursement is recognised as a separate asset, but only when the reimbursement is virtually certain. The expense relating to a provision is presented in the statement of comprehensive income net of any reimbursement.
No expense is recognised for awards that do not ultimately vest, except for equity-settled transactions for which vesting is conditional upon a market or non-vesting condition. These are treated as vesting irrespective of whether or not the market or non-vesting condition is satisfied, provided that all other performance and/or service conditions are satisfied.
When the terms of an equity-settled award are modified, the minimum expense recognised is the expense had the terms not been modified, if the original terms of the award are met. An additional expense is recognised for any modification that increases the total fair value of the share-based payment transaction, or is otherwise beneficial to the employee as measured at the date of modification.
The dilutive effect of outstanding options is reflected as additional share dilution in the computation of diluted earnings per share (further details are given in Note 4).
Revenue is recognised to the extent that it is probable that the economic benefits will flow to the Group and the revenue can be reliably measured, regardless of when the payment is being made. Revenue is measured at the fair value of the consideration received or receivable, taking into account contractually defined terms of payment and excluding goods and services tax (GST). The specific recognition criteria described below must also be met before revenue is recognised.
Sale of goodsRevenue from the sale of goods is recognised when the significant risk and rewards of ownership shifts from seller to buyer as dictated by the Incoterms specified in the sales contract. Revenue from the sale of goods is measured at the fair value of the consideration received or receivable, net of returns and allowances, trade discounts, and volume rates.
90
For
per
sona
l use
onl
y

NOTES TO THE FINANCIAL STATEMENTSfor the period ended 30 June 2015
NOTE 1: Summary of Significant Accounting Policies (continued)
Environmental protection, rehabilitation and closure costs
Group as a lessee
Earnings per Share (EPS)
Foreign Currency Translation
Provision is made for close down, restoration and environmental rehabilitation costs (which include the dismantling and demolition of infrastructure, removal of residual materials and remediation of disturbed areas) in the financial period when the related environmental disturbance occurs, based on the estimated future costs using information available at the statement of financial position date. The provision is discounted using a current market-based pre-tax discount rate that reflects the time value of money and risk specific to the liability. The unwinding of the discount is included in interest expense. At the time of establishing the provision, a corresponding asset is capitalised, where it gives rise to a future benefit, and depreciated over future production from the operations to which it relates. The provision is reviewed on an annual basis for changes to obligations, legislation or discount rates that impact estimated costs or lives of operations. The cost of the related asset is adjusted for changes in the provision resulting from changes in the estimated cash flows or discount rate and the adjusted cost of the asset is depreciated prospectively.
Wages, salaries, annual leave and sick leaveLiabilities for wages and salaries, including non-monetary benefits, annual leave and accumulating sick leave expected to be settled within 12 months of the reporting date are recognised in respect of employees' services up to the reporting date. They are measured at the amounts expected to be paid when the liabilities are settled. Based on past experience, the Group does not expect the full amount of annual leave classified as current liabilities to be settled within th next 12 months. However, these amounts must be classified as current liabilities since the Group does not have an unconditional right to defer the settlement of these amounts. Expenses for non-accumulating sick leave are recognised when the leave is taken and are measured at the rates paid or payable.
Long service leave
A lease is classified at the inception date as a finance lease or an operating lease. A lease that transfers substantially all the risks and rewards incidental to ownership to the Group is classified as a finance lease. An operating lease is a lease other than a finance lease.
Group as a lessorLeases in which the Group does not transfer substantially all the risks and benefits of ownership of an asset are classified as operating leases. Initial direct costs incurred in negotiating an operating lease are added to the carrying amount of the leased asset and recognised over the lease term on the same basis as rental income. Contingent rents are recognised as revenue in the period in which they are earned.
Borrowing Costs
Borrowing costs directly attributable to the acquisition, construction or production of an asset that necessarily takes a substantial period of time to get ready for its intended use or sale are capitalised as part of the cost of the asset. All other borrowing costs are expensed in the period in which they occur. Borrowing costs consist of interest and other costs that an entity incurs in connection with the borrowing of funds.
Basic earnings per share amounts are calculated by dividing the net profit for the year attributable to ordinary equity holders of the Parent by the weighted average number of ordinary shares outstanding during the year.
Diluted earnings per share amounts are calculated by dividing the net profit attributable to ordinary equity holders of the Parent by the weighted average number of ordinary shares outstanding during the year plus the weighted average number of ordinary shares that would be issued on conversion of all the dilutive potential ordinary shares into ordinary shares.
The Group recognises a liability for long service leave measured as the present value of expected future payments to be made in respect of services provided by employees up to the reporting date using the projected unit credit method. Consideration is given to expected future wage and salary levels, experience of employee departures, and periods of service. Expected future payments are discounted using market yields at the reporting date on the applicable corporate bond with terms to maturity and currencies that match, as closely as possible, the estimated future cash outflows.
Leases
The determination of whether an arrangement is, or contains, a lease is based on the substance of the arrangement at the inception of the lease. The arrangement is, or contains, a lease if fulfilment of the arrangement is dependent on the use of a specific asset or assets, even if that right is not explicitly specified in an arrangement.
Finance leases are capitalised at the commencement of the lease at the inception date fair value of the leased property or, if lower, at the present value of the minimum lease payments. Lease payments are apportioned between finance charges and reduction of the lease liability so as to achieve a constant rate of interest on the remaining balance of the liability. Finance charges are recognised in finance costs in the statement of comprehensive income.
A leased asset is depreciated over the useful life of the asset. However, if there is no reasonable certainty that the Group will obtain ownership by the end of the lease term, the asset is depreciated over the shorter of the estimated useful life of the asset and the lease term.
Operating lease payments are recognised as an operating expense in the statement of comprehensive income on a straight-line basis over the lease term.
The Group’s consolidated financial statements are presented in Australian dollars, which is also the Parent’s functional currency. For each entity, the Group determines the functional currency and items included in the financial statements of each entity are measured using that functional currency. The Group uses the direct method of consolidation and on disposal of a foreign operation, the gain or loss that is reclassified to profit or loss reflects the amount that arises from using this method.
Orocobre Limited I Annual Report 2015 91
For
per
sona
l use
onl
y

NOTES TO THE FINANCIAL STATEMENTSfor the period ended 30 June 2015
NOTE 1: Summary of Significant Accounting Policies (continued)
Critical Accounting Estimates and Judgements
Comparative Figures and Financial Period
Group companiesOn consolidation, the assets and liabilities of foreign operations are translated into Australian dollars at the rate of exchange prevailing at the reporting date and their statements of profit or loss are translated at the average exchange rate for each quarter of the financial year. The exchange differences arising on translation for consolidation purposes are recognised in other comprehensive income. On disposal of a foreign operation, the component of other comprehensive income relating to that particular foreign operation is recognised in profit or loss.
The preparation of the Group’s consolidated financial statements requires management to make judgements, estimates and assumptions that affect the reported amounts of revenues, expenses, assets and liabilities, and the accompanying disclosures, and the disclosure of contingent liabilities. Uncertainty about these assumptions and estimates could result in outcomes that require a material adjustment to the carrying amount of assets or liabilities affected in future periods.
The Group makes estimates and judgements in applying the accounting policies. Critical judgements in respect of accounting policies relate to exploration and evaluation assets, whereby exploration and evaluation expenditure is capitalised in certain circumstances, primarily where activities in the area of interest have not yet reached a stage which permits reasonable assessment of economically recoverable reserves. Otherwise expenditure is expensed.
Exploration, evaluation and development expenditures
Any goodwill arising on the acquisition of a foreign operation and any fair value adjustments to the carrying amounts of assets and liabilities arising on the acquisition are treated as assets and liabilities of the foreign operation and translated at the spot rate of exchange at the reporting date.
Transactions and balancesTransactions in foreign currencies are initially recorded by the Group’s entities at their respective functional currency spot rates at the date the transaction first qualifies for recognition.
Monetary assets and liabilities denominated in foreign currencies are translated at the functional currency spot rates of exchange at the reporting date.
Differences arising on settlement or translation of monetary items are recognised in profit or loss with the exception of monetary items that are designated as part of the Group’s net investment of a foreign operation. These are recognised in other comprehensive income until the net investment is disposed of, at which time, the cumulative amount is reclassified to profit or loss. Tax charges and credits attributable to exchange differences on those monetary items are also recorded in other comprehensive income.
Non-monetary items that are measured in terms of historical cost in a foreign currency are translated using the exchange rates at the dates of the initial transactions. Non-monetary items measured at fair value in a foreign currency are translated using the exchange rates at the date when the fair value is determined. The gain or loss arising on translation of non-monetary items measured at fair value is treated in line with the recognition of gain or loss on change in fair value of the item (i.e., translation differences on items whose fair value gain or loss is recognised in other comprehensive income or profit or loss are also recognised in other comprehensive income or profit or loss, respectively).
Carrying value of non-current assets subject to impairment testingThe Group considers annually whether there has been any indicators of impairment and then tests whether non-current assets, including investments in joint ventures and property, plant and equipment, have suffered any impairment, in accordance with the accounting policy stated in Note 1. The recoverable amounts of cash-generating units have been determined based on value in use calculations or fair value less costs to sell. These calculations require the use of assumptions. Refer to Notes 11 and 14 for more details on the carrying amounts of non-current assets subject to impairment testing.
As part of the identification and measurement of assets and liabilities for the acquisition of Borax Argentina S.A. in 2012, the Group has recognised a provision for rehabilitation obligations associated with Borax Argentina S.A.'s operations. In determining the fair value of the provision, assumptions and estimates are made in relation to discount rates, the expected cost to dismantle and remove the plant from the site and the expected timing of those costs. The carrying amount of the provision as at 30 June 2015 was $12,182,537 (2014: $9,848,800).
When required by Accounting Standards, comparative figures have been adjusted to conform to changes in presentation for the current financial year.
Exploration, evaluation and development expenditures incurred are capitalised in respect of each identifiable area of interest. Such costs are written off when the amounts are not expected to be recovered through the successful development of the area, or through sale. The assessment of whether successful development will occur, or the amount to be recovered in a sales transaction, involves the use of judgements and estimates.
Income TaxesThe Group records deferred tax assets when it is probable that taxable profit will be available against which the assets can be utilised. The assessment of whether taxable profit will be available requires the use of management judgements and estimates regarding future periods.
Share-based paymentsThe Group measures the cost of equity-settled transactions with employees by reference to the fair value of the equity instruments at the date at which they are granted. Estimating fair value for share-based payment transactions requires determination of the most appropriate valuation model, which is dependent on the terms and conditions of the grant. This estimate also requires determination of the most appropriate inputs to the valuation model including the expected life of the share option, volatility and dividend yield and making assumptions about them. The assumptions and models used for estimating fair value for share-based payment transactions are disclosed in Note 23.
Provision for rehabilitation
92
For
per
sona
l use
onl
y

NOTES TO THE FINANCIAL STATEMENTSfor the period ended 30 June 2015
NOTE 1: Summary of Significant Accounting Policies (continued)
Consequential amendments were also made to other standards as a result of AASB 9, introduced by AASB 2009-11 and superseded by AASB 2010-7, AASB 2010-10 and AASB 2014-1 - Part E.
Financial liabilities
- The remaining change is presented in profit or loss
Impairment
The final version of AASB 9 introduces a new expected-loss impairment model that will require more timely recognition of expected credit losses. Specifically, the new Standard requires entities to account for expected credit losses from when financial instruments are first recognised and to recognise full lifetime expected losses on a more timely basis.
New and amended standards and interpretations
The accounting policies adopted are consistent with those of the previous financial year. New accounting standards issued during the year had no impact on the Group.
AASB 9 includes requirements for a simpler approach for classification and measurement of financial assets compared with the requirements of AASB 139. There are also some changes made in relation to financial liabilities.
The main changes are described below.
a. Financial assets that are debt instruments will be classified based on (1) the objective of the entity's business model for managing the financial assets; (2) the characteristics of the contractual cash flows.
b. Allows an irrevocable election on initial recognition to present gains and losses on investments in equity instruments that are not held for trading in other comprehensive income. Dividends in respect of these investments that are a return on investment can be recognised in profit or loss and there is no impairment or recycling on disposal of the instrument.
c. Financial assets can be designated and measured at fair value through profit or loss at initial recognition if doing so eliminates or significantly reduces a measurement or recognition inconsistency that would arise from measuring assets or liabilities, or recognising the gains and losses on them, on different bases.
The Group has not early adopted any standard, interpretation or amendment that has been issued but is not yet effective.
Accounting Standards and Interpretations issued but not yet effective
Australian Accounting Standards and Interpretations that have recently been issued or amended but are not yet effective and have not been adopted by the Group for the annual reporting period ending 30 June 2015, outlined below:
Financial assets
In order to apply the new hedging rules, the Group would have to adopt AASB 9 and the consequential amendments to AASB 7 and AASB 139 in their entirety.
- Amendments to AASB 116 and AASB 138***** Clarification of Acceptable Methods of Depreciation and Amortisation (Application date of standard 1 January 2016; Application date of Group 1 July 2016)
AASB 116 Property Plant and Equipment and AASB 138 Intangible Assets both establish the principle for the basis of depreciation and amortisation as being the expected pattern of consumption of the future economic benefits of an asset.
The IASB has clarified that the use of revenue-based methods to calculate the depreciation of an asset is not appropriate because revenue generated by an activity that includes the use of an asset generally reflects factors other than the consumption of the economic benefits embodied in the asset.
Hedge Accounting
Amendments to AASB 9 (December 2009 & 2010 editions and AASB 2013-9) issued December 2013 included the new hedge accounting requirements, including changes to hedge effectiveness testing, treatment of hedging costs, risk components that can be hedged and disclosures.
AASB 2014-7 incorporates the consequential amendments arising from the issuance of AASB 9 in Dec 2014.
AASB 2014-8 limits the application of existing versions of AASB 9 (AASB 9 (December 2009) and AASB 9 (December 2010)) from 1 February 2015 and applies to annual reporting periods beginning on after 1 January 2015.
The Group has not yet assessed how its own hedging arrangements would be affected by the new rules, and it has not yet decided whether to adopt any parts of AASB 9 early.
Changes introduced by AASB 9 in respect of financial liabilities are limited to the measurement of liabilities designated at fair value through profit or loss (FVPL) using the fair value option.
Where the fair value option is used for financial liabilities, the change in fair value is to be accounted for as follows:
- The change attributable to changes in credit risk are presented in other comprehensive income (OCI)
AASB 9 also removes the volatility in profit or loss that was caused by changes in the credit risk of liabilities elected to be measured at fair value. This change in accounting means that gains or losses attributable to changes in the entity's own credit risk would be recognised in OCI. These amounts recognised in OCI are not recycled to profit or loss if the liability is ever repurchased at a discount.
- AASB 9 Financial Instruments (Application date of standard 1 January 2018; Application date of Group 1 July 2018)
Orocobre Limited I Annual Report 2015 93
For
per
sona
l use
onl
y

NOTES TO THE FINANCIAL STATEMENTSfor the period ended 30 June 2015
NOTE 1: Summary of Significant Accounting Policies (continued)
(a) Step 1: Identify the contract(s) with a customer(b) Step 2: Identify the performance obligations in the contract(c) Step 3: Determine the transaction price(d) Step 4: Allocate the transaction price to the performance obligations in the contract(e) Step 5: Recognise revenue when (or as) the entity satisfies a performance obligation
- AASB 2014-10 Amendments to Australian Accounting Standards - Sale or Contribution of Assets between an Investor and its associate or Joint Venture (Application date of standard 1 January 2016; Application date of Group 1 July 2016)
AASB 2014-10 amends AASB 10 Consolidated Financial Statements and AASB 128 to address an inconsistency between the requirements in AASB 10 and those in AASB 128 (August 2011), in dealing with the sale or contribution of assets between an investor and its associate or joint venture. The amendments require:
(a) a full gain or loss to be recognised when a transaction involves a business (whether it is housed in a subsidiary or not); and(b) a partial gain or loss to be recognised when a transaction involves assets that do not constitute a business, even if these assets are housed in a subsidiary.
AASB 2014-10 also makes an editorial correction to AASB 10.
AASB 2014-10 applies to annual reporting periods beginning on or after 1 January 2016. Early adoption permitted.
The Group has not yet assessed the impact of AASB 2014-10, and it has not yet decided whether to adopt any parts of AASB 2014-10 early.
The AASB issued the Australian equivalent of IFRS 15, being AASB 15, in December 2014.
Currently, these standards are effective for annual reporting periods commencing on or after 1 January 2017. Early application is permitted. (Note: The IASB and the AASB have proposed a one year deferral to IFRS 15/AASB 15, which if approved, would move the effective date to annual reporting periods commencing on or after 1 January 2018).
AASB 2014-5 incorporates the consequential amendments to a number Australian Accounting Standards (including interpretations) arising from the issuance of AASB 15.
The Group has not yet assessed the impact of AASB 15, and it has not yet decided whether to adopt any parts of AASB 15 early.
In May 2014, the IASB issued IFRS 15 Revenue from Contracts with Customers , which replaces IAS 11 Construction Contracts , IAS 18 Revenue and related Interpretations (IFRIC 13 Customer Loyalty Programmes , IFRIC 15 Agreements for the Construction of Real Estate , IFRIC 18 Transfers of Assets from Customers and SIC-31 Revenue—Barter Transactions Involving Advertising Services )
The core principle of IFRS 15 is that an entity recognises revenue to depict the transfer of promised goods or services to customers in an amount that reflects the consideration to which the entity expects to be entitled in exchange for those goods or services. An entity recognises revenue in accordance with that core principle by applying the following steps:
There are no other standards that are not yet effective and that are expected to have a material impact on the entity in the current or future reporting periods and on foreseeable future transactions.
The amendment also clarified that revenue is generally presumed to be an inappropriate basis for measuring the consumption of the economic benefits embodied in an intangible asset. This presumption, however, can be rebutted in certain limited circumstances.
The Group does not believe that there will be a material financial impact to either the statement of comprehensive income or the statement of financial position once this accounting standard is adopted.
- AASB 15 Revenue from Contracts with Customers (Application date of standard 1 January 2017; Application date of Group 1 July 2017)
94
For
per
sona
l use
onl
y

NOTES TO THE FINANCIAL STATEMENTSfor the period ended 30 June 2015
2015 2014$ $
NOTE 2: Other Income/Expenses and Adjustments
2a) Other IncomeExport duty reimbursement 584,595 675,458 Property rental agreements 240,662 264,020 Recovery from Joint Venture 1,021,779 1,607,122 Income from bonds sold (1) 1,673,937 - Export credit income 54,352 906,763 Net gain on disposal of property, plant and equipment 192,661 147,793 Total other income 3,767,986 3,601,156
2b) Finance IncomeInterest income on loans receivable (1) 942,984 626,552 Interest income from short term deposits 345,857 519,229 Total finance income 1,288,841 1,145,781
2c) Finance CostsInterest on loans and borrowings (1,635,656) (1,029,847) Changes in fair value of loans and borrowings (1,116,918) - Total finance costs (2,752,574) (1,029,847)
Included in corporate and administrative expenses:Depreciation 1,633,813 1,344,671 Foreign currency gain/(loss) - cash (1) 4,839,348 (3,383,511) Foreign currency gain/(loss) - non-cash (2) 5,579,162 3,793,575 Minimum lease payments recognised as an operating lease expense 137,933 130,473
2e) Employee Benefits Expense
Included in cost of goods sold:Wages and salaries 7,260,479 4,437,915
Included in corporate and administrative expenses:Wages and salaries 6,708,643 5,199,294 Contributions to defined benefit plans 133,367 112,037 Share-based payment expense 1,135,252 382,894
(153,142) (76,502) 15,084,599 10,055,638
NOTE 3: Income Tax Expense
Income Tax Expense/(Benefit)Current income tax:Current income tax charge - 329,409 Deferred tax:Relating to origination and reversal of temporary differences (1,391,480) (447,074) Relating to prior year 429,575 (6,640)
(961,905) (124,305)
(2) Fluctuations in USD denominated payables (Note 15), and receivables from joint venture & joint venture partners (Note 20)
(1) Income from bonds sold relates to profits from the purchase and sale of US Dollar bonds on the Argentinean bond market.
Consolidated Group
2d) Depreciation, Foreign Exchange Differences and Other Expenses included in the Consolidated Statement of Comprehensive Income
Less capitalised as exploration expenditureTotal employee benefits expense
The major components of income tax benefit for the years ended 30 June 2015 and 2014 are:
(1) Fluctuations in USD currency held in Cash and Cash Equivalents (Note 6), and Standby Letters of Credit (Note 10)
(1) Interest income on loans receivable is non-cash and will be recovered on ultimate repayment of the loans (see Note 20).
Income tax benefit reported in the statement of comprehensive income
Orocobre Limited I Annual Report 2015 95
For
per
sona
l use
onl
y
NOTES TO THE FINANCIAL STATEMENTSfor the period ended 30 June 2015
2015 2014$ $
Consolidated Group
NOTE 3: Income Tax Expense (continued)
Gain/(Loss) from continuing operations before income tax expense (2,006,859) (5,679,819) Tax expenses / (Benefit) at Australian tax rate of 30% (2014: 30%) (602,058) (1,703,946) Tax effect of amounts which are not deductible/(taxable) in calculating taxable income: - Share - based payments 340,576 51,883 - Entertainment expense 896 1,506 - Other (414,429) 14,083 - Share of loss of joint venture 79,694 5,200 Utilisation on tax losses / tax credits in foreign countries - (372,090) Derecognition of deferred tax balances current year (530,295) 1,873,209 Differences in tax rates (foreign subsidiaries) (265,864) 12,490 Relating to prior year 429,575 (6,640) Income tax benefit (961,905) (124,305)
Deferred tax
Deferred tax relates to the following:Deferred tax assetsPayable and accruals 653,943 1,237,117 Employee benefits 72,636 58,005 Investments 92,411 85,072 Deferred exploration expenditures 149,924 149,924 Inventory - 87,577 Other debtors 236,360 557,663 Interest 219,685 - Tax losses 2,516,026 - Share issue costs (P&L) 11,812 19,950 Share issue costs (Equity) 1,422,830 747,534 Unrealised foreign exchanges 498,180 - Set off of deferred tax liabilities pursuant to set off provisions (3,158,017) (1,475,925)
2,715,790 1,466,917 Deferred tax liabilitiesPPE (1,062,259) (1,824,605) Receivables (460,390) (333,589) Prepayments - (409) Unrealised foreign exchanges (3,166,750) (793,384) Set off of deferred tax liabilities pursuant to set off provisions 3,158,017 793,793
(1,531,382) (2,158,194) Movements:Opening Balance (691,277) (778,295) Under/(over) provision in prior years (P&L) - (360,057) Credited/(charged) to equity (Current year) 499,008 - Credited/(charged) to the statement of comprehensive income 1,376,677 447,075 Closing Balance 1,184,408 (691,277)
NOTE 4: Earnings Per Share
Profit/(Loss) for the financial year (1,044,954) (5,555,514) Exclude non-controlling interest 30,265 96,473 Net Profit/(Loss) used in the calculation of basic and dilutive EPS (1,014,689) (5,459,041)
A reconciliation between tax expense and the product of accounting profit multiplied by Australia's domestic tax rate for the years ended 30 June 2015 and 2014 is as follows:
Diluted earnings per share amounts are calculated by dividing the net profit attributable to ordinary equity holders of the Parent by the weighted average number of ordinary shares outstanding during the year plus the weighted average number of ordinary shares that would be issued on conversion of all the dilutive potential ordinary shares into ordinary shares.
The following reflects the income and share data used in the basic and diluted earnings per share computations:
Basic earnings per share amounts are calculated by dividing the net profit for the year attributable to ordinary equity holders of the Parent by the weighted average number of ordinary shares outstanding during the year.
The Group has tax losses which arose in Australia of $18,477,672 (2014: $19,985,399) that are available indefinitely for offsetting against future taxable profits of the companies in which the losses arose.
96
For
per
sona
l use
onl
y

NOTES TO THE FINANCIAL STATEMENTSfor the period ended 30 June 2015
2015 2014$ $
Consolidated Group
NOTE 4: Earnings Per Share (continued)No. No.
139,061,945 126,401,541
NOTE 5: Auditors' Remuneration
The auditor of Orocobre Limited is Ernst & Young.
Remuneration of the auditor of the consolidated group for:
184,046 309,298 184,046 309,298
NOTE 6: Cash and Cash Equivalents
Cash at bank and on hand 9,348,224 13,222,392 Short term deposits 91,095 13,080,000
9,439,319 26,302,392
Cash at bank and on hand 9,348,224 13,222,392 Short term deposits 91,095 13,080,000 Total accessible cash and short-term deposits 9,439,319 26,302,392 Bank overdrafts (see Note 10) (2,031,502) (562,860) Total cash and cash equivalents 7,407,817 25,739,532
Profit/(loss) from ordinary activities after income tax (1,044,954) (5,555,514) Non-cash flows in loss from ordinary activities:
Non-cash employee benefits expense - share based payments 1,135,252 382,894 Non-cash employee benefits expense 1,736,017 1,546,277 Depreciation of property, plant and equipment 1,633,813 1,344,671 Gain on sale of assets (192,661) (147,793) Share of loss of joint venture 227,696 315,162 Fair value adjustment of loans and financial assets 1,057,494 (12,231) Finance income (942,984) (626,552) Unrealised foreign exchange gain (10,418,511) 410,064
Changes in operating assets and liabilities:(Increase)/Decrease in receivables (3,923,446) (3,375,133) (Decrease)/Increase in payables 6,508,278 6,316,302 (Decrease)/Increase in provisions 45,011 664,778 (Decrease)/Increase in provisions - taxation (961,905) (124,305) (Increase)/Decrease in inventory (4,737,441) (524,518) (Increase)/Decrease in prepayments 516,517 (509,043)
Cash flows from operations (9,361,824) 105,059
NOTE 7: Trade and Other Receivables
Current:Trade receivables 6,420,805 4,314,481 Related party receivables 108,302 1,556,058 Other receivables 1,909,466 1,494,488 VAT tax credits 1,094,726 23,085
9,533,299 7,388,112
The effective interest rate on short term deposits was 2.94% (2014: 3.57%). Short term deposits held at 30 June 2015 relate to rental and other security deposits. Deposits relating to cash held in the prior year had an average maturity of 83 days.
There are no share options excluded from the calculation of diluted earnings per share that could potentially dilute basic earnings per share in the future because they are anti-dilutive for the current period presented.
On 6 July 2015, Orocobre Limited issued 17,000,000 fully paid ordinary shares of $1.90 each for a total consideration of $32,300,000, for the purpose of providing project funding to the Olaroz project Joint Venture.
Weighted average number of ordinary shares outstanding during the year used in the calculation of basic and diluted EPS
Reconciliation of Cash Flow from Operations with Loss after Income Tax:
For the purpose of the statement of cash flows, cash and cash equivalents comprise of the following at 30 June:
- auditing or reviewing the financial report of the entity and any other entity in the consolidated group
As the Group incurred a loss in the current and prior years, potential ordinary shares - being options to acquire ordinary shares (2015: 1,788,878; 2014: 1,001,120) are considered non-dilutive.
Orocobre Limited I Annual Report 2015 97
For
per
sona
l use
onl
y

NOTES TO THE FINANCIAL STATEMENTSfor the period ended 30 June 2015
2015 2014$ $
Consolidated Group
NOTE 7: Trade and Other Receivables (continued)
Non Current:Trade receivables 1,450,753 2,318,144 Receivable from joint venture - USD 23m (2014: USD 17.9m) 29,977,457 18,978,405 Receivable from joint venture partners - USD 5.7m (2014: USD 5.8m) 7,363,486 6,211,685 VAT tax credits 2,480,228 331,982
41,271,924 27,840,216
Trade and other receivables
Credit Risk — Trade and Other Receivables
Receivables from joint venture and joint venture partners
VAT Recovery
NOTE 8: Inventory
Current:Inventory 11,076,850 5,514,244
11,076,850 5,514,244 Non Current:
Inventory 150,901 318,934 150,901 318,934
NOTE 9: Other Assets
Current:Prepayments 16,685 502,822
NOTE 10: Financial InstrumentsFinancial Assets
Non-current - HSBC USD 37.5m Standby Letters of Credit 48,794,723 - Non-current - Shares in listed entity 12,232 24,464
48,806,955 24,464
Receivables from joint venture and joint venture partners relates to amounts receivable in respect of the Olaroz project (see Note 14). All amounts are denominated in USD and A$29,977,457 is interest bearing. The receivables will be recovered from cashflows from the Olaroz project (see Note 20).
Total inventories are carried at the lower of cost and net realisable value. Current inventories relate to borates and related products. Non current inventory relates to consumables and spare parts.
The Group has a total of $3,574,954 (2014: $355,067) of VAT recoveries due from the Argentine revenue authority. This amount represents a significant concentration of credit risk to the Group. On a geographical basis the Group has total receivables of A$13,209,585 (2014: A$8,388,757) denominated in Argentine pesos, which represents a significant concentration of credit risk to the Group.
As at 30 June 2015, no trade receivables were impaired. It is expected all balances will be received when due. There are no balances with terms that have been renegotiated but which would otherwise be past due or impaired. The amounts are non-interest bearing and generally on 120 days terms. No collateral is held over receivables. The carrying value of receivables approximate fair value.
The carrying values of the receivables from joint venture and joint venture partners approximate fair values. Fair value has been determined using a discounted cash flow valuation technique based on contractual and expected cash flows and current market interest rates (Level 3).
The USD 37.5m Standby Letters of Credit (SBLC's) are short term deposits relating to the Company issuing SBLC's on behalf of the joint venture company Sales de Jujuy S.A.. Such deposits earn rates of between 0.29% and 0.48% and are generally held for a term of six months at a time. Such SBLC's have been provided due to a working capital requirement for Sales de Jujuy S.A. which has arisen principally due to delays in the production start up. The carrying value approximates fair value.
VAT is charged on services and goods (including capital) goods at rates between 10.5% and 27%, with 21% being the standard charge. VAT is generally recouped against VAT on local sales, if any, and/or up to 21% of export sales. Hence the recovery of VAT, that has been paid on capex and expenses to date, is a slow and extended process. VAT recovery has been historically slow, and is currently recouped by Borax Argentina as a percentage of local and export sales.
98
For
per
sona
l use
onl
y

NOTES TO THE FINANCIAL STATEMENTSfor the period ended 30 June 2015
2015 2014$ $
Consolidated Group
NOTE 10: Financial Instruments (continued)
Financial LiabilitiesInterest bearing loans and borrowingsCurrent:
ARS 18m HSBC Loan 684,548 799,256 Bank overdraft (Patagonia Bank) 768,121 562,860 Bank overdraft (HSBC) 1,106,045 - Bank overdraft (Macro) 157,336 -
2,716,050 1,362,116 Non Current:
ARS 18m HSBC Loan 797,006 1,352,063 797,006 1,352,063
NOTE 11: Property, Plant and Equipment
Property, plant and equipmentLand &
buildings Work In Progress
Plant & equipment Total
At cost 5,662,434 4,235,773 5,188,859 15,087,066 Accumulated depreciation (779,352) - (943,578) (1,722,930) Total at 30 June 2014 4,883,082 4,235,773 4,245,281 13,364,136 At cost 12,484,173 1,134,431 6,885,839 20,504,443 Accumulated depreciation (1,146,005) - (2,254,009) (3,400,014) Total at 30 June 2015 11,338,168 1,134,431 4,631,830 17,104,429
Property, plant and equipment 2015 2014Reconciliation of the carrying amounts for property, plant and equipment is set out below:
Balance at the beginning of year 13,364,136 8,795,831 Additions - cash 2,547,628 6,744,627 Additions - non-cash 1,345,914 4,116,712 Depreciation expense (1,633,813) (1,344,671) Foreign currency translation movement 1,480,564 (4,948,363) Carrying amount at the end of year 17,104,429 13,364,136
Significant additions were made at Borax Argentina S.A..
Impairment
NOTE 12: Exploration, Evaluation and Development Asset
Exploration and evaluation phase - at cost 11,148,806 10,065,419
Opening balance - at cost 10,065,419 13,692,541 Capitalised exploration expenditure 376,653 386,025 Foreign currency translation movement 706,734 (4,013,147) Carrying amount at the end of year 11,148,806 10,065,419
Movement in exploration and evaluation asset:
Recoverability of the carrying amount of exploration assets is dependent on the successful exploration and development of projects or alternatively through the sale of the areas of interest.
The ARS 18m HSBC loan accrues interest at the rate of 15.25%, and has been drawn down under a four year bank facility. At 30 June 2015, the loan is repayable within 24 months and is secured by guarantee (see Note 22).
The bank overdrafts are Peso denominated, and have an indefinite term. The Patagonia Bank overdraft accrues interest at the rate of 29.5%, the HSBC overdraft accrues interest at the rate of 23.15%, and the Macro overdraft accrues interest at the rate of 26%.
The carrying amounts of the loans and borrowings approximate fair value. Fair value has been determined using a discounted cash flow valuation technique based on contractual and expected cash flows and current market interest rates (Level 2).
Exploration, evaluation and development expenditure carried forward in respect of areas of interest are:
The recoverable amount of the Borax operations has been determined using a Value in Use methodology. The post tax cash flows expressed in real terms have been discounted using a post tax discount rate of 9.25%. The cash flows are based on management’s most recent budgets and forecasts and include cash flow forecasts for the remaining mine lives based on current reserves.
In preparing the cash flows, no allowance has been made for expansion of the projects nor increases in reserves.
The material assumptions to which the Borax operation is most sensitive to are tonnage, selling prices, cost assumptions and the discount rate.
In determining there is no impairment of the Borax operations at 30 June 2015 management has forecast an improved performance in coming years with tonnage sold expected to increase 30% from FY2015 levels that were impacted by the ramp up of the Tincalayu plant and general economic conditions.
Orocobre Limited I Annual Report 2015 99
For
per
sona
l use
onl
y

NOTES TO THE FINANCIAL STATEMENTSfor the period ended 30 June 2015
2015 2014$ $
Consolidated Group
NOTE 13: Information Relating to Subsidiaries
The consolidated financial statements of the Group include:
NameSouth American Salar Minerals Pty Ltd 85.00 85.00
85.00 85.00
Borax Argentina Holding No 1 Pty Ltd 100.00 100.00 Borax Argentina Holding No 2 Pty Ltd 100.00 100.00 Borax Argentina S.A. 100.00 100.00
100.00 -
Joint venture in which the Group is a venturer
NOTE 14: Investment in Joint Venture
Investment in Joint Venture 100,536,358 94,454,572
Interest in Joint Venture
During the financial year, overdrafts of A$61 million (US$47 million) were secured to fund working capital requirements for the project. These overdrafts were secured by SBLC's held by Orocobre Ltd (see Note 10).
During the financial year, Orocobre Limited provided funding to the joint venture via equity investment of $1,109,330, loans of $6,708,449 (Note 7), and through the provision of the placement of SBLC's of $45,673,689 (Note 10).
Cash and short-term deposits held in Argentina are subject to local exchange control regulations.
Each of TTC and Orocobre Limited have granted cross charges on standard terms in favour of the other over their respective shareholding in Sales de Jujuy Pte. Ltd to better secure their respective performances of their obligations under the Sales de Jujuy Pte. Ltd joint venture agreement.
Under the terms of the Shareholder's Agreement, decisions over the relevant activities require the unanimous consent of both parties and as a result the arrangement is considered a joint venture and is accounted for using the equity accounting method.
The Group has a 72.68% interest in Sales de Jujuy Pte Ltd. The country of incorporation is Singapore and the principal place of business is Singapore. Sales de Jujuy Pte Ltd owns 91.5% of Sales de Jujuy S.A., the owner and operator of the Olaroz lithium project.
Australia
ArgentinaAustralia
AustraliaSouth American Salar S.A. (wholly owned subsidiary of South American Salar Minerals Pty Ltd)
Orocobre Brasil Representacoes E Assessoria Comercial LTDA (1)
Brazil
(1) Orocobre Brasil Representacoes E Assessoria Comercial was formed during the current financial year with the intention to be used as an importer/exporter and/or an agent of boron related products. To date the company has not yet transacted.
Argentina
The tables below provide summarised financial information for the Joint Venture of the group. The information disclosed reflects the amount presented in the financial statements of the Joint Venture and not Orocobre Limited's share of those amounts. They have been amended to reflect adjustments made by the entity when using the equity method, including fair value adjustments and modifications for differences in accounting policy.
Country of incorporation & principal place of business
% equity interest held by the Group
Orocobre Limited recognises its investment in the Olaroz project through equity accounting its interest in Sales de Jujuy Pte Ltd. (a joint venture entity) which owns 91.5% of the Olaroz project. The carrying value of the SDJ Pte equity accounted balance is assessed by reference to the recoverable amount of the Olaroz project.
Construction of the project has been majority funded by a debt facility provided by Mizuho Bank Limited (with a maximum facility limit of US$192 million). During the construction period TTC has provided a guarantee for its portion of the debt and also a joint guarantee with the Group for the Group's portion (together 100% of the debt). After completion of construction and after satisfying operating performance tests, the Japanese Government's Japanese Oil, Gas and Metal National Corporation ("JOGMEC") will provide a guarantee for a maximum of 82% of the project debt (to a maximum of US$158 million). The remaining 18% of the debt will be guaranteed by TTC who will provide a guarantee for its portion of the debt and also a joint guarantee with the Group for the Group's portion (13%). To further secure the debt facility Sales de Jujuy Pte. Ltd (an entity owned by the Group and TTC) has provided security in favour of Mizuho Bank over the shares it owns in Sales de Jujuy S.A. (the entity which holds the Olaroz project).
100
For
per
sona
l use
onl
y

NOTES TO THE FINANCIAL STATEMENTSfor the period ended 30 June 2015
2015 2014$ $
Consolidated Group
NOTE 14: Investment in Joint Venture (continued)
Summarised statement of financial position
37,354,606 20,474,073
559,513,589 358,877,052 (124,426,847) (24,742,997)
(320,058,622) (211,306,219)Joint venture's non-controlling interest (13,300,135) (12,529,315)Equity 139,082,591 130,772,594 Elimination of unrealised intercompany transactions (755,186) (813,082) Carrying amount 138,327,405 129,959,512 Proportion of the Group's ownership 72.68% 72.68%Carrying amount of the investment 100,536,358 94,454,572
(1) The major components of non-current assets as at 30 June 2015 are: 30 June 2015
Property, plant and equipment $Fair value uplift on creation of joint venture 110,194,171 Other assets 374,349,110 Other assetsRecoverable VAT 25,536,205 Inventory 12,134,311 Other assets 2,031,525 Total tangible assets 524,245,322 Intangible assetsGoodwill 35,268,267 Total non-current assets 559,513,589
Reconciliation to carrying amounts 2015 2014Opening net assets 1 July 129,959,512 208,610,538 Capital Investment 1,529,673 647,784 Profit/(loss) for the period (313,285) (433,630) Other comprehensive income 7,093,609 (78,052,098) Elimination of unrealised intercompany transactions 57,896 (813,082) Closing net assets 138,327,405 129,959,512
Group's share in % 72.68% 72.68%Group's share in $ 100,536,358 94,454,572 Carrying amount 100,536,358 94,454,572
Summarised statement of comprehensive incomeRevenue 259,208 - Cost of sales (258,712) - Other revenue - 194
12,097 80,459 (11,947) (5,626) (73,678) (34,577)
Foreign currency gain/(loss) (269,356) (514,363)Profit/(loss) before tax (342,388) (473,913)Income tax expense - - Profit/(loss) for the year from continuing operations (342,388) (473,913)Income attributable to joint venture's non-controlling interest (29,103) (40,283)Profit/(loss) for the year from continuing operations (313,285) (433,630)Group's share of profit/(loss) for the year (227,696) (315,162)
Share of the joint venture's other comprehensive income:Translation gain/(loss) on foreign operations 8,784,990 (40,518,418)Net gain/(loss) on revaluation of derivative (3,294,729) (2,566,737)Share of total other comprehensive income for the year from continuing operations 5,490,261 (43,085,155)
5,262,565 (43,400,317)
Non-current liabilities, including long-term borrowing $260,822,454 (2014: $163,169,348) and deferred tax liabilities $35,268,386 (2014: $32,185,863)
Finance costs, including interest expense $11,947 (2014: $5,626)
Non-current assets, including intangible assets $35,268,267 (2014: $32,185,754) and inventory $12,134,312 (2014: nil) (1)
Corporate & administrative expenses, including depreciation $997 (2014: $1,381)
Finance income, including interest income $12,097 (2014: $80,459)
Sales de Jujuy PTE LTD cannot distribute profits until it obtains the consent from the two venture partners.
Share of total comprehensive income for the year from continuing operations
Current assets, including cash and cash equivalents $1,799,273 (2014: $714,937), inventory $19,585,330 (2014: nil), and prepayments $5,120,462 (2014: $19,492,246)
VAT is charged on services and goods (including capital) goods at rates between 10.5% and 27%, with 21% being the standard charge. VAT is claimed back based on 21% of export sales and can also be recouped against VAT on local sales, if any. Hence the recovery of VAT, that has been paid on capex and expenses to date, is a slow and extended process. VAT related to Sales de Jujuy SA, is forecast to be fully recovered in the 2018-2019 financial year.
Current liabilities, including short-term borrowing $82,503,235 (2014: $2,233,274)
Orocobre Limited I Annual Report 2015 101
For
per
sona
l use
onl
y

NOTES TO THE FINANCIAL STATEMENTSfor the period ended 30 June 2015
2015 2014$ $
Consolidated Group
NOTE 14: Investment in Joint Venture (continued)
Operating commitments (see Note 21) 988,919 31,399,819
Key Assumptions: Base CaseBreak Even Sensitivity
Percentage Movement
Discount rate, real terms weighted average cost of capital after tax 9.25% 16.12% 6.87%Long term annual production level, 2018 onwards 17,500 tonnes 14,343 tonnes (18.04%)Long term real lithium price, 2018 onwards US$ 8,250 US$ 5,426 (34.23%)
NOTE 15: Trade and other Payables 2015 2014
Current:Unsecured liabilities:Trade payables and accrued expenses 15,922,148 7,819,393 Subsidiary and associate instalments payable (1) 2,112,308 1,061,980
18,034,456 8,881,373 Non-Current:
Unsecured liabilities:Trade payables and accrued expenses 1,477,299 2,231,755 Subsidiary and associate instalments payable (1) - 665,060
1,477,299 2,896,815
(1)
NOTE 16: Provisions
Non-Current:Provision for rehabilitation 12,182,537 9,848,800 Other provisions 70,538 22,168
12,253,075 9,870,968 Rehabilitation provision
Reconciliation of the carrying amount for provision for rehabilitation is set out below:Balance at the beginning of year 9,848,800 10,051,530 Arising during the year 1,345,914 4,116,712 Foreign currency translation 987,823 (4,319,442) Carrying amount at the end of the year 12,182,537 9,848,800
NOTE 17: Employee Benefit Liability
Annual leave:
Current 242,120 193,351
The Group's share of project development commitments which are funded through project financing:
The Group has recognised a provision for rehabilitation obligations associated with Borax S.A.'s operations. The rehabilitation is expected to commence in 2043.
The Company has advised Rio Tinto PLC that it considered Rio Tinto PLC to be in breach of certain warranties provided by Rio Tinto PLC to the Company pursuant to the Share Purchase Agreement for the acquisition of the shares of Borax Argentina S.A. The quantum of any damages that the Company may have suffered is currently being quantified. Rio Tinto PLC has referred the matter to arbitration. The hearing of the arbitration has been set for 14 December 2015. As a result of the alleged breach of warranties by Rio Tinto PLC the Company declined to make a payment to Rio Tinto PLC of USD 1,000,000 due on 21 August 2014, and a payment of USD 629,013 due 21 August 2015.
The recoverable amount of Orocobre’s investment in the Olaroz joint venture has been determined using the fair value less costs to sell methodology (FCLTS) applying discounted cash flow techniques (DCF). The DCF has been undertaken by applying a post tax discount rate to the post tax cash flows expressed in real terms as at 30 June 2015. Cash flow forecasts consist of the 3 years to June 2018, reflecting the maximum period to commercial levels of production and operating costs, together with cash flow forecasts for the remaining life of mine based on current reserves.
In preparing the DCF no allowance has been made for expansion of the project nor increases in reserves.
The material assumptions to which the Olaroz project is most sensitive to are long term annual production rate and selling prices together with the discount rate. These assumptions and the break-even sensitivity which would generate a recoverable amount equal to the current carrying value are as follows:
Impairment
The carrying amounts approximate fair value. Fair value has been determined using a discounted cash flow valuation technique based on contractual and expected cash flows and current market interest rates (Level 3).
102
For
per
sona
l use
onl
y

NOTES TO THE FINANCIAL STATEMENTSfor the period ended 30 June 2015
2015 2014$ $
Consolidated Group
NOTE 17: Employee Benefit Liability (continued)
Net employee defined benefit liability:Borax S.A. pension plan - Current 111,636 - Borax S.A. pension plan - Non-Current 1,499,377 384,191
Former employee termination costs:Current 781,111 314,636 Non-Current 536,899 242,268
Total employee benefits:Current 1,134,867 507,987 Non-Current 2,036,276 626,459
NOTE 18: Issued Capital $ $Fully paid ordinary shares 176,488,844 130,139,019 Ordinary shares No. No.
Balance at the beginning of the reporting year 132,041,911 117,745,140 Shares issued during the year:
Previous financial year - 14,296,771 12 February 2015 - Australian placement at $2.55 15,318,712 - 17 March 2015 - Australian placement at $2.55 3,925,491 - 20 March 2015 - Australian placement at $2.55 100,000 - 25 March 2015 - Australian placement at $2.55 267,563 -
Balance at the end of the reporting year 151,653,677 132,041,911
Options No. No. Unlisted Share Options and Performance Rights 2,562,493 2,562,493
Balance at the beginning of the reporting year 2,562,493 2,041,884 Options and rights issued during the year (see Note 23) 639,272 520,609 Options and rights lapsed during the year (see Note 23) (100,000) - Balance at the end of the reporting year 3,101,765 2,562,493
Share option and performance right schemes
NOTE 19: Reserves
Foreign currency translation reserve:Foreign controlled subsidiaries (6,598,139) (7,120,373) Foreign joint venture (Group's share) (31,733,427) (40,518,418)
(38,331,566) (47,638,791)
Options reserve: 2,862,326 1,727,074
Wealth tax reserve: (332,186) -
Cash flow hedge reserve: (5,861,467) (2,566,737)
Total reserves (41,662,893) (48,478,454)
NOTE 20: Related Party Disclosures
The wealth tax reserve represents the allowable reduction to net wealth taxes due to the joint venture. This represents the Group'sshare of equity accounted wealth tax reserves.
The foreign currency translation reserve records exchange differences arising on translation of foreign controlled subsidiaries with a functional currency other than Australian dollars, and the Group's share of equity accounted foreign currency translation reserves of the joint venture.
The Group had a defined benefit pension plan in Argentina. During the previous financial year, the Group decided to discontinue such plan. The remaining liability reflects the obligation with respect to former employees.
The options reserve records items recognised as expenses on valuation of employee share options.
The following table provides the total amount of transactions that have been entered into with related parties for the relevant financial year. For information regarding outstanding balances at 30 June 2015 and 2014, refer to Note 7:
The cash flow hedge reserve records the revaluation of derivative financial instruments in the joint venture that qualify for hedge accounting. This represents the Group's share of equity accounted cash flow hedge reserves.
The Group has two share schemes under which options and performance rights to subscribe for the Group’s shares have been granted to certain executives and senior employees (Note 23).
Orocobre Limited I Annual Report 2015 103
For
per
sona
l use
onl
y

NOTES TO THE FINANCIAL STATEMENTSfor the period ended 30 June 2015
2015 2014$ $
Consolidated Group
NOTE 20: Related Party Disclosures (continued)
Joint venture in which the Parent is a venturer:Sales de Jujuy PTE LTD
Exploration costs reimbursed - joint venture 1,021,779 1,607,122 Amounts owed by Joint Venture 108,302 87,232
Transactions with Joint Venture
Compensation of Key Management Personnel of the GroupShort-term employee benefits 1,929,247 1,912,394 Post-employment benefits 89,970 71,087 Other long-term benefits 33,772 80,910 Share-based payments 797,121 209,954
Total compensation 2,850,110 2,274,345
Interests held by Key Management Personnel under the Share Option and Performance Right Plans
2015 2014
Issue DateNumber
outstandingNumber
outstanding30/11/2011 Options 30/11/2016 $ 2.03 550,000 550,000 21/03/2013 Options 30/09/2015 $ 2.20 301,092 301,092 21/03/2013 P. Rights 30/09/2015 $ - 140,792 140,792 30/04/2014 P. Rights 30/09/2016 $ - 328,467 328,467 21/11/2014 P. Rights 30/09/2016 $ - 160,658 - 21/01/2015 P. Rights 30/09/2017 $ - 333,940 -
1,814,949 1,320,351
Other related parties of the group:Elementos Limited - Sales to related parties: - 436
NOTE 21: Commitments
Not later than 1 year - exploration commitments (1) 70,490 64,356 - operating leases (2) 144,383 122,802 - contracts (3) 3,464,839 31,222,740
3,679,712 31,409,898
Later than 1 year but not later than 5 years - exploration commitments (1) 281,960 257,422 - operating leases (2) 382,767 - - contracts (3) 605,457 164,566
1,270,184 421,988
$973,288 of the loan to the joint venture entity is interest bearing at LIBOR + .75% per annum and will be repaid in full before July 24, 2028.
The Group's contractual commitments to the joint venture regarding project development is set out in Note 21.
$22,362,163 of the loan to the joint venture entity is interest bearing at LIBOR +1% per annum and will be repaid during the period the joint venture is operational and after satisfaction of the minimum requirements of the project finance facility.
The parent entity's shareholding in the controlled entities is detailed in Note 13. The company also provides finance to its controlled entities.
Elementos Limited, listed on the ASX, is a related party of the Group as Mr Seville is a director of that company.
Terms and conditions of grants made during the period are disclosed in Note 23.
Details of options provided as compensation for key management personnel are also set out in the Remuneration Report included in the Directors' Report.
Exercise PriceExpiry Date
Detailed disclosures on compensation for key management personnel are set out in the Remuneration Report included in the Directors' Report.
Share options and performance rights held by key management personnel under the Share Option and Performance Right Plans to purchase ordinary shares have the following expiry dates and exercise prices:
The loan to a joint venture partner is non-interest bearing and will be repaid when the joint venture pays dividends, at 33.3% of dividends distribution to the joint venture partner.
$6,642,006 of the loan to the joint venture entity is interest bearing at LIBOR + 5% per annum and will be repaid in twelve consecutive monthly and equal instalments beginning March 20, 2018.
At 30 June 2015, $29,977,457 is recorded as a receivable from the joint venture entity, and $7,363,486 is recorded as recoverable from a joint venture partner.
104
For
per
sona
l use
onl
y

NOTES TO THE FINANCIAL STATEMENTSfor the period ended 30 June 2015
NOTE 21: Commitments (continued)(1)
(2)
(3)
NOTE 22: Contingent Items
NOTE 23: Share Based Payments 2015 2014$ $
Expense arising from equity-settled share based payment transactions 1,135,252 382,894
Options and Performance Rights
During the year, 100,000 of these options were forfeited.
The parent entity had 862,493 share options and performance rights on issue at the start of the year, 301,092 options with an exercise price $2.20 expiring 30 September 2015, 140,792 performance rights with an exercise price $0.00 expiring 30 September 2015, and 420,609 performance rights with an exercise price $0.00 expiring 30 September 2016.
Performance Rights & Option Plan (PROP)
- Refer to Note 14 for additional guarantees provided by the Group.
100% of the Options vestEqual to or greater than 50th percentile 50% of the Options vestLess than 50th percentile None of the Options vest
- Guarantee of 100% of the loan made under Loan Communication A5380 of the Central Bank of Argentina from HSBC Bank Argentina S.A. up to the loan amount of AR$18m (2015: AR$10.4m, A$1.5m; 2014: AR$16.3m, A$2.2m). This loan was granted to Borax Argentina S.A. on 25 June 2013.
Under the Performance Rights & Option Plan (PROP), awards are made to executives who have an impact on the Group’s performance, and are delivered in the form of options and rights.
This relates to equity-settled share based payments in the form of grants of options under the Employee & Officer Share Option Plan and grants of options and performance rights under the Performance Rights & Option Plan.
Proportion of Options which vestGreater than 75th percentile
The Parent has provided the following guarantee at 30 June 2015:
100% the Options vestTSR Performance Condition (Relative, 50%)
Under the Employee & Officer Share Option Plan (EOSOP), awards are made to executives and other key talent who have an impact on the Group’s performance. EOSOP awards are delivered in the form of options over shares which vest over varying periods subject to the employee remaining in service.
Proportion of Options which vestIf TSR falls below 7.5% return per annum None of the Options vestIf TSR lies between 7.5% and 10% return per annum 50% of the Options vestIf TSR lies between 10% and 12.5% return per annum
During the year, 478,614 performance right's (P.R.'s) were granted pursuant to the company's Performance Rights and Option Plan for nil consideration. Performance rights are exercisable at $0.00 each with 478,614 expiring on 30 September 2017.
TSR Performance Condition (Absolute, 50%)
Employee & Officer Share Option Plan (EOSOP)
The parent entity had 1,700,000 share options on issue at the start of the year, 400,000 with an exercise price $2.03 expiring 30 September 2015, 650,000 with an exercise price $1.50 expiring 30 November 2016, 350,000 with an exercise price $1.50 expiring 31 July 2017, 200,000 with an exercise price $1.50 expiring 31 May 2018, and 100,000 with an exercise price $2.53 expiring 1 October 2017.
i) Performance Rights & Option Plan (PROP) - 21 January 2015PROP performance rights vest over a period of 3 years and are subject to the following Total Shareholder Return (TSR) Outperformance Conditions, and continuous service until the vesting date.
75% of the Options vestIf TSR lies at or above the 12.5% return per annum
The Group has contractual commitments regarding project development.
The economic entity must meet minimum expenditure commitments in relation to option agreements over exploration tenements and to maintain those tenements in good standing.The commitments exist at balance sheet date but have not been brought to account. If the relevant mineral tenement is relinquished the expenditure commitment also ceases.The lease commitment relates to a non-cancellable lease on the office premises, with a 3 year 6 month term remaining at 30 June 2015. Rent is payable monthly in advance.
Orocobre Limited I Annual Report 2015 105
For
per
sona
l use
onl
y

NOTES TO THE FINANCIAL STATEMENTSfor the period ended 30 June 2015
NOTE 23: Share Based Payments (continued)
Movements in the year are:Number of Options &
P.R.'s
Weighted Average
Exercise Price
Number of Options & P.R.'s
Weighted Average
Exercise PriceNo $ No $
Outstanding at the beginning of the year 2,562,493 1.377 2,041,884 1.604 Granted 639,272 - 520,609 0.486 Forfeited (100,000) 1.500 - - Outstanding at year-end 3,101,765 1.089 2,562,493 1.377 Exercisable at year-end 1,437,500 1.683 1,400,000 1.670
35,198 105,594
140,792
Milestone Conditions Number of Performance Rights which may vest
All options and performance rights granted are over ordinary shares, which confer a right of one ordinary share per option or performance right. The options and performance rights hold no voting or dividend rights. At the end of the financial year there are 1,814,949 options and performance rights on issue to key management personnel (2014: 1,320,351).
PROP performance rights vest over a period of 2.5 years and are subject to the following Milestone Conditions, and continuous service until the vesting date.
Proportion of Options which vestTSR Performance Condition
The proportion of Options that vest increases linearly from 50% and 100%
PROP options over shares vest over a period of 3.5 years and are subject to continuous service from the date of grant until the first exercise date.
PROP options over shares vest over a period of 2.5 years and are subject to the following Total Shareholder Return (TSR) Outperformance Conditions, and continuous service until the vesting date.
If TSR falls below the 50th percentile
Olaroz: Production Rate Hurdle - Achieve design production rates in the 2016 financial year
PROP performance rights vest over a period of 2.4 years and are subject to a number of various Hurdle Conditions, and continuous service from the date of grant until the first exercise date.
35,051
Achieve audited Net Profit after Tax of A$5M or more in the 2015 financial year
100% the Options vest
50% of the Options vestNone of the Options vest
420,609
ii) Performance Rights & Option Plan (PROP) - 21 November 2014PROP performance rights vest over a period of 3 years and are subject to a number of various Hurdle Conditions, and continuous service from the date of grant until the first exercise date.Hurdle Conditions Number of Performance Rights Olaroz: Construction Cost Hurdle - Achieve construction costs (excluding finance charges, 13,388
13,388 Olaroz: Production Rate Hurdle - Achieve design production rates in the 2016 financial year 13,388
Borax Argentina: EBITDA Hurdle - EBITDA performance for the 2016 financial year (excluding Orocobre Ltd flow through)
Borax Argentina: EBITDA Hurdle - EBITDA performance for the 2016 financial year 80,329
During the year, 160,658 performance right's (P.R.'s) were granted pursuant to the company's Performance Rights and Option Plan for nil consideration. Performance rights are exercisable at $0.00 each with 160,658 expiring on 30 September 2016.
Hurdle Conditions Number of Performance Rights
160,658
If TSR is at the 50th percentile
40,165 External Measure: TSR Outperformance - TSR outperformance relative to component
2015
Olaroz: Construction Cost Hurdle - Achieve construction costs (excluding finance charges, marketing and Brisbane charges)Olaroz: Operating Cost Hurdle - Achieve operating costs (excluding general and administration expenses) in the 2016 financial year
35,051
210,303
Achieve satisfaction of the completed tests for the Olaroz Project, as specified in Banking Agreements with Mizuho Banking Corporation
iii) Performance Rights & Option Plan (PROP) - 30 April 2014
iv) Performance Rights & Option Plan (PROP) - 21 March 2013
If TSR lies between the 50th and 75th percentiles
If TSR lies at or above the 75th percentile
Complete construction of the Olaroz Project within 10% of the Development Budget as set out in the Shareholder's Agreement
35,051
105,153
2014
Olaroz: Operating Cost Hurdle - Achieve operating costs (excluding general and
External Measure: TSR Outperformance - TSR outperformance relative to component companies of the ASX 300 Resources Index
106
For
per
sona
l use
onl
y

NOTES TO THE FINANCIAL STATEMENTSfor the period ended 30 June 2015
NOTE 23: Share Based Payments (continued)
Year of Issue 2013 - PROP 2013 - PROP 2014 - PROP 2014 - PROP 2014 - PROP
Grant date 21/11/2014 21/11/2014 30/04/2014 30/04/2014 30/04/2014Number Issued 80,329 80,329 100,000 210,302 210,307Fair value at grant date 2.33$ 2.67$ 0.77$ 2.23$ 1.59$ Share price 2.67$ 2.67$ 2.23$ 2.23$ 2.23$ Exercise price -$ -$ 2.53$ -$ -$ Expected volatility 50% 50% 50.00% 50.00% 50.00%Option life 3 years 3 years 3.25 years 2.25 years 2.25 yearsExpected dividends nil nil nil nil nilRisk-free interest rate 2.50% 2.50% 2.84% 2.84% 2.84%
Year of Issue 2014 - PROP 2014 - PROP 2014 - PROP 2014 - PROP
Grant date 21/01/2015 21/01/2015 21/11/2014 21/11/2014Number Issued 164,284 164,291 75,019 75,020 Fair value at grant date 1.98$ 1.59$ 1.95$ 1.58$ Share price 2.74$ 2.74$ 2.67$ 2.67$ Exercise price -$ -$ -$ -$ Expected volatility 50.00% 50% 50% 50%Option life 3 years 3 years 3 years 3 yearsExpected dividends nil nil nil nilRisk-free interest rate 2.09% 2.09% 2.53% 2.53%
NOTE 24: Financial Risk Management
(a) Financial Risk Management
The main purpose of these financial instruments is to provide finance for Group operations.
Risk Management Policies
Financial Risks
Equity price risk
Interest Rate Risk
This risk is managed through the use of variable rate term deposits.
At the reporting date, the exposure to listed equity securities at fair value was $12,232. An increase or decrease of 10% on the ASX market index could have an impact of approximately $1,223 on the profit attributable to the Group, depending on whether the variance is significant or prolonged.
The Group's exposure to interest rate risk, which is the risk that a financial instrument's value will fluctuate as a result of reasonable possible changes in market interest rates arises in relation to the Group's bank balances.
The Group’s listed equity securities are susceptible to market price risk arising from uncertainties about future values of the investment securities.
The weighted average fair value of options and performance rights granted during the year was $1.96 (2014: $1.69).
The Group’s financial instruments comprise deposits with banks, financial assets, amounts receivable and payable, and interest bearing liabilities.
At the date of issue, the weighted average share price of options and performance rights granted in the current year was $2.706. The options and performance rights outstanding at 30 June 2015 had a weighted average exercise price of $1.089 and a weighted average remaining contractual life of 1.4 years.
Key management of the Group meet on a regular basis to analyse exposure and to evaluate treasury management strategies in the context of the most recent economic conditions and forecasts.
The fair value of options and performance rights granted is deemed to represent the value of the employee services received over the vesting period. The fair value of equity settled options and performance rights are estimated at the date of grant using either a Binomial Option Valuation model or Monte Carlo Simulation with the following inputs:
The main risks the economic entity is exposed to through its financial instruments are interest rate risk, foreign currency risk, credit risk and liquidity risk. There is a minor exposure to price risk through the financial assets. These risks are managed through monitoring of forecast cashflows, interest rates, economic conditions and ensuring adequate funds are available.
The Board of Directors has overall responsibility for the establishment and oversight of the Group's risk management framework. Management is responsible for developing and monitoring the risk management policies and reports to the Board.
Historical volatility has been the basis for determining expected share price volatility as it is assumed that this is indicative of future movements.
Orocobre Limited I Annual Report 2015 107
For
per
sona
l use
onl
y

NOTES TO THE FINANCIAL STATEMENTSfor the period ended 30 June 2015
NOTE 24: Financial Risk Management (continued)
Interest Rate Sensitivity
2015 2014Cash & cash equivalents 9,439,319 26,302,392 Receivables 29,977,457 18,978,405 Standby Letters of Credit 48,794,723 -
88,211,499 45,280,797 Effect on equity as a result of a:
1% +/- reasonably possible change in interest 617,480 316,966
Liquidity Risk
The Group's activities are funded from equity sources and revenue.
Contractual maturities of financial liabilities:Year ended 30 June 2015 Within 12 months 1 to 5 Years Over 5 years Total
- payables 18,034,456 1,477,299 - 19,511,755 - loans and borrowings 2,970,805 892,643 - 3,863,448
21,005,261 2,369,942 - 23,375,203
Year ended 30 June 2014 Within 12 months 1 to 5 Years Over 5 years Total- payables 8,881,373 2,896,815 - 11,778,188 - loans and borrowings 1,753,615 1,702,455 - 3,456,070
10,634,988 4,599,270 - 15,234,258
Foreign Currency Risk
Foreign Currency Sensitivity
2015 2014United States Dollar cash & cash equivalents 8,128,311 12,362,732 United States Dollar receivables 45,212,501 25,190,090 United States Dollar financial assets 48,794,723 - United States Dollar payables (2,112,308) (1,727,040)
100,023,227 35,825,782 Effect on profit as a result of a:
10% +/- Reasonably possible change in United States Dollar 7,001,626 2,507,805 Effect on equity as a result of a:
10% +/- Reasonably possible change in United States Dollar 7,001,626 2,507,805
Credit Risk
Liquidity risk is the risk that the Group will not be able meet its financial obligations as they fall due. This risk is managed by ensuring, to the extent possible, that there is sufficient liquidity to meet liabilities when due, without incurring unacceptable losses or risking damage to the Group's reputation.
With all other variables held constant, the Group’s profit after tax is affected through the impact on floating rate cash and receivables as follows:
The assumed movement in basis points for the interest rate sensitivity analysis is based on the currently observable market environment.
The group is exposed to fluctuations in the United States Dollar arising from the purchase of goods and services, and loans and receivables in currencies other than the group's measurement currency. The Group does not currently undertake any hedging of foreign currency items.
The Group does not have any material credit risk exposure to any single receivable or Group of receivables under financial instruments entered into by the Group, other than bank balances and short term deposits (Note 6), VAT tax credits, and non current receivables (Note 7).
Credit risk is managed and reviewed regularly by key management. It arises from exposures to certain financial instruments and deposits with financial institutions. Key management monitor credit risk by actively assessing the rating quality and liquidity of counter parties. Only banks and financial institutions with an ‘A’ rating are utilised.
The maximum exposure to credit risk, excluding the value of any collateral or other security, at balance date to recognised financial assets, is the carrying amount, net of any provisions for impairment of those assets, as disclosed in the statement of financial position and notes to the financial statements.
The following tables demonstrate the sensitivity to a reasonably possible change in the US Dollar exchange rates, with all other variables held constant. The impact on the Group’s profit after tax and equity is due to changes in the fair value of monetary assets and liabilities.
Credit risk is the risk that a counterparty will not meet its obligations under a financial instrument or customer contract, leading to a financial loss. The Group is exposed to credit risk from its operating activities (primarily trade receivables) and from its financing activities, including deposits with banks and financial institutions, foreign exchange transactions and other financial instruments.
108
For
per
sona
l use
onl
y
NOTES TO THE FINANCIAL STATEMENTSfor the period ended 30 June 2015
NOTE 24: Financial Risk Management (continued)
Commodity Price Risk
Trading Commodity Price Sensitivity
The following table shows the effect of price changes in boron chemicals on Trade Debtors at 30 June 2015.
Effect on profit as a result of a: 2015 201410% +/- Reasonably possible change in Boron chemicals 417,669 280,588
Capital management
Trade and other payables (Note 15) 19,511,755 11,778,188 Loans and borrowings (Note 10) 3,513,056 2,714,179 Less: cash and short-term deposits (Note 6) (9,439,319) (26,302,392) Net debt 13,585,492 (11,810,025)
Equity 212,886,128 160,735,431 Capital and net debt 226,471,620 148,925,406 Gearing ratio 6% -8%
(b) Net Fair Values
(c) Financial Assets
No financial assets or liabilities are readily traded on organised markets in a standardised form, other than shares in listed entities.
The Group’s financial instruments consist mainly of deposits with banks, local money market instruments, short-term investments, accounts receivable and payable, loans to and from subsidiaries, and joint ventures.
The totals for each category of financial instruments, measured in accordance with AASB 139 as detailed in the accounting policies to these financial statements, are as follows:
The aggregate net fair values and carrying amounts of financial assets and liabilities are disclosed in the statement of financial position and notes to the financial statements. Fair values are materially in line with carrying values. The shares in listed entities comprise listed investments for which a level 1 fair value hierarchy has been applied (quoted price in an active market). For other assets, fair value has been determined using a discounted cash flow valuation technique based on contractual and expected cash flows and current market interest rates (Level 3).
No changes were made in the objectives, policies or processes for managing capital during the years ended 30 June 2015 and 2014. The change in the gearing ratio in the current year reflects the increase in cash as a result of the capital raising during the year.
The Group manages its capital structure and makes adjustments to it in light of changes in economic conditions. To maintain or adjust the capital structure, the Group may return capital to shareholders or issue new shares.
The primary objective of the Group’s capital management is to ensure that it maintains a strong credit rating and healthy capital ratios to support its business and maximise the shareholder’s value.
Capital includes equity attributable to the equity holders of the Parent.
The Group’s prospects and share price will be influenced by the price obtained from time to time for the commodities targeted in its exploration programs, namely lithium chemicals and potash and, to a lesser extent, other minerals. The prices of such commodities have fluctuated widely in recent years and are affected by factors beyond the control of the Group including, but not limited to, the relationship between global supply and demand for such minerals which may be affected by, among other things, development and commercial acceptance of lithium based applications and technologies and/or the introduction of new technologies that may not be based on lithium, forward selling by producers, the cost of production, new mine developments and mine closures, advances in various production technologies for such minerals and general global economic conditions. The prices of such commodities are also affected by the outlook for inflation, interest rates, currency exchange rates and supply and demand issues. Also, major lithium producers may attempt to sell lithium products at artificially low prices in order to drive new entrants out of the market. These factors may have an adverse effect on the Group's exploration and any subsequent development and production activities, as well as its ability to fund its future activities.
The Group is affected by the market forces and market price cycles of boron chemical and mineral products. In relation to boron chemical and mineral products the market price is determined largely by the market supply and demand balance. There are two significant manufacturers of boron chemicals and minerals in the global market so the supply side is relatively consolidated. Boron chemical and mineral products are used in applications such as ceramic and glass manufacture, insulation and fertiliser manufacture. Although there is a cyclic profile in these markets they are considered steady growth markets linked strongly to urbanisation and food production so volatility is not considered high. In terms of inputs, the major input is ore mined from the companies own assets so input cost risk is managed through control of cost inputs such as diesel fuel, labour and gas via forward contracts. All sales contracts are agreed in USD or USD equivalent prices and forward contracts are agreed for periods of 3-12 months.
Orocobre Limited I Annual Report 2015 109
For
per
sona
l use
onl
y

NOTES TO THE FINANCIAL STATEMENTSfor the period ended 30 June 2015
NOTE 24: Financial Risk Management (continued)Note
2015 2014Financial assetsCash and cash equivalents 6 9,439,319 26,302,392 Financial assets at amortised cost (loans and receivables):
– current trade and other receivables 7 9,533,299 7,388,112 – non-current trade and other receivables 7 41,271,924 27,840,216 – non-current standby letters of credit 10 48,794,723 -
Shares in listed entities at fair value (available for sale financial asset): – listed investments 10 12,232 24,464
Total financial assets 109,051,497 61,555,184
Financial liabilitiesFinancial liabilities at amortised cost:
– current trade and other payables 15 18,034,456 8,881,373 – non-current trade and other payables 15 1,477,299 2,896,815 – current loans and borrowings 10 2,716,050 1,362,116 – non-current loans and borrowings 10 797,006 1,352,063
Total financial liabilities 23,024,811 14,492,367
NOTE 25: Segment Reporting
Segment Information
Year ended 30 June 2015 Corporate Olaroz project
South American Salars Borax Eliminations Total Entity
REVENUE $ $ $ $ $ $External revenue 90,479 - 160,516 26,829,226 - 27,080,221 Intersegment revenue - - - - - - Total segment revenue 90,479 - 160,516 26,829,226 - 27,080,221 RESULTSInterest income (Note 2b) 1,281,626 - 232,842 465,662 (691,289) 1,288,841 Interest expense (Note 2c) (1,852,332) - (470,765) (1,850,434) 1,420,957 (2,752,574) Depreciation (Note 2d) (18,914) - (49,516) (1,565,383) - (1,633,813) Share of loss of joint venture (Note 14) - (227,696) - - - (227,696) Options expense (Note 23) (1,135,252) - - - - (1,135,252) Revaluation on AFS financial assets (Note 10) 12,232 - - - - 12,232 Unrealised FX gain 12,187,928 - (26,362) (1,743,056) 10,418,510 Segment profit/(loss) 4,361,302 (227,696) (201,764) (5,018,875) 42,079 (1,044,954)
Transfer prices between operating segments are on an arm's length basis in a manner similar to transactions with third parties.
In determining operating segments, the entity has had regard to the information and reports the chief operating decision maker uses to make strategic decisions regarding resources. The Chief Executive Officer (CEO) is considered to be the chief operating decision maker and is empowered by the Board of Directors to allocate resources and assess the performance of the economic entity. The CEO assesses and reviews the business using the reportable segments below. Segment performance is evaluated based on the performance criteria parameters agreed for each segment. These include, but are not limited to: financial performance, exploration activity, mine yield, production volumes and cost controls.
The following tables present revenue and profit information about the Group's operating segments for the year ended 30 June 2015 and 2014 respectively.
Inter-segment interest of $691,289 is eliminated on consolidation.
Consolidated Group
The Group operates primarily in Argentina in the mining industry. The Group's primary focus is on exploration for and development of lithium, potash and salar mineral deposits. The Group also includes the operations of Borax.
The economic entity has four reportable segments, being Corporate, the Olaroz project, South American Salars and Borax.
110
For
per
sona
l use
onl
y
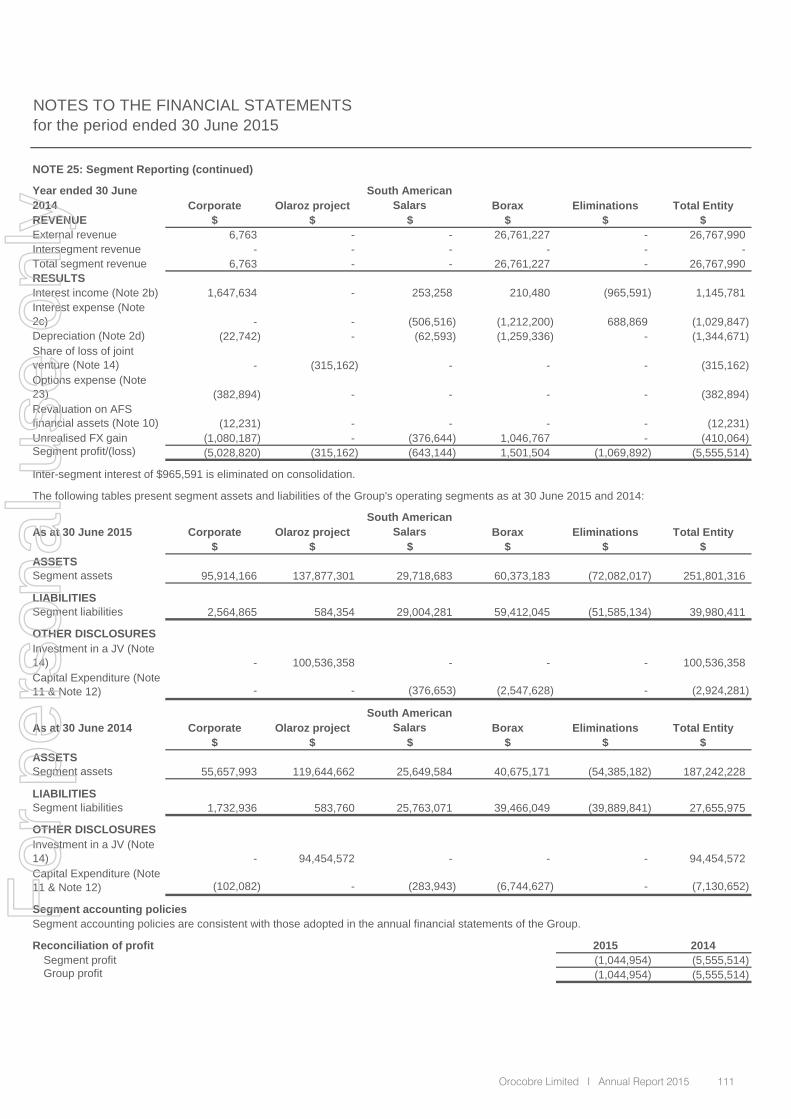
NOTES TO THE FINANCIAL STATEMENTSfor the period ended 30 June 2015
NOTE 25: Segment Reporting (continued)
Year ended 30 June 2014 Corporate Olaroz project
South American Salars Borax Eliminations Total Entity
REVENUE $ $ $ $ $ $External revenue 6,763 - - 26,761,227 - 26,767,990 Intersegment revenue - - - - - - Total segment revenue 6,763 - - 26,761,227 - 26,767,990 RESULTSInterest income (Note 2b) 1,647,634 - 253,258 210,480 (965,591) 1,145,781 Interest expense (Note 2c) - - (506,516) (1,212,200) 688,869 (1,029,847) Depreciation (Note 2d) (22,742) - (62,593) (1,259,336) - (1,344,671) Share of loss of joint venture (Note 14) - (315,162) - - - (315,162) Options expense (Note 23) (382,894) - - - - (382,894) Revaluation on AFS financial assets (Note 10) (12,231) - - - - (12,231) Unrealised FX gain (1,080,187) - (376,644) 1,046,767 - (410,064) Segment profit/(loss) (5,028,820) (315,162) (643,144) 1,501,504 (1,069,892) (5,555,514)
As at 30 June 2015 Corporate Olaroz projectSouth American
Salars Borax Eliminations Total Entity$ $ $ $ $ $
ASSETSSegment assets 95,914,166 137,877,301 29,718,683 60,373,183 (72,082,017) 251,801,316
LIABILITIESSegment liabilities 2,564,865 584,354 29,004,281 59,412,045 (51,585,134) 39,980,411
OTHER DISCLOSURESInvestment in a JV (Note 14) - 100,536,358 - - - 100,536,358 Capital Expenditure (Note 11 & Note 12) - - (376,653) (2,547,628) - (2,924,281)
As at 30 June 2014 Corporate Olaroz projectSouth American
Salars Borax Eliminations Total Entity$ $ $ $ $ $
ASSETSSegment assets 55,657,993 119,644,662 25,649,584 40,675,171 (54,385,182) 187,242,228
LIABILITIESSegment liabilities 1,732,936 583,760 25,763,071 39,466,049 (39,889,841) 27,655,975
OTHER DISCLOSURESInvestment in a JV (Note 14) - 94,454,572 - - - 94,454,572 Capital Expenditure (Note 11 & Note 12) (102,082) - (283,943) (6,744,627) - (7,130,652)
Segment accounting policies
Reconciliation of profit 2015 2014Segment profit (1,044,954) (5,555,514) Group profit (1,044,954) (5,555,514)
Segment accounting policies are consistent with those adopted in the annual financial statements of the Group.
The following tables present segment assets and liabilities of the Group's operating segments as at 30 June 2015 and 2014:
Inter-segment interest of $965,591 is eliminated on consolidation.
Orocobre Limited I Annual Report 2015 111
For
per
sona
l use
onl
y

NOTES TO THE FINANCIAL STATEMENTSfor the period ended 30 June 2015
NOTE 25: Segment Reporting (continued) 2015 2014
Reconciliation of assetsSegment operating assets 323,883,333 241,627,410 Inter-segment loans (eliminations) (51,585,134) (39,096,048) Inter-segment investments (eliminations) (20,496,883) (15,289,134) Group operating assets 251,801,316 187,242,228
Reconciliation of liabilitiesSegment operating liabilities 91,565,545 67,545,816 Inter-segment loans (eliminations) (51,585,134) (39,889,841) Group operating liabilities 39,980,411 27,655,975
Geographic InformationRevenues from external customersAustralia 90,479 6,763 Argentina 26,989,742 26,761,227 Total revenue 27,080,221 26,767,990
Segment AssetsAustralia 95,914,166 55,657,993 Argentina 155,887,150 131,584,235 Total assets 251,801,316 187,242,228
Segment LiabilitiesAustralia 2,564,865 1,732,936 Argentina 37,415,546 25,923,039 Total liabilities 39,980,411 27,655,975
NOTE 26: Events After the Reporting Period
NOTE 27: Parent Entity Information
Current assets 58,818,040 26,451,605 Non-current assets 213,710,088 192,789,722
Total assets 272,528,128 219,241,327 Current liabilities 2,548,368 1,120,643 Non-current liabilities 584,354 583,760
Total liabilities 3,132,722 1,704,403 Contributed equity 176,488,844 130,139,019 Reserves 2,862,326 1,727,074Accumulated profits/(losses) 90,044,236 85,670,831
Total equity 269,395,406 217,536,924 Profit/(loss) for the year 4,373,405 (5,146,350)
Total comprehensive profit/(loss) for the year 4,373,405 (5,146,350)
NOTE 28: Company Details
The registered office and principal place of business is: Level 1, 349 Coronation Drive, Milton, Queensland 4064, Australia.
Orocobre Limited has entered into a guarantee, in the current financial year, in relation to a loan for its subsidiary, Borax S.A. (see Note 22). The company had no contingent liabilities at year end. As set out in Note 21 the Company has an operating lease commitment for $527,150 (2014: $122,802).
The following information relates to the parent entity, Orocobre Limited at 30 June 2015. This information has been prepared in accordance with Accounting Standards using consistent accounting policies as presented in Note 1. The information is extracted from the books and records of the parent.
The revenue information above is based on the locations of the origin of the sale.
In June 2015, the Company raised $32.3m through placement to institutional and sophisticated investors. Such funds were received post year end on 3 July 2015.
Post year end, Borax Argentina received a loan of ARS 29m (approximately USD 3m) to fund productive asset improvements including the expansion of the boric acid plant.
112
For
per
sona
l use
onl
y

Directors Declaration
Directors' Declaration
In accordance with a resolution of the directors of Orocobre Limited, I state that:
1. In the opinion of the directors:
(a) the financial statements and notes of Orocobre Limited for the financial
year ended 30 June 2015 are in accordance with the Corporations Act 2001, including:
(i) giving a true and fair view of the consolidated entity’s financial position as at 30 June 2015 and of its
performance for the year ended on that date; and
(ii) complying with Accounting Standards and the Corporations Regulations 2001;
(b) the financial statements and notes also comply with International Financial Reporting Standards as
disclosed in Note 1; and
(c) there are reasonable grounds to believe that the Company will be able to pay its debts as and when they
become due and payable.
2. This declaration has been made after receiving the declarations required to be made to the directors by the
Chief Executive Officer and Chief Financial Officer in accordance with section 295A of the Corporations Act 2001 for the
financial year ended 30 June 2015.
James D Calaway Richard P Seville
Chairman Managing Director
Dated this: 23rd day of September 2015
Orocobre Limited I Annual Report 2015 113
For
per
sona
l use
onl
y

A member firm of Ernst & Young Global Limited Liability limited by a scheme approved under Professional Standards Legislation
Independent auditor's report to the members of Orocobre Limited Report on the financial report We have audited the accompanying financial report of Orocobre Limited, which comprises the consolidated statement of financial position as at 30 June 2015, the consolidated statement of comprehensive income, the consolidated statement of changes in equity and the consolidated statement of cash flows for the year then ended, notes comprising a summary of significant accounting policies and other explanatory information, and the directors' declaration of the consolidated entity comprising the company and the entities it controlled at the year's end or from time to time during the financial year.
Directors' responsibility for the financial report The directors of the company are responsible for the preparation of the financial report that gives a true and fair view in accordance with Australian Accounting Standards and the Corporations Act 2001 and for such internal controls as the directors determine are necessary to enable the preparation of the financial report that is free from material misstatement, whether due to fraud or error. In Note 1, the directors also state, in accordance with Accounting Standard AASB 101 Presentation of Financial Statements, that the financial statements comply with International Financial Reporting Standards.
Auditor's responsibility Our responsibility is to express an opinion on the financial report based on our audit. We conducted our audit in accordance with Australian Auditing Standards. Those standards require that we comply with relevant ethical requirements relating to audit engagements and plan and perform the audit to obtain reasonable assurance about whether the financial report is free from material misstatement.
An audit involves performing procedures to obtain audit evidence about the amounts and disclosures in the financial report. The procedures selected depend on the auditor's judgment, including the assessment of the risks of material misstatement of the financial report, whether due to fraud or error. In making those risk assessments, the auditor considers internal controls relevant to the entity's preparation and fair presentation of the financial report in order to design audit procedures that are appropriate in the circumstances, but not for the purpose of expressing an opinion on the effectiveness of the entity's internal controls. An audit also includes evaluating the appropriateness of accounting policies used and the reasonableness of accounting estimates made by the directors, as well as evaluating the overall presentation of the financial report.
We believe that the audit evidence we have obtained is sufficient and appropriate to provide a basis for our audit opinion.
Independence In conducting our audit we have complied with the independence requirements of the Corporations Act 2001. We have given to the directors of the company a written Auditor’s Independence Declaration, a copy of which is included in the directors’ report.
Opinion In our opinion:
a. the financial report of Orocobre Limited is in accordance with the Corporations Act 2001, including:
114
Ernst & Young 111 Eagle Street Brisbane QLD 4000 Australia GPO Box 7878 Brisbane QLD 4001
Tel: +61 7 3011 3333 Fax: +61 7 3011 3100 ey.com/au
For
per
sona
l use
onl
y

A member firm of Ernst & Young Global Limited Liability limited by a scheme approved under Professional Standards Legislation
i giving a true and fair view of the consolidated entity's financial position as at 30 June 2015 and of its performance for the year ended on that date; and
ii complying with Australian Accounting Standards and the Corporations Regulations 2001; and
b. the financial report also complies with International Financial Reporting Standards as disclosed in Note 1.
Report on the remuneration report We have audited the Remuneration Report included in the directors' report for the year ended 30 June 2015. The directors of the company are responsible for the preparation and presentation of the Remuneration Report in accordance with section 300A of the Corporations Act 2001. Our responsibility is to express an opinion on the Remuneration Report, based on our audit conducted in accordance with Australian Auditing Standards.
Opinion In our opinion, the Remuneration Report of Orocobre Limited for the year ended 30 June 2015, complies with section 300A of the Corporations Act 2001.
Ernst & Young
Kellie McKenzie Partner Brisbane 23 September 2015
Orocobre Limited I Annual Report 2015 115
For
per
sona
l use
onl
y
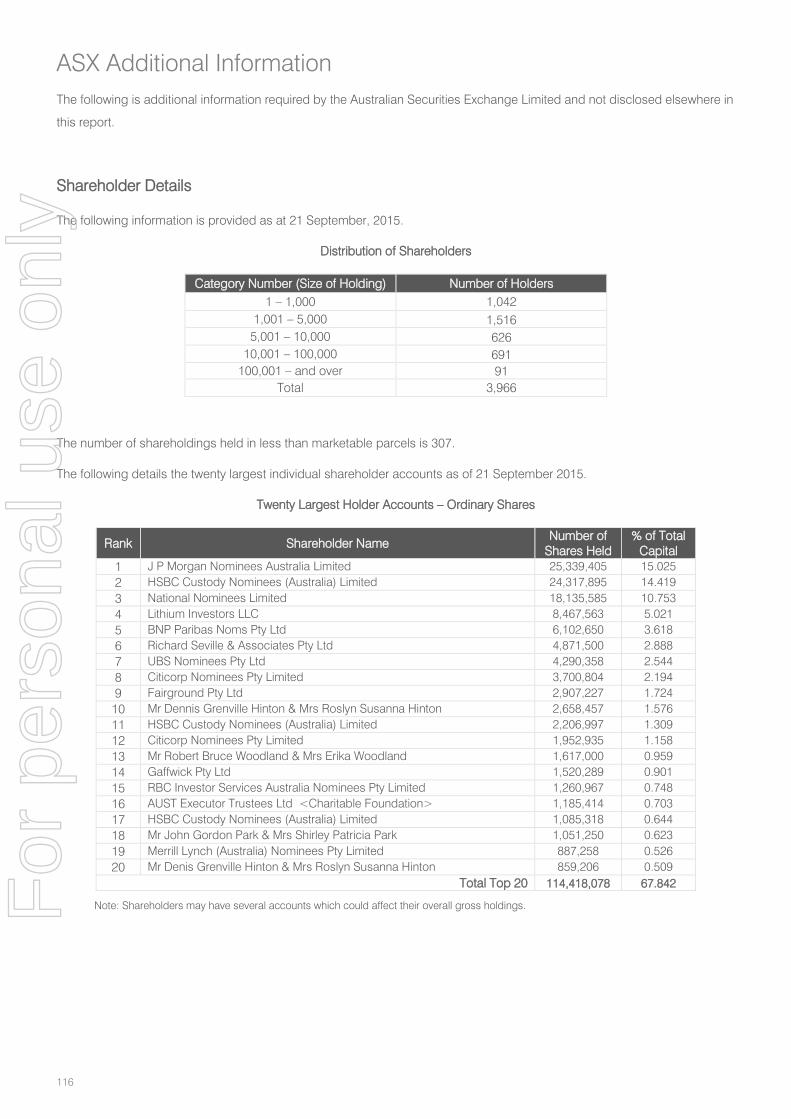
The following is additional information required by the Australian Securities Exchange Limited and not disclosed elsewhere in
this report.
Shareholder Details
The following information is provided as at 21 September, 2015.
Distribution of Shareholders
Category Number (Size of Holding) Number of Holders 1 – 1,000 1,042
1,001 – 5,000 1,516 5,001 – 10,000 626
10,001 – 100,000 691 100,001 – and over 91
Total 3,966
The number of shareholdings held in less than marketable parcels is 307.
The following details the twenty largest individual shareholder accounts as of 21 September 2015.
Twenty Largest Holder Accounts – Ordinary Shares
Rank Shareholder Name Number of
Shares Held % of Total
Capital 1 J P Morgan Nominees Australia Limited 25,339,405 15.025 2 HSBC Custody Nominees (Australia) Limited 24,317,895 14.419 3 National Nominees Limited 18,135,585 10.753 4 Lithium Investors LLC 8,467,563 5.021 5 BNP Paribas Noms Pty Ltd 6,102,650 3.618 6 Richard Seville & Associates Pty Ltd 4,871,500 2.888 7 UBS Nominees Pty Ltd 4,290,358 2.544 8 Citicorp Nominees Pty Limited 3,700,804 2.194 9 Fairground Pty Ltd 2,907,227 1.724 10 Mr Dennis Grenville Hinton & Mrs Roslyn Susanna Hinton 2,658,457 1.576 11 HSBC Custody Nominees (Australia) Limited 2,206,997 1.309 12 Citicorp Nominees Pty Limited 1,952,935 1.158 13 Mr Robert Bruce Woodland & Mrs Erika Woodland 1,617,000 0.959 14 Gaffwick Pty Ltd 1,520,289 0.901 15 RBC Investor Services Australia Nominees Pty Limited 1,260,967 0.748 16 AUST Executor Trustees Ltd <Charitable Foundation> 1,185,414 0.703 17 HSBC Custody Nominees (Australia) Limited 1,085,318 0.644 18 Mr John Gordon Park & Mrs Shirley Patricia Park 1,051,250 0.623 19 Merrill Lynch (Australia) Nominees Pty Limited 887,258 0.526 20 Mr Denis Grenville Hinton & Mrs Roslyn Susanna Hinton 859,206 0.509
Total Top 20 114,418,078 67.842
Note: Shareholders may have several accounts which could affect their overall gross holdings.
ASX Additional Information
116
For
per
sona
l use
onl
y
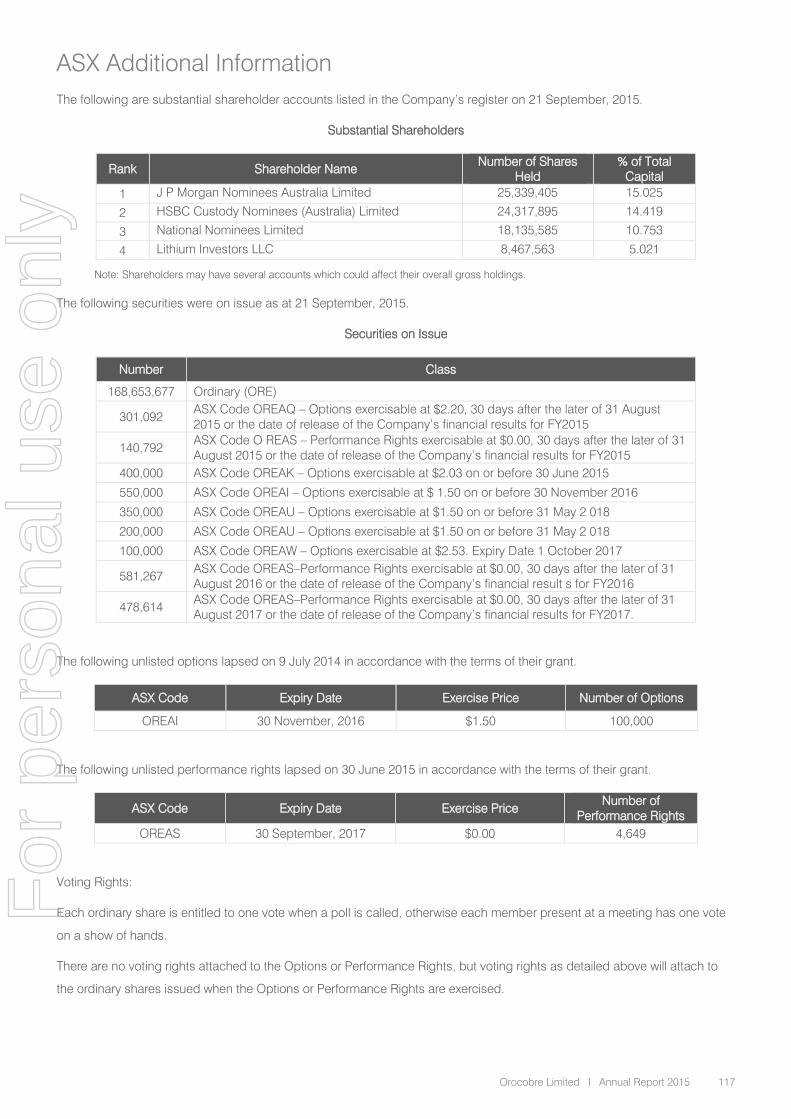
The following are substantial shareholder accounts listed in the Company’s register on 21 September, 2015.
Substantial Shareholders
Rank Shareholder Name Number of Shares Held
% of Total Capital
1 J P Morgan Nominees Australia Limited 25,339,405 15.025
2 HSBC Custody Nominees (Australia) Limited 24,317,895 14.419
3 National Nominees Limited 18,135,585 10.753
4 Lithium Investors LLC 8,467,563 5.021
Note: Shareholders may have several accounts which could affect their overall gross holdings.
The following securities were on issue as at 21 September, 2015.
Securities on Issue
Number Class
168,653,677 Ordinary (ORE)
301,092 ASX Code OREAQ – Options exercisable at $2.20, 30 days after the later of 31 August 2015 or the date of release of the Company’s financial results for FY2015
140,792 ASX Code O REAS – Performance Rights exercisable at $0.00, 30 days after the later of 31 August 2015 or the date of release of the Company’s financial results for FY2015
400,000 ASX Code OREAK – Options exercisable at $2.03 on or before 30 June 2015
550,000 ASX Code OREAI – Options exercisable at $ 1.50 on or before 30 November 2016
350,000 ASX Code OREAU – Options exercisable at $1.50 on or before 31 May 2 018
200,000 ASX Code OREAU – Options exercisable at $1.50 on or before 31 May 2 018
100,000 ASX Code OREAW – Options exercisable at $2.53. Expiry Date 1 October 2017
581,267 ASX Code OREAS–Performance Rights exercisable at $0.00, 30 days after the later of 31 August 2016 or the date of release of the Company’s financial result s for FY2016
478,614 ASX Code OREAS–Performance Rights exercisable at $0.00, 30 days after the later of 31 August 2017 or the date of release of the Company’s financial results for FY2017.
The following unlisted options lapsed on 9 July 2014 in accordance with the terms of their grant.
ASX Code Expiry Date Exercise Price Number of Options
OREAI 30 November, 2016 $1.50 100,000
The following unlisted performance rights lapsed on 30 June 2015 in accordance with the terms of their grant.
ASX Code Expiry Date Exercise Price Number of
Performance Rights OREAS 30 September, 2017 $0.00 4,649
Voting Rights:
Each ordinary share is entitled to one vote when a poll is called, otherwise each member present at a meeting has one vote
on a show of hands.
There are no voting rights attached to the Options or Performance Rights, but voting rights as detailed above will attach to
the ordinary shares issued when the Options or Performance Rights are exercised.
ASX Additional Information
Orocobre Limited I Annual Report 2015 117
For
per
sona
l use
onl
y

Registers of Securities are Held at the Following Addresses:
Boardroom Pty Limited Equity Financial Trust Company
Level 12 200 University Avenue
225 George Street Suite 400
Sydney NSW 2000 Toronto ON M5H4H1
Australia Canada
Stock Exchange Listing
Quotation has been granted for all the ordinary shares of the Company on all Member Exchanges of the Australian Stock
Exchange Limited, other than those classified as restricted securities and detailed below.
Restricted Securities
The Company currently has no restricted securities.
Use of Cash and Convertible Assets
During the period from admission to the official list of the Australian Stock Exchange to 30 June 2015, the Company has
used cash and assets readily convertible to cash in a manner consistent with its business activities. The Company is
involved in mineral exploration and development in Argentina.
Schedule of Tenements
Tenement Name Tenement Number
Area ( Hectares)
Orocobre Interest
Location of Tenements
Olaroz
1842-S-12 2988.17 66.5% Argentina
1274-P-2009 5972 66.5% Argentina
131-I-1986 100 66.5% Argentina
039-M-1998 98.4 66.5% Argentina
112-S-04 100 66.5% Argentina
117-A-44 100 66.5% Argentina
114-S-44 100 66.5% Argentina
40-M-1998 100 66.5% Argentina
029-M-1996 100 66.5% Argentina
126-T-44 100 66.5% Argentina
393-M-44 98.4 66.5% Argentina
112-D-44 299,94 66.5% Argentina
125-S-44 100 66.5% Argentina
319-T-2005 1473.97 66.5% Argentina
056-L-1991 300 66.5% Argentina
519-L-2006 2000 66.5% Argentina
ASX Additional Information
118
For
per
sona
l use
onl
y

520-L-2006 1896.52 66.5% Argentina
521-L-2006 2000 66.5% Argentina
522-L-2006 2000 66.5% Argentina
147-L-2003 1927.92 66.5% Argentina
724-L-2007 3336.19 66.5% Argentina
725-L-2007 2940.11 66.5% Argentina
726-L-2007 2889.98 66.5% Argentina
727-L-2007 3117.26 66.5% Argentina
728-L-2007 3182.35 66.5% Argentina
503-L-2006 6200 66.5% Argentina
943-R-2008 563.98 66.5% Argentina
1136-R-2009 1199.34 66.5% Argentina
1137-R-2009 1195.97 66.5% Argentina
944-R-2008 432.3 66.5% Argentina
1134-R-2009 895.70 66.5% Argentina
1135-R-2009 1098.64 66.5% Argentina
963-R-2004 1194.84 66.5% Argentina
964-R-2008 799.84 66.5% Argentina
945-R-2008 428.08 66.5% Argentina
Cauchari
259-R-2004 494.4 85% Argentina
260-R-2004 444.26 85% Argentina
948-R-2008 887.56 85% Argentina
949-R-2008 1770.51 85% Argentina
950-R-2004 1997.09 85% Argentina
1155-P-2009 1500 85% Argentina
968 R 2008 703.34 85% Argentina
1081 P 2008 1995 85% Argentina
1.119-P-2009 2493.07 85% Argentina
1082 P 2008 1468 85% Argentina
1101 P 2008 2483.9 85% Argentina
966 R 2008 117.37 85% Argentina
965 R 2008 1345 85% Argentina
951-R-2008 795 85% Argentina
1083 P 2008 1445.68 85% Argentina
1.118-P-2009 2395.70 85% Argentina
1130-P-2009 1239.96 85% Argentina
952-R-2008 487.58 85% Argentina
1084 P 2008 1526.78 85% Argentina
1156-P-2009 66.17 85% Argentina
1086 P 2008 1716.63 85% Argentina
1085 P 2008 773.90 85% Argentina
ASX Additional Information
Orocobre Limited I Annual Report 2015 119
For
per
sona
l use
onl
y
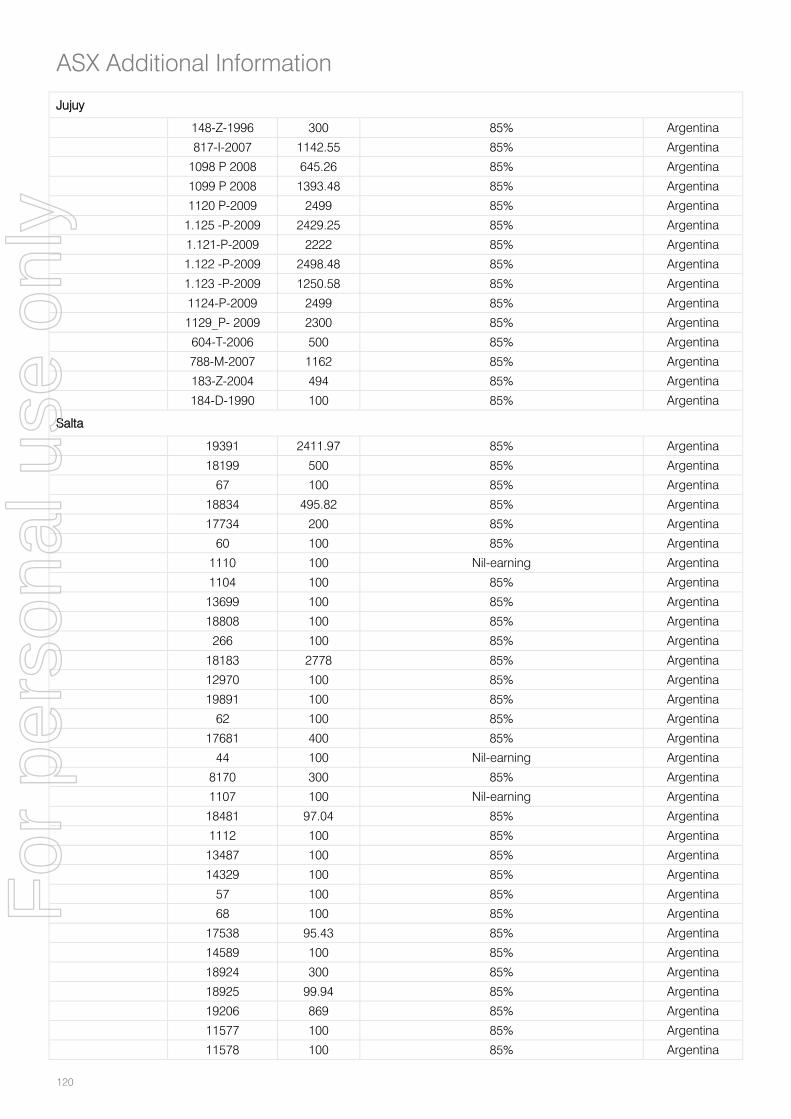
Jujuy
148-Z-1996 300 85% Argentina
817-I-2007 1142.55 85% Argentina
1098 P 2008 645.26 85% Argentina
1099 P 2008 1393.48 85% Argentina
1120 P-2009 2499 85% Argentina
1.125 -P-2009 2429.25 85% Argentina
1.121-P-2009 2222 85% Argentina
1.122 -P-2009 2498.48 85% Argentina
1.123 -P-2009 1250.58 85% Argentina
1124-P-2009 2499 85% Argentina
1129_P- 2009 2300 85% Argentina
604-T-2006 500 85% Argentina
788-M-2007 1162 85% Argentina
183-Z-2004 494 85% Argentina
184-D-1990 100 85% Argentina
Salta
19391 2411.97 85% Argentina
18199 500 85% Argentina
67 100 85% Argentina
18834 495.82 85% Argentina
17734 200 85% Argentina
60 100 85% Argentina
1110 100 Nil-earning Argentina
1104 100 85% Argentina
13699 100 85% Argentina
18808 100 85% Argentina
266 100 85% Argentina
18183 2778 85% Argentina
12970 100 85% Argentina
19891 100 85% Argentina
62 100 85% Argentina
17681 400 85% Argentina
44 100 Nil-earning Argentina
8170 300 85% Argentina
1107 100 Nil-earning Argentina
18481 97.04 85% Argentina
1112 100 85% Argentina
13487 100 85% Argentina
14329 100 85% Argentina
57 100 85% Argentina
68 100 85% Argentina
17538 95.43 85% Argentina
14589 100 85% Argentina
18924 300 85% Argentina
18925 99.94 85% Argentina
19206 869 85% Argentina
11577 100 85% Argentina
11578 100 85% Argentina
ASX Additional Information
120
For
per
sona
l use
onl
y

11579 100 85% Argentina
11580 100 85% Argentina
1111 100 85% Argentina
18833 270 85% Argentina
17321 186 85% Argentina
53 100 85% Argentina
19742 2490.07 85% T Argentina
19744 2499.97 85% T Argentina
19766 2488.09 85% T Argentina
19768 2987.09 85% T Argentina
48 100 85% Argentina
203 100 85% Argentina
204 100 85% Argentina
54 100 85% Argentina
63 100 85% Argentina
50 100 85% Argentina
1105 100 85% Argentina
65 100 85% Argentina
70 100 85% Argentina
206 100 85% Argentina
86 300 85% Argentina
17744 500 85% Argentina
18533 97.03 85% Argentina
17580 100 85% Argentina
Diablillos
1190 99.65 85% (Colorado SA has an usufruct for 40 years: i)
over the solid borates and ii) over the gold, copper, silver and molybdenum)
Argentina
18009 99 85% (Colorado SA has an usufruct for 40 years: i)
over the solid borates and ii) over the gold, copper, silver and molybdenum)
Argentina
18010 200 85% (Colorado SA has an usufruct for 40 years: i)
over the solid borates and ii) over the gold, copper, silver and molybdenum)
Argentina
1187 99.7 85% (Colorado SA has an usufruct for 40 years: i)
over the solid borates and ii) over the gold, copper, silver and molybdenum)
Argentina
1189 100 85% (Colorado SA has an usufruct for 40 years: i)
over the solid borates and ii) over the gold, copper, silver and molybdenum)
Argentina
1177 100 85% (Colorado SA has an usufruct for 40 years: i)
over the solid borates and ii) over the gold, copper, silver and molybdenum)
Argentina
Tincalayu
1271 300 100% Argentina
1215 300 100% (Galaxy Lithium has an usufruct on the
brines) Argentina
1495 200 100% (Galaxy Lithium has an usufruct on the
brines) Argentina
7772 471 100% Argentina
5596 300 100% (Galaxy Lithium has an usufruct on the
brines) Argentina
5435 300 100% Argentina
8529 900 100% Argentina
ASX Additional Information
Orocobre Limited I Annual Report 2015 121
For
per
sona
l use
onl
y

13572 647 100% Argentina
13848 (Diana) 100 100% (Galaxy Lithium has an usufruct on the brines)
Argentina
17335 (Valerio) 274,32 100% (Galaxy Lithium has an usufruct on the brines)
Argentina
Diablillos
1175 100 100% (Potasio y Litio de Argentina S.A. has an
usufruct on the brines) Argentina
1176 100 100% (Potasio y Litio de Argentina S.A. has an
usufruct on the brines) Argentina
1164 100 100% (Potasio y Litio de Argentina S.A. has an
usufruct on the brines) Argentina
Diablillos Group – File No. 11.691
1172 100 100% (Potasio y Litio de Argentina S.A. has an
usufruct on the brines) Argentina
1165 100 100% (Potasio y Litio de Argentina S.A. has an
usufruct on the brines)
1166 100 100% (Potasio y Litio de Argentina S.A. has an
usufruct on the brines) Argentina
1179 100 100% (Potasio y Litio de Argentina S.A. has an
usufruct on the brines) Argentina
1180 200 100% (Potasio y Litio de Argentina S.A. has an
usufruct on the brines) Argentina
1182 100 100% (Potasio y Litio de Argentina S.A. has an
usufruct on the brines) Argentina
1195 100 100% (Potasio y Litio de Argentina S.A. has an
usufruct on the brines) Argentina Argentina
1206 100 100% (Potasio y Litio de Argentina S.A. has an
usufruct on the brines) Argentina
1168 100 100% (Potasio y Litio de Argentina S.A. has an
usufruct on the brines) Argentina
1163 100 100% (Potasio y Litio de Argentina S.A. has an usufruct on the brines)
Argentina
1167 100 100% (Potasio y Litio de Argentina S.A. has an usufruct on the brines)
Argentina
1170 100 100% (Potasio y Litio de Argentina S.A. has an usufruct on the brines)
Argentina
1174 100 100% (Potasio y Litio de Argentina S.A. has an usufruct on the brines)
Argentina
1171 100 100% (Potasio y Litio de Argentina S.A. has an usufruct on the brines)
Argentina
7021 100 100% (Potasio y Litio de Argentina S.A. has an usufruct on the brines)
Argentina
1181 100 100% (Potasio y Litio de Argentina S.A. has an usufruct on the brines)
Argentina
12653 200 100% (Potasio y Litio de Argentina S.A. has an usufruct on the brines)
Argentina
1173 100 100% (Potasio y Litio de Argentina S.A. has an usufruct on the brines)
Argentina
1169 100 100% (Potasio y Litio de Argentina S.A. has an usufruct on the brines)
Argentina
1178 100 100% (Potasio y Litio de Argentina S.A. has an usufruct on the brines)
Argentina
12652 200 100% (Potasio y Litio de Argentina S.A. has an usufruct on the brines)
Argentina
Sijes
8587 799 100% Argentina
11800 488 100% Argentina
11801 400 100% Argentina
ASX Additional Information
122
For
per
sona
l use
onl
y
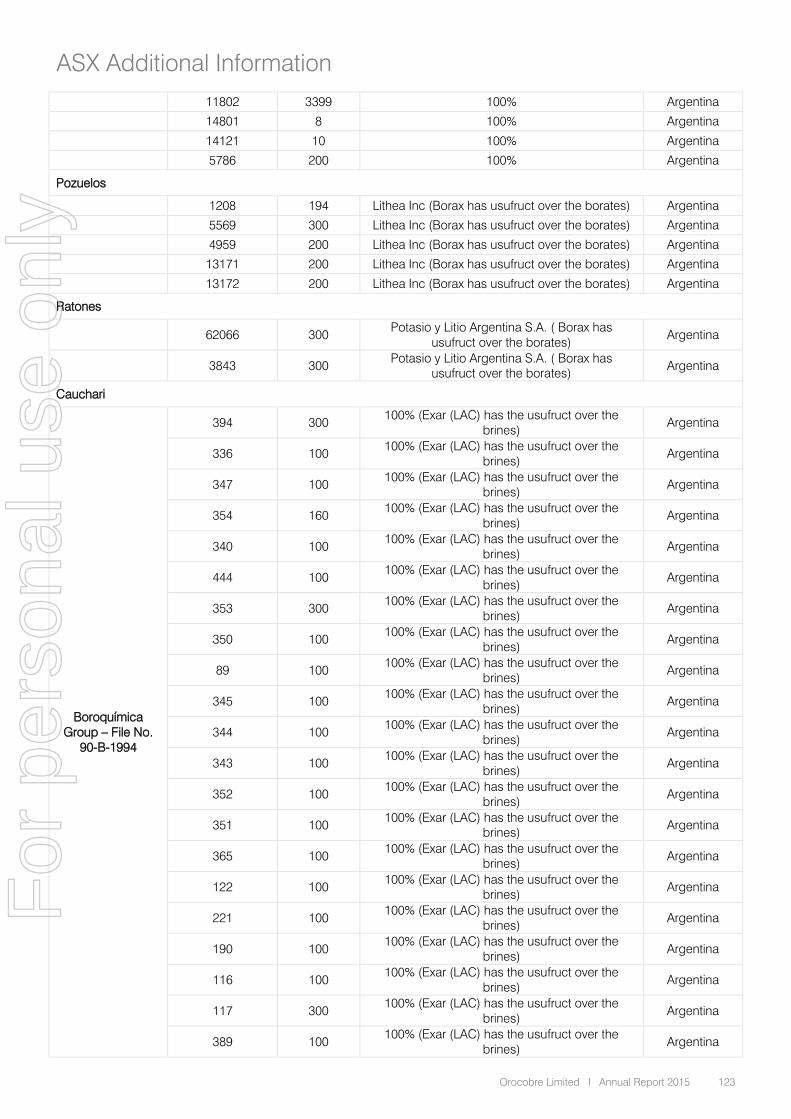
11802 3399 100% Argentina
14801 8 100% Argentina
14121 10 100% Argentina
5786 200 100% Argentina
Pozuelos
1208 194 Lithea Inc (Borax has usufruct over the borates) Argentina
5569 300 Lithea Inc (Borax has usufruct over the borates) Argentina
4959 200 Lithea Inc (Borax has usufruct over the borates) Argentina
13171 200 Lithea Inc (Borax has usufruct over the borates) Argentina
13172 200 Lithea Inc (Borax has usufruct over the borates) Argentina
Ratones
62066 300 Potasio y Litio Argentina S.A. ( Borax has usufruct over the borates)
Argentina
3843 300 Potasio y Litio Argentina S.A. ( Borax has usufruct over the borates) Argentina
Cauchari
Boroquímica Group – File No.
90-B-1994
394 300 100% (Exar (LAC) has the usufruct over the brines)
Argentina
336 100 100% (Exar (LAC) has the usufruct over the brines)
Argentina
347 100 100% (Exar (LAC) has the usufruct over the brines)
Argentina
354 160 100% (Exar (LAC) has the usufruct over the brines)
Argentina
340 100 100% (Exar (LAC) has the usufruct over the brines)
Argentina
444 100 100% (Exar (LAC) has the usufruct over the brines)
Argentina
353 300 100% (Exar (LAC) has the usufruct over the brines)
Argentina
350 100 100% (Exar (LAC) has the usufruct over the brines)
Argentina
89 100 100% (Exar (LAC) has the usufruct over the brines)
Argentina
345 100 100% (Exar (LAC) has the usufruct over the brines)
Argentina
344 100 100% (Exar (LAC) has the usufruct over the brines)
Argentina
343 100 100% (Exar (LAC) has the usufruct over the brines)
Argentina
352 100 100% (Exar (LAC) has the usufruct over the brines)
Argentina
351 100 100% (Exar (LAC) has the usufruct over the brines) Argentina
365 100 100% (Exar (LAC) has the usufruct over the brines) Argentina
122 100 100% (Exar (LAC) has the usufruct over the brines) Argentina
221 100 100% (Exar (LAC) has the usufruct over the
brines) Argentina
190 100 100% (Exar (LAC) has the usufruct over the
brines) Argentina
116 100 100% (Exar (LAC) has the usufruct over the
brines) Argentina
117 300 100% (Exar (LAC) has the usufruct over the
brines) Argentina
389 100 100% (Exar (LAC) has the usufruct over the
brines) Argentina
ASX Additional Information
Orocobre Limited I Annual Report 2015 123
For
per
sona
l use
onl
y

306 24 100% (Exar (LAC) has the usufruct over the brines)
Argentina
402 119 100% (Exar (LAC) has the usufruct over the brines)
Argentina
195 100 100% (Exar (LAC) has the usufruct over the brines)
Argentina
220 100 100% (Exar (LAC) has the usufruct over the brines)
Argentina
259 100 100% (Exar (LAC) has the usufruct over the brines)
Argentina
43 100 100% (Exar (LAC) has the usufruct over the brines)
Argentina
341 100 100% (Exar (LAC) has the usufruct over the brines)
Argentina
42 100 100% (Exar (LAC) has the usufruct over the brines)
Argentina
438 100 100% (Exar (LAC) has the usufruct over the brines) Argentina
160 100 100% (Exar (LAC) has the usufruct over the brines) Argentina
378 100 100% (Exar (LAC) has the usufruct over the brines) Argentina
339-C 100 100% (Exar (LAC) has the usufruct over the
brines) Argentina
377-C 100 100% (Exar (LAC) has the usufruct over the
brines) Argentina
191-R 100 100% (Exar (LAC) has the usufruct over the
brines) Argentina
Technical Information, Competent Persons’ and Qualified Persons’ Statements
The resource model and brine resource estimate on the Salar de Olaroz was undertaken by John Houston, an independent
consultant employed by John Houston Consulting who is a Chartered Geologist and a Fellow of the Geological Society of
London. John Houston has sufficient relevant experience to qualify as a competent person as defined in the 2004 edition of
the Australasian Code for Reporting of Exploration Results, Mineral Resources and Ore Reserves. He is also a “Qualified
Person” as defined by Canadian Securities Administrators’ National Instrument 43-101 (NI 43-101).
The Feasibility Study on the Olaroz project was prepared by John Houston and Michael Gunn, an independent consultant
employed by Gunn Metals, together with Sinclair Knight Merz and the Orocobre technical group. Mr. Houston and Mr. Gunn
prepared the technical report entitled “Technical Report – Salar de Olaroz Lithium-Potash Project, Argentina” dated 13 May
2011 (the “Olaroz Report”) under NI 43-101 in respect of the Feasibility Study, and each of Messrs. Houston and Gunn was a
Qualified Person under NI 43-101, and independent of the Company, at the date such report was prepared. Mr Gunn is a
Member of the Australian Institute of Mining and Metallurgy and is consulting mineral processing engineer with
approximately forty years’ experience.
The information relating to the Olaroz project is extracted from the report entitled “NI 43-101 “Technical Report – Salar de
Olaroz Lithium-Potash Project, Argentina”, dated 13 May 2011 and is available to view on the Company website
www.orocobre.com. Apart from the defined exploration target detailed in this announcement, the Company is not aware of
any information or data that materially affects the information included in the original market announcement and that all
material assumptions and technical parameters underpinning the estimates in the relevant market announcement continue
to apply and have not materially changed. The Company confirms that the form and context in which the Competent
Person’s findings are presented have not been materially modified from the original market announcement.
ASX Additional Information
124
For
per
sona
l use
onl
y

This information in regard to the Olaroz Project with the exception of the information pertaining to the defined exploration
target was prepared and first disclosed under the JORC Code 2004. It has not been updated since to comply with the JORC
Code 2012 on the basis that the information has not materially changed since it was last reported.
The resource estimate in regard to the defined exploration target at Olaroz was prepared by Murray Brooker, an independent
consultant employed by Hydrominex Geoscience Pty Ltd. Murray Brooker is a geologist and hydrogeologist and is a
Member of the Australian Institute of Geoscientists. Murray has sufficient relevant experience to qualify as a competent
person as defined in the 2004 edition of the Australasian Code for Reporting of Exploration Results, Mineral Resources and
Ore Reserves. He is also a “Qualified Person” as defined by Canadian Securities Administrators’ National Instrument 43-101.
The exploration target is between 1.6 and 7.5 million tonnes of lithium carbonate equivalent between 197m and 323m depth.
The basin is potentially 600m deep and additional targets to the north and the south of the exploration target area. It must be
stressed that an exploration target is not a mineral resource. The potential quantity and grade of the exploration target is
conceptual in nature, and there has been insufficient exploration to define a Mineral Resource in the volume where the
Exploration Target is outlined. It is uncertain if further exploration drilling will result in the determination of a Mineral Resource
in this volume.
The technical information relating to Salinas Grandes and Cauchari has been prepared by Murray Brooker in conjunction
with Mr Peter Ehren regarding Salinas Grandes. Murray Brooker, an independent consultant employed by Hydrominex
Geoscience Pty Ltd is a geologist and hydrogeologist and a Member of the Australian Institute of Geoscientists. Murray has
sufficient relevant experience to qualify as a competent person as defined in the 2004 edition of the Australasian Code for
Reporting of Exploration Results, Mineral Resources and Ore Reserves. He is also a “Qualified Person” as defined by
Canadian Securities Administrators’ National Instrument 43-101.
Mr Peter Ehren, an independent consultant employed by Process and Environmental Consultancy is a Member of the
Australasian Institute of Mining and Metallurgy and Chartered Professional and is a consulting mineral processing engineer
with significant experience in lithium brine deposits. Mr Ehren is responsible for the mineral processing and metallurgical
testing statements in section 15 of the Technical Report on the Salinas Grandes Lithium Project effective 16 April 2012. This
report was reviewed and updated to include a statement of Peter Ehren’s responsibilities on 12 August 2013 as a result of a
review by the Ontario Securities Commission and refiled on www.sedar.com with an accompanying media release over the
Canadian disclosure network on 23 August 2013. Mr Ehren is also a “Qualified Person” as defined in NI 43-101.
The resource information in relation to Salinas Grandes and Cauchari is extracted from the report entitled NI 43-101
Technical Report on the Salinas Grandes Project dated 16 April 2012, amended 12 August 2013 and NI 43-101 Technical
Report on the Cauchari Project dated 30 April 2010. Both reports are available to view on the Company website
www.orocobre.com.
This information in regard to Salinas Grandes and Cauchari was prepared and first disclosed under the JORC Code 2004. It
has not been updated since to comply with the JORC Code 2012 on the basis that the information has not materially
changed since it was last reported.
The information in this report that relates to resources at the Borax Argentina Tincalayu site has been prepared by Mr Murray
Brooker. Murray Brooker, an independent consultant employed by Hydrominex Geoscience Pty Ltd is a geologist and
hydrogeologist and is a Member of the Australian Institute of Geoscientists. Murray has sufficient relevant experience to
qualify as a competent person as defined in the 2004 edition of the Australasian Code for Reporting of Exploration Results,
Mineral Resources and Ore Reserves. He is also a “Qualified Person” as defined by Canadian Securities Administrators’
National Instrument 43-101. The information is extracted from the announcement titled Tincalayu Upgraded to JORC
ASX Additional Information
Orocobre Limited I Annual Report 2015 125
For
per
sona
l use
onl
y
Compliant Resource, dated 18 November 2014 and the NI 43-101 Report titled “Technical Report on the Tincalayu Borax
Mine”, dated 31 December 2014, both available to view on the Company website www.orocobre.com.
The Company confirms that it is not aware of any new information or data that materially affects the information included in
the references above and that all material assumptions and technical parameters underpinning the resource estimates
continue to apply and have not materially changed. The Company also confirms that the form and context in which the
Competent Person’s findings are presented have not been materially modified. The Company also confirms that the form
and context in which the Competent Person’s findings are presented have not been materially modified.
A previous announcement was made on the 21 August 2012 regarding the superseded historical resource at Tincalayu. The
Company is not in possession of any new information or data relating to historical estimates that materially impacts on the
reliability of the estimates or the Company’s ability to verify the historical estimates as mineral resources, in accordance with
the JORC Code. The supporting information provided in the initial market announcement on 21 August 2012 continues to
apply and has not materially changed.
Additional information relating to the Company’s projects is available on the Company’s website.
Caution Regarding Forward Looking Information
This report contains “forward-looking information” within the meaning of applicable securities legislation. Forward-looking
information may include, but is not limited to, the results of the Olaroz feasibility study, the estimation and realization of
mineral resources at the Company’s projects, the viability, recoverability and processing of such resources, costs and timing
of development of the Olaroz project, the forecasts relating to the lithium, potash and borate markets including market price
whether stated or implied, demand and other information and trends relating to any market tax, royalty and duty rates, timing
and receipt of approvals for the Company’s projects, consents and permits under applicable legislation, adequacy of
financial resources, production and other milestones for the Olaroz project, the Olaroz project’s future financial and
operating performance including production, rates of return, operating costs, capital costs and cash flows, potential
operating synergies between the Company’s projects and the Olaroz project, other matters related to the development of the
Olaroz project and the Cauchari and Salinas Grandes projects, the performance of the relocated borax plant, including
without limitation the plant’s estimated production rate, financial data, the estimates of mineral resources or mineralisation
grade at the Tincalayu mine, the economic viability of such mineral resources or mineralisation, mine life and operating costs
at the Tincalayu mine, the projected production rates associated with the borax plant.
Forward-looking information is subject to known and unknown risks, uncertainties and other factors that may cause actual
results to be materially different from those expressed or implied by such forward-looking information, including but not
limited to the risk that further funding may be required, but unavailable, for the ongoing development of the Company’s
projects; the possibility that required concessions may not be obtained, or may be obtained only on terms and conditions
that are materially worse than anticipated; changes in government regulations, policies or legislation; fluctuations or
decreases in commodity prices; the possibility that required permits or approvals may not be obtained; uncertainty in the
estimation, economic viability, recoverability and processing of mineral resources; fluctuations or decreases in commodity
prices general risks associated with the feasibility of the Company’s projects; risks associated with construction and
development of the Olaroz project; unexpected capital or operating cost increases; risks associated with weather patterns
and impact on production rate and the uncertainty of meeting anticipated program milestones at the Company’s projects;
general risks associated with the operation of the borax plant; a decrease in the price for borax resulting from, among other
things, decreased demand for borax or an increased supply of borax or substitutes.
ASX Additional Information
126
For
per
sona
l use
onl
y

The Company believes that the assumptions and expectations reflected in such forward-looking information are reasonable.
Assumptions have been made regarding, among other things: the Company’s ability to carry on its exploration and
development activities, the timely receipt of required approvals, the prices of lithium potash and borates, the ability of the
Company to operate in a safe, efficient and effective manner and the ability of the Company to obtain financing as and when
required and on reasonable terms. Readers are cautioned that the foregoing list is not exhaustive of all factors and
assumptions which may have been used.
There can be no assurance that forward-looking information will prove to be accurate, as actual results and future events
could differ materially from those anticipated in such information. Accordingly, readers should not place undue reliance on
forward-looking information. The Company does not undertake to update any forward-looking information, except in
accordance with applicable securities laws.
ASX Additional Information
Orocobre Limited I Annual Report 2015 127
For
per
sona
l use
onl
y
128
For
per
sona
l use
onl
y
OROCOBRELIMITED
Directors
Company Secretary
Non-Executive ChairmanJames D. Calaway
Neil KaplanRick Anthon
Company
OROCOBRE LIMITEDACN 112 589 910
Registered OfficeLevel 1, 349 Coronation DriveMilton QLD 4064AUSTRALIA
Principal OfficeLevel 1, 349 Coronation DriveMilton QLD 4064AUSTRALIA
Postal AddressPO Box 1946Milton QLD 4064
Telephone: Facsimile: Email:
Share RegistriesBOARDROOM PTY LIMITEDLevel 12, 225 George StreetSydney NSW 2000AUSTRALIA
AuditorsERNST & YOUNG111 Eagle StreetBrisbane QLD 4000AUSTRALIA
Legal Advisors
Managing Director & CEORichard Seville
Non-Executive DirectorsJohn W. Gibson
Courtney PratFernando Oris De Roat
Federico NicholsonRobert Hubbard
McCarthy Tetrault LLPSuite 5300 TD Bank TowerToronto Dominion Centre66 Wellington Street WestTORONTO ON M5K1E6CANADA
www.orocobre.com
EQUITY FINANCIAL TRUST COMPANY200 University AvenueSuite 400Toronto ON M5H4H1CANADA
CORPORATE DIRECTORY
Saravia Frias Cornejo AbogadosRivadavia 378(A4400BTH)SALTAARGENTINA
Rick Anthon General Counsel for Orocobre Limited349 Coronation DriveMilton QLD 4064AUSTRALIA
Orocobre Limited I Annual Report 2015 129
For
per
sona
l use
onl
y

OROCOBRELIMITED
Level 1, 349 Coronation DriveMilton QLD 4064AUSTRALIA
Telephone: Facsimile: Email:
For
per
sona
l use
onl
y