Embed Size (px)
Citation preview

Annual Report 2015

Contents
Directors’ Statement......................................................................................................... 3
Independent Auditor’s Report ......................................................................................... 5
Statement Of Comprehensive Income ............................................................................ 6
Balance Sheet .................................................................................................................... 7
Statement Of Changes In Equity ..................................................................................... 8
Statement Of Cash Flows ................................................................................................. 9
Notes To The Financial Statements............................................................................... 10
About Chubb in Singapore ............................................................................................. 47
Contact Us ....................................................................................................................... 47

Annual Report 2015. Singapore. Published 08/2016. © 2016 Chubb. Coverages underwritten by one or more subsidiary companies. Not all coverages available in all jurisdictions. Chubb® and its respective logos, and Chubb. Insured.TM are protected trademarks of Chubb.
3
Directors’ Statement For the financial year ended 31 December 2015
The directors present their statement to the shareholder together with the audited financial statements of the Company for the financial year ended 31 December 2015 and the balance sheet of the Company as at 31 December 2015.
In the opinion of the directors,
(a) the balance sheet and the financial statements as set out on pages 6 to 46 are drawn up so as to give a true and fair view of the financial position of the Company as at 31 December 2015 and the financial performance, changes in equity and cash flows of the Company for the financial year then ended; and
(b) at the date of this statement, there are reasonable grounds to believe that the Company will be able to pay its debts as and when they fall due.
Directors
The directors of the Company in office at the date of this report are as follows:
Daniel Andrew Albert Vanderkemp
Koh Choon Hui (appointed on 18 December 2015)
Gregory John Dodds (appointed on 1 March 2016)
Eric Sanderson (resigned on 18 December 2015)
Mack Eng Lip Chian (resigned on 1 March 2016)
Arrangements to enable directors to acquire shares and debentures
Neither at the end of nor at any time during the financial year was the Company a party to any arrangement whose object was to enable the directors of the Company to acquire benefits by means of the acquisition of shares in, or debentures of, the Company or any other body corporate, other than as disclosed under “Share options” in this statement.
Directors’ interests in shares or debentures
According to the register of directors’ shareholdings, none of the directors holding office at the end of the financial year had any interest in the shares in, or debentures of, the Company or its related corporations, except as follows:
Annual Report 2015
ACE Insurance Limited (Incorprated in Singapore)

Annual Report 2015. Singapore. Published 08/2016. © 2016 Chubb. Coverages underwritten by one or more subsidiary companies. Not all coverages available in all jurisdictions. Chubb® and its respective logos, and Chubb. Insured.TM are protected trademarks of Chubb.
4
Directors’ Statement (continued) For the financial year ended 31 December 2015
Directors’ interests in shares or debentures (continued)
1 This refers to restricted stock award and stock options granted by ACE Limited (incorporated in Switzerland) under the Group’s 2004 Long-Term Incentive Plans.
Directors’ contractual benefits
Since the end of the previous financial year, no director has received or become entitled to receive a benefit by reason of a contract made by the Company or a related corporation with the director or with a firm of which he is a member or with a company in which he has a substantial financial interest, except that certain directors receive remuneration as a result of their employment with related corporations.
Share options
There were no options granted during the financial year to subscribe for unissued shares of the Company.
No shares have been issued during the financial year by virtue of the exercise of options to take up unissued shares of the Company.
There were no unissued shares of the Company under option at the end of the financial year.
Independent auditor
The independent auditor, PricewaterhouseCoopers LLP, has expressed its willingness to accept re-appointment.
On behalf of the directors
Gregory John Dodds Director
Koh Choon Hui Director
28 April 2016
Holdings registered in the name of director or nominee
At 31.12.2015 At 1.1.2015 or date of appointment, if later
ACE Limited, ultimate holding corporation
Restricted stock award1
Mack Eng Lip Chian (resigned on 1 March 2016) Daniel Andrew Albert Vanderkemp
1,548 6,297
1,627 4,441
Restricted stock options1
Mack Eng Lip Chian (resigned on 1 March 2016) Daniel Andrew Albert Vanderkemp
1,724 9,986
4,556 10,652
Common shares at par value CHF24.15 each Mack Eng Lip Chian (resigned on 1 March 2016) Daniel Andrew Albert Vanderkemp
1,314 4,935
3,571 3,745

Annual Report 2015. Singapore. Published 08/2016. © 2016 Chubb. Coverages underwritten by one or more subsidiary companies. Not all coverages available in all jurisdictions. Chubb® and its respective logos, and Chubb. Insured.TM are protected trademarks of Chubb.
5
Independent Auditor’s Report To The Shareholder Of ACE Insurance Limited
Report on the Financial Statements
We have audited the accompanying financial statements of ACE Insurance Limited set out on pages 6 to 46, which comprise the balance sheet as at 31 December 2015, the statement of comprehensive income, the statement of changes in equity and the statement of cash flows for the financial year then ended, and a summary of significant accounting policies and other explanatory information.
Management’s Responsibility for the Financial Statements
Management is responsible for the preparation of financial statements that give a true and fair view in accordance with the provisions of the Singapore Companies Act (the “Act”) and Singapore Financial Reporting Standards, and for devising and maintaining a system of internal accounting controls sufficient to provide a reasonable assurance that assets are safeguarded against loss from unauthorised use or disposition; and transactions are properly authorised and that they are recorded as necessary to permit the preparation of true and fair financial statements and to maintain accountability of assets.
Auditor’s Responsibility
Our responsibility is to express an opinion on these financial statements based on our audit. We conducted our audit in accordance with Singapore Standards on Auditing. Those standards require that we comply with ethical requirements and plan and perform the audit to obtain reasonable assurance about whether the financial statements are free from material misstatement.
An audit involves performing procedures to obtain audit evidence about the amounts and disclosures in the financial statements. The procedures selected depend on the auditor’s judgement, including the assessment of the risks of material misstatement of the financial statements, whether due to fraud or error. In making those risk assessments, the auditor considers internal control relevant to the entity’s preparation of financial statements that give a true and fair view in order to design audit procedures that are appropriate in the circumstances, but not for the purpose of expressing an opinion on the effectiveness of the entity’s internal control. An audit also includes evaluating the appropriateness of accounting policies used and the reasonableness of accounting estimates made by management as well as evaluating the overall presentation of the financial statements.
We believe that the audit evidence we have obtained is sufficient and appropriate to provide a basis for our audit opinion.
Opinion
In our opinion, the financial statements of the Company are properly drawn up in accordance with the provisions of the Act and Singapore Financial Reporting Standards so as to give a true and fair view of the financial position of the Company as at 31 December 2015, and of the financial performance, changes in equity and cash flows of the Company for the financial year ended on that date.
Report on Other Legal and Regulatory Requirements
In our opinion, the accounting and other records required by the Act to be kept by the Company have been properly kept in accordance with the provisions of the Act.
Public Accountants and Chartered Accountants Singapore, 28 April 2016

The accompanying notes form an integral part of these financial statements.
Annual Report 2015. Singapore. Published 08/2016. © 2016 Chubb. Coverages underwritten by one or more subsidiary companies. Not all coverages available in all jurisdictions. Chubb® and its respective logos, and Chubb. Insured.TM are protected trademarks of Chubb.
6
Statement Of Comprehensive Income For the financial year ended 31 December 2015
Notes 2015 2014
$ $
Insurance premium revenue Insurance premium ceded to reinsurers
178,721,577 (123,693,732)
167,136,493 (111,910,273)
Net insurance premium revenue 3 55,027,845 55,226,220
Fee income from insurance contracts Investment income - Net Other operating income
4 5
42,271,820 1,746,237 1,059,819
40,240,233 1,464,941
448,966
Income 100,105,721 97,380,360
Other gain – currency exchange 1,785,938 1,170,861
Insurance claims and loss adjustment expenses Insurance claims and loss adjustment expenses recovered from reinsurers
(72,335,548)
55,027,805
(22,226,647)
12,492,693
Net insurance claims 6 (17,307,743) (9,733,954)
Expenses for acquisition of insurance contracts Expenses for asset management services received
(39,679,702) (295,301)
(36,896,623) (282,375)
Operating expenses:
Employee benefits Depreciation expense Other operating expenses
7 10 8
(20,508,824) (565,898)
(15,325,328)
(20,672,616) (313,191)
(12,513,633)
(36,400,050) (33,499,440)
Expenses (93,682,796) (80,412,392)
Profit before income tax 8,208,863 18,138,829
Income tax expense 9(a) (1,159,151) (2,873,065)
Net profit 7,049,712 15,265,764
Other comprehensive income:
Items that may be reclassified subsequently to profit or loss:
Financial assets, available-for-sale: Fair value (losses)/gains during the financial year Fair value gains transferred to profit or loss on disposal
18 18
(435,637)
(3,768)
93,174
(11,447)
Income tax credit/(expense) on fair value changes 18 60,279 (11,935)
Other comprehensive (loss)/income, net of tax (379,126) 69,792
Total comprehensive income 6,670,586 15,335,556

The accompanying notes form an integral part of these financial statements.
Annual Report 2015. Singapore. Published 08/2016. © 2016 Chubb. Coverages underwritten by one or more subsidiary companies. Not all coverages available in all jurisdictions. Chubb® and its respective logos, and Chubb. Insured.TM are protected trademarks of Chubb.
7
Balance Sheet As at 31 December 2015
Notes 2015 2014
$ $
Assets
Current assets Cash and cash equivalents Financial assets, available-for-sale Insurance receivables and other receivables Reinsurance assets
14 11 12 13
16,225,165
105,522,306 50,009,071 78,321,811
8,429,030
102,156,107 46,807,983 70,462,451
250,078,353 227,855,571
Non-current assets Property, plant and equipment Reinsurance assets Deferred income tax assets
10 13 16
9,302,996
44,835,229 -
472,446
25,937,550 27,717
54,138,225 26,437,713
Total assets 304,216,578 254,293,284
Liabilities
Current liabilities Insurance liabilities Insurance payables and other payables Current income tax liabilities
13 15
9(b)
124,721,538 53,206,988
1,332,492
114,350,303 40,202,916 3,280,826
179,261,018 157,834,045
Non-current liabilities Insurance liabilities Deferred income tax liabilities
13 16
58,055,914
235,388
36,465,567
-
58,291,302 36,465,567
Total liabilities 237,552,320 194,299,612
Net Assets 66,664,258 59,993,672
Equity
Share capital Fair value reserve Retained profits
17 18
35,000,000 (430,633)
32,094,891
35,000,000 (51,507)
25,045,179
Total Equity 66,664,258 59,993,672

The accompanying notes form an integral part of these financial statements.
Annual Report 2015. Singapore. Published 08/2016. © 2016 Chubb. Coverages underwritten by one or more subsidiary companies. Not all coverages available in all jurisdictions. Chubb® and its respective logos, and Chubb. Insured.TM are protected trademarks of Chubb.
8
Statement Of Changes In Equity For the financial year ended 31 December 2015
Share capital Fair value reserve Retained profits Total Equity
Notes $ $ $ $
2015
Beginning of financial year 35,000,000 (51,507) 25,045,179 59,993,672
Total comprehensive income - (379,126) 7,049,712 6,670,586
End of financial year 35,000,000 (430,633) 32,094,891 66,664,258
2014
Beginning of financial year 35,000,000 (121,299) 20,272,535 55,151,236
Total comprehensive income - 69,792 15,265,764 15,335,556
Dividends paid 19 - - (10,493,120) (10,493,120)
End of financial year 35,000,000 (51,507) 25,045,179 59,993,672

The accompanying notes form an integral part of these financial statements.
Annual Report 2015. Singapore. Published 08/2016. © 2016 Chubb. Coverages underwritten by one or more subsidiary companies. Not all coverages available in all jurisdictions. Chubb® and its respective logos, and Chubb. Insured.TM are protected trademarks of Chubb.
9
Statement Of Cash Flows For the financial year ended 31 December 2015
2015 2014
Notes $ $
Cash flows from operating activities
Net profit 7,049,712 15,265,764
Adjustments for:
Income tax expense Depreciation expense Net loss on sale of property, plant and equipment Net gain on sale of available-for-sale financial assets Unrealised foreign exchange (gain)/loss, net Interest income
1,159,151 565,898
5,316 (3,768)
(1,760,970) (1,742,469)
2,873,065 313,191
- (11,447)
(1,056,324) (1,453,494)
Operating cash flow before working capital changes 5,272,870 15,930,755
Change in working capital:
Insurance receivables and other receivables Insurance payables and other payables Net insurance liabilities
(3,252,671) 12,117,640 5,204,543
2,363,983 8,137,246 (781,137)
Cash generated from operations 19,342,382 25,650,847
Income tax paid - net 9(b) (2,762,214) (1,586,728)
Net cash provided by operating activities 16,580,168 24,064,119
Cash flows from investing activities
Purchases of property, plant and equipment Proceeds from disposal of property, plant and equipment Purchases of investments Proceeds from sale of investments Interest received
(8,720,387) 205,055
(32,075,815) 29,204,299
2,602,815
(492,939) 150,094
(44,251,994) 28,414,904
2,207,441
Net cash used in investing activities (8,784,033) (13,972,494)
Cash flows from financing activities
Dividends paid to shareholder of the Company - (10,493,120)
Net cash used in financing activities - (10,493,120)
Net increase/(decrease) in cash and cash equivalents held 7,796,135 (401,495)
Cash and cash equivalents at beginning of financial year 14 8,429,030 8,830,525
Cash and cash equivalents at end of financial year 14 16,225,165 8,429,030

Annual Report 2015. Singapore. Published 08/2016. © 2016 Chubb. Coverages underwritten by one or more subsidiary companies. Not all coverages available in all jurisdictions. Chubb® and its respective logos, and Chubb. Insured.TM are protected trademarks of Chubb.
10
Notes To The Financial Statements For the financial year ended 31 December 2015
These notes form an integral part of and should be read in conjunction with the accompanying financial statements.
1. General information
ACE Insurance Limited (the “Company”) is incorporated and domiciled in Singapore. The address of its registered office is 138 Market Street, #11-01 CapitaGreen, Singapore 048946.
The Company is licensed under the Insurance Act, Chapter 142 as a direct general insurer.
The principal activity of the Company consists of underwriting of general insurance including reinsurance of all classes of risks.
2. Significant accounting policies
(a) Basis of preparation
The financial statements have been prepared in accordance with Singapore Financial Reporting Standards (“FRS”). The financial statements have been prepared under the historical cost convention, except as disclosed in the accounting policies below.
The preparation of these financial statements in conformity with FRS requires management to exercise its judgement in the process of applying the Company’s accounting policies. It also requires the use of certain critical accounting estimates and assumptions. The area involving a higher degree of judgement or complexity, or area where estimates and assumptions are significant to the financial statements is the estimation of ultimate liability arising from claims made under insurance contracts, disclosed in Note 13.
Interpretations and amendments to published standards effective in 2015
On 1 January 2015, the Company adopted the new or amended FRS and Interpretations to FRS (“INT FRS”) that are mandatory for application from that date. Changes to the Company’s accounting policies have been made as required, in accordance with the transitional provisions in the respective FRS and INT FRS.
The adoption of these new or amended FRS and INT FRS did not result in substantial changes to the Company’s accounting policies and had no material effect on the amounts reported for the current or prior financial years.
(b) Revenue recognition
Premiums on insurance contracts are recognised as written, at the time of inception of the policies.
Gross written premium is shown before movement in unearned premium provision and deduction of commission and is net of taxes or duties levied on premium.
Fee income from insurance contracts relates to income earned in acquiring new and/or renewing existing reinsurance contracts and certain insurance contracts and is recognised as revenue over the period in which the related services are performed.
Interest income is recognised using the effective interest method.

Annual Report 2015. Singapore. Published 08/2016. © 2016 Chubb. Coverages underwritten by one or more subsidiary companies. Not all coverages available in all jurisdictions. Chubb® and its respective logos, and Chubb. Insured.TM are protected trademarks of Chubb.
11
2. Significant accounting policies (continued)
(c) Property, plant and equipment
All property, plant and equipment is initially recognised at cost and subsequently carried at cost less accumulated depreciation and accumulated impairment losses (Note 2(d)).
The cost of an item of property, plant and equipment initially recognised includes its purchase price and any cost that is directly attributable to bringing the asset to the location and condition necessary for it to be capable of operating in the manner intended by management. The projected cost of dismantlement, removal or restoration is recognised as part of the cost of property, plant and equipment if such obligation is incurred as a consequence of acquiring or using the asset.
Depreciation is calculated using the straight line basis to allocate their depreciable amounts over their estimated useful lives as follows:
Leasehold improvements 10% - 33 1/3% Office equipment 10% - 20% Furniture and fittings 10% - 33 1/3% Computer equipment 20% - 33 1/3%
except where the assets are less than $1,000 in value. Assets less than $1,000 in value are depreciated in the month of acquisition.
The residual values, estimated useful lives and depreciation method of property, plant and equipment are reviewed, and adjusted as appropriate, at each balance sheet date. The effects of any revision are recognised in profit or loss when the changes arise.
Subsequent expenditure relating to property, plant and equipment that has already been recognised is added to the carrying amount of the asset only when it is probable that future economic benefits associated with the item will flow to the Company and the cost of the item can be reliably measured. All other repairs and maintenance expenses are recognised in profit or loss when incurred.
On disposal of an item of property, plant and equipment, the difference between the disposal proceeds and its carrying amount is recognised in profit or loss.
(d) Impairment of non-financial assets
Property, plant and equipment are tested for impairment whenever there is any objective evidence or indication that these assets may be impaired.
For the purpose of impairment testing, the recoverable amount (i.e. the higher of the fair value less cost to sell and the value in use) is determined on an individual asset basis unless the asset does not generate cash inflows that are largely independent of those from other assets. If this is the case, the recoverable amount is determined for the cash-generating unit (“CGU”) to which the asset belongs.
If the recoverable amount of the asset (or CGU) is estimated to be less than its carrying amount, the carrying amount of the asset (or CGU) is reduced to its recoverable amount. The difference between the carrying amount and the recoverable amount is recognised as an impairment loss in profit or loss.
An impairment loss of an asset is reversed if, and only if, there has been a change in the estimates used to determine the asset’s recoverable amount since the last impairment loss was recognised. The carrying amount of this asset is increased to its revised recoverable amount, provided that this amount does not exceed the carrying amount that would have been determined (net of any accumulated depreciation) had no impairment loss been recognised for the asset in prior years. A reversal of impairment loss for an asset is recognised in profit or loss.

Annual Report 2015. Singapore. Published 08/2016. © 2016 Chubb. Coverages underwritten by one or more subsidiary companies. Not all coverages available in all jurisdictions. Chubb® and its respective logos, and Chubb. Insured.TM are protected trademarks of Chubb.
12
2. Significant accounting policies (continued)
(e) Financial assets
(1) Classification
The Company classifies its financial assets in the following categories: loans and receivables and available-for-sale. The classification depends on the nature of the asset and the purpose for which the assets were acquired. Management determines the classification of its financial assets at initial recognition.
(i) Loans and receivables
Loans and receivables are non-derivative financial assets with fixed or determinable payments that are not quoted in an active market. They are presented as current assets, except for those expected to be realised later than 12 months after the balance sheet date which are presented as non-current assets. Receivables arising from insurance contracts and other receivables are classified in this category. Insurance receivables comprise of amounts due from insured, agents, brokers and reinsurers.
(ii) Financial assets, available-for-sale
Financial assets, available-for-sale, are non-derivatives that are either designated in this category or not classified in any of the other categories. They are presented as current assets unless the investment matures or management intends to dispose of the assets more than 12 months after the balance sheet date.
(2) Recognition and derecognition
Purchases and sales of investments are recognised on trade-date – the date on which the Company commits to purchase or sell the asset. Financial assets are derecognised when the rights to receive cash flows from the financial assets have expired or have been transferred and the Company has transferred substantially all risks and rewards of ownership.
On disposal of a financial asset, the difference between the carrying amount and the sale proceeds is recognised in profit or loss. Any amount in the fair value reserve relating to that asset is reclassified to profit or loss.
(3) Initial measurement
Financial assets are initially recognised at fair value plus transaction costs.
(4) Subsequent measurement
Loans and receivables are subsequently carried at amortised cost using the effective interest method. Financial assets, available-for-sale are subsequently carried at fair value.
Interest and dividend income on financial assets, available-for-sale, are recognised separately in profit or loss.
Changes in the fair value of available-for-sale debt securities (i.e. monetary items) denominated in foreign currencies are analysed into currency translation differences on the amortised cost of the securities and other changes; the currency translation differences are recognised in profit or loss and the other changes are recognised in the fair value reserve.

Annual Report 2015. Singapore. Published 08/2016. © 2016 Chubb. Coverages underwritten by one or more subsidiary companies. Not all coverages available in all jurisdictions. Chubb® and its respective logos, and Chubb. Insured.TM are protected trademarks of Chubb.
13
2. Significant accounting policies (continued)
(5) Impairment
The Company assesses at each balance sheet date whether there is objective evidence that a financial asset or a group of financial assets is impaired and recognises an allowance for impairment when such evidence exists.
(i) Loans and receivables
Significant financial difficulties of the debtor, probability that the debtor will enter bankruptcy and default or significant delay in payments are evidence that these financial assets are impaired.
The carrying amount of these assets is reduced through the use of an impairment allowance account which is calculated as the difference between the carrying amount and the present value of estimated future cash flows, discounted at the original effective interest rate. When the asset becomes uncollectible, it is written off against the allowance account. Subsequent recoveries of amounts previously written off are recognised against the same line item in profit or loss.
The allowance for impairment loss account is reduced through profit or loss in a subsequent period when the amount of impairment loss decreases and the related decrease can be objectively measured. The carrying amount of the assets previously impaired is increased to the extent that the new carrying amount does not exceed the amortised cost had no impairment been recognised in prior periods.
(ii) Financial assets, available-for-sale
In addition to the objective evidence of impairment described in Note 2 (e)(5)(i), a significant or prolonged decline in the fair value of the security below its cost and the disappearance of an active trading market for the security are objective evidence that the available-for-sale financial asset is impaired.
If any evidence of impairment exists, the cumulative loss that was recognised in the fair value reserve is reclassified to profit or loss. The cumulative loss is measured as the difference between the acquisition cost (net of any principal repayments and amortisation) and the current fair value, less any impairment loss previously recognised as an expense.
(f) Fair value estimation
The fair values of financial instruments traded in active markets (such as exchange-traded and over-the-counter securities and derivatives) are based on quoted market prices at the balance sheet date. The quoted market prices used for financial assets are the current bid prices; the appropriate quoted market prices for financial liabilities are the current asking prices.
The fair values of financial instruments that are not traded in an active market are determined by using valuation techniques. The Company uses a variety of methods and makes assumptions that are based on market conditions existing at each balance sheet date. When appropriate, quoted market prices or dealer quotes for similar instruments are used where appropriate. Valuation techniques, such as discounted cash flow analyses, are also used to determine the fair values of the financial instruments.
The fair values of current financial assets and liabilities carried at amortised cost approximate their carrying amounts.
(g) Insurance and other payables
Insurance and other payables are initially measured at fair value and subsequently measured at amortised cost, using the effective interest method.

Annual Report 2015. Singapore. Published 08/2016. © 2016 Chubb. Coverages underwritten by one or more subsidiary companies. Not all coverages available in all jurisdictions. Chubb® and its respective logos, and Chubb. Insured.TM are protected trademarks of Chubb.
14
2. Significant accounting policies (continued)
(h) Insurance
The Company issues contracts that transfer insurance risk.
Insurance contracts are those contracts that transfer significant insurance risk. Such contracts may also
transfer financial risk. As a general guideline, the Company defines as significant insurance risk the possibility
of having to pay benefits on the occurrence of an insured event that are at least 10% more than the benefits
payable if the insured event did not occur.
Insurance contracts are classified depending on the coverage and the terms and conditions.
Casualty insurance contracts protect the Company’s customers against the risk of causing harm to third parties
as a result of their legitimate activities. Damages covered include both contractual and non-contractual events.
The typical protection offered is designed for employers who become legally liable to pay compensation to
injured employees (employers’ liability) and for individual and business customers who become liable to pay
compensation to a third party for bodily harm or property damage (public liability).
Property insurance contracts mainly compensate the Company’s customers for damage suffered to their
properties or for the value of property lost. Customers who undertake commercial activities on their premises
could also receive compensation for the loss of earnings caused by the inability to use the insured properties in
their business activities (business interruption cover).
Professional and Directors and Officers insurance contracts mainly indemnify the Company’s customers
against the legal liability as well as liability as a result of a breach of duty owed in a professional capacity in
connection with the customer’s business, such as negligence, misrepresentation and loss of personal data.
Marine cargo and hull insurance contracts protect the Company’s customers from the financial losses resulting
from marine transportation and transit which can have a drastic impact to their business.
Accident and health insurance contracts protect the Company’s customers from the consequences of events
such as hospitalisation, total permanent disability or death arising from accident or sickness or diagnosis for
dreaded diseases. Guaranteed benefits paid on occurrence of the specified insurance event are either fixed or
linked to the extent of the economic loss suffered by the policyholder. There are no maturity or surrender
benefits.
Political risk insurance contracts protect the Company’s customers against financial losses caused by
government action or political force majeure in respect of loans (export and pre-export finance), or sales,
purchase or service contracts.
Credit insurance contracts protect the lenders involved in highly structured and/or secured trade transactions
against default by a borrower/obligor due to either a political or credit event or protect exporters, contractors
and sponsors against the calling of on-demand guarantees.
Return of Premiums Products Plans are contracts where all or part of the premium received will be refunded
after a specified number of years if the policy criteria for refund are met. The ultimate outcome of this can only
be determined upon the expiry of the policies under the Plan and a provision for premium refundable for this
class of policies is calculated by the in-house actuary. The best estimate of provision for premiums refund is
deducted from gross written premium.
Annual Report 2015. Singapore. Published 08/2016. © 2016 Chubb. Coverages underwritten by one or more subsidiary companies. Not all coverages available in all jurisdictions. Chubb® and its respective logos, and Chubb. Insured.TM are protected trademarks of Chubb.
15
2. Significant accounting policies (continued)
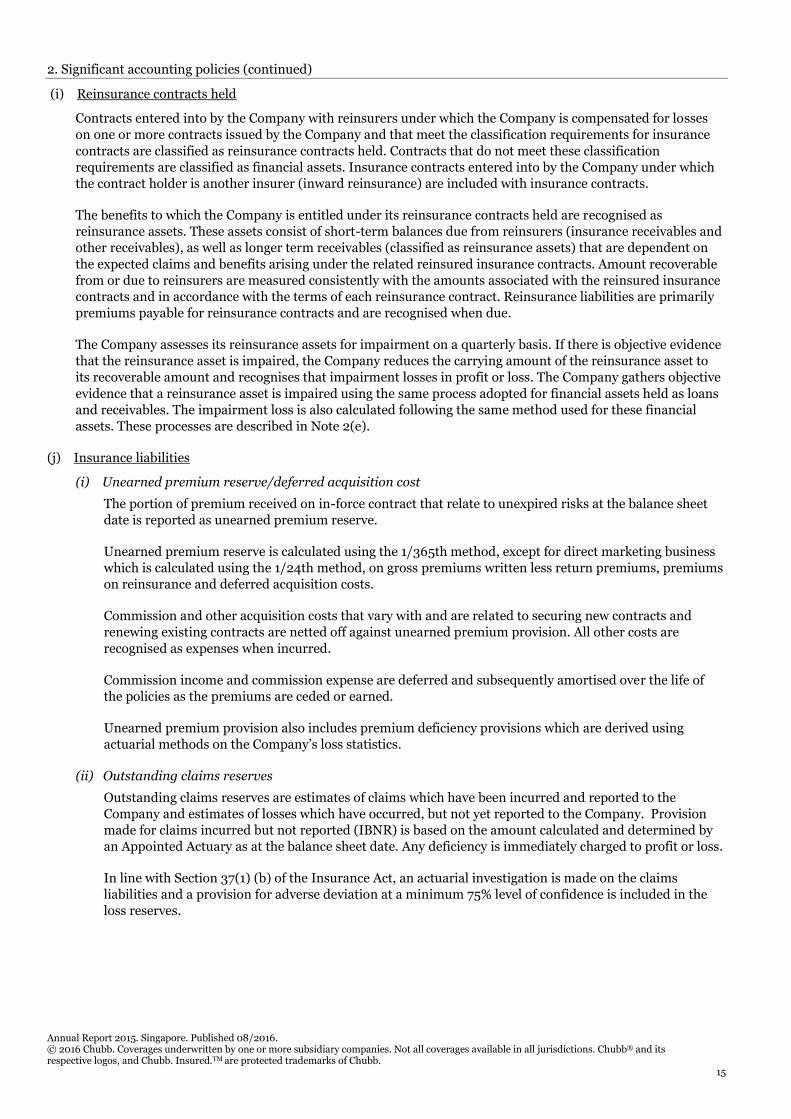
(i) Reinsurance contracts held
Contracts entered into by the Company with reinsurers under which the Company is compensated for losses
on one or more contracts issued by the Company and that meet the classification requirements for insurance
contracts are classified as reinsurance contracts held. Contracts that do not meet these classification
requirements are classified as financial assets. Insurance contracts entered into by the Company under which
the contract holder is another insurer (inward reinsurance) are included with insurance contracts.
The benefits to which the Company is entitled under its reinsurance contracts held are recognised as
reinsurance assets. These assets consist of short-term balances due from reinsurers (insurance receivables and
other receivables), as well as longer term receivables (classified as reinsurance assets) that are dependent on
the expected claims and benefits arising under the related reinsured insurance contracts. Amount recoverable
from or due to reinsurers are measured consistently with the amounts associated with the reinsured insurance
contracts and in accordance with the terms of each reinsurance contract. Reinsurance liabilities are primarily
premiums payable for reinsurance contracts and are recognised when due.
The Company assesses its reinsurance assets for impairment on a quarterly basis. If there is objective evidence
that the reinsurance asset is impaired, the Company reduces the carrying amount of the reinsurance asset to
its recoverable amount and recognises that impairment losses in profit or loss. The Company gathers objective
evidence that a reinsurance asset is impaired using the same process adopted for financial assets held as loans
and receivables. The impairment loss is also calculated following the same method used for these financial
assets. These processes are described in Note 2(e).
(j) Insurance liabilities
(i) Unearned premium reserve/deferred acquisition cost
The portion of premium received on in-force contract that relate to unexpired risks at the balance sheet
date is reported as unearned premium reserve.
Unearned premium reserve is calculated using the 1/365th method, except for direct marketing business
which is calculated using the 1/24th method, on gross premiums written less return premiums, premiums
on reinsurance and deferred acquisition costs.
Commission and other acquisition costs that vary with and are related to securing new contracts and
renewing existing contracts are netted off against unearned premium provision. All other costs are
recognised as expenses when incurred.
Commission income and commission expense are deferred and subsequently amortised over the life of
the policies as the premiums are ceded or earned.
Unearned premium provision also includes premium deficiency provisions which are derived using
actuarial methods on the Company’s loss statistics.
(ii) Outstanding claims reserves
Outstanding claims reserves are estimates of claims which have been incurred and reported to the
Company and estimates of losses which have occurred, but not yet reported to the Company. Provision
made for claims incurred but not reported (IBNR) is based on the amount calculated and determined by
an Appointed Actuary as at the balance sheet date. Any deficiency is immediately charged to profit or loss.
In line with Section 37(1) (b) of the Insurance Act, an actuarial investigation is made on the claims
liabilities and a provision for adverse deviation at a minimum 75% level of confidence is included in the
loss reserves.

Annual Report 2015. Singapore. Published 08/2016. © 2016 Chubb. Coverages underwritten by one or more subsidiary companies. Not all coverages available in all jurisdictions. Chubb® and its respective logos, and Chubb. Insured.TM are protected trademarks of Chubb.
16
2. Significant accounting policies (continued)
(k) Liability adequacy test
At the balance sheet date, liability adequacy tests are performed to ensure the adequacy of the contract
liabilities net of related deferred acquisition costs. In performing these tests, current best estimates of future
contractual cashflows and claims handling and administration expenses are used. Any deficiency is
immediately charged to profit or loss.
(l) Operating leases
Leases of assets in which a significant portion of the risks and rewards of ownership are retained by the lessor
are classified as operating lease. Payments made under operating leases (net of any incentives received from
the lessors) are recognised in profit or loss on a straight-line basis over the period of the lease.
(m) Income taxes
Current income tax for current and prior periods is recognised at the amount expected to be paid to or
recovered from the tax authorities, using the tax rates and tax laws that have been enacted or substantively
enacted by the balance sheet date.
Deferred income tax is recognised for all temporary differences arising between the tax bases of assets and
liabilities and their carrying amounts in the financial statements except when the deferred income tax arises
from the initial recognition of an asset or liability in a transaction that affects neither accounting nor taxable
profit or loss at the time of the transaction.
A deferred income tax asset is recognised to the extent that it is probable that future taxable profit will be
available against which the deductible temporary differences and tax losses can be utilised.
Deferred income tax is measured:
(i) at the tax rates that are expected to apply when the related deferred income tax asset is realised or the
deferred income tax liability is settled, based on tax rates and tax laws that have been enacted or
substantively enacted by the balance sheet date; and
(ii) based on the tax consequence that will follow from the manner in which the Company expects, at the
balance sheet date, to recover or settle the carrying amounts of its assets and liabilities.
Current and deferred income taxes are recognised as income or expense in profit or loss, except to the extent
that the tax arises from a transaction which is recognised directly in equity. Deferred tax on temporary
differences arising from the revaluation gains and losses on available-for-sale financial assets is charged or
credited directly to equity in the same period the temporary differences arise.
(n) Provisions for other liabilities and charges
Provisions for other liabilities and charges are recognised when the Company has a legal or constructive
obligation as a result of past events, it is more likely than not that an outflow of resources will be required to
settle the obligation, and the amount can be reliably estimated.

Annual Report 2015. Singapore. Published 08/2016. © 2016 Chubb. Coverages underwritten by one or more subsidiary companies. Not all coverages available in all jurisdictions. Chubb® and its respective logos, and Chubb. Insured.TM are protected trademarks of Chubb.
17
2. Significant accounting policies (continued)
(o) Employee benefits
(1) Defined contribution plans
Defined contribution plans are post-employment benefit plans under which the Company pays fixed
contributions into separate entities such as the Central Provident Fund on a mandatory, contractual or
voluntary basis. The Company has no further payment obligations once the contributions have been paid.
(2) Employee leave entitlement
Employee entitlements to annual leave and long service leave are recognised when they accrue to
employees. A provision is made for the estimated liability for annual leave and long-service leave as a
result of services rendered by employees up to the balance sheet date.
(3) Share-based compensation
The Company’s ultimate holding corporation operates several share based compensation plans as
described in Note 17(b). The total amount of equity-settled transactions to be recognised over the vesting
period is determined by reference to the fair value on the date of the grant. The cost of equity-settled
transactions is recognised as an expense together with a corresponding increase in equity over the vesting
period, and subsequently recharged by the Company’s ultimate holding corporation.
(p) Currency translation
(1) Functional and presentation currency
Items included in the financial statements of the Company are measured using the currency of the
primary economic environment in which the entity operates (“the functional currency”). The financial
statements are presented in Singapore Dollar, which is the functional currency of the Company.
(2) Transaction and balances
Transactions in a currency other than the functional currency (“foreign currency”) are translated into the
functional currency using the exchange rates at the dates of the transactions. Currency translation
differences resulting from the settlement of such transactions and from the translation of monetary assets
and liabilities denominated in foreign currencies at the closing rates at balance sheet date are recognised
in profit or loss.
Changes in the fair value of monetary securities denominated in foreign currencies classified as available-
for-sale are analysed into currency translation differences on the amortised cost of the securities, and
other changes. Currency translation differences on the amortised cost are recognised in profit or loss, and
other changes are recognised in fair value reserve within equity.
Non-monetary items measured at fair values in foreign currencies are translated using the exchange rates
at the date when the fair values are determined. Currency translation differences on non-monetary items,
whereby the gain or loss is recognised in profit or loss are reported as part of the fair value gain or loss in
profit or loss. Currency translation differences on non-monetary items whereby the gains or losses are
recognised directly in equity, such as equity investments classified as available-for-sale financial assets
are included in the fair value reserve.
(q) Cash and cash equivalents
For the purpose of presentation in the statement of cash flows, cash and cash equivalents include cash on
hand, cash at bank and fixed deposits with financial institutions which are subject to an insignificant risk of
change in value.

Annual Report 2015. Singapore. Published 08/2016. © 2016 Chubb. Coverages underwritten by one or more subsidiary companies. Not all coverages available in all jurisdictions. Chubb® and its respective logos, and Chubb. Insured.TM are protected trademarks of Chubb.
18
2. Significant accounting policies (continued)
(r) Government grants
Government grants are recognised at their fair value where there is reasonable assurance that the grant will be
received and all attaching conditions will be complied with.
Government grant are recognised in other operating income in profit or loss on a systematic basis over the
periods in which the entity recognises as expenses the related costs for which the grants are intended to
compensate.
(s) Share capital
Ordinary shares are classified as equity.
(t) Offsetting financial instruments
Financial assets and liabilities are offset and the net amount reported in the balance sheet when there is a
legally enforceable right to offset and there is an intention to settle on a net basis or realise the asset and settle
the liability simultaneously.
(u) Dividend
Dividends to the Company’s shareholder are recognised when the dividends are approved for payment.
3. Net insurance premium revenue
2015 2014
$ $
Short-term insurance contracts gross written premium change in unearned premium reserve (Note 13 (f)(ii))
178,777,001
(55,424)
168,117,021
(980,528)
Premium revenue arising from insurance contracts issued 178,721,577 167,136,493
Short-term reinsurance contracts ceded written premium change in unearned premium reserve (Note 13 (f)(ii))
(124,339,974)
646,242
(112,351,750)
441,477
Premium revenue ceded to reinsurers for insurance contracts purchased (123,693,732) (111,910,273)
Net insurance premium revenue 55,027,845 55,226,220
4. Investment income – Net
2015 2014
$ $
Financial assets, available-for-sale: interest income
1,732,446
1,445,134
Cash and cash equivalents: interest income from banks
10,023
8,360
Net realised gains on available for sale financial assets (Note 18) 3,768 11,447
1,746,237 1,464,941
Annual Report 2015. Singapore. Published 08/2016. © 2016 Chubb. Coverages underwritten by one or more subsidiary companies. Not all coverages available in all jurisdictions. Chubb® and its respective logos, and Chubb. Insured.TM are protected trademarks of Chubb.
19
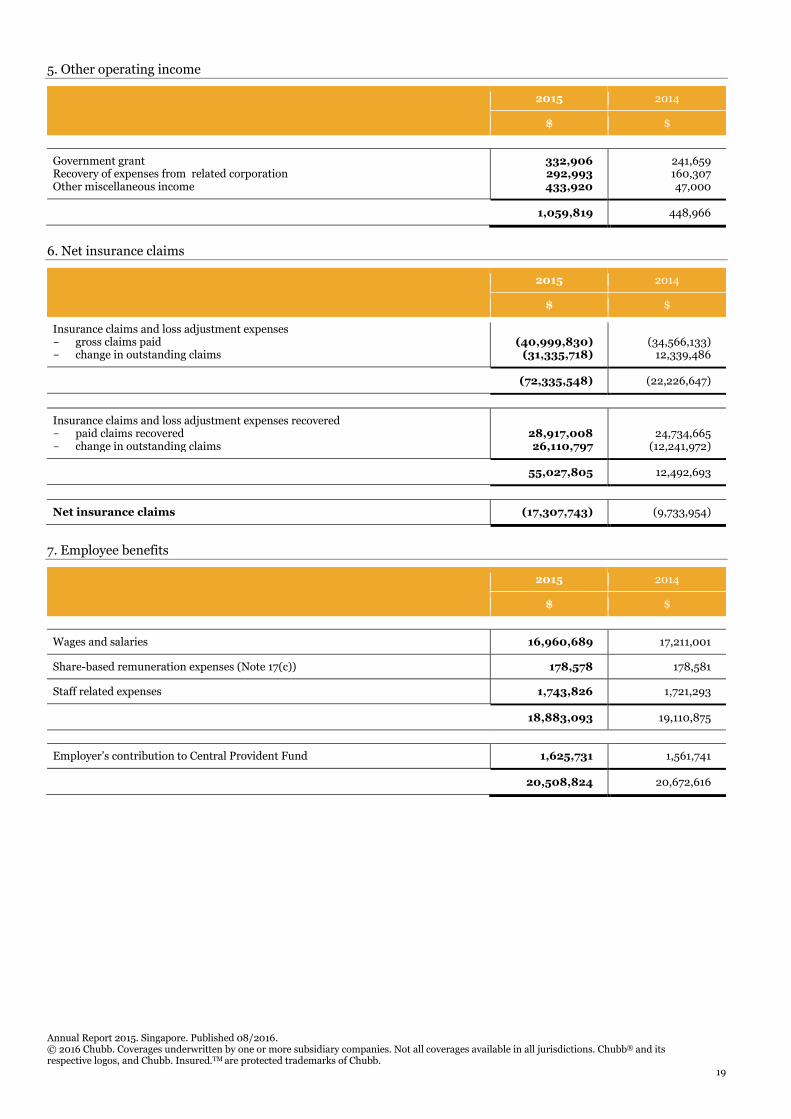
5. Other operating income
2015 2014
$ $
Government grant Recovery of expenses from related corporation Other miscellaneous income
332,906 292,993 433,920
241,659 160,307 47,000
1,059,819 448,966
6. Net insurance claims
2015 2014
$ $
Insurance claims and loss adjustment expenses gross claims paid change in outstanding claims
(40,999,830)
(31,335,718)
(34,566,133)
12,339,486
(72,335,548) (22,226,647)
Insurance claims and loss adjustment expenses recovered paid claims recovered change in outstanding claims
28,917,008 26,110,797
24,734,665
(12,241,972)
55,027,805 12,492,693
Net insurance claims (17,307,743) (9,733,954)
7. Employee benefits
2015 2014
$ $
Wages and salaries 16,960,689 17,211,001
Share-based remuneration expenses (Note 17(c)) 178,578 178,581
Staff related expenses 1,743,826 1,721,293
18,883,093 19,110,875
Employer’s contribution to Central Provident Fund 1,625,731 1,561,741
20,508,824 20,672,616
Annual Report 2015. Singapore. Published 08/2016. © 2016 Chubb. Coverages underwritten by one or more subsidiary companies. Not all coverages available in all jurisdictions. Chubb® and its respective logos, and Chubb. Insured.TM are protected trademarks of Chubb.
20
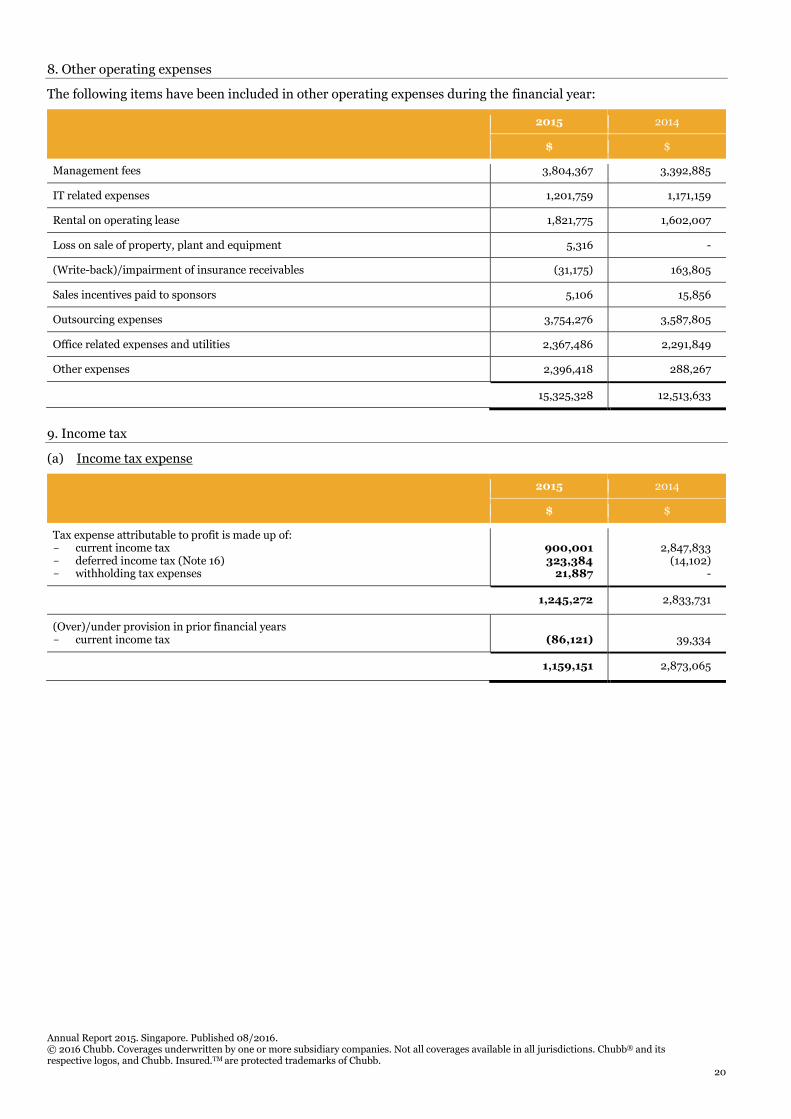
8. Other operating expenses
The following items have been included in other operating expenses during the financial year:
2015 2014
$ $
Management fees 3,804,367 3,392,885
IT related expenses 1,201,759 1,171,159
Rental on operating lease 1,821,775 1,602,007
Loss on sale of property, plant and equipment 5,316 -
(Write-back)/impairment of insurance receivables (31,175) 163,805
Sales incentives paid to sponsors 5,106 15,856
Outsourcing expenses 3,754,276 3,587,805
Office related expenses and utilities 2,367,486 2,291,849
Other expenses 2,396,418 288,267
15,325,328 12,513,633
9. Income tax
(a) Income tax expense
2015 2014
$ $
Tax expense attributable to profit is made up of: current income tax deferred income tax (Note 16) withholding tax expenses
900,001 323,384
21,887
2,847,833
(14,102) -
1,245,272 2,833,731
(Over)/under provision in prior financial years current income tax
(86,121)
39,334
1,159,151 2,873,065

Annual Report 2015. Singapore. Published 08/2016. © 2016 Chubb. Coverages underwritten by one or more subsidiary companies. Not all coverages available in all jurisdictions. Chubb® and its respective logos, and Chubb. Insured.TM are protected trademarks of Chubb.
21
9. Income tax (continued)
(a) Income tax expense (continued)
The tax expense on profit differs from the amount that would arise using the Singapore standard rate of income tax due to the following:
2015 2014
$ $
Profit before income tax 8,208,863 18,138,229
Tax calculated at a tax rate of 17% (2014: 17%) 1,395,507 3,083,601
Effects of: Income taxed at concessionary rate of 10% Expenses not deductible for tax purposes Singapore statutory stepped income exemption Tax incentives Withholding tax expenses (Over)/under provision in prior financial years
(144,810)
407,672 (25,925)
(409,059) 21,887
(86,121)
(221,183)
77,840 (25,925) (80,602)
- 39,334
Tax expense 1,159,151 2,873,065
(b) Movements in current income tax liabilities
2015 2014
$ $
At beginning of financial year 3,280,826 1,980,387
Income tax paid (2,839,986) (1,754,895)
Income tax refunded 77,772 168,167
Tax payable on profit for current financial year 900,001 2,847,833
(Under)/over provision in prior financial year tax expense (86,121) 39,334
At end of financial year 1,332,492 3,280,826

Annual Report 2015. Singapore. Published 08/2016. © 2016 Chubb. Coverages underwritten by one or more subsidiary companies. Not all coverages available in all jurisdictions. Chubb® and its respective logos, and Chubb. Insured.TM are protected trademarks of Chubb.
22
10. Property, plant and equipment
Leasehold
improvements
Office equipment Furniture and
fittings
Computer
equipment
Total
$ $ $ $ $
2015
Cost
Beginning of financial year
Additions
Disposals
3,420,142
6,250,613
(3,420,140)
917,955
899,092
(681,920)
1,595,264
1,843,219
(1,582,485)
1,963,916
613,895
(834,880)
7,897,277
9,606,819
(6,519,425)
End of financial year 6,250,615 1,135,127 1,855,998 1,742,931 10,984,671
Accumulated depreciation
Beginning of financial year
Depreciation charge
Disposals
3,184,841
321,096
(3,285,288)
905,294
47,024
(677,861)
1,498,405
87,036
(1,511,651)
1,836,291
110,742
(834,254)
7,424,831
565,898
(6,309,054)
End of financial year 220,649 274,457 73,790 1,112,779 1,681,675
Net book value
End of financial year
6,029,966
860,670
1,782,208
630,152
9,302,996
2014
Cost
Beginning of financial year
Additions
Disposals
3,256,693
322,107
(158,658)
917,955
-
-
1,522,819
72,445
-
2,064,833
98,387
(199,304)
7,762,300
492,939
(357,962)
End of financial year 3,420,142 917,955 1,595,264 1,963,916 7,897,277
Accumulated depreciation
Beginning of financial year
Depreciation charge
Disposals
3,138,342
140,063
(93,564)
899,600
5,694
-
1,471,498
26,907
-
1,810,068
140,527
(114,304)
7,319,508
313,191
(207,868)
End of financial year 3,184,841 905,294 1,498,405 1,836,291 7,424,831
Net book value
End of financial year
235,301
12,661
96,859
127,625
472,446

Annual Report 2015. Singapore. Published 08/2016. © 2016 Chubb. Coverages underwritten by one or more subsidiary companies. Not all coverages available in all jurisdictions. Chubb® and its respective logos, and Chubb. Insured.TM are protected trademarks of Chubb.
23
11. Financial assets, available-for-sale
The movements during the year are as follows:
2015 2014
$ $
Beginning of financial year 102,156,107 86,055,097
Additions 32,075,815 44,251,994
Fair value (losses)/gains recognised in other comprehensive income (435,637) 93,174
Amortisation of premiums (net of discounts) (830,650) (885,578)
Disposals (29,204,299) (28,414,904)
Currency translation differences 1,760,970 1,056,324
End of financial year 105,522,306 102,156,107
Available-for-sale financial assets are analysed as follows:
2015 2014
$ $
Listed securities: Government securities – SGD Government securities – USD
38,764,753 13,788,988
39,406,348 11,086,959
52,553,741 50,493,307
Loan stocks in corporations – SGD Loan stocks in corporations – USD
38,943,665 14,024,900
37,080,759 14,582,041
52,968,565 51,662,800
105,522,306 102,156,107
The loan stocks and government securities have maturity dates from January 2015 to March 2027 with the following weighted average effective interest rates:
2015 2014
Singapore Dollar 2.57% 2.66%
United States Dollar 2.23% 2.44%
The exposure of investments to interest rate risks is disclosed in Note 22(a)(ii).

Annual Report 2015. Singapore. Published 08/2016. © 2016 Chubb. Coverages underwritten by one or more subsidiary companies. Not all coverages available in all jurisdictions. Chubb® and its respective logos, and Chubb. Insured.TM are protected trademarks of Chubb.
24
12. Insurance receivables and other receivables
2015 2014
$ $
Receivables from insurance and reinsurance contracts:
related companies
third parties
8,699,366
36,973,650
7,236,781
32,388,792
45,673,016 39,625,573
Less provision for impairment of receivables
third parties
(265,525)
(313,858)
45,407,491 39,311,715
Other receivables:
Prepayments
Receivables from related companies
Accrued interest receivable
Rental and other deposits
Sundry receivables
166,042
988,037
754,940
2,125,065
567,496
628,175
1,915,354
784,636
2,123,495
2,044,608
4,601,580 7,496,268
Total insurance receivables and other receivables 50,009,071 46,807,983
The carrying amounts of insurance receivables and other receivables approximate their fair values.
The receivables from related companies are unsecured, interest-free and are repayable on demand.

Annual Report 2015. Singapore. Published 08/2016. © 2016 Chubb. Coverages underwritten by one or more subsidiary companies. Not all coverages available in all jurisdictions. Chubb® and its respective logos, and Chubb. Insured.TM are protected trademarks of Chubb.
25
13. Insurance liabilities and reinsurance assets
2015 2014
$ $
Gross
Current: outstanding claims reserves reserves for unearned premium* no claims bonus provision provision for premiums refund
57,872,644 62,785,657 3,333,038
730,199
47,941,740 62,730,233
3,235,358 442,972
124,721,538 114,350,303
Non-current: outstanding claims reserves provision for premiums refund
55,346,969
2,708,945
33,942,155
2,523,412
58,055,914 36,465,567
Total insurance liabilities, gross 182,777,452 150,815,870
Recoverable from reinsurers
Current: - outstanding claims reserves - reserves for unearned premium
43,823,552 34,498,259
36,610,434 33,852,017
78,321,811 70,462,451
Non-current: outstanding claims reserves
44,835,229
25,937,550
Total reinsurer’s share of insurance liabilities 123,157,040 96,400,001
* Reserves for unearned premium are shown net of deferred acquisition cost.
Net
Current: outstanding claims reserves reserves for unearned premium provision no claims bonus provision provision for premiums refund
14,049,092 28,287,398
3,333,038 730,199
11,331,306
28,878,216 3,235,358
442,972
46,399,727 43,887,852
Non-current: outstanding claims reserves provision for premiums refund
10,511,740 2,708,945
8,004,605 2,523,412
13,220,685 10,528,017
Total insurance liabilities, net 59,620,412 54,415,869

Annual Report 2015. Singapore. Published 08/2016. © 2016 Chubb. Coverages underwritten by one or more subsidiary companies. Not all coverages available in all jurisdictions. Chubb® and its respective logos, and Chubb. Insured.TM are protected trademarks of Chubb.
26
13. Insurance liabilities and reinsurance assets (continued)
Actuarial methods, assumptions and sensitivity analysis
(a) Methods
Four standard actuarial methods (Chain ladder on Incurred and Paid Claims, Bornhuetter-Ferguson and Average Incurred Cost Development) have been applied to each class of business to determine the undiscounted insurance liabilities. The selection of an appropriate method depends on the nature of the claim development and claim volatility. The Outstanding Liability is equal to the Case Estimates in situations where no further loss development is expected.
The insurance liabilities also include an appropriate allowance for allocated and unallocated future claim handling expenses. In addition, an administration expense reserve of 5.6% (2014: 4.8%) of gross premiums (or gross unearned premium reserve) and excess of loss ceded premiums has been included in the assessment of the premium liability.
(b) Assumptions
The following assumptions were used in determining the gross outstanding claim liabilities.
Discounted average weighted term to settlement
The discounted average weighted term to settlement is calculated separately by class of business based on historical payment patterns.
Ultimate claim number – current year
The ultimate claim number for the current accident year is estimated separately by class of business by projecting the number of claims reported to date based on historical reporting patterns.
Average claim size – current year
The average claim size for the current accident year is estimated separately by class of business by projecting the ultimate claims cost based on historical claim development patterns and dividing by the estimated ultimate claim number.
Unallocated claim expense rate (or indirect claim expense rate)
The unallocated claim expense rate is calculated separately by class of business based on historical unallocated claim expenses as a percentage of historical payments.
Discount rate
The discount rate is derived from market yields of government securities at the balance sheet date.
Inflation rate
The inflation rate is implicit in the valuation models used so no explicit inflation rate is used in the valuation. Movement in average claim size provides a de facto estimate of the inflation rate implied in the valuation.

Annual Report 2015. Singapore. Published 08/2016. © 2016 Chubb. Coverages underwritten by one or more subsidiary companies. Not all coverages available in all jurisdictions. Chubb® and its respective logos, and Chubb. Insured.TM are protected trademarks of Chubb.
27
13. Insurance liabilities and reinsurance assets (continued)
(c) Sensitivity analysis
The Company conducts sensitivity analysis to quantify the exposure to risk of changes in the key underlying variables. The valuations included in the reported results are calculated using certain assumptions about these variables as disclosed above. The movement in any key variable will impact the performance and equity of the Company. The table below shows how a change in each assumption will affect the outstanding claims liabilities (net) and profit or loss. As no explicit inflation rate is used in the valuation no sensitivity analysis is able to be carried out for a change in the inflation rate.
Variables Change in variable
Increase/ (decrease) in
liability
Increase/ (decrease)
in profit before tax
$ $
Discounted average weighted term to settlement +0.5 years (143,912) 143,912
-0.5 years 137,711 (137,711)
Ultimate claim number - current year +10% 2,429,335 (2,429,335)
-10% (2,429,336) 2,429,336
Average claim size - current year +10% 2,429,335 (2,429,335)
-10% (2,429,336) 2,429,336
Unallocated claim expense rate +1% 1,074,861 (1,074,861)
-1% (1,074,862) 1,074,862
Discount rate +1% (308,704) 308,704
-1% 308,661 (308,661)
(d) Process for determining risk margin
The overall risk margin was determined after allowing for uncertainty of the outstanding claim estimate. Uncertainty was analysed for each class of business taking into account potential uncertainties relating to the actuarial models and assumptions, the quality of the underlying data used in the models and the general insurance environment.
The estimate of uncertainty is greater for long tailed classes when compared to short tail classes due to the longer time until settlement of outstanding claims.
The assumptions regarding uncertainty for each class were applied to the gross and net central estimates, and the results were aggregated to arrive at an overall provision which is intended to have a 75% probability of sufficiency. The risk margin applied in 2015 is 14.1% (2014: 14.7%).
(e) Claims development tables (for all lines) The following tables show the development of gross and net undiscounted outstanding claims relative to the ultimate expected claims for the ten most recent accident years:

Annual Report 2015. Singapore. Published 08/2016. © 2016 Chubb. Coverages underwritten by one or more subsidiary companies. Not all coverages available in all jurisdictions. Chubb® and its respective logos, and Chubb. Insured.TM are protected trademarks of Chubb.
28
13. Insurance liabilities and reinsurance assets (continued)
(e) Claims development tables (for all lines) (continued)
Gross
Accident year 2006 2007 2008 2009 2010 2011 2012 2013 2014 2015 Total
$ $ $ $ $ $ $ $ $ $ $
Estimate of ultimate claims costs:
at end of accident year 30,045,680 45,913,501 32,837,304 42,464,715 42,429,626 46,821,241 47,924,426 50,202,369 44,785,161 69,498,739
one year later 26,424,190 37,024,162 26,893,995 44,190,460 33,566,706 46,802,599 43,235,716 42,203,265 48,145,072
two years later 24,087,594 37,091,297 26,197,343 40,030,663 31,682,587 42,581,975 38,166,395 41,535,495
three years later 22,413,438 36,711,639 25,094,506 37,901,754 30,558,523 36,196,967 33,926,972
four years later 20,940,647 36,207,525 23,401,250 36,270,307 29,764,524 35,706,237
five years later 20,734,686 35,412,979 23,012,851 31,535,544 29,740,136
six years later 22,710,628 35,326,658 26,644,914 31,629,263
seven years later 19,370,336 36,588,186 27,711,981
eight years later 18,781,302 36,630,364
nine years later 18,834,670
Current estimate of cumulative claims 18,834,670 36,630,364 27,711,981 31,629,263 29,740,136 35,706,237 33,926,972 41,535,495 48,145,072 69,498,739 373,358,929
Cumulative payments to date (18,673,439) (36,630,364) (27,575,600) (30,333,606) (28,597,954) (33,616,655) (29,250,166) (36,114,525) (21,578,517) (15,260,891) (277,631,717)
Outstanding claims – undiscounted 161,231 - 136,381 1,295,657 1,142,182 2,089,582 4,676,806 5,420,970 26,566,555 54,237,848 95,727,212
Discount (633) - (582) (8,360) (4,534) (14,276) (45,561) (82,308) (562,462) (1,044,471) (1,763,187)
Outstanding claims 160,598 - 135,799 1,287,297 1,137,648 2,075,306 4,631,245 5,338,662 26,004,093 53,193,377 93,964,025
Outstanding claims in respect of prior accident years
20,657
Risk margin 13,991,298
Claims handling costs 5,243,633
Total gross outstanding claims 113,219,613

Annual Report 2015. Singapore. Published 08/2016. © 2016 Chubb. Coverages underwritten by one or more subsidiary companies. Not all coverages available in all jurisdictions. Chubb® and its respective logos, and Chubb. Insured.TM are protected trademarks of Chubb.
29
13. Insurance liabilities and reinsurance assets (continued)
(e) Claims development tables (for all lines) (continued)
Net
Accident year 2006 2007 2008 2009 2010 2011 2012 2013 2014 2015 Total
$ $ $ $ $ $ $ $ $ $ $
Estimate of ultimate claims costs:
at end of accident year 8,796,499 8,684,039 8,140,996 9,725,452 9,544,407 12,724,979 11,168,927 11,079,608 13,399,865 16,324,891
one year later 8,571,017 7,511,480 6,559,241 9,066,624 9,429,816 13,371,816 9,868,167 9,647,115 11,956,984
two years later 8,155,807 7,024,983 6,635,147 8,877,843 8,804,654 12,754,415 9,135,836 10,051,642
three years later 7,674,113 6,925,373 6,580,737 8,319,805 8,490,895 11,987,156 9,033,074
four years later 7,379,051 6,954,269 6,310,748 7,945,912 8,035,862 12,090,626
five years later 7,443,926 6,890,184 6,188,027 8,142,405 8,070,935
six years later 7,085,453 6,847,504 6,265,912 7,962,161
seven years later 6,937,861 6,834,218 6,083,242
eight years later 6,642,975 6,887,772
nine years later 6,632,988
Current estimate of cumulative claims 6,632,988 6,887,772 6,083,242 7,962,161 8,070,935 12,090,626 9,033,074 10,051,642 11,956,984 16,324,891 95,094,315
Cumulative payments to date (6,472,527) (6,868,268) (5,999,309) (7,783,118) (8,031,257) (11,395,401) (8,615,853) (8,928,932) (8,972,585) (5,535,264) (78,602,514)
Outstanding claims – undiscounted 160,461 19,504 83,933 179,043 39,678 695,225 417,221 1,122,710 2,984,399 10,789,627 16,491,801
Discount (630) (77) (381) (1,453) (208) (5,285) (4,348) (18,228) (52,347) (178,176) (261,133)
Outstanding claims 159,831 19,427 83,552 177,590 39,470 689,940 412,873 1,104,482 2,932,052 10,611,451 16,230,668
Outstanding claims in respect of prior accident years
1,414
Risk margin 3,085,117
Claims handling costs 5,243,633
Total net outstanding claims 24,560,832
Annual Report 2015. Singapore. Published 08/2016. © 2016 Chubb. Coverages underwritten by one or more subsidiary companies. Not all coverages available in all jurisdictions. Chubb® and its respective logos, and Chubb. Insured.TM are protected trademarks of Chubb.
30
13. Insurance liabilities and reinsurance assets (continued)
(f) Movements in insurance liabilities and reinsurance assets
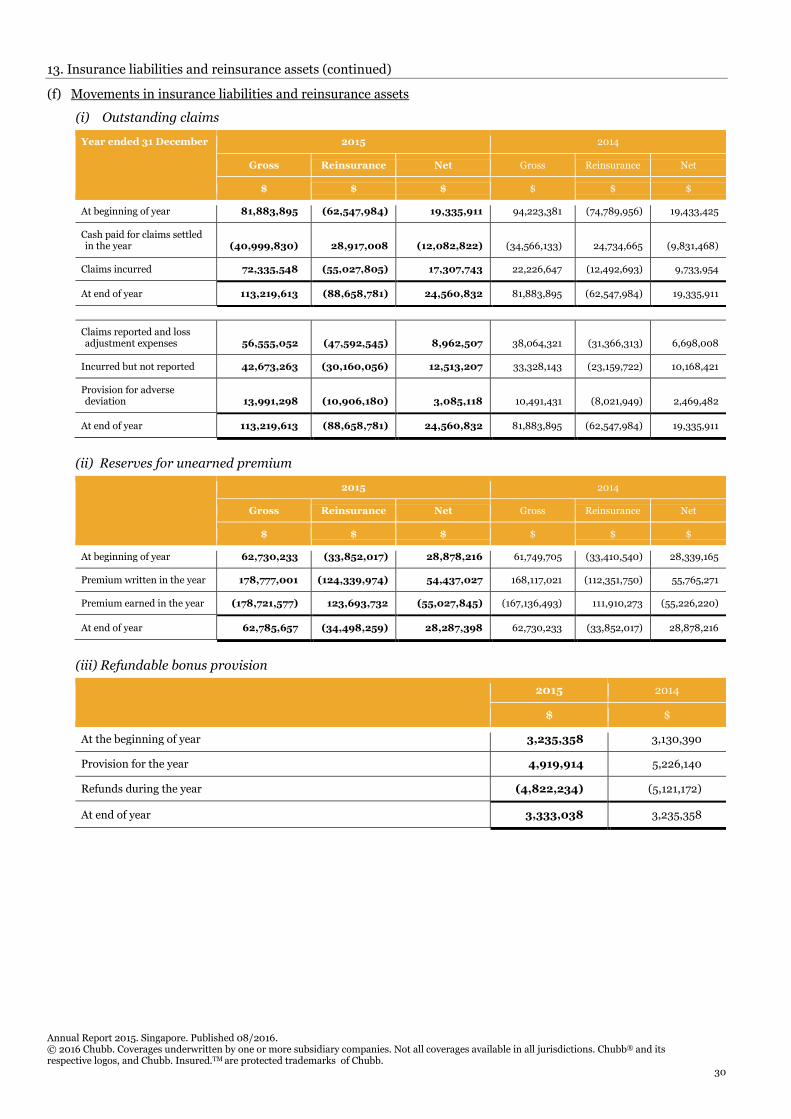
(i) Outstanding claims
Year ended 31 December 2015 2014
Gross Reinsurance Net Gross Reinsurance Net
$ $ $ $ $ $
At beginning of year 81,883,895 (62,547,984) 19,335,911 94,223,381 (74,789,956) 19,433,425
Cash paid for claims settled in the year
(40,999,830)
28,917,008
(12,082,822)
(34,566,133)
24,734,665
(9,831,468)
Claims incurred 72,335,548 (55,027,805) 17,307,743 22,226,647 (12,492,693) 9,733,954
At end of year 113,219,613 (88,658,781) 24,560,832 81,883,895 (62,547,984) 19,335,911
Claims reported and loss adjustment expenses
56,555,052
(47,592,545)
8,962,507
38,064,321
(31,366,313)
6,698,008
Incurred but not reported 42,673,263 (30,160,056) 12,513,207 33,328,143 (23,159,722) 10,168,421
Provision for adverse deviation
13,991,298
(10,906,180)
3,085,118
10,491,431
(8,021,949)
2,469,482
At end of year 113,219,613 (88,658,781) 24,560,832 81,883,895 (62,547,984) 19,335,911
(ii) Reserves for unearned premium
2015 2014
Gross Reinsurance Net Gross Reinsurance Net
$ $ $ $ $ $
At beginning of year 62,730,233 (33,852,017) 28,878,216 61,749,705 (33,410,540) 28,339,165
Premium written in the year 178,777,001 (124,339,974) 54,437,027 168,117,021 (112,351,750) 55,765,271
Premium earned in the year (178,721,577) 123,693,732 (55,027,845) (167,136,493) 111,910,273 (55,226,220)
At end of year 62,785,657 (34,498,259) 28,287,398 62,730,233 (33,852,017) 28,878,216
(iii) Refundable bonus provision
2015 2014
$ $
At the beginning of year 3,235,358 3,130,390
Provision for the year 4,919,914 5,226,140
Refunds during the year (4,822,234) (5,121,172)
At end of year 3,333,038 3,235,358

Annual Report 2015. Singapore. Published 08/2016. © 2016 Chubb. Coverages underwritten by one or more subsidiary companies. Not all coverages available in all jurisdictions. Chubb® and its respective logos, and Chubb. Insured.TM are protected trademarks of Chubb.
31
13. Insurance liabilities and reinsurance assets (continued)
(f) Movements in insurance liabilities and reinsurance assets (continued)
(iv) Provision for premium refund
2015 2014
$ $
At the beginning of year 2,966,384 4,294,026
Movement for the year 2,839,563 (156,627)
Refunds during the year (2,366,803) (1,171,015)
At end of year 3,439,144 2,966,384
14. Cash and cash equivalents
2015 2014
$ $
Cash on hand 400 2,346
Cash at bank 14,244,765 6,116,684
Fixed deposits with financial institutions 1,980,000 2,310,000
16,225,165 8,429,030
The carrying amounts of cash and cash equivalents approximate their fair values.
The Company has fixed deposits with financial institutions with an average maturity of 1 month (2014: 1 month) from the end of the financial year with the following weighted average effective interest rates:
2015 2014
$ $
Singapore Dollar 0.93% 0.15%
The exposure of cash and cash equivalents to interest rate risks is disclosed in Note 22(a)(ii).

Annual Report 2015. Singapore. Published 08/2016. © 2016 Chubb. Coverages underwritten by one or more subsidiary companies. Not all coverages available in all jurisdictions. Chubb® and its respective logos, and Chubb. Insured.TM are protected trademarks of Chubb.
32
15. Insurance payables and other payables
2015 2014
$ $
Amount due to insureds, agents, brokers and reinsurers:
related companies third parties
29,670,831 9,858,016
22,227,984 8,098,466
39,528,847 30,326,450
Other payables:
payables to related companies advanced premium received share-based remuneration payable sundry creditors GST payable accrued operating expenses
439,606 463,730 838,764
6,142,867 1,219,654 4,573,520
497,656 108,888 905,892
3,419,074 1,150,755 3,794,201
13,678,141 9,876,466
Total insurance payables and other payables 53,206,988 40,202,916
The payables to related companies are unsecured, interest-free and are repayable on demand. The carrying amounts of insurance payables and other payables approximate their fair values.
16. Deferred income taxes
Deferred income tax assets and liabilities are offset when there is a legally enforceable right to set off current income tax assets against current income tax liabilities and when the deferred income taxes relate to the same fiscal authority. The amounts, determined after appropriate offsetting, are shown on the balance sheet.
The movement in the deferred income tax account is as follows:
2015 2014
$ $
Beginning of financial year (27,717) (25,550)
Tax charge/(credit) to: Profit or loss (Note 9(a)) Fair value reserve (Note 18)
323,384 (60,279)
(14,102)
11,935
End of financial year 235,388 (27,717)
The movement in the deferred income tax assets and liabilities (prior to offsetting of balances within the same tax jurisdiction) during the financial year is as follows:

Annual Report 2015. Singapore. Published 08/2016. © 2016 Chubb. Coverages underwritten by one or more subsidiary companies. Not all coverages available in all jurisdictions. Chubb® and its respective logos, and Chubb. Insured.TM are protected trademarks of Chubb.
33
16. Deferred income taxes (continued)
Deferred income tax liabilities/(assets):
Accelerated tax depreciation
Fair value (losses)/gains
Others
Total
$ $ $ $
At 1 January 2015 34,934 (34,468) (28,183) (27,717)
Credited to profit or loss 325,623 - (2,239) 323,384
Credited to equity (Note 18) - (60,279) - (60,279)
At 31 December 2015 360,555 (94,747) (30,422) 235,388
At 1 January 2014 50,300 (46,403) (29,447) (25,550)
Credited to profit or loss (15,366) - 1,264 (14,102)
Credited to equity (Note 18) - 11,935 - 11,935
At 31 December 2014 34,934 (34,468) (28,183) (27,717)
17. Share capital
(a)
No. of shares Issued Share Capital
$
2015
Beginning and end of financial year 35,000,000 35,000,000
2014
Beginning and end of financial year 35,000,000 35,000,000
All issued ordinary shares are fully paid.
(b) Share based remuneration
ACE Limited, ultimate holding corporation has a restricted share grant plan, a restricted share option plan and an employee share purchase plan. The total share based remuneration expenses charged to profit or loss was $178,578 (2014: $178,581).
Restricted share grant plan
Under ACE Limited's 2004 Long Term Incentive Plan, 1,955 restricted common shares were awarded during the year ended 31 December 2015 (2014: 1,803 shares) to eligible employees of the Company. These shares vest at various dates over a 4-year period from the grant dates and any unvested shares are cancelled on termination of the employment of the eligible employees. This plan is a group scheme with expenses incurred under the scheme charged out by ACE Limited to the Company on an annual basis. The annual expense is based on an amortised calculation that is reflective of the current year’s expense portion of all restricted share grants issued in the current and prior years, and is consistent with the treatment required by FRS 102. There is no liability to the Company for the unamortised portion of the restrictive stock grants issued. The amortised calculation incorporates the fair market value of ACE Limited’s common shares in determining the expense amount. Expected future dividend payments in relation to the restrictive stock grants issued are made directly by ACE Limited to the eligible employees. The total value of the shares granted during the year was $144,137 (2014: $144,135).

Annual Report 2015. Singapore. Published 08/2016. © 2016 Chubb. Coverages underwritten by one or more subsidiary companies. Not all coverages available in all jurisdictions. Chubb® and its respective logos, and Chubb. Insured.TM are protected trademarks of Chubb.
34
17. Share capital (continued)
(b) Share based remuneration (continued)
Restricted share option plan
Under ACE Limited’s 2004 Long Term Incentive Plan, restrictive share options were granted to eligible employees of the Company. The exercisable price of these options is the fair market value of ACE Limited’s common shares at issue date. These options vest at various dates over a 3-year period from the grant date and any unvested options are cancelled on termination of employment. This plan is a group scheme with expenses incurred under the scheme charged out by ACE Limited to the Company on an annual basis. The annual expense is based on an amortised calculation that is reflective of the current year’s expense portion of all restricted share options issued in the current and prior years, and is consistent with the treatment required by FRS102. There is no liability to the Company for the unamortised portion of the restrictive stock options issued.
Any option not exercised or cancelled pursuant to the terms of plan will be forfeited by the tenth anniversary from the date of grant. The total value of the options granted during the year was $34,441 (2014: $34,446).
Movements in the number of share options outstanding and their related weighted average exercise prices are as follows:
2015 2014
Average exercise price in SGD per share
Options
Average exercise price in SGD per share
Options
At 1 January 9,222 8,845
Granted Transfer in Exercised Lapsed
161.64 162.27 85.52
136.89
2,601 (232)
(3,630) (288)
127.62 112.62 69.03 114.76
2,007 (498) (601) (531)
At 31 December 7,673 9,222
In 2015, 2,601 options (2014: 2,007 options) were granted at $161.64 (2014: $127.62) per option and 3,802 options (2014: 6,082) are exercisable as at 31 December 2015. 3,630 (2014: 601) options were exercised during the year and the related weighted average share price of the options exercised was $85.52 (2014: $69.03) per share.
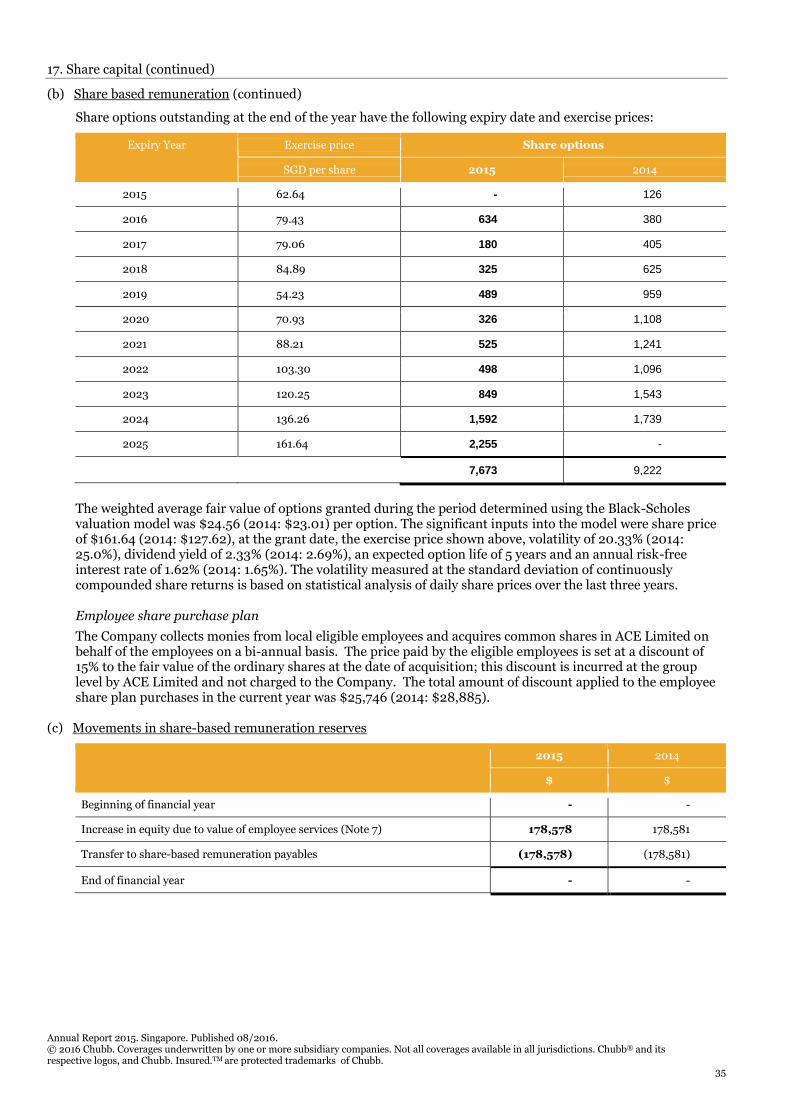
Annual Report 2015. Singapore. Published 08/2016. © 2016 Chubb. Coverages underwritten by one or more subsidiary companies. Not all coverages available in all jurisdictions. Chubb® and its respective logos, and Chubb. Insured.TM are protected trademarks of Chubb.
35
17. Share capital (continued)
(b) Share based remuneration (continued)
Share options outstanding at the end of the year have the following expiry date and exercise prices:
Expiry Year Exercise price Share options
SGD per share 2015 2014
2015 62.64 - 126
2016 79.43 634 380
2017 79.06 180 405
2018 84.89 325 625
2019 54.23 489 959
2020 70.93 326 1,108
2021 88.21 525 1,241
2022 103.30 498 1,096
2023 120.25 849 1,543
2024 136.26 1,592 1,739
2025 161.64 2,255 -
7,673 9,222
The weighted average fair value of options granted during the period determined using the Black-Scholes valuation model was $24.56 (2014: $23.01) per option. The significant inputs into the model were share price of $161.64 (2014: $127.62), at the grant date, the exercise price shown above, volatility of 20.33% (2014: 25.0%), dividend yield of 2.33% (2014: 2.69%), an expected option life of 5 years and an annual risk-free interest rate of 1.62% (2014: 1.65%). The volatility measured at the standard deviation of continuously compounded share returns is based on statistical analysis of daily share prices over the last three years.
Employee share purchase plan
The Company collects monies from local eligible employees and acquires common shares in ACE Limited on behalf of the employees on a bi-annual basis. The price paid by the eligible employees is set at a discount of 15% to the fair value of the ordinary shares at the date of acquisition; this discount is incurred at the group level by ACE Limited and not charged to the Company. The total amount of discount applied to the employee share plan purchases in the current year was $25,746 (2014: $28,885).
(c) Movements in share-based remuneration reserves
2015 2014
$ $
Beginning of financial year - -
Increase in equity due to value of employee services (Note 7) 178,578 178,581
Transfer to share-based remuneration payables (178,578) (178,581)
End of financial year - -

Annual Report 2015. Singapore. Published 08/2016. © 2016 Chubb. Coverages underwritten by one or more subsidiary companies. Not all coverages available in all jurisdictions. Chubb® and its respective logos, and Chubb. Insured.TM are protected trademarks of Chubb.
36
18. Fair value reserve
2015 2014
$ $
Beginning of financial year (51,507) (121,299)
Net fair value (losses)/gains during the financial year (435,637) 93,174
Deferred tax on fair value changes (Note 16) 60,279 (11,935)
Transfer to profit or loss on disposal (Note 4) (3,768) (11,447)
End of financial year (430,633) (51,507)
The fair value reserve is non-distributable.
19. Dividends
2015 2014
$ $
Ordinary dividends paid Interim exempt (one-tier) dividend for 2015 of nil cents (2014: 29.98 cents) per share paid
-
10,493,120
No dividend was paid in the year 2015.
20. Commitments
Operating lease commitments where company is a lessee
The Company leases various office spaces under non-cancellable operating lease agreements. The leases have varying terms, escalation clauses and renewal rights.
The future aggregate minimum lease payments under non-cancellable operating leases contracted for at the reporting date but not recognised as liabilities, are as follows:
2015 2014
$ $
Not later than one year 4,872,261 3,576,314
Later than one year but not later than five years 21,148,498 17,014,406
More than five years 3,523,171 7,397,568
29,543,930 27,988,288
The rental on operating lease amounting to $1,892,956 (2014: $1,642,147) is borne by related parties for the occupancy of the office space.
21. Immediate and ultimate holding corporations
The Company is a wholly-owned subsidiary of ACE-INA Overseas Insurance Company Limited, incorporated in Bermuda.
Following the completed acquisition of The Chubb Corporation on 14 January 2016, ACE Limited changed its name to Chubb Limited. The ultimate holding corporation is Chubb Limited, incorporated in Switzerland.

Annual Report 2015. Singapore. Published 08/2016. © 2016 Chubb. Coverages underwritten by one or more subsidiary companies. Not all coverages available in all jurisdictions. Chubb® and its respective logos, and Chubb. Insured.TM are protected trademarks of Chubb.
37
22. Financial risk management
The Company’s activities expose it to a variety of financial risks. The components of financial risk are market risk (including currency risk, price risk and interest rate risk), credit risk and liquidity risk.
These financial risks arise from the investment and underwriting activities of the business. Investment activity of the business is exposed to the general and specific market movements. The underwriting activity of the business generates credit and liquidity risk through insurance and reinsurance receivables and payables.
The Company’s overall risk management focuses to mitigate potential adverse effects of these risks on the financial performance of the Company. The notes below explain the management of financial risks.
Underwriting activity governance
The underwriting activity is governed by the Company’s Risk Management Framework. In the framework, the Board of Directors has overall risk management responsibility of the Company and approves its risk management strategy ensuring key risks are identified and managed appropriately. The framework includes the following:
i) continuous identification of risks and the management of internal controls; ii) training and guidance of all relevant employees in the management of risk; iii) management reporting, monitoring and action to address significant issues adversely affecting the business; iv) implementation of loss prevention and control measures to reduce loss, injury, or damage; v) maintenance of the highest practicable protection standards against losses to assets and business
interruption; vi) efficient management of information, records and loss recording systems; vii) implementation of proactive strategies to limit the liability of the Company and protect its reputation; viii) crisis management and recovery by planning for significant risks; ix) cost benefit management of insurance and other risk control programs; and x) clearly defined managerial responsibilities and controls.
Investment activity governance
The principal investment objective of the Company is to ensure that funds will be available to meet the Company’s primary insurance and reinsurance obligations. Within this broad liquidity constraint, the investment portfolio’s structure seeks to maximise return subject to specifically-approved guidelines of overall asset classes, credit quality, liquidity, and volatility of expected returns. As such, the Company’s investment portfolio is invested primarily in investment-graded fixed-income securities as measured by the major rating agencies.
The management of the Company’s investment portfolio is the responsibility of the Investment Committee which is accountable to ACE Asset Management Inc., incorporated in the United States of America, for monitoring, evaluating, development and coordination of the Company’s investment related activities.
The Investment Committee is chaired by the Asia Pacific Regional Chief Financial Officer and is comprised of at least three members. Under the guidance of the ACE Asset Management Inc., the Investment Committee shall:
(i) establish recommended investment guidelines that are appropriate to the prescribed asset allocation targets; (ii) monitor performance of investment returns, reporting and internal controls for all investment activities,
foreign exchange, interest rate, liquidity and credit risks and to ensure appropriate systems in place for identifying and monitoring such risks; and
(iii) recommend the appointment of fund managers.
The investment management function is outsourced to Western Asset Management Company Pte Limited.
(a) Market risk
(i) Currency risk
The Company's currency risk arises mainly with respect to insurance business and investment activities transactions denominated in United States Dollar. United States Dollar liabilities are backed by assets in the underlying currency. Exposures to foreign currency risks are monitored on an on-going basis.

Annual Report 2015. Singapore. Published 08/2016. © 2016 Chubb. Coverages underwritten by one or more subsidiary companies. Not all coverages available in all jurisdictions. Chubb® and its respective logos, and Chubb. Insured.TM are protected trademarks of Chubb.
38
22. Financial risk management (continued)
(a) Market risk (continued)
(i) Currency risk (continued)
The Company’s policy seeks to ensure an approximate currency match of assets and liabilities is maintained, with the bulk of surplus funds matched by Singapore Dollar and lesser surpluses held in United States Dollar.
The Company’s currency exposure based on the information provided to key management is as follows:
2015
SGD USD Others Total
S$ S$ S$ S$
Financial assets
Available-for-sale financial assets 77,708,418 27,813,888 - 105,522,306
Insurance receivables and other receivables 28,868,577 15,757,496 5,382,998 50,009,071
Reinsurance assets 73,518,191 45,295,276 4,343,573 123,157,040
Cash and cash equivalents 6,309,651 9,915,514 - 16,225,165
186,404,837 98,782,174 9,726,571 294,913,582
Financial liabilities
Insurance liabilities 119,498,852 54,386,320 8,892,280 182,777,452
Insurance payables and other payables 25,393,740 23,950,899 3,862,349 53,206,988
144,892,592 78,337,219 12,754,629 235,984,440
Currency exposure - 20,444,955 (3,028,058) -
2014
SGD USD Others Total
S$ S$ S$ S$
Financial assets
Available-for-sale financial assets 76,487,107 25,669,000 - 102,156,107
Insurance receivables and other receivables 26,381,356 18,164,984 2,261,643 46,807,983
Reinsurance assets 60,739,624 31,905,129 3,755,248 96,400,001
Cash and cash equivalents 5,545,785 2,883,245 - 8,429,030
169,153,872 78,622,358 6,016,891 253,793,121
Financial liabilities
Insurance liabilities 102,736,659 39,508,690 8,570,521 150,815,870
Insurance payables and other payables 26,182,915 13,636,206 383,795 40,202,916
128,919,574 53,144,896 8,954,316 191,018,786
Currency exposure - 25,477,462 (2,937,425) -

Annual Report 2015. Singapore. Published 08/2016. © 2016 Chubb. Coverages underwritten by one or more subsidiary companies. Not all coverages available in all jurisdictions. Chubb® and its respective logos, and Chubb. Insured.TM are protected trademarks of Chubb.
39
22. Financial risk management (continued)
(a) Market risk (continued)
(i) Currency risk (continued)
If USD changes against the SGD by 5% (2014: 5%) with all other variables including tax rate being held constant, the effects arising from the currency exposure will be as follows:
Increase/(decrease)
2015 2014
Profit before tax Impact on equity Profit before tax Impact on equity
S$ S$ S$ S$
Increase/(decrease)
USD against SGD strengthened weakened
1,022,248
(1,022,248)
848,466
(848,466)
1,273,873
(1,273,873)
1,057,315
(1,057,315)
(ii) Interest rate risks
Cashflow interest rate risk is the risk that the future cash flows of a financial instrument will fluctuate because of changes in market interest rates. Fair value interest rate risk is the risk that the value of a financial instrument will fluctuate due to changes in market interest rates. The Company manages its interest rate risks by placing such balances on varying maturities and interest rate terms.
The income and operating cash flows are substantially independent of the changes in market interest rates as the Company's investment policy is to only invest in fixed income securities.
A change of 50 basis points (2014: 7 basis points) for cash and bank deposits and a change of 50 basis points (2014: 50 basis points) for available-for-sale financial assets interest yield across all portfolio consecutively would increase/(decrease) the market value of the investment and equity by the amounts as shown below. This analysis assumes that all other variables remain constant.
Increase/(decrease)
2015 2014
Profit after tax Other comprehensive
income
Profit after tax Other comprehensive
income
S$ S$ S$ S$
Cash and bank deposits
- increased by (50 bps) (2014: +7 bps)
4,160
-
479
-
- decreased by (50 bps) (2014: -7 bps)
(4,160)
-
(479)
-
Available-for-sale financial assets
- increased by (50 bps) (2014: +50 bps)
-
(975,952)
-
(1,109,591)
- decreased by (50 bps) (2014: -50 bps)
-
1,091,348
-
1,214,688

Annual Report 2015. Singapore. Published 08/2016. © 2016 Chubb. Coverages underwritten by one or more subsidiary companies. Not all coverages available in all jurisdictions. Chubb® and its respective logos, and Chubb. Insured.TM are protected trademarks of Chubb.
40
22. Financial risk management (continued)
(b) Credit risk
Credit risk refers to the risk that a counterparty will default on its contractual obligations resulting in financial loss to the Company. The major classes of financial assets of the Company are insurance receivables, re-insurance assets, investments in bonds, cash and bank deposits.
Credit risk – investment
The Company is exposed to investment credit and price risk as a result of its holdings in fixed income and equity investments. The investment guidelines seek to limit the credit risk of each of the portfolios through specifying eligible/ineligible investments; setting maximum counterparty exposures and minimum weighted credit quality and individual issuer credit quality.
Credit risk – insurance operations
The Company is exposed to credit risk as a result of its regular insurance and reinsurance activity. The areas of key exposure are:
(i) reinsurers’ share of provision for claims outstanding; (ii) debtors arising from reinsurers in respect of claims already paid; (iii) amount due from direct insurance and reinsurance policyholders; and (iv) amount due from direct insurance and reinsurance intermediaries.
Ceded reinsurance is used to manage and mitigate inwards direct insurance and reinsurance risk. Ceded reinsurance does not discharge the Company’s liability as primary insurer. If a ceded reinsurer fails to pay a claim, the Company remains liable for the payment to the policyholder.
With regard to direct insurance and reinsurance receivables, the Company operates a credit control committee to review all outstanding receivables, a process for monitoring credit risk from insurance operations.
The Company manages its credit risk through brokers and reinsurers that have good credit history. The Head Office approves such reinsurers based on a credit worthiness with a minimum A rating by the rating agencies.
The maximum exposure to credit risk for each class of financial instruments is the carrying amount of that class of financial instruments presented on the balance sheet.
The credit risk for each class of financial instruments based on information provided to key management is as follows:
Rating* (AAA to A)
Rating* (BBB to B)
Rating* (CCC to D)
Unrated** Total
$ $ $ $ $
As at 31 December 2015
Insurance receivables and other receivables 14,024,115 2,685,010 11,774 33,288,172 50,009,071
Available-for sale financial assets 93,275,518 8,978,530 - 3,268,258 105,522,306
Cash and cash equivalents 16,224,765 - - 400 16,225,165
123,524,398 11,663,540 11,774 36,556,830 171,756,542
As at 31 December 2014
Insurance receivables and other receivables 11,789,975 386,711 - 34,631,297 46,807,983
Available-for sale financial assets 87,145,217 8,589,706 - 6,421,184 102,156,107
Cash and cash equivalents 8,426,684 - - 2,346 8,429,030
107,361,876 8,976,417 - 41,054,827 157,393,120

Annual Report 2015. Singapore. Published 08/2016. © 2016 Chubb. Coverages underwritten by one or more subsidiary companies. Not all coverages available in all jurisdictions. Chubb® and its respective logos, and Chubb. Insured.TM are protected trademarks of Chubb.
41
22. Financial risk management (continued)
(b) Credit risk (continued)
* Based on public ratings assigned by external rating agencies including S&P, Moody’s and A.M. Best.
** Unrated includes direct customers mainly for Accident & Health business.
(i) Financial assets that are neither past due nor impaired
Bank deposits and investments in bonds are neither past due nor impaired. Bank deposits are placed with reputable banks and financial institutions, and investments are in bonds and government-related securities. The bond portfolio and funds placed with external manager are primarily invested in investment grade securities. Insurance receivables that are neither past due nor impaired are substantially companies with a good collection history with the Company.
There is no other class of financial assets that is past due and/or impaired except for insurance receivables.
The age analysis of insurance receivables is as follows:
2015 2014
$ $
Neither past due nor impaired 22,021,649 18,903,079
Past due but not impaired Less than 3 months Above 3 months but not exceeding 9 months Above 9 months
11,366,497
10,328,338 1,691,007
10,171,388 6,895,510 3,341,738
45,407,491 39,311,715
The carrying amount of insurance receivables individually determined to be impaired and the movement in the related allowance for impairment is as follows:
2015 2014
$ $
Gross Amount 265,525 313,858
Less: Allowance for impairment (265,525) (313,858)
- -
Beginning of financial year 313,858 262,647
Allowance made 80,841 206,959
Allowance utilised (140,171) (154,752)
Currency translation difference 10,997 (996)
End of financial year 265,525 313,858
The basis of determining impairment is set out in the accounting policy Note 2(e)(5)(i).
(c) Liquidity risk
Liquidity risk refers to the risk that the Company will encounter difficulty in meeting obligations associated with financial liabilities. To manage liquidity risk, the Company monitors and maintains a level of cash and cash equivalents to finance the Company’s operations and mitigate the effects of fluctuations in cash flows. The Company maintains its investment in fixed income instruments which are easily convertible to cash whenever needed.

Annual Report 2015. Singapore. Published 08/2016. © 2016 Chubb. Coverages underwritten by one or more subsidiary companies. Not all coverages available in all jurisdictions. Chubb® and its respective logos, and Chubb. Insured.TM are protected trademarks of Chubb.
42
22. Financial risk management (continued)
(c) Liquidity risk (continued)
The table below analyses the maturity profile of the Company’s financial liabilities based on projected undiscounted cash flows.
Less than 1 year Between 1 and 5 years
More than 5 years
Total
S$ S$ S$ S$
As at 31 December 2015
Insurance liabilities 80,794,962 99,633,489 6,286,114 186,714,565
Insurance payables and other payables 53,206,988 - - 53,206,988
134,001,950 99,633,489 6,286,114 239,921,553
As at 31 December 2014
Insurance liabilities 72,745,513 76,450,993 2,856,921 152,053,427
Insurance payables and other payables 40,202,916 - - 40,202,916
112,948,429 76,450,993 2,856,921 192,256,343
(d) Capital risk
The Company’s objectives when managing capital are:
Comply with the insurance capital requirements as set out in the Insurance Act (Chapter 142) Insurance (Valuation and Capital) Regulations. In this respect the Company manages its capital on a basis of 120% of its minimum regulatory capital position. Management considers the current capital adequacy ratio of 267% (2014: 247%) sufficient to optimise shareholder’s return and to support the capital required to write its business;
Safeguard the Company’s ability to continue as a going concern, so that it can continue to provide returns for shareholders and benefits for other stakeholders; and
Provide an adequate return to shareholders by pricing insurance contracts commensurately with the level of risk.
In addition to other applicable regulatory requirements, insurers are required to maintain actuarial reserves under the Insurance Act (Chapter 142) to protect against the risk of adverse development in claims reserves in the future. The amount of the actuarial reserve is disclosed in Note 13.
(e) Fair value measurements
The following table presents the assets measured at fair value and classified by level of the following fair value measurement hierarchy:
unadjusted quoted price in active markets for identical assets or liabilities (Level 1);
inputs other than quoted prices included within Level 1 that are observable for the asset or liability, either directly or indirectly (Level 2); and
inputs for the asset or liability that are not based on observable market data (Level 3).

Annual Report 2015. Singapore. Published 08/2016. © 2016 Chubb. Coverages underwritten by one or more subsidiary companies. Not all coverages available in all jurisdictions. Chubb® and its respective logos, and Chubb. Insured.TM are protected trademarks of Chubb.
43
22. Financial risk management (continued)
(e) Fair value measurements (continued)
Level 1 Level 2 Level 3 Total
S$ S$ S$ S$
As at 31 December 2015
Financial assets, available-for-sale 12,601,340 92,920,966 - 105,522,306
As at 31 December 2014
Financial assets, available-for-sale 11,086,959 91,069,148 - 102,156,107
The Company uses pricing services to estimate fair value measurements for the majority of our fixed maturities. The pricing services use market quotations for fixed maturities that have quoted prices in active markets; such securities are classified within Level 1. For fixed maturities that generally do not trade on a daily basis, the pricing services prepare estimates of fair value measurements using their pricing applications, which include available relevant market information, benchmark curves, benchmarking of like securities, sector groupings, and matrix pricing. Additional valuation factors that can be taken into account are nominal spreads, dollar basis, and liquidity adjustments. The pricing services evaluate each asset class based on relevant market and credit information, perceived market movements, and sector news. The market inputs used in the pricing evaluation, listed in the approximate order of priority include: benchmark yields, reported trades, broker/dealer quotes, issuer spreads, two-sided markets, benchmark securities, bids, offers, reference data, and industry and economic events. The extent of the use of each input is dependent on the asset class and the market conditions. Given the asset class, the priority of the use of inputs may change or some market inputs may not be relevant. Additionally, fixed maturities valuation is more subjective when markets are less liquid due to the lack of market based inputs (i.e., stale pricing), which may increase the potential that an investment’s estimated fair value is not reflective of the price at which an actual transaction would occur. The overwhelming majority of fixed maturities are classified within Level 2 because the most significant inputs used in the pricing techniques are observable.
(f) Insurance risk
The risk under any one insurance contract is the possibility that an insured event occurs and the uncertainty of the amount of the resulting claims. By the very nature of an insurance contract, this risk is random and therefore unpredictable.
The Company’s operations are diversified by line of business and the geographic spread of risk. A global approach to risk management allows the Company to underwrite and accept large insurance accounts.
Clearly defined underwriting authorities, standards and guidelines are in place in the Company. Experienced underwriting teams maintain underwriting discipline through the use of pricing models, sophisticated catastrophe and risk management methodologies, and strict risk selection criteria. Qualified actuaries from the region work closely with the underwriting teams to provide additional expertise in the underwriting process. Centrally-coordinated reinsurance management facilitates appropriate risk transfer and efficient cost-effective use of external reinsurance markets. Reinsurers utilised by the Company must meet certain financial experience requirements and are put through a stringent financial review process in order to be pre-approved by the Head Office’s Reinsurance Security Committee, comprising senior management personnel. As a result of these controls, reinsurance is placed with a select group of only the most financially secure and experienced companies in the reinsurance industry. Consistent approach to reserving practices and the settlement of claims are also ensured. In addition to these internal controls, the Company’s operating units and functional areas are subject to review by the corporate audit team that regularly carries out operational audits.
The concentration of insurance risk before and after reinsurance by territory in relation to the major lines of business is summarised below, with reference to the carrying amount of the outstanding claims reserves (gross and net of reinsurance):

Annual Report 2015. Singapore. Published 08/2016. © 2016 Chubb. Coverages underwritten by one or more subsidiary companies. Not all coverages available in all jurisdictions. Chubb® and its respective logos, and Chubb. Insured.TM are protected trademarks of Chubb.
44
22. Financial risk management (continued)
(f) Insurance risk (continued)
2015
Territory Financial
Lines General
liabilities Accident
and Health Fire Others Total
$ $ $ $ $ $
Singapore Gross 10,841,564 11,372,598 16,607,803 9,627,233 30,012,107 78,461,305
Net 2,413,510 1,852,440 6,559,409 2,402,780 3,813,580 17,041,719
Middle East Gross 216,709 97,914 5,867 159,211 140,037 619,738
Net 745,158 767,142 9,211 868,645 (908,069) 1,482,087
Other Asian Gross 1,982,313 2,300,248 17,004 3,075,580 22,939,139 30,314,284
Countries Net 892,268 625,248 - 287,387 3,927,146 5,732,049
Europe & Gross 989,627 700,786 - 501,704 1,632,169 3,824,286
USA Net 84,367 91,405 3,183 148,223 (22,201) 304,977
Total Gross 14,030,213 14,471,546 16,630,674 13,363,728 54,723,451 113,219,613
Net 4,135,303 3,336,235 6,571,803 3,707,035 6,810,455 24,560,832
2014
Territory Financial
Lines General
liabilities Accident
and Health Fire Others Total
$ $ $ $ $ $
Singapore Gross 11,208,665 6,517,540 17,421,992 5,410,078 16,012,862 56,571,137
Net 3,180,328 1,044,664 6,395,292 1,517,850 2,576,075 14,714,209
Middle East Gross 9,743 10,221 - 8,733 83,601 112,298
Net 4,780 10,182 - 1,678 113,261 129,901
Other Asian Gross 1,698,742 1,379,457 44,879 1,043,332 20,010,819 24,177,229
Countries Net 825,275 583,527 24,877 294,955 2,210,273 3,908,907
Europe & Gross 73,389 348,754 36 82,330 518,722 1,023,231
USA Net 36,000 252,239 20 28,436 266,199 582,894
Total Gross 12,990,539 8,255,972 17,466,907 6,544,473 36,626,004 81,883,895
Net 4,046,383 1,890,612 6,420,189 1,812,919 5,165,808 19,335,911

Annual Report 2015. Singapore. Published 08/2016. © 2016 Chubb. Coverages underwritten by one or more subsidiary companies. Not all coverages available in all jurisdictions. Chubb® and its respective logos, and Chubb. Insured.TM are protected trademarks of Chubb.
45
23. Related party transactions
In addition to the information disclosed elsewhere in the financial statements, the following significant transactions took place between the Company and related parties during the financial year at terms agreed between the parties:
(a) Sales and purchases of services
2015 2014
$ $
Business from related companies Premium income Commission expense Claims paid
6,953,971
(1,025,325) (3,564,186)
7,110,721
(935,292) (3,670,921)
Business to related companies Premiums ceded Commissions received Claims recovered
(115,587,277)
40,070,571 23,565,703
(99,413,552)
36,394,183 21,285,095
General expenses billed to regional office 3,881,960 2,780,223
General expenses allocated by regional office (6,105,713) (5,835,900)
Information processing expenses billed by a related company (1,497,845) (991,178)
Service fees billed by related companies Service fees billed to related companies
(1,328,874) 404,867
(390,688) 47,000
Outstanding balances at 31 December 2015, arising from sales/purchases of services, are set out in Notes 12 and 15, respectively.
(b) Key management personnel compensation
The key management personnel compensation includes salary, bonus and other emoluments (including benefits-in-kind) computed based on the cost incurred by the Company and when the Company did not incur any costs, the value of the benefit.
Key management personnel compensation is analysed as follows:
2015 2014
$ $
Salaries and other short-term employee benefits Share based remuneration expenses
3,770,638 290,819
3,686,568 278,876
4,061,457 3,965,444

Annual Report 2015. Singapore. Published 08/2016. © 2016 Chubb. Coverages underwritten by one or more subsidiary companies. Not all coverages available in all jurisdictions. Chubb® and its respective logos, and Chubb. Insured.TM are protected trademarks of Chubb.
46
24. Comparative figures
Certain comparative figures have been amended to be consistent with the current year’s presentation. The amendment relates to the classification between current and non-current for provision for premium refund. There is no impact to the net profit and net assets. The effect of the reclassification is as follows:
2014 As restated
2014 As previously
reported
$ $
Insurance liabilities and reinsurance assets Gross
Current: provision for premium refund
442,972
-
Non-current: provision for premium refund
2,523,412
2,966,384
2,966,384 2,966,384
25. New or revised accounting standards and interpretations
Certain new standards, amendments and interpretations to existing standards have been published, and are relevant for the Company’s accounting periods beginning on or after 1 January 2016 which the Company has not early adopted.
The management anticipates that the adoption of these new standards, amendments and interpretations to existing standards in the future periods will not have a material impact on the financial statements of the Company in the period of their initial adoption.
26. Events occurring after balance sheet date
On 1 July 2015, ACE Limited, the ultimate parent of ACE Insurance Limited, announced that the Boards of Directors of ACE Limited and The Chubb Corporation had unanimously approved a definitive agreement under which ACE would acquire Chubb. Following approval from the shareholders of both Corporations and receipt of all required regulatory approvals, ACE Limited completed the acquisition of The Chubb Corporation on 14 January 2016, and subsequently changed its name to Chubb Limited.
27. Authorisation of financial statements
These financial statements were authorised for issue in accordance with a resolution of the board of directors of ACE Insurance Limited on 28 April 2016.
Important Notes: On 1 May 2016, ACE Insurance Limited (ACE) acquired Federal Insurance Company, Singapore Branch. ACE has also changed its name to Chubb Insurance Singapore Limited. Annual Report 2015. Singapore. Published 08/2016. © 2016 Chubb. Coverages underwritten by one or more subsidiary companies. Not all coverages available in all jurisdictions. Chubb® and its respective logos, and Chubb. Insured.TM are protected trademarks of Chubb.
Chubb. Insured.TM
About Chubb in Singapore
Chubb is the world’s largest publicly traded property and casualty insurer. Chubb Insurance Singapore Limited, via acquisitions by its predecessor companies, has been present in Singapore since 1948. Chubb in Singapore provides risk management and underwriting expertise for all major classes of general insurance, including Property & Casualty, Marine, Liability, Financial Lines and Group Personal Accident insurance. As one of the leading providers of Accident & Health insurance through direct marketing, the company partners with financial institutions and other companies to tailor individual policies for their clients and employees. In addition, it offers a suite of customised Personal & Specialty insurance solutions to meet the needs of consumers.
Over the years, Chubb in Singapore has established strong client relationships by offering responsive service, developing innovative products and providing market leadership built on financial strength.
More information can be found at www.chubb.com/sg
Contact Us
Chubb Insurance Singapore Limited Co Regn. No.: 199702449H 138 Market Street #11-01 CapitaGreen Singapore 048946 O +65 6398 8000 F +65 6298 1055 www.chubb.com/sg