Embed Size (px)
Citation preview

ABC-MART, INC. Annual Report 2015
For the year ended February 28, 2015

Contents 1 Consolidated Balance Sheets
3 Consolidated Statements of Income
5 Consolidated Statements of Comprehensive Income
6 Consolidated Statements of Changes in Net Assets
7 Consolidated Statements of Cash Flows
9 Notes to Consolidated Financial Statements
Independent Auditors' Report

Consolidated Balance Sheets ABC-MART, INC. and consolidated subsidiaries As of February 28, 2015 and 2014
ASSETS
Millions of yen
2015 2014
Current Assets:
Cash and deposits (Notes 3, 5 and 12) ¥ 96,493 ¥ 78,884
Notes and accounts receivable – trade (Note 5) 7,873 6,463
Less - allowance for doubtful accounts (Note 5) (41) (30)
Net trade receivables 7,832 6,432
Inventories (Note 4) 49,367 39,455
Deferred tax assets (Note 9) 2,049 1,414
Other (Note 18) 4,555 3,355
Total current assets 160,298 129,542
Noncurrent assets:
Property, plant and equipment (Notes 15 and 16):
Buildings and structures (Notes 12 and 18) 25,395 22,758
Tools, furniture and fixtures 9,006 8,012
Land (Notes 12 and 18) 19,629 17,696
Constructions in progress 327 90
Other 438 593
Total 54,797 49,152
Less accumulated depreciation (18,681) (16,367)
Net property, plant and equipment 36,115 32,784
Intangible assets:
Trademark 2,948 2,682
Goodwill 7,511 7,195
Other (Note 15) 2,083 1,770
Total intangible assets 12,543 11,649
Investments and other assets:
Investment in securities (Notes 5 and 6) 60 125
Investment in non-consolidated subsidiaries (Note 5) 102 94
Long-term loans receivable (Note 5) 2,458 2,575
Lease and guarantee deposits (Notes 5, 11 and 18) 20,892 18,960
Other (Note 9) 1,208 1,150
Less-allowance for doubtful accounts (18) (1)
Total investments and other assets 24,704 22,904
Total noncurrent assets 73,363 67,338
Total assets ¥ 233,661 ¥ 196,881
See accompanying notes to consolidated financial statements.
- 1 -

Consolidated Balance Sheets ABC-MART, INC. and consolidated subsidiaries As of February 28, 2015 and 2014
LIABILITIES
Millions of yen
2015 2014
Current Liabilities:
Notes and accounts payable:
Trade (Notes 5 and 12) ¥ 14,176 ¥ 8,551
Facilities (Notes 5 and 12) 722 778
Short-term loans payable (Notes 5 and 8) 6,355 3,278
Current portion of long-term loans payable (Notes 5, 8 and 12) 1,000 1,002
Income taxes payable (Note 5) 9,815 7,113
Provision for bonuses 702 654
Provision 291 234
Asset retirement obligations (Note 11) 14 26
Other (Notes 8 and 18) 7,992 5,722
Total current liabilities 41,070 27,362
Noncurrent liabilities:
Convertible bonds (Notes 5 and 8) 33,000 33,000
Long-term loans payable (Notes 5, 8 and 12) 500 1,500
Provision 113 658
Net defined benefit liability (Note 10) 870 -
Asset retirement obligations (Note 11) 291 243
Other (Notes 8, 9 and 12) 2,280 2,197
Total noncurrent liabilities 37,056 37,599
Total liabilities 78,126 64,961
Commitments and contingent liabilities (Note 12)
NET ASSETS (Note 13)
Shareholders’ equity:
Common stock, authorized 334,500,000 shares, issued 75,294,429 shares
in 2015 and 2014 3,482 3,482
Capital surplus 7,488 7,488
Retained earnings 131,413 112,310
Treasury stock, at cost, 208 and 164 shares in 2015 and 2014, respectively (0) (0)
Total shareholders’ equity 142,384 123,281
Accumulated other comprehensive income (Note 14):
Net unrealized gains on available-for-sale securities 14 23
Foreign currency translation adjustments 12,683 8,241
Total accumulated other comprehensive income 12,697 8,265
Minority interests in consolidated subsidiaries 453 372
Total net assets 155,535 131,919
Total liabilities and net assets ¥ 233,661 ¥ 196,881
See accompanying notes to consolidated financial statements.
- 2 -

Consolidated Statements of Income ABC-MART, INC. and consolidated subsidiaries For the years ended February 28, 2015 and 2014
Millions of yen
2015 2014
Net sales ¥ 213,584 ¥ 188,045
Cost of sales 98,523 84,317
Gross profit 115,060 103,727
Selling, general and administrative expenses:
Packing and transportation expenses 2,435 2,162
Advertising expenses 6,311 7,263
Warehousing expenses 2,226 2,044
Directors' compensations, salaries and allowances 20,235 18,737
Bonuses 1,561 1,139
Provision for bonuses 696 647
Retirement benefit expenses (Note 10) 523 104
Legal and employee benefits expenses 2,775 2,418
Rents (Note 18) 19,885 17,738
Depreciation and amortization 4,019 3,885
Utilities expenses 2,189 2,050
Commission fee 4,144 3,461
Taxes and dues 873 873
Amortization of goodwill 1,161 1,023
Other 6,369 6,051
Total 75,408 69,601
Operating income ¥ 39,651 ¥ 34,126
(Continued)
- 3 -

Millions of yen
2015 2014
Other income (expenses):
Interest income ¥ 169 ¥ 79
Interest expenses (54) (53)
Foreign exchange gains - 60
Foreign exchange losses (67) -
Gain on cancellation of derivatives - 1
Loss on cancellation of derivatives - (1,051)
Rent income 743 664
Rent expenses (230) (347)
Advertising income 56 62
Gain on sales of noncurrent assets (Note 15) 4 0
Loss on retirement of noncurrent assets (Note 15) (171) (175)
Impairment loss (Note 16) (253) (263)
Loss on disposal of merchandise - (95)
Other, net 137 222
Total 333 (894)
Income before income taxes and minority interests 39,985 33,231
Income taxes (Note 9):
Current 16,100 13,598
Deferred (536) (319)
Total 15,564 13,278
Income before minority interests 24,421 19,952
Minority interests 47 (36)
Net income ¥ 24,373 ¥ 19,989
See accompanying notes to consolidated financial statements.
- 4 -

Consolidated Statements of Comprehensive Income ABC-MART, INC. and consolidated subsidiaries For the years ended February 28, 2015 and 2014
Millions of yen
2015 2014
Income before minority interests ¥ 24,421 ¥ 19,952
Other comprehensive income (Note 14):
Net unrealized gains (losses) on available-for-sale securities (8) 9
Foreign currency translation adjustments 4,474 6,113
Total other comprehensive income 4,466 6,122
Comprehensive Income 28,887 ¥ 26,075
Comprehensive income attributable to:
Shareholders of ABC-MART, INC. ¥ 28,806 ¥ 26,062
Minority interests 80 12
See accompanying notes to consolidated financial statements.
- 5 -
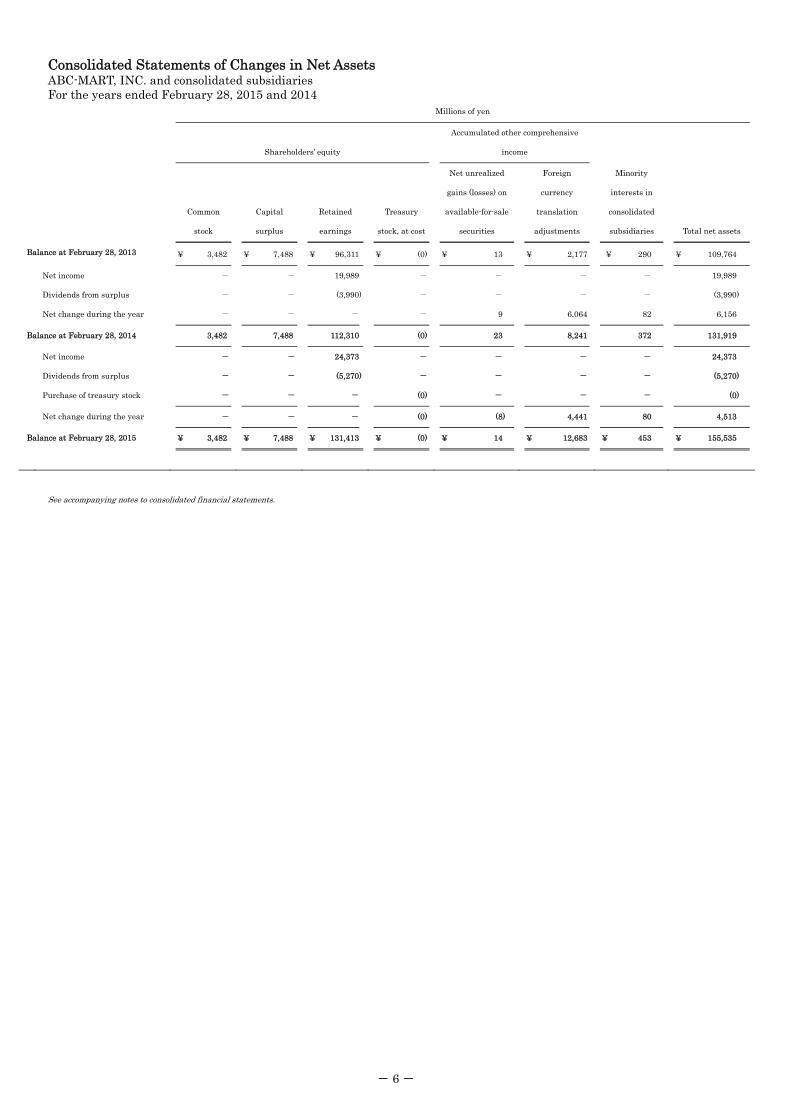
Consolidated Statements of Changes in Net Assets ABC-MART, INC. and consolidated subsidiaries For the years ended February 28, 2015 and 2014
Millions of yen
Shareholders’ equity
Accumulated other comprehensive
income
Common
stock
Capital
surplus
Retained
earnings
Treasury
stock, at cost
Net unrealized
gains (losses) on
available-for-sale
securities
Foreign
currency
translation
adjustments
Minority
interests in
consolidated
subsidiaries Total net assets
Balance at February 28, 2013 ¥ 3,482 ¥ 7,488 ¥ 96,311 ¥ (0) ¥ 13 ¥ 2,177 ¥ 290 ¥ 109,764
Net income - - 19,989 - - - - 19,989
Dividends from surplus - - (3,990) - - - - (3,990)
Net change during the year - - - - 9 6,064 82 6,156
Balance at February 28, 2014 3,482 7,488 112,310 (0) 23 8,241 372 131,919
Net income - - 24,373 - - - - 24,373
Dividends from surplus - - (5,270) - - - - (5,270)
Purchase of treasury stock - - - (0) - - - (0)
Net change during the year - - - (0) (8) 4,441 80 4,513
Balance at February 28, 2015 ¥ 3,482 ¥ 7,488 ¥ 131,413 ¥ (0) ¥ 14 ¥ 12,683 ¥ 453 ¥ 155,535
See accompanying notes to consolidated financial statements.
- 6 -
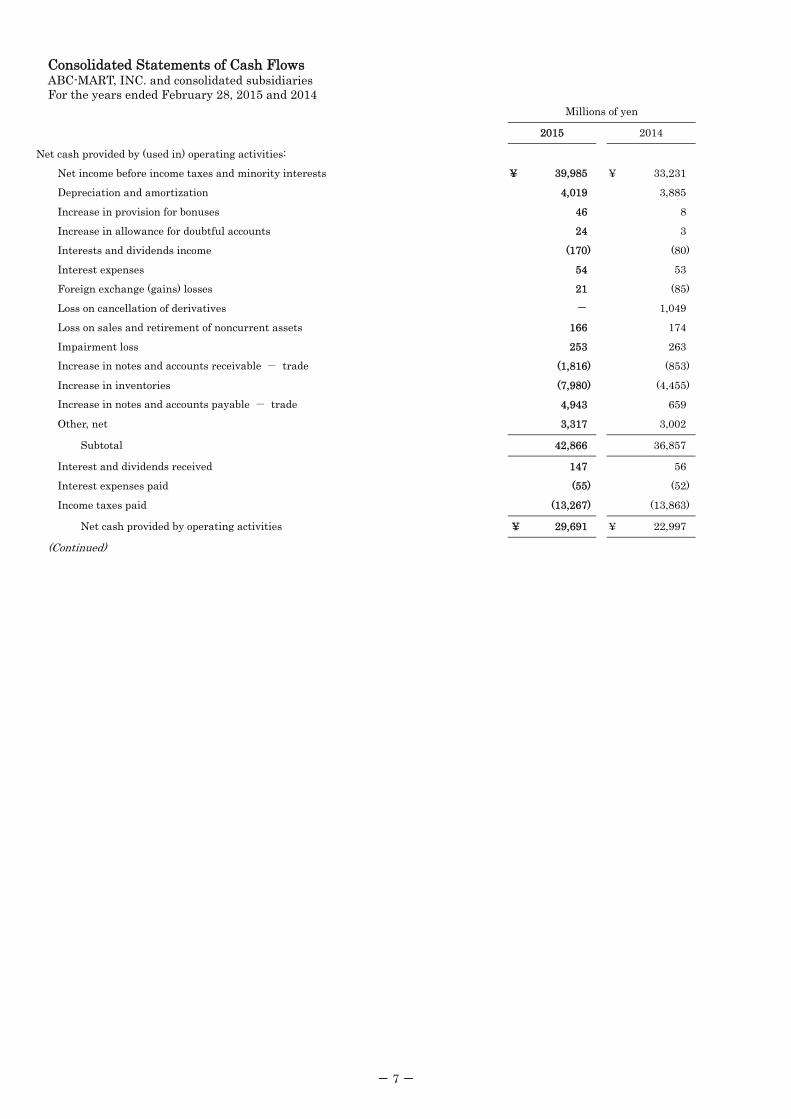
Consolidated Statements of Cash Flows ABC-MART, INC. and consolidated subsidiaries For the years ended February 28, 2015 and 2014
Millions of yen
2015 2014
Net cash provided by (used in) operating activities:
Net income before income taxes and minority interests ¥ 39,985 ¥ 33,231
Depreciation and amortization 4,019 3,885
Increase in provision for bonuses 46 8
Increase in allowance for doubtful accounts 24 3
Interests and dividends income (170) (80)
Interest expenses 54 53
Foreign exchange (gains) losses 21 (85)
Loss on cancellation of derivatives - 1,049
Loss on sales and retirement of noncurrent assets 166 174
Impairment loss 253 263
Increase in notes and accounts receivable - trade (1,816) (853)
Increase in inventories (7,980) (4,455)
Increase in notes and accounts payable - trade 4,943 659
Other, net 3,317 3,002
Subtotal 42,866 36,857
Interest and dividends received 147 56
Interest expenses paid (55) (52)
Income taxes paid (13,267) (13,863)
Net cash provided by operating activities ¥ 29,691 ¥ 22,997
(Continued)
- 7 -

Millions of yen
2015 2014
Net cash provided by (used in) investing activities:
Payment for time deposits ¥ (506) ¥ -
Proceeds from withdrawal of time deposits - 33
Payment for purchase of property, plant and equipment (6,099) (3,862)
Proceeds from sales of property, plant and equipment 5 4
Payment for purchase of intangible assets (366) (466)
Payment for removal of stores (89) (92)
Increase in loans receivable (65) (1,770)
Proceeds from collection of loans receivable 101 85
Payment for purchase of investment in a subsidiary (8) -
Payment for purchase of investment in a subsidiary resulting in change in scope of
consolidation
(1,314) -
Payment for lease and guarantee deposits (2,526) (1,993)
Proceeds from collection of lease and guarantee deposits 1,316 586
Other, net (16) (98)
Net cash used in investing activities (9,568) (7,573)
Net cash provided by (used in) financing activities:
Net increase (decrease) in short-term loans payable 2,617 (972)
Repayment of long-term loans payable (1,003) (1,002)
Cash dividends paid (5,267) (3,989)
Proceeds from share issuance to minority shareholders - 69
Other, net (22) (21)
Net cash used in financing activities (3,675) (5,916)
Effect of exchange rate changes on cash and cash equivalents 604 475
Net increase in cash and cash equivalents 17,051 9,983
Cash and cash equivalents at beginning of period 78,755 68,772
Cash and cash equivalents at end of period (Note 3) ¥ 95,807 ¥ 78,755
See accompanying notes to consolidated financial statements.
- 8 -

Notes to Consolidated Financial Statements ABC-MART, INC. and consolidated subsidiaries
1. Basis of Presentation and Financial Statement Translation The accompanying consolidated financial statements of ABC-MART, INC. and consolidated subsidiaries (“the Group”) are prepared on the
basis of accounting principles generally accepted in Japan, which are different in certain respects as to the application and disclosure
requirements of International Financial Reporting Standards (“IFRS”), and are compiled from the consolidated financial statements prepared
by ABC-MART, INC. (“the Company”) as required by the Financial Instruments and Exchange Act of Japan. Effective March 1, 2009, the
Company adopted the “Practical Solution on Unification of Accounting Policies Applied to Foreign Subsidiaries for Consolidated Financial
Statements” (PITF No. 18). In accordance with PITF No. 18, the accompanying consolidated financial statements for the years ended
February 28, 2015 and 2014 have been prepared by using the accounts of foreign consolidated subsidiaries prepared in accordance with either
IFRS or accounting principles generally accepted in the United States as adjusted for certain items.
In addition, for the convenience of readers outside Japan, the accompanying consolidated financial statements, including the notes thereof,
have been reclassified and contain additional information which is not required under accounting principles generally accepted in Japan.
As permitted under the Financial Instruments and Exchange Law of Japan, amounts of less than one million yen have been omitted. As a
result, the totals shown in the accompanying Consolidated Financial Statements do not necessarily agree with the sums of the individual
amounts. Certain reclassifications have been made to prior year balances in order to conform to the current year presentation.
2. Summary of Significant Accounting Policies (1) Basis of Consolidation
The accompanying Consolidated Financial Statements include the accounts of the Company and 12 subsidiaries (12 subsidiaries as of
February 28, 2014) with an exception of 3 non-consolidated subsidiaries due to immaterial impact on the consolidated financial statements in
net sales, total assets, aggregated amount of net income and retained earnings. The investments in the non-consolidated subsidiaries are not
accounted for by the equity-method because of the immaterial impact on the consolidated financial statements in aggregated amount of net
income and retained earnings, and therefore carried at cost (¥102 million and ¥94 million as of February 28, 2015 and 2014, respectively).
During the year ended February 28, 2015, the Company acquired a subsidiary of which the Company owns 100% of its shares. The
subsidiary is not included in scope of consolidation due to immaterial impact on the consolidated results.
The year end at ABC-MART KOREA, INC., ABC-MART TAIWAN, INC., LaCrosse Footwear, Inc. and its 6 subsidiaries is December 31.
The financial statements as of December 31 are used in preparing the consolidated financial statements for the subsidiaries. All material
transactions during the period from January 1 to balance sheet date are adjusted for in the consolidation process.
(2) Securities
Available-for-sale securities are classified into two categories, where (a) the fair value is available and (b) the fair value is not available.
(a) Securities whose fair value is available are valued at the quoted market price prevailing at the end of the year. Net unrealized gains or
losses on these securities are reported as a separate component of net assets at a net-of-tax amount. Cost of sales is determined using the
moving-average method.
(b) Securities whose fair value is not available are valued at cost and the cost is determined using the moving-average method.
(3) Inventories
Inventories held for sale in the ordinary course of business are stated at cost. The book value of inventories is reduced on the basis of declines
in profitability and is determined principally by the average method for merchandise, the FIFO method for finished goods, work in process and
raw materials and supplies in overseas subsidiaries, and the specific identification method for raw materials and supplies in the Company and
its domestic subsidiaries.
- 9 -

(4) Property, Plant and Equipment
(a) The Company and its domestic subsidiaries
Property, plant and equipment are stated at cost. Depreciation is calculated using the declining-balance method, except for the buildings
(excluding building facilities) acquired on or after April 1, 1998, which are depreciated based on the straight-line method.
Useful lives used for majority of assets are as follows:
Buildings and structures 7 to 50 years
Tools, furniture and fixtures 5 to 10 years
(b) Foreign subsidiaries:
Depreciation is calculated using the straight-line method.
(5) Intangible Assets
Intangible assets are amortized using the straight-line method. Software for internal use is amortized using the straight-line method over an
estimated useful life of five years. The useful life of goodwill is individually estimated based on a reasonable determination. Goodwill is
amortized using the straight-line method over the period determined.
(6) Leased assets
Depreciation of leased assets from finance lease transactions that are deemed to transfer ownership of the leased property is calculated using
the same method applied to noncurrent assets of which the Company has ownership. Depreciation of leased assets from finance lease
transactions that are not deemed to transfer ownership of the leased property is calculated using the straight-line method with no residual
value.
(7) Allowances for Doubtful Accounts
Allowances for doubtful accounts are provided in amounts management considers sufficient to cover possible losses on collection. With respect
to normal trade accounts receivable, it is stated at an amount based on the actual rate of historical bad debts, and for certain doubtful
receivables, the uncollectible amount is individually estimated.
(8) Provision for Bonuses
As a provision for the payment of bonuses to employees, an appropriate portion of the estimated total bonus payment requirement has been
accounted for in the year under review.
(9) Employees retirement benefit
(a) In determining the retirement benefit obligations, the Company adopts the benefit formula basis to attribute projected benefit obligations
to the year ended February 28, 2015.
(b) Actuarial differences are to be charged to expenses immediately when it occurs.
(10) Foreign Currency Translation
All assets and liabilities of the Company and its domestic consolidated subsidiaries denominated in foreign currencies are translated into
Japanese yen at the exchange rate in effect at the respective balance sheet dates. Translation gains or losses are included in the accompanying
Consolidated Statements of Income.
All balance sheet accounts of foreign subsidiaries are translated into Japanese yen at the exchange rate in effect at the respective balance
sheet dates except for shareholders’ equity, which is translated at the historical rates. All income and expense accounts are translated at the
average exchange rate for the period. The resulting translation adjustments are included in the accompanying Consolidated Balance Sheets
under “Foreign currency translation adjustments” and “Minority interests in consolidated subsidiaries.”
- 10 -

(11) Derivative Transactions and Hedge Accounting
Derivative financial instruments are valued at fair value.
(a) Hedge accounting
If derivative financial instruments are used as hedges and meet certain hedge criteria, recognition of gains or losses resulting from changes in
their fair value is deferred until the related losses or gains on the hedged items are recognized. Forward foreign exchange contracts which
meet specific matching criteria are translated at the foreign exchange rate stipulated in the contracts.
(b) Hedging instruments and hedged items
Hedging instruments – Derivative transactions (forward foreign exchange contracts)
Hedged items – Hedged items are primary trade payables denominated in foreign currencies which have risks associated with
adverse fluctuations in foreign currency.
(c) Hedge policy
Hedging transactions are being performed to mitigate future losses on the hedged items.
(d) Assessment of hedge effectiveness
Effectiveness of hedge is assessed by verifying if the foreign currency risks on the hedged items are mitigated.
(12) Cash and Cash Equivalents
Cash and cash equivalents in the accompanying Consolidated Statements of Cash Flows are comprised of cash on hand, demand deposits, and
short term investments with maturities of three months or less from the date of acquisition, that are liquid, readily convertible into cash, and
are subject to minimum risk of price fluctuation.
(13) Accounting for Consumption Taxes
The Japanese consumption taxes withheld and consumption taxes paid are not included in the accompanying Consolidated Statements of
Income.
- 11 -

3. Cash and Cash Equivalents
Cash and Cash equivalents as of February 28, 2015 and 2014 consist of the following:
Millions of yen
2015 2014
Cash and deposits ¥ 96,493 ¥ 78,884
Time deposits with maturities over three months (686) (128)
Cash and cash equivalents at end of period ¥ 95,807 ¥ 78,755
4. Inventories
Inventories as of February 28, 2015 and 2014 consist of the following:
Millions of yen
2015 2014
Merchandise and finished goods ¥ 48,362 ¥ 38,962
Work in process 44 13
Raw materials and supplies 960 479
Total ¥ 49,367 ¥ 39,455
5. Financial Instruments (1) Qualitative information on financial instruments
(a) Policies relating to financial instruments
The Group invests its funds mainly in short-term deposits and raises funds by loans from financial institutions and issuance of bonds.
Derivative transactions are foreign exchange forward contracts which are only used to avoid the risks described below. The Group does not
engage in derivative transactions for speculative purposes.
(b) Details of financial instruments and associated risk
Trade notes and accounts receivable, which are mostly related to tenant sales and credit card sales of commercial facilities, are exposed to
credit risk of customers.
Investment securities, which are mostly related to stocks of financial institutions, are exposed to market price volatility risk and credit
risk of issuers.
Investment in non-consolidated subsidiary does not have market price and is exposed to impairment risk due to financial result of the
subsidiary.
Long-term loans receivable, which are related to loans to business partners and leasehold contracts of stores, are exposed to credit risk of
borrowers.
Lease and guarantee deposits, which are mostly related to leasehold contracts of stores, are exposed to credit risk of lessors.
All notes and accounts payable and income taxes payable are due in one year.
Short-term loans payable are mostly related to funds used as payment of imported goods and Long-term loans payable are mostly related
to capital expenditures. Loans are generally borrowed with fixed rate and therefore, there is no interest rate risk.
Convertible bonds are related to funds used as mid-term capital investment and the term of redemption of the convertible bonds are 2
years and 11 months at the longest.
Derivative transactions are foreign exchange forward contracts which are used to mitigate the risk of currency exchange rates
fluctuations for receivables and payables denominated in foreign currencies. The Company also uses derivatives as hedging instruments,
which is described in Note 2. “Summary of Significant Accounting Policies”.
- 12 -

(c) Risk management systems relating to financial instruments
(i) Management of credit risk (risk relating to non-performance of a contract obligation by a counterparty, etc.)
With respect to trade receivables related to credit card sales, credit risk is fairly low because counterparties are group of financial
institutions. With respect to trade receivables related to tenant sales, as same as lease and guarantee deposits, Store Development
Department monitors the counterparty to reduce credit risk by early identification of a possible default caused by financial trouble of the
counterparty.
With respect to long-term loans receivable related to loans to business partners, quarterly monitoring of financial condition of the
borrowers are performed to reduce credit risk by early identification of a possible default caused by financial trouble.
The Company believes that the credit risk under derivative transactions is fairly low because counterparties of derivative
transactions are limited to financial institutions with a high credit rating.
(ii) Management of market risks (risks associated with fluctuations in foreign currency exchange as well as interest rates, etc.)
With respect to investment securities and investment in non-consolidated subsidiary, the Group quarterly monitors fair values as well as
the financial status of issuers (counterparties).
Basic policy of derivative transactions are decided by the Board of Directors and Import Team in Accounting Department performs
and manages transactions. Balance of derivative transactions and status of gain and losses are periodically reported to the Board of
Directors.
(iii) Management of liquidity risks associated with the procurement of funds (the risk of being unable to make payments on due dates)
The Group manages its liquidity risk by adequate preparation and update of financial planning depending on the status of funds.
(d) Supplementary explanation for fair values, etc. of financial instruments
Fair values of financial instruments are determined by market prices. If no market price is available, the fair value is based on the value that
is calculated in a reasonable manner. The determination of such value contains variable factors, and the adoption of wide ranging and
differing assumptions may cause values to change.
(2) Fair Value of financial instruments
Book values and fair values of the financial instruments on the Consolidated Balance Sheet on February 28, 2015 and 2014 are as follows.
Financial instruments whose fair value is deemed highly difficult to measure are excluded from the table.
Millions of yen
2015
Book value Fair value Difference
Cash and deposits ¥ 96,493 ¥ 96,493 ¥ -
Notes and accounts receivable – trade 7,873
Less - allowance for doubtful accounts (41)
Net trade receivables 7,832 7,832 -
Investment in securities 40 40 -
Long-term loans receivable 2,458 2,490 31
Lease and guarantee deposits 17,858 17,033 (825)
Total assets 124,683 123,889 (793)
Notes and accounts payable – trade 14,176 14,176 -
Notes payable – facilities 722 722 -
Short-term loans payable 6,355 6,355 -
Income taxes payable 9,815 9,815 -
Convertible bonds 33,000 48,592 15,592
Long-term loans payable (including current portion) 1,500 1,505 5
Total liabilities ¥ 65,569 ¥ 81,167 ¥ 15,597
- 13 -

Millions of yen
2014
Book value Fair value Difference
Cash and deposits ¥ 78,884 ¥ 78,884 ¥ -
Notes and accounts receivable – trade 6,463
Less - allowance for doubtful accounts (30)
Net trade receivables 6,432 6,432 -
Investment in securities 105 105 -
Long-term loans receivable 2,575 2,600 24
Lease and guarantee deposits 15,232 14,505 (727)
Total assets 103,229 102,527 (702)
Notes and accounts payable – trade 8,551 8,551 -
Notes payable – facilities 778 778 -
Short-term loans payable 3,278 3,278 -
Income taxes payable 7,113 7,113 -
Convertible bonds 33,000 37,042 4,042
Long-term loans payable (including current portion) 2,502 2,513 10
Total liabilities ¥ 55,224 ¥ 59,277 ¥ 4,053
Note 1: Items relating to the calculation of the fair value of financial instruments
(Assets)
(1) Cash and deposits and notes and accounts receivable, trade
Given that those items are of short duration, their current value approximates their book value, and therefore the fair value is deemed to
be that book value.
(2) Investment securities
Fair value of equity securities is based on quoted market prices. Additional information on securities classified by holding purpose is
presented in Note 2. “Summary of Significant Accounting Policies”.
(3) Long-term loans receivable
The fair value of long-term loans receivable is based on the present value, which is obtained by discounting the total of principal and
interest by the interest rate that would be applied if similar new loans were entered into.
(4) Lease and guarantee deposits
Given that lease and guarantee deposits are considered redeemable after a fixed period, their market value is calculated at a present
value discounted across the period to maturity at the government bonds interest rates closest to the maturity date.
(Liabilities)
(1) Notes and accounts payable – trade, notes payable – facilities, short-term loans payable and income taxes payable
Given that those items are of short duration, their current value approximates their book value, and therefore the fair value is deemed to
be that book value.
(2) Convertible bonds
The fair value of convertible bonds is based on market price.
(3) Long-term loans payable (including current portion)
The fair value of long-term loans payable is based on the present value, which is obtained by discounting the total of principal and
interest by the interest rate that would be applied if similar new borrowings were entered into.
- 14 -

Note 2: Items for which fair value is deemed highly difficult to measure
Millions of yen
2015 2014
Investment in securities:
Non-listed securities (*1) ¥ 20 ¥ 20
Investment in non-consolidated subsidiary:
Non-listed securities (*2) 102 94
Lease and guarantee deposits (*3) 3,033 3,727
(*1) Non-listed securities classified as investment securities are not included in “Investment securities” in the tables of fair value of financial
instruments above since determining their estimated fair values was deemed to be highly difficult, due to the fact that these do not have
market prices.
(*2) Investment in non-consolidated subsidiary are not included in the tables of fair value of financial instruments above since determining
their estimated fair values was deemed to be highly difficult, due to the fact that these do not have market prices.
(*3) These are not included in “Lease and guarantee deposits” in the tables of fair value of financial instruments above since determining
their fair values was deemed to be highly difficult, due to the fact that the amount to be refunded cannot be reasonably estimated.
Note 3: Redemption schedule for receivables and marketable securities with maturities
Millions of yen
2015
Within one year
After one year
within five years
After five years
within ten years After ten years
Deposits ¥ 96,028 ¥ - ¥ - ¥ -
Notes and accounts receivable – trade 7,873 - - -
Long-term loans receivable 160 641 1,622 114
Lease and guarantee deposits (*) 3,206 13,428 871 352
Total ¥ 107,269 ¥ 14,069 ¥ 2,494 ¥ 466
Millions of yen
2014
Within one year
After one year
within five years
After five years
within ten years After ten years
Deposits ¥ 78,573 ¥ - ¥ - ¥ -
Notes and accounts receivable – trade 6,463 - - -
Investment securities:
Available-for-securities with maturities:
Debt securities 63 - - -
Long-term loans receivable 75 630 1,693 174
Lease and guarantee deposits (*) 2,800 11,030 1,020 380
Total ¥ 87,976 ¥ 11,661 ¥ 2,714 ¥ 555
(*) Items for which fair values is deemed to be highly difficult, due to the fact that the amount to be refunded cannot be reasonably
estimated, are not included in “Lease and guarantee deposits”.
- 15 -

6. Securities Book value and acquisition cost of available-for-sale securities as of February 28, 2015 and 2014 are as follows:
Millions of yen
2015
Book value Acquisition cost Difference
Securities with book value exceeding acquisition cost:
Equity securities ¥ 40 ¥ 17 ¥ 22
Debt securities - - -
Other - - -
Sub-total 40 17 22
Securities with book value not exceeding acquisition cost:
Equity securities - - -
Debt securities - - -
Other 20 20 -
Sub-total 20 20 -
Total ¥ 60 ¥ 38 ¥ 22
Millions of yen
2014
Book value Acquisition cost Difference
Securities with book value exceeding acquisition cost:
Equity securities ¥ 31 ¥ 17 ¥ 14
Debt securities 73 49 23
Other - - -
Sub-total 105 67 37
Securities with book value not exceeding acquisition cost:
Equity securities - - -
Debt securities - - -
Other 20 20 -
Sub-total 20 20 -
Total ¥ 125 ¥ 87 ¥ 37
- 16 -

7. Leases (1) Operating leases
The amounts of outstanding future lease payments under lease agreements other than finance leases, which are non-cancelable, including the
interest portion, as of February 28, 2015 and 2014 are as follows:
Millions of yen
2015 2014
Due within one year ¥ 2,337 ¥ 1,692
Due after one year 4,243 4,010
Total ¥ 6,581 ¥ 5,703
8. Short-Term and Long-Term Debt Short-term and long-term debt as of February 28, 2015 and 2014 consist of the following:
Millions of yen
2015 2014
Short-term loans payable ¥ 6,355 ¥ 3,278
Current portion of long-term loans payable 1,000 1,002
Current portion of lease obligations 21 21
Long-term loans payable (excluding current portion) 500 1,500
Lease obligations (excluding current portion) 16 38
Convertible bonds 33,000 33,000
Total short-term and long-term debt ¥ 40,893 ¥ 38,840
Weighted-average rate of interest:
Short-term loans payable 0.78% 0.49%
Current portion of long-term loans payable 0.88% 0.88%
Current portion of lease obligations 1.91% 1.90%
Long-term loans payable (excluding current
portion)
0.88% 0.88%
Lease obligations (excluding current portion) 1.98% 1.92%
Convertible bonds - -
- 17 -

On February 5, 2013, the Company issued ¥ 33,000 million of Euro-yen convertible bonds with stock acquisition rights due in 2018. Summary
of the convertible bonds with stock acquisition right are as follows:
Type of stock to be issued upon conversion Common stock of ABC-MART, INC.
Issue price of stock acquisition rights -
Conversion price (yen) (Note 1) ¥ 4,588
Number of shares of common stock (Note 2) 7,192,676
Issue price of bonds (millions of yen) ¥ 33,000
Common stock issued upon conversion -
Percentage of stock acquisition rights granted 100%
Exercise period of conversion February 19, 2013 to January 22, 2018
Pledge Unsecured
Redemption date February 5, 2018
Balance of stock acquisition rights as of February 28, 2015 -
Note 1: Conversion price has been changed from ¥ 4,588 to ¥ 4,556.50 on March 1, 2015 because the approval of a year-end cash dividend by the shareholders at the meeting held on May 27, 2015 corresponds to the adjustment clause of bonds guideline.
Note 2: Numbers of shares of common stock are calculated on the assumption that all convertible bonds with stock acquisition rights are
converted as of February 28, 2015.
Note 3: Exercise of a stock acquisition right causes the corresponding bond to be cancelled in lieu of a cash payment of purchase of shares,
and the amount of the convertible bonds with stock acquisition right is the same as the amount of issuance.
The aggregate annual maturities of long-term debt including convertible bonds within 5 years after the years of February 28, 2015 are
summarized as follows:
Year ending February 28 or 29,
Millions of yen
2015
2017 ¥ 500
2018 33,000
2019 -
2020 -
Total long-term debt ¥ 33,500
- 18 -

9. Income Taxes (1) The significant components of deferred tax assets and liabilities as of February 28, 2015 and 2014 are as follows:
Millions of yen
2015 2014
Deferred tax assets:
Accrued enterprise tax ¥ 615 ¥ 490
Provision for bonuses 243 241
Depreciation and amortization 65 80
Allowance for doubtful accounts 17 12
Loss on valuation of inventories 771 320
Impairment loss 54 58
Tax laws adopted foreign subsidiaries 45 72
Accrued social insurance 35 34
Accrued business office tax 39 39
Asset retirement obligation 530 427
Allowance for accrued pension and severance costs - 285
Net defined benefit liability 321 -
Other 570 461
Total deferred tax assets before net of valuation
allowances
3,311 2,524
Valuation allowances (121) (133)
Total deferred tax assets 3,190 2,391
Deferred tax liabilities:
Property, plant and equipment (276) (261)
Intangible assets (1,662) (1,510)
Other (54) (36)
Total deferred tax liabilities (1,993) (1,808)
Net deferred tax assets ¥ 1,197 ¥ 583
(2) The reconciliation of the difference between the statutory tax rate and the effective tax rate for the years ended February 28, 2015 and
2014 are as follows:
2015 2014
Statutory tax rate 38.0% 38.0%
Adjustments:
Income taxes on retained earnings of family company 1.2% 2.5%
Tax rate difference in subsidiaries (1.5%) (1.3%)
Amortization of goodwill 1.1% 1.2%
Other 0.2% (0.4%)
Effective tax rate 38.9% 40.0%
(3) Correction of the amount of deferred tax assets and deferred tax liabilities due to the change of corporate tax rates, etc.
Following the promulgation on March 31, 2014 of “Act for Partial revision of the Income Tax Act, etc.” (Act No. 10 of 2014), the special
corporate tax for reconstruction were not be imposed from the years beginning on or after April l, 2014. As a result of this application, the
effective tax rates, which were used to calculate deferred income taxes, was reduced from 38.01% to 35.64% for temporary differences that are
expected to be eliminated in the year beginning on March 1, 2015. The impact of this change in tax rate on consolidated financial statements is
immaterial.
- 19 -

(4) Change in the income tax rate after the consolidated balance sheet date
“Act for Partial revision of the Income tax Act, etc.” (Act No. 9 of 2015) and “Act for Partial revision of the Local Taxation Act, etc.” (Act No.2 of
2015) were promulgated on March 31, 2015, and it has been decided that corporate tax rates will be reduced in the year beginning on or after
April 1, 2015. Associated with this, the statutory effective tax rate used for the calculation of deferred tax assets and deferred tax liabilities
will be reduced from the previous 35.64% to 33.06% for temporary differences that are expected to be realized in the year beginning on March
1, 2016 and to 32.30% for temporary differences that are expected to be realized in or after the year beginning on March 1, 2017. The impact of
this change in tax rate on consolidated financial statements is immaterial.
- 20 -
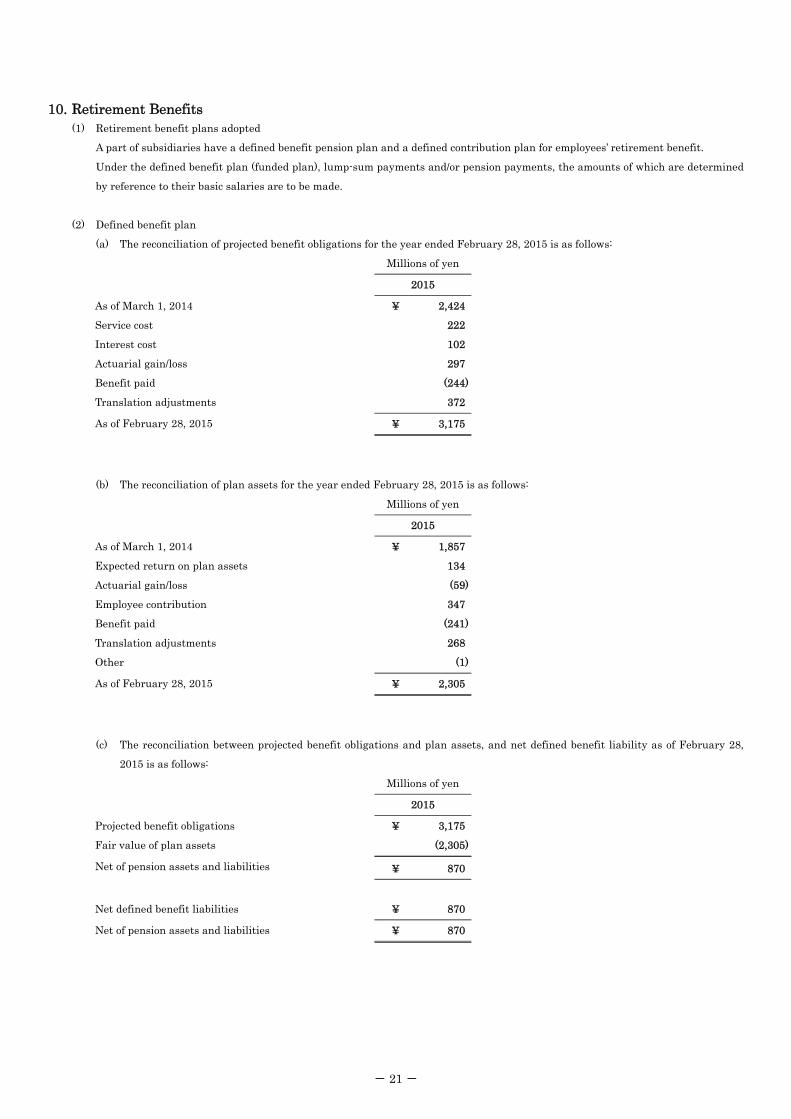
10. Retirement Benefits
(1) Retirement benefit plans adopted
A part of subsidiaries have a defined benefit pension plan and a defined contribution plan for employees’ retirement benefit.
Under the defined benefit plan (funded plan), lump-sum payments and/or pension payments, the amounts of which are determined
by reference to their basic salaries are to be made.
(2) Defined benefit plan
(a) The reconciliation of projected benefit obligations for the year ended February 28, 2015 is as follows:
Millions of yen
2015
As of March 1, 2014 ¥ 2,424
Service cost 222
Interest cost 102
Actuarial gain/loss 297
Benefit paid (244)
Translation adjustments 372
As of February 28, 2015 ¥ 3,175
(b) The reconciliation of plan assets for the year ended February 28, 2015 is as follows:
Millions of yen
2015
As of March 1, 2014 ¥ 1,857
Expected return on plan assets 134
Actuarial gain/loss (59)
Employee contribution 347
Benefit paid (241)
Translation adjustments 268
Other (1)
As of February 28, 2015 ¥ 2,305
(c) The reconciliation between projected benefit obligations and plan assets, and net defined benefit liability as of February 28,
2015 is as follows:
Millions of yen
2015
Projected benefit obligations ¥ 3,175
Fair value of plan assets (2,305)
Net of pension assets and liabilities ¥ 870
Net defined benefit liabilities ¥ 870
Net of pension assets and liabilities ¥ 870
- 21 -

(d) The components of net periodic benefit costs for the year ended February 28, 2015 are as follows:
Millions of yen
2015
Service cost ¥ 222
Interest cost 102
Expected return on plan assets (134)
Recognized actuarial loss 258
Other 1
Total ¥ 450
(e) The allocation of the plan assets as of the end of February 28, 2015 is as follows:
Millions of yen
2015
Debt securities 49.9%
Equity securities 33.0%
Cash and deposits 17.1%
Other -
Total 100.0%
In determining the expected rate of return on plan assets, the subsidiary considers the current and projected asset allocations, as
well as expected investment returns for each category of the plan assets.
(f) Assumptions used as of the end of February 28, 2015 are as follows (shown in weighted average percentage):
Discount rate 3.6%
Expected rate of return on plan assets 7.5%
Rate of salary increase 5.0%
(3) Defined contribution plan
The required contributions for the defined contribution plan for the consolidated subsidiaries are 73 million for the year ended
February 28, 2015.
- 22 -

11. Asset Retirement Obligations (1) Asset retirement obligations recorded in the Consolidated Financial Statements.
(a) Summary of asset retirement obligations
The Company recorded asset retirement obligations mainly related to the obligation to return stores to their original condition upon
termination of their lease contracts.
(b) Calculation method of the asset retirement obligations
In the calculation process of asset retirement obligations, the Company estimates terms of use between 3 and 6 years and use
government bond interest rates as discount rates.
(c) Changes in the total amounts of applicable asset retirement obligations in the year ended February 28, 2015 and 2014
Millions of yen
2015 2014
As of March 1 ¥ 270 ¥ 236
Increase due to acquisition of property, plant and equipment 34 20
Adjustment due to passage of time 3 10
Decrease due to settlement of asset retirement obligations (23) (22)
Others 20 25
As of February 28 ¥ 305 ¥ 270
(2) Asset retirement obligations not included in the consolidated balance sheets
Asset retirement obligations for leasehold contracts of certain offices and stores, for which the related amount could not be reasonably
estimated because the period of use of the properties is uncertain and there is no current plan to vacate the properties, are not included in
the consolidated balance sheets.
For certain lease and guarantee deposits, instead of recording asset retirement obligations as liability, a reasonable estimate of the
amount of deposits from rental properties, that cannot be recovered at the end of the leasehold contracts, is made, and the portion for the
corresponding year is recorded as expenses. Lease and guarantee deposits that are expected not to be recovered at the end of the
leasehold contracts are ¥916 million and ¥956 million as of February 28, 2015 and 2014, respectively.
- 23 -

12. Commitment and Contingencies (1) Assets pledged
The amount of assets pledged as collateral by the Company and corresponding liabilities as of February 28, 2015 and 2014 are as follows:
2015
Assets pledged: Millions of yen Corresponding liabilities: Millions of yen
Buildings and structures and
Land
¥ 711 Accounts payable ¥ 201
Other non-current liabilities 42
Cash and deposits ¥ 123 Accounts payable
Bank loans
¥ 60
271
Note: Total assets of LaCrosse Footwear, Inc. (¥15,007 million) are pledged for a commitment line agreement.
2014
Assets pledged: Millions of yen Corresponding liabilities: Millions of yen
Land ¥ 584 Accounts payable ¥ 79
Cash and deposits ¥ 114 Accounts payable
Bank loans
¥ 45
264
Note: Total assets of LaCrosse Footwear, Inc. (¥9,891 million) are pledged for a commitment line agreement.
(2) Notes payable with maturities
Notes payable with maturities at the end of the year are processed at the date of exchange. Following notes payable with maturities as of
February 28, 2015 are included in the consolidated balance sheet because February 28, 2015 was bank holiday.
Millions of yen
2015
Notes payable:
Trade ¥ 2,598
Facilities 162
- 24 -

13. Net Assets Net assets comprise three subsections, which are shareholders’ equity, accumulated other comprehensive income, and minority interests in
consolidated subsidiaries.
The Japanese Corporate Law (the “Law”) became effective on May 1, 2006, replacing the Japanese Commercial Code (the “Code”). The
Law is generally applicable to events and transactions occurring after April 30, 2006, and for the years ending after that date.
Under Japanese laws and regulations, the entire amount paid for new shares is required to be designated as common stock. However, a
company may, by a resolution of its board of directors, designate an amount not exceeding one-half of the prices of the new shares as additional
paid-in capital, which is included in capital surplus.
Under the Law, in cases where dividend distribution of surplus is made, the smaller of an amount equal to 10% of the dividend or the
excess, if any, of 25% of common stock over the total of additional paid-in capital and legal earnings reserve must be set aside as additional
paid-in capital or legal earnings reserve. Legal earnings reserve is included in retained earnings in the accompanying Consolidated Balance
Sheets.
Under the Code, a company is required to set aside an amount equal to at least 10% of the aggregate amount of cash dividends and other
cash appropriations as legal earnings reserve until the total of legal earnings reserve and additional paid-in capital equaled 25% of common
stock.
Under the Code, legal earnings reserve and additional paid-in capital could be used to eliminate or reduce a deficit by a resolution of the
shareholders’ meeting or could be capitalized by a resolution of the board of directors. Under the Law, both of these appropriations generally
require a resolution of the shareholders’ meeting.
Additional paid-in capital and legal earnings reserve may not be distributed as dividends. Under the Code, however, on condition that
the total amount of legal earnings reserve and additional paid-in capital remained equal to or exceeded 25% of common stock, they were
available for distribution by a resolution of the shareholders’ meeting. Under the Law, all additional paid-in capital and all legal earnings
reserve may be transferred to other capital surplus and retained earnings, respectively, which are potentially available for dividends.
The maximum amount that a company can distribute as dividends is calculated based on the Non-Consolidated Financial Statements of the
Company in accordance with the Law.
At the annual shareholders’ meeting, held on May 27, 2015, the shareholders approved cash dividends amounting to ¥4,517 million.
Such appropriations have not been accrued in the Consolidated Financial Statements as of February 28, 2015. Such appropriations are rec-
ognized in the period in which they are approved by the shareholders.
- 25 -

14. Other comprehensive income The following table presents reclassification adjustments and tax effects allocated to each component of other comprehensive income for the
year ended February 28, 2015 and 2014:
Millions of yen
2015 2014
Net unrealized gains (losses) on available-for-sale securities:
Amount arising during the year ¥ (25) ¥ 15
Reclassification adjustments for gains and losses included in net income 10 -
Net unrealized gains (losses) on available-for-sale securities before tax (14) 15
Tax effects 6 (6)
Net unrealized gains (losses) on available-for-sale securities (8) 9
Foreign currency translation adjustments:
Amount arising during the year 4,474 6,113
Total other comprehensive income ¥ 4,466 ¥ 6,122
15. Supplementary profit and loss information (1) Components of gain on sales of noncurrent assets for the years ended February 28, 2015 and 2014 are as follows:
Millions of yen
2015 2014
Tools, furniture and fixtures ¥ - ¥ 0
Vehicles 4 0
Total ¥ 4 ¥ 0
(2) Components of loss on retirement of noncurrent assets for the years ended February 28, 2015 and 2014 are as follows:
Millions of yen
2015 2014
Buildings and structures ¥ 10 ¥ 27
Tools, furniture and fixtures 79 61
Vehicles 5 -
Software 1 3
Store removal expenses 75 81
Total ¥ 171 ¥ 175
- 26 -

16. Impairment loss on property, plant and equipment For the years ended February 28, 2015 and 2014, the Company recognized ¥253 million and ¥263 million of impairment loss, respectively, on
the following groups of assets:
Millions of yen
Description Location Classification 2015
Stores Shinjuku, Tokyo and other 67 stores (Close, 12
stores and renewals, 55 stores).
Buildings ¥ 233
Tools, furniture and fixtures 20
Total impairment loss ¥ 253
Millions of yen
Description Location Classification 2014
Stores Utazu town, Ayauta, Kagawa and other 75 stores
(Close, 21 stores and renewals, 54 stores).
Buildings ¥ 247
Tools, furniture and fixtures 16
Total impairment loss ¥ 263
The Company groups its fixed assets by store, which is the minimum cash-generating unit. The book values of stores which are expected to
close or renew, or which incurred consecutive operating losses were reduced to recoverable amounts, and such deducted amounts were
recorded as an impairment loss. Values in use were used as recoverable amounts and the values in use are calculated as nil.
17. Per Share Information Net income and cash dividends per share for the years ended February 28, 2015 and 2014, and net assets per share as of February 28, 2015
and 2014 are as follows:
Yen
2015 2014
Net income per share:
Basic ¥ 323.71 ¥ 265.48
Diluted (*) 295.49 242.33
Net assets per share:
Basic ¥ 2,059.68 ¥ 1,747.10
Cash dividends per share ¥ 100.00 ¥ 55.00
Basis for the calculation of basic and diluted net income per share for the years ended February 28, 2015 and 2014 are as follows:
Millions of yen
2015 2014
Basic:
Net income ¥ 24,373 ¥ 19,989
Net income pertaining to common shareholders 24,373 19,989
Weighted-average number of shares of common
stock outstanding (shares) 75,294,263 75,294,265
Diluted:
Adjustments of net income - -
Effect of dilutive securities – convertible bonds
(shares)
7,192,676 7,192,676
Note: There is no item which had not been included in the calculation of diluted net income per share due to no dilutive effect.
- 27 -

18. Related Party Transaction Information of the related parties is as follows:
Related party Classification Address
Capital and
investments Business
Voting rights
(held)
Masahiro Miki Major shareholder - - - Directly
28.39%
Michiko Miki Major shareholder - - - Directly
12.59%
E.M Planning, LLC.
Company in which major
shareholders and their
relatives own majority of
voting rights
Shibuya
ward,
Tokyo
¥ 10 million Real estate Directly
27.39%
Hamanishi Building Co.
Company in which major
shareholders and their
relatives own majority of
voting rights
Nishi
ward,
Yokohama
¥ 43 million Real estate -
- 28 -

Transactions between the Company and the related parties for the years ended February 28, 2015 and 2014 are as follows:
Millions of yen
2015 2014
Balance of the transactions:
Masahiro Miki:
Prepaid expense ¥ 17 ¥ 16
Lease and guarantee deposits 147 147
Michiko Miki:
Prepaid expense 14 14
Lease and guarantee deposits 97 97
E.M Planning, LLC.:
Prepaid expense 40 39
Lease and guarantee deposits 378 377
Accrued expenses 0 0
Hamanishi Building Co.:
Prepaid expense 17 16
Lease and guarantee deposits 160 160
Transaction amounts:
Masahiro Miki:
Leasing of buildings ¥ 191 ¥ 191
Transferee of real-estate 1,891 -
Michiko Miki:
Leasing of buildings 165 165
E.M Planning, LLC.:
Leasing of buildings 458 436
Advances - 28,800
Receipt of commission - 0
Hamanishi Building Co.:
Leasing of buildings 192 192
Note 1:
(1) Monthly rent and lease deposit in lease contracts are determined based on prevailing market prices. A part of leasing transactions of
buildings is nominally conducted via trust bank.
(2) Purchase price of the real-estate are determined based on appraisal of real estate appraiser.
Note 2: The transaction amount is exclusive of consumption taxes.
- 29 -

19. Segment Information (1) Overview of reportable segments
With respect to its reportable segments, the Company is able to obtain delineated financial data from its structural units. Its segments are
subject to periodical review for the purpose of making decisions on allocation of managerial resources and evaluating business performance by
the Board of Directors.
The Group operates shoes retail stores, “ABC-MART” all over the world and sells retail products mainly shoes. In Japan, The Company,
ABC-MART, INC., operates its business, and in overseas, ABC-MART, KOREA, ABC-MART, TAIWAN and LaCrosse Footwear, Inc. (U.S.A)
operate their business independently as management units. Therefore, the Group consists of geographical reportable segments such as
“Domestic” and “Overseas”. Each reportable segment sells shoes and other shoes related clothing and accessories.
(2) Calculation methodology for revenues from operations, income or losses, assets and liabilities, and other items for each reportable
segment
The accounting treatment of each reportable segment is in line with Note 2. “Summary of Significant Accounting Policies”. Segment income as
reported in this section is based on operating income. Intersegment revenues and transfers are calculated at prevailing market prices.
- 30 -

(3) Information on sales, income, assets and other monetary items for each reportable segment
Millions of yen
2015
Reportable segments
Adjustments
Consolidated
total Domestic Overseas Total
Sales:
Customers ¥ 159,456 ¥ 54,128 ¥ 213,584 ¥ - ¥ 213,584
Intersegment 669 238 908 (908) -
Total revenue ¥ 160,126 ¥ 54,366 ¥ 214,492 ¥ (908) ¥ 213,584
Segment income ¥ 36,124 ¥ 3,495 ¥ 39,620 ¥ 31 ¥ 39,651
Segment assets 174,283 59,558 233,842 (180) 233,661
Other items:
Depreciation and amortization 2,274 1,744 4,019 - 4,019
Amortization of goodwill - 1,161 1,161 - 1,161
Net increase in property, plant
and equipment and intangible
assets
5,573 2,906 8,480 - 8,480
Millions of yen
2014
Reportable segments
Adjustments
Consolidated
total Domestic Overseas Total
Sales:
Customers ¥ 145,187 ¥ 42,857 ¥ 188,045 ¥ - ¥ 188,045
Intersegment 534 233 768 (768) -
Total revenue ¥ 145,721 ¥ 43,091 ¥ 188,813 ¥ (768) ¥ 188,045
Segment income ¥ 31,358 ¥ 2,782 ¥ 34,140 ¥ (14) ¥ 34,126
Segment assets 149,087 47,903 196,991 (110) 196,881
Other items:
Depreciation and amortization 2,349 1,536 3,885 - 3,885
Amortization of goodwill - 1,023 1,023 - 1,023
Net increase in property, plant
and equipment and intangible
assets 2,991 1,977 4,969 - 4,969
Note 1: The adjustments of ¥31 million and ¥(14) million for segment income and ¥(180) million and ¥(110) million for segment assets are
eliminations of intersegment transactions for the years ended February 28, 2015and 2014, respectively.
Note 2: Segment income and segment assets are reconciled with the operating income in the Consolidated Statements of Income and total
assets in Consolidated Balance Sheet, respectively.
- 31 -

(Related information)
(1) Information by products and services
Information is omitted since sales to customers of single category of products and services exceed 90% of consolidated net sales.
(2) Information by region
Information is omitted since it is described in the segment information.
(3) Information by major customers
Information is omitted since there is no customer accounting for 10% or more of consolidated net sales.
(4) Information regarding impairment loss on fixed assets by reportable segment for the year ended February 28, 2015 and 2014 is as
follows:
Millions of yen
2015
Domestic Overseas Total Adjustments
Consolidated
total
Impairment loss ¥ 249 ¥ 4 ¥ 253 ¥ - ¥ 253
Millions of yen
2014
Domestic Overseas Total Adjustments
Consolidated
total
Impairment loss ¥ 263 ¥ - ¥ 263 ¥ - ¥ 263
(5) Information on amortization and outstanding balance of goodwill by reportable segment for the year ended February 28, 2015 and 2014 is
as follows:
Millions of yen
2015
Domestic Overseas Total Adjustments
Consolidated
total
Amortization ¥ - ¥ 1,161 ¥ 1,161 ¥ - ¥ 1,161
Balance at the end of year ¥ - ¥ 7,511 ¥ 7,511 ¥ - ¥ 7,511
Millions of yen
2014
Domestic Overseas Total Adjustments
Consolidated
total
Amortization ¥ - ¥ 1,023 ¥ 1,023 ¥ - ¥ 1,023
Balance at the end of year ¥ - ¥ 7,195 ¥ 7,195 ¥ - ¥ 7,195
(6) Information regarding gain on negative goodwill by reportable segment
None
20. Subsequent Event Subsequent to February 28, 2015, the Company’s Board of Directors declared a year-end cash dividend of ¥ 4,517 million to be payable on May
28, 2015 to shareholders on record on February 28, 2015. The dividend declared was approved by the shareholders at the meeting held on May
27, 2015.
- 32 -


ABC-MART, INC. Registered office: 11-5, Jinnan 1-chome, Shibuya-ku, Tokyo 150-0041, Japan Head office: 19th Floor, Shibuya Mark City West,
12-1, Dogenzaka 1- chome, Shibuya-ku, Tokyo 150-0043, Japan Telephone: +81-3-3476-5452 URL: http://www.abc-mart.co.jp/ir/